life cycle based evaluation of harvested rainwater use in toilets and for irrigation
TRANSCRIPT

lable at ScienceDirect
Journal of Cleaner Production 95 (2015) 311e321
Contents lists avai
Journal of Cleaner Production
journal homepage: www.elsevier .com/locate/ jc lepro
Life cycle based evaluation of harvested rainwater use in toiletsand for irrigation
Jay Devkota, Hannah Schlachter, Defne Apul*
2801 W. Bancroft St. MS 307, Department of Civil Engineering, University of Toledo, Toledo, OH 43606, USA
a r t i c l e i n f o
Article history:Received 21 December 2013Received in revised form7 February 2015Accepted 8 February 2015Available online 17 February 2015
Keywords:Rainwater harvestingLife cycle assessmentIrrigationToilet flushingDormitoryNew versus renovated building
* Corresponding author. Tel.: þ1 419 530 8132; faxE-mail address: [email protected] (D. Apul)
http://dx.doi.org/10.1016/j.jclepro.2015.02.0210959-6526/© 2015 Elsevier Ltd. All rights reserved.
a b s t r a c t
Harvested rainwater is an alternative water source for buildings, especially for non-potable uses such asirrigation and toilet flushing. While rainwater harvesting is perceived as a sustainable design approach,there is limited information on the environmental and economic performance of this technology. Toaddress this literature gap, life cycle assessment and life cycle costing tools were applied for a dormitorythat could potentially use harvested rainwater to flush toilets or to irrigate the lawn. Five scenarios weremodeled including a new versus renovated building and irrigation versus toilet flushing water end use.The rainwater cisterns for all the scenarios were sized using the Yield After Spillage approach and longterm daily precipitation of Toledo. Energy and greenhouse gas emissions were calculated using EconomicInput Output Life Cycle Assessment (for construction phase and energy use by pump) and GaBi (for waterand wastewater treatment) databases. The life cycle environmental impacts and costs were estimatedand compared to the business as usual scenario, where the water supply demands are met by munici-pally supplied potable water in a combined or separate sanitary sewer network. It was discovered thatenergy and greenhouse gas emission payback periods can be achieved for almost every scenario. Yet costpayback periods of implementing harvested rainwater were found to be longer than the life time of thebuilding except for two scenarios: using rainwater for irrigation in a renovation project and usingrainwater for toilet flushing in a new construction project. These two scenarios had the lowest cost,energy and greenhouse gas emission impacts among all scenarios modeled. Reducing occupancy tomatch toilet flushing demand increased the per person impact. However, in general, the per personimpacts were much lower than a person's impact from driving or electricity use. While separate sewersdivert the stormwater runoff to the water bodies and thereby prevent the environmental problemsresulting from combined sewer overflows, a rainwater harvesting system connected to separate sewerswas found to reduce the energy and greenhouse gas emissions less than so if the rainwater harvestingsystem were connected to combined sewers.
© 2015 Elsevier Ltd. All rights reserved.
1. Introduction
Municipalities supply cities with a single quality of water forpotable as well as non-potable purposes. Harvested rainwater is analternative water source for buildings, especially for non-potableuses such as irrigation and toilet flushing. Rainwater harvesting isperceived as a sustainable design approach because it is expected toimprove the resiliency and the efficiency of the infrastructure bydecentralizing the water source, matching water quality to itsintended use (and thereby not over-treating the water), and by
: þ1 419 530 8116..
reducing the volume of water pumped long distances (Apul, 2010).In the United States, indoor and outdoor residential water use av-erages 0.382 m3 (382 L) per day per person and 19% and 25% of thisamount are used for toilet flushing and lawn irrigation, respectively(Vickers, 2001). Therefore, major reductions in municipal potablewater demand are possible by using harvested rainwater as thewater source for irrigation and toilet flushing.
Rainwater harvesting is also helpful for urban stormwatermanagement. Rainwater is considered a nuisance for urban areasand our infrastructure is designed to convey storm water offsitetypically to surface water but in some cases to a wastewatertreatment plant. Approximately 800 cities in the U.S have combinedsewer systems in which both the sewage from buildings and rain-water runoff from impervious areas are directed towards the
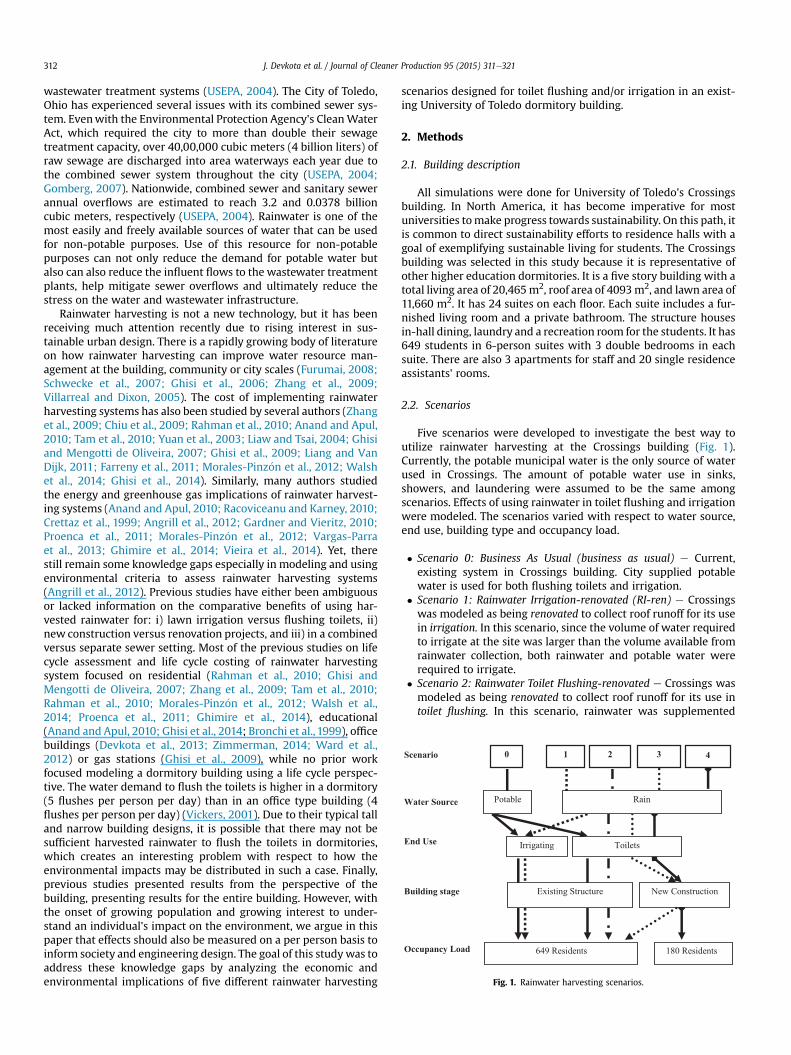
Fig. 1. Rainwater harvesting scenarios.
J. Devkota et al. / Journal of Cleaner Production 95 (2015) 311e321312
wastewater treatment systems (USEPA, 2004). The City of Toledo,Ohio has experienced several issues with its combined sewer sys-tem. Evenwith the Environmental Protection Agency's CleanWaterAct, which required the city to more than double their sewagetreatment capacity, over 40,00,000 cubic meters (4 billion liters) ofraw sewage are discharged into area waterways each year due tothe combined sewer system throughout the city (USEPA, 2004;Gomberg, 2007). Nationwide, combined sewer and sanitary sewerannual overflows are estimated to reach 3.2 and 0.0378 billioncubic meters, respectively (USEPA, 2004). Rainwater is one of themost easily and freely available sources of water that can be usedfor non-potable purposes. Use of this resource for non-potablepurposes can not only reduce the demand for potable water butalso can also reduce the influent flows to the wastewater treatmentplants, help mitigate sewer overflows and ultimately reduce thestress on the water and wastewater infrastructure.
Rainwater harvesting is not a new technology, but it has beenreceiving much attention recently due to rising interest in sus-tainable urban design. There is a rapidly growing body of literatureon how rainwater harvesting can improve water resource man-agement at the building, community or city scales (Furumai, 2008;Schwecke et al., 2007; Ghisi et al., 2006; Zhang et al., 2009;Villarreal and Dixon, 2005). The cost of implementing rainwaterharvesting systems has also been studied by several authors (Zhanget al., 2009; Chiu et al., 2009; Rahman et al., 2010; Anand and Apul,2010; Tam et al., 2010; Yuan et al., 2003; Liaw and Tsai, 2004; Ghisiand Mengotti de Oliveira, 2007; Ghisi et al., 2009; Liang and VanDijk, 2011; Farreny et al., 2011; Morales-Pinz�on et al., 2012; Walshet al., 2014; Ghisi et al., 2014). Similarly, many authors studiedthe energy and greenhouse gas implications of rainwater harvest-ing systems (Anand and Apul, 2010; Racoviceanu and Karney, 2010;Crettaz et al., 1999; Angrill et al., 2012; Gardner and Vieritz, 2010;Proenca et al., 2011; Morales-Pinz�on et al., 2012; Vargas-Parraet al., 2013; Ghimire et al., 2014; Vieira et al., 2014). Yet, therestill remain some knowledge gaps especially in modeling and usingenvironmental criteria to assess rainwater harvesting systems(Angrill et al., 2012). Previous studies have either been ambiguousor lacked information on the comparative benefits of using har-vested rainwater for: i) lawn irrigation versus flushing toilets, ii)new construction versus renovation projects, and iii) in a combinedversus separate sewer setting. Most of the previous studies on lifecycle assessment and life cycle costing of rainwater harvestingsystem focused on residential (Rahman et al., 2010; Ghisi andMengotti de Oliveira, 2007; Zhang et al., 2009; Tam et al., 2010;Rahman et al., 2010; Morales-Pinz�on et al., 2012; Walsh et al.,2014; Proenca et al., 2011; Ghimire et al., 2014), educational(Anand and Apul, 2010; Ghisi et al., 2014; Bronchi et al., 1999), officebuildings (Devkota et al., 2013; Zimmerman, 2014; Ward et al.,2012) or gas stations (Ghisi et al., 2009), while no prior workfocused modeling a dormitory building using a life cycle perspec-tive. The water demand to flush the toilets is higher in a dormitory(5 flushes per person per day) than in an office type building (4flushes per person per day) (Vickers, 2001). Due to their typical talland narrow building designs, it is possible that there may not besufficient harvested rainwater to flush the toilets in dormitories,which creates an interesting problem with respect to how theenvironmental impacts may be distributed in such a case. Finally,previous studies presented results from the perspective of thebuilding, presenting results for the entire building. However, withthe onset of growing population and growing interest to under-stand an individual's impact on the environment, we argue in thispaper that effects should also be measured on a per person basis toinform society and engineering design. The goal of this studywas toaddress these knowledge gaps by analyzing the economic andenvironmental implications of five different rainwater harvesting
scenarios designed for toilet flushing and/or irrigation in an exist-ing University of Toledo dormitory building.
2. Methods
2.1. Building description
All simulations were done for University of Toledo's Crossingsbuilding. In North America, it has become imperative for mostuniversities tomake progress towards sustainability. On this path, itis common to direct sustainability efforts to residence halls with agoal of exemplifying sustainable living for students. The Crossingsbuilding was selected in this study because it is representative ofother higher education dormitories. It is a five story building with atotal living area of 20,465m2, roof area of 4093m2, and lawn area of11,660 m2. It has 24 suites on each floor. Each suite includes a fur-nished living room and a private bathroom. The structure housesin-hall dining, laundry and a recreation room for the students. It has649 students in 6-person suites with 3 double bedrooms in eachsuite. There are also 3 apartments for staff and 20 single residenceassistants' rooms.
2.2. Scenarios
Five scenarios were developed to investigate the best way toutilize rainwater harvesting at the Crossings building (Fig. 1).Currently, the potable municipal water is the only source of waterused in Crossings. The amount of potable water use in sinks,showers, and laundering were assumed to be the same amongscenarios. Effects of using rainwater in toilet flushing and irrigationwere modeled. The scenarios varied with respect to water source,end use, building type and occupancy load.
� Scenario 0: Business As Usual (business as usual) e Current,existing system in Crossings building. City supplied potablewater is used for both flushing toilets and irrigation.
� Scenario 1: Rainwater Irrigation-renovated (RI-ren) e Crossingswas modeled as being renovated to collect roof runoff for its usein irrigation. In this scenario, since the volume of water requiredto irrigate at the site was larger than the volume available fromrainwater collection, both rainwater and potable water wererequired to irrigate.
� Scenario 2: Rainwater Toilet Flushing-renovated e Crossings wasmodeled as being renovated to collect roof runoff for its use intoilet flushing. In this scenario, rainwater was supplemented

J. Devkota et al. / Journal of Cleaner Production 95 (2015) 311e321 313
with potable water in flushing toilets because collected rain-water was not sufficient to meet the flushing demand in thebuilding.
� Scenario 3: Rainwater Toilet Flushing e new construction e
Rainwater harvesting system was assumed to be implementedat the time of constructing the building. In this scenario,collected roof runoff was used for flushing toilets.
� Scenario 4: Rainwater Toilet Flushing e less people e Rainwaterharvesting system was assumed to be implemented at the timeof constructing the building. The occupancy was assumed to belower (180 instead of 649) so as to be able to supply at least 90percent of the toilet water demand from harvested rainwater. Inthis scenario, roof runoff was used for flushing toilets.
Using rainwater for both toilet flushing and irrigation was notconsidered in a single scenario because the volume of rainwateravailable at Crossings was too low to supply both end uses.
2.3. Rainwater harvesting system design
There are several existing methods used to size rainwater har-vesting tanks. While some authors have used mean monthly pre-cipitation to size the rainwater tank (Anand and Apul, 2010;Devkota et al., 2013; Aladenola and Adeboye, 2010), the morepreferred method is the daily mass balance model (Eq. (1))(Khastagir and Jayasuriya, 2011; Imteaz et al., 2011; Ward et al.,2010; Angrill et al., 2012; Palla et al., 2011; Herrmann andSchmida, 2000; Fewkes and Wam, 2000; Liaw and Tsai, 2004;Mitchell, 2007) since the tank is thought to be oversized whenmonthly precipitation data are used. Yield before spillage (YBS) andyield after spillage (YAS) approaches are the most widely usedapproaches in the daily mass balance model. Both approaches usemass balance principles to estimate the volume of water in thetank, spillage and yield at any time period, but the Yield AfterSpillage approach which gives a conservative estimate of yield andis often the more preferred method (Mitchell, 2007; Fewkes andButler, 2000). In this study the Yield After Spillage approach andlong term daily precipitation of Toledo, Ohio were used to size therainwater tank.
The efficiency of the rainwater tank is measured in terms ofvolumetric reliability or water saving efficiency. Volumetric reli-ability of a rainwater cistern is expressed as:
Vr ¼ volumetric reliability ¼P
YtPDt
(1)
where,
Yt ¼ Volume of rainwater supplied to urban water demands(cubic meters)Dt ¼ Daily water demand (cubic meters).
In the Yield After Spillage approach, Yt and Dt were calculatedusing:
Yt ¼ MIN ðDt ;Vt�1 þ ItÞ (2)
Vt ¼ MIN ðVt�1 þ It � Yt ;C � Yt Þ (3)
where,
Vt ¼ volume of rainwater in the tank at the end of time step t(cubic meters)Vt�1 ¼ volume of rainwater in the tank at the end of previoustime step t (cubic meters)
It ¼ inflow or roof runoff (cubic meters)C ¼ Capacity of the rainwater tank (cubic meters)
Daily spillage (St) was calculated from the daily mass balanceequation (Mitchell, 2007).
Vt ¼ Vt�1 þ It þ Pt � Et � St � Lt � Yt (4)
where:
Pt ¼ incident precipitation on received by the tank (cubicmeters)Et ¼ evaporation (cubic meters)St ¼ amount of spillage due overflow from tank (cubic meters)Lt ¼ seepage or leakage (cubic meters)
Evaporation (Et) and Leakage (Lt) are very small and are alreadyconsidered while estimating the amount of rainwater collectedfrom the roof (Krishna, 2005). Incident precipitation on the tank(Pt) was not considered because the rainwater tankwould be closedall the time.
Based on the initial storage volume (Vt�1), inflow (It) and dailywater demand (Dt), the volume of rainwater supplied to urbanwater demand (Yt) was calculated for the first time step t (Eq. (2)).Volume of rainwater in the tank at the end of time step t (Vt) wasthen estimated using Eq. (3). For the second time step, Vt�1 wouldbe the volume of water at the end of the first time step. Yt and Vt
were then estimated using Eqs. (2) and (3), respectively. Then, dailyspillage was calculated using Eq. (4). A series of rainwater storagetank sizes were assessed and their corresponding volumetric re-liabilities were calculated using Eq. (1). The size of the tank wasconsidered optimum when any increase in the tank size changedthe volumetric reliability by 1% or less.
Many studies recommend the use of long term precipitation forthe rainwater tank sizing. Use of 10-year precipitation pattern doesnot significantly reduce the accuracy of the estimated yield ofrainwater tank as compared to the 50-year precipitation pattern(Mitchell, 2007). Use of 1-year precipitation is not recommendedfor rainwater tank simulation (Mitchell, 2007). Therefore, the vol-ume of rainwater available for collection was estimated using the13-year long term daily precipitation for Toledo and the building'sroof area (4093 m2). It was assumed that roof runoff would not becollected during winter months (November through February)since snow cover may not melt and collected water may freeze inthe rainwater tank. For each centimeter of rainfall, each squaremeter of roof collects 0.01 m3 (10 L) of rain. Of that, 25% wasassumed to be lost before entering the cistern (Krishna, 2005).
The water demand for flushing toilets was estimated assumingfive flushes per occupant per day at 6.05 L (1.6 gallons) per flush(Vickers, 2001). Using these assumptions, the calculated waterdemand for flushing toilets for the 649 people that reside atCrossings was approximately 20.047m3 (20,047 L) per day, which isnearly three times the total amount of roof runoff that can becaptured. Due to the high occupancy of the Crossings building, theimplementation of a rainwater harvesting system to be used forflushing toilets was also analyzed for an occupancy in which thesupplied rainwater can meet the demand for toilet flushing (180occupants, Scenario 4). The other rainwater harvesting compo-nents, such as concrete pad, length of dual piping, filter and pump,were designed and sized according to Devkota et al. (2013).
In Ohio, the irrigation recommendation for lawns is one inchonce a week (Ohio State University Extension fact Sheet e
Horticulture and Crop Science, 2014). Irrigation is typically neces-sary May through October. Irrigation demand was set to zero forother months. While designing rainwater harvesting systems, it is
J. Devkota et al. / Journal of Cleaner Production 95 (2015) 311e321314
impossible to predict whether it rains or not on the lawn on the dayit will be scheduled to be irrigated. If it rains on the day of theirrigation, the sprinkler would ideally be turned off and thecollected water would overflow from the overflow pipe provided atthe top of the tank. However, this practice does not affect how thetank is sized. Based on these methods, the lawn area that can beirrigated with rainwater is 1408 m2 which is about 10% of the lawnarea.
Combined sewers are common in the Midwest of the U.S. and inToledo. Rainwater collected from the roof was assumed to beconveyed out of the site via combined sewers and treated at thelocal wastewater treatment plant. We assume that 100% of thestormwater is treated at the wastewater treatment plant but inreality, during combined sewer overflows, part of the stormwater isreleased to the environment without treatment. Modeling treat-ment of combined sewer overflow is not included in this studybecause the frequency and intensity of combined sewer overflow ishighly dependent on the amount of sanitary sewage in the pipe,intensity of precipitation and climatic factors, and is very difficult toestimate.
2.4. Life cycle assessment
Energy and global warming implications of the construction andoperation of the different scenarios were evaluated and comparedusing the life cycle assessment method. Life cycle assessment is atechnique that assesses the environmental impacts associated witha product, process or service (EPA, 2010; ISO.14044, 2006). Func-tional units previously used for life cycle assessment of buildingsand water infrastructures include environmental impacts from thewhole building, a square meter of building (Scheuer et al., 2003;Anand and Apul, 2010), a unit volume of water (Racoviceanu andKarney, 2010), or flushes per person per day (Crettaz et al., 1999).In this study, the functional unit for the life cycle assessment wasthe provision of sanitation and irrigation services per occupant forthe life time of the building (75 years). Since this study evaluatedthe effectiveness of alternative sanitation and irrigation systems inthe specified building, the use of this functional unit allowed for adirect comparison of the studied alternatives. The ‘per occupant’analysis used in this study allows the impacts to be evaluated notonly for the entire building but also for each person using thebuilding. The life cycle assessment methodology discussed in thisresearch is of consequential type because it describes how theenvironmental impacts for respective scenarios will affect thedecision.
2.5. Life cycle inventory
2.5.1. Construction phaseConstruction phase of a rainwater harvesting system includes
the cistern, pump, dual-piping, filter and concrete pad. EconomicInput Output Life Cycle Assessment (EIO-life cycle assessment)method was used to evaluate the energy and greenhouse gasemissions associated with the materials that are required toimplement each scenario (Hendrickson et al., 1998). Energy andgreenhouse gas emission payback periods were calculated ac-cording to Devkota et al. (2013). Materials required formanufacturing, the associated sector, and cost data are shown inTable 1 for each scenario. Cost of materials used for manufacturingrainwater tank was estimated from a Michigan report (State ofMichigan e Tanks, 2014). Costs for the cistern ($181/m3), piping($1.59/m), and pumps were obtained from respective vendors. Itwas assumed that additional piping (i.e. dual piping) was onlyneeded for scenarios that required rainwater for toilet flushing(Rainwater toilet flushing-renovated, Rainwater toilet flushing-new
construction, and Rainwater toilet flushing-less people). Pipes forirrigationwere notmodeled because the sprinkler systemwould beinstalled in the irrigation area and all scenarios would have equallength of irrigation pipes independent of water source (potable orrainwater).
The cost of the concrete pad required for stabilization of thecistern was estimated for all the rainwater harvesting scenarios,whereas construction cost associated with running the new pipingto use rainwater for flushing toilets was estimated for all rainwaterharvesting scenarios except irrigation scenario. Estimation of asprinkler system is not included for this study because it is not anadditional expense that is related to using harvested rainwater andwould be required even if potablewater were used to irrigate. Laborcost included in renovated scenario was estimated using WinEstimating software®. WinEst is a professional project estimatingsoftware used as a Microsoft Excel add-in capable of constructiontakeoff, estimating audit trails, reporting, organizing labor ratesand equipment rate tables. The software also has a provision oflabor productivity factor to estimate the hours of the crews and thetotal working hours (WinEst, 2014).
Several studies have reported labor costs in the economicanalysis of rainwater harvesting systems (Rahman et al., 2010;Sturm et al., 2009; Mwenge Kahinda et al., 2007; Moges et al.,2011; Fox et al., 2005). Out of these studies, Rahman et al. (2010)reported labor cost of plumbing during the construction phase ofrainwater harvesting systems, while Sturm et al. (2009) reportedskilled labor cost for the construction of the tanks, guttering,piping, the cistern and the ground catchment. Another study toinclude labor cost in the analysis of rainwater harvesting systemswas by Mwenge Kahinda et al. (2007) who included the cost oflabor along with the cost of material. Though the labor cost hasbeen used by some studies, there remains uncertainty in the laborcosts due to geographical location, materials used, end uses, andother direct as well as indirect factors. In addition, this study alsofocuses on environmental analysis of rainwater harvesting systems.The energy and emissions from the labor and maintenance duringthe construction of rainwater harvesting systems has not been re-ported in any studies. Therefore, to be consistent, labor has notbeen included in the economic as well as environmental analysisfor all the scenarios except renovation scenario.
Transportation of construction materials was not considered inthis study. However, we included the life cycle assessment oftransportation of construction materials in another study, wherewe assumed a transportation distance of 100 km and it showed thattransportation contributes less than 0.1% of the total life cycle im-pacts of using rainwater harvesting systems in a building. Ghimireet al. (2014) and Angrill et al. (2012) also included transportation inthe life cycle assessment of rainwater harvesting system and foundout that the impacts are negligible. Therefore our omission oftransportation of construction materials should not introduce anymajor errors in the results.
2.5.2. Operational phaseInventory in the operational phase for each scenario includes
potable and wastewater treatment, and energy use by the pump.Operational phase services are shown on a monthly basis in Table 1.Economic Input Output e life cycle assessment models both thewater and wastewater treatment within one sector, and this ag-gregation creates inaccuracy in results since wastewater treatmentrequires more energy and creates more greenhouse gas emissionsthan water treatment (Sahely and Kennedy, 2007; Francois et al.,2008; GaBi, 6.0; Tillman et al., 1998; Lundin et al., 2000; Lundieet al., 2004). For this reason, in modeling water and wastewatertreatment processes, we chose to use process-based data. The datafor these two processes were taken from Eco-invent database using

Table 1Per unit values of cost, energy and GHG emissions for different rainwater harvesting scenarios. For the operation phase, total cost is the monthly cost.
System Phase Sector # Sector name Materials required No of units Total cost $ Energy (kWh) GHG emission(kg CO2 e)
Business as usual(Scenario 0)
Manufacturing N/A N/A N/A N/A N/A N/A N/AN/A N/A N/A N/A N/A N/A N/A
Operation GaBi 6 Potable Water 845.1 m3 $752.16 3.24 kWh/m3 0.31 kg CO2/m3
GaBi 6 Waste water 845.1 m3 $1098.43 3.94 kWh/m3 0.636 kg CO2/m3
Rainwater Irrigation-renovated(Scenario 1)
Manufacturing 327330 Concrete pipe brickand blockmanufacturing
Concrete Pad 9.5 m3 $3490.43 4.77 kWh/$ 1.92 kg CO2/$
332420 Metal tank, heavygauge, manufacturing
Cistern 76 m3 $10,066 3.48 kWh/$ 0.95 kg CO2/$
333319 Other commercialand service industrymachinery
Filter 1 $425.00 2.19 kWh/$ 5.33 kg CO2/$
Operation GaBi 6 Potable water 611.1 m3 $544.17 3.24 kWh/m3 0.31 kg CO2/m3
GaBi 6 Wastewater 666.5 m3 $866.22 3.94 kWh/m3 0.636 kg CO2/m3
Rainwater Toiletflushing-renovated(Scenario 2)
Manufacturing 327330 Concrete pipe brickand blockmanufacturing
Concrete Pad 9.5 m3 $3490.43 4.77 kWh/$ 1.92 kg CO2/$
230103 Other non residentialstructures
Construction (setpiping)
1 $31,715.39 2.29 kWh/$ 0.61 kg CO2/$
332420 Metal tank, heavygauge, manufacturing
Cistern 95 m3 $12,583 3.48 kWh/$ 0.95 kg CO2/$
333911 Pump and pumpingequipmentmanufacturing
Pump 0.5 hp $695.00 2.40 kWh/$ 0.56 kg CO2/$
333319 Other commercialand service industrymachinery
Floating tank filter 1 $425.00 2.19 kWh/$ 5.33 kg CO2/$
326120 Plastics pipe, fittings,and profile shapes
Pipes 611.5 m $977.00 6.71 kWh/$ 1.42 kg CO2/$
Operation GaBi 6 Potable Water 678.7 m3 $544.17 3.24 kWh/m3 0.31 kg CO2/m3
GaBi 6 Wastewater 611.4 m3 $882.11 3.94 kWh/m3 0.636 kg CO2/m3
221100 Power generationand supply
Energy use by pumps 34.6 kWh $2.42 0.07 kWh/$ 9.37 kg CO2/$
Rainwater toiletflushing e newconstruction(Scenario 3)
Manufacturing 327330 Concrete pipe brickand blockmanufacturing
Concrete Pad 9.5 m3 $3490.43 4.77 kWh/$ 1.92 kg CO2/$
332420 Metal tank, heavygauge, manufacturing
Cistern 95 m3 $12,583 3.48 kWh/$ 0.95 kg CO2/$
333911 Pump and pumpingequipmentmanufacturing
Pump 0.5 hp $695.00 2.40 kWh/$ 0.56 kg CO2/$
333319 Other commercialand service industrymachinery
Filter 1 $425.00 2.19 kWh/$ 5.33 kg CO2/$
326120 Plastics pipe, fittings,and profile shapes
Pipes 611.5 m $977.00 6.71 kWh/$ 1.42 kg CO2/$
Operation GaBi 6 Potable Water 611.5 m $544.17 3.24 kWh/m3 0.31 kg CO2/m3
GaBi 6 Wastewater 678.7 m3 $794.69 3.94 kWh/m3 0.636 kg CO2/m3
221100 Power generationand supply
Energy use by pump 34.6 kWh $2.42 0.07 kWh/$ 9.37 kg CO2/$
Rainwater ToiletFlushing e lesspeople (Scenario4)-newconstruction
Manufacturing 327330 Concrete pipe brickand blockmanufacturing
Concrete Pad 9.5 m3 $3490.43 4.77 kWh/$ 1.92 kg CO2/$
332420 Metal tank, heavygauge, manufacturing
Cistern 95 m3 $12,583 3.48 kWh/$ 0.95 kg CO2/$
333911 Pump and pumpingequipmentmanufacturing
Pump 0.5 hp $695.00 2.40 kWh/$ 0.56 kg CO2/$
333319 Other commercialand service industrymachinery
Filter 1 $425.00 2.19 kWh/$ 5.33 kg CO2/$
326120 Plastics pipe, fittings,and profile shapes
Pipes 1528.6 m $2442.26 6.71 kWh/$ 1.42 kg CO2/$
Operation GaBi 6 Potable Water 250.6 m3 $223.1 3.24 kWh/m3 0.31 kg CO2/m3
GaBi 6 Wastewater 493.6 m3 $641.6 3.94 kWh/m3 0.636 kg CO2/m3
221100 Power generationand supply
Energy use by pump 63.6 kWh $4.42 0.07 kWh/$ 9.37 kg CO2/$
J. Devkota et al. / Journal of Cleaner Production 95 (2015) 311e321 315
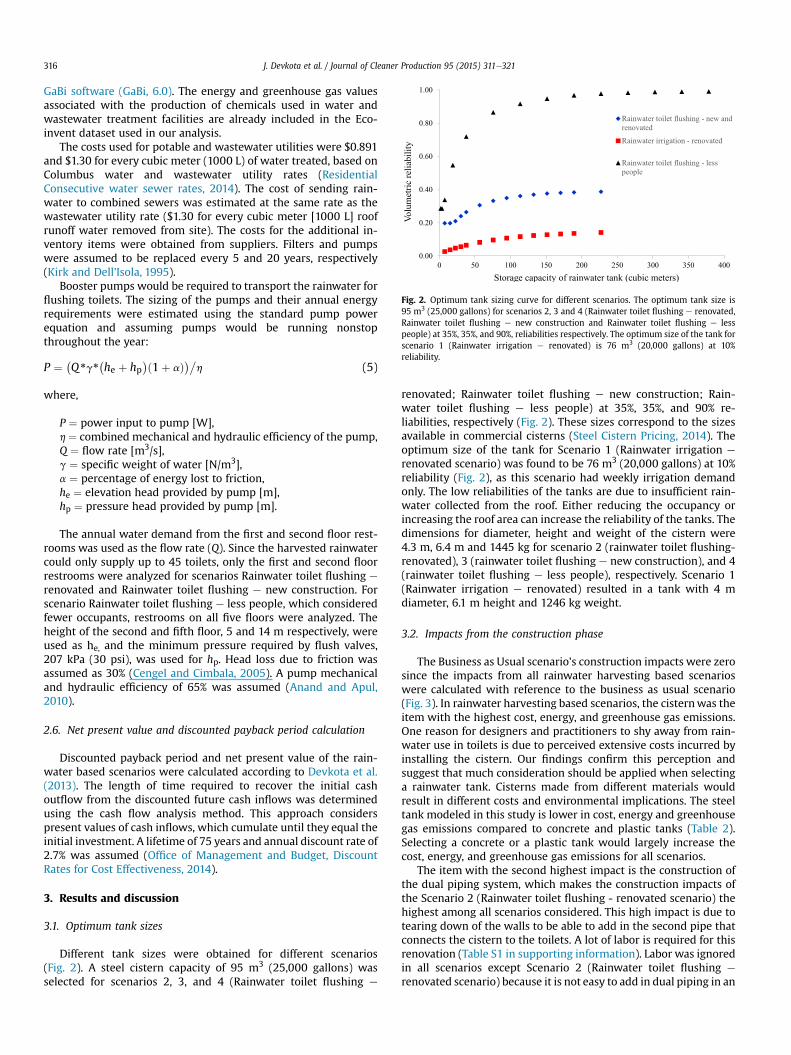
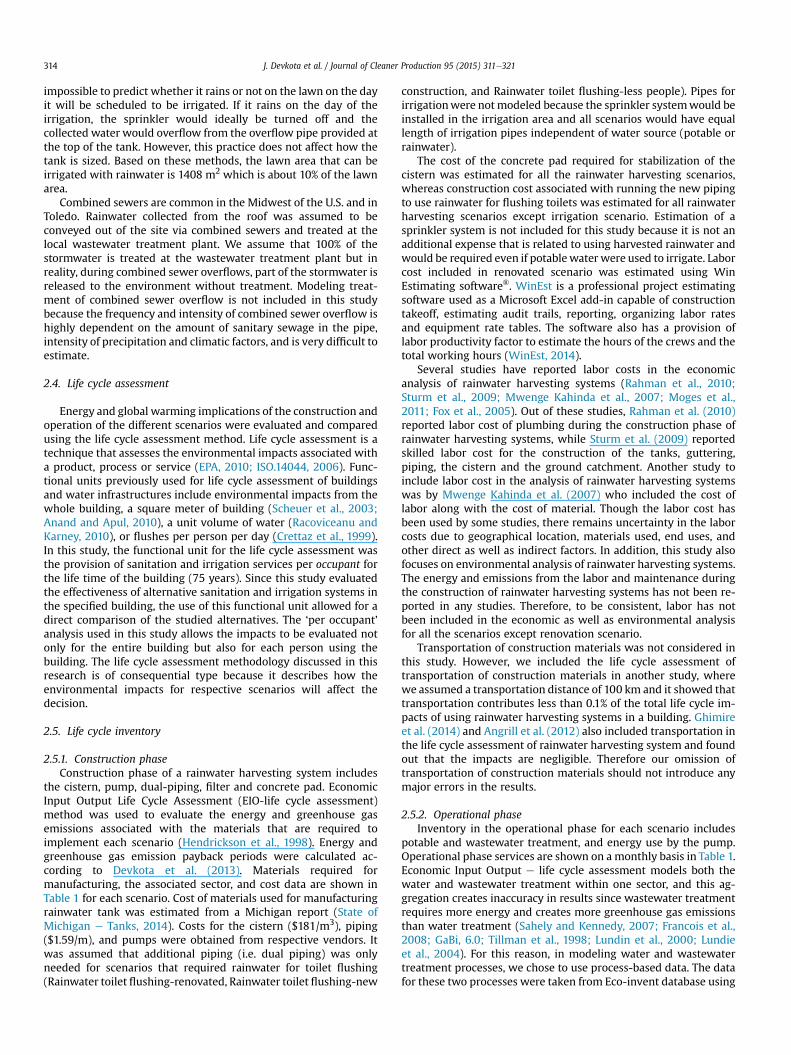
Fig. 2. Optimum tank sizing curve for different scenarios. The optimum tank size is95 m3 (25,000 gallons) for scenarios 2, 3 and 4 (Rainwater toilet flushing e renovated,Rainwater toilet flushing e new construction and Rainwater toilet flushing e lesspeople) at 35%, 35%, and 90%, reliabilities respectively. The optimum size of the tank forscenario 1 (Rainwater irrigation e renovated) is 76 m3 (20,000 gallons) at 10%reliability.
J. Devkota et al. / Journal of Cleaner Production 95 (2015) 311e321316
GaBi software (GaBi, 6.0). The energy and greenhouse gas valuesassociated with the production of chemicals used in water andwastewater treatment facilities are already included in the Eco-invent dataset used in our analysis.
The costs used for potable and wastewater utilities were $0.891and $1.30 for every cubic meter (1000 L) of water treated, based onColumbus water and wastewater utility rates (ResidentialConsecutive water sewer rates, 2014). The cost of sending rain-water to combined sewers was estimated at the same rate as thewastewater utility rate ($1.30 for every cubic meter [1000 L] roofrunoff water removed from site). The costs for the additional in-ventory items were obtained from suppliers. Filters and pumpswere assumed to be replaced every 5 and 20 years, respectively(Kirk and Dell'Isola, 1995).
Booster pumps would be required to transport the rainwater forflushing toilets. The sizing of the pumps and their annual energyrequirements were estimated using the standard pump powerequation and assuming pumps would be running nonstopthroughout the year:
P ¼ �Q*g*
�he þ hp
�ð1þ aÞ��h (5)
where,
P ¼ power input to pump [W],h ¼ combined mechanical and hydraulic efficiency of the pump,Q ¼ flow rate [m3/s],g ¼ specific weight of water [N/m3],a ¼ percentage of energy lost to friction,he ¼ elevation head provided by pump [m],hp ¼ pressure head provided by pump [m].
The annual water demand from the first and second floor rest-rooms was used as the flow rate (Q). Since the harvested rainwatercould only supply up to 45 toilets, only the first and second floorrestrooms were analyzed for scenarios Rainwater toilet flushing e
renovated and Rainwater toilet flushing e new construction. Forscenario Rainwater toilet flushing e less people, which consideredfewer occupants, restrooms on all five floors were analyzed. Theheight of the second and fifth floor, 5 and 14 m respectively, wereused as he, and the minimum pressure required by flush valves,207 kPa (30 psi), was used for hp. Head loss due to friction wasassumed as 30% (Cengel and Cimbala, 2005). A pump mechanicaland hydraulic efficiency of 65% was assumed (Anand and Apul,2010).
2.6. Net present value and discounted payback period calculation
Discounted payback period and net present value of the rain-water based scenarios were calculated according to Devkota et al.(2013). The length of time required to recover the initial cashoutflow from the discounted future cash inflows was determinedusing the cash flow analysis method. This approach considerspresent values of cash inflows, which cumulate until they equal theinitial investment. A lifetime of 75 years and annual discount rate of2.7% was assumed (Office of Management and Budget, DiscountRates for Cost Effectiveness, 2014).
3. Results and discussion
3.1. Optimum tank sizes
Different tank sizes were obtained for different scenarios(Fig. 2). A steel cistern capacity of 95 m3 (25,000 gallons) wasselected for scenarios 2, 3, and 4 (Rainwater toilet flushing e
renovated; Rainwater toilet flushing e new construction; Rain-water toilet flushing e less people) at 35%, 35%, and 90% re-liabilities, respectively (Fig. 2). These sizes correspond to the sizesavailable in commercial cisterns (Steel Cistern Pricing, 2014). Theoptimum size of the tank for Scenario 1 (Rainwater irrigation e
renovated scenario) was found to be 76 m3 (20,000 gallons) at 10%reliability (Fig. 2), as this scenario had weekly irrigation demandonly. The low reliabilities of the tanks are due to insufficient rain-water collected from the roof. Either reducing the occupancy orincreasing the roof area can increase the reliability of the tanks. Thedimensions for diameter, height and weight of the cistern were4.3 m, 6.4 m and 1445 kg for scenario 2 (rainwater toilet flushing-renovated), 3 (rainwater toilet flushing e new construction), and 4(rainwater toilet flushing e less people), respectively. Scenario 1(Rainwater irrigation e renovated) resulted in a tank with 4 mdiameter, 6.1 m height and 1246 kg weight.
3.2. Impacts from the construction phase
The Business as Usual scenario's construction impacts were zerosince the impacts from all rainwater harvesting based scenarioswere calculated with reference to the business as usual scenario(Fig. 3). In rainwater harvesting based scenarios, the cisternwas theitem with the highest cost, energy, and greenhouse gas emissions.One reason for designers and practitioners to shy away from rain-water use in toilets is due to perceived extensive costs incurred byinstalling the cistern. Our findings confirm this perception andsuggest that much consideration should be applied when selectinga rainwater tank. Cisterns made from different materials wouldresult in different costs and environmental implications. The steeltank modeled in this study is lower in cost, energy and greenhousegas emissions compared to concrete and plastic tanks (Table 2).Selecting a concrete or a plastic tank would largely increase thecost, energy, and greenhouse gas emissions for all scenarios.
The item with the second highest impact is the construction ofthe dual piping system, which makes the construction impacts ofthe Scenario 2 (Rainwater toilet flushing - renovated scenario) thehighest among all scenarios considered. This high impact is due totearing down of the walls to be able to add in the second pipe thatconnects the cistern to the toilets. A lot of labor is required for thisrenovation (Table S1 in supporting information). Labor was ignoredin all scenarios except Scenario 2 (Rainwater toilet flushing e
renovated scenario) because it is not easy to add in dual piping in an

Fig. 3. (a) Construction cost, (b) Construction energy and (c) Construction greenhousegas of rainwater harvesting systems for different scenarios.
Fig. 4. Initial cost per person and net present value at year 75 per person for differentscenarios.
J. Devkota et al. / Journal of Cleaner Production 95 (2015) 311e321 317
existing building, and this renovation aspect can be a barrier torainwater harvesting implementation. In other scenarios, the laborwas negligible and therefore not incorporated into the model.
3.3. Economic analysis
Scenarios 2 and 4 (Rainwater toilet flushing e renovated andRainwater toilet flushing e less people) did not have the costpayback within the lifetime of the building (75 years), and the netpresent value was less than zero (Fig. 4). Scenarios 1 (rainwaterirrigation e renovated) and 3 (rainwater toilet flushing e newconstruction) had relatively low construction cost and for thatreason had positive net present value with discounted cost
Table 2Cost, energy and GHG emissions for the rainwater tank made from different mate-rials.Data was obtained from the EIOLCA model.
Material Cost ($) Energy (kWh) GHG (kg CO2e)
Steel 12,583 44,167 11,900Concrete 28,510 186,111 78,000Plastic 18,962 221,111 47,600
paybacks 13 and 17 years, respectively. Even though these scenariospaid backwithin the life time of the building, these payback periodsare still fairly high. A primary reason for the poor economic per-formance of the rainwater harvesting scenarios is the low waterprices. Yet, water prices are rising in the U.S. due to building of newfacilities and renovation of aging infrastructure (Walton, 2013). Asalso reported in prior studies, increase in water prices woulddecrease the payback time of rainwater harvesting scenarios(Anand and Apul, 2010; Zhang et al., 2009).
Of all the scenarios, scenario 1 (Rainwater irrigation e reno-vated) has the highest cash flows and performs much better thanscenario 2 (Rainwater toilet flushing e renovated scenario). This isattributed to Scenario 1 (Rainwater irrigatione renovated scenario)not requiring dual piping or a booster pump. Increasing thecatchment area (e.g. by collecting rain from nearby buildings) ofwould allow more rainwater to be used for irrigation, but at thesame time the increase in tank size would increase the environ-mental impacts, too. Therefore an optimization is required betweenincreased catchment area and increased impacts from increasedcistern size. As wastewater and potablewater treatment havemajorcontributions on the life cycle impact, the increase in catchmentarea might make scenario 1 (Rainwater irrigation e renovatedscenario) even more attractive.
Scenario 3 (Rainwater toilet flushing e new construction) haslower initial cost and higher cash flows than Scenario 2 (Rainwatertoilet flushing e renovated scenario) (Fig. 4). The cost performanceof using rainwater harvesting in toilet flushing in new construction(Scenario 2) is similar to using rainwater harvesting in irrigation forthe renovated building (Scenario 1). It is also interesting to notethat while lower occupancy in Scenario 4 (Rainwater toilet flushinge less people scenario) allows matching toilet flushing demandwith available roof runoff, the lower occupancy increases the initialcost and decreases the cash flows on a per person basis.
3.4. Energy and greenhouse gas emissions
3.4.1. Life cycle impactsBusiness as usual case (Scenario 0) has higher life cycle energy
and greenhouse gas emissions per person than all rainwater har-vesting scenarios except Scenario 4 (Rainwater toilet flushing e
less) people because business as usual scenario has high use ofwater and wastewater treatment during the operation phase(Fig. 5). For all rainwater harvesting based scenarios, the impactsfrom construction phase are dwarfed by the impacts from waterand wastewater treatment. Wastewater treatment contributes
0
3,000
6,000
9,000
12,000
15,000
Scenario 0 Scenario 1 Scenario 2 Scenario 3 Scenario 4
Life
cyc
le E
nerg
y(k
Wh)
0
500
1,000
1,500
2,000
2,500
Scenario 0 Scenario 1 Scenario 2 Scenario 3 Scenario 4
Life
cyc
le G
HG
(kg
CO
2 e)
0
500
1000
1500
BAU RI-ren RT-ren RT-new RT-248
Energy use by pump Waste water treatment Water Treatment
Concrete Pad Construction to run piping Pump
Piping Cistern
(a)
(b)
Fig. 5. (a) Life time energy per person and (b) Life time greenhouse gas emission perperson for different scenarios.
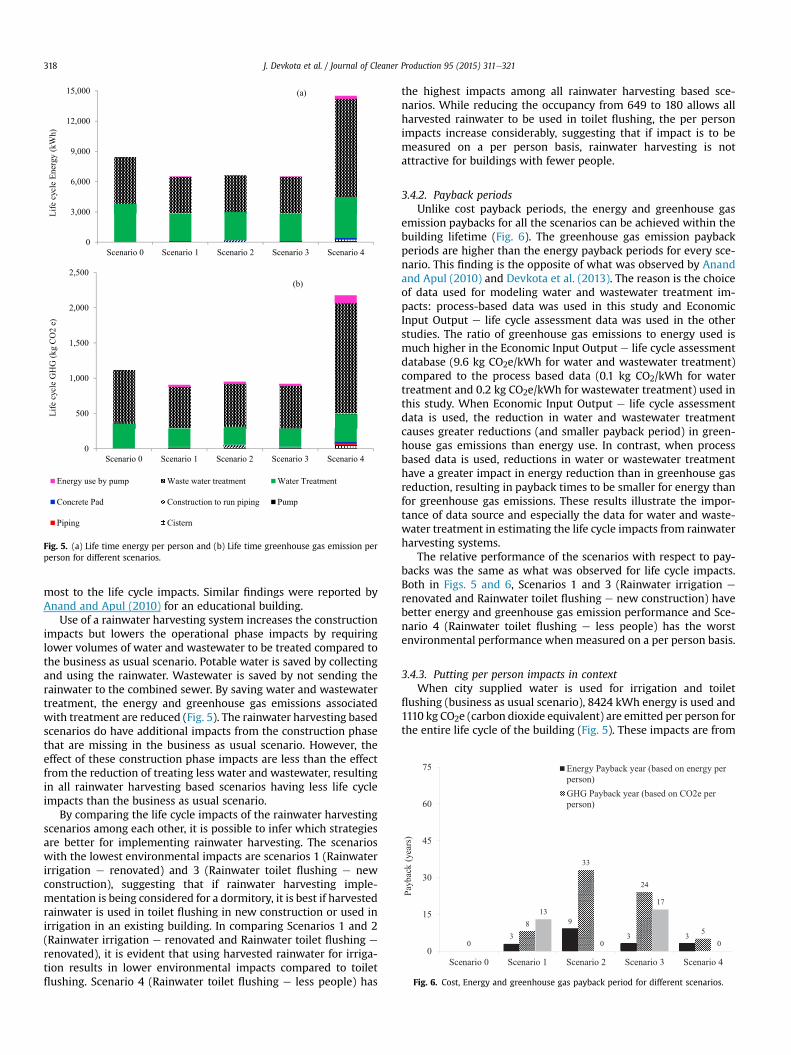
Fig. 6. Cost, Energy and greenhouse gas payback period for different scenarios.
J. Devkota et al. / Journal of Cleaner Production 95 (2015) 311e321318
most to the life cycle impacts. Similar findings were reported byAnand and Apul (2010) for an educational building.
Use of a rainwater harvesting system increases the constructionimpacts but lowers the operational phase impacts by requiringlower volumes of water and wastewater to be treated compared tothe business as usual scenario. Potable water is saved by collectingand using the rainwater. Wastewater is saved by not sending therainwater to the combined sewer. By saving water and wastewatertreatment, the energy and greenhouse gas emissions associatedwith treatment are reduced (Fig. 5). The rainwater harvesting basedscenarios do have additional impacts from the construction phasethat are missing in the business as usual scenario. However, theeffect of these construction phase impacts are less than the effectfrom the reduction of treating less water and wastewater, resultingin all rainwater harvesting based scenarios having less life cycleimpacts than the business as usual scenario.
By comparing the life cycle impacts of the rainwater harvestingscenarios among each other, it is possible to infer which strategiesare better for implementing rainwater harvesting. The scenarioswith the lowest environmental impacts are scenarios 1 (Rainwaterirrigation e renovated) and 3 (Rainwater toilet flushing e newconstruction), suggesting that if rainwater harvesting imple-mentation is being considered for a dormitory, it is best if harvestedrainwater is used in toilet flushing in new construction or used inirrigation in an existing building. In comparing Scenarios 1 and 2(Rainwater irrigation e renovated and Rainwater toilet flushing e
renovated), it is evident that using harvested rainwater for irriga-tion results in lower environmental impacts compared to toiletflushing. Scenario 4 (Rainwater toilet flushing e less people) has
the highest impacts among all rainwater harvesting based sce-narios. While reducing the occupancy from 649 to 180 allows allharvested rainwater to be used in toilet flushing, the per personimpacts increase considerably, suggesting that if impact is to bemeasured on a per person basis, rainwater harvesting is notattractive for buildings with fewer people.
3.4.2. Payback periodsUnlike cost payback periods, the energy and greenhouse gas
emission paybacks for all the scenarios can be achieved within thebuilding lifetime (Fig. 6). The greenhouse gas emission paybackperiods are higher than the energy payback periods for every sce-nario. This finding is the opposite of what was observed by Anandand Apul (2010) and Devkota et al. (2013). The reason is the choiceof data used for modeling water and wastewater treatment im-pacts: process-based data was used in this study and EconomicInput Output e life cycle assessment data was used in the otherstudies. The ratio of greenhouse gas emissions to energy used ismuch higher in the Economic Input Output e life cycle assessmentdatabase (9.6 kg CO2e/kWh for water and wastewater treatment)compared to the process based data (0.1 kg CO2/kWh for watertreatment and 0.2 kg CO2e/kWh for wastewater treatment) used inthis study. When Economic Input Output e life cycle assessmentdata is used, the reduction in water and wastewater treatmentcauses greater reductions (and smaller payback period) in green-house gas emissions than energy use. In contrast, when processbased data is used, reductions in water or wastewater treatmenthave a greater impact in energy reduction than in greenhouse gasreduction, resulting in payback times to be smaller for energy thanfor greenhouse gas emissions. These results illustrate the impor-tance of data source and especially the data for water and waste-water treatment in estimating the life cycle impacts from rainwaterharvesting systems.
The relative performance of the scenarios with respect to pay-backs was the same as what was observed for life cycle impacts.Both in Figs. 5 and 6, Scenarios 1 and 3 (Rainwater irrigation e
renovated and Rainwater toilet flushing e new construction) havebetter energy and greenhouse gas emission performance and Sce-nario 4 (Rainwater toilet flushing e less people) has the worstenvironmental performance when measured on a per person basis.
3.4.3. Putting per person impacts in contextWhen city supplied water is used for irrigation and toilet
flushing (business as usual scenario), 8424 kWh energy is used and1110 kg CO2e (carbon dioxide equivalent) are emitted per person forthe entire life cycle of the building (Fig. 5). These impacts are from

Fig. 7. Cost, Energy and greenhouse gas payback period for combined and separatesewer (Scenario 3 e Rainwater toilet flushing e new construction).
J. Devkota et al. / Journal of Cleaner Production 95 (2015) 311e321 319
treatment of water and wastewater (which includes both the toiletflushed water and the stormwater that is sent to combined sewer).Dividing these numbers by the lifetime of the building (75 years),the annual per person impacts are 112 kWh and 15 kg CO2e. Forrainwater harvesting scenarios (except Scenario 4: Rainwater toiletflushing e less people), the annual per person impacts were lower(86e89 kWh and 12e13 kg CO2e), but the impacts came not onlyfromwater and wastewater treatment, but also from the rainwaterharvesting system implementation and use.
To put these numbers in context, we compared them to a per-son's impacts from electricity use and from driving. On average,each home in the United States consumes 12,258 kWh of electricityannually (USEPA e Calculation and References, 2014). According toU.S. Census 2006, each household consists of 2.6 people. Therefore,annual electricity consumed per person is 4715 kWh, and thiselectricity use results in 3326 kg of CO2e emissions (USEPA,Greenhouse Gas Equivalencies Calculator, 2014). Similarly, in theU.S. an average person drives 21688 km (13,476 miles) per year(USDOT, Federal Highway Administration. Average Annual Milesper Driver by Age Group, 2014) and assuming a fuel efficiency of10,629 km per cubic meter (25 miles per gallon) for an averagevehicle (USDOT, Research and Innovative TechnologyAdministration, Bureau of Transportation Statistics, 2014), a per-son's greenhouse gas emissions from driving is 4792 kg of CO2(USEPA, Greenhouse Gas Equivalencies Calculator, 2014). Therefore,the greenhouse gas emission impacts per person are 300e400times greater from electricity use and from driving than from toiletflushing and irrigation end uses. Energy consumption per person isabout 50 times higher from electricity use than from energy con-sumption per person due to toilet flushing and irrigation end uses.Thewater energy nexus is an area of ongoing research and there is aneed to understand the energy impacts of water management(Stillwell et al., 2011). Based on our findings, the per person energyand greenhouse gas emission impacts from toilet and irrigationwater management are considerably lower than the impacts fromother more commonly studied activities such as electricity use anddriving.
3.5. Roof area to meet rainwater harvesting conditions
The residence hall houses 649 people in total and has a roof areaof 4093 m2. The Crossings building is in compliance with thebuilding codes with respect to occupancy per square foot. However,Crossings building does not have sufficient roof area to supplyrainwater to all the toilets in the building. This implies the need forspecific roof area guidance for rainwater harvesting systems in bothnew and existing buildings. With larger roof area requirements, it isalso important to address the increase in emissions due to use of alarger cistern. It is imperative that building design guidelines beultimately adapted to address rainwater harvesting systems. AtCrossings, a total roof area of 11,620 m2 (18 m2 per person) wouldbe needed to supply enough rainwater to accommodate for all ofthe potable water needed to flush toilets. This is nearly three timeslarger than the actual roof area. This implies that dormitories,which are commonly multi-story and have high occupancies, maynot be the most suitable choice when applying rainwater to flushtoilets.
3.6. Effect of combined versus separate sewers
The energy and CO2 paybacks are largely attributed to thereduction in rainwater being sent to the combined sewer system.Collecting the rainwater and reducing runoff reduces energy andgreenhouse gas emissions. The Crossings building was analyzedusing a combined sewer system since a large portion of Toledo's
sewer system remains combined. However, in Toledo and manyother urban areas, combined sewers are being separated to avoidcombined sewer overflows.
A separate sewer analysis of Scenario 3 (Rainwater toilet flush-ing e new construction) scenario shows that the cost, energy andgreenhouse gas payback period increases if the building is con-nected to a separate sewer instead of a combined sewer system(Fig. 7). When treatment of the rainwater at the wastewater plant iseliminated, the energy usage and greenhouse gas emissions asso-ciated with the volume of rainwater in question are avoided.Although the energy and greenhouse gas emission for the businessas usual scenario decreases, the impacts from Scenario 3 (Rainwatertoilet flushing e new construction) remain the same since almostall rainwater is used in toilet flushing. Lower impacts in the busi-ness as usual scenario and unchanged impacts from Scenario 3(Rainwater toilet flushing e new construction scenario) result inincreased payback times in a separate sewer system. This analysisshows that implementing rainwater harvesting in a combinedsewer system is more attractive for the Crossings building than in aseparate sewer system. These results are interesting consideringthat combined sewers, in general, are not preferred due to over-flows that cause pollution. Yet rainwater harvesting systems dohave lower cost, energy and greenhouse gas emission paybackperiods in combined sewer systems.
3.7. Limitations
The results of this study are not representative of all buildings.The cost, energy and carbon dioxide (CO2) equivalence paybackperiods may vary greatly depending on building type and use.While this study suggests that utilizing harvested rainwater fortoilet flushing in a university dormitory requires 3e9 years toovercome the initial energy emissions and 5e33 years to overcomegreenhouse gas emissions, dormitories that have larger roof areasper occupant will result in a shorter payback time. While this studyshows that combined sewer systems are most favorable whenconsidering environmental payback periods, combined seweroverflows are detrimental to aquatic environments and may resultin more extreme environmental emissions that were not consid-ered in this study. Another limitation of this study is that it does notexplicitly incorporate the stormwater fees and credits that areprovided for the account holder who effectively manages storm-water to reduce impacts on the regional stormwater system(NEOSRD, 2012). According to Northeast Ohio Regional SewerDistrict's Stormwater Fee Credit Manual, large amounts of surfacerunoff enters the regional stormwater system unless there is un-paved surface, rainwater harvesting system installed, or

J. Devkota et al. / Journal of Cleaner Production 95 (2015) 311e321320
stormwater detention pools. Depending on the impervious orpaved surface area of the total property, the district chargesstormwater fees to the individual account holder. An individual canget reduction in the stormwater fee if he/she reduces the volume ofsurface runoff from his/her property to enter the regional storm-water system (NEOSRD, 2012). In Crossings, the use of a rainwaterharvesting system reduces the stormwater runoff by 234 m3
(61,735 gallons) per month. In addition to the stormwater quantitycredit (up to 75%), Crossings can take advantage of educationalcredit of up to 25%. Reduction of stormwater fee could make rain-water harvesting systemmore attractive, which was not covered inour study.
4. Conclusions
In this paper we provided an economic as well as energy andgreenhouse gas assessment of the use of rainwater harvesting fortoilet flushing and irrigation for an actual dormitory with 649 or180 people using life cycle assessment methodology. Several ob-servations and recommendations were concluded from this study:
- Rainwater tank and construction to run dual piping (in the caseof renovated building) are the two items with the highest cost,energy, and greenhouse gas emissions during the constructionphase. However, in the life time of the building, the constructionphase impacts are relatively low, with the largest impactscoming from wastewater treatment.
- On a per person basis, energy and greenhouse gas emissionimpacts from irrigation and toilet flushing needs are 50e400times smaller than those from electricity use or driving (in theUnited States). Therefore, while implementing rainwater har-vesting systems would reduce energy and greenhouse gasemissions, the reductions will be small relative to other com-mon energy and greenhouse gas emission intensive activities.
- For the building analyzed, the initial cost of the rainwater har-vesting system does not payback in the life time of the buildingin case of renovated scenario and scenario with fewer people.However, energy and greenhouse gas emission paybacks can beachieved. Implementing rainwater harvesting increases the lifecycle energy and greenhouse gas emission impacts of the con-struction phase, but the reductions in the operation phase im-pacts are greater, resulting in all rainwater harvesting scenarioshaving less life cycle energy and greenhouse gas emissionimpact than the business as usual scenario.
- Scenarios 1 and 3 (Rainwater irrigation e renovated and Rain-water toilet flushing e new construction) are the two mostfavorable scenarios based on cost, energy and greenhouse gasemissions, suggesting that if rainwater harvesting systems are tobe implemented, the end use should vary depending uponrenovation of an existing building or if rainwater harvesting is tobe implemented while the building is being constructed. In arenovation, rainwater harvesting performs the best when usedfor irrigational purposes, while in new construction, rainwaterharvesting performs the best when used for toilet flushing.
- Reducing occupancy so as to match available rainwater to toiletflushing demand largely increases the impacts on a per personbasis, suggesting that rainwater harvesting is not attractive withfewer people when per person impact is used as the decisioncriterion.
- Crossings building is constructed in accordance with the inter-national building codes. However, the building's roof area is notsufficient to collect a large enough volume of rainwater tosupply the toilet flushing demand. This study suggests a need fornew building design guidelines that specifically address rain-water harvesting. It is important that roof area per person is
determined in order to collect and use sufficient volumes ofrainwater for non-potable uses in buildings. The guidelinesshould be developed for several regions in order to account forvarying precipitation data as the amount of rainfall in an area isone of the main factors that impacts harvesting of rainwater.
- The city's sewer system plays a large role in payback analysiswhen considering the environmental viability of rainwaterharvesting systems. If at the Crossings building the sewer sys-tem was upgraded to separate sewers, energy and carbon di-oxide (CO2) payback years would increase. By not sending theexcess rainwater to the wastewater treatment facility, energyconsumption and carbon dioxide (CO2) emissions from treat-ment could be avoided.
Acknowledgments
This study was partially funded by the Lake Erie Protection Fund(project # SG-363-09); Ohio Water Resources Center (grant #2010OH249O); National Science Foundation's Environmental Sus-tainability (grant #1236660) and GK-12 Programs (grant #DGE-0742395); and University of Toledo's Undergraduate ResearchProgram.
Appendix A. Supplementary data
Supplementary data related to this article can be found at http://dx.doi.org/10.1016/j.jclepro.2015.02.021.
References
Aladenola, O.O., Adeboye, O.B., 2010. Assessing the potential for rainwater har-vesting. Water Resour. Manag. 24 (10), 2129e2137.
Anand, C., Apul, D., 2010. Economic and environmental analysis of standard, highefficiency, rainwater flushed, and composting toilets. J. Environ. Manage. 92,419e428.
Angrill, S., Farreny, R., Gasol, C.M., Gabarrell, X., Vi~nolas, B., Josa, A., Rieradevall, J.,2012. Environmental analysis of rainwater harvesting infrastructures in diffuseand compact urban models of Mediterranean climate. Int. J. Life Cycle Assess. 17(1), 25e42.
Apul, D.S., 2010. Ecological design principles and their implications on waterinfrastructure engineering. J. Green. Build. 5 (3), 147e164.
Bronchi, V., Jolliet, O., Crettaz, P., 1999. Life cycle assessment of rainwater use fordomestic needs. In: Lausanne: 2nd Inter-Regional Conference on EnvironmentalWater, vol. 99.
Cengel, Y., Cimbala, J., 2005. Fluid Mechanics: Fundamentals and Applications, firsted. McGraw Hill Higher Education, Boston.
Chiu, Y.R., Liaw, C., Chen, L., 2009. Optimizing rainwater harvesting systems as aninnovative approach to saving energy in hilly communities. Renew. Energy 34(3), 492e498.
Crettaz, P., Jolliet, O., Cuanillon, J., Orlando, S., 1999. Life cycle assessment ofdrinking water and rain water for toilets flushing. J. Water Serv. Res. Technol. 48(3), 73e83.
Devkota, J., Schlachter, H., Anand, C., Phillips, R., Apul, D., 2013. Development andapplication of EEAST: a life cycle based model for use of harvested rainwaterand composting toilets in buildings. J. Environ. Manag. 130, 397e404.
EPA, SAIC National Risk Management Research Laboratory, 2010. Life CycleAssessment Principles and Practice.
Farreny, R., Morales-Pinzon, T., Guisasola, A., Taya, C., Rieradevall, J., Gabarrell, X.,2011. Roof selection for rainwater harvesting: quantity and quality assessmentsin Spain. Water Res. 45 (10), 3245e3254.
Fewkes, A., Wam, P., 2000. Method of modelling the performance of rainwatercollection systems in the United Kingdom. Build. Serv. Eng. Res. Technol. 21 (4),257e265.
Fewkes, A., Butler, D., 2000. Simulating the performance of rainwater collection andreuse systems using behavioural models. Build. Serv. Eng. Res. Technol. 21 (2),99e106.
Fox, P., Rockstr€om, J., Barron, J., 2005. Risk analysis and economic viability of waterharvesting for supplemental irrigation in semi-arid Burkina Faso and Kenya.Agric. Syst. 83 (3), 231e250.
Francois, V., Emmanuelle, A., Philippe, B., Francois, M., 2008. Life cycle assessmenttool for the environmental evaluation of potable water production. Desalination220, 37e56.
Furumai, H., 2008. Rainwater and reclaimed wastewater for sustainable urbanwater use. Phys. Chem. Earth - Parts A/B/C 33 (5), 340e346.
GaBi 6.0, Sept, 2013. GaBi Software, Software Solution by PE International.

J. Devkota et al. / Journal of Cleaner Production 95 (2015) 311e321 321
Gardner, T., Vieritz, A., 2010. The role of rainwater tanks in Australia in the twentyfirst century. Architect. Sci. Rev. 53, 107e125.
Ghimire, S.R., Johnston, J.M., Ingwersen, W.W., Hawkins, T.R., 2014. Life cycleassessment of domestic and agricultural rainwater harvesting systems. Environ.Sci. Technol. 48 (7), 4069e4077.
Ghisi, E., Montibeller, A., Schmidt, R., 2006. Potential for potable water savings byusing rainwater: an analysis over 62 cities in southern Brazil. Build. Environ. 41(2), 204e210.
Ghisi, E., Mengotti de Oliveira, S., 2007. Potential for potable water savings bycombining the use of rainwater and greywater in houses in southern Brazil.Build. Environ. 42 (4), 1731e1742.
Ghisi, E., Rupp, R.F., Triska, Y., 2014. Comparing indicators to rank strategies to savepotable water in buildings. Resour. Conserv. Recycl. 87, 137e144.
Ghisi, E., Tavares, D.D.F., Rocha, V.L., 2009. Rainwater harvesting in petrol stations inBrasilia: potential for potable water savings and investment feasibility analysis.Resour. Conserv. Recycl. 54 (2), 79e85.
Gomberg, A., 2007. Environment Ohio Research and Policy Center, Sewage Over-flow, Billions of Gallons of Sewage Contaminate Lake Erie.
Hendrickson, C., Horvath, A., Joshi, S., Lave, L., 1998. Economic Input-Output modelsfor environmental life cycle assessment. Environ. Sci. Technol. 32 (7), 184.
Herrmann, T., Schmida, U., 2000. Rainwater utilisation in Germany: efficiency,dimensioning, hydraulic and environmental aspects. Urban Water 1 (4),307e316.
Imteaz, M.A., Shanableh, A., Rahman, A., Ahsan, A., 2011. Optimisation of rainwatertank design from large roofs: a case study in Melbourne, Australia. Resour.Conserv. Recycl. 55 (11), 1022e1029.
ISO, 2006. ISO 14044: Environmental Management e Life Cycle Assessment e Re-quirements and Guidelines. International Organization for Standardization.
Khastagir, A., Jayasuriya, N., 2011. Investment evaluation of rainwater tanks. WaterResour. Manag. 25, 3769e3784.
Kirk, S.J., Dell'Isola, A.J., 1995. Life Cycle Costing for Design Professionals. McGraw-Hill, New York.
Krishna, H.J., 2005. The Texas Manual on Rainwater Harvesting, third ed. Texaswater development board. Available online from: http://www.ecy.wa.gov/programs/wr/hq/pdf/texas_rw_harvestmanual_3rdedition.pdf. (accessedOctober 2013).
Liang, X., Van Dijk, M.P., 2011. Economic and financial analysis on rainwater har-vesting for agricultural irrigation in the rural areas of Beijing. Resour. Conserv.Recycl. 55, 1100e1108.
Liaw, C.H., Tsai, Y.L., 2004. Optimum storage volume of rooftop rain water har-vesting systems for domestic use. JAWRA. J. Am. Water Resour. Assoc. 40 (4),901e912.
Lundie, S., Peters, G., Beavis, P., 2004. Life cycle assessment for sustainable metro-politan water systems planning. Environ. Sci. Technol. 38 (13), 3465e3476.
Lundin, M., Bengtsson, M., Molander, S., 2000. Life cycle assessment of wastewatersystems: Influence of system boundaries and scale on calculated environmentalloads. Environ. Sci. Technol. 34 (1), 180.
Mitchell, V.G., 2007. How important is the selection of computational analysismethod to the accuracy of rainwater tank behaviour modelling? Hydrol. Pro-cess. 21 (21), 2850e2861.
Moges, G., Hengsdijk, H., Jansen, H.C., 2011. Review and quantitative assessment ofex situ household rainwater harvesting systems in Ethiopia. Agric. WaterManag. 98 (8), 1215e1227.
Morales-Pinz�on, T., Lurue~na, R., Rieradevall, J., Gasol, C.M., Gabarrell, X., 2012.Financial feasibility and environmental analysis of potential rainwater har-vesting systems: a case study in Spain. Resour. Conserv. Recycl. 69, 130e140.
Mwenge Kahinda, J.M., Taigbenu, A.E., Boroto, J.R., 2007. Domestic rainwater har-vesting to improve water supply in rural South Africa. Phys. Chem. Earth, PartsA/B/C 32 (15), 1050e1057.
NEOSRD, 2012. North East Ohio Regional Sewer District Stormwater Fee CreditManual.
Office of Management and Budget, Discount rates for cost effectiveness. Circular A-94 Appendix C. Available online from: http://www.whitehouse.gov/omb/circulars_a094_a94_appx-c/ (revised December 2012).
Ohio State University Extension fact Sheet e Horticulture and Crop Science (OSU-HCS). Available online from: http://ohioline.osu.edu/hyg-fact/1000/1191.html(accessed June 2014).
Palla, A., Gnecco, I., Lanza, L.G., 2011. Non-dimensional design parameters andperformance assessment of rainwater harvesting systems. J. Hydrol. 401 (1),65e76.
Proenca, L.C., Ghisi, E., Tavares, D.F., Coelho, G.M., 2011. Potential for electricitysavings by reducing potable water consumption in a city scale. Resour. Conserv.Recycl. 55, 960e965.
Racoviceanu, A.L., Karney, B.W., 2010. Life-Cycle perspective on residential waterconservation strategies. J. Infrastruct. Syst. 16 (1), 40e49.
Rahman, A., Dbais, J., Imteaz, M., 2010. Sustainability of rainwater harvesting sys-tems in multistorey residential buildings. Am. J. Eng. Appl. Sci. 3 (1), 889e898.
Residential Consecutive water sewer rates. Available online from: http://publicutilities.columbus.gov/uploadedFiles/Public_Utilities/Customer_Service/Residential/2010_Rates_and_Information/RateChart11.pdf.
Sahely, H.R., Kennedy, C.A., 2007. Water use model for quantifying environmentaland economic sustainability indicators. ASCE J. Water Resour. Plan. Manag. 133(6), 550e559.
Scheuer, C., Keoleian, G.A., Reppe, P., 2003. Life cycle energy and environmentalperformance of a new university building: modeling challenges and designimplications. Energy Build. 35, 1049e1064.
Schwecke, M., Simmons, B., Basant, M., 2007. Sustainable use of stormwater forirrigation case study: Manly Golf Course. Environmentalist 27 (1), 56e61.
State of Michigan, Tanks. Available online from: http://www.michigan.gov/documents/Vol2-35UIP11Tanks_121080_7.pdf.
Steel Cistern Pricing, http://www.watertanks.com/category/162/group/2/ (accessedMay 2014).
Stillwell, A.S., King, C.W., Webber, M.E., Duncan, I.J., Hardberger, A., 2011. TheEnergy-water Nexus in Texas.
Sturm, M., Zimmermann, M., Schütz, K., Urban, W., Hartung, H., 2009. Rainwaterharvesting as an alternative water resource in rural sites in central northernNamibia. Phys. Chem. Earth, Parts A/B/C 34 (13), 776e785.
Tam, V.W.Y., Tam, L., Zeng, S.X., 2010. Cost effectiveness and tradeoff on the use ofrainwater tank: an empirical study in Australian residential decision-making.Resour. Conserv. Recyc. 54, 178e186.
Tillman, A., Svingby, M., Lundstrom, H., 1998. Life cycle assessment of municipalwastewater systems. Int. J. Life Cycle Assess. 3 (3), 145e157.
USDOT, Federal Highway Administration. Average Annual Miles per Driver by AgeGroup. Available online from: http://www.fhwa.dot.gov/ohim/onh00/bar8.htm(accessed October 2014).
USDOT, Research and Innovative Technology Administration, Bureau of Trans-portation Statistics. Average Fuel Efficiency of U.S. Light Duty Vehicles. Availableonline from: http://www.rita.dot.gov/bts/sites/rita.dot.gov.bts/files/publications/national_transportation_statistics/html/table_04_23.html(accessed October 2013).
USEPA, 2004. Report to Congress: Impacts and Control of Combined Sewer Over-flows and SSOs. National Pollution Discharge Elimination System. Availableonline from: http://www.epa.gov/npdes/pubs/csossoRTC2004_executive_summary.pdf.
USEPA, Calculation and References. Available online from: http://www.epa.gov/cleanenergy/energy-resources/refs.html (accessed October 2014).
USEPA. Greenhouse gas equivalencies calculator. Available online from: http://www.epa.gov/cleanenergy/energy-resources/calculator.html#results (accessedOctober 2014).
Vargas-Parra, M.V., Villalba, G., Gabarrell, X., 2013. Applying exergy analysis torainwater harvesting systems to assess resource efficiency. Resour. Conserv.Recycl. 72, 50e59.
Vickers, A., 2001. A Handbook of Water Use and Conservation. Water Flow Press,Amherst: MA.
Vieira, A.S., Beal, C.D., Ghisi, E., Stewart, R.A., 2014. Energy intensity of rainwaterharvesting systems: a review. Renew. Sustain. Energy Rev. 34, 225e242.
Villarreal, E.L., Dixon, A., 2005. Analysis of a rainwater collection system for do-mestic water supply in Ringdansen, Norrkoping, Sweden. Build. Environ. 40,1174e1184.
Walsh, T.C., Pomeroy, C.A., Burian, S.J., 2014. Hydrologic modeling analysis of apassive, residential rainwater harvesting program in an urbanized, semi-aridwatershed. J. Hydrol. 508, 240e253.
Walton, B., 2013. The Price of Water 2013: up Nearly 7 Percent in Last Year in 30Major U.S. Cities; 25 Percent Rise since 2010, Circle of Blue. Available onlinefrom: http://www.circleofblue.org/waternews/2013/world/the-price-of-water-2013-up-nearly-7-percent-in-last-year-in-30-major-u-s-cities-25-percent-rise-since-2010/.
Ward, S., Butler, D., Memon, F.A., 2012. Benchmarking energy consumption and CO2emissions from rainwater-harvesting systems: an improved method by proxy.Water Environ. J. 26 (2), 184e190.
Ward, S., Memon, F.A., Butler, D., 2010. Rainwater harvesting: model-based designevaluation. Water Sci. Technol. 61 (1), 85e96.
WinEst eMeridian Systems and Win Estimator. Available online from: http://www.meridiansystems.com/products/winest/overview/(accessed June 2014).
Yuan, T., Fengmin, L., Puhai, L., 2003. Economic analysis of rainwater harvesting andirrigation methods, with an example from China. Agric. Water Manag. 60 (3),217e226.
Zhang, Y., Chen, D., Chen, L., Ashbolt, S., 2009. Potential for rainwater use in high-rise buildings in Australian cities. J. Environ. Manage. 91, 222e226.
Zimmerman, J.B., 2014. Economic and environmental assessment of office buildingrainwater harvesting systems in various US cities. Environ. Sci. Technol. http://dx.doi.org/10.1021/es5046887. Accepted Manuscript.