li, m., & chapman, g. b. (2013). a big fish or a small pond? framing effects in percentages. ...
TRANSCRIPT
Organizational Behavior and Human Decision Processes 122 (2013) 190–199
Contents lists available at ScienceDirect
Organizational Behavior and Human Decision Processes
journal homepage: www.elsevier .com/ locate /obhdp
A big fish or a small pond? Framing effects in percentages
0749-5978/$ - see front matter � 2013 Elsevier Inc. All rights reserved.http://dx.doi.org/10.1016/j.obhdp.2013.07.003
⇑ Corresponding author. Address: Department of Health and Behavioral Sciences,University of Colorado Denver, Campus Box 188, PO Box 173364, Denver, CO 80217-3364, United States. Fax: +1 (303) 556 8501.
E-mail address: [email protected] (M. Li).
Meng Li a,⇑, Gretchen B. Chapman b
a University of Colorado Denver, United Statesb Department of Psychology, Rutgers University, United States
a r t i c l e i n f o
Article history:Received 21 March 2012Accepted 19 July 2013
Accepted by Harris Sondak
Keywords:Framing effectNumber perceptionPercentagesJudgment and decision making
a b s t r a c t
This paper presents three studies that demonstrate people’s preference for a large percentage of a smallsubset over a small percentage of a large subset, when the net overall quantity is equated. Because thedivision of a set into subsets is often arbitrary, this preference represents a framing effect. The framingeffect is particularly pronounced for large percentages. We propose that the effect has two causes: A par-tial neglect of the subset information, and a non-linear shaped function in the way people perceivepercentages.
� 2013 Elsevier Inc. All rights reserved.
Introduction
Judgment and decision making research has long demonstratedthat people are easily attracted by feelings of certainty—100%probability (certainty effect, Kahneman & Tversky, 1979; Tversky& Kahneman, 1992). Recent research however, has revealed a moregeneral preference for ‘‘100%’’ outside the domain of probability: InLi and Chapman (2009), participants preferred a vaccine describedas ‘‘100% effective against 70% of virus strains that cause a specificcancer’’ over one described as ‘‘70% effective against 100% of virusstrains that cause the same cancer’’, while both are preferred overvaccines with the same net benefit but that were less than 100%effective toward fewer than 100% of targets. Participants also pre-ferred a 100% discount on a cup of coffee every 10 days, as well as a10% discount everyday (100% of the days during the year) overother coffee discount programs with in-between amounts andfrequencies but the same net savings. This ‘‘100% effect’’ is ironic,because the 100% discount or time coverage are only superficial—they apply to a small subset (i.e., 1 out of every 10 days, or 10%of the price) instead of the whole set. However, people seem to fo-cus on 100% instead of the scope over which the 100% applies.
A separate line of research demonstrates that when makingprobability judgments, children and adults focus on the numerator,and sometimes ignore the denominator. For example, participantsviewed 10 out of 13 as a greater chance to win than 9 out of 11(Reyna & Brainerd, 2008), and a cancer that ‘‘kills 1286 out of
10,000 people’’ (12.86%) as riskier than one that ‘‘kills 24.14 outof 100 people’’ (24.14%) (Yamagishi, 1997). Similarly, a ratio of lar-ger numbers (e.g. 10 in 100) seems larger than the same ratio withsmaller numbers (e.g. 1 in 10) (ratio bias, see Pacini & Epstein,1999). According to Fuzzy Trace Theory (Reyna, 2004; Reyna & Bra-inerd, 1995, 2008), people mainly rely on the gist of information tomake judgments, and when they judge risk or probability, extract-ing the gist from both the numerator and denominator becomesdifficult because the numerator class (e.g., the number of peoplewho survive a surgery) is included in the denominator class (e.g.,the number of people who have the surgery), which creates confu-sion. As a result, people often focus on the salient gist in ratios, thatis, the numerator (e.g. how many patients survive the surgery,which relates to the outcome they care about), and ignore thedenominator.
Arguably, such ‘‘denominator neglect’’ is similar to the 100% ef-fect, which manifests as a focus on the salient 100% and under-weighting of the subset information (e.g., scope of the virusstrains targeted by the vaccine). However, the 100% effect cannotbe fully explained by a neglect of denominators. Li and Chapman’sstudy (2009) showed that 100% can be overweighted when it refersto either the discount amount (100% discount) or discount fre-quency (discount everyday—100% of the days), while denominatorneglect predicts the neglect of only one dimension (denominator)and overweighting of the other. An additional explanation couldbe that people perceive percentages in a non-linear fashion, witha convex curvature near 100%. It is unclear what the weightingfunction for percentages might look like, except that it curves upat 100%. Another distinction between the 100% effect and denom-inator neglect is that in denominator neglect, people are presentedwith the numerator and denominator information (the ratio of the
M. Li, G.B. Chapman / Organizational Behavior and Human Decision Processes 122 (2013) 190–199 191
two represent probability), while in the 100% effect, they are pre-sented with the denominator (scope) and percentage (not neces-sarily probability) information (the product of these representsthe numerator). Previous research has not demonstrated that ne-glect of scope also occurs in the latter case.
The 100% effect entails that 100% of a small scope looms largerthan a smaller percentage of a large scope, when both refer to thesame objective size. However, if people perceive percentages in anon-linear function, there might be over-weighting of other per-centages. Would percentages other than 100% be overweighted?In the current paper, we hypothesize a framing effect for percent-ages in general, so that a large percentage within a small scopelooms larger than a small percentage within a large scope (a regu-lar fish looks larger in a small pond). We propose that there are twomechanisms for such an effect: underweighting of the scope infor-mation, similar to denominator neglect, and a non-linear functionby which people perceive percentages.
Whether people weigh percentages in a non-linear fashion hasnot been tested before. The denominator neglect account does notrequire that percentages be weighted in a nonlinear fashion;rather, it is the underweighting of the denominator that distortsperception of percentage. However, the 100% effect is evidence thatperception of percentages is non-linear, at least in the region closeto 100%. Li and Chapman (2009) suggested that 100% is over-weighted because it is a salient reference point—especially in do-mains where 100% is a natural maximum (e.g. discount)—similarto how people weigh probability. Prospect Theory (Kahneman &Tversky, 1979; Tversky & Kahneman, 1992) specifies that peopleweigh probability using an inverse-S shape function. The currentpaper tests whether people also weigh percentages in general ina non-linearfashion.
Previous research on denominator neglect and ratio bias hasdemonstrated that there are individual differences in the denomi-nator neglect effect. For example, Stanovich and West (2008)shows that people who are high on cognitive ability, as measuredby SAT score (verbal and math score combined), are less likely todisplay denominator neglect. To identify whether numerical profi-ciency contributes to our proposed framing effect in percentages,we test whether and how participants’ numeracy affects their per-centage judgments. We used a numeracy scale similar to the oneused by Lipkus, Samsa, and Rimer (2001), which included ques-tions involving the calculation of fractions.
We conducted 3 studies to examine a framing effect in percent-ages and its mechanisms. Study 1 demonstrated a framing effectand a curvilinear percentage weighting function using a hypothet-ical scenario about organic content within coffee blends. Study 2replicated these findings with a hypothetical scenario aboutamusement park tickets that cover various percentages of park fea-tures. In Study 3, we extended the effects to real donations to char-itable projects.
Study 1
This study used a scenario about organic coffee to examine howpeople are influenced by apparent percentages, and how peopleweigh percentages. The popularity of natural products has beendemonstrated in their rising market as well as in experiments(see Dimitri & Greene, 2002; Rozin, 2005; Li & Chapman, 2012),and it is reasonable to assume that consumers will be attractedto high organic content in products. In this study, we used a hypo-thetical scenario about several multi-region coffee blends, whereorganic content within each ingredient was varied. We predict thatparticipants would be more influenced by the relative percentageswithin each ingredient that was directly presented to them thanthe absolute organic content in the coffee blends, and that the
way they weigh percentages would be a non-linear function withan upward curve close to 100%.We also tested whether individualdifferences in numeracy affect the way people respond to apparentpercentages and their percentage weighting function.
Methods
ParticipantsTwo hundred and sixty-six college students (138 men, 119 wo-
men, gender information missing for 9 participants) participated inan Internet study in exchange for course credits. In the beginningof the semester, all participants completed a battery survey, whichincludes a 10-item numeracy measure (see Appendix) adaptedfrom a similar scale in Lipkus et al. (2001). Numeracy score wascalculated as the number of items answered correctly, ranging be-tween 1 and 10. Mean numeracy among 257 participants who tookthe measure was 7.99 (SD = 2.13). The 9 participants with missingnumeracy information were not included for the Hierarchical Lin-ear Model (HLM) analysis, which included numeracy as a predictor.
QuestionnaireParticipants first read that they would be rating several types of
multi-region blend coffees, all of which had the same mixture ofbeans from 3 regions: 60 g of Guatemalan beans, 30 g of Ethiopianbeans, and 10 g of Sumatran beans in every 100 g of coffee. Theysaw a pie chart illustrating the proportion of these 3 beans. Then,on the same page, they were presented with 12 coffee blends, eachdescribed in terms of the organic content of each type of coffeebeans. The organic content were presented as ‘‘Only Guatemalanbeans are 25% (or 40%, 50%, 80%, 95%, 100%) organic’’, or ‘‘OnlyEthiopian beans are 25% (or 40%, 50%, 80%, 95%, 100%) organic’’.Thus, the relative percentage of organic content (25–100%) isnested within either a major ingredient (Guatemalan beans, 60%of the coffee content) or a minor ingredient (Ethiopian beans,30% of the coffee content) for each coffee blend, with the majorbeans constituting twice the overall content of the blend as theminor beans do. The key comparison between coffee blends with25%, 40% and 50% organic major beans versus those with 50%,80% and 100% organic minor beans formed a 3 (absolute percent-age of organic content in coffee: 15%, 24% and 30%) � 2 (type ofbeans with organic content: Guatemalan, 60% of overall contentvs. Ethiopian, 30% of overall content) within-subjects design. Therest of the coffee blends were included to mask the purpose ofthe study, and to map the percentage weighting function. Partici-pants were asked to rate how appealing each coffee was, on a16-point scale from 0 ‘‘not appealing at all’’ to 15 ‘‘very appealing’’.
Subsequently, participants’ naturalness preference was mea-sured. Participants indicated their agreement to two statementson a scale from 1 ‘‘strongly disagree’’ to 7‘‘strongly agree’’ (seeAppendix for actual measure). Naturalness preference measuredthis way has been shown to correlate with stronger beliefs thatnatural products are superior on taste, safety, healthfulness, andenvironmental friendliness (Li & Chapman, 2012). We expectedparticipants’ naturalness preferences to correlate with more likingfor coffee blends that have a higher percentage of organic content.However, it is also possible that such naturalness preference willlead to less consideration of the absolute organic content of theproduct, but more consideration of whether the ingredients were‘‘100% organic’’, thereby a more pronounced ‘‘100% effect’’.
Results
We used Hierarchical Linear Modeling (HLM) for analyses onthe percentage weighting function as well as framing effect in allstudies. Using HLM analyses enables us to accurately assess the ef-fect of the predictors while taking into account the within-subject
192 M. Li, G.B. Chapman / Organizational Behavior and Human Decision Processes 122 (2013) 190–199
nature of the design, that is, multiple ratings from one subject arenot independent. The HLM model also accounts for between-sub-ject variations on mean responses (intercept), as well as be-tween-subject variations on the effect of the within-subjectfactors. These variations are manifested as random effects (randomvariations between subjects), or fixed effects of the interaction be-tween person-level predictors and within-subject factors.
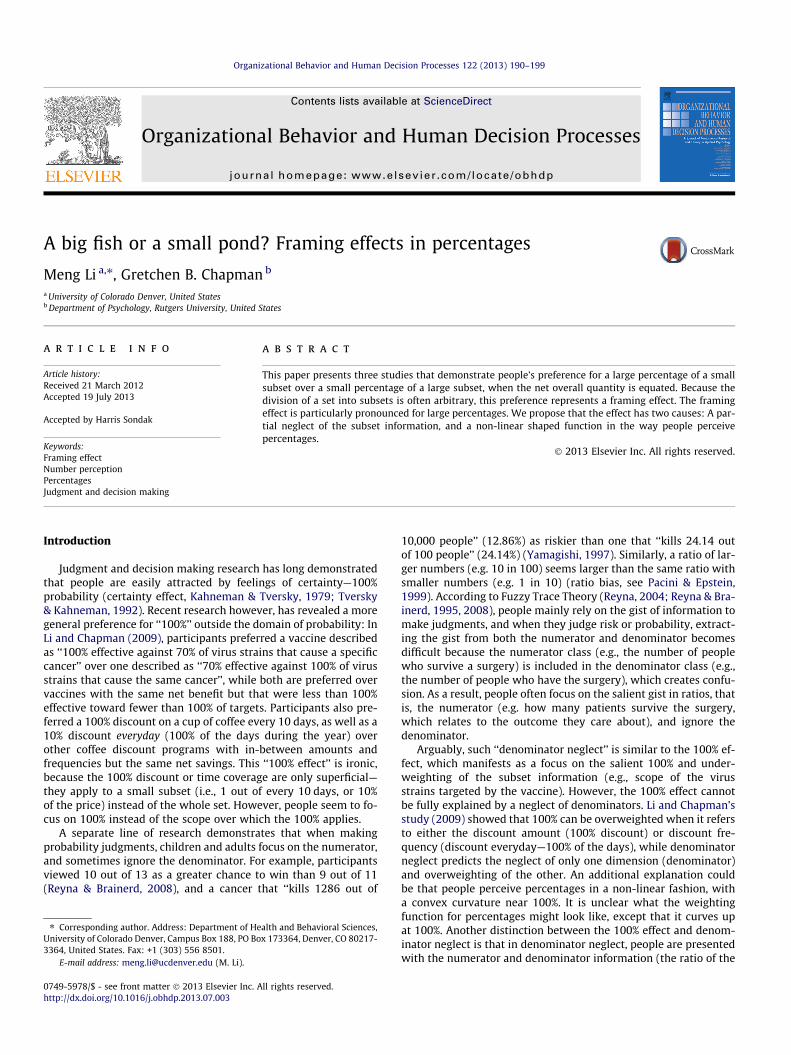
Ratings for all coffee blendsFig. 1 shows mean ratings for all the 12 coffee blends as a func-
tion of the relative organic content (25–100%) within a bean type,plotted separately by bean type. We analyzed these 12 ratingsusing HLM. We entered relative organic content (linear, quadraticand cubic effects), bean type and their interactions as Level 1 pre-dictors, numeracy and naturalness preference as Level 2 predictors,and included cross-level interactions as potential predictors. Ran-dom effects of intercept and all Level-1 predictors were tested.The final model using restricted maximum likelihood (REML)method had a fit index �2 Restricted Log Likelihood = 14362.91,with all non-significant predictors dropped out (marginally signif-icant effects with p < .10 remained in the model). The fixed effectsare listed in Table 1.
Overall, coffee blends with greater relative organic contentwithin one type of beans received higher ratings, as shown in thepositive linear effect of relative organic percentage, B = 5.63,p < .01, a positive quadratic effect, B = 3.90, p < .01, as well as a po-sitive cubic effect, B = 19.82, p < .01. These effects suggest a non-linear percentage weighting function that is concave for smallerpercentages and convex for larger percentages. Coffee blendswhose major beans (Guatemalan) were (partially or all) organicwere also rated higher than those whose minor beans (Ethiopian)were organic,B = .73, p < .01, suggesting that participants didunderstand there were more Guatemalan beans than Ethiopianbeans in the coffee blends. In addition, there was a significantinteraction between the linear effect of relative organic percentageand bean type, B = .67, p < .01, indicating that participants realizedthe same increase in organic proportion carried greater weight inthe major beans than in the minor beans, as the former lead togreater absolute increase in organic content. Numeracy had a mar-ginal interaction with the quadratic effect, B = �.53, p = .08, with atrend of high-numeracy participants showing less quadraticeffect.Naturalness preference also had a marginal interaction withlinear effect of percentage, B = .22, p < .06, so that participants withstronger naturalness bias showed marginally steeper lines. Ran-dom effects for intercept (Wald Z = 10.79), relative organic
Fig. 1. Mean ratings for 12 multi-region coffee blends. Ratings were plotted as afunction of the percentage (25–100%) of organic content in one type of beans, andwhich bean type had organic content. All coffee blends consisted of 60% Guatema-lan beans (major beans) and 30% Ethiopian beans (minor beans). Ratings were on a16-point scale from 0 (not appealing at all) to 15 (very appealing). Error bars: 95%within-subjects Confidence Interval for comparing coffee beans with the samerelative organic content from two types of beans (Loftus & Masson, 1994).
percentage-linear (Wald Z = 8.30), relative organic percentage-cu-bic (Wald Z = 2.61) and bean type (Wald Z = 8.18) were significant,p < .01 for all, indicating individual variations in baseline rating,linear slope and cubic effect of relative organic percent, as wellas the effect of bean type.
These results indicate that participants had a clear understand-ing of the scenario and their responses were consistent with theassumption that greater organic content in coffee blends wasappealing. Importantly, participants did notice that the organicpercentages presented in the scenario refer to the relative organicpercentage within each bean type. Thus, any potential framing ef-fect could not be due to misreading of the scenario. In addition,these results suggest that participants weighted the percentagesin a non-linear fashion, and the curvature was marginally influ-enced by participants’ numeracy levels.
Framing effectTo test for framing effect, we used Hierarchical Linear Modeling
(HLM) to analyze the ratings for 6 coffee blends, including coffeeblends with 25%, 40% and 50% organic content in the major beans(Guatemalan beans, 60% of the entire coffee blend), and coffeeblends with 50%, 80%, and 100% organic content in the minor beans(Ethiopian beans, 30% of the entire coffee blend). The HLM analysisallows us to test the linear and quadratic effect of absolute organiccontent (15%, 24% and 30%), the effect of bean type containing theorganic content (major beans-Guatemalan vs. minor beans-Ethio-pian), their interactions, as well as individual differences in sucheffects. In particular, The HLM analysis included total organic con-tent (linear and quadratic effects) and bean type as Level 1 predic-tors, and person level variables including numeracy andnaturalness preference score as Level 2 factors. Thus, at each levelof absolute organic content, there were two matching coffeeblends, with organic content coming from either the major beansor the minor beans. If participants evaluated coffee blends on thebasis of absolute organic content only, coffee blends with thematching absolute organic content should have the same rating,regardless of which type of beans they come from. On the otherhand, if they were more influenced by the apparent organic per-centage within one type of beans and overlooked whether it is amajor or minor ingredient, ratings would be higher for coffeeblends with a big percentage of organic content in the minor beans,showing a framing effect. Particularly, if such framing effect isstronger when 100% is involved, it would demonstrate a 100%effect.
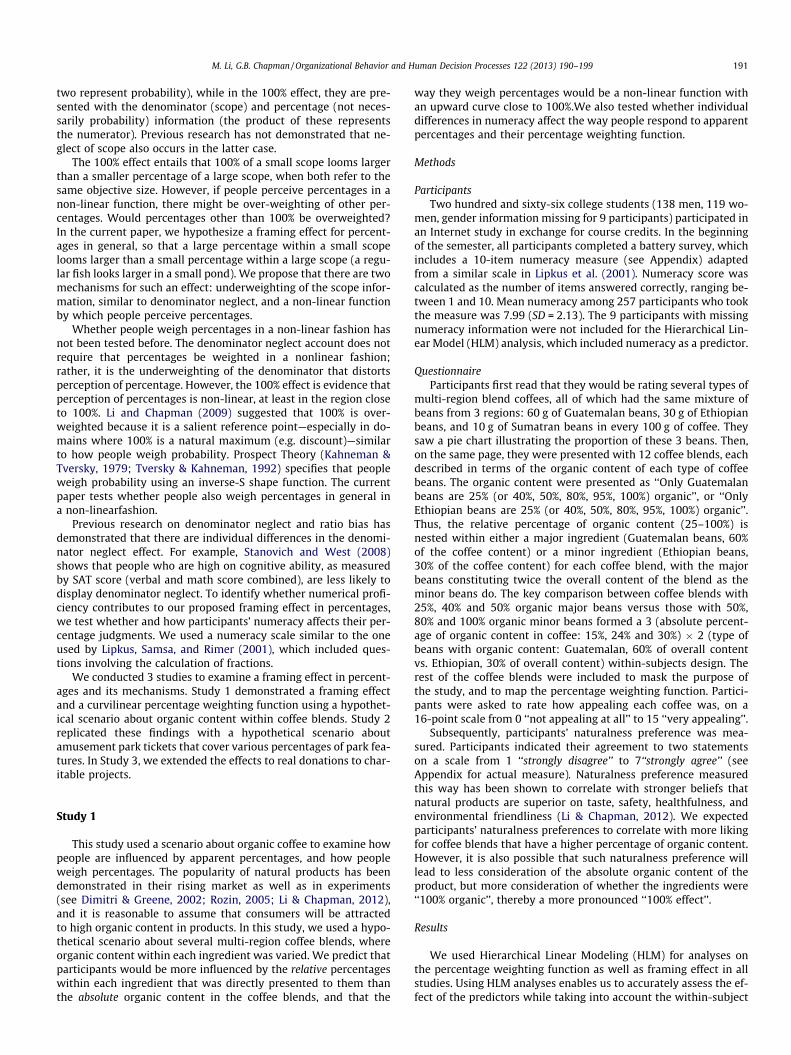
Fig. 2 shows ratings for the above mentioned 6 coffee blends asa function of absolute organic percentage within the coffee, plottedseparately by the bean type that has the organic content. Table 2shows the final HLM model with all significant fixed effects(including marginally significant effects withp < .10) in the HLManalysis, using restricted maximum likelihood (REML) method.Random effects for intercept, linear effect of total organic percent-age, and bean type were significant, indicating significant varia-tions among participants on overall rating level, the effect oftotal organic percentage on rating, and effect of bean type on rat-ing. Model fit index -2 Restricted Log Likelihood = 7613.75. The lin-ear effect of total organic percentage was significant and positive,B = 26.79, p < .01. There was a significant negative effect of beantype, B = �3.27, p < .01(see Fig. 2), which means that participantspreferred coffee beans with a bigger organic percentage within aminor ingredient, compared to a smaller organic percentage withina major ingredient, even if the absolute organic content was thesame, demonstrating a framing effect.
We also found evidence for a 100% effect. There was a signifi-cant quadratic effect of total organic percentage, B = 51.23,p = .01, which was moderated by bean type, B = �205.94, p < .01.Fig. 2 shows that the quadratic effect was positive for coffee blends

Table 1Fixed effects in final Hierarchical linear modeling analysis for ratings of 12 coffee blends to model the weighting function of percent-organic within each bean.
Effect B SE (B) df t p
Intercept 8.39 .17 326.09 49.17 <.01Percent-organic within bean Linear (L) 5.63 .47 656.77 11.96 <.01Percent-organic within bean Quadratic (Q) 3.90 .75 2171.86 5.17 <.01Percent-organic within bean Cubic (C) 19.82 3.25 782.48 6.09 <.01Bean type (T) .73 .13 256.00 5.68 <.01Naturalness Preference (N) .17 .05 254.97 3.35 <.01L � T .67 .24 2171.86 2.82 < .01L � N .22 .11 253.36 1.96 .05Q � Numeracy �.53 .31 2547.84 �1.75 .08
Note. Level 1 predictors: Percent -organic within beans (centered at the mean = 65%) in linear, quadratic and cubic terms, bean type (major bean = 0.5; minor bean = �0.5);Level 2 predictors: Naturalness Preference (centered at the mean = 8.81), Numeracy (centered at the mean = 7.99), and Gender (Male = �0.5; Female = 0.5). The onlysignificant random effects were intercept (Wald Z = 10.79), Percent-organic within beans-linear (Wald Z = 8.30), Percent-organic within beans-cubic (Wald Z = 2.61), and Beantype (Wald Z = 8.18), p < .001 for all. Model fit index �2 Restricted Log Likelihood = 14362.91.
Fig. 2. Mean ratings of 6 multi-region coffee blends. Ratings were plotted as afunction of the absolute organic content in the entire blend (15%, 24% or 30%), andwhether such organic content were in the major beans (Guatemalan beans, whichmake up 60% of the coffee blend) or the minor beans (Ethiopian beans, which makeup 30% of the coffee blend). Ratings were on a 16-point scale from 0 (not appealingat all) to 15 (very appealing). Error bars: 95% within-subjects Confidence Intervalfor comparing pairs of coffee beans with the same absolute organic content (Loftus& Masson, 1994).
M. Li, G.B. Chapman / Organizational Behavior and Human Decision Processes 122 (2013) 190–199 193
with organic content in the minor bean, B = 154.20, p < .01, as illus-trated in the reversed bell-shape curve; for coffee blends with or-ganic content in the major bean, however, the quadratic effectwas only marginally significant and in the opposite direction,B = �51.74, p = .07, as illustrated in the mostly straight lower linein the figure. The upward curve for minor beans suggests that100% organic within an ingredient was overweighted comparedto lower percentages, while the almost straight line for major beansuggests that 50% organic within an ingredient was not, despite thefact that they both constitute the same total organic content withthe coffee blend.
The linear effect of total organic content also interacted withnaturalness preference, B = .91, p = .01, so that participants with
Table 2Fixed effects in final Hierarchical linear modeling analysis for ratings of 6 coffee blends w
Effect B
Intercept 9.35Total percent-organic in coffee-Linear (L) 26.79Total percent-organic in coffee-Quadratic (Q) 51.23Bean type (T) �3.27Naturalness Preference (N) .21L � T �40.72Q � T �205.94L � N .91T � N �.10
Note. Level 1 predictors: Total percent-organic in coffee (centered at the mean = 29beans = �0.5); Level 2 predictors: Naturalness Bias (centered at the mean = 8.81) andintercept (Wald Z = 9.55), Total percent-organic-linear (Wald Z = 4.42), and Bean type (W
greater naturalness preference cared more about high total organiccontent. Numeracy did not have any significant interaction witheither the linear, quadratic effect of absolute organic percentage,or with bean type, and thus was dropped out from the final HLMmodel. The lack of interaction between numeracy and bean typeindicates that individual differences in numeracy did not affectthe magnitude of framing effect.
Discussion
Study 1 demonstrates that people are more attracted to organicproducts when a greater proportion of a minor ingredient is organ-ic, versus when a smaller proportion of a major ingredient is organ-ic, even if the absolute organic content in the product is equivalent.This effect is especially pronounced when part of the product is‘‘100% organic’’. Our finding is consistent with previous researchon the appeal of 100% (Li & Chapman, 2009). But in addition, thecurrent study revealed a non-linear function in percentage weight-ing, which included quadratic and cubic effects. In particular, theweighting function was concave for smaller percentages and con-vex for larger percentages. We found marginal individual differ-ences on the curvature of the percentage weighting function, sothat more numerate people tended to show less quadratic effect(and as such, more linear weighting of percentages). We did not,however, find individuals’ numeracy score to affect the magnitudeof the framing effect, suggesting that the overweighting of big per-centages in a small subset over small percentages in a large subsetmay be a more universal phenomenon.
One limitation of the study is the unequal intervals of specificpercentages presented to participants. Stewart, Chater, and Brown(2006) argued that decision makers determine the subjective valueof an attribute by its rank order in a random sample of objectivevalues, and the values presented in the decision context contribute
ith matching total organic content.
SE (B) df t p
.17 289.59 53.50 <.013.09 886.39 8.67 <.01
20.67 696.31 2.48 .01.22 452.82 �14.79 <.01.05 280.86 3.86 <.01
6.02 696.31 �6.76 <.0141.34 696.31 �4.98 <.01
.35 280.86 2.62 .01
.06 255.00 �1.73 .09
.25%) in linear, quadratic and cubic terms, bean type (Major beans = 0.5, minorNumeracy (centered at the mean = 7.99).The only significant random effects wereald Z = 7.71), p < .001 for all. Model fit index �2 Restricted Log Likelihood = 7613.75.
194 M. Li, G.B. Chapman / Organizational Behavior and Human Decision Processes 122 (2013) 190–199
to this sample. Thus, participants’ ratings in Study 1 might havebeen a reflection of their rank-order preference of the coffeeblends, and the unequal intervals of percentages alone could resultin a seemingly non-linear percentage weighting function, even ifthe underlying function was linear. To address this issue and to testthe framing effect in a different domain, we conducted Study 2.
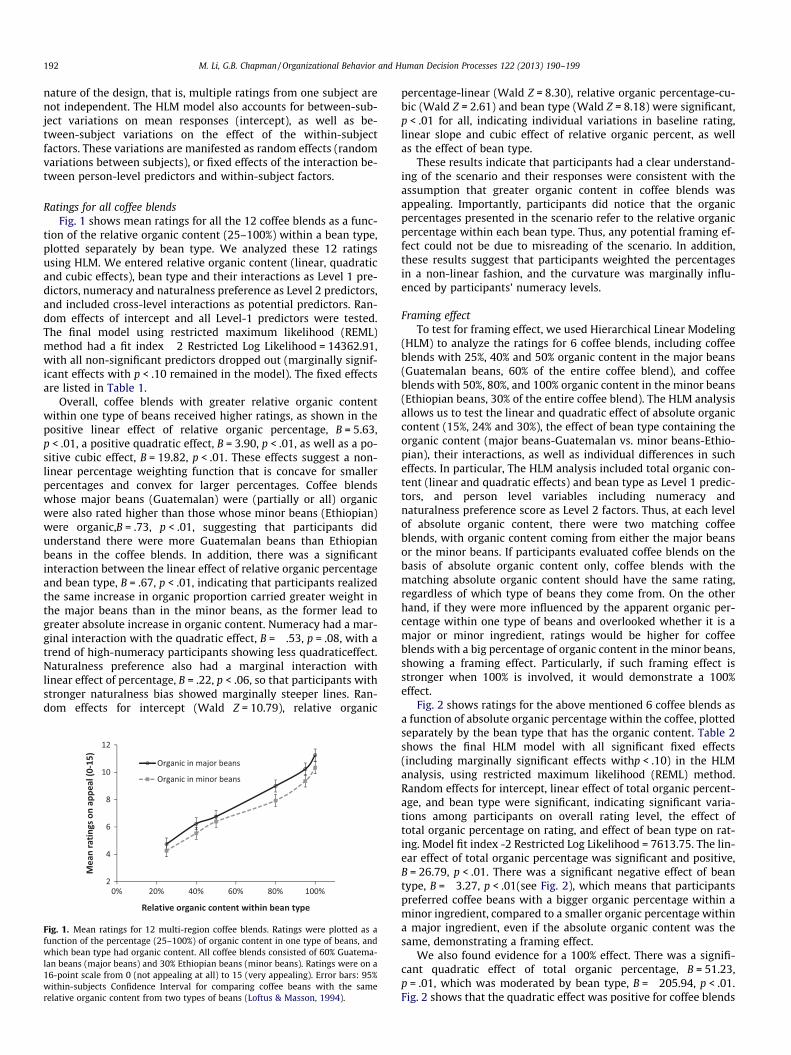
Fig. 3. Mean ratings of 8 Hot Spots passes in an amusement park. Ratings wereplotted as a function of the percentage of Hot Spots the pass covered within atheme, and which theme the Hot Spots belong to. Two thirds of all Hot Spots werein the ‘‘Adventures’’ theme (major theme) and 1/3 of were in the ‘‘Great Fun’’ theme(minor theme). Ratings were on a 16-point scale from 0 (not appealing at all) to 15(very appealing). Error bars: 95% within-subjects Confidence Interval for comparingpark passes with the same relative percent of ‘‘Hot Spots’’ covered in the twothemes (Loftus & Masson, 1994).
Study 2
In this study, we used a similar within-subject design as inStudy 1, but changed the desirable trait to attraction sites in anamusement park. Participants were asked to rate hypothetical parkpasses that allowed them to visit a certain percentage of attrac-tions (‘‘Hot Spots’’) within one of two themes in the park, whereone theme had twice as many such sites than the other theme. Per-centages used were 25%, 50%, 75% and 100%. The framing effectwas tested in two comparison pairs: 25% of the major theme versus50% of the minor theme (both constituted 17% of all ‘‘Hot Spots’’),and 50% of the major theme versus 100% of the minor theme (bothconstituted 33% of all ‘‘Hot Spots’’) in a 2 (absolute percentage ofHot Spots covered by pass) � 2 (Theme of Hot Spots) within-sub-ject design. All activities were scattered around the park so thereis no convenience benefit for visiting more ‘‘Hot Spots’’ withinone theme; presumably, participants should only care about theabsolute percentage of all ‘‘Hot Spots’’ covered. However, we ex-pected participants to violate this prescription by giving higher rat-ings to passes that cover a greater relative percentage of ‘‘HotSpots’’ within the theme that has fewer such sites, thus demon-strating a framing effect. We also expected such a framing effectto be most pronounced when the pass covers 100% of attractivesites in one theme, thus showing a 100% effect. In addition, we ex-pected to replicate the non-linear weighting function in percentageweighting.
Methods
ParticipantsTwo hundred and twenty college students (76 men, 130 wo-
men, gender information missing for 14) participated in an Inter-net study in exchange for credits toward a course requirement.Mean numeracy among 206 participants who took the measurewas 7.34 (SD = 2.35). The 14 participants whose numeracy scorewas missing were not included in the HLM analyses, which testednumeracy as a predictor.
QuestionnaireParticipants read a hypothetical scenario about an amusement
park, to which they already have a general admission ticket thatis good for a few days. However, they need to buy a pass to visitpopular sites , or ‘‘Hot Spots’’. The ‘‘Hot Spots’’ belonged to two dif-ferent themes: 2/3 of all ‘‘Hot Spots’’ were in the ‘‘Adventures’’theme while 1/3 were in the ‘‘Great Fun’’ theme, all of which theywere equally interested in. Participants rated the attractiveness of8 passes that covered various proportions of the ‘‘Hot Spots’’ ineach theme. Four of the passes covered 25%, 50%, 75% or 100% ofthe Hot Spots in the ‘‘Adventures’’ theme, and 4 passes covered25%, 50%, 75% or 100% of the Hot Spots in the ‘‘Great Fun’’ theme.To ensure that complete (100%) coverage of ‘‘Hot Spots’’ withinone theme is no more convenient than coverage of an equal num-ber of ‘‘Hot Spots’’ that accounts for 50% of those in another theme,we specified that all activities in both themes were scatteredaround the park. A diagram displayed a pie-shaped park map, withtwice as many red flags (indicating Hot Spots in the ‘‘Adventures’’theme) than yellow flags (indicating ‘‘Great Fun’’ theme) scatteredaround the park. Participants rated how appealing each pass was
on a 16-point scale from 0 ‘‘not appealing at all’’ to 15 ‘‘veryappealing’’.
Results
Mean ratings for all 8 passes are illustrated in Fig. 3. We ana-lyzed these 8 ratings using Hierarchical Linear Modeling (HLM),with relative percent of Hot Spots content within theme (linear,quadratic and cubic effects), theme, and their interactions as Level1 predictors, and numeracy as a Level 2 predictor, as well as cross -level interactions. Random effects of intercept and all Level-1 pre-dictors were tested. The final model using restricted maximumlikelihood (REML) method had a fit index �2 Restricted Log Likeli-hood = 7931.64, with all non-significant predictors dropped out.All significant (or marginally significant with p < .10) fixed effectsare listed in Table 3. Results show similar positive linear(B = 7.38, p < .01) and cubic (B = 21.02, p < .01) effects of relativepercentage as in Study 1, but the quadratic effect was non-signifi-cant and dropped out of the final model. Nevertheless, the overallshape of the percentage weighting function was the same as inStudy 1: Concave for small percentages and convex for large per-centages. Similar to Study 1, theme had a significant main effect(B = 1.41, p < .01) as well as an interaction effect (B = 1.17, p < .01)with the linear effect of relative percentage, suggesting that partic-ipants did pay attention to the size of the theme each pass wasassociated with. Unlike Study 1, however, numeracy did not havesignificant or marginally significant interactions with any Level-1effects. The only significant random effects included intercept,Wald Z = 8.91, percent of Hot Spots within theme-Linear, WaldZ = 7.49, and theme, Wald Z = 6.40, p < .01 for all, suggesting signif-icant individual variation on baseline rating, linear slope of relativepercentage within theme, as well as the effect of theme.
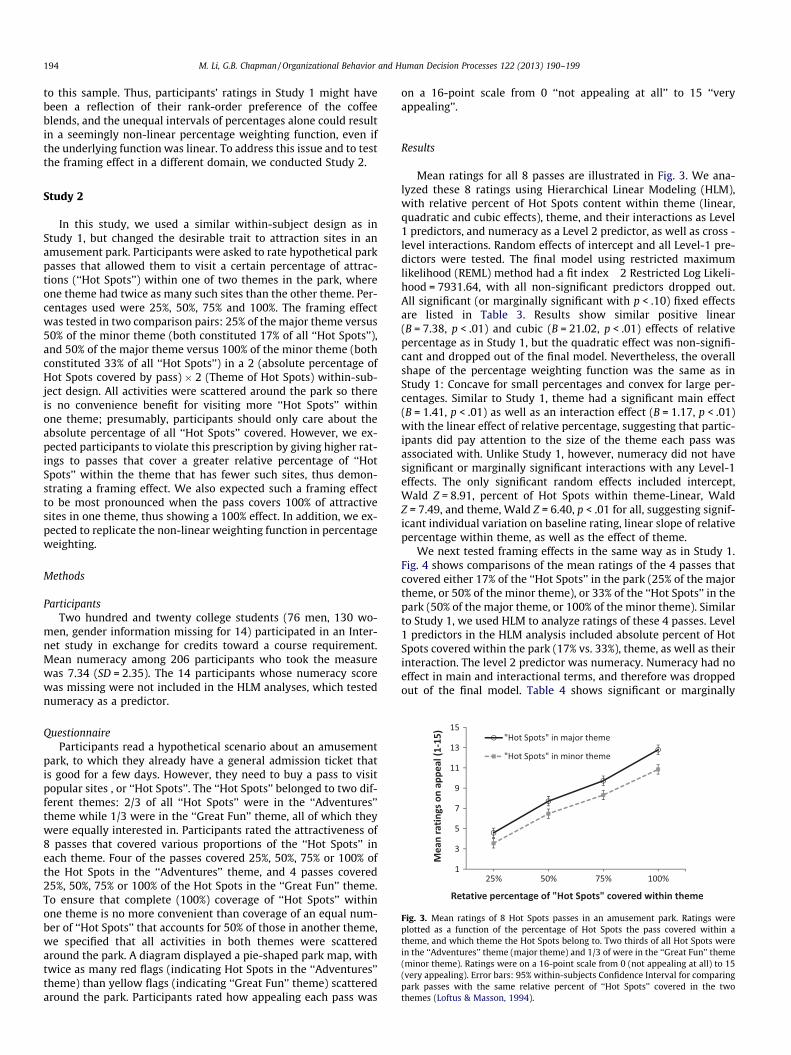
We next tested framing effects in the same way as in Study 1.Fig. 4 shows comparisons of the mean ratings of the 4 passes thatcovered either 17% of the ‘‘Hot Spots’’ in the park (25% of the majortheme, or 50% of the minor theme), or 33% of the ‘‘Hot Spots’’ in thepark (50% of the major theme, or 100% of the minor theme). Similarto Study 1, we used HLM to analyze ratings of these 4 passes. Level1 predictors in the HLM analysis included absolute percent of HotSpots covered within the park (17% vs. 33%), theme, as well as theirinteraction. The level 2 predictor was numeracy. Numeracy had noeffect in main and interactional terms, and therefore was droppedout of the final model. Table 4 shows significant or marginally
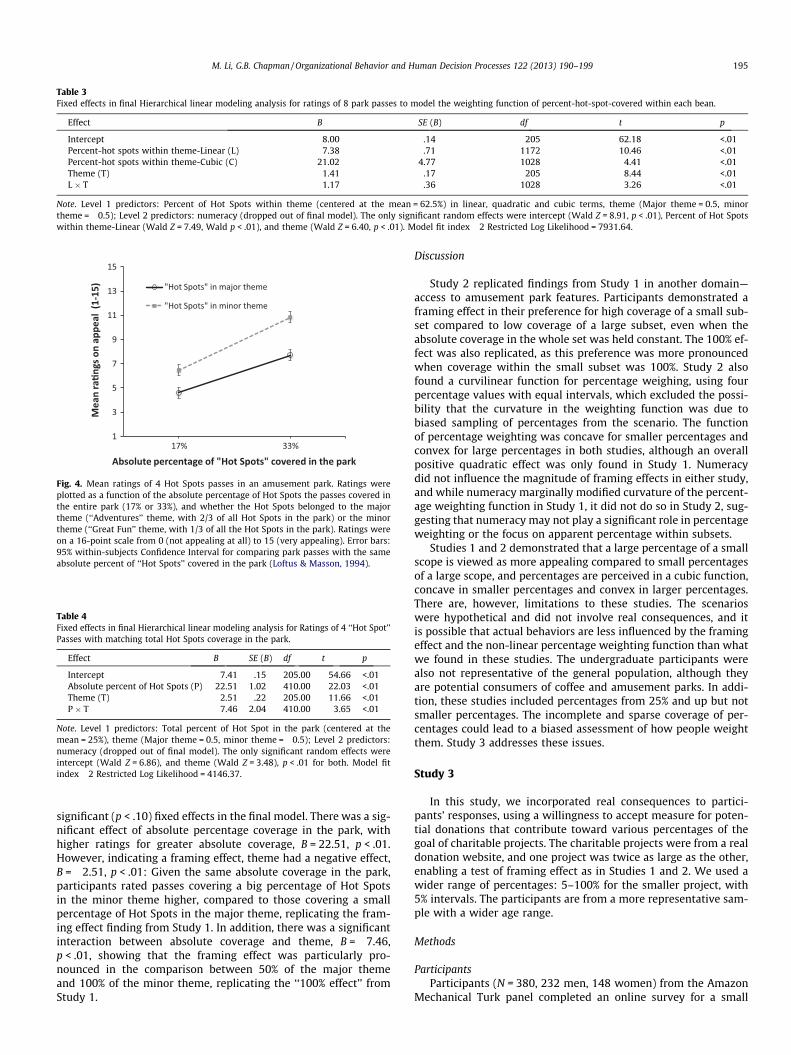
Table 3Fixed effects in final Hierarchical linear modeling analysis for ratings of 8 park passes to model the weighting function of percent-hot-spot-covered within each bean.
Effect B SE (B) df t p
Intercept 8.00 .14 205 62.18 <.01Percent-hot spots within theme-Linear (L) 7.38 .71 1172 10.46 <.01Percent-hot spots within theme-Cubic (C) 21.02 4.77 1028 4.41 <.01Theme (T) 1.41 .17 205 8.44 <.01L � T 1.17 .36 1028 3.26 <.01
Note. Level 1 predictors: Percent of Hot Spots within theme (centered at the mean = 62.5%) in linear, quadratic and cubic terms, theme (Major theme = 0.5, minortheme = �0.5); Level 2 predictors: numeracy (dropped out of final model). The only significant random effects were intercept (Wald Z = 8.91, p < .01), Percent of Hot Spotswithin theme-Linear (Wald Z = 7.49, Wald p < .01), and theme (Wald Z = 6.40, p < .01). Model fit index �2 Restricted Log Likelihood = 7931.64.
Fig. 4. Mean ratings of 4 Hot Spots passes in an amusement park. Ratings wereplotted as a function of the absolute percentage of Hot Spots the passes covered inthe entire park (17% or 33%), and whether the Hot Spots belonged to the majortheme (‘‘Adventures’’ theme, with 2/3 of all Hot Spots in the park) or the minortheme (‘‘Great Fun’’ theme, with 1/3 of all the Hot Spots in the park). Ratings wereon a 16-point scale from 0 (not appealing at all) to 15 (very appealing). Error bars:95% within-subjects Confidence Interval for comparing park passes with the sameabsolute percent of ‘‘Hot Spots’’ covered in the park (Loftus & Masson, 1994).
Table 4Fixed effects in final Hierarchical linear modeling analysis for Ratings of 4 ‘‘Hot Spot’’Passes with matching total Hot Spots coverage in the park.
Effect B SE (B) df t p
Intercept 7.41 .15 205.00 54.66 <.01Absolute percent of Hot Spots (P) 22.51 1.02 410.00 22.03 <.01Theme (T) �2.51 .22 205.00 �11.66 <.01P � T �7.46 2.04 410.00 �3.65 <.01
Note. Level 1 predictors: Total percent of Hot Spot in the park (centered at themean = 25%), theme (Major theme = 0.5, minor theme = �0.5); Level 2 predictors:numeracy (dropped out of final model). The only significant random effects wereintercept (Wald Z = 6.86), and theme (Wald Z = 3.48), p < .01 for both. Model fitindex �2 Restricted Log Likelihood = 4146.37.
M. Li, G.B. Chapman / Organizational Behavior and Human Decision Processes 122 (2013) 190–199 195
significant (p < .10) fixed effects in the final model. There was a sig-nificant effect of absolute percentage coverage in the park, withhigher ratings for greater absolute coverage, B = 22.51, p < .01.However, indicating a framing effect, theme had a negative effect,B = �2.51, p < .01: Given the same absolute coverage in the park,participants rated passes covering a big percentage of Hot Spotsin the minor theme higher, compared to those covering a smallpercentage of Hot Spots in the major theme, replicating the fram-ing effect finding from Study 1. In addition, there was a significantinteraction between absolute coverage and theme, B = �7.46,p < .01, showing that the framing effect was particularly pro-nounced in the comparison between 50% of the major themeand 100% of the minor theme, replicating the ‘‘100% effect’’ fromStudy 1.
Discussion
Study 2 replicated findings from Study 1 in another domain—access to amusement park features. Participants demonstrated aframing effect in their preference for high coverage of a small sub-set compared to low coverage of a large subset, even when theabsolute coverage in the whole set was held constant. The 100% ef-fect was also replicated, as this preference was more pronouncedwhen coverage within the small subset was 100%. Study 2 alsofound a curvilinear function for percentage weighing, using fourpercentage values with equal intervals, which excluded the possi-bility that the curvature in the weighting function was due tobiased sampling of percentages from the scenario. The functionof percentage weighting was concave for smaller percentages andconvex for large percentages in both studies, although an overallpositive quadratic effect was only found in Study 1. Numeracydid not influence the magnitude of framing effects in either study,and while numeracy marginally modified curvature of the percent-age weighting function in Study 1, it did not do so in Study 2, sug-gesting that numeracy may not play a significant role in percentageweighting or the focus on apparent percentage within subsets.
Studies 1 and 2 demonstrated that a large percentage of a smallscope is viewed as more appealing compared to small percentagesof a large scope, and percentages are perceived in a cubic function,concave in smaller percentages and convex in larger percentages.There are, however, limitations to these studies. The scenarioswere hypothetical and did not involve real consequences, and itis possible that actual behaviors are less influenced by the framingeffect and the non-linear percentage weighting function than whatwe found in these studies. The undergraduate participants werealso not representative of the general population, although theyare potential consumers of coffee and amusement parks. In addi-tion, these studies included percentages from 25% and up but notsmaller percentages. The incomplete and sparse coverage of per-centages could lead to a biased assessment of how people weightthem. Study 3 addresses these issues.
Study 3
In this study, we incorporated real consequences to partici-pants’ responses, using a willingness to accept measure for poten-tial donations that contribute toward various percentages of thegoal of charitable projects. The charitable projects were from a realdonation website, and one project was twice as large as the other,enabling a test of framing effect as in Studies 1 and 2. We used awider range of percentages: 5–100% for the smaller project, with5% intervals. The participants are from a more representative sam-ple with a wider age range.
Methods
ParticipantsParticipants (N = 380, 232 men, 148 women) from the Amazon
Mechanical Turk panel completed an online survey for a small

196 M. Li, G.B. Chapman / Organizational Behavior and Human Decision Processes 122 (2013) 190–199
compensation amount. Participants ranged from 18–68 years old(M = 30.76, SD = 9.98), with a median education at college leveland median household income in the $40,000–49,999 bracket. Ra-cial background included 74% Caucasian, 11% Asian, 7% AfricanAmerican, 4% Hispanic, 1% Native American, and 3% multi-racial.
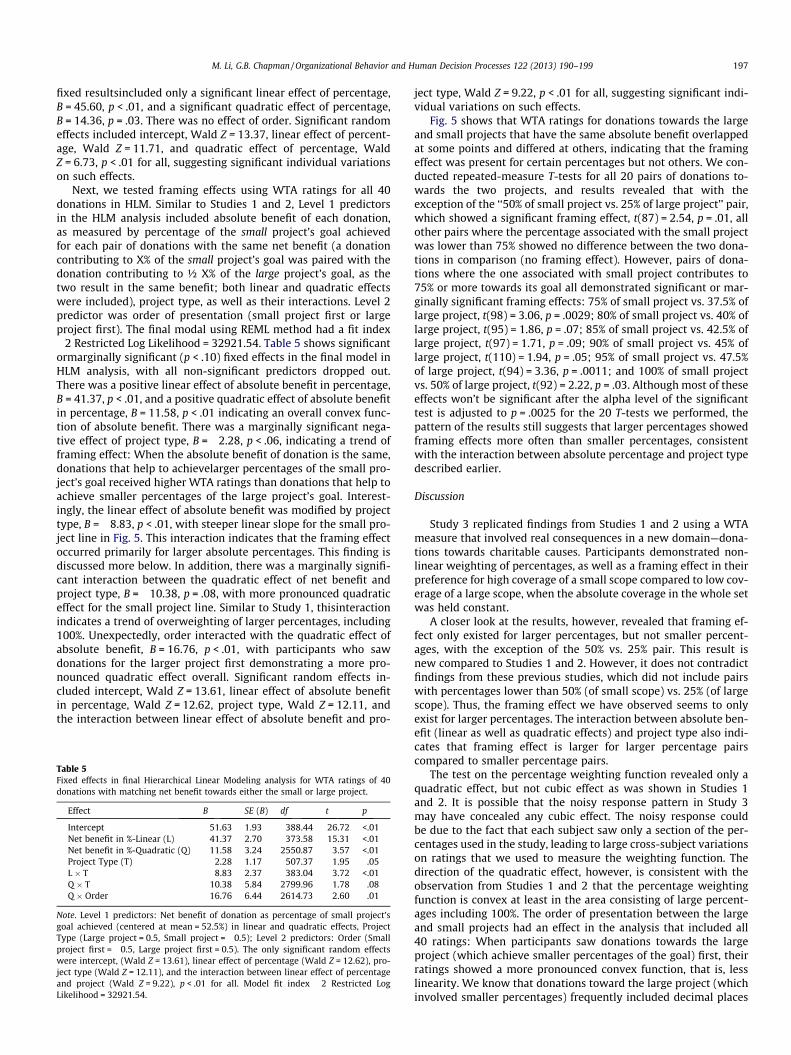
Fig. 5. Mean willingness to accept (WTA) ratings for donations. WTA ratings wereplotted as a function of net benefit achieved by the donation. Achieving Xpercentage of the small project’s goal has the same benefit as achieving ½ Xpercentage of the large project’s goal since the large project benefits twice as manystudents as the small project. Error bars: 95% within-subjects Confidence Intervalfor comparing pairs of donations with the same absolute benefit (Loftus & Masson,1994).
QuestionnaireIn the beginning of the survey, we explained the study to partic-
ipants in a detailed instruction. They were told the study had ac-tual consequences, and that ‘‘You will read several scenarios. Ineach scenario, a donation that we (the research team) give to a char-itable cause will allow it to get a certain percentage of the way to itsgoal. The charitable causes are from DonorsChoose.org, a real organi-zation where donors can contribute toward charitable projects. Afterthe study is over, a winner will be randomly selected from all partici-pants, and a random amount of money ranging from $0 to $150 will bethe monetary prize for the winner. We will also select one donationscenario from the ones presented in the study to implement in reality’’.We explained that we could either carry out the donation, or sendthe chosen amount of prize money to the winner, depending on thewinner’s response to the scenario. For each donation scenario, weasked participants to indicate the minimum amount they wouldask to receive in order to give up the donation. That is, each partic-ipant would indicate how much money she would have to receive(willingness to accept, WTA) in order to forgo having the research-ers give a donation to the charity that would allow it to get X% ofthe way to its goal. After reading the instruction, participants wentthrough two practice questions, which asked them to indicate theminimum amount they would ask to receive in order to give up adonation to an environmental group to save 10% of an endangeredspecies, and a donation to fulfill 80% of the funds needed to help acommunity set up a community garden. They then responded totwo quiz questions, asking them if a certain monetary amountwas randomly selected and the project was chosen, given theamounts they had indicated for each scenario, what outcome theywould get if they were the winner. Subsequently, they receivedfeedback on whether their responses to the quizzes were correctand why. Participants were offered a chance to read the instructionagain before proceeding to the actual survey questions.
Next, the actual survey began with an introduction of two char-itable projects from DonorsChoose.org: ‘‘The smaller charity projectwould provide art/science equipment to an urban middle school. Itwould benefit a small number of students. The larger charity projectwould also provide art/science equipment to an urban middle school.It would benefit a larger number of students— twice as many students.Therefore, the benefit of the LARGER project = 2 � the benefit of theSMALLER project. Below are potential donations we would make tohelp either the LARGER or the SMALLER project achieve a certain %of its goal. What is the minimum amount you would ask to receivein order to give up each donation?’’ We specified that the responsesshould be between $0–150 and they could use decimals if needed.
We included 20 donations for the smaller project, each helpingthe project achieve a different percentage towards its goal. Thepercentages ranged from 5% to 100%, with 5% intervals. Parallelto these donations, we also included 20 donations for the largerproject, contributing to 2.5–50% of its goal, with 2.5% intervals. Be-cause the larger project results in twice the benefit as the smallerbenefit, these 40 donations constitute 20 pairs of donations to-wards the smaller and larger projects that accomplish the samenet benefit, for example, a donation to ‘‘help the smaller projectachieve 5% of its goal’’ has the same benefit as a donation to ‘‘helpthe larger project achieve 2.5% of its goal’’, and a donation to ‘‘helpthe smaller project achieve 80% of its goal’’ has the same benefit asa donation to ‘‘help the larger project achieve 40% of its goal’’, andso on. This design allows us to test framing effect.
To prevent participant fatigue, we presented each participantwith 5 percentages randomly chosen from the 20 percentages fordonations towards the small project, and 5 counterpart percent-ages with half the magnitude for donations towards the largeproject. Thus each participant saw 5 pairs of donations, eachwith the same net benefits. The 5 donations towards the smallproject were presented on one page in random order, and thosetowards the large project were presented on a separate page,also in random order. The order of these two pages wascounter-balanced. At the end of the study, participants reportedtheir demographic information including age, gender, race, edu-cation level, and household income level. There is no numeracymeasure in this study, as doing so at the time of the studywould interfere with either the study itself or the numeracymeasure, and there was no chance to measure it at a separatetime point, as we did in Studies 1 and 2 with undergraduateresearch pool participants.
Results
Mean willingness to accept (WTA) ratings for all 40 donationsare illustrated in Fig. 5. As in Studies 1 and 2, we conducted 2HLM analyses to test the percentage weighting function and fram-ing effects separately. The HLM analyses took into account the factthat each participant only rated a selection of the donations, andtreated the donations they did not see as having missing values.This treatment allowed us to use all the data while accountingfor the within-subject design.
First, we analyzed the ratings for the 20 donations that contrib-ute to 5–100% of the goal for the small project to test whether par-ticipants weighted percentages in a non-linear fashion, Donationsassociated with the large project were not used, because they onlycovered half of the range, from 2.5 to 50%. The HLM analysis usedpercentage of small project’s goal achieved (linear, quadratic andcubic effects) as Level 1 predictors, and order (small projects pre-sented first, or large projects presented first) as the Level 2 predic-tor, as well cross -level interactions. Random effects of all Level 1predictors were tested. The final model using restricted maximumlikelihood (REML) method had a fit index �2 Restricted Log Likeli-hood = 16919.24, with all non-significant predictors dropped out(marginal effects with p < .10 would remain in the model). The
M. Li, G.B. Chapman / Organizational Behavior and Human Decision Processes 122 (2013) 190–199 197
fixed resultsincluded only a significant linear effect of percentage,B = 45.60, p < .01, and a significant quadratic effect of percentage,B = 14.36, p = .03. There was no effect of order. Significant randomeffects included intercept, Wald Z = 13.37, linear effect of percent-age, Wald Z = 11.71, and quadratic effect of percentage, WaldZ = 6.73, p < .01 for all, suggesting significant individual variationson such effects.
Next, we tested framing effects using WTA ratings for all 40donations in HLM. Similar to Studies 1 and 2, Level 1 predictorsin the HLM analysis included absolute benefit of each donation,as measured by percentage of the small project’s goal achievedfor each pair of donations with the same net benefit (a donationcontributing to X% of the small project’s goal was paired with thedonation contributing to ½ X% of the large project’s goal, as thetwo result in the same benefit; both linear and quadratic effectswere included), project type, as well as their interactions. Level 2predictor was order of presentation (small project first or largeproject first). The final modal using REML method had a fit index�2 Restricted Log Likelihood = 32921.54. Table 5 shows significantormarginally significant (p < .10) fixed effects in the final model inHLM analysis, with all non-significant predictors dropped out.There was a positive linear effect of absolute benefit in percentage,B = 41.37, p < .01, and a positive quadratic effect of absolute benefitin percentage, B = 11.58, p < .01 indicating an overall convex func-tion of absolute benefit. There was a marginally significant nega-tive effect of project type, B = �2.28, p < .06, indicating a trend offraming effect: When the absolute benefit of donation is the same,donations that help to achievelarger percentages of the small pro-ject’s goal received higher WTA ratings than donations that help toachieve smaller percentages of the large project’s goal. Interest-ingly, the linear effect of absolute benefit was modified by projecttype, B = �8.83, p < .01, with steeper linear slope for the small pro-ject line in Fig. 5. This interaction indicates that the framing effectoccurred primarily for larger absolute percentages. This finding isdiscussed more below. In addition, there was a marginally signifi-cant interaction between the quadratic effect of net benefit andproject type, B = �10.38, p = .08, with more pronounced quadraticeffect for the small project line. Similar to Study 1, thisinteractionindicates a trend of overweighting of larger percentages, including100%. Unexpectedly, order interacted with the quadratic effect ofabsolute benefit, B = 16.76, p < .01, with participants who sawdonations for the larger project first demonstrating a more pro-nounced quadratic effect overall. Significant random effects in-cluded intercept, Wald Z = 13.61, linear effect of absolute benefitin percentage, Wald Z = 12.62, project type, Wald Z = 12.11, andthe interaction between linear effect of absolute benefit and pro-
Table 5Fixed effects in final Hierarchical Linear Modeling analysis for WTA ratings of 40donations with matching net benefit towards either the small or large project.
Effect B SE (B) df t p
Intercept 51.63 1.93 388.44 26.72 <.01Net benefit in %-Linear (L) 41.37 2.70 373.58 15.31 <.01Net benefit in %-Quadratic (Q) 11.58 3.24 2550.87 3.57 <.01Project Type (T) �2.28 1.17 507.37 �1.95 .05L � T �8.83 2.37 383.04 �3.72 <.01Q � T �10.38 5.84 2799.96 �1.78 .08Q � Order 16.76 6.44 2614.73 2.60 .01
Note. Level 1 predictors: Net benefit of donation as percentage of small project’sgoal achieved (centered at mean = 52.5%) in linear and quadratic effects, ProjectType (Large project = 0.5, Small project = �0.5); Level 2 predictors: Order (Smallproject first = �0.5, Large project first = 0.5). The only significant random effectswere intercept, (Wald Z = 13.61), linear effect of percentage (Wald Z = 12.62), pro-ject type (Wald Z = 12.11), and the interaction between linear effect of percentageand project (Wald Z = 9.22), p < .01 for all. Model fit index �2 Restricted LogLikelihood = 32921.54.
ject type, Wald Z = 9.22, p < .01 for all, suggesting significant indi-vidual variations on such effects.
Fig. 5 shows that WTA ratings for donations towards the largeand small projects that have the same absolute benefit overlappedat some points and differed at others, indicating that the framingeffect was present for certain percentages but not others. We con-ducted repeated-measure T-tests for all 20 pairs of donations to-wards the two projects, and results revealed that with theexception of the ‘‘50% of small project vs. 25% of large project’’ pair,which showed a significant framing effect, t(87) = 2.54, p = .01, allother pairs where the percentage associated with the small projectwas lower than 75% showed no difference between the two dona-tions in comparison (no framing effect). However, pairs of dona-tions where the one associated with small project contributes to75% or more towards its goal all demonstrated significant or mar-ginally significant framing effects: 75% of small project vs. 37.5% oflarge project, t(98) = 3.06, p = .0029; 80% of small project vs. 40% oflarge project, t(95) = 1.86, p = .07; 85% of small project vs. 42.5% oflarge project, t(97) = 1.71, p = .09; 90% of small project vs. 45% oflarge project, t(110) = 1.94, p = .05; 95% of small project vs. 47.5%of large project, t(94) = 3.36, p = .0011; and 100% of small projectvs. 50% of large project, t(92) = 2.22, p = .03. Although most of theseeffects won’t be significant after the alpha level of the significanttest is adjusted to p = .0025 for the 20 T-tests we performed, thepattern of the results still suggests that larger percentages showedframing effects more often than smaller percentages, consistentwith the interaction between absolute percentage and project typedescribed earlier.
Discussion
Study 3 replicated findings from Studies 1 and 2 using a WTAmeasure that involved real consequences in a new domain—dona-tions towards charitable causes. Participants demonstrated non-linear weighting of percentages, as well as a framing effect in theirpreference for high coverage of a small scope compared to low cov-erage of a large scope, when the absolute coverage in the whole setwas held constant.
A closer look at the results, however, revealed that framing ef-fect only existed for larger percentages, but not smaller percent-ages, with the exception of the 50% vs. 25% pair. This result isnew compared to Studies 1 and 2. However, it does not contradictfindings from these previous studies, which did not include pairswith percentages lower than 50% (of small scope) vs. 25% (of largescope). Thus, the framing effect we have observed seems to onlyexist for larger percentages. The interaction between absolute ben-efit (linear as well as quadratic effects) and project type also indi-cates that framing effect is larger for larger percentage pairscompared to smaller percentage pairs.
The test on the percentage weighting function revealed only aquadratic effect, but not cubic effect as was shown in Studies 1and 2. It is possible that the noisy response pattern in Study 3may have concealed any cubic effect. The noisy response couldbe due to the fact that each subject saw only a section of the per-centages used in the study, leading to large cross-subject variationson ratings that we used to measure the weighting function. Thedirection of the quadratic effect, however, is consistent with theobservation from Studies 1 and 2 that the percentage weightingfunction is convex at least in the area consisting of large percent-ages including 100%. The order of presentation between the largeand small projects had an effect in the analysis that included all40 ratings: When participants saw donations towards the largeproject (which achieve smaller percentages of the goal) first, theirratings showed a more pronounced convex function, that is, lesslinearity. We know that donations toward the large project (whichinvolved smaller percentages) frequently included decimal places

198 M. Li, G.B. Chapman / Organizational Behavior and Human Decision Processes 122 (2013) 190–199
in the percentages and were rarely round numbers, but the presentdata does not offer an explanation as to whether or how such num-bers might have primed participants in a way that leads to moreconvex function of the percentage in absolute benefit. Future stud-ies are needed to test the robustness of this order effect and eluci-date its mechanisms.
General discussion
Percentages are widely used in everyday life, yet they have alsoproven to be a concept about which children and adults frequentlymake mistakes (e.g., Parker & Leinhardt, 1995; Venezky & Bregar,1988). Little research has been conducted on how people perceivepercentage information beyond probability, and the few recentstudies have focused on how people respond to percentagechanges in price (Chatterjee, Heath, Milberg, & France, 2000; Chen& Rao, 2007; Heath, Chatterjee, & France, 1995; Kruger & Vargas,2008). The current paper presents three studies on perceptionsabout percentages. Specifically, we found that people tend to focuson the apparent percentage presented to them and ignore thescope over which the percentage applies. As a result, when itcomes to positive attributes, people prefer a large percentage with-in a small subset, compared to a small percentage within a largesubset when the net overall percentages are equated. This framingeffect seems to be present for percentages greater than 50% only,and is particularly pronounced for 100% of a small subset, whichis consistent with previous research on the 100% effect (Li & Chap-man, 2009).
Note, however, the framing effect cannot be simply explainedby a complete lack of awareness about the subset information onthe part of our participants. If participants did not even notice thatthe percentages we presented referred to a proportion of a subset(50% of the Ethiopian beans within the coffee blend, or 75% of theHot Spots in the ‘‘Great Fun’’ theme within the amusement park),and that one subset is larger than the other (Guatemalan beansconstitute 60% of the coffee blend while Ethiopian beans constitute30%; Adventures theme has 2/3 of all Hot Spots in the park whileGreat Fun theme has 1/3), they would have given the exact samerating for two coffee blends or park passes as long as the apparentpercentages are the same, resulting in two completely overlappinglines on a graph showing ratings of the 12 coffee blends by beantype (Fig. 1) or the 8 park passes by theme (Fig. 3). Their actual rat-ings of coffee blends with the same apparent organic percentage,however, did differ based on whether the apparent organic per-centage referred to a larger subset or a smaller subset (similar pat-terns were found for the amusement park scenario). Further, inStudy 3, participants did not show framing effects when the pairsof percentages in comparison were below 50%. That is, participantswere capable of calculating the net benefit of donations while giv-ing full consideration of the scope information in these pairs. It ishard to imagine that participants noticed the scope informationwhen they did these comparisons, but completely forgot about itwhen they did comparisons involving larger percentages. Thus,although the framing effect shows a lack of full consideration ofthe exact size of the subset, participants did register that one sub-set is larger than the other, and incorporated such information intotheir ratings to some extent. To put it differently, participantsunderweighted the background information, but did not ignore it.
We also found that people weight the apparent percentage in anon-linear fashion, with a possibly cubic function. This findingexpands our understanding in percentage weighting outside thedomain of probability, where people demonstrate an inverse-S-shaped function. As a cubic function appears similar to theinverse-S-shaped probability weighting function, it is possible thatthe way people weight probabilities is similar to the way we pro-
cess percentages in general. However, a cubic effect was present inStudies 1 & 2, but not Study 3, while a quadratic effect was presentin Studies 1 & 3, but not Study 2. The common feature of the cur-vature through 3 studies, however, is the upward curve in largerpercentages close to 100%, consistent with the finding in Study 3that only large percentages are overweighted. The curvature ofthe percentage weighting function may be influenced by numer-acy: Study 1 showed that the more numerate participants tendedto demonstrate less quadratic effect. Therefore, our data do notpresent a conclusive picture of the percentage weighting function,and more research is needed to map the function for how peopleweight percentages and potential individual differences in thefunction.
What might cause people to be attracted to large apparent per-centages, even if they refer to a small subset? One possible expla-nation is that people lack the skills to process numericalinformation (Lipkus et al., 2001). If this account were true, partic-ipants with poor numeracy skills should show a greater framing ef-fect than those with high numeracy skills. However, numeracy skillwas unrelated to the magnitude of the framing effect in the twostudies where we measured numeracy. Alternatively, our findingsmay constitute a cognitive bias similar to denominator neglect andratio bias (Pacini & Epstein, 1999; Reyna & Brainerd, 1995, 2008;Yamagishi, 1997), except that instead of neglecting the denomina-tor when computing with percentage, people underweight thebase by which the percentage is multiplied to compute the net va-lue. However, denominator neglect has been shown to be influ-enced by cognitive abilities (SAT score, Stanovich & West, 2008),and the framing effect we found here was not influenced bynumeracy. Admittedly, the numeracy measure and SAT scoremay represent different cognitive abilities, but such finding maysuggest additional mechanisms to the framing effect unrelated todenominator neglect.
We propose that another mechanism that contributes to this‘‘big fish in a small pond’’ effect is the non-linear percentageweighting function. The curvature in the percentage weightingfunction shows that 100% is weighted more than twice as muchas 50%. This type of curvature would not be predicted by a denom-inator neglect account. The curvature, however, does not accountfor every framing effect observed in the current studies, as med-ium-range percentages such as 50% of a small scope were alsoweighted more than 25% of a large scope. Thus, the framing effectsmay be due to a combination of partial neglect of scope informa-tion and the nonlinear percentage weighting function.
One limitation of these studies is the lack of counter-balancingin the names of major and minor categories (coffee beans oramusement parks themes) in Studies 1 and 2. For example, our re-sults in framing effect in Study 1 could be explained by a generalpreference for the name ‘‘Ethiopian’’ (minor beans) over ‘‘Guate-malan’’ (major beans), as this could cause participants to attach ahigher value to organic content in the minor beans than in the ma-jor beans. However, a separate study (N = 98) that tested the ap-peal of coffee bean and park theme names showed that the namefor the minor beans ‘‘Ethiopian’’ was less appealing than that ofthe major beans ‘‘Guatemalan’’ (means 3.90 vs. 4.61, t(97) = 3.98.,p < .01), and ‘‘Great fun’’—the name for the minor park themewas less appealing than the name for the major park theme‘‘Adventures’’ (means 5.15 vs. 6.46, t(97) = 3.33, p < .01), Thus,our results were not due to differential appeal of names for the ma-jor and minor categories, and if anything, the framing effects wouldbe stronger if the names of two types of coffee beans were equallyappealing.
A fish will seem big when it is in a small pond, and ironically,percentages will also seem larger when they are framed within asmall subset. Retailers apparently understand this effect: Salesare framed as ‘‘buy one & get 50% off a second item’’ rather than
M. Li, G.B. Chapman / Organizational Behavior and Human Decision Processes 122 (2013) 190–199 199
‘‘buy two items & get 25% off’’ to capitalize on the appeal of big per-centages and the malleability of the scope over which percentagesapply. The preference for high percentages (especially 100%) in asmall subset could also be used to promote desirable behavior. En-ergy saving bulbs can be advertised as ‘‘reducing electricity usedfor illumination by 80%’’ rather than ‘‘reducing total electricityuse by 12%’’, and flu shots promotions can be framed as ‘‘get aflu vaccine and get a friend vaccinated for free!’’ rather than‘‘50% off the price of two flu shots.’’ Our perceptions of percentagesare often malleable, like the scope within which they are consid-ered, and do not follow a linear function.
Appendix A. Supplementary material
Supplementary data associated with this article can be found, inthe online version, at http://dx.doi.org/10.1016/j.obhdp.2013.07.003.
References
Chatterjee, S., Heath, T. B., Milberg, S. J., & France, K. R. (2000). The differentialprocessing of price in gains and losses: The effects of frame and need forcognition. Journal of Behavioral Decision Making, 13(1), 61–75. http://dx.doi.org/10.1002/(sici)1099-0771(200001/03)13:1<61::aid-bdm343>3.0.co;2-j.
Chen, H., & Rao, A. R. (2007). When two plus two is not equal to four: Errors inprocessing multiple percentage changes. Journal of Consumer Research, 34(3),327–340. http://dx.doi.org/10.1086/518531.
Dimitri, C., & Greene, C. (2002). Recent growth patterns in the U.S. Organic FoodsMarket. Agriculture information bulletin 777. Washington, DC: United StatesDepartment of Agriculture. <http://www.ers.usda.gov/publications/aib777/aib777.pdf>.
Heath, T. B., Chatterjee, S., & France, K. R. (1995). Mental accounting and changes inprice: The frame dependence of reference dependence. The Journal of ConsumerResearch, 22(1), 90–97. http://dx.doi.org/10.1086/209437.
Kahneman, D., & Tversky, A. (1979). Prospect theory: An analysis of decision underrisk. Econometrica: Journal of the Econometric Society, 5, 263–291. http://dx.doi.org/10.2307/1914185.
Kruger, J., & Vargas, P. (2008). Consumer confusion of percent differences. Journal ofConsumer Psychology, 18(1), 49–61. http://dx.doi.org/10.1016/j.jcps.2007.10.009.
Li, M., & Chapman, G. B. (2009). ‘100% of anything looks good’: The appeal of onehundred percent. Psychonomic Bulletin & Review, 16(1), 156–162. http://dx.doi.org/10.3758/pbr.16.1.156.
Li, M., & Chapman, G. B. (2012). Why Do People Like Natural? Instrumental andIdeational Bases for the Naturalness Preference. Journal of Applied SocialPsychology, n/a-n/a. http://dx.doi.org/10.1111/j.1559-1816.2012.00964.x
Lipkus, I. M., Samsa, G., & Rimer, B. K. (2001). General performance on a numeracyscale among highly educated samples. Medical Decision Making, 21(1), 37.http://dx.doi.org/10.1177/0272989X0102100105.
Loftus, G., & Masson, M. (1994). Using confidence intervals in within-subjectdesigns. Psychonomic Bulletin and Review, 1, 476–490. http://dx.doi.org/10.3758/BF03210951.
Pacini, R., & Epstein, S. (1999). The relation of rational and experiential informationprocessing styles to personality, basic beliefs, and the ratio-bias phenomenon.Journal of Personality and Social Psychology, 76(6), 972. http://dx.doi.org/10.1037//0022-3514.76.6.972.
Parker, M., & Leinhardt, G. (1995). Percent: A privileged proportion. Review ofEducational Research, 65(4), 421–481. http://dx.doi.org/10.2307/1170703.
Reyna, V. F. (2004). How people make decisions that involve risk. Current Directionsin Psychological Science, 13(2), 60. http://dx.doi.org/10.1111/j.0963-7214.2004.00275.x.
Reyna, V. F., & Brainerd, C. J. (1995). Fuzzy-trace theory: An interim synthesis.Learning and Individual Differences, 7(1), 1-75. http://dx.doi.org/10.1016/1041-6080(95)90031-4
Reyna, V. F., & Brainerd, C. J. (2008). Numeracy, ratio bias, and denominator neglectin judgments of risk and probability. Learning and Individual Differences, 18(1),89–107. http://dx.doi.org/10.1016/j.lindif.2007.03.011.
Rozin, P. (2005). The meaning of ‘‘natural’’. Psychological Science, 16(8), 652.Stanovich, K. E., & West, R. F. (2008). On the relative independence of thinking
biases and cognitive ability. Journal of Personality and Social Psychology, 94(4),672. http://dx.doi.org/10.1037/0022-3514.94.4.672.
Stewart, N., Chater, N., & Brown, G. (2006). Decision by sampling. CognitivePsychology, 53(1), 1–26. http://dx.doi.org/10.1016/j.cogpsych.2005.10.003.
Tversky, A., & Kahneman, D. (1992). Advances in prospect theory: Cumulativerepresentation of uncertainty. Journal of Risk and Uncertainty, 5(4), 297–323.
Venezky, R. L., & Bregar, W. S. (1988). Different levels of ability in solvingmathematical word problems. The Journal of Mathematical Behavior, 7(2),111–134.
Yamagishi, K. (1997). When a 12.86% mortality is more dangerous than 24.14%:Implications for risk communication. Applied Cognitive Psychology, 11(6),495–506. http://dx.doi.org/10.1002/(SICI)1099-0720(199712)11:6<495::AID-ACP481>3.0.CO;2-J.