leases as forms - anton strezhnev
TRANSCRIPT
LEASES AS FORMS
David A. Hoffman and Anton Strezhnev∗
January 4, 2022
ABSTRACT
We offer the first large scale descriptive study of residential leases, based on a noveldataset of∼170,000 residential leases filed in support of over∼200,000 Philadelphia evictionproceedings from 2005 through 2019. These leases are highly likely to contain unenforceableterms, and their pro-landlord tilt has increased sharply over time. Matching leases with indi-vidual tenant characteristics, and to 16,261 unique owner-landlords, we show that unenforce-able terms are likely to be associated with more expensive leaseholds in richer, whiter partsof the city. This result is linked to particular landlords’ growing adoption of shared forms,originally created by non-profit landlord associations, and more recently available online fora nominal fee. Generally, such shared form leases contain worse rules for tenants than theproprietary leases they replace. Over time, it has become easier and cheaper for landlordsto adopt such common forms, meaning that access to justice for landlords strips tenants ofrights.
∗Hoffman is the William A. Schnader Professor of Law Professor of Law at University of PennsylvaniaCarey School of Law; Strezhnev is an Assistant Professor in the Department of Political Science at theUniversity of Chicago. We thank Andrew Baker, Vince Buccola, Angus Corbett, Kevin Davis, Meirav Furth,Jonah Gelbach, Mitu Gulati, Jon Klick, Rory Van Loo, Julian Nyarko, Manisha Padi, Natasha Sarin, LiorStrahilevitz, Tess Wilkinson-Ryan and Eyal Zamir, as well as participants at the Fourth Annual EmpiricalContracts Conference, the American Law and Economics Conference, workshops at Arizona State, HebrewUniversity, Northwestern, Penn, Toronto, and Chicago, the Philadelphia Steering Committee & HousingSecurity Working Group, and lawyers from the Philadelphia Public Interest Law Center for comments.Jonathan Pyle of Philadelphia Legal Assistance scraped the underlying eviction dockets and developed thebasic coding framework we employ. We are particularly grateful to Mike Crosson whose preliminary studentwork with these data helped inspire the project. Sean Bender, Madison Gray, Jordan Konnell, ColleenO’Connor, Megan Russo, Patrick Miller-Bartley, and Sam Whillans provided invaluable research assistance.The analysis contained herein is based in part on data provided under license from The Pew CharitableTrusts. The views expressed herein are those of the authors and do not necessarily reflect the views of ThePew Charitable Trusts. Address comments to [email protected], or by mail at 3501 Sansom Street,Philadelphia PA 19104.

2 LEASES [DRAFT]
I. INTRODUCTION
Residential leases are ubiquitous, economically significant, but understudied contracts.While more than a third of American households rent, the literature has systematicallyexamined only around a hundred distinct leases. That deficit is particularly striking forcontracts whose alleged breach results in evictions, as these agreements provide the basisfor the exercise of the force of the state to (quite literally) turn poor families out on thestreet.
To understand these contracts better, we gather a novel dataset of ∼170,000 leasesfiled in support of over ∼200,000 eviction proceedings in Philadelphia from 2005 through2019. For each lease, we collect information about the leasehold (where it is in space, itstype, as well as local demographic and income characteristics), the lease (its terms, priceand length), the tenant (individual level race imputed using name-based methods), thelandlord (name, attorney, repeat filings, total properties in the city), as well as informationabout the eviction proceeding itself.
Our basic approach undermines the conventional wisdom that lease terms result froman imbalance of bargaining power between landlords and tenants. This account, foundedon limited evidence but well-established in the legal literature, both implies that rent tradesoff with terms, and that overall weaker tenants get “worse” legal protections in their con-tracts. A different approach, built on the newer literature on consumer contracts, rests ontheories of information costs. In providing a descriptive account that will inform these twotheories, we focus on several questions.
How Oppressive Are Leases? The conventional account holds that leases are uniformlyaverse to tenants. We show, in line with previous research, that both unenforceable andoppressive terms in private leases we observe a striking time trend: the incidence of bothunenforceable and oppressive terms has sharply increased over the last 20 years.
What Motivates Adoption of Unenforceable and Oppressive Terms? We find almost nowithin-landlord variation in leases in our data: landlords do not calibrate eviction leases forparticularly vulnerable tenants in their rental population. Rather, leases vary between land-lords. We show that unenforceable terms are associated with a set of highly standardizedleases that are widely shared between landlords. Though we study over a hundred thou-sand private contracts, a handful of distinct standard form leases—which we call sharedleases—make-up the plurality the dataset. The sharp increase in both unenforceable andoppressive terms in the last twenty years can be thus attributed to increasing adoption bysmall landlords of shared leases, in turn resulting from the ability to access cheap internetforms, which replace the oral or proprietary leases of the past. In this way, we illustratestandardization’s perverse effects.
Tenant race interacts with this standardization story in unexpected and complex ways.We observe that unenforceable and oppressive terms are more likely in the leases of richer,whiter, tenants. This relates to the distribution of widely-shared, long, forms, which are

[DRAFT] LEASES 3
particularly common in slightly more expensive leaseholds and in apartment buildings.Notably, however, this relationship is made more complex in majority white census tracts,where black tenants tend to live in apartment buildings while their white neighbors donot. In those places, black tenants are particularly likely to sign leases with unenforceableterms.
What is the Effect of Local Geography? In Philadelphia, the lease you sign has moreto do with where you live than who you are. Because landlords specialize in places andbuilding types, and almost never vary leases between tenants, geography generally dom-inates tenant characteristics in explaining the makeup of leases. That tight link betweenlease, place and people complicates the conventional account which suggests that leasesare priced in part based on their legal terms.
Are Leases in Evictions Different? One hazard in our approach concerns the selectednature of our dataset. We study those leases that landlords have attached to eviction filings,and not a random selection of Philadelphians’ leases: for instance, they are disproportion-ately drawn from the leases of the poor. Even within the set of poor tenants, eviction isn’trandom: tenant characteristics, landlord strategies, and neighborhood characteristics maymake it more likely. We investigate whether there is a connection between these evic-tion selection effects and lease selection. We are primarily concerned with knowing if thesorts of leases attached to eviction filings are meaningfully different from those of poorPhiladelphians generally. Attacking that problem from a variety of angles, we argue thatthey are not.
Our primary observations—the dominance and growth of both unenforceable and op-pressive terms and the role of forms—lead to set of prescriptions, which we discuss in thelast section of the paper.
We begin with a literature review.
II. LEASES AS OBJECTS OF STUDY
As Suchman (2003) argued, contracts are “social artifacts,” things worthy of study assuch. Much can be learned from micro and macro analysis of the production of theseobjects, just as scholars have benefits from the study of other technological innovations,from the wheel to the mousetrap. The study of lease contracts as artifacts has been, to date,limited. In this section we detail the results of that previous learning, and then describehow it relates to the burgeoning field of contractual innovation writ large.
A. The Conventional Account: The Landlord’s Dominion
There have been a handful of small-scale empirical projects studying leases. CurtisBerger’s pioneering work on leases focused on “representative forms” from 16 cities’ RealEstate Boards in 1972, out of 50 cities surveyed. Berger (1974) found that of the 16 model

4 LEASES [DRAFT]
leases, around half purported to waive the warranties of habitability, while most createdadditional landlord remedies and tenant obligations. The result was a set of documentsthat Berger argued treated the“residential tenant as a latter-day serf. One sees a near-pathological concern with tenant duties and landlord remedies, occupying from 50 to 80percent of every form. Much of the remaining text seeks to immunize the landlord againstthe claims of his tenant.”
This theme—that leases permit landlords to dominate tenants—continued in later works.Some argue that form leases are a faceless evil, as “it makes little difference which formone purchases, however, for their contents are strikingly uniform.” (Bentley, 1974) Schol-ars have asked why forms persistently contain unenforceable provisions, as such terms areoften denied enforcement by courts. (Sullivan, 2009; Berger, 1974; Furth-Matzkin, 2017)The general consensus is that such clauses are imposed as a part of a strategy by landlords,who seek to extract surplus from tenants given tenants’ low readings rates and inabilityto fully police such clauses in court (Furth-Matzkin, 2018; Mueller, 1970). As Williams(1987) observed, African-American tenants may seek more formal leases to protect them-selves from the power dynamics inherent in the landlord-tenant relationship.
The work closest to ours is Furth-Matzkin’s work on Boston leases. (Furth-Matzkin,2017). Employing a snowball sample, she studied 70 residential agreements, of whicha third were student leases. Of those leases, a little more than half had individual (non-corporate) landlords. Half of the studied leases were standardized forms. Furth-Matzkinidentified a relatively high number of unenforceable and misleading terms. When con-trolling for leasehold size, rental amount, tenant type, and duration, she concluded thatcorporate landlords, using commercial forms, and higher value leaseholds, all used formswith fewer unenforceable terms. Furth-Matzkin attributes her results to commercial firmsand drafters being “typically more careful than individual landlords in the drafting of theirleases.”1
1In an unpublished student paper, Nora Crawford studied 20 Philadelphia leases, 17 from students and3 from landlords. She found that 6 of the 17 student leases used language drafted by a single law firm inPhiladelphia, which listed its copyright on the leases themselves. (Crawford N.D.) Crawford interviewedthe lawyer-drafter of the form residential leases in her sample. He explained why he thought terms in leaseswere particularly sticky: landlords “look at [the lease] like the Bible, and they will not change the terms ofthe Bible.” The drafting lawyer continued that he had departed from the model Realtor Association leasebecause it had drawn attention to tenant remedies in ways not required by law: “My clients don’t want me totell the other side how to sue us and when.” He suggested that because Pennsylvania law on landlord tenantissues is “sort of confusing,” landlords seeking to comply face difficulties. For “mom and pop” operators, thedrafter believed that they originally “buy a form” but then do not update it for later developments in the law.By contrast, larger landlords were more likely to “revise [the lease] periodically, but not regularly, to reflectchanges in the law.” Finally, the drafter discussed how his leases were disseminated in the housing market.His firm’s standard residential lease is “very inexpensive” and gives the purchaser an unlimited license attheir properties. Customized leases are more expensive, and most landlords take the standard form. Hedescribed that form as a loss-leader—the “low-end” of the practice—intended to build relationships with
[DRAFT] LEASES 5
In general terms, these studies extend a consumer law tradition which focuses on thepurportedly negative effects of disparate bargaining power. Whiter and richer tenants,and men, are thought to be signatories of “better” leases, or at least leases with fewerunenforceable terms. Moreover, the literature assumes that landlords calibrate price basedon the characteristics of the applicable legal regime and the tenant. Scholars thus posit thatlandlords will charge tenants for “better” lease contracts (Ackerman, 1971).
B. A Revised Account: Leases as Forms
The above account suggests that leases are tailored for tenants. But the literature oncontracts-as-forms is to the contrary. Multiple studies have found that even for materialcontracts, terms are not well priced, nor do they change after radical shifts in the governinglegal regime (Gulati & Scott, 2012; S. J. Choi & Gulati, 2004). How can this be? Theanswer seems to be a very strong form of inertia and aversion to change of the template(Nyarko, 2020).
This in turn lends credence to drafting cost explanations for boilerplate terms. Coates,describing weak takeover defenses, argued that information costs played an important role(Coates, 2001). Where terms were less material, lawyers would be likely to adopt thosenearest to hand, meaning that contact boilerplate terms were “likely to exhibit geographiccorrelations.”
Law firms that are closer to each other in physical proximity are more likely toshare information, either formally (by sharing documents or experiences), orby lateral hiring, or by conscious borrowing from large, locally prominent lawfirms with high IPO market shares (Silicon Valley law firms are likely to lookto Wilson Sonsini; smaller New York law firms are likely to look to SkaddenArps or Sullivan & Cromwell) or via common counter-parties (particularlyaccountants, investment bankers, or VCs). In any event, more geographicallyproximate law firms are more likely to think of one another as salient sourcesof public company boilerplate.
Coates continued that once established, economic concentrations on the client side wouldbe nurtured by parallel, close-knit, networks of lawyers, who would have an interest inpreserving similar forms and practices (at the expense of outsiders). The result, in Coates’sample, was a “silicon valley law firm effect.” Other scholars have found similar differ-ences in economically significant contract practices based on law-firm fixed effects (e.g.S. Choi, Gulati, & Posner, 2012; Jennejohn, 2018).
clients who might later be interested in higher end business. Unfortunately, sometimes property managers“take” the lease from building to building as they move, or the client takes the lease to new properties withouthis notice. The result is that his leases, originally drafted to build a book of business for the law firm, havediffused through the residential market, particularly in buildings associated with richer landlords.

6 LEASES [DRAFT]
The consumer literature is less well developed, largely because there are fewer large-ndatasets of consumer facing contracts. Florencia Marotta-Wurgler has shown that firmsadjust the terms in their consumer contracts as they learn about their consumers (Marotta-Wurgler & Taylor, 2013). But, though terms may change over the long run, there is verylittle evidence that consumers react to those changes as they happen. Reading rates formass contracts are too low to generate informed minority price responses to terms. Outsideof a few very salient terms (warranty, interest rate and term in financial contracts), we areaware of no studies that find price effects for particular ordinary contract terms. (Zamir,2014) 2
C. Predictions
Putting this work together leads to cross-cutting intuitions. The extant evidence onleases focuses on unenforceable terms, and finds that landlords use “worse” leases for theleast powerful tenants. It also holds that there are few, if any variations between forms(rarely, in fact, mentioning the possibility of competition between lawyers). Finally, theevidence is blind to the effects of local geography. But these conclusions rely on very fewobservations.
Work on contracts-as-forms, by contrast, suggests that we should expect variation be-tween forms to be driven in part by drafting costs, and that such costs might result ingeographically based differences in form types. It also suggests that there will be littlechange in forms over time, and that unenforceable terms may persist, but the explanationmay turn more on the costs of change rather than an intent to dominate. This strand ofliterature, in short, does not necessarily predict that weaker tenants will get worse leases.
III. THE LEASES DATASET
A. Data
We obtained our dataset of leases with the help of the non-profit Philadelphia LegalAssistance (PLA), an organization that provides free civil legal services to low-incomePhiladelphians, as a part of a broader project analyzing eviction proceedings that scrapedthe online docket of the Philadelphia Landlord-Tenant Court. Each landlord-tenant casecontains a standardized complaint document along with a number of attached exhibits—inPDF format—containing any supplementary documents. From available dockets, PLAdownloaded all such exhibits with titles that contained any mention of the term “lease.”This yielded a total of 225,409 potential leases that accompanied evictions from 2005 to2019.
2Studies of mortgage contracts (and credit-card agreements) do observe behavioral changes in responseto changes in salient material terms (Bucks & Pence, 2008; Padi, 2018).

[DRAFT] LEASES 7
These PDFs, being images of scanned paper documents, are neither machine-readablenor searchable in their original form. With difficulty, we converted them to text.3 Afterconverting, we constructed a search via a number of fuzzy regular expressions—searchpatterns with some tolerance for mistakes or errors—to detect whether a document actuallycontained a lease and on which page the lease began.
Of the 225,409 docket entries, we identified 171,314 as residential leases for whichdata on the plaintiff and defendant were present, where we were able to detect the presenceof a lease via OCR, and where we could extract an address from the docket entry.4 Weremoved 602 leases which had missing data on rent. Overall, we have captured the vastmajority of written leases underlying Philadelphia landlord-tenant disputes from 2005 to2019.
In this sample of 170,712 residential leases, we searched for whether the dispute re-lated to a public housing or subsidized unit. While leases involving public housing weredirectly identifiable by the presence of the Philadelphia Housing Authority (PHA) as theplaintiff, a substantial share of lease contracts with private landlords involved subsidies tothe tenant administered through the HUD housing choice voucher program. Public hous-ing and subsidized leases are subject to significant regulation in what contract terms arepermitted, with both exculpatory clauses and waivers of notice of legal proceedings ex-plicitly forbidden.5 We search each of the leases for any mentions of “housing assistance”or “assistance payment,” indicating that the lease is connected to a housing assistance pay-ment contract between the tenant and the public housing authority. Of our 170,712 leases,we identified 17,859 as public housing leases where the PHA acts as the plaintiff and16,192 subsidized leases, leaving 136,661 unsubsidized lease contracts.
From the docket entries themselves, PLA extracted a number of covariates related tothe dispute and the property. Most important for us is the location of the property, whichPLA geocoded from available address data. 164,728 leases were able to be geocoded to aunique latitude/longitude and located within a Philadelphia census tract. Of these, 132,382are unsubsidized leases.
3To analyze the data in any reasonable timeframe, it was first necessary to convert the images into amachine-readable text format. We used the open-source Tesseract 4.0 Optical Character Recognition (OCR)engine to process the PDF images into text files. Often leases are scanned at poor resolutions, at difficult-to-read angles and with hand-written text and therefore the image conversions typically contain errors. Even inhigh-quality images, the OCR process does not necessarily detect paragraphs and segmentation in a reliablefashion, making it difficult to further segment the text into distinct provisions. Additionally, leases are oftenincluded with other documents such as any notices sent to the tenant or the landlord’s rental license.
4Not all scraped documents actually contained a lease. This is likely because the PLA search was some-what overly-broad and included entries such as “Notices of Lease Termination.” Other failures to detect maybe actual errors due to poor-quality OCR. Given the share of leases actually captured, we do not think thisis a substantial issue.
5See 24 CFR § 886.327
8 LEASES [DRAFT]
Beyond property-level covariates, we obtain information on the name of the plaintiff(landlord), the outcome of the case (win, loss, or withdrawal/judgment by agreement) andin the case of a judgment, whether it is a default judgment, the amount of ongoing rentdemanded (which is almost always equal to the monthly rent specified in the lease), andwhether the tenant had legal representation.
We also collect, from a private firm, information about race, gender and voting historyalong with consumer data where available for 35,735 individual tenants in cases from2014 to 2019.6 We use this information to help to validate a name-matching technique toestimate the tenant’s race in the leases.
Because individual landlords may own multiple properties through different LLCs,looking at patterns among leases with common plaintiffs will not accurately capture theextent to which landlords adopt different leases for different properties. Pursuant to anagreement with Pew Charitable Trust, we accessed a novel database of Philadelphia’s land-lords. As Pew described this data in a public report:7
The Pew Charitable Trusts worked with Reinvestment Fund, a research and fi-nancial institution that seeks to create opportunities for the underserved throughpartnerships, to develop a first-of-its-kind portrait of Philadelphia’s landlords.The effort involved analyzing administrative datasets from Philadelphia’s De-partment of Licenses and Inspections, the Office of Property Assessment, andthe Department of Records.
Our research tells us that Philadelphia has approximately 55,000 landlordswho own roughly 136,000 rental properties with 288,000 units. Althoughmost of these landlords are small businesses, they don’t own a majority of thecity’s units. Half are owned by relatively large property-owners.
We merge our lease data with the Pew dataset. Among the unsubsidized and geolocatedleases in the sample, we were able to match about 80% (106,170) of entries to buildings forwhich Pew was able to identify common owners. While we have 33,694 unique plaintiffsin the matched data, this corresponds to only 16,261 unique landlords based on Pew’sresearch. For each matched landlord, we access information about building size, type, andownership location along with information on the landlord (e.g. total number of uniqueproperties).
B. Unenforceable and Oppressive Terms
Lease forms offer varied terms within a frame that at 30,000 feet is widely shared. Mostlease forms are headlined by a title (“Pennsylvania Residential Lease”, “[Building Name]
6For more information on that firm, see infra at note 21.7(Haider, 2021).

[DRAFT] LEASES 9
Lease”, “Plain Language Lease”, etc.) They then will identify, in numbered paragraphs,the parties, the address, the nature and term of the occupancy, rent, security deposit, andthe duties of the landlord and tenant. Many leases will further describe the condition ofthe property, while attempting to disclaim various rights the tenants might have in thedefault legal regime. Finally, most leases will describe the landlord’s right to enter, retakeoccupancy, and the consequences of default. Leases are signed by both the landlord (orits management firm) and the tenant and dated. The typical lease in our dataset is a fewpages long. Some are then buttressed by addenda providing for additional rules governingthe tenants’ behavior (such as the use of drugs on the premises, the sorts of pets that canbe housed) or offering additional disclosures by the landlord (lead, etc.)
We begin our study of these forms by focusing on unenforceable and oppressive leaseterms.8 That disjunctive phrase is intentional. Some terms are unenforceable: in our view,a Pennsylvania court would be unlikely to enforce it against a properly preserved objectionbrought by a residential tenant facing eviction. In making that determination, we wereconfronted with a regional limitation in legal certainty. Though the field is nominallyjointly governed by federal statutes and Pennsylvania’s Landlord and Tenant Act of 1951,neither provides clear guidance about most provisions in modern leases. Caselaw aboutresidential leases is sparse, leaving many provisions in a limbo, where analogies mustbe drawn from from decisions about commercial tenants, or more general principles ofcontract law. Appendix A describes the relevant doctrine in detail. As we note, someterms of of unclear legality: we have a view about their enforceability, but it’s not stronglyheld.
Others terms are enforceable but tend to tilt power toward landlords. We call theseoppressive terms, and identified them after speaking to advocates for tenants in Philadel-phia.9 They described oppressive terms as ones that affected bargaining in settlementnegotiations, made eviction more likely or otherwise made shifted the rules toward thelandlord in a material way. Multiple terms potentially fell in this category, including onesthat required tenants to pay evicting landlords’ attorneys fees, limited the circumstancesunder which security deposits could be returned if the tenancy was damaged, permittedeviction when the tenant’s guests used drugs or committed crimes, and deprived the tenantof certain forms of notice prior to eviction. However, we did not ultimately identify eachof these terms in our searches.
8Our first intuition was to compare lease similarity using existing supervised learning or other forms ofmatching tools. Because of the difficulty of parsing individual paragraphs in the leases and the prevalenceof typographical errors from the transfer from PDF to text, that approach proved impracticable.
9The advocates we spoke to included attorneys at Community Legal Services of Philadelphia’s housingunit, an attorney who works with Philadelphia Legal Assistance, a private civil rights law firm who hasbrought a cases against landlords for their practices, a clinician at the University of Pennsylvania who haslitigated in the eviction court, and an attorney who regularly represents landlords in that court

10 LEASES [DRAFT]
Our strategy for identifying unenforceable or oppressive terms in leases relies on aseries of searches using approximate (or “fuzzy”) regular expressions. These are searchpatterns which we crafted to identify the key phrases that reflect the presence of a particularprovision.10 We use a number of different search expressions for each clause to reflect theslight differences in language and phrasing found. While we generally find relatively goodperformance in identifying the specific provisions we focus on, this classification methodis imperfect and may not correctly classify some leases (such as cases where the languagediffers from what is typically used or the lease scan was incredibly poor quality).11 Weprovide results validating the quality of our classifications in Appendix B using a sampleof 800 hand-coded leases. As noted, there were a number of potential terms subject tosearch: we focus on those terms whose phrasing was relatively consistent across leases.That is, some terms—like fee shifting provisions—were simply too varied in the sourcedata to capture well using our method.
The result is that we identified four terms of interest that our search technique reliablyidentified from the underlying leases, and which the relevant advocates suggested were ofparticular importance in the adjudication of eviction disputes.
1. Unenforceable terms
• Exculpatory clauses, which disclaim liability for negligence.
• As-Is clauses, which purport to waive the implied warranty of habitability.
2. Terms of Unclear Legality
• Holdover tenant penalty clauses, which state that tenants who do not leave afterthe expiration of the lease term owe an increased sum, typically a multipleof the rent. Pennsylvania law about the enforceability of these provisions inresidential leases is simply absent, particularly in their most common form,which sets damages at three times the monthly rent.
3. Oppressive Terms
• Waivers of notice, which permit the landlord to begin an eviction proceedingbefore the 15-30 day notice period required by the Landlord-Tenant Act.
10Specifically, we use the implementation found in the regex package in Python 3.11We do not believe that these errors are systematically associated with any fundamental characteristics
of the underlying lease and eviction proceeding, but note that our approach will tend to be more likely tofail to classify a lease with a particular provision (false negative) than yield a classification where there is nosuch provision (false positive).

[DRAFT] LEASES 11
IV. RESULTS
A. Summary Statistics
Our geocoded sample consists of 164,728 total lease documents with 132,382 of theseleases identified as unsubsidized and private. Based on the names of plaintiffs extractedfrom the landlord-tenant complaints, we start with 42,666 unique plaintiffs, 33 of whichappear in a case involving at least one unsubsidized lease. As we described above, onlysome of these unique plaintiffs are distinct landlords, since many landlords own multipleproperties through distinctly named LLCs. The modal number of times a unique plaintiffappears in the data is 1, so the share of repeat plaintiffs is quite small. But the distributionis extremely right-skewed. Within the subset of our sample where we identify the ultimateowner, we find that the largest landlord in the data has 508 unique addresses and 2,474unique leases in our data and, according to Pew, a total of 3,846 owned properties. Just 10unique landlords account for about 13 percent of the leases that appear in our sample.12
Figure 1: Summary of lease term prevalence in sample (all geocoded leases)
0
20
40
60
Exculp
ator
y Clau
se
Accep
t As−
is
Holdov
er Te
nant
Notice
Waiv
er
Provision
Pro
port
ion
of le
ases
con
tain
ing
prov
isio
n
Lease TypePHA Landlord(N =16968, Median rent: $224)Subsidized(N =15378, Median rent: $466)Unsubsidized(N =132382, Median rent: $750)
Figure 1 summarizes the overall frequency of each of the four provisions within thethree classes of leases we identified. It also indicates the total number and median ongo-ing rent for each category as listed in the complaint.13 Among the unsubsidized leases,
12In general, we find that average landlord size – as measured by number of properties found by Pew – isroughly constant across leases in our sample from 2010 to 2019, with a somewhat larger average size amongthose leases sampled from around 2000-2005.
13Since rent is often handwritten into a lease template, it is not possible for us to systematically extractmonthly rent from the machine-readable text as it is rarely OCRed without error. As such, the information

12 LEASES [DRAFT]
the prevalence of exculpatory clauses is quite high: about 60 percent. A slightly largershare (67%) contain an explicit waiver of notice or a reduction in notice terms. Holdovertenant clauses are comparatively rarer and likely a newer phenomenon, with only 17%of unsubsidized leases containing this provision. “As-is” clauses are less common thaneither exculpatory clauses or waivers of notice, but more frequent than holdover tenantprovisions. As expected, the Philadelphia Housing Authority leases do not contain anyunenforceable terms.14 These provisions also tend to co-occur. Of the unsubsidized leasesin our sample, 18% have one of the provisions, 22% have two, 30% have three and 8%have all four.
Figure 2: Prevalence of lease provisions by lease start date
0.5
0.6
0.7
0.8
2000
2005
2010
2015
2020
Lease Start Date
Sha
re o
f lea
ses
w/ e
xcul
pato
ry c
laus
e Exculpatory clause
0.3
0.4
0.5
0.6
2000
2005
2010
2015
2020
Lease Start Date
Sha
re o
f lea
ses
w/ '
as−
is' p
rovi
sion
Accept 'as−is'
0.1
0.2
0.3
0.4
0.5
2000
2005
2010
2015
2020
Lease Start Date
Sha
re o
f lea
ses
w/ h
oldo
ver
tena
nt c
laus
e
Holdover tenant
0.65
0.70
0.75
0.80
0.85
2000
2005
2010
2015
2020
Lease Start Date
Sha
re o
f lea
ses
w/ n
otic
e w
aive
r
Notice waiver
NOTES: N = 88,871 leases with observed start date post-2000. Estimates denote predicted probabilitiesfrom a cubic smoothing spline. Points denote binned averages plotted at the median year of each bin.
from the landlord-tenant complaint on the amount of “ongoing rent” demanded by the plaintiff provides uswith the closest approximation. Landlords have incentives to inflate this figure.
14We find a tiny fraction of matches to our search queries among the PHA leases which are likely falsepositives due to chance error in the OCR transfer. While we find a larger number of exculpatory clausesamong the subsidized leases, this is not necessarily an indicator of a high false positive rate as it is notuncommon for a HUD-approved subsidized lease agreement to be accompanied by a standard lease templatethat may contain unenforceable provisions – both of which are signed by the landlord and tenant.
[DRAFT] LEASES 13
Eviction leases have tended to contain more unenforceable and oppressive terms overtime. Figure 2 plots the estimated proportion of leases with each of the four provisionsover time.15 We use the lease start date listed in the docket and focus on leases startingfrom 2000 onwards as the sample size of leases that are listed as beginning prior to thisyear becomes very small. Lease date data is missing for many docket entries and due totypographical errors and some leases are listed with nonsensical start dates. We are ableto prune nearly all of these incorrect start dates by excluding leases that list a start dateafter the date of the filing of the dispute. This leaves us with a total of 88,871 unsubsidizedleases post-2000 for which we know the start date and which we are also able to geolocate.72,060 of these leases could also be matched to a landlord in the Pew dataset. For someclauses, the growth is stark: holdover tenant clauses were essentially unknown in 2000,but after a dramatic shift in 2010, they now are in most leases.
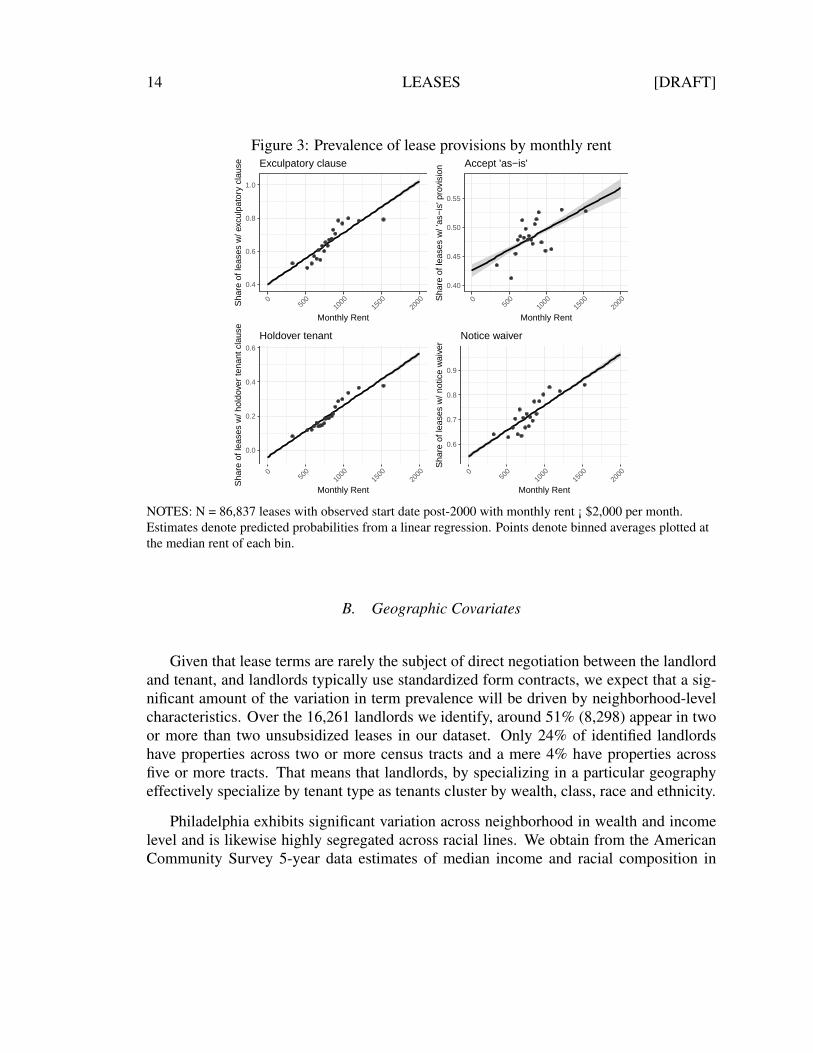
Next, we examine the correlation between the monthly rent listed in the lease andthe presence of these provisions among the unsubsidized leases.16 Figure 3 plots the re-lationship between monthly rent and the prevalence of each type of provision via linearregression models. Focusing specifically on the range of monthly rents between $500 and$1500, which covers about 90 percent of the observations in the data, there is a clear, pos-itive linear trend in the prevalence of each of these four provisions. The magnitudes arequite sizeable – the difference in the probability that a lease will contain a notice waiverbetween a lease priced at $1,500 monthly versus one priced at $500 monthly is about 30percentage points. Notably these relationships persist even when adjusting for lease startyear fixed effects to account for the fact that rents are generally rising over time.
These are striking patterns. Contrary to previous research, unenforceable and oppres-sive terms appear to be positively correlated with wealth, at least as measured by ongoingrent obligations in eviction leases. But is this relationship primarily driven by differencesin the location of the properties, or is there something about the individual characteristicsof the tenants or their landlords that predicts whether a lease will contain one of theseterms? The next section examines the spatial distribution and the extent to which neigh-borhood characteristics predict term prevalence.
15For regressions involving year, we estimate generalized additive models using cubic splines of the startdate variable as we expect likely non-linearity in the underlying time trends and do not wish to impose sig-nificant structural assumptions on the regression model. We also include a binned scatterplot that computesaverage outcome values among a number of equally sized bins. The range of the x-axes encompass the fullrange of start dates in the dataset.
16We focus on those leases with monthly rents listed as greater than 0 and less than or equal to 2000dollars per month, which accounts for over 98% of leases in the dataset. Some of the very extreme values(>$10,000 per month) are likely typographical errors, while others may be mis-classified commercial prop-erties. Overall, pruning the data to these units this leaves us with 129,130 unsubsidized, geolocated leases.86,837 have a known start date after 2000.
14 LEASES [DRAFT]
Figure 3: Prevalence of lease provisions by monthly rent
0.4
0.6
0.8
1.0
050
010
0015
0020
00
Monthly Rent
Sha
re o
f lea
ses
w/ e
xcul
pato
ry c
laus
e Exculpatory clause
0.40
0.45
0.50
0.55
050
010
0015
0020
00
Monthly Rent
Sha
re o
f lea
ses
w/ '
as−
is' p
rovi
sion
Accept 'as−is'
0.0
0.2
0.4
0.6
050
010
0015
0020
00
Monthly Rent
Sha
re o
f lea
ses
w/ h
oldo
ver
tena
nt c
laus
e
Holdover tenant
0.6
0.7
0.8
0.9
050
010
0015
0020
00
Monthly Rent
Sha
re o
f lea
ses
w/ n
otic
e w
aive
r
Notice waiver
NOTES: N = 86,837 leases with observed start date post-2000 with monthly rent ¡ $2,000 per month.Estimates denote predicted probabilities from a linear regression. Points denote binned averages plotted atthe median rent of each bin.
B. Geographic Covariates
Given that lease terms are rarely the subject of direct negotiation between the landlordand tenant, and landlords typically use standardized form contracts, we expect that a sig-nificant amount of the variation in term prevalence will be driven by neighborhood-levelcharacteristics. Over the 16,261 landlords we identify, around 51% (8,298) appear in twoor more than two unsubsidized leases in our dataset. Only 24% of identified landlordshave properties across two or more census tracts and a mere 4% have properties acrossfive or more tracts. That means that landlords, by specializing in a particular geographyeffectively specialize by tenant type as tenants cluster by wealth, class, race and ethnicity.
Philadelphia exhibits significant variation across neighborhood in wealth and incomelevel and is likewise highly segregated across racial lines. We obtain from the AmericanCommunity Survey 5-year data estimates of median income and racial composition in
[DRAFT] LEASES 15
Figure 4: Geographic distribution of lease provisions in Philadelphia, Median Income, andRace
0.25
0.50
0.75
1.00Share Exculpatory
0.00
0.25
0.50
0.75
Share Accept as−is
0.00
0.25
0.50
0.75
Share Holdover Tenant
0.00
0.25
0.50
0.75
Share Notice Waiver
20,000
50,000
100,000
Median HH Income(2017, thousands $)
25
50
75
Percent Black (2017)
NOTES: Unsubsidized, geocoded leases with non-missing start date after 2000 (N = 88,871). Hexes areapproximately 1 square kilometer in area. The bottom two figures are (left) median household incomereported in 2013-2017 inflation-adjusted dollars (ACS 5-year table S1901) and (right) the share of residentsreporting their race as one race and Black or African American (ACS 5-year table DP05). Tracts withmissing data in white.
16 LEASES [DRAFT]
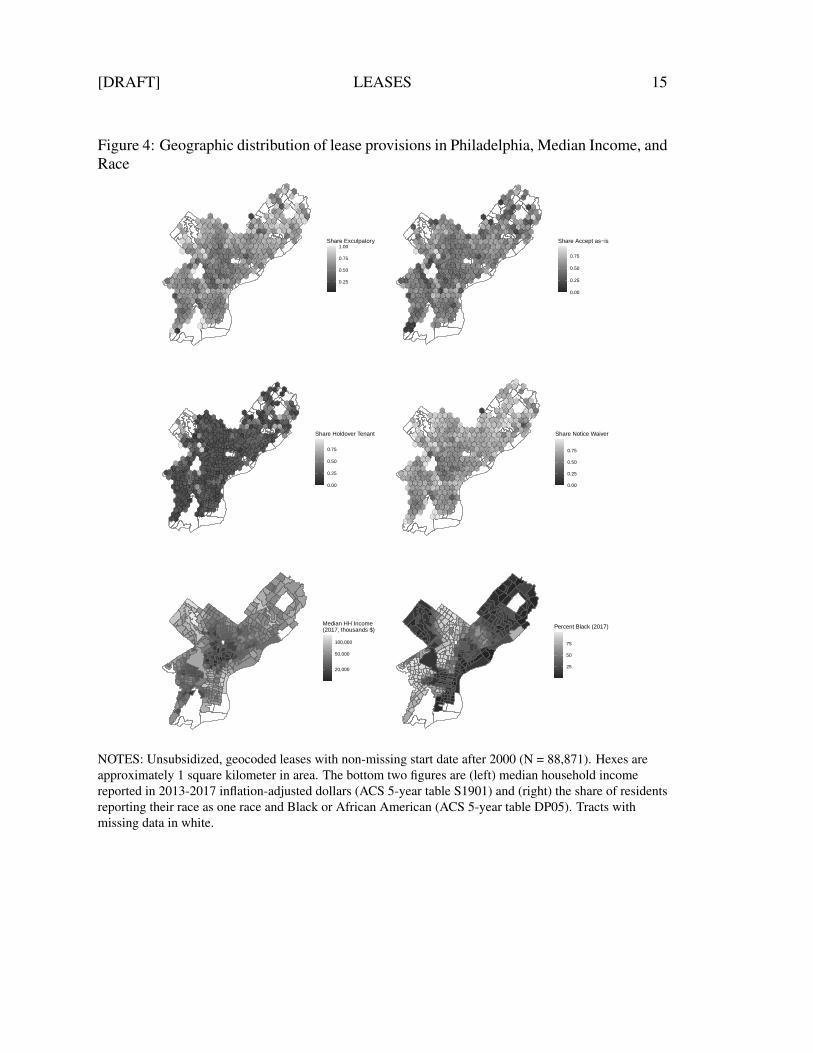
2013-2017 at the level of the census tract.17 This period covers the signing dates of mostof the leases that we have in our dataset. Both of these are highly correlated with oneanother, with poorer tracts tending to also have a larger proportion of Black residents. Ingeneral, the wealthiest and whitest areas of the city are located near the downtown area,and the northwest. In contrast, poorer tracts are found primarily in the north and west ofthe city.
Simply plotting the prevalence of each of the provisions among our sample of unsub-sidized leases strongly suggests regional effects. Figure 4 overlays on top of a map ofPhiladelphia, a series of one-square-kilometer sized hexes. Within each hex, we calcu-late the proportion of geocoded leases that contain each of our four unenforceable leaseprovisions. Exculpatory clauses, notice waivers, holdover tenant clauses and accept as-isterms tending to be more common in the northeast, northwest and downtown regions andgenerally less common in north and west Philadelphia.
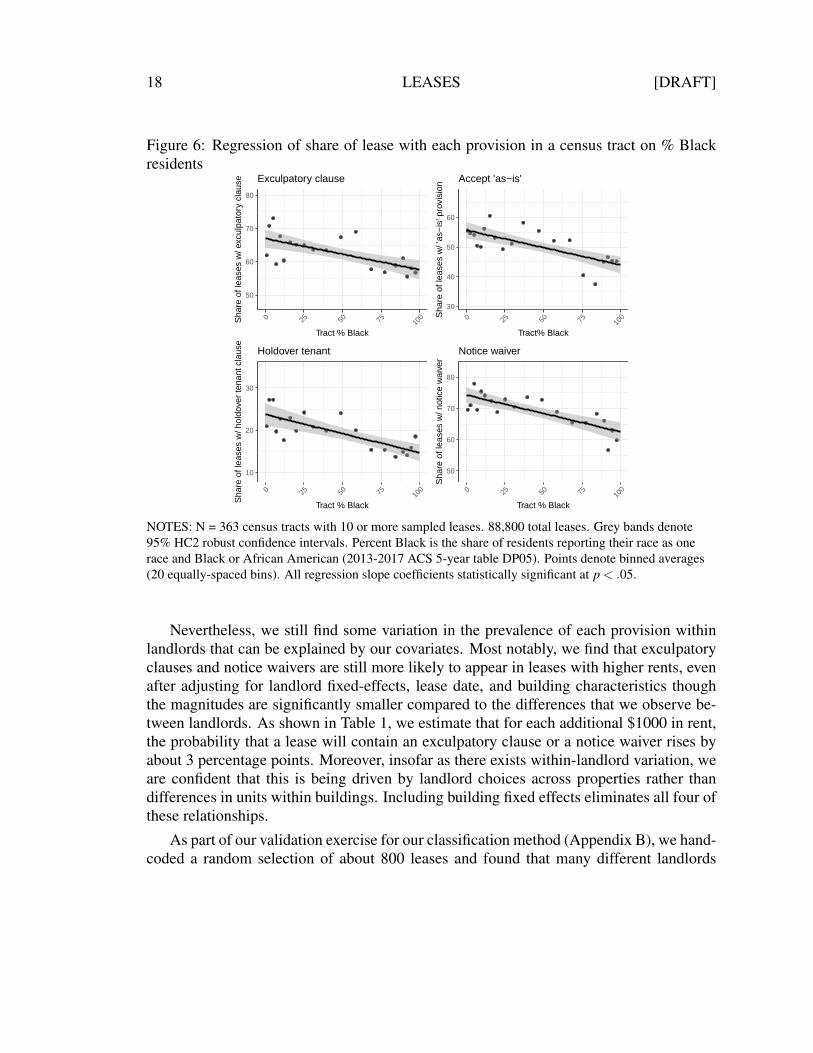
To better visualize the relationship between local conditions and unenforceable andoppressive provisions, we regress the proportion of each lease provision among leases ge-olocated to a census tract on 2013-2017 median household income and on percent Blackresidents. Figure 5 shows that the relationship between census tract log median income isroughly linear and positive. In regions of the city with greater income levels, the proportionof leases in our sample that contain one of the unenforceable provisions is notably higherthan in those regions with comparatively poorer residents. Figure 6 recovers an analogousnegative association with the proportion of Black residents in the census tract.18 Whilethere is a substantial amount of noise in how prevalent a given contract provision is ina region, all of the provisions we consider are more prevalent in leases in wealthier anddemographically whiter areas of Philadelphia. Given the problem of ecological inference,this result should not be interpreted as an effect of individual tenant race or income. How-ever, these patterns do suggest likely clustering of lease templates favorable to landlordsin particular regions of the city associated with more well-resourced landlords.
C. Templating and Within-Landlord Variation
Do landlords vary whether they include certain clauses for different tenants? Exam-ining the share of leases that contain each of the four provisions among frequent filing
17While we selected this particular period of the ACS, our results are not sensitive to the choice of when tomeasure either racial composition or median income as these variables change very minimally in Philadel-phia over the course of the time period being analyzed. The correlations between the 2017 5-year estimatesand the 2010 5-year estimates are .85 for median income and .96 for % white.
18To the extent that the two covariates are highly correlated with one another, it makes it difficult if notimpossible to meaningfully disentangle whether it is race or income that is causally responsible. Moreover,the question of whether one or the other is the “true” driving factor is poorly defined as the two are highlyinterrelated within a geographically segregated city like Philadelphia.

[DRAFT] LEASES 17
Figure 5: Regression of share of lease with each provision in a census tract on loggedmedian income
50
60
70
80
10,0
00
30,0
00
100,
000
Tract median income
Sha
re o
f lea
ses
w/ e
xcul
pato
ry c
laus
eExculpatory clause
40
50
60
70
10,0
00
30,0
00
100,
000
Tract median income
Sha
re o
f lea
ses
w/ '
as−
is' p
rovi
sion Accept 'as−is'
10
15
20
25
30
35
10,0
00
30,0
00
100,
000
Tract median income
Sha
re o
f lea
ses
w/ h
oldo
ver
tena
nt c
laus
e
Holdover tenant
50
60
70
80
90
10,0
00
30,0
00
100,
000
Tract median income
Sha
re o
f lea
ses
w/ n
otic
e w
aive
r Notice waiver
NOTES: N = 363 census tracts with 10 or more sampled leases. 88,800 total leases. Grey bands denote95% HC2 robust confidence intervals. Median household income reported in 2013-2017 inflation-adjusteddollars (ACS 5-year table S1901). Points denote binned averages (20 equally-spaced bins). All regressionslope coefficients statistically significant at p < .05.
landlords suggests that they rarely do. Because landlords may alter their leases over time,we focus on a relatively narrow time window (2015-2019) to analyze the within-landlorddistribution of lease provisions. Figure 7 plots histograms of the proportion of leaseswithin each Pew-identified landlord that contain one of the terms. We see clear bi-modaldistributions with spikes at 0 and 1, especially for exculpatory clauses and notice waivers(with some noise expected due to our imperfect searches). For most of Philadelphia’slandlords, the inclusion or exclusion of a particular provision is an all-or-nothing question.We find minimal evidence that there is any specific tailoring of leases to different tenantswith respect to these clauses. Simple linear regression models with landlord and year-of-lease fixed effects alone can explain between 57% and 62% of the variation in clausepresence among leases signed after 2000 (depending on the particular clause). Thereforethe interesting variation in our data is not within landlords, but between them.
18 LEASES [DRAFT]
Figure 6: Regression of share of lease with each provision in a census tract on % Blackresidents
50
60
70
80
0 25 50 75 100
Tract % Black
Sha
re o
f lea
ses
w/ e
xcul
pato
ry c
laus
e Exculpatory clause
30
40
50
60
0 25 50 75 100
Tract% Black
Sha
re o
f lea
ses
w/ '
as−
is' p
rovi
sion
Accept 'as−is'
10
20
30
0 25 50 75 100
Tract % Black
Sha
re o
f lea
ses
w/ h
oldo
ver
tena
nt c
laus
e
Holdover tenant
50
60
70
80
0 25 50 75 100
Tract % Black
Sha
re o
f lea
ses
w/ n
otic
e w
aive
r
Notice waiver
NOTES: N = 363 census tracts with 10 or more sampled leases. 88,800 total leases. Grey bands denote95% HC2 robust confidence intervals. Percent Black is the share of residents reporting their race as onerace and Black or African American (2013-2017 ACS 5-year table DP05). Points denote binned averages(20 equally-spaced bins). All regression slope coefficients statistically significant at p < .05.
Nevertheless, we still find some variation in the prevalence of each provision withinlandlords that can be explained by our covariates. Most notably, we find that exculpatoryclauses and notice waivers are still more likely to appear in leases with higher rents, evenafter adjusting for landlord fixed-effects, lease date, and building characteristics thoughthe magnitudes are significantly smaller compared to the differences that we observe be-tween landlords. As shown in Table 1, we estimate that for each additional $1000 in rent,the probability that a lease will contain an exculpatory clause or a notice waiver rises byabout 3 percentage points. Moreover, insofar as there exists within-landlord variation, weare confident that this is being driven by landlord choices across properties rather thandifferences in units within buildings. Including building fixed effects eliminates all four ofthese relationships.
As part of our validation exercise for our classification method (Appendix B), we hand-coded a random selection of about 800 leases and found that many different landlords

[DRAFT] LEASES 19
Figure 7: Prevalence of lease provisions within landlords (landlords w/ 5+ leases, leasesfrom 2015-2019)
Holdover Tenant Notice Waiver
Exculpatory Accept As−is
0.00 0.25 0.50 0.75 1.00 0.00 0.25 0.50 0.75 1.00
0
100
200
300
0
100
200
300
0
100
200
0
200
400
Proportion of landlord's leases w/ provision
Num
ber
of L
andl
ords
NOTES: N = 1,066 landlords, 28,484 leases.
Table 1: Landlord fixed effects regressions of lease provisions on monthly rent
Dependent variable:
Exculpatory Clause Notice Waiver Holdover Tenant Accept As-is
Monthly Rent ($1000s) 0.030∗∗∗ 0.026∗∗∗ 0.013 0.025∗
(0.012) (0.010) (0.010) (0.014)
Leases 72,065 72,065 72,065 72,065Buildings 27,111 27,111 27,111 27,111Landlords 12,778 12,778 12,778 12,778
∗p<0.1; ∗∗p<0.05; ∗∗∗p<0.01NOTES: N = 72,065 leases, 27,111 buildings. 12,778 landlords. Leases from 2000 to 2019. OLSregressions adjust for landlord and lease start year fixed effects (all omitted from the table for space).Cluster-robust standard errors clustered on landlord in parentheses.
used the same widespread shared lease. Many of these shared leases are made availableto landlords via online services that allow easy access to forms tailored to states. Usingthat hand-coding as the basis for text searches of the larger dataset, we found several

20 LEASES [DRAFT]
dominant shared leases: the Philadelphia Association of Realtors Lease (approximately16% of all leases in our dataset), the National Apartment Association Lease, the LandlordAssociation of Pennsylvania Lease, a “plain language” lease approved by the PennsylvaniaOffice of the Attorney General, the Greater Philadelphia Association of Realtors Lease,the Pennsylvania Apartment Association Lease, and a handful of internet leases that weresourced from a number of websites such as ezLandlordForms.com or ZipLogix.19
Figure 8: Prevalence of shared leases over time
0.28
0.32
0.36
0.40
0.44
2000
2005
2010
2015
2020
Lease Start Date
Sha
re o
f lea
ses
w/ f
orm
Any Shared Form
0.00
0.05
0.10
0.15
0.20
2000
2005
2010
2015
2020
Lease Start Date
Sha
re o
f lea
ses
w/ f
orm
National Apartment Assoc.
0.02
0.04
0.06
0.08
2000
2005
2010
2015
2020
Lease Start Date
Sha
re o
f lea
ses
w/ f
orm
Greater Phil. Realtors
0.10
0.15
0.20
2000
2005
2010
2015
2020
Lease Start Date
Sha
re o
f lea
ses
w/ f
orm
PA Realtors
Notes: N = 88,871 leases with observed start date and geolocation post-2000. Estimates denote predictedprobabilities from a cubic smoothing spline. Points denote binned averages (20 intervals).
We coded each contract as being a shared lease if they matched one of these organization-sponsored leases or if they are listed as coming from a website that provides landlordforms. About 35% of leases in our dataset use one of these shared leases. This is an
19Many of the forms obtained via online websites are also templates from one of these. For example,ZipLogix is often used to generate the Philadelphia Association of Realtors template. The role of non-profitsand associations in generating forms is explored in (Davis, 2007)

[DRAFT] LEASES 21
under-estimate of the total number of shared leases as some landlords may use identical(or largely identical) text from an existing lease while omitting relevant identifiers. In par-ticular, we are very likely under-counting web forms as the printed leases will often omitthe source of the document when it appears only in a document header or footer. Addition-ally, property management companies develop their own in-house leases which often havethe same or greater level of legal sophistication as the more popular shared leases. Whatwe are coding as shared leases are simply those that are common across many landlordsand identifiable by us. While essentially all leases are patterned off of models, inspectinga sample of the non-form leases in our dataset suggests that these are rather idiosyncratic –a combination of very simple leases and very long custom templates specific to a particu-lar property manager. Going forward, we’ll call contracts that aren’t widely shared acrosslandlords proprietary leases.
Figure 9: Prevalence of lease provisions by lease start date – Shared Leases vs. ProprietaryLeases
0.5
0.6
0.7
0.8
0.9
2000
2005
2010
2015
2020
Lease Start Date
Sha
re o
f lea
ses
w/ e
xcul
pato
ry c
laus
e
Exculpatory clause
0.25
0.50
0.75
1.00
2000
2005
2010
2015
2020
Lease Start Date
Sha
re o
f lea
ses
w/ '
as−
is' p
rovi
sion
Accept 'as−is'
0.0
0.2
0.4
0.6
0.8
2000
2005
2010
2015
2020
Lease Start Date
Sha
re o
f lea
ses
w/ h
oldo
ver
tena
nt c
laus
e Holdover tenant
0.5
0.6
0.7
0.8
0.9
1.0
2000
2005
2010
2015
2020
Lease Start Date
Sha
re o
f lea
ses
w/ n
otic
e w
aive
r
Notice waiver
Shared Form Yes No
NOTES: N = 88,871 leases with observed start date post-2000. Estimates denote predicted probabilitiesfrom a cubic smoothing spline. Points denote binned averages.

22 LEASES [DRAFT]
The prevalence of shared leases increased with time. Figure 8 plots the estimated shareof shared leases from 2000 to 2019. Their prevalence rises from about 34% in 2000 to over43% in 2019. Additionally, the changes in specific shared leases have been more dramatic.For example, the National Apartment Association Lease is non-existent pre-2010 but risesto nearly 20% of the sample in 2019. Conversely, the Greater Philadelphia Realtors Leasehas declined in popularity – dropping from about 6% of the sample in 2000 to essentially0 in 2019. The PA Realtors Lease – one of the most popular templates, accounting forabout 45% of our shared leases leases – rises in relative popularity from 2000 to 2010 butdeclines afterwards.
The spread of shared leases has important consequences for unenforceable and oppres-sive provisions. Figure 9 plots the trend in the prevalence of each of our four provisionsand compares shared to proprietary leases. First note the clear intercept shift — sharedleases are much more likely to contain each of the four terms. Second, this gap appearsrelatively stable over time.20 Third, we see some growth over time in the unenforceableand oppressive provisions even among the proprietary leases, suggesting that there maybe some convergence over time. This relationship is clearest when looking at the holdovertenant clause, which experiences a sharp increase in prevalence after 2010 that is drivenalmost by changes within shared leases: it was included in the 2013 edition of the Penn-sylvania Association of Realtors Residential Lease. However, we see that the prevalenceof this term grows even among the proprietary leases after 2010 as some landlords beginusing proprietary leases containing this clause.
Furthermore, we find that the lease forms that are growing in popularity over time haveworse provisions than those that are declining – that is, the composition of popular formsis changing in a way that is increasing the prevalence of our unenforceable terms. Figure10 plots the share of leases with each of our four provisions among leases matching thePennsylvania Association of Realtors (PAR) template, the National Apartment Association(NAA) template, and the Greater Philadelphia Association of Realtors (GPAR) template –three templates with different trajectories over time. In general, the forms that are growingtheir share of leases over time are worse for tenants than those in decline, which mayexplain some of the undulation in the time trends we see in Figure 9 as different templateswax and wane in popularity. It also may explain why the time trends in our four provisionsare much more pronounced compared to the trend in templating. Not only are sharedleases replacing proprietary leases, which tend to be shorter and more informal, but morepro-landlord templates are replacing less pro-landlord ones.
With shared lease networks explaining a significant chunk of why some leases containthese terms and others do not, do they exhibit similar clustering in space? Figure 11plots the prevalence of shared leases in different parts of the city, along with specific sub-
20With one notable exception in the holdover tenant clause, which is almost entirely absent from all formsprior to 2010.

[DRAFT] LEASES 23
Figure 10: Share of leases containing each provision among those classified with particulartemplates
0
25
50
75
100
Exculpatory Accept As−is Holdover Tenant Notice WaiverProvision
Per
cent
age
Lease Type
Greater Phil. Realtors
Natl. Apt. Assoc.
PA Realtors
Other Shared Form
Non−shared form
NOTES: N = 88,871 unsubsidized leases with observed start date post-2000.
plots for two prominent types: the Pennsylvania Association of Realtors template andthe National Apartment Association template. In general, we find heavier prevalence ofshared leases in the downtown area and in the north-east. We find the National ApartmentAssociation template concentrated in a few notable points in the city and nearly entirelyabsent elsewhere, likely reflecting use by large apartment complexes. The PA Associationof Realtors template is much more diffuse as it is more widely available to smaller multi-family and single-family housing but we still see clear areas of the city where it is muchmore common than others.
This clustering is associated with regional income and demographic characteristics.Figure 12 plots the regressions of the proportion of shared leases in each census tracton logged median income and % Black residents. We find one notable deviation from thepatterns seen for the prevalence of unenforceable terms – tract income predicts more formsonly up to a certain point. A quadratic polynomial fits the observed data much better thana linear model. Shared leases are most common in tracts where median incomes are inthe $50,000 range but their usage drops off in the most wealthy census tracts (which arecomparable to the poorest in our dataset). We hypothesize that the use of custom templatesamong property management companies may account for this pattern – these leases areoften extremely dense and are developed by lawyers hired by the company but may notmatch any of the commonly used form templates. Unfortunately because such leases lackany common identifiers, evaluating our hypothesis systematically would be difficult.

24 LEASES [DRAFT]
Figure 11: Geographic distribution of shared leases in PhiladelphiaAny Shared Form Natl. Apt. Assoc. PA Realtors
0.00 0.25 0.50 0.75Share of leases
NOTES: Unsubsidized, geocoded leases with non-missing start date after 2000 (N = 88,871). Hexes areapproximately 1 square kilometer in area.
Figure 12: Regression of share of leases containing shared forms in a census tract onlogged median income and race (2017)
10
20
30
40
50
10,0
00
30,0
00
100,
000
Tract median income
Per
cent
age
of le
ases
w/
any
sha
red
form
Shared forms vs. income
25
30
35
40
45
50
0 25 50 75 100
Tract % Black
Per
cent
age
of le
ases
w/
any
sha
red
form
Shared forms vs. demographics
NOTES: N = 363 census tracts with 10 or more sampled leases. 88,800 total leases. Grey bands denote95% HC2 robust confidence intervals. Median household income reported in 2017 inflation-adjusteddollars (ACS 5-year table S1901). Percent Black is the share of residents reporting their race as one raceand Black or African American (2017 ACS 5-year table DP05). Points denote binned averages (20equally-spaced bins). All regression slope coefficients statistically significant at p < .05.

[DRAFT] LEASES 25
Figure 13: Prevalence of shared leases over time by census tract median income
0.2
0.3
0.4
0.5
2005
2010
2015
2020
Lease Start Date
Sha
re o
f lea
ses
w/ f
orm
Any Shared Form
0.0
0.1
0.2
2005
2010
2015
2020
Lease Start Date
Sha
re o
f lea
ses
w/ f
orm
National Apartment Assoc.
0.00
0.04
0.08
2005
2010
2015
2020
Lease Start Date
Sha
re o
f lea
ses
w/ f
orm
Greater Phil. Realtors
0.05
0.10
0.15
0.20
0.25
2005
2010
2015
2020
Lease Start Date
Sha
re o
f lea
ses
w/ f
orm
PA Realtors
Census TractMedian Income
$0 − $25,000 $25,001 − $55,000 $55,001+
NOTES: N = 88,617 leases with observed start date and geolocation post-2000 in census tracts withobserved median income. Estimates denote predicted probabilities from a cubic smoothing spline.
What we do find, however, is that the growth of shared leases seems predominantlyconcentrated in census tracts with median incomes in roughly the 25th-75th percentile ofall tracts. Figure 13 plots the time trend in the incidence of shared leases conditional onthe census tract income bracket. Leases from census tracts in the middle of the distribution(56,185 leases from 191 tracts with median incomes between $25,000 and $55,000) arethe ones with a clear growth over time in the proportion of shared leases being used. Onething that we find in the richer census tracts is relative stability in the overall share ofshared leases but clear trends in specific types of forms – for example, a decline in thePA Realtors template coupled with a sharp growth in the National Apartment Associationtemplate. This to us is suggestive of substitution in form type towards templates morefavorable to landlords among those landlords using forms and may further explain thehigh prevalence of the unenforceable provisions in richer vs. poorer census tracts despitecomparable levels of form usage.
26 LEASES [DRAFT]
D. Building Types and Within-Tract Variation
Figure 14: Prevalence of leases from apartments by geography and income
0
25
50
75
100
% leasesfrom apartments
0
25
50
75
10,0
00
30,0
00
100,
000
Tract median income
Sha
re o
f lea
ses
from
apa
rtm
ents
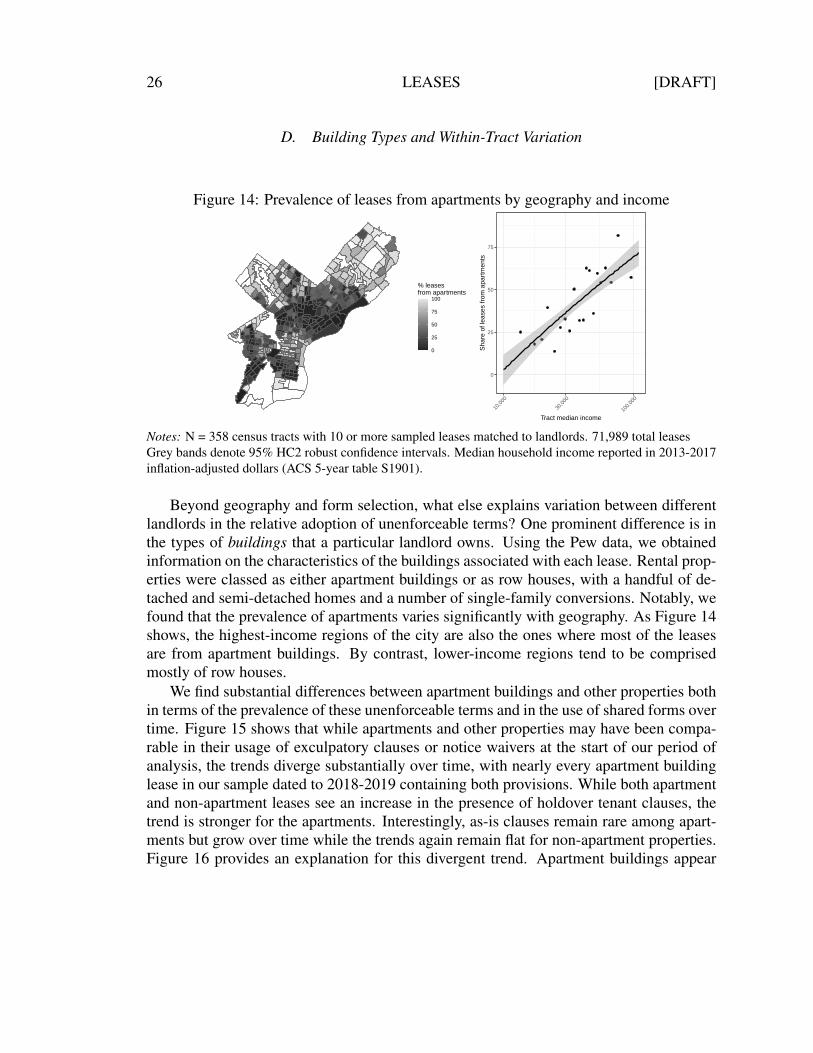
Notes: N = 358 census tracts with 10 or more sampled leases matched to landlords. 71,989 total leasesGrey bands denote 95% HC2 robust confidence intervals. Median household income reported in 2013-2017inflation-adjusted dollars (ACS 5-year table S1901).
Beyond geography and form selection, what else explains variation between differentlandlords in the relative adoption of unenforceable terms? One prominent difference is inthe types of buildings that a particular landlord owns. Using the Pew data, we obtainedinformation on the characteristics of the buildings associated with each lease. Rental prop-erties were classed as either apartment buildings or as row houses, with a handful of de-tached and semi-detached homes and a number of single-family conversions. Notably, wefound that the prevalence of apartments varies significantly with geography. As Figure 14shows, the highest-income regions of the city are also the ones where most of the leasesare from apartment buildings. By contrast, lower-income regions tend to be comprisedmostly of row houses.
We find substantial differences between apartment buildings and other properties bothin terms of the prevalence of these unenforceable terms and in the use of shared forms overtime. Figure 15 shows that while apartments and other properties may have been compa-rable in their usage of exculpatory clauses or notice waivers at the start of our period ofanalysis, the trends diverge substantially over time, with nearly every apartment buildinglease in our sample dated to 2018-2019 containing both provisions. While both apartmentand non-apartment leases see an increase in the presence of holdover tenant clauses, thetrend is stronger for the apartments. Interestingly, as-is clauses remain rare among apart-ments but grow over time while the trends again remain flat for non-apartment properties.Figure 16 provides an explanation for this divergent trend. Apartment buildings appear

[DRAFT] LEASES 27
Figure 15: Prevalence of lease provisions by lease start date – Apartments vs. Non-apartments
0.5
0.6
0.7
0.8
0.9
2000
2005
2010
2015
2020
Lease Start Date
Sha
re o
f lea
ses
w/ e
xcul
pato
ry c
laus
e
Exculpatory clause
0.2
0.4
0.6
2000
2005
2010
2015
2020
Lease Start Date
Sha
re o
f lea
ses
w/ '
as−
is' p
rovi
sion
Accept 'as−is'
0.0
0.2
0.4
0.6
2000
2005
2010
2015
2020
Lease Start Date
Sha
re o
f lea
ses
w/ h
oldo
ver
tena
nt c
laus
e Holdover tenant
0.6
0.7
0.8
0.9
2000
2005
2010
2015
2020
Lease Start Date
Sha
re o
f lea
ses
w/ n
otic
e w
aive
r
Notice waiver
Building Apartment Other
Notes: N = 72,060 leases with observed start date post-2000 matched to Pew landlord data. Estimatesdenote predicted probabilities from a cubic smoothing spline. Points denote binned averages.
to be predominantly responsible for the surge in shared lease form adoption. Conversely,trends in the use of shared templates remained flat in non-apartment properties. It is worthnoting that this lack of a trend in the non-apartment group likely masks changes in thetypes of templates being adopted which will vary in the types of provisions they contain.More crucially, this trend differs substantially by region of the city – the adoption of sharedforms by apartments is almost exclusively a trend among apartments in middle-income ar-eas of the city.
Significantly, we find that the differences in the content of the types of leases selectedby landlords of apartments relative to other types of properties result in differences inlease content across racial groups. As we illustrated earlier, neighborhoods with wealthierand whiter residents tend to have leases with more unenforceable provisions. However, be-cause of the ecological inference problem this does not necessarily extend to the individual

28 LEASES [DRAFT]
Figure 16: Prevalence of shared forms by lease start date – Apartments vs. Non-apartments
0.2
0.4
0.6
2005
2010
2015
2020
Lease Start Date
Sha
re o
f lea
ses
w/ f
orm
Building type Apartment Other
Any Shared Form
0.0
0.2
0.4
0.6
2005
2010
2015
2020
Lease Start Date
Sha
re o
f lea
ses
w/ f
orm
Census TractMedian Income
$0 − $25,000 $25,001 − $55,000 $55,001+
Any Shared Form (among Apartments)
Notes: N = 72,042 leases with observed start date post-2000 matched to Pew landlord data withnon-missing tract income data. Estimates denote predicted probabilities from a cubic smoothing spline.Points denote binned averages.
level. Detailed information about the demographic and socioeconomic status of particulartenants is difficult to obtain. However, using addresses and names, we can extract someinformation on the background of the tenant—in particular we are able to generate predic-tions regarding the race of the tenant. We also match and validate name and address pairsusing a comprehensive voter file dataset maintained by the private political research firmL2.21
We predict tenant race using the surname analysis method frequently used in the so-cial sciences (Fiscella & Fremont, 2006; Imai & Khanna, 2016) to impute individual-level race using known aggregate distributions from administrative data.22 We specifi-cally implement the method developed by Sood and Laohaprapanon (2018) which alsoincorporates information on first names to improve the quality of the prediction. Weuse the full name model trained on the Florida voting registration data used by Sood
21We extracted unique name-address pairings from our landlord-tenant dataset for cases filed between2014 and 2019. We then requested that L2 match these name-address pairings to each of its annual historicalvoter file datasets from 2016 (as far back as was available) to the present day. Of the 79,861 unique tenant-address pairings from this time period, we were able to link 14,633 to an L2 voter file record. From theserecords, we obtain information on tenant gender, ethnic description, and estimated income where availablefrom matched commercial data records.
22The approach leverages the fact that some surnames are more commonly among members of particularracial and ethnic groups. Given a known distribution of a particular surname using administrative data (suchas census or voter registration data), the method uses Bayes’ rule to obtain a predicted probability that anindividual belongs to a particular ethnic or racial group conditional on their surname.

[DRAFT] LEASES 29
and Laohaprapanon (2018) and implemented in the Python library ethnicolr, avail-able at https://github.com/appeler/ethnicolr. For our analysis below, our primary inde-pendent variable of interest is the predicted probability that an individual is non-HispanicBlack/African American.23 Because multiple tenants can reside at a single property andbe listed in the eviction filing, we have more total tenants classified than individual leasesor eviction filings.
Figure 17: Association between individual tenant race and probability of inhabiting anapartment vs. non-apartment property
0.39
0.42
0.45
0.48
0.00 0.25 0.50 0.75 1.00Predicted probability Black tenant
Pro
babi
lity
leas
e is
an
apar
tmen
t
0.3
0.4
0.5
0.6
0.7
0.00 0.25 0.50 0.75 1.00Predicted probability Black tenant
Pro
babi
lity
leas
e is
an
apar
tmen
t
Census TractDemographics
Majoritynon−white
Majoritywhite
Notes: N = 60,098 tenants, 46,365 unique eviction filings, 20,059 buildings. Estimates denote predictedprobabilities from a cubic smoothing spline. Points denote binned averages.
Figure 17 plots the probability that a tenant in our dataset will inhabit an apartmentbuilding conditional on predicted race. It also presents estimates conditional on censustract characteristics (majority white vs. majority non-white). Overall, we find that Blacktenants are on average less likely to live in an apartment building than the alternatives.This is consistent with the distribution of apartments throughout the city and its associa-tion with demographics. However, this relationship partly inverts when we condition onneighborhood demographics. Within census tracts that are majority white, Black tenants
23We verified that our measure has good predictive power by comparing it to the race/gender classifi-cations from those tenants who we were able to match to a commercial dataset obtained from politicalresearch firm L2. Using voter file data from 2016 onward, we matched 14,633 of 79,861 unique name-address pairings and obtained both registered voter data and commercial data. Race/ethnic classificationin the L2 dataset is also imputed using similar methods as Pennsylvania voter registration does not collectdata on race. Therefore, the relationship between our estimates and the commercial data classifications ispositive and monotonic but somewhat curvilinear due to imperfections in how the commercial dataset choseto coarsen the ethnic classification estimates.
30 LEASES [DRAFT]
are on average more likely to reside in apartment buildings while the relationship is muchflatter among majority non-white areas. As expected, the share of apartment complexes inmajority white areas is significantly larger compared to those that are majority non-white.Finally, we find that adjusting for the type of property (apartment vs. non-apartment) in aregression model eliminates any observed relationship between race and lease provisions(as does adjusting for landlord fixed-effects). This strongly suggests that the relationshipbetween tenant race and lease provisions has less to do with unit-level choices by land-lords and more to do with the types of properties being rented by Black tenants versuswhite tenants.
Figure 18: Time trends and census-tract level regressions for prevalence of oral leases inlandlord-tenant cases (2011-2019)
0.030
0.035
0.040
0.045
0.050
2012
2014
2016
2018
2020
Case Filing Date
Sha
re o
f cas
es w
/ ora
l lea
se
Time trend
0.000
0.025
0.050
0.075
10,0
00
30,0
00
100,
000
Tract median income
Sha
re o
f cas
es w
/ ora
l lea
se
Oral leases vs. income
0.000
0.025
0.050
0.075
0 25 50 75 100
Tract % Black
Sha
re o
f cas
es w
/ ora
l lea
se
Oral leases vs. demographics
NOTES: N = 191,626 landlord-tenant cases from 2011-2019. N = 370 census tracts with 10 or moresampled cases. Grey bands denote 95% HC2 robust confidence intervals. Median household incomereported in 2017 inflation-adjusted dollars (ACS 5-year table S1901). Percent Black is the share ofresidents reporting their race as one race and Black or African American (2017 ACS 5-year table DP05).Points denote binned averages (20 equally-spaced bins). Time trend results are predicted probabilities froma cubic smoothing spline. Income and race regressions are linear/quadratic models estimated via ordinaryleast squares. All regression slope coefficients statistically significant at p < .05.
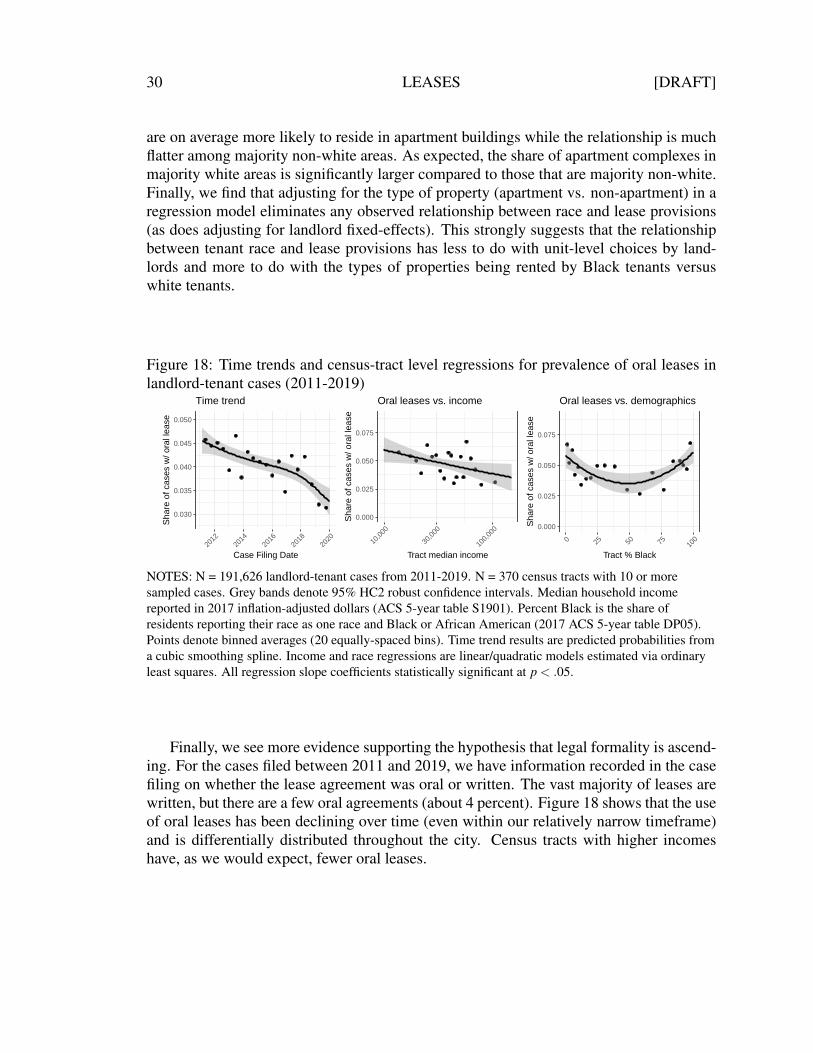
Finally, we see more evidence supporting the hypothesis that legal formality is ascend-ing. For the cases filed between 2011 and 2019, we have information recorded in the casefiling on whether the lease agreement was oral or written. The vast majority of leases arewritten, but there are a few oral agreements (about 4 percent). Figure 18 shows that the useof oral leases has been declining over time (even within our relatively narrow timeframe)and is differentially distributed throughout the city. Census tracts with higher incomeshave, as we would expect, fewer oral leases.

[DRAFT] LEASES 31
E. The Selection Question
Leases are filed as exhibits to eviction proceedings and are not a random sample of allleases in the Philadelphia, let alone all national leases. While we do not claim to speak tothe sorts of patterns that exist among Philadelphia leases in general, we do consider oursample to be a reasonable starting point for examining rental contracts among the poorerresidents of Philadelphia. Nevertheless, we consider two possible avenues through whichfocusing on leases attached to evictions could generate a form of “selection bias.” We ex-amine whether such mechanisms are plausible given additional evidence and, if they are,how our analyses above adjust for that bias. First, we consider the question of whetherselection threatens “external validity” – that is, whether our sample can reasonably gener-alize to the population of low-income resident leases or whether there are certain landlordsor types of leases that never appear or are grossly underrepresented in our sample simplybecause those landlords are able to encourage tenants to leave their properties without re-course to formal rules. Second, we consider the risk of spurious correlations induced byunobserved factors associated with lease provisions and the onset of eviction proceedings– the “collider bias” problem (Cole et al., 2010).
Figure 19: Representativeness of sampled leases compared to ACS benchmarks
−3
−2
−1
0
1
2
−1.0 −0.5 0.0 0.5 1.0Adjusted logged census tract median income
(2013−2017 ACS Estimates)
Adj
uste
d lo
gged
num
ber
ofun
subs
idiz
ed le
ases
sam
pled
0
30
60
90
−1000 −500 0 500Difference between median contract rent of sample
and median contract rent in 2017 ACS
Num
ber
of C
ensu
s Tr
acts
−1000
−500
0
500
40,000 80,000 120,000Census tract median income(2013−2017 ACS Estimates)
Diff
eren
ce b
etw
een
med
ian
cont
ract
ren
t of s
ampl
e a
nd m
edia
n co
ntra
ct r
ent i
n 20
17 A
CS
NOTES: N = 375 census tracts; 372 census tracts with observed median contract rent. Grey bands denote95% HC2 robust confidence intervals. First panel presents an added-value plot from a regression of lognumber of leases sampled on log median income adjusting for log number of renter-occupied units. Secondpanel plots a histogram of the distribution across census tracts of the differences in median contract rentfrom sampled leases and median contract rent from ACS. Vertical line denotes the median of thedistribution. Third panel plots the relationship between the sample-ACS rent difference and census tractmedian income. Median household income reported in 2017 inflation-adjusted dollars (ACS table S1901).Number of renter-occupied housing units based on 2013-2017 estimates (ACS table DP04). Mediancontract rent calculated from renter-occupied units paying cash rent (ACS table B25058).
Both external validity and collider bias concerns arise because we are only able to ob-serve those leases for which an eviction proceeding was initiated and cannot observe those
32 LEASES [DRAFT]
landlords who, for whatever reason, never choose to use the landlord-tenant court. Recentliterature on the hazards that appear to drive eviction point to a number of factors thatcould also potentially be associated with covariates of interest. In recent work, Desmondand his co-authors randomly surveyed Milwaukee residents and find that (net of other fac-tors) having children increased the likelihood of eviction, as does increase in crime in theneighborhood. Desmond has also found that being Latino in a predominantly white neigh-borhood makes one particularly at risk for eviction (from among the set of individuals whoare behind on their rent) (Desmond & Gershenson, 2017). At the same time, tenants withweaker social networks — close relationships who had recently experienced drug addic-tion, incarceration, eviction, etc. — were more likely to be evicted (Humphries, Mader,Tannenbaum, & van Dijk, 2019). If the people in landlord-tenant court are distinctive, itmight stand to reason that their leases are too.
We first focus on the question of representativeness. Do we have reason to believethat the sample of leases we collected systematically differs from the true population oflower-income leases? We do find that, after conditioning on the number of renter-occupiedunits in each census tract (using data from the American Community Survey), we aremore likely to sample leases from lower- and middle-income census tracts than we areleases from higher-income tracts. The left panel of Figure 19 shows the added-variableplot from a regression of the (logged) number of leases sampled in a census tract on thetract’s (logged) median income, adjusting also for the (logged) number of units in a tract.This is consistent with the general pattern that the poor tend to be the targets of evictionproceedings and therefore appear in our sample (Collinson & Reed, 2018). Since thispaper specifically focuses on the contracts of poor residents, this is entirely expected –areas of Philadelphia are highly segregated by income and it would be surprising if asample of the leases of lower-income residents uniformly represented all areas of the city.We would be somewhat more concerned about representativeness if we found that withineach census tract we were consistently sampling leases that looked very different from thetypical rental agreement in that tract. We do not find evidence that this is the case.
We examine the gap between the median monthly rent among sampled leases withineach census tract and the median rent reported by the ACS. As shown in the right panel ofFigure 19, the gap, on average, is very close to zero. Apart from a few extreme outliers –likely driven by single apartment complexes in otherwise low-eviction areas that are heavyinitiators of eviction proceedings – we see little systematic difference between the medianrent statistics from the ACS and median rent in our data.24 This suggests the absence ofsignificant systematic biases in the within-tract sampling process at least insofar as theywould be correlated with rents. Since rent is an obviously highly relevant covariate whenlooking at leases, it is difficult to come up with a selection mechanism that is not, insome way, associated with rents. We are relatively confident that the main factors driving
24While there is quite a bit of variability, this is expected given the nature of the sampling process.

[DRAFT] LEASES 33
selection into our sample are geographic-level factors related to resident income whichare expected and can be observed to a large extent. We do find, as the third panel shows,that there is some negative relationship between the difference between in-sample andACS rent and census tract median income though it is not particularly strong and thereis still a significant amount of variation across tracts. In richer areas, the leases that weare observing tend to be of those living in housing with lower rents than the area median,consistent with our argument that while our sample is not representative of all Philadelphialeases, it does generally represent the leases of lower-income residents.
Further, the structure of the lease ecosystem strongly suggests that it is unlikely thatthere is a type of lease that is entirely absent from the eviction sample. As we explorebelow, the dataset is dominated by shared leases – we can link around half of all leases inthe dataset to shared, commercially available forms. These shared leases contain the worstclauses for tenants, and are increasing in relative prevalence over time. Within landlorddifferences are almost entirely absent. Thus, landlords (who evict) use the same forms forall of their tenants, and they increasingly tend to use forms also adopted by other landlords.One would have to posit that such landlords use an entirely different set of forms for thatportion of their tenant population that they rationally expect not to later evict to worry thatthe selected leases and forms are unrepresentative of those landlords.
Moreover, while it is possible that the leases of landlords who don’t file as many evic-tions are different, we discount that possibility for several reasons. First, Furth-Matzkin’swork observes roughly equivalent numbers of unenforceable terms in her sample, com-posed largely of student leases, as we do. Furth-Matzkin (2017) This provides some com-fort that the selection process is not biased toward finding “worse” leases, even thoughthese are very documents that are submitted to court. In that light, it would be quite sur-prising if the set of landlords who don’t evict had better terms for their tenants than thosewho do. Second, the prevalence of the notice waiver provisions suggest that selection outof litigation is somewhat limited: landlords can file evictions with relatively little fuss,and often do so supported by attorneys whose practice is highly routine. In fact, a recentlawsuit filed accuses those very attorneys of running, in effect, eviction-mills where insuf-ficient attention was paid to the facts of each case.25 Overall, as that eviction appears toresult largely from post-rental change in tenant characteristics (such as having additionalchildren while in the leasehold) we think that pre-eviction lease selection is unlikely.
In short, while it is obvious that examining leases associated with eviction will notyield a representative sample of all leases in the city, it does give us a good window intothe the sorts of leases held by tenants on the lower end of the socio-economic spectrumthat are more at-risk for eviction.
25See Lawsuit Documents, available at https://www.pubintlaw.org/cases-and-projects/ending-exploitative-eviction-practices-by-collection-lawyers/

34 LEASES [DRAFT]
A second concern about selection comes from the risk of “collider bias” or spuri-ous correlation between variables induced by the fact that we are only examining leasesassociated with evictions. While our correlational results are presented primarily as a de-scription of interesting patterns in our dataset and not as clearly identified causal effects,it is important to consider whether the correlations we observe in the data – particularlythe individual-level ones – would still be present if we were to also observe the leases ofthose against whom eviction proceedings were not initiated. Many of the individual-leveland demographic-level covariates that we study are known to have a strong associationwith the probability of eviction proceedings. For example, as recent work by the Rein-vestment Fund suggests, Black tenants in Philadelphia are significantly over-representedin evictions relative to their share of the overall renter population (Reinvestment Fund,2021). Moreover, they are more over-represented specifically in those census tracts thatare gentrifying and undergoing significant growth in rents over time. If there are otherunobserved factors associated with both eviction and lease provisions, that may explainsome of the associations we discuss below.
This would make an interesting explanation in its own right for some of the descrip-tive patterns in lease provisions that we observe and we make no claim of an explicitlycausal association for the relationship between, for example, tenant race and lease pro-visions. One hypothesis is that this relationship may be driven by a third, unobservedfactor, related to differences in property type between Black and white tenants within cen-sus tracts, but an alternative explanation may be due to gentrification patterns that are notbeing captured by our covariates. If landlords in rapidly gentrifying areas are more likelyto adopt shared form leases and, on average, more likely to evict Black tenants, we wouldobserve Black tenants within the subsample of eviction-related leases as being more likelyto have provisions associated with shared forms. Such a pattern would nevertheless haveimportant substantive consequences for our understanding of the eviction process.
However, we have some reason to doubt that this is necessarily the only story. First,we adjust for census tract-level covariates. If it is the case that Black tenants are dispropor-tionately facing eviction in gentrifying areas of the city, then comparing Black residentsto white residents in comparable regions would rule out gentrification as an explanationfor the observed difference in our outcomes of interest. While our primary tract-levelcovariates are time-invariant, we include interactions between them and the filing date ofthe case in the regression analyses of individual tenant characteristics and lease provisions.Although we do not have an ideal time-varying measure of gentrification that encompassesour entire timeframe, this approach provides an initial way to capturing recent changes inthe relationship between geography and eviction. Second, we find no evidence of hetero-geneity across time in the association between whether a tenant is Black and the presenceof unenforceable lease provisions like the notice waiver or exculpatory clause. We wouldexpect that if the correlation were driven by a surge in evictions of Black tenants from

[DRAFT] LEASES 35
gentrifying areas in recent years that this relationship would grow stronger over time. Ul-timately, while we are certainly cautious to not draw extremely strong conclusions aboutall leases based exclusively on the subset of leases from eviction proceedings, we havetaken care to address the most likely sources of selection-induced correlation using whatdata can be gathered on census tract characteristics.
V. IMPLICATIONS AND RESEARCH DIRECTIONS
We have focused on a selected dataset: contracts submitted to a court to justify aneviction. Nonetheless, we find that most contain multiple unenforceable and oppressiveterms. The primary exception are those contracts associated with public housing agencies,which have created a regulatory inspection process which scrubs leases of unenforceableor oppressive language. Overall, we illustrate the low efficacy of ex post term policingdoctrines.
We observe landlords adopting two strategies in choosing leases, at least those that endup in eviction court. Some adopt proprietary leases, which are often short, contain fewunenforceable and oppressive terms, and are associated with cheaper leaseholds in poorercensus tracts with non-repeat play landlords. More often, and more recently, landlordsadopt shared leases. These are typically drafted by non-profits or commercial providersand disseminated at low cost. They are longer and more pro-landlord than their proprietarycounterparts. Over the last twenty years, the latter strategy has increasingly dominated theformer, which we attribute to increasing adoption by landlords who specialize in apartmentbuildings, and who are relatively poorer. But whether they adopt proprietary or sharedleases, or whether they are large or small, one thing we do not see is significant numbersof landlords tailoring leases for individual tenants. This Part explores the implications ofthese findings, considers further research questions and describes certain limitations.
A. Regulating Templates
One clear take-home message is that ex ante regulation is associated significantly fewerpro-landlord terms than when such policing is left to ex post court decisions. That’s soeven though all the studied leases were submitted in support of evictions, meaning thatmost landlords left themselves open to ready-made defenses if tenants could secure com-petent representation. Moreover, unenforceable and oppressive terms are becoming morecommon over time, suggesting that although internet-based reputational markets are in-creasingly available, they are not particularly effective at shifting power to tenants. Bycontrast, the Federal Housing Authority cleansed leases of unenforceable terms. We donot find meaningful backsliding from federal mandates in subsidized leases, though theenforcement regime is under-resourced. These findings—the prevalence of unenforceable

36 LEASES [DRAFT]
and oppressive terms, and the weakness of ex post court policing, reinforce the small ex-isting literature, but the comparative story is novel.
These data also illuminate the role of forms. We show a story of substitution overtime: from oral to written leases, and from proprietary leases to widely-shared lease tem-plates, particularly in apartment buildings, as opposed to other kinds of building types.Formality and standardization is generally associated with greater use of unenforceableand oppressive terms in leases. This is an important addition to the literature on consumercontracting, on three levels.
First, it illustrates that, although these are rather expensive consumer contracts, of greatimportance to their adherents, there is essentially no within-landlord variation in terms.Leases are not tailored to tenants. The sort of strategic drafting behavior that the literatureposits is a luxury available to those with the money to pay for counsel. Until recently, suchlandlords did not even have access to legal forms at all, let alone the capacity to calibrateforms to tenant- or building-specific risks. That is illustrated by Figure 18 which showsthat oral leases are concentrated in poorer regions. Moreover, because the landlord-tenantcourt rarely focuses on the details of the lease in ordering evictions, particularly those thatresult from defaults, landlords are free to under-invest in legal protections.
It is perverse to find that access to justice, at least for landlords, may harm tenants.Proprietary, shorter, and oral leases, though they accompany decidedly lower-resourcedleaseholds, contain fewer terms that take away tenants’ rights. This finding runs counter tothe relatively small extant studies on this topic. We show that as the costs of formalizationand standardization decreased (due to the internet), and tenants increasing faced legallyunfriendly leases. Thus, we illustrate one mechanism by which formality and access tolegal services may hurt the poor.
Our results suggest a path toward a more muscular regulatory strategy. A commonargument against pro-tenant interventions has been that they will have perverse effects,increasing the price for all tenants while merely benefiting those before the eviction court.But, ironically, because landlords appear to select between leases with little regard to ten-ant characteristics, and drafting costs seem to drive market outcomes, these data suggestthat pro-tenant regulatory interventions are unlikely to increase rents. More vigorous en-forcement of private law prohibitions on particular lease terms, or novel prohibitions onparticular clauses, would help tenants in court proceedings, and potentially reduce theincidence of evictions.
But though regulatory and ex post policing may do little harm, our results suggest amore direct proposal to improve leases. Advocates should focus their reform efforts on thepurveyors of shared leases. Many such providers are non-profit associations that may besusceptible in the near term to public pressure in ways that courts and state legislatures arenot. At the same time, a very small number of for-profit firms are providing legal forms
[DRAFT] LEASES 37
over the internet that contains terms which we think to be at least arguably unenforceable.Reformers might consider legal strategies to change these firms’ practices.
Second, the dominance of forms, and their insensitivity to tenant characteristics, un-settles the scholarly consensus that that landlords insert unenforceable provisions in leasesas a part of a deliberate strategy to take advantage of tenant sophistication. That argumentalways resulted from a complicated logic: while leases would not be read before signing,they would ex post when landlord-tenant relationship deteriorates. Only then would thelandlord use its superior sophistication to bully its tenant into accepting bad distributiveoutcomes due to clauses that were often unenforceable in court. The hypothesized resultwould be that unenforceable terms provide an unpriced, shrouded, option to landlords.
Like many accounts of shrouded contract terms, this is a hard hypothesis to prove ordisprove. However, our data is facially inconsistent with at least one part of the conven-tional story, i.e., that unenforceable terms should be more prevalent in the most vulnerabletenants. We generally find the opposite is true. That said, perhaps the story of exploitativeoptions is right but its particular implications are wrong. Some will argue that we observegreater adoption of oppressive provisions in more expensive leases because these are thevery tenants who have enough resources at stake to make bargaining outside of court nec-essary. Perhaps landlords only need leases as a tool to bully more powerful tenants: poorertenants can be evicted without further thought.
It is possible that this more nuanced account is correct. But we would offer somecautions. First, relatively richer tenants are also those with better access to the sorts ofresources which would illuminate the unenforceable natures of the underlying terms. Andthe story does not explain why national lease providers—and internet forms—are growingrapidly in this market. Overall, we think the degree of standardization within landlords,and the pattern of adoption of shared leases and their growing dominants, suggests reasonsto doubt that landlords are deliberately inserting unenforceable terms in leases to extractsurplus from their tenants. Rather, we think our descriptive account is more consistentwith thinking that transaction costs—the costs of acquiring a lease, and the value of stan-dardization across many different types of people and markets, regardless of the law’sdistinctive rules—are the primary driver of lease terms in this market.26
Third, our results have implications for the study of contracting writ large. Here,caution is in order, because these leases are those that arise from contracts with poorertenants, and thus many not reflect widespread contracting practices. However, legal schol-ars have struggled to find examples of exogenous shocks that will produce widespreadchanges to consumer contracts. (Marotta-Wurgler & Taylor, 2013) Here, we observe dra-matic changes in practice to an important and widely-shared set of contracts—the rise of
26We do not claim that unenforceable and oppressive lease terms have no functional purpose. Simply, wedo not see evidence that landlords choose leases with those hypothesized purposes in mind, or adjust pricesaccordingly.

38 LEASES [DRAFT]
holdover tenant clauses, for example—in the absence of any corresponding shifts either inthe legal regime or the rental market. Rather, non-profit associations’ forms appear to drivethe changes we observe in contract terms. This fits well with Davis (2007)’s theory of therole of such entities in contractual innovation, but is its first first empirical demonstration.
These findings do suggest that researchers could work towards a general account forthe relative rise and fall of particular types of shared leases. Does the relative success ofparticular lease templates illustrated in Figure 8 arise from competitive forces acting on thelease level, or is it merely downstream from struggles between different landlord groups.Is this a technological phenomenon, or one related to capital flows. To put it differently, weobserve what looks like a competition between forms, with some emerging as more “fit”than others. But this may be an illusion, and what is really happening is the nationalizationof the rental market, resulting in the de-localization of the forms they use.
B. The Role of Race and Lease Addenda
The story that we tell about race and lease forms is complex, and our descriptive find-ings using this selected data must be interpreted with care. It would at first glance appearthat black tenants differ from white tenants in whether they receive leases with exculpa-tory clauses or notice waivers — on average being less likely to receive them but morelikely in majority white census tracts. However, we find that these differences appear tobe predominantly driven by the types of buildings inhabited by black tenants relative towhite tenants along with the geographic distribution of different types of buildings withinthe city.
This absence of a clear race effect for these oppressive and unenforceable provisionsmay result from the minimal control that landlords exert over lease provisions once aparticular template has been chosen. However, many landlords choose to also includeaddenda to the main lease to cover additional situations and issues. To investigate therole of race in this contracting market, we examine the specific case of “crime-free” and“drug-free” provisions.
Many landlords include such provisions in their leases via addenda to the main leasethough sometimes the lease form itself will include such language. These provisions con-sider the presence of criminal activity—often specifically “drug-related criminal activity”—on the premises to be a violation of the lease and grounds for eviction. Recent work byArcher (2019) on the related phenomenon of municipal crime-free ordinances, which oftenmandate these addenda in local leases, has highlighted the likely racially discriminatoryimpact of such laws. While Philadelphia does not have a local crime-free leasing law, wenevertheless find significant adoption of provisions related to criminal activity and inves-tigate the extent to which these provisions systematically correlate with tenant race. Weconstructed a broad search for any mention of “illegal drugs” or “controlled substances”or any mention of “criminal” or “illegal” activity. Among our unsubsidized leases, about

[DRAFT] LEASES 39
35% contain such provisions, but in contrast to our other four unenforceable provisions,provisions related to drugs or crime appear in essentially all PHA leases and a large ma-jority of the subsidized leases in our sample.
Table 2: Regressions of lease provisions on predicted probability Black tenant
Outcome Regressor Model:
Year FE Tract + Year FE Landlord + Year FE Year FE + Controls
Exculpatory Clause Pr(Black) -0.0364∗∗∗ 0.00293 -0.000659 0.00358(0.0100) (0.00756) (0.00663) (0.00970)
Accept As-is Pr(Black) -0.0282∗∗ 0.0134 -0.00384 0.000447(0.0123) (0.00850) (0.00681) (0.0115)
Holdover Tenant Pr(Black) -0.0297∗∗∗ -0.00167 0.00198 -0.000244(0.0107) (0.00615) (0.00531) (0.00932)
Notice Waiver Pr(Black) -0.0321∗∗∗ 0.0108 -0.00386 0.00777(0.00961) (0.00713) (0.00565) (0.00849)
Drug or Crime Clause Pr(Black) 0.0485∗∗∗ 0.0286∗∗∗ 0.00210 0.0309∗∗∗
(0.0110) (0.00823) (0.00702) (0.0110)
Leases 60,098 60,098 60,098 60,098Buildings 20,059 20,059 20,059 20,059Landlords 9,922 9,922 9,922 9,922
∗p<0.1; ∗∗p<0.05; ∗∗∗p<0.01Notes: N = 60,098 tenants, 20,059 buildings. 9,922 landlords. Leases from 2000 to 2019. All OLSregressions adjust for lease year fixed effects. Second and third regressions adjust for census tract andlandlord fixed effects respectively. Final regression includes only year fixed effects but adjusts for buildingtype (apartment/non-apartment) and census tract % white. Cluster-robust standard errors clustered onbuilding in parentheses.
As Table 2 illustrates, in contrast to the other four provisions where controlling forcensus tract fixed effects eliminates the observed association with individual tenant race,black tenants are somewhat more likely to receive leases with drug and/or crime provisionseven when compared to other tenants within the same census tract. We find that control-ling for building type (column four) does not eliminate this relationship either as whileapartment buildings are more likely in general to contain these clauses, we still observe astatistically significant association between tenant race and drug/crime provisions even af-ter adjustment. Adjusting for landlord fixed-effects does appear to eliminate the observedassociation, suggesting that there is still minimal variation in lease provisions and addendaamong buildings owned by the same landlord where we observe multiple leases. However,building characteristics alone do not seem to explain away the observed within-tract rela-tionship between race and drug/crime provisions. Even after controlling for census tractfixed effects, building class and landlord size (as measured by total number of properties

40 LEASES [DRAFT]
owned) we still observe a positive and statistically significant relationship between theprobability a tenant is classified as Black and the presence of a drug/crime provision in thelease document.
To summarize, for our main four unenforceable lease provisions, most of what appearsas a difference between Black and white tenants can be explained by differences in localeswhere these lease provisions are common and by the types of properties that choose toadopt forms (notably, apartment complexes). But Black tenants are on average more likelyto receive leases that contain drug and crime-free provisions even when comparing tenantsacross different landlords located in similar census tracts and building types. Although theexplanation does not appear to be driven by differences in individual landlords choosingdifferent clauses across different properties, it does suggest that landlord groups specializenot only in building type (apartment, row house, etc...) but also, effectively, in tenants.27
Buildings with a larger share of black tenants appear are more likely adopt leases thatcontain drug/crime provisions even when compared to other buildings in similar areaswith a larger proportion of non-Black tenants, suggesting cross-landlord discrepancies inbehavior that are correlated with race.
Tenants choose where they live in a world of constraints. Spatial discrimination—i.e., black workers are effectively prohibited from moving freely around a city due tofactors like access to mass transit or a lack of capital—may affect employment. (Zenou &Boccard, 2000). This is a reminder that race is intertwined with other characteristics—likeincome, social capital, employment and geographic mobility–which leads tenants to rent atparticular properties. Landlords specialize both in places and in kinds of buildings/tenants,perhaps on racialized lines. Whatever the etiology, the result is that black tenants living inwhite neighborhoods face unequal hazards of oppressive terms than their white neighbors.This descriptive addition to the literature on race and contract suggests that lease formsmay operate systematically to entrench racial hierarchies.
C. Limitations and Next Steps
We have earlier discussed selection concerns. The most important take-away fromthat discussion is that these leases are representative (in the best case) the contracts ofrelatively poorer tenants in Philadelphia, but not (necessary) the leases of richer tenants.But even putting that limitation aside, Philadelphia is a distinct city. It is poor (for a largeAmerican city), geographically diffuse, and its rental market appears to be dominated bysmall landlords. Whether the relationship between templating and enforceability would
27A significant factor in housing discrimination is landlords’ ability to select their tenants. A recent auditstudy by Christensen, Sarmiento-Barbieri, and Timmins (2021) showed substantial differences in how oftenlandlords responded to requests from otherwise identical Black tenants versus white tenants, with the latterbeing more likely to obtain a response, particularly in cities in the U.S. Northeast.

[DRAFT] LEASES 41
recur in other cities is up in the air, and, consequently, the generalizability of our findingsto the tenancies across the country is unknown.
Important questions about this contracting ecosystem remain. We are interested inlearning about how landlords react to changes in applicable legal rules over time, as a re-cent literature suggests the importance of such learning in how consumer contracts change.(Marotta-Wurgler & Dari-Mattiacci, 2018). Recent changes to the rules in Philadelphia’sLandlord-Tenant court may permit us to observe how legal rules spur changes in leases.Second, were it possible to learn more about management firms, we could determine howsuch intermediaries drive lease selection, and whether learning occurs at the network levelor at the landlord level. Finally, we would be interested (and are exploring) in seeing howmatches in the characteristics of landlords and tenants (such as race and gender, to theextent landlords are individuals) affect lease terms and price.
Our more immediate concern, however, is to study how lease terms affect the hazardsof eviction itself. That is, are tenants forced to sign a lease depriving them of notice ofeviction more likely to lose their tenancy? Does agreeing to be evicted for criminal conductmean that eviction is more likely, controlling for the likelihood of criminal activity? Ournext paper using these data will turn to those questions.
CONCLUSION
This novel dataset consists of hundreds of thousands of Philadelphia leases drafted overthe last twenty years and submitted as exhibits to eviction filings. Shared lease templatesare widespread and growing more prevalent over time. As such common contracts increas-ingly substitute for oral leases and proprietary forms, particularly in apartment buildings,tenants face a more hostile legal terrain. We also uncover that tenants’ race matters to whatkind of leases they get, an effect we largely identify with segregated housing even at thehyper-local level. Eviction leases thus reveal, and reinforce, existing disparities in howformal legal rules affect citizens. With a clarified understanding of the etiology of thosedisparities in mind, better regulatory strategies, from changes in public laws to pressurecampaigns against landlord associations, may come into focus.

42 LEASES [DRAFT]
REFERENCES
Ackerman, B. (1971). Regulating slum housing markets on behalf of the poor: of housingcodes, housing subsidies and income redistribution policy. The Yale Law Journal,80(6), 1093–1197. Retrieved from http://www.jstor.org/stable/795276
Archer, D. N. (2019). The housing segregation: the jim crow effects of crime-free housingordinances. Mich. L. Rev. 118, 173.
Bentley, A. R. (1974). An alternative residential lease. Columbia Law Review, 74(5), 836–883. Retrieved from http://www.jstor.org/stable/1121521
Berger, C. J. (1974). Hard leases make bad law. Columbia Law Review, 74(5), 791–835.Retrieved from http://www.jstor.org/stable/1121520
Bucks, B. & Pence, K. (2008). Do borrowers know their mortgage terms? Journal of UrbanEconomics, 64(2), 218–233. Retrieved from https://EconPapers.repec.org/RePEc:eee:juecon:v:64:y:2008:i:2:p:218-233
Choi, S., Gulati, G., & Posner, E. (2012). The dynamics of contract evolution. Law &Society: Private Law eJournal.
Choi, S. J. & Gulati, M. (2004). Innovation in boilerplate contracts: an empirical exami-nation of sovereign bonds. Emory Law Journal, 53, 929.
Christensen, P., Sarmiento-Barbieri, I., & Timmins, C. (2021). Racial discrimination andhousing outcomes in the united states rental market. National Bureau of EconomicResearch.
Coates, J. C. (2001). Explaining variation in takeover defenses: blame the lawyers. Cali-fornia Law Review, 89(5), 1301–1421. Retrieved from http://www.jstor.org/stable/3481160
Cole, S. R., Platt, R. W., Schisterman, E. F., Chu, H., Westreich, D., Richardson, D., &Poole, C. (2010). Illustrating bias due to conditioning on a collider. Internationaljournal of epidemiology, 39(2), 417–420.
Collinson, R. & Reed, D. (2018). The effects of evictions on low-income households.Retrieved from https://economics.nd.edu/assets/303258/jmp rcollinson 1 .pdf
Davis, K. (2007, January). The role of nonprofits in the production of boilerplate. New YorkUniversity Law and Economics Working Papers, 104. doi:10.1017/CBO9780511611179.012
Desmond, M. & Gershenson, C. (2017). Who gets evicted? assessing individual, neigh-borhood, and network factors. Social Science Research, 62, 362–377.
Fiscella, K. & Fremont, A. M. (2006). Use of geocoding and surname analysis to estimaterace and ethnicity. Health services research, 41(4p1), 1482–1500.
Furth-Matzkin, M. (2017). On the unexpected use of unenforceable contract terms: evi-dence from the residential rental market. Journal of Legal Analysis, 9(1), 1–49.
Furth-Matzkin, M. (2018). The harmful effects of unenforceable contract terms: experi-mental evidence. Ala. L. Rev. 70, 1031.

[DRAFT] LEASES 43
Gulati, M. & Scott, R. E. (2012). The three minute transaction: boilerplate and the limitof contract design).
Haider, E. (2021). Who are philadelphia’s landlords? Pew Charitable Trust.Humphries, J. E., Mader, N. S., Tannenbaum, D. I., & van Dijk, W. L. (2019, August). Does
eviction cause poverty? quasi-experimental evidence from cook county, il (WorkingPaper No. 26139). National Bureau of Economic Research. doi:10.3386/w26139
Imai, K. & Khanna, K. (2016). Improving ecological inference by predicting individualethnicity from voter registration records. Political Analysis, 263–272.
Jennejohn, M. (2018). The architecture of contract innovation. Boston College Law Re-view, 59, 71.
Marotta-Wurgler, F. & Dari-Mattiacci, G. (2018). Learning in standard form contracts:theory and evidence. NYU Law and Economics Research Paper No. 18-11.
Marotta-Wurgler, F. & Taylor, R. (2013). Set in stone? change and innovation in consumerstandard form contracts. New York University Law Review, 88, 240.
Mueller, W. (1970). Residential tenants and their leases: an empirical study. Michigan LawReview, 69, 247.
Nyarko, J. (2020). Stickiness and incomplete contracts. Chicago Law Review, 87.Padi, M. (2018). Consumer protection laws and the mortgage market: evidence from ohio.Reinvestment Fund. (2021). Evictions in philadelphia: race (and place) matters. Reinvest-
ment Fund Policy Brief. Retrieved from https://www.reinvestment.com/wp-content/uploads/2021/02/ReinvestmentFund PHL-Evictions-Race-and-Place-Matters.pdf
Sood, G. & Laohaprapanon, S. (2018). Predicting race and ethnicity from the sequence ofcharacters in a name. arXiv preprint arXiv:1805.02109.
Suchman, M. (2003, April). The contract as social artifact. Law & Society Review, 37,91–142. doi:10.1111/1540-5893.3701003
Sullivan, C. (2009, April). The puzzling persistence of unenforceable contract terms. SSRNElectronic Journal. doi:10.2139/ssrn.1373841
Williams, P. J. (1987). Alchemical notes: reconstructing ideals from deconstructed rights).Harvard Civil Rights and Civil Liberties Law Review, 22, 401–432.
Zamir, E. (2014). Contract law and theory: three views of the cathedral. University ofChicago Law Review, 81.
Zenou, Y. & Boccard, N. (2000). Racial discrimination and redlining in cities. Journal ofUrban Economics, 48(2), 260–285.

44 LEASES [DRAFT]
A. APPENDIX A: PENNSYLVANIA LAW AND UNLAWFUL AND OPPRESSIVE LEASEPROVISIONS
Exculpatory ClausesExculpatory clauses (disclaiming liability for negligence) are the best known unen-
forceable term in the existing scholarship about leases.(Mueller, 1970) Exculpatory clausesin commercial leases are enforceable in Pennsylvania so long as they are very particular—that is, not merely exculpating in general terms.28 They are clearly void if they seek tovitiate the landlord’s liability for statutorily-required duties (like providing fire exits.)29 Inbetween those extremes, Pennsylvania Courts focus on bargaining power, and disapproveof exculpatory clauses where “each party [is not] a free bargaining agent, which, it is ev-ident, a prospective tenant for an apartment being unable to bargain away an exculpatoryclause, is not.”30 Following that rule, Pennsylvania courts have relatively routinely invali-dated exculpatory clauses in residential leases in the absence of strong evidence of equalbargaining power or particular specific forms of negligence.31
Figure 20 shows an extract from one of the lease documents in our sample that wefound used the 2017 PAR template. Sub-section B contains the exculpatory clause whichdisclaims the Landlord’s responsibility for any injuries occurring on the property.
Figure 20: Sample exculpatory clause - Pennsylvania Association of Realtors 2017 Stan-dard Residential Lease
As-Is ClausesPennsylvania courts enforce a non-waivable implied warranty of habitability.32 “As is”
provisions, which violate that prohibition, are per se unenforceable.
28Topp Copy Products, Inc. v. Singletary, 626 A.2d 98, 99 (Pa. 1993)29Boyd v. Smith, 94 A2d 44, 46 (Pa. 1953)30Galligan v. Arovitch, 219 A.2d 463, 465 (Pa. 1966)31Santiago v. Truitt, 23 Pa. D. C. 3rd 1982)32Fair v. Negley, 390 A.2d 240, 245 (Pa. Super. Ct. 1978) (”We can only conclude that an attempted
waiver of the implied warranty of habitability in residential leases is unconscionable and must be held to beineffective.”)
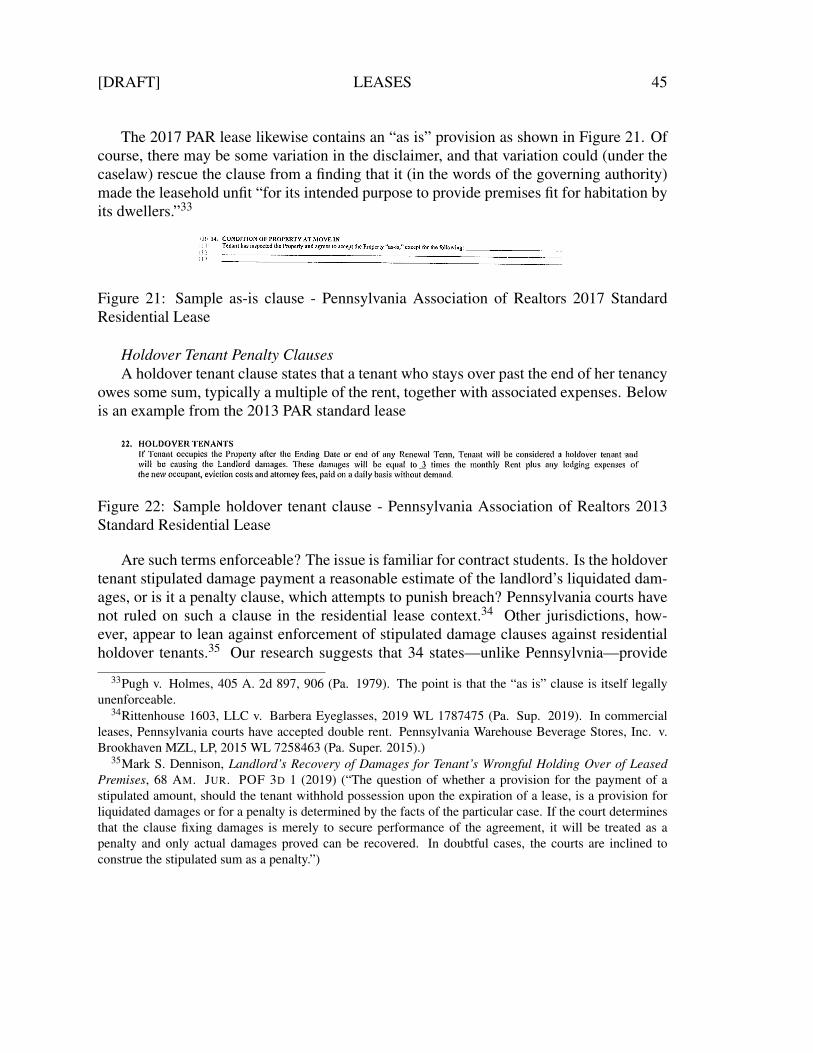
[DRAFT] LEASES 45
The 2017 PAR lease likewise contains an “as is” provision as shown in Figure 21. Ofcourse, there may be some variation in the disclaimer, and that variation could (under thecaselaw) rescue the clause from a finding that it (in the words of the governing authority)made the leasehold unfit “for its intended purpose to provide premises fit for habitation byits dwellers.”33
Figure 21: Sample as-is clause - Pennsylvania Association of Realtors 2017 StandardResidential Lease
Holdover Tenant Penalty ClausesA holdover tenant clause states that a tenant who stays over past the end of her tenancy
owes some sum, typically a multiple of the rent, together with associated expenses. Belowis an example from the 2013 PAR standard lease
Figure 22: Sample holdover tenant clause - Pennsylvania Association of Realtors 2013Standard Residential Lease
Are such terms enforceable? The issue is familiar for contract students. Is the holdovertenant stipulated damage payment a reasonable estimate of the landlord’s liquidated dam-ages, or is it a penalty clause, which attempts to punish breach? Pennsylvania courts havenot ruled on such a clause in the residential lease context.34 Other jurisdictions, how-ever, appear to lean against enforcement of stipulated damage clauses against residentialholdover tenants.35 Our research suggests that 34 states—unlike Pennsylvnia—provide
33Pugh v. Holmes, 405 A. 2d 897, 906 (Pa. 1979). The point is that the “as is” clause is itself legallyunenforceable.
34Rittenhouse 1603, LLC v. Barbera Eyeglasses, 2019 WL 1787475 (Pa. Sup. 2019). In commercialleases, Pennsylvania courts have accepted double rent. Pennsylvania Warehouse Beverage Stores, Inc. v.Brookhaven MZL, LP, 2015 WL 7258463 (Pa. Super. 2015).)
35Mark S. Dennison, Landlord’s Recovery of Damages for Tenant’s Wrongful Holding Over of LeasedPremises, 68 AM. JUR. POF 3D 1 (2019) (“The question of whether a provision for the payment of astipulated amount, should the tenant withhold possession upon the expiration of a lease, is a provision forliquidated damages or for a penalty is determined by the facts of the particular case. If the court determinesthat the clause fixing damages is merely to secure performance of the agreement, it will be treated as apenalty and only actual damages proved can be recovered. In doubtful cases, the courts are inclined toconstrue the stipulated sum as a penalty.”)
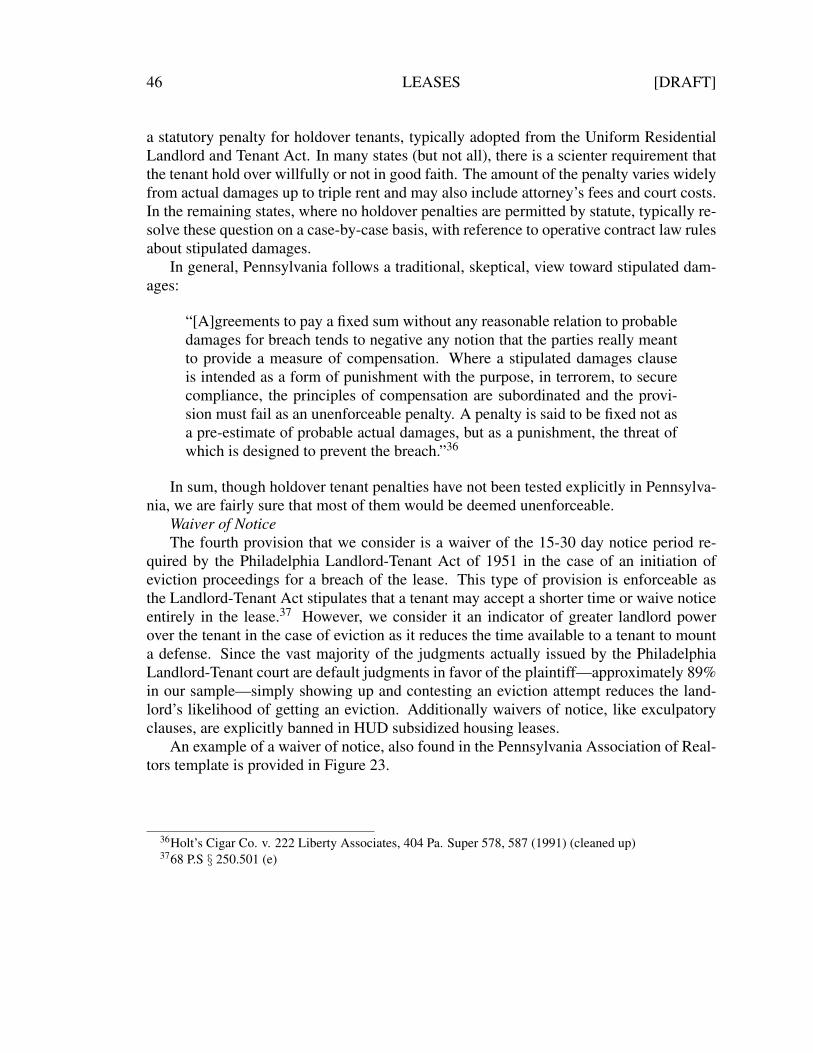
46 LEASES [DRAFT]
a statutory penalty for holdover tenants, typically adopted from the Uniform ResidentialLandlord and Tenant Act. In many states (but not all), there is a scienter requirement thatthe tenant hold over willfully or not in good faith. The amount of the penalty varies widelyfrom actual damages up to triple rent and may also include attorney’s fees and court costs.In the remaining states, where no holdover penalties are permitted by statute, typically re-solve these question on a case-by-case basis, with reference to operative contract law rulesabout stipulated damages.
In general, Pennsylvania follows a traditional, skeptical, view toward stipulated dam-ages:
“[A]greements to pay a fixed sum without any reasonable relation to probabledamages for breach tends to negative any notion that the parties really meantto provide a measure of compensation. Where a stipulated damages clauseis intended as a form of punishment with the purpose, in terrorem, to securecompliance, the principles of compensation are subordinated and the provi-sion must fail as an unenforceable penalty. A penalty is said to be fixed not asa pre-estimate of probable actual damages, but as a punishment, the threat ofwhich is designed to prevent the breach.”36
In sum, though holdover tenant penalties have not been tested explicitly in Pennsylva-nia, we are fairly sure that most of them would be deemed unenforceable.
Waiver of NoticeThe fourth provision that we consider is a waiver of the 15-30 day notice period re-
quired by the Philadelphia Landlord-Tenant Act of 1951 in the case of an initiation ofeviction proceedings for a breach of the lease. This type of provision is enforceable asthe Landlord-Tenant Act stipulates that a tenant may accept a shorter time or waive noticeentirely in the lease.37 However, we consider it an indicator of greater landlord powerover the tenant in the case of eviction as it reduces the time available to a tenant to mounta defense. Since the vast majority of the judgments actually issued by the PhiladelphiaLandlord-Tenant court are default judgments in favor of the plaintiff—approximately 89%in our sample—simply showing up and contesting an eviction attempt reduces the land-lord’s likelihood of getting an eviction. Additionally waivers of notice, like exculpatoryclauses, are explicitly banned in HUD subsidized housing leases.
An example of a waiver of notice, also found in the Pennsylvania Association of Real-tors template is provided in Figure 23.
36Holt’s Cigar Co. v. 222 Liberty Associates, 404 Pa. Super 578, 587 (1991) (cleaned up)3768 P.S § 250.501 (e)

[DRAFT] LEASES 47
Figure 23: Sample waiver of notice - Pennsylvania Association of Realtors 2017 StandardResidential Lease

48 LEASES [DRAFT]
B. APPENDIX B: VALIDATION RESULTS FOR THE LEASE PROVISION CODINGPROCEDURE
Because our method for coding leases is based on a series of (fuzzy) regular expressionsearches and the quality of the lease scans is often poor, we expect some error in whetherwe accurately classify a lease as having a particular provision. If this error is truly random,it should not bias our estimates of the relationship between various covariates and thepresence of a given provision. However, we want to ensure that there are no systematicbiases in our classification process – that our terms are both sufficiently exhaustive suchthat they do not systematically fail to capture a provision that might be worded slightlydifferently or overly-generic such that they incorrectly detect the presence of a provisionthat is absent. To validate our automated coding method, we hand-coded a randomlysampled subset of our leases and compared the hand-coded results to our keyword-basedclassifications. Overall, the validation exercise suggests that our keyword searches havevery high accuracy with minimal false positives and false negatives.
Our approach proceeded in an iterative fashion. Using an initial version of our searchstrings, for each of the four provisions, we randomly sampled 100 leases that were machine-coded as containing the provision and 100 leases that were machine-coded as not contain-ing the provision. The leases were read in their original PDF form by the research teamand coded for whether the leases actually did or did not contain the relevant provision. Forsome of the false-negatives, we found common phrases that were absent from the originalsearch strings and modified the regular expression to incorporate these. After addressingthe obvious false negatives, we re-ran our automatic coder and evaluated the remainingnumber of false positives/negatives. Table 3 presents the accuracy, false positive rate andfalse negative rate of our classification method for each of the four provisions. Overall, ac-curacy for the classifier is quite high for the notice waiver and holdover tenant provisionsand lower for the as-is and exculpatory clauses. We suspect that the lower accuracy for thelatter two provisions is due to the wide variety of ways in which such a provision couldbe worded. Conversely, notice waiver and holdover tenant provisions tend to use verysimilar wordings. However, we find that for all of the provisions there is not a particularlysystematic imbalance between false negatives and false positives suggesting that misclas-sification is primarily noise and not a systematic bias. We note that there is something of askew towards false negatives for the holdover tenant clause classifier, which would likelycause us to be underestimating the true magnitude of the trend that we observe.

[DRAFT] LEASES 49
Provision Accuracy False Positive Rate False Negative RateNotice Waiver 93.5% 4.7% 7.4%As Is Clause 88.0% 14.9% 10.3%Exculpatory Clause 74.0% 26.9% 25%Holdover Tenant Clause 92% 1.3% 12%
Table 3: Performance of lease keyword classification method on hand-coded