lead in new decorative paints: a global study - pesticide
TRANSCRIPT
Toxics Link, H2 Jungpura Extension, New Delhi-110014. Tel: 91-11-24328006, 24320711Fax: 91-11-24321747. website: www.toxicslink.org email: [email protected]
Lead in New Decorative Paints:A Global Study
By Dr Abhay Kumar
New Delhi. Chennai
and
August 2009
2
ContentsForeword ...............................................................................................................................................3About Toxics Link and IPEN ..............................................................................................................5Acknowledgement ................................................................................................................................6Executive Summary..............................................................................................................................7Introduction and Literature Survey....................................................................................................11
Use of Lead in Paints......................................................................................................................11Human Exposure Pathways ...........................................................................................................12Health Impacts of Lead ..................................................................................................................13Regulations for Lead in Paints.......................................................................................................14
Study Objectives and Methodology ..................................................................................................16Objectives........................................................................................................................................16Sampling .........................................................................................................................................16Materials and Methods...................................................................................................................17
Results and Discussion.......................................................................................................................19Sri Lanka.....................................................................................................................................19Philippines ..................................................................................................................................22Thailand ......................................................................................................................................28Tanzania......................................................................................................................................34South Africa................................................................................................................................37Nigeria.........................................................................................................................................44Senegal ........................................................................................................................................47Belarus ........................................................................................................................................51Mexico ........................................................................................................................................57Brazil ...........................................................................................................................................63India.............................................................................................................................................68All Samples.................................................................................................................................73
Recommendations...............................................................................................................................76References...........................................................................................................................................83Appendix I...........................................................................................................................................87Appendix II .........................................................................................................................................88
3
Foreword
FOREWORD
Lead still finds its way into paints, which are used in our daily lives. The paints are on walls, in toys, on furniture, in fact probably everywhere where one can see man-made colour. Lead has been recognised as prime toxic by WHO. It impacts over 40 million children worldwide, over 97 percent of whom live in developing countries. It is in these countries that lead in paints still exists, mostly purposely added by paint manufacturers evidently to improve sheen, longevity or durability of the colour.
The incredible part of the story is that there are commercially available substitutes, and have existed for the past century. As early as 1935, countries in Europe had banned the use of lead in household paints, while the United States did so in 1971. For over half a century the paint industry has known about the grave health impacts that lead in paints has on children who lick baby cots, suckle toys, or simply ingest lead laden household dust. Lead can irreversibly lower IQ, and also cause a series of coordination skill deficiencies. In fact the map of the countries where lead is still added to paints is like the political map of the world. This puts to shame all arguments about CSR and is nothing short of a criminal act.
The industry pleads ignorance. Or simply it uses the cost argument to justify its act. In this case these are nothing more than a red herring. In India, as per Toxics Link studies, only one major manufacturer of paints did not add lead to its paints, while all the other major brands did. In fact this leading brand has a competitive and significant market share. When asked by outraged parents, they simply justified this by claiming that it makes the paint ‘better.’
In 2007, when the outcry about lead in children’s toys was raised in the U.S. and Europe, it was quickly tracked to paints. In India too, the toy industry found itself ducking as another Toxics Link report found toys in India laced with lead and cadmium. However even two years later, Indian paints still have lead in them despite claims being made of its removal by major manufacturers.
It was to determine the global pattern of lead in paints that this study of paints in 10 countries was initiated. Working with the International POPs Elimination Network (IPEN), 10 developing countries were identified, which also had very active partner NGOs. IPEN is a global network of more than 700 public interest non-governmental organisations in over 100 countries working together for a toxics-free future, including the elimination of persistent organic pollutants, on an expedited yet socially equitable basis. This mission also includes achieving a world in which all chemicals are produced and used in ways that eliminate significant adverse effects on human health and the environment, and where persistent organic pollutants (POPs) and chemicals of equivalent concern no longer pollute our local and global environments, and no longer
4
contaminate our communities, our food, our bodies, or the bodies of our children and future generations.
To investigate the problem globally, Toxics Link and IPEN partnered together in 2008 to test paints for lead in local markets in countries across Africa, Asia, Latin America and Eastern Europe. The results confirmed that lead in paints is still being produced and sold, exposing children and communities to this toxic substance.
In parallel, the international community has taken action to build on this NGO initiative. Toxics Link as a member of IPEN proposed a Global Partnership to eliminate lead from paint to Forum VI of the Intergovernmental Forum on Chemical Safety (IFCS) in September 2008. IFCS, through a resolution passed at Forum VI, and the SAICM Emerging Issues Policy process, has endorsed this NGO initiative. Moreover, this issue is one of the four SAICM Emerging Issues set for discussion and cooperative action at ICCM2.
Lead samples were obtained and analysed in Delhi through Toxics Link. The results only prove what was already believed to be so. Very high lead level was found in all countries some with 100 percent of the samples exceeding standards. The study was first released at the ICCM2 in Geneva in May 2009, and helped in informing the delegates to adopt a resolution to form a Global Partnership under the auspices of UNEP and WHO to eliminate lead from paints by 2020. It is an ambitious but achievable goal.
Meanwhile all the NGO partners in the study have committed to raising the issue in their own countries and encourage Government and Industry to take immediate corrective action to remove lead at source. We hope for a lead exposure free world!
Ravi AgarwalDirector
5
About Toxics Link and IPEN
Toxics Link is an information outreach and environmental advocacy organisation set up in 1996. It has a special emphasis on reaching out to grassroots groups and community based organisations. Its engagements include research, outreach and policy advocacy on issues of communities and urban waste, toxics free healthcare, hazardous waste and pesticides.
Toxics Link works closely with all stakeholders working on similar issues and has been conducive to the formation of several common platforms for them. It is a part of international networks working on similar issues.
The mission of the organisation is:
“Working together for environmental justice and freedom from toxics. We have taken upon ourselves to collect and share both information about the sources and dangers of poisons in our environment and bodies, and information about clean and sustainable alternatives for India and rest of the world”
Delhi Address:Toxics LinkH-2, Jangpura ExtNew Delhi – 110014, IndiaPhone + 91 11 – 24328006/ 23420711 fax: [email protected]
IPEN: The International POPs Elimination Network (IPEN) is a global network of more than 700 public interest non-governmental organisations in over 100 countries working together for a toxics-free future, including the elimination of persistent organic pollutants, on an expedited yet socially equitable basis
6
Acknowledgement
Toxics Link acknowledges the following partner organisations for their important role in the timely execution of the project: Centre for Environmental Justice, Sri Lanka; Ecological Waste Coalition of the Philippines, Inc. (EcoWaste Coalition), Philippines; Campaign for Alternative Industry Network (CAIN), Thailand; AGENDA for Environment and Responsible Development, Tanzania; GroundWork- Friends of the Earth, South Africa; Friends of the Environment (FOTE)/Strategic Research and Action for Environmental Development (SRADev), Nigeria; Pesticide Action Network (PAN), South Africa and Senegal; Centre for Environmental Solutions, Belarus; Red de Acci�n en Plaguicidas y sus Alternativas en M�xico (RAPAM)/Centro de Analisis y Acci�n en T�xicos y sus Alternativas (CAATA), Mexico; and APROMAC – Environment Protection Association, Brazil.
This global study required a near-flawless coordination to procure paint samples from 10 countries situated in different continents and time zones. This was made possible by Bjorn Beeler and Jennifer Federico of the IPEN Secretariat through excellent coordination. Coordinators of the IPEN regional hubs were also very helpful. Toxics Link received vital help from Manny Calonzo, one of the regional coordinators of the IPEN South-East Asia hub, from inception to conclusion of this study. Her keen interest in this study was very supportive of our efforts.
Toxics Link also acknowledges with gratitude valuable comments it received on the draft report from Judy Stober, Executive Secretary, IFCS; Jack Weinberg and Joe Digangi, IPEN; Prof C. Scott Clark of University of Cincinnati, USA, and Perry Gottesfeld, Director, OK International, San Francisco, USA. Their knowledge sharing is immensely appreciated.
SSNC, IPEN and Centre for the Study of Public Policy, Lowell Center for Sustainable Production, University of Massachusetts Lowell, USA provided crucial financial support to this study. Without their help this study may not have been possible.
Toxics Link expresses its gratitude to Dr Prashant Rajankar for substantiating this report and Ragini Kumar Taneja for its compilation and organisation.
7
Executive Summary
Paints in general are differentiated into decorative or architectural paints and industrial paints. Lead is used in paints mainly as a colouring agent. Lead is also used to make paints more durable and corrosion resistant.
Lead based paint in older houses has long been associated with elevated blood lead in children residing there. Repeated studies have concluded that lead paint is a significant source of lead poisoning.
Several recent studies have indicated the presence of lead in high concentrations in new decorative enamel paints available for purchase by the public in five countries (Van Alphen, 19991; Clark et al, 20062; Adebamowo et al, 20073; Kumar and Gottesfeld, 20084). There is an urgent need to determine the lead content of paints in other countries to document the need worldwide for a ban on its continued use. Considering the dangerous effects of lead on human health, several countries enacted laws to regulate the lead concentrations in paints. The United States recently revised the maximum allowable concentration of lead in new paints from 600 ppm to 90ppm.
It is also important to determine the extent of lead in paints and its contamination of household dust in order to develop sound programmes to reduce exposure to lead. A pilot study in a cross section of houses in Delhi documented very high levels of lead in household dust.
There is a need for additional such studies elsewhere to determine the sources of lead in the dust, so that remedial programmes will address the major contributing sources of lead that are endangering the children and pregnant women who spend their longest time in these houses.
Children are known to eat paint chips, more commonly lead paints in and around homes contribute to dust and soil contamination that is often the most significant source of exposure for children. Children then ingest lead from playing close to the ground and having frequent hand-to-mouth contact. Significant exposure may also occur from lead
1Van Alphen, M. (1999). Lead in paints in water in India. In: George, A. M. (Ed.), Proceedings of the International Conference on Lead Poisoning Prevention & treatment: Implementing a national program in Developing countries, February 8-10, 1999. The George Foundation, Bangalore, India, pp. 265-272
2 Clark CS, Rampal KG, Thuppil V, Chen CK, Clark R, Roda S. The lead content of currently available new residential paint in several Asian countries. Environmental Research 2006; 102: 9-12.
3 Adebamowo EO, Clark CS, Roda S, Agbede OA, Sridhar MKC, Adebamowo CA. Lead content of dried films of domestic paints currently sold in Nigeria. Science of the Total Environment 2007; 388 (1-3): 116-120.
4 Kumar, A and Gottesfeld, P. (2008). Lead content in household paints in India. Science of the Total Environment, 407(1), 333-337
8
paint when smaller particles become airborne during sanding and scrapping while repainting and remodelling. In addition, damaged paint and the weathering of paints on the exterior of buildings also contribute to lead in soil.
In the United States, health authorities recommend a public health intervention when a child is found to have a blood lead level of 10 �g/dl or more. Recent body of literature points out that there may be no safety margin at existing exposures and that children exposed to even < 10 �g/dl have shown intellectual impairment. Young children (below six years old) are recognized as the most susceptible to lead exposure even at low levels. Pregnant women are the second most vulnerable group. Lead also crosses the placenta and reaches the developing foetus.
The sixth session of the Intergovernmental Forum on Chemical Safety (IFCS), held from 15–19 September 2008 in Dakar, Senegal, adopted a unanimous resolution to eliminate lead from paints worldwide.
Toxics Link and International POPs Elimination Network (IPEN) decided to work with other partner organisations in various regions of the world to determine the total lead (Pb) concentration in new decorative paints available in various developing countries in order to know the amount of lead being used in developing countries.
After initial background research, the following 10 countries were selected for sampling:
i. Sri Lanka from South Asiaii. Philippines from South Asiaiii. Thailand from South East Asiaiv. Tanzania from Africav. South Africa from Africavi. Nigeria from Africavii. Senegal from Africaviii. Belarus from East Europeix. Mexico from Latin Americax. Brazil from Latin America
Samples were received during the months of November 2008 to February 2009. A total of 317 paint samples, including 26 samples from India, were further processed for lab analysis. Samples were analysed according to Standard Operating Procedures for Lead in Paint by Hotplate or Microwave-based Acid Digestions and Inductively Coupled Plasma Emission Spectroscopy, EPA, PB92-114172, Sept. 1991; SW846-740 (U.S. EPA, 2001)
9
Results
The major findings of the study are:
1. Overall 317 paint samples, including 232 enamel samples, 78 plastic samples, and seven varnish samples were analysed for lead concentrations.
2. Taking all samples together, 53 percent of samples were found to contain more than 90 ppm of lead, while 50 percent samples had lead concentrations of more than 600 ppm.
3. Some 68.5 percent of enamel samples had lead concentrations more than 90 ppm, while 65 percent of enamel samples had lead concentrations of more than 600 ppm.
4. Only 10 percent of plastic paint samples had concentrations more than 90 ppm.5. The overall average of lead concentrations was 18,220.3 ppm, while for enamel
samples the average was 23,707.1 ppm. For plastic samples, the average was 1,508.5 ppm.
6. Taking all samples together, 50 percent of samples had lead concentrations of more than 1,541.2 ppm. In the case of enamel samples, the median lead concentration was 3,914.2 ppm. In the case of plastic paint samples, the median lead concentration was nine ppm, which implied that 50 percent of plastic samples had lead concentrations of more than nine ppm.
7. Lead concentrations ranged from 0.6 ppm to 505,716 ppm (51 percent).8. Multinational paint brands used in more than one country showed variation in
lead concentrations for samples sourced from different countries.9. (a) Of 54 paint companies with products containing lead greater than 90 ppm, six
were subsidiaries of U.S. corporations, and an additional eight were subsidiaries of European or Japanese companies.
(b) At least three of the paint companies with products containing lead above 90 ppm have ISO 14001 Certification in the country where the paints were purchased, and an additional seven companies claim to adhere to ISO 14001.
(c) Ten of the paint companies are subsidiaries or market licensed brands of larger companies that are ISO 14001 certified.
Conclusions
Major conclusions drawn from the study of paint samples from 10 countries around the globe are:
1. With a few exceptions, all plastic paint samples had low lead concentrations, often below 90 ppm.
2. Majority of enamel paint samples had lead concentrations higher than 90 ppm or 600 ppm.
3. Presence of small amount of lead in a majority of plastic samples may be due to the impurities in the raw materials, as a significant percentage of samples had lead less than 20 ppm. Out of 317 samples of plastic paints, 101 samples (32 percent) had less than 20 ppm of lead.
10
4. It is also observed that there is a little difference in the percentage of samples having lead concentrations greater than 90 ppm and percentage samples having lead concentrations more than 600 ppm.
5. It is obvious that alternatives to lead in paints exist, as a number of brands from various countries show consistently low lead concentrations even in their enamel products. Cleaner substitutes for lead based pigments, such as titanium dioxide, have been in use for some time now.
6. There is a general lack of awareness on the whole issue of lead in a majority of countries, which participated in the present study.
7. In the absence of any mandatory standard for lead in paints, industries, big and small, are indulging with lead without caring for its environmental and health impacts.
11
Introduction and Literature Survey
Paints in general are differentiated into decorative or architectural paints and industrial paints. While decorative paints serve the housing sector, industrial paints include powder coatings, high performance coating, and automotive and marine paints. Decorative paints are primarily used on the interior or exterior of homes and buildings and include other coatings such as emulsions, enamels, varnishes, wood finishes, and distempers. Based on the solvents used, decorative paints are further classified into water-based and oil-based paints. Plastic or latex or emulsion paints are water-based while enamel paints are oil-based.
Per capita annual consumption of paints varies in different regions of the world. While the global average is 15 kg per capita per annum, in developed countries the average is 22 kg. South-East Asian countries consume 4 kg of paint per capita per annum. India’s per capita per annum consumption is 0.5 kg. The average consumption includes both decorative and industrial paints. The market share of decorative and industrial paints also varies among countries. It is observed that in developed countries the market share of these two segments typically are in the proportion of 50:50, while in developing countries decorative paints dominate the market share, with India typically having decorative and industrial paints in a 70:30 proportion. Within the industrial paint segment, it is the automotive sector that is the largest consumer of paint products.
Use of Lead in Paints
Lead is used in paints mainly as a colouring agent, but also for durability and corrosion resistance. Lead also helps in drying paints faster. It provides longevity to coatings on walls, woods and metals. A number of lead compounds can be used as paint pigments such as lead oxide, lead carbonate (also known as white lead), and lead chromates/molybdates (ILZSG, 2004). Lead carbonate was historically used for wall paint in households and still is a significant source of lead exposure. Lead chromates, molybdates, and sulphates are also widely used. They are inorganic pigments for bright and opaque yellow, red, and orange colours in paints. There are, however, readily available substitutes for all these lead compounds.
Lead (Pb) is categorized as a heavy metal belonging to group IV A (14) of the periodic table having atomic number 82 and relative atomic mass 207.2. Pure lead is a silvery-white metal that oxidizes and turns blue-grey when exposed to air (U.S. EPA, 1998). It is soft (enough to be scratched by fingernail), dense (11.3 g/cm3), malleable and readily fusible. Alloying it with small amounts of arsenic, copper, antimony, or other metals hardens lead. Lead-containing products are manufactured using these alloys. The use of lead, and the process of extracting lead from ore, date back to ancient times; the earliest known example of metallic lead is a metal figure recovered from the Temple of Abydus in Upper Egypt, considered to date from 4000 BC (Thornton et al., 2001). Metallic lead occurs rarely in nature. Lead is usually obtained from sulphide ores, often in combination with other elements such as zinc, copper, and silver. Its abundance in Earth’s crust is about 0.0013 percent. Lead exists in three oxidation states Pb(0)-elemental form, Pb(II), and Pb(IV) and has three chemical forms, namely metallic lead, inorganic lead compounds, and organic lead compounds.
12
Lead-based paint in older houses has long been associated with elevated blood lead in children residing in such houses (Clark, et al., 1985). The causal relationships were considered to be mainly due to ingestion of lead-based paint chips (Lin-Fu, 1967). In one of the first studies on lead in paints and soil, Clark, et al., (2005) concluded that lead paint should be considered a significant potential source of lead poisoning in India. They also determined that lead was in 29 paint samples collected from Gujarat and Karnataka in India and reported that 11 of the samples were equal to or exceeded 1.0 mg/cm3 after the application of one to three coats.
In one of the studies to investigate the sources of lead in the environment of children with elevated blood lead concentrations, with the help of a field portable X-ray fluorescence (XRF) analyser, Kuruvilla A., et al., (2004) attributed high blood lead levels in one student to the brightly coloured swings painted with lead-based paint in an area where he routinely played. In another case, high blood lead level was associated with a railing coated with lead-based yellow paint where the child played. The third child with high blood lead level had the habit of licking the painted surface (pica), leading to ingestion of lead. Another interesting study done by Clark, et al., (2006), found 66 percent of new paint samples purchased from China, India, and Malaysia contained 5,000 ppm of lead or more, while 78 percent contained 600 ppm or more. They also pointed out that lead content in paints depended upon the regulations. The same brand could have different contents of lead in different countries depending upon whether or not any regulation existed (Clark, et al., 2006). They also reported that 100 percent (n=17) of paint samples from India had more than 600 ppm of lead concentration, while 83 percent samples had more than 5,000 ppm of lead contents. Kumar and Gottesfeld (2008) have reported that 84 percent of enamel paint samples from India that they analysed had lead more than 600 ppm, with concentrations ranging up to 140,000 ppm (0.0025 to 14 percent). All plastic (water-based) paints that they analysed had lead in low concentrations below 25 pm.
Human Exposure Pathways
Although children are known to eat paint chips, more commonly lead paint on the interior and exterior of homes contributes to dust and soil contamination that is often the most significant source of exposure for children. Children can ingest lead from playing close to the ground and having frequent hand-to-mouth contact. Significant exposure can also occur from lead paint when smaller particles become airborne during sanding and scrapping while repainting and remodelling. In addition, damaged paint and the weathering of paint on the exterior of buildings also contribute to lead in soil. Contaminated soil is a particularly significant source of exposure to children. Ingestion of contaminated soil, dust, and lead-based paint chips and licking of toys in hand-to-mouth activity are important sources of lead exposure in infants and young children. In infants and young children as much as 50 percent of dietary lead is absorbed, although absorption rates for lead from soils, dusts, and paint chips can be lower depending upon the bioavailability (IPCS, 1995).
13
Health Impacts of Lead
That lead is a toxic element has been well established (WHO, 1995; U.S. Department ofHealth and Human Services, 1988; Goldstein, 1992). It is the toxicity of lead that led the U.S. Centers for Disease Control and Prevention (CDC) to consider lead concentrations in blood higher or equal to 10 µg/dl as being elevated. In fact, a recent body of literature points out that there may be no safety margin at existing exposures and that children exposed to even < 10 µg/dl have shown intellectual impairment (Koller, et al., 2004; Needleman, 1995; Needleman and Bellinger, 2001; Needleman, et al., 2002). Some recent investigations have revealed that even low-level and long-term lead exposure can lead to health related problems such as renal dysfunction or delayed puberty in girls (Selvan, et al., 2003; Wu, et al., 2003; Marsden, 2003).
A WHO/UNECE, 2006 document describes the health effects of lead. According to this document:
“Lead is a well known neurotoxic metal. Impairment of neurodevelopment in children is the most critical lead effect. Exposure in uterus, during breast-feeding, and in early childhood may all be responsible for the effects. Lead accumulates in skeleton and its mobilization from bones during pregnancy and lactation causes exposures to foetus and breast fed infant. Hence, life time exposure of woman before pregnancy is important. Epidemiological studies show consistently that effects in children are associated with lead levels in blood (Pb-B) of about 100-150 g/l. There are indications that lead is harmful even at blood lead concentrations considerably below 100 g/l and there may be no threshold for these effects.” (WHO/UNECE, 2006)
Young children (below six years old) are recognized as the most susceptible to lead exposure even at low levels. Pregnant women are the second most vulnerable group. Lead also crosses the placenta and reaches the developing foetus. Absorbed lead is rapidly taken up by blood and soft tissue, followed by a slower redistribution to bone. Bone accumulates lead during much of the human life span and may serve as an endogenous source of lead that may be released slowly over many years after the exposure stops (IPCS, 1995). New research findings suggest that lead neurotoxicity among humans is enhanced during perinatal stage, from conception to two years old (Schnaas et al., 2006).
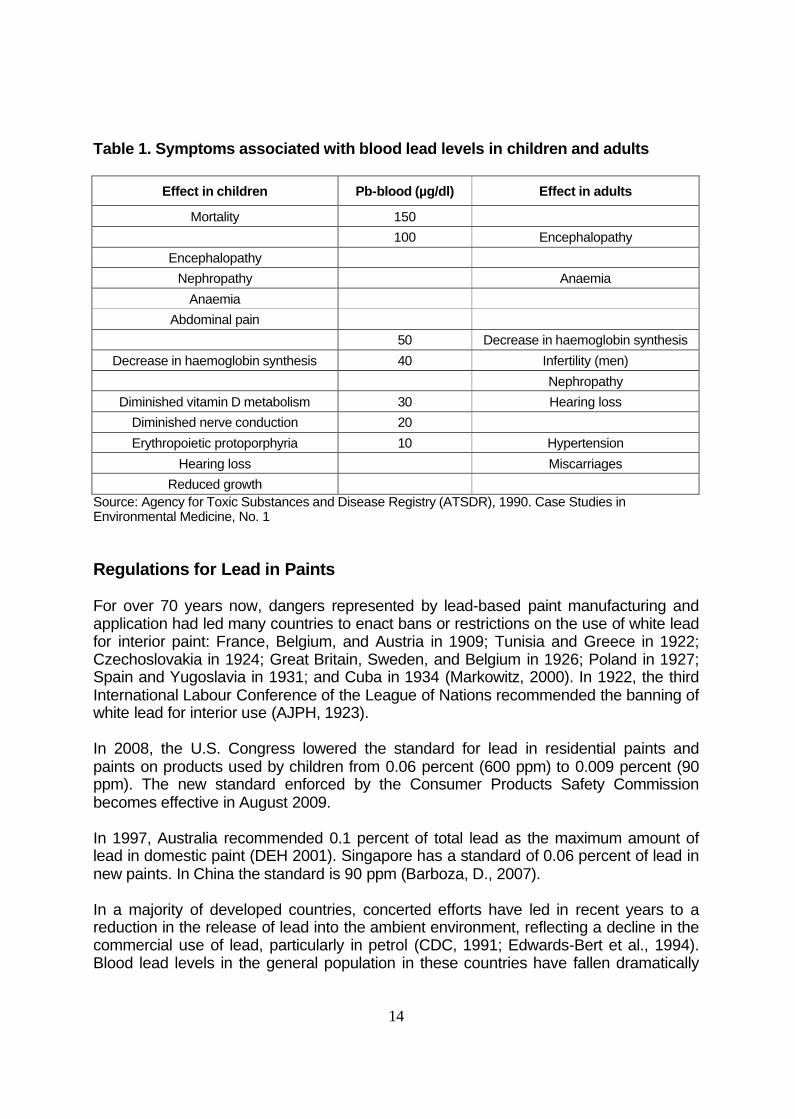
Table 1 describes symptoms associated with different possible blood lead levels in children and adults.
14
Table 1. Symptoms associated with blood lead levels in children and adults
Effect in children Pb-blood (µg/dl) Effect in adults
Mortality 150100 Encephalopathy
EncephalopathyNephropathy Anaemia
AnaemiaAbdominal pain
50 Decrease in haemoglobin synthesisDecrease in haemoglobin synthesis 40 Infertility (men)
NephropathyDiminished vitamin D metabolism 30 Hearing loss
Diminished nerve conduction 20Erythropoietic protoporphyria 10 Hypertension
Hearing loss MiscarriagesReduced growth
Source: Agency for Toxic Substances and Disease Registry (ATSDR), 1990. Case Studies in Environmental Medicine, No. 1
Regulations for Lead in Paints
For over 70 years now, dangers represented by lead-based paint manufacturing and application had led many countries to enact bans or restrictions on the use of white lead for interior paint: France, Belgium, and Austria in 1909; Tunisia and Greece in 1922; Czechoslovakia in 1924; Great Britain, Sweden, and Belgium in 1926; Poland in 1927; Spain and Yugoslavia in 1931; and Cuba in 1934 (Markowitz, 2000). In 1922, the third International Labour Conference of the League of Nations recommended the banning of white lead for interior use (AJPH, 1923).
In 2008, the U.S. Congress lowered the standard for lead in residential paints and paints on products used by children from 0.06 percent (600 ppm) to 0.009 percent (90 ppm). The new standard enforced by the Consumer Products Safety Commission becomes effective in August 2009.
In 1997, Australia recommended 0.1 percent of total lead as the maximum amount of lead in domestic paint (DEH 2001). Singapore has a standard of 0.06 percent of lead in new paints. In China the standard is 90 ppm (Barboza, D., 2007).
In a majority of developed countries, concerted efforts have led in recent years to a reduction in the release of lead into the ambient environment, reflecting a decline in the commercial use of lead, particularly in petrol (CDC, 1991; Edwards-Bert et al., 1994). Blood lead levels in the general population in these countries have fallen dramatically
15
over the past 20 years, thanks to the phasing out of lead from petrol and the reduction of environmental exposure to the metal (Edwards-Bert et al., 1994; Annest, 1983; Pirkle, et al., 1994). In the U.S. between 1976 and 1991, the mean blood lead level of persons aged one to 74 years dropped by 78 percent from 12.8 �g/dl to 2.8 �g/dl (Pirkle, et al., 1994). Mean blood lead levels of children aged one to five years declined by 72 to 77 percent for various social groups of children (Pirkle, et al., 1994).
Lead continues to be a significant public health problem in developing countries where there are considerable variations in the sources and pathways of exposure (Tong and McMichael, 1999; Falk H, 2003). In a study done on 281 children in Lebanon, it was found that the mean Pb-B was 66.0 �g/l with 14 percent children having Pb-B more than 100 �g/l (Nuwayhid, et al., 2003). Logistic regression analysis showed that elevated Pb-B was associated with paternal manual jobs (odds ratio [OR] of 4.74), residence being located in high traffic areas (OR: 4.59), summer season (OR of 4.39), using hot tap water for cooking (OR of 3.96), and living in older buildings (OR of 2.01).
In a study investigating the prevalence of elevated blood lead (Pb-B) levels in children one to six years old in Kaduna, Nigeria, mean Pb-B was found to be 10.6 �g/dl and two percent of children had Pb-B levels higher than 30 �g/dl (Nriagu, 1997). The strongest associations were found between Pb-B and whether family owned a car or lived in a house on tarred road. In a similar study done in Karachi, it was found that about 80 percent (n=430) of children (aged 36 to 60 months) had blood lead concentrations higher than 10 �g/dl (Rahbar, et al., 2002). It also derived that, at the five percent level of significance, houses nearer to the main intersection in the city center, application of surma (kohl) to children’s eyes, father’s exposure to lead at workplace, parent’s illiteracy, and child’s habit of hand-to-mouth activity were among variables associated with elevated lead concentrations in blood.
In a study on lead poisoning in major Indian cities, the George Foundation reported 51.4 percent of the total sampled population having more than 10 �g/dl of Pb-B, while 12.6 percent having more than 20 �g/dl of Pb-B (the George Foundation, 1999). In cities like Delhi and Kolkata, almost 19 percent of sampled population had blood lead concentration of more than 20�g/dl. In Mumbai, some 14.7 percent of children had more than 20 �g/dl of blood lead concentration.
In a study conducted to estimate the Pb-B and prevalence of lead toxicity in school children and children residing in urban slums in Delhi, it was found that the mean Pb-B was 7.8 �g/dl and proportion of children having more than 10 �g/dl of Pb-B was 18.4 percent (Kalra, V., et al., 2003). It also suggested that distance of the residence or school from a main road appeared to be associated with higher blood lead concentrations, but these differences were not statistically significant. Similar reports highlight high concentrations of blood lead in children in various other cities in India and relate it with local practices and exposure pathways (Kumar and Kesaree, 1999; Kaul, 1999; Patel, et al., 2001).
16
Study Objectives and Methodology
Objectives
The sixth session of the Intergovernmental Forum on Chemical Safety (IFCS), held from 15 to 19 September 2008 in Dakar, Senegal, adopted a unanimous resolution to eliminate lead from paints worldwide. The text of the resolution is given in Appendix 1. The issue of lead in paints was also on the agenda of the second session of the International Conference on Chemicals Management (ICCM) held in Geneva from 11 to 15 May 2009. To better inform the international debate on the issue, Toxics Link and International POPs Elimination Network (IPEN) decided to work with other partner organisations in various regions of the world to determine the total lead (Pb)concentration in new decorative paints available in various developing countries in the world in order to know the amount of lead being used in developing countries. This project was jointly funded by the Swedish Society for Nature Conservation (SSNC), IPEN, and the Centre for the Study of Public Policy.
Sampling
Due to the paucity of time and resources, it was decided to sample new paints from only 10 countries across the continents. The following criteria were adopted:
1. Absence of similar study in the country2. Presence of strong and effective organisations for campaigns and follow up
The following 10 countries were selected:
Sri Lanka from South Asia Philippines and Thailand from South East Asia Tanzania, South Africa, Nigeria and Senegal from Africa Belarus from Eastern Europe Mexico and Brazil from Latin America
In each of these countries Toxics Link worked closely with the IPEN International Coordinator and Regional Hubs to identify partner organisations, and, thereafter, collectively agreed on how to conduct the sample collection of new paints as per the guidelines (see Appendix II). The samples were sent via courier or air cargo to the New Delhi office of Toxics Link. Each partner organisation was supposed to send 25 to 30 samples of both plastic and enamel paints in various colours. However, a majority of the samples were of enamel paints. Since the previous studies have indicated comparatively low levels of lead in plastic paints, and for other logistical reasons, like the cost and convenience of dispatch, the total number of plastic paint samples from each partner organisation was kept at less than 10 out of 30.
17
The following organisations were involved in the sampling and collating basic information on paint industries from their respective countries. These organisations are also part of IPEN.
Centre for Environmental Justice, 20A, Kuruppu Road, Colombo 08, Sri Lanka Ecological Waste Coalition of the Philippines, Inc. (EcoWaste Coalition), Unit
329, Eagle Court Condominium, Matalino Street, Barangay Central, Quezon City, Philippines
Campaign for Alternative Industry Network (CAIN), 211/2, Ngamwongwan Rd., Soi 31, Muang, Nonthaburi 11000, Thailand
AGENDA for Environment and Responsible Development, Sinza B 545, Mashujaa St. Sinza Palestina, P.O. Box 77266, Dar es Salaam, Tanzania
GroundWork- Friends of the Earth, PO BOX 2375, Pietermaritzburg, 3200, South Africa
Friends of the Environment (FOTE)/Strategic Research and Action for Environmental Development (SRADev), 106/110 Lewis Street, Lagos, Nigeria
Pesticide Action Network (PAN) Africa, N� 15 Rue 1XJ Castors-Derkl� Dakar, BP 15938, Dakar Fann, Senegal
Centre for Environmental Solutions, P.O. Box 21, Minsk, 220141, Belarus Red de Acci�n en Plaguicidas y sus Alternativas en M�xico (RAPAM)/Centro de
An�lisis y Acci�n en T�xicos y sus Alternativas (CAATA) Amado Nervo 23, int 2, Col San Juanito, Texcoco, Edo. de Mexico CP 56121, Mexico
APROMAC – Environment Protection Association, Rua Octavio Secundino, 340 CEP 80520-480, Curitiba – Paran� – Brazil
A few samples from Indian markets were also collected to examine the claims of a few brands, which had announced lead phase out from their enamel products some time in 2008.
Samples were received from November 2008 to February 2009 in New Delhi; they were labelled and given unique identification number. A total of 317 paint samples, which included 26 samples from India, were further prepared for lab analysis.
Materials and Methods
Samples were analysed according to the standard operating procedures for lead in paint by hotplate or microwave-based acid digestions and inductively coupled plasma emission spectroscopy, EPA, PB92-114172, Sept. 1991; SW846-740 (U.S. EPA, 2001)
Sample preparation
1. Each wet paint sample was applied on a clean glass surface (one square foot) using a different brush for each sample to avoid any contamination. Samples, thus applied were left to dry for a minimum of 72 hours.
18
2. After drying, samples were scraped off from the glass surfaces using sharp and clean knives. One knife per sample was used to avoid any contamination.
3. Thus scraped, samples were collected in polyethylene bags and sent to Delhi Test House, A-62/3, G.T. Karnal Road, Industrial Area, Opposite Hans Cinema, Azadpur, Delhi-110033 for analysis. Delhi Test House (DTH) is accredited by National Accreditation Board for Testing and Calibration Laboratories (NABL).
Laboratory Methods
1. Each scraped sample was crushed using mortar and pestle to make samples as homogenous as possible. Latex paint does not grind hence they were torn into small pieces using pre-cleaned steel scissors.
2. Some 0.3 g of each paint sample was taken on a glass slide and placed in an oven at 120OC for two hours to remove any moisture.
3. Some 0.1 g of each of the dried paint sample was then accurately weighed into a closed Teflon vessel and then digested/extracted.
4. Standards were also prepared similarly.
Digestion Procedures
1. Three millilitres of concentrated nitric acid (HNO3) was added into Teflon vessels and then placed in an oven at 1500C for one hour.
2. Vessels were then allowed to cool to room temperature.3. Solution along with any precipitate was transferred to a 25 ml volumetric flask.4. Flask was diluted to volume with deionised water and mixed well. Precipitate, if
any, was allowed to settle and then the solution was filtered.5. Sample blanks were also prepared similarly.
Digested samples were then analysed for total lead (Pb) in atomic absorption spectrometer (AAS) fitted with Graphite Furnace (GF) of make GBC, Model –932 Plus. Dilutions were performed if needed to fit with the calibration curve. Recovery was between 80 to 120 percent for different lot of digestions. The detection limit of method was 1.25 ppm.
19
Results and Discussion
SRI LANKA
Background
The paint industry in Sri Lanka comprises about 30 large and small players, some of which are well known having strong market presence of brands. According to the Census and Statistics Department of the Government of Sri Lanka, 100 companies operated in 2003, which declined to 60 in 2004. Some of the major companies/brands are listed below:
1. CIC Paints, foreign collaboration with ICI2. Macksons Paints Lanka, with foreign collaboration3. Causeway Paints, with foreign collaboration4. Masons Mixtures, with foreign collaboration5. Lankem Ceylon6. Asian Paints Lanka, with foreign collaboration7. Paints & General Industries, with foreign collaboration8. Silicone Coatings (Pvt) Ltd9. Nippolac
Results
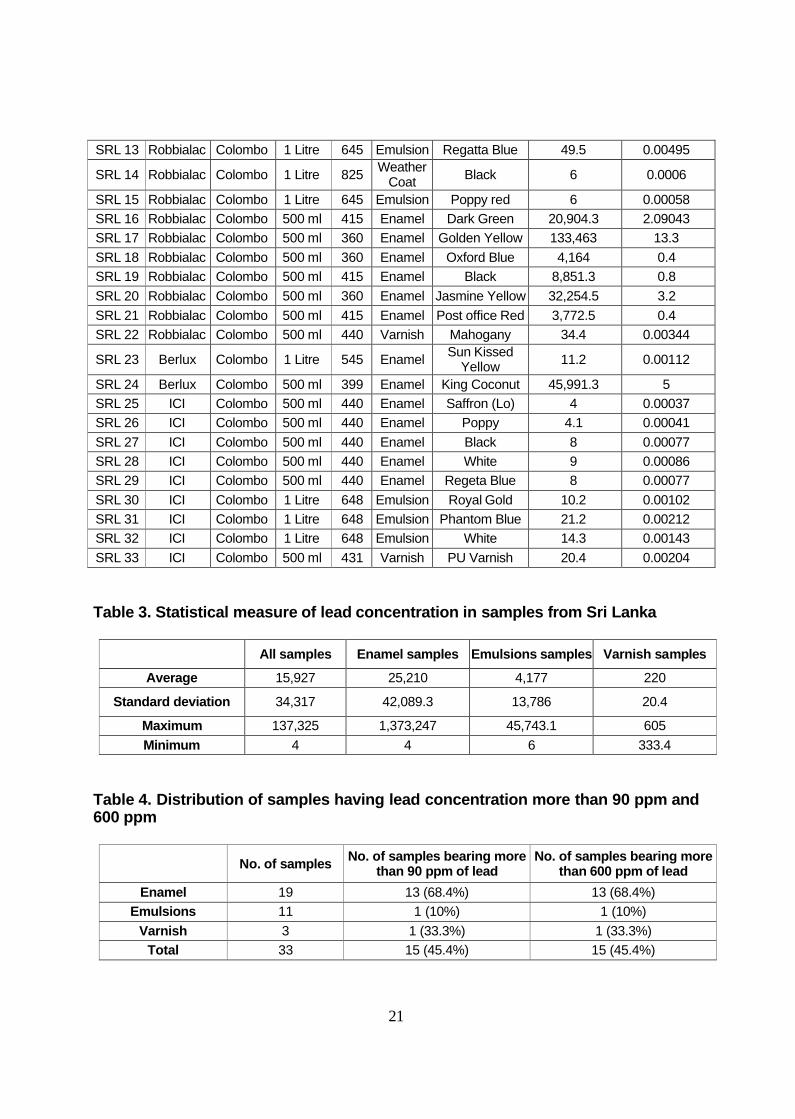
Lead concentration in the paint samples received from Sri Lanka with their general description is given in Table 2. Out of 33 paint samples received from Sri Lanka, 19 samples were of enamel paints, 10 emulsions or plastic paints, one weather coat paint, and three varnishes, including a polyurethane varnish. These samples belonged to four brands, namely Nippolac, Robbialac, Berlux, and ICI.
Statistical measure of lead concentration in enamel, plastic, and varnish samples are given in Table 3. Table 4 shows the distribution of paint samples having lead concentration more than 90 ppm. As mentioned earlier, as per a recent change in the law, the U.S. has 90 ppm of lead as the upper limit for new residential paints, which earlier was 600 ppm. So, the present data have been compared with both 90 ppm and 600 ppm of lead concentrations
Some major findings about lead in paint samples from Sri Lanka are:
1. The arithmetic mean of lead concentration in all samples was 15,927 ppm. The arithmetic mean for enamel samples was 25,210 ppm; for emulsion samples and varnish samples the average lead content was 4,177 ppm and 220 ppm respectively.
20
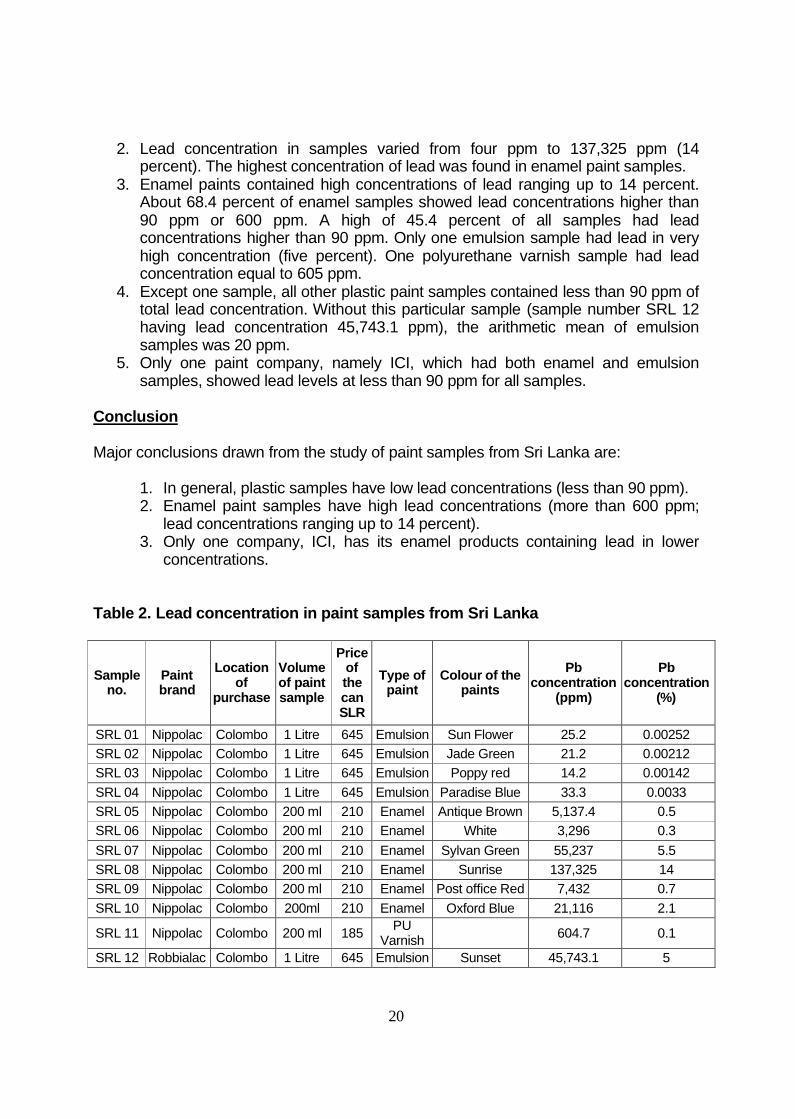
2. Lead concentration in samples varied from four ppm to 137,325 ppm (14 percent). The highest concentration of lead was found in enamel paint samples.
3. Enamel paints contained high concentrations of lead ranging up to 14 percent. About 68.4 percent of enamel samples showed lead concentrations higher than 90 ppm or 600 ppm. A high of 45.4 percent of all samples had lead concentrations higher than 90 ppm. Only one emulsion sample had lead in very high concentration (five percent). One polyurethane varnish sample had lead concentration equal to 605 ppm.
4. Except one sample, all other plastic paint samples contained less than 90 ppm of total lead concentration. Without this particular sample (sample number SRL 12 having lead concentration 45,743.1 ppm), the arithmetic mean of emulsion samples was 20 ppm.
5. Only one paint company, namely ICI, which had both enamel and emulsion samples, showed lead levels at less than 90 ppm for all samples.
Conclusion
Major conclusions drawn from the study of paint samples from Sri Lanka are:
1. In general, plastic samples have low lead concentrations (less than 90 ppm).2. Enamel paint samples have high lead concentrations (more than 600 ppm;
lead concentrations ranging up to 14 percent).3. Only one company, ICI, has its enamel products containing lead in lower
concentrations.
Table 2. Lead concentration in paint samples from Sri Lanka
Sample no.
Paint brand
Location of
purchase
Volume of paint sample
Price of the can SLR
Type of paint
Colour of the paints
Pb concentration
(ppm)
Pb concentration
(%)
SRL 01 Nippolac Colombo 1 Litre 645 Emulsion Sun Flower 25.2 0.00252SRL 02 Nippolac Colombo 1 Litre 645 Emulsion Jade Green 21.2 0.00212SRL 03 Nippolac Colombo 1 Litre 645 Emulsion Poppy red 14.2 0.00142SRL 04 Nippolac Colombo 1 Litre 645 Emulsion Paradise Blue 33.3 0.0033SRL 05 Nippolac Colombo 200 ml 210 Enamel Antique Brown 5,137.4 0.5SRL 06 Nippolac Colombo 200 ml 210 Enamel White 3,296 0.3SRL 07 Nippolac Colombo 200 ml 210 Enamel Sylvan Green 55,237 5.5SRL 08 Nippolac Colombo 200 ml 210 Enamel Sunrise 137,325 14SRL 09 Nippolac Colombo 200 ml 210 Enamel Post office Red 7,432 0.7SRL 10 Nippolac Colombo 200ml 210 Enamel Oxford Blue 21,116 2.1
SRL 11 Nippolac Colombo 200 ml 185 PU Varnish 604.7 0.1
SRL 12 Robbialac Colombo 1 Litre 645 Emulsion Sunset 45,743.1 5
21
SRL 13 Robbialac Colombo 1 Litre 645 Emulsion Regatta Blue 49.5 0.00495
SRL 14 Robbialac Colombo 1 Litre 825 Weather Coat Black 6 0.0006
SRL 15 Robbialac Colombo 1 Litre 645 Emulsion Poppy red 6 0.00058SRL 16 Robbialac Colombo 500 ml 415 Enamel Dark Green 20,904.3 2.09043SRL 17 Robbialac Colombo 500 ml 360 Enamel Golden Yellow 133,463 13.3SRL 18 Robbialac Colombo 500 ml 360 Enamel Oxford Blue 4,164 0.4SRL 19 Robbialac Colombo 500 ml 415 Enamel Black 8,851.3 0.8SRL 20 Robbialac Colombo 500 ml 360 Enamel Jasmine Yellow 32,254.5 3.2SRL 21 Robbialac Colombo 500 ml 415 Enamel Post office Red 3,772.5 0.4SRL 22 Robbialac Colombo 500 ml 440 Varnish Mahogany 34.4 0.00344
SRL 23 Berlux Colombo 1 Litre 545 Enamel Sun Kissed Yellow 11.2 0.00112
SRL 24 Berlux Colombo 500 ml 399 Enamel King Coconut 45,991.3 5SRL 25 ICI Colombo 500 ml 440 Enamel Saffron (Lo) 4 0.00037SRL 26 ICI Colombo 500 ml 440 Enamel Poppy 4.1 0.00041SRL 27 ICI Colombo 500 ml 440 Enamel Black 8 0.00077SRL 28 ICI Colombo 500 ml 440 Enamel White 9 0.00086SRL 29 ICI Colombo 500 ml 440 Enamel Regeta Blue 8 0.00077SRL 30 ICI Colombo 1 Litre 648 Emulsion Royal Gold 10.2 0.00102SRL 31 ICI Colombo 1 Litre 648 Emulsion Phantom Blue 21.2 0.00212SRL 32 ICI Colombo 1 Litre 648 Emulsion White 14.3 0.00143SRL 33 ICI Colombo 500 ml 431 Varnish PU Varnish 20.4 0.00204
Table 3. Statistical measure of lead concentration in samples from Sri Lanka
All samples Enamel samples Emulsions samples Varnish samples
Average 15,927 25,210 4,177 220
Standard deviation 34,317 42,089.3 13,786 20.4
Maximum 137,325 1,373,247 45,743.1 605Minimum 4 4 6 333.4
Table 4. Distribution of samples having lead concentration more than 90 ppm and 600 ppm
No. of samples No. of samples bearing more than 90 ppm of lead
No. of samples bearing more than 600 ppm of lead
Enamel 19 13 (68.4%) 13 (68.4%)Emulsions 11 1 (10%) 1 (10%)
Varnish 3 1 (33.3%) 1 (33.3%)Total 33 15 (45.4%) 15 (45.4%)
22
PHILIPPINES
Background
The Philippine paint sector was established in 1911. According to the Chemical Industries Association of the Philippines, or Samahan sa Pilipinas ng mga Industriyang Kimika (SPIK), there are currently over 100 direct manufacturers in the paints and coating industry, 67 of which are considered significant in size. The members of the sector own assets in the order of Php 4.5 billion.5 One of the biggest associations in the country's paint sector is the Philippine Association of Paint Manufacturers, Inc. (PAPM). It was established in 1961. It is a privately operated non-stock, non-profit, non-sectarian, and non-political organisation with more that 70 member companies.6
Pacific Paint (Boysen) Philippines Inc., maker of Boysen paints, is the leading paint company in the country with 70 percent market share.7 The said paint brand was given the most Trusted Brand Award by Readers Digest (Asia) for two consecutive years —2006 and 2007.
Based on the survey of the EcoWaste Coalition, the partner organisation in the present study, other major brands being sold in many hardware stores in Metro Manila are: Nation, the economical paint line of Boysen; Davies, and Coat Saver, manufactured by Charter Chemical and Coating Corporation; Dutch Boy and its product line by United Paints, Inc.; Welcoat and Rain or Shine by Asian Coatings, Inc.; and Sphero by Globesco, Inc.
Boysen Paints Philippines is a local paint company, which is a licensed manufacturer of Boysen Paints, a U.S.-based multinational company. Other major international players operate through licensees and subsidiaries in the Philippine market. Charter Chemicals and Coating Corporation is a licensee of Japanese company Chugoku Paints. Dutch Boy is also a Philippine subsidiary of Berger Paints International. Welcoat and Rain or Shine paint brands are made by Welbest Manufacturing, Inc., which has a joint-venture with a Japanese company Shinto Paint.
Based on phone interviews and site visits conducted by the EcoWaste Coalition to major hardware stores in Metro Manila, the most purchased decorative paints (in no particular order) were Boysen, Nation, Dutch Boy, Coat Saver, and Welcoat. Water-based coatings make up 40 percent of the market, and these are dominated by 100 percent acrylic and vinyl acetate/acrylic. On the other hand, alkyl coatings dominate the solvent sector and these are used on wood and metal surfaces.8
5 http://www.spik-ph.org/index.php?content=2&article=86http://www.spik-ph.org/index.php?content=2&article=87 http://www.spik-ph.org/index.php?content=2&article=88 http://www.spik-ph.org/index.php?content=2&article=8
23
The Philippine government identified lead as one of the priority chemicals that should be regulated due to its hazardous effect on health and environment. Under the country's Toxic Substances, Hazardous, and Nuclear Wastes Control Act of 1990 or Republic Act (RA) 6969 and Department of Environment and Natural Resources (DENR) Administrative Order 2005-05, a Chemical Control Order (CCO) should be issued to regulate the use, manufacture, import, export, transport, processing, storage, possession and wholesale of lead. In 2007, the DENR issued a draft CCO for lead, which is yet to be finalized.
The interviews with the Bureau of Product Standards of the Department of Trade and Industry (DTI) reveal that there is no standard set by the government for the use of lead in paints. According to a source in the PAPM Environment and Health Safety Committee, the association also has not prescribed any lead limit to its member manufacturers. According to the source, the association is pre-occupied with occupational safety concerns. There are plans to address the issue of lead in paints in 2009, particularly after the controversies surrounding the recall of toys contaminated with high lead levels. The officer explains that some PAPM-affiliated manufacturers are reportedly still using lead because going lead-free will require technology shift and system upgrading. He also said that their group could not provide technical assistance for technology upgrade, especially to their small members.
However, some paint companies claim to offer lead-free products such as Boysen and Dutch Boy. SPIK projects that a trend towards the greater use of water-based paints can be expected over the next ten years. Both SPIK and PAPM boast that the overall quality of paints produced in the Philippines is one of the best in Asia.
Prices of paint products vary. Among the local brands, Boysen, Davies and Dutch Boy are some of the more expensive decorative paints with prices ranging from USD 2.50 to 3.00, followed by Welcoat, Coat Saver, and Nation. Industrial paints like Sphero are more expensive with price ranging from USD 3.00 to 4.00 per litre (conversion rate estimate: USD 1.00 = Php 48.00). Lead-free, top of the line brands of Boysen, Davies, and Dutch Boy and U.S.-made paints such as Ace Paints made by Ace Hardware Corp are more expensive with prices ranging from USD 5.00 up to 10.00 per litre. Cheap and small brands such as Master, Destiny, Hudson, and Mana are available in some hardware stores with prices ranging from USD 1.00 to 2.00 per litre.
According to a market research by a global consultancy company Information Research (IRL) titled A Profile of the Asia-Pacific Industry, eighth edition, which was released in 2008, the Philippines ranks sixth in terms of paint demands in 2006 totalling 250,000 tons. Of the available brands, Master, Boysen, Hudson, Mna, Destiny, Challengar, Popular, Olympic, Welcoat, Coat Saver, Nation, Globe, Davies Megacryl, Davies Gloss-it, Sphero, Dutch Boy, Gloss Masta, and Ace paint were sampled.
24
Results
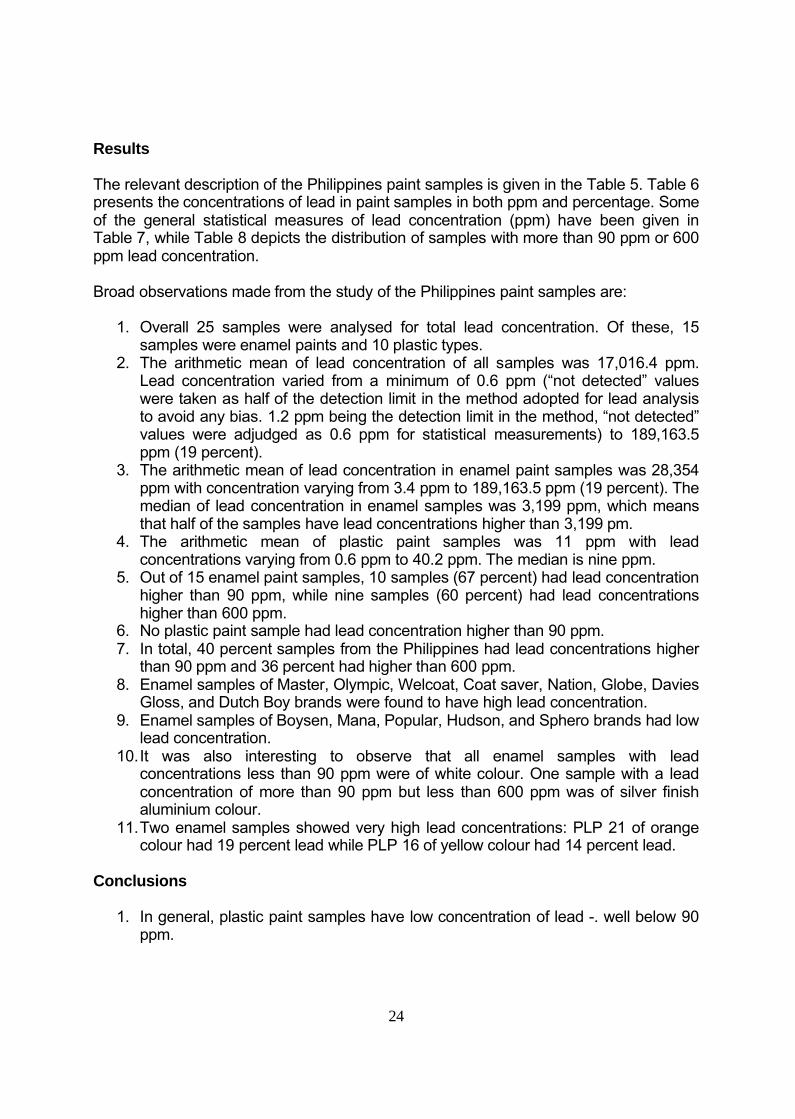
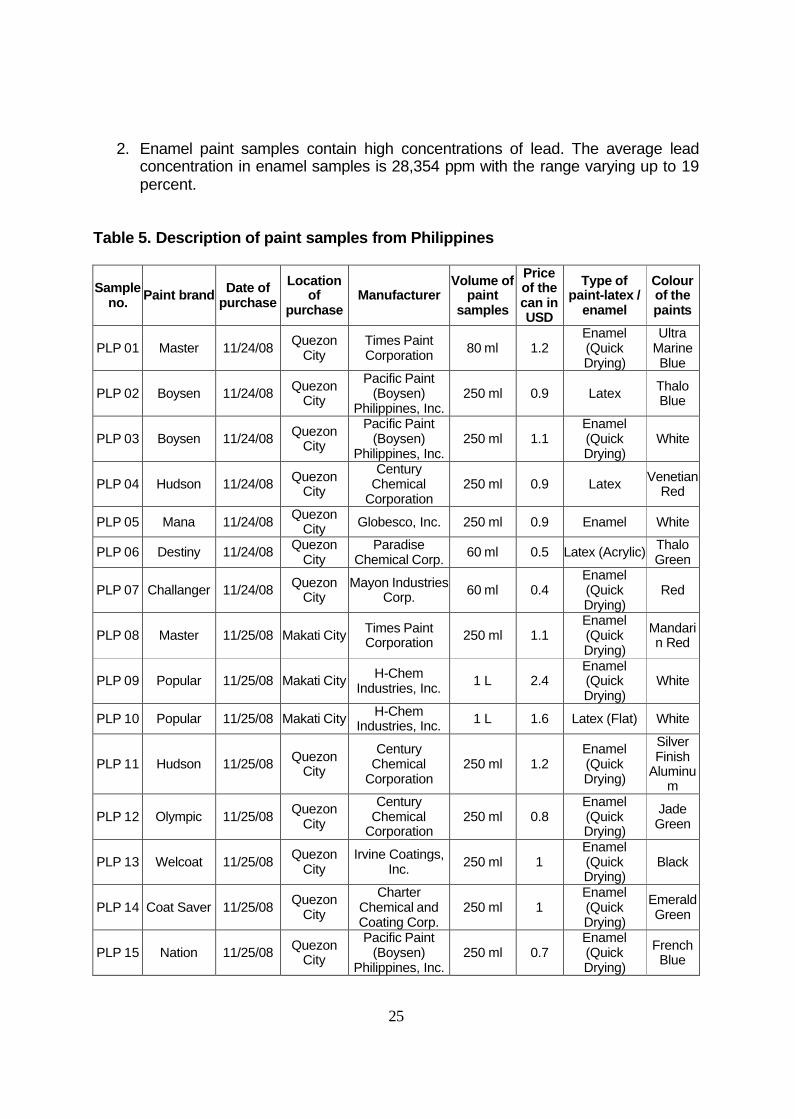
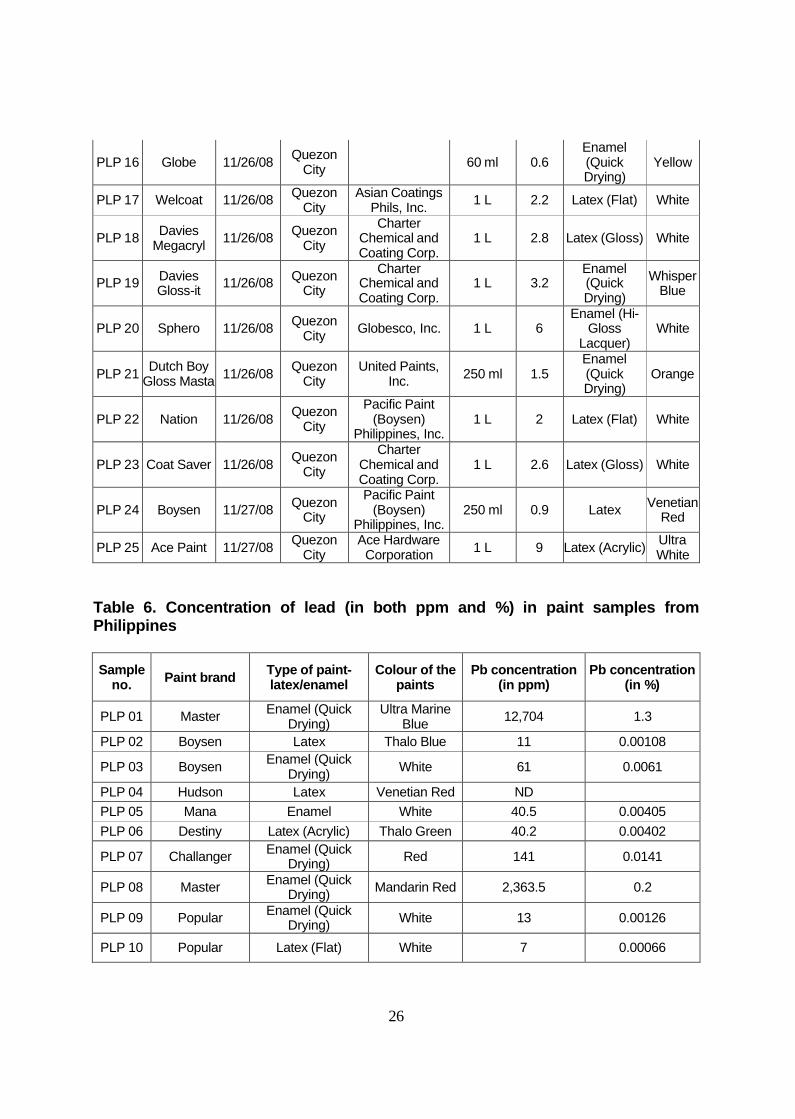
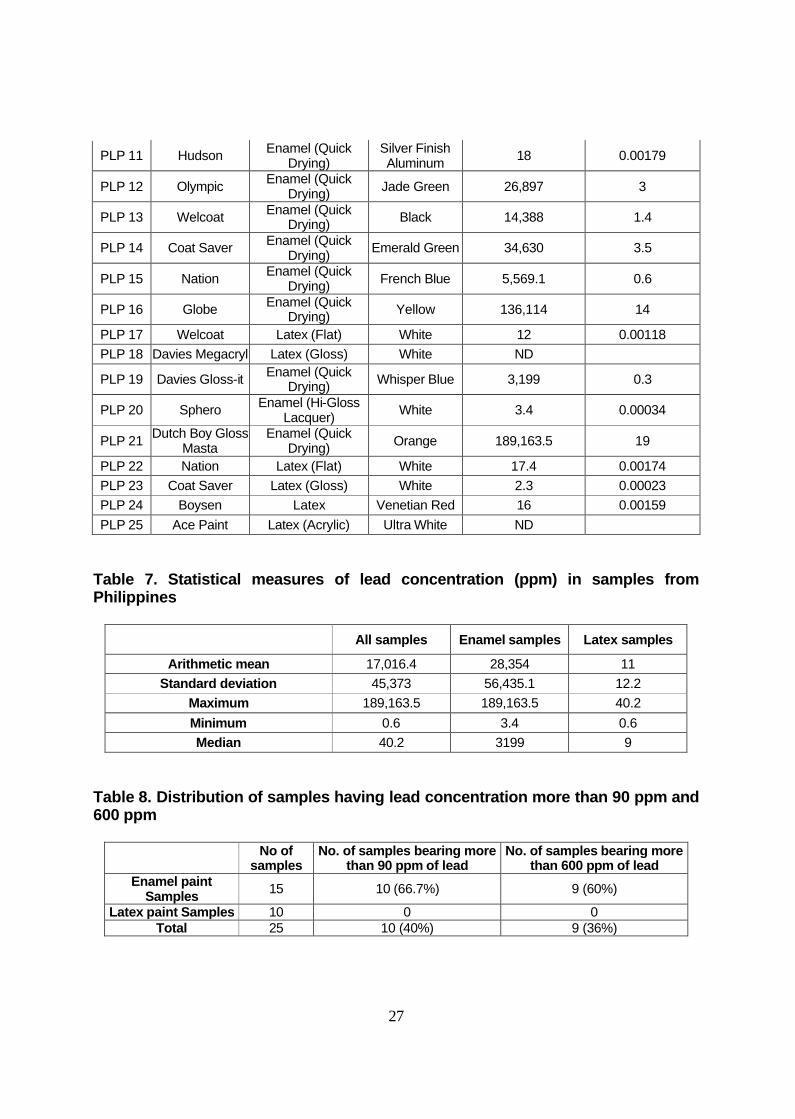
The relevant description of the Philippines paint samples is given in the Table 5. Table 6 presents the concentrations of lead in paint samples in both ppm and percentage. Some of the general statistical measures of lead concentration (ppm) have been given in Table 7, while Table 8 depicts the distribution of samples with more than 90 ppm or 600 ppm lead concentration.
Broad observations made from the study of the Philippines paint samples are:
1. Overall 25 samples were analysed for total lead concentration. Of these, 15 samples were enamel paints and 10 plastic types.
2. The arithmetic mean of lead concentration of all samples was 17,016.4 ppm. Lead concentration varied from a minimum of 0.6 ppm (“not detected” values were taken as half of the detection limit in the method adopted for lead analysis to avoid any bias. 1.2 ppm being the detection limit in the method, “not detected” values were adjudged as 0.6 ppm for statistical measurements) to 189,163.5 ppm (19 percent).
3. The arithmetic mean of lead concentration in enamel paint samples was 28,354 ppm with concentration varying from 3.4 ppm to 189,163.5 ppm (19 percent). The median of lead concentration in enamel samples was 3,199 ppm, which means that half of the samples have lead concentrations higher than 3,199 pm.
4. The arithmetic mean of plastic paint samples was 11 ppm with lead concentrations varying from 0.6 ppm to 40.2 ppm. The median is nine ppm.
5. Out of 15 enamel paint samples, 10 samples (67 percent) had lead concentration higher than 90 ppm, while nine samples (60 percent) had lead concentrations higher than 600 ppm.
6. No plastic paint sample had lead concentration higher than 90 ppm.7. In total, 40 percent samples from the Philippines had lead concentrations higher
than 90 ppm and 36 percent had higher than 600 ppm.8. Enamel samples of Master, Olympic, Welcoat, Coat saver, Nation, Globe, Davies
Gloss, and Dutch Boy brands were found to have high lead concentration.9. Enamel samples of Boysen, Mana, Popular, Hudson, and Sphero brands had low
lead concentration.10.It was also interesting to observe that all enamel samples with lead
concentrations less than 90 ppm were of white colour. One sample with a lead concentration of more than 90 ppm but less than 600 ppm was of silver finish aluminium colour.
11.Two enamel samples showed very high lead concentrations: PLP 21 of orange colour had 19 percent lead while PLP 16 of yellow colour had 14 percent lead.
Conclusions
1. In general, plastic paint samples have low concentration of lead -. well below 90 ppm.
25
2. Enamel paint samples contain high concentrations of lead. The average lead concentration in enamel samples is 28,354 ppm with the range varying up to 19 percent.
Table 5. Description of paint samples from Philippines
Sample no. Paint brand Date of
purchaseLocation
of purchase
ManufacturerVolume of
paint samples
Price of the can in USD
Type of paint-latex /
enamel
Colour of the paints
PLP 01 Master 11/24/08 Quezon City
Times Paint Corporation 80 ml 1.2
Enamel (Quick Drying)
Ultra Marine Blue
PLP 02 Boysen 11/24/08 Quezon City
Pacific Paint (Boysen)
Philippines, Inc.250 ml 0.9 Latex Thalo
Blue
PLP 03 Boysen 11/24/08 Quezon City
Pacific Paint (Boysen)
Philippines, Inc.250 ml 1.1
Enamel (Quick Drying)
White
PLP 04 Hudson 11/24/08 Quezon City
Century Chemical
Corporation250 ml 0.9 Latex Venetian
Red
PLP 05 Mana 11/24/08 Quezon City Globesco, Inc. 250 ml 0.9 Enamel White
PLP 06 Destiny 11/24/08 Quezon City
Paradise Chemical Corp. 60 ml 0.5 Latex (Acrylic) Thalo
Green
PLP 07 Challanger 11/24/08 Quezon City
Mayon Industries Corp. 60 ml 0.4
Enamel (Quick Drying)
Red
PLP 08 Master 11/25/08 Makati City Times Paint Corporation 250 ml 1.1
Enamel (Quick Drying)
Mandarin Red
PLP 09 Popular 11/25/08 Makati City H-Chem Industries, Inc. 1 L 2.4
Enamel (Quick Drying)
White
PLP 10 Popular 11/25/08 Makati City H-Chem Industries, Inc. 1 L 1.6 Latex (Flat) White
PLP 11 Hudson 11/25/08 Quezon City
Century Chemical
Corporation250 ml 1.2
Enamel (Quick Drying)
Silver Finish
Aluminum
PLP 12 Olympic 11/25/08 Quezon City
Century Chemical
Corporation250 ml 0.8
Enamel (Quick Drying)
Jade Green
PLP 13 Welcoat 11/25/08 Quezon City
Irvine Coatings, Inc. 250 ml 1
Enamel (Quick Drying)
Black
PLP 14 Coat Saver 11/25/08 Quezon City
Charter Chemical and Coating Corp.
250 ml 1Enamel (Quick Drying)
Emerald Green
PLP 15 Nation 11/25/08 Quezon City
Pacific Paint (Boysen)
Philippines, Inc.250 ml 0.7
Enamel (Quick Drying)
French Blue
26
PLP 16 Globe 11/26/08 Quezon City 60 ml 0.6
Enamel (Quick Drying)
Yellow
PLP 17 Welcoat 11/26/08 Quezon City
Asian Coatings Phils, Inc. 1 L 2.2 Latex (Flat) White
PLP 18 Davies Megacryl 11/26/08 Quezon
City
Charter Chemical and Coating Corp.
1 L 2.8 Latex (Gloss) White
PLP 19 Davies Gloss-it 11/26/08 Quezon
CityCharter
Chemical and Coating Corp.
1 L 3.2Enamel (Quick Drying)
Whisper Blue
PLP 20 Sphero 11/26/08 Quezon City Globesco, Inc. 1 L 6
Enamel (Hi-Gloss
Lacquer)White
PLP 21 Dutch Boy Gloss Masta 11/26/08 Quezon
CityUnited Paints,
Inc. 250 ml 1.5Enamel (Quick Drying)
Orange
PLP 22 Nation 11/26/08 Quezon City
Pacific Paint (Boysen)
Philippines, Inc.1 L 2 Latex (Flat) White
PLP 23 Coat Saver 11/26/08 Quezon City
Charter Chemical and Coating Corp.
1 L 2.6 Latex (Gloss) White
PLP 24 Boysen 11/27/08 Quezon City
Pacific Paint (Boysen)
Philippines, Inc.250 ml 0.9 Latex Venetian
Red
PLP 25 Ace Paint 11/27/08 Quezon City
Ace Hardware Corporation 1 L 9 Latex (Acrylic) Ultra
White
Table 6. Concentration of lead (in both ppm and %) in paint samples from Philippines
Sample no. Paint brand Type of paint-
latex/enamelColour of the
paintsPb concentration
(in ppm)Pb concentration
(in %)
PLP 01 Master Enamel (Quick Drying)
Ultra Marine Blue 12,704 1.3
PLP 02 Boysen Latex Thalo Blue 11 0.00108
PLP 03 Boysen Enamel (Quick Drying) White 61 0.0061
PLP 04 Hudson Latex Venetian Red NDPLP 05 Mana Enamel White 40.5 0.00405PLP 06 Destiny Latex (Acrylic) Thalo Green 40.2 0.00402
PLP 07 Challanger Enamel (Quick Drying) Red 141 0.0141
PLP 08 Master Enamel (Quick Drying) Mandarin Red 2,363.5 0.2
PLP 09 Popular Enamel (Quick Drying) White 13 0.00126
PLP 10 Popular Latex (Flat) White 7 0.00066
27
PLP 11 Hudson Enamel (Quick Drying)
Silver Finish Aluminum 18 0.00179
PLP 12 Olympic Enamel (Quick Drying) Jade Green 26,897 3
PLP 13 Welcoat Enamel (Quick Drying) Black 14,388 1.4
PLP 14 Coat Saver Enamel (Quick Drying) Emerald Green 34,630 3.5
PLP 15 Nation Enamel (Quick Drying) French Blue 5,569.1 0.6
PLP 16 Globe Enamel (Quick Drying) Yellow 136,114 14
PLP 17 Welcoat Latex (Flat) White 12 0.00118PLP 18 Davies Megacryl Latex (Gloss) White ND
PLP 19 Davies Gloss-it Enamel (Quick Drying) Whisper Blue 3,199 0.3
PLP 20 Sphero Enamel (Hi-Gloss Lacquer) White 3.4 0.00034
PLP 21 Dutch Boy Gloss Masta
Enamel (Quick Drying) Orange 189,163.5 19
PLP 22 Nation Latex (Flat) White 17.4 0.00174PLP 23 Coat Saver Latex (Gloss) White 2.3 0.00023PLP 24 Boysen Latex Venetian Red 16 0.00159PLP 25 Ace Paint Latex (Acrylic) Ultra White ND
Table 7. Statistical measures of lead concentration (ppm) in samples from Philippines
All samples Enamel samples Latex samples
Arithmetic mean 17,016.4 28,354 11Standard deviation 45,373 56,435.1 12.2
Maximum 189,163.5 189,163.5 40.2Minimum 0.6 3.4 0.6Median 40.2 3199 9
Table 8. Distribution of samples having lead concentration more than 90 ppm and 600 ppm
No of samples
No. of samples bearing more than 90 ppm of lead
No. of samples bearing more than 600 ppm of lead
Enamel paint Samples 15 10 (66.7%) 9 (60%)
Latex paint Samples 10 0 0Total 25 10 (40%) 9 (36%)
28
THAILAND
Background
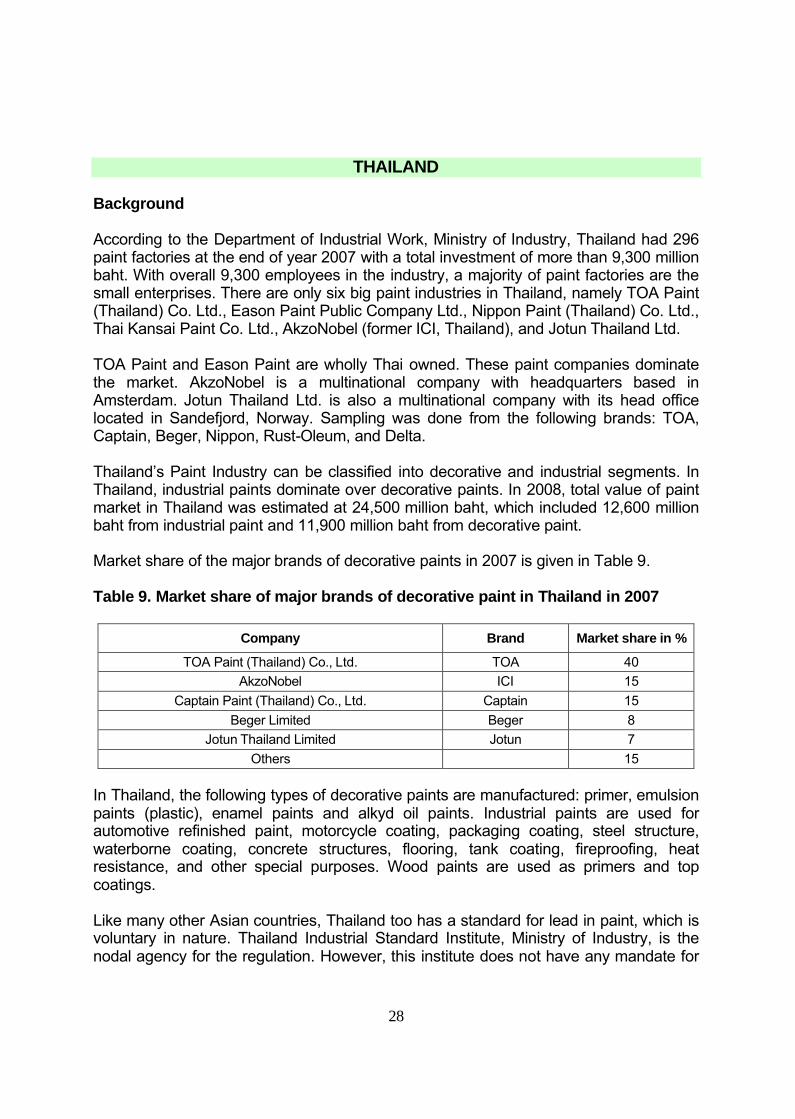
According to the Department of Industrial Work, Ministry of Industry, Thailand had 296 paint factories at the end of year 2007 with a total investment of more than 9,300 million baht. With overall 9,300 employees in the industry, a majority of paint factories are the small enterprises. There are only six big paint industries in Thailand, namely TOA Paint (Thailand) Co. Ltd., Eason Paint Public Company Ltd., Nippon Paint (Thailand) Co. Ltd., Thai Kansai Paint Co. Ltd., AkzoNobel (former ICI, Thailand), and Jotun Thailand Ltd.
TOA Paint and Eason Paint are wholly Thai owned. These paint companies dominate the market. AkzoNobel is a multinational company with headquarters based in Amsterdam. Jotun Thailand Ltd. is also a multinational company with its head office located in Sandefjord, Norway. Sampling was done from the following brands: TOA, Captain, Beger, Nippon, Rust-Oleum, and Delta.
Thailand’s Paint Industry can be classified into decorative and industrial segments. In Thailand, industrial paints dominate over decorative paints. In 2008, total value of paint market in Thailand was estimated at 24,500 million baht, which included 12,600 million baht from industrial paint and 11,900 million baht from decorative paint.
Market share of the major brands of decorative paints in 2007 is given in Table 9.
Table 9. Market share of major brands of decorative paint in Thailand in 2007
Company Brand Market share in %
TOA Paint (Thailand) Co., Ltd. TOA 40AkzoNobel ICI 15
Captain Paint (Thailand) Co., Ltd. Captain 15Beger Limited Beger 8
Jotun Thailand Limited Jotun 7Others 15
In Thailand, the following types of decorative paints are manufactured: primer, emulsion paints (plastic), enamel paints and alkyd oil paints. Industrial paints are used for automotive refinished paint, motorcycle coating, packaging coating, steel structure, waterborne coating, concrete structures, flooring, tank coating, fireproofing, heat resistance, and other special purposes. Wood paints are used as primers and top coatings.
Like many other Asian countries, Thailand too has a standard for lead in paint, which is voluntary in nature. Thailand Industrial Standard Institute, Ministry of Industry, is the nodal agency for the regulation. However, this institute does not have any mandate for
29
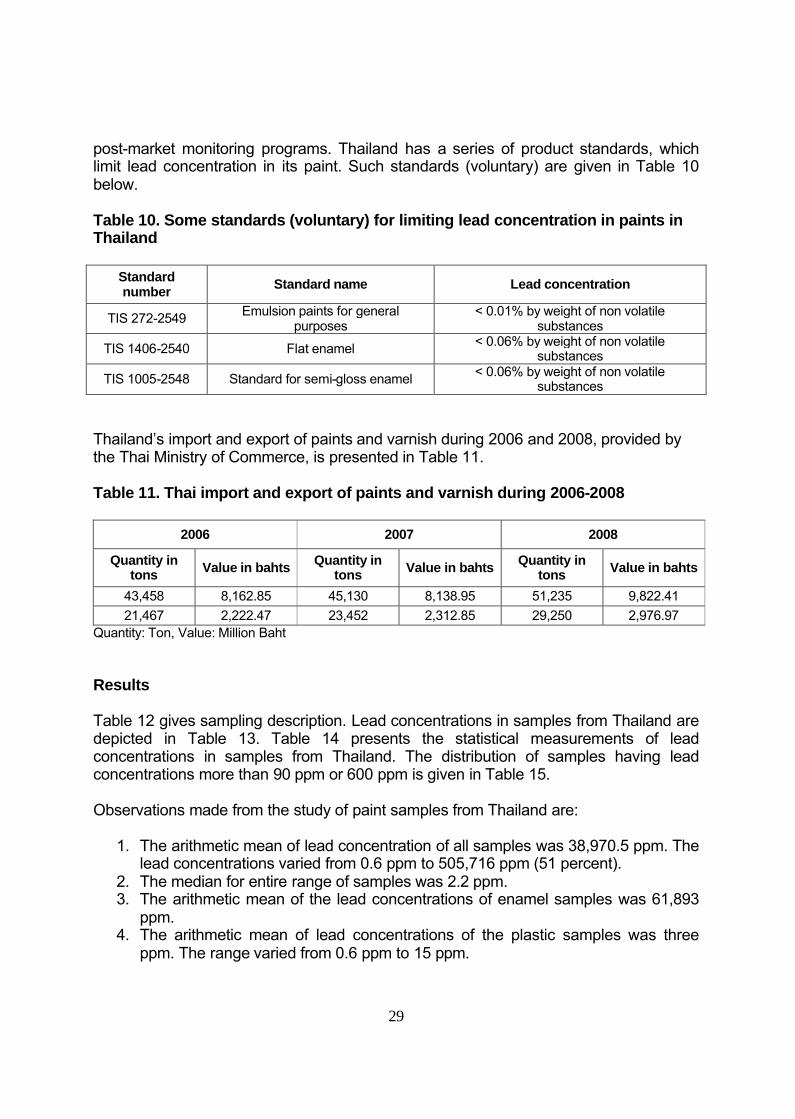
post-market monitoring programs. Thailand has a series of product standards, which limit lead concentration in its paint. Such standards (voluntary) are given in Table 10 below.
Table 10. Some standards (voluntary) for limiting lead concentration in paints in Thailand
Standard number Standard name Lead concentration
TIS 272-2549 Emulsion paints for general purposes
< 0.01% by weight of non volatile substances
TIS 1406-2540 Flat enamel < 0.06% by weight of non volatile substances
TIS 1005-2548 Standard for semi-gloss enamel < 0.06% by weight of non volatile substances
Thailand’s import and export of paints and varnish during 2006 and 2008, provided by the Thai Ministry of Commerce, is presented in Table 11.
Table 11. Thai import and export of paints and varnish during 2006-2008
2006 2007 2008
Quantity in tons Value in bahts Quantity in
tons Value in bahts Quantity in tons Value in bahts
43,458 8,162.85 45,130 8,138.95 51,235 9,822.4121,467 2,222.47 23,452 2,312.85 29,250 2,976.97
Quantity: Ton, Value: Million Baht
Results
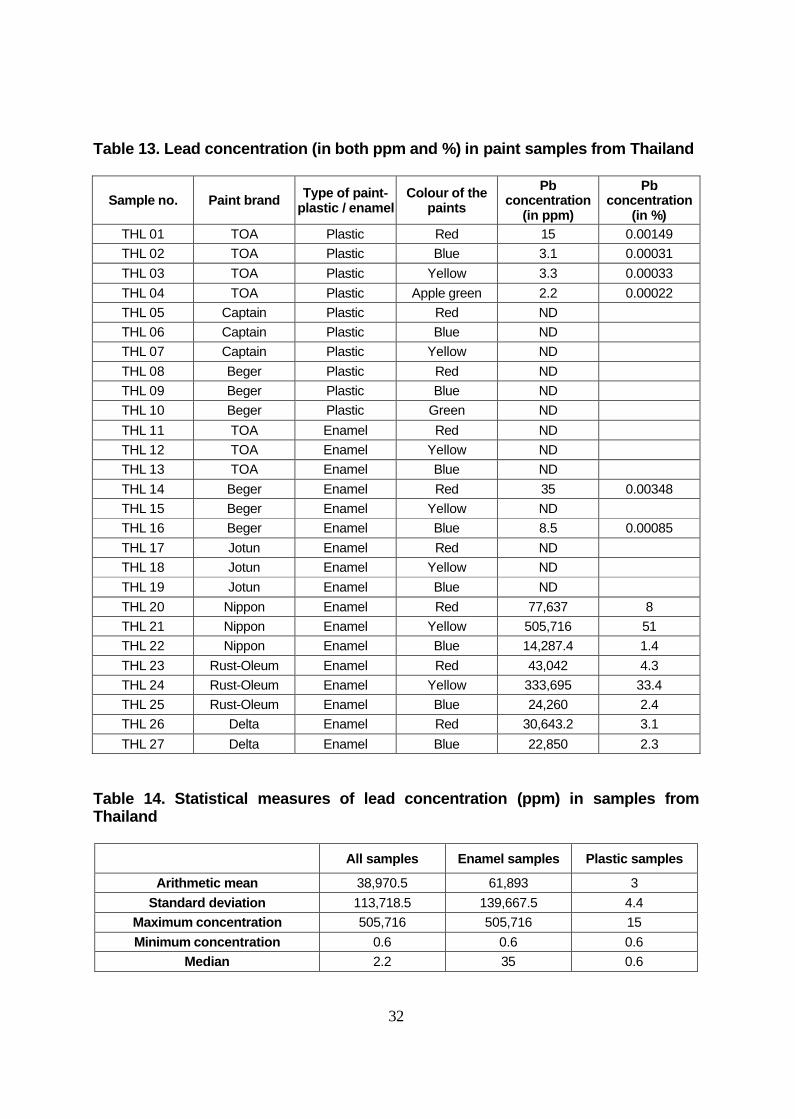
Table 12 gives sampling description. Lead concentrations in samples from Thailand are depicted in Table 13. Table 14 presents the statistical measurements of lead concentrations in samples from Thailand. The distribution of samples having lead concentrations more than 90 ppm or 600 ppm is given in Table 15.
Observations made from the study of paint samples from Thailand are:
1. The arithmetic mean of lead concentration of all samples was 38,970.5 ppm. The lead concentrations varied from 0.6 ppm to 505,716 ppm (51 percent).
2. The median for entire range of samples was 2.2 ppm.3. The arithmetic mean of the lead concentrations of enamel samples was 61,893
ppm. 4. The arithmetic mean of lead concentrations of the plastic samples was three
ppm. The range varied from 0.6 ppm to 15 ppm.
30
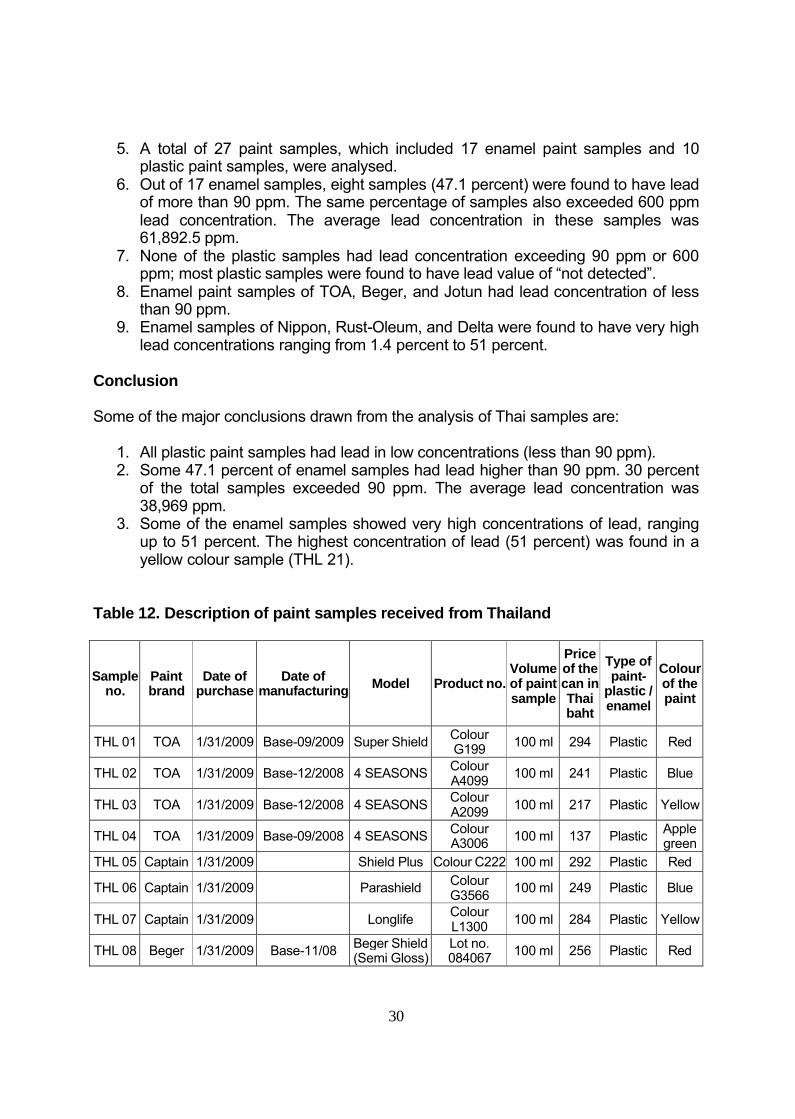
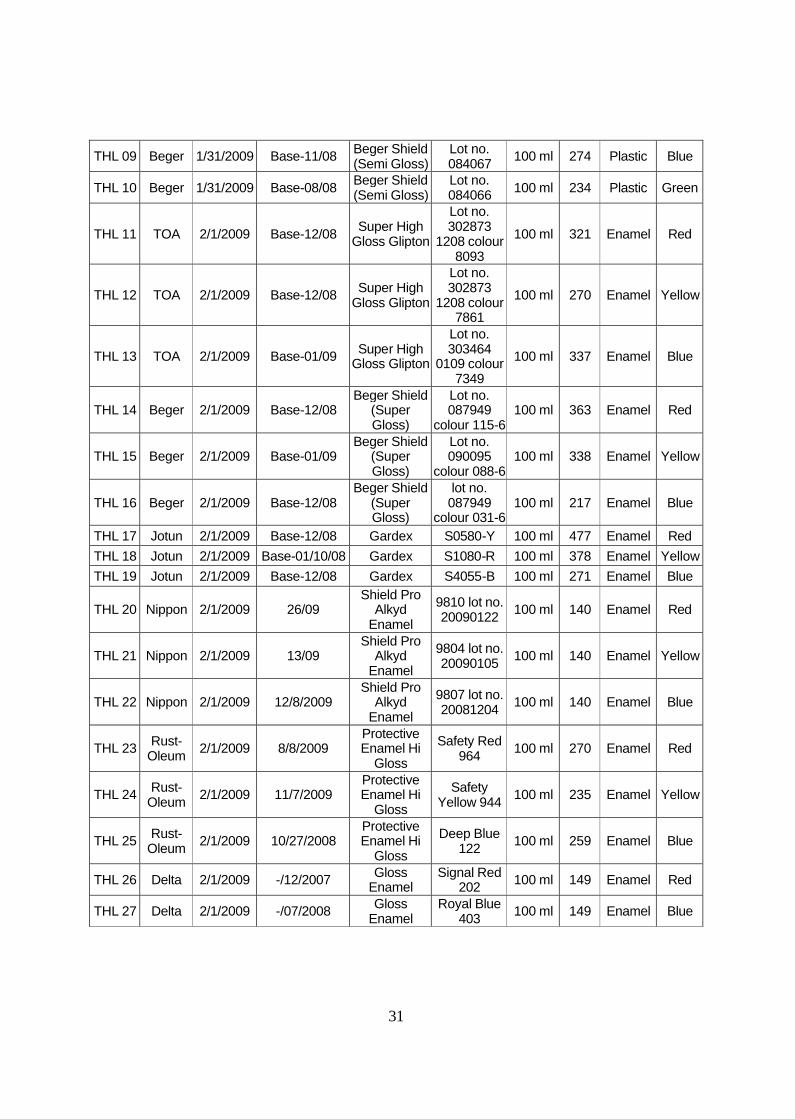
5. A total of 27 paint samples, which included 17 enamel paint samples and 10 plastic paint samples, were analysed.
6. Out of 17 enamel samples, eight samples (47.1 percent) were found to have lead of more than 90 ppm. The same percentage of samples also exceeded 600 ppm lead concentration. The average lead concentration in these samples was 61,892.5 ppm.
7. None of the plastic samples had lead concentration exceeding 90 ppm or 600 ppm; most plastic samples were found to have lead value of “not detected”.
8. Enamel paint samples of TOA, Beger, and Jotun had lead concentration of less than 90 ppm.
9. Enamel samples of Nippon, Rust-Oleum, and Delta were found to have very high lead concentrations ranging from 1.4 percent to 51 percent.
Conclusion
Some of the major conclusions drawn from the analysis of Thai samples are:
1. All plastic paint samples had lead in low concentrations (less than 90 ppm).2. Some 47.1 percent of enamel samples had lead higher than 90 ppm. 30 percent
of the total samples exceeded 90 ppm. The average lead concentration was 38,969 ppm.
3. Some of the enamel samples showed very high concentrations of lead, ranging up to 51 percent. The highest concentration of lead (51 percent) was found in a yellow colour sample (THL 21).
Table 12. Description of paint samples received from Thailand
Sample no.
Paint brand
Date of purchase
Date of manufacturing Model Product no.
Volume of paint sample
Price of the can in Thai baht
Type of paint-
plastic / enamel
Colour of the paint
THL 01 TOA 1/31/2009 Base-09/2009 Super Shield Colour G199 100 ml 294 Plastic Red
THL 02 TOA 1/31/2009 Base-12/2008 4 SEASONS Colour A4099 100 ml 241 Plastic Blue
THL 03 TOA 1/31/2009 Base-12/2008 4 SEASONS Colour A2099 100 ml 217 Plastic Yellow
THL 04 TOA 1/31/2009 Base-09/2008 4 SEASONS Colour A3006 100 ml 137 Plastic Apple
greenTHL 05 Captain 1/31/2009 Shield Plus Colour C222 100 ml 292 Plastic Red
THL 06 Captain 1/31/2009 Parashield Colour G3566 100 ml 249 Plastic Blue
THL 07 Captain 1/31/2009 Longlife Colour L1300 100 ml 284 Plastic Yellow
THL 08 Beger 1/31/2009 Base-11/08 Beger Shield (Semi Gloss)
Lot no. 084067 100 ml 256 Plastic Red
31
THL 09 Beger 1/31/2009 Base-11/08 Beger Shield (Semi Gloss)
Lot no. 084067 100 ml 274 Plastic Blue
THL 10 Beger 1/31/2009 Base-08/08 Beger Shield (Semi Gloss)
Lot no. 084066 100 ml 234 Plastic Green
THL 11 TOA 2/1/2009 Base-12/08 Super High Gloss Glipton
Lot no. 302873
1208 colour 8093
100 ml 321 Enamel Red
THL 12 TOA 2/1/2009 Base-12/08 Super High Gloss Glipton
Lot no. 302873
1208 colour 7861
100 ml 270 Enamel Yellow
THL 13 TOA 2/1/2009 Base-01/09 Super High Gloss Glipton
Lot no. 303464
0109 colour 7349
100 ml 337 Enamel Blue
THL 14 Beger 2/1/2009 Base-12/08Beger Shield
(Super Gloss)
Lot no. 087949
colour 115-6100 ml 363 Enamel Red
THL 15 Beger 2/1/2009 Base-01/09Beger Shield
(Super Gloss)
Lot no. 090095
colour 088-6100 ml 338 Enamel Yellow
THL 16 Beger 2/1/2009 Base-12/08Beger Shield
(Super Gloss)
lot no. 087949
colour 031-6100 ml 217 Enamel Blue
THL 17 Jotun 2/1/2009 Base-12/08 Gardex S0580-Y 100 ml 477 Enamel RedTHL 18 Jotun 2/1/2009 Base-01/10/08 Gardex S1080-R 100 ml 378 Enamel YellowTHL 19 Jotun 2/1/2009 Base-12/08 Gardex S4055-B 100 ml 271 Enamel Blue
THL 20 Nippon 2/1/2009 26/09Shield Pro
Alkyd Enamel
9810 lot no. 20090122 100 ml 140 Enamel Red
THL 21 Nippon 2/1/2009 13/09Shield Pro
Alkyd Enamel
9804 lot no. 20090105 100 ml 140 Enamel Yellow
THL 22 Nippon 2/1/2009 12/8/2009Shield Pro
Alkyd Enamel
9807 lot no. 20081204 100 ml 140 Enamel Blue
THL 23 Rust-Oleum 2/1/2009 8/8/2009
Protective Enamel Hi
Gloss
Safety Red 964 100 ml 270 Enamel Red
THL 24 Rust-Oleum 2/1/2009 11/7/2009
Protective Enamel Hi
Gloss
Safety Yellow 944 100 ml 235 Enamel Yellow
THL 25 Rust-Oleum 2/1/2009 10/27/2008
Protective Enamel Hi
Gloss
Deep Blue 122 100 ml 259 Enamel Blue
THL 26 Delta 2/1/2009 -/12/2007 Gloss Enamel
Signal Red 202 100 ml 149 Enamel Red
THL 27 Delta 2/1/2009 -/07/2008 Gloss Enamel
Royal Blue 403 100 ml 149 Enamel Blue
32
Table 13. Lead concentration (in both ppm and %) in paint samples from Thailand
Sample no. Paint brand Type of paint-plastic / enamel
Colour of the paints
Pb concentration
(in ppm)
Pb concentration
(in %)THL 01 TOA Plastic Red 15 0.00149THL 02 TOA Plastic Blue 3.1 0.00031THL 03 TOA Plastic Yellow 3.3 0.00033THL 04 TOA Plastic Apple green 2.2 0.00022THL 05 Captain Plastic Red NDTHL 06 Captain Plastic Blue NDTHL 07 Captain Plastic Yellow NDTHL 08 Beger Plastic Red NDTHL 09 Beger Plastic Blue NDTHL 10 Beger Plastic Green NDTHL 11 TOA Enamel Red NDTHL 12 TOA Enamel Yellow NDTHL 13 TOA Enamel Blue NDTHL 14 Beger Enamel Red 35 0.00348THL 15 Beger Enamel Yellow NDTHL 16 Beger Enamel Blue 8.5 0.00085THL 17 Jotun Enamel Red NDTHL 18 Jotun Enamel Yellow NDTHL 19 Jotun Enamel Blue NDTHL 20 Nippon Enamel Red 77,637 8THL 21 Nippon Enamel Yellow 505,716 51THL 22 Nippon Enamel Blue 14,287.4 1.4THL 23 Rust-Oleum Enamel Red 43,042 4.3THL 24 Rust-Oleum Enamel Yellow 333,695 33.4THL 25 Rust-Oleum Enamel Blue 24,260 2.4THL 26 Delta Enamel Red 30,643.2 3.1THL 27 Delta Enamel Blue 22,850 2.3
Table 14. Statistical measures of lead concentration (ppm) in samples from Thailand
All samples Enamel samples Plastic samples
Arithmetic mean 38,970.5 61,893 3Standard deviation 113,718.5 139,667.5 4.4
Maximum concentration 505,716 505,716 15Minimum concentration 0.6 0.6 0.6
Median 2.2 35 0.6
33
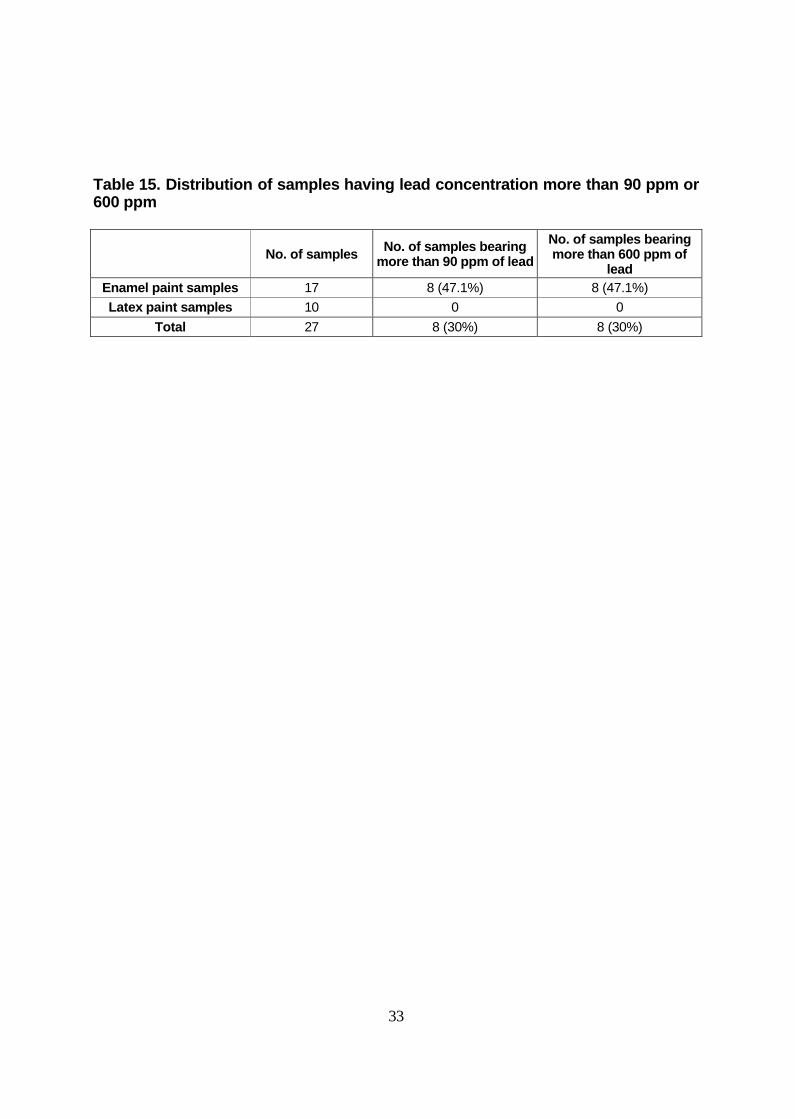
Table 15. Distribution of samples having lead concentration more than 90 ppm or 600 ppm
No. of samples No. of samples bearing more than 90 ppm of lead
No. of samples bearing more than 600 ppm of
leadEnamel paint samples 17 8 (47.1%) 8 (47.1%)Latex paint samples 10 0 0
Total 27 8 (30%) 8 (30%)
34
TANZANIA
Background
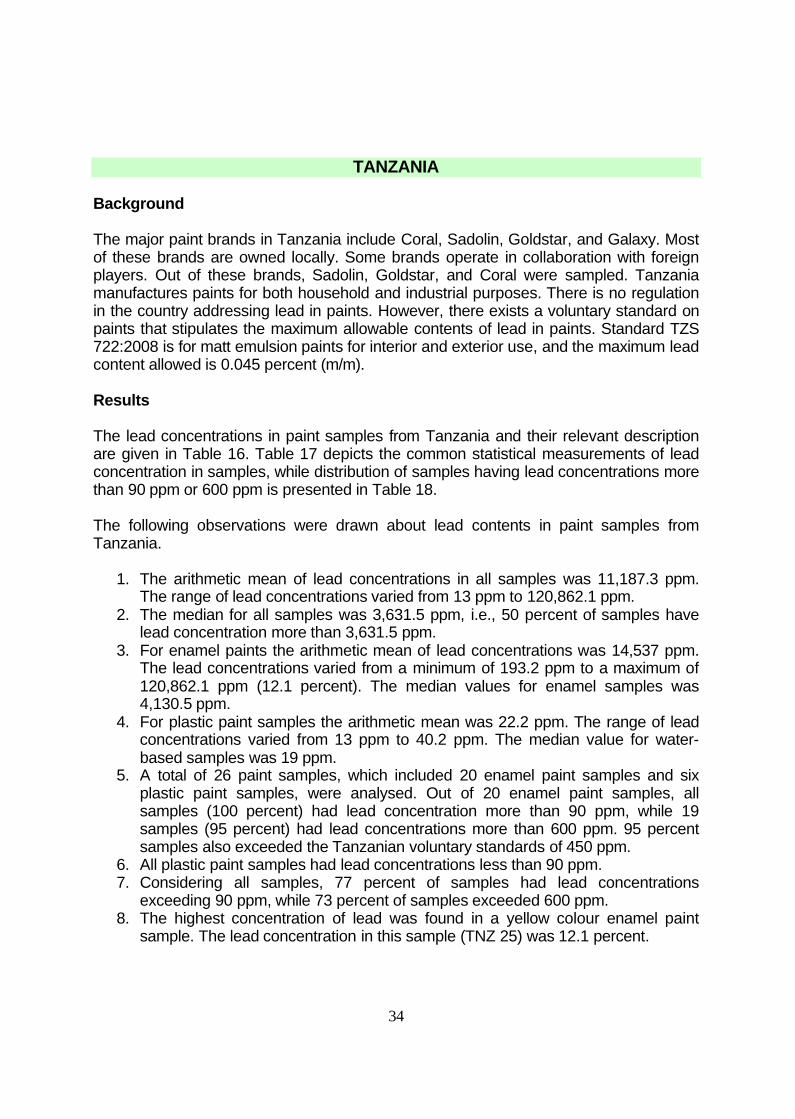
The major paint brands in Tanzania include Coral, Sadolin, Goldstar, and Galaxy. Most of these brands are owned locally. Some brands operate in collaboration with foreign players. Out of these brands, Sadolin, Goldstar, and Coral were sampled. Tanzania manufactures paints for both household and industrial purposes. There is no regulation in the country addressing lead in paints. However, there exists a voluntary standard on paints that stipulates the maximum allowable contents of lead in paints. Standard TZS 722:2008 is for matt emulsion paints for interior and exterior use, and the maximum lead content allowed is 0.045 percent (m/m).
Results
The lead concentrations in paint samples from Tanzania and their relevant description are given in Table 16. Table 17 depicts the common statistical measurements of lead concentration in samples, while distribution of samples having lead concentrations more than 90 ppm or 600 ppm is presented in Table 18.
The following observations were drawn about lead contents in paint samples from Tanzania.
1. The arithmetic mean of lead concentrations in all samples was 11,187.3 ppm. The range of lead concentrations varied from 13 ppm to 120,862.1 ppm.
2. The median for all samples was 3,631.5 ppm, i.e., 50 percent of samples have lead concentration more than 3,631.5 ppm.
3. For enamel paints the arithmetic mean of lead concentrations was 14,537 ppm. The lead concentrations varied from a minimum of 193.2 ppm to a maximum of 120,862.1 ppm (12.1 percent). The median values for enamel samples was 4,130.5 ppm.
4. For plastic paint samples the arithmetic mean was 22.2 ppm. The range of lead concentrations varied from 13 ppm to 40.2 ppm. The median value for water-based samples was 19 ppm.
5. A total of 26 paint samples, which included 20 enamel paint samples and six plastic paint samples, were analysed. Out of 20 enamel paint samples, all samples (100 percent) had lead concentration more than 90 ppm, while 19 samples (95 percent) had lead concentrations more than 600 ppm. 95 percent samples also exceeded the Tanzanian voluntary standards of 450 ppm.
6. All plastic paint samples had lead concentrations less than 90 ppm.7. Considering all samples, 77 percent of samples had lead concentrations
exceeding 90 ppm, while 73 percent of samples exceeded 600 ppm.8. The highest concentration of lead was found in a yellow colour enamel paint
sample. The lead concentration in this sample (TNZ 25) was 12.1 percent.
35
Conclusion
Some broad conclusions drawn from the study of lead content in paint samples from Tanzania are:
1. All enamel paint samples were found to have lead concentrations higher than 90 ppm. Some 95 percent of plastic paint samples had lead concentrations higher than 600 ppm or 450 ppm, the Tanzanian voluntary standard. The average lead concentration of paint samples was 11,187.4 ppm.
2. All plastic paint samples were found to have lead concentrations of less than 90 ppm.
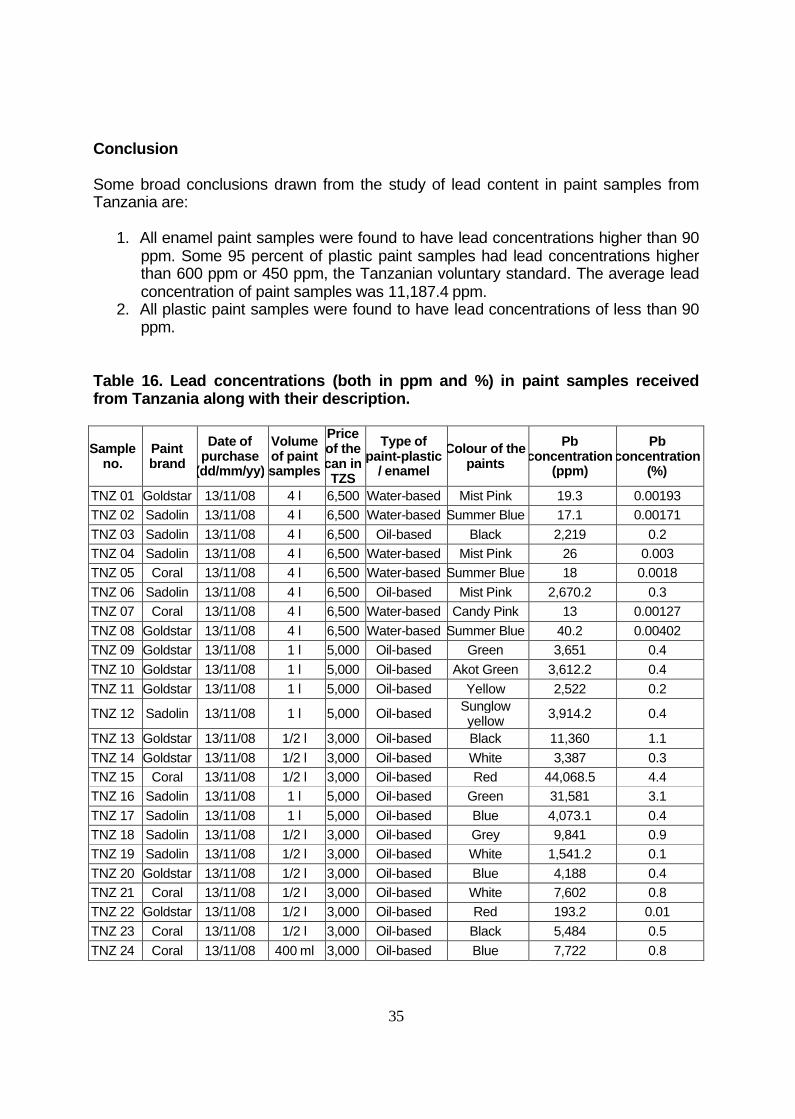
Table 16. Lead concentrations (both in ppm and %) in paint samples received from Tanzania along with their description.
Sample no.
Paint brand
Date of purchase
(dd/mm/yy)
Volume of paint samples
Price of the can in TZS
Type of paint-plastic
/ enamelColour of the
paintsPb
concentration (ppm)
Pb concentration
(%)
TNZ 01 Goldstar 13/11/08 4 l 6,500 Water-based Mist Pink 19.3 0.00193TNZ 02 Sadolin 13/11/08 4 l 6,500 Water-based Summer Blue 17.1 0.00171TNZ 03 Sadolin 13/11/08 4 l 6,500 Oil-based Black 2,219 0.2TNZ 04 Sadolin 13/11/08 4 l 6,500 Water-based Mist Pink 26 0.003TNZ 05 Coral 13/11/08 4 l 6,500 Water-based Summer Blue 18 0.0018TNZ 06 Sadolin 13/11/08 4 l 6,500 Oil-based Mist Pink 2,670.2 0.3TNZ 07 Coral 13/11/08 4 l 6,500 Water-based Candy Pink 13 0.00127TNZ 08 Goldstar 13/11/08 4 l 6,500 Water-based Summer Blue 40.2 0.00402TNZ 09 Goldstar 13/11/08 1 l 5,000 Oil-based Green 3,651 0.4TNZ 10 Goldstar 13/11/08 1 l 5,000 Oil-based Akot Green 3,612.2 0.4TNZ 11 Goldstar 13/11/08 1 l 5,000 Oil-based Yellow 2,522 0.2
TNZ 12 Sadolin 13/11/08 1 l 5,000 Oil-based Sunglow yellow 3,914.2 0.4
TNZ 13 Goldstar 13/11/08 1/2 l 3,000 Oil-based Black 11,360 1.1TNZ 14 Goldstar 13/11/08 1/2 l 3,000 Oil-based White 3,387 0.3TNZ 15 Coral 13/11/08 1/2 l 3,000 Oil-based Red 44,068.5 4.4TNZ 16 Sadolin 13/11/08 1 l 5,000 Oil-based Green 31,581 3.1TNZ 17 Sadolin 13/11/08 1 l 5,000 Oil-based Blue 4,073.1 0.4TNZ 18 Sadolin 13/11/08 1/2 l 3,000 Oil-based Grey 9,841 0.9TNZ 19 Sadolin 13/11/08 1/2 l 3,000 Oil-based White 1,541.2 0.1TNZ 20 Goldstar 13/11/08 1/2 l 3,000 Oil-based Blue 4,188 0.4TNZ 21 Coral 13/11/08 1/2 l 3,000 Oil-based White 7,602 0.8TNZ 22 Goldstar 13/11/08 1/2 l 3,000 Oil-based Red 193.2 0.01TNZ 23 Coral 13/11/08 1/2 l 3,000 Oil-based Black 5,484 0.5TNZ 24 Coral 13/11/08 400 ml 3,000 Oil-based Blue 7,722 0.8
36
TNZ 25 Coral 13/11/08 400 ml 3,000 Oil-based Yellow 120,862.1 12.1TNZ 26 Coral 13/11/08 1/2 l 3,000 Oil-based Green 20,248 2.0TZS: Tanzanian Shilling
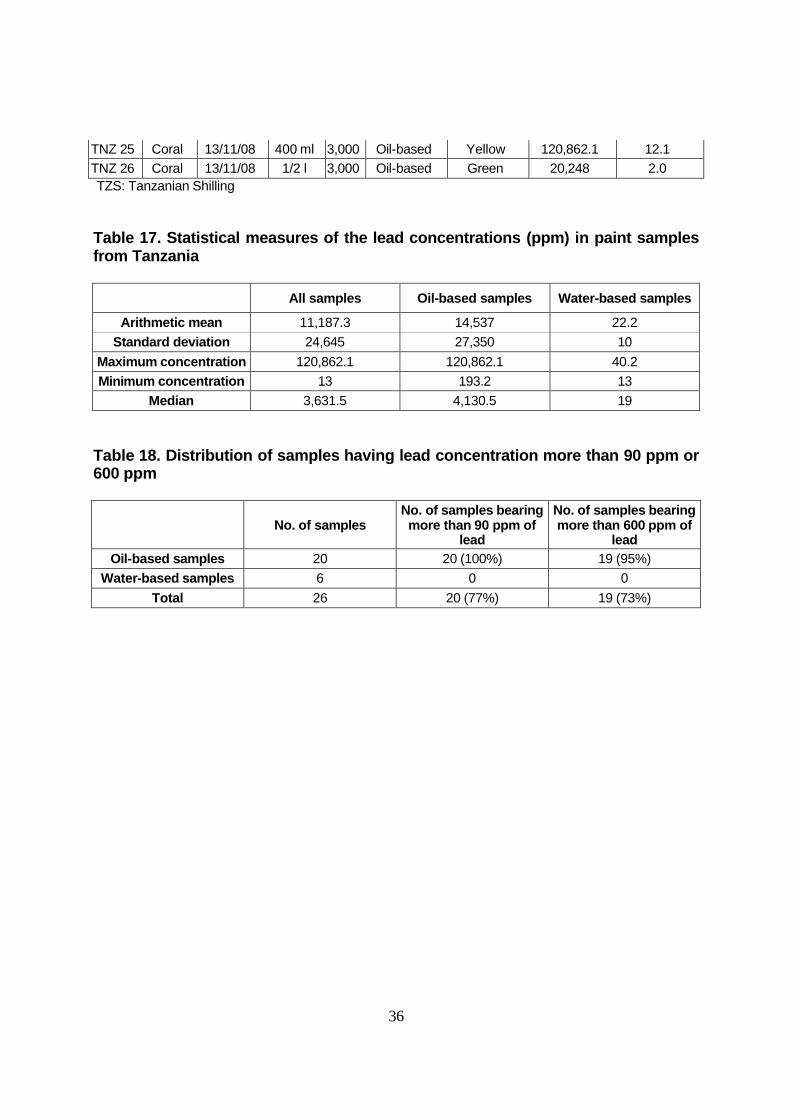
Table 17. Statistical measures of the lead concentrations (ppm) in paint samples from Tanzania
All samples Oil-based samples Water-based samples
Arithmetic mean 11,187.3 14,537 22.2Standard deviation 24,645 27,350 10
Maximum concentration 120,862.1 120,862.1 40.2Minimum concentration 13 193.2 13
Median 3,631.5 4,130.5 19
Table 18. Distribution of samples having lead concentration more than 90 ppm or 600 ppm
No. of samplesNo. of samples bearing more than 90 ppm of
lead
No. of samples bearing more than 600 ppm of
lead Oil-based samples 20 20 (100%) 19 (95%)
Water-based samples 6 0 0Total 26 20 (77%) 19 (73%)
37
SOUTH AFRICA
Background
In South Africa, the major paint brands are Plascon (30 percent market share) and Dulux (20 percent market share). Prominent Paints claims to be the third largest brand in South Africa (anecdotally they seem to have a larger market share only in certain provinces, namely Western Cape and Gauteng, and Kwa-Zulu Natal). Other brands include Homestead, Warrior Paints, Dekro, Chemspec (mostly industrial with a small market share in decorative paints), Duraline, and Duram. Exact market share of the smaller companies is not known. According to the Gauteng Economic Development Agency, there are over 350 paint manufacturers in the country. Of the brands mentioned here, samples were collected for Prominent Paints, Plascon, Dekade, Dulux, and SPRAYON.
Paint industry in South Africa recorded R4 billion revenue in 2006. Plascon’s revenue for the year end-September 2008 was R2.7 billion, while operating profit increased by 10 percent to R397m.9 Plascon employs approximately 1,350 people. Dulux has annual revenue of around R700 million. Chemspec’s revenue increased to R322.5 million in the six months by September 2008 (Business Report, 26 Nov 2008).
Plascon is a part of a larger corporation called Freeworld Coatings Ltd, active in South Africa and also Southern Africa, China, England, and Australia.10 Plascon was formerly a part of BarloWorld, but was unbundled in 2007.
Dulux was formerly owned by the South African company AECI but later sold to ICI (Imperial Chemicals Industries) in 2007.11 Through this purchase, ICI owns the Dulux brand in South Africa, Botswana, Malawi, Namibia, Swaziland and Zambia through its subsidiaries. ICI is now a part of the AkzoNobel Corporation. In 2003, AkzoNobel had claimed to have globally phased out lead use in its paint products.12
Prominent Paints is owned by Sigma Coatings (formerly SigmaKalon), which in January 2008 integrated with PPG Industries Group, one of the largest paint and coatings corporations in the world.13 Plascon and Dulux together make up 50 percent of market share. However, there are many paint manufacturers and small-scale retailers.
South Africa manufactures both decorative and industrial paints. As stated earlier, decorative paints are intended for household use while industrial paints are for the automotive and marine sectors. These are available in two variants water-based and oil-
9 http://www.fin24.com/articles/default/display_article.aspx?ArticleId=242853810 http://www.freeworldcoatings.com/docs/CO_STRUCTURE.PDF11 http://uk.reuters.com/article/hotStocksNews/idUKWLB89582007071712 http://platform.akzonobel.com/Akzo.Web.GDS/Asset.aspx?id=ce8fea43-95ba-4e2b-8ebb-206665d59888&noredirect=true13 http://corporateportal.ppg.com/PPG/ACEMEA/AfricaAsia.htm
38
based. . Decorative paints tend to label themselves as ‘lead-free’, but according to both Plascon and Dekro, some industrial paints still contain lead.
The legislative framework
In South Africa there was a voluntary agreement among the members of the South African Paint Manufacturers Association (SAPMA) in 1970 to keep lead levels low in their paints. The Recommended Code of Practice also stated that SAPMA members must affix warning labels on paint cans that contain more than 0.15 percent lead. In March 2008, lead regulations under the Hazardous Substances Act were published for the public comment. However, the current status of the legislation is not clear.
A Medical Research Council study has found very high blood lead levels among children than the permissible 10 �g per decilitre of blood.14 A study of paint samples collected from dwellings located in randomly selected Johannesburg suburbs by South African Medical Research Council had found that most manufacturers of decorative paints were not complying with their own voluntary Code of Conduct.15 It also found that plastic paints and white enamel paints did not contain lead, but pigmented enamel paints did. In response, the Department of Health started an awareness and lead poisoning prevention campaign and legislation was drawn up. The legislation (Hazardous Substances Act), published for comment in March 2008, states that ‘leaded paint’ is one that contains lead in quantities greater than 0.06 percent (or 600 ppm), and that any paint (or similar surface coating) with higher than 600 ppm is banned for sale under the Hazardous Substances Act.
The March 2008 legislation bans children’s toys and furniture coated with leaded paint, use of leaded paint in residences, schools, pre-school institutions, hospitals, parks, playgrounds, and public buildings where consumers have direct access to the painted surface.
Agricultural and industrial paints containing lead are not banned, but must carry warning labels that clearly state their lead status, and should not be used on interior surfaces near children. Unfortunately, there is no further information on the legislation whether it has been approved or not; although all of the paint retailers questioned seemed to think that the legislation was already in place or would be in place soon—by the middle of 2009. Most retailers also emphasized the link between lead and children. In South Africa, many paint cans are labelled as either “Lead-free” or “Contains lead.”
Paint sampling in South Africa
The following paint samples were purchased and sampled from South Africa: Prominent Paints (one litre), costing R70.61 at a factory shop in Pietermaritzburg; Dekade (500 ml), costing between R56 and R58 (varying colours) at a retail outlet; Plascon (500 ml),
14 MRC News, December 2006; Retrieved from http://www.mrc.ac.za/mrcnews/dec2006/stripped.htm on 11 November 2008.15 Mathee, et al., 2007.
39
costing R58.05; and Dulux (one litre), costing between R116 and R121 at any outlet in Pietermaritzburg.
In terms of cost, all paints, other than Prominent Paints, are on a par. Prominent Paint and Dulux do not retail tins smaller than one litre. However, Dekade has much smaller operation and perhaps does not benefit from the economies of scale in the way that Dulux and Plascon might.
Trade in paints
Prominent Paint has recently expanded into China, where it has opened the first of 10 stores, and has exported the largest ever order of paint from South Africa.16 Chemspec has exported automotive finishes to Mauritius and China, and is currently in talks with a partner company in East Asia to distribute a water-based automotive paint.
Chemspec currently manufactures in South Africa and in the U.S. and exports 13 percent of its South African production. Plascon does not import any paint, but exports to sub-Saharan Africa. Similarly, Dulux exports to sub-Saharan Africa and the Indian Ocean islands, but does not import into South Africa. Dekade does not export at all and its market is localized in Kwa-Zulu Natal.
Plascon claims that its decorative paint is completely lead-free, and has been so for three years. They obtain lead-free pigments for their enamel paints from suppliers in the European Union, and state that they had chosen this route because of the human safety issue. However, Plascon states that some of its industrial paints still do contain lead. Dulux is also phasing out lead from its paints, but certain colours still contain lead. Chemspec’s decorative paints division also claims to be lead-free. According to one of Dekade’s retail outlet, it only uses lead for certain colours and that it was compliant with legislation because the tins are labelled as such.
Information received from the South African Oil and Color Chemists Association states that lead in paints in South Africa is used primarily as a pigment. Dulux uses lead in their decorative paints as a pigment. Plascon’s industrial paint still contains lead as a pigment, because it is cheaper than the pigments they obtain from the EU. Other manufacturers that use lead in their industrial formulations include Dekro. Dekade also uses lead as a pigment for its paints. The head chemist from Dekade stated that it would not require a technology shift to phase out lead from paint; however, the major limitation in going for lead-free alternatives is the cost difference, which can be up to three times higher. (Dekade claims to produce entirely lead-free ranges). Titanium dioxide is a well-established alternative to lead-based pigments in paints.
16 http://www.geda.co.za/live/content.php?Item_ID=76
40
Results
A summary description of paint samples received from South Africa is given in Table 19, and their corresponding lead contents (in ppm and in %) are shown in Table 20. Some of the major features of the findings are:
1. All paint samples received from South Africa were enamel paints.2. Some 65.5 percent of the total samples had lead concentrations more than 90
ppm.3. Some 62 percent of the total samples had lead concentration more than 600
ppm.4. The arithmetic mean of the lead concentrations of all samples was 19,862 ppm
(two percent) with lead concentrations varying from three ppm (0.0003 percent) to 195,289 ppm (19.5 percent).
5. The median lead concentration of all samples was 11 ppm (0.00108 percent), implying that 50 percent of the samples had lead concentration more than 11 ppm (0.00108 percent).
6. Plascon and Dulux samples, the two major brands that claim to produce lead-free paints, had lead concentrations lower than 600 ppm. Dulux samples of all colours had lead concentration of less than 600 ppm and majority of them were labelled as ‘lead free’. This concentration of 600 ppm is the South African standard for lead in paints, as per the Hazardous Substances Act published in 2008. In fact, the majority of samples from these two brands had lead concentrations lower than 90 ppm. However, one sample had lead concentration of 506 ppm.
7. Interestingly not all brands follow their own agreed code of practices of labelling paint cans if it contains lead more than 1,500 ppm (or 0.1 percent).
8. There were five samples, three of Prominent Paints and two of Dekade paints, which had lead in high concentrations—more than 1,500 ppm (0.1 percent), ranging from 1,986.4 ppm (0.2 percent) to 54,778 ppm (5.5 percent), but without any warning labels.
9. There were two samples, spray paints of Sprayon, which had lead in high concentrations contrary to their claims. One sample (RSA 28) was found to be 10.2 percent lead while the other (RSA 29) was 19.5 percent lead. These samples prominently mention ‘no lead’ on their labels
Conclusions
The following conclusions can be drawn about the lead in paints in South Africa.
1. Some 65.5 percent of total samples (only enamel) had lead levels higher than 90 ppm. The average concentration of lead was 19,862 ppm.
2. Some 62 percent had lead concentrations more than 600 ppm (0.1 percent).3. Only some brands follow the code of practices of South African Paint
Manufacturers Association (SAPMA) according to which SAPMA members must affix warning labels on paint cans that contain more than 0.15 percent lead.
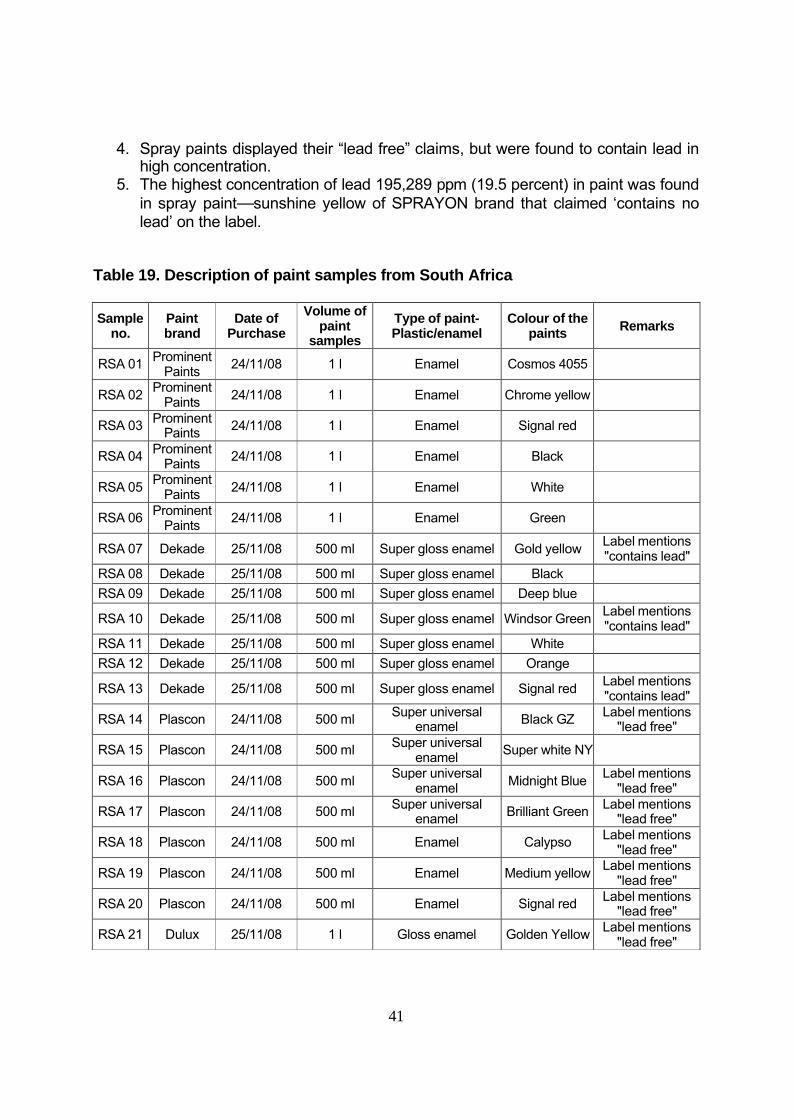
41
4. Spray paints displayed their “lead free” claims, but were found to contain lead in high concentration.
5. The highest concentration of lead 195,289 ppm (19.5 percent) in paint was found in spray paint—sunshine yellow of SPRAYON brand that claimed ‘contains no lead’ on the label.
Table 19. Description of paint samples from South Africa
Sample no.
Paint brand
Date of Purchase
Volume of paint
samplesType of paint-Plastic/enamel
Colour of the paints Remarks
RSA 01 Prominent Paints 24/11/08 1 l Enamel Cosmos 4055
RSA 02 Prominent Paints 24/11/08 1 l Enamel Chrome yellow
RSA 03 Prominent Paints 24/11/08 1 l Enamel Signal red
RSA 04 Prominent Paints 24/11/08 1 l Enamel Black
RSA 05 Prominent Paints 24/11/08 1 l Enamel White
RSA 06 Prominent Paints 24/11/08 1 l Enamel Green
RSA 07 Dekade 25/11/08 500 ml Super gloss enamel Gold yellow Label mentions "contains lead"
RSA 08 Dekade 25/11/08 500 ml Super gloss enamel BlackRSA 09 Dekade 25/11/08 500 ml Super gloss enamel Deep blue
RSA 10 Dekade 25/11/08 500 ml Super gloss enamel Windsor Green Label mentions "contains lead"
RSA 11 Dekade 25/11/08 500 ml Super gloss enamel WhiteRSA 12 Dekade 25/11/08 500 ml Super gloss enamel Orange
RSA 13 Dekade 25/11/08 500 ml Super gloss enamel Signal red Label mentions "contains lead"
RSA 14 Plascon 24/11/08 500 ml Super universal enamel Black GZ Label mentions
"lead free"
RSA 15 Plascon 24/11/08 500 ml Super universal enamel Super white NY
RSA 16 Plascon 24/11/08 500 ml Super universal enamel Midnight Blue Label mentions
"lead free"
RSA 17 Plascon 24/11/08 500 ml Super universal enamel Brilliant Green Label mentions
"lead free"
RSA 18 Plascon 24/11/08 500 ml Enamel Calypso Label mentions "lead free"
RSA 19 Plascon 24/11/08 500 ml Enamel Medium yellow Label mentions "lead free"
RSA 20 Plascon 24/11/08 500 ml Enamel Signal red Label mentions "lead free"
RSA 21 Dulux 25/11/08 1 l Gloss enamel Golden Yellow Label mentions "lead free"
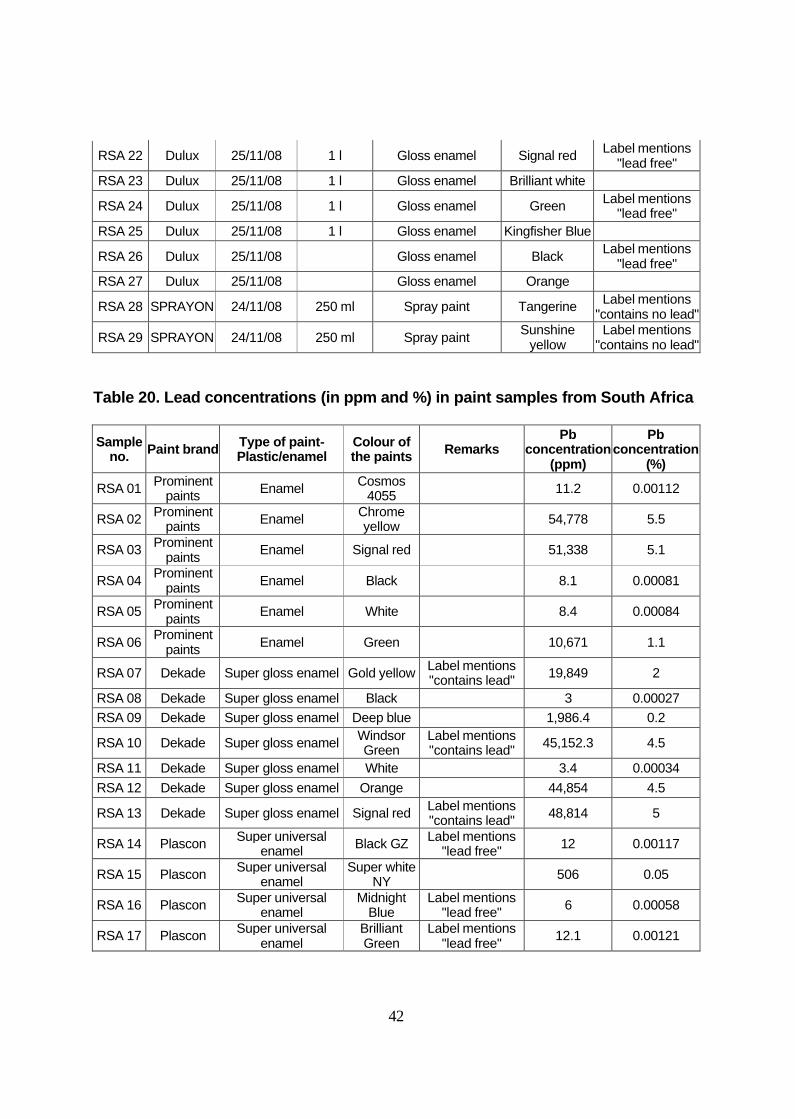
42
RSA 22 Dulux 25/11/08 1 l Gloss enamel Signal red Label mentions "lead free"
RSA 23 Dulux 25/11/08 1 l Gloss enamel Brilliant white
RSA 24 Dulux 25/11/08 1 l Gloss enamel Green Label mentions "lead free"
RSA 25 Dulux 25/11/08 1 l Gloss enamel Kingfisher Blue
RSA 26 Dulux 25/11/08 Gloss enamel Black Label mentions "lead free"
RSA 27 Dulux 25/11/08 Gloss enamel Orange
RSA 28 SPRAYON 24/11/08 250 ml Spray paint Tangerine Label mentions "contains no lead"
RSA 29 SPRAYON 24/11/08 250 ml Spray paint Sunshine yellow
Label mentions "contains no lead"
Table 20. Lead concentrations (in ppm and %) in paint samples from South Africa
Sample no. Paint brand Type of paint-
Plastic/enamelColour of the paints Remarks
Pb concentration
(ppm)
Pb concentration
(%)
RSA 01 Prominent paints Enamel Cosmos
4055 11.2 0.00112
RSA 02 Prominent paints Enamel Chrome
yellow 54,778 5.5
RSA 03 Prominent paints Enamel Signal red 51,338 5.1
RSA 04 Prominent paints Enamel Black 8.1 0.00081
RSA 05 Prominent paints Enamel White 8.4 0.00084
RSA 06 Prominent paints Enamel Green 10,671 1.1
RSA 07 Dekade Super gloss enamel Gold yellow Label mentions "contains lead" 19,849 2
RSA 08 Dekade Super gloss enamel Black 3 0.00027RSA 09 Dekade Super gloss enamel Deep blue 1,986.4 0.2
RSA 10 Dekade Super gloss enamel Windsor Green
Label mentions "contains lead" 45,152.3 4.5
RSA 11 Dekade Super gloss enamel White 3.4 0.00034RSA 12 Dekade Super gloss enamel Orange 44,854 4.5
RSA 13 Dekade Super gloss enamel Signal red Label mentions "contains lead" 48,814 5
RSA 14 Plascon Super universal enamel Black GZ Label mentions
"lead free" 12 0.00117
RSA 15 Plascon Super universal enamel
Super white NY 506 0.05
RSA 16 Plascon Super universal enamel
Midnight Blue
Label mentions "lead free" 6 0.00058
RSA 17 Plascon Super universal enamel
Brilliant Green
Label mentions "lead free" 12.1 0.00121
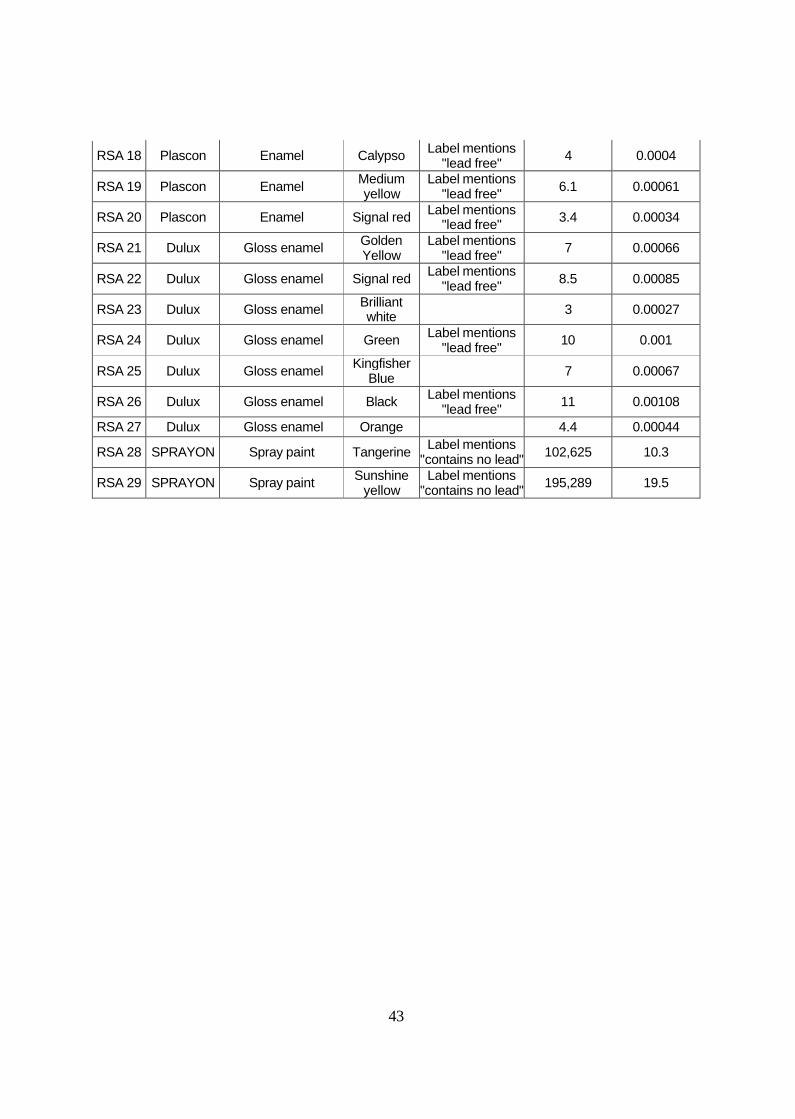
43
RSA 18 Plascon Enamel Calypso Label mentions "lead free" 4 0.0004
RSA 19 Plascon Enamel Medium yellow
Label mentions "lead free" 6.1 0.00061
RSA 20 Plascon Enamel Signal red Label mentions "lead free" 3.4 0.00034
RSA 21 Dulux Gloss enamel Golden Yellow
Label mentions "lead free" 7 0.00066
RSA 22 Dulux Gloss enamel Signal red Label mentions "lead free" 8.5 0.00085
RSA 23 Dulux Gloss enamel Brilliant white 3 0.00027
RSA 24 Dulux Gloss enamel Green Label mentions "lead free" 10 0.001
RSA 25 Dulux Gloss enamel Kingfisher Blue 7 0.00067
RSA 26 Dulux Gloss enamel Black Label mentions "lead free" 11 0.00108
RSA 27 Dulux Gloss enamel Orange 4.4 0.00044
RSA 28 SPRAYON Spray paint Tangerine Label mentions "contains no lead" 102,625 10.3
RSA 29 SPRAYON Spray paint Sunshine yellow
Label mentions "contains no lead" 195,289 19.5
44
NIGERIA
Background
Nigeria manufactures about 40 million litres of decorative paints annually. The domestic market share of decorative paints is 60 percent, industrial paints 20 percent, refinishing 10 percent, and wood finishing and automotive five percent each. The Paints Manufacturers Association of Nigeria (PMA), a sub-sector of the Chemical and Pharmaceuticals group of the Manufacturers Association of Nigeria (MAN), is an association of companies engaged in the manufacturing of paints and allied products throughout Nigeria. The PMA, established in 1982 with membership of 18, now has more than 200 registered members in its fold.
Paints manufacturing in Nigeria commenced with the establishment of three paint companies in 1962: Askar Paints Nig. Ltd at Ibadan (a subsidiary of Haifa Paints Israel), British Paint (Berger Paints) and International Paints (IPWA).
Before 1962, the bulk of paints consumed in Nigeria were imported mainly from the United Kingdom and France. The 1980s saw growth of indigenous paint manufacturing outfits both registered and unregistered, especially in the household sector. The big multinationals are still the major players in the marine and auto sectors of the industry. The brands sampled were Chemstar, Portland, President, CAPL, Berger, and MEYER; Berger is the only multinational brand.
Nigeria has no standard for lead in paints. This leaves the general public at the mercy of paint manufacturers. Lead is used during the production stage as a drying agent for the preservation of paints. However, there are alternatives to lead as a drying agent in paint production, and this is recognised by the PMA. These include zirconium, metallic zinc, cobalt, and metallic calcium, among others. An interesting fact is that it would not require a change in technology to substitute any of these in paint production.
Paint manufacturers have blamed the rising cost of production partly on high prices of imported raw materials, which they say constitute 70 percent of their production inputs. Total investment in the industry is about N15 billion, with an installed capacity in excess of 150 million litres and employing about 10,000 people. In 1998, the estimated production and consumption of paints was 38 million litres or 25.33 percent capacity utilisation. In 2003, the average production level was about 30 million litres or 20 percent capacity utilisation.
Results
Lead concentrations of all paint samples from Nigeria with their respective description are given in Table 21. Table 22 shows the statistical measurements of lead concentrations in samples from Nigeria while distribution of lead concentrations is presented in Table 23.
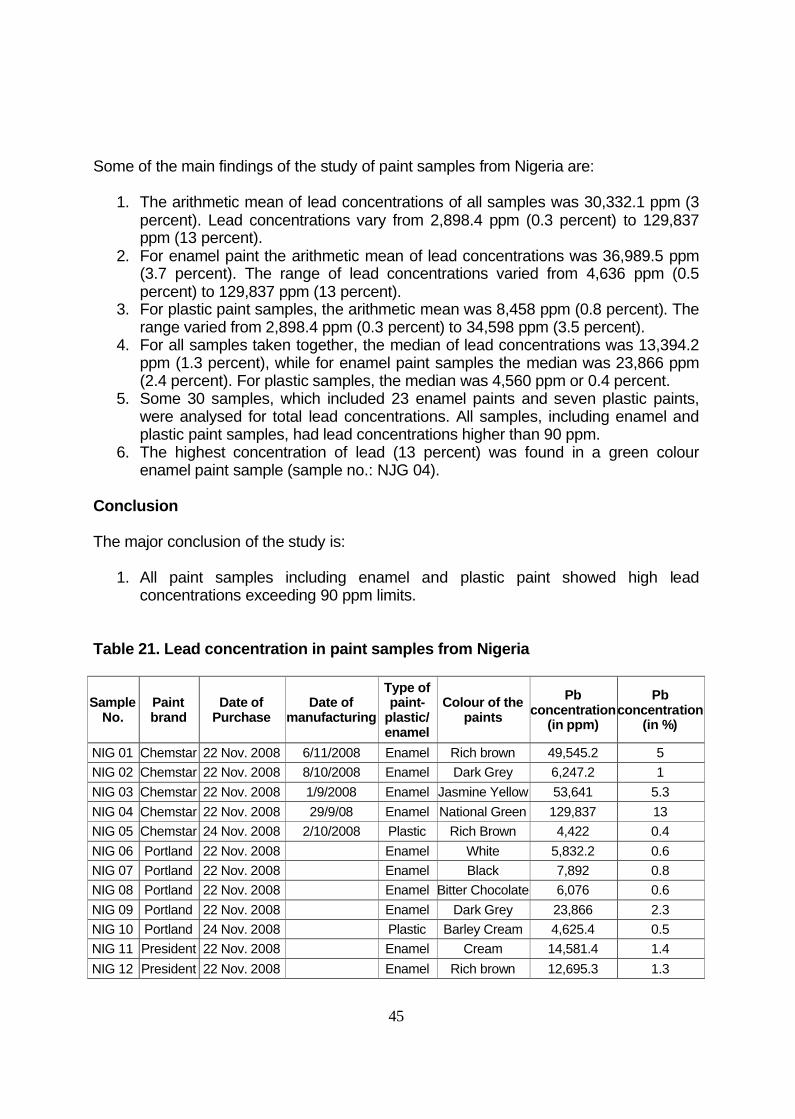
45
Some of the main findings of the study of paint samples from Nigeria are:
1. The arithmetic mean of lead concentrations of all samples was 30,332.1 ppm (3 percent). Lead concentrations vary from 2,898.4 ppm (0.3 percent) to 129,837 ppm (13 percent).
2. For enamel paint the arithmetic mean of lead concentrations was 36,989.5 ppm (3.7 percent). The range of lead concentrations varied from 4,636 ppm (0.5 percent) to 129,837 ppm (13 percent).
3. For plastic paint samples, the arithmetic mean was 8,458 ppm (0.8 percent). The range varied from 2,898.4 ppm (0.3 percent) to 34,598 ppm (3.5 percent).
4. For all samples taken together, the median of lead concentrations was 13,394.2 ppm (1.3 percent), while for enamel paint samples the median was 23,866 ppm (2.4 percent). For plastic samples, the median was 4,560 ppm or 0.4 percent.
5. Some 30 samples, which included 23 enamel paints and seven plastic paints, were analysed for total lead concentrations. All samples, including enamel and plastic paint samples, had lead concentrations higher than 90 ppm.
6. The highest concentration of lead (13 percent) was found in a green colour enamel paint sample (sample no.: NJG 04).
Conclusion
The major conclusion of the study is:
1. All paint samples including enamel and plastic paint showed high lead concentrations exceeding 90 ppm limits.
Table 21. Lead concentration in paint samples from Nigeria
Sample No.
Paint brand
Date of Purchase
Date of manufacturing
Type of paint-
plastic/ enamel
Colour of the paints
Pb concentration
(in ppm)
Pb concentration
(in %)
NIG 01 Chemstar 22 Nov. 2008 6/11/2008 Enamel Rich brown 49,545.2 5NIG 02 Chemstar 22 Nov. 2008 8/10/2008 Enamel Dark Grey 6,247.2 1NIG 03 Chemstar 22 Nov. 2008 1/9/2008 Enamel Jasmine Yellow 53,641 5.3NIG 04 Chemstar 22 Nov. 2008 29/9/08 Enamel National Green 129,837 13NIG 05 Chemstar 24 Nov. 2008 2/10/2008 Plastic Rich Brown 4,422 0.4NIG 06 Portland 22 Nov. 2008 Enamel White 5,832.2 0.6NIG 07 Portland 22 Nov. 2008 Enamel Black 7,892 0.8NIG 08 Portland 22 Nov. 2008 Enamel Bitter Chocolate 6,076 0.6NIG 09 Portland 22 Nov. 2008 Enamel Dark Grey 23,866 2.3NIG 10 Portland 24 Nov. 2008 Plastic Barley Cream 4,625.4 0.5NIG 11 President 22 Nov. 2008 Enamel Cream 14,581.4 1.4NIG 12 President 22 Nov. 2008 Enamel Rich brown 12,695.3 1.3
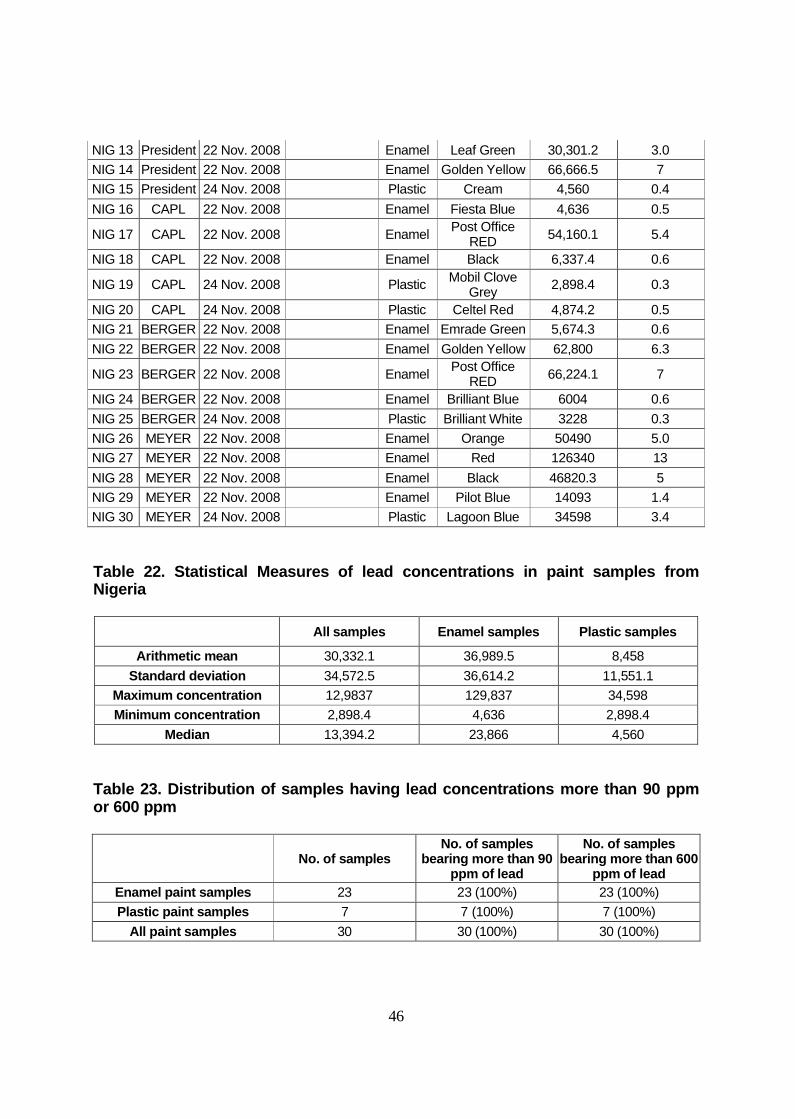
46
NIG 13 President 22 Nov. 2008 Enamel Leaf Green 30,301.2 3.0NIG 14 President 22 Nov. 2008 Enamel Golden Yellow 66,666.5 7NIG 15 President 24 Nov. 2008 Plastic Cream 4,560 0.4NIG 16 CAPL 22 Nov. 2008 Enamel Fiesta Blue 4,636 0.5
NIG 17 CAPL 22 Nov. 2008 Enamel Post Office RED 54,160.1 5.4
NIG 18 CAPL 22 Nov. 2008 Enamel Black 6,337.4 0.6
NIG 19 CAPL 24 Nov. 2008 Plastic Mobil Clove Grey 2,898.4 0.3
NIG 20 CAPL 24 Nov. 2008 Plastic Celtel Red 4,874.2 0.5NIG 21 BERGER 22 Nov. 2008 Enamel Emrade Green 5,674.3 0.6NIG 22 BERGER 22 Nov. 2008 Enamel Golden Yellow 62,800 6.3
NIG 23 BERGER 22 Nov. 2008 Enamel Post Office RED 66,224.1 7
NIG 24 BERGER 22 Nov. 2008 Enamel Brilliant Blue 6004 0.6NIG 25 BERGER 24 Nov. 2008 Plastic Brilliant White 3228 0.3NIG 26 MEYER 22 Nov. 2008 Enamel Orange 50490 5.0NIG 27 MEYER 22 Nov. 2008 Enamel Red 126340 13NIG 28 MEYER 22 Nov. 2008 Enamel Black 46820.3 5NIG 29 MEYER 22 Nov. 2008 Enamel Pilot Blue 14093 1.4NIG 30 MEYER 24 Nov. 2008 Plastic Lagoon Blue 34598 3.4
Table 22. Statistical Measures of lead concentrations in paint samples from Nigeria
All samples Enamel samples Plastic samples
Arithmetic mean 30,332.1 36,989.5 8,458Standard deviation 34,572.5 36,614.2 11,551.1
Maximum concentration 12,9837 129,837 34,598Minimum concentration 2,898.4 4,636 2,898.4
Median 13,394.2 23,866 4,560
Table 23. Distribution of samples having lead concentrations more than 90 ppm or 600 ppm
No. of samplesNo. of samples
bearing more than 90 ppm of lead
No. of samples bearing more than 600
ppm of leadEnamel paint samples 23 23 (100%) 23 (100%)Plastic paint samples 7 7 (100%) 7 (100%)
All paint samples 30 30 (100%) 30 (100%)
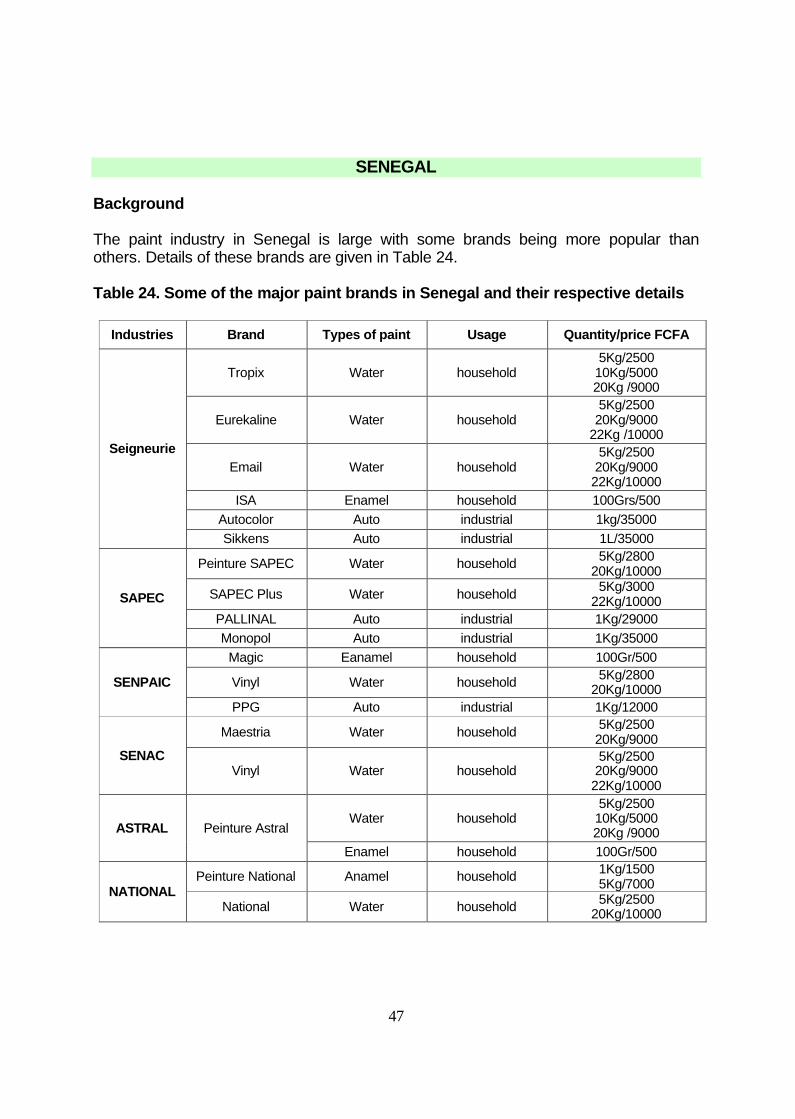
47
SENEGAL
Background
The paint industry in Senegal is large with some brands being more popular than others. Details of these brands are given in Table 24.
Table 24. Some of the major paint brands in Senegal and their respective details
Industries Brand Types of paint Usage Quantity/price FCFA
Seigneurie
Tropix Water household5Kg/2500
10Kg/500020Kg /9000
Eurekaline Water household5Kg/2500
20Kg/900022Kg /10000
Email Water household5Kg/2500
20Kg/900022Kg/10000
ISA Enamel household 100Grs/500Autocolor Auto industrial 1kg/35000Sikkens Auto industrial 1L/35000
SAPEC
Peinture SAPEC Water household 5Kg/280020Kg/10000
SAPEC Plus Water household 5Kg/300022Kg/10000
PALLINAL Auto industrial 1Kg/29000Monopol Auto industrial 1Kg/35000
SENPAIC
Magic Eanamel household 100Gr/500
Vinyl Water household 5Kg/280020Kg/10000
PPG Auto industrial 1Kg/12000
SENAC
Maestria Water household 5Kg/250020Kg/9000
Vinyl Water household5Kg/2500
20Kg/900022Kg/10000
ASTRAL Peinture AstralWater household
5Kg/250010Kg/500020Kg /9000
Enamel household 100Gr/500
NATIONALPeinture National Anamel household 1Kg/1500
5Kg/7000
National Water household 5Kg/250020Kg/10000
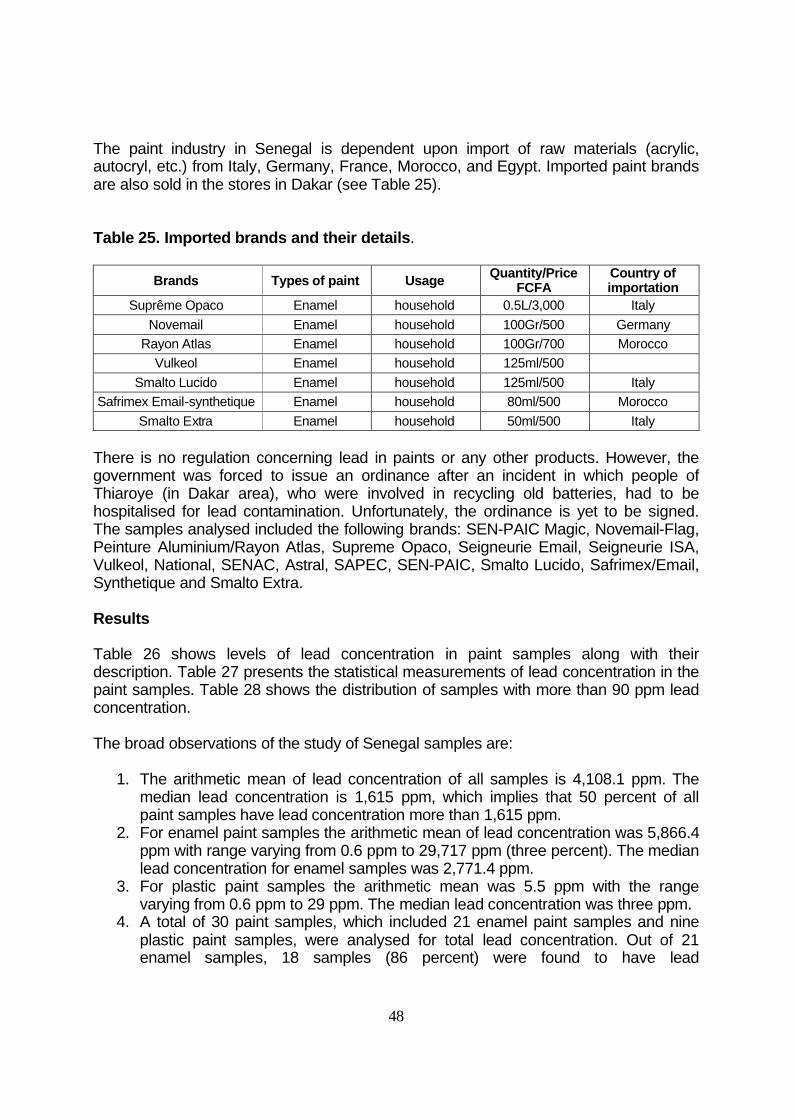
48
The paint industry in Senegal is dependent upon import of raw materials (acrylic, autocryl, etc.) from Italy, Germany, France, Morocco, and Egypt. Imported paint brands are also sold in the stores in Dakar (see Table 25).
Table 25. Imported brands and their details.
Brands Types of paint Usage Quantity/Price FCFA
Country of importation
Suprême Opaco Enamel household 0.5L/3,000 ItalyNovemail Enamel household 100Gr/500 Germany
Rayon Atlas Enamel household 100Gr/700 MoroccoVulkeol Enamel household 125ml/500
Smalto Lucido Enamel household 125ml/500 ItalySafrimex Email-synthetique Enamel household 80ml/500 Morocco
Smalto Extra Enamel household 50ml/500 Italy
There is no regulation concerning lead in paints or any other products. However, the government was forced to issue an ordinance after an incident in which people of Thiaroye (in Dakar area), who were involved in recycling old batteries, had to be hospitalised for lead contamination. Unfortunately, the ordinance is yet to be signed. The samples analysed included the following brands: SEN-PAIC Magic, Novemail-Flag, Peinture Aluminium/Rayon Atlas, Supreme Opaco, Seigneurie Email, Seigneurie ISA, Vulkeol, National, SENAC, Astral, SAPEC, SEN-PAIC, Smalto Lucido, Safrimex/Email, Synthetique and Smalto Extra.
Results
Table 26 shows levels of lead concentration in paint samples along with their description. Table 27 presents the statistical measurements of lead concentration in the paint samples. Table 28 shows the distribution of samples with more than 90 ppm lead concentration.
The broad observations of the study of Senegal samples are:
1. The arithmetic mean of lead concentration of all samples is 4,108.1 ppm. The median lead concentration is 1,615 ppm, which implies that 50 percent of all paint samples have lead concentration more than 1,615 ppm.
2. For enamel paint samples the arithmetic mean of lead concentration was 5,866.4ppm with range varying from 0.6 ppm to 29,717 ppm (three percent). The median lead concentration for enamel samples was 2,771.4 ppm.
3. For plastic paint samples the arithmetic mean was 5.5 ppm with the range varying from 0.6 ppm to 29 ppm. The median lead concentration was three ppm.
4. A total of 30 paint samples, which included 21 enamel paint samples and nine plastic paint samples, were analysed for total lead concentration. Out of 21 enamel samples, 18 samples (86 percent) were found to have lead
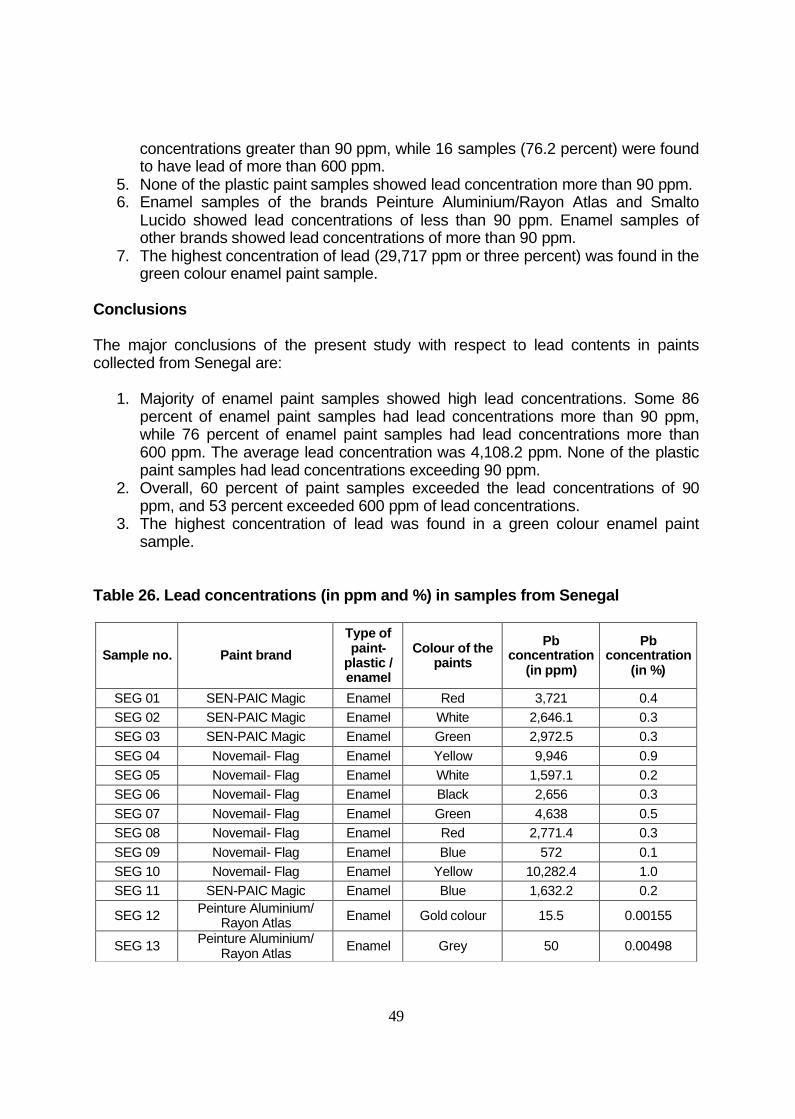
49
concentrations greater than 90 ppm, while 16 samples (76.2 percent) were found to have lead of more than 600 ppm.
5. None of the plastic paint samples showed lead concentration more than 90 ppm.6. Enamel samples of the brands Peinture Aluminium/Rayon Atlas and Smalto
Lucido showed lead concentrations of less than 90 ppm. Enamel samples of other brands showed lead concentrations of more than 90 ppm.
7. The highest concentration of lead (29,717 ppm or three percent) was found in the green colour enamel paint sample.
Conclusions
The major conclusions of the present study with respect to lead contents in paints collected from Senegal are:
1. Majority of enamel paint samples showed high lead concentrations. Some 86 percent of enamel paint samples had lead concentrations more than 90 ppm, while 76 percent of enamel paint samples had lead concentrations more than 600 ppm. The average lead concentration was 4,108.2 ppm. None of the plastic paint samples had lead concentrations exceeding 90 ppm.
2. Overall, 60 percent of paint samples exceeded the lead concentrations of 90 ppm, and 53 percent exceeded 600 ppm of lead concentrations.
3. The highest concentration of lead was found in a green colour enamel paint sample.
Table 26. Lead concentrations (in ppm and %) in samples from Senegal
Sample no. Paint brandType of paint-
plastic / enamel
Colour of the paints
Pb concentration
(in ppm)
Pb concentration
(in %)
SEG 01 SEN-PAIC Magic Enamel Red 3,721 0.4SEG 02 SEN-PAIC Magic Enamel White 2,646.1 0.3SEG 03 SEN-PAIC Magic Enamel Green 2,972.5 0.3SEG 04 Novemail- Flag Enamel Yellow 9,946 0.9SEG 05 Novemail- Flag Enamel White 1,597.1 0.2SEG 06 Novemail- Flag Enamel Black 2,656 0.3SEG 07 Novemail- Flag Enamel Green 4,638 0.5SEG 08 Novemail- Flag Enamel Red 2,771.4 0.3SEG 09 Novemail- Flag Enamel Blue 572 0.1SEG 10 Novemail- Flag Enamel Yellow 10,282.4 1.0SEG 11 SEN-PAIC Magic Enamel Blue 1,632.2 0.2
SEG 12 Peinture Aluminium/ Rayon Atlas Enamel Gold colour 15.5 0.00155
SEG 13 Peinture Aluminium/ Rayon Atlas Enamel Grey 50 0.00498
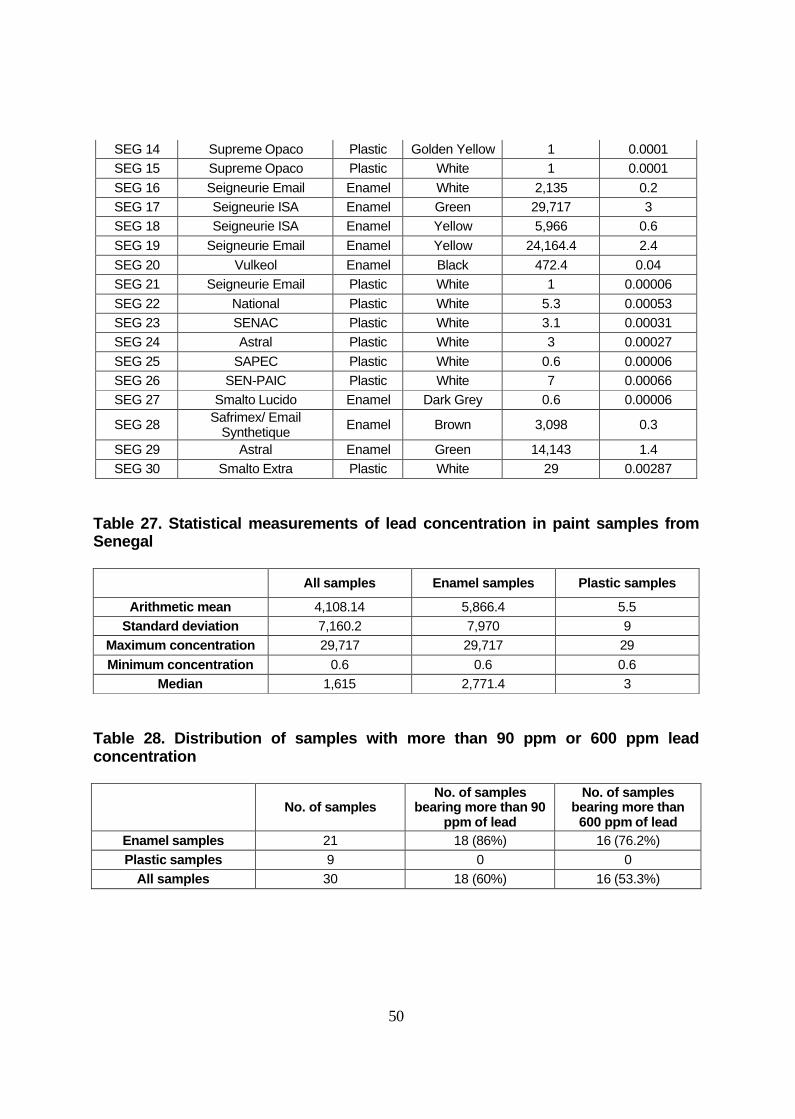
50
SEG 14 Supreme Opaco Plastic Golden Yellow 1 0.0001SEG 15 Supreme Opaco Plastic White 1 0.0001SEG 16 Seigneurie Email Enamel White 2,135 0.2SEG 17 Seigneurie ISA Enamel Green 29,717 3SEG 18 Seigneurie ISA Enamel Yellow 5,966 0.6SEG 19 Seigneurie Email Enamel Yellow 24,164.4 2.4SEG 20 Vulkeol Enamel Black 472.4 0.04SEG 21 Seigneurie Email Plastic White 1 0.00006SEG 22 National Plastic White 5.3 0.00053SEG 23 SENAC Plastic White 3.1 0.00031SEG 24 Astral Plastic White 3 0.00027SEG 25 SAPEC Plastic White 0.6 0.00006SEG 26 SEN-PAIC Plastic White 7 0.00066SEG 27 Smalto Lucido Enamel Dark Grey 0.6 0.00006
SEG 28 Safrimex/ Email Synthetique Enamel Brown 3,098 0.3
SEG 29 Astral Enamel Green 14,143 1.4SEG 30 Smalto Extra Plastic White 29 0.00287
Table 27. Statistical measurements of lead concentration in paint samples from Senegal
All samples Enamel samples Plastic samples
Arithmetic mean 4,108.14 5,866.4 5.5Standard deviation 7,160.2 7,970 9
Maximum concentration 29,717 29,717 29Minimum concentration 0.6 0.6 0.6
Median 1,615 2,771.4 3
Table 28. Distribution of samples with more than 90 ppm or 600 ppm lead concentration
No. of samplesNo. of samples
bearing more than 90 ppm of lead
No. of samples bearing more than
600 ppm of leadEnamel samples 21 18 (86%) 16 (76.2%)Plastic samples 9 0 0
All samples 30 18 (60%) 16 (53.3%)
51
BELARUS
Background
There are more than 100 paint and varnish producers in Belarus. In 2007, some 91,434 tons of paint and varnish products were produced in Belarus (80,531 tons in 2006). In the first half of 2008, some 32,028 tons of paints and varnish were produced.
The major producers of paints and varnish products in Belarus are:
1. Lakokraska (Lida) (www.lidalkm.by)2. Minsk Paint-and-Varnish Plant (Minsk) (www.mlkz.by)3. Kondor (Brest) (www.condor.by)4. Discom (Vitebsk) (www.caparol.by)5. MAB (www.mav.by)6. Esgit (www.esgit.by)7. Zebra Color (www.zebracolor.by)
Some of these brands are local; some are international. Among the local brands are Lakokraska and Minsk Paint and Varnish Plant. Discom is a joint enterprise with German company Lacufa GmbH Lacke und Farben, which is a part of Caparol group. One of the most popular paint brands produced by Discom is Alpina, which is the only licensed paint produced in Belarus. Kondor is a member of Swedish holding Eskaro Group AB. The foreign enterprise Zebra Kolor, which produces paint and varnish products under the brand name Zebracolor, is owned by German company SMI GmbH. It uses raw materials procured from foreign producers like Forcit, Du Pont, Rohm&Haas, and Bayer17. The following brands were sampled for lead analysis: MAV-akav, Condor, Gamma, MAV-deko, Deep Prime, Sniezka, Cvetogamma, LIDA, Alpine (renova), AAT ‘minski lakafarbovy zavod’, Discom innenneiss, Zaria, Mogilov, Legenda 205 and Belosnejka.
In Belarus, the import of raw material and other components is an important factor that influences the market for paint and varnish products. Belarus does not require that indigenous raw materials be used in paint production, such as acrylic monomers, pigments and functional additives. This severely restricts Belarus’ capacity to produce paints locally. The importing of raw materials also increases the prices of paint products. About half of the paint market is dominated by seven to eight major producers. The rest of the market belongs to about 100 mid-sized and small producers with capacity of 100 to 500 tons per year18.
17 Main parametres of Belarussian paint-and-varnish market. Dmitriy Zhukov, magazine Stroitel’stvo I nedvizhimost’ (Construction and Real Estate), 2008. (www.nestor.minsk.by/sn/2008/38/sn83815.html)
18 Belarussian market of paint and varnish materials for decoration works in construction. Evgeniya Ureckaya, magazine Architecture and Construction, 2007. (http://www.ais.by/content/view/1295/150/)
52
A variety of paints are available in the Belarusian market. Major types are:
Enamels, groundings, and putty on condensation resin—21,804 tons Varnishes on condensation resin—25,845 tons Varnishes, enamels, groundings, and putty on polymerization resin—11,067 tons Varnishes, enamels, groundings, and putty on cellulose ether—598 tons Solvents and washing-off liquids—2,108 tons Water-based paints—22,372 tons Heavy-bodied oil-based paints—976 tons Light-bodied oil-based paints—704 tons Drying oil—735 tons
Approximately half of these products are for household purposes.
Belarus stipulates that paint and varnish products must not exceed 0.005 mg/сm2 of lead. In case technology requires the use of higher lead content in paints, it can be allowed under the condition that the quantity of lead in the paint dust in ambient air will not exceed 0.01 mg/m3. Belarus also has mandatory technical regulations regarding sanitary rules and requirements to paint and varnish products. However, these regulations have lower status than laws. According to Safety Rules During Painting Works, there is only one type of paint that contains lead: heavy-bodied whitewash MA-011 and MA-011-H-119.
Belarus exported more than 20,000 tons of paint and varnish products in 2007, of this 15,000 tons was to Russia. In 2007, Belarus exported paint products to nine countries, and imported 28,000 tons of paint products from 21 countries. From January to June 2008, Belarus imported 8,900 tons of oil-based paints for USD 40.3 million and 18,300 tons of water-based paints for USD 67.8 million.20
Results
Description of samples analysed is given in Table 29. Table 30 shows lead concentrations in these samples. Table 31 presents the statistical measurements of lead concentrations in the samples, while distribution of paint samples bearing more than 90 ppm or 600 ppm of lead concentrations is given in Table 32.
19 Safety Rules During Painting Works, 31.12.2002. Approved by the Decision # 166 of Ministry of Labour and Social Protection of Belarus.
20 “Paint” production: situation and perspectives of Belarusian paint-and-varnish market. Vera Bobrovnik, BSG, Stroitel’naya gazeta, 2008. (http://cnb.by/content/view/495/47/lang,russian/)
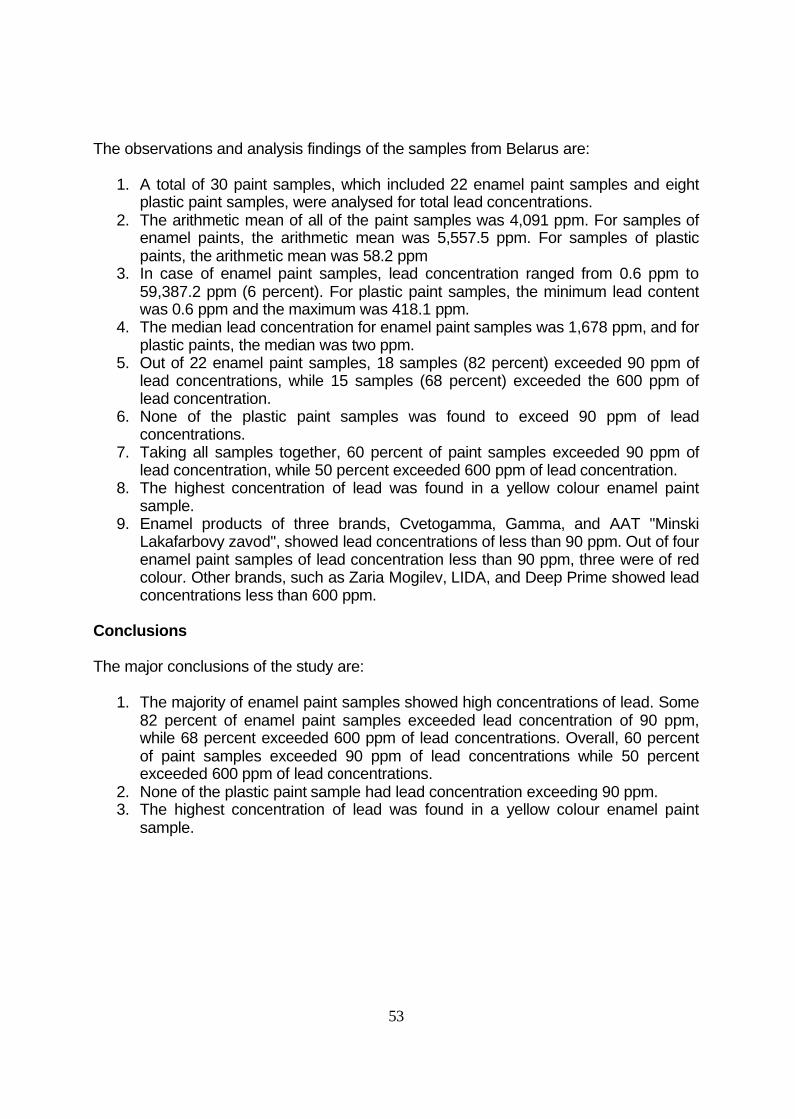
53
The observations and analysis findings of the samples from Belarus are:
1. A total of 30 paint samples, which included 22 enamel paint samples and eight plastic paint samples, were analysed for total lead concentrations.
2. The arithmetic mean of all of the paint samples was 4,091 ppm. For samples of enamel paints, the arithmetic mean was 5,557.5 ppm. For samples of plastic paints, the arithmetic mean was 58.2 ppm
3. In case of enamel paint samples, lead concentration ranged from 0.6 ppm to 59,387.2 ppm (6 percent). For plastic paint samples, the minimum lead content was 0.6 ppm and the maximum was 418.1 ppm.
4. The median lead concentration for enamel paint samples was 1,678 ppm, and for plastic paints, the median was two ppm.
5. Out of 22 enamel paint samples, 18 samples (82 percent) exceeded 90 ppm of lead concentrations, while 15 samples (68 percent) exceeded the 600 ppm of lead concentration.
6. None of the plastic paint samples was found to exceed 90 ppm of lead concentrations.
7. Taking all samples together, 60 percent of paint samples exceeded 90 ppm of lead concentration, while 50 percent exceeded 600 ppm of lead concentration.
8. The highest concentration of lead was found in a yellow colour enamel paint sample.
9. Enamel products of three brands, Cvetogamma, Gamma, and AAT "Minski Lakafarbovy zavod", showed lead concentrations of less than 90 ppm. Out of four enamel paint samples of lead concentration less than 90 ppm, three were of red colour. Other brands, such as Zaria Mogilev, LIDA, and Deep Prime showed lead concentrations less than 600 ppm.
Conclusions
The major conclusions of the study are:
1. The majority of enamel paint samples showed high concentrations of lead. Some 82 percent of enamel paint samples exceeded lead concentration of 90 ppm, while 68 percent exceeded 600 ppm of lead concentrations. Overall, 60 percent of paint samples exceeded 90 ppm of lead concentrations while 50 percent exceeded 600 ppm of lead concentrations.
2. None of the plastic paint sample had lead concentration exceeding 90 ppm.3. The highest concentration of lead was found in a yellow colour enamel paint
sample.
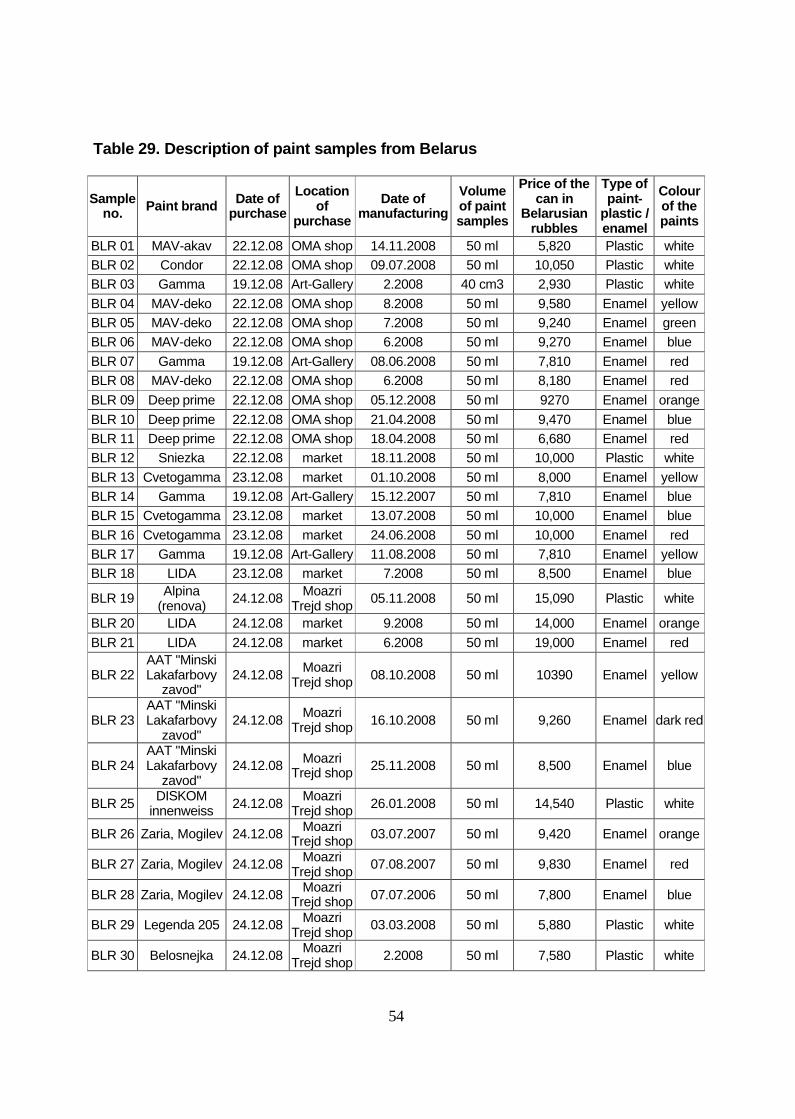
54
Table 29. Description of paint samples from Belarus
Sample no. Paint brand Date of
purchaseLocation
of purchase
Date of manufacturing
Volume of paint samples
Price of the can in
Belarusian rubbles
Type of paint-
plastic / enamel
Colour of the paints
BLR 01 MAV-akav 22.12.08 OMA shop 14.11.2008 50 ml 5,820 Plastic whiteBLR 02 Condor 22.12.08 OMA shop 09.07.2008 50 ml 10,050 Plastic whiteBLR 03 Gamma 19.12.08 Art-Gallery 2.2008 40 cm3 2,930 Plastic whiteBLR 04 MAV-deko 22.12.08 OMA shop 8.2008 50 ml 9,580 Enamel yellowBLR 05 MAV-deko 22.12.08 OMA shop 7.2008 50 ml 9,240 Enamel greenBLR 06 MAV-deko 22.12.08 OMA shop 6.2008 50 ml 9,270 Enamel blueBLR 07 Gamma 19.12.08 Art-Gallery 08.06.2008 50 ml 7,810 Enamel redBLR 08 MAV-deko 22.12.08 OMA shop 6.2008 50 ml 8,180 Enamel redBLR 09 Deep prime 22.12.08 OMA shop 05.12.2008 50 ml 9270 Enamel orangeBLR 10 Deep prime 22.12.08 OMA shop 21.04.2008 50 ml 9,470 Enamel blueBLR 11 Deep prime 22.12.08 OMA shop 18.04.2008 50 ml 6,680 Enamel redBLR 12 Sniezka 22.12.08 market 18.11.2008 50 ml 10,000 Plastic whiteBLR 13 Cvetogamma 23.12.08 market 01.10.2008 50 ml 8,000 Enamel yellowBLR 14 Gamma 19.12.08 Art-Gallery 15.12.2007 50 ml 7,810 Enamel blueBLR 15 Cvetogamma 23.12.08 market 13.07.2008 50 ml 10,000 Enamel blueBLR 16 Cvetogamma 23.12.08 market 24.06.2008 50 ml 10,000 Enamel redBLR 17 Gamma 19.12.08 Art-Gallery 11.08.2008 50 ml 7,810 Enamel yellowBLR 18 LIDA 23.12.08 market 7.2008 50 ml 8,500 Enamel blue
BLR 19 Alpina (renova) 24.12.08 Moazri
Trejd shop 05.11.2008 50 ml 15,090 Plastic white
BLR 20 LIDA 24.12.08 market 9.2008 50 ml 14,000 Enamel orangeBLR 21 LIDA 24.12.08 market 6.2008 50 ml 19,000 Enamel red
BLR 22AAT "Minski Lakafarbovy
zavod"24.12.08 Moazri
Trejd shop 08.10.2008 50 ml 10390 Enamel yellow
BLR 23AAT "Minski Lakafarbovy
zavod"24.12.08 Moazri
Trejd shop 16.10.2008 50 ml 9,260 Enamel dark red
BLR 24AAT "Minski Lakafarbovy
zavod"24.12.08 Moazri
Trejd shop 25.11.2008 50 ml 8,500 Enamel blue
BLR 25 DISKOM innenweiss 24.12.08 Moazri
Trejd shop 26.01.2008 50 ml 14,540 Plastic white
BLR 26 Zaria, Mogilev 24.12.08 Moazri Trejd shop 03.07.2007 50 ml 9,420 Enamel orange
BLR 27 Zaria, Mogilev 24.12.08 Moazri Trejd shop 07.08.2007 50 ml 9,830 Enamel red
BLR 28 Zaria, Mogilev 24.12.08 Moazri Trejd shop 07.07.2006 50 ml 7,800 Enamel blue
BLR 29 Legenda 205 24.12.08 Moazri Trejd shop 03.03.2008 50 ml 5,880 Plastic white
BLR 30 Belosnejka 24.12.08 Moazri Trejd shop 2.2008 50 ml 7,580 Plastic white
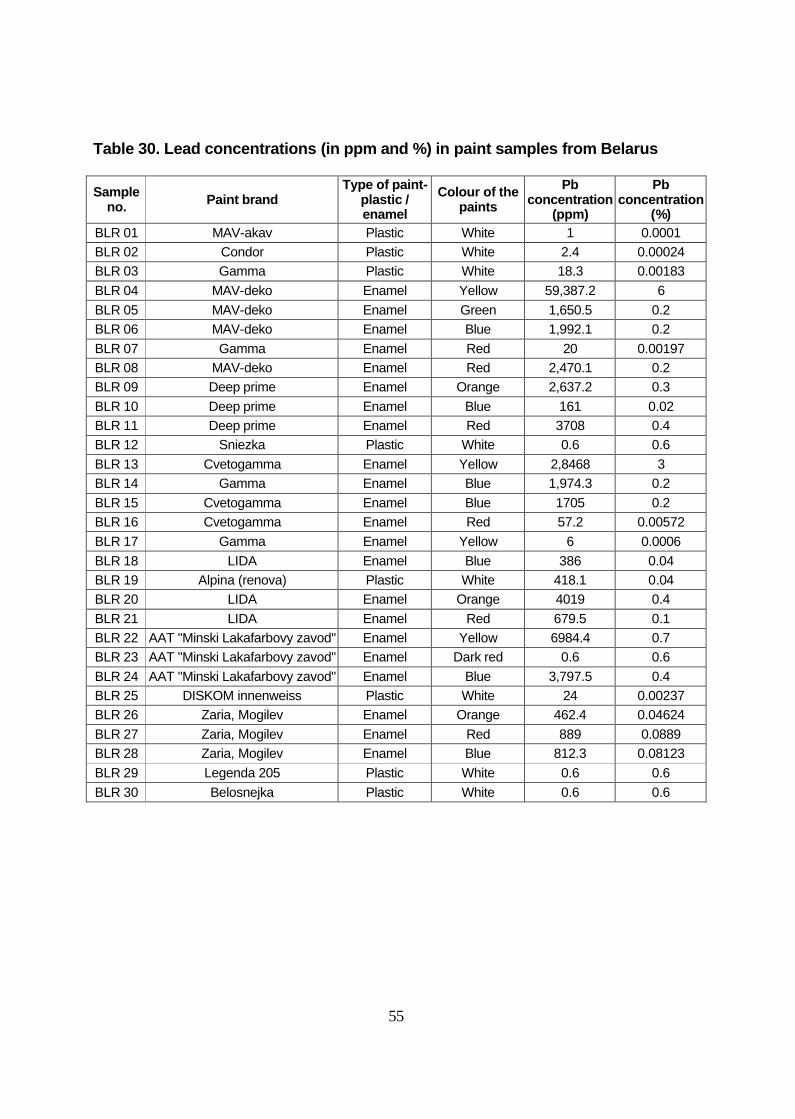
55
Table 30. Lead concentrations (in ppm and %) in paint samples from Belarus
Sample no. Paint brand
Type of paint-plastic / enamel
Colour of the paints
Pb concentration
(ppm)
Pb concentration
(%)BLR 01 MAV-akav Plastic White 1 0.0001BLR 02 Condor Plastic White 2.4 0.00024BLR 03 Gamma Plastic White 18.3 0.00183BLR 04 MAV-deko Enamel Yellow 59,387.2 6BLR 05 MAV-deko Enamel Green 1,650.5 0.2BLR 06 MAV-deko Enamel Blue 1,992.1 0.2BLR 07 Gamma Enamel Red 20 0.00197BLR 08 MAV-deko Enamel Red 2,470.1 0.2BLR 09 Deep prime Enamel Orange 2,637.2 0.3BLR 10 Deep prime Enamel Blue 161 0.02BLR 11 Deep prime Enamel Red 3708 0.4BLR 12 Sniezka Plastic White 0.6 0.6BLR 13 Cvetogamma Enamel Yellow 2,8468 3BLR 14 Gamma Enamel Blue 1,974.3 0.2BLR 15 Cvetogamma Enamel Blue 1705 0.2BLR 16 Cvetogamma Enamel Red 57.2 0.00572BLR 17 Gamma Enamel Yellow 6 0.0006BLR 18 LIDA Enamel Blue 386 0.04BLR 19 Alpina (renova) Plastic White 418.1 0.04BLR 20 LIDA Enamel Orange 4019 0.4BLR 21 LIDA Enamel Red 679.5 0.1BLR 22 AAT "Minski Lakafarbovy zavod" Enamel Yellow 6984.4 0.7BLR 23 AAT "Minski Lakafarbovy zavod" Enamel Dark red 0.6 0.6BLR 24 AAT "Minski Lakafarbovy zavod" Enamel Blue 3,797.5 0.4BLR 25 DISKOM innenweiss Plastic White 24 0.00237BLR 26 Zaria, Mogilev Enamel Orange 462.4 0.04624BLR 27 Zaria, Mogilev Enamel Red 889 0.0889BLR 28 Zaria, Mogilev Enamel Blue 812.3 0.08123BLR 29 Legenda 205 Plastic White 0.6 0.6BLR 30 Belosnejka Plastic White 0.6 0.6
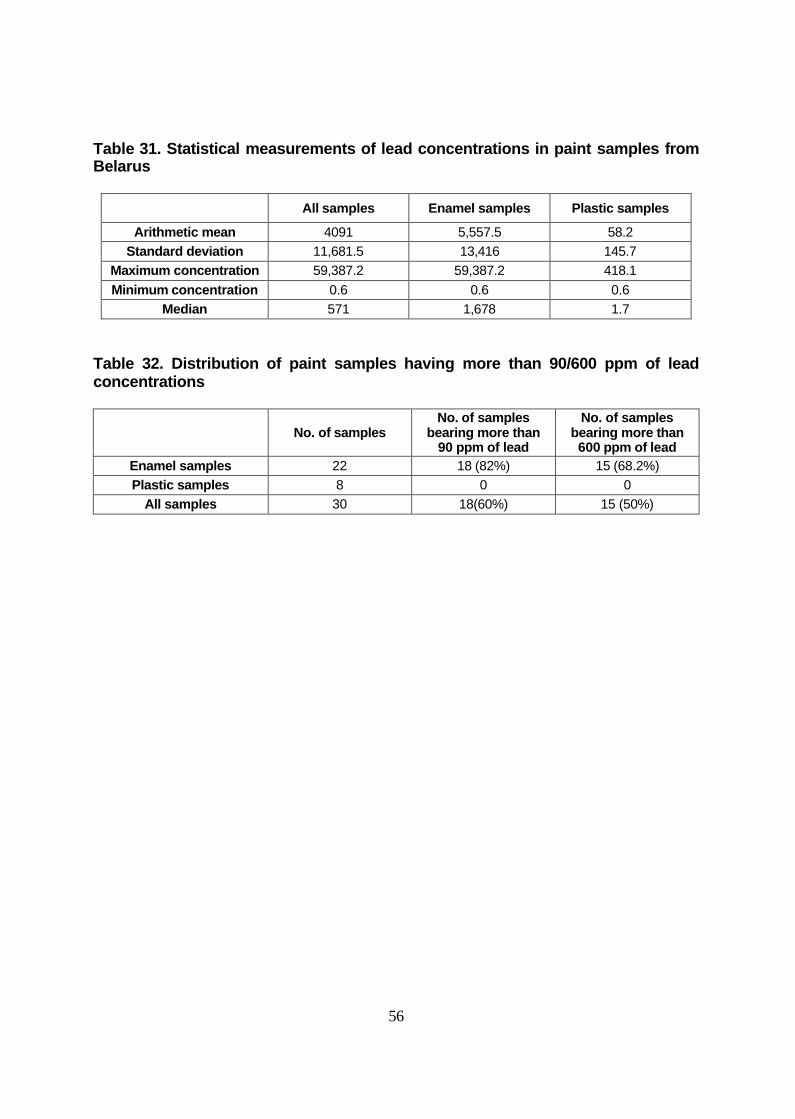
56
Table 31. Statistical measurements of lead concentrations in paint samples from Belarus
All samples Enamel samples Plastic samples
Arithmetic mean 4091 5,557.5 58.2Standard deviation 11,681.5 13,416 145.7
Maximum concentration 59,387.2 59,387.2 418.1Minimum concentration 0.6 0.6 0.6
Median 571 1,678 1.7
Table 32. Distribution of paint samples having more than 90/600 ppm of lead concentrations
No. of samplesNo. of samples
bearing more than 90 ppm of lead
No. of samples bearing more than 600 ppm of lead
Enamel samples 22 18 (82%) 15 (68.2%)Plastic samples 8 0 0
All samples 30 18(60%) 15 (50%)
57
MEXICO
Background
According to the 2004 Economic Census21 (based on 2003 data), production of paint and coating sector represented 0.52 percent of Mexican industrial production value. Paints and coatings production for year 2003 included 1,094,598,000 litres and 58,764.44 metric tons of powder and ceramic paints. A brief introduction of the major paint producers in household segment in Mexico is given below.
Comex Group is a major player in the Mexican paint market.22. Comex is the fourth largest architectural paint manufacturer in the North and Central America and serves the diverse needs of the customers through over 3,300 retails from Canada to Panama. Comex’s companies in the U.S. (Color, Wheel Paints, Frazee Paint, Kwal Paint, and Parker Paint) and Canada (General Paint) were formerly part of Professional Paint Inc. (PPI), which it acquired in October 2004.
Sherwin Williams, S.A. de C.V., is another major paint industry in Mexico. In 2007, Monterrey-based Sherwin Williams, a leading manufacturer and distributor of automotive after-market body fillers, putties, primer, and other vehicle refinish products, acquired the assets and business of important Mexican companies such as Flex Recubrimientos, S.A de C.V., and related companies (Flex Group). During the same year, Sherwin Williams also acquired Napko, a leading manufacturer and distributor of industrial maintenance coatings primarily for the government oil and power industries in Mexico.
Pintusayer ICI in Mexico is part of the Imperial Chemical Industries (ICI), which on 2 January 2008 became part of AkzoNobel.23 Optimus Paints (Pinturas Optimus), Berel, and Contimex are Mexican companies that manufacture, market, and distribute enamel and water-based paints.24,25 DuPont operates in the industrial coatings and automotive paints segment of the market.26 The National Association of Paint and Ink Manufacturers (Asociaci�n Nacional de Fabricantes Pinturas y Tintas, ANAFAPYT) is the official and united face of the paint manufacturers in Mexico. Table 33 shows some of the members of this association. According to information in Table 34, around 97 percent of Mexican paint production is controlled by large companies.
21 http://me.economia.gob.mx:81/site/482/default.aspx22 http://www.thecomexgroup.com/23 http://www.icipaints.com/index.jsp24 http://www.elpoderdelcolor.com/25 http://www.berel.com.mx/26 http://www2.dupont.com/Performance_Coatings/es_MX/index.html
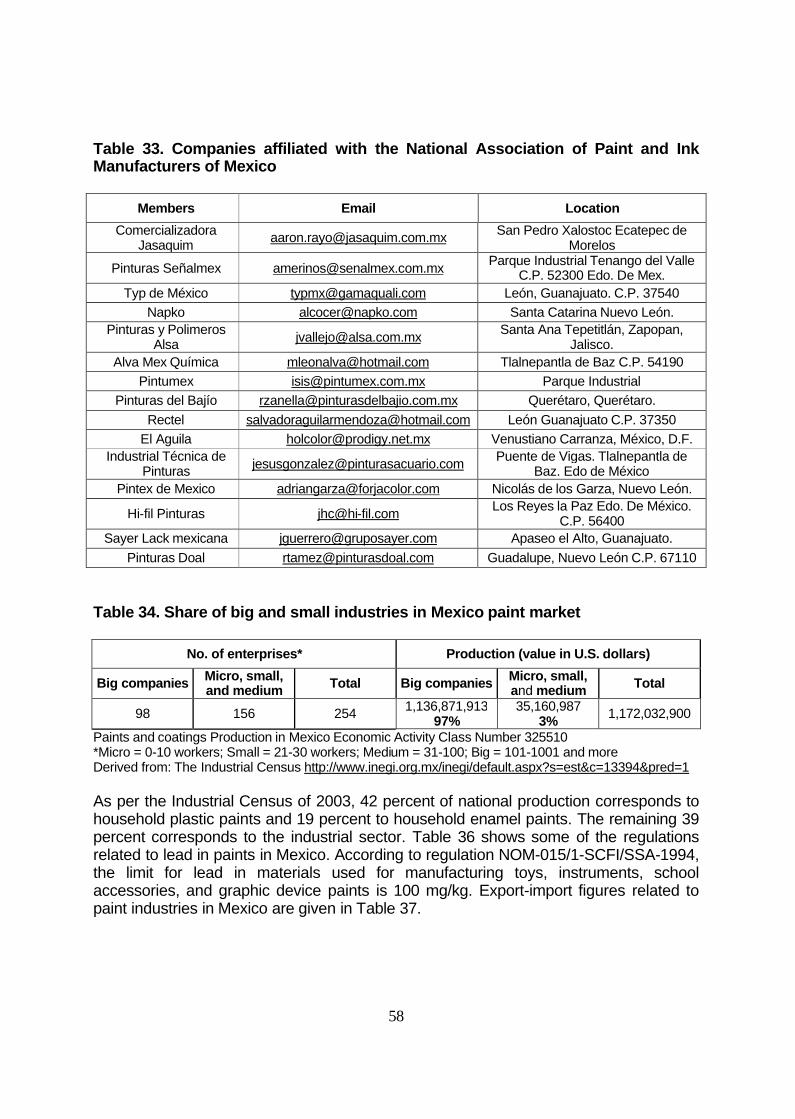
58
Table 33. Companies affiliated with the National Association of Paint and Ink Manufacturers of Mexico
Members Email LocationComercializadora
Jasaquim [email protected] San Pedro Xalostoc Ecatepec de Morelos
Pinturas Señalmex [email protected] Parque Industrial Tenango del Valle C.P. 52300 Edo. De Mex.
Typ de México [email protected] León, Guanajuato. C.P. 37540Napko [email protected] Santa Catarina Nuevo León.
Pinturas y Polimeros Alsa [email protected] Santa Ana Tepetitlán, Zapopan,
Jalisco.Alva Mex Química [email protected] Tlalnepantla de Baz C.P. 54190
Pintumex [email protected] Parque IndustrialPinturas del Bajío [email protected] Querétaro, Querétaro.
Rectel [email protected] León Guanajuato C.P. 37350El Aguila [email protected] Venustiano Carranza, México, D.F.
Industrial Técnica de Pinturas [email protected] Puente de Vigas. Tlalnepantla de
Baz. Edo de MéxicoPintex de Mexico [email protected] Nicolás de los Garza, Nuevo León.
Hi-fil Pinturas [email protected] Los Reyes la Paz Edo. De México. C.P. 56400
Sayer Lack mexicana [email protected] Apaseo el Alto, Guanajuato.Pinturas Doal [email protected] Guadalupe, Nuevo León C.P. 67110
Table 34. Share of big and small industries in Mexico paint market
No. of enterprises* Production (value in U.S. dollars)
Big companies Micro, small, and medium Total Big companies Micro, small,
and medium Total
98 156 254 1,136,871,91397%
35,160,9873% 1,172,032,900
Paints and coatings Production in Mexico Economic Activity Class Number 325510*Micro = 0-10 workers; Small = 21-30 workers; Medium = 31-100; Big = 101-1001 and moreDerived from: The Industrial Census http://www.inegi.org.mx/inegi/default.aspx?s=est&c=13394&pred=1
As per the Industrial Census of 2003, 42 percent of national production corresponds to household plastic paints and 19 percent to household enamel paints. The remaining 39 percent corresponds to the industrial sector. Table 36 shows some of the regulations related to lead in paints in Mexico. According to regulation NOM-015/1-SCFI/SSA-1994, the limit for lead in materials used for manufacturing toys, instruments, school accessories, and graphic device paints is 100 mg/kg. Export-import figures related to paint industries in Mexico are given in Table 37.
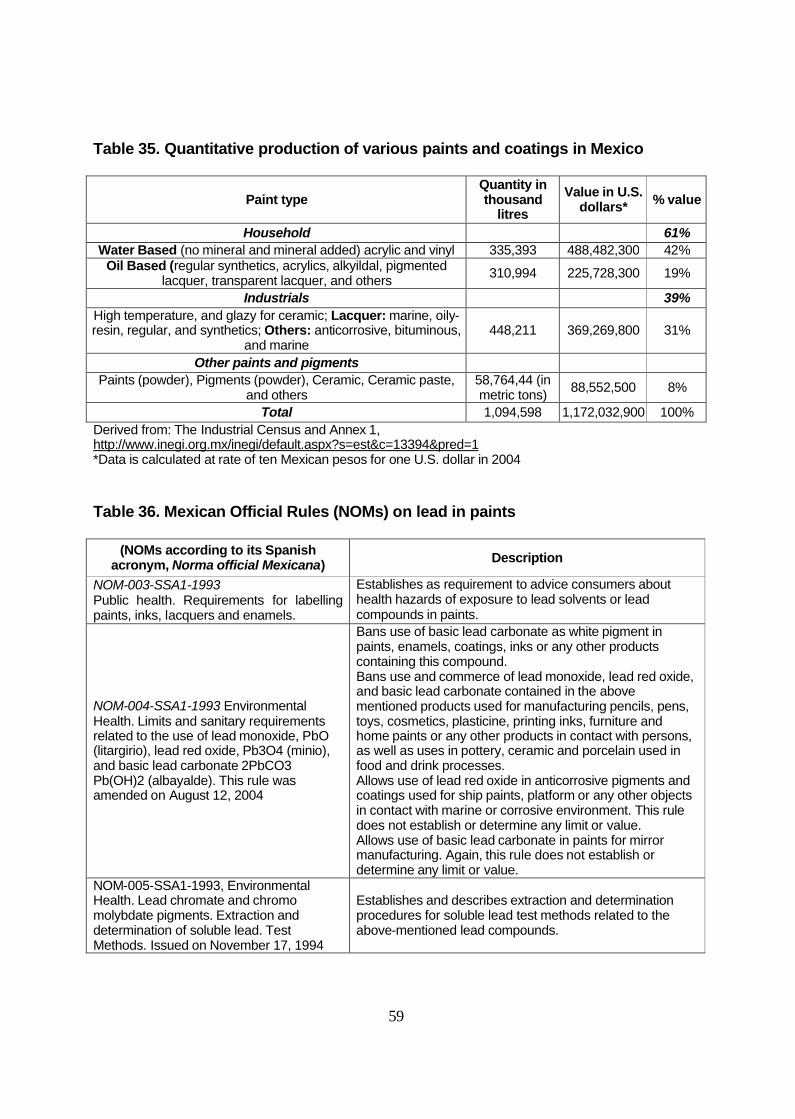
59
Table 35. Quantitative production of various paints and coatings in Mexico
Paint typeQuantity in thousand
litresValue in U.S.
dollars* % value
Household 61%Water Based (no mineral and mineral added) acrylic and vinyl 335,393 488,482,300 42%
Oil Based (regular synthetics, acrylics, alkyildal, pigmented lacquer, transparent lacquer, and others 310,994 225,728,300 19%
Industrials 39%High temperature, and glazy for ceramic; Lacquer: marine, oily-resin, regular, and synthetics; Others: anticorrosive, bituminous,
and marine448,211 369,269,800 31%
Other paints and pigmentsPaints (powder), Pigments (powder), Ceramic, Ceramic paste,
and others58,764,44 (in metric tons) 88,552,500 8%
Total 1,094,598 1,172,032,900 100%Derived from: The Industrial Census and Annex 1, http://www.inegi.org.mx/inegi/default.aspx?s=est&c=13394&pred=1*Data is calculated at rate of ten Mexican pesos for one U.S. dollar in 2004
Table 36. Mexican Official Rules (NOMs) on lead in paints
(NOMs according to its Spanish acronym, Norma official Mexicana) Description
NOM-003-SSA1-1993Public health. Requirements for labelling paints, inks, lacquers and enamels.
Establishes as requirement to advice consumers about health hazards of exposure to lead solvents or lead compounds in paints.
NOM-004-SSA1-1993 Environmental Health. Limits and sanitary requirements related to the use of lead monoxide, PbO(litargirio), lead red oxide, Pb3O4 (minio), and basic lead carbonate 2PbCO3 Pb(OH)2 (albayalde). This rule was amended on August 12, 2004
Bans use of basic lead carbonate as white pigment in paints, enamels, coatings, inks or any other products containing this compound.Bans use and commerce of lead monoxide, lead red oxide, and basic lead carbonate contained in the above mentioned products used for manufacturing pencils, pens, toys, cosmetics, plasticine, printing inks, furniture and home paints or any other products in contact with persons, as well as uses in pottery, ceramic and porcelain used in food and drink processes.Allows use of lead red oxide in anticorrosive pigments and coatings used for ship paints, platform or any other objects in contact with marine or corrosive environment. This rule does not establish or determine any limit or value.Allows use of basic lead carbonate in paints for mirror manufacturing. Again, this rule does not establish or determine any limit or value.
NOM-005-SSA1-1993, Environmental Health. Lead chromate and chromo molybdate pigments. Extraction and determination of soluble lead. Test Methods. Issued on November 17, 1994
Establishes and describes extraction and determination procedures for soluble lead test methods related to the above-mentioned lead compounds.
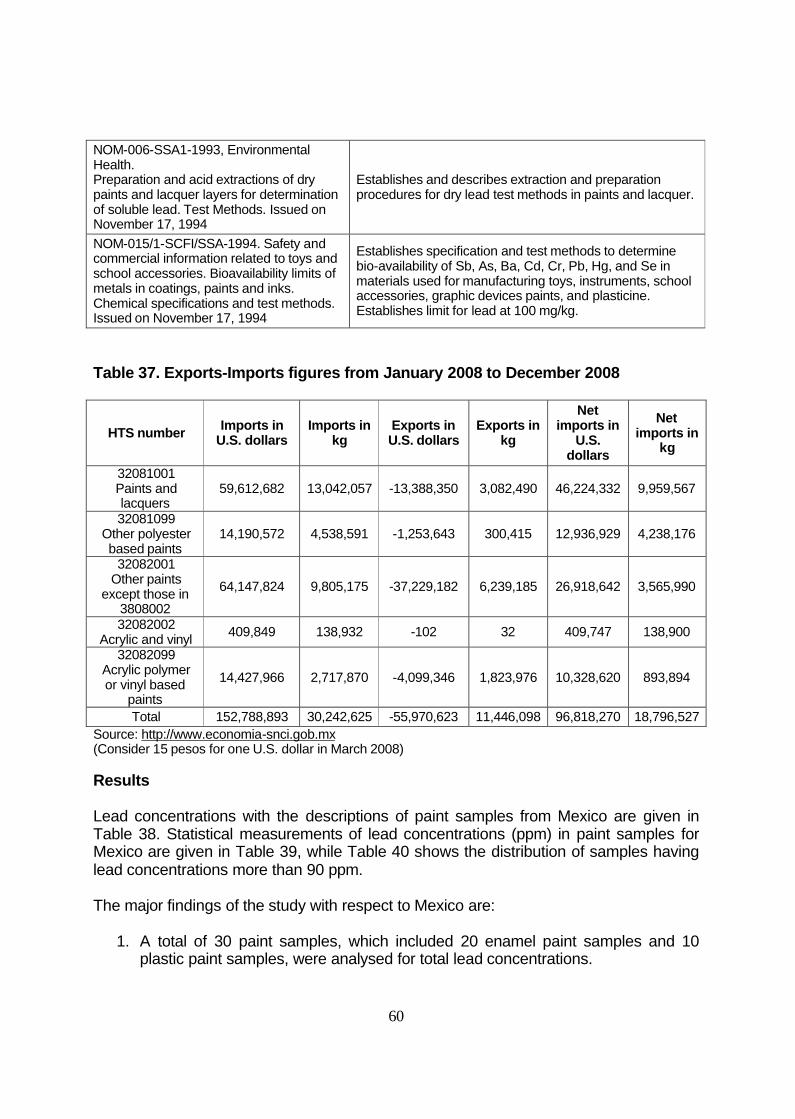
60
NOM-006-SSA1-1993, Environmental Health.Preparation and acid extractions of dry paints and lacquer layers for determination of soluble lead. Test Methods. Issued on November 17, 1994
Establishes and describes extraction and preparation procedures for dry lead test methods in paints and lacquer.
NOM-015/1-SCFI/SSA-1994. Safety and commercial information related to toys and school accessories. Bioavailability limits of metals in coatings, paints and inks. Chemical specifications and test methods. Issued on November 17, 1994
Establishes specification and test methods to determine bio-availability of Sb, As, Ba, Cd, Cr, Pb, Hg, and Se in materials used for manufacturing toys, instruments, school accessories, graphic devices paints, and plasticine.Establishes limit for lead at 100 mg/kg.
Table 37. Exports-Imports figures from January 2008 to December 2008
HTS number Imports in U.S. dollars
Imports in kg
Exports in U.S. dollars
Exports in kg
Net imports in
U.S. dollars
Net imports in
kg
32081001Paints and lacquers
59,612,682 13,042,057 -13,388,350 3,082,490 46,224,332 9,959,567
32081099Other polyester based paints
14,190,572 4,538,591 -1,253,643 300,415 12,936,929 4,238,176
32082001Other paints
except those in 3808002
64,147,824 9,805,175 -37,229,182 6,239,185 26,918,642 3,565,990
32082002Acrylic and vinyl 409,849 138,932 -102 32 409,747 138,900
32082099Acrylic polymer or vinyl based
paints14,427,966 2,717,870 -4,099,346 1,823,976 10,328,620 893,894
Total 152,788,893 30,242,625 -55,970,623 11,446,098 96,818,270 18,796,527Source: http://www.economia-snci.gob.mx(Consider 15 pesos for one U.S. dollar in March 2008)
Results
Lead concentrations with the descriptions of paint samples from Mexico are given in Table 38. Statistical measurements of lead concentrations (ppm) in paint samples for Mexico are given in Table 39, while Table 40 shows the distribution of samples having lead concentrations more than 90 ppm.
The major findings of the study with respect to Mexico are:
1. A total of 30 paint samples, which included 20 enamel paint samples and 10 plastic paint samples, were analysed for total lead concentrations.
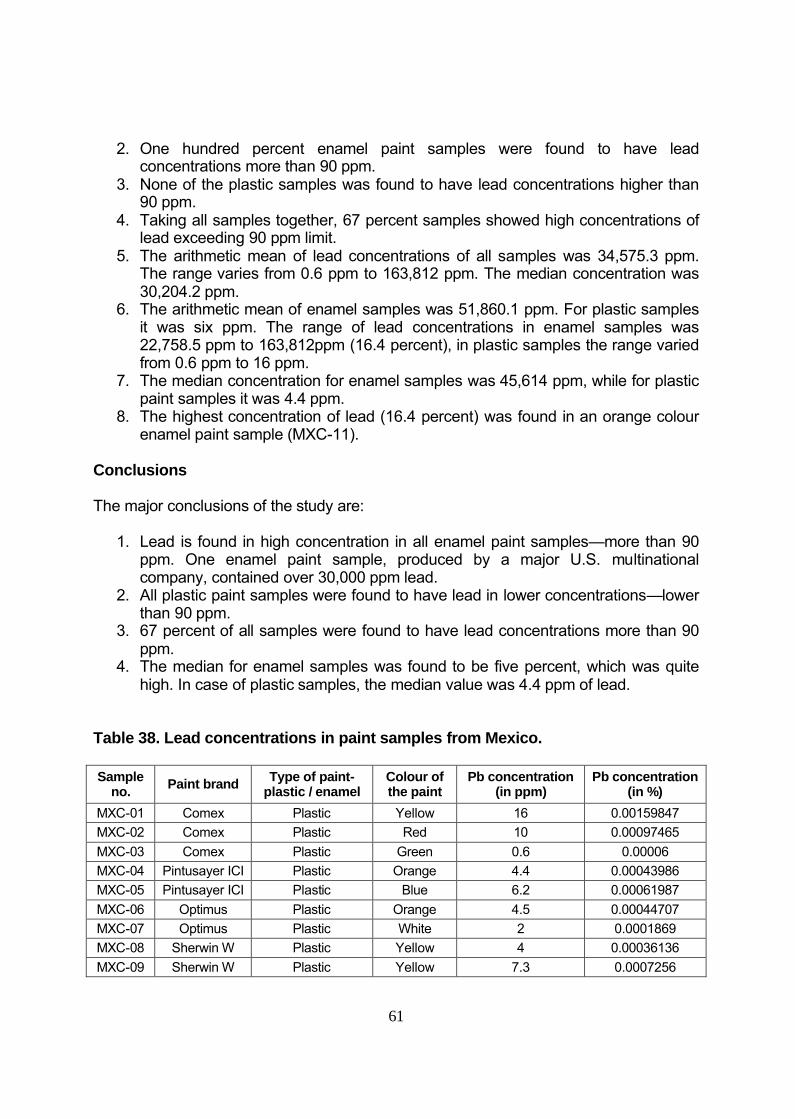
61
2. One hundred percent enamel paint samples were found to have lead concentrations more than 90 ppm.
3. None of the plastic samples was found to have lead concentrations higher than 90 ppm.
4. Taking all samples together, 67 percent samples showed high concentrations of lead exceeding 90 ppm limit.
5. The arithmetic mean of lead concentrations of all samples was 34,575.3 ppm. The range varies from 0.6 ppm to 163,812 ppm. The median concentration was 30,204.2 ppm.
6. The arithmetic mean of enamel samples was 51,860.1 ppm. For plastic samples it was six ppm. The range of lead concentrations in enamel samples was 22,758.5 ppm to 163,812ppm (16.4 percent), in plastic samples the range varied from 0.6 ppm to 16 ppm.
7. The median concentration for enamel samples was 45,614 ppm, while for plastic paint samples it was 4.4 ppm.
8. The highest concentration of lead (16.4 percent) was found in an orange colour enamel paint sample (MXC-11).
Conclusions
The major conclusions of the study are:
1. Lead is found in high concentration in all enamel paint samples—more than 90 ppm. One enamel paint sample, produced by a major U.S. multinational company, contained over 30,000 ppm lead.
2. All plastic paint samples were found to have lead in lower concentrations—lower than 90 ppm.
3. 67 percent of all samples were found to have lead concentrations more than 90 ppm.
4. The median for enamel samples was found to be five percent, which was quite high. In case of plastic samples, the median value was 4.4 ppm of lead.
Table 38. Lead concentrations in paint samples from Mexico.
Sample no. Paint brand Type of paint-
plastic / enamelColour of the paint
Pb concentration (in ppm)
Pb concentration (in %)
MXC-01 Comex Plastic Yellow 16 0.00159847MXC-02 Comex Plastic Red 10 0.00097465MXC-03 Comex Plastic Green 0.6 0.00006MXC-04 Pintusayer ICI Plastic Orange 4.4 0.00043986MXC-05 Pintusayer ICI Plastic Blue 6.2 0.00061987MXC-06 Optimus Plastic Orange 4.5 0.00044707MXC-07 Optimus Plastic White 2 0.0001869MXC-08 Sherwin W Plastic Yellow 4 0.00036136MXC-09 Sherwin W Plastic Yellow 7.3 0.0007256
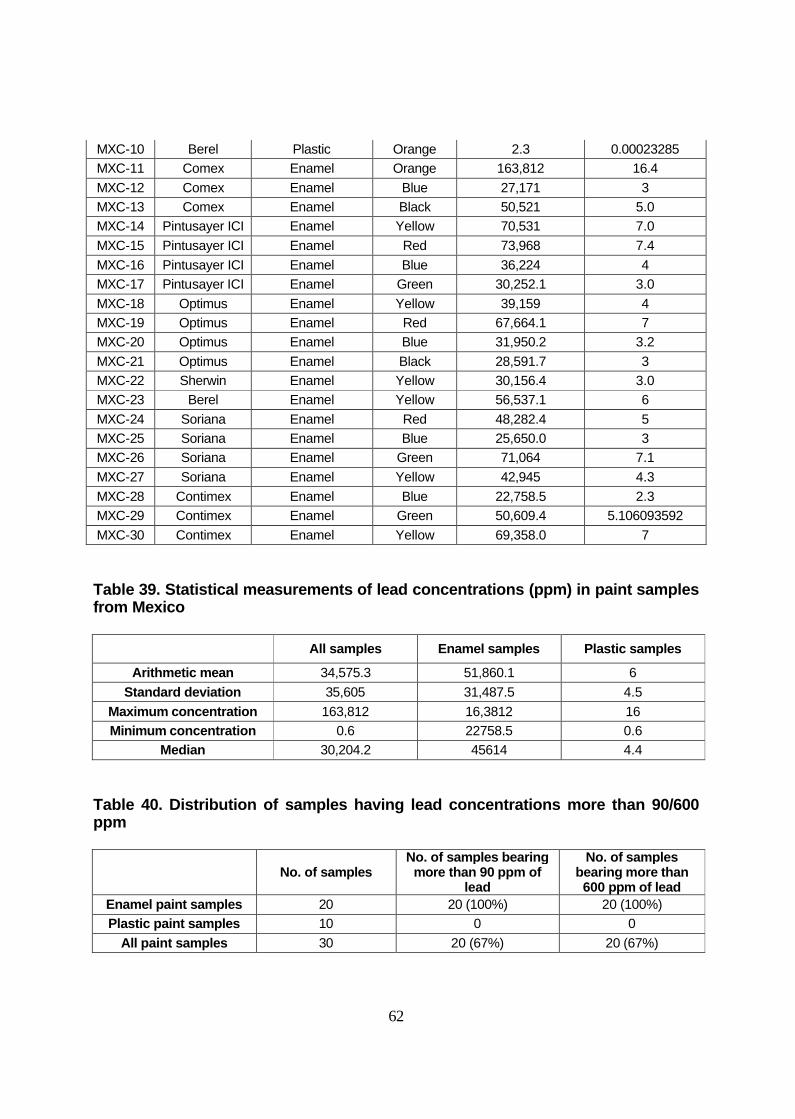
62
MXC-10 Berel Plastic Orange 2.3 0.00023285MXC-11 Comex Enamel Orange 163,812 16.4MXC-12 Comex Enamel Blue 27,171 3MXC-13 Comex Enamel Black 50,521 5.0MXC-14 Pintusayer ICI Enamel Yellow 70,531 7.0MXC-15 Pintusayer ICI Enamel Red 73,968 7.4MXC-16 Pintusayer ICI Enamel Blue 36,224 4MXC-17 Pintusayer ICI Enamel Green 30,252.1 3.0MXC-18 Optimus Enamel Yellow 39,159 4MXC-19 Optimus Enamel Red 67,664.1 7MXC-20 Optimus Enamel Blue 31,950.2 3.2MXC-21 Optimus Enamel Black 28,591.7 3MXC-22 Sherwin Enamel Yellow 30,156.4 3.0MXC-23 Berel Enamel Yellow 56,537.1 6MXC-24 Soriana Enamel Red 48,282.4 5MXC-25 Soriana Enamel Blue 25,650.0 3MXC-26 Soriana Enamel Green 71,064 7.1MXC-27 Soriana Enamel Yellow 42,945 4.3MXC-28 Contimex Enamel Blue 22,758.5 2.3MXC-29 Contimex Enamel Green 50,609.4 5.106093592MXC-30 Contimex Enamel Yellow 69,358.0 7
Table 39. Statistical measurements of lead concentrations (ppm) in paint samples from Mexico
All samples Enamel samples Plastic samples
Arithmetic mean 34,575.3 51,860.1 6Standard deviation 35,605 31,487.5 4.5
Maximum concentration 163,812 16,3812 16Minimum concentration 0.6 22758.5 0.6
Median 30,204.2 45614 4.4
Table 40. Distribution of samples having lead concentrations more than 90/600 ppm
No. of samplesNo. of samples bearing
more than 90 ppm of lead
No. of samples bearing more than 600 ppm of lead
Enamel paint samples 20 20 (100%) 20 (100%)Plastic paint samples 10 0 0
All paint samples 30 20 (67%) 20 (67%)
63
BRAZIL
Background
Brazilian paint market is among the five biggest markets of the world. Its own consumption however is very small—the annual per capita consumption is 5.5 litres. There are around 300 manufacturers and 17,000 direct employees engaged in this sector. The production volume for 2008 was 864 million litres worth USD 5.4 billion. The housing paints represent about 77 percent of the total volume.27
Out of 800 million litres, 328 million litres (41 percent) of economic paint line, 299 million litres (37 percent) of paint premium line, and 173 million litres (12 percent) of standard line housing paints are sold in Brazil market. According to industry experts, the profits are declining, and the trend is towards the consolidation of big companies.28
Some of the major paint companies operating in Brazil include: BASF S/A (Suvinil brand); Dacar Quimica do Brasil S/A (Dacar brand); Eucatex Quimica e Mineral Ltda.; Sherwin Williams do Brasil; Coral; Killing S/A; Renner Sayerlack S/A (Renner); and AkzoNobel Ltda. (Coral paints). Of these companies, only Dacar, Eucatex, and Lukscolor are Brazilian, the others are multinationals. The paint brands that were sampled included Dacar, Coral/Coralamine, Suvinil, Sherwin Williams Novacor, Renner, Coral-Coralit, and 3 RM.
According to law no. 11762 published on 4 August 2008,29 the maximum limit of lead in the manufacture of housing paints and those for children’s products and schools, varnish and similar materials is 0.06 percent by weight, expressed as metallic lead, determined in dry basis or total non-volatile content. This law will come into effect one year after its publication. The Federal Environment Agency, Ibama, will be legally responsible for the enforcement of this law. This law does not apply to paints, varnishes and similar materials of surface coating used in:
1. Agricultural and industrial equipment2. Industrial, agricultural, and commercial metallic structures3. Painting-based anticorrosive treatment4. Traffic and safety signalling5. Auto-motors, airplanes, ships, and rail vehicles6. Graphic arts7. Housing gadgets and metallic furniture8. Exclusive-use artistic paints and similar materials9. Graphic paints
27 http://www.abrafati.com.br/bn_conteudo.asp?cod=9428 http://maquina.com.br/revista/qd469/tintas.html29 http://www.planalto.gov.br/ccivil_03/_Ato2007-2010/2008/Lei/L11762.htm
64
Results
Description of paint samples from Brazil is given in Table 41. Lead concentrations in the samples are given in Table 42. Table 43 shows the statistical measurements of leadconcentrations in Brazil paint samples, while distribution of samples having lead concentrations more than 90 ppm is shown in Table 44.
The major findings of the study are:
1. A total of 31 paint samples, which included 24 enamel paint samples and seven plastic paints, were analysed for total lead concentrations.
2. Out of 24 enamel paint samples, ten samples (42 percent) were found to have lead concentrations more than 90 ppm, while nine samples (37 percent) had lead concentrations exceeding 600 ppm. The average concentration was 15,000 ppm.
3. None of the plastic paint samples was found to have lead concentration more than 90 ppm.
4. Overall 32 percent of samples showed lead concentrations more than 90 ppm, and 28 percent had lead higher than 600 ppm.
5. The arithmetic mean of lead concentrations of all samples was 11,618.3 ppm; for enamel samples, 15,004.1 ppm; and for plastic samples, 9.8 ppm.
6. Lead concentrations for enamel samples varied from 0.6 ppm to 170,258.4 ppm (17 percent). For plastic samples, the lead concentrations ranged from 0.6 ppm to 14.4 ppm. The median for enamel paint samples was 40 ppm.
7. All enamel samples of Sherwin Williams Novacor and Coral-Coralit had lead concentrations less than 90 ppm.
8. Brands such as Renner, Dacar, and Suvinil had some enamel samples showing lead concentrations less than 90 ppm. Lead contents seem to depend upon colour of enamel samples of these brands. Enamel samples of white, black and in some cases blue colour of these brands showed lead concentrations lower than 90 ppm.
9. The highest concentration of lead (17 percent) was found in a yellow colour enamel sample from Renner (BRZ 14).
Conclusions
1. Plastic paint samples have low lead concentrations, lower than 90 ppm2. Some 42 percent of enamel samples had lead contents lower than 90 ppm, while
37 percent of enamel samples had lead contents lower than 600 ppm.3. All enamel paint samples of brands, such as Sherwin Williams Novacor and
Coral-Coralit, had lead concentrations lower than 90 ppm.4. Not all samples of other brands showed lead concentrations lower than 90 ppm.
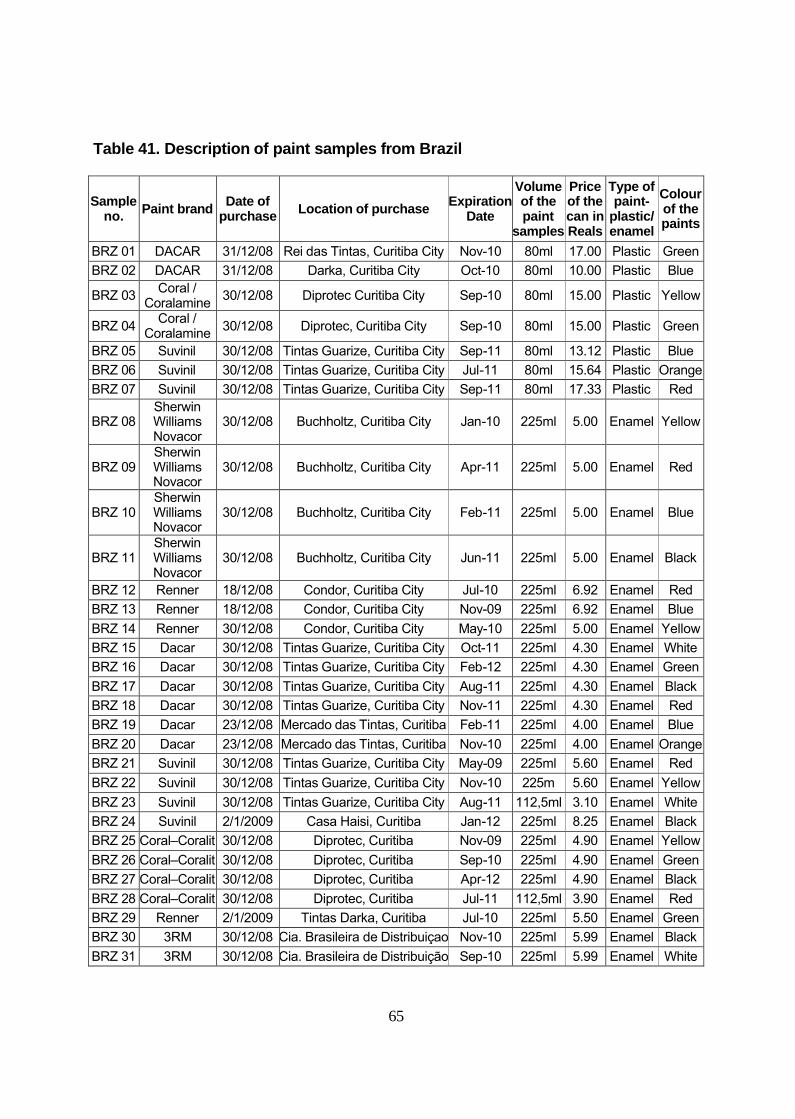
65
Table 41. Description of paint samples from Brazil
Sample no. Paint brand Date of
purchase Location of purchase Expiration Date
Volume of the paint
samples
Price of the can in Reals
Type of paint-
plastic/ enamel
Colour of the paints
BRZ 01 DACAR 31/12/08 Rei das Tintas, Curitiba City Nov-10 80ml 17.00 Plastic GreenBRZ 02 DACAR 31/12/08 Darka, Curitiba City Oct-10 80ml 10.00 Plastic Blue
BRZ 03 Coral / Coralamine 30/12/08 Diprotec Curitiba City Sep-10 80ml 15.00 Plastic Yellow
BRZ 04 Coral / Coralamine 30/12/08 Diprotec, Curitiba City Sep-10 80ml 15.00 Plastic Green
BRZ 05 Suvinil 30/12/08 Tintas Guarize, Curitiba City Sep-11 80ml 13.12 Plastic BlueBRZ 06 Suvinil 30/12/08 Tintas Guarize, Curitiba City Jul-11 80ml 15.64 Plastic OrangeBRZ 07 Suvinil 30/12/08 Tintas Guarize, Curitiba City Sep-11 80ml 17.33 Plastic Red
BRZ 08Sherwin Williams Novacor
30/12/08 Buchholtz, Curitiba City Jan-10 225ml 5.00 Enamel Yellow
BRZ 09Sherwin Williams Novacor
30/12/08 Buchholtz, Curitiba City Apr-11 225ml 5.00 Enamel Red
BRZ 10Sherwin Williams Novacor
30/12/08 Buchholtz, Curitiba City Feb-11 225ml 5.00 Enamel Blue
BRZ 11Sherwin Williams Novacor
30/12/08 Buchholtz, Curitiba City Jun-11 225ml 5.00 Enamel Black
BRZ 12 Renner 18/12/08 Condor, Curitiba City Jul-10 225ml 6.92 Enamel RedBRZ 13 Renner 18/12/08 Condor, Curitiba City Nov-09 225ml 6.92 Enamel BlueBRZ 14 Renner 30/12/08 Condor, Curitiba City May-10 225ml 5.00 Enamel YellowBRZ 15 Dacar 30/12/08 Tintas Guarize, Curitiba City Oct-11 225ml 4.30 Enamel White BRZ 16 Dacar 30/12/08 Tintas Guarize, Curitiba City Feb-12 225ml 4.30 Enamel GreenBRZ 17 Dacar 30/12/08 Tintas Guarize, Curitiba City Aug-11 225ml 4.30 Enamel BlackBRZ 18 Dacar 30/12/08 Tintas Guarize, Curitiba City Nov-11 225ml 4.30 Enamel RedBRZ 19 Dacar 23/12/08 Mercado das Tintas, Curitiba Feb-11 225ml 4.00 Enamel BlueBRZ 20 Dacar 23/12/08 Mercado das Tintas, Curitiba Nov-10 225ml 4.00 Enamel OrangeBRZ 21 Suvinil 30/12/08 Tintas Guarize, Curitiba City May-09 225ml 5.60 Enamel RedBRZ 22 Suvinil 30/12/08 Tintas Guarize, Curitiba City Nov-10 225m 5.60 Enamel YellowBRZ 23 Suvinil 30/12/08 Tintas Guarize, Curitiba City Aug-11 112,5ml 3.10 Enamel WhiteBRZ 24 Suvinil 2/1/2009 Casa Haisi, Curitiba Jan-12 225ml 8.25 Enamel BlackBRZ 25 Coral–Coralit 30/12/08 Diprotec, Curitiba Nov-09 225ml 4.90 Enamel YellowBRZ 26 Coral–Coralit 30/12/08 Diprotec, Curitiba Sep-10 225ml 4.90 Enamel GreenBRZ 27 Coral–Coralit 30/12/08 Diprotec, Curitiba Apr-12 225ml 4.90 Enamel BlackBRZ 28 Coral–Coralit 30/12/08 Diprotec, Curitiba Jul-11 112,5ml 3.90 Enamel RedBRZ 29 Renner 2/1/2009 Tintas Darka, Curitiba Jul-10 225ml 5.50 Enamel GreenBRZ 30 3RM 30/12/08 Cia. Brasileira de Distribui�ao Nov-10 225ml 5.99 Enamel BlackBRZ 31 3RM 30/12/08 Cia. Brasileira de Distribui��o Sep-10 225ml 5.99 Enamel White
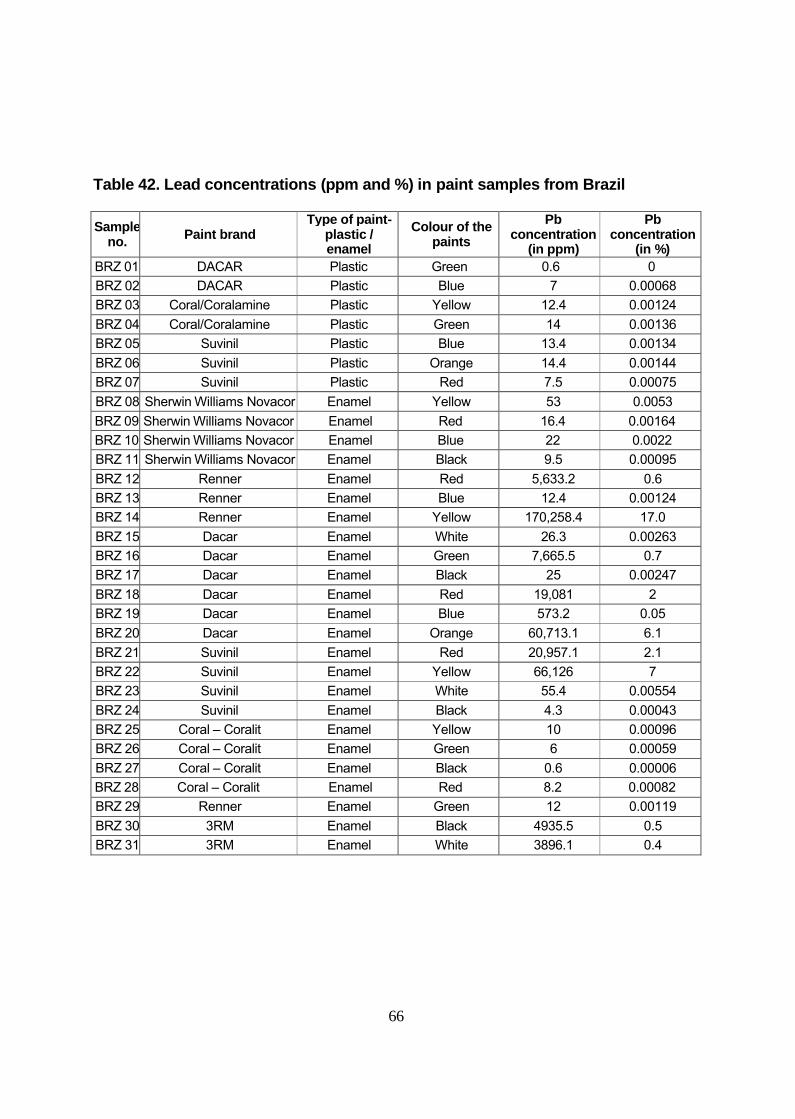
66
Table 42. Lead concentrations (ppm and %) in paint samples from Brazil
Sample no. Paint brand
Type of paint-plastic / enamel
Colour of the paints
Pb concentration
(in ppm)
Pb concentration
(in %)BRZ 01 DACAR Plastic Green 0.6 0BRZ 02 DACAR Plastic Blue 7 0.00068BRZ 03 Coral/Coralamine Plastic Yellow 12.4 0.00124BRZ 04 Coral/Coralamine Plastic Green 14 0.00136BRZ 05 Suvinil Plastic Blue 13.4 0.00134BRZ 06 Suvinil Plastic Orange 14.4 0.00144BRZ 07 Suvinil Plastic Red 7.5 0.00075BRZ 08 Sherwin Williams Novacor Enamel Yellow 53 0.0053BRZ 09 Sherwin Williams Novacor Enamel Red 16.4 0.00164BRZ 10 Sherwin Williams Novacor Enamel Blue 22 0.0022BRZ 11 Sherwin Williams Novacor Enamel Black 9.5 0.00095BRZ 12 Renner Enamel Red 5,633.2 0.6BRZ 13 Renner Enamel Blue 12.4 0.00124BRZ 14 Renner Enamel Yellow 170,258.4 17.0BRZ 15 Dacar Enamel White 26.3 0.00263BRZ 16 Dacar Enamel Green 7,665.5 0.7BRZ 17 Dacar Enamel Black 25 0.00247BRZ 18 Dacar Enamel Red 19,081 2BRZ 19 Dacar Enamel Blue 573.2 0.05BRZ 20 Dacar Enamel Orange 60,713.1 6.1BRZ 21 Suvinil Enamel Red 20,957.1 2.1BRZ 22 Suvinil Enamel Yellow 66,126 7BRZ 23 Suvinil Enamel White 55.4 0.00554BRZ 24 Suvinil Enamel Black 4.3 0.00043BRZ 25 Coral – Coralit Enamel Yellow 10 0.00096BRZ 26 Coral – Coralit Enamel Green 6 0.00059BRZ 27 Coral – Coralit Enamel Black 0.6 0.00006BRZ 28 Coral – Coralit Enamel Red 8.2 0.00082BRZ 29 Renner Enamel Green 12 0.00119BRZ 30 3RM Enamel Black 4935.5 0.5BRZ 31 3RM Enamel White 3896.1 0.4
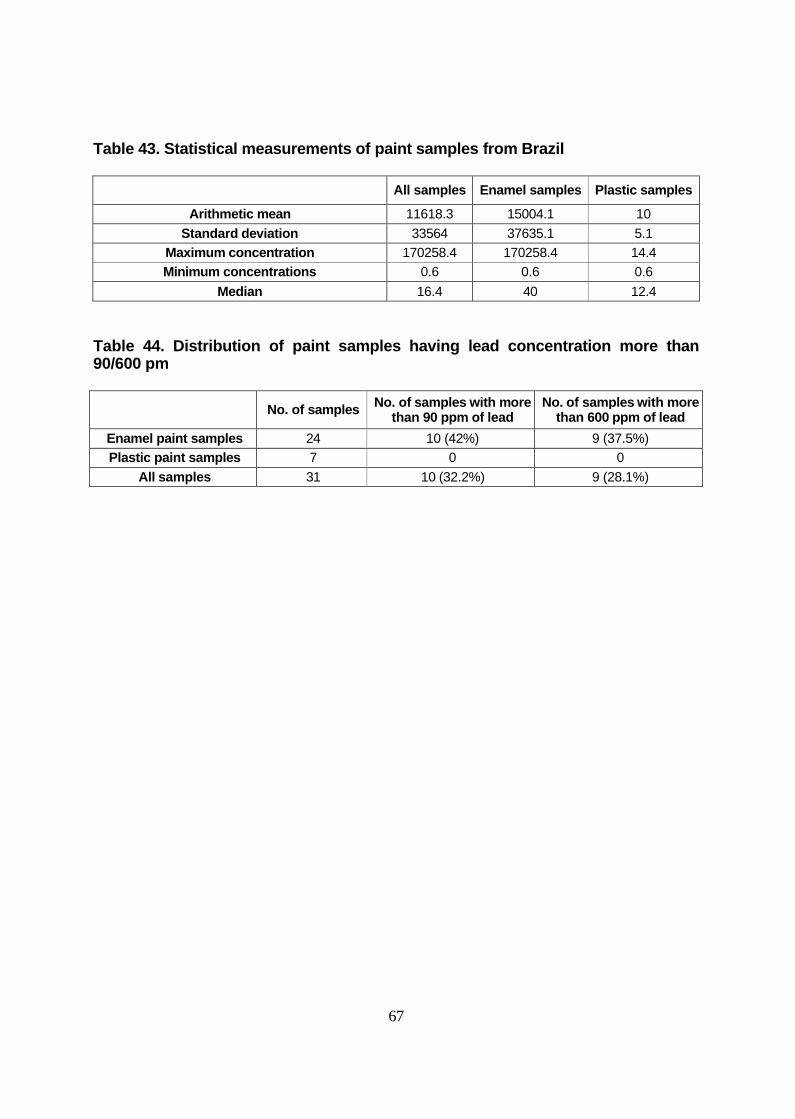
67
Table 43. Statistical measurements of paint samples from Brazil
All samples Enamel samples Plastic samples
Arithmetic mean 11618.3 15004.1 10Standard deviation 33564 37635.1 5.1
Maximum concentration 170258.4 170258.4 14.4Minimum concentrations 0.6 0.6 0.6
Median 16.4 40 12.4
Table 44. Distribution of paint samples having lead concentration more than 90/600 pm
No. of samples No. of samples with more than 90 ppm of lead
No. of samples with more than 600 ppm of lead
Enamel paint samples 24 10 (42%) 9 (37.5%)Plastic paint samples 7 0 0
All samples 31 10 (32.2%) 9 (28.1%)
68
INDIA
Background
The size of the paint market is estimated at Rs 110 billion, with organized sectors accounting for 65 percent of the market and unorganised sectors 35 percent. India produces both decorative and industrial paints. Decorative paints can further be classified into premium, medium, and distemper segments. Premium decorative paints are acrylic emulsions used mostly in the metropolitan areas. The medium range segments consist of enamels, which are popular in smaller cities and towns. Distempers are economy products demanded in the suburban and rural markets. Nearly 20 percent of all decorative paints sold are distempers, in which the unorganised sector has the dominance. Industrial paints include powder coatings, high performance coatings, and automotive and marine paints. Two-thirds of the industrial paints produced in India are automotive paints. The decorative paint segment accounts for 70 percent of the sector and the industrial paints segments 30 percent. Other sub-segments are marine paints, powder coatings for large appliances such as like refrigerators and washing machines, and industrial coatings.
Market share of various decorative paint products30
Enamels 50%Distemper 19%Emulsions 17%Exterior Coatings 12%Wood Finishes 2%
Market share of various industrial paint products
Automotive Paints 50%High Performance Coating 30%Powder Coating 10%Coil Coating 5%Marine Paints 5%
Goodlass and Asian Paints are the leading OEM players. Berger and Goodlass lead in the solid powder coating segment used for decoration and protection of large appliances, electronic equipment, and auto components. ICI and Asian Paints lead the segment of solvent based paints for sheets. Shalimar and Bombay Paints are the major players in these anti-corrosive, underwater marine paints used for ships and containers. Asian Paints dominates the decorative segment with a 38 percent market share. GNPL is number two in the decorative segment with a 14 percent market share. Berger and ICI have nine percent and eight percent shares, respectively, in this segment, followed
30 http://www.managementparadise.com/forums/archive/index.php/t-72869.html
69
by J&N and Shalimar with one and six percent shares, respectively. GNPL dominates the industrial paints segment with 41 percent market share.
India does not have any mandatory regulation for lead limits in paints. The issue is only addressed in a voluntary portion of the government’s Eco Mark Scheme, which suggests that lead should not be more than 0.1 percent in certain types of paints. A previous study by Toxics Link had found that 84 percent of enamel paint samples had lead concentrations in excess of 600 ppm (Kumar and Gottesfeld, 2008). The study had also found that except one brand (ICI Dulux), enamel paint samples of all other brands, (Asian Paints, Kansai Nerolac, Goodlass Nerolac, Berger, Bombay Paints, Jenson & Nicholson, and Shalimar Paints) had lead concentrations of more than 600 ppm. All plastic samples were found to have lead concentrations of less than 25 ppm.
Results
As a part of this study, a total of 26 paint samples, which included four varnish samples, were analysed for total lead concentrations. Table 45 gives the description of paint samples collected from India. Table 46 shows the lead concentrations in the paint samples. Table 47 shows the statistical summary of lead concentrations of paint samples. Distribution of paint samples with more than 90 ppm or 600 ppm of lead concentrations is given in Table 48.
The major findings of the study of Indian paint samples are:
1. Some 26 enamel paint samples, which were analysed for total lead concentration, belonged to four brands, namely Kansai Nerolac, ICI Dulux, Berger, and Asian Paints, and one sample of Shalimar Paints.
2. While all enamel samples of Kansai Nerolac and ICI Dulux had lead concentrations lower than 90 ppm, some enamel samples of Asian Paints showed lead concentrations higher than 90 ppm.
3. All enamel samples of Berger Paints showed lead concentrations higher than 90 ppm.
4. None of the varnish sample showed lead concentrations higher than 90 ppm.5. Out of 22 enamel samples, eight samples (36 percent) showed lead
concentrations higher than 90 ppm. Overall 31 percent of samples showed lead concentrations higher than 90 ppm.
6. The arithmetic mean of lead concentrations of all samples was 7,966.3 ppm with the range varying from 0.6 ppm to 49,593 ppm. The arithmetic mean of enamel samples was 9,411 ppm with lead concentration ranging from 8.1 ppm to 49,593 ppm (five percent)
7. The median lead concentration for enamel samples was 25 ppm.8. The highest concentration of lead, five percent, was found in a bus green colour
enamel paint sample of Berger Paints.
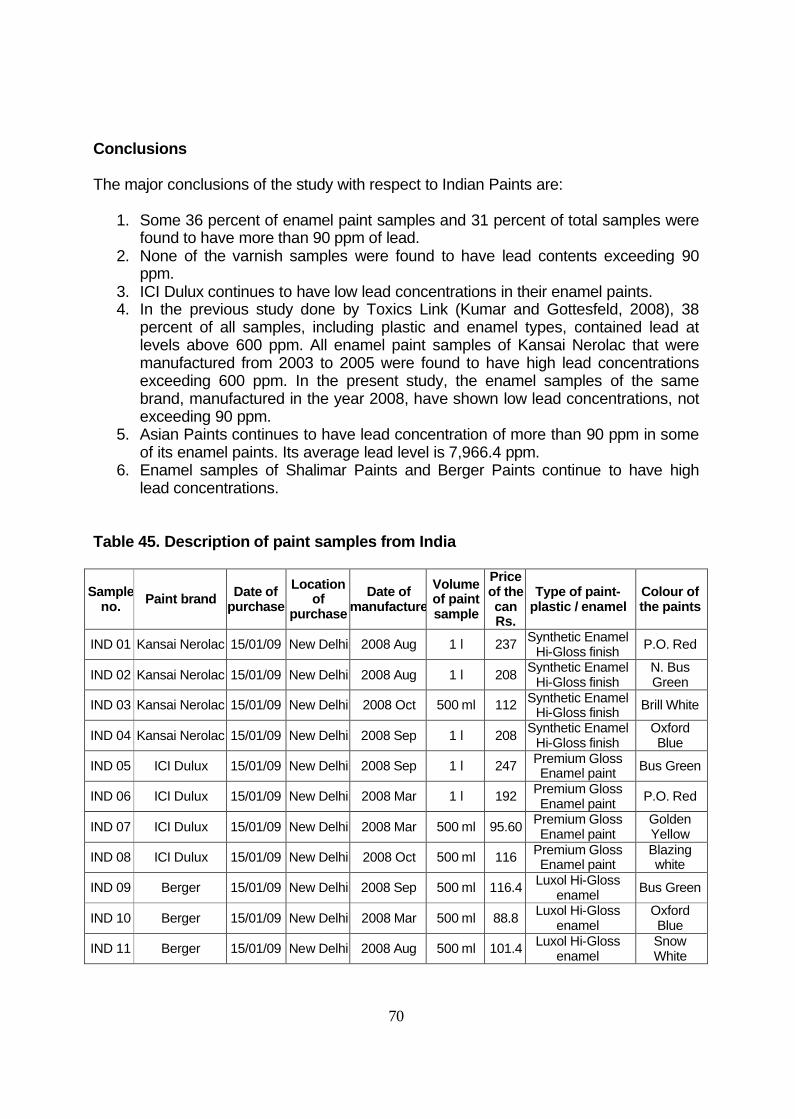
70
Conclusions
The major conclusions of the study with respect to Indian Paints are:
1. Some 36 percent of enamel paint samples and 31 percent of total samples were found to have more than 90 ppm of lead.
2. None of the varnish samples were found to have lead contents exceeding 90 ppm.
3. ICI Dulux continues to have low lead concentrations in their enamel paints.4. In the previous study done by Toxics Link (Kumar and Gottesfeld, 2008), 38
percent of all samples, including plastic and enamel types, contained lead at levels above 600 ppm. All enamel paint samples of Kansai Nerolac that were manufactured from 2003 to 2005 were found to have high lead concentrations exceeding 600 ppm. In the present study, the enamel samples of the same brand, manufactured in the year 2008, have shown low lead concentrations, not exceeding 90 ppm.
5. Asian Paints continues to have lead concentration of more than 90 ppm in some of its enamel paints. Its average lead level is 7,966.4 ppm.
6. Enamel samples of Shalimar Paints and Berger Paints continue to have high lead concentrations.
Table 45. Description of paint samples from India
Sample no. Paint brand Date of
purchaseLocation
of purchase
Date of manufacture
Volume of paint sample
Price of the can Rs.
Type of paint-plastic / enamel
Colour of the paints
IND 01 Kansai Nerolac 15/01/09 New Delhi 2008 Aug 1 l 237 Synthetic Enamel Hi-Gloss finish P.O. Red
IND 02 Kansai Nerolac 15/01/09 New Delhi 2008 Aug 1 l 208 Synthetic Enamel Hi-Gloss finish
N. Bus Green
IND 03 Kansai Nerolac 15/01/09 New Delhi 2008 Oct 500 ml 112 Synthetic Enamel Hi-Gloss finish Brill White
IND 04 Kansai Nerolac 15/01/09 New Delhi 2008 Sep 1 l 208 Synthetic Enamel Hi-Gloss finish
Oxford Blue
IND 05 ICI Dulux 15/01/09 New Delhi 2008 Sep 1 l 247 Premium Gloss Enamel paint Bus Green
IND 06 ICI Dulux 15/01/09 New Delhi 2008 Mar 1 l 192 Premium Gloss Enamel paint P.O. Red
IND 07 ICI Dulux 15/01/09 New Delhi 2008 Mar 500 ml 95.60 Premium Gloss Enamel paint
Golden Yellow
IND 08 ICI Dulux 15/01/09 New Delhi 2008 Oct 500 ml 116 Premium Gloss Enamel paint
Blazing white
IND 09 Berger 15/01/09 New Delhi 2008 Sep 500 ml 116.4 Luxol Hi-Gloss enamel Bus Green
IND 10 Berger 15/01/09 New Delhi 2008 Mar 500 ml 88.8 Luxol Hi-Gloss enamel
Oxford Blue
IND 11 Berger 15/01/09 New Delhi 2008 Aug 500 ml 101.4 Luxol Hi-Gloss enamel
Snow White
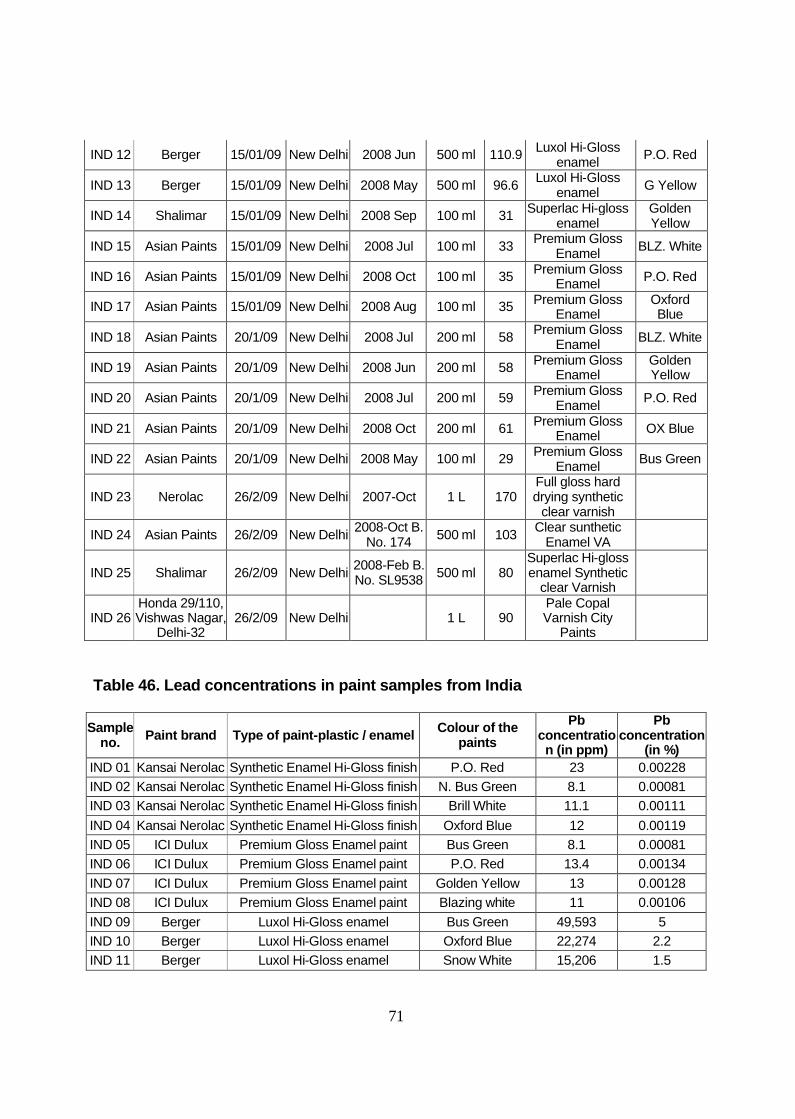
71
IND 12 Berger 15/01/09 New Delhi 2008 Jun 500 ml 110.9 Luxol Hi-Gloss enamel P.O. Red
IND 13 Berger 15/01/09 New Delhi 2008 May 500 ml 96.6 Luxol Hi-Gloss enamel G Yellow
IND 14 Shalimar 15/01/09 New Delhi 2008 Sep 100 ml 31 Superlac Hi-gloss enamel
Golden Yellow
IND 15 Asian Paints 15/01/09 New Delhi 2008 Jul 100 ml 33 Premium Gloss Enamel BLZ. White
IND 16 Asian Paints 15/01/09 New Delhi 2008 Oct 100 ml 35 Premium Gloss Enamel P.O. Red
IND 17 Asian Paints 15/01/09 New Delhi 2008 Aug 100 ml 35 Premium Gloss Enamel
Oxford Blue
IND 18 Asian Paints 20/1/09 New Delhi 2008 Jul 200 ml 58 Premium Gloss Enamel BLZ. White
IND 19 Asian Paints 20/1/09 New Delhi 2008 Jun 200 ml 58 Premium Gloss Enamel
Golden Yellow
IND 20 Asian Paints 20/1/09 New Delhi 2008 Jul 200 ml 59 Premium Gloss Enamel P.O. Red
IND 21 Asian Paints 20/1/09 New Delhi 2008 Oct 200 ml 61 Premium Gloss Enamel OX Blue
IND 22 Asian Paints 20/1/09 New Delhi 2008 May 100 ml 29 Premium Gloss Enamel Bus Green
IND 23 Nerolac 26/2/09 New Delhi 2007-Oct 1 L 170Full gloss hard drying synthetic
clear varnish
IND 24 Asian Paints 26/2/09 New Delhi 2008-Oct B. No. 174 500 ml 103 Clear sunthetic
Enamel VA
IND 25 Shalimar 26/2/09 New Delhi 2008-Feb B. No. SL9538 500 ml 80
Superlac Hi-gloss enamel Synthetic
clear Varnish
IND 26Honda 29/110, Vishwas Nagar,
Delhi-3226/2/09 New Delhi 1 L 90
Pale Copal Varnish City
Paints
Table 46. Lead concentrations in paint samples from India
Sample no. Paint brand Type of paint-plastic / enamel Colour of the
paintsPb
concentration (in ppm)
Pb concentration
(in %)IND 01 Kansai Nerolac Synthetic Enamel Hi-Gloss finish P.O. Red 23 0.00228IND 02 Kansai Nerolac Synthetic Enamel Hi-Gloss finish N. Bus Green 8.1 0.00081IND 03 Kansai Nerolac Synthetic Enamel Hi-Gloss finish Brill White 11.1 0.00111IND 04 Kansai Nerolac Synthetic Enamel Hi-Gloss finish Oxford Blue 12 0.00119IND 05 ICI Dulux Premium Gloss Enamel paint Bus Green 8.1 0.00081IND 06 ICI Dulux Premium Gloss Enamel paint P.O. Red 13.4 0.00134IND 07 ICI Dulux Premium Gloss Enamel paint Golden Yellow 13 0.00128IND 08 ICI Dulux Premium Gloss Enamel paint Blazing white 11 0.00106IND 09 Berger Luxol Hi-Gloss enamel Bus Green 49,593 5IND 10 Berger Luxol Hi-Gloss enamel Oxford Blue 22,274 2.2IND 11 Berger Luxol Hi-Gloss enamel Snow White 15,206 1.5
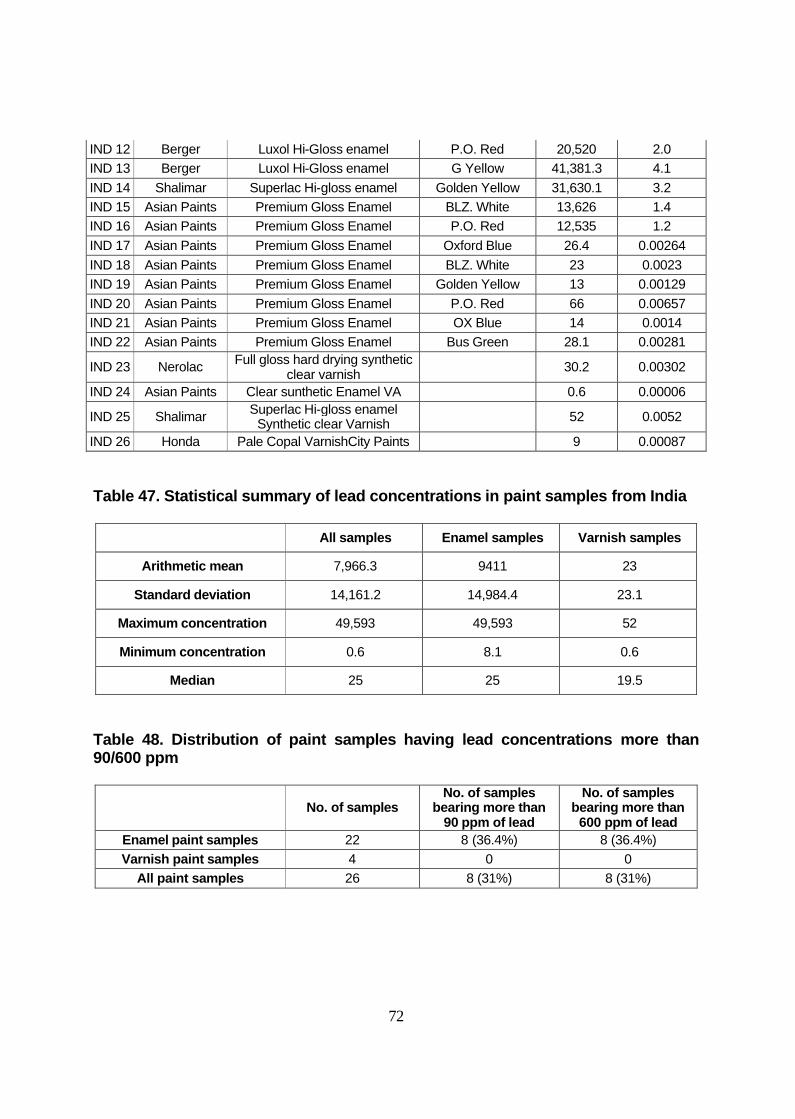
72
IND 12 Berger Luxol Hi-Gloss enamel P.O. Red 20,520 2.0IND 13 Berger Luxol Hi-Gloss enamel G Yellow 41,381.3 4.1IND 14 Shalimar Superlac Hi-gloss enamel Golden Yellow 31,630.1 3.2IND 15 Asian Paints Premium Gloss Enamel BLZ. White 13,626 1.4IND 16 Asian Paints Premium Gloss Enamel P.O. Red 12,535 1.2IND 17 Asian Paints Premium Gloss Enamel Oxford Blue 26.4 0.00264IND 18 Asian Paints Premium Gloss Enamel BLZ. White 23 0.0023IND 19 Asian Paints Premium Gloss Enamel Golden Yellow 13 0.00129IND 20 Asian Paints Premium Gloss Enamel P.O. Red 66 0.00657IND 21 Asian Paints Premium Gloss Enamel OX Blue 14 0.0014IND 22 Asian Paints Premium Gloss Enamel Bus Green 28.1 0.00281
IND 23 Nerolac Full gloss hard drying synthetic clear varnish 30.2 0.00302
IND 24 Asian Paints Clear sunthetic Enamel VA 0.6 0.00006
IND 25 Shalimar Superlac Hi-gloss enamel Synthetic clear Varnish 52 0.0052
IND 26 Honda Pale Copal VarnishCity Paints 9 0.00087
Table 47. Statistical summary of lead concentrations in paint samples from India
All samples Enamel samples Varnish samples
Arithmetic mean 7,966.3 9411 23
Standard deviation 14,161.2 14,984.4 23.1
Maximum concentration 49,593 49,593 52
Minimum concentration 0.6 8.1 0.6
Median 25 25 19.5
Table 48. Distribution of paint samples having lead concentrations more than 90/600 ppm
No. of samplesNo. of samples
bearing more than 90 ppm of lead
No. of samples bearing more than
600 ppm of leadEnamel paint samples 22 8 (36.4%) 8 (36.4%)Varnish paint samples 4 0 0
All paint samples 26 8 (31%) 8 (31%)
73
ALL SAMPLES
Table 49 shows the statistical summary of lead concentrations of all samples taken together, while the distribution of samples having lead concentrations greater than 90 ppm is given in Table 50. Table 51 depicts the lead concentration in the multinational brands, which were sampled from different source countries. There are four multinational paint brands for which samples were taken from more than one country, i.e., ICI Dulux, Sherwin Williams, Coral, and Asian Paints (Berger International in Thailand and Nigeria).
The major findings of the study are:
1. Overall 317 paint samples, which included 232 enamel samples, 78 plastic samples and seven varnish samples, were analyzed for lead concentrations.
2. Taking all samples together, 53 percent of samples were found to contain more than 90 ppm of lead, while 50 percent samples had lead concentrations of more than 600 ppm.
3. Some 68.5 percent of enamel samples had lead concentrations of more than 90 ppm, while 65 percent of enamel samples had lead concentrations of more than 600 ppm.
4. Only 10 percent of plastic paint samples had concentrations more than 90 ppm.5. The overall average of lead concentrations was 18,220.3 ppm, while for enamel
samples the average was 23,707.1 ppm. For plastic samples the average was 1,508.5 ppm.
6. Taking all samples together, 50 percent of samples had lead concentrations of more than 1,541.2 ppm. In the case of enamel samples, the median lead concentration was 3,914.2 ppm. In the case of plastic paint samples, the median lead concentration was nine ppm, which implied that 50 percent of plastic samples had lead concentrations of more than nine ppm.
7. Lead concentrations in samples ranged from 0.6 ppm to 505,716 ppm (51 percent).
8. Multinational paint brands, brands used in more than one country, showed variation in lead concentrations for samples sourced from different countries.
(a) Of the 54 paint companies with products containing lead concentrations greater than 90 ppm, six were subsidiary companies of U.S. corporations. An additional eight paint companies were subsidiaries of European or Japanese companies.
(b)At least three of the paint companies with products containing lead concentrations above 90 ppm have ISO 14001 Certification in the country in which the paints were purchased. An additional seven companies claim to adhere to ISO 14001.
(c) In addition, 10 companies are subsidiary companies or market licensed brands of larger companies that are ISO 14001 certified.
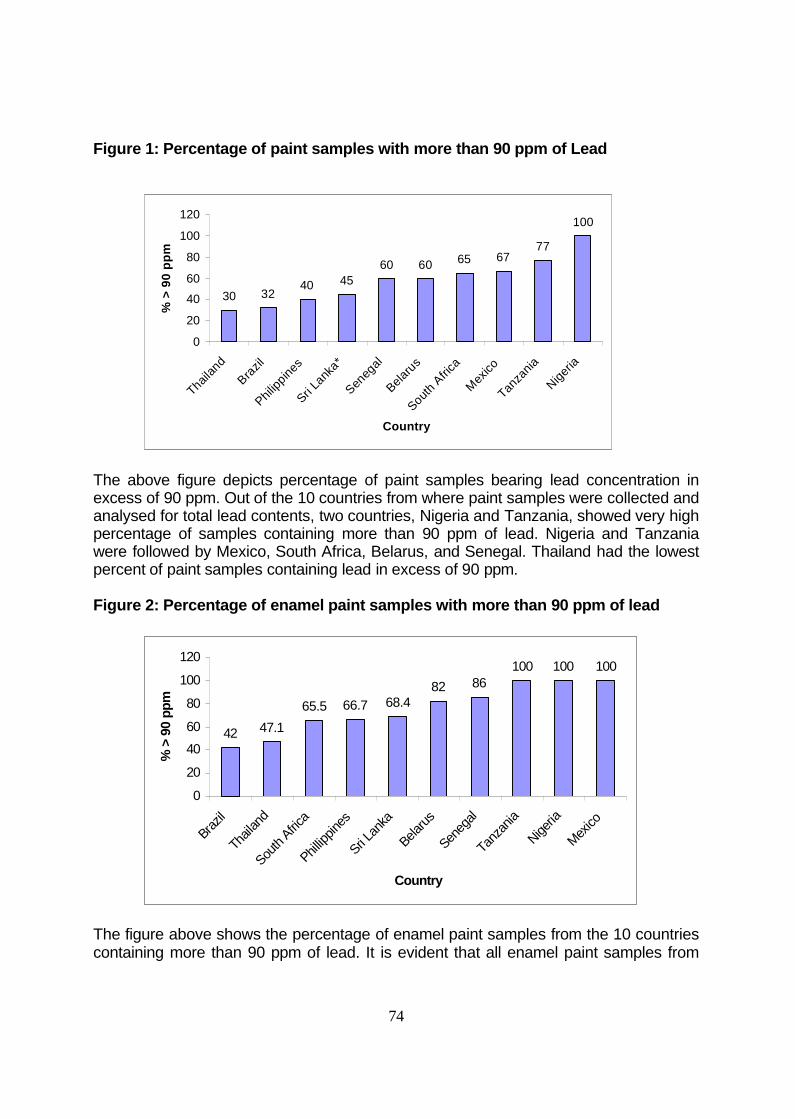
74
Figure 1: Percentage of paint samples with more than 90 ppm of Lead
The above figure depicts percentage of paint samples bearing lead concentration in excess of 90 ppm. Out of the 10 countries from where paint samples were collected and analysed for total lead contents, two countries, Nigeria and Tanzania, showed very high percentage of samples containing more than 90 ppm of lead. Nigeria and Tanzania were followed by Mexico, South Africa, Belarus, and Senegal. Thailand had the lowest percent of paint samples containing lead in excess of 90 ppm.
Figure 2: Percentage of enamel paint samples with more than 90 ppm of lead
42 47.165.5 66.7 68.4
82 86100 100 100
0
20
40
60
80
100
120
Brazil
Thail
and
South
Africa
Phillip
pines
Sri Lan
ka
Belarus
Seneg
al
Tanz
ania
Nigeria
Mexico
Country
%>
90pp
m
The figure above shows the percentage of enamel paint samples from the 10 countries containing more than 90 ppm of lead. It is evident that all enamel paint samples from
30 3240 45
60 60 65 6777
100
0
20
40
60
80
100
120
Thailan
dBrazil
Philipp
ines
Sri Lank
a*
Seneg
al
Belarus
SouthAfric
a
Mexico
Tanza
nia
Nigeria
Country
%>
90pp
m
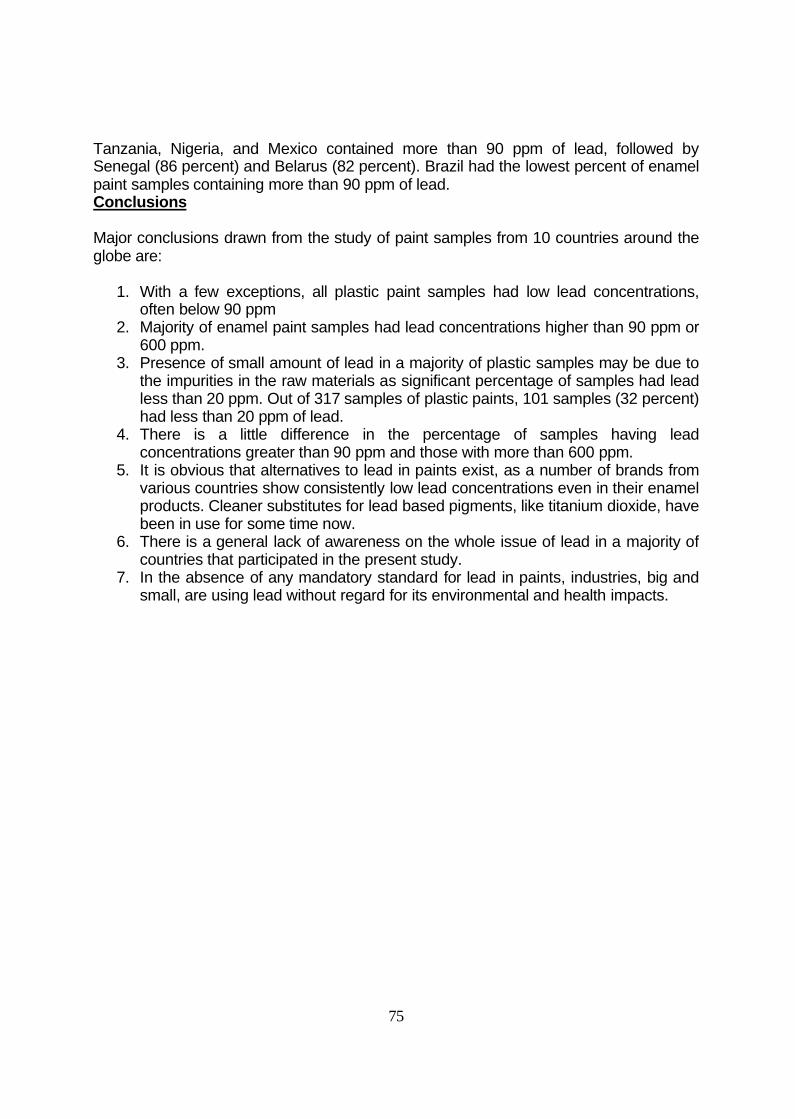
75
Tanzania, Nigeria, and Mexico contained more than 90 ppm of lead, followed by Senegal (86 percent) and Belarus (82 percent). Brazil had the lowest percent of enamel paint samples containing more than 90 ppm of lead.Conclusions
Major conclusions drawn from the study of paint samples from 10 countries around the globe are:
1. With a few exceptions, all plastic paint samples had low lead concentrations, often below 90 ppm
2. Majority of enamel paint samples had lead concentrations higher than 90 ppm or 600 ppm.
3. Presence of small amount of lead in a majority of plastic samples may be due to the impurities in the raw materials as significant percentage of samples had lead less than 20 ppm. Out of 317 samples of plastic paints, 101 samples (32 percent) had less than 20 ppm of lead.
4. There is a little difference in the percentage of samples having lead concentrations greater than 90 ppm and those with more than 600 ppm.
5. It is obvious that alternatives to lead in paints exist, as a number of brands from various countries show consistently low lead concentrations even in their enamel products. Cleaner substitutes for lead based pigments, like titanium dioxide, have been in use for some time now.
6. There is a general lack of awareness on the whole issue of lead in a majority of countries that participated in the present study.
7. In the absence of any mandatory standard for lead in paints, industries, big and small, are using lead without regard for its environmental and health impacts.
76
Recommendations
Recommendations include the following:
1. Regulations: Lead use in paints is not regulated in developing countries. Health effects of lead are well recognized in most developed countries and many governments have taken stringent actions against it. Lead poisoning is the most serious environmental disease among children in developing countries; therefore, it is imperative to enact mandatory national regulations for limiting lead concentrations in paints. The use of paints with lead, such as industrial paints, should be reduced to a minimum.
2. Monitoring: For effective implementation of the lead standards, a proper monitoring plan should be devised to ensure that the industry complies with the standards. The government agencies in collaboration with non-government organisations can play a key role in monitoring the presence of lead in paints. Before 2012, a follow-up paint sampling from these 10 countries could be conducted to monitor possible markets phase-out of lead in paint or market shifts.
3. Household Exposures: Only limiting the lead contents in new paints would not be enough. A programme has to be developed to determine the sources of lead contamination of household dust, which is a prime exposure route for children.
4. Legacy Issues: The paint industry and health care professionals should set guidelines to reduce exposure to lead while removing old paints or recoating with new ones.
5. Public awareness on lead toxicity is extremely low in developing countries. A mass campaign should be launched to educate and make people aware (especially painters, architects, and the paint industry) of the hazards associated with lead. Such a campaign should comprise programmes for an aggressive implementation of preventive measures. Support of important stakeholders, like the governments, industry, public health professionals, public interest groups, etc., must be elicited to prevent lead poisoning.
6. Labelling: The paint industry should include a lead-free paint symbol on products, as well as guidelines for use including for home decorative or industrial and commercial.
7. Partnerships: Concerted efforts should be made to evolve partnerships among the civil society organisations and other stakeholders in the developing region of the world in order to ensure that lead is eventually eliminated from paints worldwide. Also a coordinated and organised network of NGOs and civil society organisations will help in achieving the targets.
8. Global Efforts: The Global Partnership on Lead In Paints formed under UNEP and WHO at the May 2009 ICCM2 is an example of global efforts. All stakeholders, particularly national governments and industry, must support this effort. Further, industry through its global outreach and partnerships of various sorts must work to eradicate this problem.
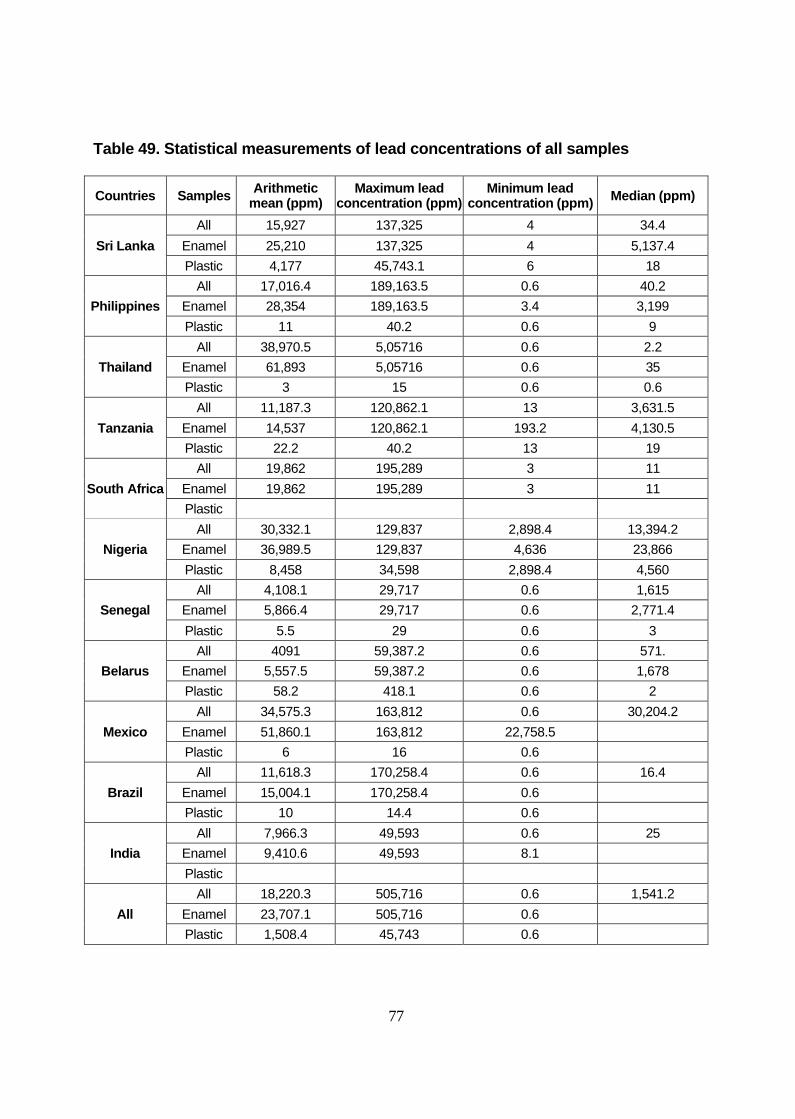
77
Table 49. Statistical measurements of lead concentrations of all samples
Countries Samples Arithmetic mean (ppm)
Maximum lead concentration (ppm)
Minimum lead concentration (ppm) Median (ppm)
Sri LankaAll 15,927 137,325 4 34.4
Enamel 25,210 137,325 4 5,137.4Plastic 4,177 45,743.1 6 18
PhilippinesAll 17,016.4 189,163.5 0.6 40.2
Enamel 28,354 189,163.5 3.4 3,199Plastic 11 40.2 0.6 9
ThailandAll 38,970.5 5,05716 0.6 2.2
Enamel 61,893 5,05716 0.6 35Plastic 3 15 0.6 0.6
TanzaniaAll 11,187.3 120,862.1 13 3,631.5
Enamel 14,537 120,862.1 193.2 4,130.5Plastic 22.2 40.2 13 19
South AfricaAll 19,862 195,289 3 11
Enamel 19,862 195,289 3 11Plastic
NigeriaAll 30,332.1 129,837 2,898.4 13,394.2
Enamel 36,989.5 129,837 4,636 23,866Plastic 8,458 34,598 2,898.4 4,560
SenegalAll 4,108.1 29,717 0.6 1,615
Enamel 5,866.4 29,717 0.6 2,771.4Plastic 5.5 29 0.6 3
BelarusAll 4091 59,387.2 0.6 571.
Enamel 5,557.5 59,387.2 0.6 1,678Plastic 58.2 418.1 0.6 2
MexicoAll 34,575.3 163,812 0.6 30,204.2
Enamel 51,860.1 163,812 22,758.5Plastic 6 16 0.6
BrazilAll 11,618.3 170,258.4 0.6 16.4
Enamel 15,004.1 170,258.4 0.6Plastic 10 14.4 0.6
IndiaAll 7,966.3 49,593 0.6 25
Enamel 9,410.6 49,593 8.1Plastic
AllAll 18,220.3 505,716 0.6 1,541.2
Enamel 23,707.1 505,716 0.6Plastic 1,508.4 45,743 0.6
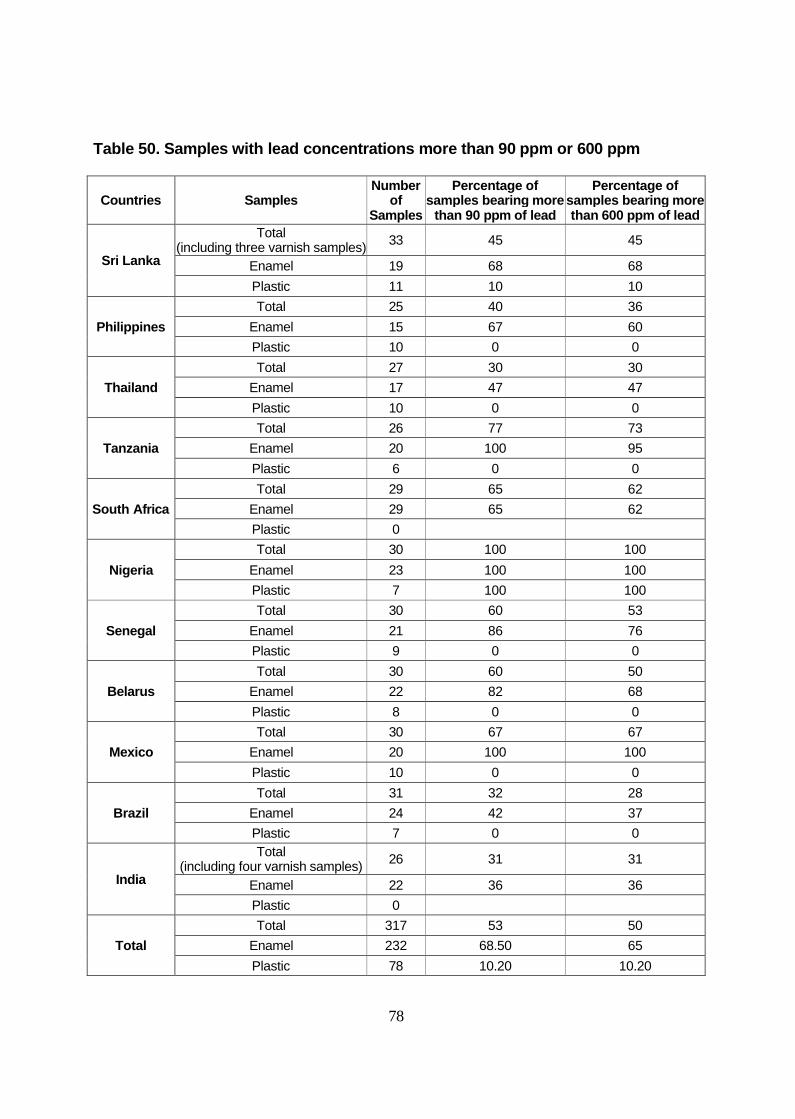
78
Table 50. Samples with lead concentrations more than 90 ppm or 600 ppm
Countries SamplesNumber
of Samples
Percentage of samples bearing more
than 90 ppm of lead
Percentage of samples bearing more than 600 ppm of lead
Sri Lanka
Total(including three varnish samples) 33 45 45
Enamel 19 68 68Plastic 11 10 10
PhilippinesTotal 25 40 36
Enamel 15 67 60Plastic 10 0 0
ThailandTotal 27 30 30
Enamel 17 47 47Plastic 10 0 0
TanzaniaTotal 26 77 73
Enamel 20 100 95Plastic 6 0 0
South AfricaTotal 29 65 62
Enamel 29 65 62Plastic 0
NigeriaTotal 30 100 100
Enamel 23 100 100Plastic 7 100 100
SenegalTotal 30 60 53
Enamel 21 86 76Plastic 9 0 0
BelarusTotal 30 60 50
Enamel 22 82 68Plastic 8 0 0
MexicoTotal 30 67 67
Enamel 20 100 100Plastic 10 0 0
BrazilTotal 31 32 28
Enamel 24 42 37Plastic 7 0 0
India
Total(including four varnish samples) 26 31 31
Enamel 22 36 36Plastic 0
TotalTotal 317 53 50
Enamel 232 68.50 65Plastic 78 10.20 10.20
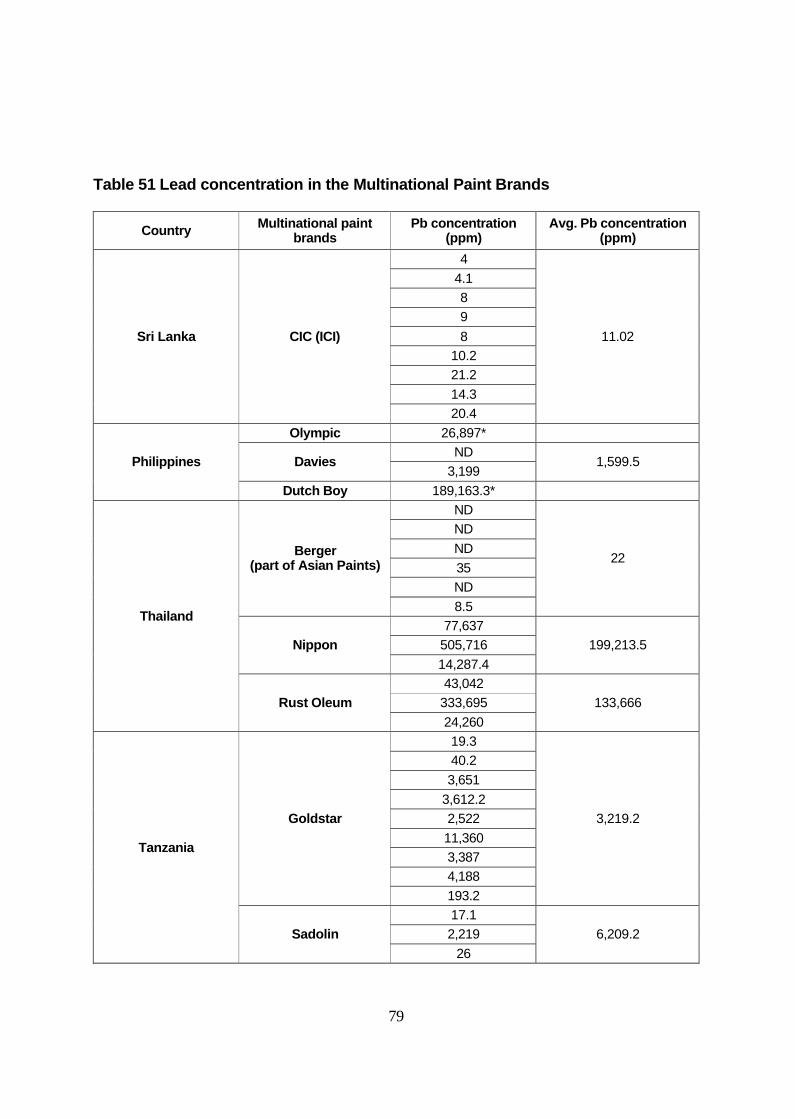
79
Table 51 Lead concentration in the Multinational Paint Brands
Country Multinational paint brands
Pb concentration(ppm)
Avg. Pb concentration (ppm)
Sri Lanka CIC (ICI)
4
11.02
4.1898
10.221.214.320.4
Philippines
Olympic 26,897*
DaviesND
1,599.53,199
Dutch Boy 189,163.3*
Thailand
Berger(part of Asian Paints)
ND
22
NDND35ND8.5
Nippon77,637
199,213.5505,71614,287.4
Rust Oleum43,042
133,666333,69524,260
Tanzania
Goldstar
19.3
3,219.2
40.23,651
3,612.22,52211,3603,3874,188193.2
Sadolin17.1
6,209.22,21926
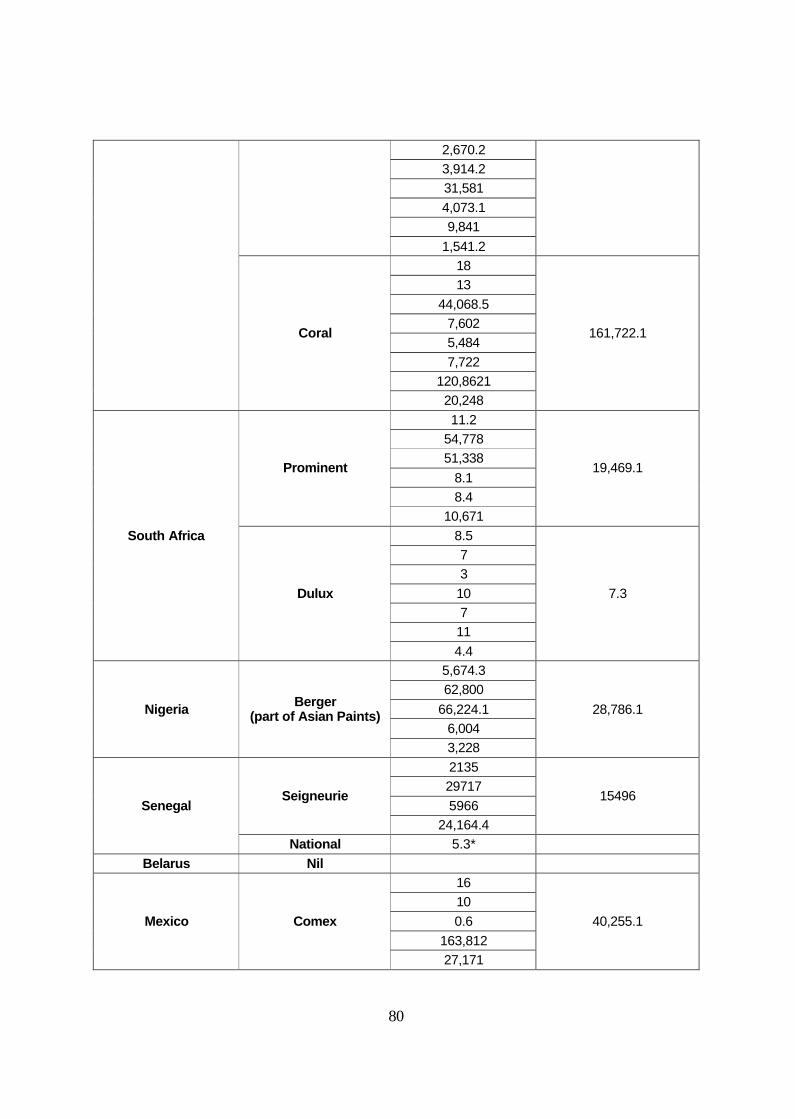
80
2,670.23,914.231,5814,073.19,841
1,541.2
Coral
18
161,722.1
1344,068.5
7,6025,4847,722
120,862120,248
South Africa
Prominent
11.2
19,469.1
54,77851,338
8.18.4
10,671
Dulux
8.5
7.3
73
107
114.4
Nigeria Berger(part of Asian Paints)
5,674.3
28,786.162,800
66,224.16,0043,228
SenegalSeigneurie
2135
15496297175966
24,164.4National 5.3*
Belarus Nil
Mexico Comex
16
40,255.1100.6
163,81227,171
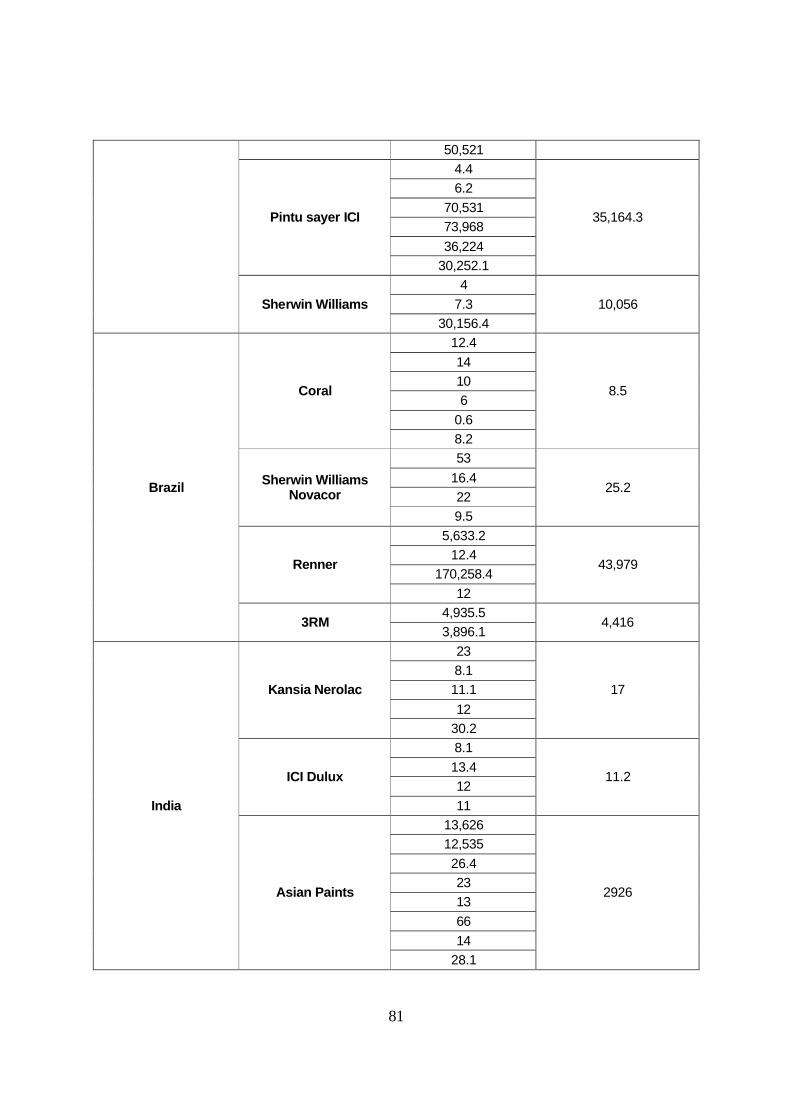
81
50,521
Pintu sayer ICI
4.4
35,164.3
6.270,53173,96836,224
30,252.1
Sherwin Williams4
10,0567.330,156.4
Brazil
Coral
12.4
8.5
14106
0.68.2
Sherwin Williams Novacor
53
25.216.4229.5
Renner
5,633.2
43,97912.4
170,258.412
3RM4,935.5
4,4163,896.1
India
Kansia Nerolac
23
178.111.112
30.2
ICI Dulux
8.1
11.213.41211
Asian Paints
13,626
2926
12,53526.423136614
28.1

82
0.6* Indicates the Pb concentration of only one sample.
83
References
American Journal of Public Health, 1923. Prohibition of white lead in Belgium. 13. 337.
Annest, J. L., 1983. Trends in the blood lead levels of the U.S. population. In Rutter M, Jones RR, eds. Lead versus health. Chichester, England, John Wiley & Sons, 33-58.
Barboza, David., 2007. 11 September. Why Lead in Toy Paint? It’s Cheaper. New York Times. http://www.nytimes.com/2007/09/11/business/worldbusiness/11lead.html(accessed in September).
Centers for Disease Control and Prevention, 1991. Preventing lead poisoning in young children: a statement by the Centers for Disease Control and Prevention. Atlanta, GA.
Clark, C.S., Bornshein, R.L., Succop, P., Que Hee, S.S., Hammond, P.B. and Peace, B., 1985. Condition and Type of Housing as an indicator of potential Environmental Lead Exposure and Pediatric Blood Lead Levels. Environmental Research. 38, 46-53.
Clark, C.S., K.G. Rampal, V Thuppil, C.K. Chen, R Clark, S. Roda., 2006. The lead content of currently available new residential paint in several Asian countries. Environmental Research. 102, 9-12.
Clark, C.S., Thuppil, V., Clark, R., Sinha, S., Menezes, G., D’Souza, H., Nayak, N., Kuruvila, A., Law, T., Dave, P. and Shah, S., 2005. Lead in Paints and Soil in Karnataka and Gujarat, India. Journal of Occupational and Environmental Hygiene, 2: 38-44.
Consumer Product Safety Improvement Act, 2008. One Hundred and Tenth Congress of the United States of America at the Second Session begun and held at the City of Washington on Thursday, the third day of January, two thousand eight. p. 5 (http://frwebgate.access.gpo.gov/cgi-bin/getdoc.cgi?dbname=110_cong_bills&docid=f:h4040enr.txt.pdf) (accessed in September 2008).
Department of Environment and Heritage, 2001. Australian Governmenthttp://www.environment.gov.au/atmosphere/airquality/publications/housepaint.html(accessed in August 2007).
Edwards-Bert, P., Calder, I. C., Maynard, E. J., 1994. National review of public exposure to lead in Australia. Adelaide, South Australian Health Commission.
ILZSG, 2004. World lead chemicals productions and usage. International Lead and Zinc Study Group, Lisbon, Portugal.
84
IPCS, 1995. Inorganic Lead - Environmental Health Criteria 85. World Health Organisation, International Programme on Chemical Safety. World Health Organisation, Geneva, Switzerland.
Kalra, Veena., Chitralekha, K. T., Dua, T., Pandey, R.M. and Gupta, Y., 2003. Blood lead levels and risk factors for lead toxicity in Children from schools and an Urban Slum in Delhi. Journal of Tropical Pediatrics 49 (2): 121-123.
Kaul, B., 1999. Lead exposure and iron deficiency among Jammu and New Delhi children. Indian Journal of Paediatrics. 66, 27-35.
Koller, Karin; Terry, Brown., Anne, Spurgeon, and Len, Levy, 2004. Recent Developments in Low-Level Lead Exposure and Intellectual Impairment in Children. Environmental Health Perspectives. 112, 9, 987-994.
Kumar, R. K. and Kesaree, N., 1999. Blood lead levels in urban and rural Indian children. Indian Paediatrics, 36. 303-306.
Kumar, A and Gottesfeld, P. (2008). Lead content in household paints in India. Science of the Total Environment. 407(1), 333-337.
Kuruvilla, A., Pillay, V.V., Venkatesh, T., Adhikari, P., Chakrapani, M., Clark, C.S., D’Souza, H., Menezes, G., Nayak, N., Clark, R., Sinha, S., 2004. Portable lead analyser to locate source of lead. Indian Journal of Paediatrics, 71: 495-499.
Lin-Fu, J. S., 1967. Lead poisoning in children. Social and Rehabilitations Service. U.S. Department of Health, Education and Welfare. Children’s Bureau Publication 452, U.S. Government Printing Office, Washington, D.C., as cited in Clark et al., 1985.
Markowitz, Gerald. 2000. “Cater to the Children”: The Role of the Lead Industry in a Public Health Tragedy, 1900-1955. American Journal of Public Health, 90, 1, 36-46.
Marsden, A. Philip, 2003 Increased body lead burden-causes or consequences of chronic renal insufficiency? The New England Journal of Medicine. Editorials. 348, 4, 345-347.
Mathee, A., R�llin, H., Levin, J. and Naik, I. (2007). Lead in Paint: Three Decades Later and Still a Hazard for African Children? Environmental Health Perspectives, 115 (3), 321-322 (Retrieved on 11 November 2008 from website:http://www.pubmedcentral.nih.gov/articlerender.fcgi?artid=1849931).
Needleman, H.L. 1995. Environmental lead and children’s intelligence. Studies included in the meta-analysis are not representative [Letter]. British Medical Journal. 310, 1408.
85
Needleman, H. L., Bellinger, D. 2001. Studies of lead exposure and the developing central nervous system: a reply to Kaufman. Archives of Clinical Neuropsychology. 16, 359-374.
Needleman, H. L., McFarland, C., Ness, R. B., Fienberg, S.E., Tobin, M. J. 2002. Bone lead levels in adjudicated delinquents. A case control study. Neurotoxicology and Teratology. 24, 711-717.
Nriagu, J., Ngozi, T., Oleru, Charles, Cudjoe., Ada, Chine., 1997. Lead poisoning of children in Africa, III. Kaduna, Nigeria. The Science of the Total Environment. 197, 13-19.
Nuwayhid, Iman, Nabulsi, M., Muwakkit, S., Kouzi, S., Salem, G., Mikati, M., and Ariss, M., 2003. Blood lead concentrations in 1-3 year old Lebanese children: A Cross-sectional study. Environmental Health: A Global Access Science Source. 2:5 (http://www.ehjournal.net/content/2/1/5)
Patel, K.S., Shrivas. K., Hoffman, P., and Jakubowski. N., 2006. A survey of lead pollution in Chattisgarh State, central India. Environmental Geochemistry and Health. 28, 11-17.
Pirkle, J. L., Brody, D. J., Gunter, E.W., Kramer, R. A., Paschal, D. C., Flegal, K. M., Matte, T. D., 1994. The decline in blood lead levels in the United States. The National Health and Nutrition Examination Surveys. Journal of the American Medical Association 272 (4): 284-291.
Rahbar, M.H., Franklin, White, Mubina, Agboatwalla., Siroos, Hozhabri., and Stephen Luby., 2002. Factors associated with elevated blood lead concentrations in children in Karachi, Pakistan in Bulletin of the World Health Organisation. 80(10).
Schnaas, L., Rothenberg, S. J., Flores, M., Martinez, S., Hernandez, C., Osorio, E., Velasco, S. R., and Perroni, E. 2006. Reduced intellectual development in children with prenatal lead exposure. Environmental Health Perspectives. 114(5), 791-797.
Selevan, S. G., Deborah, C. R., Karne, A., Hogan, Susan Y. Euling, Andrea Pfahles-Hutchens, and James Bethel, 2003. Blood lead concentration and delayed puberty in girls. The New England Journal of Medicine. 348, 16, 1527-1536.
The George Foundation. Project lead-free: a study of lead poisoning in major Indian cities. George A, M, ed. Proceedings of the International Conference on Lead Poisoning Prevention and Treatment, February 8-10, 1999. Bangalore, India, The George Foundation; 1999: 79-85.
Tong, S., McMichael, A. J., 1999. The magnitude, persistence and public health significance of cognitive effects of environmental lead exposure in childhood. Journal of Environmental Medicine. 1. 103-110.
86
United States Department of Health and Human Services, 1988. The nature and extent of lead poisoning in children in the United States: a report to Congress. Atlanta, GA, United States.
United States Environmental Protection Agency ( U.S. EPA), 2001. Standard Operating Procedures for Lead in Paint by Hotplate or microwave-based Acid Digestions and Atomic Absorption or Inductively Coupled Plasma Emission Spectroscopy, EPA, PB92-114172, September, 1991.
WHO/UNECE, 2006. Health risks of heavy metals from long-range transboundary air pollution. Draft of May 2006. World Health Organisation (WHO) and United Nations Economic Commission for Europe (UNECE), Geneva, Switzerland. (To be updated when final version is available).
World Health Organisation. 1995. Inorganic Lead (Environmental Health Criteria, No. 165), Geneva.
Wu, T., Germaine, M. Buck and Pauline, Mendola., 2003. Blood lead levels and sexual maturation in U.S. girls: the third national health and nutrition examination survey, 1988-1994. Environmental Health Perspectives. 111.5. 737-741.
87
Appendix I
IFCS Resolution for Eliminating Lead in Paints
The following resolution was adopted by the delegates of the IFCS, Forum VI, at its meeting in Dakar, Senegal, 15-19 September, 2008:
o Recognise that lead in paints poses serious risks to human health and the environment, especially to the health of children
o Take into account that most children exposed to lead live in developing countries and countries with economies in transition
o Recognise that household paints sold in developing countries contain leado Aware that safer and affordable alternatives for lead in paints already existo Affirm that many consumers, especially in developing countries, are unaware of
the dangers posed by lead in paintso WSSD POI paragraph 56 (b) supports the phasing out of lead in gasolineo Applaud the important work of the Partnership for Clean Fuels and
Vehicles (PCFV) in its implementation of WSSD POI paragraph 56 (b)o Acknowledge that much progress has been made towards achieving a global
phase out of lead in automotive fuelso Recognise that the WSSD POI, in paragraph 57, calls for the phasing out of lead
in paints and other sources of human exposure. It calls for work to prevent children's exposure to lead, and to strengthen monitoring and surveillance efforts and the treatment of lead poisoning.
The meeting decided that a global partnership to promote the implementation of the measures contained in WSSD POI paragraph 57 is essential, especially for developing countries and countries with economies in transition.
Support the phase out of lead in paints
The Forum Standing Committee suggested setting up an ad-hoc Working Group to prepare a draft Terms of Reference, to be submitted to the ICCM-2, for a global partnership to consider taking a decision to support the concerted action in the implementation of the measures contained in WSSD POI paragraph 57.
It suggested a role for the governing bodies of the relevant intergovernmental organisations, including UNEP, WHO, and other IGOs to support and participate in such an initiative.
It Invited the UNEP Governing Council at its 25th Session to consider providing support for such concerted action.
88
Appendix II
Sampling Protocol
This study is designed for analysing lead concentration in household paints. Paints can broadly be classified as industrial and decorative paints. Industrial paints are automotive and marine paints and those used for specific purposes. Decorative paints are those used to paint houses. Decorative paints are further classified on the basis of solvents used as water-based plastic or latex paints and oil-based enamel paints. Water-based paints are used to paint walls of houses while oil-based paints are primarily meant for coating wooden surfaces, iron grills etc. However, it must be kept in mind that paints are often found to be used differently from their intended purposes.
The total number of decorative paint samples meant for household use that should be purchased is 25 to 30. Out of which 10 should be water-based plastic paints, while the rest should be oil-based enamel paints. Samples may include the following colours: yellow, orange, blue, green, red, black, and white. One may choose different shades of these colours. Samples should consist of all or most of the popular brands in the country, including those from unorganised small-scale industrial sectors. The total number of samples from each country must not exceed 30. In case there are more than four popular brands, samples should be so chosen that together they make for more than 80 percent of market share. The above-mentioned seven colours may be chosen from across the brands. Samples should be purchased in lowest available amount, such as 25/50 ml cans. Sometimes, the smallest packaging of plastic paints is of one litre. The cans should not be tampered with, including the seal and labelling and other information. After being purchased, the samples should be given a unique number using a permanent marker and transparent adhesive tape should be stuck on it so that the marking does not fade during the can’s shipment.
All relevant information about the samples should be noted down as per the attachedsample catalogue form. Samples with their seals and all labelling information should be couriered to Toxics Link office along with a copy of sample catalogue.