late quaternary glaciation and equilibrium-line altitudes of the mayan ice cap, guatemala, central...
TRANSCRIPT
Quaternary Research 74 (2010) 1–7
Contents lists available at ScienceDirect
Quaternary Research
j ourna l homepage: www.e lsev ie r.com/ locate /yqres
Short Paper
Late Quaternary glaciation and equilibrium-line altitudes of the Mayan Ice Cap,Guatemala, Central America
Alex J. Roy 1, Matthew S. Lachniet ⁎University of Nevada, Las Vegas, Department of Geoscience, 4505 Maryland Parkway, Las Vegas, NV 89154, USA
⁎ Corresponding author. Fax: +702 895 4064.E-mail addresses: [email protected] (A.J. Roy), m
(M.S. Lachniet).1 Present address: Maryland Department of the
Waterways Program, 1800 Washington Blvd., Baltimore
0033-5894/$ – see front matter © 2010 University of Wdoi:10.1016/j.yqres.2010.04.010
a b s t r a c t
a r t i c l e i n f oArticle history:Received 22 May 2009
Keywords:Tropical glaciationGuatemalaEquilibrium-line altitudeLast glacial maximum
The Sierra los Cuchumatanes (3837 m), Guatemala, supported a plateau ice cap and valley glaciers aroundMontaña San Juan (3784 m) that totaled ∼43 km2 in area during the last local glacial maximum. Former icelimits are defined by sharp-crested lateral and terminal moraines that extend to elevations of ∼3450 m alongthe ice cap margin, and to ca. 3000–3300 m for the valley glaciers. Equilibrium-line altitudes (ELAs)estimated using the area–altitude balance ratio method for the maximum late Quaternary glaciation reachedas low as 3470 m for the valley glaciers and 3670 m for the Mayan Ice Cap. Relative to the modern altitude ofthe 0°C isotherm of ∼4840 m, we determined ELA depressions of 1110–1436 m. If interpreted in terms of adepression of the freezing level during maximal glaciation along the modern lapse rate of −5.3°C km−1, thisΔELA indicates tropical highland cooling of ∼5.9 to 7.6±1.2°C. Our data support greater glacial highlandcooling than at sea level, implying a high tropical sensitivity to global climate changes. The large magnitudeof ELA depression in Guatemala may have been partially forced by enhanced wetness associated withsouthward excursions of the boreal winter polar air mass.
© 2010 University of Washington. Published by Elsevier Inc. All rights reserved.
Introduction
Background and context
Former tropical glacier extents and equilibrium-line altitudes(ELAs) provide important evidence about paleoclimates during thelast glacial period (Porter, 2001; Kaser and Osmaston, 2002; Benn etal., 2005; Mark et al., 2005; Osmaston, 2005), yet few data areavailable to constrain past temperature reductions at tropical highaltitudes. Glaciation in Central America is limited to those peaks olderthan the late glacial and having altitudes exceeding ca. 3500 m inGuatemala and Costa Rica (Anderson, 1969a; Anderson et al., 1973;Hastenrath, 1974; Horn, 1990; Orvis and Horn, 2000; Lachniet, 2007;Marshall, 2007). Glacial evidence suggests a 5–8°C highland coolingthat is considerably more than at sea level (CLIMAP, 1976; Crowley,2000; Lea, 2004), an observation dubbed the “tropical paleotempera-ture paradox” (Rind and Peteet, 1985; Ballantyne et al., 2005). Globallast glacial maximum (LGM) sea-surface temperature (SST) and land-surface temperature depressions were 2.7±0.5°C and 5.4±0.3°C,respectively, with more cooling in the tropical Atlantic then thetropical Pacific (Ballantyne et al., 2005). However, further paleotem-
Environment, Wetlands and, Maryland, 21230-4170, USA.
ashington. Published by Elsevier I
perature data are needed from locations sensitive to sea-surfacetemperature forcing in order to evaluate last glacial highlandtemperature reductions. Our study area is a key location for such atest because it is closely bordered by the Caribbean Sea, the Gulf ofMexico, and the Pacific Ocean. To this end, we have completed glacialgeologic field mapping in the Sierra los Cuchumatanes in the northernGuatemalan highlands, reconstructed past equilibrium-line altitudes(ELAs) for the last local glacial maximum (LLGM), and provideestimates of tropical highland cooling.
Study area
The Sierra los Cuchumatanes (15°30.0′N, 91°30.0′W) is a highlimestone plateau, located within the Mayan Highlands at thesouthernmost limit of North America (Fig. 1) (Anderson et al., 1973;Bundschuh et al., 2007a). The plateau contains the highest non-volcanic point in Central America at 3837 m (Bundschuh et al.,2007a), and traces of former glaciation were documented by previousstudies (Enjalbert, 1967; Anderson, 1969b; Anderson et al., 1973;Hastenrath, 1974). Although no radiometric ages for the glaciationexist, the slightly weathered till suggested a late Wisconsin age(Anderson, 1969b). The late Quaternary ELA was estimated at ca.3650 m (Hastenrath, 1974). The plateau also shows karst landformswith largely internal, subterranean drainage (Blake, 1934; Enjalbert,1967; Anderson et al., 1973; Hastenrath, 1974). The glacial geology ofnearby Montaña San Juan, located south of the main plateau region,has not previously been described.
nc. All rights reserved.
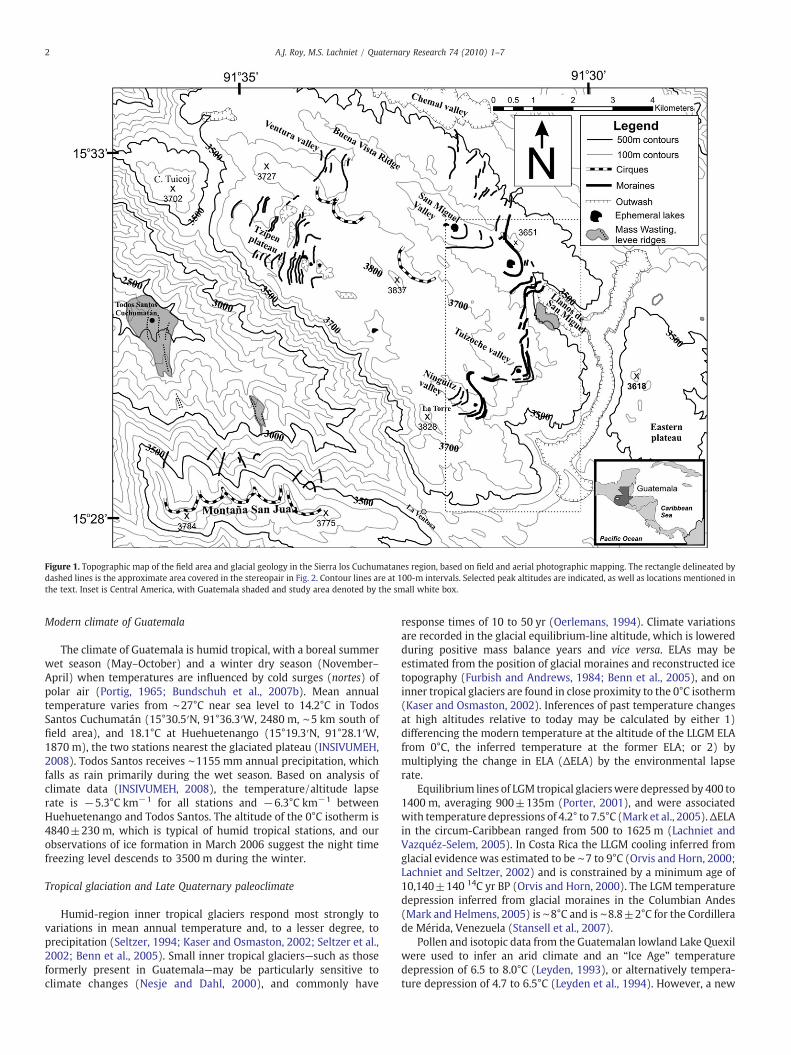
Figure 1. Topographic map of the field area and glacial geology in the Sierra los Cuchumatanes region, based on field and aerial photographic mapping. The rectangle delineated bydashed lines is the approximate area covered in the stereopair in Fig. 2. Contour lines are at 100-m intervals. Selected peak altitudes are indicated, as well as locations mentioned inthe text. Inset is Central America, with Guatemala shaded and study area denoted by the small white box.
2 A.J. Roy, M.S. Lachniet / Quaternary Research 74 (2010) 1–7
Modern climate of Guatemala
The climate of Guatemala is humid tropical, with a boreal summerwet season (May–October) and a winter dry season (November–April) when temperatures are influenced by cold surges (nortes) ofpolar air (Portig, 1965; Bundschuh et al., 2007b). Mean annualtemperature varies from ∼27°C near sea level to 14.2°C in TodosSantos Cuchumatán (15°30.5′N, 91°36.3′W, 2480 m, ∼5 km south offield area), and 18.1°C at Huehuetenango (15°19.3′N, 91°28.1′W,1870 m), the two stations nearest the glaciated plateau (INSIVUMEH,2008). Todos Santos receives ∼1155 mm annual precipitation, whichfalls as rain primarily during the wet season. Based on analysis ofclimate data (INSIVUMEH, 2008), the temperature/altitude lapserate is −5.3°C km−1 for all stations and −6.3°C km−1 betweenHuehuetenango and Todos Santos. The altitude of the 0°C isotherm is4840±230 m, which is typical of humid tropical stations, and ourobservations of ice formation in March 2006 suggest the night timefreezing level descends to 3500 m during the winter.
Tropical glaciation and Late Quaternary paleoclimate
Humid-region inner tropical glaciers respond most strongly tovariations in mean annual temperature and, to a lesser degree, toprecipitation (Seltzer, 1994; Kaser and Osmaston, 2002; Seltzer et al.,2002; Benn et al., 2005). Small inner tropical glaciers—such as thoseformerly present in Guatemala—may be particularly sensitive toclimate changes (Nesje and Dahl, 2000), and commonly have
response times of 10 to 50 yr (Oerlemans, 1994). Climate variationsare recorded in the glacial equilibrium-line altitude, which is loweredduring positive mass balance years and vice versa. ELAs may beestimated from the position of glacial moraines and reconstructed icetopography (Furbish and Andrews, 1984; Benn et al., 2005), and oninner tropical glaciers are found in close proximity to the 0°C isotherm(Kaser and Osmaston, 2002). Inferences of past temperature changesat high altitudes relative to today may be calculated by either 1)differencing the modern temperature at the altitude of the LLGM ELAfrom 0°C, the inferred temperature at the former ELA; or 2) bymultiplying the change in ELA (ΔELA) by the environmental lapserate.
Equilibrium lines of LGM tropical glacierswere depressed by 400 to1400 m, averaging 900±135m (Porter, 2001), and were associatedwith temperature depressions of 4.2° to 7.5°C (Mark et al., 2005).ΔELAin the circum-Caribbean ranged from 500 to 1625 m (Lachniet andVazquéz-Selem, 2005). In Costa Rica the LLGM cooling inferred fromglacial evidence was estimated to be ∼7 to 9°C (Orvis and Horn, 2000;Lachniet and Seltzer, 2002) and is constrained by a minimum age of10,140±140 14C yr BP (Orvis and Horn, 2000). The LGM temperaturedepression inferred from glacial moraines in the Columbian Andes(Mark and Helmens, 2005) is ∼8°C and is ∼8.8±2°C for the Cordillerade Mérida, Venezuela (Stansell et al., 2007).
Pollen and isotopic data from the Guatemalan lowland Lake Quexilwere used to infer an arid climate and an “Ice Age” temperaturedepression of 6.5 to 8.0°C (Leyden, 1993), or alternatively tempera-ture depression of 4.7 to 6.5°C (Leyden et al., 1994). However, a new
3A.J. Roy, M.S. Lachniet / Quaternary Research 74 (2010) 1–7
chronology for high-resolution proxy data from a Lake Petén Itzásediment core confirms that the LGM (23 to 18 ka) was moist in theGuatemalan lowlands (Hodell et al., 2008; Bush et al., 2009).Following drying associated with Heinrich event 1, the Peténremained dry between 18.0 and 14.7 ka, just prior to a return to wetconditions during the Bølling–Allerød interstade, which was in turnfollowed by a relatively dry Younger Dryas stade (Hodell et al., 2008).The wet conditions between 23 and 18 ka may have been the result ofincreased nortes, which bring orographic precipitation to leewardmountains, and is consistent with a pollen-based temperaturereduction of 4 to 5°C (Bush et al., 2009). The LGM-to-Holocenetransition in Costa Rica was marked by an ∼8°C temperature rise at2300 m elevation (Hooghiemstra et al., 1992), and the Younger Dryasstade was marked by a 2.5 to 3.0°C temperature reduction (Islebe andHooghiemstra, 1997).
Methods
Glacial geology and ELA estimation
Glacial landforms were mapped in the field and with topographicmaps and aerial stereophotographs (INSIVUMEH, 2007). The maxi-mum ice extent was delineated by the lowest limit of terminalmoraines and extrapolated lateral moraines on Montaña San Juan. Toconstrain realistic basal shear stress for the former glaciers, icethicknesses inferred from the moraine limits were adjusted to matchthe glacial geomorphology (Paterson, 1981; Benn and Evans, 1998)via the equation
τ = ρigh sinα
where τ is the shear stress, ρi the density of ice (917 kg m−3), g thegravitational acceleration (9.81 m/s−2), h is the ice thickness (m) and
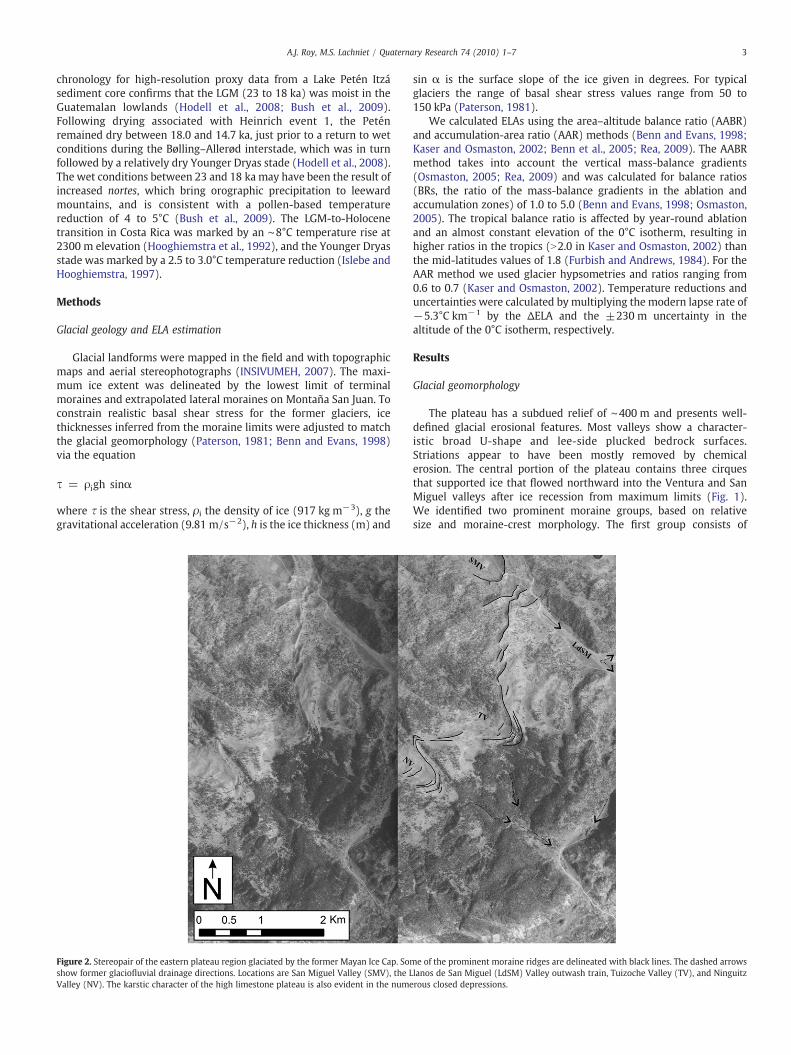
Figure 2. Stereopair of the eastern plateau region glaciated by the former Mayan Ice Cap. Somshow former glaciofluvial drainage directions. Locations are San Miguel Valley (SMV), the LValley (NV). The karstic character of the high limestone plateau is also evident in the nume
sin α is the surface slope of the ice given in degrees. For typicalglaciers the range of basal shear stress values range from 50 to150 kPa (Paterson, 1981).
We calculated ELAs using the area–altitude balance ratio (AABR)and accumulation-area ratio (AAR) methods (Benn and Evans, 1998;Kaser and Osmaston, 2002; Benn et al., 2005; Rea, 2009). The AABRmethod takes into account the vertical mass-balance gradients(Osmaston, 2005; Rea, 2009) and was calculated for balance ratios(BRs, the ratio of the mass-balance gradients in the ablation andaccumulation zones) of 1.0 to 5.0 (Benn and Evans, 1998; Osmaston,2005). The tropical balance ratio is affected by year-round ablationand an almost constant elevation of the 0°C isotherm, resulting inhigher ratios in the tropics (N2.0 in Kaser and Osmaston, 2002) thanthe mid-latitudes values of 1.8 (Furbish and Andrews, 1984). For theAAR method we used glacier hypsometries and ratios ranging from0.6 to 0.7 (Kaser and Osmaston, 2002). Temperature reductions anduncertainties were calculated by multiplying the modern lapse rate of−5.3°C km−1 by the ΔELA and the ±230 m uncertainty in thealtitude of the 0°C isotherm, respectively.
Results
Glacial geomorphology
The plateau has a subdued relief of ∼400 m and presents well-defined glacial erosional features. Most valleys show a character-istic broad U-shape and lee-side plucked bedrock surfaces.Striations appear to have been mostly removed by chemicalerosion. The central portion of the plateau contains three cirquesthat supported ice that flowed northward into the Ventura and SanMiguel valleys after ice recession from maximum limits (Fig. 1).We identified two prominent moraine groups, based on relativesize and moraine-crest morphology. The first group consists of
e of the prominent moraine ridges are delineated with black lines. The dashed arrowslanos de San Miguel (LdSM) Valley outwash train, Tuizoche Valley (TV), and Ninguitzrous closed depressions.
4 A.J. Roy, M.S. Lachniet / Quaternary Research 74 (2010) 1–7
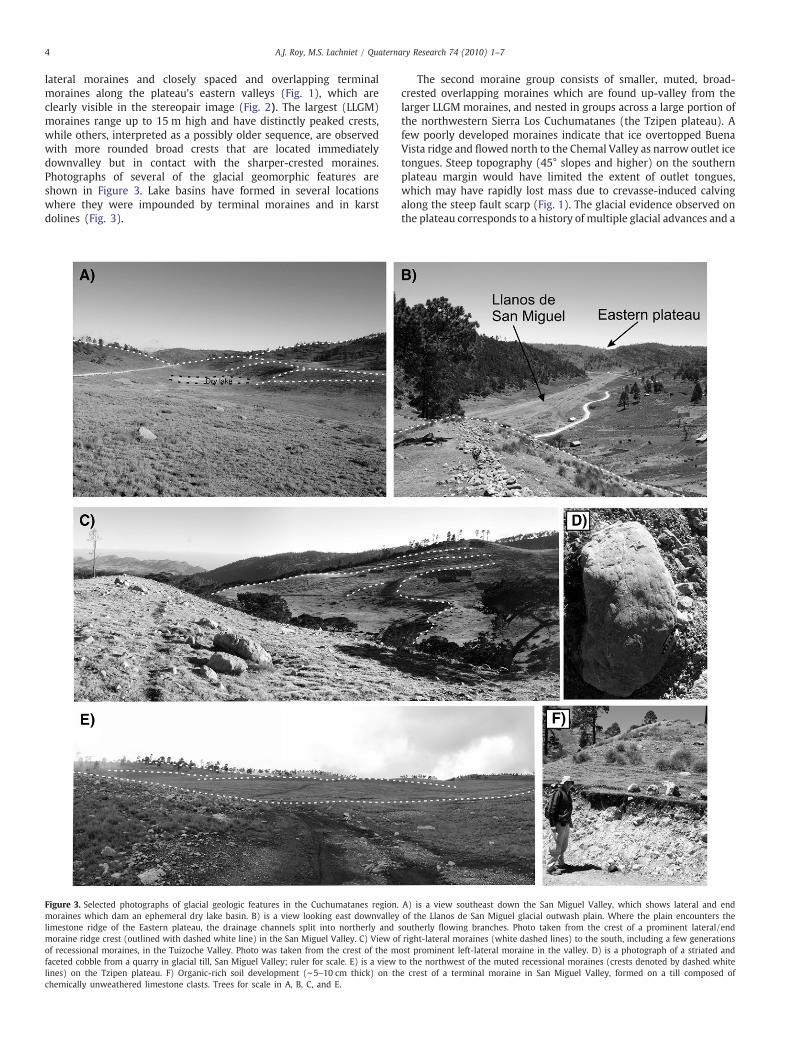
lateral moraines and closely spaced and overlapping terminalmoraines along the plateau's eastern valleys (Fig. 1), which areclearly visible in the stereopair image (Fig. 2). The largest (LLGM)moraines range up to 15 m high and have distinctly peaked crests,while others, interpreted as a possibly older sequence, are observedwith more rounded broad crests that are located immediatelydownvalley but in contact with the sharper-crested moraines.Photographs of several of the glacial geomorphic features areshown in Figure 3. Lake basins have formed in several locationswhere they were impounded by terminal moraines and in karstdolines (Fig. 3).
Figure 3. Selected photographs of glacial geologic features in the Cuchumatanes region.moraines which dam an ephemeral dry lake basin. B) is a view looking east downvalleylimestone ridge of the Eastern plateau, the drainage channels split into northerly andmoraine ridge crest (outlined with dashed white line) in the San Miguel Valley. C) View ofof recessional moraines, in the Tuizoche Valley. Photo was taken from the crest of the mfaceted cobble from a quarry in glacial till, San Miguel Valley; ruler for scale. E) is a viewlines) on the Tzipen plateau. F) Organic-rich soil development (∼5–10 cm thick) on thchemically unweathered limestone clasts. Trees for scale in A, B, C, and E.
The second moraine group consists of smaller, muted, broad-crested overlapping moraines which are found up-valley from thelarger LLGM moraines, and nested in groups across a large portion ofthe northwestern Sierra Los Cuchumatanes (the Tzipen plateau). Afew poorly developed moraines indicate that ice overtopped BuenaVista ridge and flowed north to the Chemal Valley as narrow outlet icetongues. Steep topography (45° slopes and higher) on the southernplateau margin would have limited the extent of outlet tongues,which may have rapidly lost mass due to crevasse-induced calvingalong the steep fault scarp (Fig. 1). The glacial evidence observed onthe plateau corresponds to a history of multiple glacial advances and a
A) is a view southeast down the San Miguel Valley, which shows lateral and endof the Llanos de San Miguel glacial outwash plain. Where the plain encounters the
southerly flowing branches. Photo taken from the crest of a prominent lateral/endright-lateral moraines (white dashed lines) to the south, including a few generations
ost prominent left-lateral moraine in the valley. D) is a photograph of a striated andto the northwest of the muted recessional moraines (crests denoted by dashed whitee crest of a terminal moraine in San Miguel Valley, formed on a till composed of
5A.J. Roy, M.S. Lachniet / Quaternary Research 74 (2010) 1–7
retreat of the ice cap, with maximal advances not significantlyexceeding the LLGM limits.
Below the SanMiguel valley terminal moraines, a now-dry narrowoutwash valley train extends for ∼2 km (Fig. 1). Diamict deposits,interpreted as a subglacial till, were observed at the western edge ofthe Ventura Valley to an altitude of ∼3500 m, which is overlain byoutwash in places. Between ∼3560 and 3600 m a set of four smallmuted moraines are evident in Ventura Valley, one of which dams adry lake. Most exposedmorainal boulders havemoderately developedrillenkarren surfaces and relief that indicate post-depositionalchemical weathering. The average rillenkarren depth measured onthree boulders was 15.6 mm (n=29; max 32 mm), and chert noduleson one boulder stand an average height of 9.8 mm (n=13) above theweathered limestone. These measurements provide minimum ero-sion amounts since moraine stabilization.
The Montaña San Juan (3784 m) is flanked by several north-facingcirques that contain rounded and scoured bedrock and small closedbasins. Cirque headwalls at ∼3650 m are joined by well-definedarêtes and small horns. Below the cirques, small lateral and endmoraine segments descend downvalley. Below the glacial limit onMontaña San Juan, several linear ridges lead to a large hummocky lobeof sediment with a central depression that forms the town site ofTodos Santos Cuchumatán. We interpret these linear ridges as debris-flow levees, and the hummocky lobe as a debris flow that partiallydammed the Rio Limón valley (Fig. 1). We examined numerous glacialsedimentary exposures in several quarries, home sites, and in thewalls of hand-dug wells in moraines in the San Miguel, Tuizoche, andNinguitz valleys. Bouldery tills consist of a poorly rounded clast-
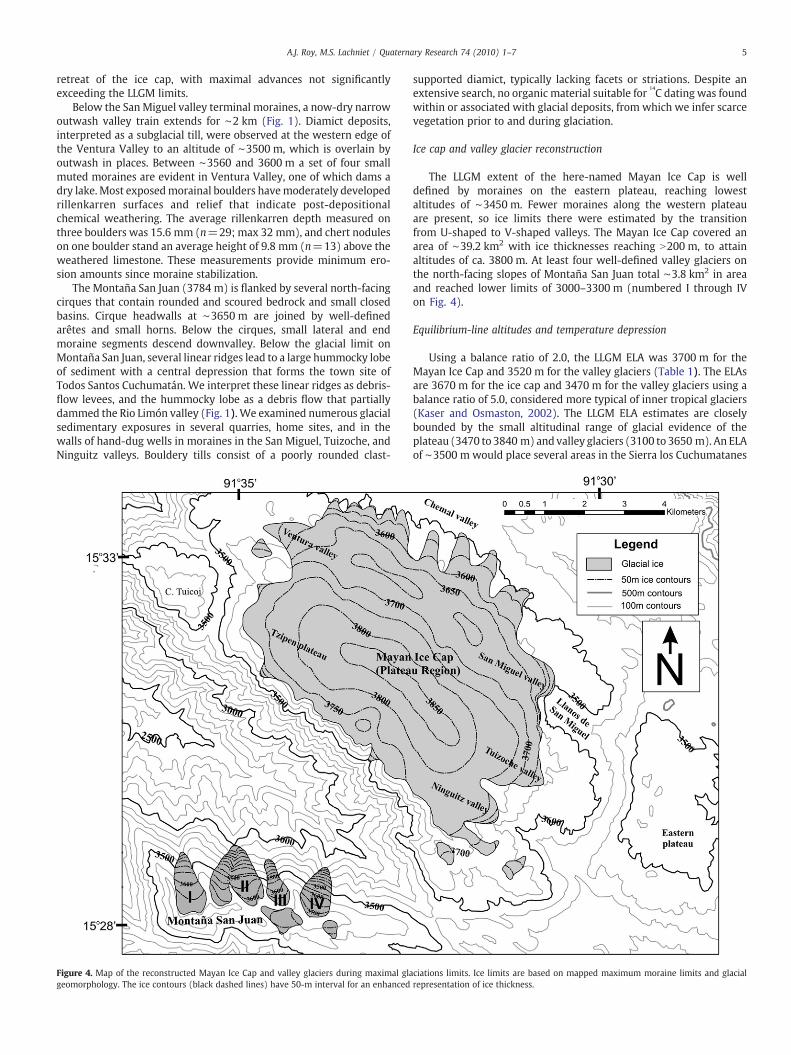
Figure 4. Map of the reconstructed Mayan Ice Cap and valley glaciers during maximal glageomorphology. The ice contours (black dashed lines) have 50-m interval for an enhanced
supported diamict, typically lacking facets or striations. Despite anextensive search, no organic material suitable for
14C dating was found
within or associated with glacial deposits, from which we infer scarcevegetation prior to and during glaciation.
Ice cap and valley glacier reconstruction
The LLGM extent of the here-named Mayan Ice Cap is welldefined by moraines on the eastern plateau, reaching lowestaltitudes of ∼3450 m. Fewer moraines along the western plateauare present, so ice limits there were estimated by the transitionfrom U-shaped to V-shaped valleys. The Mayan Ice Cap covered anarea of ∼39.2 km2 with ice thicknesses reaching N200 m, to attainaltitudes of ca. 3800 m. At least four well-defined valley glaciers onthe north-facing slopes of Montaña San Juan total ∼3.8 km2 in areaand reached lower limits of 3000–3300 m (numbered I through IVon Fig. 4).
Equilibrium-line altitudes and temperature depression
Using a balance ratio of 2.0, the LLGM ELA was 3700 m for theMayan Ice Cap and 3520 m for the valley glaciers (Table 1). The ELAsare 3670 m for the ice cap and 3470 m for the valley glaciers using abalance ratio of 5.0, considered more typical of inner tropical glaciers(Kaser and Osmaston, 2002). The LLGM ELA estimates are closelybounded by the small altitudinal range of glacial evidence of theplateau (3470 to 3840 m) and valley glaciers (3100 to 3650 m). An ELAof ∼3500 m would place several areas in the Sierra los Cuchumatanes
ciations limits. Ice limits are based on mapped maximum moraine limits and glacialrepresentation of ice thickness.
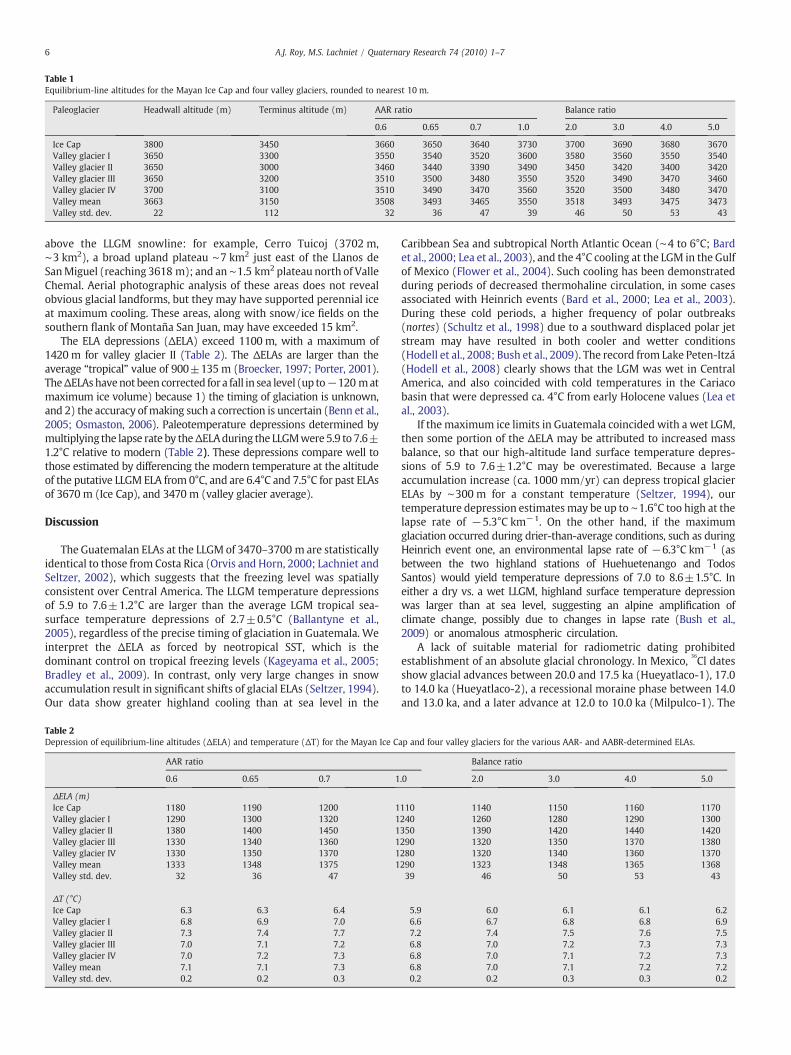
Table 1Equilibrium-line altitudes for the Mayan Ice Cap and four valley glaciers, rounded to nearest 10 m.
Paleoglacier Headwall altitude (m) Terminus altitude (m) AAR ratio Balance ratio
0.6 0.65 0.7 1.0 2.0 3.0 4.0 5.0
Ice Cap 3800 3450 3660 3650 3640 3730 3700 3690 3680 3670Valley glacier I 3650 3300 3550 3540 3520 3600 3580 3560 3550 3540Valley glacier II 3650 3000 3460 3440 3390 3490 3450 3420 3400 3420Valley glacier III 3650 3200 3510 3500 3480 3550 3520 3490 3470 3460Valley glacier IV 3700 3100 3510 3490 3470 3560 3520 3500 3480 3470Valley mean 3663 3150 3508 3493 3465 3550 3518 3493 3475 3473Valley std. dev. 22 112 32 36 47 39 46 50 53 43
6 A.J. Roy, M.S. Lachniet / Quaternary Research 74 (2010) 1–7
above the LLGM snowline: for example, Cerro Tuicoj (3702 m,∼3 km2), a broad upland plateau ∼7 km2 just east of the Llanos deSanMiguel (reaching 3618 m); and an∼1.5 km2 plateau north of ValleChemal. Aerial photographic analysis of these areas does not revealobvious glacial landforms, but they may have supported perennial iceat maximum cooling. These areas, along with snow/ice fields on thesouthern flank of Montaña San Juan, may have exceeded 15 km2.
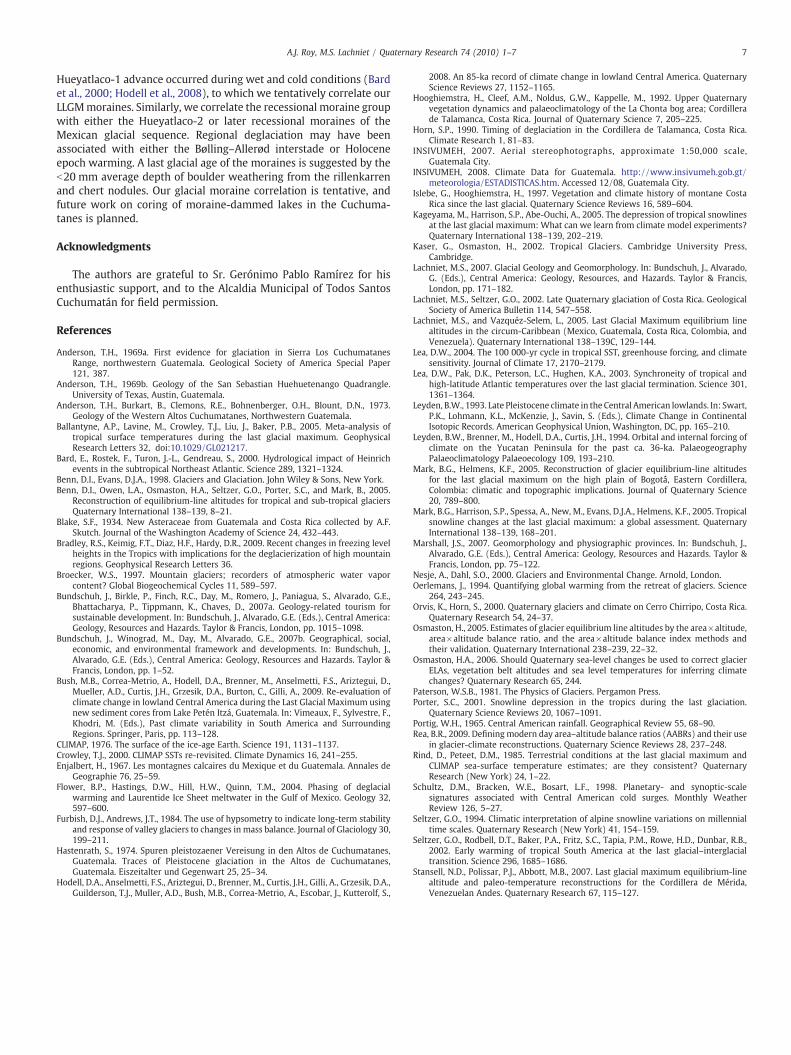
The ELA depressions (ΔELA) exceed 1100 m, with a maximum of1420 m for valley glacier II (Table 2). The ΔELAs are larger than theaverage “tropical” value of 900±135 m (Broecker, 1997; Porter, 2001).TheΔELAshavenot been corrected for a fall in sea level (up to−120 matmaximum ice volume) because 1) the timing of glaciation is unknown,and 2) the accuracy ofmaking such a correction is uncertain (Benn et al.,2005; Osmaston, 2006). Paleotemperature depressions determined bymultiplying the lapse rate by theΔELAduring the LLGMwere 5.9 to 7.6±1.2°C relative to modern (Table 2). These depressions compare well tothose estimated by differencing the modern temperature at the altitudeof the putative LLGM ELA from 0°C, and are 6.4°C and 7.5°C for past ELAsof 3670 m (Ice Cap), and 3470 m (valley glacier average).
Discussion
The Guatemalan ELAs at the LLGM of 3470–3700 m are statisticallyidentical to those from Costa Rica (Orvis and Horn, 2000; Lachniet andSeltzer, 2002), which suggests that the freezing level was spatiallyconsistent over Central America. The LLGM temperature depressionsof 5.9 to 7.6±1.2°C are larger than the average LGM tropical sea-surface temperature depressions of 2.7±0.5°C (Ballantyne et al.,2005), regardless of the precise timing of glaciation in Guatemala. Weinterpret the ΔELA as forced by neotropical SST, which is thedominant control on tropical freezing levels (Kageyama et al., 2005;Bradley et al., 2009). In contrast, only very large changes in snowaccumulation result in significant shifts of glacial ELAs (Seltzer, 1994).Our data show greater highland cooling than at sea level in the
Table 2Depression of equilibrium-line altitudes (ΔELA) and temperature (ΔT) for the Mayan Ice C
AAR ratio
0.6 0.65 0.7 1
ΔELA (m)Ice Cap 1180 1190 1200 1Valley glacier I 1290 1300 1320 1Valley glacier II 1380 1400 1450 1Valley glacier III 1330 1340 1360 1Valley glacier IV 1330 1350 1370 1Valley mean 1333 1348 1375 1Valley std. dev. 32 36 47
ΔT (°C)Ice Cap 6.3 6.3 6.4Valley glacier I 6.8 6.9 7.0Valley glacier II 7.3 7.4 7.7Valley glacier III 7.0 7.1 7.2Valley glacier IV 7.0 7.2 7.3Valley mean 7.1 7.1 7.3Valley std. dev. 0.2 0.2 0.3
Caribbean Sea and subtropical North Atlantic Ocean (∼4 to 6°C; Bardet al., 2000; Lea et al., 2003), and the 4°C cooling at the LGM in the Gulfof Mexico (Flower et al., 2004). Such cooling has been demonstratedduring periods of decreased thermohaline circulation, in some casesassociated with Heinrich events (Bard et al., 2000; Lea et al., 2003).During these cold periods, a higher frequency of polar outbreaks(nortes) (Schultz et al., 1998) due to a southward displaced polar jetstream may have resulted in both cooler and wetter conditions(Hodell et al., 2008; Bush et al., 2009). The record from Lake Peten-Itzá(Hodell et al., 2008) clearly shows that the LGM was wet in CentralAmerica, and also coincided with cold temperatures in the Cariacobasin that were depressed ca. 4°C from early Holocene values (Lea etal., 2003).
If the maximum ice limits in Guatemala coincided with a wet LGM,then some portion of the ΔELA may be attributed to increased massbalance, so that our high-altitude land surface temperature depres-sions of 5.9 to 7.6±1.2°C may be overestimated. Because a largeaccumulation increase (ca. 1000 mm/yr) can depress tropical glacierELAs by ∼300 m for a constant temperature (Seltzer, 1994), ourtemperature depression estimates may be up to ∼1.6°C too high at thelapse rate of −5.3°C km−1. On the other hand, if the maximumglaciation occurred during drier-than-average conditions, such as duringHeinrich event one, an environmental lapse rate of −6.3°C km−1 (asbetween the two highland stations of Huehuetenango and TodosSantos) would yield temperature depressions of 7.0 to 8.6±1.5°C. Ineither a dry vs. a wet LLGM, highland surface temperature depressionwas larger than at sea level, suggesting an alpine amplification ofclimate change, possibly due to changes in lapse rate (Bush et al.,2009) or anomalous atmospheric circulation.
A lack of suitable material for radiometric dating prohibitedestablishment of an absolute glacial chronology. In Mexico,
36Cl dates
show glacial advances between 20.0 and 17.5 ka (Hueyatlaco-1), 17.0to 14.0 ka (Hueyatlaco-2), a recessional moraine phase between 14.0and 13.0 ka, and a later advance at 12.0 to 10.0 ka (Milpulco-1). The
ap and four valley glaciers for the various AAR- and AABR-determined ELAs.
Balance ratio
.0 2.0 3.0 4.0 5.0
110 1140 1150 1160 1170240 1260 1280 1290 1300350 1390 1420 1440 1420290 1320 1350 1370 1380280 1320 1340 1360 1370290 1323 1348 1365 136839 46 50 53 43
5.9 6.0 6.1 6.1 6.26.6 6.7 6.8 6.8 6.97.2 7.4 7.5 7.6 7.56.8 7.0 7.2 7.3 7.36.8 7.0 7.1 7.2 7.36.8 7.0 7.1 7.2 7.20.2 0.2 0.3 0.3 0.2
7A.J. Roy, M.S. Lachniet / Quaternary Research 74 (2010) 1–7
Hueyatlaco-1 advance occurred during wet and cold conditions (Bardet al., 2000; Hodell et al., 2008), to which we tentatively correlate ourLLGMmoraines. Similarly, we correlate the recessional moraine groupwith either the Hueyatlaco-2 or later recessional moraines of theMexican glacial sequence. Regional deglaciation may have beenassociated with either the Bølling–Allerød interstade or Holoceneepoch warming. A last glacial age of the moraines is suggested by theb20 mm average depth of boulder weathering from the rillenkarrenand chert nodules. Our glacial moraine correlation is tentative, andfuture work on coring of moraine-dammed lakes in the Cuchuma-tanes is planned.
Acknowledgments
The authors are grateful to Sr. Gerónimo Pablo Ramírez for hisenthusiastic support, and to the Alcaldia Municipal of Todos SantosCuchumatán for field permission.
References
Anderson, T.H., 1969a. First evidence for glaciation in Sierra Los CuchumatanesRange, northwestern Guatemala. Geological Society of America Special Paper121, 387.
Anderson, T.H., 1969b. Geology of the San Sebastian Huehuetenango Quadrangle.University of Texas, Austin, Guatemala.
Anderson, T.H., Burkart, B., Clemons, R.E., Bohnenberger, O.H., Blount, D.N., 1973.Geology of the Western Altos Cuchumatanes, Northwestern Guatemala.
Ballantyne, A.P., Lavine, M., Crowley, T.J., Liu, J., Baker, P.B., 2005. Meta-analysis oftropical surface temperatures during the last glacial maximum. GeophysicalResearch Letters 32, doi:10.1029/GL021217.
Bard, E., Rostek, F., Turon, J.-L., Gendreau, S., 2000. Hydrological impact of Heinrichevents in the subtropical Northeast Atlantic. Science 289, 1321–1324.
Benn, D.I., Evans, D.J.A., 1998. Glaciers and Glaciation. John Wiley & Sons, New York.Benn, D.I., Owen, L.A., Osmaston, H.A., Seltzer, G.O., Porter, S.C., and Mark, B., 2005.
Reconstruction of equilibrium-line altitudes for tropical and sub-tropical glaciersQuaternary International 138–139, 8–21.
Blake, S.F., 1934. New Asteraceae from Guatemala and Costa Rica collected by A.F.Skutch. Journal of the Washington Academy of Science 24, 432–443.
Bradley, R.S., Keimig, F.T., Diaz, H.F., Hardy, D.R., 2009. Recent changes in freezing levelheights in the Tropics with implications for the deglacierization of high mountainregions. Geophysical Research Letters 36.
Broecker, W.S., 1997. Mountain glaciers; recorders of atmospheric water vaporcontent? Global Biogeochemical Cycles 11, 589–597.
Bundschuh, J., Birkle, P., Finch, R.C., Day, M., Romero, J., Paniagua, S., Alvarado, G.E.,Bhattacharya, P., Tippmann, K., Chaves, D., 2007a. Geology-related tourism forsustainable development. In: Bundschuh, J., Alvarado, G.E. (Eds.), Central America:Geology, Resources and Hazards. Taylor & Francis, London, pp. 1015–1098.
Bundschuh, J., Winograd, M., Day, M., Alvarado, G.E., 2007b. Geographical, social,economic, and environmental framework and developments. In: Bundschuh, J.,Alvarado, G.E. (Eds.), Central America: Geology, Resources and Hazards. Taylor &Francis, London, pp. 1–52.
Bush, M.B., Correa-Metrio, A., Hodell, D.A., Brenner, M., Anselmetti, F.S., Ariztegui, D.,Mueller, A.D., Curtis, J.H., Grzesik, D.A., Burton, C., Gilli, A., 2009. Re-evaluation ofclimate change in lowland Central America during the Last Glacial Maximum usingnew sediment cores from Lake Petén Itzá, Guatemala. In: Vimeaux, F., Sylvestre, F.,Khodri, M. (Eds.), Past climate variability in South America and SurroundingRegions. Springer, Paris, pp. 113–128.
CLIMAP, 1976. The surface of the ice-age Earth. Science 191, 1131–1137.Crowley, T.J., 2000. CLIMAP SSTs re-revisited. Climate Dynamics 16, 241–255.Enjalbert, H., 1967. Les montagnes calcaires du Mexique et du Guatemala. Annales de
Geographie 76, 25–59.Flower, B.P., Hastings, D.W., Hill, H.W., Quinn, T.M., 2004. Phasing of deglacial
warming and Laurentide Ice Sheet meltwater in the Gulf of Mexico. Geology 32,597–600.
Furbish, D.J., Andrews, J.T., 1984. The use of hypsometry to indicate long-term stabilityand response of valley glaciers to changes in mass balance. Journal of Glaciology 30,199–211.
Hastenrath, S., 1974. Spuren pleistozaener Vereisung in den Altos de Cuchumatanes,Guatemala. Traces of Pleistocene glaciation in the Altos de Cuchumatanes,Guatemala. Eiszeitalter und Gegenwart 25, 25–34.
Hodell, D.A., Anselmetti, F.S., Ariztegui, D., Brenner, M., Curtis, J.H., Gilli, A., Grzesik, D.A.,Guilderson, T.J., Muller, A.D., Bush, M.B., Correa-Metrio, A., Escobar, J., Kutterolf, S.,
2008. An 85-ka record of climate change in lowland Central America. QuaternaryScience Reviews 27, 1152–1165.
Hooghiemstra, H., Cleef, A.M., Noldus, G.W., Kappelle, M., 1992. Upper Quaternaryvegetation dynamics and palaeoclimatology of the La Chonta bog area; Cordillerade Talamanca, Costa Rica. Journal of Quaternary Science 7, 205–225.
Horn, S.P., 1990. Timing of deglaciation in the Cordillera de Talamanca, Costa Rica.Climate Research 1, 81–83.
INSIVUMEH, 2007. Aerial stereophotographs, approximate 1:50,000 scale,Guatemala City.
INSIVUMEH, 2008. Climate Data for Guatemala. http://www.insivumeh.gob.gt/meteorologia/ESTADISTICAS.htm. Accessed 12/08, Guatemala City.
Islebe, G., Hooghiemstra, H., 1997. Vegetation and climate history of montane CostaRica since the last glacial. Quaternary Science Reviews 16, 589–604.
Kageyama, M., Harrison, S.P., Abe-Ouchi, A., 2005. The depression of tropical snowlinesat the last glacial maximum: What can we learn from climate model experiments?Quaternary International 138–139, 202–219.
Kaser, G., Osmaston, H., 2002. Tropical Glaciers. Cambridge University Press,Cambridge.
Lachniet, M.S., 2007. Glacial Geology and Geomorphology. In: Bundschuh, J., Alvarado,G. (Eds.), Central America: Geology, Resources, and Hazards. Taylor & Francis,London, pp. 171–182.
Lachniet, M.S., Seltzer, G.O., 2002. Late Quaternary glaciation of Costa Rica. GeologicalSociety of America Bulletin 114, 547–558.
Lachniet, M.S., and Vazquéz-Selem, L., 2005. Last Glacial Maximum equilibrium linealtitudes in the circum-Caribbean (Mexico, Guatemala, Costa Rica, Colombia, andVenezuela). Quaternary International 138–139C, 129–144.
Lea, D.W., 2004. The 100 000-yr cycle in tropical SST, greenhouse forcing, and climatesensitivity. Journal of Climate 17, 2170–2179.
Lea, D.W., Pak, D.K., Peterson, L.C., Hughen, K.A., 2003. Synchroneity of tropical andhigh-latitude Atlantic temperatures over the last glacial termination. Science 301,1361–1364.
Leyden, B.W., 1993. Late Pleistocene climate in the Central American lowlands. In: Swart,P.K., Lohmann, K.L., McKenzie, J., Savin, S. (Eds.), Climate Change in ContinentalIsotopic Records. American Geophysical Union, Washington, DC, pp. 165–210.
Leyden, B.W., Brenner, M., Hodell, D.A., Curtis, J.H., 1994. Orbital and internal forcing ofclimate on the Yucatan Peninsula for the past ca. 36-ka. PalaeogeographyPalaeoclimatology Palaeoecology 109, 193–210.
Mark, B.G., Helmens, K.F., 2005. Reconstruction of glacier equilibrium-line altitudesfor the last glacial maximum on the high plain of Bogotá ́, Eastern Cordillera,Colombia: climatic and topographic implications. Journal of Quaternary Science20, 789–800.
Mark, B.G., Harrison, S.P., Spessa, A., New, M., Evans, D.J.A., Helmens, K.F., 2005. Tropicalsnowline changes at the last glacial maximum: a global assessment. QuaternaryInternational 138–139, 168–201.
Marshall, J.S., 2007. Geomorphology and physiographic provinces. In: Bundschuh, J.,Alvarado, G.E. (Eds.), Central America: Geology, Resources and Hazards. Taylor &Francis, London, pp. 75–122.
Nesje, A., Dahl, S.O., 2000. Glaciers and Environmental Change. Arnold, London.Oerlemans, J., 1994. Quantifying global warming from the retreat of glaciers. Science
264, 243–245.Orvis, K., Horn, S., 2000. Quaternary glaciers and climate on Cerro Chirripo, Costa Rica.
Quaternary Research 54, 24–37.Osmaston, H., 2005. Estimates of glacier equilibrium line altitudes by the area×altitude,
area×altitude balance ratio, and the area×altitude balance index methods andtheir validation. Quaternary International 238–239, 22–32.
Osmaston, H.A., 2006. Should Quaternary sea-level changes be used to correct glacierELAs, vegetation belt altitudes and sea level temperatures for inferring climatechanges? Quaternary Research 65, 244.
Paterson, W.S.B., 1981. The Physics of Glaciers. Pergamon Press.Porter, S.C., 2001. Snowline depression in the tropics during the last glaciation.
Quaternary Science Reviews 20, 1067–1091.Portig, W.H., 1965. Central American rainfall. Geographical Review 55, 68–90.Rea, B.R., 2009. Defining modern day area–altitude balance ratios (AABRs) and their use
in glacier-climate reconstructions. Quaternary Science Reviews 28, 237–248.Rind, D., Peteet, D.M., 1985. Terrestrial conditions at the last glacial maximum and
CLIMAP sea-surface temperature estimates; are they consistent? QuaternaryResearch (New York) 24, 1–22.
Schultz, D.M., Bracken, W.E., Bosart, L.F., 1998. Planetary- and synoptic-scalesignatures associated with Central American cold surges. Monthly WeatherReview 126, 5–27.
Seltzer, G.O., 1994. Climatic interpretation of alpine snowline variations on millennialtime scales. Quaternary Research (New York) 41, 154–159.
Seltzer, G.O., Rodbell, D.T., Baker, P.A., Fritz, S.C., Tapia, P.M., Rowe, H.D., Dunbar, R.B.,2002. Early warming of tropical South America at the last glacial–interglacialtransition. Science 296, 1685–1686.
Stansell, N.D., Polissar, P.J., Abbott, M.B., 2007. Last glacial maximum equilibrium-linealtitude and paleo-temperature reconstructions for the Cordillera de Mérida,Venezuelan Andes. Quaternary Research 67, 115–127.