large multi-gene phylogenetic trees of the grasses (poaceae): progress towards complete tribal and...
TRANSCRIPT
Available online at www.sciencedirect.com
www.elsevier.com/locate/ympev
Molecular Phylogenetics and Evolution 47 (2008) 488–505
Large multi-gene phylogenetic trees of the grasses (Poaceae):Progress towards complete tribal and generic level sampling
Yanis Bouchenak-Khelladi a,*, Nicolas Salamin b, Vincent Savolainen c, Felix Forest c,Michelle van der Bank d, Mark W. Chase c, Trevor R. Hodkinson a,*
a Department of Botany, School of Natural Sciences, Trinity College Dublin, D2, Irelandb Department of Ecology and Evolution, University of Lausanne, 1015 Lausanne, Switzerland
c Royal Botanic Gardens, Kew, Jodrell Laboratory, Richmond, Surrey TW9 3DS, UKd Department of Plant Science and Biotechnology, University of Johannesburg, Auckland Park 2092, Johannesburg, South Africa
Received 23 March 2007; revised 1 October 2007; accepted 29 January 2008Available online 9 February 2008
Abstract
In this paper we included a very broad representation of grass family diversity (84% of tribes and 42% of genera). Phylogenetic infer-ence was based on three plastid DNA regions rbcL, matK and trnL-F, using maximum parsimony and Bayesian methods. Our resultsresolved most of the subfamily relationships within the major clades (BEP and PACCMAD), which had previously been unclear, suchas, among others the: (i) BEP and PACCMAD sister relationship, (ii) composition of clades and the sister-relationship of Ehrhartoideaeand Bambusoideae + Pooideae, (iii) paraphyly of tribe Bambuseae, (iv) position of Gynerium as sister to Panicoideae, (v) phylogeneticposition of Micrairoideae. With the presence of a relatively large amount of missing data, we were able to increase taxon sampling sub-stantially in our analyses from 107 to 295 taxa. However, bootstrap support and to a lesser extent Bayesian inference posterior proba-bilities were generally lower in analyses involving missing data than those not including them. We produced a fully resolved phylogeneticsummary tree for the grass family at subfamily level and indicated the most likely relationships of all included tribes in our analysis.� 2008 Elsevier Inc. All rights reserved.
Keywords: Grasses (Pocaeae); Subfamilies; Tribes; Phylogenetic trees; Missing data; Large sample size
1. Introduction
Large and comprehensive phylogenetic trees are highlydesirable for classification of organisms, and studyingmacro-evolutionary processes, but the computational taskof generating these trees grows more than exponentiallywith addition of each new taxon (Sanderson et al., 1998;Barraclough and Nee, 2001). However, theoretical studieshave suggested that large phylogenetic trees can be easierto analyze than previously thought (Hillis, 1996; Salaminet al., 2005), and empirical studies have also shown thatlarge, combined, multi-gene analyses can correctly infer
1055-7903/$ - see front matter � 2008 Elsevier Inc. All rights reserved.
doi:10.1016/j.ympev.2008.01.035
* Corresponding authors. Fax: +353 1 896 1147.E-mail addresses: [email protected] (Y. Bouchenak-Khelladi), Trevor.
[email protected] (T.R. Hodkinson).
large phylogenetic trees (Soltis et al., 1999; Savolainenet al., 2000; Salamin et al., 2005; Chase et al., 2006).
Grasses (Poaceae) are one of the largest and mostdiverse families in the angiosperms, consisting of approxi-mately 10,000 species and 600–700 genera (Clayton andRenvoize, 1986; Watson and Dallwitz, 1992). Understand-ing the evolution of such large groups of organismsrequires comprehensive and robust phylogenetic trees (Kel-logg, 2000; Hodkinson and Parnell, 2007) and althoughsome advances in this research area have been reached(Grass Phylogeny Working Group (GPWG), 2001, Hod-kinson et al., 2007a,b), we are still far from a complete ‘Treeof Life’ for the grass family. Grass classification beganalmost 200 years ago (Brown, 1810) with most subsequentclassifications based largely on morphology and anatomy(Prat, 1932; Stebbins and Crampton, 1961; Clayton and
Y. Bouchenak-Khelladi et al. / Molecular Phylogenetics and Evolution 47 (2008) 488–505 489
Renvoize, 1986; Tzvelev, 1989; Renvoize and Clayton,1992; Watson and Dallwitz, 1992). However, these classifi-cations have more recently been revised by studies based onmolecular evidence. In the last two decades, molecular datahave provided numerous and robust phylogenetic hypothe-ses at the family level (Doebley et al., 1990; Barker et al.,1995; Clark et al., 1995; Duvall and Morton, 1996; Sorengand Davis, 1998; Hilu et al., 1999; GPWG, 2001). The firstmolecular phylogenetic trees of the grasses using the rbcL
plastid gene (Hamby and Zimmer, 1988; Doebley et al.,1990) supported the monophyly of a group containing Pani-coideae, Arundinoideae, Centothecoideae and Chloridoi-deae (the PACC clade). However, only nine grass species(with two outgroups) from three recognized subfamilieswere sequenced. A larger sample with a total of 47 speciesrepresenting 26 tribes and six subfamilies, was included byClark et al. (1995), who used the plastid gene ndhF. Theyrecovered a tree with two major groups, the PACC andthe BEP (containing Bambusoideae, Ehrhartoideae andPooideae) clades and two isolated clades that were succes-sive sisters to the rest: Anomochloa Brong. and Streptocha-
eta Schrad. in one clade and Pharus P. Browne in the other.The most significant combined data analysis consisted ofDNA sequences (plastid and nuclear), plastid restrictionsite data and morphological data and included 61 genera,but it represented only 8% of all grass genera (GPWG,2001). A relatively robust and well-resolved topology wasobtained, supporting a PACCAD group (PACC plusAristidoideae and Danthonioideae), a BEP group and thesame two isolated clades plus a third isolated clade, subse-quently recognized as Anomochlooideae, Pharoideae andPuelioideae. Finally, Sanchez-Ken et al. (2007), by includ-ing 31 taxa representing 27 grass genera, recognized anothersubfamily, Micrairoideae (comprising Eriachne, Isachne
and Micraira), and hence expanded the PACCAD cladeto the PACCMAD clade.
Sample sizes of all previous phylogenetic analyses of thefamily, with the exception of supertree reconstructions(Salamin et al., 2002; Hodkinson et al., 2007b), rangedfrom 11 (Doebley et al., 1990) to more than 100 species(Hsiao et al., 1999). Most analyses with large sample sizeshave studied smaller taxonomic units and included only asmall proportion of grass diversity (Petersen and Seberg,1997; Duvall et al., 2001; Doust and Kellogg, 2002; Hod-kinson et al., 2002; Mathews et al., 2002; Aliscioni et al.,2003).
Even though the larger subfamilies of the grasses arewell established, major questions remain to be resolved,especially regarding relationships within and between thesubfamilies. For example, the phylogenetic relationshipsamong major lineages within the PACCMAD clade remainunclear and the placements of certain genera are notresolved such as Gynerium P.Beauv. and Streptogyna
P.Beauv. (GPWG, 2001). Exact circumscriptions of Arun-dinoideae, Centothecoideae and Danthonioideae have notbeen determined and cannot be adequately assessedbecause of the limited sampling of genera (GPWG, 2001).
Monophyly of Anomochlooideae may not have beenassessed adequately because of long-branch attractionproblems, which may have been responsible for the group-ing of Anomochloa and Streptochaeta in some analyses(GPWG, 2001).
Tribal relationships of many of the grasses have notbeen sufficiently well addressed using phylogenetic analysesbecause, as explained by the GPWG (2001), this requiresan extensive sampling within each subfamily. Indeed, themonophyly of some previously recognized tribes has notbeen supported when more taxa were incorporated intophylogenetic analyses (e.g., Catalan et al., 1997). It is thusdesirable to include a large number of species within tribesand subfamilies to adequately evaluate their monophyly.No previous studies have concentrated specifically on gen-erating large trees of the family with good sampling oftribes and genera. Furthermore, none has compared suchtrees with those based on limited taxon sampling to checkfor the consistency of clades when more taxa are added.
For most groups of organisms, only a few species havebeen sequenced for many genes and a few genes have beensequenced for many species. Consequently, a supermatrixapproach that tries to gather most of the potential dataavailable for phylogenetic purposes often results in datasets containing a large amount of missing data (Sandersonand Driskell, 2003). Producing large datasets by samplingthe same taxon for several genes requires either a central-ized effort in a single laboratory or a coordinated oneamong multiple laboratories. Such ventures are rare andrequire large amounts of time, money and scientific input.However, as suggested by Wiens (2005), it may be possibleto reap the benefits of increased taxon sampling withouthaving data for all characters for all taxa, and thus in thismanner increased taxon sampling might be obtained farmore readily and cheaply.
Different approaches have been considered to resolvedifferences in phylogenetic estimates from different datasets (Huelsenbeck et al., 1996). It has been shown that amulti-gene approach often yields more accurate trees thana partitioned approach, in particular with recent computa-tional advances allowing different substitution patternsbetween the genes considered (Gadagkar et al., 2005). Firstproposed by Kluge (1989), the ‘total evidence’ approachstated that all independent characters available for the setof species sampled should be combined because differentdata may interact positively to resolve a phylogenetic tree(Hillis, 1987). For example, the combined analysis of rbcL
and matK has been shown to generate more robust trees formonocotyledons than those based on single-gene analyses(Tamura et al., 2004). However, obvious or problematicheterogeneity across data partitions has often not beentaken into account (for instance, between morphologicaland molecular data or between different genes) because ofcomputational complexity (Nylander et al., 2004). Inresponse, the recent development of Bayesian inference(hereafter BI) using Markov chain Monte Carlo (MCMC)methods (Yang and Rannala, 1997) has facilitated multi-
490 Y. Bouchenak-Khelladi et al. / Molecular Phylogenetics and Evolution 47 (2008) 488–505
gene analyses so that among-partition heterogeneity, if it ispresent, can be addressed (Nylander et al., 2004).
To combine multiple sequences for the same set of spe-cies with the widest possible sampling, we have in thispaper sequenced plastid rbcL, matK and trnL intron andtrnL-F intergenic spacer (the last two lumped as trnL-Fafter this) regions. A number of grass rbcL, matK andtrnL-F sequences have been published and/or depositedin GenBank/EMBL, but the overlap between taxa is notoptimal. Therefore, our sequencing effort was intended tomaximize the number of taxa for which these DNA regionshave been sequenced. It would have been very valuable toinclude a nuclear DNA sequence region in our analysisbecause the choice of three plastid markers may introducebias into the analyses. However, it would not have beenfeasible to sequence such a large number of nuclear DNAsequences to optimize our sample size.
The aim of this study was to generate and phylogeneti-cally analyze large multi-gene sequence matrices thatinclude a larger representation of grass diversity than pre-vious studies (and especially poorly sampled taxa). To dothis, we analyzed two combined data sets: one with perfectparallel sampling (107 taxa) and the other with missingdata (295 taxa). The latter data set included a much morethorough sampling of genera and tribes than any previousanalysis (84% of tribes and 42% of genera). We discusseffects of increased taxon sampling and the impact of miss-ing data (i.e., taxa for which there is a proportion of miss-ing character states) on resolution and support for majorclades and compare our results with previous phylogeneticstudies at subfamily and tribal levels in grasses using max-imum parsimony (hereafter MP) and BI.
2. Materials and methods
2.1. Taxon sampling
Total genomic DNA was extracted from silica-gelstored leaf material collected by T.R. Hodkinson at Trin-ity College Dublin, Ireland (TCD), from specimens found
Table 1Primers used for amplification of rbcL, matK and trnL-F
Primers Sequences (50–30)
rbcL
1 Forward ATG TCA CCA CAA ACA GA724 Reverse TCG CAT GTA CCY GCA GT627 Forward CAT TTA TGC GCT GGA GA1504 Reverse GAA TTA CTG ATT TCG CAA
matK
19 Forward CGT TCT GAC CAT ATT GCA9 Reverse GCT AGA ACT TTA GCT CGT390 Forward CGA TCT ATT CAT TCA ATAtrnK-2 Reverse AAC TAG TCG GAT GGA GT
trnL-FtrnL-F c CGA AAT CGG TAG ACG CTtrnL-F f ATT TGA ACT GGT GAC AC
in the living collection at the Royal Botanic Gardens,Kew, England (Kew) and specimens in the herbarium atTCD (Appendix 1). DNA samples were also obtainedfrom the DNA bank at Kew (http://www.rbgkew.org.uk/data/dnaBank/homepage.html) and from theDNA bank at TCD. We analyzed sequences of rbcL,matK and trnL-F from 359 Poaceae species in 295 genera,42 tribes and all 12 subfamilies (Appendix 1). Subfamilialclassification follows the GPWG (2001) and tribal classifi-cation generally follows Watson and Dallwitz (1992),except for the tribal classification of Chloridoideae thatfollows Clayton and Renvoize (1986). For rbcL, wesequenced 61 taxa and downloaded a further 157sequences from GenBank/EMBL (obtaining 218 taxa intotal). For matK, we sequenced 94 taxa and downloaded114 sequences (208 taxa in total), and for trnL-F, wesequenced 116 taxa and downloaded 41 sequences (157taxa in total). In combined analyses, sequence data fromdifferent species of the same genus were combined to cre-ate a ‘conglomerate’ sequence for analysis (see Appendix1 for more details). This was necessary because of insuffi-cient taxon overlap for such analyses. We also includedtwo hybrids: Ammocalamagrostis (Ammophila � Calama-
grostis) and Triticosecale (Triticum � Secale). Five genera,Ecdeiocolea (Ecdeiocoleaceae), Elegia (Restionaceae), Fla-
gellaria (Flagellariaceae), Joinvillea (Joinvilleaceae) andRestio (Restionaceae) were selected as outgroups (Appen-dix 1) because they are closely related to the grasses andclearly positioned in Poales (Doyle et al., 1992; Chaseet al., 1993; Duvall et al., 1993; Briggs and Johnson,2000; Bremer, 2002; see review in Linder and Rudall,2005).
2.2. DNA extraction, amplification and sequencing
Between 0.1 and 0.5 g of silica-gel or herbarium driedleaf (Chase and Hills, 1991) or up to 1 g of fresh leaf (orseed) was used for DNA extraction. Total genomic DNAwas prepared following the CTAB method (Doyle andDoyle, 1987; Hodkinson et al., 2007c). For herbarium
Source or reference
A ACT AAA GC DoloresLledo et al. (1998)T GCG ACC G
C
CTA TG Molvray et al. (2000)A Hilu et al. (1999)
TTT C Cuenoud et al. (2002)A G Johnson and Soltis (1994)
ACG Taberlet et al. (1991)G AG Taberlet et al. (1991)
Y. Bouchenak-Khelladi et al. / Molecular Phylogenetics and Evolution 47 (2008) 488–505 491
material the CTAB protocol was modified by precipitatingthe DNA with propan-2-ol instead of ethanol and thenstoring samples at �20 �C for four weeks because longstorage periods can increase DNA precipitation (Laslo Czi-ba, Kew, personal comm.). All DNA extracts were purifiedby caesium chloride/ethidium bromide gradient centrifuga-tion (1.55 g ml�1). For herbarium samples, concentratedDNA extracts were obtained by cleaning 100 ll of dialyzedsolutions through QIAquickTM Spin Columns (QIAGENLtd., West Crawley, UK) with a final elution volume of50 ll.
The three DNA regions (rbcL, matK and trnL-F) wereamplified using a GeneAmp� PCR System 9700 thermalcycler (ABI, Applied Biosystems, Warrington, Cheshire,UK) using the polymerase chain reaction (PCR). Eachreaction was carried out using the primers in Table 1.PCR volumes (50 ll) included between 1 and 1.5 ll of tem-plate DNA (with DNA concentrations mostly rangingfrom 400 to 1200 ng ll�1), 1 ll of a 0.4% bovine serumalbumin solution, 0.5 ll of forward and reverse primers(100 ng ll�1), 45 ll of 1.1� ReddyMixTM PCR MasterMix (1.25 U Thermoprime Plus DNA Polymerase,75 mM Tris–HCl pH 8.8, 2.5 mM MgCl2, 0.2 mM for eachdATP, CTP, GTP, TTP, 20 mM (NH4)2SO4) and between1.5 and 2 ll of sterile ultrapure water (MilliQ).
Cycle sequencing reactions were carried out in a Gene-Amp PCR System 9700 thermal cycler using the ABI Big-Dye Terminator v3.1. Cycle Sequencing Kit�. Variousstrategies were used for sequencing, the most successfulbeing described in Table 1. After a series of cleaning with250 ll of 70% ethanol, samples were suspended into 10 llHiDiTM formamide (ABI) and run on a 3100 AutomatedDNA sequencer (ABI). Contigs were assembled usingAutoAssembler 2.1 (ABI).
2.3. Phylogenetic analyses
Alignment of complete sequences of rbcL and matK wasunambiguous and, thus, done manually. Alignment oftrnL-F was done using Clustal W (Thompson et al.,1994) with subsequent manual adjustment according tothe guidelines in Kelchner (2000); sections of ambiguousalignment were excluded from the analysis (717 charactersexcluded from trnL-F alignment). Sections at the 50 and 30
ends of rbcL and matK sequences were also excluded (323and 93 characters for rbcL and matK, respectively). MPand BI methods of phylogenetic inference were used asimplemented in PAUP*4.0b10 (Swofford, 2002) and MrBa-yes 3.0b4 (Huelsenbeck and Ronquist, 2001), respectively.All analyses were done on the Trinity Centre for High Per-formance Computing Cluster (http://www.tchpc.tcd.ie).
The three regions were amalgamated into a combinedmatrix because all three regions come from the plastid gen-ome, which is believed to be inherited maternally in mostgrasses (Ferris et al., 1997). Two combined data sets (matri-ces) were analyzed: one with perfect parallel sampling(hereafter DS I) and the other with missing data (hereafter
DS II). Both datasets are available online as supplementaldata at the Elsevier website. DS I included 107 taxasequenced for the three DNA regions (3923 characters)with no missing sequences. It represents 15% of all grassgenera, 51% of all tribes, and 10 subfamilies (Aristidoideaeand Puelioideae were not sampled). DS II consisted of 295taxa (as several species were conglomerated within a singlegenus or exemplar) including all taxa from DS I and taxathat have missing sequences for either one or two DNAregions (Appendix 1). It represents 42% of all grass genera,84% of tribes and all subfamilies. Heuristic MP analysesfor the two combined data sets included 10,000 replicatesof random sequence addition and TBR swapping, savingno more than 50 trees for each replicate. Robustness wasassessed with the bootstrap (Felsenstein, 1985) using 1000replicates of random taxon additions and TBR swappingwith a limit of 50 trees for each replicate.
The substitution model used for the three different genesequences was determined using a hierarchical likelihoodratio test framework as implemented in MODELTEST3.06 (Posada and Crandall, 1998). The optimal modelsidentified were HKY + C + I (Hasegawa et al., 1985) forthe rbcL data, TVM + C + I (Posada and Crandall, 1998)for the matK data and K81 + C + I (Kimura, 1981) forthe trnL-F data.
The two combined matrices were analyzed using BI bypartitioning the sequences by DNA region. This allowedindependent estimation of parameters for each partition.Site-specific rates of substitution were allowed to varyacross partitions (ratepr = variable). The HKY + C + Imodel was used for the rbcL, and the more generalGTR + C + I model (Yang, 1994) was used for the matK
and the trnL-F data. The matK and trnL-F sequences wereanalyzed using the GTR substitution model as neither theTVM nor the K81 models can be implemented in MrBayes3.0b4. For DS I, four parallel MCMC were run for2,000,000 generations with trees sampled every 1000 gener-ations. For DS II, four parallel MCMC were run for4,000,000 generations with trees sampled every 1000 gener-ations. Two independent analyses were performed to checkwhether convergence on the same posterior distributionwas reached. The first 1000 and 2500 trees were discardedas burn-in for DS I and DS II, respectively.
3. Results
3.1. DS I
DS I included 107 taxa sequenced for the three genes(107 taxa � 3968 characters) with identical taxon sampling.Of the 3923 included characters, 2112 were constant and1232 potentially parsimony informative. MP analysisresulted in 193 equally most parsimonious trees of 5220steps, CI (Kluge and Farris, 1969) of 0.50 and RI (Farris,1989) of 0.79. The MP strict consensus tree is highly con-gruent with the tree obtained from BI. The tree illustratedin Fig. 1 is the Bayesian tree of posterior probabilities
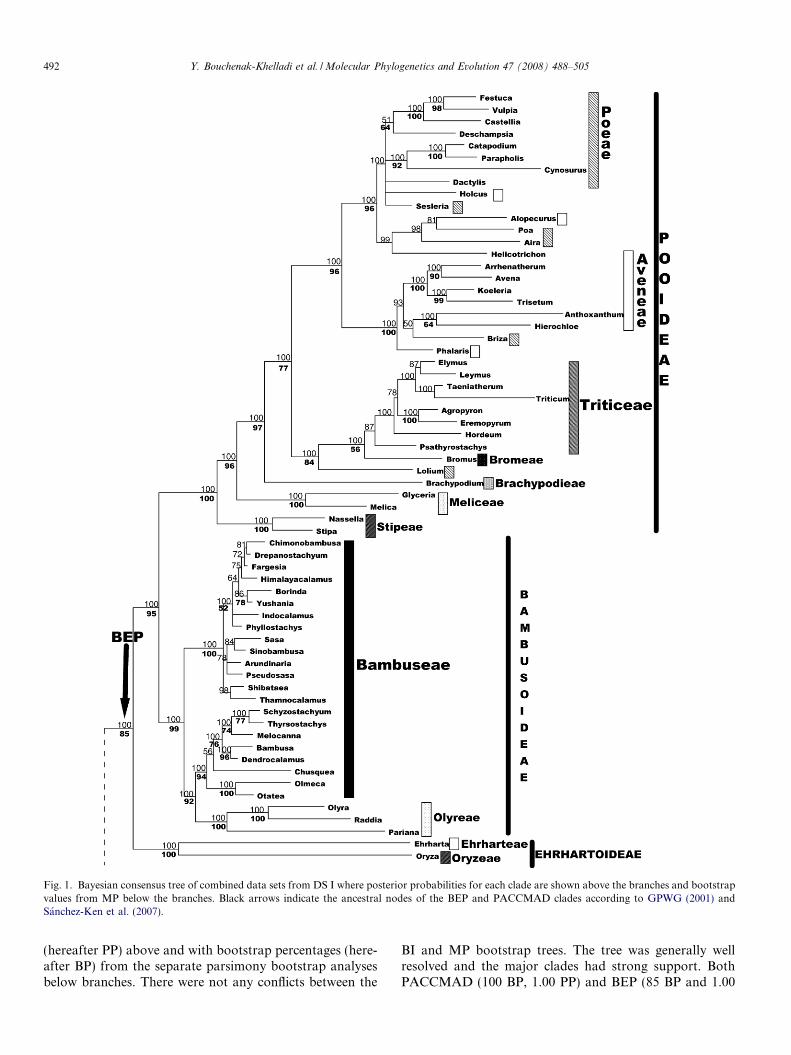
Fig. 1. Bayesian consensus tree of combined data sets from DS I where posterior probabilities for each clade are shown above the branches and bootstrapvalues from MP below the branches. Black arrows indicate the ancestral nodes of the BEP and PACCMAD clades according to GPWG (2001) andSanchez-Ken et al. (2007).
492 Y. Bouchenak-Khelladi et al. / Molecular Phylogenetics and Evolution 47 (2008) 488–505
(hereafter PP) above and with bootstrap percentages (here-after BP) from the separate parsimony bootstrap analysesbelow branches. There were not any conflicts between the
BI and MP bootstrap trees. The tree was generally wellresolved and the major clades had strong support. BothPACCMAD (100 BP, 1.00 PP) and BEP (85 BP and 1.00
Fig
.1
(co
nti
nu
ed)
Y. Bouchenak-Khelladi et al. / Molecular Phylogenetics and Evolution 47 (2008) 488–505 493
494 Y. Bouchenak-Khelladi et al. / Molecular Phylogenetics and Evolution 47 (2008) 488–505
PP) clades as well as all subfamilies were strongly sup-ported, except for Centothecoideae, sensu the GPWG(2001), which was not monophyletic in either analysis. Pha-
rus (Pharoideae) and Streptochaeta (Anomochlooideae)were successively sister to the rest of the grass family (both100 BP, 1.00 PP). Puelia was not included in DS I.
Within the BEP clade, Pooideae were strongly sup-ported (100 BP and 1.00 PP). A large clade containingtribes Aveneae, Bromeae, Poeae and Triticeae wasretrieved in both analyses (77 BP, 1.00 PP; Fig. 1). Noneof these tribes were found to be monophyletic in both anal-yses. However, there was a sister relationship (77 BP, 1.00PP) between a clade made up of mainly Triticeae + Bro-meae (84 BP, 1.00 PP), and an Aveneae + Poeae clade(96 BP, 1.00 PP). Three clades were successively sister tothese, Brachypodieae (97 BP, 1.00 PP), Meliceae (96 BP,1.00 PP) and Stipeae (100 BP, 1.00 PP) (Fig. 1). Meliceaeand Stipeae were supported as monophyletic (both 100BP, 1.00 PP).
The sister group relationship of Pooideae and Bambu-soideae was strongly supported in both analyses (95 BP,1.00 PP; Fig. 1). Bambusoideae were strongly supported(99 BP, 1.00 PP), and were divided into two well-supportedsubclades. One subclade contained representatives of thetemperate bamboos, tribe Bambuseae (100 BP, 1.00 PP).The other contained tropical Bambuseae (94 BP, 1.00 PP)and Olyreae (100 BP, 1.00 PP) as sister groups (92 BP,1.00 PP). This clade therefore had representatives of trop-ical woody bamboos (Old and New World) as well as her-baceous bamboos. Bambuseae were clearly notmonophyletic. Finally, within the BEP clade, Ehrharto-ideae were sister (85 BP, 1.00 PP) to the Pooideae + Bam-busoideae and themselves were strongly supported (100BP, 1.00 PP).
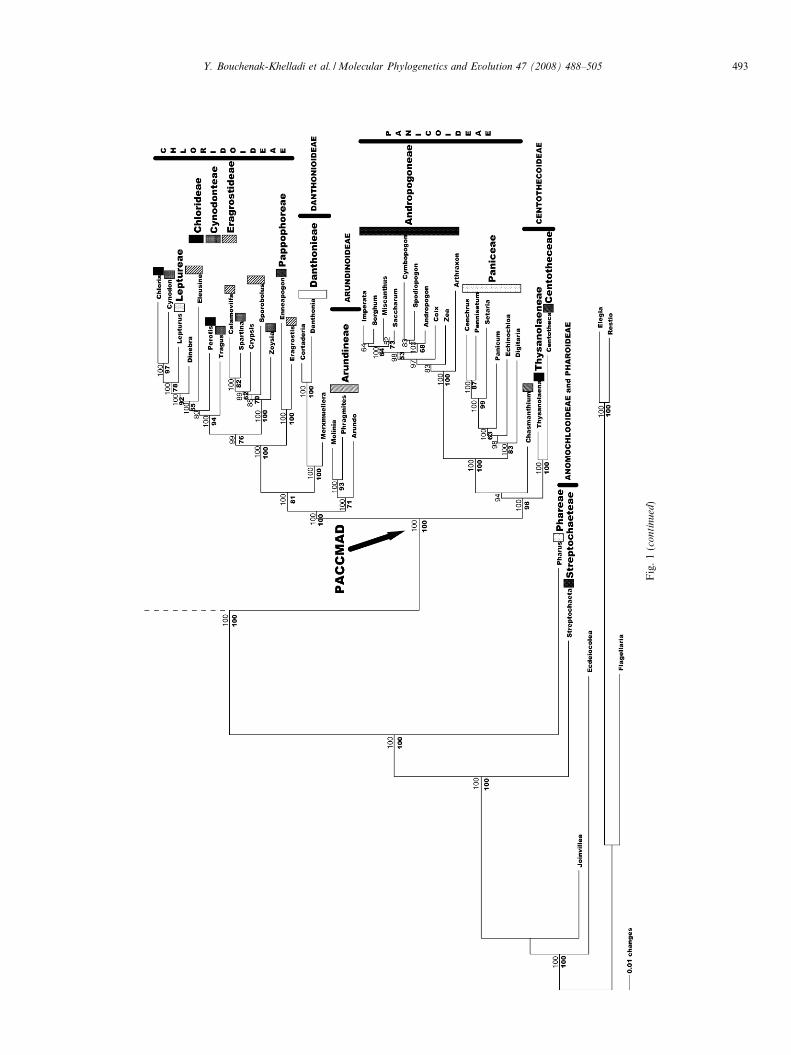
Two major clades were resolved within a strongly sup-ported PACCMAD clade. One clade (98 BP, 1.00 PP) con-tained Panicoideae (100 BP, 1.00 PP) and a polyphyleticCentothecoideae. The other clade (100 BP, 1.00 PP) con-tained the three subfamilies Arundinoideae, Chloridoideaeand Danthonioideae. Relationships between these threesubfamilies were generally well supported (100 BP and1.00 PP for Arundinoideae as sister to the other two; 81BP and 1.00 PP for a Danthonioideae + Chloridoideaegroup). A Centothecoideae grade (Centotheca + Thysan-
olaena, Chasmanthium) were sister to a well-supportedPanicoideae (98 BP, 1.00 PP). Panicoideae were dividedinto two major tribes (Paniceae and Andropogoneae), forwhich a sister relationship was well supported (100 BP,1.00 PP). Andropogoneae were strongly supported asmonophyletic (100 BP, 1.00 PP). Paniceae were monophy-letic (83 BP, 1.00 PP). The clade Cenchrus + Pennise-
tum + Setaria was strongly supported (99 BP, 1.00 PP).Arundinoideae were strongly supported with BI (1.00
PP), but only weakly supported with MP (71 BP). How-ever, the grouping of Molinia and Phragmites was stronglysupported in both analyses (93 BP, 1.00 PP). SubfamiliesChloridoideae (100 BP, 1.00 PP) and Danthonioideae
(100 BP, 1.00 PP) were sister groups (81 BP, 1.00 PP).Tribes within Chloridoideae were polyphyletic. Tribe Pap-pophoreae and Eragrostis were sister to the rest of Chlori-doideae (100 BP, 1.00 PP). The remaining taxa formed aclade with an assemblage between two sister clades (76BP, 0.99 PP), one containing Chlorideae + Cynodon-teae + Eragrostideae + Leptureae (94 BP, 1.00 PP) andthe other containing only two tribes Cynodonteae + Eragr-ostideae (100 BP, 1.00 PP).
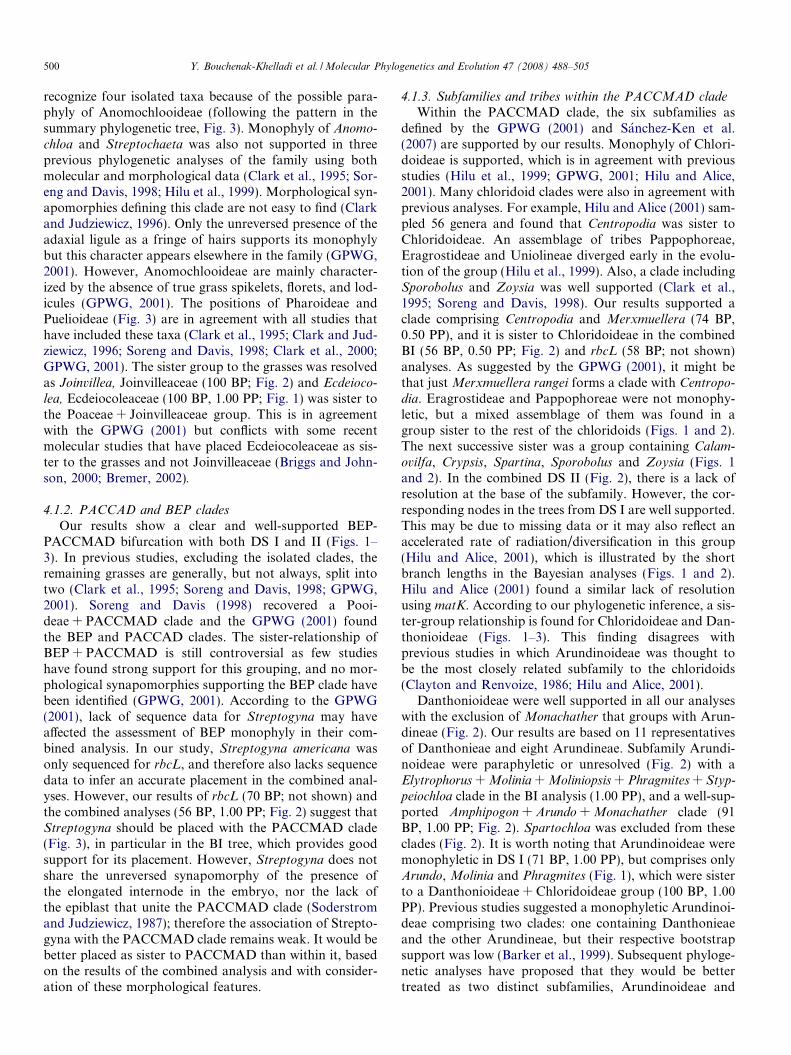
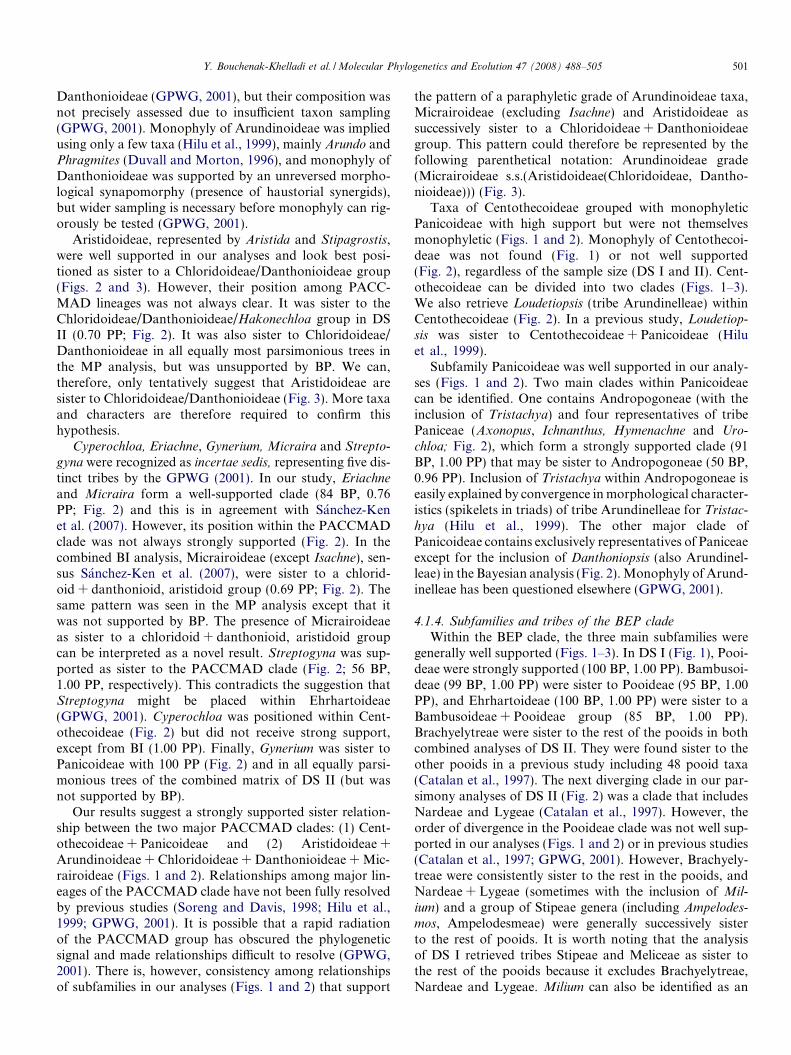
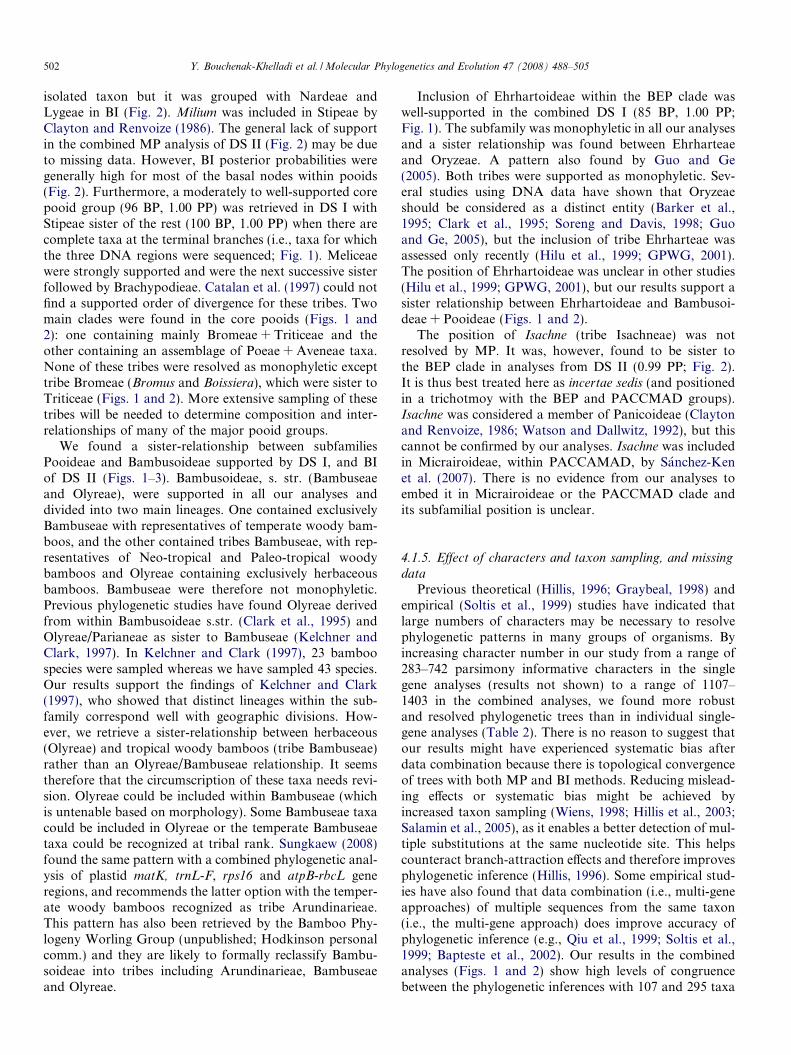
3.2. DS II
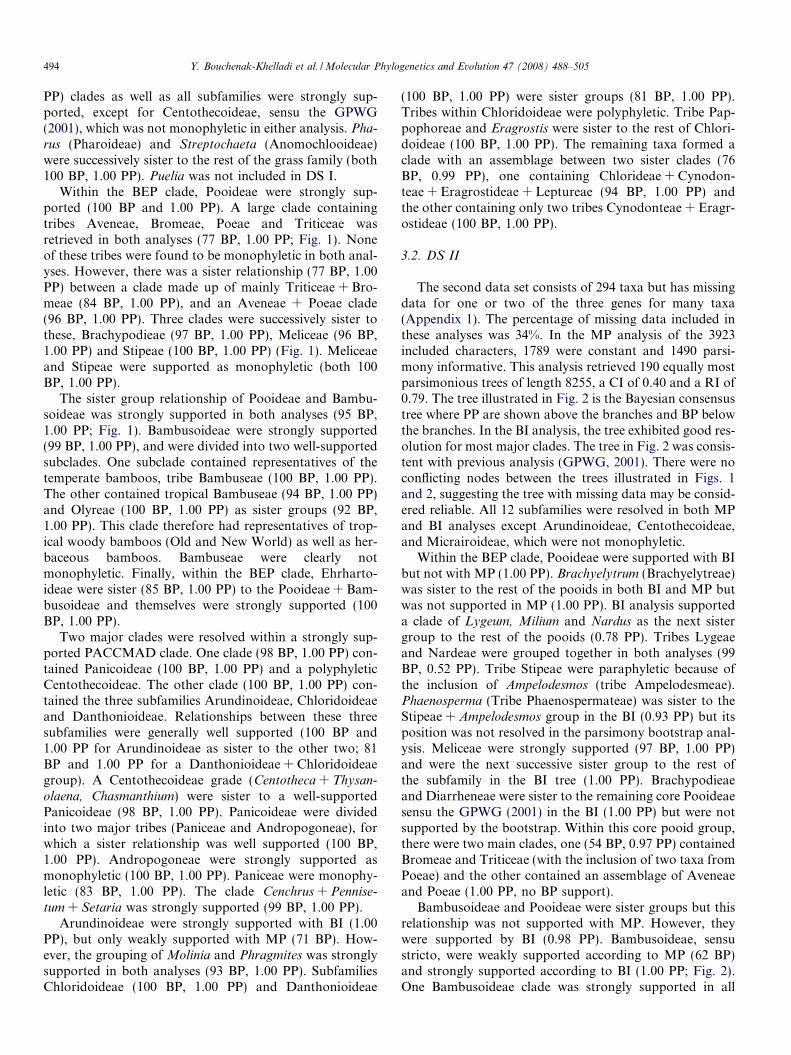
The second data set consists of 294 taxa but has missingdata for one or two of the three genes for many taxa(Appendix 1). The percentage of missing data included inthese analyses was 34%. In the MP analysis of the 3923included characters, 1789 were constant and 1490 parsi-mony informative. This analysis retrieved 190 equally mostparsimonious trees of length 8255, a CI of 0.40 and a RI of0.79. The tree illustrated in Fig. 2 is the Bayesian consensustree where PP are shown above the branches and BP belowthe branches. In the BI analysis, the tree exhibited good res-olution for most major clades. The tree in Fig. 2 was consis-tent with previous analysis (GPWG, 2001). There were noconflicting nodes between the trees illustrated in Figs. 1and 2, suggesting the tree with missing data may be consid-ered reliable. All 12 subfamilies were resolved in both MPand BI analyses except Arundinoideae, Centothecoideae,and Micrairoideae, which were not monophyletic.
Within the BEP clade, Pooideae were supported with BIbut not with MP (1.00 PP). Brachyelytrum (Brachyelytreae)was sister to the rest of the pooids in both BI and MP butwas not supported in MP (1.00 PP). BI analysis supporteda clade of Lygeum, Milium and Nardus as the next sistergroup to the rest of the pooids (0.78 PP). Tribes Lygeaeand Nardeae were grouped together in both analyses (99BP, 0.52 PP). Tribe Stipeae were paraphyletic because ofthe inclusion of Ampelodesmos (tribe Ampelodesmeae).Phaenosperma (Tribe Phaenospermateae) was sister to theStipeae + Ampelodesmos group in the BI (0.93 PP) but itsposition was not resolved in the parsimony bootstrap anal-ysis. Meliceae were strongly supported (97 BP, 1.00 PP)and were the next successive sister group to the rest ofthe subfamily in the BI tree (1.00 PP). Brachypodieaeand Diarrheneae were sister to the remaining core Pooideaesensu the GPWG (2001) in the BI (1.00 PP) but were notsupported by the bootstrap. Within this core pooid group,there were two main clades, one (54 BP, 0.97 PP) containedBromeae and Triticeae (with the inclusion of two taxa fromPoeae) and the other contained an assemblage of Aveneaeand Poeae (1.00 PP, no BP support).
Bambusoideae and Pooideae were sister groups but thisrelationship was not supported with MP. However, theywere supported by BI (0.98 PP). Bambusoideae, sensustricto, were weakly supported according to MP (62 BP)and strongly supported according to BI (1.00 PP; Fig. 2).One Bambusoideae clade was strongly supported in all
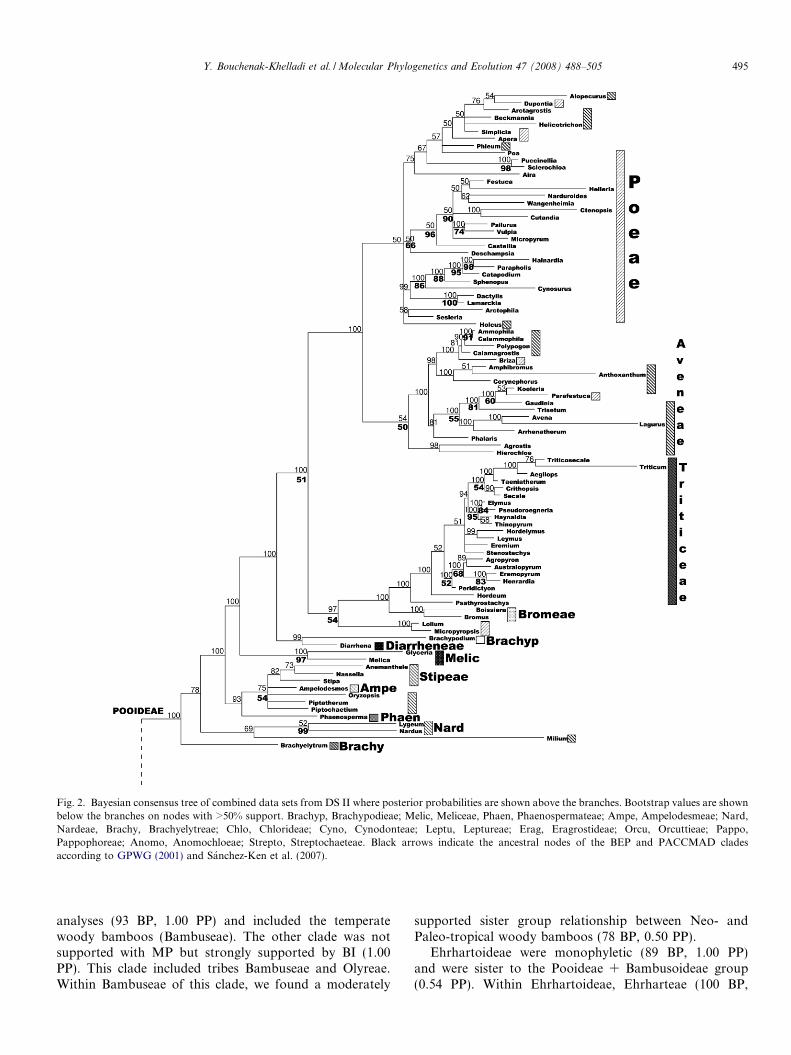
Fig. 2. Bayesian consensus tree of combined data sets from DS II where posterior probabilities are shown above the branches. Bootstrap values are shownbelow the branches on nodes with >50% support. Brachyp, Brachypodieae; Melic, Meliceae, Phaen, Phaenospermateae; Ampe, Ampelodesmeae; Nard,Nardeae, Brachy, Brachyelytreae; Chlo, Chlorideae; Cyno, Cynodonteae; Leptu, Leptureae; Erag, Eragrostideae; Orcu, Orcuttieae; Pappo,Pappophoreae; Anomo, Anomochloeae; Strepto, Streptochaeteae. Black arrows indicate the ancestral nodes of the BEP and PACCMAD cladesaccording to GPWG (2001) and Sanchez-Ken et al. (2007).
Y. Bouchenak-Khelladi et al. / Molecular Phylogenetics and Evolution 47 (2008) 488–505 495
analyses (93 BP, 1.00 PP) and included the temperatewoody bamboos (Bambuseae). The other clade was notsupported with MP but strongly supported by BI (1.00PP). This clade included tribes Bambuseae and Olyreae.Within Bambuseae of this clade, we found a moderately
supported sister group relationship between Neo- andPaleo-tropical woody bamboos (78 BP, 0.50 PP).
Ehrhartoideae were monophyletic (89 BP, 1.00 PP)and were sister to the Pooideae + Bambusoideae group(0.54 PP). Within Ehrhartoideae, Ehrharteae (100 BP,
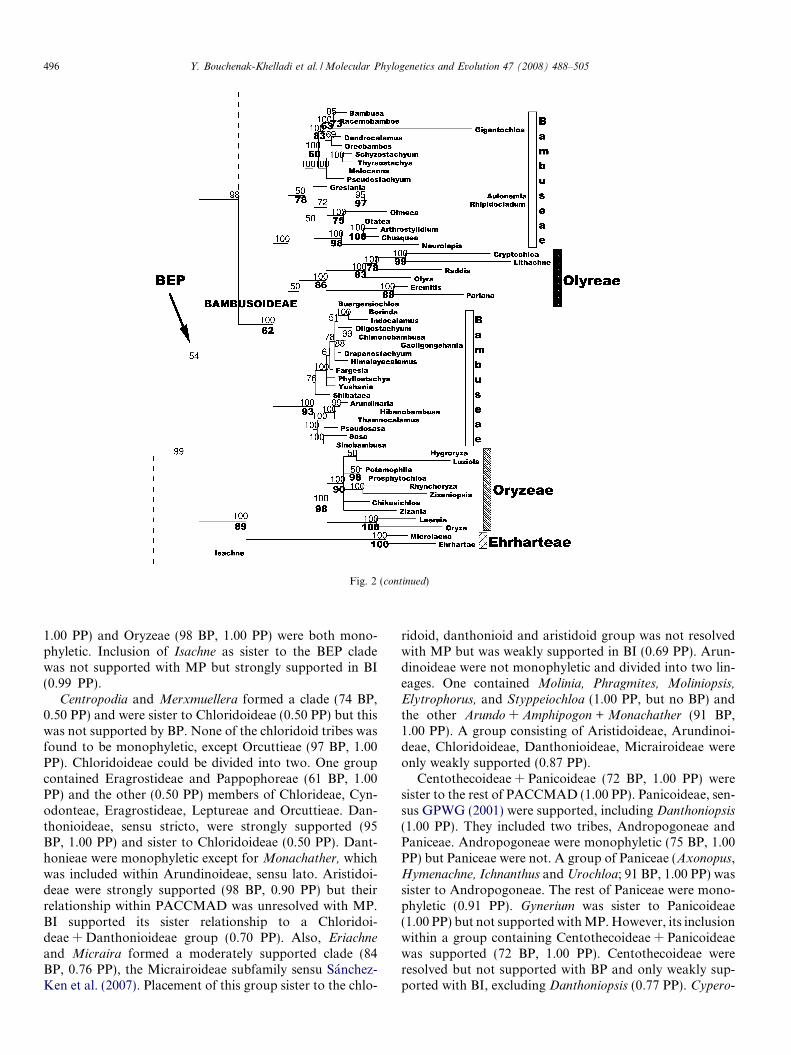
Fig. 2 (continued)
496 Y. Bouchenak-Khelladi et al. / Molecular Phylogenetics and Evolution 47 (2008) 488–505
1.00 PP) and Oryzeae (98 BP, 1.00 PP) were both mono-phyletic. Inclusion of Isachne as sister to the BEP cladewas not supported with MP but strongly supported in BI(0.99 PP).
Centropodia and Merxmuellera formed a clade (74 BP,0.50 PP) and were sister to Chloridoideae (0.50 PP) but thiswas not supported by BP. None of the chloridoid tribes wasfound to be monophyletic, except Orcuttieae (97 BP, 1.00PP). Chloridoideae could be divided into two. One groupcontained Eragrostideae and Pappophoreae (61 BP, 1.00PP) and the other (0.50 PP) members of Chlorideae, Cyn-odonteae, Eragrostideae, Leptureae and Orcuttieae. Dan-thonioideae, sensu stricto, were strongly supported (95BP, 1.00 PP) and sister to Chloridoideae (0.50 PP). Dant-honieae were monophyletic except for Monachather, whichwas included within Arundinoideae, sensu lato. Aristidoi-deae were strongly supported (98 BP, 0.90 PP) but theirrelationship within PACCMAD was unresolved with MP.BI supported its sister relationship to a Chloridoi-deae + Danthonioideae group (0.70 PP). Also, Eriachne
and Micraira formed a moderately supported clade (84BP, 0.76 PP), the Micrairoideae subfamily sensu Sanchez-Ken et al. (2007). Placement of this group sister to the chlo-
ridoid, danthonioid and aristidoid group was not resolvedwith MP but was weakly supported in BI (0.69 PP). Arun-dinoideae were not monophyletic and divided into two lin-eages. One contained Molinia, Phragmites, Moliniopsis,
Elytrophorus, and Styppeiochloa (1.00 PP, but no BP) andthe other Arundo + Amphipogon + Monachather (91 BP,1.00 PP). A group consisting of Aristidoideae, Arundinoi-deae, Chloridoideae, Danthonioideae, Micrairoideae wereonly weakly supported (0.87 PP).
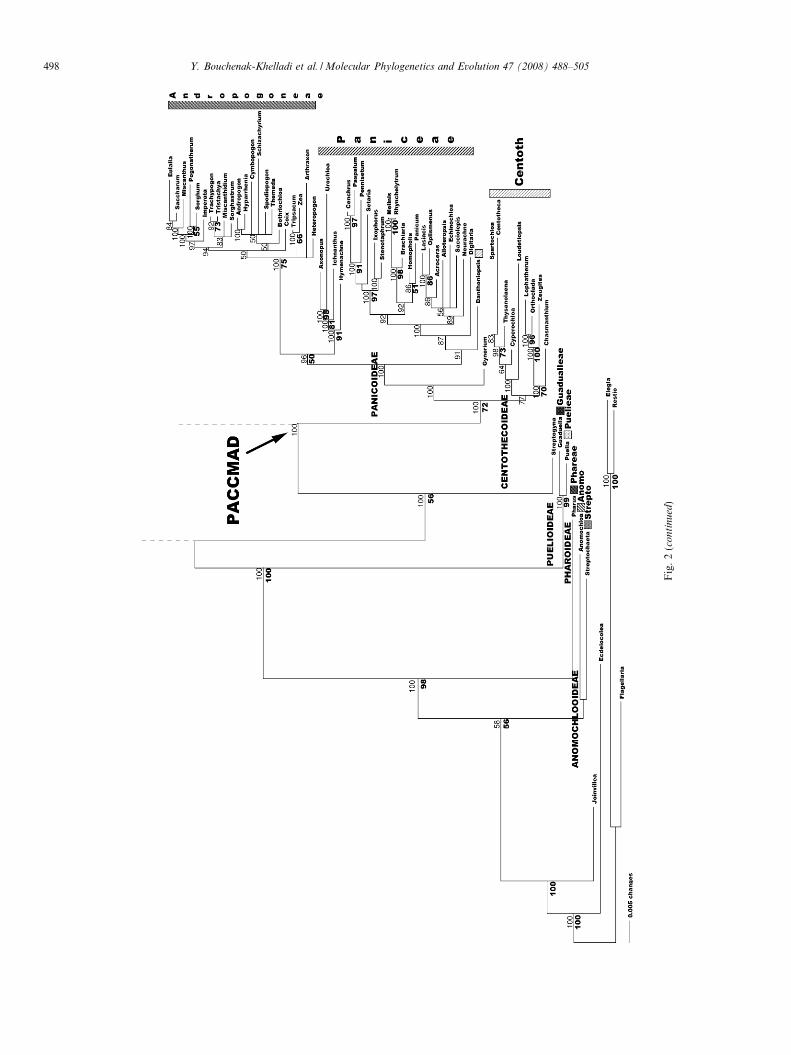
Centothecoideae + Panicoideae (72 BP, 1.00 PP) weresister to the rest of PACCMAD (1.00 PP). Panicoideae, sen-sus GPWG (2001) were supported, including Danthoniopsis
(1.00 PP). They included two tribes, Andropogoneae andPaniceae. Andropogoneae were monophyletic (75 BP, 1.00PP) but Paniceae were not. A group of Paniceae (Axonopus,Hymenachne, Ichnanthus and Urochloa; 91 BP, 1.00 PP) wassister to Andropogoneae. The rest of Paniceae were mono-phyletic (0.91 PP). Gynerium was sister to Panicoideae(1.00 PP) but not supported with MP. However, its inclusionwithin a group containing Centothecoideae + Panicoideaewas supported (72 BP, 1.00 PP). Centothecoideae wereresolved but not supported with BP and only weakly sup-ported with BI, excluding Danthoniopsis (0.77 PP). Cypero-
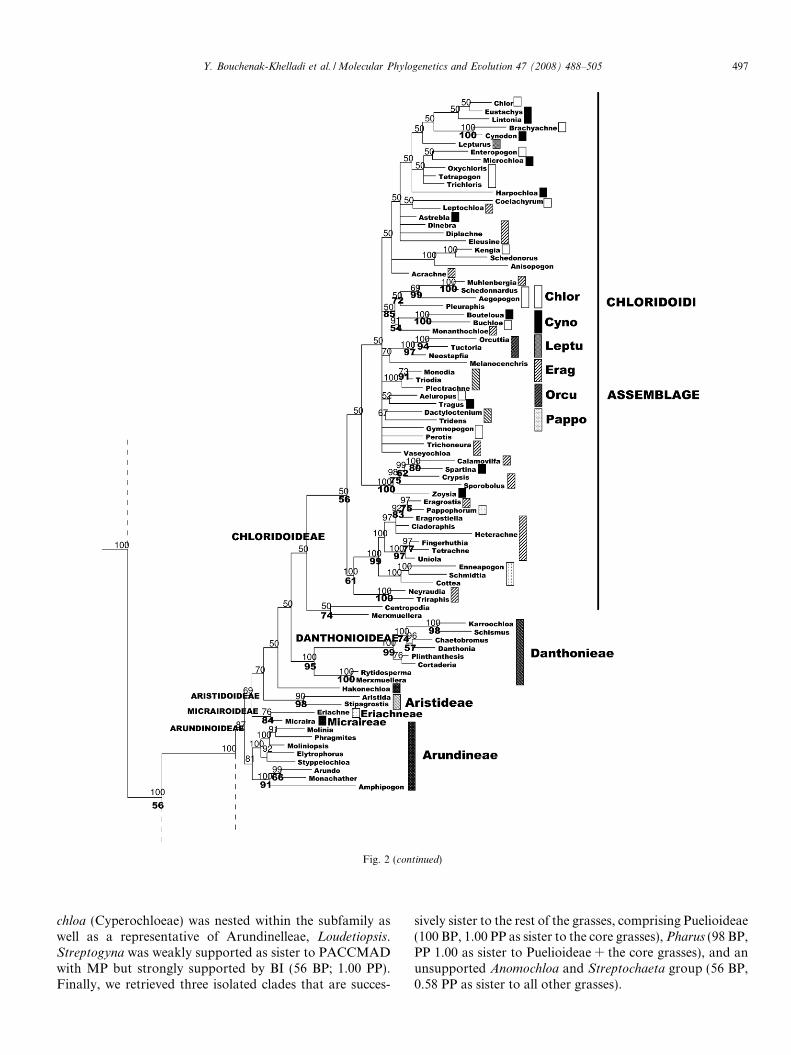
Fig. 2 (continued)
Y. Bouchenak-Khelladi et al. / Molecular Phylogenetics and Evolution 47 (2008) 488–505 497
chloa (Cyperochloeae) was nested within the subfamily aswell as a representative of Arundinelleae, Loudetiopsis.Streptogyna was weakly supported as sister to PACCMADwith MP but strongly supported by BI (56 BP; 1.00 PP).Finally, we retrieved three isolated clades that are succes-
sively sister to the rest of the grasses, comprising Puelioideae(100 BP, 1.00 PP as sister to the core grasses), Pharus (98 BP,PP 1.00 as sister to Puelioideae + the core grasses), and anunsupported Anomochloa and Streptochaeta group (56 BP,0.58 PP as sister to all other grasses).
Fig
.2
(co
nti
nu
ed)
498 Y. Bouchenak-Khelladi et al. / Molecular Phylogenetics and Evolution 47 (2008) 488–505
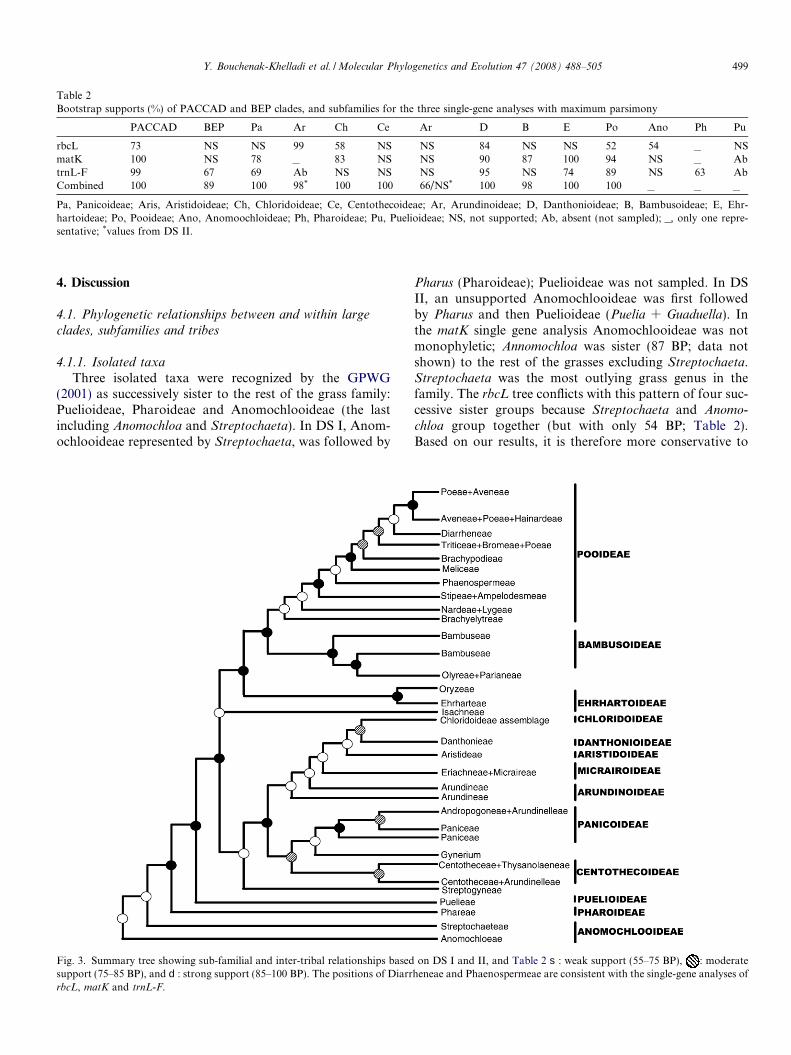
Table 2Bootstrap supports (%) of PACCAD and BEP clades, and subfamilies for the three single-gene analyses with maximum parsimony
PACCAD BEP Pa Ar Ch Ce Ar D B E Po Ano Ph Pu
rbcL 73 NS NS 99 58 NS NS 84 NS NS 52 54 _ NSmatK 100 NS 78 _ 83 NS NS 90 87 100 94 NS _ AbtrnL-F 99 67 69 Ab NS NS NS 95 NS 74 89 NS 63 AbCombined 100 89 100 98* 100 100 66/NS* 100 98 100 100 _ _ _
Pa, Panicoideae; Aris, Aristidoideae; Ch, Chloridoideae; Ce, Centothecoideae; Ar, Arundinoideae; D, Danthonioideae; B, Bambusoideae; E, Ehr-hartoideae; Po, Pooideae; Ano, Anomoochloideae; Ph, Pharoideae; Pu, Puelioideae; NS, not supported; Ab, absent (not sampled); _, only one repre-sentative; *values from DS II.
Y. Bouchenak-Khelladi et al. / Molecular Phylogenetics and Evolution 47 (2008) 488–505 499
4. Discussion
4.1. Phylogenetic relationships between and within large
clades, subfamilies and tribes
4.1.1. Isolated taxa
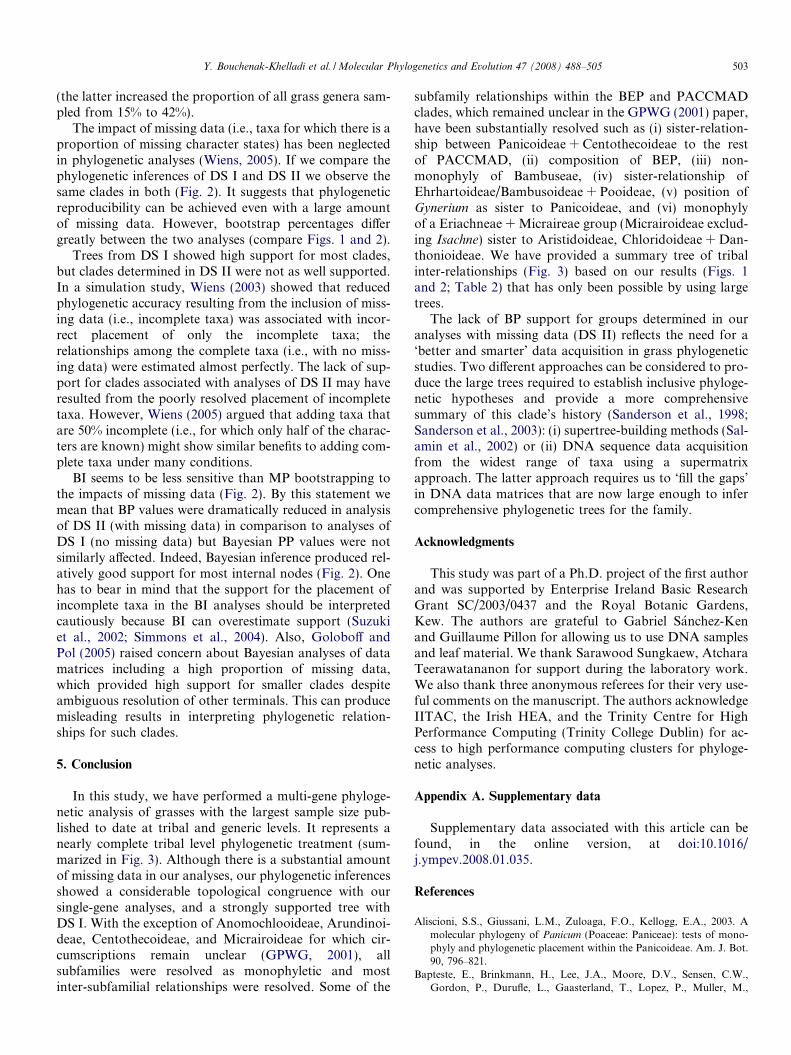
Three isolated taxa were recognized by the GPWG(2001) as successively sister to the rest of the grass family:Puelioideae, Pharoideae and Anomochlooideae (the lastincluding Anomochloa and Streptochaeta). In DS I, Anom-ochlooideae represented by Streptochaeta, was followed by
Fig. 3. Summary tree showing sub-familial and inter-tribal relationships basedsupport (75–85 BP), and d: strong support (85–100 BP). The positions of DiarrrbcL, matK and trnL-F.
Pharus (Pharoideae); Puelioideae was not sampled. In DSII, an unsupported Anomochlooideae was first followedby Pharus and then Puelioideae (Puelia + Guaduella). Inthe matK single gene analysis Anomochlooideae was notmonophyletic; Annomochloa was sister (87 BP; data notshown) to the rest of the grasses excluding Streptochaeta.Streptochaeta was the most outlying grass genus in thefamily. The rbcL tree conflicts with this pattern of four suc-cessive sister groups because Streptochaeta and Anomo-
chloa group together (but with only 54 BP; Table 2).Based on our results, it is therefore more conservative to
on DS I and II, and Table 2 s: weak support (55–75 BP), : moderateheneae and Phaenospermeae are consistent with the single-gene analyses of
500 Y. Bouchenak-Khelladi et al. / Molecular Phylogenetics and Evolution 47 (2008) 488–505
recognize four isolated taxa because of the possible para-phyly of Anomochlooideae (following the pattern in thesummary phylogenetic tree, Fig. 3). Monophyly of Anomo-
chloa and Streptochaeta was also not supported in threeprevious phylogenetic analyses of the family using bothmolecular and morphological data (Clark et al., 1995; Sor-eng and Davis, 1998; Hilu et al., 1999). Morphological syn-apomorphies defining this clade are not easy to find (Clarkand Judziewicz, 1996). Only the unreversed presence of theadaxial ligule as a fringe of hairs supports its monophylybut this character appears elsewhere in the family (GPWG,2001). However, Anomochlooideae are mainly character-ized by the absence of true grass spikelets, florets, and lod-icules (GPWG, 2001). The positions of Pharoideae andPuelioideae (Fig. 3) are in agreement with all studies thathave included these taxa (Clark et al., 1995; Clark and Jud-ziewicz, 1996; Soreng and Davis, 1998; Clark et al., 2000;GPWG, 2001). The sister group to the grasses was resolvedas Joinvillea, Joinvilleaceae (100 BP; Fig. 2) and Ecdeioco-
lea, Ecdeiocoleaceae (100 BP, 1.00 PP; Fig. 1) was sister tothe Poaceae + Joinvilleaceae group. This is in agreementwith the GPWG (2001) but conflicts with some recentmolecular studies that have placed Ecdeiocoleaceae as sis-ter to the grasses and not Joinvilleaceae (Briggs and John-son, 2000; Bremer, 2002).
4.1.2. PACCAD and BEP clades
Our results show a clear and well-supported BEP-PACCMAD bifurcation with both DS I and II (Figs. 1–3). In previous studies, excluding the isolated clades, theremaining grasses are generally, but not always, split intotwo (Clark et al., 1995; Soreng and Davis, 1998; GPWG,2001). Soreng and Davis (1998) recovered a Pooi-deae + PACCMAD clade and the GPWG (2001) foundthe BEP and PACCAD clades. The sister-relationship ofBEP + PACCMAD is still controversial as few studieshave found strong support for this grouping, and no mor-phological synapomorphies supporting the BEP clade havebeen identified (GPWG, 2001). According to the GPWG(2001), lack of sequence data for Streptogyna may haveaffected the assessment of BEP monophyly in their com-bined analysis. In our study, Streptogyna americana wasonly sequenced for rbcL, and therefore also lacks sequencedata to infer an accurate placement in the combined anal-yses. However, our results of rbcL (70 BP; not shown) andthe combined analyses (56 BP, 1.00 PP; Fig. 2) suggest thatStreptogyna should be placed with the PACCMAD clade(Fig. 3), in particular in the BI tree, which provides goodsupport for its placement. However, Streptogyna does notshare the unreversed synapomorphy of the presence ofthe elongated internode in the embryo, nor the lack ofthe epiblast that unite the PACCMAD clade (Soderstromand Judziewicz, 1987); therefore the association of Strepto-gyna with the PACCMAD clade remains weak. It would bebetter placed as sister to PACCMAD than within it, basedon the results of the combined analysis and with consider-ation of these morphological features.
4.1.3. Subfamilies and tribes within the PACCMAD clade
Within the PACCMAD clade, the six subfamilies asdefined by the GPWG (2001) and Sanchez-Ken et al.(2007) are supported by our results. Monophyly of Chlori-doideae is supported, which is in agreement with previousstudies (Hilu et al., 1999; GPWG, 2001; Hilu and Alice,2001). Many chloridoid clades were also in agreement withprevious analyses. For example, Hilu and Alice (2001) sam-pled 56 genera and found that Centropodia was sister toChloridoideae. An assemblage of tribes Pappophoreae,Eragrostideae and Uniolineae diverged early in the evolu-tion of the group (Hilu et al., 1999). Also, a clade includingSporobolus and Zoysia was well supported (Clark et al.,1995; Soreng and Davis, 1998). Our results supported aclade comprising Centropodia and Merxmuellera (74 BP,0.50 PP), and it is sister to Chloridoideae in the combinedBI (56 BP, 0.50 PP; Fig. 2) and rbcL (58 BP; not shown)analyses. As suggested by the GPWG (2001), it might bethat just Merxmuellera rangei forms a clade with Centropo-
dia. Eragrostideae and Pappophoreae were not monophy-letic, but a mixed assemblage of them was found in agroup sister to the rest of the chloridoids (Figs. 1 and 2).The next successive sister was a group containing Calam-
ovilfa, Crypsis, Spartina, Sporobolus and Zoysia (Figs. 1and 2). In the combined DS II (Fig. 2), there is a lack ofresolution at the base of the subfamily. However, the cor-responding nodes in the trees from DS I are well supported.This may be due to missing data or it may also reflect anaccelerated rate of radiation/diversification in this group(Hilu and Alice, 2001), which is illustrated by the shortbranch lengths in the Bayesian analyses (Figs. 1 and 2).Hilu and Alice (2001) found a similar lack of resolutionusing matK. According to our phylogenetic inference, a sis-ter-group relationship is found for Chloridoideae and Dan-thonioideae (Figs. 1–3). This finding disagrees withprevious studies in which Arundinoideae was thought tobe the most closely related subfamily to the chloridoids(Clayton and Renvoize, 1986; Hilu and Alice, 2001).
Danthonioideae were well supported in all our analyseswith the exclusion of Monachather that groups with Arun-dineae (Fig. 2). Our results are based on 11 representativesof Danthonieae and eight Arundineae. Subfamily Arundi-noideae were paraphyletic or unresolved (Fig. 2) with aElytrophorus + Molinia + Moliniopsis + Phragmites + Styp-
peiochloa clade in the BI analysis (1.00 PP), and a well-sup-ported Amphipogon + Arundo + Monachather clade (91BP, 1.00 PP; Fig. 2). Spartochloa was excluded from theseclades (Fig. 2). It is worth noting that Arundinoideae weremonophyletic in DS I (71 BP, 1.00 PP), but comprises onlyArundo, Molinia and Phragmites (Fig. 1), which were sisterto a Danthonioideae + Chloridoideae group (100 BP, 1.00PP). Previous studies suggested a monophyletic Arundinoi-deae comprising two clades: one containing Danthonieaeand the other Arundineae, but their respective bootstrapsupport was low (Barker et al., 1999). Subsequent phyloge-netic analyses have proposed that they would be bettertreated as two distinct subfamilies, Arundinoideae and
Y. Bouchenak-Khelladi et al. / Molecular Phylogenetics and Evolution 47 (2008) 488–505 501
Danthonioideae (GPWG, 2001), but their composition wasnot precisely assessed due to insufficient taxon sampling(GPWG, 2001). Monophyly of Arundinoideae was impliedusing only a few taxa (Hilu et al., 1999), mainly Arundo andPhragmites (Duvall and Morton, 1996), and monophyly ofDanthonioideae was supported by an unreversed morpho-logical synapomorphy (presence of haustorial synergids),but wider sampling is necessary before monophyly can rig-orously be tested (GPWG, 2001).
Aristidoideae, represented by Aristida and Stipagrostis,were well supported in our analyses and look best posi-tioned as sister to a Chloridoideae/Danthonioideae group(Figs. 2 and 3). However, their position among PACC-MAD lineages was not always clear. It was sister to theChloridoideae/Danthonioideae/Hakonechloa group in DSII (0.70 PP; Fig. 2). It was also sister to Chloridoideae/Danthonioideae in all equally most parsimonious trees inthe MP analysis, but was unsupported by BP. We can,therefore, only tentatively suggest that Aristidoideae aresister to Chloridoideae/Danthonioideae (Fig. 3). More taxaand characters are therefore required to confirm thishypothesis.
Cyperochloa, Eriachne, Gynerium, Micraira and Strepto-
gyna were recognized as incertae sedis, representing five dis-tinct tribes by the GPWG (2001). In our study, Eriachne
and Micraira form a well-supported clade (84 BP, 0.76PP; Fig. 2) and this is in agreement with Sanchez-Kenet al. (2007). However, its position within the PACCMADclade was not always strongly supported (Fig. 2). In thecombined BI analysis, Micrairoideae (except Isachne), sen-sus Sanchez-Ken et al. (2007), were sister to a chlorid-oid + danthonioid, aristidoid group (0.69 PP; Fig. 2). Thesame pattern was seen in the MP analysis except that itwas not supported by BP. The presence of Micrairoideaeas sister to a chloridoid + danthonioid, aristidoid groupcan be interpreted as a novel result. Streptogyna was sup-ported as sister to the PACCMAD clade (Fig. 2; 56 BP,1.00 PP, respectively). This contradicts the suggestion thatStreptogyna might be placed within Ehrhartoideae(GPWG, 2001). Cyperochloa was positioned within Cent-othecoideae (Fig. 2) but did not receive strong support,except from BI (1.00 PP). Finally, Gynerium was sister toPanicoideae with 100 PP (Fig. 2) and in all equally parsi-monious trees of the combined matrix of DS II (but wasnot supported by BP).
Our results suggest a strongly supported sister relation-ship between the two major PACCMAD clades: (1) Cent-othecoideae + Panicoideae and (2) Aristidoideae +Arundinoideae + Chloridoideae + Danthonioideae + Mic-rairoideae (Figs. 1 and 2). Relationships among major lin-eages of the PACCMAD clade have not been fully resolvedby previous studies (Soreng and Davis, 1998; Hilu et al.,1999; GPWG, 2001). It is possible that a rapid radiationof the PACCMAD group has obscured the phylogeneticsignal and made relationships difficult to resolve (GPWG,2001). There is, however, consistency among relationshipsof subfamilies in our analyses (Figs. 1 and 2) that support
the pattern of a paraphyletic grade of Arundinoideae taxa,Micrairoideae (excluding Isachne) and Aristidoideae assuccessively sister to a Chloridoideae + Danthonioideaegroup. This pattern could therefore be represented by thefollowing parenthetical notation: Arundinoideae grade(Micrairoideae s.s.(Aristidoideae(Chloridoideae, Dantho-nioideae))) (Fig. 3).
Taxa of Centothecoideae grouped with monophyleticPanicoideae with high support but were not themselvesmonophyletic (Figs. 1 and 2). Monophyly of Centothecoi-deae was not found (Fig. 1) or not well supported(Fig. 2), regardless of the sample size (DS I and II). Cent-othecoideae can be divided into two clades (Figs. 1–3).We also retrieve Loudetiopsis (tribe Arundinelleae) withinCentothecoideae (Fig. 2). In a previous study, Loudetiop-
sis was sister to Centothecoideae + Panicoideae (Hiluet al., 1999).
Subfamily Panicoideae was well supported in our analy-ses (Figs. 1 and 2). Two main clades within Panicoideaecan be identified. One contains Andropogoneae (with theinclusion of Tristachya) and four representatives of tribePaniceae (Axonopus, Ichnanthus, Hymenachne and Uro-chloa; Fig. 2), which form a strongly supported clade (91BP, 1.00 PP) that may be sister to Andropogoneae (50 BP,0.96 PP). Inclusion of Tristachya within Andropogoneae iseasily explained by convergence in morphological character-istics (spikelets in triads) of tribe Arundinelleae for Tristac-
hya (Hilu et al., 1999). The other major clade ofPanicoideae contains exclusively representatives of Paniceaeexcept for the inclusion of Danthoniopsis (also Arundinel-leae) in the Bayesian analysis (Fig. 2). Monophyly of Arund-inelleae has been questioned elsewhere (GPWG, 2001).
4.1.4. Subfamilies and tribes of the BEP clade
Within the BEP clade, the three main subfamilies weregenerally well supported (Figs. 1–3). In DS I (Fig. 1), Pooi-deae were strongly supported (100 BP, 1.00 PP). Bambusoi-deae (99 BP, 1.00 PP) were sister to Pooideae (95 BP, 1.00PP), and Ehrhartoideae (100 BP, 1.00 PP) were sister to aBambusoideae + Pooideae group (85 BP, 1.00 PP).Brachyelytreae were sister to the rest of the pooids in bothcombined analyses of DS II. They were found sister to theother pooids in a previous study including 48 pooid taxa(Catalan et al., 1997). The next diverging clade in our par-simony analyses of DS II (Fig. 2) was a clade that includesNardeae and Lygeae (Catalan et al., 1997). However, theorder of divergence in the Pooideae clade was not well sup-ported in our analyses (Figs. 1 and 2) or in previous studies(Catalan et al., 1997; GPWG, 2001). However, Brachyely-treae were consistently sister to the rest in the pooids, andNardeae + Lygeae (sometimes with the inclusion of Mil-
ium) and a group of Stipeae genera (including Ampelodes-
mos, Ampelodesmeae) were generally successively sisterto the rest of pooids. It is worth noting that the analysisof DS I retrieved tribes Stipeae and Meliceae as sister tothe rest of the pooids because it excludes Brachyelytreae,Nardeae and Lygeae. Milium can also be identified as an
502 Y. Bouchenak-Khelladi et al. / Molecular Phylogenetics and Evolution 47 (2008) 488–505
isolated taxon but it was grouped with Nardeae andLygeae in BI (Fig. 2). Milium was included in Stipeae byClayton and Renvoize (1986). The general lack of supportin the combined MP analysis of DS II (Fig. 2) may be dueto missing data. However, BI posterior probabilities weregenerally high for most of the basal nodes within pooids(Fig. 2). Furthermore, a moderately to well-supported corepooid group (96 BP, 1.00 PP) was retrieved in DS I withStipeae sister of the rest (100 BP, 1.00 PP) when there arecomplete taxa at the terminal branches (i.e., taxa for whichthe three DNA regions were sequenced; Fig. 1). Meliceaewere strongly supported and were the next successive sisterfollowed by Brachypodieae. Catalan et al. (1997) could notfind a supported order of divergence for these tribes. Twomain clades were found in the core pooids (Figs. 1 and2): one containing mainly Bromeae + Triticeae and theother containing an assemblage of Poeae + Aveneae taxa.None of these tribes were resolved as monophyletic excepttribe Bromeae (Bromus and Boissiera), which were sister toTriticeae (Figs. 1 and 2). More extensive sampling of thesetribes will be needed to determine composition and inter-relationships of many of the major pooid groups.
We found a sister-relationship between subfamiliesPooideae and Bambusoideae supported by DS I, and BIof DS II (Figs. 1–3). Bambusoideae, s. str. (Bambuseaeand Olyreae), were supported in all our analyses anddivided into two main lineages. One contained exclusivelyBambuseae with representatives of temperate woody bam-boos, and the other contained tribes Bambuseae, with rep-resentatives of Neo-tropical and Paleo-tropical woodybamboos and Olyreae containing exclusively herbaceousbamboos. Bambuseae were therefore not monophyletic.Previous phylogenetic studies have found Olyreae derivedfrom within Bambusoideae s.str. (Clark et al., 1995) andOlyreae/Parianeae as sister to Bambuseae (Kelchner andClark, 1997). In Kelchner and Clark (1997), 23 bamboospecies were sampled whereas we have sampled 43 species.Our results support the findings of Kelchner and Clark(1997), who showed that distinct lineages within the sub-family correspond well with geographic divisions. How-ever, we retrieve a sister-relationship between herbaceous(Olyreae) and tropical woody bamboos (tribe Bambuseae)rather than an Olyreae/Bambuseae relationship. It seemstherefore that the circumscription of these taxa needs revi-sion. Olyreae could be included within Bambuseae (whichis untenable based on morphology). Some Bambuseae taxacould be included in Olyreae or the temperate Bambuseaetaxa could be recognized at tribal rank. Sungkaew (2008)found the same pattern with a combined phylogenetic anal-ysis of plastid matK, trnL-F, rps16 and atpB-rbcL generegions, and recommends the latter option with the temper-ate woody bamboos recognized as tribe Arundinarieae.This pattern has also been retrieved by the Bamboo Phy-logeny Worling Group (unpublished; Hodkinson personalcomm.) and they are likely to formally reclassify Bambu-soideae into tribes including Arundinarieae, Bambuseaeand Olyreae.
Inclusion of Ehrhartoideae within the BEP clade waswell-supported in the combined DS I (85 BP, 1.00 PP;Fig. 1). The subfamily was monophyletic in all our analysesand a sister relationship was found between Ehrharteaeand Oryzeae. A pattern also found by Guo and Ge(2005). Both tribes were supported as monophyletic. Sev-eral studies using DNA data have shown that Oryzeaeshould be considered as a distinct entity (Barker et al.,1995; Clark et al., 1995; Soreng and Davis, 1998; Guoand Ge, 2005), but the inclusion of tribe Ehrharteae wasassessed only recently (Hilu et al., 1999; GPWG, 2001).The position of Ehrhartoideae was unclear in other studies(Hilu et al., 1999; GPWG, 2001), but our results support asister relationship between Ehrhartoideae and Bambusoi-deae + Pooideae (Figs. 1 and 2).
The position of Isachne (tribe Isachneae) was notresolved by MP. It was, however, found to be sister tothe BEP clade in analyses from DS II (0.99 PP; Fig. 2).It is thus best treated here as incertae sedis (and positionedin a trichotmoy with the BEP and PACCMAD groups).Isachne was considered a member of Panicoideae (Claytonand Renvoize, 1986; Watson and Dallwitz, 1992), but thiscannot be confirmed by our analyses. Isachne was includedin Micrairoideae, within PACCAMAD, by Sanchez-Kenet al. (2007). There is no evidence from our analyses toembed it in Micrairoideae or the PACCMAD clade andits subfamilial position is unclear.
4.1.5. Effect of characters and taxon sampling, and missing
dataPrevious theoretical (Hillis, 1996; Graybeal, 1998) and
empirical (Soltis et al., 1999) studies have indicated thatlarge numbers of characters may be necessary to resolvephylogenetic patterns in many groups of organisms. Byincreasing character number in our study from a range of283–742 parsimony informative characters in the singlegene analyses (results not shown) to a range of 1107–1403 in the combined analyses, we found more robustand resolved phylogenetic trees than in individual single-gene analyses (Table 2). There is no reason to suggest thatour results might have experienced systematic bias afterdata combination because there is topological convergenceof trees with both MP and BI methods. Reducing mislead-ing effects or systematic bias might be achieved byincreased taxon sampling (Wiens, 1998; Hillis et al., 2003;Salamin et al., 2005), as it enables a better detection of mul-tiple substitutions at the same nucleotide site. This helpscounteract branch-attraction effects and therefore improvesphylogenetic inference (Hillis, 1996). Some empirical stud-ies have also found that data combination (i.e., multi-geneapproaches) of multiple sequences from the same taxon(i.e., the multi-gene approach) does improve accuracy ofphylogenetic inference (e.g., Qiu et al., 1999; Soltis et al.,1999; Bapteste et al., 2002). Our results in the combinedanalyses (Figs. 1 and 2) show high levels of congruencebetween the phylogenetic inferences with 107 and 295 taxa
Y. Bouchenak-Khelladi et al. / Molecular Phylogenetics and Evolution 47 (2008) 488–505 503
(the latter increased the proportion of all grass genera sam-pled from 15% to 42%).
The impact of missing data (i.e., taxa for which there is aproportion of missing character states) has been neglectedin phylogenetic analyses (Wiens, 2005). If we compare thephylogenetic inferences of DS I and DS II we observe thesame clades in both (Fig. 2). It suggests that phylogeneticreproducibility can be achieved even with a large amountof missing data. However, bootstrap percentages differgreatly between the two analyses (compare Figs. 1 and 2).
Trees from DS I showed high support for most clades,but clades determined in DS II were not as well supported.In a simulation study, Wiens (2003) showed that reducedphylogenetic accuracy resulting from the inclusion of miss-ing data (i.e., incomplete taxa) was associated with incor-rect placement of only the incomplete taxa; therelationships among the complete taxa (i.e., with no miss-ing data) were estimated almost perfectly. The lack of sup-port for clades associated with analyses of DS II may haveresulted from the poorly resolved placement of incompletetaxa. However, Wiens (2005) argued that adding taxa thatare 50% incomplete (i.e., for which only half of the charac-ters are known) might show similar benefits to adding com-plete taxa under many conditions.
BI seems to be less sensitive than MP bootstrapping tothe impacts of missing data (Fig. 2). By this statement wemean that BP values were dramatically reduced in analysisof DS II (with missing data) in comparison to analyses ofDS I (no missing data) but Bayesian PP values were notsimilarly affected. Indeed, Bayesian inference produced rel-atively good support for most internal nodes (Fig. 2). Onehas to bear in mind that the support for the placement ofincomplete taxa in the BI analyses should be interpretedcautiously because BI can overestimate support (Suzukiet al., 2002; Simmons et al., 2004). Also, Goloboff andPol (2005) raised concern about Bayesian analyses of datamatrices including a high proportion of missing data,which provided high support for smaller clades despiteambiguous resolution of other terminals. This can producemisleading results in interpreting phylogenetic relation-ships for such clades.
5. Conclusion
In this study, we have performed a multi-gene phyloge-netic analysis of grasses with the largest sample size pub-lished to date at tribal and generic levels. It represents anearly complete tribal level phylogenetic treatment (sum-marized in Fig. 3). Although there is a substantial amountof missing data in our analyses, our phylogenetic inferencesshowed a considerable topological congruence with oursingle-gene analyses, and a strongly supported tree withDS I. With the exception of Anomochlooideae, Arundinoi-deae, Centothecoideae, and Micrairoideae for which cir-cumscriptions remain unclear (GPWG, 2001), allsubfamilies were resolved as monophyletic and mostinter-subfamilial relationships were resolved. Some of the
subfamily relationships within the BEP and PACCMADclades, which remained unclear in the GPWG (2001) paper,have been substantially resolved such as (i) sister-relation-ship between Panicoideae + Centothecoideae to the restof PACCMAD, (ii) composition of BEP, (iii) non-monophyly of Bambuseae, (iv) sister-relationship ofEhrhartoideae/Bambusoideae + Pooideae, (v) position ofGynerium as sister to Panicoideae, and (vi) monophylyof a Eriachneae + Micraireae group (Micrairoideae exclud-ing Isachne) sister to Aristidoideae, Chloridoideae + Dan-thonioideae. We have provided a summary tree of tribalinter-relationships (Fig. 3) based on our results (Figs. 1and 2; Table 2) that has only been possible by using largetrees.
The lack of BP support for groups determined in ouranalyses with missing data (DS II) reflects the need for a‘better and smarter’ data acquisition in grass phylogeneticstudies. Two different approaches can be considered to pro-duce the large trees required to establish inclusive phyloge-netic hypotheses and provide a more comprehensivesummary of this clade’s history (Sanderson et al., 1998;Sanderson et al., 2003): (i) supertree-building methods (Sal-amin et al., 2002) or (ii) DNA sequence data acquisitionfrom the widest range of taxa using a supermatrixapproach. The latter approach requires us to ‘fill the gaps’in DNA data matrices that are now large enough to infercomprehensive phylogenetic trees for the family.
Acknowledgments
This study was part of a Ph.D. project of the first authorand was supported by Enterprise Ireland Basic ResearchGrant SC/2003/0437 and the Royal Botanic Gardens,Kew. The authors are grateful to Gabriel Sanchez-Kenand Guillaume Pillon for allowing us to use DNA samplesand leaf material. We thank Sarawood Sungkaew, AtcharaTeerawatananon for support during the laboratory work.We also thank three anonymous referees for their very use-ful comments on the manuscript. The authors acknowledgeIITAC, the Irish HEA, and the Trinity Centre for HighPerformance Computing (Trinity College Dublin) for ac-cess to high performance computing clusters for phyloge-netic analyses.
Appendix A. Supplementary data
Supplementary data associated with this article can befound, in the online version, at doi:10.1016/j.ympev.2008.01.035.
References
Aliscioni, S.S., Giussani, L.M., Zuloaga, F.O., Kellogg, E.A., 2003. Amolecular phylogeny of Panicum (Poaceae: Paniceae): tests of mono-phyly and phylogenetic placement within the Panicoideae. Am. J. Bot.90, 796–821.
Bapteste, E., Brinkmann, H., Lee, J.A., Moore, D.V., Sensen, C.W.,Gordon, P., Durufle, L., Gaasterland, T., Lopez, P., Muller, M.,
504 Y. Bouchenak-Khelladi et al. / Molecular Phylogenetics and Evolution 47 (2008) 488–505
Philippe, 2002. The analysis of 100 genes supports the grouping ofthree highly divergent amoebae: Dictyostelium, Entamoeba, andMastigamoeba. Proc. Natl. Acad. Sci. USA 99, 1414–1419.
Barraclough, T.G., Nee, S., 2001. Phylogenetics and speciation. TrendsEcol. Evol. 16, 391–399.
Barker, N.P., Linder, H.P., Harley, E.H., 1995. Polyphyly of Arundinoi-deae (Poaceae): evidence from rbcL sequence data. Syst. Biol. 20, 423–435.
Barker, N.P., Linder, H.P., Harley, E.H., 1999. Sequences of the grass-specific insert in the chloroplast rpo C2 gene elucidate genericrelationships of the Arundinoideae (Poaceae). Syst. Bot. 23, 327–350.
Bremer, K., 2002. Gondwanan evolution of the grass alliance of families(Poales). Evolution 56, 1374–1387.
Briggs, B.G., Johnson, L.A.S., 2000. Hopkinsiaceae and Lyginiaceae, twonew families of Poales in Western Australia, with revisions ofHopkinsia and Lyginia. Telopea 8, 477.
Brown, R. 1810. Prodomus florae Novae Hollandiae et insulae Van-Diemen,London.
Catalan, P., Kellogg, E.A., Olmstead, R.G., 1997. Phylogeny of Poaceaesubfamily based on chloroplast ndhF gene sequences. Mol. Phylogenet.Evol. 8, 150–166.
Chase, M.W., Hills, H.G., 1991. Silica gel: an ideal material for fieldpreservation of leaf samples for DNA studies. Taxon 40, 215–220.
Chase, M.W., Soltis, D.E., Olmstead, R.G., Morgan, D., Les, D.H.,Mishler, B.D., Duvall, M.R., Price, R.A., Hills, H.G., Qiu, Y.L.,Kron, K.A., Rettig, J.H., Conti, E., Palmer, J.D., Manhart, J.R.,Sytsma, K.J., Michaels, H.J., Kress, W.J., Karol, K.G., Clark, W.D.,Hedren, M., Gaut, B.S., Jansen, R.K., Kim, K.J., Wimpee, C.F.,Smith, J.F., Furnier, G.R., Strauss, S.H., Xiang, Q.Y., Plunkett, G.M.,Soltis, P.S., Swensen, S.M., Williams, S.E., Gadek, P.A., Quinn, C.J.,Eguiarte, L.E., Golenberg, E.M., Learn, G.H., Graham, S.W., Barrett,S.C.H., Dayanandan, S., Albert, V.A., 1993. Phylogenetics of seedplants—an analysis of nucleotide—sequences from the plastid generbcL. Ann. Missouri Bot. Gard. 80, 528–580.
Chase, M.W., Fay, M.F., Soltis, D.E., Soltis, P.S., Savolainen, V., 2006.Simple phylogenetic tree searches easily succeed with large matrices ofsingle genes. Taxon 55, 573–578.
Clark, L.G., Judziewicz, E.J., 1996. The grass subfamilies Anomoochloi-deae and Pharoideae (Poaceae). Taxon 45, 641–645.
Clark, L.G., Kobayashi, M., Mathews, S., Spangler, R.E., Kellogg, E.A.,2000. The Puelioideae, a new subfamily of Poaceae. Syst. Bot. 25, 181–187.
Clark, L.G., Zhang, W., Wendel, J.F., 1995. A phylogeny of the grassfamily (Poaceae) based on ndhF sequence data. Syst. Bot. 20, 436–460.
Clayton, W.D., Renvoize, S.A., 1986. Genera Graminum, Grasses of theWorld. Her Majesty’s Stationery Office, London.
Cuenoud, P., Savolainen, V., Chartrou, L.W., Powell, M., Grayer, R.J.,Chase, M.W., 2002. Molecular phylogenetics of Caryophyllales basedon nuclear 18S rDNA and plastid rbcL, atpB, and matK DNAsequences. Am. J. Bot. 89, 132–144.
Doebley, J., Durbin, M., Golenberg, E.M., Clegg, M.T., Ma, D.P., 1990.Evolutionary analysis of the large subunit of carboxylase (rbcL) nucleotidesequence data among the grasses (Poaceae). Evolution 44, 1097–1108.
DoloresLledo, M., Crespo, M.B., Cameron, K.M., Fay, M.F., Chase,M.W., 1998. Systematics of Plumbaginaceae based upon cladisticanalysis of rbcL sequence data. Syst. Bot. 23, 21–29.
Doust, A.N., Kellogg, E.A., 2002. Inflorescence diversification in thepanicoid ‘‘bristle grass” clade (Paniceae, Poaceae): evidence frommolecular phylogenies and developmental morphology. Am. J. Bot.89, 1203–1222.
Doyle, J.J., Davis, J.I., Soreng, R.J., Garvin, D., Anderson, M., 1992.Chloroplast DNA inversions and the origin of the grass family(Poaceae). Proc. Natl. Acad. Sci. USA 89, 7722–7726.
Doyle, J.J., Doyle, J.L., 1987. A rapid isolation procedure for smallquantities of fresh leaf tissue. Phytochem. Bull. 19, 65–66.
Duvall, M.R., Clegg, M.T., Chase, M.W., Clark, W.D., Kress, W.J., Hills,H.G., Eguiarte, L.E., Smith, J.F., Gaut, B.S., Zimmer, E.A., Learn,G.J., 1993. Phylogenetic hypotheses for the monocotyledons con-
structed from rbcL sequence data. Ann. Missouri Bot. Gard. 80, 607–619.
Duvall, M.R., Morton, B.R., 1996. Molecular phylogenetics of Poaceae:an expanded analysis of rbcL sequence data. Mol. Phylogenet. Evol. 5,352–358.
Duvall, M.R., Noll, J.D., Minn, A.H., 2001. Phylogenetics of Paniceae(Poaceae). Am. J. Bot. 88, 1988–1992.
Farris, J.S., 1989. The retention index and the rescaled consistency index.Cladistics 5, 417–419.
Felsenstein, J., 1985. Confidence limits on phylogenies: an approach usingthe bootstrap. Evolution 39, 783–791.
Ferris, C., King, R.A., Gray, J.A., 1997. Molecular evidence for thematernal parentage in the hybrid origin of Spartina anglica C.E.Hubbard. Mol. Ecol. 6, 185–187.
Gadagkar, S.R., Rosenberg, M.S., Kumar, S., 2005. Inferring speciesphylogenies from multiple genes: concatenated sequence tree versusconsensus gene tree. J. Exp. Zool. B Mol. Dev. Evol. 304B, 64–74.
Goloboff, P.A., Pol, D., 2005. Parsimony and Bayesian phylogenetics. In:Albert, V.A. (Ed.), Parsimony, Phylogeny, and Genomics. OxfordUniversity Press, Oxford, UK, pp. 48–159.
Grass Phylogeny Working Group (GPWG) 2001. Phylogeny and sub-familial classification of the grasses (Poaceae). Ann. Missouri Bot.Gard. 88, 373–457.
Graybeal, A., 1998. Is it better to add taxa or characters to a difficultphylogenetic problem? Syst. Biol. 47, 9–17.
Guo, Y.L., Ge, S., 2005. Molecular phylogeny of Oryzeae (Poaceae) basedon DNA sequences from chloroplast, mitochondrial, and nucleargenomes. Am. J. Bot. 92, 1548–1558.
Hasegawa, M., Kishino, H., Yano, T., 1985. Dating the human-apesplitting by a molecular clock of mitochondrial DNA. J. Mol. Evol. 22,160–174.
Hamby, R.K., Zimmer, E.A., 1988. Ribosomal RNA sequences forinferring phylogeny within the grass family (Poaceae). Plant Syst. Evol.160, 29–37.
Hillis, D.M., 1987. Molecular versus morphological approaches tosystematics. Annu. Rev. Ecol. Syst. 18, 23–42.
Hillis, D.M., 1996. Inferring complex phylogenies. Nature 383, 130–131.Hillis, D.M., Pollock, D.D., McGuire, J.A., Zwickl, D.J., 2003. Is sparse
taxon sampling a problem for phylogenetic inference? Syst. Biol. 52,124–126.
Hilu, K.W., Alice, L.A., Liang, H., 1999. Phylogeny of Poaceae inferredfrom matK sequences. Ann. Missouri Bot. Gard. 86, 835–851.
Hilu, K.W., Alice, L.A., 2001. A phylogeny of Chloridoideae (Poaceae)based on matK sequences. Syst. Bot. 26, 386–405.
Hodkinson, T.R., Chase, M.W., Lledo, M.D., Salamin, N., Renvoize,S.A., 2002. Phylogenetics of Miscanthus, Saccharum and relatedgenera (Saccharinae, Andropogoneae, Poaceae) based on DNAsequences from ITS nuclear ribosomal DNA and plastid trnL intronand trnL-F intergenic spacers. J. Plant. Res. 115, 381–392.
Hodkinson, T.R., Parnell, J.A.N., 2007. Introduction to the systematics ofspecies rich groups. In: Hodkinson, T.R., Parnell, J.A.N. (Eds.),Reconstructing the Tree of Life: Taxonomy and Systematics of SpeciesRich Taxa. CRC Press, Boca Raton, FL, USA, pp. 3–20.
Hodkinson, T.R., Salamin, N., Chase, M.W., Bouchenak-Khelladi, Y.,Renvoize, S.A., Savolainen, V., 2007a. Large trees, supertrees anddiversification of the grass family. Aliso 23, 248–258.
Hodkinson, T.R., Savolainen, V., Jacobs, S.W.L., Bouchenak-Khelladi,Y., Kinney, M.S., Salamin, N. 2007b. In: Hodkinson, T.R., Parnell,J.A.N. (Eds.), Reconstructing the Tree of Life: Taxonomy andSystematics of Species Rich Taxa, CRC Press, Boca Raton, FL,USA, pp. 275–295.
Hodkinson, T.R., Waldren, S., Parnell, J.A.N., Kelleher, C.T., Salamin,K., Salamin, N., 2007c. DNA banking for plant breeding, biotech-nology and biodiversity evaluation. J. Plant. Res. 120, 17–29.
Hsiao, C., Jacobs, S.W.L., Chatterton, N.J., Asay, K.H., 1999. Amolecular phylogeny of the grass family (Poaceae) based on thesequences of nuclear ribosomal DNA (ITS). Aust. Syst. Bot. 11, 667–688.
Y. Bouchenak-Khelladi et al. / Molecular Phylogenetics and Evolution 47 (2008) 488–505 505
Huelsenbeck, J.P., Bull, J.J., Cunningham, C.W., 1996. Combining data inphylogenetic analysis. Tree 11, 152–158.
Huelsenbeck, J.P., Ronquist, F., 2001. MrBayes: Bayesian inference ofphylogenetic trees. Bioinformatics 17, 754–755.
Johnson, L.A., Soltis, D.E., 1994. MatK DNA sequences and phylogeneticreconstruction in Saxifragaceae s.str. Syst. Bot. 19, 143–156.
Kelchner, S.A., 2000. The evolution of non-coding chloroplast DNA andits application in plant systematics. Ann. Missouri Bot. Gard. 87, 482–498.
Kelchner, S.A., Clark, L.G., 1997. Molecular evolution and phylogeneticutility of the chloroplast rpl16 intron in Chusquea and the Bambusoi-deae (Poaceae). Mol. Phylogenet. Evol. 8, 385–397.
Kellogg, E.A., 2000. The grasses: a case study in macroevolution. Annu.Rev. Ecol. Syst. 31, 217–238.
Kimura, M., 1981. Estimation of evolutionary distances between homol-ogous nucleotide sequences. Proc. Natl. Acad. Sci. USA 78, 454–458.
Kluge, A.G., 1989. A concern for evidence and a phylogenetic hypothesisfor relationships among Epicrates (Boidae, Serpentes). Syst. Zool. 38,1–25.
Kluge, A.G., Farris, J.S., 1969. Quantitative phyletics and the evolution ofAnurans. Syst. Zool. 18, 1–32.
Linder, H.P., Rudall, P.J., 2005. Evolutionary history of Poales. Annu.Rev. Ecol. Evol. Syst. 36, 107–124.
Mathews, S., Spangler, R.E., Mason-Gamer, R.J., Kellogg, E.A., 2002.Phylogeny of Andropogoneae inferred from phytochrome b, gbssi, andndhF. Int. J. Plant. Sci. 163, 441–450.
Molvray, M.P., Kores, P.J., Chase, M.W. 2000. In: Wilson, K.L.,Morrison, D.A. (Eds.), Monocots: Systematics and Evolution,CSIRO, Melbourne, Australia, pp. 441–448.
Nylander, J.A.A., Ronquist, F., Huelsenbeck, J.P., Nieves-Aldrey, J.L.,2004. Bayesian phylogenetic analysis of combined data. Syst. Biol. 53,47–67.
Petersen, G., Seberg, O., 1997. Phylogenetic analysis of the Triticeae(Poaceae) based on rpoA sequence data. Mol. Phylogenet. Evol. 7,217–230.
Posada, D., Crandall, K., 1998. Modeltest: testing the model of DNAsubstitution. Bioinformatics 14, 817–818.
Prat, H., 1932. L’epiderme des Graminees: etude anatomique et systema-tique. Ann. Sci. Nat. Bot. Biol. 14, 117–324.
Qiu, Y.L., Lee, J., Bernasconi-Quadroni, F., Soltis, D.E., Soltis, P.S.,Zanis, M., Zimmer, E.A., Chen, Z., Savolainen, V., Chase, M.W.,1999. The earliest angiosperms: evidence from mitochondrial, plastidand nuclear genomes. Nature 402, 404–407.
Renvoize, S.A., Clayton, W.D., 1992. In: Chapman (Ed.), Grass Evolu-tion and Domestication. Cambridge University Press, Cambridge, UK,pp. 3–37.
Salamin, N., Hodkinson, T.R., Savolainen, V., 2002. Building supertrees:an empirical assessment using the grass family (Poaceae). Syst. Bot. 51,136–150.
Salamin, N., Hodkinson, T.R., Savolainen, V., 2005. Towards buildingthe Tree of Life: a simulation study for all angiosperm genera. Syst.Biol. 54, 183–196.
Sanchez-Ken, J.G., Clark, L.G., Kellogg, E.A., Kay, E.E., 2007. Rein-statement and emendation of subfamily Micrairoideae (Poaceae). Syst.Bot. 32, 71–80.
Sanderson, M.J., Purvis, A., Henze, C., 1998. Phylogenetic supertrees:assembling the trees of life. Tree 13, 105–109.
Sanderson, M.J., Driskell, A.C., 2003. The challenges of constructinglarge phylogenetic trees. Trends Plant Sci. 8, 374–379.
Sanderson, M.J., Driskell, A.C., Ree, R.H., Eulenstein, O., Langley, S.,2003. Obtaining maximal concatenated phylogenetic data sets fromlarge sequence databases. Mol. Biol. Evol. 20, 1036–1042.
Savolainen, V., Chase, M.W., Hoot, S.B., Morton, C.M., Soltis, D.E.,Bayer, C., Fay, M.F., De Bruijn, A.Y., Sullivan, S., Qiu, Y.L., 2000.Phylogenetics of flowering plants based on combined analysis ofplastid atpB and rbcL gene sequences. Syst. Biol. 49, 306–362.
Simmons, M.P.K., Pickett, K.M., Miya, M., 2004. How meaningful areBayesian support values? Mol. Biol. Evol. 21, 188–199.
Soderstrom, T.R., Judziewicz, E.J., 1987. The Phareae and Streptogyneaeof Sri Lanka: a morphological–anatomical study. Ann. Missouri Bot.Gard. 74, 871–888.
Soltis, P.S., Soltis, D.E., Chase, M.W., 1999. Angiosperm phylogenyinferred from multiple genes as a tool for comparative biology. Nature402, 402–403.
Soreng, R.J., Davis, J.I., 1998. Phylogenetics and character evolution inthe grass family (Poaceae): simultaneous analysis of morphologicaland chloroplast DNA restriction site character sets. Bot. Rev. 64, 1–85.
Stebbins, G.L., Crampton, B. 1961. In: Recent Advances in Botany, Vol.1. University of Toronto Press, Toronto, pp. 133–145.
Sungkaew, S., 2008. Taxonomy and systematics of Dendrocalamus
(Bambuseae; Poaceae). PhD Thesis, University of Dublin, TrinityCollege Dublin, Ireland.
Suzuki, Y., Glazko, G.V., Nei, M., 2002. Overcredibility of molecularphylogenies obtained by Bayesian phylogenetics. Proc. Natl. Acad. Sci.USA 99, 16138–16143.
Swofford, D.L. 2002. Sinauer Associates, I. (Ed.), Massachussetts,Sunderland
Taberlet, P., Gielly, L., Pautou, G., Bouvet, J., 1991. Universal primers foramplification of three non-coding regions of chloroplast DNA. PlantMol. Biol. 17, 1105–1109.
Tamura, M.N., Yamashita, J., Fuse, S., Haraguchi, M., 2004. Molecularphylogeny of monocotyledons inferred from combined analysis ofplastid matK and rbcL gene sequences. J. Plant Res. 117, 109–120.
Thompson, J.D., Higgins, D.G., Gibson, T.J., 1994. CLUSTAL W:improving the sensitivity of progressive multiple sequence alignmentthrough sequence weighting, position-specific gap penalties and weightmatrix choice. Nucleic Acids Res. 22 (22), 14673–14680.
Tzvelev, N.N., 1989. The system of grasses (Poaceae) and their evolution.Bot. Rev. 55, 141–203.
Watson, L., Dallwitz, M.J., 1992. The Grass Genera of the World. CABInternational, Wallingford, UK.
Wiens, J.J., 1998. The accuracy of methods for coding and samplinghigher-level taxa for phylogenetic analysis: a simulation study. Syst.Biol. 47, 381–397.
Wiens, J.J., 2003. Missing data, incomplete taxa, and phylogeneticaccuracy. Syst. Biol. 52, 528–538.
Wiens, J.J., 2005. Can incomplete taxa rescue phylogenetic analyses fromlong-branch attraction? Syst. Biol. 54, 731–742.
Yang, Z.H., 1994. Maximum-likelihood phylogenetic estimation fromDNA sequences with variable rates over sites: approximate methods. J.Mol. Evol. 39, 306–314.
Yang, Z.H., Rannala, B., 1997. Bayesian phylogenetic inference usingDNA sequence: a Markov Chain Monte Carlo method. Mol. Biol.Evol. 14, 717–724.