language and foreign trade
TRANSCRIPT

ARTICLE IN PRESS
European Economic Review 52 (2008) 667–699
0014-2921/$ -
doi:10.1016/j
�CorrespoEdinburgh E
E-mail ad
www.elsevier.com/locate/eer
Language and foreign trade
Jacques Melitza,b,c,�
aDepartment of Economics, Mary Burton Building, Heriot-Watt University, Edinburgh EH14 4AS, UKbCREST-INSEE, PariscCEPR, London, UK
Received 28 October 2005; accepted 14 May 2007
Available online 8 June 2007
Abstract
While language plays an important role in gravity models, there has been little attention to the
channels through which a common language promotes bilateral trade. This work proposes separate
series for a common language depending upon whether ease of communication facilitates trade
through translation or the ability to communicate directly. The series related to direct
communication is far more important in explaining bilateral trade, but the other series, based on
translation, makes a distinct contribution as well. Either measure of a common language
outperforms the measure in popular use, which is implicitly related to translation, and a combination
of the two does far better. In addition, the paper examines the effect of two country-specific linguistic
influences on trade: Literacy and linguistic diversity at home. Both of these influences promote
foreign relative to domestic trade. Finally, the article studies the separate roles of English and
network externalities.
r 2007 Elsevier B.V. All rights reserved.
JEL classification: F10; F40
Keywords: Language; Foreign trade; Gravity model
0. Introduction
Gravity models provide ample evidence that a common language has a significantimpact on bilateral trade but studies of these models leave open the question of the
see front matter r 2007 Elsevier B.V. All rights reserved.
.euroecorev.2007.05.002
nding author at: Department of Economics, Mary Burton Building, Heriot-Watt University,
H14 4AS, UK. Tel.: +44131 451 3626; fax: +44131 552 3296.
dress: [email protected]

ARTICLE IN PRESSJ. Melitz / European Economic Review 52 (2008) 667–699668
channels through which the effect takes place.1 The typical step is to use a binary measureof a common language as zero or one. But the channel of influence that this concerns is notobvious. Direct communication (DC) cannot be the entire answer since the measure oftentreats a common language as present when only a minority in either country in a pair couldcommunicate directly with the people in the other. For example, India and Tanzania aresupposed to be an English pair and Niger and Senegal a French one. But if we consider theprobability that a random pair of people from India and Tanzania both speak English or asimilar random pair from Niger and Senegal both speak French, the figure is less than 10percent in both cases. Implicitly, a widespread ability to communicate directly is notessential and an adequate system of translation will do as well. In this paper, I propose toconstruct a separate series for a common language that depends on translation, and aseparate series that depends on DC. This will make it possible to see whether translationacts a separate channel, as distinct from DC, through which ease of communicationpromotes bilateral trade. Better measures of a common language will result as well.The usual reliance on binary variables as indicators of a common language probably
reflects mostly the difficulty of quantifying the numbers of speakers of different languagesin a country. Yet considerable headway is possible by relying on Grimes (2000), now in its14th edition since it first appeared in 1951. This work is the result of a massive effort tocondense the information supplied by the entire profession of ethnologists about worldlanguages. There have indeed been at least three recent efforts to use this work to constructa general quantitative index of language in economic research: Hall and Jones (1999),Wagner (2000) and Rauch and Trindade (2002). But the aim, in these cases, has never beento provide a general index of the ability to communicate directly in foreign trade. Hall andJones focus on language out of a concern with certain institutional/legal features. In closeconnection, they limit their attention to a few major languages. Though concerned withcommunication, Wagner deals strictly with the trade of Canadian provinces, and chooseshis languages accordingly. Rauch and Trindade focus on ethnic ties. Consequently, theycollect data strictly on common native languages, whereas, of course, bilingualism is of theessence in regard to communication. There has been one earlier effort to construct ageneral quantitative index of a common language in order to analyze world trade from asimilar perspective as mine, by Boisso and Ferrantino (1997). But the authors proceed, inthis pioneering work, like Rauch and Trindade, to attribute only a single language to eachperson (not necessarily the mother tongue). They also rely on a far more summarytreatment than Grimes’, by Katzner (1986).Besides the issue of the channels of influence of a common language, I propose to deal
with a number of other major questions about the influence of language on foreign trade.One is the question whether the world’s dominant language, English, is more effective thanthe rest in promoting trade. Another is the impact of linguistic diversity at home andliteracy on foreign trade. As I will argue below, in principle, both of these country-specificaspects of language should promote foreign trade. I will also consider the issue of thepossible network externalities of a common language.The basic results can be summarized as follows. First, a common language promotes
international trade via translation as well as through DC. DC is far more important. But,very significantly, an established network facilitating access to a language plays a basic role
1For bibliography and examples, see Frankel (1997), Frankel and Rose (2002), and Anderson and van Wincoop
(2004).
ARTICLE IN PRESSJ. Melitz / European Economic Review 52 (2008) 667–699 669
too. These considerations lead to a higher estimate of the influence of a common languageon foreign trade than found in previous work. Next, despite the dominant position ofEnglish as a world language, English is no more effective in promoting trade than othermajor European languages. On the other hand, the major European languages as a group(including English) are more efficient than other languages in promoting trade. Further,both literacy and a diversity of tongues at home do indeed boost foreign trade, inaccordance with theory. Finally, I find no evidence of network externalities of language.However, the search for such evidence yields one important result, namely, that a scarcityof advantages of a common language leads to more intensive exploitation of thoseadvantages of a common language that do exist.
The discussion will begin by examining the construction of the linguistic variables andthe theoretical basis for their influence. Section 2 will develop the gravity equation that willserve in the empirical analysis. It will also deal with the problem of estimation and thechoice of estimation procedure. Section 3 will then present the econometric results for theinfluences of the bilateral variables in the model, including DC and indirect communica-tion via translation. Section 4 will next proceed to introduce the separate country-specificinfluences in the model. Following, Section 5 will explore the network externalities of acommon language. The final section will add some general discussion and suggestions forfuture research. All the raw linguistic series, including those I constructed, follow in aseparate data Appendix (Table A1).
1. The linguistic influences and their measure
1.1. General discussion
The meaning of a common language between two countries ceases to be obvious once weadmit translation. In principle, a small group of bilinguals could make all marketinformation available to each person in his or her preferred tongue in both countries. Thiscould be done on-line via an electronic system. Or alternatively, one could imaginewholesalers employing translators to provide all market information to everyone furtherdown the distribution chain in their own language. In either case, the marginal cost of thetranslation services could be zero to the final users. This last condition is essential for acommon language to exist in any meaningful sense. To see why, consider the analogy withmoney. National currencies can also be converted through banks. But the purchaser offoreign currency pays the exchange cost in every transaction. If it were necessary to pay forthe translation of every separate message in a foreign tongue, there would be no questionof a common language. But if new foreign-language messages can be received in one’shome tongue for free, then the linguistic barrier may be non-existent or weak. As indicatedbefore, the usual treatment of a common language as an all-or-nothing condition implicitlysupposes that translation is a free good at the margin.
In fact, a sensible question in connection with a common language is how the absence ofa common language and the consequent presence of linguistic barriers can possibly be aproblem when translation can link up all world languages to one another. To this query,there are two fundamental answers. The first regards the costs of translation—both thesocial overhead costs of preparing the ground for the wide distribution of translationservices to large groups of people and the costs of dealing out such services to themindividually. Even if true, in line with the previous paragraph, that once an appropriate

ARTICLE IN PRESSJ. Melitz / European Economic Review 52 (2008) 667–699670
foundation has been laid for widespread translation, the services can be meted out topeople individually at a negligible cost, the social overhead costs can still be veryimportant. Indeed, the usual treatment of a common language in foreign trade says thatthey are since this treatment allows for only two common languages at most. Thetreatment therefore implicitly says that the problems of mounting and maintaining alanguage network are so large that, regardless of population size and number of languages,only two common languages can exist between any pair of countries. The second answer tothe question how can there be a language problem when it is possible to resort totranslation is that DC is important. We have some clear indication of the importance ofDC from results of gravity models showing that immigrants promote trade with theircountry of origin (see Gould (1994), Head and Ries (1998), and Dunlevy and Hutchinson(1999), Wagner et al. (2002), and Rauch and Trindade (2002)). One likely reason for thisimpact of immigrants is their ability to speak their native language (as well as theircapacity to translate this language into the primary one(s) in the host country). But whilewe know that these two sources of a language problem exist, we do not know their relativeimportance or even if one dominates the other entirely.Accordingly, I will develop a separate measure of a common language pertaining to each
separate channel of influence. One will relate to a communication network and the other toDC. In developing both measures, I will rely on only one reference in addition to Grimes(2000)—the Central Intelligence Agency (CIA) country factbook, of frequent use amongeconomists. The factbook will serve either to cover gaps in Grimes about official languages,or else in the case of literacy rates, as the primary source. The reason for switching to thefactbook as the main source for literacy is that Grimes pays too little attention to theuniformity of dating this variable. I decided to stick to Grimes and the CIA factbook,following a broader search, mainly to facilitate reproduction.The first measure, titled ‘‘open-circuit communication,’’ OCC, will require no set
number of speakers for a common language, but simply demand that the language beeither official or widely spoken in both countries (in any combination). By ‘‘widelyspoken,’’ I will mean that 20 percent or more of the population possesses the language.2 Inaccordance with previous work, I will also recognize only two ‘‘open-circuit’’ languages atmost in any country. Seldom will this last limitation make any difference, and where itdoes, I will retain the two languages that have the widest international currency. This willessentially mean sticking to Arabic, English and French in some African examples whereSwahili, Hausa or Fulfulde could have served instead. OCC has a value of one if therequired condition is met (in any combination of the two alternatives for the two countries)and zero otherwise. It cannot be overemphasized that this measure should be understoodas the result of an effort to make sense of the usual binary indices of a common language.Fifteen open-circuit languages result from the criterion, all of which are listed in Table 1.The second measure, ‘‘direct communication,’’ DC, depends on the percentage of
speakers in both countries who can communicate directly. Fortunately, those percentagesneeded to be calculated only when they were large enough to make any statisticaldifference in explaining bilateral trade. I eventually retained 4% as the minimum figure fora language to count for DC. This limited the number of relevant languages to 29 out of the
2Anything in the 10–30% range would have made only modest difference in light of the importance of official
status. de Swaan (2001) provides some interesting discussion of the frequent assignment of official status to a
minority language in multilingual societies.

ARTICLE IN PRESS
Table 1
Languages
Open-circuit languages Other direct-communication languages
Arabic Albanian
Chinese Fang
Danish Fulfulde
Dutch Hausa
English Hungarian
French Italian
German Javanese
Greek Lingala
Hindi Nepali
Malay Pashto
Persian (Farsi) Quechua
Portuguese Swahili
Spanish Tamil
Swedish Urdu
Turkish
J. Melitz / European Economic Review 52 (2008) 667–699 671
total of over 5000 in the 157 ‘‘countries’’ in the study (including some overseasdepartments and territories). Lowering the required percentage to 3 would have increasedthe relevant number of languages by a dozen or so without affecting the estimatesperceptibly. In constructing the figures, I treated different dialects, creole and pidginversions of a language as equivalent. I also deliberately cumulated speakers of a languagewithout regard to any second languages they may possess.3 Where numbers of speakerscould not be inferred from Grimes in any other way, I used literacy as a guide, whilepaying attention to the alternative language(s) to which the literacy rates might refer. Inthose instances, the CIA country factbook served significantly, since as indicated earlier, Irelied primarily on this source for the literacy rates and only used Grimes to fill in missingvalues. DC obtains by summing up the products of the respective percentages of speakersover all the relevant languages (at least 4%) in the two trading countries. In principle,those values could have exceeded one because of bilingualism. But very few such casesarose. In those cases, I set the numbers equal to one, which was equivalent to a generalnormalization.
As regards the country-specific linguistic variables that enter the study, the latest editionof Grimes (2000) provides an index of linguistic diversity for the first time. This index,covering all the countries in the study, concerns ‘‘the probability that any two people in thecountry picked at random will have different mother tongues’’ (Grimes (2000), p. x). Thehigher the index—the closer to one—the higher the probability that a random pair ofindividuals will have different mother tongues (see Lieberson (1981)). It would have servedme better to have an index of the probability that any two people at random in a country
3Hutchinson (2002) tests the difference between English as a first language and as a second language (based on
data in Crystal (1997)) using a gravity specification. But he does so exclusively with regard to bilateral trade with
the United States. Paradoxically, English as a second language emerges, if anything, as more significant (which
tends to support my emphasis on language as a tool of communication). However, judging from the results, the
distinction between English as a first or a second language would not pass any statistical test of significance.

ARTICLE IN PRESSJ. Melitz / European Economic Review 52 (2008) 667–699672
will not be able to communicate through a common language, since two people withdifferent mother tongues may evidently both be fluent in a third language. But thelinguistic diversity index in Grimes may serve as a reflection of my preferred one.4
The underlying hypotheses about the signs of the influences of the language variables inthe study are fairly intuitive, but their full importance comes out best when we focus on thepossible substitution between domestic and foreign trade. Different languages areimpediments to communication, therefore trade. However, there exists more uniformityof language within a country than between a country and the rest of the world. Thus,linguistic obstacles must interfere particularly with foreign trade. On this ground, higherlevels of both OCC and DC should raise foreign trade. It also follows fairly naturally thatif linguistic diversity is considerable at home, domestic trade will be less effective inavoiding problems of communication. Thus, if we compare a country with many largelanguage groups, like South Africa, with another with only one, like Venezuela, linguisticbarriers favor domestic trade more in Venezuela than South Africa. Of course, SouthAfricans consequently have more incentive to acquire multiple languages. But this merelyreinforces the point that linguistic diversity reduces the tendency of the language factor towork in favor of home relative to foreign trade. In sum, linguistic diversity at home shouldpromote foreign trade. Finally, if language is important, then the inability to read andwrite should matter since it means that people must rely strictly on speech in linguisticcommunication. Not only is this a handicap, but the handicap must be more important indistant trade, where speech is impossible except by telephone. In addition, distant tradealso eliminates the possibility of non-verbal communication that exists face to face(through bodily expression and action, etc.). Thus, illiteracy must interfere especially withforeign trade, and it follows that literacy promotes foreign relative to home trade.Some earlier studies have looked for separate influences of different languages on
bilateral trade (Havrylyshyn and Pritchett (1991), Foroutan and Pritchett (1993), Frankelet al. (1998) and Helliwell (1999)). This raises several other issues. It is not obvious that theparticular language should matter in DC. If two people understand the same language—especially if the language belongs to the 30 or 40 most prominent ones in the world today—it ought to matter little for trade which of them they use. However, the idea that somelanguages serve better in indirect communication, or are more effective means of gettingmessages across through a go-between or in translation, seems reasonable. Languages arenot of equal difficulty in adult learning. For example, Basque is known to require muchmore time to learn in adult education than Castilian Spanish. If it is necessary to resort tonative speakers for indirect communication, then translation can be more of a problemsince there will be fewer people around able to perform the job. Although this might seemsubordinate, differences in alphabet may also be important. Some alphabets are even
4A similar index, drawn from Taylor and Hudson (1972) and resting entirely on a detailed Soviet linguistic
study dating to 1964 with the sociological title ‘‘ethnolinguistic fractionalization’’ pertains to the identical issue as
Grimes’: whether two randomly chosen individuals in a country will share the same maternal language. There
have been a number of recent uses of the Taylor–Hudson index in economics: Mauro (1995), Alesina and
Wacziarg (1998), Easterly and Levine (1997) and La Porta et al. (1999). All of these authors employ the index to
treat issues of societal division and government behavior, whereas I shall use the Grimes index strictly in
connection with communication. The broad sociological and political usage of the Taylor–Hudson index by these
authors has also aroused criticism from Collier (2001). For some detailed discussion of this index and other closely
related indices, see Easterly and Levine (1997). In regard to the 108 ‘‘countries’’ that both Grimes and
Taylor–Hudson score for linguistic diversity, the correlation coefficient between the two indices is high: .85.

ARTICLE IN PRESSJ. Melitz / European Economic Review 52 (2008) 667–699 673
difficult to learn at home. There have been numerous reforms of alphabets for this reasonover the centuries. Ataturk’s introduction of the Roman alphabet in Turkey is often citedas one of his major accomplishments. The substitution of Arabic for Roman numerals iswidely thought to have spurred progress in the history of mathematics. Is somethingsimilar not possible regarding alphabets? The use of a common alphabet in trade could bea special help in itself. In addition, the size of a language could be important. Largerlanguages might be more effective in diffusing messages in the light of economies of scale.Size could matter as well because of network externalities. However, network externalitiesshould be considered as an issue apart since they raise questions about the very meaning ofa language’s size. If network externalities matter, a language with twice as many speakers ismore than twice as large. In addition, the relevant surface over which speakers should becounted is an issue. Speakers outside the borders of two trading parties may be asimportant as those inside. I shall treat network externalities as a totally distinct issuerequiring separate investigation. As a final reason why different languages may matter inindirect communication, my proposed measure of OCC is only an approximation. Themeasure could miss some distinctions in the ability to serve as an intermediary that aconsideration of separate languages would pick up.
1.2. The series
Table 1 lists all 29 languages figuring in the DC index and shows all 15 of those that alsoserve as open-circuit languages. In the case of OCC, the cited languages are strictly‘‘source’’ languages. The ‘‘destination’’ languages—those in which the messages arereceived—constitute a considerable number, probably over a hundred; the number remainsundetermined here. There are about 250 languages in the world with over a millionspeakers, and some small languages, like Maltese, receive strong government support.However, it is noteworthy that a few of the 15 open-circuit languages are small, whereasmany big languages are missing from the 29 direct-communication ones. Big languagesmay be missing because of their strict importance in domestic trade. Japanese is anexample. They could also be missing because of a lack of trade data. Some strikingexamples come from the ex-Soviet Union and include Russian.
Table A1 in the Appendix contains my scoring of the linguistic information underlyingthe construction of the language variables. There, I also display the assignment oflanguages by country by Frankel and Rose (2002), whose database I shall use for the othervariables besides language. Table 2 shows the correlation matrix relating to my two indicesof a common language and their single one over the (approximately) 30,000 observationsof bilateral trade in the statistical analysis. The correlation matrix also covers the indices ofliteracy and language diversity in the study. As can be seen, the correlation between OCCand Frankel and Rose’s (hereafter FR) Common Language variable is only .81. This israther low if we consider that the two variables are basically meant to signify exactly thesame thing. This imperfect correlation stems entirely from my more frequent assignment of‘‘open-circuit’’ languages to countries than theirs (with the single exception of Mauritania,which they list as French-speaking and I do not). In the first place, there are six open-circuit languages in my work that FR do not recognize at all: Danish, Greek, Turkish,Persian (Farsi), Hindi and Malay. In addition, I assign the other nine open-circuitlanguages many more times than they do (for example, Spanish in Gibraltar, Dutch inthe Dutch Antilles, English in St. Helena, French in Algeria, Morocco and Tunisia, etc.).

ARTICLE IN PRESS
Table 2
Correlation matrix
Open-circuit
communication
Direct
communication
Common
language
Literacy Language
diversity
Open-circuit 1
Direct .73 (.19)a 1
Frankel–Rose .81 (.27)a .75 (.42)a 1
Literacy �.10 .10 �.03 1
Diversity .14 �.08 .07 �.43 1
aThe parenthetical correlations relate to the 23 percent of the observations in the effective test sample where at
least one of the three language indices is positive.
J. Melitz / European Economic Review 52 (2008) 667–699674
As also noteworthy, the correlation coefficient between my two language indices, OCC andDC, is .73. While this ratio is high, both indices are zero in the majority of cases, whichraises the correlation. If we limit ourselves to the 23 percent of the test observations whereone or the other of the two indices is positive, the correlation between them is only .19.From this other and also relevant perspective, the difference between the two indices isvery wide.5
Table 2 further displays the lack of any correlation between my two indices of linguisticties and either literacy or linguistic diversity. However, these last two variables aresignificantly negatively correlated with one another (�.43). We would expect this to be sosince a large number of major languages in a country will often be the sign of a low level ofmarket integration (not always, if only because of immigration). Consequently, thesurvival of many large languages tends to go together with poverty and illiteracy.
2. The gravity model
2.1. The theoretical specification
The gravity model will serve to study the impact of the linguistic influences in foreigntrade. This has two basic advantages. First, the model has been the exclusive tool in similarresearch thus far. Second, and more significantly, the model is particularly fitting since itfocuses on the barriers to trade. Without controlling for other obstacles and aids to tradebesides language—distance, political association, ex-colonial relationships, and the rest—itwould be difficult, if not impossible, to draw inferences about linguistic effects as such.Since the basic issue in connection with language is the impact on total bilateral trade
rather than any influence on imports relative to exports, an important simplifyingassumption is possible in the model, namely, that trade frictions raise the price to theimporter above the exporter’s price by the same percentage, regardless whether the goodsmove one way or the other. On that supposition, Anderson and van Wincoop (2003)(hereafter AvW) show that given the other usual assumptions of gravity models—namely,that all countries specialize in the production of separate goods or separate varieties and
5In the cases where at least one of the three language indices in question is positive, the FR index is more highly
correlated with DC than OCC (see Table 2). The reason is that in the frequent cases where the FR index is zero
and OCC is one, DC is mostly somewhere in between.

ARTICLE IN PRESSJ. Melitz / European Economic Review 52 (2008) 667–699 675
utility functions are identical, homothetic, and CES everywhere—then balanced bilateraltrade follows and there is nothing but aggregate trade to investigate. AvW also show that aparticularly simple form of the gravity equation results, namely,
Tij ¼Y iY j
YW
tij
PiPj
� �1�s
. (1)
Tij in this statement is the trade flow in either direction between countries i and j, Yi andYj are the respective incomes of the two countries, YW is the world income, s is theelasticity of substitution between different goods, tij is 1+xij where xij stands for thepercentage of the costs attributable to foreign trade frictions in relation to the exportprice p (regardless whether this price (fob) is pi or pj), and Pi and Pj are the respectiveDixit–Stiglitz price levels (based on utility maximization) in the two countries. In the caseof Pi:
Pi ¼X
j
ðZjpjtijÞ1�s
" #1=ð1�sÞ, (2)
where the summation sign embraces all j prices inclusive of pi (in which case, exceptionally,tii ¼ 1) and Zj is the distribution parameter of the utility function (for good j or the varietiescoming from country j). The corresponding equation holds for Pj. Evidently, s must begreater than one, as empirical work tells us is predominantly the case, if there is to be anegative effect of tij on trade.
As seen from Eq. (2), any influence on the bilateral trade frictions tij in the numerator ofEq. (1) affects the denominator PiPj as well. That is, the impact of any particular barrier tobilateral trade depends on its influence on the ratio tij/PiPj. In AvW’s terms, the question isthe impact on bilateral trade resistance relative to multilateral trade resistance. AvW(2003) stress the importance of this point in their study, which deals with the borderbetween Canada and the US. Based on the gravity model, as they point out, theUS–Canadian border must encourage trade between any two Canadian provinces morethan between any two US states simply because the Canadian provinces have many feweralternatives for avoiding problems of national borders in trade than the US states do. Inother words, the absence of national borders lowers bilateral trade resistance relative tomultilateral trade resistance far more for a pair of Canadian provinces than for a pair ofUS states. Another familiar example from earlier discussion concerns distance. Thedistance between New Zealand and Australia is about the same as the one between Franceand Greece. But according to the gravity model, distance will discourage trade much lessbetween New Zealand and Australia than between France and Greece, since New Zealandand Australia have fewer alternatives to one another to overcome problems of distance inforeign trade than France and Greece have. The application of the logic to language isstraightforward. There are numerous English-speaking countries but few Dutch-speakingones. Therefore, ease of communication via a common language will encourage trade morebetween a Dutch pair than an English pair.6 In a word, as ever with the use of the gravitymodel, multilateral trade resistance will be capital in this study.
6Of course, a Dutch pair consequently has greater incentive to learn English than an English pair to learn
Dutch. But this simply affects the magnitudes without upsetting the basic point.
ARTICLE IN PRESSJ. Melitz / European Economic Review 52 (2008) 667–699676
To proceed, suppose the tij term in Eq. (1) takes a simple log-linear form. Specifically let
tij ¼Ymk¼1
ðuij;kÞgk � exp
Xn
k¼mþ1
gkuij;k
!, (3)
where [uij, k]k ¼ 1,y,. n represents a vector of n symmetric bilateral trade frictions betweencountries i and j, and [gk]k ¼ 1,y, n represents the vector of the associated elasticities orsemi-elasticities. For kpm, the uij bilateral variables (for example, distance) are continuous(and the gk terms elasticities), while for k4m, they are either 0–1 dummies (likemembership in a currency union) or percentage values (and the gk terms semi-elasticities).The specific controls for the frictions or aids to trade in the tests must evidently include
DC and OCC. The other variables will be distance, adjacency, currency union, politicalunion, free trade agreement, common ex-colonizer and relation between ex-colony andex-colonizer. Distance, adjacency, political union and past colonial attachments clearlyhave strong linguistic implications. Therefore, if these variables were missing, it would bedifficult to interpret the significance of the linguistic variables as pertaining to ease ofcommunication as such. The dummy variables for the political associations also providesome reflection of protectionism, which is not otherwise taken into account. There existdetailed indices of trade protection, but these are available only for a much narrowersample of countries than the one in the study.The price level indices Pi and Pj, in turn, depend on the domestic trade costs underlying
tii and tjj as well as the previous influences on tij. tii and tjj have been indexed as one, butthey take on values whose level matters and may well affect pi and pj, the export prices fobtoo. In their recent study of trade costs, AvW (2004) notably stress domestic as well asforeign trade frictions. Domestic trade costs affect home sales relative to foreign salesgenerally. Literacy and linguistic diversity enter in this connection. Other variables thatcome in are population, land area and landlocked. A larger population widens theopportunities to trade at home and without bearing the costs of foreign trade (compareFrankel and Romer (1999)). Therefore, a larger population may work against foreignrelative to home trade at any given level of output, and more specifically (since morepopulation generally means more output), at any given level of output per head. Landarea, in turn, is a proxy for internal distance. People who live in large countries will findforeigners to be further away than those who live in small countries (compare Nitsch(2000)). Correspondingly, large countries will tend to be less open. A dummy formembership in the ex-Soviet Union is also important in this study since trade outside theSoviet bloc was notoriously small under the Soviet arrangement for reasons havingnothing to do with consumer preferences while literacy was unusually high among themembers. Therefore, failure to consider membership in the Soviet bloc could interfere witha proper assessment of the impact of literacy on trade.
2.2. The problem of estimation
Controlling for multilateral trade resistance or PiPj in the tests is thus essential, as I haveunderlined. But it is also a problem since the individual frictions (the uij terms in Eq. (3)) enternon-linearly in Eq. (1). AvW manage this problem by constructing a tailor-made program andthen using FIML to estimate their entire model consisting of a separate budget constraint foreach trading party in their data set in addition to Eqs. (1)–(3). Feenstra (2004, chapter 5)

ARTICLE IN PRESSJ. Melitz / European Economic Review 52 (2008) 667–699 677
subsequently pointed out the possibility of admitting country-fixed effects to control formultilateral trade resistance or PiPj and then estimating the model with OLS. The resultingestimates, he showed, yield results that are entirely consistent with AvW’s. Country-fixed effectshave since become very popular in testing the gravity model. But Feenstra’s stratagem has someimportant drawbacks here since it interferes with the study of literacy and linguistic diversity,two country-specific influences of basic concern that I will treat as constants over time.
There are other relevant differences between Feenstra’s procedure and AvW’s. Each hassome advantages over the other. On the one hand, the use of country-fixed effects controlsfor all country-specific influences, not only those that are separately identified, as AvW’smethod does. On the other hand, the use of country-fixed effects does not permit estimatingthe impact of a change in the bilateral trade frictions while AvW’s does. To enlarge on thislast point, suppose we estimate the impact of a common language on bilateral trade with theuse of country-fixed effects. Then we control for multilateral trade resistance or PiPj in thesample period. That is, the estimate tells us how much a common language contributes tobilateral trade over the sample: It gives us an average effect over the past. But the methodwill not enable us to answer a question like the impact of a doubling of the Russian-speakingpopulation of Israel on the composition of Israel’s trade with different countries. To do thatwe would need to allow for the resulting changes in multilateral trade resistance in each andevery country, Israel (most of all) and Russia in particular. That is, we would need to admitchanges in the country-fixed effects as well. Baier and Bergstrand (2006) (BB) clarify this lastpoint in a recent study, where they also suggest a way of surmounting the difficulty withoutresorting to AvW’s complicated estimation procedure. They propose using a linearapproximation to all influences on the multilateral trade resistance (implicitly the country-specific ones too) and then proceeding with OLS estimates. BB show that if this is done, veryclose results to AvW’s obtain for the Canadian provinces and for the US states in the case ofAvW’s (2003) data set. OLS can therefore serve to analyze the impact of exogenous changesor to engage in comparative static exercises.
2.3. The estimation forms
In the light of these considerations, I will proceed in three steps. First, I will test theinfluence of the bilateral trade frictions while controlling for multilateral trade resistancewith the use of country-fixed effects in the popular way.7 In this case, all time-invariantcountry-specific effects will be omitted, including literacy and linguistic diversity, which Itreat as constants. However, since output varies in my panel data, the variable can enter.Thus, a test of the unitary elasticity of output (YiYj) in the time dimension is possible.
Specifically, the estimation form will then be the following, where t subscripts serve tosignify variables that move over time:
log Tijt ¼ ao þ at þ dcZc þ ay log ðY itY jtÞ þ b1 log distanceij þ b2 adjacencyij
þ b3 open-circuit communicationij þ b4 direct communicationij
þ b5 currency-unionijt þ b6 common-countryij þ b7 free-trade-areaijt
þ b8 Excolij þ b9 Comcolij þ �ijt. (4)
7As regards the popularity of country-fixed effects, see, for example, Eaton and Kortum (2002) or Helpman
et al. (2006).
ARTICLE IN PRESSJ. Melitz / European Economic Review 52 (2008) 667–699678
ao here is a constant. at is a time-fixed effect for all periods except one (and embraces thevarying levels of world income Yt
W over time). dcZc, in turn, relates to the country-fixedeffects (concerning PiPj). dc represents these effects themselves while Zc is a vector ofindicator variables (one per country), where Zc ¼ 1 if c ¼ i or j and is 0 otherwise. Thecoefficient ay of the log (YitYjt) term should evidently equal one. The bk coefficients,k ¼ 1,y, 9, bk ¼ (1�s)gk, represent product terms relating either to overall elasticities orsemi-elasticities of trade, depending on continuous variables or dummies and percentageterms. The bilateral variables associated with these bk coefficients were mentionedpreviously. Excol refers to a relation between an ex-colonizer and an ex-colony, andComcol refers to a relation between two former colonies of the same colonizer. Timesubscripts are present for currency union and free trade agreement because of entries andexits into both arrangements. eijt is white noise associated with the dependent variable,bilateral trade.In a second series of tests, I will look for the impact of the country-specific influences on
the country-fixed effects (dc), as they were estimated in the first stage. In this next step, Iwill then include average output as a separate country-specific influence in addition tothose mentioned in the earlier discussion. This will make possible a separate test of theassumption of unitary elasticity of output in the cross-sectional dimension. Apart frompermitting this separate test, including average output is useful in isolating the influence ofliteracy since output and literacy are highly correlated in the cross-section. The estimatingequation will then be
dc ¼ a1 þ at þ ay logðY=PÞ þ b10 log Pþ b11 areaþ b12 landlocked
þ b13 linguistic diversityþ b14 literacyþ b15 ex-Soviet Unionþ �c. (5)
Y=P refers here to average per capita income and P to average population while theother country-specific variables besides Y=P are easily recognized from before. The reasonfor including average output per head and population rather than aggregate output andpopulation is that aggregate output and population are highly positively correlated. Usingoutput per head then permits a better assessment of the negative influence of population.8
The number of observations will equal the number of countries in this test.In a third series of tests, I will then experiment with the Baier–Bergstrand method.9 The
resulting estimating equation demands more space. BB recommend applying a first-orderTaylor expansion to all of the terms explicitly entering in PiPj. Let there be Ni observationsof bilateral trade for country i and Nj observations of bilateral trade for country j.Let x stand for any of the 15 variables associated with the coefficients b1 through b15 inEqs. (4) and (5) and let xPiPj
be the contribution of x to PiPj. Then, as concerns thevariables associated with b1 through b9 in Eq. (4), the linear approximation for the value ofxPiPj
is
ðxijtÞPiPj¼
1
Ni
XNi
k¼1
xirt þ1
Nj
XNj
k¼1
xjst �1
Ni
XNi
k¼1
xirt
1
Nj
XNj
k¼1
xjst, (6)
8To anticipate, the estimates with output and population instead of output per head and population are
perfectly identical in all respects except that when per capita output serves, the size and t value of the negative
coefficient of population are both much smaller.9See Egger and Nelson (2007) for another recent use of the Baier–Bergstrand method.

ARTICLE IN PRESSJ. Melitz / European Economic Review 52 (2008) 667–699 679
where r is an index of the country partners of i and s is an index of the country partners ofj. As concerns the variables associated with b10 through b15 in Eq. (5) (where i and j’spartners do not matter), the linear approximation for xPiPj
is instead
ðxitxjtÞPiPj¼
1
Ni
XNi
k¼1
xit þ1
Nj
XNj
k¼1
xjt �1
Ni
XNi
k¼1
xit
1
Nj
XNj
k¼1
xjt. (7)
Thus,10 according to fairly obvious notation, the estimating equation becomes:
log Tijt ¼ ao þ at þ ay logðY itY jtÞ þ b1ðlog distanceij � log distancePiPjÞ
þ b2ðadjacencyij � adjacencyPiPjÞ þ b3ðOCCij �OCCPiPj
Þ
þ b4ðDCij �DCPiPjÞ þ b5ðcurrency-unionijt
� currency-unionPitPjtÞ þ b6ðcommon-countryij � common-countryPiPj
Þ
þ b7ðfree-trade-areaijt � free-trade-areaPitPjtÞ þ b8ðExcolij
� ExcolPiPjÞ þ b9ðComcolij � ComcolPiPj
Þ þ b10 logðPopiPopjÞPiPj
þ b11 logðareaiareajÞPiPjþ b12ðlandlockedilandlockedjÞPiPj
þ b13ðLingDivi LingDivjÞPiPjþ b14ðLitiLitjÞPiPj
þ b15ðEx-SovUiEx-SovUjÞPiPjþ �ijt, (8)
(where Eq. (6) underlies the construction of the terms with the PiPj subscripts that areassociated with coefficients b1 through b9 and Eq. (7) underlies those that are associatedwith b10 through b15). The simplicity of this specification may seem excessive because of theomission of any weights Yi/Y
W and Yj/YW (or any regard for the distribution parameter Zj
in Eq. (2)). But as BB explain, those weights become separate additive terms entering in theconstant ao of Eq. (8) once we convert Eq. (1) (following substitution of Eqs. (2) and (3) fortij and PiPj) into logs. Here again I will estimate ay separately. But in dealing with Eq. (8), Iwill report the results of estimates where ay equals one, as AvW, Feenstra and BB do fromscratch.
Eq. (8) permits an estimate of the entire model in a single step, which is a distinctadvantage. It also permits an estimate applying to marginal changes—another advantage.On the other hand, the test imposes the same elasticity of influence of output over time andin the cross section; it ignores all influences on multilateral trade resistance except thosethat are explicitly mentioned (or at least supposes that those influences are uncorrelatedwith the rest); it is only valid near the means and it is only valid if the means are close toequilibrium. While BB defend both of the last assumptions (about the means),11 the factremains that using country-fixed effects does not require any of the assumptions. In sum,Eqs. (4), (5) and (8) are of separate interest. Since I will treat all the language variables asconstants, I will also repeat all the tests for each separate year in the study.
10In case x is constant over time, Eq. (7) simply reduces to ðxixjÞPiPj¼ xi þ xj � xixj .
11BB are at considerable pains to show that their linearization works well in the neighborhood of equilibrium by
comparing their results with AvW’s and doing some Monte Carlo simulations with different data sets. It should be
mentioned, in light of my subsequent results, that like AvW, they include no country-specific influences on
multilateral trade resistance in their experiments, only ‘‘border’’ effects.

ARTICLE IN PRESSJ. Melitz / European Economic Review 52 (2008) 667–699680
3. The results for common language
Virtually all of the data for the variables besides language in the study come from FR(2002) and are described in their data appendix. I owe a considerable debt to Rose formaking this data public on his website. There are only two changes here in the relevantRose database apart from the differences concerning language. First, I measuregeographical distance differently. Whereas he locates countries at their geographicalcenter (in conformity with the CIA), I place them wherever their most populous citystands. Second, I consider all departments and territories of a country as automaticallybelonging to a free trade zone in the mother country. As a result, my dummies for acommon country and free trade area are mutually exclusive. As in FR, bilateral trade willbe measured as nominal imports plus exports in dollars deflated by the US GDP chainprice index and divided by two. Like them too, the basic tests will cover observations forsix separate years at 5-year intervals, starting with 1970 and ending in 1995, and thereforewill include controls for the individual years.Table 3 contains the main tests of Eq. (4). The Student t’s are based on robust standard
errors (after correction for clustering of data for individual trading pairs). However, theestimated coefficients for the time- and country-fixed effects are omitted. The first columnshows the results based on FR’s measure of a common language, which I will take asrepresentative. These results notably confirm the hypothesis of a unitary elasticity ofbilateral trade with respect to output. Thus, the treatment of output as exogenous isinessential. When we impose unitary elasticity with respect to output (more exactly, YitYjt),the results are unaffected. This will be true throughout. The coefficients and significance of
Table 3
Common language
regressand: Log of bilateral trade
(1) (2) (3) (4) (5) (6) (7)
Log product of real GDP 1.04 (27) 1.04 (27) 1.04 (27) 1.04 (27) 1.04 (27) 1.04 (27)
Log of distance �1.27 (�47) �1.24 (�46) �1.24 (�46) �1.24 (�46) �1.24 (�46) �1.25 (�46) �1.25 (�46)
Adjacency (0,1) .44 (3.41) .44 (3.53) .44 (3.42) .44 (3.46) .43 (3.4) .44 (3.4) .42 (3.21)
Common language:
Frankel–Rose (0,1)
.52 (8.9) �.15 (�1.3)
Open-circuit communication
(0,1)
.094 (1.25)
Open-circuit communication:
European (0,1)
.27 (3.7) .33 (4.12) .34 (3.82)
Open-circuit communication:
English (0,1)
�.14 (�1.3)
Direct communication (0-1) 1 (8) .83 (7.3) .94 (7.2) .83 (7.3)
Common language (0-1) .95 (12.9) .96 (13)
Currency union (0,1) .9 (4.8) .92 (4.9) .91 (4.9) .93 (5) .89 (4.8) .91 (4.9) 1.06 (5.7)
Political union (0,1) .95 (2.53) .5 (1.31) .52 (1.37) .47 (1.22) .51 (1.35) .62 (1.66) 0.53 (1.4)
Free trade area (0,1) .36 (2.88) .28 (2.27) .29 (2.37) .29 (2.34) .3 (2.47) .33 (2.63) .31 (2.36)
Ex-colonial relationship (0,1) 1.75 (13.8) 1.69 (13.7) 1.63 (13.3) 1.65 (13.3) 1.63 (13.4) 1.61 (13.1) 1.62 (13)
Ex-common-colonizer (0,1) .69 (8.5) .71 (8.6) .65 (7.76) .66 (7.9) .66 (7.87) .58 (7.26) .61 (7.6)
R2 .73 .73 .73 .73 .73 .73 .75
RMSE 1.73 1.73 1.73 1.73 1.73 1.73 1.68
Number of observations: 31,010. Country-specific fixed effects and year-specific fixed effects (first 6 columns) and
country-year fixed effects (last column) are not reported. Student t’s are in parentheses. These are based on robust
standard errors after corrections for clustering of country pairs.

ARTICLE IN PRESSJ. Melitz / European Economic Review 52 (2008) 667–699 681
distance and adjacency are also of the usual order. So are the coefficients and thesignificance of the five political variables, as a comparison with FR (2002) will show(though there are some differences concerning Currency union and Ex-common colonizer).Most important, the coefficient of a common language is .52 with a Student t of 8.9.The comparable estimate in FR’s paper is .54–.56 (that is, when they include the colonialand common country variables; otherwise—quite significantly—their estimate is muchhigher).
Next, column 2 shows the result with Direct Communication (DC) and OCC as themeasures of common language instead. DC has a coefficient of 1, almost twice as high asFR’s conventional measure, with a Student t of 8, while OCC is insignificant. If wesubstitute FR’s measure for OCC while keeping DC, FR’s measure is also totallyinsignificant. This would then seem to say that the usual implicit emphasis on indirectcommunication is mistaken. But further probing shows differently, that the usual emphasisis right. As seen in column 3, once we eliminate the non-European languages from OCC(Arabic, Chinese, Hindi, Malay, Persian and Turkish) and only keep the rest, OCC ishighly significant with a Student t close to 4. This last result fits in well with the earlierdiscussion of the possible significance of a common alphabet. All of the relevant Europeanlanguages except Greek use the Roman alphabet whereas the non-European languages inOCC use a variety of alphabets, some of which like the Chinese, are also morecomplicated. Turkish is the one non-European language in OCC that also uses the Romanalphabet. But both Turkish and Greek owe their presence in OCC strictly to Cyprus. Thus,the Greek and Turkish trade with Cyprus is the only thing that changes if we substituteOCC in the Roman alphabet for OCC in the European languages. The difference is trivial.Notwithstanding, I will stick to my emphasis on OCC in the European languages and thebroader reference to Europe.
Column 4 shows the result of adding the FR measure of a common language to the twomeasures in column 3. Its presence hardly even alters the estimates and Student t’s of DCand OCC in European languages while it enters (insignificantly) with the wrong sign. Thus,my measure of indirect communication succeeds in displaying the separate significance oftranslation whereas the FR index does not. As a basic conclusion thus far, the impact ofDC is about three times higher (83/27 according to column 3) than indirectcommunication, but translation plays a distinct and separate role.
Such is the supremacy of English as a world language today that there is also cause towonder whether this language bears a greater impact than the rest. Is English moreeffective in promoting trade than the other languages? In line with earlier discussion, I willnot even entertain the idea that English conveys information better than other major worldlanguages in person-to-person communication—that is, except through external effects,which I will consider separately. But in the case of OCC, English could be more effectivebecause of economies of scale in the diffusion of messages and independently of anyexternalities. The question then is whether English exerts a greater influence as a sourcelanguage on trade through indirect communication (via translation) than the otherEuropean open-circuit languages do.
The fifth column in Table 3 contains the relevant test. Following the introduction ofOCC in English, the estimates for DC and OCC in the European languages stay essentiallythe same while OCC in English appears as insignificant and even with the wrong (negative)sign. Therefore, the hypothesis fails. There is no evidence that English possesses any specialadvantage over the other European tongues in OCC. To all indication, the role of English

ARTICLE IN PRESS
Table 4
Common language
regressand: Log of ratio of bilateral trade to product of GDP
1970 1975 1980 1985 1990 1995
Log distance �1.09 (�23) �1.22 (�27) �1.26 (�33) �1.28 (�34) �1.25 (�34) �1.43 (�38)
Adjacency (0, 1) .51 (2.7) .37 (2.2) .6 (3.63) .45 (2.69) .4 (2.29) .15 (.78)
Common language (0–1) 1.12 (8.9) 1.05 (8.6) .81 (7.6) .79 (7.6) 1.04 (10.4) 1.01 (10.6)
Currency union (0, 1) .76 (2) .87 (2.38) .98 (3.96) 1.1 (3.89) 1.52 (4.44) .9 (1.92)
Political union (0,1) �.12 (�.15) .36 (.75) .3 (.77) 1.2 (3.1) .25 (.29) .38 (.91)
Free trade area (0,1) �.02 (�.09) .35 (1.47) .29 (1.56) .51 (2.99) .35 (2.58) �.06 (�.39)
Ex-colonial relationship (0,1) 1.91 (9.5) 1.8 (10) 1.81 (13.8) 1.61 (12.4) 1.35 (9.1) 1.31 (8.7)
Ex-common colonizer (0,1) .77 (5.5) .71 (5.1) .67 (5.5) .61 (5) .44 (3.75) .39 (3.03)
R2 .52 .51 .54 .55 .63 .65
RMSE 1.79 1.9 1.74 1.7 1.49 1.39
Number of observations 4617 5149 5889 5950 4875 4530
Country-specific fixed effects are not reported. Student t’s are in parentheses. These are based on robust standard
errors.
J. Melitz / European Economic Review 52 (2008) 667–699682
is already adequately captured by the earlier two linguistic indices, where the languagelooms large.12,13
Column 6 adds important information. It shows what happens when we use a straight-line average of DC and OCC in European languages. The coefficient and the significanceof the combined variable exceed those of DC alone (the ones in column 3). Thiscorroborates the distinct and separate contribution of translation. The last column ofTable 3 adds an important test based on the index in the previous column, or commonlanguage, as I will now refer to it. There I introduce separate country-fixed effects fordifferent years and correspondingly drop the preceding year and country-fixed effects(as well as YitYjt). (At this point, the dcZc terms of Eq. (4) are then indexed by t while at
and ay drop out.) Following, the size and statistical significance of the coefficient ofcommon language stays the same. (This is equally true if the ratio of trade to output servesas the dependent variable.)Table 4 extends the preceding robustness test by showing what happens in case of
separate year-by-year estimates of the equation in column 6. Since the output variable
12Helliwell (1999) gets seemingly conflicting results. He finds English to be far more important than German,
French or Spanish in a related study treating a common language as a binary variable (explicitly based on status
as an official language). But the conflict could come from the fact that he does not use DC (in which English plays
a prominent role) as a control variable, whereas I do. In other words, as opposed to him, I test only for the
separate significance of English as an OCC language. In addition, Helliwell’s sample covers a much narrower
group of countries, only 33, 22 of them from the OECD. As he notes himself, in a similar study to his using more
countries, 63, Frankel et al. (1998) report no difference in the significance of English as opposed to Spanish,
French or German. Like other earlier students of language, Helliwell also does not introduce country-fixed effects.
But this should have worked against English, as I previously observed. That is, on the assumption that English is
as effective as other languages in foreign trade, no more no less, the absence of controls for multilateral trade
resistance should have led to a lower impact of English on bilateral trade than any other common language in the
tests.13I experimented too with the hypothesis that English, Spanish, and French—or the three most important
languages in the study—are the only languages providing an effective circuit of communication. This next
conjecture is impossible to reject. However, the hypothesis that all of the European languages serve in OCC stands
up as well, and I will stick to this last hypothesis.

ARTICLE IN PRESSJ. Melitz / European Economic Review 52 (2008) 667–699 683
must then be dropped, I assume unitary elasticity. All of the annual coefficients of commonlanguage are highly significant, mostly close to one, and they show no trend. Somedifference appears in the annual coefficients (they go from .79 to 1.12), but this is true forthe other variables as well. No other variable is any steadier in percentage terms.
The .95 coefficient of common language in column 6 of Table 3 may serve for generaldiscussion of magnitudes. It implies an elasticity of influence of 1.59 (sinceexp(.95) ¼ 2.59). Of course, that influence largely reflects the elasticity of substitutionbetween goods s (since bcomlang ¼ (1�s)gcomlang given Eqs. (1) and (3)). Usual estimates ofthis next elasticity go from 6 to 10 (based on Obstfeld and Rogoff (2000) and AvW (2004)).On this basis, the elasticity of influence of a common language, per se (gcomlang), onbilateral trade is between .32 and .18 (1.59 divided by 6–1 or 10–1). These are largernumbers than the .05–.12 figures that AvW (2004) retain in their recent survey of tradecosts (based on Eaton and Kortum (2002) and Hummels (1999)). But their numbers aresomewhat on the low side as compared with the general literature (see, for example, FR(2002) or Frankel (1997)). In addition, those numbers rest strictly on dummy variables,while, as I have shown, such reliance leads to underestimates of the impact of a commonlanguage. As a final observation, my proposed .18–.32 range for the influence of a commonlanguage is of the general order of the figures in Table 3 for the impacts of the political aidsto trade (which are quite ordinary in terms of the general literature).
4. Literacy and linguistic diversity
We turn next to the estimate of the impact of literacy and linguistic diversity based onEq. (5). In other words, we will now consider how well the country-specific variables in ourtheoretical discussion explain the country-fixed effects themselves, as they were estimatedbefore. The focus will be on the estimate in column 6 of Table 3 where the .95 figure forcommon language appears. But focus on column 3 instead, where OCC and DC show upas separate variables, would make no difference. Nor would it matter if we used theestimate that followed setting the elasticity of output equal exactly to one. There are 157observations.14
The result is in columns 1 and 2 of Table 5. The difference between the two is thatcolumn 2 drops 13 political units accounting for exceptionally few observations in theearlier estimates. These 13 units are also all extremely small (both in terms of populationand output) and consist predominantly of dependencies with little or no independentpolitical status. The 13, as well as all the remaining 144, are listed in an appendix(Table A2). Examination shows that the basic difference in column 2 where the 13 are outis a rise in the coefficient for output per head and a fall in the ones for population andliteracy. I favor column 2.
As can be seen, all seven explanatory variables enter significantly at the 5% confidencelevel with the right sign, except for landlocked which is only significant at the 10%confidence level. Output per head shows up with a coefficient of .28 and statisticallysignificantly less than one. Thus, while the hypothesis of a unitary output elasticity of tradeworks well with regard to changes over time, it does not do so at all in comparing different
14I experimented with remoteness too, taken either as a straight-line (unweighted) average or an output-
weighted average of distance from all other countries. Remoteness turns out to be totally insignificant. Thus, I
ignore the variable here.

ARTIC
LEIN
PRES
STable 5
Literacy and linguistic diversity
Regressand Country-fixed
effects
Country-fixed
effects
Country-fixed
effects
Regressand Log bilateral
trade
Log ratio of trade to
product GDP
Log ratio of trade
to product GDP
(1) (2) (3) (4) (5) (6)
Log of average real GDP .2 (2.43) .28 (3.63) .3 (3.72) Log product of real
GDP
1.35 (69)
Log of distance �1.08 (�44) �1.14 (�38) �1.15 (�38)
Adjacency (0,1) .6 (4.9) .65 (5.6) .63 (5.41)
Common language .81 (11) .68 (7.8) .74 (8.4)
Currency union (0,1) 1.35 (7.2) 1.38 (7.1) 1.35 (7)
Political union (0,1) .67 (1.48) .5 (1.2) .49 (1.16)
Free trade area (0,1) .86 (8.6) 1.05 (11.3) 1.07 (11.5)
Ex-colonial
relationship (0,1)
1.93 (15) 2.25 (15) 2.26 (15)
Ex-common-
colonizer (0,1)
.3 (3.59) .28 (3) .26 (2.85)
Log of average
population
�.29 (�3.21) �.1 (�2.12) �.12 (�2.47) Log product of
population
�.4 (�18) �.15 (�18) �.15 (�18)
Log of land area �.11 (�3.09) �.12 (�3.27) �.12 (�3.12) Log product of land
area
�.16 (�17) �.16 (�20) �.16 (�21)
Landlocked �.36 (�1.92) �.31 (�1.79) �.38 (�2.2) Landlocked (0,1,2) �.17 (�4.02) �.1 (�1.06) �.3 (�3.14)
Literacy rate 1.18 (3.04) .98 (2.66) .8 (2.17) Product of literacy
rate
.86 (7.3) 3.37 (9) 2.89 (7.8)
Linguistic diversity .45 (2.09) .42 (2.05) .48 (2.3) Product of linguistic
diversity
.67 (5.9) .45 (1.61) .69 (2.44)
Ex-Soviet Union (0,1) �.73 (�2.47) �.73 (�2.68) Ex-Soviet Union
(0,1)
�.84 (�13) �1.28 (�9.7)
Adjusted R squared .48 .51 .49 R squared .65 .88 .88
RMSE .72 .66 .68 RMSE 1.94 2.01 2.02
Observations 157 144 144 Observations 31,010 31,010 31,010
The dependent variable on the left-hand side is the set of country-fixed effects resulting from the estimate in Table 3, column 6. Year-specific fixed effects are always
present and not reported. Student t’s are in parentheses. These are based on robust standard errors (after correcting for clustering in columns 4 through 6). While the
estimates on the right-hand side do not contain any country-fixed effects, the measures of the variables affecting columns 5 and 6 have been adjusted for multilateral
trade resistance and differ from those of the same variables affecting column 4. For further explanation, see the text.
J.
Melitz
/E
uro
pea
nE
con
om
icR
eview5
2(
20
08
)6
67
–6
99
684

ARTICLE IN PRESSJ. Melitz / European Economic Review 52 (2008) 667–699 685
countries. (This result holds up exactly if we use aggregate output instead of output perhead together with population.)
But attention properly centers on literacy and linguistic diversity. Of the two, literacyshows up with the larger coefficient and the higher significance level. Quite significantly,the joint presence of output per head and population means that we can interpret theinfluence of literacy in the estimate as resulting from the ability to communicate. As is wellknown from the growth literature (Barro (1991)), literacy has a marked impact on percapita output. Therefore, if per capita output were absent, the effect of literacy wouldreflect largely a positive impact of productivity rather than anything to do with the abilityto trade. (In fact, the coefficient of literacy shoots up from .98 to 1.82 and its Student t goesup from 2.66 to 6 in this absence.) Of further interest, the coefficient of literacy greatlyexceeds that of per capita output.15
The third column of Table 5 shows the result of dropping the index of membershipin the ex-Soviet Union. Following, the significance of literacy falls, though it still holds upat the 5% confidence level. But this is easy to interpret. As emphasized earlier, themembers of the ex-Soviet Union displayed both exceptionally high literacy rates andexceptionally low levels of foreign trade. Failure to control for this particularity of thepolitical arrangement, which has no general significance at all, obscures the influence ofliteracy on trade.
As a preliminary step before turning to the estimate of Eq. (8) (which will introduce allof the explanatory variables in the model in a single step), it is interesting to see whathappens if we simply add the country-specific variables in Eq. (5) to the bilateral variablesin Eq. (4) while omitting the country-fixed effects. Column 4 of Table 5 shows theoutcome. (The year dummies remain.) All of the country-specific variables emerge ashighly significant with the right signs, while the earlier variables in Tables 3 and 4 remainso as well (but the coefficient of output goes up suspiciously high). Note that if anything, inthis absence of the country-fixed effects the influence of common language emerges less
strongly than before in Table 3. As also notable, the coefficients of the country-specificvariables bear a certain resemblance to those in the earlier columns of Table 5, though theones for population and landlocked notably differ. In particular, the estimate for literacy issimilar to the ones in columns 2 and 3, while the one for linguistic diversity is somewhathigher. However, column 4 is now completely out of favor in the literature because itignores the multilateral effects of the bilateral influences or their effects on PiPj withoutcontrolling for these effects in any way. Thus, the estimate is fundamentally at odds withthe gravity model. Since AvW’s (2003) persuasive demonstration of the pitfalls of brushingover effects of bilateral trade barriers on PiPj, many would now even argue that theestimate has little to do with the gravity model. Let us then turn to the Baier–Bergstrandmethod of introducing PiPj.
In applying this method, I made some preliminary estimates without imposing a unitaryelasticity for output. These yielded elasticities around 1.2 for output and statistically verysignificantly above one. Those elasticities do not particularly affect the bilateral influences,but they do touch some of the multilateral ones notably, in particular literacy. They arealso at odds with the earlier estimates, which are statistically significantly below 1.2 in thetime series dimension (Table 3) and even significantly below one in the cross-sectional
15There is a .8 probability that the impact of literacy on trade exceeds that of output on an F test (applied to
column 2).
ARTICLE IN PRESSJ. Melitz / European Economic Review 52 (2008) 667–699686
dimension (Table 5, columns 1–3).16 For this reason, I will focus instead on the resultsfollowing the imposition of unitary elasticity with respect to output. Not only are those lastresults more comparable to the previous ones, but they are also particularly in the spirit ofthe tests with the Baier–Bergstrand method, which adhere closely to the exact choice oftheoretical specification. The results with a unitary elasticity for output are in columns 5and 6. In reporting those results, I have also normalized all the variables to assurecomparability of the coefficients with the earlier estimates. Specifically, I set all the meansof the variables equal in columns 5 and 6 and column 4. That is, the means of the series forcommon language that affect columns 5 and 6 are exactly the same as those that affectcolumn 4, etc. Evidently, this normalization has no effect on the general fit, the individualcontributions (as measured by the coefficients times the values of the variables), or theStudent t’s. The difference between columns 5 and 6 is that column 5 controls for theex-USSR whereas column 6 does not.We may begin by looking at the bilateral influences. In this case, there is a striking
similarity with the results without any control for the associated changes in multilateraltrade resistance in column 4. But the most important comparison is obviously with theestimate in column 6 of the preceding Table 3, where there are controls for multilateraltrade resistance in the form of country-fixed effects. As compared with this previousestimate, we find larger coefficients and Student t’s for some of the variables—namely,adjacency, currency union, free trade area, ex-colonial relationship—and lower coefficientsand Student t’s for others—namely, distance, common language, and ex-commoncolonizer. Those differences in estimates must be interpreted with care. In both cases,the estimates are averages for different countries and years. But, theoretically, those inTable 3 refer to an average effect, while those in Table 5 refer to a marginal effect (an effectfollowing associated changes in multilateral trade resistance). The average and themarginal effect could differ. As regards language, the interpretation, therefore, is that onaverage across countries and time, the marginal effect (.68 in column 5, my preferredestimate) is lower than the average effect (.95).Consider next the country-specific influences in columns 5 and 6. The signs are all
correct and the statistical significance is uniformly very high except for linguistic diversityin column 5 (where statistical significance only exists at the 10% confidence level) andlandlocked in column 5 (where there is no statistical significance). But the differencesbetween the estimates in columns 5 and 6 and column 4 (which partly result from thegreater-than-one estimate of income elasticity in column 4) are rather important. However,the most important comparison is not with column 4 but with columns 2 and 3. In thiscase, the results are pretty similar for population, land area, and linguistic diversity(as between columns 2 and 5 or columns 3 and 6).17 But for literacy, the difference isenormous. The estimates in columns 5 and 6 are 3 to 4 times higher than the correspondingones in columns 2 and 3. There is a simple interpretation: Literacy may be highly positivelycorrelated with some positive influences on multilateral trade resistance that are taken intoaccount in the country-fixed effects but are ignored using BB’s method. (On this
16It should be noted as well that the cross-sectional dimension is the essential one in distinguishing between
output and literacy. This makes the 1.2 estimates less appropriate still. True, if we remove literacy from the
estimates in columns 2 and 3 of Table 5, the elasticity of output rises. But only to .4 and it becomes statistically
even more significantly below one.17This is not entirely evident with regard to linguistic diversity, where the similarity of columns 3 and 6 can be
questioned.

ARTICLE IN PRESS
Table 6
Literacy and linguistic diversity
Regressand: Country-fixed effects 1970 1975 1980 1985 1990 1995
Log of real GDP .3 (2.48) .42 (3.59) .21 (2.54) .3 (3.51) .46 (4.94) .46 (5.46)
Log of population �.06 (�.96) �.07 (�1.11) �.06 (�1.17) �.08 (�1.6) �.05 (�.99) �.04 (�.85)
Log of land area �.17 (�3.12) �.1 (�1.84) �.11 (�2.71) �.11 (�2.71) �.13 (�3) �.18 (�4.34)
Landlocked .01 (.04) �.19 (�.72) �.22 (�1.1) �.41 (�2.23) �.19 (�.94) �.19 (�.94)
Literacy rate 1.07 (2.02) .74 (1.41) 1.33 (3.28) .77 (1.92) .87 (1.87) .88 (2)
Linguistic diversity .52 (1.71) .41 (1.4) .29 (1.28) .37 (1.67) .48 (2.05) .23 (1.03)
Ex-Soviet Union (0,1) �.19 (�.49) �.58 (�1.51) �.97 (�3.24) �.84 (�2.86) �.97 (�2.66) �.79 (�2.22)
Adjusted R2 .31 .32 .43 .45 .54 .61
RMSE .85 .84 .72 .71 .67 .67
Number of observations 117 120 137 141 117 124
Regressand: Log ratio of bilateral
trade to product of GDP
1970 1975 1980 1985 1990 1995
Common language .87 (6) .71 (5.24) .56 (4.77) .57 (5) .7 (6.3) .66 (5.66)
Log product of population �.16 (�6.8) �.24 (�11) �.22 (�12) �.21 (�11) �.15 (�8.7) �.04 (�3.47)
Log product of land area �.18 (�13) �.1 (�7.3) �.14 (�12) �.15 (�13) �.18 (�15) �.22 (�18)
Landlocked (0,1,2) .46 (2.56) .13 (.69) �.12 (�.84) �.29 (�2.2) �.21 (�1.52) �.83 (�5.86)
Product of literacy rate 1.68 (2.67) 2.29 (3.67) 2.9 (5.91) 2.75 (5.1) 5.13 (8.3) 5.31 (9.1)
Product of linguistic diversity 1.51 (3.29) .96 (2.2) 1.29 (3.51) . 5 (1.36) .45 (1.11) .06 (.02)
Ex-Soviet Union (0,1) .17 (.81) �1.18 (�5.4) �1.35 (�7.2) �1.21 (�6.2) �1.16 (�5.9) �1.21 (�6.5)
R2 .28 .29 .35 .38 .44 .43
RMSE 2.18 2.25 2.04 1.98 1.81 1.75
Number of observations 4617 5149 5889 5950 4875 4530
The dependent variables on the top half are the sets of country-fixed effects resulting from the corresponding
estimates in the annual equations in Table 4. In the case of the bottom half, the table only shows the results for the
country-specific and the common language variables even though all of the variables in the corresponding
equation in row 5 of Table 5 were included in the estimates. Student ts are in parentheses. These are based on
robust standard errors.
J. Melitz / European Economic Review 52 (2008) 667–699 687
interpretation, of course, land and population are not correlated with missing(or unobserved) variables based on BB’s method whereas literacy is.) It is difficult toresist the logic of this interpretation in light of the enormous estimates of literacy based onBB’s method.
Table 6 adds year-by-year estimates of the tests in Table 5. The top of the table showsthe estimates based on the fixed effects by individual year in Table 4. The bottom of thetable shows the estimates of the equation in column 5 of Table 5 on a yearly basis. In thislast case, however, only the results for the country-specific influences and commonlanguage are displayed. In the top half of the table, literacy performs reasonably well yearby year while linguistic diversity does less so but still respectably. In the bottom part,literacy does very well for all the years while linguistic diversity does so too but only for theearly years, 1970, 1975, and 1980. However, as concerns the strong performance of literacyin the bottom part of the table, the same doubts as before hover over the results: Thecoefficients look much too high. On the whole, the estimates with fixed effects seem morereliable than those with the BB method in the case of literacy and linguistic diversity. Ifavor the estimate of close to 1 for literacy and close to .4 for linguistic diversity in column2 of Table 5.
In sum, I have had little success in assessing the influence of a change in literacy andlinguistic diversity at the margin with any precision. But, viewed as a whole, the evidence

ARTICLE IN PRESSJ. Melitz / European Economic Review 52 (2008) 667–699688
strongly supports the hypothesis that both variables exert positive effects on foreign tradein accordance with theory.
5. Network externalities
All the preceding results use measures of a common language that ignore the possibilityof ‘‘network externalities.’’ Advertisers pay more to publicize at peak times and in well-frequented places. It is entirely plausible that speakers of a language would benefit fromlarger numbers of other speakers of the same tongue in the market. Perhaps theoutstanding formal development of the idea comes from Church and King (1993) (whowrote with the issue of French and English in Canada in mind). A related development isin Lazear (1999), whose presentation has the added interest of centering the externalbenefits precisely on trade (though he does not focus on externalities himself). Randomencounters take place between people. If they speak the same language, a trade occurs.Otherwise, it does not. The more individuals in a surrounding who speak the samelanguage, the higher the probability that random encounter will result in trades.18 It shouldbe noted that both Church and King and Lazear consider the issue to be strictly DC, as isnot the case here. Numerous passing references to network externalities of a commonlanguage are also in print. (One outstanding, oft-cited case is Sabourin (1985).)Interestingly, Dowd and Greenaway (1993) end an article on the network externalitiesof money with a paragraph suggesting the application of their reasoning to language. Yet Iknow of no previous attempt to test the hypothesis of external benefits of a commonlanguage.In trying to do so here, I will entertain two separate but complementary meanings (or
manifestations) of external benefits of a common language. The first is intrinsic; the secondis not but often intimated. Any network externality of a common language says that theimpact of the language depends on the numbers of people who are connected (eitherdirectly or through a circuit) rather than merely the percentages. Thus, a given percentageof English speakers in a small community should have a smaller impact on the intensity oftrade, or the ratio of trade to income, than the same percentage in a huge community ifnetwork externalities really matter. Beyond numbers, though, what must be relevant is theaggregate income of the people in a language circuit (or who are hooked up). Accordingly,my first measure of a source of external effects of a common language is the aggregate realincome of the people with linguistic ties, that is, the product of the percentage value,common language, and the sum of real incomes of the two trading countries combined(in logs). Since common language is a constant in the study, I shall use a constant for realincome as well, namely, the value for 1990, or in the few cases where only earlier figures areavailable (at 5-year intervals), the latest one. This first measure amounts to looking for ascale effect of the aggregate income of a trading pair with a common language whileconditioning the aggregate on the language weights. It is a joint effect.My second, and more conjectural, measure relates to the external effects of a common
language stemming from third countries. The hypothesis in this case is that worldwide
18I used the same idea—if only implicitly—that a larger population implies a higher probability that random
encounters between people will result in trades in explaining the basis for the population variable but did so
without reference to language. Lazear’s hypothesis proposes a joint effect: a product effect of population and a
common language.

ARTICLE IN PRESSJ. Melitz / European Economic Review 52 (2008) 667–699 689
usage is important. A simple interpretation would be that so far as people have a choice oflanguage because they are bilingual (multilingual) or live in a country which receivesmessages in two open-circuit languages, they will tend to gravitate toward the one with thewidest international currency—even if (as concerns DC) that language is not theirpreferred one and they do not master it well. Under this hypothesis, a language withwidespread usage in the world may wield a larger impact on bilateral trade than anotherlanguage that is better known within the two countries. Evidently, this last sort of externaleffect on bilateral trade cannot be captured by any aggregate of income within the twocountries. An externality is particularly clear.
Accordingly, I constructed a separate measure of income for the next sort of externaleffects. In this instance, nine languages drop out (including two of the open-circuitlanguages, Swedish, which strictly functions between Sweden and Finland, and Greek,which strictly functions between Greece and Cyprus). This leaves 20. For every bilateralpair, I constructed a different total of these 20 world aggregates of income. An examplewill suffice. Consider a trading pair with a common language of .8, composed of .5 forEnglish, .2 for Arabic and .1 for a third language that does not operate elsewhere(or, effectively, is neither official nor spoken by as many as 4% of the population anywhereelse). The construction of the index then begins with the separate totals for the worldincome of people who can receive messages sent in English and in Arabic, where the totalsrest on a previous calculation based on the data in the language appendix and 1990 realincome.19 The third language is simply ignored. Next, the respective contributions of thetrading pair to the preceding English and Arabic income aggregates are deducted. Finally,a coefficient of .5 is applied to the remainder for English, one of .2 to the remainder forArabic, and the two totals are added up. The log of this sum of world income serves in theestimates.
The two measures of external effects are only negligibly positively correlated in therelevant instances (7%), namely, those where common language is positive (as otherwiseboth indices are zero by definition). This is easily explained. The measure of externaleffects coming from within trading pairs tends to be low for small country pairs andhigh for large country pairs (where small and large refer to income). As a result, in thecases where common language is positive, this measure tends to be uncorrelated withcommon language, which varies independently of country size (the correlation is zero).On the other hand, in those same cases, the measure of external effects coming fromoutside the trading pair tends to be high whenever the common language is large inthe rest of the world (concerning English in particular). Thus, the correlation withcommon language is substantial (it is .56). This explains why the two measures of externaleffects are little correlated with one another in the cases where common languageis positive.
In this case, I limit the analysis to estimates of Eq. (4) with country-fixed effects.Columns 1 and 2 of Table 7 show what happens when the two indices of external effectsenter one at a time and column 3 shows what happens when the two are included together.When the two enter separately, they both show up with a highly significant negative sign
19The previous calculation goes as follows in the example of English. For each country, in turn, start with one
or zero depending upon whether English is an open-circuit language, add the figure for English under spoken
languages, divide by two, and multiply by the country’s 1990 income. Then add up all the country totals. Repeat
for Arabic, etc.

ARTICLE IN PRESS
Table 7
Network externalities
regressand: Log of bilateral trade
(1) (2) (3)
Log product of real GDP 1.04 (27) 1.04 (27) 1.04 (27)
Log of distance �1.25 (�47) �1.25 (�46) �1.25 (�47)
Adjacency (0,1) .49 (3.83) .47 (3.59) .5 (3.86)
Common language 1.65 (9.7) 1.66 (8.2) 1.61 (7.9)
Network externality from within �.03 (�4.62) �.03 (�2.54)
Network externality from outside �.026 (�3.78) .004 (0.34)
Currency union (0,1) .8 (4.26) .9 (4.84) .79 (4.09)
Political union (0,1) .55 (1.45) .47 (1.21) .56 (1.49)
Free trade area (0,1) .26 (2.15) .29 (2.38) .26 (2.12)
Ex-colonial relationship (0,1) 1.67 (13.4) 1.63 (13.2) 1.67 (13.3)
Ex-common-colonizer (0,1) .62 (7.7) .64 (7.8) .61 (7.4)
R2 .73 .73 .73
RMSE 1.73 1.73 1.72
Number of observations: 31,010. Country-specific fixed effects and year-specific fixed effects are not reported.
Student ts are in parentheses. These are based on robust standard errors after corrections for clustering of country
pairs.
J. Melitz / European Economic Review 52 (2008) 667–699690
(while the coefficient of common language rises in compensation and everything else staysthe same).20 When the two enter together, the external effect coming from within thecountry pair still shows up as significantly negative while the other effect vanishes.Therefore, the former effect is clearly the more important of the two.These results are plainly at odds with the hypothesis of positive externalities. We are
evidently not picking up any positive effect of crowding and size. What we find instead is apositive effect of smallness for pairs with a common language. In the case of column 1, thiseffect would seem to reflect the fewer opportunities for profitable trade at home in smallcountries than large ones. Small countries with a common language would then trade morewith one another than large countries with a common language. As regards column 2, thepositive effect appears to reflect, instead, the tendency for greater trade between countrypairs who share a small language than country pairs who share a large one. The latter pairshave more ways to benefit from linguistic ease in trade than by trading together. Bothconclusions make sense. Both of them say that a scarcity of advantages of a commonlanguage intensifies the exploitation of those advantages of a common language that doexist. Both of them also proceed with a measure of these advantages incorporating a jointeffect of a common language and output. But both conclusions put in question the idea ofa positive effect of size on ratios of trade to output between partners with a commonlanguage. Both of them contradict the presence of network externalities. This is the result Iwish to stress here.21
20It is easy to understand why the estimate for the product of the GDPs is not affected since the new variables
relate strictly to joint effects of common language and a constant output level (for 1990) while the coefficient for
the product of the GDPs in estimates of Eq. (4) picks up nothing but an effect of output movement over time.21In the light of the results, of course, both of the relevant variables could be relabeled without reference to
network externalities and the present nomenclature reflects the hypotheses that led to their construction.

ARTICLE IN PRESSJ. Melitz / European Economic Review 52 (2008) 667–699 691
6. Discussion and conclusion
We knew beforehand that a common language promotes trade. This study sheds light onthe channels through which language exerts this influence and introduces a number of effectsof language that had gone unnoticed before, or at least had not been studied. Apart from DC,translation is important in surmounting linguistic obstacles. Though few people may speakPortuguese in a country, they may be ‘‘tuned’’ to the language all the same. Thus, the impactof a common language on foreign trade can issue from translation as well as the ability tocommunicate directly. Notwithstanding, DC appears about three times more effective thanindirect communication in promoting trade. Taking both direct and indirect communicationinto account and measuring them with more care than usual, we find an impact of a commonlanguage nearly twice as high as before. Two general linguistic influences on foreign trade alsoemerge in the study. If people can read and write in any language, they can cope better withthe problems posed by foreign languages in general. In addition, if they face linguisticobstacles at home, they trade more with foreigners. Accordingly, based on identical scores forcommon language (notably including zero), the pull of linguistic factors in favor of domestictrade is uneven and is lower for country pairs sharing high literacy rates or sharing highlinguistic diversity or both. Further, English seems to offer no particular advantage in foreigntrade, while the European languages as a whole do. These languages emerge as betterinstruments of OCC than other ones. In addition, there is no evidence that networkexternalities of language contribute to trade between countries. The importance of thoseexternalities has thus been exaggerated. The reason may have to do with the fact that a lot ofmarket information gets transmitted without a common language (through limitedvocabularies, small numbers of fluent speakers, dictionaries, and means of non-verbalcommunication). The separate significance of literacy and linguistic diversity would alsoargue that communication does not break down entirely without a common language.22
The study suggests a number of avenues of further research. First, it would be interestingto see if the relative significance of OCC and DC differs for trade in different sorts ofgoods. As a possibility, rudimentary communication might suffice for trade inhomogeneous goods while trade in heterogeneous goods might require more sophisticatedintercourse. If so, OCC might be particularly important in trade in homogenous goodswhile DC is unusually so in trade in heterogeneous goods. Rauch (1999) suggests ahypothesis of this sort. He argues that close personal relations between exporters andimporters are much more significant in trade in heterogeneous goods than perfectlyhomogeneous ones. Because of issues of information, private ‘‘networks’’ are necessary inone case whereas ‘‘markets’’ suffice in the other. The proposed hypothesis about theseparate roles of OCC and DC in different markets follows easily.23,24
22The focus on trade is relevant here. A common language may be more important in production than in trade.
In fact, to all indication, even varying shades in the ability to communicate directly matter a lot in the labor
market. Empirical work regularly shows a considerable impact of linguistic skill on wages: see McManus et al.
(1983), Chiswick and Miller (1995), and the references in a broad survey by Grin (1996).23In the case of certain homogeneous goods, including crude oil and many primary products, the relevant
information could even be so small and easy to get (in part, if not entirely, because of organized exchanges) that
there are no language hurdles at all. Translation might resolve the communication problem altogether at no
mentionable cost.24Interestingly, Rauch and Trindade (2002) apply the proposed hypothesis to the distinction between a common
language and an ethnic network rather than between OCC and DC. In their reasoning, a common language works

ARTICLE IN PRESSJ. Melitz / European Economic Review 52 (2008) 667–699692
Another basic extension of the study would be to admit additional variables reflectingculture or ethnicity. Language has been interpreted here strictly as a tool ofcommunication, even though it obviously reflects many aspects of culture as well. Thereason for this narrow interpretation is that, in the context of worldwide trade, the onlyfeatures of the language variables that apply generally regard communication. Otherassociated features are not always present, as it would be easy to document. This is obviousin the case of OCC where translation is the central mechanism. But even as regards DC, Ihave taken steps to assure the primacy of communication by including second-languageand non-native speakers. Based on other work in the literature, one missing culturalvariable that easily comes to mind is the stock of immigrants. As the analysis here stands,immigrants are implicit since they affect the index of linguistic diversity. But this index alsoreflects longstanding, sometimes ancestral, linguistic divisions inside national boundaries(as in the case of India or Switzerland, for example). The interest of a separateconsideration of immigrants would lie in setting apart the element of ethnic ties to othercommunities abroad (which affects tastes, skills, trust and information) from strict issuesof communication. A separate treatment of immigrants would generally promote theinterpretation of the linguistic variables as relating exclusively to communication (comparenote 24).A further extension of the study would be to examine trade in goods that are
especially connected to language, such as movies, television programs, books, andvocal music. In these cases, the world dominance of English and the production bythe US in particular, is notorious. Cultural products in English sell extremely well inmany places where English is otherwise secondary in foreign as well as domestic trade.Broadly, how come English plays no special role in facilitating foreign trade butdominates the market for language-related products?25 Evidently, the question cannot bestudied within the confines of the current version of the gravity model, which appliesstrictly to two-way trade, but would require a more intricate version of the model thatdistinguishes between exports and imports (and is often associated with Bergstrand(1985)).26
Finally, it would be interesting also to move beyond the idea that the language variablesare constants. Literacy rates have risen substantially in the last 50 years. Migrationsaccelerated in the nineties in many parts of the world. Spanish is now significant in the US,Russian in Israel, etc. In treating the data furnished in Grimes (2000) as roughlycontemporaneous and steady, I have followed the practice in the field of trade of viewingall indicators of a common language and linguistic diversity in foreign trade as slow-moving variables that can be regarded as fixed.27 Grimes (2000) also corroborates this
(footnote continued)
the same way in all trade, whereas an ethnic network promotes trade in differentiated goods as such. The ethnic
network in their study is the Chinese diaspora across the world. They also treat a common language as a common
mother tongue (measured as a continuous variable), which they consider—questionably, I think—as essentially
reflecting common tastes. In regard to world trade, even a common native language may mostly reflect the ability
to communicate. I will return to this issue shortly in the text.25For data and further discussion, see Melitz (2007).26See Gould (1994), Head and Ries (1998), Dunlevy and Hutchinson (1999), Wagner et al. (2002) and
Hutchinson (2002), all of whom distinguish between the influence of immigrant links on imports and exports and
all of whom also rely on specifications that are related to Bergstrand.27The same practice does not hold in labor. Labor studies of the impact of linguistic skills on wages make
prominent use of time series evidence (see the references in note 22).

ARTICLE IN PRESSJ. Melitz / European Economic Review 52 (2008) 667–699 693
practice by furnishing unique figures for linguistic variables despite wide discrepancies indating when dates even appear. Yet from the standpoint of trade analysis, there is littledoubt that more coherent series for literacy, OCC and DC could be constructed from abroad variety of national sources. Doing so would foster study of the evolution of all threevariables and their influences on trade.
Acknowledgments
Many thanks for valuable comments to Francis Kramarz and Eric Maurin at CREST-INSEE in Paris, and, most of all, to Jeffrey Bergstrand, Marc Melitz and an anonymousreferee.
Appendix
Table A1
The language dataa
Country Literacy Diversity Languages
(Frankel–Rose)
Open-circuit
languages
Spoken languages
Afghanistan .31 .7 – Persian Pashto .45 Persian .4
Albania .93 .26 – – Albanian .98
Algeria .62 .31 Arabic Arabic, French Arabic .83 French .2
American Samoa .97 .12 English English English .97
Angola .42 .76 Portuguese Portuguese Portuguese .42
Anguilla .95 0 English English English 1
Antigua and Barbuda .89 0 English English English 1
Argentina .96 .21 Spanish Spanish Spanish .92 Italian .04
Aruba .97 0 – Dutch, Spanish Spanish .74
Australia .99 .13 English English English .99
Austria .98 .14 German German German .98
Bahamas .98 .01 English English English .98
Bahrain .85 .53 Arabic Arabic Arabic .85
Bangladesh .38 .31 – – –
Barbados .97 .09 English English English .97
Belgium .98 .65 Dutch, French Dutch, French Dutch .56 French .56
Belize .70 .70 English English, Spanish English .93 Spanish .35
Benin .37 .90 French French French .37
Bermuda .98 0 – English English 1
Bhutan .42 .82 – – Nepali .08
Bolivia .83 .68 Spanish Spanish Spanish .44 Quechua .36
Brazil .83 .03 Portuguese Portuguese Portuguese .95
Brit. Indian Ocean
Terr’s
.98 0 – English English 1
British Virgin Islands .98 .24 English English English .98
Brunei .88 .45 – Malay, English Malay .88 English .05
Bulgaria .98 .22 – Turkish Turkish .09
Burkina Faso .19 .76 French French French .19
Burundi .35 0 French French French .35
Cambodia .35 .31 – – –
Cameroon .63 .97 French, English French, English French .42 Fulfulde .30 English .21
Fang .05

ARTICLE IN PRESS
Table A1 (continued )
Country Literacy Diversity Languages
(Frankel–Rose)
Open-circuit
languages
Spoken languages
Canada .97 .55 English, French English, French English .65 French .22
Cayman Islands .98 .58 – English English .98
Central African
Republic
.60 .96 French French French .6
Chad .48 .95 French Arabic, French Arabic .5 French .48
Chile .95 .60 Spanish Spanish Spanish .93
China .81 .48 Chinese Chinese Chinese .84
Colombia .91 .03 Spanish Spanish Spanish .84
Comoros .57 .01 French, Arabic French, Arabic French .3 Arabic .3
Congo Democratic
Republic
.77 .92 French French French .58 Swahili .17 Lingala .12
Congo Republic .75 .61 French French French .7 Lingala .12
Cook Islands .93 .37 English English English .93
Costa Rica .95 .04 Spanish Spanish Spanish .87
Cote d’Ivoire .48 .91 French French French .48
Cuba .96 0 – Spanish Spanish .91
Cyprus .94 .37 – Greek, Turkish Greek .75 Turkish .20
Czech Republic .99 .06 – – –
Czechoslovakia .99 .11 – – Hungarian .04
Denmark .99 .05 – Danish, German Danish 1
Djibouti .46 .58 French, Arabic French, Arabic French .46 Arabic .11
Dominica .94 0 English English, French English 1 French .7
Dominican Republic .82 .05 Spanish Spanish Spanish .87
Ecuador .9 .26 Spanish Spanish Spanish .79 Quechua .12
Egypt Arab Republic .51 .46 Arabic Arabic Arabic .97
El Salvador .71 0 Spanish Spanish Spanish .92
Ethiopia .35 .84 – English English .35
Faeroe Islands .99 0 – Danish Danish 1
Falkland Islands – 0 – English English 1
Fiji .92 .60 English English English .92
Finland .99 .14 Swedish Swedish Swedish .12
France .99 .24 French French French .99
French Guiana .83 .47 – French French .83
French So.
Antarc.Terr’s
1 0 French French French 1
Gabon .63 .53 French French French .63 Fang .29
Gambia .39 .73 English English English .39 Fulfulde .17
Germany, West .99 .18 German German German .99
Germany, East .99 .18 German German German .99
Ghana .64 .79 English English English .48
Gibraltar .80 .50 – Spanish, English Spanish .88 English .13
Greece .95 .14 – Greek Greek .99
Greenland .93 .27 – Danish Danish .93
Grenada .98 0 English English English .98
Guadeloupe .90 0 – French French 1
Guam .99 .64 English English English .99
Guatemala .56 .60 Spanish Spanish Spanish .44
Guinea .35 .75 French French French .35 Fulfulde .04
Guinea-Bissau .54 .85 Portuguese Portuguese Portuguese .54
Guyana .98 .07 English English English .98
Haiti .45 0 French French French 1
Honduras .73 .05 Spanish Spanish Spanish .92
Hong Kong .92 .48 Chinese, English Chinese, English Chinese .95
Hungary .99 .14 – – Hungarian .98
J. Melitz / European Economic Review 52 (2008) 667–699694
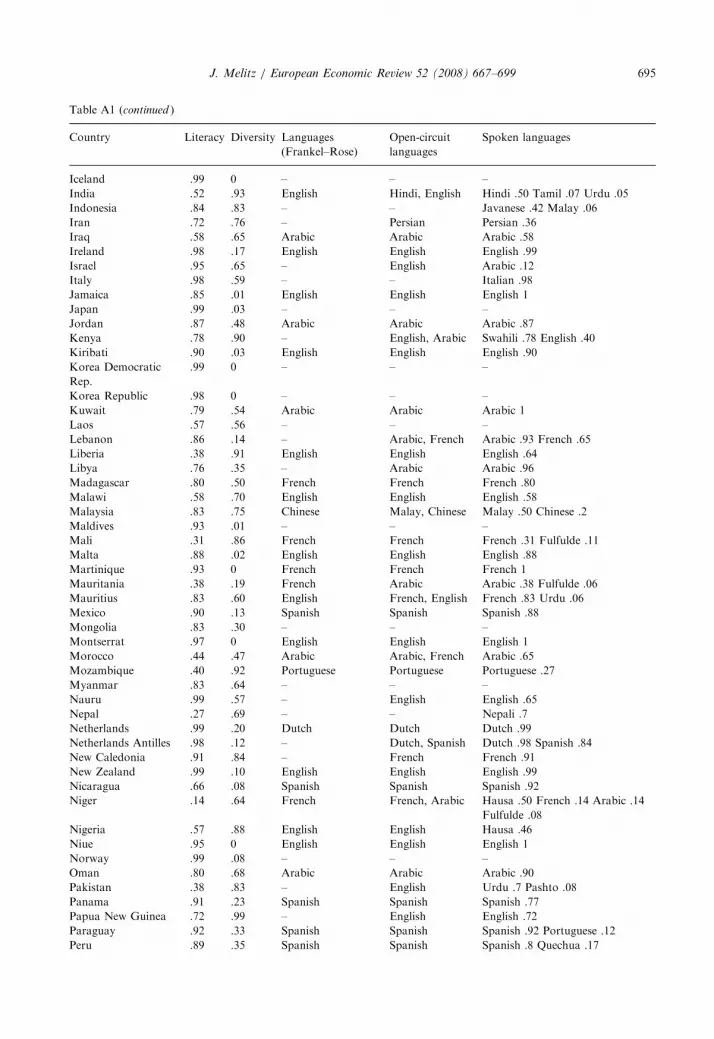
ARTICLE IN PRESS
Table A1 (continued )
Country Literacy Diversity Languages
(Frankel–Rose)
Open-circuit
languages
Spoken languages
Iceland .99 0 – – –
India .52 .93 English Hindi, English Hindi .50 Tamil .07 Urdu .05
Indonesia .84 .83 – – Javanese .42 Malay .06
Iran .72 .76 – Persian Persian .36
Iraq .58 .65 Arabic Arabic Arabic .58
Ireland .98 .17 English English English .99
Israel .95 .65 – English Arabic .12
Italy .98 .59 – – Italian .98
Jamaica .85 .01 English English English 1
Japan .99 .03 – – –
Jordan .87 .48 Arabic Arabic Arabic .87
Kenya .78 .90 – English, Arabic Swahili .78 English .40
Kiribati .90 .03 English English English .90
Korea Democratic
Rep.
.99 0 – – –
Korea Republic .98 0 – – –
Kuwait .79 .54 Arabic Arabic Arabic 1
Laos .57 .56 – – –
Lebanon .86 .14 – Arabic, French Arabic .93 French .65
Liberia .38 .91 English English English .64
Libya .76 .35 – Arabic Arabic .96
Madagascar .80 .50 French French French .80
Malawi .58 .70 English English English .58
Malaysia .83 .75 Chinese Malay, Chinese Malay .50 Chinese .2
Maldives .93 .01 – – –
Mali .31 .86 French French French .31 Fulfulde .11
Malta .88 .02 English English English .88
Martinique .93 0 French French French 1
Mauritania .38 .19 French Arabic Arabic .38 Fulfulde .06
Mauritius .83 .60 English French, English French .83 Urdu .06
Mexico .90 .13 Spanish Spanish Spanish .88
Mongolia .83 .30 – – –
Montserrat .97 0 English English English 1
Morocco .44 .47 Arabic Arabic, French Arabic .65
Mozambique .40 .92 Portuguese Portuguese Portuguese .27
Myanmar .83 .64 – – –
Nauru .99 .57 – English English .65
Nepal .27 .69 – – Nepali .7
Netherlands .99 .20 Dutch Dutch Dutch .99
Netherlands Antilles .98 .12 – Dutch, Spanish Dutch .98 Spanish .84
New Caledonia .91 .84 – French French .91
New Zealand .99 .10 English English English .99
Nicaragua .66 .08 Spanish Spanish Spanish .92
Niger .14 .64 French French, Arabic Hausa .50 French .14 Arabic .14
Fulfulde .08
Nigeria .57 .88 English English Hausa .46
Niue .95 0 English English English 1
Norway .99 .08 – – –
Oman .80 .68 Arabic Arabic Arabic .90
Pakistan .38 .83 – English Urdu .7 Pashto .08
Panama .91 .23 Spanish Spanish Spanish .77
Papua New Guinea .72 .99 – English English .72
Paraguay .92 .33 Spanish Spanish Spanish .92 Portuguese .12
Peru .89 .35 Spanish Spanish Spanish .8 Quechua .17
J. Melitz / European Economic Review 52 (2008) 667–699 695

ARTICLE IN PRESS
Table A1 (continued )
Country Literacy Diversity Languages
(Frankel–Rose)
Open-circuit
languages
Spoken languages
Philippines .95 .85 English English English .52
Poland .99 .12 – – –
Portugal .87 .02 Portuguese Portuguese Portuguese 1
Qatar .79 .57 Arabic Arabic, Persian Arabic .79 Persian .23
Reunion .79 .09 French French French 1 Tamil .18
Romania .97 .20 – – Hungarian .11
Russia .98 .27 – – –
Rwanda .60 0 French, English French, English French .5 English .5
Samoa .97 0 English English English .97
Saudi Arabia .63 .56 Arabic Arabic Arabic .82
Senegal .33 .77 French French French .3 Fulfulde .23
Seychelles .58 .07 – French, English French .95 English .58
Sierra Leone .31 .82 English English English .31
Singapore .91 .74 Chinese, English Chinese, English Chinese .51 English .27 Malay .16
Solomon Islands .32 .97 English English English .32
Somalia .24 .2 Arabic Arabic, English English .18
South Africa .82 .87 English English English .3 Hindi .05
Spain .97 .44 Spanish Spanish Spanish .97
Sri Lanka .90 .31 – – Tamil .16
St. Helena .97 0 – English English 1
St. Kitts and Nevis .97 0 English English English 1
St. Lucia .54 .67 English English, French English 1 French .85
St. Vincent and
Grenadines
.96 0 English English English 1
St. Pierre and
Miquelon
.99 .07 French French French 1
Sudan .46 .56 Arabic Arabic Arabic .51
Suriname .93 .79 Dutch Dutch, Hindi Dutch .93 Hindi .38 Javanese .15
Sweden .99 .37 Swedish Swedish Swedish .99
Switzerland .99 .53 German, French German, French German .72 French .33 Italian .07
Syria .71 .50 Arabic Arabic Arabic .8
Taiwan .91 .49 Chinese Chinese Chinese .91
Tanzania .68 .95 English English, Arabic Swahili .93 English .05
Thailand .94 .75 – – Malay .05
Togo .52 .89 French French French .52
Tonga .98 .01 – English English .98
Trinidad and Tobago .98 .47 English English English .98
Tunisia .67 .01 Arabic Arabic, French Arabic .98
Turkey .82 .25 – Turkish Turkish .9
Turks and Caicos
Islands
.98 0 – English English 1
Tuvalu .96 .17 English English –
USSR .98 .40 – – –
Uganda .62 .93 English English English .62
United Arab Emirates .79 .78 Arabic Arabic Arabic .89
United Kingdom .99 .07 English English English .99
United States .97 .35 English English English .97 Spanish .09
Uruguay .97 .09 Spanish Spanish Spanish 1
Venezuela .91 .02 Spanish Spanish Spanish .93
Vietnam .94 .20 – – –
Virgin Islands (US) .92 .34 English English English 1
Yemen .38 .56 – Arabic Arabic .95
Yugoslavia .91 .32 – – Albanian .16
J. Melitz / European Economic Review 52 (2008) 667–699696
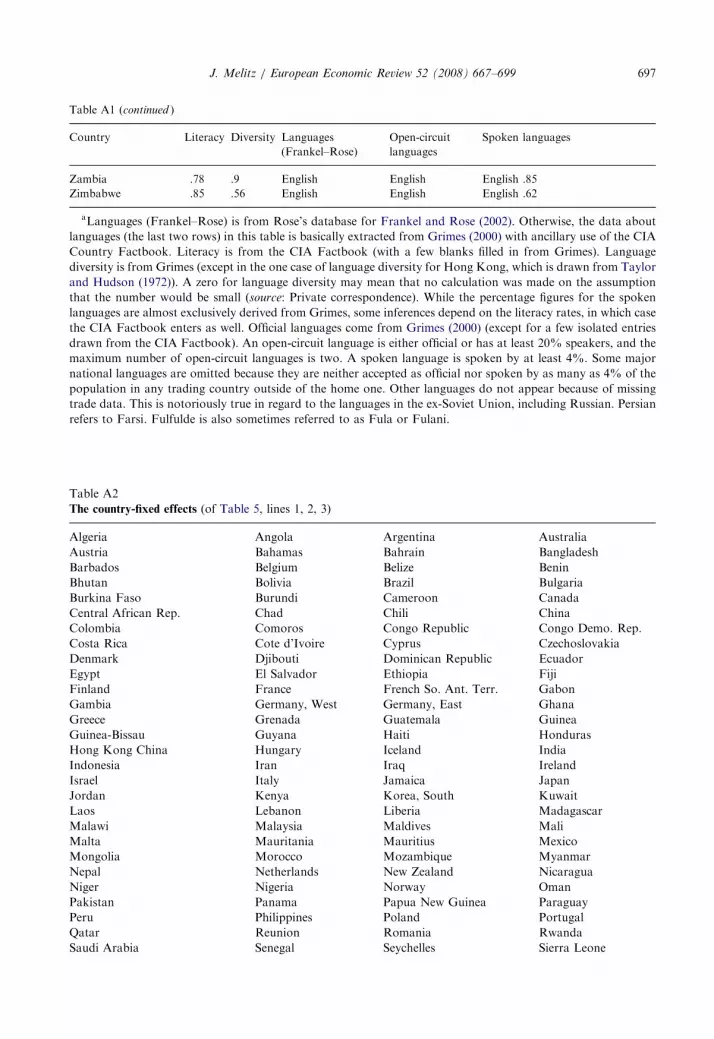
ARTICLE IN PRESS
Table A1 (continued )
Country Literacy Diversity Languages
(Frankel–Rose)
Open-circuit
languages
Spoken languages
Zambia .78 .9 English English English .85
Zimbabwe .85 .56 English English English .62
aLanguages (Frankel–Rose) is from Rose’s database for Frankel and Rose (2002). Otherwise, the data about
languages (the last two rows) in this table is basically extracted from Grimes (2000) with ancillary use of the CIA
Country Factbook. Literacy is from the CIA Factbook (with a few blanks filled in from Grimes). Language
diversity is from Grimes (except in the one case of language diversity for Hong Kong, which is drawn from Taylor
and Hudson (1972)). A zero for language diversity may mean that no calculation was made on the assumption
that the number would be small (source: Private correspondence). While the percentage figures for the spoken
languages are almost exclusively derived from Grimes, some inferences depend on the literacy rates, in which case
the CIA Factbook enters as well. Official languages come from Grimes (2000) (except for a few isolated entries
drawn from the CIA Factbook). An open-circuit language is either official or has at least 20% speakers, and the
maximum number of open-circuit languages is two. A spoken language is spoken by at least 4%. Some major
national languages are omitted because they are neither accepted as official nor spoken by as many as 4% of the
population in any trading country outside of the home one. Other languages do not appear because of missing
trade data. This is notoriously true in regard to the languages in the ex-Soviet Union, including Russian. Persian
refers to Farsi. Fulfulde is also sometimes referred to as Fula or Fulani.
Table A2
The country-fixed effects (of Table 5, lines 1, 2, 3)
Algeria Angola Argentina Australia
Austria Bahamas Bahrain Bangladesh
Barbados Belgium Belize Benin
Bhutan Bolivia Brazil Bulgaria
Burkina Faso Burundi Cameroon Canada
Central African Rep. Chad Chili China
Colombia Comoros Congo Republic Congo Demo. Rep.
Costa Rica Cote d’Ivoire Cyprus Czechoslovakia
Denmark Djibouti Dominican Republic Ecuador
Egypt El Salvador Ethiopia Fiji
Finland France French So. Ant. Terr. Gabon
Gambia Germany, West Germany, East Ghana
Greece Grenada Guatemala Guinea
Guinea-Bissau Guyana Haiti Honduras
Hong Kong China Hungary Iceland India
Indonesia Iran Iraq Ireland
Israel Italy Jamaica Japan
Jordan Kenya Korea, South Kuwait
Laos Lebanon Liberia Madagascar
Malawi Malaysia Maldives Mali
Malta Mauritania Mauritius Mexico
Mongolia Morocco Mozambique Myanmar
Nepal Netherlands New Zealand Nicaragua
Niger Nigeria Norway Oman
Pakistan Panama Papua New Guinea Paraguay
Peru Philippines Poland Portugal
Qatar Reunion Romania Rwanda
Saudi Arabia Senegal Seychelles Sierra Leone
J. Melitz / European Economic Review 52 (2008) 667–699 697
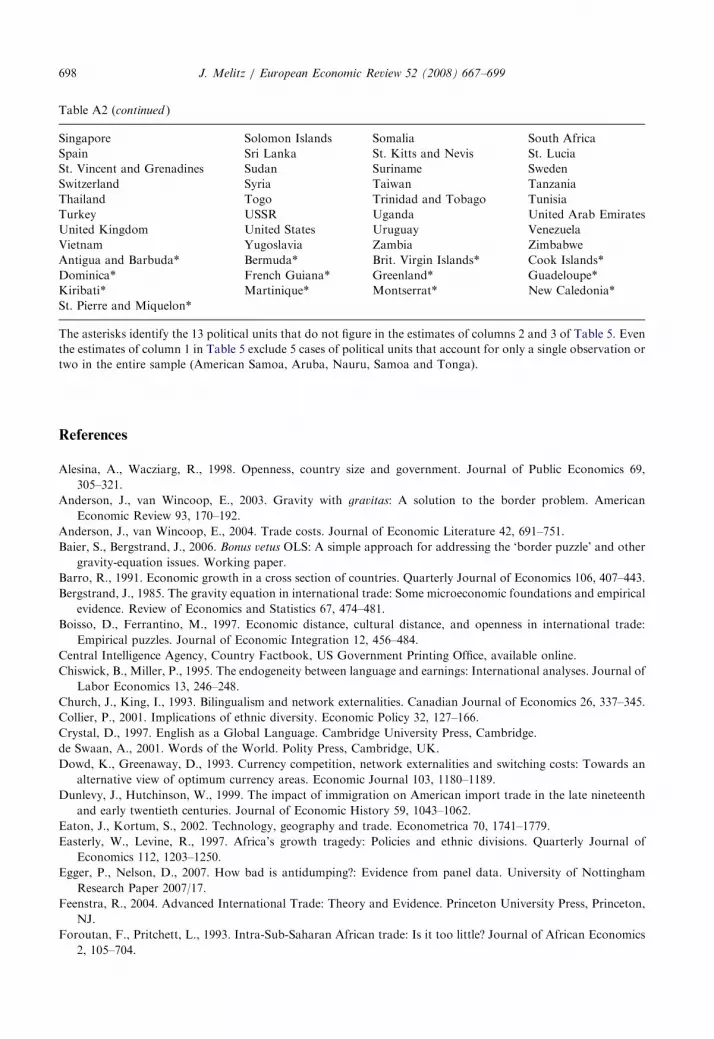
ARTICLE IN PRESS
Table A2 (continued )
Singapore Solomon Islands Somalia South Africa
Spain Sri Lanka St. Kitts and Nevis St. Lucia
St. Vincent and Grenadines Sudan Suriname Sweden
Switzerland Syria Taiwan Tanzania
Thailand Togo Trinidad and Tobago Tunisia
Turkey USSR Uganda United Arab Emirates
United Kingdom United States Uruguay Venezuela
Vietnam Yugoslavia Zambia Zimbabwe
Antigua and Barbuda* Bermuda* Brit. Virgin Islands* Cook Islands*
Dominica* French Guiana* Greenland* Guadeloupe*
Kiribati* Martinique* Montserrat* New Caledonia*
St. Pierre and Miquelon*
The asterisks identify the 13 political units that do not figure in the estimates of columns 2 and 3 of Table 5. Even
the estimates of column 1 in Table 5 exclude 5 cases of political units that account for only a single observation or
two in the entire sample (American Samoa, Aruba, Nauru, Samoa and Tonga).
J. Melitz / European Economic Review 52 (2008) 667–699698
References
Alesina, A., Wacziarg, R., 1998. Openness, country size and government. Journal of Public Economics 69,
305–321.
Anderson, J., van Wincoop, E., 2003. Gravity with gravitas: A solution to the border problem. American
Economic Review 93, 170–192.
Anderson, J., van Wincoop, E., 2004. Trade costs. Journal of Economic Literature 42, 691–751.
Baier, S., Bergstrand, J., 2006. Bonus vetus OLS: A simple approach for addressing the ‘border puzzle’ and other
gravity-equation issues. Working paper.
Barro, R., 1991. Economic growth in a cross section of countries. Quarterly Journal of Economics 106, 407–443.
Bergstrand, J., 1985. The gravity equation in international trade: Some microeconomic foundations and empirical
evidence. Review of Economics and Statistics 67, 474–481.
Boisso, D., Ferrantino, M., 1997. Economic distance, cultural distance, and openness in international trade:
Empirical puzzles. Journal of Economic Integration 12, 456–484.
Central Intelligence Agency, Country Factbook, US Government Printing Office, available online.
Chiswick, B., Miller, P., 1995. The endogeneity between language and earnings: International analyses. Journal of
Labor Economics 13, 246–248.
Church, J., King, I., 1993. Bilingualism and network externalities. Canadian Journal of Economics 26, 337–345.
Collier, P., 2001. Implications of ethnic diversity. Economic Policy 32, 127–166.
Crystal, D., 1997. English as a Global Language. Cambridge University Press, Cambridge.
de Swaan, A., 2001. Words of the World. Polity Press, Cambridge, UK.
Dowd, K., Greenaway, D., 1993. Currency competition, network externalities and switching costs: Towards an
alternative view of optimum currency areas. Economic Journal 103, 1180–1189.
Dunlevy, J., Hutchinson, W., 1999. The impact of immigration on American import trade in the late nineteenth
and early twentieth centuries. Journal of Economic History 59, 1043–1062.
Eaton, J., Kortum, S., 2002. Technology, geography and trade. Econometrica 70, 1741–1779.
Easterly, W., Levine, R., 1997. Africa’s growth tragedy: Policies and ethnic divisions. Quarterly Journal of
Economics 112, 1203–1250.
Egger, P., Nelson, D., 2007. How bad is antidumping?: Evidence from panel data. University of Nottingham
Research Paper 2007/17.
Feenstra, R., 2004. Advanced International Trade: Theory and Evidence. Princeton University Press, Princeton,
NJ.
Foroutan, F., Pritchett, L., 1993. Intra-Sub-Saharan African trade: Is it too little? Journal of African Economics
2, 105–704.
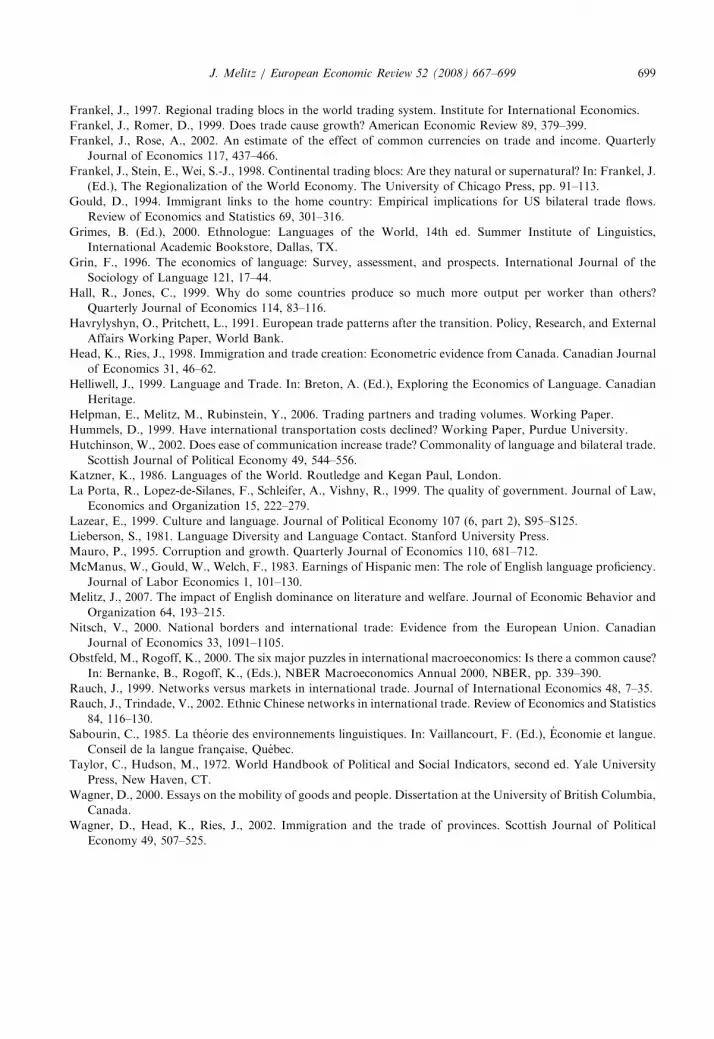
ARTICLE IN PRESSJ. Melitz / European Economic Review 52 (2008) 667–699 699
Frankel, J., 1997. Regional trading blocs in the world trading system. Institute for International Economics.
Frankel, J., Romer, D., 1999. Does trade cause growth? American Economic Review 89, 379–399.
Frankel, J., Rose, A., 2002. An estimate of the effect of common currencies on trade and income. Quarterly
Journal of Economics 117, 437–466.
Frankel, J., Stein, E., Wei, S.-J., 1998. Continental trading blocs: Are they natural or supernatural? In: Frankel, J.
(Ed.), The Regionalization of the World Economy. The University of Chicago Press, pp. 91–113.
Gould, D., 1994. Immigrant links to the home country: Empirical implications for US bilateral trade flows.
Review of Economics and Statistics 69, 301–316.
Grimes, B. (Ed.), 2000. Ethnologue: Languages of the World, 14th ed. Summer Institute of Linguistics,
International Academic Bookstore, Dallas, TX.
Grin, F., 1996. The economics of language: Survey, assessment, and prospects. International Journal of the
Sociology of Language 121, 17–44.
Hall, R., Jones, C., 1999. Why do some countries produce so much more output per worker than others?
Quarterly Journal of Economics 114, 83–116.
Havrylyshyn, O., Pritchett, L., 1991. European trade patterns after the transition. Policy, Research, and External
Affairs Working Paper, World Bank.
Head, K., Ries, J., 1998. Immigration and trade creation: Econometric evidence from Canada. Canadian Journal
of Economics 31, 46–62.
Helliwell, J., 1999. Language and Trade. In: Breton, A. (Ed.), Exploring the Economics of Language. Canadian
Heritage.
Helpman, E., Melitz, M., Rubinstein, Y., 2006. Trading partners and trading volumes. Working Paper.
Hummels, D., 1999. Have international transportation costs declined? Working Paper, Purdue University.
Hutchinson, W., 2002. Does ease of communication increase trade? Commonality of language and bilateral trade.
Scottish Journal of Political Economy 49, 544–556.
Katzner, K., 1986. Languages of the World. Routledge and Kegan Paul, London.
La Porta, R., Lopez-de-Silanes, F., Schleifer, A., Vishny, R., 1999. The quality of government. Journal of Law,
Economics and Organization 15, 222–279.
Lazear, E., 1999. Culture and language. Journal of Political Economy 107 (6, part 2), S95–S125.
Lieberson, S., 1981. Language Diversity and Language Contact. Stanford University Press.
Mauro, P., 1995. Corruption and growth. Quarterly Journal of Economics 110, 681–712.
McManus, W., Gould, W., Welch, F., 1983. Earnings of Hispanic men: The role of English language proficiency.
Journal of Labor Economics 1, 101–130.
Melitz, J., 2007. The impact of English dominance on literature and welfare. Journal of Economic Behavior and
Organization 64, 193–215.
Nitsch, V., 2000. National borders and international trade: Evidence from the European Union. Canadian
Journal of Economics 33, 1091–1105.
Obstfeld, M., Rogoff, K., 2000. The six major puzzles in international macroeconomics: Is there a common cause?
In: Bernanke, B., Rogoff, K., (Eds.), NBER Macroeconomics Annual 2000, NBER, pp. 339–390.
Rauch, J., 1999. Networks versus markets in international trade. Journal of International Economics 48, 7–35.
Rauch, J., Trindade, V., 2002. Ethnic Chinese networks in international trade. Review of Economics and Statistics
84, 116–130.
Sabourin, C., 1985. La theorie des environnements linguistiques. In: Vaillancourt, F. (Ed.), Economie et langue.
Conseil de la langue franc-aise, Quebec.
Taylor, C., Hudson, M., 1972. World Handbook of Political and Social Indicators, second ed. Yale University
Press, New Haven, CT.
Wagner, D., 2000. Essays on the mobility of goods and people. Dissertation at the University of British Columbia,
Canada.
Wagner, D., Head, K., Ries, J., 2002. Immigration and the trade of provinces. Scottish Journal of Political
Economy 49, 507–525.