land tenure and deforestation patterns in the ecuadorian amazon: conflicts in land conservation in...
TRANSCRIPT
ARTICLE IN PRESS
Applied Geography 26 (2006) 113–128
0143-6228/$ -
doi:10.1016/j
�CorrespoE-mail ad
(C.F. Mena)
www.elsevier.com/locate/apgeog
Land tenure and deforestation patterns in theEcuadorian Amazon: Conflicts in land
conservation in frontier settings
Joseph P. Messinaa,�, Stephen J. Walshb, Carlos F. Menab,Paul L. Delamatera
aDepartment of Geography & Center for Global Change and Earth Observations, 101 Manly Miles Building,
Michigan State University, East Lansing, MI 48824-1115, USAbDepartment of Geography & Carolina Population Center, University of North Carolina,
Chapel Hill, NC 27599-3220, USA
Abstract
The Cuyabeno Wildlife Production Reserve (Cuyabeno Reserve), located in the northeastern
Ecuadorian Amazon, is a special protected area. Using a satellite image time-series, landscape
ecology and evolving boundary definitions, shifts in landscape composition are described that focus
on the spatial and temporal dynamics of land use and cover change (LUCC) within the vicinity of the
Cuyabeno Reserve. Changes in local land tenancy and the implementation of protection buffers have
accelerated the process of fragmentation and exacerbated the conflict between development and
protection. Further, variations in management strategies and ownership histories confound LUCC
patterns, rates, and trajectories.
r 2005 Elsevier Ltd. All rights reserved.
Keywords: Parks; Land tenure; Landscape ecology; Ecuador
Introduction
In recent years, there has been renewed discussion related to the conflicts and benefitsof people living in protected areas (Peres & Zimmerman, 2001; Schwartzman, Moreira,
see front matter r 2005 Elsevier Ltd. All rights reserved.
.apgeog.2005.11.003
nding author. Tel.: +1517 353 1715; fax: +1 517 353 2932.
dresses: [email protected] (J.P. Messina), [email protected] (S.J. Walsh), [email protected]
, [email protected] (P.L. Delamater).
ARTICLE IN PRESSJ.P. Messina et al. / Applied Geography 26 (2006) 113–128114
& Nepstad, 2000; Terborgh, 1999). A case study is presented of how the presence ofpeople, the interactions among them, and the unique social and physical relationshipswithin and around the Cuyabeno Wildlife Production Reserve (Cuyabeno Reserve) hasshaped the landscapes within the protected area and the trajectories for future land usepatterns. The Cuyabeno Reserve, a special protected area within the protected areas ofEcuador, was created in 1979 to promote the ‘‘production’’ of wildlife. The wildlifeproduction was intended to offer alternative subsistence for inhabitants of the area,incorporate the rich indigenous traditions of the region, and also reflect social, economic,and political realities (Coello-Hinojosa, 1992). As time passed, the Cuyabeno Reserve wasseen as an example of a protected area that combined the protection of plant and animalspecies with service to human indigenous populations. Unfortunately, the area quicklybecame an area of multi-scale conflict between extractive oil activities, colonists,indigenous communities, and ecosystem services (Kimerling, 1990). In 1993, the boundaryof the Reserve changed. Land was surrendered to colonists who had settled in the Reserve,and a restricted land use category, ‘‘patrimony forest,’’ was created that allowedcolonization and communal land titles. Collocated communities further exacerbated landuse and cover change (LUCC) patterns in direct and indirect ways. What followed was amosaic of land tenure systems involving colonists and indigenous groups, a set ofcommunities linked through a road located at the Reserve’s edge, changes in thecomposition, rate, and fragmentation patterns of land use and cover, and conflicts betweenland conservation and protection and the development goals of the primary stakeholders.The transformation of the boundaries of the Cuyabeno Reserve shows how the failedcross-linkages between local and national interests and institutions have generatedspatially explicit responses in the landscape.
Study area
Ecuador has approximately 26%, excluding the Galapagos Biological Marine Reserve,of its territory under some kind of protection (World Resource Institute, 2003). TheCuyabeno Reserve (see Fig. 1), which is part of the Ecuadorian System of Protected Areas,covers approximately 12% of the protected land and encompasses high biological (Balslev,Valencia, Paz y Mino, Christensen, & Nielsen, 1998; Valencia, Balslev, & Paz y Mino,1994) and cultural diversity (Araya & Peters, 2000). The Cuyabeno Reserve, created in1979 with an initial area of 256,760 ha, was the result of the National ConservationStrategy created in 1974 by consultants of the Food and Agriculture Organization (FAO),invited to Ecuador to assess the natural resources of the region. Initially, the CuyabenoReserve was delimited to include the entire Cuyabeno River Basin, the main tributary ofthe Aguarico River. The Cuyabeno Reserve protects an ecosystem located in an area ofunique hydrologic and biologic characteristics. The Cuyabeno Lakes district sits at theconfluence of both black and white water rivers, which, when seasonally inundated, mergeto form an interconnected 14 lake complex that creates a rare combination of rainforestand wetlands (Nations & Coello-Hinojosa, 1989). The Cuyabeno Reserve is also rich incultural and ethnic diversity. It is home to several indigenous and unrelated communities:Siona, Secoya, Cofan, Quichua, and Shuar. These indigenous groups have differentmigration histories, degrees of acculturation and market integration (Holt, Bilsborrow,& Ona, 2004), and, in any case, have strong links to the ecosystems services within theCuyabeno Reserve (Vickers, 1993; Vickers & Plowman, 1984).
ARTICLE IN PRESS
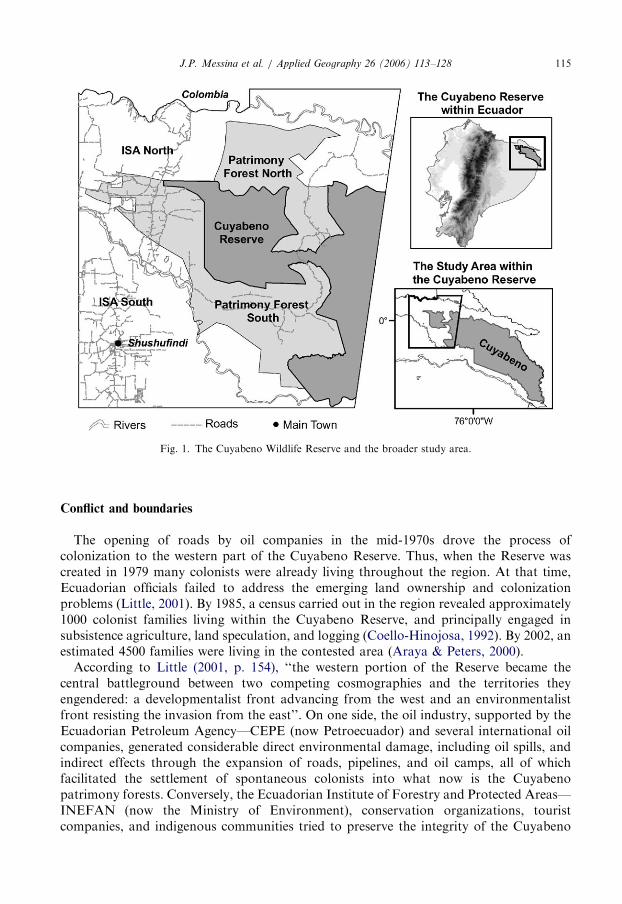
Fig. 1. The Cuyabeno Wildlife Reserve and the broader study area.
J.P. Messina et al. / Applied Geography 26 (2006) 113–128 115
Conflict and boundaries
The opening of roads by oil companies in the mid-1970s drove the process ofcolonization to the western part of the Cuyabeno Reserve. Thus, when the Reserve wascreated in 1979 many colonists were already living throughout the region. At that time,Ecuadorian officials failed to address the emerging land ownership and colonizationproblems (Little, 2001). By 1985, a census carried out in the region revealed approximately1000 colonist families living within the Cuyabeno Reserve, and principally engaged insubsistence agriculture, land speculation, and logging (Coello-Hinojosa, 1992). By 2002, anestimated 4500 families were living in the contested area (Araya & Peters, 2000).
According to Little (2001, p. 154), ‘‘the western portion of the Reserve became thecentral battleground between two competing cosmographies and the territories theyengendered: a developmentalist front advancing from the west and an environmentalistfront resisting the invasion from the east’’. On one side, the oil industry, supported by theEcuadorian Petroleum Agency—CEPE (now Petroecuador) and several international oilcompanies, generated considerable direct environmental damage, including oil spills, andindirect effects through the expansion of roads, pipelines, and oil camps, all of whichfacilitated the settlement of spontaneous colonists into what now is the Cuyabenopatrimony forests. Conversely, the Ecuadorian Institute of Forestry and Protected Areas—INEFAN (now the Ministry of Environment), conservation organizations, touristcompanies, and indigenous communities tried to preserve the integrity of the Cuyabeno
ARTICLE IN PRESSJ.P. Messina et al. / Applied Geography 26 (2006) 113–128116
Reserve. The institutional changes, in the form of changes in land tenure regimes andboundaries, are the result of the struggle between the advance of the agricultural frontierpushed by exogenous factors and the responses from governmental and non-governmentalconservationist groups working in the area.As a direct result of these conflicts, the Cuyabeno extension was modified twice: first, in
1991 when the ecosystems of the lower Aguarico River basin were added, enlarging theReserve to 655,760 ha. The expansion of the Reserve was made to protect rare lakeecosystems including Imuya and Zancudococha and several other lakes that are part of theLagartococha River Basin. The expansion included territories of the Cofan Community ofZabalo and the Quichua community of Zancudo, and also accelerated the development oftourism in the area. After several years of failed negotiations between colonists livinginside of the Cuyabeno Reserve and government authorities, INEFAN, in 1993,unilaterally converted farms within the Reserve into Patrimonio Forestal (PatrimonyForest), which granted colonist pre-cooperatives communal title over the lands. Formally,colonists were given communal titles by the Ecuadorian government, however, colonists inthe Ecuadorian Amazon traditionally have not worked within communities and in practicecommunal title does not directly imply productive communal activities or organization.This second modification to the Cuyabeno Reserve converted 52,401 ha of Reserve intoPatrimony Forest leaving the Cuyabeno Reserve with the reduced area of 603,359 ha.Patrimony forest status limits extractive activities, but farming and timber extraction areallowed within strict environmental constraints. The most important unique characteristicof patrimony forestlands is that these lands cannot be privately owned and cannot be soldon the open market. These restrictions have basic social organization implications. Themost significant being that the communal lands force landscape organization strategiesthat differ from the privately owned farm system characteristics of the colonization areascommon throughout the Northern Ecuadorian Amazon.Colonists criticized this action and argued that: (1) some colonists were already living in
the area when the Cuyabeno Reserve was created and those that settled later were given noindication of the existence of protected areas, and, therefore, settlers have rights over theland, (2) although settlers are not as destructive as oil companies, the oil companies areallowed to perform exploratory activities within the Cuyabeno Reserve, and (3) in 25 yearsof colonization, 15–30% of the colonized area has been deforested and the remainder offorest lands can be effectively managed (Little, 2001). Various peasants’ organizations,local and national politicians, and some non-governmental organizations supported thesecolonist claims. By 1999, the colonists agreed with the Ministry of the Environment thatthe government should seek reforms to the Forestry Law and allow the transformation ofcommunal land titles into individual properties to be used within a management plan(Araya & Peters, 2000).Several factors contributed to LUCC (e.g., deforestation, agricultural extensification,
secondary forest succession, and community formation and incipient urbanization) in andaround the Cuyabeno Wildlife Reserve. For instance, the improvement and expansion ofthe road network through infrastructure development and oil exploration and productionaffects the geographic accessibility within the region and the connections of people to nearand distant places (Pan et al., 2004). However, changes in land tenancy, particularlyaround protected areas, can also affect LUCC changes by imposing restrictions on landuse rights that further influence the direct and indirect processes of land change byretarding development in ecologically sensitive environments (Hansen, Defries, & Turner,
ARTICLE IN PRESSJ.P. Messina et al. / Applied Geography 26 (2006) 113–128 117
2004). In this setting, the creation of the Patrimony Forest land use category,establishment of protection buffers, and development of land tenancy policies combinedto reduce the rate, intensity, pattern, and areal extent of deforestation and forestfragmentation patterns throughout the region, but, most specifically, in and around theCuyabeno Wildlife Reserve (see e.g. Walsh & Crews-Meyer, 2002).
We hypothesize that the dismemberment of the Cuyabeno Reserve (1993), whichincluded a change in land tenancy status from ‘‘protected area’’ (non-agriculturalactivities) to ‘‘patrimony forest’’ (communal agricultural activities) increased the process ofdeforestation and fragmentation in the patrimony forest area. Further, comparisonsbetween areas with communal ownership (patrimony forest) with areas with privateownership (areas outside of patrimony forest and outside of the Reserve) revealsdifferences in landscape class structure, spatial configuration, and rates of change. Finally,the creation of buffer areas will, over time, decrease the connectivity of the ‘‘neck’’ (theregion first retitled as Patrimony Forest) within the greater ecosystem, leading to theisolation of the Reserve.
Methods
Data
Profors (Sucumbios Forestry Program), a program sponsored by the German Agency ofInternational Cooperation—GTZ (Deutsche Gesellschaft fur Technische Zusammenar-beit) and INEFAN, provided advisory services in the fields of agroforestry, forestry, andnature conservation in the Sucumbios Province. Profors mapped the Legal Status of Landsin the Northern Ecuadorian Amazon (PROFORS, 1993), which identifies protected areas,patrimony forest, indigenous territories, colonization areas, and other areas under legalconflict. For this study, the Profors map (1:250,000 scale) was enhanced using moredetailed maps of the Ecuadorian System of Protected Areas from the Ecuadorian Ministryof Environment and verified using the Official Registry of the Ecuadorian NationalCongress. The Profors map was digitized by the Spatial Analysis Unit of the CarolinaPopulation Center and edited using the detailed boundary maps of the Cuyabeno Reserve.Although the Profors map constitutes a unique tool in understanding the spatial aspectsrelated to land tenancy, it is limited by the dynamic nature of the relationships amonginstitutions engaged within the region. For example, the relationships between protectedareas and colonist areas rapidly change through time, because of the intense immigrationinto the area. Fig. 1 shows the ‘‘Cuyabeno Ear’’, and includes the western portion ofthe Cuyabeno Wildlife Reserve, the Cuyabeno patrimony forest, and other legallydisputed areas.
The Cuyabeno Wildlife Reserve Boundary indicates the current status of the Reservelimits after its last modification in 1993. The areas under ‘‘patrimony forest’’ indicate landsthat were transformed in 1993 by INEFAN from Wildlife Production Reserve status topatrimony forest where agricultural and extractive activities are limited with communaltitles granted to farmers. Intensive Study Areas (ISA) that cover regions outside of theCuyabeno Reserve and the patrimony forest have been identified and compared. Theseareas comprise mostly colonist sectors, a few indigenous communities living outside of theReserve, and areas of oil infrastructure and towns.
ARTICLE IN PRESSJ.P. Messina et al. / Applied Geography 26 (2006) 113–128118
The scale, pattern, and process relationships of LUCC within the region were assessedusing the aforementioned map, a time-series of Landsat imagery, and pattern metrics. Theecological importance of not only the level of clearing by small farmers, but alsothe pattern of land transformations over time and space has been analyzed through studiesof forest fragmentation and patch dynamics (Walsh et al., 2003). Landscape ecology isrooted in the paradigm that the spatial pattern of a landscape strongly influences theecological characteristics of that landscape, and that the relationships between ecosystemsare interactive and dynamic (Risser, Karr, & Forman, 1984). A patch is defined as adiscrete area of relatively homogeneous environmental conditions where the patchboundaries are distinguished by discontinuities in environmental character from theirsurroundings. For example, a patch may be a contiguous agricultural field that iscomposed of multiple pixels. Classes are the combination of similar patches (i.e., allagriculture within some specified region or farm), whereas a landscape is composedof a mosaic of patches of similar and different types (e.g., agriculture and forest),associated with specific landscape delineations. Landscape metrics are commonlyused to quantify the spatial structure of the landscape matrix within the designatedlandscape boundaries by defining composition and spatial organization for specifictime periods and/or specific landscape strata. This analysis uses composition andpattern metrics to summarize land fragmentation and patch dynamics as aconsequence of deforestation and associated land management practices along anested spatial hierarchy in which biophysical, social, and geographic factors areintegrated.
Image processing
Three Landsat scenes (Path 9, Row 60 of the World Reference System) were orderedfrom the Center for Global Change and Earth Observations at Michigan State University(www.landsat.org). The imagery was acquired on August 23, 1986 (Thematic Mapper);October 21, 1996 (Thematic Mapper); and October 14, 2002 (Enhanced ThematicMapper). A series of processing steps were taken to normalize sensor collection errors andatmospheric effects for each image in the time-series. Radiometric correction requires theconversion of the digital numbers (DN) of the image to radiance values (Eq. (1)) toreflectance values at the top of atmosphere (TOA) (Eq. (2)) (NASA):
Ll ¼Lmax l � Lmin l
Qcalmax �Qcalmin
� �ðQcal�QcalminÞ þ Lmin l, (1)
where Ll is the spectral radiance at the sensor’s aperture, Lmax l the spectral radiance thatis scaled to Qcalmax, Lmin l the spectral radiance that is scaled to Qcalmin, Qcal thequantized calibrated pixel value or DN, Qcalmax the maximum quantized calibrated pixelvalue, and Qcalmin minimum quantized calibrated pixel value:
rp ¼pLld
2
Esun l cos Ys
� �, (2)
where rp is the planetary reflectance, Ll the spectral radiance at the sensor’s aperture, d theearth–sun distance in astronomical units, Esun l the mean solar exoatmospheric irradiances,cosYs the solar zenith angle. After the images were converted to TOA reflectance values, aSimulation of the Satellite Signal in the Solar Spectrum (5S) atmospheric correction (Tanre
ARTICLE IN PRESSJ.P. Messina et al. / Applied Geography 26 (2006) 113–128 119
et al., 1990) was applied to remove the effects of the atmosphere on the signal and to bringthe pixel values to surface reflectance values. A model was constructed by using a linearregression model of the corresponding r and rp values as follows:
r ¼ f ðrp; atmospheric conditionsÞ, (3)
where rp is the planetary reflectance and r the surface reflectance.Geometric corrections were performed using ERDAS Imagine software, a ground
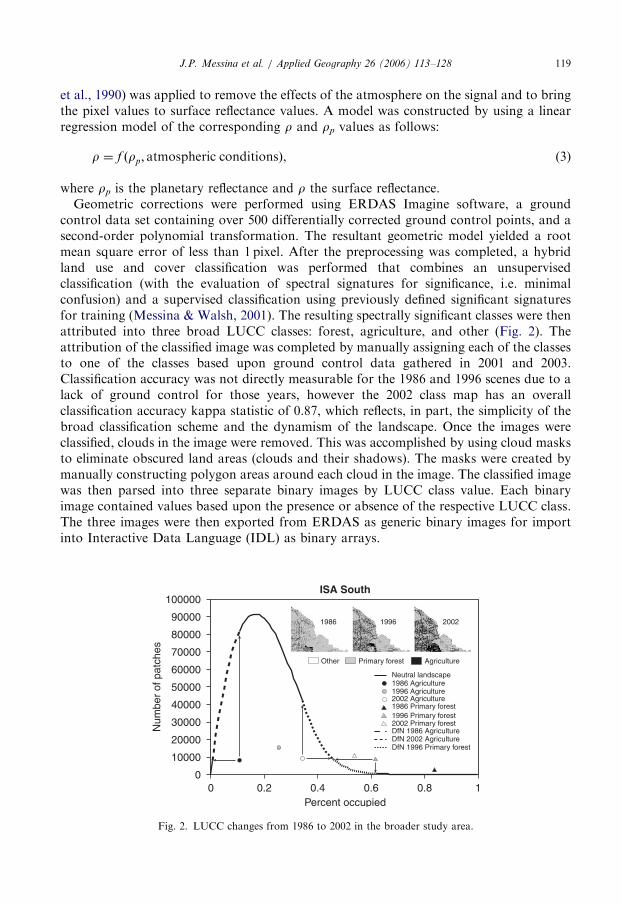
control data set containing over 500 differentially corrected ground control points, and asecond-order polynomial transformation. The resultant geometric model yielded a rootmean square error of less than 1 pixel. After the preprocessing was completed, a hybridland use and cover classification was performed that combines an unsupervisedclassification (with the evaluation of spectral signatures for significance, i.e. minimalconfusion) and a supervised classification using previously defined significant signaturesfor training (Messina & Walsh, 2001). The resulting spectrally significant classes were thenattributed into three broad LUCC classes: forest, agriculture, and other (Fig. 2). Theattribution of the classified image was completed by manually assigning each of the classesto one of the classes based upon ground control data gathered in 2001 and 2003.Classification accuracy was not directly measurable for the 1986 and 1996 scenes due to alack of ground control for those years, however the 2002 class map has an overallclassification accuracy kappa statistic of 0.87, which reflects, in part, the simplicity of thebroad classification scheme and the dynamism of the landscape. Once the images wereclassified, clouds in the image were removed. This was accomplished by using cloud masksto eliminate obscured land areas (clouds and their shadows). The masks were created bymanually constructing polygon areas around each cloud in the image. The classified imagewas then parsed into three separate binary images by LUCC class value. Each binaryimage contained values based upon the presence or absence of the respective LUCC class.The three images were then exported from ERDAS as generic binary images for importinto Interactive Data Language (IDL) as binary arrays.
100000
90000
80000
70000
60000
50000
40000
30000
20000
10000
00 0.2 0.4 0.6 0.8 1
Percent occupied
Num
ber
of p
atch
es
1996 20021986
Other Primary forest Agriculture
ISA South
1986 Agriculture1996 Agriculture2002 Agriculture1986 Primary forest1996 Primary forest2002 Primary forestDfN 1986 AgricultureDfN 2002 AgricultureDfN 1996 Primary forest
Neutral landscape
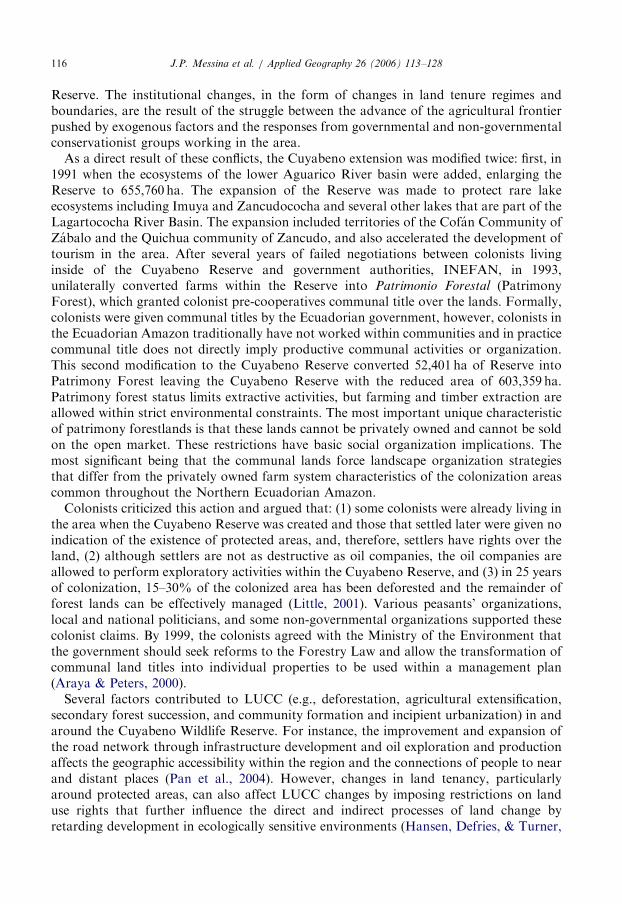
Fig. 2. LUCC changes from 1986 to 2002 in the broader study area.
ARTICLE IN PRESSJ.P. Messina et al. / Applied Geography 26 (2006) 113–128120
Spatial metrics and neutral models
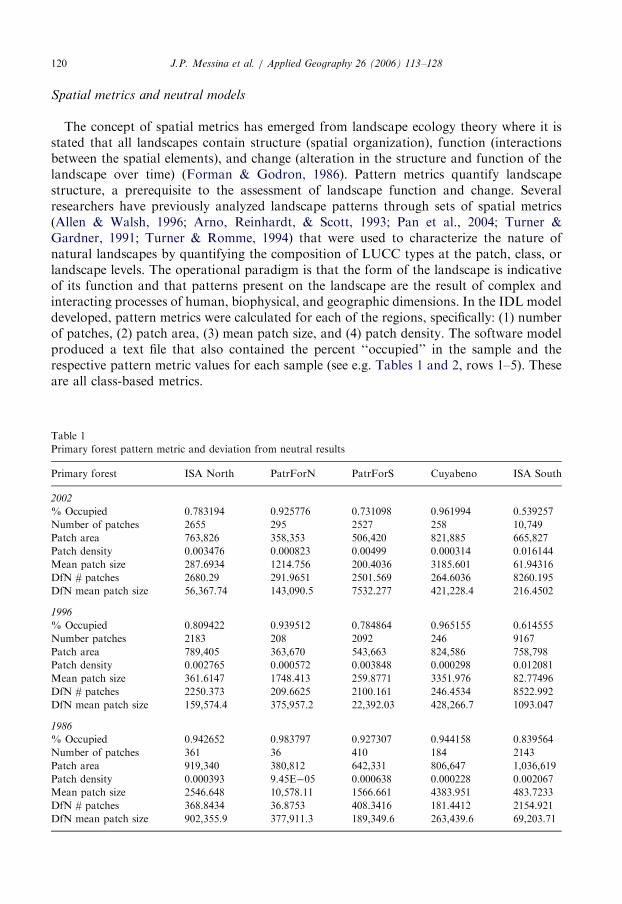
The concept of spatial metrics has emerged from landscape ecology theory where it isstated that all landscapes contain structure (spatial organization), function (interactionsbetween the spatial elements), and change (alteration in the structure and function of thelandscape over time) (Forman & Godron, 1986). Pattern metrics quantify landscapestructure, a prerequisite to the assessment of landscape function and change. Severalresearchers have previously analyzed landscape patterns through sets of spatial metrics(Allen & Walsh, 1996; Arno, Reinhardt, & Scott, 1993; Pan et al., 2004; Turner &Gardner, 1991; Turner & Romme, 1994) that were used to characterize the nature ofnatural landscapes by quantifying the composition of LUCC types at the patch, class, orlandscape levels. The operational paradigm is that the form of the landscape is indicativeof its function and that patterns present on the landscape are the result of complex andinteracting processes of human, biophysical, and geographic dimensions. In the IDL modeldeveloped, pattern metrics were calculated for each of the regions, specifically: (1) numberof patches, (2) patch area, (3) mean patch size, and (4) patch density. The software modelproduced a text file that also contained the percent ‘‘occupied’’ in the sample and therespective pattern metric values for each sample (see e.g. Tables 1 and 2, rows 1–5). Theseare all class-based metrics.
Table 1
Primary forest pattern metric and deviation from neutral results
Primary forest ISA North PatrForN PatrForS Cuyabeno ISA South
2002
% Occupied 0.783194 0.925776 0.731098 0.961994 0.539257
Number of patches 2655 295 2527 258 10,749
Patch area 763,826 358,353 506,420 821,885 665,827
Patch density 0.003476 0.000823 0.00499 0.000314 0.016144
Mean patch size 287.6934 1214.756 200.4036 3185.601 61.94316
DfN # patches 2680.29 291.9651 2501.569 264.6036 8260.195
DfN mean patch size 56,367.74 143,090.5 7532.277 421,228.4 216.4502
1996
% Occupied 0.809422 0.939512 0.784864 0.965155 0.614555
Number patches 2183 208 2092 246 9167
Patch area 789,405 363,670 543,663 824,586 758,798
Patch density 0.002765 0.000572 0.003848 0.000298 0.012081
Mean patch size 361.6147 1748.413 259.8771 3351.976 82.77496
DfN # patches 2250.373 209.6625 2100.161 246.4534 8522.992
DfN mean patch size 159,574.4 375,957.2 22,392.03 428,266.7 1093.047
1986
% Occupied 0.942652 0.983797 0.927307 0.944158 0.839564
Number of patches 361 36 410 184 2143
Patch area 919,340 380,812 642,331 806,647 1,036,619
Patch density 0.000393 9.45E�05 0.000638 0.000228 0.002067
Mean patch size 2546.648 10,578.11 1566.661 4383.951 483.7233
DfN # patches 368.8434 36.8753 408.3416 181.4412 2154.921
DfN mean patch size 902,355.9 377,911.3 189,349.6 263,439.6 69,203.71
ARTICLE IN PRESS
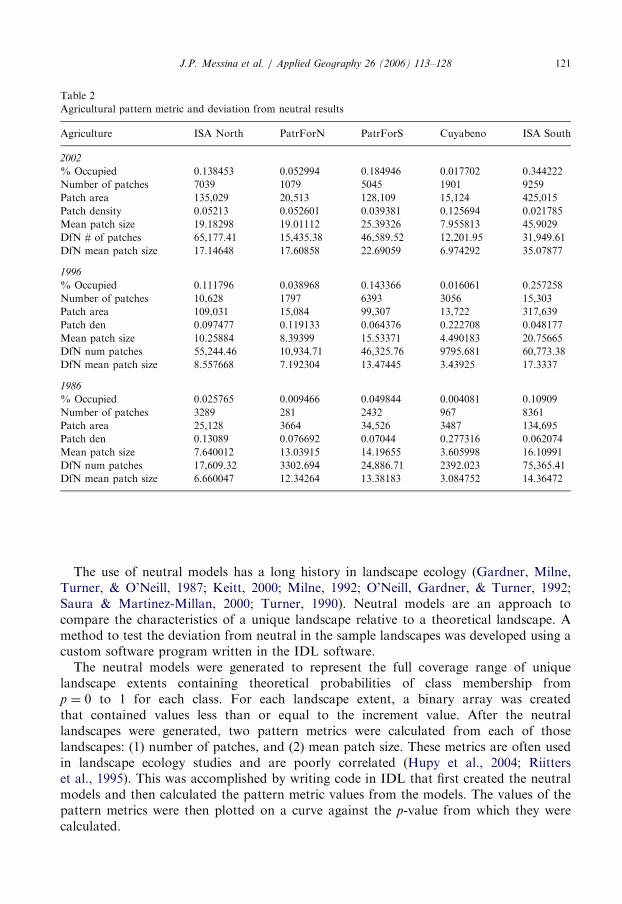
Table 2
Agricultural pattern metric and deviation from neutral results
Agriculture ISA North PatrForN PatrForS Cuyabeno ISA South
2002
% Occupied 0.138453 0.052994 0.184946 0.017702 0.344222
Number of patches 7039 1079 5045 1901 9259
Patch area 135,029 20,513 128,109 15,124 425,015
Patch density 0.05213 0.052601 0.039381 0.125694 0.021785
Mean patch size 19.18298 19.01112 25.39326 7.955813 45.9029
DfN # of patches 65,177.41 15,435.38 46,589.52 12,201.95 31,949.61
DfN mean patch size 17.14648 17.60858 22.69059 6.974292 35.07877
1996
% Occupied 0.111796 0.038968 0.143366 0.016061 0.257258
Number of patches 10,628 1797 6393 3056 15,303
Patch area 109,031 15,084 99,307 13,722 317,639
Patch den 0.097477 0.119133 0.064376 0.222708 0.048177
Mean patch size 10.25884 8.39399 15.53371 4.490183 20.75665
DfN num patches 55,244.46 10,934.71 46,325.76 9795.681 60,773.38
DfN mean patch size 8.557668 7.192304 13.47445 3.43925 17.3337
1986
% Occupied 0.025765 0.009466 0.049844 0.004081 0.10909
Number of patches 3289 281 2432 967 8361
Patch area 25,128 3664 34,526 3487 134,695
Patch den 0.13089 0.076692 0.07044 0.277316 0.062074
Mean patch size 7.640012 13.03915 14.19655 3.605998 16.10991
DfN num patches 17,609.32 3302.694 24,886.71 2392.023 75,365.41
DfN mean patch size 6.660047 12.34264 13.38183 3.084752 14.36472
J.P. Messina et al. / Applied Geography 26 (2006) 113–128 121
The use of neutral models has a long history in landscape ecology (Gardner, Milne,Turner, & O’Neill, 1987; Keitt, 2000; Milne, 1992; O’Neill, Gardner, & Turner, 1992;Saura & Martinez-Millan, 2000; Turner, 1990). Neutral models are an approach tocompare the characteristics of a unique landscape relative to a theoretical landscape. Amethod to test the deviation from neutral in the sample landscapes was developed using acustom software program written in the IDL software.
The neutral models were generated to represent the full coverage range of uniquelandscape extents containing theoretical probabilities of class membership fromp ¼ 0 to 1 for each class. For each landscape extent, a binary array was createdthat contained values less than or equal to the increment value. After the neutrallandscapes were generated, two pattern metrics were calculated from each of thoselandscapes: (1) number of patches, and (2) mean patch size. These metrics are often usedin landscape ecology studies and are poorly correlated (Hupy et al., 2004; Riitterset al., 1995). This was accomplished by writing code in IDL that first created the neutralmodels and then calculated the pattern metric values from the models. The values of thepattern metrics were then plotted on a curve against the p-value from which they werecalculated.
ARTICLE IN PRESS
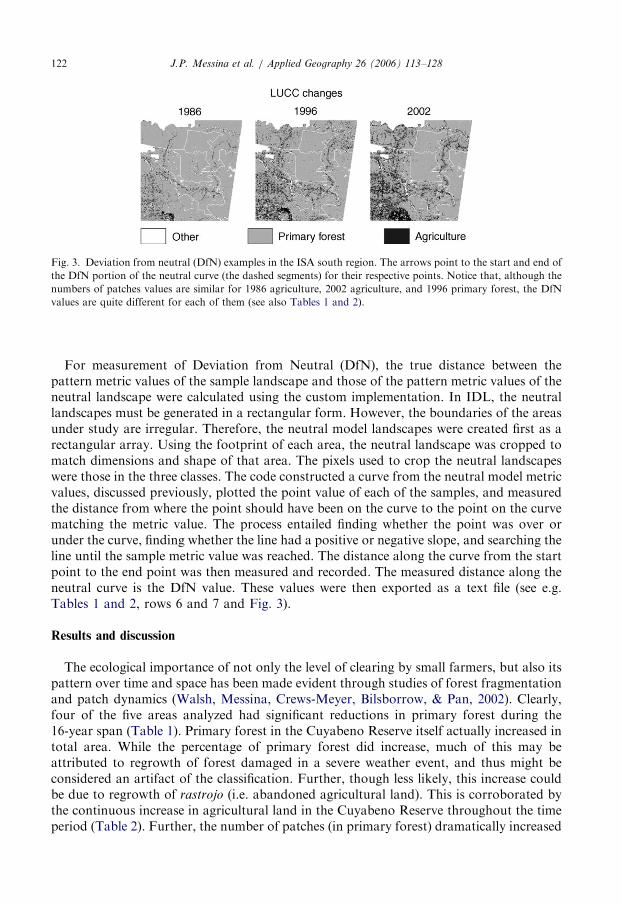
Fig. 3. Deviation from neutral (DfN) examples in the ISA south region. The arrows point to the start and end of
the DfN portion of the neutral curve (the dashed segments) for their respective points. Notice that, although the
numbers of patches values are similar for 1986 agriculture, 2002 agriculture, and 1996 primary forest, the DfN
values are quite different for each of them (see also Tables 1 and 2).
J.P. Messina et al. / Applied Geography 26 (2006) 113–128122
For measurement of Deviation from Neutral (DfN), the true distance between thepattern metric values of the sample landscape and those of the pattern metric values of theneutral landscape were calculated using the custom implementation. In IDL, the neutrallandscapes must be generated in a rectangular form. However, the boundaries of the areasunder study are irregular. Therefore, the neutral model landscapes were created first as arectangular array. Using the footprint of each area, the neutral landscape was cropped tomatch dimensions and shape of that area. The pixels used to crop the neutral landscapeswere those in the three classes. The code constructed a curve from the neutral model metricvalues, discussed previously, plotted the point value of each of the samples, and measuredthe distance from where the point should have been on the curve to the point on the curvematching the metric value. The process entailed finding whether the point was over orunder the curve, finding whether the line had a positive or negative slope, and searching theline until the sample metric value was reached. The distance along the curve from the startpoint to the end point was then measured and recorded. The measured distance along theneutral curve is the DfN value. These values were then exported as a text file (see e.g.Tables 1 and 2, rows 6 and 7 and Fig. 3).
Results and discussion
The ecological importance of not only the level of clearing by small farmers, but also itspattern over time and space has been made evident through studies of forest fragmentationand patch dynamics (Walsh, Messina, Crews-Meyer, Bilsborrow, & Pan, 2002). Clearly,four of the five areas analyzed had significant reductions in primary forest during the16-year span (Table 1). Primary forest in the Cuyabeno Reserve itself actually increased intotal area. While the percentage of primary forest did increase, much of this may beattributed to regrowth of forest damaged in a severe weather event, and thus might beconsidered an artifact of the classification. Further, though less likely, this increase couldbe due to regrowth of rastrojo (i.e. abandoned agricultural land). This is corroborated bythe continuous increase in agricultural land in the Cuyabeno Reserve throughout the timeperiod (Table 2). Further, the number of patches (in primary forest) dramatically increased
ARTICLE IN PRESSJ.P. Messina et al. / Applied Geography 26 (2006) 113–128 123
in each area and in each year. The Cuyabeno Reserve study area does show relativestability in terms of percentage primary forest, including some recovery between 1986 and1996. However within the Reserve, forest patch density increased, while mean patch sizedecreased indicating a continuous process of fragmentation. The patrimony forests in thenorth and south regions show different histories. The patrimony forest, south region showsa decrease in primary forest between 1986 and 1996 that was approximately 11.5% of thetotal patrimony forest area, and 5.3% between 1996 and 2002. While in the patrimonyforest, north region, the decrease of primary was lower, almost 3.6% between 1986 and2002 and 1.4% between 1996 and 2002. In terms of fragmentation, the patrimony forest,south region, also has larger relative decreases in the mean patch size and increases inpatch density than the patrimony forest, north region, further indicating both a fasterprocess of fragmentation in the south region as well as suggesting exogenous factorsinfluencing LUCC patterns. Agricultural land development increased in all areas during alltime periods. The ISA south region, in particular, experienced an early oil production area,has a well-developed road network, thereby predisposing the area towards agriculturalextensification and intensification. Further, the results show that there is a continuousprocess of deforestation, agricultural extensification, and fragmentation within the studyarea, especially in the southern portion of the patrimony forest. However, these results alsoshow that in relation to the larger area of colonization (ISA north and south regions), thepatrimony forest has lower amounts of landscape change, which suggests that thepatrimony forest did constrain the process of forest conversion. The differences betweenpatrimony forests in the north and south regions also indicate the complex nature of thefactors that drive deforestation in protected areas where land tenancy is just onecomponent.
There are several factors that contribute to deforestation and fragmentation patterns inand around the Cuyabeno Wildlife Reserve. This research infers that changes in landtenancy, the creation of patrimony forests, and the implementation of protection bufferswithin and around the Reserve have affected the processes of LUCC change in ways thatdiffer from those observed in other colonist areas in the Northern Ecuadorian Amazonand in other areas of the Cuyabeno Reserve that are more remote and still awaiting theclash of development vs. protection in this frontier environment. Development fronts, likethose seen here, focus LUCC change, town and infrastructure development, and placeconsiderable pressure on nearby protected areas and beyond. However, protected areascan decelerate LUCC change, alter trajectories of change in nearby areas, and shape landfragmentation patterns by serving as a development brake, buoyed by environmentalpolicies, in this case, associated with land tenancy, restrictions in land use rights,demarcation of protection buffers, and the designation of a forest category designed tocurtail and shape the agricultural frontier.
Methodologically, each of the images contained unique clouded areas that wereremoved during the image processing steps discussed earlier. As the clouds (and shadows)in each image make up a very small portion of the total area in the image, the differencesbetween the location and size of the clouds were originally considered negligible to theoutcome of the neutral model process. This theory was proven wrong, as the neutrallandscape curves, created uniquely for each year in the time series, varied significantly inthe ‘‘mean patch size’’ metric. The variation most often began near p40.85 as the numberof patches neared 1 and area included increased. Consider the problem, if 90% of the totalpixels are included in one patch, then the ‘‘mean patch size’’ metric result is equal to 90%
ARTICLE IN PRESSJ.P. Messina et al. / Applied Geography 26 (2006) 113–128124
of the total landscape area. However if that same 90% of the pixels are included in anotherrealization, but are separated into two patches, then the ‘‘mean patch size’’ metric result isonly 45% of the total image area. When the landscape area is large, as in this research, thenthis can result in dramatic differences in the DfN results. Since clouds were unique to eachimage, the p-value at which the neutral landscape (with clouded areas removed) reached alow number of patches varied. The unique locations of the clouded areas between yearscreated unique landscapes (and neutral model curves) that could not be compared to eachother. This problem was resolved by combining the clouded areas in all the images into onecloud mask and then removing all cloud pixels (from any year) from each of the images.This created a common landscape that was comparable across the time series andpermitted meaningful DfN calculations.The DfN metric illustrates unique complex relationships. For example, in the patrimony
forest, north region, the DfN values for primary forest change only slightly from 1986 to1996, but from 1996 to 2002, a significant change occurs. This is despite the relatively smallchange in percent occupied during the later period. The greater change in DfN in this casegenerates the additional hypothesis: forest in the later period (1996–2002) is undergoinggreater change in structure independently of the absolute change in percent forest. TheDfN metric is best applied in cases where the absolute values are similar and traditionalmetrics fail. For example, landscape structure between agricultural classes ISA north(1996) and ISA south (1986) regions show very similar percent occupied, but mostsignificantly different DfN results. DfN can also be used to describe the spatialcharacteristics of the landscape throughout the time series. The best example is found inthe agricultural classes throughout all the regions. As the amount of land under agricultureincreases (a human modification of the landscape), the DfN values for both number ofpatches and mean patch size increase for each time step (with few exceptions). An increasein DfN values means that a landscape is becoming less like a neutral landscape and moreordered in its spatial structure. In this case, the changes in DfN values show,quantitatively, that these regions have become more ordered (spatially) with theconversion of forest to agricultural land. The DfN metric makes it possible to infer howthese changes in the pattern metric values organize spatially on the landscape. In Fig. 3, theDfN variations from the traditional metrics are shown. The basic arrangement of thepoints, while quite noticeably different from the neutral line, parallels the non-linearity.
Conclusions
Governments in Amazon-basin countries have long promoted colonization of rainforestfrontier regions to relieve population pressures elsewhere, secure borders, increaseagricultural production, and defuse political problems. The underlying causes ofdeforestation or generally LUCC by migrant small farmers in the Ecuadorian Amazonare attributed to a combination of distal causes including national population growth,poverty, high unemployment, land tenure regimes, urban development policies, mechan-ization of agriculture, and globalization of markets (Bilsborrow, 1987; Walsh et al., 2002).Local or proximate forces of land transformation includes geographic accessibility offarms to other farms and local communities and regional market centers, resourceendowments, terrain settings, household characteristics, and labor availability. Thesefactors are among the forces that drive people to migrate to the frontier, and which affectlocal decisions of households that impact land use change patterns and future trajectories.
ARTICLE IN PRESSJ.P. Messina et al. / Applied Geography 26 (2006) 113–128 125
Specifically in the northern Ecuadorian Amazon, access was made initially possible bythe petroleum boom, beginning in the late 1960s. Once oil was discovered, oil companiesbuilt roads to lay pipelines, and along these roads came spontaneous colonists seeking landfor household farms. Deforestation and agricultural extensification of subsistence andcommercial crops followed. While there is no large-scale timber extraction in the region,much small-scale cutting of trees occurs on both settler plots and indigenous lands.Household farms are considered the central proximate cause of deforestation in theEcuadorian Amazon (Rudel & Horowitz, 1993). The usual sequence of land clearing is thatsettlers first convert small areas to food crops for subsistence, then cash crops, and finallypasture. While relatively rare in Ecuador, settlers may abandon land and move on to startnew farms elsewhere, but more commonly, farmers deforest new patches within their farmsto accommodate economic opportunities or kinship ties.
Pressure on the Cuyabeno has occurred as a consequence of the juxtaposition of a majorprotected area established within the context of on-going colonization, an improving andexpanding road network, the pull of in-migrants into the region to acquire land forhousehold farms, oil exploration and production in and around the Reserve, infrastructuredevelopment associated with towns and their links to other places, and more recentpolitical unrest in nearby areas. These results also show that in relation to the larger area ofcolonization, the patrimony forest has lesser degrees of landscape change, which suggeststhat the patrimony forest has, in some limited fashion, constrained the process of forestconversion. More importantly, the rate of change declined dramatically in the south regionpatrimony forest during the post-patrimony forest designation period. The differencesbetween patrimony forests, north and south regions, also indicates the complex nature ofthe factors that drive deforestation in protected areas where land tenancy is just onecomponent. Anecdotally, this disparity is likely influenced by instability in the northernpatrimony forest due to movement of guerrillas crossing the border between Colombiaand Ecuador.
The change of land tenancy status from protected area to patrimony forest, whichgranted communal formal titles to farmers, tried to solve the problem of colonization inthe Reserve. Clearly, there is a continuous process of deforestation and fragmentation inthe patrimony forests surrounding the ‘‘Ear’’ of the Cuyabeno Reserve, within the Reserveitself and throughout the ISAs. However, the rate of change within the patrimony forestsand the Reserve dramatically declined after the titling policy was implemented. Thisexogenous change does not directly imply or produce a modification in colonial behaviorin terms of communal activities. Traditionally, colonists in the Ecuadorian Amazon havemanaged their land as private property paying no attention to their perceived or actuallegal title. Landscape metrics and neutral models show that in the patrimony forest,although the degree of official protection decreased, the spatially explicit response wasconstrained. As a policy, with the goal of minimizing impacts by controlling deforestationand fragmentation on the Cuyabeno Reserve, the Patrimony Forest, was successful as abarrier to land transformation by deforestation and agricultural extensification. While theconflict between development and protection might never truly be solved in the CuyabenoReserve, this study contributes to the understanding of past and current situations thatfocus on landscape ecology issues and the interactions of people–policy–environment onLUCC change patterns in the ‘‘neck’’ of the Cuyabeno. The work helps to establish a baseline for subsequent studies of LUCC change around protected areas, where nationalpolicies have been created to stem the tide of development around areas of critical
ARTICLE IN PRESSJ.P. Messina et al. / Applied Geography 26 (2006) 113–128126
ecological significance. Further, the work suggests that despite the number of factors thatcontribute to deforestation in the Cuyabeno region, the designation of protected areas isan effective tool to attenuate the advance of the agricultural frontier, even in the case of theCuyabeno where the degree of protection changed throughout recent times toaccommodate new pressures on the land, and risks to the ecological integrity of theregion and the biodiversity of special places.
Acknowledgements
This work is based on projects of the Center for Global Change and Earth Observationsand the Department of Geography at Michigan State University and of the CarolinaPopulation Center and the Departments of Geography and Biostatistics at the Universityof North Carolina in Chapel Hill, in collaboration with EcoCiencia, in Quito, Ecuador.We are grateful to the US National Aeronautics and Space Administration (NASA)(NAG 5-12617, NCC5-295 and NCC5-699), the National Institutes of Health (NIH) (R01-HD38777-01), the Mellon Foundation, the Summit and Compton Foundations,PROFORS (funded by GTZ, the German foreign aid program); and to the Ministry ofEnvironment of Ecuador and the Petramaz project, and the Centro de Estudios dePoblacion y Desarrollo Social (CEPAR) in Quito. Finally, we greatly appreciate thehelpful suggestions and comments of the reviewers and Special Issue Organizer HariniNagendra.
References
Allen, T. R., & Walsh, S. J. (1996). Spatial and compositional structure of the alpine treeline ecotone.
Photogrammetric Engineering and Remote Sensing, 62(11), 1261–1268.
Araya, I., & Peters, H. (2000). Participacion de comunidades locales en la gestion de areas protegidas y sus zonas
de apoyo: Primeros pasos en la formacion de un comite de manejo compartido en la Reserva de Produccion
Faunıstica Cuyabeno, Amazonıa Ecuatoriana. In Annual meeting of the Latin America Studies Association,
Miami, FL.
Arno, S. F., Reinhardt, E. D., & Scott, J. H. (1993). Forest structure and landscape patterns in the subalpine
lodgepole pine type: A procedure for quantifying past and present conditions. General Technical Report
INT-294, USDA Forest Service, Intermountain Research Station, 17pp.
Balslev, H., Valencia, R., Paz y Mino, G., Christensen, H., & Nielsen, I. (1998). Species count of vascular plants in
one hectare of humid lowland forest in Amazonian Ecuador. In F. Dallmeier, & J. A. Comiskey (Eds.), Forest
biodiversity in north, central and south America, and the Caribbean (pp. 585–594). Paris: UNESCO.
Bilsborrow, R. E. (1987). Population pressure and agricultural development in developing countries: A conceptual
framework and recent evidence. World Development, 15(2), 183–203.
Coello-Hinojosa, F. (1992). The Cuyabeno Wildlife Production Reserve: Human needs and natural resource
conservation in the Ecuadorian Amazon. In K. H. Redford, & C. Padoch (Eds.), Conservation of neotropical
forests. New York: Columbia University Press.
Forman, R. T. T., & Godron, M. (1986). Landscape ecology. New York: Wiley 619pp.
Gardner, R. H., Milne, B. T., Turner, M. G., & O’Neill, R. V. (1987). Neutral models for the analysis of broad-
scale landscape pattern. Landscape Ecology, 1(1), 19–28.
Hansen, A. J., Defries, R. S., & Turner, W. (2004). Land use change and biodiversity. In G. Gutman, et al. (Eds.),
Land change science: Observing, monitoring and understanding trajectories of change on the earth’s surface
(pp. 277–299). Boston: Kluwer Academic Publishers.
Holt, F. L., Bilsborrow, R. E., & Ona, A. (2004). Demography, household economics, and land and resource use of
five indigenous populations in the northern Ecuadorian Amazon: A summary of ethnographic research. Carolina
Population Center Occasional Paper.
ARTICLE IN PRESSJ.P. Messina et al. / Applied Geography 26 (2006) 113–128 127
Hupy, C. M., Schaetzl, R. J., Messina, J. P., Hupy, J. P., Delamater, P., Enander, H., et al. (2004). Complexity of
different, recently deglaciated soil landscapes as a function of map scale. Geoderma, 123, 115–130.
Keitt, T. H. (2000). Spectral representation of neutral landscapes. Landscape Ecology, 15, 479–493.
Kimerling, J. (1990). Disregarding environmental law: Petroleum development in protected natural areas and
indigenous homelands in the Ecuadorian Amazon. Hastings International Comparative Law Review, 14,
849–903.
Little, P. E. (2001). Amazonia: Territorial struggles on perennial frontiers. Baltimore, MD: The Johns Hopkins
University Press.
Messina, J. P., & Walsh, S. J. (2001). 2.5D morphogenesis: Modeling landuse and landcover dynamics in the
Ecuadorian Amazon. Plant Ecology, 156(1), 75–88.
Milne, B. T. (1992). Spatial aggregation and neutral models in fractal landscapes. American Naturalist, 139(1),
32–57.
NASA. Landsat 7 science data users handbook.
Nations, J. D., & Coello-Hinojosa, F. (1989). Cuyabeno Wildlife Production Reserve. In J. O. Browder (Ed.),
Fragile lands of Latin America. Boulder, CO: Westview Press.
O’Neill, R. V., Gardner, R. H., & Turner, M. G. (1992). A hierarchical neutral model for landscape analysis.
Landscape Ecology, 7(1), 55–61.
Pan, W. K. Y., Walsh, S. J., Bilsborrow, R. E., Frizzelle, B. G., Erlien, C. M., & Baquero, F. D. (2004). Farm-
level models of spatial patterns of land use and land cover dynamics in the Ecuadorian Amazon. Agriculture,
Ecosystems, and Environment, 101, 117–134.
Peres, C. A., & Zimmerman, B. (2001). Perils in parks or parks in peril? Reconciling conservation in Amazonian
Reserves with and without use. Conservation Biology, 15, 793–797.
PROFORS (1993). Northern Ecuadorian Amazon Map: Legal Status of Land. Scale 1:250,000. Programa
Forestal Sucumbios (PROFORS), German Aid Agency (GTZ), Instituto Ecuatoriano Forestal y de Areas
Naturales y Vida Silvestre (INEFAN), Instituto Geografico Militar (IGM). Updated in 1996. Quito, Ecuador.
Risser, P. G., Karr, J. R., & Forman, R. T. T. (1984). Landscape ecology: Directions and approaches. Special
Publication 2, Illinois Natural History Survey, Champaign, 18pp.
Riitters, K. H., O’Neill, R. V., Hunsaker, C. T., Wickham, J. D., Yankee, D. H., Timmins, S. P., et al. (1995).
A factor analysis of landscape pattern and structure metrics. Landscape Ecology, 10, 23–29.
Rudel, T., & Horowitz, B. (1993). Tropical deforestation: Small farmers and forest clearing in the Ecuadorian
Amazon. New York: Columbia University Press.
Saura, S., & Martinez-Millan, J. (2000). Landscape patterns simulation with a modified random clusters method.
Landscape Ecology, 15, 661–678.
Schwartzman, S., Moreira, A., & Nepstad, D. (2000). Rethinking tropical forest conservation: Perils in parks.
Conservation Biology, 14, 1351–1357.
Tanre, D., Deroo, C., Duhaut, P., Herman, M., Morcrette, J. J., Perbos, J., et al. (1990). Description of a
computer code to simulate the satellite signal in the solar spectrum: The 5S code. International Journal of
Remote Sensing, 11(4), 659–668.
Terborgh, J. (1999). Requiem for nature. Washington, DC: Island Press.
Turner, M. G. (1990). Spatial and temporal analysis of landscape patterns. Landscape Ecology, 4(1), 21–30.
Turner, M. G., & Gardner, R. H. (Eds.). (1991). Quantitative methods in landscape ecology. New York: Springer.
Turner, M. G., & Romme, W. H. (1994). Landscape dynamics in crown fire ecosystems. Landscape Ecology, 9(1),
59–77.
Valencia, R., Balslev, H., & Paz y Mino, G. (1994). High tree alpha-diversity in Amazonian Ecuador. Biodiversity
and Conservation, 3, 21–28.
Vickers, W. T. (1993). Changing tropical forest resource management strategies among the Siona and Secoya
Indians. In C. M. Hladik, A. Hladik, O. F. Linares, H. Pagezy, A. Semple, & A. Hadley (Eds.), Tropical
forests, people and food: Biocultural interactions and applications to development (pp. 463–477). Paris:
UNESCO.
Vickers, W.T., & Plowman, T. (1984). Useful plants of the Siona and Secoya Indians of eastern Ecuador.
Fieldiana: Botany, Vol. 15, Publication #1356, Chicago, IL, 63pp.
Walsh, S. J., Bilsborrow, R. E., McGregor, S. J., Frizzelle, B. G., Messina, J. P., Pan, W. K. T., et al. (2003).
Integration of longitudinal surveys, remote sensing time-series, and spatial analyses: Approaches for linking
people and place. In J. Fox, R. R. Rindfuss, S. J. Walsh, & V. Mishra (Eds.), People and the environment:
Approaches for linking household and community surveys to remote sensing and GIS (pp. 91–130). Boston:
Kluwer Academic Publishers.
ARTICLE IN PRESSJ.P. Messina et al. / Applied Geography 26 (2006) 113–128128
Walsh, S. J., & Crews-Meyer, K. A. (Eds.). (2002). Linking people, place, and policy: A GIScience approach
(p. 341). Boston: Kluwer Academic Publishers.
Walsh, S. J., Messina, J. P., Crews-Meyer, K. A., Bilsborrow, R. E., & Pan, W. (2002). Characterizing and
modeling patterns of deforestation and agricultural extensification in the Ecuadorian Amazon. In S. J. Walsh,
& K. A. Crews-Meyer (Eds.), Linking people, place, and policy: A GIScience approach (pp. 187–214). Boston:
Kluwer Academic Publishers.
World Resource Institute. (2003). Earth trends: Biodiversity and protected areas—Ecuador country profile.