lampiran data main test uji validitas dan
TRANSCRIPT
123
LAMPIRAN
DATA MAIN TEST
UJI VALIDITAS DAN RELIABILITAS
Estimates (Group number 1 - Default model)
Scalar Estimates (Group number 1 - Default model)
Maximum Likelihood Estimates
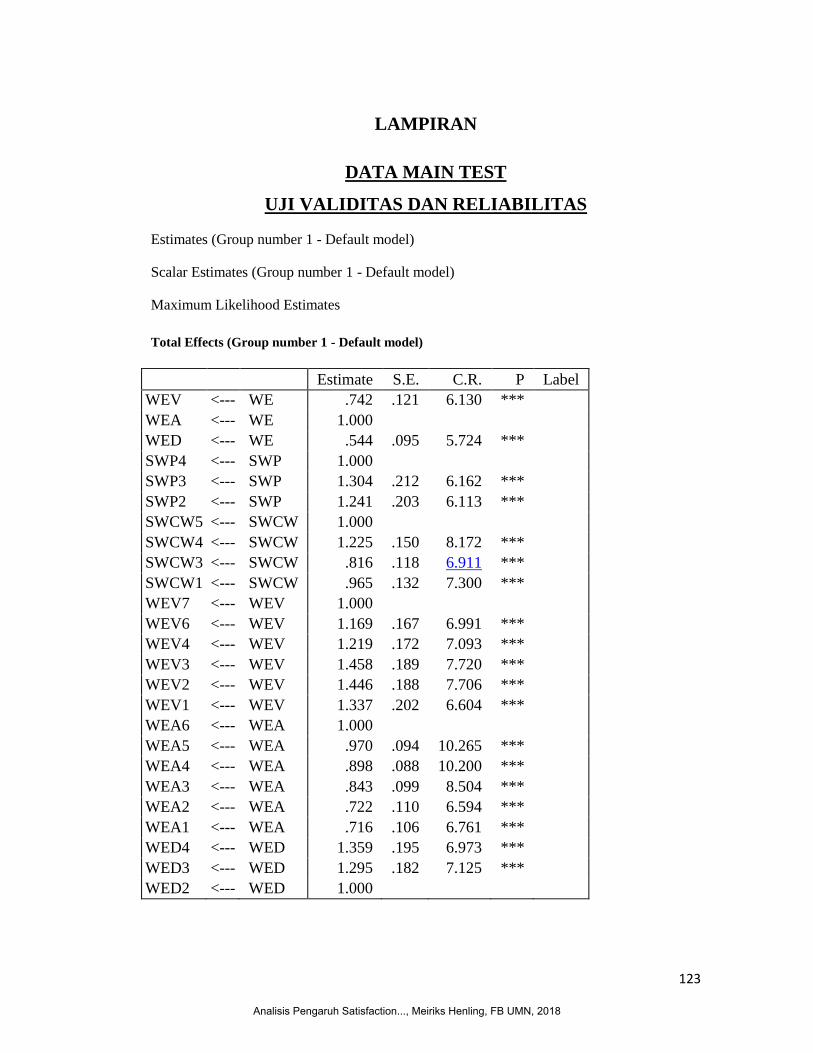
Total Effects (Group number 1 - Default model)
Estimate S.E. C.R. P Label
WEV <--- WE .742 .121 6.130 ***
WEA <--- WE 1.000
WED <--- WE .544 .095 5.724 ***
SWP4 <--- SWP 1.000
SWP3 <--- SWP 1.304 .212 6.162 ***
SWP2 <--- SWP 1.241 .203 6.113 ***
SWCW5 <--- SWCW 1.000
SWCW4 <--- SWCW 1.225 .150 8.172 ***
SWCW3 <--- SWCW .816 .118 6.911 ***
SWCW1 <--- SWCW .965 .132 7.300 ***
WEV7 <--- WEV 1.000
WEV6 <--- WEV 1.169 .167 6.991 ***
WEV4 <--- WEV 1.219 .172 7.093 ***
WEV3 <--- WEV 1.458 .189 7.720 ***
WEV2 <--- WEV 1.446 .188 7.706 ***
WEV1 <--- WEV 1.337 .202 6.604 ***
WEA6 <--- WEA 1.000
WEA5 <--- WEA .970 .094 10.265 ***
WEA4 <--- WEA .898 .088 10.200 ***
WEA3 <--- WEA .843 .099 8.504 ***
WEA2 <--- WEA .722 .110 6.594 ***
WEA1 <--- WEA .716 .106 6.761 ***
WED4 <--- WED 1.359 .195 6.973 ***
WED3 <--- WED 1.295 .182 7.125 ***
WED2 <--- WED 1.000
Analisis Pengaruh Satisfaction..., Meiriks Henling, FB UMN, 2018

124
Standardized Regression Weights: (Group number 1 - Default model)
Estimate
WEV <--- WE .937
WEA <--- WE .858
WED <--- WE .752
SWP4 <--- SWP .604
SWP3 <--- SWP .776
SWP2 <--- SWP .734
SWCW5 <--- SWCW .743
SWCW4 <--- SWCW .782
SWCW3 <--- SWCW .636
SWCW1 <--- SWCW .675
WEV7 <--- WEV .611
WEV6 <--- WEV .708
WEV4 <--- WEV .723
WEV3 <--- WEV .818
WEV2 <--- WEV .815
WEV1 <--- WEV .656
WEA6 <--- WEA .748
WEA5 <--- WEA .842
WEA4 <--- WEA .837
WEA3 <--- WEA .707
WEA2 <--- WEA .557
WEA1 <--- WEA .570
WED4 <--- WED .745
WED3 <--- WED .780
WED2 <--- WED .650
Covariances: (Group number 1 - Default model)
Estimate S.E. C.R. P Label
SWP <--> SWCW .135 .042 3.199 .001
SWP <--> WE .187 .048 3.894 ***
SWCW <--> WE .263 .061 4.310 ***
Correlations: (Group number 1 - Default model)
Analisis Pengaruh Satisfaction..., Meiriks Henling, FB UMN, 2018

125
Estimate
SWP <--> SWCW .393
SWP <--> WE .540
SWCW <--> WE .551
Variances: (Group number 1 - Default model)
Estimate S.E. C.R. P Label
SWP
.248 .070 3.556 ***
SWCW
.472 .099 4.779 ***
WE
.483 .112 4.311 ***
e28
.037 .022 1.650 .099
e29
.110 .033 3.337 ***
e30
.173 .052 3.310 ***
e1
.430 .060 7.136 ***
e2
.278 .060 4.658 ***
e3
.328 .060 5.462 ***
e4
.383 .062 6.209 ***
e5
.449 .081 5.567 ***
e6
.463 .063 7.302 ***
e8
.527 .075 6.997 ***
e9
.508 .063 8.031 ***
e10
.411 .054 7.653 ***
e12
.412 .054 7.573 ***
e13
.319 .048 6.710 ***
e14
.319 .047 6.742 ***
e15
.717 .091 7.884 ***
e16
.515 .070 7.406 ***
e17
.253 .040 6.321 ***
e18
.227 .035 6.412 ***
e19
.467 .061 7.662 ***
e20
.761 .093 8.166 ***
e21
.698 .086 8.137 ***
e24
.373 .062 6.016 ***
e25
.273 .050 5.416 ***
e26
.346 .049 7.118 ***
Matrices (Group number 1 - Default model)
Total Effects (Group number 1 - Default model)
Analisis Pengaruh Satisfaction..., Meiriks Henling, FB UMN, 2018

126
WE SWCW SWP WED WEA WEV
WED .544 .000 .000 .000 .000 .000
WEA 1.000 .000 .000 .000 .000 .000
WEV .742 .000 .000 .000 .000 .000
WED2 .544 .000 .000 1.000 .000 .000
WED3 .705 .000 .000 1.295 .000 .000
WED4 .739 .000 .000 1.359 .000 .000
WEA1 .716 .000 .000 .000 .716 .000
WEA2 .722 .000 .000 .000 .722 .000
WEA3 .843 .000 .000 .000 .843 .000
WEA4 .898 .000 .000 .000 .898 .000
WEA5 .970 .000 .000 .000 .970 .000
WEA6 1.000 .000 .000 .000 1.000 .000
WEV1 .992 .000 .000 .000 .000 1.337
WEV2 1.073 .000 .000 .000 .000 1.446
WEV3 1.082 .000 .000 .000 .000 1.458
WEV4 .904 .000 .000 .000 .000 1.219
WEV6 .867 .000 .000 .000 .000 1.169
WEV7 .742 .000 .000 .000 .000 1.000
SWCW1 .000 .965 .000 .000 .000 .000
SWCW3 .000 .816 .000 .000 .000 .000
SWCW4 .000 1.225 .000 .000 .000 .000
SWCW5 .000 1.000 .000 .000 .000 .000
SWP2 .000 .000 1.241 .000 .000 .000
SWP3 .000 .000 1.304 .000 .000 .000
SWP4 .000 .000 1.000 .000 .000 .000
Standardized Total Effects (Group number 1 - Default model)
WE SWCW SWP WED WEA WEV
WED .752 .000 .000 .000 .000 .000
WEA .858 .000 .000 .000 .000 .000
WEV .937 .000 .000 .000 .000 .000
WED2 .489 .000 .000 .650 .000 .000
WED3 .587 .000 .000 .780 .000 .000
WED4 .561 .000 .000 .745 .000 .000
WEA1 .489 .000 .000 .000 .570 .000
WEA2 .478 .000 .000 .000 .557 .000
WEA3 .606 .000 .000 .000 .707 .000
Analisis Pengaruh Satisfaction..., Meiriks Henling, FB UMN, 2018

127
WE SWCW SWP WED WEA WEV
WEA4 .718 .000 .000 .000 .837 .000
WEA5 .722 .000 .000 .000 .842 .000
WEA6 .642 .000 .000 .000 .748 .000
WEV1 .615 .000 .000 .000 .000 .656
WEV2 .764 .000 .000 .000 .000 .815
WEV3 .766 .000 .000 .000 .000 .818
WEV4 .677 .000 .000 .000 .000 .723
WEV6 .664 .000 .000 .000 .000 .708
WEV7 .573 .000 .000 .000 .000 .611
SWCW1 .000 .675 .000 .000 .000 .000
SWCW3 .000 .636 .000 .000 .000 .000
SWCW4 .000 .782 .000 .000 .000 .000
SWCW5 .000 .743 .000 .000 .000 .000
SWP2 .000 .000 .734 .000 .000 .000
SWP3 .000 .000 .776 .000 .000 .000
SWP4 .000 .000 .604 .000 .000 .000
Direct Effects (Group number 1 - Default model)
WE SWCW SWP WED WEA WEV
WED .544 .000 .000 .000 .000 .000
WEA 1.000 .000 .000 .000 .000 .000
WEV .742 .000 .000 .000 .000 .000
WED2 .000 .000 .000 1.000 .000 .000
WED3 .000 .000 .000 1.295 .000 .000
WED4 .000 .000 .000 1.359 .000 .000
WEA1 .000 .000 .000 .000 .716 .000
WEA2 .000 .000 .000 .000 .722 .000
WEA3 .000 .000 .000 .000 .843 .000
WEA4 .000 .000 .000 .000 .898 .000
WEA5 .000 .000 .000 .000 .970 .000
WEA6 .000 .000 .000 .000 1.000 .000
WEV1 .000 .000 .000 .000 .000 1.337
WEV2 .000 .000 .000 .000 .000 1.446
WEV3 .000 .000 .000 .000 .000 1.458
WEV4 .000 .000 .000 .000 .000 1.219
WEV6 .000 .000 .000 .000 .000 1.169
WEV7 .000 .000 .000 .000 .000 1.000
SWCW1 .000 .965 .000 .000 .000 .000
Analisis Pengaruh Satisfaction..., Meiriks Henling, FB UMN, 2018

128
WE SWCW SWP WED WEA WEV
SWCW3 .000 .816 .000 .000 .000 .000
SWCW4 .000 1.225 .000 .000 .000 .000
SWCW5 .000 1.000 .000 .000 .000 .000
SWP2 .000 .000 1.241 .000 .000 .000
SWP3 .000 .000 1.304 .000 .000 .000
SWP4 .000 .000 1.000 .000 .000 .000
Standardized Direct Effects (Group number 1 - Default model)
WE SWCW SWP WED WEA WEV
WED .752 .000 .000 .000 .000 .000
WEA .858 .000 .000 .000 .000 .000
WEV .937 .000 .000 .000 .000 .000
WED2 .000 .000 .000 .650 .000 .000
WED3 .000 .000 .000 .780 .000 .000
WED4 .000 .000 .000 .745 .000 .000
WEA1 .000 .000 .000 .000 .570 .000
WEA2 .000 .000 .000 .000 .557 .000
WEA3 .000 .000 .000 .000 .707 .000
WEA4 .000 .000 .000 .000 .837 .000
WEA5 .000 .000 .000 .000 .842 .000
WEA6 .000 .000 .000 .000 .748 .000
WEV1 .000 .000 .000 .000 .000 .656
WEV2 .000 .000 .000 .000 .000 .815
WEV3 .000 .000 .000 .000 .000 .818
WEV4 .000 .000 .000 .000 .000 .723
WEV6 .000 .000 .000 .000 .000 .708
WEV7 .000 .000 .000 .000 .000 .611
SWCW1 .000 .675 .000 .000 .000 .000
SWCW3 .000 .636 .000 .000 .000 .000
SWCW4 .000 .782 .000 .000 .000 .000
SWCW5 .000 .743 .000 .000 .000 .000
SWP2 .000 .000 .734 .000 .000 .000
SWP3 .000 .000 .776 .000 .000 .000
SWP4 .000 .000 .604 .000 .000 .000
Analisis Pengaruh Satisfaction..., Meiriks Henling, FB UMN, 2018

129
Indirect Effects (Group number 1 - Default model)
WE SWCW SWP WED WEA WEV
WED .000 .000 .000 .000 .000 .000
WEA .000 .000 .000 .000 .000 .000
WEV .000 .000 .000 .000 .000 .000
WED2 .544 .000 .000 .000 .000 .000
WED3 .705 .000 .000 .000 .000 .000
WED4 .739 .000 .000 .000 .000 .000
WEA1 .716 .000 .000 .000 .000 .000
WEA2 .722 .000 .000 .000 .000 .000
WEA3 .843 .000 .000 .000 .000 .000
WEA4 .898 .000 .000 .000 .000 .000
WEA5 .970 .000 .000 .000 .000 .000
WEA6 1.000 .000 .000 .000 .000 .000
WEV1 .992 .000 .000 .000 .000 .000
WEV2 1.073 .000 .000 .000 .000 .000
WEV3 1.082 .000 .000 .000 .000 .000
WEV4 .904 .000 .000 .000 .000 .000
WEV6 .867 .000 .000 .000 .000 .000
WEV7 .742 .000 .000 .000 .000 .000
SWCW1 .000 .000 .000 .000 .000 .000
SWCW3 .000 .000 .000 .000 .000 .000
SWCW4 .000 .000 .000 .000 .000 .000
SWCW5 .000 .000 .000 .000 .000 .000
SWP2 .000 .000 .000 .000 .000 .000
SWP3 .000 .000 .000 .000 .000 .000
SWP4 .000 .000 .000 .000 .000 .000
Standardized Indirect Effects (Group number 1 - Default model)
WE SWCW SWP WED WEA WEV
WED .000 .000 .000 .000 .000 .000
WEA .000 .000 .000 .000 .000 .000
WEV .000 .000 .000 .000 .000 .000
WED2 .489 .000 .000 .000 .000 .000
WED3 .587 .000 .000 .000 .000 .000
WED4 .561 .000 .000 .000 .000 .000
WEA1 .489 .000 .000 .000 .000 .000
WEA2 .478 .000 .000 .000 .000 .000
Analisis Pengaruh Satisfaction..., Meiriks Henling, FB UMN, 2018

130
WE SWCW SWP WED WEA WEV
WEA3 .606 .000 .000 .000 .000 .000
WEA4 .718 .000 .000 .000 .000 .000
WEA5 .722 .000 .000 .000 .000 .000
WEA6 .642 .000 .000 .000 .000 .000
WEV1 .615 .000 .000 .000 .000 .000
WEV2 .764 .000 .000 .000 .000 .000
WEV3 .766 .000 .000 .000 .000 .000
WEV4 .677 .000 .000 .000 .000 .000
WEV6 .664 .000 .000 .000 .000 .000
WEV7 .573 .000 .000 .000 .000 .000
SWCW1 .000 .000 .000 .000 .000 .000
SWCW3 .000 .000 .000 .000 .000 .000
SWCW4 .000 .000 .000 .000 .000 .000
SWCW5 .000 .000 .000 .000 .000 .000
SWP2 .000 .000 .000 .000 .000 .000
SWP3 .000 .000 .000 .000 .000 .000
SWP4 .000 .000 .000 .000 .000 .000
Model Fit Summary
CMIN
Model NPAR CMIN DF P CMIN/DF
Default model 50 386.672 203 .000 1.905
Saturated model 253 .000 0
Independence model 22 1765.046 231 .000 7.641
RMR, GFI
Model RMR GFI AGFI PGFI
Default model .066 .806 .758 .646
Saturated model .000 1.000
Independence model .311 .267 .197 .243
Baseline Comparisons
Model NFI
Delta1
RFI
rho1
IFI
Delta2
TLI
rho2 CFI
Default model .781 .751 .882 .864 .880
Analisis Pengaruh Satisfaction..., Meiriks Henling, FB UMN, 2018

131
Model NFI
Delta1
RFI
rho1
IFI
Delta2
TLI
rho2 CFI
Saturated model 1.000
1.000
1.000
Independence model .000 .000 .000 .000 .000
Parsimony-Adjusted Measures
Model PRATIO PNFI PCFI
Default model .879 .686 .774
Saturated model .000 .000 .000
Independence model 1.000 .000 .000
NCP
Model NCP LO 90 HI 90
Default model 183.672 131.983 243.170
Saturated model .000 .000 .000
Independence model 1534.046 1404.111 1671.418
FMIN
Model FMIN F0 LO 90 HI 90
Default model 2.630 1.249 .898 1.654
Saturated model .000 .000 .000 .000
Independence model 12.007 10.436 9.552 11.370
RMSEA
Model RMSEA LO 90 HI 90 PCLOSE
Default model .078 .067 .090 .000
Independence model .213 .203 .222 .000
AIC
Model AIC BCC BIC CAIC
Default model 486.672 505.220 636.532 686.532
Saturated model 506.000 599.855 1264.295 1517.295
Independence model 1809.046 1817.208 1874.985 1896.985
ECVI
Model ECVI LO 90 HI 90 MECVI
Analisis Pengaruh Satisfaction..., Meiriks Henling, FB UMN, 2018

132
Model ECVI LO 90 HI 90 MECVI
Default model 3.311 2.959 3.715 3.437
Saturated model 3.442 3.442 3.442 4.081
Independence model 12.306 11.423 13.241 12.362
HOELTER
Model HOELTER
.05
HOELTER
.01
Default model 91 97
Independence model 23 24
Analisis Pengaruh Satisfaction..., Meiriks Henling, FB UMN, 2018
133
DATA UJI GOF DAN HIPOTESIS
Estimates (Group number 1 - Default model)
Scalar Estimates (Group number 1 - Default model)
Maximum Likelihood Estimates
Regression Weights: (Group number 1 - Default model)
Estimate S.E. C.R. P Label
WE <--- SWP .555 .144 3.840 ***
WE <--- SWCW .446 .103 4.325 ***
WEV <--- WE .743 .128 5.810 ***
WEA <--- WE 1.000
WED <--- WE .542 .099 5.469 ***
SWP4 <--- SWP 1.000
SWP3 <--- SWP 1.233 .200 6.158 ***
SWP2 <--- SWP 1.205 .196 6.148 ***
SWCW5 <--- SWCW 1.000
SWCW4 <--- SWCW 1.272 .157 8.115 ***
SWCW3 <--- SWCW .826 .121 6.847 ***
SWCW1 <--- SWCW .952 .135 7.056 ***
WEV7 <--- WEV 1.000
WEV6 <--- WEV 1.165 .172 6.777 ***
WEV5 <--- WEV .858 .152 5.660 ***
WEV4 <--- WEV 1.220 .177 6.899 ***
WEV3 <--- WEV 1.433 .193 7.423 ***
WEV2 <--- WEV 1.430 .192 7.440 ***
WEV1 <--- WEV 1.323 .208 6.362 ***
WEA6 <--- WEA 1.000
WEA4 <--- WEA .869 .099 8.763 ***
WEA3 <--- WEA .903 .110 8.221 ***
WEA2 <--- WEA .738 .120 6.167 ***
WEA1 <--- WEA .749 .116 6.466 ***
WED4 <--- WED 1.367 .202 6.780 ***
WED3 <--- WED 1.281 .187 6.867 ***
WED2 <--- WED 1.000
Standardized Regression Weights: (Group number 1 - Default model)
Estimate
Analisis Pengaruh Satisfaction..., Meiriks Henling, FB UMN, 2018

134
Estimate
WE <--- SWP .426
WE <--- SWCW .452
WEV <--- WE .935
WEA <--- WE .870
WED <--- WE .741
SWP4 <--- SWP .625
SWP3 <--- SWP .759
SWP2 <--- SWP .737
SWCW5 <--- SWCW .734
SWCW4 <--- SWCW .802
SWCW3 <--- SWCW .636
SWCW1 <--- SWCW .657
WEV7 <--- WEV .600
WEV6 <--- WEV .697
WEV5 <--- WEV .550
WEV4 <--- WEV .715
WEV3 <--- WEV .798
WEV2 <--- WEV .801
WEV1 <--- WEV .639
WEA6 <--- WEA .726
WEA4 <--- WEA .787
WEA3 <--- WEA .734
WEA2 <--- WEA .547
WEA1 <--- WEA .574
WED4 <--- WED .743
WED3 <--- WED .765
WED2 <--- WED .642
Variances: (Group number 1 - Default model)
Estimate S.E. C.R. P Label
SWP
.265 .072 3.663 ***
SWCW
.461 .098 4.686 ***
e31
.277 .073 3.809 ***
e28
.036 .023 1.570 .116
e29
.109 .033 3.280 .001
e30
.145 .053 2.716 .007
e1
.413 .060 6.855 ***
e2
.296 .062 4.781 ***
Analisis Pengaruh Satisfaction..., Meiriks Henling, FB UMN, 2018

135
Estimate S.E. C.R. P Label
e3
.324 .062 5.205 ***
e4
.394 .063 6.267 ***
e5
.413 .081 5.076 ***
e6
.463 .064 7.274 ***
e8
.549 .077 7.111 ***
e9
.504 .063 8.037 ***
e10
.408 .053 7.668 ***
e11
.483 .059 8.162 ***
e12
.404 .053 7.571 ***
e13
.332 .048 6.880 ***
e14
.324 .047 6.846 ***
e15
.720 .091 7.914 ***
e16
.535 .076 7.059 ***
e18
.275 .043 6.335 ***
e19
.415 .059 6.979 ***
e20
.757 .095 8.000 ***
e21
.678 .086 7.913 ***
e24
.365 .062 5.891 ***
e25
.281 .051 5.524 ***
e26
.345 .049 7.092 ***
Matrices (Group number 1 - Default model)
Total Effects (Group number 1 - Default model)
SWCW SWP WE WED WEA WEV
WE .446 .555 .000 .000 .000 .000
WED .242 .301 .542 .000 .000 .000
WEA .446 .555 1.000 .000 .000 .000
WEV .331 .412 .743 .000 .000 .000
WED2 .242 .301 .542 1.000 .000 .000
WED3 .310 .385 .695 1.281 .000 .000
WED4 .331 .411 .742 1.367 .000 .000
WEA1 .334 .415 .749 .000 .749 .000
WEA2 .329 .409 .738 .000 .738 .000
WEA3 .403 .501 .903 .000 .903 .000
WEA4 .388 .482 .869 .000 .869 .000
WEA6 .446 .555 1.000 .000 1.000 .000
WEV1 .439 .545 .983 .000 .000 1.323
WEV2 .474 .589 1.062 .000 .000 1.430
Analisis Pengaruh Satisfaction..., Meiriks Henling, FB UMN, 2018

136
SWCW SWP WE WED WEA WEV
WEV3 .475 .591 1.065 .000 .000 1.433
WEV4 .404 .503 .906 .000 .000 1.220
WEV5 .284 .353 .637 .000 .000 .858
WEV6 .386 .480 .866 .000 .000 1.165
WEV7 .331 .412 .743 .000 .000 1.000
SWCW1 .952 .000 .000 .000 .000 .000
SWCW3 .826 .000 .000 .000 .000 .000
SWCW4 1.272 .000 .000 .000 .000 .000
SWCW5 1.000 .000 .000 .000 .000 .000
SWP2 .000 1.205 .000 .000 .000 .000
SWP3 .000 1.233 .000 .000 .000 .000
SWP4 .000 1.000 .000 .000 .000 .000
Standardized Total Effects (Group number 1 - Default model)
SWCW SWP WE WED WEA WEV
WE .452 .426 .000 .000 .000 .000
WED .334 .315 .741 .000 .000 .000
WEA .393 .370 .870 .000 .000 .000
WEV .422 .398 .935 .000 .000 .000
WED2 .215 .202 .475 .642 .000 .000
WED3 .256 .241 .567 .765 .000 .000
WED4 .249 .234 .551 .743 .000 .000
WEA1 .226 .213 .500 .000 .574 .000
WEA2 .215 .203 .476 .000 .547 .000
WEA3 .288 .272 .639 .000 .734 .000
WEA4 .309 .292 .685 .000 .787 .000
WEA6 .285 .269 .631 .000 .726 .000
WEV1 .270 .254 .598 .000 .000 .639
WEV2 .338 .319 .749 .000 .000 .801
WEV3 .337 .318 .746 .000 .000 .798
WEV4 .302 .285 .668 .000 .000 .715
WEV5 .232 .219 .514 .000 .000 .550
WEV6 .294 .277 .652 .000 .000 .697
WEV7 .253 .239 .561 .000 .000 .600
SWCW1 .657 .000 .000 .000 .000 .000
SWCW3 .636 .000 .000 .000 .000 .000
SWCW4 .802 .000 .000 .000 .000 .000
SWCW5 .734 .000 .000 .000 .000 .000
Analisis Pengaruh Satisfaction..., Meiriks Henling, FB UMN, 2018

137
SWCW SWP WE WED WEA WEV
SWP2 .000 .737 .000 .000 .000 .000
SWP3 .000 .759 .000 .000 .000 .000
SWP4 .000 .625 .000 .000 .000 .000
Direct Effects (Group number 1 - Default model)
SWCW SWP WE WED WEA WEV
WE .446 .555 .000 .000 .000 .000
WED .000 .000 .542 .000 .000 .000
WEA .000 .000 1.000 .000 .000 .000
WEV .000 .000 .743 .000 .000 .000
WED2 .000 .000 .000 1.000 .000 .000
WED3 .000 .000 .000 1.281 .000 .000
WED4 .000 .000 .000 1.367 .000 .000
WEA1 .000 .000 .000 .000 .749 .000
WEA2 .000 .000 .000 .000 .738 .000
WEA3 .000 .000 .000 .000 .903 .000
WEA4 .000 .000 .000 .000 .869 .000
WEA6 .000 .000 .000 .000 1.000 .000
WEV1 .000 .000 .000 .000 .000 1.323
WEV2 .000 .000 .000 .000 .000 1.430
WEV3 .000 .000 .000 .000 .000 1.433
WEV4 .000 .000 .000 .000 .000 1.220
WEV5 .000 .000 .000 .000 .000 .858
WEV6 .000 .000 .000 .000 .000 1.165
WEV7 .000 .000 .000 .000 .000 1.000
SWCW1 .952 .000 .000 .000 .000 .000
SWCW3 .826 .000 .000 .000 .000 .000
SWCW4 1.272 .000 .000 .000 .000 .000
SWCW5 1.000 .000 .000 .000 .000 .000
SWP2 .000 1.205 .000 .000 .000 .000
SWP3 .000 1.233 .000 .000 .000 .000
SWP4 .000 1.000 .000 .000 .000 .000
Standardized Direct Effects (Group number 1 - Default model)
SWCW SWP WE WED WEA WEV
WE .452 .426 .000 .000 .000 .000
WED .000 .000 .741 .000 .000 .000
WEA .000 .000 .870 .000 .000 .000
Analisis Pengaruh Satisfaction..., Meiriks Henling, FB UMN, 2018

138
SWCW SWP WE WED WEA WEV
WEV .000 .000 .935 .000 .000 .000
WED2 .000 .000 .000 .642 .000 .000
WED3 .000 .000 .000 .765 .000 .000
WED4 .000 .000 .000 .743 .000 .000
WEA1 .000 .000 .000 .000 .574 .000
WEA2 .000 .000 .000 .000 .547 .000
WEA3 .000 .000 .000 .000 .734 .000
WEA4 .000 .000 .000 .000 .787 .000
WEA6 .000 .000 .000 .000 .726 .000
WEV1 .000 .000 .000 .000 .000 .639
WEV2 .000 .000 .000 .000 .000 .801
WEV3 .000 .000 .000 .000 .000 .798
WEV4 .000 .000 .000 .000 .000 .715
WEV5 .000 .000 .000 .000 .000 .550
WEV6 .000 .000 .000 .000 .000 .697
WEV7 .000 .000 .000 .000 .000 .600
SWCW1 .657 .000 .000 .000 .000 .000
SWCW3 .636 .000 .000 .000 .000 .000
SWCW4 .802 .000 .000 .000 .000 .000
SWCW5 .734 .000 .000 .000 .000 .000
SWP2 .000 .737 .000 .000 .000 .000
SWP3 .000 .759 .000 .000 .000 .000
SWP4 .000 .625 .000 .000 .000 .000
Indirect Effects (Group number 1 - Default model)
SWCW SWP WE WED WEA WEV
WE .000 .000 .000 .000 .000 .000
WED .242 .301 .000 .000 .000 .000
WEA .446 .555 .000 .000 .000 .000
WEV .331 .412 .000 .000 .000 .000
WED2 .242 .301 .542 .000 .000 .000
WED3 .310 .385 .695 .000 .000 .000
WED4 .331 .411 .742 .000 .000 .000
WEA1 .334 .415 .749 .000 .000 .000
WEA2 .329 .409 .738 .000 .000 .000
WEA3 .403 .501 .903 .000 .000 .000
WEA4 .388 .482 .869 .000 .000 .000
WEA6 .446 .555 1.000 .000 .000 .000
Analisis Pengaruh Satisfaction..., Meiriks Henling, FB UMN, 2018

139
SWCW SWP WE WED WEA WEV
WEV1 .439 .545 .983 .000 .000 .000
WEV2 .474 .589 1.062 .000 .000 .000
WEV3 .475 .591 1.065 .000 .000 .000
WEV4 .404 .503 .906 .000 .000 .000
WEV5 .284 .353 .637 .000 .000 .000
WEV6 .386 .480 .866 .000 .000 .000
WEV7 .331 .412 .743 .000 .000 .000
SWCW1 .000 .000 .000 .000 .000 .000
SWCW3 .000 .000 .000 .000 .000 .000
SWCW4 .000 .000 .000 .000 .000 .000
SWCW5 .000 .000 .000 .000 .000 .000
SWP2 .000 .000 .000 .000 .000 .000
SWP3 .000 .000 .000 .000 .000 .000
SWP4 .000 .000 .000 .000 .000 .000
Standardized Indirect Effects (Group number 1 - Default model)
SWCW SWP WE WED WEA WEV
WE .000 .000 .000 .000 .000 .000
WED .334 .315 .000 .000 .000 .000
WEA .393 .370 .000 .000 .000 .000
WEV .422 .398 .000 .000 .000 .000
WED2 .215 .202 .475 .000 .000 .000
WED3 .256 .241 .567 .000 .000 .000
WED4 .249 .234 .551 .000 .000 .000
WEA1 .226 .213 .500 .000 .000 .000
WEA2 .215 .203 .476 .000 .000 .000
WEA3 .288 .272 .639 .000 .000 .000
WEA4 .309 .292 .685 .000 .000 .000
WEA6 .285 .269 .631 .000 .000 .000
WEV1 .270 .254 .598 .000 .000 .000
WEV2 .338 .319 .749 .000 .000 .000
WEV3 .337 .318 .746 .000 .000 .000
WEV4 .302 .285 .668 .000 .000 .000
WEV5 .232 .219 .514 .000 .000 .000
WEV6 .294 .277 .652 .000 .000 .000
WEV7 .253 .239 .561 .000 .000 .000
SWCW1 .000 .000 .000 .000 .000 .000
SWCW3 .000 .000 .000 .000 .000 .000
Analisis Pengaruh Satisfaction..., Meiriks Henling, FB UMN, 2018

140
SWCW SWP WE WED WEA WEV
SWCW4 .000 .000 .000 .000 .000 .000
SWCW5 .000 .000 .000 .000 .000 .000
SWP2 .000 .000 .000 .000 .000 .000
SWP3 .000 .000 .000 .000 .000 .000
SWP4 .000 .000 .000 .000 .000 .000
Model Fit Summary
CMIN
Model NPAR CMIN DF P CMIN/DF
Default model 49 387.981 204 .000 1.902
Saturated model 253 .000 0
Independence model 22 1662.181 231 .000 7.196
RMR, GFI
Model RMR GFI AGFI PGFI
Default model .082 .807 .761 .651
Saturated model .000 1.000
Independence model .300 .279 .210 .255
Baseline Comparisons
Model NFI
Delta1
RFI
rho1
IFI
Delta2
TLI
rho2 CFI
Default model .767 .736 .874 .854 .871
Saturated model 1.000
1.000
1.000
Independence model .000 .000 .000 .000 .000
Parsimony-Adjusted Measures
Model PRATIO PNFI PCFI
Default model .883 .677 .770
Saturated model .000 .000 .000
Independence model 1.000 .000 .000
Analisis Pengaruh Satisfaction..., Meiriks Henling, FB UMN, 2018

141
NCP
Model NCP LO 90 HI 90
Default model 183.981 132.214 243.558
Saturated model .000 .000 .000
Independence model 1431.181 1305.481 1564.322
FMIN
Model FMIN F0 LO 90 HI 90
Default model 2.639 1.252 .899 1.657
Saturated model .000 .000 .000 .000
Independence model 11.307 9.736 8.881 10.642
RMSEA
Model RMSEA LO 90 HI 90 PCLOSE
Default model .078 .066 .090 .000
Independence model .205 .196 .215 .000
AIC
Model AIC BCC BIC CAIC
Default model 485.981 504.158 632.844 681.844
Saturated model 506.000 599.855 1264.295 1517.295
Independence model 1706.181 1714.342 1772.119 1794.119
ECVI
Model ECVI LO 90 HI 90 MECVI
Default model 3.306 2.954 3.711 3.430
Saturated model 3.442 3.442 3.442 4.081
Independence model 11.607 10.752 12.512 11.662
HOELTER
Model HOELTER
.05
HOELTER
.01
Default model 91 97
Independence model 24 26
Analisis Pengaruh Satisfaction..., Meiriks Henling, FB UMN, 2018

142
PRE TEST
UJI VALIDITAS SATISFACTION WITH PROMOTION
KMO and Bartlett's Test
Kaiser-Meyer-Olkin Measure of Sampling Adequacy. .592
Bartlett's Test of Sphericity Approx. Chi-Square 9.194
df 6
Sig. .163
Anti-image Matrices
Satisfaction
with
Promotion 1
Satisfaction
with
Promotion 2
Satisfaction
with
Promotion 3
Satisfaction
with
Promotion 4
Anti-image
Covariance
Satisfaction with
Promotion 1 .996 -.029 -.020 .052
Satisfaction with
Promotion 2 -.029 .829 -.062 -.284
Satisfaction with
Promotion 3 -.020 -.062 .854 -.258
Satisfaction with
Promotion 4 .052 -.284 -.258 .745
Anti-image
Correlation
Satisfaction with
Promotion 1 .315
a -.031 -.022 .060
Satisfaction with
Promotion 2 -.031 .608
a -.074 -.362
Satisfaction with
Promotion 3 -.022 -.074 .630
a -.323
Satisfaction with
Promotion 4 .060 -.362 -.323 .564
a
a. Measures of Sampling Adequacy(MSA)
Analisis Pengaruh Satisfaction..., Meiriks Henling, FB UMN, 2018

143
Component Matrixa
Component
1 2
Satisfaction with Promotion 1 -.041 .997
Satisfaction with Promotion 2 .719 .070
Satisfaction with Promotion 3 .690 .048
Satisfaction with Promotion 4 .823 -.052
Extraction Method: Principal Component Analysis.
a. 2 components extracted.
UJI RELIABILITAS SATISFACTION WITH PROMOTION
Reliability Statistics
Cronbach's
Alpha
Cronbach's
Alpha Based on
Standardized
Items N of Items
.438 .435 4
UJI VALIDITAS SATISFACTION WITH CO – WORKERS
KMO and Bartlett's Test
Kaiser-Meyer-Olkin Measure of Sampling
Adequacy. .704
Bartlett's Test of
Sphericity
Approx. Chi-Square 48.134
df 10
Sig. .000
Analisis Pengaruh Satisfaction..., Meiriks Henling, FB UMN, 2018

144
Anti-image Matrices
Satisfaction
with Co -
Workers 1
Satisfaction
with Co -
Workers 2
Satisfaction
with Co -
Workers 3
Satisfaction
with Co -
Workers 4
Satisfaction
with Co -
Workers 5
Anti-image
Covariance
Satisfaction with
Co - Workers 1 .462 .079 -.209 .019 -.041
Satisfaction with
Co - Workers 2 .079 .837 -.114 -.060 -.034
Satisfaction with
Co - Workers 3 -.209 -.114 .279 -.199 -.159
Satisfaction with
Co - Workers 4 .019 -.060 -.199 .578 .099
Satisfaction with
Co - Workers 5 -.041 -.034 -.159 .099 .687
Anti-image
Correlation
Satisfaction with
Co - Workers 1 .722
a .127 -.582 .036 -.072
Satisfaction with
Co - Workers 2 .127 .797
a -.236 -.086 -.045
Satisfaction with
Co - Workers 3 -.582 -.236 .638
a -.496 -.363
Satisfaction with
Co - Workers 4 .036 -.086 -.496 .724
a .157
Satisfaction with
Co - Workers 5 -.072 -.045 -.363 .157 .782
a
a. Measures of Sampling Adequacy(MSA)
Analisis Pengaruh Satisfaction..., Meiriks Henling, FB UMN, 2018

145
Component Matrixa
Component
1
Satisfaction with Co -
Workers 1 .798
Satisfaction with Co -
Workers 2 .505
Satisfaction with Co -
Workers 3 .926
Satisfaction with Co -
Workers 4 .724
Satisfaction with Co -
Workers 5 .661
Extraction Method: Principal Component
Analysis.
a. 1 components extracted.
UJI RELIABILITAS SATISFACTION WITH CO – WORKERS
Reliability Statistics
Cronbach's
Alpha
Cronbach's
Alpha Based on
Standardized
Items N of Items
.712 .776 5
Analisis Pengaruh Satisfaction..., Meiriks Henling, FB UMN, 2018

146
UJI VALIDITAS WORK ENGAGEMENT – VIGOR
KMO and Bartlett's Test
Kaiser-Meyer-Olkin Measure of Sampling Adequacy. .793
Bartlett's Test of Sphericity Approx. Chi-Square 121.963
Df 21
Sig. .000
Anti-image Matrices
Work
Engagem
ent -
Vigor 1
Work
Engagem
ent -
Vigor 2
Work
Engagem
ent -
Vigor 3
Work
Engagem
ent -
Vigor 4
Work
Engagem
ent -
Vigor 5
Work
Engagem
ent -
Vigor 6
Work
Engagem
ent -
Vigor 7
Anti-
image
Covaria
nce
Work
Engagem
ent -
Vigor 1
.466 -.138 -.067 .040 .066 -.042 .057
Work
Engagem
ent -
Vigor 2
-.138 .212 -.078 -.057 -.025 .026 -.131
Work
Engagem
ent -
Vigor 3
-.067 -.078 .251 -.146 -.031 -.026 .049
Work
Engagem
ent -
Vigor 4
.040 -.057 -.146 .319 -.045 -.057 .053
Work
Engagem
ent -
Vigor 5
.066 -.025 -.031 -.045 .668 -.159 .076
Work
Engagem
ent -
Vigor 6
-.042 .026 -.026 -.057 -.159 .305 -.201
Analisis Pengaruh Satisfaction..., Meiriks Henling, FB UMN, 2018

147
Work
Engagem
ent -
Vigor 7
.057 -.131 .049 .053 .076 -.201 .326
Anti-
image
Correlati
on
Work
Engagem
ent -
Vigor 1
.842a -.438 -.196 .103 .119 -.111 .146
Work
Engagem
ent -
Vigor 2
-.438 .802a -.339 -.218 -.067 .103 -.500
Work
Engagem
ent -
Vigor 3
-.196 -.339 .829a -.515 -.076 -.095 .171
Work
Engagem
ent -
Vigor 4
.103 -.218 -.515 .836a -.098 -.182 .166
Work
Engagem
ent -
Vigor 5
.119 -.067 -.076 -.098 .836a -.353 .163
Work
Engagem
ent -
Vigor 6
-.111 .103 -.095 -.182 -.353 .771a -.637
Work
Engagem
ent -
Vigor 7
.146 -.500 .171 .166 .163 -.637 .654a
a. Measures of Sampling Adequacy(MSA)
Analisis Pengaruh Satisfaction..., Meiriks Henling, FB UMN, 2018

148
Component Matrixa
Component
1
Work Engagement - Vigor 1 .729
Work Engagement - Vigor 2 .904
Work Engagement - Vigor 3 .856
Work Engagement - Vigor 4 .816
Work Engagement - Vigor 5 .581
Work Engagement - Vigor 6 .813
Work Engagement - Vigor 7 .689
Extraction Method: Principal Component Analysis.
a. 1 components extracted.
UJI RELIABILITAS WORK ENGAGEMENT – VIGOR
Reliability Statistics
Cronbach's
Alpha
Cronbach's
Alpha Based on
Standardized
Items N of Items
.885 .886 7
UJI VALIDITAS WORK ENGAGEMENT – DEDICATION
KMO and Bartlett's Test
Kaiser-Meyer-Olkin Measure of Sampling Adequacy. .750
Bartlett's Test of Sphericity Approx. Chi-Square 127.806
df 15
Sig. .000
Analisis Pengaruh Satisfaction..., Meiriks Henling, FB UMN, 2018

149
Anti-image Matrices
Work
Engageme
nt -
Dedication
1
Work
Engageme
nt -
Dedication
2
Work
Engageme
nt -
Dedication
3
Work
Engageme
nt -
Dedication
4
Work
Engageme
nt -
Dedication
5
Work
Engageme
nt -
Dedication
6
Anti-
image
Covarian
ce
Work
Engageme
nt -
Dedication
1
.195 -.157 -.053 -.041 .103 -.142
Work
Engageme
nt -
Dedication
2
-.157 .233 .021 .018 -.118 .078
Work
Engageme
nt -
Dedication
3
-.053 .021 .305 -.137 -.032 -.004
Work
Engageme
nt -
Dedication
4
-.041 .018 -.137 .231 -.118 .028
Work
Engageme
nt -
Dedication
5
.103 -.118 -.032 -.118 .255 -.143
Work
Engageme
nt -
Dedication
6
-.142 .078 -.004 .028 -.143 .410
Analisis Pengaruh Satisfaction..., Meiriks Henling, FB UMN, 2018

150
Anti-
image
Correlatio
n
Work
Engageme
nt -
Dedication
1
.664a -.739 -.218 -.194 .463 -.502
Work
Engageme
nt -
Dedication
2
-.739 .714a .077 .078 -.483 .251
Work
Engageme
nt -
Dedication
3
-.218 .077 .868a -.516 -.115 -.012
Work
Engageme
nt -
Dedication
4
-.194 .078 -.516 .810a -.485 .092
Work
Engageme
nt -
Dedication
5
.463 -.483 -.115 -.485 .704a -.442
Work
Engageme
nt -
Dedication
6
-.502 .251 -.012 .092 -.442 .776a
a. Measures of Sampling Adequacy(MSA)
Analisis Pengaruh Satisfaction..., Meiriks Henling, FB UMN, 2018

151
Component Matrixa
Component
1
Work Engagement -
Dedication 1 .843
Work Engagement -
Dedication 2 .841
Work Engagement -
Dedication 3 .852
Work Engagement -
Dedication 4 .878
Work Engagement -
Dedication 5 .839
Work Engagement -
Dedication 6 .785
Extraction Method: Principal Component
Analysis.
a. 1 components extracted.
UJI RELIABILITAS WORK ENGAGEMENT – DEDICATION
Reliability Statistics
Cronbach's
Alpha
Cronbach's
Alpha Based on
Standardized
Items N of Items
.915 .916 6
Analisis Pengaruh Satisfaction..., Meiriks Henling, FB UMN, 2018
152
UJI VALIDITAS WORK ENGAGEMENT – ABSORPTION
KMO and Bartlett's Test
Kaiser-Meyer-Olkin Measure of Sampling Adequacy. .776
Bartlett's Test of Sphericity Approx. Chi-Square 128.032
df 15
Sig. .000
Anti-image Matrices
Work
Engageme
nt -
Absorption
1
Work
Engageme
nt -
Absorption
2
Work
Engageme
nt -
Absorption
3
Work
Engageme
nt -
Absorption
4
Work
Engageme
nt -
Absorption
5
Work
Engageme
nt -
Absorption
6
Anti-
image
Covarian
ce
Work
Engageme
nt -
Absorption
1
.488 -.105 -.111 .008 .009 -.030
Work
Engageme
nt -
Absorption
2
-.105 .278 .040 -.041 -.033 -.161
Work
Engageme
nt -
Absorption
3
-.111 .040 .258 -.127 .089 -.091
Work
Engageme
nt -
Absorption
4
.008 -.041 -.127 .137 -.127 .048
Analisis Pengaruh Satisfaction..., Meiriks Henling, FB UMN, 2018

153
Work
Engageme
nt -
Absorption
5
.009 -.033 .089 -.127 .229 -.064
Work
Engageme
nt -
Absorption
6
-.030 -.161 -.091 .048 -.064 .339
Anti-
image
Correlatio
n
Work
Engageme
nt -
Absorption
1
.900a -.285 -.314 .032 .027 -.074
Work
Engageme
nt -
Absorption
2
-.285 .842a .148 -.209 -.129 -.525
Work
Engageme
nt -
Absorption
3
-.314 .148 .721a -.675 .365 -.308
Work
Engageme
nt -
Absorption
4
.032 -.209 -.675 .703a -.716 .224
Work
Engageme
nt -
Absorption
5
.027 -.129 .365 -.716 .746a -.230
Analisis Pengaruh Satisfaction..., Meiriks Henling, FB UMN, 2018

154
Work
Engageme
nt -
Absorption
6
-.074 -.525 -.308 .224 -.230 .812a
a. Measures of Sampling Adequacy(MSA)
Component Matrixa
Component
1
Work Engagement -
Absorption 1 .763
Work Engagement -
Absorption 2 .875
Work Engagement -
Absorption 3 .832
Work Engagement -
Absorption 4 .899
Work Engagement -
Absorption 5 .835
Work Engagement -
Absorption 6 .832
Extraction Method: Principal Component
Analysis.
a. 1 components extracted.
UJI RELIABILITAS WORK ENGAGEMENT – ABSORPTION
Case Processing Summary
N %
Cases Valid 30 100.0
Excludeda 0 .0
Total 30 100.0
a. Listwise deletion based on all variables in the
procedure.
Analisis Pengaruh Satisfaction..., Meiriks Henling, FB UMN, 2018

155
Reliability Statistics
Cronbach's
Alpha
Cronbach's
Alpha Based on
Standardized
Items N of Items
.912 .916 6
UJI VALIDITAS SATISFACTION WITH PROMOTION (FINAL)
KMO and Bartlett's Test
Kaiser-Meyer-Olkin Measure of Sampling Adequacy. .596
Bartlett's Test of Sphericity Approx. Chi-Square 9.206
df 3
Sig. .027
Anti-image Matrices
Satisfaction with
Promotion 2
Satisfaction with
Promotion 3
Satisfaction with
Promotion 4
Anti-image Covariance Satisfaction with Promotion
2 .829 -.063 -.284
Satisfaction with Promotion
3 -.063 .854 -.258
Satisfaction with Promotion
4 -.284 -.258 .747
Anti-image Correlation Satisfaction with Promotion
2 .611
a -.074 -.361
Satisfaction with Promotion
3 -.074 .631
a -.322
Satisfaction with Promotion
4 -.361 -.322 .567
a
a. Measures of Sampling Adequacy(MSA)
Analisis Pengaruh Satisfaction..., Meiriks Henling, FB UMN, 2018

156
Component Matrixa
Component
1
Satisfaction with Promotion
2 .720
Satisfaction with Promotion
3 .691
Satisfaction with Promotion
4 .822
Extraction Method: Principal Component
Analysis.
a. 1 components extracted.
UJI RELIABILITAS SATISFACTION WITH PROMOTION
(FINAL)
Reliability Statistics
Cronbach's
Alpha
Cronbach's
Alpha Based on
Standardized
Items N of Items
.595 .600 3
Analisis Pengaruh Satisfaction..., Meiriks Henling, FB UMN, 2018

157
HASIL IN-DEPTH-INTERVIEW
Waktu : Kamis, 8 Maret 2018
Tempat : PT. XYZ
Interviewer : Meirika Henling
Narasumber : Bapak SMRN (Karyawan)
A : Meirika
B: Bapak SMRN
A : Selamat siang, Bapak! Pertama – tama, Bapak bisa memperkenalkan diri Bapak
terlebih dahulu dan berasal dari divisi apa?
B : Nama saya SMRN, dari divisi human resource
A : Baik, pak. Selama ini Bapak telah bekerja berapa lama nih pak di PT. XYZ?
B : Kurang lebih selama 3 tahun.
A : Nah 3 tahun kan cukup lama ya Pak, pernah gak Bapak merasa malas atau kurang
bersemangat ketika bekerja?
B : Hmmm, pernah sih pas waktu itu kayak kurang excited pas lagi kerja, imbasnya
jadi males – malesan ngerjain apa – apa.
A : Bapak merasa bangga gak pak dengan pekerjaan Bapak sekarang?
B : Cukup bangga walaupun saya ada harapan untuk lebih dari yang sekarang.
A : Bapak punya keinginan gak pak untuk pindah dari pekerjaan Bapak saat ini?
B : Pernah ada pikiran kesitu, tapi belum tahu juga ya gimana kedepannya.
A : Oh begitu ya pak.. Nah selama 3 tahun ini, Bapak pernah gak pak mendapat
kesempatan promosi jabatan di perusahaan ini? Terus apakah Bapak sudah puas
dengan sistem yang ada?
Analisis Pengaruh Satisfaction..., Meiriks Henling, FB UMN, 2018

158
B: Ya pernah tapi disini itu sebenernya proses kenaikan jabatan tidak dapat
ditentukan secara pasti untuk berapa bulan atau tahun kah lamanya. Jadi bisa aja
waktunya lama. Pas ada posisi yang kosong baru deh dilakuin promosi jabatan ke
karyawan – karyawan.
A : Terus pak, biasanya posisi yang kosong tersebut di karenakan apa pak? Apakah
karyawan sebelumnya di pecat atau hal lain pak?
B : Bisa macam – macam.. Ada yang karena pensiun, resign, promosi ke jabatan yang
lebih tinggi, atau hanya di mutasi ke bagian lain yang masih sama tapi hanya beda
cabang perusahaan aja..
A: Kalo selama Bapak bekerja disini, pernah gak Pak ada masalah dengan sesama
rekan kerja? Kalo ada biasanya seperti apa pak?
B: Masalah personal sih gak ada, paling kalo rekan kerja suka ingin menang sendiri
pas lagi kerja sama dalam satu tim, akibatnya jadi kepancing kesel dan jadi ngomong
pake nada tinggi..
A: Baiklah pak. Saya rasa sudah cukup. Terimakasih atas waktunya. Selamat bekerja
kembali, Pak!
Analisis Pengaruh Satisfaction..., Meiriks Henling, FB UMN, 2018

159
Waktu : Kamis, 8 Maret 2018
Tempat : PT. XYZ
Interviewer : Meirika Henling
Narasumber : Bapak ENGR (Karyawan)
A : Meirika
B: Bapak ENGR
A : Selamat siang, Bapak! Pertama – tama, Bapak bisa memperkenalkan diri Bapak
terlebih dahulu dan berasal dari divisi apa?
B : Saya ENGR, dari divisi IT
A : Baik, pak. Selama ini Bapak telah bekerja berapa lama nih pak di PT. XYZ?
B : Selama 5 tahun.
A : Nah 5 tahun kan cukup lama ya Pak, pernah gak Bapak merasa malas atau kurang
bersemangat ketika bekerja?
B : Ya namanya kerja, pasti ada rasa malas sih Mba Meirika..
A : Bapak merasa bangga gak pak dengan pekerjaan Bapak sekarang?
B : Kalo boleh dibilang sebenarnya kurang sih, karena saya yakin saya mampu untuk
bisa ada di posisi yang lebih tinggi lagi.
A : Bapak punya keinginan gak pak untuk pindah dari pekerjaan Bapak saat ini?
B : Ada sebenernya, cuman mungkin tunggu jalannya aja.
A : Oh begitu ya pak.. Nah selama 3 tahun ini, Bapak pernah gak pak mendapat
kesempatan promosi jabatan di perusahaan ini? Terus apakah Bapak sudah puas
dengan sistem yang ada?
Analisis Pengaruh Satisfaction..., Meiriks Henling, FB UMN, 2018

160
B: Pernah kok, tapi ya gitu saya kurang puas soalnya kan disini karyawan bisa naik
biasanya tergantung dari status atasan karyawan lagi ada yang kosong atau gak. Jadi,
kesempatannya minim sih menurut saya.
A : Terus pak, biasanya posisi yang kosong tersebut di karenakan apa pak? Apakah
karyawan sebelumnya di pecat atau hal lain pak?
B : Pensiun atau ada yang di pindah tugaskan.
A : Kalo selama Bapak bekerja disini, pernah gak Pak ada masalah dengan sesama
rekan kerja? Kalo ada biasanya seperti apa pak?
B : Masalah nya gak sampe yang bagaimana sih, biasanya paling ada nih rekan kerja
kita yang kurang kompeten jadinya kan kita musti cover kerjaan dia. Jadi kan kerjaan
kita jadi double dan kadang bisa lembur.
A : Baiklah pak. Saya rasa sudah cukup. Terimakasih atas waktunya. Selamat bekerja
kembali, Pak!
Analisis Pengaruh Satisfaction..., Meiriks Henling, FB UMN, 2018

161
Waktu : Kamis, 8 Maret 2018
Tempat : PT. XYZ
Interviewer : Meirika Henling
Narasumber : Bapak SP (Karyawan)
A : Meirika
B: Bapak SP
A : Selamat siang, Bapak! Pertama – tama, Bapak bisa memperkenalkan diri Bapak
terlebih dahulu dan berasal dari divisi apa?
B : Perkenalkan saya SP, dari divisi finance & accounting
A : Baik, pak. Selama ini Bapak telah bekerja berapa lama nih pak di PT. XYZ?
B: Kurang lebih 2 tahun.
A : Nah walaupun baru 2 tahun, pernah gak Bapak merasa malas atau kurang
bersemangat ketika bekerja?
B : Selama 2 tahun ini sih, jarang sih, mungkin karena masih baru juga saya bekerja.
A : Bapak merasa bangga gak pak dengan pekerjaan Bapak sekarang?
B: Ya oke lah.
A: Bapak punya keinginan gak pak untuk pindah dari pekerjaan Bapak saat ini?
B: Kalau pindah posisi mungkin ingin sih asalkan tetap di PT. XYZ, kan jadi naik
jabatan, tapi kalau pindah tempat kerja belum kepikiran sih, saya juga masih nyaman
disini.
Analisis Pengaruh Satisfaction..., Meiriks Henling, FB UMN, 2018

162
A : Oh begitu ya pak.. Nah selama 2 tahun ini, Bapak pernah gak pak mendapat
kesempatan promosi jabatan di perusahaan ini? Terus apakah Bapak sudah puas
dengan sistem yang ada?
B: Pernah, waktu 1 tahun kerja saya diberi kesempatan untuk naik jabatan walaupun
hanya menggantikan rekan satu divisi yang keluar dari perusahaan sebenarnya, tetapi
hak & tanggung jawabnya hampir sama dengan yang sebelumnya, jadi kayak sama
aja rasanya.
A: Kalo selama Bapak bekerja disini, pernah gak Pak ada masalah dengan sesama
rekan kerja? Kalo ada biasanya seperti apa pak?
B: Masalah communication aja dengan karyawan yang level yang diatas, kalau saya
merasanya, level senior menganggap kita masih anak bawang mungkin kali ya. Jadi
apa yang kita omongin kurang di dengar.
A: Baiklah pak. Saya rasa sudah cukup. Terimakasih atas waktunya. Selamat bekerja
kembali, Pak!
Analisis Pengaruh Satisfaction..., Meiriks Henling, FB UMN, 2018

163
Waktu : Kamis, 8 Maret 2018
Tempat : PT. XYZ
Interviewer : Meirika Henling
Narasumber : Ibu MLN (Karyawan)
A : Meirika
B: Ibu MLN
A : Selamat siang, Ibu! Pertama – tama, Ibu bisa memperkenalkan diri Ibu terlebih
dahulu dan berasal dari divisi apa?
B : Saya MLN, dari divisi finance & accounting
A : Baik, Ibu. Selama ini Ibu telah bekerja berapa lama nih Bu di PT. XYZ?
B : 7 tahunan.
A : 7 tahun kan dapat dikatakan cukup lama ya Ibu, pernah gak Ibu merasa malas atau
kurang bersemangat ketika bekerja?
B : Pernah sih, mungkin yang udah kerja 5 tahun ke atas semakin sering potensi
malas ketika bekerja.
A : Ibu merasa bangga gak dengan pekerjaan Ibu sekarang?
B : Untuk jabatan saya saat ini kurang mungkin ya.
A : Ibu punya keinginan gak untuk pindah dari pekerjaan Ibu saat ini?
B : Ada sih, saya soalnya suka hunting lowongan pekerjaan di internet belakangan ini
yang mungkin bisa cocok dengan pengalaman saya sampai saat ini.
A : Oh begitu ya Bu. Nah selama 7 tahun ini, Ibu pernah gak bu mendapat
kesempatan promosi jabatan di perusahaan ini? Terus apakah Ibu sudah puas dengan
sistem yang ada?
Analisis Pengaruh Satisfaction..., Meiriks Henling, FB UMN, 2018

164
B: Pernah, tapi ya kurang puas sebenarnya makanya seperti yang saya bilang tadi,
saya sambil mencari posisi di perusahaan lain yang memang sesuai dengan apa yang
saya inginkan.
A : Kalo selama Ibu bekerja disini, pernah gak Ibu ada masalah dengan sesama rekan
kerja? Kalo ada biasanya seperti apa Bu?
B : Saya rasa tidak pernah ya. Paling hanya masalah beda pendapat atau sudut
pandang saja dan menurut saya itu wajar kalau ada argumen sedikit.
A : Baiklah Bu. Saya rasa sudah cukup. Terimakasih atas waktunya. Selamat bekerja
kembali, Bu!
Analisis Pengaruh Satisfaction..., Meiriks Henling, FB UMN, 2018

165
Waktu : Kamis, 8 Maret 2018
Tempat : PT. XYZ
Interviewer : Meirika Henling
Narasumber : Ibu DW (Karyawan)
A : Meirika
B: Ibu DW
A : Selamat siang, Ibu! Pertama – tama, Ibu bisa memperkenalkan diri Ibu terlebih
dahulu dan berasal dari divisi apa?
B : Saya DW, dari divisi Marketing
A : Baik, Ibu. Selama ini Ibu telah bekerja berapa lama nih Bu di PT. XYZ?
B : 4 tahunan.
A : 4 tahun kan dapat dikatakan cukup lama ya Ibu, pernah gak Ibu merasa malas atau
kurang bersemangat ketika bekerja?
B : Tentu ada, apalagi rumah saya cukup jauh juga dari kantor, jadi rasa malas bisa
aja muncul pas baru mulai perjalanan ke kantor.
A : Ibu merasa bangga gak dengan pekerjaan Ibu sekarang?
B : Kalo ada angka 1-5 mungkin rasa bangga saya ada di 3.5.
A : Ibu punya keinginan gak untuk pindah dari pekerjaan Ibu saat ini?
B : Dari hati kecil sih kepingin pindah kerja ke perusahaan impian saya kedepannya,
tetapi untuk saat ini mungkin saya masih lebih fokus untuk menggali ilmu dan
mengasah skill yang saya punya untuk perusahaan ini.
Analisis Pengaruh Satisfaction..., Meiriks Henling, FB UMN, 2018
166
A : Oh begitu ya Bu. Nah selama 4 tahun ini, Ibu pernah gak bu mendapat
kesempatan promosi jabatan di perusahaan ini? Terus apakah Ibu sudah puas dengan
sistem yang ada?
B: Pernah,awalnya atasan melihat hasil penilaian kinerja saya, terus beliau angkat
saya karena beliau merasa saya capable buat menggantikan posisi beliau. Ya kalau
dibilang puas sih sebenarnya, saya masih berharap kedepannya sistem promosi di PT.
XYZ bisa semakin jelas, soalnya saya rasa juga ini karena kebetulan posisi atasan
saya akan kosong, jadi saya bisa naik jabatan.
A : Kalo selama Ibu bekerja disini, pernah gak Ibu ada masalah dengan sesama rekan
kerja? Kalo ada biasanya seperti apa Bu?
B : Kalau perasaan gak suka pasti pernah ada, bisa karena sifat atau perilaku
karyawan itu pas kerja yang menyebalkan, tetapi gak saya utarakan, paling hanya
curcol aja ke temen kantor atau ya dipendam saja. Karena kan disini saya belajar
professional aja.
A : Baiklah Bu. Saya rasa sudah cukup. Terimakasih atas waktunya. Selamat bekerja
kembali, Bu!
Analisis Pengaruh Satisfaction..., Meiriks Henling, FB UMN, 2018
167
Waktu : Kamis, 8 Maret 2018
Tempat : PT. XYZ
Interviewer : Meirika Henling
Narasumber : Ibu ST (Karyawan)
A : Meirika
B: Ibu ST
A : Selamat siang, Ibu! Pertama – tama, Ibu bisa memperkenalkan diri Ibu terlebih
dahulu dan berasal dari divisi apa?
B : Saya ST, dari divisi human resource
A : Baik, Ibu. Selama ini Ibu telah bekerja berapa lama nih Bu di PT. XYZ?
B : 5 tahunan.
A : 5 tahun kan dapat dikatakan cukup lama ya Ibu, pernah gak Ibu merasa malas atau
kurang bersemangat ketika bekerja?
B : Tentu ada, tetapi balik lagi ke gimana kita handle rasa malas itu sih.
A : Ibu merasa bangga gak dengan pekerjaan Ibu sekarang?
B : Saya sih sudah cukup merasa bangga sampai saat ini, setidaknya saya tidak
menganggur karena saya orangnya suka beraktifitas.
A : Ibu punya keinginan gak untuk pindah dari pekerjaan Ibu saat ini?
B : Ya kadang – kadang kepingin, apalagi jika sedang ada pressure dalam pekerjaan.
A : Oh begitu ya Bu. Nah selama 5 tahun ini, Ibu pernah gak bu mendapat
kesempatan promosi jabatan di perusahaan ini? Terus apakah Ibu sudah puas dengan
sistem yang ada?
Analisis Pengaruh Satisfaction..., Meiriks Henling, FB UMN, 2018

168
B: Pernah kok, overall sih sebenernya udah cukup banyak karyawan yang dapet
kesempatan promosi jabatan disini tapi ya masih ada yang perlu dibenahi sedikit.
Karena berdasarkan pengalaman juga, kalaupun naik jabatan, challenge di posisi baru
tidak jauh beda dengan di posisi sebelumnya, padahal kan karyawan juga ingin
berkembang..
A : Kalo selama Ibu bekerja disini, pernah gak Ibu ada masalah dengan sesama rekan
kerja? Kalo ada biasanya seperti apa Bu?
B : Masalah yang berat gitu sih gak ada. Ya palingan hanya kayak males ketemu atau
ngomong dengan rekan – rekan aja pas emang lagi ada masalah. Biasanya urusan
kerjaan, karena masih pada egois satu sama lain terus jadi gak ketemu deh hasil
akhirnya harus ngapain.
A : Baiklah Bu. Saya rasa sudah cukup. Terimakasih atas waktunya. Selamat bekerja
kembali, Bu!
Analisis Pengaruh Satisfaction..., Meiriks Henling, FB UMN, 2018

169
Waktu : Kamis, 8 Maret 2018
Tempat : PT. XYZ
Interviewer : Meirika Henling
Narasumber : Bapak RH (Karyawan)
A : Meirika
B: Bapak RH
A : Selamat siang, Bapak! Pertama – tama, Bapak bisa memperkenalkan diri Bapak
terlebih dahulu dan berasal dari divisi apa?
B : Saya RH, dari divisi business development.
A : Baik, Pak. Selama ini Bapak telah bekerja berapa lama nih Bu di PT. XYZ?
B : 5 tahunan.
A : 5 tahun kan dapat dikatakan cukup lama ya Pak, pernah gak Bapak merasa malas
atau kurang bersemangat ketika bekerja?
B : 1 tahun belakangan ini mungkin mulai jenuh sih terhadap pekerjaan.
A : Bapak merasa bangga gak dengan pekerjaan Bapak sekarang?
B : Ya tidak juga sih, tetapi ya dijalani saja kalau saya.
A : Bapak punya keinginan gak untuk pindah dari pekerjaan Bapak saat ini?
B : Jika di tempat lain ada yang cocok, mungkin saya akan mempertimbangkannya.
A : Oh begitu ya Pak. Nah selama 5 tahun ini, Bapak pernah gak pak mendapat
kesempatan promosi jabatan di perusahaan ini? Terus apakah Bapak sudah puas
dengan sistem yang ada?
Analisis Pengaruh Satisfaction..., Meiriks Henling, FB UMN, 2018

170
B: Pernah kok, tetapi kasus saya hanya di pindah tugaskan ke cabang PT. XYZ disini,
sehingga sebenarnya tantangan yang didapat tidak berbeda jauh juga karena hal yang
dikerjakan tidak jauh berbeda.
A : Kalo selama Bapak bekerja disini, pernah gak Bapak ada masalah dengan sesama
rekan kerja? Kalo ada biasanya seperti apa Pak?
B : Mungkin ketika waktu saya awal – awal pindah kesini, karena saya karyawan
baru notabenenya, jadi agak sulit untuk berkomunikasi dengan sesama rekan kerja
dalam satu divisi.
A : Baiklah Pak. Saya rasa sudah cukup. Terimakasih atas waktunya. Selamat bekerja
kembali, Pak!
Analisis Pengaruh Satisfaction..., Meiriks Henling, FB UMN, 2018
30/7/2018 Kuesioner Penelitian Kepuasan Kerja Karyawan dalam Hal Promosi dan Hubungan dengan Rekan Kerja terhadap Work Engagement Ka…
https://docs.google.com/forms/d/1b2FMUrNONzIsegp238cQZB_upH9U9YfpjgaRHIVQA44/edit 1/7
Kuesioner Penelitian Kepuasan Kerja Karyawan dalamHal Promosi dan Hubungan dengan Rekan Kerjaterhadap Work Engagement KaryawanKepada Yth, Para Responden di tempat
Perkenalkan nama saya, Meirika Henling, mahasiswi tingkat akhir jurusan Manajemen Sumber Daya Manusia - Universitas Multimedia Nusantara, Tangerang.
Pada kesempatan kali ini saya, saya meminta kesediaan para responden untuk mengisi kuesioner ini yang berisikan pernyataan - pernyataan seputar pekerjaan Anda. Pernyataan dalam kuesioner ini berguna untuk mengukur aspek - aspek kepuasan bekerja dalam hal promosi dan hubungan Anda dengan sesama rekan kerja terhadap terciptanya work engagement di Perusahaan.
Setiap jawaban yang Anda berikan akan sangat bermanfaat khususnya bagi kemajuan perusahaan dalam membantu menciptakan kepuasan kerja terhadap para karyawannya serta membantu menciptakan hubungan kerja antara Anda dengan sesama rekan kerja lebih baik lagi kedepannya.
Anda di harapkan menjawab semua pernyataan dengan jujur. Terimakasih atas perhatian dan kerjasamanya!
Best regards, Meirika Henling 14130110068
* Required
1. Jenis Kelamin *Mark only one oval.
Laki - Laki
Perempuan
2. Berapakah usia Anda tahun ini? *Mark only one oval.
18 - 22 tahun
23 - 27 tahun
28 - 32 tahun
33 - 37 tahun
38 - 42 tahun
43 - 47 tahun
48 - 52 tahun
53 - 57 tahun
Analisis Pengaruh Satisfaction..., Meiriks Henling, FB UMN, 2018

30/7/2018 Kuesioner Penelitian Kepuasan Kerja Karyawan dalam Hal Promosi dan Hubungan dengan Rekan Kerja terhadap Work Engagement Ka…
https://docs.google.com/forms/d/1b2FMUrNONzIsegp238cQZB_upH9U9YfpjgaRHIVQA44/edit 2/7
3. Divisi Pekerjaan *Mark only one oval.
Operation (Mining)
Operation (Hauling)
Operation (Port)
Operation (Shipping)
Operation (Komersiil & Marketing)
Non - Operation (Finance & Accounting & Tax)
Non - Operation (Human Resource)
Non - Operation (IT)
Non - Operation (Legal)
Non - Operation (Audit)
Non - Operation (CSR)
Other:
4. Lama Bekerja *Mark only one oval.
1 - 5 tahun
6 - 10 tahun
11 - 15 tahun
lebih dari 15 tahun
5. Tipe Karyawan *Mark only one oval.
Karyawan Tetap
Karyawan Kontrak After the last question in this section, stop filling out this form.
6. Pernah mendapat kesempatan PROMOSI jabatan? *Mark only one oval.
Ya, Pernah
Tidak Pernah Stop filling out this form.
BAGIAN 11. Bacalah setiap pernyataan secara teliti sebelum Anda menjawab. 2. Anda diminta untuk menjawab seluruh pernyataan dengan jujur dan se-objektif mungkin. 3. Berikan penilaian Anda atas pernyataan - pernyataan dibawah ini sesuai kondisi yang Anda rasakan sampai saat ini. Pilihlah salah satu jawaban dengan cara memberikan tanda pada lingkaran putih yang tersedia di setiap pernyataan sesuai dengan penilaian Anda dengan skala penilaian 1 ( Sangat Tidak Setuju ) sampai dengan 7 ( Sangat Setuju )
Analisis Pengaruh Satisfaction..., Meiriks Henling, FB UMN, 2018

30/7/2018 Kuesioner Penelitian Kepuasan Kerja Karyawan dalam Hal Promosi dan Hubungan dengan Rekan Kerja terhadap Work Engagement Ka…
https://docs.google.com/forms/d/1b2FMUrNONzIsegp238cQZB_upH9U9YfpjgaRHIVQA44/edit 3/7
7. Di perusahaan saya bekerja, apabila seseorang sudah bekerja dengan baik, akan mendapatkesempatan promosi jabatan yang adil *Mark only one oval.
1 2 3 4 5 6 7
Sangat Tidak Setuju Sangat Setuju
8. Di perusahaan saya bekerja, karyawan cepat mendapatkan promosi kerja sama seperti diperusahaan lain *Mark only one oval.
1 2 3 4 5 6 7
Sangat Tidak Setuju Sangat Setuju
9. Saya puas dengan kesempatan saya untuk mendapatkan promosi jabatan *Mark only one oval.
1 2 3 4 5 6 7
Sangat Tidak Setuju Sangat Setuju
10. Saya suka dengan rekan - rekan kerja di tempat saya bekerja *Mark only one oval.
1 2 3 4 5 6 7
Sangat Tidak Setuju Sangat Setuju
11. Saya tidak harus bekerja lebih ekstra karena sudah memiliki rekan kerja di dalam tim yangkompeten *Mark only one oval.
1 2 3 4 5 6 7
Sangat Tidak Setuju Sangat Setuju
12. Saya menikmati hubungan yang terjalin dengan sesama rekan kerja saya *Mark only one oval.
1 2 3 4 5 6 7
Sangat Tidak Setuju Sangat Setuju
Analisis Pengaruh Satisfaction..., Meiriks Henling, FB UMN, 2018

30/7/2018 Kuesioner Penelitian Kepuasan Kerja Karyawan dalam Hal Promosi dan Hubungan dengan Rekan Kerja terhadap Work Engagement Ka…
https://docs.google.com/forms/d/1b2FMUrNONzIsegp238cQZB_upH9U9YfpjgaRHIVQA44/edit 4/7
13. Saya tidak merasa ada perselisihan (adu mulut, cekcok) di antara sesama rekan kerja diperusahaan *Mark only one oval.
1 2 3 4 5 6 7
Sangat Tidak Setuju Sangat Setuju
14. Saya tidak merasa ada pertengkaran (adu fisik) di antara sesama rekan kerja di perusahaan *Mark only one oval.
1 2 3 4 5 6 7
Sangat Tidak Setuju Sangat Setuju
BAGIAN 21. Bacalah setiap pernyataan secara teliti sebelum Anda menjawab. 2. Anda diminta untuk menjawab seluruh pernyataan dengan jujur dan se-objektif mungkin. 3. Berikan penilaian Anda atas pernyataan - pernyataan dibawah ini sesuai kondisi yang Anda rasakan sampai saat ini. Pilihlah salah satu jawaban dengan cara memberikan tanda pada lingkaran putih yang tersedia di setiap pernyataan sesuai dengan penilaian Anda dengan skala penilaian 1 (Tidak Pernah ) sampai dengan 7 ( Selalu )
15. Ketika sedang bekerja, saya merasa penuh dengan energi *Mark only one oval.
1 2 3 4 5 6 7
Tidak Pernah Selalu
16. Saya merasa kuat ketika sedang bekerja *Mark only one oval.
1 2 3 4 5 6 7
Tidak Pernah Selalu
17. Saya merasa bersemangat ketika sedang bekerja *Mark only one oval.
1 2 3 4 5 6 7
Tidak Pernah Selalu
18. Ketika bangun di pagi hari, saya merasa bersemangat untuk bekerja *Mark only one oval.
1 2 3 4 5 6 7
Tidak Pernah SelaluAnalisis Pengaruh Satisfaction..., Meiriks Henling, FB UMN, 2018

30/7/2018 Kuesioner Penelitian Kepuasan Kerja Karyawan dalam Hal Promosi dan Hubungan dengan Rekan Kerja terhadap Work Engagement Ka…
https://docs.google.com/forms/d/1b2FMUrNONzIsegp238cQZB_upH9U9YfpjgaRHIVQA44/edit 5/7
19. Saya merasa dapat terus bekerja untuk waktu yang sangat lama *Mark only one oval.
1 2 3 4 5 6 7
Tidak Pernah Selalu
20. Saya merasa ulet ketika sedang bekerja *Mark only one oval.
1 2 3 4 5 6 7
Tidak Pernah Selalu
21. Saya selalu tekun dalam bekerja walaupun di saat keadaan tidak sedang berjalan dengan baik*Mark only one oval.
1 2 3 4 5 6 7
Tidak Pernah Selalu
22. Saya merasa pekerjaan saya penuh dengan makna *Mark only one oval.
1 2 3 4 5 6 7
Tidak Pernah Selalu
23. Saya merasa pekerjaan saya penuh dengan tujuan *Mark only one oval.
1 2 3 4 5 6 7
Tidak Pernah Selalu
24. Saya antusias dengan pekerjaan saya *Mark only one oval.
1 2 3 4 5 6 7
Tidak Pernah Selalu
25. Pekerjaan saya menginspirasi saya *Mark only one oval.
1 2 3 4 5 6 7
Tidak Pernah Selalu
Analisis Pengaruh Satisfaction..., Meiriks Henling, FB UMN, 2018

30/7/2018 Kuesioner Penelitian Kepuasan Kerja Karyawan dalam Hal Promosi dan Hubungan dengan Rekan Kerja terhadap Work Engagement Ka…
https://docs.google.com/forms/d/1b2FMUrNONzIsegp238cQZB_upH9U9YfpjgaRHIVQA44/edit 6/7
26. Saya bangga dengan pekerjaan yang saya lakukan *Mark only one oval.
1 2 3 4 5 6 7
Tidak Pernah Selalu
27. Saya merasa pekerjaan saya menantang *Mark only one oval.
1 2 3 4 5 6 7
Tidak Pernah Selalu
28. Saya merasa waktu berlalu begitu cepat ketika saya sedang bekerja *Mark only one oval.
1 2 3 4 5 6 7
Tidak Pernah Selalu
29. Ketika saya sedang bekerja, saya melupakan semua hal lain di sekitar saya *Mark only one oval.
1 2 3 4 5 6 7
Tidak Pernah Selalu
30. Saya merasa bahagia ketika saya bekerja dengan seluruh kemampuan yang saya miliki *Mark only one oval.
1 2 3 4 5 6 7
Tidak Pernah Selalu
31. Saya merasa asyik ketika sedang bekerja *Mark only one oval.
1 2 3 4 5 6 7
Tidak Pernah Selalu
32. Saya selalu terbawa kedalam suasana yang menyenangkan ketika sedang bekerja *Mark only one oval.
1 2 3 4 5 6 7
Tidak Pernah Selalu
Analisis Pengaruh Satisfaction..., Meiriks Henling, FB UMN, 2018
30/7/2018 Kuesioner Penelitian Kepuasan Kerja Karyawan dalam Hal Promosi dan Hubungan dengan Rekan Kerja terhadap Work Engagement Ka…
https://docs.google.com/forms/d/1b2FMUrNONzIsegp238cQZB_upH9U9YfpjgaRHIVQA44/edit 7/7
Powered by
33. Saya merasa sulit untuk terlepas dengan pekerjaan saya *Mark only one oval.
1 2 3 4 5 6 7
Tidak Pernah Selalu
Analisis Pengaruh Satisfaction..., Meiriks Henling, FB UMN, 2018
Analisis Pengaruh Satisfaction..., Meiriks Henling, FB UMN, 2018

Analisis Pengaruh Satisfaction..., Meiriks Henling, FB UMN, 2018

Analisis Pengaruh Satisfaction..., Meiriks Henling, FB UMN, 2018

Analisis Pengaruh Satisfaction..., Meiriks Henling, FB UMN, 2018
Evidence-based HRM: a Global Forum for Empirical ScholarshipFacets of job satisfaction and work engagementZeynep Yesim Yalabik, Bruce A. Rayton, Andriana Rapti,
Article information:To cite this document:Zeynep Yesim Yalabik, Bruce A. Rayton, Andriana Rapti, (2017) "Facets of job satisfaction and workengagement", Evidence-based HRM: a Global Forum for Empirical Scholarship, Vol. 5 Issue: 3,pp.248-265, https://doi.org/10.1108/EBHRM-08-2015-0036Permanent link to this document:https://doi.org/10.1108/EBHRM-08-2015-0036
Downloaded on: 04 March 2018, At: 19:19 (PT)References: this document contains references to 87 other documents.To copy this document: [email protected] fulltext of this document has been downloaded 327 times since 2017*
Users who downloaded this article also downloaded:(2015),"Organizational identification, work engagement, and job satisfaction", Journal of ManagerialPsychology, Vol. 30 Iss 8 pp. 1019-1033 <a href="https://doi.org/10.1108/JMP-11-2013-0359">https://doi.org/10.1108/JMP-11-2013-0359</a>(2016),"Work engagement, job satisfaction, and turnover intentions: A comparisonbetween supervisors and line-level employees", International Journal of ContemporaryHospitality Management, Vol. 28 Iss 4 pp. 737-761 <a href="https://doi.org/10.1108/IJCHM-07-2014-0360">https://doi.org/10.1108/IJCHM-07-2014-0360</a>
Access to this document was granted through an Emerald subscription provided by emerald-srm:602776 []
For AuthorsIf you would like to write for this, or any other Emerald publication, then please use our Emeraldfor Authors service information about how to choose which publication to write for and submissionguidelines are available for all. Please visit www.emeraldinsight.com/authors for more information.
About Emerald www.emeraldinsight.comEmerald is a global publisher linking research and practice to the benefit of society. The companymanages a portfolio of more than 290 journals and over 2,350 books and book series volumes, aswell as providing an extensive range of online products and additional customer resources andservices.
Emerald is both COUNTER 4 and TRANSFER compliant. The organization is a partner of theCommittee on Publication Ethics (COPE) and also works with Portico and the LOCKSS initiative fordigital archive preservation.
*Related content and download information correct at time of download.
Dow
nloa
ded
by U
nive
rsita
s M
ultim
edia
Nus
anta
ra A
t 19:
19 0
4 M
arch
201
8 (P
T)
Analisis Pengaruh Satisfaction..., Meiriks Henling, FB UMN, 2018
Facets of job satisfactionand work engagementZeynep Yesim Yalabik and Bruce A. Rayton
School of Management, University of Bath, Bath, UK, andAndriana Rapti
Kingston Business School, Kingston University,London, UK
AbstractPurpose – The purpose of this paper is to analyze the relationship between the facets of job satisfaction andthe work engagement. Previous studies that focus on the linkages between work engagement and overall jobsatisfaction ignore the multi-faceted nature of job satisfaction construct. In this study, how job satisfactionfacets are linked to three dimensions of work engagement – i.e. vigor, dedication and absorption – isdiscussed by drawing on the social exchange theory.Design/methodology/approach – The cross-lagged data used in this study come from the specialistlending division of a UK bank. The linear multiple regression analyses are run to test the proposedtheoretical model.Findings – The results show that among all the job satisfaction facets, the “satisfaction with work itself” is thekey driver of all dimensions of work engagement, i.e. vigor, dedication and absorption. The “satisfaction withconditions” is negatively linked to absorption of employees in their work. This means that the employees withhigh workload might not be absorbed in their work. Finally, it is found that employees who are satisfied with thecommunication in their work are also absorbed in their work.Originality/value – This study contributes to our knowledge of the drivers of work engagement over time.The facets of job satisfaction as the drivers help us to have a comprehensive understanding of the linkbetween the job satisfaction facets and work engagement. This study first contributes to the workengagement literature which has neglected the multi-dimensional approach of job satisfaction. This studyalso contributes to the limited number of work engagement studies conducted in service sector and in UK.Keywords Social exchange theory, Work engagement, Facets of job satisfactionPaper type Research paper
1. IntroductionWork engagement is a widely researched construct that has significant links to workmotivation and motivational behavior, thus, an important concept for organizations due toits positive impact on performance outcomes (Christian et al., 2011). It has been shown bythe studies of both practitioners and academics that a disengaged workforce is costly(Rayton et al., 2012). Therefore, the current focus of the literature is on identifying job andorganizational characteristics that contribute to the engagement of employees. Drawing onthe social exchange theory, our study contributes to the literature by explaining the impactof job satisfaction facets, which are about how employees feel about various aspects of theirjob, on the engagement of employees in their work.
The type of employee engagement our study focuses on is work engagement, which is anindependent, persistent and pervasive affective-cognitive and motivational psychologicalstate (Schaufeli et al., 2002, 2006). Work engagement is a narrow-focused conceptualization ofthe relationship between the employee and his/her job (Truss et al., 2013). Every job hasphysical, social and organizational aspects or characteristics that motivate employees toachieve their work goals and foster personal growth, learning and development (Bakkerand Demerouti, 2008). To be able to understand the link between job-related characteristics andwork engagement, our study focuses on the traditional job satisfaction concept and its facets.
Job satisfaction is an attitude which reflects how much an employee likes or dislikeshis/her job (Spector, 1997). It requires an evaluation of the “emotional state”which is a result
Evidence-based HRM: a GlobalForum for Empirical ScholarshipVol. 5 No. 3, 2017pp. 248-265© Emerald Publishing Limited2049-3983DOI 10.1108/EBHRM-08-2015-0036
Received 26 August 2015Revised 21 April 2016Accepted 20 June 2016
The current issue and full text archive of this journal is available on Emerald Insight at:www.emeraldinsight.com/2049-3983.htm
248
EBHRM5,3
Dow
nloa
ded
by U
nive
rsita
s M
ultim
edia
Nus
anta
ra A
t 19:
19 0
4 M
arch
201
8 (P
T)
Analisis Pengaruh Satisfaction..., Meiriks Henling, FB UMN, 2018

of what an employee perceives, feels and thinks about his/her job (Weiss, 2002). It is wellestablished in the literature that job satisfaction is a multi-faceted construct since employeesmay have different feelings toward various aspects of their job (e.g. Smith et al., 1969;Locke, 1976; Spector, 1997). Based on the social exchange theory (Cropanzano andMitchell, 2005), we argue that satisfaction with various job characteristics or facets will bereciprocated with more positive attitudes such as work engagement.
As Rutherford et al. (2009) explain, an overall or global job satisfaction measure provides avery limited approach to understanding whether an employee is happy about their job or not.In order to accurately reflect an employee’s job satisfaction, a number of job facets need to beevaluated as these may not be of equal importance to each employee (Churchill et al., 1974;Boles et al., 2007). Thus, taking a multi-dimensional approach or considering eachjob satisfaction facet provides us a more detailed and complete understanding of anemployee’s satisfaction in their work (Spector, 1997; Boles et al., 2007; Rutherford et al., 2009;Spagnoli et al., 2012).
The link between overall or global job satisfaction and work engagement has beenexplored through various studies (e.g. Saks, 2006; Avery McKay and Wilson, 2007;Bakker et al., 2008). However, to our knowledge, the multi-faceted nature of job satisfactionhas not been recognized in the employee engagement literature. We are yet to understandwhich of these job satisfaction facets are more likely to result in higher work engagement.By exploring job satisfaction facets-work engagement link, our study contributes to thecurrent literature on what drives work engagement. Focusing on the long-lasting jobsatisfaction literature and combining it with the newly developing work engagementconcept is expected to benefit organizations to understand job-specific sources of employeeengagement, which is an existing, continuous problem in today’s organizations.
Our model is tested by a sample from a specialist lending division of a UK bank.The engagement of service employees is a neglected area in the literature (Menguc et al., 2012).Therefore, our study further contributes to the literature by specifically focusing on theengagement of service employees. Finally, our cross-lagged data contribute to ourunderstanding of long-term impact of job satisfaction facets on work engagement. As workengagement is a motivational construct (Schaufeli et al., 2002), it is important to understandwhich facets of job satisfaction impact motivation of employees in the long run. In the nextsection, we discuss the link between job satisfaction and work engagement, and develop ourhypotheses. This discussion is followed by testing of hypotheses and explanation of ourresults and their implications.
2. Literature review2.1 Work engagement and job satisfaction relationshipWork engagement is a motivational psychological state with three dimensions: vigor,dedication and absorption (Schaufeli et al., 2002, 2006). Vigor refers to energy, mentalresilience, determination and investing consistent effort in your job. Dedication is aboutbeing inspired, identified with, enthusiastic and highly involved in your job. The lastdimension, absorption, refers to a sense of detachment from your surroundings, a highdegree of concentration on and immersion in your job and a general lack of consciousawareness of the amount of time spent on the job. An engaged employees, thus, is one who isenergetic, enthusiastic and absorbed in his/her job.
There are different conceptualizations of employee engagement in the literature.As defined by Kahn (1990, p. 694), engagement is specifically related to the employees“presenting and absenting themselves during task performances.” In other words, it is about“involvement of ‘self’ in the work” (Kahn, 1990; Meyer et al., 2010, p. 63). Drawing onKahn’s (1990) conceptualization of psychological presence, work engagement is explained asan “implied” state and an antipode of burnout (Schaufeli et al., 2002). Recent studies,
249
Facets of jobsatisfactionand work
engagement
Dow
nloa
ded
by U
nive
rsita
s M
ultim
edia
Nus
anta
ra A
t 19:
19 0
4 M
arch
201
8 (P
T)
Analisis Pengaruh Satisfaction..., Meiriks Henling, FB UMN, 2018

however, separate burnout and engagement as independent psychological states(e.g. Schaufeli et al., 2006; Salanova and Schaufeli, 2008). Furthermore, Saks (2006) focuseson job and organizational engagement of employees and it is one of the first studies thatfocus on engagement directed toward a factor other than the work. While Macey andSchneider (2008) provide a more comprehensive model by differentiating among state, traitand behavioral aspects of engagement, this model has not been empirically tested probablydue to its complexity. A more recent conceptualization is job engagement (Rich et al., 2010),which also draws on the psychological presence similar to work engagement and has threedimensions as physical, emotional and cognitive engagement. Finally, Soane et al. (2012)discuss ISA, which stands for intellectual, social and affective, engagement. Among allthese different conceptualizations, work engagement is the only one that has received the mostempirical support by its validation across various contexts and counties as well as theextensive discussion in the academic literature.
Our study argues that satisfaction with various job aspects is important for employees tobecome energetic, dedicated and absorbed in their job. By taking this view, we agree that jobsatisfaction and work engagement are distinct concepts, which is in line with the existingliterature (e.g. Scahufeli, 2013); and job satisfaction is an antecedent of work engagement.The discussion on whether job satisfaction is an antecedent or an outcome of workengagement is still debated. There is support for both views. Some studies argue that jobsatisfaction is an outcome (e.g. Saks, 2006; Avery et al., 2007; Vecina et al., 2012), while otherstudies explain that job satisfaction is an antecedent of work engagement (e.g. Simpson,2009; Rayton and Yalabik, 2014; Salanova et al., 2011; Yalabik et al., 2013).
Our first reason to view job satisfaction as the antecedent of work engagement is about thesatiation-activation differentiation. Job satisfaction is an emotional evaluation of the job and islinked to the satiation state (Macey and Schneider, 2008), while work engagement is amotivational state and linked to activation (Macey and Schneider, 2008; Salanova et al., 2011).This means that once employees have evaluated their job, they are ready (or not, if they arenot satisfied) to move into a motivational state, i.e. become engaged. Next, drawing on thesocial exchange theory, Seers et al. (1995) suggest that the reciprocity-based relationshipbetween an organization and its employees predict positive work attitudes in the veil of jobsatisfaction. Therefore, when employees are satisfied with various facets of their job, they maythen provide the organization with increased levels of work engagement.Moreover, considering that work engagement is emerged from the burnout concept as itsantipode (Bakker and Demerouti, 2008), we follow the same directionality between jobsatisfaction and burnout. It is well established that job satisfaction is an antecedentof burnout (Lee and Ashforth, 1996); thus, job satisfaction is also more likely to be theantecedent of work engagement.
2.2 Facets of job satisfactionSocial exchange theory is the theoretical framework adopted to explain the relationshipbetween facets of job satisfaction and work engagement in our study. The key principle ofthe social exchange theory is the norm of reciprocity (Cropanzano and Mitchell, 2005).The social exchange signifies the expectation that when one person does a favor, this favorwill be returned in the future (Aryee et al., 2002). Drawing on Blau (1964), the organization inorder to initiate the exchange has to provide resources that are valuable to the employees(Cole et al., 2012). These resources provided by the organization entail an obligation on thepart of the employees to reciprocate with more positive personal attitudes and positivebehaviors to the organization (Cropanzano and Mitchell, 2005; Aryee et al., 2002;Eisenberger et al., 2001). The organization may initiate exchange by offering resources tothe employees who enjoy higher levels of satisfaction with various job facets and willreciprocate with higher levels of work engagement. Alternatively, employees may initiate
250
EBHRM5,3
Dow
nloa
ded
by U
nive
rsita
s M
ultim
edia
Nus
anta
ra A
t 19:
19 0
4 M
arch
201
8 (P
T)
Analisis Pengaruh Satisfaction..., Meiriks Henling, FB UMN, 2018
exchange by perceiving these resources valuable and they are satisfied with facets oftheir job. Put differently, as employee expectations about job conditions and rewards aresatisfied by their organization, the organizations, in return, receive positive attitudinal andbehavioral outcomes reciprocity which creates an exchange relationship between employeesand organizations (Settoon et al., 1996). Thus, we argue that when the employees aresatisfied with various aspects of their job, they are more likely to reciprocate by becomingmore engaged in their job.
One stream of researchers focus on a global job satisfaction measure, while the othersargue that different facets of a job might create satisfaction or dissatisfaction for employees(Weiss, 2002; Bowling et al., 2008). It is supported that each facet significantly contributes tooverall job satisfaction of employees (Skalli et al., 2008; Spagnoli et al., 2012). Job satisfactionis stable over time and facets are important indicators of an overall job satisfaction(Spagnoli et al., 2012).
In this study, we adopt nine job satisfaction facets proposed by Spector (1997) assatisfaction with: nature of work, operating conditions, pay, benefits, rewards, promotion,supervisor, co-workers and communication. Spector’s (1997) categorization ofjob satisfaction facets and his scale is one of the most reliable scales in the literature(Spagnoli et al., 2012). Table I presents the facets of job satisfaction discussed and measuredin our study, which is consistent with Spector’s (1997) categorization.
The first job satisfaction facet is the nature of work. Previous research indicates that thecharacteristics of a job impact an employee’s affective state, which in return impactsbehavior toward the job. Employees who find their jobs more psychologically meaningfulare found to be more engaged (Kahn, 1990; May et al., 2004). Earlier engagement studiesargue that favorable job characteristics will lead to higher employee engagement(Saks, 2006). Alternatively, as discussed, satisfaction with work is measured in the form ofoverall job satisfaction, which is positively linked to employee engagement (Saks, 2006;Alarcon and Lyons, 2011; Tims et al., 2013). Similarly, we argue that:
H1. Satisfaction with the nature of work will be positively related to work engagement.
The second dimension, satisfaction with operating conditions, has not been analyzed inprevious engagement studies. However, workload or work overload concepts are similar tothe concept Spector (1997) named as operating conditions. Workload or work overloadoccurs when job demands exceed individual capabilities; hence, workload is seen as achallenge stressor (Podsakoff et al., 2007; van den Broeck et al., 2010). Workload is positivelyrelated to burnout’s exhaustion dimension, which is conceptualized as the opposite of thededication dimension (Maslach and Leiter, 2008). Workload is also shown to be negativelylinked to work engagement as a job demand (Schaufeli and Bakker, 2004; Bakker andDemerouti, 2008; Crawford et al., 2010; Cole et al., 2012; Tims et al., 2013). It is argued that notall demands are negative and employees with reasonable job demands are found to be moreenergetic in their jobs (Schaufeli and Bakker, 2004). Thus, we expect that employees who aresatisfied with their workload should have higher work engagement:
H2. Satisfaction with operating conditions will be positively related to work engagement.
Our next set of hypotheses is related to pay satisfaction, benefits satisfaction, promotionsatisfaction and rewards satisfaction. To our knowledge, only a recent study byHulkko-Nyman et al. (2012) specifically focuses on the relationship between work engagementand a comprehensive view of pay, benefits, promotion and rewards. Hulkko-Nyman et al.(2012) find that non-monetary rewards, more precisely appreciation of work, are significantpositive predictors of vigor, dedication and absorption. Furthermore, their study shows thatcompared to other dimensions, benefits is the main one that is strongly related to thededication of employees.
251
Facets of jobsatisfactionand work
engagement
Dow
nloa
ded
by U
nive
rsita
s M
ultim
edia
Nus
anta
ra A
t 19:
19 0
4 M
arch
201
8 (P
T)
Analisis Pengaruh Satisfaction..., Meiriks Henling, FB UMN, 2018

Traditionally, pay or compensation in one’s job has been considered as the most importantaspect of an employee’s satisfaction (Deckop, 1992). However, the pay level is not a strongpredictor of job satisfaction (Spector, 1997), though it does impact other work attitudes suchas organizational commitment and intention to stay (Chew and Chan, 2008), and paysatisfaction (Heneman et al., 1997). Moreover, Herzberg et al. (2011) suggest that jobsatisfaction is determined by “motivators” such as job content, recognition, achievement,responsibilities, advancement and opportunities; whereas job dissatisfaction is influencedby “hygiene factors” such as salary and working conditions, which also shows a weakrelationship between pay and job satisfaction.
Bakker et al. (2006) find that financial rewards are negatively related to perceptions of workengagement, although satisfaction with fringe benefits is positively related to work engagement.
Facets of job satisfaction Scale items
Nature of work I sometimes feel my job is meaningless (R)a
I like doing the things I do at workI feel a sense of pride in doing my jobMy job is enjoyable
Operating conditions Many of our rules and procedures make doing a good job difficultI have too much to do at workI have too much paperwork
My efforts to do a good job are seldom blocked by red tapeb
Promotion There is really too little chance for promotion on my jobThose who do well on the job stand a fair chance of being promotedPeople get ahead as fast here as they do in other placesI am satisfied with my chances for promotion
Pay I feel I am being paid a fair amount for the work I doRaises are too few and far between (R)I feel unappreciated by the organization when I think about what they pay me (R)I feel satisfied with my chances for salary increases
Supervision My supervisor is quite competent in doing his/her jobc
My supervisor is unfair to me (R)My supervisor shows too little interest in the feelings of subordinates (R)I like my supervisor
Benefits I am not satisfied with the benefits I receive (R)The benefits we receive are as good as most other organizations offerThe benefit package we have is equitableThere are benefits we do not have which we should have
Rewards When I do a good job, I receive the recognition for it that I should receiveI do not feel that the work I do is appreciated (R)There are few rewards for those who work here (R)I don't feel my efforts are rewarded the way they should be (R)
Co-workers I like the people I work withI find I have to work harder at my job because of the incompetence of peopleI work with (R)I enjoy my co-workersThere is too much bickering and fighting at work (R)
Communication Communications seem good within this organizationThe goals of this organization are not clear to me (R)I often feel that I do not know what is going on with the organization (R)Work assignments are not fully explained (R)
Notes: a(R), reverse coded; bthis italicized item for “operating conditions” facet is not included in our scalecalculations and reliability analyses; cthe term supervisor is replaced with “line manager” in our surveySource: Spector (1997), Job Satisfaction Survey ( JSS): http://shell.cas.usf.edu/~pspector/scales/jssovr.html
Table I.Facets of jobsatisfaction andsurvey items
252
EBHRM5,3
Dow
nloa
ded
by U
nive
rsita
s M
ultim
edia
Nus
anta
ra A
t 19:
19 0
4 M
arch
201
8 (P
T)
Analisis Pengaruh Satisfaction..., Meiriks Henling, FB UMN, 2018
On the other hand, Gorter et al. (2008) show that financial rewards are positively related to workengagement. In addition, Fairlie (2011) does not find any link between extrinsic rewards, whichis measured as combinations of fair pay, perks and other rewards for one’s efforts, and workengagement. A meta-analysis study by Crawford et al. (2010) suggests that the relationshipbetween rewards and engagement can be either positive or negative since extrinsic rewards,such as pay, may damage intrinsic motivation. Therefore, while rewards are important jobcharacteristics that contribute to work engagement, further research is needed to understandtheir impact on engagement (Crawford et al., 2013).
Only a few studies consider promotion aspect as part of job characteristics and workengagement relationship. de Lange et al. (2008) examine the difference between employeeswho stayed in their job, promoted or left rather than focusing on promotion perceptions ofemployees. They find that there is a positive relationship between job resources andwork engagement of the employees who have been recently promoted. Moreover,Balducci et al. (2011) find that promotion prospects (combined with job autonomy and socialaspects) are positively related to work engagement; however, the individual impact ofpromotion prospects on work engagement is not specified. Recent changes to theemployment relationship may mean that employees are more interested in careeradvancements in their job (Sullivan and Baruch, 2009), thus, increasing the importance ofsatisfaction with promotion opportunities.
Finally, improved rewards have been linked to work engagement (Demerouti et al., 2001;Koyuncu et al., 2006; Maslach and Leiter, 2008; Crawford et al., 2010). All these previousstudies view rewards as part of job which positively contribute to work engagement ofemployees. Drawing from the social exchange theory, when employees are satisfied with therewards offered by their organization, they are expected to reciprocate with positiveattitudes such as work engagement. Therefore, we hypothesize that:
H3. Satisfaction with pay will be positively related to work engagement.
H4. Satisfaction with benefits will be positively related to work engagement.
H5. Satisfaction with promotion will be positively related to work engagement.
H6. Satisfaction with rewards will be positively related to work engagement.
In the work engagement literature, satisfaction with co-workers and supervisor/linemanager is categorized as “social support” under the job demands-resources ( JD-R) model.Social support is one of the mostly researched job resources in JD-R model (Bakker et al.,2004; Saks, 2006; de Lange et al., 2008; Fairlie, 2011; van den Broeck et al., 2010; Cole et al.,2012; van Beek et al., 2012; Mastenbroek et al., 2014), and it is measured in a variety of waysacross studies. One group of studies uses a specific social support scale that includes bothcoworker and supervisor/line manager support (Bakker et al., 2004; de Lange et al., 2008).Other set of studies differentiate between coworker and supervisor/line manager support(Saks, 2006; Fairlie, 2011; van den Broeck et al., 2010; Cole et al., 2012; van Beek et al., 2012;Mastenbroek et al., 2014).
Social aspects of the work environment, for example, having friendly and supportivecolleagues, has a significant impact on employee job perceptions (Chalofsky, 2003). Co-workers and supervisor/line manager play important roles in various types of informationacquisition, etc., and employees may become detached from their jobs if supervisor/linemanager are not perceived to be available and responsive (Lapalme et al., 2009). Thus, socialsupport from co-workers and supervisor/line manager has been linked to increased workengagement (Demerouti et al., 2001; Schaufeli and Bakker, 2004; Bakker and Demerouti,2007; Freeney and Fellenz, 2013).
Social exchange theory helps us to explain why “support” is reciprocated by increasedpositive attitudes such as engagement. Reciprocity not only ensures repaying, but it also
253
Facets of jobsatisfactionand work
engagement
Dow
nloa
ded
by U
nive
rsita
s M
ultim
edia
Nus
anta
ra A
t 19:
19 0
4 M
arch
201
8 (P
T)
Analisis Pengaruh Satisfaction..., Meiriks Henling, FB UMN, 2018

creates a stronger and more solid relationship between the employee and the organization(Rousseau, 1995). In that sense, individuals seek to reciprocate so as to enhance the receipt offuture resources and, hence, maintain the exchange relationship. Therefore, the exchangedresources signal the appearance of mutual support and maintenance of long-termrelationships among the organizational members (Cropanzano and Mitchell, 2005; Aryeeet al., 2002). According to the social exchange theory, employees reciprocate the care/supporttheir organizations show with more effort and positive attitudes (Cropanzano andMitchell, 2005). Thus, we hypothesize that employees who are satisfied in their interactionswith their co-workers and supervisors/line managers will be more engaged with their work:
H7. Satisfaction with co-workers will be positively related to work engagement.
H8. Satisfaction with line managers will be positively related to work engagement.
Our last hypothesis relates to communication satisfaction facet. Communication contributesto the development of employee trust in organizations (Thomas et al., 2009). Communicationsatisfaction is an important contributory factor in the interaction between employees andtheir job environment, and it is linked with positive employee attitudes such asorganizational identification (Postmes et al., 2001). While the importance of communicationhas been linked to engagement in practitioner-based sources (MacLeod and Clarke, 2009),the academic research has been slow to show such relationship.
May et al. (2004) explain the importance of open communication as a factor thatcontributes to supervisor support and impacts perceptions of supervisors. Similarly,Fairlie (2011) includes communication as part of leadership and organizational features aswell as organizational support; however, there is not a direct linkage shown betweencommunication and work engagement. Iyer and Israel’s (2012) study has an extensivefocus on communication satisfaction and engagement, which is defined and measured asthe combination of commitment, satisfaction and withdrawal cognition of employees.They find that communication satisfaction has a positive significant impact on employeeengagement. Furthermore, Vogelgesang et al. (2013) show that communicationtransparency, as part of the perceptions of leader behavioral integrity, and followers’work engagements have been positively related. Finally, Rees et al. (2013) find a directrelationship between perceptions of voice behavior and job engagement. While there are afew studies in the current literature on communication and engagement, no specific studyfocused on communication satisfaction and work engagement. Again drawing on thesocial exchange theory, we expect that employees who have high communicationsatisfaction are more likely to be engaged in their work:
H9. Satisfaction with communication will be positively related to work engagement.
3. MethodologyOur data come from employees in the specialist lending division of a UK bank. In thisdivision, the employees provide a service for the provision of non-standard mortgageproducts as well as self-employed applicants. The employees are involved in the processingand approval of applications generated through the retail branch network of the bank ratherthan directly dealing with customers. We collected our data via paper-based questionnairesin August 2009 and repeated the survey in August 2010. All 520 employees in the specialistlending division received our questionnaire. In 2009, 377 surveys were returned (73 percent).As a result of the second data collection, we had 202 repeat respondents. However, due to themissing data, the final data set decreases to 175 in the regression analyses (34 percent finalresponse rate). While the sample available for analysis is contingent on missing data,missing values analyses revealed no patterns to the missing observations.
254
EBHRM5,3
Dow
nloa
ded
by U
nive
rsita
s M
ultim
edia
Nus
anta
ra A
t 19:
19 0
4 M
arch
201
8 (P
T)
Analisis Pengaruh Satisfaction..., Meiriks Henling, FB UMN, 2018

To be able to answer our survey, the employees were given time-off during their work.We asked respondents their employee numbers to be able to match the surveysacross time. To be able to protect the confidentiality of the respondents, pre-paidenvelopes were provided so that the respondents would be able to return the completedsurvey directly to the authors. In addition, the three randomly selected respondents wereidentified and provided monetary incentives[1]. As supported by Newby et al. (2003),monetary incentives positively contribute to survey response rate and quality datawithout introducing bias.
3.1 MeasuresThis section explains our dependent, independent and control variables. Unless otherwiseindicated, dependent and independent variables are measured by using a seven-point Likertscale (1¼ Strongly Disagree, 7¼ Strongly Agree). All constructs pass confirmatoryfactor-analytic tests for unidimensionality. All hypotheses are tested via ordinary least squares(OLS) regression analyses. In the regression analyses, all job satisfaction facets-related scalesare measured in Time 1 (i.e. August 2009) while the work engagement measure comes from thesecond-wave of our data, i.e. Time 2 (August 2010).
3.1.1 Dependent variable: work engagement. Work engagement is measured by the17-item version of Utrecht Work Engagement Scale (Schaufeli et al., 2006). The workengagement is measured during Time 2.
Vigor is measured by six items (α¼ 0.84). A sample item is, “When I get up in themorning, I feel like going to work.” Dedication is measured by five items (α¼ 0.92). A sampleitem is, “I am enthusiastic about my job.” The third work engagement dimension,absorption, is measured by six items (α¼ 0.87). A sample item is, “When I am working,I forget everything else around me.”
3.1.2 Facets of job satisfaction. To measure facets of job satisfaction, we have used jobsatisfaction survey developed by Spector (1997) (please see Table I for items).All independent variables (i.e. job satisfaction facets) are measured during Time 1.
For operating conditions facet, we had to drop one of the items i.e. “My efforts to do agood job are seldom blocked by red tape” due to low reliability score. In addition, althoughSpector (1997) originally implemented the supervision facet with the term “supervisor,” ourinvestigation of the organizational structure of the company we collected our data fromindicated that the term “line manager” was used. In order to avoid confusing respondents,we replaced the term supervisor with line manager in our survey questions. Since there weremany different departments in this organization, there were enough line managers togenerate variance.
Descriptive statistics, correlations and reliability statistics for both dependent andindependent variables are presented in Table II.
3.1.3 Control variables. With the permission of respondents, we provided a list ofemployee numbers to the company in order to obtain detailed demographic information.The company was not provided any survey responses for obvious ethical reasons. We usedthese data to construct age, gender, tenure and job-level controls, all of which have beenfound to be important contextual factors in the measurement of employee attitudes. Age andtenure are continuous variables based on birthdates and dates of initial employment withthe company. Gender is a dummy variable which equals 1 for women and 0 for men.
Job level captures the position of the employee in the company hierarchy. There are threejob levels among respondents: non-managerial, front line managers and senior managers,each corresponding to a salary band. We excluded all nine responses from senior managersin the interests of comparability, though our results are unaffected by this choice. The frontline managers represent the first tier of management above the entry level, and we have
255
Facets of jobsatisfactionand work
engagement
Dow
nloa
ded
by U
nive
rsita
s M
ultim
edia
Nus
anta
ra A
t 19:
19 0
4 M
arch
201
8 (P
T)
Analisis Pengaruh Satisfaction..., Meiriks Henling, FB UMN, 2018

Mean
SD1
23
45
67
89
1011
1213
1415
16
1.Vigor
4.46
1.08
(0.84)
2.Dedication
4.62
1.34
0.762**
(0.92)
3.Absorption
4.50
1.16
0.684**
0.744**
(0.87)
4.Satisfaction
with
work
5.04
1.26
0.576**
0.582**
0.492**
(0.88)
5.Satisfaction
with
operating
cond
itions
3.71
1.41
0.116
0.140
−0.023
0.266**
(0.74)
6.Satisfaction
with
pay
3.56
1.24
0.235**
0.211**
0.169*
0.363**
0.249**
(0.78)
7.Satisfaction
with
benefits
4.33
0.90
0.226**
0.243**
0.154*
0.364**
0.233**
0.515**
(0.78)
8.Satisfaction
with
rewards
3.98
1.34
0.307**
0.343**
0.232**
0.549**
0.348**
0.553**
0.461**
(0.85)
9.Satisfaction
with
prom
otion
3.74
1.23
0.269**
0.258**
0.216**
0.425**
0.201**
0.467**
0.315**
0.548**
(0.84)
10.S
atisfaction
with
co-workers
5.23
1.00
0.181*
0.211**
0.173*
0.354**
0.222**
0.308*
0.346**
0.421**
0.293**
(0.67)
11.S
atisfaction
with
line
manager
5.23
1.24
0.168*
0.174*
0.090
0.344**
0.220**
0.255**
0.305**
0.498**
0.318**
0.461**
(0.87)
12.S
atisfaction
with
commun
ication
4.38
1.14
0.378**
0.315**
0.333**
0.475**
0.287**
0.348**
0.299**
0.521**
0.416**
0.420**
0.324**
(0.78)
13.A
ge(in
years)
34.02
11.10
−0.005
0.074
0.063
0.069
−0.106
0.164**
0.030
0.013
0.038
0.017
−0.157**
−0.087
(NA)
14.F
emale
0.58
0.49
0.026
0.165*
0.188**
0.066
0.110*
−0.059
0.060
0.053
−0.002
0.101
0.042
0.040
−0.109*
(NA)
15.T
enure
(inyears)
4.66
4.74
0.016
0.055
0.057
0.063
−0.057
0.203**
0.108*
−0.013
−0.014
0.008
−0.150**
0.015
0.531**
−0.099
(NA)
16.N
on-m
anagerial
worker
0.76
0.43
−0.256**
−0.197**
−0.200**
−0.287**
0.148**
−0.349**
−0.246**
−0.177**
−0.192**
−0.089
0.063
−0.214**
−0.283**
0.179**
−0.343**
(NA)
Notes
:Cronb
ach’sαmeasuresareprovided
inparentheseson
themaindiagonal.*,**C
orrelatio
nsaresign
ificant
at0.05
and0.01
level(tw
o-tailed)
Table II.Descriptive statistics,correlations andreliability statistics
256
EBHRM5,3
Dow
nloa
ded
by U
nive
rsita
s M
ultim
edia
Nus
anta
ra A
t 19:
19 0
4 M
arch
201
8 (P
T)
Analisis Pengaruh Satisfaction..., Meiriks Henling, FB UMN, 2018

retained them in the sample because the majority of their day-to-day tasks are the same asthose of the people they lead. As a result, we include a job-level dummy variable equalingone for the 70 percent of our sample who are non-managerial employees.
4. Analyses and resultsOLS regression is the method used to run our analyses via SPSS 22 statistical analysessoftware. We conducted separate regression analyses on our three dependent variables(i.e. vigor, dedication and absorption) in order to evaluate their relationships with each jobsatisfaction facet. The results are presented in Table III.
The first hypothesis stated that satisfaction with the “nature of work” would bepositively related to work engagement. We see that “satisfaction with work itself” is apositive predictor of vigor ( β¼ 0.570, po0.01), dedication ( β¼ 0.548, po0.01) andabsorption ( β¼ 0.483, po0.01)[2].
These results provide full support for H1. H2 is about the satisfaction with operatingconditions. The way satisfaction with operating conditions is measured means that higherscores mean low satisfaction with operating conditions. In other words, higher scores meanhigh workload. Our results show that “satisfaction with workload” is inversely related toabsorption ( β¼−0.232, po0.01). We conclude that H2 is partially supported as there is norelationship of satisfaction with operating conditions with vigor and dedication.
For the rest of our hypotheses we find no support. ForH3, there is no support for the linkbetween pay satisfaction and vigor ( β¼ 0.015, po0.00), dedication ( β¼−0.059, po0.00)and absorption ( β¼−0.045, po0.00). H4 is not supported, and our analyses show thatthere is no significant relationship between benefits satisfaction and vigor ( β¼−0.012,po0.00), dedication ( β¼−0.012, po0.00) and absorption ( β¼−0.007, po0.00).H5, whichis about promotion-work engagement link, is not supported. There is no link betweenpromotion and vigor ( β¼−0.026, po0.00), dedication ( β¼−0.027, po0.00) andabsorption ( β¼−0.035, po0.00). Finally, there is no support for the relationship
Vigor Dedication Absorption
Control variablesAge (in years) −0.081 0.025* 0.007Female 0.014 0.161* 0.178*Tenure (in years) 0.062 0.079 0.038Non-managerial worker −0.085** −0.062 −0.053
Facets of job satisfactionSatisfaction with work 0.570** 0.548** 0.483**Satisfaction with operating conditions −0.083 −0.034 −0.232**Satisfaction with pay 0.015 −0.059 −0.045Satisfaction with benefits −0.012 −0.012 −0.007Satisfaction with rewards 0.006 0.101 0.045Satisfaction with promotion −0.026 −0.027 −0.035Satisfaction with co-workers −0.053 −0.015 0.010Satisfaction with line manager −0.037 −0.069 −0.123Satisfaction with communication 0.099 0.042 0.182*R2 0.361 0.371 0.326Adjusted R2 0.309 0.321 0.271F-value 6.944** 7.351** 5.940**Number of observations 174 176 174Notes: The standardized regression coefficients are provided. *po0.05; **po0.01
Table III.Multiple regression
analyses
257
Facets of jobsatisfactionand work
engagement
Dow
nloa
ded
by U
nive
rsita
s M
ultim
edia
Nus
anta
ra A
t 19:
19 0
4 M
arch
201
8 (P
T)
Analisis Pengaruh Satisfaction..., Meiriks Henling, FB UMN, 2018
between rewards and vigor ( β¼−0.06, po0.00), dedication ( β¼ 0.101, po0.00) andabsorption ( β¼ 0.045, po0.00), i.e. no support for H6.
We did not find any statistically significant relationships between work engagement andsatisfaction with co-workers (i.e. H7) and vigor ( β¼−0.053, po0.00), dedication( β¼−0.015, po0.00) and absorption ( β¼ 0.010, po0.00). There is no support for therelationship between satisfaction with line managers (i.e. H8) and vigor ( β¼−0.037,po0.00), dedication ( β¼−0.069, po0.00) and absorption ( β¼−0.123, po0.00). The finalhypothesis, i.e. satisfaction with communication (H9), is partially supported. Our resultsshow no link between satisfaction with communication and vigor ( β¼ 0.099 po0.00),dedication ( β¼ 0.042, po0.00) and absorption ( β¼ 0.182, po0.05). Our finding means thatthe employees who are satisfied with the communication in their job are more absorbed intheir work.
Considering that nine job satisfaction facets are correlated with each other, we also testedfor multi-collinearity in our regression analyses. The tolerance and variance inflation factor(VIF) scores, which are indicators of multi-collinearity, are calculated in SPPS and presented inTable IV. It is accepted that tolerance scores that are under 0.10 (e.g. Tabachnick andFidell, 2001) and VIF scores over 10 are problematic (Neter et al., 1989). The multi-collinearityscores of tolerance and VIF in Table IV do not fall in the undesired levels. Thus, we concludethat multi-collinearity is not a problem in our regression analyses.
5. Discussion and conclusionThe purpose of our study is to understand the impact of job satisfaction facets on workengagement. Our results show that “satisfaction with work itself” is a key driver of alldimensions of work engagement, i.e. vigor, dedication and absorption. In addition,“satisfaction with operating conditions” (i.e. high workload) is negatively related toabsorption of employees in their work. Finally, our results show that “satisfaction withcommunication” is negatively linked to the absorption of employees in their work.
Our study contributes to our understanding about the drivers of work engagement.The key concepts were drawn from work engagement and well-established job satisfactionliteratures to explore the relationship between the job satisfaction perceptions of employeesand their work engagement. While the JD-R model has been frequently tested in theliterature, none of the previous studies provided a systematic and complete reflection of job
Vigor Dedication AbsorptionTolerance VIF Tolerance VIF Tolerance VIF
Control variablesAge (in years) 0.604 1.656 0.603 1.659 0.604 1.657Female 0.875 1.143 0.871 1.148 0.865 1.156Tenure (in years) 0.577 1.735 0.581 1.721 0.585 1.709Non-managerial worker 0.582 1.718 0.584 1.713 0.586 1.708
Facets of job satisfactionSatisfaction with work 0.496 2.017 0.499 2.003 0.500 1.998Satisfaction with operating conditions 0.667 1.498 0.667 1.499 0.665 1.504Satisfaction with pay 0.499 2.004 0.507 1.973 0.489 2.045Satisfaction with benefits 0.653 1.532 0.656 1.524 0.632 1.582Satisfaction with rewards 0.415 2.412 0.416 2.404 0.414 2.418Satisfaction with promotion 0.632 1.581 0.631 1.584 0.631 1.585Satisfaction with co-workers 0.679 1.473 0.677 1.477 0.676 1.479Satisfaction with line manager 0.596 1.679 0.596 1.678 0.596 1.677Satisfaction with communication 0.531 1.883 0.541 1.848 0.538 1.859
Table IV.Multi-collinearitystatistics
258
EBHRM5,3
Dow
nloa
ded
by U
nive
rsita
s M
ultim
edia
Nus
anta
ra A
t 19:
19 0
4 M
arch
201
8 (P
T)
Analisis Pengaruh Satisfaction..., Meiriks Henling, FB UMN, 2018

characteristics and discussed their impact on work engagement. Thus, by drawing on thewell-established job satisfaction concept and its facets, we expand the JD-R model andobserve the impact job satisfaction facets have on the work engagement of serviceemployees. Barnes and Collier (2013) find that job satisfaction has significant impact onwork engagement compared to service environment and affective commitment. Consideringthe challenges faced by employees in the service sector, work engagement is harder toachieve and worth exploring in the service context (Menguc et al., 2012). Thus, our studyalso contributes to the limited number of studies that focus on work engagement of servicesector employees in UK. Finally, the longitudinal dimension of our study helps us tounderstand the impact of which job satisfaction facets on work engagement continue in thelong run, and helps us to avoid common method bias in our results.
The first part of our results indicates that when employees are satisfied with the work,they are more likely to become engaged. This finding supports a social exchangeperspective and specifically the norm of reciprocity. In other words, employees who aresatisfied with their work will display more vigor, dedication and absorption. Our findingssuggest that organizations that care about employee well-being; consider employee goals,values and opinions; and help employees with the problems they face will have employeeswho are energetic, enthusiastic and captivated in their jobs, and who are engaged with thewhole organization.
Satisfaction with work itself is a main facet employees use to evaluate their job(Skalli et al., 2008). Our finding is in line with the previous research as satisfaction with workfacet is positively linked to vigor, dedication and absorption of employees. Finding meaningin work comes from the interaction between the internal world of employees and theexternal context of the workplace (Cartwright and Holmes, 2006; Chalofsky and Krishna,2009), but the work itself is argued to be the strongest predictor of meaning in the workplaceand the main motivator for employees (Chalofsky, 2003). Work is a source of intrinsic andextrinsic motivation, both of which are about exerting effort, persistence and energy towarda specific goal (Katzell and Thompson, 1990). In work, the task content, the activitiesperformed and the fulfillment of personal needs drive employees. Intrinsic motivation andextrinsic motivation are closely related to the vigor and dedication dimensions of workengagement (Bakker et al., 2008). Our results support these previous studies.
Following the same discussion, our study shows that the employees who perceived theirworkload as high (i.e. satisfaction with operating conditions) are less likely to be absorbed intheir work. That is also in line with the previous literature. However, the previous studiesthat consider the workload as a job demand mostly focus on the overall work engagement.Our study shows that its relationship is only with the absorption dimension. This findingimplies that absorption and how it is impacted by workload should be considered in moredetail. It might be that having high workload might act as a distraction for the employeesand decrease their absorption in their work due to the worry and/or stress it creates.
Finally, our study shows that satisfaction with communication is positively linked toabsorption of the employees in their work. As discussed in the literature section, satisfactionwith communication has been the focus of only a few previous studies in terms of itsrelationship to employee engagement, not specifically work engagement. Alternatively, theway communication defined is different from what we find in our study. Therefore, to ourknowledge, our study is the first study that considers the link between satisfaction withcommunication facet and work engagement. We find that satisfaction with communicationis positively linked to the absorption of employees in their work. This means that claritywith what is going on in the organization helps employees to be immersed in their work.
Our results did not find any support about the link between satisfaction with pay andwork engagement, which is in line with the previous literature. We can conclude that paysatisfaction is a hygiene factor as discussed in the literature (e.g. Herzberg et al., 2011).
259
Facets of jobsatisfactionand work
engagement
Dow
nloa
ded
by U
nive
rsita
s M
ultim
edia
Nus
anta
ra A
t 19:
19 0
4 M
arch
201
8 (P
T)
Analisis Pengaruh Satisfaction..., Meiriks Henling, FB UMN, 2018

Similarly, satisfaction with benefits is not found to be linked to work engagement.As benefits satisfaction has not been explored much in the work engagement literature,there is need for more studies to understand how benefits satisfaction is linked to workengagement. The link between satisfaction with rewards and work engagement is an under-researched area as discussed. Our study does not show any linkages between rewardssatisfaction and individual dimensions of work engagement. We also could not find anyrelationship between promotion satisfaction and work engagement dimensions. Consideringthe limited previous research in the area, our study might be a starting point but there isdefinitely need for further research as todays employees are very much interested inpromotion opportunities (Sullivan and Baruch, 2009).
As explained, line manager support and coworker support are combined as “socialsupport” job resource in previous work engagement studies. There is no unified way ofmeasuring or defining social support. In this study, we specifically focused on satisfactionwith co-workers and satisfaction with line managers. It is surprising that our results do notshow any support for the link between coworker or line manager support and individualdimensions of work engagement. There is definitely a need to unwrap the dynamics ofcoworker or line manager support and work engagement in the future studies.
The results of our study have important implications for organizations. Understandingsources of satisfaction for service sector employees might help organizations about underwhich conditions to expect engagement from their employees. Engaged employees are morelikely to stay with their organizations (Saks, 2006), and a disengaged workforce might leadto higher costs associated with higher turnover, lower productivity, eroded psychologicalwell-being and poor physical health (Ruhlman and Siegman, 2009). Our findings suggestthat the nature of work, promotion opportunities and pay satisfaction are important aspectsorganizations should consider to manage these costs.
As with all studies, ours has limitations. Generalization of our results is difficult since thedata are from a single UK company in the service sector, though we note that our resultsare consistent with those found by other researchers where comparisons are possible.Future studies might apply our theoretical model to other contexts. For example, jobsatisfaction facets and work engagement link might be tested to compare of service sectoremployees to employees in other industries. As the work conditions differ among sectors,the facets that shape employees’ engagement might differ across sectors. Such comparisonis yet to be provided in the literature. Furthermore, Skalli et al. (2008) argue that differencesin economic and cultural aspects across countries might shape the impact of job satisfactionfacets on employee attitudes. Therefore, future studies might also focus on expanding ourresults to different country contexts.
Notes
1. The three prizes were for £250, £100 and £50 in cash, respectively.
2. β is the standardized regression coefficient.
References
Alarcon, G.M. and Lyons, J.B. (2011), “The relationship of engagement and job satisfaction in workingsamples”, The Journal of Psychology, Vol. 145 No. 5, pp. 463-480.
Aryee, S., Bushwar, P. and Chen, Z.X. (2002), “Trust as a mediator of the relationship betweenorganizational justice and work outcomes: test of a social exchange model”, Journal ofOrganisational Behavior, Vol. 23 No. 3, pp. 267-285.
Avery, D.R., McKay, P.F. and Wilson, D.C. (2007), “Engaging the aging workforce: the relationshipbetween perceived age similarity, satisfaction with co-workers and employee engagement”,Journal of Applied Psychology, Vol. 92 No. 6, pp. 1542-1556.
260
EBHRM5,3
Dow
nloa
ded
by U
nive
rsita
s M
ultim
edia
Nus
anta
ra A
t 19:
19 0
4 M
arch
201
8 (P
T)
Analisis Pengaruh Satisfaction..., Meiriks Henling, FB UMN, 2018

Bakker, A.B. and Demerouti, E. (2007), “The job demands-resources model: state of the art”, Journal ofManagerial Psychology, Vol. 22 No. 3, pp. 309-328.
Bakker, A.B. and Demerouti, E. (2008), “Towards a model of work engagement”, Career DevelopmentInternational, Vol. 13 No. 3, pp. 209-223.
Bakker, A.B., Demerouti, E. and Verbeke, W. (2004), “Using the job demands-resources model to predictburnout and performance”, Human Resource Management, Vol. 43, pp. 83-104.
Bakker, A.B., van Emmerik, H. and Euwema, M.C. (2006), “Crossover of burnout and engagement inwork teams”, Work and Occupations, Vol. 33 No. 4, pp. 464-489.
Bakker, A.B., Schaufeli, W.B., Leiter, M.P. and Taris, T.W. (2008), “Work engagement: an emergingconcept in occupational health psychology”, Work & Stress, Vol. 22 No. 3, pp. 187-200.
Balducci, C., Fraccaroli, F. and Schaufeli, W.B. (2011), “Workplace bullying and its relation with workcharacteristics, personality, and post-traumatic stress symptoms: an integrated model”, Anxiety,Stress & Coping, Vol. 24 No. 5, pp. 499-513.
Barnes, D.C. and Collier, J.E. (2013), “Investigating work engagement in the service environment”,Journal of Services Marketing, Vol. 27 No. 6, pp. 485-499.
Blau, P.M. (1964), Exchange and Power in Social Life, Wiley, New York, NY.
Boles, J., Madupalli, R., Rutherford, B. and Wood, J.A. (2007), “The relationship of facets of salespersonjob satisfaction with affective organizational commitment”, Journal of Business& Industrial Marketing, Vol. 22 No. 5, pp. 311-321, available at: https://doi.org/10.1108/08858620710773440
Bowling, N.A., Hendricks, E.A. and Wagner, S.H. (2008), “Positive and negative affectivity andfacet satisfaction: a meta-analysis”, Journal of Business and Psychology, Vol. 23 Nos 3/4,pp. 115-125.
Cartwright, S. and Holmes, N. (2006), “The meaning of work: the challenge of regaining employeeengagement and reducing cynicism”, Human Resource Management Review, Vol. 16 No. 2,pp. 199-208.
Chalofsky, N. (2003), “An emerging construct for meaningful work”, Human Resource DevelopmentInternational, Vol. 6 No. 1, pp. 69-83.
Chalofsky, N. and Krishna, V. (2009), “Meaningfulness, commitment and engagement: the intersectionof a deeper level of intrinsic motivation”, Advances in Developing Human Resources, Vol. 11No. 2, pp. 189-203.
Chew, J. and Chan, C.A. (2008), “Human resource practices, organizational commitment and intention tostay”, International Journal of Manpower, Vol. 29 No. 6, pp. 503-522.
Christian, M.S., Garza, A.S. and Slaughter, J.E. (2011), “Work engagement: a quantitative review andtest of its relations with task and contextual performance”, Personnel Psychology, Vol. 64 No. 1,pp. 89-136.
Churchill, G.A. Jr, Ford, N.M. and Walker, O.C. Jr (1974), “Measuring the job satisfaction of industrialsalesmen”, Journal of Marketing Research, Vol. 11 No. 3, pp. 254-260.
Cole, M.S., Walter, F., Bedeian, A.G. and O’Boyle, E.H. (2012), “Job burnout and employee engagement ameta-analytic examination of construct proliferation”, Journal of Management, Vol. 38 No. 5,pp. 1550-1581.
Crawford, E.R., LePine, J.A. and Rich, B.L. (2010), “Linking job demands and resources to employeeengagement and burnout: a theoretical extension and meta-analytic test”, Journal of AppliedPsychology, Vol. 95 No. 5, pp. 834-848.
Crawford, E.R., Rich, B.L., Buckman, B. and Bergeron, J. (2013), “The antecedents and drivers ofemployee engagement”, in Truss, C., Delbridge, R., Alfes, K., Shantz, A. and Soane, E. (Eds),Employee Engagement in Theory and Practice, Routledge, London, pp. 57-81.
Cropanzano, R. and Mitchell, M.S. (2005), “Social exchange theory: an interdisciplinary review”, Journalof Management, Vol. 31 No. 6, pp. 874-900.
261
Facets of jobsatisfactionand work
engagement
Dow
nloa
ded
by U
nive
rsita
s M
ultim
edia
Nus
anta
ra A
t 19:
19 0
4 M
arch
201
8 (P
T)
Analisis Pengaruh Satisfaction..., Meiriks Henling, FB UMN, 2018

de Lange, A.H., De Witte, H. and Notelaers, G. (2008), “Should I stay or should I go? Examininglongitudinal relations among job resources and work engagement for stayers versus movers”,Work & Stress, Vol. 22 No. 3, pp. 201-223.
Deckop, J.R. (1992), “Organizational and career pay satisfaction”, Human Resource ManagementReview, Vol. 2 No. 2, pp. 115-130.
Demerouti, E., Bakker, A.B., Nachreiner, F. and Schaufeli, W.B. (2001), “The job demands-resourcesmodel of burnout”, Journal of Applied Psychology, Vol. 86 No. 3, pp. 499-512.
Eisenberger, R., Armeli, S., Rexwinkel, B., Lynch, P.D. and Rhoades, L. (2001), “Reciprocation ofperceived organizational support”, Journal of Applied Psychology, Vol. 86 No. 1, pp. 42-51.
Fairlie, P. (2011), “Meaningful work, employee engagement, and other key employee outcomes:implications for human resource development”, Advances in Developing Human Resource,Vol. 13 No. 4, pp. 508-525.
Freeney, Y. and Fellenz, M.R. (2013), “Work engagement, job design and the role of the social context atwork: exploring antecedents from a relational perspective”, Human Relations, Vol. 66 No. 1,pp. 1427-1445.
Gorter, R.C., Te Brake, H.J., Hoogstraten, J. and Eijkman, M.A. (2008), “Positive engagement and jobresources in dental practice”, Community Dentistry and Oral Epidemiology, Vol. 36 No. 1,pp. 47-54.
Heneman, R.L., Porter, G., Greenberger, D.B. and Strasser, S. (1997), “Modeling the relationship betweenpay level and pay satisfaction”, Journal of Business and Psychology, Vol. 12 No. 2, pp. 147-159.
Herzberg, F., Mausner, B. and Snyderman, B.B. (2011), The Motivation to Work, Vol. 1, TransactionPublishers, Routledge Taylor & Francis Group, London and New York, NY.
Hulkko-Nyman, K., Sarti, D., Hakonen, A. and Sweins, C. (2012), “Total rewards perceptions and workengagement in elder-care organizations”, International Studies of Management andOrganization, Vol. 42 No. 1, pp. 24-49.
Iyer, S. and Israel, D. (2012), “Structural equation modelling for testing the impact of organizationcommunication satisfaction on employee engagement”, South Asian Journal of Management,Vol. 19 No. 1, pp. 51-81.
Kahn, W.A. (1990), “Psychological conditions of personal engagement and disengagement at work”,Academy of Management Journal, Vol. 33 No. 4, pp. 692-724.
Katzell, R.A. and Thompson, D.E. (1990), “An integrative model of work attitudes, motivation, andperformance”, Human Performance, Vol. 3 No. 2, pp. 63-86.
Koyuncu, M., Burke, R.J. and Fiksenbaum, L. (2006), “Work engagement among women managers andprofessionals in a Turkish bank: potential antecedents and consequences”, Equal OpportunitiesInternational, Vol. 25 No. 4, pp. 299-310.
Lapalme, M.-E., Tremblay, M. and Simard, G. (2009), “The relationship between career plateauing,employee commitment, and psychological distress: the role of organisational and supervisorsupport”, International Journal of Human Resource Management, Vol. 20 No. 5, pp. 1132-1145.
Lee, R.T. and Ashforth, B.E. (1996), “A meta-analytic examination of the correlates of the threedimensions of job burnout”, Journal of Applied Psychology, Vol. 81 No. 2, pp. 123-133.
Locke, E.A. (1976), “The nature and causes of job satisfaction”, in Dunnette, M.D. (Ed.), Handbook ofIndustrial and Organizational Psychology, Rand McNally, Chicago, IL, pp. 1297-1349.
Macey, W.H. and Schneider, B. (2008), “The meaning of employee engagement”, Industrial andOrganizational Psychology, Vol. 1 No. 1, pp. 3-30.
MacLeod, D. and Clarke, N. (2009), Engaging for success: enhancing performance through employeeengagement”, Department for Business, Innovation and Skills, Crown Copyright, BIS/Pub 8859/07/09NP.URN09/1075, available at: https://engageforsuccess.org/wp-content/uploads/2015/08/file52215.pdf
Maslach, C. and Leiter, M.P. (2008), “Early predictors of job burnout and engagement”, Journal ofApplied Psychology, Vol. 93 No. 3, pp. 498-512.
262
EBHRM5,3
Dow
nloa
ded
by U
nive
rsita
s M
ultim
edia
Nus
anta
ra A
t 19:
19 0
4 M
arch
201
8 (P
T)
Analisis Pengaruh Satisfaction..., Meiriks Henling, FB UMN, 2018
Mastenbroek, N.J.J.M., Jaarsma, A.D.C., Scherpbier, A.J.J.A., van Beukelen, P. and Demerouti, E. (2014),“The role of personal resources in explaining well-being and performance: a study among youngveterinary professionals”, European Journal of Work and Organizational Psychology, Vol. 23No. 2, pp. 190-202.
May, D.R., Gilson, R.L. and Harter, L.M. (2004), “The psychological conditions of meaningfulness,safety and availability and the engagement of the human spirit at work”, Journal of Occupationaland Organizational Psychology, Vol. 77 No. 1, pp. 11-37.
Menguc, B., Auh, S., Fisher, M. and Haddad, A. (2012), “To be engaged or not to be engaged: theantecedents and consequences of service employee engagement”, Journal of Business Research,Vol. 66 No. 11, pp. 2163-2170.
Meyer, J.P., Gagne, M. and Parfyonova, N.M. (2010), “Toward an evidence-based model ofengagement: what we can learn from motivation and commitment research”, in Albrecht, S.L.(Ed.), Handbook of Employee Engagement: Perspectives, Issues, Research and Practice, EdwardElgar, Cheltenham, pp. 62-73.
Neter, J., Wasserman, W. and Kutner, M.H. (1989), Applied Linear Regression Models, 2nd ed., Irwin,Homewood IL.
Newby, R., Watson, J. and Woodliff, D. (2003), “SME survey methodology: response rates, data quality,and cost effectiveness”, Entrepreneurship Theory and Practice, Vol. 28 No. 2, pp. 163-172.
Podsakoff, N.P., LePine, J.A. and LePine, M.A. (2007), “Differential challenge stressor-hindrancestressor relationships with job attitudes, turnover intentions, turnover and withdrawal behavior:a meta-analysis”, Journal of Applied Psychology, Vol. 92 No. 2, pp. 438-454.
Postmes, T., Tanis, M. and de Wit, B. (2001), “Communication and commitment in organizations:a social identity approach”, Group Processes & Intergroup Relations, Vol. 4 No. 3, pp. 227-246.
Rayton, B., Dodge, T. and D’Analeze, S. (2012), Employee Engagement – The Evidence, Engage forSuccess, London.
Rayton, B.A. and Yalabik, Z.Y. (2014), “Work engagement, psychological contract breach and jobsatisfaction”, The International Journal of Human Resource Management, Vol. 25 No. 17,pp. 2382-2400.
Rees, C., Alfes, K. and Gatenby, M. (2013), “Employee voice and engagement: connections andconsequences”, International Journal of Human Resource Management, Vol. 24 No. 14, pp. 2780-2798.
Rich, B.L., Lepine, J.A. and Crawford, E.R. (2010), “Job engagement: antecedents and effects on jobperformance”, Academy of Management Journal, Vol. 53 No. 3, pp. 617-635.
Rousseau, D.M. (1995), Psychological Contracts in Organizations: Understanding Written and UnwrittenAgreements, Sage, Thousand Oaks, CA.
Ruhlman, J. and Siegman, C. (2009), “Boosting engagement while cutting costs”, Gallup ManagementJournal, June, available at: http://gmj.gallup.com/content/120884/boosting-engagement-cutting-costs.aspx (accessed August 2015).
Rutherford, B., Boles, J., Hamwi, G.A., Madupalli, R. and Rutherford, L. (2009), “The role of the sevendimensions of job satisfaction in salesperson’s attitudes and behaviours”, Journal of BusinessResearch, Vol. 62 No. 11, pp. 1146-1151.
Saks, A.M. (2006), “Antecedents and consequences of employee engagement”, Journal of ManagerialPsychology, Vol. 21 No. 7, pp. 600-619.
Salanova, M. and Schaufeli, W.B. (2008), “A cross-national study of work engagement as mediatorbetween job resources and proactive behaviour”, International Journal of Human ResourceManagement, Vol. 19 No. 1, pp. 116-131.
Salanova, M., Llorens, S. and Schaufeli, W.B. (2011), “ ‘Yes, I can, I feel good, and I just do it!’ On gaincycles and spirals of efficacy beliefs, affect, and engagement”, Applied Psychology, Vol. 60 No. 2,pp. 255-285.
Scahufeli, W.B. (2013), “What is engagement?”, in Truss, C., Alfes, K., Delbridge, R., Shantz, A. andSoane, E.C. (Eds), Employee Engagement in Theory and Practice, Routledge, London.
263
Facets of jobsatisfactionand work
engagement
Dow
nloa
ded
by U
nive
rsita
s M
ultim
edia
Nus
anta
ra A
t 19:
19 0
4 M
arch
201
8 (P
T)
Analisis Pengaruh Satisfaction..., Meiriks Henling, FB UMN, 2018

Schaufeli, W.B. and Bakker, A.B. (2004), “Job demands, job resources, and their relationship withburnout and engagement: a multi-sample study”, Journal of Organizational Behavior, Vol. 25No. 3, pp. 293-315.
Schaufeli, W.B., Bakker, A.B. and Salanova, M. (2006), “The measurement of work engagement with ashort questionnaire: a cross-national study”, Educational and Psychological Measurement,Vol. 66 No. 4, pp. 701-716.
Schaufeli, W.B., Salanova, M., Gonzales-Roma, V. and Bakker, A.B. (2002), “The measurement ofengagement and burnout: a two sample confirmatory factor analytic approach”, Journal ofHappiness Studies, Vol. 3 No. 1, pp. 71-92.
Seers, A., Petty, M.M. and Cashman, J.F. (1995), “Team-member exchange under team and traditionalmanagement”, Group & Organization Management, Vol. 20 No. 1, pp. 18-38.
Settoon, R.P., Bennett, N. and Liden, R.C. (1996), “Social exchange in organizations: perceivedorganizational support, leader –member exchange, and employee reciprocity”, Journal ofApplied Psychology, Vol. 81 No. 3, pp. 219-227.
Simpson, M.R. (2009), “Predictors of work engagement among medical-surgical registered nurses”,Western Journal of Nursing Research, Vol. 31 No. 1, pp. 44-65.
Skalli, A., Theodossiou, I. and Vasileiou, E. (2008), “Jobs as Lancaster goods: facets of job satisfactionand overall job satisfaction”, The Journal of Socio-Economics, Vol. 37 No. 5, pp. 1906-1920.
Smith, P.C., Hulin, C.L. and Kendall, L.M. (1969), The Measurement of Job Satisfaction in Work andRetirement, Rand-McNally, Chicago, IL.
Soane, E., Truss, C., Alfes, K., Shantz, A., Rees, C. and Gatenby, M. (2012), “Development andapplication of a new measure of employee engagement: the ISA engagement scale”, HumanResource Development International, Vol. 15 No. 5, pp. 529-547.
Spagnoli, P., Caetano, A. and Santos, S.C. (2012), “Satisfaction with job aspects: do patters change overtime?”, Journal of Business Research, Vol. 65, pp. 609-616.
Spector, P.E. (1997), Job Satisfaction: Application, Assessment, Causes and Consequences, AdvancedTopics in Organizational Behavior (ATOB), London.
Sullivan., S.E. and Baruch, Y. (2009), “Advances in career theory and research: a critical review andagenda for future exploration”, Journal of Management, Vol. 35 No. 6, pp. 1542-1571.
Tabachnick, B.G. and Fidell, L.S. (2001), Using Multivariate Statistics, Allyn and Bacon, Boston, MA.
Thomas, G.F., Zolin, R. and Hartman, J.L. (2009), “The central role of communication in developingtrust and its effect on employee involvement”, Journal of Business Communication, Vol. 46 No. 3,pp. 287-310.
Tims, M., Bakker, A.B. and Derks, D. (2013), “The impact of job crafting on job demands, job resources,and well-being”, Journal of Occupational Health Psychology, Vol. 18 No. 2, pp. 230-240.
Truss, C., Delbridge, R., Alfes, K., Shantz, A. and Soane, E. (2013), “Introduction”, in Truss, C.,Delbridge, R., Alfes, K., Shantz, A. and Soane, E. (Eds), Employee Engagement in Theory andPractice, Routledge, London, pp. 1-12.
van Beek, I., Hu, Q., Schaufeli, W.B., Taris, T.W. and Schreurs, B.H. (2012), “For fun, love, or money:what drives workaholic, engaged, and burned-out employees at work?”, Applied Psychology,Vol. 61 No. 1, pp. 30-55.
van den Broeck, A., De Cuyper, N., De Witte, H. and Vansteenkiste, M. (2010), “Not all job demands areequal: differentiating job hindrances and job challenges in the job demands – resources model”,European Journal of Work and Organizational Psychology, Vol. 19 No. 6, pp. 735-759.
Vecina, M.L., Chacon, F., Suerio, M. and Barron, A. (2012), “Volunteer engagement: does engagementpredict the degree of satisfaction among new volunteers and the commitment of those who havebeen active longer?”, Applied Psychology: An International Review, Vol. 61 No. 1, pp. 130-148.
Vogelgesang, G.R., Leroy, H. and Avolio, B.J. (2013), “The mediating effects of leader integrity withtransparency in communication and work engagement/performance”,The Leadership Quarterly,Vol. 24 No. 3, pp. 405-413.
264
EBHRM5,3
Dow
nloa
ded
by U
nive
rsita
s M
ultim
edia
Nus
anta
ra A
t 19:
19 0
4 M
arch
201
8 (P
T)
Analisis Pengaruh Satisfaction..., Meiriks Henling, FB UMN, 2018

Weiss, H.M. (2002), “Deconstructing job satisfaction: separating evaluations, beliefs and affectiveexperiences”, Human Resource Management Review, Vol. 12 No. 2, pp. 173-195.
Yalabik, Z.Y., Popaitoon, P., Chowne, J.A. and Rayton, B.A. (2013), “Work engagement as a mediatorbetween employee attitudes and outcomes”, The International Journal of Human ResourceManagement, Vol. 24 No. 14, pp. 2799-2823.
Further reading
Lee, H.C. and Bruvold, N.T. (2003), “Creating value for employees: investment in employee development”,International Journal of Human Resource Management, Vol. 14 No. 6, pp. 981-1000.
Porter, L.W. (1962), “Job attitudes in management: perceived deficiencies in need fulfilment as afunction of job level”, Journal of Applied Psychology, Vol. 46 No. 6, pp. 375-384.
Yu, B.B. and Egri, C.P. (2005), “Human resource management practices and organizationalcommitment: a comparison of Chinese employees in a state-owned enterprise and a jointventure”, Asia Pacific Journal of Human Resources, Vol. 43 No. 3, pp. 332-360.
Corresponding authorZeynep Yesim Yalabik can be contacted at: [email protected]
For instructions on how to order reprints of this article, please visit our website:www.emeraldgrouppublishing.com/licensing/reprints.htmOr contact us for further details: [email protected]
265
Facets of jobsatisfactionand work
engagement
Dow
nloa
ded
by U
nive
rsita
s M
ultim
edia
Nus
anta
ra A
t 19:
19 0
4 M
arch
201
8 (P
T)
Analisis Pengaruh Satisfaction..., Meiriks Henling, FB UMN, 2018
10.1177/0013164405282471Educational and Psychological MeasurementSchaufeli et al. / Measurement of W ork Engagement
The Measurement ofWork Engagement With aShort QuestionnaireA Cross-National Study
Wilmar B. SchaufeliArnold B. BakkerUtrecht University
Marisa SalanovaJaume I University
This article reports on the development of a short questionnaire to measure workengagement—a positive work-related state of fulfillment that is characterized by vigor,dedication, and absorption. Data were collected in 10 different countries (N = 14,521),and results indicated that the original 17-item Utrecht Work Engagement Scale (UWES)can be shortened to 9 items (UWES-9). The factorial validity of the UWES-9 was demon-strated using confirmatory factor analyses, and the three scale scores have good internalconsistency and test-retest reliability. Furthermore, a two-factor model with a reducedBurnout factor (including exhaustion and cynicism) and an expanded Engagement factor(including vigor, dedication, absorption, and professional efficacy) fit best to the data.These results confirm that work engagement may be conceived as the positive antipode ofburnout. It is concluded that the UWES-9 scores has acceptable psychometric propertiesand that the instrument can be used in studies on positive organizational behavior.
Keywords: work engagement; measurement; burnout; Utrecht Work EngagementScale (UWES)
Since the beginning of this century, increased attention has been paid to what hasbeen coined positive psychology: the scientific study of human strength and opti-
mal functioning (Seligman & Csikszentmihalyi, 2000). This approach is considered
701
Educational andPsychological Measurement
Volume 66 Number 4August 2006 701-716
© 2006 Sage Publications10.1177/0013164405282471
http://epm.sagepub.comhosted at
http://online.sagepub.com
Authors’ Note: The authors express their gratitude to the following colleagues who have provided data (inalphabetical order): Sarah Jane Cotton (Australia), Edgar Bresó (Spain), Jan de Jonge (Netherlands),Maureen Dollard (Australia), Martin Euwema (Netherlands), Esther Greenglass (Canada), AsbjørnGrimsmo (Norway), Gabriele Haeslich (Germany), Jari Hakanen (Finland), Sandrine Hollet (France), SaarLangelaan (Netherlands), Pascale Le Blanc (Netherlands), Susana Llorens (Spain), Stig Berge Matthiesen(Norway), Maria Peeters (Netherlands), Astrid Richardsen (Norway), Peter Richter (Germany), Ian Roth-mann (South Africa), Katariina Salmela-Aro (Finland), Sabine Sonnentag (Germany), Willem van
Analisis Pengaruh Satisfaction..., Meiriks Henling, FB UMN, 2018

to supplement the traditional focus of psychology on disease, damage, disorder, anddisability. The recent trend to concentrate on optimal functioning also has arousedattention in organizational psychology, as illustrated by Luthans’s (2002) recent pleafor “the study of positively oriented human resource strengths and psychologicalcapacities that can be measured, developed, and effectively managed for performanceimprovement in today’s workplace” (p. 698).
One of these positive states is work engagement, which is considered to be the anti-pode of burnout. The current article is about the development and psychometric evalu-ation of a short self-report questionnaire to measure work engagement. Contrary tothose who suffer from burnout, engaged employees have a sense of energetic andeffective connection with their work activities, and they see themselves as able to dealwell with the demands of their jobs. Work engagement is defined as a positive, fulfill-ing work-related state of mind that is characterized by vigor, dedication, and absorp-tion (Schaufeli & Salanova, in press; Schaufeli, Salanova, Gonzalez-Romá, & Bakker,2002).
Rather than a momentary and specific state, engagement refers to a more persistentand pervasive affective-cognitive state that is not focused on any particular object,event, individual, or behavior. Vigor is characterized by high levels of energy andmental resilience while working, the willingness to invest effort in one’s work, andpersistence even in the face of difficulties. Dedication refers to being strongly in-volved in one’s work and experiencing a sense of significance, enthusiasm, inspira-tion, pride, and challenge. Finally, absorption is characterized by being fully concen-trated and happily engrossed in one’s work, whereby time passes quickly and one hasdifficulties with detaching oneself from work. Accordingly, vigor and dedication areconsidered direct opposites of the core burnout dimensions of exhaustion and cyni-cism, respectively (Maslach, Schaufeli, & Leiter, 2001). Therefore, particularly thecorrelations between vigor and exhaustion and between dedication and cynicism areexpected to be strongly negative. The remaining dimensions of burnout (i.e., profes-sional efficacy) and of work engagement (i.e., absorption) are distinct aspects that arenot considered as opposites.
Based on the above-mentioned definition, a self-report questionnaire—the UtrechtWork Engagement Scale (UWES)—has been developed that includes the three consti-tuting dimensions of work engagement: vigor, dedication, and absorption. Originally,the UWES included 24 items, but after psychometric evaluation, 7 unsound itemswere eliminated so that three scales, totaling 17 items, remained (Schaufeli, Salanova,et al., 2002): Vigor (VI, 6 items), Dedication (DE, 5 items), and Absorption (AB, 6items) scales (see the appendix). Using a large international database, the current arti-cle seeks to reduce the number of items of the UWES. The reason for shortening theUWES is basically pragmatic: Researchers strive to include as few items as possible
702 Educational and Psychological Measurement
Rhenen (Netherlands), Toon Taris (Netherlands), Peter Vlerick (Belgium), Tony Winefield (Australia),Hans de Witte (Belgium), and Dieter Zapf (Germany). Please address correspondence to Wilmar B.Schaufeli, PhD, Utrecht University, Department of Psychology, P.O. Box 80140, 3508 TC Utrecht, theNetherlands.
Analisis Pengaruh Satisfaction..., Meiriks Henling, FB UMN, 2018
for measuring a particular construct because respondents should not be unnecessarilybothered. Besides, long questionnaires increase the likelihood of attrition.
The original UWES-17 has encouraging psychometric features for its scores. Forinstance, internal consistencies (Cronbach’s alpha) typically range between .80 and.90 (Demerouti, Bakker, Janssen, & Schaufeli, 2001; Durán, Extremera, & Rey, 2004;Montgomery, Peeters, Schaufeli, & Den Ouden, 2003; Salanova, Schaufeli, Llorens,Peiró, & Grau, 2001; Schaufeli & Bakker, 2004). Thus, values of Cronbach’s alphaexceed the value of .70 that is traditionally used as a rule of thumb (Nunnally &Bernstein, 1994), and even more so, in almost all cases, alpha satisfies the more strin-gent value of .80 that is now considered a generally accepted standard (Henson, 2001).
Furthermore, confirmatory factor analyses have shown that the hypothesized three-factor structure of the UWES is superior to the one-factor model (Schaufeli, Martínez,Marques-Pinto, Salanova, & Bakker, 2002; Schaufeli, Salanova, et al., 2002). How-ever, in contrast, using explorative factor analyses, Sonnentag (2003) did not find aclear three-factor structure and decided to use the total score of the UWES as a mea-sure for work engagement. Furthermore, the three-factor structure of the slightlyadapted student version of the UWES is largely invariant across samples from Spain,the Netherlands, and Portugal (Schaufeli, Martínez, et al., 2002). In a similar vein, theUWES can be used as an unbiased instrument to measure work engagement becauseits equivalence is acceptable for different racial groups (Storm & Rothmann, 2003).Although confirmatory factor analyses have supported the three-dimensional struc-ture of the UWES, the dimensions are very closely related. That is, correlationsbetween the scales usually exceed .65 (e.g., Demerouti et al., 2001; Salanova et al.,2001; Schaufeli, Martínez, et al., 2002; Schaufeli, Salanova, et al., 2002), whereascorrelations between latent variables of a covariance structure model range fromabout .80 to more than .90 (Salanova et al., 2001; Schaufeli, Martínez, et al., 2002;Schaufeli, Salanova, et al., 2002).
Because engagement has been defined as the opposite of burnout (Maslach et al.,2001), it is expected that both concepts are negatively related. Indeed, the three burn-out dimensions—as measured with the Maslach Burnout Inventory (MBI; Maslach,Jackson, & Leiter, 1996)—correlate negatively with the three dimensions of workengagement (Demerouti et al., 2001; Montgomery et al., 2003; Salanova et al., 2001;Schaufeli & Bakker, 2004; Schaufeli, Martínez, et al., 2002; Schaufeli, Salanova,et al., 2002). However, the pattern of relationships slightly differs from what wasexpected. Namely, the negative correlations between vigor and exhaustion and be-tween dedication and cynicism do not appear to be the strongest but, instead, the corre-lations between lack of professional efficacy and all three aspects of engagement. Inthe discussion, we will elaborate on this. As a consequence, a second-order factormodel, in which the three engagement scales weighted together with professional effi-cacy constitute on one factor (Engagement) and exhaustion and cynicism on theother factor (Burnout), fits best to the data (Salanova et al., 2001; Schaufeli & Bakker,2004; Schaufeli, Salanova, et al., 2002). A similar result was obtained by Demeroutiet al. (2001) using discriminant analyses. In this study, the three engagement scales
Schaufeli et al. / Measurement of Work Engagement 703
Analisis Pengaruh Satisfaction..., Meiriks Henling, FB UMN, 2018

plus professional efficacy weighted on one discriminant function, whereas both otherburnout scales weighted on the second remaining function.
The aims of the current study are five-fold: (a) to shorten the UWES as much aspossible; (b) to compare the fit of a one-factor model of the short version to that of thethree-factor model and to evaluate the cross-national invariance of both models; (c) tostudy some psychometric features of the short version of the UWES (i.e., internal con-sistency, stability, and correlations with the original scales); (d) to analyze the relation-ship between engagement and burnout, whereby based on previous studies (seeabove), we expect that the two-factor model with a reduced Burnout factor (includingexhaustion and cynicism) and an expanded Engagement factor (including vigor, dedi-cation, absorption, and professional efficacy) fits the data best; and (e) to carry outsome descriptive analyses with the short UWES version, evaluating its relationshipwith gender, age, and occupation.
Method
Samples and Procedure
A database was constructed of 27 studies that have been carried out between 1999and 2003 in 10 different countries (see Table 1). In all studies, the work engagementand burnout questionnaires were included as part of a larger employee well-being sur-vey. In most cases, this survey was distributed at the work site; in 6 studies, the surveyswere sent to the employees’home addresses. The surveys that were used in the variousstudies were distributed at different times of the year during the study period, and theorder of both questionnaires in the survey differed.
704 Educational and Psychological Measurement
Table 1Countries Included in the Database
Country n %
1. Australia 473 3.32. Belgiuma 767 5.33. Canada 267 1.84. Finland 3,651 25.15. France 221 1.56. Germany 465 3.27. The Netherlandsa 2,163 14.98. Norwaya 2,114 14.69. South Africa 2,547 17.5
10. Spain 1,832 12.6
Total 14,521 100.0
a. Burnout data are (partly) not available (see text).
Analisis Pengaruh Satisfaction..., Meiriks Henling, FB UMN, 2018

Table 2 presents an overview of the occupational groups that are included in thedatabase. The database includes slightly more men (n = 7,621 men [53.3%] vs. 6,684women [46.7%]), and ages range from 16 to 68 years (M = 40.3; SD = 11.7).
Instruments
Engagement was assessed with the UWES (Schaufeli, Salanova, et al., 2002). Atest manual of the UWES, as well as several language versions, may be downloadedfrom www.schaufeli.com. The items of the UWES (see the appendix) are grouped intothree subscales that reflect the underlying dimensions of engagement: VI (6 items),DE (5 items), and AB (6 items). All items are scored on a 7-point frequency ratingscale ranging from 0 (never) to 6 (always).
Burnout was assessed with the MBI–General Survey (MBI-GS; Schaufeli, Leiter,Maslach, & Jackson, 1996). The MBI-GS includes three subscales: Exhaustion (EX, 5items; e.g., “feel used up at the end of a work day”), Cynicism (CY, 5 items; e.g.,“doubt the significance of my work”), and Professional Efficacy (PE, 6 items; e.g., “Ican effectively solve the problems that arise in my work”). The burnout items arescored in a similar manner as the items of the UWES. However, all PE items arereversibly scored so that high scores on EX, CY, and PE (i.e., lack of professional effi-cacy) are indicative of burnout. Internal consistencies (Cronbach’s alpha) across thevarious countries range between .72 and .90, .73 and .86, and .73 and .83 for EX, CY,and PE, respectively. Previous studies have demonstrated the cross-national validityof the MBI-GS scores across samples of Finnish, Swedish, and Dutch employees(Schutte, Toppinnen, Kalimo, & Schaufeli, 2000) as well as their validity across vari-ous occupations (Bakker, Demerouti, & Schaufeli, 2002; Leiter & Schaufeli, 1996).
Schaufeli et al. / Measurement of Work Engagement 705
Table 2Occupational Groups Included in the Database
Occupational Group n %
Social work 822 5.8Blue-collar 1,024 7.2Health care 2,777 18.8White-collar (profit) 1,374 9.7White-collar (not for profit) 147 1.2Teaching 3,041 21.4Police 2,650 18.7Management 871 6.1Information missing 314 2.2
Total 14,521 100.0
Analisis Pengaruh Satisfaction..., Meiriks Henling, FB UMN, 2018

Analyses
Structural equation modeling as implemented by AMOS (Arbuckle, 1997) wasused for data analysis. Model testing was carried out in all 10 national samples simul-taneously by using multiple-group analyses. First, two factor-analytic models weretested: a model that assumes that all engagement items weight on one single factor(M1) and a model that assumes three correlated factors—Vigor, Dedication, andAbsorption (M2). Because both models are nested, the χ2 difference test can be used toassess the best-fitting model. Following Taris, Bok, and Meijer (1998), the factorialinvariance of M1 and M2 was investigated by constraining the factor coefficients andthe factor covariances to be equal across all national samples, respectively. When thefit of the constrained model to the data is not significantly statistically worse than thefit of the unconstrained model, invariance has been demonstrated. This means that thefactor coefficients or the covariances between the factors do not differ significantlybetween countries.
Next, 3 second-order two-factor models were tested across samples, again usingthe multiple-group method: (a) the hypothesized model that assumes that EX and CYrelate to a reduced Burnout factor and that all three engagement dimensions plus pro-fessional efficacy weight on an extended Engagement factor (MHyp), (b) the one-factormodel that assumes one underlying factor (Well-Being) including all burnout andengagement dimensions (MWel), and (c) the alternative model that assumes that thethree MBI dimensions weight on one factor, whereas the three UWES dimensionsweight on another factor (MAlt). Finally, the invariance across countries of the best-fitting model was assessed by comparing the unconstrained model with its constrainedcounterparts (see above).
Fit indices. Maximum likelihood estimation methods were used, and the input foreach analysis was the covariance matrix of the items or the scale scores. A check on thenormal distribution of the items revealed that the skewness and kurtosis of virtually allengagement items were within the acceptable range (±1.96), only in the French sam-ple the distribution of three items (VI1, VI2, DE2) was slightly peaked. In five coun-tries, the kurtosis of the burnout item “In my opinion, I am good at my job” (PE)exceeded the critical value, whereas in the German sample, another four burnout itemswere peaked as well.
The goodness of fit of the models was evaluated using the following absolutegoodness-of-fit indices (cf. Jöreskog & Sörbom, 1986): (a) the c2 goodness-of-fit sta-tistic, (b) the root mean square error of approximation, (c) the goodness-of-fit index,and (d) the adjusted goodness-of-fit index. Because c2 is sensitive to sample size (i.e.,the probability of rejecting a hypothesized model increases with sample size), the useof relative goodness-of-fit measures is strongly recommended (Bentler, 1990). Fol-lowing Marsh, Balla, and Hau (1996), three relative goodness-of-fit measures werecalculated: (a) normed fit index, (b) nonnormed fit index (NNFI), and (c) comparativefit index. Because the distribution of the goodness-of-fit index and the adjusted good-ness-of-fit index is unknown, no statistical test or critical value is available (Jöreskog
706 Educational and Psychological Measurement
Analisis Pengaruh Satisfaction..., Meiriks Henling, FB UMN, 2018

& Sörbom, 1986). Values smaller than .08 for the root mean square error of approxi-mation are indicative of an acceptable fit, and values greater than .1 should lead tomodel rejection (Cudeck & Browne, 1993). For all three relative fit indices, as a rule ofthumb, values greater than .90 are considered as indicating a good fit (Hoyle, 1995).More recently, Hu and Bentler (1999) have recommended slightly higher cutoff val-ues, such as .95 for the comparative fit index.
Results
Construction of the Short Version of the UWES
To reduce the number of items of the UWES as much as possible, an iterative pro-cess was carried out, whereby the samples of each country were analyzed separately.First, the most characteristic item of each scale was selected on the basis of face valid-ity. Next, this item was regressed on the remaining items of that particular scale. Theitem with the highest β value was then added to the initial item. In the next step, thesum of these two items was regressed on the remaining items of the scale, and againthe item with the highest β value was added to both items that were previouslyselected. Next, the sum of these three items was regressed on the remaining items ofthat scale, and so on. This iterative procedure was aborted either when no substantialvariance was added by a subsequent item or when no similar additional item emergedacross the 10 countries.
The most characteristic item for the VI scale was “At my work, I feel bursting withenergy” (VI1). This item was supplemented in the next step by “At my job, I feelstrong and vigorous” (VI2), as this item had the highest β values in all countries (rang-ing between .21 and .59; median = .42). Both items were summed and regressed on theremaining four VI items, whereby the item “When I get up in the morning, I feel likegoing to work” (VI3) showed the highest β values in almost all countries (rangingbetween .12 and .71; median = .39). Only in Spain and Finland did another item (VI6)show slightly higher β values. Regressing the sum of the three items (i.e., VI1, VI2,and VI3) on the remaining three VI items did not yield a particular additional item thatcould be included in the short version. Thus, the final short VI scale consists of VI1,VI2, and VI3.
The most characteristic item for the DE scale reads “I am enthusiastic about myjob” (DE2). This item was supplemented by “My job inspires me” (DE3) because ithad the highest β value in all but two countries (ranging between .20 and .49; median =.32). In Belgium and Canada, another DE item (DE4) had slightly higher β values.Next, DE2 and DE3 were summed and regressed on the remaining three DE items.The item “I am proud of the work that I do” (DE4) showed the highest β values in allcountries (ranging between .12 and .48; median = .27). Regressing the sum of the threeitems (i.e., DE2, DE3, and DE4) on the remaining two DE scale items did not yield aparticular additional item that could be included in the short version. Thus, the finalshort DE scale consists of DE2, DE3, and DE4.
Schaufeli et al. / Measurement of Work Engagement 707
Analisis Pengaruh Satisfaction..., Meiriks Henling, FB UMN, 2018

The most characteristic item for the AB scale was “I am immersed in my work”(AB4). This item was supplemented by “I get carried away when I’m working” (AB5)because it had the highest β values in all but two countries (ranging between .21 and.47; median = .27). In Belgium and Spain, another AB item (AB3) had slightly higherβ values. Next, AB4 and AB5 are summed and regressed on the remaining four ABitems. The item “I feel happy when I am working intensely” (AB3) showed the highestβ values in almost all countries (ranging between .20 and .62; median = .37). Only inCanada and Spain did another item (AB6) show slightly higher β values. Regressingthe sum of the three items (i.e., AB3, AB4, and AB5) on the remaining three AB scaleitems did not yield a particular additional item that could be included in the short ver-sion. Thus, the final short AB scale consists of AB3, AB4, and AB5.
Factorial Validity
The one-factor (M1) and three-factor (M2) models were fitted to all 10 nationalsamples simultaneously. M2 fit quite well to the data with all fit indices meeting theircorresponding minimums/maximums for acceptability (see Table 3). Moreover, in allnational samples, all items had statistically significant coefficients on their latent fac-tors. Although M1 also fit reasonably well to the data—with only NNFI not meeting(but approaching) its criterion of .90—the fit of M2 is superior to that of M1: ∆χ2(30) =2917.23, p < .001. The reason for this is that the latent factors of M2 were highly corre-lated in the various national samples: .88 < rvi – de < .98 (median = .95), .75 < rde – ab < .97(median = .92), and .75 < rvi – ab < .96 (median = .90).
In the next step, the factor coefficients in both models were constrained to be equalacross all national samples. Because the fit of both constrained models deterioratedsignificantly—for M1: ∆χ2(72) = 1189.35, p < .001; for M2: ∆χ2(54) = 952.89, p <.001—it was concluded that the factor coefficients differed systematically across
708 Educational and Psychological Measurement
Table 3The Fit of the UWES-9 Models
Model χ2 df GFI AGFI RMSEA NFI NNFI CFI
One-factor model (M1)Freely estimated 6144.52 270 .89 .82 .04 .91 .89 .91Constrained factor coefficients 7333.87 342 .88 .84 .04 .89 .89 .90
Three-factor model (M2)Freely estimated 3227.29 240 .95 .90 .03 .95 .93 .96Constrained factor coefficients 4180.18 294 .93 .89 .03 .94 .93 .94Constrained covariances 3504.17 267 .94 .90 .03 .95 .94 .95
Null model 63064.50 36 .33 .16 .35 — — —
Note: Multiple-group method employed (N = 14,521). UWES = Utrecht Work Engagement Scale; GFI =goodness-of-fit index; AGFI = adjusted goodness-of-fit index; RMSEA = root mean square error of approxi-mation; NFI = normed fit index; NNFI = nonnormed fit index; CFI = comparative fit index. For a descriptionof the models, see text.
Analisis Pengaruh Satisfaction..., Meiriks Henling, FB UMN, 2018

countries. Finally, a model with the covariances of the factors constrained to be equalacross samples was simultaneously fitted to the data of all national samples. Com-pared to the unconstrained three-factor model, the fit of this constrained model alsodeteriorated significantly: ∆χ2(27) = 267.88, p < .001. Hence, the covariances of thethree latent engagement factors differed significantly between countries.
In sum, the three-factor model fit slightly better to the data of the 10 countries thandid the one-factor model. However, the three subscales of the short version of theUWES are highly interrelated. The one-factor and three-factor models are not invari-ant; that is, factor coefficients and covariances between factors differ across countries.
Additional Psychometric Analyses
Internal consistency. Cronbach’s alpha of the three-item VI scale varied acrosscountries between .60 and .88 (median = .77), with Finland (α = .65) and France (α =.60) as the only 2 countries with values lower than .70. Cronbach’s alpha of the shortDE scale varied between .75 and .90 (median = .85), whereas alpha values for thethree-item AB scale varied between .66 and .86 (median = .78), with Spain (α = .66) asthe only country with a value lower than .70. Finally, Cronbach’s alpha for the totalnine-item scale varied between .85 and .92 (median = .92) across all 10 countries. Insum, with very few exceptions, the internal consistencies of the scores of the three-item scales seem to be satisfactory in the sense that they exceed the value of .70(Nunnally & Bernstein, 1994), whereas values of Cronbach’s alpha of the total nine-item scale are good across all national samples, satisfying the more stringent value of.80 (Henson, 2001).
Stability. In two countries—Australia (n = 293) and Norway (n = 2,111)—theUWES was administered twice with an interval of 1 year. The stability coefficientsfor VI, DE, and AB for Australia were .61, .56, and .60, respectively, and for Norwaywere .71, .66, and .68, respectively. The corresponding values of the total nine-itemscore for Australia and Norway were .64 and .73, respectively.
Correlations with the original scales. The correlations between the short three-item VI scale and the original six-item scale exceeded .90 in all countries exceptFrance (r = .83; median = .91). The correlations between the short three-item DE scaleand the original five-item scale exceeded .95 in all countries (median = .96). The cor-relations between the short three-item AB scale and the original six-item scale ex-ceeded .90 in all countries, except Belgium (r = .85) and Spain (r = .89; median = .92).In sum, with only few exceptions, the short UWES scales share more than 80% of theirvariances with the corresponding longer original versions.
Relationship With Burnout
For Norway and Belgium, as well as for a part of the Dutch sample (n = 488), noburnout data were available, thus leaving a total sample of n = 11,152 to be used for
Schaufeli et al. / Measurement of Work Engagement 709
Analisis Pengaruh Satisfaction..., Meiriks Henling, FB UMN, 2018
investigating the relationship between work engagement and burnout. As expected,burnout and engagement were negatively correlated; this was especially true forvigor and exhaustion (–.32 < r < –.44; median = –.40) and for dedication and cynicism(–.37 < r < –.54; median = –.50). After all, these dimensions were meant to be eachother’s direct opposites. Interestingly, reduced professional efficacy was consistentlyand substantively correlated with all three engagement dimensions (–.36 < r < –.73;median = –.49), suggesting that MHyp would probably be the best-fitting model.
As shown in Table 4, the fit of the hypothesized model (MHyp) was indeed superiorto that of the one-factor model (MWel), ∆χ2(8) = 3348.78, p < .001, as well as to thatof the alternative model (MAlt). Moreover, the so-called modification indices of MAlt
indicated that the fit of the model could be improved significantly when instead ofrelations to burnout, professional efficacy would weight on engagement. All scaleshad statistically significant coefficients on the corresponding latent factor of MHyp,whereas the correlations between the latent Burnout and Engagement factors rangedbetween –.45 and –.64 (median = –.58).
In the next and final step, all factor coefficients and the covariance of the latentburnout and engagement factors of MHyp were constrained to be equal across allnational samples, respectively. Compared to the freely estimated MHyp, the fit of bothconstrained models deteriorated significantly: For the constrained factor coefficients,∆χ2(28) = 1746.57, p < .001, and for the constrained covariance, ∆χ2(7) = 70.34, p <.001. Hence, it is concluded that the factor coefficients as well as the covariance be-tween the latent Burnout and Engagement factors differed systematically across theeight countries involved.
Descriptive Analyses: Relationships WithAge, Gender, and Occupational Group
Engagement was weakly positively related with age; that is, correlations with theshort versions of VI, DE, and AB ranged from .00 to .28 (median = .08), 02 to .28
710 Educational and Psychological Measurement
Table 4The Fit of the Second-Order Burnout and Engagement Models
Model χ2 df GFI AGFI RMSEA NFI NNFI CFI
One-factor model (MWel) 4894.11 72 .88 .72 .08 .84 .74 .85Alternative model (MAlt) 3325.19 64 .91 .77 .07 .89 .81 .90Hypothesized model (MHyp)
Freely estimated 1545.33 64 .96 .90 .05 .95 .91 .95Constrained factor coefficients 3291.90 92 .92 .85 .06 .90 .87 .90Constrained covariance 1615.67 71 .96 .90 .04 .95 .92 .95
Null model 31509.94 120 .47 .26 .15 — — —
Note: Multiple-group method employed (total sample, n = 11,152). GFI = goodness-of-fit index; AGFI =adjusted goodness-of-fit index; RMSEA = root mean square error of approximation; NFI = normed fit index;NNFI= nonnormed fit index; CFI = comparative fit index. For a description of the models, see text.
Analisis Pengaruh Satisfaction..., Meiriks Henling, FB UMN, 2018
(median = .09), and .00 to .27 (median = .12), respectively. Although in many casesstatistically significant, these correlations generally lacked practical significance. Forinstance, with the exception of the Canadian sample, correlations in all other sampleswere .15 or less.
Relationships between work engagement and gender were weak but equivocal. Inthe Australian, Canadian, and French samples, no gender differences were observed.On the other hand, in the Belgian, German, Finnish, and Norwegian samples, menscored slightly higher on the three engagement dimensions than did women, whereasthe reverse was true for the South African (only VI), Spanish (only DE and AB), andDutch samples. However, the gender differences also lack practical significance,which is illustrated by the fact that in all cases, Cohen’s d—a statistic for effect sizethat is independent of sample size—was lower than .20 (Cohen, 1969). In the presentstudy, such low effects were not considered meaningful.
To explore the relationship of engagement with occupational group, a pooled sam-ple was used because not all occupational groups were represented in each country.Systematic differences were found between occupational groups in levels of vigor,F(7, 13644) = 78.30, p < .001, dedication, F(7, 13630) = 84.24, p < .001, and absorp-tion, F(7, 13635) = 90.38, p < .001. The highest levels of vigor were found among edu-cators (M = 4.41), managers (M = 4.40), and police officers (M = 4.14), whereas thelowest scores were observed for blue-collar workers (M = 3.47), social workers andcounselors (M = 3.89), and health care workers (M = 3.94). The highest levels of dedi-cation were found among police officers (M = 4.55), managers (M = 4.48), and educa-tors (M = 4.40), whereas the lowest scores were observed for blue-collar workers (M =3.40), white-collar workers in the nonprofit sector (M = 4.14), and social workers andcounselors (M = 4.17). The highest levels of absorption were found among police offi-cers (M = 4.05), managers (M = 3.78), and educators (M = 3.70), whereas the lowestscores were observed for blue-collar workers (M = 2.74), white-collar workers in thenonprofit sector (M = 3.49), and health care workers (M = 3.55). Post hoc testsrevealed that all differences between the high-scoring occupations and the low-scoringoccupations were statistically significant (p < .001). The Cohen’s d effect sizes of thedifferences between blue-collar workers and the three highest-scoring occupationalgroups (i.e., police officers, managers, and educators) exceeded .80 and have to bequalified as “strong,” whereas the differences between the remaining low-scoringgroups with the three highest-scoring groups have to be qualified as “small” (.20 < d <.30). In other words, particularly blue-collar workers are less engaged in their workthan are police officers, managers, and educators.
Discussion
Using a large international database, the current study set out to develop a shortquestionnaire to measure work engagement and validate its scores. The point of depar-ture was a longer scale that was recently introduced—the 17-item UWES (Schaufeli,Salanova, et al., 2002). Scale construction was successful because after an iterative
Schaufeli et al. / Measurement of Work Engagement 711
Analisis Pengaruh Satisfaction..., Meiriks Henling, FB UMN, 2018

process, the three original scales of the UWES could be reduced to 3 items each. Theshortened versions of the scales correlated highly with their original longer counter-parts, sharing more than 80% of their variances. Furthermore, internal consistenciesof the scores from the three short scales were sufficient in almost all 10 countries thatwere included in the database. In fact, in only 3 of 30 cases (10%), Cronbach’s alphawas slightly lower than .70; in 7 cases (23%), values of alpha ranged between .70 and.80; whereas in the remaining 27 cases (67%), alpha exceeded .80.
Although the three-factor model including vigor, dedication, and absorption fit sig-nificantly better to the data than did the one-factor model that assumed that all itemsweighted on one underlying Engagement factor, this result was not unequivocal. First,the one-factor model also fit reasonably well to the data, with three of four fit indicesmeeting their criterion and the remaining index (NNFI) approaching its criterion of.90. Second, correlations between the latent Vigor, Dedication, and Absorption fac-tors were very high with medians > .90 across the national samples. Finally, withoutexception, the internal consistency of the scores of the total nine-item version ap-peared to be very high in all national samples. So, practically speaking, rather thancomputing three different scores for VI, DE, and AB, researchers might considerusing the total nine-item score as an indicator of work engagement. In doing so, forinstance, problems with multicollinearity are avoided when VI, DE, and AB are en-tered simultaneously as independent predictors in a regression equation. Alterna-tively, researchers could consider structure coefficients when using all three scales aspredictors (cf. Courville & Thompson, 2001). On the other hand, when using struc-tural equation modeling, the three aspects may be used as indicators of the latentengagement construct. For the time being, it seems that the total UWES-9 score can beused as an overall measure of work engagement. However, a final conclusion as tousing a single composite engagement score versus three scale scores still stands out.Future research should uncover whether VI, DE, and AB have different causes andconsequences so that instead of a single score, a differentiation between the threeaspects would be preferred.
As far as the 1-year stability of engagement is concerned, this is of the same magni-tude as burnout (Schaufeli & Enzmann, 1998, pp. 96-97): Between 31% and 53% ofthe variance in (aspects of) engagement of the second measurement is explained by thefirst measurement. This means that, like burnout, engagement is a chronic rather thana transient state.
As expected, engagement as measured with the UWES-9 is negatively related toburnout. This is particularly the case for the direct opposites vigor and exhaustion, aswell as for dedication and absorption. In addition, it appeared that professional effi-cacy is rather strongly related to all three engagement dimensions. Hence, our hy-pothesized two-factor model was confirmed by the data: exhaustion and cynicismweighted on a factor representing the “core of burnout” (cf. Green, Walkey, & Taylor,1991), whereas vigor, dedication, absorption, and professional efficacy weighted onan extended Engagement factor. Two explanations might be given for this result. First,during the past decade, evidence has accumulated on the divergent role that lack ofprofessional efficacy plays in burnout as compared to exhaustion and cynicism (e.g.,
712 Educational and Psychological Measurement
Analisis Pengaruh Satisfaction..., Meiriks Henling, FB UMN, 2018

Lee & Ashforth, 1996; Leiter, 1993), whereas conceptually speaking, it makes sensethat engaged workers feel efficacious in their jobs (Maslach & Leiter, 1997). Futurelongitudinal research should uncover whether professional efficacy might be consid-ered a consequence (or an antecedent) of engagement rather than a constituting ele-ment. Based on the cross-sectional analyses of the current study, it can only be con-cluded that work engagement is related to professional efficacy, but no conclusion canbe drawn about any causal order. An alternative explanation might be that lack of pro-fessional efficacy is measured with items that are positively formulated and that aresubsequently reversed to constitute a “negative” score that is supposed to be indicativeof lack of professional efficacy. Recently, Bouman, Te Brake, and Hoogstraten (2002)showed that the notoriously low negative correlations between professional efficacyand both other burnout dimensions change dramatically in much higher positive cor-relations when, instead of reversing positively formulated items, negative items areused to measure lack of efficacy. Future research that includes negatively worded in-efficacy items instead of positive PE items should demonstrate whether a two-factormodel in which inefficacy positively weights on burnout fits better to the data than amodel in which inefficacy negatively weights on engagement.
As a rule, no indications were found for factorial invariance across samples fromthe various countries. This means that the structure of the relationships between theitems (and scales) is similar across countries but that the size of the estimates (i.e., fac-tor coefficients and covariances of the factors) differs systematically. Earlier studiesusing the original 17-item UWES showed its invariance across countries (Schaufeli,Martínez, et al., 2002) and racial groups (Storm & Rothmann, 2003). However, inthese cases, university students from various countries or police officers from differ-ent racial groups were included, respectively. In other words, factorial invariance wasdemonstrated for members of the same group originating from different countriesor racial backgrounds. In contrast, the present study includes different occupationalgroups from different countries. As a result, factorial invariance is less likely to beobserved. Therefore, future research on factorial invariance of the UWES should in-clude similar occupational groups from different countries.
Contrary to the idea that burnout decreases with age (Schaufeli & Enzmann, 1998,p. 76), it seems that work engagement slightly increases with age. However, the rela-tionship with age is so weak that it can hardly be considered meaningful. Except forcynicism—men are usually more cynical than are women—no systematic gender dif-ferences were observed for burnout (Schaufeli & Enzmann, 1998, p. 76). Also, levelsof engagement did not seem to differ systematically between both genders. As far asoccupational groups are concerned, it appeared that blue-collar workers were lessengaged compared to managers, educators, and police officers. A possible explana-tion might be that compared to the latter, the former might draw less on job resourcesthat are known to be positively related to work engagement (Schaufeli & Bakker,2004). However, like the relationships with age and gender, the relationships betweenengagement and occupational group should be interpreted with caution becauseinstead of using representative national samples, convenience samples have beenused. For instance, the Finnish sample consisted largely of educators, whereas the
Schaufeli et al. / Measurement of Work Engagement 713
Analisis Pengaruh Satisfaction..., Meiriks Henling, FB UMN, 2018

South African sample consisted largely of police officers. In conclusion, we hope thatthe introduction of this short questionnaire to measure engagement, which seems tohave encouraging psychometric features, stimulates further research on positive orga-nizational psychology.
AppendixWork and Well-Being Survey (UWES)
The following 17 statements are about how you feel at work. Please read each statement care-fully and decide if you ever feel this way about your job. If you have never had this feeling, crossthe “0” (zero) in the space after the statement. If you have had this feeling, indicate how oftenyou felt it by crossing the number (from 1 to 6) that best describes how frequently you feel thatway.
Never Almost Never Rarely Sometimes Often Very Often Always0 1 2 3 4 5 6
Never A few times Once a month A few times Once A few times Everya year or less or less a month a week a week day
1. At my work, I feel bursting with energy.a (VI1)2. I find the work that I do full of meaning and purpose. (DE1)3. Time flies when I am working. (AB1)4. At my job, I feel strong and vigorous.a (VI2)5. I am enthusiastic about my job.a (DE2)6. When I am working, I forget everything else around me. (AB2)7. My job inspires me.a (DE3)8. When I get up in the morning, I feel like going to work.a (VI3)9. I feel happy when I am working intensely.a (AB3)
10. I am proud of the work that I do.a (DE4)11. I am immersed in my work.a (AB4)12. I can continue working for very long periods at a time. (VI4)13. To me, my job is challenging. (DE5)14. I get carried away when I am working.a (AB5)15. At my job, I am very resilient, mentally. (VI5)16. It is difficult to detach myself from my job. (AB6)17. At my work, I always persevere, even when things do not go well. (VI6)
Source: Schaufeli and Bakker (2003).Note: VI = Vigor scale; DE = Dedication scale; AB = Absorption scale.a. Shortened version (Utrecht Work Engagement Scale–9 [UWES-9]).
References
Arbuckle, J. L. (1997). Amos users’ guide (Version 4.0). Chicago: Smallwaters.Bakker, A. B., Demerouti, E., & Schaufeli, W. B. (2002). Validation of the Maslach Burnout Inventory–
General Survey: An Internet study. Anxiety, Stress & Coping, 15, 245-260.
714 Educational and Psychological Measurement
Analisis Pengaruh Satisfaction..., Meiriks Henling, FB UMN, 2018

Bentler, P. M. (1990). Comparative fit indexes in structural equation models. Psychological Bulletin, 107,238-246.
Bouman, A. M., Te Brake, H., & Hoogstraten, J. (2002). Significant effects due to rephrasing the MaslachBurnout Inventory’s personal accomplishment items. Psychological Reports, 91, 825-826.
Cohen, J. (1969). Statistical power analysis for the behavioral sciences. New York: Academic Press.Courville, T., & Thompson, B. (2001). Use of structure coefficients in published multiple regression arti-
cles: β is not enough. Educational and Psychological Measurement, 61, 229-248.Cudeck, R., & Browne, M. W. (1993). Alternative ways of assessing model fit. In K. A. Bollen & J. Scott
Long (Eds.), Testing structural equation models (pp. 1-9). Newbury Park, CA: Sage.Demerouti, E., Bakker, A. B., Janssen, P. P. M., & Schaufeli, W. B. (2001). Burnout and engagement at work
as a function of demands and control. Scandinavian Journal of Work and Environment and Heath, 27,279-286.
Durán, A., Extremera, N., & Rey, L. (2004). Engagement and burnout: Analysing their association patterns.Psychological Reports, 94, 1048-1050.
Green, D. E., Walkey, F. H., & Taylor, A. J. W. (1991). The three-factor structure of the Maslach BurnoutInventory. Journal of Science Behavior and Personality, 6, 453-472.
Henson, R. K. (2001). Understanding internal consistency reliability estimates: A conceptual primer oncoefficient alpha. Measurement and Evaluation in Counseling and Development, 34, 177-189.
Hoyle, R. H. (1995). The structural equation modeling approach: Basic concepts and fundamental issues. InR. H. Hoyle (Ed.), Structural equation modeling, concepts, issues, and applications (pp. 1-15). Thou-sand Oaks, CA: Sage.
Hu, L., & Bentler, P. (1999). Cutoff criteria for fit indexes in covariance structure analysis: Conventional cri-teria versus new alternatives. Structural Equation Modeling, 6, 1-55.
Jöreskog, K. G., & Sörbom, D. (1986). LISREL user guide version VI (4th ed.). Mooresville, IL: ScientificSoftware International.
Lee, R. T., & Ashforth, B. E. (1996). A meta-analytic examination of the correlates of the three dimensionsof job burnout. Journal of Applied Psychology, 81, 123-133.
Leiter, M. P. (1993). Burnout as a developmental process: Consideration of models. In W. B. Schaufeli,C. Maslach, & T. Marek (Eds.), Professional burnout: Recent developments in theory and research(pp. 237-250). Washington, DC: Taylor & Francis.
Leiter, M. P., & Schaufeli, W. B. (1996). Consistency of the burnout construct across occupations. Anxiety,Stress & Coping, 9, 229-243.
Luthans, F. (2002). The need for and meaning of positive organizational behavior. Journal of OrganizationalBehavior, 23, 695-706.
Marsh, H. W., Balla, J. R., & Hau, K. T. (1996). An evaluation of incremental fit indices: A clarification ofmathematical and empirical properties. In G. A. Marcoulides & R. E. Schumacker (Eds.), Advancedstructural equation modeling, issues and techniques (pp. 315-353). Mahwah, NJ: Lawrence Erlbaum.
Maslach, C., Jackson, S. E., & Leiter, M. P. (1996). Maslach Burnout Inventory—Manual (3rd ed.). PaloAlto, CA: Consulting Psychologists Press.
Maslach, C., & Leiter, M. P. (1997). The truth about burnout: How organizations cause personal stress andwhat to do about it. San Francisco: Jossey-Bass.
Maslach, C., Schaufeli, W. B., & Leiter, M. P. (2001). Job burnout. Annual Review of Psychology, 52, 397-422.
Montgomery, A., Peeters, M. C. W., Schaufeli, W. B., & Den Ouden, M. (2003). Work-home interferenceamong newspaper managers: Its relationship with burnout and engagement. Anxiety, Stress & Coping,16, 195-211.
Nunnally, J. C., & Bernstein, I. H. (1994). Psychometric theory (3rd ed.). New York: McGraw-Hill.Salanova, M., Schaufeli, W. B., Llorens, S., Peiró, J. M., & Grau, R. (2001). Desde el “burnout” al
“engamement”: una nueva perspective [From “burnout” to “engagement”: A new perspective]. Revistade Psicología del Trabajo y de las Organizaciones, 16, 117-134.
Schaufeli, W. B., & Bakker, A. B. (2003). Test manual for the Utrecht Work Engagement Scale. Unpublishedmanuscript, Utrecht University, the Netherlands. Retrieved from http://www.schaufeli.com
Schaufeli et al. / Measurement of Work Engagement 715
Analisis Pengaruh Satisfaction..., Meiriks Henling, FB UMN, 2018

Schaufeli, W. B., & Bakker, A. B. (2004). Job demands, job resources and their relationship with burnoutand engagement: A multi-sample study. Journal of Organizational Behavior, 25, 293-315.
Schaufeli, W. B., & Enzmann, D. (1998). The burnout companion to study and research: A critical analysis.London: Taylor & Francis.
Schaufeli, W. B., Leiter, M. P., Maslach, C., & Jackson, S. E. (1996). Maslach Burnout Inventory—GeneralSurvey. In C. Maslach, S. E. Jackson, & M. P. Leiter (Eds.), Maslach Burnout Inventory—Test manual(3rd ed., pp. 22-26). Palo Alto, CA: Consulting Psychologists Press.
Schaufeli, W. B., Martínez, I., Marques-Pinto, A., Salanova, M., & Bakker, A. B. (2002). Burnout andengagement in university students: A cross national study. Journal of Cross-Cultural Psychology, 33,464-481.
Schaufeli, W. B., & Salanova, M. (in press). Work engagement: An emerging psychological concept and itsimplications for organizations. In S. W. Gilliland, D. D. Steiner, & D. P. Skarlicki (Eds.), Research insocial issues in management: Vol. 5. Managing social and ethical issues in organizations. Greenwich,CT: Information Age Publishers.
Schaufeli, W. B., Salanova, M., Gonzalez-Romá, V., & Bakker, A. B. (2002). The measurement of engage-ment and burnout: A confirmative analytic approach. Journal of Happiness Studies, 3, 71-92.
Schutte, N., Toppinnen, S., Kalimo, R., & Schaufeli, W. B. (2000). The factorial validity of the MaslachBurnout Inventory–General Survey across occupational groups and nations. Journal of Occupationaland Organizational Psychology, 73, 53-66.
Seligman, M. E. P., & Csikszentmihalyi, M. (2000). Positive psychology: An introduction. American Psy-chologist, 55, 5-14.
Sonnentag, S. (2003). Recovery, work engagement, and proactive behavior: A new look at the interfacebetween non-work and work. Journal of Applied Psychology, 88, 518-528.
Storm, K., & Rothmann, I. (2003). A psychometric analysis of the Utrecht Work Engagement Scale in theSouth African police service. South African Journal of Industrial Psychology, 29, 62-70.
Taris, T. W., Bok, I. A., & Meijer, Z. Y. (1998). Assessing stability and change of psychometric properties ofmulti-item concepts across different situation: A general approach. Journal of Psychology, 123, 301-316.
716 Educational and Psychological Measurement
Analisis Pengaruh Satisfaction..., Meiriks Henling, FB UMN, 2018