laboratories for integrating bioinformatics into the life sciences
TRANSCRIPT

Tested Studies for Laboratory TeachingProceedings of the Association for Biology Laboratory EducationVol. 36, Article 6, 2015
1
Laboratories for Integrating Bioinformaticsinto the Life SciencesGarry Duncan1, William McClung2, Letitia Reichart3, Dawn Simon3, William Tap-prich5, Neal Grandgenett6 and Mark Pauley7
1Nebraska Wesleyan University, Biology Department, 5000 Saint Paul Ave., Lincoln NE 68504 USA 2Nebraska Wesleyan University, Mathematics and Computer Science Department, 5000 Saint Paul Ave., Lincoln NE 68504 USA 3University of Nebraska at Kearney, Department of Biology, 905 West 25th St., Kearney NE 68849 USA 4University of Nebraska at Omaha, Department of Biology, 6001 Dodge St., Omaha NE 68182 USA5University of Nebraska at Omaha, Department of Teacher Education, 6001 Dodge St., Omaha NE 68182 USA 6University of Nebraska at Omaha, School of Interdisciplinary Informatics, 6001 Dodge St., Omaha NE 68182 USA ([email protected]; [email protected]; [email protected]; [email protected]; [email protected]; [email protected]; [email protected])
Bioinformatics is a rapidly emerging discipline integrating mathematical and computational techniques with bio-logical knowledge to analyze genetic information. The essential nature of bioinformatics is well recognized in graduate programs, research consortia, and biotechnology industries, but exposure to bioinformatics has been slow to reach undergraduate life science curricula. The goal of this workshop is to present three bioinformatics-focused laboratories that have been developed, assessed, and implemented by the authors at three universities in Nebraska. The laboratories use a variety of online bioinformatics tools and real-world data and can be used in introductory and intermediate classes. FirstpageKeywords: bioinformatics, computational biology, sequence alignment, ORF, sequence assembly
© 2015, Garry Duncan, William McClung, Letitia Reichart, Dawn Simon, William Tapprich, Neal Grandgenett, and Mark Pauley
shop is to present three bioinformatics laboratories that have been developed, assessed, and implemented by the authors at Nebraska Wesleyan University, the University of Nebraska at Kearney, and the University of Nebraska at Omaha. The laboratories use a variety of online bioinformatics tools and real-world data and can be used in introductory and interme-diate classes
Bioinformatics is a rapidly emerging discipline inte-grating mathematical and computational techniques with biological knowledge to analyze genetic information. The essential nature of bioinformatics is well recognized in grad-uate programs, research consortia, and biotechnology indus-tries, but exposure to bioinformatics has been slow to reach undergraduate life science curricula, and bioinformatics-fo-cused laboratories are not yet widely available nor have they been integrated into resource materials for biology courses either online or through publishers. The goal of this work-
Introduction
Link to Supplemental Materials
http://www.ableweb.org/volumes/vol-36/duncan/supplement.htm

2 Tested Studies for Laboratory Teaching
Duncan, McClung, Reichart, Simon, Tapprich, Grandgenett, Pauley
Student OutlineLaboratory 1—Genomes and Bioinformatics: Analysis of Genomic DNA Sequences Pre-lab Preparation
Read the laboratory exercises and the following sections in Campbell Biology:• Read the DNA sequencing research method box in Figure 20.12 (p. 408)• Review the new genome sequencing approaches (pp. 427–429)• Investigate bioinformatics approaches for the understanding of genome function (pp. 429–430)
Pre-lab QuestionsAt the beginning of lab, you will be asked to answer two of the following questions. You will receive one point for each
correct answer.1. What does the dideoxy chain termination method help us to learn?
2. WhatisthepurposeofthefluorescentdideoxyribonucleotidesusedinthedideoxychainterminationmethodofDNAsequencing?
3. What does an electropherogram display?
4. What font are you instructed to use to record the sequences of DNA from the 6 Neanderthal individuals?
5. What is an open reading frame?
6. How would DNA sequence information provide information on evolutionary relationships?
7. What web browser should you use when searching for open reading frames in Part 3?
IntroductionThefirstcompletehumangenomesequencewaspublishedin2003.Thiswasapivotaladvanceinourunderstandingof
biologyandanamazingtechnicalandscientificmilestone.Toputtheprojectinperspective,imagineyouwereabletodecipherthe sequence of one million base pairs of DNA a day and worked every day of the year. Even at that pace, it would take you almost nine years to completely sequence the 3.2 billion base pairs in the human genome.
Inadditiontothehumangenome,additionalgenomeprojectshavealsoproducedcompletegenomesequencesofhun-dreds of species with examples from the entire tree of life. Obviously, these genome sequences represent an incredible infor-mation resource. However, given the quantity of information that has been, and continues to be, generated, it is impossible toanalyzethesesequenceswithouttheassistanceofcomputers.Bioinformaticsisthescientificdisciplinethatdevelopsthecomputer tools necessary to store, organize, and analyze biological information. An excellent example of bioinformatics can be found in the computer tools that analyze genomic sequence information. In this laboratory, we will use bioinformatics to explore some newly generated human DNA sequences.
Sequencing Neanderthal DNADNA sequencing technology has advanced to the point where the genome of any organism can be sequenced in only
a few months. Incredibly, it is also possible to recover and sequence DNA from organisms that died long ago. For example, the genome of the extinct wooly mammoth has been sequenced as well as the genome of Neanderthals, an extinct relative of modern humans!
In this laboratory, we will explore the properties of a short region of genome sequence from six different individuals. In this exercise, we are assuming the sequences were derived from DNA isolated from the bone fragments of six Neanderthals discoveredinacaveinCroatia.Wewilltakethesameapproachthatisusedtosolvegenomesequencesingenomeprojects.
DNA Sequencing TechnologyTo learn the sequence of an unknown DNA fragment, an approach called the dideoxy chain termination method is
used. Figure 1 shows the basics of this approach, and a complete description is available in your textbook on pages 407–409. Briefly,themethodfirstshearstheunknownDNAintoasetofrandom,overlappingpieces.Eachofthesepiecesthenservesas a template to generate a set of nested DNA fragments that are complementary to the unknown DNA piece. The nested DNA fragments are made by annealing a primer to the template, then using DNA polymerase to extend the primer. The extension is carriedoutinthepresenceoffluorescentdideoxyribonucleotidesthatwillterminatetheextensioninarandomfashionbutwilllabelfragmentsendinginthesamenucleotidewithasinglefluorescentcolor.Thefragmentsareseparatedbycapillaryelectro-phoresisandmonitoredbyalaserthatcatalogstheorderoffluorescentfragments.Acomputertrackstheorderoffluorescentfragments and generates a set of colored curves that indicate the order of nucleotides.

Proceedings of the Association for Biology Laboratory Education, Volume 36, 2015 3
Major Workshop: Labs for Integrating Bioinformatics into the Life Sciences
Analysis of DNA from Six Individuals
Neanderthal bone fragments recovered from six different individuals were used to isolate DNA. A region of genomic DNAfromeachindividualwassubjectedtodideoxychainterminationsequencing.Thissequencingresultedinareadoutofcurvescalledanelectropherogram.Inthefirstpartoftheanalysis,youwillreadtheelectropherogramstomakeafileofDNAsequence for each individual.
Figure 1. The Sanger (chain-termination) method for DNA sequencing. (1) A primer is annealed to a sequence. (2) Reagents are added to the primer and template, including: DNA polymerase, dNTPs, andasmallamountofallfourdideoxynucleotides(ddNTPs)labeledwithfluorophores.Duringprimerelongation, the random insertion of a ddNTP instead of a dNTP terminates synthesis of the chain because DNA polymerase cannot react with the missing hydroxyl. This produces all possible lengths of chains. (3) The products are separated on a single lane capillary gel, where the resulting bands are read by an imaging system. (4) This produces several hundred thousand nucleotides a day, data which requirestorageandsubsequentcomputationalanalysis.Thisfigure,whichhasnotbeenmodified,wasauthoredbyuserEstevezjandwasobtainedfromhttp://commons.wikimedia.org/wiki/File:Sanger-se-quencing.svg. It is provided under the Creative Commons Attribution-Share Alike 3.0 Unported license (http://creativecommons.org/licenses/by-sa/3.0/deed.en).
4 Tested Studies for Laboratory Teaching
Duncan, McClung, Reichart, Simon, Tapprich, Grandgenett, Pauley
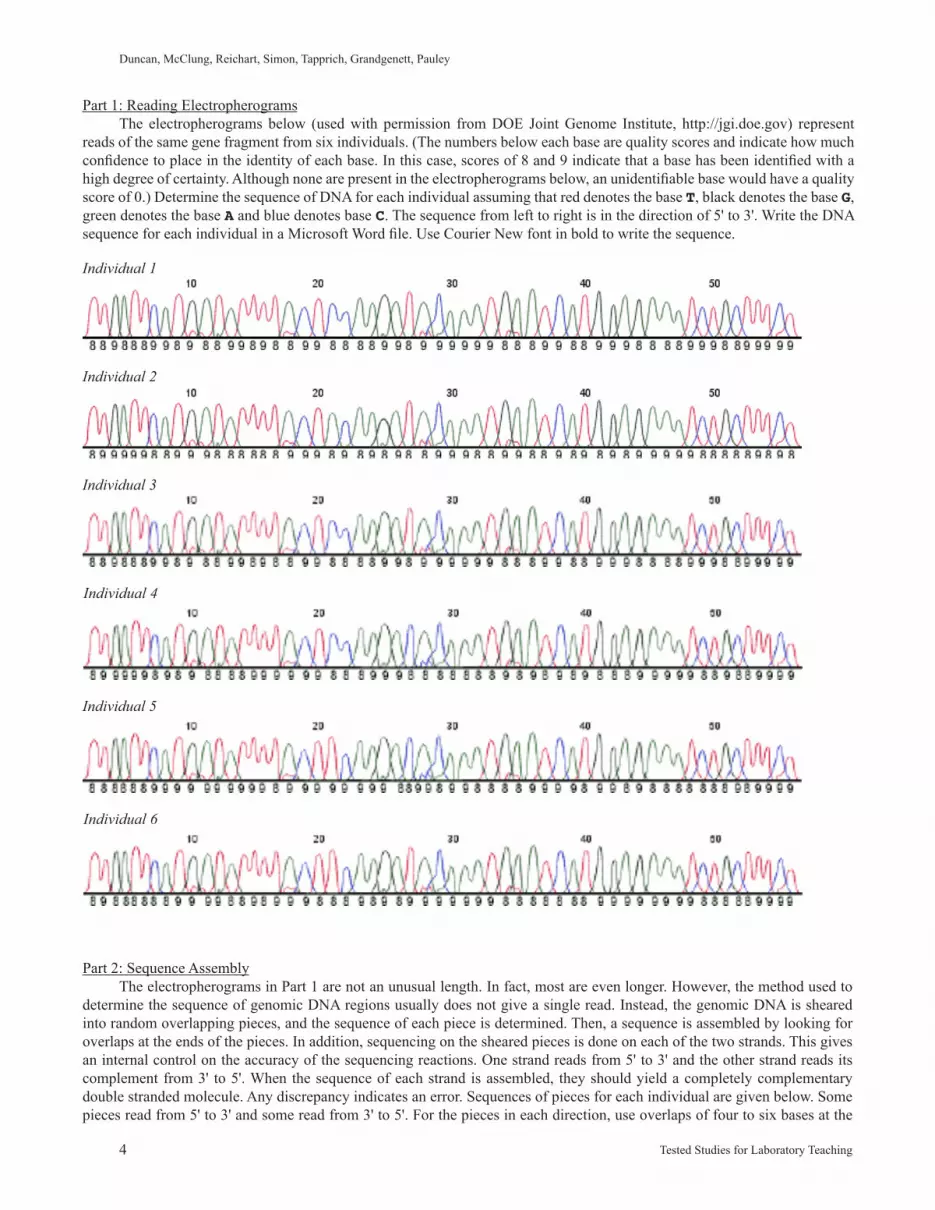
Part 1: Reading ElectropherogramsThe electropherograms below (usedwith permission fromDOE JointGenome Institute, http://jgi.doe.gov) represent
reads of the same gene fragment from six individuals. (The numbers below each base are quality scores and indicate how much confidencetoplaceintheidentityofeachbase.Inthiscase,scoresof8and9indicatethatabasehasbeenidentifiedwithahighdegreeofcertainty.Althoughnonearepresentintheelectropherogramsbelow,anunidentifiablebasewouldhaveaqualityscore of 0.) Determine the sequence of DNA for each individual assuming that red denotes the base T, black denotes the base G, green denotes the base A and blue denotes base C. The sequence from left to right is in the direction of 5' to 3'. Write the DNA sequenceforeachindividualinaMicrosoftWordfile.UseCourierNewfontinboldtowritethesequence.
Part 2: Sequence AssemblyThe electropherograms in Part 1 are not an unusual length. In fact, most are even longer. However, the method used to
determine the sequence of genomic DNA regions usually does not give a single read. Instead, the genomic DNA is sheared into random overlapping pieces, and the sequence of each piece is determined. Then, a sequence is assembled by looking for overlaps at the ends of the pieces. In addition, sequencing on the sheared pieces is done on each of the two strands. This gives an internal control on the accuracy of the sequencing reactions. One strand reads from 5' to 3' and the other strand reads its complement from 3' to 5'. When the sequence of each strand is assembled, they should yield a completely complementary double stranded molecule. Any discrepancy indicates an error. Sequences of pieces for each individual are given below. Some pieces read from 5' to 3' and some read from 3' to 5'. For the pieces in each direction, use overlaps of four to six bases at the
Individual 1
Individual 2
Individual 3
Individual 4
Individual 5
Individual 6

Proceedings of the Association for Biology Laboratory Education, Volume 36, 2015 5
Major Workshop: Labs for Integrating Bioinformatics into the Life Sciences
ends to assemble a complete strand, then line up the two strands into a double strand. Again, write your sequences in a Micro-softWordfile.Lookforanyerrorsinthesequences.Usingtheassembledsequences,lookforerrorsinthesequencesoftheelectropherogram reads in Part 1. Correct the electropherogram sequences using the assembled sequences as the more reliable dataset. Using Individual 1 as a control, identify positions where sequence variations exist between individuals.
Individual 15'-TTGATTCATGATAT-3'5'-ATATTTTACTCCAAGATACAAATGAATCAT-3'5'-ATCATGGAGAAATCTGCTTTCT-3'3'-ACTAAGTACTATAAAATGAGG-5'3'-ATGAGGTTCTATGTTTACTTAGTACCTCTTTAGAC-5'3'-AGACGAAAGA-5'
Individual 25'-TTGATTCATGATATTTTACT-3'5'-TTACTACAAGATACAAATGAA-3'5'-ATGAATCATGGAGAAATCTGCTTTCT-3'3'-AACTAAGTACTATAAAATGATGTTC-5'3'-TGTTCTATGTTTACTTAGTACCTCTTTA-5'3'-TTTAGACGAAAGA-5'
Individual 35'-TTGATTCATG-3'5'-CATGATATTTTACTCCAAGATAC-3'5'-GATACAAATGAATCATGGAGAAATCTGCTTTCT-3'3'-AACTAAGTACTATAAA-5'3'-TAAAATGAGGTTCTATGTTTACTTAGTAC-5'3'-GTACCTCTTTAGACGAAAGA-5'
Individual 45'-TTGATTCATGATATTTTACTCCAA-3'5'-CCAAGACACAAATGAATCAT-3'5'-ATCATGGAGAAATCTGCTTTCT-3'3'-AACTAAGTACTA-5'3'-ACTATAAAATGAGGTTCTGTGTTT-5'3'-TGTTTACTTAGTACCTCTTTAGACGAAAGA-5'
Individual 55'-TTGATTCATGATA-3'5'-GATATTTTACTTCAAGACACAAATGAATCATGG-3'5'-CATGGAGAAATCTGCTTTCT-3'3'-AACTAAGTACTATAAAATGAAGTT-5'3'-AGTTCTGTGTTTACTTAGTACCTCTT-5'3'-CCTCTTTAGACGAAAGA-5'
Individual 65'-TTGATTCATGATATTTTACTTCAAGATAC-3'5'-ATACAAATGAATCATGGAGAAATCTG-3'5'-TCTGCTTTCT-3'3'-AACTAAGTACTATAAAATGAAGTTCT-5'3'-GTTCTATGTTTACTTAGTACCTCT-5'3'-CTCTTTAGACGAAAGA-5'

6 Tested Studies for Laboratory Teaching
Duncan, McClung, Reichart, Simon, Tapprich, Grandgenett, Pauley
Part 3: Open Reading Frame (ORF) Finding One of the most important types of analysis for a newly sequenced DNA region is to determine whether the sequence
contains a gene. This is where bioinformatics approaches are their most powerful. If a sequence of DNA contains a gene, the nucleotide sequence should be able to code for a reasonably-sized protein. Therefore, the sequence should contain a start codon (ATG) followed by a long string of consecutive codons that are not stop codons (TTA, TGA, TAG). Such a string is called anopen reading frame or ORF. To search for ORFs, a DNA sequence must be analyzed in each of the three reading frames on both strands (six total reading frames). Bioinformaticians have developed computer tools that automatically search a DNA sequence for ORFs in each of the six possible reading frames. For this and subsequent parts of this procedure, please use the Firefox browser and not Internet Explorer. Go to the site http://www.bioinformatics.org/sms2. Using the ORF Finder applet, translate each of your sequences into ORFs for each of the six possible reading frames. Paste a DNA sequence into the text area (replac-ing the text that is already in the text area). Below the text area, use the dropdown boxes to enter the following parameters: ORFs can begin with atg; search ORFs in the reading frame 1, 2, and 3, on the direct strand; return ORFs that are 5 codons long; use the standard genetic code. Click on the Submitbutton.PastetheresultintoyourMicrosoftWordfile.RepeattheORFfindingonthissequence, but change the parameter to search the reversestrand.PastethisresultintoyourMicrosoftWordfile.DotheORFfindingonthesequencesfromeachindividual.Theaminoacidsequencesarelistedbyone-letterabbreviations.Table 1 shows the abbreviations.
Amino Acid Three-Letter One-LetterAlanine Ala AArginine Arg R
Asparagine Asn NAspartic acid Asp D
Cysteine Cys CGlutamine Gln Q
Glutamic Acid Glu EGlycine Gly GHistidine His HIsoleucine Ile ILeucine Leu LLysine Lys K
Methionine Met MPhenylalanine Phe F
Proline Pro PSerine Ser S
Threonine Thr TTryptophan Trp W
Tyrosine Tyr YValine Val V
Table 1. Amino Acid Abbreviations

Proceedings of the Association for Biology Laboratory Education, Volume 36, 2015 7
Major Workshop: Labs for Integrating Bioinformatics into the Life Sciences
Part 4: Nucleotide Sequence AlignmentAnother powerful bioinformatics method is sequence alignment and sequence comparison. This enables direct compari-
son of genome sequences for similarities and differences. This indicates evolutionary relationships between individuals. In this part, you will perform a multiple sequence alignment on your sequences. To do this you will use a program called ClustalW. Anonlineversionofthisprogramcanbefoundhere:http://www.ebi.ac.uk/Tools/msa/clustalw2.Toenteryoursequences,firstconvert them into FASTA format, which is of the form:
>SequenceIdentifierSequence
Note there is not a space between > and the SequenceIdentifier andnospaceswithinthesequenceidentifieritself.Use Individual1, Individual2,etc.asthesequenceidentifiers.
Your FASTA format for Individual 1 should look like this:>Individual1TTGATTCATGATATTTTACTCCAAGATACAAATGAATCATGGAGAAATCTGCTTTCTMakeaMicrosoftWordfilewhereallofthesequencesarelistedconsecutivelyinFASTAformat,thenpastethislistinto
the ClustalW window. Be sure that “DNA” is selected from the dropdown menu that is above the text box. Leave all other settings at their default values.
PastetheresultsofthesequencealignmentintoyourMicrosoftWordfile.Identifythedifferencesbetweenthesequenceof Individual 1 and the other individuals. For example, Individual 2 has an A at position 21 while Individual 1 has a C at thatposition. If no differences exist, record “same as control sequence.”
Part 5: Generating a Sequence LogoSequence logos are a graphical representation of an amino acid or nucleic acid multiple sequence alignment. Each logo
consists of stacks of symbols, one stack for each position in the sequence. The overall height of the stack indicates the sequence conservation at that position, while the height of symbols within the stack indicates the relative frequency of each amino acid or nucleotide at that position. In general, a sequence logo provides a richer and more precise description of, for example, a binding site than would a consensus sequence. A consensus sequence is a sequence that appears most often when comparing multiple sequences.
Use the tool at http://weblogo.threeplusone.com/create.cgi to generate a sequence logo of your six sequences. Paste your six FASTA formatted sequences into the window. In the parameter section of the webpage, change the number of “Stacks per line”to60anduncheckthe“Errorbars”box.PastethesequencelogoyougenerateintoyourMicrosoftWordfile.
Part 6: Amino Acid AlignmentExtract the amino acid sequences from reading frame 2 of your sequences (that you found in Part 3) and generate FASTA
formatted amino acid sequences from them (see Part 4 above). Use the ClustalW tool at http://www.ebi.ac.uk/Tools/msa/clust-alw2 to align the sequences. Be sure that “PROTEIN” is selected from the dropdown menu that is above the text box. Copy andpasteyouralignmentintoyourMicrosoftWordfile.Summarizethedifferencesbetweeneachaminoacidsequenceandtheamino acid sequence for Individual 1 in reading frame 2. For example, in reading frame 2, sequence 2 has a V at position 12 while the control sequence has a G at that position.
Laboratory 2—Invasion of Common Reed (Phragmites Australis) into North American WetlandsIntroduction
For centuries, humans have intentionally or accidentally released organisms outside of their native geographic range. These species are called introduced species and are found in ecosystems all over the globe. Most introduced species never es-tablish themselves in the new environment; however, a small fraction of these species do (Mack et al. 2000). Species capable of establishment and spread are called invasive species. Introduced organisms that become invasive species often have several characteristics that allow them to successfully invade an area and outcompete native organisms.
What characteristics (e.g., type of reproduction) would allow an introduced species to successfully establish itself as an invasive species?

8 Tested Studies for Laboratory Teaching
Duncan, McClung, Reichart, Simon, Tapprich, Grandgenett, Pauley
Often factors associated with the environment or the community in which the introduced species arrives may allow it to become invasive. What environments or environmental conditions might allow an introduced species to become invasive?
Ecological impacts of invasive species are primarily negative. Invasive species are commonly associated with a reduction in biodiversity (i.e., the number of different species in an ecosystem) through extinction of native species. A striking example of this is the brown tree snake (Boiga irregularis). It is native to Southeast Asia and Australia, but was introduced to the island of Guam between 1945 and 1950 (Rodda et al., 1992). Since its introduction, only 3 of 13 native bird species remain on the island (Shwiff et al.,2010).Otherpotentialecologicalimpactsofinvasivespeciesincludemodificationofhabitatstructure(e.g.,opensandbars commonly used as nesting habitat are now covered with thick stands of the plant Phragmites)andmodificationofdisturbanceregimes(e.g.,increasedfrequencyandintensityoffiresbycheatgrass).
The brown tree snake is a particularly successful invasive species. What characteristics or environmental conditions may have allowed the brown tree snake to successfully eliminate ten native bird species on Guam?
Presence of Phragmites australis in North AmericaPhragmites australis, also known as common reed, is a tall grass that can grow up to twelve feet high and often forms
dense aggregations of 200 stems or more. Most plants readily grow along the edges of waterways, wetland margins, and road-side ditches. Reproduction in Phragmites commonly occurs via asexual rhizomes, which are underground lateral stems that produce new plants genetically identical to the parent plant. Phragmites is widely distributed around the world and has been present in North America for at least the last 40,000 years (Hansen, 1978). However, in the last 150 years, the distribution of Phragmites has expanded considerably (Figure 2; Saltonstall, 2002), to the extent that it is now often considered an invasive species. Research examining the recent explosion of Phragmites populations in North America has shown that there are now two varieties of Phragmites that co-occur in North America, a native variety and a nonnative variety. These studies have also shown that population expansion of Phragmites is attributed to an increase in the abundance of the nonnative variety (Salton-stall, 2002).
Increased abundance of dense stands of nonnative Phragmites has had negative ecological consequences. For example, thesedensestands,whichoftenoccuralongwaterways,havealteredtheflowofwatersuchthatsedimentationhasincreasedand additional channels have been created. Also, following regional colonization of nonnative Phragmites, plant diversity is dramatically reduced (Meyerson et al., 2000). Given the negative consequences of nonnative Phragmites, habitat managers have implemented a variety of mechanisms to control the spread and attempt eradication of the nonnative variety. Current man-agement actions use repeated applications of herbicides that kill the stems and rhizomes of Phragmites (Chun and Choi, 2009).Use of Genetic Markers to identify native and nonnative Phragmites australis
While there are a number of phenotypic differences between the native and nonnative forms of Phragmites, these dif-ferencesaresubtle.Amoredefinitivemethodfordifferentiationbetweenformsisthroughgeneticanalysis.ThiswasinitiallydonebySaltonstall(2002)usingsequencesfromtwodifferentgeneticloci.Ageneticlocus(pl.loci)canbedefinedasaspecificregion or sequence of a chromosome. The genetic loci used to differentiate native and nonnative forms are two intergenic (i.e., occurring between genes) regions in the chloroplast. They are abbreviated trnT-trnL and rbcL-psaI. In order to generate sequences,thespecificgeneticlocusisamplifiedusingthepolymerase chain reaction (PCR). PCR results in the production of large quantities of DNA from the desired genetic locus for use in downstream applications, such as sequencing.
Sequencing of each genetic locus allowed Saltonstall (2002) to identify different sequence variants within the species Phragmites australis. These variants are called haplotypes.Ahaplotypeisgenerallydefinedasasetofsequencevariantsthatare inherited together. We know that there are at least 11 haplotypes (A-H, S, Z, and AA) that are found only in the United States and are therefore considered native. Many other haplotypes of Phragmites exist around the world, but a single haplotype (M) is widespread both in the United States and other regions across the world (Europe, Asia/Australia, and Africa). In addition, haplotypeMisnotcloselyrelatedtoanyofthenativeUnitedStateshaplotypesandhasbeenidentifiedastheinvasiveformofPhragmites australis.

Proceedings of the Association for Biology Laboratory Education, Volume 36, 2015 9
Major Workshop: Labs for Integrating Bioinformatics into the Life Sciences
Part 1: Sequence Alignment BasicsSaltonstall(2002)haspreviouslyidentifiedanumberofPhragmites australis haplotypes. Using these sequences, you
willnowlearnhowtoalignsequencesand investigate thespecificsequencedifferencesbetweenhaplotypes.Asdescribedabove,twointergenicsequencesareusedinidentificationofPhragmites australis haplotypes. However, for this exercise we will focus only on the rbcL-psaI region.
1. Downloadthesequencefile(rbcL-psaI_known.txt)fromBlackboard(openusingthewebbrowserFirefox).Savethesefilesinafolder(withyourname)onthedesktop.OpenthisfileinMicrosoftWordandexamineit.ThefilesareinaformatcalledFASTA,whichmeansthateachentrystartswitha>andisfollowedbyauniqueidentifier(i.e.,sequencename).Inthiscase,theidentifieristhehaplotypenumberandthegeneticlocus.Thisisfollowedbythenucleotidese-quence.Answerthequestionsbelowandthenclosethefile.
a) Examinethefirstentryinthefile.Whatistheuniqueidentifier(i.e.,sequencename)?
b)Whatisthefirstnucleotideinthissequence?
c) Are the sequences all the same length? (Use the “word count” tool in Microsoft Word to determine the number of char-acters in each sequence.)
2. In the next step, the sequences will be aligned to each other using a program called MUSCLE. To do this, you will use thefollowingsite:http://www.ebi.ac.uk/Tools/msa/muscle.(Hint:usetheFirefoxInternetbrowser.)Uploadyourfile(“Choosefile”andselecttheappropriatefile)andclickthe“Submit”button.Leavethewindowopenandusuallyafterlessthanaminutethealignmentwillbefinishedandreadytovisualize.
3. There are two types of mutations that can occur resulting in differences between individual sequences. Point mutations are differences in a single base pair and insertion-deletions (“indels”) are regions that represent either an insertion in one or more sequences or a deletion in other sequences (see examples below).
Figure 2. Distribution of Phragmites haplotypes in North America. Green triangles represent the 11 native haplotypes, blue squares represent haplotype I, and red circles represent the invasive haplotype M (a and b). The distribution of haplotypes in the 62 herbarium samples collected before 1910 (c and d). The distribution of haplotypes in 195 samples collected after 1960 (Saltonstall, 2002). Copyright (2002) National Academy of Sciences, USA.

10 Tested Studies for Laboratory Teaching
Duncan, McClung, Reichart, Simon, Tapprich, Grandgenett, Pauley
A. Point Mutation at position 6 B. Indel mutation at position 7
Sample 1 AAGGAACCTAAGTA Sample 1 AAGGAA---CCTAAGTA
Sample 2 AAGGATCCTAAGTA Sample 2 AAGGAATTTCCTAAGTA
Now you will examine your alignment for these two types of mutations. Click on “Results summary” and then “Start JalView” to examine this alignment. At the bottom of the window is the consensus sequence. It indicates the most common nucleotide at each position across all sequences. Above this is a histogram in black that shows the proportion of sequences that match the consensus. Use the histogram to help identify places in the alignment where mutations have occurred. Based on these results, answer the following questions for each alignment.
a) In the rbcL-psaIalignment,atwhichpositiondoesthefirstpointmutationoccur?(Notethatpositionsareindicatedbythe scale at the top of the alignment.)
b) Locate position 258 in the rbcL-psaI alignment; is this a point mutation or an indel?
c) Locate position 355 in the rbcL-psaI alignment; is this a point mutation or an indel?
d) Locate the indel beginning at position 884. Based on this mutation alone, predict which sequences come from plantsthat are closely related to each other. (Hint, there will be two groups.) List the sequences in each group below. The se-quence names and their lengths are indicated to the left of the actual sequence (e.g., 9/1-1072 means that the sequenceis haplotype 9 and it begins at position 1 and extends to position 1072 on the alignment).
GroupI:____________________________________________
GroupII:___________________________________________
Part 2: Comparison of Sequences to Identify Native and Nonnative PhragmitesAs discussed above, expansion of nonnative Phragmites can have serious consequences for native plants and animals.
One particular concern is destruction of avian habitat at migratory stopover sites. For this reason, Kulmatiski et al. (2010) stud-ied the distribution of native and nonnative Phragmites in Utah wetlands. These wetlands host approximately 35 million birds peryearastheytravelalongthePacificflywayfromAlaskatoPatagonia(AldrichandPaul,2002).
Nativeandnonnativepopulationscanbedistinguishedbasedongeneticdata.Inparticular,Saltonstall(2002)identifiedthe single composite haplotype (M) for nonnative Phragmites. Using this knowledge and Table 1, you will identify indi-vidual sequences as native or nonnative.Specifically,Kulmatiskiet al. (2010) generated sequences for both the trnT-trnL and rbcL-psaI chloroplast intergenic regions from plants sampled at 26 sites in Northern Utah.
1. DownloadthesequencefilesfromBlackboard(trnT-trnL_Utah.txtandrbcLpsaI_Utah.txt).Savethesefilesinafolder(with your name) on the desktop.
2. EachofthesequencefilescontainsboththeknownhaplotypesfromPart1(indicatedbyanumber)andtheunknownsamples from Utah. Align each set of sequences (as in Part 1) using the following site: http://www.ebi.ac.uk/Tools/msa/muscle.Next,click“DownloadAlignmentFile”andsavethisfileinafolder(withyourname)onthedesktop.SaveastrnT-trnL_UTalign.txtandrbcLpsaI_UTalign.txt.Tovisualize,openthealignmentusingtheprogramBioEdit.

Proceedings of the Association for Biology Laboratory Education, Volume 36, 2015 11
Major Workshop: Labs for Integrating Bioinformatics into the Life Sciences
rbcL-psaI haplotype trnT-trnL haplotype composite haplotype1 10 A1 11 B1 13 C1 16 D2 2 E2 8 F2 9 G2 11 H3 5 I4 1 J4 3 K4 4 M4 5 L4 6 N4 7 O5 1 P5 5 Q6 5 R7 2 S8 5 T9 5 U10 5 V11 15 W12 15 X13 14 Y14 8 Z
Table 1. Haplotypes of Phragmites australis
You will use BioEdit to compare the unknown Utah sequences with known haplotypes. To make this easier, you should be aware of the following functions in BioEdit:
• The order of the sequences can be manipulated by clicking on the sequence name and dragging it up or down. You mayfinditusefultosortsequencesintosimilargroupsinthisway.
• Adding blank sequences can help with organization. To do this, click on the menu item “Sequence,” then “New Se-quence.” A window will open; type “blank” in the name and click “Apply and Close.” This will insert a blank sequence underneath the last sequence, which can be moved to separate groups of sequences.
• Another important feature is the “shade identities and similarities in alignment window” tab (see Figure 3). Clicking onthistabwillshadecolumnsbasedonsequenceidentity(whichcanbespecifiedusingthe“shadethreshold”dropdownmenu). Change the shade threshold to 100% to highlight those columns that are identical in every sequence.
3. Based on this alignment, identify the haplotype of each sample (for each loci) and make an inference based on Table 1aboutwhetherthesampleis“native”or“nonnative.”Todothis,fillinTable2below.

12 Tested Studies for Laboratory Teaching
Duncan, McClung, Reichart, Simon, Tapprich, Grandgenett, Pauley
Figure 3. Screenshot of BioEdit alignment program.
Sample rbcL-psaI haplo-type
trnT-trnL haplo-type
Composite haplotype
Native or nonnative?
1234567891011121314151617181920212223242526
Table 2. Haplotypes of Phragmites australis samples from Utah

Proceedings of the Association for Biology Laboratory Education, Volume 36, 2015 13
Major Workshop: Labs for Integrating Bioinformatics into the Life Sciences
Part 3: Identification of Native and Nonnative Phragmites Using Restriction EnzymesRestriction enzymescleaveDNAatspecificsequences.WhenusedonaPCRproduct,theycandifferentiatebetween
haplotypes. For example, the restriction enzyme EcoRV recognizes the sequence GATATC and cuts the DNA between GAT and ATC. Now, imagine two PCR products with the sequences shown below.
PCR 1 AAGGATCCTAAGTATTCTGGCATTGGCTAGTCGATATCTTAGTGGACCACPCR 2 AAGGATCCTAAGTATTCTGGCATTGGCTAGTCGATTTCTTAGTGGACCAC
If these products were digested with EcoRV, how many fragments would be produced from each sequence?
PCR1: _________________________ PCR2:_______________________
What size would each fragment be?
PCR1: _________________________ PCR2:_______________________
Using restriction enzymes, it is possible to differentiate between samples without sequencing the PCR product and ana-lyzing the entire sequence (as you did in Part 2). This technique in general is called Restriction Fragment Length Polymorphism (RFLP)analysis.ThefirststepistogenerateaPCRproductinthelab,thencleaveitwithanappropriaterestrictionenzyme,andfinallyanalyzetheproductsonanagarosegel.Figure4showswhattheseresultsmightlooklike.
Based on Figure 4, which samples do you predict are most closely related to one another?
Figure 4. Example RFLP.

14 Tested Studies for Laboratory Teaching
Duncan, McClung, Reichart, Simon, Tapprich, Grandgenett, Pauley
Ifappropriaterestrictionenzymescanbefound,thismethodcanbeusedasanalternativetosequencingforidentificationof native and nonnative Phragmites australis. What is the key characteristic that would make an enzyme useful for this purpose?
Now, you will use the following restriction enzymes (Table 3) and the sequences of known North American haplotypes to design an RFLP experiment that would allow native and nonnative Phragmites australis in North America to be differentiated. You will choose one restriction enzyme for each genetic locus (rbcL-psaI or trnT-trnL).
1. DownloadthesequencefilesfromBlackboard(trnT-trnL_NorthAmerica.txtandrbcLpsaI_NorthAmerica.txt).Savethesefilesinafolder(withyourname)onthedesktop.
2. Nowyoucansearchforparticularsequenceswithin thesesequences.Thestrategywillbe tofindacombinationofrestriction sequences that are found only in either the native or nonnative haplotypes. Use Table 2 to remind yourself whichhaplotypesarenativeandnonnative.(Hint:UsethesearchfunctioninMicrosoftWordtofindtherestrictionsequence of each enzyme in Table 3. “Highlight all items” to see all target sequences simultaneously.)
Which specific enzymes would be useful for distinguishing between native and nonnative Phragmites? Choose one restriction enzyme for each genetic locus.
rbcL-psaI:_______________________ trnT-trnL:______________________
Enzyme Sequence1
EcoRV GAT-ATCHhaI GCG-CPvuII CAG-CTGRsaI GT-ACSalI G-TCGAC
Table 3. Restriction enzymes.
1Hypen indicates cut site.

Proceedings of the Association for Biology Laboratory Education, Volume 36, 2015 15
Major Workshop: Labs for Integrating Bioinformatics into the Life Sciences
Part 4. Inference of PatternUsing a combination of direct sequencing and RFLPs, Kulmatiski et al. (2010) analyzed a total of 39 historic samples and
225 present-day samples of Phragmites australis in Utah. Their results are summarized in Figure 5.
A critical part of any study is the careful and thorough interpretation of the data.Based on the results shown in Figure 4 write three specific conclusions in the space below.
Now, think about those conclusions in a broader context. Describe one of the wider implications of these results (in terms of spread, management, etc.)?
Figure 5. Distribution of native and nonnative Phragmites australis in Utah. Sampling dates are indi-cated for historic samples; all others are samples collected during 2000–2006. Sampling sites with a lowercase “r” are locations where plants were collected for greenhouse experiments (not shown here). Aplayaisaflatareathatissometimestemporarilycoveredwithwater,whicheitherslowlyevaporatesor is absorbed into the ground (Kulmatiski et al., 2010). Copyright (2010) Western North America Naturalist..

16 Tested Studies for Laboratory Teaching
Duncan, McClung, Reichart, Simon, Tapprich, Grandgenett, Pauley
Laboratory 3—Proteins: Historians of Life on EarthIntroduction
The exercises in this laboratory are designed to empower you to pose biological and evolutionary questions that can be solved by analyzing molecular data, DNA, and protein in particular. To accomplish this, you will use a web-based interface that enables you to access DNA and protein databases, perform alignments, and generate phylogenetic trees. The Biology Work-Bench (hereafter the WorkBench), developed by the National Center for Supercomputing Applications (NCSA), provides this user-friendly, web-based interface.
Prior to the 1980s, one of the most commonly accepted taxonomic hypotheses in biology was that all organisms belonged to one of two domains: 1) the eukaryotes, which included organisms whose cells contain a well-formed nucleus; and 2) the prokaryotes, which included unicellular organisms whose cells lacked a nucleus, such as the bacteria. Over the past two de-cades, there has been a fundamental rethinking of this view. New evidence has led to the new hypothesis that the prokaryote domain is actually composed of two distinct domains. Some bacteria-like organisms look like normal bacteria but may have a distinct phylogenetic history. Consequently, these bacteria-like organisms may comprise a distinct domain, given the name Archaebacteria,ormoresimply,Archaea.Thenamereflectsan,asofyet,unprovenconjectureabouttheirevolutionarystatus.RecentphylogeneticevidencesuggeststhattheArchaeamaybeatleastasoldastheothermajordomains;hence,itnowseemspossible that the newest group of organisms may actually be the oldest. It is important to note that not all scientists agree with the three-domain hypothesis, although the number of scientists who disagree is dwindling.
Nucleotide substitutions in DNA and amino acid substitutions in proteins can be considered molecular fossils. These changes act as historical records of evolutionary events and give us clues about the relatedness of different species through their molecular material, much in the same way that changes in morphological characters, preserved in the form of fossils, give us clues. The extraordinary growth of sequence databases, along with the development of tools to explore and mine these databases, has radically enhanced the ability of biologists to uncover the patterns of organic evolution that occurred through geologic time.
Part 1: Explorations in Evolution through Protein Sequence Alignments and Phylogenetic Tree ConstructionObjectives
1) Gain experience using bioinformatics tools and databases, primarily through the WorkBench, and 2) use protein se-quence data and analyses to evaluate the two hypotheses described above regarding the number of domains of organisms (i.e., twodomainsversusthree).InordertoaccomplishObjective2,aproteinthatisfoundinallorganismsneedstobeexamined.Inthis investigation, you will examine and compare the protein sequences of enolase (phosphopyruvate dehydratase), an enzyme involved in the last stage of glycolysis during which 3-phosphoglycerate is converted into pyruvate and a second molecule of ATP is formed. Enolase is a ubiquitous enzyme since all organisms utilize glycolysis to produce ATP for metabolism. You will compare the amino acid sequences of enolase from the seven species in Table 1 along with several species of your own choos-ing.
Species name GroupMethanococcus jannaschii Archaea
Pyrococcus horikoshii ArchaeaEscherichia coli Bacteria (Gram negative)Bacillus subtilis Bacteria (Gram positive)
Drosophila melanogaster EukaryaHomo sapiens Eukarya
Saccharomyces cerevisiae (yeast) Eukarya
Table 1. List of species used in the investigation.

Proceedings of the Association for Biology Laboratory Education, Volume 36, 2015 17
Major Workshop: Labs for Integrating Bioinformatics into the Life Sciences
Overview of OperationsSince we do not have an amino acid sequence of enolase for comparison, we must search for one. Once we have a
sequence, we will do the following: 1) generate a list of proteins with similar sequences by conducting a BLAST search for similarsequences;2)selectawidevarietyofspeciesrepresentingallthemajorgroups(speciesinTable1plusoneormoreselections of your own) and then align them with ClustalW; and 3) construct a phylogenetic tree based on the sequence align-ments. The WorkBench provides all of the databases and tools for these steps.
1. Entering the WorkBench
a) Launch your web browser and go to the following URL for the Biology WorkBench: http://workbench.sdsc.edu. This page presents a wealth of materials that you may wish to browse through at some point in time.
b) If you have already set up an account on the WorkBench, go to Step 1c) now. If you have not used the WorkBenchbefore, then click on the register hyperlink to set up an account. Fill out the account information, click the Submitbutton, and go to Step 2 below.
c) Click on the hyperlink Enter the Biology WorkBench 3.2.
d) Enter your user ID and password and then click the Submit button.
2. Starting a new session or resuming an old session
Before you can use the WorkBench, you need to begin a New session or Resumeaprevioussession,justasyouneedtobeginanewfileorcontinueapreviousfileinwordprocessing.Inotherwords,youcannotusetheProteinTools, Nucleic Tools, Alignment Tools, or Structure Tools until either you have resumed an old session or starteda new session. Scroll down the page and click on the Session Tools button.a) To start a new session, click Start New Session in the scrollable window and then click the Run button. On the new
webpagethatappears,youneedtonamethesession(i.e.,file)youareabouttobegin.Inthiscase,wearegoingtoname the session Enolase since we are going to be conducting a protein search, amino acid sequence alignment,and tree construction for enolase. Now click the Start New Session button. The webpage (homepage) that nowcomes up is the same as the one that you were on a moment ago, except that your new session (i.e., Enolase, whichisnowafilenameonaremoteserver)isnowlistedwithyourprevioussessions(forwhichyouhavenoneifthisisyourfirsttimeenteringtheWorkBench).(YoumayhavetoscrolldownthepagetoseetheEnolase session.) If theradio button for the Enolase session is not already selected, click it now.
b) You are now ready to begin searching for amino acid sequences. So, click the Protein Tools button near the top ofthe page.
3. Selecting a sequence
a) Now that you are in the Protein Tools window, you need access to protein databases in order to perform your search.To get access, select Ndjinn – Multiple Database Search in the scrollable window and then click the Run button.When the new webpage appears, type in the word enolase; change the Hits per page from 10 to 100; select thePDBFINDERdatabase(abouthalfwaydownthemulti-screenlist,justbelowtheblueOMIMdatabase;useyourcomputer’sFINDfeatureifyoudon’tquicklyandeasilyfindit);andfinally,clicktheSearch button at the bottom ofthe webpage. Note that we are using this particular database, the PDB or Protein Data Bank, because the 3D struc-tures are known for all of the proteins in it.
The results page indicates that you have matched > 60 unique records (numbering starts with 0). (Note that because new records are continuously being added, this number will change over time.) Click the box in front of the record that says PDBFINDER:4ENL(CARBON-OXYGENLYASE).(Remember,ifyoudon’tfindthisrecordrightaway, use the FIND feature on the computer.) This will be the enolase sequence in which we will anchor the rest of our searches. Now click the Import Sequence(s) button all the way at the bottom and continue to Step 3b).
b) Beforegoingfurther,youshouldfindoutmoreaboutthisenolasemolecule.Clicktheboxinfrontoftheproteinrecordyoujustadded,selectView Database Records of Imported Sequences from the scrollable window (or listof buttons), and then click the Run button. In the webpage that now appears, select the Formatted radio button andthen click the Show Record(s) button. The resulting page contains a wealth of information about this protein, includ-ing its amino acid sequence, its enzyme code number, citations, etc. You can even view the molecule in 3D (upperright of page; requires additional software). After reviewing, click the Return button at the bottom of the webpage.

18 Tested Studies for Laboratory Teaching
Duncan, McClung, Reichart, Simon, Tapprich, Grandgenett, Pauley
4. Searching for records with similar sequences using BLASTP (Basic Local Alignment Search Tool for Proteins)
a) If it isn’t already selected, click the box in front of PDBFINDER:4ENL_CARBON-OXYGEN LYASE.
b) In the scrollable window (or list of buttons), select BLASTP – Compare a PS to a PS DB (PS = protein sequence),and then click the Run button. Select all 10 of the SwissProt databases (curated) in the scrollable window. As youscroll to the bottom of the webpage, you will note that you can control a number of search criteria. For our purposes,we will use most of the default selections. As you scroll, change 1-line descriptions to 500 and Alignments to 500.At the bottom of the webpage, click the Submitbutton.TheBLASTPtoolwillfindothersimilarproteinsequencesin the SwissProt databases. Note that the search should only take a few seconds but may take longer if a large numberof people are using WorkBench.
5. Selecting records for alignment
a) Scroll down the BLASTP results page. For the enolase activity, select the six records below. (The yeast record, whichyou have already selected, acts as the seventh record and does not need to be selected again.) These six records are intheorderyouwillfindthem,andyouwillhavetoscrollorusetheFINDfeature(e.g.,DROME).Clicktheirboxesto select them.
ENO_DROME Drosophila melanogaster
ENOB_HUMAN human
ENO_METJA Methanococcus jannaschii
ENO_PYRHO Pyrococcus horikoshii
ENO_BACSU Bacillus subtilis
ENO_ECOLI Escherichia coli
In addition, select at least one more species of your choice (perhaps a plant like MAIZE), and make a prediction (hypothesis)aboutwhereyouthinkyourspecieswillfitonthephylogenetictree.(Todeterminethespecies,clickthenumber in the Score column. This will take you to the alignment for that sequence, and the complete species name will be given there. If not shown, use your favorite search engine to determine the common name of the organism.)
b) Scroll back up to near the top of the webpage and click the Import Sequences button. This action will import theamino acid sequences of all of the records (i.e., sequences) you have selected. (The yeast record with which youstarted was already imported.) In the next step of the investigation, you will align the sequences.
6. Conducting an alignment using the CLUSTALW – Multiple Sequence Alignment tool
a) Click the boxes of all of the records you wish to align, including the yeast record.
b) Select the CLUSTALW tool in the scrollable window (or buttons). Now click the Run button. The ClustalW pageappears that contains all of the different settings you can alter. For this investigation, use all of the default settings.Next click the Submit button. It will take the computer a few moments to calculate the alignments.
c) Scroll down the page and see the alignments. You are looking at one- to two-billion years of evolutionary history oflife on earth! Note that ClustalW automatically generates an unrooted phylogenetic tree for you.
d) Insert this unrooted tree as an image at the end of this paragraph, i.e., between sections d) and e). On the Mac, pressand hold the Apple (command) button, then press and hold the Shift button, and then press the number 4 button. Thatwill give you a + cursor that you can control with your mouse. Click and hold either the right or left mouse buttonwhile you scroll from the upper left of the image to the lower right. Once you release the mouse, that image will be-comeafileonthedesktop.(Youmayhearaclickthatsoundsliketheclickofacamerashutterwhenyoureleasethemouse button.) Insert (drag and drop) the picture you created above into the space below. Or, you can select Insert |Picture and then navigate to the desktop and select the picture, which is located on the desktop.
e) Near the bottom of the page, click the Import Alignments button so that you will then be able to launch applicationsto construct rooted and unrooted phylogenetic trees and/or change sequence formats (e.g., if you wish to change froman MSF format to FASTA format).

Proceedings of the Association for Biology Laboratory Education, Volume 36, 2015 19
Major Workshop: Labs for Integrating Bioinformatics into the Life Sciences
7. Tree Construction
a) In the Alignment Tools webpage, click the box in front of the CLUSTALW-Proteinfileofthealignedsequences.Selecting this box acts to select the entire list of records that have been aligned.
b) Select the DRAWGRAM application tool in the scrollable window, and then click the Run button. (This tool draws a rooted phylogenetic tree.) The DRAWGRAM page that appears contains all of the different settings for the pro-gram. Again, we will use all of the default settings. Click the Submit button.
c) Above the phylogenetic tree, click the Download a PostScript version of the output link. Your computer should convertthefilefromapostscript(ps)filetoapdffile.Youcanresavethefileandrenameit.Inserttheimageoftherooted phylogenetic tree at the end of this paragraph using the method you used above to insert the unrooted tree into this document.
In a phylogenetic tree, the branch points are called nodes, while the lines are called branches. The length of the branch is a direct measure of the amount of change that has occurred. To help with your understanding to this tree, it would be good for you to go back and explore the parameters of the DRAWGRAM program.
8. Questions for discussion (provide your answer after each question)
a) Where would you expect Methanococcus and Pyrococcus to split off of the rooted tree if the two domain (i.e., Bac-teria and Eukarya) hypothesis is correct?
b) Where would you expect Methanococcus and Pyrococcus to split off of the rooted tree if the three domain (i.e., Bacteria, Archaea, and Eukarya) hypothesis is correct?
c) Did the species you added to the investigation appear on the tree where you predicted?
d) Which hypothesis does your tree support? (It might be easier to answer this question by looking at the unrooted tree that you inserted above.)
Part 2: Visualizing the Evolution of Protein Structure in 3DObjectives
1) Become familiar with the many capabilities of ConSurf, 2) be able to load a 3D structure of a protein into ConSurf for viewing, 3) be able to place aligned sequences (FASTA format) into ConSurf, and 4) be able to visualize in 3D the evolutionary changes within the protein structure; highly conserved regions provide strong clues about the important region(s) of proteins.
Overview of Operations1. Exporting sequence alignments in FASTA format
a) Click the Return button at the bottom of the webpage in order to return to the Alignment Tools webpage. Click the box in front of the CLUSTALW-Proteinrecord(file)ofthealignedsequences.Inthescrollablewindow(orbuttons), select View Aligned Sequence(s) (or the View button) and then click the Run button. This will take you to the View window.
b) Scroll down the webpage to view the sequences.
c) If you wish to import the sequence into ConSurf, you will need to change the format to FASTA. Initially, the Format window will probably indicate MSF; click the arrow for the dropdown window to change the selection to Fasta. This selection will automatically change the format to FASTA. Once the format has been changed, click the Download/view all sequences in text format hyperlink near the top left of the webpage.
d) A new webpage will open, containing the aligned sequences in FASTA format. Save these sequences by selecting File | Save Page As.Namethefile Enolase aligned sequences; select the Desktop and click Save.
e) Nowfindthefileonthedesktop,clickonitsfilename,andchangetheextensionfrom.txt to .msa (which stands for multiple sequence alignment).
2. Uploading and viewing protein 3D sequences in ConSurf—the role of evolution
In this section of the exercise, you will upload your FASTA alignment sequences into ConSurf. Remember that yourstartingenolasesequencefromyeasthasaknowncrystalstructure(4ENL).Whenyouhavefinishedthefol-lowing steps, you will be able to see the 3D structure of enolase, but the amino acids will be color-coded to indicate their level of conservation. The colored 3D structure will reveal to you the most important regions of the protein;

20 Tested Studies for Laboratory Teaching
Duncan, McClung, Reichart, Simon, Tapprich, Grandgenett, Pauley
that is, the important regions of the protein should have highly conserved amino acids, while the amino acids in less important regions of the protein will be poorly conserved.a) Go to the ConSurf website: http://consurf.tau.ac.il.
b) Since we will be looking at protein structure, click the Amino Acids button.
c) Click the YES button where it says “Is there a known protein structure?”.
d) Type the PDB ID, 4ENL (or 4enl), into the box and then click the Next button.
e) Select AfromtheChainIdentifierdropdownmenu,andthenclicktheYES button.
f) The website will now request more information from you. In the section labeled Do you have a Multiple SequenceAlignment (MSA) to upload?, click the YES button, and then click the Choose File button in order to direct thecomputertothefileyousavedinStep1e)above.Finally,intheboxtotherightofIndicate the Query SequenceName, type (or copy/paste) PDBFINDER_4ENL_A.
g) In the next section of the webpage, Do you have a Tree file to upload?, click NO. In the box to the right of JobTitle,typeinthenameofyourjob(e.g.,Enolase3D).
h) Sometimes the ConSurf server is very busy, so it is not a bad idea to enter your email address. When the server hasfinishedyourproject,itwillsendaweblinktoyousothatyoucanviewyourproteinin3D.NowclickSubmit.
i) Once the results page comes up, which will say FINISHED in red font, click Go to the results, and then click ViewConsurf Results with FirstGlance in Jmol. Once the page loads, you may need to tell your browser that it is okayto load the Java applet (right-click your mouse).
j) Onceyouareabletodisplayyour3Dmolecule:
i. Click the Spin box in order to stop the molecule from spinning, giving you more control.
ii. Usingyourmouse,rotatethemolecule.Seeifyoucanfindaverylargeconservedregion(domain)ofthemol-ecule—the active site. Look for some other conserved regions as well.
iii.Thedefaultisaspacefillingmodel.SeeotherviewsofthemoleculebyclickingtheBackbone button and thenthe Cartoon button.
iv. There are up and down arrows in the upper region of the left panel. You can zoom in or out on the molecule.
v. Another way to zoom in or out on the molecule is to click on the molecule and then right click your mouse.You will note that you can do a whole host of things, including zooming in and out on the molecule. You wouldhave to spend some time learning more about ConSurf in order to know all of the options you have.
vi. Note that at the bottom of the left panel there is a link that you can follow to download and save your results.There is also a link that provides information on how to include your molecule in a presentation (e.g., Micro-soft PowerPoint).
3. Questions for discussion (provide your answer after each question)
a) What does the complete conservation of the amino acids in the active site suggest to you?
b) Why do you think the peripheral region of the enolase molecule has varied so much over time in contrast to the sta-bility of the active site?
c) Are other regions on the enolase molecule highly conserved, besides the active site? (Hint: are there conserved re-gions on the peripheral part of the molecule? What might be the role of those regions?)
d) Do you think you would get the same results if you compared sequences only from mammals?
Explain your answer.

Proceedings of the Association for Biology Laboratory Education, Volume 36, 2015 21
Major Workshop: Labs for Integrating Bioinformatics into the Life Sciences
MaterialsThe only equipment and supplies needed for the three
laboratories are computers that are connected to the Internet. The ability for students to record results electronically (e.g., in a word-processing document) is recommended but not re-quired.Specific software requirements are addressed aboveunder the relevant Student Outline section for each laboratory.
Notes for the Instructor Laboratory 1—Genomes and Bioinformatics: Analysis of Genomic DNA Sequences
SettingThis laboratory has been implemented in a number of
venues of differing sizes and profiles. For example, it hasbeen delivered for nine consecutive semesters in the first-semesterbiologycourseformajors(Biology1450:BiologyI) at the University of Nebraska at Omaha (UNO). UNO is apublic university of about 15,000 students. Biology I at UNO has six laboratory sections of 36 students each in a typical semester. Laboratory sections are taught by faculty together with a graduate teaching assistant (GTA). Typically, three dif-ferent faculty members and three different GTAs are involved in the teaching. The laboratory was also implemented in the first-semesterbiologycourseformajors(Biol)attheUniver-sity of Nebraska at Kearney, which is a public university of about 8,000 students, as well as in a third-year bioinformatics course at Nebraska Wesleyan University, which is a private liberal arts institution of about 3,000 students.
Background and Intended Audience
This laboratory is meant to introduce DNA sequence analysis to introductory biologymajorswithin a laboratorysetting. The laboratory should be implemented after or con-currently with the fundamental principles of genes and gene expression. The laboratory will introduce genome projectsand the promise of genome analysis. The laboratory also intro-duces the methods and technology involved in DNA sequence determination. Implicit in the concept of DNA sequence gen-eration and analysis is the overwhelmingly large amount of data generated. These data necessarily require computer in-terface and bioinformatics. The discipline of bioinformatics is introduced,defined,andreviewed.
In the laboratory, a 50+ nucleotide DNA region from six individuals is determined and compared using current techniques. These include electropherogram reading, DNA fragmentassembly,DNAsequencealignment,ORFfinding,sequence logo generation, and amino acid alignment. The sequences are provided to students in the form of electro-pherograms and in the form of overlapping fragments. The electropherogram reading and the fragment assembly are done by hand. The DNA sequence alignment and amino acid alignment will use ClustalW found at http://www.ebi.ac.uk/Tools/msa/clustalw2. To use this tool, students must format their sequences in FASTA format. This exercise emphasizes
the diversity in gene sequences among individuals. The dif-ference between nucleotide variability and amino acid vari-abilityshouldbehighlighted.TheORFfindingusestheORFFinder applet that is part of http://www.bioinformatics.org/sms2. This exercise will reinforce the concepts of reading frame and coding from either strand of the DNA double he-lix. Sequence logos are generated using the tool at http://we-blogo.threeplusone.com/create.cgi. This exercise shows how bioinformatics algorithms can create a graphical display that can be analyzed to generate new insights
Organizational Recommendations for InstructorsIdeally, each student should have access to a web-
capable computer workstation, but the exercise will also work if students are in pairs. Groups larger than two will havechallengesworkingwith thefilesandalgorithms.Anintroduction to the laboratory should make students famil-iarwithgenomeprojects,thetechnologyofDNAsequenceanalysis, and the role of the discipline of bioinformatics. This generally takes twenty minutes. It is best to give a short introduction to each section and provide tips for success be-fore letting students begin the analysis. Students will work at very different paces. Some are extremely comfortable with web-based tools and others are less so. We have encouraged studentswhofinishasectionearlytoworkwiththeirneigh-bors. The interaction assists both students. When it is clear that most students have completed a section, we get all of the students’ attention and introduce the next section. Keeping the entire class at about the same place is extremely helpful, but students who are very advanced can move ahead if they can do so without burdening the instructor. As the exercise progresses, students will become better with the interfaces and will need less attention. The later sections go much more quickly than the early sections. Encourage the students to buildtheirresultsfilewhiletheyareinclass.Weaskthestu-dentstoemailtheresultsfiletotheinstructor,anditworkswell to have them send the email before they leave the labo-ratory.
Learning Objectives• Students will appreciate the importance of genome
projectsintermsofthetechnicalaccomplishmentandthe potential for biological understanding.
• Studentswilldefinethedisciplineofbioinformatics.• Students will apply their knowledge of DNA replica-
tion to the method used to determine the sequence ofDNA.
• Students will interpret an electropherogram (sequencecurvefile)togenerateaDNAsequence.
• Students will assemble a DNA sequence using over-lapping sequence fragments.
• Students will use an open-reading-frame algorithmto detect potential protein-coding genes in a DNA se-quence.
• Students will compile DNA sequences and amino acid

22 Tested Studies for Laboratory Teaching
Duncan, McClung, Reichart, Simon, Tapprich, Grandgenett, Pauley
sequences into FASTA format.• Students will interact with web-based sequence analy-
sis algorithms to determine open reading frames, align a series of sequences, and analyze sequence polymor-phisms at the nucleotide and amino acid levels.
Laboratory 2—Invasion of Common Reed (Phragmites Australis) into North American WetlandsSetting
This laboratory has been implemented in both fresh-man- and sophomore-level biology courses. It has been used in a sophomore-level course during four semesters at the University of Nebraska at Kearney, a primarily undergradu-ate teaching institution of approximately 8,000 students. The lab has also been implemented during a freshman-level introductory biology class at the University of Nebraska at Omaha.
Background and Intended AudienceThis laboratory is meant to introduce DNA sequence
analysis and restriction fragment polymorphism analysis to freshmanorsophomorebiologymajors.Specifically,thislabillustrates how molecular tools can be used for an applied purpose, to inform conservation biologists or habitat man-agers. The topic introduced is also useful for understanding general concepts regarding the ecology of invasive species. The data analyzed in this activity require a computer inter-face and introduce students to bioinformatics tools.
In the laboratory, DNA sequences of known genet-ic variants of the common reed, Phragmites australis, are compared to DNA sequences of unknown genetic variants. Students learn to align DNA sequences and use sets of DNA sequences generated for two intergenic regions of the chlo-roplast to assign unknown samples a status of either native or non-native genetic variant. After analysis of DNA sequenc-es, students learn Restriction Fragment Length Polymor-phism (RFLP) analysis. Specifically, students learn aboutrestrictionenzymesandhowspecificcut sites inDNAse-quence fragments can be used to distinguish genetic variants of Phragmites australis.
Organizational Recommendations for InstructorsStudents work individually on a computer interface
that has access to the web. Instructors should also include an external mouse if laptops are used. External mice allow students to easily manipulate the options within the online software. If fewer computers are available, it is possible to allow students to work in groups of two. Each student should record their answers directly in a word-processing document of the laboratory, which can then be uploaded and submit-ted to a course management website, such as Blackboard, or printed and submitted. Students will use two software pro-grams, MUSCLE (http://www.ebi.ac.uk/Tools/msa/muscle) and BioEdit (http://www.mbio.ncsu.edu/bioedit/bioedit.html). BioEdit should be downloaded and installed on com-
puters prior to student use. MUSCLE can be used during the lab directly from the web.
The introductory PowerPoint presentation should be usedtoprovidebackgroundforthelabactivity.Specifical-ly, the presentation can be used to discuss and introduce the ecology of invasive species, the current ecological problem of Phragmites australis in North America, and general in-formation about the two molecular tools useful to distin-guish native and invasive forms of Phragmites. Introduction of theDNAsequencing information isprovidedfirst;aftermost students have completed the DNA sequence analysis, the instructor can then present background information for RFLPs. The introductory material will take approximately thirty minutes of class time. Students typically complete the lab activities within three hours; however, some students may take up to four hours to complete the lab. The lab can be conducted over two class periods where students com-plete the DNA sequence analysis in one period and the RFLP analysis in a second class period. The level of ability varies among students, and some students are more comfortable us-ingcomputersandcomputersoftware.Studentsoftenfindal-ternative ways to organize and view DNA sequences and fre-quently help neighbors, facilitating group interaction during lab.Thelabcanbemodifiedforashorterclassperiodwherestudents only complete a single section of the lab exercise in approximately two hours or less.
Most students complete the lab with no problems and minimal questions. The most common questions arise when studentsdonotsavealigneddatafilesinthecorrectfilefor-mat and when students have trouble locating analysis tools within BioEdit. Instructors should familiarize themselves with analysis tools in BioEdit prior to implementing the laboratory activity.
Learning Objectives• Students will learn about characteristics of invasive
species.• Students will align DNA sequences using freely avail-
able bioinformatics software.• Students will learn to identify and distinguish point
mutations and indels present in DNA sequences.• Students will use DNA sequences from two intergenic
regions of the chloroplast to assign genetic identity to unknown samples.
• Students will learn about restriction enzymes and iden-tify a useful combination of enzymes to distinguish native and non-native genetic variants of Phragmites australis.

Proceedings of the Association for Biology Laboratory Education, Volume 36, 2015 23
Major Workshop: Labs for Integrating Bioinformatics into the Life Sciences
Laboratory 3—Proteins: Historians of Life on EarthSetting
This bioinformatics laboratory exercise has been in-tegrated into three upper-division undergraduate biology courses at Nebraska Wesleyan University, including a labo-ratory-based course in molecular biology, a laboratory-based course in bioinformatics, and a lecture-based course (with outside exercises) in evolution.
Background and Intended AudienceThis exercise is meant to help students gain an under-
standing of how they can ask biological questions and de-velop biological hypotheses that can be answered using the tools of bioinformatics to analyze nucleotide and amino acid sequences. The protein of focus in this exercise is enolase (phosphopyruvate hydratase), an enzyme that performs the finalbiochemicalstep inglycolysis,abiochemicalprocessfound in all living organisms. The students use BLAST to find/retrieve enolase sequences of organisms from all do-mains of life, including one taxon in which the crystal struc-ture of enolase is known. They use ClustalW to align those sequences. The students then do two things with the aligned sequences; first, they use a phylogenetics program,Draw-gram, to produce a phylogenetic tree involving the species in thealignment.Theyfindthataminoacidsubstitutions,col-lectively, act as molecular fossils and that the phylogenetic tree supports the three-domain hypothesis of life. Second, they upload the sequence alignment to the ConSurf website (http://consurf.tau.ac.il). This website allows the students to map the amino acid substitutions onto the 3D structure of the protein.Thestudentsfindthattheactivesiteoftheenzymeishighly conserved over all domains of life. In the case of the bioinformatics course in which this exercise has been used, students used many of the tools and approaches introduced inthisexercisetodevelopindividualprojectslaterinthese-mester.
Organizational Recommendations for InstructorsFor most students, this exercise takes about two hours.
It can be performed by students in a laboratory setting if they have computers with Internet access. We have had students successfully work individually and in pairs of two. The num-ber of available computers may determine which option to use.
Learning Objectives• Gain experience using bioinformatics tools and data-
bases, primarily through the use of the Biology Work-Bench (http://workbench.sdsc.edu).
• Use protein sequence data and analyses to evaluate thetwo hypotheses regarding the number of domains of life—i.e., two domains versus three.
• Become familiar with the many capabilities of Con-Surf.
• Be able to load a 3D structure of a protein into ConSurffor viewing.
• Be able to place aligned sequences (FASTA format)into ConSurf.
• Be able to visualize in 3D the evolutionary changeswithin the protein structure; highly conserved regionsprovide strong clues about the important region(s) ofproteins.
AcknowledgementsThe laboratories presented in this workshop were de-
veloped with funding from an NSF TUES (now IUSE) Phase 2 Award (#1122971).
Literature CitedAldrich, T. W., and D. S. Paul. 2002. Avian ecology of Great
Salt Lake. In: Gwynn, J. W. editor. Great Salt Lake: an overview of change. Utah Department of Natural Resources, Salt Lake City, Utah, p. 343–374.
Chun, Y., and Y. D. Choi. 2009. Expansion of Phragmites australis (cav.) trin. ex steud. (common reed) into Ty-pha spp. (cattail) wetlands in northwestern Indiana, USA. Journal of Plant Biology. 52: 220–228.
Hansen, R. M. 1978. Shasta ground sloth food habits, Ram-part Cave, Arizona. Paleobiology. 4: 302–319.
Kulmatiski, A., K. H. Beard, L. A. Meyerson, J. R. Gib-son, and K. E. Mock. 2010. Nonnative Phragmites australis invasion into Utah Wetlands. Western North American Naturalist. 70: 541–552.
Mack, R. N., D. Simberloff, W. M. Lonsdale, H. Evans, M. Clout, and A. Bazzaz. 2000. Biotic invasions: causes, epidemiology, global consequences, and control. Eco-logical Applications. 10: 689–710.
Meyerson, L. A., K. Saltonstall, L. Windham, E. Kiviat, and S. Findlay. 2000. A comparison of Phragmites aus-tralis in freshwater and brackish marsh environments in North America. Wetlands Ecology and Manage-ment. 8: 89–103.
Rodda, G. H., T. H. Fritts, and P. J. Conry. 1992. Origin and population growth of the brown tree snake, Boiga irregularis, on Guam. Pacific Science. 46: 46–57.
Saltonstall, K. 2002. Cryptic invasion by a non-native gen-otype of the common reed, Phragmites australis, into North America. Proceedings of the National Acade-my of Sciences of the United States of America. 99: 2445–2449.
Shwiff, S. A., K. Gebhardt, K. N. Kirkpatrick, and S. S. Shwiff. 2010. Potential economic damage from intro-duction of brown tree snakes, Boiga irregularis (rep-tilia: colubridae), to the islands of Hawai’i. Pacific Science. 64: 1–10.

24 Tested Studies for Laboratory Teaching
Duncan, McClung, Reichart, Simon, Tapprich, Grandgenett, Pauley
About the AuthorsGarry Duncan received a B.S. in Zoology and an
M.S. in Zoology from Arizona State University and a Ph.D. in Genetics from the University of Arizona. He is current-ly a Professor of Biology at Nebraska Wesleyan University (NWU) where he teaches courses in genetics, evolution, mo-lecular biology, and bioinformatics. Dr. Duncan has received NWU’s top teaching award three times.
O. William McClung received a B.A. in Mathemat-ics from Williams College, an M.A. in Mathematics from Columbia University, a Ph.D. in Mathematics from the Uni-versity of Oregon, and an M.S. in Computer Science from Stanford University. He is Professor Emeritus of Computer Science at Nebraska Wesleyan University and is interested in the applications of computing to bioinformatics.
Letitia Reichart received a B.S. in Biology from the Indiana University of Pennsylvania and a Ph.D. in Zoology from Washington State University. She is an Assistant Pro-fessor of Biology at the University of Nebraska at Kearney, and she conducts ornithological research on physiology in migratory birds and nutrient acquisition in migratory birds during spring migration. She also teaches introductory bi-ology for science majors and ornithology. In all areas ofteaching, her interests include identifying and creating new inquiry-based learning activities for undergraduate students.
Dawn Simon received a B.S. in Biology and a Ph.D. in Biology, both from the University of Iowa, and complet-ed a postdoctoral fellowship at the University of Calgary. She currently holds the position of Associate Professor at the University of Nebraska at Kearney. Her research interests are in thefieldsofmolecularevolutionandphylogenetics,specificallytheoriginandevolutionofintrons.Shecurrent-ly teaches evolution at both the undergraduate and graduate levels.
William Tapprich received a B.A. in Biology and a Ph.D. in Biochemistry, both from the University of Montana, and he completed a post-doctoral fellowship at Brown Uni-versity. He is currently Professor and Chair of Biology at the University of Nebraska at Omaha (UNO) as well as the Kahn Professor of Biology. In his research, Dr. Tapprich explores RNA structure and function and viral RNA genomes as well asdiscipline-basededucationresearch,primarilyinprojectsthat integrate bioinformatics experiences into the life science curriculum. He teaches courses in general biology, molecu-lar biology, biochemistry, and virology.
Neal Grandgenett received a B.S. in Education and an M.S. in Math Education from the University of Nebraska at Omaha (UNO) and a Ph.D. in Curriculum and Instruction from Iowa State University. He is the Dr. George and Sal-ly Haddix Community Chair of STEM Education at UNO, where he coordinates the campus STEM priority and teaches courses in interdisciplinary STEM learning. Dr. Grandgenett is a review editor for the Mathematics and Computer Edu-cation Journal (MACE) and has received various awards for his work, including the Nebraska Technology Professor of the Year and the NASA Mission Home Award.
Mark Pauley received a B.S. in Chemistry from the University of Florida, an M.S. in Physical Chemistry from the University of North Carolina at Chapel Hill, and a Ph.D. in Physical Chemistry from the University of Nebraska–Lin-coln. He is currently a faculty member in the School of In-terdisciplinary Informatics at the University of Nebraska at Omaha (UNO) and is one of a small group of faculty mem-berswhodevelopedanundergraduatemajorinbioinformat-ics at UNO that has been available since 2004. Dr. Pauley is acourseeditor for the journalCourseSource.His teachingand research interests center around bioinformatics and bio-informatics education.

Proceedings of the Association for Biology Laboratory Education, Volume 36, 2015 25
Major Workshop: Labs for Integrating Bioinformatics into the Life Sciences
Appendix ALaboratory 1—Genomes and Bioinformatics Results (Answer Key)
Part 1: Reading ElectropherogramsIndividual 1
5’-TTGATTCATGATATTTTACTCCAAGATACAAATGAATCATGGAGAAATCTGCTTTCT-3’
Individual 2
5’-TTGATTCATGATATTTTACTACAAGATACAAATGAATCATGGAGAAATCTGCTTTCT-3’
Individual 3
5’-TTGATTCATGATATTTTACTCCAAGATACAAATGAATCATGGAGAAATCTGCTTTCT-3’
Individual 4
5’-TTGATTCATGATATTTTACTCCAAGACACAAATGAATCATGGAGAAATCTGCTTTCT-3’
Individual 5
5’-TTGATTCATGATATTTTACTTCAAGACACAAATGAATCATGGAGAAATCTGCTTTCT-3’
Individual 6
5’-TTGATTCATGATATTTTACTTCAAGATACAAATGAATCATGGAGAAATCTGCTTTCT-3’
Part 2: Sequence AssemblyIndividual 1
5’-TTGATTCATGATATTTTACTCCAAGATACAAATGAATCATGGAGAAATCTGCTTTCT-3’3’-AACTAAGTACTATAAAATGAGGTTCTATGTTTACTTAGTACCTCTTTAGACGAAAGA-5’
Individual 2
5’-TTGATTCATGATATTTTACTACAAGATACAAATGAATCATGGAGAAATCTGCTTTCT-3’3’-AACTAAGTACTATAAAATGATGTTCTATGTTTACTTAGTACCTCTTTAGACGAAAGA-5’
Individual 3
5’-TTGATTCATGATATTTTACTCCAAGATACAAATGAATCATGGAGAAATCTGCTTTCT-3’3’-AACTAAGTACTATAAAATGAGGTTCTATGTTTACTTAGTACCTCTTTAGACGAAAGA-5’
Individual 4
5’-TTGATTCATGATATTTTACTCCAAGACACAAATGAATCATGGAGAAATCTGCTTTCT-3’3’-AACTAAGTACTATAAAATGAGGTTCTGTGTTTACTTAGTACCTCTTTAGACGAAAGA-5’
Individual 5
5’-TTGATTCATGATATTTTACTTCAAGACACAAATGAATCATGGAGAAATCTGCTTTCT-3’3’-AACTAAGTACTATAAAATGAAGTTCTGTGTTTACTTAGTACCTCTTTAGACGAAAGA-5’
Individual 6
5’-TTGATTCATGATATTTTACTTCAAGATACAAATGAATCATGGAGAAATCTGCTTTCT-3’3’-AACTAAGTACTATAAAATGAAGTTCTATGTTTACTTAGTACCTCTTTAGACGAAAGA-5’

26 Tested Studies for Laboratory Teaching
Duncan, McClung, Reichart, Simon, Tapprich, Grandgenett, Pauley
Part 3: ORF FindingIndividual 1No ORFs were found in reading frame 1.>ORF number 1 in reading frame 2 on the direct strand extends from base 8 to base 55. ATGATATTTTACTCCAAGATACAAATGAATCATGGAGAAATCTGCTTT >Translation of ORF number 1 inreading frame 2 on the direct strand. MIFYSKIQMNHGEICF>ORF number 1 in reading frame 3 on the direct strand extends from base 39 to base 56. ATGGAGAAATCTGCTTTC>Translation of ORF number 1 in reading frame 3 on the direct strand. MEKSAF
No ORFs were found in reading frame 4.No ORFs were found in reading frame 5.>ORF number 1 in reading frame 6 on the reverse strand extends from base 18 to base 56. ATGATTCATTTGTATCTTGGAGTAAAATATCATGAATCA >Translation of ORF number 1 in readingframe 3 on the reverse strand. MIHLYLGVKYHES
Individual 2No ORFs were found in reading frame 1.>ORF number 1 in reading frame 2 on the direct strand extends from base 8 to base 55. ATGATATTTTACTACAAGATACAAATGAATCATGGAGAAATCTGCTTT >Translation of ORF number 1 inreading frame 2 on the direct strand. MIFYYKIQMNHGEICF>ORF number 1 in reading frame 3 on the direct strand extends from base 39 to base 56. ATGGAGAAATCTGCTTTC>Translation of ORF number 1 in reading frame 3 on the direct strand. MEKSAF
No ORFs were found in reading frame 4.No ORFs were found in reading frame 5.>ORF number 1 in reading frame 6 on the reverse strand extends from base 18 to base 56. ATGATTCATTTGTATCTTGTAGTAAAATATCATGAATCA >Translation of ORF number 1 in readingframe 3 on the reverse strand. MIHLYLVVKYHES
Individual 3No ORFs were found in reading frame 1.>ORF number 1 in reading frame 2 on the direct strand extends from base 8 to base 55. ATGATATTTTACTCCAAGATACAAATGAATCATGGAGAAATCTGCTTT >Translation of ORF number 1 inreading frame 2 on the direct strand. MIFYSKIQMNHGEICF>ORF number 1 in reading frame 3 on the direct strand extends from base 39 to base 56. ATGGAGAAATCTGCTTTC>Translation of ORF number 1 in reading frame 3 on the direct strand. MEKSAF
No ORFs were found in reading frame 4.No ORFs were found in reading frame 5.>ORF number 1 in reading frame 6 on the reverse strand extends from base 18 to base 56. ATGATTCATTTGTATCTTGGAGTAAAATATCATGAATCA >Translation of ORF number 1 in readingframe 3 on the reverse strand. MIHLYLGVKYHES

Proceedings of the Association for Biology Laboratory Education, Volume 36, 2015 27
Major Workshop: Labs for Integrating Bioinformatics into the Life Sciences
Individual 4No ORFs were found in reading frame 1.>ORF number 1 in reading frame 2 on the direct strand extends from base 8 to base 55. ATGATATTTTACTCCAAGACACAAATGAATCATGGAGAAATCTGCTTT >Translation of ORF number 1 inreading frame 2 on the direct strand. MIFYSKTQMNHGEICF>ORF number 1 in reading frame 3 on the direct strand extends from base 39 to base 56. ATGGAGAAATCTGCTTTC>Translation of ORF number 1 in reading frame 3 on the direct strand. MEKSAF
No ORFs were found in reading frame 4.No ORFs were found in reading frame 5.>ORF number 1 in reading frame 6 on the reverse strand extends from base 18 to base 56. ATGATTCATTTGTGTCTTGGAGTAAAATATCATGAATCA >Translation of ORF number 1 in readingframe 3 on the reverse strand. MIHLCLGVKYHES
Individual 5No ORFs were found in reading frame 1.>ORF number 1 in reading frame 2 on the direct strand extends from base 8 to base 55. ATGATATTTTACTTCAAGACACAAATGAATCATGGAGAAATCTGCTTT >Translation of ORF number 1 inreading frame 2 on the direct strand. MIFYFKTQMNHGEICF>ORF number 1 in reading frame 3 on the direct strand extends from base 39 to base 56. ATGGAGAAATCTGCTTTC>Translation of ORF number 1 in reading frame 3 on the direct strand. MEKSAF
No ORFs were found in reading frame 4.No ORFs were found in reading frame 5.>ORF number 1 in reading frame 6 on the reverse strand extends from base 18 to base 56. ATGATTCATTTGTGTCTTGAAGTAAAATATCATGAATCA >Translation of ORF number 1 in readingframe 3 on the reverse strand. MIHLCLEVKYHES
Individual 6No ORFs were found in reading frame 1.>ORF number 1 in reading frame 2 on the direct strand extends from base 8 to base 55. ATGATATTTTACTTCAAGATACAAATGAATCATGGAGAAATCTGCTTT >Translation of ORF number 1 inreading frame 2 on the direct strand. MIFYFKIQMNHGEICF>ORF number 1 in reading frame 3 on the direct strand extends from base 39 to base 56. ATGGAGAAATCTGCTTTC>Translation of ORF number 1 in reading frame 3 on the direct strand. MEKSAF
No ORFs were found in reading frame 4.No ORFs were found in reading frame 5.>ORF number 1 in reading frame 6 on the reverse strand extends from base 18 to base 56. ATGATTCATTTGTATCTTGAAGTAAAATATCATGAATCA >Translation of ORF number 1 in readingframe 3 on the reverse strand. MIHLYLEVKYHES

28 Tested Studies for Laboratory Teaching
Duncan, McClung, Reichart, Simon, Tapprich, Grandgenett, Pauley
Part 4: Nucleotide Sequence Alignment
FASTA format of sequences
>Individual1
TTGATTCATGATATTTTACTCCAAGATACAAATGAATCATGGAGAAATCTGCTTTCT
>Individual2
TTGATTCATGATATTTTACTACAAGATACAAATGAATCATGGAGAAATCTGCTTTCT
>Individual3
TTGATTCATGATATTTTACTCCAAGATACAAATGAATCATGGAGAAATCTGCTTTCT
>Individual4
TTGATTCATGATATTTTACTCCAAGACACAAATGAATCATGGAGAAATCTGCTTTCT
>Individual5
TTGATTCATGATATTTTACTTCAAGACACAAATGAATCATGGAGAAATCTGCTTTCT
>Individual6
TTGATTCATGATATTTTACTTCAAGATACAAATGAATCATGGAGAAATCTGCTTTCT
Individual1 TTGATTCATGATATTTTACTCCAAGATACAAATGAATCATGGAGAAATCTGCTTTCT 57Individual3 TTGATTCATGATATTTTACTCCAAGATACAAATGAATCATGGAGAAATCTGCTTTCT 57Individual2 TTGATTCATGATATTTTACTACAAGATACAAATGAATCATGGAGAAATCTGCTTTCT 57Individual6 TTGATTCATGATATTTTACTTCAAGATACAAATGAATCATGGAGAAATCTGCTTTCT 57Individual4 TTGATTCATGATATTTTACTCCAAGACACAAATGAATCATGGAGAAATCTGCTTTCT 57Individual5 TTGATTCATGATATTTTACTTCAAGACACAAATGAATCATGGAGAAATCTGCTTTCT 57
******************** ***** ****************************** At position 21, Individual 1 has a C, while Individual 2 has an A and Individuals 5 and 6 have a T.
At position 27, Individual 1 has a T while Individuals 4 and 5 have a C.
Part 5: Generating a Sequence Logo
Part 6: Amino Acid Comparison
FASTA format of ORFs for reading frame 3
>Individual1MEKSAF>Individual2MEKSAF>Individual3MEKSAF>Individual4MEKSAF>Individual5MEKSAF>Individual6
MEKSAF

Proceedings of the Association for Biology Laboratory Education, Volume 36, 2015 29
Major Workshop: Labs for Integrating Bioinformatics into the Life Sciences
Comparison result for reading frame 3Individual1 MEKSAF 6 Individual2 MEKSAF 6 Individual3 MEKSAF 6 Individual4 MEKSAF 6 Individual6 MEKSAF 6 Individual5 MEKSAF 6
******
All sequences in reading frame 3 are identical.
FASTA format of ORFs for reading frame 2
>Individual1MIFYSKIQMNHGEICF>Individual2MIFYYKIQMNHGEICF>Individual3MIFYSKIQMNHGEICF>Individual4MIFYSKTQMNHGEICF>Individual5MIFYFKTQMNHGEICF>Individual6MIFYFKIQMNHGEICF
Comparison result for reading frame 2Individual1 MIFYSKIQMNHGEICF 16Individual3 MIFYSKIQMNHGEICF 16Individual2 MIFYYKIQMNHGEICF 16Individual6 MIFYFKIQMNHGEICF 16Individual4 MIFYSKTQMNHGEICF 16Individual5 MIFYFKTQMNHGEICF 16
**** * *********
Individual 1 has a serine at position 5 while Individual 2 has a tyrosine, and Individuals 5 and 6 have a phenylalanine. Individual 1 has an isoleucine at position 7 while Individuals 4 and 5 have a threonine.

30 Tested Studies for Laboratory Teaching
Duncan, McClung, Reichart, Simon, Tapprich, Grandgenett, Pauley
Appendix BLaboratory 2—Invasion of Common Reed Results (Answer Key)
Introduction1. What characteristics (e.g., type of reproduction) would allow an introduced species to successfully establish itself as an
invasive species?
There are many possible answers for this: asexual reproduction (e.g., rhizomes), high fecundity, tolerance of a variety of environmental conditions, etc.
2. What environments or environmental conditions might allow an introduced species to become invasive?
There are many possible answers for this: organisms associated with human activity, disturbance events that encouragespeciesinvasions(fire,flood,volcaniceruption,clearcuttingforesthabitat,dividingthelandscapeupinto small patches with more edge habitat and less continuous habitat), lack of biotic limitation (invasive species often do not have predators, have no competition, and are not susceptible to local diseases that might affect native species).
3. What characteristics or environmental conditions may have allowed the brown tree snake to successfully eliminate tennative bird species on Guam?
The brown tree snake likely has high fecundity, is well adapted to living near humans, has no natural preda-tors, is able to outcompete native species, and is not susceptible to local diseases. There could be other possible answers too.
Part 1: Sequence Alignment Basics1. Examinethefirstentryinthefile.Whatistheuniqueidentifier(i.e.,sequencename)?
rbcL-psaI
2. Whatisthefirstnucleotideinthissequence?
G3. Are the sequences all the same length? (Use the “word count” tool in Microsoft Word to determine the number of
characters in each sequence)
No4. IntherbcL-psaIalignment,atwhichpositiondoesthefirstpointmutationoccur?(Notethatpositionsareindicatedby
the scale at the top of the alignment).
1045. Locate position 258 in the rbcL-psaI alignment; is this a point mutation or an indel?
Point mutation6. Locate position 355 in the rbcL-psaI alignment; is this a point mutation or an indel?
Indel7. Locate the indel beginning at position 884. Based on this mutation alone, predict which sequences come from plants
that are closely related to each other. (Hint, there will be two groups.) List the sequences in each group below. The se-quence names and their lengths are indicated to the left of the actual sequence (e.g., 9/1-1072 means that the sequenceis haplotype 9 and it begins at position 1 and extends to position 1072 on the alignment).
Group I: 11, 12, 1Group II: 9, 3, 8, 4, 6, 10, 14, 7, 1, 2, 5, 13

Proceedings of the Association for Biology Laboratory Education, Volume 36, 2015 31
Major Workshop: Labs for Integrating Bioinformatics into the Life Sciences
Part 2: Comparison of Sequences to Identify Native and Nonnative Phragmites1. Based on this alignment, identify the haplotype of each sample (for each loci) and make an inference based on Table 1
aboutwhetherthesampleis“native”or“nonnative.”Todothis,fillinTable2below.
Sample rbcL-psaI haplotype
trnT-trnL haplotype
Composite haplotype
Native or nonnative?
1 1 10 A Native2 1 10 A Native3 1 16 D Native4 2 11 H Native5 2 11 H Native6 4 4 M Nonnative7 1 16 D Native8 2 11 H Native9 4 4 M Nonnative10 1 16 D Native11 4 4 M Nonnative12 4 4 M Nonnative13 4 4 M Nonnative14 4 4 M Nonnative15 1 16 D Native16 4 4 M Nonnative17 1 16 D Native18 4 4 M Nonnative19 4 4 M Nonnative20 4 4 M Nonnative21 4 4 M Nonnative22 4 4 M Nonnative23 4 4 M Nonnative24 4 4 M Nonnative25 4 4 M Nonnative26 4 4 M Nonnative
Table 2. Haplotypes of Phragmites australis samples from Utah.

32 Tested Studies for Laboratory Teaching
Duncan, McClung, Reichart, Simon, Tapprich, Grandgenett, Pauley
Part 3: Identification of Native and Nonnative Phragmites Using Restriction Enzymes1. If these products were digested with EcoRV, how many fragments would be produced from each sequence?
PCR 1: 2 PCR 2: 12. What size would each of the fragments be?
PCR 1: 35 nt, 10 nt PCR 2: 45 nt3. Basedonthisfigure,whichsamplesdoyoupredictaremostcloselyrelatedtooneanother?
1, 3, 5, 8, 9 and 2, 4, 6, 74. Ifappropriaterestrictionenzymescanbefound,thismethodcanbeusedasanalternativetosequencingforidentifica-
tion of native and nonnative Phragmites australis. What is the key characteristic that would make an enzyme useful forthis purpose?
A restriction site that is unique to either native or nonnative haplotypes5. WhichspecificenzymeswouldbeusefulfordistinguishingbetweennativeandnonnativePhragmites?Chooseone
restriction enzyme for each genetic locus.
rbcL-psaI: HhaI trnT-trnL: RsaI
Part 4: Inference of Pattern1. A critical part of any study is the careful and thorough interpretation of the data. Based on the results shown in Figure
2writethreespecificconclusionsinthespacebelow.
Anyobservationisfine.Somepossibilitiesare:
a) Most historic samples are native.
b) Most current samples are nonnative.
c) Eastern shore of the Great Salt Lake is dominated by nonnative plants.
d) Apparent association of Phragmites with waterways; none were sampled on the playa.
2. Now think about those conclusions in a broader context. Describe one of the wider implications of these results (interms of spread, management, etc.)?
Possible answers include:
a) Nonnative plants currently dominate the shoreline, may expect them to soon completely replace native plants.
b) Managementofnonnativeplantswithoutharmingnativeonesmaybedifficultgiventhattheyappeartoco-occuralong the shore.
c) Management should focus along waterways (as opposed to playa areas).
d) Others

Proceedings of the Association for Biology Laboratory Education, Volume 36, 2015 33
Major Workshop: Labs for Integrating Bioinformatics into the Life Sciences
Appendix CLaboratory 3—Proteins: Historians of Life on Earth Results (Answer Key)
Part 1: Explorations in Evolution through Protein Sequence Alignments and Phylogenetic Tree Constructiona) Where would you expect Methanococcus and Pyrococcus to split off of the rooted tree if the two domain (i.e., Bacteria
and Eukarya) hypothesis is correct?
They would be branches from the bacterial portion of the tree.
b) Where would you expect Methanococcus and Pyrococcus to split off of the rooted tree if the three domain (i.e., Bacteria,Archaea and Eukarya) hypothesis is correct?
They would extend from a node that would be somewhere between the eukaryotic region of the tree and the bacterial region of the tree.
c) Did the species you added to the investigation appear on the tree where you predicted?
If they assume the three-domain hypothesis, then the answer will very likely be “yes.”
d) Which hypothesis does your tree support? (It might be easier to answer this question by looking at the unrooted tree thatyou inserted above.)
The three-domain hypothesis.
Part 2: Visualizing the Evolution of Protein Structure in 3Da) What does the complete conservation of the amino acids in the active site suggest to you?
All of the amino acids associated with the active site, in the case of enolase, are critical to the functioning of the enzyme. Any amino acid substitutions would lead to a partial or complete loss of enzyme function. Individuals carrying such changes would be selected against.
b) Why do you think the peripheral region of the enolase molecule has varied so much over time in contrast to the stabilityof the active site?
Most of the amino acids on the peripheral region of the enzyme do not perform a critical function other than to keep the enzyme hydrophilic. Consequently, certain amino acid substitutions are more likely to be tolerated.
c) Are other regions on the enolase molecule highly conserved, besides the active site? (Hint: are there conserved regionson the peripheral part of the molecule? What might be the role of those regions?)
Some enzymes are known to dock with other molecules, such as other enzymes. Perhaps one or more of those conserved sites serves such a function or some other important function.
d) Do you think you would get the same results if you compared sequences only from mammals? Explain your answer.
The amino acids in the active site would of course remain conserved. The peripheral part of the enzyme, however, would be more conserved as there has been less time for divergence.

34 Tested Studies for Laboratory Teaching
Duncan, McClung, Reichart, Simon, Tapprich, Grandgenett, Pauley
Mission, Review Process & Disclaimer The Association for Biology Laboratory Education (ABLE) was founded in 1979 to promote information exchange
among university and college educators actively concerned with teaching biology in a laboratory setting. The focus of ABLE is to improve the undergraduate biology laboratory experience by promoting the development and dissemination of interesting, innovative, and reliable laboratory exercises. For more information about ABLE, please visit http://www.ableweb.org/
Papers published in Tested Studies for Laboratory Teaching: Peer-Reviewed Proceedings of the Conference of the As-sociation for Biology Laboratory Education are evaluated and selected by a committee prior to presentation at the conference, peer-reviewed by participants at the conference, and edited by members of the ABLE Editorial Board.
Citing This Article Duncan, G., W. McClung, L. Reichart, D. Simon, W. Tapprich, N. Grandgenett, and M. Pauley. 2015. Laboratories for
integrating bioinformatics into the life sciences. Article 6 in Tested Studies for Laboratory Teaching, Volume 36 (K. McMa-hon, Editor). Proceedings of the 36th Conference of the Association for Biology Laboratory Education (ABLE). http://www.ableweb.org/volumes/vol-36/?art=6
Compilation © 2015 by the Association for Biology Laboratory Education, ISBN 1-890444-18-9. All rights reserved. No part of this publication may be reproduced, stored in a retrieval system, or transmitted, in any form or by any means, elec-tronic, mechanical, photocopying, recording, or otherwise, without the prior written permission of the copyright owner.
ABLE strongly encourages individuals to use the exercises in this proceedings volume in their teaching program. If thisexerciseisusedsolelyatone’sowninstitutionwithnointentforprofit,itisexcludedfromtheprecedingcopyrightrestric-tion, unless otherwise noted on the copyright notice of the individual chapter in this volume. Proper credit to this publication must be included in your laboratory outline for each use; a sample citation is given above.
Endpage