kwak hu rosso felmy hoyt 2011 ijgcc roleh2ofosterite 1-s2.0-s1750583611000739-main
TRANSCRIPT

Journal Identification = IJGGC Article Identification = 434 Date: August 9, 2011 Time: 6:17 pm
T
JJP
a
ARRA
KCCNXFW
1
tttrBiddimpC(
Coi
eK
1d
International Journal of Greenhouse Gas Control 5 (2011) 1081–1092
Contents lists available at ScienceDirect
International Journal of Greenhouse Gas Control
j ourna l ho mepage: www.elsev ier .com/ locate / i jggc
he role of H2O in the carbonation of forsterite in supercritical CO2
a Hun Kwak, Jian Zhi Hu ∗, Romulus V.F. Turcu, Kevin M. Rosso, Eugene S. Ilton, Chongmin Wang,esse A. Sears, Mark H. Engelhard, Andrew R. Felmy, David W. Hoyt ∗∗
acific Northwest National Laboratory, P.O. Box 999, MS K8-98, Richland, WA 99352, USA
r t i c l e i n f o
rticle history:eceived 3 December 2010eceived in revised form 18 April 2011ccepted 5 May 2011
eywords:arbon sequestration
a b s t r a c t
The effect of variable H2O content on the carbonation of forsterite in supercritical CO2 (scCO2) at 80 ◦C and76 bars (7.6 MPa) was investigated by a combination of NMR, XRD, TEM and XPS. When trace amounts ofH2O were included, limited reaction was observed. Below H2O saturation in scCO2, reaction products werea mixture of partially hydrated/hydroxylated magnesium carbonates and hydroxylated silica species thatwere mainly in an amorphous state, forming a non-resolved layer on the forsterite surface. At H2O contentabove saturation, where forsterite was in contact with both a CO2-saturated aqueous fluid and H2O-
O2
MRPSorsteriteater threshold
saturated scCO2, solid reaction products were magnesite (MgCO3) and an amorphous polymerized SiO2.Formation of these anhydrous phases implies H2O initially bound in precursor hydrated/hydroxylatedreaction products was liberated, inducing further reaction. Hence, for a given fluid/mineral ratio thereis a H2O threshold above which a significant portion of the H2O serves in a catalytic role where moreextensive carbonation reaction occurs. Defining the role of H2O, even in low H2O content environments,is therefore critical to determining the long term impact of CO2 reactivity in the subsurface.
© 2011 Elsevier Ltd. All rights reserved.
. Introduction
Capture and storage of carbon dioxide in deep geologic forma-ions represent one of the most promising options for mitigatinghe impacts of greenhouse gases on global warming, owing tohe potentially large capacity of these formations and their broadegional availability (Bachu, 2002, 2008; Bachu and Adams, 2003;enson and Surles, 2006). CO2 is injected into formation flu-
ds, nominally saline aquifers, as a supercritical fluid (scCO2) atepths that maintain its supercritical state. A critical issue is toemonstrate that the CO2 will remain stored over the long-term
n the geological formation where it is injected. In this regard,ineral–fluid interactions are of prime importance for reservoir
ermanence through prospective carbonation reactions that trapO2 in the form of mineral phases such as metal carbonatesKaszuba et al., 2003, 2005; Pruess et al., 2003; Xu et al., 2007).
Previous research on mineral–fluid interaction for subsurface
O2 storage has focused almost entirely on reactivity with aque-us solutions or brines containing dissolved CO2 because of themportance of these interactions at the advancing plume front∗ Corresponding author at: Department of Fundamental and Computational Sci-nces, Pacific Northwest National Laboratory, 902 Battelle Blvd, P.O. Box 999, MS8-98, Richland, WA 99352, USA. Tel.: +1 509 371 6544; fax: +1 509 371 6555.
∗∗ Corresponding author. Tel.: +1 509 371 6545.E-mail addresses: [email protected] (J.Z. Hu), [email protected] (D.W. Hoyt).
750-5836/$ – see front matter © 2011 Elsevier Ltd. All rights reserved.oi:10.1016/j.ijggc.2011.05.013
(Giammar et al., 2005; Daval et al., 2009; Andreani et al., 2009;Bearat et al., 2006; Diefenbacher et al., 2005; Hanchen et al., 2008;Hanchen et al., 2006; Mckelvy et al., 2004; Prasad et al., 2009; Wolfet al., 2004; Schaef et al., 2009). However, interactions with “wet”H2O-containing scCO2 could be of equal if not more importanceat later stages as the buoyant scCO2 plume progressively displacesformation fluid at the interface with overlying caprock. Initially,dry injected scCO2 will contain H2O immediately after injection.scCO2 is highly diffusive relative to aqueous solution owing to itslow viscosity, and the presence of dissolved H2O alters the min-eral wettability of the scCO2 fluid. Consequently, it is possible thatwet scCO2 will dominate some of the key interfacial contact areawith mineral surfaces, and permeate the overlying caprock porenetwork to a greater extent than previously considered.
Little is currently known about mineral interactions with wetscCO2 (Lin et al., 2008). Initial work in our group on the inter-action of forsterite with a limited set of fluid compositions (neatscCO2, and water-saturated scCO2 with co-existing CO2-saturatedaqueous solution) at 80 ◦C and 76 bars indicated that mineralcarbonation reactions in water-saturated scCO2 fundamentallydiffer from those in aqueous solutions. For example, we found(Kwak et al., 2010) that interaction of the scCO2-dominated fluidwith forsterite was limited in extent and mediated by local-
ized mineral replacement or transformation reactions that formedamorphous hydrated/hydroxylated Mg-carbonates and variablyprotonated silica species at the forsterite surface. This con-trasts with dissolution/re-precipitation reactions involving mass
Journal Identification = IJGGC Article Identification = 434 Date: August 9, 2011 Time: 6:17 pm
1 Green
ticeeLOWmuprtlpepfseTwptpawst
2
2
oudowrrTipit(t
tcoirretvawassl
082 J.H. Kwak et al. / International Journal of
ransport of ions through an aqueous solution phase that resultsn leached layers and discrete solid phase reaction products thatan either nucleate locally or distally (Giammar et al., 2005; Caseyt al., 1993; Casey and Swaddle, 2003; Matson et al., 1986; Magit al., 1984; Tsomaia et al., 2003; Alexander et al., 1954; Blum andasaga, 1988; Chen and Brantley, 2000; Goff and Lackner, 1998;elkers, 2001; Rosso and Rimstidt, 2000; Westrich et al., 1993;ogelius and Walther, 1991; Felmy et al., 2001). Further, becauseineral carbonation reactions tend to have positive molar vol-
me changes and because in scCO2-dominated fluids the reactionroducts formed cannot back dissolve into a solution phase, sucheactions are more likely to result in pore or fracture plugging thanhe corresponding reactions in aqueous solution. However, to dateittle is known concerning the effect of variable H2O content in theresence of scCO2, especially below saturation in scCO2, on min-ral transformation processes (Lin et al., 2008).Here we extend ourrior work by investigating the effect of variable H2O content onorsterite carbonation in scCO2, from neat scCO2 to H2O-saturatedcCO2, as well as different H2O contents above saturation (i.e., co-xisting H2O-saturated scCO2 and CO2-saturated H2O fluid phases).he main objective was to better document the transition betweenet-scCO2 and aqueous phase reaction pathways and reactionroducts. Run conditions were 80 ◦C and 76 bars. A relatively highemperature was chosen to facilitate reaction kinetics. Reactionroducts were analyzed by ex situ solid state 29Si, 13C, SP-MASnd CP-MAS NMR, XRD, TEM, and XPS. 13C isotope-enriched CO2as used to enhance the 13C NMR sensitivity. Collectively, these
tudies help define the role of variable H2O content on mineralransformations in subsurface scCO2 disposal environments.
. Experimental methods
.1. Materials and experimental design
As-received forsterite (Mg2SiO4) with 99% (metal based purity)btained from Alfa Aesar was oven dried at 100 ◦C for 12 h beforese. The BET surface area of the oven dried forsterite samples wasetermined as 1.0 m2/g. A stainless steel vessel with a net volumef 11.5 cm3 was used as the reactor, and experimental proceduresere similar to those in our previous study (Kwak et al., 2010). No
eaction was observed between the scCO2 and the stainless steeleaction vessel. Briefly, 1 g Mg2SiO4 was loaded into the reactor.hen a controlled amount of H2O, ranging from 1 g to 1 mg, wasnjected into the reactor containing the forsterite powder using aipette or micro-pipette. In these samples water was allowed to
nitially contact the forsterite powder. In other samples, an open-opped stainless steel container was filled with sufficient water0.3 g) to always maintain water saturation in the scCO2 withouthe water coming into direct contact with the forsterite powder.
The specific issue of liquid water contacting or not contactinghe forsterite surface prior to scCO2 is an important experimentalonsideration under low water content conditions, which dependsn how rapidly the mineral reacts and how fast the water transfersnto the scCO2. If the transfer of water to the scCO2 is relativelyapid (under undersaturated conditions) compared to the mineraleaction rate then there would be little impact on the observed min-ral reactivity. If the mineral reactivity is rapid relative to the waterransfer rate then correspondingly there could be some initial irre-ersible mineral transformations that could manifest later in thenalysis. To test for this possibility we conducted experiments atater saturation in two different ways. In the first experiments, we
dded the water at levels near saturation directly to the forsteriteample prior to scCO2 loading. In the second experiments, we addedufficient water to maintain water saturation in the scCO2 to a stain-ess steel tube open to the reaction chamber but not in contact with
house Gas Control 5 (2011) 1081–1092
the forsterite. In the latter case the mineral surface would have onlyseen water that was transferred through the scCO2. In both studiesthe observed changes in forsterite reactivity were essentially thesame, indicating that water contact prior to loading with scCO2 didnot affect the outcome of the experiments. Of course, at water con-tents greater than that required to saturate the scCO2 with waterthe liquid water must be added directly to the sample. Further-more, in real subsurface systems for sequestration, we expect theprior presence of bulk water in contact with mineral surfaces as arule.
The standard volumetric adsorption method was then employedto load a controlled amount of CO2 into the reactor. This was doneby condensing 51.5 cm3 of CO2 at 16 bars (1.6 MPa) into the reactorusing liquid nitrogen cooling, corresponding to an initial CO2 massof 1.646 g based on an estimated CO2 density of 0.03197 g/cm3 at16 bars (Angus et al., 1976). This mass of CO2 will yield an initial CO2pressure of 76 bars at our reaction temperature of 80 ◦C with a netCO2 volume of 11 ± 0.1 cm3 (subtracting the volume of forsteriteand H2O).
After CO2 was added, the system was raised to the reactiontemperature for a predefined time period as detailed in Section 3below. The initial compositions for each experiment are summa-rized in Table 1. At the end of the reaction, the experiments werequenched to room temperature and pressure. The samples wereflow-dried with dry nitrogen at room temperature for about 4 h andthen packed into 7.5 mm NMR rotor for the NMR measurements.Portions of the quenched samples were also prepared for XPS andXRD analyses.
2.2. Analytical methods
Both single pulse (SP), and cross polarization (CP) 29Si and13C magic angle spinning (MAS) experiments combined with highpower 1H decoupling were performed on a Varian-Chemagnetics300 MHz Infinity spectrometer, corresponding to 1H, 13C and 29SiLarmor frequencies of 299.982, 75.43, and 59.59 MHz, respectively.A commercial cross-polarization/MAS probe with a 7.5 mm outsidediameter and 6 mm internal diameter pencil type spinner systemwas used. The sample cell resembles the commercial cell exceptthat two solid Teflon plugs were made in such a manner that theycan only be fully inserted into the zirconium cylinder after pre-cooling using liquid nitrogen to seal ∼0.3 g of sample. The samplespinning rate used for all the measurements was about 5.0 kHz.Tetrakis(trimethylsilyl) silane (TKS), [(CH3)3Si]4Si, was used as thesecondary references for 13C (3.5 ppm) and 29Si (−9.8 ppm) relativeto TMS (0 ppm for both 13C and 29Si) (Hayashi and Hayamizu, 1991).The pulse angle for acquiring both 13C and 29Si spectra was approx-imately 45◦. The recycle times used were 5 s for 13C SP and 20 s for29Si SP, respectively, while 2 s was used for 1H–13C and 1H–29Si CPusing a contact time of 4 ms unless otherwise stated. The CP con-dition for both 29Si and 13C CP experiments was carefully set-upusing TKS and a sample spinning rate of 4 kHz. For each sample,the same CP match condition was maintained by accurately settingthe resonant frequencies of both the 29Si and 1H RF channels of theprobe using a network analyzer. All the spectra were acquired atroom temperature. The acquisition of a single spectrum took 1–3days.
XRD was carried out on a Philips PW3040/00 X’Pert powder X-ray diffractometer using Cu K�1 radiation in step mode between2� values of 15 and 75◦, with a step size of 0.04◦/s. Data analy-sis was accomplished using JADE (Materials Data, Inc., Livermore,CA) as well as the Powder Diffraction File database (2003 Release,
International Center for Diffraction Data, Newtown Square, PA).TEM was carried out on a JEOL JEM 2010 microscope at anoperating voltage of 200 keV. The composition of the particleswas analyzed by energy-dispersive X-ray spectroscopy (EDS). TEM

Journal Identification = IJGGC Article Identification = 434 Date: August 9, 2011 Time: 6:17 pm
J.H. Kwak et al. / International Journal of Green
Tab
le
1Th
e
reac
tion
ingr
edie
nts
at
the
begi
nn
ing
of
the
reac
tion
, an
d
the
esti
mat
ed
H2O
film
(liq
uid
wat
er
laye
r)
thic
knes
s
on
Mg 2
SiO
4su
rfac
e.
Mg 2
SiO
4
(g)
H2O
(g)
Mg 2
SiO
4
(10−2
mol
e)H
2O
(10−2
mol
e)C
O2
(10−2
mol
e)H
2O
:CO
2:M
g 2Si
O4
(mol
ar
rati
o)H
2O
/CO
2
(mol
ar
rati
o)In
itia
l H2O
satu
rati
on
(see
not
e)
(%)
Exce
ss
H2O
(mol
e)
(H2O
-0.
0374
) ×
10−2
H2O
film
(nm
)
11
0.71
5.56
3.74
7.8:
5.3:
11.
4914
,900
5.52
399
41
0.5
0.71
2.77
8
3.74
3.9:
5.3:
1
0.74
3
7430
2.74
1
493
10.
30.
711.
667
3.74
2.35
:5.3
:10.
446
4460
1.63
293
1
0.25
0.71
1.38
89
3.74
1.96
:5.3
:1
0.37
1
3710
1.35
2 24
31
0.1
0.71
0.55
63.
74
0.78
:5.3
:1
0.14
9
1485
0.51
9 93
.31
0.05
0.71
0.27
8
3.74
0.39
:5.3
:1
0.07
43
743
0.24
1
43.4
10.
03
0.71
0.16
7
3.74
0.23
5:5.
3:1
0.04
47
447
0.13
23.4
10.
025
0.71
0.13
893.
740.
196:
5.3:
10.
0371
371
0.10
218
.41
0.01
0.71
0.05
56
3.74
0.07
8:5.
3:1
0.01
487
149
0.01
8
3.2
1Sa
tura
ted
H2O
leve
l in
CO
2a0.
01
100
0–
1
0.00
5
0.71
0.02
778
3.74
0.03
9:5.
3:1
0.00
74
74
–
–1
0.00
3
0.71
0.01
667
3.74
0.02
3:5.
3:1
0.00
445
45
–
–1
0.00
10.
710.
0055
563.
740.
0078
:5.3
:10.
0014
915
––
10
0.71
0
3.74
0.0:
6.3:
1
0
0 –
–
Not
e:
The
mol
ar
rati
o
of
H2O
/CO
2in
H2O
satu
rate
d
scC
O2
ph
ase
at
76
bar
and
80◦ C
is
con
stan
t,
i.e.,
abou
t
1.0%
(Sp
ych
er
et
al.,
2003
).a
If
the
amou
nt
of
H2O
add
ed
is
mor
e
than
that
nee
ded
to
satu
rate
the
scC
O2
ph
ase,
the
exce
ss
H2O
wil
l go
to
the
min
eral
surf
ace
to
form
a
H2O
film
. To
sim
ply
the
dis
cuss
ion
on
the
amou
nt
of
H2O
add
ed, w
e
defi
ne
a
quan
tity
nam
ed
“in
itia
l H2O
satu
rati
on”
as:
(th
e
init
ial H
2O
/CO
2m
olar
rati
o)/(
the
requ
ired
H2O
/CO
2m
olar
rati
o
nee
ded
to
satu
rate
the
scC
O2
in
the
reac
tor)
.
house Gas Control 5 (2011) 1081–1092 1083
specimens were prepared by dusting the powder particles onto aporous carbon film coated 200 mesh copper TEM grid.
XPS measurements were performed with a Physical ElectronicsQuantera Scanning X-ray Microprobe. This system uses a focusedmonochromatic Al K� X-ray (1486.7 eV) source for excitation and aspherical section analyzer. The instrument has a 16 element multi-channel detection system. A 104 W X-ray beam focused to 100 �mdiameter was rastered over a 1.4 mm × 0.2 mm rectangle on thesample. The X-ray beam is incident normal to the sample and thephotoelectron detector is at 45◦ off-normal. Spectra were collectedusing a pass-energy of 69.0 eV with a step size of 0.125 eV. For theAg 3d5/2 line, these conditions produced a FWHM of 0.91 eV.
Regional scans of the Si2p, O1s, Mg2p, and C1s region wererecorded, and the energy scale was referenced to adventitiousC1s at 285.0 eV. The peaks of interest were modeled with 30/70%Lorentzian/Gaussian functions and linear backgrounds using theCasaXPS curve resolution program. Elemental ratios were quan-tified using empirical sensitivity factors derived under currentoperating conditions of the XPS.
For Si2p, three components were used to represent forsterite,SiO2, and potential protonated species. Each component was mod-eled with the Si2p3/2 and Si2p1/2 peaks. The Si2p spin–orbit splittingparameters were set at atomic values, where the separation was0.617 eV and Si2p1/2 was at 50% the intensity of Si2p3/2. Previ-ous XPS studies of olivine have used the same fitting methodology(Zakaznova-Herzog et al., 2005; Duval et al., 2002). All peaks, andconsequently all components, were constrained to have the samefull-width-at-half-maximum (FWHM). Mg2p has a spin–orbit split-ting of only 0.28 eV, and was modeled with one primary peak.However, a minor asymmetry required a second component, con-strained to have the same FWHM, that floated between 3 and10 mole fraction and 1–1.7 eV above the primary peak.
The O1s peak was modeled using a constrained four compo-nent fit. We constrained the position of each component (exceptfor the protonated species) to ±0.3 eV of an appropriate standard(see Table 2) and fixed the concentration of carbonate to ±10%of the value determined independently by CO3(C1s)/O(O1s). Thecomponents mostly stayed within ±0.2 eV of the standard valuesand SiO2/forsterite ratios conformed significantly closer to resultsfrom fitting Si2p compared to the unconstrained O1s fits (data notshown).
Reference materials for XPS are listed and characterized inTable 2. Standards for Mg-carbonates (i.e., dypingite and nesque-honite) are the same as described in the NMR section. Our quartzstandard was a clean natural single crystal from Herkimer County,USA, which was cleaned as described previously (Yanina et al.,2006). The forsterite powders were the same as used in the NMRmeasurements. Some minor alteration was apparent in both theO1s and Si2p peaks of the unreacted forsterite sample and quartzstandard. However, the binding energies of the primary compo-nents for both forsterite and quartz are within 0.1 eV of those givenin Zakaznova-Herzog et al. (2005) for vacuum-fractured single crys-tal quartz and forsterite specimens.
3. Results
3.1. NMR analyses
Fig. 1 shows 29Si SP-MAS spectra acquired on forsterite samplesreacted for 4 days in scCO2 at different water contents. A commonpeak at −61.9 ppm was observed in each of the spectra correspond-ing to SiO4 tetrahedra in forsterite (Magi et al., 1984; Davis et al.,
2009). Reaction products, evident only at and above 149% initialsaturation, yielded a peak centered at −111.6 ppm with a shoul-der at about −102 ppm. These peaks are assigned to amorphoussilica Q4 (−111.6 ppm), and Q3 (−102 ppm) species (Kwak et al.,
Journal Identification = IJGGC Article Identification = 434 Date: August 9, 2011 Time: 6:17 pm
1084 J.H. Kwak et al. / International Journal of Greenhouse Gas Control 5 (2011) 1081–1092
Table 2XPS determined binding energies (eV).
Si2p Mg2p O1s C1s
SiO2 Forsterite SiOHn SiO2 Forsterite CO3 H2O′ H2O′′ CO3
103.5 532.7 Quartz: this study103.6 532.8 Quartz: Zakaznova-Herzog et al. (2005)
∼104a ∼533.6a ∼534.6a Quartz: Duval et al. (2002)a
101.7 50.2 531 Forsterite, Zakaznova-Herzog et al. (2005)50.3 531.7 533.2 nd 289.9 Dypingite, this study50.5 531.9 533 534.3 290.1 Nesquihonite, this study
Initial H2O saturationnd 101.8 104.3 50.4 nd 530.9 531.8 533.8 290.1 0.0% H2O saturation103.3 102.1 104.7 50.5 532.8 531.2 532.2 534.2 290.4 15% H2O saturation103.4 102.2 104.9 50.7 532.9 531.3 532.2 534.2 290.5 45% H2O saturation103.3 102 104.4 50.5 532.8 531.2 532.1 534.2 290.3 74% H2O saturation103.3 102 104.7 50.5 532.7 531.1 532 534.1 289.9 149% H2O saturation103.5 101.8 105.5 51.1b 532.9 530.9 532.5b 534.5 290.8b 371% H2O saturation103.5 101.9 105.4 50.6 532.7 nd 531.8 534.5 290.1 1485% H2O saturation103.2 101.7 105 50.3 532.7 531.1 532 534.3 290 3710%H2O saturation
SiOHn stands for variably protonated SiO4 moieties; the higher the binding energy the higher the H/Si ratio. H2O′ and H2O′′ stand for high binding energy species that couldrepresent high H SiOHn moieties or bound water. Nd stands for not detected.
a Binding energies read off figures and adjusted to C1s at 285.0 eV for comparison to this study. Values are specific to surface species after subtraction of bulk signal, whichw 2O′′ is proposed to be H2O sorbed to >SiO− . See Duval et al. (2002) for more details.
bove imposed limits (see Section 2). We note that the C1s CO3 component and Mg2p isa ical contact with SiO2 and forsterite.
2nactgais
Frfis
as not directly determined, where SiOHn and H2O′ are identified as SiOH2+ and H
b In order to obtain a good fit the O1s and CO3 component was allowed to float also anomalously high which suggest that the carbonate phase is not in good electr
010) which consist of polymerized SiO4 tetrahedra sharing cor-ers with four or three other SiO4 tetrahedra, respectively. Thesessignments are reinforced by the 1H–29Si CP-MAS analyses dis-ussed later. The extent of reaction (percent conversion based onhe total number of silicon atoms) was calculated using the inte-rated areas of the Q4 + Q3 peaks and the forsterite peak (Fig. 1). The
mount of forsterite converted to these amorphous silica productsncreased dramatically from 3.7% to 40.6% when the initial H2Oaturation increased from 149% to 743%. However, the extent ofForsteriteVertically -61.9Initial H2O
×3215%
×32
reactedExpanded bysaturation
45%
74%×32
149%×32
371%×32
3.7%
743% ×47.9%
40.6%Q4
Q3
1485% ×4
3710% ×4
38.4%
46.0%
7430% ×4
-150-100-50050
42.1%
ppm
ig. 1. 29Si SP-MAS spectra obtained on 1 g Mg2SiO4 + 11 cm3 CO2 at 76 bar + xH2Oeacted at 80 ◦C for 4 days with “x”, in unit of initial H2O saturation in scCO2, changesrom 0 to 7430%. Peak assignments are −61.9 ppm (bulk Mg2SiO4), −102 ppm (sil-ca Q3), and −111.6 ppm (silica Q4). Peaks at about 20 and −149 ppm are samplepinning sidebands.
s
Initial watersaturation
-73.0ppm
15%(f)
*at saturated H2O
45%(e)
-84.8-91.8
(d)
74%
149%
3 4
-61.
5-7
8.8
-102
(c)
**1000mg noCO2
F01 2 -1
11.6
(a)
(b)
-150-100-50050ppm
Fig. 2. The 1H–29Si CP-MAS spectra of 1 g Mg2SiO4 + 1 g H2O (a), and 1 gMg2SiO4 + 11 cm3 CO2 at 76 bar + xH2O, where x = 149% (b), 74% (c), at exactly watersaturation (d), 45% (e) and 15% (f) initial H2O saturation, respectively. All the sam-ples were reacted at 80 ◦C for 4 days. Peak assignments are as follows. F: 3 SiOMg, 1SiOH; 0: no SiOSi, 4 SiOH (Q0); 1: 1 SiOSi, 3 SiOH (Q1); 2: 2 SiOSi, 2 SiOH (Q2); 3: 3SiOSi, 1 SiOH (Q3); 4: 4 SiOSi, 0 SiOH (Q4).
Journal Identification = IJGGC Article Identification = 434 Date: August 9, 2011 Time: 6:17 pm
Green
rt1
sFacf(sbSa−ettaaaemafoicoQrtS
t9u1sbttMn1t(o(hr
btswpbar(7arai
J.H. Kwak et al. / International Journal of
eaction reached a plateau from 743 to 7430% initial H2O satura-ion. Reaction products were not detected by 29Si SP-MAS below49% H2O saturation.
Fig. 2 gives 1H–29Si CP spectra, a technique that can be moreensitive to protonated forms of silica, for selected experiments.or the case of H2O with no scCO2, four distinct peaks are observedt −61.5, −78.8, −84.8 and −91.8 ppm. The −61.5 ppm peak islose to that of forsterite (−61.9 ppm) and is assigned to a silanolunctional group (Si–OH), possibly at the forsterite surface (e.g.,MgO)3SiOH). The −78.8 ppm peak is tentatively assigned to aurface Q0 monosilicic acid species (Si(OH)4) which was inferredy interpolating between experimentally determined values fori(OH)4 in aqueous solution (Cho et al., 2006; Unger et al., 1994)nd the dimer, (HO)3Si–O–Si(OH)3 (Cho et al., 2006). The peaks at84.8 and the −91.8 ppm are assigned to Q1 and Q2 species (Kwakt al., 2010). The CP spectrum at 149% initial H2O saturation, con-ains two peaks at −102 (Q3) and −111.6 ppm (Q4). Compared withhe SP spectrum (Fig. 1), the Q3 signal is significantly enhanced rel-tive to Q4, consistent with the existence of one –OH group in Q3nd no OH group in Q4, where only remote protons contributed to
weak CP signal. A longer contact time of 8 ms (relative to 4 ms)nhanced the Q4 signal (Fig. S1), reinforcing the Q3 and Q4 assign-ents. For H2O contents at or below initial scCO2 saturation, in
ddition to the putative (MgO)3SiOH species at −61.5 ppm, a broadeature likely arising from densely packed and overlapped peaks isbserved between −61.9 and −85.0 ppm indicating a variety of sil-ca species. Possible species include Q0, Q1, Q2, and silica directlyoordinated with one, two and three –O–Mg– groups and vari-us combinations in the second coordination shell. The fact that3 and Q4 species do not appear below 149% initial H2O satu-
ation is a key observation that will be discussed later in regardo the role that H2O plays in forming non-hydrous amorphousiO2.
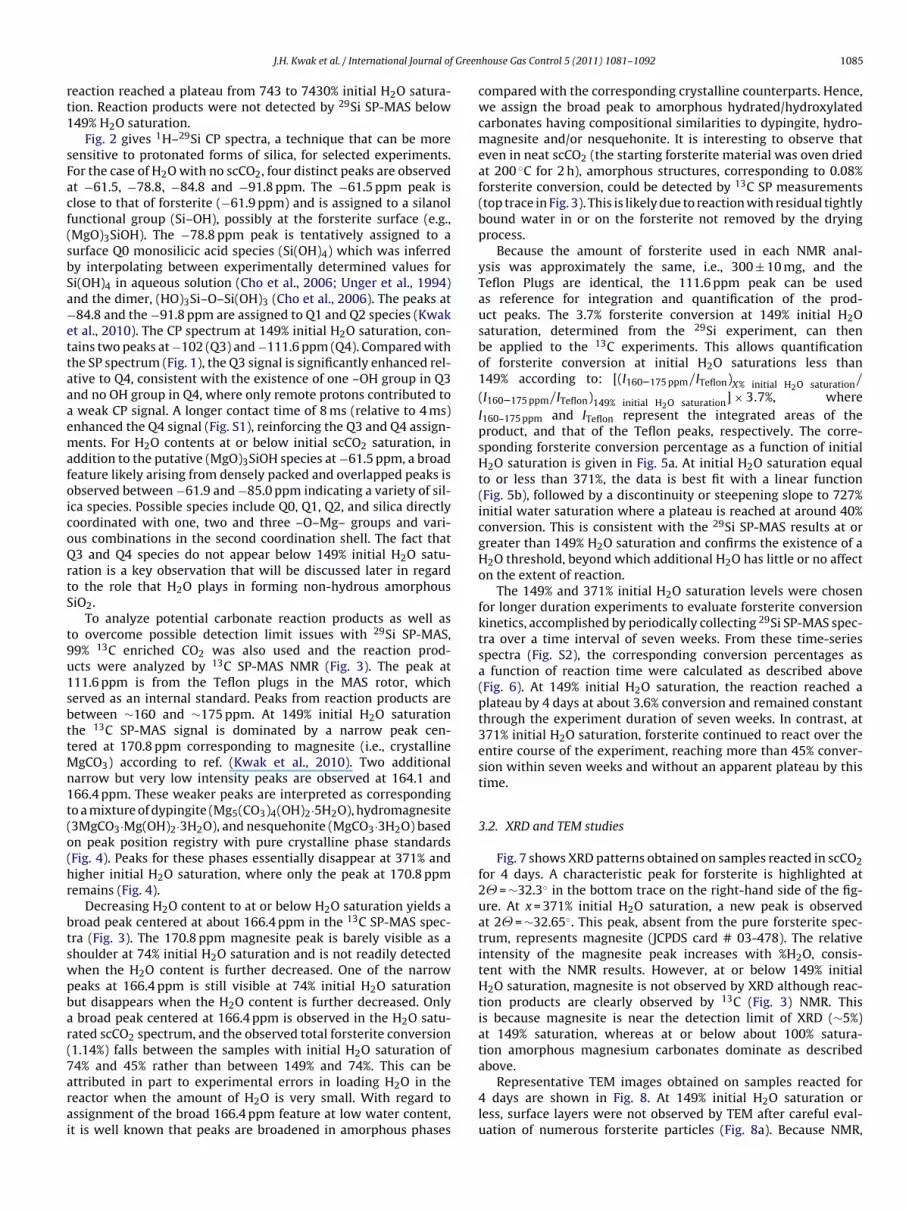
To analyze potential carbonate reaction products as well aso overcome possible detection limit issues with 29Si SP-MAS,9% 13C enriched CO2 was also used and the reaction prod-cts were analyzed by 13C SP-MAS NMR (Fig. 3). The peak at11.6 ppm is from the Teflon plugs in the MAS rotor, whicherved as an internal standard. Peaks from reaction products areetween ∼160 and ∼175 ppm. At 149% initial H2O saturationhe 13C SP-MAS signal is dominated by a narrow peak cen-ered at 170.8 ppm corresponding to magnesite (i.e., crystalline
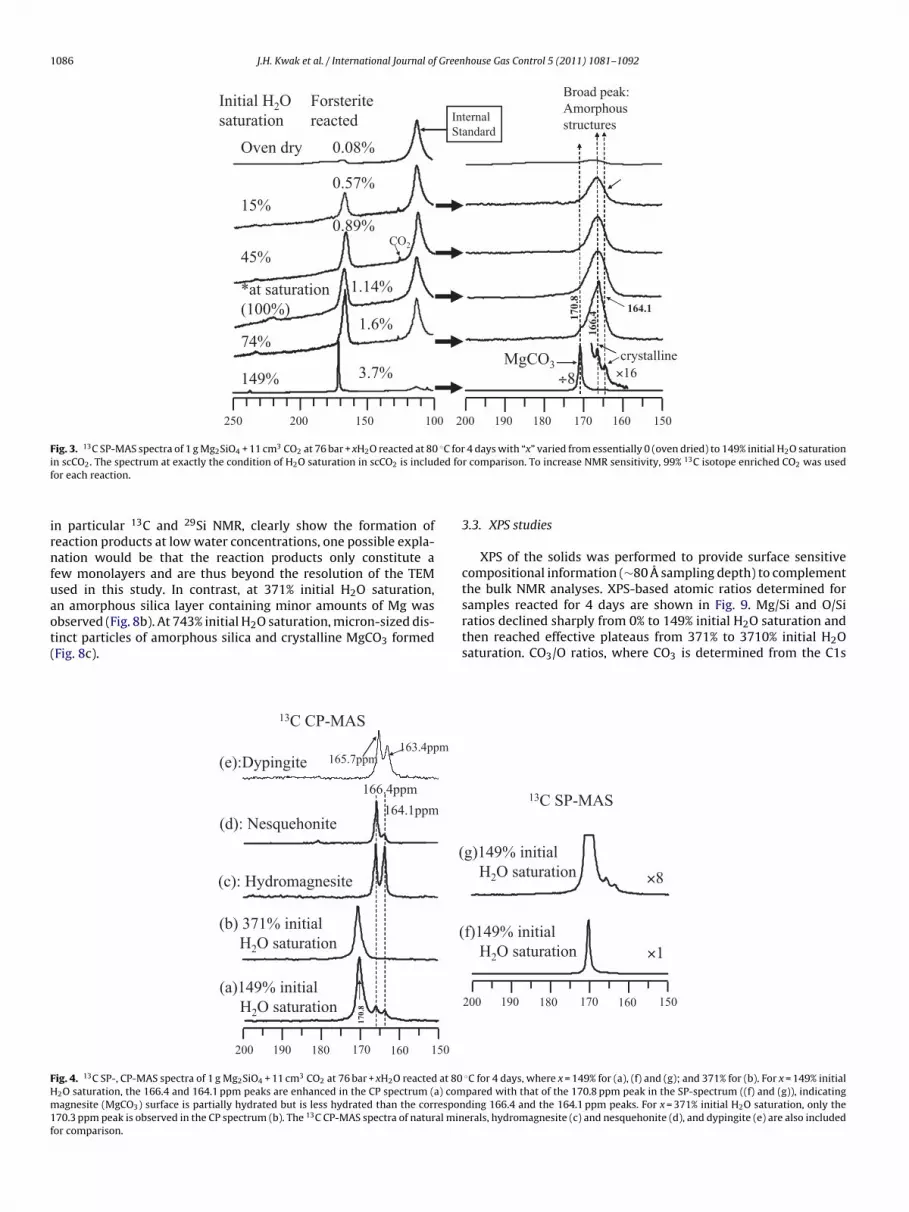
gCO3) according to ref. (Kwak et al., 2010). Two additionalarrow but very low intensity peaks are observed at 164.1 and66.4 ppm. These weaker peaks are interpreted as correspondingo a mixture of dypingite (Mg5(CO3)4(OH)2·5H2O), hydromagnesite3MgCO3·Mg(OH)2·3H2O), and nesquehonite (MgCO3·3H2O) basedn peak position registry with pure crystalline phase standardsFig. 4). Peaks for these phases essentially disappear at 371% andigher initial H2O saturation, where only the peak at 170.8 ppmemains (Fig. 4).
Decreasing H2O content to at or below H2O saturation yields aroad peak centered at about 166.4 ppm in the 13C SP-MAS spec-ra (Fig. 3). The 170.8 ppm magnesite peak is barely visible as ahoulder at 74% initial H2O saturation and is not readily detectedhen the H2O content is further decreased. One of the narroweaks at 166.4 ppm is still visible at 74% initial H2O saturationut disappears when the H2O content is further decreased. Only
broad peak centered at 166.4 ppm is observed in the H2O satu-ated scCO2 spectrum, and the observed total forsterite conversion1.14%) falls between the samples with initial H2O saturation of4% and 45% rather than between 149% and 74%. This can be
ttributed in part to experimental errors in loading H2O in theeactor when the amount of H2O is very small. With regard tossignment of the broad 166.4 ppm feature at low water content,t is well known that peaks are broadened in amorphous phaseshouse Gas Control 5 (2011) 1081–1092 1085
compared with the corresponding crystalline counterparts. Hence,we assign the broad peak to amorphous hydrated/hydroxylatedcarbonates having compositional similarities to dypingite, hydro-magnesite and/or nesquehonite. It is interesting to observe thateven in neat scCO2 (the starting forsterite material was oven driedat 200 ◦C for 2 h), amorphous structures, corresponding to 0.08%forsterite conversion, could be detected by 13C SP measurements(top trace in Fig. 3). This is likely due to reaction with residual tightlybound water in or on the forsterite not removed by the dryingprocess.
Because the amount of forsterite used in each NMR anal-ysis was approximately the same, i.e., 300 ± 10 mg, and theTeflon Plugs are identical, the 111.6 ppm peak can be usedas reference for integration and quantification of the prod-uct peaks. The 3.7% forsterite conversion at 149% initial H2Osaturation, determined from the 29Si experiment, can thenbe applied to the 13C experiments. This allows quantificationof forsterite conversion at initial H2O saturations less than149% according to: [(I160–175 ppm/ITeflon)X% initial H2O saturation/
(I160–175 ppm/ITeflon)149% initial H2O saturation] × 3.7%, whereI160–175 ppm and ITeflon represent the integrated areas of theproduct, and that of the Teflon peaks, respectively. The corre-sponding forsterite conversion percentage as a function of initialH2O saturation is given in Fig. 5a. At initial H2O saturation equalto or less than 371%, the data is best fit with a linear function(Fig. 5b), followed by a discontinuity or steepening slope to 727%initial water saturation where a plateau is reached at around 40%conversion. This is consistent with the 29Si SP-MAS results at orgreater than 149% H2O saturation and confirms the existence of aH2O threshold, beyond which additional H2O has little or no affecton the extent of reaction.
The 149% and 371% initial H2O saturation levels were chosenfor longer duration experiments to evaluate forsterite conversionkinetics, accomplished by periodically collecting 29Si SP-MAS spec-tra over a time interval of seven weeks. From these time-seriesspectra (Fig. S2), the corresponding conversion percentages asa function of reaction time were calculated as described above(Fig. 6). At 149% initial H2O saturation, the reaction reached aplateau by 4 days at about 3.6% conversion and remained constantthrough the experiment duration of seven weeks. In contrast, at371% initial H2O saturation, forsterite continued to react over theentire course of the experiment, reaching more than 45% conver-sion within seven weeks and without an apparent plateau by thistime.
3.2. XRD and TEM studies
Fig. 7 shows XRD patterns obtained on samples reacted in scCO2for 4 days. A characteristic peak for forsterite is highlighted at2� = ∼32.3◦ in the bottom trace on the right-hand side of the fig-ure. At x = 371% initial H2O saturation, a new peak is observedat 2� = ∼32.65◦. This peak, absent from the pure forsterite spec-trum, represents magnesite (JCPDS card # 03-478). The relativeintensity of the magnesite peak increases with %H2O, consis-tent with the NMR results. However, at or below 149% initialH2O saturation, magnesite is not observed by XRD although reac-tion products are clearly observed by 13C (Fig. 3) NMR. Thisis because magnesite is near the detection limit of XRD (∼5%)at 149% saturation, whereas at or below about 100% satura-tion amorphous magnesium carbonates dominate as describedabove.
Representative TEM images obtained on samples reacted for4 days are shown in Fig. 8. At 149% initial H2O saturation orless, surface layers were not observed by TEM after careful eval-uation of numerous forsterite particles (Fig. 8a). Because NMR,
Journal Identification = IJGGC Article Identification = 434 Date: August 9, 2011 Time: 6:17 pm
1086 J.H. Kwak et al. / International Journal of Greenhouse Gas Control 5 (2011) 1081–1092
Broad peak: Amorphousstructures
Initial H2Osaturation Internal
Forsteritereacted
Stan dardOven dry 0.08%
0.57%15%
0.89%CO2
*at saturation
45%
1.14%164.1
166.
4170.
8
(100%)1.6%
×16MgCO3
crystalline74%
3.7%149% ÷8
100150200250 150200 160170180190
Fig. 3. 13C SP-MAS spectra of 1 g Mg2SiO4 + 11 cm3 CO2 at 76 bar + xH2O reacted at 80 ◦C for 4 days with “x” varied from essentially 0 (oven dried) to 149% initial H2O saturationi ed fof
irnfuaot(
FHm1f
n scCO2. The spectrum at exactly the condition of H2O saturation in scCO2 is includor each reaction.
n particular 13C and 29Si NMR, clearly show the formation ofeaction products at low water concentrations, one possible expla-ation would be that the reaction products only constitute a
ew monolayers and are thus beyond the resolution of the TEMsed in this study. In contrast, at 371% initial H2O saturation,n amorphous silica layer containing minor amounts of Mg was
bserved (Fig. 8b). At 743% initial H2O saturation, micron-sized dis-inct particles of amorphous silica and crystalline MgCO3 formedFig. 8c).163.4ppm
13C CP-MAS
166.4ppm
165.7ppm(e):Dyp ingit e
164.1ppm(d): Nesquehonite
(
(c): Hydromagnesite
(b) 371% initialH2O saturation
(
(a)149% initial H2O saturation
150200 160170180190
170.
8
ig. 4. 13C SP-, CP-MAS spectra of 1 g Mg2SiO4 + 11 cm3 CO2 at 76 bar + xH2O reacted at 802O saturation, the 166.4 and 164.1 ppm peaks are enhanced in the CP spectrum (a) comagnesite (MgCO3) surface is partially hydrated but is less hydrated than the correspon
70.3 ppm peak is observed in the CP spectrum (b). The 13C CP-MAS spectra of natural minor comparison.
r comparison. To increase NMR sensitivity, 99% 13C isotope enriched CO2 was used
3.3. XPS studies
XPS of the solids was performed to provide surface sensitivecompositional information (∼80 A sampling depth) to complementthe bulk NMR analyses. XPS-based atomic ratios determined forsamples reacted for 4 days are shown in Fig. 9. Mg/Si and O/Si
ratios declined sharply from 0% to 149% initial H2O saturation andthen reached effective plateaus from 371% to 3710% initial H2Osaturation. CO3/O ratios, where CO3 is determined from the C1s13C SP-MAS
g)149% initial ×8H2O saturation
f)149% initial H2O saturation ×1
150200 160170180190
◦C for 4 days, where x = 149% for (a), (f) and (g); and 371% for (b). For x = 149% initialpared with that of the 170.8 ppm peak in the SP-spectrum ((f) and (g)), indicatingding 166.4 and the 164.1 ppm peaks. For x = 371% initial H2O saturation, only theerals, hydromagnesite (c) and nesquehonite (d), and dypingite (e) are also included

Journal Identification = IJGGC Article Identification = 434 Date: August 9, 2011 Time: 6:17 pm
J.H. Kwak et al. / International Journal of Greenhouse Gas Control 5 (2011) 1081–1092 1087
50(a) 10
(b)
2SiO
4re
acte
d
20
30
40
f = f0*(1-exp(-x/x0))f0=45±4
6
8f=a*x
0.0008a=0.0218 ±
0
10x0=727±207
0
2
4
f: %
of M
g
80006000400020000% Initial H2O saturation in scCO2
% Initial H2O saturation in scCO 2
4003002001000
Fig. 5. The percentage of Mg2SiO4 conversion (f) as a function of H2O content (x) on 1 g Mg2SiO4 + 11 cm3 CO2 at 76 atm + xH2O reacted at 80 ◦C for 4 days, where x is in unitof initial H2O saturation in scCO2. The data corresponding to x = 149–14,900%, are from 29Si SP-MAS experiments while the data corresponding to x = 0–149% are from 13CSP-NMR. (a) For x = 0–14,900%, the curve can be fit with f = f∞ × (1 − exp(−x/x0)), yielding f0 = 45 ± 4% and x0 = 727 ± 207%. (b) For x = 0–371%, the curve can be fit well withf = a × x, yielding a = 0.0218 ± 0.0008.
5 50
3
4
30
40
4re
acte
d
4re
acte
d
0
1
2
0
10
202SiO 2SiO
6040200
t: Reaction time (days)t: Reaction time (days)403020100 50
f: %
of M
g
f: %
of M
g
Fig. 6. The percentage of Mg2SiO4 conversion as a function of reaction time determined from the 29Si SP-MAS spectra in Fig. S2. (a) 149% initial H2O saturation, the curvec ithfulls t0 = 3
leabsiHr1f
FTp
an be fit with f = f∞ × (1 − exp(−t/t0)), yielding f0 = 3.6 ± 1.1%, and t0 can not be faaturation, the curve can be fit with f = f∞ × (1 − exp(−t/t0)), yielding f0 = 60 ± 5% and
ine, indicate that about 15–21% of oxygen is present as carbonateven at low water concentrations. This result supports the NMRnd TEM observations, i.e., amorphous hydrated/hydroxylated car-onates formed, possibly as a sub nanometer layer at the forsteriteurface, even when the H2O content was at or well below saturationn scCO2. CO3/Mg ratios increase modestly from 0 to 149% initial
2O saturation sample, sharply from 149 to 371% initial H2O satu-
ation, and then reach a plateau, approaching but not quite reaching.0, the stoichiometry of MgCO3. Consequently, the sharp increaserom 149% to 371% and the later plateau is consistent with the for-Insa
Initial water saturation
114900%
7430%3710%1485%743%
MMg2SiO4
371%149%
10 20 30 40 50 60 702Ѳ
31
ig. 7. Left traces: XRD patters of samples from 1 g Mg2SiO4 + 11 cm3 76 bar CO2 + xH2O at 8he bottom trace is the XRD of a pure Mg2SiO4 sample. Right traces: the horizontally expaeaks of Mg2SiO4, and MgCO3.
y determined due to insufficient date between 0 and 4 days; (b) 371% initial H2O2 ± 4.6 days.
mation of magnesite of considerable size and quantity, consistentwith NMR and TEM findings.
Curve fitting Si2p yielded three distinguishable components atdifferent binding energies (Table 2). Fig. 9b shows the mole frac-tions of several classes of near-surface species as a function of initialH2O saturation. In neat scCO2, 81.9 and 1.6% of the Si2p signal isderived from forsterite and Si–O–H species, respectively. 16.6% of
the signal indicates a component with a binding energy that is lowerthan that of SiO2 but higher than that of forsterite, reflecting thepresence of a partially polymerized silica species. With the additionitial water turation
4900%
7430%3710%1485%
743%371%149%g2SiO 4
32 33 342Ѳ
0 ◦C for 4 days, where x = 149, 371, 743, 1485, 3710, 7430, and 14,900%, respectively.nded XRD patterns of the corresponding left traces, highlighting the characteristic

Journal Identification = IJGGC Article Identification = 434 Date: August 9, 2011 Time: 6:17 pm
1088 J.H. Kwak et al. / International Journal of Greenhouse Gas Control 5 (2011) 1081–1092
F 2O at 8i
oosctta1tftwct1
eNoutsicto3i
piiso(snpSfH
ig. 8. TEM images obtained on samples from 1 g Mg2SiO4 + 11 cm3 76 bar CO2 + xHnserts are EDS spectra of the indicated locations.
f a little water, i.e., 15% initial H2O saturation, a small decrease wasbserved in the forsterite component, little to no change in Si–OHpecies (concentrations are near detection limits), and possibleonversion of the partially polymerized species to SiO2. From 15%o 371% initial H2O saturation, forsterite systematically decreaseso 3.5% of the Si2p signal and SiO2 increases to 94%. These resultsre consistent with the 29Si SP- and CP-MAS results at and above49% initial H2O saturation, where both XPS and NMR recordedhe formation of Q4 SiO2 species. Further, the binding energy of theorsterite component is consistently 0.3–0.5 eV higher than that ofhe standard value at low H2O contents (15–149% H2O saturation),hereas it is closer to the standard value at neat scCO2 and at H2O
ontents above 149% H2O saturation (Table 2). This possibly reflectshe partially protonated forsterite (surface) species recorded byH–29Si CP NMR from 15 to 100% H2O saturation (Fig. 2). How-ver, XPS detected SiO2 (Q4) at low water concentrations whereasMR did not. This either highlights the surface sensitivity of XPSr possibly is an artifact of the ultra-high vacuum environmentsed for XPS analyses which might have caused some dehydra-ion. Nonetheless, XPS does record a higher proportion of hydratedilica species relative to SiO2 at low H2O (less than or equal to 149%nitial H2O saturation) compared to experiments with higher H2Oontent, which mimics the trend recorded by NMR. In other words,here appears to be a critical H2O content above which conversionf hydrated silica species to SiO2 was facilitated. Interestingly, from71 to 3710% saturation, the mole fractions of forsterite and SiO2
ncrease and decrease, respectively.Curve fitting the O1s line revealed three distinguishable com-
onents (Fig. 9c) in addition to carbonate which was a constrainedndependent parameter derived from the C1s line (see XPS exper-mental section). The binding energies of these components areimilar to those of forsterite or non-bridging oxygens (NBO), SiO2r bridging oxygens (BO), and bound H2O and/or SiOH1 + n speciesTable 2). Detection of bound H2O or SiOH1 + n species is also con-istent with NMR, where it was demonstrated (Figs. 2 and 3) thatear or below initial H2O saturation, a variety of hydrated reaction
roducts were formed. The trend in the proportion of forsterite andiO2 as a function of initial H2O saturation is similar to that derivedrom the Si2p line, where SiO2 increases from 0 to 371% initial2O saturation and then modestly decreases from 371 to 7410%
0 ◦C reacted for 4 days, where x = 149% (a); 371% (b) and 743% (c), respectively. The
initial H2O saturation, whereas forsterite shows a near mirrortrend.
4. Discussion
NMR, TEM, and XPS results are consistent in showing con-sumption of forsterite and production of various silica species andMg-carbonates, where XRD was limited to detection of crystallinereaction products. However, each technique documented differ-ent aspects of the carbonation reaction, providing comprehensiveinsight into the role of H2O. As discussed below, the collective evi-dence suggests H2O is directly involved as a reactant with forsterite,is consumed as a component of hydrated solid phase products, andin sufficient amounts it can serve a catalytic role in the formationof anhydrous solid phase products. Further, the formation of H2Ointerfacial films of varying thickness or a discrete bulk aqueousphase strongly dictates carbonation reaction extent.
4.1. Evidence for H2O surface films and a bulk aqueous phase as afunction of H2O content
Above H2O saturation, H2O nominally forms a discrete bulkaqueous phase saturated in CO2. Below saturation, it is reason-able to speculate that H2O can form thin water films with non-bulkproperties that coat the mineral surfaces in a continuous or dis-continuous manner. NMR demonstrated that H2O did partition tothe surface at concentrations below saturation, as recorded by theformation of hydrated/hydroxylated Mg-carbonates. XPS providesadditional support for this observation. In the absence of a bulkaqueous phase, constant Mg/Si ratios, particularly the bulk ratio,are expected because a means to transport components away fromthe forsterite surface is not present. Nonetheless, the XPS silica sig-nal was enhanced relative to Mg with increasing initial H2O contentbelow saturation, indicating that Si and Mg have incongruentlysegregated in some fashion at the near-surface. As it is unlikelythat Mg would migrate downward relative to Si, it is reasonable to
hypothesize that a thin surface film of H2O formed which promotedhydrolysis of bridging Mg–O–Si bonds and formation of Si–OH sur-face groups, 2H+–Mg++ exchange, and limited transport of Mg andCO3 to nucleation sites for incipient Mg-carbonates of relatively low
Journal Identification = IJGGC Article Identification = 434 Date: August 9, 2011 Time: 6:17 pm
J.H. Kwak et al. / International Journal of Green
4 Mg2p/Si2pO1s/Si2pCO3(C1s)/O1s
3 CO3(C1s)/Mg
Ato
mic
ratio
s
2
0
1
% Initial H O Saturation37102968222614847420
2
1.00
Forsterite
SiO2
a
a
b
c
0.60
0.80
Variably protonated Si-O-H0.20
0.40
Mol
e fr
actio
n
b0.120.14
0.00
Si-O-H/SiO2
0.040.060.080.10
0.000.02
37102968222614847420% Initial H2O Saturation
1.00forsteritecarbonateH2O (bound)
0.60
0.80 SiO2
Mol
e fr
actio
n
0.20
0.40
0.0037102968222614847420
% Initial H2O Saturation
Fig. 9. The XPS determined atomic ratios (a) on samples from 1 g Mg2SiO4 + 11 cm3
73(
sowst
29
6 bar scCO2 + xH2O at 80 ◦C for 4 days, where x = 0, 15, 45, 74, 149, 371, 1485 and710% initial H2O saturation, respectively, (b) XPS results from fitting the Si2p line,c) XPS results from curve fitting the O1 line.
urface area and hence lower XPS determined Mg/Si ratios. More-
ver, at higher water content, the XPS-based forsterite/SiO2 ratioas observed to modestly increase from 371 to 3710% initial H2Oaturation whereas NMR recorded a plateau. Under these condi-ions a separate aqueous phase formed capable of facilitating rapid
house Gas Control 5 (2011) 1081–1092 1089
transport of reaction products away from forsterite surfaces. Sus-tained exposure of forsterite surfaces could then yield an apparentincrease in the XPS determined forsterite/SiO2 ratio. TEM resultsclearly confirm this hypothesis showing discrete magnesite crys-tals and SiO2 particles at 743% initial H2O saturation, consistentwith facile mass transport via a bulk aqueous phase.
4.2. Estimating H2O film thickness
Many of the questions concerning the role of water in theforsterite carbonation reaction concern the physical state of H2Oat the surface in the presence of the scCO2; whether it formeda separate bulk aqueous phase, with attendant bulk properties,or whether it partitioned to the surface of forsterite to form afilm, and if so, how thick and continuous a film and what areits solvating and transport-mediating properties. Without inde-pendent information, film thickness at or below initial saturationcannot be adequately estimated. However, at and above 149% ini-tial H2O saturation, one can estimate H2O film thicknesses withlimiting assumptions. Unfortunately, there was insufficient mate-rial in each experiment to accurately measure surface area afterreaction. Therefore, only initial film thicknesses were estimated,using 1 g of forsterite with a BET surface area of 1.0 m2/g and0.0374 moles CO2 (Table 1). Given that the H2O/CO2 molar ratiois near 1.0% in water-saturated scCO2 at the experimental con-ditions (Spycher et al., 2003), the required amount of H2O toreach saturation is 0.0374 × 10⁻² moles. Excess H2O, defined asthe amount of H2O above saturation, is treated as film conden-sate at the mineral surface. The thickness and distribution ofthe film will depend on numerous factors, including the wet-ting properties of forsterite and the total surface area. If allexcess H2O is assumed to partition to the mineral surface attime = 0 and forms a uniform film, then its average initial thick-ness is (x − 0.0374 × 10⁻² moles) × W/(� × A) = (excess H2O in unitof mole) × W/(� × A), where “x” is the amount of H2O in moles; “W”is the molar weight of H2O, i.e., 18 g/moles; and “�” is the den-sity of H2O, i.e., 1 g/cm3, and “A” is the total forsterite surface area,i.e., 1.0 m2 = 1.0 × 104 cm2. Resulting thickness estimates are listedin Table 1 for different initial H2O contents. For example, at 149%initial H2O saturation the estimated corresponding film thicknessis 3.2 nm. Assuming that the average H2O monolayer thickness isabout 2 A (Fig. S3), ∼16H2O monolayers would be present on theforsterite surface, on average, in this case. With respect to the pos-sibility of water films below H2O saturation, thickness estimatessuch as those above represent an upper bounds.
4.3. H2O consumption
Water films as characterized above assume an excess of H2O, acondition expected to vary with reaction progress. Below satura-tion, progressive H2O consumption is reflected in the formation ofprotonated surface species, variably protonated silica species fromQ0 to Q2, and amorphous hydrated/hydroxylated Mg-carbonatephases. Near saturation, magnesite begins to appear at the expenseof amorphous hydrated/hydroxylated phases. By 149% initial H2Osaturation, conversion to magnesite and Q3 + Q4 species is nearlycomplete. Thus, at and above 149% saturation one can effectivelymodel H2O consumption using Q3 as follows. Each Q3 unit containsone Si–OH group originally formed by exchange of protons for Mgin forsterite. Consequently, the Q3 species store protons generatedby the consumption of H2O during reaction. In this sense, everytwo Q3 species records the consumption of one H2O. Using line-
shape deconvolution of the Si NMR spectra (Kwak et al., 2010),the mole fraction of Q3 and Q4 species were obtained at and above149% initial H2O saturation as a function of reaction time (Table 3).The absolute amount of Q3 or Q4 formed was estimated by multi-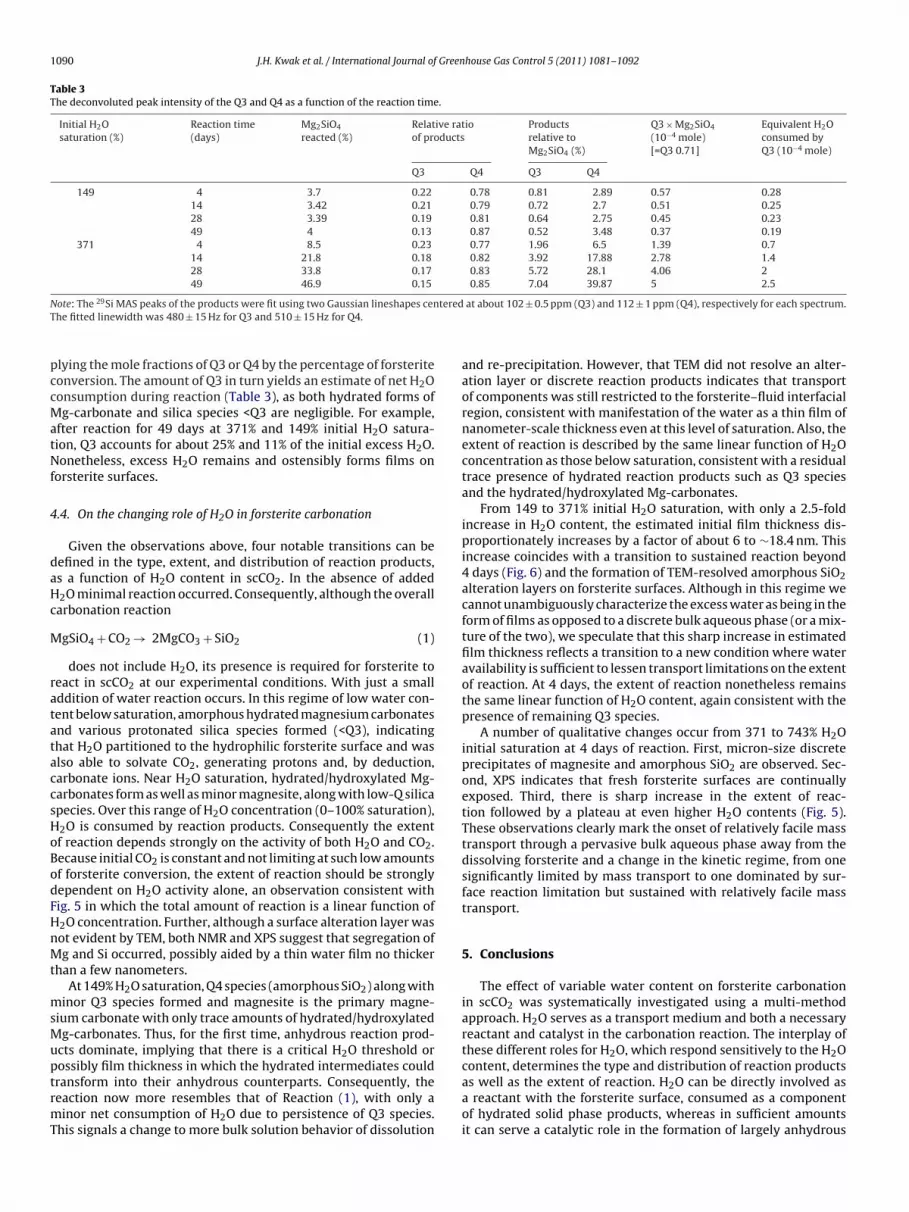
Journal Identification = IJGGC Article Identification = 434 Date: August 9, 2011 Time: 6:17 pm
1090 J.H. Kwak et al. / International Journal of Greenhouse Gas Control 5 (2011) 1081–1092
Table 3The deconvoluted peak intensity of the Q3 and Q4 as a function of the reaction time.
Initial H2Osaturation (%)
Reaction time(days)
Mg2SiO4
reacted (%)Relative ratioof products
Productsrelative toMg2SiO4 (%)
Q3 × Mg2SiO4
(10−4 mole)[=Q3 0.71]
Equivalent H2Oconsumed byQ3 (10−4 mole)
Q3 Q4 Q3 Q4
149 4 3.7 0.22 0.78 0.81 2.89 0.57 0.2814 3.42 0.21 0.79 0.72 2.7 0.51 0.2528 3.39 0.19 0.81 0.64 2.75 0.45 0.2349 4 0.13 0.87 0.52 3.48 0.37 0.19
371 4 8.5 0.23 0.77 1.96 6.5 1.39 0.714 21.8 0.18 0.82 3.92 17.88 2.78 1.428 33.8 0.17 0.83 5.72 28.1 4.06 249 46.9 0.15 0.85 7.04 39.87 5 2.5
N teredT
pccMatNf
4
daHc
M
ratataccsHoBodFHnMt
msMuptrmT
ote: The 29Si MAS peaks of the products were fit using two Gaussian lineshapes cenhe fitted linewidth was 480 ± 15 Hz for Q3 and 510 ± 15 Hz for Q4.
lying the mole fractions of Q3 or Q4 by the percentage of forsteriteonversion. The amount of Q3 in turn yields an estimate of net H2Oonsumption during reaction (Table 3), as both hydrated forms ofg-carbonate and silica species <Q3 are negligible. For example,
fter reaction for 49 days at 371% and 149% initial H2O satura-ion, Q3 accounts for about 25% and 11% of the initial excess H2O.onetheless, excess H2O remains and ostensibly forms films on
orsterite surfaces.
.4. On the changing role of H2O in forsterite carbonation
Given the observations above, four notable transitions can beefined in the type, extent, and distribution of reaction products,s a function of H2O content in scCO2. In the absence of added2O minimal reaction occurred. Consequently, although the overallarbonation reaction
gSiO4 + CO2 → 2MgCO3 + SiO2 (1)
does not include H2O, its presence is required for forsterite toeact in scCO2 at our experimental conditions. With just a smallddition of water reaction occurs. In this regime of low water con-ent below saturation, amorphous hydrated magnesium carbonatesnd various protonated silica species formed (<Q3), indicatinghat H2O partitioned to the hydrophilic forsterite surface and waslso able to solvate CO2, generating protons and, by deduction,arbonate ions. Near H2O saturation, hydrated/hydroxylated Mg-arbonates form as well as minor magnesite, along with low-Q silicapecies. Over this range of H2O concentration (0–100% saturation),2O is consumed by reaction products. Consequently the extentf reaction depends strongly on the activity of both H2O and CO2.ecause initial CO2 is constant and not limiting at such low amountsf forsterite conversion, the extent of reaction should be stronglyependent on H2O activity alone, an observation consistent withig. 5 in which the total amount of reaction is a linear function of2O concentration. Further, although a surface alteration layer wasot evident by TEM, both NMR and XPS suggest that segregation ofg and Si occurred, possibly aided by a thin water film no thicker
han a few nanometers.At 149% H2O saturation, Q4 species (amorphous SiO2) along with
inor Q3 species formed and magnesite is the primary magne-ium carbonate with only trace amounts of hydrated/hydroxylatedg-carbonates. Thus, for the first time, anhydrous reaction prod-
cts dominate, implying that there is a critical H2O threshold orossibly film thickness in which the hydrated intermediates could
ransform into their anhydrous counterparts. Consequently, theeaction now more resembles that of Reaction (1), with only ainor net consumption of H2O due to persistence of Q3 species.his signals a change to more bulk solution behavior of dissolution
at about 102 ± 0.5 ppm (Q3) and 112 ± 1 ppm (Q4), respectively for each spectrum.
and re-precipitation. However, that TEM did not resolve an alter-ation layer or discrete reaction products indicates that transportof components was still restricted to the forsterite–fluid interfacialregion, consistent with manifestation of the water as a thin film ofnanometer-scale thickness even at this level of saturation. Also, theextent of reaction is described by the same linear function of H2Oconcentration as those below saturation, consistent with a residualtrace presence of hydrated reaction products such as Q3 speciesand the hydrated/hydroxylated Mg-carbonates.
From 149 to 371% initial H2O saturation, with only a 2.5-foldincrease in H2O content, the estimated initial film thickness dis-proportionately increases by a factor of about 6 to ∼18.4 nm. Thisincrease coincides with a transition to sustained reaction beyond4 days (Fig. 6) and the formation of TEM-resolved amorphous SiO2alteration layers on forsterite surfaces. Although in this regime wecannot unambiguously characterize the excess water as being in theform of films as opposed to a discrete bulk aqueous phase (or a mix-ture of the two), we speculate that this sharp increase in estimatedfilm thickness reflects a transition to a new condition where wateravailability is sufficient to lessen transport limitations on the extentof reaction. At 4 days, the extent of reaction nonetheless remainsthe same linear function of H2O content, again consistent with thepresence of remaining Q3 species.
A number of qualitative changes occur from 371 to 743% H2Oinitial saturation at 4 days of reaction. First, micron-size discreteprecipitates of magnesite and amorphous SiO2 are observed. Sec-ond, XPS indicates that fresh forsterite surfaces are continuallyexposed. Third, there is sharp increase in the extent of reac-tion followed by a plateau at even higher H2O contents (Fig. 5).These observations clearly mark the onset of relatively facile masstransport through a pervasive bulk aqueous phase away from thedissolving forsterite and a change in the kinetic regime, from onesignificantly limited by mass transport to one dominated by sur-face reaction limitation but sustained with relatively facile masstransport.
5. Conclusions
The effect of variable water content on forsterite carbonationin scCO2 was systematically investigated using a multi-methodapproach. H2O serves as a transport medium and both a necessaryreactant and catalyst in the carbonation reaction. The interplay ofthese different roles for H2O, which respond sensitively to the H2Ocontent, determines the type and distribution of reaction products
as well as the extent of reaction. H2O can be directly involved asa reactant with the forsterite surface, consumed as a componentof hydrated solid phase products, whereas in sufficient amountsit can serve a catalytic role in the formation of largely anhydrous
Journal Identification = IJGGC Article Identification = 434 Date: August 9, 2011 Time: 6:17 pm
Green
sccitfanictoarHtptttthiptr
A
tPmSeusioD
A
t
R
A
A
A
B
B
B
B
B
J.H. Kwak et al. / International Journal of
olid phase products. Below saturation, reaction products were aomplex mixture of partially hydrated/hydroxylated magnesiumarbonate solids and hydroxylated silica species that were mainlyn an amorphous state, forming a spatially non-resolved layer onhe forsterite surface. At H2O contents above saturation, whereorsterite was in contact with both a CO2-saturated aqueous fluidnd H2O-saturated scCO2, reaction products were the solids mag-esite (MgCO3) and amorphous SiO2. Transformation of hydrated
ntermediates to these phases implies H2O initially bound in pre-ursor hydrated/hydroxylated reaction products was liberated andhereby available to induce further reaction. Direct evidence wasbtained that for a given fluid/mineral ratio there is a H2O thresholdbove which a significant portion of the H2O serves in a catalyticole, unlocking extensive carbonation reaction. This transition of2O to a catalyst for metal carbonation coincides with and is poten-
ially abetted by the formation of thicker H2O films and ultimately aervasive aqueous phase that can facilitate mass transport. Longererm experiments are planned for exploring the role of water inhe carbonation of forsterite at conditions (e.g., lower tempera-ures) that are more representative of potential geologic sites forhe sequestration of CO2. Nonetheless, the present contributionas indicated that in low water content environments, such as is
nferred to occur at the contact between a subsurface wet scCO2lume and caprock minerals, the role of local H2O content is poten-ially pivotal for predicting mineral carbonation products and botheaction rates and extent.
cknowledgments
This work was supported by the Carbon Sequestration Initia-ive funded by Laboratory Directed Research and Development atacific Northwest National Laboratory (PNNL), and the U.S. Depart-ent of Energy (DOE), Office of Basic Energy Sciences through a
ingle Investigator Small Group Research (SISGR) grant. All thexperiments were performed using at the Environmental Molec-lar Science Laboratory, EMSL, a national scientific user facilityponsored by the Department of Energy’s DOE Office of Biolog-cal and Environmental Research, and located at PNNL. PNNL isperated for DOE by Battelle Memorial Institute under Contract#E-AC06-76RLO-1830.
ppendix A. Supplementary data
Supplementary data associated with this article can be found, inhe online version, at doi:10.1016/j.ijggc.2011.05.013.
eferences
lexander, G.B., Heston, W.M., Iler, R.K., 1954. The solubility of amorphous silica inwater. J. Phys. Chem. 58, 453–455.
ndreani, M., Luquot, L., Guoze, P., Godard, M., Hoise, E., Gibert, B., 2009. Experi-mental study of carbon sequestration reactions controlled by the percolation ofCO2-rich brine through peridotites. Environ. Sci. Technol. 43 (4), 1226–1231.
ngus, S., Armstrong, B., deRuck, K.M., 1976. International thermodynamic tables ofthe fluid state: carbon dioxide, vol. 3. Pergamon Press, New York.
achu, S., 2002. Sequestration of CO2 in geological media in response to climatechange: road map for site selection using the transform of the geological spaceinto the CO2 phase space. Energ. Convers. Manage. 43 (1), 87–102.
achu, S., Adams, J.J., 2003. Sequestration of CO2 in geological media in response toclimate change: capacity of deep saline aquifers to sequester CO2 in solution.Energ. Convers. Manage. 44 (20), 3151–3175.
achu, S., 2008. CO2 storage in geological media: role, means, status and barriers todeployment. Prog. Energ. Combust. 34 (2), 254–273.
earat, H., Mickelvy, M.J., Chizmeshya, A.V.G., Gormley, D., Nunez, R., Carpenter,R.W., Squires, K., Wolf, G.H., 2006. Carbon sequestration via aqueous olivine
mineral carbonation: role of passivating layer formation. Environ. Sci. Technol.40 (15), 4802–4808.enson, S.M., Surles, T., 2006. Carbon dioxide capture and storage: an overview withemphasis on capture and storage in deep geological formations. Proc. IEEE 94(10), 1795–1805.
house Gas Control 5 (2011) 1081–1092 1091
Blum, A., Lasaga, A.C., 1988. Role of surface speciation in the low-temperature dis-solution of minerals. Nature 331, 431–433.
Casey, W.H., Westrich, H.R., Banfield, J.F., Ferruzzi, G., Arnold, G.W., 1993. Leachingand reconstruction at the surface of dissolving chain-silicate mineral. Nature366, 253–256.
Casey, W.H., Swaddle, T.W., 2003. Why small? The use of small inorganic clustersto understand mineral surface and dissolution reaction in geochemistry. Rev.Geophys. 41 (2), 1008.
Chen, Y., Brantley, S.L., 2000. Dissolution of forsterite olivine at 65 ◦C and 2 < pH < 5.Chem. Geol. 165, 267–281.
Cho, H., Felmy, A.R., Craciun, R., Keenum, J.P., Shah, N., Dixon, D.A., 2006. Solutionstate structure determination of silicate oligomers by 29Si NMR spectroscopyand molecular modeling. J. Am. Chem. Soc. 128, 2324–2335.
Daval, D., Martinez, I., Corvisier, J., Findling, N., Goffe, B., Guyot, F., 2009. Carbonationof Ca-bearing silicates, the case of wollastonite: experimental investigations andkinetic modeling. Chem. Geol. 265 (1–2), 63–78.
Davis, M.C., Brouwer, W.J., Wesolowski, D.J., Anovitz, L.M., Lipton, A.S., Mueller,K.T., 2009. Magnesium silicate dissolution investigated by 29Si MAS, 1H-29SiCPMAS, 25Mg QCPMG, and 1H–25Mg CP QCPMG NMR. Phys. Chem. Chem. Phys.11, 7013–7021.
Diefenbacher, J., McKelvy, M., Chizmeshya, V.G., Wolf, G.H., 2005. Externally con-trolled pressure and temperature microreactor for in situ X-ray diffraction,visual and spectroscopic reaction investigations under supercritical and sub-critical conditions. Rev. Sci. Instrum. 76 (1), 015103.
Duval, Y., Mielczarski, J.A., Pokrovsky, O.S., Mielczarski, E., Ehrhardt, J.J., 2002. Evi-dence of the existence of three types of species at the quartz-aqueous solutioninterface at pH 0–10: XPS surface group quantification and surface complexationmodeling. J. Phys. Chem. B 106 (11), 2937–2945.
Felmy, A.R., Cho, H.M., Rustad, J.R., Mason, M.J., 2001. An aqueous thermodynamicmodel for polymerized silica species to high ionic strength. J. Solut. Chem. 30,509–525.
Giammar, D.E., Bruant Jr., R.G., Peters, C.A., 2005. Forsterite dissolution and mag-nesite precipitation at conditions relevant for deep saline aquifer storage andsequestration of carbon dioxide. Chem. Geol. 217 (3–4), 257–276.
Goff, F., Lackner, K.S., 1998. Carbon dioxide sequestration using ultramafic rocks.Environ. Geosci. 5, 89.
Hanchen, M., Prigiobbe, V., Storti, G., Seward, T.M., Mazzotti, M., 2006. Dissolutionkinetics of fosteritic olivine at 90–150 ◦C including effects of the presence of CO2.Geochim. Cosmochim. Acta 70 (17), 4403–4416.
Hanchen, M., Prigiobbe, V., Baciocchi, R., Mazzotti, M., 2008. Precipitation in theMg–carbonate system – effects of temperature and CO2 pressure. Chem. Eng.Sci. 63 (4), 1012–1028.
Hayashi, S., Hayamizu, K., 1991. Chemical shifts standards in high-resolution solid-state NMR (1) 13C, 29Si, and 1H nuclei. Bull. Chem. Soc. Jpn. 64, 685–687.
Kaszuba, J.P., Janecky, D.R., Snow, M.G., 2003. Carbon dioxide reaction processes ina model brine aquifer at 200 ◦C and 200 bars: implications for geologic seques-tration of carbon. Appl. Geochem. 18 (7), 1065–1080.
Kaszuba, J.P., Janecky, D.R., Snow, M.G., 2005. Experimental evaluation of mixed fluidreactions between supercritical carbon dioxide and NaCl brine: relevance to theintegrity of a geologic carbon repository. Chem. Geol. 217 (3–4), 277–293.
Kwak, J.H., Hu, J.Z., Hoyt, D.W., Sears, J.A., Wang, C., Rosso, K.M., Felmy, A.R., 2010.Metal carbonation of forsterite in supercritical CO2 and H2O using solid state29Si, 13C NMR spectroscopy. J. Phys. Chem. C 114, 4126–4134.
Lin, H., Fujii, T., Takisawa, R., Takahashi, T., Hashida, T., 2008. Experimental evaluationof interactions in supercritical CO2/water/rock minerals system under geologicCO2 sequestration conditions. J. Mater. Sci. 43, 2307–2315.
Magi, M., Lippmaa, E., Samoson, A., Engelhardt, G., Grimmer, A.R., 1984. Solid-state high-resolution silicon-29 chemical shifts in silicates. J. Phys. Chem. 88,1518–1522.
Matson, D.W., Sharma, S.K., Philpotts, J.A., 1986. Raman spectra of some tectosilicatesand of glasses along the orthoclase–anorthite and nepheline–anorthite joins.Am. Mineral. 71, 694–704.
Mckelvy, M.J., Chizmeshya, A.V.G., Diffembacher, J., Bearat, H., Wolf, G., 2004. Explo-ration of the role of heat activation in enhancing serpentine carbon sequestrationreactions. Environ. Sci. Technol. 38 (24), 6897–6903.
Oelkers, E.H., 2001. An experimental study of forsterite dissolution rates as a func-tion of temperature and aqueous Mg and Si concentrations. Chem. Geol. 175,485–494.
Prasad, P.S.R., Sarma, D.S., Sudhakar, L., Basavaraju, U., Singh, R.S., Begum, Z., Archana,K.B., Chavan, C.D., Charan, S.N., 2009. Geological sequestration of carbon dioxidein Deccan basalts: preliminary laboratory study. Curr. Sci. India 96 (2), 288–291.
Pruess, K., Xu, T., Apps, J., Garcia, J., 2003. Numerical modeling of aquifer disposal ofCO2. SPE J. 8 (1), 49–60.
Rosso, J.J., Rimstidt, J.D., 2000. A high resolution study of forsterite dissolution rates.Geochim. Cosmochim. Acta 64, 797–811.
Schaef, H.T., McGrail, B.P., Qwen, A.T., 2009. Basalt–CO2–H2O interactions and vari-ability in carbonate mineralization rates. Greenhouse Gas Control Technologies9 1 (1), 4899–4906.
Spycher, N., Pruess, K., Ennis-King, J., 2003. CO2–H2O mixtures in the geologicalsequestration of CO2. I: assessment and calculation of mutual solubili-ties from 12 to 100 ◦C and up to 600 bar. Geochim. Cosmochim. Acta 67,
3015–3031.Tsomaia, N., Brantley, S.L., Hamilton, J.P., Pantano, C.G., Mueller, K.T., 2003. NMRevidence for formation of octahedral and tetrahedral Al and repolymerizationof the Si network during dissolution of aluminosilicate glass and crystal. Am.Mineral. 88, 54–67.

Journal Identification = IJGGC Article Identification = 434 Date: August 9, 2011 Time: 6:17 pm
1 Green
U
W
W
W
092 J.H. Kwak et al. / International Journal of
nger, B., Jancke, H., Hahnert, M., Stade, H., 1994. The early stages of the sol–gelprocessing of TEOS. J. Sol–Gel Sci. Technol. 2, 51.
estrich, H.R., Cygan, R.T., Casey, W.H., Zemitis, C., Arnold, G.W., 1993. The dissolu-tion kinetics of mixed-cation orthosilicate minerals. Am. J. Sci. 293, 869–893.
ogelius, R.A., Walther, J.V., 1991. Olivine dissolution at 25 ◦C: effects of pH, CO2,and organic acids. Geochim. Cosmochim. Acta 55 (4), 943–954.
olf, G.H., Chizmeshya, A.V.G., Diffembacher, J., Mickelvy, M.J., 2004. In situ observa-tion of CO2 sequestration reactions using a novel microreaction system. Environ.Sci. Technol. 38 (3), 932–936.
house Gas Control 5 (2011) 1081–1092
Xu, T., Apps, J.A., Pruess, K., Yamamoto, H., 2007. Numerical modeling of injectionand mineral trapping of CO2 with H2S and SO2 in a sandstone formation. Chem.Geol. 242 (3–4), 319–346.
Yanina, S.M., Rosso, K.M., Meakin, P., 2006. Defect distribution and dissolution mor-
phologies on low-index surfaces of a-quartz. Geochim. Cosmochim. Acta 70,1113–1127.Zakaznova-Herzog, V.P., Nesbit, H.W., Bancroft, G.M., Tse, J.S., Gao, X., Skinner, W.,2005. High-resolution valence-band XPS spectra of the nonconductors quartzand olivine. Phys. Rev. B 72, 205113.