s2.0 s1878029613003095 main
TRANSCRIPT

Procedia Environmental Sciences 19 ( 2013 ) 341 – 350
1878-0296 © 2013 The Authors. Published by Elsevier B.V Open access under CC BY-NC-ND license.Selection and/or peer-review under responsibility of the Scientific Committee of the Conferencedoi: 10.1016/j.proenv.2013.06.039
Available online at www.sciencedirect.com
Four Decades of Progress in Monitoring and Modeling of Processes in the Soil-Plant-
Atmosphere System: Applications and Challenges
Comparing the hydraulic properties of forested and grassed soils on an experimental hillslope in a Mediterranean
environment
M. Pirastru*, M. Castellini, F. Giadrossich, M. Niedda aDepartment of Agraria, Viale Italia 39, Sassari 07100, Italy
Abstract
This experimental research compares the physical and hydraulic properties of two adjacent soils, one covered with a native forest of Mediterranean maquis, and the other with spontaneous grass. The latter replaced the previous natural forest. The aim is to quantify the significant differences in the soil properties caused by the removal of the natural vegetation. Although the soil texture was similar in the different land uses, the soil under the forest had a higher organic matter content, a lower apparent density and a higher water content at saturation than the grassed soil. The analysis of the water retention characteristics indicated that the retained water content of the forest soil exceeded that of the grassed soil in the range from saturation to -50 cm of water tension. This suggests that changing the land use altered the soil pore structure within this range. The hydraulic conductivity of the forest soil exceeded that of the grassed soil at water tensions of -10, -5 and -3 cm. Conversely the hydraulic conductivity of the grassed soil was similar to that of the forest soil at -1 cm of water tension and at saturation. This result was probably due to the hydraulic activation of the desiccation cracks in the grassed soil. This increased the amount of infiltrated water in saturated and near-saturated soil conditions. This work shows that changes in land use have an unfavorable impact on the physical and hydraulic properties of the soil. Soil covered with grass is more vulnerability to water erosion than that under forest, and there is likely to be general worsening of flow regimes.
© 2013 The Authors. Published by Elsevier B.V. Selection and/or peer-review under responsibility of the Scientific Committee of the conference.
Keywords: land use; Mediterranean maquis; soil hydraulic properties; infiltration
* Corresponding author. Tel.: +039 079229342; fax: +039 079229340. E-mail address: [email protected].
© 2013 The Authors. Published by Elsevier B.V Open access under CC BY-NC-ND license.Selection and/or peer-review under responsibility of the Scientific Committee of the conference

342 M. Pirastru et al. / Procedia Environmental Sciences 19 ( 2013 ) 341 – 350
1. Introduction
The relationship between vegetation and soil water dynamics and the effects of changes in land use on the soil water balance are central themes in eco-hydrology. The type of vegetation has an impact on soil erosion and slope stability [1,2], and on chemical and physical soil properties, such as organic matter content, soil structure, pore size distribution, porosity, and bulk density [1,3,4]. These properties affect the soil's hydraulic properties, such as water retention and hydraulic conductivity. These properties govern the transportation processes of solutes and water in the porous media. The effects of changes in land use on the hydraulic properties of the soil and on water flow are the subject of many important recent advances [4,5,6,7]. In these studies grazed pastures or cultivated lands appear to be more compacted and stripped of the organic-rich upper horizon than do soils covered with native, undisturbed vegetation (generally forest or natural grassland). A great reduction in the organic matter content, a significantly increased bulk density, a decreased porosity and a degraded structure can be expected for these soils. Generally speaking, the soil water retention characteristics and hydraulic conductivity are also altered by changes in land use, and this is more evident in the topsoil, and for soil tensions close to saturation [4,8]. Stable continuous root channels and macropores caused by soil fauna activity are typically observed in forested and natural soils. Even though macropores are only a limited fraction of the total soil pore volume, they transport most of the water in wet soil conditions. In heavy rainfall, this allow much of the water to infiltrate without involvement of the Hortonian runoff generation processes. Soils impacted by human activity are generally associated with decreased rooting networks and animal activity, thereby reducing the potential for well-developed and efficient macropore networks. These soils have low infiltration and water storage capacity, and this increases the possibility of runoff being generated [6].
The conversion of native forests and pasture lands into croplands is often reflected in worsened flow regimes and water availability in hydrological watersheds [9]. High peak flow, high runoff volume and decreased concentration times for floods are generally observed after extensive land use modification [11,12]. The levels of surface soil erosion due to atmospheric forcing (heavy rainfall, wetting-drying cycles, etc.) and agricultural practices also increase, because the soil is more vulnerable to erosion [1,2]. In Mediterranean watersheds this worsening of regime flow and erosion processes is exacerbated by the great frequency of high intensity rainfall events, and also by the seasonal mismatch between evapotraspiration and rainfall. In these climatic conditions it is crucial to understand how removal of the native vegetation influences the hydrological properties of the soil. In this way data can be provided to the authorities which will improve regional hydrological modeling and which will forecast a catchment area's hydrological response to changes in land use. In this work we investigate the hydrological properties of two hillslope soils with contrasting land use, i.e. a well developed forest of Mediterranean maquis and an uncultivated area covered by spontaneous grass, which replaced the previous natural forest. The objective was to quantify the effects of the changes in land use on the hydrological properties of the soils.
2. Materials and methods
2.1. Site description
The experimental area is located in the Baratz Lake watershed (described in detail by [9,10]), in North-West Sardinia, Italy. The climate is Mediterranean, semi-arid with a mild winter, a warm summer, and a high water deficit between April and September. Average annual precipitation is about 600 mm and this falls mainly from autumn to spring.
The experimental site was on the steep side of a hill, lateral to the main valley of the catchment area. The hillslope faces north and has a mean elevation of 57 m a.s.l.. It is about 70 m long with a mean
343 M. Pirastru et al. / Procedia Environmental Sciences 19 ( 2013 ) 341 – 350
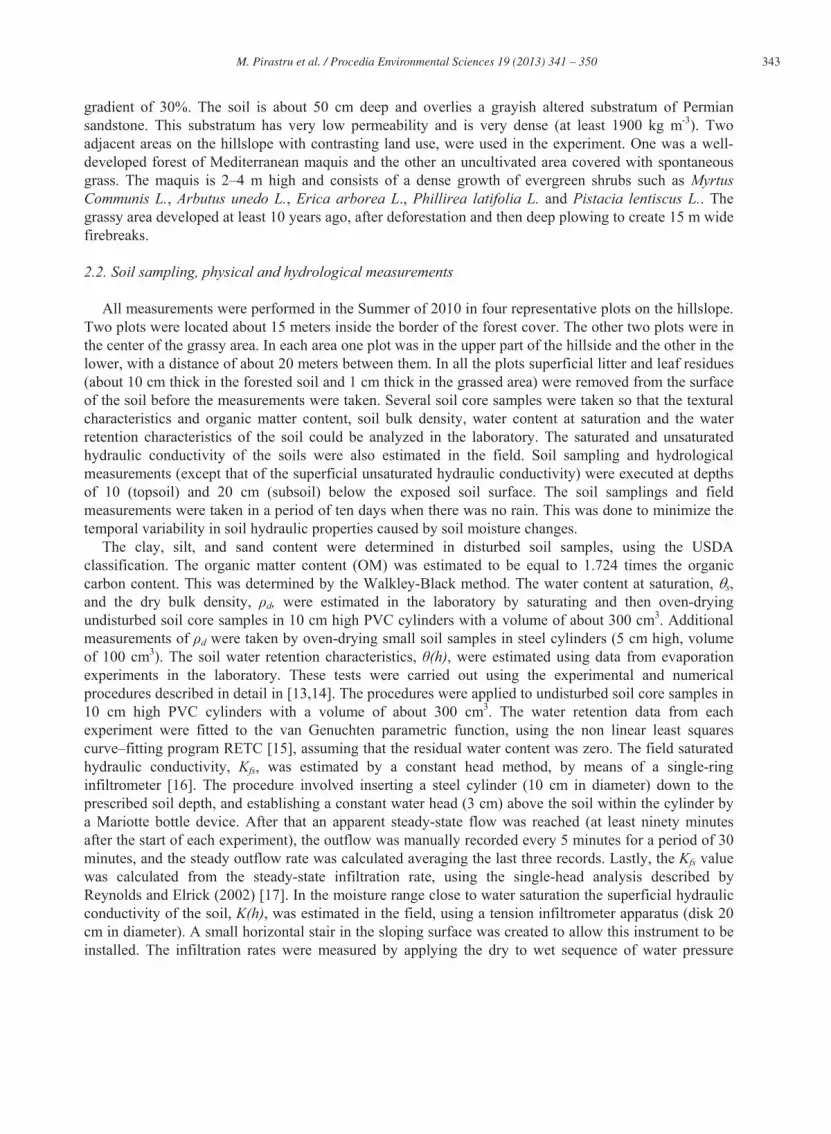
gradient of 30%. The soil is about 50 cm deep and overlies a grayish altered substratum of Permian sandstone. This substratum has very low permeability and is very dense (at least 1900 kg m-3). Two adjacent areas on the hillslope with contrasting land use, were used in the experiment. One was a well-developed forest of Mediterranean maquis and the other an uncultivated area covered with spontaneous grass. The maquis is 2–4 m high and consists of a dense growth of evergreen shrubs such as Myrtus Communis L., Arbutus unedo L., Erica arborea L., Phillirea latifolia L. and Pistacia lentiscus L.. The grassy area developed at least 10 years ago, after deforestation and then deep plowing to create 15 m wide firebreaks.
2.2. Soil sampling, physical and hydrological measurements
All measurements were performed in the Summer of 2010 in four representative plots on the hillslope. Two plots were located about 15 meters inside the border of the forest cover. The other two plots were in the center of the grassy area. In each area one plot was in the upper part of the hillside and the other in the lower, with a distance of about 20 meters between them. In all the plots superficial litter and leaf residues (about 10 cm thick in the forested soil and 1 cm thick in the grassed area) were removed from the surface of the soil before the measurements were taken. Several soil core samples were taken so that the textural characteristics and organic matter content, soil bulk density, water content at saturation and the water retention characteristics of the soil could be analyzed in the laboratory. The saturated and unsaturated hydraulic conductivity of the soils were also estimated in the field. Soil sampling and hydrological measurements (except that of the superficial unsaturated hydraulic conductivity) were executed at depths of 10 (topsoil) and 20 cm (subsoil) below the exposed soil surface. The soil samplings and field measurements were taken in a period of ten days when there was no rain. This was done to minimize the temporal variability in soil hydraulic properties caused by soil moisture changes.
The clay, silt, and sand content were determined in disturbed soil samples, using the USDA classification. The organic matter content (OM) was estimated to be equal to 1.724 times the organic carbon content. This was determined by the Walkley-Black method. The water content at saturation, s, and the dry bulk density, d, were estimated in the laboratory by saturating and then oven-drying undisturbed soil core samples in 10 cm high PVC cylinders with a volume of about 300 cm3. Additional measurements of d were taken by oven-drying small soil samples in steel cylinders (5 cm high, volume of 100 cm3). The soil water retention characteristics, (h), were estimated using data from evaporation experiments in the laboratory. These tests were carried out using the experimental and numerical procedures described in detail in [13,14]. The procedures were applied to undisturbed soil core samples in 10 cm high PVC cylinders with a volume of about 300 cm3. The water retention data from each experiment were fitted to the van Genuchten parametric function, using the non linear least squares curve–fitting program RETC [15], assuming that the residual water content was zero. The field saturated hydraulic conductivity, Kfs, was estimated by a constant head method, by means of a single-ring infiltrometer [16]. The procedure involved inserting a steel cylinder (10 cm in diameter) down to the prescribed soil depth, and establishing a constant water head (3 cm) above the soil within the cylinder by a Mariotte bottle device. After that an apparent steady-state flow was reached (at least ninety minutes after the start of each experiment), the outflow was manually recorded every 5 minutes for a period of 30 minutes, and the steady outflow rate was calculated averaging the last three records. Lastly, the Kfs value was calculated from the steady-state infiltration rate, using the single-head analysis described by Reynolds and Elrick (2002) [17]. In the moisture range close to water saturation the superficial hydraulic conductivity of the soil, K(h), was estimated in the field, using a tension infiltrometer apparatus (disk 20 cm in diameter). A small horizontal stair in the sloping surface was created to allow this instrument to be installed. The infiltration rates were measured by applying the dry to wet sequence of water pressure

344 M. Pirastru et al. / Procedia Environmental Sciences 19 ( 2013 ) 341 – 350
heads of h= -10, -5, -3 and -1 cm at the same soil sites. The amount of water infiltrating into the soil was measured by manually recording the drop in the water level in the graduated reservoir tower. This was done at time interval of 5 minutes and for a total period of 30 minutes, after that an apparent steady-state flow was reached. The steady-state infiltration rate was calculated based on the last three measurements. Lastly, the K(h) values were calculated by means of the double tension approach described by Ankeny et al. (1991) [18], using the Wooding (1968) [19] analytical solution for steady-state flow from a circular source, written for two different hydraulic heads and the two corresponding water volume flux rates of infiltration.
2.3. Data treatment and statistical analysis
In the four plots and at the two investigated soil depths, the measurements were repeated from a minimum of two to a maximum of five times, depending on the kind of the measurement. A prior visual analysis indicated that there was no difference in the physical and hydraulic data from the upper and lower part of the hillslope in the two land use classes. Hence, within a land use class, all the measurements coming from the same depth were pooled, and in this way four statistical samples were obtained. These represented a combination of land use class and soil depth. The exceptions were the measurements of the (h) and K(h), where two statistical samples were obtained, one for each land use class. The minimum sample size was nmin=4 for the soil texture characteristics and OM, nmin = 10 for the
b in 100 cm3 soil samples (nmin =4 for 300 cm3 soil samples) and nmin =4 for the s, nmin =4 for (h). These soil properties are expected to exhibit low or medium variability [20], and so we believe that, despite using the minimum sample size, we were still able to approximately characterize these physical and hydrological properties of the soil at a given area and soil depth. For the Kfs and K(h), the minimum sample size was nmin =4. These hydrological soil properties are expected to show higher spatial variability [20], so that, in general, larger sample sizes are needed in order to obtain fully representative values. Unfortunately, the number of repeated samples was limited by the difficulties encountered during the installation of the instruments. These difficulties were due to the steepness of the slope, the stoniness of soil and the inaccessibility of the undergrowth in the maquis. Each data set was summarized from their mean behavior as well as their variability (min, max, coefficient of variation, CV, and mean absolute error, MAE). Non-parametric Mann-Whitney Rank Sum tests were performed to test for the significance of the differences between the values of the measured properties for a given depth and land use class. A threshold value of p=0.05 was used to define statistical significance. All analyzes were performed using the functions of the statistic toolbox in MATLAB.
3. Results and discussion
3.1. Soil texture and organic matter content
The mean percentages of sand, silt and clay ranged from 61.1% to 68.6%, 14.4% to 21.6% and 11.8% to 18.7%, respectively. The variation coefficients ranged from 0.09 to 0.18 for the sandy fraction, from 0.06 to 0.37 for the silt fraction, and from 0.16 to 0.45 for the clay fraction. As shown in Fig. 1a, of the total of 16 soil samples analyzed, 13 were classified as sandy loam and 3 were sandy clay loam. When the soil particle sizes of the forested and the grassed areas were compared, no statistically significant differences were detected at any depth of sampling. The sand, clay and silt content at the two soil depths of 10 and 20 cm were also not statistically significant for each land use class. These results were expected, because the parent material was identical for the two land use classes. The similarity in the textures of the soils is important, because it suggests that possible differences between the forest area and

345 M. Pirastru et al. / Procedia Environmental Sciences 19 ( 2013 ) 341 – 350
the adjacent grassed area in the other physical and hydraulic properties of the soil can be attributed with a certain degree of confidence to the effects of land use.
The mean OM at 10 and 20 cm of soil depth in the forested area were 14.8% and 8.8%, and the CV were 0.09 and 0.33, respectively. At the same depths in the grassed area the mean OM were 4.6% and 3.3%, and the CV were 0.21 and 0.31, respectively. The differences between land use were statistically significant at both depths. In the forested area the mean OM at 10 cm was also significantly greater than that at 20 cm of depth. This vertical gradient in the OM was not clearly evident in the grassed area, and the OM at 10 and 20 cm of depth did not differ in a statistically significant way. The results of the OM analysis are in line with the findings of several other studies [1,5,6], and this indicates that forested areas create the most favorable conditions for producing and storing OM.
3.2. Soil bulk density
The b data (Fig. 1b) indicate that the forested soil had a lower b than did the grassed soil at the two investigated depths. In the forested soil the mean b (measured using 100 cm3 soil samples) was 1157 kg m-3 (CV=0.18) at the depth of 10 cm, and 1396 kg m-3 (CV= 0.073) at the depth of 20 cm. In the grassed soil the b of topsoil was 1.4 times higher than that for forested soil at the same depth, and the CV was 0.076. The difference between the soil types was somewhat less at 20 cm of depth, where the b of the grassed area was about 1.2 times greater than that of the forest soil, and the variation coefficient was 0.071. Statistical comparison between the two land use classes showed that at all depths the differences were significant. In the forested area the b of the upper samples also differed significantly from that of lower samples, whilst this physical property did not vary significantly with depth in the soil covered with grass.
Using 300 cm3 soil samples, mean b was lower at all soil depths in both land use classes. In the forested area the mean b was 1077 kg m-3 (CV=0.15) at a depth of 10 cm and 1329 kg m-3 (CV=0.1) at a depth of 20 cm. In the grassed area, the mean b was 1549 kg m-3 (CV=0.1) in the upper layer, and decreased slightly (1472 kg m-3, CV=0.007) in the deeper layer. When large soil samples were used, the statistical test also confirmed that b was significantly higher at all soil depths in the grassed area than in the forested area. Only in the forested soil did this physical property of the soil vary significantly with depth. The results of our study agree with those of several other studies [3,4,21], and support the general conclusion that after disruption of the natural land cover one must expect an increase in b in the soil.
0
400
800
1200
1600
2000
2400
b (kg
m-3
)
20 cm10 cm
Grass (100 / 300 cm3 soil samples)
min / maxForest (100/300 cm3 soil samples)
/
MAE
/
(b)(a)
0
400
800
1200
1600
2000
2400
b (kg
m-3
)
20 cm10 cm
Grass (100 / 300 cm3 soil samples)
min / maxForest (100/300 cm3 soil samples)
/
MAE
/
(b)
0
400
800
1200
1600
2000
2400
b (kg
m-3
)
20 cm10 cm
Grass (100 / 300 cm3 soil samples)
min / maxForest (100/300 cm3 soil samples)
/
MAE
/
0
400
800
1200
1600
2000
2400
b (kg
m-3
)
20 cm10 cm
Grass (100 / 300 cm3 soil samples)
min / maxForest (100/300 cm3 soil samples)
/
MAE
/Grass (100 / 300 cm3 soil samples)
min / maxForest (100/300 cm3 soil samples)
/
MAE
/
(b)(a)
Fig. 1. (a) Particle size distribution in the USDA textural triangle of the 16 soil samples collected at 10 and 20 cm of depth in the forested and grassed soils; (b) averages, minimum and maximum values and mean absolute errors (MAE) of b derived from 100 cm3 and 300 cm3 samples collected at depths of 10 and 20 cm in the forested and grassed soils.
346 M. Pirastru et al. / Procedia Environmental Sciences 19 ( 2013 ) 341 – 350
3.3. Soil water content at saturation
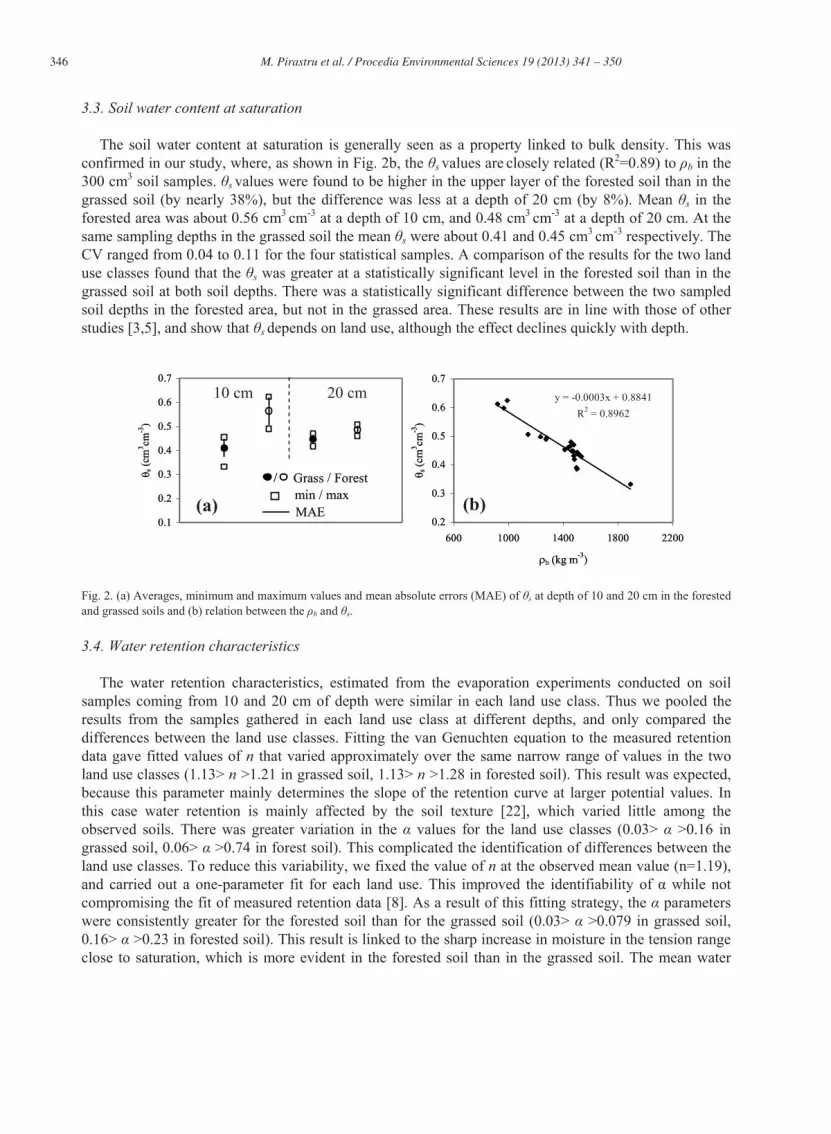
The soil water content at saturation is generally seen as a property linked to bulk density. This was confirmed in our study, where, as shown in Fig. 2b, the s values are closely related (R2=0.89) to b in the 300 cm3 soil samples. s values were found to be higher in the upper layer of the forested soil than in the grassed soil (by nearly 38%), but the difference was less at a depth of 20 cm (by 8%). Mean s in the forested area was about 0.56 cm3 cm-3 at a depth of 10 cm, and 0.48 cm3 cm-3 at a depth of 20 cm. At the same sampling depths in the grassed soil the mean s were about 0.41 and 0.45 cm3 cm-3 respectively. The CV ranged from 0.04 to 0.11 for the four statistical samples. A comparison of the results for the two land use classes found that the s was greater at a statistically significant level in the forested soil than in the grassed soil at both soil depths. There was a statistically significant difference between the two sampled soil depths in the forested area, but not in the grassed area. These results are in line with those of other studies [3,5], and show that s depends on land use, although the effect declines quickly with depth.
0.1
0.2
0.3
0.4
0.5
0.6
0.7
s (cm
3 cm-3
)
Grass / Forest/min / maxMAE
10 cm 20 cm y = -0.0003x + 0.8841R2 = 0.8962
0.2
0.3
0.4
0.5
0.6
0.7
600 1000 1400 1800 2200
b (kg m-3)
s (cm
3 cm-3
)
(a) (b)0.1
0.2
0.3
0.4
0.5
0.6
0.7
s (cm
3 cm-3
)
Grass / Forest/min / maxMAE
10 cm 20 cm y = -0.0003x + 0.8841R2 = 0.8962
0.2
0.3
0.4
0.5
0.6
0.7
600 1000 1400 1800 2200
b (kg m-3)
s (cm
3 cm-3
)
0.1
0.2
0.3
0.4
0.5
0.6
0.7
s (cm
3 cm-3
)
Grass / Forest/min / maxMAE
Grass / Forest//min / maxMAE
10 cm 20 cm y = -0.0003x + 0.8841R2 = 0.8962
0.2
0.3
0.4
0.5
0.6
0.7
600 1000 1400 1800 2200
b (kg m-3)
s (cm
3 cm-3
)
(a) (b)
Fig. 2. (a) Averages, minimum and maximum values and mean absolute errors (MAE) of s at depth of 10 and 20 cm in the forested and grassed soils and (b) relation between the b and s.
3.4. Water retention characteristics
The water retention characteristics, estimated from the evaporation experiments conducted on soil samples coming from 10 and 20 cm of depth were similar in each land use class. Thus we pooled the results from the samples gathered in each land use class at different depths, and only compared the differences between the land use classes. Fitting the van Genuchten equation to the measured retention data gave fitted values of n that varied approximately over the same narrow range of values in the two land use classes (1.13> n >1.21 in grassed soil, 1.13> n >1.28 in forested soil). This result was expected, because this parameter mainly determines the slope of the retention curve at larger potential values. In this case water retention is mainly affected by the soil texture [22], which varied little among the observed soils. There was greater variation in the values for the land use classes (0.03> >0.16 in grassed soil, 0.06> >0.74 in forest soil). This complicated the identification of differences between the land use classes. To reduce this variability, we fixed the value of n at the observed mean value (n=1.19), and carried out a one-parameter fit for each land use. This improved the identifiability of while not compromising the fit of measured retention data [8]. As a result of this fitting strategy, the parameters were consistently greater for the forested soil than for the grassed soil (0.03> >0.079 in grassed soil, 0.16> >0.23 in forested soil). This result is linked to the sharp increase in moisture in the tension range close to saturation, which is more evident in the forested soil than in the grassed soil. The mean water

347 M. Pirastru et al. / Procedia Environmental Sciences 19 ( 2013 ) 341 – 350
retention characteristics, shown in Fig. 3, indicate that the potential values at which the retained water contents of forested soil exceed those of grassed soil were limited to the range from saturation to -50 cm of water tension. This suggests that changes in land use alter the soil pore structure mainly within this range of potential values.
0.15
0.25
0.35
0.45
0.55
0.1 1.0 10.0 100.0 1000.0Water pressure head |cm|
Soil
wat
er c
onte
nt (c
m3 c
m-3)
Grass
Forest
MAE
0.15
0.25
0.35
0.45
0.55
0.1 1.0 10.0 100.0 1000.0Water pressure head |cm|
Soil
wat
er c
onte
nt (c
m3 c
m-3)
Grass
Forest
MAE
Grass
Forest
MAE
Fig. 3. Averaged van Genuchten retention curves and mean absolute errors (MAE) of the soil water content retained at various water tensions in the forested and grassed soils.
3.5. Field saturated hydraulic conductivity
As shown in Fig. 4a, in the forested area the Kfs values ranged from 130 to 600 mm h-1. At 10 cm of depth, the mean Kfs was 455 mm h-1 (CV=0.25), and at 20 cm of depth the mean Kfs value was 280 mm h-1 (CV=0.52). In the soil covered with grass, the minimum and maximum Kfs values were 9.5 and 390 mm h-1 respectively. At 10 cm of depth, the mean Kfs was 280 mm h-1 (CV=0.46) This fell to 180 mm h-1 (CV=0.73) at a soil depth of 20 cm. Statistical comparison of the Kfs measurements indicated that in both land use classes the Kfs did not vary significantly with depth. The Kfs of the forested and the grassed area were also statistically similar for each soil depth. These results were probably due to the small Kfs sample sizes, and of the great variation in the measurements. This variation was probably due to the local heterogeneity in macropore flow. As a result there was some difficulty in reproducing the results. In order to increase the sample size, measurements from different depths within each land use class were grouped, and in this way one larger statistical sample (nmin=8) was obtained for each land use. Testing the null hypothesis that there was no difference between the Kfs samples found that the null hypothesis cannot be rejected at a probability of 0.05, although it can at p = 0.1.
Our results for Kfs are in line with those of some other field studies [1,4,23], which found that conversion from forest to pasture (or vice versa) do not necessarily cause a statistically relevant alteration in the saturated hydraulic conductivity of the soil. However it is well-known that the Kfs is not a steady soil property, but varies with time, depending of the seasonal pattern of soil moisture. Bormann and Klaassen (2008) [24] and Zhou et al. (2008) [25] found that the surface hydraulic conductivities measured under pasture and cropland in late spring or summer were several times higher than those measured in wetter periods. These results were connected to the increase in soil macroporosity, which was itself due to the development of animal burrows and earthworm channels in the spring and the appearance of dessication cracks in the surface of the soil in the dry summer months. In woodland the macropore structure was more stable over time, and the Kfs was less sensitive to temporal changes in soil moisture [25]. Because we often observed desiccation cracks in the grassed soil in our experimental area, we expect that the Kfs of this soil exhibit a marked seasonal variability. This temporal variation may have been superimposed on its spatial variation, thus hiding the effects associated to the land use change.
348 M. Pirastru et al. / Procedia Environmental Sciences 19 ( 2013 ) 341 – 350
3.6. Superficial unsaturated hydraulic conductivity
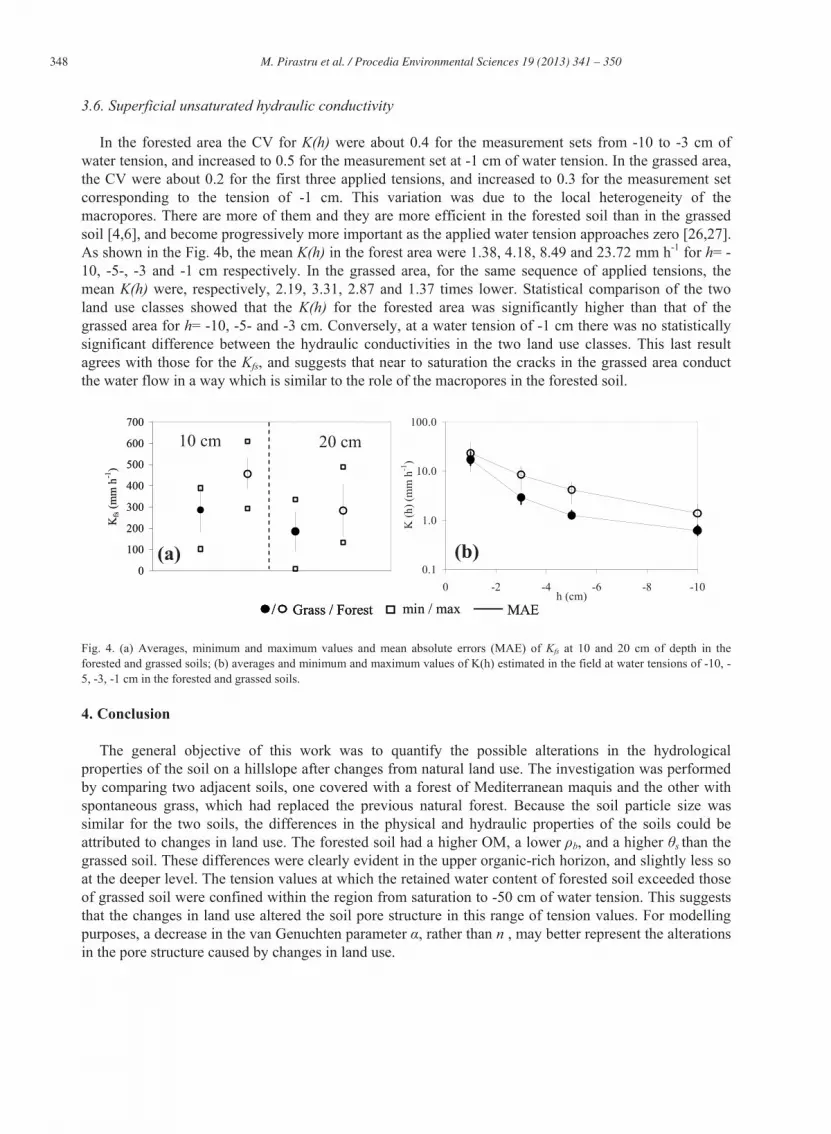
In the forested area the CV for K(h) were about 0.4 for the measurement sets from -10 to -3 cm of water tension, and increased to 0.5 for the measurement set at -1 cm of water tension. In the grassed area, the CV were about 0.2 for the first three applied tensions, and increased to 0.3 for the measurement set corresponding to the tension of -1 cm. This variation was due to the local heterogeneity of the macropores. There are more of them and they are more efficient in the forested soil than in the grassed soil [4,6], and become progressively more important as the applied water tension approaches zero [26,27]. As shown in the Fig. 4b, the mean K(h) in the forest area were 1.38, 4.18, 8.49 and 23.72 mm h-1 for h= -10, -5-, -3 and -1 cm respectively. In the grassed area, for the same sequence of applied tensions, the mean K(h) were, respectively, 2.19, 3.31, 2.87 and 1.37 times lower. Statistical comparison of the two land use classes showed that the K(h) for the forested area was significantly higher than that of the grassed area for h= -10, -5- and -3 cm. Conversely, at a water tension of -1 cm there was no statistically significant difference between the hydraulic conductivities in the two land use classes. This last result agrees with those for the Kfs, and suggests that near to saturation the cracks in the grassed area conduct the water flow in a way which is similar to the role of the macropores in the forested soil.
0
100
200
300
400
500
600
700
Kfs (m
m h
-1)
0.1
1.0
10.0
100.0
-10-8-6-4-20h (cm)
K (h
) (m
m h
-1)
Grass / Forest/ min / max MAE
(a) (b)
10 cm 20 cm
0
100
200
300
400
500
600
700
Kfs (m
m h
-1)
0.1
1.0
10.0
100.0
-10-8-6-4-20h (cm)
K (h
) (m
m h
-1)
Grass / Forest/ min / max MAEGrass / Forest/ Grass / Forest// min / max MAE
(a) (b)
10 cm 20 cm
Fig. 4. (a) Averages, minimum and maximum values and mean absolute errors (MAE) of Kfs at 10 and 20 cm of depth in the forested and grassed soils; (b) averages and minimum and maximum values of K(h) estimated in the field at water tensions of -10, -5, -3, -1 cm in the forested and grassed soils.
4. Conclusion
The general objective of this work was to quantify the possible alterations in the hydrological properties of the soil on a hillslope after changes from natural land use. The investigation was performed by comparing two adjacent soils, one covered with a forest of Mediterranean maquis and the other with spontaneous grass, which had replaced the previous natural forest. Because the soil particle size was similar for the two soils, the differences in the physical and hydraulic properties of the soils could be attributed to changes in land use. The forested soil had a higher OM, a lower b, and a higher s than the grassed soil. These differences were clearly evident in the upper organic-rich horizon, and slightly less so at the deeper level. The tension values at which the retained water content of forested soil exceeded those of grassed soil were confined within the region from saturation to -50 cm of water tension. This suggests that the changes in land use altered the soil pore structure in this range of tension values. For modelling purposes, a decrease in the van Genuchten parameter , rather than n , may better represent the alterations in the pore structure caused by changes in land use.
349 M. Pirastru et al. / Procedia Environmental Sciences 19 ( 2013 ) 341 – 350
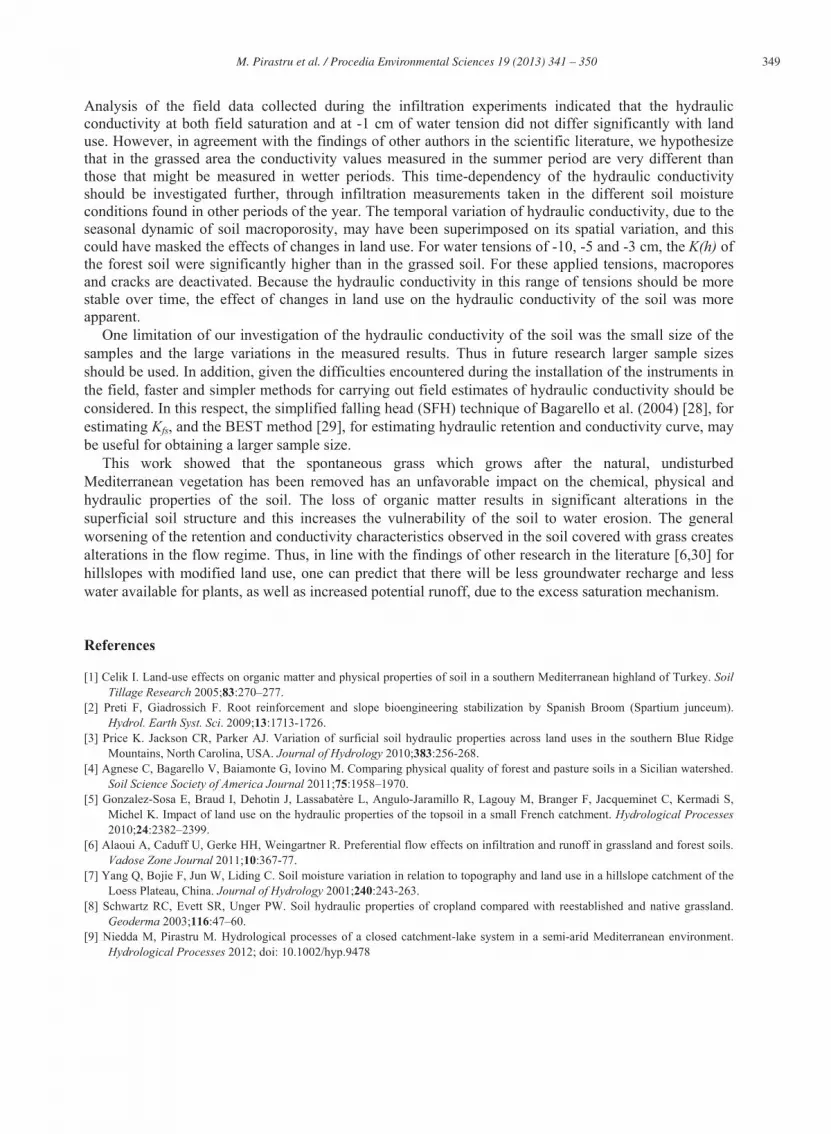
Analysis of the field data collected during the infiltration experiments indicated that the hydraulic conductivity at both field saturation and at -1 cm of water tension did not differ significantly with land use. However, in agreement with the findings of other authors in the scientific literature, we hypothesize that in the grassed area the conductivity values measured in the summer period are very different than those that might be measured in wetter periods. This time-dependency of the hydraulic conductivity should be investigated further, through infiltration measurements taken in the different soil moisture conditions found in other periods of the year. The temporal variation of hydraulic conductivity, due to the seasonal dynamic of soil macroporosity, may have been superimposed on its spatial variation, and this could have masked the effects of changes in land use. For water tensions of -10, -5 and -3 cm, the K(h) of the forest soil were significantly higher than in the grassed soil. For these applied tensions, macropores and cracks are deactivated. Because the hydraulic conductivity in this range of tensions should be more stable over time, the effect of changes in land use on the hydraulic conductivity of the soil was more apparent.
One limitation of our investigation of the hydraulic conductivity of the soil was the small size of the samples and the large variations in the measured results. Thus in future research larger sample sizes should be used. In addition, given the difficulties encountered during the installation of the instruments in the field, faster and simpler methods for carrying out field estimates of hydraulic conductivity should be considered. In this respect, the simplified falling head (SFH) technique of Bagarello et al. (2004) [28], for estimating Kfs, and the BEST method [29], for estimating hydraulic retention and conductivity curve, may be useful for obtaining a larger sample size.
This work showed that the spontaneous grass which grows after the natural, undisturbed Mediterranean vegetation has been removed has an unfavorable impact on the chemical, physical and hydraulic properties of the soil. The loss of organic matter results in significant alterations in the superficial soil structure and this increases the vulnerability of the soil to water erosion. The general worsening of the retention and conductivity characteristics observed in the soil covered with grass creates alterations in the flow regime. Thus, in line with the findings of other research in the literature [6,30] for hillslopes with modified land use, one can predict that there will be less groundwater recharge and less water available for plants, as well as increased potential runoff, due to the excess saturation mechanism.
References
[1] Celik I. Land-use effects on organic matter and physical properties of soil in a southern Mediterranean highland of Turkey. Soil Tillage Research 2005;83:270–277.
[2] Preti F, Giadrossich F. Root reinforcement and slope bioengineering stabilization by Spanish Broom (Spartium junceum). Hydrol. Earth Syst. Sci. 2009;13:1713-1726.
[3] Price K. Jackson CR, Parker AJ. Variation of surficial soil hydraulic properties across land uses in the southern Blue Ridge Mountains, North Carolina, USA. Journal of Hydrology 2010;383:256-268.
[4] Agnese C, Bagarello V, Baiamonte G, Iovino M. Comparing physical quality of forest and pasture soils in a Sicilian watershed. Soil Science Society of America Journal 2011;75:1958–1970.
[5] Gonzalez-Sosa E, Braud I, Dehotin J, Lassabatère L, Angulo-Jaramillo R, Lagouy M, Branger F, Jacqueminet C, Kermadi S, Michel K. Impact of land use on the hydraulic properties of the topsoil in a small French catchment. Hydrological Processes 2010;24:2382–2399.
[6] Alaoui A, Caduff U, Gerke HH, Weingartner R. Preferential flow effects on infiltration and runoff in grassland and forest soils. Vadose Zone Journal 2011;10:367-77.
[7] Yang Q, Bojie F, Jun W, Liding C. Soil moisture variation in relation to topography and land use in a hillslope catchment of the Loess Plateau, China. Journal of Hydrology 2001;240:243-263.
[8] Schwartz RC, Evett SR, Unger PW. Soil hydraulic properties of cropland compared with reestablished and native grassland. Geoderma 2003;116:47–60.
[9] Niedda M, Pirastru M. Hydrological processes of a closed catchment-lake system in a semi-arid Mediterranean environment. Hydrological Processes 2012; doi: 10.1002/hyp.9478
350 M. Pirastru et al. / Procedia Environmental Sciences 19 ( 2013 ) 341 – 350
[10] Pirastru M., Niedda M. Evaluation of the soil water balance in an alluvial floodplain with a shallow groundwater table. Hydrological Sciences Journal 2013;58: doi:10.1080/02626667.2013.783216
[11] Cognard-Plancq AL, Marc V, Didon-Lescot JF, Normand M. The role of forest cover on streamflow down sub-Mediterranean mountain watersheds: a modelling approach. Journal of Hydrology 2001;254:229-243.
[12] Costa MH, Botta A, Cardille JA. Effects of large-scale changes in land cover on the discharge of the Tocantins Rivers, Southeastern Amazonia. Journal of Hydrology 2003;283:206-217.
[13] Arya LA. Wind and hot-air methods. In: Dane JH, Topp GC editors. Methods of Soil Analysis, Part 4, Physical Methods. SSSA Book Series, No. 5. Soil Sci. Soc. Am.; 2002, p.916-926.
[14] Pirastru M, Niedda M. Field monitoring and dual permeability modelling of water flow through unsaturated calcareous rocks. Journal of Hydrology, 2010;392:40-53.
[15] van Genuchten MTh, Leij FJ, Yates SR. The RETC Code for Quantifying the Hydraulic Functions of Unsaturated Soils, Version 1.0. EPA Report 600/2-91/065, U.S. Salinity Laboratory, USDA, ARS, Riverside, California1991.
[16] Reynolds WD, Elrick DE, Youngs EG. Ring or cylinder infiltrometers (vadose zone). In: Dane JH, Topp GC editors. Methods of Soil Analysis, Part 4, Physical Methods,. SSSA Book Series, No. 5. Soil Sci. Soc. Am.; 2002, p. 818–820.
[17] Reynolds WD, Elrick DE. Pressure infiltrometer. In: Dane JH, Topp GC, editors. Methods of Soil Analysis, Part 4: Physical Methods, No. 5. Soil Sci. Soc. Am.; 2002, p. 826-836.
[18] Ankeny MD, Kaspar TC, Horton R. Simple field method for determining unsaturated hydraulic conductivity. Soil Science Society of America Journal 1991;55:467–470.
[19] Wooding RA. Steady infiltration from a shallow circular pond. Water Resources Research 1968;4:1259–1273. [20] Warrick AW. Spatial variability. In: Hillel D, Editor. Environmental Soil Physics, San Diego: Academic Press; 1998, p. 655–
675. [21] Martinez LJ, Zink JA. Temporal variation of soil compaction and deterioration of soil quality in pasture areas of Columbian
Amazonia. Soil and Tillage Research 2004;75:3-18. [22] van Genuchten MTh, Nielsen DR. On describing and predicting the hydraulic properties of unsaturated soils. Annales
Geophysicae, 1985;3:615-628. [23] Hassler SK, Zimmermann B, van Breugel M, Hall JS, Elsenbeer H. Recovery of saturated hydraulic conductivity under
secondary succession on former pasture in the humid tropics. Forest Ecology and Management 2010;261:1634–1642. [24] Bormann H, Klaassen K. Seasonal and land use dependent variability of soil hydraulic and soil hydrological properties of two
German soils. Geoderma 2008;145:295-302. [25] Zhou X, Lin HS, White EA. Surface soil hydraulic properties in four soil series under different land uses and their temporal
changes. Catena 2008;73(2):180-188. [26] Beven K, Germann P. Macropores and water flow in soils, Water Resources Research 1982;18(5):1311-1325. [27] Šim nek J, Jarvis NJ, Van Genuchten MTh, Gärdenäs A. Review and comparison of models for describing non-equilibrium
and preferential ow and transport in the vadose zone. Journal of Hydrology 2003;272:14-35. [28] Bagarello V, Iovino M, Elrick D. A simplified falling head technique for rapid determination of field-saturated hydraulic
conductivity. Soil Science Society of America Journal 2004;68:66–73. [29] Lassabatère L, Angulo-Jaramillo R, Soria Ugalde JM, Cuenca R, Braud I, Haverkamp R. Beerkan estimation of soil transfer
parameters through infiltration experiments-BEST. Soil Science Society of America Journal 2006;70:521–532. [30] Germer S, Neill C, Krusche AV, Elsenbeer H.. Influence of land-use change on near-surface hydrological processes:
undisturbed forest to pasture. Journal of Hydrology 2010;380:473-480.