knowledge media technologies
TRANSCRIPT

Knowledge Media Technologies
First International Core-to-Core Workshop
Klaus P. Jantke & Gunther Kreuzberger (eds.)
Nr. 21 July 2006
Herausgeber: Der Rektor der Technischen Universität Ilmenau Redaktion: Institut für Medien- und Kommunikationswissenschaft, Prof. Dr. Paul Klimsa ISSN 1617-9048 Kontakt: Klaus P. Jantke, Tel.: +49 3677 69 47 35 E-Mail: [email protected]


Table of Contents
Knowledge Federation and Utilization
Yuzuru Tanaka A Formal Model for the Proximity-Based Federation among Smart Objects....................................................5
Hidetoshi Nonaka and Masahito Kurihara Protean sensor network for context aware services.................................………………………………….....21
Hosting Team Presentations
Klaus P. Jantke Pattern Concepts for Digital Games Research...................................…………………………..……...……..29
Anja Beyer Security Aspects in Online Games Targets, Threats and Mechanisms………………………………….....…41
Jürgen Nützel and Mario Kubek Personal File Sharing in a Personal Bluetooth Environment ..........…………………………………...…..…47
Henrik Tonn-Eichstädt User Interfaces for People with Special Needs...................................…………………………………....…..54
Knowledge Clustering and Text Summarization
Jan Poland and Thomas Zeugmann Clustering the Google Distance with Eigenvectors and Semidefinite Programming ......................…...….…61
Tetsuya Yoshida Toward Soft Clustering in the Sequential Information Bottleneck Method………………………...………..70
Masaharu Yoshioka and Makoto Haraguchi Multiple News Articles Summarization based on Event Reference Information with Hierarchical Structure Analysis...........……………………………………………………………………………..........................…79
Core-to-Core Partners I
Roland H. Kaschek, Heinrich Mayr, Klaus Kienzl Using Metaphors for the Pragmatic Construction of Discourse Domains……………………………………88
Gunar Fiedler, Bernhard Thalheim, Dirk Fleischer, Heye Rumohr Data Mining in Biological Data for BiOkIS................……………………………………………………...104
Christian Reuschling and Sandra Zilles Personalized information filtering for mobile applications............………………………………….……...114

Data and Text Mining
Hiroki Arimura and Takeaki Uno Efficient Algorithms for Mining Maximal Flexible Patterns in Texts and Sequences..........……………….125 Takuya Kida, Takashi Uemura, and Hiroki Arimura Application of Truncated Suffix Trees to Finding Sentences from the Internet...............................………..136
Shin-ichi Minato Generating Frequent Closed Item Sets Using Zero-suppressed BDDs…………………………………...…145
Kimihito Ito, Manabu Igarashi, Ayato Takada Data Mining in Amino Acid Sequences of H3N2 Influenza Viruses Isolated during 1968 to 2006......……154
Core-to-Core Partners II
Nigel Waters The Links Between GIScience and Information Science ..………………………………….............……...159
Rainer Knauf and Klaus P. Jantke Storyboarding – An AI Technology to Represent, Process, Evaluate, and Refine Didactic Knowledge.......170
Jürgen Cleve, Christian Andersch, Stefan Wissuwa Data Mining on Traffic Accident Data............………………………………….................................……..180
Core-to-Core Partners III
Torsten Brix, Ulf Döring, Sabine Trott, Rike Brecht, Hendrik Thomas The Digital Mechanism and Gear Library – a Modern Knowledge Space………………………………….188
Donna M. Delparte The Use of GIS in Avalanche Modelling.....................…………………………………...................………195
Jochen Felix Böhm and Jun Fujima A Case Study for Knowledge Externalization using an Interactive Video Environment on E-learning...….199
Preface Knowledge Media Technologies has been chosen as a headline for the present workshop proceedings to focus the audience's attention to the central problem domain around which a variety of investiga-tions have been grouped. The Japanese Core-to-Core cooperation programme has been providing the framework for this work-shop. This farsighted programme does encourage and support Japanese centers of research excellence to widen and deepen their scientific connections to other research centers around the world. For this purpose, scientists from Europe, from Northern America, and from other regions such as New Zealand decided to go to Dagstuhl Castle, Germany, to meet a larger group of Japanese scientists headed and coordinated by Dr. Yuzuru Tanaka, professor and director of the Meme Media Laboratory at Hokkai-do University Sapporo, Japan. Tanaka's research center is strong in and world-wide known for its work on knowledge media tech-nologies. For almost half a century, the transformation into a knowledge society has been recognized world-wide. Science and technologies as well as politics strive hard to act appropriately. With the advent of global communication networks, the development and exchange of information is boosted. Combinations of knowledge media sources open unpredictable potentials. But most sources on the Web are not prepared to be effectively combined with other sources. What is known as the enterprise application integration problem locally shows even more seriously and with higher potential impact globally. The Japanese programme on Knowledge Media Technologies for the Advanced Federation, Utilization and Distribution of Knowledge Ressources addresses one of the most important scientific and engi-neering issues of the present and the near future. The work belongs to the wide field of information and communication technologies, but is surely relevant to all other disciplines. The workshop programme is completed by three sessions on Digital Games. This field is a rather new discipline with high economic, scientific, and social potentials. Issues of game knowledge lead to a natural integration of these sessions into the workshop program, although the Digital Games sessions are not reflected in the present proceedings. Preparing the proceedings of this First International Core-to-Core Workshop has been a great pleas-ure. We are looking forward to invaluable cooperations of an unforeseeable reach and impact. Klaus P. Jantke Ilmenau, July 2006 Gunther Kreuzberger
3

A Formal Model for the Proximity-BasedFederation among Smart Objects
Yuzuru TanakaMeme Media Laboratory
Hokkaido UniversityN13, W8, Sapporo, 060-8628 Japana
tanaka, fujima, [email protected]
Abstract
This paper proposes a new formal model of autonomic proximity-based federation among smart objectswith wireless network connectivity and services available on the Internet. Federation here denotes thedefinition and execution of interoperation among smart objects and/or services that are accessible eitherthrough the Internet or through peer-to-peer ad hoc communication without previously designed interop-eration interface. This paper proposes a new formal model for autonomic federation among smart objectsthrough peer-to-peer communication, and then extends this model to cope with federation among smartobjects through the Internet as well as federation including services over the Web. Each smart object ismodeled as a set of ports, each of which represents an I/O interface for a function of this smart objectto interoperate with some function of another smart object. Here we consider the matching of service-requesting queries and service-providing capabilities that are represented as service-requesting ports andservice-providing ports, instead of the matching of a service requesting message with a service-providingmessage. Our model extracts the federation mechanism of each smart object as its interoperation interfacethat is logically represented as a set of ports. Such an abstract description of each smart object from theview point of its federation capability will allow us to discuss both the matching mechanism for federationand complex federation among smart objects in terms of a simple mathematical model. Applications canbe described from the view point of their federation structures. This enables us to extract a common sub-structure from applications sharing the same typical federation scenario. Such an extracted substructureworks as an application framework for this federation scenario. This paper first proposes our mathemati-cal modeling of smart objects and their federation, then gives the semantics of our federation model, andfinally, based on our model, shows several application frameworks using smart object federation.
1. Introduction
This paper proposes a new formal modelof autonomic proximity-based federationamong smart objects with wireless networkconnectivity and services available on theInternet. Smart objects here denote comput-ing devices such as RFID tag chips, smartchips with sensors and/or actuators that areembedded in pervasive computing environ-ments such as home, office, and social in-frastructure environments, mobile PDAs, in-telligent electronic appliances, embeddedcomputers, and access points with networkservers. Federation here denotes the defini-
tion and execution of interoperation amongsmart objects and/or services that are acces-sible either through the Internet or throughpeer-to-peer ad hoc communication with-out previously designed interoperation inter-face. Federation is different from integrationin which member objects involved are as-sumed to have previously designed standardinteroperation interface.
The Web works not only as an open pub-lishing repository of documents, but also asan open repository of services represented asWeb applications and/or Web services. Per-vasive computing denotes an open system of
5
computing resources in which users can dy-namically select and federate some of thesecomputing resources as well as some ofthose computing resources accessible onlythrough peer-to-peer ad hoc wireless com-munication to perform their jobs satisfyingtheir dynamically changing demands. Suchcomputing resources include not only ser-vices on the Internet, but also functions pro-vided by embedded and/or mobile smart ob-jects connected either to the Internet throughWiFi communication or directly to the user’sdevice through peer-to-peer ad hoc wirelessconnection.
Federation over the Web is attracting the at-tention not only for user-oriented integrationof mutually related legacy Web-based busi-ness applications and services, but also forinterdisciplinary and international advancedreuse and interoperation of heterogeneousintellectual resources especially in scientificsimulations, digital libraries, and researchactivities. Federation may be classified intotwo types: ad hoc federation defined byusers and autonomic federation defined byprograms. We have already proposed ourapproach based on meme media technolo-gies [5] for ad hoc federation over the Web[8, 7, 9], and its extension to aggregate adhoc federation over the Web [6]. Here in thispaper, we will propose a new formal modelfor autonomic federation among smart ob-jects through peer-to-peer communication,and then extend this model to cope with fed-eration among smart objects through the In-ternet as well as federation including ser-vices over the Web.
Every preceding studies on federation ba-sically proposed two things, i.e., a stan-dard communication protocol with a lan-guage to use it, and a repository-and-lookupservice that allows each member to reg-ister its service-providing capabilities, andto request a service that matches its de-mand. For each request with a speci-fied demand, a repository-and-lookup ser-vice searches all the registered service ca-pabilities for those satisfying the specifieddemand. A repository-and-lookup service
matches service-requesting queries with cor-responding service-providing capabilities.The origin of such an idea can be foundin the original tuple space model Linda [1]and its extension Lime [4] that copes withmobile objects by providing each of thema dedicated tuple space. Linda and Limeare languages that use tuples to registerservice-providing capabilities and to issueservice-requesting queries to a repository-and-lookup service called a tuple space. JavaSpace [2] and Jini [3] are Java versions ofLinda and Lime architectures.
In these preceding studies, each service-requesting message is matched with aservice-providing message in a com-mon repository of service requests andservice-providing capabilities. Both eachservice-requesting message and eachservice-providing message are representedas tuples, and they are matched with eachother based on the tuple matching algo-rithm. Each tuple consists of a single ormore than one attribute-value pair in whichsome attributes may take variables. Sucha match of tuples is temporarily used toassociate two objects, one issuing a service-requesting message and the other issuinga service-providing message. There maybe more than one repository-and-lookupservice in such a system. Each of theseservices can delegate such a query that is notmatched in itself to one or more than oneneighboring repository-and-lookup service,and obtain a match result.
Here in this paper, we focus on the inter-face of smart objects for their federationwith each other and with services over theWeb. We will hide any details on howfunctions of each smart object are imple-mented, and focus on abstract level model-ing of its federation interface. Each smartobject is modeled as a set of ports, eachof which represents an I/O interface for afunction of this smart object to interoperatewith some function of another smart object.Here, we consider the matching of service-requesting queries and service-providing ca-pabilities that are represented as service-
6
requesting ports and service-providing ports,instead of the matching of a service re-questing message with a service-providingmessage. One of these functions requeststhe service provided by the other function.Therefore, each port represents an interfaceof either a service-requesting function or aservice-providing function.
In the preceding research studies, federationmechanisms were described in the codes thatdefine the behaviors of participating smartobjects, and were not separated from thesecodes to be discussed independently fromthem. Here in this paper, we will extractthe federation mechanism of each smart ob-ject as its interoperation interface that is log-ically represented as a set of ports. Suchan abstract description of each smart objectfrom the view point of its federation capabil-ity will allow us to discuss both the match-ing mechanism for federation and complexfederation among smart objects in terms ofa simple mathematical model. Applicationscan be described from the view point oftheir federation structures. This enables usto extract a common substructure from ap-plications sharing the same typical federa-tion scenario. Such an extracted substruc-ture may work as an application frameworkfor this federation scenario.
In the following sections, we will first pro-pose our mathematical modeling of smartobjects and their federation, then give the se-mantics of our federation model, and finally,based on our model, show several applica-tion frameworks using smart object federa-tion.
2. Smart Object and its FormalModeling
Each smart object communicates with an-other smart object through a peer-to-peercommunication facility, which is either a di-rect cable connection or a wireless connec-tion such as Bluetooth and IrDA wirelessconnection. Some smart objects may haveWiFi communication facilities for their In-ternet connection. These different types ofwireless connections are all proximity-based
connections, i.e., each of them has a distancerange of wireless communication. We modelthis distance range by a function ,which denotes a set of smart objects thatare currently accessible by an smart object. This set may also include othersmart objects that are accessible through theInternet if the smart object is currently con-nected to the Internet. Therefore, the func-tion does not directly correspond tothe wireless communication range of eachobject, but defines its current accessibility toother smart objects.
Each smart object provides and/or requestsservices. A service executed by a smart ob-ject may request another service provided byanother smart object. For a smart object torequest a service running on another smartobject, it needs to know the id and the inter-face of the service at least. We may assumethat each service is uniquely identified byits service type in its providing smart object.Therefore, each service can be identified bythe concatenation of the object id of its pro-viding smart object and its service type. Theinterface of a service can be modeled in var-ious different ways. Here we model it as aset of attribute-value pairs without any du-plicates of the same attribute. We call eachattribute and its value respectively a signalname and a signal value.
Now we need to consider the pluggabilitybetween smart objects. If a smart objectneeds to explicitly specify, in its code, theidentifier of the service it wants to access,then this smart object cannot federate withany other smart object providing the sametype of services. The substitutability of eachsmart object in an arbitrary federation withanother one providing the same type of ser-vice is called the pluggability of smart ob-jects. Pluggable smart objects cannot spec-ify its service request by explicitly specify-ing the service id. Instead, they need to spec-ify the service they request by its name, byits type, or by its property. The conversionfrom each of these three different types ofreference to the service id is called ‘reso-lution’. Service-name resolution converts a
7
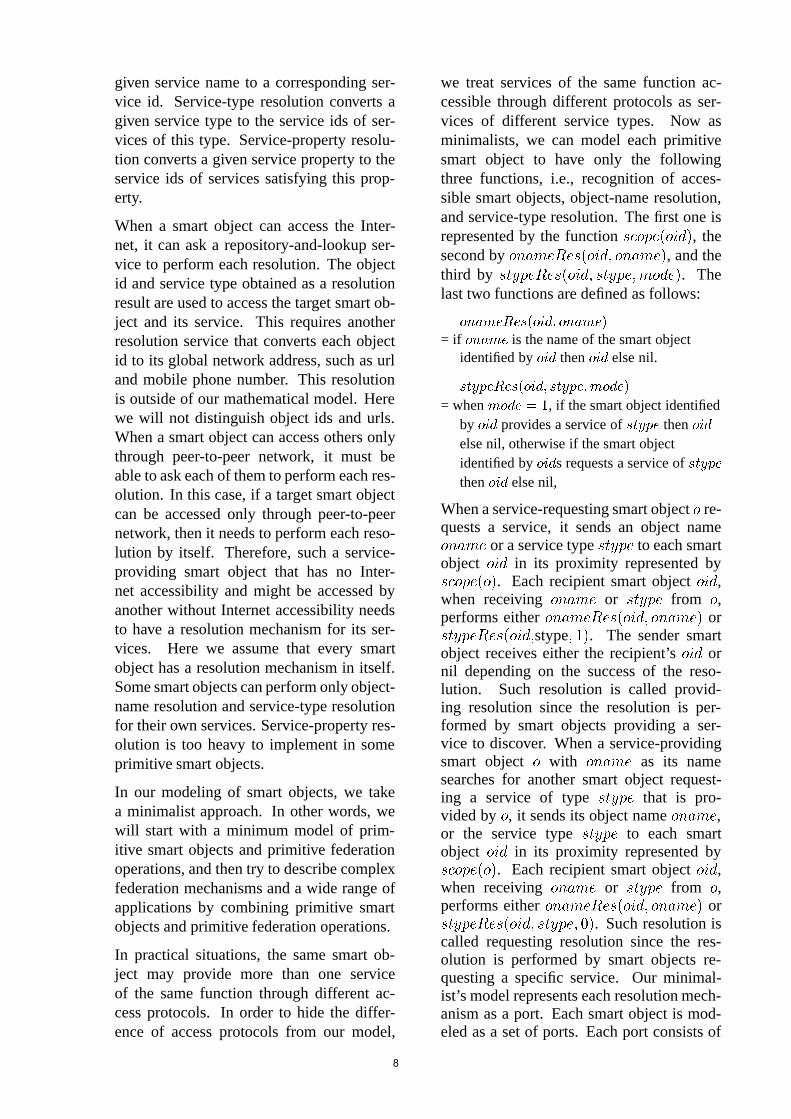
given service name to a corresponding ser-vice id. Service-type resolution converts agiven service type to the service ids of ser-vices of this type. Service-property resolu-tion converts a given service property to theservice ids of services satisfying this prop-erty.
When a smart object can access the Inter-net, it can ask a repository-and-lookup ser-vice to perform each resolution. The objectid and service type obtained as a resolutionresult are used to access the target smart ob-ject and its service. This requires anotherresolution service that converts each objectid to its global network address, such as urland mobile phone number. This resolutionis outside of our mathematical model. Herewe will not distinguish object ids and urls.When a smart object can access others onlythrough peer-to-peer network, it must beable to ask each of them to perform each res-olution. In this case, if a target smart objectcan be accessed only through peer-to-peernetwork, then it needs to perform each reso-lution by itself. Therefore, such a service-providing smart object that has no Inter-net accessibility and might be accessed byanother without Internet accessibility needsto have a resolution mechanism for its ser-vices. Here we assume that every smartobject has a resolution mechanism in itself.Some smart objects can perform only object-name resolution and service-type resolutionfor their own services. Service-property res-olution is too heavy to implement in someprimitive smart objects.
In our modeling of smart objects, we takea minimalist approach. In other words, wewill start with a minimum model of prim-itive smart objects and primitive federationoperations, and then try to describe complexfederation mechanisms and a wide range ofapplications by combining primitive smartobjects and primitive federation operations.
In practical situations, the same smart ob-ject may provide more than one serviceof the same function through different ac-cess protocols. In order to hide the differ-ence of access protocols from our model,
we treat services of the same function ac-cessible through different protocols as ser-vices of different service types. Now asminimalists, we can model each primitivesmart object to have only the followingthree functions, i.e., recognition of acces-sible smart objects, object-name resolution,and service-type resolution. The first one isrepresented by the function , thesecond by , and thethird by . Thelast two functions are defined as follows:
= if is the name of the smart object
identified by then else nil.
= when , if the smart object identifiedby provides a service of then
else nil, otherwise if the smart objectidentified by s requests a service of then else nil,
When a service-requesting smart object re-quests a service, it sends an object name or a service type to each smartobject in its proximity represented by. Each recipient smart object ,when receiving or from ,performs either or stype . The sender smartobject receives either the recipient’s ornil depending on the success of the reso-lution. Such resolution is called provid-ing resolution since the resolution is per-formed by smart objects providing a ser-vice to discover. When a service-providingsmart object with as its namesearches for another smart object request-ing a service of type that is pro-vided by , it sends its object name ,or the service type to each smartobject in its proximity represented by. Each recipient smart object ,when receiving or from ,performs either or . Such resolution iscalled requesting resolution since the res-olution is performed by smart objects re-questing a specific service. Our minimal-ist’s model represents each resolution mech-anism as a port. Each smart object is mod-eled as a set of ports. Each port consists of
8
a port type and its polarity, i.e., either a pos-itive polarity ‘+’ or a negative polarity ‘-’.Providing resolution is represented by a pos-itive port, while requesting resolution is rep-resented by a negative port. Object-identifierresolution and object-name resolution arerespectively represented by port types
and with polarities. A smart ob-ject with and has ports
and/or if it has respectively anobject-identifier-resolution function and/oran object-name-resolution function. A smartobject has ports and/or if itrequests another smart object identified by and/or . Service-type resolutionis represented by a port with a port type and a polarity. If it is a providingresolution, then it is represented by ,else by . Each port represents both arequest and the capability of correspondingresolution. Therefore, if a smart object en-ters the proximity of another smart object,and if they have ports with the same porttype and different polarities, one can senda resolution request to another to obtain thepartner object id successfully. This meansthat each request for a specific smart objector a specific service is satisfied by the part-ner smart object. This step is called the porttype matching in our model. Ports are math-ematically defined as follows. Let , N, andS denote respectively the set of object iden-tifiers, the set of object names, and the set ofservice types. The set P of ports is definedas follows:
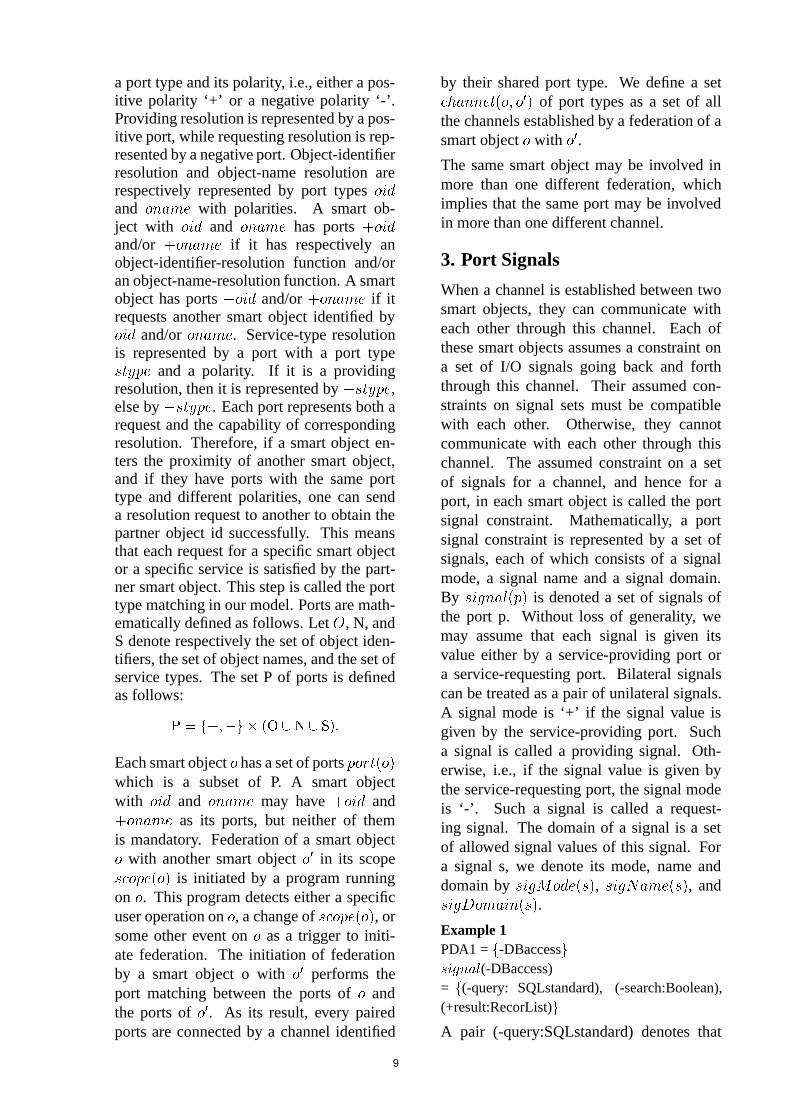
Each smart object has a set of ports which is a subset of P. A smart objectwith and may have and as its ports, but neither of themis mandatory. Federation of a smart object with another smart object in its scope is initiated by a program runningon . This program detects either a specificuser operation on , a change of , orsome other event on as a trigger to initi-ate federation. The initiation of federationby a smart object o with performs theport matching between the ports of andthe ports of . As its result, every pairedports are connected by a channel identified
by their shared port type. We define a set of port types as a set of allthe channels established by a federation of asmart object with .
The same smart object may be involved inmore than one different federation, whichimplies that the same port may be involvedin more than one different channel.
3. Port Signals
When a channel is established between twosmart objects, they can communicate witheach other through this channel. Each ofthese smart objects assumes a constraint ona set of I/O signals going back and forththrough this channel. Their assumed con-straints on signal sets must be compatiblewith each other. Otherwise, they cannotcommunicate with each other through thischannel. The assumed constraint on a setof signals for a channel, and hence for aport, in each smart object is called the portsignal constraint. Mathematically, a portsignal constraint is represented by a set ofsignals, each of which consists of a signalmode, a signal name and a signal domain.By is denoted a set of signals ofthe port p. Without loss of generality, wemay assume that each signal is given itsvalue either by a service-providing port ora service-requesting port. Bilateral signalscan be treated as a pair of unilateral signals.A signal mode is ‘+’ if the signal value isgiven by the service-providing port. Sucha signal is called a providing signal. Oth-erwise, i.e., if the signal value is given bythe service-requesting port, the signal modeis ‘-’. Such a signal is called a request-ing signal. The domain of a signal is a setof allowed signal values of this signal. Fora signal s, we denote its mode, name anddomain by , , and.
Example 1PDA1 = -DBaccess(-DBaccess)= (-query: SQLstandard), (-search:Boolean),(+result:RecorList)
A pair (-query:SQLstandard) denotes that
9
PDA1:Jack
-PPTprojection
-DocPrint
Room1:Mike
+PPTprojection
+DocPrint
requesting ports have negative polarity
providing ports have positive polarity.
PDA1 has two requesting ports,one for the PPT projection, and the other for the printing.
Room1 has two providing ports,one for a PPT projection service, and the other for a printing service.
service typepolarity
service typepolarity
+Jack
oid oname
oname
+Mike
oname
PDA1
range of accessibility of PDA1
(a) Two smart objects PDA1 and Room1
PDA1
-PPTprojection
-DocPrint
Room1
+PPTprojection
+DocPrint
Room1∈scope(PDA1)
channel(PDA1, Room1)
=PPTprojection, DocPrint
Whenever Room1∈scope(PDA1) holds,
PDA1 initiates a federation with Room1.
+Jack
+Mike
(b) Room1 enters the scope of PDA1
Figure 1: Fedration of PDA1 with Room1 and the channels established between them.
this signal value is given by a service-requesting port, and that it has ‘query’ andSQLstandard (the domain of SQL Standardqueries) as its name and domain. Thisservice-requesting port -DBaccess issues aquery in SQL Standard and a Boolean searchcommand to obtain a search result as arecord list.
Room1 = +DBaccess
(+DBaccess) =
(-query,: SQL),
(-search:Boolean),
(+result:RecorList),
(+currentRecord:Record),
(-nextRecord, Boolean),
(-previousRecord, Boolean)
This service-providing port +DBaccess re-ceives a query in Oracle SQL, a Booleansearch command, and a Boolean next-recordor previous-record command, and returns asearch result as a record list and a currentrecord pointed to by a record cursor that ismoved back and forth by the next-record andprevious-record command. Now, we willdefine the compatibility of ports. A service-requesting port -p and a service-providingport +p are compatible with each other anddenoted by -p +p if the following holds:
In example 1, the port -DBaccess and theport +DBaccess are compatible with eachother, i.e., -DBaccess +DBaccess since itholds that SQLstandard OracleSQL.
4. Applications Running on aSmart Object
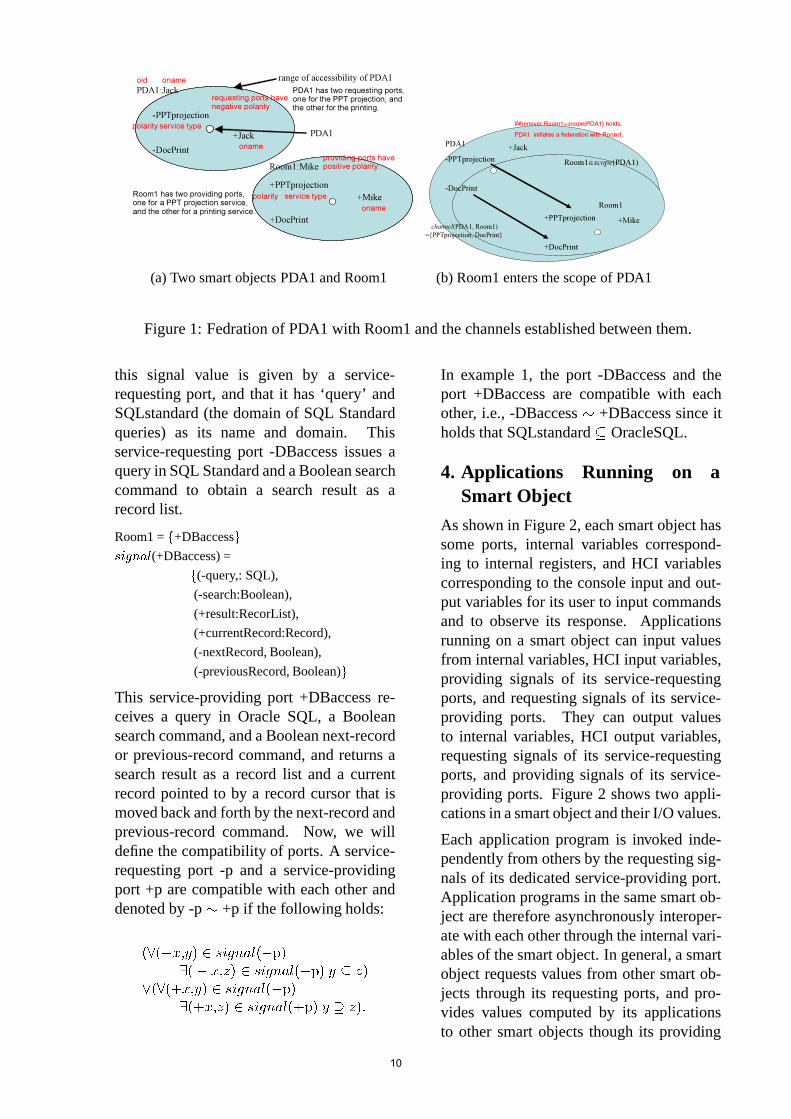
As shown in Figure 2, each smart object hassome ports, internal variables correspond-ing to internal registers, and HCI variablescorresponding to the console input and out-put variables for its user to input commandsand to observe its response. Applicationsrunning on a smart object can input valuesfrom internal variables, HCI input variables,providing signals of its service-requestingports, and requesting signals of its service-providing ports. They can output valuesto internal variables, HCI output variables,requesting signals of its service-requestingports, and providing signals of its service-providing ports. Figure 2 shows two appli-cations in a smart object and their I/O values.
Each application program is invoked inde-pendently from others by the requesting sig-nals of its dedicated service-providing port.Application programs in the same smart ob-ject are therefore asynchronously interoper-ate with each other through the internal vari-ables of the smart object. In general, a smartobject requests values from other smart ob-jects through its requesting ports, and pro-vides values computed by its applicationsto other smart objects though its providing
10

-p1(-s1, +s2)
+p4(-s7, +s8)
-p2(-s3, +s4)
f1 f2
y1=h2(f2(h1(x2,x4)), x2, x4)
x1 y1
x3
app1x2
g1
x4
y2 y2=g2(f1(x1), x3)
app2
+p3(-s5, +s6)
g2
h1
h2
h3
y3
y3=h3(f2(h1(x2,x4)), x2, x4)
x2=g1(f1(x1), x3)
internal variable: x2
HCI variable: x1 (input), y1 (output)
Smart Object
Figure 2: Applications running on a smartobject.
ports. Two important classes of smart ob-jects are providing-only smart objects calledsupplier objects and requesting-only smartobjects called consumer objects. Supplierobjects have providing ports only. For ex-ample, bar codes and RFID tag chips in con-sumer products, Web applications, or Webservices are supplier objects. Consumer ob-jects have requesting ports only. For exam-ple, remote controllers of all kinds are con-sumer objects. In general, a smart objectcannot be copied. However, there are im-portant classes of objects where this is vir-tually possible by copying their proxy ob-jects. Most notably this is possible for soft-ware smart objects we will mention later.
A service-requesting port p1 is replaceablewith another service-requesting port p2 ifthe following holds:
A service-providing port p1 is replaceablewith another service-providing port p2 if thefollowing holds:
5. Semantics of Federation
Let us consider a federation among threesmart objects , , and as shown inFigure 3. and perform addition andmultiplication, while compose these twofunctions provided by and to calcu-late (s1+s2) s2 as the value of s3. Weneed to define the semantics of smart objectsand their federation so that we can calculatethe composed function from the functions ofparticipating smart objects. Here we will de-scribe the federation semantics using a Pro-log like description of the function of eachsmart object.
-p1(-s1, -s2, +s3) -p2(-s1, -s2, +s3)
+p1(-s1, -s2, +s3)
+
+p2(-s1, -s2, +s3)
×
+p0(-s1, -s2, +s3)
s3=s1+s2s3=s1×s2
s3=(s1+s2)×s2
O0
O1
O2
Figure 3: Federation among , , and .
The function of each smart object in Figure 3is described as follows in our description.
: p0(-s1:x, -s2:y, +s3:z) p1(-s1:x, -s2:y, +s3:w),
p2(-s1:w, -s2:y, +s3:z)
( p0(-s1:x, -s2:y, +s3:z) is implied byp1(-s1:x, -s2:y, +s3:w) and p2(-s1:w, -s2:y,+s3:z) )
: p1(-s1:x, -s2:y, +s3:z) [z:=x+y]
( p1(-s1:x, -s2:y, +s3:z) is implied by the eval-uation of z:=x+y. )
: p2(-s1:x, -s2:y, +s3:z) [z:=x y]
The functions of a smart object is describedby a set of rules. Each rule has zero or oneliteral on the left-hand side, and zero or anarbitrary number of literals on the right-handside. Each literal on the left-hand side cor-responds to a service-providing port, whileeach literal on the right-hand side corre-sponds to either a program code to evaluate
11

or a service-requesting port. Each port mayhave a set of pairs, each of which consists ofa signed signal name and its value. A sig-nal value may be represented by a variable.Similarly to the logical resolution in Prolog,we start with the evaluation of a given goalwith arbitrary number of literals only on theright-hand side:
Such a rule without any left-hand side literalis called a goal. The first literal Li that is nota program code in this goal is logically re-solved with some literal with the same porttype that appears on the left-hand side ofsome other rule, and is replaced with theright-hand side of this rule with all the vari-ables changed to the expressions that unifiesthese two literals. Let a rule
be such a rule. Each port literal has a set ofsignal pairs, each of which consist of a sig-nal name and a value, whereas a predicate inProlog has parameters, the number of whichis fixed for the same predicate name. Aright-hand side literal can be uni-fied with a left-hand side literal if the following holds:
where and are substitutions of variables.A pair (, ) is called a unifier. Generally,such a unifier is not uniquely determined. Insuch a case, there exists the most generalunifier (,
). Using these substitutions,
the current goal is replaced with
This operation is the extension of Prolog res-olution mechanism to the resolution of ourrules. When the service-providing port p0of is accessed with two signal values a
and b from outside, starts to evaluate agoal
which is resolved by the rule in , and isreduced to
Then the first literal is resolved by the rule in, and the second by the rule in , sincethe port -p1 and -p2 in are respectivelyconnected to the ports +p1 in and +p2 in through channels, i.e.,
This result has only program codes, and canbe partially evaluated to obtain the follow-ing:
This is the function composed by the feder-ation of these three smart objects.
Example 1 revisitedThe semantics of PDA1 and Room1 in Example1 is described as follows:
PDA1App(x)DBservice(-query:q, -search:true, +result:x).
Room1DBservice(-query:x, -search:y,
+result:z, +currentRecord:u,-nextRecord:v,-previousRecord:w)
[PDB(x, y, z, u, v, w)].
App(x) is an application running on PDA1, whilePDB(x, y, z, u, v, w) is a program code exe-cuted by Room1 to access its database to answera given query. Whenever PDA1 starts to evaluatea goal App(x),
it is reduced as follows:
DBservice(-query:q, -search:true, +result:x) [PDB(q, true, x, u, v, w)].
Example 2Let us consider federations among a PDA PDA2,
12
a video cassette recorder VCR1, and a monitordisplay MonitorDisplay1, where PDA2 works asa remote controller of VCR1, and the audio andvideo signals of VCR1 are sent to MonitorDis-play.
VCR1=-VideoDisplay, +VideoControl(-VideoDisplay)
=(video: NTSC),(audioL: Audio),(audioR: Audio)
(+VideoControl)=(play: Boolean), (ff: Boolean),(rewind: Boolean), (record: Boolean),(stop: Boolean)
MonitorDisplay1=+VideoDisplay(+VideoDisplay)
=(video: NTSC, PAL),(audioL: Audio),(audioR: Audio)
PDA2=-VideoControl(-VideoControl)
=(play: boolean), (ff: boolean),(rewind: boolean),(stop: boolean)
Their semantics is described as follows:
VCR1VideoControl(-play:x1, -ff:x2, -rewind:x3,
-record:x4, -stop:x5) [PVCR(x1, x2, x3, x4, x5, y1, y2, y3)],VideoDisplay(-video:y1, audioL:y2,audioR:y3)
When VCR1 receives a service request throughthe port +VideoControl, it performs its operationdepending on the input command signals. If thecommand signal is ‘play’, it plays the loadedvideo tape and sends out its audio-video out-put signals through the service-requesting port -VideoDisplay. If the command is ‘ff’ i.e., ‘fastforward’, then it fast-forward the tape until an-other command signal is input, and sends outthe fast-forward mark as its video output sig-nal through the port -VideoDisplay. It simi-larly treats other command signals, ‘rewind’, and‘stop’. If the command is ‘record’, it startsthe recording of its input video signal onto theloaded tape, and sends out the input video sig-nal combined with the recording mark as itsaudio-video output signals through the port -VideoDisplay. The first literal [PVCR(x1, x2,x3, x4, x5, y1, y2, y3)] on the right-hand sideof this rule represents the internal mechanism ofVCR1.
MonitorDisplay1
VideoDisplay(-video:y1, audioL:y2,audioR:y3)[PMonitor(y1, y2, y3)]
The literal on the right-hand side represents thevideo displaying function of this monitor dis-play.
PDA2HCIPDA(-key1:x1, -key2:x2,
-key3;x3, -key5:x4, -key5:x5) VideoControl(-play:x1, -ff:x2,-rewind:x3, -stop:x5)
The literal on the left-hand side represents thehuman-computer interaction interface of thisPDA. This rule uses only five keys of PDA2,key1, key2, key3, key4, and key5 for its userto input the five commands, i.e., ‘play’, ‘ff’,‘rewind’, ‘record’ and ‘stop’. When one of thesekeys is pushed, PDA2 sends a service requestwith the corresponding command signal throughthe port -VideoControl.
Let us assume that the two federations, i.e.,PDA2 with VCR1, and VCR1 with MonitorDis-play1, are both established. In order to know thecomposed function of each key input to PDA2 inthese federations, we can evaluate the followinggoal:
HCIPDA(-key1:x1, -key2:x2,-key3;x3, -key5:x4, -key5:x5)
This is reduced as follows:
VideoControl(-play:x1, -ff:x2,-rewind:x3, -stop:x5)
[PVCR(x1, x2, x3, x4, x5, y1, y2, y3)],VideoDisplay(-video:y1,audioL:y2, audioR:y3)
[PVCR(x1, x2, x3, x4, x5, y1, y2, y3)],[PMonitor(y1, y2, y3)].
6. Service-Property ResolutionService
As mentioned in Chapter 2, our model doesnot treat service-property resolution as aprimitive function. Instead, it treats this typeof resolution as a service. Therefore, smartobjects with this type of resolution func-tion are modeled to have +sPropertyReso-lution port, whereas those capable to issuea query to another smart object for service-property resolution are modeled to have -sPropertyResolution port. These ports may
13
have arbitrary number of signals specifyingconditions on different attributes of the ser-vice property since there may be a large va-riety of different types of service-propertyresolution. The service-property resolutionmechanism is defined as follows:
sPropertyResolution(attr1:x1, , attrk:xk,stype:y, signal1:y1, , signalh:yh)
[find(attr1:x1, , attrk:xk,stype:y, signal1:y1, , signalh:yh),openNewPort(+y)]
When a channel is set up between-sPropertyResolution and +sProper-tyResolution, a smart object with -sPropertyResolution port sends the serviceproperty information attr1:x1, attr2:x2, , attrk:xk through this channel toanother smart object with +sProper-tyResolution port to find out a servicesatisfying this property, and to create anew port with y as its service type, andwith
as its
signals. This newly created port enables theservice-requesting smart object to set upanother channel from its preset port -y withh signals to the newly created port of the service-providing smart object.
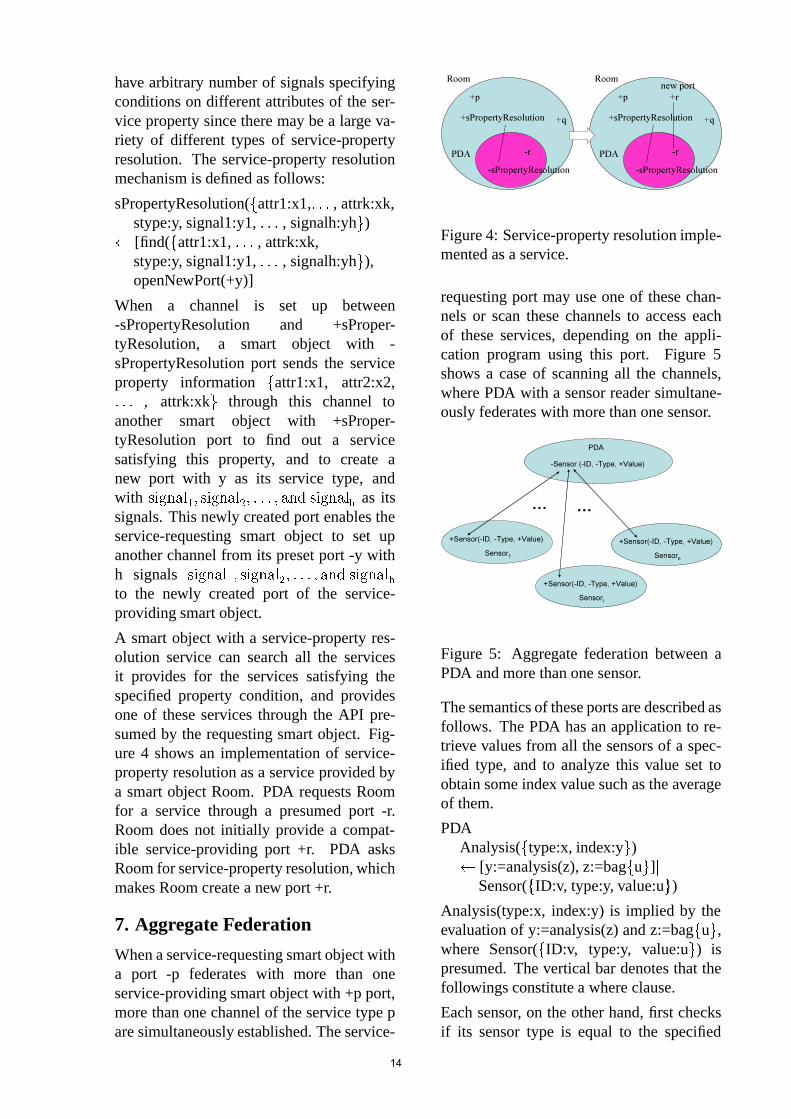
A smart object with a service-property res-olution service can search all the servicesit provides for the services satisfying thespecified property condition, and providesone of these services through the API pre-sumed by the requesting smart object. Fig-ure 4 shows an implementation of service-property resolution as a service provided bya smart object Room. PDA requests Roomfor a service through a presumed port -r.Room does not initially provide a compat-ible service-providing port +r. PDA asksRoom for service-property resolution, whichmakes Room create a new port +r.
7. Aggregate Federation
When a service-requesting smart object witha port -p federates with more than oneservice-providing smart object with +p port,more than one channel of the service type pare simultaneously established. The service-
+p
+q
-sPropertyResolution
Room
PDA
+sPropertyResolution
-r
+p
+q
-sPropertyResolution
Room
PDA
+sPropertyResolution
-r
+r
new port
Figure 4: Service-property resolution imple-mented as a service.
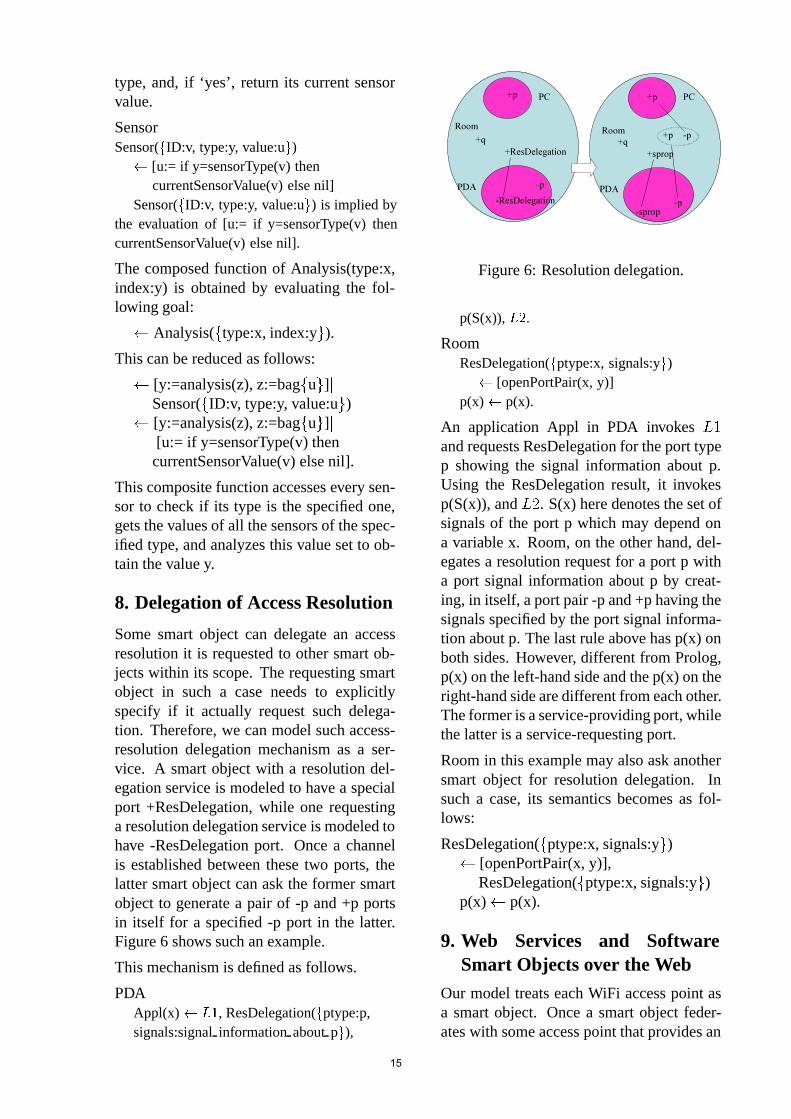
requesting port may use one of these chan-nels or scan these channels to access eachof these services, depending on the appli-cation program using this port. Figure 5shows a case of scanning all the channels,where PDA with a sensor reader simultane-ously federates with more than one sensor.
-Sensor (-ID, -Type, +Value)
+Sensor(-ID, -Type, +Value)
PDA
Sensor1
+Sensor(-ID, -Type, +Value)
Sensori
+Sensor(-ID, -Type, +Value)
Sensorn
……
Figure 5: Aggregate federation between aPDA and more than one sensor.
The semantics of these ports are described asfollows. The PDA has an application to re-trieve values from all the sensors of a spec-ified type, and to analyze this value set toobtain some index value such as the averageof them.
PDAAnalysis(type:x, index:y) [y:=analysis(z), z:=bagu]
Sensor(ID:v, type:y, value:u)
Analysis(type:x, index:y) is implied by theevaluation of y:=analysis(z) and z:=bagu,where Sensor(ID:v, type:y, value:u) ispresumed. The vertical bar denotes that thefollowings constitute a where clause.
Each sensor, on the other hand, first checksif its sensor type is equal to the specified
14
type, and, if ‘yes’, return its current sensorvalue.
SensorSensor(ID:v, type:y, value:u) [u:= if y=sensorType(v) then
currentSensorValue(v) else nil]Sensor(ID:v, type:y, value:u) is implied by
the evaluation of [u:= if y=sensorType(v) thencurrentSensorValue(v) else nil].
The composed function of Analysis(type:x,index:y) is obtained by evaluating the fol-lowing goal:
Analysis(type:x, index:y).
This can be reduced as follows:
[y:=analysis(z), z:=bagu]Sensor(ID:v, type:y, value:u)
[y:=analysis(z), z:=bagu][u:= if y=sensorType(v) thencurrentSensorValue(v) else nil].
This composite function accesses every sen-sor to check if its type is the specified one,gets the values of all the sensors of the spec-ified type, and analyzes this value set to ob-tain the value y.
8. Delegation of Access Resolution
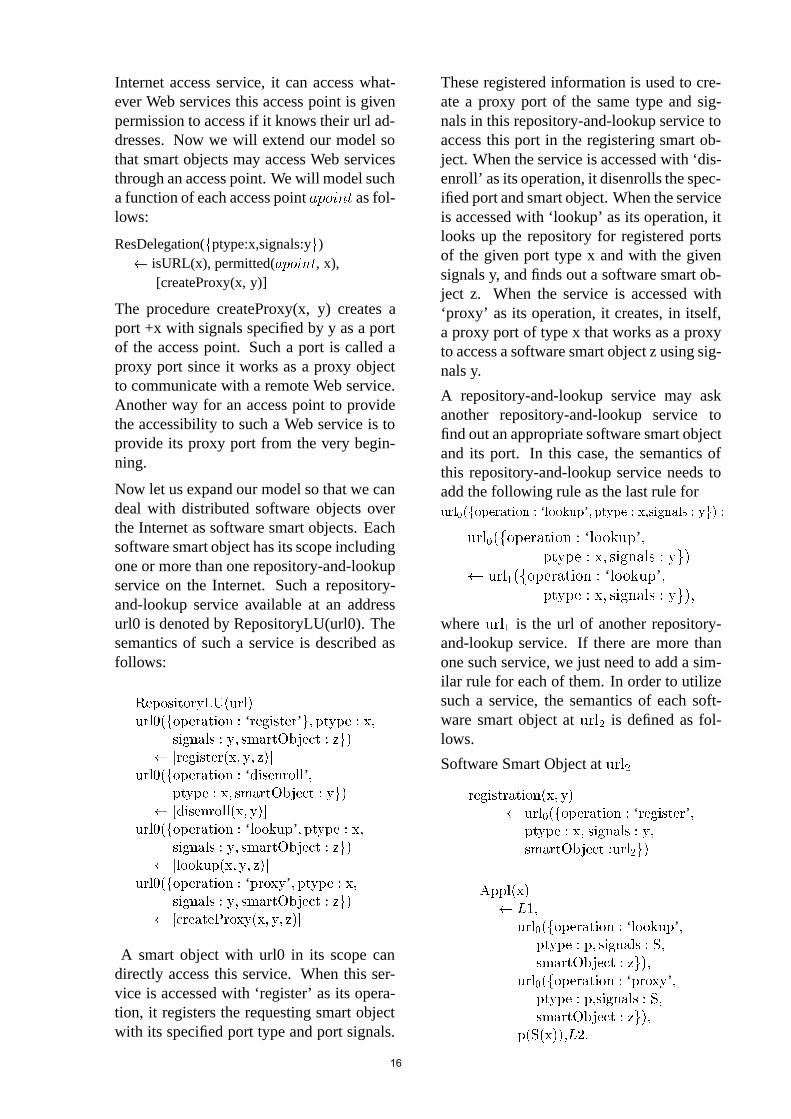
Some smart object can delegate an accessresolution it is requested to other smart ob-jects within its scope. The requesting smartobject in such a case needs to explicitlyspecify if it actually request such delega-tion. Therefore, we can model such access-resolution delegation mechanism as a ser-vice. A smart object with a resolution del-egation service is modeled to have a specialport +ResDelegation, while one requestinga resolution delegation service is modeled tohave -ResDelegation port. Once a channelis established between these two ports, thelatter smart object can ask the former smartobject to generate a pair of -p and +p portsin itself for a specified -p port in the latter.Figure 6 shows such an example.
This mechanism is defined as follows.
PDAAppl(x) , ResDelegation(ptype:p,signals:signal information about p),
+q
-ResDelegation
Room
PDA
+ResDelegation+q
-p
-sprop
Room
PDA
+sprop
-p
-p
+p
PC PC+p+p
Figure 6: Resolution delegation.
p(S(x)), .
RoomResDelegation(ptype:x, signals:y) [openPortPair(x, y)]
p(x) p(x).
An application Appl in PDA invokes and requests ResDelegation for the port typep showing the signal information about p.Using the ResDelegation result, it invokesp(S(x)), and . S(x) here denotes the set ofsignals of the port p which may depend ona variable x. Room, on the other hand, del-egates a resolution request for a port p witha port signal information about p by creat-ing, in itself, a port pair -p and +p having thesignals specified by the port signal informa-tion about p. The last rule above has p(x) onboth sides. However, different from Prolog,p(x) on the left-hand side and the p(x) on theright-hand side are different from each other.The former is a service-providing port, whilethe latter is a service-requesting port.
Room in this example may also ask anothersmart object for resolution delegation. Insuch a case, its semantics becomes as fol-lows:
ResDelegation(ptype:x, signals:y) [openPortPair(x, y)],
ResDelegation(ptype:x, signals:y)p(x) p(x).
9. Web Services and SoftwareSmart Objects over the Web
Our model treats each WiFi access point asa smart object. Once a smart object feder-ates with some access point that provides an
15
Internet access service, it can access what-ever Web services this access point is givenpermission to access if it knows their url ad-dresses. Now we will extend our model sothat smart objects may access Web servicesthrough an access point. We will model sucha function of each access point as fol-lows:
ResDelegation(ptype:x,signals:y) isURL(x), permitted( , x),
[createProxy(x, y)]
The procedure createProxy(x, y) creates aport +x with signals specified by y as a portof the access point. Such a port is called aproxy port since it works as a proxy objectto communicate with a remote Web service.Another way for an access point to providethe accessibility to such a Web service is toprovide its proxy port from the very begin-ning.
Now let us expand our model so that we candeal with distributed software objects overthe Internet as software smart objects. Eachsoftware smart object has its scope includingone or more than one repository-and-lookupservice on the Internet. Such a repository-and-lookup service available at an addressurl0 is denoted by RepositoryLU(url0). Thesemantics of such a service is described asfollows:
‘ ’
! " # "$
‘% ’ !
#% $ ‘&’
! " #& "$
‘’ ! "
#! "$
A smart object with url0 in its scope candirectly access this service. When this ser-vice is accessed with ‘register’ as its opera-tion, it registers the requesting smart objectwith its specified port type and port signals.
These registered information is used to cre-ate a proxy port of the same type and sig-nals in this repository-and-lookup service toaccess this port in the registering smart ob-ject. When the service is accessed with ‘dis-enroll’ as its operation, it disenrolls the spec-ified port and smart object. When the serviceis accessed with ‘lookup’ as its operation, itlooks up the repository for registered portsof the given port type x and with the givensignals y, and finds out a software smart ob-ject z. When the service is accessed with‘proxy’ as its operation, it creates, in itself,a proxy port of type x that works as a proxyto access a software smart object z using sig-nals y.
A repository-and-lookup service may askanother repository-and-lookup service tofind out an appropriate software smart objectand its port. In this case, the semantics ofthis repository-and-lookup service needs toadd the following rule as the last rule for ‘’
‘’
‘’
where is the url of another repository-and-lookup service. If there are more thanone such service, we just need to add a sim-ilar rule for each of them. In order to utilizesuch a service, the semantics of each soft-ware smart object at is defined as fol-lows.
Software Smart Object at
‘ ’
!
'
‘&’ ! "
‘’ ! "
16
The semantics of the operation ‘regis-ter’ is obvious. The application invokes ‘’ ! and
" to create a proxy portof type p that communicates with a softwaresmart object z using signals S, where S de-notes a set of pairs, each of which consistsof a signal name and a signal domain. S(x)is a set of pairs, each of which consists of asignal name and its value, and denotes thatit has the same set of signal names as S, andtheir values somehow depends on x.
10. Application Frameworks usingSmart Objects
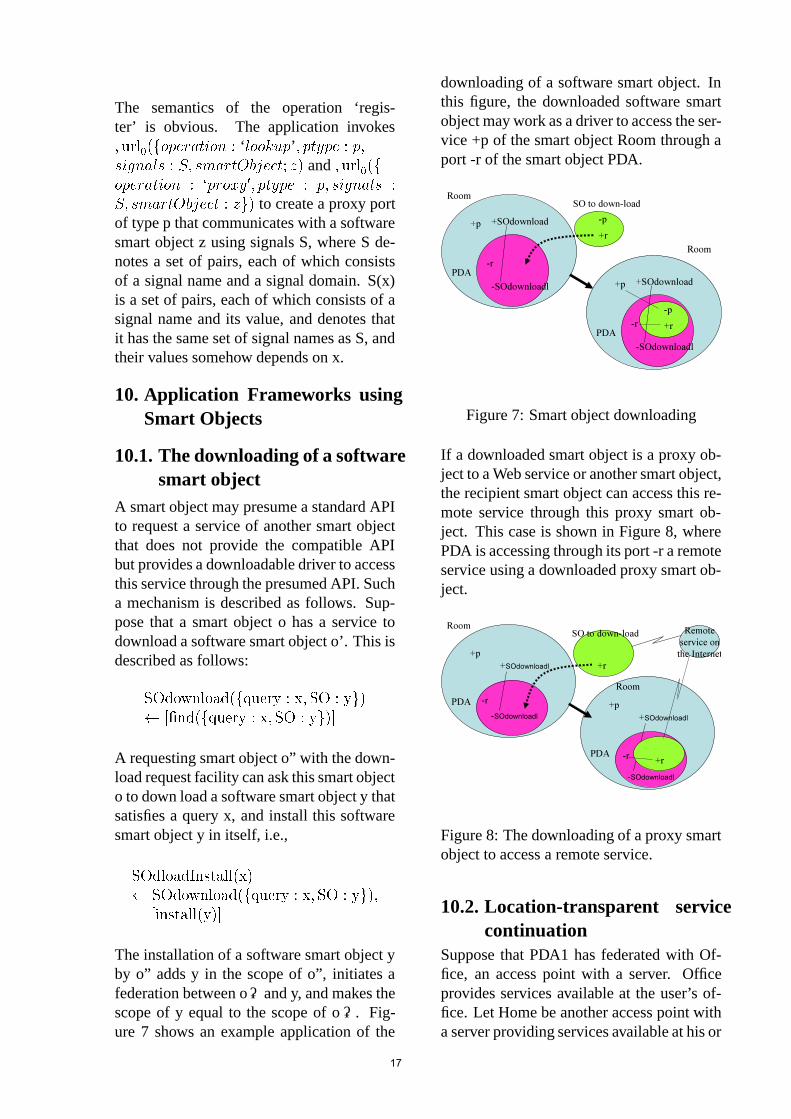
10.1. The downloading of a softwaresmart object
A smart object may presume a standard APIto request a service of another smart objectthat does not provide the compatible APIbut provides a downloadable driver to accessthis service through the presumed API. Sucha mechanism is described as follows. Sup-pose that a smart object o has a service todownload a software smart object o’. This isdescribed as follows:
# $#
A requesting smart object o” with the down-load request facility can ask this smart objecto to down load a software smart object y thatsatisfies a query x, and install this softwaresmart object y in itself, i.e.,
% #
The installation of a software smart object yby o” adds y in the scope of o”, initiates afederation between o”and y, and makes thescope of y equal to the scope of o”. Fig-ure 7 shows an example application of the
downloading of a software smart object. Inthis figure, the downloaded software smartobject may work as a driver to access the ser-vice +p of the smart object Room through aport -r of the smart object PDA.
+p
-SOdownloadl
Room
PDA
+SOdownload -p
SO to down-load
+r
-r
+p
-SOdownloadl
Room
PDA
+SOdownload
-r
-p
+r
Figure 7: Smart object downloading
If a downloaded smart object is a proxy ob-ject to a Web service or another smart object,the recipient smart object can access this re-mote service through this proxy smart ob-ject. This case is shown in Figure 8, wherePDA is accessing through its port -r a remoteservice using a downloaded proxy smart ob-ject.
+p
-SOdownloadl
Room
PDA
+SOdownloadl
SO to down-load Remote
service on
the Internet
+r
+p
-SOdownloadl
Room
PDA
+SOdownloadl
+r-r
-r
Figure 8: The downloading of a proxy smartobject to access a remote service.
10.2. Location-transparent servicecontinuation
Suppose that PDA1 has federated with Of-fice, an access point with a server. Officeprovides services available at the user’s of-fice. Let Home be another access point witha server providing services available at his or
17
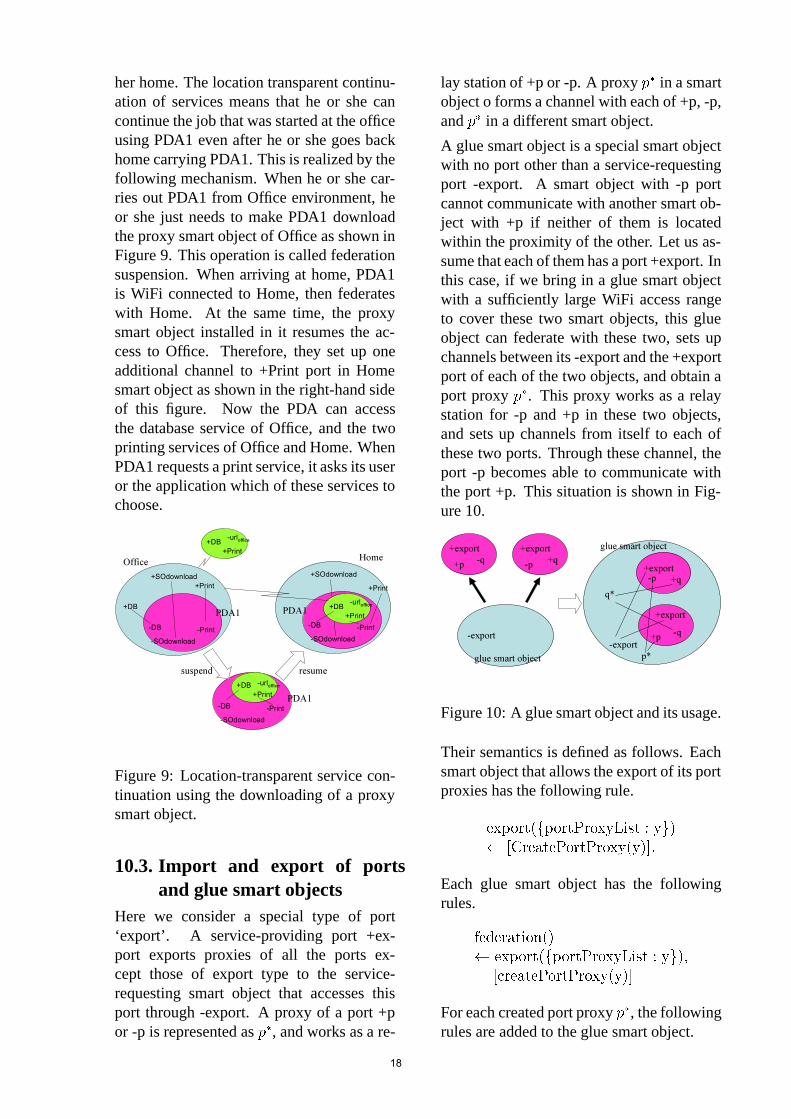
her home. The location transparent continu-ation of services means that he or she cancontinue the job that was started at the officeusing PDA1 even after he or she goes backhome carrying PDA1. This is realized by thefollowing mechanism. When he or she car-ries out PDA1 from Office environment, heor she just needs to make PDA1 downloadthe proxy smart object of Office as shown inFigure 9. This operation is called federationsuspension. When arriving at home, PDA1is WiFi connected to Home, then federateswith Home. At the same time, the proxysmart object installed in it resumes the ac-cess to Office. Therefore, they set up oneadditional channel to +Print port in Homesmart object as shown in the right-hand sideof this figure. Now the PDA can accessthe database service of Office, and the twoprinting services of Office and Home. WhenPDA1 requests a print service, it asks its useror the application which of these services tochoose.
-SOdownload
-DB -Print
+SOdownload
+DB
+DB
-urloffice
-SOdownload
-DB -Print
+DB
-urloffice
-SOdownload
-DB -Print
+SOdownload
+DB
-urloffice
OfficeHome
suspend resume
PDA1
PDA1
PDA1
Figure 9: Location-transparent service con-tinuation using the downloading of a proxysmart object.
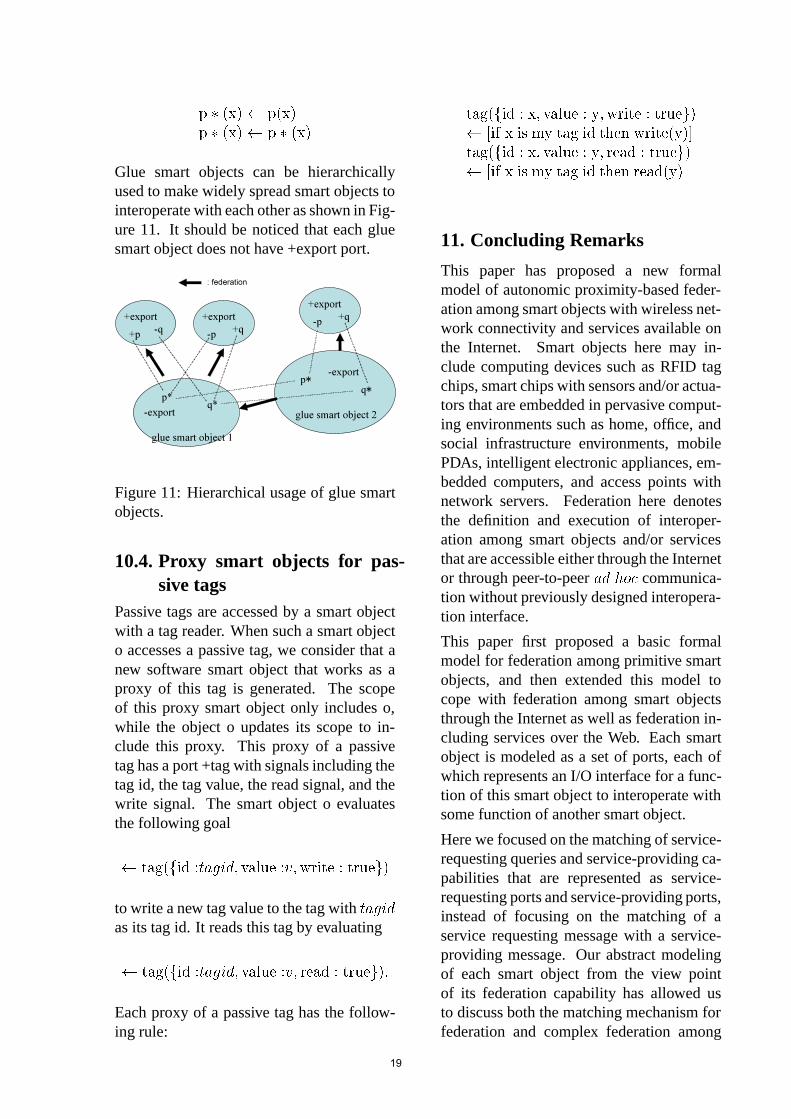
10.3. Import and export of portsand glue smart objects
Here we consider a special type of port‘export’. A service-providing port +ex-port exports proxies of all the ports ex-cept those of export type to the service-requesting smart object that accesses thisport through -export. A proxy of a port +por -p is represented as , and works as a re-
lay station of +p or -p. A proxy in a smartobject o forms a channel with each of +p, -p,and in a different smart object.
A glue smart object is a special smart objectwith no port other than a service-requestingport -export. A smart object with -p portcannot communicate with another smart ob-ject with +p if neither of them is locatedwithin the proximity of the other. Let us as-sume that each of them has a port +export. Inthis case, if we bring in a glue smart objectwith a sufficiently large WiFi access rangeto cover these two smart objects, this glueobject can federate with these two, sets upchannels between its -export and the +exportport of each of the two objects, and obtain aport proxy . This proxy works as a relaystation for -p and +p in these two objects,and sets up channels from itself to each ofthese two ports. Through these channel, theport -p becomes able to communicate withthe port +p. This situation is shown in Fig-ure 10.
+export
-export
+p-q
+export
-p+q
+export
+p-q
-export
p*
+export-p +q
q*
glue smart object
glue smart object
Figure 10: A glue smart object and its usage.
Their semantics is defined as follows. Eachsmart object that allows the export of its portproxies has the following rule.
& ' ( &&
Each glue smart object has the followingrules.
) & '
* &&
For each created port proxy , the followingrules are added to the glue smart object.
18
Glue smart objects can be hierarchicallyused to make widely spread smart objects tointeroperate with each other as shown in Fig-ure 11. It should be noticed that each gluesmart object does not have +export port.
+export
-export
+p-q
+export
-p+q
glue smart object 1
p*q*
+export
-p+q
-export
q*p*
glue smart object 2
: federation
Figure 11: Hierarchical usage of glue smartobjects.
10.4. Proxy smart objects for pas-sive tags
Passive tags are accessed by a smart objectwith a tag reader. When such a smart objecto accesses a passive tag, we consider that anew software smart object that works as aproxy of this tag is generated. The scopeof this proxy smart object only includes o,while the object o updates its scope to in-clude this proxy. This proxy of a passivetag has a port +tag with signals including thetag id, the tag value, the read signal, and thewrite signal. The smart object o evaluatesthe following goal
+ !
to write a new tag value to the tag with
as its tag id. It reads this tag by evaluating
+ !
Each proxy of a passive tag has the follow-ing rule:
+ ) , - + ) , -
11. Concluding Remarks
This paper has proposed a new formalmodel of autonomic proximity-based feder-ation among smart objects with wireless net-work connectivity and services available onthe Internet. Smart objects here may in-clude computing devices such as RFID tagchips, smart chips with sensors and/or actua-tors that are embedded in pervasive comput-ing environments such as home, office, andsocial infrastructure environments, mobilePDAs, intelligent electronic appliances, em-bedded computers, and access points withnetwork servers. Federation here denotesthe definition and execution of interoper-ation among smart objects and/or servicesthat are accessible either through the Internetor through peer-to-peer communica-tion without previously designed interopera-tion interface.
This paper first proposed a basic formalmodel for federation among primitive smartobjects, and then extended this model tocope with federation among smart objectsthrough the Internet as well as federation in-cluding services over the Web. Each smartobject is modeled as a set of ports, each ofwhich represents an I/O interface for a func-tion of this smart object to interoperate withsome function of another smart object.
Here we focused on the matching of service-requesting queries and service-providing ca-pabilities that are represented as service-requesting ports and service-providing ports,instead of focusing on the matching of aservice requesting message with a service-providing message. Our abstract modelingof each smart object from the view pointof its federation capability has allowed usto discuss both the matching mechanism forfederation and complex federation among
19

smart objects in terms of a simple mathe-matical model. Our model has enabled usto describe applications from the view pointof their federation structures. This has en-abled us to extract a common substructurefrom applications sharing the same typicalfederation scenario as an application frame-work for this federation scenario. This pa-per has also given the semantics of our fed-eration model based on a Prolog like logicalframework.
Federation of smart objects also require se-curity mechanism to protect each smart ob-ject from unexpected or evil federation. Se-cure federation requires the integration ofsome security mechanism with our federa-tion model, on which we are also currentlyworking.
References
[1] David Gelernter. Generative communi-cation in linda. ACM Trans. Program.Lang. Syst., 7(1):80–112, 1985.
[2] Sun Microsystems. Javaspaces servicespecification, version 1.2, 2001.
[3] Sun Microsystems. Jini technologycore platform specification, version 1.2,2001.
[4] Gian Pietro Picco, Amy L. Murphy, andGruia-Catalin Roman. Lime: Lindameets mobility. In ICSE ’99: Proceed-ings of the 21st international conferenceon Software engineering, pages 368–377, Los Alamitos, CA, USA, 1999.IEEE Computer Society Press.
[5] Yuzuru Tanaka. Meme Media and MemeMarket Architectures: Knowledge Me-dia for Editing, Distributing, and Man-aging Intellectual Resources. Wiley-IEEE Press, 2003.
[6] Yuzuru Tanaka. Knowledge federationover the web based on meme mediatechnologies. In Lecture Notes in Com-puter Science, 3847, pages 159–182,2006.
[7] Yuzuru Tanaka, Jun Fujima, and MakotoOhigashi. Meme media for the knowl-edge federation over the web and perva-sive computing environments. In ASIAN2004, Lecture Notes in Computer Sci-ence, 3321, pages 33–47, 2004.
[8] Yuzuru Tanaka and Kimihito Ito. Mememedia architecture for the reediting andredistribution of web resources. InFQAS 2004: Lecture Notes in ComputerScience, 3055, pages 1–12, 2004.
[9] Yuzuru Tanaka, Kimihito Ito, and JunFujima. Meme media for clipping andcombining web resources. World WideWeb, 9(2):117–142, 2006.
20
Protean sensor networkfor context aware services
Nonaka, H. and Kurihara, M.Graduate School of Information Science and Technology
Hokkaido University, Sapporo 060 0814, Japannonaka, [email protected]
AbstractWe present a wearable sensor network system. In our study, we refer a personal area network as“sensor network.” The main part of our system is eye and head movement tracking module basedon visual sensorimotor integration. Eye-head cooperation is considered, especially head gestureaccompanied with vestibulo-ocular reflex is used for a cue of person’s intention. Each sensor isresponsible for respective roll, which varies according to the modality. And the modality dependson the person’s context. In order to change the function of each node, respective firmware is re-programmed by each other using in-circuit serial programming.
Keywords:sensor network, context-aware computing, eye movement tracking, wearable computer,gesture recognition
1. Introduction
Recently, the term “sensor network” hasbeen often used for an ad-hoc wirelessnetwork or a multi-hopping network, es-pecially in the research field of wirelesscommunication networks. Huge num-bers of inexpensive sensor nodes are de-ployed geographically or attached to mo-bile robots [2] [6] [18]. Sensor nodesacquire only local information from theirsurroundings. However each sensor nodehas limited communication and computa-tion ability, large scaled sensor networkcan be constructed by organizing theminto collaborative, without a priori sens-ing infrastructure. Now such a networksystem is commercialized [3] and be-coming available for information acquisi-tion including target tracking, area search,environmental monitoring, infrastructuremaintenance, feature localization, bordermonitoring, battlefield monitoring, disas-
ter relief, and so on.
“Sensor network” is also used as that forextracting or inferring a person’s context,especially in the research field of ubiqui-tous computing or pervasive computing.The term “context” is defined, for exam-ple, as follows:
“Context: any information that can beused to characterize the situation of enti-ties (i.e., whether a person, place, or ob-ject) that are considered relevant to theinteraction between a user and an appli-cation , including the user and the ap-plication themselves. Context is typicallythe location, identity, and state of people,groups, and computational and physicalobjects.” by Dey et al. [4]
In order to acquire and gather informa-tion available for extracting a person’scontext, variety of sensors are installed,as is often the case, by invisible way.
21
In the case of a room, they are embed-ded in furniture, electronic appliances,the ceiling, the floor, and so on. Therange extends to a building, public facili-ties, station premise, airport, city, and soforth. Various systems and utilities forcontext-aware computing have been pro-posed based on such sensor networks [1][4] [7] [17].
In our study, we refer a personal area sen-sor network as “sensor network,” how-ever it is used for context-aware services.Context resides intrinsically in each per-son’s mind, therefore, context-aware ser-vices are preferable to be provided bypersonal belongings, rather than by sur-roundings. Some people may feel un-comfortable to be taken pictures whereverthey go, even if they take pictures wher-ever. They should prefer GPS as a posi-tioning service to that with satellite im-ages or surveillance cameras. If an ID-tagsystem is available for a context-awareservice, they might desire to take belonga tag reader rather than a tag.
From these considerations, we proceededto develop a personal area sensor networkclose to a person. The sensor networkis constructed by heterogeneous sensornodes, for example, pressure sensors [9][10], acceleration sensors [11], ultrasonicsensors [12]. The main part of our systemis eye and head movement tracking mod-ule based on visual sensori-motor integra-tion. Eye-head cooperation is considered,especially head gesture accompanied withvestibulo-ocular reflex is used for a cueof person’s intention. We adopted aposition sensitive device (S7848, Hama-matsu) for eye tracking. Accelerometer(ADXL311E, Analog Devices), gyro sen-sor (ADXRS300, Analog Devices), andmagnetic sensor (AMI201, Aichi MicroSystems) are used for head tracking. Eachsensor is responsible for respective roll,which varies according to the modality.
And the modality depends on the person’scontext, for example, eye-gaze is used fornot only seeing or looking, but also sig-naling or directing a partner. In order tochange the function of each node, respec-tive firmware is re-programmed by eachother using in-circuit serial programming.
2. Network configuration
Heterogeneous sensor nodes are inter-connected by both wired and wire-less communication links. Neighbor-ing nodes are mainly linked single-wire(two-core) connections overlapped withpower supply. For inter-PCB connec-tion, we adopted four-core equilibriumhalf-duplex transmission that is compli-ant with RS-422, with the view of re-ducing radiated electromagnetic interfer-ence. Wireless links are used for externalcommunications with surroundings. Forsimplicity, only one node is allowed todrive the transmission line in any mo-ment, and the other nodes can only re-ceive data, therefore, carry sense or col-lision detection are not required. The net-work performs at a time in one of fourmodes: normal-packet-mode, cascaded-packet-mode, pulsed-network-mode, andprogramming-mode.
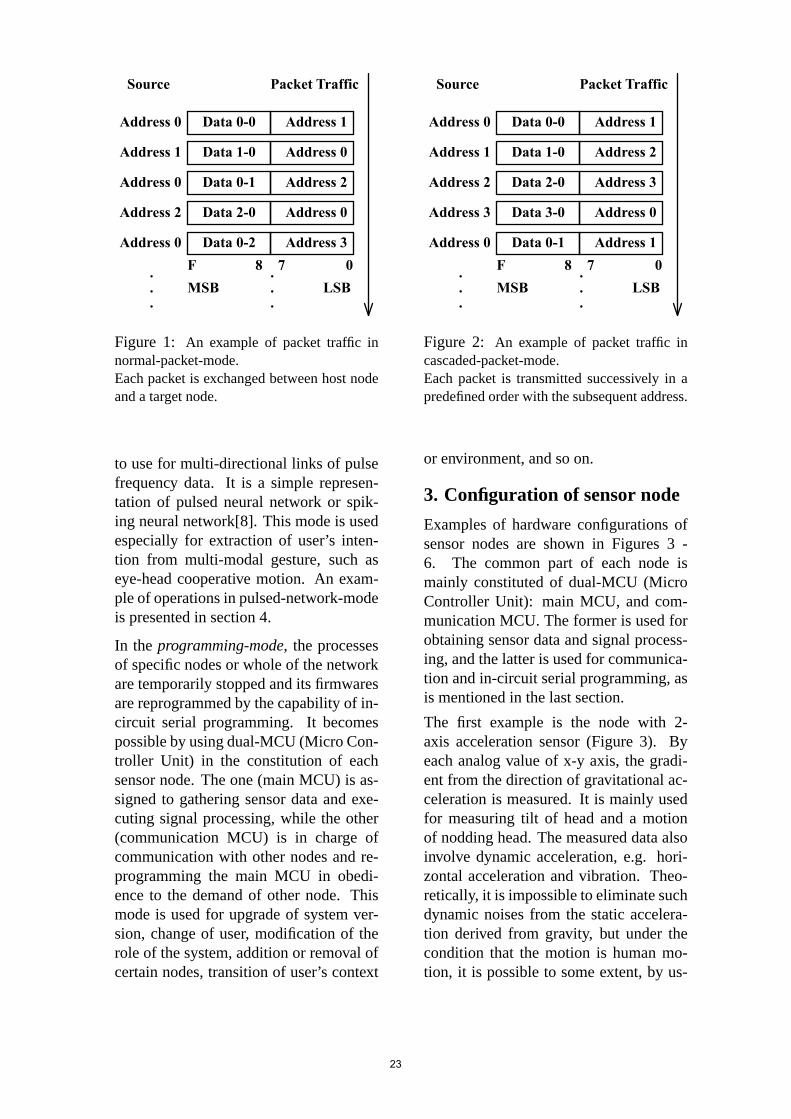
In the normal-packet-mode, each packetis exchanged between host node and atarget node with corresponding addresses(Figure 1). The network initially starts inthis mode, and it enters the other modesusing packet exchange in this mode.
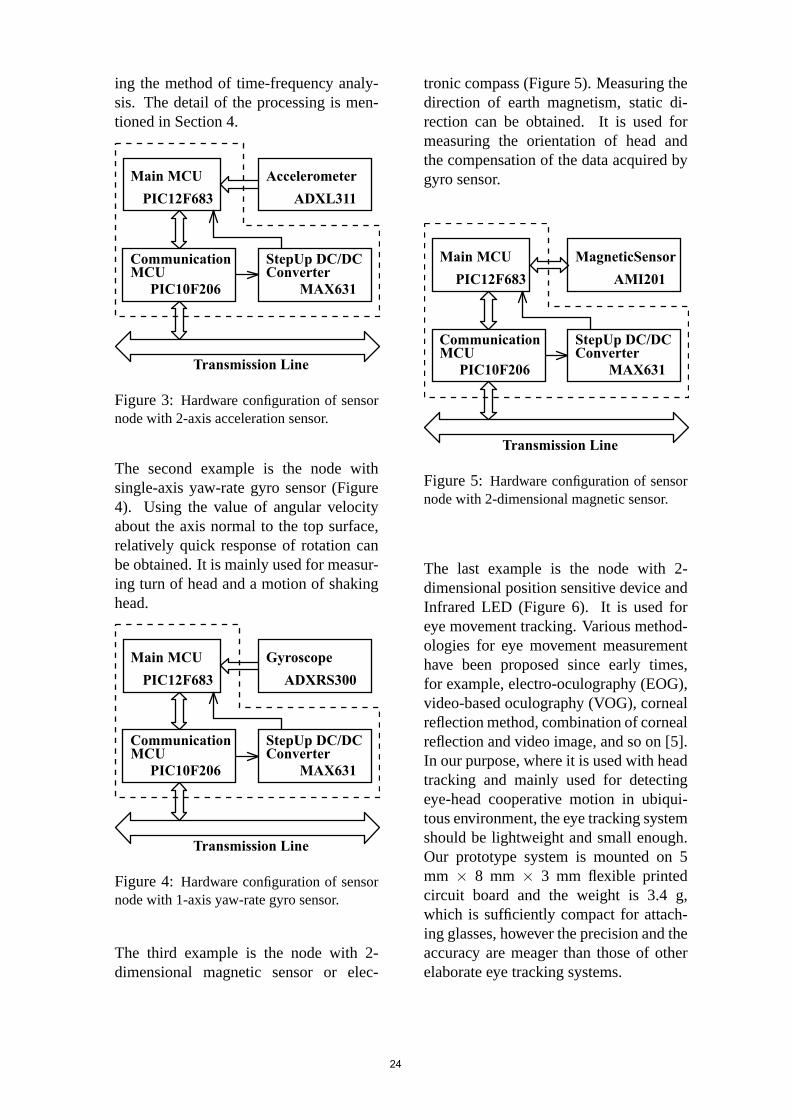
In the cascaded-packet-mode, eachpacket is transmitted from node to nodesuccessively in a predefined order withthe subsequent address (Figure 2). Whilethe period of transmission, every trafficis observed by host node. Broadcastingmessage and gathering sensor data areusually achieved in this mode.
In the pulsed-network-mode, the trans-mission line is allowed in a given period
22
LSBMSB
Address 1Data 0-0Address 0
Address 0Data 1-0Address 1
Address 2Data 0-1Address 0
Address 0Data 2-0Address 2
Address 3Data 0-2Address 0
Source Packet Traffic
.
.
.
.
.
.
078F
Figure 1: An example of packet traffic innormal-packet-mode.Each packet is exchanged between host nodeand a target node.
to use for multi-directional links of pulsefrequency data. It is a simple represen-tation of pulsed neural network or spik-ing neural network[8]. This mode is usedespecially for extraction of user’s inten-tion from multi-modal gesture, such aseye-head cooperative motion. An exam-ple of operations in pulsed-network-modeis presented in section 4.
In the programming-mode, the processesof specific nodes or whole of the networkare temporarily stopped and its firmwaresare reprogrammed by the capability of in-circuit serial programming. It becomespossible by using dual-MCU (Micro Con-troller Unit) in the constitution of eachsensor node. The one (main MCU) is as-signed to gathering sensor data and exe-cuting signal processing, while the other(communication MCU) is in charge ofcommunication with other nodes and re-programming the main MCU in obedi-ence to the demand of other node. Thismode is used for upgrade of system ver-sion, change of user, modification of therole of the system, addition or removal ofcertain nodes, transition of user’s context
LSBMSB
Address 1Data 0-0Address 0
Address 2Data 1-0Address 1
Address 3Data 2-0Address 2
Address 0Data 3-0Address 3
Address 1Data 0-1Address 0
Source Packet Traffic
.
.
.
.
.
.
078F
Figure 2: An example of packet traffic incascaded-packet-mode.Each packet is transmitted successively in apredefined order with the subsequent address.
or environment, and so on.
3. Configuration of sensor node
Examples of hardware configurations ofsensor nodes are shown in Figures 3 -6. The common part of each node ismainly constituted of dual-MCU (MicroController Unit): main MCU, and com-munication MCU. The former is used forobtaining sensor data and signal process-ing, and the latter is used for communica-tion and in-circuit serial programming, asis mentioned in the last section.
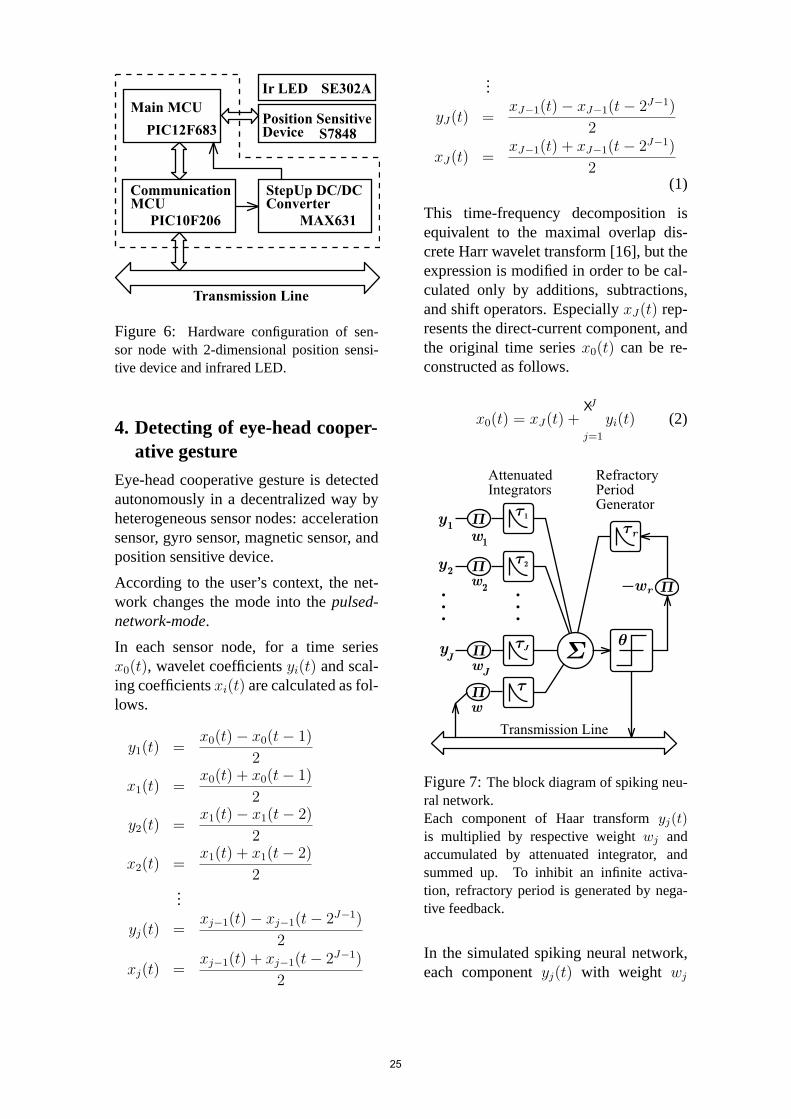
The first example is the node with 2-axis acceleration sensor (Figure 3). Byeach analog value of x-y axis, the gradi-ent from the direction of gravitational ac-celeration is measured. It is mainly usedfor measuring tilt of head and a motionof nodding head. The measured data alsoinvolve dynamic acceleration, e.g. hori-zontal acceleration and vibration. Theo-retically, it is impossible to eliminate suchdynamic noises from the static accelera-tion derived from gravity, but under thecondition that the motion is human mo-tion, it is possible to some extent, by us-
23
ing the method of time-frequency analy-sis. The detail of the processing is men-tioned in Section 4.
Transmission Line
Main MCU
Communication
MCU
PIC12F683
PIC10F206
StepUp DC/DC
Converter
MAX631
Accelerometer
ADXL311
Figure 3: Hardware configuration of sensornode with 2-axis acceleration sensor.
The second example is the node withsingle-axis yaw-rate gyro sensor (Figure4). Using the value of angular velocityabout the axis normal to the top surface,relatively quick response of rotation canbe obtained. It is mainly used for measur-ing turn of head and a motion of shakinghead.
Transmission Line
Main MCU
Communication
MCU
PIC12F683
PIC10F206
StepUp DC/DC
Converter
MAX631
Gyroscope
ADXRS300
Figure 4: Hardware configuration of sensornode with 1-axis yaw-rate gyro sensor.
The third example is the node with 2-dimensional magnetic sensor or elec-
tronic compass (Figure 5). Measuring thedirection of earth magnetism, static di-rection can be obtained. It is used formeasuring the orientation of head andthe compensation of the data acquired bygyro sensor.
Transmission Line
Main MCU
Communication
MCU
PIC12F683
PIC10F206
StepUp DC/DC
Converter
MAX631
MagneticSensor
AMI201
Figure 5: Hardware configuration of sensornode with 2-dimensional magnetic sensor.
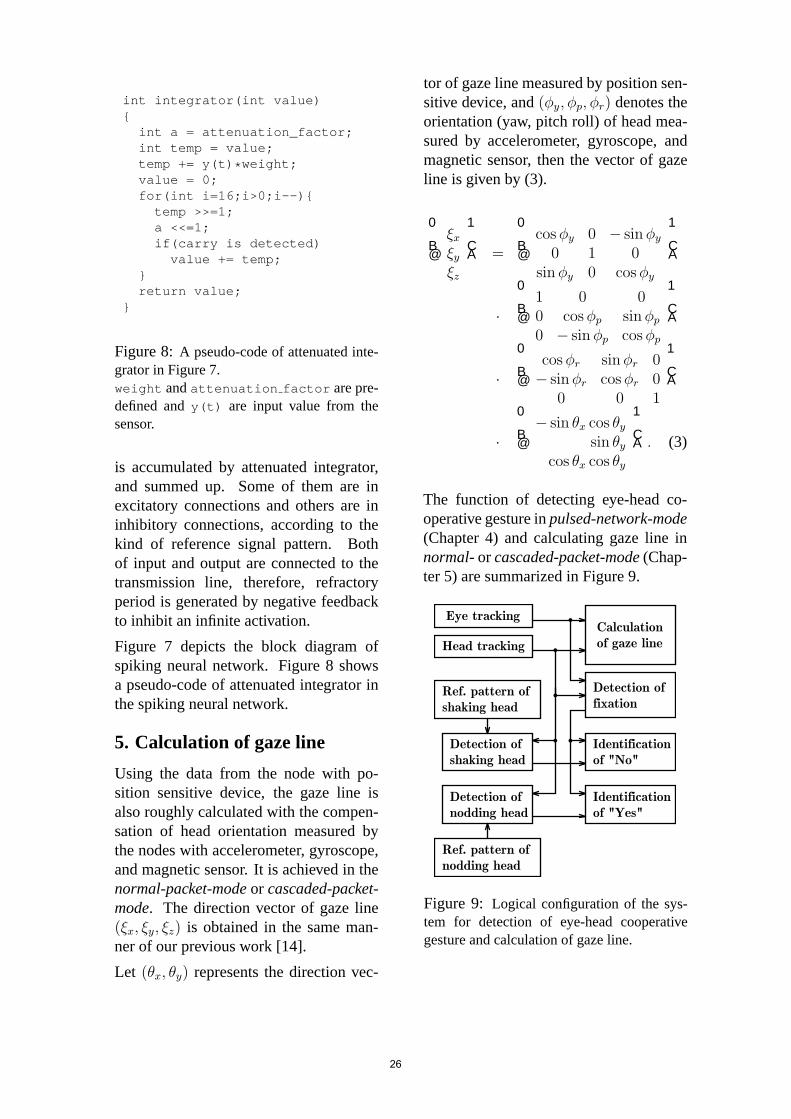
The last example is the node with 2-dimensional position sensitive device andInfrared LED (Figure 6). It is used foreye movement tracking. Various method-ologies for eye movement measurementhave been proposed since early times,for example, electro-oculography (EOG),video-based oculography (VOG), cornealreflection method, combination of cornealreflection and video image, and so on [5].In our purpose, where it is used with headtracking and mainly used for detectingeye-head cooperative motion in ubiqui-tous environment, the eye tracking systemshould be lightweight and small enough.Our prototype system is mounted on 5mm × 8 mm × 3 mm flexible printedcircuit board and the weight is 3.4 g,which is sufficiently compact for attach-ing glasses, however the precision and theaccuracy are meager than those of otherelaborate eye tracking systems.
24
Transmission Line
Main MCU
Communication
MCU
PIC12F683
PIC10F206
StepUp DC/DC
Converter
MAX631
Position Sensitive
Device S7848
Ir LED SE302A
Figure 6: Hardware configuration of sen-sor node with 2-dimensional position sensi-tive device and infrared LED.
4. Detecting of eye-head cooper-ative gesture
Eye-head cooperative gesture is detectedautonomously in a decentralized way byheterogeneous sensor nodes: accelerationsensor, gyro sensor, magnetic sensor, andposition sensitive device.
According to the user’s context, the net-work changes the mode into thepulsed-network-mode.
In each sensor node, for a time seriesx0(t), wavelet coefficientsyi(t) and scal-ing coefficientsxi(t) are calculated as fol-lows.
y1(t) =x0(t)− x0(t− 1)
2
x1(t) =x0(t) + x0(t− 1)
2
y2(t) =x1(t)− x1(t− 2)
2
x2(t) =x1(t) + x1(t− 2)
2...
yj(t) =xj−1(t)− xj−1(t− 2J−1)
2
xj(t) =xj−1(t) + xj−1(t− 2J−1)
2
...
yJ(t) =xJ−1(t)− xJ−1(t− 2J−1)
2
xJ(t) =xJ−1(t) + xJ−1(t− 2J−1)
2(1)
This time-frequency decomposition isequivalent to the maximal overlap dis-crete Harr wavelet transform [16], but theexpression is modified in order to be cal-culated only by additions, subtractions,and shift operators. EspeciallyxJ(t) rep-resents the direct-current component, andthe original time seriesx0(t) can be re-constructed as follows.
x0(t) = xJ(t) +J∑j=1
yi(t) (2)
Transmission Line
τ
θ
τ
τ
τ
AttenuatedIntegrators
RefractoryPeriodGenerator
Π
Π
Π Σ
1
2
J
1w
2w
J
Jw
Π
w
1y
2y
y
r−w
r
τ
Π
Figure 7:The block diagram of spiking neu-ral network.Each component of Haar transformyj(t)is multiplied by respective weightwj andaccumulated by attenuated integrator, andsummed up. To inhibit an infinite activa-tion, refractory period is generated by nega-tive feedback.
In the simulated spiking neural network,each componentyj(t) with weight wj
25
int integrator(int value)
int a = attenuation_factor;int temp = value;temp += y(t) * weight;value = 0;for(int i=16;i>0;i--)
temp >>=1;a <<=1;if(carry is detected)
value += temp;return value;
Figure 8:A pseudo-code of attenuated inte-grator in Figure 7.weight andattenuation factor are pre-defined andy(t) are input value from thesensor.
is accumulated by attenuated integrator,and summed up. Some of them are inexcitatory connections and others are ininhibitory connections, according to thekind of reference signal pattern. Bothof input and output are connected to thetransmission line, therefore, refractoryperiod is generated by negative feedbackto inhibit an infinite activation.
Figure 7 depicts the block diagram ofspiking neural network. Figure 8 showsa pseudo-code of attenuated integrator inthe spiking neural network.
5. Calculation of gaze line
Using the data from the node with po-sition sensitive device, the gaze line isalso roughly calculated with the compen-sation of head orientation measured bythe nodes with accelerometer, gyroscope,and magnetic sensor. It is achieved in thenormal-packet-modeor cascaded-packet-mode. The direction vector of gaze line(ξx, ξy, ξz) is obtained in the same man-ner of our previous work [14].
Let (θx, θy) represents the direction vec-
tor of gaze line measured by position sen-sitive device, and(φy, φp, φr) denotes theorientation (yaw, pitch roll) of head mea-sured by accelerometer, gyroscope, andmagnetic sensor, then the vector of gazeline is given by (3).
ξxξyξz
=
cosφy 0 − sinφy0 1 0
sinφy 0 cosφy
·
1 0 00 cosφp sinφp0 − sinφp cosφp
·
cosφr sinφr 0− sinφr cosφr 0
0 0 1
·
− sin θx cos θysin θy
cos θx cos θy
. (3)
The function of detecting eye-head co-operative gesture inpulsed-network-mode(Chapter 4) and calculating gaze line innormal-or cascaded-packet-mode(Chap-ter 5) are summarized in Figure 9.
Eye tracking
Head tracking
Calculation
of gaze line
Detection of
fixation
Ref. pattern of
shaking head
Ref. pattern of
nodding head
Detection of
shaking head
Detection of
nodding head
Identification
of "No"
Identification
of "Yes"
Figure 9: Logical configuration of the sys-tem for detection of eye-head cooperativegesture and calculation of gaze line.
26
6. Conclusions
This paper proposed a wearable sensornetwork system based on a capability ofin-circuit serial programming. The mainpart of our system is eye-head movementtracking, and the roll of these movementdepends on the modality and user’s con-text. In order to cope with such variety ofmodality and context, we introduced fournetwork modes: normal-packet-mode,cascaded-packet-mode, pulsed-network-mode, and programming-mode. Wepresented several applications of thesemodes for acquisition of user’s intention.
At present we have only made a prepa-ration for context-aware services withgeneral-purpose equipment. Now we arestarting on development of context-awaresystem with present network system com-bined with nonverbal interaction proto-cols. In addition, the consideration for in-dividual difference is needed for furtherimprovement, as a necessary part of ourfuture work.
References
[1] Benerecetti, M., Bouquet, P., andBonifacio, M.: Distributed Context-Aware Systems, Human-ComputerInteraction, 16(3):213-228, 2001.
[2] D’Costa, A., Sayeed, A.M.: Col-laborative Signal Processing for Dis-tributed Classification in Sensor Net-works, ISPN2003, LNCS2634:193-208, 2003.
[3] Mote System, Crossbow TechnologyInc., http://www.xbow.com.
[4] Dey, A.K., Abowd, G.D., and Salber,D.: A Conceptual Framework and aToolkit for Supporting the Rapid Pro-totyping of Context-Aware Applica-tions, Human-Computer Interaction,16(2):97-166, 2001.
[5] Duchowski, A.T.: Eye TrackingMethodology — Theory and practice,Springer Verlag, 2003.
[6] Grocholsky, B., Makarenko, A.,Kaupp, T., and Durrant-Whyte, H.F.:Scalable Control of DecentralisedSensor Platforms,ISPN2003, LNCS2634:96-112, 2003.
[7] Itao, T., Nakamura, T., Matsuo,M., and Aoyama, T.: Context-AwareConstruction of Ubiquitous Services,IEICE Transactions on Communica-tions, E84-B(12):3181-3188, 2001.
[8] Jahnke, A., Roth, U., and Schonauer,T.: Digital Simulation of Spik-ing Neural Networks, “Pulsed Neu-ral Networks”, ed. Maas,W. andBishop,C.M., MIT Press, 237-257,1998.
[9] Nonaka, H., and Kurihara, M.: Sens-ing pressure for authentication sys-tem using keystroke dynamics,Inter-national Journal of Computational In-telligence, 1(1):19-22, 2004.
[10] Nonaka, H., and Kurihara, M.: An-ticipation of Mouse Pointer Move-ment Using Pressure Sensors,Inter-national Conference on ComputingAnticipatory Systems, 7, Liege, 2005
[11] Nonaka, H., and Kurihara, M.:Time-Frequency Decomposition inGesture Recognition System UsingAccelerometer,International Confer-ence on Knowledge-Based IntelligentInformation & Engineering Systems,LNAI, 3213:1072-1078, Wellington,2004.
[12] Nonaka, H., and Kurihara, M.:Pulse-Based Learning for ObjectIdentification using Ultrasound,International Conference on NeuralInformation Processing, 9, Singapore,2002.
27

[13] Nonaka, H., and Kurihara, M.:Anticipatory Matching Method forQuery-Based Head Gesture Identifi-cation,International Journal of Com-puting Anticipatory Systems, 15:279-287, 2004.
[14] Nonaka, H.: Communication Inter-face with Eye-gaze and Head Gestureusing Successive DP Matching andFuzzy Inference,Journal of Intelli-gent Information Systems, 21(2):105-112, 2003.
[15] Nonaka, H., and Kurihara, M.: Eye-Contact Based Communication Proto-col in Human-Agent Interaction,In-ternational Workshop on IntelligentVirtual Agents, LNAI, 2792:106-110,Irsee, 2003.
[16] Percival, D.B., and walden, A.T.:Wavelet Methods for Time SeriesAnalysis, Cambridge Univ. Press,2000.
[17] Yamaguchi, A., Ohashi, M., andMurakami, H.: Autonomous Decen-tralized Control in Ubiquitous Com-puting, IEICE Transaction s on Com-munications, E88-B(12):4421-4426,2005.
[18] Liu, J., Reich, L.J., Chung, P., andZhao, F.: Distributed Group Manage-ment for Track Initiation and Main-tenance in Target Localization Appli-cations,ISPN2003, LNCS2634:113-128, 2003.
28
Pattern Concepts forDigital Games Research
Klaus P. JantkeTechnical University of Ilmenau
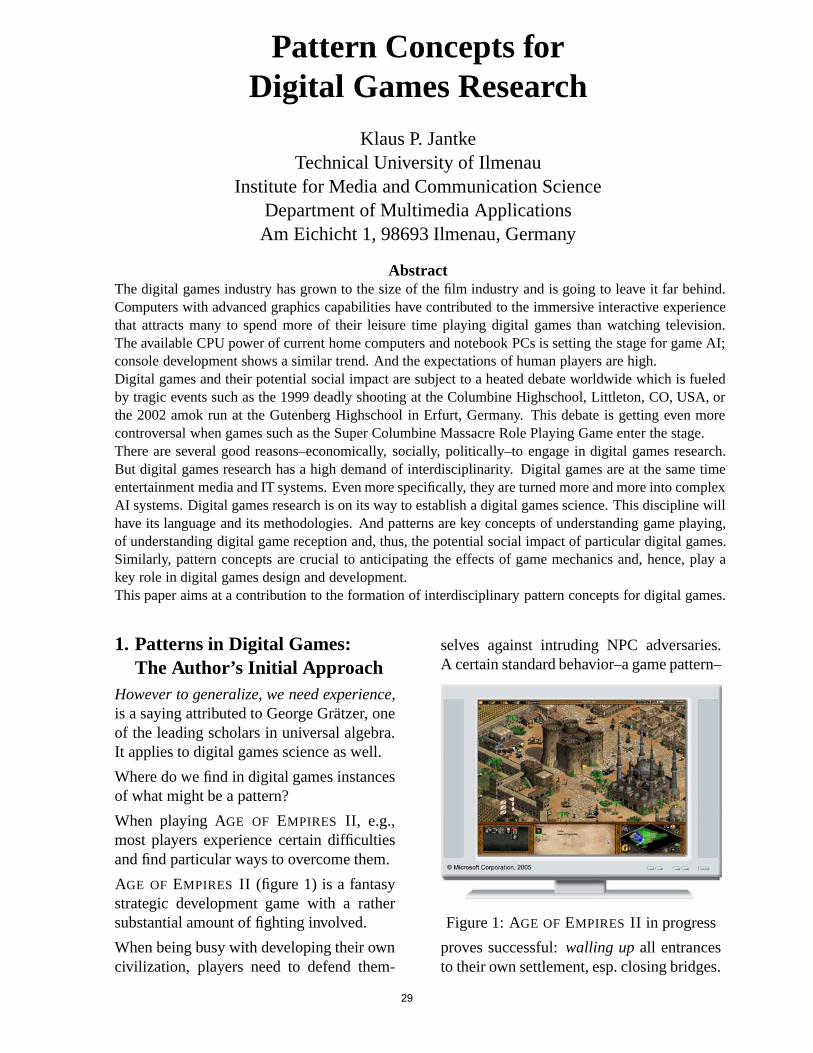
Institute for Media and Communication ScienceDepartment of Multimedia ApplicationsAm Eichicht 1, 98693 Ilmenau, Germany
AbstractThe digital games industry has grown to the size of the film industry and is going to leave it far behind.Computers with advanced graphics capabilities have contributed to the immersive interactive experiencethat attracts many to spend more of their leisure time playing digital games than watching television.The available CPU power of current home computers and notebook PCs is setting the stage for game AI;console development shows a similar trend. And the expectations of human players are high.Digital games and their potential social impact are subject to a heated debate worldwide which is fueledby tragic events such as the 1999 deadly shooting at the Columbine Highschool, Littleton, CO, USA, orthe 2002 amok run at the Gutenberg Highschool in Erfurt, Germany. This debate is getting even morecontroversal when games such as the Super Columbine Massacre Role Playing Game enter the stage.There are several good reasons–economically, socially, politically–to engage in digital games research.But digital games research has a high demand of interdisciplinarity. Digital games are at the same timeentertainment media and IT systems. Even more specifically, they are turned more and more into complexAI systems. Digital games research is on its way to establish a digital games science. This discipline willhave its language and its methodologies. And patterns are key concepts of understanding game playing,of understanding digital game reception and, thus, the potential social impact of particular digital games.Similarly, pattern concepts are crucial to anticipating the effects of game mechanics and, hence, play akey role in digital games design and development.This paper aims at a contribution to the formation of interdisciplinary pattern concepts for digital games.
1. Patterns in Digital Games:The Author’s Initial Approach
However to generalize, we need experience,is a saying attributed to George Gratzer, oneof the leading scholars in universal algebra.It applies to digital games science as well.
Where do we find in digital games instancesof what might be a pattern?
When playing AGE OF EMPIRES II, e.g.,most players experience certain difficultiesand find particular ways to overcome them.
AGE OF EMPIRES II (figure 1) is a fantasystrategic development game with a rathersubstantial amount of fighting involved.
When being busy with developing their owncivilization, players need to defend them-
selves against intruding NPC adversaries.A certain standard behavior–a game pattern–
Figure 1: AGE OF EMPIRES II in progress
proves successful: walling up all entrancesto their own settlement, esp. closing bridges.
29

2. The Underlying Perspectiveat Digital Games
Digital games are–no doubt–entertainmentmedia and as such they are subject to mediaresearch. This is quite far beyond the limitsof IT and AI.
When digital games are accepted as an artform, they deserve all the rights other artsenjoy such as free speech, to say it in brief.
Figure 2: Download Page of a Free Game
Does this truly apply to all games includingthe SUPER COLUMBINE MASSACRE ROLE
PLAYING GAME (see figure 2) . . . ? In thissimple point and click shooting game, theplayer takes the role of one of the two teenswho shot a dozen of their school mates and ateacher before they finally shot themselves.
Digital games reflect reality to some extent.In turn, playing digital games might haveimpact on some players’ behavior in the sur-rounding real world (see [4, 17] for somecomprehensive approaches and [11] for aninterdisciplinary discussion).
Digital games have to be taken seriously. Forthe class of massively multi-player onlinerole playing games (MMORPG, for short),Jeff Strain, co-founder of ArenaNet, in aninterview1, characterized those games as justpolished incarnations of a traditional MMOthat was laid down ten years ago with Ul-tima Online. Its a game mechanic that re-quires you to grind away, in many cases, try-ing to level up. The whole goal in many ofthose games is to just get higher and higher
1www.just-rpg.com, April 28, 2006
leveled so that you can eventually, after athousand hours, get to see the cool stuff. Youdont take on those games lightly. If you’regoing to play a traditional MMO, not onlydo you have to be willing to commit to it fi-nancially in terms of an ongoing subscrip-tion, but also in terms of your life. You dontplay casually–you’re either completely im-mersed in it or you quit. Its kind of like peo-ple kicking a drug addiction.
Immersion or flow [7] is crucial to playinggames [10]: Games create a cybernetic sys-tem between you and the machine, with yoursenses eventually expanding to possess youravatar when you’ve sufficiently mastered thecontrol system. This is the absolute magic ofthe form, where you stop thinking, ”I needto press X to jump”, and start thinking, ”I’lljump”. Just look at the language peopleuse to talk about games to show how muchtheir sense of identity has merged with theirin-game character. If someones enjoying agame, it’s, ”It hit me”, never, ”It hit mycharacter”, . . . Videogames are the simula-tor which swallows your consciousness aliveand takes you to another place.
In addition to the entertainment media per-spective, digital games are clearly–usuallycomplex–IT systems. Going even further,they should be seen as systems of artificialintelligence (AI). Computer scientists mightbe surprised, but in gamer communities, itstill is a rather ‘unusual perspective’ to seedigital games as IT systems ([16], p. 16).
To the author, it is fundamental to considerdigital games at the same time as entertain-ment media and as systems of AI [11, 12].
When being interested in the way in whichdigital games might have impact on somehuman brains and, thus, have an impact ofsocial relevance, one needs a holistic viewat digital games: IT systems that affect thehuman brain by rewarding experiences [14].
Next to the analytical perspective, digitalgames science deals with principles andproblems of digital game synthesis: design,development, and implementation of enter-taining IT systems.
30
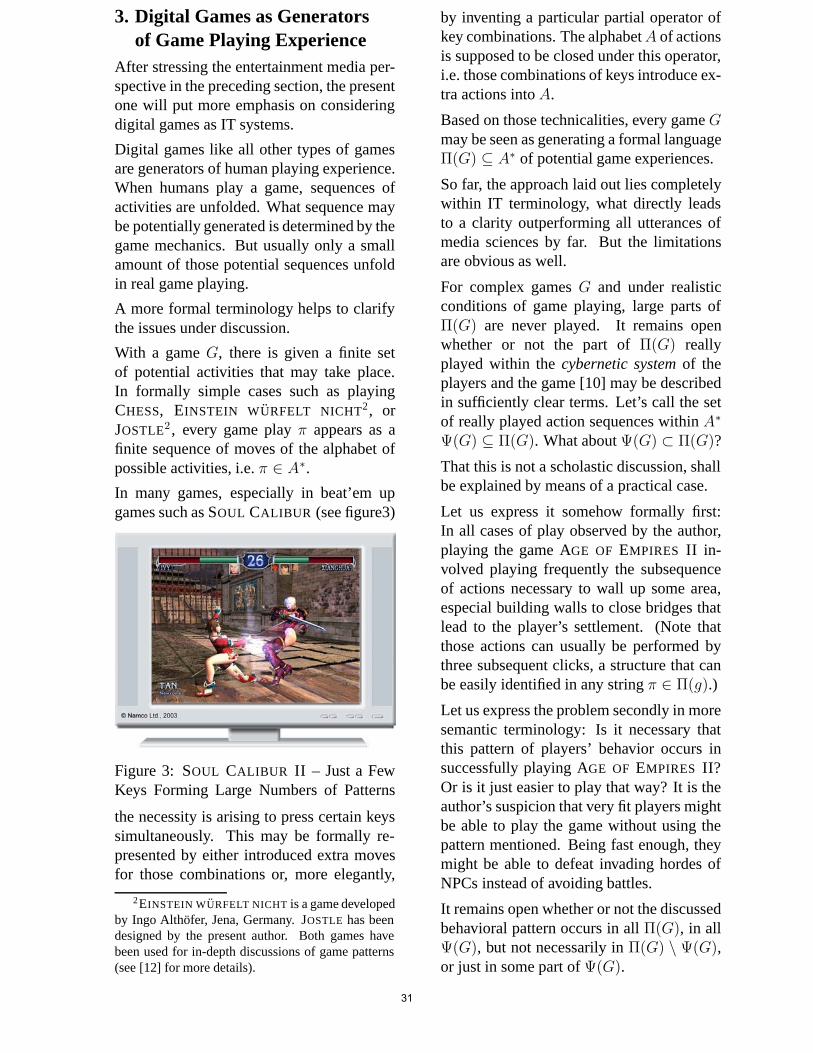
3. Digital Games as Generatorsof Game Playing Experience
After stressing the entertainment media per-spective in the preceding section, the presentone will put more emphasis on consideringdigital games as IT systems.
Digital games like all other types of gamesare generators of human playing experience.When humans play a game, sequences ofactivities are unfolded. What sequence maybe potentially generated is determined by thegame mechanics. But usually only a smallamount of those potential sequences unfoldin real game playing.
A more formal terminology helps to clarifythe issues under discussion.
With a game G, there is given a finite setof potential activities that may take place.In formally simple cases such as playingCHESS, EINSTEIN WURFELT NICHT2, orJOSTLE2 , every game play π appears as afinite sequence of moves of the alphabet ofpossible activities, i.e. π ∈ A∗.
In many games, especially in beat’em upgames such as SOUL CALIBUR (see figure3)
Figure 3: SOUL CALIBUR II – Just a FewKeys Forming Large Numbers of Patterns
the necessity is arising to press certain keyssimultaneously. This may be formally re-presented by either introduced extra movesfor those combinations or, more elegantly,
2EINSTEIN WURFELT NICHT is a game developedby Ingo Althofer, Jena, Germany. JOSTLE has beendesigned by the present author. Both games havebeen used for in-depth discussions of game patterns(see [12] for more details).
by inventing a particular partial operator ofkey combinations. The alphabetA of actionsis supposed to be closed under this operator,i.e. those combinations of keys introduce ex-tra actions into A.
Based on those technicalities, every game Gmay be seen as generating a formal languageΠ(G) ⊆ A∗ of potential game experiences.
So far, the approach laid out lies completelywithin IT terminology, what directly leadsto a clarity outperforming all utterances ofmedia sciences by far. But the limitationsare obvious as well.
For complex games G and under realisticconditions of game playing, large parts ofΠ(G) are never played. It remains openwhether or not the part of Π(G) reallyplayed within the cybernetic system of theplayers and the game [10] may be describedin sufficiently clear terms. Let’s call the setof really played action sequences within A∗
Ψ(G) ⊆ Π(G). What about Ψ(G) ⊂ Π(G)?
That this is not a scholastic discussion, shallbe explained by means of a practical case.
Let us express it somehow formally first:In all cases of play observed by the author,playing the game AGE OF EMPIRES II in-volved playing frequently the subsequenceof actions necessary to wall up some area,especial building walls to close bridges thatlead to the player’s settlement. (Note thatthose actions can usually be performed bythree subsequent clicks, a structure that canbe easily identified in any string π ∈ Π(g).)
Let us express the problem secondly in moresemantic terminology: Is it necessary thatthis pattern of players’ behavior occurs insuccessfully playing AGE OF EMPIRES II?Or is it just easier to play that way? It is theauthor’s suspicion that very fit players mightbe able to play the game without using thepattern mentioned. Being fast enough, theymight be able to defeat invading hordes ofNPCs instead of avoiding battles.
It remains open whether or not the discussedbehavioral pattern occurs in all Π(G), in allΨ(G), but not necessarily in Π(G) \ Ψ(G),or just in some part of Ψ(G).
31
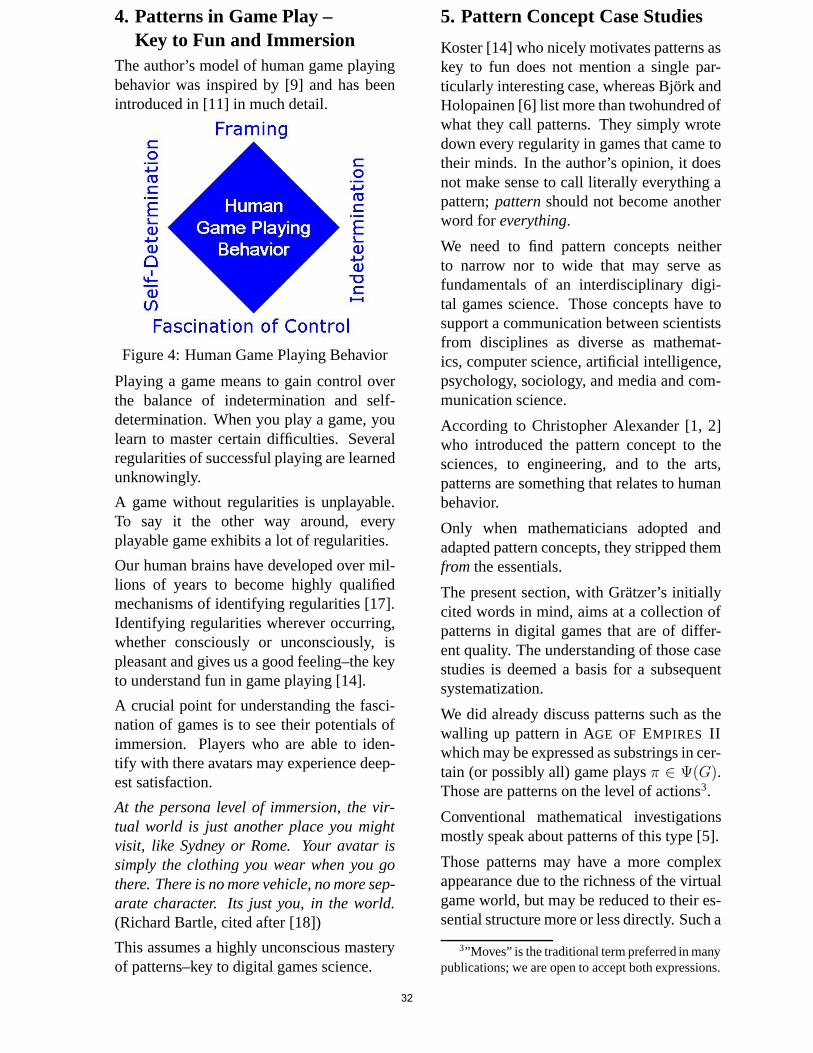
4. Patterns in Game Play –Key to Fun and Immersion
The author’s model of human game playingbehavior was inspired by [9] and has beenintroduced in [11] in much detail.
Figure 4: Human Game Playing Behavior
Playing a game means to gain control overthe balance of indetermination and self-determination. When you play a game, youlearn to master certain difficulties. Severalregularities of successful playing are learnedunknowingly.
A game without regularities is unplayable.To say it the other way around, everyplayable game exhibits a lot of regularities.
Our human brains have developed over mil-lions of years to become highly qualifiedmechanisms of identifying regularities [17].Identifying regularities wherever occurring,whether consciously or unconsciously, ispleasant and gives us a good feeling–the keyto understand fun in game playing [14].
A crucial point for understanding the fasci-nation of games is to see their potentials ofimmersion. Players who are able to iden-tify with there avatars may experience deep-est satisfaction.
At the persona level of immersion, the vir-tual world is just another place you mightvisit, like Sydney or Rome. Your avatar issimply the clothing you wear when you gothere. There is no more vehicle, no more sep-arate character. Its just you, in the world.(Richard Bartle, cited after [18])
This assumes a highly unconscious masteryof patterns–key to digital games science.
5. Pattern Concept Case Studies
Koster [14] who nicely motivates patterns askey to fun does not mention a single par-ticularly interesting case, whereas Bjork andHolopainen [6] list more than twohundred ofwhat they call patterns. They simply wrotedown every regularity in games that came totheir minds. In the author’s opinion, it doesnot make sense to call literally everything apattern; pattern should not become anotherword for everything.
We need to find pattern concepts neitherto narrow nor to wide that may serve asfundamentals of an interdisciplinary digi-tal games science. Those concepts have tosupport a communication between scientistsfrom disciplines as diverse as mathemat-ics, computer science, artificial intelligence,psychology, sociology, and media and com-munication science.
According to Christopher Alexander [1, 2]who introduced the pattern concept to thesciences, to engineering, and to the arts,patterns are something that relates to humanbehavior.
Only when mathematicians adopted andadapted pattern concepts, they stripped themfrom the essentials.
The present section, with Gratzer’s initiallycited words in mind, aims at a collection ofpatterns in digital games that are of differ-ent quality. The understanding of those casestudies is deemed a basis for a subsequentsystematization.
We did already discuss patterns such as thewalling up pattern in AGE OF EMPIRES IIwhich may be expressed as substrings in cer-tain (or possibly all) game plays π ∈ Ψ(G).Those are patterns on the level of actions3.
Conventional mathematical investigationsmostly speak about patterns of this type [5].
Those patterns may have a more complexappearance due to the richness of the virtualgame world, but may be reduced to their es-sential structure more or less directly. Such a
3”Moves” is the traditional term preferred in manypublications; we are open to accept both expressions.
32

case shows in HALF-LIFE 2: EPISODE ONE
as illustrated by figure 5.
In the survival game Half-Life 2 the humanplayer is accompanied by his fellow NPCnamed Alyx. When the player solves somekey tasks, Alyx is taking care of the rest ofthe work by eliminating all other attackingadversaries.
Figure 5: HALF-LIFE 2: EPISODE ONE –Cars for Blocking Exits of Ant Lions’ Nests
During mission 3, the player has to passsome underground parking area as depictedin figure 5. Certain adversary monstersnamed ant lions live in nests in the under-ground. The player has to avoid or to fightthem. A quite useful tactics is to block thenest exits by pushing cars to block the holes.The same pattern of player activity solvesthe problem repeatedly five or six times.
Those are examples of patterns in sequencesof actions–repeatedly occurring substrings.
In a larger number of point & click criminalstory adventures such as BLACK MIRROR,AGATHA CHRISTIE: AND THEN THERE
WERE NONE, and THE DA VINCI CODE
solving riddles is essential to playing thegame successfully.
Riddles (puzzles, . . . ) in games establishbottlenecks in the state space illustrated infigure 6. To reach certain sets of game states,one needs to pass a comparably small classof other states before.
Those bottlenecks may be characterized indifferent ways. Usually, the cardinality ofbottlenecks is a secondary, but characteristicproperty. In many cases, it helps to look at
game states in an attribute-value-way adopt-ing terminology from relational databases.There are bottlenecks characterized by somefinite number of attributes a1, . . . , an andparticular values c1, . . . , cn. Game states sin a bottleneck are defined by the property∧
i=1,...,n s.ai = ci being valid in all states ofthe bottleneck, but in no predecessor state.
Figure 6: Bottlenecks in a Game State Space
Bottlenecks decompose the game state spaceinto subspaces as depicted in figure 6.
The game THE DA VINCI CODE providesan extreme case study of a rigid game spacestructure with narrow bottlenecks. On thegame phase from which the screenshot infigure 7 is taken, the human player is stuckuntil a certain number of actions has beenperformed to set certain attribute values.
Figure 7: THE DA VINCI CODE – Bottle-necks in the Game State Space DeterminingPatterns of Human Game Playing Behavior
The whole game THE DA VINCI CODE con-sists of subspaces like that. The descriptionof the pattern identified requires to speakabout sets of game states and, perhaps, prop-erties of states in a set.
Compared to the pattern found above in AGE
OF EMPIRES, this is a higher level pattern.
33

Games such as BLACK MIRROR andAGATHA CHRISTIE: AND THEN THERE
WERE NONE show the same pattern, but notas rigid as in THE DA VINCI CODE.
Let us conclude the present case study bysome speculation. The strength of the playerguidance through the game’s state spacemakes those games good candidates forimplementing something like a dramaturgy[15] and this, in turn, makes them subject torelated analyzes [8, 13].
There is a large family of games normallycalled ego-shooters or first person shooters;those games are usually also quite linearlyorganized and, therefore, potentially goodcandidates of employing dramaturgy.
The player gets a usually simple mission andhas to shoot a number of adversaries on hisway. The game play is characterized by thefirst person perspective of seeing the wholeenvironment ‘through the eyes of the avatar’.
Literally all fantasy adventure games con-tain potions (magic drinks in fancy bottles oranything like that) for recreating an avatar’slife energy or, a little bit stronger, to give himextra lives.
In first person shooters, those potions havea different appearances and look much lessmagically, though their effect is as magic asin any fantasy game.
Figure 8: CALL OF DUTY – Widely UsedPatterns between Helpful and Annoying
There are simple patterns of presentation toattract the player’s attention to the potionssuch a first-aid kits in the ego-shooter CALL
OF DUTY that are glowing or even blinking.
In other games, avatars are turning theirheads, e.g., to signal something important.In BLACK MIRROR certain keys are shining.
Let us direct our attention to properly morecomplex patterns. CALL OF DUTY is anaward winning4 ego-shooter distinguishedby several features that make playing moresuccessful and, thus, more fun.
Figure 9: CALL OF DUTY – Patterns ofHigher Level Guidance to Human Players
In the game CALL OF DUTY, the humanplayer fights within a group of NPC fellows.The figures 9, 10 and 11 show screenshotstaken within a few subsequent seconds ofgame play. From the player’s perspective,the experience is as follows:
Figure 10: CALL OF DUTY – Screenshotsfrom a Playing Experience, the Second Step
I am running through a building. My NPCfellows pass me. They leave the housethrough some doorway and I follow them(figure 9). They turn left (figure 9 and 10)and I do so as well. Outside (figure 10) they
4more than 80 awards since its publication in 2003
34

turn left and I am rather hot on their heels.In this way, we reach the next point wherewe are facing our adversaries (figure 11).
Figure 11: CALL OF DUTY – Screenshotsfrom a Playing Experience, the Third Step
This guidance by NPC fellows exemplifiedis very valuable to the human player in somerespect. Firstly, the NPC guidance helpsfinding the way in the virtual environment.Secondly, it keeps the pace high enough tocope with the time limits. Thirdly, the forcedspeed of movement keeps the tension highand contributes to the overall experience.Last but not least, when the player’s NPCfellows run for cover, this indicates somedanger and helps the human player also toact appropriately, e.g., to take cover as well.
The pattern in the NPC behavior is difficultto describe in terms of states and moves, buteasy to identify in game play.
Figure 12: METROID – The Morphing Ball
In the METROID games series, the humanplayer acts as the intergalactic bounty hunterSamus Aran. This female NPC can changeher appearance drastically (figure 12).
Shapped as the so-called morphing ball, sheis better prepared for speed runs and able topass quite narrow passages.
The syntactic form of the transformation asa behavioral pattern is extremely simple–justa single key pressed, i.e., a single letter in asequence π ∈ Ψ(G).
Obviously, identifying the change from theavatar Samus Aran into the morphing balland, vice versa, unfolding Samus Aran fromher spherical form does not say much aboutthe experience of game playing.
Identifying a pattern syntactically rarelytells much. The crux is to relate syntax andsemantics.
The METROID case study has been chosento illustrate the key problem in especiallysimple terms.
In other cases, both syntax and semantics aredifficult, but nevertheless important patternsoccur. Consider, for instance, the survivalgame CALL OF CTHULHU which did appearin a PC version in Germany in early 2006.How is a truly creepy atmosphere provokedto arise?
Figure 13: The Creepy CALL OF CTHULHU
The question for the principles of touchinghuman emotions is among the most difficultand deep problems of the arts. There are nouniversal recipes [15], but several dozens ofexamples we may learn from [8, 13].
One may call some of the tricks in use in thefilm industry patterns. There is some hopethat the digital games science will also learnfrom the arts.
35
37
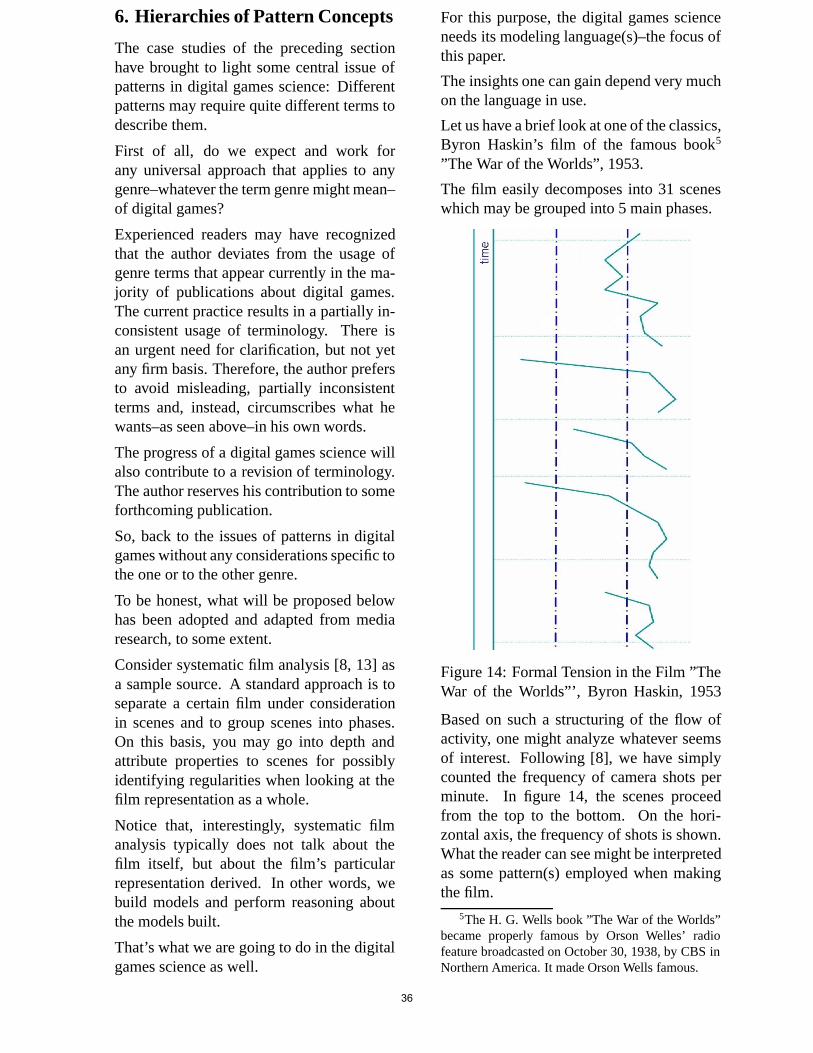
6. Hierarchies of Pattern Concepts
The case studies of the preceding sectionhave brought to light some central issue ofpatterns in digital games science: Differentpatterns may require quite different terms todescribe them.
First of all, do we expect and work forany universal approach that applies to anygenre–whatever the term genre might mean–of digital games?
Experienced readers may have recognizedthat the author deviates from the usage ofgenre terms that appear currently in the ma-jority of publications about digital games.The current practice results in a partially in-consistent usage of terminology. There isan urgent need for clarification, but not yetany firm basis. Therefore, the author prefersto avoid misleading, partially inconsistentterms and, instead, circumscribes what hewants–as seen above–in his own words.
The progress of a digital games science willalso contribute to a revision of terminology.The author reserves his contribution to someforthcoming publication.
So, back to the issues of patterns in digitalgames without any considerations specific tothe one or to the other genre.
To be honest, what will be proposed belowhas been adopted and adapted from mediaresearch, to some extent.
Consider systematic film analysis [8, 13] asa sample source. A standard approach is toseparate a certain film under considerationin scenes and to group scenes into phases.On this basis, you may go into depth andattribute properties to scenes for possiblyidentifying regularities when looking at thefilm representation as a whole.
Notice that, interestingly, systematic filmanalysis typically does not talk about thefilm itself, but about the film’s particularrepresentation derived. In other words, webuild models and perform reasoning aboutthe models built.
That’s what we are going to do in the digitalgames science as well.
For this purpose, the digital games scienceneeds its modeling language(s)–the focus ofthis paper.
The insights one can gain depend very muchon the language in use.
Let us have a brief look at one of the classics,Byron Haskin’s film of the famous book5
”The War of the Worlds”, 1953.
The film easily decomposes into 31 sceneswhich may be grouped into 5 main phases.
Figure 14: Formal Tension in the Film ”TheWar of the Worlds”’, Byron Haskin, 1953
Based on such a structuring of the flow ofactivity, one might analyze whatever seemsof interest. Following [8], we have simplycounted the frequency of camera shots perminute. In figure 14, the scenes proceedfrom the top to the bottom. On the hori-zontal axis, the frequency of shots is shown.What the reader can see might be interpretedas some pattern(s) employed when makingthe film.
5The H. G. Wells book ”The War of the Worlds”became properly famous by Orson Welles’ radiofeature broadcasted on October 30, 1938, by CBS inNorthern America. It made Orson Wells famous.
36

When analyzing digital games, let us have alook at game play in a similar fashion. Whengame play proceeds, one scene follows theother. It depends very much on what youconsider a scene.
Figure 15: Some Schematic Approach to the(not only) Digital Game Play Understanding
On the atomistic level, one might considerevery action in A a scene. In such a way,the sequence of scenes listed (in figure 15from the top to the bottom) coincides withπ ∈ Ψ(G).
Every traditional protocol of a CHESS game,for instance, forms such a sequence. Theabove-mentioned sequences of actions inAGE OF EMPIRES II fit as well.
Even without any assigned particular seman-tics, one may go for string mining to exhibitpotential patterns of game play.
Though this seems trivial because of beingmuch too formal, it yields several resultssuch as the preferred combinations of hits,kicks, and movements in a row a particularplayer of SOUL CALIBUR II performs.
The case study of AGE OF EMPIRES II wasintended to point to the fact that several low-level patterns may have some higher-levelmeaning such as walling-up a bridge.
For understanding digital games, we need todecide about the language expressions ad-missible to describe meaning as indicated infigure 15.
What might seem difficult at a first glancebecomes easier when having a closer look.Let us just ask what terminology we need totell the story6 of a game play.
6This is not to be confused with storytelling as itis used in some communities: The author does notclaim that every game tells a story. But we may tell astory about every game we are playing.
Once again, we take inspiration from themedia sciences. For talking about drama andfilm, there does exist a rich terminologywith concepts such as anagnorisis, climax,denouement, and peripeteia, to mention afew. We need to develop words–or, better,concepts–to talk about playing a game.
The language of digital games science doesnot yet exist.
We need to develop a layered language,whereby layers may be visualized like thecolumns in figure 15; there is, naturally, nolimitation to just three layers.
A few layers are immediately obvious:
• game states and moves,
• sets of game states,
• composite actions that establish somemeaning which may be circumscribedon a higher language level.
Walling up a bridge is of the third type. Weare still able to name the actions and havea look at every syntactic detail, but it seemsclearly more convenient to communicate ona semantic level.
Other languages constructs may be intro-duced to talk about structural digital gamesfeatures such as
• embedding of cut scenes,
• integration of puzzles,
• changing camera positions (switchingbetween first person and third personviews, e.g.).
The third point comes close to the level offormal tension (see figure 14).
Another higher level refers to informa-tion resp. knowledge of human players andNPCs;
• information systematically delivered inportions,
• indications given to make a player wor-rying (towards ’Eigenaffekt’ a la [15]).
On the highest level according to the presentapproach, one might talk about the player’smental states, her/his goals and intentionsand the like. Such a language level would be
37
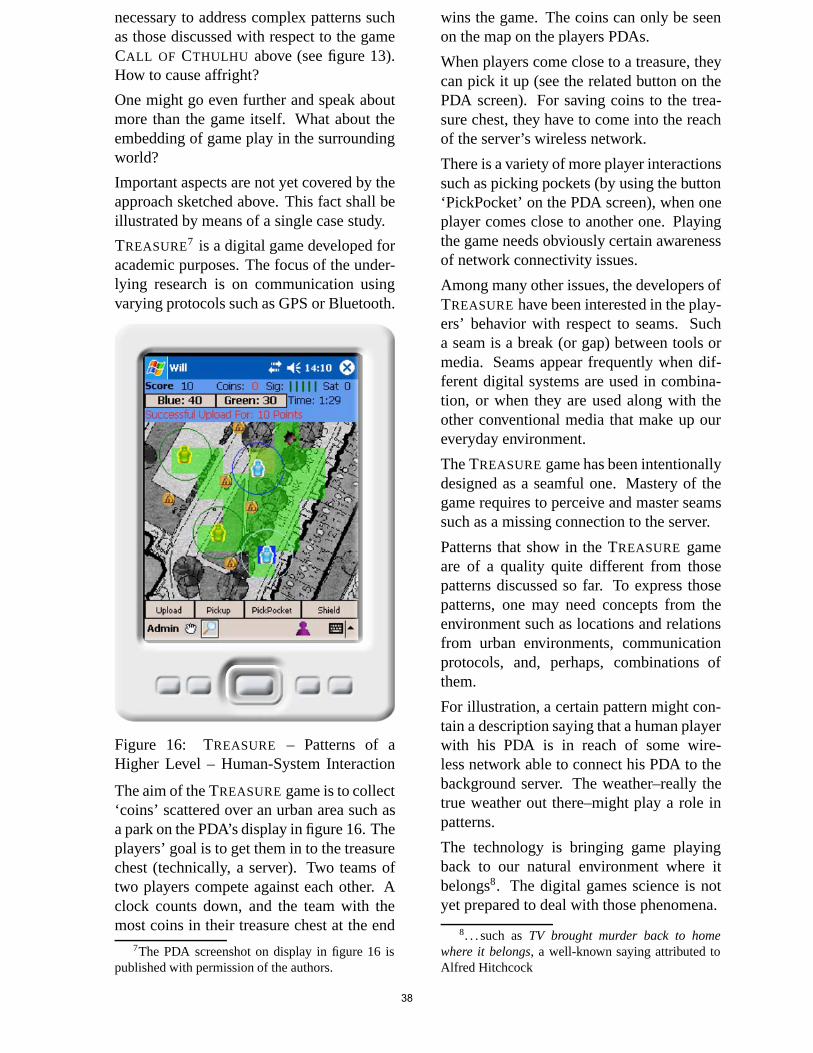
necessary to address complex patterns suchas those discussed with respect to the gameCALL OF CTHULHU above (see figure 13).How to cause affright?
One might go even further and speak aboutmore than the game itself. What about theembedding of game play in the surroundingworld?
Important aspects are not yet covered by theapproach sketched above. This fact shall beillustrated by means of a single case study.
TREASURE7 is a digital game developed foracademic purposes. The focus of the under-lying research is on communication usingvarying protocols such as GPS or Bluetooth.
Figure 16: TREASURE – Patterns of aHigher Level – Human-System Interaction
The aim of the TREASURE game is to collect‘coins’ scattered over an urban area such asa park on the PDA’s display in figure 16. Theplayers’ goal is to get them in to the treasurechest (technically, a server). Two teams oftwo players compete against each other. Aclock counts down, and the team with themost coins in their treasure chest at the end
7The PDA screenshot on display in figure 16 ispublished with permission of the authors.
wins the game. The coins can only be seenon the map on the players PDAs.
When players come close to a treasure, theycan pick it up (see the related button on thePDA screen). For saving coins to the trea-sure chest, they have to come into the reachof the server’s wireless network.
There is a variety of more player interactionssuch as picking pockets (by using the button‘PickPocket’ on the PDA screen), when oneplayer comes close to another one. Playingthe game needs obviously certain awarenessof network connectivity issues.
Among many other issues, the developers ofTREASURE have been interested in the play-ers’ behavior with respect to seams. Sucha seam is a break (or gap) between tools ormedia. Seams appear frequently when dif-ferent digital systems are used in combina-tion, or when they are used along with theother conventional media that make up oureveryday environment.
The TREASURE game has been intentionallydesigned as a seamful one. Mastery of thegame requires to perceive and master seamssuch as a missing connection to the server.
Patterns that show in the TREASURE gameare of a quality quite different from thosepatterns discussed so far. To express thosepatterns, one may need concepts from theenvironment such as locations and relationsfrom urban environments, communicationprotocols, and, perhaps, combinations ofthem.
For illustration, a certain pattern might con-tain a description saying that a human playerwith his PDA is in reach of some wire-less network able to connect his PDA to thebackground server. The weather–really thetrue weather out there–might play a role inpatterns.
The technology is bringing game playingback to our natural environment where itbelongs8. The digital games science is notyet prepared to deal with those phenomena.
8. . . such as TV brought murder back to homewhere it belongs, a well-known saying attributed toAlfred Hitchcock
38
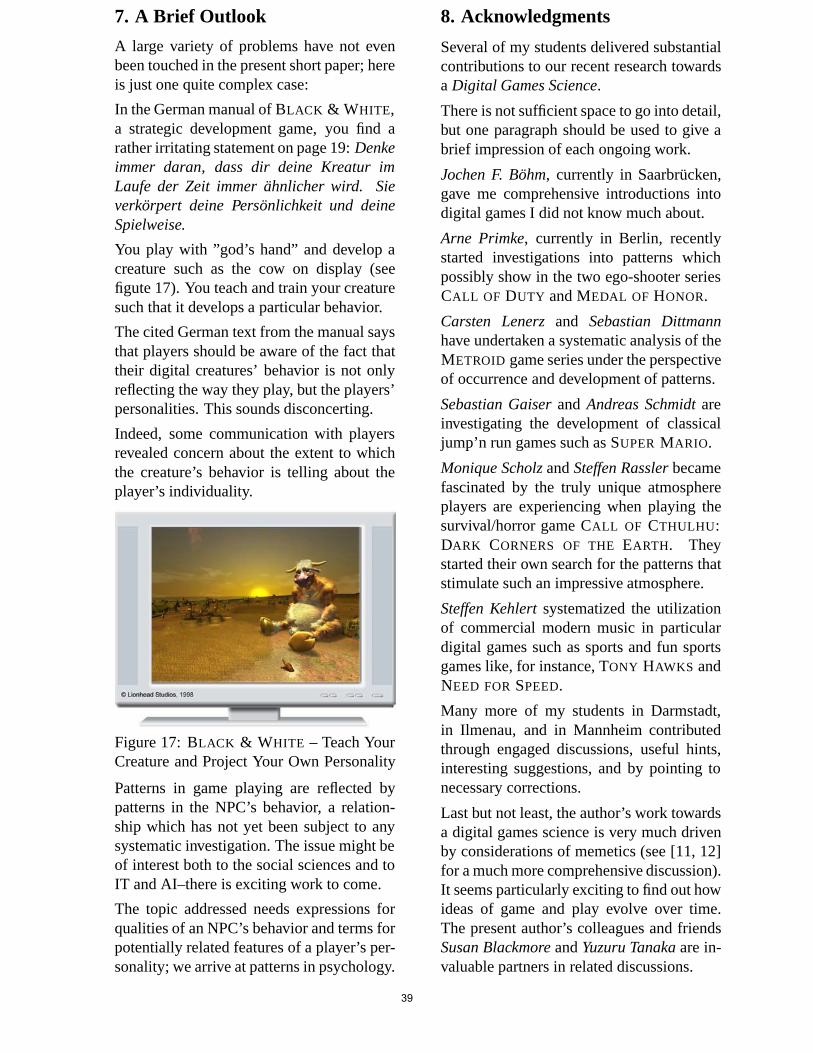
7. A Brief Outlook
A large variety of problems have not evenbeen touched in the present short paper; hereis just one quite complex case:
In the German manual of BLACK & WHITE,a strategic development game, you find arather irritating statement on page 19: Denkeimmer daran, dass dir deine Kreatur imLaufe der Zeit immer ahnlicher wird. Sieverkorpert deine Personlichkeit und deineSpielweise.
You play with ”god’s hand” and develop acreature such as the cow on display (seefigute 17). You teach and train your creaturesuch that it develops a particular behavior.
The cited German text from the manual saysthat players should be aware of the fact thattheir digital creatures’ behavior is not onlyreflecting the way they play, but the players’personalities. This sounds disconcerting.
Indeed, some communication with playersrevealed concern about the extent to whichthe creature’s behavior is telling about theplayer’s individuality.
Figure 17: BLACK & WHITE – Teach YourCreature and Project Your Own Personality
Patterns in game playing are reflected bypatterns in the NPC’s behavior, a relation-ship which has not yet been subject to anysystematic investigation. The issue might beof interest both to the social sciences and toIT and AI–there is exciting work to come.
The topic addressed needs expressions forqualities of an NPC’s behavior and terms forpotentially related features of a player’s per-sonality; we arrive at patterns in psychology.
8. Acknowledgments
Several of my students delivered substantialcontributions to our recent research towardsa Digital Games Science.
There is not sufficient space to go into detail,but one paragraph should be used to give abrief impression of each ongoing work.
Jochen F. Bohm, currently in Saarbrucken,gave me comprehensive introductions intodigital games I did not know much about.
Arne Primke, currently in Berlin, recentlystarted investigations into patterns whichpossibly show in the two ego-shooter seriesCALL OF DUTY and MEDAL OF HONOR.
Carsten Lenerz and Sebastian Dittmannhave undertaken a systematic analysis of theMETROID game series under the perspectiveof occurrence and development of patterns.
Sebastian Gaiser and Andreas Schmidt areinvestigating the development of classicaljump’n run games such as SUPER MARIO.
Monique Scholz and Steffen Rassler becamefascinated by the truly unique atmosphereplayers are experiencing when playing thesurvival/horror game CALL OF CTHULHU:DARK CORNERS OF THE EARTH. Theystarted their own search for the patterns thatstimulate such an impressive atmosphere.
Steffen Kehlert systematized the utilizationof commercial modern music in particulardigital games such as sports and fun sportsgames like, for instance, TONY HAWKS andNEED FOR SPEED.
Many more of my students in Darmstadt,in Ilmenau, and in Mannheim contributedthrough engaged discussions, useful hints,interesting suggestions, and by pointing tonecessary corrections.
Last but not least, the author’s work towardsa digital games science is very much drivenby considerations of memetics (see [11, 12]for a much more comprehensive discussion).It seems particularly exciting to find out howideas of game and play evolve over time.The present author’s colleagues and friendsSusan Blackmore and Yuzuru Tanaka are in-valuable partners in related discussions.
39
Appendix A: (Digital) Games thatare Mentioned in this Publication
AGATHA CHRISTIE: AND THEN THERE
WERE NONE
AGE OF EMPIRES II
BLACK MIRROR
BLACK & WHITE
CALL OF CTHULHU: DARK CORNER OF
THE EARTH
CALL OF DUTY
CHESS
EINSTEIN WURFELT NICHT
HALF-LIFE 2: EPISODE ONE
JOSTLE
MEDAL OF HONOR
METROID
NEED FOR SPEED
SOUL CALIBUR II
SUPER COLUMBINE MASSACRE RPG
SUPER MARIO
THE DA VINCI CODE
TONY HAWKS
TREASURE
ULTIMA ONLINE
References
[1] C. Alexander. The Timeless Way ofBuilding. New York: Oxford Univer-sity Press, 1979.
[2] C. Alexander, S. Ishikawa, and M. Sil-verstein. A Pattern Language. NewYork: Oxford University Press, 1977.
[3] R. Bartle. I was young and I needed themoney. The Escapist, (43):4–9, 2006.
[4] J. Berndt. Bildschirmspiele: Faszina-tion und Wirkung auf die heutige Ju-gend. Munster: Monsenstein und Van-nerdat, 2005.
[5] J. Bewersdorff. Luck, Logic & WhiteLies. The Mathematics of Games.Wellesley, MA, USA: A K Peters,2005.
[6] S. Bjork and J. Holopainen. Patternsin Game Design. Hingham, MA, USA:Charles River Media, 2004.
[7] M. Csikszentmihalyi. Flow: ThePsychology of Optimal Experience.Harper Perennial, 1991.
[8] W. Faulstich. Grundkurs Filmanalyse.Munchen: Wilhelm Fink Verlag, 2002.
[9] J. Fritz. Das Spiel verstehen. EineEinfuhrung in Theorie und Bedeutung.Weinheim & Munchen: Juventa, 2004.
[10] K. Gillen. Culture wargames. The Es-capist, (1):8–13, 2005.
[11] K. P. Jantke. Digital game knowl-edge media (Invited Keynote). InY. Tanaka, editor, Proceedings of the3rd International Symposium on Ubiq-uitous Knowledge Network Environ-ment, February 27 March 1, 2006,Sapporo Convention Center, Sapporo,Japan, Volume of Keynote SpeakerPresentations, pages 53–83. HokkaidoUniversity of Sapporo, Japan, 2006.
[12] K. P. Jantke. Knowledge evolution ingame design – just for fun. In CSIT2006, Amman, Jordan, April 5-7, 2006,2006.
[13] H. Korte. Einfuhrung in die Syste-matische Filmanalyse. Berlin: ErichSchmidt Verlag, 2004.
[14] R. Koster. A Theory of Fun forGame Design. Scottsdale, AZ, USA:Paraglyph Press, Inc., 2005.
[15] P. Rabenalt. Filmdramaturgie. VIS-TAS media production, 2004.
[16] T. Schreiner. Faszination Videospiele.PLAYZONE, (08/06, Ausg. 94):16–21,2006.
[17] M. Spitzer. Lernen. Gehirnforschungund die Schule des Lebens. SpektrumAkademischer Verlag, 2002.
[18] M. Wallace. In celebration of the innerRouge. the escapist, (30):4–6, 2006.
40
Security Aspects in Online GamesTargets, Threats and Mechanisms
Anja BeyerTechnische Universitat Ilmenau
Institut fur Medien und KommunikationswissenschaftAm Eichicht 1, 98693 Ilmenau
AbstractThis paper presents a summary of possible threats in Online Games based on the fundamentals ofIT-Security. The IT security is defined via its targets confidentiality, integrity, availability, privacy andnon-repudiation. Possible threats are identified and protection mechanisms are discussed. An outlook onthe oncoming project to security in Online Games will conclude the paper.
1. Motivation
Since ”World of Warcraft (WoW)” was pub-lished in the USA in 2004 Online Gamesare truly booming. WoW started with about200.000 players in the United States. Inthe meanwhile there are about six millionpeople playing WoW on 40 servers aroundthe world in one environment. For gameslike this, where thousands of players canplay simultanuously in the same environ-ment via the Internet, a new term was cre-ated: ”Massive(ly) Multiplayer Online Role-Playing Games (MMORPG)”. Before theOnline Games became popular the gameswere designed for one player against a vir-tual player simulated by the game software.The Online Games allow the people play-ing together (with real human beings) fromall over the world [16]. That this develop-ment is an important one (not only) for thefuture of games is invigorated through thestatement of Kirmse and Kirmse. They sayOnline Games are the biggest revolution ingames since the introduction of home com-puters [9]. WoW is the most popular andsuccessful MMORPG but not the only oneas there are lots of others (e.g. Dungeonsand Dragons online, Guild Wars, Lineage 2).
A relatively new effect in this genre is thatthe virtual worlds and the reality affect each
other increasingly. That means, that playingan Online Game is not only fun but in somecases also real business [10]. For the players”the virtual worlds are as real as the physi-cal world” [6]. They do not only have funplaying the games, they spend money andleisure time in the virtual world and experi-ence flow [5]. The players get carried awayin the games and they attach a certain im-portance on them. At this point the gamesbecome a serious touch and thoughts of se-curity issues are necessary.
In the academic field a lot of work is doneon graphics and hardware improvement forgames but less work is done on security is-sues. Smed et al. [15] concentrate on the net-working issues, like latency, bandwidth andcomputational power. Kirmse and Kirmse[9] recognize two security goals for onlinegames: protecting sensitive data (like creditcard numbers) and providing a fair playingfield. These two goals are of high concernbut do not cover all security needs. Otherpublications are only focused to cheating[17, 3, 1]. Of course honest players do notlike other players cheating and so they exertpressure on the publishers to provide a fairgame setting. The games industry has real-ized that they will lose players and moneywhen they do not act against cheating [15].In this paper the author wants to show that
41
IT-Security is an important topic and morethan just protection against cheating. How-ever this paper does not provide a full listof all possible threats, so the author focusesthe most valuable assets of the player and theprovider.
2. IT-Security Targets
From the daily IT news one could get animpression on how important the topic IT-Security already is. The number of ”badnews” is increasing steadily. With more andmore applications connected to the insecurenetwork ’Internet’, the problems will not be-come less and the topic IT-Security will beof even more importance in the future. Togive a short introduction the author wants togive an overview on what IT-Security is.
2.1. In General ...
In [11], IT-Security is mostly defined via itsprotection targets confidentiality, integrityand availibility. In e-commerce systems thegoals non-repudiation and privacy are addi-tionally important.
Confidentiality means the protectionagainst unauthorized access to data andinformation. Communication betweentwo partners is thought to take place se-cretly. That means that no third party isallowed to acquire knowledge about thecommunication.
Integrity refers to protection against unau-thorized modification of data or information:the shown information has to be correct andpresented unmodified.
Availability indicates the protection againstunauthorized interference of functionality.
Non-repudiation expresses the unautho-rized non-commitment, meaning the loss ofbindingness. Business partners have to besure that both stay with their proposal to sellor buy.
Privacy, also regulated by the EU Directive95/46/EC on the protection of personal data[4], is the right of an individual person oninformational self determination. It allows
individual persons to decide about the usageof their personal data.
2.2. ... and in Online GamesFrom [11] we have learned that it is impor-tant not to consider IT-Security from onlyone perspective (multilateral security). Thatis why this chapter shows which security re-quirements apply to Online Games from theplayers and from the publishers view.
As described above, confidentiality is nec-essary in interpersonal communication andin e-commerce transactions. This is espe-cially true in Games and specifically essen-tial in Online Games. The communicationof two players or a team is done via the In-ternet which does not provide any protectionagainst eavesdropping or trapping informa-tion. When the players in an Online Gamearrange a strategy to fight against other play-ers or to win a match, it is unaccepted thatthis information reaches the combatant be-cause in that case the combatant would havean unfair advantage. Also payment data, likecredit card numbers have to be confidential.
From the players perspective there are twomain concerns that affect integrity: on theone hand the player is interested in thereached score or level, stored on the serverof the publisher, not to be unauthorized mod-ified. The most valuable asset of the playeris the reached score or level of the game.On the other hand, the player’s system hasto be kept integer, so that no unauthorizedchanges are done in the system without therecognition of the user (as lately happenedwith the Sony root kit [14]). As the playerpays a monthly fee (e 10,99 for WoW) forplaying Online Games on the publishersserver, he or she will not accept an hour ordaily long unavailability of the server. So thethe publisher is forced to install mechanismsthat assure the availability of the servers (seechapter 3).
Once agreed to a contract and having paidfor the usage, the player is unwilling to ac-cept a repudiation of the contract from thepublisher. But this is exactly what regularlyhappens when players are proven cheating.
42
Also privacy is a goal that must not be un-derestimated. According to the law [4], eachperson has the right to decide who may saveand to what extent he or she is allowed tosave the personal data.
The publishers most valuable asset is ofcourse the game itself because this earns themoney. So the publisher is interested inthe integrity of the game. This means thatno unauthorized person should be able tochange the setting of the game. In combina-tion with that, the availability of the serveris an important target for the publisher. Sopeople will only pay for the game if they areable to play. Here the targets of the playerand the publisher are the same.
Furthermore, the publisher wants to makethe players satisfied to make them keep onpaying. They will do if their interests arefulfilled. They will not be satisfied if otherplayers will have an unfair advantage. Sothe publisher has to act against cheating. Inthe example of WoW the publisher scans theuser’s system for cheating tools which is aheavy intervention in the users system.
Also, the usability of the system is an impor-tant target because high support costs haveimmense economic consequences.
It is obvious that the security targets of thepublishers are not always the same like thesecurity targets of the players. They com-pete in some cases (system scan, data col-lection).
3. Security Threats in OnlineGames
In the following chapters, possible threats onclient side and on servers/publishers side aredescribed. The classification is according towhere the attack takes place. This meansthat the damage can be at another place. Ife.g. the publisher does not protect its serversin an adequate way, there might be the possi-bility that an attacker can read out the creditcard payment data of the customers. The at-tack is on the servers side but the user is af-fected of the damage if the attacker uses hisor her credit card number for not intendedpurposes.
3.1. On Clients SideAn attack on confidentiality on clients sideis the eavesdropping of the communicationbetween players. If a combatant is able tolisten to their communication and finds outabout their strategy, he or she would have anunfair advantage. Considering confidential-ity, a player also has to be aware of phishingattacks. The term phishing derives from thetwo words password and fishing. It is a crim-inal activity belonging to social engineering[12]. An attacker pretends to be a trustwor-thy person or company and tries to fraudu-lently acquire account names and passwordsby asking the players directly using mail.Furthermore on confidentiality, there is therisk of malware injection. Malware standsfor malicious software and means viruses,trojan horses, worms, etc. that are pro-grammed to spy out account data and pass-words.
Considering integrity, there is the risk ofunauthorized modification of the clientshardware or software configuration.
A Denial-of-Service (DOS) attack can makethe client game software unserviceable sothat it cannot be used anymore.
Privacy attacks are also possible, when anattacker is able to spy out personal data onthe clients side.
If a player does not stay with the promiseto buy or pay, we speak of the threat ofnon-repudiation. This is e.g. the case ifplayers are displeased with dishonest play-ers cheating. This once happened with theMMORPG Call of Duty 2, when playerscalled out a boycott [2].
3.2. On Servers SideA possible threat concerning confidentialityon server side is to spy out secret informa-tion about the combatant, e.g. the amount ofgold he or she owns.
There are several attacks on integrity on theservers side. First of all, there is the threatof unauthorized modification of the gamesfunctionality. Since the game is the mostvaluable asset for the publisher, it might be
43

the worst case scenario if an attacker suc-ceeds in changing the games setting, e.g. todeactivate a whole continent of an environ-ment.
The games scores of the players are savedon the server. So the publisher has to protectthe scores from unauthorized modificationof the games scores of the players. A thirdattack imaginable is URL-Spoofing. Thismeans, if an attacker succeeds in changingthe URL’s of the gaming servers, the playersare forwarded to a third-party server with therisk of revealing sensitive information to anuntrustworthy party.
There is also the risk of Non-Availability ofthe server, e.g. due to unscheduled mainte-nance or DOS attacks.
Publishing personal data of players eitherwillfully or through inappropriate protectionof the storage is an attack on Privacy.
There is the danger of an attack on Non-Repudiation on servers side, too. If the pub-lisher decides to eliminate players from thegame, e.g. because he or she suspects orprooves them cheating, he steps back fromthe contract although the player has payedfor the usage. That is why the publishersinsert an clause in general terms and condi-tions to leave that option open.
Some examples show that it must not alwaysbe the bad attackers from the outside whothreat the games. The threats can also comefrom the inside (e.g. unsatisfied or carelessemployees) or due to act of nature beyondcontrol.
3.3. CheatingAs the above threats concern digital gamesthey are not really special for Online Games.All other IT application systems are ex-posed to these threats, too. As digital gamesare special IT application systems [7] thesethreats also apply to them. Not a new but avery special threat to digital games is cheat-ing. Yan [8] defines ”any behavior that aplayer may use to get an unfair advantage,or achieve a target that he is not supposed tois cheating.” Yan and Randell [16] classify
cheats into 15 categories:
• Cheating due to misplaced trust (A)
• Cheating due to Collusion (B)
• Cheating by Abusing Game Procedure(C)
• Cheating related to Virtual Assets (D)
• Cheating due to Machine Intelligence(E)
• Cheating via the Graphics driver (F)
• Cheating by Denying Service to PeerPlayers (G)
• Timing Cheating (H)
• Cheating by Compromising Passwords(I)
• Cheating due to Lack of Secrecy (J)
• Cheating due to Lack of Authentication(K)
• Cheating by Exploiting a Bug or Loop-hole (L)
• Cheating by Compromising GameServers (M)
• Cheating Related to Internal Misuse(N)
• Cheating by Social Engineering (O)
The above list covers two aspects why cheat-ing is possible: first because of the tech-nical possibilities (I, J, K, L, M, N): Thecheater, if he or she has enough malicious in-tend might exploit the games procedure andbugs to gain an unfair advantage. Second isthe social aspect (D, G, O): some players arenot aware of the threats and give trust to thewrong people (O).
4. Security MechanismsFor a wide variety of threats there alreadyexist protection mechanisms. A secret com-munication can be realized via encryption
44
and virtual private networks (VPN). Protec-tion against malicious software can be donethrough firewalls, virus scanners, intrusiondetection systems and an adequate config-uration of hard- and software. The condi-tion is that they are kept updated. To avoida breakdown of the servers due to mainte-nance or due to unforeseen incident, back-upsystems are recommended.
To prevent players from cheating the one andonly solution at the moment is to scan theusers system to detect additionally installedcheating software. The game producers in-tegrate software to scan the users system forcheating software. One famous tool is calledPunkBuster [13] which is used in e.g. Worldof Warcraft and Call of Duty 2. If once aplayer is proven cheating, he or she will beeliminated from the game. From the authorsview, until now, there is not a good solutionto fight against cheating. Especially the so-cial aspects of cheating, like social engineer-ing or denying service, can not be prevented.
It follows that not all of the threats can befaced with pure technical solutions. For ex-ample phishing is a real awareness problem.It is important to call the attention of the peo-ple to reduce such attacks.
Maybe not all forms of cheating can be cir-cumvented easily, but at least a proper im-plementation and configuration is the mini-mum. To meet the social aspects of cheatingtakes much more effort because the aware-ness of the people has to grow in their heads.
5. Conclusions and Further Work
Online Games are IT application systemswhich have to meet security standards asusual networked IT applications do. Fur-thermore, the games have an additional emo-tional factor. As the players identify them-selves with the avatars and spend much timein the games, they will have to be satisfiedby the games industry who earn money withthe games.
In our future work, we want to analysethe security mechanisms in current OnlineGames. We expect that not enough security
mechanisms are realized to meet the secu-rity requirements of these games. We willprovide a proposal of which and how furthermechanisms can be included.
Our aim is to raise the awareness for exist-ing threats of the producers, publishers andplayers. In our ”Security in Online Games”project, starting from August 2006, we wantto survey how security can be implementedwithout the players loosing the fun of gam-ing (e.g. by clicking away security alerts).
References
[1] H. Banavar. Security issues inmulti-player, distributed networkgames. http://ww2.cs.fsu.edu/ ba-navar/research/NSPaper.htm, 2000.
[2] Call of duty 2 - community ruft zumboykott auf. Winfuture - WindowsOnline Magazin,http://www.winfuture.de/news,23212.html [28/11/2005], June2006.
[3] Y.-C Chen, J.-J. Hwang, R. Song,G. Yee, and L. Korba. Online gam-ing cheating and security issue. In-ternational Conference on InformationTechnology: Coding and Computing(ITCC’05), 1:518–523, 2005.
[4] Directive 95/46/EC of the europeanparliament and of the council of 24 oc-tober 1995 on the protection of indi-viduals with regard to the processingof personal data and on the free move-ment of such data, 1995.
[5] Moore R.J. Ducheneaut, N. Thesocial side of gaming: A study ofinteraction patterns in a massivelymultiplayer online game. Proceed-ings of ACM CSCW’04 Conferenceon Computer-Supported CooperativeWork, 6(3):360–369, 2004.
[6] M. Jakobsson. Virtual worlds and so-cial interaction design. PhD thesis,Umea University, Department of Infor-matics, 2006.
[7] K. P. Jantke. Digitale SpieleForschung, Technologie, Wirkung& Markt, Invited Plenary Talk,Wismar, Germany, June 8/9, 2006.
45

[8] Yan J.J and Choi H.-J. Security issuesin online games. The Electronic Li-brary, 20(2):125–133, 2002.
[9] C. Kirmse and A. Kirmse. Security inonline games. Gamasutrahttp://www.gamasutra.com, originallypublished in Game Developer, July1997.
[10] Dr. A. Lober and O. Weber. Money fornothing? - Handel mit Spiel-Accountsund virtuellen Gegenstanden. c’t,20:178–180, 2005.
[11] G. Muller and A. Pfitzmann. Sicher-heit, insbesondere mehrseitige IT-Sicherheit. In Mehrseitige Sicherheitin der Kommunikationstechnik Ver-fahren, Komponenten, Integration,pages 21–29. Addison-Wesley-Longman, 1997.
[12] Phishing. Wikipedia,http://en.wikipedia.org/wiki/Phishing[29/06/2006], June 2006.
[13] PunkBuster Anti-Cheating Software.http://www.evenbalance.com, July2006.
[14] M. Russinovich. Sony, rootkits anddigital rights management gone toofar. http://www.sysinternals.com/blog/2005 10 01 archive.html, published31.10.2005, June 2006.
[15] Hakonen Harri Smed J., Kauko-ranta T. Aspects of networking inmultiplayer computer games. In Pro-ceedings of International Conferenceon Application and Development ofComputer Games in the 21st Cen-tury, pages 74–81, 2001. availableat http://www.tucs.fi/Publications/ pro-ceedings/pSmKaHaa.php.
[16] J. Yan and B. Randell. Security incomputer games: from pong to onlinepoker. Technical Report Series, Pub-lished by the University of Newcastleupon Tyne, 2005.
[17] George Yee, Larry Korba, RonggongSong, and Ying-Chieh Chen. Towardsdesigning secure online games. In 20thInternational Conference on AdvancedInformation Networking and Applica-tions (AINA 2006), 18-20 April 2006,Vienna, Austria, pages 44–48, 2006.
46
Personal File Sharing in a Personal Bluetooth Environment
Jürgen Nützel and Mario Kubek
Technische Universität Ilmenau
Institut für Medien- und Kommunikationswissenschaft
Am Eichicht 1
98684 Ilmenau
AbstractThis paper introduces a piconet file sharing application using Bluetooth. The described Java-based application is designed for mobile devices supporting J2ME. The focus of the paper is on the description of the needed client/server architecture, the used message protocols and the final implementation. Therefore common Bluetooth protocols and Bluetooth APIs for J2ME are explained. The paper concludes with a view on future enhancements regarding automatic program activation, the handling of DRM and the integration of user profiles.
1. IntroductionModern mobile devices like cell phones or PocketPCs offer many different connectivity solutions. Beside WAN protocols based on W-CDMA and GSM, short-distance wireless communication technologies like IrDA, Bluetooth and WLAN are very common.The usage of these technologies is free of charge (WLAN can be an exception) and does not require network operators or providers for data transfer, which makes them attractive for users that are currently in the same area and need to exchange data. While IrDA based connections have a lack of flexibility as they can only be established between two devices that point to one another during the data transfer, WLAN support is only available in premium class devices. The Bluetooth technology in mobile devices, which is the main focus of this paper, offers more flexibility than IrDA and is available in nearly every business class device. Data transmission is realized via radio communication.
The Bluetooth Special Interest Group (SIG) [1] with members like Ericsson, IBM, Intel and Nokia releases the Bluetooth specification. The Bluetooth standard 1.x supports data rates of 723,2 kBit/s. In 2004 version 2.0 was released. This standard enables data rates of 2.1 MBit/s. A Bluetooth network (Piconet) can contain up to 16,7 Mio participants, whereby only eight devices can be active at the same time. Application specific profiles, that represent the capabilities of a mobile device, are the structure for data transfer via Bluetooth. Common profiles among others are the Dial-up Networking Profile, the File Transfer Profile, the Headset Profile and the Fax Profile. Their signature is exchanged between the devices, so that their capabilities can be matched in order to use the different services. Bluetooth even supports security mechanisms as authentication and confidentiality.Additionally many mobile operating systems like Windows Mobile or Symbian offer Bluetooth APIs for
47
development. Applications built for these devices will not run on other devices. Therefore the Java virtual machine has been developed. This way J2ME (the mobile edition of Java) applications, called MIDlets, can run on many devices with different operating systems. The J2ME is built on configurations and profiles. They are the basic classes and methods that J2ME programs can use on the devices. The most common profile is the MIDP, based on the Connected Limited Device Configuration (CLDC). These classes can be extended by the device vendors with optional APIs to support device specific features. Examples are the Mobile Media API (JSR-135), the Location API (JSR-179) and the Bluetooth API (JSR-82). JSR stands for Java specification request.This paper describes a mobile file sharing application, called BlueMatch, which can run on devices supporting MIDP 2.0 and the Bluetooth API (JSR-82). The special characteristic of BlueMatch lies in its combined client/server architecture, which follows the peer-to-peer model, so users can search and download files, while others can download from their devices at the same time.First we want to present the components of the Bluetooth API before we go into details of BlueMatch's system architecture and message protocol. Future enhancements and a view on the handling of DRM-encrypted files in such an application conclude the paper.
2. The Bluetooth APIThe Bluetooth stack consists of several protocol layers, that are implemented in hardware and software. The low level layers radio, baseband/link controller and link manager are not covered in this paper. We will focus on higher level
protocols like RFCOMM (radio frequency communication) and SDP (service discovery protocol), as they are used in the file-sharing application BlueMatch. Therefore it is useful to introduce the Bluetooth API (JSR-82) first, because it enables the usage of these protocols in mobile Java applications.The Bluetooth API (JSR-82) [2] consists of two packages javax.bluetooth and javax.obex, the optional Object Exchange API. The classes in javax.bluetooth offer methods for discovery of devices and services, the support for connections using L2CAP (logical link and adaptation protocol) and RFCOMM, as well as device and data interfaces. These packages rely on the generic connection framework (GCF) in package javax.microedition.io. We do not want to cover the methods offered in the API, instead we discuss the general abilities of these classes.The following Bluetooth protocols can be used in JSR-82:• SDP for device/service discovery and
service registration• L2CAP for packet-oriented
connections• RFCOMM for stream-oriented
connections• OBEX for transferring objects like
files, images and vCardsThe protocol RFCOMM, which offers two-way communication over virtual serial ports, resides on top of L2CAP and enables multiple concurrent stream-oriented connections between devices, even over one Bluetooth link. L2CAP segments the data by RFCOMM into packets before they are sent and reassembles received packets into larger messages. L2CAP is an packet-oriented protocol and is suitable for developers that wish to build custom packet-
48
oriented protocols. In this case flow control has to be implemented explicitly. RFCOMM supports this already and enables security parameters. Therefore the BlueMatch application relies on this protocol. OBEX is implemented on top of RFCOMM, but actually only a few devices on the market support this optional protocol in Java applications. So file transfer has to be implemented using RFCOMM or L2CAP. The service discovery protocol (SDP) is used by clients to search for Bluetooth devices and services. It is also responsible for registering custom service records in the device's service discovery database (SDDB). After registration a server can accept and open connections by clients.
Security MechanismsRFCOMM enables secure Bluetooth connections. These security parameters for service usage can be set:• authenticate
• encrypt
• authorize
Authentication means, that two devices must be paired in order to exchange data. Encryption can be activated to secure a link between two devices and relies on authentication. The keys used for authentication and encryption are generated by modified versions of the 128-bit block cipher algorithm SAFER+ [3]. Authorization is used to demand a permission for remote devices to use a service. The requested device grants or denies access to a service, for instance after asking the user through a man-machine interface to grant trust. This trust can be temporary or permanent.
3. BlueMatchNow we want to present the prototype application BlueMatch, which enables
users in passing to share files via Bluetooth. As a MIDlet BlueMatch can run on mobile devices that support MIDP 2.0 applications and implement the Bluetooth API (JSR-82) and the file connection API (JSR-75). It is based on a client/server architecture, whereby the client part runs concurrently with the server part in separate threads. That means an instance can connect to the server on other devices, but can even process connections initialized by remote devices. On incoming connections, the server accepts and opens them automatically without asking the user.Currently these features are already implemented:• search and display remote devices
running BlueMatch• download of file lists from remote
devices• download of files from remote devices
• serving of local file lists and files for remote devices
• leaving notification for other members when quitting BlueMatch
These functions are the use cases of this application, embedded in the general system architecture, which will now be described.
The Client ImplementationEach BlueMatch instance is starting a client thread. In this thread, remote devices and their BlueMatch services are searched and called. After a connection to a service has been established, BlueMatch specific commands can be transmitted to the server. These commands will be described in the BlueMatch message protocol (chapter 4). In theory the client and the server together can hold a maximum of seven connections to remote devices, for
49
instance for simultaneous downloads. But if this limit is reached, the client and the server as well can not establish or open any new connections until a connection has been closed. Actually this limit can be lower on real devices. A minimum of two connections at a time must be allowed by the device to run BlueMatch properly, as it needs at least one connection for the client and one for an incoming connection on the server.
The Server ImplementationThe threaded server in BlueMatch creates and opens a service with an universally unique identifier (UUID). This service can be searched by clients on remote devices. The connections between clients and the server are stream-oriented, based on the RFCOMM protocol. For each client that connects to the server the server accepts and opens the connection, if the maximum number of allowed connections on the device has not been reached already. Every connection is processed in a separate thread. This allows to accept more than one connection at a time. The processing is done automatically without notifying the user. This is possible, because the BlueMatch service does not rely on authorization and authentication. So the MIDlet can run in the background, for instance on multitasking operating systems like Symbian and wait for other users to connect.
Data ManagementThe following application data have to be managed in BlueMatch:• list of discovered remote devices
• list of BlueMatch services on remote devices
• local files
• list of files on remote devices
• incoming files from remote devices
The lists of found remote devices and BlueMatch services are used to connect to other devices also running BlueMatch. To the user only the community list is visible, which displays the friendly names of the found devices with BlueMatch services in their SDDB. To send and receive files and filenames a special class handling files has been implemented. This class, which uses the file connection API (JSR-75), is used by the client and the server to access an existing memory card or hard disk in the phone. This is done through the MIDP-property “fileconn.dir.Memorycard”, which points to the necessary drive name. A memory card is usually the best solution in a phone to store large files, whereby some phones like the Nokia N91 [4] might have an integrated hard disk. For simplicity of the prototype only the root of the card is used by BlueMatch.
4. The BlueMatch Message ProtocolBlueMatch implements a custom message protocol. The commands a client sends to a remote service represent the use cases of BlueMatch. Each command is sent as an UTF-string, using methods in the MIDP-class DataOutput-Stream. Within a command additional parameters are transmitted to the service depending on the use case. Now these commands will be explained.
The PresentationAfter a BlueMatch instance was started, other devices also running the BlueMatch service will be searched for and put into the local community list. To each found BlueMatch service the client introduces himself with the command
50
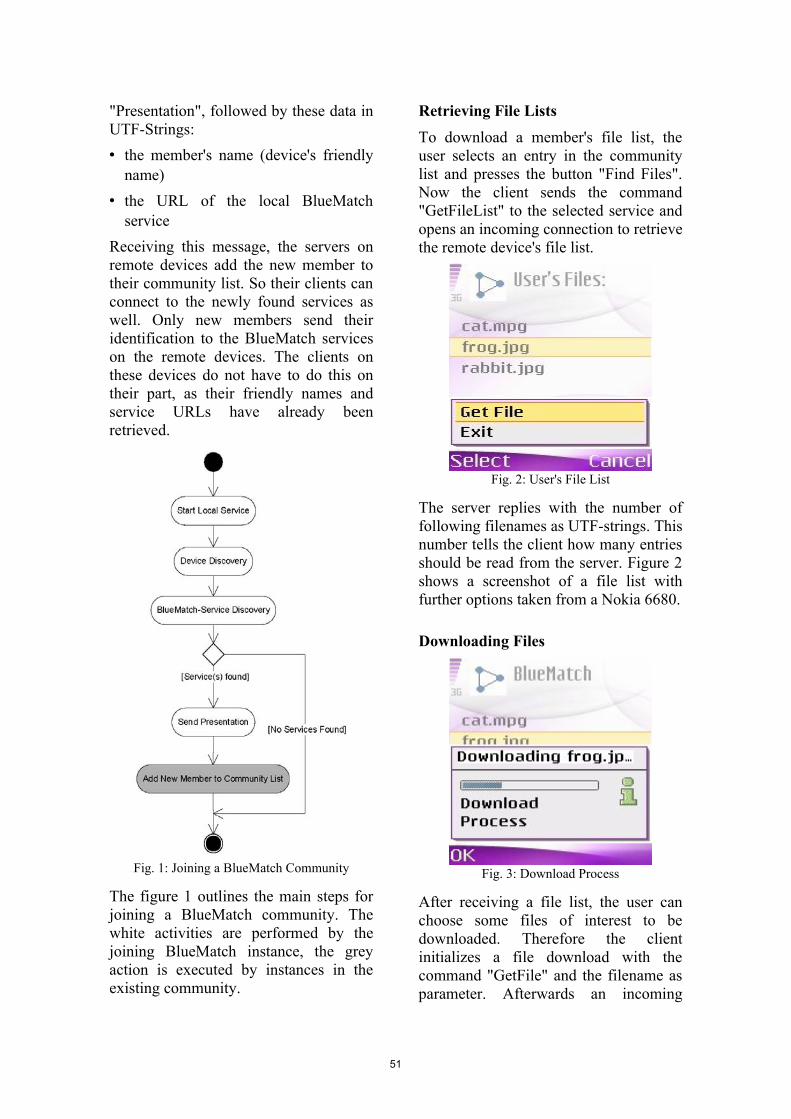
"Presentation", followed by these data in UTF-Strings:• the member's name (device's friendly
name)• the URL of the local BlueMatch
service Receiving this message, the servers on remote devices add the new member to their community list. So their clients can connect to the newly found services as well. Only new members send their identification to the BlueMatch services on the remote devices. The clients on these devices do not have to do this on their part, as their friendly names and service URLs have already been retrieved.
The figure 1 outlines the main steps for joining a BlueMatch community. The white activities are performed by the joining BlueMatch instance, the grey action is executed by instances in the existing community.
Retrieving File ListsTo download a member's file list, the user selects an entry in the community list and presses the button "Find Files". Now the client sends the command "GetFileList" to the selected service and opens an incoming connection to retrieve the remote device's file list.
The server replies with the number of following filenames as UTF-strings. This number tells the client how many entries should be read from the server. Figure 2 shows a screenshot of a file list with further options taken from a Nokia 6680.
Downloading Files
After receiving a file list, the user can choose some files of interest to be downloaded. Therefore the client initializes a file download with the command "GetFile" and the filename as parameter. Afterwards an incoming
Fig. 2: User's File List
Fig. 1: Joining a BlueMatch Community Fig. 3: Download Process
51

connection is opened to receive the file data. The requested server now returns the filename, the filesize and the file data to the client. The filesize is used on the client side to calculate the size of the download puffers and to determine, whether there is enough space left on the phone's memory card. A gauge bar visualizes the download process as shown in figure 3.
Leaving the CommunityIf a user decides to leave the community and closes the program, the other members should be informed, so they can delete the corresponding entry in the local community list. Therefore the client sends a "Goodbye" message with the local service URL to all found BlueMatch services. Afterwards the program quits.
Figure 4 shows these steps in an activity diagram. The white activities are performed by the leaving BlueMatch program.
5. Future DevelopmentNow we want to list some options to improve BlueMatch. The MIDP 2.0 offers the possibility to start MIDlets automatically using timer based activation or on inbound network connections. This function is called push registry. Therefore an inbound server connection must be registered with it. This is even possible with Bluetooth server connections. This way, the program does not have to be started to be reached by remote devices. This function could be implemented in BlueMatch with some modifications. In the presented prototype the type of the transferred files will not be checked. In future versions it is possible to restrict file transfer to encrypted DRM-files (Digital Rights Management). This will be a basic functionality to support legal superdistribution. With the transaction tracking [5] feature from OMA's (Open Mobile Alliance) DRM v2.0 it is possible to reward the content redistribution by the Rights Issuer. As one of the first devices the Nokia N91 [4] implements this new DRM standard.Based on user transactions and file information personal profiles could be modelled to implement a mobile distributed recommendation engine to find suitable files on remote devices. The user profile could be sent as part of the presentation, so that other users have a quick overview of community members matching their taste. Papers regarding this function have been released in [6] and [7]. Furthermore the persistent storage of application data like favoured community members and recent transactions is an useful improvement.
6. References[1] Homepage of Bluetooth SIG; www.bluetooth.org
Fig. 4: Leaving the Community
52

[2] Java APIs for Bluetooth Wireless Technology (JSR-82); www.jcp.org/en/jsr/detail?id=82[3] Hole, K. J.; Wi-Fi and Bluetooth Course; University of Bergen; 2006; www.kjhole.com/Standards/BT/BTdownloads.html[4] Nokia N91 Device Specification; 2006; www.forum.nokia.com/devices/N91 [5] OMA DRM v2.0 Specification; 2006 www.openmobilealliance.org/release_program/docs/DRM/drm_v2_0.html
[6] Kubek, M.; “Verteiltes Nutzer- und Content-Matching in mobilen Kommunikationssystemen im Umfeld des PotatoSystems”; Diploma Thesis; Technical University Ilmenau; 2005; www.4fo.de/de/students#kubek [7] Nützel, J. and Kubek, M; “A Mobile Peer-To-Peer Application for Distributed Recommendation and Re-sale of Music”; 2006; AXMEDIS 2006 conference contribution
53

User Interfaces for People with SpecialNeeds
Henrik Tonn-EichstadtTechnische Universitat Ilmenau
Institut fur Medien- und KommunikationswissenschaftAm Eichicht 1, 98693 Ilmenau
AbstractAssistive technologies for people with disabilities transfer information to the appropriate, usable sensesand so assists the users’ special abilities. Pure transformation of contents is sometimes not enough,because the transformed information only relies on a textual representation of non-text content.At this point, it seems to be interesting how far assistive technologies can usefully go and if there is analternative to pure transformation. This paper describes some ideas about (new) interfaces for peoplewith special needs.
1. Introduction
In ’International Classification of Function-ing and Disability’ (ICIDH-1, [6]), theWorld Health Organization (WHO) definesthree steps concerning disabilities. First, animpairment as ”loss or abnormality of [...]structure or function at the organ level” is thebasis which could result in a disability whichis described as ”restriction or lack of abil-ity to perform an activity in a normal man-ner.” Both, impairment and disability, can -but need not to - result in a handicap whichmeans having a disadvantage in social life.
To mitigate such handicaps, disabled peopleare frequently using computers. With com-puters, these people learn, have assistancein real world communication (e.g. speechsynthesis) or are connected to the Internet.The Internet offers an opportunity to takepart in social life and to be able to act au-tonomously, without the help of others1. Forblind people, the Internet means a broad ac-cess to everyday life as the Internet is thefirst place where blind people can (inter)act
1In Germany, this is often called ’Daseinsentfal-tung’ in connection with legal aspects. A transla-tion to the English language does not exist. The termcould be described as ’independent expansion of a be-ings’ existence’.
1. in unknown domains without help,
2. without being in danger of being in-volved in a real world accident and
3. without the danger of buying bean tinsinstead of pineapple tins due to the lackof vision.
Some people need to have special media tounderstand the presented content. Deaf andsome users hard of hearing need to see texttranslated into sign language. Many of thosepeople do not understand written language.
As blind and a lot of other disabled peoplecan not rely on standard I/O-technologies,assistive devices and technology help themgetting access to the computer. Foot-mice and mouthsticks are alternative de-vices for motor impaired persons. Screen-reader, braille displays and speech outputare helpful to the blind; screen magnifier tolow vision people. Screenreader transformgraphical output into a textual representa-tion which then can be rendered for percep-tion through the sense of touch or hearing.Media that can not be transformed needs tobe coded with alternative text (e.g. the alt-attribute for images in HTML). If this alter-native text is missing, the content can not be
54

perceived by blind users.
Though assistive technologies work fairlywell, in most cases they only convert graph-ical output optimized for sighted users to anoutput of minor quality. Thus, users withspecial needs - especially blind users - haveto cope with challenges that arise due to in-terfaces based on graphical paradigms. Thispaper deals with concepts of interfaces andinteraction strategies which could be devel-oped and optimized with regard to blind peo-ple. The basic ideas behind these presentedconcepts can be transferred to everyday sit-uations where sighted people have to inter-act in a situation which is similar to theblind users’ everyday live regarding percep-tion prospects. These situations could bedealing with
1. audio menus of telephone applications,
2. interacting with a navigation systemwhile driving or
3. operating a machine blindly.
2. Audio interfaces
Considering auditory output, several prob-lems have to be taken into account. Au-dio is a sequential phenomenon: informationhas to be presented in a linear way. Paral-lel presentation of audio would lead to babeland results in unusable output. Further on,audio features several degrees of freedom.Sound perception is influenced by volume,pitch, timbre and loudness. A challenge isto create different sounds which vary thoseaspects and are doubtlessly distinguishable.
Some time ago, Edwards ([4]) tried to con-vey direct manipulation objects from thegraphical world to the audio world. Thework ends with the conclusion that muchresearch has to be done to reach an us-able interface. In principle, the approachhas proven suitable. Asakawa et al. ([1])somehow continue the work and try to trans-port visual effects into audio and tactile pre-sentation. They are proposing ’backgroundcolour music’ and ’foreground sound’. But
they encounter the problem of interferingsound. The authors also ”[...] would like tomore precisely evaluate the suitable type ofinformation for each sense.”
Rober and Masuch ([10]) investigate thesonification of objects in a 3D virtual world.By distinguishing different sounds, userscan decide on moving in this world andchoosing the appropriate interaction for thepresented objects. This approach is demon-strated in a digital game prototype. A verysimilar idea is described in [8]. There, anaudible space was presented to blind peoplewho reviewed this new presentation form asusable.
The 3D approach seems to be interesting.Sighted users are arranging object icons ona 2D iconical desktop to achieve a certainorder in their files and programs. Blind peo-ple cannot do that. Although screenreaderstransform the visual output into a linear textform, spacial - or better surfacial - relationsbetween the objects get lost. A clue on thedistance between or the grouping of objectsis not available to these users.
In order to compensate the lack of vision,blind people have evolved distinct skills inhearing. So it seems to be a good idea tothink about an auditory represented roomwhere users can place objects. [8] showedthat this approach is of interest.
Looking at the sketch of such a room in Fig-ure 1, it becomes obvious that this interfacecould be adequate to perceive auditory in-formation about all existing objects. Howthis information can be coded is analysed ine.g. [7] for synthetic sound (’earcons’) andin [12] for pieces of real sounds (’auditoryicons’).
At least, two main questions quickly arise:
1. How should the objects be pre-sented? As a constant playing soundwill counterwork usability basics andrise ’sound pollution’, alternative op-tions have to be checked. Some basicresearch from [11] deals with the abilityof human beings to extract informationfrom simultaneously presented sounds.
55
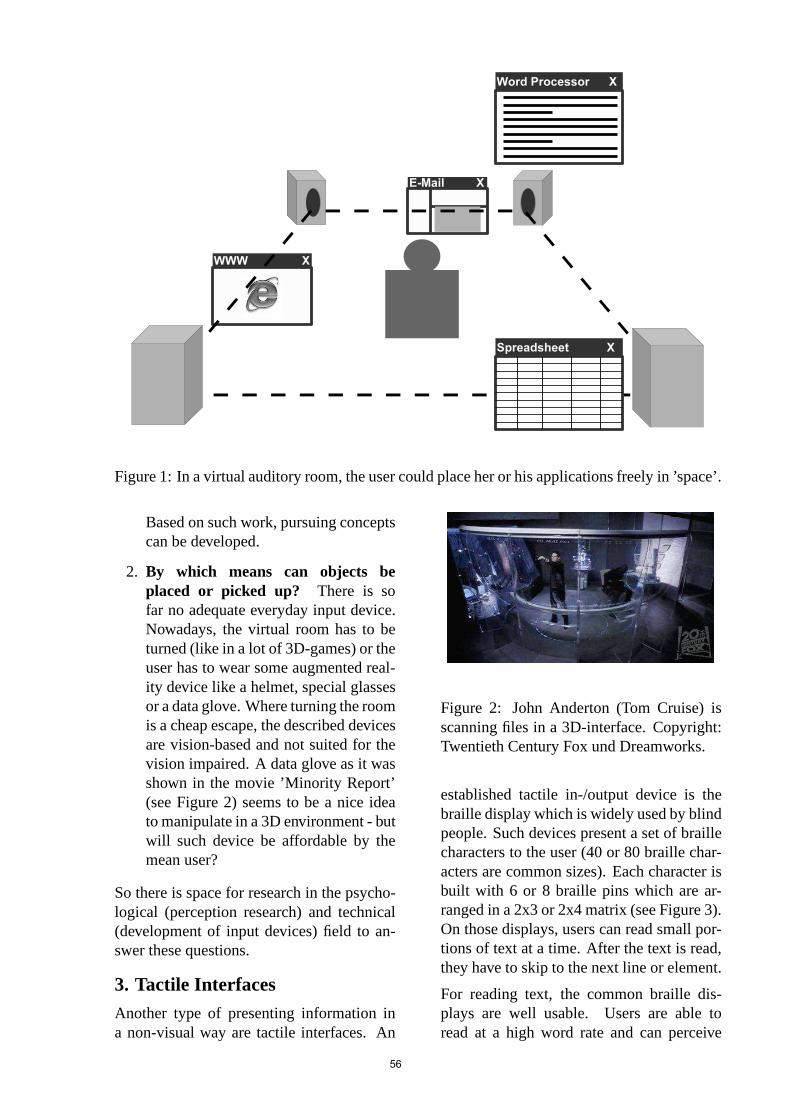
Figure 1: In a virtual auditory room, the user could place heror his applications freely in ’space’.
Based on such work, pursuing conceptscan be developed.
2. By which means can objects beplaced or picked up? There is sofar no adequate everyday input device.Nowadays, the virtual room has to beturned (like in a lot of 3D-games) or theuser has to wear some augmented real-ity device like a helmet, special glassesor a data glove. Where turning the roomis a cheap escape, the described devicesare vision-based and not suited for thevision impaired. A data glove as it wasshown in the movie ’Minority Report’(see Figure 2) seems to be a nice ideato manipulate in a 3D environment - butwill such device be affordable by themean user?
So there is space for research in the psycho-logical (perception research) and technical(development of input devices) field to an-swer these questions.
3. Tactile Interfaces
Another type of presenting information ina non-visual way are tactile interfaces. An
Figure 2: John Anderton (Tom Cruise) isscanning files in a 3D-interface. Copyright:Twentieth Century Fox und Dreamworks.
established tactile in-/output device is thebraille display which is widely used by blindpeople. Such devices present a set of braillecharacters to the user (40 or 80 braille char-acters are common sizes). Each character isbuilt with 6 or 8 braille pins which are ar-ranged in a 2x3 or 2x4 matrix (see Figure 3).On those displays, users can read small por-tions of text at a time. After the text is read,they have to skip to the next line or element.
For reading text, the common braille dis-plays are well usable. Users are able toread at a high word rate and can perceive
56
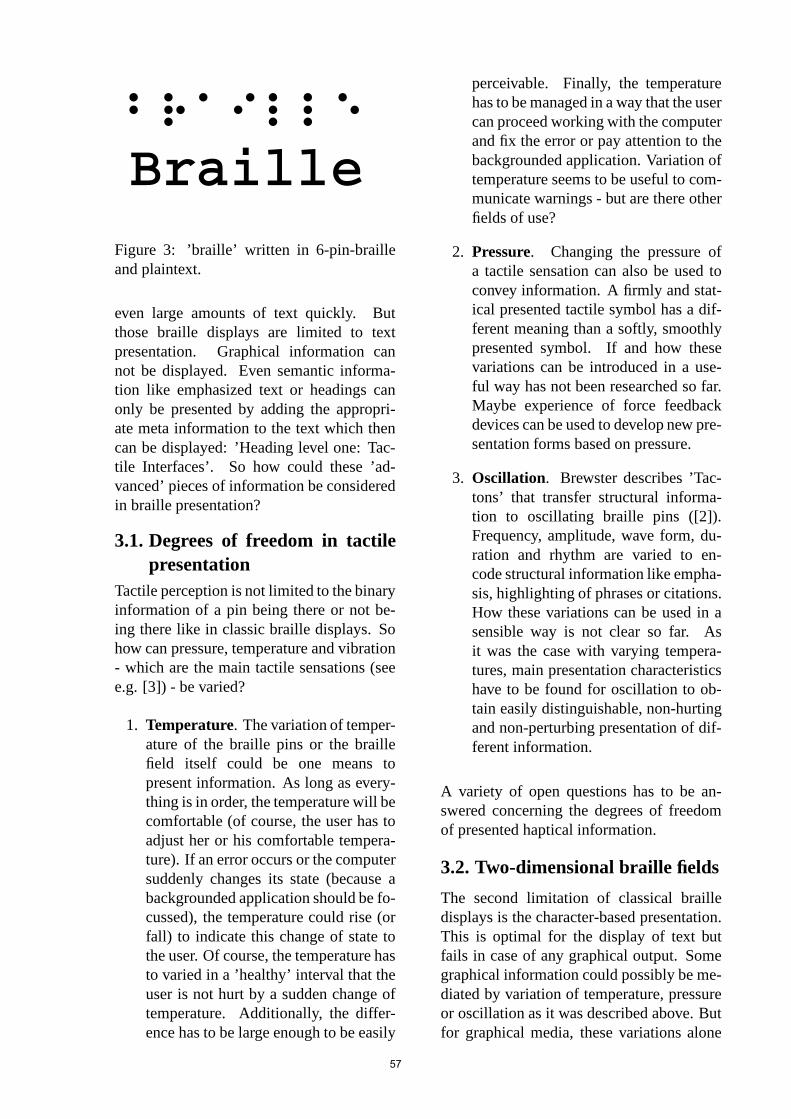
Figure 3: ’braille’ written in 6-pin-brailleand plaintext.
even large amounts of text quickly. Butthose braille displays are limited to textpresentation. Graphical information cannot be displayed. Even semantic informa-tion like emphasized text or headings canonly be presented by adding the appropri-ate meta information to the text which thencan be displayed: ’Heading level one: Tac-tile Interfaces’. So how could these ’ad-vanced’ pieces of information be consideredin braille presentation?
3.1. Degrees of freedom in tactilepresentation
Tactile perception is not limited to the binaryinformation of a pin being there or not be-ing there like in classic braille displays. Sohow can pressure, temperature and vibration- which are the main tactile sensations (seee.g. [3]) - be varied?
1. Temperature. The variation of temper-ature of the braille pins or the braillefield itself could be one means topresent information. As long as every-thing is in order, the temperature will becomfortable (of course, the user has toadjust her or his comfortable tempera-ture). If an error occurs or the computersuddenly changes its state (because abackgrounded application should be fo-cussed), the temperature could rise (orfall) to indicate this change of state tothe user. Of course, the temperature hasto varied in a ’healthy’ interval that theuser is not hurt by a sudden change oftemperature. Additionally, the differ-ence has to be large enough to be easily
perceivable. Finally, the temperaturehas to be managed in a way that the usercan proceed working with the computerand fix the error or pay attention to thebackgrounded application. Variation oftemperature seems to be useful to com-municate warnings - but are there otherfields of use?
2. Pressure. Changing the pressure ofa tactile sensation can also be used toconvey information. A firmly and stat-ical presented tactile symbol has a dif-ferent meaning than a softly, smoothlypresented symbol. If and how thesevariations can be introduced in a use-ful way has not been researched so far.Maybe experience of force feedbackdevices can be used to develop new pre-sentation forms based on pressure.
3. Oscillation. Brewster describes ’Tac-tons’ that transfer structural informa-tion to oscillating braille pins ([2]).Frequency, amplitude, wave form, du-ration and rhythm are varied to en-code structural information like empha-sis, highlighting of phrases or citations.How these variations can be used in asensible way is not clear so far. Asit was the case with varying tempera-tures, main presentation characteristicshave to be found for oscillation to ob-tain easily distinguishable, non-hurtingand non-perturbing presentation of dif-ferent information.
A variety of open questions has to be an-swered concerning the degrees of freedomof presented haptical information.
3.2. Two-dimensional braille fields
The second limitation of classical brailledisplays is the character-based presentation.This is optimal for the display of text butfails in case of any graphical output. Somegraphical information could possibly be me-diated by variation of temperature, pressureor oscillation as it was described above. Butfor graphical media, these variations alone
57
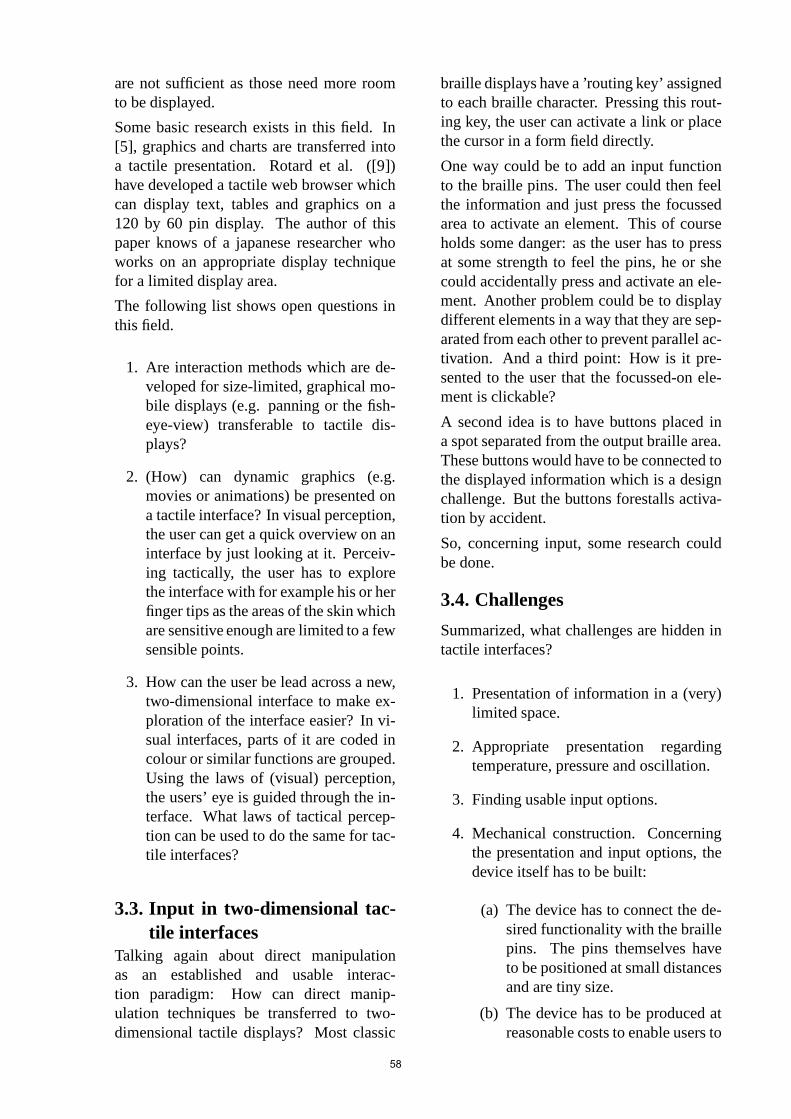
are not sufficient as those need more roomto be displayed.
Some basic research exists in this field. In[5], graphics and charts are transferred intoa tactile presentation. Rotard et al. ([9])have developed a tactile web browser whichcan display text, tables and graphics on a120 by 60 pin display. The author of thispaper knows of a japanese researcher whoworks on an appropriate display techniquefor a limited display area.
The following list shows open questions inthis field.
1. Are interaction methods which are de-veloped for size-limited, graphical mo-bile displays (e.g. panning or the fish-eye-view) transferable to tactile dis-plays?
2. (How) can dynamic graphics (e.g.movies or animations) be presented ona tactile interface? In visual perception,the user can get a quick overview on aninterface by just looking at it. Perceiv-ing tactically, the user has to explorethe interface with for example his or herfinger tips as the areas of the skin whichare sensitive enough are limited to a fewsensible points.
3. How can the user be lead across a new,two-dimensional interface to make ex-ploration of the interface easier? In vi-sual interfaces, parts of it are coded incolour or similar functions are grouped.Using the laws of (visual) perception,the users’ eye is guided through the in-terface. What laws of tactical percep-tion can be used to do the same for tac-tile interfaces?
3.3. Input in two-dimensional tac-tile interfaces
Talking again about direct manipulationas an established and usable interac-tion paradigm: How can direct manip-ulation techniques be transferred to two-dimensional tactile displays? Most classic
braille displays have a ’routing key’ assignedto each braille character. Pressing this rout-ing key, the user can activate a link or placethe cursor in a form field directly.
One way could be to add an input functionto the braille pins. The user could then feelthe information and just press the focussedarea to activate an element. This of courseholds some danger: as the user has to pressat some strength to feel the pins, he or shecould accidentally press and activate an ele-ment. Another problem could be to displaydifferent elements in a way that they are sep-arated from each other to prevent parallel ac-tivation. And a third point: How is it pre-sented to the user that the focussed-on ele-ment is clickable?
A second idea is to have buttons placed ina spot separated from the output braille area.These buttons would have to be connected tothe displayed information which is a designchallenge. But the buttons forestalls activa-tion by accident.
So, concerning input, some research couldbe done.
3.4. Challenges
Summarized, what challenges are hidden intactile interfaces?
1. Presentation of information in a (very)limited space.
2. Appropriate presentation regardingtemperature, pressure and oscillation.
3. Finding usable input options.
4. Mechanical construction. Concerningthe presentation and input options, thedevice itself has to be built:
(a) The device has to connect the de-sired functionality with the braillepins. The pins themselves haveto be positioned at small distancesand are tiny size.
(b) The device has to be produced atreasonable costs to enable users to
58
afford it (standard braille displayscost around 5.000 EUR and up atthe moment which makes it dif-ficult for users to afford such de-vices).
4. Summary
This paper gave a brief overview on pos-sible research on user interfaces for peoplewith special needs. What is common toboth scenarios is that users could not relyon graphical output. To even this out, alter-native senses are used: the senses of hear-ing and touch. For each of these senses,an appropriate interface is imaginable. Partsof the presented ideas are already integratedin established products. Nevertheless, theseproducts lack some functions. Adding thesefunctions or building enhanced devices is theaim of the described ideas. Possibly, find-ings from this future research can help to im-prove everyday devices for all users.
References
[1] Chieko Asakawa, Hironobu Takagi,Shuichi Ino, and Tohru Ifukube. Au-ditory and tactile interfaces for repre-senting the visual effects on the web.In Assets ’02: Proceedings of the fifthinternational ACM conference on As-sistive technologies, pages 65–72, NewYork, NY, USA, 2002. ACM Press.
[2] Stephen Brewster. Nonspeech au-ditory output. In The human-computer interaction handbook: fun-damentals, evolving technologies andemerging applications, pages 220–239. Lawrence Erlbaum Associates,Inc., Mahwah, NJ, USA, 2003.
[3] Alan Dix, Janet Finlay, GregoryAbowd, and Russell Beale.Human-Computer Interaction (2nd edition).Prentice Hall Europe, Hertfordshire,1998.
[4] Alistair D. N. Edwards. The designof auditory interfaces for visually dis-abled users. InCHI ’88: Proceedings
of the SIGCHI conference on Humanfactors in computing systems, pages83–88, New York, NY, USA, 1988.ACM Press.
[5] Richard E. Ladner, Melody Y. Ivory,Rajesh Rao, Sheryl Burgstahler, DanComden, Sangyun Hahn, MatthewRenzelmann, Satria Krisnandi, Maha-lakshmi Ramasamy, Beverly Slabosky,Andrew Martin, Amelia Lacenski, Stu-art Olsen, and Dmitri Groce. Automat-ing tactile graphics translation. InAs-sets ’05: Proceedings of the 7th inter-national ACM SIGACCESS conferenceon Computers and accessibility, pages150–157, New York, NY, USA, 2005.ACM Press.
[6] Rolf-Gerd Matthesius, Kurt-AlphonsJochheim, and Gerhard S. Barolin.ICIDH, International Classification ofImpairements, Dissabilities, and hand-icaps. Huber, Bern, Switzerland, 1999.
[7] David K. McGookin and Stephen A.Brewster. Space, the final frontearcon:The identification of concurrently pre-sented earcons in a synthetic spa-tialised auditory environment. InPro-ceedings of ICAD 04 - Tenth Meet-ing of the International Conference onAuditory Display, Sydney, Australia,2004.
[8] Veronika Putz. Spatial auditory userinterfaces. Master’s thesis, Institute ofElectronic Music, University of Musicand Dramatic Arts Graz, Graz, Austria,October 2004.
[9] Martin Rotard, Sven Knodler, andThomas Ertl. A tactile web browser forthe visually disabled. InHYPERTEXT’05: Proceedings of the sixteenth ACMconference on Hypertext and hyper-media, pages 15–22, New York, NY,USA, 2005. ACM Press.
[10] Niklas Rober and Maik Masuch. In-teracting with sound - an interactionparadigm for virtual auditory works.
59

In Proceedings of ICAD 04 - TenthMeeting of the International Confer-ence on Auditory Display, Sydney, Aus-tralia, 2004.
[11] Barbara Shinn-Cunningham and AntjeIhlefeld. Selective and divided atten-tion: Extracting information from si-multaneaous sound sources. InPro-ceedings of ICAD 04 - Tenth Meet-ing of the International Conference onAuditory Display, Sydney, Australia,2004.
[12] Catherine Stevens and David Brennanans Simon Parker. Simultaneous ma-nipulation of parameters of auditoryicons to convey direction, size, and dis-tance: Effects on recognition and in-terpretation. InProceedings of ICAD04 - Tenth Meeting of the InternationalConference on Auditory Display, Syd-ney, Australia, 2004.
60

Clustering the Google Distance withEigenvectors and Semidefinite
Programming
Jan Poland and Thomas ZeugmannDivision of Computer Science
Hokkaido UniversityN-14, W-9, Sapporo 060-0814, Japanjan,[email protected]
AbstractWeb mining techniques are becoming increasingly popular and more accurate, as the informationbody of the World Wide Web grows and reflects a more and more comprehensive picture of thehumans’ view of the world. One simple web mining tool is called the Google distance and hasbeen recently suggested by Cilibrasi and Vitanyi. It is an information distance between twoterms in natural language, and can be derived from the “similarity metric”, which is definedin the context of Kolmogorov complexity. The Google distance can be calculated from justcounting how often the terms occur in the web (page counts), e.g. using the Google searchengine. In this work, we compare two clustering methods for quickly and fully automaticallydecomposing a list of terms into semantically related groups: Spectral clustering and clusteringby semidefinite programming.
1. Introduction
The Google distance has been suggestedby Cilibrasi and Vitanyi [2] as a semanti-cal distance function on pairs of words orterms. For instance, for most of today’speople, the terms “Claude Debussy” and“Bela Bartok” are much tighter relatedthan “Bela Bartok” and “Michael Schu-macher”.
The World Wide Web represents partsof the world we live in as a huge collec-tion of documents, mostly written in nat-ural language. By just counting the rel-ative frequency of a term or a tuple ofterms, we may obtain a probability of thisterm or tuple. From there, one may de-fine conditional probabilities and, by tak-ing logarithms, complexities. Li et al. [7]have proposed a distance function basedon Kolmogorov complexity, which can be
used for other complexities, such as thosederived from the WWW frequencies.
Spectral clustering is an increasingly pop-ular method for analyzing and clusteringdata by using only the matrix of pairwisesimilarities. It was invented more than 30years ago for partitioning graphs (see e.g.[11] for a brief history). Formally, spectralclustering can be related to approximat-ing the normalized min-cut of the graphdefined by the adjacency matrix of pair-wise similarities [15]. Finding the exactlyminimizing cut is an NP-hard problem.
The Google distances can be transformedto similarities by means of a suitable ker-nel. However, as such a transformationpotentially introduces errors, since in par-ticular the kernel has to be chosen appro-priately and the clustering is quite sen-sitive to this choice, it seems natural to
61
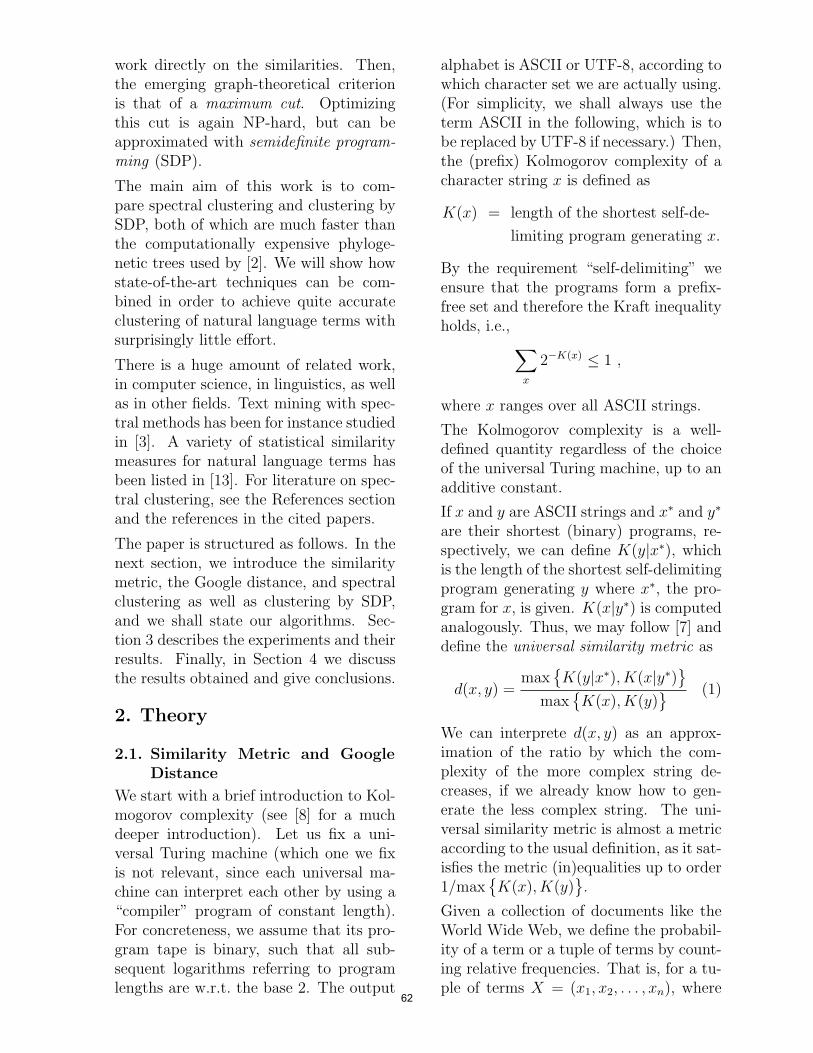
work directly on the similarities. Then,the emerging graph-theoretical criterionis that of a maximum cut. Optimizingthis cut is again NP-hard, but can beapproximated with semidefinite program-ming (SDP).
The main aim of this work is to com-pare spectral clustering and clustering bySDP, both of which are much faster thanthe computationally expensive phyloge-netic trees used by [2]. We will show howstate-of-the-art techniques can be com-bined in order to achieve quite accurateclustering of natural language terms withsurprisingly little effort.
There is a huge amount of related work,in computer science, in linguistics, as wellas in other fields. Text mining with spec-tral methods has been for instance studiedin [3]. A variety of statistical similaritymeasures for natural language terms hasbeen listed in [13]. For literature on spec-tral clustering, see the References sectionand the references in the cited papers.
The paper is structured as follows. In thenext section, we introduce the similaritymetric, the Google distance, and spectralclustering as well as clustering by SDP,and we shall state our algorithms. Sec-tion 3 describes the experiments and theirresults. Finally, in Section 4 we discussthe results obtained and give conclusions.
2. Theory
2.1. Similarity Metric and GoogleDistance
We start with a brief introduction to Kol-mogorov complexity (see [8] for a muchdeeper introduction). Let us fix a uni-versal Turing machine (which one we fixis not relevant, since each universal ma-chine can interpret each other by using a“compiler” program of constant length).For concreteness, we assume that its pro-gram tape is binary, such that all sub-sequent logarithms referring to programlengths are w.r.t. the base 2. The output
alphabet is ASCII or UTF-8, according towhich character set we are actually using.(For simplicity, we shall always use theterm ASCII in the following, which is tobe replaced by UTF-8 if necessary.) Then,the (prefix) Kolmogorov complexity of acharacter string x is defined as
K(x) = length of the shortest self-de-
limiting program generating x.
By the requirement “self-delimiting” weensure that the programs form a prefix-free set and therefore the Kraft inequalityholds, i.e., ∑
x
2−K(x) ≤ 1 ,
where x ranges over all ASCII strings.
The Kolmogorov complexity is a well-defined quantity regardless of the choiceof the universal Turing machine, up to anadditive constant.
If x and y are ASCII strings and x∗ and y∗
are their shortest (binary) programs, re-spectively, we can define K(y|x∗), whichis the length of the shortest self-delimitingprogram generating y where x∗, the pro-gram for x, is given. K(x|y∗) is computedanalogously. Thus, we may follow [7] anddefine the universal similarity metric as
d(x, y) =max
K(y|x∗), K(x|y∗)
max
K(x), K(y)
(1)
We can interprete d(x, y) as an approx-imation of the ratio by which the com-plexity of the more complex string de-creases, if we already know how to gen-erate the less complex string. The uni-versal similarity metric is almost a metricaccording to the usual definition, as it sat-isfies the metric (in)equalities up to order1/max
K(x), K(y)
.
Given a collection of documents like theWorld Wide Web, we define the probabil-ity of a term or a tuple of terms by count-ing relative frequencies. That is, for a tu-ple of terms X = (x1, x2, . . . , xn), where
62
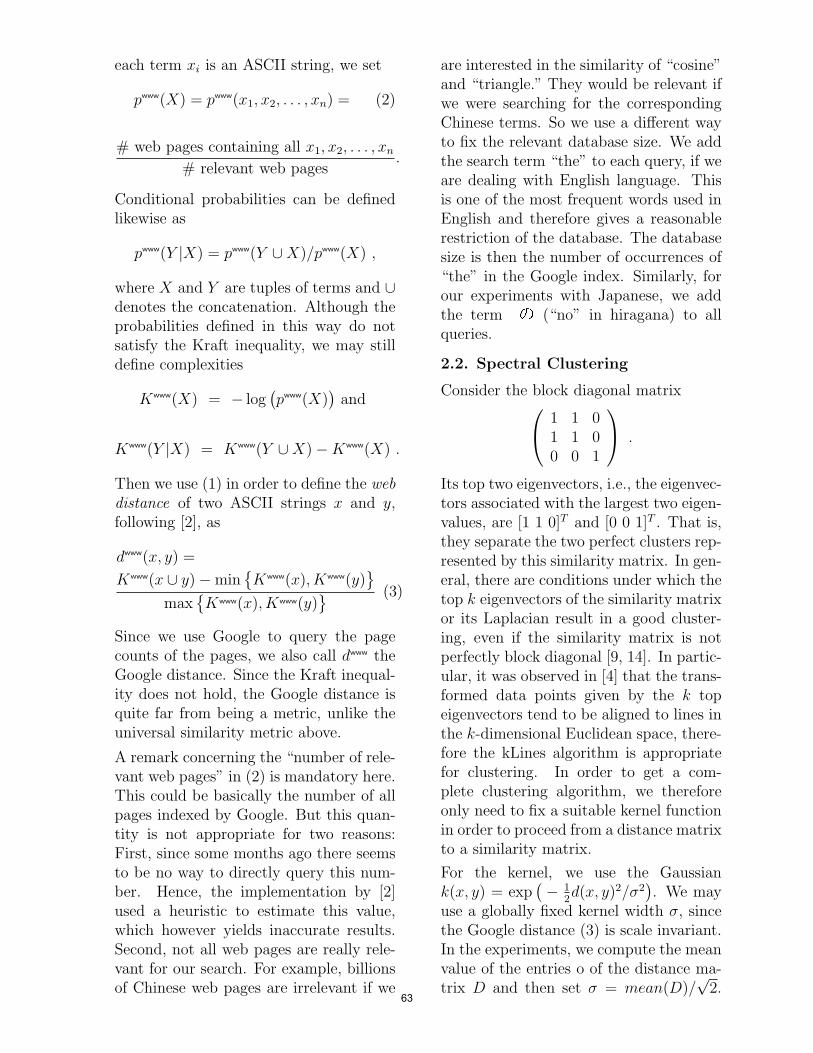
each term xi is an ASCII string, we set
pwww(X) = pwww(x1, x2, . . . , xn) = (2)
# web pages containing all x1, x2, . . . , xn
# relevant web pages.
Conditional probabilities can be definedlikewise as
pwww(Y |X) = pwww(Y ∪X)/pwww(X) ,
where X and Y are tuples of terms and ∪denotes the concatenation. Although theprobabilities defined in this way do notsatisfy the Kraft inequality, we may stilldefine complexities
Kwww(X) = − log(pwww(X)
)and
Kwww(Y |X) = Kwww(Y ∪X)−Kwww(X) .
Then we use (1) in order to define the webdistance of two ASCII strings x and y,following [2], as
dwww(x, y) =
Kwww(x ∪ y)−minKwww(x), Kwww(y)
max
Kwww(x), Kwww(y)
(3)
Since we use Google to query the pagecounts of the pages, we also call dwww theGoogle distance. Since the Kraft inequal-ity does not hold, the Google distance isquite far from being a metric, unlike theuniversal similarity metric above.
A remark concerning the “number of rele-vant web pages” in (2) is mandatory here.This could be basically the number of allpages indexed by Google. But this quan-tity is not appropriate for two reasons:First, since some months ago there seemsto be no way to directly query this num-ber. Hence, the implementation by [2]used a heuristic to estimate this value,which however yields inaccurate results.Second, not all web pages are really rele-vant for our search. For example, billionsof Chinese web pages are irrelevant if we
are interested in the similarity of “cosine”and “triangle.” They would be relevant ifwe were searching for the correspondingChinese terms. So we use a different wayto fix the relevant database size. We addthe search term “the” to each query, if weare dealing with English language. Thisis one of the most frequent words used inEnglish and therefore gives a reasonablerestriction of the database. The databasesize is then the number of occurrences of“the” in the Google index. Similarly, forour experiments with Japanese, we addthe term n (“no” in hiragana) to allqueries.
2.2. Spectral Clustering
Consider the block diagonal matrix 1 1 01 1 00 0 1
.
Its top two eigenvectors, i.e., the eigenvec-tors associated with the largest two eigen-values, are [1 1 0]T and [0 0 1]T . That is,they separate the two perfect clusters rep-resented by this similarity matrix. In gen-eral, there are conditions under which thetop k eigenvectors of the similarity matrixor its Laplacian result in a good cluster-ing, even if the similarity matrix is notperfectly block diagonal [9, 14]. In partic-ular, it was observed in [4] that the trans-formed data points given by the k topeigenvectors tend to be aligned to lines inthe k-dimensional Euclidean space, there-fore the kLines algorithm is appropriatefor clustering. In order to get a com-plete clustering algorithm, we thereforeonly need to fix a suitable kernel functionin order to proceed from a distance matrixto a similarity matrix.
For the kernel, we use the Gaussiank(x, y) = exp
(− 1
2d(x, y)2/σ2
). We may
use a globally fixed kernel width σ, sincethe Google distance (3) is scale invariant.In the experiments, we compute the meanvalue of the entries o of the distance ma-trix D and then set σ = mean(D)/
√2.
63
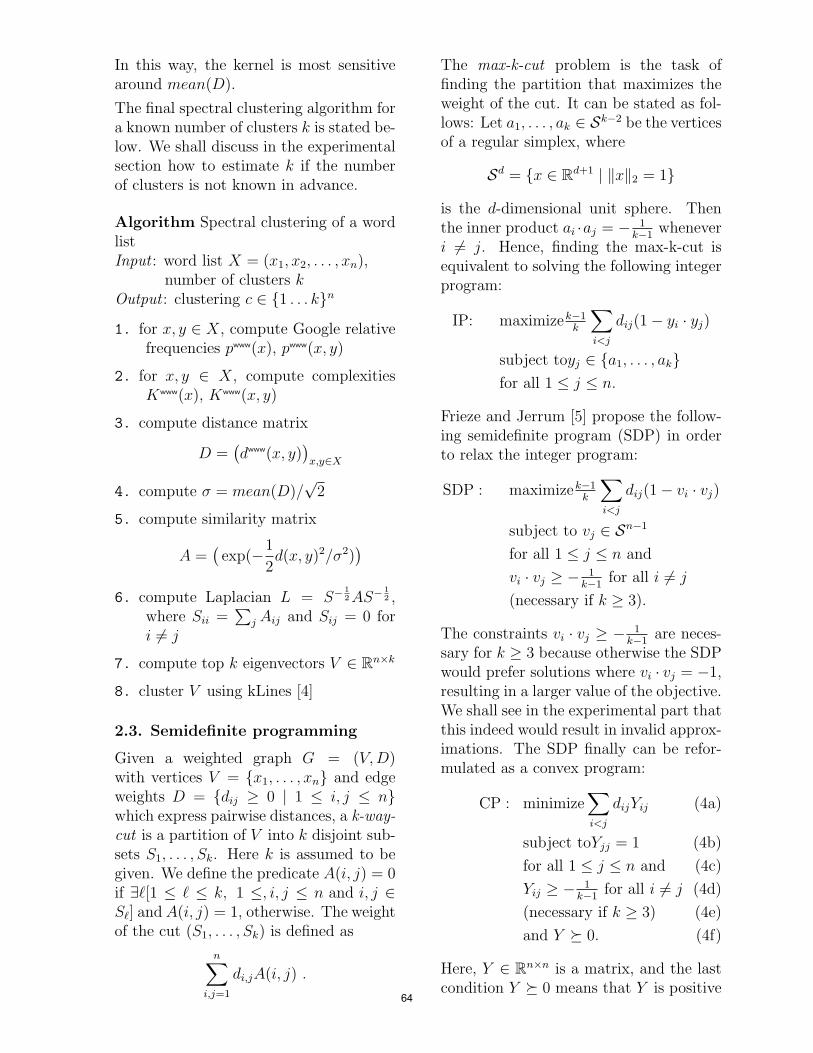
In this way, the kernel is most sensitivearound mean(D).
The final spectral clustering algorithm fora known number of clusters k is stated be-low. We shall discuss in the experimentalsection how to estimate k if the numberof clusters is not known in advance.
Algorithm Spectral clustering of a wordlistInput : word list X = (x1, x2, . . . , xn),
number of clusters kOutput : clustering c ∈ 1 . . . kn
1. for x, y ∈ X, compute Google relativefrequencies pwww(x), pwww(x, y)
2. for x, y ∈ X, compute complexitiesKwww(x), Kwww(x, y)
3. compute distance matrix
D =(dwww(x, y)
)x,y∈X
4. compute σ = mean(D)/√
2
5. compute similarity matrix
A =(exp(−1
2d(x, y)2/σ2)
)6. compute Laplacian L = S−
12 AS−
12 ,
where Sii =∑
j Aij and Sij = 0 fori 6= j
7. compute top k eigenvectors V ∈ Rn×k
8. cluster V using kLines [4]
2.3. Semidefinite programming
Given a weighted graph G = (V, D)with vertices V = x1, . . . , xn and edgeweights D = dij ≥ 0 | 1 ≤ i, j ≤ nwhich express pairwise distances, a k-way-cut is a partition of V into k disjoint sub-sets S1, . . . , Sk. Here k is assumed to begiven. We define the predicate A(i, j) = 0if ∃`[1 ≤ ` ≤ k, 1 ≤, i, j ≤ n and i, j ∈S`] and A(i, j) = 1, otherwise. The weightof the cut (S1, . . . , Sk) is defined as
n∑i,j=1
di,jA(i, j) .
The max-k-cut problem is the task offinding the partition that maximizes theweight of the cut. It can be stated as fol-lows: Let a1, . . . , ak ∈ Sk−2 be the verticesof a regular simplex, where
Sd = x ∈ Rd+1 | ‖x‖2 = 1
is the d-dimensional unit sphere. Thenthe inner product ai ·aj = − 1
k−1whenever
i 6= j. Hence, finding the max-k-cut isequivalent to solving the following integerprogram:
IP: maximizek−1k
∑i<j
dij(1− yi · yj)
subject toyj ∈ a1, . . . , akfor all 1 ≤ j ≤ n.
Frieze and Jerrum [5] propose the follow-ing semidefinite program (SDP) in orderto relax the integer program:
SDP : maximizek−1k
∑i<j
dij(1− vi · vj)
subject to vj ∈ Sn−1
for all 1 ≤ j ≤ n and
vi · vj ≥ − 1k−1
for all i 6= j
(necessary if k ≥ 3).
The constraints vi · vj ≥ − 1k−1
are neces-sary for k ≥ 3 because otherwise the SDPwould prefer solutions where vi · vj = −1,resulting in a larger value of the objective.We shall see in the experimental part thatthis indeed would result in invalid approx-imations. The SDP finally can be refor-mulated as a convex program:
CP : minimize∑i<j
dijYij (4a)
subject toYjj = 1 (4b)
for all 1 ≤ j ≤ n and (4c)
Yij ≥ − 1k−1
for all i 6= j (4d)
(necessary if k ≥ 3) (4e)
and Y 0. (4f)
Here, Y ∈ Rn×n is a matrix, and the lastcondition Y 0 means that Y is positive
64

semidefinite. Hence, Y will be a kernelmatrix. Efficient solvers are available forthis kind of optimization problems, suchas CSDP [1] or SeDuMi [12]. In orderto implement the constraints Yij ≥ − 1
k−1
with these solvers, actually positive slackvariables Zij have to be introduced to-gether with the equality constraints
Yij − Zij = − 1
k − 1.
Finally, in order obtain the partitioningfrom the vectors vj or the matrix Y , [5]propose to sample k points z1, . . . , zk ran-domly on Sn−1 and assign each vj to thegroup by the closest zi. They show ap-proximation guarantees generalizing thoseof Goemans and Williamson [6]. In prac-tice however, the approximation guaran-tee does not necessarily yield a good clus-tering, and applying the k-means algo-rithm for clustering the vj gives betterresults here. We use the kernel k-means(probably introduced for the first time by[10]) which directly works on the scalarproducts Yij = vi · vj, without need of re-covering the vj. We thus arrive at thefollowing algorithm:
Algorithm SDP clustering of a word listInput : word list X = (x1, x2, . . . , xn),
number of clusters kOutput : clustering c ∈ 1 . . . kn
1. for x, y ∈ X, compute Google relativefrequencies pwww(x), pwww(x, y)
2. for x, y ∈ X, compute complexitiesKwww(x), Kwww(x, y)
3. compute distance matrix
D =(dwww(x, y)
)x,y∈X
4. solve the SDP by using CP (cf. (4a)through (4f))
5. cluster the resulting matrix Y usingkernel k-means [10]
3. Experiments
In this section, we present the experi-ments of our clustering algorithm appliedto four lists of terms. First we show stepby step how the algorithm acts on the firstdata set, which is the following list of 60English words:
axiom,average,coefficient,probability,
continuous,coordinate,cube,
denominator,disjoint, domain, exponent,
function,histogram, infinity, inverse,
logarithm,permutation, polyhedra,
quadratic, random, cancer, abnormal,
abscess, bacillus,delirium,
betablocker, vasomotor, hypothalamic,
cardiovascular, chemotherapy,
chromosomal, dermatitis, diagnosis,
endocrine, epilepsy, oestrogen,
ophthalmic,vaccination, traumatic,
transplantation, nasdaq, investor,
obligation, benefit,bond, account,
clearing, currency, deposit, stock,
market, option, bankruptcy,creditor,
assets, liability, transactions,
insolvent, accrual, unemployment
The first 20 words are commonly used inmathematics, the next 20 words have beentaken from a medical glossary, and thefinal 20 words are financial terms. Thematrix containing the complexities is de-picted in Figure 1 (large complexities arewhite, small complexities black). Clearly,the single complexities on the diagonal aresmaller than the pairwise complexities off-diagonal.
Fig. 1: Complexities Fig. 2: Distances
In the distance matrix (Figure 2), the65
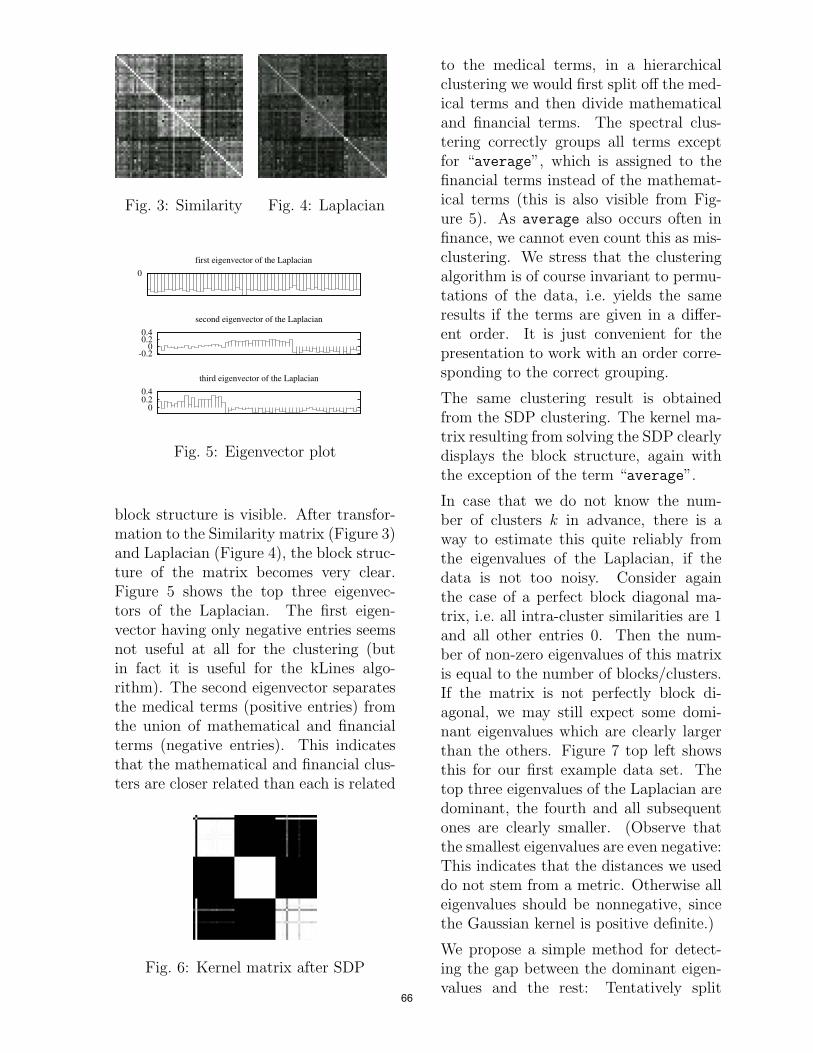
Fig. 3: Similarity Fig. 4: Laplacian
0first eigenvector of the Laplacian
-0.2 0
0.2 0.4
second eigenvector of the Laplacian
0 0.2 0.4
third eigenvector of the Laplacian
Fig. 5: Eigenvector plot
block structure is visible. After transfor-mation to the Similarity matrix (Figure 3)and Laplacian (Figure 4), the block struc-ture of the matrix becomes very clear.Figure 5 shows the top three eigenvec-tors of the Laplacian. The first eigen-vector having only negative entries seemsnot useful at all for the clustering (butin fact it is useful for the kLines algo-rithm). The second eigenvector separatesthe medical terms (positive entries) fromthe union of mathematical and financialterms (negative entries). This indicatesthat the mathematical and financial clus-ters are closer related than each is related
Fig. 6: Kernel matrix after SDP
to the medical terms, in a hierarchicalclustering we would first split off the med-ical terms and then divide mathematicaland financial terms. The spectral clus-tering correctly groups all terms exceptfor “average”, which is assigned to thefinancial terms instead of the mathemat-ical terms (this is also visible from Fig-ure 5). As average also occurs often infinance, we cannot even count this as mis-clustering. We stress that the clusteringalgorithm is of course invariant to permu-tations of the data, i.e. yields the sameresults if the terms are given in a differ-ent order. It is just convenient for thepresentation to work with an order corre-sponding to the correct grouping.
The same clustering result is obtainedfrom the SDP clustering. The kernel ma-trix resulting from solving the SDP clearlydisplays the block structure, again withthe exception of the term “average”.
In case that we do not know the num-ber of clusters k in advance, there is away to estimate this quite reliably fromthe eigenvalues of the Laplacian, if thedata is not too noisy. Consider againthe case of a perfect block diagonal ma-trix, i.e. all intra-cluster similarities are 1and all other entries 0. Then the num-ber of non-zero eigenvalues of this matrixis equal to the number of blocks/clusters.If the matrix is not perfectly block di-agonal, we may still expect some domi-nant eigenvalues which are clearly largerthan the others. Figure 7 top left showsthis for our first example data set. Thetop three eigenvalues of the Laplacian aredominant, the fourth and all subsequentones are clearly smaller. (Observe thatthe smallest eigenvalues are even negative:This indicates that the distances we useddo not stem from a metric. Otherwise alleigenvalues should be nonnegative, sincethe Gaussian kernel is positive definite.)
We propose a simple method for detect-ing the gap between the dominant eigen-values and the rest: Tentatively split
66

0 0.2 0.4 0.6 0.8
1eigenvalues of the Laplacian: math-med-finance
0 0.2 0.4 0.6 0.8
1eigenvalues of the Laplacian: colors-nums
0 0.2 0.4 0.6 0.8
1eigenvalues of the Laplacian: people
0 0.2 0.4 0.6 0.8
1eigenvalues of the Laplacian: Japanese
Fig. 7: Plots of the eigenvalues of theLaplacian (bars) and the s.s.e. score fordetermining the number of clusters (lines)for the four data sets
after the second eigenvalue, compute themeans of the eigenvalues in the two groups“dominant” and “non-dominant” (ignorethe top eigenvalue, which is always muchlarger), and calculate the sum square er-ror (s.s.e.) of all eigenvalues w.r.t. theirmeans. Compute this s.s.e. score also forthe split after the third eigenvalue, thefourth eigenvalue and so forth. Choosethe split with the lowest score. We havedepicted the s.s.e. scores in Figure 7 bysolid lines. For the math-med-financedata set, the minimum score is at the cor-rect number of k = 3 clusters.
Note that this method works only for thespectral clustering, there is no obviouscorresponding algorithm for the SDP clus-tering.
The next data set is the “colors-nums”data set from [2]:
purple, three, blue, red, eight,
transparent, black, white, small, six,
yellow,seven, fortytwo, five,
chartreuse, two, green, one, zero,
orange, four
Although the intended clustering hastwo groups, colors and numbers (where“small” is supposed to be a number and“transparent” a color), the eigenvaluesof the Laplacian in Figure 7 bottom leftindicate that there are three clusters.Indeed, in the final spectral clustering,“fortytwo” forms a singleton group,and “white” and “transparent” aremisclustered as numbers. Clusteringwith SDP gives a slightly different result:Here, best results are obtained with k = 2clusters, in which case only “fortytwo”is wrongly assigned to the colors.
The next data set,
Takemitsu, Stockhausen, Kagel, Xenakis,
Ligeti, Kurtag, Martinu, Berg, Britten,
Crumb,Penderecki, Bartok, Beethoven,
Mozart, Debussy, Hindemith, Ravel,
Schoenberg, Sibelius,Villa-Lobos, Cage,
Boulez, Kodaly, Prokofiev, Schubert,
Rembrandt, Rubens, Beckmann, Botero, Braque,
Chagall, Duchamp, Escher, Frankenthaler,
Giacometti, Hotere, Kirchner, Kandinsky,
Kollwitz, Klimt, Malevich, Modigliani,
Munch, Picasso, Rodin, Schlemmer, Tinguely,
Villafuerte, Vasarely, Warhol, Rowling,
Brown, Frey, Hosseini, McCullough, Friedman,
Warren, Paolini, Oz, Grisham, Osteen,
Gladwell, Trudeau, Levitt, Kidd, Haddon,
Brashares, Guiliano, Maguire, Sparks,
Roberts, Snicket, Lewis, Patterson, Kostova,
Pythagoras, Archimedes, Euclid, Thales,
Descartes, Pascal, Newton, Lagrange, Laplace,
Leibniz, Euler, Gauss, Hilbert, Galois,
Cauchy, Dedekind, Kantor, Poincare, Godel,
Ramanujan, Wiles, Riemann, Erdos, Thomas
Zeugmann, Jan Poland, Rolling, Stones,
Madonna,Elvis, Depeche, Mode, Pink, Floyd,
Elton, John, Beatles, Phil, Collins,67

Toten, Hosen, McLachan, Prinzen, Aguilera,
Queen, Britney, Spears, Scorpions,
Metallica, Blackmore, Mercy
consists of five groups of each 25 (moreor less) famous people: composers,artists, last year’s bestseller authors,mathematicians (including the authors ofthe present paper), and pop music per-formers. We deliberately did not specifythe terms very well (except for our ownmuch less popular names), in this waythe algorithm could “decide” itself if“Oz” meant one of the authors Amos andMehmet Oz or one of the pop music songswith Oz in the title. The eigenvalue plotin Figure 7 top right shows clearly fiveclusters. From the 125 names, 9 were notclustered into the intended groups usingthe spectral method. The highest numberof incorrectly clustered names (4 mis-clusterings) occurred in the least populargroup of the mathematicians (but ourtwo names were correctly assigned). Wealso observed that the spectral clusteringgets disproportionately harder when thenumber of clusters increases: Clusteringonly the first 50, 75, and 100 names gives0, 2, and 5 clustering errors, respectively.We also tried clustering the same dataset w.r.t. the Japanese web sites in theGoogle index, this gave 0, 1, 4, and 16clustering errors for the first 50, 75, 100,and 125 names, respectively.
Clustering with SDP gives better resultshere: 0, 0, 1, and 4 clustering errors forthe first 50, 75, 100, and 125 names, re-spectively.
The last data set consists of 20 Japaneseterms from finance and 10 Japanese termsfrom computer science (taken from glos-saries):
<, ºÿ, ¶m, Ø, *¡, °, Ñ), o,Ç(, üe, ¡?, *¡, =-, 8ú, Ñ, òØ, 4», AÕ', ¡<8, ©ï, Þï, ;Ïæ, ;Ï'., ¢p, Ñ<, Âp, b, Ö, , S.
The eigenvalue plot in Figure 7 does not
clearly indicate the correct number ofk = 2 clusters. However, when usingk = 2, only the term “°” (whichmeans “environment”) is non-intendedlygrouped with the computer science wordsby the spectral clustering. SDP clusteringgives the same result here.
The computational resources requiredby our clustering algorithms are muchlower than those needed by Cilibrasi andVitanyi’s algorithm [2]. Their clusteringtries to optimize a quality function, a taskwhich is NP hard. The approximationcosts hours even for small lists of n = 20words. On the other hand, our spectralclustering’s naive time complexity is cubicO(n3) in the number of words. This canbe improved to O(n2k) by using Lanczosmethod for computing the top k eigenvec-tors.
On our largest “people” data set withn = 125, our spectral clustering needsabout 0.11sec on a 3GHz Pentium4 pro-cessor with the ATLAS library.
Solving the SDP in order to approximatemax-cut is more expensive. The respec-tive complexity is O(n3 + m3) (cf. [1]),where m is the number of constraints. Ifk = 2, then m = n and the overall com-plexity is cubic. However, for k ≥ 3,we need m = O(n2) constraints, resultingin an overall computational complexity ofO(n6). On our largest “people” data setwith n = 125, our SDP clustering needsabout 2544sec.
4. Discussion and Conclusions
We have shown that it needs surprisinglylittle effort, just a few queries to a popularsearch engine together with some state-of-the-art methods in machine learning, toautomatically separate lists of terms intoclusters which make sense. We have fo-cused on unsupervised learning in this pa-per, but for other tasks such as supervisedlearning, appropriate tools are availableas well (e.g. SVM). Our methods are theo-retically quite well founded, basing on the
68

theories of Kolmogorov complexity on theone hand and graph cut criteria and spec-tral clustering or semidefinite program-ming on the other hand. The SDP clus-tering is the more direct approach, as itneeds less steps. Also, it yields slightlybetter results. However, it is compu-tationally more expensive than spectralclustering.
References
[1] B. Borchers and J. G. Young. Imple-mentation of a primal-dual methodfor sdp on a shared memory parallelarchitecture. March 27, 2006.
[2] R. Cilibrasi and P. M. B. Vitanyi.Automatic meaning discovery usingGoogle. Manuscript, CWI, Amster-dam, 2006.
[3] I. Dhillon. Co-clustering documentsand words using bipartite spectralgraph partitioning. In Proceedingsof the 7th ACM SIGKDD Int. Con-ference on Knowledge Discovery andData Mining(KDD), pages 269–274,2001.
[4] I. Fischer and J. Poland. New meth-ods for spectral clustering. TechnicalReport IDSIA-12-04, IDSIA / USI-SUPSI, Manno, Switzerland, 2004.
[5] A. Frieze and M. Jerrum. Improvedalgorithms for max k-cut and maxbisection. Algorithmica, 18:67–81,1997.
[6] M. X. Goemans and D. P.Williamson. .879-approximationalgorithms for MAX CUT and MAX2SAT. In STOC ’94: Proceedingsof the twenty-sixth annual ACMsymposium on Theory of computing,pages 422–431. ACM Press, 1994.
[7] M. Li, X. Chen, X. Li, B. Ma, andP. M. B. Vitanyi. The similarity met-ric. IEEE Transactions on Informa-tion Theory, 50(12):3250–3264, 2004.
[8] M. Li and P. M. B. Vitanyi. An in-troduction to Kolmogorov complexityand its applications. Springer, 2ndedition, 1997.
[9] A. Ng, M. Jordan, and Y. Weiss. Onspectral clustering: Analysis and analgorithm. In Advances in NeuralInformation Processing Systems 14,2001.
[10] B. Scholkopf, A. Smola, and K.-R.Muller. Nonlinear component anal-ysis as a kernel eigenvalue problem.Neural Computation, 10(5):1299–1319, 1998.
[11] D. A. Spielman and S. Teng. Spectralpartitioning works: Planar graphsand finite element meshes. In IEEESymposium on Foundations of Com-puter Science, pages 96–105, 1996.
[12] J. Sturm. Using SeDuMi 1.02, aMATLAB toolbox for optimizationover symmetric cones. OptimizationMethods and Software, 11(12):625–653, 1999.
[13] E. L. Terra and C. L. A. Clarke. Fre-quency estimates for statistical wordsimilarity measures. In HLT-NAACL2003: Main Proceedings, pages 244–251, Edmonton, Alberta, Canada,2003.
[14] U. von Luxburg, O. Bousquet, andM. Belkin. Limits of spectral cluster-ing. In Advances in Neural Informa-tion Processing Systems (NIPS) 17.MIT Press, 2005.
[15] S. X. Yu and J. Shi. Multiclass spec-tral clustering. In ICCV ’03: Pro-ceedings of the Ninth IEEE Interna-tional Conference on Computer Vi-sion, pages 313–319. IEEE ComputerSociety, 2003.
69
Toward Soft Clustering in theSequential Information Bottleneck
Method
Tetsuya YoshidaGraduate School of Information Science and Technology,
Hokkaido UniversityWest 9, North 14, Kita-ku, Sapporo, Hokkaido 060-0814, Japan
AbstractThis paper briefly explains the Information Bottleneck method which was originally proposed byTishby [8], and describes our preliminary attempt to extend the Information Bottleneck (IB) methodtoward soft clustering. Until now four algorithms have been proposed in the framework of IB.Among them, we focus on an algorithm called sequential IB (sIB), and propose an approach forextending it toward soft clustering. We propose an approach for softening the partition in the orig-inal sIB and for cluster merger among the softened clusters. Some properties in our extension arereported, and remaining issues are discussed.
1. Introduction
By rapid progress of network and storagetechnologies, a huge amount of electronicdata has been accumulated and availablethese days. Especially, as typified byWeb pages, the amount of machine read-able documents have been ever increas-ing. Since it is almost impossible for hu-mans to manually classify or categorizethe huge amount of documents over theWeb, a lot of research efforts have beenconducted on ext clustering or classifica-tion [2, 1, 6]
Recently, a new information theoreticprinciple, termed the Information Bottle-neck method (IB), has been proposed andinvestigated [8, 3, 4, 7] It is based on thefollowing idea: given the empirical jointdistribution of two variables, one vari-able is compressed so that the compressedrepresentation preserves the informationabout the other relevant variable as muchas possible. It has been applied to many
application domains, especially for docu-ment clustering. One of the strength ofthis approach is that it is possible to findout some “structure” out of the given dataitself without imposing extra assumptionsor constraints.
This paper describes our preliminary at-tempt to extend the Information Bottle-neck method toward soft clustering. Untilnow four algorithms are proposed in theIB method. Among them, we focus on analgorithm called sequential IB (sIB), andproposed an approach toward soft clus-tering. Some properties in our extensionare reported and remaining issues are de-scribed.
This paper is organized as follows. Sec-tion explains the preliminaries in prob-abilistic approach in clustering. Sec-tion briefly explains the Information Bot-tleneck method based on [8, 3], andsets up the context of our research. Sec-tion describes our approach for towardsoft clustering, and reports our current
70
status. Section gives brief concluding re-marks.
2. Preliminaries
Definition 1 (KL divergence) TheKullback-Leibler (KL) divergence be-tween two probability distributions p1(x)and p2(x) is defined as
DKL[p1(x)||p2(x)]
=
∑x
p1(x) logp1(x)
p2(x)
=∑x
p1(x) log p2(x)−H [p1(x)](1)
where H [p1(x)] represents the entropy ofp1(x).
Definition 2 (JS divergence) TheJensen-Shannon (JS)divergence betweentwo probability distributions p1(x) andp2(x) is defined as
JSΠ[p1(x), p2(x)]= π1DKL[p1(x)||p(x)]
+π2DKL[p2(x)||p(x)]= H [p(x)]
−(π1H [p1(x)] + π2H [p2(x)])
(2)
where Π = πi, πj, 0 < π1, π2 < 1, π1 +π2 = 1, and p(x) = π1p1(x) + π2p2(x).
3. Information BottleneckMethod
3.1. IB Variational Principle
Tishby et al. proposed to cope withthe precision complexity tradeoff with-out defining any distortion measure in ad-vance [8]. They formulated the prob-lem by introducing a relevant variable onwhich the mutual information should be
preserved as high as possible, while thegive data points are compressed.
The goal is: minimizing the compressioninformation while preserving the relevantinformation as high as possible. Here, therelevant information refers to the infor-mation about the relevant variable. Theabove problem is formulated as: given ajoint statics p(x, y) for a random variableX and the relevant variable Y , find a com-pressed representation T of the originalrepresentation X . This process is illus-trated in Figure 1. To solve this problem,one observation is that T should be com-pletely defined given X , irrelevant to Y ,since T is a compressed representation ofX . This observation is formulated as fol-lows.
Definition 3 (IB Markovian relation)
T ↔ X ↔ Y (3)
where X is a random variable, Y is therelevant variable, and T is a compressedrepresentation of X .
Under IB Markovian relation, the follow-ing properties hold:
p(t|x, y) = p(t|x) (4)
p(x, y, t) = p(x, y)p(t|x, y)= p(x, y)p(t|x) (5)
To find the optimal compression ofX intoT using the method of Lagrange multipli-ers, Tishby et. al [8] suggested the fol-lowing IB variational principle.
Definition 4 (IB variational principle)
L[p(t|x)] = I(X;T )− βI(T ;Y ) (6)
where I(T ;X), I(T ;Y ) are the mutualinformation between the variables, β is aLagrange multiplier.
71
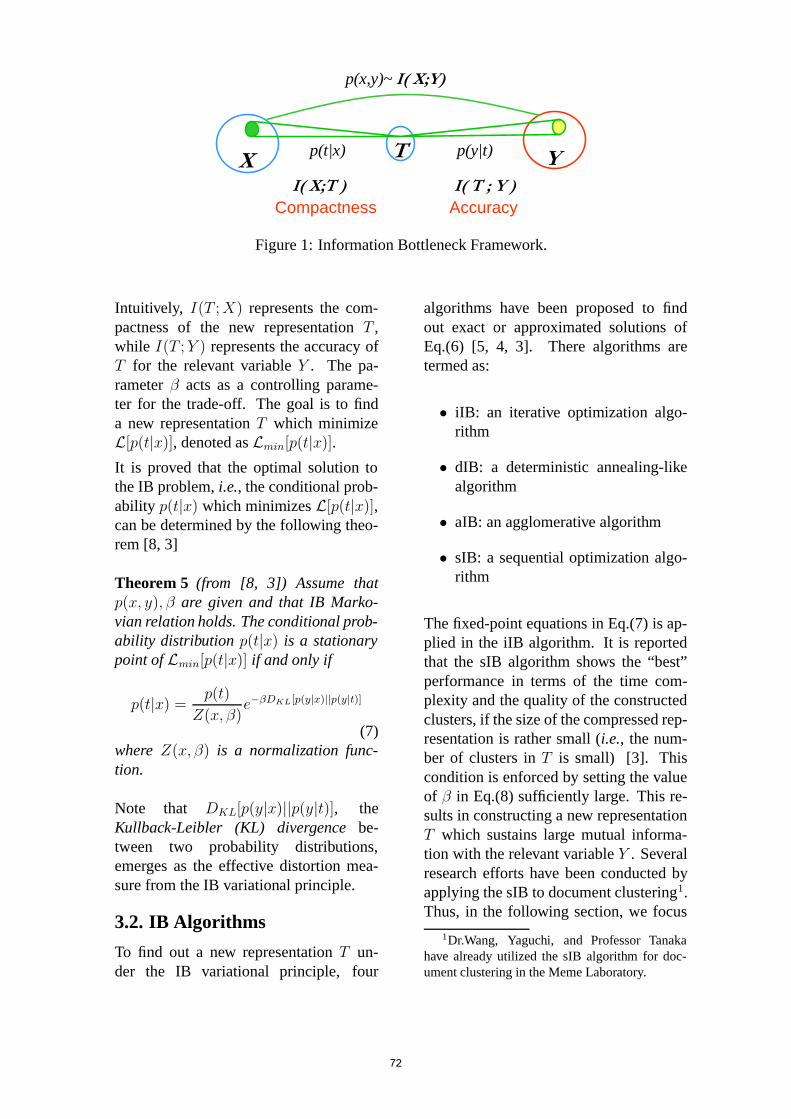
CompactnessI( X;T )
AccuracyI( T ; Y )
TX Y
p(t|x)
p(x,y)~ I( X;Y)
p(y|t)
Figure 1: Information Bottleneck Framework.
Intuitively, I(T ;X) represents the com-pactness of the new representation T ,while I(T ;Y ) represents the accuracy ofT for the relevant variable Y . The pa-rameter β acts as a controlling parame-ter for the trade-off. The goal is to finda new representation T which minimizeL[p(t|x)], denoted as Lmin[p(t|x)].It is proved that the optimal solution tothe IB problem, i.e., the conditional prob-ability p(t|x) which minimizes L[p(t|x)],can be determined by the following theo-rem [8, 3]
Theorem 5 (from [8, 3]) Assume thatp(x, y), β are given and that IB Marko-vian relation holds. The conditional prob-ability distribution p(t|x) is a stationarypoint of Lmin[p(t|x)] if and only if
p(t|x) =p(t)
Z(x, β)e−βDKL[p(y|x)||p(y|t)]
(7)where Z(x, β) is a normalization func-tion.
Note that DKL[p(y|x)||p(y|t)], theKullback-Leibler (KL) divergence be-tween two probability distributions,emerges as the effective distortion mea-sure from the IB variational principle.
3.2. IB Algorithms
To find out a new representation T un-der the IB variational principle, four
algorithms have been proposed to findout exact or approximated solutions ofEq.(6) [5, 4, 3]. There algorithms aretermed as:
• iIB: an iterative optimization algo-rithm
• dIB: a deterministic annealing-likealgorithm
• aIB: an agglomerative algorithm
• sIB: a sequential optimization algo-rithm
The fixed-point equations in Eq.(7) is ap-plied in the iIB algorithm. It is reportedthat the sIB algorithm shows the “best”performance in terms of the time com-plexity and the quality of the constructedclusters, if the size of the compressed rep-resentation is rather small (i.e., the num-ber of clusters in T is small) [3]. Thiscondition is enforced by setting the valueof β in Eq.(8) sufficiently large. This re-sults in constructing a new representationT which sustains large mutual informa-tion with the relevant variable Y . Severalresearch efforts have been conducted byapplying the sIB to document clustering1.Thus, in the following section, we focus
1Dr.Wang, Yaguchi, and Professor Tanakahave already utilized the sIB algorithm for doc-ument clustering in the Meme Laboratory.
72

on the sIB algorithm and consider its ex-tension toward soft clustering. In the fol-lowing, we explain the aIB and sIB algo-rithm as the preliminaries for Section .
3.3. Cluster Merger in IB
For aIB and sIB algorithms, the followingdual form is considered for the optimiza-tion of p(t|x):
Lmax[p(t|x)]= I(T ;Y )− β−1I(X;T )
(8)Clearly, minimization of L[p(t|x)] inEq.(6) corresponds to maximization ofLmax[p(t|x)] in Eq.(8).
The agglomerative procedure is con-ducted by merging two values (clusters) tiand tj into a single value t, i.e., the clustermerger ti, tj ⇒ t.
Definition 6 (Merger Membership)(from [3]) Let ti, tj ⇒ t be somemerger in T. We define the cluster mergermembership as the union of the events tiand tj as:
p(t|x) = p(ti|x)+p(tj |x), ∀x ∈ X (9)
Proposition 7 (Cluster Merger in IB)(from [3]) Let ti, tj ⇒ t be somemerger in T defined through Eq.(6). If IBMarkovian relation holds, then
p(t) = p(ti) + p(tj) (10)
p(y|t) = πip(y|ti) + πjp(tj) (11)
where
Π = πi, πj = p(ti)p(t)
,p(tj)
p(t) (12)
To select the merger cluster, it is provedthat the cluster which minimizes the fol-lowing merger cost should be selected tomaximize Lmax[p(t|x)] in Eq.(8).
T t1
t2
t3
x: as asingletoncluster
xdraw
merge
Figure 2: Overview of sIB algorithm.
Proposition 8 (Merger Cost) (from [3])Let ti, tj ∈ T be two clusters. Then, themerger cost is defined as:
ΔLmax(ti, tj) = p(t) · d(ti, tj) (13)
where
d(tj , tx)= JSΠ[p(y|ti), p(y|tj)]−β−1JSΠ[p(x|ti), p(x|tj)]
(14)
Using Eq.(13), two clusters ti, tj ∈ Twhich minimize ΔLmax(ti, tj) are se-lected and merged iteratively.
3.4. sIB: a sequential optimiza-tion algorithm
In [4], Slonim et al. proposed a frame-work for casting a known agglomerativealgorithm into a sequential K-means likealgorithm, and proposed a sequential op-timization algorithm called sIB. The se-quential maintains a (flat) partition in Twith exactly m clusters (t1 . . . tm ∈ T ).
Given the initial partition, at each stepsome data x ∈ X is drawn fromits current cluster t (x was exclusivelyassigned to t), and represented as anew singleton cluster x. Then, thesingleton cluster x is merged with
73

or inserted into tj such that tnewj =argmintj∈TΔLmax(x, tj), tnewj = tj x. If tj = t, this process constitutesa reassignment of x, which contributesto increasing the value of Lmax[p(t|x)] inEq.(8). The above process is illustrated inFigure 2.
4. An Extension toward SoftClustering in sIB
In the original sIB algorithm, hard clus-tering is assumed, i.e., each data x ∈ X isassigned to only one cluster t ∈ T . Hardclustering is formulated as:
p(t|x) =
1 x ∈ t0 x ∈ t (15)
However, the original IB variational prin-ciple in Definition 3 does not impose this(extra) constraint. Actually, the solutionfound by the iIB algorithm, which appliesthe standard strategy in variational meth-ods, does not necessarily obey this con-straint and conducts soft clustering.
4.1. An Approach toward SoftClustering in sIB
To extend sIB algorithm toward soft clus-tering, we employ the following ap-proach:
a) “cluster division & merger” strategyAs in the original sIB, ∀x ∈ X, ∃t ∈T s.t. x ∈ t, divide the cluster tinto t′ , tx. Here, t ⇒ t
′ ∪ tx, txis treated as a singleton cluster butwith probabilistic assignment, as ex-plained below. Then, tx is mergedwith some tj ∈ T as tx, tj ⇒ tj .
b) sequential update for each x ∈ X forsimplicityOne drawback of this approach isthat, it requires the O(|X|) loop.However, as a initial trial, we employsequential update for simplicity.
procedure sIBsoft(p(x, y), β,|T |)// p(x, y): joint distribution// β: trade - off parameter// |T |: cardinality of clusters// initialization1: For every x ∈ X2: For every t ∈ T3: Set random value for p(t|x) ∈ [0, 1]
s.t.∑
t p(t|x) = 1// Main Loop4: While not Done5: Done← TRUE6: For every x ∈ X7: Select t ∈ T8: Divide t into t′, tx9: Select tj ∈ T\t ∪ t
′ ∪ tx10: If tj = t,11: Done← FALSE12: Merge tx into tj13: Return p(t|x)
Figure 3: Pseudo-code of soft clusteringin sIB.
Difference from the original hard cluster-ing in sIB is that, a data x ∈ t is not en-tirely drawn from the cluster t. Instead,only some portion of x is drawn and as-signed to a new cluster tx.
Our procedure of soft clustering in sIB issummarized as the procedure sIBsoft inFigure fig:sIB-psuedo-code. The exten-sion from the original sIB algorithm is thelines 7,8,9.
To realize the above soft clustering, thefollowing issues should be resolved.
• Selection of the cluster t ∈ T foreach x ∈ X s.t. x ∈ t (line 7)
• Soft partitioning of t into t′, tx.(line 8)
• Selection of the merger cluster tj(line 9)
74
In the following sections, we describe ourcurrent approach for the above issues.
4.2. Soft Partitioning andMerger
Our approach for soft partitioning in sIBis formulated as follows:
Definition 9 (Soft Partitioning) Foreach x ∈ X, ∃t ∈ T s.t. x ∈ t, lett ⇒ t′, tx be a soft partitioning of thecluster t with a parameter γ (0 < γ ≤ 1).Then, ∀x′ ∈ X, ∀tj ∈ T ,
p(tx|x′) =
γp(t|x) x′ = x0 x′ = x
(16)
p(t′ |x′) =
(1− γ)p(t|x) x′ = xp(t|x′) x′ = x
(17)For the rests, i.e., ∀tj ∈ T s.t. tj = t
′ ∧tj = tx, ∀x
′ = x, p(tj |x′) unchanged.
For the clusters which are defined in Def-inition9, we follow the cluster mergermembership in Definition6. Thus, inour soft clustering, if clusters ti, tj aremerged into t, the cluster merger member-ship is set as
p(t|x) = p(ti|x) + p(tj|x), ∀x ∈ X
We need to The value of γ (γ ∈ [0, 1])
4.3. Some Properties in SoftClustering
In hard clustering, JSΠ[p(x|ti), p(x|tj)]in Eq.(14) can be simplified asJSΠ[p(x|ti), p(x|tj)] = H [Π] ([3],p.36). However, this does not hold forsoft clustering. Fortunately, similarrelation to Eq.(11) holds.
Proposition 10 Let ti, tj ⇒ t be somemerger in T defined through Eq.(6). If IBMarkovian relation holds, then
p(x|t) = πip(x|ti) + πjp(x|tj) (18)
Note that Eq.(18) holds for both hard andsoft clustering.
Proposition 11 Let t⇒ tx, t′ be some
soft partitioning of a cluster t ∈ T definedin Definition 9. If IB Markovian relationholds, then
p(t) = p(t′) + p(tx) (19)
p(y|tx) = p(y|x) (20)
p(x′|tx) =
1 x′ = x0 x′ = x
Eq.(19) shows that Eq.(10) holds in bothhard and soft clustering.
4.4. Cluster Merger Criterion
Observation 12 Let ti, tj ∈ T be twoclusters and consider the cluster mergerti, tj ⇒ t. For soft clustering, ifwe set conditional probability in themerged cluster p(t|x) following Eq.(6),from Proposition12, Eqs.(10) and (11)xhold. Thus, Merger cost ΔLmax(ti, tj) inEq.(13) holds both for hard and soft clus-tering.
From Observation 12, for our defini-tion of soft partitioning in Eqs.(16) and(17), we can utilize ΔLmax(tx, tj) as themerger cost of tx, tj into tj . Thus, wecan set line 9 in Figure 3 as “Select tj =argmint∈T Lmax
(tx, t
)”.
Based on the above observation, we fol-low the criterion in Eq.(8) and selectthe cluster tj ∈ T which minimizesΔLmax(tx, tj) in Eq.(13). There are twocases for cluster merger:
• Cluster re-merge: t′
is selected andmerged as t
′ ⇒ t′ ∪ tx = t (as t
′)
∀tj ∈ T s.t. tj = t′,
ΔLmax(tx, t′) ≤ ΔLmax(tx, tj)
75

• cluster merge: ∃tj ∈ T s.th.tj =t′, tj ⇒ tj ∪ tx = tj∃tj ∈ T s.t. tj = t
′,
ΔLmax(tx, t′) > ΔLmax(tx, tj)
For cluster re-merge,
p(y|t) = πt′p(y|t′) + πtxp(y|tx)(21)
Π = πt′ , πtx
= p(t′)
p(t),p(tx)
p(t)
= 1− γp(x|t), γp(x|t)(22)
Here, p(x|t) corresponds to the weight(contribution) of x ∈ t for p(t)
tj = t′
corresponds the re-merger to theoriginal cluster t (tx, t
′ ⇒ t′
= t); tj =t′
corresponds to a cluster update.
4.5. Cluster Selection
There are two ways to conduct cluster se-lection.
• No a priori selection:∀x ∈ X , ∀t ∈ T s.t. x ∈ t,select the cluster t which minimizeΔLmax(tx, tj).Since this approach requires at leastO(XT ) loops, as in aIB, the worstcase time complexity is at leatO(|X|2). However, if we can assumethat |T | is fixed and that |T | |X|,this does not matter in practice.
• Heuristic selection:Select the most “distant” cluster t foreach x.
Our current plan is to utilize the latterapproach and select a cluster t ∈ T foreach x ∈ X . Since the framework of IBconducts clustering based on the condi-tional distribution with resect to the rel-evant variable Y (see Eq.(7)), we plan to
utilize the measure for conditional distri-butions.
4.6. Remaining Issues in SoftClustering
We have described our current status forthe extension toward soft clustering insIB. The followings are the remaining is-sues resolved:
i). Selection of the most “distant” clus-ter t for x
ii). Value of γ
For i.), as stated in the previous subsec-tion, one heuristic approach for cluster se-lection is to select the most distant clusterw.r.t. the (conditional) probability distri-bution for the relevant variable.
Among many diversity measure for prob-ability distributions, it would be naturalto utilize either DKL in Eq.(1) or JSΠ
in Eq.(2), because these diversity mea-sures emerged out of the framework of IB.At this moment we have not yet decidedwhich divercity measure, DKL in Eq.(1)or JSΠ in Eq.(2), should be utilized tomeasure the distance.
For ii.), ideally, it is desirable to show theanalytic solution for the value of γ. If it isdifficult or impossible, we plan to utilizeuniform or adaptive value, i.e.,1) uniform for ∀x ∈ X , or,2) adaptive for each x.
Our current plan for determining thevalue of γ is as follows. We assume thatthe cluster t s.t. x ∈ t is already se-lected (hopefully using the diversity mea-sure as described above). Once the clus-ter t is fixed, for each tj ∈ T\t ∪ t
′ ∪tx, since p(tj), p(y|tj), and p(x|tj) arecalculated beforehand, ΔLmax(tx, tj)can be expressed as a function of γ.Thus, we can represent ΔLmax(tx, tj)
76
as ΔLmax(γ) for each tj. We plan to uti-lize the variational method and determinethe stationary point of γ for each tj, andutilize the value to compute ΔLmax(γ).
5. Concluding Remarks
This paper briefly explained the Informa-tion Bottleneck method which was orig-inally proposed by Tishby [8] and sub-stantially extended in [3], and describedour preliminary attempt to extend the In-formation Bottleneck (IB) method towardsoft clustering. Until now four algorithmshave been proposed in the IB method.Among them, we focus on an algorithmcalled sequential IB (sIB), and proposedan approach toward soft clustering. Weproposed an approach for softening thepartition in the original sIB and for clustermerger among the softened clusters.
Our current status is very preliminary andthere are many remaining issues, e.g., theselection of the cluster to divide, determi-nation of the value of γ. We plan to tacklethese issues in near future. We also planto implement the described approach andconducts experiments to evaluate our ap-proach.
Acknowledgments This work is par-tially supported by JSPS Core-to-CoreProgram “Center for Research on Knowl-edge Media Technologies for the Ad-vanced Federation, Utilization and Dis-tribution of Knowledge Resrouces” andThe 21st Century COE Program “Meme-Media Technology Approach to the R&Dof Next-Generation Information Tech-nologies” The author is grateful to Profes-sor Yuzuru Tanaka for encouraging thispath of research in this project.
References
[1] R. Bekkerman, R. El-Yaniv,N. Tishby, and Y. Winter. Dis-tributional Word Clusters vs.Wordsfor Text Categorization. Journalof Machine Learning Research,3:1183–1208, 2003.
[2] F.C. Pereira, N. Tishby, and L. Lee.Distributional clustering of Englishwords. In Proceedings of the 30thAnnual Meeting of the Associationfor Computational Linguistics, pages183–190, 1993.
[3] N. Slonim. The Information Bottle-neck:Theory and Applications. PhDthesis, School of Computer Scienceand Engineering, Hebrew University,2002.
[4] N. Slonim, N. Friedman, andN. Tishby. Unsupervised Docu-ment Classification using SequentialInformation Maximization. In Pro-ceedings of the 25th InternationalConference on Research and De-velopment in Information Retrieval(SIGIR), 2002.
[5] N. Slonim and N. Tishby. Agglom-erative Information Bottleneck. InAdvances in Neural Information Pro-cessing Systems (NIPS) 12, pages617–623, 1999.
[6] N. Slonim and N. Tishby. The Powerof Word Clusters for Text Classifica-tion. In Proceedings of the 23rd Euro-pean Colloquium on Information Re-trieval Research, 2001.
[7] N. Tishby. Efficient Data Repre-sentations that Preserve Information.In Proceedings of the 6th Interna-tional Conference on Discovery Sci-ence (DS2003), page 45, 2003.
77

[8] N. Tishby, F. Pereira, and W. Bialek.The Information Bottleneck Method.In Proceedings of the 37th AllertonConference on Communication andComputation, 1999.
Appendix
Proof of Eq.(18)
p(x, t) =∑y
p(x, y)p(t|x, y)
=∑y
p(x, y)p(t|x)
=∑y
p(x, y)(p(ti|x) + p(tj |x)
=∑y
p(x, y)p(ti|x)
+∑y
p(x, y)p(tj|x)
=∑y
p(x, y)p(ti|x, y)
+∑y
p(x, y)p(tj|x, y)
=∑y
p(x, y, ti) +∑y
p(x, y, tj)
= p(x, ti) + p(x, tj)
= p(ti)p(x|ti) + p(tj)p(x|tj)∴ p(x|t) = πip(x|ti) + πjp(x|tj)
where Π = πi, πj = p(ti)p(t)
,p(tj)
p(t),
Proof of Eq.(19)
p(tx) =∑x′p(tx, x
′)
= p(tx, x) = p(tx|x)p(x)= γp(t|x)p(x)= γp(t, x)
p(t′) =
∑x′p(t
′, x′)
=∑x′p(x′)p(t
′ |x′)
=∑x′ =x
p(x′)p(t|x′
)
+p(x)((1− γ)p(t|x))=
∑x′p(x
′, t)− p(x)γp(t|x)
= p(t)− p(tx)∴ p(t) = p(tx) + p(t
′)
Proof of Eq.(20).
p(y|tx) = p(y, tx)/p(tx)
=
∑x′ p(x
′, y)p(tx|x′, y)∑x′ p(tx|x′)p(x′)
=
∑x′ p(x
′, y)p(tx|x′)∑x′ p(tx′ |x)p(x′)
=p(x, y)p(tx|x)p(tx|x)p(x)
=p(x, y)
p(x)
= p(y|x)
Proof of Eq.(21).
p(x|tx) =p(tx|x)p(x)
p(tx)
=p(tx, x)∑x′ p(tx, x
′)
=p(tx, x)
p(tx, x)= 1
p(x′ |tx) = 0 (x
′ = x)
78

Multiple News Articles Summarizationbased on Event Reference Informationwith Hierarchical Structure Analysis
Masaharu Yoshioka Makoto HaraguchiGraduate School of Information Science and Technology, Hokkaido University
N14 W9, Kita-ku, Sapporo-shi, Hokkaido, JAPANyoshioka,[email protected]
AbstractIn this paper, we describe our method to generate summary from multiple news articles. Since most ofnews articles report several events and these events are refereed with following articles, we use this eventreference information to calculate importance of a sentence in multiple news articles. We also propose amethod to delete redundant description by using similarity of events. Finally we discuss its effectivenessbased on the evaluation result.
1. Introduction
Nowadays, we can access a large amount oftext data. As a result, even for a simple topic,it becomes difficult to read through all doc-uments that are related to the topic. There-fore, demand for multiple document summa-rization is increasing and a task for multipledocument summarization that uses news ar-ticles is proposed for tackling this issue inTSC-3[4].
Most significant characteristic of multipledocument summarization compared withsingle one is that there are redundant in-formation in a document set. For exam-ple, most of news articles reports events thatoccurred at particular date and these eventswere refereed in following articles. Basedon the assumption that repetitions of thesame event description represent the rela-tionship among different articles, we havealready proposed a method to summarizemultiple news article by using event refer-ence information [10].
By using TSC-3 data, we show the usage ofevent reference information is useful. How-ever this method tends to select sentencesthat include many repetitive events. As aresult, sentences that have similar repetitive
events among different news articles gainshigh score and sentences that are importantonly in one article are not selected as impor-tant sentences. In order to solve this prob-lem, we propose a method to combine im-portant sentence extraction method for eachdocument and for whole document for re-ducing this effect in this paper.
2. Multiple News Articles Summa-rization based on Event Refer-ence Information
2.1. Extraction of the Event Refer-ence Information
As McKeown proposed in [7], there are sev-eral categories for multiple document sum-marization. Single-event summarization is acategory that aims to summarize a set of arti-cles includes ones that reports occurrence ofevents and ones that reports following events(e.g., real fact of the event and sequel of theevent). In this type of articles sets, follow-ing articles refer to the events that were al-ready described in previous articles and addanother information that were related to pre-vious events. Therefore, we assume iden-tification of events in different articles andreference information among these events is
79

useful to make a summary.
Lexical cohesion method is one approach todeal with this reference information for sum-marizing a single document. However, inorder to deal with reference information indifferent documents, we cannot use informa-tion such as distance between two sentences.
So we propose a method to extract event in-formation from news articles and to identifyevent by using similarity measure betweentwo events. In this paper, we define “Event”as follows.
Event is information that describes factsand related information on particulardate.
Extraction of Events
Event is a unit to represent relationshipamong different articles and it should haveinformation that is useful to identify sameevents. In order to extract rich event infor-mation from sentences in a document, it isbetter to analyze deep structure of sentencesin a document; e.g., discourse analysis andanaphoric analysis. However, it is very diffi-cult to use such deep structural information,we decide to use results of dependency anal-ysis and we set a size of a unit simple. Inaddition, date information is useful for dis-crimination of similar events; e.g., press re-lease in May is different from press releasein April.
Based on this discussion, we select follow-ing slots to define an event.
Root is a word that dominates an event(verb that represents action or noun thatrepresents subject or object)
Modifier is words that modify root word.Words are categorized into severalgroups, such as subject and objectwords for verbs and adjective and ad-nominal words for nouns.
Negative represents modality of expres-sion.
Depth is a path length between Root of theevent and root of the sentence in depen-dency analysis tree.
Date is a date that characterize the event.This slot is not a required slot to definean event.
ArticleDate is a date that the article waspublished.
Chunks represents list of word positions ina sentence.
In this method, we extract event informationfrom a sentence by using following steps.
1. We apply Cabocha[5] to obtain depen-dency analysis tree.
2. We select verbs and nouns that havemodification words as candidates of“Root” for events.
3. We check whether negative expressionis included in root or not and set “Neg-ative” based on this analysis.
4. We extract “Modifier” informationfrom dependency analysis tree. At thistime, we classify types of modifier byusing POS tag and postpositional par-ticle (postpositional particle with “が”and “は” are categorized into “Sub-ject” and other postpositional parti-cle are categorized into “postpositional-postpositional particle” (e.g., “postpo-sitional-に”). Modifier information in-cludes not only words that directly de-pendent on Root word but also modi-fiers for modifier words. Modifiers fora modifier word are categorized into thesame category of the modifier words.
5. When we can extract date informationfrom the sentence, we set this date as“Date” for events that has dependencywith date words.
6. “Article Date” is obtained from articleinformation.
80
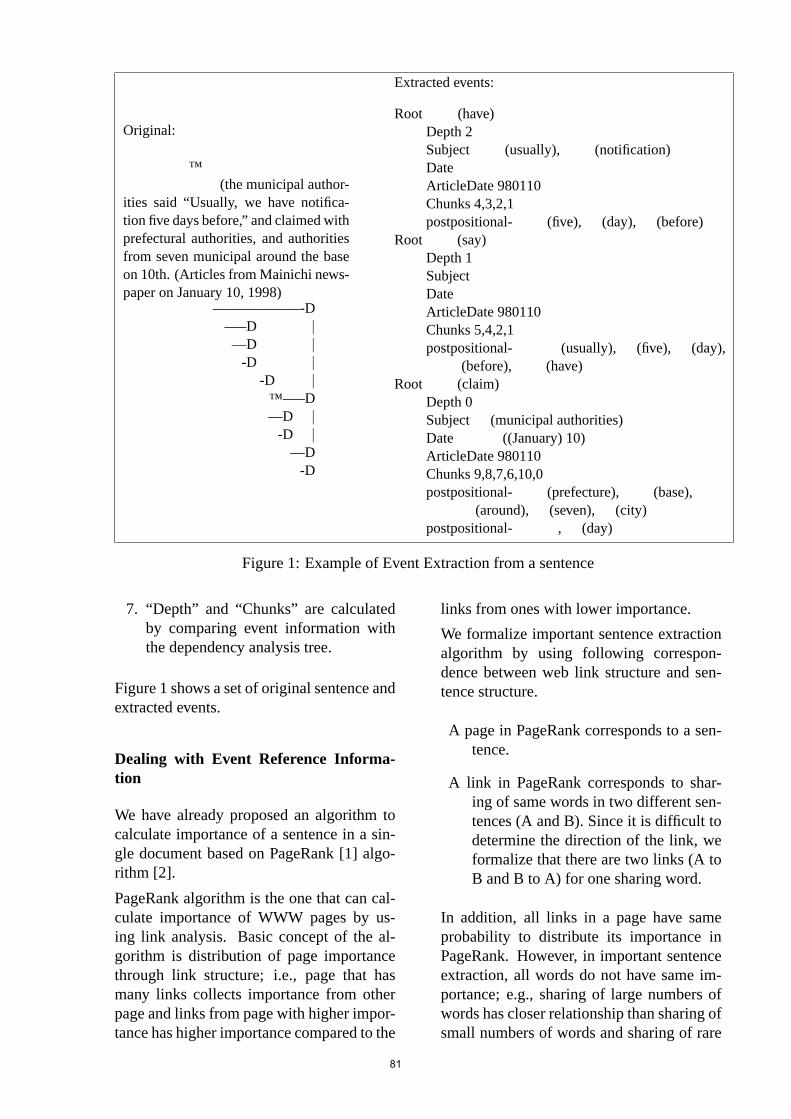
Original:市は「通常は5日前までに通告がある」と話し、県と基地周辺7市で10日に抗議する。(the municipal author-ities said “Usually, we have notifica-tion five days before,” and claimed withprefectural authorities, and authoritiesfrom seven municipal around the baseon 10th. (Articles from Mainichi news-paper on January 10, 1998)
市は——————-D「通常は—–D |
5日前までに—D |通告が-D |ある」と-D |
話し、—–D県と—D |
基地周辺-D |7市で—D10日に-D抗議する。
Extracted events:
Rootある (have)Depth 2Subject通常 (usually),通告 (notification)DateArticleDate 980110Chunks 4,3,2,1postpositional-に5 (five),日 (day),前 (before)
Root話す (say)Depth 1SubjectDateArticleDate 980110Chunks 5,4,2,1postpositional-と通常 (usually),5 (five),日 (day),前 (before),ある (have)
Root抗議 (claim)Depth 0Subject市 (municipal authorities)Date10日 ((January) 10)ArticleDate 980110Chunks 9,8,7,6,10,0postpositional-で県 (prefecture),基地 (base),周辺 (around),7 (seven),市 (city)
postpositional-に10,日 (day)
Figure 1: Example of Event Extraction from a sentence
7. “Depth” and “Chunks” are calculatedby comparing event information withthe dependency analysis tree.
Figure 1 shows a set of original sentence andextracted events.
Dealing with Event Reference Informa-tion
We have already proposed an algorithm tocalculate importance of a sentence in a sin-gle document based on PageRank [1] algo-rithm [2].
PageRank algorithm is the one that can cal-culate importance of WWW pages by us-ing link analysis. Basic concept of the al-gorithm is distribution of page importancethrough link structure; i.e., page that hasmany links collects importance from otherpage and links from page with higher impor-tance has higher importance compared to the
links from ones with lower importance.
We formalize important sentence extractionalgorithm by using following correspon-dence between web link structure and sen-tence structure.
A page in PageRank corresponds to a sen-tence.
A link in PageRank corresponds to shar-ing of same words in two different sen-tences (A and B). Since it is difficult todetermine the direction of the link, weformalize that there are two links (A toB and B to A) for one sharing word.
In addition, all links in a page have sameprobability to distribute its importance inPageRank. However, in important sentenceextraction, all words do not have same im-portance; e.g., sharing of large numbers ofwords has closer relationship than sharing ofsmall numbers of words and sharing of rare
81

words has closer relationship than sharing ofcommon words. Therefore, we calculate im-portance of link based on the role of sharedword in a sentence and Inverted DocumentFrequency (IDF). This important measureaffects a transition matrix of PageRank thatis used to calculate distribution of impor-tance.
In this formalization, we merge all docu-ments as a single document and calculateimportance by using same algorithm for asingle document.
Therefore, we employ latter approach to cal-culate importance of all sentences.
In previous algorithm, links are generatedwhen two different sentences shares sameword(s). In order to handle event referenceinformation, we modify link generation al-gorithm.
Since we can express same events in differ-ent ways, identification of same event is dif-ficult to identification of same word. There-fore, we introduce similarity measure be-tween two events by using following two cri-teria.
1. Similarity of wordsFirst, we compare all words in “Root”and each category in “Modifiers.” Foreach category, we calculate existenceratio of same word(s) that is biased byIDF. Second, we calculate weighted av-erage of existence ratio for all cate-gories. “Root” and “Subject” in “Mod-ifiers” has higher weight compared tothe other ones. We set threshold valueto check whether the event pair belongsto candidate similar event pairs or not.
2. Judgment of consistency of dateWhen the event has “Date” informa-tion, we verify consistency of date.When “Date” information lacks spe-cific date such as year and/or month,we complement this information by us-ing “ArticleDate” information. Whenone article has “Date” information andother one does not have this informa-tion, we compare them by using “Ar-
ticleDate” information. When incon-sistency is found, the pair of events isremoved from candidate similar eventpairs.
We generate links between two differentsentences that shares candidate similar eventpair(s). We also calculate importance oflink based on the importance of events ina sentence. Since we assume most impor-tant issues discussed in a sentence are lo-cated at the end of the sentence, we calculateimportance of event based on the “Depth”information. Another possible measure tocalculate this importance is a frequencybased measure. However, since frequencyof events is already considered to calculateimportance as a number of links, we do notuse this measure.
We also set direction of the link as previousone; i.e., we formalize that there are bidirec-tional two links for one similar event pair.
We applied this event identification methodfor test run data and we found some links be-tween two related events are missing. Onereason of this problem is that we can ex-press same event by using different vocab-ulary. However, we found some words areshared for these event sets. Therefore, wealso use sharing of same word(s) for han-dling these relationships.
In PageRank algorithm, importance of pageis calculated as a convergent vector of fol-lowing recurrence formula.
mij is an element of transition matrixMof i-th row and j-th column and repre-sents transition probability fromj-th sen-tence toi-th sentence based on link struc-ture. Sincem1j,m2j, · · · ,mnj representstransition probability,
∑ni=1 mij = 1. When
there is a sentencek that has no relationshipwith other sentence, we setmik = 0 .
−→r = M−→r (1)
In order to handle both types of links (shar-ing events and sharing words), we make twomatricesMe(meij) andMw(mwij) that cor-responds to transition matrix made by shar-
82

ing events and one made by sharing words,respectively. In order to satisfy constraint∑n
i=1 mij = 1, overall transition matrixM(mij) is calculated by using parameterβand following formula.
mij = β ∗meij + (1− β) ∗mwij
whenn∑
i=1
meij 6= 0,n∑
i=1
mwij 6= 0
mij = meij
whenn∑
i=1
mwij = 0
mij = mwij
whenn∑
i=1
meij = 0
Since a sentence that has no relationshipwith other sentence is meaningless to in-clude into an abstract, we remove rows andcolumns that corresponds to the sentence inthe matrixM . Calculation of a convergentvector is conducted by using eigen vectorcalculation. Since convergent vector sat-isfies following formula, convergent vectoris an eigen vector of matrixM with eigenvalue = 1.
−→rc = M−→rc (2)
Usage of Sentence Position
Since, in news articles, important sentencesmay be described early part of each arti-cle, we use sentence position informationfor calculating importance of each sentence.In PageRank, an algorithm to set initial im-portance of each page is proposed as Topic-Sensitive PageRank [3]. This algorithm isproposed to calculate importance of eachpage based on the category that the page be-longs to. In this algorithm, they modify re-currence formula of PageRank as follows.−→v corresponds to initial importance vectorandα is a parameter to control strength ofthe effect by the vector.
−→rc = (1− α) ∗M−→rc + α ∗ −→v (3)
In this paper, we use simple formula1/log(n+1) (n: sentence number in an arti-cle) for initial value of−→v . −→v is normalizedwith Σm
i=0vi = 1 (m is number of all sen-tences andvi is an initial importance valuefor i-th sentence).
By using the algorithm discussed above,since similar sentences have similar links,similar sentences have similar scores. As aresult, there is a chance to select redundantsentences when we select sentences fromhigher score ones. Therefore, we need amechanism to detect such redundant sen-tences and it is required to remove such re-dundant description[6].
In this research, we use similarity measureof two events to calculate redundancy of newdescription. Since we can describe same in-formation by using different numbers of sen-tences, we do not compare sentences one byone. We decompose a sentence into a set ofevents and we check redundancy of a sen-tence by comparing with an extracted eventset that is obtained from extracted sentence;i.e., we calculate weighted average of exis-tence ratio of events in the sentence. Sincewe assume most important issues discussedin a sentence are located at the end of sen-tence, we set higher weight for an event withlower “Depth.”
By using this redundancy check mechanism,sentence extraction algorithm is as follows.
1. Construction of an initial extractedevent setA sentence with highest importance isselected as an extracted sentence. Aninitial extracted event set is constructedfrom events in the selected sentence.
2. Redundancy check and addition of newdescriptionOur system tries to add new descrip-tion from a sentence with higher im-portance. The system checks redun-dancy of the sentence and add it when itdoes not exceed predefined redundancylevel. The system also adds events inthe selected sentence to the extracted
83
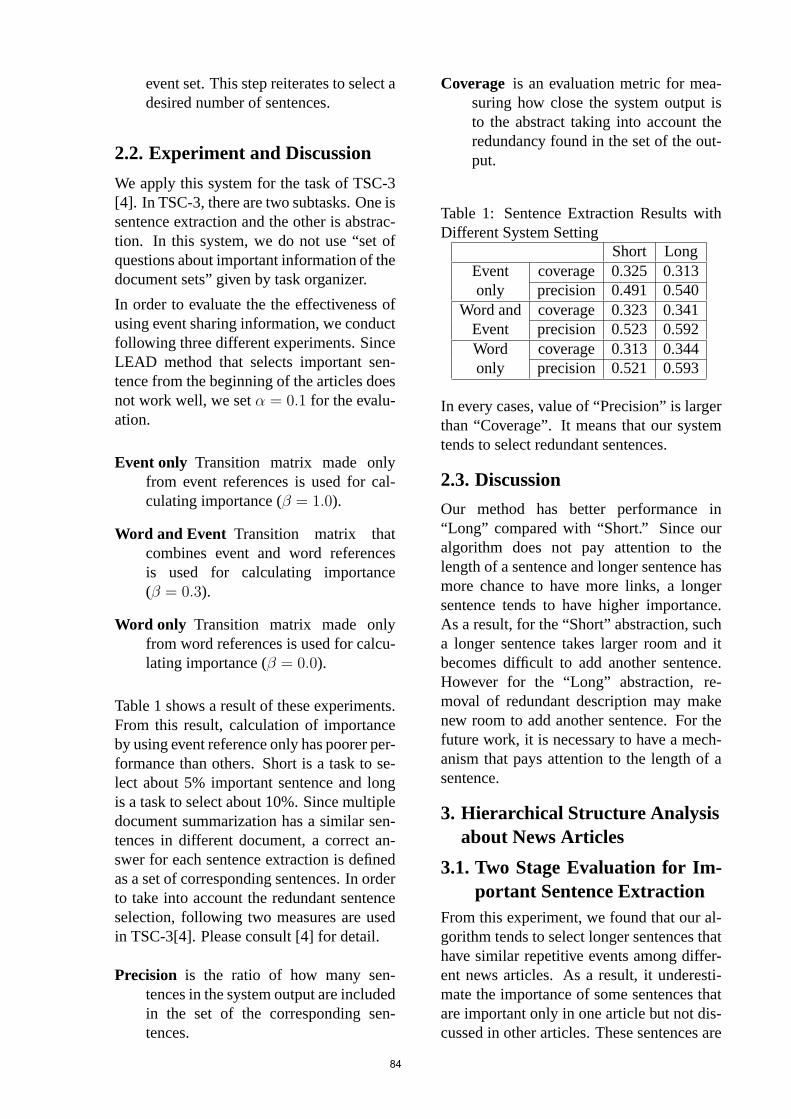
event set. This step reiterates to select adesired number of sentences.
2.2. Experiment and Discussion
We apply this system for the task of TSC-3[4]. In TSC-3, there are two subtasks. One issentence extraction and the other is abstrac-tion. In this system, we do not use “set ofquestions about important information of thedocument sets” given by task organizer.
In order to evaluate the the effectiveness ofusing event sharing information, we conductfollowing three different experiments. SinceLEAD method that selects important sen-tence from the beginning of the articles doesnot work well, we setα = 0.1 for the evalu-ation.
Event only Transition matrix made onlyfrom event references is used for cal-culating importance (β = 1.0).
Word and Event Transition matrix thatcombines event and word referencesis used for calculating importance(β = 0.3).
Word only Transition matrix made onlyfrom word references is used for calcu-lating importance (β = 0.0).
Table 1 shows a result of these experiments.From this result, calculation of importanceby using event reference only has poorer per-formance than others. Short is a task to se-lect about 5% important sentence and longis a task to select about 10%. Since multipledocument summarization has a similar sen-tences in different document, a correct an-swer for each sentence extraction is definedas a set of corresponding sentences. In orderto take into account the redundant sentenceselection, following two measures are usedin TSC-3[4]. Please consult [4] for detail.
Precision is the ratio of how many sen-tences in the system output are includedin the set of the corresponding sen-tences.
Coverage is an evaluation metric for mea-suring how close the system output isto the abstract taking into account theredundancy found in the set of the out-put.
Table 1: Sentence Extraction Results withDifferent System Setting
Short LongEvent coverage 0.325 0.313only precision 0.491 0.540
Word and coverage 0.323 0.341Event precision 0.523 0.592Word coverage 0.313 0.344only precision 0.521 0.593
In every cases, value of “Precision” is largerthan “Coverage”. It means that our systemtends to select redundant sentences.
2.3. Discussion
Our method has better performance in“Long” compared with “Short.” Since ouralgorithm does not pay attention to thelength of a sentence and longer sentence hasmore chance to have more links, a longersentence tends to have higher importance.As a result, for the “Short” abstraction, sucha longer sentence takes larger room and itbecomes difficult to add another sentence.However for the “Long” abstraction, re-moval of redundant description may makenew room to add another sentence. For thefuture work, it is necessary to have a mech-anism that pays attention to the length of asentence.
3. Hierarchical Structure Analysisabout News Articles
3.1. Two Stage Evaluation for Im-portant Sentence Extraction
From this experiment, we found that our al-gorithm tends to select longer sentences thathave similar repetitive events among differ-ent news articles. As a result, it underesti-mate the importance of some sentences thatare important only in one article but not dis-cussed in other articles. These sentences are
84
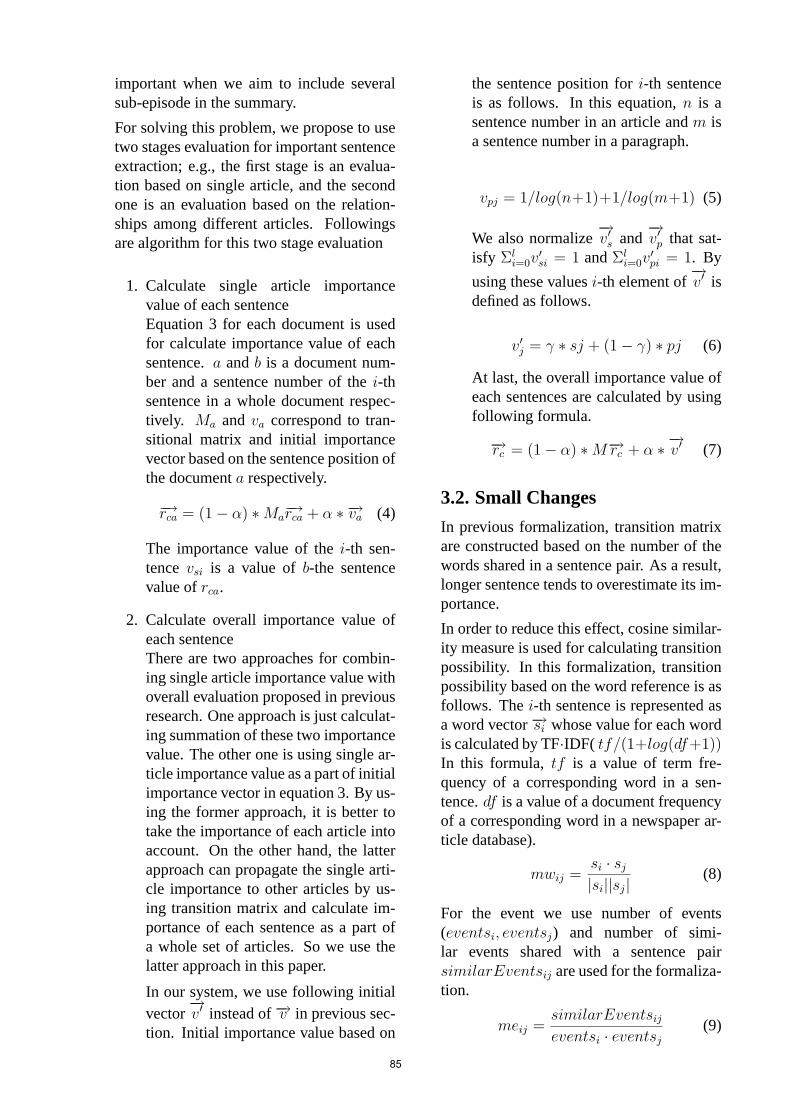
important when we aim to include severalsub-episode in the summary.
For solving this problem, we propose to usetwo stages evaluation for important sentenceextraction; e.g., the first stage is an evalua-tion based on single article, and the secondone is an evaluation based on the relation-ships among different articles. Followingsare algorithm for this two stage evaluation
1. Calculate single article importancevalue of each sentenceEquation 3 for each document is usedfor calculate importance value of eachsentence.a andb is a document num-ber and a sentence number of thei-thsentence in a whole document respec-tively. Ma andva correspond to tran-sitional matrix and initial importancevector based on the sentence position ofthe documenta respectively.
−→rca = (1− α) ∗Ma−→rca + α ∗ −→va (4)
The importance value of thei-th sen-tencevsi is a value ofb-the sentencevalue ofrca.
2. Calculate overall importance value ofeach sentenceThere are two approaches for combin-ing single article importance value withoverall evaluation proposed in previousresearch. One approach is just calculat-ing summation of these two importancevalue. The other one is using single ar-ticle importance value as a part of initialimportance vector in equation 3. By us-ing the former approach, it is better totake the importance of each article intoaccount. On the other hand, the latterapproach can propagate the single arti-cle importance to other articles by us-ing transition matrix and calculate im-portance of each sentence as a part ofa whole set of articles. So we use thelatter approach in this paper.
In our system, we use following initialvector
−→v′ instead of−→v in previous sec-
tion. Initial importance value based on
the sentence position fori-th sentenceis as follows. In this equation,n is asentence number in an article andm isa sentence number in a paragraph.
vpj = 1/log(n+1)+1/log(m+1) (5)
We also normalize−→v′s and
−→v′p that sat-
isfy Σli=0v
′si = 1 andΣl
i=0v′pi = 1. By
using these valuesi-th element of−→v′ is
defined as follows.
v′j = γ ∗ sj + (1− γ) ∗ pj (6)
At last, the overall importance value ofeach sentences are calculated by usingfollowing formula.
−→rc = (1− α) ∗M−→rc + α ∗ −→v′ (7)
3.2. Small Changes
In previous formalization, transition matrixare constructed based on the number of thewords shared in a sentence pair. As a result,longer sentence tends to overestimate its im-portance.
In order to reduce this effect, cosine similar-ity measure is used for calculating transitionpossibility. In this formalization, transitionpossibility based on the word reference is asfollows. Thei-th sentence is represented asa word vector−→si whose value for each wordis calculated by TF·IDF( tf/(1+log(df+1))In this formula, tf is a value of term fre-quency of a corresponding word in a sen-tence.df is a value of a document frequencyof a corresponding word in a newspaper ar-ticle database).
mwij =si · sj
|si||sj| (8)
For the event we use number of events(eventsi, eventsj) and number of simi-lar events shared with a sentence pairsimilarEventsij are used for the formaliza-tion.
meij =similarEventsij
eventsi · eventsj
(9)
85
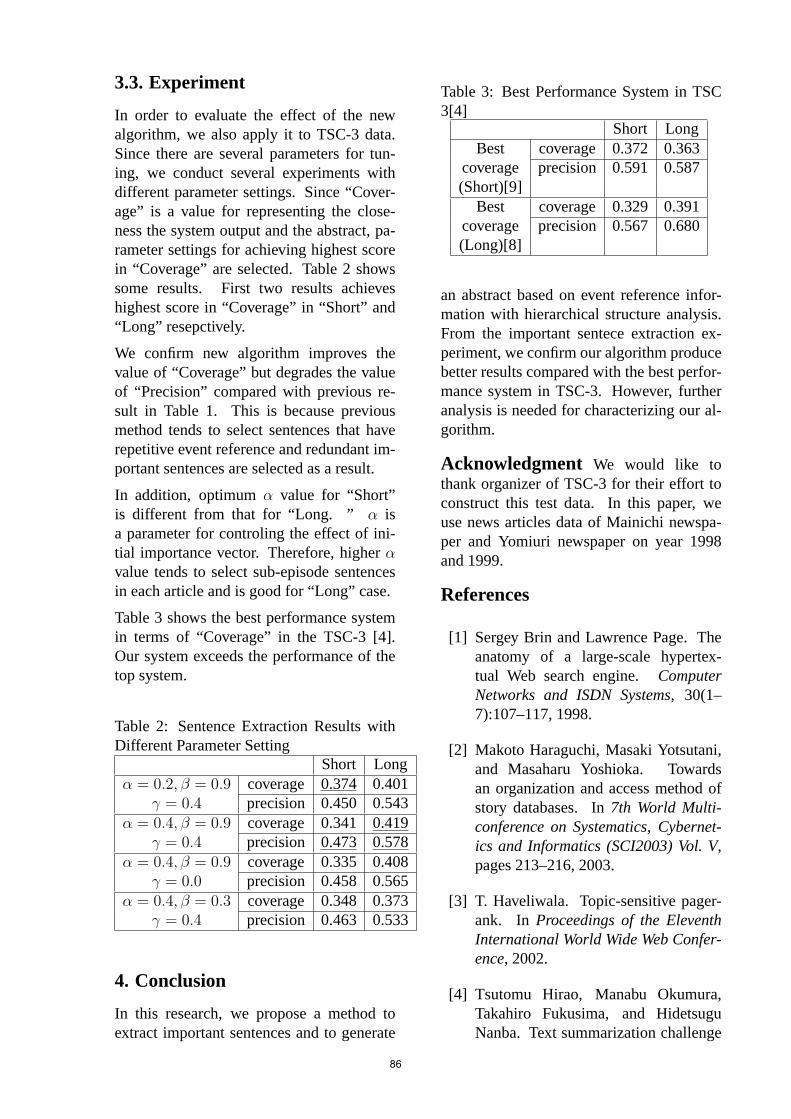
3.3. Experiment
In order to evaluate the effect of the newalgorithm, we also apply it to TSC-3 data.Since there are several parameters for tun-ing, we conduct several experiments withdifferent parameter settings. Since “Cover-age” is a value for representing the close-ness the system output and the abstract, pa-rameter settings for achieving highest scorein “Coverage” are selected. Table 2 showssome results. First two results achieveshighest score in “Coverage” in “Short” and“Long” resepctively.
We confirm new algorithm improves thevalue of “Coverage” but degrades the valueof “Precision” compared with previous re-sult in Table 1. This is because previousmethod tends to select sentences that haverepetitive event reference and redundant im-portant sentences are selected as a result.
In addition, optimumα value for “Short”is different from that for “Long. ” α isa parameter for controling the effect of ini-tial importance vector. Therefore, higherαvalue tends to select sub-episode sentencesin each article and is good for “Long” case.
Table 3 shows the best performance systemin terms of “Coverage” in the TSC-3 [4].Our system exceeds the performance of thetop system.
Table 2: Sentence Extraction Results withDifferent Parameter Setting
Short Longα = 0.2, β = 0.9 coverage 0.374 0.401
γ = 0.4 precision 0.450 0.543α = 0.4, β = 0.9 coverage 0.341 0.419
γ = 0.4 precision 0.473 0.578α = 0.4, β = 0.9 coverage 0.335 0.408
γ = 0.0 precision 0.458 0.565α = 0.4, β = 0.3 coverage 0.348 0.373
γ = 0.4 precision 0.463 0.533
4. Conclusion
In this research, we propose a method toextract important sentences and to generate
Table 3: Best Performance System in TSC3[4]
Short LongBest coverage 0.372 0.363
coverage precision 0.591 0.587(Short)[9]
Best coverage 0.329 0.391coverage precision 0.567 0.680(Long)[8]
an abstract based on event reference infor-mation with hierarchical structure analysis.From the important sentece extraction ex-periment, we confirm our algorithm producebetter results compared with the best perfor-mance system in TSC-3. However, furtheranalysis is needed for characterizing our al-gorithm.
Acknowledgment We would like tothank organizer of TSC-3 for their effort toconstruct this test data. In this paper, weuse news articles data of Mainichi newspa-per and Yomiuri newspaper on year 1998and 1999.
References
[1] Sergey Brin and Lawrence Page. Theanatomy of a large-scale hypertex-tual Web search engine.ComputerNetworks and ISDN Systems, 30(1–7):107–117, 1998.
[2] Makoto Haraguchi, Masaki Yotsutani,and Masaharu Yoshioka. Towardsan organization and access method ofstory databases. In7th World Multi-conference on Systematics, Cybernet-ics and Informatics (SCI2003) Vol. V,pages 213–216, 2003.
[3] T. Haveliwala. Topic-sensitive pager-ank. In Proceedings of the EleventhInternational World Wide Web Confer-ence, 2002.
[4] Tsutomu Hirao, Manabu Okumura,Takahiro Fukusima, and HidetsuguNanba. Text summarization challenge
86
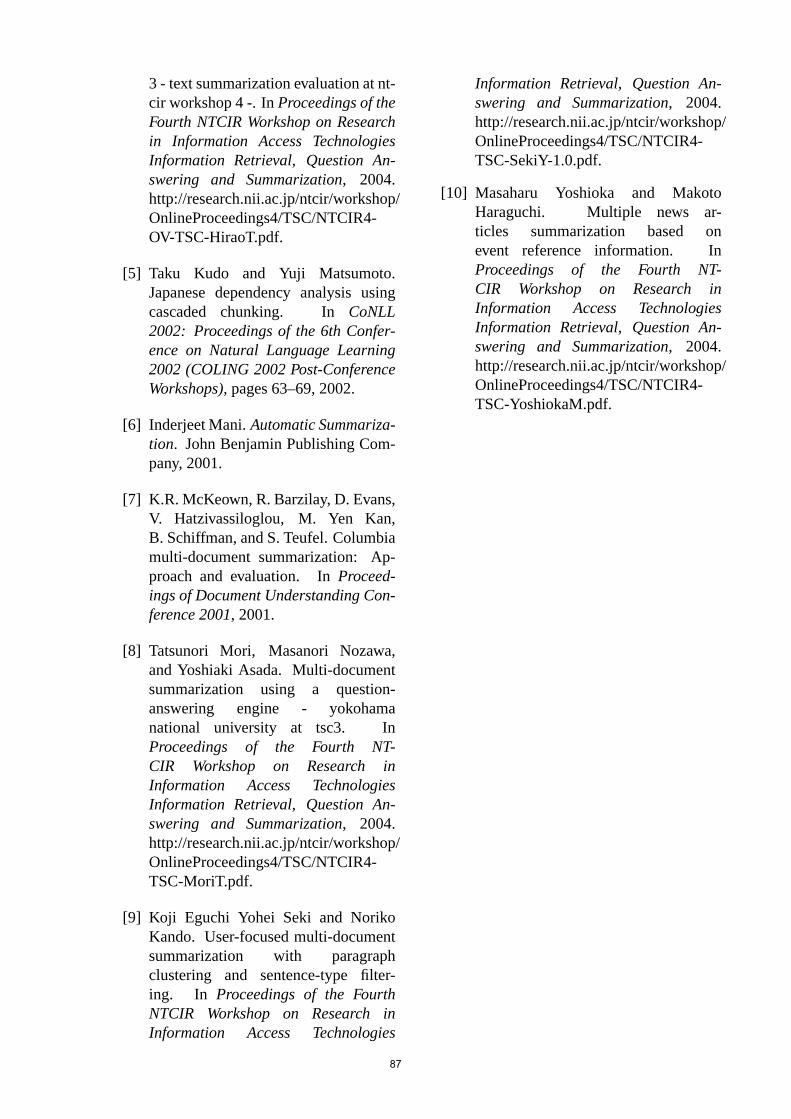
3 - text summarization evaluation at nt-cir workshop 4 -. InProceedings of theFourth NTCIR Workshop on Researchin Information Access TechnologiesInformation Retrieval, Question An-swering and Summarization, 2004.http://research.nii.ac.jp/ntcir/workshop/OnlineProceedings4/TSC/NTCIR4-OV-TSC-HiraoT.pdf.
[5] Taku Kudo and Yuji Matsumoto.Japanese dependency analysis usingcascaded chunking. InCoNLL2002: Proceedings of the 6th Confer-ence on Natural Language Learning2002 (COLING 2002 Post-ConferenceWorkshops), pages 63–69, 2002.
[6] Inderjeet Mani.Automatic Summariza-tion. John Benjamin Publishing Com-pany, 2001.
[7] K.R. McKeown, R. Barzilay, D. Evans,V. Hatzivassiloglou, M. Yen Kan,B. Schiffman, and S. Teufel. Columbiamulti-document summarization: Ap-proach and evaluation. InProceed-ings of Document Understanding Con-ference 2001, 2001.
[8] Tatsunori Mori, Masanori Nozawa,and Yoshiaki Asada. Multi-documentsummarization using a question-answering engine - yokohamanational university at tsc3. InProceedings of the Fourth NT-CIR Workshop on Research inInformation Access TechnologiesInformation Retrieval, Question An-swering and Summarization, 2004.http://research.nii.ac.jp/ntcir/workshop/OnlineProceedings4/TSC/NTCIR4-TSC-MoriT.pdf.
[9] Koji Eguchi Yohei Seki and NorikoKando. User-focused multi-documentsummarization with paragraphclustering and sentence-type filter-ing. In Proceedings of the FourthNTCIR Workshop on Research inInformation Access Technologies
Information Retrieval, Question An-swering and Summarization, 2004.http://research.nii.ac.jp/ntcir/workshop/OnlineProceedings4/TSC/NTCIR4-TSC-SekiY-1.0.pdf.
[10] Masaharu Yoshioka and MakotoHaraguchi. Multiple news ar-ticles summarization based onevent reference information. InProceedings of the Fourth NT-CIR Workshop on Research inInformation Access TechnologiesInformation Retrieval, Question An-swering and Summarization, 2004.http://research.nii.ac.jp/ntcir/workshop/OnlineProceedings4/TSC/NTCIR4-TSC-YoshiokaM.pdf.
87

Using Metaphors for the PragmaticConstruction of Discourse Domains
Roland Kaschek1, Heinrich Mayr2, Klaus Kienzl31 Department of Information Systems, Massey University
Palmerston North, New [email protected]
2 IWAS, University of KlagenfurtKlagenfurt, Austria
[email protected] Hohere Bundeslehr- und Versuchsanstalt Villach
Villach, [email protected]
AbstractConceptual modeling is an important task in systems development. It, however, is more often usedas a tool rather than made the subject of research papers. Human thought is considered as essentiallymetaphorical. The paper therefore proposes to look at the metaphors that might be employed byconceptual modeling. We identify the metaphor INFORMATION IS A NETWORK as a key tool ofconceptual modeling. We suppose that focusing on this metaphor has the potential for improvingunderstanding of how conceptual modeling proceeds. The implications of this metaphor and a variantof it are discussed. This discussion includes the metaphor’s impact on the theory of abstraction. Thepaper contributes in two ways to a theory of conceptual modeling. It firstly provides a unifying viewof the pragmatic construction of discourse domains that is based on using the metaphor INFORMATION
IS A NETWORK. It secondly proposes an approach to abstraction theory that fits this unifying view onconceptual modeling.
1. Introduction
In a wide sense of the term conceptual mod-eling (CM) can be used to mean concep-tualizing, i.e. constructing a discourse do-main in terms of concepts that belong tothe domain. For example CM can be usedfor analyzing or describing computer ap-plications or to prescribe their characteris-tics. In other realms of informatics suchas reference modeling, enterprize model-ing or similar CM is contributing essentiallyto the achievements. CM thus is under-stood to be of major importance in infor-matics. While there are major internationalconferences dedicated to CM, such as theEntity-Relationship conference, approachestowards a theory of CM seem to be rare, see
[29].
A theory of CM could aid in teaching CM,practically carry out CM, and impact the re-search on CM. We presuppose that it wouldbe useful to cover automated activities byour theory of CM. Therefore we aim at atheory that avoids mentalism and is orientedat linguistics and semiotics. Obviously wehave to take a look at papers from artificialintelligence that deal with related subjects.Abstraction must be expected to be of majorimportance for our study since informaticsor computer science occasionally is consid-ered as the discipline of abstraction.
CM has a precursor in philosophy, i.e. Car-nap’s logical construction of the world. Weare going to briefly discuss Carnap’s ap-
88
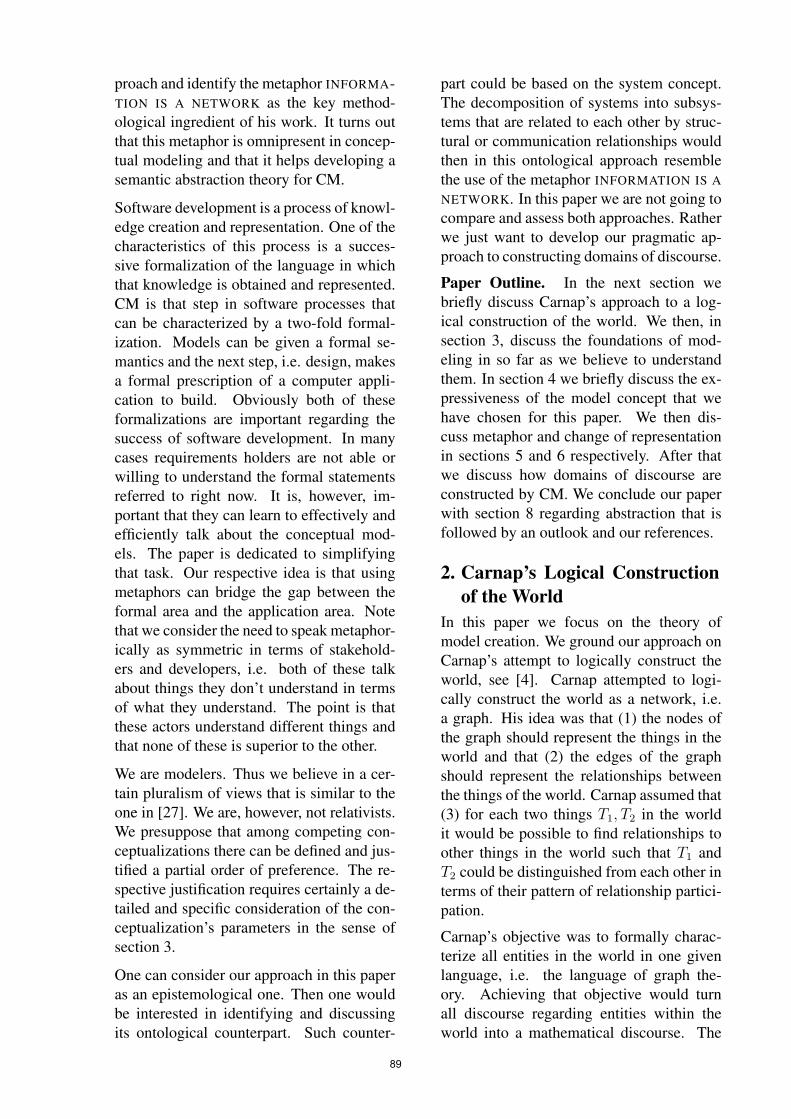
proach and identify the metaphor INFORMA-TION IS A NETWORK as the key method-ological ingredient of his work. It turns outthat this metaphor is omnipresent in concep-tual modeling and that it helps developing asemantic abstraction theory for CM.
Software development is a process of knowl-edge creation and representation. One of thecharacteristics of this process is a succes-sive formalization of the language in whichthat knowledge is obtained and represented.CM is that step in software processes thatcan be characterized by a two-fold formal-ization. Models can be given a formal se-mantics and the next step, i.e. design, makesa formal prescription of a computer appli-cation to build. Obviously both of theseformalizations are important regarding thesuccess of software development. In manycases requirements holders are not able orwilling to understand the formal statementsreferred to right now. It is, however, im-portant that they can learn to effectively andefficiently talk about the conceptual mod-els. The paper is dedicated to simplifyingthat task. Our respective idea is that usingmetaphors can bridge the gap between theformal area and the application area. Notethat we consider the need to speak metaphor-ically as symmetric in terms of stakehold-ers and developers, i.e. both of these talkabout things they don’t understand in termsof what they understand. The point is thatthese actors understand different things andthat none of these is superior to the other.
We are modelers. Thus we believe in a cer-tain pluralism of views that is similar to theone in [27]. We are, however, not relativists.We presuppose that among competing con-ceptualizations there can be defined and jus-tified a partial order of preference. The re-spective justification requires certainly a de-tailed and specific consideration of the con-ceptualization’s parameters in the sense ofsection 3.
One can consider our approach in this paperas an epistemological one. Then one wouldbe interested in identifying and discussingits ontological counterpart. Such counter-
part could be based on the system concept.The decomposition of systems into subsys-tems that are related to each other by struc-tural or communication relationships wouldthen in this ontological approach resemblethe use of the metaphor INFORMATION IS A
NETWORK. In this paper we are not going tocompare and assess both approaches. Ratherwe just want to develop our pragmatic ap-proach to constructing domains of discourse.
Paper Outline. In the next section webriefly discuss Carnap’s approach to a log-ical construction of the world. We then, insection 3, discuss the foundations of mod-eling in so far as we believe to understandthem. In section 4 we briefly discuss the ex-pressiveness of the model concept that wehave chosen for this paper. We then dis-cuss metaphor and change of representationin sections 5 and 6 respectively. After thatwe discuss how domains of discourse areconstructed by CM. We conclude our paperwith section 8 regarding abstraction that isfollowed by an outlook and our references.
2. Carnap’s Logical Constructionof the World
In this paper we focus on the theory ofmodel creation. We ground our approach onCarnap’s attempt to logically construct theworld, see [4]. Carnap attempted to logi-cally construct the world as a network, i.e.a graph. His idea was that (1) the nodes ofthe graph should represent the things in theworld and that (2) the edges of the graphshould represent the relationships betweenthe things of the world. Carnap assumed that(3) for each two things T1, T2 in the worldit would be possible to find relationships toother things in the world such that T1 andT2 could be distinguished from each other interms of their pattern of relationship partici-pation.
Carnap’s objective was to formally charac-terize all entities in the world in one givenlanguage, i.e. the language of graph the-ory. Achieving that objective would turnall discourse regarding entities within theworld into a mathematical discourse. The
89
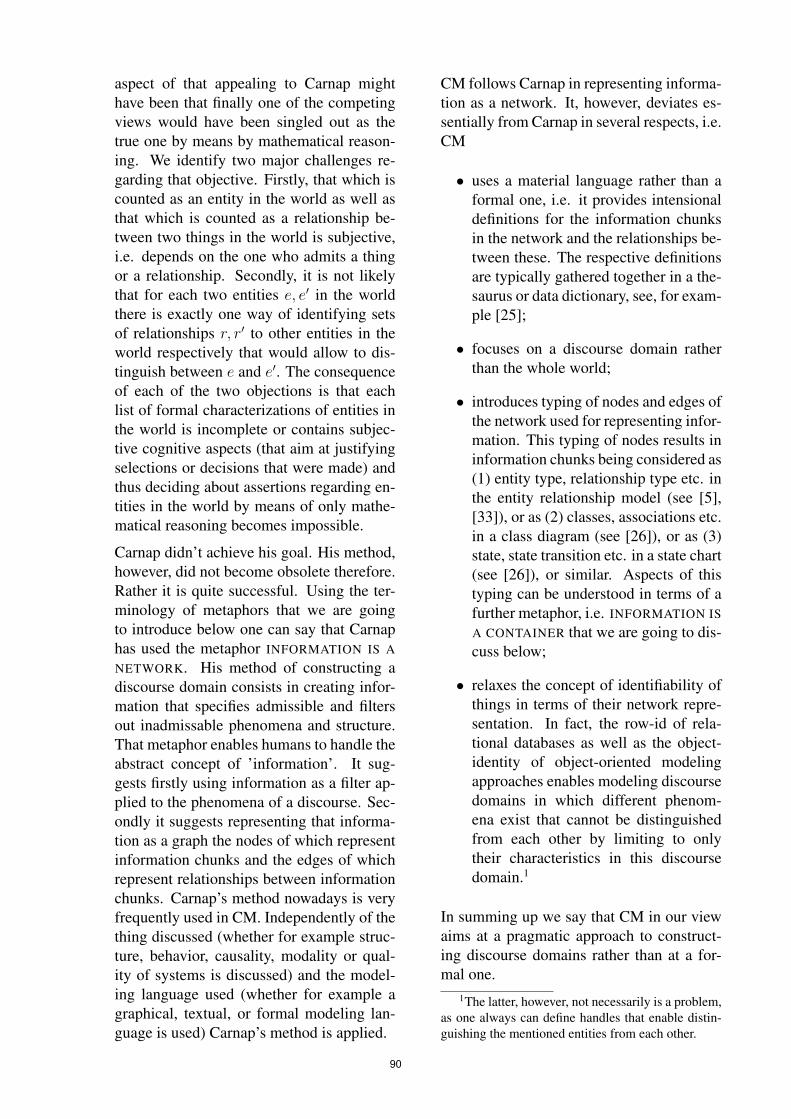
aspect of that appealing to Carnap mighthave been that finally one of the competingviews would have been singled out as thetrue one by means by mathematical reason-ing. We identify two major challenges re-garding that objective. Firstly, that which iscounted as an entity in the world as well asthat which is counted as a relationship be-tween two things in the world is subjective,i.e. depends on the one who admits a thingor a relationship. Secondly, it is not likelythat for each two entities e, e′ in the worldthere is exactly one way of identifying setsof relationships r, r′ to other entities in theworld respectively that would allow to dis-tinguish between e and e′. The consequenceof each of the two objections is that eachlist of formal characterizations of entities inthe world is incomplete or contains subjec-tive cognitive aspects (that aim at justifyingselections or decisions that were made) andthus deciding about assertions regarding en-tities in the world by means of only mathe-matical reasoning becomes impossible.
Carnap didn’t achieve his goal. His method,however, did not become obsolete therefore.Rather it is quite successful. Using the ter-minology of metaphors that we are goingto introduce below one can say that Carnaphas used the metaphor INFORMATION IS A
NETWORK. His method of constructing adiscourse domain consists in creating infor-mation that specifies admissible and filtersout inadmissable phenomena and structure.That metaphor enables humans to handle theabstract concept of ’information’. It sug-gests firstly using information as a filter ap-plied to the phenomena of a discourse. Sec-ondly it suggests representing that informa-tion as a graph the nodes of which representinformation chunks and the edges of whichrepresent relationships between informationchunks. Carnap’s method nowadays is veryfrequently used in CM. Independently of thething discussed (whether for example struc-ture, behavior, causality, modality or qual-ity of systems is discussed) and the model-ing language used (whether for example agraphical, textual, or formal modeling lan-guage is used) Carnap’s method is applied.
CM follows Carnap in representing informa-tion as a network. It, however, deviates es-sentially from Carnap in several respects, i.e.CM
• uses a material language rather than aformal one, i.e. it provides intensionaldefinitions for the information chunksin the network and the relationships be-tween these. The respective definitionsare typically gathered together in a the-saurus or data dictionary, see, for exam-ple [25];
• focuses on a discourse domain ratherthan the whole world;
• introduces typing of nodes and edges ofthe network used for representing infor-mation. This typing of nodes results ininformation chunks being considered as(1) entity type, relationship type etc. inthe entity relationship model (see [5],[33]), or as (2) classes, associations etc.in a class diagram (see [26]), or as (3)state, state transition etc. in a state chart(see [26]), or similar. Aspects of thistyping can be understood in terms of afurther metaphor, i.e. INFORMATION IS
A CONTAINER that we are going to dis-cuss below;
• relaxes the concept of identifiability ofthings in terms of their network repre-sentation. In fact, the row-id of rela-tional databases as well as the object-identity of object-oriented modelingapproaches enables modeling discoursedomains in which different phenom-ena exist that cannot be distinguishedfrom each other by limiting to onlytheir characteristics in this discoursedomain.1
In summing up we say that CM in our viewaims at a pragmatic approach to construct-ing discourse domains rather than at a for-mal one.
1The latter, however, not necessarily is a problem,as one always can define handles that enable distin-guishing the mentioned entities from each other.
90
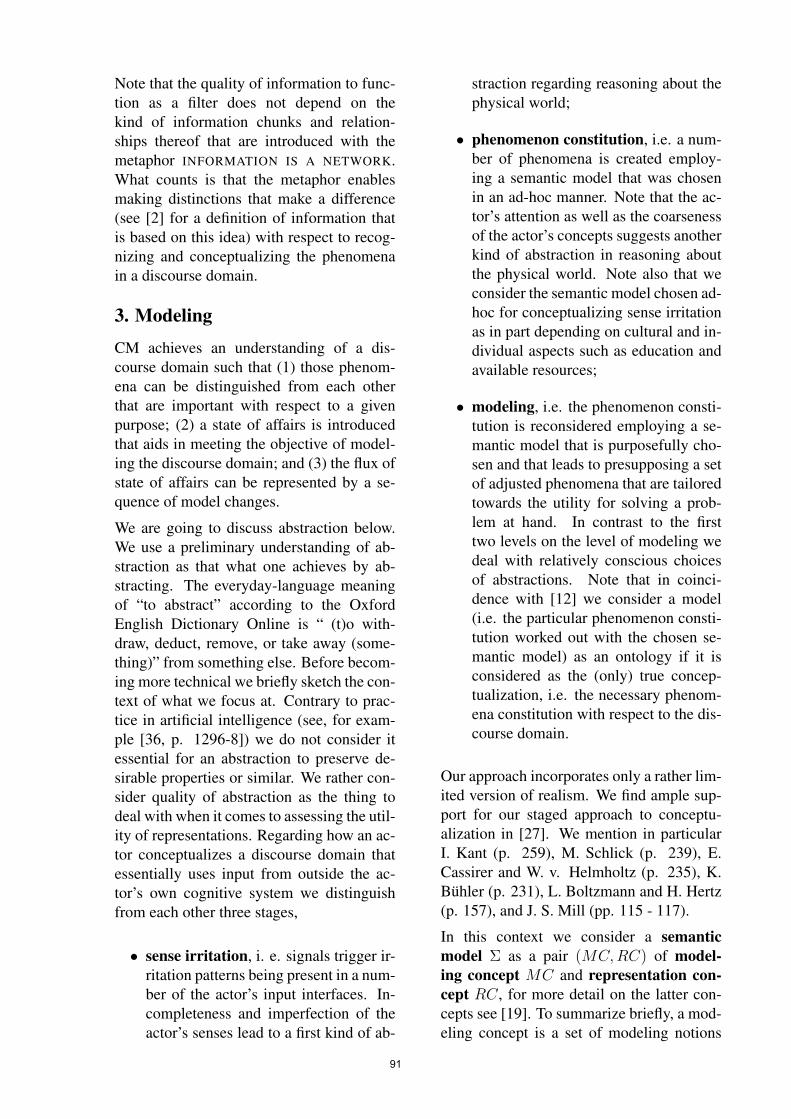
Note that the quality of information to func-tion as a filter does not depend on thekind of information chunks and relation-ships thereof that are introduced with themetaphor INFORMATION IS A NETWORK.What counts is that the metaphor enablesmaking distinctions that make a difference(see [2] for a definition of information thatis based on this idea) with respect to recog-nizing and conceptualizing the phenomenain a discourse domain.
3. Modeling
CM achieves an understanding of a dis-course domain such that (1) those phenom-ena can be distinguished from each otherthat are important with respect to a givenpurpose; (2) a state of affairs is introducedthat aids in meeting the objective of model-ing the discourse domain; and (3) the flux ofstate of affairs can be represented by a se-quence of model changes.
We are going to discuss abstraction below.We use a preliminary understanding of ab-straction as that what one achieves by ab-stracting. The everyday-language meaningof “to abstract” according to the OxfordEnglish Dictionary Online is “ (t)o with-draw, deduct, remove, or take away (some-thing)” from something else. Before becom-ing more technical we briefly sketch the con-text of what we focus at. Contrary to prac-tice in artificial intelligence (see, for exam-ple [36, p. 1296-8]) we do not consider itessential for an abstraction to preserve de-sirable properties or similar. We rather con-sider quality of abstraction as the thing todeal with when it comes to assessing the util-ity of representations. Regarding how an ac-tor conceptualizes a discourse domain thatessentially uses input from outside the ac-tor’s own cognitive system we distinguishfrom each other three stages,
• sense irritation, i. e. signals trigger ir-ritation patterns being present in a num-ber of the actor’s input interfaces. In-completeness and imperfection of theactor’s senses lead to a first kind of ab-
straction regarding reasoning about thephysical world;
• phenomenon constitution, i.e. a num-ber of phenomena is created employ-ing a semantic model that was chosenin an ad-hoc manner. Note that the ac-tor’s attention as well as the coarsenessof the actor’s concepts suggests anotherkind of abstraction in reasoning aboutthe physical world. Note also that weconsider the semantic model chosen ad-hoc for conceptualizing sense irritationas in part depending on cultural and in-dividual aspects such as education andavailable resources;
• modeling, i.e. the phenomenon consti-tution is reconsidered employing a se-mantic model that is purposefully cho-sen and that leads to presupposing a setof adjusted phenomena that are tailoredtowards the utility for solving a prob-lem at hand. In contrast to the firsttwo levels on the level of modeling wedeal with relatively conscious choicesof abstractions. Note that in coinci-dence with [12] we consider a model(i.e. the particular phenomenon consti-tution worked out with the chosen se-mantic model) as an ontology if it isconsidered as the (only) true concep-tualization, i.e. the necessary phenom-ena constitution with respect to the dis-course domain.
Our approach incorporates only a rather lim-ited version of realism. We find ample sup-port for our staged approach to conceptu-alization in [27]. We mention in particularI. Kant (p. 259), M. Schlick (p. 239), E.Cassirer and W. v. Helmholtz (p. 235), K.Buhler (p. 231), L. Boltzmann and H. Hertz(p. 157), and J. S. Mill (pp. 115 - 117).
In this context we consider a semanticmodel Σ as a pair (MC, RC) of model-ing concept MC and representation con-cept RC, for more detail on the latter con-cepts see [19]. To summarize briefly, a mod-eling concept is a set of modeling notions
91
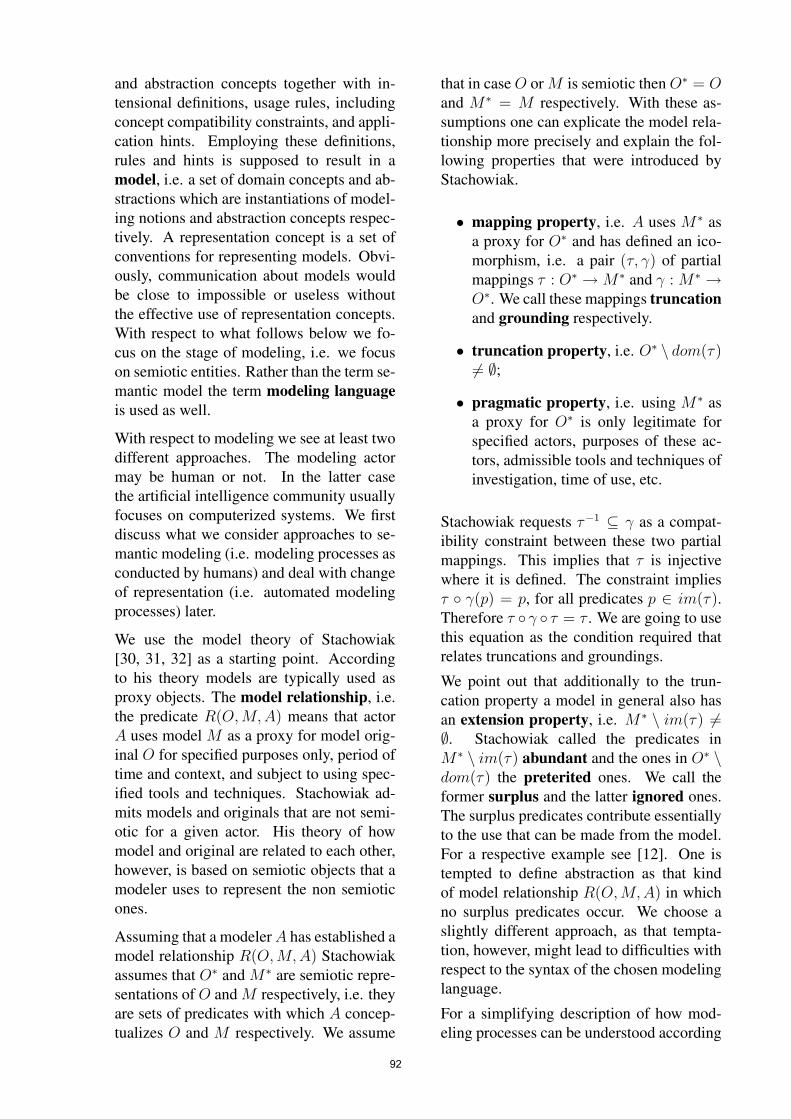
and abstraction concepts together with in-tensional definitions, usage rules, includingconcept compatibility constraints, and appli-cation hints. Employing these definitions,rules and hints is supposed to result in amodel, i.e. a set of domain concepts and ab-stractions which are instantiations of model-ing notions and abstraction concepts respec-tively. A representation concept is a set ofconventions for representing models. Obvi-ously, communication about models wouldbe close to impossible or useless withoutthe effective use of representation concepts.With respect to what follows below we fo-cus on the stage of modeling, i.e. we focuson semiotic entities. Rather than the term se-mantic model the term modeling languageis used as well.
With respect to modeling we see at least twodifferent approaches. The modeling actormay be human or not. In the latter casethe artificial intelligence community usuallyfocuses on computerized systems. We firstdiscuss what we consider approaches to se-mantic modeling (i.e. modeling processes asconducted by humans) and deal with changeof representation (i.e. automated modelingprocesses) later.
We use the model theory of Stachowiak[30, 31, 32] as a starting point. Accordingto his theory models are typically used asproxy objects. The model relationship, i.e.the predicate R(O, M, A) means that actorA uses model M as a proxy for model orig-inal O for specified purposes only, period oftime and context, and subject to using spec-ified tools and techniques. Stachowiak ad-mits models and originals that are not semi-otic for a given actor. His theory of howmodel and original are related to each other,however, is based on semiotic objects that amodeler uses to represent the non semioticones.
Assuming that a modeler A has established amodel relationship R(O,M,A) Stachowiakassumes that O∗ and M∗ are semiotic repre-sentations of O and M respectively, i.e. theyare sets of predicates with which A concep-tualizes O and M respectively. We assume
that in case O or M is semiotic then O∗ = Oand M∗ = M respectively. With these as-sumptions one can explicate the model rela-tionship more precisely and explain the fol-lowing properties that were introduced byStachowiak.
• mapping property, i.e. A uses M∗ asa proxy for O∗ and has defined an ico-morphism, i.e. a pair (τ, γ) of partialmappings τ : O∗ → M∗ and γ : M∗ →O∗. We call these mappings truncationand grounding respectively.
• truncation property, i.e. O∗ \ dom(τ)6= ∅;
• pragmatic property, i.e. using M∗ asa proxy for O∗ is only legitimate forspecified actors, purposes of these ac-tors, admissible tools and techniques ofinvestigation, time of use, etc.
Stachowiak requests τ−1 ⊆ γ as a compat-ibility constraint between these two partialmappings. This implies that τ is injectivewhere it is defined. The constraint impliesτ γ(p) = p, for all predicates p ∈ im(τ).Therefore τ γ τ = τ . We are going to usethis equation as the condition required thatrelates truncations and groundings.
We point out that additionally to the trun-cation property a model in general also hasan extension property, i.e. M∗ \ im(τ) 6=∅. Stachowiak called the predicates inM∗ \ im(τ) abundant and the ones in O∗ \dom(τ) the preterited ones. We call theformer surplus and the latter ignored ones.The surplus predicates contribute essentiallyto the use that can be made from the model.For a respective example see [12]. One istempted to define abstraction as that kindof model relationship R(O,M, A) in whichno surplus predicates occur. We choose aslightly different approach, as that tempta-tion, however, might lead to difficulties withrespect to the syntax of the chosen modelinglanguage.
For a simplifying description of how mod-eling processes can be understood according
92
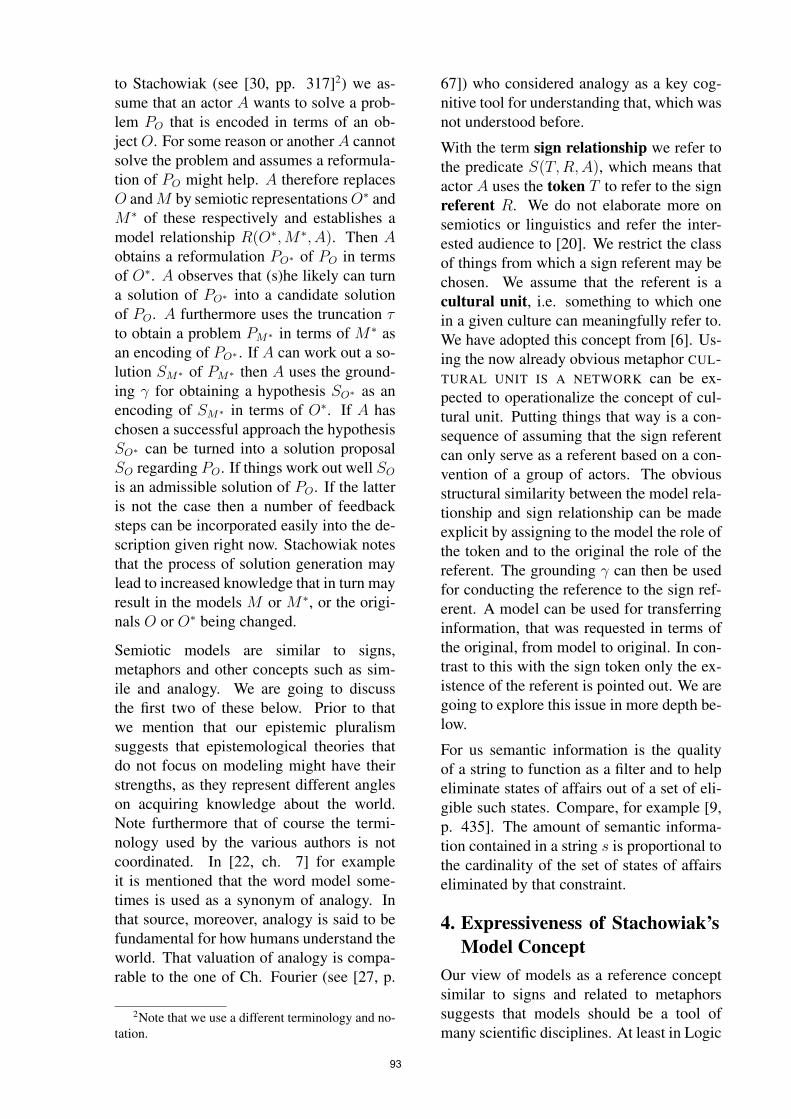
to Stachowiak (see [30, pp. 317]2) we as-sume that an actor A wants to solve a prob-lem PO that is encoded in terms of an ob-ject O. For some reason or another A cannotsolve the problem and assumes a reformula-tion of PO might help. A therefore replacesO and M by semiotic representations O∗ andM∗ of these respectively and establishes amodel relationship R(O∗,M∗, A). Then Aobtains a reformulation PO∗ of PO in termsof O∗. A observes that (s)he likely can turna solution of PO∗ into a candidate solutionof PO. A furthermore uses the truncation τto obtain a problem PM∗ in terms of M∗ asan encoding of PO∗ . If A can work out a so-lution SM∗ of PM∗ then A uses the ground-ing γ for obtaining a hypothesis SO∗ as anencoding of SM∗ in terms of O∗. If A haschosen a successful approach the hypothesisSO∗ can be turned into a solution proposalSO regarding PO. If things work out well SO
is an admissible solution of PO. If the latteris not the case then a number of feedbacksteps can be incorporated easily into the de-scription given right now. Stachowiak notesthat the process of solution generation maylead to increased knowledge that in turn mayresult in the models M or M∗, or the origi-nals O or O∗ being changed.
Semiotic models are similar to signs,metaphors and other concepts such as sim-ile and analogy. We are going to discussthe first two of these below. Prior to thatwe mention that our epistemic pluralismsuggests that epistemological theories thatdo not focus on modeling might have theirstrengths, as they represent different angleson acquiring knowledge about the world.Note furthermore that of course the termi-nology used by the various authors is notcoordinated. In [22, ch. 7] for exampleit is mentioned that the word model some-times is used as a synonym of analogy. Inthat source, moreover, analogy is said to befundamental for how humans understand theworld. That valuation of analogy is compa-rable to the one of Ch. Fourier (see [27, p.
2Note that we use a different terminology and no-tation.
67]) who considered analogy as a key cog-nitive tool for understanding that, which wasnot understood before.
With the term sign relationship we refer tothe predicate S(T, R,A), which means thatactor A uses the token T to refer to the signreferent R. We do not elaborate more onsemiotics or linguistics and refer the inter-ested audience to [20]. We restrict the classof things from which a sign referent may bechosen. We assume that the referent is acultural unit, i.e. something to which onein a given culture can meaningfully refer to.We have adopted this concept from [6]. Us-ing the now already obvious metaphor CUL-TURAL UNIT IS A NETWORK can be ex-pected to operationalize the concept of cul-tural unit. Putting things that way is a con-sequence of assuming that the sign referentcan only serve as a referent based on a con-vention of a group of actors. The obviousstructural similarity between the model rela-tionship and sign relationship can be madeexplicit by assigning to the model the role ofthe token and to the original the role of thereferent. The grounding γ can then be usedfor conducting the reference to the sign ref-erent. A model can be used for transferringinformation, that was requested in terms ofthe original, from model to original. In con-trast to this with the sign token only the ex-istence of the referent is pointed out. We aregoing to explore this issue in more depth be-low.
For us semantic information is the qualityof a string to function as a filter and to helpeliminate states of affairs out of a set of eli-gible such states. Compare, for example [9,p. 435]. The amount of semantic informa-tion contained in a string s is proportional tothe cardinality of the set of states of affairseliminated by that constraint.
4. Expressiveness of Stachowiak’sModel Concept
Our view of models as a reference conceptsimilar to signs and related to metaphorssuggests that models should be a tool ofmany scientific disciplines. At least in Logic
93

and Mathematics concepts referred to asmodels are actually important. For simpli-fying our terminology we call our conceptof model a Philosophical one. Additionallywe consider a Linguistic concept of Model.We are going to show that our Philosophi-cal model concept in fact can be understoodas a generalization of the Linguistic modelconcepts.
4.1. Structures
Modeling, as considered above, involvescreating semiotic models, i.e. sets of pred-icates. Since predicates reflect someone ac-crediting a notion to an entity we considersemiotic models as verdictive utterances, i.e.an utterance by means of which an actor ac-credits to a number of subjects a predicatenotion. For more detail regarding verdici-tive utterances see, e.g. [1]. In some casesof verdictive utterances the utterance createsa social fact. In these cases the utterancein general will only then be successful ifthe utterer is authorized, performs the utter-ance in the right context and in the requiredway. These social parameters of verdictiveutterances are not in the focus of our paper.However, they cannot be ignored completelybecause in organizations where CM is ap-plied a consensus needs to be fixed and adecision needs to be made that is binding inor for that organization. Here we abstractfrom these parameters. Considering CM inthe narrower sense leads to the concept ofjudgment coming into the focus. Judgmentsare forms of verdictive utterances that areelementary with respect to the informationconveyed. Judgments can be represented aspredicates U(S, P, C, A). Such a predicatemeans that the actor A accredits to all in-stances of the subject notion S the predicatenotion P in a way specified by the copulanotion C. For an elaborated theory of judg-ment see, e.g. [24].
It has been shown in [17] that algebraic aswell as relational structures can be speci-fied as sets of judgments. It thus is not asevere limitation to (with respect to model-ing purposes) restrict oneself to verdictive
utterances. At least the more well-known se-mantic models of informatics such as entity-relationship models, class diagrams, statecharts, Petri nets, or similar can be shownto be covered by that language. Recall thata structure R is called retract of a structureC if there are morphisms ι : R → C, andπ : C → R, such that π ι = 1R. Insuch situation is C called a co-retract of R.Since the identity morphism 1R is the iden-tity on R the morphism ι is an injective map-ping and so the pair (ι, π) can be consideredas an icomorphism. Since π ι = 1R im-plies ι π ι = ι one can (in the sense ofStachowiak) consider a structure as a modelof each of its retracts. A characterization ofco-retracts of algebraic structures is given in[11].
4.2. GrammarsWe are going to show that a formal gram-mar can be considered as a model of eachof the words that belong to the language de-fined by the grammar. Recall for this (seefor example the chapter on formal languagesin [34]) that a formal grammar is defined asa quadruple Γ = (S, N, T, R), where N, Tare finite disjoint sets that are called non-terminals and terminals respectively. Fur-ther S ∈ N is called the start symbol andR = (σ, τ) | σ, τ ∈ (N ∪ T )∗, σ =σ1 . . . σm, σ1, . . . , σm ∩ N 6= ∅ a set ofproduction rules. The language Λ(Γ) de-fined by Γ is the intersection of all sets Σwith the properties
• S ∈ Σ, and
• s ∈ Σ, (σ, τ) ∈ R, α, ω ∈ (N ∪ T )∗,s = ασω imply that ατω ∈ Σ.
If there is a rule r = (σ, τ) ∈ R in agrammar Γ = (S, N, T, R) and ασω, ατω ∈Λ(Γ) then one says that ατω is directly de-rived from ασω. In that case we writer(ασω → ατω). Direct derivation is a re-lation on Λ(Γ) its transitive closure is calledderivation δ and for ξ, ψ ∈ Λ(Γ) one saysthat ψ is derived from ξ if (ξ, ψ) ∈ δ.
For a grammar Γ = (S, N, T, R) let Γ′ =(1, S)∪(2, n) | n ∈ N∪(3, t) |
94

t ∈ T∪(4, r) | r ∈ R. Obviouslyµ : Γ | Γ is a grammar → Γ′ |Γ is a grammar,Γ 7→ Γ′, is a bijec-tion. For each λ ∈ Λ(Γ) choose a short-est derivation s1s2 . . . sm. Define Π(λ) =(i, si−1, si, r) | 1 ≤ i ≤ m, s0 =S, sm = λ, r(si−1 → si), for all i.We define now τ : Π(λ) → Γ′, suchthat (i, si−1, si, r) 7→ (4, r). We further-more define γ : Γ′ → Π(λ), such that(j, x) 7→ (i, si−1, si, x), if j = 4 and iis the smallest index with (i, si−1, si, x) ∈Π(λ), and (1, s0, s1, r) otherwise. Then itfollows that τγτ(i, si−1, si, r) = τγ(4, r) =τ(k, sk−1, sk, r) = (4, r) = τ(i, si−1, si, r).Therefore τ γ τ = τ , which had to beshown.
5. Metaphors
One of the most basic phenomena of lan-guage use is the capability of speakers touse different words for the same purposeor thing.3 Metaphor is a particular way ofachieving that effect. According to [18] ametaphor is a partial mapping out of a sourcedomain in a target domain. These domains,if the metaphor is supposed to work, mustbe cultural units. Lakoff in [18] has used themetaphors LOVE IS A JOURNEY, and LIFE
IS A JOURNEY to illustrate the concept ofmetaphor. The notational convention bor-rowed from Lakoff puts the metaphor namein small capitals and lists the source domainbefore the infix IS A and the target domainafter that infix. Metaphors are used for trans-ferring information from the target domainto the source domain. If one ever has under-stood a metaphor such as LOVE IS A JOUR-NEY then it offers no difficulty to understanda metaphorical expression such as our re-lationship is at a dead end even if one hasnever encountered it before. It is a strikingadvantage of Lakoff’s theory of metaphor toenable understanding that fact that, by theway, couldn’t be explained satisfactorily bythe elder theory of metaphor (see for ex-ample Searle’s paper in [23]). In the tradi-
3We thank Tilman Reuther for mentioning this ob-servation to us.
tional theory of metaphor the so-called ’lit-eral meaning’ of a phrase was supposed tobe the standard mode of language use. Wedo not go into respective detail here. Ratherwe refer to Rumelhart’s paper in [23] for adiscussion of some of the problems regard-ing ’literal meaning’.
Examples of further metaphors that are usedwith respect to software systems are not onlythe interface metaphors such as THE COM-PUTER IS A DESKTOP or THE COMPUTER
IS A COUPLE OF (DIRECT MANIPULATION)OBJECTS. Rather metaphors such as SOFT-WARE IS A LIVING THING or SOFTWARE
IS A BUILDING are used as well. The lat-ter ones respectively enable humans to talkabout software systems in terms of these sys-tems aging or getting infected by a virusor similar and in terms of their architec-ture. It occurs such that the metaphor SOFT-WARE IS AN ACTIVE THING is a precursorof the metaphor SOFTWARE IS A LIVING
THING. It is presupposed in talking aboutprograms in terms of the metaphorical ex-pressions as ”the programm calls a subpro-gram”, ”the program is executing”, or sim-ilar. Obviously, presupposing current com-puter technology, programs are not active.Rather the computer uses them for control-ling its own behavior. In [13] the metaphor-ical expressions assistant, agent, master andpeer are used for discussing roles that canbe played by computers in human computerinteraction. These metaphorical expressionsfit the metaphor THE COMPUTER IS AN IN-TERLOCUTOR. The role of metaphors withrespect to the evolution of knowledge that isrelevant for computer use was discussed in[15].
The Oxford English Dictionary Online de-fines dynamics as “(t)hat branch of any sci-ence in which force or forces are consid-ered.” The term ’dynamic modeling’ isquite frequently used in systems develop-ment when one wants to refer to understand-ing the changes of states of certain itemssuch as the objects in an object model. Ob-viously the use of that term is a metaphor-ical one, as the events that occur and im-
95
pact the state of such objects neither areforces nor exert forces on the considered ob-jects. Rather the computer is supposed touse the information that the event has oc-curred for adapting the objects’ state ade-quately. One could use the metaphor IN-FORMATION IS A FORCE as the base of us-ing the term ’dynamic modeling’. Compara-ble metaphors are in use in software processmodeling. Finally, also talking about staticmodeling when referring to creating entity-relationship diagrams or class diagrams is ametaphoric language use, as static also is aterm used in studying forces and their con-sequences.
The obvious similarity between metaphorsand model relationships can be made ex-plicit by assigning to the original and themodel the role of the source domain andthe target domain respectively. The actualmapping is then conducted by the trunca-tion τ . The difference between models andmetaphors is that metaphors compared tomodels achieve a significantly reduced infor-mation transfer from model to original be-cause the only mappings that can be used asa grounding are subsets of τ−1, i.e. the re-lation inverse of the truncation. Metaphorsare important with respect to CM as themodern consensus of linguistics is that hu-man thought is essentially metaphorical. Formore detail see, e.g. [21].
6. Change of representation
According to [8, p. 1197] change of rep-resentation in artificial intelligence meansthat an actor changes a problem statement.The actor is usually presupposed to be acomputerized one. The outline of model-ing processes as described above obviouslycovers reformulation, since reformulationnot necessarily has to explicitly refer to thenon-semiotic entities in the role of originaland model respectively that were mentionedabove. [8, p. 1197] gives a nice exampleshowing that in fact mentioning such enti-ties not necessarily is required. In [36, p.1297] it is then defined that “an abstractionis a change in representation, in a same for-
malism, that hides details and preserves de-sirable properties.” Obviously the terms ’de-tail’, and ’desirable property’ need furtherclarification. It is our view that these termsonly can be explained with respect to thepurpose of the abstraction performed. To-gether with these terms also the term ’sim-plicity’ is used in the literature for explain-ing aspects of abstraction. The latter term,however, as well is notoriously hard to de-fine.
[36, p. 1300] states that it is important tochoose abstractions carefully and that “. . .the utility of abstraction is related to the util-ity of the representation change that is asso-ciated with it.” The drawbacks that mightoccur with respect to the utility of an ab-straction are defined in terms of computa-tional cost and problem complexity. It oc-curs as a reasonable assumption that changeof representation is a particular kind of mod-eling approach that is designed for use bycomputerized systems. With respect to hu-man modeling processes various reasons canbe mentioned that justify modeling (suchas ethical, legal, or practical reasons). Re-garding change of representation, however,the dominating concern is the computationalcost of problem solving. Abstraction isaimed at because it often, but by no meansalways (see [36, 4.(d)]), achieves its poten-tial for cost reduction. With respect to theterminology used in CM one would want torefer to model quality to capture abstractnessor simplicity of representations.
In reviewing abstraction theory, as used inartificial intelligence, [36, pp. 1298-9] usesthe metaphors4
1. ABSTRACTION IS A MAPPING
BETWEEN PREDICATE SETS
2. ABSTRACTION IS A MAPPING
BETWEEN FORMAL SYSTEMS,
3. ABSTRACTION IS A SEMANTIC
MAPPING OF INTERPRETATION
MODELS, and4Note that the source does not explicitly uses the
terminology of metaphors.
96
4. ABSTRACTION IS A SEMANTIC
MAPPING OF FORMULAE.
Using the first metaphor seems to sug-gest the problem that was already men-tioned above when discussing abstraction inthe context of Stachowiak’s model theory.Therefore we do not accept that metaphor.As [36] mentions, the second metaphorseems not to be suited for aiding actorsin finding new abstractions. It also seemsnot to fit to our general view of modelingprocesses, as it does not refer to the phe-nomena in a discourse domain. We thus re-ject that metaphor as well. The last two ap-proaches comply with our view of modelingprocesses as involving phenomena that con-stitute an object level with respect to whichon a meta level semantic information can bespecified for restricting the state of affairs atthe object level. We are going to use aspectsof both of these metaphors for our proposalof abstraction in CM.
[36] proposes a new theory of abstraction.We reject that theory with respect to CMfor reasons we explain shortly. That the-ory employs the metaphor ABSTRACTION
IS A MAPPING BETWEEN PRESENTATION
FRAMEWORKS. A presentation frameworkis a 4-tuple D = (P, S, L, T ) where P is aset of phenomena that are typed as either ob-ject, attribute, function, or relationship; S isa storage structure for storing the phenom-ena including their typing; L is a languagefor talking about the phenomena; and T is atheory on which reasoning about the worldis based. A presentation framework is sup-posed to have a number of parameters. Twoof these are of particular importance for ourpurposes. The first one is a world W thatis represented by the framework. The sec-ond one is a process P that generates the setP out of W . For the process P [36] doesnot provide a specification. Only a referenceto [28] is given. In that source, however,there only is given an example of a digitalcamera that is capable of providing bit pat-terns that function as phenomena. That is animportant point as [36, p. 1303] says thatthe concept of ’world’ by no means is re-
stricted to a physical one. For non-physicalworlds, however, no hints at all are given asto how the phenomena in P could be deter-mined. For another reason, that we are goingto explain now, this point is very importantas well. These two points make us reject thatabstraction theory for CM.
Given a world W an abstraction is thena mapping A from a presentation frame-work Dg(W ) onto a presentation frame-work Da(W ) such that (1) Dg(W ) =(Pg, Sg, Lg, Tg), Da(W ) = (Pa, Sa, La, Ta),(2) A(Pg) = Pa, and (3) Pa is sim-pler than Pg. The predicate simpler is de-fined such that for the Kolmogorov com-plexity K the following condition holds:K(Γg) ≤ K(Γa).5 In this condition thesets Γg, Γa are so-called configurations ofthe perception processes Pg,Pa respectivelythat generate Pg, Pa respectively. Not onlyis the Kolmogorov complexity known tobe a non-computable function and thereforepractically computing the values K(Γg) andK(Γa) might be not feasible. The configu-rations furthermore are assumed to be setsof bit strings and the Kolmogorov complex-ity of a configuration is the maximum of theKolmogorov complexities of the bit stringsin that configuration (see [28, p. 766]). Forinfinite configurations a maximum not nec-essarily exists and thus the complexity com-parison might be meaningless. Finally, sincethere were no process quality aspects spec-ified for the processes Pg and Pa it cannotbe guaranteed that repeated or concurrentprocess execution is invariant against Kol-mogorov complexity. We consequently cur-rently see no way of using the abstractiontheory under discussion for CM.
7. Constructing Discourse Do-mains
The main purpose of CM is conceptualizingin a suitable way a discourse domain at hand.The phenomena in the discourse domain can
5Recall that for a string S the complexity K(S) isdefined as the length of a shortest program that putsout S. A very brief introduction to Kolmogorov com-plexity can be found in The Wikipedia.
97

be distinguished from each other by a com-bination of structural, extensional, and in-tensional parts of the conceptualization. CMmay be concerned with concepts (see, e.g.[14] for a definition and discussion) in twoways. First of all, if CM is used by an actorA to conceptualize a discourse domain D∗
then A creates a model M∗ of D∗, i.e. Acreates a model relationship R(D∗,M∗, A).For this paper D∗,M∗ are a semiotic en-tity and thus involves concepts. Finally, thediscourse domain D that has D∗ as a semi-otic representation in R(D∗,M∗, A) may al-ready be a conceptualization. That, for ex-ample, is the case in requirements elicitationand analysis.
A discourse domain is something that onecan sensibly talk about, i.e. something thatcan be a matter of discourse. We assumethat the minimum assumption for that tobe possible is that one can identify in thediscourse domain a collection of phenom-ena. In our view when conceptualizing adiscourse domain a modeler aims at provid-ing semantic information that rules out allnon-sensible phenomena. Our thesis is thatin this respect conceptual modelers use themetaphor INFORMATION IS A NETWORK.This metaphor suggests that the required in-formation can be represented as a numberof information chunks (nodes of the net-work) and that several of these chunks arerelated to each other (edges in the network).Applying that metaphor enables modelersto qualitatively classify discourse domain-phenomena as thing and thing relationshiprespectively. If the modeler wants a more so-phisticated conceptualization then the mod-eler may chose a target domain for the men-tioned metaphor that has node labels or edgelabels. These labels can be used to de-fine types of discourse domain-phenomena.The semantic information initially requiredmost easily can be represented graphicallysuch that nodes labeled equally will be rep-resented by a given shape (such as a rectan-gle or a diamond etc.) and that the edgeslabeled equally will be represented as a par-ticular edge type. Both edges and nodes willbe attached an identifier of the phenomena
mapped onto node or edge.
A further metaphor is used in constructionsof discourse domains, i.e. INFORMATION
IS A CONTAINER. In this metaphor infor-mation is considered as something that cancontain information in the sense that the lat-ter can be put in or out. For example, whenmodeling with state charts (see, e.g. [25]or [26]) one uses two forms of nesting, i.e.of including state charts into a given statechart. The latter is then considered as be-ing at a higher level of abstraction. Thesetwo ways represent generalization and ag-gregation of states respectively. Similarly,in class diagrams one uses boxes to repre-sent classes. Inside of these boxes the at-tributes as well as the methods of objectsof the respective class are listed. In classdiagrams the metaphor INFORMATION IS A
CONTAINER is used for representing dataencapsulation. Please note that typically inER diagrams that metaphor is not employedsince data encapsulation is not a modelingnotion of the ER model. ER modeling aswell as Petri Net modeling use the metaphorINFORMATION IS A CONTAINER in a furtherway. An elementary model part such as anentity, a relationship, or a place, or a transi-tion is defined as including a whole ER di-agram or Petri Net respectively. The latterform of applying the metaphor INFORMA-TION IS A CONTAINER is called refinement.
In refinement the elementary model part issupposed to be at a higher level of abstrac-tion than is the refining model. The pur-pose of refinement is exactly the introduc-tion of these levels of abstraction. These lev-els make complex models more usable be-cause for some use of them it is sufficientto focus on a given level of abstraction andignore the rest of the model. Thus refine-ment has the potential of significantly reduc-ing the complexity an actor has to deal withat once for solving a problem at hand. Ob-viously, applying the metaphor INFORMA-TION IS A CONTAINER can be made redun-dant by explicitly typing nodes and edgesin a graph that represents information ac-cording to the metaphor INFORMATION IS
98
A NETWORK.
Providing evidence for a theory like the onewe have outlined in this paper is not a sim-ple task. Currently we have no clues ofhow to empirically confirm our theory. Wecan, however, mention three observationsthat could be considered as such confirma-tion. Firstly, in object-relational databasemanagement systems the subtype as well asthe sub-table relationship is denoted as ”un-der” (see [35]). This seems surprising sinceestablished different terminology is avail-able. The chosen terminology seems to pre-suppose the metaphor INFORMATION IS A
SPATIAL NETWORK. Secondly, there is along tradition of work regarding the ques-tion whether relationship types in the ER-model can have attributes or not. There isquite some work of Ron Weber and col-laborators devoted to that question. Weberhas argued in two ways, i.e. empiricallyand theoretically. In his empirical respec-tive work he has tried to show that modelersfind it more difficult to understand relation-ships in the ER-model that have attributesrather than relationships without such at-tributes. In his theoretical respective workWeber has argued that ontological reason-ing suggests that relationships must not haveattributes. It is however a severe weak-ness in his latter reasoning that he only usesBunge’s ontology and does not provide arationale for choosing an ontology. Whilefrom the view of an ontology’s purpose thatmight not be particularly worrying it is how-ever known that a number of ontologies ex-ist and that for example Chisholm’s ontol-ogy has been applied to information systemsrelated questions. The obvious weakness ofnot providing a justification of the choicemade for the ontology seems to suggest apredisposition in place against attributes ofrelationships. The conventional use of themetaphor INFORMATION IS A NETWORK
has the potential to explain the existence ofsuch a predisposition. According to thatmetaphor information is only representedby two-dimensional items (such as rectan-gle or circle which represent entity typeand value type respectively) rather than one-
dimensional ones. One-dimensional items,i.e. lines cannot have attributes because thatwould involve a line connecting a line witha two-dimensional item, i.e. an informationchunk.
Thirdly, our theory complies with a lot ofmodeling practice that we are aware of. Wemention in particular the use of the metaphorINFORMATION IS A SPATIAL NETWORK
that we are going to discuss in detail in sec-tion 8.1. We mention here only the interest-ing point that this metaphor enables makingpragmatic distinctions that are usually notsupported by formal model semantics.
8. AbstractionAbstraction comes in at least two forms,i.e. intra model abstraction (as levels of ab-straction within a model) and inter modelabstractions (as different views on a givendiscourse domain). In contrast to that wesuggest understanding the intra model ab-straction as consequence of replacing themetaphor INFORMATION IS A NETWORK
by the metaphor INFORMATION IS A SPA-TIAL NETWORK. Intra model abstractionis mainly used for improving model qual-ities such as readability, memorizabilty, ormaintainability. This form of abstractionmainly is concerned with the detail of spec-ification. We suggest understanding intermodel abstraction as omitting informationrepresented by one model in comparisonto another model. For providing a frame-work that tells us what kind of informationcan be omitted from a model we refer tothe metaphor INFORMATION IS A SPATIAL
NETWORK. We thus suggest that the infor-mation that can be omitted concerns rulingout a discourse domain-phenomenon fromthe model, or typing it inadequately, or byrelating it to undesirable phenomena in anundesirable way.
It appears to exist a separation of interest inabstraction with respect to data engineeringand artificial intelligence. In [36, p. 1294-6] five examples of inter model abstractionare discussed while intra model abstractionis ignored. In [3, section 2.1] only the tra-
99
ditional examples of intra model abstractionare considered, i.e. classification, general-ization and aggregation. In [7] a further in-tra model abstraction is mentioned, i.e. de-contextualization. [16] is among the papersthat have discussed further concepts of intramodel abstraction, i.e. cooperations. It is anobvious idea to employ intra model abstrac-tion for achieving inter model abstraction.From a view of systematic model develop-ment one feels tempted to challenge that in-ter model abstraction is not discussed in dataengineering. It seems that data engineeringaims at finding the right abstractions onlywithin a model while artificial intelligenceaims at finding the right level of abstractionof the models, i.e. one tries to find minimumcomplexity models of a given discourse do-main. From a holistic point of view both ofthe disciplines seem to have chosen an in-complete approach to abstraction.
8.1. Intra model abstractionDiagrams as the ones obtained from em-ploying the metaphor INFORMATION IS A
NETWORK may be confusing as no obvi-ous principle to group nodes and edges canbe applied. For introducing hierarchy intothe diagram the basic metaphor INFORMA-TION IS A NETWORK is complemented bythe metaphors INFORMATION IS A SPATIAL
NETWORK and INFORMATION IS A CON-TAINER. This allows in the diagram tomake use of the well-known pairs of spatialconcepts such as (up, down), (left, right),(front, rear), and (in, out). These spa-tial concepts can be applied to the semanticinformation as represented by the networkbecause of the typing of nodes and edges.Some of the nodes are considered as primaryand others as secondary. The primary onesare considered such that they represent theinformation regarding the discourse domainand the secondary ones provide the detail ordata for that. Of two related primary nodesthe one would then considered as less ab-stract that has a more detailed description.The more abstract node would in the dia-gram then be placed above the less abstractone. In doing so the revised metaphor en-
ables using Plato’s idea of heaven of ideasby associating top with heaven, and bottomwith earth.
A sophisticated concept of intra model ab-straction was discussed in [10]. In thatpaper a cohesion C is understood to be apair C = (A,PA) where A is a set ofroles or perspectives and PA is a mappingPA : P(
⋃a∈A ε(a)) → true, false that
defines which entities in the union of theextensions ε(a) of roles a ∈ A are relatedto each other by C.6 Intra model abstrac-tion was understood as provided by abstrac-tion concepts such as aggregation, classifi-cation, and generalization. An abstractionconcept was in that source understood as amapping α : (A,PA) → (B, PB) where(A,PA) and (B, PB) are cohesion and B ⊆A, as well as PB = PA|B, i.e. PB iswhat one gets by restricting PA to the rolesin B. The metaphor INFORMATION IS A
NETWORK together with the idea of typingnodes and edges suggests the concept of co-hesion, as one node (i.e. information chunk)can be typed such that it represents a cohe-sion and the edges that connect it to othernodes can be understood as the function ofthe latter nodes in that cohesion. This con-cept of abstraction can be described by themetaphor ABSTRACTION IS A SEMANTIC
EXCEPTION FROM COHESION. The latteris similar to the metaphor ABSTRACTION IS
A SEMANTIC MAPPING OF FORMULAE (see[36]) because cohesion in a model can be un-derstood as a formula.
The metaphor INFORMATION IS A SPATIAL
NETWORK can be extended such that it ex-ploits not only the vertical spatial dimen-sion (i.e. up vs down). Rather the depthspace dimension can be included as well (i.e.front vs. back). In that extended version themetaphor enables relating perceived size ofa concept representation as proximity to themodel user. That which appears to be largeris closer to the model user and thus more rel-evant for him or her. The spatial dimensionof breadth (i.e. left vs. right) can be ex-
6For a set S the set of subsets of S is denoted asP(S).
100
ploited too. For example, in modeling withstate charts it is a very common to arrangethem such that object creation occurs in thetop left corner of a diagram and that the se-quence of object states is arranged in linesfrom left to right and from top to bottomof the diagram.7 A respective metaphor thatcould justify that implicit convention is IN-FORMATION IS A TEXT.
Proximity of information chunks in a model(and thus recognized by the model user)can be understood as meaning relatedness.Similarly the metaphor INFORMATION IS A
CONTAINER can be used to address encap-sulation and protection.
8.2. Inter model abstractionWe understand semantic information assomething that can be used for eliminatingor reducing uncertainty. That is what makesus interested in having information aboutmany entities of the one or another discoursedomain. This understanding is coherent withthe well-known definition of information asthe distinction or difference that makes a dif-ference ([2]). Aiming at applying this viewof information to our problem of defininginter model abstraction makes us focus atthe ways in which phenomena are includedinto models. The details of the used mod-eling language come to mind. Since we areinterested in a pragmatic theory of abstrac-tion we do not, however, focus on technicalor formal detail. We rather again make useof the metaphor INFORMATION IS A NET-WORK and our explanation of it providedabove.
Consider an entity O the history of whichis captured as the sequence Oii∈I . Leti ∈ I and O∗ be a semiotic representa-tion of Oi. Consider model relationshipsR(O∗,M, A), and R(O∗,M ′, A) with Mand M ′ being semiotic entities. Considerthe predicates ci(o,X), ti(o,X), ri(o,X).Let them mean that phenomenon o is be-ing included in model X of O∗, that it istyped the right way in X and that it is
7We thank Bernhard Rumpe for mentioning thisobservation to us.
related the right way to other phenomenaincluded into model X of O∗. We canthen define the predicate α(M ′,M, P,O∗).It means that model M ′ is more abstractthan model M with respect to purpose Pof actor A and original O in state i if|o ∈ Oi|ci(o,M
′) = true or ti(o, M′) =
true or ri(o,M′) = true | ≤ |o ∈
Oi|ci(o,M) = true or ti(o, M) =true or ri(o,M) = true |.Obviously more research is required forworking out an operational approach toachieving more abstract models that meetgiven requirements such as given queriescan be efficiently processed. Our idea inthat respect is to investigate design primi-tives such as the one in [3] with respect totheir impact on inter model abstraction.
9. OutlookIt would be of some interest to have a morecomplete list of the metaphors that are usedin CM.
As we have introduced two kinds of abstrac-tion it is our aim in future work for eachitem L in a given list of modeling languagesto provide a list of abstraction concepts thatenables for a given model M to create allthe models that are more abstract than M .The top-down primitives proposed in [3] arenot complete, i.e. do not enable construct-ing all entity-relationship diagrams. Provid-ing a sufficiently expressive set of abstrac-tion concepts must thus considered to be anon-trivial task.
The idea proposed in [28] to use the Kol-mogorov complexity K as a simplicity mea-sure for bit strings that represent a state ofa world W appears as promising. It wouldbe interesting to work out formulae for thecomplexity K(p : M) for each model M andeach design primitive p taken from a set P ofdesign primitives. It could be possible to useK as a measure of model complexity and tofind strategies for complexity reduction thatpreserves information contents, i.e. specifiesthe same discourse domain model.
References101
[1] John Longshaw Austin. Zur Theorieder Sprechakte. Philip Reclam jun.,Stuttgart,1979.
[2] Gregory Bateson. Mind and nature: anecessary unity. Dutton, New York.
[3] Carlo Batini, Stefano Ceri, andShamkant Navathe. Conceptualdatabase design. The Benjamin /Cummings Publishing Company; Inc.,Redwood City, California, 1992.
[4] Rudolf Carnap. The logical construc-tion of the world, (In German). Fe-lix Meiner Verlag, Hamburg, 2nd ed.1961.
[5] Peter Chen. The entity relationshipmodel: toward a unified view of data.ACM Transactions on Database Sys-tems 1(1976), pp. 9 - 37.
[6] Umberto Eco. Introduction to semi-otics, (In German). Wilhelm Fink Ver-lag & Co. KG, 1994.
[7] Pierre Luigi Ferrari. Abstraction inmathemattics. In Lorenza Saitta, edi-tor, The abstraction paths: from expe-rience to concept. Philosophical trans-actions of The Royal Society, Biolog-ical Sciences, vol. 358, no. 1435. July2003, pp. 1225 - 1230.
[8] Robert C. Holte and Berthe Y.Choueiry. Abstraction and reformu-lation in artificial intelligence. InLorenza Saitta, editor, The abstractionpaths: from experience to concept.Philosophical transactions of TheRoyal Society, Biological Sciences,vol. 358, no. 1435. July 2003, pp. 1197- 1204.
[9] Philip Johnson-Laird. A taxonomy ofthinking. In R. J. Sternberg and E.Smith , editors, The psychology ofhuman thought, Cambridge UniversityPress, 1988, pp. 429 - 457.
[10] Roland Kaschek. A little theory of ab-straction. In Bernhard Rumpe, Wolf-gang Hesse, editors, Modellierung
2004: Proceedings zur Tagung. GILecture Notes in Informatics, P-45,2004.
[11] Roland Kaschek. A characterization ofco-retracts of functional structures. InW. Ghler and G. Preuss, editors, Cat-egorical Structures and their Applica-tions. World Scientific Publishers, NewJersey et al., 2004.
[12] Roland Kaschek. Modeling ontol-ogy use for information systems. InKlaus-Dieter Althoff, Andreas Den-gel, Ralph Bergmann, Markus Nick ,Thomas Roth-Berghofer Th., editors,Professional Knowledge Management.LNCS 3782 Springer Verlag, 2005.
[13] Roland Kaschek. Preface. In RolandKaschek, editor, Intelligent assistantsystems: concepts, techniques, tech-nologies. To appear IDEA Group Inc.,2006.
[14] Wilhelm Kamlah and Paul Lorenzen.Logical propaedeutics: preschool ofsensible sppeech, (In German). VerlagJ. B. Metzler, Stuttgart, Weimar, 1996.
[15] Roland Kaschek and Alexei Tretiakov.Knowledge evolution: the metaphorcase. In Proceedings of CSIT 2006,Amman 5 - 7 April 2006.
[16] Roland Kaschek and Claudia Kohl andHeinrich Mayr: Cooperations- an ab-straction concept suitable for businessprocess reengineering. In J. Gyorkosand M. Krisper and H. Mayr, edi-tors, Re-Technologies for InformationSystems, ReTIS’95 Conference Pro-ceedings, Oldenbourg Verlag, Wien,Mnchen, 1995.
[17] Roland Kaschek and Klaus P. Jan-tke and Tibor-Istvan Nebel. Towardsunderstanding meme media knowl-edge evolution. In Klaus P. Jantkeand Aran Lunzer and Nicolas Spyratosand Yuzuru Tanaka, editors, Federa-tion over the Web. LNAI 3847 SpringerVerlag, 2006.
102
[18] George Lakoff. The contemporary the-ory of metaphor. In Andrew Ortony,editor, Metaphor and Thought, 4th.printing of second edition of 1992.Cambridge University Press, 1998.
[19] Peter C. Lockemann and Heinrich C.Mayr. Computer supported informa-tion systems, (In German). SpringerVerlag Berlin, Heidelberg, 1978.
[20] Angelika Linke, Markus Nussbaumer,and Paul R. Portmann; Transscript lin-guistics, (In German). Max NiemeyerVerlag, Tubingen, 4th. unchanged edi-tion 2001.
[21] George Lakoff and Mark Johnson.Metaphors we live by. University ofChicago Press, Chicago, 1980.
[22] Werner Metzig and Martin Schus-ter. Learning to learn, (In German).Springer, Berlin, Heidelberg, 7th. edi-tion, 2006.
[23] Andrew Ortony (editor). Metaphor andThought, 4th. printing of second edi-tion of 1992. Cambridge UniversityPress, 1998.
[24] Alexander Pfander. Logic, (In Ger-man). Verlag von Max Niemeyer, Hallea. d. Saale, 1921.
[25] James Rumbaugh et al. Object-oriented modeling and design.Prentice-Hall, Englewood Cliffs, NJ,1991.
[26] James Rumbaugh and Michael Blaha.Object-oriented modeling and design,2nd edition. Prentice-Hall, EnglewoodCliffs, NJ, 2004.
[27] Hans Jorg Sandkuhler. Nature andknowledge cultures: Sorbonne lec-tures on pluralism and epistemology,(In German). Verlag J. B. Metzler,Stuttgart, Weimar, 2002.
[28] Lorenza Saitta and Jean-DanielZucker. A model of abstraction in
visual perception. Applied ArtificialIntelligence 15,8(2001), pp. 761 - 776.
[29] Reinhard Schuette and Thomas Rot-thowe. The Guidelines of Modeling- an approach to enhance the qualityin information models. Proceedings ofthe 1998 Entity-Relationship confer-ence.
[30] Herbert Stachowiak. General modeltheory, (In German). Springer, 1973.
[31] Herbert Stachowiak. Knowledge levelstowards systematic neo-pragmatismand general model theory, (In Ger-man). In Herbert Stachowiak, editor,Modelle: Constructions of reality, (InGerman), pages 87 - 146. WilhelmFink Verlag, Munchen, 1983.
[32] Herbert Stachowiak. Model, (In Ger-man). In Helmut Seiffert and Ger-ard Radnitzky, editors, Handlexikonzur Wissenschaftstheorie, pages 219- 222. Deutscher Taschenbuch VerlagGmbH&Co. KG, Munchen, 1992.
[33] Bernhard Thalheim. Entity-relationship modeling. Springer-Verlag, Berlin, Heidelberg, 2000.
[34] Allan Tucker, editor. Computer sciencehandbook, Chapman & Hall / CRC andACM, 2004.
[35] Can Turker and Gunther Saake.Object-relational datbases (In Ger-man). dpunkt, 2006
[36] Jean-Daniel Zucker. A grounded the-ory of abstraction in artificial intel-ligence. In Lorenza Saitta (ed.) Theabstraction paths: from experience toconcept. Philosophical transactions ofThe Royal Society, Biological Sci-ences, vol. 358, no. 1435. July 2003,pp. 1203 - 1309.
103
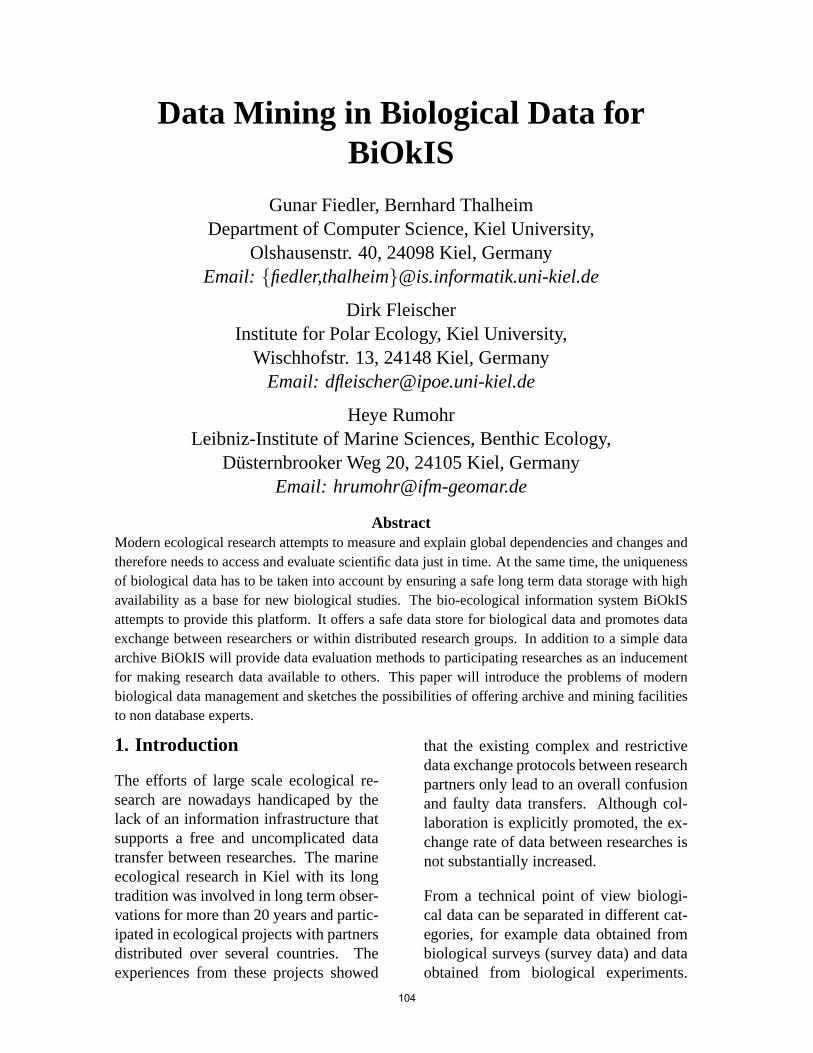
Data Mining in Biological Data forBiOkIS
Gunar Fiedler, Bernhard ThalheimDepartment of Computer Science, Kiel University,
Olshausenstr. 40, 24098 Kiel, GermanyEmail: fiedler,[email protected]
Dirk FleischerInstitute for Polar Ecology, Kiel University,
Wischhofstr. 13, 24148 Kiel, GermanyEmail: [email protected]
Heye RumohrLeibniz-Institute of Marine Sciences, Benthic Ecology,
Dusternbrooker Weg 20, 24105 Kiel, GermanyEmail: [email protected]
AbstractModern ecological research attempts to measure and explain global dependencies and changes andtherefore needs to access and evaluate scientific data just in time. At the same time, the uniquenessof biological data has to be taken into account by ensuring a safe long term data storage with highavailability as a base for new biological studies. The bio-ecological information system BiOkISattempts to provide this platform. It offers a safe data store for biological data and promotes dataexchange between researchers or within distributed research groups. In addition to a simple dataarchive BiOkIS will provide data evaluation methods to participating researches as an inducementfor making research data available to others. This paper will introduce the problems of modernbiological data management and sketches the possibilities of offering archive and mining facilitiesto non database experts.
1. Introduction
The efforts of large scale ecological re-search are nowadays handicaped by thelack of an information infrastructure thatsupports a free and uncomplicated datatransfer between researches. The marineecological research in Kiel with its longtradition was involved in long term obser-vations for more than 20 years and partic-ipated in ecological projects with partnersdistributed over several countries. Theexperiences from these projects showed
that the existing complex and restrictivedata exchange protocols between researchpartners only lead to an overall confusionand faulty data transfers. Although col-laboration is explicitly promoted, the ex-change rate of data between researches isnot substantially increased.
From a technical point of view biologi-cal data can be separated in different cat-egories, for example data obtained frombiological surveys (survey data) and dataobtained from biological experiments.
104
Survey data is usually of a descriptivecharacter. To obtain biological surveydata an area of interest is defined and sam-ples are taken. These samples are associ-ated with their geographic references (lat-itude and longitude values). The sample’sparameters of interest, e.g. number of in-dividuals of a certain species, or the in-dividual’s size, are determined by apply-ing specific techniques. Where appropri-ate, the data is compared with results fromformer surveys. Projects that describe re-gional communities of species or changeswithin a region collect a huge amount ofdata over the years, e.g. 2500 records for5 stations per year.
If hypotheses are made based on surveydata, there is always the need for an ex-periment that verifies the result. A singlebiological experiment produces approxi-mately 1000 records. Due to modern pro-cedures of taking samples this size is evenincreased.
Additional to these traditional invasivemethods of taking samples out of a habi-tat, photographs and video sequences areused for visual scans without removingindividuals from the habitats of interestand for tracking species hardly repre-sented by quantitative methods.
Geographically referenced data can beused e.g. for creation of distribution mapsfor species or other (higher) taxa. Usingobtained biomass data it is possible to es-timate the number of individuals of cer-tain species in different regions.
Table 1 gives an impression of the sizeof available biological data. It shows theamount of survey data and experimen-tal data available at the Research Groupfor Marine Benthic Ecology at the Leib-niz Institute of Marine Science and theKiel University. The data is geograph-ically referenced and described by metadata. Figure 1 shows a map of stationswhere survey data is obtained. Addition-
ally, the research group processed numer-ous historical data sources from the last100 years, e.g. diploma theses and PhDtheses. This data is now annotated, doc-umented, and available in an electronicform.
This stock of data seems to be a solidground for formulating hypotheses on bi-ological questions. But unfortunately, themanagement of biological data has to faceseveral problems on the technical as wellas on the organizational level that pre-vent an efficient evaluation. The technicalproblems are the typical ones known e.g.from distributed systems and data integra-tion scenarios ([5]):
Heterogeneity of data: data provided bydifferent researchers or research groupsdiffer from each other. Due to the orga-nization of biological research, data setsare designed based on different pointsof view. Depending on the utilization,the personal goals and expectations, eachresearcher chooses its own structures.There is a common agreement about pro-cedures and the overall set of conceptsthat are represented in data sets, but it isvery costly to fully map raw data fromdifferent sources.
Discretization of data orconversion ofcontinous data to discrete data leads todifferent interpretations of data. Dis-cretization may be based on time, space,or other abstractions which may varyamong different research groups.
The scope of data representationis of-ten concentrated on the scope of the user.This leads to the representation of macrodata in the data sets which are compre-hensions of micro data. Additionally,data abstractionsare often used insteadof basic data. Attribute names are usuallynot documented, abbreviations are quitecommonly used. The data sets are fullof symbolic values and artifical identifica-tors without any meaning outside this par-
105

Type Estimated Number of Recordssurvey data (quantitative) ca. 250,000 recordssurvey data (qualitative) ca. 100,000 recordsexperimental data ca. 150,000 recordsphotographs ca. 6500video sequences ca. 530 hours
Table 1: data collected by researches from Kiel
Figure 1: survey stations
ticular data set and without any documen-tation. Type information is often missing,e.g. because the data set is represented asa plain text file. This leads to additionalproblems concerning the quality of dataat the instance level: values are missing,attributes are coded differently (e.g. usingdegrees with decimals for geographic ref-erences vs. using degrees with minutes ofarc and decimals) or have wrong values.
The organization of biological researchalso leads to specific problems which pre-vent an effective usage of data. Most ofthe work is done during student’s work orother time limited projects, e.g. while stu-
dents write their diploma theses or PhDtheses. All these students are pressed forlimited time only, so local and personaloptimizations of obtaining, storing, andevaluating data naturally occur. Biologi-cal researchers are no computer scientistsand so, they are usually not familar withaspects of data modeling, data exchange,and long term data storage. Especiallythe description of data by meta data andbackup procedures are often not presentin mind. After the thesis is finishedthe researcher usually leaves the researchgroup, home directories are deleted, andraw data is lost. Only comprehensions
106
like reports and publications remain. Buteven if raw data can be preserved, theknowledge about the data structure, theconcepts behind the data, the descriptionof the procedures that were applied to ob-tain the data is lost. That’s why biologicaldata sets may end up uninterpretable orhave to be downscaled after a few yearsor even months.
Publication of research results usuallydoesn’t contribute to the public outreach,because publications only contain com-prehensions of data, raw data remains atthe author. The usual peer review proce-dure delays publications together with thereusage of data sets for several months.
Additional to these arguments there aresome further aspects that prevent an ef-ficient reuse of biological data. Failed ex-periments are usually not documented oreven published. But especially these fail-ures may be important for the researchcommunity because learning from otherfailures may speed up the developmentof functional solutions. Distributed re-search projects often lack of an efficientdata transfer between local groups dueto technical difficulties and complex datatransfer protocols. The interested publicis excluded from participating in scien-tific results due to journal publication, soresearch groups have to make additionalinvestments for public relationship man-agement and popular science.
2. Existing Information Systems
The problem of data loss in biologi-cal research is known for a couple ofyears. There exist some informationsystems that try to address this topic.The world’s data archive for environmen-tal, marine, and geological data PAN-GAEA (www.pangaea.de) ensures longterm archiving of geographically refer-enced data. Researchers are called tostore their data in PANGAEA. It was in-
vented to store geological data from coredrillings. This causes disadvantages: theexisting data model has to be used tostore biological data which is structurallyand semantically totally different. PAN-GAEA is bringing data online right afterpublication, but unfortunately, diplomatheses or student research projects are notconsidered as real publications. There-fore, they will seldomly become avail-able. The data transfer protocols of PAN-GAEA are complex to use for many re-searches. So many problems addressedabove remain unsolved.
There is a number of highly specializedinformation systems for research dataas well as popular science. For ex-ample, FishBase (www.fishbase.org) is adatabase containing facts about fishes. Itcan be used by taxonomists, fishermen,teachers, or pupils and provides factsabout species as well as multimedia con-tent like photographs. FishBase as anexample shows the possibilities of pro-viding scientific information over a Webbased information system. It addressesthe needs of the public due to its greatstock of available photographs.
ReefBase (www.reefbase.org) is the firstonline information system concerningcoral reefs. It provides information andservices for professionals e.g. in the ar-eas of management, science, and pollu-tion control. ReefBase provides a greatvariety of geographically referenced andannotated photographs. Visualization issupported using a mapping service thatproduces interactive maps. This enablesa playful handling of information.
The Ocean Biogeographic InformationSystem OBIS (www.iobis.org) providesdownloadable data sets from a networkof institutions from 45 nations. Unfor-tunately, these data sets are restricted toobservations (presence of individuals, notabsence). Distribution maps that reveal
107
distribution pattern for a great number ofspecies all around the world can be gen-erated online.
3. General Goals
The problems mentioned above can befaced by using an information systemwith a central data storage that is capableof providing extensive descriptions anddocumentation of arbitrary data sets fromthe known domain. In detail, the follow-ing points are currently missing:
Controlled data input: data transfer intothe system should be user-oriented andnot backed by complex exchange proto-cols or data formats. Data import shouldtake place as soon as possible, in the idealcase directly when data is obtained. Theuser should be guided through the importprocedure, integrity checks should be ap-plied both on syntactical as well as on thesemantical level. In the case of detectederrors, the user should instantly correctthe data. Common data formats that areused by researches like CSV or spread-sheet formats have to be supported.
At each step the user has to be forced toannotate the data. Who obtained the data?Which procedures were made? Where thesurvey / experiment took place? Whatis the meaning of the record’s attributes?How is the data encoded? Is this dataset based on special assumptions? Mosterrors will be detected on the syntacti-cal level, but it is also possible to ap-ply a basic set of tests whether the dataset is plausible according to the commonknowledge of the research community forthis domain.
Association between data sets:very im-portant is the linking between depend-ing data sets. Which experiments arebased on which surveys? Which evalua-tions were already made for a certain dataset? Which publications exist? Which re-search group used a particular data set?
Which data sets are geographically or tax-onomically related? Is there any multi-media material supporting this data set?Many of these associations can be auto-matically obtained based on the data’s us-age or meta data.
Searchable data sets:Who is workingon a similar topic? Are there data sets thatI need for my hypotheses? Did the ex-periment I am currently planning alreadyfailed in a similar context?
Controlled output of biological data:Two points are important: first, the sup-port for common data formats used in theresearch community and transformationsbetween these formats. Second, there isa need for a mechanism that controlls ac-cess to data sets such that every providerof data sets is notified when data is down-loaded or displayed.
Virtual working groups: Data sets growover time. To publish a data set is onlyuseful if major steps of the survey or ex-periment are finished. Additionally, re-searchers are usually not interested in anuncontrolled distribution of the raw data;especially, if own publications are stillin the queue. On the other hand it isadequate to share unfinished and locallyincomplete data sets among project col-leagues or trusted partners. After a pre-defined period of time where the data isreserved for private use it is made avail-able to the public, but still under down-load control.
Cooperation with other systems: An-notated and documented data sets canbe automatically transfered to cooperat-ing information systems like PANGAEAor OBIS so researchers save time fordata publication. For that reason, openstandards and formats have to be sup-ported like the Darwin Core exchange for-mat ([6]) developed by the TaxonomicDatabases Working Group ([8]).
108
A system that fulfills these requirementscan be used as a library for sophisticateddata evaluation. In principle, there aretwo possibilities for using this data: Inthe simple case data sets are searched,downloaded, and processed locally bythird-party statistical or data mining soft-ware. As a surplus value to providers ofdata sets the information system can pro-vide a set of evaluation methods, so dataproviders do not need to care about tech-nical questions, e.g. obtaining and in-stalling complex software just to processcommon evaluation techniques. In bio-logical research, a couple of methods areestablished, e.g.:
• Bray-Curtis similarity matrices (sim-ilarity between samples according tofound species and individuals, [2])
• Simpson Index (diversity indexbased on the number of species,[13])
• Margalef Index• Shannon-Weaver Index (diversity in-
dex based on the number of speciesand individuals, [12])
• Pielou Evenness (analysis of the dis-tribution of individuals, [10])
• taxonomic distinctness ([3])• AMBI, BQI (diversity indexes for
classifying ecological quality, [1,11])
• statistical significance testsBeside these statistical evaluation meth-ods there are a couple of standard visu-alization techniques that can be applied,e.g. for creating project summaries orother kinds of reports. Some techniquesmay be:
Visualization of geographically refer-enced data usingannotated maps: Fig-ure 2 shows a screenshot of Google Earth([7]) with a data set that is visualized ac-cording to the geographical references ofthe records. Because of the facilities ofnavigating in Google Earth together with
its support of linking placemarks withWeb resources it is easily possible to pro-duce distribution maps in different stylesor to display measures or multimedia ele-ments according to their coordinates.
Survey data can be visualized by dia-grams showing the number of individu-als or species at a certain place over a pe-riod of time. This enables researchers tochoose data sets for comparative studiesor to make a long term observation of ageographical region of interest. Figure 3show an example. The same discussioncan be made for experimental data.
Figure 4 shows possibilities for data min-ing approaches. For example, by usingBray-Curtis similarity matrices it is pos-sible to identify the species of importancefor a data set. This may lead to a betterunderstanding of the biological system.
4. Provided Services within abio-ecological InformationSystem
Looking at different types of users a bio-ecological information system will pro-vide different services. Although the sys-tem will mainly be used by scientists,there are also interesting services for theinterested public or sponsors of researchprojects.
The group of researchers can be dividedin two groups: data providers and datausers. Data providers publish annotateddata sets by using the system. Data usersare researchers that will use data setsstored in the system for further research.
Data providers are offered a long termarchiving of their published data sets,so the researcher needs not to deal withbackup procedures. If it is wanted, thedata sets are distributed, e.g. to the worlddata center. As a surplus value, each dataprovider can use predefined data evalua-tion methods. Predefined data visualiza-
109

Figure 2: Data Visualization with Google Earth
tion can easily be used for public out-reach. Each data provider is notifiedif some user accesses the provided datasets, so data providers always have anoverview about the impact factor of theirresearch. Researchers working in dis-tributed working groups can define pri-vate areas for data that is currently underprocessing, so data transfer between localgroups is simplified.
The online overview of downloaded ordisplayed data enables research sponsorsto participate in data ascertainment andthe project’s progress. Within the sys-tem a statistical evaluation of queried datagrouped by projects is possible. Thisevaluation continues after the project’slifetime and reveals the impact of theproject within the research communityor the public. Evaluation results can belinked to the sponsor’s homepage to im-prove the sponsor’s own public outreach.
Researchers acting as data users are of-fered an archive with semantically anno-tated, documented, and linked data setsthat are searchable and browseable ac-cording to numerous parameters. Re-ports, visualizations, and publications re-lated to data sets are accessible.
Because biology is a popular sciencethe interested public should be explic-itly included in any thoughts about abio-ecological information system. Es-pecially multimedial content that is pro-duced during non-invasive surveys can beeasily reused for public relations manage-ment as long as they are annotated. Butthere are also other interesting servicespossible like visual classification wizardsthat allow classification of individuals ac-cording to the taxonomy of species by it-eratively presenting photographs of pos-sible species.
110
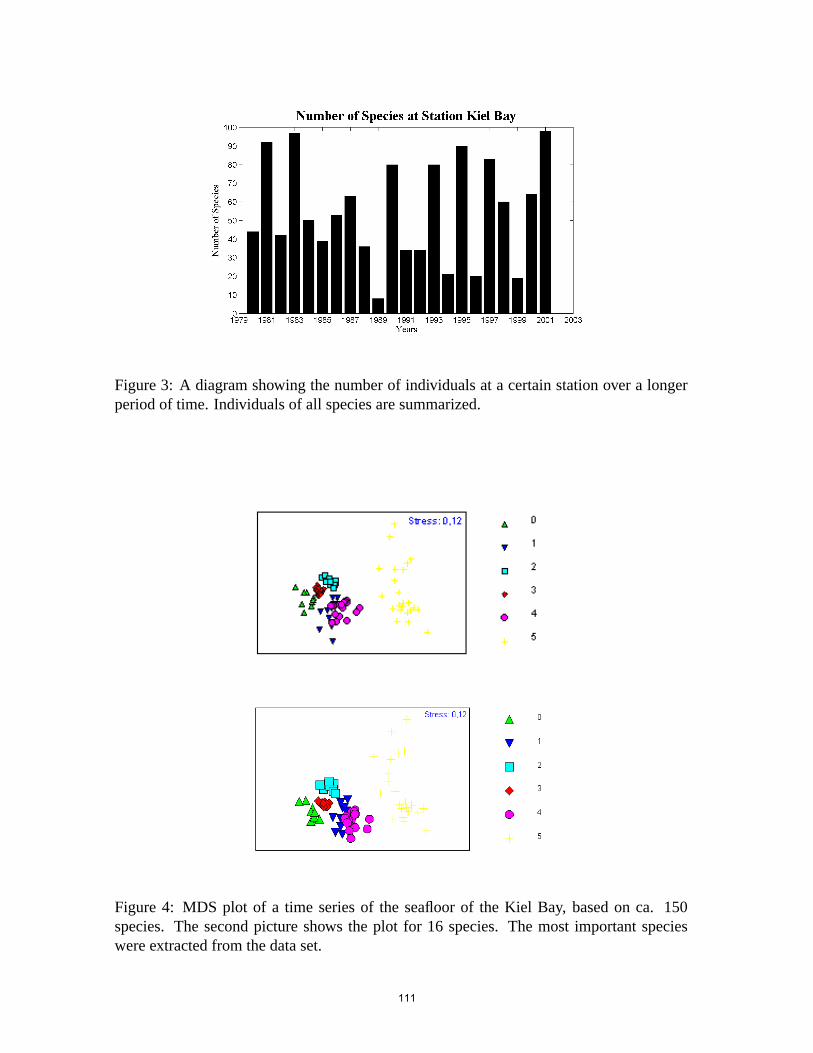
Figure 3: A diagram showing the number of individuals at a certain station over a longerperiod of time. Individuals of all species are summarized.
Figure 4: MDS plot of a time series of the seafloor of the Kiel Bay, based on ca. 150species. The second picture shows the plot for 16 species. The most important specieswere extracted from the data set.
111
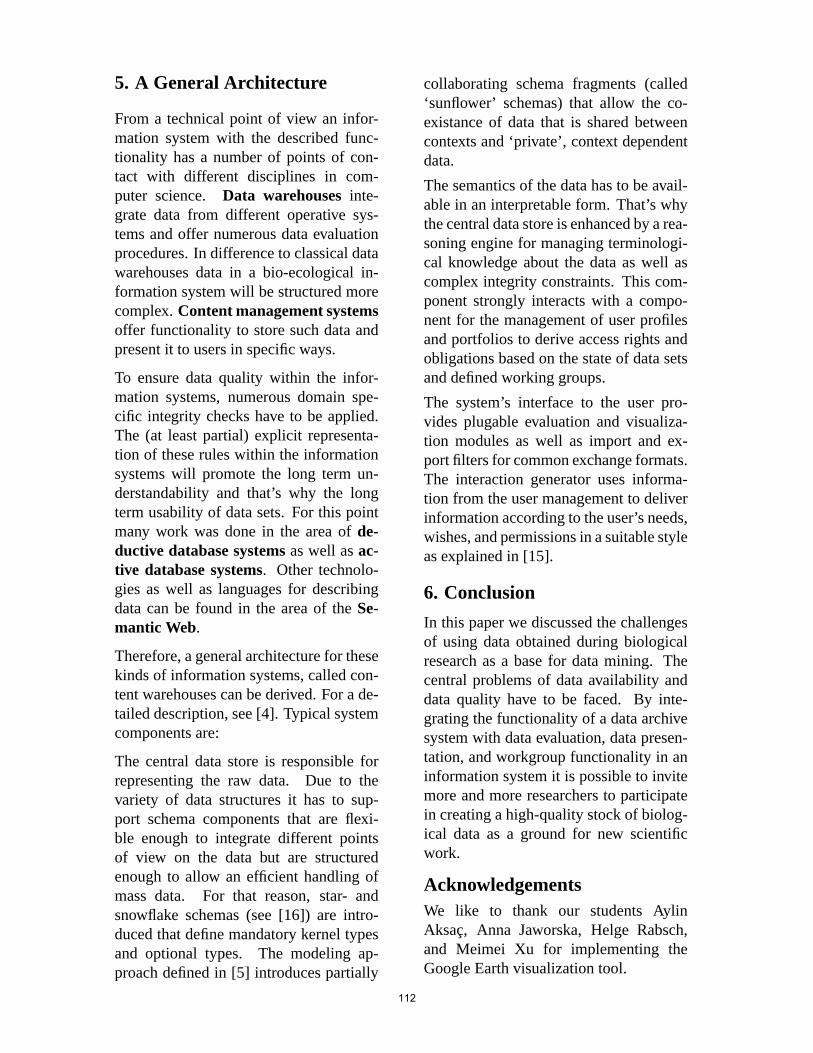
5. A General Architecture
From a technical point of view an infor-mation system with the described func-tionality has a number of points of con-tact with different disciplines in com-puter science. Data warehousesinte-grate data from different operative sys-tems and offer numerous data evaluationprocedures. In difference to classical datawarehouses data in a bio-ecological in-formation system will be structured morecomplex.Content management systemsoffer functionality to store such data andpresent it to users in specific ways.
To ensure data quality within the infor-mation systems, numerous domain spe-cific integrity checks have to be applied.The (at least partial) explicit representa-tion of these rules within the informationsystems will promote the long term un-derstandability and that’s why the longterm usability of data sets. For this pointmany work was done in the area ofde-ductive database systemsas well asac-tive database systems. Other technolo-gies as well as languages for describingdata can be found in the area of theSe-mantic Web.
Therefore, a general architecture for thesekinds of information systems, called con-tent warehouses can be derived. For a de-tailed description, see [4]. Typical systemcomponents are:
The central data store is responsible forrepresenting the raw data. Due to thevariety of data structures it has to sup-port schema components that are flexi-ble enough to integrate different pointsof view on the data but are structuredenough to allow an efficient handling ofmass data. For that reason, star- andsnowflake schemas (see [16]) are intro-duced that define mandatory kernel typesand optional types. The modeling ap-proach defined in [5] introduces partially
collaborating schema fragments (called‘sunflower’ schemas) that allow the co-existance of data that is shared betweencontexts and ‘private’, context dependentdata.
The semantics of the data has to be avail-able in an interpretable form. That’s whythe central data store is enhanced by a rea-soning engine for managing terminologi-cal knowledge about the data as well ascomplex integrity constraints. This com-ponent strongly interacts with a compo-nent for the management of user profilesand portfolios to derive access rights andobligations based on the state of data setsand defined working groups.
The system’s interface to the user pro-vides plugable evaluation and visualiza-tion modules as well as import and ex-port filters for common exchange formats.The interaction generator uses informa-tion from the user management to deliverinformation according to the user’s needs,wishes, and permissions in a suitable styleas explained in [15].
6. Conclusion
In this paper we discussed the challengesof using data obtained during biologicalresearch as a base for data mining. Thecentral problems of data availability anddata quality have to be faced. By inte-grating the functionality of a data archivesystem with data evaluation, data presen-tation, and workgroup functionality in aninformation system it is possible to invitemore and more researchers to participatein creating a high-quality stock of biolog-ical data as a ground for new scientificwork.
AcknowledgementsWe like to thank our students AylinAksac, Anna Jaworska, Helge Rabsch,and Meimei Xu for implementing theGoogle Earth visualization tool.
112
References
[1] A. Borja, J. Franco, and V. Perez. AMarine Biotic Index to Establish theEcological Quality of Soft-BottomBenthos within European Estuarineand Coastal Environments.MarinePollution Bulletin, 40:1100–1114,2000.
[2] J.R. Bray and J.T. Curtis. An ordi-nation of upland forest communitiesof southern Wisconsin.EcologicalMonographs, 27:325–349, 1957.
[3] K.R. Clark and R.M. Warwick. Ataxonomical distinctness index andits statistical properties. Journalof Applied Ecology, 35:523–531,1998.
[4] G. Fiedler, A. Czerniak, D. Fleis-cher, H. Rumohr, M. Spindler,and B. Thalheim. Content Ware-houses. Preprint 0605, Departmentof Computer Science, Kiel Univer-sity, March 2006.
[5] G. Fiedler, Th. Raak, and B. Thal-heim. Database Collaboration In-stead of Integration. In Sven Hart-mann and Markus Stumptner, edi-tors,APCCM, volume 43 ofConfer-ences in Research and Practice inInformation Technology. AustralianComputer Society Inc., 2005.
[6] Darwin Core Exchange Format.http://darwincore.calacademy.org/.
[7] Google, Inc. Google Earth(http://earth.google.com).
[8] Taxonomic Databases WorkingGroup. http://www.tdwg.org/, 2006.
[9] T. Kruscha, B. Briel, G. Fiedler,K. Jannaschk, Th. Raak, andB. Thalheim. Integratives HMI-Warehouse fur einen durchgangigen
HMI-Entwicklungsprozess. In VDI,editor, Elektronik im Kraftfahrzeug2005. 12. Internationaler KongressElectronic Systems for Vehicles,number 1907 in VDI-Berichte.VDI, VDI-Verlag, 2005.
[10] E.C. Pielou. The measurement of di-versity in different types of biologi-cal collections.Journal of Theoreti-cal Biology, 13:131–144, 1966.
[11] R. Rosenberg, M. Blomqvist,H. Nilsson, H. Cederwall, andA. Dimming. Marine quality as-sessment by use of benthic speciesabundance distribution: a proposednew protocol within the EuropeanUnion Water Framework Direc-tive. Marine Pollution Bulletin,49:728–739, 2004.
[12] C. E. Shannon and W. Weaver.TheMathematical Theory of Communi-cation. University of Illinois Press,1963.
[13] E.H. Simpson. Measure of diversity.Nature, 163:pp 688, 1949.
[14] B. Thalheim. Entity-relationshipmodeling – Foundations of databasetechnology. Springer, Berlin, 2000.See also http://www.informatik.tu-cottbus.de/∼thalheim/HERM.htm.
[15] B. Thalheim. Co-Design of Struc-turing, Functionality, Distribution,and Interactivity of Large Informa-tion Systems. Technical Report15/03, Brandenburg University ofTechnology at Cottbus, 2003.
[16] B. Thalheim. Component de-velopment and construction fordatabase design.Data Knowl. Eng.,54(1):77–95, 2005.
113
Personalized information filteringfor mobile applications
Christian Reuschling and Sandra ZillesDFKI GmbH
Erwin-Schrodinger-Str. 5767663 Kaiserslautern, Germany
christian.reuschling,[email protected]
AbstractRecent technological development has enhanced research inthe field of pervasive computing for mobileapplications. In particular, topics like ad-hoc communitybuilding and personalized contextual productoffers are of relevance for cellular radio providers. In this context, we propose a generic approach topersonalized information filtering.This concerns first an appropriate representation scheme for the application domain, the user, as wellas the information to be filtered. Here we propose to model thedomain in an ontology with specialweight attributes in RDFS, such that personal interests or resources (e. g., product descriptions) can berepresented as RDF instances of this ontology.Using case based reasoning techniques, we second propose animplementation of a similarity measurebetween such instances. On the one hand, given a special domain model, this similarity measure allowsfor filtering a list of resources according to a person’s interests in a way immediately suitable for theintended applications; on the other hand, this similarity measure is defined generally enough to allow forthe comparison of RDF instances in general, with different specialized similarity measures depending onthe intended semantics of similarity.Third, in addition, the problem of how to maintain representations of user interests and resourcedescriptions in a dynamic domain is addressed briefly.
1. Introduction
Recent technological development, such asconcerning UMTS and smartphones, hasenhanced research in the field of perva-sive computing for mobile applications. Inparticular, topics like socializing, ad-hoccommunity building, entertainment on de-mand, and personalized contextual productoffers are of relevance for cellular radioproviders and for the corresponding thirdparty providers. What many products cel-lular radio providers aim at have in commonis the fact that they implement
• a model for representation of the user,
• a model for representation of a user’scontext1,
1i. e., additional constraints describing the currentsituation of a user’s fluently changing environment
• a model for representation of avail-able information or resources (e. g.,products, entertainment offers, otherusers2),
• a scenario for filtering and recommen-dation of information or resources,
• a process for content acquisition (in-cluding maintenance of the informationrepresented).
Here the main difference compared to clas-sical, non-mobile applications is the focuson the user’s context, in particular, e. g., hercurrent location, the current daytime, currentand/or previous tasks, active applicationsand services, etc., cf. [15, 9, 14]. Roughly
2Note that users themselves can be resources, forinstance, in applications focusing on socializing sce-narios.
114
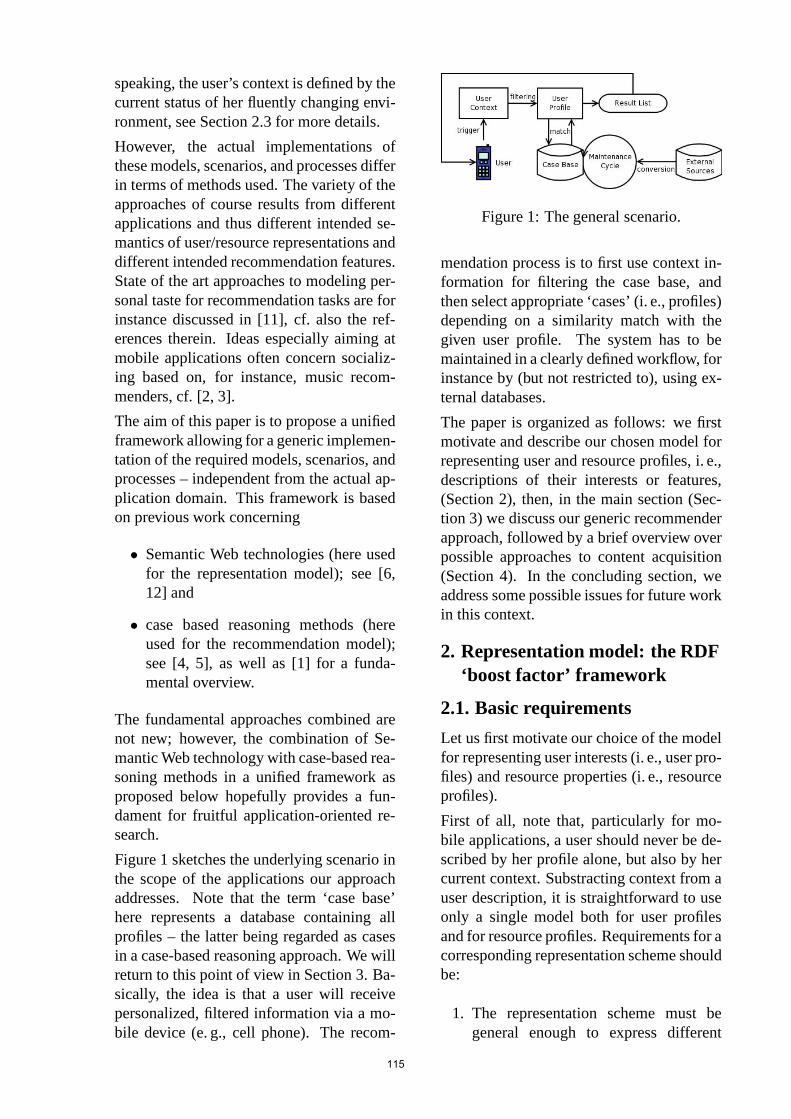
speaking, the user’s context is defined by thecurrent status of her fluently changing envi-ronment, see Section 2.3 for more details.
However, the actual implementations ofthese models, scenarios, and processes differin terms of methods used. The variety of theapproaches of course results from differentapplications and thus different intended se-mantics of user/resource representations anddifferent intended recommendation features.State of the art approaches to modeling per-sonal taste for recommendation tasks are forinstance discussed in [11], cf. also the ref-erences therein. Ideas especially aiming atmobile applications often concern socializ-ing based on, for instance, music recom-menders, cf. [2, 3].
The aim of this paper is to propose a unifiedframework allowing for a generic implemen-tation of the required models, scenarios, andprocesses – independent from the actual ap-plication domain. This framework is basedon previous work concerning
• Semantic Web technologies (here usedfor the representation model); see [6,12] and
• case based reasoning methods (hereused for the recommendation model);see [4, 5], as well as [1] for a funda-mental overview.
The fundamental approaches combined arenot new; however, the combination of Se-mantic Web technology with case-based rea-soning methods in a unified framework asproposed below hopefully provides a fun-dament for fruitful application-oriented re-search.
Figure 1 sketches the underlying scenario inthe scope of the applications our approachaddresses. Note that the term ‘case base’here represents a database containing allprofiles – the latter being regarded as casesin a case-based reasoning approach. We willreturn to this point of view in Section 3. Ba-sically, the idea is that a user will receivepersonalized, filtered information via a mo-bile device (e. g., cell phone). The recom-
Figure 1: The general scenario.
mendation process is to first use context in-formation for filtering the case base, andthen select appropriate ‘cases’ (i. e., profiles)depending on a similarity match with thegiven user profile. The system has to bemaintained in a clearly defined workflow, forinstance by (but not restricted to), using ex-ternal databases.
The paper is organized as follows: we firstmotivate and describe our chosen model forrepresenting user and resource profiles, i. e.,descriptions of their interests or features,(Section 2), then, in the main section (Sec-tion 3) we discuss our generic recommenderapproach, followed by a brief overview overpossible approaches to content acquisition(Section 4). In the concluding section, weaddress some possible issues for future workin this context.
2. Representation model: the RDF‘boost factor’ framework
2.1. Basic requirements
Let us first motivate our choice of the modelfor representing user interests (i. e., user pro-files) and resource properties (i. e., resourceprofiles).
First of all, note that, particularly for mo-bile applications, a user should never be de-scribed by her profile alone, but also by hercurrent context. Substracting context from auser description, it is straightforward to useonly a single model both for user profilesand for resource profiles. Requirements for acorresponding representation scheme shouldbe:
1. The representation scheme must begeneral enough to express different
115

kinds of real-world concepts and theirrelations. In particular it must provideoptions for
(a) representing taxonomies of con-cepts (in order to allow for properrecommendations of specializedto generalized profiles and viceversa),
(b) representing the amount of userinterest in each of the real-worldconcepts (in order to allow formore specially personalized rec-ommendations),
(c) transferring user or resource pro-files from (publicly) availabledatabases into the predefined rep-resentation scheme (in order to al-low for content acquisition in arecommender system),
(d) modifying a given domain modelas well as the profiles (in order toallow for reflecting the changes ina dynamic application domain).
2. The representation scheme must bespecialized enough to be suitable for ef-ficient content acquisition and recom-mendation. In particular, it must allowfor
(a) an efficient extraction and trans-formation of external data,
(b) an efficientcomputation of simi-larities between profiles (in orderto determine recommendations),
(c) efficientprofile generation and up-date tools.
In particular, the need for feasible contentacquisition methods suggests using stan-dards in the basic representation scheme.Moreover, basing on the requirement forrepresenting taxonomies (profiles expresssome special interests or features of a col-lection of – maybe inter-related – conceptsin the application domain), we chose anontology-based approach for representation.That means, concepts of the domain are
modeled in an ontology, using a represen-tation scheme expressive enough for repre-senting taxonomies, whereas user and re-source profiles are instances of this ontology(respecting some particular features, as willbe explained in Subsection 2.2).
Currently, there are several standards for on-tology representation schemes, e. g., RDFS,OWL (OWL Full and restrictions OWL DLand OWL Lite), etc., see also [17, 16]. Onthe one hand, a language like OWL Full isvery expressive, but on the other hand, thisexpressiveness entails high costs in the tasksresulting from our requirements. There-fore a first reasonable step towards a genericframework for recommender systems is tochoose RDFS/RDF for modeling the domainontology and the profiles (as instances).
Note that an additional benefit from usingRDF might be that RDF is the language ofthe Semantic Web, where many users ex-press their personal interests within a net oflinked RDF resources. This may entail fur-ther options for extracting contents for a rec-ommender system.
Moreover, the quite simple structure ofRDFS may have usability benefits; for real-world applications it would be rather incon-venient to model in OWL Full.
2.2. From general RDF to interestprofiles
So we propose to model the application do-main in an RDFS ontology; profiles are in-stances of the latter. However, some detailedrequirements have to be taken into account,in order to use RDF specifically for repre-senting interest profiles. These detailed re-quirements concern
1. the attribute types considered,
2. attributes for user rating in interest pro-files,
3. degrees of relationships between con-cepts in the ontology.
116
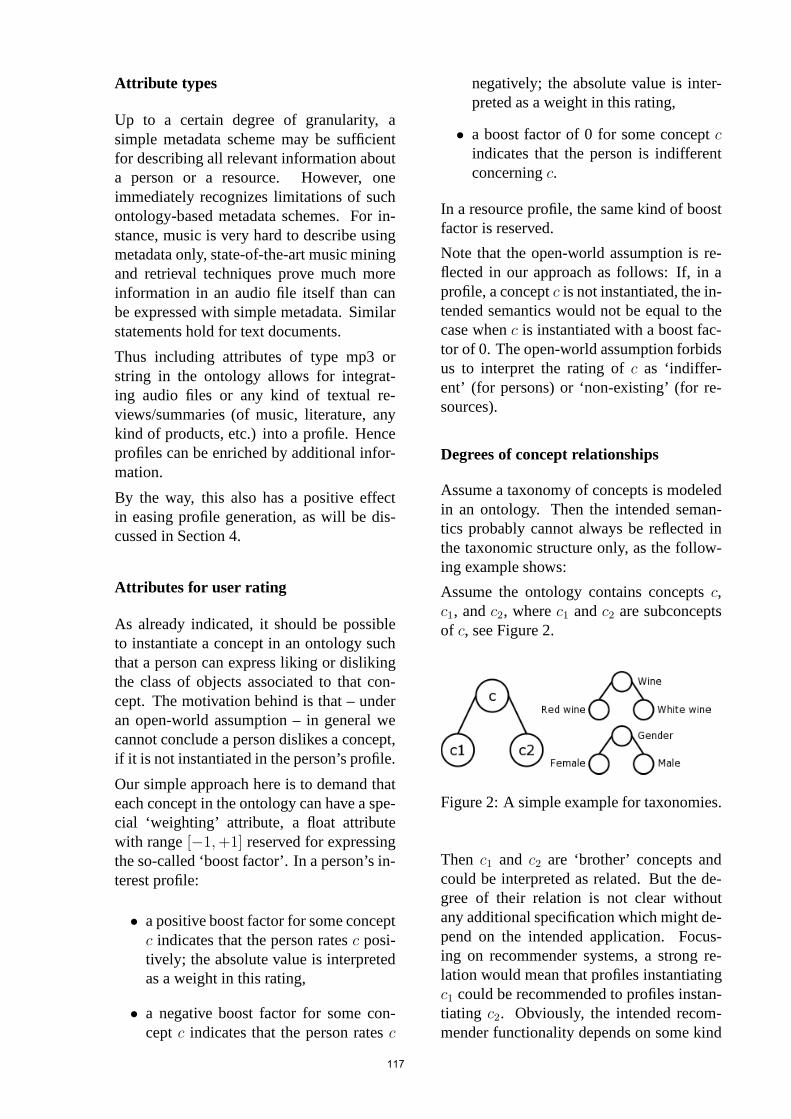
Attribute types
Up to a certain degree of granularity, asimple metadata scheme may be sufficientfor describing all relevant information abouta person or a resource. However, oneimmediately recognizes limitations of suchontology-based metadata schemes. For in-stance, music is very hard to describe usingmetadata only, state-of-the-art music miningand retrieval techniques prove much moreinformation in an audio file itself than canbe expressed with simple metadata. Similarstatements hold for text documents.
Thus including attributes of type mp3 orstring in the ontology allows for integrat-ing audio files or any kind of textual re-views/summaries (of music, literature, anykind of products, etc.) into a profile. Henceprofiles can be enriched by additional infor-mation.
By the way, this also has a positive effectin easing profile generation, as will be dis-cussed in Section 4.
Attributes for user rating
As already indicated, it should be possibleto instantiate a concept in an ontology suchthat a person can express liking or dislikingthe class of objects associated to that con-cept. The motivation behind is that – underan open-world assumption – in general wecannot conclude a person dislikes a concept,if it is not instantiated in the person’s profile.
Our simple approach here is to demand thateach concept in the ontology can have a spe-cial ‘weighting’ attribute, a float attributewith range[−1, +1] reserved for expressingthe so-called ‘boost factor’. In a person’s in-terest profile:
• a positive boost factor for some conceptc indicates that the person ratesc posi-tively; the absolute value is interpretedas a weight in this rating,
• a negative boost factor for some con-ceptc indicates that the person ratesc
negatively; the absolute value is inter-preted as a weight in this rating,
• a boost factor of 0 for some conceptc
indicates that the person is indifferentconcerningc.
In a resource profile, the same kind of boostfactor is reserved.
Note that the open-world assumption is re-flected in our approach as follows: If, in aprofile, a conceptc is not instantiated, the in-tended semantics would not be equal to thecase whenc is instantiated with a boost fac-tor of 0. The open-world assumption forbidsus to interpret the rating ofc as ‘indiffer-ent’ (for persons) or ‘non-existing’ (for re-sources).
Degrees of concept relationships
Assume a taxonomy of concepts is modeledin an ontology. Then the intended seman-tics probably cannot always be reflected inthe taxonomic structure only, as the follow-ing example shows:
Assume the ontology contains conceptsc,c1, andc2, wherec1 andc2 are subconceptsof c, see Figure 2.
Figure 2: A simple example for taxonomies.
Then c1 and c2 are ‘brother’ concepts andcould be interpreted as related. But the de-gree of their relation is not clear withoutany additional specification which might de-pend on the intended application. Focus-ing on recommender systems, a strong re-lation would mean that profiles instantiatingc1 could be recommended to profiles instan-tiating c2. Obviously, the intended recom-mender functionality depends on some kind
117
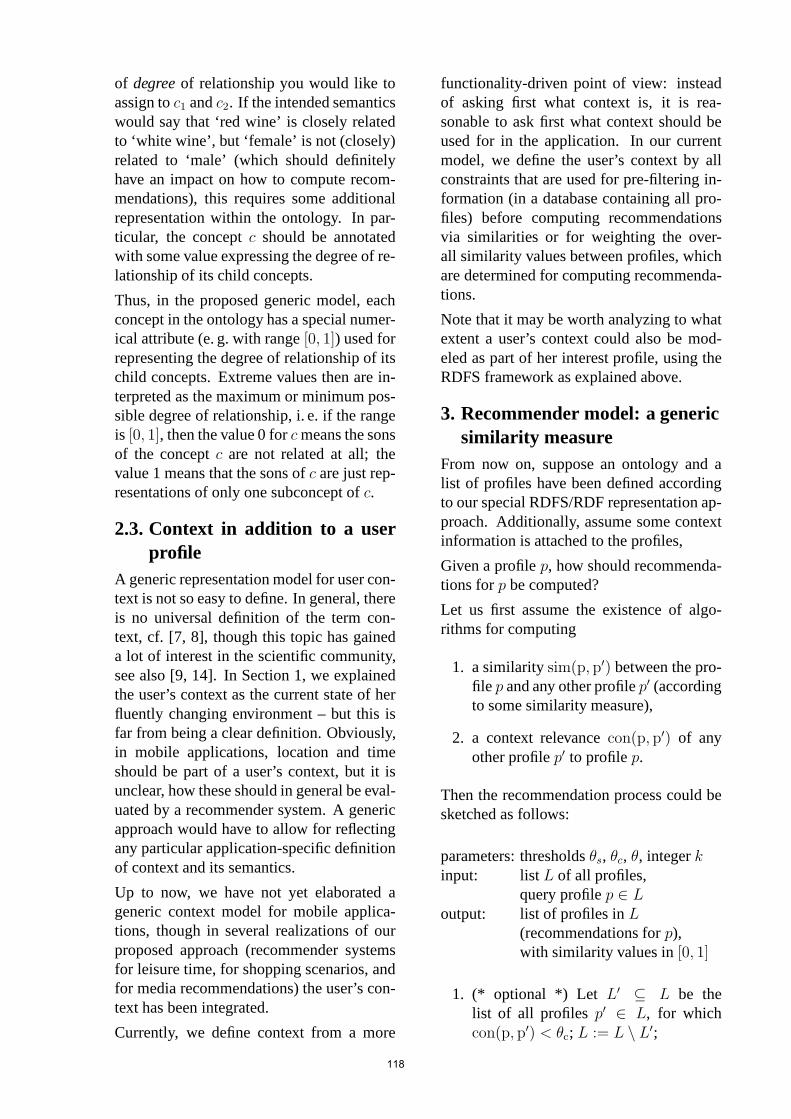
of degreeof relationship you would like toassign toc1 andc2. If the intended semanticswould say that ‘red wine’ is closely relatedto ‘white wine’, but ‘female’ is not (closely)related to ‘male’ (which should definitelyhave an impact on how to compute recom-mendations), this requires some additionalrepresentation within the ontology. In par-ticular, the conceptc should be annotatedwith some value expressing the degree of re-lationship of its child concepts.
Thus, in the proposed generic model, eachconcept in the ontology has a special numer-ical attribute (e. g. with range[0, 1]) used forrepresenting the degree of relationship of itschild concepts. Extreme values then are in-terpreted as the maximum or minimum pos-sible degree of relationship, i. e. if the rangeis [0, 1], then the value 0 forc means the sonsof the conceptc are not related at all; thevalue 1 means that the sons ofc are just rep-resentations of only one subconcept ofc.
2.3. Context in addition to a userprofile
A generic representation model for user con-text is not so easy to define. In general, thereis no universal definition of the term con-text, cf. [7, 8], though this topic has gaineda lot of interest in the scientific community,see also [9, 14]. In Section 1, we explainedthe user’s context as the current state of herfluently changing environment – but this isfar from being a clear definition. Obviously,in mobile applications, location and timeshould be part of a user’s context, but it isunclear, how these should in general be eval-uated by a recommender system. A genericapproach would have to allow for reflectingany particular application-specific definitionof context and its semantics.
Up to now, we have not yet elaborated ageneric context model for mobile applica-tions, though in several realizations of ourproposed approach (recommender systemsfor leisure time, for shopping scenarios, andfor media recommendations) the user’s con-text has been integrated.
Currently, we define context from a more
functionality-driven point of view: insteadof asking first what context is, it is rea-sonable to ask first what context should beused for in the application. In our currentmodel, we define the user’s context by allconstraints that are used for pre-filtering in-formation (in a database containing all pro-files) before computing recommendationsvia similarities or for weighting the over-all similarity values between profiles, whichare determined for computing recommenda-tions.
Note that it may be worth analyzing to whatextent a user’s context could also be mod-eled as part of her interest profile, using theRDFS framework as explained above.
3. Recommender model: a genericsimilarity measure
From now on, suppose an ontology and alist of profiles have been defined accordingto our special RDFS/RDF representation ap-proach. Additionally, assume some contextinformation is attached to the profiles,
Given a profilep, how should recommenda-tions forp be computed?
Let us first assume the existence of algo-rithms for computing
1. a similaritysim(p, p′) between the pro-file p and any other profilep′ (accordingto some similarity measure),
2. a context relevancecon(p, p′) of anyother profilep′ to profilep.
Then the recommendation process could besketched as follows:
parameters: thresholdsθs, θc, θ, integerkinput: listL of all profiles,
query profilep ∈ L
output: list of profiles inL(recommendations forp),with similarity values in[0, 1]
1. (* optional *) Let L′ ⊆ L be thelist of all profiles p′ ∈ L, for whichcon(p, p′) < θc; L := L \ L′;
118

2. (* options: a, b, c, d *)
(a) For all profiles p′ ∈ L
with sim(p, p′) ≥ θs, return(p′, sim(p, p′).
(b) For all profiles p′ ∈ L withsim(p, p′) · con(p, p′) ≥ θ, return(p′, sim(p, p′) · con(p, p′).
(c) Return (p1, sim(p, p1)), . . .,(pk, sim(p, pk)), for profilesp1, . . . , pk ∈ L, such thatsim(p, pi) ≥ sim(p, p′) for alli ∈ 1, . . . , k and all profilesp′ ∈ L.
(d) Return (p1, sim(p, p1) ·con(p, p1)), . . ., (pk, sim(p, pk) ·con(p, pk)), for profilesp1, . . . , pk ∈ L, such thatsim(p, pi) · con(p, pi) ≥sim(p, p′) · con(p, p′) for alli ∈ 1, . . . , k and all profilesp′ ∈ L.
In other words, one usually recommends ei-ther all resources with a minimum similar-ity or just k resources with highest similar-ity. The context relevance may be used forpre-filtering and/or as a weight for the over-all similarity.
So a generic framework requires a definitionof a suitable similarity measure, and thus ageneric algorithm for matching RDF files.We propose a matching algorithm whichshould be a fixed component in any con-crete application task, such that, with eachnew application, it remains only to define anew ontology and a new context model (thelatter including definitions of how to com-pute context relevance values). That means,the matching algorithm proposed is generic;its parameters are the ontology and the algo-rithm for computing the context relevance.Basically, the desired similarity measure isimplemented in this matching algorithm inthe sense that the latter compares two pro-files and returns a similarity value in[0, 1].
Requirements for such a similarity mea-sure should concern local similarities, whichmust be defined for all relevant attributes, aswell as the global (overall) similarity.
Local similarity
Concerning local similarities, there is a needfor different type-specific similarity mea-sures, e. g., for audio files of the types oc-curring in the ontology, for html documents,for general string values, and for numericalvalues. Here different similarities must bedefined for different intended semantics ofcertain attributes:
Two stringss, s′ can have a similarity de-fined by
1. 0, if s 6= s′ and 1, ifs = s′; or
2. 1 − l(s, s′), wherel(s, s′) is the Leven-shtein distance ofs ands′ (normalizedin the interval[0, 1]), cf. [10]; or
3. ...
Two numerical valuesr, r′ can have a simi-larity defined by
1. 1−d, whered is their absolute distance(normalized in the interval[0, 1]); or
2. 0, if r 6= r′ and 1, ifr = r′; or
3. 0, if r < r′ and 1, ifr ≥ r′; or
4. 0, if r > r′ and 1, ifr ≤ r′; or
5. ...
Similar variants are conceivable for differenttypes of attributes.
Note that each variant of a local similar-ity measure goes along with different in-tended semantics of the corresponding at-tribute. Consequently, this has to be ex-pressed by formally different types of stringattributes or different types of numerical at-tributes in the ontology.
The need for these different semantics is ob-vious: If, for instance, a numerical attributerepresents a production year of a movie auser is interested in, then the local similar-ity for this attribute should be defined usingtheir absolute distance, since the user maypresumably like movies from that time, butnot only from that year. The intended local
119
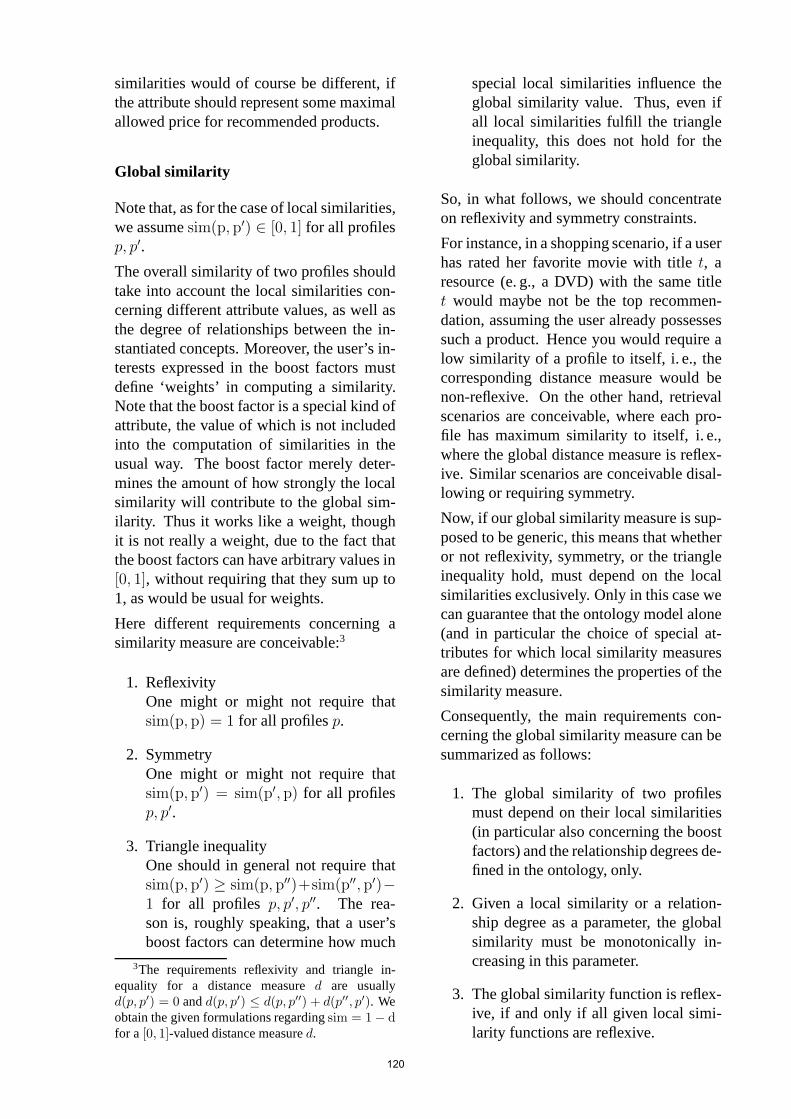
similarities would of course be different, ifthe attribute should represent some maximalallowed price for recommended products.
Global similarity
Note that, as for the case of local similarities,we assumesim(p, p′) ∈ [0, 1] for all profilesp, p′.
The overall similarity of two profiles shouldtake into account the local similarities con-cerning different attribute values, as well asthe degree of relationships between the in-stantiated concepts. Moreover, the user’s in-terests expressed in the boost factors mustdefine ‘weights’ in computing a similarity.Note that the boost factor is a special kind ofattribute, the value of which is not includedinto the computation of similarities in theusual way. The boost factor merely deter-mines the amount of how strongly the localsimilarity will contribute to the global sim-ilarity. Thus it works like a weight, thoughit is not really a weight, due to the fact thatthe boost factors can have arbitrary values in[0, 1], without requiring that they sum up to1, as would be usual for weights.
Here different requirements concerning asimilarity measure are conceivable:3
1. ReflexivityOne might or might not require thatsim(p, p) = 1 for all profilesp.
2. SymmetryOne might or might not require thatsim(p, p′) = sim(p′, p) for all profilesp, p′.
3. Triangle inequalityOne should in general not require thatsim(p, p′) ≥ sim(p, p′′)+sim(p′′, p′)−1 for all profiles p, p′, p′′. The rea-son is, roughly speaking, that a user’sboost factors can determine how much
3The requirements reflexivity and triangle in-equality for a distance measured are usuallyd(p, p′) = 0 andd(p, p′) ≤ d(p, p′′) + d(p′′, p′). Weobtain the given formulations regardingsim = 1 − dfor a [0, 1]-valued distance measured.
special local similarities influence theglobal similarity value. Thus, even ifall local similarities fulfill the triangleinequality, this does not hold for theglobal similarity.
So, in what follows, we should concentrateon reflexivity and symmetry constraints.
For instance, in a shopping scenario, if a userhas rated her favorite movie with titlet, aresource (e. g., a DVD) with the same titlet would maybe not be the top recommen-dation, assuming the user already possessessuch a product. Hence you would require alow similarity of a profile to itself, i. e., thecorresponding distance measure would benon-reflexive. On the other hand, retrievalscenarios are conceivable, where each pro-file has maximum similarity to itself, i. e.,where the global distance measure is reflex-ive. Similar scenarios are conceivable disal-lowing or requiring symmetry.
Now, if our global similarity measure is sup-posed to be generic, this means that whetheror not reflexivity, symmetry, or the triangleinequality hold, must depend on the localsimilarities exclusively. Only in this case wecan guarantee that the ontology model alone(and in particular the choice of special at-tributes for which local similarity measuresare defined) determines the properties of thesimilarity measure.
Consequently, the main requirements con-cerning the global similarity measure can besummarized as follows:
1. The global similarity of two profilesmust depend on their local similarities(in particular also concerning the boostfactors) and the relationship degrees de-fined in the ontology, only.
2. Given a local similarity or a relation-ship degree as a parameter, the globalsimilarity must be monotonically in-creasing in this parameter.
3. The global similarity function is reflex-ive, if and only if all given local simi-larity functions are reflexive.
120
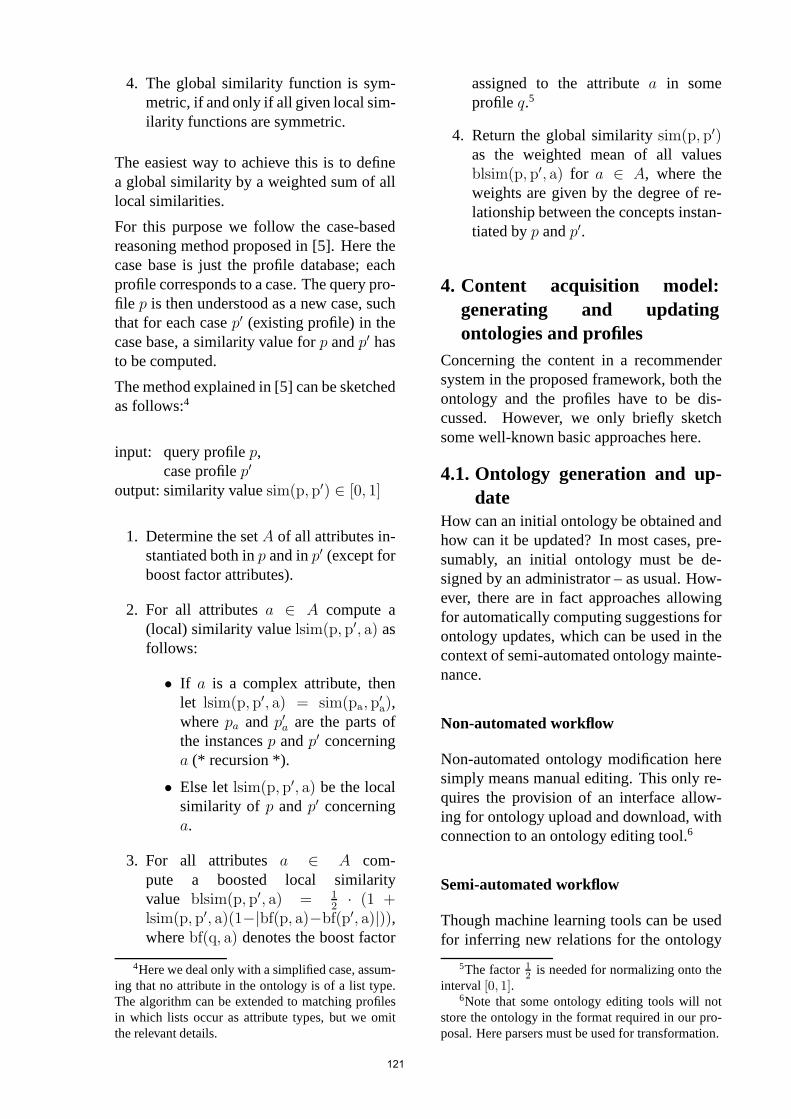
4. The global similarity function is sym-metric, if and only if all given local sim-ilarity functions are symmetric.
The easiest way to achieve this is to definea global similarity by a weighted sum of alllocal similarities.
For this purpose we follow the case-basedreasoning method proposed in [5]. Here thecase base is just the profile database; eachprofile corresponds to a case. The query pro-file p is then understood as a new case, suchthat for each casep′ (existing profile) in thecase base, a similarity value forp andp′ hasto be computed.
The method explained in [5] can be sketchedas follows:4
input: query profilep,case profilep′
output: similarity valuesim(p, p′) ∈ [0, 1]
1. Determine the setA of all attributes in-stantiated both inp and inp′ (except forboost factor attributes).
2. For all attributesa ∈ A compute a(local) similarity valuelsim(p, p′, a) asfollows:
• If a is a complex attribute, thenlet lsim(p, p′, a) = sim(pa, p
′
a),wherepa and p′
aare the parts of
the instancesp andp′ concerninga (* recursion *).
• Else letlsim(p, p′, a) be the localsimilarity of p andp′ concerninga.
3. For all attributes a ∈ A com-pute a boosted local similarityvalue blsim(p, p′, a) = 1
2· (1 +
lsim(p, p′, a)(1−|bf(p, a)−bf(p′, a)|)),wherebf(q, a) denotes the boost factor
4Here we deal only with a simplified case, assum-ing that no attribute in the ontology is of a list type.The algorithm can be extended to matching profilesin which lists occur as attribute types, but we omitthe relevant details.
assigned to the attributea in someprofile q.5
4. Return the global similaritysim(p, p′)as the weighted mean of all valuesblsim(p, p′, a) for a ∈ A, where theweights are given by the degree of re-lationship between the concepts instan-tiated byp andp′.
4. Content acquisition model:generating and updatingontologies and profiles
Concerning the content in a recommendersystem in the proposed framework, both theontology and the profiles have to be dis-cussed. However, we only briefly sketchsome well-known basic approaches here.
4.1. Ontology generation and up-date
How can an initial ontology be obtained andhow can it be updated? In most cases, pre-sumably, an initial ontology must be de-signed by an administrator – as usual. How-ever, there are in fact approaches allowingfor automatically computing suggestions forontology updates, which can be used in thecontext of semi-automated ontology mainte-nance.
Non-automated workflow
Non-automated ontology modification heresimply means manual editing. This only re-quires the provision of an interface allow-ing for ontology upload and download, withconnection to an ontology editing tool.6
Semi-automated workflow
Though machine learning tools can be usedfor inferring new relations for the ontology
5The factor12
is needed for normalizing onto theinterval[0, 1].
6Note that some ontology editing tools will notstore the ontology in the format required in our pro-posal. Here parsers must be used for transformation.
121
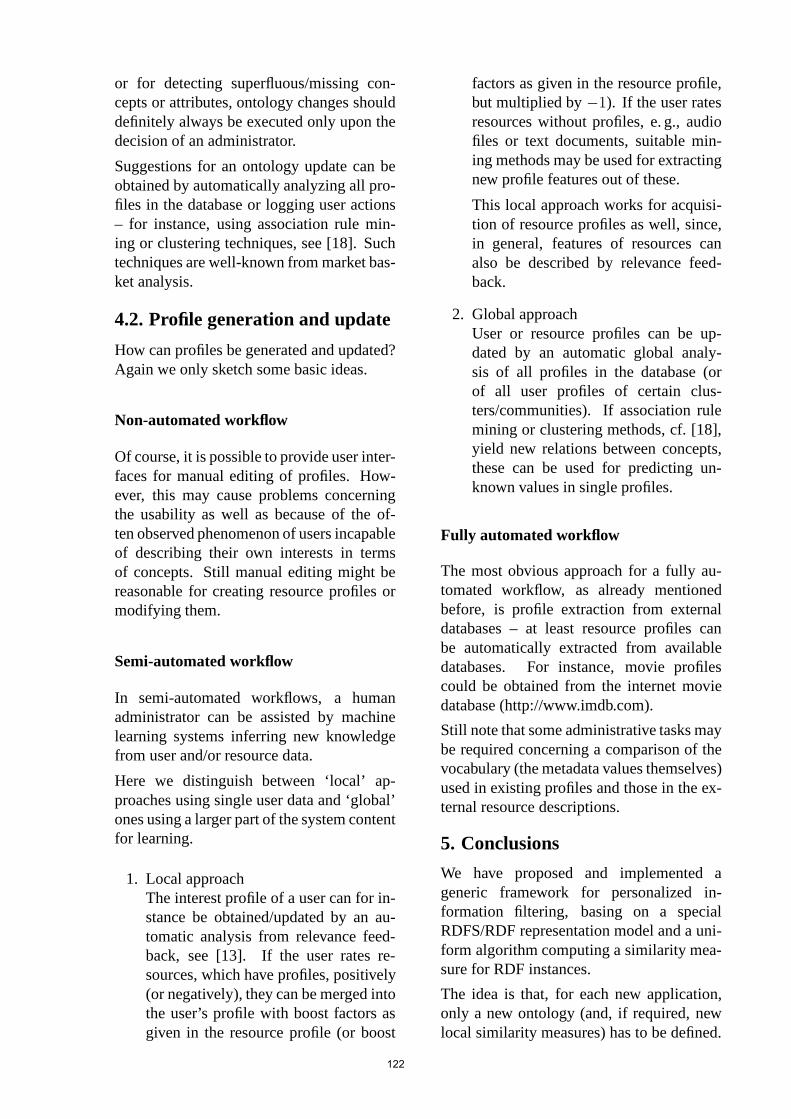
or for detecting superfluous/missing con-cepts or attributes, ontology changes shoulddefinitely always be executed only upon thedecision of an administrator.
Suggestions for an ontology update can beobtained by automatically analyzing all pro-files in the database or logging user actions– for instance, using association rule min-ing or clustering techniques, see [18]. Suchtechniques are well-known from market bas-ket analysis.
4.2. Profile generation and update
How can profiles be generated and updated?Again we only sketch some basic ideas.
Non-automated workflow
Of course, it is possible to provide user inter-faces for manual editing of profiles. How-ever, this may cause problems concerningthe usability as well as because of the of-ten observed phenomenon of users incapableof describing their own interests in termsof concepts. Still manual editing might bereasonable for creating resource profiles ormodifying them.
Semi-automated workflow
In semi-automated workflows, a humanadministrator can be assisted by machinelearning systems inferring new knowledgefrom user and/or resource data.
Here we distinguish between ‘local’ ap-proaches using single user data and ‘global’ones using a larger part of the system contentfor learning.
1. Local approachThe interest profile of a user can for in-stance be obtained/updated by an au-tomatic analysis from relevance feed-back, see [13]. If the user rates re-sources, which have profiles, positively(or negatively), they can be merged intothe user’s profile with boost factors asgiven in the resource profile (or boost
factors as given in the resource profile,but multiplied by−1). If the user ratesresources without profiles, e. g., audiofiles or text documents, suitable min-ing methods may be used for extractingnew profile features out of these.
This local approach works for acquisi-tion of resource profiles as well, since,in general, features of resources canalso be described by relevance feed-back.
2. Global approachUser or resource profiles can be up-dated by an automatic global analy-sis of all profiles in the database (orof all user profiles of certain clus-ters/communities). If association rulemining or clustering methods, cf. [18],yield new relations between concepts,these can be used for predicting un-known values in single profiles.
Fully automated workflow
The most obvious approach for a fully au-tomated workflow, as already mentionedbefore, is profile extraction from externaldatabases – at least resource profiles canbe automatically extracted from availabledatabases. For instance, movie profilescould be obtained from the internet moviedatabase (http://www.imdb.com).
Still note that some administrative tasks maybe required concerning a comparison of thevocabulary (the metadata values themselves)used in existing profiles and those in the ex-ternal resource descriptions.
5. Conclusions
We have proposed and implemented ageneric framework for personalized in-formation filtering, basing on a specialRDFS/RDF representation model and a uni-form algorithm computing a similarity mea-sure for RDF instances.
The idea is that, for each new application,only a new ontology (and, if required, newlocal similarity measures) has to be defined.
122
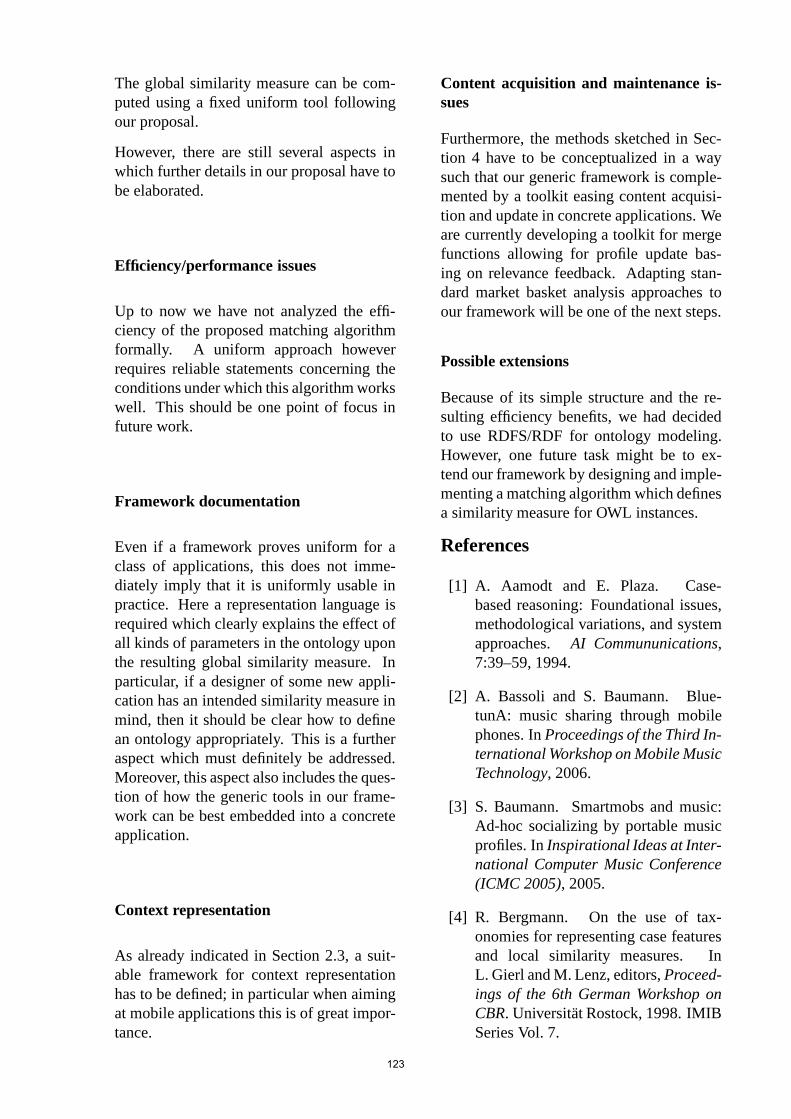
The global similarity measure can be com-puted using a fixed uniform tool followingour proposal.
However, there are still several aspects inwhich further details in our proposal have tobe elaborated.
Efficiency/performance issues
Up to now we have not analyzed the effi-ciency of the proposed matching algorithmformally. A uniform approach howeverrequires reliable statements concerning theconditions under which this algorithm workswell. This should be one point of focus infuture work.
Framework documentation
Even if a framework proves uniform for aclass of applications, this does not imme-diately imply that it is uniformly usable inpractice. Here a representation language isrequired which clearly explains the effect ofall kinds of parameters in the ontology uponthe resulting global similarity measure. Inparticular, if a designer of some new appli-cation has an intended similarity measure inmind, then it should be clear how to definean ontology appropriately. This is a furtheraspect which must definitely be addressed.Moreover, this aspect also includes the ques-tion of how the generic tools in our frame-work can be best embedded into a concreteapplication.
Context representation
As already indicated in Section 2.3, a suit-able framework for context representationhas to be defined; in particular when aimingat mobile applications this is of great impor-tance.
Content acquisition and maintenance is-sues
Furthermore, the methods sketched in Sec-tion 4 have to be conceptualized in a waysuch that our generic framework is comple-mented by a toolkit easing content acquisi-tion and update in concrete applications. Weare currently developing a toolkit for mergefunctions allowing for profile update bas-ing on relevance feedback. Adapting stan-dard market basket analysis approaches toour framework will be one of the next steps.
Possible extensions
Because of its simple structure and the re-sulting efficiency benefits, we had decidedto use RDFS/RDF for ontology modeling.However, one future task might be to ex-tend our framework by designing and imple-menting a matching algorithm which definesa similarity measure for OWL instances.
References
[1] A. Aamodt and E. Plaza. Case-based reasoning: Foundational issues,methodological variations, and systemapproaches. AI Commununications,7:39–59, 1994.
[2] A. Bassoli and S. Baumann. Blue-tunA: music sharing through mobilephones. InProceedings of the Third In-ternational Workshop on Mobile MusicTechnology, 2006.
[3] S. Baumann. Smartmobs and music:Ad-hoc socializing by portable musicprofiles. InInspirational Ideas at Inter-national Computer Music Conference(ICMC 2005), 2005.
[4] R. Bergmann. On the use of tax-onomies for representing case featuresand local similarity measures. InL. Gierl and M. Lenz, editors,Proceed-ings of the 6th German Workshop onCBR. Universitat Rostock, 1998. IMIBSeries Vol. 7.
123
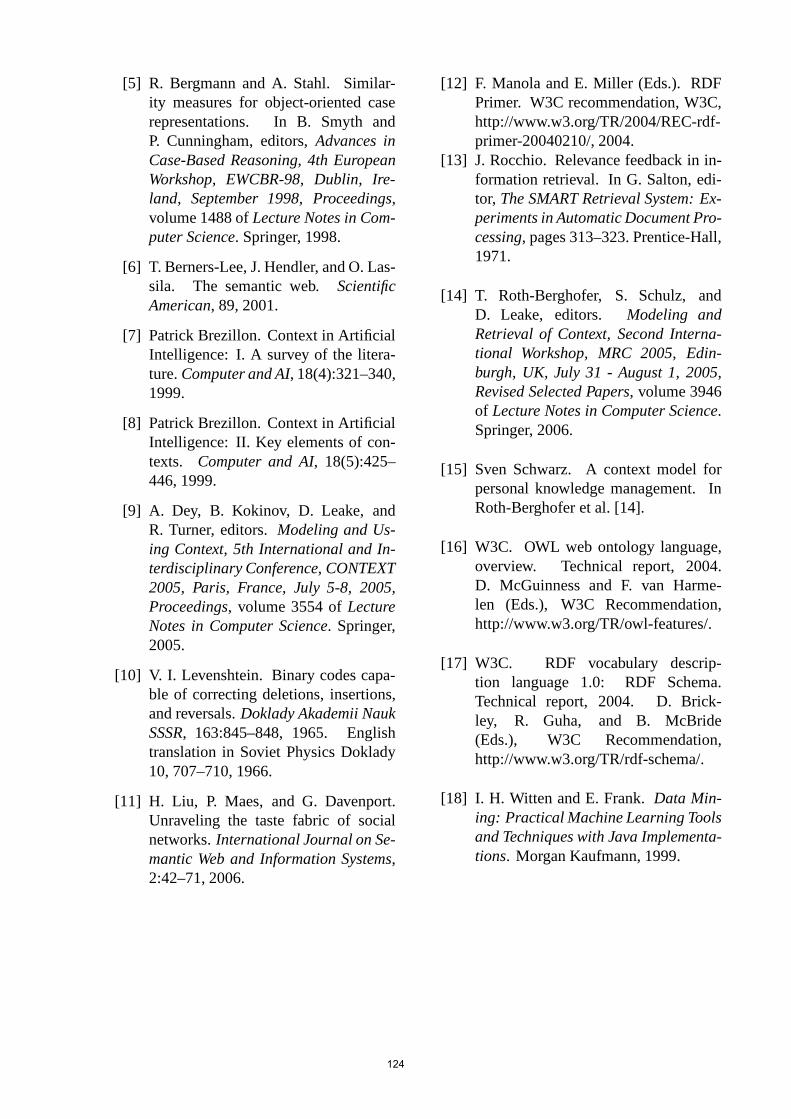
[5] R. Bergmann and A. Stahl. Similar-ity measures for object-oriented caserepresentations. In B. Smyth andP. Cunningham, editors,Advances inCase-Based Reasoning, 4th EuropeanWorkshop, EWCBR-98, Dublin, Ire-land, September 1998, Proceedings,volume 1488 ofLecture Notes in Com-puter Science. Springer, 1998.
[6] T. Berners-Lee, J. Hendler, and O. Las-sila. The semantic web. ScientificAmerican, 89, 2001.
[7] Patrick Brezillon. Context in ArtificialIntelligence: I. A survey of the litera-ture.Computer and AI, 18(4):321–340,1999.
[8] Patrick Brezillon. Context in ArtificialIntelligence: II. Key elements of con-texts. Computer and AI, 18(5):425–446, 1999.
[9] A. Dey, B. Kokinov, D. Leake, andR. Turner, editors.Modeling and Us-ing Context, 5th International and In-terdisciplinary Conference, CONTEXT2005, Paris, France, July 5-8, 2005,Proceedings, volume 3554 ofLectureNotes in Computer Science. Springer,2005.
[10] V. I. Levenshtein. Binary codes capa-ble of correcting deletions, insertions,and reversals.Doklady Akademii NaukSSSR, 163:845–848, 1965. Englishtranslation in Soviet Physics Doklady10, 707–710, 1966.
[11] H. Liu, P. Maes, and G. Davenport.Unraveling the taste fabric of socialnetworks.International Journal on Se-mantic Web and Information Systems,2:42–71, 2006.
[12] F. Manola and E. Miller (Eds.). RDFPrimer. W3C recommendation, W3C,http://www.w3.org/TR/2004/REC-rdf-primer-20040210/, 2004.
[13] J. Rocchio. Relevance feedback in in-formation retrieval. In G. Salton, edi-tor, The SMART Retrieval System: Ex-periments in Automatic Document Pro-cessing, pages 313–323. Prentice-Hall,1971.
[14] T. Roth-Berghofer, S. Schulz, andD. Leake, editors. Modeling andRetrieval of Context, Second Interna-tional Workshop, MRC 2005, Edin-burgh, UK, July 31 - August 1, 2005,Revised Selected Papers, volume 3946of Lecture Notes in Computer Science.Springer, 2006.
[15] Sven Schwarz. A context model forpersonal knowledge management. InRoth-Berghofer et al. [14].
[16] W3C. OWL web ontology language,overview. Technical report, 2004.D. McGuinness and F. van Harme-len (Eds.), W3C Recommendation,http://www.w3.org/TR/owl-features/.
[17] W3C. RDF vocabulary descrip-tion language 1.0: RDF Schema.Technical report, 2004. D. Brick-ley, R. Guha, and B. McBride(Eds.), W3C Recommendation,http://www.w3.org/TR/rdf-schema/.
[18] I. H. Witten and E. Frank.Data Min-ing: Practical Machine Learning Toolsand Techniques with Java Implementa-tions. Morgan Kaufmann, 1999.
124
Effcient Algorithms for Mining MaximalFlexible Patterns in Texts and Sequences
Hiroki Arimura and Takeaki UnoGraduate School of Information Science and Technology, Hokkaido University
Kita 14 Nishi 9, Sapporo 060-0814, Japan
National Institute of Informatics2-1-2, Hitotsubashi, Chiyoda-ku, Tokyo 101-8430, Japan
AbstractIn this paper, we study the enumeration algorithm for the maximal pattern discovery problem for the classERP of flexible sequence patterns, also known as erasing regular patterns, in a given seqeunce, withapplications to text mining. Out notion of maximality is based on the position occurrences and weakerthan the traditional notion of maximality based on the document occurrences. We present a polynomialspace and polynomial delay algorithm for enumerating all maximal patterns without duplicates for theclass of ERP of flexible sequence patterns based on the framework of reverse search. As a corollary, theenumeration problem for maximal flexible patterns is shown to be solvable in output polynomial time. Wealso discuss the utility of maximal pattern discovery in document clssification and a heuristic algorithmfor discovering document-maximal flexible patterns in a set of input strings.
Keywords: Data mining, Enumeration algorithms, Sequence databases, Maximal pattern, Motif Discov-ery
1. Introduction
By the rapid growth of the amount ofhuman-readable electronic data on networksand storages, there are potential demandsfor the efficient computational methods toextract useful information and knowledgefrom massive amount of electronic data scat-tered over the network. Some prominent ex-amples of such knowledge discovery tasksare: Automatic classification of natural lan-guage texts and web pages, characteristicand descriptive pattern discovery, predictionof trends from market data, detection of ma-licious activities from audit data, and clus-tering of documents. Pattern discovery isone of the most basic technology to find aclass of patterns appearing in a data set satis-fying given constraints, and plays an impor-tant role in many knowledge discovery prob-lems.
In this paper, we consider the maximal pat-tern discovery problem [9, 10, 13, 14] ina set of sequences. A pattern is maximalif there is no properly more specific pat-tern w.r.t. some generalization ordering overthe class of patterns that has the same oc-currence, or equivalently, has the same fre-quency, in a given set of input sequences.Since the set of all maximal patterns are typ-ically much smaller than the set of all pat-terns appearing in a data set while the formarcontains the complete information of the lat-ter, maximal pattern discovery has meritsin efficiency and comprehensiveness. Onthe other hands, the computational complex-ity of maximal pattern discovery is higherthan that of frequent pattern disocovery. Forexample, there are few patterns classes forwhich the maximal pattern discovery prob-lem have the polynomial output time com-plexity.
125
The class of patterns we consider is the classERP of erasing regular patterns of Shino-hara [12], which is also called flexible pat-terns in bioinformatics area [9]. The classERP is a super class of the class of subse-quence patterns for which polynomial out-put maximal pattern enumeration algorithmis known [14]. However, there is no output-polynomial algorithm for the maximal pat-tern problem for ERP. A potential prob-lem for the class ERP of flexible patternsis, unlike classes of itemsets and rigid pat-terns [3, 9], there are no unique maximalpattern in each equivalence class of pat-terns. To overcome this problem, we intro-duce a weaker notion of maximality, calledposition-maximality, for ERP, where twopatterns P and Q are regarded as equivalentif they have the same sets of left-positionsin an input string. The position-maximalityis implicitly used in maximal pattern miningfor subsequence patterns [14].
As a main result of this paper, un-der this definition of maximality, wepresent a polynomial-space and polynomial-delay algorithm for enumerating all max-imal patterns appearing in a given stringwithout duplicates in terms of postion-maximality. This result generalizes theoutput-polynomial complexity of [14] forsubsequence patterns to the class ERP . Thepolynomial-space and delay property indi-cates that it can be used as a light-weightand high-throughput algorithm for patterndiscovery. Finally, we presented a heuris-tics algorithm for enumerating document-maximal patterns in a collection of stringsfor the class ERP with non-trivial pruningstrategies. The motivation of this study isapplication of the maximal pattern discoveryto the optimal pattern discovery problem inmachine learning and knowledge discoverywith application to text mining.
2. Preliminaries
Let A be an alphabet of symbols. We denoteby A∗ the set of all finite strings over A anddefine Σ+ = Σ∗ − ε. Let s = a1 · · ·an ∈A∗ be a string overA of length n. We denote
|s| = n the length of s and by ε the emptystring. For any indices 1 ≤ i ≤ j ≤ n,we denote by s[i] = ai the i-th letter of s,and by s[i..j] the substring s[i..j] = ai · · ·ajthat starts with i and ends with j. For a setS ⊆ A∗, we denote by |S| the cardinality ofS and by ||S|| = ∑
s∈S |s| be the total size ofthe strings in S.
For strings u, v, w ∈ A∗, we say that u,v, and w, respectively, are a prefix, a sub-string, and a suffix of a string s = uvw.Then, the substring v occurs in s at positionp = |u|+1. Equivalently, if s = s[1] · · · s[n],then v occurs in s at position i iff v =s[i] · · · s[i + |v| − 1]. The left position andthe right position of v corresponding to thisoccurrence of in t are i and i+|v|−1, respec-tively. The reversal of a string x = a1 · · ·amis defined by xR = an · · ·a1.
2.1. Text and Patterns
In this subsection, we introduce the classERP of erasing regular patterns of Shi-nohara [12], also known as flexible pat-terns [9]. Let Σ = a, b, c, . . . be a fi-nite alphabet of constant symbols. We as-sume a special symbol ∗ ∈ Σ called a vari-able (a string wildcard or variable-lengthdon’t cares, VLDC), which represents ar-bitrary long possibly-empty finite string inΣ∗. Then, an erasing regular pattern (orpattern, for short) over Σ is a string P ∈(Σ ∪ ∗)∗ consisting of constant symbolsand variables. An erasing regular pattern Pis said to be in canonical form if it is writ-ten as P = w0 ∗ w1 ∗ · · · ∗ wm for someinteger m ≥ 0 and some non-empty stringsw0, w1, . . . , wm ∈ Σ+. Each constant stringwi is called a segment of P . An erasing reg-ular pattern is also called as a VLDC patternor a flexible pattern. We denote by ERP theclass of erasing regular patterns over Σ incanonical form. We note that Σ∗ ⊆ ERP .
Let Σ be a fixed alphabet of constants.An input string is a constant string T =a1 · · ·an (n ≥ 0) over Σ. Let P = w0 ∗w1 ∗· · ·∗wm ∈ (Σ∪∗)∗ be a pattern withm ≥0 variables in canonical form. A substitutionfor P is any m-tuple θ = (u1, . . . , um) ∈
126
((Σ ∪ ∗)∗)m of strings. Then, we definethe application of θ to P , denoted by Pθ,as the string Pθ = w0u1w1u2 · · ·umwm ∈(Σ∪∗)∗, where the i-th occurrence of vari-able ∗ is replaced with the i-th string ui forevery i = 1, . . . , m. The string Pθ is said tobe an instance of P by substition θ.
For strings P,Q ∈ (Σ ∪ ∗)∗, P occurs inQ at position 1 ≤ i ≤ n if there exists someinstance I of P that is a substring of Q start-ing at p, that is, Q[i .. i+ |Pθ| − 1] = Pθ forsome substitution θ for P . Particularly, thepositions i and i + |Pθ| − 1, respectively,correspond to the left and the right endsof the occurrence of instance Pθ, and arecalled the left and the right positions of P inT (See Fig. 1). We denote by LO(P,Q) andRO(P,Q) the set of all left-positions and theset of all right-positions of pattern P in textQ, respectively. We refer to LO(P,Q) andRO(P,Q) as the left-location list and theright-location list of P in T , respectively.
Lemma 1 Let P be a pattern and T bea text. For any position 1 ≤ p ≤ n,p ∈ ROT (P ) if and only if n − p + 1 ∈LOTR(PR).
By the symmetry between the left andthe right location lists in Lemma 1, it issufficient to consider only LO(P, T ) thanRO(P, T ). Thus, we only consider the loca-tion list O(P, T ) = LO(P, T ) in what fol-lows.
Lemma 2 The location list LO(P, T ) iscomputable in O(mn) time, where m = |P |and n = |T |.
We define a binary relation over P as fol-lows. For patterns P,Q ∈ ERP , P is morespecific than Q, denoted by P Q, iff Poccurs in T at some position 1 ≤ p ≤ n− 1.If P Q and Q P hold, then we say thatP is properly more specific than Q and de-note P Q. We note that if P Q andQ P hold then P = Q holds.
Lemma 3 Let T be any text. Then,
(ERP,) is a partial ordering with thesmallest element ε.
In machine learning area, the learning prob-lem for the class formal languages de-fined by ERP has been studied exten-sively [12]. For a erasing regular patternP ∈ ERP , the language defined by P is theset LangΣ(P ) = s ∈ Σ∗ : P s ⊆ Σ∗.It is easy to see that for any regular patternP ∈ (Σ∪∗)∗, there exists someQ ∈ ERPin canonical form such that LangΣ(P ) =LangΣ(Q).
2.2. Maximal patterns
Let T be a fixed text of length n ≥ 0. Thefrequency of a pattern P in T is |OT (P )|.A minimum support threshold is a nonnega-tive integer 0 ≤ σ ≤ n. A pattern P is σ-frequent in T if it has the frequency no lessthan σ in T , i.e., |OT (P )| ≥ σ.
Definition 1 A pattern P is maximal in T ifthere is no proper specialization Q of P thathas the same location list, i.e., P Q andOT (P ) = OT (Q).
We see that a pattern P ∈ ERP is max-imal iff P is a maximal element w.r.t. in the equivalence class [P ]≡T
= Q ∈ERP : P ≡T Q under the equivalence re-lation ≡T defined by P ≡T Q ⇔ OT (P ) =OT (Q).
Lemma 4 The maximal patterns in eachequivalence class [P ]≡T
is not unique ingeneral.
We denote by Fσ,M, and Mθ = Fσ ∩M the classes of the σ-frequent patterns,the maximal patterns, and the maximal σ-frequent patterns in T . It is easy see that thenumber of frequent flexible patterns in an in-put text S is exponential in the total length nof T in the worst case.
Lemma 5 There is an infinite sequence(Ti)i≥0 of texts such that the number of max-imal flexible patterns in Ti is exponential inn = |Ti|, i.e., |Mσ| = 2Ω(n).
127
Now, we state our data mining problem con-sidered in this paper as follows.
Maximal Flexible Pattern EnumerationProblem:Input: An alphabet Σ, a text T of length n,and a minimum support threshold σ.Task: To generate all maximal frequent flex-ible patterns in Mσ ⊆ ERP in T withoutduplicates.
It is easy to see thatMθ = Fσ ∩M. There-fore, we will first present an efficient enu-meration algorithm forM = M1, and thenextend it forMσ for every σ ≥ 1.
3. Motivated Applications of Max-imal Pattern Discovery
In this section, we discuss potential applica-tions of maximal pattern discovery consid-ered in this paper to predictive mining andclassification.
3.1. Predictive Mining and Classi-fication
First, we introduce a practical model ofmachine learning from noizy environment,known as robust training or agnostic learn-ing according to, e.g.,[5, 6]. Suppose weare given a finite collection S = xi : i =1, . . . , m ⊆ Σ∗ of strings, called a sam-ple, and a binary labeling function F : S →0, 1, called an objective function. Eachstring s ∈ S is called a document and thevalue of the funcion F (s) ∈ 0, 1 indicateswhether the document is, e.g., interesting ornot. Let P be a class of classification rulesor patterns, where each pattern P ∈ P rep-resents a binary function P : S → 0, 1. Inour case, for any document s ∈ S, P (s) = 1if P matches s and P (s) = 0 otherwise. Fora predicate π(x), [π(x)] ∈ 0, 1 is the indi-cator function that returns 1 or 0 dependingon the truth value of π(x). Now, we state ourpattern discovery problem [6].
Empirical Error Minimization Problem:Input: A sample S and an objective functionF : S → 0, 1.Task: To find an optimal pattern P ∈ P that
minimizes within P the empirical error
ERRS,F (P ) =∑x∈S
[P (x) = F (x)].
In learning theory, it is known that any algo-rithm that efficiently solves the above empir-ical error minimization problem can approx-imate a target concept within a given con-cept class under arbitrary unknown proba-bility distributions, and thus can work withnoisy environments [11].
3.2. Optimal Pattern Discovery
The above framework can be extended formore general classes of score functions [4].An impurity function is any real-valuedfunction ψ : [0, 1] → Real such that (i) ittakes the maximum value ψ(1/2), (ii) theminimum value ψ(0) = ψ(1) = 0, and(iii) ψ(x) is convex, i.e., ψ(1
2(x + y)) ≥
12(ψ(x) + ψ(y)) for every x, y ∈ [0, 1].
• The information entropy: ψ1(x) =−x log x− (1− x) log(1− x).
• The Gini index: ψ2(x) = 2x(1− x).
Given objective function F , and patternP , the contingency table is a 4-tuple(M1,M0, N1, N0), whereM1 andM0 are thenumbers of the matched positive and nega-tive examples, and N1 and N0 are the num-bers of positive and negative examples in S.Now, we describe the optimal pattern dis-covery problem, which is parameterized byan impurity function ψ, as follows (See, e.g.,Devroy et al. [4]).
ψ-Optimal Pattern Discovery Problem:Input: A sample S and an objective functionF : S → 0, 1.Task: To find an optimal pattern P ∈ P thatminimizes within P the cost
GψS,F (P ) = N1 · ψ(
M1
N1) +N0 · ψ(
M0
N0),
where (M1,M0, N1, N0) is the contingencytable defined by S, F , and pattern P .
128
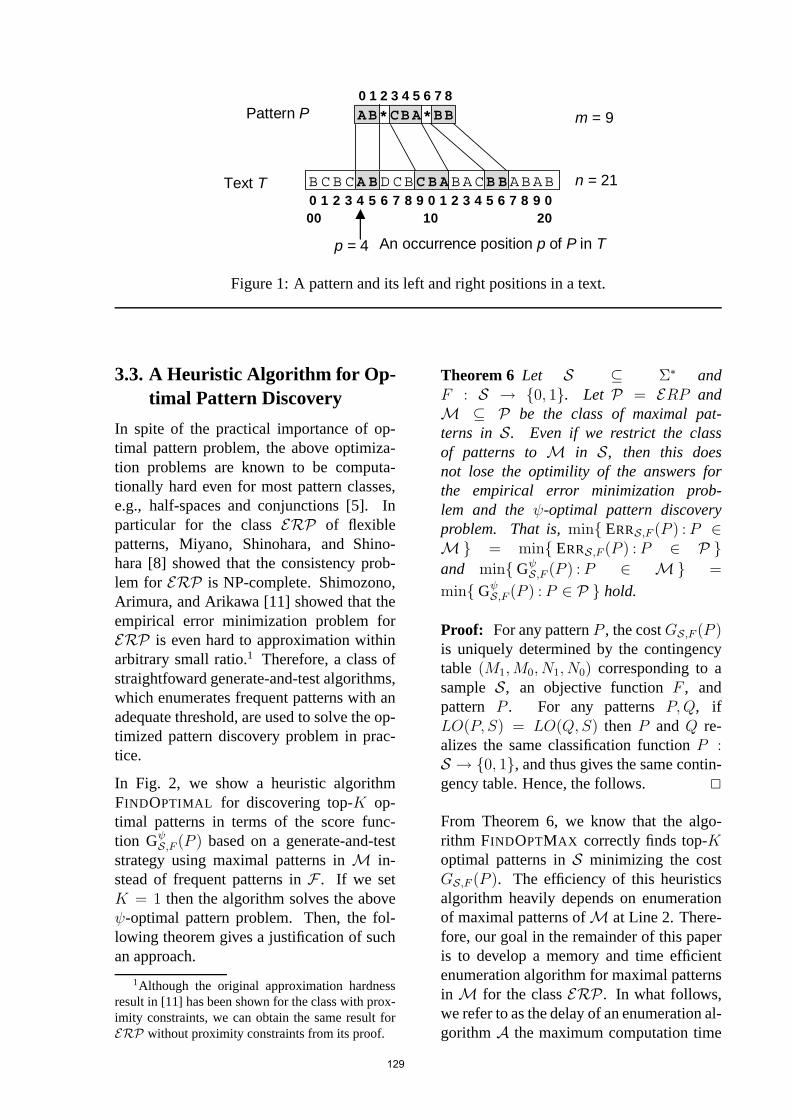
AB*CBA*BB
0 1 2 3 4 5 6 7 8 9 0 1 2 3 4 5 6 7 8 9 010 2000
B C B CA B D CBC BABACB BABAB
Pattern P
Text T
An occurrence position p of P in Tp = 4
n = 21
m = 9
0 1 2 3 4 5 6 7 8
Figure 1: A pattern and its left and right positions in a text.
3.3. A Heuristic Algorithm for Op-timal Pattern Discovery
In spite of the practical importance of op-timal pattern problem, the above optimiza-tion problems are known to be computa-tionally hard even for most pattern classes,e.g., half-spaces and conjunctions [5]. Inparticular for the class ERP of flexiblepatterns, Miyano, Shinohara, and Shino-hara [8] showed that the consistency prob-lem for ERP is NP-complete. Shimozono,Arimura, and Arikawa [11] showed that theempirical error minimization problem forERP is even hard to approximation withinarbitrary small ratio.1 Therefore, a class ofstraightfoward generate-and-test algorithms,which enumerates frequent patterns with anadequate threshold, are used to solve the op-timized pattern discovery problem in prac-tice.
In Fig. 2, we show a heuristic algorithmFINDOPTIMAL for discovering top-K op-timal patterns in terms of the score func-tion Gψ
S,F (P ) based on a generate-and-teststrategy using maximal patterns in M in-stead of frequent patterns in F . If we setK = 1 then the algorithm solves the aboveψ-optimal pattern problem. Then, the fol-lowing theorem gives a justification of suchan approach.
1Although the original approximation hardnessresult in [11] has been shown for the class with prox-imity constraints, we can obtain the same result forERP without proximity constraints from its proof.
Theorem 6 Let S ⊆ Σ∗ andF : S → 0, 1. Let P = ERP andM ⊆ P be the class of maximal pat-terns in S. Even if we restrict the classof patterns to M in S, then this doesnot lose the optimility of the answers forthe empirical error minimization prob-lem and the ψ-optimal pattern discoveryproblem. That is, min ERRS,F (P ) : P ∈M = min ERRS,F (P ) : P ∈ P and min Gψ
S,F (P ) : P ∈ M =
min GψS,F (P ) : P ∈ P hold.
Proof: For any pattern P , the costGS,F (P )is uniquely determined by the contingencytable (M1,M0, N1, N0) corresponding to asample S, an objective function F , andpattern P . For any patterns P,Q, ifLO(P, S) = LO(Q,S) then P and Q re-alizes the same classification function P :S → 0, 1, and thus gives the same contin-gency table. Hence, the follows.
From Theorem 6, we know that the algo-rithm FINDOPTMAX correctly finds top-Koptimal patterns in S minimizing the costGS,F (P ). The efficiency of this heuristicsalgorithm heavily depends on enumerationof maximal patterns ofM at Line 2. There-fore, our goal in the remainder of this paperis to develop a memory and time efficientenumeration algorithm for maximal patternsin M for the class ERP . In what follows,we refer to as the delay of an enumeration al-gorithm A the maximum computation time
129
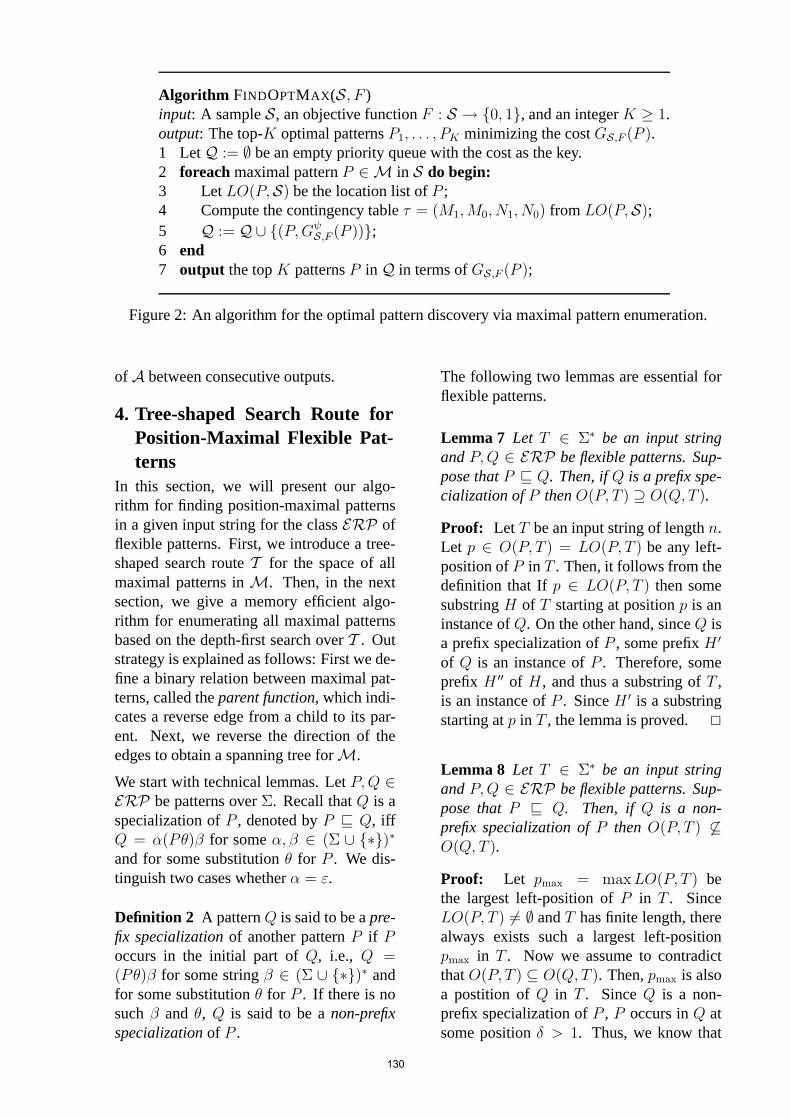
Algorithm FINDOPTMAX(S, F )input: A sample S, an objective function F : S → 0, 1, and an integer K ≥ 1.output: The top-K optimal patterns P1, . . . , PK minimizing the cost GS,F (P ).1 Let Q := ∅ be an empty priority queue with the cost as the key.2 foreach maximal pattern P ∈M in S do begin:3 Let LO(P,S) be the location list of P ;4 Compute the contingency table τ = (M1,M0, N1, N0) from LO(P,S);5 Q := Q∪ (P,Gψ
S,F (P ));6 end7 output the top K patterns P in Q in terms of GS,F (P );
Figure 2: An algorithm for the optimal pattern discovery via maximal pattern enumeration.
of A between consecutive outputs.
4. Tree-shaped Search Route forPosition-Maximal Flexible Pat-terns
In this section, we will present our algo-rithm for finding position-maximal patternsin a given input string for the class ERP offlexible patterns. First, we introduce a tree-shaped search route T for the space of allmaximal patterns in M. Then, in the nextsection, we give a memory efficient algo-rithm for enumerating all maximal patternsbased on the depth-first search over T . Outstrategy is explained as follows: First we de-fine a binary relation between maximal pat-terns, called the parent function, which indi-cates a reverse edge from a child to its par-ent. Next, we reverse the direction of theedges to obtain a spanning tree forM.
We start with technical lemmas. Let P,Q ∈ERP be patterns over Σ. Recall that Q is aspecialization of P , denoted by P Q, iffQ = α(Pθ)β for some α, β ∈ (Σ ∪ ∗)∗and for some substitution θ for P . We dis-tinguish two cases whether α = ε.
Definition 2 A pattern Q is said to be a pre-fix specialization of another pattern P if Poccurs in the initial part of Q, i.e., Q =(Pθ)β for some string β ∈ (Σ ∪ ∗)∗ andfor some substitution θ for P . If there is nosuch β and θ, Q is said to be a non-prefixspecialization of P .
The following two lemmas are essential forflexible patterns.
Lemma 7 Let T ∈ Σ∗ be an input stringand P,Q ∈ ERP be flexible patterns. Sup-pose that P Q. Then, if Q is a prefix spe-cialization of P then O(P, T ) ⊇ O(Q, T ).
Proof: Let T be an input string of length n.Let p ∈ O(P, T ) = LO(P, T ) be any left-position of P in T . Then, it follows from thedefinition that If p ∈ LO(P, T ) then somesubstring H of T starting at position p is aninstance of Q. On the other hand, since Q isa prefix specialization of P , some prefix H ′
of Q is an instance of P . Therefore, someprefix H ′′ of H , and thus a substring of T ,is an instance of P . Since H ′ is a substringstarting at p in T , the lemma is proved.
Lemma 8 Let T ∈ Σ∗ be an input stringand P,Q ∈ ERP be flexible patterns. Sup-pose that P Q. Then, if Q is a non-prefix specialization of P then O(P, T ) ⊆O(Q, T ).
Proof: Let pmax = maxLO(P, T ) bethe largest left-position of P in T . SinceLO(P, T ) = ∅ and T has finite length, therealways exists such a largest left-positionpmax in T . Now we assume to contradictthat O(P, T ) ⊆ O(Q, T ). Then, pmax is alsoa postition of Q in T . Since Q is a non-prefix specialization of P , P occurs in Q atsome position δ > 1. Thus, we know that
130

q = pmax + δ − 1 is a position of P in T .If δ > 1 then q is strictly larger than pmax.This contradicts the assumption that pmax isthe largest position of P in T , and thus weconclude that O(P, T ) ⊆ O(Q, T ). Hence,the result is proved.
Corollary 9 Let T ∈ Σ∗ be an input stringand P,Q ∈ ERP be flexible patterns. Sup-pose that P Q. Then, if Q is a non-prefix specialization of P then O(P, T ) =O(Q, T ).
We define the parent-child relationship be-tween two flexible patterns in ERP as fol-lows.
Definition 3 Let Q = w0 ∗ w1 ∗ · · · ∗ wmbe a flexible pattern over Σ, where m ≥ 0and w1, . . . , wm ∈ Σ+. Then, we define theparent ofQ, denoted by P(Q), is the patternsatisfying the the followings (i) or (ii):
(i) If |w0| ≥ 2, that is, w0 = au0 forsome letter a ∈ Σ and a non-emptystring u0 ∈ Σ+, then then P(Q) =u0 ∗ w1 ∗ · · · ∗ wm.
(ii) If |w0| = 1, that is, w0 = a for someletter a ∈ Σ thenP(Q) = w1∗· · ·∗wm.
In summary, the parent P(Q) is the flexi-ble pattern obtained fromQ by removing thefirst letter, and then remove the first variable∗ at the starting position if it exists. The re-moval of the initial ∗ ensures the canonicityof the resulting pattern.
Lemma 10 For any non-empty flexible pat-tern Q ∈ ERP in cannonical form, its par-ent P(Q) is always defined, unique, anda flexible pattern in canonical form, i.e., amember of ERP .
Let n ≥ 0 be a positive integer. For anonnegative integer 0 ≤ k ≤ n and a setX ⊆ 1, . . . , n, we define X + k = x +k : x ∈ X . For sets X, Y ⊆ 1, . . . , n,we define X ≤ Y = p ∈ X : p ≤q for some q ∈ Y . By definition, both of
X + k and X ≤Y are subsets of X . Usingthese operators, we can describe the locationlists of a composite pattern of the form wPor w ∗ P , where w ∈ Σ+ and P ∈ ERP asfollows.
Lemma 11 Let T ∈ Σ∗ be any input string,w ∈ Σ+ be any non-empty constant string,and P ∈ ERP be any flexible pattern. Then,the following (a) and (b) hold:
(a) LO(wP ) = LO(w, T ) ∩ (LO(P, T )−|w|).
(b) LO(w ∗ P ) = LO(w, T ) ≤(LO(P, T )− |w|).
Let T ∈ Σ∗ be any input string of length n ≥0. A maximal pattern P is a root pattern inT ifO(P, T ) = 1, . . . , |T |. Now, we showthe main result of this section.
Theorem 12 (reverse search property ofM)Let Q ∈ M be a maximal pattern in T thatis not a root pattern. Then, P(Q) is also amaximal pattern in T . That is, if Q ∈ Mthen P(Q) ∈ M holds. Furthermore,|P(Q)| < |Q| holds.
Proof: Let Q be a maximal pattern that isnot a root pattern, and let P = P(Q) be theparent of Q. In what follows, for any patternR, we write LO(R) for LO(R, T ) by omit-ting T for simplicity. Suppose to contradictthat P is not maximal in T . Then, there ex-ists some proper specialization P ′ of P , i.e.,P P ′, such that LO(P ) = LO(P ′).
If P P ′ then P occurs in P ′ at some posi-tion, say, 1 ≤ p ≤ |P ′|. There are two casesbelow.
(i) The case where p = 1: Then, P ′ is anon-prefix specialization of P . It immedi-ately follows from Lemma 9 that LO(P ) =LO(P ′). This is a contradiction.
(ii) The case where p = 1: Then, P ′ is aprefix specialization of P . By the definitionof the parent, there are the following casesfor P and Q.
(ii.a) The case where Q = aP for someletter a ∈ Σ: Let Q′ = aP ′ ∈ ERP.
131
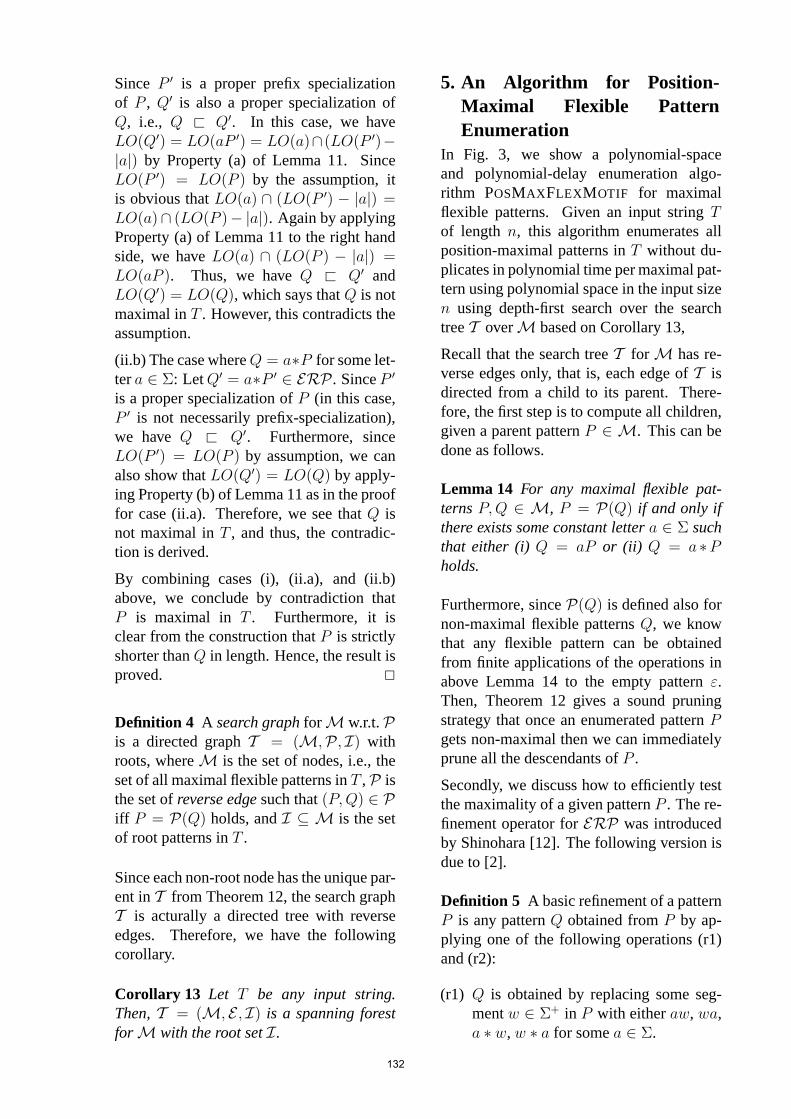
Since P ′ is a proper prefix specializationof P , Q′ is also a proper specialization ofQ, i.e., Q Q′. In this case, we haveLO(Q′) = LO(aP ′) = LO(a)∩ (LO(P ′)−|a|) by Property (a) of Lemma 11. SinceLO(P ′) = LO(P ) by the assumption, itis obvious that LO(a) ∩ (LO(P ′) − |a|) =LO(a)∩ (LO(P )− |a|). Again by applyingProperty (a) of Lemma 11 to the right handside, we have LO(a) ∩ (LO(P ) − |a|) =LO(aP ). Thus, we have Q Q′ andLO(Q′) = LO(Q), which says that Q is notmaximal in T . However, this contradicts theassumption.
(ii.b) The case whereQ = a∗P for some let-ter a ∈ Σ: LetQ′ = a∗P ′ ∈ ERP . Since P ′
is a proper specialization of P (in this case,P ′ is not necessarily prefix-specialization),we have Q Q′. Furthermore, sinceLO(P ′) = LO(P ) by assumption, we canalso show that LO(Q′) = LO(Q) by apply-ing Property (b) of Lemma 11 as in the prooffor case (ii.a). Therefore, we see that Q isnot maximal in T , and thus, the contradic-tion is derived.
By combining cases (i), (ii.a), and (ii.b)above, we conclude by contradiction thatP is maximal in T . Furthermore, it isclear from the construction that P is strictlyshorter than Q in length. Hence, the result isproved.
Definition 4 A search graph forM w.r.t. Pis a directed graph T = (M,P, I) withroots, whereM is the set of nodes, i.e., theset of all maximal flexible patterns in T , P isthe set of reverse edge such that (P,Q) ∈ Piff P = P(Q) holds, and I ⊆ M is the setof root patterns in T .
Since each non-root node has the unique par-ent in T from Theorem 12, the search graphT is acturally a directed tree with reverseedges. Therefore, we have the followingcorollary.
Corollary 13 Let T be any input string.Then, T = (M, E , I) is a spanning forestforM with the root set I.
5. An Algorithm for Position-Maximal Flexible PatternEnumeration
In Fig. 3, we show a polynomial-spaceand polynomial-delay enumeration algo-rithm POSMAXFLEXMOTIF for maximalflexible patterns. Given an input string Tof length n, this algorithm enumerates allposition-maximal patterns in T without du-plicates in polynomial time per maximal pat-tern using polynomial space in the input sizen using depth-first search over the searchtree T overM based on Corollary 13,
Recall that the search tree T forM has re-verse edges only, that is, each edge of T isdirected from a child to its parent. There-fore, the first step is to compute all children,given a parent pattern P ∈ M. This can bedone as follows.
Lemma 14 For any maximal flexible pat-terns P,Q ∈ M, P = P(Q) if and only ifthere exists some constant letter a ∈ Σ suchthat either (i) Q = aP or (ii) Q = a∗Pholds.
Furthermore, since P(Q) is defined also fornon-maximal flexible patterns Q, we knowthat any flexible pattern can be obtainedfrom finite applications of the operations inabove Lemma 14 to the empty pattern ε.Then, Theorem 12 gives a sound pruningstrategy that once an enumerated pattern Pgets non-maximal then we can immediatelyprune all the descendants of P .
Secondly, we discuss how to efficiently testthe maximality of a given pattern P . The re-finement operator for ERP was introducedby Shinohara [12]. The following version isdue to [2].
Definition 5 A basic refinement of a patternP is any pattern Q obtained from P by ap-plying one of the following operations (r1)and (r2):
(r1) Q is obtained by replacing some seg-ment w ∈ Σ+ in P with either aw, wa,a ∗ w, w ∗ a for some a ∈ Σ.
132

Algorithm POSMAXFLEXMOTIF(Σ, S, σ)input: An alphabet Σ, an input string S,minimum frequency threshold 0 ≤ σ ≤ |S|;output: All maximal patterns inM;1 Let ⊥ be the maximal pattern in T which equivalent to ε (the root pattern).2 ENUMMAXIMAL(ε, σ);
Procedure ENUMMAXIMAL(P, LO(P ), σ)input: A maximal pattern P and its left-location list LO(P ).output: All maximal patterns that are descendants of P .1 Compute LO(P );2 if |LO(P )| = 0 then return;3 if P is not maximal in S then return;4 Output P ;5 foreach a ∈ Σ do begin:6 ENUMMAXIMAL(aP, LO(aP ), σ);7 ENUMMAXIMAL(a ∗ P, LO(a ∗ P ), σ);7 end
Figure 3: An algorithm POSMAXFLEXMOTIF for enumerating all maximal flexible patterns inan input sequence.
(r2) Q is obtained by replacing a pairof consecutive segments v ∗ w ∈Σ+∗Σ+ in P with vw.
For a pattern P , we define ρ(P ) ⊆ ERP tobe the set of all basic refinements of P .
Lemma 15 A flexible pattern P is maximalin T if and only if there is no basic refine-ment Q ∈ ρ(P ) such that LO(P, T ) =LO(Q, T ).
Corollary 16 The maximality of a flexiblepattern P in an input string T is decidablein O(|Σ|m2n) time, where m = |P | andn = |T |.
On the shape of T , we have the followinglemma.
Lemma 17 Let P ∈ M be any maximalpattern in T and m = |P |. Then,
(i) The depth of P in T (the length of theunique path from the root to P ) is atmost m.
(ii) The branching of P in T (the number ofthe children for P ) is at most O(|Σ|m).
By combining the above lemmas, we havethe main result of this paper. This saysthat our algorithm POSMAXFLEXMOTIF isa memory and time efficient algorithm fordiscovering maximal flexible patterns.
Theorem 18 Let Σ be an alphabet andT ∈ Σ∗ be an input string of length n ≥0. Then, the algorithm POSMAXFLEX-MOTIF in Fig. 3 enumerates all position-maximal patterns P in T without duplicatesin O(|Σ|kmn2) delay per maximal patternusing O(mn) space, where m = |P | andk = O(m) are the size and the number ofvariables of the pattern P to be enumerated.
Corollary 19 The maximal pattern enu-meration problem for the class ERP offlexible patterns (or erasing regular pat-terns) w.r.t. position-maximality is solvablein polynomial-space and polynomial-delayin the total input size.
133
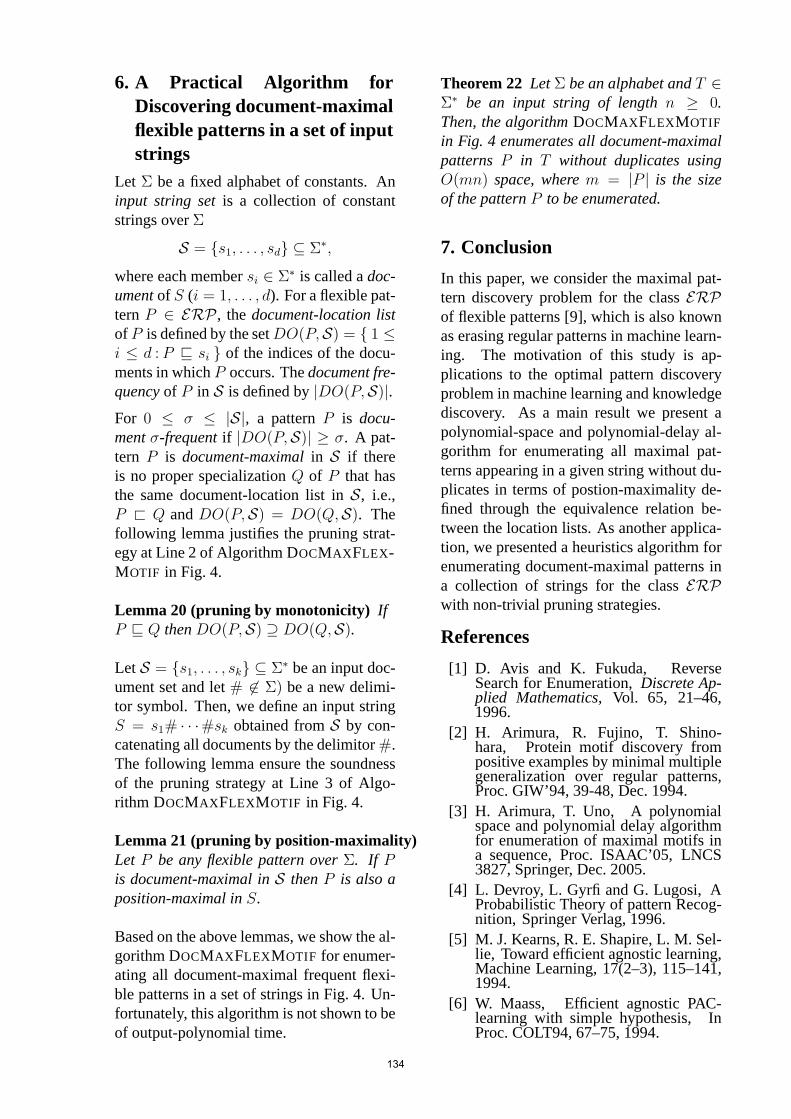
6. A Practical Algorithm forDiscovering document-maximalflexible patterns in a set of inputstrings
Let Σ be a fixed alphabet of constants. Aninput string set is a collection of constantstrings over Σ
S = s1, . . . , sd ⊆ Σ∗,
where each member si ∈ Σ∗ is called a doc-ument of S (i = 1, . . . , d). For a flexible pat-tern P ∈ ERP , the document-location listof P is defined by the setDO(P,S) = 1 ≤i ≤ d : P si of the indices of the docu-ments in which P occurs. The document fre-quency of P in S is defined by |DO(P,S)|.For 0 ≤ σ ≤ |S|, a pattern P is docu-ment σ-frequent if |DO(P,S)| ≥ σ. A pat-tern P is document-maximal in S if thereis no proper specialization Q of P that hasthe same document-location list in S, i.e.,P Q and DO(P,S) = DO(Q,S). Thefollowing lemma justifies the pruning strat-egy at Line 2 of Algorithm DOCMAXFLEX-MOTIF in Fig. 4.
Lemma 20 (pruning by monotonicity) IfP Q then DO(P,S) ⊇ DO(Q,S).
Let S = s1, . . . , sk ⊆ Σ∗ be an input doc-ument set and let # ∈ Σ) be a new delimi-tor symbol. Then, we define an input stringS = s1# · · ·#sk obtained from S by con-catenating all documents by the delimitor #.The following lemma ensure the soundnessof the pruning strategy at Line 3 of Algo-rithm DOCMAXFLEXMOTIF in Fig. 4.
Lemma 21 (pruning by position-maximality)Let P be any flexible pattern over Σ. If Pis document-maximal in S then P is also aposition-maximal in S.
Based on the above lemmas, we show the al-gorithm DOCMAXFLEXMOTIF for enumer-ating all document-maximal frequent flexi-ble patterns in a set of strings in Fig. 4. Un-fortunately, this algorithm is not shown to beof output-polynomial time.
Theorem 22 Let Σ be an alphabet and T ∈Σ∗ be an input string of length n ≥ 0.Then, the algorithm DOCMAXFLEXMOTIF
in Fig. 4 enumerates all document-maximalpatterns P in T without duplicates usingO(mn) space, where m = |P | is the sizeof the pattern P to be enumerated.
7. Conclusion
In this paper, we consider the maximal pat-tern discovery problem for the class ERPof flexible patterns [9], which is also knownas erasing regular patterns in machine learn-ing. The motivation of this study is ap-plications to the optimal pattern discoveryproblem in machine learning and knowledgediscovery. As a main result we present apolynomial-space and polynomial-delay al-gorithm for enumerating all maximal pat-terns appearing in a given string without du-plicates in terms of postion-maximality de-fined through the equivalence relation be-tween the location lists. As another applica-tion, we presented a heuristics algorithm forenumerating document-maximal patterns ina collection of strings for the class ERPwith non-trivial pruning strategies.
References
[1] D. Avis and K. Fukuda, ReverseSearch for Enumeration, Discrete Ap-plied Mathematics, Vol. 65, 21–46,1996.
[2] H. Arimura, R. Fujino, T. Shino-hara, Protein motif discovery frompositive examples by minimal multiplegeneralization over regular patterns,Proc. GIW’94, 39-48, Dec. 1994.
[3] H. Arimura, T. Uno, A polynomialspace and polynomial delay algorithmfor enumeration of maximal motifs ina sequence, Proc. ISAAC’05, LNCS3827, Springer, Dec. 2005.
[4] L. Devroy, L. Gyrfi and G. Lugosi, AProbabilistic Theory of pattern Recog-nition, Springer Verlag, 1996.
[5] M. J. Kearns, R. E. Shapire, L. M. Sel-lie, Toward efficient agnostic learning,Machine Learning, 17(2–3), 115–141,1994.
[6] W. Maass, Efficient agnostic PAC-learning with simple hypothesis, InProc. COLT94, 67–75, 1994.
134
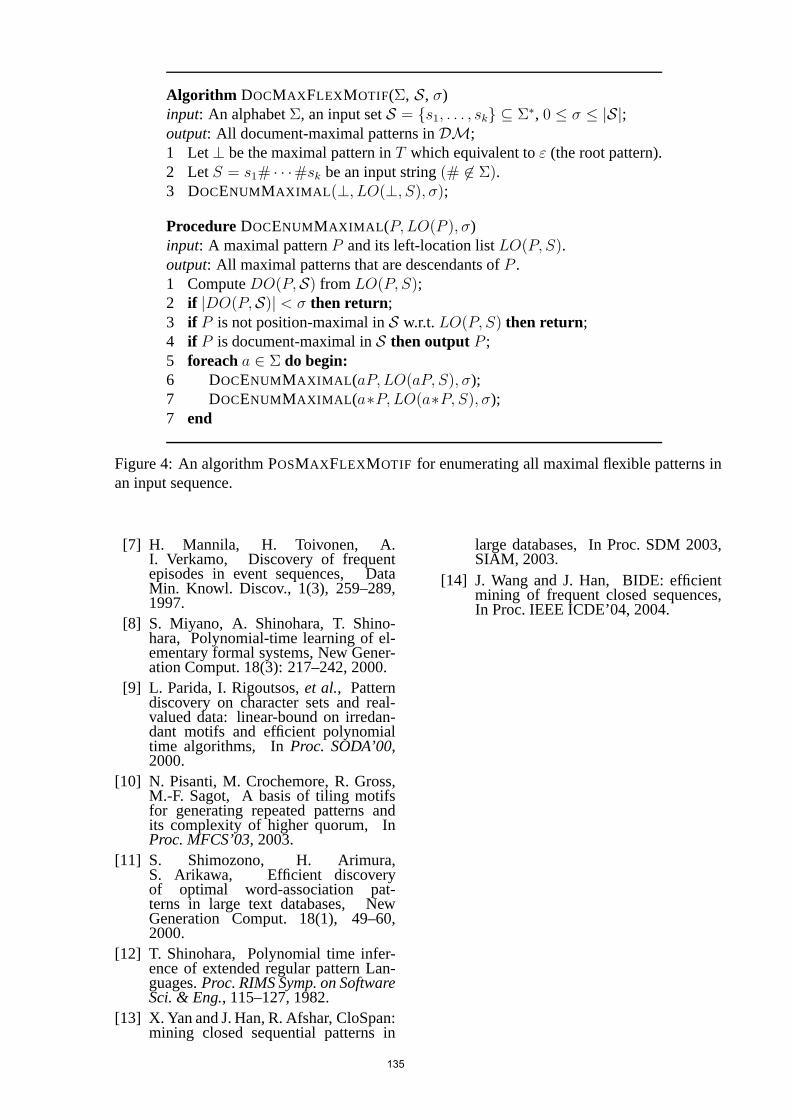
Algorithm DOCMAXFLEXMOTIF(Σ, S, σ)input: An alphabet Σ, an input set S = s1, . . . , sk ⊆ Σ∗, 0 ≤ σ ≤ |S|;output: All document-maximal patterns in DM;1 Let ⊥ be the maximal pattern in T which equivalent to ε (the root pattern).2 Let S = s1# · · ·#sk be an input string (# ∈ Σ).3 DOCENUMMAXIMAL(⊥, LO(⊥, S), σ);
Procedure DOCENUMMAXIMAL(P, LO(P ), σ)input: A maximal pattern P and its left-location list LO(P, S).output: All maximal patterns that are descendants of P .1 Compute DO(P,S) from LO(P, S);2 if |DO(P,S)| < σ then return;3 if P is not position-maximal in S w.r.t. LO(P, S) then return;4 if P is document-maximal in S then output P ;5 foreach a ∈ Σ do begin:6 DOCENUMMAXIMAL(aP, LO(aP, S), σ);7 DOCENUMMAXIMAL(a∗P, LO(a∗P, S), σ);7 end
Figure 4: An algorithm POSMAXFLEXMOTIF for enumerating all maximal flexible patterns inan input sequence.
[7] H. Mannila, H. Toivonen, A.I. Verkamo, Discovery of frequentepisodes in event sequences, DataMin. Knowl. Discov., 1(3), 259–289,1997.
[8] S. Miyano, A. Shinohara, T. Shino-hara, Polynomial-time learning of el-ementary formal systems, New Gener-ation Comput. 18(3): 217–242, 2000.
[9] L. Parida, I. Rigoutsos, et al., Patterndiscovery on character sets and real-valued data: linear-bound on irredan-dant motifs and efficient polynomialtime algorithms, In Proc. SODA’00,2000.
[10] N. Pisanti, M. Crochemore, R. Gross,M.-F. Sagot, A basis of tiling motifsfor generating repeated patterns andits complexity of higher quorum, InProc. MFCS’03, 2003.
[11] S. Shimozono, H. Arimura,S. Arikawa, Efficient discoveryof optimal word-association pat-terns in large text databases, NewGeneration Comput. 18(1), 49–60,2000.
[12] T. Shinohara, Polynomial time infer-ence of extended regular pattern Lan-guages. Proc. RIMS Symp. on SoftwareSci. & Eng., 115–127, 1982.
[13] X. Yan and J. Han, R. Afshar, CloSpan:mining closed sequential patterns in
large databases, In Proc. SDM 2003,SIAM, 2003.
[14] J. Wang and J. Han, BIDE: efficientmining of frequent closed sequences,In Proc. IEEE ICDE’04, 2004.
135
Application of Truncated Suffix Trees toFinding Sentences from the Internet
Takuya Kida Takashi Uemura Hiroki ArimuraHokkaido University
Graduate School of Information Science and TechnologyKita 14, Nishi 9, Kita-ku, Sapporo, Hokkaido,
060-0814, Japan
AbstractWe propose a space saving index structure based on the suffix tree, called the truncated suffix treewith k-words limitation, which is a tree structure obtained by eliminating the nodes that indicate thesubstrings longer than k words in a given text. Although such tree may confuse any substrings that occurat the different positions but the same string, it is suitable for counting short substrings. We presented itcan be constructed on-line in O(n) time and space. Our experimental result shows that the number ofnodes falls broadly when k is small. The reduction ratio is almost half in comparison with the originalsuffix tree when k = 3 in practice. We also discuss about the application of it to Kiwi system which canhelp us to find keywords from the Internet.
1. Introduction
Since information created by people has in-creased rapidly after moving into the 21stcentury, efficient technologies for dealingwith numerous data become more and moreimportant. There are many documents anddatabases on the Internet now, and it is ur-gently necessary to develop information re-trieval technologies that one can pick up thedesired information.
Nowadays almost everyone uses search en-gines like Google or Yahoo to get informa-tion which one wants to know. Such searchengines may display search results quicklywhen a user throws appropriate queries intothem. However the user would not be able toobtain sufficient results if proper keywordsare not come to mind. Therefore, to giveusers some clues for proper queries, or toextract semi-automatically the desired infor-mation from the Internet, many researchershave studied about the web data mining.
Kiwi system[13] developed by Tanaka andNakagawa[14] is one of the solutions to helpsuch situation. It is originally developedwith the aim of presenting the users some
phrase examples that match into the inputedcontext. Though it is based on the sameidea of the KWIC (Key Word in Context)tool, it can present phrases that match theuser’s needs better by using data on the In-ternet rather than a fixed dictionary. Thereare some similar systems like WebCorp[1],Google Fight[2], Google Duel[10], and soon, but Kiwi has a superior feature that canhandle any languages and flexible queries.
The current Kiwi system gathers the searchresults for the temporal dictionary to be usedby touching search engine’s API for eachquery request. However, such mechanismmay take several minutes before replying thefinal results. Although the response time canbe reduced if the system gathers less searchresults, the precision of the final results willdrop down. Since users usually can not standfor waiting more than several tens of sec-onds, the text data to be used must be in a lo-cal server, and the system must be able to re-trieve keywords quickly from them, to guar-antee the sufficient precision and responsespeed.
Suffix tree[5] is a useful data structure thatcan index every substring in a given text.
136

The size of the tree for the text is O(n),where n is the text length. By using thesuffix tree, searching a keyword can bedone in O(m) time, where m is the key-word length[16]. Several well-known opti-mal algorithms for constructing suffix treesexist[8, 15], and various extensions havebeen proposed.
Admitting that the suffix tree is a compactdata structure which can deal with all sub-strings in O(n) space as mentioned above,the required memory space tends to grow toan enormous size for practical purposes be-cause the size n of the target data itself isoften large. Therefore, more compact datastructures that have almost the same func-tion as the suffix tree, is desirable. From theviewpoint of application of the suffix tree,there are few cases that very long substringsare needed. For the purpose of searchingshort sentences, for example, it is sufficientto index only substrings that cover severalwords.
In order to speed up the response time, Ichiiet al.1 improved Kiwi system by using a suf-fix tree for n-gram that indexes all n-gramsof the text data which are gathered from theInternet in advance and stored locally. Theirproposed data structure is fundamentally thesame as that of Na et al.[9]. They succeededto shorten the response time dramatically.However, it can not retrieve the sentenceslonger than the fixed size n.
In this paper, we propose a new data struc-ture which can index any substring shorterthan k words in a given text, called thetruncated suffix tree with K-words limita-tion (k-WST for short). We also present itcan be constructed in O(n) time. Assumethat the input text T is split into theN wordssequence with delimiter symbol #, that is,T = w1#w2# · · ·#wN . Then, for T and agiven integer k, k-WST represents all sub-strings of the string wi#wi+1# . . .#wi+k−1
for every i (1 ≤ i ≤ N − k + 1). The pro-posed algorithm is based on the online algo-rithm of Ukkonen[15]. k-WST can be con-
1This paper was published in the workshop pro-ceeding written in Japanese
structed inO(n) time and space for the inputtext of length n. The basic idea of our al-gorithm is to close partially the extensionsof leaves in the suffix tree, which are au-tomatically extended in the original Ukko-nen’s algorithm[15], whenever each delim-iter is loaded. By applying k-WST to Kiwisystem, there exists a possibility to make itmore flexible and useful.
Related works Implementing data com-pression methods such as Ziv-Lempel fam-ily is one of the most important applicationsof suffix trees. The original suffix tree isnot applicable to the LZ77 scheme becausethat the string can be referred as a dictionaryis restricted by the sliding window. Severalmethods which can overcome this problemhave been proposed[11, 4, 7]. Na et al.[9]defined the truncated suffix tree which canrepresent all substrings whose length is lessthan k, and proposed the constructing algo-rithm in proportion to the text length. Al-though our algorithm can be seen as an ex-tension of their idea, closing leaves’ exten-sion is done at different time intervals foreach leaves since the length of the suffixesregistered with the tree is not fixed.
For Kiwi system, by adopting the several de-mands of the field of linguistics, the newlysystem, called Tonguen, has developed byTanaka and Ishii[12].
2. Preliminaries
Let Σ be a finite alphabet and let Σ∗ be theset of all strings over Σ. We denote thelength of string x ∈ Σ∗ by |x|. The stringwhose length is 0 is denoted by ε, calledempty string, that is |ε| = 0. We also de-fine that Σ+ = Σ∗−ε. The concatenationof two strings x1 and x2 ∈ Σ∗ is denoted byx1 · x2, and also write it simply as x1x2 if noconfusion occurs.
Strings x, y, and z are said to be a prefix,factor, and suffix of the string w = zyz, re-spectively. The ith symbol of a string w isdenoted by w[i], and the factor of u that be-gins at position i and ends at position j isdenoted by w[i . . . j]. For convenience, let
137

w[i . . . j] = ε for j < i. We also denote bySuf (w) the set of all suffixes of the stringw ∈ Σ∗, and denote by Fac(w) the set of allfactors of w ∈ Σ∗.
2.1. Kiwi system
We will make a brief sketch of the pro-cessing of Kiwi system according to [13].Kiwi system was developed as a consulta-tion tool. It answers what kind of stringspreceded/succeeded by the phrase which anuser inputs, by using some search engines onthe Internet. An input query phrase can in-clude a meta character ‘∗’, for example, ‘su-per ∗’, ‘∗-like man’, ‘ABC of ∗ for’, and soon. The system extracts the candidate stringsthat match at the place of ‘∗’ from the searchresults. The outline of the processing is asfollows:
1. Receive a query from a user.
2. Tokenize the query and then send it tosearch engines.
3. Extract all fixed-length strings from thesearch results, which include the candi-dates.
4. Cut these strings to the proper length toextract candidates.
5. Rank them before answer.
The clipping positions can be straightfor-wardly determined when the ‘∗’ is used inthe middle. In the case that a query is pre-ceded or succeeded by ‘∗’, it is a problem todetermine how long we must take as a can-didate string. Cutting at each word separa-tor for segmented languages, or cutting byfixed-length for non-segmented languages,are in common use for the other KWIC sys-tems, while Kiwi system takes another ap-proach.
Now we concentrate in the case that the in-put query ends with ‘∗’, since the case that itstarts with ‘∗’ can be managed as the sameway by viewing the target texts in reverse.
We call a string obtained by eliminating ‘∗’from a query as a clue string. What we want
Figure 1: Method for clipping candidates
to do is to cut out the candidate from thestring x which has the clue string P as a pre-fix. The candidates we expect must have thefollowing natures:
(i) It occurs frequently in the text.
(ii) It has the moderate length.
(iii) It is succeeded by various kind of words(namely characters).
Let denote by Xi the prefix x[1 . . . i] (i >|P |) of x, and also denote by Ci the numberof kinds of character x[i+1] preceded byXi
in the target text. From the condition (iii),the Kiwi system extracts Xi as a candidatewhen
Ci > Ci−1.
In order to do this, an n-gram trie for the textis constructed and traversed. That is, the sys-tem determines the candidates by cutting atthe position where the number of branchesin the trie turns from downward to upwardin the traversing (see Figure 1). Such can-didate strings often satisfy the condition (ii).
This method is empirically and do not neces-sarily go well at any time. Actually, the ad-ditional efforts are required because it mayfail when the candidates hardly appear in thetext. However, it has an advantage that it isindependent of language.
In the step of ranking, Kiwi system uses theformula
F (X) = freq(X) log(|X |+ 1)
138
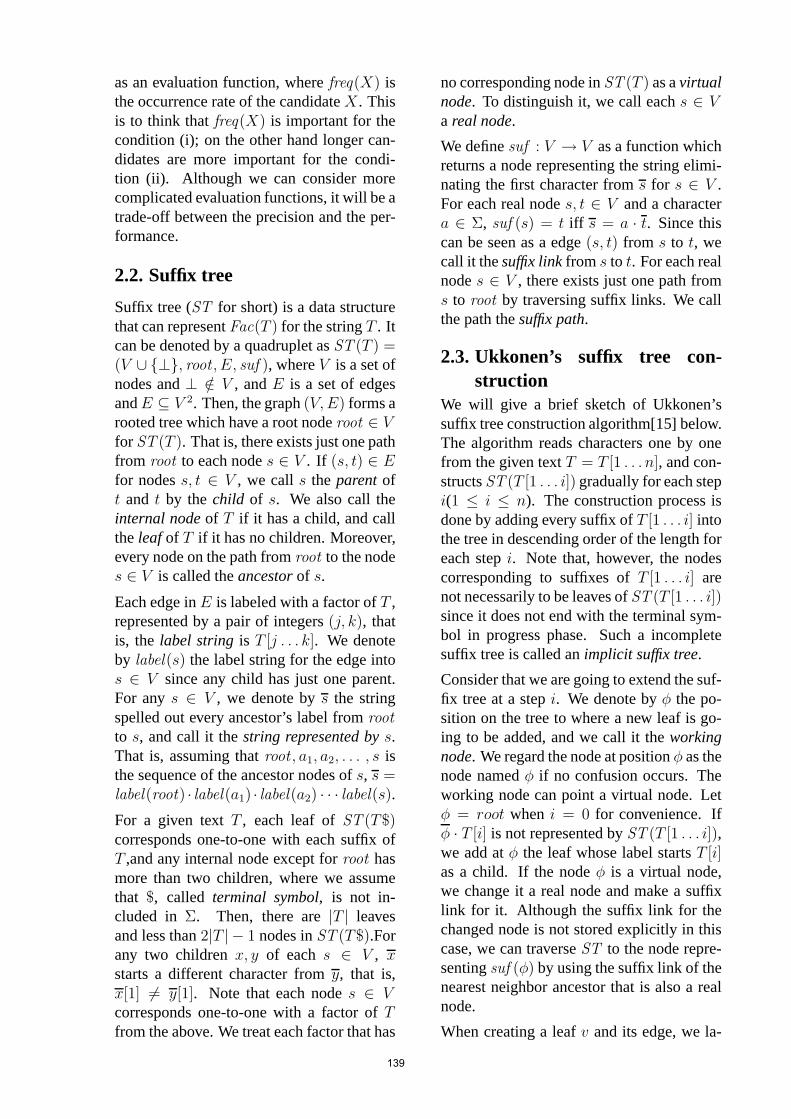
as an evaluation function, where freq(X) isthe occurrence rate of the candidate X . Thisis to think that freq(X) is important for thecondition (i); on the other hand longer can-didates are more important for the condi-tion (ii). Although we can consider morecomplicated evaluation functions, it will be atrade-off between the precision and the per-formance.
2.2. Suffix tree
Suffix tree (ST for short) is a data structurethat can represent Fac(T ) for the string T . Itcan be denoted by a quadruplet as ST (T ) =(V ∪ ⊥, root , E, suf ), where V is a set ofnodes and ⊥ /∈ V , and E is a set of edgesandE ⊆ V 2. Then, the graph (V,E) forms arooted tree which have a root node root ∈ Vfor ST (T ). That is, there exists just one pathfrom root to each node s ∈ V . If (s, t) ∈ Efor nodes s, t ∈ V , we call s the parent oft and t by the child of s. We also call theinternal node of T if it has a child, and callthe leaf of T if it has no children. Moreover,every node on the path from root to the nodes ∈ V is called the ancestor of s.
Each edge in E is labeled with a factor of T ,represented by a pair of integers (j, k), thatis, the label string is T [j . . . k]. We denoteby label(s) the label string for the edge intos ∈ V since any child has just one parent.For any s ∈ V , we denote by s the stringspelled out every ancestor’s label from rootto s, and call it the string represented by s.That is, assuming that root , a1, a2, . . . , s isthe sequence of the ancestor nodes of s, s =label(root) · label(a1) · label(a2) · · · label(s).For a given text T , each leaf of ST (T$)corresponds one-to-one with each suffix ofT ,and any internal node except for root hasmore than two children, where we assumethat $, called terminal symbol, is not in-cluded in Σ. Then, there are |T | leavesand less than 2|T | − 1 nodes in ST (T$).Forany two children x, y of each s ∈ V , xstarts a different character from y, that is,x[1] = y[1]. Note that each node s ∈ Vcorresponds one-to-one with a factor of Tfrom the above. We treat each factor that has
no corresponding node in ST (T ) as a virtualnode. To distinguish it, we call each s ∈ Va real node.
We define suf : V → V as a function whichreturns a node representing the string elimi-nating the first character from s for s ∈ V .For each real node s, t ∈ V and a charactera ∈ Σ, suf (s) = t iff s = a · t. Since thiscan be seen as a edge (s, t) from s to t, wecall it the suffix link from s to t. For each realnode s ∈ V , there exists just one path froms to root by traversing suffix links. We callthe path the suffix path.
2.3. Ukkonen’s suffix tree con-struction
We will give a brief sketch of Ukkonen’ssuffix tree construction algorithm[15] below.The algorithm reads characters one by onefrom the given text T = T [1 . . . n], and con-structs ST (T [1 . . . i]) gradually for each stepi(1 ≤ i ≤ n). The construction process isdone by adding every suffix of T [1 . . . i] intothe tree in descending order of the length foreach step i. Note that, however, the nodescorresponding to suffixes of T [1 . . . i] arenot necessarily to be leaves of ST (T [1 . . . i])since it does not end with the terminal sym-bol in progress phase. Such a incompletesuffix tree is called an implicit suffix tree.
Consider that we are going to extend the suf-fix tree at a step i. We denote by φ the po-sition on the tree to where a new leaf is go-ing to be added, and we call it the workingnode. We regard the node at position φ as thenode named φ if no confusion occurs. Theworking node can point a virtual node. Letφ = root when i = 0 for convenience. Ifφ · T [i] is not represented by ST (T [1 . . . i]),we add at φ the leaf whose label starts T [i]as a child. If the node φ is a virtual node,we change it a real node and make a suffixlink for it. Although the suffix link for thechanged node is not stored explicitly in thiscase, we can traverse ST to the node repre-senting suf (φ) by using the suffix link of thenearest neighbor ancestor that is also a realnode.
When creating a leaf v and its edge, we la-
139
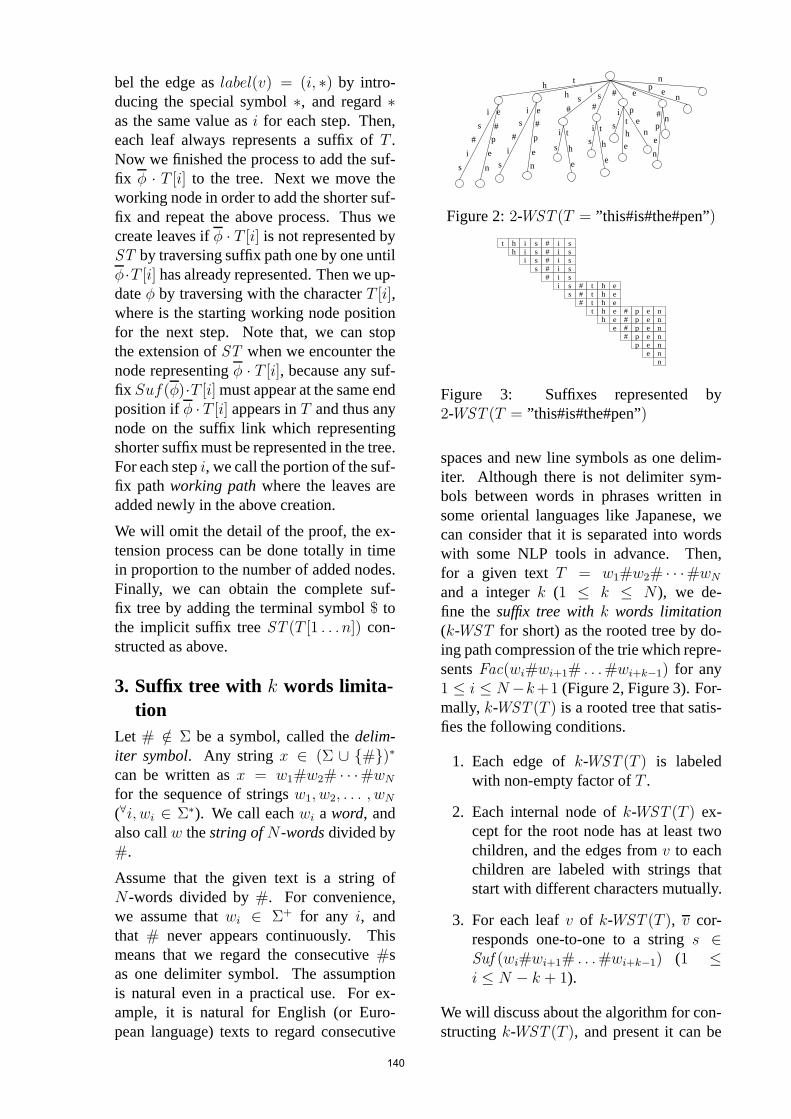
bel the edge as label(v) = (i, ∗) by intro-ducing the special symbol ∗, and regard ∗as the same value as i for each step. Then,each leaf always represents a suffix of T .Now we finished the process to add the suf-fix φ · T [i] to the tree. Next we move theworking node in order to add the shorter suf-fix and repeat the above process. Thus wecreate leaves if φ · T [i] is not represented byST by traversing suffix path one by one untilφ·T [i] has already represented. Then we up-date φ by traversing with the character T [i],where is the starting working node positionfor the next step. Note that, we can stopthe extension of ST when we encounter thenode representing φ · T [i], because any suf-fix Suf (φ)·T [i] must appear at the same endposition if φ · T [i] appears in T and thus anynode on the suffix link which representingshorter suffix must be represented in the tree.For each step i, we call the portion of the suf-fix path working path where the leaves areadded newly in the above creation.
We will omit the detail of the proof, the ex-tension process can be done totally in timein proportion to the number of added nodes.Finally, we can obtain the complete suf-fix tree by adding the terminal symbol $ tothe implicit suffix tree ST (T [1 . . . n]) con-structed as above.
3. Suffix tree with k words limita-tion
Let # /∈ Σ be a symbol, called the delim-iter symbol. Any string x ∈ (Σ ∪ #)∗can be written as x = w1#w2# · · ·#wNfor the sequence of strings w1, w2, . . . , wN(∀i, wi ∈ Σ∗). We call each wi a word, andalso call w the string of N-words divided by#.
Assume that the given text is a string ofN-words divided by #. For convenience,we assume that wi ∈ Σ+ for any i, andthat # never appears continuously. Thismeans that we regard the consecutive #sas one delimiter symbol. The assumptionis natural even in a practical use. For ex-ample, it is natural for English (or Euro-pean language) texts to regard consecutive
e
h
is
#i
s
#p
e
n
t
eis
#i
s
#p
en
h s#
i
i
s
t
h
e
#
i t
h
e
s
s
#
ithe
s
pe
n
e
pen
# n
p e n
n
Figure 2: 2-WST (T = ”this#is#the#pen”)
t h i s # i sh i s # i s
i s # i ss # i s
# i si s # t h e
s # t h e# t h e
t h e # p e nh e # p e n
e # p e n# p e n
p e ne n
n
Figure 3: Suffixes represented by2-WST (T = ”this#is#the#pen”)
spaces and new line symbols as one delim-iter. Although there is not delimiter sym-bols between words in phrases written insome oriental languages like Japanese, wecan consider that it is separated into wordswith some NLP tools in advance. Then,for a given text T = w1#w2# · · ·#wNand a integer k (1 ≤ k ≤ N), we de-fine the suffix tree with k words limitation(k-WST for short) as the rooted tree by do-ing path compression of the trie which repre-sents Fac(wi#wi+1# . . .#wi+k−1) for any1 ≤ i ≤ N−k+1 (Figure 2, Figure 3). For-mally, k-WST (T ) is a rooted tree that satis-fies the following conditions.
1. Each edge of k-WST (T ) is labeledwith non-empty factor of T .
2. Each internal node of k-WST (T ) ex-cept for the root node has at least twochildren, and the edges from v to eachchildren are labeled with strings thatstart with different characters mutually.
3. For each leaf v of k-WST (T ), v cor-responds one-to-one to a string s ∈Suf (wi#wi+1# . . .#wi+k−1) (1 ≤i ≤ N − k + 1).
We will discuss about the algorithm for con-structing k-WST (T ), and present it can be
140

constructed in O(n) time and space. There-fore, our claim is as follows.
Theorem 1. Given a N-words text T =w1#w2# · · ·#wN whose length is n, as-suming # /∈ Σ and ∀i, wi ∈ Σ+, and a in-teger k (1 ≤ k ≤ N), the suffix tree with kwords limitation of T can be constructed inO(n) time and space.
3.1. Constructing algorithm
The most important thing is not to processfor redundant leaves and to close the exten-sion of appropriate leaves just before theyextend over k+1 words when the tree is up-dated for each step. To close the extensionof the leaf is done by replacing the label’send mark ∗ into i − 1. We call this processclosing a leaf. Here, we consider that thelabel for each closed leaf is added virtuallya terminal symbol /∈ Σ. From the aboveprocedure, we can prevent from entering thesuffixes longer than k+1 words into the tree.
Figure 4 is the detail of the algorithm.
Procedure for updating the tree Con-sider that we have now k-WST (T [1 . . . i −1]) and process the updating the tree forT [i]. Let numφ be the number of # whichthe suffix φ includes, and also let lposφ bethe start position of φ in T , that is, φ =T [lposφ . . . i − 1]. We increase numφ1 byone when traversing the tree with T [i] =#. On the other hand, we decrease numφ
by one when traversing the suffix path andT [lposφ] = #. Then we increase lposφ byone. We can manage correctly the numberof words for φ in this way.
The procedure for adding leaves on theworking path is basically the same as thatof Ukkonen’s algorithm. However, we needadditional effort if the k-words string con-tains another k-words string as a prefix likethe case in Figure 5. Then, we must create aleaf which represents the end of the word forthe shorter one, too. Although the label of itis ε, we assume that it represents a virtualterminal symbol /∈ Σ. On the other hand,
procedure update(φ, numφ, lposφ, i);method:c = T [i]; oldr = root ;while (φc has not represented yet)
if (c = # orthere isn’t a closed leaf representing φ)
if (φ is a virtual node)Change the node φ into a real node;
Create a child q, label(q) = (i, ∗) of φ;if (oldr = root)suf (oldr) = φ;
oldr = φ;φ = suf (φ);if (T [lposφ] = #)numφ = numφ − 1;
lposφ = lposφ + 1;if (oldr = root)suf (oldr) = φ;
φ = φc;if (c = #)numφ = numφ + 1;
return (φ, numφ, lposφ);end.
procedure close(ψ, numψ, lposψ, i);method:
if (T [i] = #) while (numψ = k − 1)
Close the leaf ψ with i− 1;if (T [lposψ] = #)numψ = numψ − 1;
lposψ = lposψ + 1; ψ = suf (ψ);numψ = numψ + 1;return (ψ, numψ, lposψ);
end.
Algorithm constructing k-WST ;input: k, T [1 . . . n];output: k-WST (T );method:
Create the root root and the auxiliary node ⊥,and then add an edge (⊥, root);
foreach c ∈ Σ ∪ #, $ doAdd an edge (⊥, root) labeled with c;
φ = root; numφ = 0; lposφ = 1;ψ = root ; numψ = 0; lposψ = 1;for (i = 1 . . . n)
(φ, numφ, lposφ) = update(φ, numφ, lposφ, i);(ψ, numψ, lposψ) = close(ψ, numψ, lposψ, i);Report k-WST (T ).
Figure 4: Algorithm for constructingk-WST
141
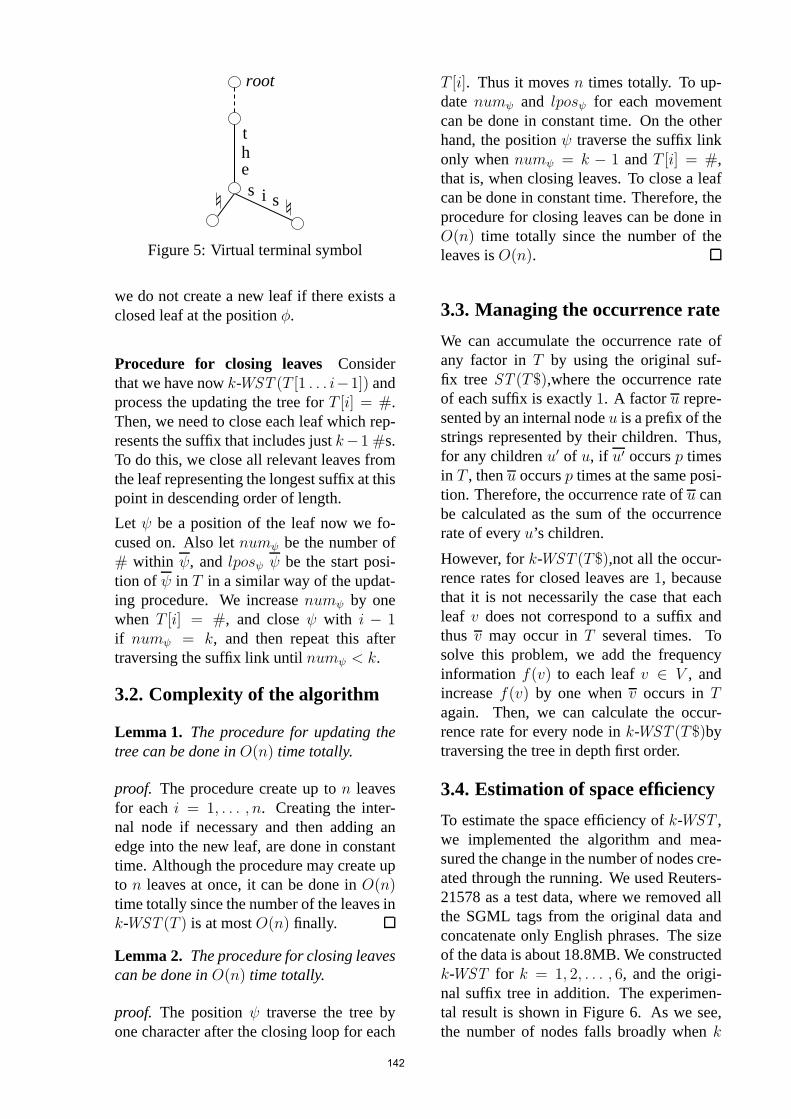
thes i s
root
Figure 5: Virtual terminal symbol
we do not create a new leaf if there exists aclosed leaf at the position φ.
Procedure for closing leaves Considerthat we have now k-WST (T [1 . . . i−1]) andprocess the updating the tree for T [i] = #.Then, we need to close each leaf which rep-resents the suffix that includes just k−1 #s.To do this, we close all relevant leaves fromthe leaf representing the longest suffix at thispoint in descending order of length.
Let ψ be a position of the leaf now we fo-cused on. Also let numψ be the number of# within ψ, and lposψ ψ be the start posi-tion of ψ in T in a similar way of the updat-ing procedure. We increase numψ by onewhen T [i] = #, and close ψ with i − 1if numψ = k, and then repeat this aftertraversing the suffix link until numψ < k.
3.2. Complexity of the algorithm
Lemma 1. The procedure for updating thetree can be done in O(n) time totally.
proof. The procedure create up to n leavesfor each i = 1, . . . , n. Creating the inter-nal node if necessary and then adding anedge into the new leaf, are done in constanttime. Although the procedure may create upto n leaves at once, it can be done in O(n)time totally since the number of the leaves ink-WST (T ) is at most O(n) finally.
Lemma 2. The procedure for closing leavescan be done in O(n) time totally.
proof. The position ψ traverse the tree byone character after the closing loop for each
T [i]. Thus it moves n times totally. To up-date numψ and lposψ for each movementcan be done in constant time. On the otherhand, the position ψ traverse the suffix linkonly when numψ = k − 1 and T [i] = #,that is, when closing leaves. To close a leafcan be done in constant time. Therefore, theprocedure for closing leaves can be done inO(n) time totally since the number of theleaves is O(n).
3.3. Managing the occurrence rate
We can accumulate the occurrence rate ofany factor in T by using the original suf-fix tree ST (T$),where the occurrence rateof each suffix is exactly 1. A factor u repre-sented by an internal node u is a prefix of thestrings represented by their children. Thus,for any children u′ of u, if u′ occurs p timesin T , then u occurs p times at the same posi-tion. Therefore, the occurrence rate of u canbe calculated as the sum of the occurrencerate of every u’s children.
However, for k-WST (T$),not all the occur-rence rates for closed leaves are 1, becausethat it is not necessarily the case that eachleaf v does not correspond to a suffix andthus v may occur in T several times. Tosolve this problem, we add the frequencyinformation f(v) to each leaf v ∈ V , andincrease f(v) by one when v occurs in Tagain. Then, we can calculate the occur-rence rate for every node in k-WST (T$)bytraversing the tree in depth first order.
3.4. Estimation of space efficiency
To estimate the space efficiency of k-WST ,we implemented the algorithm and mea-sured the change in the number of nodes cre-ated through the running. We used Reuters-21578 as a test data, where we removed allthe SGML tags from the original data andconcatenate only English phrases. The sizeof the data is about 18.8MB. We constructedk-WST for k = 1, 2, . . . , 6, and the origi-nal suffix tree in addition. The experimen-tal result is shown in Figure 6. As we see,the number of nodes falls broadly when k
142
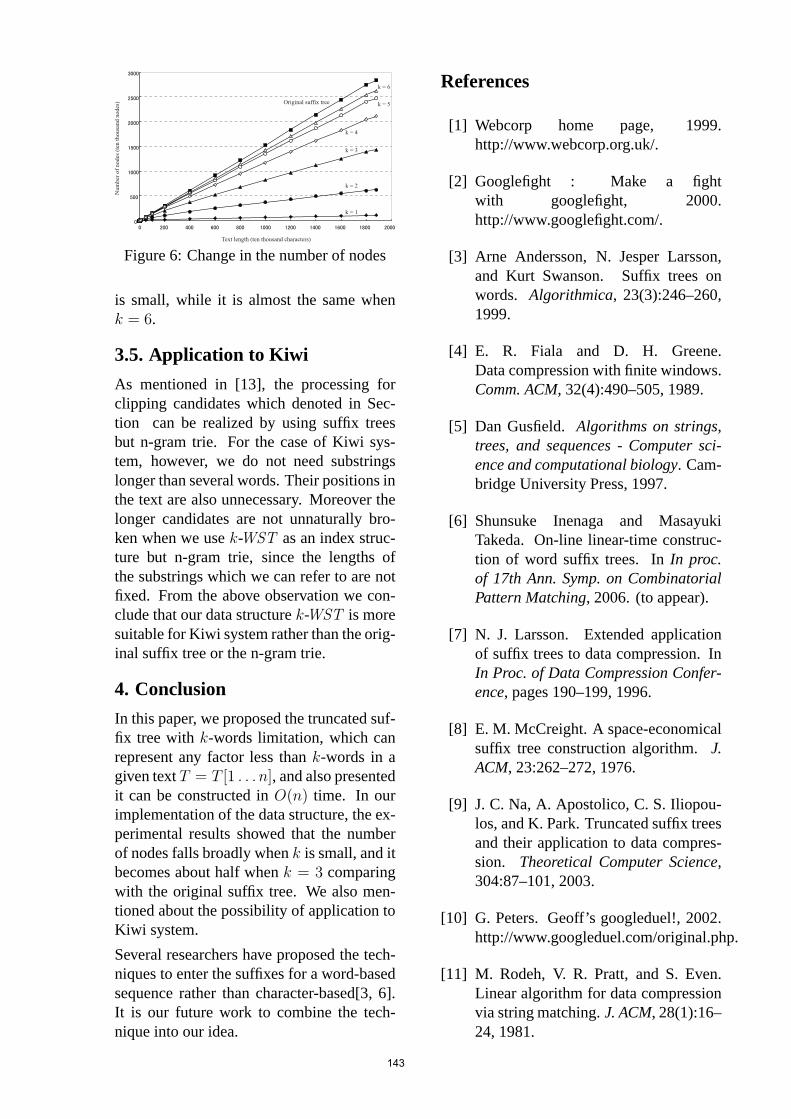
Figure 6: Change in the number of nodes
is small, while it is almost the same whenk = 6.
3.5. Application to Kiwi
As mentioned in [13], the processing forclipping candidates which denoted in Sec-tion can be realized by using suffix treesbut n-gram trie. For the case of Kiwi sys-tem, however, we do not need substringslonger than several words. Their positions inthe text are also unnecessary. Moreover thelonger candidates are not unnaturally bro-ken when we use k-WST as an index struc-ture but n-gram trie, since the lengths ofthe substrings which we can refer to are notfixed. From the above observation we con-clude that our data structure k-WST is moresuitable for Kiwi system rather than the orig-inal suffix tree or the n-gram trie.
4. Conclusion
In this paper, we proposed the truncated suf-fix tree with k-words limitation, which canrepresent any factor less than k-words in agiven text T = T [1 . . . n], and also presentedit can be constructed in O(n) time. In ourimplementation of the data structure, the ex-perimental results showed that the numberof nodes falls broadly when k is small, and itbecomes about half when k = 3 comparingwith the original suffix tree. We also men-tioned about the possibility of application toKiwi system.
Several researchers have proposed the tech-niques to enter the suffixes for a word-basedsequence rather than character-based[3, 6].It is our future work to combine the tech-nique into our idea.
References
[1] Webcorp home page, 1999.http://www.webcorp.org.uk/.
[2] Googlefight : Make a fightwith googlefight, 2000.http://www.googlefight.com/.
[3] Arne Andersson, N. Jesper Larsson,and Kurt Swanson. Suffix trees onwords. Algorithmica, 23(3):246–260,1999.
[4] E. R. Fiala and D. H. Greene.Data compression with finite windows.Comm. ACM, 32(4):490–505, 1989.
[5] Dan Gusfield. Algorithms on strings,trees, and sequences - Computer sci-ence and computational biology. Cam-bridge University Press, 1997.
[6] Shunsuke Inenaga and MasayukiTakeda. On-line linear-time construc-tion of word suffix trees. In In proc.of 17th Ann. Symp. on CombinatorialPattern Matching, 2006. (to appear).
[7] N. J. Larsson. Extended applicationof suffix trees to data compression. InIn Proc. of Data Compression Confer-ence, pages 190–199, 1996.
[8] E. M. McCreight. A space-economicalsuffix tree construction algorithm. J.ACM, 23:262–272, 1976.
[9] J. C. Na, A. Apostolico, C. S. Iliopou-los, and K. Park. Truncated suffix treesand their application to data compres-sion. Theoretical Computer Science,304:87–101, 2003.
[10] G. Peters. Geoff’s googleduel!, 2002.http://www.googleduel.com/original.php.
[11] M. Rodeh, V. R. Pratt, and S. Even.Linear algorithm for data compressionvia string matching. J. ACM, 28(1):16–24, 1981.
143

[12] Kumiko Tanaka-Ishii andYuichiro Ishii. Tonguen -search your tongue’s end, 2006.http://cantor.ish.ci.i.u-tokyo.ac.jp/ ku-miko/tonguen/tonguen.cgi.
[13] Kumiko Tanaka-Ishii and Hi-roshi Nakagawa. Kiwi site, 2004.http://kiwi.r.dl.itc.u-tokyo.ac.jp/.
[14] Kumiko Tanaka-Ishii and Hiroshi Nak-agawa. A multilingual usage consul-tation tool based on internet searching:more than a search engine, less than qa.In In Proc. of the 14th internat. WWWConference, pages 363–371, 2005.
[15] E. Ukkonen. On-line construction ofsuffix-trees. Algorithmica, 14(3):249–260, 1995.
[16] P. Weiner. Linear pattern matching al-gorithms. In In Proc. of the 14th IEEESymp. on Switching and Automata The-ory, pages 1–11, 1973.
144
Generating Frequent Closed Item SetsUsing Zero-suppressed BDDs
Shin-ichi Minato
Graduate School of Information Science and Technology,Hokkaido University
Sapporo, 060-0814 Japan.
AbstractFrequent item set mining is one of the fundamental techniques for knowledge discovery anddata mining. In the last decade, a number of efficient algorithms for frequent item set mininghave been presented, but most of them focused on just enumerating the item set patterns whichsatisfy the given conditions, and it was a different matter how to store and index the resultof patterns for efficient data analysis. Recently, we proposed a fast algorithm of extracting allfrequent item set patterns from transaction databases and simultaneously indexing the resultof huge patterns using Zero-suppressed BDDs (ZBDDs). That method, ZBDD-growth, is notonly enumerating/listing the patterns efficiently, but also indexing the output data compactlyon the memory to be analyzed with various algebraic operations. In this paper, we present avariation of ZBDD-growth algorithm to generate frequent closed item sets. This is a quite simplemodification of ZBDD-growth, and additional computation cost is relatively small compared withthe original algorithm for generating all patterns. Our method can conveniently be utilized inthe environment of ZBDD-based pattern indexing.
1. Introduction
Frequent item set mining is one of the fun-damental techniques for knowledge dis-covery and data mining. Since the intro-duction by Agrawal et al.[1], the frequentitem set mining and association rule anal-ysis have been received much attentionsfrom many researchers, and a number ofpapers have been published about the newalgorithms or improvements for solvingsuch mining problems[4, 6, 11]. However,most of such item set mining algorithmsfocused on just enumerating or listing theitem set patterns which satisfy the givenconditions and it was a different matterhow to store and index the result of pat-terns for efficient data analysis.
Recently, we proposed a fast algorithm[8]of extracting all frequent item set pat-terns from transaction databases, and si-multaneously indexing the result of hugepatterns on the computer memory using
Zero-suppressed BDDs. That method,called ZBDD-growth, does not only enu-merate/list the patterns efficiently, butalso indexes the output data compactlyon the memory. After mining, the resultof patterns can efficiently be analyzed byusing algebraic operations.
The key of the method is to use BDD-based data structure for representing setsof patterns. BDDs[2] are graph-basedrepresentation of Boolean functions, nowwidely used in VLSI logic design and ver-ification area. For the data mining ap-plications, it is important to use Zero-suppressed BDDs (ZBDDs)[7], a specialtype of BDDs, which are suitable for han-dling large-scale sets of combinations. Us-ing ZBDDs, we can implicitly enumeratecombinatorial item set data and efficientlycompute set operations over the ZBDDs.
In this paper, we present an interestingvariation of ZBDD-growth algorithm to
145
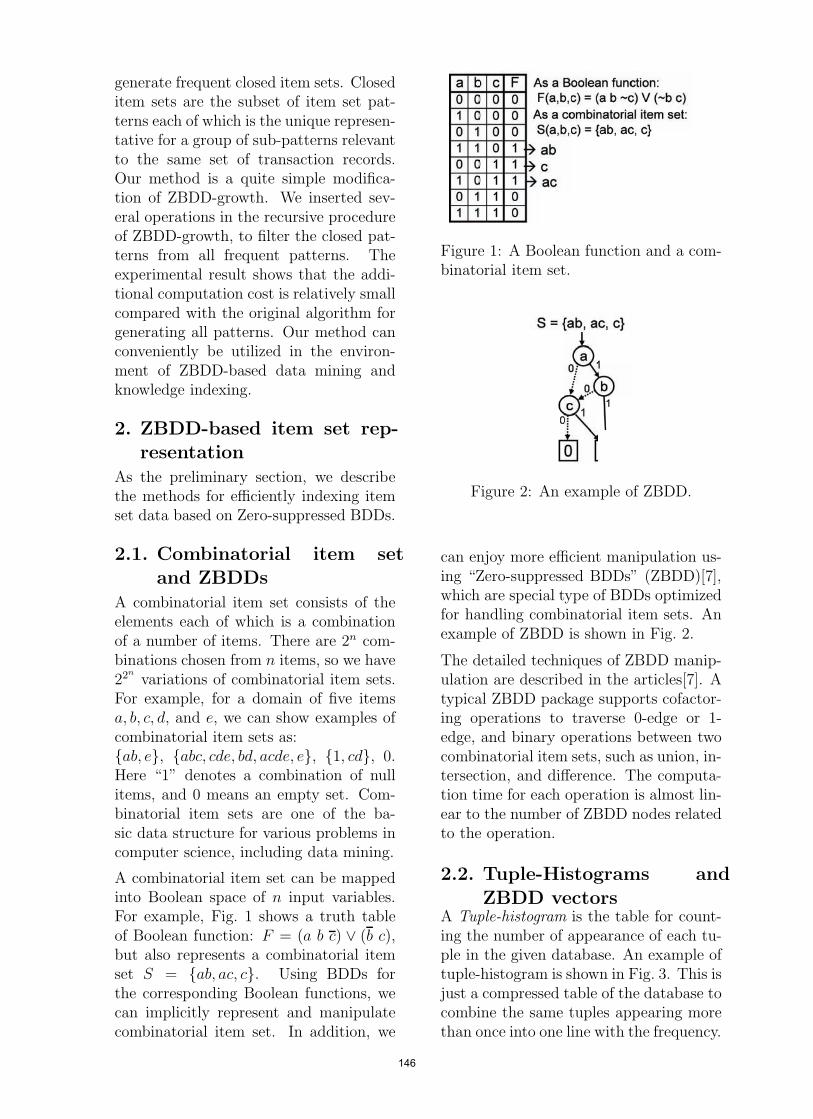
generate frequent closed item sets. Closeditem sets are the subset of item set pat-terns each of which is the unique represen-tative for a group of sub-patterns relevantto the same set of transaction records.Our method is a quite simple modifica-tion of ZBDD-growth. We inserted sev-eral operations in the recursive procedureof ZBDD-growth, to filter the closed pat-terns from all frequent patterns. Theexperimental result shows that the addi-tional computation cost is relatively smallcompared with the original algorithm forgenerating all patterns. Our method canconveniently be utilized in the environ-ment of ZBDD-based data mining andknowledge indexing.
2. ZBDD-based item set rep-resentation
As the preliminary section, we describethe methods for efficiently indexing itemset data based on Zero-suppressed BDDs.
2.1. Combinatorial item setand ZBDDs
A combinatorial item set consists of theelements each of which is a combinationof a number of items. There are 2n com-binations chosen from n items, so we have22n
variations of combinatorial item sets.For example, for a domain of five itemsa, b, c, d, and e, we can show examples ofcombinatorial item sets as:ab, e, abc, cde, bd, acde, e, 1, cd, 0.Here “1” denotes a combination of nullitems, and 0 means an empty set. Com-binatorial item sets are one of the ba-sic data structure for various problems incomputer science, including data mining.
A combinatorial item set can be mappedinto Boolean space of n input variables.For example, Fig. 1 shows a truth tableof Boolean function: F = (a b c) ∨ (b c),but also represents a combinatorial itemset S = ab, ac, c. Using BDDs forthe corresponding Boolean functions, wecan implicitly represent and manipulatecombinatorial item set. In addition, we
Figure 1: A Boolean function and a com-binatorial item set.
Figure 2: An example of ZBDD.
can enjoy more efficient manipulation us-ing “Zero-suppressed BDDs” (ZBDD)[7],which are special type of BDDs optimizedfor handling combinatorial item sets. Anexample of ZBDD is shown in Fig. 2.
The detailed techniques of ZBDD manip-ulation are described in the articles[7]. Atypical ZBDD package supports cofactor-ing operations to traverse 0-edge or 1-edge, and binary operations between twocombinatorial item sets, such as union, in-tersection, and difference. The computa-tion time for each operation is almost lin-ear to the number of ZBDD nodes relatedto the operation.
2.2. Tuple-Histograms and
ZBDD vectorsA Tuple-histogram is the table for count-ing the number of appearance of each tu-ple in the given database. An example oftuple-histogram is shown in Fig. 3. This isjust a compressed table of the database tocombine the same tuples appearing morethan once into one line with the frequency.
146
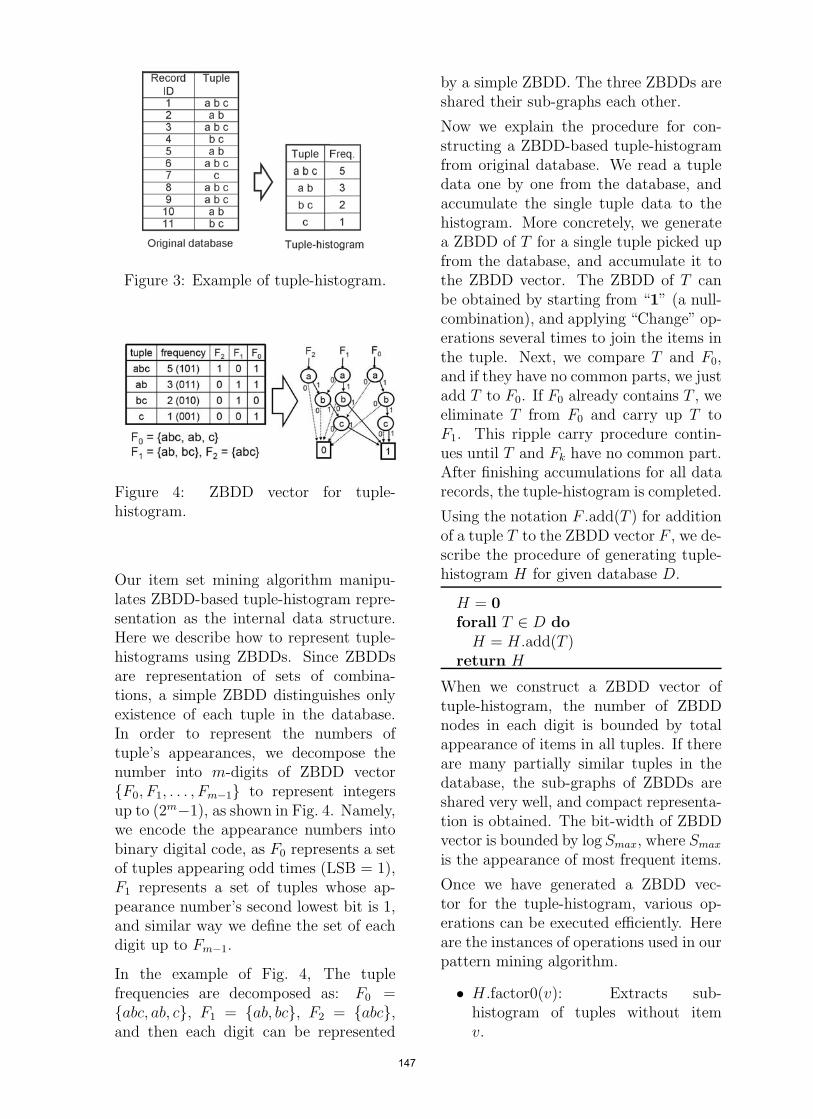
Figure 3: Example of tuple-histogram.
Figure 4: ZBDD vector for tuple-histogram.
Our item set mining algorithm manipu-lates ZBDD-based tuple-histogram repre-sentation as the internal data structure.Here we describe how to represent tuple-histograms using ZBDDs. Since ZBDDsare representation of sets of combina-tions, a simple ZBDD distinguishes onlyexistence of each tuple in the database.In order to represent the numbers oftuple’s appearances, we decompose thenumber into m-digits of ZBDD vectorF0, F1, . . . , Fm−1 to represent integersup to (2m−1), as shown in Fig. 4. Namely,we encode the appearance numbers intobinary digital code, as F0 represents a setof tuples appearing odd times (LSB = 1),F1 represents a set of tuples whose ap-pearance number’s second lowest bit is 1,and similar way we define the set of eachdigit up to Fm−1.
In the example of Fig. 4, The tuplefrequencies are decomposed as: F0 =abc, ab, c, F1 = ab, bc, F2 = abc,and then each digit can be represented
by a simple ZBDD. The three ZBDDs areshared their sub-graphs each other.
Now we explain the procedure for con-structing a ZBDD-based tuple-histogramfrom original database. We read a tupledata one by one from the database, andaccumulate the single tuple data to thehistogram. More concretely, we generatea ZBDD of T for a single tuple picked upfrom the database, and accumulate it tothe ZBDD vector. The ZBDD of T canbe obtained by starting from “1” (a null-combination), and applying “Change” op-erations several times to join the items inthe tuple. Next, we compare T and F0,and if they have no common parts, we justadd T to F0. If F0 already contains T , weeliminate T from F0 and carry up T toF1. This ripple carry procedure contin-ues until T and Fk have no common part.After finishing accumulations for all datarecords, the tuple-histogram is completed.
Using the notation F .add(T ) for additionof a tuple T to the ZBDD vector F , we de-scribe the procedure of generating tuple-histogram H for given database D.
H = 0forall T ∈ D doH = H .add(T )
return H
When we construct a ZBDD vector oftuple-histogram, the number of ZBDDnodes in each digit is bounded by totalappearance of items in all tuples. If thereare many partially similar tuples in thedatabase, the sub-graphs of ZBDDs areshared very well, and compact representa-tion is obtained. The bit-width of ZBDDvector is bounded by log Smax, where Smax
is the appearance of most frequent items.
Once we have generated a ZBDD vec-tor for the tuple-histogram, various op-erations can be executed efficiently. Hereare the instances of operations used in ourpattern mining algorithm.
• H .factor0(v): Extracts sub-histogram of tuples without itemv.
147
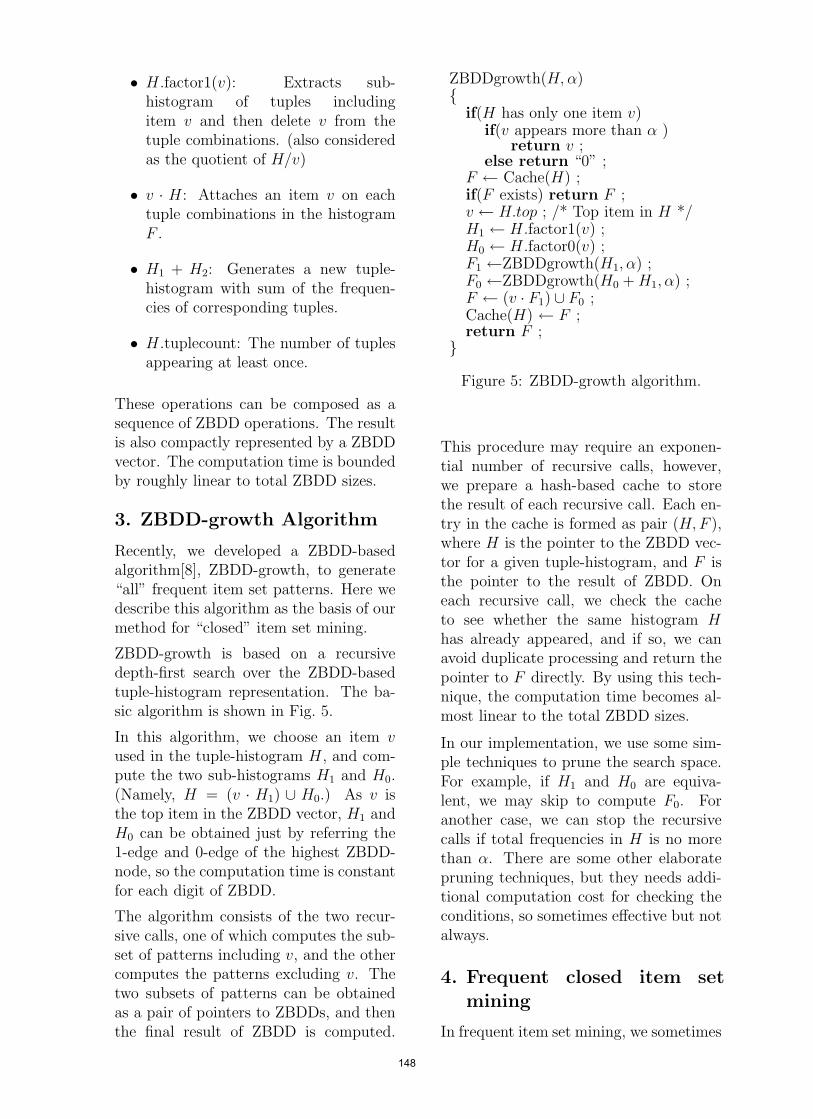
• H .factor1(v): Extracts sub-histogram of tuples includingitem v and then delete v from thetuple combinations. (also consideredas the quotient of H/v)
• v · H : Attaches an item v on eachtuple combinations in the histogramF .
• H1 + H2: Generates a new tuple-histogram with sum of the frequen-cies of corresponding tuples.
• H .tuplecount: The number of tuplesappearing at least once.
These operations can be composed as asequence of ZBDD operations. The resultis also compactly represented by a ZBDDvector. The computation time is boundedby roughly linear to total ZBDD sizes.
3. ZBDD-growth Algorithm
Recently, we developed a ZBDD-basedalgorithm[8], ZBDD-growth, to generate“all” frequent item set patterns. Here wedescribe this algorithm as the basis of ourmethod for “closed” item set mining.
ZBDD-growth is based on a recursivedepth-first search over the ZBDD-basedtuple-histogram representation. The ba-sic algorithm is shown in Fig. 5.
In this algorithm, we choose an item vused in the tuple-histogram H , and com-pute the two sub-histograms H1 and H0.(Namely, H = (v · H1) ∪ H0.) As v isthe top item in the ZBDD vector, H1 andH0 can be obtained just by referring the1-edge and 0-edge of the highest ZBDD-node, so the computation time is constantfor each digit of ZBDD.
The algorithm consists of the two recur-sive calls, one of which computes the sub-set of patterns including v, and the othercomputes the patterns excluding v. Thetwo subsets of patterns can be obtainedas a pair of pointers to ZBDDs, and thenthe final result of ZBDD is computed.
ZBDDgrowth(H, α)
if(H has only one item v)if(v appears more than α )
return v ;else return “0” ;
F ← Cache(H) ;if(F exists) return F ;v ← H.top ; /* Top item in H */H1 ← H .factor1(v) ;H0 ← H .factor0(v) ;F1 ←ZBDDgrowth(H1, α) ;F0 ←ZBDDgrowth(H0 +H1, α) ;F ← (v · F1) ∪ F0 ;Cache(H) ← F ;return F ;
Figure 5: ZBDD-growth algorithm.
This procedure may require an exponen-tial number of recursive calls, however,we prepare a hash-based cache to storethe result of each recursive call. Each en-try in the cache is formed as pair (H,F ),where H is the pointer to the ZBDD vec-tor for a given tuple-histogram, and F isthe pointer to the result of ZBDD. Oneach recursive call, we check the cacheto see whether the same histogram Hhas already appeared, and if so, we canavoid duplicate processing and return thepointer to F directly. By using this tech-nique, the computation time becomes al-most linear to the total ZBDD sizes.
In our implementation, we use some sim-ple techniques to prune the search space.For example, if H1 and H0 are equiva-lent, we may skip to compute F0. Foranother case, we can stop the recursivecalls if total frequencies in H is no morethan α. There are some other elaboratepruning techniques, but they needs addi-tional computation cost for checking theconditions, so sometimes effective but notalways.
4. Frequent closed item set
mining
In frequent item set mining, we sometimes
148
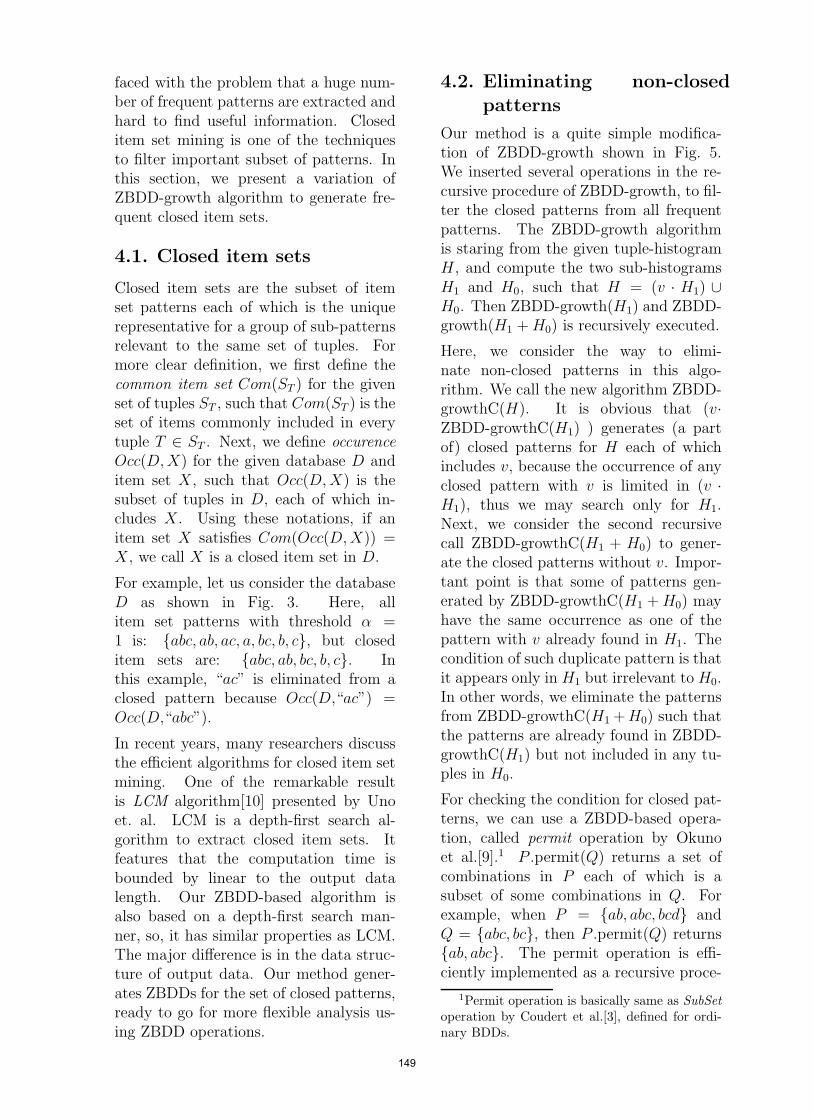
faced with the problem that a huge num-ber of frequent patterns are extracted andhard to find useful information. Closeditem set mining is one of the techniquesto filter important subset of patterns. Inthis section, we present a variation ofZBDD-growth algorithm to generate fre-quent closed item sets.
4.1. Closed item sets
Closed item sets are the subset of itemset patterns each of which is the uniquerepresentative for a group of sub-patternsrelevant to the same set of tuples. Formore clear definition, we first define thecommon item set Com(ST ) for the givenset of tuples ST , such that Com(ST ) is theset of items commonly included in everytuple T ∈ ST . Next, we define occurenceOcc(D,X) for the given database D anditem set X, such that Occ(D,X) is thesubset of tuples in D, each of which in-cludes X. Using these notations, if anitem set X satisfies Com(Occ(D,X)) =X, we call X is a closed item set in D.
For example, let us consider the databaseD as shown in Fig. 3. Here, allitem set patterns with threshold α =1 is: abc, ab, ac, a, bc, b, c, but closeditem sets are: abc, ab, bc, b, c. Inthis example, “ac” is eliminated from aclosed pattern because Occ(D,“ac”) =Occ(D,“abc”).
In recent years, many researchers discussthe efficient algorithms for closed item setmining. One of the remarkable resultis LCM algorithm[10] presented by Unoet. al. LCM is a depth-first search al-gorithm to extract closed item sets. Itfeatures that the computation time isbounded by linear to the output datalength. Our ZBDD-based algorithm isalso based on a depth-first search man-ner, so, it has similar properties as LCM.The major difference is in the data struc-ture of output data. Our method gener-ates ZBDDs for the set of closed patterns,ready to go for more flexible analysis us-ing ZBDD operations.
4.2. Eliminating non-closedpatterns
Our method is a quite simple modifica-tion of ZBDD-growth shown in Fig. 5.We inserted several operations in the re-cursive procedure of ZBDD-growth, to fil-ter the closed patterns from all frequentpatterns. The ZBDD-growth algorithmis staring from the given tuple-histogramH , and compute the two sub-histogramsH1 and H0, such that H = (v · H1) ∪H0. Then ZBDD-growth(H1) and ZBDD-growth(H1 +H0) is recursively executed.
Here, we consider the way to elimi-nate non-closed patterns in this algo-rithm. We call the new algorithm ZBDD-growthC(H). It is obvious that (v·ZBDD-growthC(H1) ) generates (a partof) closed patterns for H each of whichincludes v, because the occurrence of anyclosed pattern with v is limited in (v ·H1), thus we may search only for H1.Next, we consider the second recursivecall ZBDD-growthC(H1 + H0) to gener-ate the closed patterns without v. Impor-tant point is that some of patterns gen-erated by ZBDD-growthC(H1 +H0) mayhave the same occurrence as one of thepattern with v already found in H1. Thecondition of such duplicate pattern is thatit appears only in H1 but irrelevant to H0.In other words, we eliminate the patternsfrom ZBDD-growthC(H1 +H0) such thatthe patterns are already found in ZBDD-growthC(H1) but not included in any tu-ples in H0.
For checking the condition for closed pat-terns, we can use a ZBDD-based opera-tion, called permit operation by Okunoet al.[9].1 P .permit(Q) returns a set ofcombinations in P each of which is asubset of some combinations in Q. Forexample, when P = ab, abc, bcd andQ = abc, bc, then P .permit(Q) returnsab, abc. The permit operation is effi-ciently implemented as a recursive proce-
1Permit operation is basically same as SubSetoperation by Coudert et al.[3], defined for ordi-nary BDDs.
149

P .permit(Q)
if(P =“0” or Q =“0”) return “0” ;if(P = Q) return F ;if(P =“1”) return “1” ;if(Q =“1”)
if(P include “1” ) return “1” ;else return “0” ;
R← Cache(P,Q) ;if(R exists) return R ;v ←TopItem(P,Q) ; /* Top item in P,Q */(P0, P1)←factors of P by v ;(Q0, Q1)←factors of Q by v ;R← (v · P1.permit(Q1))
∪ (P0.permit(Q0 ∪Q1)) ;Cache(P,Q) ← R ;return R ;
Figure 6: Permit operation.
dure of ZBDD manipulation, as shown inFig. 6. The computation time of permitoperation is almost linear to the ZBDDsize.
Finally, we describe the ZBDD-growthCalgorithm using the permit operation, asshown in Fig. 7. The difference from theoriginal algorithm is only one line, writtenin the frame box.
5. Experimental Results
Here we show the experimental results toevaluate our new method. We used aPentium-4 PC, 800MHz, 1.5GB of mainmemory, with SuSE Linux 9. We can dealwith up to 40,000,000 nodes of ZBDDs inthis machine.
Table 1 shows the time and spacefor generating ZBDD vectors of tuple-histograms for the FIMI2003 benchmarkdatabases[5]. This table shows the com-putation time and space for providing in-put data for ZBDD-growth algorithm. Inthis table, #T shows the number of tu-ples, total|T | is the total of tuple sizes(total appearances of items), and |ZBDD|is the number of ZBDD nodes for thetuple-histograms. We can see that tuple-
ZBDDgrowthC(H,α)
if(H has only one item v)if(v appears more than α )
return v ;else return “0” ;
F ← Cache(H) ;if(F exists) return F ;v ← H.top ; /* Top item in H */H1 ← H.factor1(v) ;H0 ← H.factor0(v) ;F1 ←ZBDDgrowthC(H1, α) ;F0 ←ZBDDgrowthC(H0 +H1, α) ;F ← (v · F1) ∪
(F0 − (F1 − F1.permit(H0))) ;Cache(H) ← F ;return F ;
Figure 7: ZBDD-growthC algorithm.
histograms can be constructed for all in-stances in a feasible time and space. TheZBDD sizes are almost same or less thantotal|T |.
After generating ZBDD vectors for thetuple-histograms, we applied ZBDD-growth algorithm to generate frequentpatterns. Table 2 show the results ofthe original ZBDD-growth algorithm[8]for the selected benchmark examples,“mushroom,” “T10I4D100K,” and“BMS-WebView-1.” The execution timeincludes the time for generating the initialZBDD vectors for tuple-histograms.
The results shows that the ZBDD size isexponentially smaller than the number ofpatterns for “mushroom.” This is a sig-nificant effect of using the ZBDD datastructure. On the other hand, no remark-able reduction is seen in ”T10I4D100K.””T10I4D100K” is known as an artificialdatabase, consists of randomly generatedcombinations, so there are almost no re-lationship between the tuples. In suchcases, ZBDD nodes cannot be shared well,and only the overhead factor is revealed.For the third example, “BMS-WebView-1,” the ZBDD size is almost linear to the
150
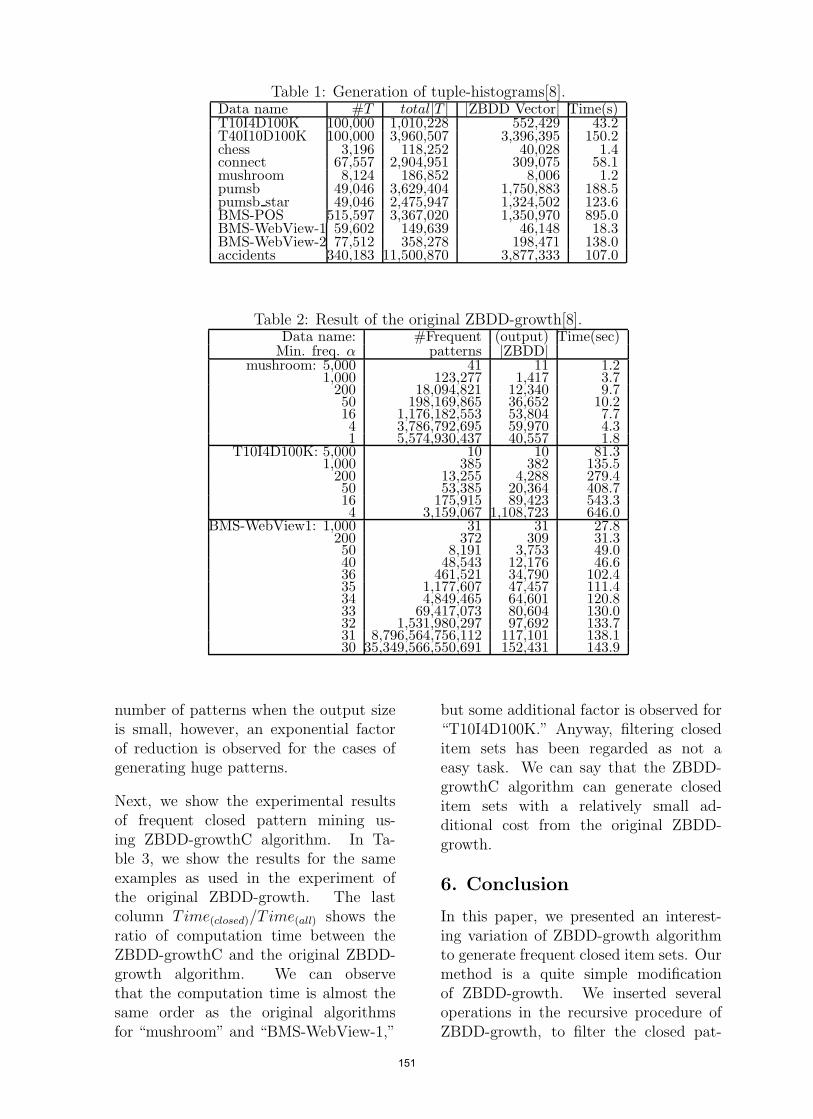
Table 1: Generation of tuple-histograms[8].Data name #T total|T | |ZBDD Vector| Time(s)T10I4D100K 100,000 1,010,228 552,429 43.2T40I10D100K 100,000 3,960,507 3,396,395 150.2chess 3,196 118,252 40,028 1.4connect 67,557 2,904,951 309,075 58.1mushroom 8,124 186,852 8,006 1.2pumsb 49,046 3,629,404 1,750,883 188.5pumsb star 49,046 2,475,947 1,324,502 123.6BMS-POS 515,597 3,367,020 1,350,970 895.0BMS-WebView-1 59,602 149,639 46,148 18.3BMS-WebView-2 77,512 358,278 198,471 138.0accidents 340,183 11,500,870 3,877,333 107.0
Table 2: Result of the original ZBDD-growth[8].Data name: #Frequent (output) Time(sec)
Min. freq. α patterns |ZBDD|mushroom: 5,000 41 11 1.2
1,000 123,277 1,417 3.7200 18,094,821 12,340 9.750 198,169,865 36,652 10.216 1,176,182,553 53,804 7.74 3,786,792,695 59,970 4.31 5,574,930,437 40,557 1.8
T10I4D100K: 5,000 10 10 81.31,000 385 382 135.5
200 13,255 4,288 279.450 53,385 20,364 408.716 175,915 89,423 543.34 3,159,067 1,108,723 646.0
BMS-WebView1: 1,000 31 31 27.8200 372 309 31.350 8,191 3,753 49.040 48,543 12,176 46.636 461,521 34,790 102.435 1,177,607 47,457 111.434 4,849,465 64,601 120.833 69,417,073 80,604 130.032 1,531,980,297 97,692 133.731 8,796,564,756,112 117,101 138.130 35,349,566,550,691 152,431 143.9
number of patterns when the output sizeis small, however, an exponential factorof reduction is observed for the cases ofgenerating huge patterns.
Next, we show the experimental resultsof frequent closed pattern mining us-ing ZBDD-growthC algorithm. In Ta-ble 3, we show the results for the sameexamples as used in the experiment ofthe original ZBDD-growth. The lastcolumn T ime(closed)/T ime(all) shows theratio of computation time between theZBDD-growthC and the original ZBDD-growth algorithm. We can observethat the computation time is almost thesame order as the original algorithmsfor “mushroom” and “BMS-WebView-1,”
but some additional factor is observed for“T10I4D100K.” Anyway, filtering closeditem sets has been regarded as not aeasy task. We can say that the ZBDD-growthC algorithm can generate closeditem sets with a relatively small ad-ditional cost from the original ZBDD-growth.
6. Conclusion
In this paper, we presented an interest-ing variation of ZBDD-growth algorithmto generate frequent closed item sets. Ourmethod is a quite simple modificationof ZBDD-growth. We inserted severaloperations in the recursive procedure ofZBDD-growth, to filter the closed pat-
151
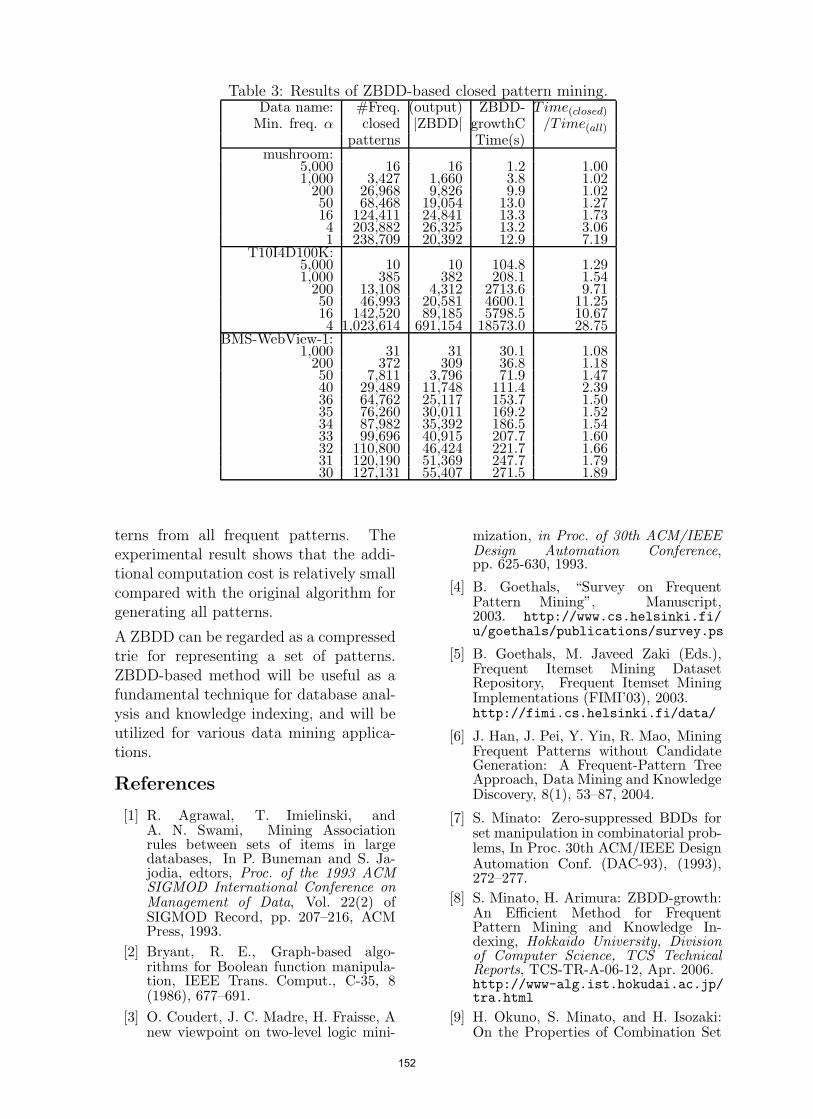
Table 3: Results of ZBDD-based closed pattern mining.Data name: #Freq. (output) ZBDD- T ime(closed)
Min. freq. α closed |ZBDD| growthC /T ime(all)
patterns Time(s)mushroom:
5,000 16 16 1.2 1.001,000 3,427 1,660 3.8 1.02
200 26,968 9,826 9.9 1.0250 68,468 19,054 13.0 1.2716 124,411 24,841 13.3 1.734 203,882 26,325 13.2 3.061 238,709 20,392 12.9 7.19
T10I4D100K:5,000 10 10 104.8 1.291,000 385 382 208.1 1.54
200 13,108 4,312 2713.6 9.7150 46,993 20,581 4600.1 11.2516 142,520 89,185 5798.5 10.674 1,023,614 691,154 18573.0 28.75
BMS-WebView-1:1,000 31 31 30.1 1.08
200 372 309 36.8 1.1850 7,811 3,796 71.9 1.4740 29,489 11,748 111.4 2.3936 64,762 25,117 153.7 1.5035 76,260 30,011 169.2 1.5234 87,982 35,392 186.5 1.5433 99,696 40,915 207.7 1.6032 110,800 46,424 221.7 1.6631 120,190 51,369 247.7 1.7930 127,131 55,407 271.5 1.89
terns from all frequent patterns. Theexperimental result shows that the addi-tional computation cost is relatively smallcompared with the original algorithm forgenerating all patterns.
A ZBDD can be regarded as a compressedtrie for representing a set of patterns.ZBDD-based method will be useful as afundamental technique for database anal-ysis and knowledge indexing, and will beutilized for various data mining applica-tions.
References
[1] R. Agrawal, T. Imielinski, andA. N. Swami, Mining Associationrules between sets of items in largedatabases, In P. Buneman and S. Ja-jodia, edtors, Proc. of the 1993 ACMSIGMOD International Conference onManagement of Data, Vol. 22(2) ofSIGMOD Record, pp. 207–216, ACMPress, 1993.
[2] Bryant, R. E., Graph-based algo-rithms for Boolean function manipula-tion, IEEE Trans. Comput., C-35, 8(1986), 677–691.
[3] O. Coudert, J. C. Madre, H. Fraisse, Anew viewpoint on two-level logic mini-
mization, in Proc. of 30th ACM/IEEEDesign Automation Conference,pp. 625-630, 1993.
[4] B. Goethals, “Survey on FrequentPattern Mining”, Manuscript,2003. http://www.cs.helsinki.fi/u/goethals/publications/survey.ps
[5] B. Goethals, M. Javeed Zaki (Eds.),Frequent Itemset Mining DatasetRepository, Frequent Itemset MiningImplementations (FIMI’03), 2003.http://fimi.cs.helsinki.fi/data/
[6] J. Han, J. Pei, Y. Yin, R. Mao, MiningFrequent Patterns without CandidateGeneration: A Frequent-Pattern TreeApproach, Data Mining and KnowledgeDiscovery, 8(1), 53–87, 2004.
[7] S. Minato: Zero-suppressed BDDs forset manipulation in combinatorial prob-lems, In Proc. 30th ACM/IEEE DesignAutomation Conf. (DAC-93), (1993),272–277.
[8] S. Minato, H. Arimura: ZBDD-growth:An Efficient Method for FrequentPattern Mining and Knowledge In-dexing, Hokkaido University, Divisionof Computer Science, TCS TechnicalReports, TCS-TR-A-06-12, Apr. 2006.http://www-alg.ist.hokudai.ac.jp/tra.html
[9] H. Okuno, S. Minato, and H. Isozaki:On the Properties of Combination Set
152

Operations, Information Procssing Let-ters, Elsevier, 66 (1998), pp. 195-199,1998.
[10] T. Uno, Y. Uchida, T. Asai, andH. Arimura: “LCM: An EfficientAlgorithm for Enumerating FrequentClosed Item Sets,” Proc. Workshop onFrequent Itemset Mining Implementa-tions (FIMI’03), Mohammed J. Zakiand Bart Goethals (eds.), 2003.http://fimi.cs.helsinki.fi/fimi03/
[11] M. J. Zaki, Scalable Algorithms for As-sociation Mining, IEEE Trans. Knowl.Data Eng. 12(2), 372–390, 2000.
153

Data Mining in Amino Acid Sequences ofH3N2 Influenza Viruses Isolated during
1968 to 2006Kimihito Ito, Manabu Igarashi, Ayato Takada
Hokkaido University Research Center for Zoonosis ControlSapporo 060-0818, Japan
AbstractThe hemagglutinin (HA) of influenza viruses undergoes antigenic drift to escape from antibody-mediatedimmune pressure. In order to predict possible structural changes of the HA molecules in future, it isimportant to understand the patterns of amino acid mutations and structural changes in the past. Weperformed a retrospective and comprehensive analysis of structural changes in H3 hemagglutinins ofhuman influenza viruses isolated during 1968 to 2006. Amino acid sequence data of more than 2000strains have been collected from NCBI Influenza virus resources. Information theoretic analysis of thecollected sequences revealed a number of simultaneous mutations of amino acids at two or more differentpositions (correlated mutations). We also calculated the net charge of the HA1 subunit, based on thenumber of charged amino acid residues, and found that the net charge increased linearly from 1968 to1984 and, after then, has been saturated. This level of the net charge may be an upper limit for H3 HAto be functional. It is noted that ”correlated mutations” with the conversion of acidic and basic aminoacid residues between two different positions were frequently found after 1984, suggesting that thesemutations contributed to counterbalancing effect to keep the net charge of the HA . These approachesmay open the way to find the direction of future antigenic drift of influenza viruses.
1. IntroductionInfluenza A virus causes highly contagious,acute respiratory illness, and continues to bea major cause of morbidity and mortality.The viral strains mutates from year to year,causing the annual epidemic world wide.
The hemagglutinin (HA) is the major sur-face glycoprotein of influenza viruses andplays an important role in virus entry intohost cells. The HA undergoes antigenicdrifts which occur by accumulation of a se-ries of amino acid substitutions. Influenzaviruses that escape from antibody-mediatedimmune pressure of human population ac-quire a new antigenic structure and contin-uously cause epidemic in the world.
In order to predict possible structuralchanges of the HA molecules in future, it isimportant to understand the patterns of anti-genic drift of influenza viruses in the past.We have been studying computational meth-
ods that include information theoretic anal-ysis to find patterns of amino acids substi-tutions, molecular modeling to reveal thechanges in 3D structure of antigenically dif-ferent HAs, and molecular simulation to in-vestigate the antigen-antibody interaction.
We performed a retrospective and compre-hensive analysis of structural changes inH3 HAs of human influenza viruses iso-lated during 1968 to 2006. Amino acid se-quence data of more than 2000 strains havebeen collected from NCBI Influenza virusresources and used for the analysis. Theseapproaches may open the way to find the di-rection of future antigenic drift of influenzaviruses.
2. Information Theoretic Analysisof the Past HA Sequences
The entropy and mutual information areused to find simultaneous mutations of
154
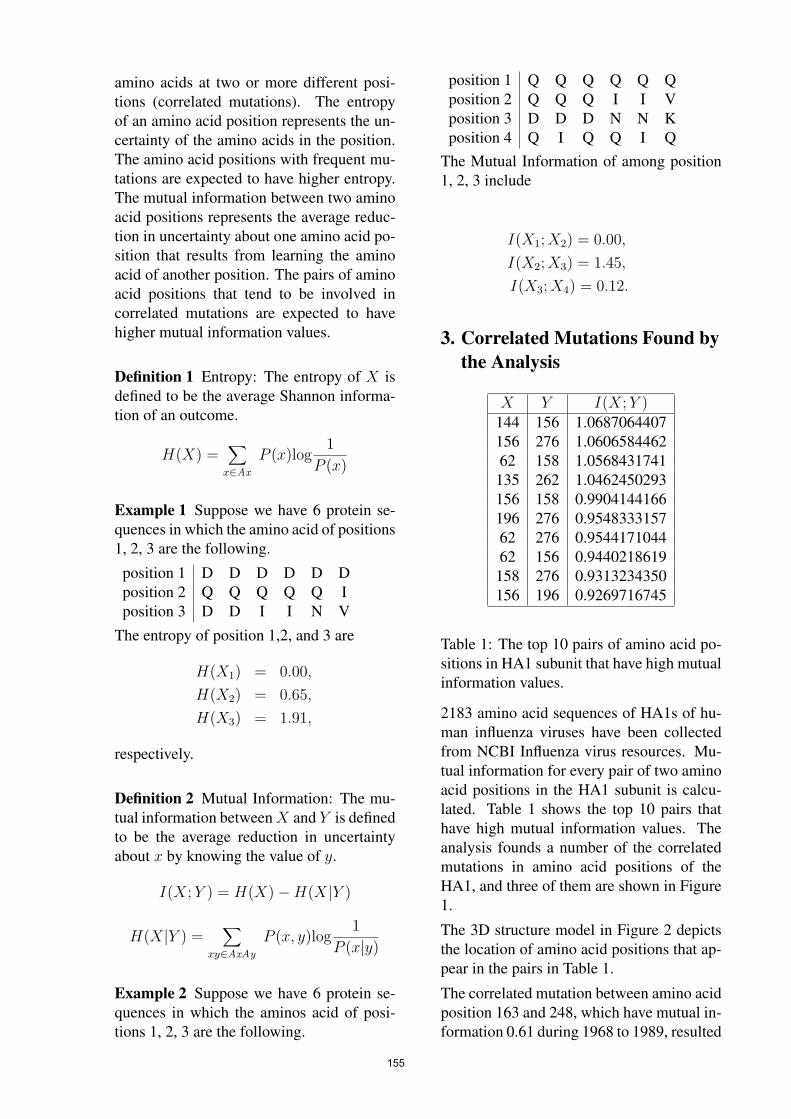
amino acids at two or more different posi-tions (correlated mutations). The entropyof an amino acid position represents the un-certainty of the amino acids in the position.The amino acid positions with frequent mu-tations are expected to have higher entropy.The mutual information between two aminoacid positions represents the average reduc-tion in uncertainty about one amino acid po-sition that results from learning the aminoacid of another position. The pairs of aminoacid positions that tend to be involved incorrelated mutations are expected to havehigher mutual information values.
Definition 1 Entropy: The entropy of X isdefined to be the average Shannon informa-tion of an outcome.
H(X) =∑x∈Ax
P (x)log1
P (x)
Example 1 Suppose we have 6 protein se-quences in which the amino acid of positions1, 2, 3 are the following.
position 1 D D D D D Dposition 2 Q Q Q Q Q Iposition 3 D D I I N V
The entropy of position 1,2, and 3 are
H(X1) = 0.00,
H(X2) = 0.65,
H(X3) = 1.91,
respectively.
Definition 2 Mutual Information: The mu-tual information betweenX and Y is definedto be the average reduction in uncertaintyabout x by knowing the value of y.
I(X;Y ) = H(X)−H(X|Y )
H(X|Y ) =∑
xy∈AxAy
P (x, y)log1
P (x|y)
Example 2 Suppose we have 6 protein se-quences in which the aminos acid of posi-tions 1, 2, 3 are the following.
position 1 Q Q Q Q Q Qposition 2 Q Q Q I I Vposition 3 D D D N N Kposition 4 Q I Q Q I Q
The Mutual Information of among position1, 2, 3 include
I(X1;X2) = 0.00,
I(X2;X3) = 1.45,
I(X3;X4) = 0.12.
3. Correlated Mutations Found bythe Analysis
X Y I(X;Y )144 156 1.0687064407156 276 1.060658446262 158 1.0568431741
135 262 1.0462450293156 158 0.9904144166196 276 0.954833315762 276 0.954417104462 156 0.9440218619
158 276 0.9313234350156 196 0.9269716745
Table 1: The top 10 pairs of amino acid po-sitions in HA1 subunit that have high mutualinformation values.
2183 amino acid sequences of HA1s of hu-man influenza viruses have been collectedfrom NCBI Influenza virus resources. Mu-tual information for every pair of two aminoacid positions in the HA1 subunit is calcu-lated. Table 1 shows the top 10 pairs thathave high mutual information values. Theanalysis founds a number of the correlatedmutations in amino acid positions of theHA1, and three of them are shown in Figure1.
The 3D structure model in Figure 2 depictsthe location of amino acid positions that ap-pear in the pairs in Table 1.
The correlated mutation between amino acidposition 163 and 248, which have mutual in-formation 0.61 during 1968 to 1989, resulted
155
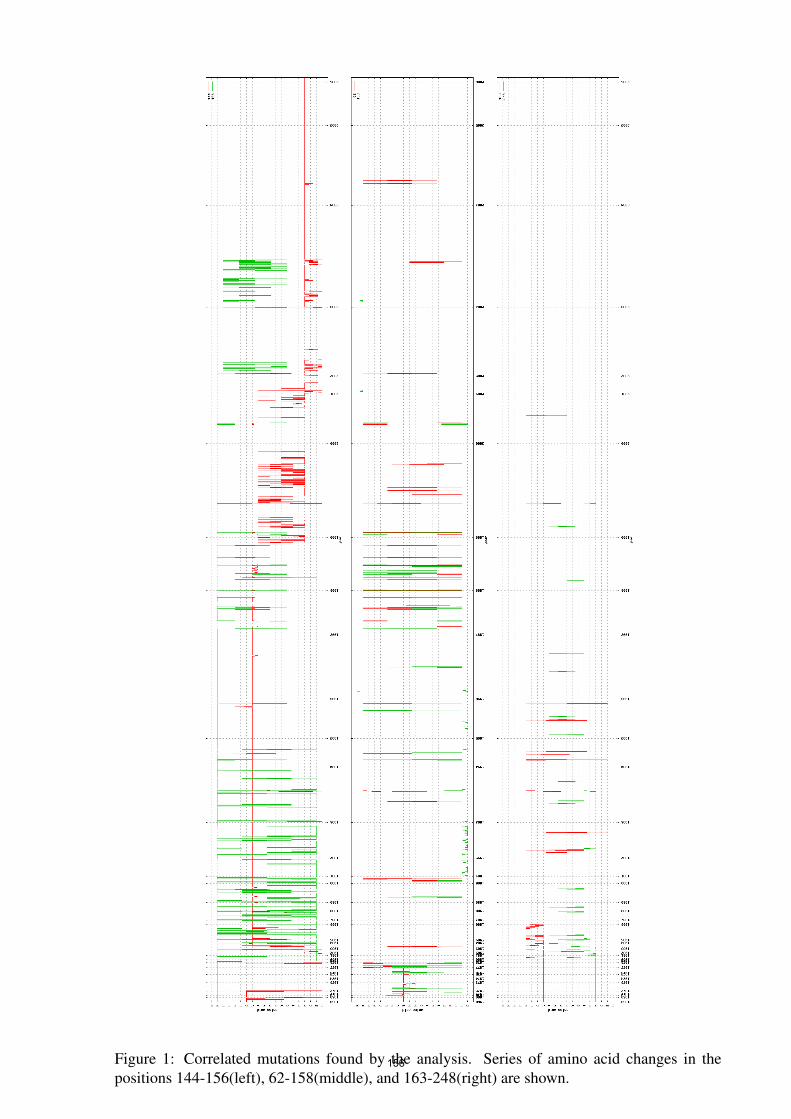
Figure 1: Correlated mutations found by the analysis. Series of amino acid changes in thepositions 144-156(left), 62-158(middle), and 163-248(right) are shown.
156
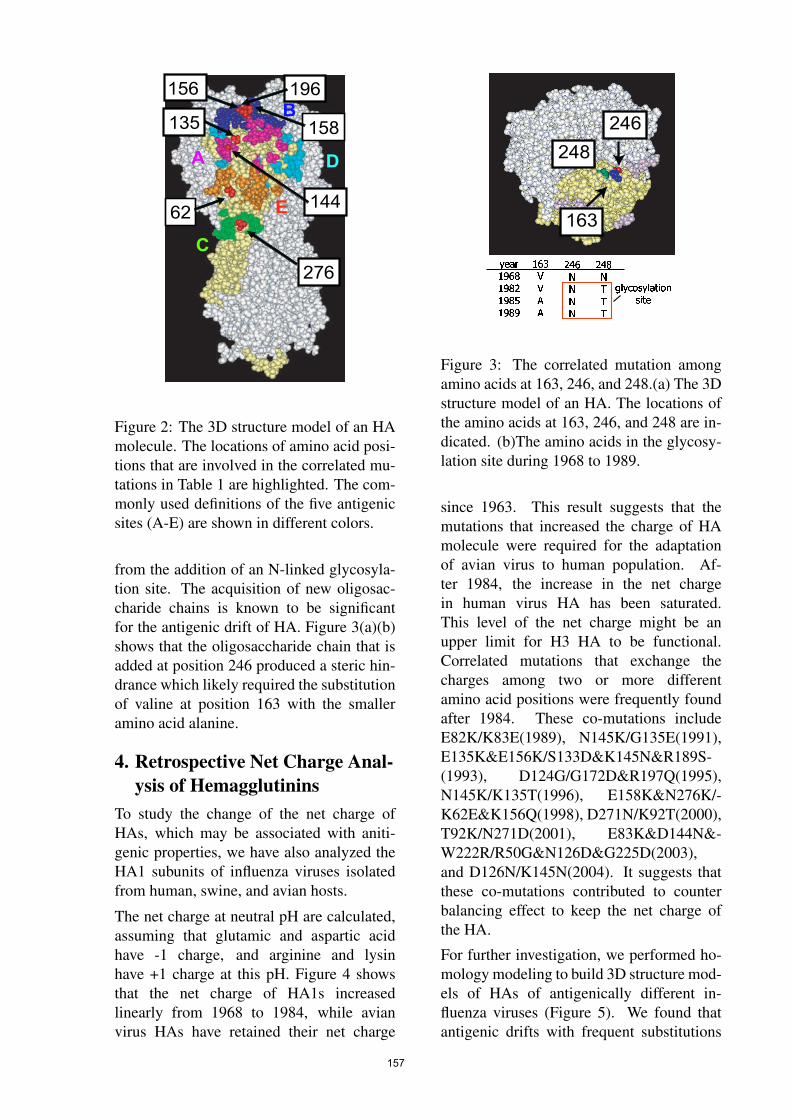
Figure 2: The 3D structure model of an HAmolecule. The locations of amino acid posi-tions that are involved in the correlated mu-tations in Table 1 are highlighted. The com-monly used definitions of the five antigenicsites (A-E) are shown in different colors.
from the addition of an N-linked glycosyla-tion site. The acquisition of new oligosac-charide chains is known to be significantfor the antigenic drift of HA. Figure 3(a)(b)shows that the oligosaccharide chain that isadded at position 246 produced a steric hin-drance which likely required the substitutionof valine at position 163 with the smalleramino acid alanine.
4. Retrospective Net Charge Anal-ysis of Hemagglutinins
To study the change of the net charge ofHAs, which may be associated with aniti-genic properties, we have also analyzed theHA1 subunits of influenza viruses isolatedfrom human, swine, and avian hosts.
The net charge at neutral pH are calculated,assuming that glutamic and aspartic acidhave -1 charge, and arginine and lysinhave +1 charge at this pH. Figure 4 showsthat the net charge of HA1s increasedlinearly from 1968 to 1984, while avianvirus HAs have retained their net charge
Figure 3: The correlated mutation amongamino acids at 163, 246, and 248.(a) The 3Dstructure model of an HA. The locations ofthe amino acids at 163, 246, and 248 are in-dicated. (b)The amino acids in the glycosy-lation site during 1968 to 1989.
since 1963. This result suggests that themutations that increased the charge of HAmolecule were required for the adaptationof avian virus to human population. Af-ter 1984, the increase in the net chargein human virus HA has been saturated.This level of the net charge might be anupper limit for H3 HA to be functional.Correlated mutations that exchange thecharges among two or more differentamino acid positions were frequently foundafter 1984. These co-mutations includeE82K/K83E(1989), N145K/G135E(1991),E135K&E156K/S133D&K145N&R189S-(1993), D124G/G172D&R197Q(1995),N145K/K135T(1996), E158K&N276K/-K62E&K156Q(1998), D271N/K92T(2000),T92K/N271D(2001), E83K&D144N&-W222R/R50G&N126D&G225D(2003),and D126N/K145N(2004). It suggests thatthese co-mutations contributed to counterbalancing effect to keep the net charge ofthe HA.
For further investigation, we performed ho-mology modeling to build 3D structure mod-els of HAs of antigenically different in-fluenza viruses (Figure 5). We found thatantigenic drifts with frequent substitutions
157
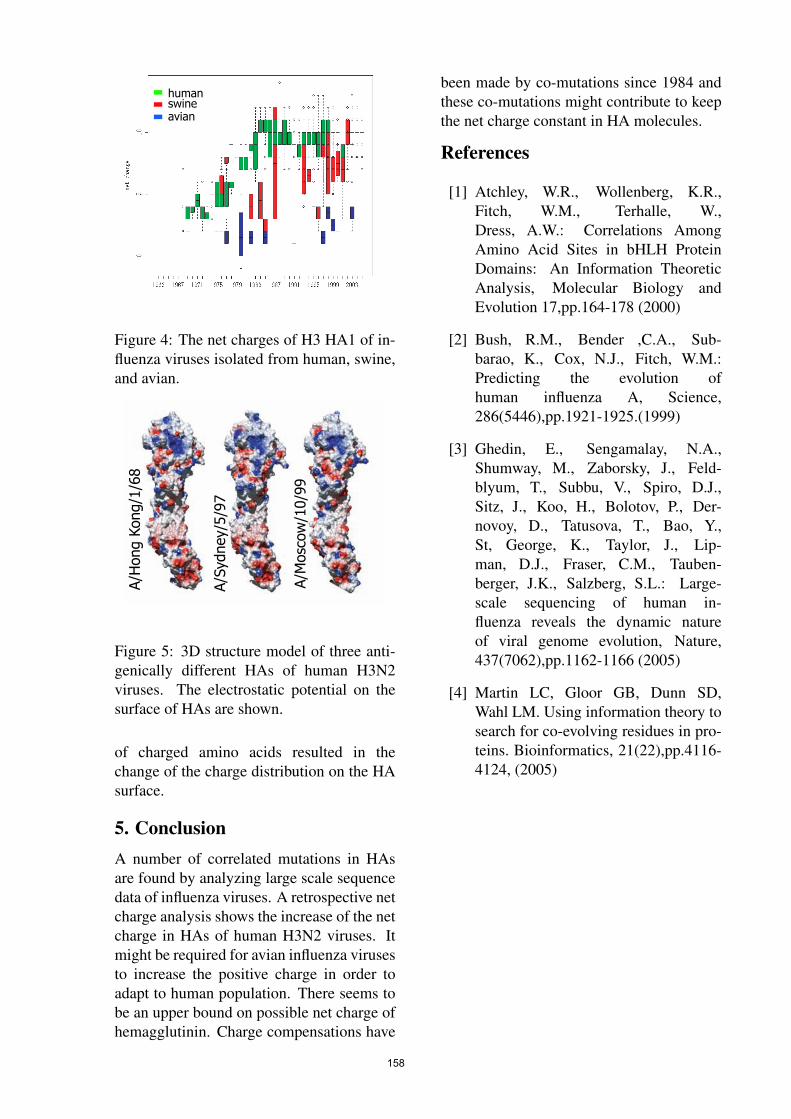
Figure 4: The net charges of H3 HA1 of in-fluenza viruses isolated from human, swine,and avian.
Figure 5: 3D structure model of three anti-genically different HAs of human H3N2viruses. The electrostatic potential on thesurface of HAs are shown.
of charged amino acids resulted in thechange of the charge distribution on the HAsurface.
5. ConclusionA number of correlated mutations in HAsare found by analyzing large scale sequencedata of influenza viruses. A retrospective netcharge analysis shows the increase of the netcharge in HAs of human H3N2 viruses. Itmight be required for avian influenza virusesto increase the positive charge in order toadapt to human population. There seems tobe an upper bound on possible net charge ofhemagglutinin. Charge compensations have
been made by co-mutations since 1984 andthese co-mutations might contribute to keepthe net charge constant in HA molecules.
References
[1] Atchley, W.R., Wollenberg, K.R.,Fitch, W.M., Terhalle, W.,Dress, A.W.: Correlations AmongAmino Acid Sites in bHLH ProteinDomains: An Information TheoreticAnalysis, Molecular Biology andEvolution 17,pp.164-178 (2000)
[2] Bush, R.M., Bender ,C.A., Sub-barao, K., Cox, N.J., Fitch, W.M.:Predicting the evolution ofhuman influenza A, Science,286(5446),pp.1921-1925.(1999)
[3] Ghedin, E., Sengamalay, N.A.,Shumway, M., Zaborsky, J., Feld-blyum, T., Subbu, V., Spiro, D.J.,Sitz, J., Koo, H., Bolotov, P., Der-novoy, D., Tatusova, T., Bao, Y.,St, George, K., Taylor, J., Lip-man, D.J., Fraser, C.M., Tauben-berger, J.K., Salzberg, S.L.: Large-scale sequencing of human in-fluenza reveals the dynamic natureof viral genome evolution, Nature,437(7062),pp.1162-1166 (2005)
[4] Martin LC, Gloor GB, Dunn SD,Wahl LM. Using information theory tosearch for co-evolving residues in pro-teins. Bioinformatics, 21(22),pp.4116-4124, (2005)
158
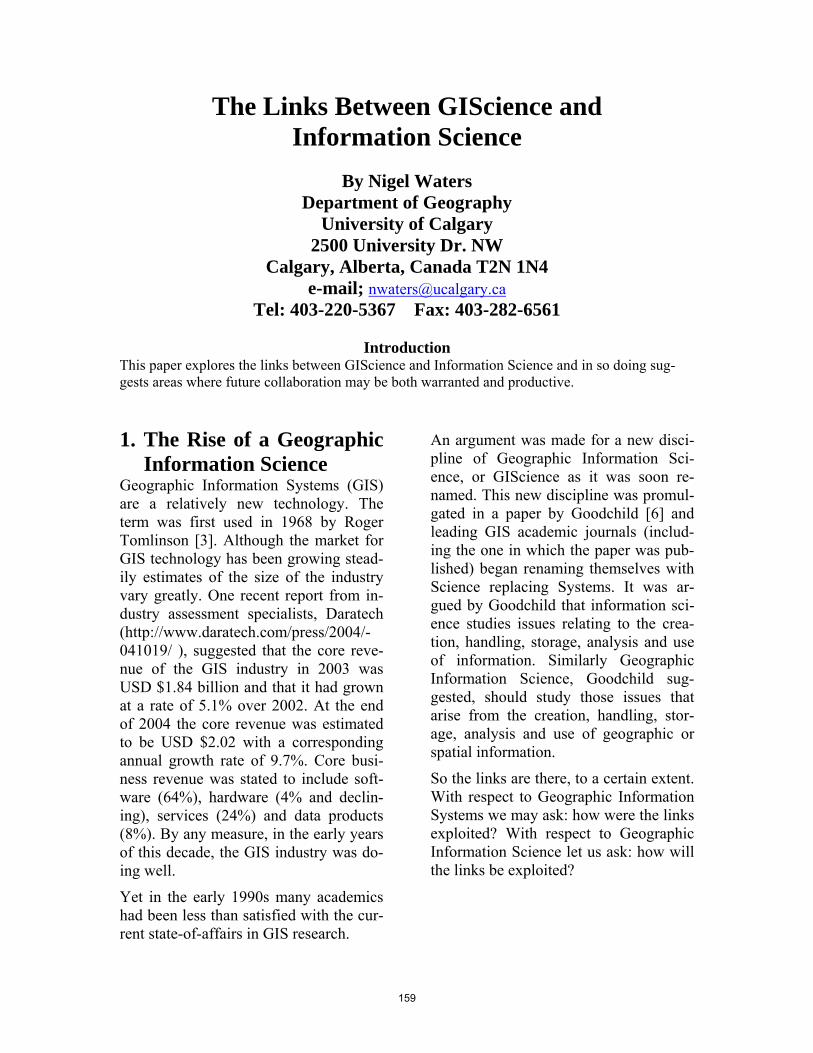
The Links Between GIScience and Information Science
By Nigel Waters
Department of Geography University of Calgary
2500 University Dr. NW Calgary, Alberta, Canada T2N 1N4
e-mail; [email protected] Tel: 403-220-5367 Fax: 403-282-6561
Introduction
This paper explores the links between GIScience and Information Science and in so doing sug-gests areas where future collaboration may be both warranted and productive. 1. The Rise of a Geographic
Information Science Geographic Information Systems (GIS) are a relatively new technology. The term was first used in 1968 by Roger Tomlinson [3]. Although the market for GIS technology has been growing stead-ily estimates of the size of the industry vary greatly. One recent report from in-dustry assessment specialists, Daratech (http://www.daratech.com/press/2004/-041019/ ), suggested that the core reve-nue of the GIS industry in 2003 was USD $1.84 billion and that it had grown at a rate of 5.1% over 2002. At the end of 2004 the core revenue was estimated to be USD $2.02 with a corresponding annual growth rate of 9.7%. Core busi-ness revenue was stated to include soft-ware (64%), hardware (4% and declin-ing), services (24%) and data products (8%). By any measure, in the early years of this decade, the GIS industry was do-ing well.
Yet in the early 1990s many academics had been less than satisfied with the cur-rent state-of-affairs in GIS research.
An argument was made for a new disci-pline of Geographic Information Sci-ence, or GIScience as it was soon re-named. This new discipline was promul-gated in a paper by Goodchild [6] and leading GIS academic journals (includ-ing the one in which the paper was pub-lished) began renaming themselves with Science replacing Systems. It was ar-gued by Goodchild that information sci-ence studies issues relating to the crea-tion, handling, storage, analysis and use of information. Similarly Geographic Information Science, Goodchild sug-gested, should study those issues that arise from the creation, handling, stor-age, analysis and use of geographic or spatial information.
So the links are there, to a certain extent. With respect to Geographic Information Systems we may ask: how were the links exploited? With respect to Geographic Information Science let us ask: how will the links be exploited?
159

2. The Links Between Geo-graphic Information Sys-tems and Information Science
The early approach to GISystems im-plemented by Environmental Systems Research Institute (ESRI) in their pio-neering ArcInfo software was to have one solution for handling the spatial data (Arc) and a second solution for handling the attribute data (the proprietary Info database) in their GISystem software. The Info part used traditional database technology that was imported directly from Information Science. Originally ESRI used their own database technol-ogy but links with commercial relational database technology soon followed.
Towards the end of the 1990s the rela-tional database approach was supple-mented by object-oriented solutions made available in the ArcGIS generation of products. The current state of the art is described in Designing Geodatabases: Case Studies in GIS Data Modeling by Arctur and Zeiler [1]. They identify ten steps in designing and building an ex-emplary geodatabase:
“Conceptual Design”: 1. Identify the information products
that will be produced with your GIS. 2. Identify the key thematic layers
based on your information require-ments.
3. Specify the scale ranges and spatial representation for each thematic layer.
4. Group representation into datasets.
“Logical design”: 5. Define the tabular database structure
and behavior for descriptive attrib-utes.
6. Define the spatial properties of your datasets.
7. Propose a geodatabase design.
“Physical Design”: 8. Implement, prototype, review and
refine your design. 9. Design workflows for building and
maintaining each layer. 10. Document your design using appro-
priate methods.” [1]
Under step 7 Arctur and Zeiler suggest studying existing design for examples and ESRI provides a website that in-cludes a collection of downloadable case studies that provide detailed geodatabase models (http://support.esri.com/index.-cfm?fa=downloads.dataModels.caseStudies ).
Most areas of application have their own distinct challenges and issues. Two of particular note are the transportation and atmospheric data models. Problems with the transportation data model arose even in the era of the use of relational data-base models. Two issues of concern were the need to develop linear referenc-ing systems and the need for the ability to change data attributes, for example speed limits, along a single link in the network. The latter problem was re-solved with the introduction of dynamic segmentation approaches ([17, 18], see also the ArcGIS Transportation Data Model for New York State available at http://support.esri.com/index.cfm?fa=downloads.dataModels.caseStudies ). One particular challenge remains and this is the handling of continuously vary-ing data. This is a problem along trans-portation networks and makes for diffi-culties in calculating the spatial autocor-relation indices of, for example, accident data [2]. It is a problem for data that it is distributed over surfaces and even more so for continuously varying data in three
160
or even four dimensions, for example atmospheric data. This is a problem that is still not handled well as a data model in GIS (although the analytical tools are there in abundance). These concerns were noted by Mike Goodchild in a Key-note Address to the Annual GEOIDE Conference held in Banff June 1st, 2006. The problem is addressed from the per-spective of scientific analysis of atmos-pheric data by Nativi et al. [10]). They note the difficulty in integrating atmos-pheric data within a GIS framework and suggest interim remedies in their article. 3. Selected Issues in Infor-
mation Science Recently Tanaka [15] has described some of the challenges facing Informa-tion Science with respect to developing a knowledge federation over the Web. He begins by noting that the Web may be seen as a depository of distributed intel-ligent resources. These resources include traditional server-client applications as well as mobile applications. Tanaka con-tinues by defining pervasive computing as an open system of intelligent re-sources that a user can interact with in a seamless interoperable environment. Pervasive computing is assumed to link a wide variety of intelligent resources that are distributed in both virtual envi-ronments (the Web) and the geographi-cal environment of the real world.
The ad hoc definition and implementa-tion of pervasive computer in either or both environments is defined as a federa-tion. The intelligent resources that form part of this definition are assumed to be in the form of documents. Suggested uses include scientific simulations, digi-tal libraries and research activities. Ta-naka [15] continues by noting that a fed-eration of intelligent resources may be defined by programs that access such
resources using web service technologies (the autonomic approach) or they can be defined by users (the ad hoc approach). Noting that there is extensive literature exploring the former, the autonomic ap-proach, he focuses on the latter, ad hoc methodologies. He thus advocates the use of meme-media technologies to ex-tract intelligent resources from web documents and applications. The ap-proach is similar to a structured query to a relational database but in this case the query is defined by HTML pathway ex-pressions to Web documents and/or ap-plications.
It will be seen below that there are many broad areas of application in a GIS envi-ronment where Professor Tanaka’s ap-proach will provide new research oppor-tunities.
Spyratos [14] has presented a functional model for the analysis of large volumes of transactional data. The model pre-sented used a data schema with an acyclic graph and a single root. An ex-ample was provided for product pur-chases from a store. Since the store is located in geographical space the exam-ple has obvious implications for GIS analysis in the field of Business Geographics [9]. Geographers refer to this as panel data.
Professor Tanaka and his colleagues at the Meme Media Laboratory have de-signed an interface to the Digital Li-brary. The metaphor that has been used is that of a City. So that the user can move through a network of streets and then into a building, a room and then, finally, remove a book from a virtual shelf. Additional challenges have in-cluded providing a cell phone interface to the library.
Geographers have considered similar problems in trying to build digital librar-
161

ies of maps (http://www.alexandria.-ucsb.edu/ ). The digital map library pro-vides additional challenges in storing, referencing and accessing the spatial in-formation. Tanaka [15] addressed prob-lems with which geographers are also concerned. For example, he showed a movie in which fish were linked to a map. We have similarly experimented with the use of case-based reasoning software to link the resources of indige-nous peoples in northern Canada with a GIS and map based information [4]. Similarly we have developed Visual Ba-sic templates to input indigenous knowl-edge into a GIS.
Algorithms for searching the web for documents are a major area of research in information science. Several papers at the Third International Symposium con-centrated on these technologies. These procedures are of interest to GIScientists because they too need faster, more effi-cient web search algorithms and because they use similar algorithms for the analysis of spatial and socio-economic data. Examples of new Web Document search algorithms are provided by La-monova and Tanaka [8] and Poland and Zeugmann [11]. Both papers describe approaches that are of great interest to GIScientists. For example, similar fuzzy clustering algorithms to those developed by Lamonova and Tanaka are now being in used to classify commuters in trans-portation planning models and the spec-tral approaches used by Poland and Zeugmann are of great interest to spatial analysts as are the neural nets and wave-let approaches mentioned by Lamonova in her presentation.
4. The Nexus of GIS and IS The use of Tanaka’s approach to the ac-quisition of documents over the Web has obvious implications for our Mapping the Media in the Americas (MMA) Pro-ject ([18] and www.mediamap.info for a complete description). The MMA Pro-ject is a collaboration between the Uni-versity of Calgary, the Carter center in Atlanta and the Canadian Foundation for the Americas (FOCAL) in Ottawa. The three-year project began in September 2004 and will conclude in August, 2007. The Project seeks to portray and explain the impact of the media (TV, radio and newspapers) on the electoral process in 12 countries in the Americas. To-date we have completed research on Canada and three Latin American countries (Peru, Guatemala, and the Dominican Repub-lic).
The research process involves scouring the internet for spatial and aspatial data on socio-economic variables for the countries question. We also need to map the locations of TV and radio antenna and the distribution points for newspa-pers. Spatial data on the results of the most recent national or federal elections are obtained. Although the research process usually begins with a visit to the capital city of each country in question, in addition, we search the Web inten-sively for appropriate resources. This research process would obviously be more efficient if the resources that we require were intelligent resources, as en-visaged by Tanaka, that could be searched with more intelligent algo-rithms. In one sense our research aims to bring together the information in one location thus removing the need for such searches. Moreover, Tanaka’s [15] C3W framework that allows the clipping of arbitrary HTML elements from web pages and then the subsequent pasting of
162
these clips on to a special C3Wsheet Pad would appear to have enormous potential for increasing the efficiency of our re-search process.
The data, once acquired, is assembled into a GIS. This GIS is then migrated to an interactive, GIS-based web server. For our work the GIS is built using ESRI’s ArcGIS 9.1 (www.esri.com ). Likewise we use an ESRI product, Ar-cIMS (Internet Map Server), to produce the web-based GIS. The final product may be found at www.mediamap.info . The splash screen for the website pro-vides an introduction to the project and, like the rest of the site is available in two languages: Spanish and English for the Latin American countries and French and English for Canada.
One goal of the MMA Project is to show the impact of the media on the electoral process. This can be achieved , in part, through the use of visualization tech-niques. Thus we can map the results of the elections and we can map socio-economic data, and the locations of the media. We can visualize the results as individual layers or we can map two or more layers together. This is most effec-tive where just one of the layers is a polygon layer and the additional layers are point files such as the locations of two or more different types of media. We have experimented with different types of shading for two different poly-gon layers e.g. solid colors that are over-lain by hatched shading for the second variable. This, however, has met with limited success.
Essentially our work has brought to-gether disparate data sets in an interac-tive, web-based GIS. We have achieved the goal suggested by Tanaka ([15], and see discussion above) but we have done this by physically locating the resources
on a single website rather than allowing the user to access the data on-the-fly from a federated knowledge network.
Our website does fulfill the third of Ta-naka’s goals, listed above, namely that of allowing for enhanced research activi-ties. These may be carried out either by those campaigning for political office or by their party strategists. It is also a re-source for statistical analysis for aca-demics. Thus we have built Ordinary Least Squares regression models to pre-dict electoral outcomes based on the socio-economic variables included in the website. As might be expected such models have met with limited success because political support and the inde-pendent variables that can be used to predict that support vary geographically. Geographers have proposed various so-lutions to this problem. These include the use of Spatial Regressions and Geo-graphically Weighted Regression (GWR; [5]).
163

Figure 1: Splash Screen for the Mapping the Media in the Americas Project GIS-Based Interactive Website: www.mediamap.info
The original OLS model, using five in-dependent variables that represented socio-economic status, education, liter-acy, and languages spoken, achieved goodness-of-fit statistics (R-squared) of only about 35%. When we used the GWR model, with a spatially varying kernel of about 100 points, the R-squared values ranged from 27% to 83%. Our work here is reminiscent of the work of Taniguchi and Haraguchi [16]. They noted that correlations in their global database were lower than in a local data-base. The result appeared to be due to temporal autocorrelation in the US Cen-sus data with which they experimented.
Essentially, our results are the spatial equivalent of their temporal autocorrela-tions. It would appear that a collabora-tion in this area would be mutually bene-ficial to both Information Scientists and GIScientists.
Since in the MMA Project we are con-cerned with the reach of the broadcast media we have been building models of wave propagation from radio antenna towers. Based on the height of the tow-ers and by incorporating their power these broadcast models, in conjunction with digital elevation models, provide an estimate of the reach of the radio station in mountainous countries such as Peru. We combine these models with data on population distribution and language spoken from the census data incorpo-rated into our web-based GIS and this then provides an estimate of the reach of the radio station. In turn this can be combined with information from past elections to determine if it is worthwhile for a political candidate to invest adver-tising resources in radio or TV broad-casts. Figure 3 shows one such propaga-tion model from ReMartinez [13].
164

Figure 2: A Query to the TV Antenna Database for the Peruvian Website Showing How One National Television Network Does Note Reach an Area Where the Indigenous Quechuan Speaking Population Predominate.
165
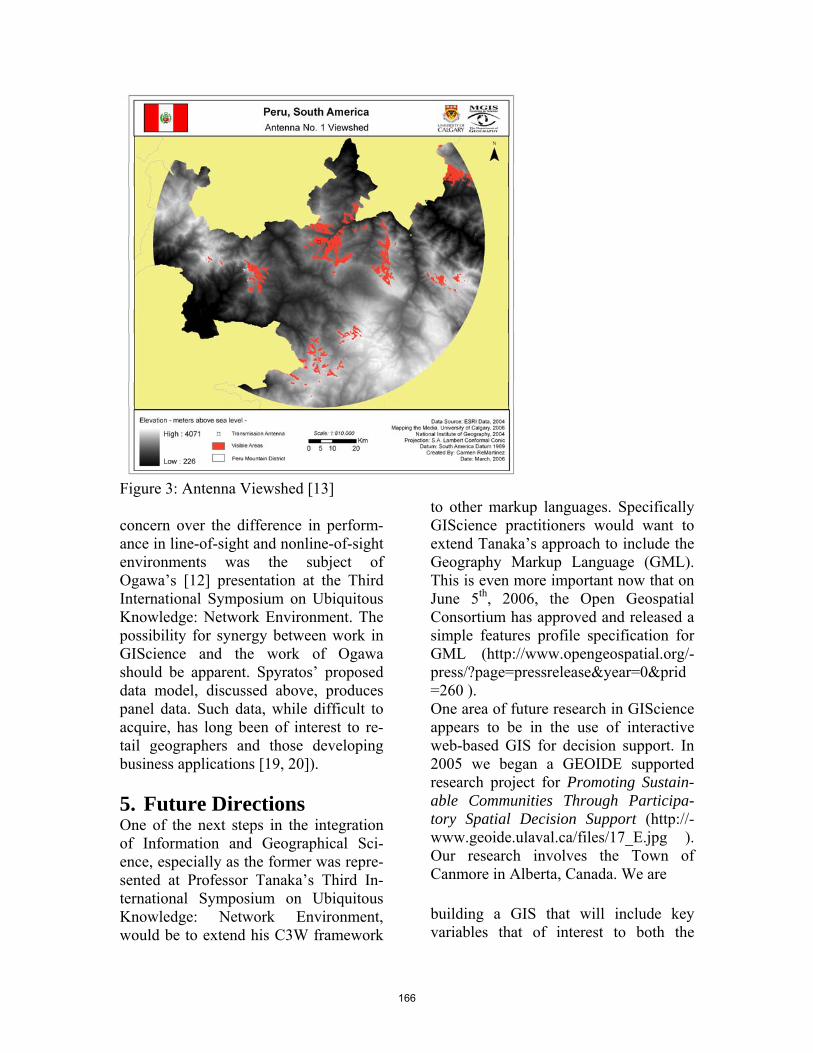
Figure 3: Antenna Viewshed [13] concern over the difference in perform-ance in line-of-sight and nonline-of-sight environments was the subject of Ogawa’s [12] presentation at the Third International Symposium on Ubiquitous Knowledge: Network Environment. The possibility for synergy between work in GIScience and the work of Ogawa should be apparent. Spyratos’ proposed data model, discussed above, produces panel data. Such data, while difficult to acquire, has long been of interest to re-tail geographers and those developing business applications [19, 20]). 5. Future Directions One of the next steps in the integration of Information and Geographical Sci-ence, especially as the former was repre-sented at Professor Tanaka’s Third In-ternational Symposium on Ubiquitous Knowledge: Network Environment, would be to extend his C3W framework
to other markup languages. Specifically GIScience practitioners would want to extend Tanaka’s approach to include the Geography Markup Language (GML). This is even more important now that on June 5th, 2006, the Open Geospatial Consortium has approved and released a simple features profile specification for GML (http://www.opengeospatial.org/-press/?page=pressrelease&year=0&prid=260 ). One area of future research in GIScience appears to be in the use of interactive web-based GIS for decision support. In 2005 we began a GEOIDE supported research project for Promoting Sustain-able Communities Through Participa-tory Spatial Decision Support (http://-www.geoide.ulaval.ca/files/17_E.jpg ). Our research involves the Town of Canmore in Alberta, Canada. We are building a GIS that will include key variables that of interest to both the
166
planners and the citizens in the town. These GIS maps will then be entered into an interactive GIS based website using one of two technologies: MapChat or ArguMap. The latter is already being used for a similar research experiment at University College London (http://ernie.ge.ucl.ac.uk:8080/Web_System/faces/2_Results.jsp?argumap=yes ). One of the components of any such sys-tem might be the ability to bring in new material from the Web and to use in sub-sequent analysis. Meme media extended to geographical objects would be ex-tremely useful, as would fast internet search algorithms.
The research that Jantke [7] presented at the Meme Media workshop in Sapporo in early 2006 included a discussion of how a movie such as The Kingdom of Heaven could have digital tags attached to items in the screen shot. These tags allow the viewer to access additional in-formation relation to the tagged object. This type of technology could be used effectively within an environment such as MapChat or ArguMap. Thus the plan-ner or citizen working within the interac-tive environment could query an object in the GIS or perhaps on a Google Earth or orthophoto backdrop and be provided with additional information that would lead to a more informed planning choice. 6. Conclusion This paper has attempted to show the links between GIScience and Informa-tion Science. It began with a short intro-duction to Geographic Information Sys-tems and then discussed the rise of GIS-Cience as a distinct discipline. It then provided a small subset of examples that show some of the more intriguing links between the GIScience research that is being conducted at the University of Calgary and the Information Science at
the Institute for Media and Information Science at Ilmenau in Germany and at the Meme Media Lab at the University of Hokkaido in Sapporo. References [1] D. Arctur and M. Zeiler. Design-
ing Geodatabases: Case Studies in GIS Data Modeling. ESRI Press, Redlands, CA., 2004.
[2] W. Black. and I. Thomas. Acci-
dents on the Belgium Motorway System: A Network Autocorrela-tion Analysis. Journal of Trans-port Geography, 6, 23-31, 1998.
[3] N. Chrisman. Charting the Un-
known: How Computer Mapping at Harvard became GIS. ESRI Press, Redlands, CA, 2006.
[4] D. Clayton and N. Waters. Dis-
tributed Knowledge, Distributed Processing, Distributed Users: Integrating Case Based Reason-ing and GIS for Multicriteria De-cision Making. Chapter in Mul-ticriteria Decision-Making and Analysis: A Geographic Informa-tion Sciences Approach, edited by Jean-Claude Thill, Ashgate, Brookfield, USA, 275-308, 1999.
[5] A. S. Fotheringham, C. Brunsdon
and M. Charlton. Geographically Weighted Regression: The Analysis of Spatially Varying Relationships. Wiley, Chichester, UK, 2002.
[6] M. F. Goodchild. Geographical
Information Science. Interna-tional Journal of Geographical
167
Information Systems, 6, 31-45, 1992.
[7] K. Jantke. Media Integration for
Film in the Digital Bibliotheque City. Paper presented at the Meme Media Workshop, associ-ated with the 21st Center of Ex-cellence Program in Information, Electrics and Electronic at Hok-kaido University, Sapporo, Feb-ruary 28 – March 1, 2006.
[8] N. Lamonova and Y. Tanaka. A
Robust Probabilistic Fuzzy Clus-tering Algorithm with Applica-tion to Web Document. Paper presented at the Meme Media Workshop, associated with the 21st Center of Excellence Pro-gram in Information, Electrics and Electronic at Hokkaido Uni-versity, Sapporo, February 28 – March 1, 2006.
[9] P. A. Longley and G. Clarke.
GIS for Business and Service Planning. Wiley, New York, 1996
[10] S. Nativi, M. B. Blementhal, J.
Caron, B. Domenico, T. Haber-mann, D. Hertzmann, Y. Ho, R. Raskin and J. Weber. Differences Among the Data Models Used by the Geographic Information Sys-tems and Atmospheric Science Communities, 2003. Retrieved from http://support.esri.com/index.cfm?fa=downloads.dataModels.caseStudies
[11] J. Poland and T. Zeugmann.
Spectral Clustering of the Google Distance. Paper presented at the Meme Media Workshop, associ-
ated with the 21st Center of Ex-cellence Program in Information, Electrics and Electronic at Hok-kaido University, Sapporo, Feb-ruary 28 – March 1, 2006.
[12] Y. Ogawa. Multiple Antenna
Systems and Their Applications. In Proceedings of the Third In-ternational Symposium on Ubiq-uitous Knowledge: Network En-vironment, February 27 – March 1, 2006, Sapporo Convention Center, Sapporo, Japan, pp. 143-151, 2006.
[13] C. ReMartinez. A GIS Coverage
Broadcast Prediction Model for Transmitted FM Radio Waves in Peru. MGIS Research Project, Department of Geography, Uni-versity of Calgary, Calgary, Al-berta, Canada, 2006.
[14] N. Spyratos. A Functional Model
for Data Analysis. In Proceedings of the Third International Sym-posium on Ubiquitous Knowl-edge: Network Environment, February 27 – March 1, 2006, Sapporo Convention Center, Sapporo, Japan, pp. 37-48, 2006.
[15] Y. Tanaka. Knowledge Federa-
tion Over the Web Based on Meme Media Technologies. In Proceedings of the Third Interna-tional Symposium on Ubiquitous Knowledge: Network Environ-ment, February 27 – March 1, 2006, Sapporo Convention Cen-ter, Sapporo, Japan, pp. 13-36, 2006.
[16] T. Taniguchi and M. Haraguchi.
Discovery of Implicit Correla-tions Based on Differences of
168

Correlations. Paper presented at the Meme Media Workshop, as-sociated with the 21st Center of Excellence Program in Informa-tion, Electrics and Electronic at Hokkaido University, Sapporo, February 28 – March 1, 2006.
[17] N. Waters. Transportation GIS:
GIS-T. In Geographical Informa-tion Systems: Principles, Tech-niques, Applications and Man-agement, 2nd Edition, Edited by Paul Longley, Michael Good-child, David Maguire, and David Rhind, John Wiley and Sons, pp. 827-844, 1999.
[18] N. M. Waters. Transportation
GIS: GIS-T. In Geographical In-formation Systems, Second Edi-tion, Abridged, edited by Long-ley, P.A., Goodchild, M.F., Maguire, D.J. and Rhind, D.W.; Wiley, New York, 2005.
[19] N. Wrigley. Categorical data
Analysis for Geographers and Environmental Scientists. Long-man, London, 1985.
[20] N. Wrigley and M. S. Lowe.
Reading Retail: A Geographical Perspective on Retailing and Consumption Spaces. Arnold, New York, 2002.
169
Storyboarding – An AI Technologyto Represent, Process, Evaluate,and Refine Didactic Knowledge
Rainer Knauf1 and Klaus P. Jantke2
Technical University Ilmenau1Faculty of Computer Science and Automation
Chair of Artificial Intelligence2Institute of Media and Communication Sciences
PO Box 10056598684 Ilmenau
AbstractThe current state of affair in learning systems in general and in e-learning in particular suffers from alack of an explicit and adaptable didactic design. Students complain about the insufficient adaptabilityof e-learning to the learners’ needs. Learning content and services need to reach their audience properly.That is, according to their different prerequisites, needs, and different learning conditions. After a shortintroduction to the storyboard concept, which is a way to address these concerns, we present an exampleof using storyboards for the didactic design of a university course on Intelligent Systems. In particular,we show the way to express didactic variants and didactic intentions within storyboards. Finally, wesketch ideas to for a machine supported knowledge processing, knowledge evaluation, knowledgerefinement, and knowledge engineering with storyboards.
1. Introduction
Successful university instructors are oftennot those with the very best scientific back-ground or outstanding research results. Themost successful ones are typically those thatsuccessfully utilize didactical experiences aswell as ‘soft skills’ in dealing with other ac-tors in the teaching process. Besides thestudents and colleagues, such actors includee-learning systems as well ass the largeamount of active (desirable and undesirable,conscious and unconscious) ‘content presen-ters’ that include news, web sources and ad-vertisements.
The design of learning activities in colle-giate instruction is a very interdisciplinaryprocess. Besides deep, topical knowledgein the subject being thought, an instructorneeds knowledge and skills in many othersubjects. This includes IT-related skills to
use today’s presentation equipment, didacticskills to effectively present the topical con-tent, plus skills in fields like social sciences,psychology and ergonomics.
University instruction, however, often suf-fers from a lack of didactic knowledge.Since universities are also research insti-tutions, their professors are usually hiredbased on their topical skills. Didactic skillsare often underestimated in the recruitingprocess. At German universities, e.g., thereis no didactic education required as a pre-requisite for a professorship. Such skills areonly checked by asking (usually just two)students about their impression on this issueafter watching a single talk given by the ap-plicant.
Here, we refrain from further discussing rea-sons for that, but focus the issue of involvingit a little more. We propose an approach to
170
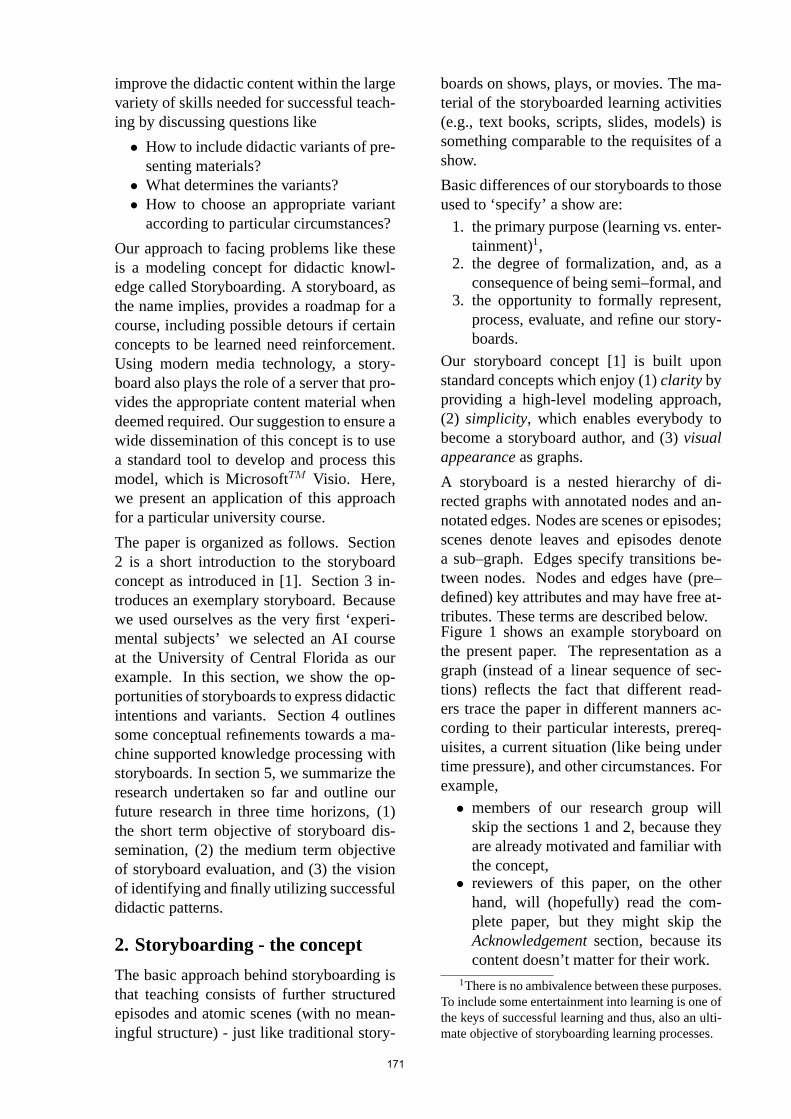
improve the didactic content within the largevariety of skills needed for successful teach-ing by discussing questions like
• How to include didactic variants of pre-senting materials?
• What determines the variants?• How to choose an appropriate variant
according to particular circumstances?
Our approach to facing problems like theseis a modeling concept for didactic knowl-edge called Storyboarding. A storyboard, asthe name implies, provides a roadmap for acourse, including possible detours if certainconcepts to be learned need reinforcement.Using modern media technology, a story-board also plays the role of a server that pro-vides the appropriate content material whendeemed required. Our suggestion to ensure awide dissemination of this concept is to usea standard tool to develop and process thismodel, which is MicrosoftTM Visio. Here,we present an application of this approachfor a particular university course.
The paper is organized as follows. Section2 is a short introduction to the storyboardconcept as introduced in [1]. Section 3 in-troduces an exemplary storyboard. Becausewe used ourselves as the very first ‘experi-mental subjects’ we selected an AI courseat the University of Central Florida as ourexample. In this section, we show the op-portunities of storyboards to express didacticintentions and variants. Section 4 outlinessome conceptual refinements towards a ma-chine supported knowledge processing withstoryboards. In section 5, we summarize theresearch undertaken so far and outline ourfuture research in three time horizons, (1)the short term objective of storyboard dis-semination, (2) the medium term objectiveof storyboard evaluation, and (3) the visionof identifying and finally utilizing successfuldidactic patterns.
2. Storyboarding - the concept
The basic approach behind storyboarding isthat teaching consists of further structuredepisodes and atomic scenes (with no mean-ingful structure) - just like traditional story-
boards on shows, plays, or movies. The ma-terial of the storyboarded learning activities(e.g., text books, scripts, slides, models) issomething comparable to the requisites of ashow.
Basic differences of our storyboards to thoseused to ‘specify’ a show are:
1. the primary purpose (learning vs. enter-tainment)1,
2. the degree of formalization, and, as aconsequence of being semi–formal, and
3. the opportunity to formally represent,process, evaluate, and refine our story-boards.
Our storyboard concept [1] is built uponstandard concepts which enjoy (1)clarity byproviding a high-level modeling approach,(2) simplicity, which enables everybody tobecome a storyboard author, and (3)visualappearanceas graphs.
A storyboard is a nested hierarchy of di-rected graphs with annotated nodes and an-notated edges. Nodes are scenes or episodes;scenes denote leaves and episodes denotea sub–graph. Edges specify transitions be-tween nodes. Nodes and edges have (pre–defined) key attributes and may have free at-tributes. These terms are described below.Figure 1 shows an example storyboard onthe present paper. The representation as agraph (instead of a linear sequence of sec-tions) reflects the fact that different read-ers trace the paper in different manners ac-cording to their particular interests, prereq-uisites, a current situation (like being undertime pressure), and other circumstances. Forexample,
• members of our research group willskip the sections 1 and 2, because theyare already motivated and familiar withthe concept,
• reviewers of this paper, on the otherhand, will (hopefully) read the com-plete paper, but they might skip theAcknowledgementsection, because itscontent doesn’t matter for their work.
1There is no ambivalence between these purposes.To include some entertainment into learning is one ofthe keys of successful learning and thus, also an ulti-mate objective of storyboarding learning processes.
171
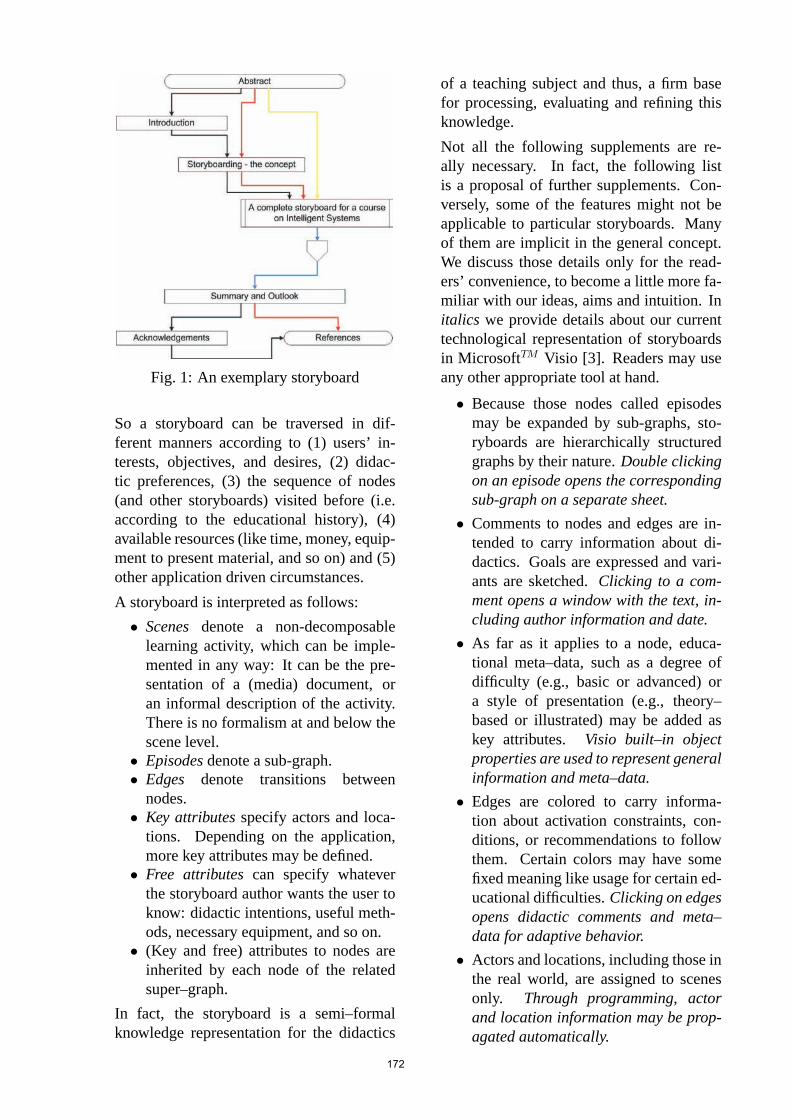
Fig. 1: An exemplary storyboard
So a storyboard can be traversed in dif-ferent manners according to (1) users’ in-terests, objectives, and desires, (2) didac-tic preferences, (3) the sequence of nodes(and other storyboards) visited before (i.e.according to the educational history), (4)available resources (like time, money, equip-ment to present material, and so on) and (5)other application driven circumstances.
A storyboard is interpreted as follows:
• Scenes denote a non-decomposablelearning activity, which can be imple-mented in any way: It can be the pre-sentation of a (media) document, oran informal description of the activity.There is no formalism at and below thescene level.
• Episodesdenote a sub-graph.• Edges denote transitions between
nodes.• Key attributesspecify actors and loca-
tions. Depending on the application,more key attributes may be defined.
• Free attributescan specify whateverthe storyboard author wants the user toknow: didactic intentions, useful meth-ods, necessary equipment, and so on.
• (Key and free) attributes to nodes areinherited by each node of the relatedsuper–graph.
In fact, the storyboard is a semi–formalknowledge representation for the didactics
of a teaching subject and thus, a firm basefor processing, evaluating and refining thisknowledge.
Not all the following supplements are re-ally necessary. In fact, the following listis a proposal of further supplements. Con-versely, some of the features might not beapplicable to particular storyboards. Manyof them are implicit in the general concept.We discuss those details only for the read-ers’ convenience, to become a little more fa-miliar with our ideas, aims and intuition. Initalics we provide details about our currenttechnological representation of storyboardsin MicrosoftTM Visio [3]. Readers may useany other appropriate tool at hand.
• Because those nodes called episodesmay be expanded by sub-graphs, sto-ryboards are hierarchically structuredgraphs by their nature.Double clickingon an episode opens the correspondingsub-graph on a separate sheet.
• Comments to nodes and edges are in-tended to carry information about di-dactics. Goals are expressed and vari-ants are sketched.Clicking to a com-ment opens a window with the text, in-cluding author information and date.
• As far as it applies to a node, educa-tional meta–data, such as a degree ofdifficulty (e.g., basic or advanced) ora style of presentation (e.g., theory–based or illustrated) may be added askey attributes. Visio built–in objectproperties are used to represent generalinformation and meta–data.
• Edges are colored to carry informa-tion about activation constraints, con-ditions, or recommendations to followthem. Certain colors may have somefixed meaning like usage for certain ed-ucational difficulties.Clicking on edgesopens didactic comments and meta–data for adaptive behavior.
• Actors and locations, including those inthe real world, are assigned to scenesonly. Through programming, actorand location information may be prop-agated automatically.
172
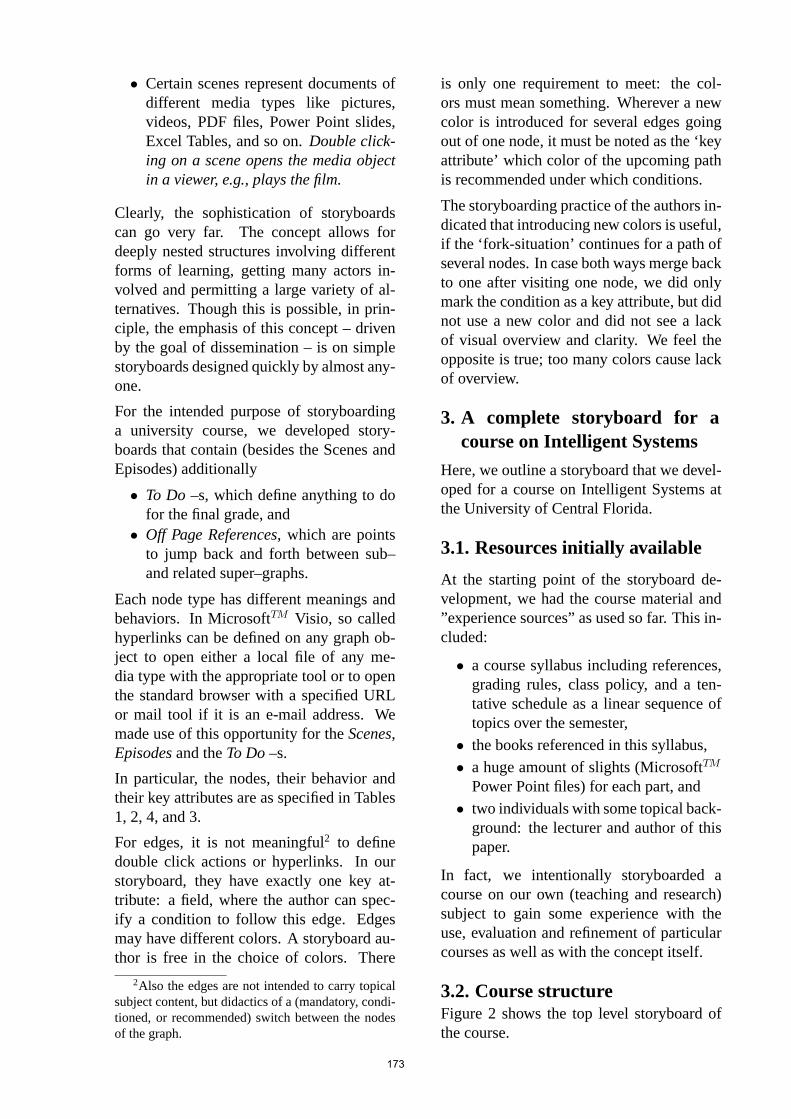
• Certain scenes represent documents ofdifferent media types like pictures,videos, PDF files, Power Point slides,Excel Tables, and so on.Double click-ing on a scene opens the media objectin a viewer, e.g., plays the film.
Clearly, the sophistication of storyboardscan go very far. The concept allows fordeeply nested structures involving differentforms of learning, getting many actors in-volved and permitting a large variety of al-ternatives. Though this is possible, in prin-ciple, the emphasis of this concept – drivenby the goal of dissemination – is on simplestoryboards designed quickly by almost any-one.
For the intended purpose of storyboardinga university course, we developed story-boards that contain (besides the Scenes andEpisodes) additionally
• To Do –s, which define anything to dofor the final grade, and
• Off Page References, which are pointsto jump back and forth between sub–and related super–graphs.
Each node type has different meanings andbehaviors. In MicrosoftTM Visio, so calledhyperlinks can be defined on any graph ob-ject to open either a local file of any me-dia type with the appropriate tool or to openthe standard browser with a specified URLor mail tool if it is an e-mail address. Wemade use of this opportunity for theScenes,Episodesand theTo Do–s.
In particular, the nodes, their behavior andtheir key attributes are as specified in Tables1, 2, 4, and 3.
For edges, it is not meaningful2 to definedouble click actions or hyperlinks. In ourstoryboard, they have exactly one key at-tribute: a field, where the author can spec-ify a condition to follow this edge. Edgesmay have different colors. A storyboard au-thor is free in the choice of colors. There
2Also the edges are not intended to carry topicalsubject content, but didactics of a (mandatory, condi-tioned, or recommended) switch between the nodesof the graph.
is only one requirement to meet: the col-ors must mean something. Wherever a newcolor is introduced for several edges goingout of one node, it must be noted as the ‘keyattribute’ which color of the upcoming pathis recommended under which conditions.
The storyboarding practice of the authors in-dicated that introducing new colors is useful,if the ‘fork-situation’ continues for a path ofseveral nodes. In case both ways merge backto one after visiting one node, we did onlymark the condition as a key attribute, but didnot use a new color and did not see a lackof visual overview and clarity. We feel theopposite is true; too many colors cause lackof overview.
3. A complete storyboard for acourse on Intelligent Systems
Here, we outline a storyboard that we devel-oped for a course on Intelligent Systems atthe University of Central Florida.
3.1. Resources initially available
At the starting point of the storyboard de-velopment, we had the course material and”experience sources” as used so far. This in-cluded:
• a course syllabus including references,grading rules, class policy, and a ten-tative schedule as a linear sequence oftopics over the semester,
• the books referenced in this syllabus,• a huge amount of slights (MicrosoftTM
Power Point files) for each part, and• two individuals with some topical back-
ground: the lecturer and author of thispaper.
In fact, we intentionally storyboarded acourse on our own (teaching and research)subject to gain some experience with theuse, evaluation and refinement of particularcourses as well as with the concept itself.
3.2. Course structureFigure 2 shows the top level storyboard ofthe course.
173

Symbol
Behavior when doubleclicked
• opening a material document• nothing, if just verbally described scene
Behavior when following ahyperlink
• opening a material document• visiting a website with the standard browser, if URL• opening the standard mail tool, if it is an e–mail address
Key annotationsScene scene name:free textKey words key words:free textEducational difficulty degree of complexity:any| basic| advancedEducational presentation style: any| theory based| illustratedMedia media documents needed:free textUnspecified media media documents to be specified:free textActors human actors:instructor | students| both# slides # of slides:integerEstimated time consumptionapprox. time needed: [h]:[min]Location location and equipment requirements:free text
Table 1: Scenes
Symbol
Behavior when doubleclicked
opening the sub-graph that specifies the episode
Behavior when following ahyperlink
• opening a material document• visiting a website with the standard browser, if URL• opening the standard mail tool, if it is an e–mail address
Key annotationsEpisode episode name:free textKey words key words:free textEducational difficulty degree of complexity:any| basic| advancedSlides slide file in the conventional course: [file name].pptEquipment equipment needed for the episode:free textMedia media documents needed:free textUnspecified media media documents to be specified:free text
Table 2: Episodes
Symbols@@ ¡¡ @@ ¡¡End
Behavior when doubleclicked
jumping back and forth
Behavior when following ahyperlink
• opening a material document• visiting a website with the standard browser, if URL• opening the standard mail tool, if it is an e–mail address
Key annotation: name of sub– or super/graph:free text
Table 3: Off–Page References
174
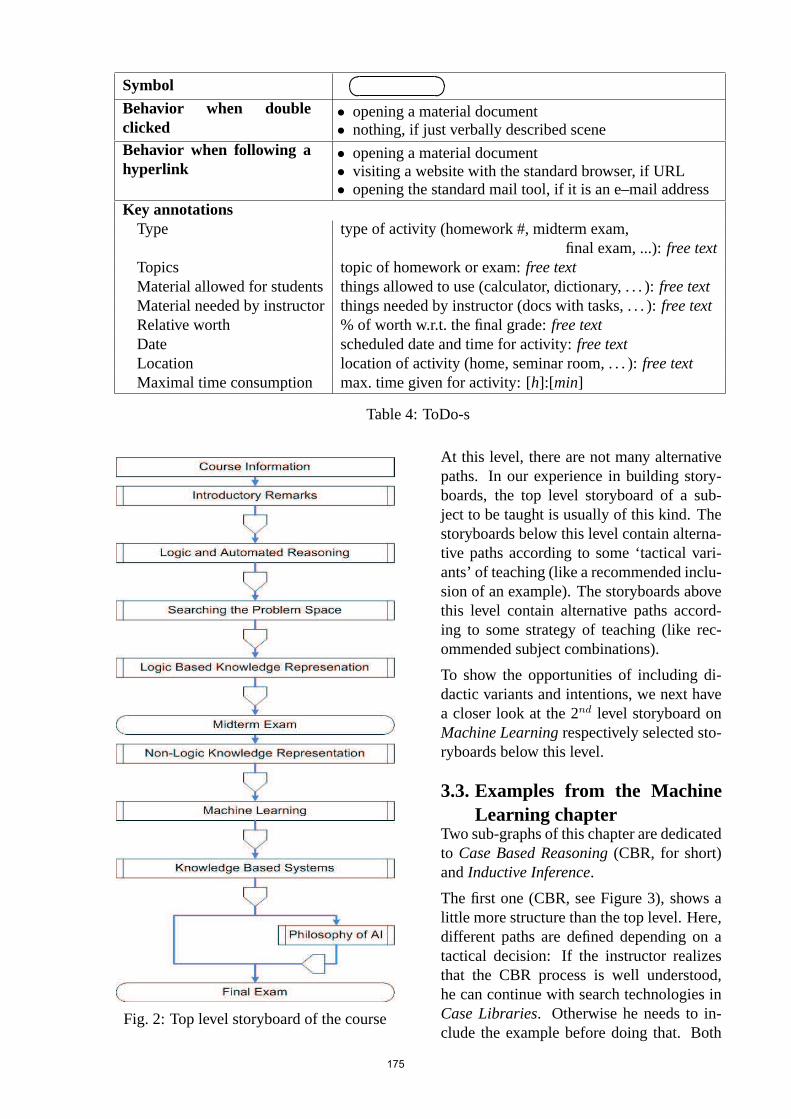
Symbol®
©ª
Behavior when doubleclicked
• opening a material document• nothing, if just verbally described scene
Behavior when following ahyperlink
• opening a material document• visiting a website with the standard browser, if URL• opening the standard mail tool, if it is an e–mail address
Key annotationsType type of activity (homework #, midterm exam,
final exam, ...):free textTopics topic of homework or exam:free textMaterial allowed for students things allowed to use (calculator, dictionary, . . . ):free textMaterial needed by instructorthings needed by instructor (docs with tasks, . . . ):free textRelative worth % of worth w.r.t. the final grade:free textDate scheduled date and time for activity:free textLocation location of activity (home, seminar room, . . . ):free textMaximal time consumption max. time given for activity: [h]:[min]
Table 4: ToDo-s
Fig. 2: Top level storyboard of the course
At this level, there are not many alternativepaths. In our experience in building story-boards, the top level storyboard of a sub-ject to be taught is usually of this kind. Thestoryboards below this level contain alterna-tive paths according to some ‘tactical vari-ants’ of teaching (like a recommended inclu-sion of an example). The storyboards abovethis level contain alternative paths accord-ing to some strategy of teaching (like rec-ommended subject combinations).
To show the opportunities of including di-dactic variants and intentions, we next havea closer look at the 2nd level storyboard onMachine Learningrespectively selected sto-ryboards below this level.
3.3. Examples from the MachineLearning chapter
Two sub-graphs of this chapter are dedicatedto Case Based Reasoning(CBR, for short)andInductive Inference.
The first one (CBR, see Figure 3), shows alittle more structure than the top level. Here,different paths are defined depending on atactical decision: If the instructor realizesthat the CBR process is well understood,he can continue with search technologies inCase Libraries. Otherwise he needs to in-clude the example before doing that. Both
175

Fig. 3: Storyboard on Case Based Reasoning
paths are distinguished by different colorsand by a description of conditions to fol-low the one or the other as an annotationto the respective edge at the ‘fork point’ ofthese different ways to continue. Moreover,for the ‘advanced students’ who follow thegreen path, an additional optional node isvisited. Sincethe k–NN Method(see lastscene in Figure 4) is some sort of CBR,which overcomes some drawbacks in Induc-tive Inference (which is another 3rd levelsub–graph besides CBR), there is a referenceback and forth. Depending on whether thisscene is visited as a supplement to InductiveInference or as a regular part of CBR, the re-latedOff-Page Referenceneeds to be clickedto jump back.
A nice example for including didactic inten-tions can be seen in the storyboard of Induc-tive Inference (see Figure 4). Here, the sim-ple play ‘guess my number’ is intended togive the students an idea of what the termIn-formation Entropymeans, because this con-cept is utilized in the subsequent scene. Aninstructor might decide whether such a (en-
Fig. 4: Storyboard on Inductive Inference
tertaining) bridge towards the next topic isappropriate. Moreover, the open discussionon requirements the Example Set inInduc-tive Inferenceshould meet forCLSandID3and the impact of these sets on the qualityof inference results, if they are not met prop-erly, leads directly to a concept to addressthese drawbacks: thek–NN Method. Sincek–NNis not a method ofInductive Inference,but closely related to CBR, anOff–Page Ref-erenceto the related node in the CBR story-board is placed here.A scene that hasn’t been a part of theMa-chine Learningepisode in the course beforeits storyboarding, isInductive Inference withFOPC expressions(see Figure 4), which is atechnology to compute a so–calledbest in-ductive conclusionon a set of expressions oftheFirst Order Predicate Calculus(FOPC).This is a technology that is not presented inany AI textbook, but included in a relatedcourse of the first author. By including itas an optional scene in the second author’scourse on Intelligent Systems, we utilizedthe storyboard as a medium of collabora-tion in teachingArtificial Intelligence. Asthe double click action, we implemented the
176
opening of a MicrosoftTM Power Point pre-sentation to this topic as used in the firstauthor’s course3. Furthermore, clicking thewww–symbol in the lower left corner of thescene opens the webpage of the first author,at which all slides and scripts of the firstauthor for teaching AI can be downloadedby interested users (instructors or students).Additionally, there is an information symboli in the lower left corner, which indicates asource of further information on this learn-ing content. What it does is open the stan-dard mail tool of the PC under use with therecipient address of somebody who is ableto answer questions on this learning content:the first author.
A similar use of the storyboard for sharingteaching material has been done with thescene on theCLS Algorithm. Here, two hy-perlinks are defined, one that opens the orig-inal slides of the course on Intelligent Sys-tems and another one that opens (an Englishtranslation of) the slides for the same topic inthe first authors’ course onArtificial Intelli-gence. Generally, the number of hyperlinksis unlimited, so that a scene can carry manydifferent material to provide its content, in-cluding web addresses.
Another didactic measure that helps to real-ize the nature of the various Machine Learn-ing technologies on the very first view is thelabeling of the scenes (1)CLS Algorithm, (2)ID3 Algorithm, and (3)Inductive Inferencewith FOPC expressions. By the commentsabove these scenes are titled
(1) A straightforward induction of a rule-based classifier in a n–dimensionalspace of attributes
(2) Induction of an optimal rule-based classifier for objects in a n–dimensional space of attributes drivenby the information gain, respectively
(3) Computing a best inductive conclu-sion for a set of examples by Anti-Unification
The storyboard user (instructor and student)receives some knowledge on how these three
3Of course, this is a version translated in English.
topics are related to each other. Provid-ing this information in conventional coursematerial exclusively (e.g., books, scripts,slides), which is sequentially organized,bags the risk, that the user doesn’t recognizethat this information is some sort of meta–knowledge about these three technologies.The nesting of storyboards supports imple-menting such knowledge, effectively.
4. Current efforts towards formal-izing the concept
With the objectives of
1. a software realization ofknowledgeprocessing(i.e. deductive inference onstoryboards),
2. evaluatingstoryboards by case–basedvalidation technologies such as de-scribed in [2],
3. machine learning(i.e. the identificationof didactic patterns by some sort of datamining and inductive inference),
4. knowledge refinementby improvingparticular storyboards due to didacticinsights that became explicit by story-boarding, and finally
5. knowledge engineeringby supportingthe storyboard development with a tool-box of didactic patterns that are provento be appropriate in former use,
the overall concept is currently under revi-sion.
In opposition to classical knowledgeprocessing in Artificial Intelligence, de-duction on the knowledge modelled bystoryboards is not 100 % performed bymachines. Albeit the traversing can besoftware-guided, there are some decisionsleft to humans respectively depend froma input parameter that might be providedby humans. Furthermore, the knowledgewithin (and below) the Scenes is usuallyinformal and thus, absconds itself fromformal processing.
However, we made some conceptual refine-ments that improve the opportunities for asoftware supported (deductive) knowledgeprocessing as a very first step towards thefirst one of the visionary objectives above.
177
4.1. Conceptual refinements ofnodes
A view at figure 3 reveals that jumping backinto a related super–graph is not uniquelydefined, formally. For better opportunities tosupport the storyboard traversing by an ap-propriate software, we additionally limitedthe expressiveness by requesting, that thegraph hierarchy has to be a tree of graphs.In other words, a graph that implements anepisode can only be a sub–graph of exactlyone super–graph. This implies, that, when-ever a sub–graph has been completely tra-versed by reaching its final node, the is aunique super–graph into which the story-board interpreter has to jump back.
Also, the definition of exactly one startingpoint and exactly one end point is necessaryto interpret graphs without any elbowroomfor human interpretation respectively mis-understandings. Other references betweengraphs than start– and end–nodes have tobe forbidden to enable a software supportedstoryboard traversing.
4.2. Conceptual refinements ofedges
Since humans are still an essential part ofa storyboard interpreter, the modelling lan-guage must be easy to read and to under-stand. So we shifted the representation ofconditions to follow an edge from the (ratherhidden) key annotation of it to an obviousannotation within the arrow that representsthe edge.
To ensure decidable conditions for edges, welimit these conditions to
• dynamic conditions regarding the tra-versing history (visited nodes, e.g.) and
• input parameter with case–specific val-ues that don’t change after their evalua-tion.
Furthermore, if node–outgoing edges carrya condition, there have to be at least two ofthose to avoid dead ends of traversing.
Fork situations If there are several edgesthat leave a node, three cases have to be dis-
tinguished: (1) they are alternatives that ex-clude each other, (2) they are edges that needto be traversed concurrently, and (3) there isa rule that determines something in–betweenboth (‘follow at least three of 10 edges’ e.g.).
These cases are syntactically distinguishedin the way these edges branch and merge af-ter finishing the the alternative or concurrentpaths: (1) alternative paths start and end withdifferent edges (2) concurrent paths start andend with one edge that spreads at the branchpoint and re–unites at the merge point in thegraph. (3) The third case is treated as a spe-cial case of the second one by expressing therules at the branch and merge point of thepaths.
Edge coloration Additionally, rules ofcoloring edges have been established. Sofar, a color specifies a path to follow undera certain condition. This raises a problem,if there are several edges of different col-ors towards a node and also several edgesof different colors leaving a node. So thecolor concept so far was not able to expressthe rules how to determine possible outgoingcolors depending on the incoming color.
By introducing the concept of bi–colorededges that change their color within theedge, these rules can be expressed in a verysimple and formally decidable way: Alledges having the same color as the incomingedge, are the only possible outgoing edges.
5. Summary and outlook
Storyboards in general, and the one intro-duced in this paper in particular, are an ap-proach to make the didactic design of univer-sity courses explicit. Since their scenes arenot limited to the presentation of electronicmaterial, but may representany learning ac-tivity, the application of this concept goes farbeyond the IT approaches to support learn-ing so far.
The idea to represent knowledge at a highlevel with a modeling concept that is ap-propriate to be used by topical experts (uni-versity instructors, in this case) without the
178
need of an IT– or even software techno-logical background is very much AI–driven.Here, the term ‘topical knowledge’ is not re-lated to the learning content, but to its di-dactics instead. In particular, didactical in-tentions and variants can be specified as anested graph–structure.
To validate the usefulness in practice, we de-veloped a storyboard on an AI related courseat the second author’s university. After itsdevelopment, we presented the result to thecurrent instructor of this course (as well asother university instructors). There was, infact, no need to convince him in using thisstoryboard; he was quite happy to have sucha useful tool to support his teaching.
One essential property of this concept and itsimplementation is its simplicity in terms ofboth the concept itself and the tool we usedto implement it. Everybody, also universityinstructors of subjects that are far removedfrom information technology, are able to de-velop storyboards.
Of course, we won’t stop this research afterhaving a high-level modeling concept for di-dactic design and asking university instruc-tors to perform their ‘knowledge processing’with it.
Our upcoming research on this issue is asfollows:
1. A short term objectiveis, of course,promoting the development and use ofthis concept.
2. After that, as amedium term objective,we plan to develop an evaluation con-cept for storyboards based on the learn-ing results of the students as acquiredfrom the final grade they achieve for thestoryboarded courses as well as the stu-dents’ specific comments in a question-naire.
3. Our long term objectiveis to identifytypical didactic patterns of successfulstoryboards. Since the learning resultof a particular student is associated to aparticular path through the storyboard,we should be able to identify success-ful storyboards in general, but also suc-
cessful paths within storyboards in par-ticular. Through the use of MachineLearning methods, we finally might beable to find out what these successfulstoryboards respectively paths have incommon and in which properties theydiffer from the less successful ones.Thus, we might be able to identify suc-cessful didactic patterns.
The latter is, in fact, the vision of knowl-edge discovery in didactics. By utilizing thedidactic insights acquired by this approachfor the upcoming storyboards, we intend toclose the loop of the never ending storyboarddevelopment spiral.
Acknowledgements The authors aregrateful for the generous support from theLaboratory of Interdisciplinary InformationScience and Technology (I2-Lab) at theSchool of Electrical Engineering and Com-puter Science at the University of CentralFlorida. Thanks to this support we couldbuild the exemplary storyboard, which is (1)an important source of experience for the au-thors, (2) a starting point for future researchto refine the concept and, most importantly(3) a launch pad of a campaign that aims atthe wide dissemination of this concept.
References
[1] K.P. Jantke and R. Knauf. Didacticdesign though storyboarding: Standardconcepts for standard tools. InProc.of the 4th International Symposium onInformation and Communication Tech-nologies, Workshop on Dissemination ofe-Learning Technologies and Applica-tions, Cape Town, South Africa, 2005,pages 20–25, 2005.
[2] R. Knauf, A.J. Gonzalez, and T. Abel. Aframework for validation of rule-basedsystems.IEEE Transactions of Systems,Man and Cybernetics - Part B: Cyber-netics, 32(3):281–295, June 2002.
[3] M.H. Walker and N. Eaton.icrosoft Of-fice Visio 2003 Inside Out. Redmond,Washington: Microsoft Press, 2004.
179
Data Mining on Traffic Accident Data
Jurgen Cleve†, Christian Andersch?, Stefan Wissuwa†
†University of Wismar, Dept. of EconomicsPhilipp-Muller-Str., D-23952 Wismar, Germany
Phone: +49 3841 753-527E-mail: j.cleve,[email protected]
http://www.wi.hs-wismar.de/kiwi
?Current affiliation: MIT – Management Intelligenter Technologien GmbHPascalstr. 69, D-52076 Aachen, Germany
E-mail: [email protected]
Abstract
A large number of people is killed or injured in traffic accidents every year. We describean approach to determine the seriousness of potential accidents. Therefore, we use datamining techniques to analyze data from traffic accidents and to build models for prediction.We use freely available data mining tools and self-developed software for data preprocessingand automation.
Keywords: data analysis, data mining, machine learning, traffic accident data
1 Traffic Accident Data
The number of people killed in trafficaccidents per year is about 1.2 millionworldwide. Even more get injured: 50million people [6]. It is important tolower these numbers.
Analyzing the accidents may helpto understand and isolate facts withsignificant influence. In this paper wedescribe the analysis of traffic accidentdata from the Rostock1 area. Thequestion is: If there is an accident,how serious will it be?2
1City located in the northern part of Ger-many; important Baltic seaport
2See also: “Improving road safety withdata mining”, http://soleunet.ijs.si/website/html/cocasesolutions.html
We have access to official statistics cov-ering several years of the Rostock area.There are a total of 10,813 anonymizedrecords available. Each is marked witha ‘score’ that indicates the seriousnessof the accident [2]. The score is an in-teger number on a scale from 1 to 9with 9 as maximum. It was originallycalculated from the number of injuredor killed people and the material dam-age as shown in Table 1. It is worthto notice that the rules for the scorewere created by physicians. Since thematerial damage is not included in thedata provided, the mapping from mate-rial damage and personal injury to thescore cannot be reversed.
Each record contains 52 attributes de-scribing the circumstances of the acci-dent. The attributes include weather
180
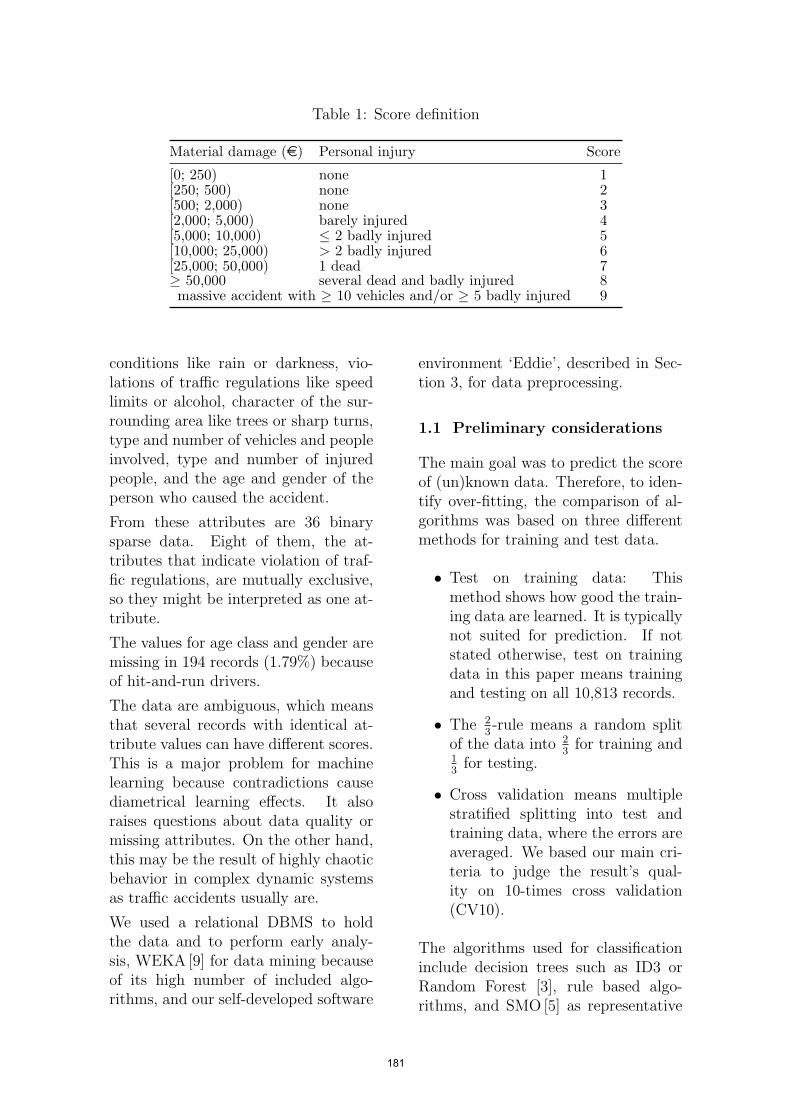
Table 1: Score definition
Material damage (e) Personal injury Score
[0; 250) none 1[250; 500) none 2[500; 2,000) none 3[2,000; 5,000) barely injured 4[5,000; 10,000) ≤ 2 badly injured 5[10,000; 25,000) > 2 badly injured 6[25,000; 50,000) 1 dead 7≥ 50,000 several dead and badly injured 8massive accident with ≥ 10 vehicles and/or ≥ 5 badly injured 9
conditions like rain or darkness, vio-lations of traffic regulations like speedlimits or alcohol, character of the sur-rounding area like trees or sharp turns,type and number of vehicles and peopleinvolved, type and number of injuredpeople, and the age and gender of theperson who caused the accident.
From these attributes are 36 binarysparse data. Eight of them, the at-tributes that indicate violation of traf-fic regulations, are mutually exclusive,so they might be interpreted as one at-tribute.
The values for age class and gender aremissing in 194 records (1.79%) becauseof hit-and-run drivers.
The data are ambiguous, which meansthat several records with identical at-tribute values can have different scores.This is a major problem for machinelearning because contradictions causediametrical learning effects. It alsoraises questions about data quality ormissing attributes. On the other hand,this may be the result of highly chaoticbehavior in complex dynamic systemsas traffic accidents usually are.
We used a relational DBMS to holdthe data and to perform early analy-sis, WEKA [9] for data mining becauseof its high number of included algo-rithms, and our self-developed software
environment ‘Eddie’, described in Sec-tion 3, for data preprocessing.
1.1 Preliminary considerations
The main goal was to predict the scoreof (un)known data. Therefore, to iden-tify over-fitting, the comparison of al-gorithms was based on three differentmethods for training and test data.
• Test on training data: Thismethod shows how good the train-ing data are learned. It is typicallynot suited for prediction. If notstated otherwise, test on trainingdata in this paper means trainingand testing on all 10,813 records.
• The 23-rule means a random split
of the data into 23
for training and13
for testing.
• Cross validation means multiplestratified splitting into test andtraining data, where the errors areaveraged. We based our main cri-teria to judge the result’s qual-ity on 10-times cross validation(CV10).
The algorithms used for classificationinclude decision trees such as ID3 orRandom Forest [3], rule based algo-rithms, and SMO [5] as representative
181
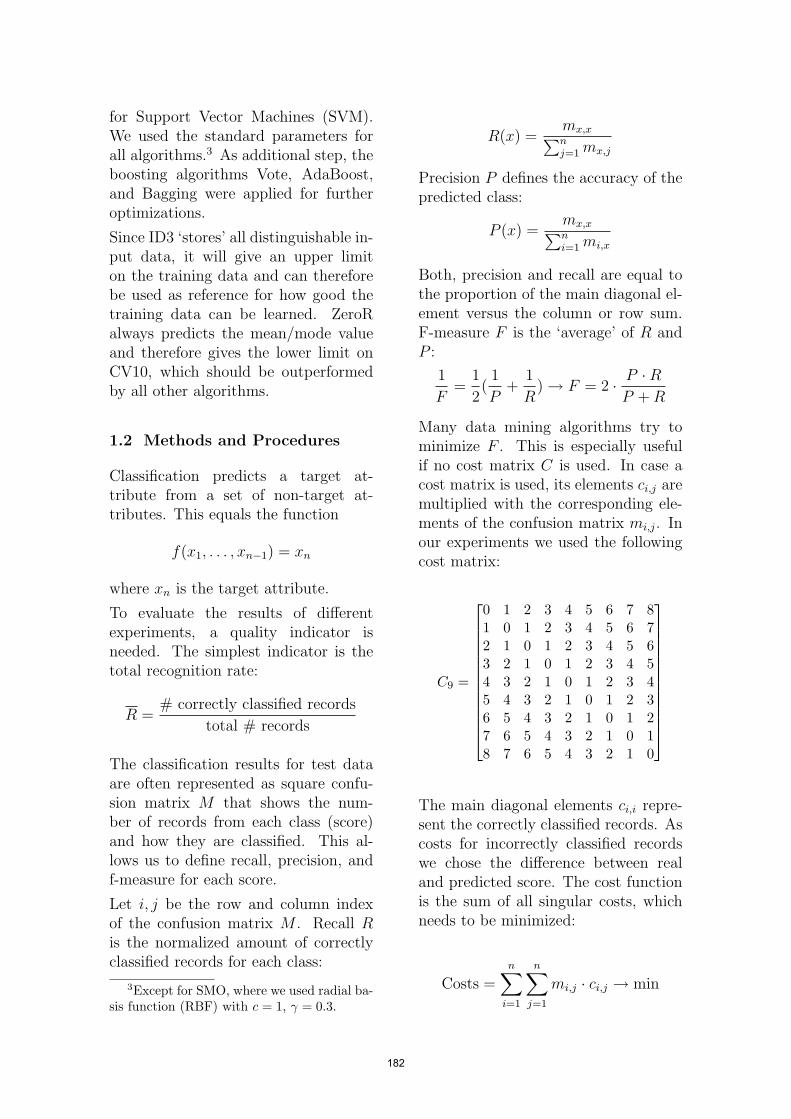
for Support Vector Machines (SVM).We used the standard parameters forall algorithms.3 As additional step, theboosting algorithms Vote, AdaBoost,and Bagging were applied for furtheroptimizations.
Since ID3 ‘stores’ all distinguishable in-put data, it will give an upper limiton the training data and can thereforebe used as reference for how good thetraining data can be learned. ZeroRalways predicts the mean/mode valueand therefore gives the lower limit onCV10, which should be outperformedby all other algorithms.
1.2 Methods and Procedures
Classification predicts a target at-tribute from a set of non-target at-tributes. This equals the function
f(x1, . . . , xn−1) = xn
where xn is the target attribute.
To evaluate the results of differentexperiments, a quality indicator isneeded. The simplest indicator is thetotal recognition rate:
R =# correctly classified records
total # records
The classification results for test dataare often represented as square confu-sion matrix M that shows the num-ber of records from each class (score)and how they are classified. This al-lows us to define recall, precision, andf-measure for each score.
Let i, j be the row and column indexof the confusion matrix M . Recall Ris the normalized amount of correctlyclassified records for each class:
3Except for SMO, where we used radial ba-sis function (RBF) with c = 1, γ = 0.3.
R(x) =mx,x∑nj=1 mx,j
Precision P defines the accuracy of thepredicted class:
P (x) =mx,x∑ni=1 mi,x
Both, precision and recall are equal tothe proportion of the main diagonal el-ement versus the column or row sum.F-measure F is the ‘average’ of R andP :
1
F=
1
2(1
P+
1
R) → F = 2 · P ·R
P + R
Many data mining algorithms try tominimize F . This is especially usefulif no cost matrix C is used. In case acost matrix is used, its elements ci,j aremultiplied with the corresponding ele-ments of the confusion matrix mi,j. Inour experiments we used the followingcost matrix:
C9 =
0 1 2 3 4 5 6 7 81 0 1 2 3 4 5 6 72 1 0 1 2 3 4 5 63 2 1 0 1 2 3 4 54 3 2 1 0 1 2 3 45 4 3 2 1 0 1 2 36 5 4 3 2 1 0 1 27 6 5 4 3 2 1 0 18 7 6 5 4 3 2 1 0
The main diagonal elements ci,i repre-sent the correctly classified records. Ascosts for incorrectly classified recordswe chose the difference between realand predicted score. The cost functionis the sum of all singular costs, whichneeds to be minimized:
Costs =n∑
i=1
n∑j=1
mi,j · ci,j → min
182
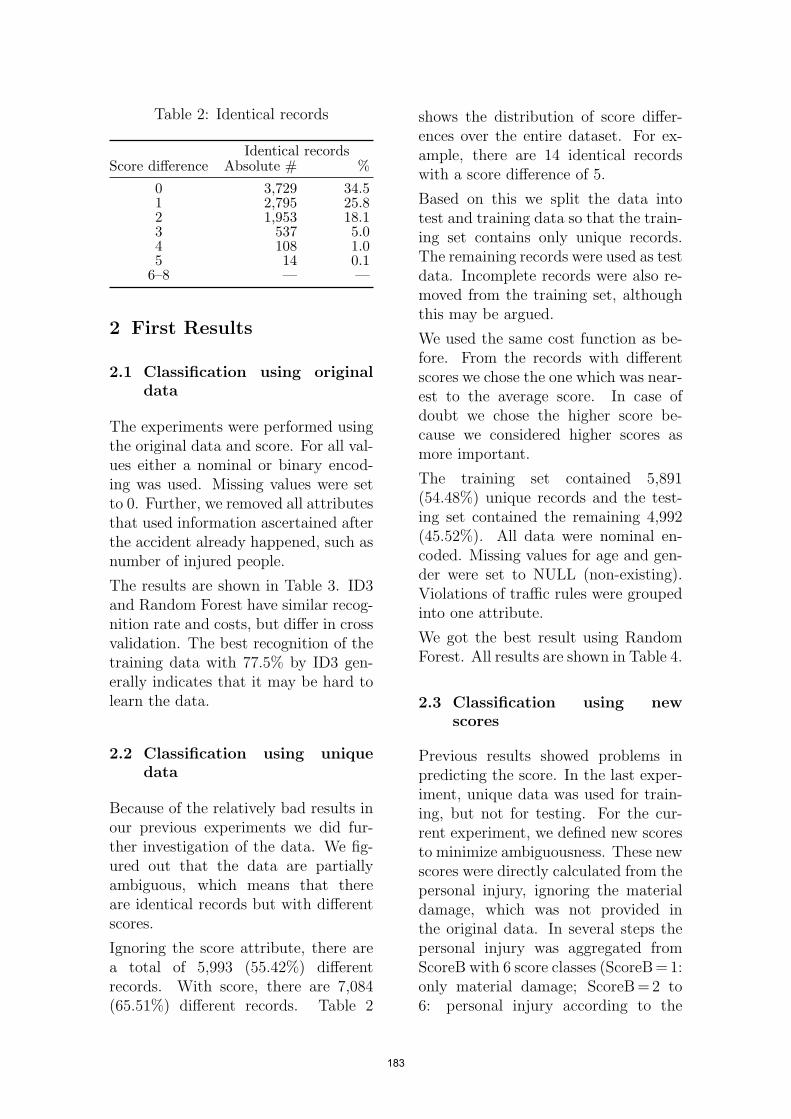
Table 2: Identical records
Identical recordsScore difference Absolute # %
0 3,729 34.51 2,795 25.82 1,953 18.13 537 5.04 108 1.05 14 0.1
6–8 — —
2 First Results
2.1 Classification using originaldata
The experiments were performed usingthe original data and score. For all val-ues either a nominal or binary encod-ing was used. Missing values were setto 0. Further, we removed all attributesthat used information ascertained afterthe accident already happened, such asnumber of injured people.
The results are shown in Table 3. ID3and Random Forest have similar recog-nition rate and costs, but differ in crossvalidation. The best recognition of thetraining data with 77.5% by ID3 gen-erally indicates that it may be hard tolearn the data.
2.2 Classification using uniquedata
Because of the relatively bad results inour previous experiments we did fur-ther investigation of the data. We fig-ured out that the data are partiallyambiguous, which means that thereare identical records but with differentscores.
Ignoring the score attribute, there area total of 5,993 (55.42%) differentrecords. With score, there are 7,084(65.51%) different records. Table 2
shows the distribution of score differ-ences over the entire dataset. For ex-ample, there are 14 identical recordswith a score difference of 5.
Based on this we split the data intotest and training data so that the train-ing set contains only unique records.The remaining records were used as testdata. Incomplete records were also re-moved from the training set, althoughthis may be argued.
We used the same cost function as be-fore. From the records with differentscores we chose the one which was near-est to the average score. In case ofdoubt we chose the higher score be-cause we considered higher scores asmore important.
The training set contained 5,891(54.48%) unique records and the test-ing set contained the remaining 4,992(45.52%). All data were nominal en-coded. Missing values for age and gen-der were set to NULL (non-existing).Violations of traffic rules were groupedinto one attribute.
We got the best result using RandomForest. All results are shown in Table 4.
2.3 Classification using newscores
Previous results showed problems inpredicting the score. In the last exper-iment, unique data was used for train-ing, but not for testing. For the cur-rent experiment, we defined new scoresto minimize ambiguousness. These newscores were directly calculated from thepersonal injury, ignoring the materialdamage, which was not provided inthe original data. In several steps thepersonal injury was aggregated fromScoreB with 6 score classes (ScoreB=1:only material damage; ScoreB =2 to6: personal injury according to the
183

Table 3: Original data—total recognition rate and costs per algorithm
Total recognition rate (%) CostsAlgorithm Training CV10 2
3 -rule Training CV10 23 -rule
Random Forest 77.3 46.9 44.4 3,697 9,005 3,208J48 60.7 44.5 44.2 6,507 9,303 3,100REPTree 49.2 41.6 41.1 8,352 9,496 3,291ZeroR 38.4 38.4 39.4 9,776 9,776 3,266ID3 77.5 43.8 40.8 3,678 10,426 3,858
Table 4: Unique data—total recognition rate and costs per algorithm
Total recognition rate (%) CostsAlgorithm Train. Test Total CV10∗ Train. Test Total CV10∗
Rand. Forest 93.2 48.4 72.8 35.5 686 3,439 4,125 6,109J48 60.1 43.8 52.7 40.7 3,715 3,804 7,519 5,405REPTree 47.0 42.1 44.8 38.6 4,808 3,898 8,706 5,483ZeroR 34.4 43.1 38.4 34.4 5,830 3,946 9,776 5,830ID3 93.4 47.3 72.4 28.6 680 4,370 5,050 8,108∗CV10 on unique data, therefore reduced costs compared to Table 3, CV10
original score) to ScoreF (ScoreF=1:only material damage; ScoreF=2: alsopersonal injury). Results for ScoreBas the most complex and ScoreF asthe most simple differentiation are de-scribed here, for other scores see [1].
We used nominal encoding and setmissing values to a special value. At-tributes for violations of traffic ruleswere not grouped into one attributeas before. All attributes collected af-ter the accident were removed. Alto-gether, we used 44 attributes includingthe score.
The results for total recognition showsTable 5. The total recognition rate isin inverse proportion to the number ofclasses used. ID3 on training data rec-ognizes exactly the number of distin-guishable records, as verified by analyz-ing the database. Using CV10 as crite-ria, SMO gives the best results.
Table 7 shows a detailed overview ofsingle and total recognition as well ascosts when using CV10.
Most algorithms did not predict thehigher scores at all. Furthermore, therecognition rate of a score is nearly pro-portional to the number of appearancesin the original data. This cannot begeneralized for score 4 to 6 becauseof their very low appearance. Ran-dom Forest and SMO have the low-est costs and highest total recognitionrate, but only Random Forest predictshigher scores.
Directly learning score variants withfewer classes shows slightly better re-sults than learning ScoreB and aggre-gating to ScoreF afterwards [1]. Detailsfor ScoreF and one algorithm shows Ta-ble 6.
ScoreF only distinguishes the binarydecision problem material damage vs.personal injury. Therefore, the costmatrix leads to costs that equal thenumber of wrongly classified records:
C2 =
[0 11 0
]
184

Table 5: Total recognition rate (%)
Alg. Test Score ScoreB ScoreF
ID3 Train. 77.5 97.0 97.4CV10 45.2 87.0 89.423 -rule 42.7 85.7 88.8
J48 Train. 59.9 90.7 91.9CV10 44.4 88.0 90.823 -rule 43.6 87.9 90.6
SMO Train. 58.3 91.6 93.4CV10 46.5 88.7 91.123 -rule 45.5 88.5 91.1
Table 6: Details of ScoreF for J48,CV10; R is recall, P is precision (%)
S 1 2 R1 9,047 203 97.812 797 766 49.01P 91.90 79.05 90.75
As new optimization criteria, f-measurefor ScoreF =2 (personal injury) wasused, since it shows the quality andprecision of the classification of seriousaccidents. The reduced complexity al-lowed us to further use several boostingalgorithms. The best results are shownin Table 8 including recall and precisionfor ScoreF=2, total recognition rate,and costs.
The best result with the highest f-measure of 0.667, almost 60% recog-nition and little more than 21% false-positive was achieved with voting usingRandom Forest and the rather simplealgorithms Decision Stump and ID3.Replacing ID3 with PART resulted inslightly lower f-measure, but higher to-tal recognition rate of 92.0% and lowercosts. For J48, Table 8 compared toTable 5 also shows that boosting algo-rithms do not always lead to a bettertotal recognition rate.
3 Data Mining Environ-ment for Preprocessingand Automation
We are developing a data mining en-vironment for data preprocessing, au-tomation and integration of data min-ing software, called Eddie: Extensi-ble Dynamic Data Interchange Envi-ronment. The system was used in partfor data preprocessing and table oper-ations. It is designed to support scien-tific experiments, which need a flexibleand in-depth capability to adjust pa-rameters, to handle very large amountsof data, and to perform multiple exper-iments automatically [7], [8], [4].
3.1 Motivation
When running data mining experi-ments, we often have to use several soft-ware applications. Reasons are thatnot every algorithm is supported byevery software, non-transparent algo-rithms complicate the interpretationof results or models (especially truefor Neural Networks), and visualizationcapabilities are not always appropri-ate. It is necessary to exchange databetween different applications and tomanually perform various formattingsteps because of proprietary data for-mats. While for a single experimentthis is not a limiting factor, it becomesvery time consuming and error pronefor larger series of experiments.
To solve these issues we decided todevelop a set of data transformationtools that convert data from propri-etary formats into a single exchangeformat and back, all using standard in-put and output streams so they caneasily be appended. We chose XMLas standard exchange format since itis easy to parse, to edit, and human
185

Table 7: New score—recognition rate (%) and costs for ScoreB, CV10
ScoreB % ID3 Dec.Table PART J48 NBTree SMO C.Rule Rand.For.
1 85.5 94.8 98.2 96.4 98.1 97.3 98.6 98.1 97.32 9.5 44.4 39.3 36.9 33.1 41.9 40.1 42.3 43.53 4.2 38.9 13.1 26.0 21.4 8.1 12.0 — 38.44 0.3 18.2 9.1 — — — — — 18.25 0.3 36.1 — — — — — — 39.56 0.1 50.0 8.3 — — 5.6 — — 50.0
uncl. — 0.2 — — — — — — —
Total: 100.0 87.0 88.3 87.0 88.0 87.5 88.7 87.9 89.2
Costs: 1,878 1,720 1,890 1,772 1,857 1,671 1,764 1,545
Table 8: Best boosted ScoreF, CV10; based on f-measure for ScoreF =2 (F-M2)
Algorithm F-M2 R2 (%) P2 (%) Total (%) Costs
Vote: Rand.For., Dec.Stump, ID3 0.677 59.4 78.6 91.8 887Vote: Rand.For., Dec.Stump, PART 0.663 54.4 84.6 92.0 867Random Forest: Bagging 0.646 56.0 76.1 91.1 962PART: AdaBoost 0.645 58.3 72.0 90.7 1,005J48: AdaBoost 0.640 57.6 72.0 90.6 1,013· · ·SMO∗ 0.621 50.6 80.3 91.1 966· · ·∗not boosted because of much higher CPU consumption
readable. Because this set of programswas already very flexible, we found thatusing the underlying architecture couldbe used to describe and automate gen-eral data flows and preprocessing steps.
3.2 Architecture
Its main concept is to split function-ality into several stand-alone programsfor well-defined tasks, which commu-nicate with each other using a flexi-ble XML-based protocol, which we callSXML. These modules can be con-nected via input and output streams tobuild a workflow or to exchange datawith other applications, as shown inFig. 1. This allows us to build com-plex data flows, to store intermediateresults at any time for further investi-gation, and to integrate the function-ality of existing applications, such asWEKA for data mining and SNNS [10]
as specialized software for Neural Net-works.
Each module reads and writes SXMLdata, which contains the data to beprocessed as well as configuration infor-mation. Therefore, a workflow can bedescribed as configuration for a specialmodule, which then reads its configura-tion, executes programs, and managesthe data flow between them. Becausethe workflow module itself reads andwrites SXML code, a workflow can eas-ily be integrated within another work-flow. Data import and export as well asintegration of existing applications arehandled this way using special modules.
4 Conclusion
A large number of correctly predicted,but less serious accidents resulted in arelatively high total recognition rate.
186

Fig. 1: System architecture of Eddie
The best result for the separation ofhigh and low score achieved a voting al-gorithm with an f-measure of 0.677 forthe high score. Such higher scores aremore important as they indicate situa-tions with matter of life and dead.
Better results may be possible by de-creasing the ambiguity of the data com-bined with a more specific subset oftraining data. Especially the score def-inition is not mathematically derivedand very subjective. Further, an asym-metric cost matrix with higher penaltyfor too low classified records shouldproduce better models.
Our experiments show that many diffi-culties in building data mining modelsare caused by inadequate data, whichhad been raised and partially pre-processed without taking information-theoretical aspects into account.
References
[1] C. Andersch and J. Cleve. DataMining auf Unfalldaten. Universityof Wismar, January 2006. Wis-mar Discussion Paper 01/2006,http://www.wi.hs-wismar.de/fbw/aktuelles/wdp/.
[2] D. Bastian and R. Stoll. Risikopoten-ziale und Risikomanagementim Straßenverkehr. Technicalreport, Forschungsinstitut fur
Verkehrssicherheit GmbH Schwerin,University of Rostock, July 2004.
[3] L. Breiman. Random forests. Ma-chine Learning, 45(1):5–32, 2001.
[4] J. Cleve, U. Lammel, and S. Wis-suwa. Data Mining on TransactionData. In Nejdet Delener and Chiang-Nan Chiao, editors, Global Marketsin Dynamic Environments, Lisboa,2005. GBATA.
[5] J. Platt. Sequential Minimal Op-timization: A Fast Algorithm forTraining Support Vector Machines,1998. Microsoft Research TechnicalReport MSR-TR-98-14.
[6] WHO. World Health Day:Road safety is no accident!,2004. Press release for theWorld Health Day 2004, http://www.who.int/mediacentre/news/releases/2004/pr24/en/.
[7] S. Wissuwa. Data Mining und XML– Modularisierung und Automa-tisierung von Verarbeitungsschritten.University of Wismar, 2003. Wis-mar Discussion Paper 12/2003,http://www.wi.hs-wismar.de/fbw/aktuelles/wdp/.
[8] S. Wissuwa, U. Lammel, andJ. Cleve. XML-basierte Beschrei-bung von Data-Mining-Prozessen.In J. Biethahn, A. Lackner, andV. Nissen, editors, Information-Mining und Wissensmanagement inWissenschaft und Wirtschaft, Proc.AFN-Jahrestagung, pages 37–48,Gottingen, June 2004. University ofGottingen.
[9] I. H. Witten and E. Frank. DataMining: Practical Machine LearningTools and Techniques. Morgan Kauf-mann, San Francisco, 2nd edition,2005.
[10] Andreas Zell. Simulation NeuronalerNetze. Oldenbourg, Munchen, 2003.
187
The Digital Mechanism and Gear Library– a Modern Knowledge Space
Torsten Brix, Ulf Doring, Sabine Trott, Rike Brecht, Hendrik ThomasTechnical University of Ilmenau, PO Box 10 05 65
98684 Ilmenau, [email protected]
AbstractMechanisms and gears are an essential part of technical products in industry. However, the worldwideexisting knowledge about mechanisms in theory and practiceis mostly scattered and only fragmentarilyaccessible for users like students, engineers and scientist. It does not comply with today’s requirementsconcerning a rapid information retrieval. This paper presents the “Digital Mechanism and Gear Library”(DMG-Lib). In this interdisciplinary project of the Technical Universities of Ilmenau, Dresden and theRWTH Aachen a new digital, internet-based library (www.dmg-lib.de) is built to collect, preserve andpresent the knowledge of mechanism and gear science on a new level of quality. The DMG-Lib containsa wide range of digitalized information resources in very heterogeneous media types. The resources areenriched with various additional information like animations and simulations. Combined with innovativemultimedia applications and a semantic information retrieval environment, the DMG-Lib provides anefficient access to this knowledge space of mechanism and gear science.
1. Introduction
In the middle of the 19th century in Ger-many the systematic research on mecha-nisms and gears started as a result of thefast growing engine building industry in thistime [5]. Especially the theoretical reflec-tions and practical works of the German en-gineer F. Reuleaux [15] became important.Mechanism and gear technology is todaystill essential for industry and it will becomeeven more important due to the introduc-tion of new technologies like nanotechnol-ogy and corresponding new fields of appli-cation.
The existing knowledge about mechanismsin theory and practice is worldwide scatteredin hand- and textbooks, photographs, solidfunctional models, engineering drawings,etc. It is only limited and very fragmentarilyaccessible and does not comply with today’srequirements concerning a rapid informationretrieval [5]. However, industrial compa-nies and research institutes demand an ef-ficient access to the whole mechanism andgear theory [7]. Existing activities to pro-
vide such access are promising (e. g. [3])but by far insufficiently. Today in Germanyonly 12 university institutes with focus onmechanism and gear science are left. Moreand more didactical experiences and valu-able training material are lost because ex-perts on this field of application retire orthrough economy measures specialized in-stitutes are closed. Also old and unique liter-ature with only a few numbers left are quitedifficult to access like the publications ofReuleaux. They have to be digitized andonline presented so that this still importantknowledge becomes accessible for the pub-lic again.
A solution of these problems is the collec-tion and presentation of all relevant informa-tion resources for mechanism and gear sci-ence in a centralized worldwide accessibleplatform [5, 8]. The research and educationin various ingenious disciplines would cer-tainly benefit from such a comprehensive li-brary of knowledge.
In 2004 the development of the worldwideaccessible “Digital Mechanism and Gear Li-
188
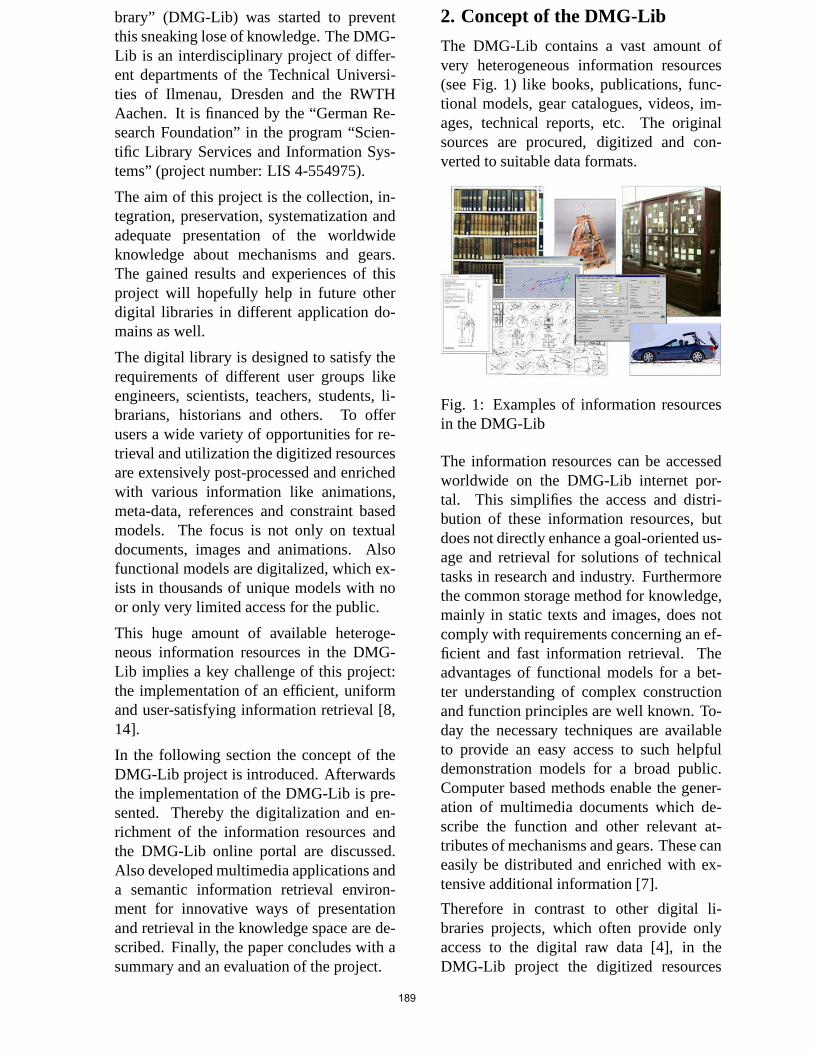
brary” (DMG-Lib) was started to preventthis sneaking lose of knowledge. The DMG-Lib is an interdisciplinary project of differ-ent departments of the Technical Universi-ties of Ilmenau, Dresden and the RWTHAachen. It is financed by the “German Re-search Foundation” in the program “Scien-tific Library Services and Information Sys-tems” (project number: LIS 4-554975).
The aim of this project is the collection, in-tegration, preservation, systematization andadequate presentation of the worldwideknowledge about mechanisms and gears.The gained results and experiences of thisproject will hopefully help in future otherdigital libraries in different application do-mains as well.
The digital library is designed to satisfy therequirements of different user groups likeengineers, scientists, teachers, students, li-brarians, historians and others. To offerusers a wide variety of opportunities for re-trieval and utilization the digitized resourcesare extensively post-processed and enrichedwith various information like animations,meta-data, references and constraint basedmodels. The focus is not only on textualdocuments, images and animations. Alsofunctional models are digitalized, which ex-ists in thousands of unique models with noor only very limited access for the public.
This huge amount of available heteroge-neous information resources in the DMG-Lib implies a key challenge of this project:the implementation of an efficient, uniformand user-satisfying information retrieval [8,14].
In the following section the concept of theDMG-Lib project is introduced. Afterwardsthe implementation of the DMG-Lib is pre-sented. Thereby the digitalization and en-richment of the information resources andthe DMG-Lib online portal are discussed.Also developed multimedia applications anda semantic information retrieval environ-ment for innovative ways of presentationand retrieval in the knowledge space are de-scribed. Finally, the paper concludes with asummary and an evaluation of the project.
2. Concept of the DMG-Lib
The DMG-Lib contains a vast amount ofvery heterogeneous information resources(see Fig. 1) like books, publications, func-tional models, gear catalogues, videos, im-ages, technical reports, etc. The originalsources are procured, digitized and con-verted to suitable data formats.
Fig. 1: Examples of information resourcesin the DMG-Lib
The information resources can be accessedworldwide on the DMG-Lib internet por-tal. This simplifies the access and distri-bution of these information resources, butdoes not directly enhance a goal-oriented us-age and retrieval for solutions of technicaltasks in research and industry. Furthermorethe common storage method for knowledge,mainly in static texts and images, does notcomply with requirements concerning an ef-ficient and fast information retrieval. Theadvantages of functional models for a bet-ter understanding of complex constructionand function principles are well known. To-day the necessary techniques are availableto provide an easy access to such helpfuldemonstration models for a broad public.Computer based methods enable the gener-ation of multimedia documents which de-scribe the function and other relevant at-tributes of mechanisms and gears. These caneasily be distributed and enriched with ex-tensive additional information [7].
Therefore in contrast to other digital li-braries projects, which often provide onlyaccess to the digital raw data [4], in theDMG-Lib project the digitized resources
189
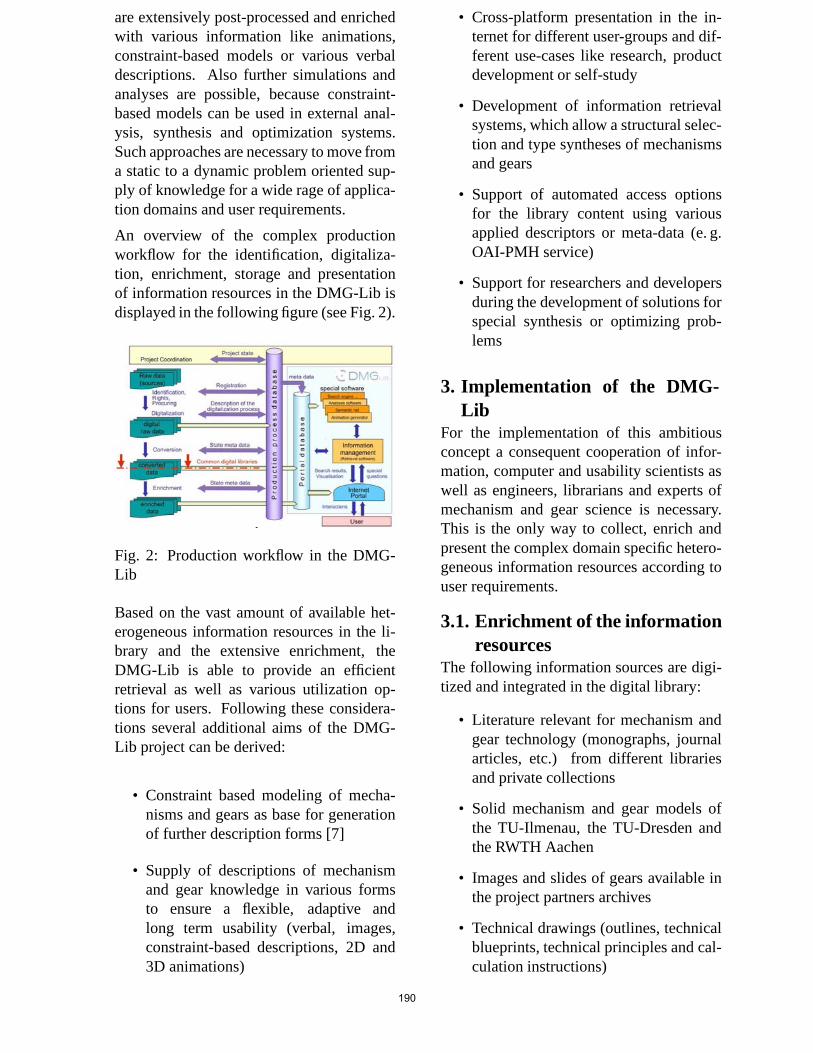
are extensively post-processed and enrichedwith various information like animations,constraint-based models or various verbaldescriptions. Also further simulations andanalyses are possible, because constraint-based models can be used in external anal-ysis, synthesis and optimization systems.Such approaches are necessary to move froma static to a dynamic problem oriented sup-ply of knowledge for a wide rage of applica-tion domains and user requirements.
An overview of the complex productionworkflow for the identification, digitaliza-tion, enrichment, storage and presentationof information resources in the DMG-Lib isdisplayed in the following figure (see Fig. 2).
Fig. 2: Production workflow in the DMG-Lib
Based on the vast amount of available het-erogeneous information resources in the li-brary and the extensive enrichment, theDMG-Lib is able to provide an efficientretrieval as well as various utilization op-tions for users. Following these considera-tions several additional aims of the DMG-Lib project can be derived:
• Constraint based modeling of mecha-nisms and gears as base for generationof further description forms [7]
• Supply of descriptions of mechanismand gear knowledge in various formsto ensure a flexible, adaptive andlong term usability (verbal, images,constraint-based descriptions, 2D and3D animations)
• Cross-platform presentation in the in-ternet for different user-groups and dif-ferent use-cases like research, productdevelopment or self-study
• Development of information retrievalsystems, which allow a structural selec-tion and type syntheses of mechanismsand gears
• Support of automated access optionsfor the library content using variousapplied descriptors or meta-data (e. g.OAI-PMH service)
• Support for researchers and developersduring the development of solutions forspecial synthesis or optimizing prob-lems
3. Implementation of the DMG-Lib
For the implementation of this ambitiousconcept a consequent cooperation of infor-mation, computer and usability scientists aswell as engineers, librarians and experts ofmechanism and gear science is necessary.This is the only way to collect, enrich andpresent the complex domain specific hetero-geneous information resources according touser requirements.
3.1. Enrichment of the informationresources
The following information sources are digi-tized and integrated in the digital library:
• Literature relevant for mechanism andgear technology (monographs, journalarticles, etc.) from different librariesand private collections
• Solid mechanism and gear models ofthe TU-Ilmenau, the TU-Dresden andthe RWTH Aachen
• Images and slides of gears available inthe project partners archives
• Technical drawings (outlines, technicalblueprints, technical principles and cal-culation instructions)
190
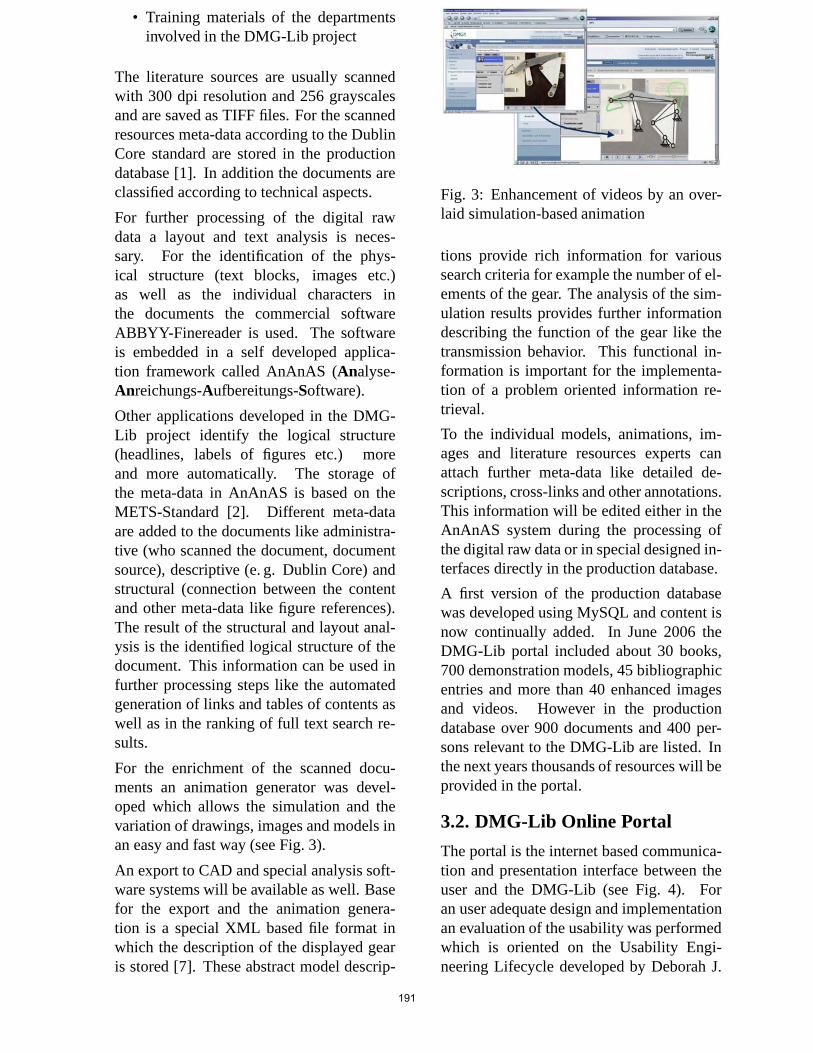
• Training materials of the departmentsinvolved in the DMG-Lib project
The literature sources are usually scannedwith 300 dpi resolution and 256 grayscalesand are saved as TIFF files. For the scannedresources meta-data according to the DublinCore standard are stored in the productiondatabase [1]. In addition the documents areclassified according to technical aspects.
For further processing of the digital rawdata a layout and text analysis is neces-sary. For the identification of the phys-ical structure (text blocks, images etc.)as well as the individual characters inthe documents the commercial softwareABBYY-Finereader is used. The softwareis embedded in a self developed applica-tion framework called AnAnAS (Analyse-Anreichungs-Aufbereitungs-Software).
Other applications developed in the DMG-Lib project identify the logical structure(headlines, labels of figures etc.) moreand more automatically. The storage ofthe meta-data in AnAnAS is based on theMETS-Standard [2]. Different meta-dataare added to the documents like administra-tive (who scanned the document, documentsource), descriptive (e. g. Dublin Core) andstructural (connection between the contentand other meta-data like figure references).The result of the structural and layout anal-ysis is the identified logical structure of thedocument. This information can be used infurther processing steps like the automatedgeneration of links and tables of contents aswell as in the ranking of full text search re-sults.
For the enrichment of the scanned docu-ments an animation generator was devel-oped which allows the simulation and thevariation of drawings, images and models inan easy and fast way (see Fig. 3).
An export to CAD and special analysis soft-ware systems will be available as well. Basefor the export and the animation genera-tion is a special XML based file format inwhich the description of the displayed gearis stored [7]. These abstract model descrip-
Fig. 3: Enhancement of videos by an over-laid simulation-based animation
tions provide rich information for varioussearch criteria for example the number of el-ements of the gear. The analysis of the sim-ulation results provides further informationdescribing the function of the gear like thetransmission behavior. This functional in-formation is important for the implementa-tion of a problem oriented information re-trieval.
To the individual models, animations, im-ages and literature resources experts canattach further meta-data like detailed de-scriptions, cross-links and other annotations.This information will be edited either in theAnAnAS system during the processing ofthe digital raw data or in special designed in-terfaces directly in the production database.
A first version of the production databasewas developed using MySQL and content isnow continually added. In June 2006 theDMG-Lib portal included about 30 books,700 demonstration models, 45 bibliographicentries and more than 40 enhanced imagesand videos. However in the productiondatabase over 900 documents and 400 per-sons relevant to the DMG-Lib are listed. Inthe next years thousands of resources will beprovided in the portal.
3.2. DMG-Lib Online Portal
The portal is the internet based communica-tion and presentation interface between theuser and the DMG-Lib (see Fig. 4). Foran user adequate design and implementationan evaluation of the usability was performedwhich is oriented on the Usability Engi-neering Lifecycle developed by Deborah J.
191

Mayhew [11]. According to this method arequirement analysis and expert interviewshave been carried out to develop a concep-tual model of the DMG-Lib portal.
In March 2006 the prototypic online portalon www.dmg-lib.org was activated. It cur-rently serves as a platform for usability tests.Beside the interactive search option in theweb portal the content of the DMG-Lib canbe accessed with an OAI-PMH web serviceas well.
Fig. 4: DMG-Lib portal
3.3. Multimedia Applications ofthe DMG-Lib
Parallel to the internet portal interface otherinteractive multimedia applications are de-veloped like the multimedia timeline (seeFig. 5) and the virtual mechanism and gearmuseum.
Fig. 5: Timeline of mechanism and gear de-velopment
The timeline application gives users a mul-timedial overview of important persons, in-ventions and publications in the historicaldevelopment of mechanism and gear sci-ence. Users will be able to directly ac-cess corresponding information resources,for example available books of selected per-sons in the library.
Beside traditional browsing and retrievalmethods these applications provide alterna-tive ways to access the knowledge stored inthe library. Prototypes of these applicationsare integrated in the DMG-Lib portal and arecurrently tested by the user community.
3.4. Semantic Information Re-trieval
A further field of research is the retrievalin heterogeneous information resources us-ing different mechanism and gear hierar-chies like the structural system of Reuleaux[15] or other classification systems of well-known publications (e. g. [6]).
A visualization and an efficient navigationover these different categories of gears couldhelp users to get a systematic overview overthe huge amount of existing mechanism andgear constructions. However, the identifi-cation and modeling of these classificationsand relations between the different technicalterms are quite complicated, because differ-ent opinions of experts and authors have tobe considered.
To solve this problem semantic web tech-nologies can be used. With the help ofTopic Maps, as a special kind of seman-tic networks, the knowledge of mechanismand gear science can be generalized andexplicit modeled in a semantic meta-layer[12, 13]. With the extensive descriptivepower of Topic Maps, all relevant conceptsand relations between the concepts of thisapplication domain can be modeled. Ad-ditionally, valid contexts, alternative namesand other relevant semantic information canbe included. Furthermore each concept inthe semantic meta-layer is linked to all rel-evant information resources available in thelibrary (see Fig. 6).
192
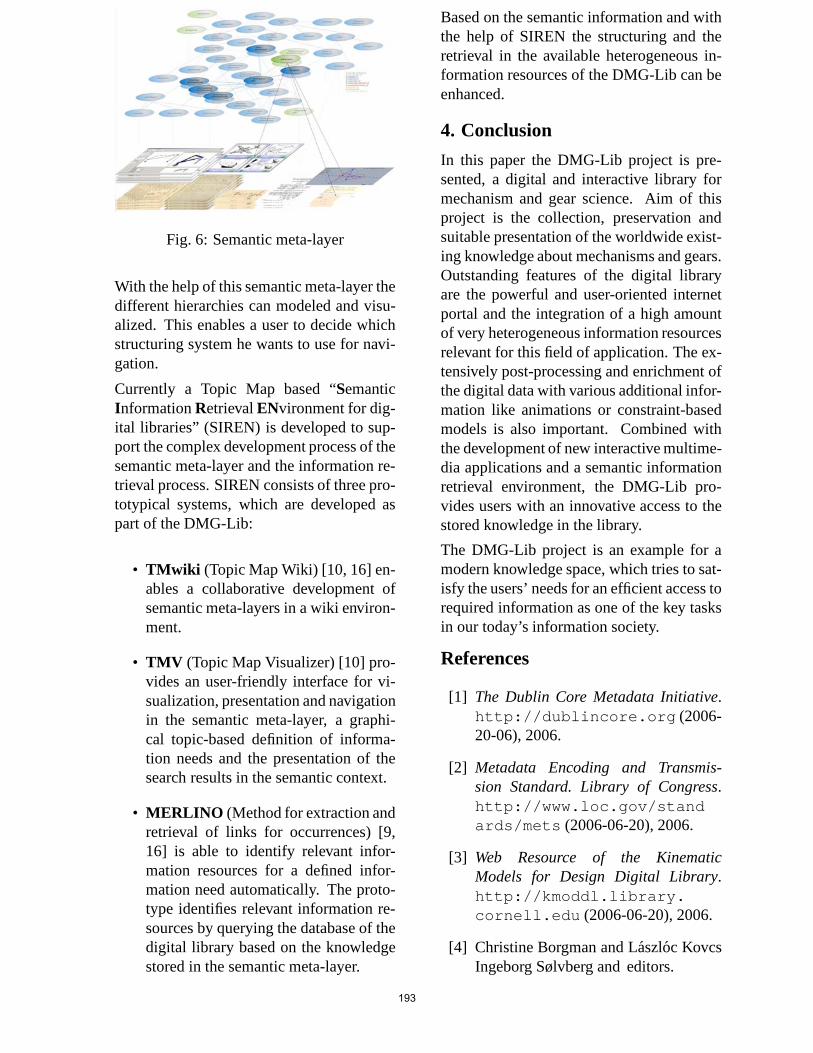
Fig. 6: Semantic meta-layer
With the help of this semantic meta-layer thedifferent hierarchies can modeled and visu-alized. This enables a user to decide whichstructuring system he wants to use for navi-gation.
Currently a Topic Map based “SemanticInformationRetrievalENvironment for dig-ital libraries” (SIREN) is developed to sup-port the complex development process of thesemantic meta-layer and the information re-trieval process. SIREN consists of three pro-totypical systems, which are developed aspart of the DMG-Lib:
• TMwiki (Topic Map Wiki) [10, 16] en-ables a collaborative development ofsemantic meta-layers in a wiki environ-ment.
• TMV (Topic Map Visualizer) [10] pro-vides an user-friendly interface for vi-sualization, presentation and navigationin the semantic meta-layer, a graphi-cal topic-based definition of informa-tion needs and the presentation of thesearch results in the semantic context.
• MERLINO (Method for extraction andretrieval of links for occurrences) [9,16] is able to identify relevant infor-mation resources for a defined infor-mation need automatically. The proto-type identifies relevant information re-sources by querying the database of thedigital library based on the knowledgestored in the semantic meta-layer.
Based on the semantic information and withthe help of SIREN the structuring and theretrieval in the available heterogeneous in-formation resources of the DMG-Lib can beenhanced.
4. Conclusion
In this paper the DMG-Lib project is pre-sented, a digital and interactive library formechanism and gear science. Aim of thisproject is the collection, preservation andsuitable presentation of the worldwide exist-ing knowledge about mechanisms and gears.Outstanding features of the digital libraryare the powerful and user-oriented internetportal and the integration of a high amountof very heterogeneous information resourcesrelevant for this field of application. The ex-tensively post-processing and enrichment ofthe digital data with various additional infor-mation like animations or constraint-basedmodels is also important. Combined withthe development of new interactive multime-dia applications and a semantic informationretrieval environment, the DMG-Lib pro-vides users with an innovative access to thestored knowledge in the library.
The DMG-Lib project is an example for amodern knowledge space, which tries to sat-isfy the users’ needs for an efficient access torequired information as one of the key tasksin our today’s information society.
References
[1] The Dublin Core Metadata Initiative.http://dublincore.org (2006-20-06), 2006.
[2] Metadata Encoding and Transmis-sion Standard. Library of Congress.http://www.loc.gov/standards/mets (2006-06-20), 2006.
[3] Web Resource of the KinematicModels for Design Digital Library.http://kmoddl.library.cornell.edu (2006-06-20), 2006.
[4] Christine Borgman and Laszloc KovcsIngeborg Sølvberg and editors.
193
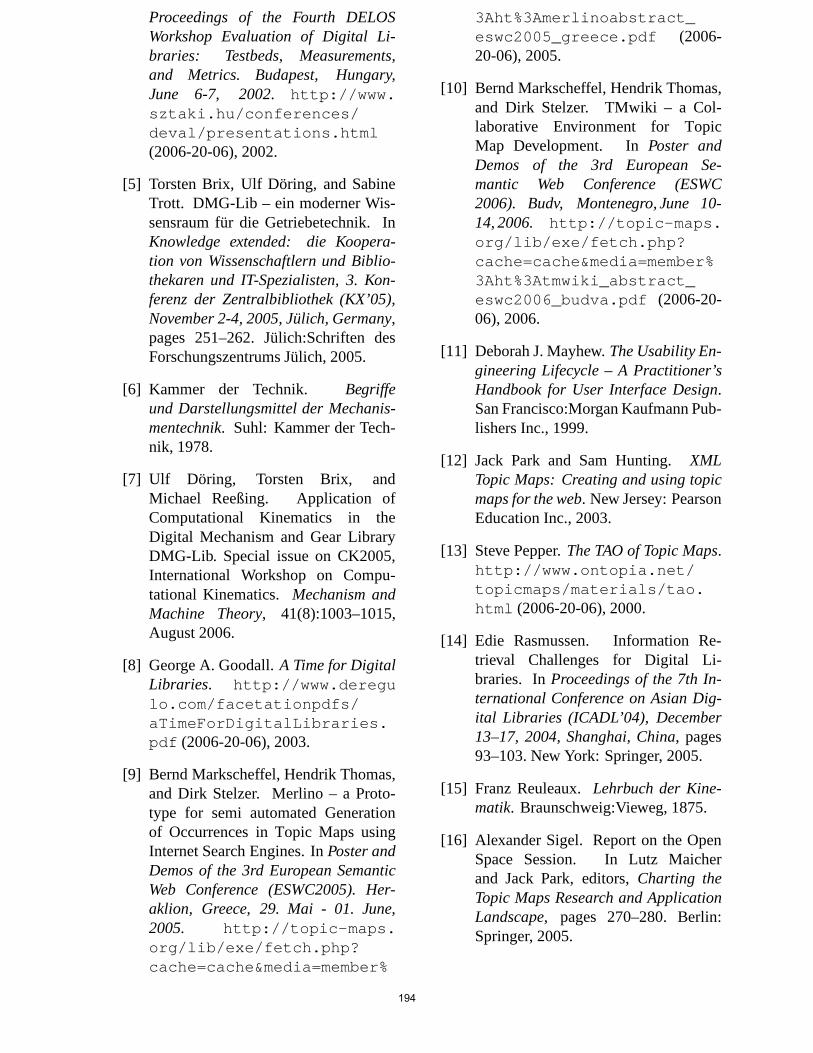
Proceedings of the Fourth DELOSWorkshop Evaluation of Digital Li-braries: Testbeds, Measurements,and Metrics. Budapest, Hungary,June 6-7, 2002. http://www.sztaki.hu/conferences/deval/presentations.html(2006-20-06), 2002.
[5] Torsten Brix, Ulf Doring, and SabineTrott. DMG-Lib – ein moderner Wis-sensraum fur die Getriebetechnik. InKnowledge extended: die Koopera-tion von Wissenschaftlern und Biblio-thekaren und IT-Spezialisten, 3. Kon-ferenz der Zentralbibliothek (KX’05),November 2-4, 2005, Julich, Germany,pages 251–262. Julich:Schriften desForschungszentrums Julich, 2005.
[6] Kammer der Technik. Begriffeund Darstellungsmittel der Mechanis-mentechnik. Suhl: Kammer der Tech-nik, 1978.
[7] Ulf Doring, Torsten Brix, andMichael Reeßing. Application ofComputational Kinematics in theDigital Mechanism and Gear LibraryDMG-Lib. Special issue on CK2005,International Workshop on Compu-tational Kinematics. Mechanism andMachine Theory, 41(8):1003–1015,August 2006.
[8] George A. Goodall.A Time for DigitalLibraries. http://www.deregulo.com/facetationpdfs/aTimeForDigitalLibraries.pdf (2006-20-06), 2003.
[9] Bernd Markscheffel, Hendrik Thomas,and Dirk Stelzer. Merlino – a Proto-type for semi automated Generationof Occurrences in Topic Maps usingInternet Search Engines. InPoster andDemos of the 3rd European SemanticWeb Conference (ESWC2005). Her-aklion, Greece, 29. Mai - 01. June,2005. http://topic-maps.org/lib/exe/fetch.php?cache=cache&media=member%
3Aht%3Amerlinoabstract_eswc2005_greece.pdf (2006-20-06), 2005.
[10] Bernd Markscheffel, Hendrik Thomas,and Dirk Stelzer. TMwiki – a Col-laborative Environment for TopicMap Development. InPoster andDemos of the 3rd European Se-mantic Web Conference (ESWC2006). Budv, Montenegro, June 10-14, 2006. http://topic-maps.org/lib/exe/fetch.php?cache=cache&media=member%3Aht%3Atmwiki_abstract_eswc2006_budva.pdf (2006-20-06), 2006.
[11] Deborah J. Mayhew.The Usability En-gineering Lifecycle – A Practitioner’sHandbook for User Interface Design.San Francisco:Morgan Kaufmann Pub-lishers Inc., 1999.
[12] Jack Park and Sam Hunting.XMLTopic Maps: Creating and using topicmaps for the web. New Jersey: PearsonEducation Inc., 2003.
[13] Steve Pepper.The TAO of Topic Maps.http://www.ontopia.net/topicmaps/materials/tao.html (2006-20-06), 2000.
[14] Edie Rasmussen. Information Re-trieval Challenges for Digital Li-braries. InProceedings of the 7th In-ternational Conference on Asian Dig-ital Libraries (ICADL’04), December13–17, 2004, Shanghai, China, pages93–103. New York: Springer, 2005.
[15] Franz Reuleaux.Lehrbuch der Kine-matik. Braunschweig:Vieweg, 1875.
[16] Alexander Sigel. Report on the OpenSpace Session. In Lutz Maicherand Jack Park, editors,Charting theTopic Maps Research and ApplicationLandscape, pages 270–280. Berlin:Springer, 2005.
194
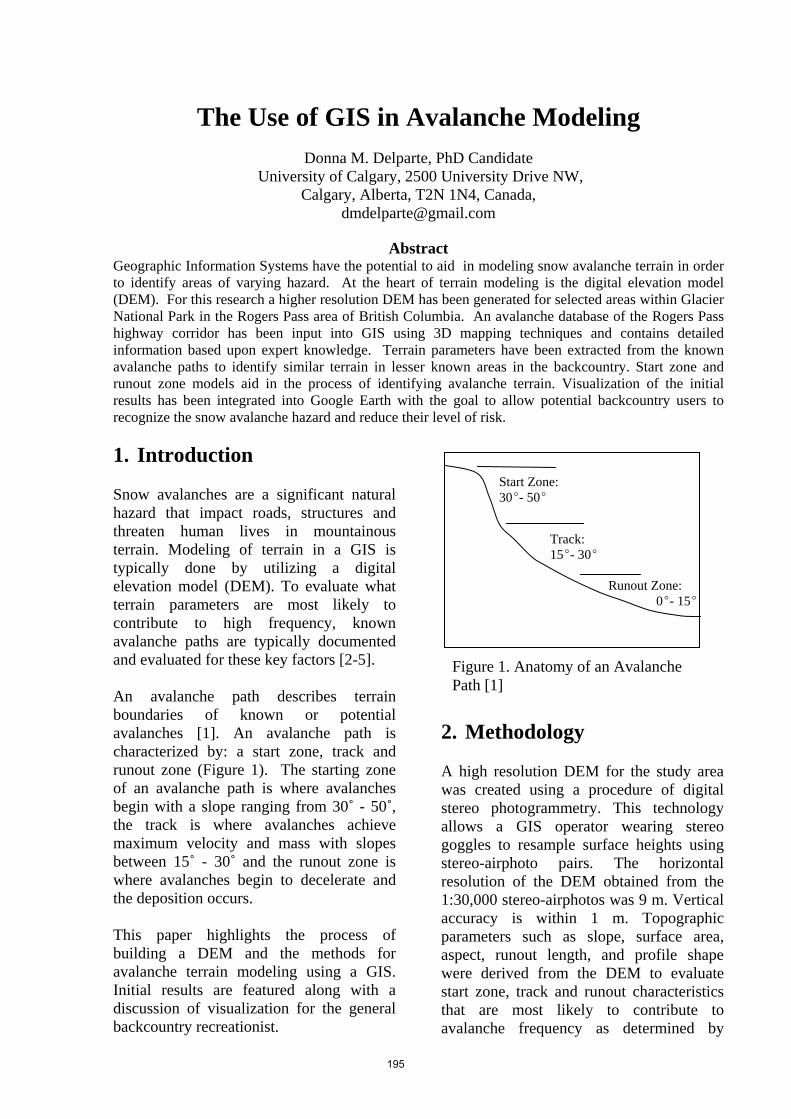
The Use of GIS in Avalanche Modeling
Donna M. Delparte, PhD Candidate University of Calgary, 2500 University Drive NW,
Calgary, Alberta, T2N 1N4, Canada, [email protected]
Abstract
Geographic Information Systems have the potential to aid in modeling snow avalanche terrain in order to identify areas of varying hazard. At the heart of terrain modeling is the digital elevation model (DEM). For this research a higher resolution DEM has been generated for selected areas within Glacier National Park in the Rogers Pass area of British Columbia. An avalanche database of the Rogers Pass highway corridor has been input into GIS using 3D mapping techniques and contains detailed information based upon expert knowledge. Terrain parameters have been extracted from the known avalanche paths to identify similar terrain in lesser known areas in the backcountry. Start zone and runout zone models aid in the process of identifying avalanche terrain. Visualization of the initial results has been integrated into Google Earth with the goal to allow potential backcountry users to recognize the snow avalanche hazard and reduce their level of risk. 1. Introduction Snow avalanches are a significant natural hazard that impact roads, structures and threaten human lives in mountainous terrain. Modeling of terrain in a GIS is typically done by utilizing a digital elevation model (DEM). To evaluate what terrain parameters are most likely to contribute to high frequency, known avalanche paths are typically documented and evaluated for these key factors [2-5]. An avalanche path describes terrain boundaries of known or potential avalanches [1]. An avalanche path is characterized by: a start zone, track and runout zone (Figure 1). The starting zone of an avalanche path is where avalanches begin with a slope ranging from 30˚ - 50˚, the track is where avalanches achieve maximum velocity and mass with slopes between 15˚ - 30˚ and the runout zone is where avalanches begin to decelerate and the deposition occurs. This paper highlights the process of building a DEM and the methods for avalanche terrain modeling using a GIS. Initial results are featured along with a discussion of visualization for the general backcountry recreationist.
Start Zone: 30E- 50E
Track: 15E- 30E
Runout Zone: 0E- 15E
Figure 1. Anatomy of an Avalanche Path [1]
2. Methodology A high resolution DEM for the study area was created using a procedure of digital stereo photogrammetry. This technology allows a GIS operator wearing stereo goggles to resample surface heights using stereo-airphoto pairs. The horizontal resolution of the DEM obtained from the 1:30,000 stereo-airphotos was 9 m. Vertical accuracy is within 1 m. Topographic parameters such as slope, surface area, aspect, runout length, and profile shape were derived from the DEM to evaluate start zone, track and runout characteristics that are most likely to contribute to avalanche frequency as determined by
195
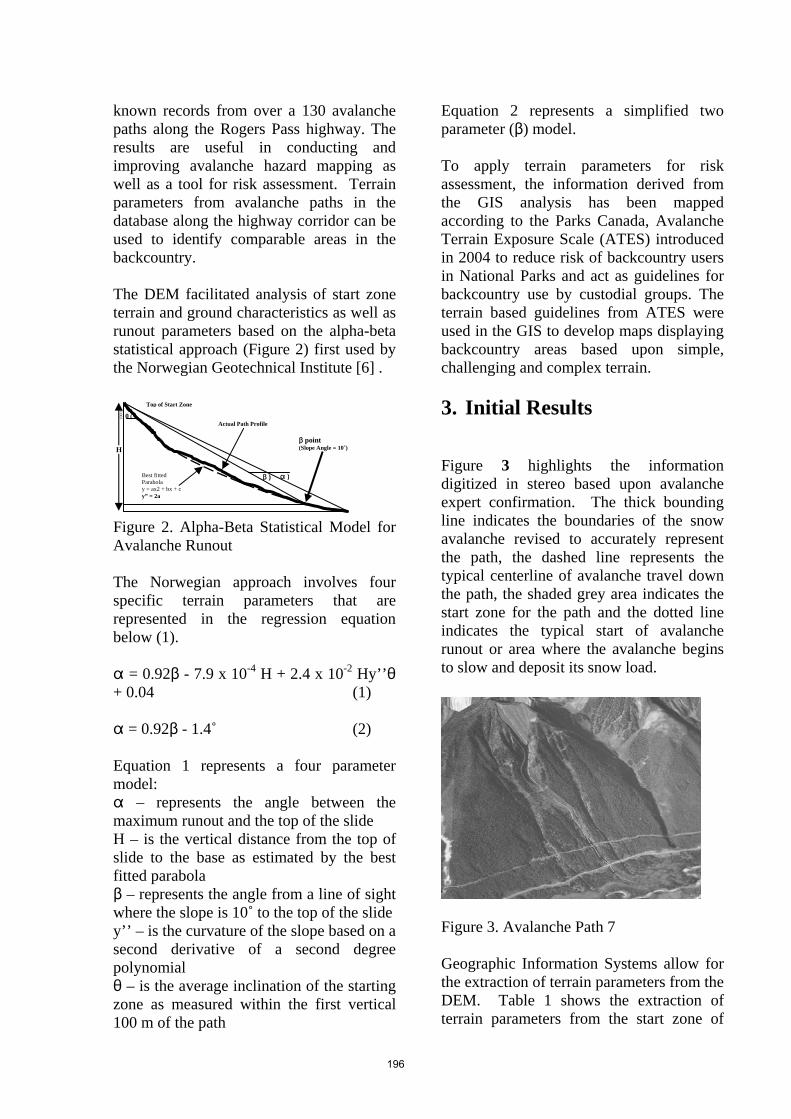
known records from over a 130 avalanche paths along the Rogers Pass highway. The results are useful in conducting and improving avalanche hazard mapping as well as a tool for risk assessment. Terrain parameters from avalanche paths in the database along the highway corridor can be used to identify comparable areas in the backcountry. The DEM facilitated analysis of start zone terrain and ground characteristics as well as runout parameters based on the alpha-beta statistical approach (Figure 2) first used by the Norwegian Geotechnical Institute [6] .
Figure 2. Alpha-Beta Statistical Model for Avalanche Runout The Norwegian approach involves four specific terrain parameters that are represented in the regression equation below (1). " = 0.92$ - 7.9 x 10⁻⁴ H + 2.4 x 10⁻² Hy’’2 + 0.04 (1) " = 0.92$ - 1.4˚ (2) Equation 1 represents a four parameter model: " – represents the angle between the maximum runout and the top of the slide H – is the vertical distance from the top of slide to the base as estimated by the best fitted parabola $ – represents the angle from a line of sight where the slope is 10˚ to the top of the slide y’’ – is the curvature of the slope based on a second derivative of a second degree polynomial 2 – is the average inclination of the starting zone as measured within the first vertical 100 m of the path
Equation 2 represents a simplified two parameter ($) model. To apply terrain parameters for risk assessment, the information derived from the GIS analysis has been mapped according to the Parks Canada, Avalanche Terrain Exposure Scale (ATES) introduced in 2004 to reduce risk of backcountry users in National Parks and act as guidelines for backcountry use by custodial groups. The terrain based guidelines from ATES were used in the GIS to develop maps displaying backcountry areas based upon simple, challenging and complex terrain. 3. Initial Results Figure 3 highlights the information digitized in stereo based upon avalanche expert confirmation. The thick bounding line indicates the boundaries of the snow avalanche revised to accurately represent the path, the dashed line represents the typical centerline of avalanche travel down the path, the shaded grey area indicates the start zone for the path and the dotted line indicates the typical start of avalanche runout or area where the avalanche begins to slow and deposit its snow load.
Figure 3. Avalanche Path 7 Geographic Information Systems allow for the extraction of terrain parameters from the DEM. Table 1 shows the extraction of terrain parameters from the start zone of
" ) $ )
Top of Start Zone
$ point (Slope Angle = 10˚)
2 (
Best fitted Parabola y = ax2 + bx + c y” = 2a
Actual Path Profile
100
m
H
196
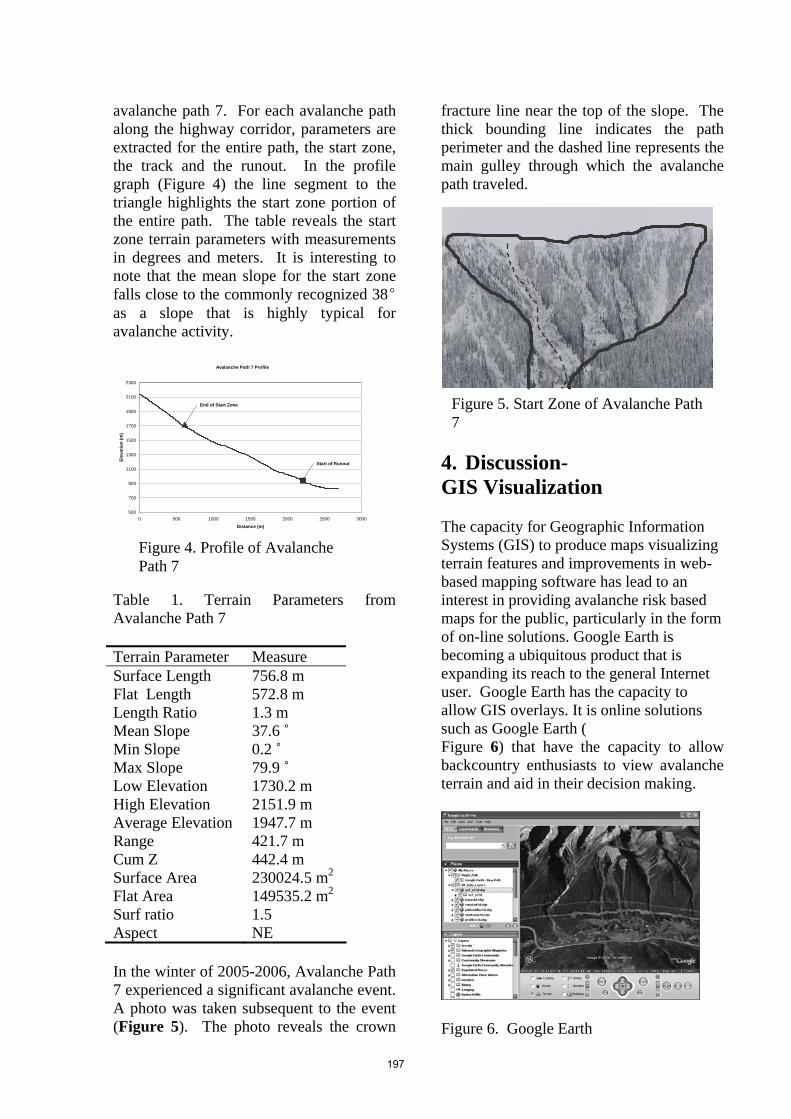
avalanche path 7. For each avalanche path along the highway corridor, parameters are extracted for the entire path, the start zone, the track and the runout. In the profile graph (Figure 4) the line segment to the triangle highlights the start zone portion of the entire path. The table reveals the start zone terrain parameters with measurements in degrees and meters. It is interesting to note that the mean slope for the start zone falls close to the commonly recognized 38E as a slope that is highly typical for avalanche activity.
Avalanche Path 7 Profile
500
700
900
1100
1300
1500
1700
1900
2100
2300
0 500 1000 1500 2000 2500 3000
Distance (m)
Elev
atio
n (m
)
Start of Runout
End of Start Zone
Table 1. Terrain Parameters from Avalanche Path 7 Terrain Parameter Measure Surface Length 756.8 m Flat Length 572.8 m Length Ratio 1.3 m Mean Slope 37.6 ˚ Min Slope 0.2 ˚ Max Slope 79.9 ˚ Low Elevation 1730.2 m High Elevation 2151.9 m Average Elevation 1947.7 m Range 421.7 m Cum Z 442.4 m Surface Area 230024.5 m2 Flat Area 149535.2 m2 Surf ratio 1.5 Aspect NE In the winter of 2005-2006, Avalanche Path 7 experienced a significant avalanche event. A photo was taken subsequent to the event (Figure 5). The photo reveals the crown
fracture line near the top of the slope. The thick bounding line indicates the path perimeter and the dashed line represents the main gulley through which the avalanche path traveled.
Figure 5. Start Zone of Avalanche Path 7
4. Discussion- GIS Visualization The capacity for Geographic Information Systems (GIS) to produce maps visualizing terrain features and improvements in web-based mapping software has lead to an interest in providing avalanche risk based maps for the public, particularly in the form of on-line solutions. Google Earth is becoming a ubiquitous product that is expanding its reach to the general Internet user. Google Earth has the capacity to allow GIS overlays. It is online solutions such as Google Earth (
Figure 4. Profile of Avalanche Path 7
Figure 6) that have the capacity to allow backcountry enthusiasts to view avalanche terrain and aid in their decision making.
Figure 6. Google Earth
197
5. References 1. Mears, A.I., Snow Avalanche
Hazard Analysis for Land-Use Planning and Engineering. Vol. Bulletin 49. 1992, Denver, Colorado: Colorado Geological Survey, Geological Survey, Dept. of Natural Resources. 54.
2. Maggioni, M., U. Gruber, and A. Stoffel. Definition and characterisation of potential avalanche release areas. in Proceedings of the 2001 ESRI International User Conference. 2001. San Diego.
3. Maggioni, M. and U. Gruber, The influence of topographic parameters on avalanche release dimension and frequency. Cold Regions Science and Technology, 2003. 37: p. 407-419.
4. Gruber, U. Using GIS for avalanche hazard mapping in Switzerland. in Proceedings of the 2001 ESRI International User Conference. 2001. San Diego.
5. Gruber, U. and S. Sardemann. High frequency avalanches: Release area characteristics and runout distances. in International Snow Science Workshop (ISSW). 2002. Penticton, BC, Canada.
6. Lied, K. and S. Bakkehoi, Empirical calculation of snow-avalanche run-out distance based on topographic parameters. Journal of Glaciology, 1980. 26(94): p. 165-177.
198

A Case Study for KnowledgeExternalization using an Interactive Video
Environment on E-learningJochen Felix BoehmSaarland UniversityInformation sciences
Saarbruecken, [email protected]
Jun FujimaHokkaido University
Meme Media LaboratorySapporo, Japan
AbstractE-learning technology today should provide different means for the user to interact with the presentedknowledge. In this case study an electronic instruction manual based on an instructional movieis presented and enhanced with interactive components. The integration of novel technologies –IntelligentPad and DVDconnector – is presented in this paper and the new possibilities for E-learning bythese technologies is shown. The instruction manual application takes advantage of dynamic high qualityvideos and the possibility to interact with the learning environment. Also a new dimension of interactionwill be shown. In standard E-learning scenarios the user normally acts with the information system andthe environment seperately. Using a special kind of pad, the system is now able to receive informationvia a sensor from the environment and can store this information as knowledge based items in formof IntelligentPads within the E-learning application. This paper shows a case study for externalizationof knowledge in an interactive video environment based on an E-learning application designed as anelectronic instruction manual for putting strings on a violin and tuning-up the violin. The user obtains allnecessary information to correctly perform each step and can verify the correctness via a sensor interfaceshowing the frequency of the violin.
1. Introduction
Nowadays E-learning is still used in waysof mediating knowledge from the teacher tothe student, often only in textual form andsometimes supported with audio-visual me-dia. The main forms of interaction givento the user are means of testing sequencesto verify if the content has been success-fully mediated and means of choosing hisown learning path. However, in standard E-learning scenarios the user has to carry outthese tasks separately, since the informationsystem and the external environment are in-dependent.
In order to provide a flexible and interactiveE-Learning environment, various kinds ofknowledge should be externalized as knowl-edge objects which can be accessed or ma-
Environment
Information System
Sensor
Generator
User created PadsSystem generated Pad
Environmental generated Pad
Figure 1: Model for representing knowledgeobjects in information systems
199
nipulated by the user. If the learning systemis more advanced, new knowledge objectscan also be created dynamically throughsome types of processes. Figure 1 shows themodel for representing knowledge as knowl-edge objects in information systems. Eachknowledge object can be created throughthree different processes. One can be gen-erated automatically by the system. Anothercan be created by the user himself throughoperations with the system. The third pos-sibility is the generation of knowledge ob-jects by processing input data from the exter-nal environment through some kind of sen-sor devices.
This paper shows a case study for represen-tation of knowledge in an E-learning appli-cation. The user can obtain necessary in-formation through knowledge objects in dif-ferent processes, such as interactive video,online/offline contents described by HTMLor interactive object connected to sensor de-vices.
In this project, we use DVDconnector tech-nology for providing an interactive videoenvironment with dynamical contents andMeme Media [6] technology for represent-ing interactive knowledge objects in in-formation systems. DVDconnector pro-vides DVD-based high quality videos whichhave the ability to access online/offline con-tents. On the other hand, Meme Media isa media technology for externalizing var-ious kinds of intellectual information re-sources and distributing them among com-puter users. The integration of DVDconnec-tor and Meme Media technology providesflexible and interactive environments for E-learning.
Following the basic approach of learning byimitation [2], the authors developed an E-Learning module about putting on strings ona violin and tuning-up the instrument. Inaddition to providing a step-by-step instruc-tion via audio-visual and textual informa-tion, the user is also able to interact withthe video employing so called Hotspots inthe video. These Hotspots enable the userto draw the sound of a tuned-up string out
of the video and place it in the TunerPadwindow. This pad resembles a knowledgeobject. The exact frequency of the soundof the corresponding string is contained init. This object is provided by the system.The user also will be able to play his violinand record the played sounds with the use ofa microphone to verify that the tuning pro-cess has been correct. The frequency of theplayed sound will be displayed on the Tuner-Pad, using the microphone as a sensor inputdevice to pass that information from the en-vironment into the system.
First, the basic concept of this project shallbe described, while drawing a parallel be-tween complex instructions and E-learningapplications. Subsequently, we will focuson the design and the technical execution ofthe project, as well as a description of theused technology. In a conclusion, we dis-cuss other possibilities of using the modulesof content and future work.
2. Project scenarioBasic idea of the project is to create a mul-timedia manual for fastening the strings ofa violin and tuning the instrument. Whilethe instruction should appeal to the user, itshould also offer the possibility of verifyingthe learning success, and designed in such away as to allow its use for other applications,thereby ensuring its sustainability.
Conventional manuals describe in longer orshorter text sequences the steps necessaryto achieve a certain result. Illustrations fa-cilitate understanding of complex manualsand, in addition, offer the possibility of anoverview of the respective step. Thus sec-tioned, the user is always able to again re-turn to the manual from any point and, withthe help of the illustrations, he is able to atleast visually verify whether the steps takenhave been performed correctly. In complexmanuals, the purely textual form is mostlysupplemented by graphs. This can help theuser in mentally simulating real processes[4]. Mental simulation, however, has its lim-its. Complex processes require the iterativecompletion of approximation cycles [5].
200
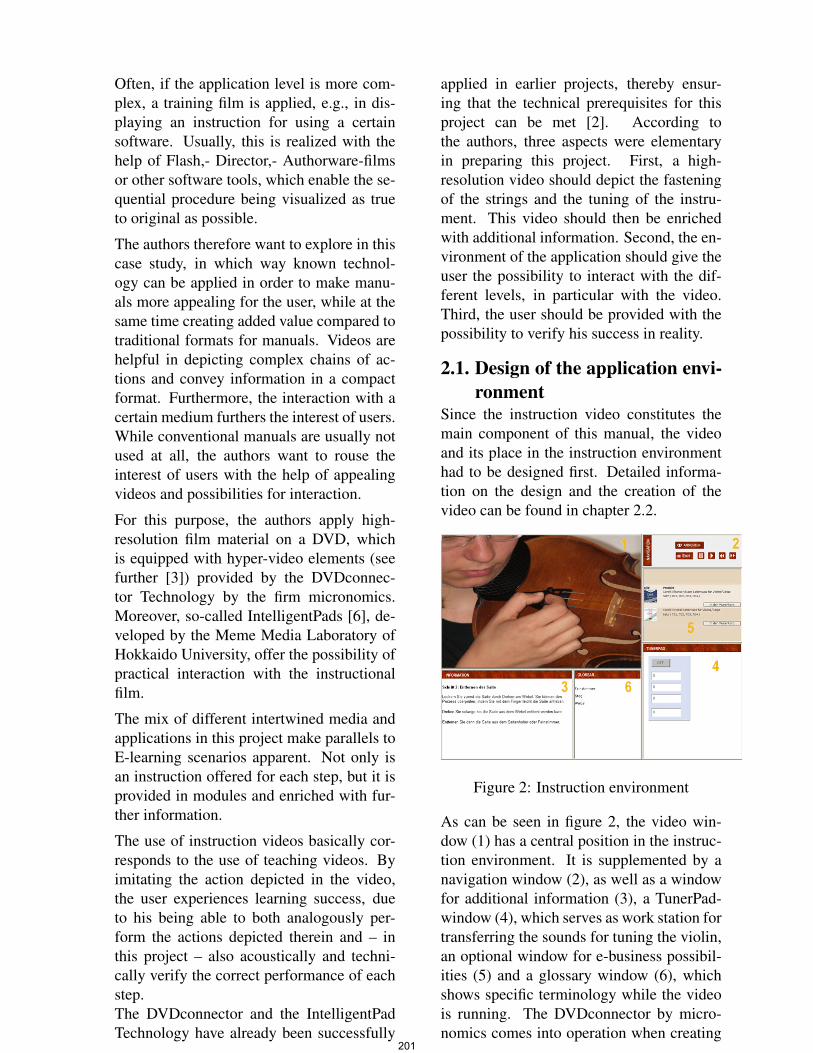
Often, if the application level is more com-plex, a training film is applied, e.g., in dis-playing an instruction for using a certainsoftware. Usually, this is realized with thehelp of Flash,- Director,- Authorware-filmsor other software tools, which enable the se-quential procedure being visualized as trueto original as possible.
The authors therefore want to explore in thiscase study, in which way known technol-ogy can be applied in order to make manu-als more appealing for the user, while at thesame time creating added value compared totraditional formats for manuals. Videos arehelpful in depicting complex chains of ac-tions and convey information in a compactformat. Furthermore, the interaction with acertain medium furthers the interest of users.While conventional manuals are usually notused at all, the authors want to rouse theinterest of users with the help of appealingvideos and possibilities for interaction.
For this purpose, the authors apply high-resolution film material on a DVD, whichis equipped with hyper-video elements (seefurther [3]) provided by the DVDconnec-tor Technology by the firm micronomics.Moreover, so-called IntelligentPads [6], de-veloped by the Meme Media Laboratory ofHokkaido University, offer the possibility ofpractical interaction with the instructionalfilm.
The mix of different intertwined media andapplications in this project make parallels toE-learning scenarios apparent. Not only isan instruction offered for each step, but it isprovided in modules and enriched with fur-ther information.
The use of instruction videos basically cor-responds to the use of teaching videos. Byimitating the action depicted in the video,the user experiences learning success, dueto his being able to both analogously per-form the actions depicted therein and – inthis project – also acoustically and techni-cally verify the correct performance of eachstep.The DVDconnector and the IntelligentPadTechnology have already been successfully
applied in earlier projects, thereby ensur-ing that the technical prerequisites for thisproject can be met [2]. According tothe authors, three aspects were elementaryin preparing this project. First, a high-resolution video should depict the fasteningof the strings and the tuning of the instru-ment. This video should then be enrichedwith additional information. Second, the en-vironment of the application should give theuser the possibility to interact with the dif-ferent levels, in particular with the video.Third, the user should be provided with thepossibility to verify his success in reality.
2.1. Design of the application envi-ronment
Since the instruction video constitutes themain component of this manual, the videoand its place in the instruction environmenthad to be designed first. Detailed informa-tion on the design and the creation of thevideo can be found in chapter 2.2.
Figure 2: Instruction environment
As can be seen in figure 2, the video win-dow (1) has a central position in the instruc-tion environment. It is supplemented by anavigation window (2), as well as a windowfor additional information (3), a TunerPad-window (4), which serves as work station fortransferring the sounds for tuning the violin,an optional window for e-business possibil-ities (5) and a glossary window (6), whichshows specific terminology while the videois running. The DVDconnector by micro-nomics comes into operation when creating
201
this instruction environment. It offers toseamlessly link different media and applica-tions and represents a basis for the essentialhyper-video component (see also [1]).
2.2. Creating the instruction videoGenerally, a manual follows sequentialsteps, which create a final product. Conse-quently, the video is designed likewise, i.e.,the single steps from fastening the strings totuning the instrument are sequentially docu-mented.
The video is subdivided into 2 units. Thefirst part comprises the fastening of thestrings, while the second part consists of thetuning of the instrument. Both units con-stitute modules which can be used indepen-dently from each other in other projects.
In addition to the audio commentary, whichcomments the different steps, the sound is asignificant component for tuning the instru-ment. The authors therefore deem the highquality of the audiovisual media to be essen-tial. We hence picked a DVD as medium, inorder to be able to provide for sound and vi-sion in best quality. To generate the medium,we used a Mini DV camera and convertedthe film data files into DVD format with thehelp of a WinAVI video converter.
3. Applied technologiesIn order to allow for the interaction of theuser with the manual, the Meme MediaTechnology and the DVDconnector Tech-nology was applied. The DVDconnectorconstitutes the framework and the basis forthe hypervideo function, while the Intelli-gentPad Technology allows for linking dif-ferent applications with the DVDconnector.
3.1. Meme Media TechnologyThe Meme Media Technology [6] allowsfor editing, distributing and linking differentprogram resources with one another.
The IntelligentPad Technology [6], [7] ispart of the Meme Media application. In-telligentPad presents every functional com-ponent as a two-dimensional object, which
is termed Pad. The user can combine twoPads to form one new Pad and thus equipit with complex functions. Each Pad hasan interface, which displays its status dataand is termed Slot. If one Pad is insertedinto another Pad, the user can define a ”Par-ent - Child Relation” between both Padsand link their Slots, thereby establishing afunctional connection between the Pads. Inthis way, Pads can be connected to one an-other to form different multimedia docu-ments and applications. Unless otherwisedefined, combined Pads can always be sep-arated and changed again. Recently, theMeme Media Technology was enhanced forthe reuse of web-based resources, such asweb documents and web applications. Webresources can thus be modified and theirfunctions can be combined by ”Copy andPaste”.
3.2. Tuning functionFor tuning the violin, two Pads were im-plemented, the SoundPad and the TunerPad.The SoundPad represents a sound bearing acertain frequency, which is determined as avalue in the Frequency Slot. If the user nowclicks on a SoundPad, a defined sound isplayed-back (e.g. the sound of the A-string).The TunerPad recognizes the pitch recordedby the microphone and visualizes informa-tion on the sound, such as volume, basic fre-quency and the deviation between the origi-nal frequency and the desired frequency. ATunerPad transfers these values to the Input,Frequency and Difference Slots. If the usercombines a SoundPad with a TunerPad, theSoundPad transfers its frequency to the Tar-getFrequency Slot of the TunerPad and thusdefines the desired frequency for the tuningprocedure. If the user clicks on a string ofthe violin in the video, a SoundPad appears,which contains as information the sound fre-quency of the tuned violin. The User cannow drag this Pad to his work station in theTunerPad window. Upon clicking on it, thisSoundPad produces the sound of the tunedstring and the user can tune the respectiveviolin string with the help of this sound. Inorder to tune the string precisely, he can
202
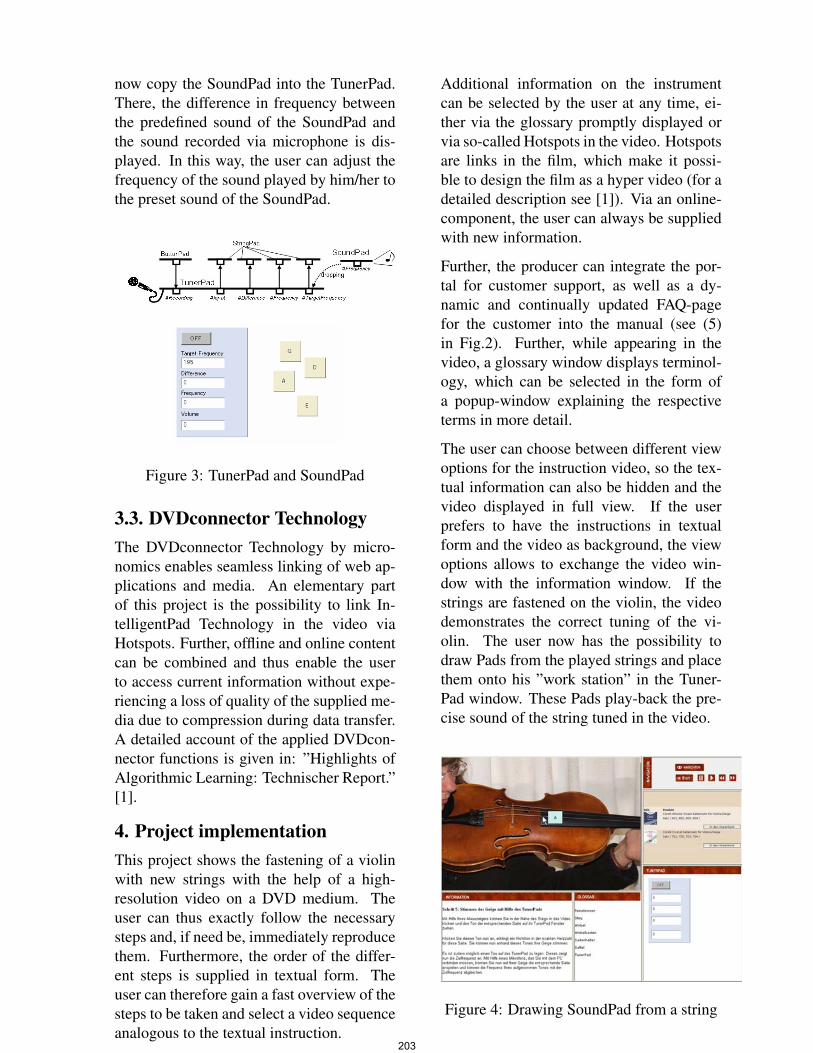
now copy the SoundPad into the TunerPad.There, the difference in frequency betweenthe predefined sound of the SoundPad andthe sound recorded via microphone is dis-played. In this way, the user can adjust thefrequency of the sound played by him/her tothe preset sound of the SoundPad.
Figure 3: TunerPad and SoundPad
3.3. DVDconnector TechnologyThe DVDconnector Technology by micro-nomics enables seamless linking of web ap-plications and media. An elementary partof this project is the possibility to link In-telligentPad Technology in the video viaHotspots. Further, offline and online contentcan be combined and thus enable the userto access current information without expe-riencing a loss of quality of the supplied me-dia due to compression during data transfer.A detailed account of the applied DVDcon-nector functions is given in: ”Highlights ofAlgorithmic Learning: Technischer Report.”[1].
4. Project implementationThis project shows the fastening of a violinwith new strings with the help of a high-resolution video on a DVD medium. Theuser can thus exactly follow the necessarysteps and, if need be, immediately reproducethem. Furthermore, the order of the differ-ent steps is supplied in textual form. Theuser can therefore gain a fast overview of thesteps to be taken and select a video sequenceanalogous to the textual instruction.
Additional information on the instrumentcan be selected by the user at any time, ei-ther via the glossary promptly displayed orvia so-called Hotspots in the video. Hotspotsare links in the film, which make it possi-ble to design the film as a hyper video (for adetailed description see [1]). Via an online-component, the user can always be suppliedwith new information.
Further, the producer can integrate the por-tal for customer support, as well as a dy-namic and continually updated FAQ-pagefor the customer into the manual (see (5)in Fig.2). Further, while appearing in thevideo, a glossary window displays terminol-ogy, which can be selected in the form ofa popup-window explaining the respectiveterms in more detail.
The user can choose between different viewoptions for the instruction video, so the tex-tual information can also be hidden and thevideo displayed in full view. If the userprefers to have the instructions in textualform and the video as background, the viewoptions allows to exchange the video win-dow with the information window. If thestrings are fastened on the violin, the videodemonstrates the correct tuning of the vi-olin. The user now has the possibility todraw Pads from the played strings and placethem onto his ”work station” in the Tuner-Pad window. These Pads play-back the pre-cise sound of the string tuned in the video.
Figure 4: Drawing SoundPad from a string
203
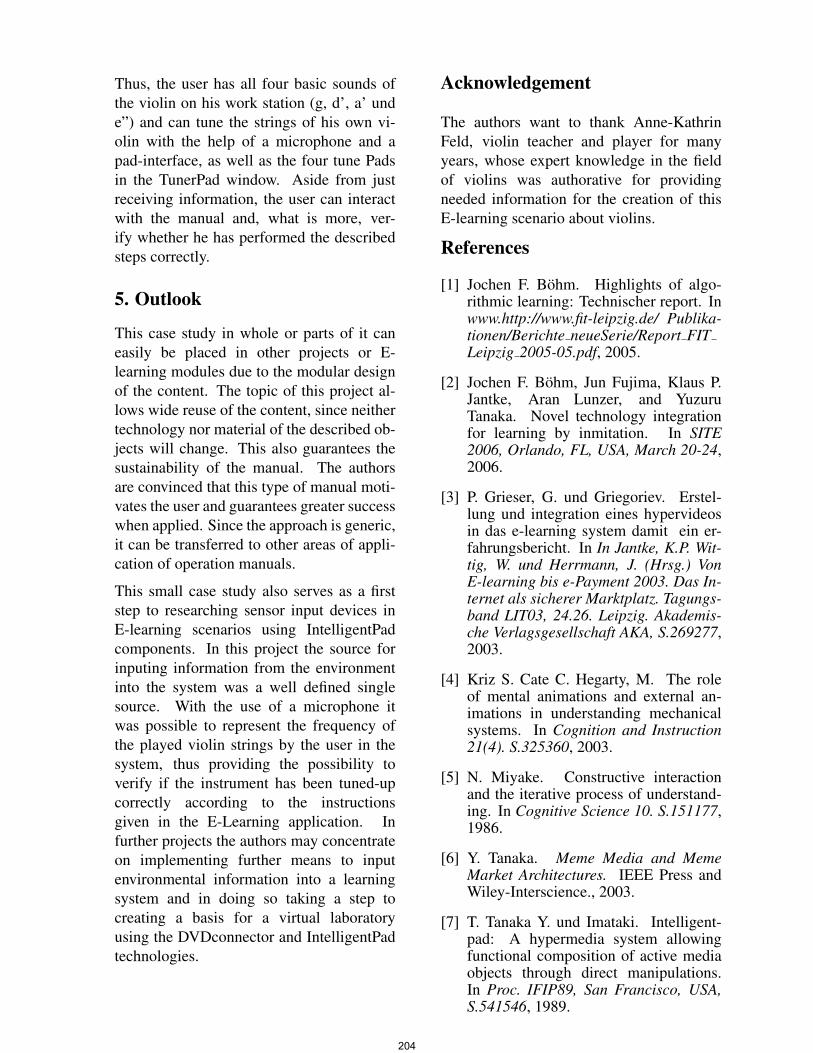
Thus, the user has all four basic sounds ofthe violin on his work station (g, d’, a’ unde”) and can tune the strings of his own vi-olin with the help of a microphone and apad-interface, as well as the four tune Padsin the TunerPad window. Aside from justreceiving information, the user can interactwith the manual and, what is more, ver-ify whether he has performed the describedsteps correctly.
5. Outlook
This case study in whole or parts of it caneasily be placed in other projects or E-learning modules due to the modular designof the content. The topic of this project al-lows wide reuse of the content, since neithertechnology nor material of the described ob-jects will change. This also guarantees thesustainability of the manual. The authorsare convinced that this type of manual moti-vates the user and guarantees greater successwhen applied. Since the approach is generic,it can be transferred to other areas of appli-cation of operation manuals.
This small case study also serves as a firststep to researching sensor input devices inE-learning scenarios using IntelligentPadcomponents. In this project the source forinputing information from the environmentinto the system was a well defined singlesource. With the use of a microphone itwas possible to represent the frequency ofthe played violin strings by the user in thesystem, thus providing the possibility toverify if the instrument has been tuned-upcorrectly according to the instructionsgiven in the E-Learning application. Infurther projects the authors may concentrateon implementing further means to inputenvironmental information into a learningsystem and in doing so taking a step tocreating a basis for a virtual laboratoryusing the DVDconnector and IntelligentPadtechnologies.
Acknowledgement
The authors want to thank Anne-KathrinFeld, violin teacher and player for manyyears, whose expert knowledge in the fieldof violins was authorative for providingneeded information for the creation of thisE-learning scenario about violins.
References
[1] Jochen F. Bohm. Highlights of algo-rithmic learning: Technischer report. Inwww.http://www.fit-leipzig.de/ Publika-tionen/Berichte neueSerie/Report FITLeipzig 2005-05.pdf, 2005.
[2] Jochen F. Bohm, Jun Fujima, Klaus P.Jantke, Aran Lunzer, and YuzuruTanaka. Novel technology integrationfor learning by inmitation. In SITE2006, Orlando, FL, USA, March 20-24,2006.
[3] P. Grieser, G. und Griegoriev. Erstel-lung und integration eines hypervideosin das e-learning system damit ein er-fahrungsbericht. In In Jantke, K.P. Wit-tig, W. und Herrmann, J. (Hrsg.) VonE-learning bis e-Payment 2003. Das In-ternet als sicherer Marktplatz. Tagungs-band LIT03, 24.26. Leipzig. Akademis-che Verlagsgesellschaft AKA, S.269277,2003.
[4] Kriz S. Cate C. Hegarty, M. The roleof mental animations and external an-imations in understanding mechanicalsystems. In Cognition and Instruction21(4). S.325360, 2003.
[5] N. Miyake. Constructive interactionand the iterative process of understand-ing. In Cognitive Science 10. S.151177,1986.
[6] Y. Tanaka. Meme Media and MemeMarket Architectures. IEEE Press andWiley-Interscience., 2003.
[7] T. Tanaka Y. und Imataki. Intelligent-pad: A hypermedia system allowingfunctional composition of active mediaobjects through direct manipulations.In Proc. IFIP89, San Francisco, USA,S.541546, 1989.
204

01 Rüdiger Grimm, „Vertrauen im Internet – Wie sicher soll E-Commerce sein?“, April 2001, 22 S.
TU Ilmenau, Institut für Medien- und Kommunikationswissenschaft, [email protected] 02 Martin Löffelholz, „Von Weber zum Web – Journalismusforschung im 21. Jahrhundert: theoretische Konzepte und
empirische Befunde im systematischen Überblick“, Juli 2001, 25 S. TU Ilmenau, Institut für Medien- und Kommunikationswissenschaft, [email protected]
03 Alfred Kirpal, „Beiträge zur Mediengeschichte – Basteln, Konstruieren und Erfinden in der Radioentwicklung“, Oktober
2001, 28 S. TU Ilmenau, Institut für Medien- und Kommunikationswissenschaft, [email protected]
04 Gerhard Vowe, „Medienpolitik: Regulierung der medialen öffentlichen Kommunikation“, November 2001, 68 S.
TU Ilmenau, Institut für Medien- und Kommunikationswissenschaft, [email protected] 05 Christiane Hänseroth, Angelika Zobel, Rüdiger Grimm, „Sicheres Homebanking in Deutschland – Ein Vergleich mit 1998
aus organisatorisch-technischer Sicht“, November 2001, 54 S. TU Ilmenau, Institut für Medien- und Kommunikationswissenschaft, [email protected]
06 Paul Klimsa, Anja Richter, „Psychologische und didaktische Grundlagen des Einsatzes von Bildungsmedien“, Dezember
2001, 53 S. TU Ilmenau, Institut für Medien- und Kommunikationswissenschaft, [email protected] 07 Martin Löffelholz, „Von ‚neuen Medien’ zu ‚dynamischen Systemen’, Eine Bestandsaufnahme zentraler Metaphern zur
Beschreibung der Emergenz öffentlicher Kommunikation“, Juli 2002, 29 S. TU Ilmenau, Institut für Medien- und Kommunikationswissenschaft, [email protected]
08 Gerhard Vowe, „Politische Kommunikation. Ein historischer und systematischer Überblick der Forschung“, September 2002,
43 S. TU Ilmenau, Institut für Medien- und Kommunikationswissenschaft, [email protected]
09 Rüdiger Grimm (Ed.), „E-Learning: Beherrschbarkeit und Sicherheit“, November 2003, 90 S.
TU Ilmenau, Institut für Medien- und Kommunikationswissenschaft, [email protected] 10 Gerhard Vowe, „Der Informationsbegriff in der Politikwissenschaft“, Januar 2004, 25 S.
TU Ilmenau, Institut für Medien- und Kommunikationswissenschaft, [email protected] 11 Martin Löffelholz, David H. Weaver, Thorsten Quandt, Thomas Hanitzsch, Klaus-Dieter Altmeppen, „American and
German online journalists at the beginning of the 21st century: A bi-national survey“, Januar 2004, 15 S. TU Ilmenau, Institut für Medien- und Kommunikationswissenschaft, [email protected]
12 Rüdiger Grimm, Barbara Schulz-Brünken, Konrad Herrmann, „Integration elektronischer Zahlung und Zugangskontrolle in
ein elektronisches Lernsystem“, Mai 2004, 23 S. TU Ilmenau, Institut für Medien- und Kommunikationswissenschaft, [email protected]
TU Ilmenau - Institut für Medien- und Kommunikationswissenschaft Am Eichicht 1, 98693 Ilmenau

13 Alfred Kirpal, Andreas Ilsmann, „Die DDR als Wissenschaftsland? Themen und Inhalte von Wissenschaftsmagazinen im DDR-Fernsehen“, August 2004, 21 S. TU Ilmenau, Institut für Medien- und Kommunikationswissenschaft, [email protected]
14 Paul Klimsa, Torsten Konnopasch, „Der Einfluss von XML auf die Redaktionsarbeit von Tageszeitungen“, September 2004,
30 S. TU Ilmenau, Institut für Medien- und Kommunikationswissenschaft, [email protected] 15 Rüdiger Grimm, „Shannon verstehen. Eine Erläuterung von C. Shannons mathematischer Theorie der Kommunikation“,
Dezember 2004, 51 S. TU Ilmenau, Institut für Medien- und Kommunikationswissenschaft, [email protected]
16 Gerhard Vowe, „Mehr als öffentlicher Druck und politischer Einfluss: Das Spannungsfeld von Verbänden und Medien“,
Februar 2005, 51 S. TU Ilmenau, Institut für Medien- und Kommunikationswissenschaft, [email protected]
17 Alfred Kirpal, Marcel Norbey, „Technikkommunikation bei Hochtechnologien: Situationsbeschreibung und inhaltsanalytische Untersuchung zu den Anfängen der Transistorelektronik unter besonderer Berücksichtigung der deutschen Fachzeitschriften“, September 2005, 121 S. TU Ilmenau, Institut für Medien- und Kommunikationswissenschaft, [email protected]
18 Sven Jöckel, „Digitale Spiele und Event-Movie im Phänomen Star Wars. Deskriptive Ergebnisse zur cross-medialen Verwertung von Filmen und digitalen Spielen der Star Wars Reihe“, November 2005, 31 S. TU Ilmenau, Institut für Medien- und Kommunikationswissenschaft, [email protected]
19 Sven Jöckel, Andreas Will, „Die Bedeutung von Marketing und Zuschauerbewertungen für den Erfolg von Kinospielfilmen.
Eine empirische Untersuchung der Auswertung erfolgreicher Kinospielfilme“, Januar 2006, 29 S. TU Ilmenau, Institut für Medien- und Kommunikationswissenschaft, [email protected]
20 Paul Klimsa, Carla Colona G., Lukas Ispandriarno, Teresa Sasinska-Klas, Nicola Döring, Katharina Hellwig, „Generation
„SMS“. An empirical, 4-country study carried out in Germany, Poland, Peru, and Indonesia“, Februar 2006, 21 S. TU Ilmenau, Institut für Medien- und Kommunikationswissenschaft, [email protected]
21 Klaus P. Jantke & Gunther Kreuzberger (eds.), „Knowledge Media Technologies. First International Core-to-Core
Workshop“, July 2006, 204 S. TU Ilmenau, Institut für Medien- und Kommunikationswissenschaft, [email protected]
TU Ilmenau - Institut für Medien- und Kommunikationswissenschaft Am Eichicht 1, 98693 Ilmenau