key element for our future key element for our
TRANSCRIPT
A n n u a l R e p o r t 2 0 1 6
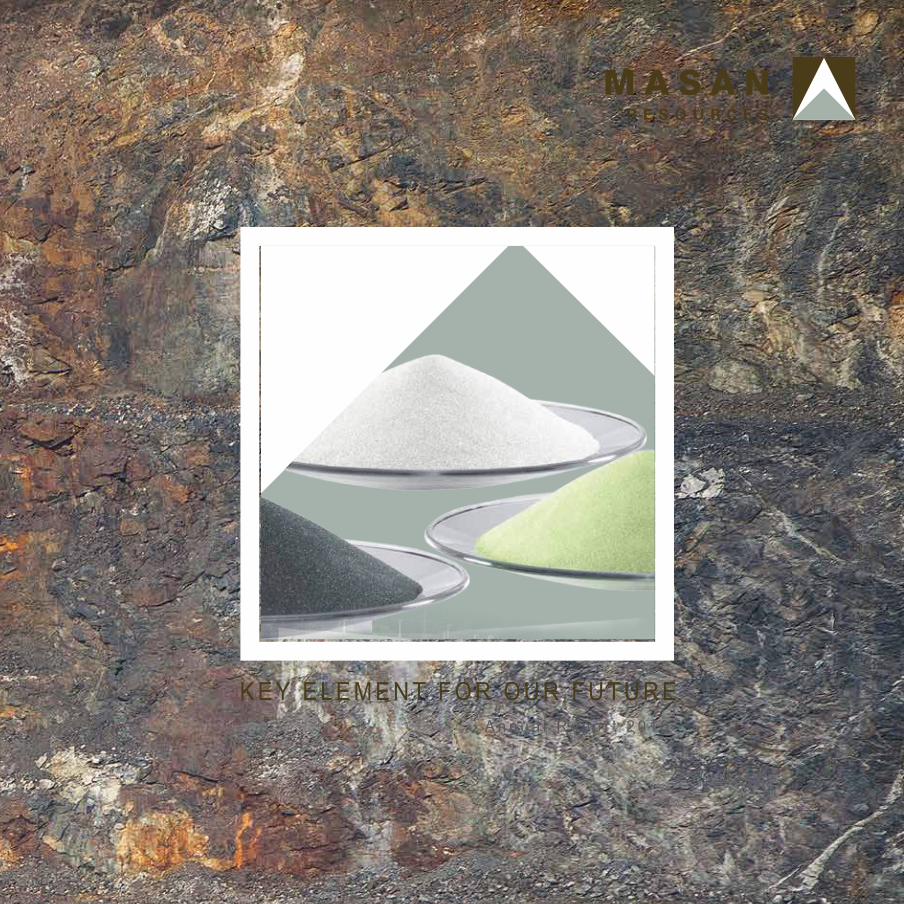
K E Y E L E M E N T F O R O U R F U T U R EA n n u a l R e p o r t 2 0 1 6
K E Y E L E M E N T F O R O U R F U T U R E
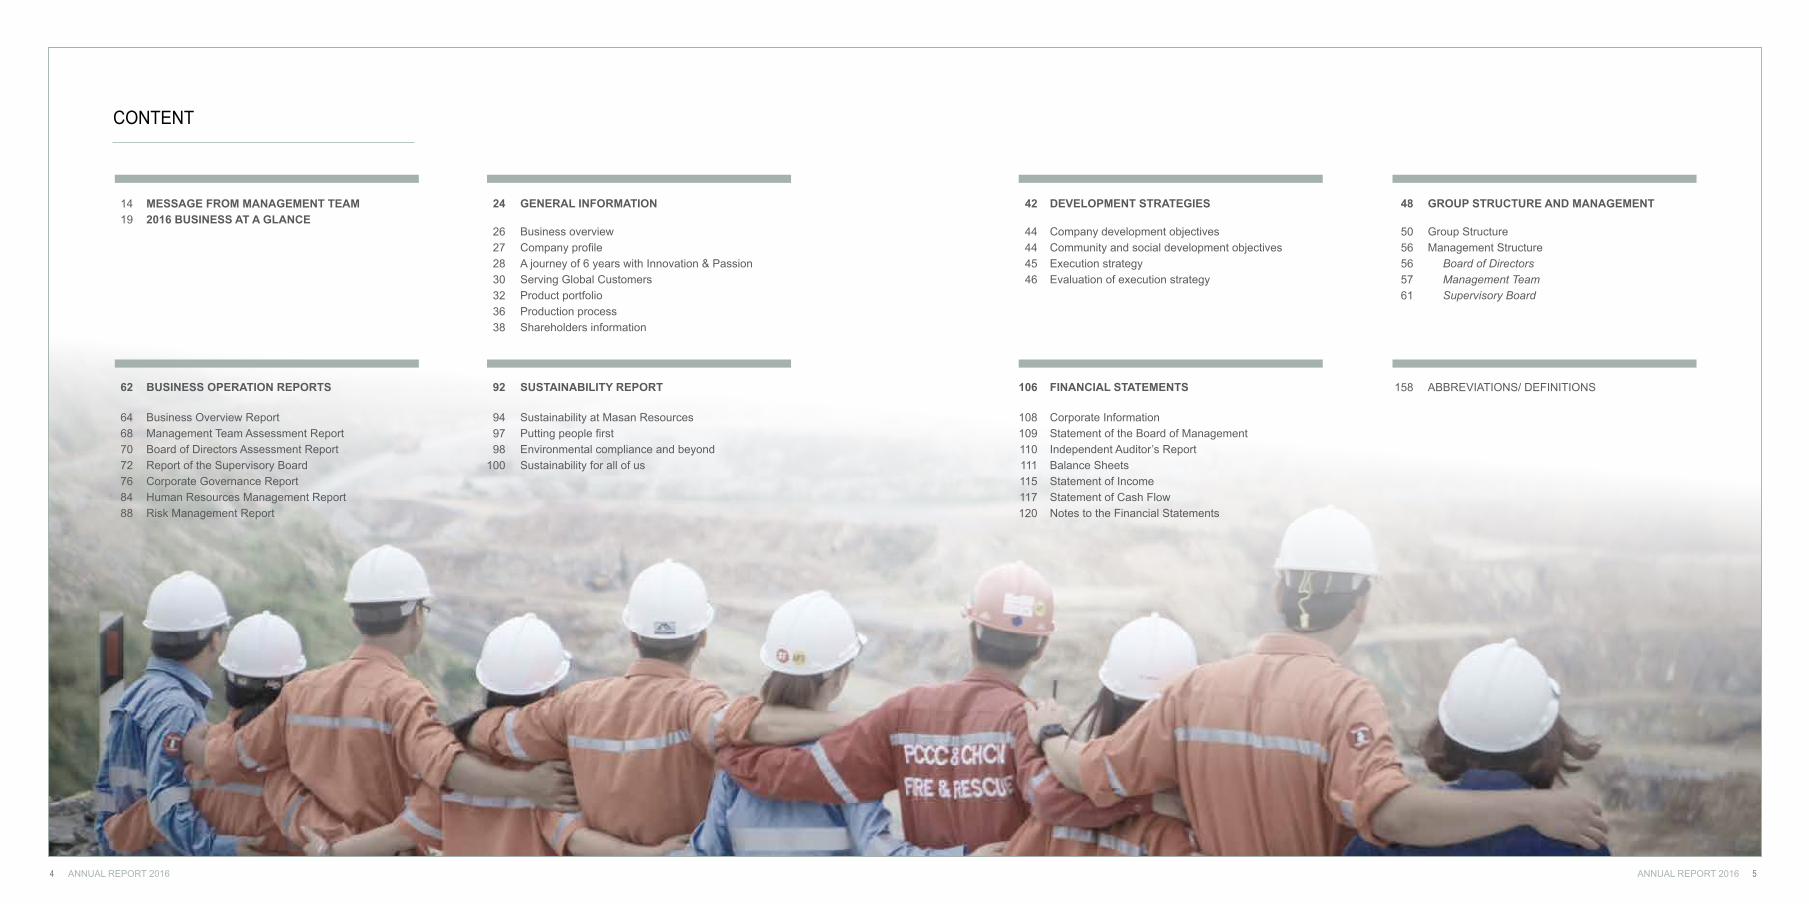
CONTENT
GENERAL INFORMATION24
62 92
DEVELOPMENT STRATEGIES42 48 GROUP STRUCTURE AND MANAGEMENT
BUSINESS OPERATION REPORTS SUSTAINABILITY REPORT 106 FINANCIAL STATEMENTS
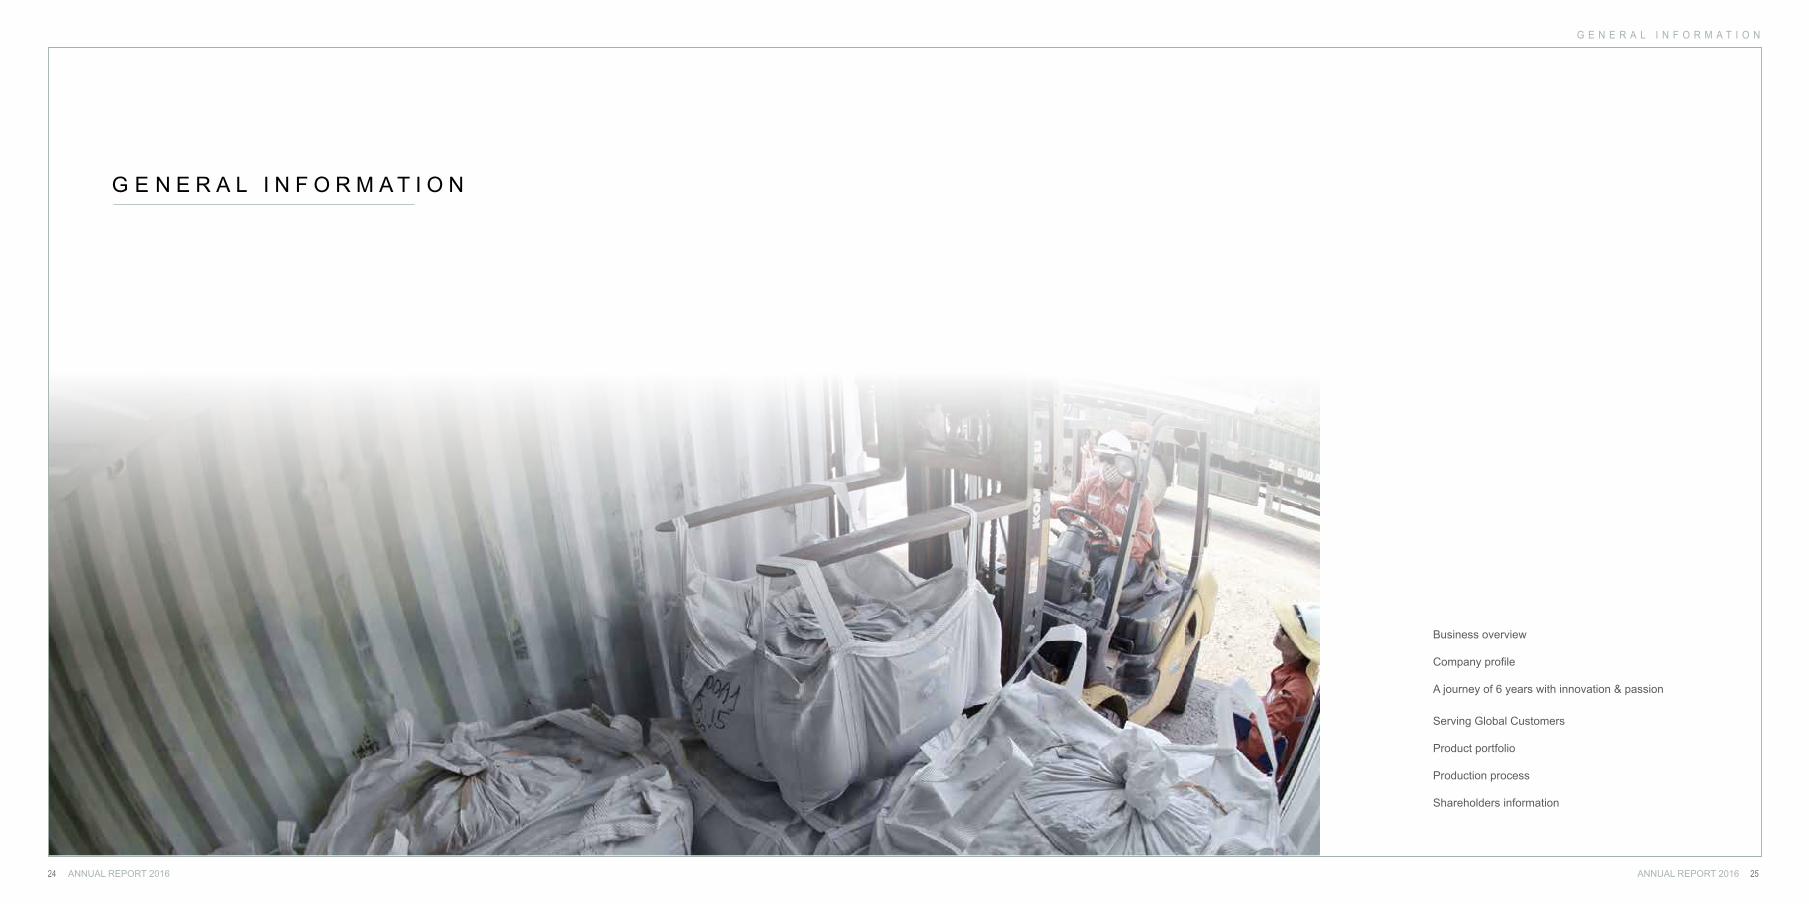
Business overviewCompany profileA journey of 6 years with Innovation & PassionServing Global CustomersProduct portfolio Production processShareholders information
Company development objectives Community and social development objectives Execution strategy Evaluation of execution strategy
Group StructureManagement Structure
Board of DirectorsManagement Team Supervisory Board
Business Overview ReportManagement Team Assessment ReportBoard of Directors Assessment ReportReport of the Supervisory BoardCorporate Governance ReportHuman Resources Management Report Risk Management Report
Sustainability at Masan Resources Putting people firstEnvironmental compliance and beyondSustainability for all of us
Corporate InformationStatement of the Board of ManagementIndependent Auditor’s ReportBalance SheetsStatement of IncomeStatement of Cash FlowNotes to the Financial Statements
MESSAGE FROM MANAGEMENT TEAM2016 BUSINESS AT A GLANCE
ABBREVIATIONS/ DEFINITIONS
1419
26272830323638
44444546
5056565761
64687072768488
949798
100
158
108109110111115117120
ANNUAL REPORT 2016ANNUAL REPORT 20164 5
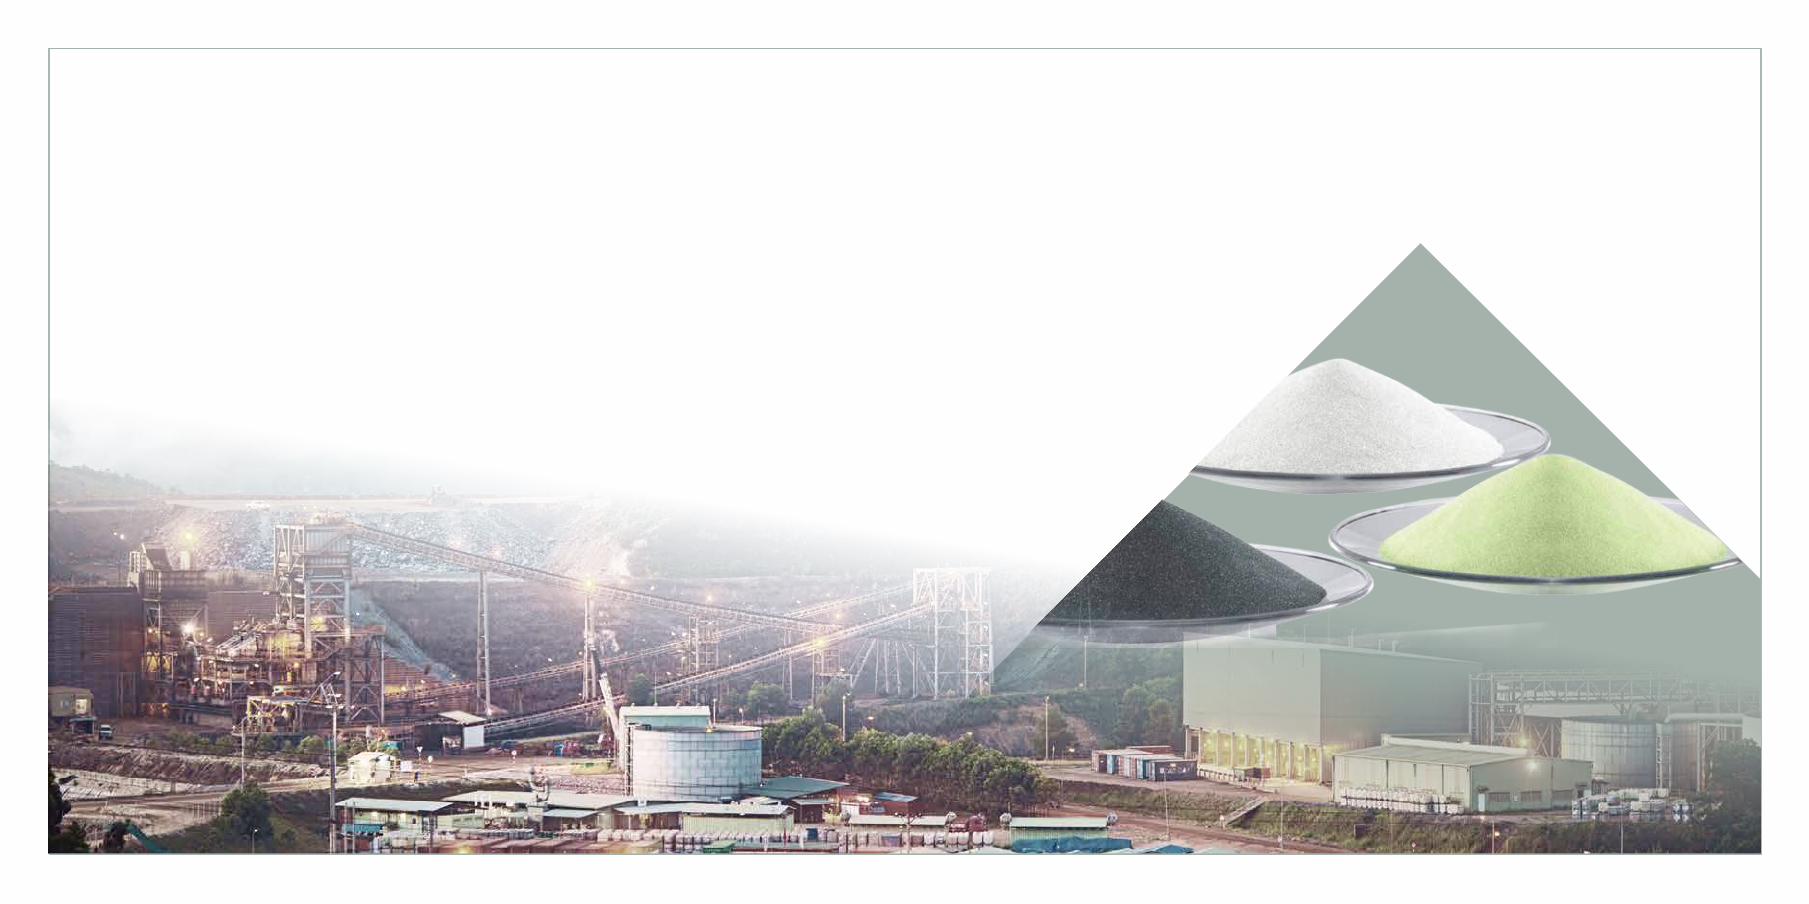
ANNUAL REPORT 2016ANNUAL REPORT 20166 7
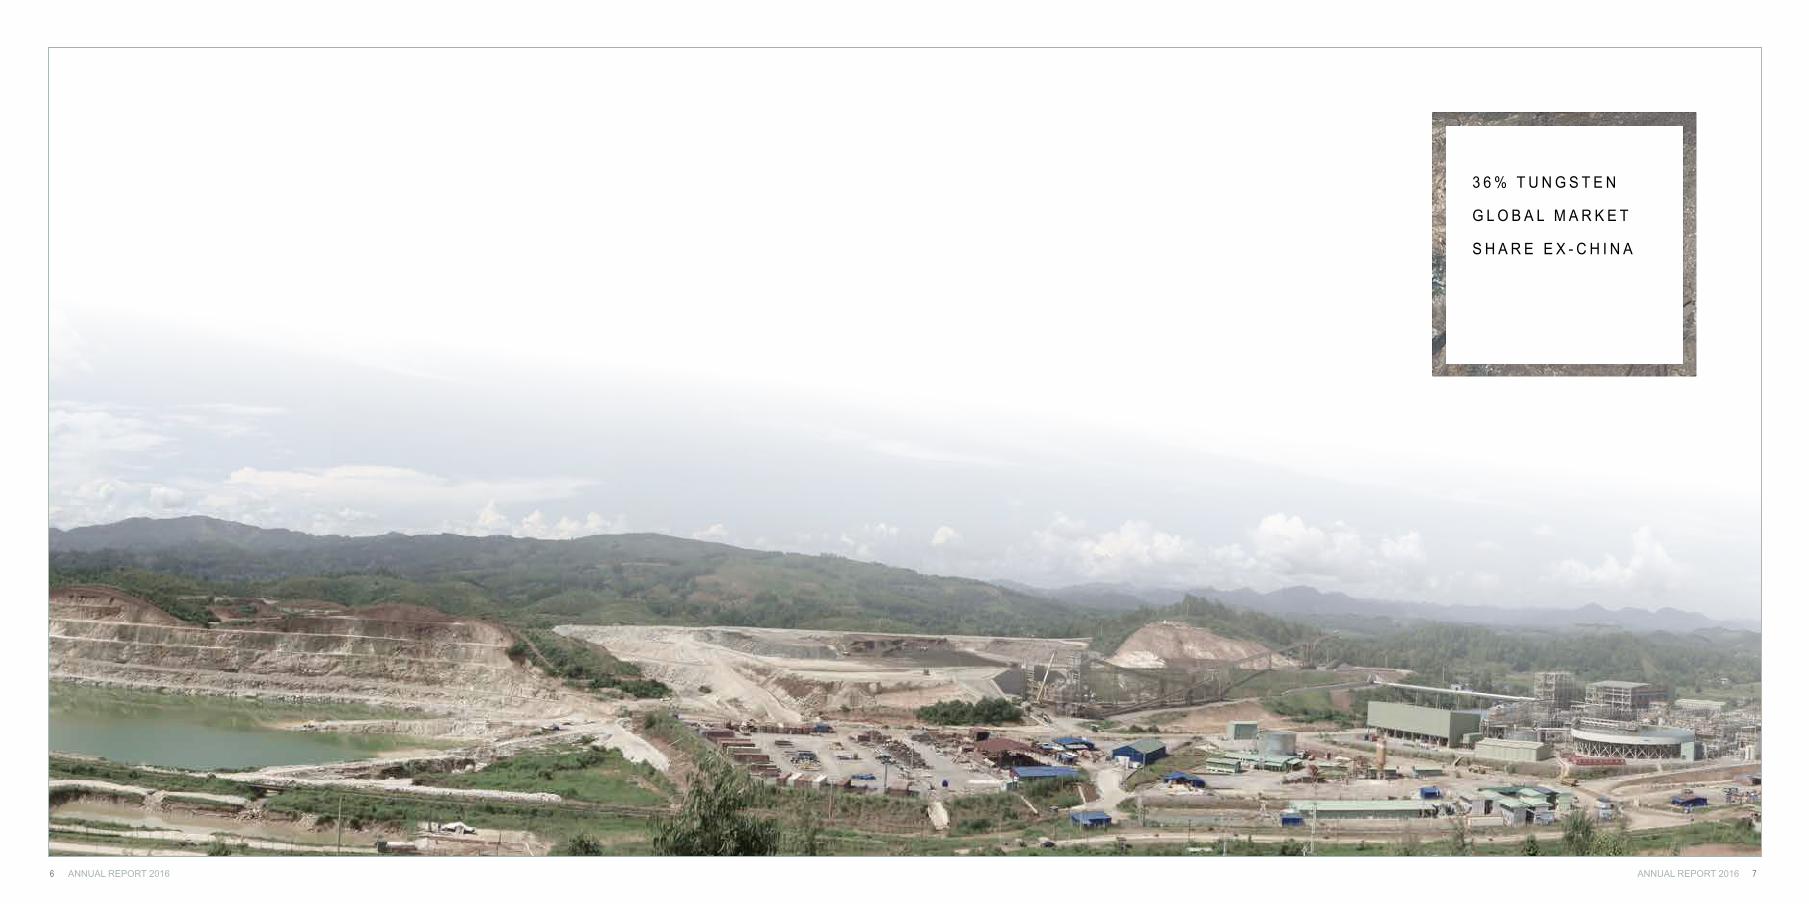
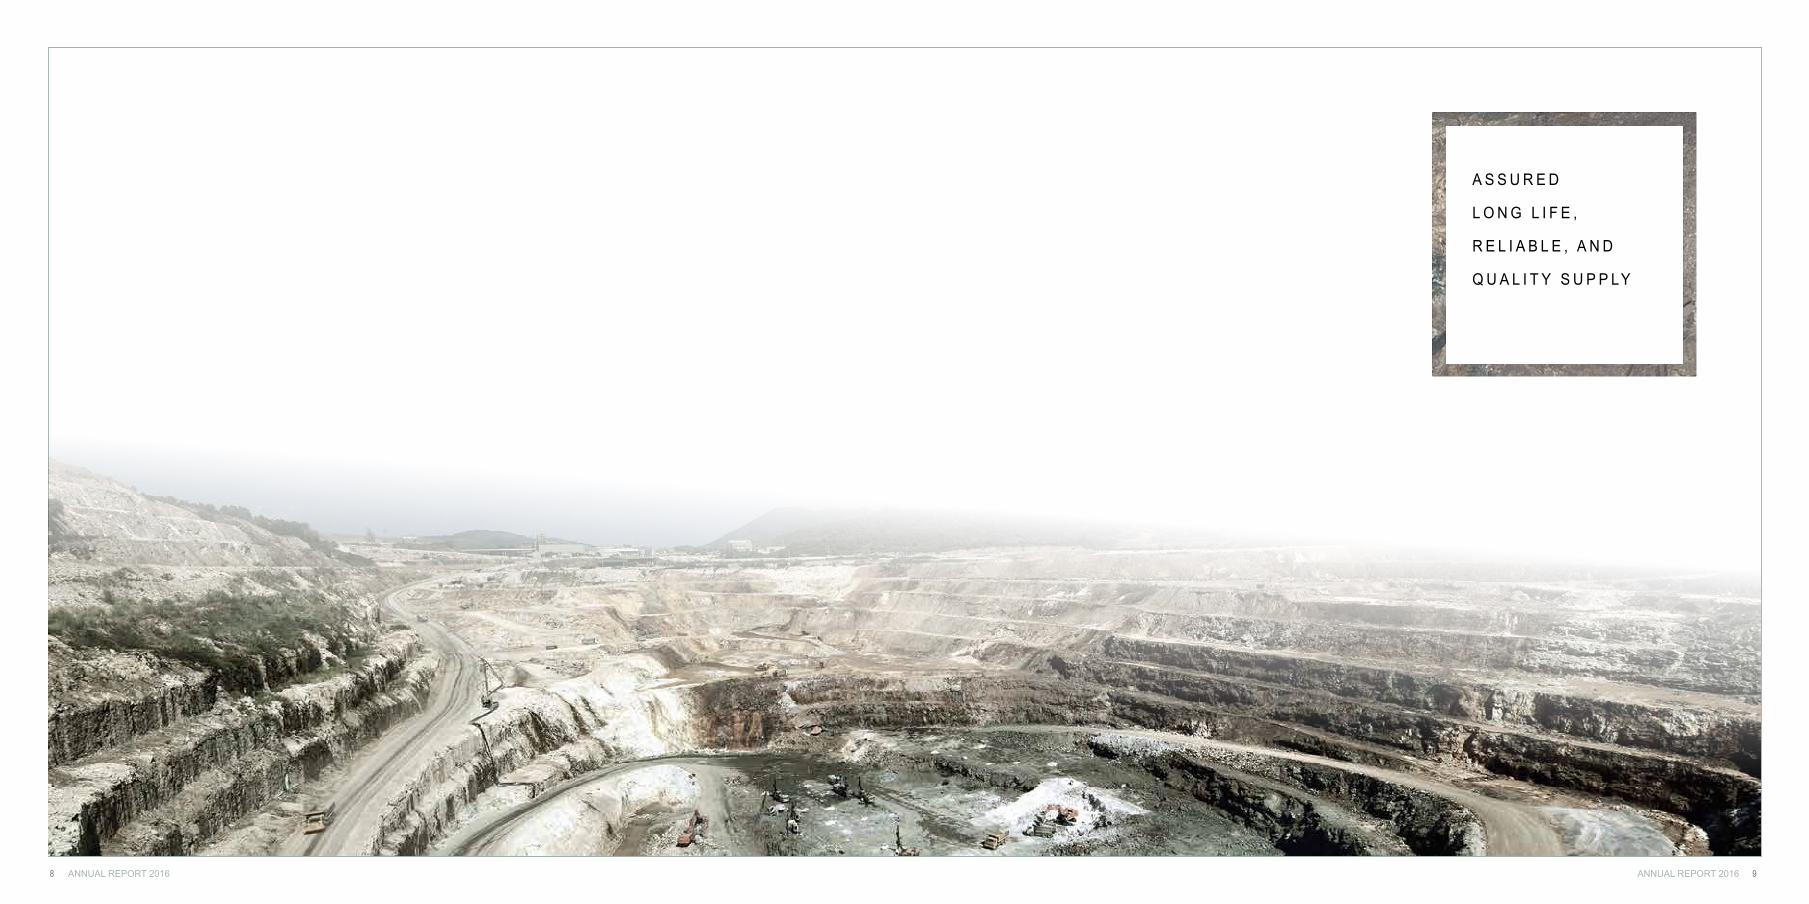
3 6 % T U N G S T E N
G L O B A L M A R K E T
S H A R E E X - C H I N A
ANNUAL REPORT 2016ANNUAL REPORT 20168 9
A S S U R E D
L O N G L I F E ,
R E L I A B L E , A N D
Q U A L I T Y S U P P LY
ANNUAL REPORT 2016ANNUAL REPORT 201610 11
V N D 11 0 B N I N
AT T R I B U TA B L E
N E T P R O F I T
ANNUAL REPORT 2016ANNUAL REPORT 201612 13
U N I Q U E S A F E T Y
R E C O R D O V E R
1 8 M I L L I O N M A N -
H O U R S W I T H O U T LT I
ANNUAL REPORT 2016ANNUAL REPORT 201614 15
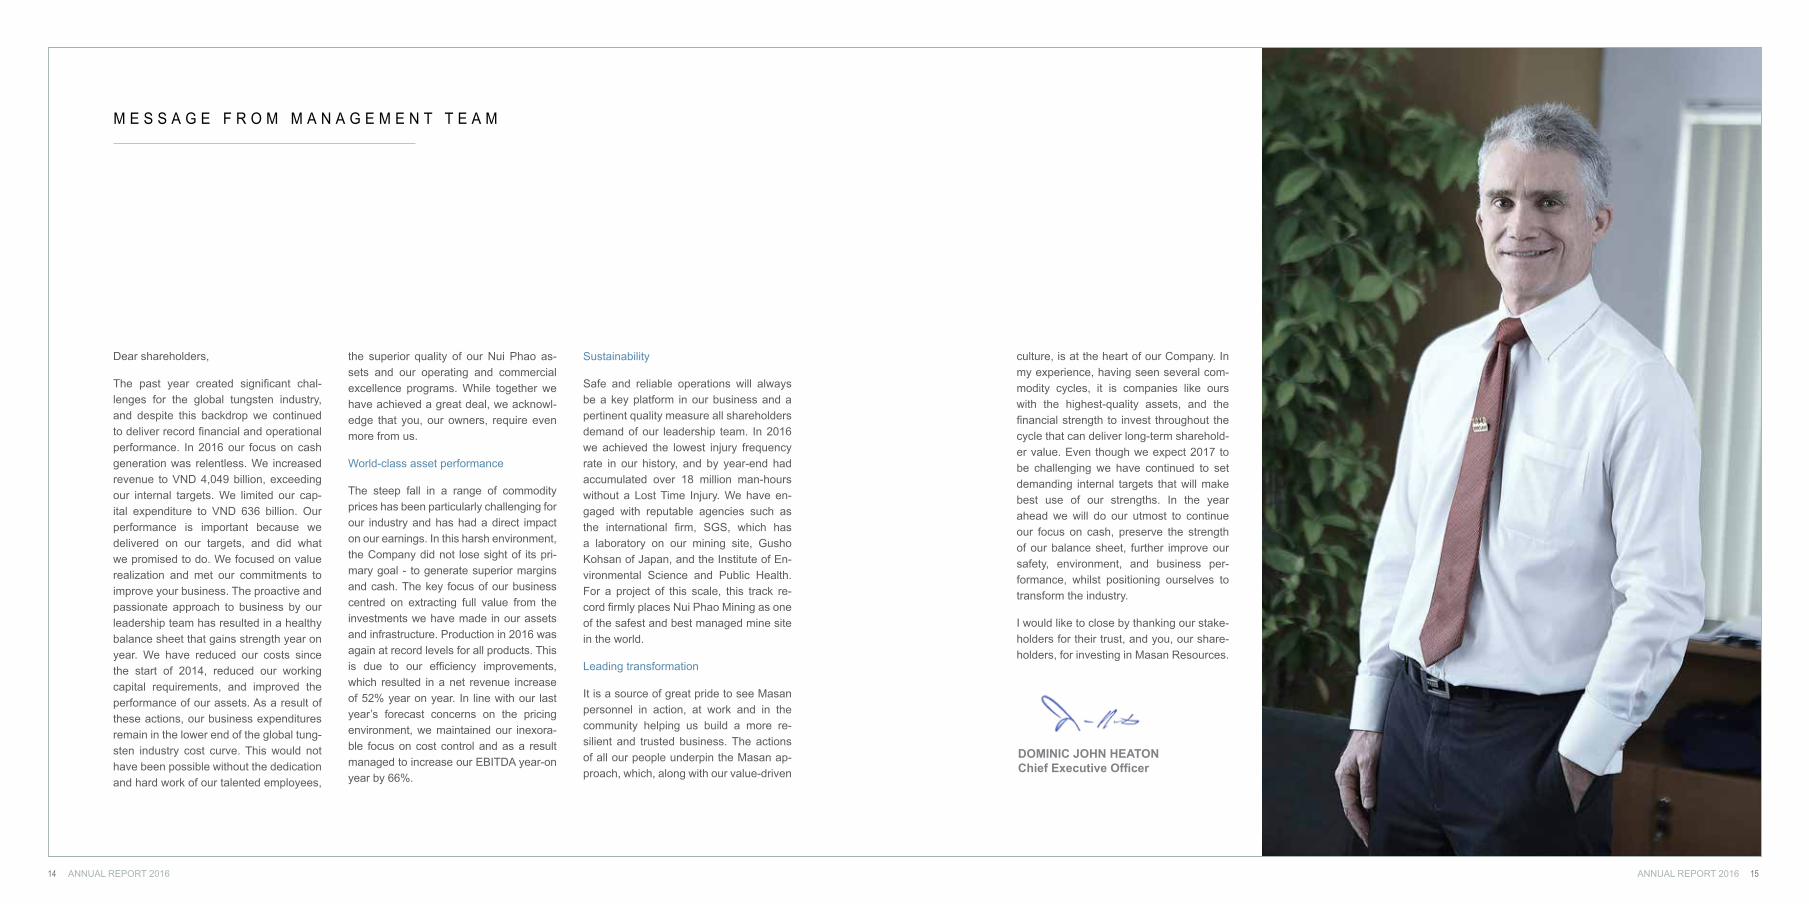
Dear shareholders,
The past year created significant chal-lenges for the global tungsten industry, and despite this backdrop we continued to deliver record financial and operational performance. In 2016 our focus on cash generation was relentless. We increased revenue to VND 4,049 billion, exceeding our internal targets. We limited our cap-ital expenditure to VND 636 billion. Our performance is important because we delivered on our targets, and did what we promised to do. We focused on value realization and met our commitments to improve your business. The proactive and passionate approach to business by our leadership team has resulted in a healthy balance sheet that gains strength year on year. We have reduced our costs since the start of 2014, reduced our working capital requirements, and improved the performance of our assets. As a result of these actions, our business expenditures remain in the lower end of the global tung-sten industry cost curve. This would not have been possible without the dedication and hard work of our talented employees,
the superior quality of our Nui Phao as-sets and our operating and commercial excellence programs. While together we have achieved a great deal, we acknowl-edge that you, our owners, require even more from us.
World-class asset performance
The steep fall in a range of commodity prices has been particularly challenging for our industry and has had a direct impact on our earnings. In this harsh environment, the Company did not lose sight of its pri-mary goal - to generate superior margins and cash. The key focus of our business centred on extracting full value from the investments we have made in our assets and infrastructure. Production in 2016 was again at record levels for all products. This is due to our efficiency improvements, which resulted in a net revenue increase of 52% year on year. In line with our last year’s forecast concerns on the pricing environment, we maintained our inexora-ble focus on cost control and as a result managed to increase our EBITDA year-on year by 66%.
Sustainability
Safe and reliable operations will always be a key platform in our business and a pertinent quality measure all shareholders demand of our leadership team. In 2016 we achieved the lowest injury frequency rate in our history, and by year-end had accumulated over 18 million man-hours without a Lost Time Injury. We have en-gaged with reputable agencies such as the international firm, SGS, which has a laboratory on our mining site, Gusho Kohsan of Japan, and the Institute of En-vironmental Science and Public Health. For a project of this scale, this track re-cord firmly places Nui Phao Mining as one of the safest and best managed mine site in the world.
Leading transformation
It is a source of great pride to see Masan personnel in action, at work and in the community helping us build a more re-silient and trusted business. The actions of all our people underpin the Masan ap-proach, which, along with our value-driven
M E S S A G E F R O M M A N A G E M E N T T E A M
culture, is at the heart of our Company. In my experience, having seen several com-modity cycles, it is companies like ours with the highest-quality assets, and the financial strength to invest throughout the cycle that can deliver long-term sharehold-er value. Even though we expect 2017 to be challenging we have continued to set demanding internal targets that will make best use of our strengths. In the year ahead we will do our utmost to continue our focus on cash, preserve the strength of our balance sheet, further improve our safety, environment, and business per-formance, whilst positioning ourselves to transform the industry.
I would like to close by thanking our stake-holders for their trust, and you, our share-holders, for investing in Masan Resources.
DOMINIC JOHN HEATONChief Executive Officer
V I S I O N
GROW MASAN RESOURCES INTO AN INDUSTRY LEADER THAT IS
ABLE TO TRANSFORM THE GLOBAL TUNGSTEN MARKET.
M I S S I O N
MASAN RESOURCES IS WORKING, WITHIN BEST-IN-CLASS PARAMETERS,
TO DEVELOP AND EXPAND OUR BUSINESS WITH THE AIM OF INCREASING
SHAREHOLDER VALUE. WE HAVE ASSEMBLED A TEAM OF WORLD-CLASS
PROFESSIONALS WITH EXTENSIVE INTERNATIONAL AND REGIONAL
EXPERIENCE WHO ARE PASSIONATE TO SHOW THE WORLD THAT A
VIETNAMESE COMPANY CAN LEAD THE TRANSFORMATION OF THE GLOBAL
TUNGSTEN MARKET.
ANNUAL REPORT 2016ANNUAL REPORT 201616 17
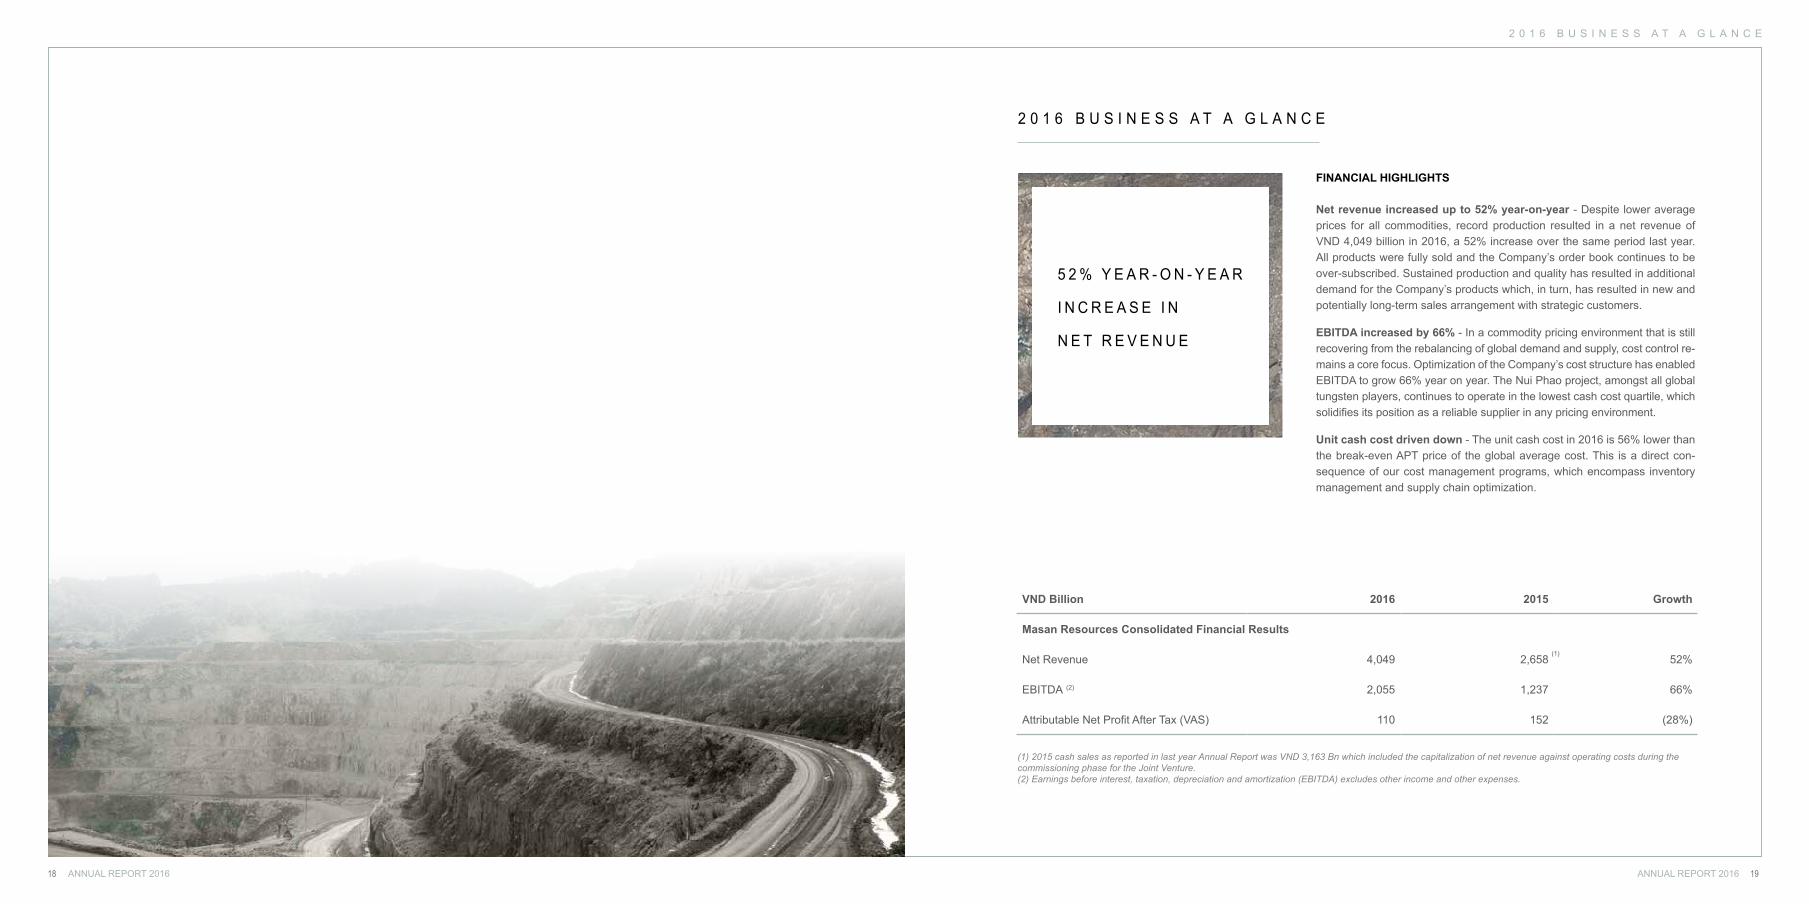
2 0 1 6 B U S I N E S S A T A G L A N C E
FINANCIAL HIGHLIGHTS
Net revenue increased up to 52% year-on-year - Despite lower average prices for all commodities, record production resulted in a net revenue of VND 4,049 billion in 2016, a 52% increase over the same period last year. All products were fully sold and the Company’s order book continues to be over-subscribed. Sustained production and quality has resulted in additional demand for the Company’s products which, in turn, has resulted in new and potentially long-term sales arrangement with strategic customers.
EBITDA increased by 66% - In a commodity pricing environment that is still recovering from the rebalancing of global demand and supply, cost control re-mains a core focus. Optimization of the Company’s cost structure has enabled EBITDA to grow 66% year on year. The Nui Phao project, amongst all global tungsten players, continues to operate in the lowest cash cost quartile, which solidifies its position as a reliable supplier in any pricing environment.
Unit cash cost driven down - The unit cash cost in 2016 is 56% lower than the break-even APT price of the global average cost. This is a direct con-sequence of our cost management programs, which encompass inventory management and supply chain optimization.
VND Billion 2016 2015 Growth
Masan Resources Consolidated Financial Results
Net Revenue 4,049 2,658 52%
EBITDA (2) 2,055 1,237 66%
Attributable Net Profit After Tax (VAS) 110 152 (28%)
(1)
ANNUAL REPORT 2016ANNUAL REPORT 201618 19
2 0 1 6 B U S I N E S S A T A G L A N C E
5 2 % Y E A R - O N - Y E A R
I N C R E A S E I N
N E T R E V E N U E
(1) 2015 cash sales as reported in last year Annual Report was VND 3,163 Bn which included the capitalization of net revenue against operating costs during the commissioning phase for the Joint Venture.(2) Earnings before interest, taxation, depreciation and amortization (EBITDA) excludes other income and other expenses.
ANNUAL REPORT 2016ANNUAL REPORT 201620 21
2 0 1 6 B U S I N E S S A T A G L A N C E
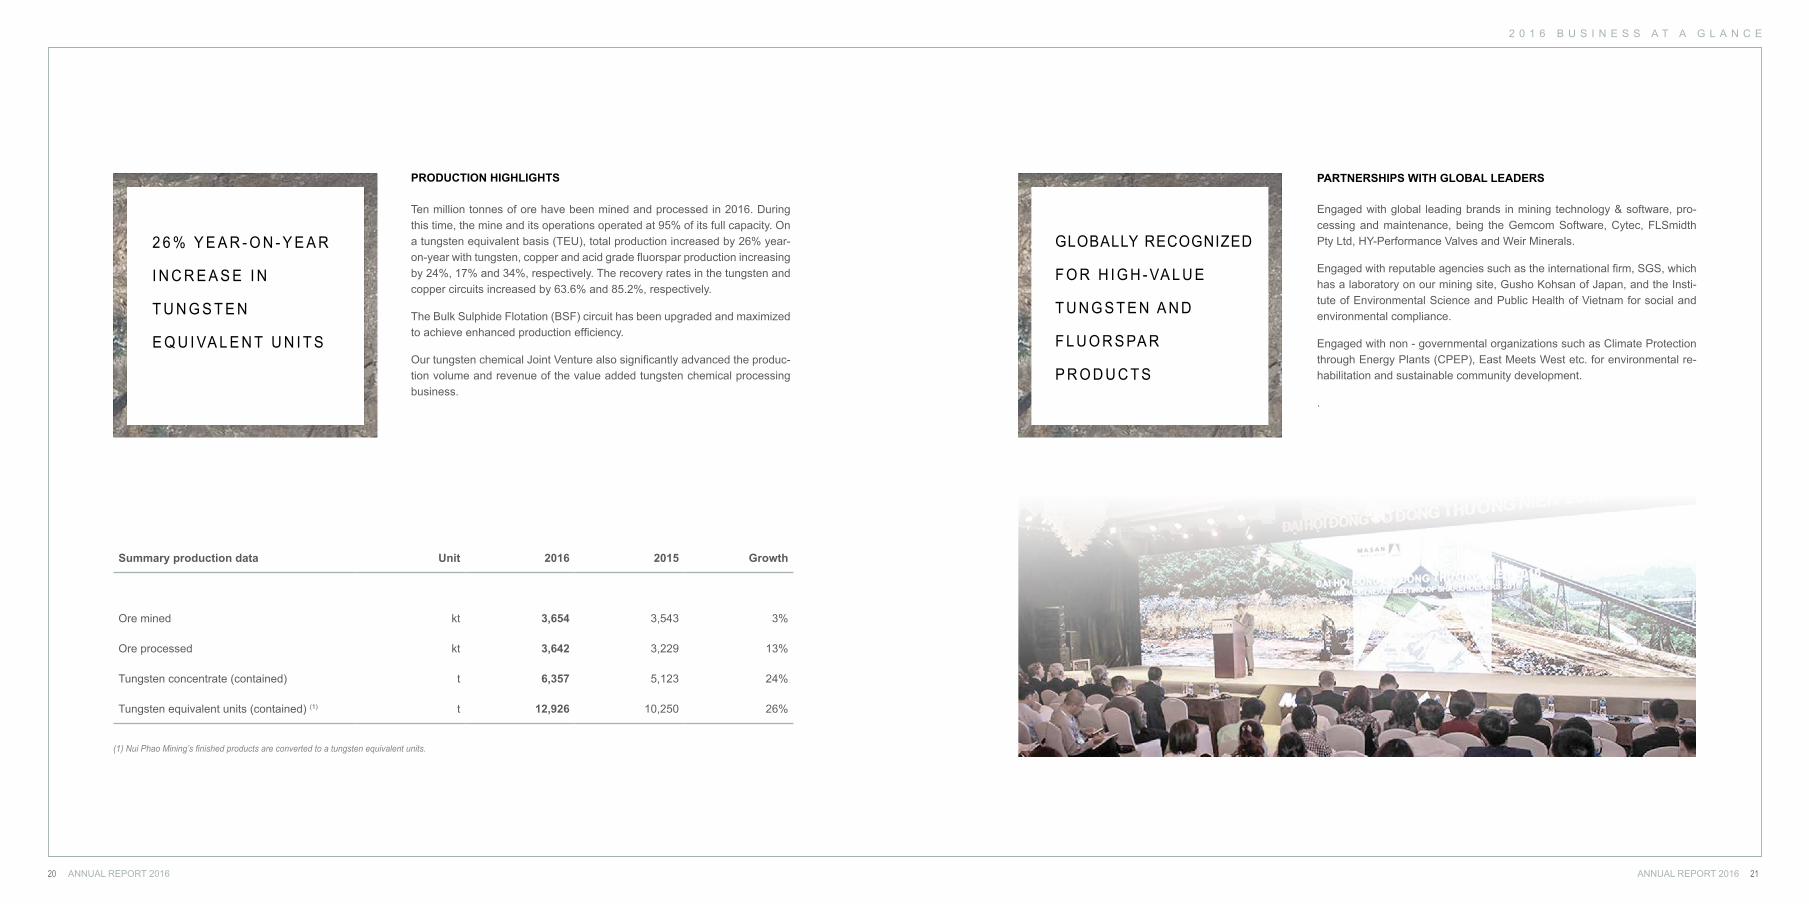
PRODUCTION HIGHLIGHTS
Ten million tonnes of ore have been mined and processed in 2016. During this time, the mine and its operations operated at 95% of its full capacity. On a tungsten equivalent basis (TEU), total production increased by 26% year-on-year with tungsten, copper and acid grade fluorspar production increasing by 24%, 17% and 34%, respectively. The recovery rates in the tungsten and copper circuits increased by 63.6% and 85.2%, respectively.
The Bulk Sulphide Flotation (BSF) circuit has been upgraded and maximized to achieve enhanced production efficiency.
Our tungsten chemical Joint Venture also significantly advanced the produc-tion volume and revenue of the value added tungsten chemical processing business.
Summary production data Unit 2016 2015 Growth
Ore mined kt 3,654 3,543 3%
Ore processed kt 3,642 3,229 13%
Tungsten concentrate (contained) t 6,357 5,123 24%
Tungsten equivalent units (contained) (1) t 12,926 10,250 26%
(1) Nui Phao Mining’s finished products are converted to a tungsten equivalent units.
PARTNERSHIPS WITH GLOBAL LEADERS
2 6 % Y E A R - O N - Y E A R
I N C R E A S E I N
T U N G S T E N
E Q U I VA L E N T U N I T S
GLOBALLY RECOGNIZED
F O R H I G H - VA L U E
T U N G S T E N A N D
F L U O R S PA R
P R O D U C T S
Engaged with global leading brands in mining technology & software, pro-cessing and maintenance, being the Gemcom Software, Cytec, FLSmidth Pty Ltd, HY-Performance Valves and Weir Minerals.
Engaged with reputable agencies such as the international firm, SGS, which has a laboratory on our mining site, Gusho Kohsan of Japan, and the Insti-tute of Environmental Science and Public Health of Vietnam for social and environmental compliance.
Engaged with non - governmental organizations such as Climate Protection through Energy Plants (CPEP), East Meets West etc. for environmental re-habilitation and sustainable community development.
.
A W A R D S & R E C O G N I T I O N
Certificate for “Green Branch 2015”
Natural Resources & Environment Magazine, Ministry of Natural Resources & Environment
Merit for Enterprise with Outstanding Achievements in implementation of mission 2015
Certificate of sponsor with great contribution to the success of Dai Tu Tea Festival 2016
Merit for Enterprise with Outstanding Achievement in the Mass Movement of Fire Prevention and Rescue 2016
Certificate of “Enterprise of culture standards”
Thai Nguyen Provincial People’s Committee
Dai Tu district People’s Committee Dai Tu district People’s CommitteeDai Tu district People’s Committee
Merit for Outstanding Achievements in Occupational Safety and Health and Fire & Explosion Prevention in 2015
Bureau for Safe Work
Certificate for Trusted Brand Index (TBI) 2016
Vietnam Enterprise Institute joint with the InterComformity Assessment and Certification Company (Federal Republic of Germany)
Gold Cup Excellent Enterprise
Thai Nguyen Department of Labor Invalids and Social Affairs (DOLISA) in co-operation with Thai Nguyen Provincial Peo-ple’s Committee
Certificate of Top 500 biggest Enterprises in Vietnam
Vietnam Report
Certificate for Top 10 Prestigious Enterprises in Mining Industry 2015
Enterprise Credit Rating Appraise Science Center (CRC) under Vietnam Union of Science & Technology Associa-tions (VUSTA)
Merit for Outstanding Achievement in State Budget Performance 2015 (*)
Thai Nguyen Department of Taxation
Certificate and Order of Merit “Joining hands to imple-ment emulation movement on building new-style rural areas”
General Council of Agriculture and Rural Development Vietnam
Merit Certificate for Outstanding Performance in contri-bution to development of Vietnam’s Industry and Trade on the 65th anniversary of establishment – 14 May 1954 – 14 May 2016
Thai Nguyen Provincial Industry and Trade Department
Merit for Outstanding Achievement in Cultural – Sport Activities 2015
Vietnam General Confederation of Labor
Merit Certificate for Excellent Achievement in develop-ing Trade Union organizations firmly and strongly
Thai Nguyen Provincial Labor Confederation
Awarded byAwarded byAwarded by
Awarded by
Awarded by
Awarded by Awarded by
Awarded by
Awarded by
Awarded by
Awarded by
Awarded byAwarded by
Awarded by
Awarded by
(*) four consecutive years 2012, 2013, 2014 and 2015 (**) four consecutive years 2013, 2014, 2015 and 2016
ANNUAL REPORT 2016ANNUAL REPORT 201622 23
2 0 1 6 B U S I N E S S A T A G L A N C E
G E N E R A L I N F O R M A T I O N
G E N E R A L I N F O R M A T I O N
ANNUAL REPORT 2016ANNUAL REPORT 201624 25
Business overview
Company profile
A journey of 6 years with innovation & passion
Serving Global Customers
Product portfolio
Production process
Shareholders information
G E N E R A L I N F O R M A T I O N
B U S I N E S S O V E R V I E W
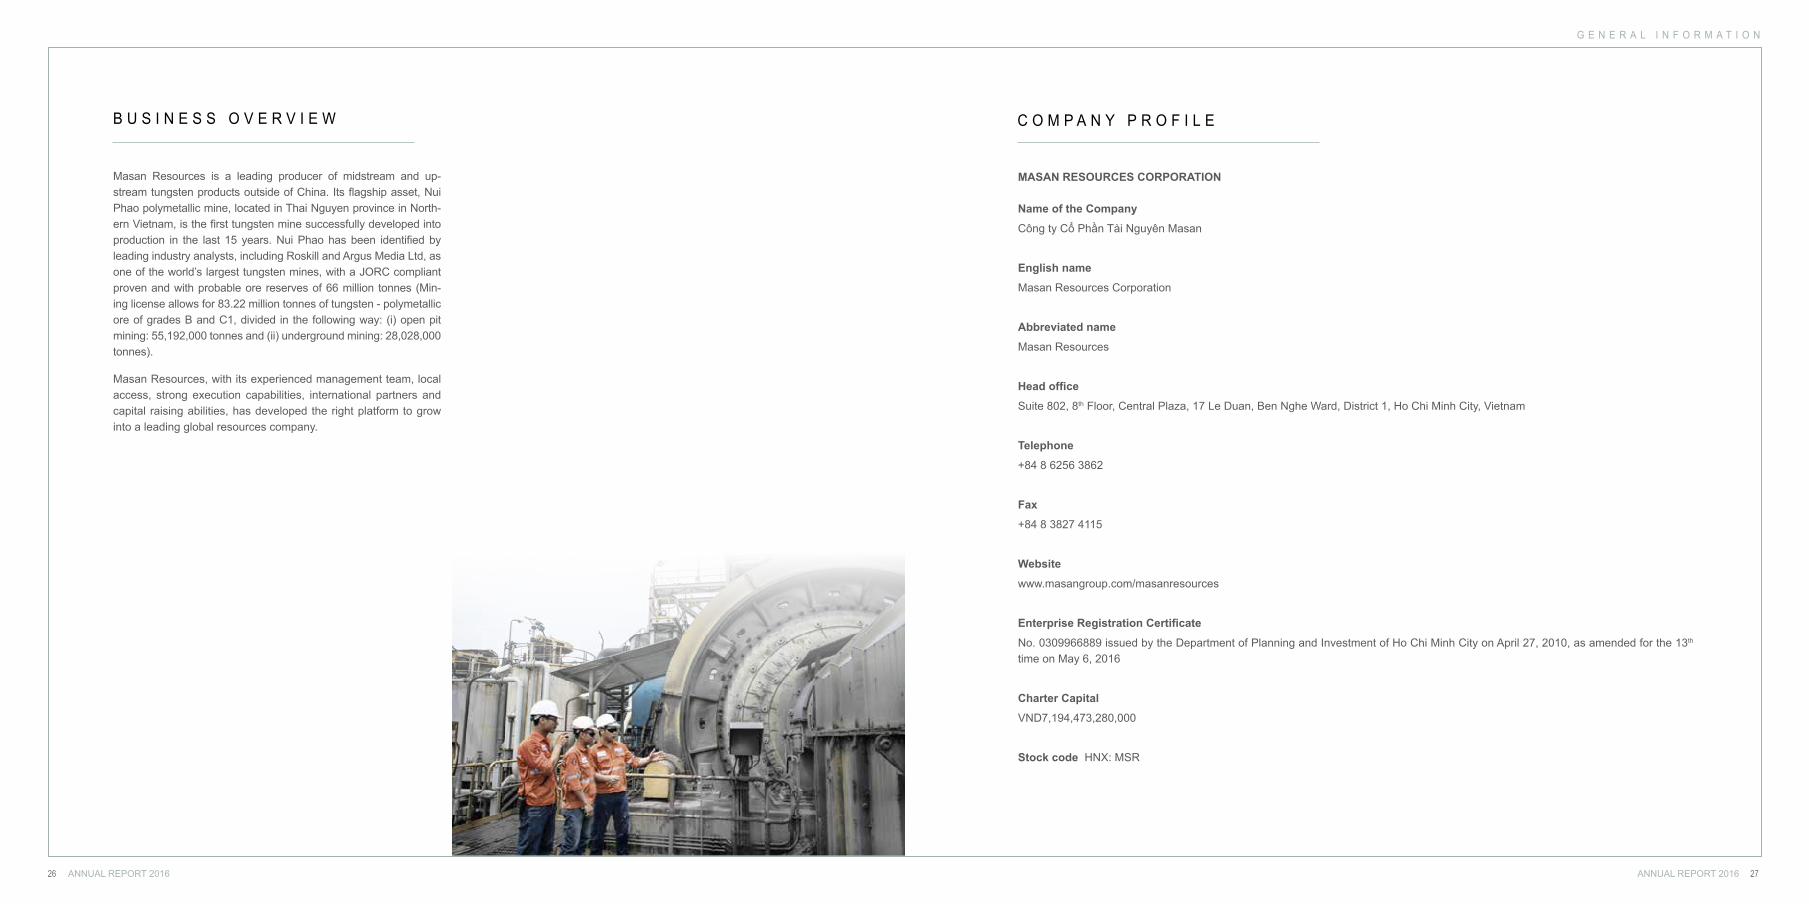
Masan Resources is a leading producer of midstream and up-stream tungsten products outside of China. Its flagship asset, Nui Phao polymetallic mine, located in Thai Nguyen province in North-ern Vietnam, is the first tungsten mine successfully developed into production in the last 15 years. Nui Phao has been identified by leading industry analysts, including Roskill and Argus Media Ltd, as one of the world’s largest tungsten mines, with a JORC compliant proven and with probable ore reserves of 66 million tonnes (Min-ing license allows for 83.22 million tonnes of tungsten - polymetallic ore of grades B and C1, divided in the following way: (i) open pit mining: 55,192,000 tonnes and (ii) underground mining: 28,028,000 tonnes).
Masan Resources, with its experienced management team, local access, strong execution capabilities, international partners and capital raising abilities, has developed the right platform to grow into a leading global resources company.
C O M P A N Y P R O F I L E
MASAN RESOURCES CORPORATION
Name of the Company
Công ty Cổ Phần Tài Nguyên Masan
English name
Masan Resources Corporation
Abbreviated name
Masan Resources
Head office
Suite 802, 8th Floor, Central Plaza, 17 Le Duan, Ben Nghe Ward, District 1, Ho Chi Minh City, Vietnam
Telephone
+84 8 6256 3862
Fax
+84 8 3827 4115
Website
www.masangroup.com/masanresources
Enterprise Registration Certificate
No. 0309966889 issued by the Department of Planning and Investment of Ho Chi Minh City on April 27, 2010, as amended for the 13th time on May 6, 2016
Charter Capital
VND7,194,473,280,000
Stock code HNX: MSR
ANNUAL REPORT 2016 27ANNUAL REPORT 201626
G E N E R A L I N F O R M A T I O N
2011
2012
2013
A J O U R N E Y O F 6 Y E A R S
W I T H I N N O V A T I O N & P A S S I O N
The Company was established on April 27, 2010 with the view to undertake mining and resources activities of the Masan Group. Significant events in the Company’s business are set out below:
2014
2015
2016
Record production achieved for all four commodities. The Joint Venture ob-tained the Certificate of High Tech is-sued by Ministry of Science and Tech-nology on April 24, 2015.
Achieved design capacity and success-fully commissioned JV’s APT plant. In-itiatives undertaken to further ramp up production and increase operational ef-ficiencies.
In September, Masan Resources suc-cessfully completed its listing on Hanoi’s UPCOM exchange.
In September, MSR hosted the 28th In-ternational Tungsten Industry Associa-tion (ITIA) annual meeting, attended by over 120 global delegations.
Successfully held the first AGM after list-ing on April 22, 2016; ranked as premi-um on the UPCOM Board of the Hanoi Stock Exchange.
Continued innovating and investing in upgrading with new processes and tech-nology, cost saving, change in business process, developed new way of engage-ment.
The Joint Venture has significantly ad-vanced the production volume and reve-nue of the value added tungsten chemi-cal processing business.
In December 2016, Masan Group through its wholly owned subsidiaries, successfully completed the tender offer for shares of Masan Resources, there-by providing an exit to Mount Kellett and increasing its ownership in MSR to 93.78%, paving the way for the next round of strategic capital and growth.
ANNUAL REPORT 2016ANNUAL REPORT 201628 29
Acceleration of project development for the Nui Phao Project.
In March, MRC Ltd., an investment vehi-cle of Mount Kellett Capital Management L.P., became a shareholder holding 20% of the Company’s charter capital.
In December, the National Mineral Re-serves Assessment Council acknowl-edged the results of the Nui Phao Project’s resources and reserve grade conversion.
In February, Nui Phao Mining obtained MOIT’s official approval of the Nui Phao Project’s basic mine design.
In January, Private Equity New Markets II K/S, an investment vehicle of Bank-Invest, became a shareholder holding 2.86% of the Company’s charter capital.
In June, MRC Ltd. increased its stake in the Company to 21% of the Company’s charter capital.
In August, the Company received In-vestment Certificate No. 41122000131 from the People’s Committee of Ho Chi Minh City.
The Nui Phao Project started commer-cial production for Tungsten Concentra-de and Copper Concentrate on March 1, Fluorspar Acid Grade on June 1, and Bismuth Concentrate on September 1.
G E N E R A L I N F O R M A T I O N
NUI PHAO PROJECT
The Nui Phao mine is a polymetallic mine situated within three communes (Hung Son, Ha Thuong, and Tan Linh) of Dai Tu district in Thai Nguyen province. The mine is approximately 80 km from Hanoi and is accessible via highway. Road and rail links connect the mine to the nearest ports of Hai Phong and Quang Ninh, from which the products can be shipped to international customers.
The Nui Phao mine’s proven and probable ore reserves are estimated at 66 million tonnes, with an estimated mine life of 20 years.
The major project components are:• Open pit mine; • Waste rock disposal facilities; • Modern mine plant and facilities, including a crushing
plant, grinding, thickening, flotation, and gravity recovery; • An Ammonium Paratungstate (APT) plant that processes
tungsten concentrate into higher value-added Ammonium Paratungstate;
• A tailings storage facility (TSF) with water and tailings management ponds;
• Buffer zones, relocation sites, haul roads, and mine ser-vices.
Products from Nui Phao are shipped to worldwide markets from Quang Ninh Port (in Ha Long city, 197 km to the south-east of the Project). The port is also used to receive equip-ment and materials required to run the mine.
S E R V I N G G L O B A L C U S T O M E R S
DISTRIBUTION NETWORK
Our Sales and Marketing department is based in Hanoi and main-tains a strong network of relationships with blue-chip customers globally. Our successful efforts to nurture and expand our network of customers and partners have enabled Masan Resources to generate in excess of 82% of its revenue from sales to an inter-national customer base across Asia, North America, Europe and the Middle East, with the balance of 18% generated from domestic sales.
Our products are sold to customers spread across different end-user segments and generally to repeat counterparties under established long-term contracts. In all cases, international prices
are used as the underlying valuation within contract formulas to capture the product quality premiums and delivery & payments terms.
Our customer relationship management strategy follows a part-nership approach in which we seek to work with key personnel at all levels within each customer organization thereby allowing us to define the best solutions for all parties. As part of our strategy, we encourage non-proprietary exchanges with customers in an effort to share information on, but not limited to, analytical techniques, customer needs and product development.
Sales by country (*)
(*) JV sales are included
2%9%
12%
14%
18%
46%
Middle East
EU
US + Canada
Vietnam
Japan
Other
The location of Nui Phao Mine site
VIET NA
M
NUIPHAO PROJECT
Ha Noi
ANNUAL REPORT 2016ANNUAL REPORT 201630 31
H.C.Starck GmbH Global Tungsten & Powders Corp.
Advanced Material Japan Corporation
CMC Cometals 5N Plus IncJapan New Metals Co.,Ltd.
G E N E R A L I N F O R M A T I O N
ANNUAL REPORT 2016ANNUAL REPORT 201632 33
P R O D U C T P O R T F O L I O
Refregeration
Air conditioners
Oil & Gas refining Drug
Core copper wire
Coin
Copper pipe
Dentistry
Cosmetic
Some productsmade from Fluorspar
Some productsmade from Cooper
Some productsmade from Bismuth
Refregeration
Air conditioners
Oil & Gas refining Drug
Core copper wire
Coin
Copper pipe
Dentistry
Cosmetic
Some productsmade from Fluorspar
Some productsmade from Cooper
Some productsmade from Bismuth
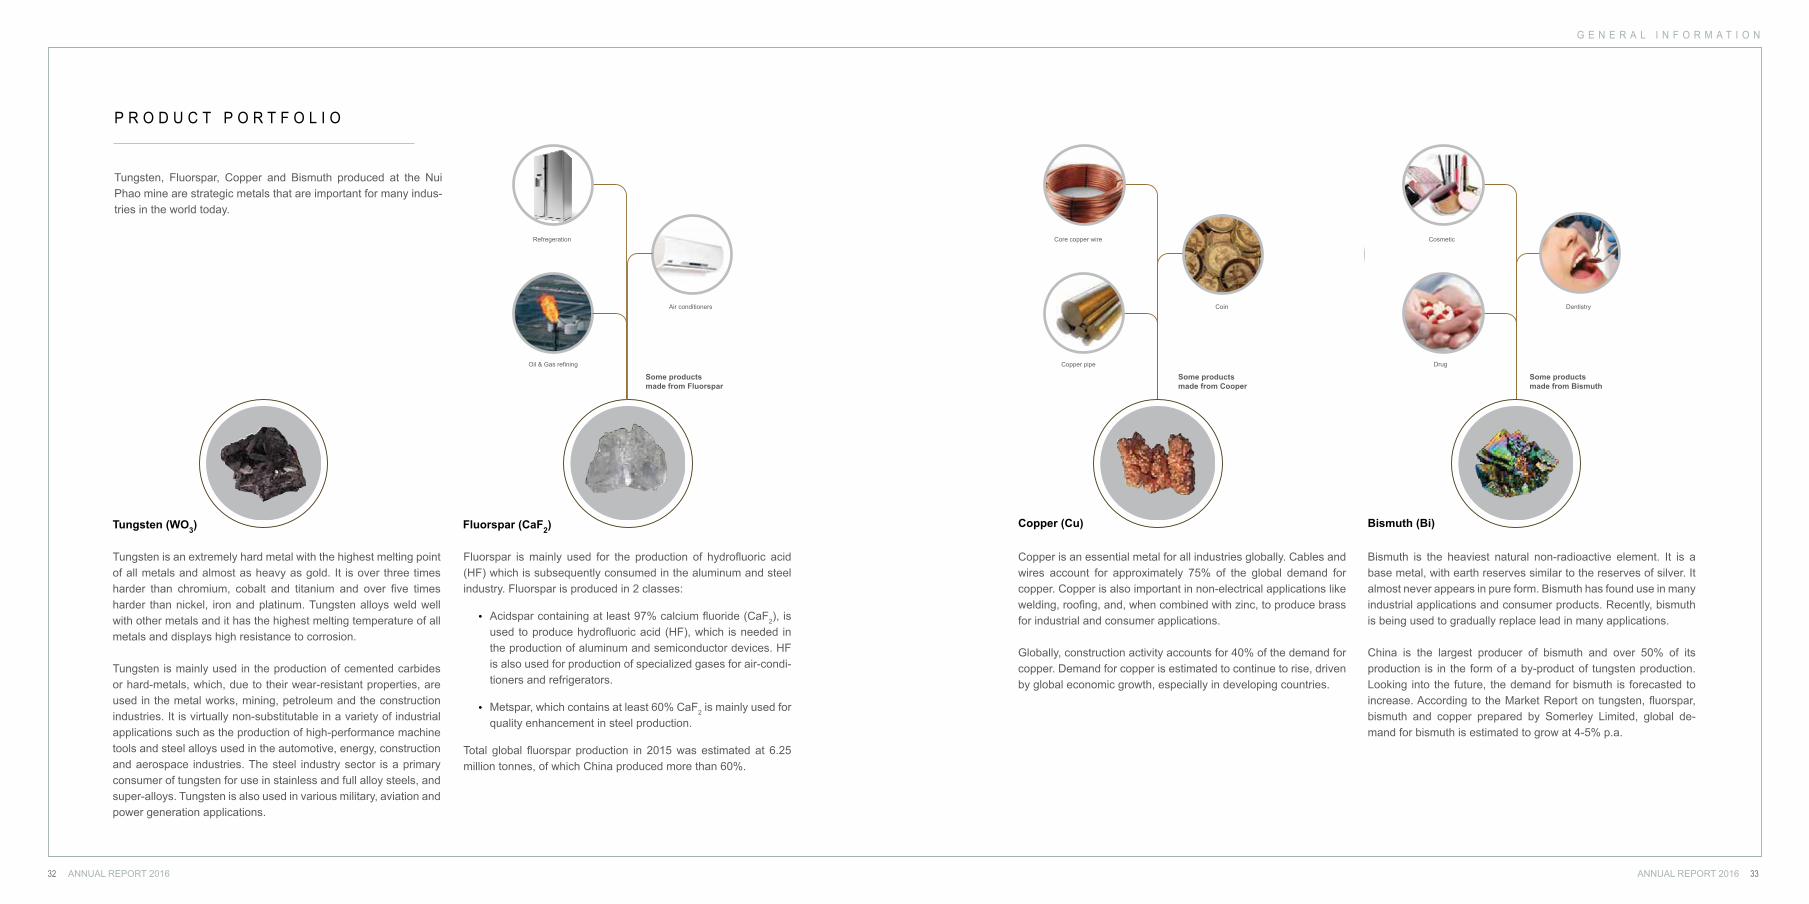
Tungsten, Fluorspar, Copper and Bismuth produced at the Nui Phao mine are strategic metals that are important for many indus-tries in the world today.
Fluorspar (CaF2)
Fluorspar is mainly used for the production of hydrofluoric acid (HF) which is subsequently consumed in the aluminum and steel industry. Fluorspar is produced in 2 classes:
• Acidspar containing at least 97% calcium fluoride (CaF2), is used to produce hydrofluoric acid (HF), which is needed in the production of aluminum and semiconductor devices. HF is also used for production of specialized gases for air-condi-tioners and refrigerators.
• Metspar, which contains at least 60% CaF2 is mainly used for quality enhancement in steel production.
Total global fluorspar production in 2015 was estimated at 6.25 million tonnes, of which China produced more than 60%.
Tungsten (WO3)
Tungsten is an extremely hard metal with the highest melting point of all metals and almost as heavy as gold. It is over three times harder than chromium, cobalt and titanium and over five times harder than nickel, iron and platinum. Tungsten alloys weld well with other metals and it has the highest melting temperature of all metals and displays high resistance to corrosion.
Tungsten is mainly used in the production of cemented carbides or hard-metals, which, due to their wear-resistant properties, are used in the metal works, mining, petroleum and the construction industries. It is virtually non-substitutable in a variety of industrial applications such as the production of high-performance machine tools and steel alloys used in the automotive, energy, construction and aerospace industries. The steel industry sector is a primary consumer of tungsten for use in stainless and full alloy steels, and super-alloys. Tungsten is also used in various military, aviation and power generation applications.
Refregeration
Air conditioners
Oil & Gas refining Drug
Core copper wire
Coin
Copper pipe
Dentistry
Cosmetic
Some productsmade from Fluorspar
Some productsmade from Cooper
Some productsmade from Bismuth
Refregeration
Air conditioners
Oil & Gas refining Drug
Core copper wire
Coin
Copper pipe
Dentistry
Cosmetic
Some productsmade from Fluorspar
Some productsmade from Cooper
Some productsmade from Bismuth
Bismuth (Bi)
Bismuth is the heaviest natural non-radioactive element. It is a base metal, with earth reserves similar to the reserves of silver. It almost never appears in pure form. Bismuth has found use in many industrial applications and consumer products. Recently, bismuth is being used to gradually replace lead in many applications.
China is the largest producer of bismuth and over 50% of its production is in the form of a by-product of tungsten production. Looking into the future, the demand for bismuth is forecasted to increase. According to the Market Report on tungsten, fluorspar, bismuth and copper prepared by Somerley Limited, global de-mand for bismuth is estimated to grow at 4-5% p.a.
Copper (Cu)
Copper is an essential metal for all industries globally. Cables and wires account for approximately 75% of the global demand for copper. Copper is also important in non-electrical applications like welding, roofing, and, when combined with zinc, to produce brass for industrial and consumer applications.
Globally, construction activity accounts for 40% of the demand for copper. Demand for copper is estimated to continue to rise, driven by global economic growth, especially in developing countries.
G E N E R A L I N F O R M A T I O N
ANNUAL REPORT 2016ANNUAL REPORT 201634 35
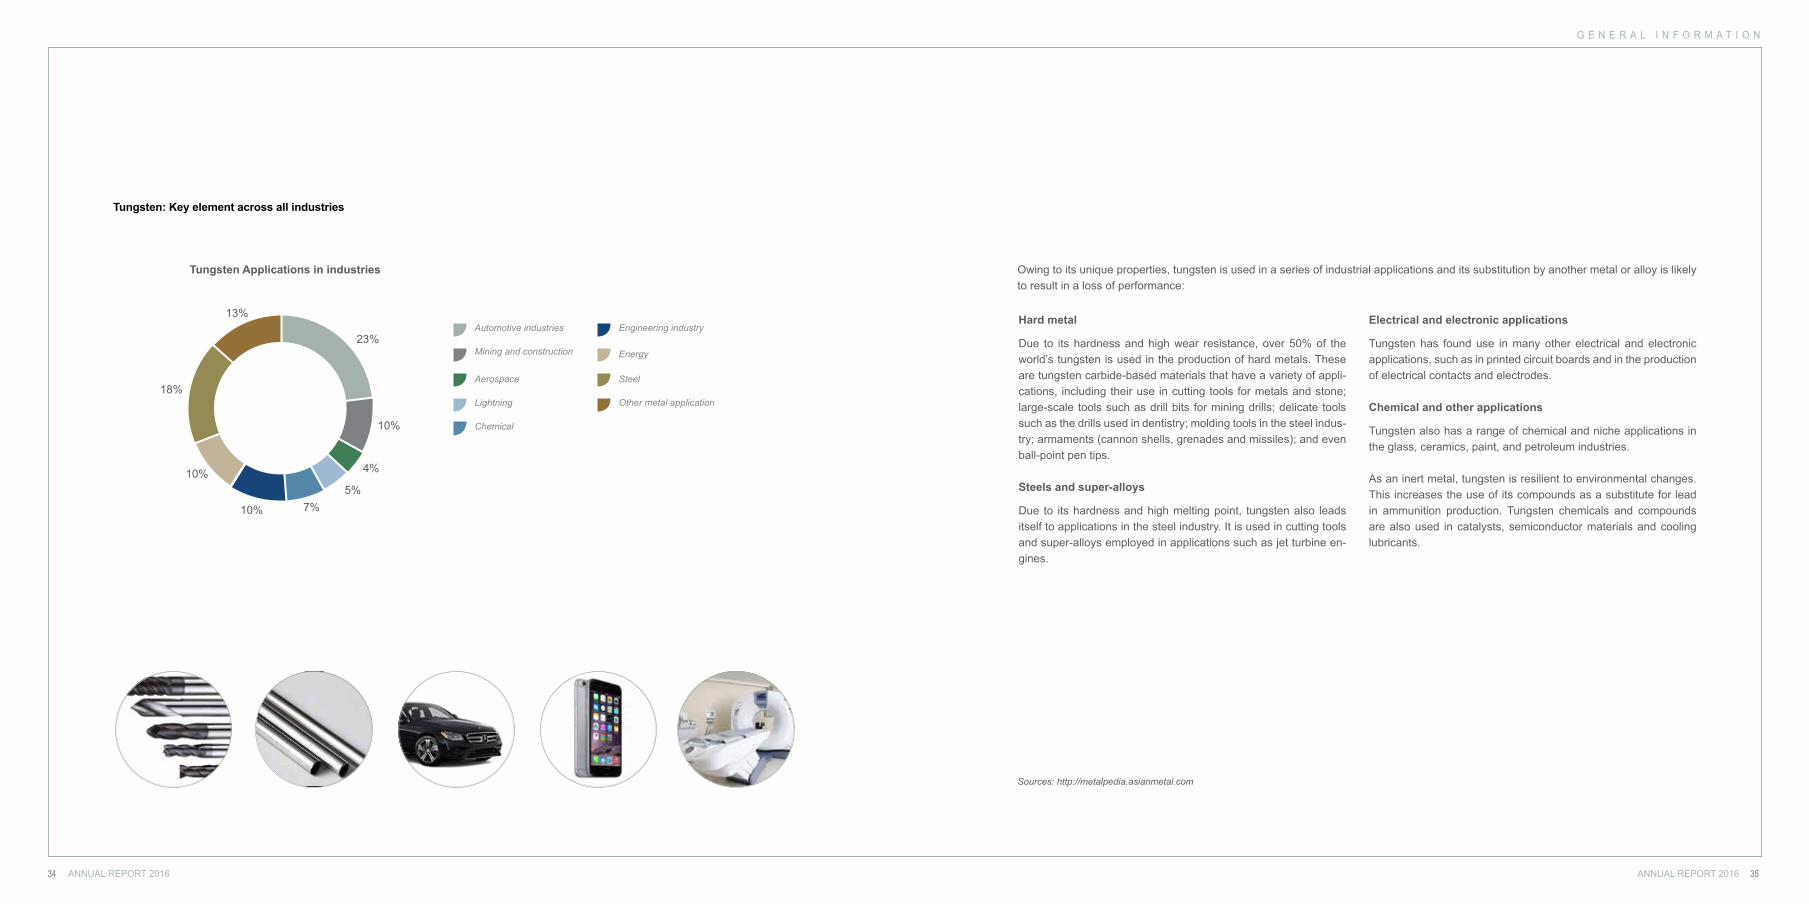
Tungsten: Key element across all industries
Tungsten Applications in industries
13%
18%
10%
10% 7%5%
4%
10%
23%Automotive industries Engineering industry
Other metal application
Mining and construction Energy
Aerospace Steel
Lightning
Chemical
Sources: http://metalpedia.asianmetal.com
Hard metal
Due to its hardness and high wear resistance, over 50% of the world’s tungsten is used in the production of hard metals. These are tungsten carbide-based materials that have a variety of appli-cations, including their use in cutting tools for metals and stone; large-scale tools such as drill bits for mining drills; delicate tools such as the drills used in dentistry; molding tools in the steel indus-try; armaments (cannon shells, grenades and missiles); and even ball-point pen tips.
Steels and super-alloys
Due to its hardness and high melting point, tungsten also leads itself to applications in the steel industry. It is used in cutting tools and super-alloys employed in applications such as jet turbine en-gines.
Electrical and electronic applications
Tungsten has found use in many other electrical and electronic applications, such as in printed circuit boards and in the production of electrical contacts and electrodes.
Chemical and other applications
Tungsten also has a range of chemical and niche applications in the glass, ceramics, paint, and petroleum industries.
As an inert metal, tungsten is resilient to environmental changes. This increases the use of its compounds as a substitute for lead in ammunition production. Tungsten chemicals and compounds are also used in catalysts, semiconductor materials and cooling lubricants.
Owing to its unique properties, tungsten is used in a series of industrial applications and its substitution by another metal or alloy is likely to result in a loss of performance:
G E N E R A L I N F O R M A T I O N
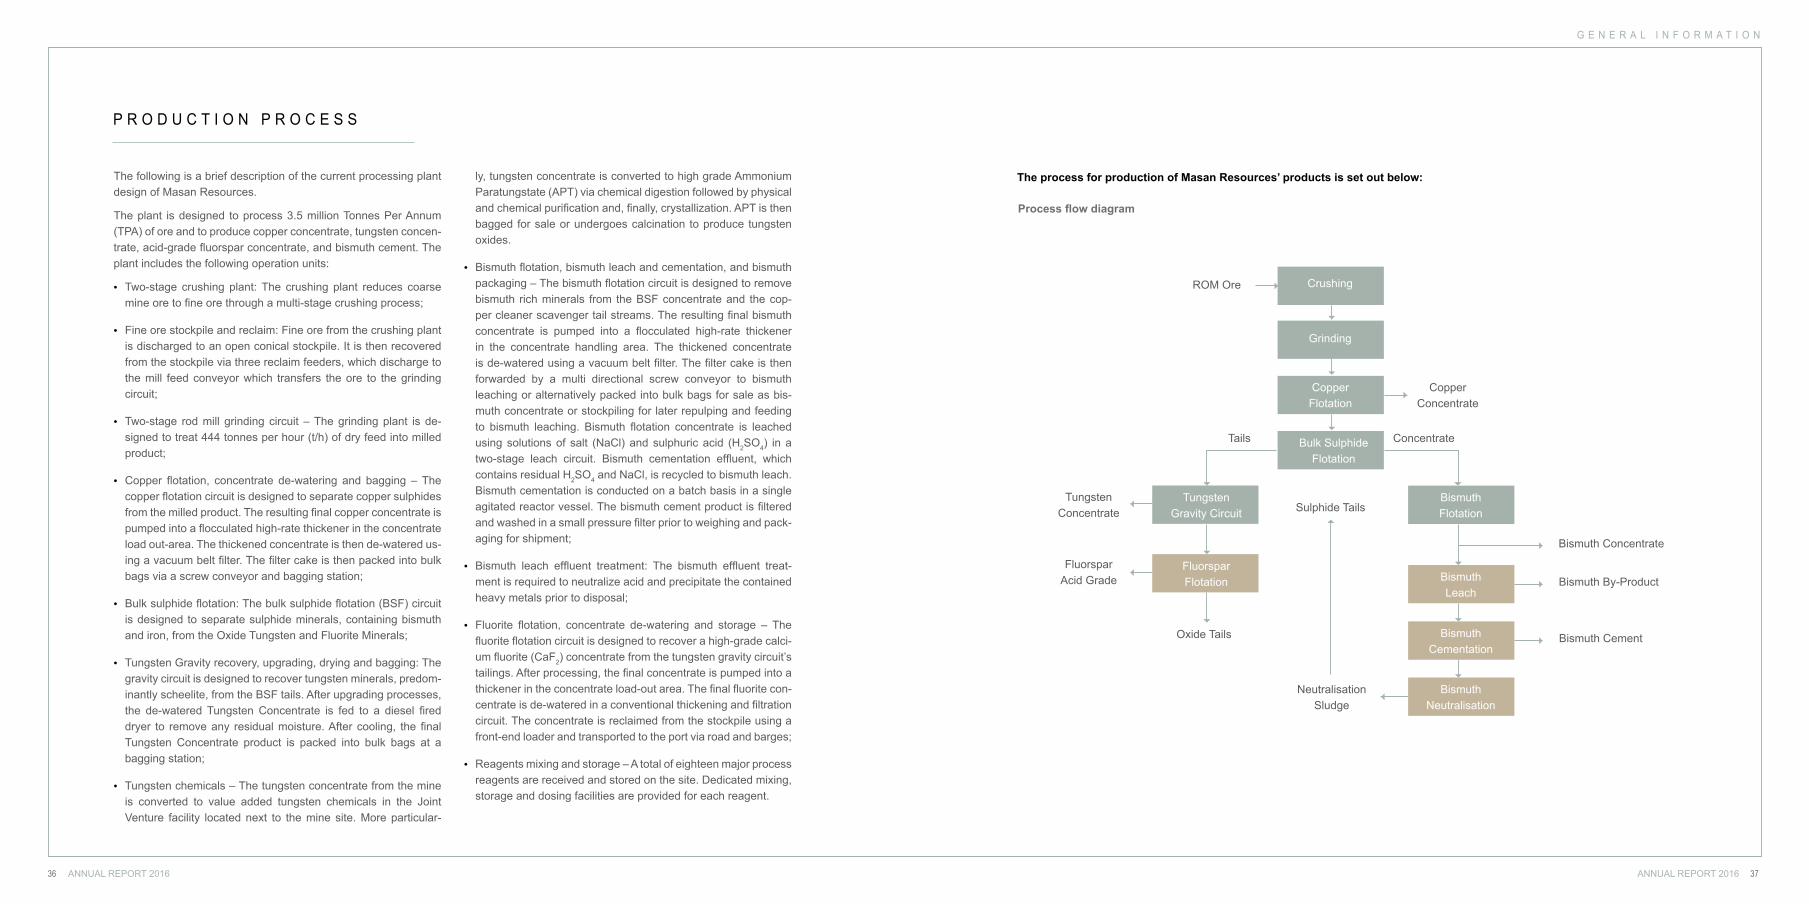
P R O D U C T I O N P R O C E S S
The following is a brief description of the current processing plant design of Masan Resources.
The plant is designed to process 3.5 million Tonnes Per Annum (TPA) of ore and to produce copper concentrate, tungsten concen-trate, acid-grade fluorspar concentrate, and bismuth cement. The plant includes the following operation units:
• Two-stage crushing plant: The crushing plant reduces coarse mine ore to fine ore through a multi-stage crushing process;
• Fine ore stockpile and reclaim: Fine ore from the crushing plant is discharged to an open conical stockpile. It is then recovered from the stockpile via three reclaim feeders, which discharge to the mill feed conveyor which transfers the ore to the grinding circuit;
• Two-stage rod mill grinding circuit – The grinding plant is de-signed to treat 444 tonnes per hour (t/h) of dry feed into milled product;
• Copper flotation, concentrate de-watering and bagging – The copper flotation circuit is designed to separate copper sulphides from the milled product. The resulting final copper concentrate is pumped into a flocculated high-rate thickener in the concentrate load out-area. The thickened concentrate is then de-watered us-ing a vacuum belt filter. The filter cake is then packed into bulk bags via a screw conveyor and bagging station;
• Bulk sulphide flotation: The bulk sulphide flotation (BSF) circuit is designed to separate sulphide minerals, containing bismuth and iron, from the Oxide Tungsten and Fluorite Minerals;
• Tungsten Gravity recovery, upgrading, drying and bagging: The gravity circuit is designed to recover tungsten minerals, predom-inantly scheelite, from the BSF tails. After upgrading processes, the de-watered Tungsten Concentrate is fed to a diesel fired dryer to remove any residual moisture. After cooling, the final Tungsten Concentrate product is packed into bulk bags at a bagging station;
• Tungsten chemicals – The tungsten concentrate from the mine is converted to value added tungsten chemicals in the Joint Venture facility located next to the mine site. More particular-
ly, tungsten concentrate is converted to high grade Ammonium Paratungstate (APT) via chemical digestion followed by physical and chemical purification and, finally, crystallization. APT is then bagged for sale or undergoes calcination to produce tungsten oxides.
• Bismuth flotation, bismuth leach and cementation, and bismuth packaging – The bismuth flotation circuit is designed to remove bismuth rich minerals from the BSF concentrate and the cop-per cleaner scavenger tail streams. The resulting final bismuth concentrate is pumped into a flocculated high-rate thickener in the concentrate handling area. The thickened concentrate is de-watered using a vacuum belt filter. The filter cake is then forwarded by a multi directional screw conveyor to bismuth leaching or alternatively packed into bulk bags for sale as bis-muth concentrate or stockpiling for later repulping and feeding to bismuth leaching. Bismuth flotation concentrate is leached using solutions of salt (NaCl) and sulphuric acid (H2SO4) in a two-stage leach circuit. Bismuth cementation effluent, which contains residual H2SO4 and NaCl, is recycled to bismuth leach. Bismuth cementation is conducted on a batch basis in a single agitated reactor vessel. The bismuth cement product is filtered and washed in a small pressure filter prior to weighing and pack-aging for shipment;
• Bismuth leach effluent treatment: The bismuth effluent treat-ment is required to neutralize acid and precipitate the contained heavy metals prior to disposal;
• Fluorite flotation, concentrate de-watering and storage – The fluorite flotation circuit is designed to recover a high-grade calci-um fluorite (CaF2) concentrate from the tungsten gravity circuit’s tailings. After processing, the final concentrate is pumped into a thickener in the concentrate load-out area. The final fluorite con-centrate is de-watered in a conventional thickening and filtration circuit. The concentrate is reclaimed from the stockpile using a front-end loader and transported to the port via road and barges;
• Reagents mixing and storage – A total of eighteen major process reagents are received and stored on the site. Dedicated mixing, storage and dosing facilities are provided for each reagent.
The process for production of Masan Resources’ products is set out below:
Process flow diagram
CrushingROM Ore
Grinding
CopperFlotation
CopperConcentrate
TungstenConcentrate
Bismuth Concentrate
Bismuth By-Product
Bismuth Cement
Neutralisation Sludge
Fluorspar Acid Grade
Bulk SulphideFlotation
BismuthFlotation
BismuthLeach
BismuthCementation
BismuthNeutralisation
TungstenGravity Circuit
FluorsparFlotation
Sulphide Tails
Oxide Tails
Tails Concentrate
ANNUAL REPORT 2016ANNUAL REPORT 201636 37
G E N E R A L I N F O R M A T I O N
ANNUAL REPORT 2016ANNUAL REPORT 201638 39
S H A R E H O L D E R S I N F O R M A T I O N
Source: List of shareholders of the Company provided by VSD.
Source: List of shareholders of the Company provided by VSD.
SHAREHOLDERS STRUCTURE
List of shareholders holding at least 5% of the charter capital of the Company
The shareholder structure of the Company as of December 31, 2016 is as follows:
The list of shareholders holding at least 5% of the Charter Capital of the Company as of December 31, 2016 is as follows:
No. Shareholder Structure 31/12/2016 Number of
ShareholdersNumber of
shares heldValue (by par value)
(VND)Shareholding
percentage
1 Domestic Shareholder 1,202 687,646,541 6,876,465,410,000 95.58%
Institutions 10 674,991,657 6,749,916,570,000 93.82%
Individuals 1,192 12,654,884 126,548,840,000 1.76%
2 Foreign Shareholders 21 31,800,787 318,007,870,000 4.42%
Institutions 1 19,082,916 190,829,160,000 2.65%
Individuals 20 12,717,871 127,178,710,000 1.77%
Total 1,223 719,447,328 7,194,473,280,000 100.00%
1 Domestic ShareholderNumber of
shares heldValue (by par value)
(VND)Shareholding
percentage
Masan Horizon 674,713,683 6,747,136,830,000 93.78%
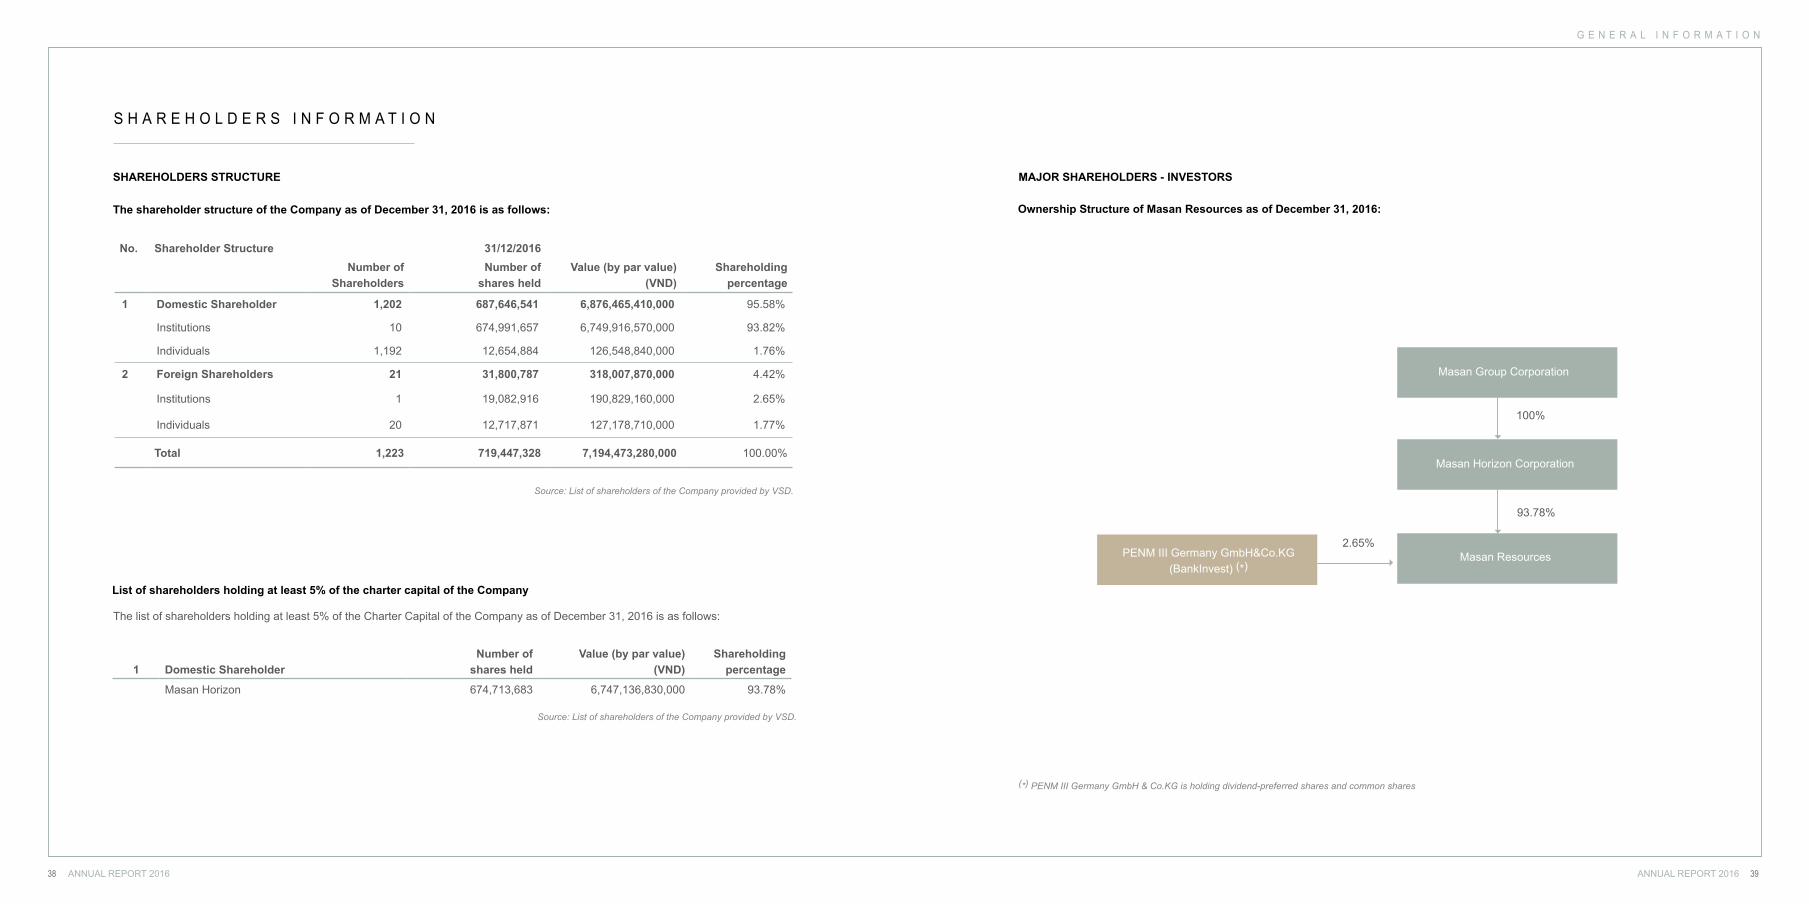
Ownership Structure of Masan Resources as of December 31, 2016:
MAJOR SHAREHOLDERS - INVESTORS
(*) PENM III Germany GmbH & Co.KG is holding dividend-preferred shares and common shares
Masan Group Corporation
Masan Horizon Corporation
PENM III Germany GmbH&Co.KG(BankInvest) (*)
Masan Resources
100%
93.78%
2.65%
G E N E R A L I N F O R M A T I O N
ANNUAL REPORT 2016ANNUAL REPORT 201640 41
INSTITUTIONAL SHAREHOLDERS
Domestic Shareholder
Masan Group Corporation
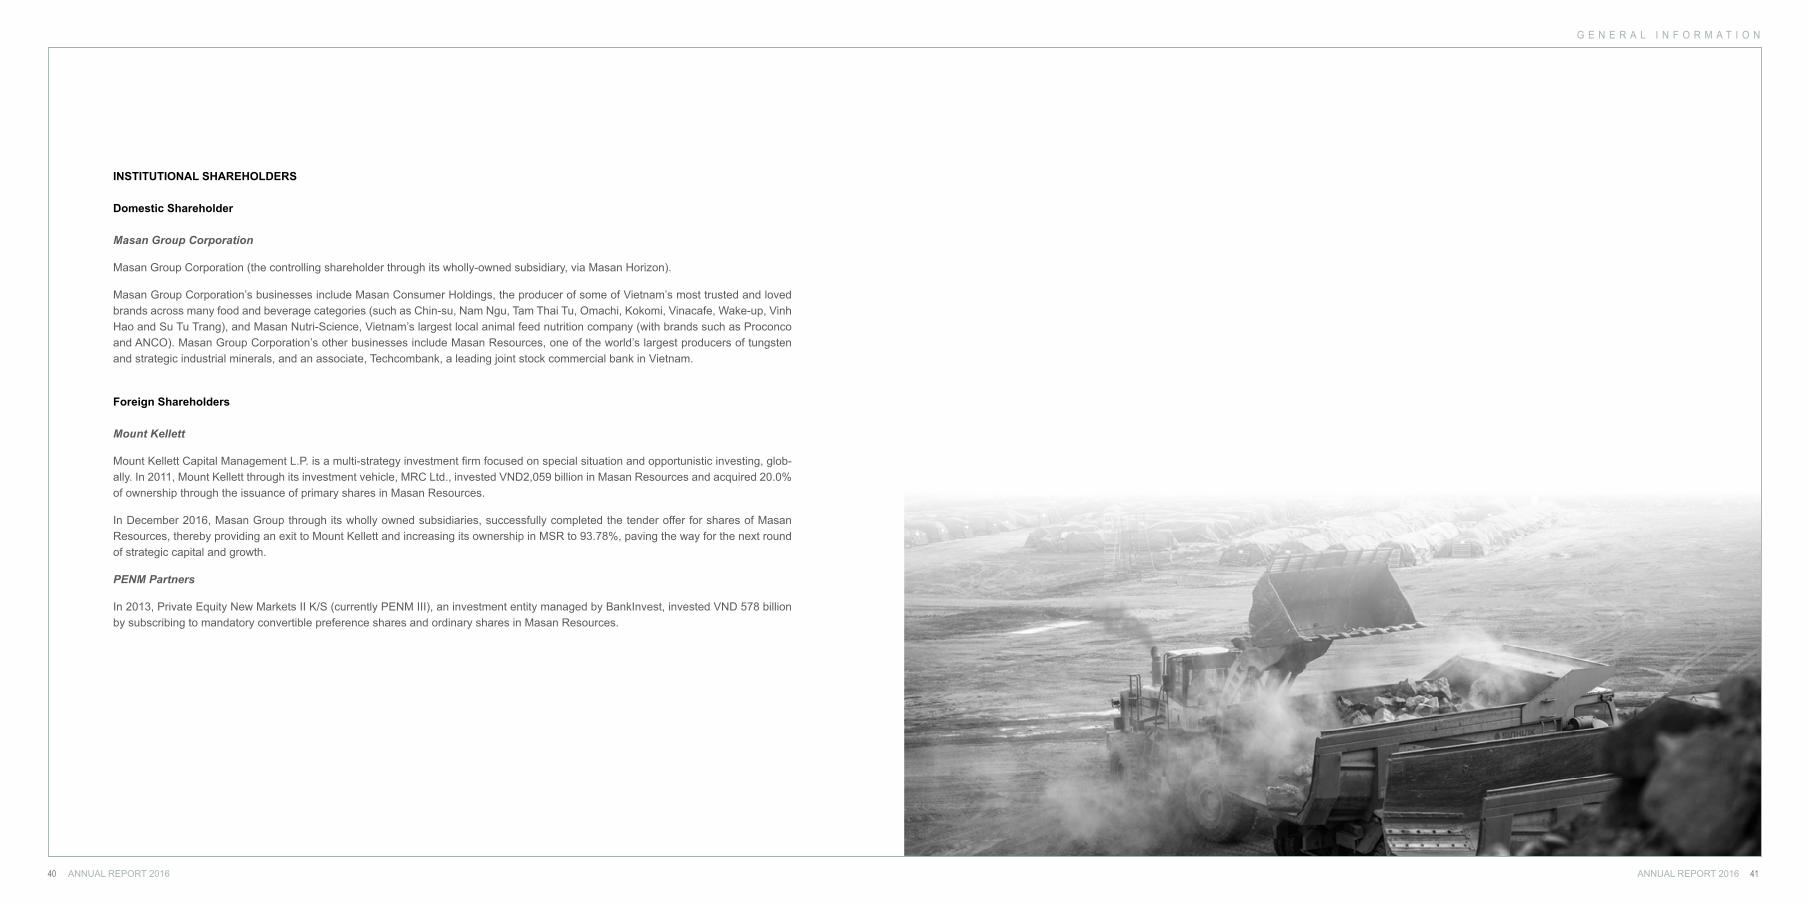
Masan Group Corporation (the controlling shareholder through its wholly-owned subsidiary, via Masan Horizon).
Masan Group Corporation’s businesses include Masan Consumer Holdings, the producer of some of Vietnam’s most trusted and loved brands across many food and beverage categories (such as Chin-su, Nam Ngu, Tam Thai Tu, Omachi, Kokomi, Vinacafe, Wake-up, Vinh Hao and Su Tu Trang), and Masan Nutri-Science, Vietnam’s largest local animal feed nutrition company (with brands such as Proconco and ANCO). Masan Group Corporation’s other businesses include Masan Resources, one of the world’s largest producers of tungsten and strategic industrial minerals, and an associate, Techcombank, a leading joint stock commercial bank in Vietnam.
Foreign Shareholders
Mount Kellett
Mount Kellett Capital Management L.P. is a multi-strategy investment firm focused on special situation and opportunistic investing, glob-ally. In 2011, Mount Kellett through its investment vehicle, MRC Ltd., invested VND2,059 billion in Masan Resources and acquired 20.0% of ownership through the issuance of primary shares in Masan Resources.
In December 2016, Masan Group through its wholly owned subsidiaries, successfully completed the tender offer for shares of Masan Resources, thereby providing an exit to Mount Kellett and increasing its ownership in MSR to 93.78%, paving the way for the next round of strategic capital and growth.
PENM Partners
In 2013, Private Equity New Markets II K/S (currently PENM III), an investment entity managed by BankInvest, invested VND 578 billion by subscribing to mandatory convertible preference shares and ordinary shares in Masan Resources.
ANNUAL REPORT 2016ANNUAL REPORT 201642 43
D E V E L O P M E N T S T R A T E G Y
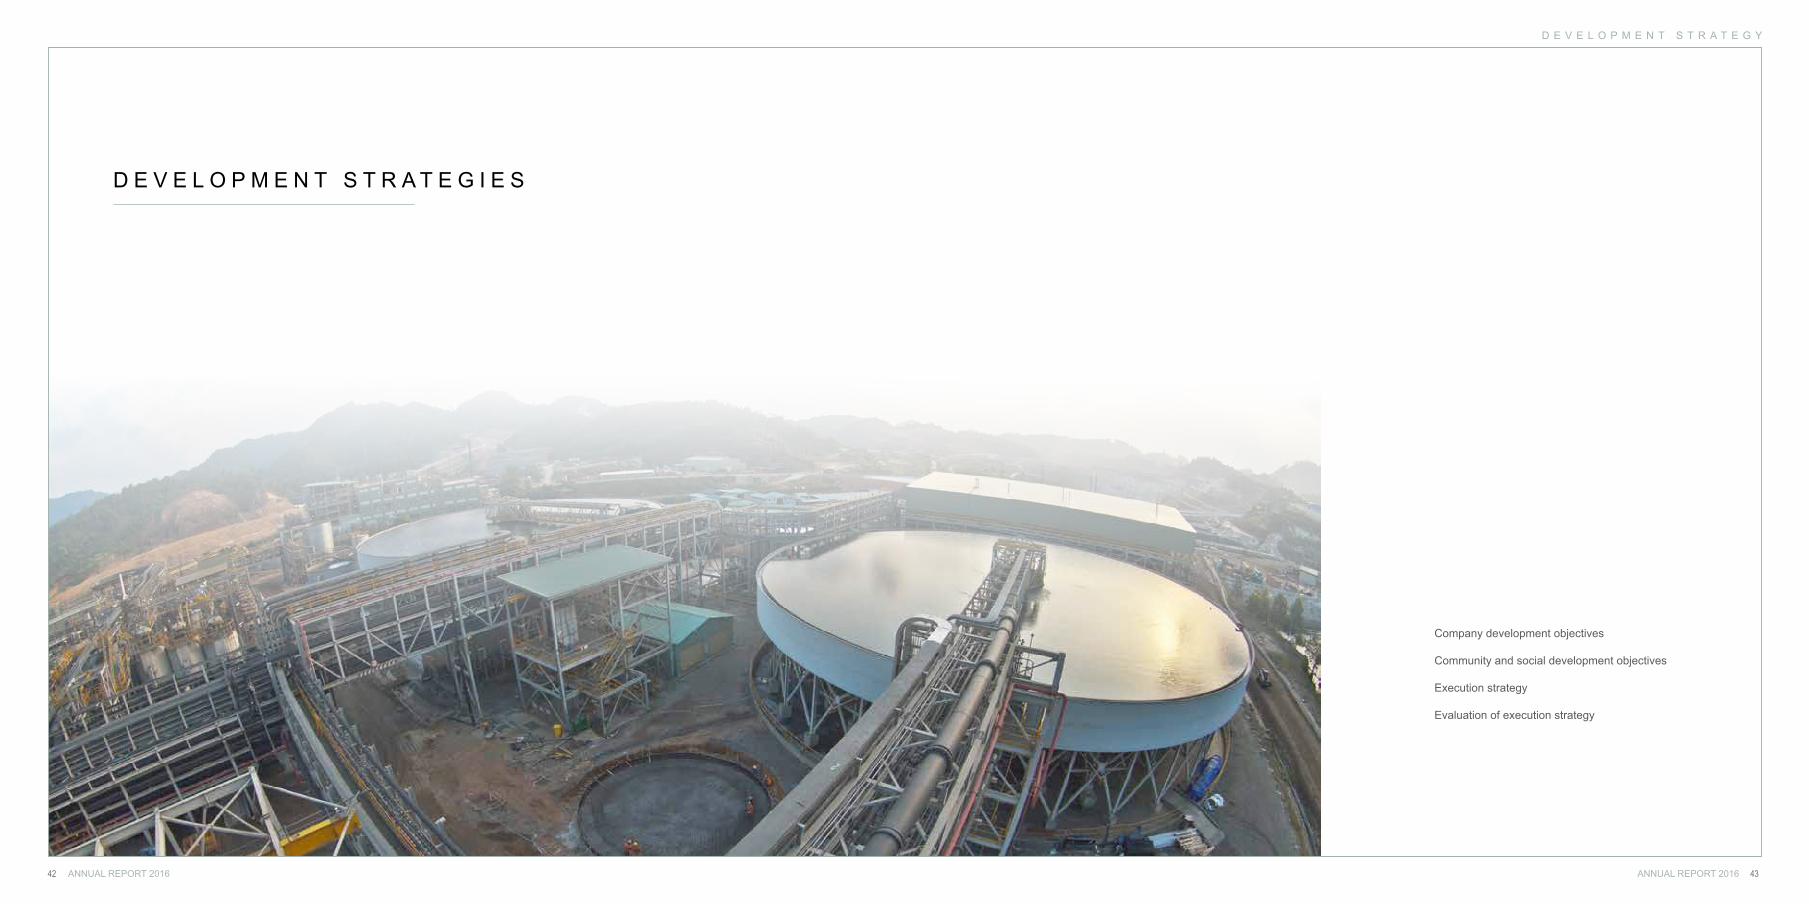
D E V E L O P M E N T S T R A T E G I E S
Company development objectives
Community and social development objectives
Execution strategy
Evaluation of execution strategy
ANNUAL REPORT 2016ANNUAL REPORT 201644 45
Masan Resources believes that a strong local understanding of community concerns and local sensitivities is critical for successful project development. We have been able to create a favorable business environment to develop and operate the Nui Phao mine by working proactively with our local communities.
On identification of value accretive scalable assets, Masan Resources has the ability to access internal and external capital to acquire, develop and stabilize these assets to insure the realization of sustainable long-term shareholder value.
Masan Resources is hedged against commodity price fluctuations through the diversification of its portfolio of metals and minerals. Masan Resources’ low operational and financial risk is a result of its management’s ability to leverage their and Masan Group’s vast investor and partner network.
EXECUTION STRATEGY
Our execution strategy for building our business is focused on three key areas:
Leverage local relationships to access and execute on opportunities
Use capital to acquire and develop quality assets
Derisking projects through the Masan platform
D E V E L O P M E N T S T R A T E G Y
COMPANY DEVELOPMENT OBJECTIVES
COMMUNITY AND SOCIAL DEVELOPMENT OBJECTIVES
Through our values of Respect, Action and Results in all of our interactions, Masan Resources commits to continuously honor its respon-sibilities.
We deeply care about the impact of our project on the surrounding communities and the environment. Accordingly, our environmental and social plans are built in accordance with IMF Performance Standards and with Equator Principles (the ‘golden standard’ for social and environmental sustainability for mining projects) to add value to our communities and to minimize any adverse impacts from our project works.
In order to become an industry leader that is able to transform the global tungsten market, our development objectives are to:
Achieve industrial superior returns for our shareholders.Acquire, explore and develop value accretive assets to become the largest non-China producer of tungsten products.Constantly work to improve operational efficiencies and maintain cost discipline.Operate as one of the most environmentally sustainable global mining and processing companies with world-class safety standards.
ANNUAL REPORT 2016ANNUAL REPORT 201646 47
EVALUATION OF EXECUTION STRATEGY IN THE CONTEXT OFINDUSTRY STRATEGY, STATE POLICIES AND THE GLOBAL TRENDS
Masan Resources commits to deliver shareholder value by lever-aging off its four development pillars:
Organic and inorganic growth
As part of Masan Resources’ approach to operations, we are con-stantly seeking to grow organically by optimizing our existing facil-ities to maximize productivity and efficiency. Through margin-led improvement plans we aim to further reduce our unit cost of pro-duction. From the onset of mining operations, Masan Resources has successfully demonstrated its ability to grow the resources and reserves base at a rate greater than its depletion.
Masan Resources is seeking to acquire Tier 1 (high value, strate-gically positioned, long-life, and low cost production) reserves from distressed industry players or by carving-out specific non-core as-sets from larger integrated players.
Consistent focus on cost discipline and improving productivity
Mining as an industry is a long-term play. Masan Resources’ con-sistent focus on cost discipline combined with relentless efforts to improve productivity enhances its ability to take long-term invest-ment decisions and enables it to withstand pricing and market vol-atility.
Long-term capital
Masan Resources tailors its capitalization structure to that of the operational profile of its assets. The VND 8,100 billion refinancing of our existing debt and the transformation of Masan Resources into a public company are the steps we took in 2015 to secure the right form of capital to support our long-term strategy. Our listing on HNX’s UPCOM platform allows us to reduce our cost of funds going forward as it provides lenders and strategic long-term inves-tors a ‘liquid currency’ through which to better manage their risk appetite.
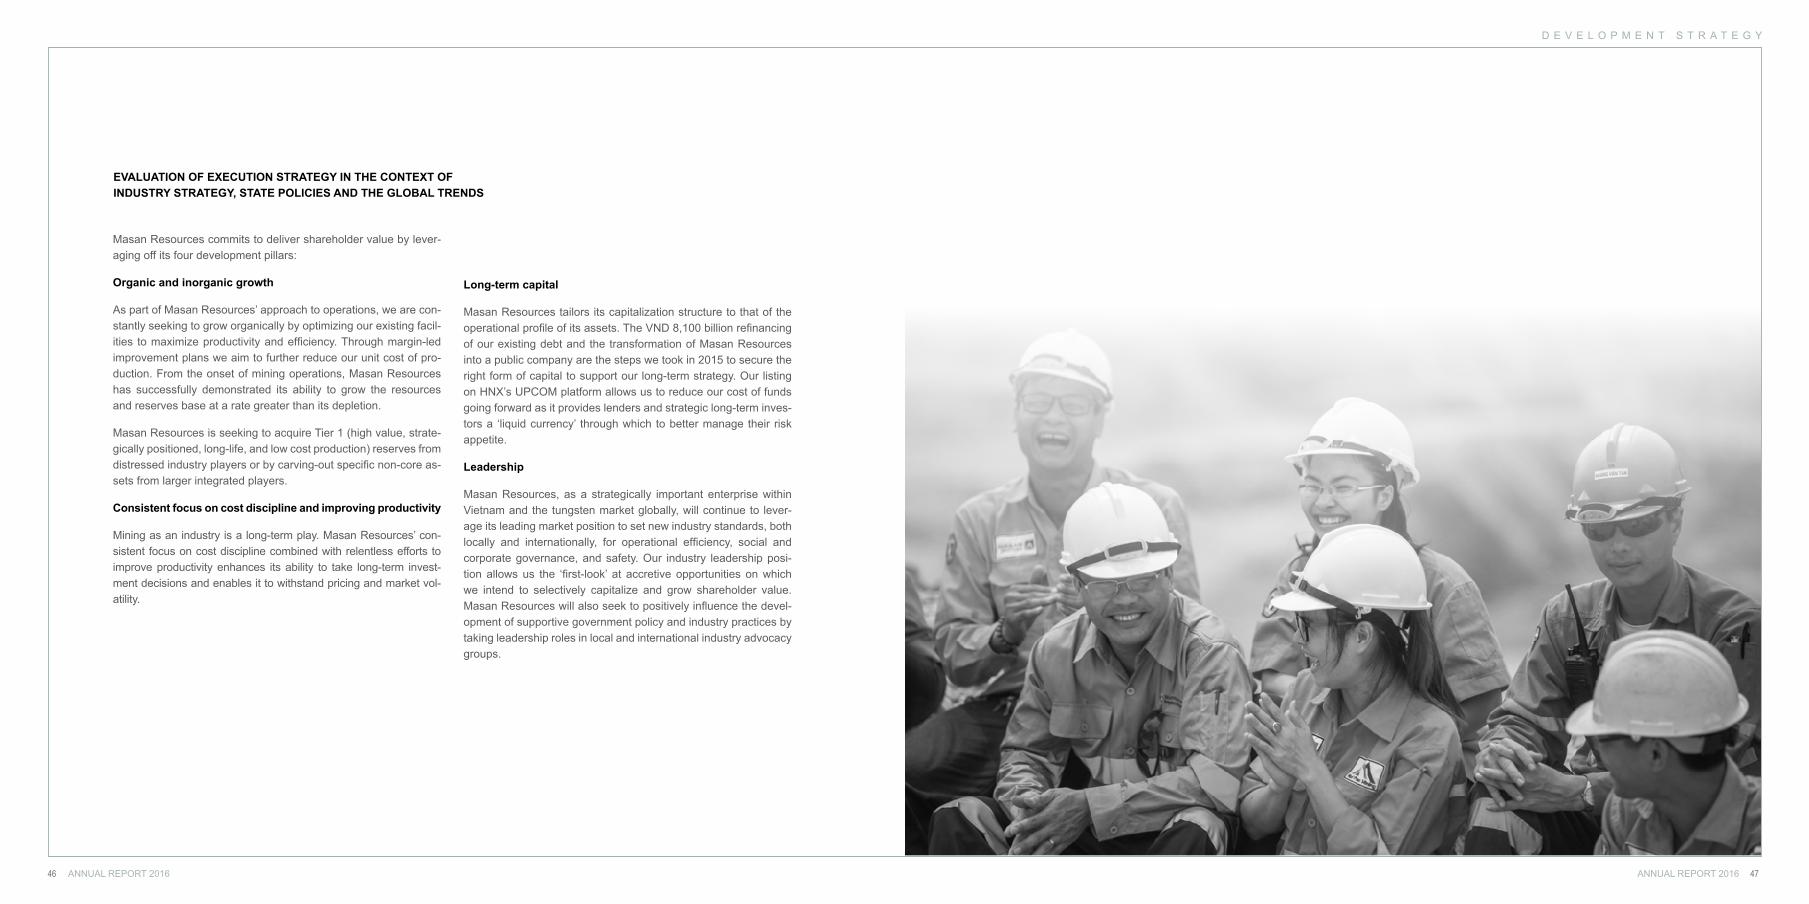
Leadership
Masan Resources, as a strategically important enterprise within Vietnam and the tungsten market globally, will continue to lever-age its leading market position to set new industry standards, both locally and internationally, for operational efficiency, social and corporate governance, and safety. Our industry leadership posi-tion allows us the ‘first-look’ at accretive opportunities on which we intend to selectively capitalize and grow shareholder value. Masan Resources will also seek to positively influence the devel-opment of supportive government policy and industry practices by taking leadership roles in local and international industry advocacy groups.
D E V E L O P M E N T S T R A T E G Y
ANNUAL REPORT 2016ANNUAL REPORT 201648 49
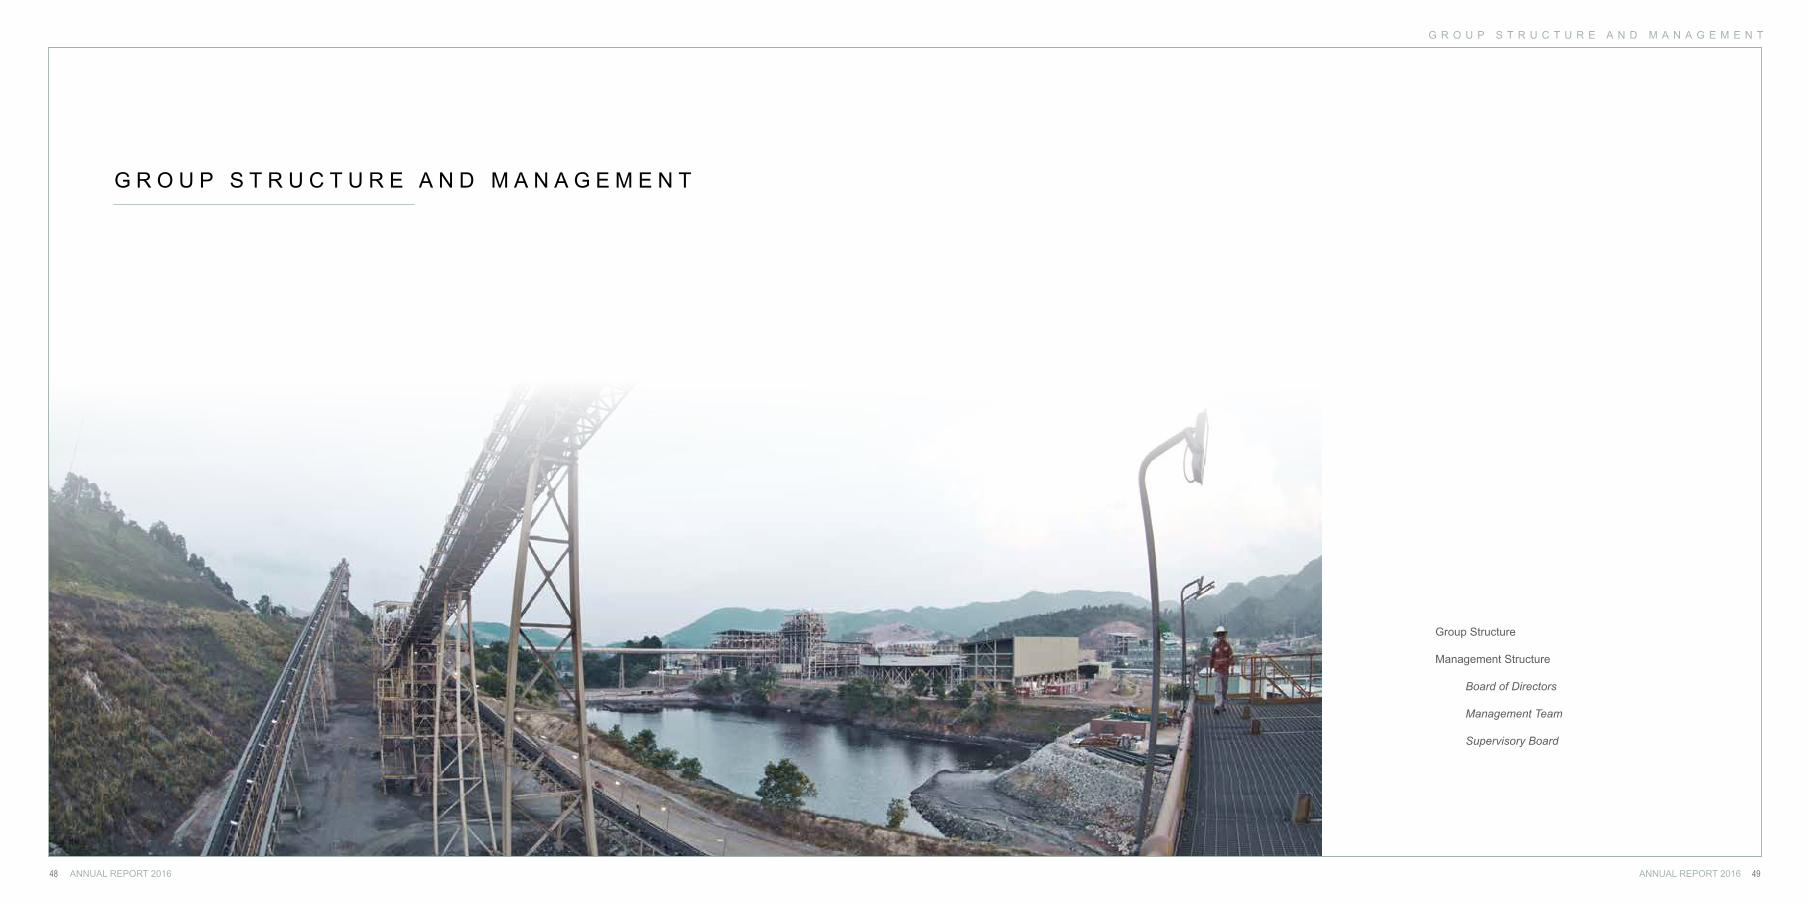
G R O U P S T R U C T U R E A N D M A N A G E M E N T
G R O U P S T R U C T U R E A N D M A N A G E M E N T
Group Structure
Management Structure
Board of Directors
Management Team
Supervisory Board
ANNUAL REPORT 2016ANNUAL REPORT 201650 51
G R O U P S T R U C T U R E A N D M A N A G E M E N T
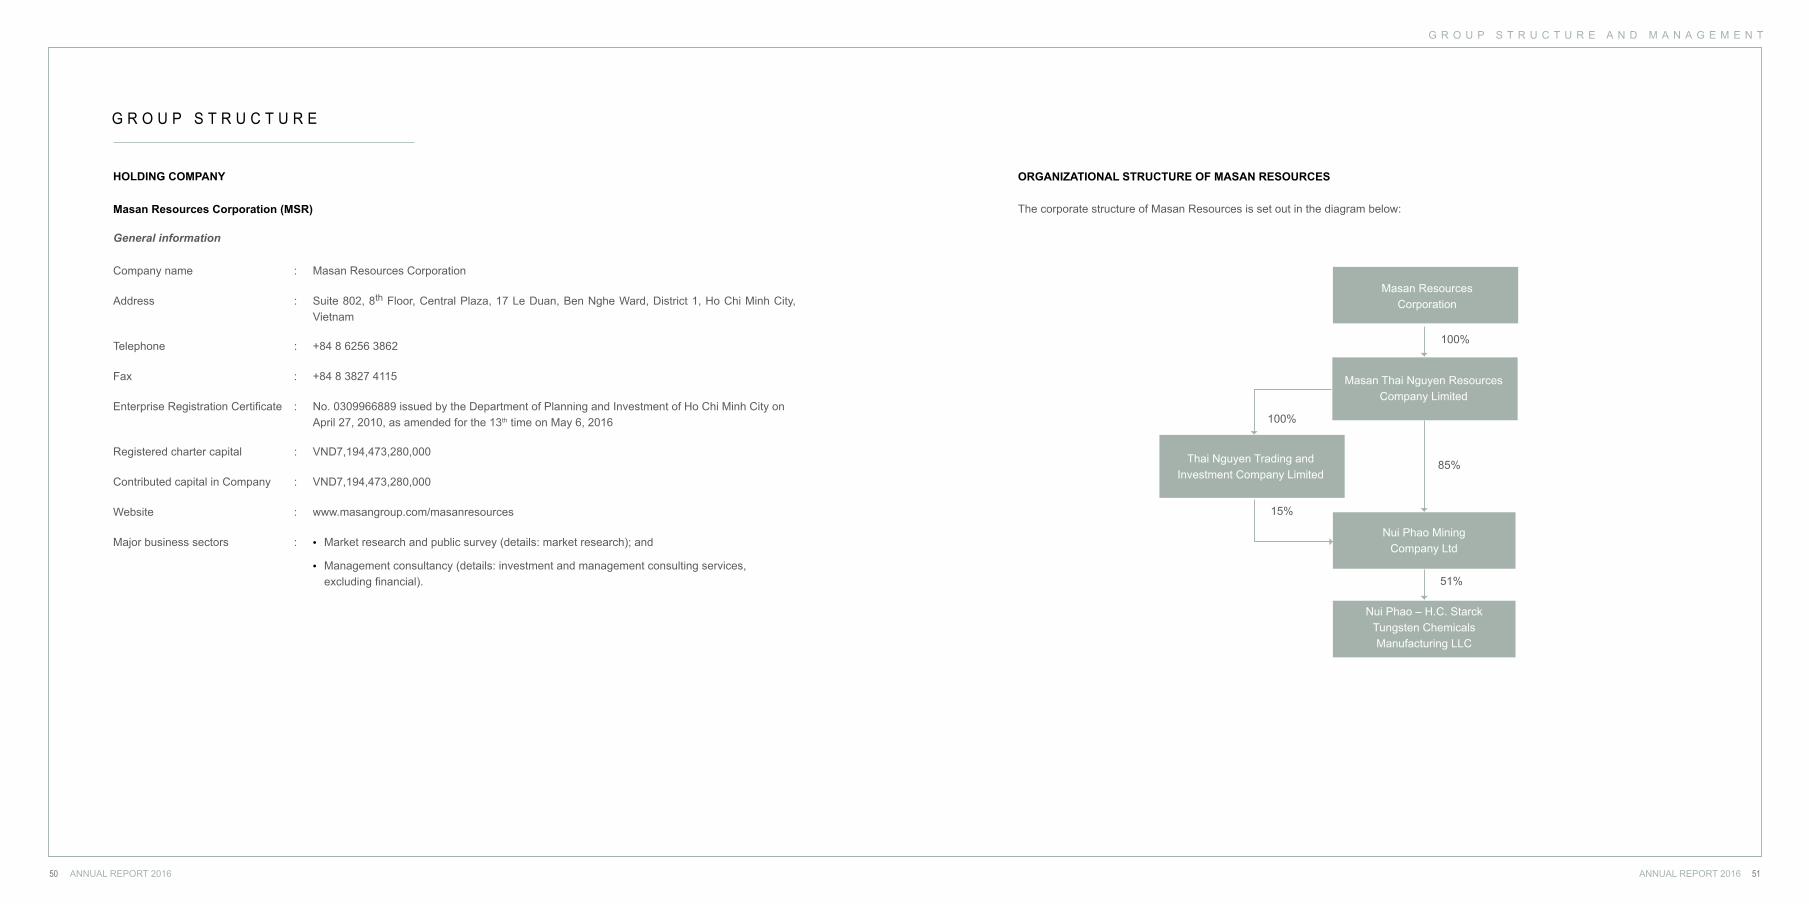
G R O U P S T R U C T U R E
HOLDING COMPANY
Company name : Masan Resources Corporation
Address : Suite 802, 8th Floor, Central Plaza, 17 Le Duan, Ben Nghe Ward, District 1, Ho Chi Minh City, Vietnam
Telephone : +84 8 6256 3862
Fax : +84 8 3827 4115
Enterprise Registration Certificate : No. 0309966889 issued by the Department of Planning and Investment of Ho Chi Minh City on April 27, 2010, as amended for the 13th time on May 6, 2016
Registered charter capital : VND7,194,473,280,000
Contributed capital in Company : VND7,194,473,280,000
Website : www.masangroup.com/masanresources
Major business sectors : • Market research and public survey (details: market research); and
• Management consultancy (details: investment and management consulting services,excluding financial).
Masan Resources Corporation (MSR)
General information
ORGANIZATIONAL STRUCTURE OF MASAN RESOURCES
The corporate structure of Masan Resources is set out in the diagram below:
100%
100%
15%
85%
51%
Masan Resources Corporation
Masan Thai Nguyen Resources Company Limited
Thai Nguyen Trading andInvestment Company Limited
Nui Phao Mining Company Ltd
Nui Phao – H.C. Starck Tungsten Chemicals Manufacturing LLC
ANNUAL REPORT 2016ANNUAL REPORT 201652 53
G R O U P S T R U C T U R E A N D M A N A G E M E N T
Masan Thai Nguyen Resources Company Limited (MRTN)
CONSOLIDATED SUBSIDIARIES
Company name : Masan Thai Nguyen Resources
Address : Suite 802, 8th Floor, Central Plaza, 17 Le Duan, Ben Nghe Ward, District 1,Ho Chi Minh City, Vietnam
Telephone : +84 8 6256 3862
Fax : +84 8 3827 4115
Enterprise Registration Certificate : No. 0309960069 issued by the Department of Planning and Investment of Ho Chi Minh City on May 7, 2010, and amended for the 5th time on June 17, 2016
Registered charter capital : VND 5,140,335,573,000
Contributed capital in Company : VND 5,140,335,573,000
Capital contribution ratio of the Company : 100% of charter capital
Major business sectors : • Market research and public survey (details: market research); and
• Management consultancy (details: investment and management consulting services, excluding financial).
General information
Thai Nguyen Trading and Investment Company Limited (TNTI)
Company name : Thai Nguyen Trading and Investment Company Limited
Address : Suite 802, 8th Floor, Central Plaza, 17 Le Duan, Ben Nghe Ward, District 1,Ho Chi Minh City, Vietnam
Telephone : +84 8 6256 3862
Fax : +84 8 3827 4115
Enterprise Registration Certificate : No. 0310352925 issued by the Department of Planning and Investment of Ho Chi Minh City on October 15, 2010, as amended for the 6th time on April 17, 2014
Registered charter capital : VND1,624,861,500,000
Contributed capital in Company : VND1,624,861,500,000
Capital contribution ratio of the Company : 100% of charter capital
Major business sectors : • Management consultancy (details: investment and management consulting services,excluding financial and accounting consulting services);
• Advertising;
• Market research and public survey (details: market research);
• Extraction of precious and rare minerals (not operating at the head office);
• Extraction of non-ferrous metals (not operating at the head office);
• Trade promotion; and
• Financial support services, not classified (details: investment consulting services,excluding legal, financial and accounting consulting services).
General information
TNTI was incorporated on October 15, 2010 as a one-member limited liability company to carry out the business of consultancy (excluding financial and accounting consultancy), advertising, market research and trading promotion. Among the group of companies established to develop the Nui Phao Project were MRTN, Nui Phao Mining and TNTI.
ANNUAL REPORT 2016ANNUAL REPORT 201654 55
G R O U P S T R U C T U R E A N D M A N A G E M E N T
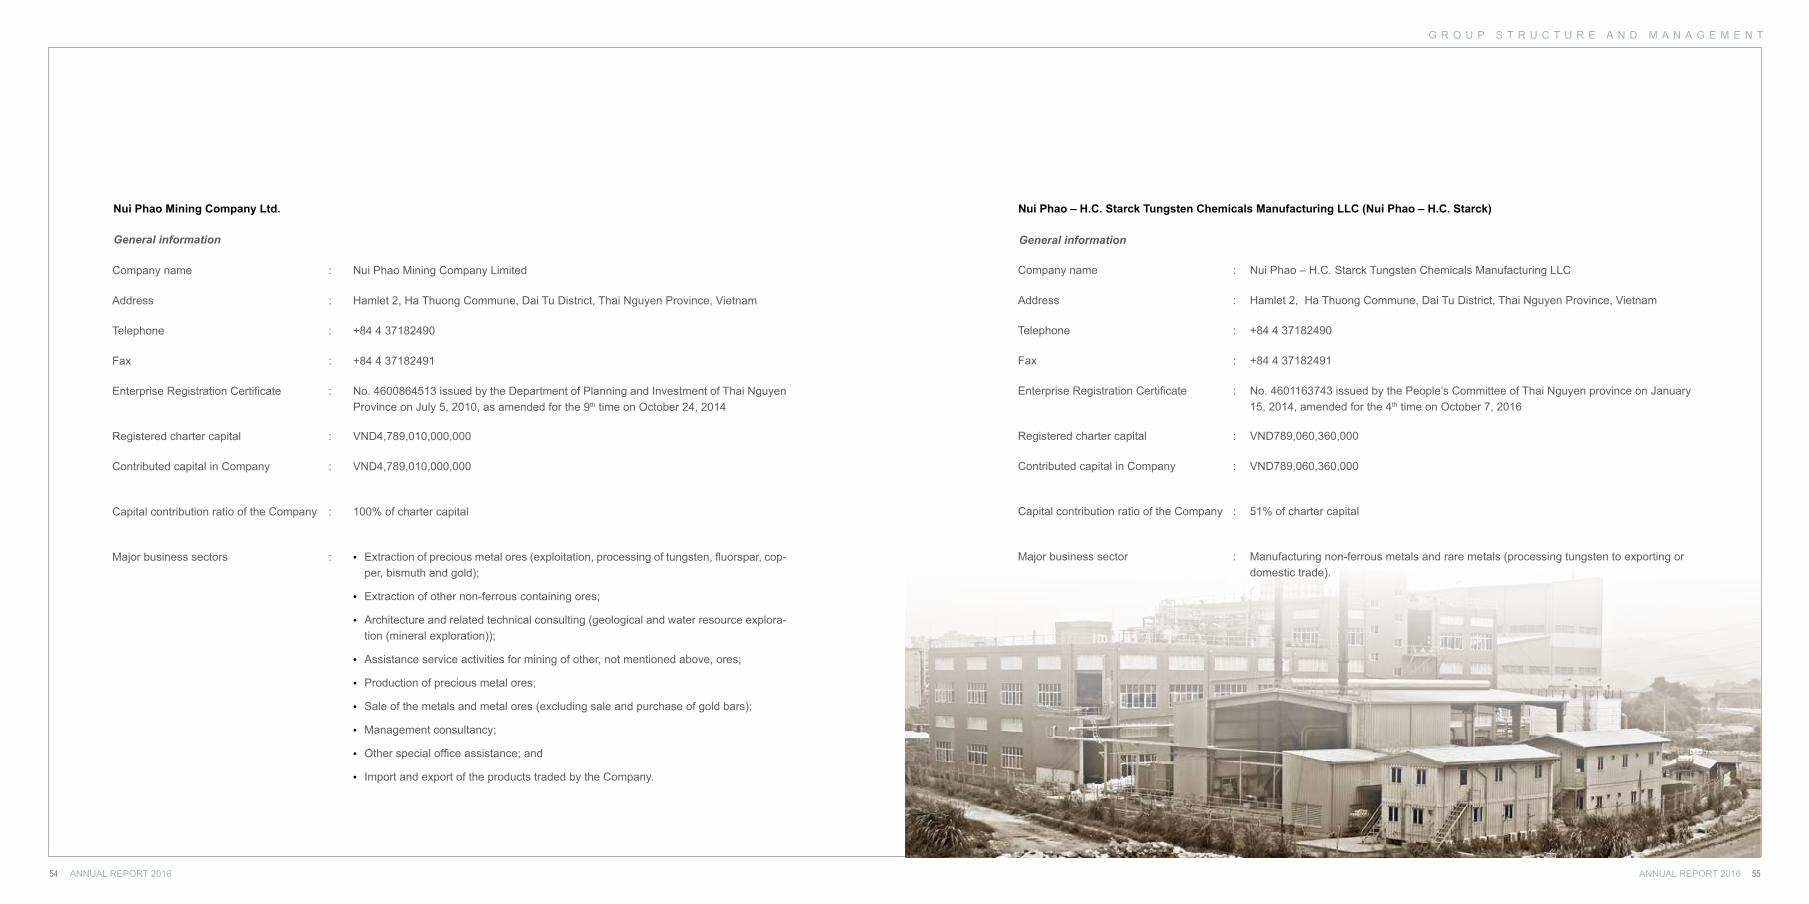
Nui Phao Mining Company Ltd.
Company name : Nui Phao Mining Company Limited
Address : Hamlet 2, Ha Thuong Commune, Dai Tu District, Thai Nguyen Province, Vietnam
Telephone : +84 4 37182490
Fax : +84 4 37182491
Enterprise Registration Certificate : No. 4600864513 issued by the Department of Planning and Investment of Thai Nguyen Province on July 5, 2010, as amended for the 9th time on October 24, 2014
Registered charter capital : VND4,789,010,000,000
Contributed capital in Company : VND4,789,010,000,000
Capital contribution ratio of the Company : 100% of charter capital
Major business sectors : • Extraction of precious metal ores (exploitation, processing of tungsten, fluorspar, cop-per, bismuth and gold);
• Extraction of other non-ferrous containing ores;
• Architecture and related technical consulting (geological and water resource explora-tion (mineral exploration));
• Assistance service activities for mining of other, not mentioned above, ores;
• Production of precious metal ores;
• Sale of the metals and metal ores (excluding sale and purchase of gold bars);
• Management consultancy;
• Other special office assistance; and
• Import and export of the products traded by the Company.
General information
Nui Phao – H.C. Starck Tungsten Chemicals Manufacturing LLC (Nui Phao – H.C. Starck)
Company name : Nui Phao – H.C. Starck Tungsten Chemicals Manufacturing LLC
Address : Hamlet 2, Ha Thuong Commune, Dai Tu District, Thai Nguyen Province, Vietnam
Telephone : +84 4 37182490
Fax : +84 4 37182491
Enterprise Registration Certificate : No. 4601163743 issued by the People’s Committee of Thai Nguyen province on January 15, 2014, amended for the 4th time on October 7, 2016
Registered charter capital : VND789,060,360,000
Contributed capital in Company : VND789,060,360,000
Capital contribution ratio of the Company : 51% of charter capital
Major business sector : Manufacturing non-ferrous metals and rare metals (processing tungsten to exporting or domestic trade).
General information
ANNUAL REPORT 2016ANNUAL REPORT 201656 57
G R O U P S T R U C T U R E A N D M A N A G E M E N T
M A N A G E M E N T S T R U C T U R E
Dr. NguyenDang QuangMember
Mr. NguyenThieu NamMember
Mr. Chetan Prakash BaxiChairman
Mr. Jonathan David FiorelloMember
Mr. Dominic JohnHeatonMember
BOARD OF DIRECTORS
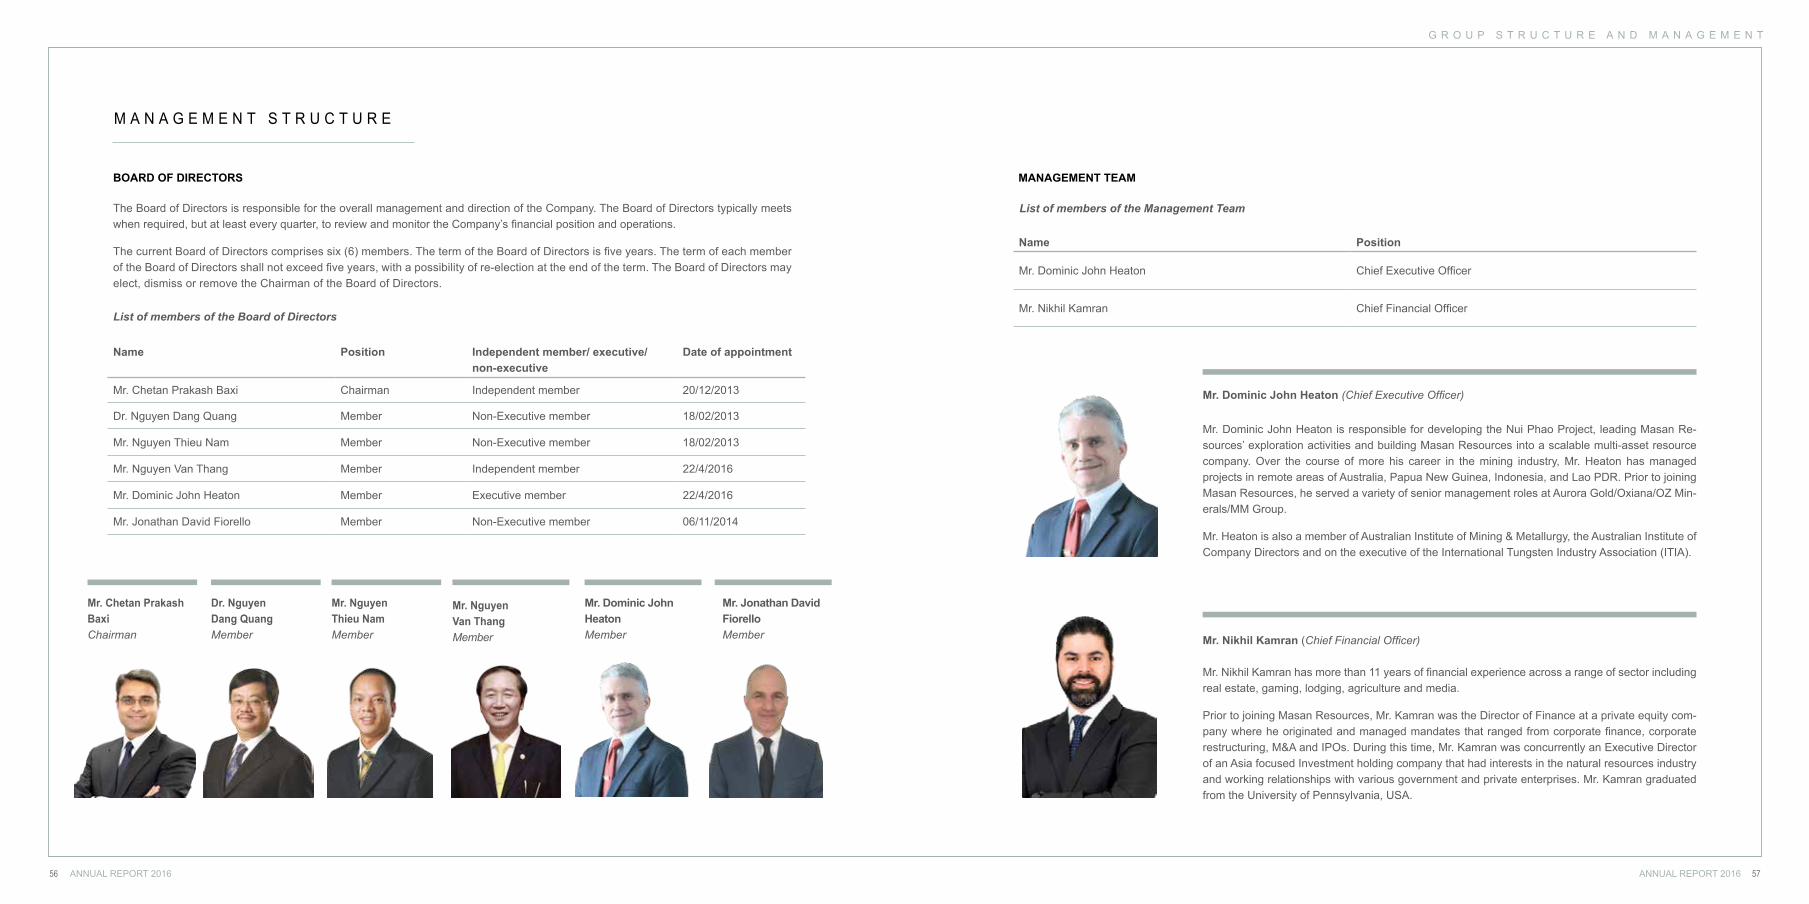
The Board of Directors is responsible for the overall management and direction of the Company. The Board of Directors typically meets when required, but at least every quarter, to review and monitor the Company’s financial position and operations.
The current Board of Directors comprises six (6) members. The term of the Board of Directors is five years. The term of each member of the Board of Directors shall not exceed five years, with a possibility of re-election at the end of the term. The Board of Directors may elect, dismiss or remove the Chairman of the Board of Directors.
List of members of the Board of Directors
Name Position Independent member/ executive/ non-executive
Date of appointment
Mr. Chetan Prakash Baxi Chairman Independent member 20/12/2013
Dr. Nguyen Dang Quang Member Non-Executive member 18/02/2013
Mr. Nguyen Thieu Nam Member Non-Executive member 18/02/2013
Mr. Nguyen Van Thang Member Independent member 22/4/2016
Mr. Dominic John Heaton Member Executive member 22/4/2016
Mr. Jonathan David Fiorello Member Non-Executive member 06/11/2014
Mr. NguyenVan ThangMember
List of members of the Management Team
MANAGEMENT TEAM
Mr. Dominic John Heaton (Chief Executive Officer)
Mr. Nikhil Kamran (Chief Financial Officer)
Mr. Dominic John Heaton is responsible for developing the Nui Phao Project, leading Masan Re-sources’ exploration activities and building Masan Resources into a scalable multi-asset resource company. Over the course of more his career in the mining industry, Mr. Heaton has managed projects in remote areas of Australia, Papua New Guinea, Indonesia, and Lao PDR. Prior to joining Masan Resources, he served a variety of senior management roles at Aurora Gold/Oxiana/OZ Min-erals/MM Group.
Mr. Heaton is also a member of Australian Institute of Mining & Metallurgy, the Australian Institute of Company Directors and on the executive of the International Tungsten Industry Association (ITIA).
Name Position
Mr. Dominic John Heaton Chief Executive Officer
Mr. Nikhil Kamran Chief Financial Officer
Mr. Nikhil Kamran has more than 11 years of financial experience across a range of sector including real estate, gaming, lodging, agriculture and media.
Prior to joining Masan Resources, Mr. Kamran was the Director of Finance at a private equity com-pany where he originated and managed mandates that ranged from corporate finance, corporate restructuring, M&A and IPOs. During this time, Mr. Kamran was concurrently an Executive Director of an Asia focused Investment holding company that had interests in the natural resources industry and working relationships with various government and private enterprises. Mr. Kamran graduated from the University of Pennsylvania, USA.
ANNUAL REPORT 2016ANNUAL REPORT 201658 59
G R O U P S T R U C T U R E A N D M A N A G E M E N T
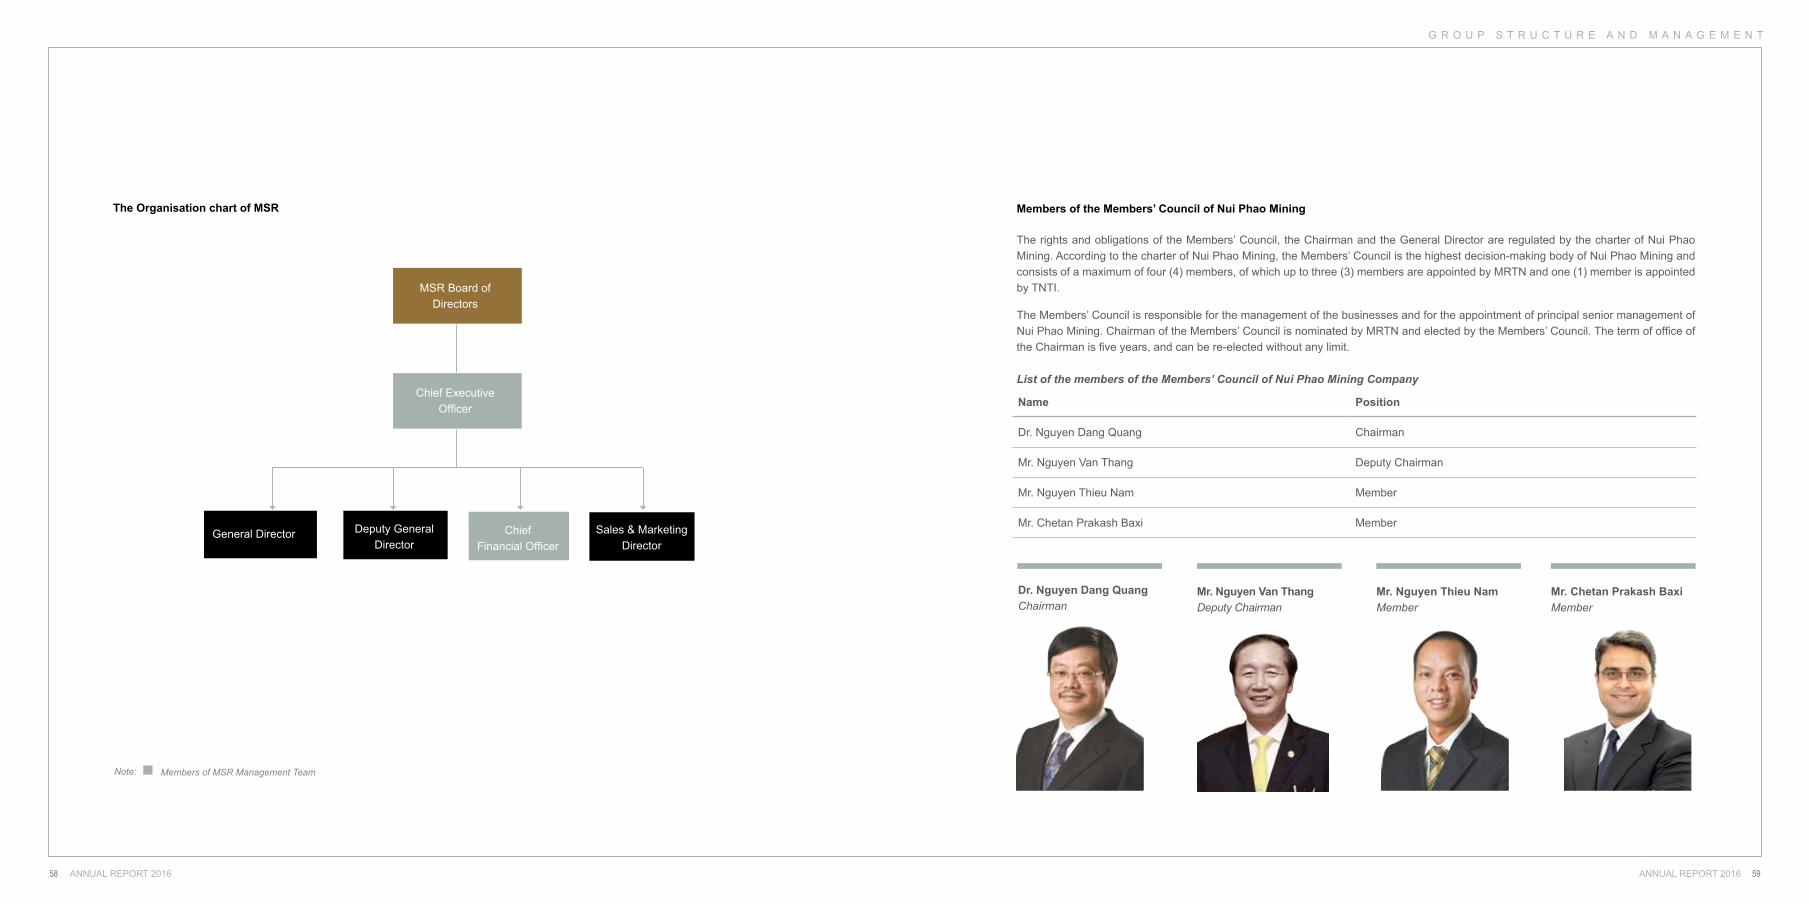
Chief Executive Officer
MSR Board of Directors
General Director Deputy General Director
ChiefFinancial Officer
Sales & Marketing Director
The Organisation chart of MSR
Note: Members of MSR Management Team
Members of the Members’ Council of Nui Phao Mining
List of the members of the Members’ Council of Nui Phao Mining Company
The rights and obligations of the Members’ Council, the Chairman and the General Director are regulated by the charter of Nui Phao Mining. According to the charter of Nui Phao Mining, the Members’ Council is the highest decision-making body of Nui Phao Mining and consists of a maximum of four (4) members, of which up to three (3) members are appointed by MRTN and one (1) member is appointed by TNTI.
The Members’ Council is responsible for the management of the businesses and for the appointment of principal senior management of Nui Phao Mining. Chairman of the Members’ Council is nominated by MRTN and elected by the Members’ Council. The term of office of the Chairman is five years, and can be re-elected without any limit.
Name Position
Dr. Nguyen Dang Quang Chairman
Mr. Nguyen Van Thang Deputy Chairman
Mr. Nguyen Thieu Nam Member
Mr. Chetan Prakash Baxi Member
Dr. Nguyen Dang Quang Chairman
Mr. Nguyen Thieu Nam Member
Mr. Chetan Prakash Baxi Member
Mr. Nguyen Van Thang Deputy Chairman
ANNUAL REPORT 2016ANNUAL REPORT 201660 61
G R O U P S T R U C T U R E A N D M A N A G E M E N T
Mr. Craig Bradshaw has over 23 years’ experience in the mining business, spanning mining and processing opera-tions, logistics, and sales and marketing in Australia, Thai-land and Lao PDR. Mr. Brad-shaw was previously Senior Commercial Manager for Lang Xang Minerals Ltds Sepon Mine. He has also previously served as the Country Gen-eral Manager for Thailand for Toll, Australasia’s largest fully integrated logistics service pro-vider.
Mr. Vu Hong has more than 30 years of experience in pro-ject development including six years at the World Bank, which took him from Vietnam to Lao PDR, East Timor, China and the Philippines. Mr. Vu Hong graduated from Hanoi Water Resources University, Hanoi, Vietnam and has a Master’s degree in Hydrology from the University of Roorkee, India.
Mr. Vu Hong is a member of the executive committee of the Business Association of Geol-ogy and Minerals of Vietnam (VAGME).
Management Team of Nui Phao Mining Company Ltd,.
Mr. Tony Fitzgerald has more than 25 years of experience in the metals industry across a range of commodities and products including refined cop-per, zinc, lead and mineral con-centrates. Mr. Fitzgerald has worked with Pasminco, MIM, Xstrata, Transamine and Lou-is Dreyfus in marketing, inter-national sales, metals trading, business development and mine to market logistics. He holds a BA in multi-disciplinary from Victoria College, Australia.
Mr. Nikhil Kamran has more than 11 years of financial expe-rience across a range of sector including real estate, gaming, lodging, agriculture and media.Prior to joining Masan Resourc-es, Mr. Kamran was the Direc-tor of Finance at a private equity company where he originated and managed mandates that ranged from corporate finance, corporate restructuring, M&A and IPOs. During this time, Mr. Kamran was concurrently an Executive Director of an Asia focused Investment holding company that had interests in the natural resources industry and working relationships with various government and private enterprises. Mr. Kamran grad-uated from the University of Pennsylvania, USA.
Mr. Nikhil KamranChief Financial Officer
Mr. Tony FitzgeraldSales & Marketing Director
Mr. Vu HongDeputy General Director
Mr. Craig Bradshaw General Director
SUPERVISORY BOARD
List of members of the Supervisory Board
Name Position Date of appointment
Ms. Doan Thi My Duyen Head of the Supervisory Board 05/5/2015
Mr. Nguyen Quynh Lam Member 22/4/2016
Mr. Tung Hoang Nguyen Member 22/4/2016
Mr. Nguyen Quynh Lam is a member of the Supervisory Board of MSR, and the Head of the Supervisory Board of both MSN and MSC. He joined Masan Group since 2001 and has held various senior fi-nancial positions in Masan Group compa-nies. He holds a BSc in Mining Economic.
Ms. Doan Thi My Duyen is the Head of the Supervisory Board of MSR, and the Chief Accountant of MSN. At MSN, she is in charge of reporting on financial conditions and announcement and management of the financial matters. Prior to joining Masan Group, she was with KPMG Lim-ited, Vietnam. She holds an MBA in Ac-counting from the University of Econom-ics of Ho Chi Minh City, Vietnam and is a member of the Association of Chartered Certified Accountants (ACCA).
Mr. Tung Hoang Nguyen is a member of the Supervisory Board of MSR, and the Chief Financial Officer of Masan Con-sumer Holdings. He also used to be the Chief Financial Officer of Masan Nu-tri-Science. Prior to joining Masan Group, he held senior financial positions at vari-ous corporations in Canada. He holds an MBA in Strategic Planning and a Master in International Accounting. He is also a Chartered Professional Accountant (CPA) of Canada.
Ms. Doan Thi My Duyen Mr. Nguyen Quynh Lam Mr. Tung Hoang Nguyen
B U S I N E S S O P E R A T I O N R E P O R T S
ANNUAL REPORT 2016ANNUAL REPORT 201662 63
B U S I N E S S O P E R A T I O N R E P O R T S
Business Overview Report
Management Team Assessment Report
Board of Directors Assessment Report
Report of the Supervisory Board
Corporate Governance Report
Human Resources Management Report
Risk Management Report
B U S I N E S S O P E R A T I O N R E P O R T S
ANNUAL REPORT 2016ANNUAL REPORT 201664 65
B U S I N E S S O V E R V I E W R E P O R T
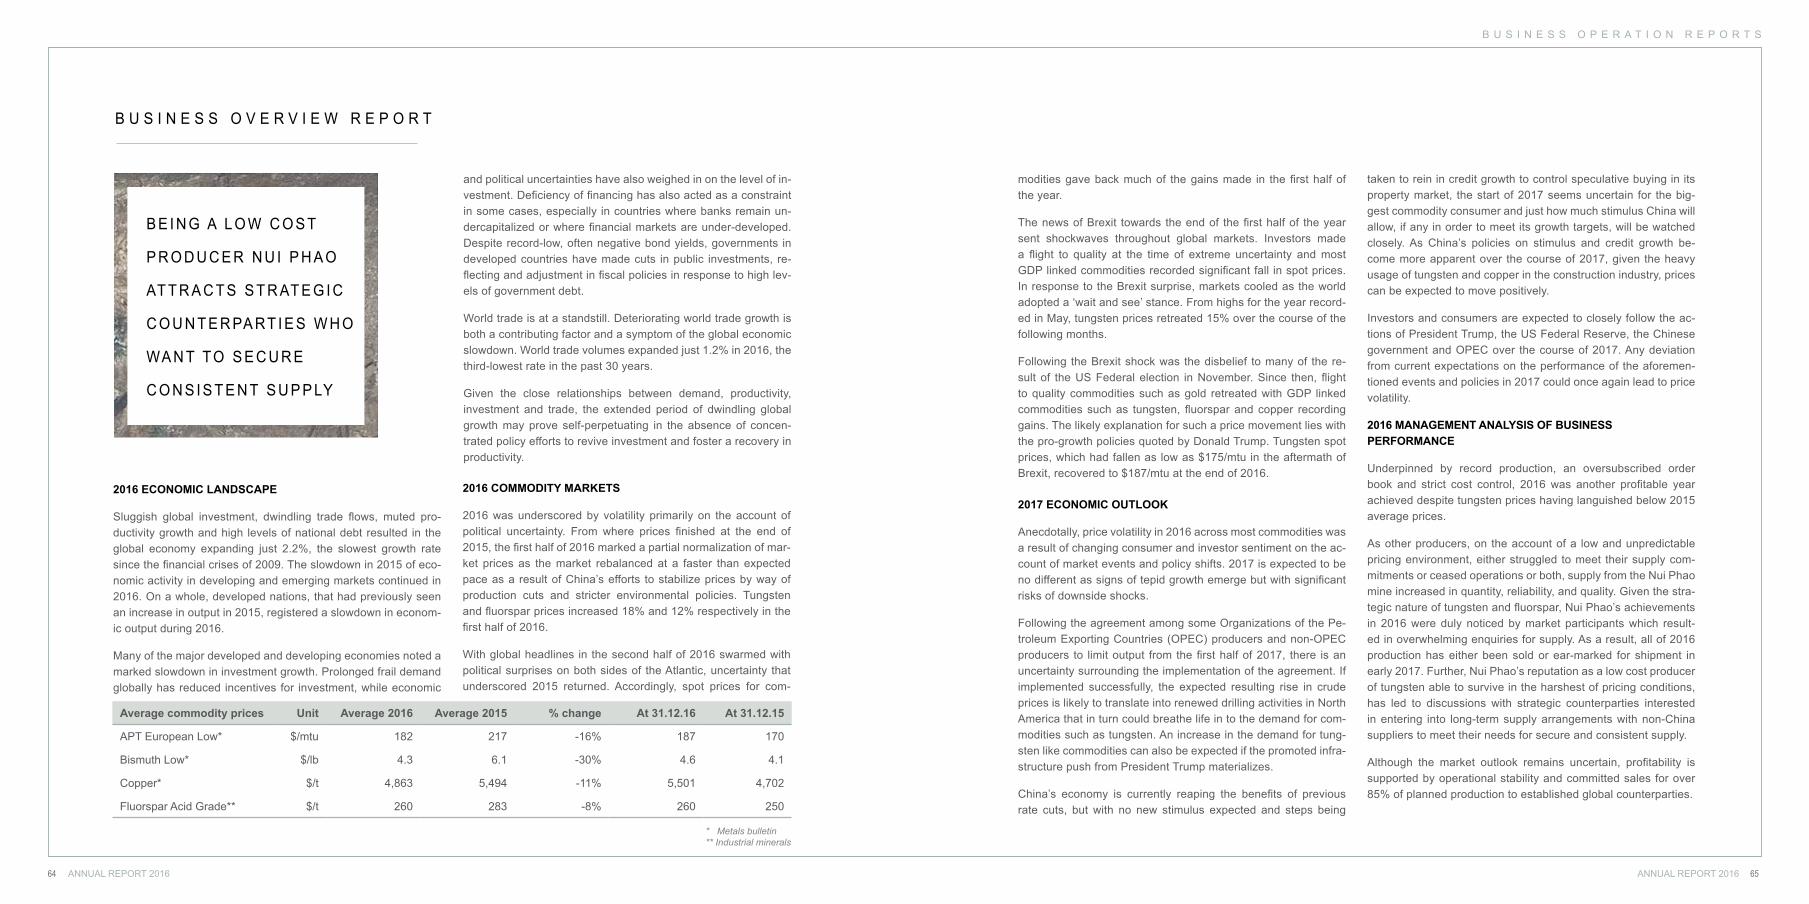
2016 ECONOMIC LANDSCAPE
Sluggish global investment, dwindling trade flows, muted pro-ductivity growth and high levels of national debt resulted in the global economy expanding just 2.2%, the slowest growth rate since the financial crises of 2009. The slowdown in 2015 of eco-nomic activity in developing and emerging markets continued in 2016. On a whole, developed nations, that had previously seen an increase in output in 2015, registered a slowdown in econom-ic output during 2016.
Many of the major developed and developing economies noted a marked slowdown in investment growth. Prolonged frail demand globally has reduced incentives for investment, while economic
2016 COMMODITY MARKETS
2016 was underscored by volatility primarily on the account of political uncertainty. From where prices finished at the end of 2015, the first half of 2016 marked a partial normalization of mar-ket prices as the market rebalanced at a faster than expected pace as a result of China’s efforts to stabilize prices by way of production cuts and stricter environmental policies. Tungsten and fluorspar prices increased 18% and 12% respectively in the first half of 2016.
With global headlines in the second half of 2016 swarmed with political surprises on both sides of the Atlantic, uncertainty that underscored 2015 returned. Accordingly, spot prices for com-
Average commodity prices Unit Average 2016 Average 2015 % change At 31.12.16 At 31.12.15
APT European Low* $/mtu 182 217 -16% 187 170
Bismuth Low* $/lb 4.3 6.1 -30% 4.6 4.1
Copper* $/t 4,863 5,494 -11% 5,501 4,702
Fluorspar Acid Grade** $/t 260 283 -8% 260 250
* Metals bulletin** Industrial minerals
and political uncertainties have also weighed in on the level of in-vestment. Deficiency of financing has also acted as a constraint in some cases, especially in countries where banks remain un-dercapitalized or where financial markets are under-developed. Despite record-low, often negative bond yields, governments in developed countries have made cuts in public investments, re-flecting and adjustment in fiscal policies in response to high lev-els of government debt.
World trade is at a standstill. Deteriorating world trade growth is both a contributing factor and a symptom of the global economic slowdown. World trade volumes expanded just 1.2% in 2016, the third-lowest rate in the past 30 years.
Given the close relationships between demand, productivity, investment and trade, the extended period of dwindling global growth may prove self-perpetuating in the absence of concen-trated policy efforts to revive investment and foster a recovery in productivity.
B E I N G A L O W C O S T
P R O D U C E R N U I P H A O
AT T R A C T S S T R AT E G I C
C O U N T E R PA RT I E S W H O
WA N T TO S E C U R E
C O N S I S T E N T S U P P LY
2017 ECONOMIC OUTLOOK
Anecdotally, price volatility in 2016 across most commodities was a result of changing consumer and investor sentiment on the ac-count of market events and policy shifts. 2017 is expected to be no different as signs of tepid growth emerge but with significant risks of downside shocks.
Following the agreement among some Organizations of the Pe-troleum Exporting Countries (OPEC) producers and non-OPEC producers to limit output from the first half of 2017, there is an uncertainty surrounding the implementation of the agreement. If implemented successfully, the expected resulting rise in crude prices is likely to translate into renewed drilling activities in North America that in turn could breathe life in to the demand for com-modities such as tungsten. An increase in the demand for tung-sten like commodities can also be expected if the promoted infra-structure push from President Trump materializes.
China’s economy is currently reaping the benefits of previous rate cuts, but with no new stimulus expected and steps being
modities gave back much of the gains made in the first half of the year.
The news of Brexit towards the end of the first half of the year sent shockwaves throughout global markets. Investors made a flight to quality at the time of extreme uncertainty and most GDP linked commodities recorded significant fall in spot prices. In response to the Brexit surprise, markets cooled as the world adopted a ‘wait and see’ stance. From highs for the year record-ed in May, tungsten prices retreated 15% over the course of the following months.
Following the Brexit shock was the disbelief to many of the re-sult of the US Federal election in November. Since then, flight to quality commodities such as gold retreated with GDP linked commodities such as tungsten, fluorspar and copper recording gains. The likely explanation for such a price movement lies with the pro-growth policies quoted by Donald Trump. Tungsten spot prices, which had fallen as low as $175/mtu in the aftermath of Brexit, recovered to $187/mtu at the end of 2016.
taken to rein in credit growth to control speculative buying in its property market, the start of 2017 seems uncertain for the big-gest commodity consumer and just how much stimulus China will allow, if any in order to meet its growth targets, will be watched closely. As China’s policies on stimulus and credit growth be-come more apparent over the course of 2017, given the heavy usage of tungsten and copper in the construction industry, prices can be expected to move positively.
Investors and consumers are expected to closely follow the ac-tions of President Trump, the US Federal Reserve, the Chinese government and OPEC over the course of 2017. Any deviation from current expectations on the performance of the aforemen-tioned events and policies in 2017 could once again lead to price volatility.
2016 MANAGEMENT ANALYSIS OF BUSINESSPERFORMANCE
Underpinned by record production, an oversubscribed order book and strict cost control, 2016 was another profitable year achieved despite tungsten prices having languished below 2015 average prices.
As other producers, on the account of a low and unpredictable pricing environment, either struggled to meet their supply com-mitments or ceased operations or both, supply from the Nui Phao mine increased in quantity, reliability, and quality. Given the stra-tegic nature of tungsten and fluorspar, Nui Phao’s achievements in 2016 were duly noticed by market participants which result-ed in overwhelming enquiries for supply. As a result, all of 2016 production has either been sold or ear-marked for shipment in early 2017. Further, Nui Phao’s reputation as a low cost producer of tungsten able to survive in the harshest of pricing conditions, has led to discussions with strategic counterparties interested in entering into long-term supply arrangements with non-China suppliers to meet their needs for secure and consistent supply.
Although the market outlook remains uncertain, profitability is supported by operational stability and committed sales for over 85% of planned production to established global counterparties.
B U S I N E S S O P E R A T I O N R E P O R T S
ANNUAL REPORT 2016ANNUAL REPORT 201666 67
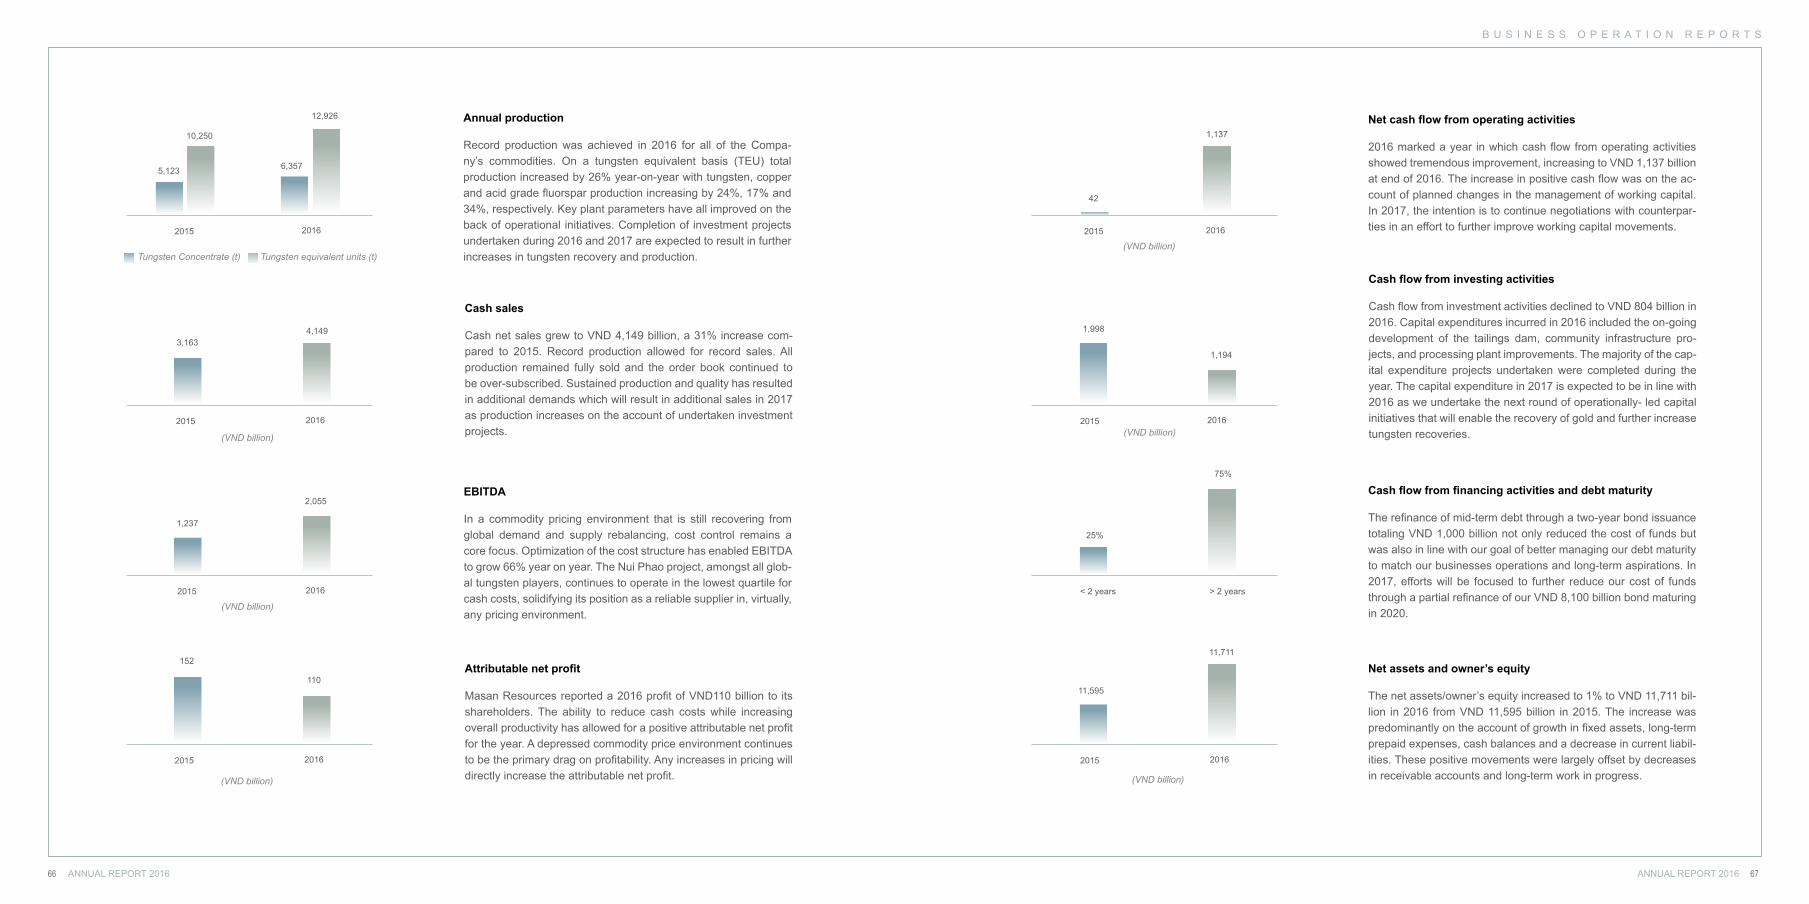
Annual production
Record production was achieved in 2016 for all of the Compa-ny’s commodities. On a tungsten equivalent basis (TEU) total production increased by 26% year-on-year with tungsten, copper and acid grade fluorspar production increasing by 24%, 17% and 34%, respectively. Key plant parameters have all improved on the back of operational initiatives. Completion of investment projects undertaken during 2016 and 2017 are expected to result in further increases in tungsten recovery and production.
Cash sales
Cash net sales grew to VND 4,149 billion, a 31% increase com-pared to 2015. Record production allowed for record sales. All production remained fully sold and the order book continued to be over-subscribed. Sustained production and quality has resulted in additional demands which will result in additional sales in 2017 as production increases on the account of undertaken investment projects.
EBITDA
In a commodity pricing environment that is still recovering from global demand and supply rebalancing, cost control remains a core focus. Optimization of the cost structure has enabled EBITDA to grow 66% year on year. The Nui Phao project, amongst all glob-al tungsten players, continues to operate in the lowest quartile for cash costs, solidifying its position as a reliable supplier in, virtually, any pricing environment.
Attributable net profit
Masan Resources reported a 2016 profit of VND110 billion to its shareholders. The ability to reduce cash costs while increasing overall productivity has allowed for a positive attributable net profit for the year. A depressed commodity price environment continues to be the primary drag on profitability. Any increases in pricing will directly increase the attributable net profit.
5,123
3,163
1,237
152
10,250
4,149
2,055
110
12,926
6,357
2015
2015
2015
2015
Tungsten Concentrate (t)
(VND billion)
(VND billion)
(VND billion)
Tungsten equivalent units (t)
2016
2016
2016
2016
Net cash flow from operating activities
2016 marked a year in which cash flow from operating activities showed tremendous improvement, increasing to VND 1,137 billion at end of 2016. The increase in positive cash flow was on the ac-count of planned changes in the management of working capital. In 2017, the intention is to continue negotiations with counterpar-ties in an effort to further improve working capital movements.
Cash flow from investing activities
Cash flow from investment activities declined to VND 804 billion in 2016. Capital expenditures incurred in 2016 included the on-going development of the tailings dam, community infrastructure pro-jects, and processing plant improvements. The majority of the cap-ital expenditure projects undertaken were completed during the year. The capital expenditure in 2017 is expected to be in line with 2016 as we undertake the next round of operationally- led capital initiatives that will enable the recovery of gold and further increase tungsten recoveries.
Cash flow from financing activities and debt maturity
The refinance of mid-term debt through a two-year bond issuance totaling VND 1,000 billion not only reduced the cost of funds but was also in line with our goal of better managing our debt maturity to match our businesses operations and long-term aspirations. In 2017, efforts will be focused to further reduce our cost of funds through a partial refinance of our VND 8,100 billion bond maturing in 2020.
Net assets and owner’s equity
The net assets/owner’s equity increased to 1% to VND 11,711 bil-lion in 2016 from VND 11,595 billion in 2015. The increase was predominantly on the account of growth in fixed assets, long-term prepaid expenses, cash balances and a decrease in current liabil-ities. These positive movements were largely offset by decreases in receivable accounts and long-term work in progress.
42
1,998
25%
11,595
1,137
1,194
75%
11,711
2015
2015
< 2 years > 2 years
2015
2016
2016
2016
(VND billion)
(VND billion)
(VND billion)
B U S I N E S S O P E R A T I O N R E P O R T S
ANNUAL REPORT 2016ANNUAL REPORT 201668 69
M A N A G E M E N T T E A M A S S E S S M E N T R E P O R T
A S U C C E S S F U L
O P E R AT I O N A L Y E A R
D U R I N G A P E R I O D O F
C O N T I N U E D P R I C I N G
P R E S S U R E
Dear Shareholders,
In 2016, MSR had a very successful operational year during a pe-riod of continued pricing pressure. The possession of the world’s largest tungsten mine with a reserve of 66 million tonnes and the on-going focus on cost efficiency in 2016 give a MSR competitive advantage over the market.
We are proud to highlight the following significant outcomes in 2016:
Production
Record high production was once again achieved for all Com-pany’s commodities. On a tungsten equivalent basis, production increased more than 26% year on year. In comparison to 2015, tungsten and bismuth production increased 24% and 51%, re-spectively. The increase in ore processed, recovery rates and other key plant parameters were a direct result of targeted cap-ital investment projects undertaken during the year, and further increases are expected to materialize in 2017.
Nui Phao’s Joint Venture (JV) that produces high quality val-ue added tungsten products, including APT, BTO and YTO, has demonstrated the ability to operate above design capacity. The production and sales record achievements are a testament to the efforts of the team.
Workforce
At the end of 2016 the total number of direct employees was 1,027 with expatriates accounting for 9% of our workforce. Our Contrac-tors, similarly, employ 600 personnel. During 2016 we continued the development of the MSR Academy as the prime training and development tool for our personnel. MSR in partnership with a number of local universities and training institutions has developed a growing library of technical and soft skill courses for our employ-ees. 528 employees including senior supervisors, staff and junior staff attended a variety of specific subject-based training courses in 2016 representing a 210% increase in the employees being up-skilled. Our focus and commitment remains to employ and train people from the local communities we work with. This ensures we have the right people with the right skills, while enabling the local communities to benefit from our project.
Safety
The Total Recordable Injuries Frequency Rate and Lost Time Inju-ry Frequency Rate, per million man-hours worked was 0.00 (2015: 0.54) and 0.00 (2015: 0.00) respectively for 2016, firmly establish-ing MSR among the safest mines in the world, which our team and our shareholders should all be proud of. Our constant focus on safety has resulted in our Nui Phao operations running for over 18 million man-hours without Lost Time Injury as of December 2016.
CSR & environment
In 2016 we continued to comply and deliver on our social and en-vironmental commitments made to our communities while contin-uing to operate in a sustainable and environmental-friendly way. We believe that sustainable development is an important matter and from the very start Masan Resources has implemented high Vietnamese and international standards.
Collaboration with community
For MSR, developing successful mining arrangements with local people is not only about technical solutions; it is about relation-ships, reconciliation and the balance of interest.
In keeping with our involvement pledge with the community, in 2016 the Company contributed VND 3.7 billion towards commu-nity development initiatives, including infrastructure construction, agricultural service extension, generation of economic restoration funds and various other corporate social responsibilities.
In particular, in 2016 Masan Resources invested VND 1,221 mil-lion into the construction and upgrade of many community assets, such as a culture house, a concrete road, an asphalt road, an irrigation system and a full reconstruction of an overflow bridge in the affected communes.
In 2016, our open dialogues with local communities have con-tinued being mutually beneficial. There were more than 4,000 of company information items disclosed and more than 600 visits to our information center located at the project site. Further, in 2016 we held 45 community meetings with a total of 705 participants. In regards to the grievance mechanism, some issues where not able to be resolved promptly, which required the involvement of either a third-party or government agencies.
The outcomes of our community collaboration present our com-mitment to ongoing and honest dialogues - transparent, timely and two-way communications; and the consideration of community interests in our decision-making. These outcomes are critical to building trust relationships based on mutual respect as well as to managing the risks present in our business.
Finance
The Company was promoted to the premium board on HNX’s UP-COM exchange, in recognition of its importance and high profile with global customers and partners. As a sign of our growing ma-turity we also successfully released our first Annual Report and conducted our first AGM after listing in April in Hanoi with over 210 shareholders attending.
Public recognition
In 2016 we once again received a number of awards. Of particular significance is the Top 500 Biggest Enterprises in Vietnam certified by the Vietnam Report. This recognition represents a third party recognition of the Company’s competitiveness and reputation both nationally and internationally.
Development of Masan Resources brand globally
Given the strategic nature of MSR’s business we continued to fo-cus on developing Masan Resources as a global brand. The Com-pany attended and successfully presented at a number of local and international industry forums including the 7th Ganzhou Tung-sten Industry Summit in March, the Argus Metals Week in London in March, the International Tungsten Industry Association (ITIA) annual conference in Stockholm in September, and the Industrial Minerals Fluorspar Conference in Toronto in October 2016.
In the coming year, our Management Team plans to continue hon-oring the Company’s commitments, by investing time and focusing on working directly with customers, developing increasingly higher quality products and executing on the business plan as outlined at our 2016 AGM. We plan to further increase our participation in industry forums on best practices and cooperate with research in-stitutes to develop next generation performance through improved output and recovery. In line with our commitments, we will contin-ue to develop our resettlement and economic restoration program that will ensure that project benefits are shared with shareholders, people directly affected by the project, and the surrounding com-munities.
Finally, we also commit to continue to improve our compliance ac-tivities and transparent reporting initiatives.
B U S I N E S S O P E R A T I O N R E P O R T S
ANNUAL REPORT 2016ANNUAL REPORT 201670 71
B O A R D O F D I R E C T O R S A S S E S S M E N T R E P O R T
Dear Shareholders, The Board of Directors (the “BOD”) of Masan Resources is hon-ored to submit the BOD’s performance assessment report of the Company in 2016.
BOD assessment of the Company performance
In last year’s Company report we focused on value creation that can be achieved by unlocking Vietnam’s “National Treasure”, which is a function of both natural and human resources. The BOD is pleased that under the leadership of the Management Team you are the Company delivered what was promised, given the tough pricing environment faced across all commodities.
The Management has demonstrated that they focused beyond merely extracting commodities for export, but going deeper into the value chain as demonstrated by bringing in more technology and know-how to Vietnam whilst containing costs. In maintaining
the operational safety record and developing the MSR Academy, the Company has continued to demonstrate how its employees are truly valued as human capital. To reiterate what was said last year: “we do not see Vietnamese people as a source of affordable labor, but as the next generation of talent, innovation and passion that will drive Vietnam’s growth”.
This belief underpins our commitment to developing and operat-ing a best-in-class tungsten platform and training local talent. This is what we mean by “Unlocking” Vietnam’s National Treasure. By making the Company successful, we do not only create value for the shareholders, but also for the people of Vietnam.
The Company continues to employ best-in-class standards on all issues related to the environment, safety, and the local communi-ty. For safety, the Company has maintained its world-class safe-ty performance with zero fatalities and no lost-time injury for 34 months - a truly exceptional result. Community resettlement also continued in compliance with the Equator Principles, the industry gold standard.
Our Joint Venture continues to produce high quality APT, YTO and BTO that are in demand internationally, with customer demand of-ten exceeding supply in a facility that is now operating consistently at or above its design capacity.
The BOD has fulfilled its duties in reviewing and approving the resolutions on the operation of the Company and its subsidiaries. In 2016, no members of the BOD received any remuneration for their duties as BOD’s members, nor they incurred any expenses.
In December 2016, Masan Group through its wholly owned sub-sidiary, successfully completed the tender offer for shares of Masan Resources, thereby providing an exit to Mount Kellett and increasing its ownership in MSR to 93.78%, paving the way for the next round of strategic capital and growth.
R E - S T R U C T U R I N G
F I N A N C I A L O W N E R S H I P
F O R T H E N E X T R O U N D
O F S T R AT E G I C C A P I TA L
A N D G R O W T H
BOD assessment of the Company Management Teamperformance
The Management Team continues to manage the Company in a manner deserving the BOD’s and shareholders on-going trust and support. The Chief Executive Officer and other managers fulfilled their duties and functions in 2016, and properly implemented all resolutions from the General Meetings of Shareholders.
The BOD’s responsibility to review and oversee the Manage-ment Team’s performance will be formalized via the appropriate sub-committees that have been established in 2016 and will be part of future reporting. This evolution of internal governance is a sign of increased safety of your investment as shareholders.
BOD Plans and directions
The Company’s objective remains to demonstrate to the world that a Vietnamese company can transform the global tungsten market. Throughout 2016, the Company has continued to fortify its core values and has laid down the milestones for growth as it continues to work towards building a branded world-class mine.
The BOD fully supports the Management Team’s efforts to grow the Company. The BOD feels that the plans outlined during the 2016 AGM are validated by the physical and financial performance of the operation which demonstrates both the underlying driver for growth, as well as reflecting the growing global customer appetite for the Company’s quality products. Further, continuing third par-ty recognition via local awards and invitations to participate and present at international forums demonstrates that the Company’s is being recognized for its strategic importance across a growing number of industries and communities within Vietnam and beyond.
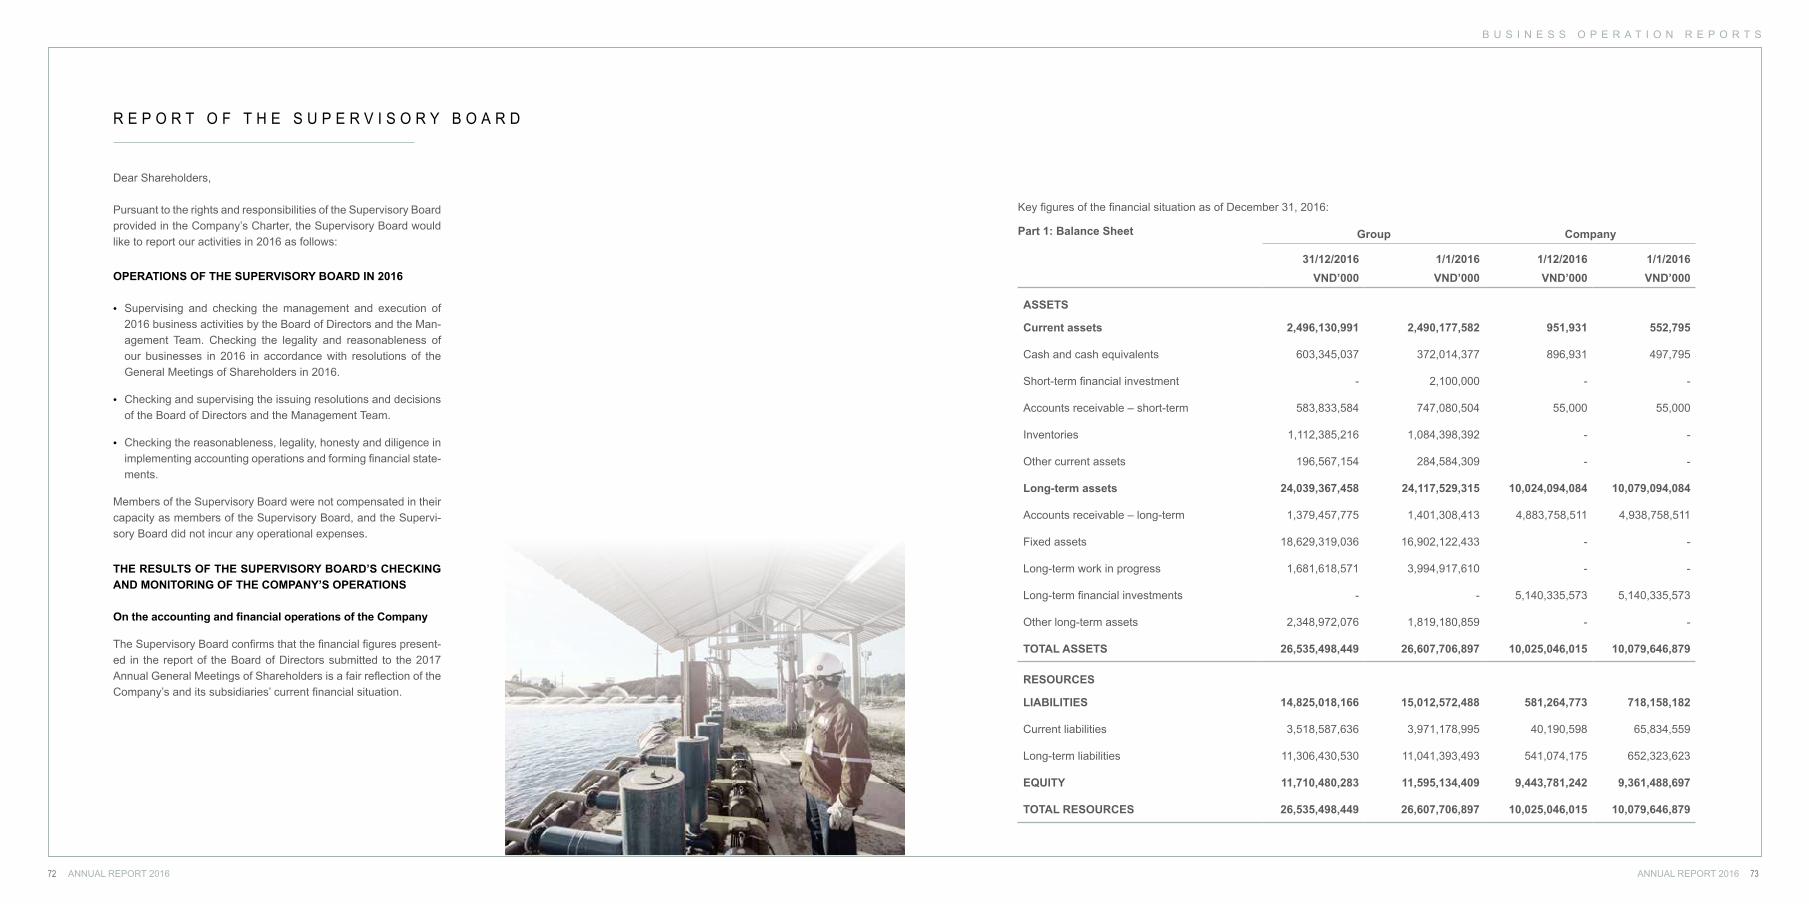
B U S I N E S S O P E R A T I O N R E P O R T S
ANNUAL REPORT 2016ANNUAL REPORT 201672 73
R E P O R T O F T H E S U P E R V I S O R Y B O A R D
Dear Shareholders,
Pursuant to the rights and responsibilities of the Supervisory Board provided in the Company’s Charter, the Supervisory Board would like to report our activities in 2016 as follows:
THE RESULTS OF THE SUPERVISORY BOARD’S CHECKING AND MONITORING OF THE COMPANY’S OPERATIONS
On the accounting and financial operations of the Company
The Supervisory Board confirms that the financial figures present-ed in the report of the Board of Directors submitted to the 2017 Annual General Meetings of Shareholders is a fair reflection of the Company’s and its subsidiaries’ current financial situation.
OPERATIONS OF THE SUPERVISORY BOARD IN 2016
• Supervising and checking the management and execution of 2016 business activities by the Board of Directors and the Man-agement Team. Checking the legality and reasonableness of our businesses in 2016 in accordance with resolutions of the General Meetings of Shareholders in 2016.
• Checking and supervising the issuing resolutions and decisions of the Board of Directors and the Management Team.
• Checking the reasonableness, legality, honesty and diligence in implementing accounting operations and forming financial state-ments.
Members of the Supervisory Board were not compensated in their capacity as members of the Supervisory Board, and the Supervi-sory Board did not incur any operational expenses.
Group Company
31/12/2016 1/1/2016 1/12/2016 1/1/2016VND’000 VND’000 VND’000 VND’000
ASSETS
Current assets 2,496,130,991 2,490,177,582 951,931 552,795
Cash and cash equivalents 603,345,037 372,014,377 896,931 497,795
Short-term financial investment - 2,100,000 - -
Accounts receivable – short-term 583,833,584 747,080,504 55,000 55,000
Inventories 1,112,385,216 1,084,398,392 - -
Other current assets 196,567,154 284,584,309 - -
Long-term assets 24,039,367,458 24,117,529,315 10,024,094,084 10,079,094,084
Accounts receivable – long-term 1,379,457,775 1,401,308,413 4,883,758,511 4,938,758,511
Fixed assets 18,629,319,036 16,902,122,433 - -
Long-term work in progress 1,681,618,571 3,994,917,610 - -
Long-term financial investments - - 5,140,335,573 5,140,335,573
Other long-term assets 2,348,972,076 1,819,180,859 - -
TOTAL ASSETS 26,535,498,449 26,607,706,897 10,025,046,015 10,079,646,879
RESOURCES
LIABILITIES 14,825,018,166 15,012,572,488 581,264,773 718,158,182
Current liabilities 3,518,587,636 3,971,178,995 40,190,598 65,834,559
Long-term liabilities 11,306,430,530 11,041,393,493 541,074,175 652,323,623
EQUITY 11,710,480,283 11,595,134,409 9,443,781,242 9,361,488,697
TOTAL RESOURCES 26,535,498,449 26,607,706,897 10,025,046,015 10,079,646,879
Part 1: Balance Sheet
Key figures of the financial situation as of December 31, 2016:
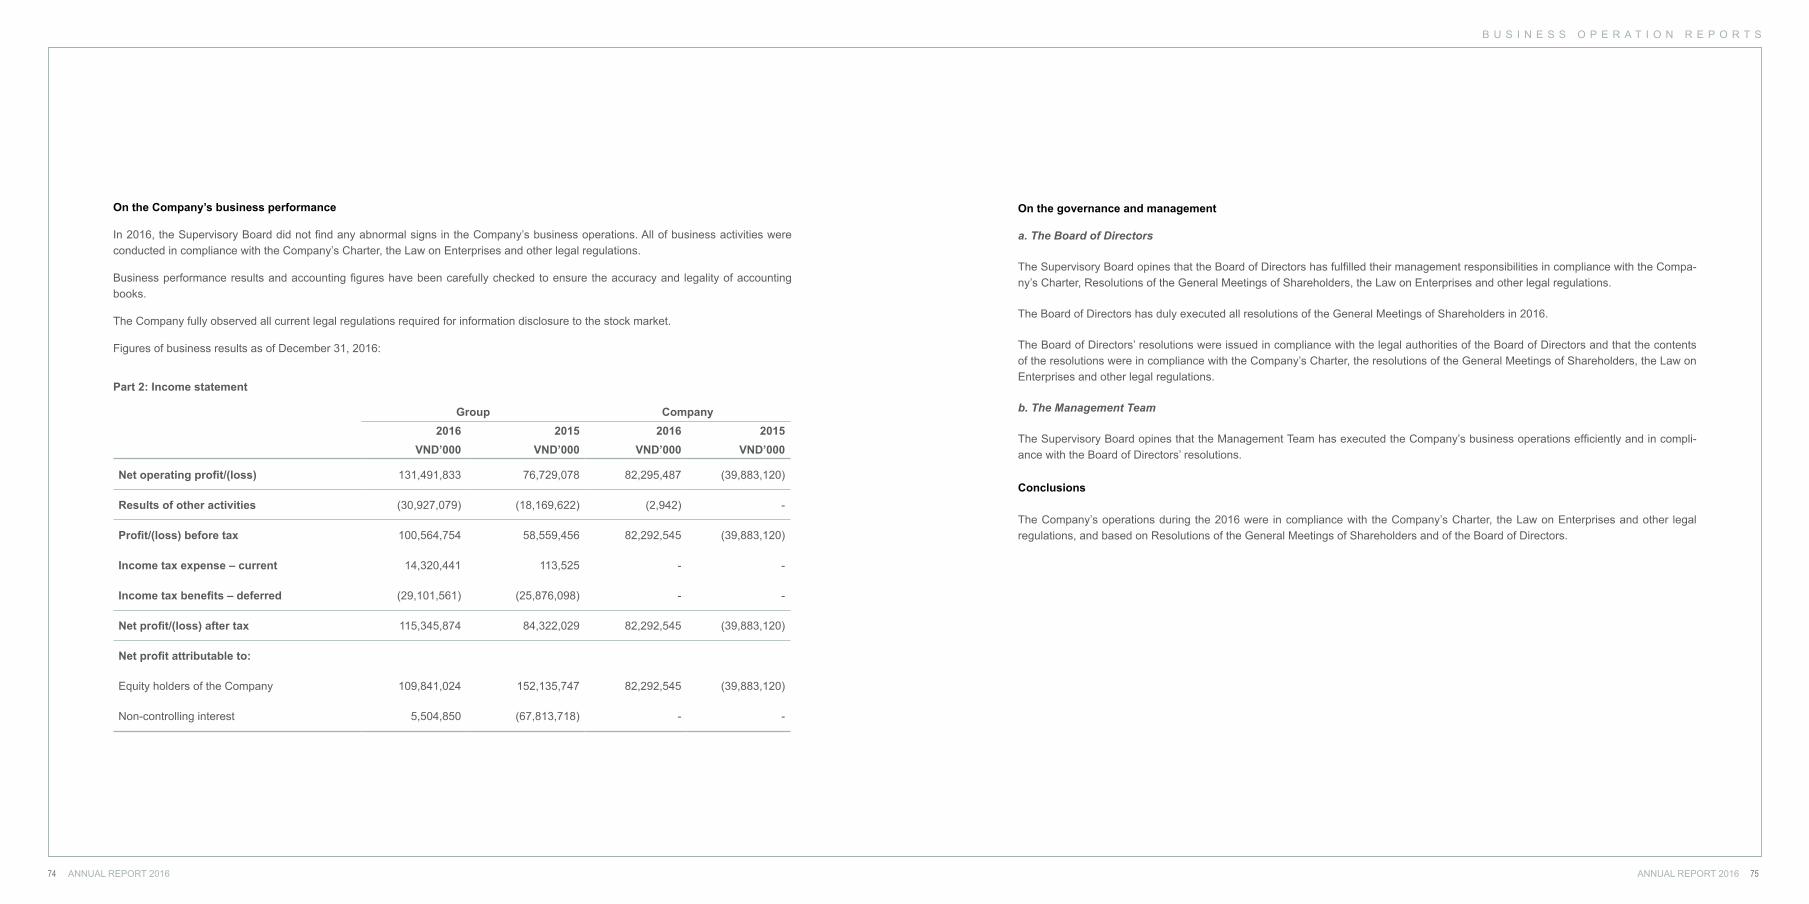
B U S I N E S S O P E R A T I O N R E P O R T S
ANNUAL REPORT 2016ANNUAL REPORT 201674 75
On the Company’s business performance
In 2016, the Supervisory Board did not find any abnormal signs in the Company’s business operations. All of business activities were conducted in compliance with the Company’s Charter, the Law on Enterprises and other legal regulations.
Business performance results and accounting figures have been carefully checked to ensure the accuracy and legality of accounting books.
The Company fully observed all current legal regulations required for information disclosure to the stock market.
Figures of business results as of December 31, 2016:
Part 2: Income statement
Group Company2016 2015 2016 2015
VND’000 VND’000 VND’000 VND’000
Net operating profit/(loss) 131,491,833 76,729,078 82,295,487 (39,883,120)
Results of other activities (30,927,079) (18,169,622) (2,942) -
Profit/(loss) before tax 100,564,754 58,559,456 82,292,545 (39,883,120)
Income tax expense – current 14,320,441 113,525 - -
Income tax benefits – deferred (29,101,561) (25,876,098) - -
Net profit/(loss) after tax 115,345,874 84,322,029 82,292,545 (39,883,120)
Net profit attributable to:
Equity holders of the Company 109,841,024 152,135,747 82,292,545 (39,883,120)
Non-controlling interest 5,504,850 (67,813,718) - -
On the governance and management
a. The Board of Directors
The Supervisory Board opines that the Board of Directors has fulfilled their management responsibilities in compliance with the Compa-ny’s Charter, Resolutions of the General Meetings of Shareholders, the Law on Enterprises and other legal regulations.
The Board of Directors has duly executed all resolutions of the General Meetings of Shareholders in 2016.
The Board of Directors’ resolutions were issued in compliance with the legal authorities of the Board of Directors and that the contents of the resolutions were in compliance with the Company’s Charter, the resolutions of the General Meetings of Shareholders, the Law on Enterprises and other legal regulations.
b. The Management Team
The Supervisory Board opines that the Management Team has executed the Company’s business operations efficiently and in compli-ance with the Board of Directors’ resolutions.
Conclusions
The Company’s operations during the 2016 were in compliance with the Company’s Charter, the Law on Enterprises and other legal regulations, and based on Resolutions of the General Meetings of Shareholders and of the Board of Directors.
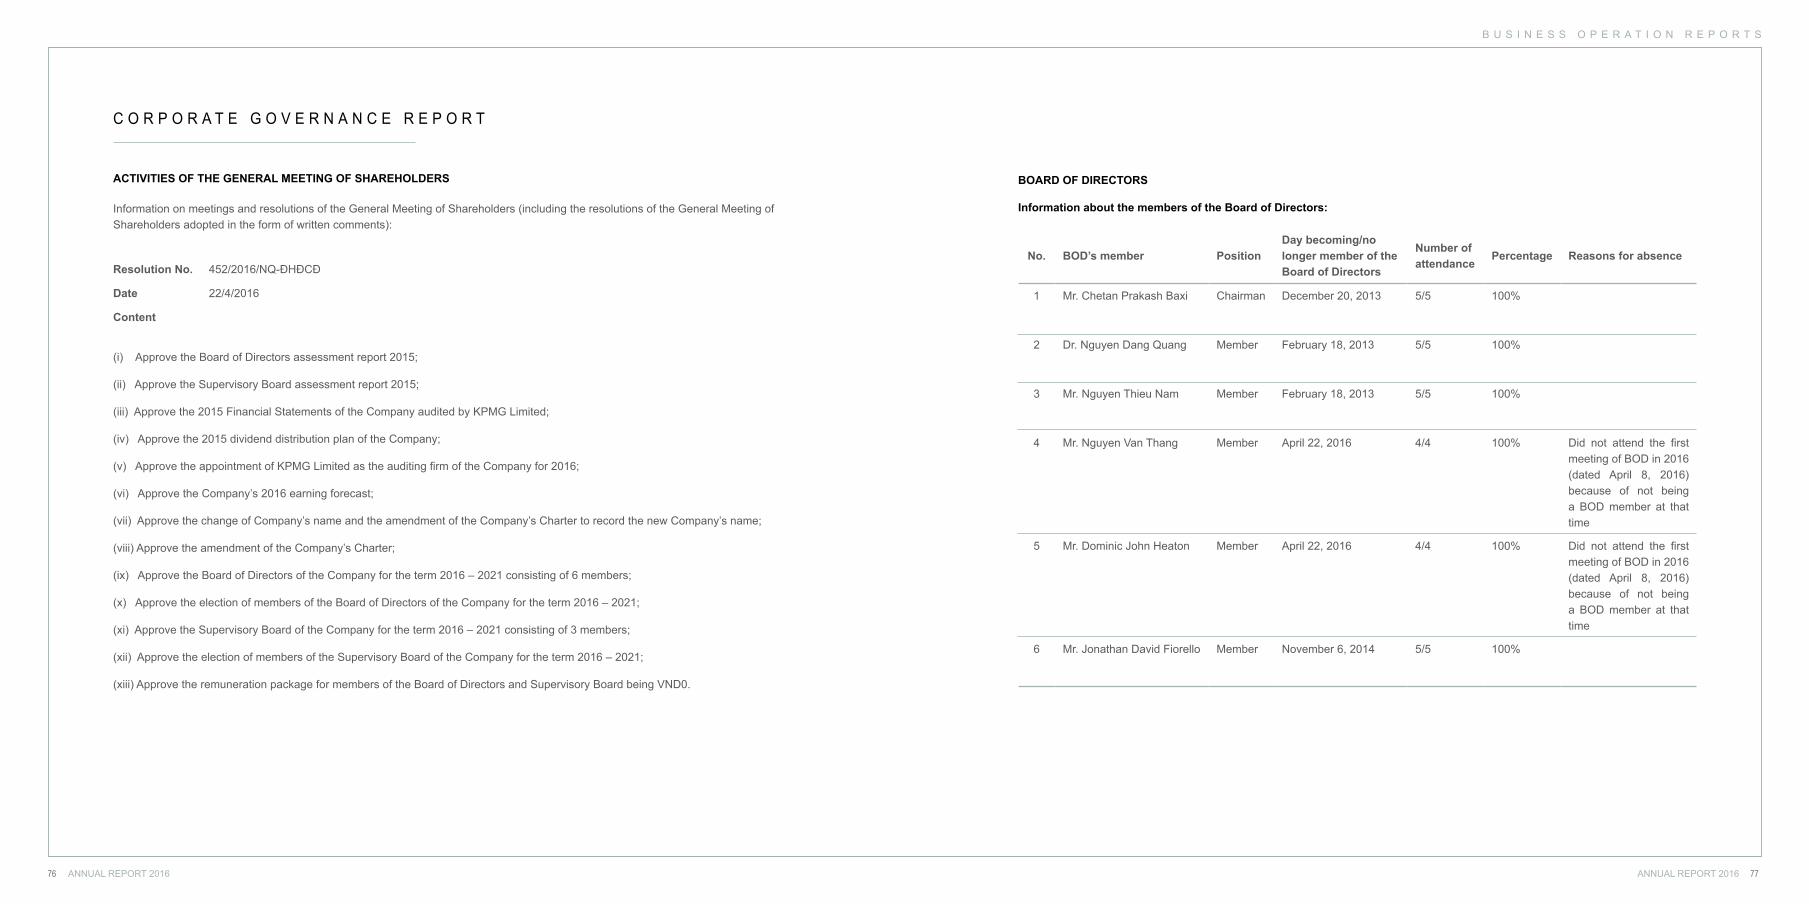
B U S I N E S S O P E R A T I O N R E P O R T S
ANNUAL REPORT 2016ANNUAL REPORT 201676 77
C O R P O R A T E G O V E R N A N C E R E P O R T
ACTIVITIES OF THE GENERAL MEETING OF SHAREHOLDERS
Information on meetings and resolutions of the General Meeting of Shareholders (including the resolutions of the General Meeting of Shareholders adopted in the form of written comments):
Resolution No. 452/2016/NQ-ĐHĐCĐ
Date 22/4/2016
Content
(i) Approve the Board of Directors assessment report 2015;
(ii) Approve the Supervisory Board assessment report 2015;
(iii) Approve the 2015 Financial Statements of the Company audited by KPMG Limited;
(iv) Approve the 2015 dividend distribution plan of the Company;
(v) Approve the appointment of KPMG Limited as the auditing firm of the Company for 2016;
(vi) Approve the Company’s 2016 earning forecast;
(vii) Approve the change of Company’s name and the amendment of the Company’s Charter to record the new Company’s name;
(viii) Approve the amendment of the Company’s Charter;
(ix) Approve the Board of Directors of the Company for the term 2016 – 2021 consisting of 6 members;
(x) Approve the election of members of the Board of Directors of the Company for the term 2016 – 2021;
(xi) Approve the Supervisory Board of the Company for the term 2016 – 2021 consisting of 3 members;
(xii) Approve the election of members of the Supervisory Board of the Company for the term 2016 – 2021;
(xiii) Approve the remuneration package for members of the Board of Directors and Supervisory Board being VND0.
BOARD OF DIRECTORS
Information about the members of the Board of Directors:
No. BOD’s member PositionDay becoming/no longer member of the Board of Directors
Number of attendance
Percentage Reasons for absence
1 Mr. Chetan Prakash Baxi Chairman December 20, 2013 5/5 100%
2 Dr. Nguyen Dang Quang Member February 18, 2013 5/5 100%
3 Mr. Nguyen Thieu Nam Member February 18, 2013 5/5 100%
4 Mr. Nguyen Van Thang Member April 22, 2016 4/4 100% Did not attend the first meeting of BOD in 2016 (dated April 8, 2016) because of not being a BOD member at that time
5 Mr. Dominic John Heaton Member April 22, 2016 4/4 100% Did not attend the first meeting of BOD in 2016 (dated April 8, 2016) because of not being a BOD member at that time
6 Mr. Jonathan David Fiorello Member November 6, 2014 5/5 100%
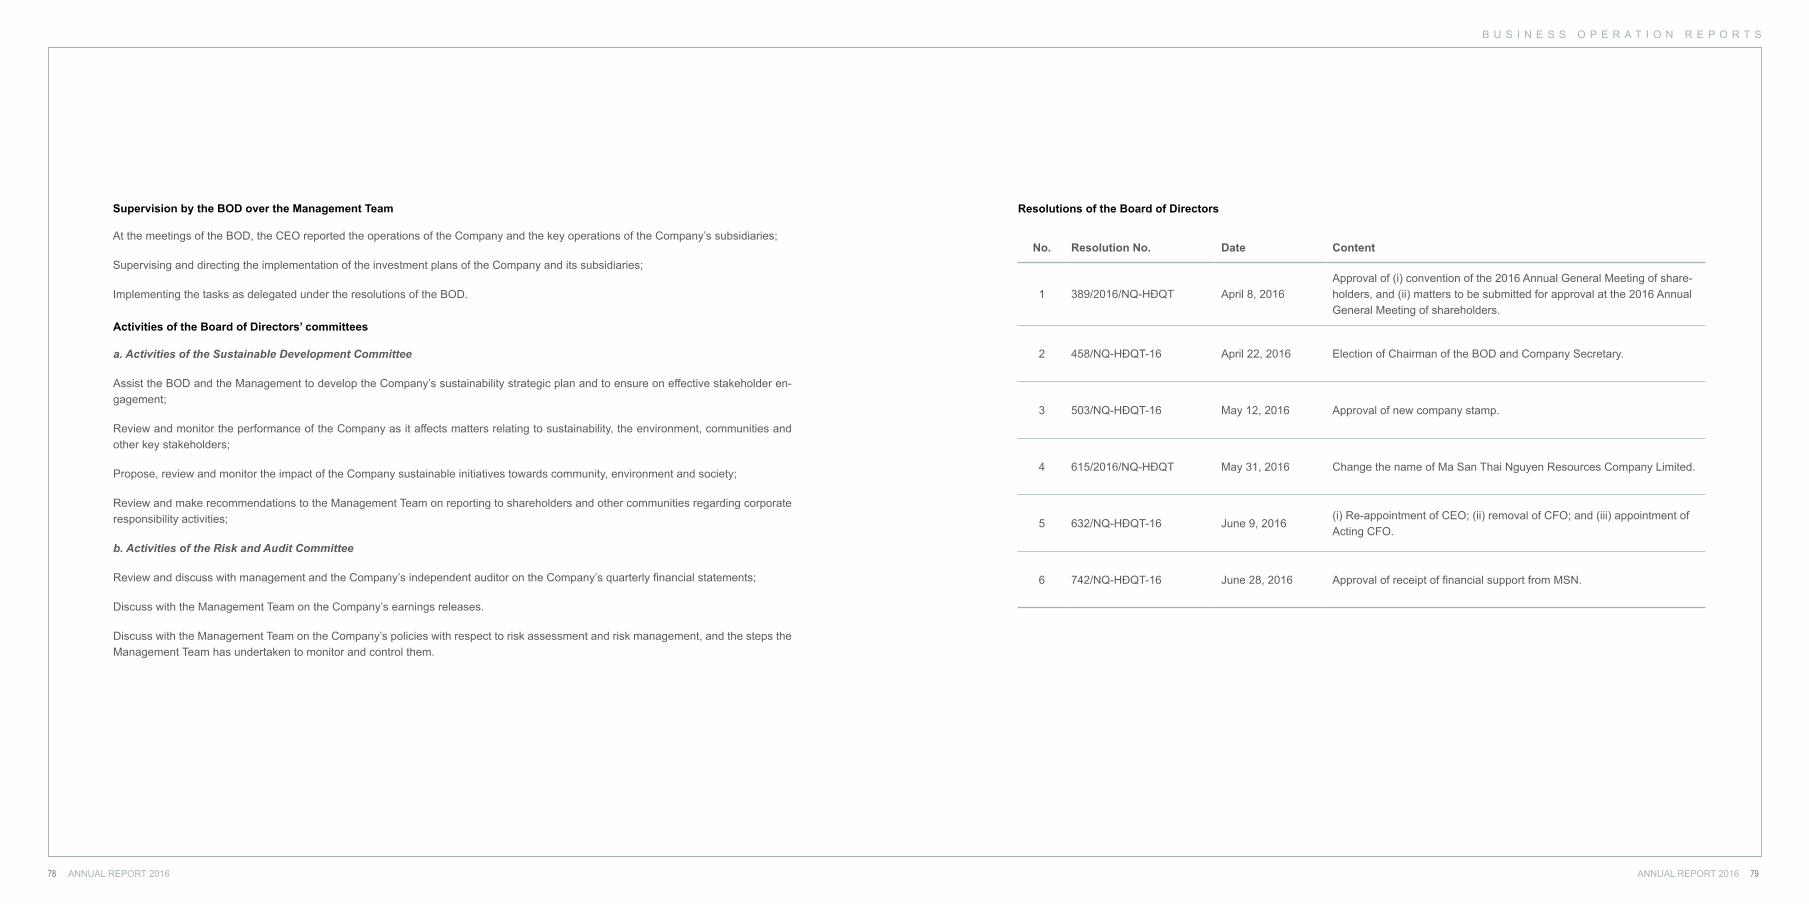
B U S I N E S S O P E R A T I O N R E P O R T S
ANNUAL REPORT 2016ANNUAL REPORT 201678 79
Supervision by the BOD over the Management Team
At the meetings of the BOD, the CEO reported the operations of the Company and the key operations of the Company’s subsidiaries;
Supervising and directing the implementation of the investment plans of the Company and its subsidiaries;
Implementing the tasks as delegated under the resolutions of the BOD.
Activities of the Board of Directors’ committees
a. Activities of the Sustainable Development Committee
Assist the BOD and the Management to develop the Company’s sustainability strategic plan and to ensure on effective stakeholder en-gagement;
Review and monitor the performance of the Company as it affects matters relating to sustainability, the environment, communities and other key stakeholders;
Propose, review and monitor the impact of the Company sustainable initiatives towards community, environment and society;
Review and make recommendations to the Management Team on reporting to shareholders and other communities regarding corporate responsibility activities;
b. Activities of the Risk and Audit Committee
Review and discuss with management and the Company’s independent auditor on the Company’s quarterly financial statements;
Discuss with the Management Team on the Company’s earnings releases.
Discuss with the Management Team on the Company’s policies with respect to risk assessment and risk management, and the steps the Management Team has undertaken to monitor and control them.
Resolutions of the Board of Directors
No. Resolution No. Date Content
1 389/2016/NQ-HĐQT April 8, 2016Approval of (i) convention of the 2016 Annual General Meeting of share-holders, and (ii) matters to be submitted for approval at the 2016 Annual General Meeting of shareholders.
2 458/NQ-HĐQT-16 April 22, 2016 Election of Chairman of the BOD and Company Secretary.
3 503/NQ-HĐQT-16 May 12, 2016 Approval of new company stamp.
4 615/2016/NQ-HĐQT May 31, 2016 Change the name of Ma San Thai Nguyen Resources Company Limited.
5 632/NQ-HĐQT-16 June 9, 2016(i) Re-appointment of CEO; (ii) removal of CFO; and (iii) appointment of Acting CFO.
6 742/NQ-HĐQT-16 June 28, 2016 Approval of receipt of financial support from MSN.
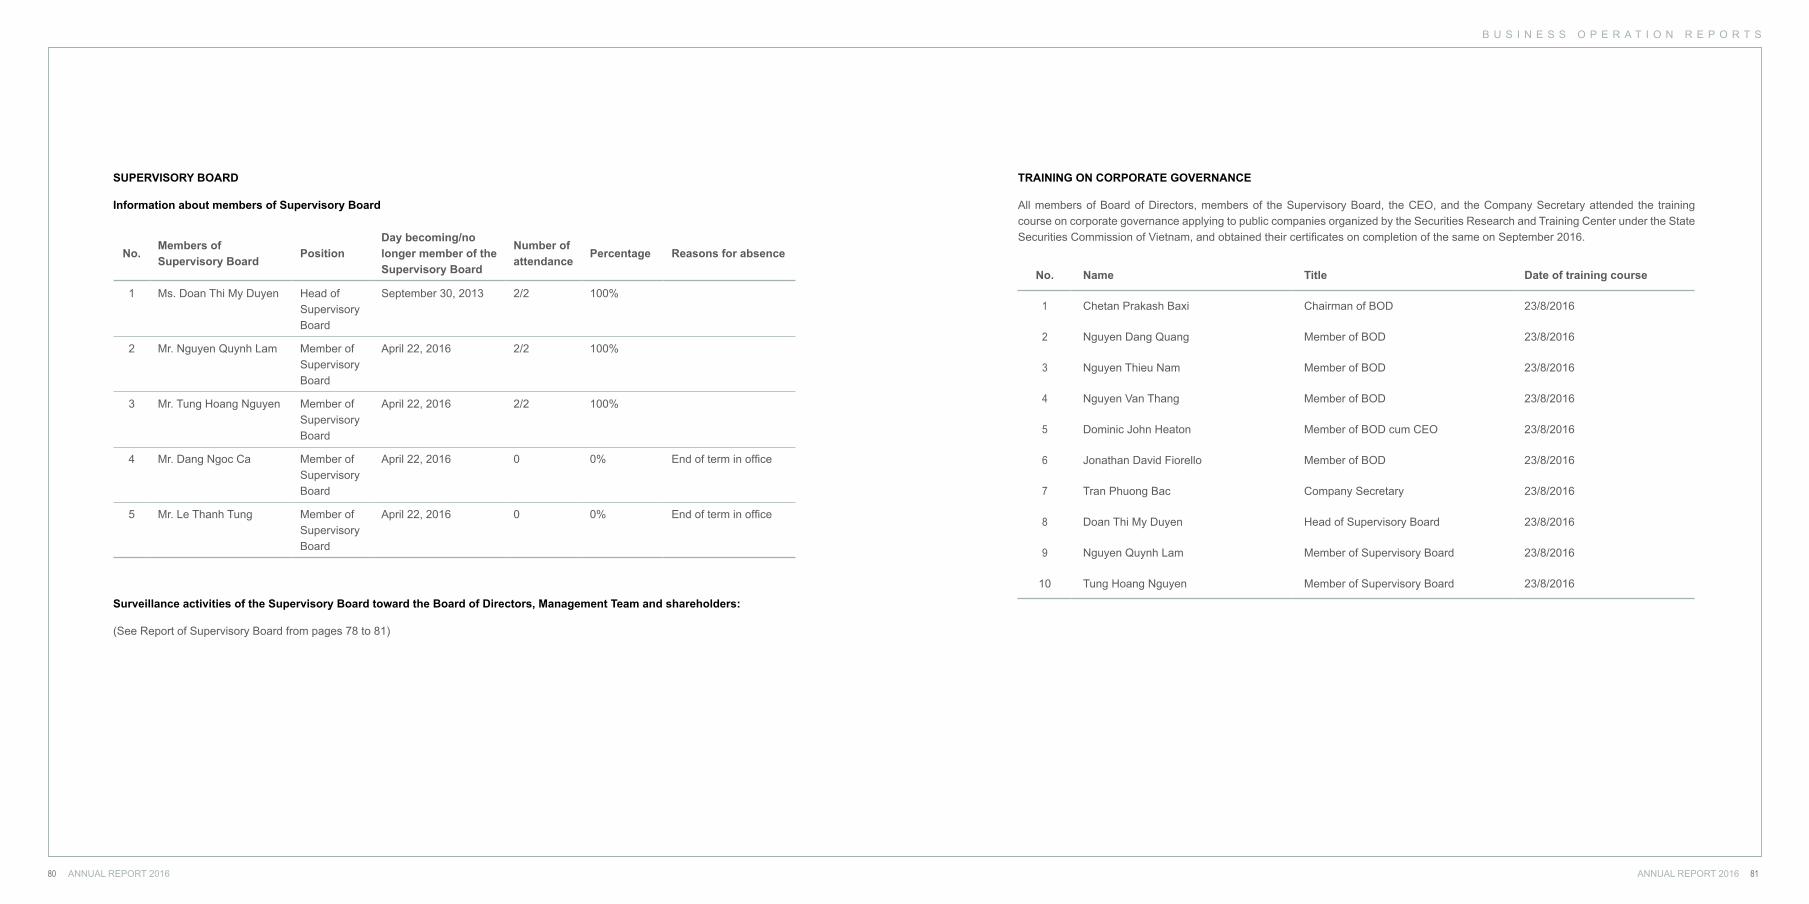
B U S I N E S S O P E R A T I O N R E P O R T S
ANNUAL REPORT 2016ANNUAL REPORT 201680 81
SUPERVISORY BOARD
Information about members of Supervisory Board
No.Members ofSupervisory Board
PositionDay becoming/no longer member of the Supervisory Board
Number of attendance
Percentage Reasons for absence
1 Ms. Doan Thi My Duyen Head of Supervisory Board
September 30, 2013 2/2 100%
2 Mr. Nguyen Quynh Lam Member of Supervisory Board
April 22, 2016 2/2 100%
3 Mr. Tung Hoang Nguyen Member of Supervisory Board
April 22, 2016 2/2 100%
4 Mr. Dang Ngoc Ca Member of Supervisory Board
April 22, 2016 0 0% End of term in office
5 Mr. Le Thanh Tung Member of Supervisory Board
April 22, 2016 0 0% End of term in office
Surveillance activities of the Supervisory Board toward the Board of Directors, Management Team and shareholders:
(See Report of Supervisory Board from pages 78 to 81)
TRAINING ON CORPORATE GOVERNANCE
All members of Board of Directors, members of the Supervisory Board, the CEO, and the Company Secretary attended the training course on corporate governance applying to public companies organized by the Securities Research and Training Center under the State Securities Commission of Vietnam, and obtained their certificates on completion of the same on September 2016.
No. Name Title Date of training course
1 Chetan Prakash Baxi Chairman of BOD 23/8/2016
2 Nguyen Dang Quang Member of BOD 23/8/2016
3 Nguyen Thieu Nam Member of BOD 23/8/2016
4 Nguyen Van Thang Member of BOD 23/8/2016
5 Dominic John Heaton Member of BOD cum CEO 23/8/2016
6 Jonathan David Fiorello Member of BOD 23/8/2016
7 Tran Phuong Bac Company Secretary 23/8/2016
8 Doan Thi My Duyen Head of Supervisory Board 23/8/2016
9 Nguyen Quynh Lam Member of Supervisory Board 23/8/2016
10 Tung Hoang Nguyen Member of Supervisory Board 23/8/2016
B U S I N E S S O P E R A T I O N R E P O R T S
ANNUAL REPORT 2016ANNUAL REPORT 201682 83
TRANSACTIONS OF AFFILIATED PERSONS OF THE COMPANY WITH THE COMPANY
Transactions between the company and the affiliated persons or between the company and major shareholders, internal per-sons and related person of internal person.
Name of organization/ individual Masan Group Corporation
RelationshipDr. Nguyen Dang Quang (a BOD member of the Company) is the Chairman of BOD of MSN
NSH No.*, date of issue, place of issue0302100924 dated September 13, 2000 issued by Ho Chi Minh Department of Planning and Investment
Address Suite 802, 8th floor, Central Plaza, 17 Le Duan Street, District 1, Ho Chi Minh City
Time of transactions 30/6/2016
Number of resolutions / decisions of the AGM / BOD adopted (if any, specify date of issue)
No. 742/NQ-HDQT-16 dated June 28, 2016
Number, ownership proportion of shares held after the transaction
0
Note Financial support
Transaction between internal person of listed company and company’s subsidiaries, or the company in which listed company takes controlling power: None.
Transactions between the company and other objects
Transactions between the Company and companies that members of Board of Directors, members of the Supervisory Board, or the CEO of the Company is or was a founding member, members of Board of Directors, or the CEO of those companies (the “Related persons”) in the last three (03) years (as at the time of reporting).
Year Related person (having transactions with the Company)
Relationship with the Company Description of transaction
2014 MSNBOD member of the Company is also a BOD member of the related person
Inter-company loan
2015 MSNBOD member of the Company is also a BOD member of the related person
Inter-company loan
2016 MSNBOD member of the Company is also a BOD member of the related person
Financial support
Transactions between the company and the company that related person of members of Board of Directors, members of the Supervisory Board, Director (CEO) as a member of Board of Directors, Director (CEO): None.
Other transactions of the company (if any) may be beneficial material or immaterial for members of Board of Directors, members of the Supervisory Board, Director (CEO): None.
TRANSACTIONS OF INTERNAL PERSONS AND RELATED PERSON OF INTERNAL PERSON
No. Transaction executor Relationship with internal person
Number of shares owned at the beginning of the period
Number of shares owned at the end of the period
Reasons for in-crease, decrease (purchase, sale, switch, reward...)
Number of shares
Percentage Number of shares
Percentage
1 Dominic John Heaton CEO 8,420,857 1.17% 8,400,257 1.17% Sale of shares
2 Nguyen Thi Hai Yen Chief Accountant 20,000 0.003% 0 0% Sale of shares
3 Nguyen Quynh Lam Member of Super-visory Board
0 0% 63,000 0.009% Purchase of shares
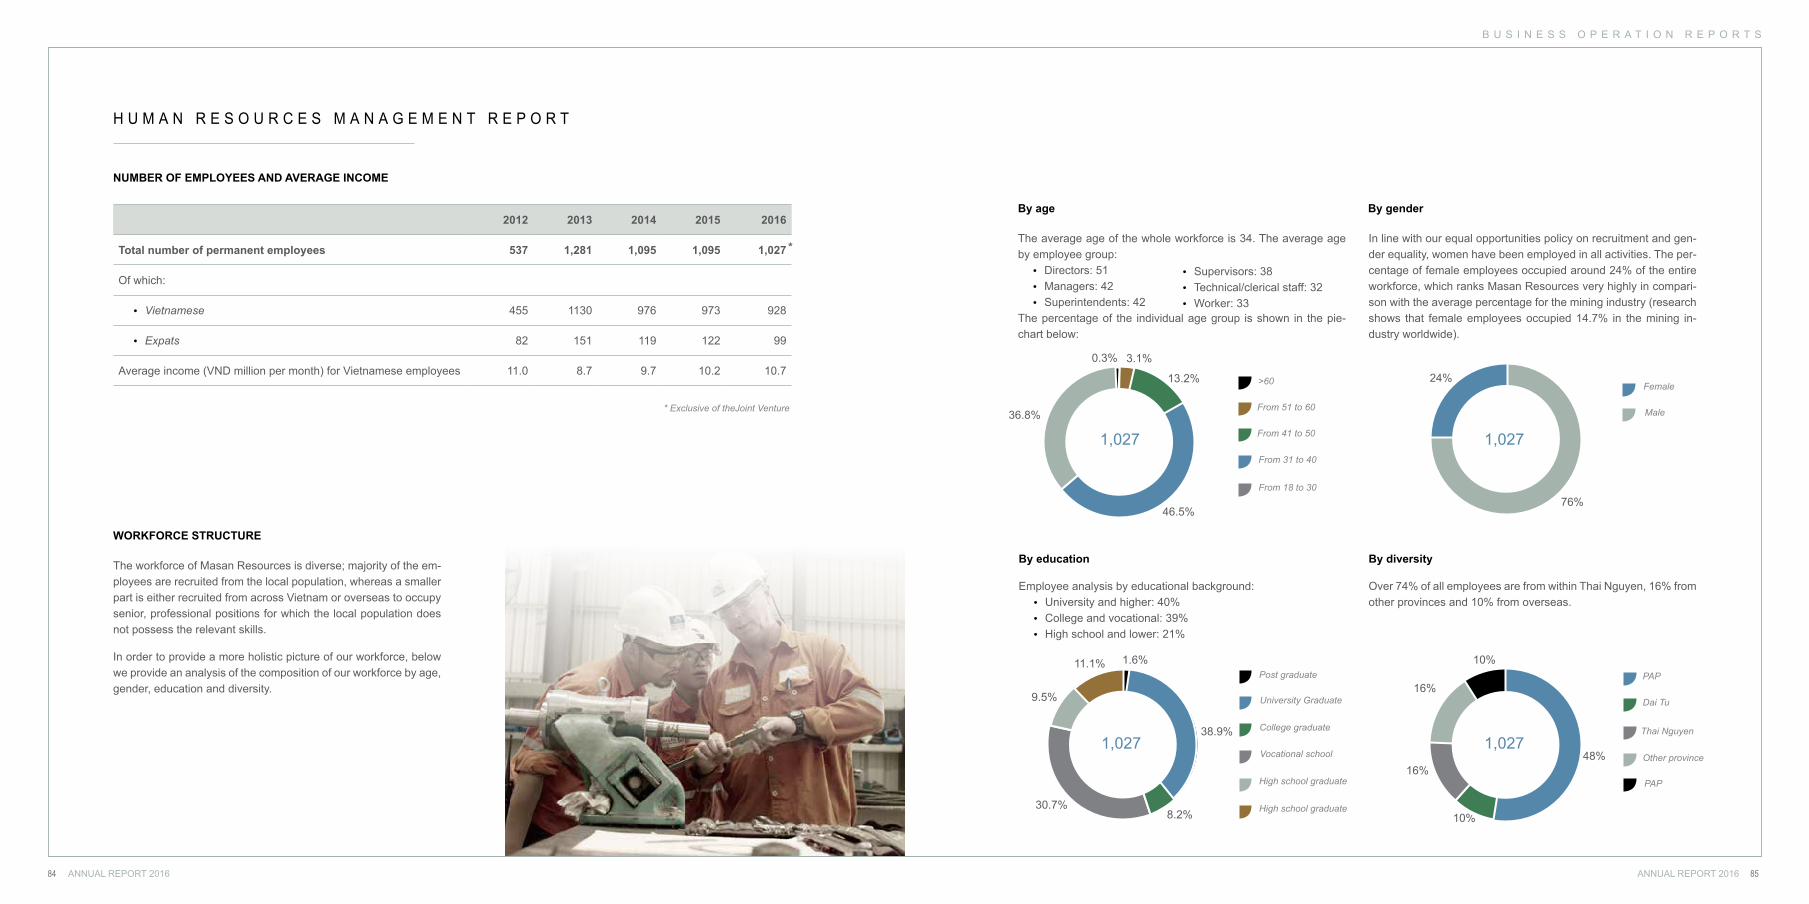
B U S I N E S S O P E R A T I O N R E P O R T S
ANNUAL REPORT 2016ANNUAL REPORT 201684 85
H U M A N R E S O U R C E S M A N A G E M E N T R E P O R T
2012 2013 2014 2015 2016
Total number of permanent employees 537 1,281 1,095 1,095 1,027
Of which:
• Vietnamese 455 1130 976 973 928
• Expats 82 151 119 122 99
Average income (VND million per month) for Vietnamese employees 11.0 8.7 9.7 10.2 10.7
NUMBER OF EMPLOYEES AND AVERAGE INCOME
WORKFORCE STRUCTURE
The workforce of Masan Resources is diverse; majority of the em-ployees are recruited from the local population, whereas a smaller part is either recruited from across Vietnam or overseas to occupy senior, professional positions for which the local population does not possess the relevant skills.
In order to provide a more holistic picture of our workforce, below we provide an analysis of the composition of our workforce by age, gender, education and diversity.
*
* Exclusive of theJoint Venture
By age By gender
By education By diversity
The average age of the whole workforce is 34. The average age by employee group:
• Directors: 51 • Managers: 42 • Superintendents: 42
The percentage of the individual age group is shown in the pie-chart below:
In line with our equal opportunities policy on recruitment and gen-der equality, women have been employed in all activities. The per-centage of female employees occupied around 24% of the entire workforce, which ranks Masan Resources very highly in compari-son with the average percentage for the mining industry (research shows that female employees occupied 14.7% in the mining in-dustry worldwide).
Employee analysis by educational background:• University and higher: 40%• College and vocational: 39%• High school and lower: 21%
Over 74% of all employees are from within Thai Nguyen, 16% from other provinces and 10% from overseas.
1.6%
38.9%
8.2%30.7%
9.5%
11.1%Post graduate
University Graduate
College graduate
Vocational school
High school graduate
High school graduate
• Supervisors: 38• Technical/clerical staff: 32• Worker: 33
36.8%
0.3% 3.1%
13.2%
46.5%
>60
From 51 to 60
From 41 to 50
From 31 to 40
From 18 to 30
Male
Female24%
76%
PAP
PAP
Dai Tu
Thai Nguyen
Other province
10%
48%
10%
16%
16%
1,027 1,027
1,027 1,027
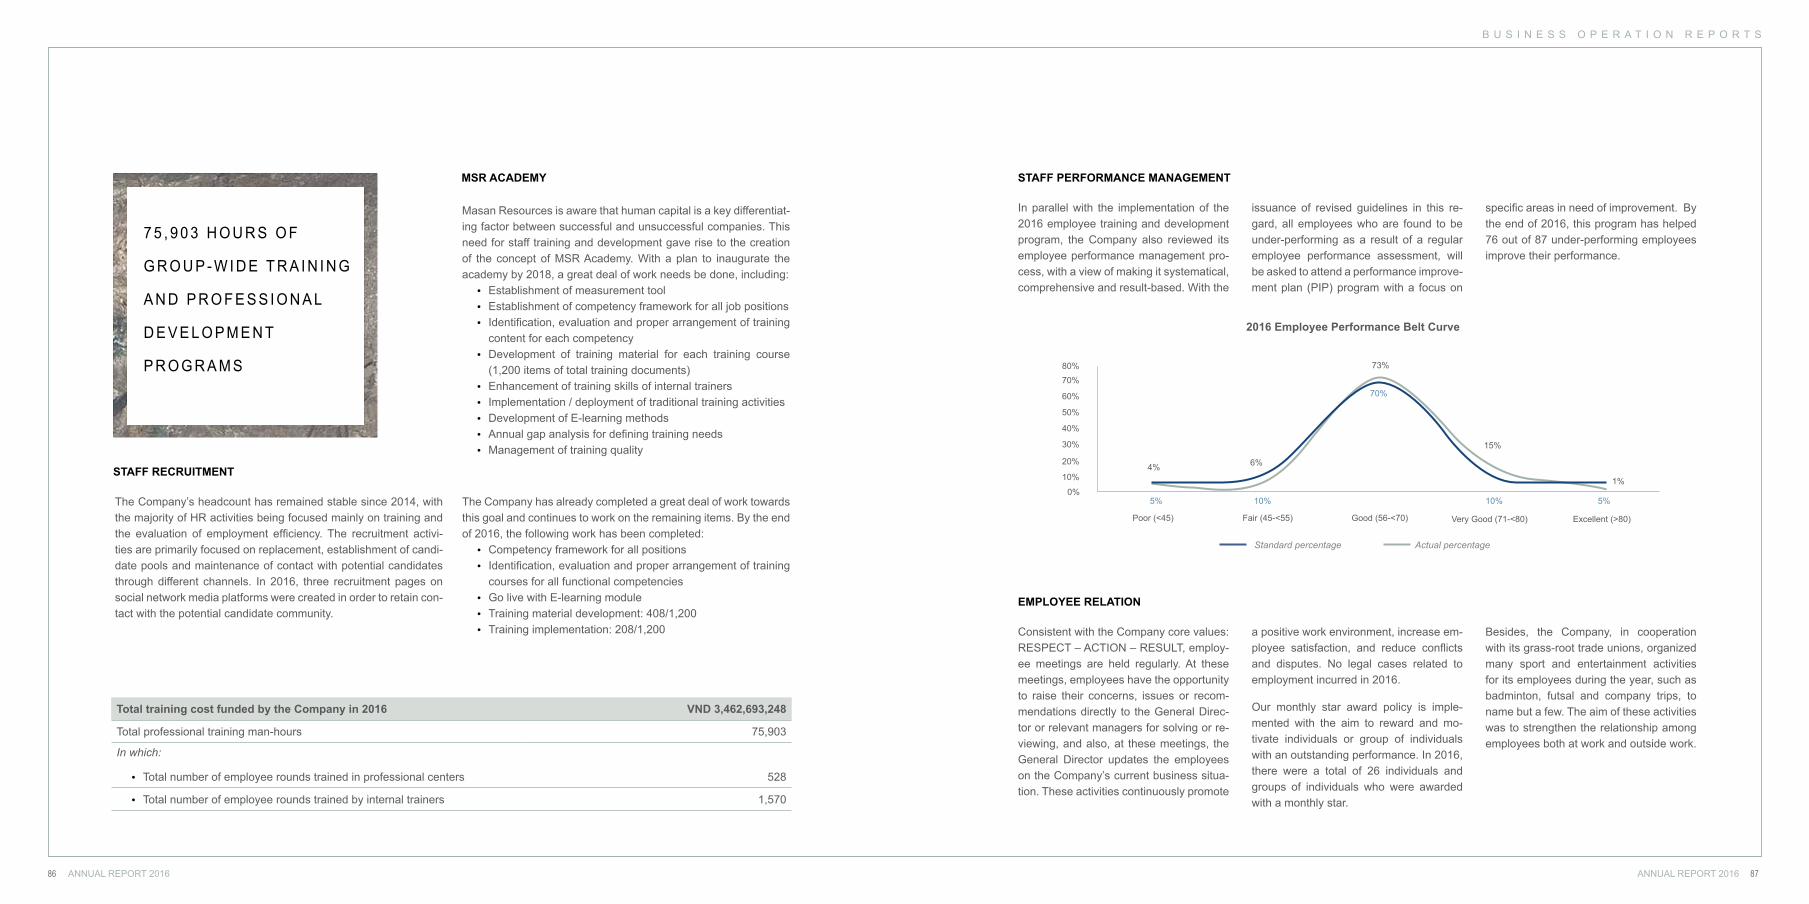
B U S I N E S S O P E R A T I O N R E P O R T S
ANNUAL REPORT 2016ANNUAL REPORT 201686 87
STAFF RECRUITMENT
MSR ACADEMY
The Company’s headcount has remained stable since 2014, with the majority of HR activities being focused mainly on training and the evaluation of employment efficiency. The recruitment activi-ties are primarily focused on replacement, establishment of candi-date pools and maintenance of contact with potential candidates through different channels. In 2016, three recruitment pages on social network media platforms were created in order to retain con-tact with the potential candidate community.
Masan Resources is aware that human capital is a key differentiat-ing factor between successful and unsuccessful companies. This need for staff training and development gave rise to the creation of the concept of MSR Academy. With a plan to inaugurate the academy by 2018, a great deal of work needs be done, including:
• Establishment of measurement tool • Establishment of competency framework for all job positions• Identification, evaluation and proper arrangement of training
content for each competency• Development of training material for each training course
(1,200 items of total training documents)• Enhancement of training skills of internal trainers• Implementation / deployment of traditional training activities• Development of E-learning methods• Annual gap analysis for defining training needs • Management of training quality
The Company has already completed a great deal of work towards this goal and continues to work on the remaining items. By the end of 2016, the following work has been completed:
• Competency framework for all positions • Identification, evaluation and proper arrangement of training
courses for all functional competencies • Go live with E-learning module • Training material development: 408/1,200• Training implementation: 208/1,200
Total training cost funded by the Company in 2016 VND 3,462,693,248
Total professional training man-hours 75,903
In which:
• Total number of employee rounds trained in professional centers 528
• Total number of employee rounds trained by internal trainers 1,570
7 5 , 9 0 3 H O U R S O F
G R O U P - W I D E T R A I N I N G
A N D P R O F E S S I O N A L
D E V E L O P M E N T
P R O G R A M S
STAFF PERFORMANCE MANAGEMENT
EMPLOYEE RELATION
In parallel with the implementation of the 2016 employee training and development program, the Company also reviewed its employee performance management pro-cess, with a view of making it systematical, comprehensive and result-based. With the
issuance of revised guidelines in this re-gard, all employees who are found to be under-performing as a result of a regular employee performance assessment, will be asked to attend a performance improve-ment plan (PIP) program with a focus on
specific areas in need of improvement. By the end of 2016, this program has helped 76 out of 87 under-performing employees improve their performance.
Consistent with the Company core values: RESPECT – ACTION – RESULT, employ-ee meetings are held regularly. At these meetings, employees have the opportunity to raise their concerns, issues or recom-mendations directly to the General Direc-tor or relevant managers for solving or re-viewing, and also, at these meetings, the General Director updates the employees on the Company’s current business situa-tion. These activities continuously promote
a positive work environment, increase em-ployee satisfaction, and reduce conflicts and disputes. No legal cases related to employment incurred in 2016.
Our monthly star award policy is imple-mented with the aim to reward and mo-tivate individuals or group of individuals with an outstanding performance. In 2016, there were a total of 26 individuals and groups of individuals who were awarded with a monthly star.
Besides, the Company, in cooperation with its grass-root trade unions, organized many sport and entertainment activities for its employees during the year, such as badminton, futsal and company trips, to name but a few. The aim of these activities was to strengthen the relationship among employees both at work and outside work.
2016 Employee Performance Belt Curve
0%
Poor (<45)
4%
5% 10%
70%
10% 5%
6%
73%
15%
1%
Fair (45-<55) Good (56-<70) Very Good (71-<80) Excellent (>80)
10%
20%
30%
40%
50%
60%
70%80%
Standard percentage Actual percentage
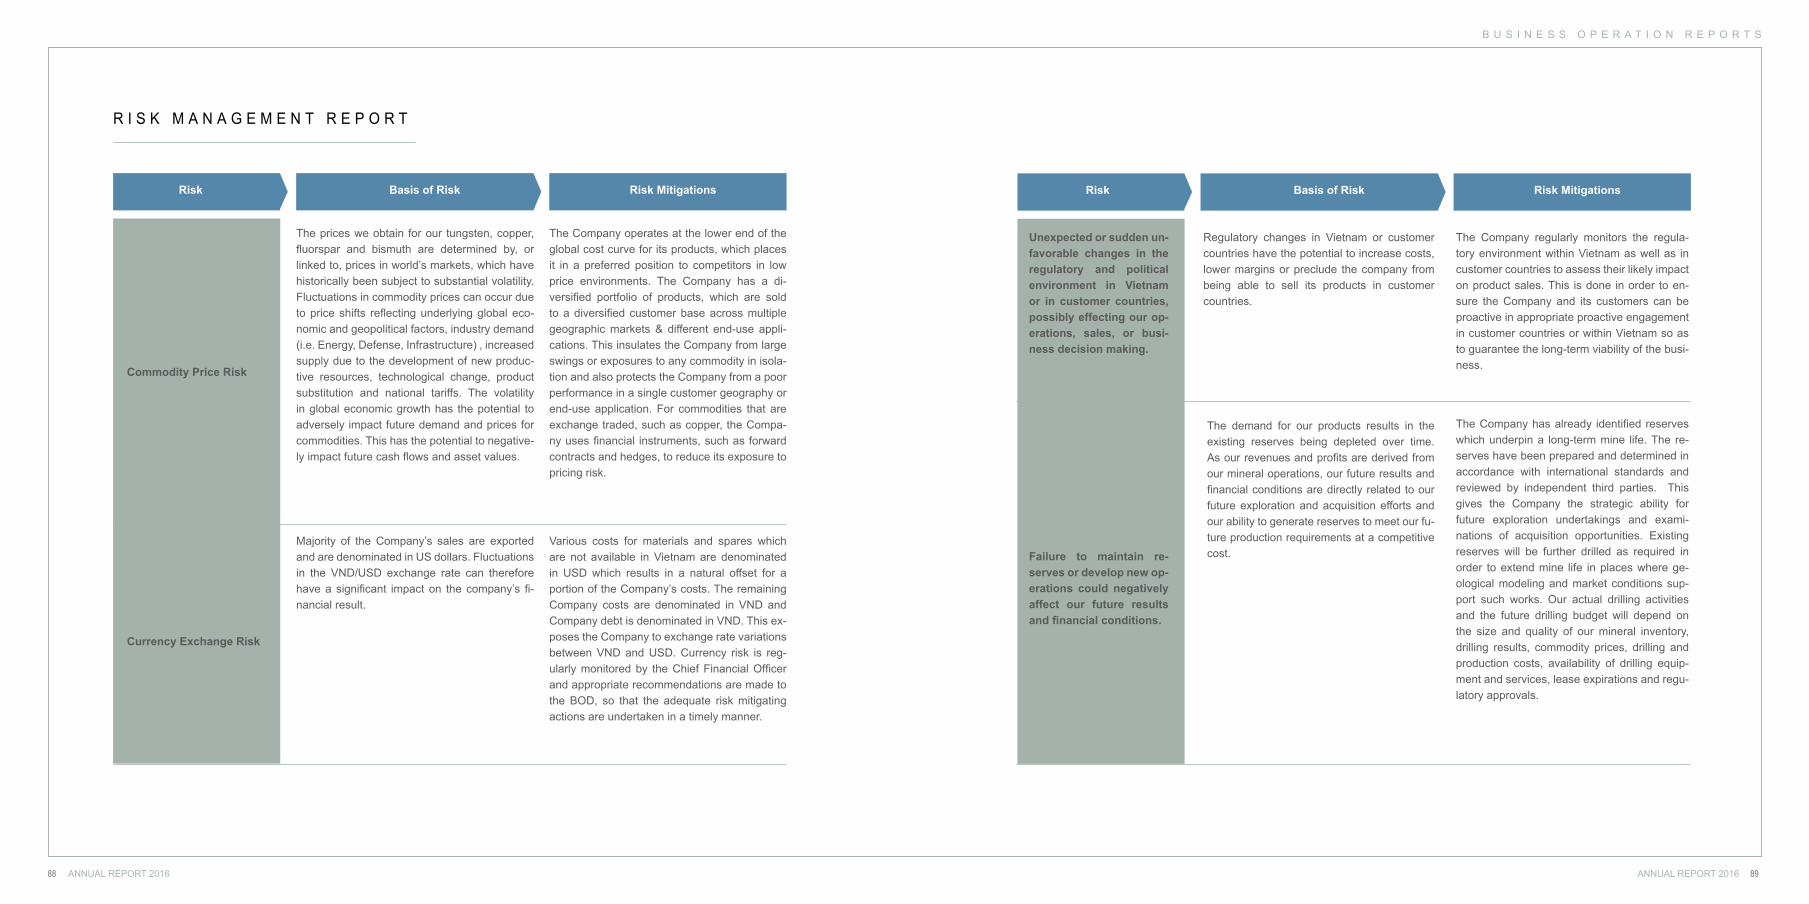
B U S I N E S S O P E R A T I O N R E P O R T S
ANNUAL REPORT 2016ANNUAL REPORT 201688 89
R I S K M A N A G E M E N T R E P O R T
Risk Basis of Risk Risk Mitigations
Commodity Price Risk
Currency Exchange Risk
The prices we obtain for our tungsten, copper, fluorspar and bismuth are determined by, or linked to, prices in world’s markets, which have historically been subject to substantial volatility. Fluctuations in commodity prices can occur due to price shifts reflecting underlying global eco-nomic and geopolitical factors, industry demand (i.e. Energy, Defense, Infrastructure) , increased supply due to the development of new produc-tive resources, technological change, product substitution and national tariffs. The volatility in global economic growth has the potential to adversely impact future demand and prices for commodities. This has the potential to negative-ly impact future cash flows and asset values.
Majority of the Company’s sales are exported and are denominated in US dollars. Fluctuations in the VND/USD exchange rate can therefore have a significant impact on the company’s fi-nancial result.
The Company operates at the lower end of the global cost curve for its products, which places it in a preferred position to competitors in low price environments. The Company has a di-versified portfolio of products, which are sold to a diversified customer base across multiple geographic markets & different end-use appli-cations. This insulates the Company from large swings or exposures to any commodity in isola-tion and also protects the Company from a poor performance in a single customer geography or end-use application. For commodities that are exchange traded, such as copper, the Compa-ny uses financial instruments, such as forward contracts and hedges, to reduce its exposure to pricing risk.
Various costs for materials and spares which are not available in Vietnam are denominated in USD which results in a natural offset for a portion of the Company’s costs. The remaining Company costs are denominated in VND and Company debt is denominated in VND. This ex-poses the Company to exchange rate variations between VND and USD. Currency risk is reg-ularly monitored by the Chief Financial Officer and appropriate recommendations are made to the BOD, so that the adequate risk mitigating actions are undertaken in a timely manner.
Risk Basis of Risk Risk Mitigations
Unexpected or sudden un-favorable changes in the regulatory and political environment in Vietnam or in customer countries, possibly effecting our op-erations, sales, or busi-ness decision making.
Failure to maintain re-serves or develop new op-erations could negatively affect our future results and financial conditions.
Regulatory changes in Vietnam or customer countries have the potential to increase costs, lower margins or preclude the company from being able to sell its products in customer countries.
The demand for our products results in the existing reserves being depleted over time. As our revenues and profits are derived from our mineral operations, our future results and financial conditions are directly related to our future exploration and acquisition efforts and our ability to generate reserves to meet our fu-ture production requirements at a competitive cost.
The Company regularly monitors the regula-tory environment within Vietnam as well as in customer countries to assess their likely impact on product sales. This is done in order to en-sure the Company and its customers can be proactive in appropriate proactive engagement in customer countries or within Vietnam so as to guarantee the long-term viability of the busi-ness.
The Company has already identified reserves which underpin a long-term mine life. The re-serves have been prepared and determined in accordance with international standards and reviewed by independent third parties. This gives the Company the strategic ability for future exploration undertakings and exami-nations of acquisition opportunities. Existing reserves will be further drilled as required in order to extend mine life in places where ge-ological modeling and market conditions sup-port such works. Our actual drilling activities and the future drilling budget will depend on the size and quality of our mineral inventory, drilling results, commodity prices, drilling and production costs, availability of drilling equip-ment and services, lease expirations and regu-latory approvals.
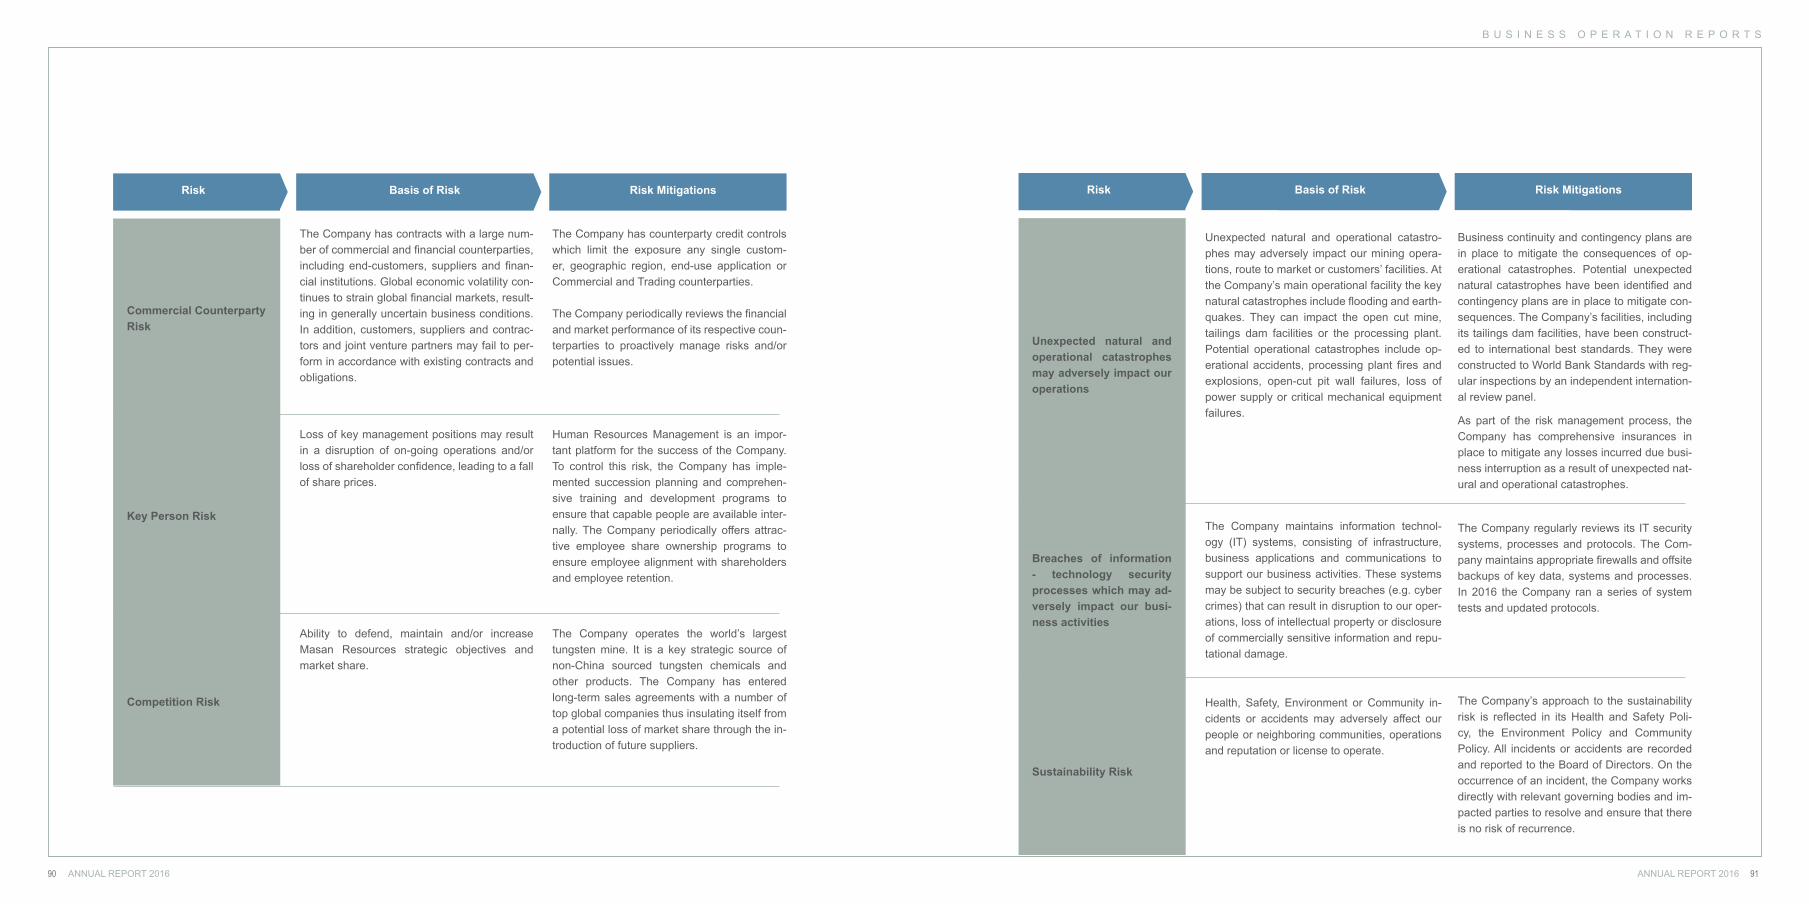
B U S I N E S S O P E R A T I O N R E P O R T S
ANNUAL REPORT 2016ANNUAL REPORT 201690 91
Commercial Counterparty Risk
Key Person Risk
Competition Risk
The Company has contracts with a large num-ber of commercial and financial counterparties, including end-customers, suppliers and finan-cial institutions. Global economic volatility con-tinues to strain global financial markets, result-ing in generally uncertain business conditions. In addition, customers, suppliers and contrac-tors and joint venture partners may fail to per-form in accordance with existing contracts and obligations.
Loss of key management positions may result in a disruption of on-going operations and/or loss of shareholder confidence, leading to a fall of share prices.
Ability to defend, maintain and/or increase Masan Resources strategic objectives and market share.
The Company has counterparty credit controls which limit the exposure any single custom-er, geographic region, end-use application or Commercial and Trading counterparties.
The Company periodically reviews the financial and market performance of its respective coun-terparties to proactively manage risks and/or potential issues.
Human Resources Management is an impor-tant platform for the success of the Company. To control this risk, the Company has imple-mented succession planning and comprehen-sive training and development programs to ensure that capable people are available inter-nally. The Company periodically offers attrac-tive employee share ownership programs to ensure employee alignment with shareholders and employee retention.
The Company operates the world’s largest tungsten mine. It is a key strategic source of non-China sourced tungsten chemicals and other products. The Company has entered long-term sales agreements with a number of top global companies thus insulating itself from a potential loss of market share through the in-troduction of future suppliers.
Risk Basis of Risk Risk Mitigations
Unexpected natural and operational catastrophes may adversely impact our operations
Breaches of information - technology security processes which may ad-versely impact our busi-ness activities
Sustainability Risk
Unexpected natural and operational catastro-phes may adversely impact our mining opera-tions, route to market or customers’ facilities. At the Company’s main operational facility the key natural catastrophes include flooding and earth-quakes. They can impact the open cut mine, tailings dam facilities or the processing plant. Potential operational catastrophes include op-erational accidents, processing plant fires and explosions, open-cut pit wall failures, loss of power supply or critical mechanical equipment failures.
The Company maintains information technol-ogy (IT) systems, consisting of infrastructure, business applications and communications to support our business activities. These systems may be subject to security breaches (e.g. cyber crimes) that can result in disruption to our oper-ations, loss of intellectual property or disclosure of commercially sensitive information and repu-tational damage.
Health, Safety, Environment or Community in-cidents or accidents may adversely affect our people or neighboring communities, operations and reputation or license to operate.
Business continuity and contingency plans are in place to mitigate the consequences of op-erational catastrophes. Potential unexpected natural catastrophes have been identified and contingency plans are in place to mitigate con-sequences. The Company’s facilities, including its tailings dam facilities, have been construct-ed to international best standards. They were constructed to World Bank Standards with reg-ular inspections by an independent internation-al review panel.
As part of the risk management process, the Company has comprehensive insurances in place to mitigate any losses incurred due busi-ness interruption as a result of unexpected nat-ural and operational catastrophes.
The Company regularly reviews its IT security systems, processes and protocols. The Com-pany maintains appropriate firewalls and offsite backups of key data, systems and processes. In 2016 the Company ran a series of system tests and updated protocols.
The Company’s approach to the sustainability risk is reflected in its Health and Safety Poli-cy, the Environment Policy and Community Policy. All incidents or accidents are recorded and reported to the Board of Directors. On the occurrence of an incident, the Company works directly with relevant governing bodies and im-pacted parties to resolve and ensure that there is no risk of recurrence.
Risk Basis of Risk Risk Mitigations
ANNUAL REPORT 2016ANNUAL REPORT 201692 93
S U S T A I N A B I L I T Y R E P O R T
S U S T A I N A B I L I T Y R E P O R T
Sustainability at Masan Resources
Putting people first
Environmental compliance and beyond
Sustainability for all of us
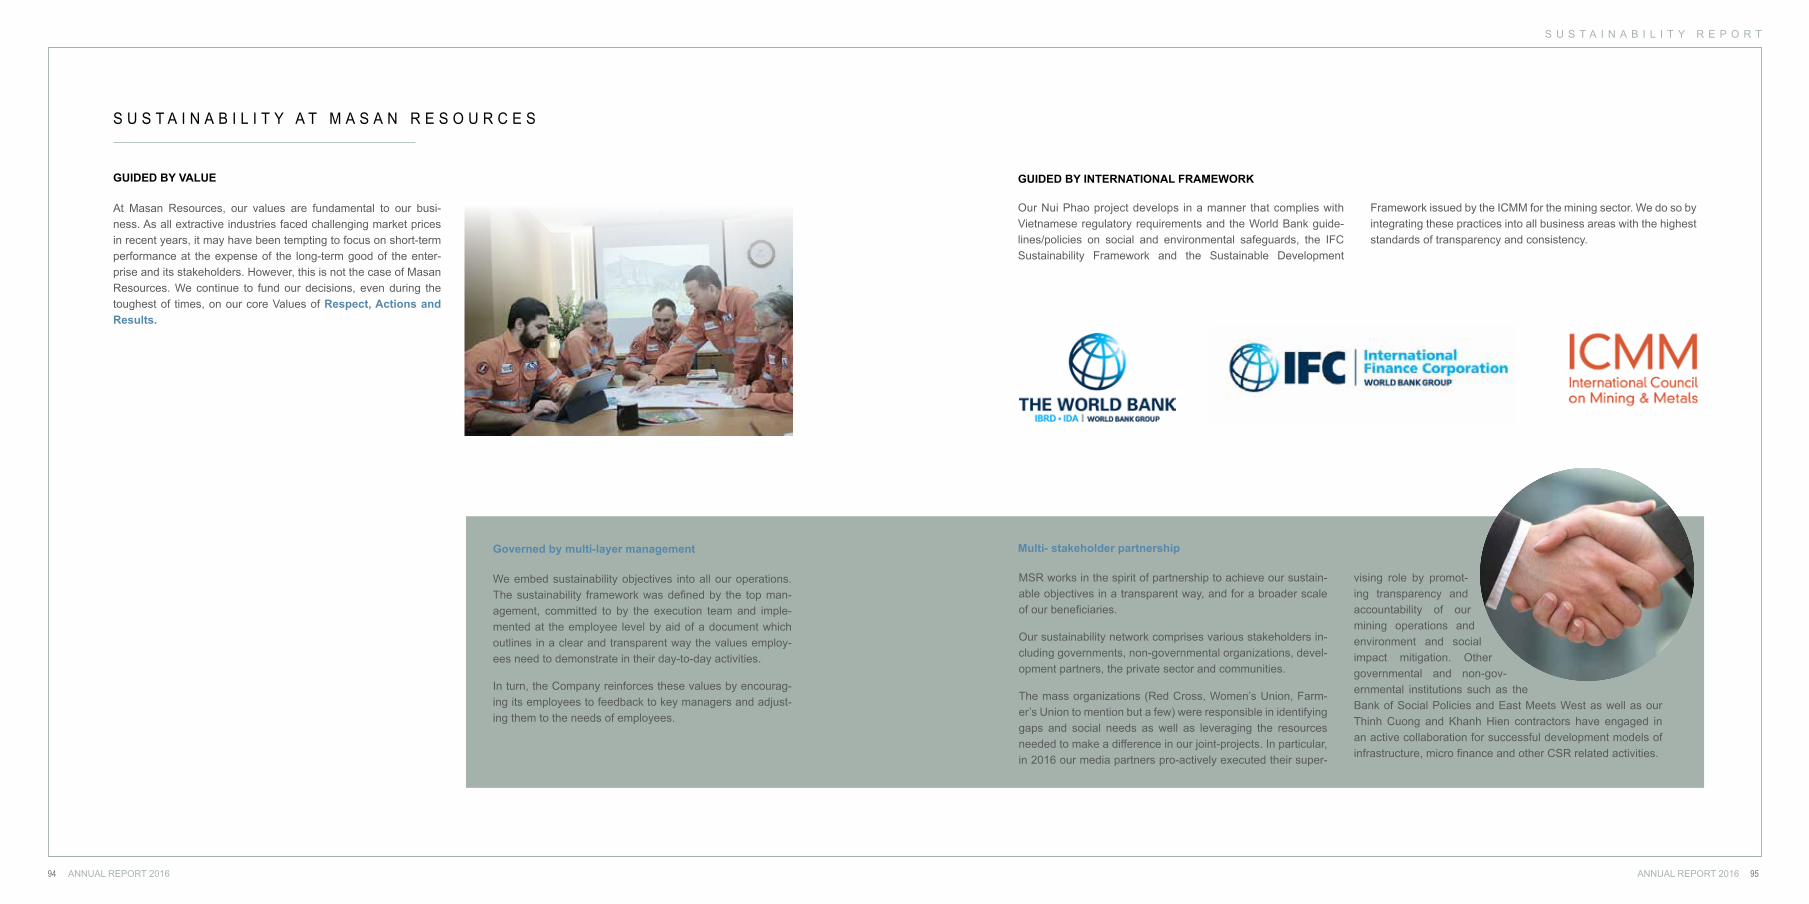
S U S T A I N A B I L I T Y A T M A S A N R E S O U R C E S
ANNUAL REPORT 2016ANNUAL REPORT 201694 95
S U S T A I N A B I L I T Y R E P O R T
GUIDED BY VALUE
At Masan Resources, our values are fundamental to our busi-ness. As all extractive industries faced challenging market prices in recent years, it may have been tempting to focus on short-term performance at the expense of the long-term good of the enter-prise and its stakeholders. However, this is not the case of Masan Resources. We continue to fund our decisions, even during the toughest of times, on our core Values of Respect, Actions and Results.
We embed sustainability objectives into all our operations. The sustainability framework was defined by the top man-agement, committed to by the execution team and imple-mented at the employee level by aid of a document which outlines in a clear and transparent way the values employ-ees need to demonstrate in their day-to-day activities.
In turn, the Company reinforces these values by encourag-ing its employees to feedback to key managers and adjust-ing them to the needs of employees.
Governed by multi-layer management
GUIDED BY INTERNATIONAL FRAMEWORK
MSR works in the spirit of partnership to achieve our sustain-able objectives in a transparent way, and for a broader scale of our beneficiaries.
Our sustainability network comprises various stakeholders in-cluding governments, non-governmental organizations, devel-opment partners, the private sector and communities.
The mass organizations (Red Cross, Women’s Union, Farm-er’s Union to mention but a few) were responsible in identifying gaps and social needs as well as leveraging the resources needed to make a difference in our joint-projects. In particular, in 2016 our media partners pro-actively executed their super-
vising role by promot-ing transparency and accountability of our mining operations and environment and social impact mitigation. Other governmental and non-gov-ernmental institutions such as the Bank of Social Policies and East Meets West as well as our Thinh Cuong and Khanh Hien contractors have engaged in an active collaboration for successful development models of infrastructure, micro finance and other CSR related activities.
Our Nui Phao project develops in a manner that complies with Vietnamese regulatory requirements and the World Bank guide-lines/policies on social and environmental safeguards, the IFC Sustainability Framework and the Sustainable Development
Framework issued by the ICMM for the mining sector. We do so by integrating these practices into all business areas with the highest standards of transparency and consistency.
Multi- stakeholder partnership
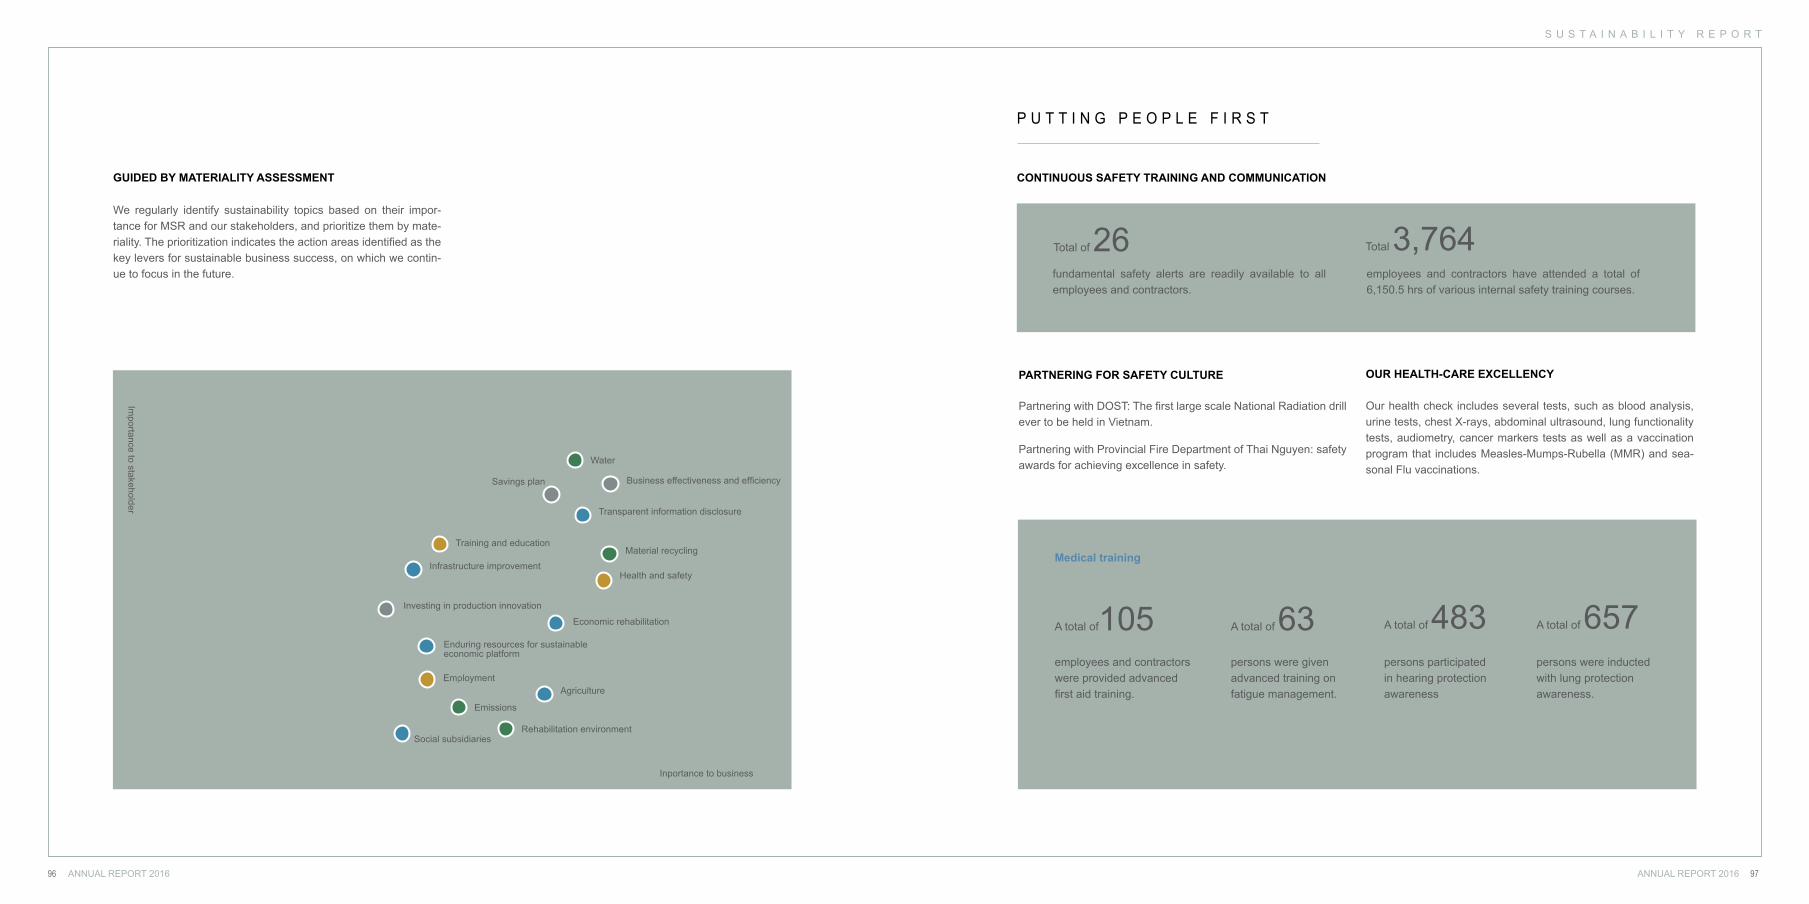
ANNUAL REPORT 2016ANNUAL REPORT 201696 97
S U S T A I N A B I L I T Y R E P O R T
GUIDED BY MATERIALITY ASSESSMENT
We regularly identify sustainability topics based on their impor-tance for MSR and our stakeholders, and prioritize them by mate-riality. The prioritization indicates the action areas identified as the key levers for sustainable business success, on which we contin-ue to focus in the future.
Water
Rehabilitation environment
Savings plan
Transparent information disclosure
Social subsidiaries
AgricultureEmployment
Health and safetyInfrastructure improvement
Investing in production innovation
Economic rehabilitation
Business effectiveness and efficiency
Enduring resources for sustainable economic platform
Material recyclingTraining and education
Partnering with DOST: The first large scale National Radiation drill ever to be held in Vietnam.
Partnering with Provincial Fire Department of Thai Nguyen: safety awards for achieving excellence in safety.
CONTINUOUS SAFETY TRAINING AND COMMUNICATION
PARTNERING FOR SAFETY CULTURE
Total of 26 Total 3,764fundamental safety alerts are readily available to all employees and contractors.
employees and contractors have attended a total of 6,150.5 hrs of various internal safety training courses.
P U T T I N G P E O P L E F I R S T
A total of105employees and contractors were provided advanced first aid training.
A total of 63persons were givenadvanced training on fatigue management.
A total of 483 persons participated in hearing protection awareness
A total of 657persons were inducted with lung protection awareness.
Our health check includes several tests, such as blood analysis, urine tests, chest X-rays, abdominal ultrasound, lung functionality tests, audiometry, cancer markers tests as well as a vaccination program that includes Measles-Mumps-Rubella (MMR) and sea-sonal Flu vaccinations.
OUR HEALTH-CARE EXCELLENCY
Medical training
Emissions
Importance to stakeholder
Inportance to business
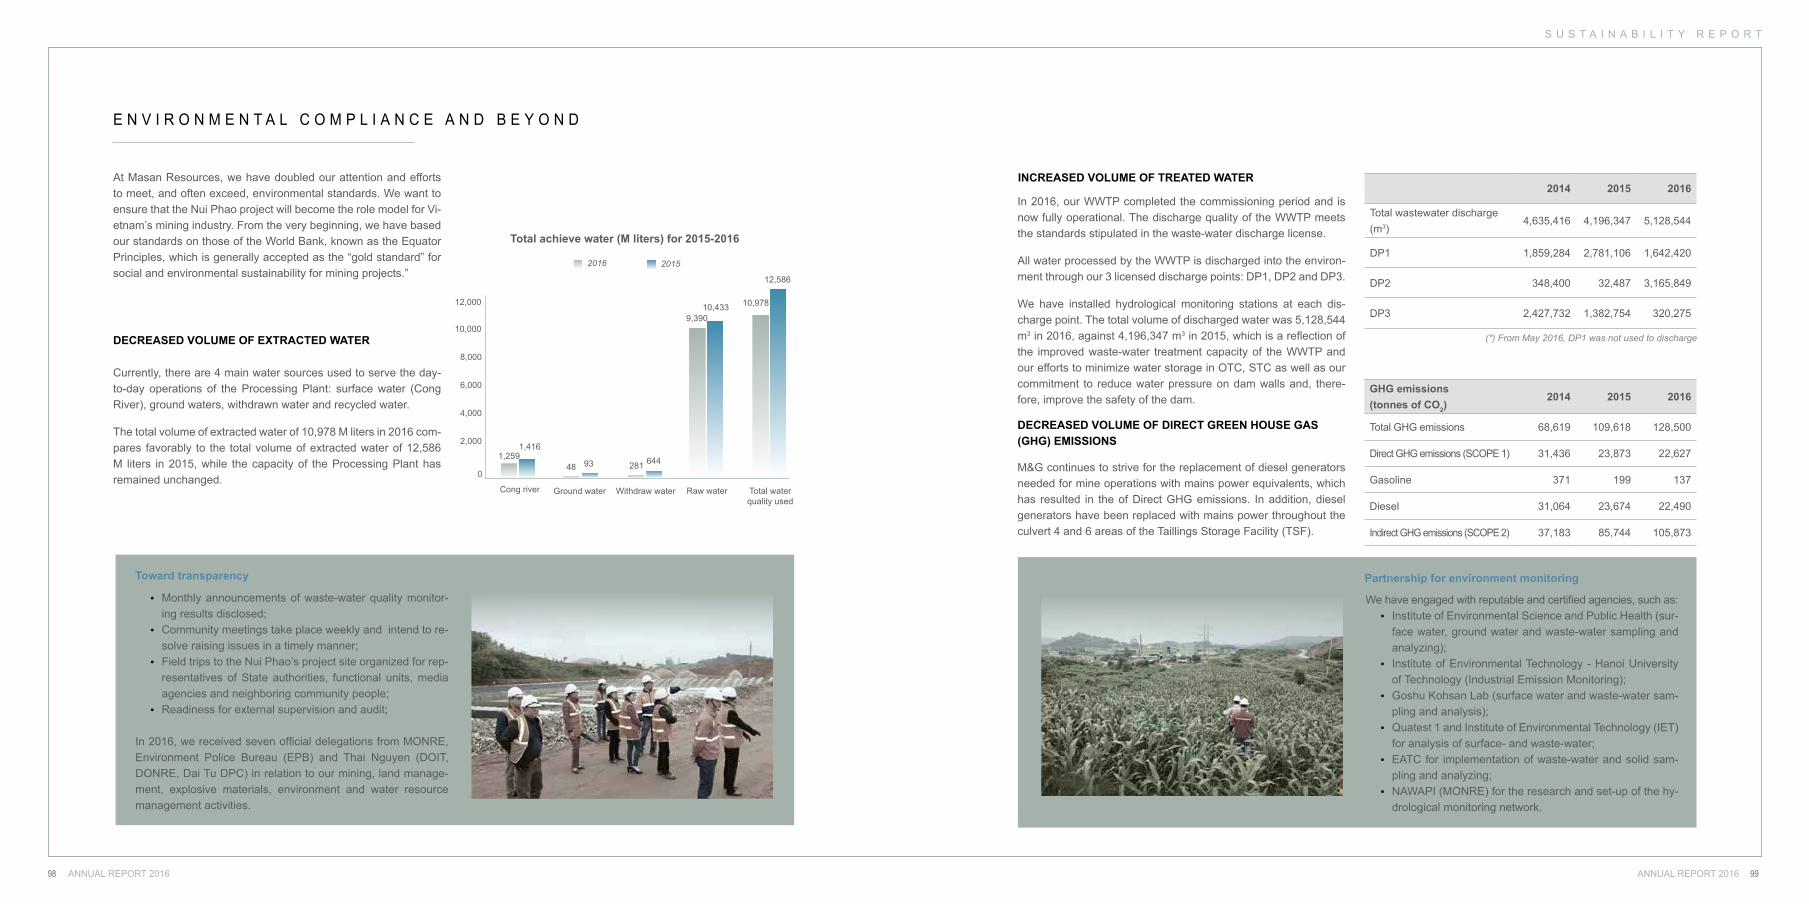
ANNUAL REPORT 2016ANNUAL REPORT 201698 99
S U S T A I N A B I L I T Y R E P O R T
E N V I R O N M E N T A L C O M P L I A N C E A N D B E Y O N D
At Masan Resources, we have doubled our attention and efforts to meet, and often exceed, environmental standards. We want to ensure that the Nui Phao project will become the role model for Vi-etnam’s mining industry. From the very beginning, we have based our standards on those of the World Bank, known as the Equator Principles, which is generally accepted as the “gold standard” for social and environmental sustainability for mining projects.”
Currently, there are 4 main water sources used to serve the day-to-day operations of the Processing Plant: surface water (Cong River), ground waters, withdrawn water and recycled water.
The total volume of extracted water of 10,978 M liters in 2016 com-pares favorably to the total volume of extracted water of 12,586 M liters in 2015, while the capacity of the Processing Plant has remained unchanged.
• Monthly announcements of waste-water quality monitor-ing results disclosed;
• Community meetings take place weekly and intend to re-solve raising issues in a timely manner;
• Field trips to the Nui Phao’s project site organized for rep-resentatives of State authorities, functional units, media agencies and neighboring community people;
• Readiness for external supervision and audit;
In 2016, we received seven official delegations from MONRE, Environment Police Bureau (EPB) and Thai Nguyen (DOIT, DONRE, Dai Tu DPC) in relation to our mining, land manage-ment, explosive materials, environment and water resource management activities.
DECREASED VOLUME OF EXTRACTED WATER
Toward transparency
In 2016, our WWTP completed the commissioning period and is now fully operational. The discharge quality of the WWTP meets the standards stipulated in the waste-water discharge license.
All water processed by the WWTP is discharged into the environ-ment through our 3 licensed discharge points: DP1, DP2 and DP3.
We have installed hydrological monitoring stations at each dis-charge point. The total volume of discharged water was 5,128,544 m3 in 2016, against 4,196,347 m3 in 2015, which is a reflection of the improved waste-water treatment capacity of the WWTP and our efforts to minimize water storage in OTC, STC as well as our commitment to reduce water pressure on dam walls and, there-fore, improve the safety of the dam.
INCREASED VOLUME OF TREATED WATER
M&G continues to strive for the replacement of diesel generators needed for mine operations with mains power equivalents, which has resulted in the of Direct GHG emissions. In addition, diesel generators have been replaced with mains power throughout the culvert 4 and 6 areas of the Taillings Storage Facility (TSF).
DECREASED VOLUME OF DIRECT GREEN HOUSE GAS (GHG) EMISSIONS
2014 2015 2016
Total wastewater discharge (m3)
4,635,416 4,196,347 5,128,544
DP1 1,859,284 2,781,106 1,642,420
DP2 348,400 32,487 3,165,849
DP3 2,427,732 1,382,754 320,275
GHG emissions(tonnes of CO2)
2014 2015 2016
Total GHG emissions 68,619 109,618 128,500
Direct GHG emissions (SCOPE 1) 31,436 23,873 22,627
Gasoline 371 199 137
Diesel 31,064 23,674 22,490
Indirect GHG emissions (SCOPE 2) 37,183 85,744 105,873
Partnership for environment monitoring
We have engaged with reputable and certified agencies, such as:• Institute of Environmental Science and Public Health (sur-
face water, ground water and waste-water sampling and analyzing);
• Institute of Environmental Technology - Hanoi University of Technology (Industrial Emission Monitoring);
• Goshu Kohsan Lab (surface water and waste-water sam-pling and analysis);
• Quatest 1 and Institute of Environmental Technology (IET) for analysis of surface- and waste-water;
• EATC for implementation of waste-water and solid sam-pling and analyzing;
• NAWAPI (MONRE) for the research and set-up of the hy-drological monitoring network.
(*) From May 2016, DP1 was not used to discharge
Total achieve water (M liters) for 2015-2016
Cong river Ground water Withdraw water Raw water Total water quality used
0
2,000
4,000
6,000
8,000
10,000
12,000
1,416
48 93 281 644
10,433
12,586
2016 2015
1,259
9,390
10,978
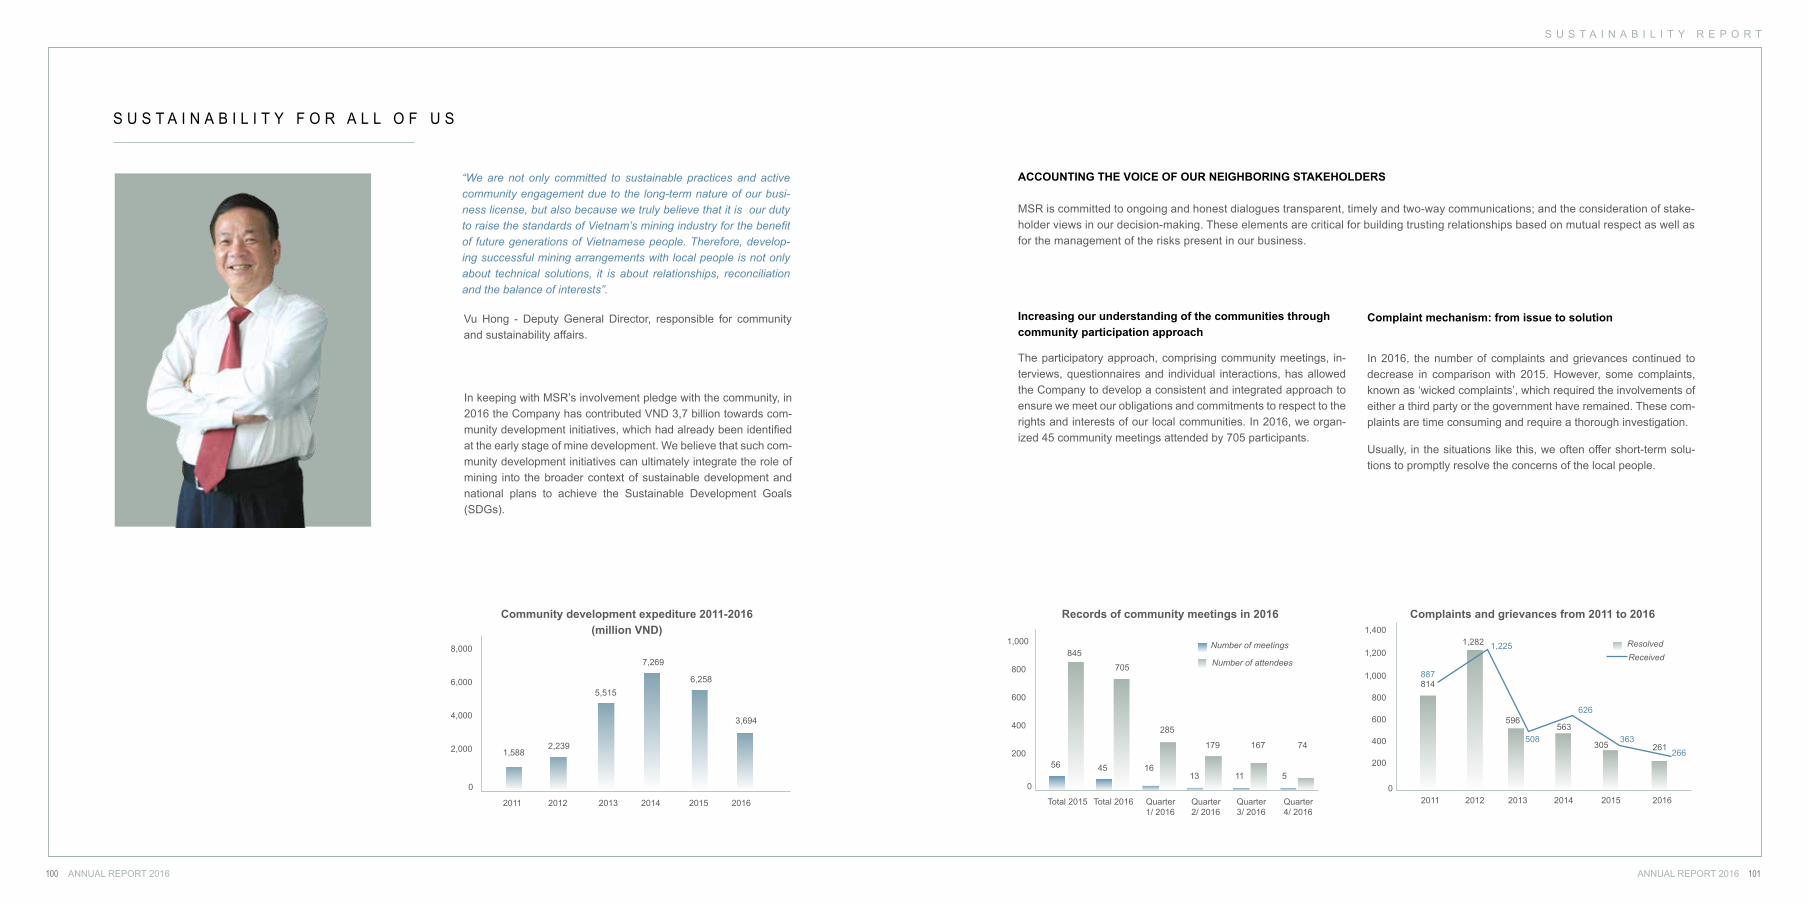
ANNUAL REPORT 2016ANNUAL REPORT 2016100 101
S U S T A I N A B I L I T Y R E P O R T
S U S T A I N A B I L I T Y F O R A L L O F U S
“We are not only committed to sustainable practices and active community engagement due to the long-term nature of our busi-ness license, but also because we truly believe that it is our duty to raise the standards of Vietnam’s mining industry for the benefit of future generations of Vietnamese people. Therefore, develop-ing successful mining arrangements with local people is not only about technical solutions, it is about relationships, reconciliation and the balance of interests”.
In keeping with MSR’s involvement pledge with the community, in 2016 the Company has contributed VND 3,7 billion towards com-munity development initiatives, which had already been identified at the early stage of mine development. We believe that such com-munity development initiatives can ultimately integrate the role of mining into the broader context of sustainable development and national plans to achieve the Sustainable Development Goals (SDGs).
Vu Hong - Deputy General Director, responsible for community and sustainability affairs.
MSR is committed to ongoing and honest dialogues transparent, timely and two-way communications; and the consideration of stake-holder views in our decision-making. These elements are critical for building trusting relationships based on mutual respect as well as for the management of the risks present in our business.
The participatory approach, comprising community meetings, in-terviews, questionnaires and individual interactions, has allowed the Company to develop a consistent and integrated approach to ensure we meet our obligations and commitments to respect to the rights and interests of our local communities. In 2016, we organ-ized 45 community meetings attended by 705 participants.
In 2016, the number of complaints and grievances continued to decrease in comparison with 2015. However, some complaints, known as ‘wicked complaints’, which required the involvements of either a third party or the government have remained. These com-plaints are time consuming and require a thorough investigation.
Usually, in the situations like this, we often offer short-term solu-tions to promptly resolve the concerns of the local people.
ACCOUNTING THE VOICE OF OUR NEIGHBORING STAKEHOLDERS
Increasing our understanding of the communities through community participation approach
Complaint mechanism: from issue to solution
Records of community meetings in 2016
Total 2015 Total 2016 Quarter1/ 2016
Quarter2/ 2016
Quarter3/ 2016
Quarter4/ 2016
0
200
400
600
800
1,000
56 45 1613 11 5
845
705
285
179 167 74
Number of meetings
Number of attendees
Complaints and grievances from 2011 to 2016
2011 2012 2013 2014 2015 20160
200
400
600
800
1,000
1,200
1,400
814887
1,225
508
626
363266
596563
305 261
1,282 ResolvedReceived
Community development expediture 2011-2016 (million VND)
0
2,000
4,000
6,000
8,000
1,588
2011 2012 2013 2014 2015 2016
2,239
5,515
7,269
6,258
3,694
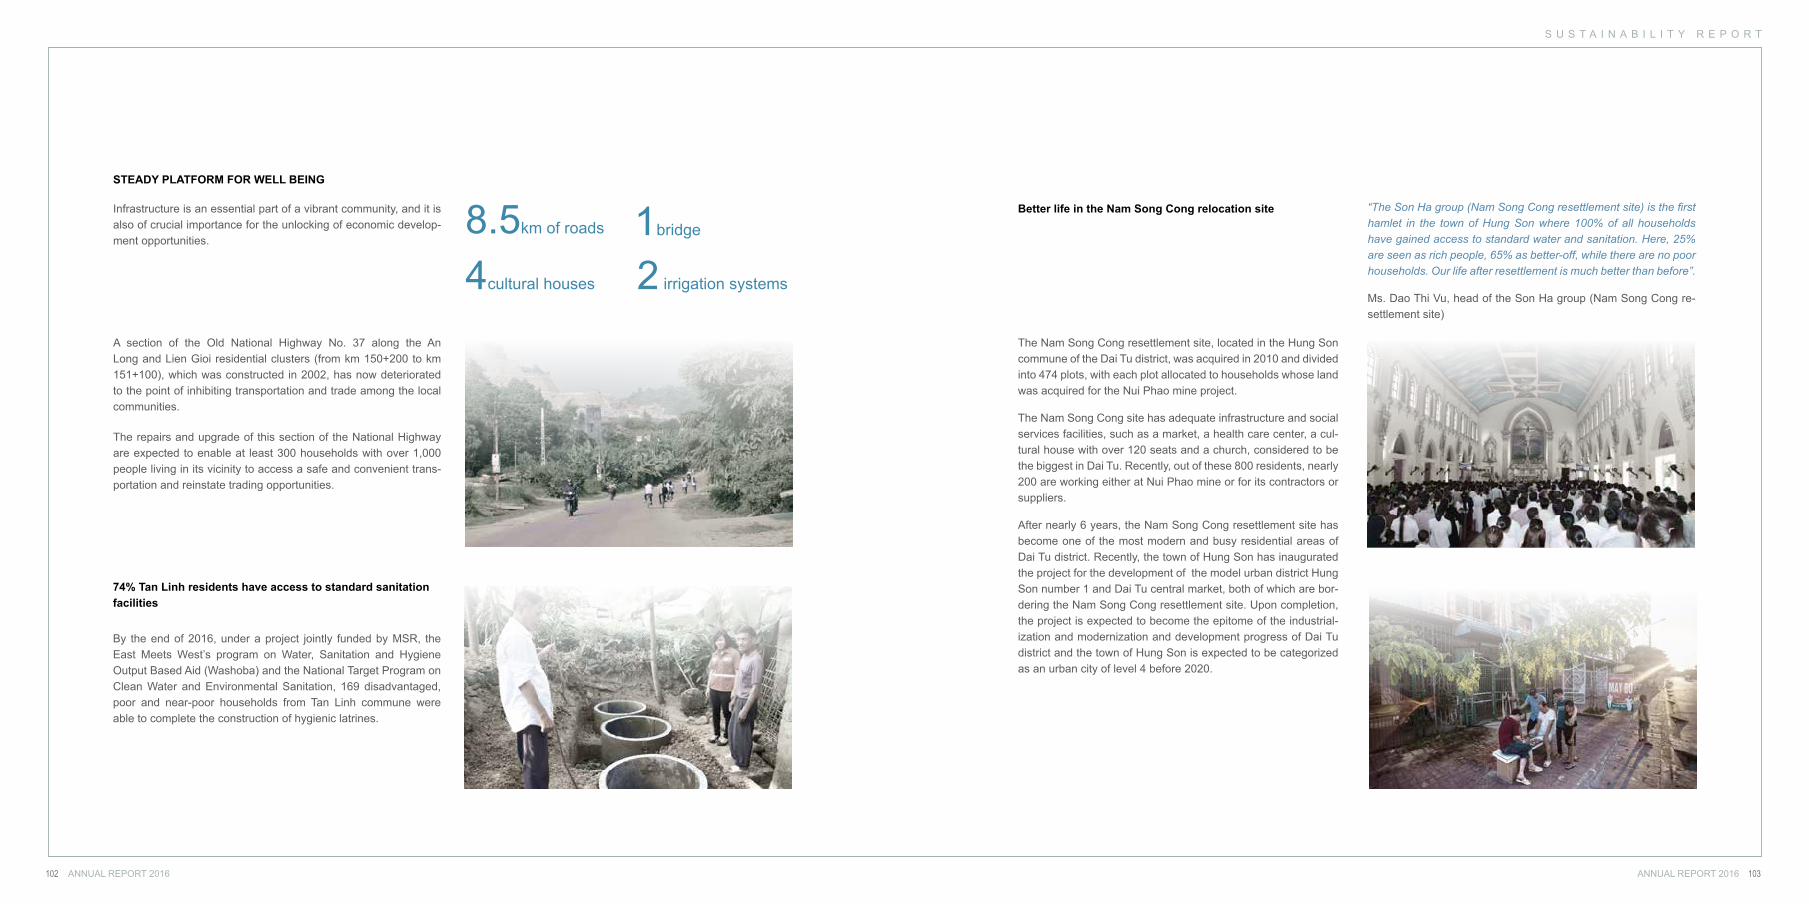
ANNUAL REPORT 2016ANNUAL REPORT 2016102 103
S U S T A I N A B I L I T Y R E P O R T
Infrastructure is an essential part of a vibrant community, and it is also of crucial importance for the unlocking of economic develop-ment opportunities.
A section of the Old National Highway No. 37 along the An Long and Lien Gioi residential clusters (from km 150+200 to km 151+100), which was constructed in 2002, has now deteriorated to the point of inhibiting transportation and trade among the local communities.
The repairs and upgrade of this section of the National Highway are expected to enable at least 300 households with over 1,000 people living in its vicinity to access a safe and convenient trans-portation and reinstate trading opportunities.
STEADY PLATFORM FOR WELL BEING
By the end of 2016, under a project jointly funded by MSR, the East Meets West’s program on Water, Sanitation and Hygiene Output Based Aid (Washoba) and the National Target Program on Clean Water and Environmental Sanitation, 169 disadvantaged, poor and near-poor households from Tan Linh commune were able to complete the construction of hygienic latrines.
74% Tan Linh residents have access to standard sanitation facilities
8.5km of roads
4cultural houses
1bridge
2 irrigation systems
The Nam Song Cong resettlement site, located in the Hung Son commune of the Dai Tu district, was acquired in 2010 and divided into 474 plots, with each plot allocated to households whose land was acquired for the Nui Phao mine project.
The Nam Song Cong site has adequate infrastructure and social services facilities, such as a market, a health care center, a cul-tural house with over 120 seats and a church, considered to be the biggest in Dai Tu. Recently, out of these 800 residents, nearly 200 are working either at Nui Phao mine or for its contractors or suppliers.
After nearly 6 years, the Nam Song Cong resettlement site has become one of the most modern and busy residential areas of Dai Tu district. Recently, the town of Hung Son has inaugurated the project for the development of the model urban district Hung Son number 1 and Dai Tu central market, both of which are bor-dering the Nam Song Cong resettlement site. Upon completion, the project is expected to become the epitome of the industrial-ization and modernization and development progress of Dai Tu district and the town of Hung Son is expected to be categorized as an urban city of level 4 before 2020.
Better life in the Nam Song Cong relocation site “The Son Ha group (Nam Song Cong resettlement site) is the first hamlet in the town of Hung Son where 100% of all households have gained access to standard water and sanitation. Here, 25% are seen as rich people, 65% as better-off, while there are no poor households. Our life after resettlement is much better than before”.
Ms. Dao Thi Vu, head of the Son Ha group (Nam Song Cong re-settlement site)
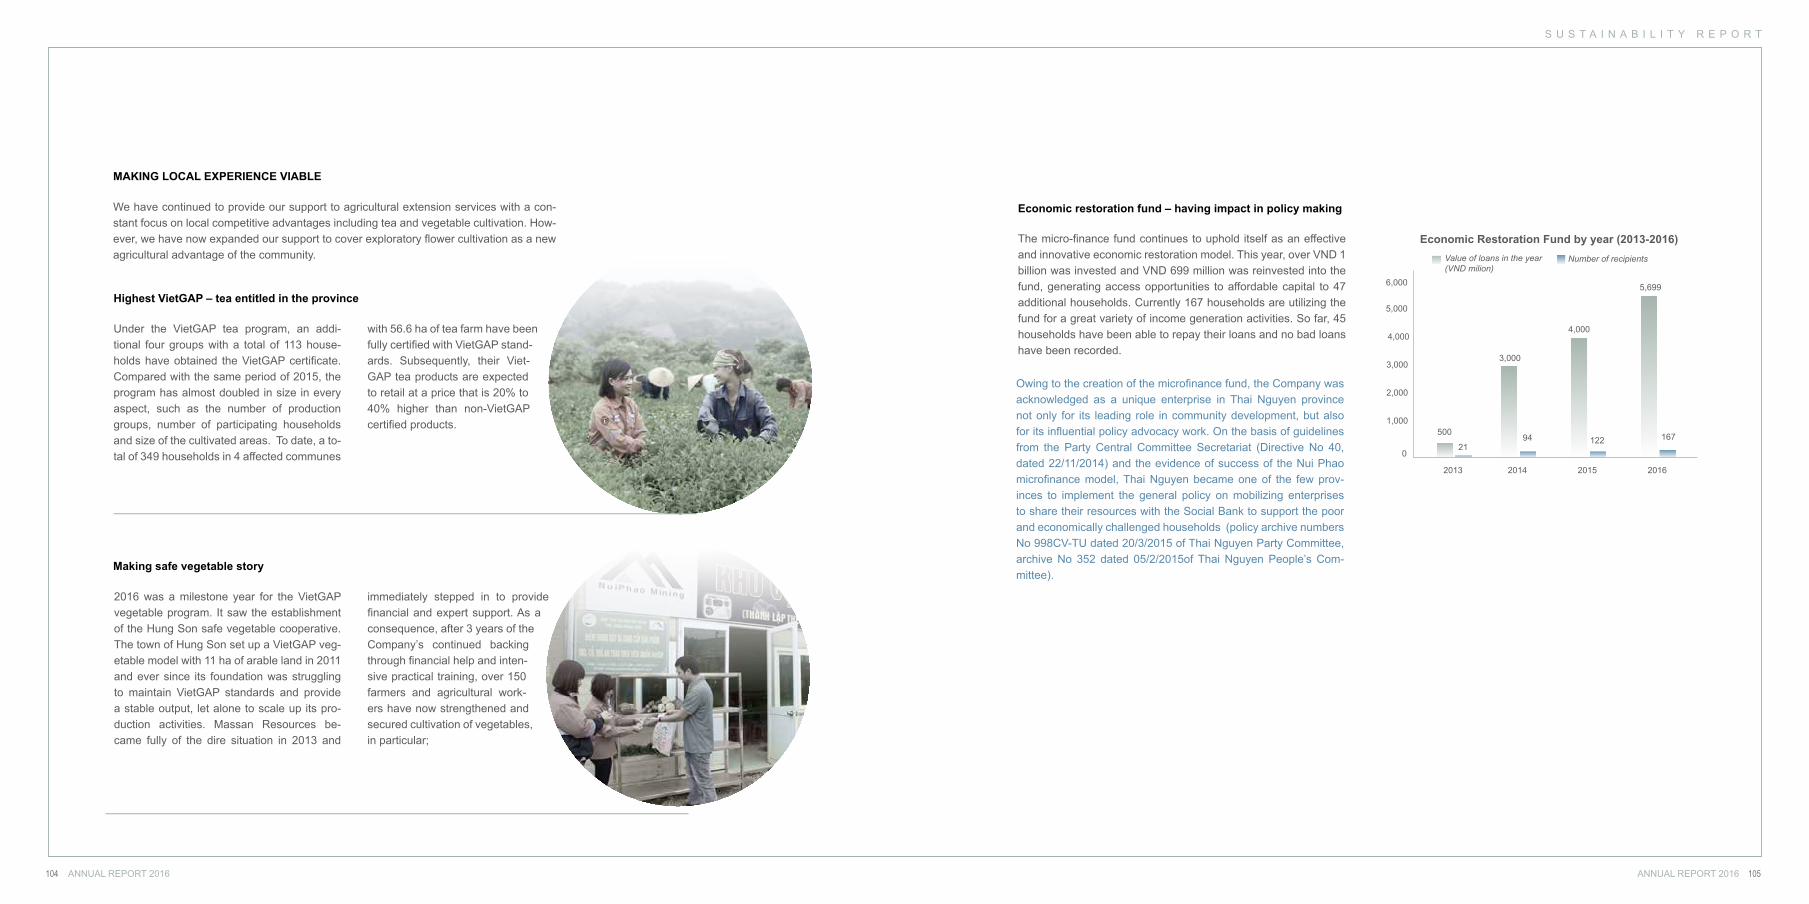
ANNUAL REPORT 2016ANNUAL REPORT 2016104 105
S U S T A I N A B I L I T Y R E P O R T
MAKING LOCAL EXPERIENCE VIABLE
We have continued to provide our support to agricultural extension services with a con-stant focus on local competitive advantages including tea and vegetable cultivation. How-ever, we have now expanded our support to cover exploratory flower cultivation as a new agricultural advantage of the community.
Under the VietGAP tea program, an addi-tional four groups with a total of 113 house-holds have obtained the VietGAP certificate. Compared with the same period of 2015, the program has almost doubled in size in every aspect, such as the number of production groups, number of participating households and size of the cultivated areas. To date, a to-tal of 349 households in 4 affected communes
with 56.6 ha of tea farm have been fully certified with VietGAP stand-ards. Subsequently, their Viet-GAP tea products are expected to retail at a price that is 20% to 40% higher than non-VietGAP certified products.
2016 was a milestone year for the VietGAP vegetable program. It saw the establishment of the Hung Son safe vegetable cooperative. The town of Hung Son set up a VietGAP veg-etable model with 11 ha of arable land in 2011 and ever since its foundation was struggling to maintain VietGAP standards and provide a stable output, let alone to scale up its pro-duction activities. Massan Resources be-came fully of the dire situation in 2013 and
immediately stepped in to provide financial and expert support. As a consequence, after 3 years of the Company’s continued backing through financial help and inten-sive practical training, over 150 farmers and agricultural work-ers have now strengthened and secured cultivation of vegetables, in particular;
Highest VietGAP – tea entitled in the province
Making safe vegetable story
Economic Restoration Fund by year (2013-2016)
2013 2014 2015 2016
0
1,000
2,000
3,000
4,000
5,000
6,000
500
3,000
4,000
5,699
2194 122 167
Value of loans in the year(VND milion)
Number of recipients
The micro-finance fund continues to uphold itself as an effective and innovative economic restoration model. This year, over VND 1 billion was invested and VND 699 million was reinvested into the fund, generating access opportunities to affordable capital to 47 additional households. Currently 167 households are utilizing the fund for a great variety of income generation activities. So far, 45 households have been able to repay their loans and no bad loans have been recorded.
Owing to the creation of the microfinance fund, the Company was acknowledged as a unique enterprise in Thai Nguyen province not only for its leading role in community development, but also for its influential policy advocacy work. On the basis of guidelines from the Party Central Committee Secretariat (Directive No 40, dated 22/11/2014) and the evidence of success of the Nui Phao microfinance model, Thai Nguyen became one of the few prov-inces to implement the general policy on mobilizing enterprises to share their resources with the Social Bank to support the poor and economically challenged households (policy archive numbers No 998CV-TU dated 20/3/2015 of Thai Nguyen Party Committee, archive No 352 dated 05/2/2015of Thai Nguyen People’s Com-mittee).
Economic restoration fund – having impact in policy making
F I N A N C I A L S T A T E M E N T S
ANNUAL REPORT 2016ANNUAL REPORT 2016106 107
F I N A N C I A L S T A T E M E N T S
MASAN RESOURCES CORPORATION (FORMERLY KNOWN AS MA SAN RESOURCES CORPORATION)
Corporate Information
Statement of the Board of Management
Independent Auditor Report
Balance Sheets
Statement of Income
Statement of Cash Flow
Notes to the Financial Statements
F I N A N C I A L S T A T E M E N T S
ANNUAL REPORT 2016ANNUAL REPORT 2016108 109
C O R P O R A T E I N F O R M A T I O N
Enterprise Registration Certificate No.
Investment Certificate No.
Board of Directors
Board of Management
Registered Office
Auditor
0309966889 6 May 2016The Company’s Enterprise Registration Certificate has been amended several times, the most recent of which was dated 6 May 2016. The Certificate and its amendments were is-sued by the Department of Planning and Investment of Ho Chi Minh City. The first Business Registration Certificate No. 0309966889 was issued on 27 April 2010.
41122000131 2 August 2013The Investment Certificate was issued by the People’s Committee of Ho Chi Minh City to the Company to implement the investment of “Ma San Resources Corporation”. The project has a term of 10 years from the date of the Investment Certificate.
Mr. Chetan Prakash Baxi Chairman (from 22 April 2016)Dr. Nguyen Dang Quang Chairman (until 21 April 2016)Dr. Nguyen Dang Quang Member (from 22 April 2016)Mr. Chetan Prakash Baxi Member (until 21 April 2016)Mr. Nguyen Thieu Nam MemberMr. Jonathan David Fiorello MemberMr. Dominic John Heaton Member (from 22 April 2016)Mr. Nguyen Van Thang Member (from 22 April 2016)
Mr Dominic John Heaton General Director
Suite 802, 8th Floor, Central Plaza BuildingNo. 17 Le Duan, Ben Nghe Ward, District 1Ho Chi Minh CityVietnam
KPMG LimitedVietnam
MASAN RESOURCES CORPORATION (FORMERLY KNOWN AS MA SAN RESOURCES CORPORATION)
S T A T E M E N T O F T H E B O A R D O F M A N A G E M E N T
The Board of Management of Masan Resources Corporation (formerly known as Ma San Resources Corporation) (“the Company”) presents this statement and the accompanying consolidated and separate financial statements of the Company and its subsidiaries (collectively re-ferred to as “the Group”) as of and for the year ended 31 December 2016.
The Board of Management is responsible for the preparation and presentation of the consolidated and separate financial statements in accordance with Vietnamese Accounting Standards, the Vietnamese Accounting System for enterprises and the relevant statutory require-ments applicable to financial reporting. In the opinion of the Board of Management:
(a) the consolidated and separate financial statements set out on pages 111 to 156 give a true and fair view of the financial position of the Group and of the Company as at 31 December 2016, and of the results of operations and the cash flows of the Group and of the Compa-ny for the year then ended in accordance with the Vietnamese Accounting Standards, the Vietnamese Accounting System for enterprises and the relevant statutory requirements applicable to financial reporting; and
(b) at the date of this statement, there are no reasons to believe that the Group will not be able to pay its debts as and when they fall due.
The Board of Management has, on the date of this statement, authorised these consolidated and separate financial statements for issue.
On behalf of the Board of Management
Dominic John Heaton General Director
Ho Chi Minh City, 15 March 2017
MASAN RESOURCES CORPORATION (FORMERLY KNOWN AS MA SAN RESOURCES CORPORATION)
F I N A N C I A L S T A T E M E N T S
ANNUAL REPORT 2016ANNUAL REPORT 2016110 111
I N D E P E N D E N T A U D I T O R ’ S R E P O R T
To the ShareholdersMasan Resources Corporation (formerly known as Ma San Resources Corporation)
We have audited the accompanying consolidated and separate financial statements of Masan Resources Corporation (formerly known as Ma San Resources Corporation) (“the Company”) and its subsidiaries (collectively “the Group”), which comprise the consolidated and separate balance sheets as at 31 December 2016, the related consolidated and separate statements of income and cash flows for the year then ended and the explanatory notes thereto which were authorised for issue by the Company’s management on 15 March 2017, as set out on pages 111 to 156.
Management’s Responsibility The Company’s management is responsible for the preparation and fair presentation of these consolidated and separate financial statements in accordance with Vietnamese Accounting Standards, the Vietnamese Accounting System for enterprises and the relevant statutory requirements applicable to financial reporting and for such internal control as the management determines necessary to enable the preparation of consolidated and separate financial statements that are free from material misstatement, whether due to fraud or error.
Auditor’s ResponsibilityOur responsibility is to express an opinion on these consolidated and separate financial statements based on our audit. We conducted our audit in accordance with Vietnamese Standards on Auditing. Those standards require that we comply with ethical requirements and plan and perform the audit to obtain reasonable assurance about whether the consolidated and separate financial statements are free of material misstatement.
An audit involves performing procedures to obtain audit evidence about the amounts and disclosures in the financial statements. The procedures selected depend on the auditor’s judgement, including the assessment of the risks of material misstatement of the financial statements, whether due to fraud or error. In making those risk assessments, the auditor considers internal control relevant to the Company’s preparation and fair presentation of the financial statements in order to design audit procedures that are appropriate in the circumstances, but not for the purpose of expressing an opinion on the effectiveness of the Company’s internal control. An audit also includes evaluating the appropriateness of accounting policies used and the reasonableness of accounting estimates made by the Company’s management, as well as evaluating the overall presentation of the financial statements.
We believe that the audit evidence we have obtained is sufficient and appropriate to provide a basis for our audit opinion.
Auditor’s OpinionIn our opinion, the consolidated and separate financial statements give a true and fair view, in all material respects, of the financial positions of the Group and the Company as at 31 December 2016 and of their consolidated and separate results of operations and their consolidated and separate cash flows for the year then ended in accordance with Vietnamese Accounting Standards, the Vietnamese Accounting System for enterprises and the relevant statutory requirements applicable to financial reporting.
Le Viet HungPracticing Auditor RegistrationCertificate No.: 0296-2013-007-1
Wang Toon Kim Practicing Auditor Registration Certificate No.: 0557-2013-007-1Deputy General DirectorHanoi, 15 March 2017
KPMG Limited VietnamAudit Report No.: 16-02-153-A
B A L A N C E S H E E T S
Balance sheets as at 31 December 2016 Form B 01 – DN/HN(Issued under Circular No. 200/2014/TT-BTC and No. 202/2014/TT-BTC
dated 22 December 2014 of the Ministry of Finance)
Group Company
Code Note 31/12/2016 1/1/2016 31/12/2016 1/1/2016
VND’000 VND’000 VND’000 VND’000
ASSETS
Current assets (100 = 110 + 120+ 130 + 140 + 150) 100 2,496,130,991 2,490,177,582 951,931 552,795
Cash and cash equivalents 110 5 603,345,037 372,014,377 896,931 497,795
Cash 111 536,715,037 370,384,377 896,931 497,795
Cash equivalents 112 66,630,000 1,630,000 - -
Short-term financial investments 120 - 2,100,000 - -
Held-to-maturity investments 123 - 2,100,000 - -
Accounts receivable - short-term 130 583,833,584 747,080,504 55,000 55,000
Accounts receivable from customers 131 271,197,824 241,247,245 - -
Prepayments to suppliers 132 42,094,159 75,767,652 - -
Other receivables 136 6 277,397,165 432,350,795 55,000 55,000
Allowance for doubtful debts 137 (6,855,564) (2,285,188) - -
Inventories 140 7 1,112,385,216 1,084,398,392 - -
Inventories 141 1,112,385,216 1,084,398,392 - -
Other current assets 150 196,567,154 284,584,309 - -
Short-term prepaid expenses 151 61,782,483 42,783,827 - -
Deductible value added tax 152 134,784,671 241,800,482 - -
The accompanying notes are an integral part of these financial statements
MASAN RESOURCES CORPORATION (FORMERLY KNOWN AS MA SAN RESOURCES CORPORATION) AND ITS SUBSIDIARIES
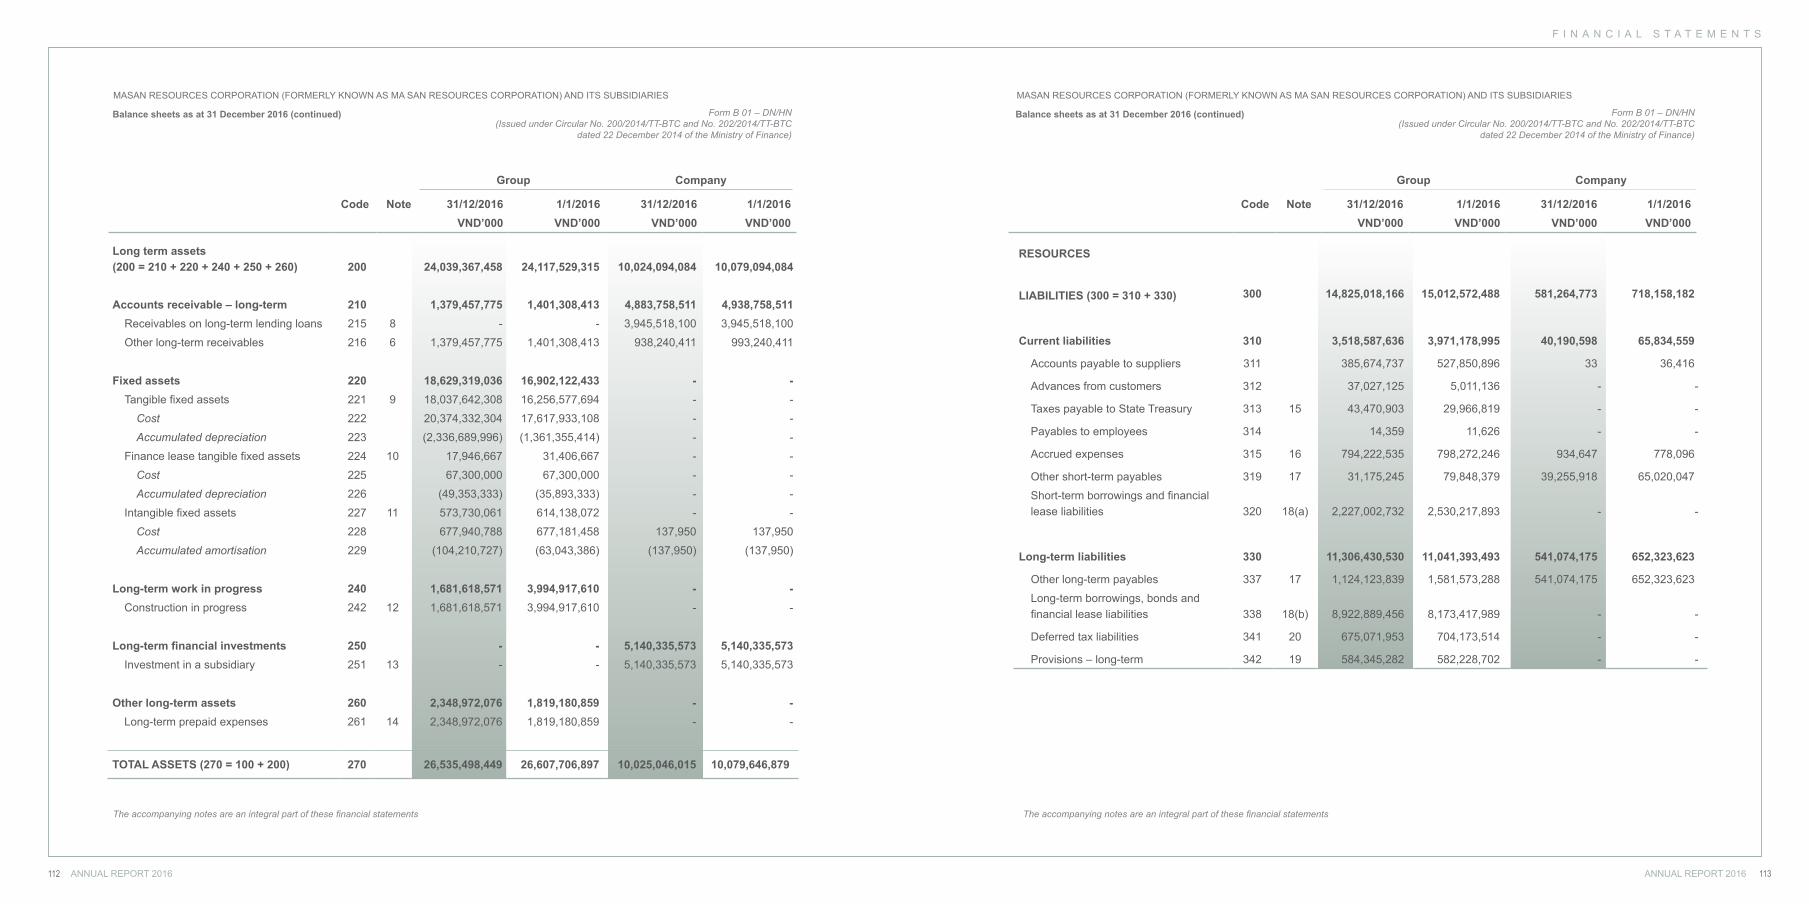
F I N A N C I A L S T A T E M E N T S
ANNUAL REPORT 2016 113112 ANNUAL REPORT 2016
MASAN RESOURCES CORPORATION (FORMERLY KNOWN AS MA SAN RESOURCES CORPORATION) AND ITS SUBSIDIARIES MASAN RESOURCES CORPORATION (FORMERLY KNOWN AS MA SAN RESOURCES CORPORATION) AND ITS SUBSIDIARIES
Group Company
Code Note 31/12/2016 1/1/2016 31/12/2016 1/1/2016VND’000 VND’000 VND’000 VND’000
The accompanying notes are an integral part of these financial statements
Long term assets (200 = 210 + 220 + 240 + 250 + 260) 200 24,039,367,458 24,117,529,315 10,024,094,084 10,079,094,084
Accounts receivable – long-term 210 1,379,457,775 1,401,308,413 4,883,758,511 4,938,758,511Receivables on long-term lending loans 215 8 - - 3,945,518,100 3,945,518,100
Other long-term receivables 216 6 1,379,457,775 1,401,308,413 938,240,411 993,240,411
Fixed assets 220 18,629,319,036 16,902,122,433 - -Tangible fixed assets 221 9 18,037,642,308 16,256,577,694 - -
Cost 222 20,374,332,304 17,617,933,108 - -
Accumulated depreciation 223 (2,336,689,996) (1,361,355,414) - -
Finance lease tangible fixed assets 224 10 17,946,667 31,406,667 - -
Cost 225 67,300,000 67,300,000 - -
Accumulated depreciation 226 (49,353,333) (35,893,333) - -
Intangible fixed assets 227 11 573,730,061 614,138,072 - -
Cost 228 677,940,788 677,181,458 137,950 137,950
Accumulated amortisation 229 (104,210,727) (63,043,386) (137,950) (137,950)
Long-term work in progress 240 1,681,618,571 3,994,917,610 - -Construction in progress 242 12 1,681,618,571 3,994,917,610 - -
Long-term financial investments 250 - - 5,140,335,573 5,140,335,573Investment in a subsidiary 251 13 - - 5,140,335,573 5,140,335,573
Other long-term assets 260 2,348,972,076 1,819,180,859 - -Long-term prepaid expenses 261 14 2,348,972,076 1,819,180,859 - -
TOTAL ASSETS (270 = 100 + 200) 270 26,535,498,449 26,607,706,897 10,025,046,015 10,079,646,879
Balance sheets as at 31 December 2016 (continued) Form B 01 – DN/HN(Issued under Circular No. 200/2014/TT-BTC and No. 202/2014/TT-BTC
dated 22 December 2014 of the Ministry of Finance)
Group Company
Code Note 31/12/2016 1/1/2016 31/12/2016 1/1/2016VND’000 VND’000 VND’000 VND’000
The accompanying notes are an integral part of these financial statements
RESOURCES
LIABILITIES (300 = 310 + 330) 300 14,825,018,166 15,012,572,488 581,264,773 718,158,182
Current liabilities 310 3,518,587,636 3,971,178,995 40,190,598 65,834,559
Accounts payable to suppliers 311 385,674,737 527,850,896 33 36,416
Advances from customers 312 37,027,125 5,011,136 - -
Taxes payable to State Treasury 313 15 43,470,903 29,966,819 - -
Payables to employees 314 14,359 11,626 - -
Accrued expenses 315 16 794,222,535 798,272,246 934,647 778,096
Other short-term payables 319 17 31,175,245 79,848,379 39,255,918 65,020,047
Short-term borrowings and financial lease liabilities 320 18(a) 2,227,002,732 2,530,217,893 - -
Long-term liabilities 330 11,306,430,530 11,041,393,493 541,074,175 652,323,623
Other long-term payables 337 17 1,124,123,839 1,581,573,288 541,074,175 652,323,623
Long-term borrowings, bonds and financial lease liabilities 338 18(b) 8,922,889,456 8,173,417,989 - -
Deferred tax liabilities 341 20 675,071,953 704,173,514 - -
Provisions – long-term 342 19 584,345,282 582,228,702 - -
Balance sheets as at 31 December 2016 (continued) Form B 01 – DN/HN(Issued under Circular No. 200/2014/TT-BTC and No. 202/2014/TT-BTC
dated 22 December 2014 of the Ministry of Finance)
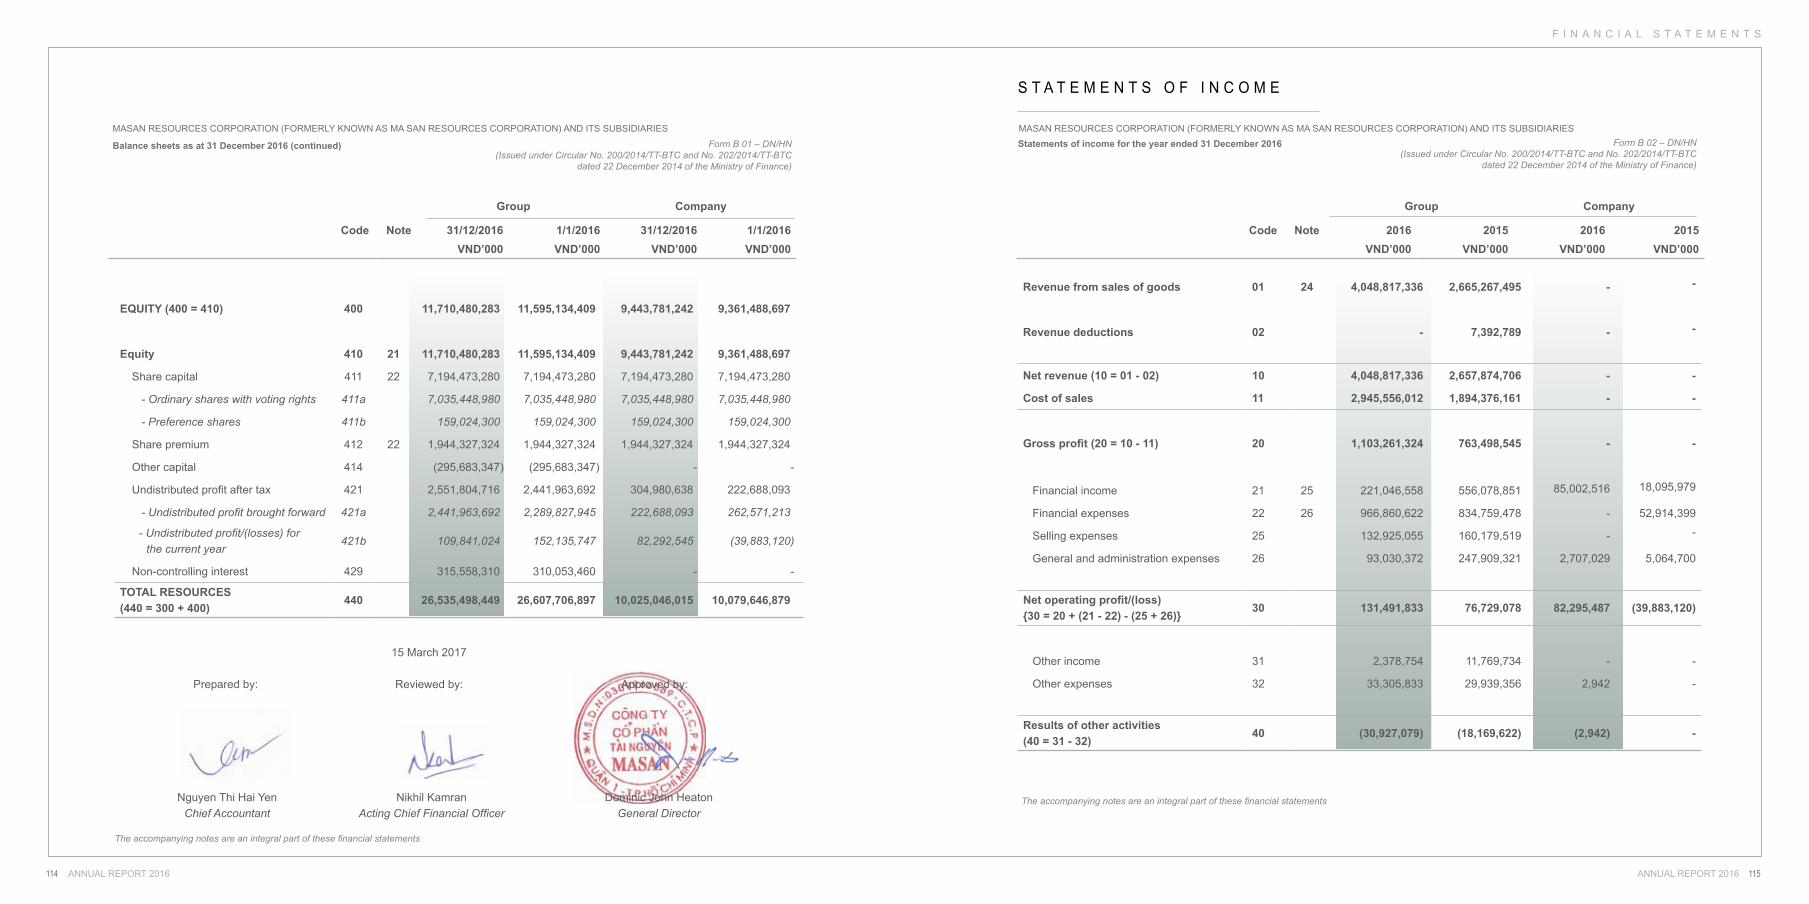
F I N A N C I A L S T A T E M E N T S
ANNUAL REPORT 2016ANNUAL REPORT 2016114 115
EQUITY (400 = 410) 400 11,710,480,283 11,595,134,409 9,443,781,242 9,361,488,697
Equity 410 21 11,710,480,283 11,595,134,409 9,443,781,242 9,361,488,697
Share capital 411 22 7,194,473,280 7,194,473,280 7,194,473,280 7,194,473,280
- Ordinary shares with voting rights 411a 7,035,448,980 7,035,448,980 7,035,448,980 7,035,448,980
- Preference shares 411b 159,024,300 159,024,300 159,024,300 159,024,300
Share premium 412 22 1,944,327,324 1,944,327,324 1,944,327,324 1,944,327,324
Other capital 414 (295,683,347) (295,683,347) - -
Undistributed profit after tax 421 2,551,804,716 2,441,963,692 304,980,638 222,688,093
- Undistributed profit brought forward 421a 2,441,963,692 2,289,827,945 222,688,093 262,571,213
- Undistributed profit/(losses) for the current year
421b 109,841,024 152,135,747 82,292,545 (39,883,120)
Non-controlling interest 429 315,558,310 310,053,460 - -
TOTAL RESOURCES(440 = 300 + 400)
440 26,535,498,449 26,607,706,897 10,025,046,015 10,079,646,879
Balance sheets as at 31 December 2016 (continued) Form B 01 – DN/HN(Issued under Circular No. 200/2014/TT-BTC and No. 202/2014/TT-BTC
dated 22 December 2014 of the Ministry of Finance)
15 March 2017
Prepared by: Reviewed by: Approved by:
Nguyen Thi Hai YenChief Accountant
Nikhil KamranActing Chief Financial Officer
Dominic John HeatonGeneral Director
The accompanying notes are an integral part of these financial statements
MASAN RESOURCES CORPORATION (FORMERLY KNOWN AS MA SAN RESOURCES CORPORATION) AND ITS SUBSIDIARIES
Group Company
Code Note 31/12/2016 1/1/2016 31/12/2016 1/1/2016VND’000 VND’000 VND’000 VND’000
Group Company
Code Note 2016 2015 2016 2015VND’000 VND’000 VND’000 VND’000
Form B 02 – DN/HN(Issued under Circular No. 200/2014/TT-BTC and No. 202/2014/TT-BTC
dated 22 December 2014 of the Ministry of Finance)
S T A T E M E N T S O F I N C O M E
Statements of income for the year ended 31 December 2016
The accompanying notes are an integral part of these financial statements
Revenue from sales of goods 01 24 4,048,817,336 2,665,267,495 - -
Revenue deductions 02 - 7,392,789 - -
Net revenue (10 = 01 - 02) 10 4,048,817,336 2,657,874,706 - -
Cost of sales 11 2,945,556,012 1,894,376,161 - -
Gross profit (20 = 10 - 11) 20 1,103,261,324 763,498,545 - -
Financial income 21 25 221,046,558 556,078,851 85,002,516 18,095,979
Financial expenses 22 26 966,860,622 834,759,478 - 52,914,399
Selling expenses 25 132,925,055 160,179,519 - -
General and administration expenses 26 93,030,372 247,909,321 2,707,029 5,064,700
Net operating profit/(loss){30 = 20 + (21 - 22) - (25 + 26)}
30 131,491,833 76,729,078 82,295,487 (39,883,120)
Other income 31 2,378,754 11,769,734 - -
Other expenses 32 33,305,833 29,939,356 2,942 -
Results of other activities (40 = 31 - 32)
40 (30,927,079) (18,169,622) (2,942) -
MASAN RESOURCES CORPORATION (FORMERLY KNOWN AS MA SAN RESOURCES CORPORATION) AND ITS SUBSIDIARIES
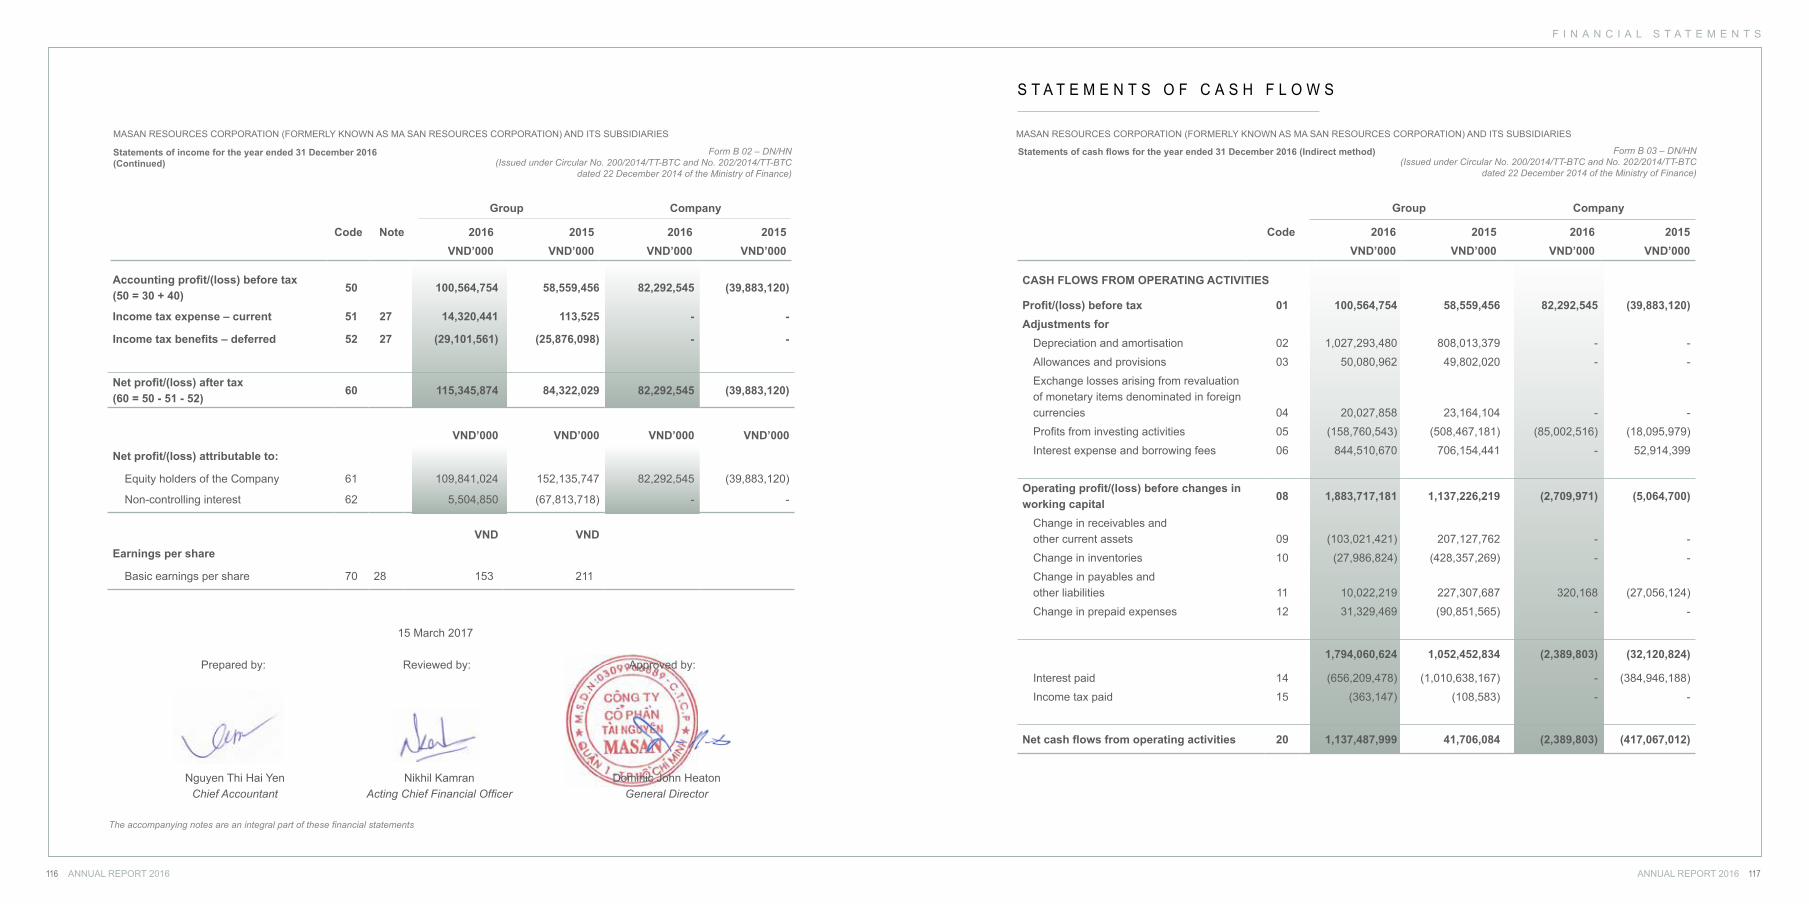
F I N A N C I A L S T A T E M E N T S
ANNUAL REPORT 2016ANNUAL REPORT 2016116 117
Group Company
Code Note 2016 2015 2016 2015VND’000 VND’000 VND’000 VND’000
Form B 02 – DN/HN(Issued under Circular No. 200/2014/TT-BTC and No. 202/2014/TT-BTC
dated 22 December 2014 of the Ministry of Finance)
Statements of income for the year ended 31 December 2016(Continued)
Accounting profit/(loss) before tax(50 = 30 + 40)
50 100,564,754 58,559,456 82,292,545 (39,883,120)
Income tax expense – current 51 27 14,320,441 113,525 - -
Income tax benefits – deferred 52 27 (29,101,561) (25,876,098) - -
Net profit/(loss) after tax (60 = 50 - 51 - 52)
60 115,345,874 84,322,029 82,292,545 (39,883,120)
VND’000 VND’000 VND’000 VND’000
Net profit/(loss) attributable to:
Equity holders of the Company 61 109,841,024 152,135,747 82,292,545 (39,883,120)
Non-controlling interest 62 5,504,850 (67,813,718) - -
VND VNDEarnings per share
Basic earnings per share 70 28 153 211
The accompanying notes are an integral part of these financial statements
15 March 2017
Prepared by: Reviewed by: Approved by:
Nguyen Thi Hai YenChief Accountant
Nikhil KamranActing Chief Financial Officer
Dominic John HeatonGeneral Director
MASAN RESOURCES CORPORATION (FORMERLY KNOWN AS MA SAN RESOURCES CORPORATION) AND ITS SUBSIDIARIES
Form B 03 – DN/HN(Issued under Circular No. 200/2014/TT-BTC and No. 202/2014/TT-BTC
dated 22 December 2014 of the Ministry of Finance)
S T A T E M E N T S O F C A S H F L O W S
Statements of cash flows for the year ended 31 December 2016 (Indirect method)
Group Company
Code 2016 2015 2016 2015VND’000 VND’000 VND’000 VND’000
CASH FLOWS FROM OPERATING ACTIVITIES
Profit/(loss) before tax 01 100,564,754 58,559,456 82,292,545 (39,883,120)Adjustments for
Depreciation and amortisation 02 1,027,293,480 808,013,379 - -
Allowances and provisions 03 50,080,962 49,802,020 - -
Exchange losses arising from revaluation of monetary items denominated in foreign currencies 04 20,027,858 23,164,104 - -
Profits from investing activities 05 (158,760,543) (508,467,181) (85,002,516) (18,095,979)
Interest expense and borrowing fees 06 844,510,670 706,154,441 - 52,914,399
Operating profit/(loss) before changes in working capital
08 1,883,717,181 1,137,226,219 (2,709,971) (5,064,700)
Change in receivables and other current assets 09 (103,021,421) 207,127,762 - -
Change in inventories 10 (27,986,824) (428,357,269) - -
Change in payables and other liabilities 11 10,022,219 227,307,687 320,168 (27,056,124)
Change in prepaid expenses 12 31,329,469 (90,851,565) - -
1,794,060,624 1,052,452,834 (2,389,803) (32,120,824)
Interest paid 14 (656,209,478) (1,010,638,167) - (384,946,188)
Income tax paid 15 (363,147) (108,583) - -
Net cash flows from operating activities 20 1,137,487,999 41,706,084 (2,389,803) (417,067,012)
MASAN RESOURCES CORPORATION (FORMERLY KNOWN AS MA SAN RESOURCES CORPORATION) AND ITS SUBSIDIARIES
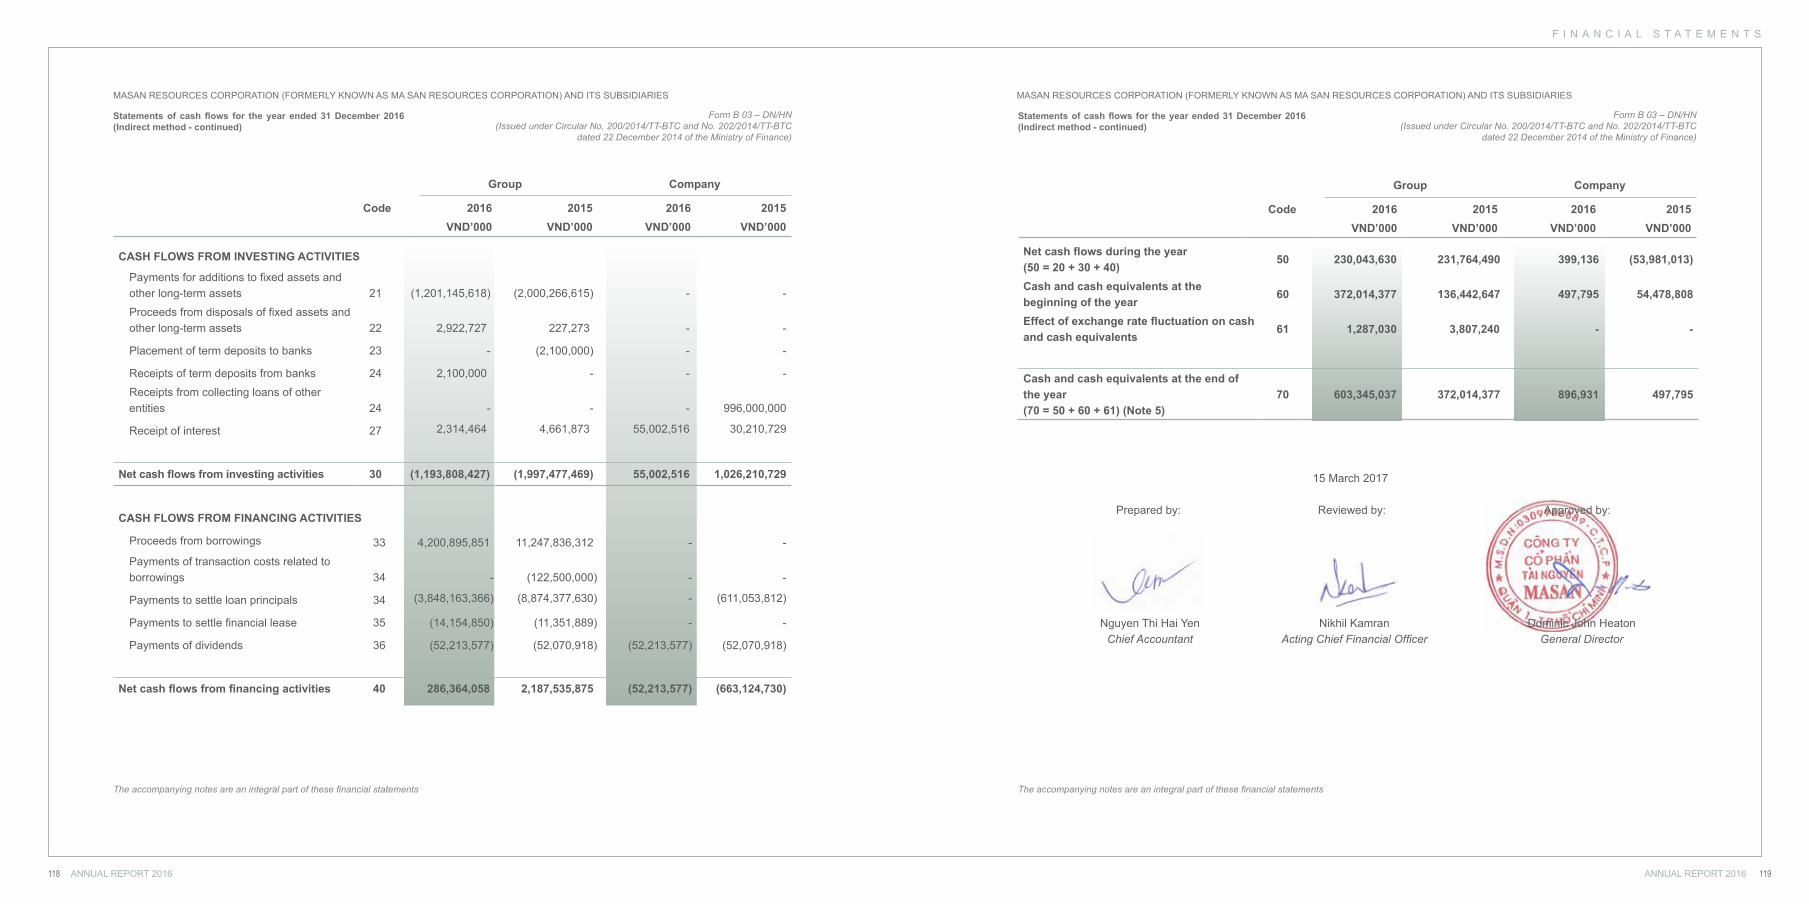
F I N A N C I A L S T A T E M E N T S
ANNUAL REPORT 2016 119118 ANNUAL REPORT 2016
MASAN RESOURCES CORPORATION (FORMERLY KNOWN AS MA SAN RESOURCES CORPORATION) AND ITS SUBSIDIARIES MASAN RESOURCES CORPORATION (FORMERLY KNOWN AS MA SAN RESOURCES CORPORATION) AND ITS SUBSIDIARIES
Group Company
Code 2016 2015 2016 2015VND’000 VND’000 VND’000 VND’000
CASH FLOWS FROM INVESTING ACTIVITIES
Payments for additions to fixed assets and other long-term assets 21 (1,201,145,618) (2,000,266,615) - -
Proceeds from disposals of fixed assets and other long-term assets 22 2,922,727 227,273 - -
Placement of term deposits to banks 23 - (2,100,000) - -
Receipts of term deposits from banks 24 2,100,000 - - -
Receipts from collecting loans of other entities 24 - - - 996,000,000
Receipt of interest 27 2,314,464 4,661,873 55,002,516 30,210,729
Net cash flows from investing activities 30 (1,193,808,427) (1,997,477,469) 55,002,516 1,026,210,729
The accompanying notes are an integral part of these financial statements
CASH FLOWS FROM FINANCING ACTIVITIES
Proceeds from borrowings 33 4,200,895,851 11,247,836,312 - -
Payments of transaction costs related to borrowings 34 - (122,500,000) - -
Payments to settle loan principals 34 (3,848,163,366) (8,874,377,630) - (611,053,812)
Payments to settle financial lease 35 (14,154,850) (11,351,889) - -
Payments of dividends 36 (52,213,577) (52,070,918) (52,213,577) (52,070,918)
Net cash flows from financing activities 40 286,364,058 2,187,535,875 (52,213,577) (663,124,730)
Form B 03 – DN/HN(Issued under Circular No. 200/2014/TT-BTC and No. 202/2014/TT-BTC
dated 22 December 2014 of the Ministry of Finance)
Statements of cash flows for the year ended 31 December 2016 (Indirect method - continued)
The accompanying notes are an integral part of these financial statements
Form B 03 – DN/HN(Issued under Circular No. 200/2014/TT-BTC and No. 202/2014/TT-BTC
dated 22 December 2014 of the Ministry of Finance)
Statements of cash flows for the year ended 31 December 2016 (Indirect method - continued)
Group Company
Code 2016 2015 2016 2015VND’000 VND’000 VND’000 VND’000
Net cash flows during the year (50 = 20 + 30 + 40)
50 230,043,630 231,764,490 399,136 (53,981,013)
Cash and cash equivalents at thebeginning of the year
60 372,014,377 136,442,647 497,795 54,478,808
Effect of exchange rate fluctuation on cash and cash equivalents
61 1,287,030 3,807,240 - -
Cash and cash equivalents at the end of the year (70 = 50 + 60 + 61) (Note 5)
70 603,345,037 372,014,377 896,931 497,795
15 March 2017
Prepared by: Reviewed by: Approved by:
Nguyen Thi Hai YenChief Accountant
Nikhil KamranActing Chief Financial Officer
Dominic John HeatonGeneral Director
F I N A N C I A L S T A T E M E N T S
ANNUAL REPORT 2016ANNUAL REPORT 2016120 121
Form B 09 – DN/HN(Issued under Circular No. 200/2014/TT-BTC and No. 202/2014/TT-BTC
dated 22 December 2014 of the Ministry of Finance)
Notes to the financial statements for the year ended 31 December 2016
These notes form an integral part of and should be read in conjunction with the accompanying financial statements.
1. Reporting entity
Ownership and group structureMasan Resources Corporation (formerly known as Ma San Resources Corporation) (“the Company” or “MSR”) is incorporated as a joint stock company in Vietnam. The principal activity of the Company is investment holding.
The consolidated financial statements comprise the Company and its subsidiaries (collectively referred to as “the Group”).
The principal activities of the subsidiaries are described as follows:
The percentage of economic interests represents the effective percentage of economic interests of the Company both directly and indi-rectly in the subsidiaries.
All the subsidiaries are incorporated in Vietnam.
As at 31 December 2016, the Company had 2 employees (1/1/2016: 2 employees) and the Group had 1,343 employees (1/1/2016: 1,475 employees).
Name Principal activityPercentage of
economic interests at
31/12/2016 1/1/2016
Masan Thai Nguyen Resources Co., Ltd (formerly known as Ma San Thai Nguyen Resources Company Limited) (“MRTN”)
Investment holding 100% 100%
Thai Nguyen Trading and Investment Company Ltd (“TNTI”) Investment holding 100% 100%
Nui Phao Mining Co., Ltd (“NPM”) Exploring and processing mineral
100% 100%
Nui Phao – H.C. Starck Tungsten Chemicals Manufacturing LLC (“NPHCS”)
Deep processing of nonfer-rous metals and precious metals (Tungsten)
51% 51%
N O T E S T O T H E F I N A N C I A L S T A T E M E N T S
MASAN RESOURCES CORPORATION (FORMERLY KNOWN AS MA SAN RESOURCES CORPORATION) AND ITS SUBSIDIARIES
Form B 09 – DN/HN(Issued under Circular No. 200/2014/TT-BTC and No. 202/2014/TT-BTC
dated 22 December 2014 of the Ministry of Finance)
Notes to the financial statements for the year ended 31 December 2016 (continued)
2. Basis of preparation
(a) Statement of complianceThe consolidated and separate financial statements have been prepared in accordance with Vietnamese Accounting Standards, the Vietnamese Accounting System for enterprises and the relevant statutory requirements applicable to financial reporting.
(b) Basis of measurementThe consolidated and separate financial statements, except for the consolidated and separate statement of cash flows, are prepared on the accrual basis using the historical cost con-cept. The consolidated and separate statement of cash flows is prepared using the indirect method.
(c) Annual accounting periodThe annual accounting period of the Company and its subsid-iaries are from 1 January to 31 December.
(d) Accounting and presentation currencyThe Company’s accounting currency is Vietnam Dong (“VND”). The consolidated and separate financial statements are prepared and presented in VND rounded to the nearest thousand (“VND’000”).
3. Summary of significant accounting policies
The following significant accounting policies have been adopted by the Group and the Company in the preparation of these sepa-rate and consolidated financial statements.
(a) Basis of consolidation(i) Business combinations
Business combinations are accounted for using the purchase method as at the acquisition date, which is the date on which control is transferred to the Group. Control exists when the Group has the power to govern the financial and operating policies of an entity so as to obtain benefits from its activities. In assessing control, the Group takes into consideration the potential voting rights that currently are exercisable.
Under the purchase method, the assets and liabilities of the acquired entity are consolidated using their fair values. Cost of acquisition consists of the aggregate fair value at the date of exchange, of assets given, liabilities incurred or assumed, and equity instruments issued by the Group. Goodwill repre-sents the excess of the cost of acquisition over the Group’s interest in the net fair value of the identifiable assets, liabilities and contingent liabilities of the acquired entity. When the ex-cess is negative, it is recognised immediately in the statement of income.
Transaction costs, other than those associated with the issue of debt or equity securities, that the Group incurred in connec-tion with business combinations included any costs directly attributable to the combination, such as professional fees paid to accountants, legal advisers, valuers and other consultants to effect the combination. Transaction costs are capitalised into the cost of business combination. General administrative costs and other costs that cannot be directly attributed to the particular combination being accounted for are not included in the cost of the combination; they are recognised as an ex-pense when incurred.
(ii) SubsidiariesSubsidiaries are entities controlled by the Group. Control ex-ists when the Group has the power to govern the financial and operating policies of an entity so as to obtain benefits from its activities. In assessing control, potential voting rights that cur-rently are exercisable are taken into account. The financial statements of subsidiaries are included in the consolidated financial statements from the date that control commences until the date that control ceases.
(iii) Non-controlling interestsNon-controlling interests (“NCI”) are measured by their pro-portionate economic interest in the acquiree’s identifiable net assets at date of acquisition.
MASAN RESOURCES CORPORATION (FORMERLY KNOWN AS MA SAN RESOURCES CORPORATION) AND ITS SUBSIDIARIES
F I N A N C I A L S T A T E M E N T S
ANNUAL REPORT 2016 123122 ANNUAL REPORT 2016
MASAN RESOURCES CORPORATION (FORMERLY KNOWN AS MA SAN RESOURCES CORPORATION) AND ITS SUBSIDIARIES MASAN RESOURCES CORPORATION (FORMERLY KNOWN AS MA SAN RESOURCES CORPORATION) AND ITS SUBSIDIARIES
(iv) Transactions eliminated on consolidationIntra-group balances, and any unrealised income and expens-es arising from intra-group transactions, are eliminated in pre-paring the consolidated financial statements.
(b) Foreign currencyTransactions in currencies other than VND during the year have been translated into VND at rates approximating actual rates of exchange ruling at the transaction dates.
Monetary assets and liabilities denominated in currencies oth-er than VND are translated into VND at the account transfer buying rate and account transfer selling rate at the end of the accounting period quoted by the commercial bank where the Company or its subsidiaries most frequently conducts trans-actions.
All foreign exchange differences are recorded in the statement of income.
(c) Cash and cash equivalentsCash comprises cash balances and call deposits. Cash equiv-alents are short-term highly liquid investments that are readily convertible to known amount of cash, are subject to an insignif-icant risk of changes in value, and are held for the purpose of meeting short-term cash commitments rather than for invest-ment or other purposes.
(d) Investments(i) Held to maturity investments
Held-to-maturity investments are those that the Group’s man-agement has the intention and ability to hold until maturity. Held-to-maturity investments include term deposits at bank and receivables on lending loans held to maturity. These investments are stated at costs less allowance for doubtful debts.
(ii) Investments in subsidiariesFor the purpose of separate financial statements, investments in subsidiaries are initially recognised at cost which includes
purchase price plus any directly attributable transaction costs. Subsequent to initial recognition, these investments are stated at cost less allowance for diminution in value. An allowance is made for diminution in investment value if the investee has suffered a loss, except where such a loss was anticipated by the Group’s management before making the investment. The allowance is reversed if the investee subsequently made a profit that offsets the previous loss for which the allowance had been made. An allowance is reversed only to the extent that the investment’s carrying amount does not exceed the carrying amount that would have been determined if no allowance had been recognised.
(e) Accounts receivableAccounts receivable from customers and other receivables are stated at cost less allowance for doubtful debts.
(f) InventoriesInventories are stated at the lower of cost and net realisable value. Cost is determined on a weighted average basis and includes all costs incurred in bringing the inventories to their present location and condition. Cost in the case of finished goods and work in progress includes raw materials, direct la-bour and attributable mining and manufacturing overheads. Net realisable value is the estimated selling price of inventory items, less the estimated costs of completion and selling ex-penses.
The Group applies the perpetual method of accounting for in-ventories.
(g) Tangible fixed assets(i) Cost
Upon completion of the mine construction phase, the assets are transferred into “building and structures”, “machinery and equipment” or “other mining assets” in tangible fixed assets. Tangible fixed assets are stated at cost less accumulated de-preciation. The initial cost of a tangible fixed asset comprises its purchase price or construction cost, including import duties,
Form B 09 – DN/HN(Issued under Circular No. 200/2014/TT-BTC and No. 202/2014/TT-BTC
dated 22 December 2014 of the Ministry of Finance)
Notes to the financial statements for the year ended 31 December 2016 (continued)
Form B 09 – DN/HN(Issued under Circular No. 200/2014/TT-BTC and No. 202/2014/TT-BTC
dated 22 December 2014 of the Ministry of Finance)
Notes to the financial statements for the year ended 31 December 2016 (continued)
non-refundable purchase taxes and any directly attributable costs of bringing the asset to its working condition and location for its intended use, and the costs of dismantling and removing the asset and restoring the site on which it is located. Ex-penditure incurred after tangible fixed assets have been put into operation, such as repairs and maintenance and overhaul costs, is normally charged to the statement of income in the period in which the costs are incurred. In situations where it can be clearly demonstrated that the expenditure has resulted in an increase in the future economic benefits expected to be obtained from the use of tangible fixed assets beyond their originally assessed standard of performance, the expenditure is capitalised as an additional cost of tangible fixed assets.
Other mining assets comprise mine rehabilitation assets; and fair value of mineral reserves and mineral resources from busi-ness combination.
(ii) DepreciationMachinery and equipment and fair value of mineral reserves from business combination directly related to mining activitiesMachinery and equipment and fair value of mineral reserves from business combination which are directly related to the mining exploitation activities is depreciated over its mineral reserve on a unit-of-production basis. Mineral reserves are estimates of the amount of product that can be economically and legally extracted from the Group’s mining properties.
Machinery and equipment of a subsidiary directly related to production activitiesTangible fixed assets of a subsidiary which are directly related to the deep processing of tungsten products are depreciated over its estimated useful lives on a units of production basis. The estimated total production quantity output which tangible fixed assets are depreciated on a unit-of-production basis over are as follows:
•ST plant 91,000 tonnes of tungsten•APT plant 86,215 tonnes of tungsten
OthersDepreciation is computed on a straight-line basis over the esti-mated useful lives of tangible fixed assets. The estimated use-ful lives are as follows:
•buildings and structures 5 – 20 years•machinery and equipment 5 – 15 years•office equipment 3 – 10 years •motor vehicles 3 – 6 years•other mining assets 15 – 20 years
(h) Finance lease tangible fixed assetsLeases in terms of which the Group assumes substantially all the risks and rewards of ownership are classified as finance leases. Tangible fixed assets acquired by way of finance leas-es are stated at an amount equal to the lower of fair value and the present value of the minimum lease payments at inception of the lease, less accumulated depreciation.
Depreciation on finance leased assets is computed on a straight-line basis over the estimated useful lives of items of the leased assets which is five (5) years.
(i) Intangible fixed assets(i) Software
Cost of acquisition of new software, which is not an integral part of the related hardware, is capitalised and treated as an intangible asset. Software costs are amortised on a straight-line basis over three (3) to eight (8) years.
(ii) Mining rightsThe mining rights is calculated based on the remaining exploit-able reserves multiplied with the price as announced by the provincial authorities in accordance with Decree 203/2013/ND/CP dated 28 November 2013 which became effective from 20 January 2014. Cost of mining rights are stated at an amount equal to the present value of mining rights fee and is capital-ised and treated as an intangible asset. Amortisation of mining rights is computed on a straight-line basis over the period of the economic life of the mineral reserves.
F I N A N C I A L S T A T E M E N T S
ANNUAL REPORT 2016 125124 ANNUAL REPORT 2016
MASAN RESOURCES CORPORATION (FORMERLY KNOWN AS MA SAN RESOURCES CORPORATION) AND ITS SUBSIDIARIES MASAN RESOURCES CORPORATION (FORMERLY KNOWN AS MA SAN RESOURCES CORPORATION) AND ITS SUBSIDIARIES
(j) Construction in progressConstruction in progress represents mineral assets under de-velopment and cost of construction and machinery which have not been fully completed, installed and commissioned. It also comprises mineral reserves, mineral resources and related de-velopment costs acquired in a business combination and sub-sequent development expenditure. These assets qualify for capitalisation when the mineral reserves to which they relate is proven to be commercially and technically viable. They are initially recognised at their fair values as part of business com-bination accounting and subsequent development expenditure are capitalised net of proceeds from the sale of commission-ing products during the development phase. On completion of construction defined as the time when the assets are brought into the condition of its intended use, all assets are reclassified to tangible fixed assets as either “buildings and structures”, “machinery and equipment” or “other mining assets”; or long-term prepaid expenses as “other mining costs”.
No depreciation is provided for construction in progress during the period of development, construction, installation and com-missioning stages.
(k) Long-term prepaid expenses(i) Pre-operating expenses
Pre-operating expenses are recorded in the statement of in-come, except for establishment costs and expenditures on training, advertising and promotional activities incurred from the incorporation date to the commercial operation date. These expenses are recognised as long-term prepaid expens-es, initially stated at cost, and are amortised on a straight line basis over three (3) years starting from the date of commercial operation.
(ii) Land compensation costsLand compensation costs comprise prepaid land lease rentals and other costs incurred in conjunction with securing the use of leased land for its mining activities. These costs are recog-nised in the statement of income on a straight-line basis over the term of the lease of twenty (20) years.
(iii) Other mining costsIn accordance with the letter No. 12727/BTC-TCDN dated 14 September 2015 from the Ministry of Finance which provides guidance that mining related costs could be recognised as long-term prepaid expenses under non-current assets.
Other mining costs comprise:• Exploration, evaluation and development expenditure (in-
cluding development stripping); and• Production stripping (as described below in ‘Deferred strip-
ping costs’).
Deferred stripping costsIn open pit mining operations, it is necessary to remove over-burden and other waste materials to access ore body. Strip-ping costs incurred in the development phase of a mine (de-velopment stripping costs) are recorded as part of the cost of construction of the mine. All development stripping expendi-ture incurred during construction phase are transferred to oth-er mining costs.
The costs of removal of the waste material during a mine’s pro-duction phase (production stripping costs) are deferred where they give rise to future benefits:a) It is probable that the future economic benefits will flow to
the Group;b) The component of the ore body for which access has been
improved can be identified; andc) The costs incurred can be measured reliably.
Production stripping costs are allocated between inventory and long-term prepaid expenses in accordance with the life of mine strip ratio.
The life of mine strip ratio represents the estimated total vol-ume of waste, to the estimated total quantity of economically recoverable ore, over the life of the mine. These costs are recognised as long-term prepaid expenses where the current
Form B 09 – DN/HN(Issued under Circular No. 200/2014/TT-BTC and No. 202/2014/TT-BTC
dated 22 December 2014 of the Ministry of Finance)
Notes to the financial statements for the year ended 31 December 2016 (continued)
Form B 09 – DN/HN(Issued under Circular No. 200/2014/TT-BTC and No. 202/2014/TT-BTC
dated 22 December 2014 of the Ministry of Finance)
Notes to the financial statements for the year ended 31 December 2016 (continued)
period actual stripping ratio is higher than the average life of mine strip ratio.
The development and production stripping costs are amortised over the life of the proven and probable reserves of the rele-vant components on a systematic basis.
(iv) Other prepaid expensesOther prepaid expenses include service fees which are initially stated at cost and amortised on a straight-line basis over the term of the contracts.
(l) Accounts payableAccounts payable to suppliers and other payables are stated at their cost.
(m) ProvisionsA provision is recognised if, as a result of a past event, the Group or the Company has a present legal or constructive ob-ligation that can be estimated reliably, and it is probable that an outflow of economic benefits will be required to settle the obligation. Provisions are determined by discounting the ex-pected future cash flows at a pre-tax rate that reflects current market assessments of the time value of money and the risks specific to the liability.
(i) Mining rightsIn accordance with the Law on Minerals 2010, a subsidiary of the Company has an obligation to pay the government fees for mining rights grant. The mining rights fees is calculated based on the remaining exploitable reserves multiplied with the price as announced by the provincial authorities in accordance with Decree 203/2013/ND/CP dated 28 November 2013 which be-came effective from 20 January 2014. Mining rights fees are recognised as intangible fixed assets.
(ii) Mine rehabilitationThe mining, extraction and processing activities of the Group normally give rise to obligations for site closure or rehabil-itation. Closure and rehabilitation works can include facility
decommissioning and dismantling; site and land rehabilita-tion. The extent of work required and the associated costs are dependent on the requirements of the Ministry of Natural Resources and Environment (“MONRE”) and the Group’s en-vironmental policies based on the Environment Impact Report.
Provisions for the cost of each closure and rehabilitation pro-gram are recognised at the time that environmental distur-bance occurs. When the extent of disturbance increases over the life of an operation, the provision is increased accordingly. Costs included in the provision encompass all closure and re-habilitation activity expected to occur progressively over the life of the operation proportional to the degree of influence on the environment existing at the reporting date.
Where rehabilitation is conducted systematically over the life of the operation, rather than at the time of closure, provision is made for the estimated outstanding continuous rehabilitation work at each reporting dates and the cost is charged to the statement of income. Routine operating costs that may impact the ultimate closure and rehabilitation activities, such as waste material handling conducted as an integral part of a mining or production process, are not included in the provision. Costs arising from unforeseen circumstances, such as the contami-nation caused by unplanned discharges, are recognised as an expense and liability when the event gives rise to an obligation which is probable and capable of reliable estimation.
The timing of the actual closure and rehabilitation expenditure is dependent on the life of the mine. Closure and rehabilitation provisions are measured at the expected value of future cash flows, discounted to their present value and determined ac-cording to the probability of alternative estimates of cash flows occurring for each operation. Significant judgments and esti-mates are involved in forming expectations of future activities and the amount and timing of the associated cash flow. Those expectations are formed based on existing environmental and regulatory requirements which give rise to a constructive ob-ligation.
F I N A N C I A L S T A T E M E N T S
ANNUAL REPORT 2016 127126 ANNUAL REPORT 2016
MASAN RESOURCES CORPORATION (FORMERLY KNOWN AS MA SAN RESOURCES CORPORATION) AND ITS SUBSIDIARIES MASAN RESOURCES CORPORATION (FORMERLY KNOWN AS MA SAN RESOURCES CORPORATION) AND ITS SUBSIDIARIES
When provisions for closure and rehabilitation are initially rec-ognised, the corresponding cost is capitalised as an asset, representing part of the cost of acquiring the future economic benefits of the operation. The capitalised cost of closure and rehabilitation activities is recognised in other mining assets and depreciated accordingly. The value of the provision is pro-gressively increased over time as the effect of the discounting unwinds, creating an expense recognised in financial expens-es.
Closure and rehabilitation provisions will also be adjusted for changes in estimates. These adjustments will be accounted for as a change in the corresponding capitalised cost, except where a reduction in the provision is greater than the under-de-preciated capitalised cost of the related assets, in which the capitalised cost is reduced to nil and the remaining adjustment is recognised in the consolidated income statement. Chang-es to the capitalized cost result in an adjustment to future de-preciation. Adjustments to the estimated amount and timing of future closure and rehabilitation cash flows are a normal occurrence in light of the significant judgements and estimates involved.
(n) Bonds issuedAt initial recognition, bonds are measured at cost which com-prises proceeds from issuance net of issuance costs. Any dis-count, premium or issuance costs are amortised on a straight-line basis over the term of the bond.
(o) Equity(i) Ordinary shares
Ordinary share capital is classified as equity. The excess of proceeds contributed over the par value of shares issued is recorded as share premium. Incremental costs directly attrib-utable to the issue of ordinary shares are recognised as a de-duction from share premium.
(ii) Preference sharesMandatorily convertible preference shares are classified as equity, because they are entitled to fixed dividends and any
discretionary dividends declared to ordinary shareholders and it participate equally in the residual assets on dissolution. The excess of proceeds contributed over the par value of shares issued is recorded as share premium. Incremental costs di-rectly attributable to the preference shares are recognised as a deduction from share premium.
(iii) Other capital Equity movements resulting from acquisition or disposal to non-controlling interests and transactions involving equity in-struments were recorded in “Other capital”.
(p) TaxationIncome tax on the profit or loss for the year comprises current and deferred tax. Income tax is recognised in the statement of income except to the extent that it relates to items recognised directly to equity, in which case it is recognised in equity.
Current tax is the expected tax payable on the taxable income for the year, using tax rates enacted at the end of the account-ing period, and any adjustment to tax payable in respect of previous years.
Deferred tax is provided using the balance sheet method, pro-viding for temporary differences between the carrying amounts of assets and liabilities for financial reporting purposes and the amounts used for taxation purposes. The amount of deferred tax provided is based on the expected manner of realisation or settlement of the carrying amounts of assets and liabilities using tax rates enacted or substantively enacted at end of the annual accounting period.
A deferred tax asset is recognised only to the extent that it is probable that future taxable profits will be available against which the temporary difference can be utilised. Deferred tax assets are reduced to the extent that it is no longer probable that the related tax benefit will be realised.
(q) Revenue from the sale of goodsRevenue from the sale of goods is recognised in the statement of income when significant risks and rewards of ownership
have been transferred to the buyer. No revenue is recognised if there are significant uncertainties regarding recovery of the consideration due or the possible return of goods. Revenue on sales of goods is recognised at the net amount after deducting sales discounts stated on the invoice.
For sales of minerals, the sales price is usually determined on a provisional basis at the date of revenue recognition and adjustments to the sales price subsequently occurs based on movements in quoted market or contractual prices up to the date of final pricing. The period between provisional invoicing and final pricing is typically between 30 and 60 days, but in some cases can be as long as 90 days. Revenue on provi-sionally priced sales is recognised based on the estimated fair value of the total consideration receivable.
In cases where the terms of the executed contractual sales agreement allow for an adjustment to the sales price based on a survey of the goods by the customer, assay results issued by a third party are preferable, unless customer’s survey is within executed contractual tolerance, then sales recognition is based on the most recently determined product specifica-tions agreed by parties.
(r) Financial income and financial expenses(i) Financial income
Financial income comprises interest income from deposits and loans and foreign exchange gains. Interest income is recog-nised as it accrues in the statement of income.
(ii) Financial expensesFinancial expenses comprise interest expenses on borrow-ings, facility fees, financing costs, transaction costs and for-eign exchange losses.
(s) Operating lease paymentsPayments made under operating leases are recognised in the statement of income on a straight-line basis over the term of the lease. Lease incentives received are recognised in the statement of income as an integral part of the total lease ex-pense.
(t) Borrowing costsBorrowings costs comprise interest expenses on borrowings, facility fees, financing costs and transaction costs. Borrow-ing costs are recognised as an expense in the year in which they are incurred, except where the borrowing costs relate to borrowings in respect of the construction of qualifying assets, in which case the borrowing costs incurred during the period of construction are capitalised as part of the cost of the fixed assets concerned.
(u) Earnings per shareThe Group presents basic and diluted, if any, earnings per share (“EPS”) for its ordinary shares. Basic EPS is calculated by dividing the profit or loss attributable to the ordinary share-holders of the Company by the weighted average number of ordinary shares outstanding during the year. To determine the profit or loss attributable to ordinary equity holders, profit or loss for the year is allocated to the ordinary shares and partic-ipating equity instruments. This allocation is made in accord-ance with the rights of the other class of shares to participate in distributions if the entire profit or loss were distributed.
Diluted EPS is determined by adjusting the profit or loss at-tributable to the ordinary shareholders and the weighted aver-age number of ordinary shares outstanding for the effect of all dilutive potential ordinary shares. Dilutive potential ordinary shares does not include convertible instruments that are man-datorily convertible.
(v) Segment reportingA segment is a distinguishable component of the Group that is engaged either in providing related products or services (busi-ness segment), or in providing products or services within a particular economic environment, which is subject to risks and rewards that are different from those of other segments. The Group’s primary format for segment reporting is based on busi-ness segments.
(w) Related partiesParties are considered to be related to the Group if one party has the ability, directly or indirectly, to control the other party or to exercise significant influence over the other party in making
Form B 09 – DN/HN(Issued under Circular No. 200/2014/TT-BTC and No. 202/2014/TT-BTC
dated 22 December 2014 of the Ministry of Finance)
Notes to the financial statements for the year ended 31 December 2016 (continued)
Form B 09 – DN/HN(Issued under Circular No. 200/2014/TT-BTC and No. 202/2014/TT-BTC
dated 22 December 2014 of the Ministry of Finance)
Notes to the financial statements for the year ended 31 December 2016 (continued)
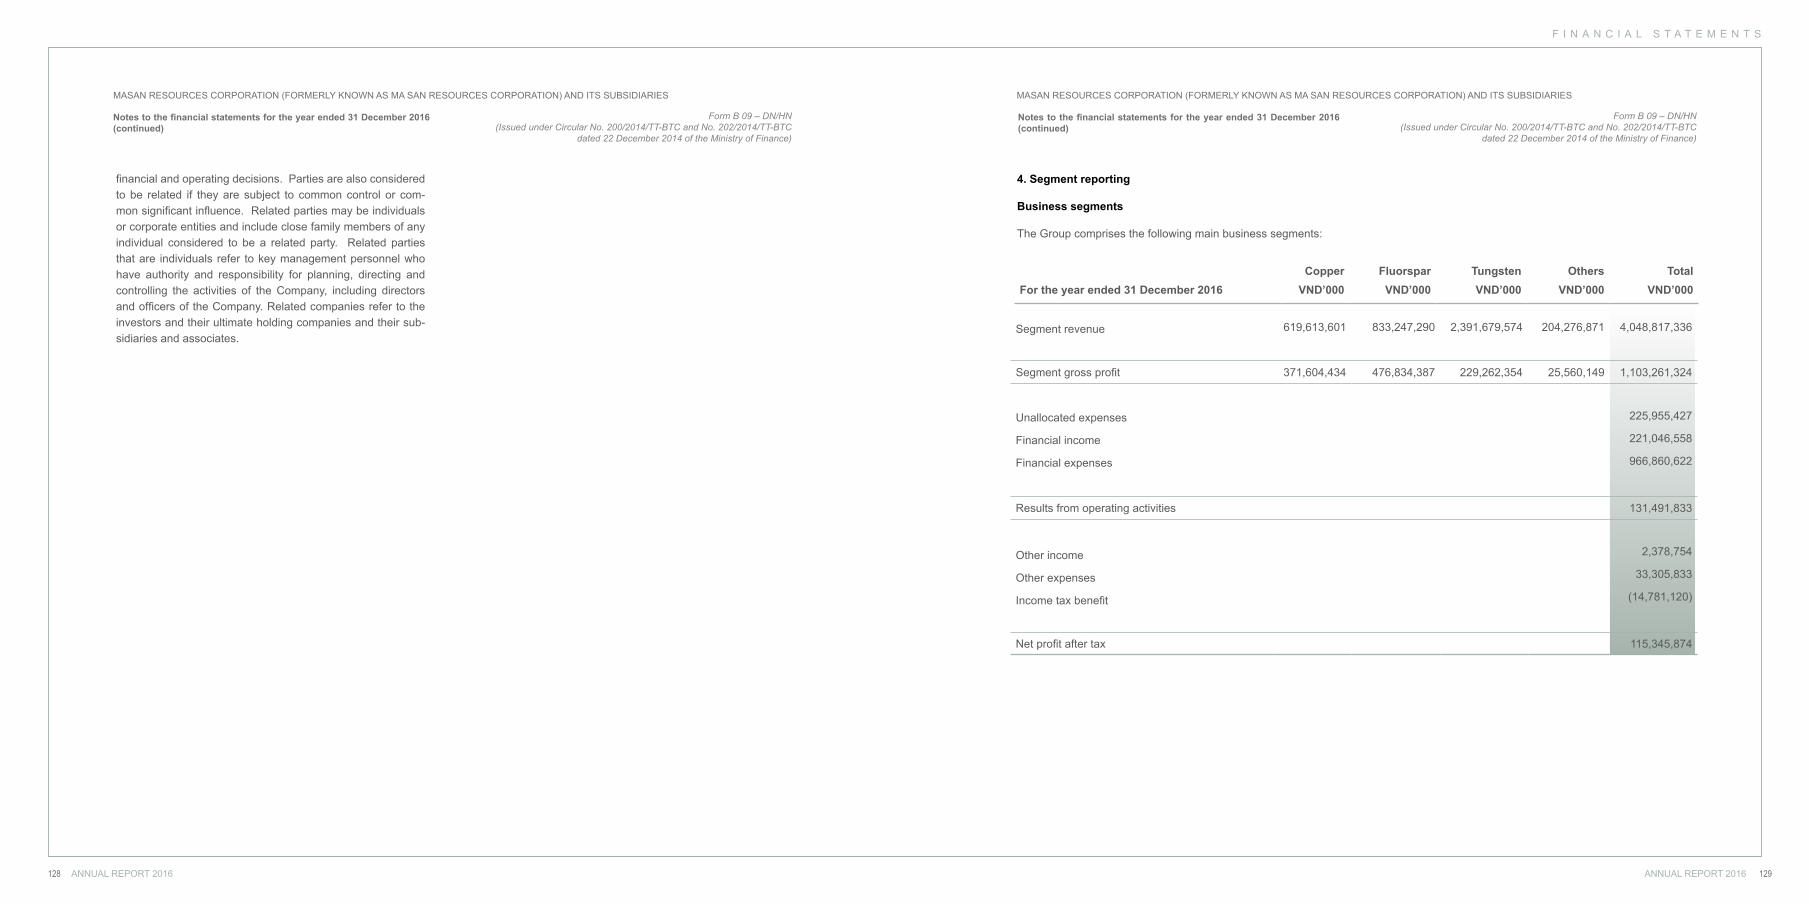
F I N A N C I A L S T A T E M E N T S
ANNUAL REPORT 2016 129128 ANNUAL REPORT 2016
MASAN RESOURCES CORPORATION (FORMERLY KNOWN AS MA SAN RESOURCES CORPORATION) AND ITS SUBSIDIARIES MASAN RESOURCES CORPORATION (FORMERLY KNOWN AS MA SAN RESOURCES CORPORATION) AND ITS SUBSIDIARIES
financial and operating decisions. Parties are also considered to be related if they are subject to common control or com-mon significant influence. Related parties may be individuals or corporate entities and include close family members of any individual considered to be a related party. Related parties that are individuals refer to key management personnel who have authority and responsibility for planning, directing and controlling the activities of the Company, including directors and officers of the Company. Related companies refer to the investors and their ultimate holding companies and their sub-sidiaries and associates.
4. Segment reporting
Business segments
The Group comprises the following main business segments:
Copper Fluorspar Tungsten Others TotalFor the year ended 31 December 2016 VND’000 VND’000 VND’000 VND’000 VND’000
Segment revenue 619,613,601 833,247,290 2,391,679,574 204,276,871 4,048,817,336
Segment gross profit 371,604,434 476,834,387 229,262,354 25,560,149 1,103,261,324
Unallocated expenses 225,955,427
Financial income 221,046,558
Financial expenses 966,860,622
Results from operating activities 131,491,833
Other income 2,378,754
Other expenses 33,305,833
Income tax benefit (14,781,120)
Net profit after tax 115,345,874
Form B 09 – DN/HN(Issued under Circular No. 200/2014/TT-BTC and No. 202/2014/TT-BTC
dated 22 December 2014 of the Ministry of Finance)
Notes to the financial statements for the year ended 31 December 2016 (continued)
Form B 09 – DN/HN(Issued under Circular No. 200/2014/TT-BTC and No. 202/2014/TT-BTC
dated 22 December 2014 of the Ministry of Finance)
Notes to the financial statements for the year ended 31 December 2016 (continued)
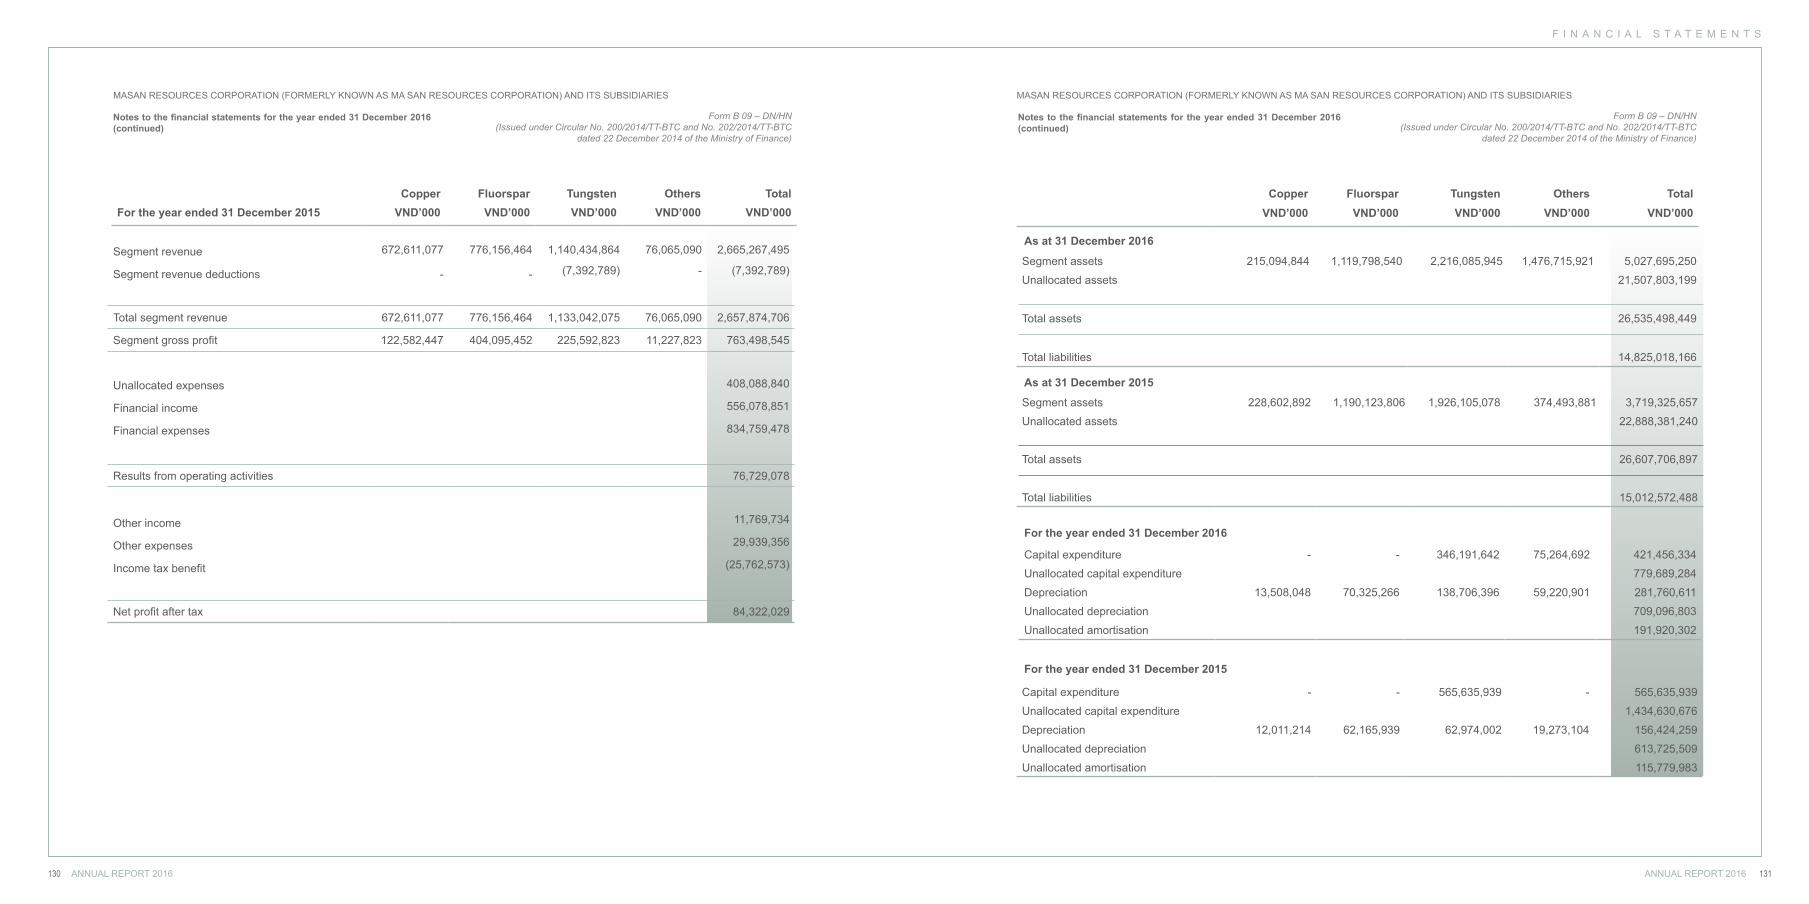
F I N A N C I A L S T A T E M E N T S
ANNUAL REPORT 2016 131130 ANNUAL REPORT 2016
MASAN RESOURCES CORPORATION (FORMERLY KNOWN AS MA SAN RESOURCES CORPORATION) AND ITS SUBSIDIARIES MASAN RESOURCES CORPORATION (FORMERLY KNOWN AS MA SAN RESOURCES CORPORATION) AND ITS SUBSIDIARIES
Copper Fluorspar Tungsten Others TotalFor the year ended 31 December 2015 VND’000 VND’000 VND’000 VND’000 VND’000
Segment revenue 672,611,077 776,156,464 1,140,434,864 76,065,090 2,665,267,495
Segment revenue deductions - - (7,392,789) - (7,392,789)
Total segment revenue 672,611,077 776,156,464 1,133,042,075 76,065,090 2,657,874,706
Segment gross profit 122,582,447 404,095,452 225,592,823 11,227,823 763,498,545
Unallocated expenses 408,088,840
Financial income 556,078,851
Financial expenses 834,759,478
Results from operating activities 76,729,078
Other income 11,769,734
Other expenses 29,939,356
Income tax benefit (25,762,573)
Net profit after tax 84,322,029
Copper Fluorspar Tungsten Others TotalVND’000 VND’000 VND’000 VND’000 VND’000
Capital expenditure - - 346,191,642 75,264,692 421,456,334
Unallocated capital expenditure 779,689,284
Depreciation 13,508,048 70,325,266 138,706,396 59,220,901 281,760,611
Unallocated depreciation 709,096,803
Unallocated amortisation 191,920,302
For the year ended 31 December 2016
As at 31 December 2015
As at 31 December 2016
For the year ended 31 December 2015
Segment assets 215,094,844 1,119,798,540 2,216,085,945 1,476,715,921 5,027,695,250
Unallocated assets 21,507,803,199
Total assets 26,535,498,449
Total liabilities 14,825,018,166
Segment assets 228,602,892 1,190,123,806 1,926,105,078 374,493,881 3,719,325,657
Unallocated assets 22,888,381,240
Total assets 26,607,706,897
Total liabilities 15,012,572,488
Capital expenditure - - 565,635,939 - 565,635,939
Unallocated capital expenditure 1,434,630,676
Depreciation 12,011,214 62,165,939 62,974,002 19,273,104 156,424,259
Unallocated depreciation 613,725,509
Unallocated amortisation 115,779,983
Form B 09 – DN/HN(Issued under Circular No. 200/2014/TT-BTC and No. 202/2014/TT-BTC
dated 22 December 2014 of the Ministry of Finance)
Notes to the financial statements for the year ended 31 December 2016 (continued)
Form B 09 – DN/HN(Issued under Circular No. 200/2014/TT-BTC and No. 202/2014/TT-BTC
dated 22 December 2014 of the Ministry of Finance)
Notes to the financial statements for the year ended 31 December 2016 (continued)
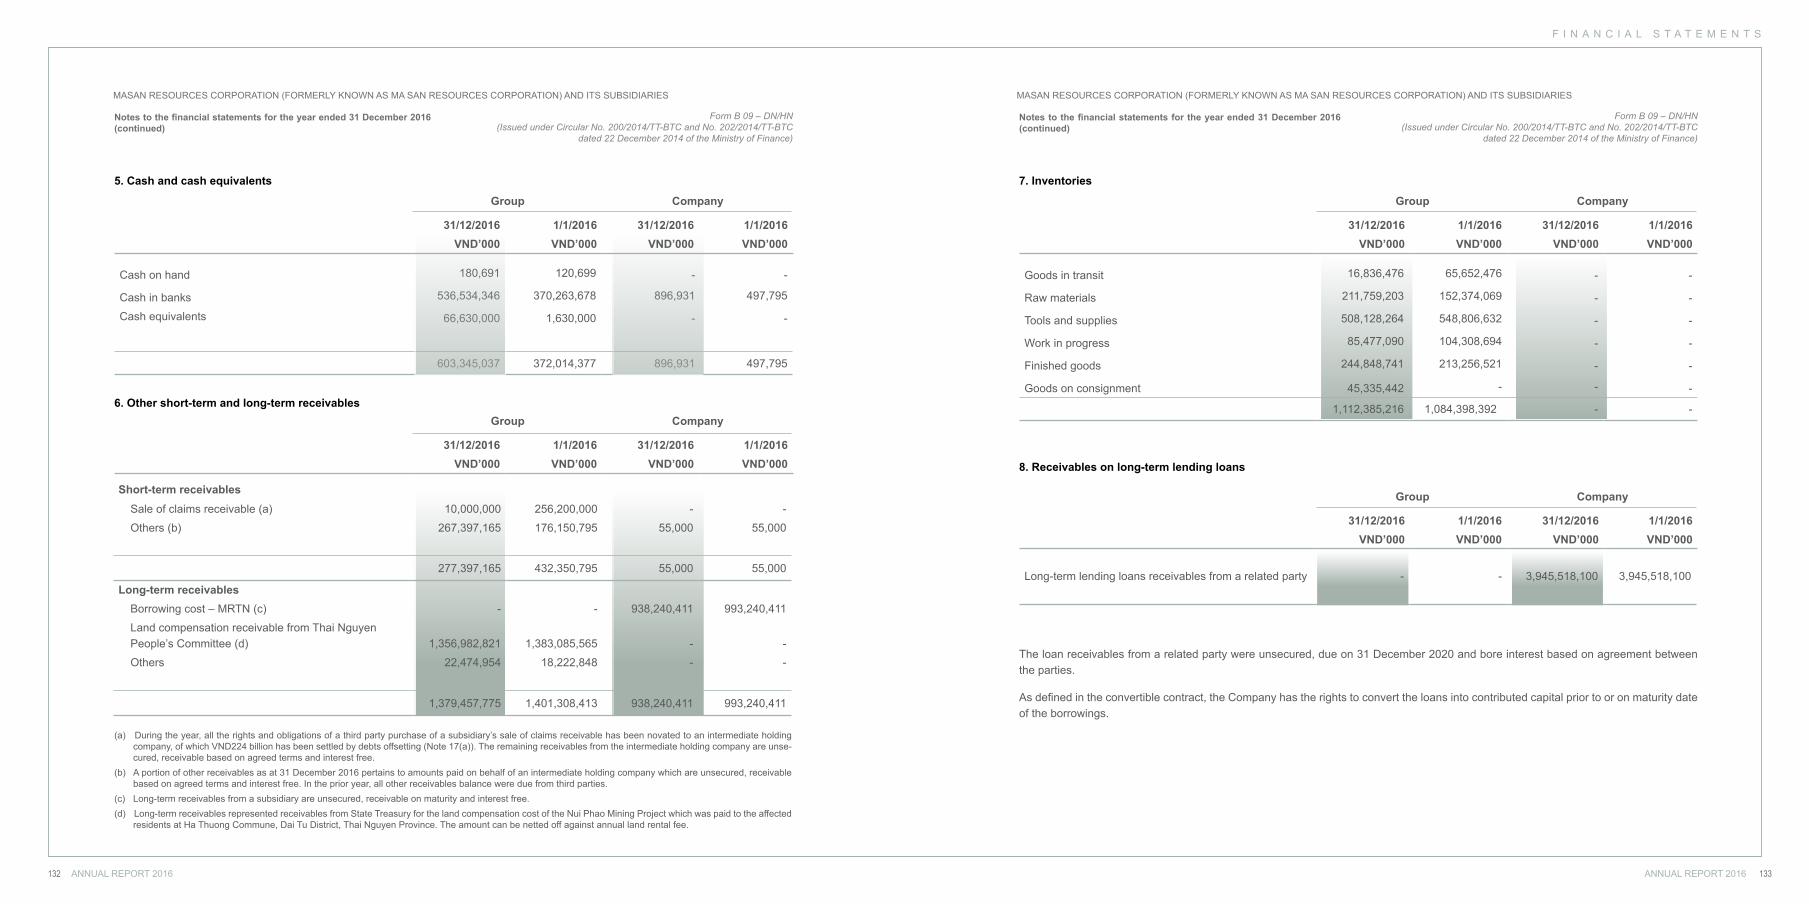
F I N A N C I A L S T A T E M E N T S
ANNUAL REPORT 2016 133132 ANNUAL REPORT 2016
MASAN RESOURCES CORPORATION (FORMERLY KNOWN AS MA SAN RESOURCES CORPORATION) AND ITS SUBSIDIARIES MASAN RESOURCES CORPORATION (FORMERLY KNOWN AS MA SAN RESOURCES CORPORATION) AND ITS SUBSIDIARIES
Group Company
31/12/2016 1/1/2016 31/12/2016 1/1/2016VND’000 VND’000 VND’000 VND’000
Cash on hand 180,691 120,699 - -
Cash in banks 536,534,346 370,263,678 896,931 497,795
Cash equivalents 66,630,000 1,630,000 - -
603,345,037 372,014,377 896,931 497,795
Group Company
31/12/2016 1/1/2016 31/12/2016 1/1/2016VND’000 VND’000 VND’000 VND’000
5. Cash and cash equivalents
6. Other short-term and long-term receivables
Short-term receivablesSale of claims receivable (a) 10,000,000 256,200,000 - -
Others (b) 267,397,165 176,150,795 55,000 55,000
277,397,165 432,350,795 55,000 55,000
Long-term receivablesBorrowing cost – MRTN (c) - - 938,240,411 993,240,411
Land compensation receivable from Thai NguyenPeople’s Committee (d) 1,356,982,821 1,383,085,565 - -
Others 22,474,954 18,222,848 - -
1,379,457,775 1,401,308,413 938,240,411 993,240,411
(a) During the year, all the rights and obligations of a third party purchase of a subsidiary’s sale of claims receivable has been novated to an intermediate holding company, of which VND224 billion has been settled by debts offsetting (Note 17(a)). The remaining receivables from the intermediate holding company are unse-cured, receivable based on agreed terms and interest free.
(b) A portion of other receivables as at 31 December 2016 pertains to amounts paid on behalf of an intermediate holding company which are unsecured, receivable based on agreed terms and interest free. In the prior year, all other receivables balance were due from third parties.
(c) Long-term receivables from a subsidiary are unsecured, receivable on maturity and interest free.(d) Long-term receivables represented receivables from State Treasury for the land compensation cost of the Nui Phao Mining Project which was paid to the affected
residents at Ha Thuong Commune, Dai Tu District, Thai Nguyen Province. The amount can be netted off against annual land rental fee.
Group Company
31/12/2016 1/1/2016 31/12/2016 1/1/2016VND’000 VND’000 VND’000 VND’000
Group Company
31/12/2016 1/1/2016 31/12/2016 1/1/2016VND’000 VND’000 VND’000 VND’000
7. Inventories
8. Receivables on long-term lending loans
Goods in transit 16,836,476 65,652,476 - -
Raw materials 211,759,203 152,374,069 - -
Tools and supplies 508,128,264 548,806,632 - -
Work in progress 85,477,090 104,308,694 - -
Finished goods 244,848,741 213,256,521 - -
Goods on consignment 45,335,442 - - -
1,112,385,216 1,084,398,392 - -
Long-term lending loans receivables from a related party - - 3,945,518,100 3,945,518,100
The loan receivables from a related party were unsecured, due on 31 December 2020 and bore interest based on agreement between the parties.
As defined in the convertible contract, the Company has the rights to convert the loans into contributed capital prior to or on maturity date of the borrowings.
Form B 09 – DN/HN(Issued under Circular No. 200/2014/TT-BTC and No. 202/2014/TT-BTC
dated 22 December 2014 of the Ministry of Finance)
Notes to the financial statements for the year ended 31 December 2016 (continued)
Form B 09 – DN/HN(Issued under Circular No. 200/2014/TT-BTC and No. 202/2014/TT-BTC
dated 22 December 2014 of the Ministry of Finance)
Notes to the financial statements for the year ended 31 December 2016 (continued)
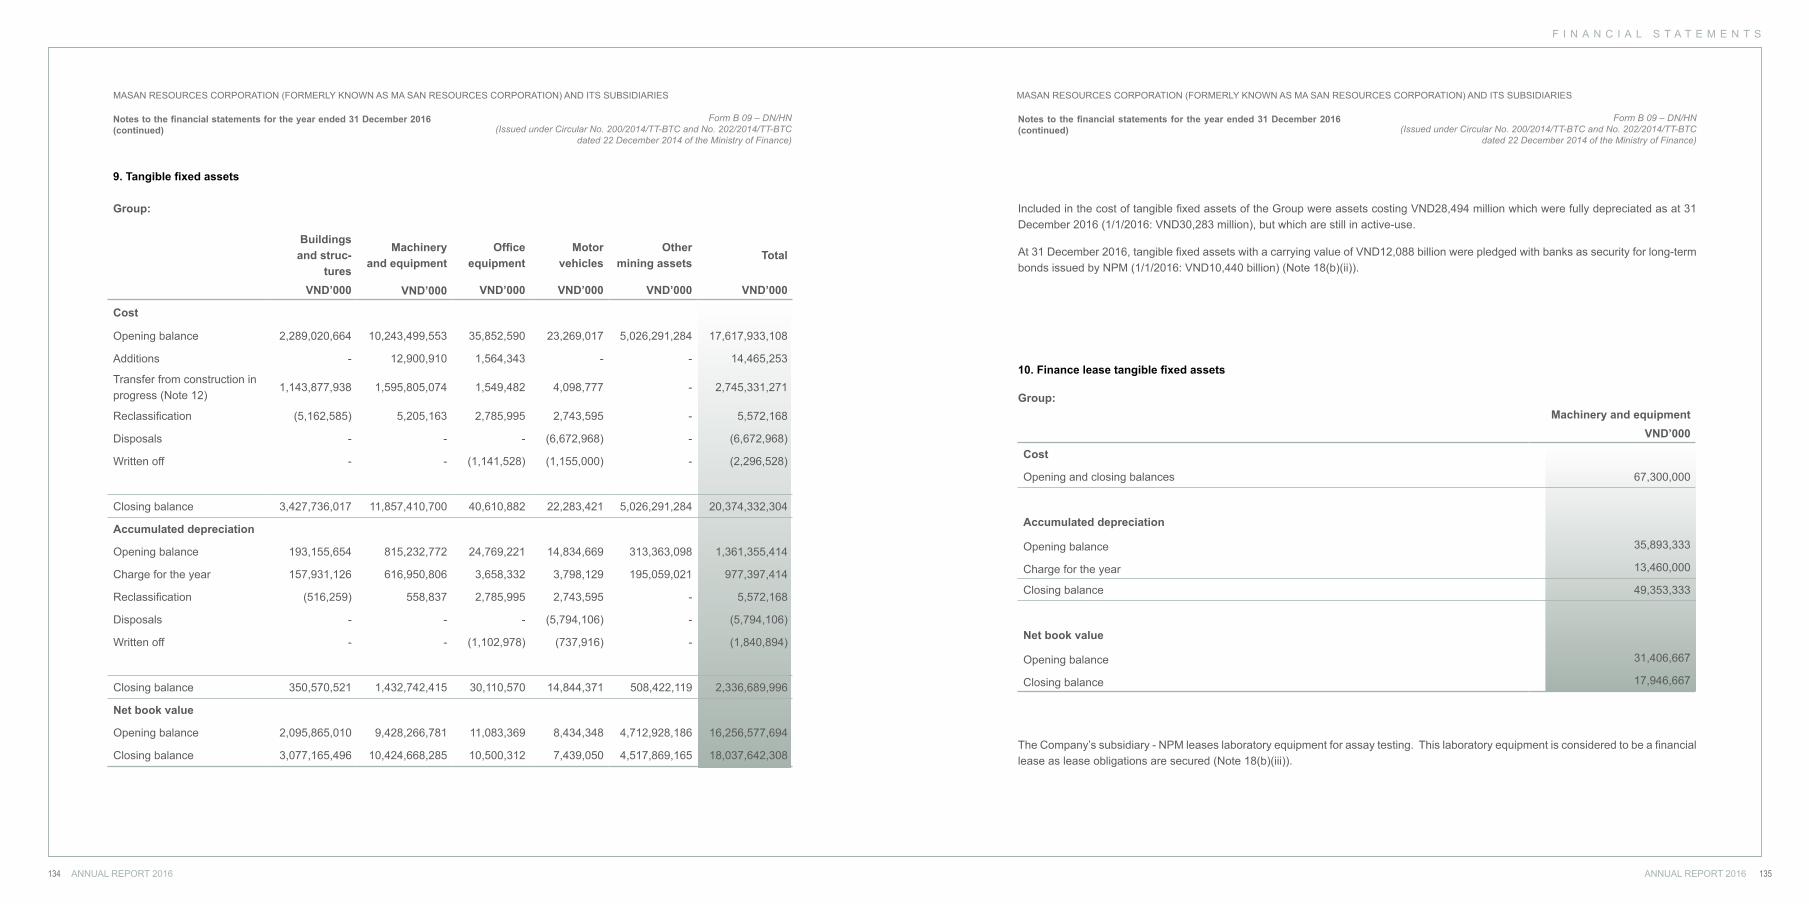
F I N A N C I A L S T A T E M E N T S
ANNUAL REPORT 2016 135134 ANNUAL REPORT 2016
MASAN RESOURCES CORPORATION (FORMERLY KNOWN AS MA SAN RESOURCES CORPORATION) AND ITS SUBSIDIARIES MASAN RESOURCES CORPORATION (FORMERLY KNOWN AS MA SAN RESOURCES CORPORATION) AND ITS SUBSIDIARIES
9. Tangible fixed assets
Group:
Buildings and struc-
tures
Machinery and equipment
Office equipment
Motor vehicles
Other mining assets
Total
VND’000 VND’000 VND’000 VND’000 VND’000 VND’000
Cost
Opening balance 2,289,020,664 10,243,499,553 35,852,590 23,269,017 5,026,291,284 17,617,933,108
Additions - 12,900,910 1,564,343 - - 14,465,253
Transfer from construction in progress (Note 12)
1,143,877,938 1,595,805,074 1,549,482 4,098,777 - 2,745,331,271
Reclassification (5,162,585) 5,205,163 2,785,995 2,743,595 - 5,572,168
Disposals - - - (6,672,968) - (6,672,968)
Written off - - (1,141,528) (1,155,000) - (2,296,528)
Closing balance 3,427,736,017 11,857,410,700 40,610,882 22,283,421 5,026,291,284 20,374,332,304
Accumulated depreciation
Opening balance 193,155,654 815,232,772 24,769,221 14,834,669 313,363,098 1,361,355,414
Charge for the year 157,931,126 616,950,806 3,658,332 3,798,129 195,059,021 977,397,414
Reclassification (516,259) 558,837 2,785,995 2,743,595 - 5,572,168
Disposals - - - (5,794,106) - (5,794,106)
Written off - - (1,102,978) (737,916) - (1,840,894)
Closing balance 350,570,521 1,432,742,415 30,110,570 14,844,371 508,422,119 2,336,689,996
Net book value
Opening balance 2,095,865,010 9,428,266,781 11,083,369 8,434,348 4,712,928,186 16,256,577,694
Closing balance 3,077,165,496 10,424,668,285 10,500,312 7,439,050 4,517,869,165 18,037,642,308
10. Finance lease tangible fixed assets
Group:
Included in the cost of tangible fixed assets of the Group were assets costing VND28,494 million which were fully depreciated as at 31 December 2016 (1/1/2016: VND30,283 million), but which are still in active-use.
At 31 December 2016, tangible fixed assets with a carrying value of VND12,088 billion were pledged with banks as security for long-term bonds issued by NPM (1/1/2016: VND10,440 billion) (Note 18(b)(ii)).
The Company’s subsidiary - NPM leases laboratory equipment for assay testing. This laboratory equipment is considered to be a financial lease as lease obligations are secured (Note 18(b)(iii)).
Machinery and equipmentVND’000
Cost
Opening and closing balances 67,300,000
Accumulated depreciation
Opening balance 35,893,333
Charge for the year 13,460,000
Closing balance 49,353,333
Net book value
Opening balance 31,406,667
Closing balance 17,946,667
Form B 09 – DN/HN(Issued under Circular No. 200/2014/TT-BTC and No. 202/2014/TT-BTC
dated 22 December 2014 of the Ministry of Finance)
Notes to the financial statements for the year ended 31 December 2016 (continued)
Form B 09 – DN/HN(Issued under Circular No. 200/2014/TT-BTC and No. 202/2014/TT-BTC
dated 22 December 2014 of the Ministry of Finance)
Notes to the financial statements for the year ended 31 December 2016 (continued)
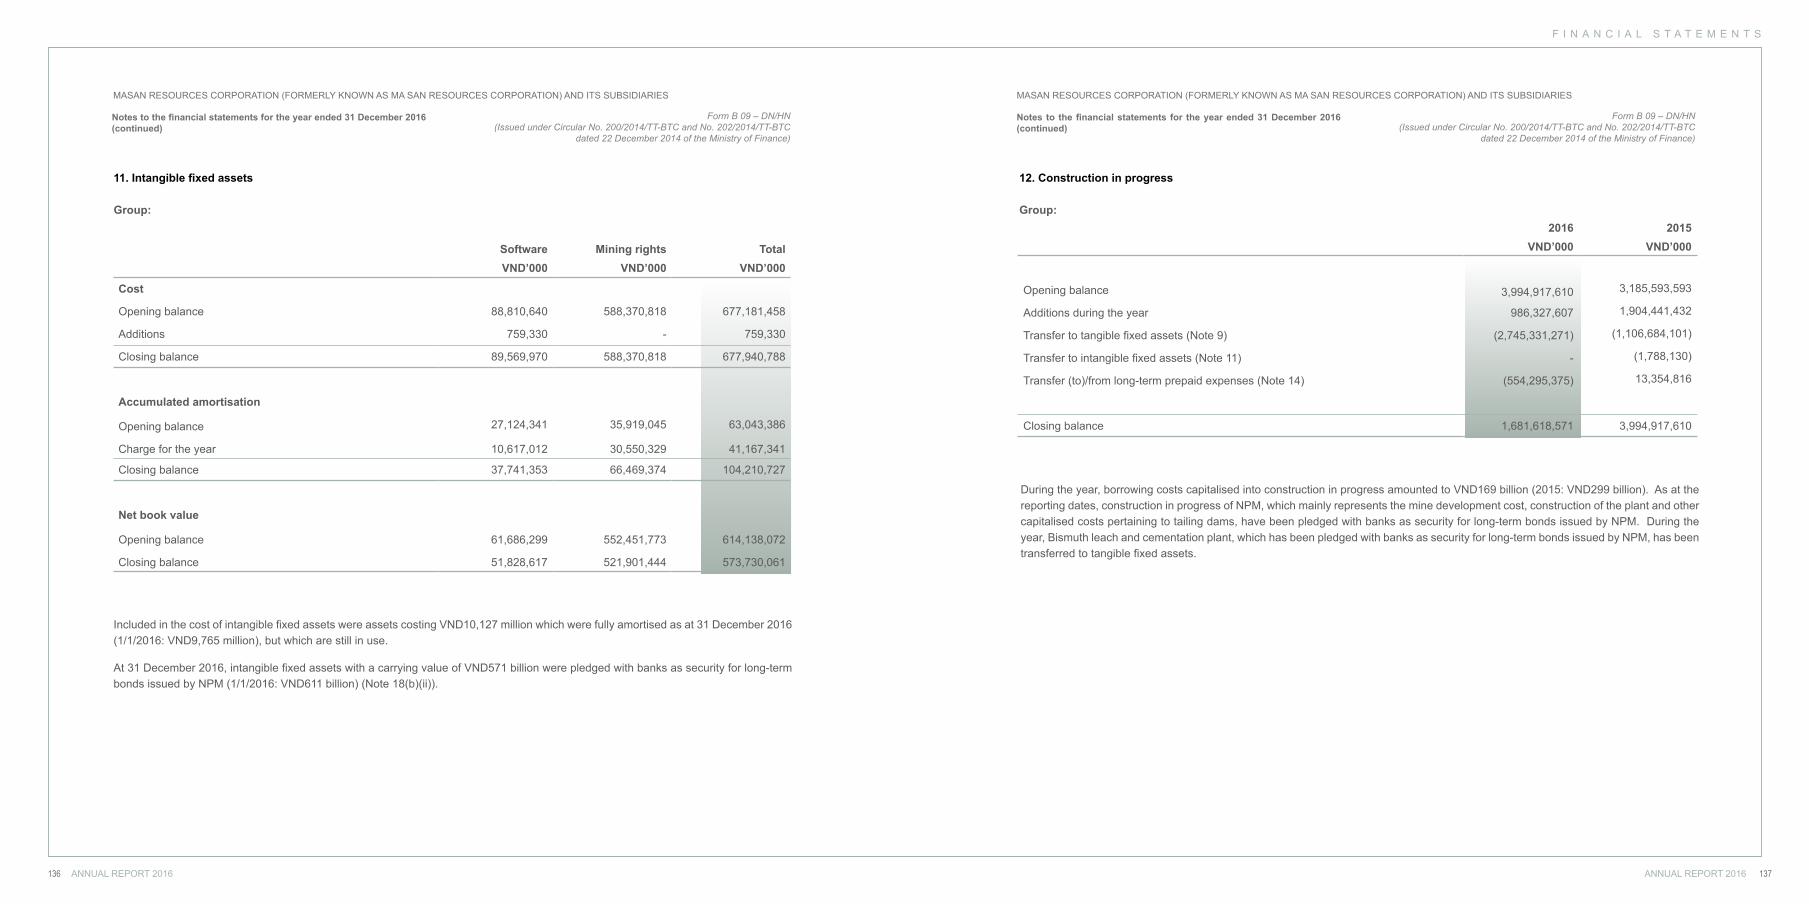
F I N A N C I A L S T A T E M E N T S
ANNUAL REPORT 2016 137136 ANNUAL REPORT 2016
MASAN RESOURCES CORPORATION (FORMERLY KNOWN AS MA SAN RESOURCES CORPORATION) AND ITS SUBSIDIARIES MASAN RESOURCES CORPORATION (FORMERLY KNOWN AS MA SAN RESOURCES CORPORATION) AND ITS SUBSIDIARIES
11. Intangible fixed assets
Group:
Software Mining rights TotalVND’000 VND’000 VND’000
Cost
Opening balance 88,810,640 588,370,818 677,181,458
Additions 759,330 - 759,330
Closing balance 89,569,970 588,370,818 677,940,788
Accumulated amortisation
Opening balance 27,124,341 35,919,045 63,043,386
Charge for the year 10,617,012 30,550,329 41,167,341
Closing balance 37,741,353 66,469,374 104,210,727
Net book value
Opening balance 61,686,299 552,451,773 614,138,072
Closing balance 51,828,617 521,901,444 573,730,061
Included in the cost of intangible fixed assets were assets costing VND10,127 million which were fully amortised as at 31 December 2016 (1/1/2016: VND9,765 million), but which are still in use.
At 31 December 2016, intangible fixed assets with a carrying value of VND571 billion were pledged with banks as security for long-term bonds issued by NPM (1/1/2016: VND611 billion) (Note 18(b)(ii)).
Form B 09 – DN/HN(Issued under Circular No. 200/2014/TT-BTC and No. 202/2014/TT-BTC
dated 22 December 2014 of the Ministry of Finance)
Notes to the financial statements for the year ended 31 December 2016 (continued)
Form B 09 – DN/HN(Issued under Circular No. 200/2014/TT-BTC and No. 202/2014/TT-BTC
dated 22 December 2014 of the Ministry of Finance)
Notes to the financial statements for the year ended 31 December 2016 (continued)
12. Construction in progress
Group:
During the year, borrowing costs capitalised into construction in progress amounted to VND169 billion (2015: VND299 billion). As at the reporting dates, construction in progress of NPM, which mainly represents the mine development cost, construction of the plant and other capitalised costs pertaining to tailing dams, have been pledged with banks as security for long-term bonds issued by NPM. During the year, Bismuth leach and cementation plant, which has been pledged with banks as security for long-term bonds issued by NPM, has been transferred to tangible fixed assets.
2016 2015VND’000 VND’000
Opening balance 3,994,917,610 3,185,593,593
Additions during the year 986,327,607 1,904,441,432
Transfer to tangible fixed assets (Note 9) (2,745,331,271) (1,106,684,101)
Transfer to intangible fixed assets (Note 11) - (1,788,130)
Transfer (to)/from long-term prepaid expenses (Note 14) (554,295,375) 13,354,816
Closing balance 1,681,618,571 3,994,917,610
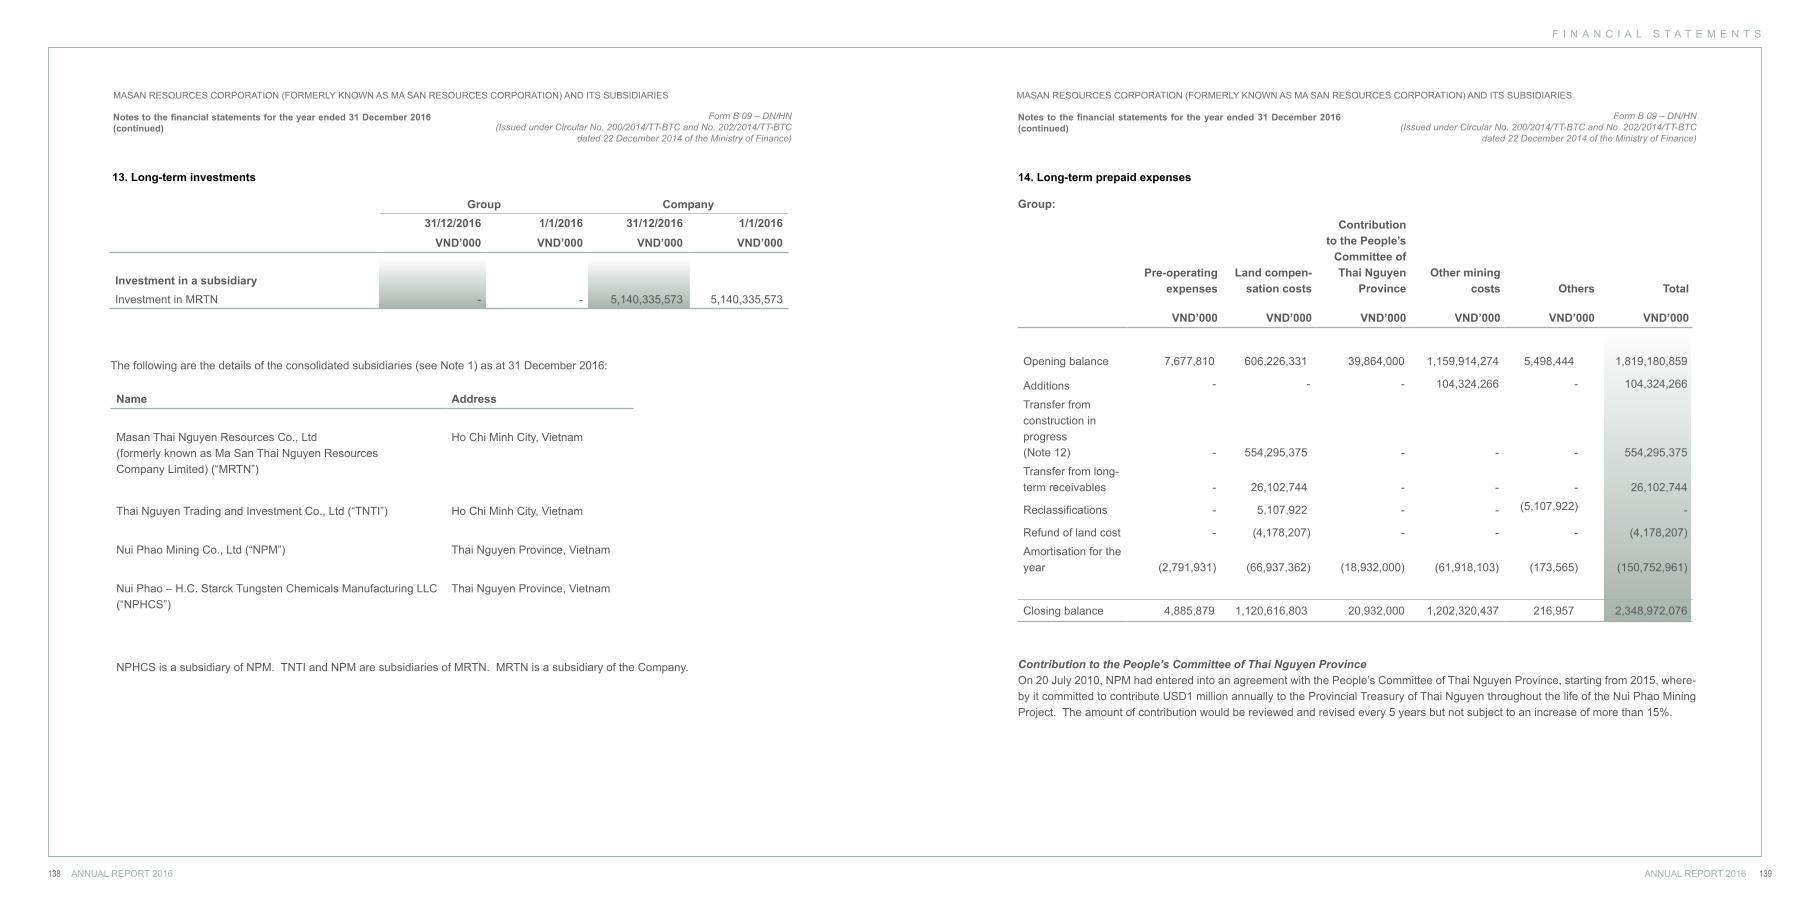
F I N A N C I A L S T A T E M E N T S
ANNUAL REPORT 2016 139138 ANNUAL REPORT 2016
MASAN RESOURCES CORPORATION (FORMERLY KNOWN AS MA SAN RESOURCES CORPORATION) AND ITS SUBSIDIARIES MASAN RESOURCES CORPORATION (FORMERLY KNOWN AS MA SAN RESOURCES CORPORATION) AND ITS SUBSIDIARIES
The following are the details of the consolidated subsidiaries (see Note 1) as at 31 December 2016:
Name Address
Masan Thai Nguyen Resources Co., Ltd (formerly known as Ma San Thai Nguyen ResourcesCompany Limited) (“MRTN”)
Ho Chi Minh City, Vietnam
Thai Nguyen Trading and Investment Co., Ltd (“TNTI”) Ho Chi Minh City, Vietnam
Nui Phao Mining Co., Ltd (“NPM”) Thai Nguyen Province, Vietnam
Nui Phao – H.C. Starck Tungsten Chemicals Manufacturing LLC (“NPHCS”)
Thai Nguyen Province, Vietnam
NPHCS is a subsidiary of NPM. TNTI and NPM are subsidiaries of MRTN. MRTN is a subsidiary of the Company.
13. Long-term investments
Group Company31/12/2016 1/1/2016 31/12/2016 1/1/2016
VND’000 VND’000 VND’000 VND’000
Investment in a subsidiaryInvestment in MRTN - - 5,140,335,573 5,140,335,573
Pre-operating expenses
VND’000
Land compen-sation costs
VND’000
Contribution to the People’s
Committee of Thai Nguyen
Province
VND’000
Other mining costs
VND’000
Others
VND’000
Total
VND’000
Opening balance 7,677,810 606,226,331 39,864,000 1,159,914,274 5,498,444 1,819,180,859
Additions - - - 104,324,266 - 104,324,266
Transfer from construction in progress(Note 12) - 554,295,375 - - - 554,295,375
Transfer from long-term receivables - 26,102,744 - - - 26,102,744
Reclassifications - 5,107,922 - - (5,107,922) -
Refund of land cost - (4,178,207) - - - (4,178,207)
Amortisation for the year (2,791,931) (66,937,362) (18,932,000) (61,918,103) (173,565) (150,752,961)
Closing balance 4,885,879 1,120,616,803 20,932,000 1,202,320,437 216,957 2,348,972,076
14. Long-term prepaid expenses
Group:
Contribution to the People’s Committee of Thai Nguyen ProvinceOn 20 July 2010, NPM had entered into an agreement with the People’s Committee of Thai Nguyen Province, starting from 2015, where-by it committed to contribute USD1 million annually to the Provincial Treasury of Thai Nguyen throughout the life of the Nui Phao Mining Project. The amount of contribution would be reviewed and revised every 5 years but not subject to an increase of more than 15%.
Form B 09 – DN/HN(Issued under Circular No. 200/2014/TT-BTC and No. 202/2014/TT-BTC
dated 22 December 2014 of the Ministry of Finance)
Notes to the financial statements for the year ended 31 December 2016 (continued)
Form B 09 – DN/HN(Issued under Circular No. 200/2014/TT-BTC and No. 202/2014/TT-BTC
dated 22 December 2014 of the Ministry of Finance)
Notes to the financial statements for the year ended 31 December 2016 (continued)
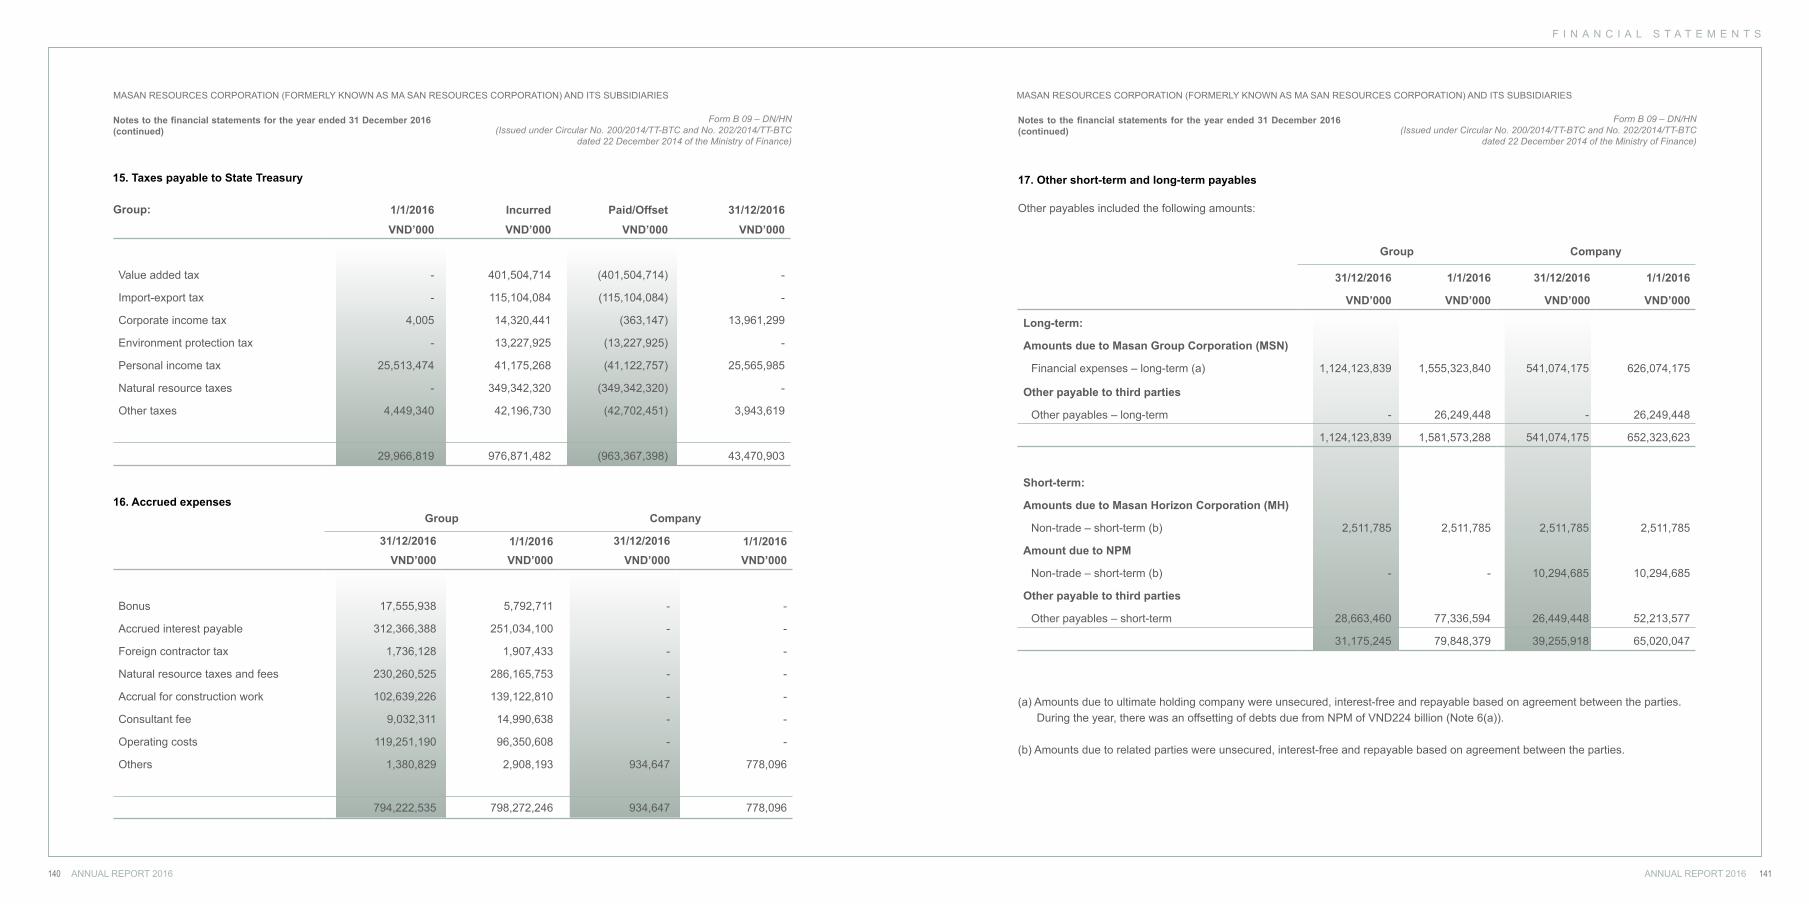
F I N A N C I A L S T A T E M E N T S
ANNUAL REPORT 2016 141140 ANNUAL REPORT 2016
MASAN RESOURCES CORPORATION (FORMERLY KNOWN AS MA SAN RESOURCES CORPORATION) AND ITS SUBSIDIARIES MASAN RESOURCES CORPORATION (FORMERLY KNOWN AS MA SAN RESOURCES CORPORATION) AND ITS SUBSIDIARIES
1/1/2016
VND’000
Incurred
VND’000
Paid/Offset
VND’000
31/12/2016
VND’000
Value added tax - 401,504,714 (401,504,714) -
Import-export tax - 115,104,084 (115,104,084) -
Corporate income tax 4,005 14,320,441 (363,147) 13,961,299
Environment protection tax - 13,227,925 (13,227,925) -
Personal income tax 25,513,474 41,175,268 (41,122,757) 25,565,985
Natural resource taxes - 349,342,320 (349,342,320) -
Other taxes 4,449,340 42,196,730 (42,702,451) 3,943,619
29,966,819 976,871,482 (963,367,398) 43,470,903
Group:
16. Accrued expensesGroup Company
31/12/2016 1/1/2016 31/12/2016 1/1/2016VND’000 VND’000 VND’000 VND’000
Bonus 17,555,938 5,792,711 - -
Accrued interest payable 312,366,388 251,034,100 - -
Foreign contractor tax 1,736,128 1,907,433 - -
Natural resource taxes and fees 230,260,525 286,165,753 - -
Accrual for construction work 102,639,226 139,122,810 - -
Consultant fee 9,032,311 14,990,638 - -
Operating costs 119,251,190 96,350,608 - -
Others 1,380,829 2,908,193 934,647 778,096
794,222,535 798,272,246 934,647 778,096
Form B 09 – DN/HN(Issued under Circular No. 200/2014/TT-BTC and No. 202/2014/TT-BTC
dated 22 December 2014 of the Ministry of Finance)
Notes to the financial statements for the year ended 31 December 2016 (continued)
Form B 09 – DN/HN(Issued under Circular No. 200/2014/TT-BTC and No. 202/2014/TT-BTC
dated 22 December 2014 of the Ministry of Finance)
Notes to the financial statements for the year ended 31 December 2016 (continued)
17. Other short-term and long-term payables15. Taxes payable to State Treasury
Other payables included the following amounts:
Group Company
31/12/2016 1/1/2016 31/12/2016 1/1/2016
VND’000 VND’000 VND’000 VND’000
Long-term:
Amounts due to Masan Group Corporation (MSN)
Financial expenses – long-term (a) 1,124,123,839 1,555,323,840 541,074,175 626,074,175
Other payable to third parties
Other payables – long-term - 26,249,448 - 26,249,448
1,124,123,839 1,581,573,288 541,074,175 652,323,623
Short-term:
Amounts due to Masan Horizon Corporation (MH)
Non-trade – short-term (b) 2,511,785 2,511,785 2,511,785 2,511,785
Amount due to NPM
Non-trade – short-term (b) - - 10,294,685 10,294,685
Other payable to third parties
Other payables – short-term 28,663,460 77,336,594 26,449,448 52,213,577
31,175,245 79,848,379 39,255,918 65,020,047
(a) Amounts due to ultimate holding company were unsecured, interest-free and repayable based on agreement between the parties. During the year, there was an offsetting of debts due from NPM of VND224 billion (Note 6(a)).
(b) Amounts due to related parties were unsecured, interest-free and repayable based on agreement between the parties.
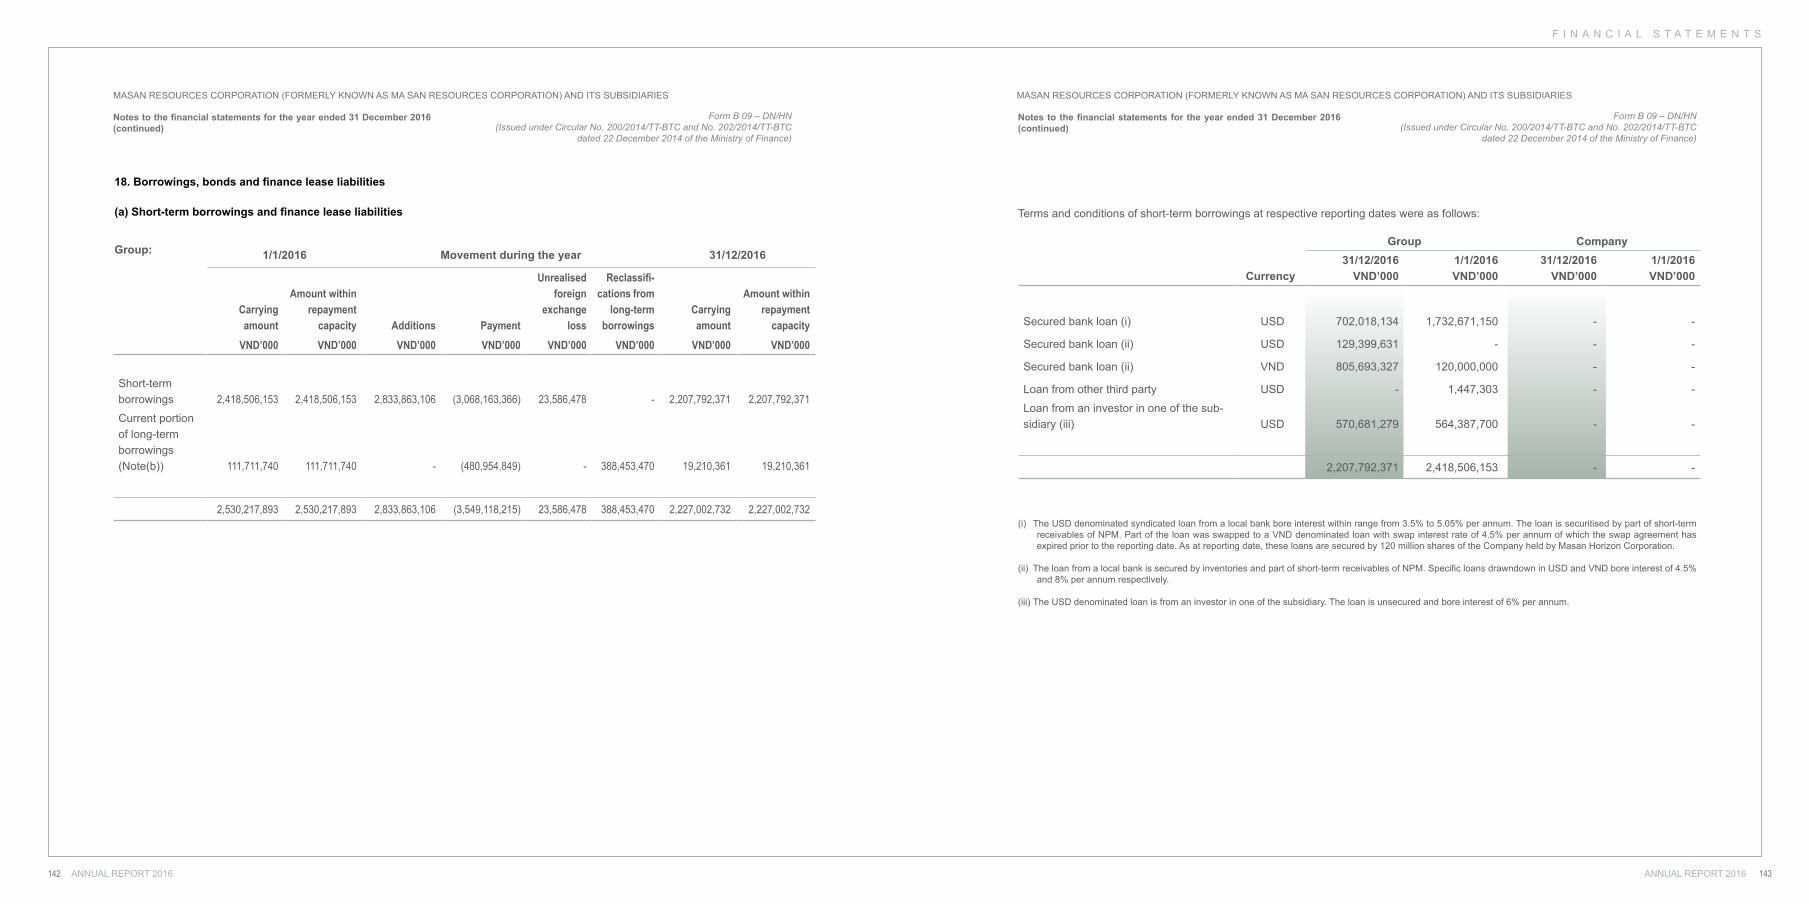
F I N A N C I A L S T A T E M E N T S
ANNUAL REPORT 2016 143142 ANNUAL REPORT 2016
MASAN RESOURCES CORPORATION (FORMERLY KNOWN AS MA SAN RESOURCES CORPORATION) AND ITS SUBSIDIARIES MASAN RESOURCES CORPORATION (FORMERLY KNOWN AS MA SAN RESOURCES CORPORATION) AND ITS SUBSIDIARIES
18. Borrowings, bonds and finance lease liabilities
(a) Short-term borrowings and finance lease liabilities
1/1/2016 Movement during the year 31/12/2016
Carrying amount
Amount within repayment
capacity Additions Payment
Unrealised foreign
exchange loss
Reclassifi-cations from
long-term borrowings
Carrying amount
Amount within repayment
capacityVND’000 VND’000 VND’000 VND’000 VND’000 VND’000 VND’000 VND’000
Short-term borrowings 2,418,506,153 2,418,506,153 2,833,863,106 (3,068,163,366) 23,586,478 - 2,207,792,371 2,207,792,371
Current portion of long-term borrowings (Note(b)) 111,711,740 111,711,740 - (480,954,849) - 388,453,470 19,210,361 19,210,361
2,530,217,893 2,530,217,893 2,833,863,106 (3,549,118,215) 23,586,478 388,453,470 2,227,002,732 2,227,002,732
Group:
Terms and conditions of short-term borrowings at respective reporting dates were as follows:
Group Company
Currency31/12/2016
VND’0001/1/2016 VND’000
31/12/2016 VND’000
1/1/2016 VND’000
Secured bank loan (i) USD 702,018,134 1,732,671,150 - -
Secured bank loan (ii) USD 129,399,631 - - -
Secured bank loan (ii) VND 805,693,327 120,000,000 - -
Loan from other third party USD - 1,447,303 - -
Loan from an investor in one of the sub-sidiary (iii) USD 570,681,279 564,387,700 - -
2,207,792,371 2,418,506,153 - -
(i) The USD denominated syndicated loan from a local bank bore interest within range from 3.5% to 5.05% per annum. The loan is securitised by part of short-term receivables of NPM. Part of the loan was swapped to a VND denominated loan with swap interest rate of 4.5% per annum of which the swap agreement has expired prior to the reporting date. As at reporting date, these loans are secured by 120 million shares of the Company held by Masan Horizon Corporation.
(ii) The loan from a local bank is secured by inventories and part of short-term receivables of NPM. Specific loans drawndown in USD and VND bore interest of 4.5% and 8% per annum respectively.
(iii) The USD denominated loan is from an investor in one of the subsidiary. The loan is unsecured and bore interest of 6% per annum.
Form B 09 – DN/HN(Issued under Circular No. 200/2014/TT-BTC and No. 202/2014/TT-BTC
dated 22 December 2014 of the Ministry of Finance)
Notes to the financial statements for the year ended 31 December 2016 (continued)
Form B 09 – DN/HN(Issued under Circular No. 200/2014/TT-BTC and No. 202/2014/TT-BTC
dated 22 December 2014 of the Ministry of Finance)
Notes to the financial statements for the year ended 31 December 2016 (continued)
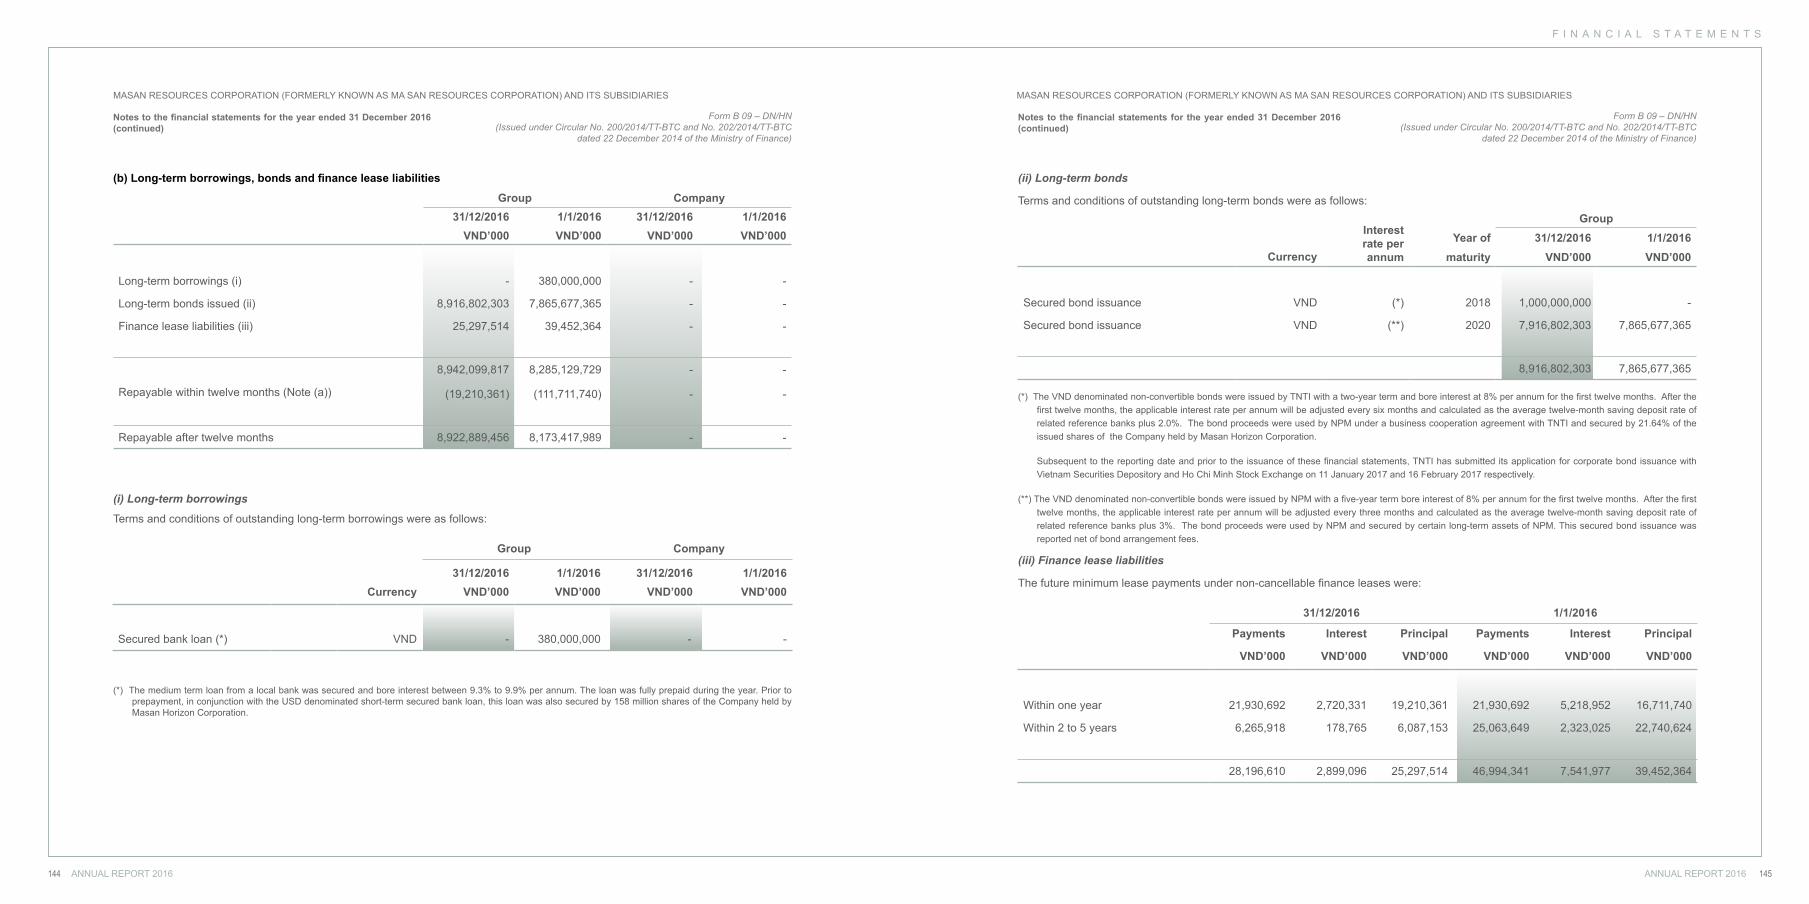
F I N A N C I A L S T A T E M E N T S
ANNUAL REPORT 2016 145144 ANNUAL REPORT 2016
MASAN RESOURCES CORPORATION (FORMERLY KNOWN AS MA SAN RESOURCES CORPORATION) AND ITS SUBSIDIARIES MASAN RESOURCES CORPORATION (FORMERLY KNOWN AS MA SAN RESOURCES CORPORATION) AND ITS SUBSIDIARIES
(b) Long-term borrowings, bonds and finance lease liabilities
(i) Long-term borrowings
Terms and conditions of outstanding long-term borrowings were as follows:
Group Company
31/12/2016 1/1/2016 31/12/2016 1/1/2016Currency VND’000 VND’000 VND’000 VND’000
Secured bank loan (*) VND - 380,000,000 - -
(*) The medium term loan from a local bank was secured and bore interest between 9.3% to 9.9% per annum. The loan was fully prepaid during the year. Prior to prepayment, in conjunction with the USD denominated short-term secured bank loan, this loan was also secured by 158 million shares of the Company held by Masan Horizon Corporation.
Group Company31/12/2016 1/1/2016 31/12/2016 1/1/2016
VND’000 VND’000 VND’000 VND’000
Long-term borrowings (i) - 380,000,000 - -
Long-term bonds issued (ii) 8,916,802,303 7,865,677,365 - -
Finance lease liabilities (iii) 25,297,514 39,452,364 - -
8,942,099,817 8,285,129,729 - -
Repayable within twelve months (Note (a)) (19,210,361) (111,711,740) - -
Repayable after twelve months 8,922,889,456 8,173,417,989 - -
(ii) Long-term bonds
(iii) Finance lease liabilities
Terms and conditions of outstanding long-term bonds were as follows:
The future minimum lease payments under non-cancellable finance leases were:
(*) The VND denominated non-convertible bonds were issued by TNTI with a two-year term and bore interest at 8% per annum for the first twelve months. After the first twelve months, the applicable interest rate per annum will be adjusted every six months and calculated as the average twelve-month saving deposit rate of related reference banks plus 2.0%. The bond proceeds were used by NPM under a business cooperation agreement with TNTI and secured by 21.64% of the issued shares of the Company held by Masan Horizon Corporation.
Subsequent to the reporting date and prior to the issuance of these financial statements, TNTI has submitted its application for corporate bond issuance with Vietnam Securities Depository and Ho Chi Minh Stock Exchange on 11 January 2017 and 16 February 2017 respectively.
(**) The VND denominated non-convertible bonds were issued by NPM with a five-year term bore interest of 8% per annum for the first twelve months. After the first twelve months, the applicable interest rate per annum will be adjusted every three months and calculated as the average twelve-month saving deposit rate of related reference banks plus 3%. The bond proceeds were used by NPM and secured by certain long-term assets of NPM. This secured bond issuance was reported net of bond arrangement fees.
Interest rate perannum
GroupYear of 31/12/2016 1/1/2016
Currency maturity VND’000 VND’000
Secured bond issuance VND (*) 2018 1,000,000,000 -
Secured bond issuance VND (**) 2020 7,916,802,303 7,865,677,365
8,916,802,303 7,865,677,365
31/12/2016 1/1/2016
Payments Interest Principal Payments Interest Principal
VND’000 VND’000 VND’000 VND’000 VND’000 VND’000
Within one year 21,930,692 2,720,331 19,210,361 21,930,692 5,218,952 16,711,740
Within 2 to 5 years 6,265,918 178,765 6,087,153 25,063,649 2,323,025 22,740,624
28,196,610 2,899,096 25,297,514 46,994,341 7,541,977 39,452,364
Form B 09 – DN/HN(Issued under Circular No. 200/2014/TT-BTC and No. 202/2014/TT-BTC
dated 22 December 2014 of the Ministry of Finance)
Notes to the financial statements for the year ended 31 December 2016 (continued)
Form B 09 – DN/HN(Issued under Circular No. 200/2014/TT-BTC and No. 202/2014/TT-BTC
dated 22 December 2014 of the Ministry of Finance)
Notes to the financial statements for the year ended 31 December 2016 (continued)
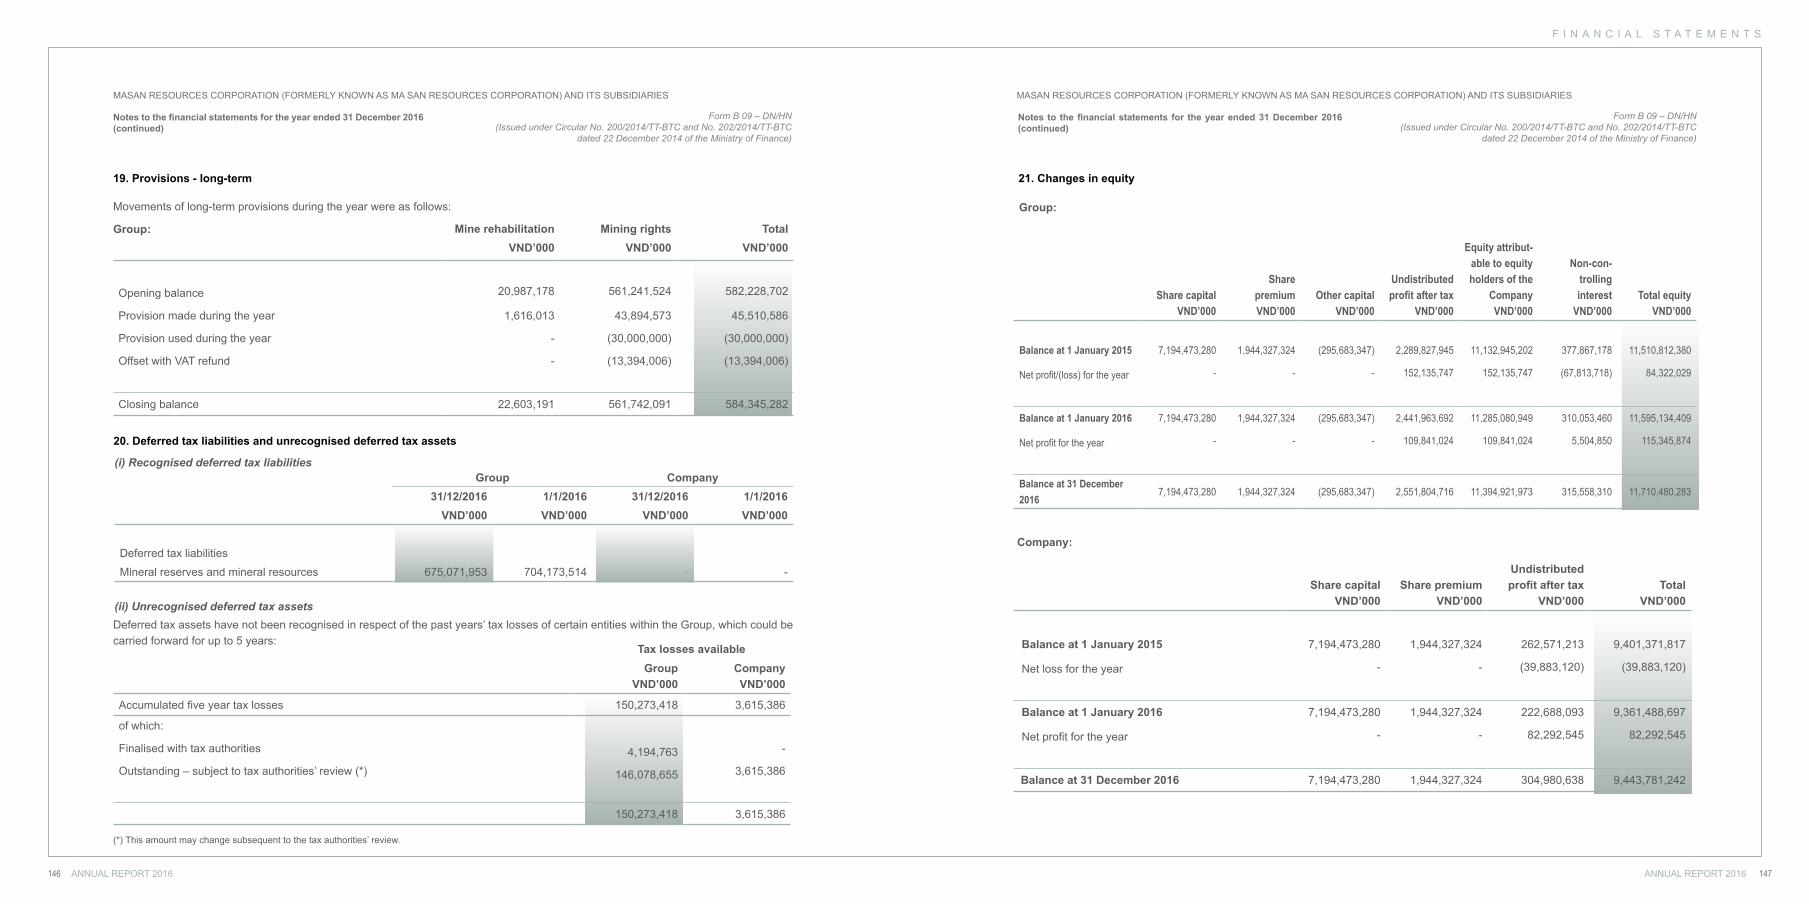
F I N A N C I A L S T A T E M E N T S
ANNUAL REPORT 2016 147146 ANNUAL REPORT 2016
MASAN RESOURCES CORPORATION (FORMERLY KNOWN AS MA SAN RESOURCES CORPORATION) AND ITS SUBSIDIARIES MASAN RESOURCES CORPORATION (FORMERLY KNOWN AS MA SAN RESOURCES CORPORATION) AND ITS SUBSIDIARIES
Group Company31/12/2016 1/1/2016 31/12/2016 1/1/2016
VND’000 VND’000 VND’000 VND’000
Deferred tax liabilities
Mineral reserves and mineral resources 675,071,953 704,173,514 - -
19. Provisions - long-term
Movements of long-term provisions during the year were as follows:
Deferred tax assets have not been recognised in respect of the past years’ tax losses of certain entities within the Group, which could be carried forward for up to 5 years:
Mine rehabilitation Mining rights TotalVND’000 VND’000 VND’000
Opening balance 20,987,178 561,241,524 582,228,702
Provision made during the year 1,616,013 43,894,573 45,510,586
Provision used during the year - (30,000,000) (30,000,000)
Offset with VAT refund - (13,394,006) (13,394,006)
Closing balance 22,603,191 561,742,091 584,345,282
Group:
20. Deferred tax liabilities and unrecognised deferred tax assets
(i) Recognised deferred tax liabilities
(ii) Unrecognised deferred tax assets
Tax losses availableGroup
VND’000CompanyVND’000
Accumulated five year tax losses 150,273,418 3,615,386
of which:
Finalised with tax authorities 4,194,763 -
Outstanding – subject to tax authorities’ review (*) 146,078,655 3,615,386
150,273,418 3,615,386
(*) This amount may change subsequent to the tax authorities’ review.
Form B 09 – DN/HN(Issued under Circular No. 200/2014/TT-BTC and No. 202/2014/TT-BTC
dated 22 December 2014 of the Ministry of Finance)
Notes to the financial statements for the year ended 31 December 2016 (continued)
Group:
21. Changes in equity
Share capitalVND’000
Sharepremium VND’000
Other capital VND’000
Undistributed profit after tax
VND’000
Equity attribut-able to equity holders of the
Company VND’000
Non-con-trolling interest
VND’000Total equity
VND’000
Balance at 1 January 2015 7,194,473,280 1,944,327,324 (295,683,347) 2,289,827,945 11,132,945,202 377,867,178 11,510,812,380
Net profit/(loss) for the year - - - 152,135,747 152,135,747 (67,813,718) 84,322,029
Balance at 1 January 2016 7,194,473,280 1,944,327,324 (295,683,347) 2,441,963,692 11,285,080,949 310,053,460 11,595,134,409
Net profit for the year - - - 109,841,024 109,841,024 5,504,850 115,345,874
Balance at 31 December 2016
7,194,473,280 1,944,327,324 (295,683,347) 2,551,804,716 11,394,921,973 315,558,310 11,710,480,283
Form B 09 – DN/HN(Issued under Circular No. 200/2014/TT-BTC and No. 202/2014/TT-BTC
dated 22 December 2014 of the Ministry of Finance)
Notes to the financial statements for the year ended 31 December 2016 (continued)
Company:
Share capitalVND’000
Share premiumVND’000
Undistributed profit after tax
VND’000Total
VND’000
Balance at 1 January 2015 7,194,473,280 1,944,327,324 262,571,213 9,401,371,817
Net loss for the year - - (39,883,120) (39,883,120)
Balance at 1 January 2016 7,194,473,280 1,944,327,324 222,688,093 9,361,488,697
Net profit for the year - - 82,292,545 82,292,545
Balance at 31 December 2016 7,194,473,280 1,944,327,324 304,980,638 9,443,781,242
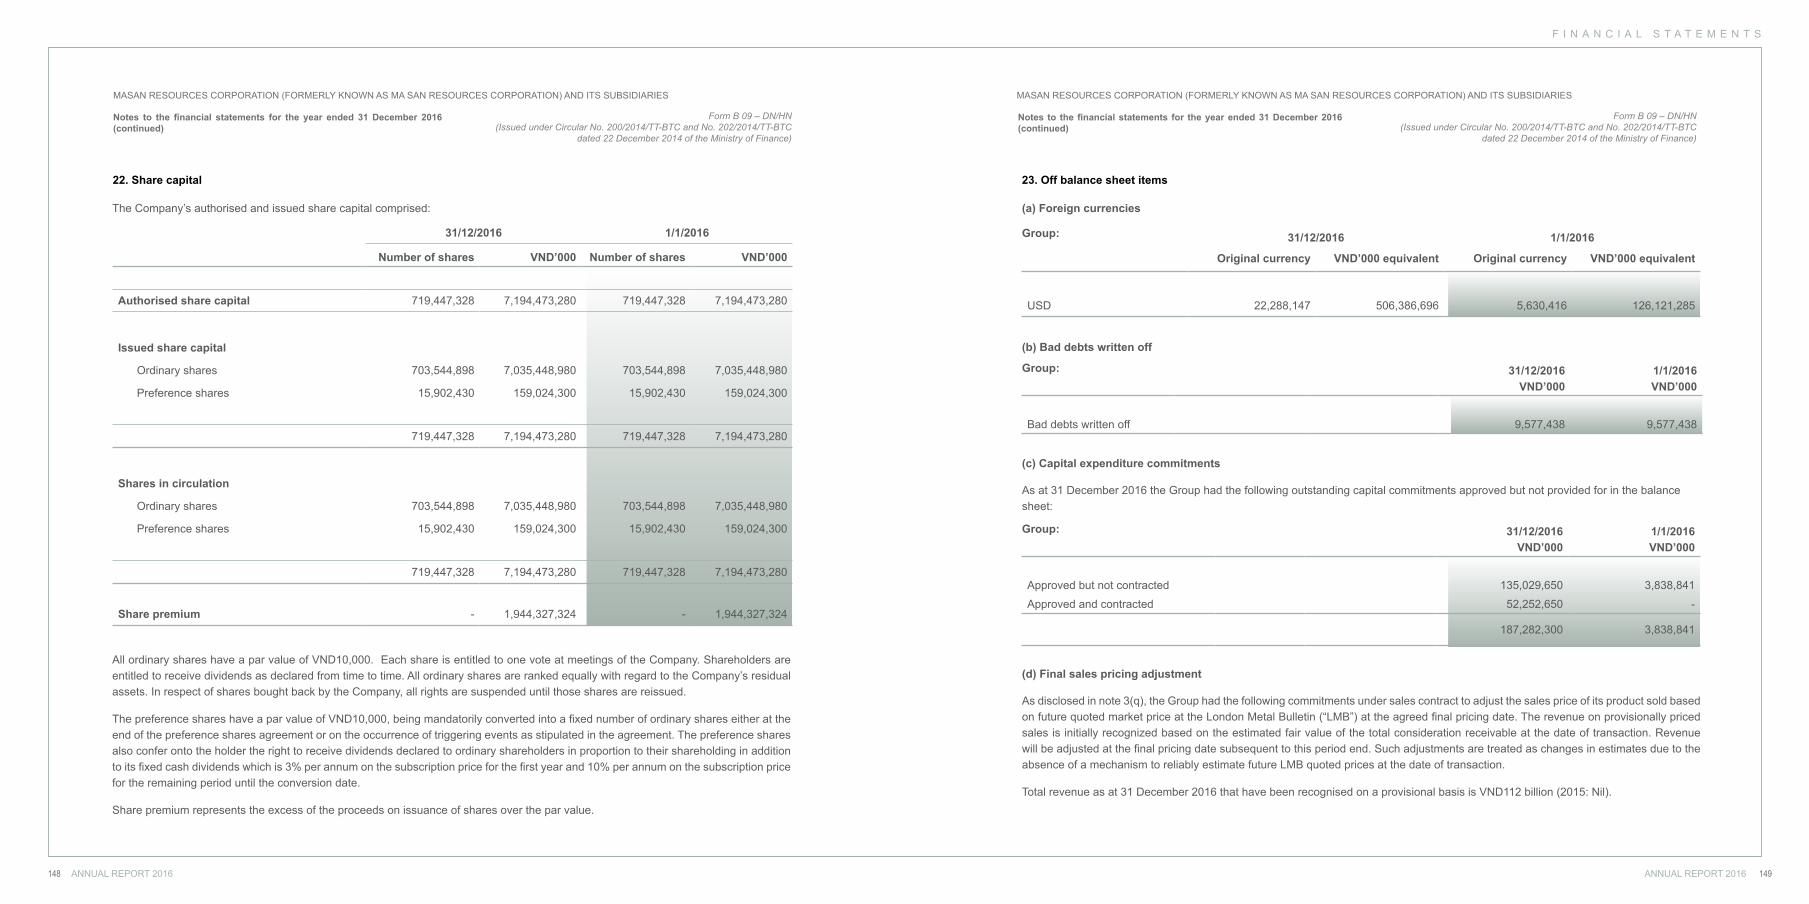
F I N A N C I A L S T A T E M E N T S
ANNUAL REPORT 2016 149148 ANNUAL REPORT 2016
MASAN RESOURCES CORPORATION (FORMERLY KNOWN AS MA SAN RESOURCES CORPORATION) AND ITS SUBSIDIARIES MASAN RESOURCES CORPORATION (FORMERLY KNOWN AS MA SAN RESOURCES CORPORATION) AND ITS SUBSIDIARIES
Form B 09 – DN/HN(Issued under Circular No. 200/2014/TT-BTC and No. 202/2014/TT-BTC
dated 22 December 2014 of the Ministry of Finance)
Notes to the financial statements for the year ended 31 December 2016 (continued)
22. Share capital
The Company’s authorised and issued share capital comprised:
All ordinary shares have a par value of VND10,000. Each share is entitled to one vote at meetings of the Company. Shareholders are entitled to receive dividends as declared from time to time. All ordinary shares are ranked equally with regard to the Company’s residual assets. In respect of shares bought back by the Company, all rights are suspended until those shares are reissued.
The preference shares have a par value of VND10,000, being mandatorily converted into a fixed number of ordinary shares either at the end of the preference shares agreement or on the occurrence of triggering events as stipulated in the agreement. The preference shares also confer onto the holder the right to receive dividends declared to ordinary shareholders in proportion to their shareholding in addition to its fixed cash dividends which is 3% per annum on the subscription price for the first year and 10% per annum on the subscription price for the remaining period until the conversion date.
Share premium represents the excess of the proceeds on issuance of shares over the par value.
31/12/2016 1/1/2016
Number of shares VND’000 Number of shares VND’000
Authorised share capital 719,447,328 7,194,473,280 719,447,328 7,194,473,280
Issued share capital
Ordinary shares 703,544,898 7,035,448,980 703,544,898 7,035,448,980
Preference shares 15,902,430 159,024,300 15,902,430 159,024,300
719,447,328 7,194,473,280 719,447,328 7,194,473,280
Shares in circulation
Ordinary shares 703,544,898 7,035,448,980 703,544,898 7,035,448,980
Preference shares 15,902,430 159,024,300 15,902,430 159,024,300
719,447,328 7,194,473,280 719,447,328 7,194,473,280
Share premium - 1,944,327,324 - 1,944,327,324
31/12/2016 VND’000
1/1/2016 VND’000
Bad debts written off 9,577,438 9,577,438
31/12/2016 1/1/2016
Original currency VND’000 equivalent Original currency VND’000 equivalent
USD 22,288,147 506,386,696 5,630,416 126,121,285
Form B 09 – DN/HN(Issued under Circular No. 200/2014/TT-BTC and No. 202/2014/TT-BTC
dated 22 December 2014 of the Ministry of Finance)
Notes to the financial statements for the year ended 31 December 2016 (continued)
23. Off balance sheet items
(a) Foreign currencies
(c) Capital expenditure commitments
(d) Final sales pricing adjustment
As at 31 December 2016 the Group had the following outstanding capital commitments approved but not provided for in the balance sheet:
As disclosed in note 3(q), the Group had the following commitments under sales contract to adjust the sales price of its product sold based on future quoted market price at the London Metal Bulletin (“LMB”) at the agreed final pricing date. The revenue on provisionally priced sales is initially recognized based on the estimated fair value of the total consideration receivable at the date of transaction. Revenue will be adjusted at the final pricing date subsequent to this period end. Such adjustments are treated as changes in estimates due to the absence of a mechanism to reliably estimate future LMB quoted prices at the date of transaction.
Total revenue as at 31 December 2016 that have been recognised on a provisional basis is VND112 billion (2015: Nil).
(b) Bad debts written off
31/12/2016 VND’000
1/1/2016 VND’000
Approved but not contracted 135,029,650 3,838,841
Approved and contracted 52,252,650 -
187,282,300 3,838,841
Group:
Group:
Group:
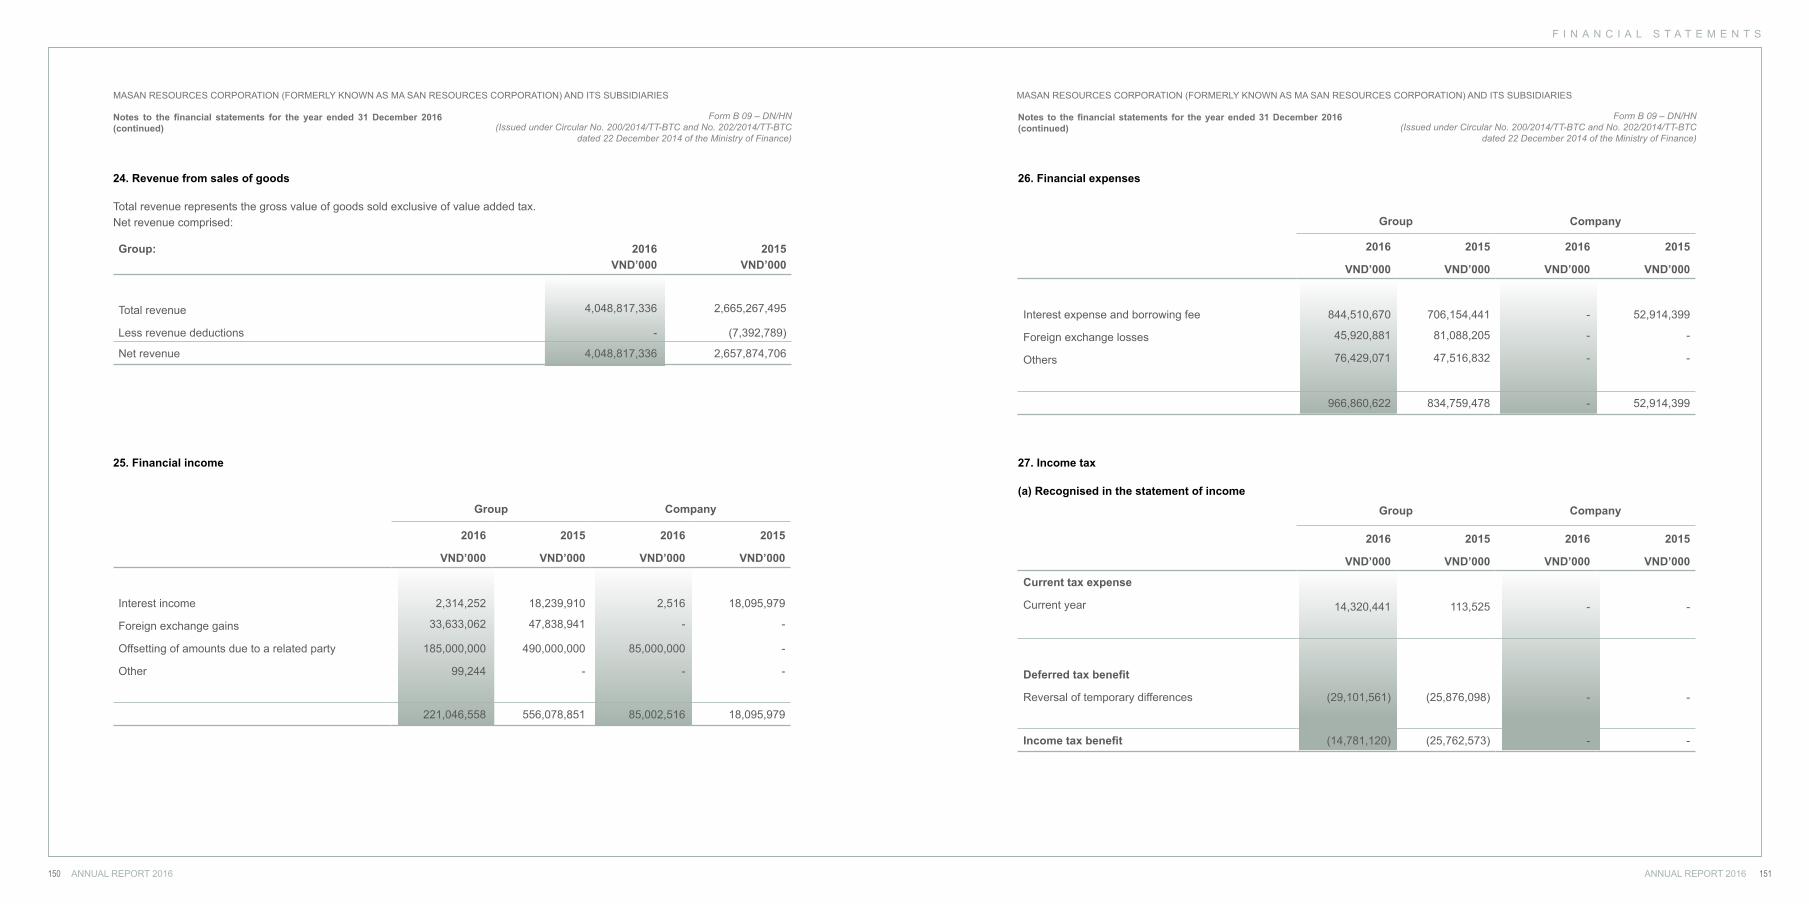
F I N A N C I A L S T A T E M E N T S
ANNUAL REPORT 2016 151150 ANNUAL REPORT 2016
MASAN RESOURCES CORPORATION (FORMERLY KNOWN AS MA SAN RESOURCES CORPORATION) AND ITS SUBSIDIARIES MASAN RESOURCES CORPORATION (FORMERLY KNOWN AS MA SAN RESOURCES CORPORATION) AND ITS SUBSIDIARIES
Form B 09 – DN/HN(Issued under Circular No. 200/2014/TT-BTC and No. 202/2014/TT-BTC
dated 22 December 2014 of the Ministry of Finance)
Notes to the financial statements for the year ended 31 December 2016 (continued)
24. Revenue from sales of goods
Total revenue represents the gross value of goods sold exclusive of value added tax.Net revenue comprised:
Group: 2016VND’000
2015VND’000
Total revenue 4,048,817,336 2,665,267,495
Less revenue deductions - (7,392,789)
Net revenue 4,048,817,336 2,657,874,706
25. Financial income
Group Company
2016 2015 2016 2015
VND’000 VND’000 VND’000 VND’000
Interest income 2,314,252 18,239,910 2,516 18,095,979
Foreign exchange gains 33,633,062 47,838,941 - -
Offsetting of amounts due to a related party 185,000,000 490,000,000 85,000,000 -
Other 99,244 - - -
221,046,558 556,078,851 85,002,516 18,095,979
Form B 09 – DN/HN(Issued under Circular No. 200/2014/TT-BTC and No. 202/2014/TT-BTC
dated 22 December 2014 of the Ministry of Finance)
Notes to the financial statements for the year ended 31 December 2016 (continued)
26. Financial expenses
Group Company
2016 2015 2016 2015
VND’000 VND’000 VND’000 VND’000
Interest expense and borrowing fee 844,510,670 706,154,441 - 52,914,399
Foreign exchange losses 45,920,881 81,088,205 - -
Others 76,429,071 47,516,832 - -
966,860,622 834,759,478 - 52,914,399
27. Income tax
(a) Recognised in the statement of income
Group Company
2016 2015 2016 2015
VND’000 VND’000 VND’000 VND’000
Current tax expense
Current year 14,320,441 113,525 - -
Deferred tax benefit
Reversal of temporary differences (29,101,561) (25,876,098) - -
Income tax benefit (14,781,120) (25,762,573) - -
F I N A N C I A L S T A T E M E N T S
ANNUAL REPORT 2016 153152 ANNUAL REPORT 2016
MASAN RESOURCES CORPORATION (FORMERLY KNOWN AS MA SAN RESOURCES CORPORATION) AND ITS SUBSIDIARIES MASAN RESOURCES CORPORATION (FORMERLY KNOWN AS MA SAN RESOURCES CORPORATION) AND ITS SUBSIDIARIES
(b) Reconciliation of effective tax rate
Group Company
2016 2015 2016 2015
VND’000 VND’000 VND’000 VND’000
Profit/(loss) before tax 100,564,754 58,559,456 82,292,545 (39,883,120)
Tax at the Company tax rate 20,112,951 12,883,080 16,458,509 (8,774,286)
Non-deductible expenses 6,123,679 6,397,990 588 616
Tax incentives (18,800,157) - - -
Effect of different tax rate in subsidiaries (6,776,723) 24,747,423 - -
Tax losses utilised (26,788,428) (86,202,797) (16,459,097) -
Deferred tax asset not recognised 54,755 21,641,657 - 8,773,670
Changes in temporary differences 11,292,803 (5,229,926) - -
(14,781,120) (25,762,573) - -
(c) Applicable tax rates
(d) Tax contingencies
The Company has an obligation to pay the government corporate income tax at the rate of 20% of taxable profits (2015: 22%). The Com-pany’s subsidiaries have obligation to pay the government income tax in accordance with the prevailing regulations.
The standard income tax rate applicable to enterprises before any incentives is 20% (2015: 22%).
The taxation laws and their application in Vietnam were subject to interpretation and may change over time. The final tax position may be subject to review and investigation by a number of authorities, who are enabled by law to impose severe fines, penalties and interest charges. These facts may create tax risks in Vietnam that are more significant than in other countries. Management believes that it had adequately provided for tax liabilities based on its interpretation of tax and legislation, including on transfer pricing requirements and computation of corporate income tax and deferred tax liabilities. However, the relevant authorities may have differing interpretations.
Form B 09 – DN/HN(Issued under Circular No. 200/2014/TT-BTC and No. 202/2014/TT-BTC
dated 22 December 2014 of the Ministry of Finance)
Notes to the financial statements for the year ended 31 December 2016 (continued)
Basic earnings per share
(a) Net profit attributable to shareholders
The calculation of basic earnings per share for the year ended 31 December 2016 was based on the profit attributable to ordinary shareholders of VND107,413 million (2015: VND148,773 million) and a weighted average number of ordinary shares outstanding of 703,544,898 shares (2015: 703,544,898 shares), calculated as follows:
28. Earnings per share
2016 2015
VND’000 VND’000
Net profit attributable to:
Mandatorily convertible preference shareholders 2,427,890 3,362,759
Ordinary shareholders 107,413,134 148,772,988
109,841,024 152,135,747
(b) Weighted average number of shares
2016 2015
Issued shares at the beginning and closing of the year 719,447,328 719,447,328
Of which:
Mandatorily convertible preference shares 15,902,430 15,902,430
Ordinary shares 703,544,898 703,544,898
Form B 09 – DN/HN(Issued under Circular No. 200/2014/TT-BTC and No. 202/2014/TT-BTC
dated 22 December 2014 of the Ministry of Finance)
Notes to the financial statements for the year ended 31 December 2016 (continued)
F I N A N C I A L S T A T E M E N T S
ANNUAL REPORT 2016 155154 ANNUAL REPORT 2016
MASAN RESOURCES CORPORATION (FORMERLY KNOWN AS MA SAN RESOURCES CORPORATION) AND ITS SUBSIDIARIES MASAN RESOURCES CORPORATION (FORMERLY KNOWN AS MA SAN RESOURCES CORPORATION) AND ITS SUBSIDIARIES
Form B 09 – DN/HN(Issued under Circular No. 200/2014/TT-BTC and No. 202/2014/TT-BTC
dated 22 December 2014 of the Ministry of Finance)
Notes to the financial statements for the year ended 31 December 2016 (continued)
29. Significant transactions with related parties
In addition to related party balances and transactions disclosed in other notes to these financial statements, the Group and the Company had the following significant transactions with related parties during the year:
Group:
Related Party Nature of transaction 2016 2015VND’000 VND’000
Ultimate holding companyMasan Group Corporation Conversion of interest payable into loan
principal - 78,156,014
Offsetting of debts due from NPM 324,000,000 490,000,000
Offsetting of debts due from MSR 85,000,000 -
Interest expense and borrowing fees - 64,236,148
Interest expense and borrowing fees paid 22,200,000 384,946,188
Loan paid - 611,053,812
Intermediary holding CompanyMasan Horizon Corporation Sales of claim settled via offsetting of debts
with NPM 224,000,000 -
Sales of claim settled by cash to NPM 22,200,000 -
Ultimate holding company’s associateLocal bank Interest expense and borrowing fees 127,732,924 129,582,179
Bond proceeds received (*) 1,000,000,000 -
Loan received 1,602,550,679 2,442,424,470
Loan paid 3,027,719,261 1,375,111,828
Key management personnelSalary, bonus and other benefits (**) 18,727,458 15,883,505
(*) The bond will be listed and sold to a broader set of investors pursuant to an arrangement agreement. The application for corporate bond issuance has been sub-mitted to Vietnam Securities Depository and Ho Chi Minh Stock Exchange on 11 January 2017 and 16 February 2017 respectively.
(**) No board fees were paid to Board of Directors members for the year ended 31 December 2016 and 31 December 2015.
Form B 09 – DN/HN(Issued under Circular No. 200/2014/TT-BTC and No. 202/2014/TT-BTC
dated 22 December 2014 of the Ministry of Finance)
Notes to the financial statements for the year ended 31 December 2016 (continued)
Company:
Related Party Nature of transactions 2016 2015VND’000 VND’000
Ultimate holding companyMasan Group Corporation Conversion of interest payable into loan principle - 52,221,014
Interest expense and borrowing fees - 52,914,399
Interest expense and borrowing fees paid - 384,946,188
Loan paid - 611,053,812
Offsetting of debts 85,000,000 -
Other related partiesMasan Thai Nguyen Resources Co., Ltd
Financial income from loan provided to a subsidiary - 17,914,950
Collection of long-term loans receivable - 996,000,000
Financial income received 36,711,320 30,000,000
Nui Phao Mining Co., Ltd Financial income received 18,288,680 -
Other advances paid - 27,000,000
F I N A N C I A L S T A T E M E N T S
ANNUAL REPORT 2016 157156 ANNUAL REPORT 2016
MASAN RESOURCES CORPORATION (FORMERLY KNOWN AS MA SAN RESOURCES CORPORATION) AND ITS SUBSIDIARIES
30. Non-cash investing and financing activities
Group Company
2016 2015 2016 2015
VND’000 VND’000 VND’000 VND’000
Conversion of interest payable into loan principal 32,967,256 95,997,456 - 52,221,014
Depreciation and amortisation capitalised into construc-tion in progress 4,731,276 3,876,382 - -
Form B 09 – DN/HN(Issued under Circular No. 200/2014/TT-BTC and No. 202/2014/TT-BTC
dated 22 December 2014 of the Ministry of Finance)
Notes to the financial statements for the year ended 31 December 2016 (continued)
15 March 2017
Prepared by: Reviewed by: Approved by:
Nguyen Thi Hai YenChief Accountant
Nikhil KamranActing Chief Financial Officer
Dominic John HeatonGeneral Director
C A U T I O N A R Y N O T E R E G A R D I N G F O R W A R D L O O K I N G S TAT E M E N T S
This communication contains information that may constitute “forward-looking statements”. Generally, the words “believe”, “expect”, “in-tend”, “aim”, “estimate”, “anticipate”, “project”, “will” and similar expressions identify forward-looking statements, which generally are not historical in nature. However, the absence of these words or similar expressions does not mean that a statement is not forward-looking. All statements that address operating performance, events or developments that we expect or anticipate will occur in the future – including statements relating to volume growth, share of sales and earnings per share growth, and statements expressing general views about future operating results – are forward-looking statements.
Management believes that these forward-looking statements are reasonable as and when made. However, caution should be taken not to place undue reliance on any such forward-looking statements because such statements speak only as of the date when made. Masan Resources Corporation undertakes no obligation to publicly update or revise any forward-looking statements, whether as a result of new information, future events or otherwise, except as required by law. In addition, forward-looking statements are subject to certain risks and uncertainties that could cause audited results to differ materially from our company’s historical experience and our present expectations or projections. These risks include commodity pricing risks and the prices we obtain for our Tungsten, Copper, Fluorspar and Bismuth are determined by, or linked to, prices in world markets, which have historically been subject to substantial volatility. Fluctuations in commodity prices can occur due to price shifts reflecting underlying global economic and geopolitical factors, industry demand, increased supply due to the development of new productive resources, technological change, product substitution and national tariffs. Volatility in global eco-nomic growth has the potential to adversely impact future demand and prices for commodities. This has the potential to negatively impact future earnings and cash flows. These risks and uncertainties include, but are not limited to, those described elsewhere in this report and those described from time to time in our future reports filed with the Hanoi Stock Exchange.
This communication is not for distribution in the United States. This communication and the information contained herein is not an offer of securities for sale in the United States. Securities may not be offered or sold in the United States absent registration pursuant to the U.S. Securities Act of 1933, as amended, or an exemption from registration. Any public offering of securities to be made in the United States will be made by means of a prospectus that may be obtained from the issuer or selling security holder and that will contain detailed information about the company and management, as well as financial statements.
ANNUAL REPORT 2016ANNUAL REPORT 2016158 159
A B B R E V I A T I O N S / D E F I N I T I O N S
APT Ammonium Paratungstate
AGME The Association of Geology and Minerals of Vietnam
Board of Directors or BOD The board of directors of the Company
Bn Billion
BSF The bulk sulphide flotation
BTO Blue Tungsten oxide
CEO Chief Executive Officer
CFO Chief Financial Officer
Charter The charter of the Company dated May 26, 2015 and its amendments
Charter Capital The Charter capital of the Company
CPEP Climate Protection through Energy Plants
Company Masan Resources Corporation and its subsidiaries
CSR Corporate social responsibility
DOIT Department of Industry and Trade (Thai Nguyen)
DOLISA Department of Labor, Invalids and Social Affairs (Thai Nguyen)
DONRE Department of Natural Resources and Environment (Thai Nguyen)
DOST Department of Science and Technology (Thai Nguyen)
DPI Department of Planning and Investment (Thai Nguyen)
EATC Environment analysing and technique Joint Stock Company
EBITDA Earnings before Interest, Taxes, Depreciation and Amortization
EIA Environmental Impact Assessment
EPS Earning per share
GDP Gross Domestic Product
GHG Greenhouse gasses
LTI Lost-Time-Injuries
H.C. Starck H.C. Starck GmbH
H1 First half
HNX The Hanoi Stock Exchange
HR Human Resources Department
hrs Hours
HSS Health, Security and Safety Department
ICMM The International Council on Mining and Metals
IFC International Finance Corporation
IMF International Monetary Fund
IT Information technology
ITIA The International Tungsten Industry Association
JORC Code Joint Ore Reserves Committee is a professional code of practice that sets minimum standards for Public Reporting of minerals Exploration Results, Mineral Resources and Ore Reserves
JV Joint Venture between Nui Phao Mining and H.C. Starck
Law on Enterprises Law on Enterprises No. 68/2014/QH13 dated November 26, 2014 of the National Assembly of the Socialist Republic of Vietnam
Masan Group MSN and its subsidiaries
Masan Horizon or MH Masan Horizon Corporation
MDGs Millennium Development Goals
MOIT Ministry of Industry and Trade of Vietnam (Vietnam)
MONRE Ministry of Natural Resources and Environment (Vietnam)
MPI Ministry of Planning and Investment (Vietnam)
MRTN Masan Thai Nguyen Resources Company Limited
mtu Metric tonne unit
MSN Masan Group Corporation
MSC Masan Consumer Corporation
MSR or Masan Resources Masan Resources Corporation
NAWAPI Water Resources Planning and Investigation for the North of Vietnam
Nui Phao Mining or NPM Nui Phao Mining Company Ltd
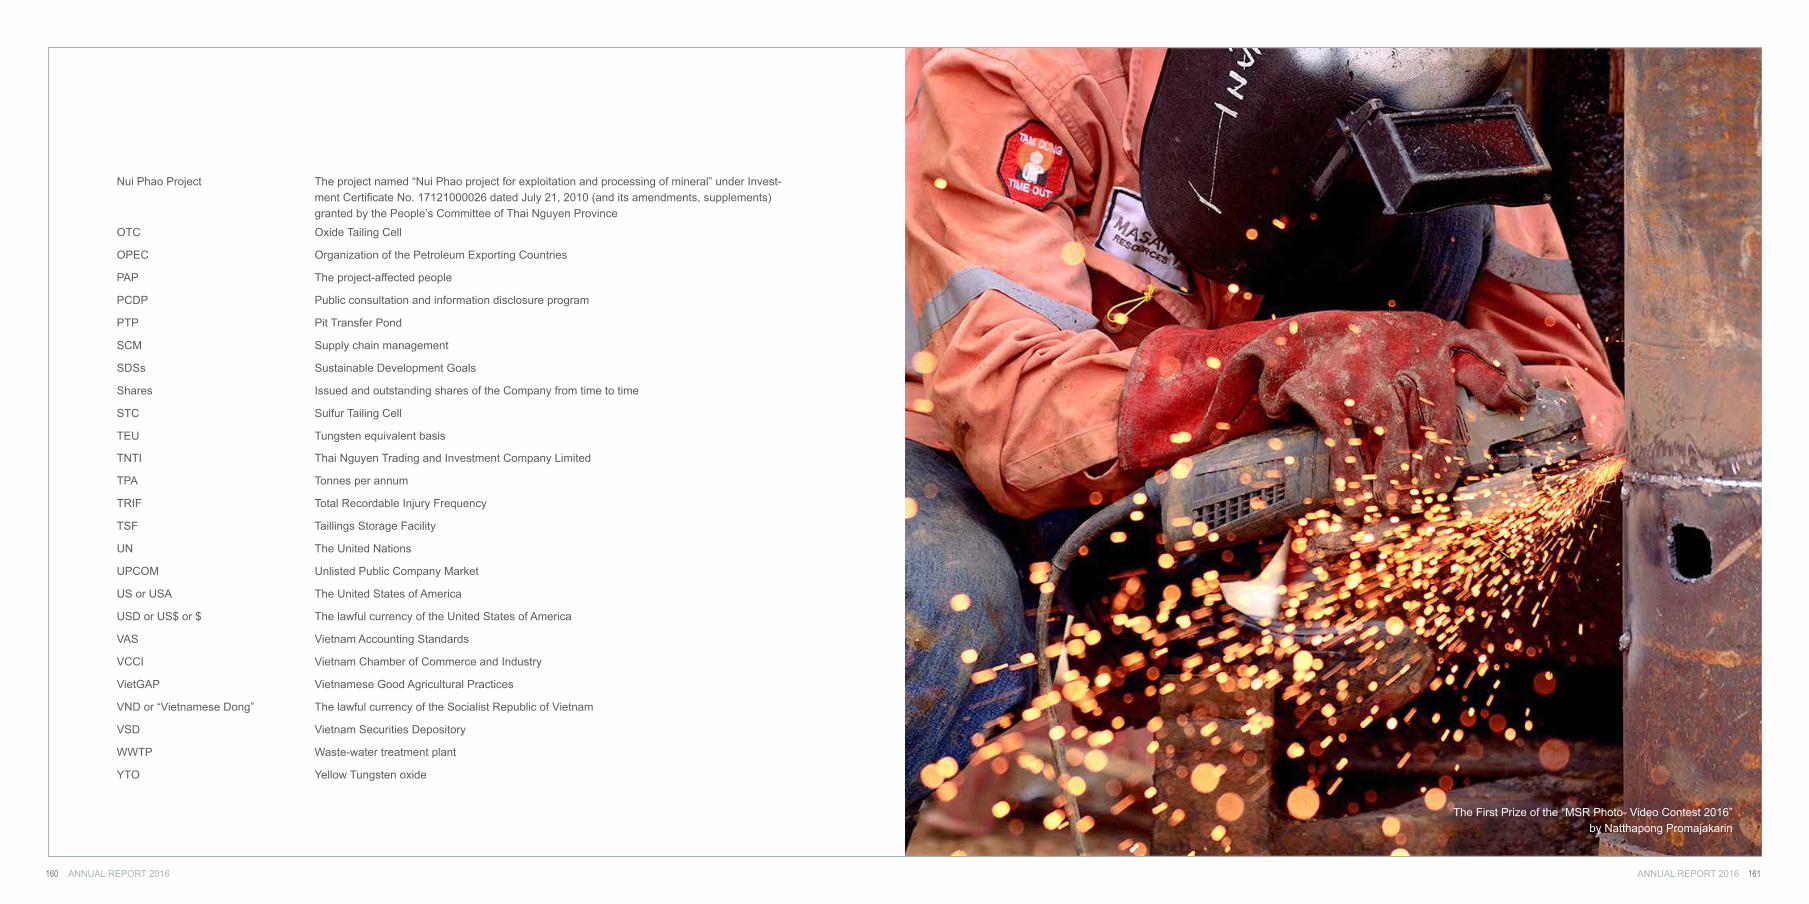
ANNUAL REPORT 2016ANNUAL REPORT 2016160 161
Nui Phao Project The project named “Nui Phao project for exploitation and processing of mineral” under Invest-ment Certificate No. 17121000026 dated July 21, 2010 (and its amendments, supplements) granted by the People’s Committee of Thai Nguyen Province
OTC Oxide Tailing Cell
OPEC Organization of the Petroleum Exporting Countries
PAP The project-affected people
PCDP Public consultation and information disclosure program
PTP Pit Transfer Pond
SCM Supply chain management
SDSs Sustainable Development Goals
Shares Issued and outstanding shares of the Company from time to time
STC Sulfur Tailing Cell
TEU Tungsten equivalent basis
TNTI Thai Nguyen Trading and Investment Company Limited
TPA Tonnes per annum
TRIF Total Recordable Injury Frequency
TSF Taillings Storage Facility
UN The United Nations
UPCOM Unlisted Public Company Market
US or USA The United States of America
USD or US$ or $ The lawful currency of the United States of America
VAS Vietnam Accounting Standards
VCCI Vietnam Chamber of Commerce and Industry
VietGAP Vietnamese Good Agricultural Practices
VND or “Vietnamese Dong” The lawful currency of the Socialist Republic of Vietnam
VSD Vietnam Securities Depository
WWTP Waste-water treatment plant
YTO Yellow Tungsten oxide
The First Prize of the “MSR Photo- Video Contest 2016” by Natthapong Promajakarin

MASAN RESOURCES CORPORATIONSuite 802, 8th Floor, Central Plaza, 17 Le Duan, Ben Nghe Ward, District 1, Ho Chi Minh City, VietnamTel : +84 8 6256 3862Fax : +84 8 3827 4115
Representative OfficeLevel 15, Hoa Binh International Building106 Hoang Quoc Viet Street, Cau Giay District,Hanoi, VietnamTel : +84 4 3718 2490Fax : +84 4 3718 2491