k-shell photoabsorption of magnesium ions
TRANSCRIPT
The Astrophysical Journal Supplement Series, 214:8 (10pp), 2014 September doi:10.1088/0067-0049/214/1/8C© 2014. The American Astronomical Society. All rights reserved. Printed in the U.S.A.
K-SHELL PHOTOABSORPTION OF MAGNESIUM IONS
M. F. Hasoglu1, Sh. A. Abdel-Naby2, E. Gatuzz3, J. Garcıa4, T. R. Kallman5, C. Mendoza3,6, and T. W. Gorczyca61 Department of Computer Engineering, Hasan Kalyoncu University, 27100 Sahinbey, Gaziantep, Turkey
2 Department of Physics, Auburn University, Auburn, AL 36849, USA3 Centro de Fısica, Instituto Venezolano de Investigaciones Cientıficas, Caracas 1020, Venezuela
4 Harvard-Smithsonian Center for Astrophysics, MS-6, 60 Garden Street, Cambridge, MA 02138, USA5 NASA Goddard Space Flight Center, Greenbelt, MD 20771, USA
6 Department of Physics, Western Michigan University, Kalamazoo, MI 49008-5252, USAReceived 2013 March 21; accepted 2014 July 24; published 2014 September 2
ABSTRACT
X-ray photoabsorption cross sections have been computed for all magnesium ions with three or more electrons usingthe R-matrix method. A comparison with other available data for Mg ii–Mg x shows good qualitative agreementin the resultant resonance shapes. However, for the lower ionization stages, and for singly ionized Mg ii in particular,the previous R-matrix results overestimate the K-edge position due to the neglect of important orbital relaxationeffects, and a global shift downward in photon energy of those cross sections is therefore warranted. We have foundthat the cross sections for Mg i and Mg ii are further complicated by the M-shell (n = 3) occupancy. As a result,the treatment of spectator Auger decay of 1s → np resonances using a method based on multichannel quantumdefect theory and an optical potential becomes problematic, making it necessary to implement an alternative,approximate treatment of Auger decay for neutral Mg i. The new cross sections are used to fit the Mg K edge inXMM-Newton spectra of the low-mass X-ray binary GS 1826-238, where most of the interstellar Mg is found to bein ionized form.
Key words: atomic data – atomic processes – ISM: abundances – line: formation
Online-only material: color figures
1. INTRODUCTION
Accurate K-shell photoabsorption cross sections are neces-sary for modeling astrophysical plasmas, interpreting the ob-served spectra from distant cosmic emitters, and determining theelemental abundances of the interstellar medium (ISM). Spectraof K-shell processes can be observed from all ionic stages of themost abundant elements between oxygen and nickel (Paerels &Kahn 2003). Magnesium K lines, in particular, have been ob-served since the early days of X-ray astronomy; for instance, inthe spectrum taken with the Broad-Band X-Ray Telescope ofthe O4 ζ Puppis star that was associated with a thermal plasmaof ∼6 × 10⁶ K (Corcoran et al. 1993). These findings wereused, in spite of observational shortcomings such as short expo-sure times, to constrain the location, temperature, and chemicalabundances of the emitting region.
With the advent of high-resolution satellite-borne observato-ries such as Chandra, XMM-Newton, and Suzaku, X-ray spec-troscopy has come of age to provide unique opportunities forstudying in detail the physical conditions and processes of exoticand energetic sources. Such is the case of emission K lines fromhydrogen-, helium-, and lithium-like Mg ions observed in thesupernova remnant N132D (Behar et al. 2001); the active nu-cleus of the giant elliptical galaxy M 87 (Sakelliou et al. 2002);the massive X-ray binary Cen X-3, where the importance of res-onant line scattering in photoionized plasmas was highlighted(Wojdowski et al. 2003); the accretion disk of the low-massX-ray binary system EXO 0748-676 providing evidence of aneutron star (Jimenez-Garate et al. 2003); the Seyfert 2 galaxyMkn 3 (Pounds & Page 2005); the outflow component of quasarPG 1211+143 (Kaspi & Behar 2006); the Cap region above thedisk of the starburst galaxy M82, where metal abundance ratiosare consistent with Type-II supernova nucleosynthesis (Tsuru
et al. 2007); the Fornax intracluster medium allowing an accu-rate measurement of the Mg abundance that leads to an estimateof the ratio [Mg/Fe] ≈ 0.5–0.7 that reflects a stellar metal-licity (Matsushita et al. 2007); the highly variable narrow-lineSeyfert Type 1 galaxy NGC 4051 giving outflow velocities of∼600 km s−1 (Lobban et al. 2011); and the Galactic supernovaremnant G346.6-0.2 that suggests ejecta-dominated emissionwith relative abundances pointing to a Type Ia supernova ex-plosion (Sezer et al. 2011). Yamaguchi et al. (2012) have re-cently studied the spectrum of the Galactic supernova remnantG344.70.1, detecting for the first time in an extended celestialsource the Kα line from Al xii at ∼1.6 keV. This is an importantfinding because, since both Mg and Al are synthesized duringC/Ne burning, the Al/Mg abundance ratio would be a sensi-tive metallicity diagnostic. This indicator is currently limited byboth spectral resolution and atomic data.
Absorption Mg K lines are also observed in ISM spectratoward X-ray sources where a desirable feature would beto determine the amount of this element locked up in grainminerals. Pinto et al. (2010) have measured the spectrum of thelow-mass X-ray binary GS 1826-238, finding a Mg abundanceof 2.45±0.35 solar that appears to be consistent with a proposedGalactic gradient. Also, the ultra-compact binary candidate4U0614+091 observed by Schulz et al. (2010) shows a strongvariability that causes an excess component intrinsic to thesource that demands adjustments of the Ne edge; however, anexcess in the Mg edge is not as yet conclusive partly due to itsunestablished morphology.
In previous studies, we have carried out accurate calculationsof K-shell photoabsorption cross sections that have been appliedto X-ray spectral diagnostics; e.g., all ionization stages of carbon(Hasoglu et al. 2010), oxygen (Gorczyca & McLaughlin 2000;Garcıa et al. 2005; Juett et al. 2004; Gorczyca et al. 2013), and
1
The Astrophysical Journal Supplement Series, 214:8 (10pp), 2014 September Hasoglu et al.
neon (Gorczyca 2000; Juett et al. 2006). This project is herebyextended to the magnesium isonuclear sequence where a furthercomplication arises for the two lowest ionization stages (Mg iand Mg ii) as the n = 3 M shell becomes occupied: the atomicradius now doubles in size, and our usual treatment based onmultichannel quantum defect theory (MQDT) and an opticalpotential (Gorczyca & Robicheaux 1999) becomes problematicfor the lower 1s → np resonances. We have neverthelesscome up with an approximate procedure for treating thesecases that yields reliable X-ray photoabsorption cross sectionsfor all relevant magnesium ions, i.e., Mg i–Mg x. Furthermore,these new cross sections have allowed us to revise the ISMMg abundance toward the low-mass X-ray binary GS 1826-238and, in particular, to determine the ionic fractions of the lowlyionized species.
2. THEORETICAL APPROACH
K-shell photoabsorption consists of the direct photoionizationof the 1s electron, which is treated in a straightforward mannerusing R-matrix methods, and the strong 1s → np photoab-sorption resonances. Photoexcitation of these resonance statesis then followed by two competing decay routes. The first isparticipator Auger decay, where the np valence electron takespart in the autoionization process with a decay rate that scalesas 1/n3 and goes to zero near the K-shell threshold. These chan-nels are included in the R-matrix calculation. The second routeis spectator Auger decay, in which the np valence electron isoblivious to the autoionization process giving instead a decaywidth that is independent of n. Therefore, the latter is the dom-inant decay route as n → ∞, and guarantees a smooth crosssection as the K-shell threshold is approached. Above threshold,K-shell photoionization to the 1s2�q states occurs instead.
For the present work we use the R-matrix method (Berring-ton et al. 1995; Burke 2011) with modifications to account forthe spectator Auger broadening via an optical potential as de-scribed by Gorczyca & Robicheaux (1999). This enhanced R-matrix method has been shown to be accurate in describing ex-perimental synchrotron measurements for argon (Gorczyca &Robicheaux 1999), oxygen (Gorczyca & McLaughlin 2000;Gorczyca et al. 2013), neon (Gorczyca 2000), and carbon(Hasoglu et al. 2010). The orbital bases employed are the similar1s, 2s, and 2p physical orbitals augmented by the 3s, 3p, and3d pseudo-orbitals to account for relaxation effects following 1svacancy. Inclusion of these pseudo-orbitals necessitates a cor-responding pseudo-resonance elimination method (Gorczycaet al. 1995) to produce physically smooth cross sections (seeGorczyca et al. 2013 for a more recent, detailed discussion ofthis phenomenon).
The Auger widths for the 1s2�q states are computed by apply-ing the Smith (1960) time-delay method to the photoabsorptionR-matrix calculation of the neighboring 1s22�q−1 magnesiumion. Further details can be found in our previous work (Gorczyca& Robicheaux 1999; Gorczyca & McLaughlin 2000; Gorczyca2000; Hasoglu et al. 2010; Gorczyca et al. 2013).
3. CROSS SECTION RESULTS
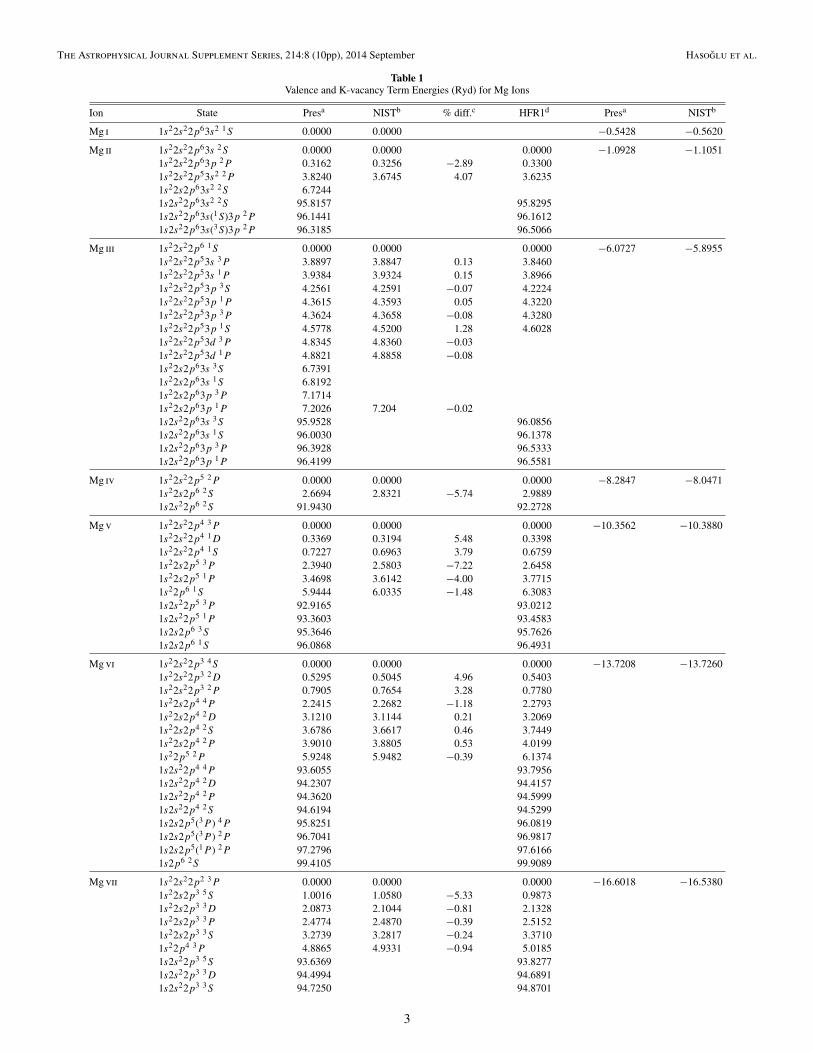
As an assessment of our atomic descriptions, the computedtarget-state energies and binding energies are tabulated inTable 1. It is seen that the present target-state energies arewithin 8% of the recommended NIST spectroscopic values.More typically, the agreement is within 1% for about two-thirds(40 out of 61) of the available NIST transition energies. This is
a strong indication that our choice of orbitals and configurations
used—most notably the 2p2 → 3d2
two-particle, two-holecorrelation and the 2l → 3l relaxation effect—give an adequaterepresentation of the target states from which the photoelectronis scattered (or to which the Rydberg electron is bound).
Listed in the last two columns of Table 1 are the presentand NIST values for the binding energy of the initial (pre-photoionization) ion relative to the final (post-photoionization)additionally ionized state, i.e., the ionization energy. While notlisted explicitly, it can be readily assessed that the ionizationenergy differences are −3.4%, +3.0%, +3.0%, and −0.3% forMg i, Mg ii, Mg iii, and Mg iv, respectively, becoming evensmaller for higher ionization stages. This is a further indicationthat the two different ionization stages, initial and final, areadequately represented relative to each other.
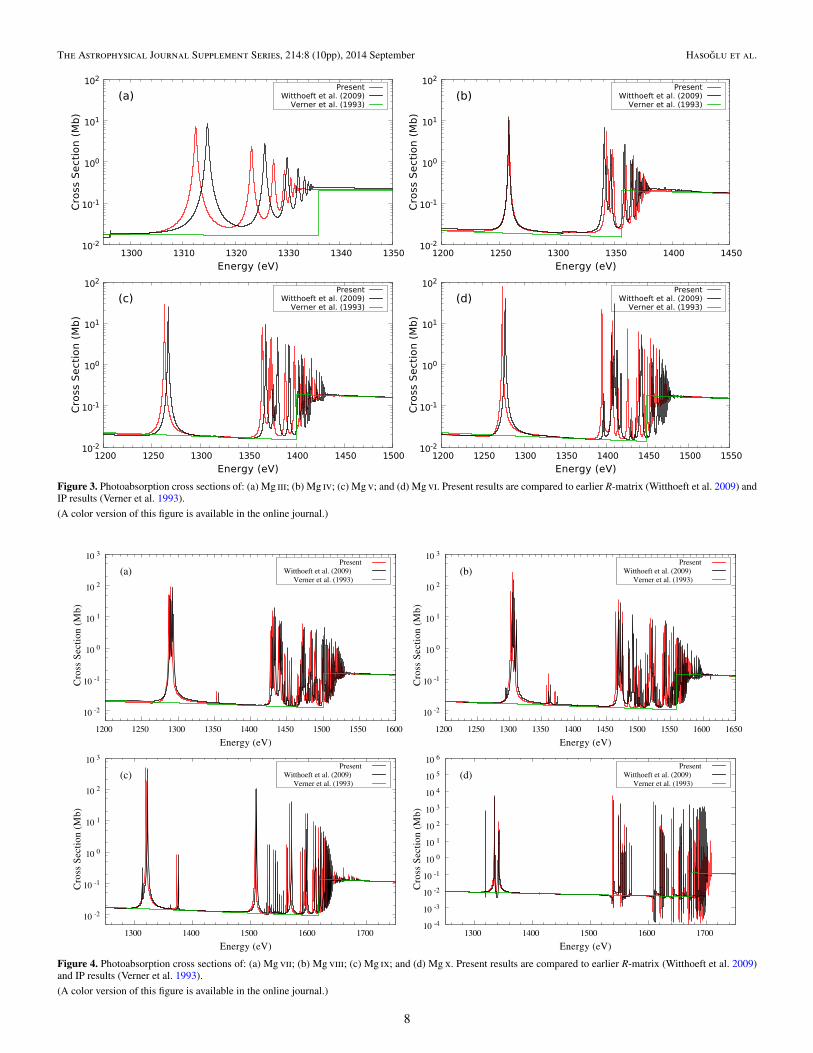
The computed core Auger widths, which are used withinthe MQDT optical potential approach for treating spectatorAuger resonance broadening, are listed in Table 2. Comparisonwith other available data, including a percentage-differencecolumn between the Hartree–Fock with relativistic corrections(HFR1) results of Palmeri et al. (2008) and our values, showsfairly good agreement in most cases, although there are notableexceptions. In particular, there are several cases for which theHFR1 widths differ from ours by more than 20%; however,there are two important points to bear in mind when consideringsuch differences. First and foremost, the spectator Auger widthused in our calculations only changes the shape of the resonanceabsorption profile, not the energy-integrated strength. Therefore,once the further convolution in the xstar spectral modeling code(Bautista & Kallman 2001) is performed, any differences—evenas large as a factor of two—in the preconvoluted width areessentially washed out in the final spectral fit. Second andequally important in its own right, the specific atomic core Augertransitions listed in Table 2 that show these large differences(between present and HFR1 widths) are those only accessedvia two-electron transitions following single-photon absorption,and, therefore, the Rydberg series belonging to these two-electron excited core states are extremely weak. For instance,the two largest differences are found for the 1s2s(1S)2p3(4S)state in Mg viii (−52.60%) and the 1s2s(1S)2p2(3P ) state inMg ix (+170.27%). However, each of these states is accessedonly through simultaneous excitation and/or ionization of boththe 1s and 2s electrons—an extremely weak process. Indeed,the Rydberg series for either is seen in Figures 4(b) and (c) to beinsignificant compared to the much stronger 1s → np single-excitation series building up to the 1s−1 single-vacancy statesat lower photon energies.
The final K-shell photoabsorption cross sections computedfrom our R-matrix approach are shown in Figures 1–4, where theindependent-particle (IP) photoionization results of Verner et al.(1993) are also included. It can be seen that the present R-matrixresults are in good quantitative agreement with the IP resultsabove the K-shell thresholds, but the IP cross sections lackthe important resonance absorption lines below threshold. Wenote that, except for neutral Mg i away from threshold (Henkeet al. 1993), there are no experimental data with which we cancompare the present cross sections, and, besides the IP results,only the earlier R-matrix calculations of Witthoeft et al. (2009,2011) exist for comparison purposes; this will be done ion byion in the next subsection.
Before analyzing each of the various cross sections, how-ever, it is worth discussing how we could improve the accu-racy of our chosen atomic description. As far as additional
2
The Astrophysical Journal Supplement Series, 214:8 (10pp), 2014 September Hasoglu et al.
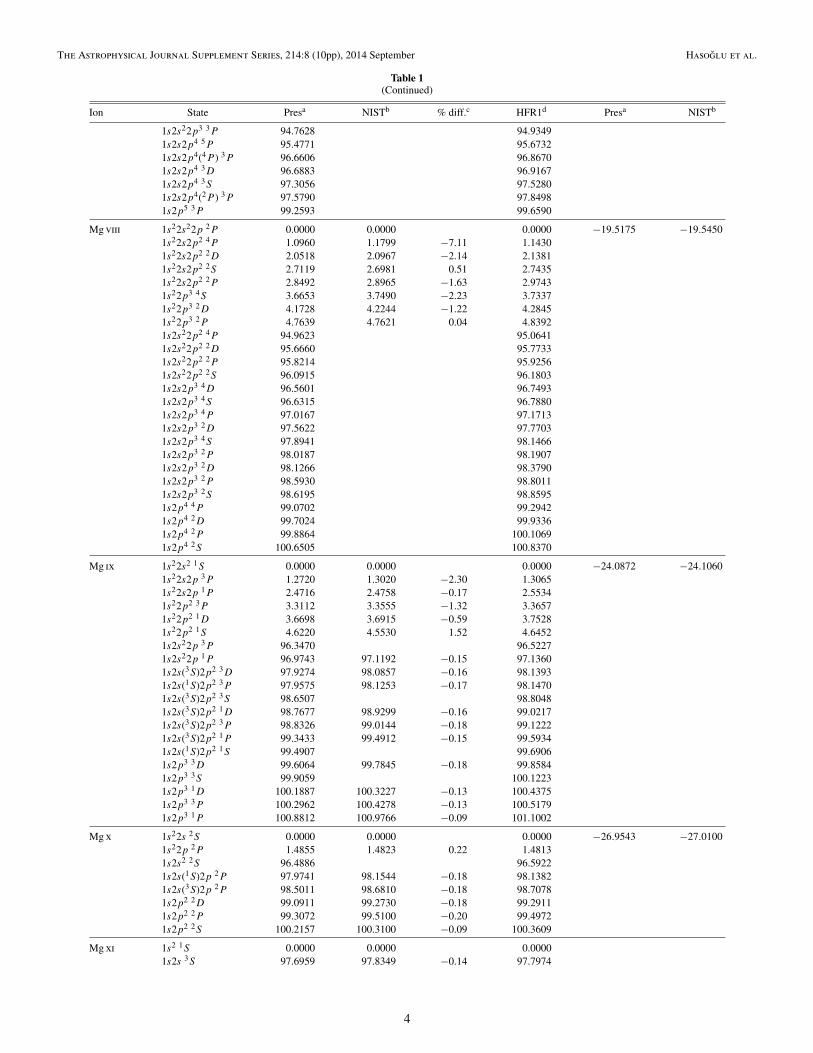
Table 1Valence and K-vacancy Term Energies (Ryd) for Mg Ions
Ion State Presa NISTb % diff.c HFR1d Presa NISTb
Mg i 1s22s22p63s2 1S 0.0000 0.0000 −0.5428 −0.5620
Mg ii 1s22s22p63s 2S 0.0000 0.0000 0.0000 −1.0928 −1.10511s22s22p63p 2P 0.3162 0.3256 −2.89 0.33001s22s22p53s2 2P 3.8240 3.6745 4.07 3.62351s22s2p63s2 2S 6.72441s2s22p63s2 2S 95.8157 95.82951s2s22p63s(1S)3p 2P 96.1441 96.16121s2s22p63s(3S)3p 2P 96.3185 96.5066
Mg iii 1s22s22p6 1S 0.0000 0.0000 0.0000 −6.0727 −5.89551s22s22p53s 3P 3.8897 3.8847 0.13 3.84601s22s22p53s 1P 3.9384 3.9324 0.15 3.89661s22s22p53p 3S 4.2561 4.2591 −0.07 4.22241s22s22p53p 1P 4.3615 4.3593 0.05 4.32201s22s22p53p 3P 4.3624 4.3658 −0.08 4.32801s22s22p53p 1S 4.5778 4.5200 1.28 4.60281s22s22p53d 3P 4.8345 4.8360 −0.031s22s22p53d 1P 4.8821 4.8858 −0.081s22s2p63s 3S 6.73911s22s2p63s 1S 6.81921s22s2p63p 3P 7.17141s22s2p63p 1P 7.2026 7.204 −0.021s2s22p63s 3S 95.9528 96.08561s2s22p63s 1S 96.0030 96.13781s2s22p63p 3P 96.3928 96.53331s2s22p63p 1P 96.4199 96.5581
Mg iv 1s22s22p5 2P 0.0000 0.0000 0.0000 −8.2847 −8.04711s22s2p6 2S 2.6694 2.8321 −5.74 2.98891s2s22p6 2S 91.9430 92.2728
Mg v 1s22s22p4 3P 0.0000 0.0000 0.0000 −10.3562 −10.38801s22s22p4 1D 0.3369 0.3194 5.48 0.33981s22s22p4 1S 0.7227 0.6963 3.79 0.67591s22s2p5 3P 2.3940 2.5803 −7.22 2.64581s22s2p5 1P 3.4698 3.6142 −4.00 3.77151s22p6 1S 5.9444 6.0335 −1.48 6.30831s2s22p5 3P 92.9165 93.02121s2s22p5 1P 93.3603 93.45831s2s2p6 3S 95.3646 95.76261s2s2p6 1S 96.0868 96.4931
Mg vi 1s22s22p3 4S 0.0000 0.0000 0.0000 −13.7208 −13.72601s22s22p3 2D 0.5295 0.5045 4.96 0.54031s22s22p3 2P 0.7905 0.7654 3.28 0.77801s22s2p4 4P 2.2415 2.2682 −1.18 2.27931s22s2p4 2D 3.1210 3.1144 0.21 3.20691s22s2p4 2S 3.6786 3.6617 0.46 3.74491s22s2p4 2P 3.9010 3.8805 0.53 4.01991s22p5 2P 5.9248 5.9482 −0.39 6.13741s2s22p4 4P 93.6055 93.79561s2s22p4 2D 94.2307 94.41571s2s22p4 2P 94.3620 94.59991s2s22p4 2S 94.6194 94.52991s2s2p5(3P ) 4P 95.8251 96.08191s2s2p5(3P ) 2P 96.7041 96.98171s2s2p5(1P ) 2P 97.2796 97.61661s2p6 2S 99.4105 99.9089
Mg vii 1s22s22p2 3P 0.0000 0.0000 0.0000 −16.6018 −16.53801s22s2p3 5S 1.0016 1.0580 −5.33 0.98731s22s2p3 3D 2.0873 2.1044 −0.81 2.13281s22s2p3 3P 2.4774 2.4870 −0.39 2.51521s22s2p3 3S 3.2739 3.2817 −0.24 3.37101s22p4 3P 4.8865 4.9331 −0.94 5.01851s2s22p3 5S 93.6369 93.82771s2s22p3 3D 94.4994 94.68911s2s22p3 3S 94.7250 94.8701
3
The Astrophysical Journal Supplement Series, 214:8 (10pp), 2014 September Hasoglu et al.
Table 1(Continued)
Ion State Presa NISTb % diff.c HFR1d Presa NISTb
1s2s22p3 3P 94.7628 94.93491s2s2p4 5P 95.4771 95.67321s2s2p4(4P ) 3P 96.6606 96.86701s2s2p4 3D 96.6883 96.91671s2s2p4 3S 97.3056 97.52801s2s2p4(2P ) 3P 97.5790 97.84981s2p5 3P 99.2593 99.6590
Mg viii 1s22s22p 2P 0.0000 0.0000 0.0000 −19.5175 −19.54501s22s2p2 4P 1.0960 1.1799 −7.11 1.14301s22s2p2 2D 2.0518 2.0967 −2.14 2.13811s22s2p2 2S 2.7119 2.6981 0.51 2.74351s22s2p2 2P 2.8492 2.8965 −1.63 2.97431s22p3 4S 3.6653 3.7490 −2.23 3.73371s22p3 2D 4.1728 4.2244 −1.22 4.28451s22p3 2P 4.7639 4.7621 0.04 4.83921s2s22p2 4P 94.9623 95.06411s2s22p2 2D 95.6660 95.77331s2s22p2 2P 95.8214 95.92561s2s22p2 2S 96.0915 96.18031s2s2p3 4D 96.5601 96.74931s2s2p3 4S 96.6315 96.78801s2s2p3 4P 97.0167 97.17131s2s2p3 2D 97.5622 97.77031s2s2p3 4S 97.8941 98.14661s2s2p3 2P 98.0187 98.19071s2s2p3 2D 98.1266 98.37901s2s2p3 2P 98.5930 98.80111s2s2p3 2S 98.6195 98.85951s2p4 4P 99.0702 99.29421s2p4 2D 99.7024 99.93361s2p4 2P 99.8864 100.10691s2p4 2S 100.6505 100.8370
Mg ix 1s22s2 1S 0.0000 0.0000 0.0000 −24.0872 −24.10601s22s2p 3P 1.2720 1.3020 −2.30 1.30651s22s2p 1P 2.4716 2.4758 −0.17 2.55341s22p2 3P 3.3112 3.3555 −1.32 3.36571s22p2 1D 3.6698 3.6915 −0.59 3.75281s22p2 1S 4.6220 4.5530 1.52 4.64521s2s22p 3P 96.3470 96.52271s2s22p 1P 96.9743 97.1192 −0.15 97.13601s2s(3S)2p2 3D 97.9274 98.0857 −0.16 98.13931s2s(1S)2p2 3P 97.9575 98.1253 −0.17 98.14701s2s(3S)2p2 3S 98.6507 98.80481s2s(3S)2p2 1D 98.7677 98.9299 −0.16 99.02171s2s(3S)2p2 3P 98.8326 99.0144 −0.18 99.12221s2s(3S)2p2 1P 99.3433 99.4912 −0.15 99.59341s2s(1S)2p2 1S 99.4907 99.69061s2p3 3D 99.6064 99.7845 −0.18 99.85841s2p3 3S 99.9059 100.12231s2p3 1D 100.1887 100.3227 −0.13 100.43751s2p3 3P 100.2962 100.4278 −0.13 100.51791s2p3 1P 100.8812 100.9766 −0.09 101.1002
Mg x 1s22s 2S 0.0000 0.0000 0.0000 −26.9543 −27.01001s22p 2P 1.4855 1.4823 0.22 1.48131s2s2 2S 96.4886 96.59221s2s(1S)2p 2P 97.9741 98.1544 −0.18 98.13821s2s(3S)2p 2P 98.5011 98.6810 −0.18 98.70781s2p2 2D 99.0911 99.2730 −0.18 99.29111s2p2 2P 99.3072 99.5100 −0.20 99.49721s2p2 2S 100.2157 100.3100 −0.09 100.3609
Mg xi 1s2 1S 0.0000 0.0000 0.00001s2s 3S 97.6959 97.8349 −0.14 97.7974
4
The Astrophysical Journal Supplement Series, 214:8 (10pp), 2014 September Hasoglu et al.
Table 1(Continued)
Ion State Presa NISTb % diff.c HFR1d Presa NISTb
1s2p 3P 98.5492 98.7331 −0.19 98.69811s2s 1S 98.6309 98.7702 −0.14 98.77131s2p 1P 99.2148 99.3884 −0.17 99.3824
Notes. Positive and negative term energies (Ryd) relative to the ground state and ionization limit of each ion, respectively.a Present work.b NIST spectroscopic values (Kramida et al. 2013).c Percentage difference: 100 × (EPres − ENIST)/ENIST.d Relativistic Hartree–Fock calculation of Palmeri et al. (2008).
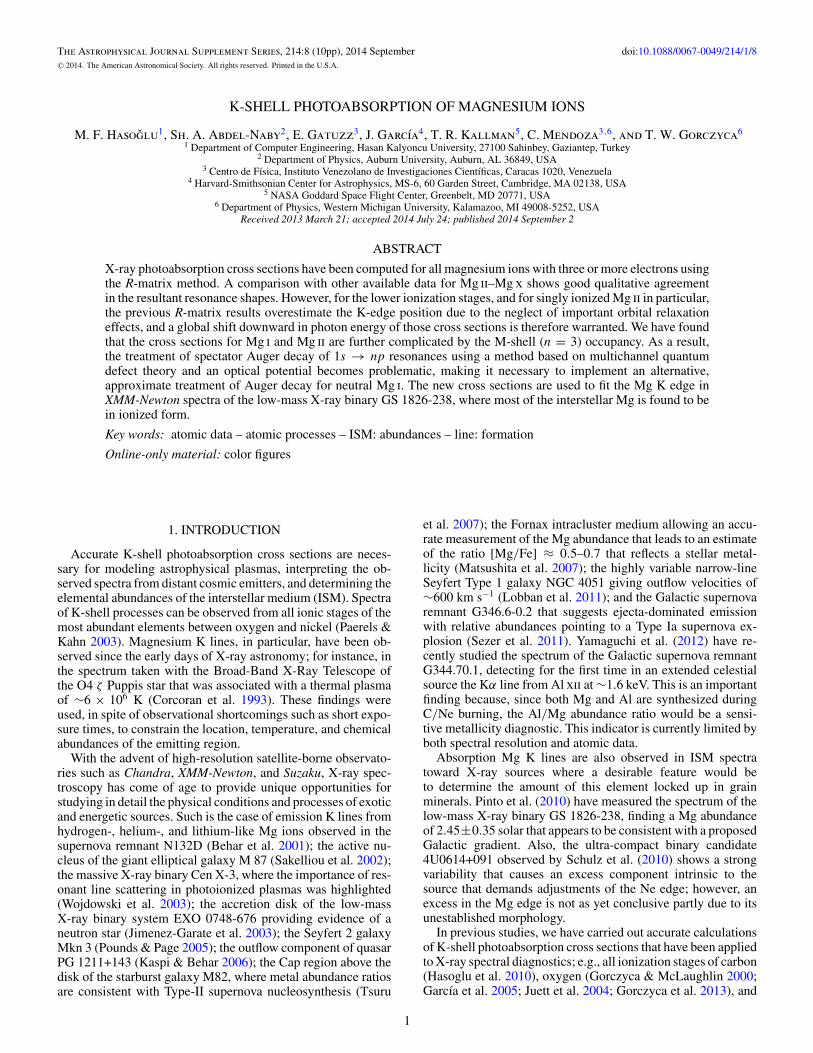
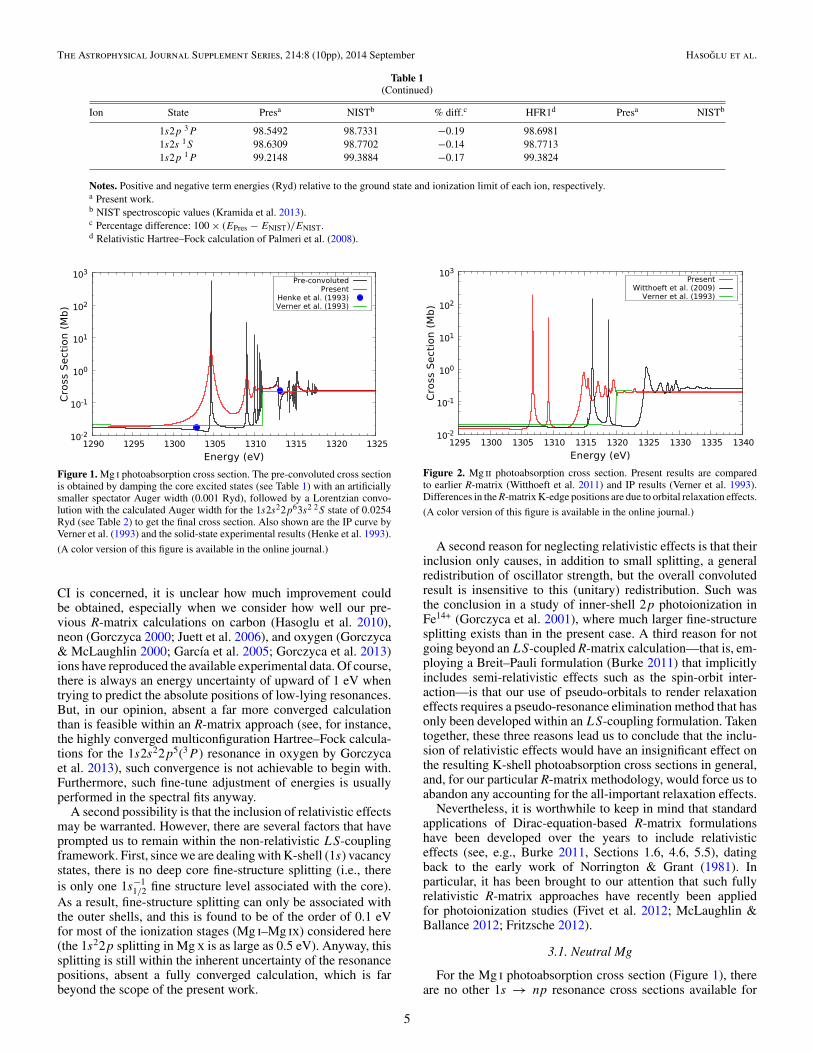
Figure 1. Mg i photoabsorption cross section. The pre-convoluted cross sectionis obtained by damping the core excited states (see Table 1) with an artificiallysmaller spectator Auger width (0.001 Ryd), followed by a Lorentzian convo-lution with the calculated Auger width for the 1s2s22p63s2 2S state of 0.0254Ryd (see Table 2) to get the final cross section. Also shown are the IP curve byVerner et al. (1993) and the solid-state experimental results (Henke et al. 1993).
(A color version of this figure is available in the online journal.)
CI is concerned, it is unclear how much improvement couldbe obtained, especially when we consider how well our pre-vious R-matrix calculations on carbon (Hasoglu et al. 2010),neon (Gorczyca 2000; Juett et al. 2006), and oxygen (Gorczyca& McLaughlin 2000; Garcıa et al. 2005; Gorczyca et al. 2013)ions have reproduced the available experimental data. Of course,there is always an energy uncertainty of upward of 1 eV whentrying to predict the absolute positions of low-lying resonances.But, in our opinion, absent a far more converged calculationthan is feasible within an R-matrix approach (see, for instance,the highly converged multiconfiguration Hartree–Fock calcula-tions for the 1s2s22p5(3P ) resonance in oxygen by Gorczycaet al. 2013), such convergence is not achievable to begin with.Furthermore, such fine-tune adjustment of energies is usuallyperformed in the spectral fits anyway.
A second possibility is that the inclusion of relativistic effectsmay be warranted. However, there are several factors that haveprompted us to remain within the non-relativistic LS-couplingframework. First, since we are dealing with K-shell (1s) vacancystates, there is no deep core fine-structure splitting (i.e., thereis only one 1s−1
1/2 fine structure level associated with the core).As a result, fine-structure splitting can only be associated withthe outer shells, and this is found to be of the order of 0.1 eVfor most of the ionization stages (Mg i–Mg ix) considered here(the 1s22p splitting in Mg x is as large as 0.5 eV). Anyway, thissplitting is still within the inherent uncertainty of the resonancepositions, absent a fully converged calculation, which is farbeyond the scope of the present work.
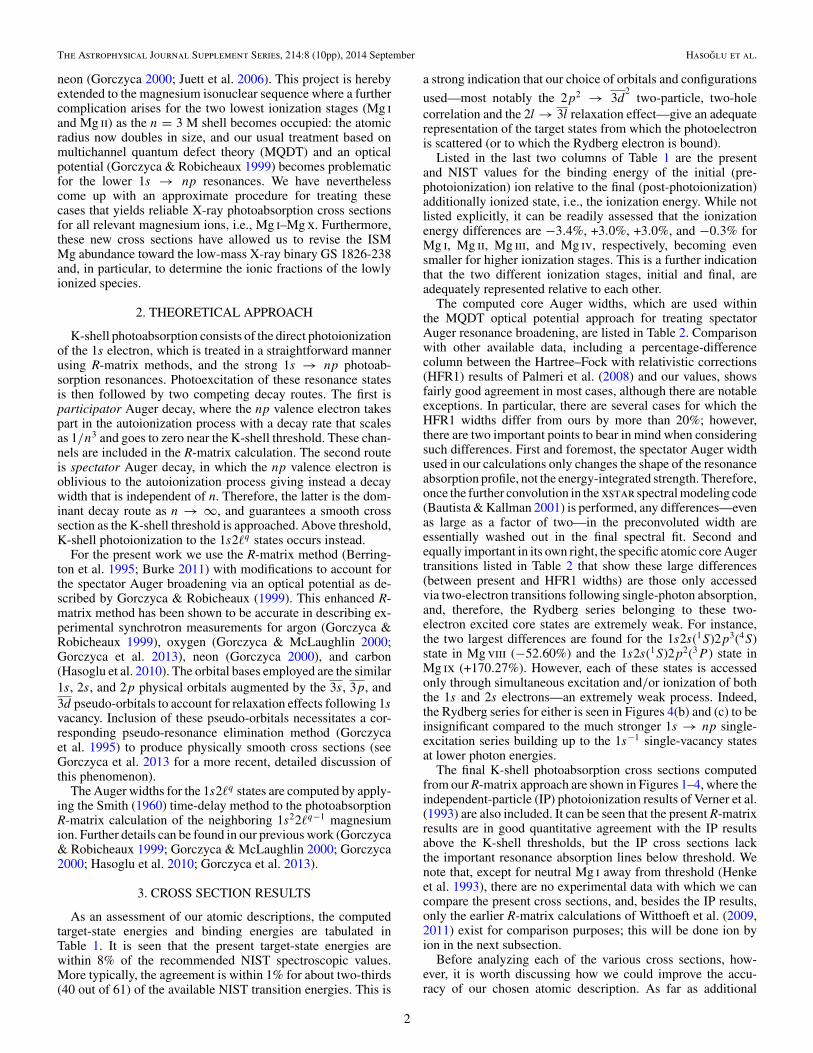
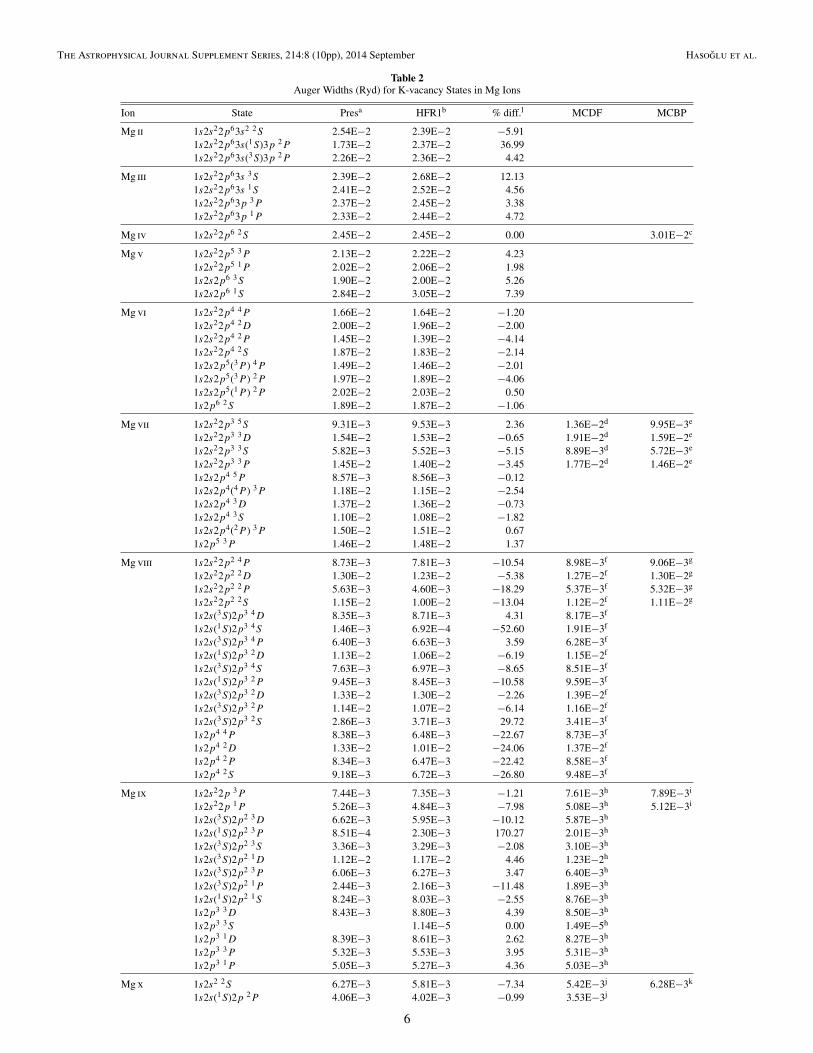
Figure 2. Mg ii photoabsorption cross section. Present results are comparedto earlier R-matrix (Witthoeft et al. 2011) and IP results (Verner et al. 1993).Differences in the R-matrix K-edge positions are due to orbital relaxation effects.
(A color version of this figure is available in the online journal.)
A second reason for neglecting relativistic effects is that theirinclusion only causes, in addition to small splitting, a generalredistribution of oscillator strength, but the overall convolutedresult is insensitive to this (unitary) redistribution. Such wasthe conclusion in a study of inner-shell 2p photoionization inFe14+ (Gorczyca et al. 2001), where much larger fine-structuresplitting exists than in the present case. A third reason for notgoing beyond an LS-coupled R-matrix calculation—that is, em-ploying a Breit–Pauli formulation (Burke 2011) that implicitlyincludes semi-relativistic effects such as the spin-orbit inter-action—is that our use of pseudo-orbitals to render relaxationeffects requires a pseudo-resonance elimination method that hasonly been developed within an LS-coupling formulation. Takentogether, these three reasons lead us to conclude that the inclu-sion of relativistic effects would have an insignificant effect onthe resulting K-shell photoabsorption cross sections in general,and, for our particular R-matrix methodology, would force us toabandon any accounting for the all-important relaxation effects.
Nevertheless, it is worthwhile to keep in mind that standardapplications of Dirac-equation-based R-matrix formulationshave been developed over the years to include relativisticeffects (see, e.g., Burke 2011, Sections 1.6, 4.6, 5.5), datingback to the early work of Norrington & Grant (1981). Inparticular, it has been brought to our attention that such fullyrelativistic R-matrix approaches have recently been appliedfor photoionization studies (Fivet et al. 2012; McLaughlin &Ballance 2012; Fritzsche 2012).
3.1. Neutral Mg
For the Mg i photoabsorption cross section (Figure 1), thereare no other 1s → np resonance cross sections available for
5
The Astrophysical Journal Supplement Series, 214:8 (10pp), 2014 September Hasoglu et al.
Table 2Auger Widths (Ryd) for K-vacancy States in Mg Ions
Ion State Presa HFR1b % diff.l MCDF MCBP
Mg ii 1s2s22p63s2 2S 2.54E−2 2.39E−2 −5.911s2s22p63s(1S)3p 2P 1.73E−2 2.37E−2 36.991s2s22p63s(3S)3p 2P 2.26E−2 2.36E−2 4.42
Mg iii 1s2s22p63s 3S 2.39E−2 2.68E−2 12.131s2s22p63s 1S 2.41E−2 2.52E−2 4.561s2s22p63p 3P 2.37E−2 2.45E−2 3.381s2s22p63p 1P 2.33E−2 2.44E−2 4.72
Mg iv 1s2s22p6 2S 2.45E−2 2.45E−2 0.00 3.01E−2c
Mg v 1s2s22p5 3P 2.13E−2 2.22E−2 4.231s2s22p5 1P 2.02E−2 2.06E−2 1.981s2s2p6 3S 1.90E−2 2.00E−2 5.261s2s2p6 1S 2.84E−2 3.05E−2 7.39
Mg vi 1s2s22p4 4P 1.66E−2 1.64E−2 −1.201s2s22p4 2D 2.00E−2 1.96E−2 −2.001s2s22p4 2P 1.45E−2 1.39E−2 −4.141s2s22p4 2S 1.87E−2 1.83E−2 −2.141s2s2p5(3P ) 4P 1.49E−2 1.46E−2 −2.011s2s2p5(3P ) 2P 1.97E−2 1.89E−2 −4.061s2s2p5(1P ) 2P 2.02E−2 2.03E−2 0.501s2p6 2S 1.89E−2 1.87E−2 −1.06
Mg vii 1s2s22p3 5S 9.31E−3 9.53E−3 2.36 1.36E−2d 9.95E−3e
1s2s22p3 3D 1.54E−2 1.53E−2 −0.65 1.91E−2d 1.59E−2e
1s2s22p3 3S 5.82E−3 5.52E−3 −5.15 8.89E−3d 5.72E−3e
1s2s22p3 3P 1.45E−2 1.40E−2 −3.45 1.77E−2d 1.46E−2e
1s2s2p4 5P 8.57E−3 8.56E−3 −0.121s2s2p4(4P ) 3P 1.18E−2 1.15E−2 −2.541s2s2p4 3D 1.37E−2 1.36E−2 −0.731s2s2p4 3S 1.10E−2 1.08E−2 −1.821s2s2p4(2P ) 3P 1.50E−2 1.51E−2 0.671s2p5 3P 1.46E−2 1.48E−2 1.37
Mg viii 1s2s22p2 4P 8.73E−3 7.81E−3 −10.54 8.98E−3f 9.06E−3g
1s2s22p2 2D 1.30E−2 1.23E−2 −5.38 1.27E−2f 1.30E−2g
1s2s22p2 2P 5.63E−3 4.60E−3 −18.29 5.37E−3f 5.32E−3g
1s2s22p2 2S 1.15E−2 1.00E−2 −13.04 1.12E−2f 1.11E−2g
1s2s(3S)2p3 4D 8.35E−3 8.71E−3 4.31 8.17E−3f
1s2s(1S)2p3 4S 1.46E−3 6.92E−4 −52.60 1.91E−3f
1s2s(3S)2p3 4P 6.40E−3 6.63E−3 3.59 6.28E−3f
1s2s(1S)2p3 2D 1.13E−2 1.06E−2 −6.19 1.15E−2f
1s2s(3S)2p3 4S 7.63E−3 6.97E−3 −8.65 8.51E−3f
1s2s(1S)2p3 2P 9.45E−3 8.45E−3 −10.58 9.59E−3f
1s2s(3S)2p3 2D 1.33E−2 1.30E−2 −2.26 1.39E−2f
1s2s(3S)2p3 2P 1.14E−2 1.07E−2 −6.14 1.16E−2f
1s2s(3S)2p3 2S 2.86E−3 3.71E−3 29.72 3.41E−3f
1s2p4 4P 8.38E−3 6.48E−3 −22.67 8.73E−3f
1s2p4 2D 1.33E−2 1.01E−2 −24.06 1.37E−2f
1s2p4 2P 8.34E−3 6.47E−3 −22.42 8.58E−3f
1s2p4 2S 9.18E−3 6.72E−3 −26.80 9.48E−3f
Mg ix 1s2s22p 3P 7.44E−3 7.35E−3 −1.21 7.61E−3h 7.89E−3i
1s2s22p 1P 5.26E−3 4.84E−3 −7.98 5.08E−3h 5.12E−3i
1s2s(3S)2p2 3D 6.62E−3 5.95E−3 −10.12 5.87E−3h
1s2s(1S)2p2 3P 8.51E−4 2.30E−3 170.27 2.01E−3h
1s2s(3S)2p2 3S 3.36E−3 3.29E−3 −2.08 3.10E−3h
1s2s(3S)2p2 1D 1.12E−2 1.17E−2 4.46 1.23E−2h
1s2s(3S)2p2 3P 6.06E−3 6.27E−3 3.47 6.40E−3h
1s2s(3S)2p2 1P 2.44E−3 2.16E−3 −11.48 1.89E−3h
1s2s(1S)2p2 1S 8.24E−3 8.03E−3 −2.55 8.76E−3h
1s2p3 3D 8.43E−3 8.80E−3 4.39 8.50E−3h
1s2p3 3S 1.14E−5 0.00 1.49E−5h
1s2p3 1D 8.39E−3 8.61E−3 2.62 8.27E−3h
1s2p3 3P 5.32E−3 5.53E−3 3.95 5.31E−3h
1s2p3 1P 5.05E−3 5.27E−3 4.36 5.03E−3h
Mg x 1s2s2 2S 6.27E−3 5.81E−3 −7.34 5.42E−3j 6.28E−3k
1s2s(1S)2p 2P 4.06E−3 4.02E−3 −0.99 3.53E−3j
6
The Astrophysical Journal Supplement Series, 214:8 (10pp), 2014 September Hasoglu et al.
Table 2(Continued)
Ion State Presa HFR1b % diff.l MCDF MCBP
1s2s(3S)2p 2P 2.89E−4 3.21E−4 11.07 5.44E−4j
1s2p2 2D 6.39E−3 6.90E−3 7.98 6.61E−3j
1s2p2 2P 3.98E−5 0.00 3.37E−5j
1s2p2 2S 9.41E−4 1.05E−3 11.58 1.10E−3j
Notes. a Present work. b HFR (level-averaged) calculation of Palmeri et al. (2008). c MCBP calculation of Gorczyca et al. (2003).d MCDF (level-averaged) calculation of Hasoglu et al. (2008). e MCBP (level-averaged) calculation of Hasoglu et al. (2008). f MCDF(level-averaged) calculation of Chen & Craseman (1988). g MCBP (level-averaged) calculation of Hasoglu et al. (2006). h MCDF (level-averaged) calculation of Chen (1985). i MCBP (level-averaged) calculation of Gorczyca et al. (2003). j MCDF (level-averaged) calculationof Chen (1986). k MCBP (level-averaged) calculation of Gorczyca et al. (2006). l Percentage difference: 100 × (ΓHFR1 − ΓPres)/ΓPres.
comparison. However, as can be deduced from Table 1, ourtheoretical K-shell threshold is at 96.3585 Ryd (1311.03 eV) infairly good agreement with the experimental value of 1311.4 eV(Banna et al. 1982). Furthermore, since our above-thresholdcross section is seen to align with the IP results, we are con-fident about the below-threshold resonance oscillator strengththat merges to the above-threshold oscillator strength densitythrough continuity conditions intrinsic to the R-matrix frame-work. Also shown in Figure 1 are the solid-state experimen-tal results of Henke et al. (1993). It is interesting to note thatthe present R-matrix results for neutral magnesium align moreclosely with experiment than with the IP results that do notinclude relaxation effects, but shift the threshold downward toalign with experiment.
Regarding the R-matrix calculations for Mg i, it was notpossible to apply the usual MQDT optical potential method(Gorczyca & Robicheaux 1999) to render spectator Augerbroadening since, due to the larger radius of the R-matrix box(Berrington et al. 1995; Burke 2011), the energy dependence ofthe MQDT parameters at the lower resonances invalidated thesimple E → E + iΓ/2 substitution (Gorczyca & Robicheaux1999). Instead, a more rigorous approach (beyond the scope ofthis paper) is necessary to effectively model the Auger width.(As noted before, the strength is not affected by the particularwidth used.)
As a consequence, in order to present reliable cross sectionsfor this study, we first perform calculations using a spectatorwidth that is small enough such that the energy-dependentMQDT parameters can still be treated as constant over the widthof a resonance, but large enough such that the resonance Rydbergseries can be mapped out with a finite number of R-matrix energypoints. These cross sections are then further convoluted with aLorentzian profile of width 0.0254 Ryd (see Table 2) to simulatethe known Auger broadening.
3.2. Ionized Mg Species
The only other reported K-absorption (1s → np) crosssections of Mg ionized species are those by Witthoeft et al.(2009, 2011), which have been computed with a similarR-matrix approach; however, important orbital relaxation ef-fects were therein neglected. Relaxation is due to the suddenchange in the potential perceived by the outermost electronsfollowing excitation or ionization of an inner-shell electron (1selectron in this case), the relative change in potential strengthreaching a maximum at the lower ionization stages; hence, Mg iiis expected to be the most affected by relaxation as evidencedby the K-shell threshold being overestimated by approximately10 eV (see Figure 2). This overestimate, due to the absence ofrelaxation effects, is seen to diminish as the ionic charge in-
creases to the order of 2 eV, which seems to indicate a lack ofcorrelation, perhaps from strong 2p2 → 3d
2double promotions
that, in addition, would require the inclusion of optimized 3dpseudo-orbitals.
3.3. Final Atomic Data
Having computed reliable photoabsorption cross sections forMg i–Mg x in the vicinity of their respective K edges, we havethen produced final data sets for the xstar spectral modelingcode (Bautista & Kallman 2001) through a single fitting formulafor each ion as described more fully in the recent paper on O iphotoabsorption by Gorczyca et al. (2013). Briefly, the X-rayphotoabsorption cross section for each ion is modeled as a sumof contributions from all possible photoionization mechanisms.For the direct (non-resonant) photoionization cross sections ofthe 1s, 2s, 2p, and, for Mg i and Mg ii, 3s sub-shells, the analyticformulae by Verner et al. (1993) and Verner et al. (1996) areused. However, due to the relatively larger relaxation effects forneutral Mg i, we introduce instead a three-parameter asymptoticinverse power-law fit to the data of Henke et al. (1993) for the1s partial cross section. A similar procedure was carried out forneutral O i for reasons discussed at length in Gorczyca et al.(2013).
While the inverse power-law formula and those by Verneret al. (1993) and Verner et al. (1996) yield the direct partial crosssections, the resonant absorption components (predominantlydue to the 1s → np resonances) contributing to the total crosssection are represented by infinite sums of Lorentzian profilesfor each Rydberg series. We note also that, for the weakerexcited 1s2s22p63s3pns and 1s2s22p63s3pnd series in Mg i,as shown above the Mg ii 1s2s22p63s2 threshold of 1311 eVin Figure 1, a modified asymmetric Fano profile is used ratherthan a Lorentzian fit. This single analytic expression for the totalphotoabsorption cross section—one for each Mg ion, differingonly in the fitting parameters—ensures a reliable and continuousdata set for the entire X-ray region of interest, going well aboveand well below the Mg K-edge region.
4. MODELING THE Mg K EDGE
We use XMM-Newton spectra from the low-mass X-ray binaryGS 1826-238 (Galactic coordinates l = 9.27 and b = −6.08)to analyze Mg photoabsorption in the ISM. The data wereobtained with the Reflection Grating Spectrometers (RGS),and the reduction process was performed with the XMM-Newton Science Analysis System (SAS, version 12.0.1). Thetwo observations (see Table 3) are fitted simultaneously inthe 8–11 Å wavelength interval, the data being rebinned to
7
The Astrophysical Journal Supplement Series, 214:8 (10pp), 2014 September Hasoglu et al.
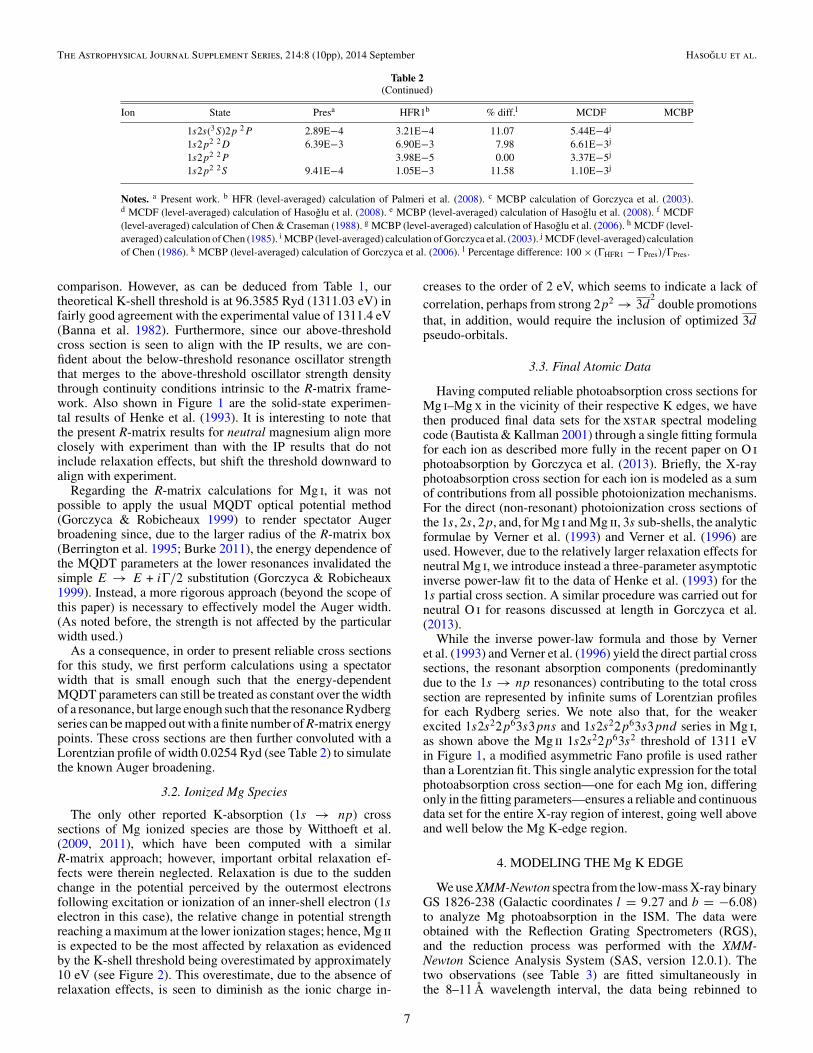
Figure 3. Photoabsorption cross sections of: (a) Mg iii; (b) Mg iv; (c) Mg v; and (d) Mg vi. Present results are compared to earlier R-matrix (Witthoeft et al. 2009) andIP results (Verner et al. 1993).
(A color version of this figure is available in the online journal.)
10 -2
10 -1
10 0
10 1
10 2
10 3
1200 1250 1300 1350 1400 1450 1500 1550 1600
Cro
ss S
ecti
on (
Mb)
Energy (eV)
(a)Present
Witthoeft et al. (2009)Verner et al. (1993)
10 -2
10 -1
10 0
10 1
10 2
10 3
1200 1250 1300 1350 1400 1450 1500 1550 1600 1650
Cro
ss S
ecti
on (
Mb)
Energy (eV)
(b)Present
Witthoeft et al. (2009)Verner et al. (1993)
10 -2
10 -1
10 0
10 1
10 2
10 3
1300 1400 1500 1600 1700
Cro
ss S
ecti
on (
Mb)
Energy (eV)
(c)Present
Witthoeft et al. (2009)Verner et al. (1993)
10 -4
10 -3
10 -2
10 -1
10 0
10 1
10 2
10 3
10 4
10 5
10 6
1300 1400 1500 1600 1700
Cro
ss S
ecti
on (
Mb)
Energy (eV)
(d)Present
Witthoeft et al. (2009)Verner et al. (1993)
Figure 4. Photoabsorption cross sections of: (a) Mg vii; (b) Mg viii; (c) Mg ix; and (d) Mg x. Present results are compared to earlier R-matrix (Witthoeft et al. 2009)and IP results (Verner et al. 1993).
(A color version of this figure is available in the online journal.)
8
The Astrophysical Journal Supplement Series, 214:8 (10pp), 2014 September Hasoglu et al.
0.006
0.007
0.008
0.009
0.010
0.011
0.012
0.013P
hoto
ns c
m−
2 s−
1 Å−
1
0.8
1
1.2
8 8.5 9 9.5 10 10.5 11
Rat
io
Wavelength (Å)
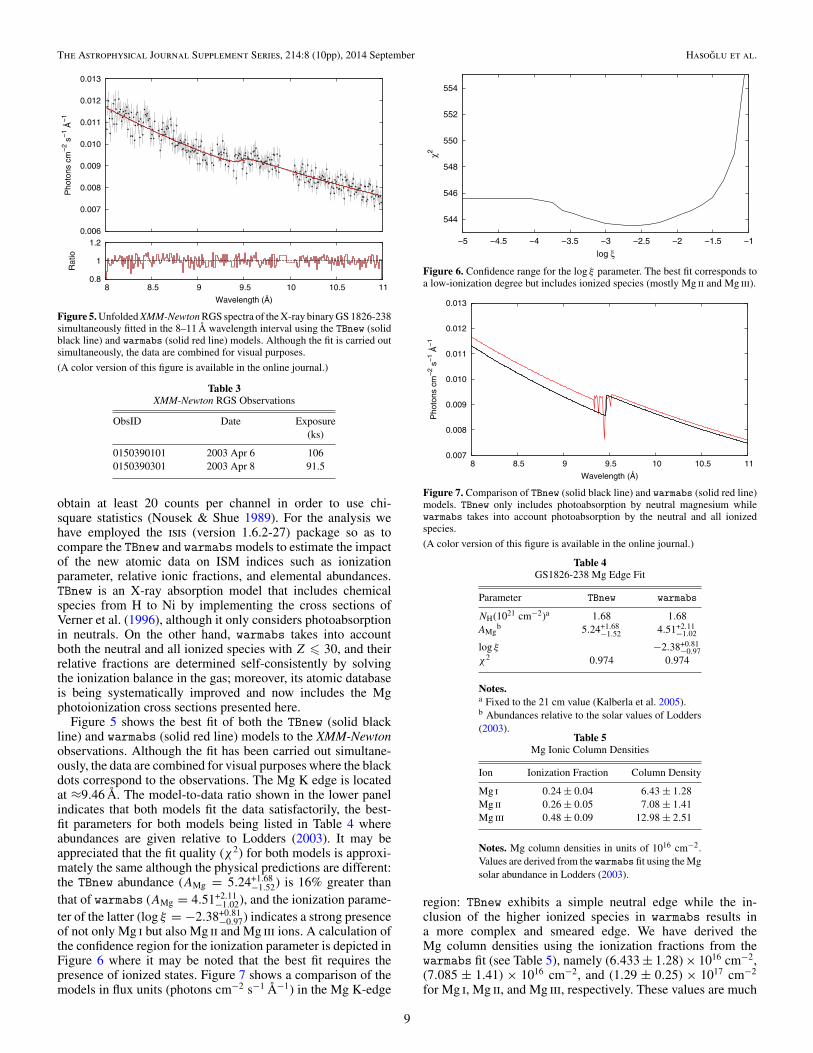
Figure 5. Unfolded XMM-Newton RGS spectra of the X-ray binary GS 1826-238simultaneously fitted in the 8–11 Å wavelength interval using the TBnew (solidblack line) and warmabs (solid red line) models. Although the fit is carried outsimultaneously, the data are combined for visual purposes.
(A color version of this figure is available in the online journal.)
Table 3XMM-Newton RGS Observations
ObsID Date Exposure(ks)
0150390101 2003 Apr 6 1060150390301 2003 Apr 8 91.5
obtain at least 20 counts per channel in order to use chi-square statistics (Nousek & Shue 1989). For the analysis wehave employed the isis (version 1.6.2-27) package so as tocompare the TBnew and warmabs models to estimate the impactof the new atomic data on ISM indices such as ionizationparameter, relative ionic fractions, and elemental abundances.TBnew is an X-ray absorption model that includes chemicalspecies from H to Ni by implementing the cross sections ofVerner et al. (1996), although it only considers photoabsorptionin neutrals. On the other hand, warmabs takes into accountboth the neutral and all ionized species with Z � 30, and theirrelative fractions are determined self-consistently by solvingthe ionization balance in the gas; moreover, its atomic databaseis being systematically improved and now includes the Mgphotoionization cross sections presented here.
Figure 5 shows the best fit of both the TBnew (solid blackline) and warmabs (solid red line) models to the XMM-Newtonobservations. Although the fit has been carried out simultane-ously, the data are combined for visual purposes where the blackdots correspond to the observations. The Mg K edge is locatedat ≈9.46 Å. The model-to-data ratio shown in the lower panelindicates that both models fit the data satisfactorily, the best-fit parameters for both models being listed in Table 4 whereabundances are given relative to Lodders (2003). It may beappreciated that the fit quality (χ2) for both models is approxi-mately the same although the physical predictions are different:the TBnew abundance (AMg = 5.24+1.68
−1.52) is 16% greater thanthat of warmabs (AMg = 4.51+2.11
−1.02), and the ionization parame-ter of the latter (log ξ = −2.38+0.81
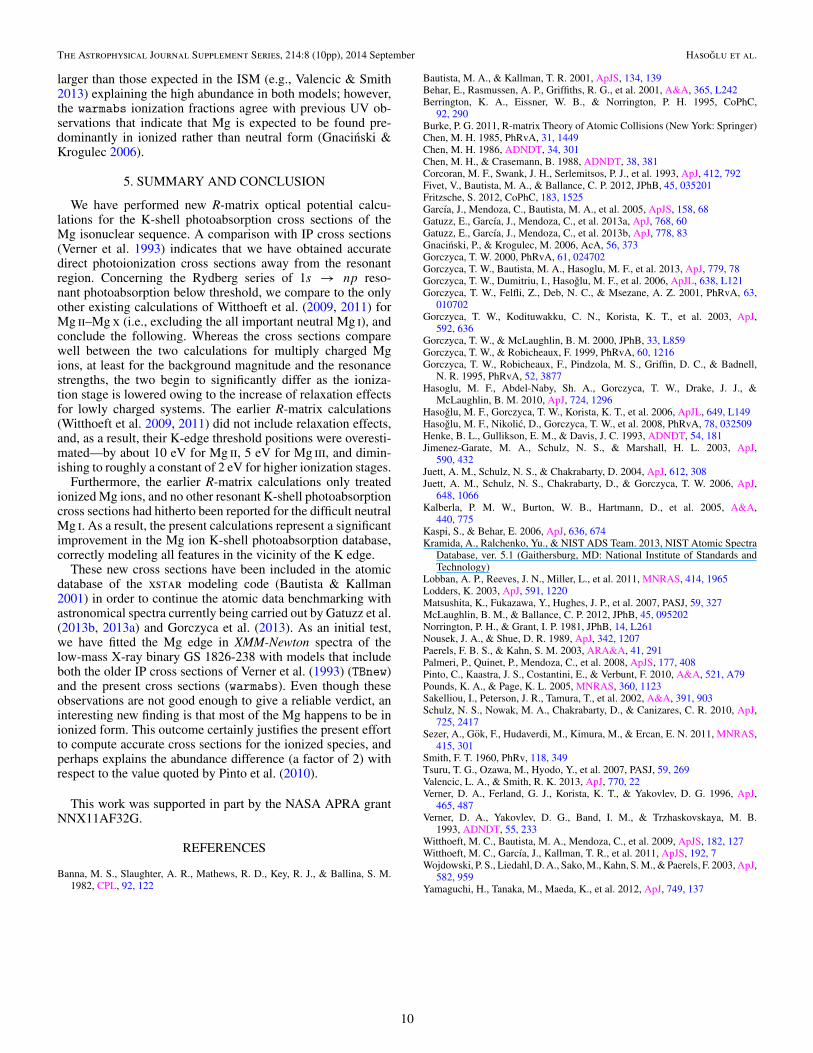
−0.97) indicates a strong presenceof not only Mg i but also Mg ii and Mg iii ions. A calculation ofthe confidence region for the ionization parameter is depicted inFigure 6 where it may be noted that the best fit requires thepresence of ionized states. Figure 7 shows a comparison of themodels in flux units (photons cm−2 s−1 Å−1) in the Mg K-edge
544
546
548
550
552
554
−5 −4.5 −4 −3.5 −3 −2.5 −2 −1.5 −1
χ2
log ξ
Figure 6. Confidence range for the log ξ parameter. The best fit corresponds toa low-ionization degree but includes ionized species (mostly Mg ii and Mg iii).
0.007
0.008
0.009
0.010
0.011
0.012
0.013
8 8.5 9 9.5 10 10.5 11
Pho
tons
cm
−2 s
−1 Å
−1
Wavelength (Å)
Figure 7. Comparison of TBnew (solid black line) and warmabs (solid red line)models. TBnew only includes photoabsorption by neutral magnesium whilewarmabs takes into account photoabsorption by the neutral and all ionizedspecies.
(A color version of this figure is available in the online journal.)
Table 4GS1826-238 Mg Edge Fit
Parameter TBnew warmabs
NH(1021 cm−2)a 1.68 1.68AMg
b 5.24+1.68−1.52 4.51+2.11
−1.02
log ξ −2.38+0.81−0.97
χ2 0.974 0.974
Notes.a Fixed to the 21 cm value (Kalberla et al. 2005).b Abundances relative to the solar values of Lodders(2003).
Table 5Mg Ionic Column Densities
Ion Ionization Fraction Column Density
Mg i 0.24 ± 0.04 6.43 ± 1.28Mg ii 0.26 ± 0.05 7.08 ± 1.41Mg iii 0.48 ± 0.09 12.98 ± 2.51
Notes. Mg column densities in units of 1016 cm−2.Values are derived from the warmabs fit using the Mgsolar abundance in Lodders (2003).
region: TBnew exhibits a simple neutral edge while the in-clusion of the higher ionized species in warmabs results ina more complex and smeared edge. We have derived theMg column densities using the ionization fractions from thewarmabs fit (see Table 5), namely (6.433 ± 1.28) × 1016 cm−2,(7.085 ± 1.41) × 1016 cm−2, and (1.29 ± 0.25) × 1017 cm−2
for Mg i, Mg ii, and Mg iii, respectively. These values are much
9
The Astrophysical Journal Supplement Series, 214:8 (10pp), 2014 September Hasoglu et al.
larger than those expected in the ISM (e.g., Valencic & Smith2013) explaining the high abundance in both models; however,the warmabs ionization fractions agree with previous UV ob-servations that indicate that Mg is expected to be found pre-dominantly in ionized rather than neutral form (Gnacinski &Krogulec 2006).
5. SUMMARY AND CONCLUSION
We have performed new R-matrix optical potential calcu-lations for the K-shell photoabsorption cross sections of theMg isonuclear sequence. A comparison with IP cross sections(Verner et al. 1993) indicates that we have obtained accuratedirect photoionization cross sections away from the resonantregion. Concerning the Rydberg series of 1s → np reso-nant photoabsorption below threshold, we compare to the onlyother existing calculations of Witthoeft et al. (2009, 2011) forMg ii–Mg x (i.e., excluding the all important neutral Mg i), andconclude the following. Whereas the cross sections comparewell between the two calculations for multiply charged Mgions, at least for the background magnitude and the resonancestrengths, the two begin to significantly differ as the ioniza-tion stage is lowered owing to the increase of relaxation effectsfor lowly charged systems. The earlier R-matrix calculations(Witthoeft et al. 2009, 2011) did not include relaxation effects,and, as a result, their K-edge threshold positions were overesti-mated—by about 10 eV for Mg ii, 5 eV for Mg iii, and dimin-ishing to roughly a constant of 2 eV for higher ionization stages.
Furthermore, the earlier R-matrix calculations only treatedionized Mg ions, and no other resonant K-shell photoabsorptioncross sections had hitherto been reported for the difficult neutralMg i. As a result, the present calculations represent a significantimprovement in the Mg ion K-shell photoabsorption database,correctly modeling all features in the vicinity of the K edge.
These new cross sections have been included in the atomicdatabase of the xstar modeling code (Bautista & Kallman2001) in order to continue the atomic data benchmarking withastronomical spectra currently being carried out by Gatuzz et al.(2013b, 2013a) and Gorczyca et al. (2013). As an initial test,we have fitted the Mg edge in XMM-Newton spectra of thelow-mass X-ray binary GS 1826-238 with models that includeboth the older IP cross sections of Verner et al. (1993) (TBnew)and the present cross sections (warmabs). Even though theseobservations are not good enough to give a reliable verdict, aninteresting new finding is that most of the Mg happens to be inionized form. This outcome certainly justifies the present effortto compute accurate cross sections for the ionized species, andperhaps explains the abundance difference (a factor of 2) withrespect to the value quoted by Pinto et al. (2010).
This work was supported in part by the NASA APRA grantNNX11AF32G.
REFERENCES
Banna, M. S., Slaughter, A. R., Mathews, R. D., Key, R. J., & Ballina, S. M.1982, CPL, 92, 122
Bautista, M. A., & Kallman, T. R. 2001, ApJS, 134, 139Behar, E., Rasmussen, A. P., Griffiths, R. G., et al. 2001, A&A, 365, L242Berrington, K. A., Eissner, W. B., & Norrington, P. H. 1995, CoPhC,
92, 290Burke, P. G. 2011, R-matrix Theory of Atomic Collisions (New York: Springer)Chen, M. H. 1985, PhRvA, 31, 1449Chen, M. H. 1986, ADNDT, 34, 301Chen, M. H., & Crasemann, B. 1988, ADNDT, 38, 381Corcoran, M. F., Swank, J. H., Serlemitsos, P. J., et al. 1993, ApJ, 412, 792Fivet, V., Bautista, M. A., & Ballance, C. P. 2012, JPhB, 45, 035201Fritzsche, S. 2012, CoPhC, 183, 1525Garcıa, J., Mendoza, C., Bautista, M. A., et al. 2005, ApJS, 158, 68Gatuzz, E., Garcıa, J., Mendoza, C., et al. 2013a, ApJ, 768, 60Gatuzz, E., Garcıa, J., Mendoza, C., et al. 2013b, ApJ, 778, 83Gnacinski, P., & Krogulec, M. 2006, AcA, 56, 373Gorczyca, T. W. 2000, PhRvA, 61, 024702Gorczyca, T. W., Bautista, M. A., Hasoglu, M. F., et al. 2013, ApJ, 779, 78Gorczyca, T. W., Dumitriu, I., Hasoglu, M. F., et al. 2006, ApJL, 638, L121Gorczyca, T. W., Felfli, Z., Deb, N. C., & Msezane, A. Z. 2001, PhRvA, 63,
010702Gorczyca, T. W., Kodituwakku, C. N., Korista, K. T., et al. 2003, ApJ,
592, 636Gorczyca, T. W., & McLaughlin, B. M. 2000, JPhB, 33, L859Gorczyca, T. W., & Robicheaux, F. 1999, PhRvA, 60, 1216Gorczyca, T. W., Robicheaux, F., Pindzola, M. S., Griffin, D. C., & Badnell,
N. R. 1995, PhRvA, 52, 3877Hasoglu, M. F., Abdel-Naby, Sh. A., Gorczyca, T. W., Drake, J. J., &
McLaughlin, B. M. 2010, ApJ, 724, 1296Hasoglu, M. F., Gorczyca, T. W., Korista, K. T., et al. 2006, ApJL, 649, L149Hasoglu, M. F., Nikolic, D., Gorczyca, T. W., et al. 2008, PhRvA, 78, 032509Henke, B. L., Gullikson, E. M., & Davis, J. C. 1993, ADNDT, 54, 181Jimenez-Garate, M. A., Schulz, N. S., & Marshall, H. L. 2003, ApJ,
590, 432Juett, A. M., Schulz, N. S., & Chakrabarty, D. 2004, ApJ, 612, 308Juett, A. M., Schulz, N. S., Chakrabarty, D., & Gorczyca, T. W. 2006, ApJ,
648, 1066Kalberla, P. M. W., Burton, W. B., Hartmann, D., et al. 2005, A&A,
440, 775Kaspi, S., & Behar, E. 2006, ApJ, 636, 674Kramida, A., Ralchenko, Yu., & NIST ADS Team. 2013, NIST Atomic Spectra
Database, ver. 5.1 (Gaithersburg, MD: National Institute of Standards andTechnology)
Lobban, A. P., Reeves, J. N., Miller, L., et al. 2011, MNRAS, 414, 1965Lodders, K. 2003, ApJ, 591, 1220Matsushita, K., Fukazawa, Y., Hughes, J. P., et al. 2007, PASJ, 59, 327McLaughlin, B. M., & Ballance, C. P. 2012, JPhB, 45, 095202Norrington, P. H., & Grant, I. P. 1981, JPhB, 14, L261Nousek, J. A., & Shue, D. R. 1989, ApJ, 342, 1207Paerels, F. B. S., & Kahn, S. M. 2003, ARA&A, 41, 291Palmeri, P., Quinet, P., Mendoza, C., et al. 2008, ApJS, 177, 408Pinto, C., Kaastra, J. S., Costantini, E., & Verbunt, F. 2010, A&A, 521, A79Pounds, K. A., & Page, K. L. 2005, MNRAS, 360, 1123Sakelliou, I., Peterson, J. R., Tamura, T., et al. 2002, A&A, 391, 903Schulz, N. S., Nowak, M. A., Chakrabarty, D., & Canizares, C. R. 2010, ApJ,
725, 2417Sezer, A., Gok, F., Hudaverdi, M., Kimura, M., & Ercan, E. N. 2011, MNRAS,
415, 301Smith, F. T. 1960, PhRv, 118, 349Tsuru, T. G., Ozawa, M., Hyodo, Y., et al. 2007, PASJ, 59, 269Valencic, L. A., & Smith, R. K. 2013, ApJ, 770, 22Verner, D. A., Ferland, G. J., Korista, K. T., & Yakovlev, D. G. 1996, ApJ,
465, 487Verner, D. A., Yakovlev, D. G., Band, I. M., & Trzhaskovskaya, M. B.
1993, ADNDT, 55, 233Witthoeft, M. C., Bautista, M. A., Mendoza, C., et al. 2009, ApJS, 182, 127Witthoeft, M. C., Garcıa, J., Kallman, T. R., et al. 2011, ApJS, 192, 7Wojdowski, P. S., Liedahl, D. A., Sako, M., Kahn, S. M., & Paerels, F. 2003, ApJ,
582, 959Yamaguchi, H., Tanaka, M., Maeda, K., et al. 2012, ApJ, 749, 137
10