joint multi-pitch detection using harmonic envelope estimation for polyphonic music transcription
TRANSCRIPT

Benetos, E. & Dixon, S. (2011). Joint Multi-Pitch Detection Using Harmonic Envelope Estimation
for Polyphonic Music Transcription. IEEE Journal of Selected Topics in Signal Processing, 5(6), pp.
1111-1123. doi: 10.1109/JSTSP.2011.2162394
City Research Online
Original citation: Benetos, E. & Dixon, S. (2011). Joint Multi-Pitch Detection Using Harmonic
Envelope Estimation for Polyphonic Music Transcription. IEEE Journal of Selected Topics in Signal
Processing, 5(6), pp. 1111-1123. doi: 10.1109/JSTSP.2011.2162394
Permanent City Research Online URL: http://openaccess.city.ac.uk/2049/
Copyright & reuse
City University London has developed City Research Online so that its users may access the
research outputs of City University London's staff. Copyright © and Moral Rights for this paper are
retained by the individual author(s) and/ or other copyright holders. All material in City Research
Online is checked for eligibility for copyright before being made available in the live archive. URLs
from City Research Online may be freely distributed and linked to from other web pages.
Versions of research
The version in City Research Online may differ from the final published version. Users are advised
to check the Permanent City Research Online URL above for the status of the paper.
Enquiries
If you have any enquiries about any aspect of City Research Online, or if you wish to make contact
with the author(s) of this paper, please email the team at [email protected].
IEEE JOURNAL OF SELECTED TOPICS IN SIGNAL PROCESSING 1
Joint Multi-pitch Detection using HarmonicEnvelope Estimation for Polyphonic Music
TranscriptionEmmanouil Benetos,Student Member, IEEE and Simon Dixon
Abstract—In this paper, a method for automatic transcrip-tion of music signals based on joint multiple-F0 estimationisproposed. As a time-frequency representation, the constant-Qresonator time-frequency image is employed, while a novel noisesuppression technique based on pink noise assumption is appliedin a preprocessing step. In the multiple-F0 estimation stage, theoptimal tuning and inharmonicity parameters are computed anda salience function is proposed in order to select pitch candidates.For each pitch candidate combination, an overlapping partialtreatment procedure is used, which is based on a novel spectralenvelope estimation procedure for the log-frequency domain, inorder to compute the harmonic envelope of candidate pitches.In order to select the optimal pitch combination for each timeframe, a score function is proposed which combines spectralandtemporal characteristics of the candidate pitches and alsoaimsto suppress harmonic errors. For postprocessing, hidden Markovmodels (HMMs) and conditional random fields (CRFs) trainedon MIDI data are employed, in order to boost transcriptionaccuracy. The system was trained on isolated piano soundsfrom the MAPS database and was tested on classic and jazzrecordings from the RWC database, as well as on recordingsfrom a Disklavier piano. A comparison with several state-of-the-art systems is provided using a variety of error metrics, whereencouraging results are indicated.
Index Terms—Automatic music transcription, Harmonic en-velope estimation, Conditional random fields, Resonator time-frequency image
I. I NTRODUCTION
A UTOMATIC music transcription is the process of con-verting an audio recording into a symbolic representation
using some form of musical notation. Even for expert musi-cians, transcribing polyphonic pieces of music is not a trivialtask, and while the problem of automatic pitch estimationfor monophonic signals is considered to be a solved prob-lem, the creation of an automated system able to transcribepolyphonic music without setting restrictions on the degreeof polyphony and the instrument type still remains open. Inthe past years, the problem of automatic music transcriptionhas gained considerable research interest due to the numerousapplications associated with the area, such as automatic searchand annotation of musical information, interactive music sys-tems (i.e. computer participation in live human performances,score following, and rhythm tracking), as well as musicolog-ical analysis [1]–[3]. Important subtasks for automatic music
The authors are with the Queen Mary University of London, Centrefor Digital Music, School of Electronic Engineering and Computer Sci-ence, E1 4NS London, U.K. (e-mail: [email protected]; [email protected]).
transcription include pitch estimation, onset/offset detection,loudness estimation, instrument recognition, and extractionof rhythmic information. For an overview on transcriptionapproaches, the reader is referred to [3], while in [4] a reviewof multiple fundamental frequency estimation systems is given.
Proposed methods for automatic transcription can be orga-nized according to the various techniques or models employed.A large subset of the proposed systems employ signal process-ing techniques, usually for feature extraction, without resortingto any supervised or unsupervised learning procedures orclassifiers for pitch estimation (see [3] for an overview).Several approaches for note tracking have been proposedusing variants of non-negative matrix factorization (NMF), e.g.[5]. Maximum likelihood approaches, usually employing theexpectation-maximization algorithm, have been also proposedin order to estimate the spectral envelope of candidate pitchesor to estimate the likelihood of a set of pitch candidates(e.g. [2], [6]). Hidden Markov models (HMMs) are frequentlyused in a postprocessing stage for note tracking, due to thesequential structure offered by the models (e.g. [7], [8]).
Approaches for transcription related to the current workare discussed here. Yeh et al. in [9] present a multipitchestimation algorithm based on a pitch candidate set scorefunction. The front-end of the algorithm consists of an STFTcomputation followed by an adaptive noise level estimationmethod based on the assumption that the noise amplitudefollows a Rayleigh distribution. Given a pitch candidate set,the overlapping partials are detected and smoothed accordingto the spectral smoothness principle. The weighted scorefunction consists of 4 features: harmonicity, mean bandwidth,spectral centroid, and synchronicity. A polyphony inferencemechanism based on the score function increase selects theoptimal pitch candidate set. Zhou [10] proposed an iterativemethod for polyphonic pitch estimation using a complexresonator filterbank as a front-end, called resonator time-frequency image (RTFI). F0 candidates are selected accordingto their pitch energy spectrum value and a set of rules isutilized in order to cancel extra estimated pitches. These rulesare based on the number of harmonic components detectedfor each pitch and the spectral irregularity measure, whichmeasures the concentrated energy around possibly overlappedpartials from harmonically-related F0s.
A probabilistic method is proposed by in [6], where pi-ano notes are jointly estimated using a likelihood functionwhich models the spectral envelope of overtones using asmooth autoregressive (AR) model and models the residual
(c) 2011 IEEE. Personal use of this material is permitted. Permission from IEEE must be obtained for all other users, including reprinting/ republishing this material for advertising or promotional purposes, creating new collective works for resale or redistribution to servers or lists, or reuse of any copyrighted components of this work in other works. Published version: IEEE Journal of Selected Topics in Signal Processing, 5(6):1111-1123, Oct. 2011. doi: 10.1109/JSTSP.2011.2162394
2 IEEE JOURNAL OF SELECTED TOPICS IN SIGNAL PROCESSING
noise using a low-order moving average (MA) model. Thelikelihood function is able to handle inharmonicity and theamplitudes of overtones are assumed to be generated by acomplex Gaussian random variable. In [7], Poliner and Ellisused STFT bins for frame-level piano note classification usingone-versus-all support vector machines (SVMs). In order toimprove transcription performance, the classification output ofthe SVMs was fed as input to HMMs for post-processing.
Finally, previous work by the authors includes an iterativesystem for multiple-F0 estimation for piano sounds [11] whichincorporates temporal information for pitch estimation basedon the common amplitude modulation (CAM) assumptionand a public evaluation of the aforementioned system forthe MIREX 2010 multiple fundamental frequency estimationtask [12]. Results for the MIREX task were encouraging,considering that the system was trained on isolated pianosounds and tested on woodwind and string recordings, notingalso that no note tracking procedure was incorporated.
In this work, a system for automatic transcription is pro-posed which is based on joint multiple-F0 estimation andsubsequent note tracking. The constant-Q RTFI is used asa suitable time-frequency representation for music signalsand a noise suppression method based on cepstral smoothingand pink noise assumption is proposed. For the multiple-F0 estimation step, a salience function is proposed for pitchcandidate selection that incorporates tuning and inharmonicityestimation. For each possible pitch combination, an overlap-ping partial treatment procedure is proposed that is based ona novel method for spectral envelope estimation in the log-frequency domain, used for computing the harmonic envelopeof candidate pitches. A score function which combines spectraland temporal features is proposed in order to select the optimalpitch set. Note smoothing is also applied in a postprocessingstage, employing HMMs and conditional random fields (CRFs)[13]. To the best knowledge of the authors, CRFs have notbeen used in the past for transcription approaches. The systemwas trained on a set of piano chords from the MAPS dataset[6], and tested on classic, jazz, and random piano chords fromthe same set, as well as on recordings from the RWC database[14], Disklavier recordings prepared in [7], and the MIREXrecording used for the multiple-F0 estimation task [15]. Theproposed system is compared with several approaches inthe literature, where competitive results are provided usingseveral error metrics which indicate that the current systemoutperforms state-of-the-art methods in many cases.
The outline of the paper is as follows. Section II describesthe preprocessing steps used in the transcription system.The proposed multiple-F0 estimation method is presented inSection III. The HMM- or CRF-based postprocessing stepsof the system are detailed in Section IV. In Section V,the datasets used for training and testing are presented, theemployed error metrics are defined, and experimental resultsare shown and discussed. Finally, conclusions are drawn andfuture directions are indicated in Section VI, while in theAppendices a derivation for the noise suppression algorithmis given and the proposed log-frequency spectral envelopeestimation method is described.
II. PREPROCESSING
A. Resonator Time-Frequency Image
Firstly, the input music signal is loudness-normalized to70dB relative to the reference amplitude for 16-bit audiofiles, as in [16]. The resonator time-frequency image (RTFI)is employed as a time-frequency representation [10]. TheRTFI selects a first-order complex resonator filter bank toimplement a frequency-dependent time-frequency analysis. Itcan be formulated as:
RTFI(t, ω) = x(t) ∗ IR(t, ω) (1)
whereIR(t, ω) = r(ω)e(−r(ω)+jω)t. (2)
x(t) stands for the input signal,IR(t, ω) is the impulseresponse of the first-order complex resonator filter with oscilla-tion frequencyω andr(ω) is a decay factor which additionallysets the frequency resolution.
Here, a constant-Q RTFI is selected for the time-frequencyanalysis, due to its suitability for music signal processingtechniques, because the inter-harmonic spacings are the samefor any periodic sounds. The time interval between twosuccessive frames is set to 40ms, which is typical for multiple-F0 estimation approaches [3]. A sampling rate of 44.1 kHz isconsidered for the input samples (some recordings with sam-pling rate 8 kHz which are presented in subsection V-A wereup-converted) and the centre frequency difference betweentwoneighboring filters is set to 10 cents (thus, the number ofbins per octaveb is set to 120). The frequency range is setfrom 27.5 Hz (A0) to 12.5 kHz (which reaches up to the 3rdharmonic of C8). The employed absolute value of the RTFIwill be denoted asX [n, k] from now on, wheren denotes thetime frame andk the log-frequency bin. When needed,X [k]will stand for the RTFI slice for a single time-frame.
B. Spectral Whitening
Spectral whitening (or flattening) is a key preprocessingstep applied in multiple-F0 estimation systems, in order tosuppress timbral information and make the following analysismore robust to different sound sources. When viewed from anauditory perspective, it can be interpreted as the normalizationof the hair cell activity level [17]. In this paper, we employa method similar to the one in [3], but modified for log-frequency spectra instead of linear frequency ones. For eachfrequency bin, the power within a subband of1
3 octave spanmultiplied by a Hann-windowWhann[k] is computed. Thesquare root of the power within each subband is:
σ[k] =
(
1
K
k+K/2∑
l=k−K/2
Whann[l]|X [l]|2)1/2
(3)
whereK = b/3 = 40 bins. Afterwards, each bin is scaledaccording to:
Y [k] = (σ[k])ν−1X [k] (4)
where ν is a parameter which determines the amount ofspectral whitening applied andX [k] is the absolute value ofthe RTFI for a single time frame, andY [k] is the final whitenedRTFI slice. As in [3],ν was set to 0.33.
BENETOS AND DIXON: JOINT MULTI-PITCH DETECTION USING HARMONIC ENVELOPE ESTIMATION FOR POLYPHONIC MUSIC TRANSCRIPTION 3
AUDIO LOUDNESS
NORMALIZATION
RTFI
ANALYSIS
SPECTRAL
WHITENING
NOISE
SUPPRESSION
PREPROCESSING
SALIENCE
FUNCTION
PITCH CANDIDATE
SELECTION
MULTIPLE-F0 ESTIMATION
PITCH SET
SCORE FUNCTION
FOR EACH C ⊆ C
POSTPROCESSING
TRANSCRIPTIONC
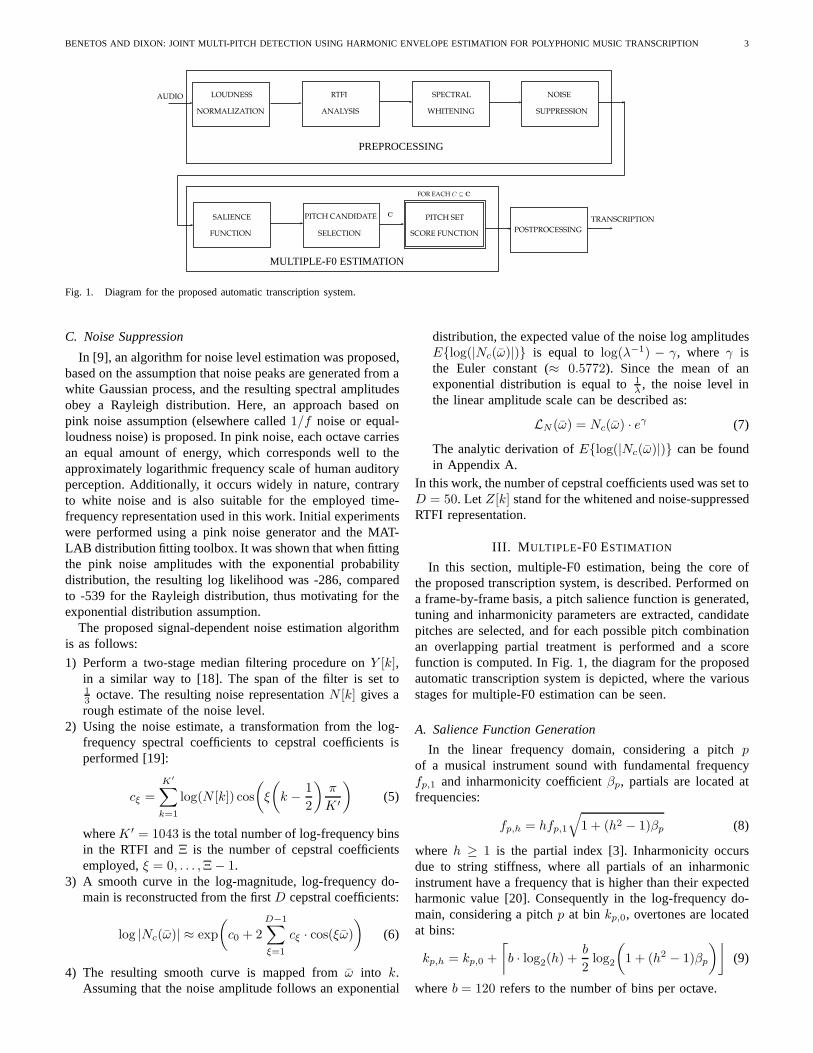
Fig. 1. Diagram for the proposed automatic transcription system.
C. Noise Suppression
In [9], an algorithm for noise level estimation was proposed,based on the assumption that noise peaks are generated from awhite Gaussian process, and the resulting spectral amplitudesobey a Rayleigh distribution. Here, an approach based onpink noise assumption (elsewhere called1/f noise or equal-loudness noise) is proposed. In pink noise, each octave carriesan equal amount of energy, which corresponds well to theapproximately logarithmic frequency scale of human auditoryperception. Additionally, it occurs widely in nature, contraryto white noise and is also suitable for the employed time-frequency representation used in this work. Initial experimentswere performed using a pink noise generator and the MAT-LAB distribution fitting toolbox. It was shown that when fittingthe pink noise amplitudes with the exponential probabilitydistribution, the resulting log likelihood was -286, comparedto -539 for the Rayleigh distribution, thus motivating for theexponential distribution assumption.
The proposed signal-dependent noise estimation algorithmis as follows:
1) Perform a two-stage median filtering procedure onY [k],in a similar way to [18]. The span of the filter is set to13 octave. The resulting noise representationN [k] gives arough estimate of the noise level.
2) Using the noise estimate, a transformation from the log-frequency spectral coefficients to cepstral coefficients isperformed [19]:
cξ =
K′
∑
k=1
log(N [k]) cos
(
ξ
(
k −1
2
)
π
K ′
)
(5)
whereK ′ = 1043 is the total number of log-frequency binsin the RTFI andΞ is the number of cepstral coefficientsemployed,ξ = 0, . . . ,Ξ− 1.
3) A smooth curve in the log-magnitude, log-frequency do-main is reconstructed from the firstD cepstral coefficients:
log |Nc(ω)| ≈ exp
(
c0 + 2
D−1∑
ξ=1
cξ · cos(ξω)
)
(6)
4) The resulting smooth curve is mapped fromω into k.Assuming that the noise amplitude follows an exponential
distribution, the expected value of the noise log amplitudesE{log(|Nc(ω)|)} is equal to log(λ−1) − γ, where γ isthe Euler constant (≈ 0.5772). Since the mean of anexponential distribution is equal to1λ , the noise level inthe linear amplitude scale can be described as:
LN (ω) = Nc(ω) · eγ (7)
The analytic derivation ofE{log(|Nc(ω)|)} can be foundin Appendix A.
In this work, the number of cepstral coefficients used was settoD = 50. LetZ[k] stand for the whitened and noise-suppressedRTFI representation.
III. M ULTIPLE-F0 ESTIMATION
In this section, multiple-F0 estimation, being the core ofthe proposed transcription system, is described. Performed ona frame-by-frame basis, a pitch salience function is generated,tuning and inharmonicity parameters are extracted, candidatepitches are selected, and for each possible pitch combinationan overlapping partial treatment is performed and a scorefunction is computed. In Fig. 1, the diagram for the proposedautomatic transcription system is depicted, where the variousstages for multiple-F0 estimation can be seen.
A. Salience Function Generation
In the linear frequency domain, considering a pitchpof a musical instrument sound with fundamental frequencyfp,1 and inharmonicity coefficientβp, partials are located atfrequencies:
fp,h = hfp,1
√
1 + (h2 − 1)βp (8)
whereh ≥ 1 is the partial index [3]. Inharmonicity occursdue to string stiffness, where all partials of an inharmonicinstrument have a frequency that is higher than their expectedharmonic value [20]. Consequently in the log-frequency do-main, considering a pitchp at bin kp,0, overtones are locatedat bins:
kp,h = kp,0 +
⌈
b · log2(h) +b
2log2
(
1 + (h2 − 1)βp
)⌋
(9)
whereb = 120 refers to the number of bins per octave.
4 IEEE JOURNAL OF SELECTED TOPICS IN SIGNAL PROCESSING
In addition, variations occur concerning the position of thefundamental; in [21], a model is proposed assuming that thefrequency of the first partial can be shifted by a specifictuning factor. In this work, a pitch salience functions[p, δp, βp]operating in the log-frequency domain is proposed, whichincorporates tuning and inharmonicity information:
s[p, δp, βp] =
H∑
h=1
maxmh
{
J [kp,h + δp,mh, βp]
}
(10)
where
J [k,mh, βp] =
√
Z
[
k +
⌈
bmh +b
2log2(1 + (h2 − 1)βp)
⌋]
(11)δp is the tuning deviation, andmh ∈ N
∗ specifies a searchrange around overtone positions, belonging to the interval(ml
h,muh), whereml
h = ⌈ log2(h−1)+(M−1) log2(h)M ⌋, mu
h =
⌈ (M−1) log2(h)+log2(h+1)M ⌋. M ∈ R
∗+ is a factor controlling
the width of the interval, since in the log-frequency domainthe search space for each harmonic is inversely proportionalto the harmonic index. HereM was set to 60, so the searchrange for the 2nd harmonic is[−2, 2] log-frequency bins, andfor the 3rd and 4th harmonics is[−1, 1] bins.
While the employed salience functions in the linear fre-quency domain (e.g. [18]) used a constant search space foreach overtone, the proposed log-frequency salience functionsets the search space to be inversely proportional to thepartial index. The number of considered overtonesH is setto 13 at maximum. The tuning deviationδp takes values from[−4, . . . , 4] log-frequency bins for each pitch (thus havinga tuning search space of±40 cents around the referencetuning frequency), thus allowing the detection of notes thatare not tuned using the reference frequency. The range ofthe inharmonicity coefficientβp is set between0 (completelyharmonic sounds) and5·10−4 (moderately inharmonic sounds,e.g. from a baby grand piano [20]). The explicit modelling ofinharmonicity can also be useful for temperament estimationsystems, such as [22].
In order to accurately estimate the ideal tuning factor and theinharmonicity coefficient for each pitch, a 2-D maximizationprocedure is applied tos[p, δp, βp] for each pitchp, in asimilar manner to the work in [6]. Herep = 1, . . . , 88 whichcorresponds to notes A0 to C8, where the pitch referenceis A4 (MIDI note 69) = 440 Hz. This results in a pitchsalience function estimates′[p], a tuning deviation vector andan inharmonicity coefficient vector. All in all, the compu-tational complexity for the salience function generation isO(Np·Nh·Nδ·Nβ), whereNp = 88, Nh = 13, Nδ = 9, andNβ = 6 (the number of discrete values each variable takes).
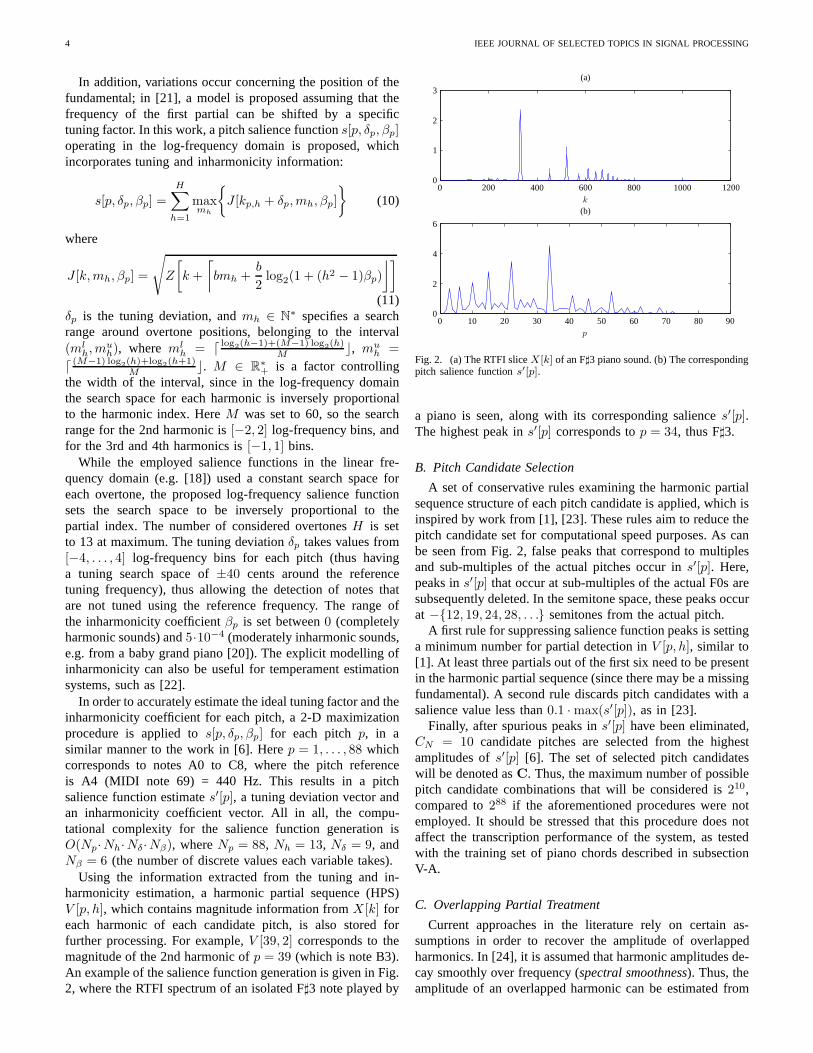
Using the information extracted from the tuning and in-harmonicity estimation, a harmonic partial sequence (HPS)V [p, h], which contains magnitude information fromX [k] foreach harmonic of each candidate pitch, is also stored forfurther processing. For example,V [39, 2] corresponds to themagnitude of the 2nd harmonic ofp = 39 (which is note B3).An example of the salience function generation is given in Fig.2, where the RTFI spectrum of an isolated F♯3 note played by
k
(a)
p
(b)
0 10 20 30 40 50 60 70 80 90
0 200 400 600 800 1000 1200
0
2
4
6
0
1
2
3
Fig. 2. (a) The RTFI sliceX[k] of an F♯3 piano sound. (b) The correspondingpitch salience functions′[p].
a piano is seen, along with its corresponding saliences′[p].The highest peak ins′[p] corresponds top = 34, thus F♯3.
B. Pitch Candidate Selection
A set of conservative rules examining the harmonic partialsequence structure of each pitch candidate is applied, which isinspired by work from [1], [23]. These rules aim to reduce thepitch candidate set for computational speed purposes. As canbe seen from Fig. 2, false peaks that correspond to multiplesand sub-multiples of the actual pitches occur ins′[p]. Here,peaks ins′[p] that occur at sub-multiples of the actual F0s aresubsequently deleted. In the semitone space, these peaks occurat −{12, 19, 24, 28, . . .} semitones from the actual pitch.
A first rule for suppressing salience function peaks is settinga minimum number for partial detection inV [p, h], similar to[1]. At least three partials out of the first six need to be presentin the harmonic partial sequence (since there may be a missingfundamental). A second rule discards pitch candidates withasalience value less than0.1 ·max(s′[p]), as in [23].
Finally, after spurious peaks ins′[p] have been eliminated,CN = 10 candidate pitches are selected from the highestamplitudes ofs′[p] [6]. The set of selected pitch candidateswill be denoted asC. Thus, the maximum number of possiblepitch candidate combinations that will be considered is210,compared to288 if the aforementioned procedures were notemployed. It should be stressed that this procedure does notaffect the transcription performance of the system, as testedwith the training set of piano chords described in subsectionV-A.
C. Overlapping Partial Treatment
Current approaches in the literature rely on certain as-sumptions in order to recover the amplitude of overlappedharmonics. In [24], it is assumed that harmonic amplitudes de-cay smoothly over frequency (spectral smoothness). Thus, theamplitude of an overlapped harmonic can be estimated from
BENETOS AND DIXON: JOINT MULTI-PITCH DETECTION USING HARMONIC ENVELOPE ESTIMATION FOR POLYPHONIC MUSIC TRANSCRIPTION 5
the amplitudes of neighboring non-overlapped harmonics. In[25], the amplitude of the overlapped harmonic is estimatedthrough non-linear interpolation on the neighboring harmonics.In [26], each set of harmonics is filtered from the spectrumand in the case of overlapping harmonics, linear interpolationis employed.
In this work, an overlapping partial treatment procedurebased on spectral envelope estimation of candidate pitchesis proposed. The proposed spectral envelope estimation algo-rithm for the log-frequency domain is presented in AppendixB. For each possible pitch combinationC ⊆ C, overlappingpartial treatment is performed, in order to accurately estimatethe partial amplitudes. The proposed overlapping partial treat-ment procedure is as follows:
1) Given a setC of pitch candidates, estimate a partialcollision list.
2) For a given harmonic partial sequence, if the number ofoverlapped partials is less thanNover, then estimate theharmonic envelopeSEp[k] of the candidate pitch usingonly amplitude information from non-overlapped partials.
3) For a given harmonic partial sequence, if the numberof overlapped partials is equal or greater thanNover,estimate the harmonic envelope using information fromthe complete harmonic partial sequence.
4) For each overlapped partial, estimate its amplitude usingthe harmonic envelope parameters of the correspondingpitch candidate (see Appendix B).
The output of the overlapping partial treatment procedure isthe updated harmonic partial sequenceV [p, h] for each pitchset combination.
D. Pitch set score function
Having selected a set of possible pitch candidates andperformed overlapping partial treatment on each possible com-bination, the goal is to select the optimal pitch combination fora specific time frame. In [9], Yeh proposed a score functionwhich combined four criteria for each pitch: harmonicity,bandwidth, spectral centroid, and synchronicity. Also, in[23],a simple score function was proposed for pitch set selection,based on the smoothness of the pitch set. Finally, in [6] amultipitch detection function was proposed, which employedthe spectral flatness of pitch candidates along with the spectralflatness of the noise residual.
Here, a weighted pitch set score function is proposed, whichcombines spectral and temporal characteristics of the candidateF0s, and also attempts to minimize the noise residual toavoid any missed detections. Also, features which concernharmonically-related F0s are included in the score function,in order to suppress any harmonic errors. Given a candidatepitch setC ⊆ C with size |C|, the proposed pitch set scorefunction is:
L(C) =
|C|∑
p=1
(Lp) + Lres (12)
whereLp is the score function for each candidate pitchp ∈ C,andLres is the score for the residual spectrum.Lp andLres
are defined as:
Lp = w1Fl [p] + w2Sm[p]− w3SC [p] + w4PR[p]− w5AM [p]
Lres = w6Fl [Res] (13)
Fl [p] denotes the spectral flatness of the harmonic partialsequence:
Fl [p] =e[∑
Hh=1 log(V [p,h])]/H
1H
∑Hh=1 V [p, h]
(14)
The spectral flatness is a measure of the ‘whiteness’ of thespectrum. Its values lie between 0 and 1 and it is maximizedwhen the input sequence is smooth, which is the ideal case foran HPS. It has been used previously for multiple-F0 estimationin [6], [23]. Here, the definition given for the spectral flatnessmeasure is the one adapted by the MPEG-7 framework, whichcan be seen in [27].Sm[p] is the smoothness measure of a harmonic partial
sequence, which was proposed in [23]. The definition ofsmoothness stems from the spectral smoothness principle andits definition stems from the definition ofsharpness:
Sr [p] =H∑
h=1
(SE p[kp,h]− V [p, h]) (15)
Here, instead of a low-pass filtered HPS using a Gaussian win-dow as in [23], the estimated harmonic envelopeSEp of eachcandidate pitch is employed for the smoothness computation.Sr [p] is normalized intoSr [p] and the smoothness measureSm[p] is defined as:Sm[p] = 1 − Sr [p]. A high value ofSm[p] indicates a smooth HPS.SC [p] is the spectral centroid for a given HPS and has been
used for the score function in [9]:
SC [p] =
√
√
√
√2 ·
∑Hh=1 h · |V [p, h]|2∑H
h=1 |V [p, h]|2(16)
It indicates the center of gravity of an HPS; for pitchedpercussive instruments it is positioned at lower partials.Atypical value for a piano note would be1.5 denoting thatthe center of gravity of its HPS is between the 1st and 2ndharmonic.PR[p] is a novel feature, which stands for the harmonically-
related pitch ratio. Here, harmonically-related pitches [9] arecandidate pitches inC that have a semitone difference of⌈12 · log2(l)⌋ = {12, 19, 24, 28, . . .}, where l > 1, l ∈ N.PR[p] is applied only in cases of harmonically-related pitches,in an attempt to estimate the ratio of the energy of thesmoothed partials of the higher pitch compared to the energyof the smoothed partials of the lower pitch. It is formulatedas follows:
PRl[p] =
3∑
h=1
V [p+ ⌈12 · log2(l)⌋, h]
V [p, l · h](17)
wherep stands for the lower pitch andp+⌈12·log2(l)⌋ for thehigher harmonically-related pitch.l stands for the harmonic re-lation between the two pitches (fhigh = lflow). In case of morethan one harmonic relation between the candidate pitches,a mean value is computed:PR[p] = 1
|Nhr |
∑
l∈NhrPRl[p],
6 IEEE JOURNAL OF SELECTED TOPICS IN SIGNAL PROCESSING
whereNhr is the set of harmonic relations. A high value ofPR
indicates the presence of a pitch in the higher harmonically-related position.
Another novel feature applied in the case of harmonically-related F0s, measuring the amplitude modulation similaritybetween an overlapped partial and a non-overlapped partialfrequency region, is proposed. The feature is based on thecommon amplitude modulation (CAM) assumption, whichstates that partial amplitudes of a harmonic source are cor-related over time [28]. Here, an extra assumption is madethat frequency deviations are also correlated over time. Thetime-frequency region of a non-overlapped partial is comparedwith the time-frequency region of the fundamental. In orderto compare 2-D time-frequency partial regions, the normalizedtensor scalar product [29] is used:
AM l[p] =3
∑
h=1
∑
i,j ΛijBhij
√
∑
i,j ΛijBhij ·
√
∑
i,j ΛijBhij
(18)
where
Λ = X [n0 : n1, kp,1 − 4 : kp,1 + 4]
Bh = X [n0 : n1, kp,hl − 4 : kp,hl + 4] (19)
wherei, j denote the indexes of matricesΛ andBh andn0 andn1 = n0 + 5 denote the frame boundaries of the time-frameregion selected for consideration. The normalized tensor scalarproduct is a generalization of the cosine similarity measure,which compares two vectors, finding the cosine of the anglebetween them.Res denotes the residual spectrum, which can be expressed
in a similar way to the linear frequency version in [6]:
Res =
{
Z[k]
/
∀p, ∀h,
∣
∣
∣
∣
k − kp,h >∆W
2
∣
∣
∣
∣
}
(20)
where ∆W denotes the mainlobe width of the employedwindowW . In order to find a measure of the ‘whiteness’ of theresidual,1−Fl [Res], which denotes the residual smoothness,is used.
It should be noted that featuresFl , Sr , SC ,PR,AM havealso been weighted by the salience function of the candidatepitch and divided by the sum of the salience function of thecandidate pitch set, for normalization purposes. In order totrain the weight parameterswi, i = 1, . . . , 6 of the features in(13), we used the Nelder-Mead search algorithm for parameterestimation [30]. The training set employed for experimentsisdescribed in subsection V-A. Finally, the pitch candidate setthat maximizes the score function:
C = argmaxC⊆C
L(C) (21)
is selected as the pitch estimate for the current frame.
IV. POSTPROCESSING
Although temporal information has been included in theframe-based multiple-F0 estimation system, additional post-processing is needed in order to track notes over time, andeliminate any single-frame errors. In the transcription litera-ture, hidden Markov models (HMMs) [31] have been used
(a)
MID
IS
cale
(b)
MID
IS
cale
200 400 600 800 1000 1200 1400 1600 1800 2000 2200
200 400 600 800 1000 1200 1400 1600 1800 2000 2200
50
60
70
50
60
70
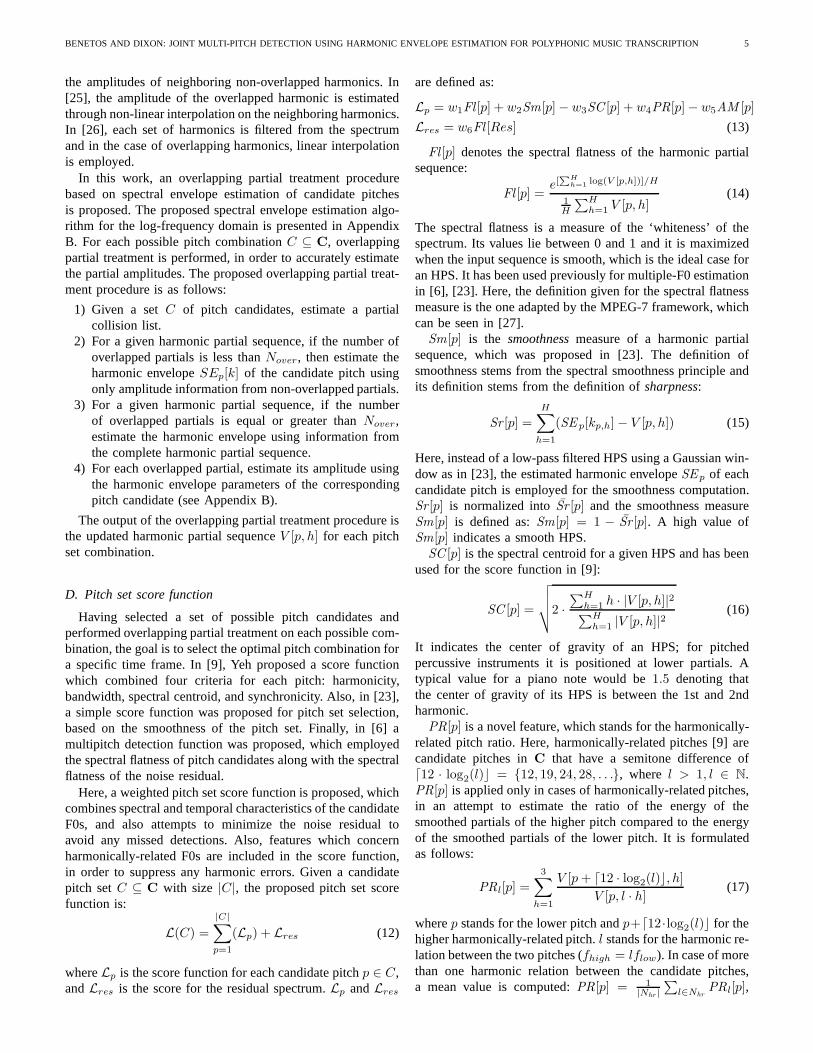
Fig. 3. Transcription output of an excerpt of ‘RWC MDB-J-2001 No. 2’(jazz piano) in a 10 ms time scale (a) Output of the multiple-F0 estimationsystem (b) Piano-roll transcription after HMM postprocessing.
for postprocessing. In [32], three-state note-event HMMs weretrained for each pitch, where the input features were thepitch salience value and the onset strength of the currentframe. Poliner and Ellis [7] trained two-state HMMs for eachnote using MIDI data from the RWC database and used asobservation probabilities the pseudo-posteriors of the one-versus-all SVM classifiers used for frame-based multiple-F0estimation of piano recordings. In [33], each possible notecombination between two onsets is represented by one HMMstate, where the state transitions were also learned using MIDIdata and the observation probability is given by the spectralflatness of the HPS of the pitch set. Finally, Canadas-Quesadaet al. also utilized two-state HMMs for each pitch that weretrained using MIDI data, where the observation likelihood isgiven by the salience of the candidate pitch [8]. In all casesmentioned, the Viterbi algorithm is used to extract the beststate sequence.
In this work, two postprocessing methods were employed:the first using HMMs and the second using conditional randomfields (CRFs), which to the authors’ knowledge have not beenused before in music transcription research.
A. HMM Postprocessing
In this work, each pitchp = 1, . . . , 88 is modeled by atwo-state HMM, denoting pitch activity/inactivity, as in [7],[8]. The observation sequence is given by the output of theframe-based multiple-F0 estimation step for each pitchp:Op = {op[n]}, n = 1, . . . , N , while the state sequence is givenby Qp = {qp[n]}. Essentially, in the HMM post-processingstep, detected pitches from the multiple-F0 estimation stepare tracked over time and their note activation boundariesare estimated using information from the salience function.In order to estimate the state priorsP (qp[1]) and the statetransition matrixP (qp[n]|qp[n − 1]), MIDI files from theRWC database [14] from the classic and jazz subgenres wereemployed, as in [8]. For each pitch, the most likely statesequence is given by:
Q′p = argmax
qp[n]
∏
n
P (qp[n]|qp[n− 1])P (op[n]|qp[n]) (22)
BENETOS AND DIXON: JOINT MULTI-PITCH DETECTION USING HARMONIC ENVELOPE ESTIMATION FOR POLYPHONIC MUSIC TRANSCRIPTION 7
in order to estimate the observation probabilitiesP (op[n]|qp[n]), we employ a sigmoid curve which hasas input the salience function of an active pitch from theoutput of the multiple-F0 estimation step:
P (op[n]|qp[n] = 1) =1
1 + e−(s′[p,n]−1)(23)
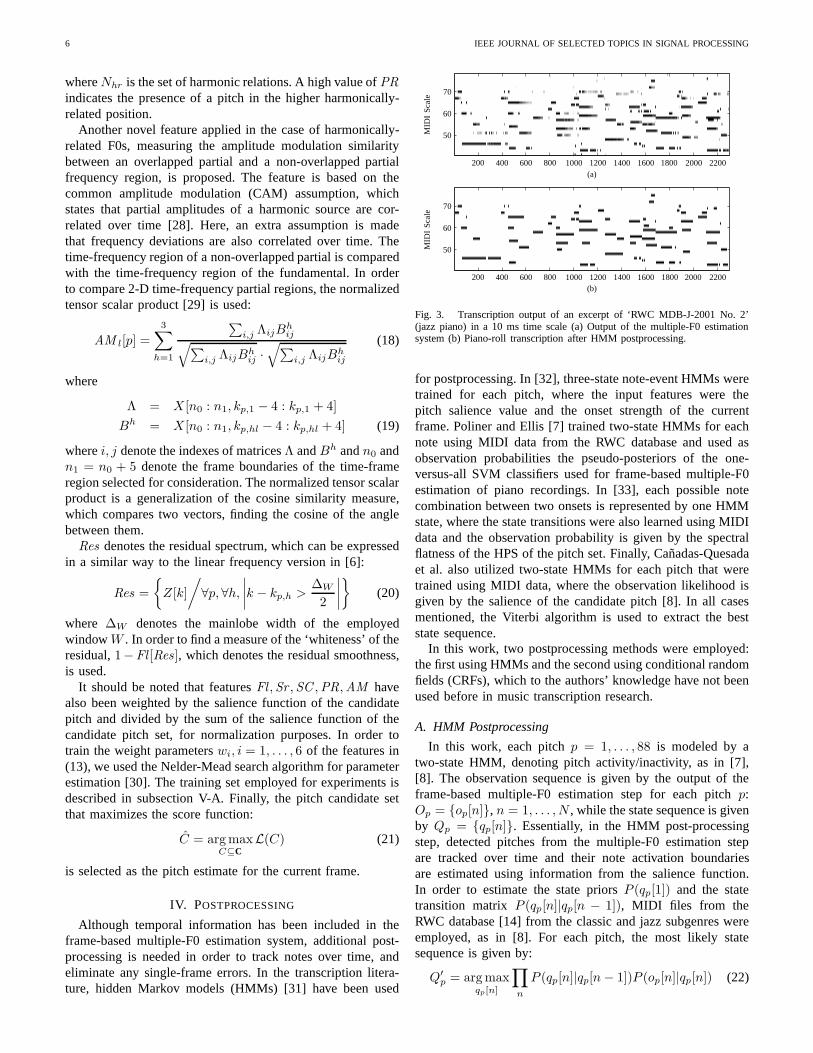
where s[p, n] denotes the salience function value at framen. The output of the HMM-based postprocessing step isgenerated using the Viterbi algorithm. The transcription outputof an example recording at the multiple-F0 estimation stageand after the HMM postprocessing is depicted in Fig. 3. Inaddition, in Fig. 4(a) the graphical structure of the employedHMMs is displayed.
B. CRF Postprocessing
Although the HMMs have repeatedly proved to be aninvaluable tool for smoothing sequential data, they sufferfromthe limitation that the observation at a given time framedepends only on the current state. In addition, the current statedepends only on its immediate predecessor. In order to allevi-ate these assumptions, conditional random fields (CRFs) [13]can be employed. CRFs are undirected graphical models thatdirectly model the conditional distributionP (Q|O) instead ofthe joint probability distributionP (Q,O) as in the HMMs.This indicates that HMMs belong to the class ofgenerativemodels, while the un-directed CRFs arediscriminative models.The assumptions concerning the state independence and theobservation dependence on the current state which are posedfor the HMMs are relaxed.
In this work, 88 linear-chain CRFs are employed (one foreach pitchp), where the current stateq[n] is dependent notonly on the current observationo[n], but also ono[n− 1]. Forlearning, we used the same note priors and state transitionsfrom the RWC database which were also utilized for theHMMs post-processing. For inference, the most likely statesequence for each pitch is computed using a Viterbi-likerecursion which estimates:
Q′p = argmax
Qp
P (Qp|Op) (24)
where P (Qp|Op) =∏
n P (qp[n]|Op) and the observationprobability for a given state is given as a sum of two potentialfunctionsTS:
P (Op|qp[n] = 1) =1
1 + e−(s′[p,n]−1)+
1
1 + e−(s′[p,n−1]−1)
(25)It should be noted that in our employed CRF model we assumethat each note state depends only on its immediate predecessor(like in the HMMs), while the relaxed assumption over theHMMs concerns the observation potentials. The graphicalstructure of the linear-chain CRF which was used in ourexperiments is presented in Fig. 4(b).
V. EVALUATION
A. Datasets
For training the system parameters, samples from the MIDIAligned Piano Sounds (MAPS) database [6] were used. The
qp[1] qp[2] qp[3]
op[1] op[2] op[3]
...
(a)
qp[1] qp[2] qp[3]
op[1] op[2] op[3]
...
(b)
Fig. 4. Graphical structure of the employed (a) HMM (b) Linear chain CRFnetworks for postprocessing.
MAPS database contains real and synthesized recordings ofisolated notes, musical chords, random chords, and musicpieces, produced by 9 real and synthesized pianos in differentrecording conditions, containing around 10000 sounds in total.Recordings are stereo, sampled at 44.1 kHz, while MIDI filesare provided as ground truth. Here, 103 samples from twopiano types were employed for training1, while 6832 samplesfrom the remaining 7 piano types were used for testing onpolyphonic piano sounds. The test set consists of classic, jazz,and randomly generated chords of polyphony levels 1-6, whilethe note range was C2-B6, in order to match the experimentsperformed in [6]. It should be noted that the postprocessingstage was not employed for the MAPS dataset, since it consistsof isolated chords.
For the transcription experiments, we firstly used 12 ex-cerpts from the RWC database [14], which have been used inthe past to evaluate polyphonic music transcription approachesin [8], [34], [35]. A list of the employed recordings alongwith the instruments present in each one is shown in the tophalf of Table I. The recordings containing ‘MDB-J’ in theirRWC ID belong to the jazz genre, while those that contain‘MDB-C’ belong to the classic genre. For the recording titlesand composer, the reader can refer to [35]. Five additionalpieces were also selected from the RWC database, whichhave not yet been evaluated in the literature. These pieces aredescribed in the bottom half of Table I (data 13-17). Also,the full wind quintet recording from the MIREX multi-F0development set was also used for experiments [15]. Finally,the test dataset developed by Poliner and Ellis [7] was alsoused for transcription experiments. It contains 10 one-minuterecordings from a Yamaha Disklavier grand piano, sampled at8 kHz.
As far as ground-truth for the RWC data 1-12 Table I,non-aligned MIDI files are provided along with the origi-
1Trained weight parameterswi were{1.3, 1.4, 0.6, 0.5, 0.2, 25}.
8 IEEE JOURNAL OF SELECTED TOPICS IN SIGNAL PROCESSING
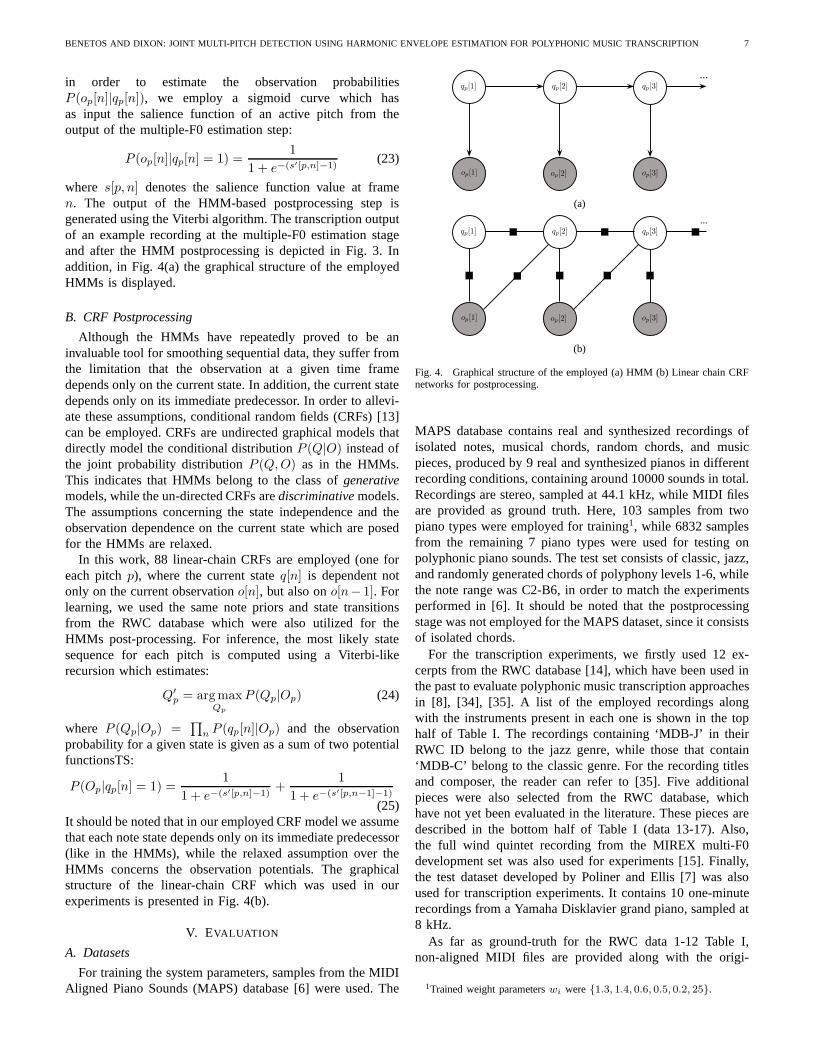
RWC ID Instruments
1 RWC-MDB-J-2001 No. 1 Piano2 RWC-MDB-J-2001 No. 2 Piano3 RWC-MDB-J-2001 No. 6 Guitar4 RWC-MDB-J-2001 No. 7 Guitar5 RWC-MDB-J-2001 No. 8 Guitar6 RWC-MDB-J-2001 No. 9 Guitar7 RWC-MDB-C-2001 No. 30 Piano8 RWC-MDB-C-2001 No. 35 Piano9 RWC-MDB-J-2001 No. 12 Flute + Piano10 RWC-MDB-C-2001 No. 12 Flute + String Quartet11 RWC-MDB-C-2001 No. 42 Cello + Piano12 RWC-MDB-C-2001 No. 49 Tenor + Piano
13 RWC-MDB-C-2001 No. 13 String Quartet14 RWC-MDB-C-2001 No. 16 Clarinet + String Quartet15 RWC-MDB-C-2001 No. 24a Harpsichord16 RWC-MDB-C-2001 No. 36 Violin (polyphonic)17 RWC-MDB-C-2001 No. 38 Violin
TABLE ITHE RWC DATA USED FOR TRANSCRIPTION EXPERIMENTS.
nal 44.1 kHz recordings. However, these MIDI files containseveral note errors and omissions, as well as unrealisticnote durations, thus making them unsuitable for transcriptionevaluation. As in [8], [34], [35], aligned ground-truth MIDIdata was created for the first 23s of each recording, usingSonic Visualiser [36] for spectrogram visualization and MIDIediting. For the RWC data 13-17 in Table I, the newly-releasedsyncRWC ground truth annotations were utilized2.
B. Figures of Merit
In order to assess and compare the performance of theproposed system, several figures of merit from the automatictranscription literature are employed. For the piano chordsusing the MAPS dataset, the precision, recall, and F-measureare used:
Pre =tp
tp + fp, Rec =
tp
tp + fn, F =
2 · Pre ·Rec
Pre + Rec(26)
where tp is the number of correctly estimated pitches,fp isthe number of false pitch detections, andfn is the number ofmissed pitches.
For the recordings used for the transcription experiments,several metrics are employed. It should be noted that allevaluations take place by comparing the transcribed outputand the ground-truth MIDI files at a 10 ms scale, as is thestandard for the multiple-F0 MIREX evaluation [15]. The firstmetric that is used is the overall accuracy, defined by Dixon[37]:
Acc1 =tp
fp + fn + tp(27)
WhenAcc1 = 1, a perfect transcription is achieved [7]. For(27), tp, fp, andfn refer to the number of true positives, falsepositives, and false negatives respectively, for all frames of therecording.
A second accuracy measure is also used, which was pro-posed by Kameoka et al. [34] which also includes pitch substi-tution errors. LetNref [n] stand for the number of ground-truth
2http://staff.aist.go.jp/m.goto/RWC-MDB/AIST-Annotation/SyncRWC/
pitches at framen,Nsys [n] the number of detected pitches, andNcorr [n] the number of correctly detected pitches. The numberof false negatives at the current frame isNfn [n], the number offalse positives isNfp [n], and the number of substitution errorsis given byNsubs [n] = min(Nfn [n], Nfp [n]). The accuracymeasure is defined as:
Acc2 =
∑
nNref [n]−Nfn [n]−Nfp [n] +Nsubs [n]∑
nNref [n](28)
From the aforementioned definitions, several error metricshave been defined in [7] that measure the substitution errors(Esubs), miss detection errors (Efn ), false alarm errors (Efp),and the total error (Etot ):
Esubs =
∑
nmin(Nref [n], Nsys [n])−Ncorr [n]∑
nNref [n]
Efn =
∑
nmax(0, Nref [n]−Nsys [n])∑
nNref [n]
Efp =
∑
nmax(0, Nsys [n]−Nref [n])∑
nNref [n]
Etot = Esubs + Efn + Efp (29)
It should be noted that the aforementioned error metrics canexceed 100% if the number of false alarms is very high [7].
C. Results
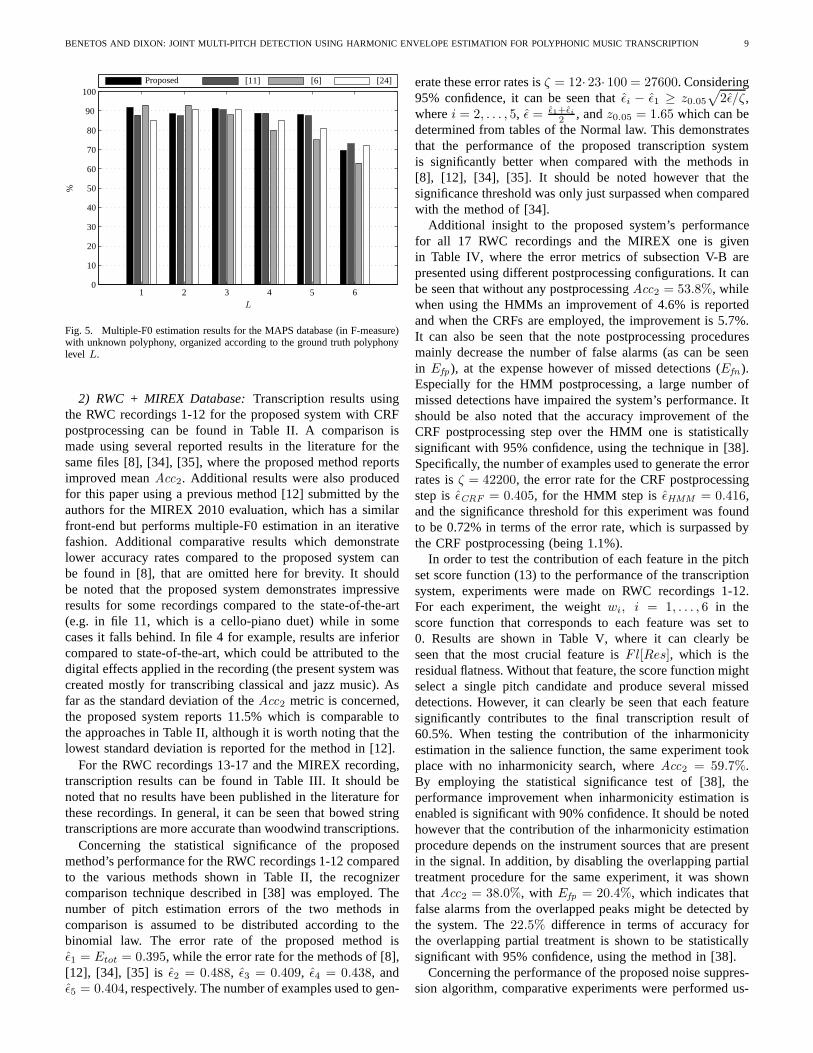
1) MAPS Database: For the isolated chord experimentsusing the MAPS database, the performance of the proposedtranscription system compared with the results shown in[11] and [6] is shown in Fig. 5, organized according tothe polyphony level of the ground truth (experiments wereperformed with unknown polyphony). The mean F-measuresfor polyphony levelsL = 1, . . . , 6 are 91.86%, 88.61%,91.30%, 88.83%, 88.14%, and 69.55% respectively. It shouldbe noted that the subset of polyphony level 6 consists onlyof 350 samples of random notes and not of classical andjazz chords. As far as precision is concerned, reported ratesare high for all polyphony levels, ranging from 89.88% to96.19%, with the lowest precision rate reported forL = 1.Recall displays the opposite performance, reaching 96.40%forone-note polyphony, and decreasing with the polyphony level,reaching 86.53%, 88.65%, 85.00%, and 83.14%, and 57.44%for levels 2-6.
In terms of a general comparison between all systems, theglobal F-measure for all sounds was used, where the proposedsystem outperforms all other approaches, reaching 88.54%.The system in [11] reports 87.47%, the system in [6] 83.70%,and finally the algorithm of [24] used for comparison in [6]reports 85.25%. By applying the same significance tests as in[11], it can be seen that the proposed method outperforms themethods of [6], [11], [24] in a statistically significant mannerwith 95% confidence. The aforementioned methods used forcomparison follow the same pattern whenPre and Rec areconcerned, reporting highPre rates for all polyphony levelsand decreasingRec rates as polyphony increases.
BENETOS AND DIXON: JOINT MULTI-PITCH DETECTION USING HARMONIC ENVELOPE ESTIMATION FOR POLYPHONIC MUSIC TRANSCRIPTION 9
L
%Proposed [11] [6] [24]
1 2 3 4 5 60
10
20
30
40
50
60
70
80
90
100
Fig. 5. Multiple-F0 estimation results for the MAPS database (in F-measure)with unknown polyphony, organized according to the ground truth polyphonylevel L.
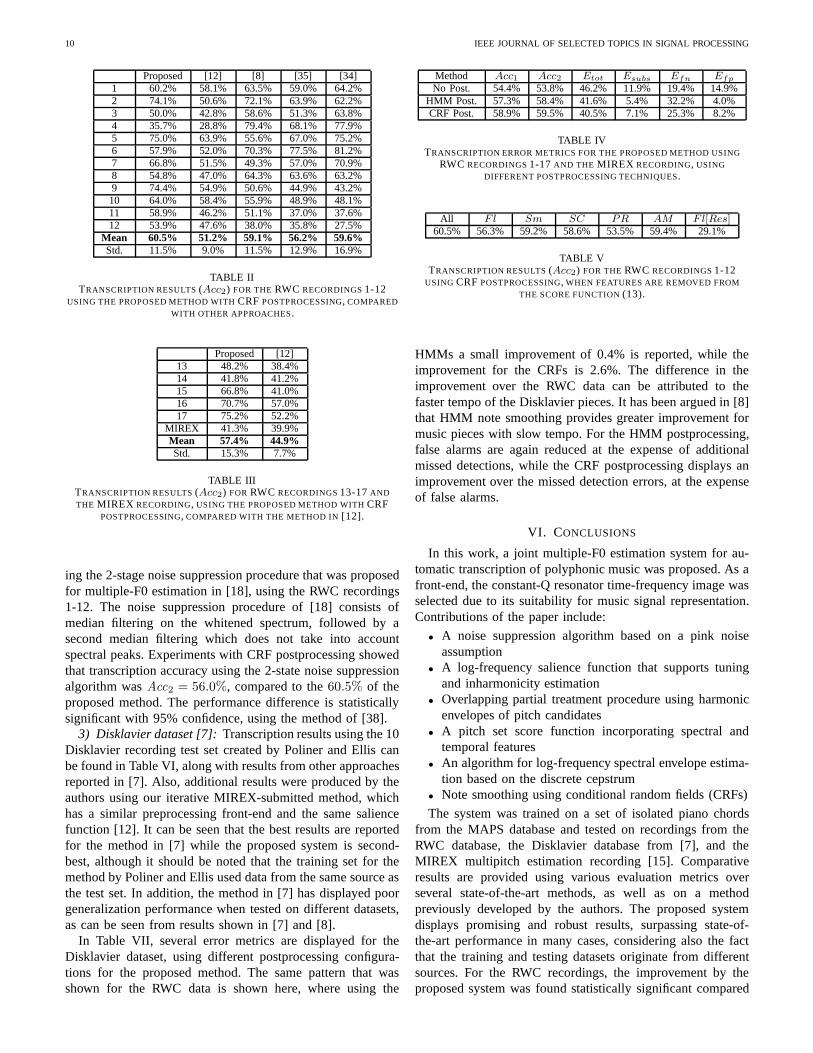
2) RWC + MIREX Database: Transcription results usingthe RWC recordings 1-12 for the proposed system with CRFpostprocessing can be found in Table II. A comparison ismade using several reported results in the literature for thesame files [8], [34], [35], where the proposed method reportsimproved meanAcc2. Additional results were also producedfor this paper using a previous method [12] submitted by theauthors for the MIREX 2010 evaluation, which has a similarfront-end but performs multiple-F0 estimation in an iterativefashion. Additional comparative results which demonstratelower accuracy rates compared to the proposed system canbe found in [8], that are omitted here for brevity. It shouldbe noted that the proposed system demonstrates impressiveresults for some recordings compared to the state-of-the-art(e.g. in file 11, which is a cello-piano duet) while in somecases it falls behind. In file 4 for example, results are inferiorcompared to state-of-the-art, which could be attributed tothedigital effects applied in the recording (the present system wascreated mostly for transcribing classical and jazz music).Asfar as the standard deviation of theAcc2 metric is concerned,the proposed system reports 11.5% which is comparable tothe approaches in Table II, although it is worth noting that thelowest standard deviation is reported for the method in [12].
For the RWC recordings 13-17 and the MIREX recording,transcription results can be found in Table III. It should benoted that no results have been published in the literature forthese recordings. In general, it can be seen that bowed stringtranscriptions are more accurate than woodwind transcriptions.
Concerning the statistical significance of the proposedmethod’s performance for the RWC recordings 1-12 comparedto the various methods shown in Table II, the recognizercomparison technique described in [38] was employed. Thenumber of pitch estimation errors of the two methods incomparison is assumed to be distributed according to thebinomial law. The error rate of the proposed method isǫ1 = Etot = 0.395, while the error rate for the methods of [8],[12], [34], [35] is ǫ2 = 0.488, ǫ3 = 0.409, ǫ4 = 0.438, andǫ5 = 0.404, respectively. The number of examples used to gen-
erate these error rates isζ = 12· 23· 100 = 27600. Considering95% confidence, it can be seen thatǫi − ǫ1 ≥ z0.05
√
2ǫ/ζ,wherei = 2, . . . , 5, ǫ = ǫ1+ǫi
2 , andz0.05 = 1.65 which can bedetermined from tables of the Normal law. This demonstratesthat the performance of the proposed transcription systemis significantly better when compared with the methods in[8], [12], [34], [35]. It should be noted however that thesignificance threshold was only just surpassed when comparedwith the method of [34].
Additional insight to the proposed system’s performancefor all 17 RWC recordings and the MIREX one is givenin Table IV, where the error metrics of subsection V-B arepresented using different postprocessing configurations.It canbe seen that without any postprocessingAcc2 = 53.8%, whilewhen using the HMMs an improvement of 4.6% is reportedand when the CRFs are employed, the improvement is 5.7%.It can also be seen that the note postprocessing proceduresmainly decrease the number of false alarms (as can be seenin Efp), at the expense however of missed detections (Efn ).Especially for the HMM postprocessing, a large number ofmissed detections have impaired the system’s performance.Itshould be also noted that the accuracy improvement of theCRF postprocessing step over the HMM one is statisticallysignificant with 95% confidence, using the technique in [38].Specifically, the number of examples used to generate the errorrates isζ = 42200, the error rate for the CRF postprocessingstep isǫCRF = 0.405, for the HMM step isǫHMM = 0.416,and the significance threshold for this experiment was foundto be 0.72% in terms of the error rate, which is surpassed bythe CRF postprocessing (being 1.1%).
In order to test the contribution of each feature in the pitchset score function (13) to the performance of the transcriptionsystem, experiments were made on RWC recordings 1-12.For each experiment, the weightwi, i = 1, . . . , 6 in thescore function that corresponds to each feature was set to0. Results are shown in Table V, where it can clearly beseen that the most crucial feature isFl[Res], which is theresidual flatness. Without that feature, the score functionmightselect a single pitch candidate and produce several misseddetections. However, it can clearly be seen that each featuresignificantly contributes to the final transcription resultof60.5%. When testing the contribution of the inharmonicityestimation in the salience function, the same experiment tookplace with no inharmonicity search, whereAcc2 = 59.7%.By employing the statistical significance test of [38], theperformance improvement when inharmonicity estimation isenabled is significant with 90% confidence. It should be notedhowever that the contribution of the inharmonicity estimationprocedure depends on the instrument sources that are presentin the signal. In addition, by disabling the overlapping partialtreatment procedure for the same experiment, it was shownthat Acc2 = 38.0%, with Efp = 20.4%, which indicates thatfalse alarms from the overlapped peaks might be detected bythe system. The22.5% difference in terms of accuracy forthe overlapping partial treatment is shown to be statisticallysignificant with 95% confidence, using the method in [38].
Concerning the performance of the proposed noise suppres-sion algorithm, comparative experiments were performed us-
10 IEEE JOURNAL OF SELECTED TOPICS IN SIGNAL PROCESSING
Proposed [12] [8] [35] [34]1 60.2% 58.1% 63.5% 59.0% 64.2%2 74.1% 50.6% 72.1% 63.9% 62.2%3 50.0% 42.8% 58.6% 51.3% 63.8%4 35.7% 28.8% 79.4% 68.1% 77.9%5 75.0% 63.9% 55.6% 67.0% 75.2%6 57.9% 52.0% 70.3% 77.5% 81.2%7 66.8% 51.5% 49.3% 57.0% 70.9%8 54.8% 47.0% 64.3% 63.6% 63.2%9 74.4% 54.9% 50.6% 44.9% 43.2%10 64.0% 58.4% 55.9% 48.9% 48.1%11 58.9% 46.2% 51.1% 37.0% 37.6%12 53.9% 47.6% 38.0% 35.8% 27.5%
Mean 60.5% 51.2% 59.1% 56.2% 59.6%Std. 11.5% 9.0% 11.5% 12.9% 16.9%
TABLE IITRANSCRIPTION RESULTS(Acc2) FOR THERWC RECORDINGS1-12
USING THE PROPOSED METHOD WITHCRFPOSTPROCESSING, COMPARED
WITH OTHER APPROACHES.
Proposed [12]13 48.2% 38.4%14 41.8% 41.2%15 66.8% 41.0%16 70.7% 57.0%17 75.2% 52.2%
MIREX 41.3% 39.9%Mean 57.4% 44.9%Std. 15.3% 7.7%
TABLE IIITRANSCRIPTION RESULTS(Acc2) FOR RWC RECORDINGS13-17AND
THE MIREX RECORDING, USING THE PROPOSED METHOD WITHCRFPOSTPROCESSING, COMPARED WITH THE METHOD IN [12].
ing the 2-stage noise suppression procedure that was proposedfor multiple-F0 estimation in [18], using the RWC recordings1-12. The noise suppression procedure of [18] consists ofmedian filtering on the whitened spectrum, followed by asecond median filtering which does not take into accountspectral peaks. Experiments with CRF postprocessing showedthat transcription accuracy using the 2-state noise suppressionalgorithm wasAcc2 = 56.0%, compared to the60.5% of theproposed method. The performance difference is statisticallysignificant with 95% confidence, using the method of [38].
3) Disklavier dataset [7]: Transcription results using the 10Disklavier recording test set created by Poliner and Ellis canbe found in Table VI, along with results from other approachesreported in [7]. Also, additional results were produced by theauthors using our iterative MIREX-submitted method, whichhas a similar preprocessing front-end and the same saliencefunction [12]. It can be seen that the best results are reportedfor the method in [7] while the proposed system is second-best, although it should be noted that the training set for themethod by Poliner and Ellis used data from the same source asthe test set. In addition, the method in [7] has displayed poorgeneralization performance when tested on different datasets,as can be seen from results shown in [7] and [8].
In Table VII, several error metrics are displayed for theDisklavier dataset, using different postprocessing configura-tions for the proposed method. The same pattern that wasshown for the RWC data is shown here, where using the
Method Acc1 Acc2 Etot Esubs Efn Efp
No Post. 54.4% 53.8% 46.2% 11.9% 19.4% 14.9%HMM Post. 57.3% 58.4% 41.6% 5.4% 32.2% 4.0%CRF Post. 58.9% 59.5% 40.5% 7.1% 25.3% 8.2%
TABLE IVTRANSCRIPTION ERROR METRICS FOR THE PROPOSED METHOD USING
RWC RECORDINGS1-17AND THE MIREX RECORDING, USINGDIFFERENT POSTPROCESSING TECHNIQUES.
All F l Sm SC PR AM Fl[Res]60.5% 56.3% 59.2% 58.6% 53.5% 59.4% 29.1%
TABLE VTRANSCRIPTION RESULTS(Acc2) FOR THERWC RECORDINGS1-12
USING CRFPOSTPROCESSING, WHEN FEATURES ARE REMOVED FROM
THE SCORE FUNCTION(13).
HMMs a small improvement of 0.4% is reported, while theimprovement for the CRFs is 2.6%. The difference in theimprovement over the RWC data can be attributed to thefaster tempo of the Disklavier pieces. It has been argued in [8]that HMM note smoothing provides greater improvement formusic pieces with slow tempo. For the HMM postprocessing,false alarms are again reduced at the expense of additionalmissed detections, while the CRF postprocessing displays animprovement over the missed detection errors, at the expenseof false alarms.
VI. CONCLUSIONS
In this work, a joint multiple-F0 estimation system for au-tomatic transcription of polyphonic music was proposed. Asafront-end, the constant-Q resonator time-frequency imagewasselected due to its suitability for music signal representation.Contributions of the paper include:
• A noise suppression algorithm based on a pink noiseassumption
• A log-frequency salience function that supports tuningand inharmonicity estimation
• Overlapping partial treatment procedure using harmonicenvelopes of pitch candidates
• A pitch set score function incorporating spectral andtemporal features
• An algorithm for log-frequency spectral envelope estima-tion based on the discrete cepstrum
• Note smoothing using conditional random fields (CRFs)
The system was trained on a set of isolated piano chordsfrom the MAPS database and tested on recordings from theRWC database, the Disklavier database from [7], and theMIREX multipitch estimation recording [15]. Comparativeresults are provided using various evaluation metrics overseveral state-of-the-art methods, as well as on a methodpreviously developed by the authors. The proposed systemdisplays promising and robust results, surpassing state-of-the-art performance in many cases, considering also the factthat the training and testing datasets originate from differentsources. For the RWC recordings, the improvement by theproposed system was found statistically significant compared
BENETOS AND DIXON: JOINT MULTI-PITCH DETECTION USING HARMONIC ENVELOPE ESTIMATION FOR POLYPHONIC MUSIC TRANSCRIPTION 11
Method Proposed [11] [7] [32] [39]Acc1 49.4% 43.3% 56.5% 41.2% 38.4%
TABLE VIMEAN TRANSCRIPTION RESULTS(Acc1) FOR THE RECORDINGS FROM[7]
USING CRFPOSTPROCESSING, COMPARED WITH OTHER APPROACHES.
Method Acc1 Acc2 Etot Esubs Efn Efp
No Post. 46.8% 48.2% 51.8% 10.5% 35.2% 6.1%HMM Post. 47.2% 48.3% 51.7% 8.5% 38.1% 5.1%CRF Post. 49.4% 49.8% 50.2% 10.1% 31.4% 8.6%
TABLE VIITRANSCRIPTION ERROR METRICS USING THE RECORDINGS FROM[7] AND
DIFFERENT POSTPROCESSING TECHNIQUES.
to other approaches in the literature. For public evaluation, aniterative variant of this system was submitted for the MIREX2010 multiple-F0 estimation task [12] displaying encouragingresults, even without any postprocessing. In general, the pro-posed system showed improvement over the one in [12] thatcan be attributed to the use of pitch combinations instead ofiterative selection, and the postprocessing module.
In the future, the present system will be submitted for thenext MIREX evaluation. In general, results generally indicateda relatively low false alarm rate, but a considerable numberof missed detections. This can be rectified in the futureby relaxing several assumptions concerning the inharmonic-ity range and spectral smoothness (which would also allowfor multipitch estimation of inharmonic instruments such asmarimba or vibraphone), but at the expense of additional falsepositives. Also, in order to improve transcription performance,training could be applied using a multi-instrument dataset,such as the one used in [24]. In addition, more general formsof CRFs that link multiple states together could improve noteprediction and smoothing. Finally, system performance canbeimproved by performing joint multiple-F0 estimation and notetracking, instead of frame-based multipitch estimation withsubsequent note tracking.
APPENDIX AEXPECTEDVALUE OF NOISE LOG-AMPLITUDES
We assume that the noise amplitude follows an exponentialdistribution. In order to find the expected value of the noiselogamplitudesE{log(|Nc(ω)|)}, we adopt a technique similar to[9]. Let Θ = log(Nc(ω)) = Φ(N):
E{Θ} =
∫ +∞
−∞
θp(θ)dθ =
∫ +∞
−∞
θp(Φ−1(θ))
∣
∣
∣
∣
dΦ−1(θ)
dθ
∣
∣
∣
∣
=
∫ +∞
−∞
λθe−λeθ
eθdθ =
∫ +∞
0
λ log(ψ)e−λψdψ
= −γ − λ log(λ) ·
∫ +∞
0
e−λψdψ
= log(λ−1)− γ (30)
whereγ is the Euler constant:
γ = −
∫ +∞
0
e−ψ log(ψ)dψ ≈ 0.57721. (31)
APPENDIX BLOG-FREQUENCY SPECTRAL ENVELOPE ESTIMATION
An algorithm for posterior-warped log-frequency regular-ized spectral envelope estimation is proposed. Given a setof harmonic partial sequences (HPS) in the log-frequencydomain, the algorithm estimates the log-frequency envelopeusing linear regularized discrete cepstrum estimation. In[40]a method for estimating the spectral envelope using discretecepstrum coefficients in the Mel-scale was proposed. Thesuperiority of discrete cepstrum over the continuous cepstrumcoefficients and the linear prediction coefficients for spectralenvelope estimation was argued in [41]. Other methods forenvelope estimation in the linear frequency domain includea weighted maximum likelihood spectral envelope estimationtechnique in [42], which was employed for multiple-F0 es-timation experiments in [6]. To the authors’ knowledge, noother log-frequency harmonic envelope estimation algorithmhas been proposed in the literature. The proposed algorithmcan be outlined as follows:
1) Extract the harmonic partial sequenceV [p, h] and corre-sponding log-frequency binskp,h for a given pitchp andharmonic indexh = 1, . . . , 13.
2) Convert the log-frequency binskp,h to linear angularfrequenciesωp,h (where fs = 44.1 kHz and the lowestfrequency for analysis isflow = 27.5 Hz ):
ωp,h = 27.5 ·2π
fs· 2
kp,h120 (32)
3) Perform spectral envelope estimation onV [p, h] andωp,husing linear regularized discrete cepstrum (estimate coeffi-cientscp). Coefficientscp are estimated as:
cp = (MTp Mp + K)−1MT
p ap (33)
where ap = [ln(V [p, 1]) . . . ln(V [p,H ])],K = diag([0 12 22 · · · (K − 1)2]), K is the cepstrumorder, is the regularization parameter, and
Mp =
1 2 cos(ωp,1) · · · 2 cos(Kωp,1)...
......
1 2 cos(ωp,H) · · · 2 cos(Kωp,H)
(34)
4) Estimate the vector of log-frequency discrete cepstral coef-ficientsdp from cp. In order to estimatedp from cp, we notethat the function which converts linear angular frequenciesinto log-frequencies is given by:
g(ω) = 120 · log2
(
fs · ω
2π · 27.5
)
(35)
which is defined forω ∈ [ 2π·27.5fs, π]. Function g(ω) is
normalized usingg(ω) = πg(π)g(ω), which becomes:
g(ω) =π
log2(fs
2·27.5 )· log2
(
fs · ω
2π · 27.5
)
(36)
The inverse function, which converts angular log-frequencies into angular linear frequencies is given by:
g−1(ω) =2π · 27.5
fs· 2
ω log2(fs
2·27.5)
π (37)
12 IEEE JOURNAL OF SELECTED TOPICS IN SIGNAL PROCESSING
k
RT
FI
Mag
nitu
de
0 200 400 600 800 10000
0.5
1
1.5
2
2.5
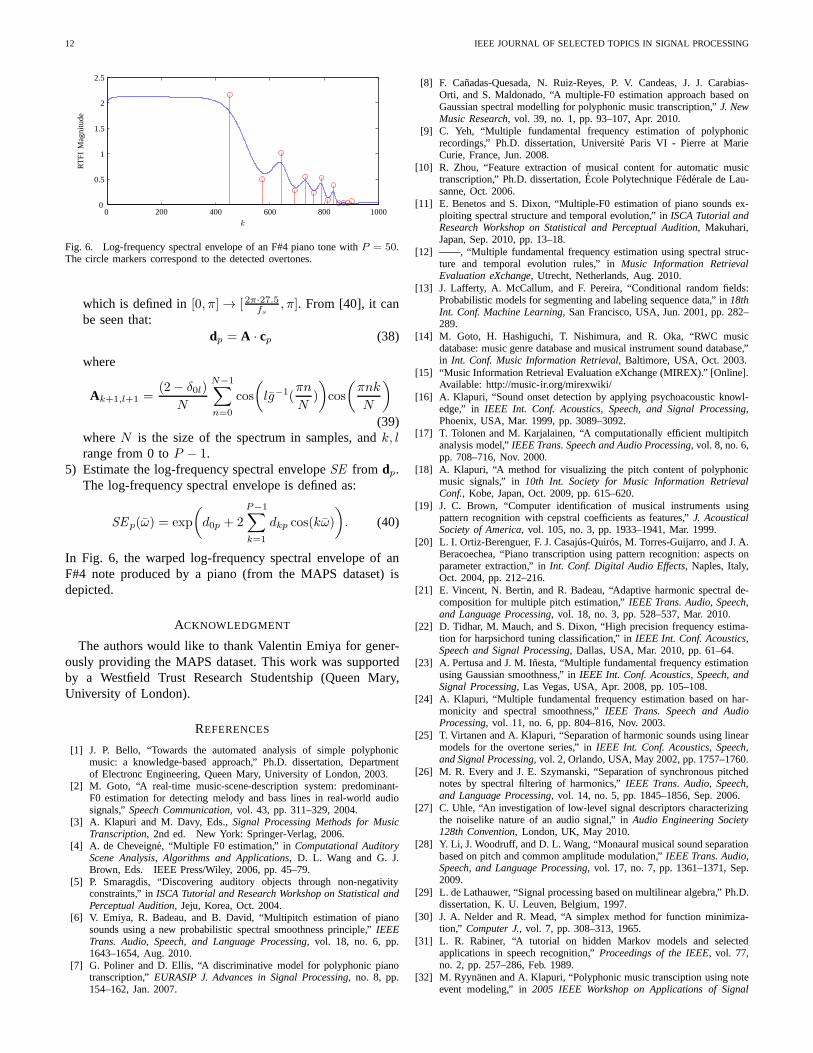
Fig. 6. Log-frequency spectral envelope of an F#4 piano tonewith P = 50.The circle markers correspond to the detected overtones.
which is defined in[0, π] → [ 2π·27.5fs, π]. From [40], it can
be seen that:dp = A · cp (38)
where
Ak+1,l+1 =(2− δ0l)
N
N−1∑
n=0
cos
(
lg−1(πn
N)
)
cos
(
πnk
N
)
(39)whereN is the size of the spectrum in samples, andk, lrange from 0 toP − 1.
5) Estimate the log-frequency spectral envelopeSE from dp.The log-frequency spectral envelope is defined as:
SEp(ω) = exp
(
d0p + 2
P−1∑
k=1
dkp cos(kω)
)
. (40)
In Fig. 6, the warped log-frequency spectral envelope of anF#4 note produced by a piano (from the MAPS dataset) isdepicted.
ACKNOWLEDGMENT
The authors would like to thank Valentin Emiya for gener-ously providing the MAPS dataset. This work was supportedby a Westfield Trust Research Studentship (Queen Mary,University of London).
REFERENCES
[1] J. P. Bello, “Towards the automated analysis of simple polyphonicmusic: a knowledge-based approach,” Ph.D. dissertation, Departmentof Electronc Engineering, Queen Mary, University of London, 2003.
[2] M. Goto, “A real-time music-scene-description system:predominant-F0 estimation for detecting melody and bass lines in real-world audiosignals,”Speech Communication, vol. 43, pp. 311–329, 2004.
[3] A. Klapuri and M. Davy, Eds.,Signal Processing Methods for MusicTranscription, 2nd ed. New York: Springer-Verlag, 2006.
[4] A. de Cheveigne, “Multiple F0 estimation,” inComputational AuditoryScene Analysis, Algorithms and Applications, D. L. Wang and G. J.Brown, Eds. IEEE Press/Wiley, 2006, pp. 45–79.
[5] P. Smaragdis, “Discovering auditory objects through non-negativityconstraints,” inISCA Tutorial and Research Workshop on Statistical andPerceptual Audition, Jeju, Korea, Oct. 2004.
[6] V. Emiya, R. Badeau, and B. David, “Multipitch estimation of pianosounds using a new probabilistic spectral smoothness principle,” IEEETrans. Audio, Speech, and Language Processing, vol. 18, no. 6, pp.1643–1654, Aug. 2010.
[7] G. Poliner and D. Ellis, “A discriminative model for polyphonic pianotranscription,” EURASIP J. Advances in Signal Processing, no. 8, pp.154–162, Jan. 2007.
[8] F. Canadas-Quesada, N. Ruiz-Reyes, P. V. Candeas, J. J.Carabias-Orti, and S. Maldonado, “A multiple-F0 estimation approachbased onGaussian spectral modelling for polyphonic music transcription,” J. NewMusic Research, vol. 39, no. 1, pp. 93–107, Apr. 2010.
[9] C. Yeh, “Multiple fundamental frequency estimation of polyphonicrecordings,” Ph.D. dissertation, Universite Paris VI - Pierre at MarieCurie, France, Jun. 2008.
[10] R. Zhou, “Feature extraction of musical content for automatic musictranscription,” Ph.D. dissertation,Ecole Polytechnique Federale de Lau-sanne, Oct. 2006.
[11] E. Benetos and S. Dixon, “Multiple-F0 estimation of piano sounds ex-ploiting spectral structure and temporal evolution,” inISCA Tutorial andResearch Workshop on Statistical and Perceptual Audition, Makuhari,Japan, Sep. 2010, pp. 13–18.
[12] ——, “Multiple fundamental frequency estimation usingspectral struc-ture and temporal evolution rules,” inMusic Information RetrievalEvaluation eXchange, Utrecht, Netherlands, Aug. 2010.
[13] J. Lafferty, A. McCallum, and F. Pereira, “Conditionalrandom fields:Probabilistic models for segmenting and labeling sequencedata,” in18thInt. Conf. Machine Learning, San Francisco, USA, Jun. 2001, pp. 282–289.
[14] M. Goto, H. Hashiguchi, T. Nishimura, and R. Oka, “RWC musicdatabase: music genre database and musical instrument sound database,”in Int. Conf. Music Information Retrieval, Baltimore, USA, Oct. 2003.
[15] “Music Information Retrieval Evaluation eXchange (MIREX).” [Online].Available: http://music-ir.org/mirexwiki/
[16] A. Klapuri, “Sound onset detection by applying psychoacoustic knowl-edge,” in IEEE Int. Conf. Acoustics, Speech, and Signal Processing,Phoenix, USA, Mar. 1999, pp. 3089–3092.
[17] T. Tolonen and M. Karjalainen, “A computationally efficient multipitchanalysis model,”IEEE Trans. Speech and Audio Processing, vol. 8, no. 6,pp. 708–716, Nov. 2000.
[18] A. Klapuri, “A method for visualizing the pitch contentof polyphonicmusic signals,” in10th Int. Society for Music Information RetrievalConf., Kobe, Japan, Oct. 2009, pp. 615–620.
[19] J. C. Brown, “Computer identification of musical instruments usingpattern recognition with cepstral coefficients as features,” J. AcousticalSociety of America, vol. 105, no. 3, pp. 1933–1941, Mar. 1999.
[20] L. I. Ortiz-Berenguer, F. J. Casajus-Quiros, M. Torres-Guijarro, and J. A.Beracoechea, “Piano transcription using pattern recognition: aspects onparameter extraction,” inInt. Conf. Digital Audio Effects, Naples, Italy,Oct. 2004, pp. 212–216.
[21] E. Vincent, N. Bertin, and R. Badeau, “Adaptive harmonic spectral de-composition for multiple pitch estimation,”IEEE Trans. Audio, Speech,and Language Processing, vol. 18, no. 3, pp. 528–537, Mar. 2010.
[22] D. Tidhar, M. Mauch, and S. Dixon, “High precision frequency estima-tion for harpsichord tuning classification,” inIEEE Int. Conf. Acoustics,Speech and Signal Processing, Dallas, USA, Mar. 2010, pp. 61–64.
[23] A. Pertusa and J. M. Inesta, “Multiple fundamental frequency estimationusing Gaussian smoothness,” inIEEE Int. Conf. Acoustics, Speech, andSignal Processing, Las Vegas, USA, Apr. 2008, pp. 105–108.
[24] A. Klapuri, “Multiple fundamental frequency estimation based on har-monicity and spectral smoothness,”IEEE Trans. Speech and AudioProcessing, vol. 11, no. 6, pp. 804–816, Nov. 2003.
[25] T. Virtanen and A. Klapuri, “Separation of harmonic sounds using linearmodels for the overtone series,” inIEEE Int. Conf. Acoustics, Speech,and Signal Processing, vol. 2, Orlando, USA, May 2002, pp. 1757–1760.
[26] M. R. Every and J. E. Szymanski, “Separation of synchronous pitchednotes by spectral filtering of harmonics,”IEEE Trans. Audio, Speech,and Language Processing, vol. 14, no. 5, pp. 1845–1856, Sep. 2006.
[27] C. Uhle, “An investigation of low-level signal descriptors characterizingthe noiselike nature of an audio signal,” inAudio Engineering Society128th Convention, London, UK, May 2010.
[28] Y. Li, J. Woodruff, and D. L. Wang, “Monaural musical sound separationbased on pitch and common amplitude modulation,”IEEE Trans. Audio,Speech, and Language Processing, vol. 17, no. 7, pp. 1361–1371, Sep.2009.
[29] L. de Lathauwer, “Signal processing based on multilinear algebra,” Ph.D.dissertation, K. U. Leuven, Belgium, 1997.
[30] J. A. Nelder and R. Mead, “A simplex method for function minimiza-tion,” Computer J., vol. 7, pp. 308–313, 1965.
[31] L. R. Rabiner, “A tutorial on hidden Markov models and selectedapplications in speech recognition,”Proceedings of the IEEE, vol. 77,no. 2, pp. 257–286, Feb. 1989.
[32] M. Ryynanen and A. Klapuri, “Polyphonic music transciption using noteevent modeling,” in2005 IEEE Workshop on Applications of Signal
BENETOS AND DIXON: JOINT MULTI-PITCH DETECTION USING HARMONIC ENVELOPE ESTIMATION FOR POLYPHONIC MUSIC TRANSCRIPTION 13
Processing to Audio and Acoustics, New Paltz, USA, Oct. 2005, pp.319–322.
[33] V. Emiya, R. Badeau, and B. David, “Automatic transcription of pianomusic based on HMM tracking of jointly estimated pitches,” in EuropeanSignal Processing Conf., Lausanne, Switzerland, Aug. 2008.
[34] H. Kameoka, T. Nishimoto, and S. Sagayama, “A multipitch analyzerbased on harmonic temporal structured clustering,”IEEE Trans. Audio,Speech, and Language Processing, vol. 15, no. 3, pp. 982–994, Mar.2007.
[35] S. Saito, H. Kameoka, K. Takahashi, T. Nishimoto, and S.Sagayama,“Specmurt analysis of polyphonic music signals,”IEEE Trans. Audio,Speech, and Language Processing, vol. 16, no. 3, pp. 639–650, Mar.2008.
[36] “Sonic Visualiser 1.7.1.” [Online]. Available: http://www.sonicvisualiser.org/
[37] S. Dixon, “On the computer recognition of solo piano music,” in 2000Australasian Computer Music Conf., Jul. 2000, pp. 31–37.
[38] I. Guyon, J. Makhoul, R. Schwartz, and V. Vapnik, “What size test setgives good error estimates?”IEEE Trans. Pattern Analysis and MachineIntelligence, vol. 20, no. 1, pp. 52–64, Jan. 1998.
[39] M. Marolt, “A connectionist approach to automatic transcription ofpolyphonic piano music,”IEEE Trans. Multimedia, vol. 6, no. 3, pp.439–449, Jun. 2004.
[40] W. D’haes and X. Rodet, “Discrete cepstrum coefficientsas perceptualfeatures,” inInternational Computer Music Conf., Sep. 2003.
[41] D. Schwarz and X. Rodet, “Spectral envelope estimationand represen-tation for sound analysis-synthesis,” inInternational Computer MusicConf., Beijing, China, Oct. 1999.
[42] R. Badeau and B. David, “Weighted maximum likelihood autoregressiveand moving average spectrum modeling,” inIEEE Int. Conf. Acoustics,Speech, and Signal Processing, Las Vegas, USA, Apr. 2008, pp. 3761–3764.
Emmanouil Benetos(S’09) received the B.Sc. de-gree in informatics and the M.Sc. degree in digitalmedia from the Aristotle University of Thessaloniki,Greece, in 2005 and 2007, respectively. In 2008,he was with the Multimedia Informatics Lab, De-partment of Computer Science, University of Crete,Greece. He is currently pursuing the Ph.D. degree atthe Centre for Digital Music, Queen Mary Universityof London, U.K., in the field of automatic musictranscription. His research interests include musicand speech signal processing and machine learning.
Mr. Benetos is a member of the Alexander S. Onassis Scholars Association.
Simon Dixon leads the Music Informatics area atthe Centre for Digital Music, Queen Mary Uni-versity of London. His research interests are fo-cussed on accessing and manipulating musical con-tent and knowledge, and involve music signal anal-ysis, knowledge representation and semantic webtechnologies. He has a particular interest in high-level aspects of music such as rhythm and harmony,and has published research on beat tracking, audioalignment, chord and note transcription, characteri-sation of musical style, analysis of expressive per-
formance, and the use of technology in musicology and music education. Heis author of the beat tracking software BeatRoot and the audio alignmentsoftware MATCH. He was Programme Chair for ISMIR 2007, and GeneralCo-chair of the 2011 Dagstuhl Seminar on Multimodal Music Processing, andhas published over 80 papers in the area of music informatics.