joint annotation of chromatin state and chromatin conformation reveals relationships among domain...
TRANSCRIPT
Joint annotation of chromatin state and chromatinconformation reveals relationships among domaintypes and identifies domains of cell-type-specificexpression
Maxwell W. Libbrecht,1 Ferhat Ay,2 Michael M. Hoffman,3,4 David M. Gilbert,5
Jeffrey A. Bilmes,6 and William Stafford Noble1,21Department of Computer Science and Engineering, University of Washington, Seattle, Washington 98195, USA; 2Departmentof Genome Sciences, University of Washington, Seattle, Washington 98195, USA; 3Princess Margaret Cancer Centre, Universityof Toronto, ON M5G 1L7, Canada; 4Department of Medical Biophysics, University of Toronto, ON M5G 1L7, Canada;5Department of Biological Science, The Florida State University, Tallahassee, Florida 32304, USA; 6Department of ElectricalEngineering, University of Washington, Seattle, Washington 98195, USA
The genomic neighborhood of a gene influences its activity, a behavior that is attributable in part to domain-scale regula-
tion. Previous genomic studies have identified many types of regulatory domains. However, due to the difficulty of inte-
grating genomics data sets, the relationships among these domain types are poorly understood. Semi-automated genome
annotation (SAGA) algorithms facilitate human interpretation of heterogeneous collections of genomics data by simulta-
neously partitioning the human genome and assigning labels to the resulting genomic segments. However, existing SAGA
methods cannot integrate inherently pairwise chromatin conformation data. We developed a new computational method,
called graph-based regularization (GBR), for expressing a pairwise prior that encourages certain pairs of genomic loci to receive
the same label in a genome annotation. We used GBR to exploit chromatin conformation information during genome an-
notation by encouraging positions that are close in 3D to occupy the same type of domain. Using this approach, we pro-
duced a model of chromatin domains in eight human cell types, thereby revealing the relationships among known domain
types. Through this model, we identified clusters of tightly regulated genes expressed in only a small number of cell types,
which we term “specific expression domains.” We found that domain boundaries marked by promoters and CTCF motifs
are consistent between cell types even when domain activity changes. Finally, we showed that GBR can be used to transfer
information from well-studied cell types to less well-characterized cell types during genome annotation, making it possible
to produce high-quality annotations of the hundreds of cell types with limited available data.
[Supplemental material is available for this article.]
Although the mechanism of regulation of a gene by a promoterdirectly upstream of its transcription start site is well understood,this type of local regulation does not explain the large effect of ge-nomic neighborhood on gene regulation. The neighborhood ef-fect is in part the consequence of domain-scale regulation, inwhich regions of hundreds or thousands of kilobases known as do-mains are regulated as a unit (Chakalova et al. 2005; Akhtar et al.2013; Bickmore and van Steensel 2013). Current understandingof domain-scale regulation is based on a number of domain types,each defined based on a different type of data, such as histonemodificationChIP-seq, replication timing, ormeasures of chroma-tin conformation. However, as a result of the difficulty of integrat-ing genomics data sets, the relationships among these domaintypes are poorly understood. Therefore, a principled method forjointly modeling all available types of data is needed to improveour understanding of domain-scale regulation.
A class of methods we term semi-automated genome annota-tion (SAGA) algorithms is widely used to jointly model diverse ge-
nomics data sets. These algorithms take as input a collection ofgenomics data sets and simultaneously partition the genomeand label each segment with an integer such that positions withthe same label have similar patterns of activity. These algorithmsare “semi-automated” because a human performs a functional in-terpretation of the labels after the annotation process. Examples ofSAGA algorithms include HMMSeg (Day et al. 2007), ChromHMM(Ernst and Kellis 2010), Segway (Hoffman et al. 2012), and others(Thurman et al. 2007; Lian et al. 2008; Filion et al. 2010). These ge-nome annotation algorithms have had great success in interpret-ing genomics data and have been shown to recapitulate knownfunctional elements including genes, promoters, and enhancers.
However, existing SAGA methods cannot model chromatinconformation information. The 3D arrangement of chromatin inthe nucleus plays a central role in gene regulation, chromatin stateand replication timing (Misteli 2007; Dekker 2008; Ryba et al.2010; Dixon et al. 2012). Chromatin architecture can be
Corresponding author: [email protected] published online before print. Article, supplemental material, and publi-cation date are at http://www.genome.org/cgi/doi/10.1101/gr.184341.114.
© 2015 Libbrecht et al. This article is distributed exclusively by Cold SpringHarbor Laboratory Press for the first six months after the full-issue publicationdate (see http://genome.cshlp.org/site/misc/terms.xhtml). After six months, itis available under a Creative Commons License (Attribution-NonCommercial4.0 International), as described at http://creativecommons.org/licenses/by-nc/4.0/.
Method
544 Genome Research 25:544–557 Published by Cold Spring Harbor Laboratory Press; ISSN 1088-9051/15; www.genome.orgwww.genome.org
investigated using chromatin conformation capture (3C) assays,including the genome-wide conformation capture assay, Hi-C. AHi-C experiment outputs a matrix of contact counts, where thecontact frequency of a pair of positions is inversely proportionalto the positions’ 3D distance in the nucleus (Lieberman-Aidenet al. 2009; Ay et al. 2014b). Existing SAGA methods can incorpo-rate any data set that can be represented as a vector defined linearlyacross the genome, but they cannot incorporate inherently pair-wise Hi-C data without resorting to simplifying transformationssuch as principal component analysis.
We present a method for integrating chromatin architectureinformation into a genome annotation method. Motivated bythe observation that pairs of loci close in 3D tend to occupy thesame type of domain, we encourage these pairs to be assignedthe same label in a genome annotation through a pairwise prior.We developed a novel computational method, called graph-basedregularization (GBR), which performs inference in the presence ofsuch a pairwise prior, and we extended the existing SAGA algo-rithm Segway (Hoffman et al. 2012) to implement this method.
GBR can also be used for the seemingly unrelated task oftransferring information fromwell-studied cell types for the anno-tation of cell types with limited available data. Consortia such asENCODE have characterized a small set of cell types in great detailusing hundreds of genomics assays. However, due to the high costof genomics experiments, it is feasible to perform only a few assayson any additional cell type of interest. For example, ENCODE andRoadmap Epigenomics Consortia have each performed two to 10experiments in more than 100 cell types, and it is common foran individual laboratory to perform a small number of experi-ments on a particular cell type or perturbation of interest. Insuch settings, it is crucial to leverage information garnered fromwell-studied cell types to allow accurate annotation of other celltypes using just a few experiments. We transfer informationfrom well-studied cell types with GBR by using the pairwise priorthat loci that were assigned the same label in many well-studiedcell types should be more likely to receive the same label in a celltype of interest. Therefore, GBR makes it possible to producehigh-quality annotations of the hundreds of cell types with limit-ed available data.
Results
Chromatin domains colocalize with domains of similar activity
Previous research has shown that large chromatin domains(∼1 Mb) tend to colocalize with domains of similar activity in 3D(Lieberman-Aiden et al. 2009; Ryba et al. 2010). To further explorethis trend, we compared the 1D genomics data at pairs of statisti-cally significantly interacting loci (Supplemental Fig. 1). As expect-ed, we found that chromatin signalswere highly consistent at pairsof positions nearby in 3D. First, histone modification and replica-tion signal values at pairs of significantly interacting loci are morehighly correlated than for a rotational permutation control, whichcontrols for the 1D pattern of the signal (Supplemental Fig. 1A).Second, Segway labels generatedwithout usingGBR from an anno-tation of the genome were assigned the same label much more of-ten than a rotational permutation control (Supplemental Fig. 1B).Note that this pattern is in stark contrast to small elements (∼100base pairs [bp]) such as promoters and enhancers, which do not, ingeneral, cluster with elements of the same type. These observa-tions suggest that chromatin conformation data might best be in-corporated using a pairwise prior stating that a pair of positions
should be more likely to receive the same label if the positionsare close in 3D. Therefore, we sought to develop new methodsfor leveraging chromatin conformation data using this colocaliza-tion pattern.
GBR expresses a pairwise prior in a SAGA method
Existing SAGA algorithms use dynamic programming algorithmsto perform inference in a chain-structured Bayesian networksuch as a hidden Markov model. Dynamic programming algo-rithms such as the forward-backward algorithm can be used to per-form inference efficiently in models with chain-structureddependencies; however, applying these methods in the presenceof a pairwise prior that connects arbitrary pairs of positions resultsin inference costs that grow exponentially in the number of geno-mic positions. Therefore, these methods cannot be applied to ge-nome annotation problems with millions or billions of variables.We propose a novel convex optimization framework that allowsfor efficient inference in this case.
The method takes as input a set of genomics data sets andweighted graphs over the genomic positions, where a large weighton a given pair of positions indicates that we have a strong priorbelief that this pair should receive the same label. It outputs a prob-ability distribution over the integer labels at each position. Themethod encourages pairs of positions connected by edges in thegraph to be assigned the same label by minimizing a measure ofdissimilarity between their output probability distributions calledthe Kullback-Leibler (KL) divergence.
We call this strategy of using a graph to incorporate a pairwiseprior graph-based regularization (GBR) (Methods). Note that inthis article we use the word “prior” in the nontechnical sense of“prior information,” not in the sense of a prior distribution for aBayesianmodel.We have developed an efficient, novel alternatingminimization algorithm that optimizes this objective (Supple-mental Note 1). Using synthetic data, we determined that GBRoutperforms alternativemethods based on approximate inference,as well as existing methods for GBR (Supplemental Note 2). Wethen extended the SAGA method Segway to implement this algo-rithm (Supplemental Note 3; Hoffman et al. 2012).
Using GBR to integrate 3D structure information improves
prediction of replication and topological domains
We used GBR to integrate chromatin conformation informationusing the pairwise prior that positions close in 3D should bemore likely to be identified as the same domain type (Fig. 1A).To do this, we construct a GBR graph that connects each pair of po-sitions with weight proportional to our statistical confidence thatthe positions physically interact (Methods; Ay et al. 2014a). Thismeasure of statistical confidence controls for the bias of Hi-C forpositions close in 1D, as well as biases for sequence features suchas GC content and restriction site density.
Incorporating Hi-C data using GBR has the effect of bothaligning domains to regions of self-interacting chromatin andhelping to determine the label of each segment. We evaluatedthe first effect, as a sanity check, by computing the accuracywith which our annotation predicts self-interacting regions ofchromatin of size ∼1 Mb called topological domains (Dixonet al. 2012; Filippova et al. 2014). We evaluated the second effectby comparing to replication time, which is highly correlatedwith gene expression and chromatin state and therefore is agood proxy for domain type. In order to evaluate our performancein a variety of conditions, we ran Segway augmented with GBR
Joint domain annotation of chromatin conformation
Genome Research 545www.genome.org
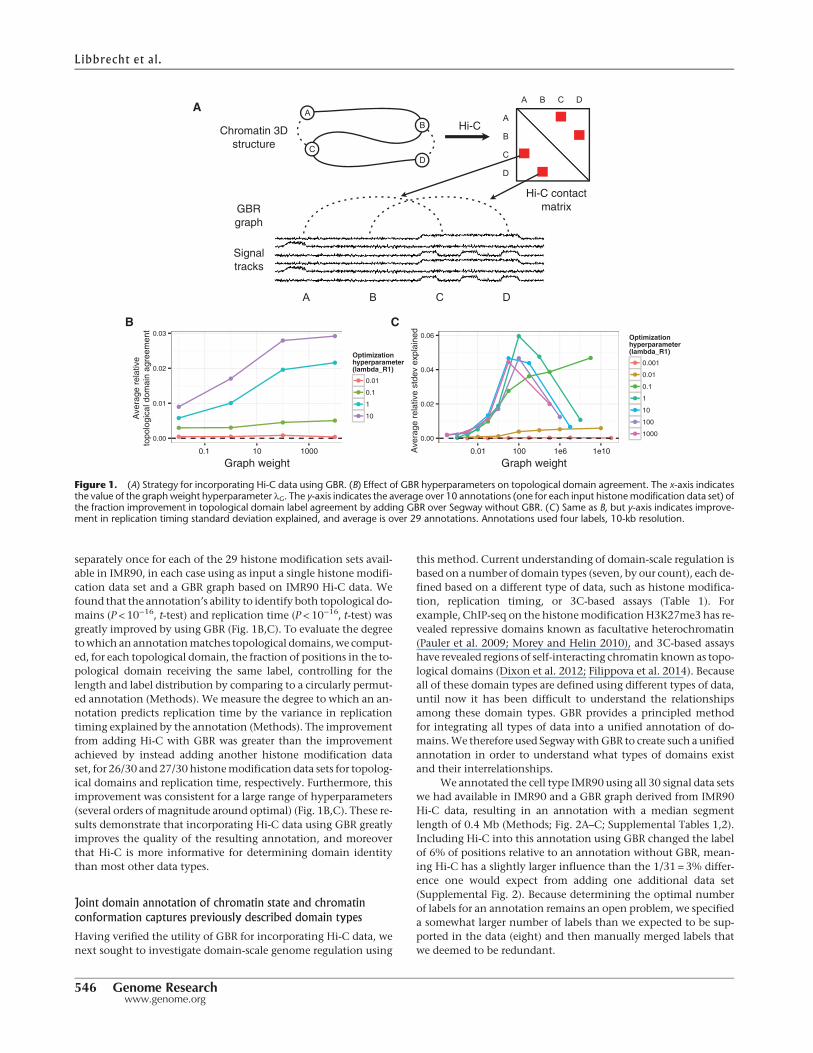
separately once for each of the 29 histone modification sets avail-able in IMR90, in each case using as input a single histone modifi-cation data set and a GBR graph based on IMR90 Hi-C data. Wefound that the annotation’s ability to identify both topological do-mains (P < 10−16, t-test) and replication time (P < 10−16, t-test) wasgreatly improved by using GBR (Fig. 1B,C). To evaluate the degreetowhich an annotationmatches topological domains,we comput-ed, for each topological domain, the fraction of positions in the to-pological domain receiving the same label, controlling for thelength and label distribution by comparing to a circularly permut-ed annotation (Methods). We measure the degree to which an an-notation predicts replication time by the variance in replicationtiming explained by the annotation (Methods). The improvementfrom adding Hi-C with GBR was greater than the improvementachieved by instead adding another histone modification dataset, for 26/30 and 27/30 histonemodification data sets for topolog-ical domains and replication time, respectively. Furthermore, thisimprovement was consistent for a large range of hyperparameters(several orders of magnitude around optimal) (Fig. 1B,C). These re-sults demonstrate that incorporating Hi-C data using GBR greatlyimproves the quality of the resulting annotation, and moreoverthat Hi-C is more informative for determining domain identitythan most other data types.
Joint domain annotation of chromatin state and chromatin
conformation captures previously described domain types
Having verified the utility of GBR for incorporating Hi-C data, wenext sought to investigate domain-scale genome regulation using
this method. Current understanding of domain-scale regulation isbased on a number of domain types (seven, by our count), each de-fined based on a different type of data, such as histone modifica-tion, replication timing, or 3C-based assays (Table 1). Forexample, ChIP-seq on the histonemodificationH3K27me3 has re-vealed repressive domains known as facultative heterochromatin(Pauler et al. 2009; Morey and Helin 2010), and 3C-based assayshave revealed regions of self-interacting chromatin known as topo-logical domains (Dixon et al. 2012; Filippova et al. 2014). Becauseall of these domain types are defined using different types of data,until now it has been difficult to understand the relationshipsamong these domain types. GBR provides a principled methodfor integrating all types of data into a unified annotation of do-mains.We therefore used SegwaywithGBR to create such a unifiedannotation in order to understand what types of domains existand their interrelationships.
We annotated the cell type IMR90 using all 30 signal data setswe had available in IMR90 and a GBR graph derived from IMR90Hi-C data, resulting in an annotation with a median segmentlength of 0.4 Mb (Methods; Fig. 2A–C; Supplemental Tables 1,2).Including Hi-C into this annotation using GBR changed the labelof 6% of positions relative to an annotation without GBR, mean-ing Hi-C has a slightly larger influence than the 1/31 = 3% differ-ence one would expect from adding one additional data set(Supplemental Fig. 2). Because determining the optimal numberof labels for an annotation remains an open problem, we specifieda somewhat larger number of labels than we expected to be sup-ported in the data (eight) and then manually merged labels thatwe deemed to be redundant.
AB
CD
A B C D
Chromatin 3D structure
A
B
C
D
A B C D
Hi-C contact matrixGBR
graph
Signaltracks
Hi-C
0.00
0.01
0.02
0.03
1e 01 1e+01 1e+03Graph weight
Ave
rage
rel
ativ
eto
polo
gica
l dom
ain
agre
emen
t
Optimizationhyperparameter(lambda_R1)
0.01
0.1
1
10
0.00
0.02
0.04
0.06
1e 02 1e+02 1e+06 1e+10Graph weight
Ave
rage
rel
ativ
e st
dev
expl
aine
d
Optimizationhyperparameter(lambda_R1)
0.001
0.01
0.1
1
10
100
1000
A
B C
Graph weight0.1 100.1 1000
Graph weight0.01 100 1e6 1e10
Ave
rage
rel
ativ
e to
polo
gica
l dom
ain
agre
emen
t
Ave
rage
rel
ativ
e st
dev
expl
aine
d
Figure 1. (A) Strategy for incorporating Hi-C data using GBR. (B) Effect of GBR hyperparameters on topological domain agreement. The x-axis indicatesthe value of the graphweight hyperparameter λG. The y-axis indicates the average over 10 annotations (one for each input histonemodification data set) ofthe fraction improvement in topological domain label agreement by adding GBR over Segway without GBR. (C) Same as B, but y-axis indicates improve-ment in replication timing standard deviation explained, and average is over 29 annotations. Annotations used four labels, 10-kb resolution.
Libbrecht et al.
546 Genome Researchwww.genome.org
We compared our annotation to eight types of features (Table2). On the basis of these analyses, we merged labels that appearedredundant and assigned names to each integer label (or group oflabels) that best matched our interpretation of their function.This procedure yielded five types of domains: (1) broad expression(BRD), (2) specific expression (SPC), (3) facultative heterochroma-tin (FAC), (4) constitutive heterochromatin (CON), and (5) quies-cent (QUI). We describe the analyses that led us to these namesin the following sections.
In order to understand how domains change state betweencell types, we additionally annotated eight cell types using12 data sets present in all eight types and aGBR graph representingcommon 3D contacts generated by combining the IMR90 andH1-hESC Hi-C data sets (Methods; Supplemental Table 2). Thisstrategy of combining Hi-C data sets is motivated by the consisten-cy of Hi-C across cell types (Supplemental Fig. 3). Again, we usedeight labels and merged redundant labels, to which we assignedthe same five names. We investigated the properties of these fivedomain types.
Repressive domains are divided into constitutive, facultative
and quiescent heterochromatin
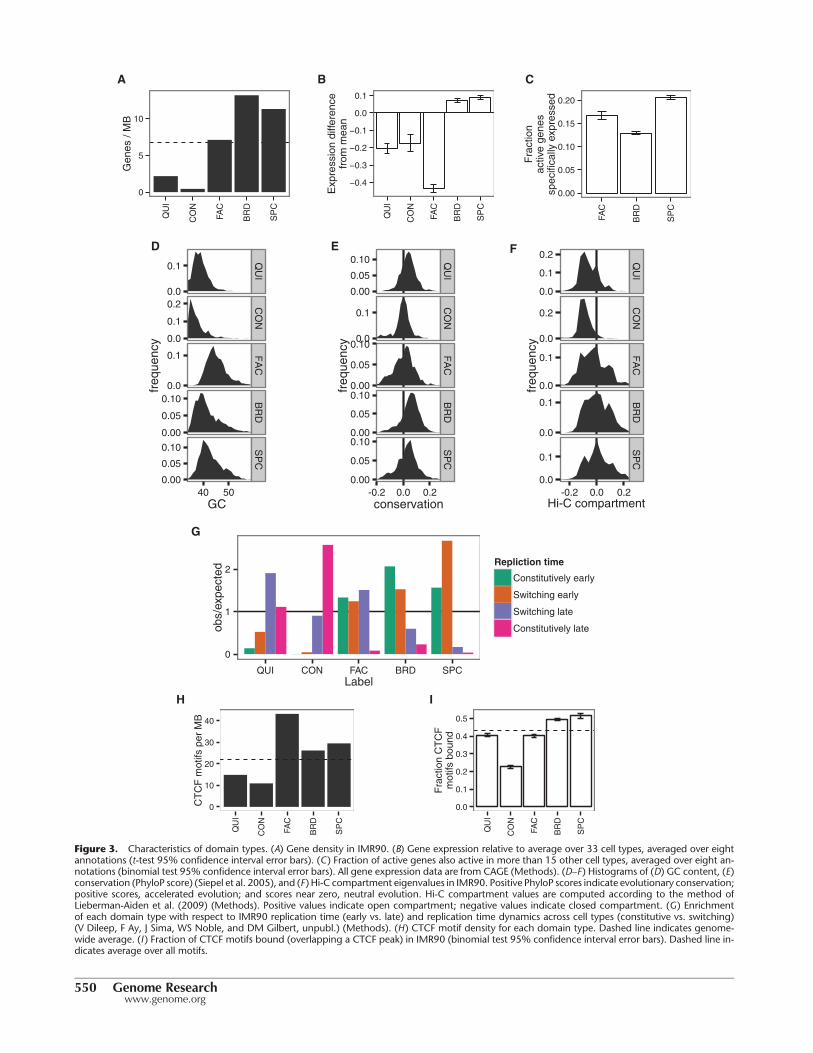
Previous studies have reported two types of repressive domains.The first type, best known as “constitutive heterochromatin” butsometimes referred to simply as “heterochromatin,” is regulatedby the HP1 complex and associated with the histone modificationH3K9me3 (Lachner et al. 2003). Constitutive heterochromatin isthought to repress permanently silent regions such as centromeresand telomeres. As expected, one output domain type “CON” ex-hibits all the known properties of constitutive heterochromatin.CON domains are associated with H3K9me3 (Fig. 2A,D), are ex-tremely depleted for genes (Fig. 3A), are associated with low GCcontent and lack of evolutionary conservation (Fig. 3D,E), appearwithin the Hi-C eigenvector closed compartment (Fig. 3F; Meth-ods), and cover regions that are constitutively late replicating inall cell types (Fig. 3G). CON domains are depleted both for tran-scription factor motifs and for transcription factor binding at mo-tifs (Fig. 3H,I).
The second known type of repressive domain is best known as“facultative heterochromatin” but is also sometimes referred toas BLOCs or Polycomb-repressed chromatin (Pauler et al. 2009;
Morey and Helin 2010). Facultative heterochromatin is regulatedby the Polycomb complex and is associated with the histonemod-ificationH3K27me3. Facultative heterochromatin is thought to re-press tissue-specific genes in cells where they are inactive. Asexpected, the output domain type “FAC” has all the known prop-erties of facultative heterochromatin. FAC domains are marked byH3K27me3 (Fig. 2A,D), and they are enriched for genes (Fig. 3A),GC content (Fig. 3D), and conservation (Fig. 3E), but strongly de-pleted for gene expression relative to an average across cell types(Fig. 3B), indicating that FAC domains have a direct repressive ef-fect. FAC domains are mixed between the open and closed com-partments, indicating that facultative repression is independentof compartment-driven repression (Fig. 3F). However, FAC do-mains are almost completely absent from the annotation of theembryonic stem cell line H1-hESC, consistent with previous obser-vations that H3K27me3 does not form domains in embryonicstem cells but rather occurs only at so-called poised or bivalent pro-moters (Supplemental Fig. 4; Bernstein et al. 2006).
Other semi-automated genome annotation analyses have re-ported a third type of repressive domain, characterized by a lack ofsignal from any mark, termed “quiescent domains” (Ernst andKellis 2010; Filion et al. 2010; Hoffman et al. 2012; Julienneet al. 2013). We identified this domain type as the QUI label(Fig. 2A). Note that Segway marginalizes over missing data ratherthan setting the values to zero (Supplemental Note 3), so theQUI label is not simply an artifact of unmappable regions. QUI do-mains are highly depleted for genes (Fig. 3A) and occur in theclosed compartment (Fig. 3F). QUI domains are depleted for tran-scription factor motifs but, unlike FAC and CON domains, are notdepleted for transcription factor binding at motifs, indicating thatQUI chromatin does not have a direct repressive effect (Fig. 3H,I).The mechanism behind the activity of QUI domains is unknown,but these results are consistent with a model in which QUI do-mains lack any activating signals but are not directly repressed.
Active domains are divided between broad
and specific gene expression
Previous studies of human domains have focused on various typesof repressive domains but have assigned all active chromatin toone domain category (Pauler et al. 2009; Wen et al. 2009; Julienneet al. 2013). However, studies in other organisms have reported
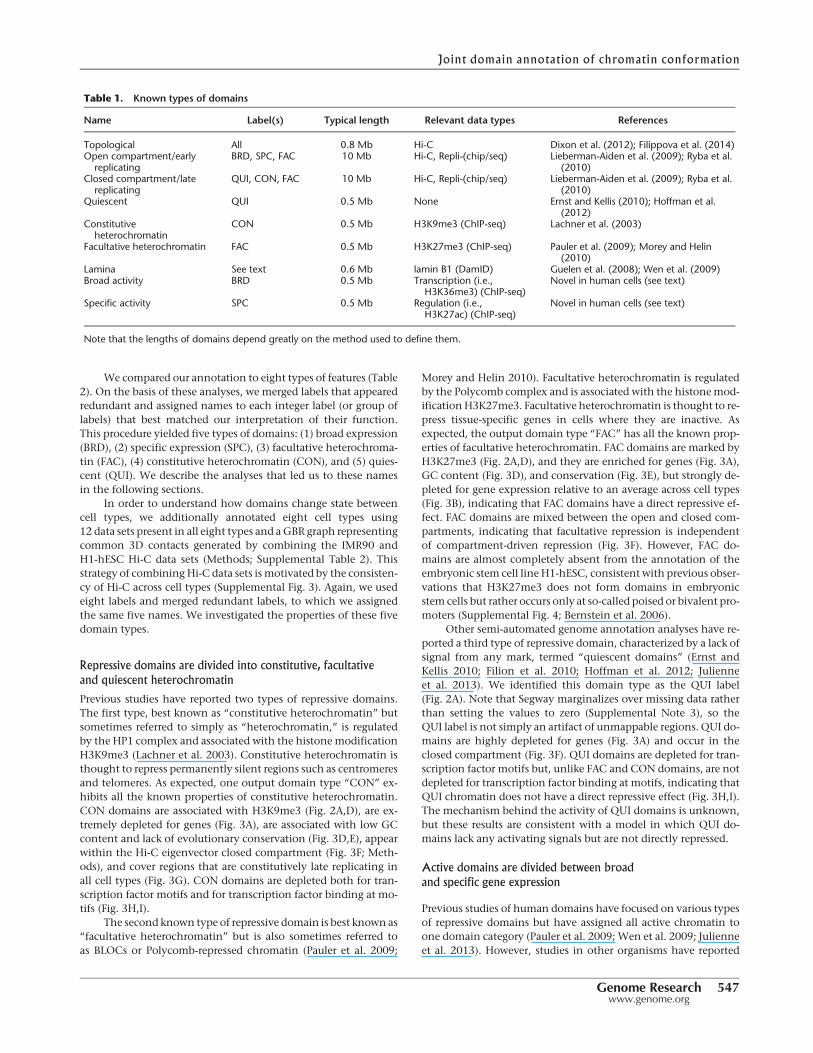
Table 1. Known types of domains
Name Label(s) Typical length Relevant data types References
Topological All 0.8 Mb Hi-C Dixon et al. (2012); Filippova et al. (2014)Open compartment/early
replicatingBRD, SPC, FAC 10 Mb Hi-C, Repli-(chip/seq) Lieberman-Aiden et al. (2009); Ryba et al.
(2010)Closed compartment/late
replicatingQUI, CON, FAC 10 Mb Hi-C, Repli-(chip/seq) Lieberman-Aiden et al. (2009); Ryba et al.
(2010)Quiescent QUI 0.5 Mb None Ernst and Kellis (2010); Hoffman et al.
(2012)Constitutive
heterochromatinCON 0.5 Mb H3K9me3 (ChIP-seq) Lachner et al. (2003)
Facultative heterochromatin FAC 0.5 Mb H3K27me3 (ChIP-seq) Pauler et al. (2009); Morey and Helin(2010)
Lamina See text 0.6 Mb lamin B1 (DamID) Guelen et al. (2008); Wen et al. (2009)Broad activity BRD 0.5 Mb Transcription (i.e.,
H3K36me3) (ChIP-seq)Novel in human cells (see text)
Specific activity SPC 0.5 Mb Regulation (i.e.,H3K27ac) (ChIP-seq)
Novel in human cells (see text)
Note that the lengths of domains depend greatly on the method used to define them.
Joint domain annotation of chromatin conformation
Genome Research 547www.genome.org
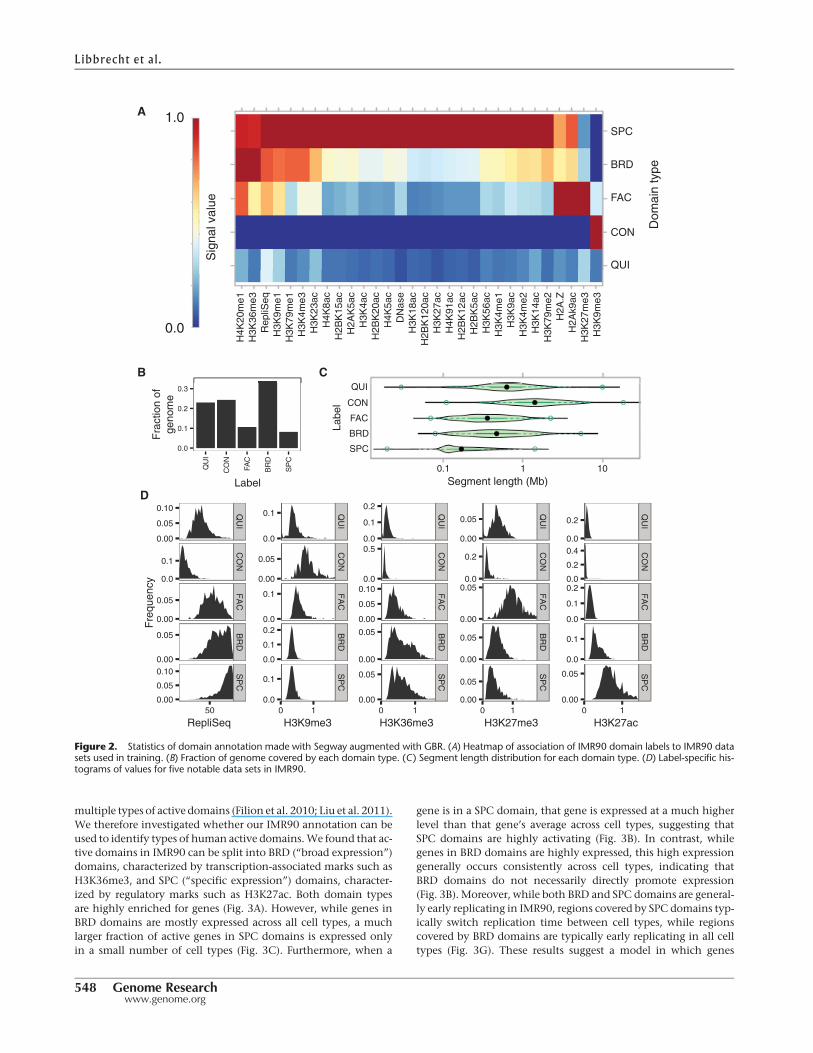
multiple types of active domains (Filion et al. 2010; Liu et al. 2011).We therefore investigated whether our IMR90 annotation can beused to identify types of human active domains.We found that ac-tive domains in IMR90 can be split into BRD (“broad expression”)domains, characterized by transcription-associated marks such asH3K36me3, and SPC (“specific expression”) domains, character-ized by regulatory marks such as H3K27ac. Both domain typesare highly enriched for genes (Fig. 3A). However, while genes inBRD domains are mostly expressed across all cell types, a muchlarger fraction of active genes in SPC domains is expressed onlyin a small number of cell types (Fig. 3C). Furthermore, when a
gene is in a SPC domain, that gene is expressed at a much higherlevel than that gene’s average across cell types, suggesting thatSPC domains are highly activating (Fig. 3B). In contrast, whilegenes in BRD domains are highly expressed, this high expressiongenerally occurs consistently across cell types, indicating thatBRD domains do not necessarily directly promote expression(Fig. 3B). Moreover, while both BRD and SPC domains are general-ly early replicating in IMR90, regions covered by SPC domains typ-ically switch replication time between cell types, while regionscovered by BRD domains are typically early replicating in all celltypes (Fig. 3G). These results suggest a model in which genes
0.0
0.1
0.2
0.3
QU
I
CO
N
FAC
BR
D
SP
C
label
Fra
ctio
n of
geno
me
BRD
CON
FAC
QUI
SPC
Labe
l
Segment length (MB)0.1 1 10
QUI
Sig
nal v
alue
SPC
BRD
FAC
CON
QUI
Dom
ain
type
1.0
0.0
A
B C
0.0
0.2
0.0
0.2
0.4
0.0
0.1
0.2
0.0
0.1
0.00
0.05
QU
IC
ON
FA
CB
RD
SP
C
0 1imr90_h3k27ac
freq
uenc
y
0.00
0.05
0.0
0.2
0.00
0.05
0.00
0.05
0.00
0.05
QU
IC
ON
FA
CB
RD
SP
C
0 1imr90_h3k27me3
freq
uenc
y
0.0
0.1
0.2
0.0
0.5
0.00
0.05
0.10
0.00
0.05
0.00
0.05
QU
IC
ON
FA
CB
RD
SP
C
0 1imr90_h3k36me3
freq
uenc
y
0.0
0.1
0.00
0.05
0.0
0.1
0.0
0.1
0.2
0.0
0.1
QU
IC
ON
FA
CB
RD
SP
C
0 1imr90_h3k9me3
freq
uenc
y
0.00
0.05
0.10
0.0
0.1
0.00
0.05
0.00
0.05
0.00
0.05
0.10
QU
IC
ON
FA
CB
RD
SP
C
50imr90_rt
freq
uenc
y
D
H4K
20m
e1H
3K36
me3
Rep
liSeq
H3K
9me1
H3K
79m
e1H
3K4m
e3H
3K23
acH
4K8a
cH
2BK
15ac
H2A
K5a
cH
3K4a
cH
2BK
20ac
H4K
5ac
DN
ase
H3K
18ac
H2B
K12
0ac
H3K
27ac
H4K
91ac
H2B
K12
acH
2BK
5ac
H3K
56ac
H3K
4me1
H3K
9ac
H3K
4me2
H3K
14ac
H3K
79m
e2H
2A.Z
H2A
k9ac
H3K
27m
e3H
3K9m
e3
RepliSeq H3K9me3 H3K36me3 H3K27me3 H3K27ac
Segment length (Mb)Label
Fra
ctio
n of
geno
me
Fre
quen
cy
Sig
nal v
alue
Dom
ain
type
SPC
BRD
FAC
CON
QUI
Figure 2. Statistics of domain annotation made with Segway augmented with GBR. (A) Heatmap of association of IMR90 domain labels to IMR90 datasets used in training. (B) Fraction of genome covered by each domain type. (C) Segment length distribution for each domain type. (D) Label-specific his-tograms of values for five notable data sets in IMR90.
Libbrecht et al.
548 Genome Researchwww.genome.org
performing housekeeping functions such as DNA repair havestrong promoters but little other regulation, whereas genes specificto a given tissue are regulated by a complex web of regulatory ele-ments, allowing the genome to specify precise conditions underwhich the gene is active.
To test this hypothesis, we computed the enrichment of GeneOntology (GO) terms for genes in BRD and SPC domains (GeneOntology Consortium 2000; Boyle et al. 2004). We found thatgenes in BRD domains were enriched for housekeeping functionssuch as cell cycle and DNA repair, while genes in SPC domainswere enriched for IMR90-specific developmental functions suchas vasculature development and stimulus response (SupplementalTables 3, 4; Supplemental Fig. 5). In order to avoid hindsight bias,before looking at these GO term enrichments, we mixed the en-riched terms with an equal number of decoy terms matched ac-cording to the number of genes associated with each term, andmanually labeled which terms matched our hypothesized func-tions for each domain (housekeeping for BRD, IMR90-specific forSPC). We correctly identified 21/32 BRD enrichments (1/31 =3%) and 54/64 SPC enrichments (P = 1.4 × 10⁻⁶). This demon-strates that active regions can be divided into domains of broadlyexpressed housekeeping genes and domains of specifically ex-pressed developmental genes. To our knowledge, this is the firsttime a split between domains of BRD and SPC has been reportedin human cells.
Lamina association is driven by a complex structure
of domains
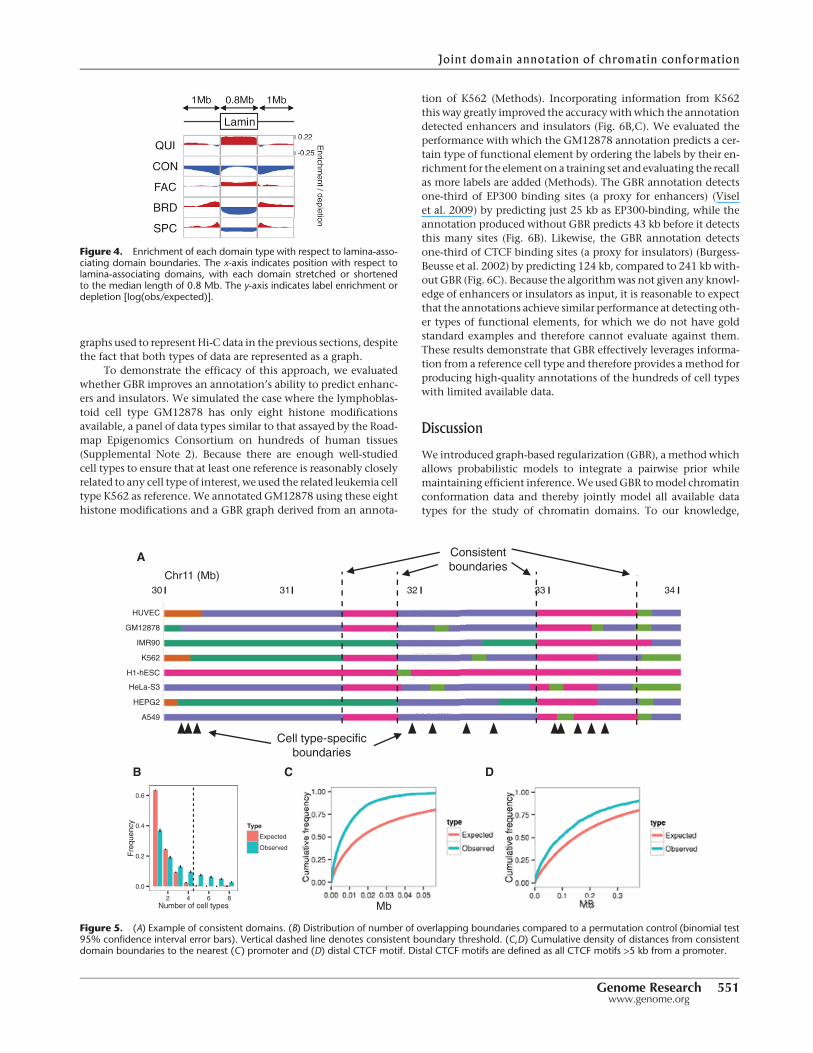
Previouswork has shown that some repressive domains aremarkedwith the histonemodification H3K9me2, associate with the factorlamin B1, and localize to the nuclear lamina (Guelen et al. 2008;Wen et al. 2009). We found that comparing lamina associationto domain annotations based on many data sets reveals a muchmore complex interaction than does comparison to each mark in-dividually (Fig. 4). As expected, repressive domains (QUI and FAC)are enriched inside lamina-associating chromatin domains, whileactive domains are depleted. However, this analysis also revealsthat CON domains are depleted immediately inside lamina-asso-ciating domain boundaries while being comparatively enrichedat their centers. In contrast, FAC domains are highly enriched atlamina-associating domain boundaries while being comparativelydepleted at their centers. In addition, while active domains (SPCand BRD) are depleted inside lamina-associating domains, theyare highly enriched directly outside their boundaries. These obser-vations suggest that lamina-associating domains form around acore of repressed chromatin and spread until they hit a strong ac-tive element.
Developmentally consistent domain boundaries are marked
by identifiable sequence elements
Previous research has shown that domain boundaries tend to beconsistent between cell types even when the state of the domainchanges. For example, when a region’s replication time is per-turbed by leukemia, the boundaries of the resulting replicationdomain tend to occur at the same positions as developmental rep-lication timing domain boundaries (Ryba et al. 2012). However,the cause of these consistent domain boundaries remains unclear.We investigated the consistency of domain boundaries using ourdomain annotations. As expected, domain boundaries frequentlyoccurred at consistent positions across cell types, even when thedomains’ state changed (Fig. 5A). To identify these consistentdomain boundaries, we combined all boundaries occurring in atleast one cell type and merged boundaries within 50 kb. We de-fined groups of five or more boundaries as consistent (Methods;Fig. 5B). As expected, these consistent boundaries are enrichedfor replication domain boundaries, but many consistent domainboundaries do not overlap a replication domain boundary(Supplemental Fig. 6). We additionally found that consistentdomain boundaries are highly enriched for promoters and CTCFmotifs, suggesting that these elements may drive domain bound-ary formation (Fig. 5C,D).
Using GBR to transfer information between cell types
improves accuracy of predicting functional elements
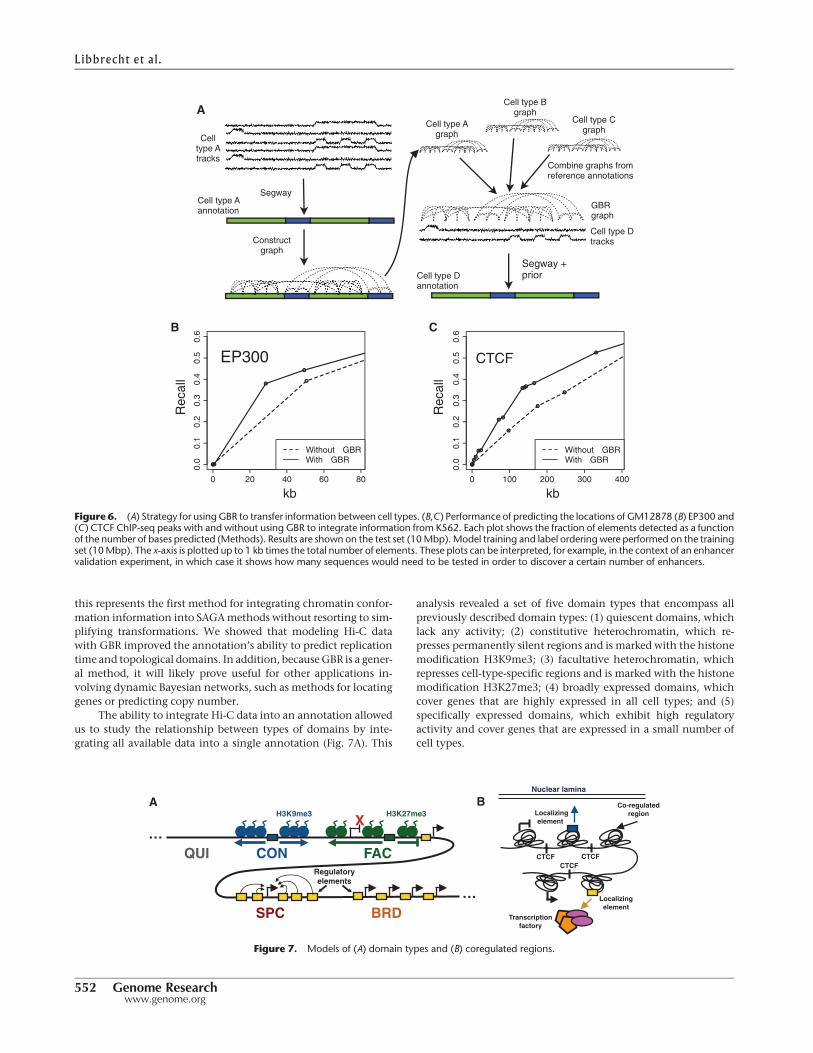
GBR can also be used for the seemingly unrelated task of transfer-ring information fromwell-studied cell types for the annotation ofcell types with limited available data (Fig. 6A). Existing SAGAmethods work well on data from a single cell type, but integratinginformation between cell types remains an open problem. Existingmethods for using data frommultiple cell types for genome anno-tation fail to effectively address this problem (Supplemental Note4). We propose a novel strategy for leveraging information fromwell-studied cell types using the pairwise prior that if two positionsreceived the same label in many well-studied cell types, then theyshould be more likely to receive the same label in the target celltype (Fig. 6A). To express this pairwise prior, we first perform aSegway annotation (without GBR) of each well-studied cell typeand create a GBR graph that connects each pair of positions withweight proportional to the number of cell types in which thepair receive the same label, placing higherweight on cell types sim-ilar to the cell type of interest (Methods).We then use this graph incombination with the data sets available in the target cell type toproduce an annotation of this cell type. Note that this GBR graphrepresents an entirely different type of information from the
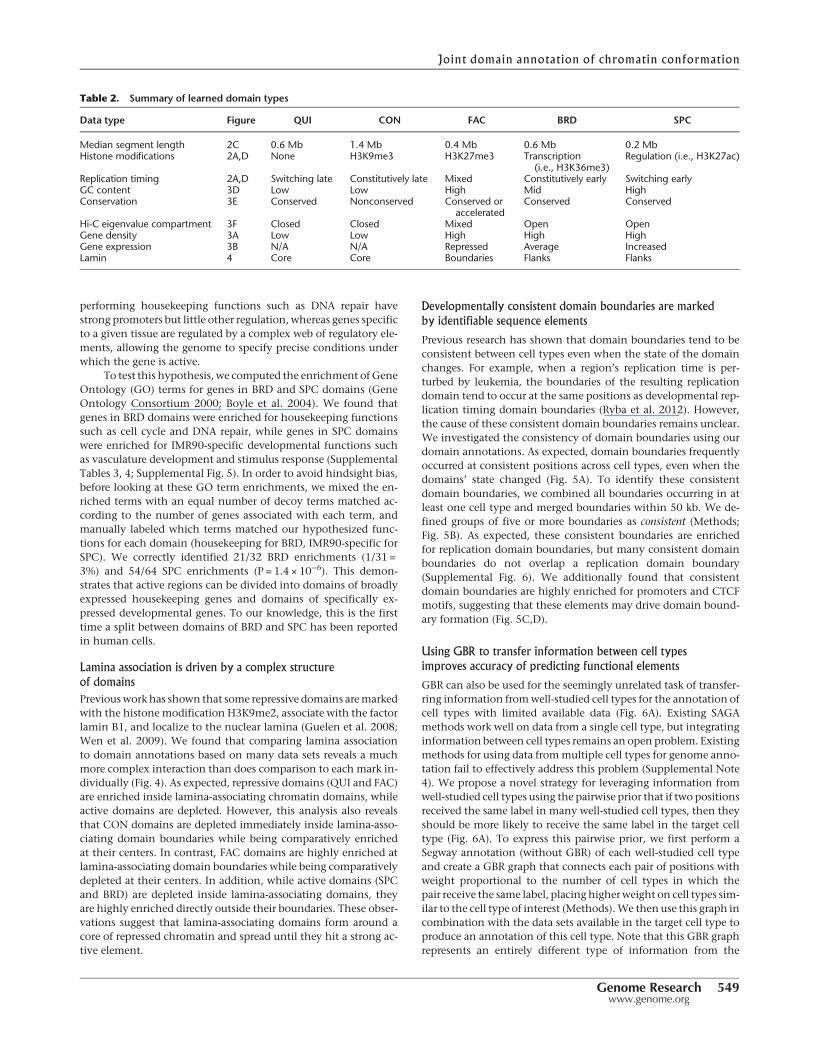
Table 2. Summary of learned domain types
Data type Figure QUI CON FAC BRD SPC
Median segment length 2C 0.6 Mb 1.4 Mb 0.4 Mb 0.6 Mb 0.2 MbHistone modifications 2A,D None H3K9me3 H3K27me3 Transcription
(i.e., H3K36me3)Regulation (i.e., H3K27ac)
Replication timing 2A,D Switching late Constitutively late Mixed Constitutively early Switching earlyGC content 3D Low Low High Mid HighConservation 3E Conserved Nonconserved Conserved or
acceleratedConserved Conserved
Hi-C eigenvalue compartment 3F Closed Closed Mixed Open OpenGene density 3A Low Low High High HighGene expression 3B N/A N/A Repressed Average IncreasedLamin 4 Core Core Boundaries Flanks Flanks
Joint domain annotation of chromatin conformation
Genome Research 549www.genome.org
Hi-C compartment
0.0
0.1
0.2
0.0
0.2
0.0
0.1
0.0
0.1
0.0
0.1
QU
IC
ON
FA
CB
RD
SP
C
-0.2 0.0 0.2
freq
uenc
y
0.00
0.05
0.10
0.0
0.1
0.00
0.05
0.10
0.00
0.05
0.10
0.00
0.05
0.10
QU
IC
ON
FA
CB
RD
SP
C
-0.2 0.0 0.2conservation
freq
uenc
y
0.0
0.1
0.0
0.1
0.2
0.0
0.1
0.00
0.05
0.10
0.00
0.05
0.10
QU
IC
ON
FA
CB
RD
SP
C
40 50GC
freq
uenc
y
0
5
10
QU
I
CO
N
FAC
BR
D
SP
C
Gen
es /
MB
0.4
0.3
0.2
0.1
0.0
0.1
QU
I
CO
N
FAC
BR
D
SP
C
Exp
ress
ion
diffe
renc
efr
om m
ean
0.00
0.05
0.10
0.15
0.20
FAC
BR
D
SP
C
Fra
ctio
nac
tive
gene
ssp
ecifi
cally
exp
ress
ed
0
1
2
QUI CON FAC BRD SPCLabel
obs/
expe
cted
Repliction time
Constitutively early
Switching early
Switching late
Constitutively late
0.0
0.1
0.2
0.3
0.4
0.5
QU
I
CO
N
FAC
BR
D
SP
C
Fra
ctio
n C
TC
Fm
otifs
bou
nd
0
10
20
30
40
QU
I
CO
N
FAC
BR
D
SP
C
CT
CF
mot
ifs p
er M
B
A B C
G
D E F
H I
Figure 3. Characteristics of domain types. (A) Gene density in IMR90. (B) Gene expression relative to average over 33 cell types, averaged over eightannotations (t-test 95% confidence interval error bars). (C) Fraction of active genes also active in more than 15 other cell types, averaged over eight an-notations (binomial test 95% confidence interval error bars). All gene expression data are from CAGE (Methods). (D–F ) Histograms of (D) GC content, (E)conservation (PhyloP score) (Siepel et al. 2005), and (F ) Hi-C compartment eigenvalues in IMR90. Positive PhyloP scores indicate evolutionary conservation;positive scores, accelerated evolution; and scores near zero, neutral evolution. Hi-C compartment values are computed according to the method ofLieberman-Aiden et al. (2009) (Methods). Positive values indicate open compartment; negative values indicate closed compartment. (G) Enrichmentof each domain type with respect to IMR90 replication time (early vs. late) and replication time dynamics across cell types (constitutive vs. switching)(V Dileep, F Ay, J Sima, WS Noble, and DM Gilbert, unpubl.) (Methods). (H) CTCF motif density for each domain type. Dashed line indicates genome-wide average. (I) Fraction of CTCF motifs bound (overlapping a CTCF peak) in IMR90 (binomial test 95% confidence interval error bars). Dashed line in-dicates average over all motifs.
550 Genome Researchwww.genome.org
graphs used to represent Hi-C data in the previous sections, despitethe fact that both types of data are represented as a graph.
To demonstrate the efficacy of this approach, we evaluatedwhether GBR improves an annotation’s ability to predict enhanc-ers and insulators. We simulated the case where the lymphoblas-toid cell type GM12878 has only eight histone modificationsavailable, a panel of data types similar to that assayed by the Road-map Epigenomics Consortium on hundreds of human tissues(Supplemental Note 2). Because there are enough well-studiedcell types to ensure that at least one reference is reasonably closelyrelated to any cell type of interest, we used the related leukemia celltype K562 as reference. We annotated GM12878 using these eighthistone modifications and a GBR graph derived from an annota-
tion of K562 (Methods). Incorporating information from K562this way greatly improved the accuracywithwhich the annotationdetected enhancers and insulators (Fig. 6B,C). We evaluated theperformance with which the GM12878 annotation predicts a cer-tain type of functional element by ordering the labels by their en-richment for the element on a training set and evaluating the recallas more labels are added (Methods). The GBR annotation detectsone-third of EP300 binding sites (a proxy for enhancers) (Viselet al. 2009) by predicting just 25 kb as EP300-binding, while theannotation produced without GBR predicts 43 kb before it detectsthis many sites (Fig. 6B). Likewise, the GBR annotation detectsone-third of CTCF binding sites (a proxy for insulators) (Burgess-Beusse et al. 2002) by predicting 124 kb, compared to 241 kb with-outGBR (Fig. 6C). Because the algorithmwas not given any knowl-edge of enhancers or insulators as input, it is reasonable to expectthat the annotations achieve similar performance at detecting oth-er types of functional elements, for which we do not have goldstandard examples and therefore cannot evaluate against them.These results demonstrate that GBR effectively leverages informa-tion from a reference cell type and therefore provides a method forproducing high-quality annotations of the hundreds of cell typeswith limited available data.
Discussion
We introduced graph-based regularization (GBR), a methodwhichallows probabilistic models to integrate a pairwise prior whilemaintaining efficient inference.We usedGBR tomodel chromatinconformation data and thereby jointly model all available datatypes for the study of chromatin domains. To our knowledge,
Figure 4. Enrichment of each domain type with respect to lamina-asso-ciating domain boundaries. The x-axis indicates position with respect tolamina-associating domains, with each domain stretched or shortenedto the median length of 0.8 Mb. The y-axis indicates label enrichment ordepletion [log(obs/expected)].
Consistentboundaries
boundaries
0.0
0.2
0.4
0.6
2 4 6 8Number of cell types
Fre
quen
cy Type
Expected
Observed
A
B C D
Mb Mb
Chr11 (Mb)30 3431 32 33
HUVEC
GM12878
IMR90
K562
H1-hESC
HeLa-S3
HEPG2
A549
MbMbMbMbMbMMbMbMbMMMbMMbbMMMMbMbMMbMMbMbMMbMbMbbbMbMMMbMMbMMbMbbbMbMbMbMMbMMbMbMMbMbMMbMMbbbbMMbMbMMbbMbMbMMMMbbMMMMbMbbMbMMMMbMMMMMbMbMMMbMMMMbbbbbMMMMbMMMMMM
Figure 5. (A) Example of consistent domains. (B) Distribution of number of overlapping boundaries compared to a permutation control (binomial test95% confidence interval error bars). Vertical dashed line denotes consistent boundary threshold. (C,D) Cumulative density of distances from consistentdomain boundaries to the nearest (C) promoter and (D) distal CTCF motif. Distal CTCF motifs are defined as all CTCF motifs >5 kb from a promoter.
Joint domain annotation of chromatin conformation
Genome Research 551www.genome.org
this represents the first method for integrating chromatin confor-mation information into SAGAmethods without resorting to sim-plifying transformations. We showed that modeling Hi-C datawith GBR improved the annotation’s ability to predict replicationtime and topological domains. In addition, becauseGBR is a gener-al method, it will likely prove useful for other applications in-volving dynamic Bayesian networks, such as methods for locatinggenes or predicting copy number.
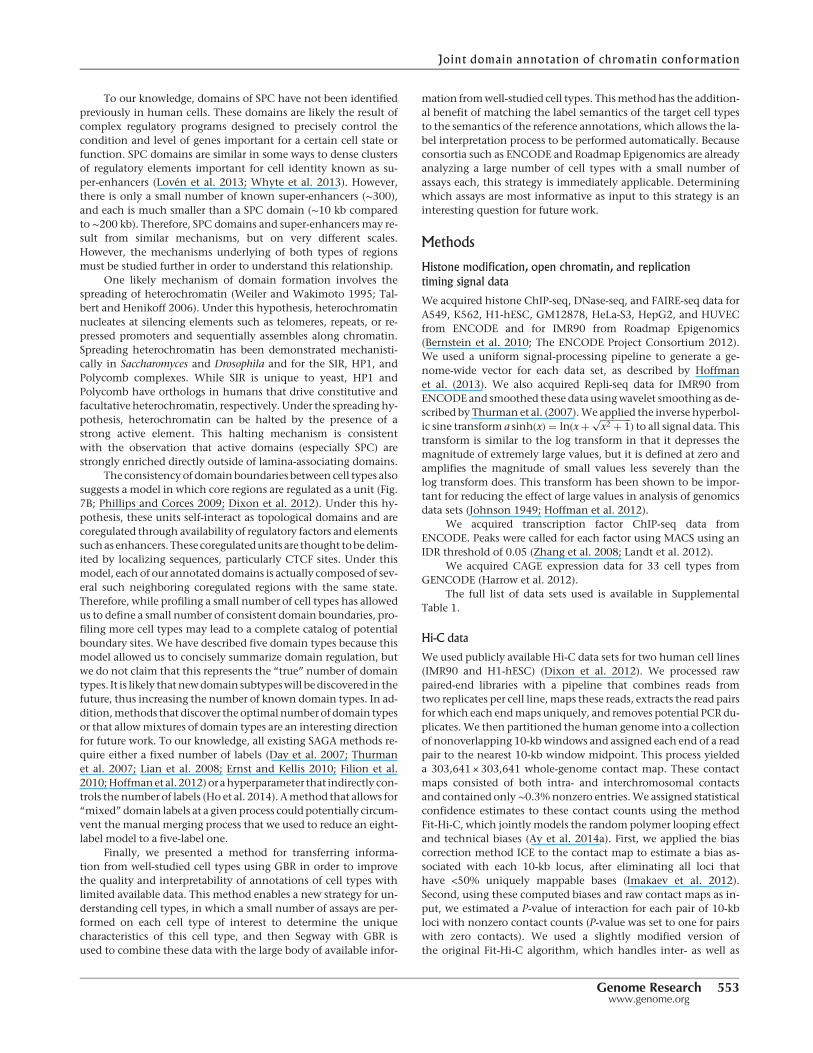
The ability to integrate Hi-C data into an annotation allowedus to study the relationship between types of domains by inte-grating all available data into a single annotation (Fig. 7A). This
analysis revealed a set of five domain types that encompass allpreviously described domain types: (1) quiescent domains, whichlack any activity; (2) constitutive heterochromatin, which re-presses permanently silent regions and is marked with the histonemodification H3K9me3; (3) facultative heterochromatin, whichrepresses cell-type-specific regions and is marked with the histonemodification H3K27me3; (4) broadly expressed domains, whichcover genes that are highly expressed in all cell types; and (5)specifically expressed domains, which exhibit high regulatoryactivity and cover genes that are expressed in a small number ofcell types.
Cell type D annotation
Cell type A annotation
Cell type A graph
sCell
type A tracks
Segway
Construct graph
g p
Combine graphs from reference annotations
Segway + prior
GBR graph
Cell type D tracks
Cell type B graph
Cell type C graph
Bases (x1000)0 100 200 300 400
0.0
0.1
0.2
0.3
0.4
0.5
0.6
Bases
Rec
all
Without EGBRWith EGBR
CTCF
Bases (x1000)0 20 40 60 80
0.0
0.1
0.2
0.3
0.4
0.5
0.6
Bases
Rec
all
Without EGBRWith EGBR
P300
Bases (x1000)
A
B C
EP300
kb kb
Rec
all
Rec
all
Figure 6. (A) Strategy for using GBR to transfer information between cell types. (B,C) Performance of predicting the locations of GM12878 (B) EP300 and(C ) CTCF ChIP-seq peaks with and without using GBR to integrate information from K562. Each plot shows the fraction of elements detected as a functionof the number of bases predicted (Methods). Results are shown on the test set (10Mbp). Model training and label ordering were performed on the trainingset (10Mbp). The x-axis is plotted up to 1 kb times the total number of elements. These plots can be interpreted, for example, in the context of an enhancervalidation experiment, in which case it shows how many sequences would need to be tested in order to discover a certain number of enhancers.
SPC BRD
QUI FAC
H3K27me3H3K9me3X
CONRegulatoryelements
A
CTCF
Nuclear lamina
Localizing element
Localizing element
CTCFCTCF
Transcriptionfactory
Co-regulatedregion
B
Figure 7. Models of (A) domain types and (B) coregulated regions.
Libbrecht et al.
552 Genome Researchwww.genome.org
To our knowledge, domains of SPC have not been identifiedpreviously in human cells. These domains are likely the result ofcomplex regulatory programs designed to precisely control thecondition and level of genes important for a certain cell state orfunction. SPC domains are similar in some ways to dense clustersof regulatory elements important for cell identity known as su-per-enhancers (Lovén et al. 2013; Whyte et al. 2013). However,there is only a small number of known super-enhancers (∼300),and each is much smaller than a SPC domain (∼10 kb comparedto ∼200 kb). Therefore, SPC domains and super-enhancers may re-sult from similar mechanisms, but on very different scales.However, the mechanisms underlying of both types of regionsmust be studied further in order to understand this relationship.
One likely mechanism of domain formation involves thespreading of heterochromatin (Weiler and Wakimoto 1995; Tal-bert and Henikoff 2006). Under this hypothesis, heterochromatinnucleates at silencing elements such as telomeres, repeats, or re-pressed promoters and sequentially assembles along chromatin.Spreading heterochromatin has been demonstrated mechanisti-cally in Saccharomyces and Drosophila and for the SIR, HP1, andPolycomb complexes. While SIR is unique to yeast, HP1 andPolycomb have orthologs in humans that drive constitutive andfacultative heterochromatin, respectively. Under the spreading hy-pothesis, heterochromatin can be halted by the presence of astrong active element. This halting mechanism is consistentwith the observation that active domains (especially SPC) arestrongly enriched directly outside of lamina-associating domains.
The consistencyof domainboundaries between cell types alsosuggests a model in which core regions are regulated as a unit (Fig.7B; Phillips and Corces 2009; Dixon et al. 2012). Under this hy-pothesis, these units self-interact as topological domains and arecoregulated through availability of regulatory factors and elementssuchas enhancers. These coregulatedunits are thought tobedelim-ited by localizing sequences, particularly CTCF sites. Under thismodel, each of our annotated domains is actually composed of sev-eral such neighboring coregulated regions with the same state.Therefore, while profiling a small number of cell types has allowedus to define a small number of consistent domain boundaries, pro-filing more cell types may lead to a complete catalog of potentialboundary sites. We have described five domain types because thismodel allowed us to concisely summarize domain regulation, butwe do not claim that this represents the “true” number of domaintypes. It is likely thatnewdomain subtypeswill bediscovered in thefuture, thus increasing the number of known domain types. In ad-dition,methods that discover the optimalnumberof domain typesor that allowmixtures of domain types are an interesting directionfor future work. To our knowledge, all existing SAGA methods re-quire either a fixed number of labels (Day et al. 2007; Thurmanet al. 2007; Lian et al. 2008; Ernst and Kellis 2010; Filion et al.2010;Hoffmanet al. 2012)or ahyperparameter that indirectly con-trols the number of labels (Ho et al. 2014). Amethod that allows for“mixed” domain labels at a given process could potentially circum-vent the manual merging process that we used to reduce an eight-label model to a five-label one.
Finally, we presented a method for transferring informa-tion from well-studied cell types using GBR in order to improvethe quality and interpretability of annotations of cell types withlimited available data. This method enables a new strategy for un-derstanding cell types, in which a small number of assays are per-formed on each cell type of interest to determine the uniquecharacteristics of this cell type, and then Segway with GBR isused to combine these data with the large body of available infor-
mation fromwell-studied cell types. Thismethodhas the addition-al benefit of matching the label semantics of the target cell typesto the semantics of the reference annotations, which allows the la-bel interpretation process to be performed automatically. Becauseconsortia such as ENCODE and Roadmap Epigenomics are alreadyanalyzing a large number of cell types with a small number ofassays each, this strategy is immediately applicable. Determiningwhich assays are most informative as input to this strategy is aninteresting question for future work.
Methods
Histone modification, open chromatin, and replication
timing signal data
We acquired histone ChIP-seq, DNase-seq, and FAIRE-seq data forA549, K562, H1-hESC, GM12878, HeLa-S3, HepG2, and HUVECfrom ENCODE and for IMR90 from Roadmap Epigenomics(Bernstein et al. 2010; The ENCODE Project Consortium 2012).We used a uniform signal-processing pipeline to generate a ge-nome-wide vector for each data set, as described by Hoffmanet al. (2013). We also acquired Repli-seq data for IMR90 fromENCODE and smoothed these data usingwavelet smoothing as de-scribed by Thurman et al. (2007).We applied the inverse hyperbol-ic sine transform a sinh(x) = ln(x+ ��������
x2 + 1√ ) to all signal data. This
transform is similar to the log transform in that it depresses themagnitude of extremely large values, but it is defined at zero andamplifies the magnitude of small values less severely than thelog transform does. This transform has been shown to be impor-tant for reducing the effect of large values in analysis of genomicsdata sets (Johnson 1949; Hoffman et al. 2012).
We acquired transcription factor ChIP-seq data fromENCODE. Peaks were called for each factor using MACS using anIDR threshold of 0.05 (Zhang et al. 2008; Landt et al. 2012).
We acquired CAGE expression data for 33 cell types fromGENCODE (Harrow et al. 2012).
The full list of data sets used is available in SupplementalTable 1.
Hi-C data
We used publicly available Hi-C data sets for two human cell lines(IMR90 and H1-hESC) (Dixon et al. 2012). We processed rawpaired-end libraries with a pipeline that combines reads fromtwo replicates per cell line,maps these reads, extracts the read pairsfor which each endmaps uniquely, and removes potential PCR du-plicates.We then partitioned the human genome into a collectionof nonoverlapping 10-kb windows and assigned each end of a readpair to the nearest 10-kb window midpoint. This process yieldeda 303,641 × 303,641 whole-genome contact map. These contactmaps consisted of both intra- and interchromosomal contactsand contained only ∼0.3%nonzero entries.We assigned statisticalconfidence estimates to these contact counts using the methodFit-Hi-C, which jointly models the random polymer looping effectand technical biases (Ay et al. 2014a). First, we applied the biascorrection method ICE to the contact map to estimate a bias as-sociated with each 10-kb locus, after eliminating all loci thathave <50% uniquely mappable bases (Imakaev et al. 2012).Second, using these computed biases and raw contact maps as in-put, we estimated a P-value of interaction for each pair of 10-kbloci with nonzero contact counts (P-value was set to one for pairswith zero contacts). We used a slightly modified version ofthe original Fit-Hi-C algorithm, which handles inter- as well as
Joint domain annotation of chromatin conformation
Genome Research 553www.genome.org
intrachromosomal contacts and omits the refinement step for fastcomputation. Because Fit-Hi-C normalizes for 1D genomic dis-tance, the majority of significant contacts were at long distances(Supplemental Fig. 7). Note that while the data sets we used haveinsufficient coverage to identify many high-confidence contactsat 10-kb resolution, Segway with GBR aggregates informationover ∼400 kb in order to make each domain call, so individualhigh-confidence interactions are not necessary.
We computed the genome chromatin compartment usingeigenvalue decomposition on the normalized contact maps ofIMR90 and H1-ESC cell lines at 1-Mb resolution as described byLieberman-Aiden et al. (2009). For each chromosome, we cal-culated the Pearson correlation between each pair of rows of theintrachromosomal contact matrix and applied eigenvalue decom-position to the correlation matrix. Similar to Lieberman-Aidenet al. (2009), we used the second eigenvector in cases where thefirst eigenvector values were either all positive or all negative todefine the compartments. We used average GC content to mapsigns of eigenvectors to either open (higher GC content) or closedchromatin compartments.
Graph-based regularization
In a SAGAmethod, we are given a set of vertices V that index a setof n = |V| random variablesXV = {X1,…,Xn} and a probability distri-bution parameterized by θ, pθ(XH,XO). Different SAGA methodsemploy different distributions pθ. GBR could be applied to anyprobabilistic model, but in this work we use the Segway model(Supplemental Methods) because it can handle real-valued andmissing data, and it can use nongeometric segment length distri-butions. We denote random variables with capital letters (e.g.,XH) and instantiations of variables with lower-case letters [e.g.,xH∈ domain(XH)].We use capitals to denote sets and lowercase let-ters to denote values (e.g., Xh for h∈H).
Training the model involves a set of observed data �xO, wherea subset of variables O⊆V is observed and the remainder H =V/Oare hidden. The maximum likelihood training procedure optimiz-es the objective
maximizeu J(u) W L(u) +R(u) (1)where
L(u) W log pu(�xO) = log∑xH
pu(xH , �xO), (2)
where R(θ) is a regularizer that expresses prior knowledge aboutthe parameters. Many regularizers are used in practice, such asthe ℓ2 or ℓ1 norms, which encourage parameters to be small orsparse, respectively.
Dynamic programming algorithms such as the forward-back-ward algorithm can be used to perform inference in SAGAmodels,because all such existing models have dependencies in the formof a chain. That is, the variables associated with position i de-pend only on the variables associated with positions i− 1 and i +1. Examples of such chain-structured models include hiddenMarkov models and dynamic Bayesian networks. However, thesedynamic programming algorithms do not apply if a pairwise prioris added to the model, since the prior may have an arbitrary struc-ture. Several techniques have been proposed to handle modelswith arbitrary structure (Supplemental Note 5). However, noneof these techniques are optimal for expressing a pairwise prior.
Therefore, we instead employ a novel strategy based on poste-rior regularization (Ganchev et al. 2010) to integrate this prior. This
is done by introducing an auxiliary joint distribution q(XH), plac-ing a regularizer on q(XH), and encouraging q to be similar to pθthrough a KL divergence penalty. The regularizer is
RPR(u) W maxqRPR(u, q) (3)R′
PR(u, q) W −D(q(XH ) ‖ pu(XH |�xO)) + PR(q), (4)where D(· ‖ ·) is the KL divergence
D( p(XH ) ‖ q(XH )) =∑xH
p(xH ) log( p(xH )/q(xH ))
and PR(q) is a posterior regularizer that expresses prior knowledgeabout the posterior distribution. KL divergence measures the dis-similarity of probability distributions, such that D( p ‖ q) is zero ifthe distributions are identical and can be arbitrarily large if theyare not. Several posterior regularizers have been proposed in thepast, such as those that require posteriors to satisfy constraints inexpectation (Ganchev et al. 2010).
We propose a new type of posterior regularizer that expressesa pairwise prior (Fig. 8). We are given a weighted, undirected regu-larization graph over the hidden variables GR = (H, ER), where ER⊆H ×H is a set of edges with non-negative similarity weightsw : ER � R+, such that a large w(u, v) indicates that we have astrong belief that Xu and Xv should be similar. (We describe howwe generate this graph in the next two sections.) For a distributionp(XH), let pMh (Xh) indicate the marginal distribution over Xh,pMh (xh) =
∑xH/h
p(xH ). Let λG be a hyperparameter controlling the
strength of regularization. The posterior regularizer is
PRGBR(q) W −lG∑
(u,v)[ER
w(u, v)D(qMu (Xu) ‖ qMv (Xv)). (5)
Thus the full objective is
maximizeu,q
JGBR(u) W L(u)−D(q(XH )‖ pu(XH |�xO))−lG
∑(u,v)[ER
w(u, v)D(qMu (Xu) ‖ qMv (Xv)).(6)
We term this strategy of adding graph-based penalties graph-basedregularization (GBR).
GBR optimization
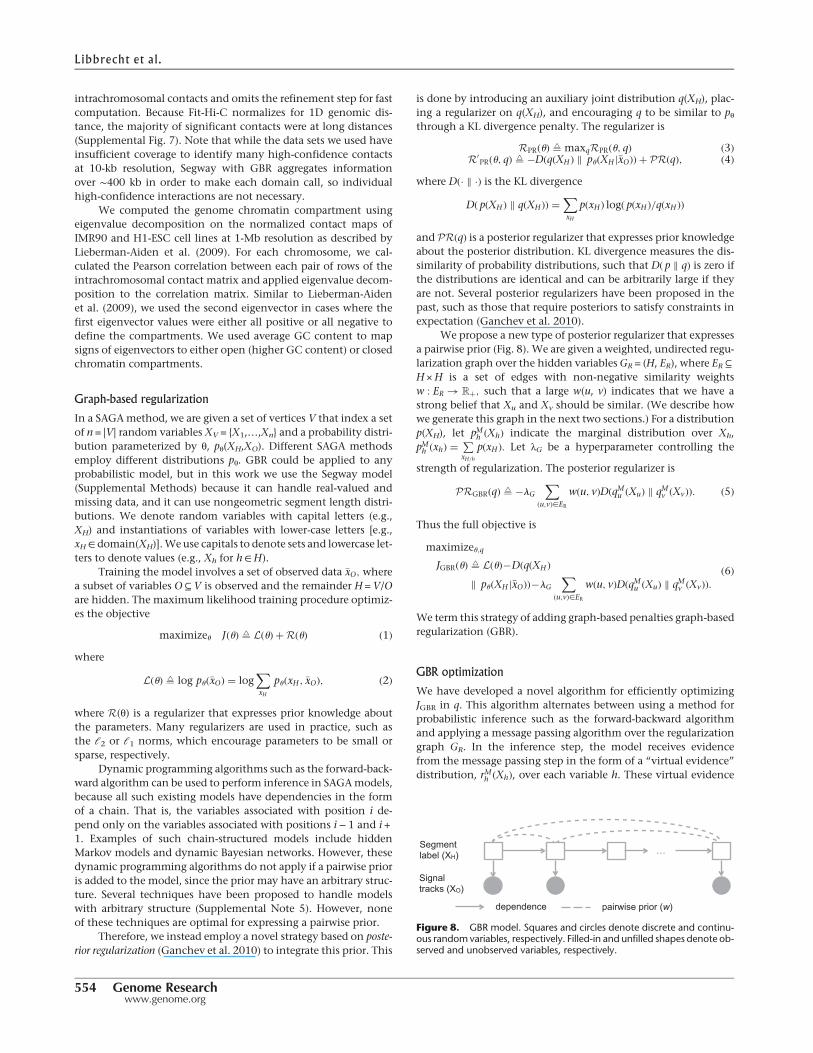
We have developed a novel algorithm for efficiently optimizingJGBR in q. This algorithm alternates between using a method forprobabilistic inference such as the forward-backward algorithmand applying a message passing algorithm over the regularizationgraph GR. In the inference step, the model receives evidencefrom the message passing step in the form of a “virtual evidence”distribution, rMh (Xh), over each variable h. These virtual evidence
Segment label (XH)
Signal tracks (XO)
dependence pairwise prior (w)
Figure 8. GBR model. Squares and circles denote discrete and continu-ous random variables, respectively. Filled-in and unfilled shapes denote ob-served and unobserved variables, respectively.
Libbrecht et al.
554 Genome Researchwww.genome.org
distributions are used in conjunction with the original SAGAmodel to compute a posterior distribution over the labels usingany algorithm for probabilistic inference on dynamic Bayesiannetworks, such as belief propagation or the forward-backwardalgorithm.
In themessage passing step, the algorithm updates rM tomin-imize the KL penalties in the objective function JGBR. This messagepassing step is itself performed using an alternating optimiza-tion algorithm, which passes messages over the regularizationgraph GR. This algorithm is similar to one originally developedfor the field of semi-supervised learning (Subramanya and Bilmes2011).
The inference and message passing steps are iterated untilconvergence. These two updates are linear in the number of vari-ables (for chain-structured models, which include all existingSAGA methods) and linear in the degree of the regularizationgraph, respectively. The algorithm exhibits monotonic con-vergence, similar to the EM algorithm. We derive the algorithmfor optimizing JGBR and prove its convergence in SupplementalNote 1.
GBR graph for incorporating Hi-C data
When we are using GBR to incorporate Hi-C data, we are given amatrix of contact P-values P [ Rn×n, generated from a matrix ofcontact counts as described above. To remove noise and decreasethe degree of the graph, we removed all contacts with uncorrectedP-value P > 10−6 and multiplied the remaining P-values by 106,similar to a Bonferroni correction. Note that due to the large num-ber of hypotheses, performing a full Bonferroni correction wouldresult in very few contacts. Moreover, the graph weights allowthe algorithm to take into account the strength of each connec-tion, so the choice of 106 was made for computational, not statis-tical, reasons. We computed the weights as
w(i, j) W max(0,−loge( p(i, j)/106)). (7)As with the graph for transferring information between cell types,the multiplicative scale of the weights is arbitrary, since it is con-trolled by the graph weight hyperparameter λG. We used onlyintrachromosomal contacts for forming the GBR graph. To pro-duce a GBR graph representing cell type–consistent chromatinconformation used in the domain annotation of eight cell types,we added the edge weights from the IMR90 and H1-hESC Hi-CGBR graphs.
GBR graph for annotation of multiple cell types
When we are using GBR to transfer information about cell type Ato improve annotation of cell type B, we are given an annotationaA1:n [ {1...k}n of cell type A, produced without GBR. We constructa GBR graph from this annotation by connecting each pair of po-sitions that received the same label in aA with an undirected edgeof weight 1. Note that the weight is arbitrary, since it is scaled bythe regularization parameter λG. To mitigate the problem of qua-dratic growth in the degree of this graph,we randomly subsampledthis graph such that each node had an outgoing degree 17≈ loge-(n). We chose this graph degree because a randomly subsampledgraph with n logen edges has the same connected components asthe full graph with high likelihood (Erdös and Rényi 1960), andour experiments on synthetic data (not shown) showed that thesparse graph performed similarly to a complete graph.
Circular permutation
As a null model for several experiments, we performed a circularpermutation of the genome along each chromosome arm as fol-lows. We randomly choose a translation fraction θ∈ [0,1]. Foreach coordinate i∈ {1…n} within a chromosome arm that spansthe range [a,b), we translate i to t(i), where
t(i) = mod(b−a)(i+ u(b− a)) + a. (8)To circularly permute a genome feature, such as an annotation or aHi-C contactmap, we translate each element fromposition i to t(i).Thus, when a circularly permuted feature is compared to an unper-muted feature, all positional correspondence between permutedand unpermuted features are removed, but each feature’s spatialpatterns are preserved. In each case, we performed this permuta-tion 200 times and report the average over all permutations. Ifthe feature includes any centromere- or telomere-defined ele-ments, we remove these as a preprocessing step.
Topological domain agreement
To evaluate the degree to which an annotation A matches a set oftopological domains, we computed the number cd,ℓ of bases bywhich domain d is covered by label ℓ. We then computedc∗d = maxℓcd,ℓ to be the number of bases covered by the highest-coverage label for domain d, and divided c∗d by the length of d toproduce f ∗d , the fraction of d covered by its plurality label. Theagreement f ∗d takes its maximum value of one if the domain d iscovered by exactly one annotation label.We computed the raw ge-nome-wide agreement
fraw = (1/|d|)∑d
f ∗d .
This raw genome-wide agreement fraw can be improved simply byincreasing the length of segments and decreasing the number oflabels. Therefore, we circularly permuted A to form Ap and usedthis permuted annotation to compute f praw. Finally, we computedthe topological domain agreement a = fraw/f
praw as the ratio of
unpermuted and permuted raw agreements. This normalizedagreement is large when the annotation has small segments thatexactly match the topological domains and is small when the an-notation’s segments are not correlated with topological domains.
Signal variance explained
To evaluate the similarity between a genome-wide signal vectorand a genome annotation, we use the following measure, whichwe term the variance explained (VE).We are given a genome anno-tation with k labels a1:n [ {1...k}n and a vector x1:n [ Rn. We com-pute the signal mean over the positions assigned a given label ℓ as
mℓ W
∑ni=1
1(ai = ℓ)xi∑ni=1
1(ai = ℓ)for ℓ [ {1...k}. (9)
We define a predicted signal vector xpi = mai and compute the pre-diction error as di = xi − xpi . We compute the residual standarddeviation of the signal vector as
s W stdev(d1:n) =����������������������������1n
∑ni=1
(di −mean(d1:n))2√√√√ =
���������1n
∑ni=1
d2i
√√√√ . (10)
The last equality holds because mean(d1:n) = 0 by construction.
Joint domain annotation of chromatin conformation
Genome Research 555www.genome.org
We define the VE for annotation a and signal vector x asVE W stdev(d1:n) − stdev(x1:n). VE is bounded by the range[0, stdev(x1:n)]. VE is a measure of the extent to which a genome-wide signal data set and annotation are similar, where higher val-ues indicate better agreement.
Genomic element prediction
We form a classifier for a set of genomic elements based on an an-notation using the following strategy. We are given a genomeannotation with k labels a1:n [ {1...k}n and a set of positionsS # {1...n}, which represent some set of elements of interest suchas enhancers or CTCF binding sites. Define Aℓ = {i|ai = ℓ} to bethe positions annotated by label ℓ. To avoid biases caused by differ-ing-size elements, we assume that each element occupies just 1 bp.In the case of larger elements (such as MACS-called TF bindingsites, which are ∼200 bp), we define each element as the middlebase pair of the range.
For each label, we compute the predictive precision of labelℓ as
precision(ℓ) = |S> Aℓ||Aℓ| for ℓ [ {1...k}. (11)
We rank the labels in decreasing order of their precision on a train-ing set to get an order s1:k [ {1...k}k. Using this ordering, we formk predictors,
Pj =⋃j
i=1
Asi for j [ {1...k}.
The true positives and false positives of a predictor P areTP(P) = P > S and FP(P) = P > ({1...n}/S), respectively. The predic-tors are in order of decreasing stringency; that is, Pj−1 # Pj.
We can trace out the full sensitivity–specificity tradeoff (suchas for an ROC or PR curve) by interpolating between each succes-sive pair of predictors. To interpolate between a pair of predictorsPj and Pj+1, we form an interpolated predictor Pj,j+1,θ by samplingeach position i [ Pj/Pj−1 with probability θ∈ [0,1]. The expectednumber of true positives and false positives of an interpolated pre-dictor Pj,j+1,u can be shown to be
E[|TP(P j,j+1,u)|] = |TP(Pj)| + u|TP(Aj+1)| (12)and
E[|FP(P j,j+1,u)|] = |FP(Pj)| + u|FP(Aj+1)|, (13)respectively. We report our performance using a test set disjointfrom the training set used to order the labels.
Developmental replication domains
In order to evaluate the replication timing dynamics of differenttypes of domains, we used a four-label (constitutive early/late,switching early/late) annotation of the human genome usingpublished replication timing data for 16 different human cell types(gathered by V Dileep, F Ay, J Sima, WS Noble, and DM Gilbert,unpubl.). This annotation first windowed replication timing datainto 40-kb bins and then determined for each window whetherit replicates early (RT value > 0.5) or late (RT value <−0.2) in allcell types. Such windows with consistent timing profiles acrossall cell types were labeled as “constitutively early” and “constitu-tively late,” respectively. The remaining windows either were la-beled as switching or were left unlabeled. Switching windows aredetermined as those with an absolute value of replication timing
larger than 0.5 in all cell types but with an opposite sign than oth-ers in at least one cell type. Switching windows that are early andlate replicating in IMR90 were labeled as switching early andswitching late, respectively.
Consistent domain boundaries
When we annotated domains in eight cell types, we found thatdomain boundaries were shared between annotations muchmore often than would be expected by chance. To identify devel-opmentally consistent domain boundaries, we first formed a list ofall segment boundaries that occurred in at least one cell type. Foreach boundary, we computed the number of cell types withboundaries within 50 kb. We formed a set of representative bygreedily selecting the boundary with the most nearby boundariesas a representative, removing all boundaries near the representa-tive from the list, and repeating the process until no two boundar-ies in the list werewithin 50 kb of one another.While this problemis an instance of the NP-hard set cover problem, the greedy ap-proach is guaranteed to result in a constant-factor approximationof optimal (Nemhauser et al. 1978). This yielded a set of 13,906boundary groups, each >50 kb from all other groups. We definedthe 2967 boundary groups composed of at least five boundariesas consistent boundaries.
Data access
Domain annotations and code for Segway with GBR are availableas Supplemental Material and online at http://noble.gs.washing-ton.edu/proj/gbr.
Acknowledgments
This work was supported by NIH awards U41HG007000 andR01ES024917 and by the Princess Margaret Cancer Foundation.
References
Akhtar W, de Jong J, Pindyurin AV, Pagie L, Meuleman W, de Ridder J,Berns A, Wessels LF, van Lohuizen M, van Steensel B. 2013.Chromatin position effects assayed by thousands of reporters integratedin parallel. Cell 154: 914–927.
Ay F, Bailey TL, Noble WS. 2014a. Statistical confidence estimation forHi-C data reveals regulatory chromatin contacts. Genome Res 24: 999–1011.
Ay F, Bunnik EM, Varoquaux N, Bol SM, Prudhomme J, Vert JP, Noble WS,Le Roch KG. 2014b. Three-dimensional modeling of the P. falciparumgenome during the erythrocytic cycle reveals a strong connectionbetween genome architecture and gene expression. Genome Res 24:974–988.
Bernstein BE, Mikkelsen TS, Xie X, Kamal M, Huebert DJ, Cuff J, Fry B,Meissner A, Wernig M, Plath K, et al. 2006. A bivalent chromatin struc-ture marks key developmental genes in embryonic stem cells. Cell 125:315–326.
Bernstein BE, Stamatoyannopoulos JA, Costello JF, Ren B, Milosavljevic A,Meissner A, Kellis M, Marra MA, Beaudet AL, Ecker JR, et al. 2010. TheNIH Roadmap Epigenomics Mapping Consortium. Nat Biotechnol 28:1045–1048.
Bickmore WA, van Steensel B. 2013. Genome architecture: domain organi-zation of interphase chromosomes. Cell 152: 1270–1284.
Boyle EI, Weng S, Gollub J, Jin H, Botstein D, Cherry JM, Sherlock G.2004. Go::TermFinder: open source software for accessing GeneOntology information and finding significantly enriched GeneOntology terms associated with a list of genes. Bioinformatics 20:3710–3715.
Burgess-Beusse B, Farrell C, Gaszner M, Litt M, Mutskov V, Recillas-Targa F,Simpson M, West A, Felsenfeld G. 2002. The insulation of genes fromexternal enhancers and silencing chromatin. Proc Natl Acad Sci 99:16433.
Libbrecht et al.
556 Genome Researchwww.genome.org
Chakalova L, Debrand E, Mitchell JA, Osborne CS, Fraser P. 2005.Replication and transcription: shaping the landscape of the genome.Nat Rev Genet 6: 669–677.
Day N, Hemmaplardh A, Thurman RE, Stamatoyannopoulos JA,Noble WS. 2007. Unsupervised segmentation of continuous genomicdata. Bioinformatics 23: 1424–1426.
Dekker J. 2008. Gene regulation in the third dimension. Science 319:1793–1794.
Dixon JR, Selvaraj S, Yue F, Kim A, Li Y, Shen Y, Hu M, Liu JS, Ren B. 2012.Topological domains in mammalian genomes identified by analysis ofchromatin interactions. Nature 485: 376–380.
Erdös P, Rényi A. 1960. On the evolution of random graphs. Magyar TudAkad Mat Kutató Int Közl 5: 17–61.
The ENCODE Project Consortium. 2012. An integrated encyclopedia ofDNA elements in the human genome. Nature 489: 57–74.
Ernst J, Kellis M. 2010. Discovery and characterization of chromatin statesfor systematic annotation of the human genome. Nat Biotechnol 28:817–825.
Filion GJ, van Bemmel JG, Braunschweig U, Talhout W, Kind J, Ward LD,Brugman W, de Castro IJ, Kerkhoven RM, Bussemaker HJ, et al. 2010.Systematic protein location mapping reveals five principal chromatintypes in Drosophila cells. Cell 143: 212–224.
Filippova D, Patro R, Duggal G, Kingsford C. 2014. Identification of alterna-tive topological domains in chromatin. Algorithms Mol Biol 9: 14.
Ganchev K, Graça J, Gillenwater J, Taskar B. 2010. Posterior regulariza-tion for structured latent variable models. J Mach Learn Res 11: 2001–2049.
Gene Ontology Consortium. 2000. Gene ontology: tool for the unificationof biology. Nat Genet 25: 25–29.
Guelen L, Pagie L, Brasset E, MeulemanW, FazaMB, TalhoutW, Eussen BH,de Klein A,Wessels L, de LaatW, et al. 2008. Domain organization of hu-man chromosomes revealed bymapping of nuclear lamina interactions.Nature 453: 948–951.
Harrow J, Frankish A, Gonzalez JM, Tapanari E, Diekhans M, Kokocinski F,Aken BL, Barrell D, Zadissa A, Searle S, et al. 2012. GENCODE: the refer-ence human genome annotation for The ENCODE Project. Genome Res22: 1760–1774.
Ho JW, Jung YL, Liu T, Alver BH, Lee S, Ikegami K, Sohn KA, Minoda A,TolstorukovMY, Appert A, et al. 2014. Comparative analysis of metazo-an chromatin organization. Nature 512: 449–452.
Hoffman MM, Buske OJ, Wang J, Weng Z, Bilmes JA, Noble WS. 2012.Unsupervised pattern discovery in human chromatin structure throughgenomic segmentation. Nat Methods 9: 473–476.
Hoffman MM, Ernst J, Wilder SP, Kundaje A, Harris RS, Libbrecht M,Giardine B, Ellenbogen PM, Bilmes JA, Birney E, et al. 2013.Integrative annotation of chromatin elements from ENCODE data.Nucleic Acids Res 41: 827–841.
Imakaev M, Fudenberg G, McCord RP, Naumova N, Goloborodko A,Lajoie BR, Dekker J, Mirny LA. 2012. Iterative correction of Hi-C data re-veals hallmarks of chromosome organization.NatMethods 9: 999–1003.
Johnson NL. 1949. Systems of frequency curves generated by methods oftranslation. Biometrika 36: 149–176.
Julienne H, Zoufir A, Audit B, Arneodo A. 2013. Human genome replicationproceeds through four chromatin states. PLoS Comput Biol 9: e1003233.
LachnerM,O’Sullivan RJ, Jenuwein T. 2003. An epigenetic roadmap for his-tone lysine methylation. J Cell Sci 116: 2117–2124.
Landt SG, Marinov GK, Kundaje A, Kheradpour P, Pauli F, Batzoglou S,Bernstein BE, Bickel P, Brown JB, Cayting P, et al. 2012. ChIP-seq guide-lines and practices of the ENCODE andmodENCODE consortia.GenomeRes 22: 1813–1831.
Lian H, Thompson W, Thurman RE, Stamatoyannopoulos JA, Noble WS,Lawrence C. 2008. Automated mapping of large-scale chromatin struc-ture in ENCODE. Bioinformatics 24: 1911–1916.
Lieberman-Aiden E, van Berkum NL, Williams L, Imakaev M, Ragoczy T,Telling A, Amit I, Lajoie BR, Sabo PJ, Dorschner MO, et al. 2009.Comprehensive mapping of long-range interactions reveals foldingprinciples of the human genome. Science 326: 289–293.
Liu T, Rechtsteiner A, Egelhofer TA, Vielle A, Latorre I, Cheung MS, Ercan S,Ikegami K, Jensen M, Kolasinska-Zwierz P, et al. 2011. Broad chromo-somal domains of histone modification patterns in C. elegans. GenomeRes 21: 227–236.
Lovén J, Hoke HA, Lin CY, Lau A, OrlandoDA, Vakoc CR, Bradner JE, Lee TI,Young RA. 2013. Selective inhibition of tumor oncogenes by disruptionof super-enhancers. Cell 153: 320–334.
Misteli T. 2007. Beyond the sequence: cellular organization of genome func-tion. Cell 128: 787–800.
Morey L, Helin K. 2010. Polycomb group protein-mediated repression oftranscription. Trends Biochem Sci 35: 323–332.
Nemhauser GL, Wolsey LA, Fisher ML. 1978. An analysis of approxima-tions for maximizing submodular set functions: I. Math Prog 14:265–294.
Pauler FM, Sloane MA, Huang R, Regha K, Koerner MV, Tamir I,Sommer A, Aszodi A, Jenuwein T, Barlow DP. 2009. H3k27me3 formsblocs over silent genes and intergenic regions and specifies a histonebanding pattern on a mouse autosomal chromosome. Genome Res 19:221–233.
Phillips JE, Corces VG. 2009. CTCF: master weaver of the genome. Cell 137:1194–1211.
Ryba T, Hiratani I, Lu J, Itoh M, Kulik M, Zhang J, Schulz TC, Robins AJ,Dalton S, Gilbert DM. 2010. Evolutionarily conserved replication tim-ing profiles predict long-range chromatin interactions and distinguishclosely related cell types. Genome Res 20: 761–770.
Ryba T, Battaglia D, Chang BH, Shirley JW, Buckley Q, Pope BD, Devidas M,Druker BJ, Gilbert DM. 2012. Abnormal developmental control of repli-cation-timing domains in pediatric acute lymphoblastic leukemia.Genome Res 22: 1833–1844.
Siepel A, Bejerano G, Pedersen JS, Hinrichs AS, Hou M, Rosenbloom K,Clawson H, Spieth J, Hillier LW, Richards S, et al. 2005. Evolutionarilyconserved elements in vertebrate, insect, worm, and yeast genomes.Genome Res 15: 1034–1050.
Subramanya A, Bilmes J. 2011. Semi-supervised learning with measurepropagation. J Mach Learn Res 12: 3311–3370.
Talbert PB, Henikoff S. 2006. Spreading of silent chromatin: inaction at adistance. Nat Rev Genet 7: 793–803.
Thurman RE, Day N, Noble WS, Stamatoyannopoulos JA. 2007.Identification of higher-order functional domains in the humanENCODE regions. Genome Res 17: 917–927.
Visel A, Blow MJ, Li Z, Zhang T, Akiyama JA, Holt A, Plajzer-Frick I,Shoukry M, Wright C, Chen F, et al. 2009. ChIP-seq accurately predictstissue-specific activity of enhancers. Nature 457: 854–858.
Weiler KS, Wakimoto BT. 1995. Heterochromatin and gene expression inDrosophila. Annu Rev Genet 29: 577–605.
Wen B, Wu H, Shinkai Y, Irizarry RA, Feinberg AP. 2009. Large organizedchromatin K9-modifications (LOCKs) distinguish differentiated fromembryonic stem cells. Nat Genet 41: 246.
Whyte WA, Orlando DA, Hnisz D, Abraham BJ, Lin CY, Kagey MH,Rahl PB, Lee TI, Young RA. 2013. Master transcription factors andmedi-ator establish super-enhancers at key cell identity genes. Cell 153:307–319.
Zhang Y, Liu T, Meyer CA, Eeckhoute J, Johnson DS, Bernstein BE,Nusbaum C, Myers RM, Brown M, Li W, et al. 2008. Model-based anal-ysis of ChIP-Seq (MACS). Genome Biol 9: R137.
Received September 13, 2014; accepted in revised form February 6, 2015.
Joint domain annotation of chromatin conformation
Genome Research 557www.genome.org