john & jennifer sample your financial plan
TRANSCRIPT

John & Jennifer SampleYour Financial Plan
August 2020
Your Lead Advisor Abrin Berkemeyer, CFP® [email protected]
Prepared by…
Your Support Advisor Craig Joncas, CFP® [email protected]

Portland, Maine One Monument Square Suite 501
Bangor, Maine 74 Hammond Street
Website: www.penobscotfa.com Email: [email protected]
Reach us at…P: 207-990-1901 F: 877-369-2947
With offices in…
Portland, Maine One Monument Square, Suite 501
Penobscot Financial Advisors' method is centered around financial wellness. As you look through this plan, our hope is that you are motivated to take small steps to improving your financial health. If you have any questions while reviewing the plan, please reach out!

Summary of Recommendations When your eyes have glazed over, and numbers are blurred, return to this summary for important educational pieces and recommendations.
Financial Snapshot Take some time to understand where you stand today. The path to your future starts here.
Financial Goal Plan Are you on track to reach your goals and dreams? Check out what it takes to get you from point A to point B.
Investment Analysis Look ‘under the hood’ at your investment portfolio. We are digging past what you can see on your statement, to make sure your portfolio is meeting your objectives.
Additional Information Thirsty for more knowledge? Review this information at your leisure to learn more about key planning concepts.

Section1

One Monument Square Suite 501, Portland, Maine 04101 | www.penobscotfa.com
Penobscot Financial Advisors is an SEC Registered Investment Advisor.
Summary of Recommendations John & Jennifer Sample – Sept. 2020
Retirement Planning Outlook: From our analysis, we believe you may be we-funded to meet your retirement
goals. Using Monte Carlo analysis, we have derived a 79% probability of successfully meeting your goals. We will discuss the impacts that retirement age, spending levels, and savings rates have on your plan. See Section 3.
Monte Carlo Analysis: Your retirement assets, including future contributions and distributions, are run through 1000 trials of different market returns. The dial percentage corresponds to how many times your money “out lived” you. We recommend clients in your proximity to retirement have at least a 70% probability of success.
Sources of Income: Your first source of income in retirement will be social security. Your retirement savings, through work and personal, will be drawn upon to fund the remainder of your goals.
o Social Security: This plan assumes John takes his social security when he retires, and Jennifer delays her benefit until age 70. When one spouse dies, the other will get the larger of the two benefits. This way, the larger benefit Jennifer is accruing will last if either one of you is alive. We should reassess strategies closer to retirement as your situation or thoughts about social security and longevity may change over time.
Savings Rate: John is saving 6% of his income in his 401K with a 3% company match. Jennifer contributes 8% of her income to her 403B with a dollar for dollar match up to 8%. John and Jennifer also contribute to their Roth IRAs every year, $6,000 to each account. Overall, the household savings rate is 20%. This is a strong savings rate.
o Catch-Up Contributions: Since you are both age 50 and older, you are eligible to contribute an additional $1,000 a year to each Roth IRA. Increasing your savings rates today would provide greater certainty of achieving your retirement as shown in the last scenario in Section 3.
Retirement Age: With a strong probability of successfully retiring in 2033 at ages 65 and 63, it may be possible to consider an earlier retirement. Realized investment performance will play a key role.
Expenditures in Retirement: Your basic living expense of $67,000 will cover your expenses such as utilities, entertainment, clothes, food, gasoline, etc... You will also have to pay for health care and your travel goal in retirement. It is important to remember that all these figures are net, after-tax figures.
Recommendation: If you would like to implement any increase to your savings rate, I recommend taking advantage of the catch-up contributions on the Roth IRAs before looking to increase employer retirement plan contributions since you are already receiving the maximum matching dollars from those plans.
One Monument Square Suite 501, Portland, Maine 04101 | www.penobscotfa.com
Penobscot Financial Advisors is an SEC Registered Investment Advisor.
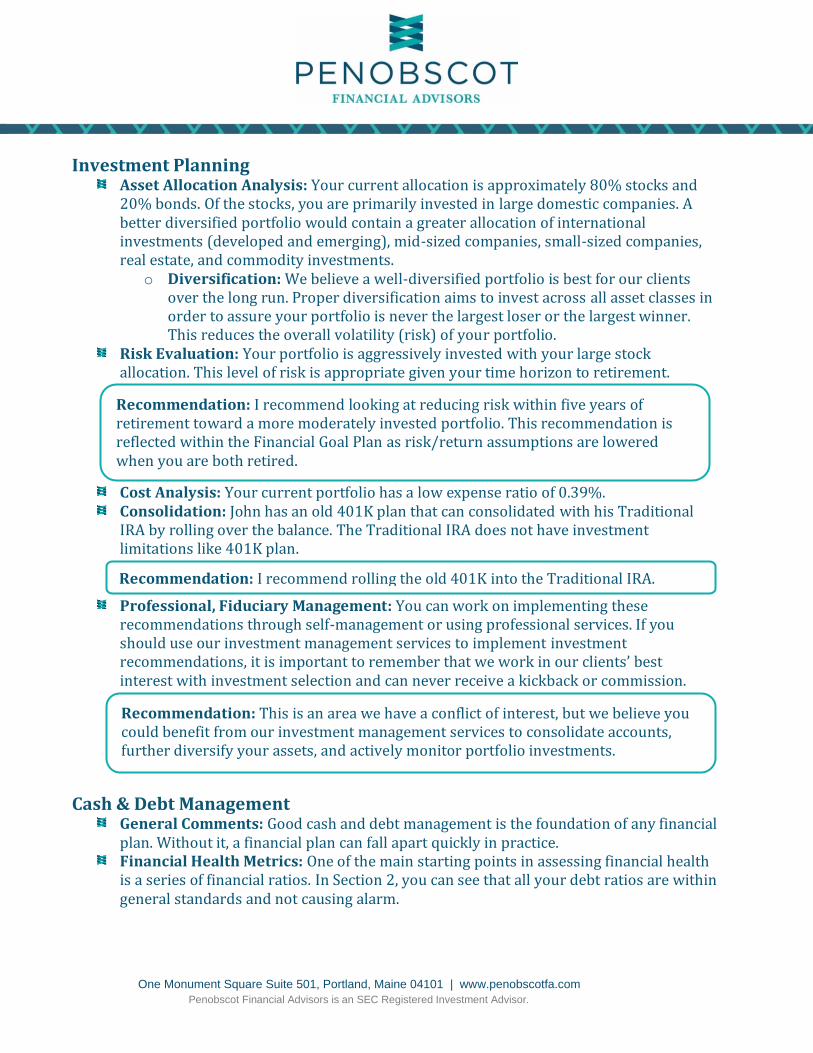
Investment Planning Asset Allocation Analysis: Your current allocation is approximately 80% stocks and
20% bonds. Of the stocks, you are primarily invested in large domestic companies. A better diversified portfolio would contain a greater allocation of international investments (developed and emerging), mid-sized companies, small-sized companies, real estate, and commodity investments.
o Diversification: We believe a well-diversified portfolio is best for our clients over the long run. Proper diversification aims to invest across all asset classes in order to assure your portfolio is never the largest loser or the largest winner. This reduces the overall volatility (risk) of your portfolio.
Risk Evaluation: Your portfolio is aggressively invested with your large stock allocation. This level of risk is appropriate given your time horizon to retirement.
Cost Analysis: Your current portfolio has a low expense ratio of 0.39%. Consolidation: John has an old 401K plan that can consolidated with his Traditional
IRA by rolling over the balance. The Traditional IRA does not have investment limitations like 401K plan.
Professional, Fiduciary Management: You can work on implementing these recommendations through self-management or using professional services. If you should use our investment management services to implement investment recommendations, it is important to remember that we work in our clients’ best interest with investment selection and can never receive a kickback or commission.
Cash & Debt Management General Comments: Good cash and debt management is the foundation of any financial
plan. Without it, a financial plan can fall apart quickly in practice. Financial Health Metrics: One of the main starting points in assessing financial health
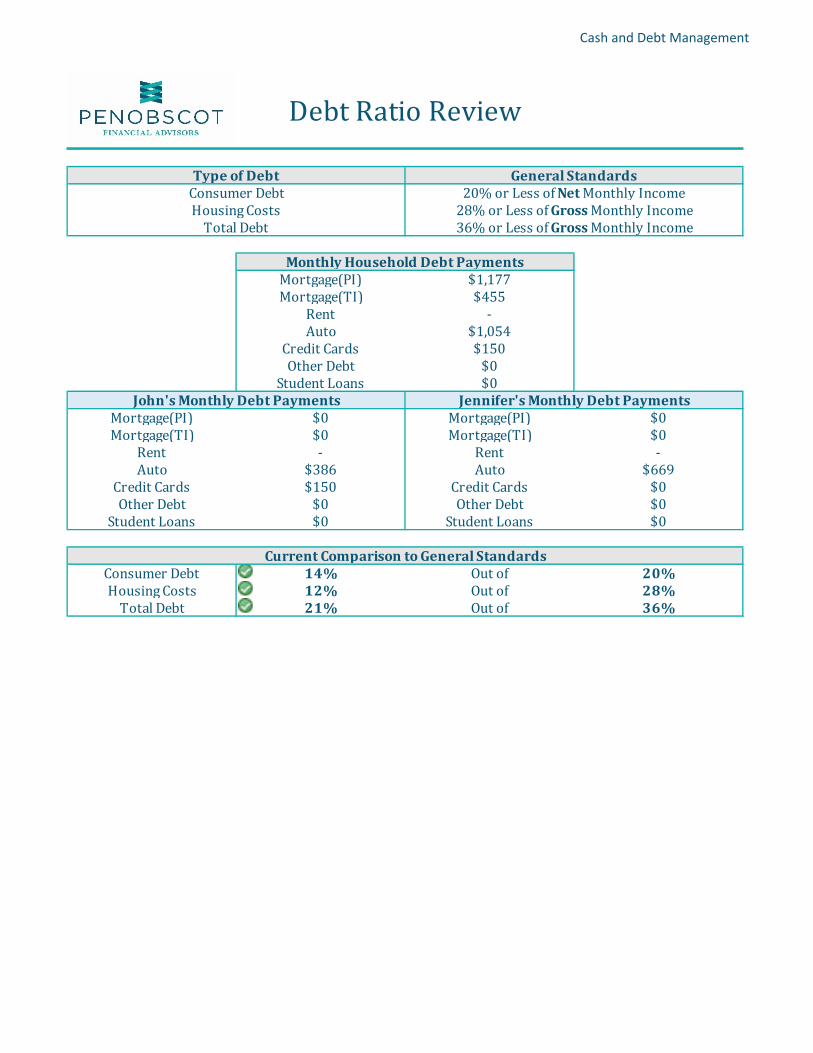
is a series of financial ratios. In Section 2, you can see that all your debt ratios are within general standards and not causing alarm.
Recommendation: I recommend looking at reducing risk within five years of retirement toward a more moderately invested portfolio. This recommendation is reflected within the Financial Goal Plan as risk/return assumptions are lowered when you are both retired.
Recommendation: This is an area we have a conflict of interest, but we believe you could benefit from our investment management services to consolidate accounts, further diversify your assets, and actively monitor portfolio investments.
Recommendation: I recommend rolling the old 401K into the Traditional IRA.
One Monument Square Suite 501, Portland, Maine 04101 | www.penobscotfa.com
Penobscot Financial Advisors is an SEC Registered Investment Advisor.
Debt Reduction Strategy: Maintaining high interest debt can make it hard to achieve
other goals. Some of this debt can be consolidated to reduce your interest rates and cut back on the amount of interest you will pay.
Emergency Funds: An emergency fund is imperative to the success of your financial plan. Periods of crisis arise in most households. Generally, a well-funded emergency fund is three to six months’ worth of living expenses. We identified an emergency fund of $11,000 currently.
Yield on Cash: Your current savings is earning 0.10% at your bank. There are better options for where you can hold your cash.
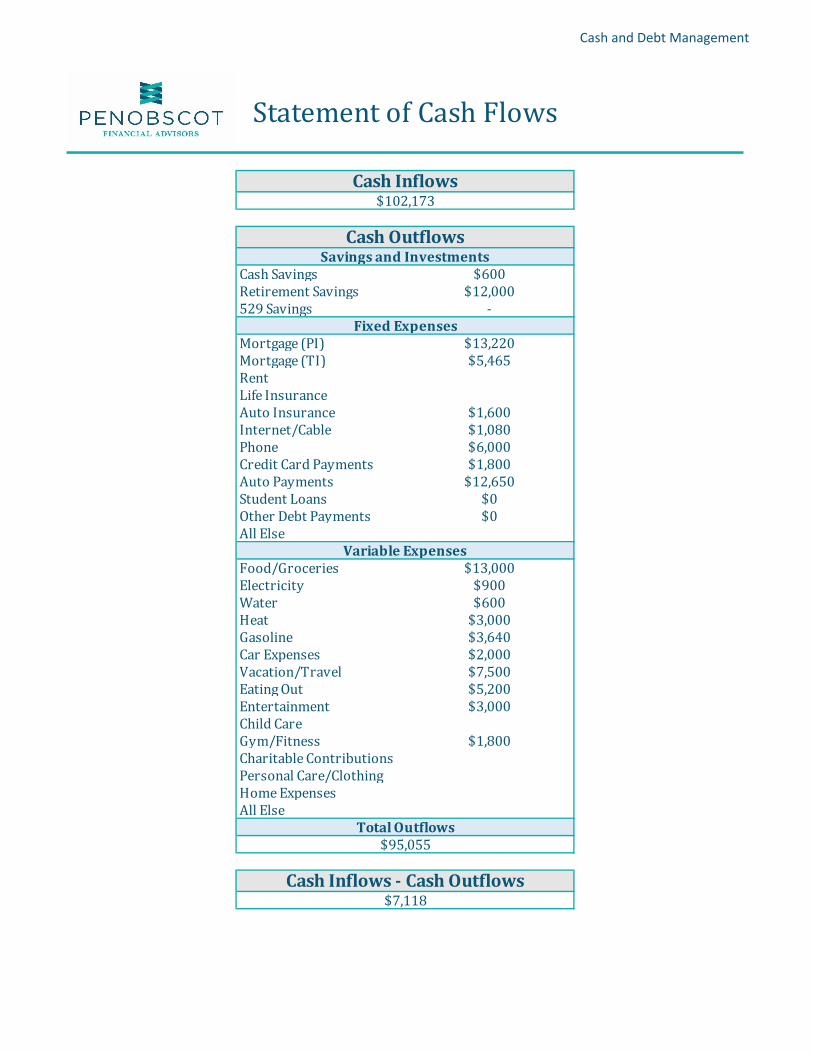
Budgeting: The statement of cash flows in Section 2 identified a $7,100 difference between cash in-flows and cash out-flows. It would be helpful to keep track of your expense over a couple of months to see if we can identify the areas that money is likely being spent in.
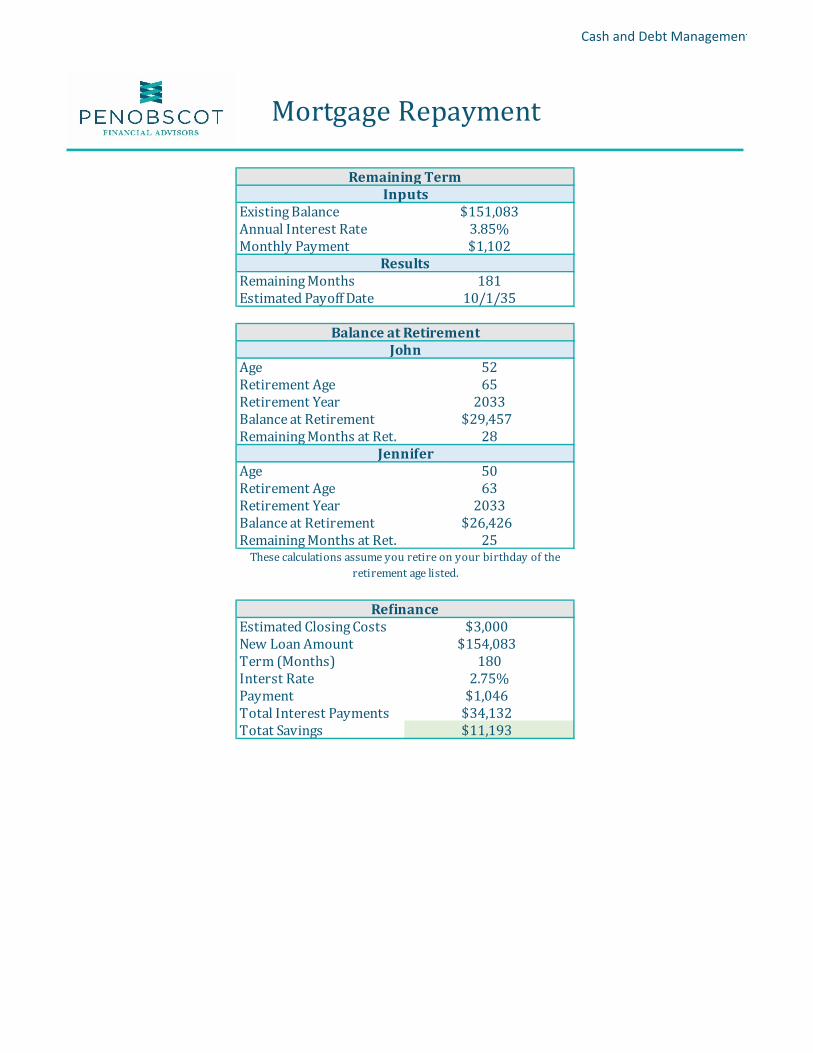
Mortgage Refinance: Interest rate environments change over time and today you may be able to get a lower interest rate on a 15-year loan than what you have today. This would provide long-term savings in comparison to your current loan. See Section 2.
Risk Management Life Insurance: An analysis of your existing life insurance coverage shows that
Jennifer’s insurance is adequate, and that John is underinsured. Without additional coverage, Jennifer would be stuck paying the mortgage on one income and at a loss of John’s future retirement savings contributions.
Recommendation: I recommend using your home equity line of credit to pay off John’s credit card and Jennifer’s SUV then allocating those payments to the HELOC. This will save you money on interest and consolidate payments.
Recommendation: I recommend saving up $20,500 to $41,000 for a fully funded emergency fund.
Recommendation: I recommend you hold your cash savings in a high yield savings account. High yield savings accounts are insured and can provide interest rates up to 10 times what you are earning today.
Recommendation: I recommend reaching out to your current lender and your existing banking relationships to see what interest rates and closing costs you can get on a 15-year fixed rate mortgage.
Recommendation: I recommend that John investigates purchasing a 10-year $550,000 term-life insurance policy. It would also be prudent to compare a 10-year, $500,000 term-life policy premium to Jennifer’s supplemental coverage at work.

One Monument Square Suite 501, Portland, Maine 04101 | www.penobscotfa.com
Penobscot Financial Advisors is an SEC Registered Investment Advisor.
Disability Insurance: You both have identified that your employers pay for long-term
disability insurance on your behalf. John then pays for short-term disability coverage while Jennifer’s employer does not offer the benefit. Without the short-term coverage for Jennifer, it is more imperative to have a well-funded emergency fund.
Health Insurance: You are currently paying for a high deductible family health plan through John’s employer. Having a high deductible plan qualifies you to be able to contribute to a Health Savings Account or HSA.
o HSA: Contributions to HSAs are done on a pre-tax basis (tax deduction today). Like an FSA, if the money is used to pay for qualified medical expenses, you will not pay income taxes on the distributions from the account. For 2020, you can contribute $7,100 a year under a family plan. The money rolls over year to year and can be invested with tax-free growth.
Long-Term Care: Many people think of nursing homes when they picture long-term care when in fact most long-term care happens in the home. Long-term care insurance can help pay for home assistance as well as the cases where you may need to spend time in a facility. With a good retirement outlook and the ability to absorb some increased spending within your plan, it is prudent to explore the costs and benefits of purchasing long-term care policies.
Tax Planning
Asset Location: Efficient investing considers the tax implications of the account an asset is held in. Assets that are expected to grow at faster paces, such as equity investments, can create a lower tax liability in the future if held in a Roth account because of the tax-free growth. Slower growing assets, such as fixed income or bonds, should be held in pre-tax accounts where the whole withdrawal will be taxed as income when it is taken.
RMD Planning: The IRS imposes Required Minimum Distributions (RMDs) from Traditional IRAs, 403Bs, and 401Ks. These distributions are calculated based off your life expectancy and must begin by April 1 of the year after you turn 72. While social security income is low delaying Jennifer’s benefit, it may be prudent to withdraw pre-tax assets earlier in retirement to reduce RMDs later in retirement.
Home Sale: Should you decide to move in the future, the IRS allows for a $500,000 tax exclusion on capital gains from the sale of your home if it has been your primary residence for two of the past five years.
Recommendation: I recommend we meet with a local insurance broker to compare costs and coverages and how long-term care policies may fit into your plan.
Recommendation: I recommend stopping your FSA contributions at next open enrollment and instead depositing them into an HSA.

One Monument Square Suite 501, Portland, Maine 04101 | www.penobscotfa.com
Penobscot Financial Advisors is an SEC Registered Investment Advisor.
Estate Planning Estate & Gift Taxes: The estate and gift tax exemption for 2020 is $11.58 million per
individual. Federal estate taxes would not be owed if you were to pass. You may give up to $15,000 a year per individual before the tax exemption kicks in.
Beneficiaries and Joint Titling: Accounts with beneficiary designations pass to your heirs outside of probate. It is critically important that your beneficiaries are up to date with your wishes and reviewed annually since your will cannot override your designations. Since your bank accounts are jointly owned, the surviving spouse will immediately inherit the balances as well.
o Probate: Probate is the process by which the state government follows to distribute the assets of the deceased that were not jointly owned or containing beneficiary designations. Legal documents, such as a will, help facilitate the distribution of such assets in accordance to the deceased’s wishes rather than heirs deemed by law.
Legal Documents: For your wishes to be met in the distribution of your probate estate, it is a good idea to have your wills drawn by an attorney. Other legal documents, such as a power of attorney and health care directive, are also important for situations where you may not be able to make decisions for yourself.
Recommendation: I recommend we call John’s old 401K provider to check his beneficiary designations on the account and update as needed.
Recommendation: I recommend that you meet with a Maine Estate Planning attorney to draft a will, power of attorney, and health care directive. PFA can provide referrals and work with the attorney as needed.

Section2
Cash and Debt Management
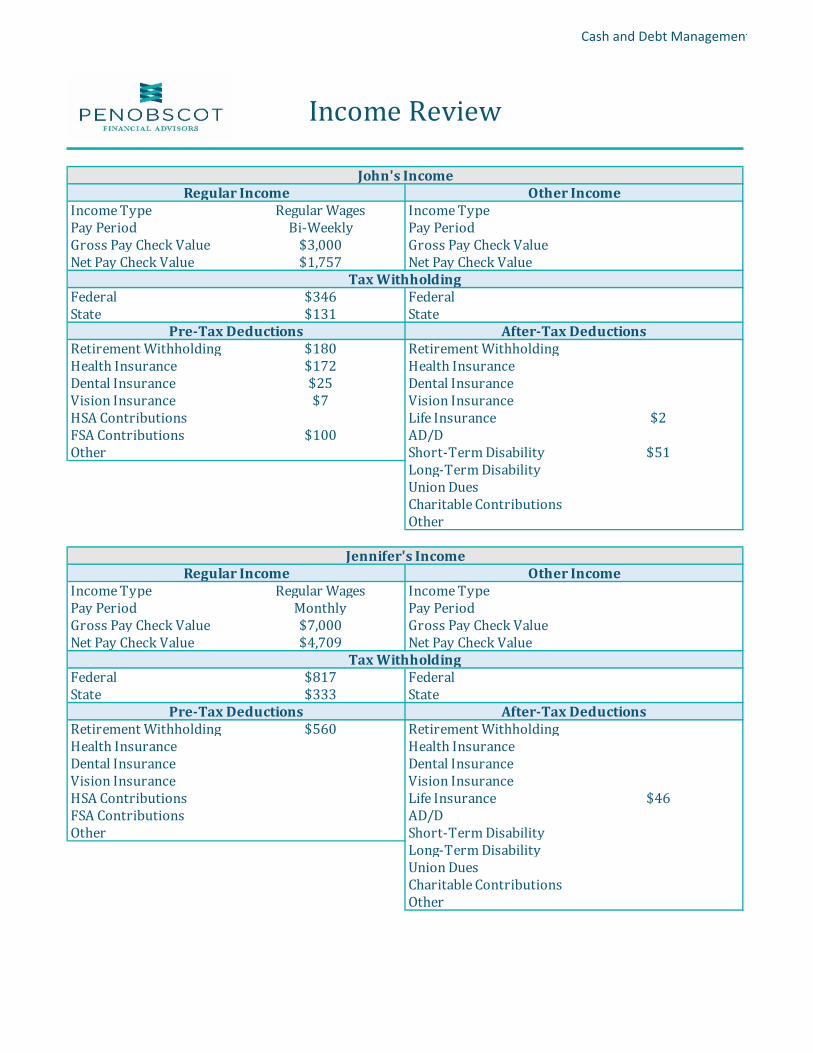
IncomeType RegularWages IncomeTypePayPeriod Bi-Weekly PayPeriodGrossPayCheckValue $3,000 GrossPayCheckValueNetPayCheckValue $1,757 NetPayCheckValue
Federal $346 FederalState $131 State
RetirementWithholding $180 RetirementWithholdingHealthInsurance $172 HealthInsuranceDentalInsurance $25 DentalInsuranceVisionInsurance $7 VisionInsuranceHSAContributions LifeInsurance $2FSAContributions $100 AD/DOther Short-TermDisability $51
Long-TermDisabilityUnionDuesCharitableContributionsOther
IncomeType RegularWages IncomeTypePayPeriod Monthly PayPeriodGrossPayCheckValue $7,000 GrossPayCheckValueNetPayCheckValue $4,709 NetPayCheckValue
Federal $817 FederalState $333 State
RetirementWithholding $560 RetirementWithholdingHealthInsurance HealthInsuranceDentalInsurance DentalInsuranceVisionInsurance VisionInsuranceHSAContributions LifeInsurance $46FSAContributions AD/DOther Short-TermDisability
Long-TermDisabilityUnionDuesCharitableContributionsOther
Jennifer'sIncomeRegularIncome
IncomeReview
RegularIncome OtherIncome
Pre-TaxDeductions After-TaxDeductions
TaxWithholding
John'sIncome
OtherIncome
TaxWithholding
Pre-TaxDeductions After-TaxDeductions
Cash and Debt Management
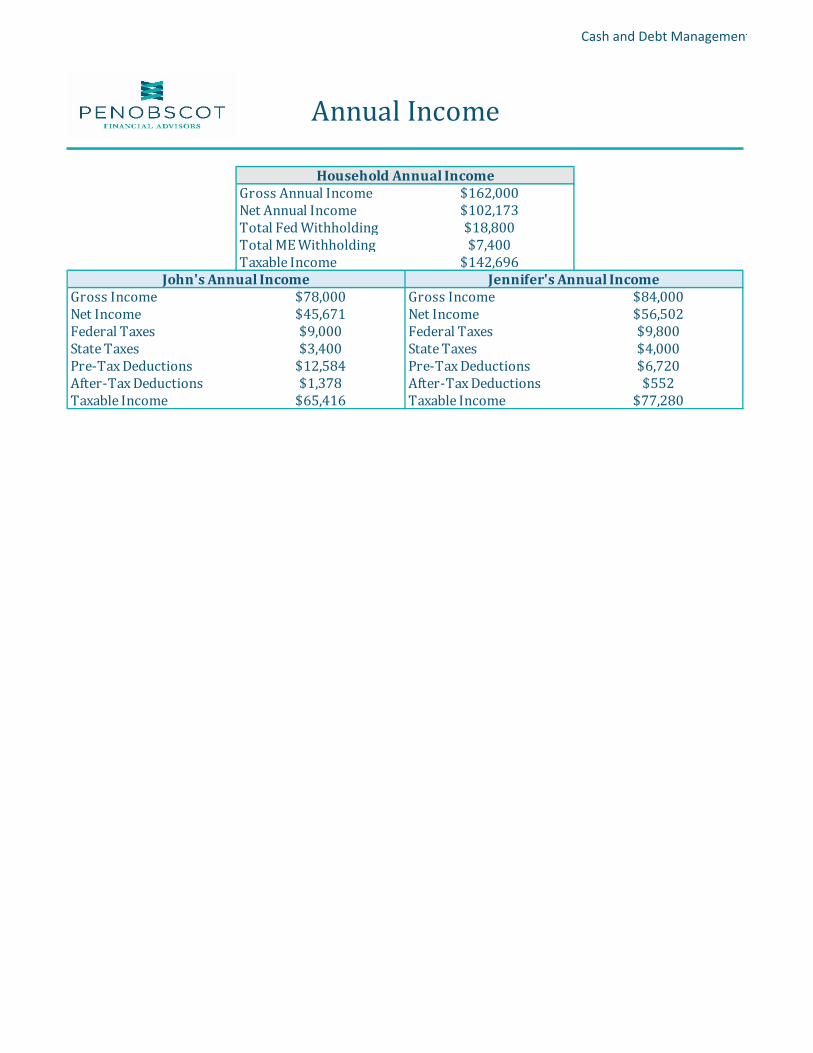
GrossAnnualIncome $162,000NetAnnualIncome $102,173TotalFedWithholding $18,800TotalMEWithholding $7,400TaxableIncome $142,696
GrossIncome $78,000 GrossIncome $84,000NetIncome $45,671 NetIncome $56,502FederalTaxes $9,000 FederalTaxes $9,800StateTaxes $3,400 StateTaxes $4,000Pre-TaxDeductions $12,584 Pre-TaxDeductions $6,720After-TaxDeductions $1,378 After-TaxDeductions $552TaxableIncome $65,416 TaxableIncome $77,280
AnnualIncome
John'sAnnualIncome Jennifer'sAnnualIncome
HouseholdAnnualIncome
Cash and Debt Management
CashSavings $600RetirementSavings $12,000529Savings -
Mortgage(PI) $13,220Mortgage(TI) $5,465RentLifeInsuranceAutoInsurance $1,600Internet/Cable $1,080Phone $6,000CreditCardPayments $1,800AutoPayments $12,650StudentLoans $0OtherDebtPayments $0AllElse
Food/Groceries $13,000Electricity $900Water $600Heat $3,000Gasoline $3,640CarExpenses $2,000Vacation/Travel $7,500EatingOut $5,200Entertainment $3,000ChildCareGym/Fitness $1,800CharitableContributionsPersonalCare/ClothingHomeExpensesAllElse
StatementofCashFlows
CashInflows$102,173
CashOutflowsSavingsandInvestments
FixedExpenses
VariableExpenses
CashInflows-CashOutflows$7,118
TotalOutflows$95,055
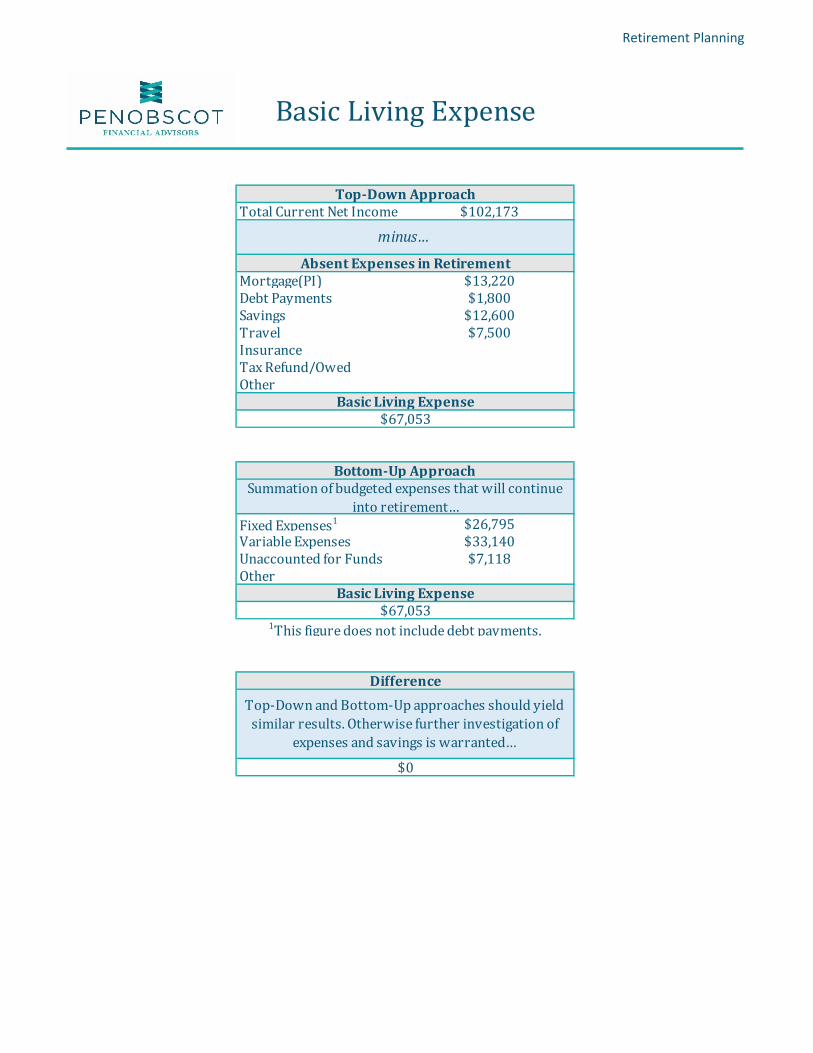
Retirement Planning
TotalCurrentNetIncome $102,173
Mortgage(PI) $13,220DebtPayments $1,800Savings $12,600Travel $7,500InsuranceTaxRefund/OwedOther
FixedExpenses1 $26,795VariableExpenses $33,140UnaccountedforFunds $7,118Other
DifferenceTop-DownandBottom-Upapproachesshouldyieldsimilarresults.Otherwisefurtherinvestigationof
expensesandsavingsiswarranted…
$0
Bottom-UpApproach
BasicLivingExpense$67,053
Summationofbudgetedexpensesthatwillcontinueintoretirement…
1Thisfiguredoesnotincludedebtpayments.
$67,053
BasicLivingExpense
minus…
AbsentExpensesinRetirement
BasicLivingExpense
Top-DownApproach
Cash and Debt Management
Mortgage(PI) $1,177Mortgage(TI) $455
Rent -Auto $1,054
CreditCards $150OtherDebt $0
StudentLoans $0
Mortgage(PI) $0 Mortgage(PI) $0Mortgage(TI) $0 Mortgage(TI) $0
Rent - Rent -Auto $386 Auto $669
CreditCards $150 CreditCards $0OtherDebt $0 OtherDebt $0
StudentLoans $0 StudentLoans $0
ConsumerDebt 14% Outof 20%HousingCosts 12% Outof 28%TotalDebt 21% Outof 36%
CurrentComparisontoGeneralStandards
DebtRatioReview
TypeofDebt GeneralStandardsConsumerDebt 20%orLessofNetMonthlyIncomeHousingCosts 28%orLessofGrossMonthlyIncomeTotalDebt 36%orLessofGrossMonthlyIncome
John'sMonthlyDebtPayments Jennifer'sMonthlyDebtPayments
MonthlyHouseholdDebtPayments
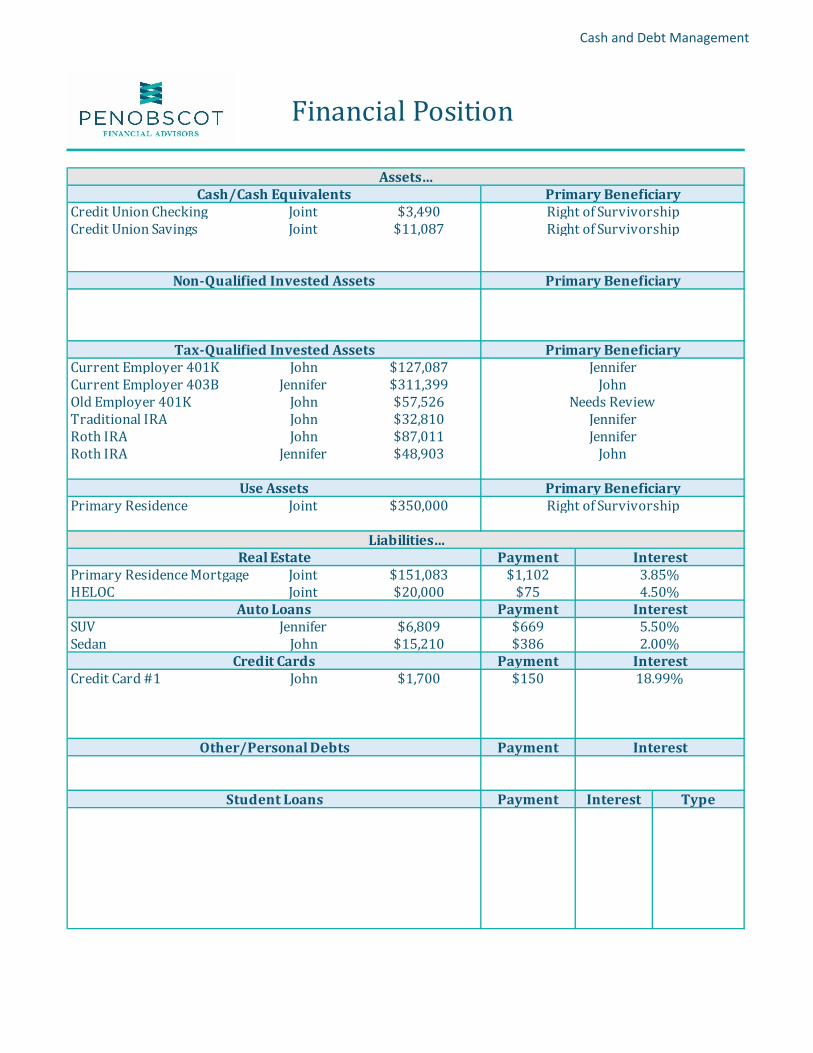
Cash and Debt Management
CreditUnionChecking Joint $3,490CreditUnionSavings Joint $11,087
CurrentEmployer401K John $127,087CurrentEmployer403B Jennifer $311,399OldEmployer401K John $57,526TraditionalIRA John $32,810RothIRA John $87,011RothIRA Jennifer $48,903
PrimaryResidence Joint $350,000
PaymentPrimaryResidenceMortgage Joint $151,083 $1,102HELOC Joint $20,000 $75
PaymentSUV Jennifer $6,809 $669Sedan John $15,210 $386
PaymentCreditCard#1 John $1,700 $150
Payment
Payment Interest TypeStudentLoans
InterestOther/PersonalDebts
Non-QualifiedInvestedAssets
Tax-QualifiedInvestedAssets
UseAssets
18.99%
3.85%
PrimaryBeneficiary
RightofSurvivorship
John
FinancialPosition
PrimaryBeneficiaryAssets…
Cash/CashEquivalentsRightofSurvivorshipRightofSurvivorship
PrimaryBeneficiary
PrimaryBeneficiary
Liabilities…Interest
JenniferJohn
NeedsReviewJenniferJennifer
CreditCards
4.50%
5.50%2.00%
RealEstate
AutoLoans Interest
Interest

Cash and Debt Management
TotalAssets… $1,029,313TotalLiabilities… Minus $194,802NetWorth… Equals $834,511
Assets Liabilities NetWorth$1,029,313 $194,802 $834,511
StatementofFinancialPosition
$1,029,313
$194,802
$834,511
$0
$200,000
$400,000
$600,000
$800,000
$1,000,000
$1,200,000
NetWorth Snapshot
Assets
LiabilitiesNetWorth
Cash and Debt Management
ExistingBalance $151,083AnnualInterestRate 3.85%MonthlyPayment $1,102
RemainingMonths 181EstimatedPayoffDate 10/1/35
Age 52RetirementAge 65RetirementYear 2033BalanceatRetirement $29,457RemainingMonthsatRet. 28
Age 50RetirementAge 63RetirementYear 2033BalanceatRetirement $26,426RemainingMonthsatRet. 25
EstimatedClosingCosts $3,000NewLoanAmount $154,083Term(Months) 180InterstRate 2.75%Payment $1,046TotalInterestPayments $34,132TotatSavings $11,193
MortgageRepayment
RemainingTerm
Results
Inputs
John
Jennifer
BalanceatRetirement
Thesecalculationsassumeyouretireonyourbirthdayoftheretirementagelisted.
Refinance
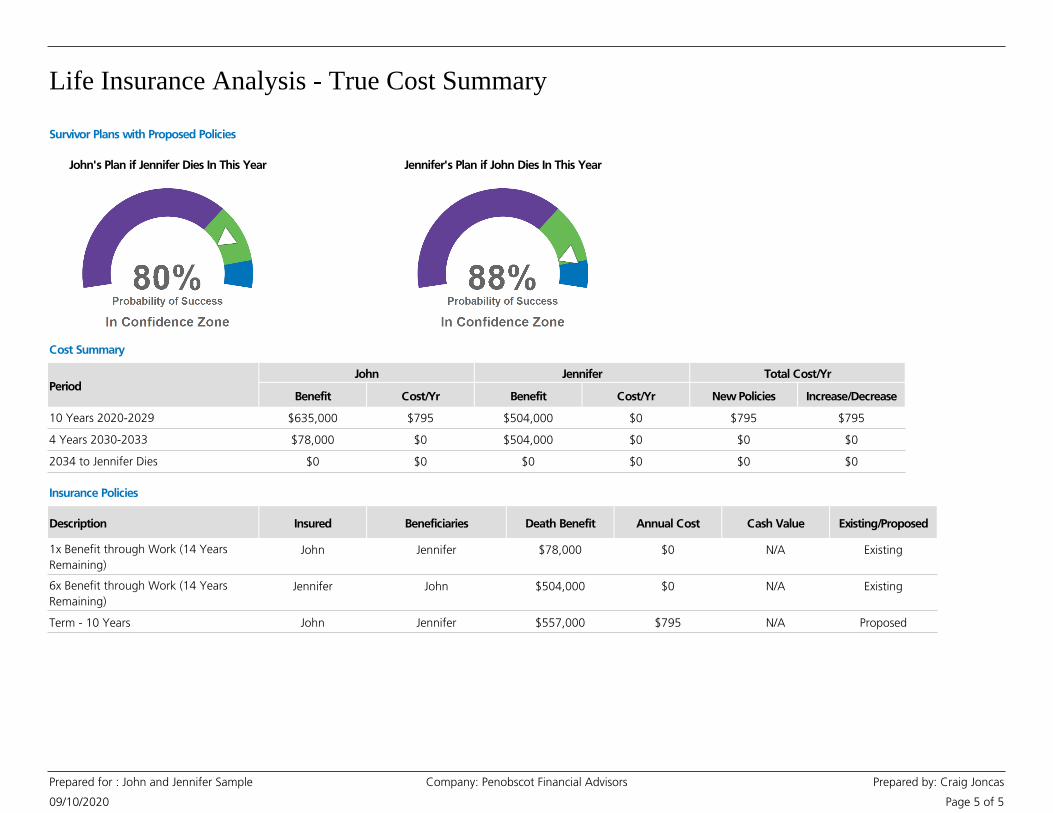
Life Insurance Analysis - True Cost Summary
09/10/2020
Prepared for : John and Jennifer Sample Company: Penobscot Financial Advisors Prepared by: Craig Joncas
Page 5 of 5
Survivor Plans with Proposed Policies
Jennifer's Plan if John Dies In This YearJohn's Plan if Jennifer Dies In This Year
Cost Summary
PeriodJohn
Benefit Cost/Yr
Jennifer
Benefit Cost/Yr
Total Cost/Yr
New Policies Increase/Decrease
10 Years 2020-2029 $635,000 $795 $504,000 $0 $795 $795
4 Years 2030-2033 $78,000 $0 $504,000 $0 $0 $0
2034 to Jennifer Dies $0 $0 $0 $0 $0 $0
Description Insured Beneficiaries Death Benefit
Insurance Policies
Annual Cost Cash Value Existing/Proposed
1x Benefit through Work (14 Years
Remaining)
N/AJennifer $78,000 $0John Existing
6x Benefit through Work (14 Years
Remaining)
N/AJohn $504,000 $0Jennifer Existing
Term - 10 Years N/AJennifer $557,000 $795John Proposed
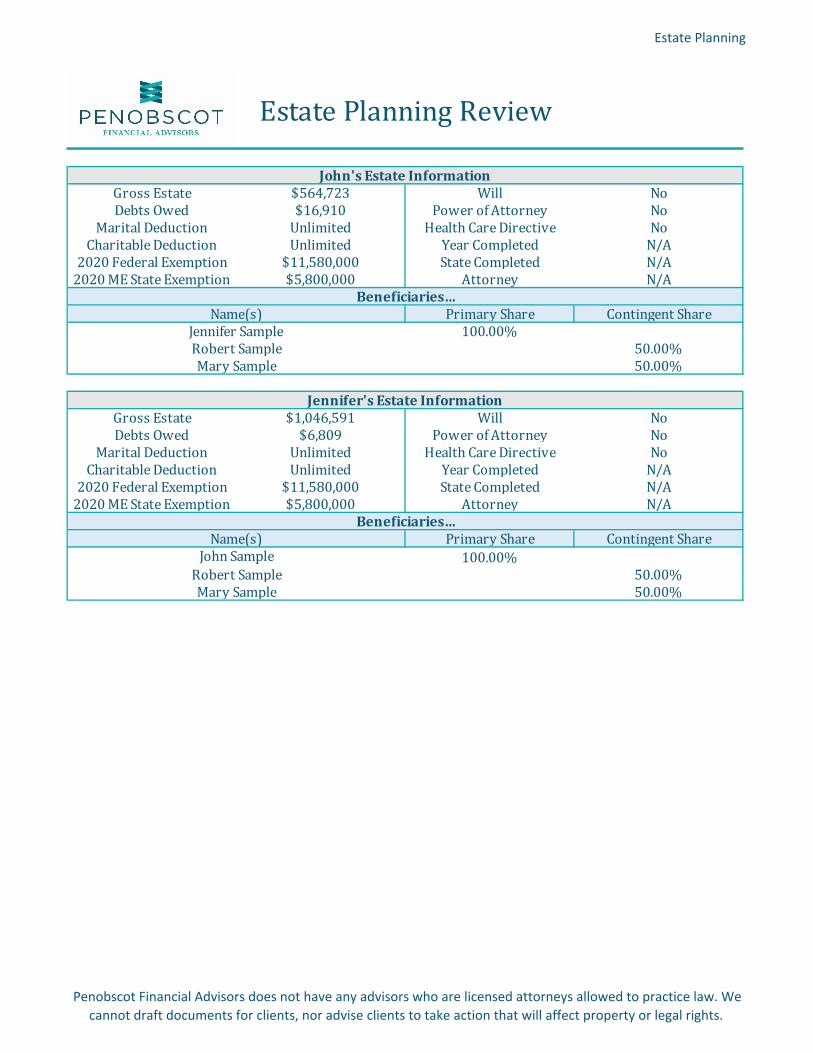
Estate Planning
Penobscot Financial Advisors does not have any advisors who are licensed attorneys allowed to practice law. We cannot draft documents for clients, nor advise clients to take action that will affect property or legal rights.
GrossEstate $564,723 Will NoDebtsOwed $16,910 PowerofAttorney No
MaritalDeduction Unlimited HealthCareDirective NoCharitableDeduction Unlimited YearCompleted N/A2020FederalExemption $11,580,000 StateCompleted N/A2020MEStateExemption $5,800,000 Attorney N/A
PrimaryShare ContingentShare100.00%
50.00%50.00%
GrossEstate $1,046,591 Will NoDebtsOwed $6,809 PowerofAttorney No
MaritalDeduction Unlimited HealthCareDirective NoCharitableDeduction Unlimited YearCompleted N/A2020FederalExemption $11,580,000 StateCompleted N/A2020MEStateExemption $5,800,000 Attorney N/A
PrimaryShare ContingentShare100.00%
50.00%50.00%
Beneficiaries…Name(s)
JohnSampleRobertSampleMarySample
Jennifer'sEstateInformation
EstatePlanningReview
John'sEstateInformation
Beneficiaries…Name(s)
JenniferSampleRobertSampleMarySample

Section3

John and Jennifer Sample
Financial Goal Plan
Prepared by:
Craig Joncas, CFP
Financial Advisor
September 10, 2020

Table Of Contents
Summary of Goals and Resources
Personal Information and Summary of Financial Goals 1 - 2
Current Financial Goals Graph 3
Resources Summary 4
Life Expectancy Table and Graph 5
Tax and Inflation Assumptions 6
Results
What If Worksheet 7 - 13
Worksheet Detail - Combined Details 14 - 37
IMPORTANT DISCLOSURE INFORMATION 38 - 42

Summary of Goals and Resources
Personal Information and Summary of Financial Goals
09/10/2020
Prepared for : John and Jennifer Sample Company: Penobscot Financial Advisors Prepared by: Craig Joncas
Page 1 of 42
See Important Disclosure Information section in this Report for explanations of assumptions, limitations, methodologies, and a glossary.
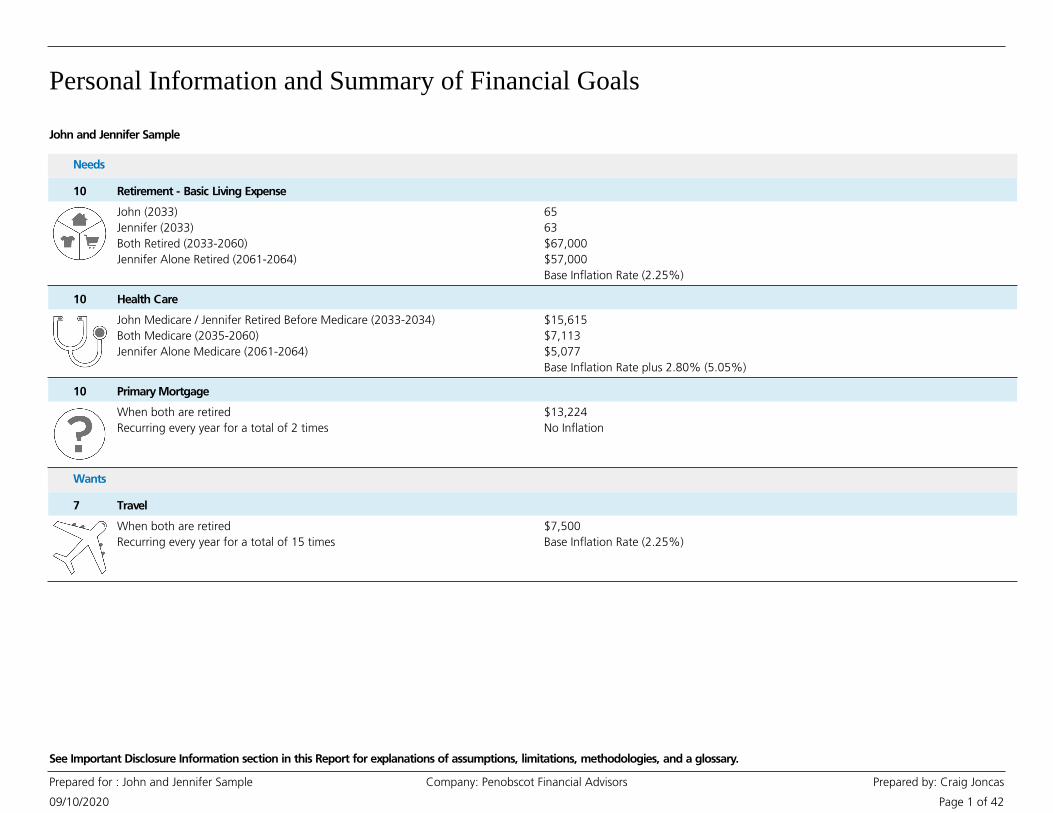
John and Jennifer Sample
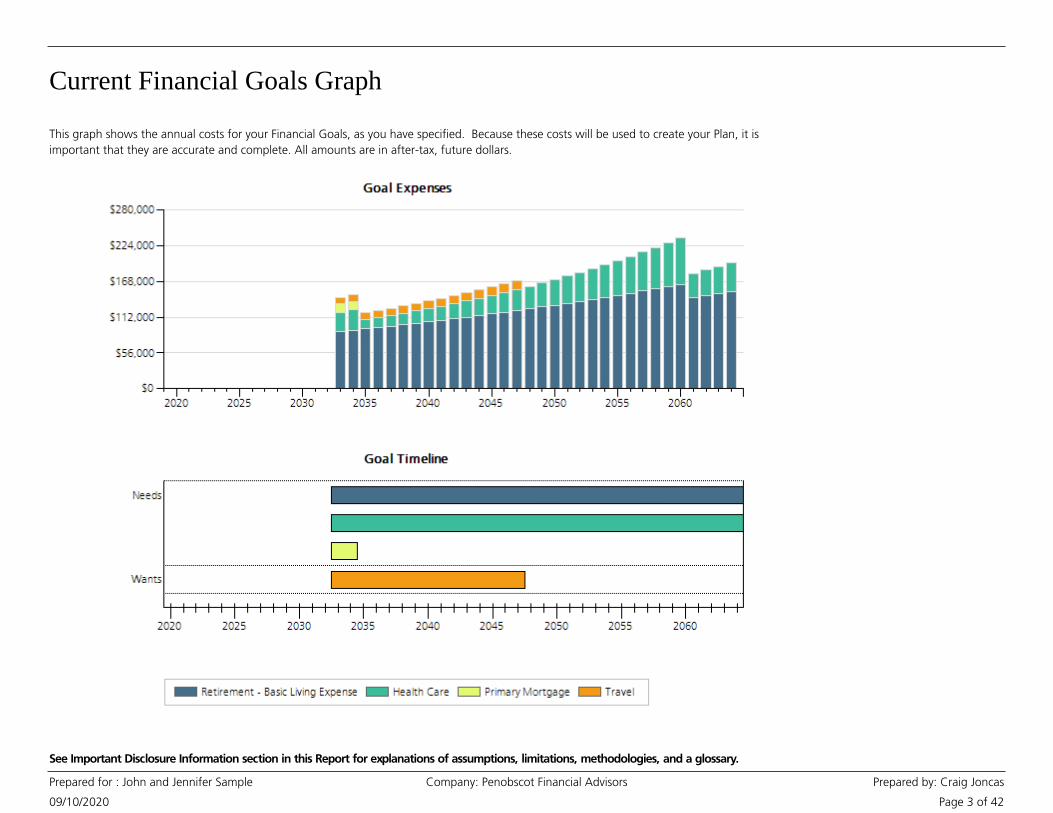
Needs
Retirement - Basic Living Expense10
John (2033)
Jennifer (2033)
Both Retired (2033-2060)
Jennifer Alone Retired (2061-2064)
65
63
$67,000
$57,000
Base Inflation Rate (2.25%)
Health Care10
John Medicare / Jennifer Retired Before Medicare (2033-2034)
Both Medicare (2035-2060)
Jennifer Alone Medicare (2061-2064)
$15,615
$7,113
$5,077
Base Inflation Rate plus 2.80% (5.05%)
Primary Mortgage10
When both are retired
Recurring every year for a total of 2 times
$13,224
No Inflation
Wants
Travel7
When both are retired
Recurring every year for a total of 15 times
$7,500
Base Inflation Rate (2.25%)

Personal Information and Summary of Financial Goals
09/10/2020
Prepared for : John and Jennifer Sample Company: Penobscot Financial Advisors Prepared by: Craig Joncas
Page 2 of 42
See Important Disclosure Information section in this Report for explanations of assumptions, limitations, methodologies, and a glossary.
Personal Information
John
Male - born 05/19/1968, age 52
Jennifer
Female - born 08/03/1970, age 50
Married, US Citizens living in ME
Employed - $78,000
Employed - $84,000
• This section lists the Personal and Financial Goal information you provided, which will
be used to create your Report. It is important that it is accurate and complete.
Participant Name Date of Birth Age Relationship
Jennifer 12/10/1998 21 Child of Both
Robert 07/29/2003 17 Child of Both
Current Financial Goals Graph
09/10/2020
Prepared for : John and Jennifer Sample Company: Penobscot Financial Advisors Prepared by: Craig Joncas
Page 3 of 42
See Important Disclosure Information section in this Report for explanations of assumptions, limitations, methodologies, and a glossary.
This graph shows the annual costs for your Financial Goals, as you have specified. Because these costs will be used to create your Plan, it is
important that they are accurate and complete. All amounts are in after-tax, future dollars.
Resources Summary
09/10/2020
Prepared for : John and Jennifer Sample Company: Penobscot Financial Advisors Prepared by: Craig Joncas
Page 4 of 42
See Important Disclosure Information section in this Report for explanations of assumptions, limitations, methodologies, and a glossary.
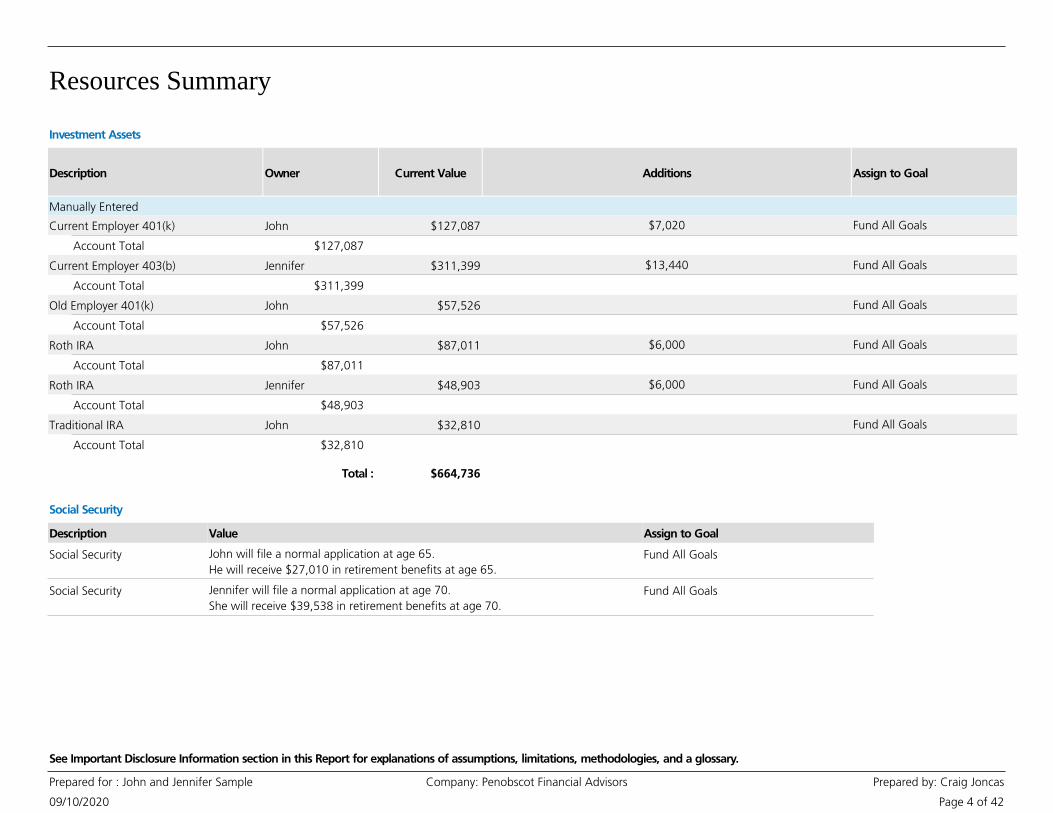
Description Owner Current Value
Investment Assets
Additions Assign to Goal
Manually Entered
JohnCurrent Employer 401(k) $127,087 $7,020 Fund All Goals
$127,087Account Total
JenniferCurrent Employer 403(b) $311,399 $13,440 Fund All Goals
$311,399Account Total
JohnOld Employer 401(k) $57,526 Fund All Goals
$57,526Account Total
JohnRoth IRA $87,011 $6,000 Fund All Goals
$87,011Account Total
JenniferRoth IRA $48,903 $6,000 Fund All Goals
$48,903Account Total
JohnTraditional IRA $32,810 Fund All Goals
$32,810Account Total
$664,736Total :
Social Security
Description Value Assign to Goal
Social Security John will file a normal application at age 65.
He will receive $27,010 in retirement benefits at age 65.
Fund All Goals
Social Security Jennifer will file a normal application at age 70.
She will receive $39,538 in retirement benefits at age 70.
Fund All Goals
Life Expectancy Table and Graph
09/10/2020
Prepared for : John and Jennifer Sample Company: Penobscot Financial Advisors Prepared by: Craig Joncas
Page 5 of 42
See Important Disclosure Information section in this Report for explanations of assumptions, limitations, methodologies, and a glossary.
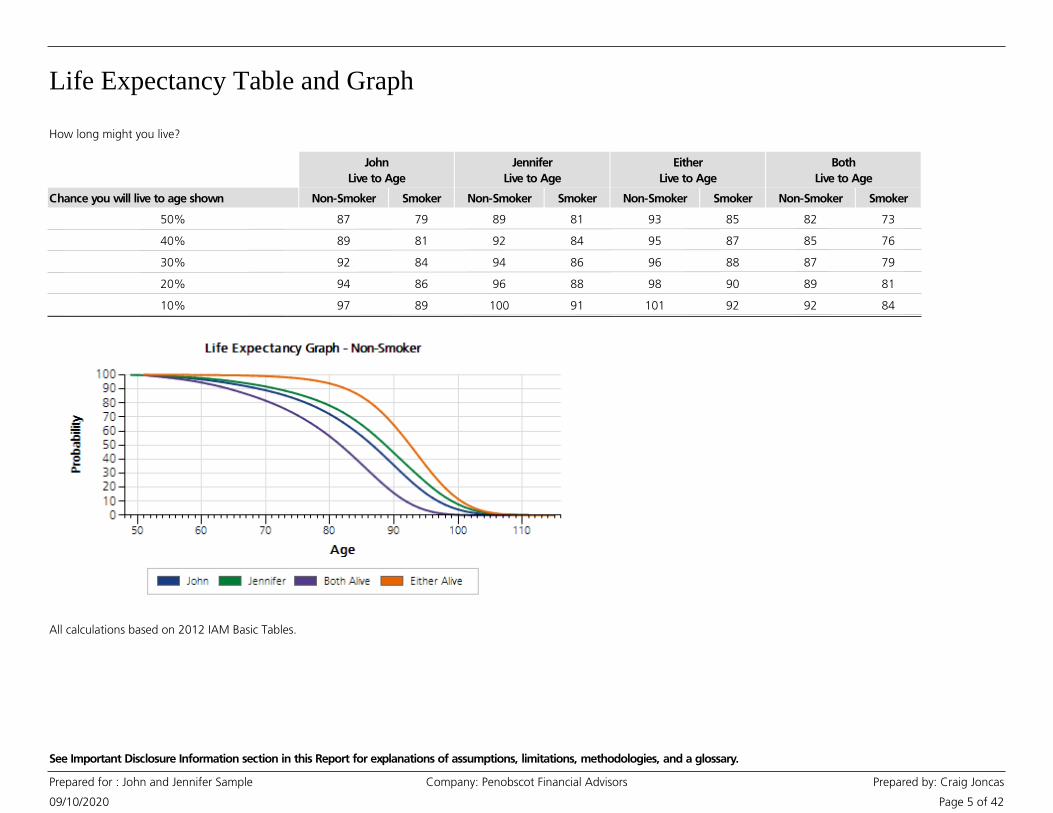
How long might you live?
Chance you will live to age shown Non-Smoker Smoker Non-Smoker Smoker Non-Smoker Smoker
John
Live to Age
Jennifer
Live to Age
Either
Live to Age
Non-Smoker Smoker
Both
Live to Age
50% 87 79 89 81 93 85 82 73
40% 89 81 92 84 95 87 85 76
30% 92 84 94 86 96 88 87 79
20% 94 86 96 88 98 90 89 81
10% 97 89 100 91 101 92 92 84
All calculations based on 2012 IAM Basic Tables.

Tax and Inflation Assumptions
09/10/2020
Prepared for : John and Jennifer Sample Company: Penobscot Financial Advisors Prepared by: Craig Joncas
Page 6 of 42
See Important Disclosure Information section in this Report for explanations of assumptions, limitations, methodologies, and a glossary.
Do you want to waive required minimum distributions in
2020?
No
Do you want to expire or sunset income tax provisions? No
Base Inflation Rate
Inflation rate : 2.25%
Social Security Inflation rate : 1.75%
Tax Assumption Inflation rate : 2.25%
Tax Rates : 22.00%
Federal
7.15%
State
0.00%
Local
Marginal Tax Rates Before Retirement
Untaxed Gain on Taxable Earnings - Before Retirement
What portion of your Annual Taxable Investment
Earnings will not be taxed until withdrawn?
0.00%
What portion of your Taxable Investment Earnings
will be taxed at the LTCG rate?
20.00%
Long Term Capital Gains rate : 15.00%
Long Term Capital Gains (LTCG) - Before Retirement
Tax Rates During Retirement
Local rate : 0.00%
Deduction estimate : Use standard deductions
Let the Program calculate taxes each year
0.00%
Untaxed Gain on Taxable Earnings - During Retirement
What portion of your Annual Taxable Investment
Earnings will not be taxed until withdrawn?
Long Term Capital Gains (LTCG) - During Retirement
What portion of your Taxable Investment Earnings
will be taxed at the LTCG rate?
20.00%
Long Term Capital Gains rate : Use Program estimate
Taxation of Social Security
What portion of Social Security will be taxed? 85.00%
Tax Penalty
Include penalties in Plan? : Yes
Treat Tax-Free Assets as Tax-Free
Tax Free Earnings - Options

Results
What If Worksheet
09/10/2020
Prepared for : John and Jennifer Sample Company: Penobscot Financial Advisors Prepared by: Craig Joncas
Page 7 of 42
See Important Disclosure Information section in this Report for explanations of assumptions, limitations, methodologies, and a glossary.
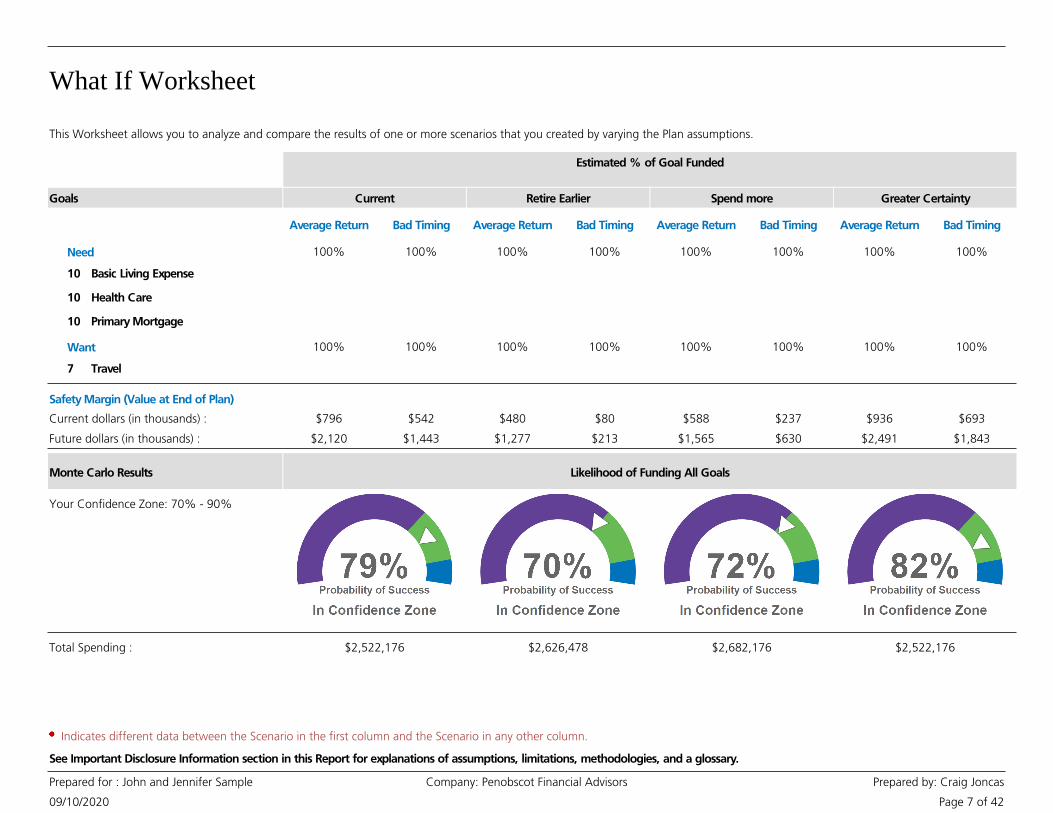
This Worksheet allows you to analyze and compare the results of one or more scenarios that you created by varying the Plan assumptions.
Goals
Estimated % of Goal Funded
Current Retire Earlier Spend more Greater Certainty
Average Return Bad Timing Average Return Bad Timing Average Return Bad Timing Average Return Bad Timing
Need 100% 100% 100% 100% 100% 100% 100% 100%
10 Basic Living Expense
10 Health Care
10 Primary Mortgage
Want 100% 100% 100% 100% 100% 100% 100% 100%
7 Travel
$796
$2,120
Current dollars (in thousands) :
Future dollars (in thousands) :
$480
$1,277
Safety Margin (Value at End of Plan)
$588
$1,565
$936
$2,491
$542
$1,443
$80
$213
$237
$630
$693
$1,843
Your Confidence Zone: 70% - 90%
Likelihood of Funding All GoalsMonte Carlo Results
Total Spending : $2,522,176 $2,626,478 $2,682,176 $2,522,176
Indicates different data between the Scenario in the first column and the Scenario in any other column.
What If Worksheet
09/10/2020
Prepared for : John and Jennifer Sample Company: Penobscot Financial Advisors Prepared by: Craig Joncas
Page 8 of 42
See Important Disclosure Information section in this Report for explanations of assumptions, limitations, methodologies, and a glossary.
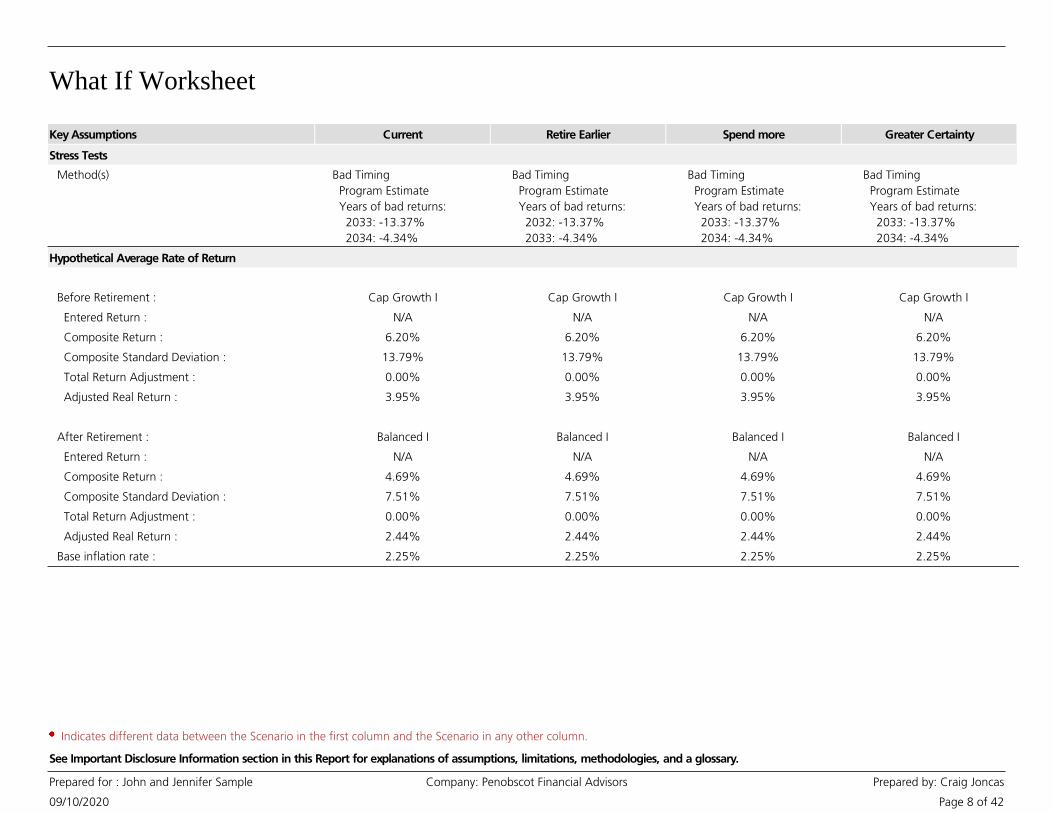
Key Assumptions Current Retire Earlier Spend more Greater Certainty
Stress Tests
Method(s) Bad Timing
Program Estimate
Years of bad returns:
2033: -13.37%
2034: -4.34%
Bad Timing
Program Estimate
Years of bad returns:
2032: -13.37%
2033: -4.34%
Bad Timing
Program Estimate
Years of bad returns:
2033: -13.37%
2034: -4.34%
Bad Timing
Program Estimate
Years of bad returns:
2033: -13.37%
2034: -4.34%
False 0
Hypothetical Average Rate of Return
False 1
Before Retirement : Cap Growth I Cap Growth I Cap Growth I Cap Growth I False 1
Entered Return : N/A N/A N/A N/A False 1
Composite Return : 6.20% 6.20% 6.20% 6.20% False 1
Composite Standard Deviation : 13.79% 13.79% 13.79% 13.79% False 1
Total Return Adjustment : 0.00% 0.00% 0.00% 0.00% False 1
Adjusted Real Return : 3.95% 3.95% 3.95% 3.95% False 1
False 1
After Retirement : Balanced I Balanced I Balanced I Balanced I False 1
Entered Return : N/A N/A N/A N/A False 1
Composite Return : 4.69% 4.69% 4.69% 4.69% False 1
Composite Standard Deviation : 7.51% 7.51% 7.51% 7.51% False 1
Total Return Adjustment : 0.00% 0.00% 0.00% 0.00% False 1
Adjusted Real Return : 2.44% 2.44% 2.44% 2.44% False 1
Base inflation rate : 2.25% 2.25% 2.25% 2.25% False 1
Indicates different data between the Scenario in the first column and the Scenario in any other column.
What If Worksheet
09/10/2020
Prepared for : John and Jennifer Sample Company: Penobscot Financial Advisors Prepared by: Craig Joncas
Page 9 of 42
See Important Disclosure Information section in this Report for explanations of assumptions, limitations, methodologies, and a glossary.
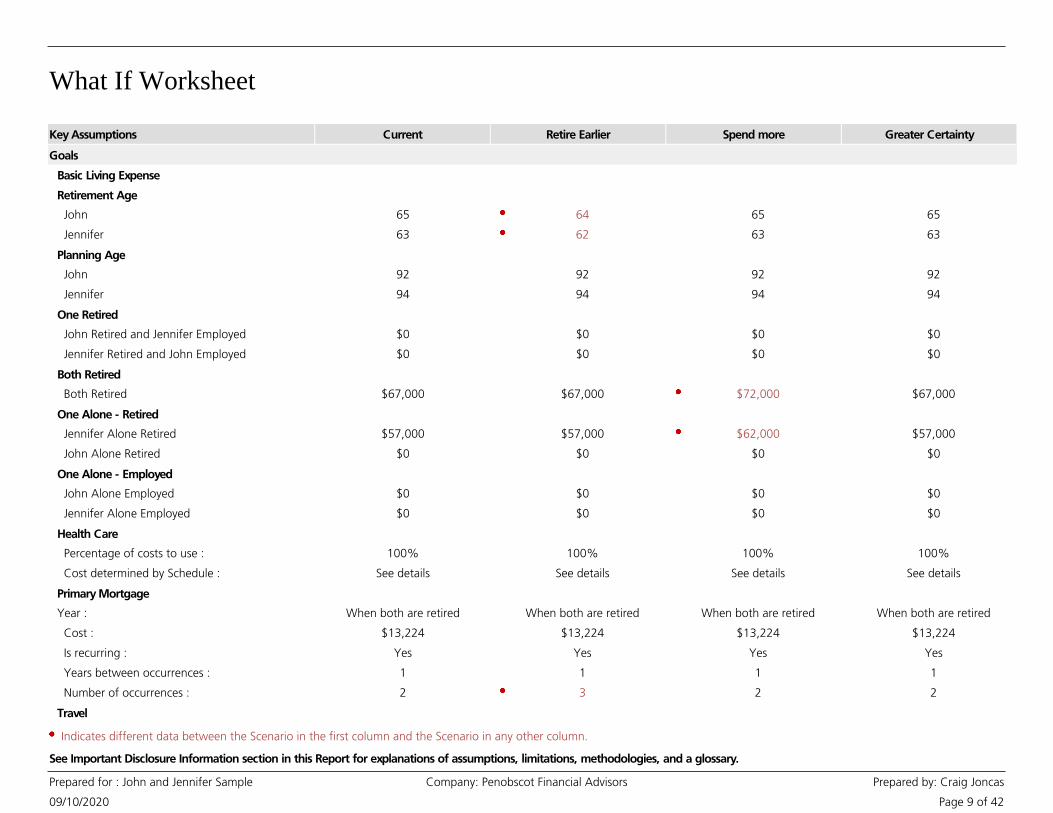
Key Assumptions Current Retire Earlier Spend more Greater Certainty
Goals
Basic Living Expense True 1
Retirement Age True 1
John 65 64 65 65 False 1
Jennifer 63 62 63 63 False 1
Planning Age True 1
John 92 92 92 92 False 1
Jennifer 94 94 94 94 False 1
One Retired True 1
John Retired and Jennifer Employed $0 $0 $0 $0 False 1
Jennifer Retired and John Employed $0 $0 $0 $0 False 1
Both Retired True 1
Both Retired $67,000 $67,000 $72,000 $67,000 False 1
One Alone - Retired True 1
Jennifer Alone Retired $57,000 $57,000 $62,000 $57,000 False 1
John Alone Retired $0 $0 $0 $0 False 1
One Alone - Employed True 1
John Alone Employed $0 $0 $0 $0 False 1
Jennifer Alone Employed $0 $0 $0 $0 False 1
Health Care True 1
Percentage of costs to use : 100% 100% 100% 100% False 1
Cost determined by Schedule : See details See details See details See details False 1
Primary Mortgage True 1
Year : When both are retired When both are retired When both are retired When both are retired False 1
Cost : $13,224 $13,224 $13,224 $13,224 False 1
Is recurring : Yes Yes Yes Yes False 1
Years between occurrences : 1 1 1 1 False 1
Number of occurrences : 2 3 2 2 False 1
Travel True 1
Indicates different data between the Scenario in the first column and the Scenario in any other column.

What If Worksheet
09/10/2020
Prepared for : John and Jennifer Sample Company: Penobscot Financial Advisors Prepared by: Craig Joncas
Page 10 of 42
See Important Disclosure Information section in this Report for explanations of assumptions, limitations, methodologies, and a glossary.
Key Assumptions Current Retire Earlier Spend more Greater Certainty
Goals
Year : When both are retired When both are retired When both are retired When both are retired False 1
Cost : $7,500 $7,500 $7,500 $7,500 False 1
Is recurring : Yes Yes Yes Yes False 1
Years between occurrences : 1 1 1 1 False 1
Number of occurrences : 15 15 15 15 False 1
Retirement Income
Social Security True 1
Select Social Security Strategy Current Current Current Current False 1
John True 1
Filing Method : Normal Normal Normal Normal False 1
Age to File Application : 65 64 65 65 False 1
Age Retirement Benefits begin : 65 64 65 65 False 1
First Year Benefit : $27,010 $24,929 $27,010 $27,010 False 1
Jennifer True 1
Filing Method : Normal Normal Normal Normal False 1
Age to File Application : 70 70 70 70 False 1
Age Retirement Benefits begin : 70 70 70 70 False 1
First Year Benefit : $39,538 $39,529 $39,538 $39,538 False 1
Reduce Benefits By : 0% 0% 0% 0% False 1
Indicates different data between the Scenario in the first column and the Scenario in any other column.
What If Worksheet
09/10/2020
Prepared for : John and Jennifer Sample Company: Penobscot Financial Advisors Prepared by: Craig Joncas
Page 11 of 42
See Important Disclosure Information section in this Report for explanations of assumptions, limitations, methodologies, and a glossary.
Key Assumptions Current Retire Earlier Spend more Greater Certainty
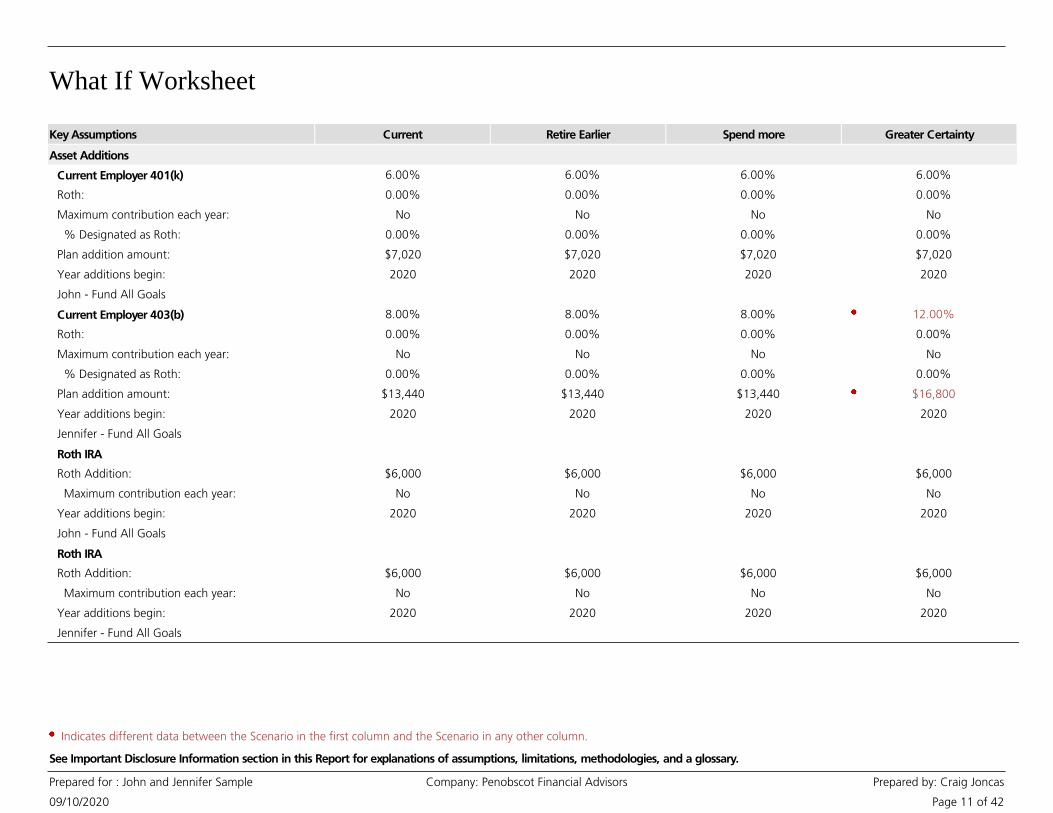
Asset Additions
Current Employer 401(k) 6.00% 6.00% 6.00% 6.00% True 1
Roth: 0.00% 0.00% 0.00% 0.00% False 1
Maximum contribution each year: No No No No False 1
% Designated as Roth: 0.00% 0.00% 0.00% 0.00% False 1
Plan addition amount: $7,020 $7,020 $7,020 $7,020 False 1
Year additions begin: 2020 2020 2020 2020 False 1
John - Fund All Goals False 1
Current Employer 403(b) 8.00% 8.00% 8.00% 12.00% True 1
Roth: 0.00% 0.00% 0.00% 0.00% False 1
Maximum contribution each year: No No No No False 1
% Designated as Roth: 0.00% 0.00% 0.00% 0.00% False 1
Plan addition amount: $13,440 $13,440 $13,440 $16,800 False 1
Year additions begin: 2020 2020 2020 2020 False 1
Jennifer - Fund All Goals False 1
Roth IRA True 1
Roth Addition: $6,000 $6,000 $6,000 $6,000 False 1
Maximum contribution each year: No No No No False 1
Year additions begin: 2020 2020 2020 2020 False 1
John - Fund All Goals False 1
Roth IRA True 1
Roth Addition: $6,000 $6,000 $6,000 $6,000 False 1
Maximum contribution each year: No No No No False 1
Year additions begin: 2020 2020 2020 2020 False 1
Jennifer - Fund All Goals False 1
Indicates different data between the Scenario in the first column and the Scenario in any other column.
What If Worksheet
09/10/2020
Prepared for : John and Jennifer Sample Company: Penobscot Financial Advisors Prepared by: Craig Joncas
Page 12 of 42
See Important Disclosure Information section in this Report for explanations of assumptions, limitations, methodologies, and a glossary.
Key Assumptions Current Retire Earlier Spend more Greater Certainty
Extra Savings by Tax Category
John's Qualified $0 $0 $0 $0 False 1
Jennifer's Qualified $0 $0 $0 $0 False 1
John's Roth $0 $0 $0 $1,000 False 1
Jennifer's Roth $0 $0 $0 $1,000 False 1
John's Tax-Deferred $0 $0 $0 $0 False 1
Jennifer's Tax-Deferred $0 $0 $0 $0 False 1
Taxable $0 $0 $0 $0 False 1
Cash Reserve
Include : No No No No False 1
Your Goal Coverage True 1
Needs : 3 3 3 3 False 1
Wants : 2 2 2 2 False 1
Wishes : 1 1 1 1 False 1
Minimum Amount in Cash Reserve : $0 $0 $0 $0 False 1
Annual offset for Cash Reserve : $0 $0 $0 $0 False 1
Selected Allocation : Enter Own Return and
Standard Deviation
Enter Own Return and
Standard Deviation
Enter Own Return and
Standard Deviation
Enter Own Return and
Standard Deviation
False 1
Return : 0.00% 0.00% 0.00% 0.00% False 1
Standard Deviation : 0.00% 0.00% 0.00% 0.00% False 1
Aspirational Bucket
Include : No No No No False 1
Additional : $0 $0 $0 $0 False 1
Selected Allocation : Enter Own Return and
Standard Deviation
Enter Own Return and
Standard Deviation
Enter Own Return and
Standard Deviation
Enter Own Return and
Standard Deviation
False 1
Return : 9.00% 9.00% 9.00% 9.00% False 1
Standard Deviation : 18.00% 18.00% 18.00% 18.00% False 1
Indicates different data between the Scenario in the first column and the Scenario in any other column.
What If Worksheet
09/10/2020
Prepared for : John and Jennifer Sample Company: Penobscot Financial Advisors Prepared by: Craig Joncas
Page 13 of 42
See Important Disclosure Information section in this Report for explanations of assumptions, limitations, methodologies, and a glossary.
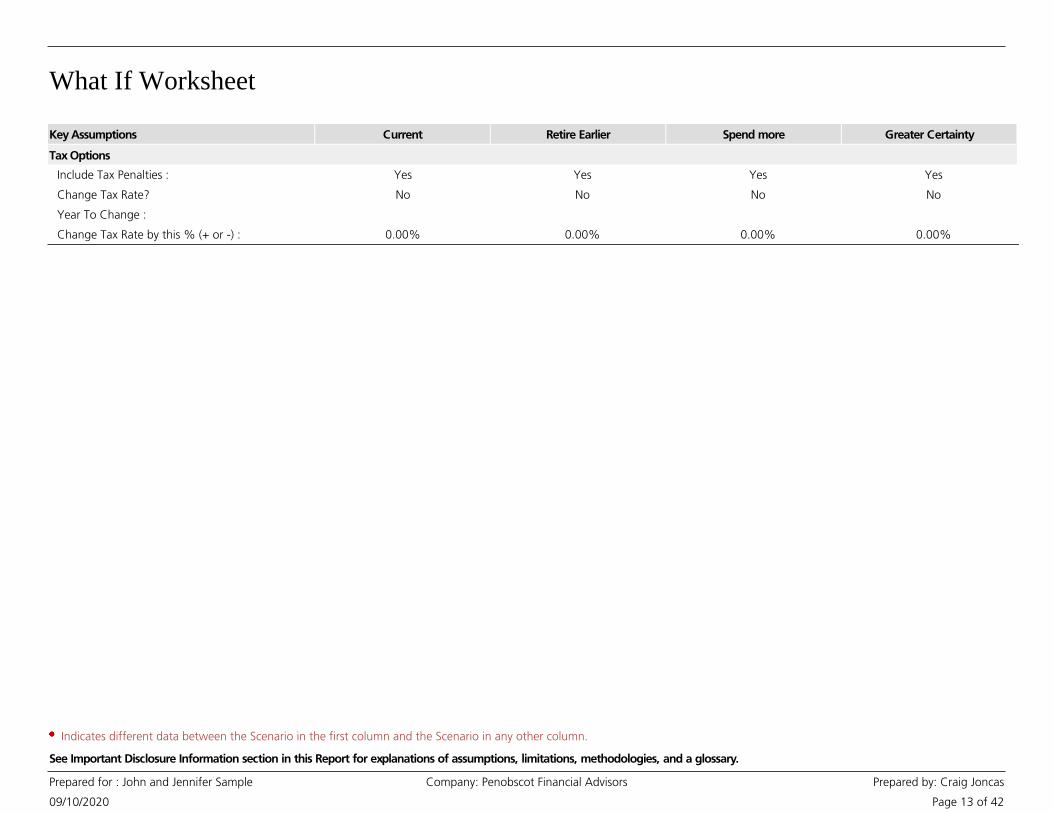
Key Assumptions Current Retire Earlier Spend more Greater Certainty
Tax Options
Include Tax Penalties : Yes Yes Yes Yes False 1
Change Tax Rate? No No No No False 1
Year To Change : False 1
Change Tax Rate by this % (+ or -) : 0.00% 0.00% 0.00% 0.00% False 1
Indicates different data between the Scenario in the first column and the Scenario in any other column.
Worksheet Detail - Combined Details
09/10/2020
Prepared for : John and Jennifer Sample Company: Penobscot Financial Advisors Prepared by: Craig Joncas
Page 14 of 42
See Important Disclosure Information section in this Report for explanations of assumptions, limitations, methodologies, and a glossary.
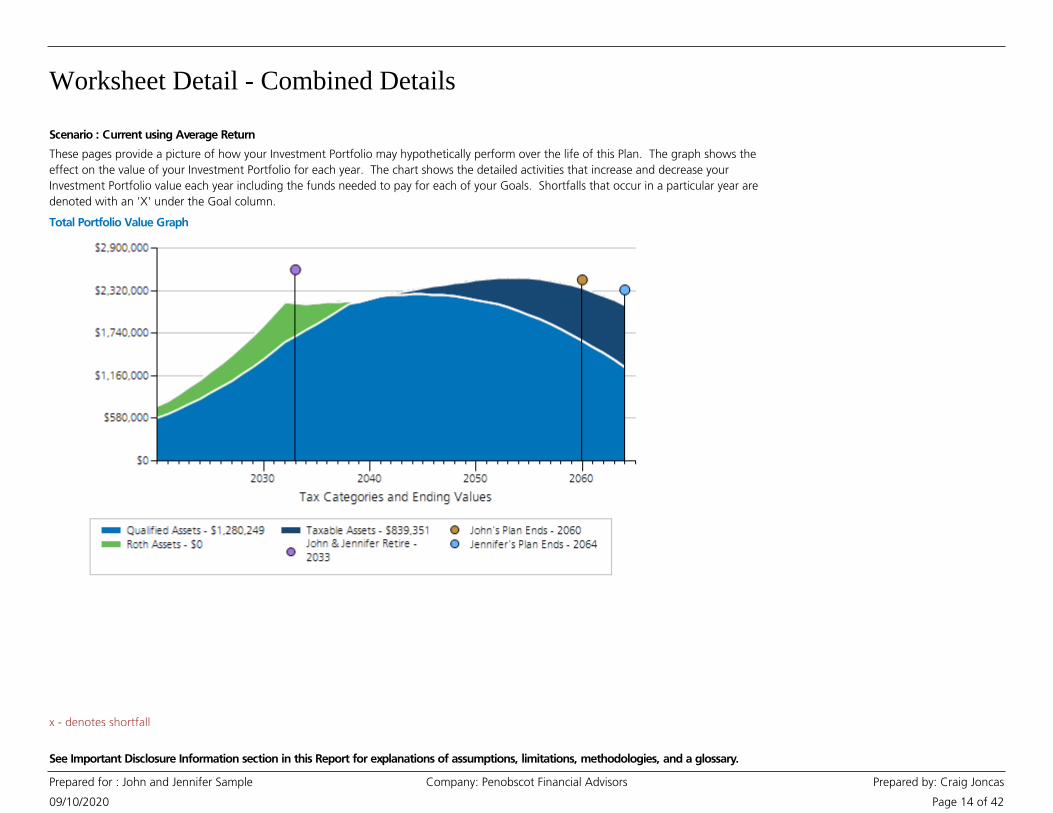
Total Portfolio Value Graph
These pages provide a picture of how your Investment Portfolio may hypothetically perform over the life of this Plan. The graph shows the
effect on the value of your Investment Portfolio for each year. The chart shows the detailed activities that increase and decrease your
Investment Portfolio value each year including the funds needed to pay for each of your Goals. Shortfalls that occur in a particular year are
denoted with an 'X' under the Goal column.
Scenario : Current using Average Return
x - denotes shortfall

Worksheet Detail - Combined Details
09/10/2020
Prepared for : John and Jennifer Sample Company: Penobscot Financial Advisors Prepared by: Craig Joncas
Page 15 of 42
See Important Disclosure Information section in this Report for explanations of assumptions, limitations, methodologies, and a glossary.
Event or Ages Year
Beginning Portfolio Value
Earmarked Fund All Goals Additions To
Assets
Other
Additions
Post
Retirement
Income
Investment
Earnings
Investment
Return
Taxes
Funds Used
All Goals Ending Portfolio
Value
52/50 2020 0 664,736 32,460 0 0 43,261 6.21% 0 0 740,457
53/51 2021 0 740,457 32,920 0 0 47,988 6.21% 0 0 821,365
54/52 2022 0 821,365 33,391 0 0 53,038 6.21% 0 0 907,794
55/53 2023 0 907,794 33,872 0 0 58,430 6.21% 0 0 1,000,097
56/54 2024 0 1,000,097 34,364 0 0 64,188 6.21% 0 0 1,098,649
57/55 2025 0 1,098,649 34,867 0 0 70,335 6.21% 0 0 1,203,851
58/56 2026 0 1,203,851 35,382 0 0 76,894 6.21% 0 0 1,316,128
59/57 2027 0 1,316,128 35,908 0 0 83,894 6.21% 0 0 1,435,930
60/58 2028 0 1,435,930 36,446 0 0 91,361 6.21% 0 0 1,563,737
61/59 2029 0 1,563,737 36,996 0 0 99,325 6.21% 0 0 1,700,059
62/60 2030 0 1,700,059 37,559 0 0 107,819 6.21% 0 0 1,845,436
63/61 2031 0 1,845,436 38,134 0 0 116,876 6.21% 0 0 2,000,446
64/62 2032 0 2,000,446 38,722 0 0 126,530 6.21% 0 0 2,165,698
John & Jennifer
Retire
2033 0 2,165,698 0 0 33,843 96,606 4.70% 0 142,342 2,153,805
66/64 2034 0 2,153,805 0 0 34,435 95,878 4.70% 0 146,545 2,137,574
67/65 2035 0 2,137,574 0 0 35,038 96,442 4.70% 0 118,911 2,150,143
68/66 2036 0 2,150,143 0 0 35,651 96,905 4.70% 0 122,219 2,160,480
69/67 2037 0 2,160,480 0 0 36,275 97,258 4.70% 0 125,683 2,168,330
70/68 2038 0 2,168,330 0 0 36,910 97,486 4.70% 0 129,310 2,173,415
71/69 2039 0 2,173,415 0 0 37,556 97,112 4.70% 9,900 133,094 2,165,088
72/70 2040 0 2,165,088 0 0 94,150 98,896 4.70% 16,241 137,036 2,204,856
73/71 2041 0 2,204,856 0 0 95,798 100,620 4.70% 16,856 141,126 2,243,291
74/72 2042 0 2,243,291 0 0 97,474 102,059 4.70% 22,234 145,368 2,275,221
75/73 2043 0 2,275,221 0 0 99,180 103,396 4.70% 23,211 149,763 2,304,824
76/74 2044 0 2,304,824 0 0 100,915 104,617 4.70% 24,414 154,315 2,331,627
77/75 2045 0 2,331,627 0 0 102,681 105,696 4.70% 25,623 159,033 2,355,348
78/76 2046 0 2,355,348 0 0 104,478 106,618 4.70% 26,927 163,919 2,375,598
79/77 2047 0 2,375,598 0 0 106,307 107,375 4.70% 28,122 168,984 2,392,175
80/78 2048 0 2,392,175 0 0 108,167 108,604 4.70% 29,632 160,246 2,419,067
81/79 2049 0 2,419,067 0 0 110,060 109,672 4.70% 31,076 165,371 2,442,353
82/80 2050 0 2,442,353 0 0 111,986 110,562 4.70% 32,554 170,685 2,461,663
83/81 2051 0 2,461,663 0 0 113,946 111,257 4.70% 34,062 176,195 2,476,609
Scenario : Current using Average Return
x - denotes shortfall

Worksheet Detail - Combined Details
09/10/2020
Prepared for : John and Jennifer Sample Company: Penobscot Financial Advisors Prepared by: Craig Joncas
Page 16 of 42
See Important Disclosure Information section in this Report for explanations of assumptions, limitations, methodologies, and a glossary.
Event or Ages Year
Beginning Portfolio Value
Earmarked Fund All Goals Additions To
Assets
Other
Additions
Post
Retirement
Income
Investment
Earnings
Investment
Return
Taxes
Funds Used
All Goals Ending Portfolio
Value
84/82 2052 0 2,476,609 0 0 115,940 111,739 4.70% 35,597 181,905 2,486,785
85/83 2053 0 2,486,785 0 0 117,969 111,992 4.70% 37,061 187,837 2,491,847
86/84 2054 0 2,491,847 0 0 120,033 111,995 4.70% 38,532 194,001 2,491,344
87/85 2055 0 2,491,344 0 0 122,134 111,736 4.70% 39,811 200,417 2,484,986
88/86 2056 0 2,484,986 0 0 124,271 111,194 4.70% 41,056 207,087 2,472,309
89/87 2057 0 2,472,309 0 0 126,446 110,347 4.70% 42,255 213,991 2,452,857
90/88 2058 0 2,452,857 0 0 128,659 109,182 4.70% 43,260 221,122 2,426,315
91/89 2059 0 2,426,315 0 0 130,910 107,680 4.70% 44,179 228,445 2,392,281
John's Plan Ends 2060 0 2,392,281 0 0 133,201 105,833 4.70% 44,724 235,980 2,350,611
-/91 2061 0 2,350,611 0 0 80,523 103,737 4.70% 51,370 180,198 2,303,304
-/92 2062 0 2,303,304 0 0 81,933 101,326 4.70% 51,887 185,530 2,249,146
-/93 2063 0 2,249,146 0 0 83,366 98,592 4.70% 52,255 191,027 2,187,823
Jennifer's Plan Ends 2064 0 2,187,823 0 0 84,825 95,546 4.70% 51,945 196,650 2,119,600
Scenario : Current using Average Return
x - denotes shortfall

Worksheet Detail - Combined Details
09/10/2020
Prepared for : John and Jennifer Sample Company: Penobscot Financial Advisors Prepared by: Craig Joncas
Page 17 of 42
See Important Disclosure Information section in this Report for explanations of assumptions, limitations, methodologies, and a glossary.
Scenario : Current using Average Return
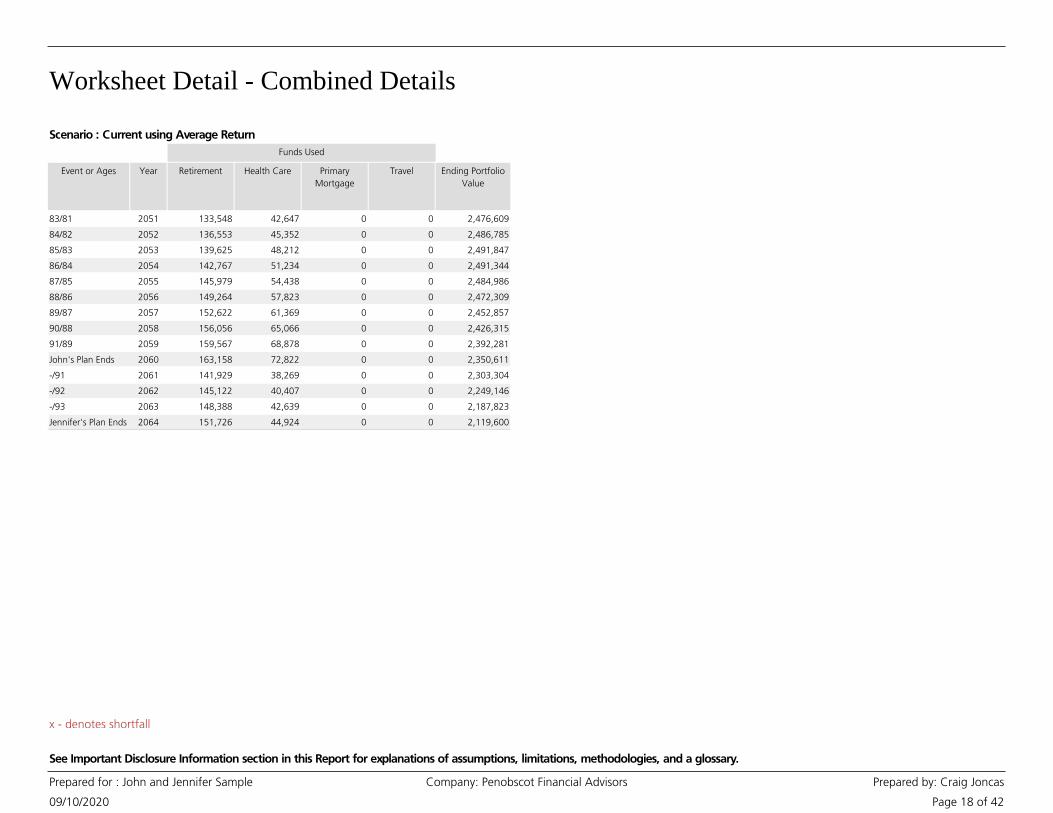
Event or Ages Year
Funds Used
Retirement Health Care Primary
Mortgage
Travel Ending Portfolio
Value
52/50 2020 0 0 0 0 740,457
53/51 2021 0 0 0 0 821,365
54/52 2022 0 0 0 0 907,794
55/53 2023 0 0 0 0 1,000,097
56/54 2024 0 0 0 0 1,098,649
57/55 2025 0 0 0 0 1,203,851
58/56 2026 0 0 0 0 1,316,128
59/57 2027 0 0 0 0 1,435,930
60/58 2028 0 0 0 0 1,563,737
61/59 2029 0 0 0 0 1,700,059
62/60 2030 0 0 0 0 1,845,436
63/61 2031 0 0 0 0 2,000,446
64/62 2032 0 0 0 0 2,165,698
John & Jennifer
Retire
2033 89,474 29,628 13,224 10,016 2,153,805
66/64 2034 91,487 31,592 13,224 10,241 2,137,574
67/65 2035 93,546 14,893 0 10,472 2,150,143
68/66 2036 95,651 15,861 0 10,707 2,160,480
69/67 2037 97,803 16,932 0 10,948 2,168,330
70/68 2038 100,003 18,113 0 11,194 2,173,415
71/69 2039 102,253 19,395 0 11,446 2,165,088
72/70 2040 104,554 20,779 0 11,704 2,204,856
73/71 2041 106,907 22,253 0 11,967 2,243,291
74/72 2042 109,312 23,820 0 12,236 2,275,221
75/73 2043 111,772 25,479 0 12,512 2,304,824
76/74 2044 114,286 27,236 0 12,793 2,331,627
77/75 2045 116,858 29,094 0 13,081 2,355,348
78/76 2046 119,487 31,057 0 13,375 2,375,598
79/77 2047 122,176 33,132 0 13,676 2,392,175
80/78 2048 124,925 35,322 0 0 2,419,067
81/79 2049 127,735 37,635 0 0 2,442,353
82/80 2050 130,609 40,075 0 0 2,461,663
x - denotes shortfall
Worksheet Detail - Combined Details
09/10/2020
Prepared for : John and Jennifer Sample Company: Penobscot Financial Advisors Prepared by: Craig Joncas
Page 18 of 42
See Important Disclosure Information section in this Report for explanations of assumptions, limitations, methodologies, and a glossary.
Scenario : Current using Average Return
Event or Ages Year
Funds Used
Retirement Health Care Primary
Mortgage
Travel Ending Portfolio
Value
83/81 2051 133,548 42,647 0 0 2,476,609
84/82 2052 136,553 45,352 0 0 2,486,785
85/83 2053 139,625 48,212 0 0 2,491,847
86/84 2054 142,767 51,234 0 0 2,491,344
87/85 2055 145,979 54,438 0 0 2,484,986
88/86 2056 149,264 57,823 0 0 2,472,309
89/87 2057 152,622 61,369 0 0 2,452,857
90/88 2058 156,056 65,066 0 0 2,426,315
91/89 2059 159,567 68,878 0 0 2,392,281
John's Plan Ends 2060 163,158 72,822 0 0 2,350,611
-/91 2061 141,929 38,269 0 0 2,303,304
-/92 2062 145,122 40,407 0 0 2,249,146
-/93 2063 148,388 42,639 0 0 2,187,823
Jennifer's Plan Ends 2064 151,726 44,924 0 0 2,119,600
x - denotes shortfall

Worksheet Detail - Combined Details
09/10/2020
Prepared for : John and Jennifer Sample Company: Penobscot Financial Advisors Prepared by: Craig Joncas
Page 19 of 42
See Important Disclosure Information section in this Report for explanations of assumptions, limitations, methodologies, and a glossary.
Notes
• Calculations are based on a “Rolling Year” rather than a Calendar Year. The current date
begins the 365-day “Rolling Year”.
• Additions and withdrawals occur at the beginning of the year.
• Post Retirement Income includes the following: Social Security, pension, annuity, rental
property, royalty, alimony, part-time employment, trust, and any other retirement income as
entered in the Plan.
• Other Additions come from items entered in the Other Assets section and any applicable
proceeds from insurance policies.
• Stock Options and Restricted Stock values are after-tax.
• Strategy Income is based on the particulars of the Goal Strategies selected. Strategy Income
from immediate annuities, 72(t) distributions, and variable annuities with a guaranteed minimum
withdrawal benefit (GMWB) is pre-tax. Strategy Income from Net Unrealized Appreciation (NUA)
is after-tax.
• Investment Earnings are calculated on all assets after any withdrawals for 'Goal Expense', 'Taxes
on Withdrawals' and 'Tax Penalties' are subtracted.
• When married, if either Social Security Program Estimate or Use a Better Estimate of Annual
Benefits is selected for a participant, the program will default to the greater of the selected
benefit or the age adjusted spousal benefit, which is based on the other participant's benefit.
• Funds for each Goal Expense are first used from Earmarked Assets. If sufficient funds are not
available from Earmarked Assets, Fund All Goals Assets will be used to fund the remaining
portion of the Goal Expense, if available in that year.
• These calculations do not incorporate penalties associated with use of 529 Plan withdrawals for
non-qualified expenses.
• All funds needed for a Goal must be available in the year the Goal occurs. Funds from
Earmarked Assets that become available after the Goal year(s) have passed are not included in the
funding of that Goal, and accumulate until the end of the Plan.
• When married, ownership of qualified assets is assumed to roll over to the surviving co-client at
the death of the original owner. It is also assumed the surviving co-client inherits all assets of the
original owner.
• The taxes column is a sum of (1) taxes on retirement income, (2) taxes on strategy income, (3)
taxes on withdrawals from qualified assets for Required Minimum Distributions, (4) taxes on
withdrawals from taxable assets' untaxed gain used to fund Goals in that year, (5) taxes on
withdrawals from tax-deferred or qualified assets used to fund Goals in that year, and (6) taxes
on the investment earnings of taxable assets. Tax rates used are detailed in the Tax and Inflation
Options page. (Please note, the Taxes column does not include any taxes owed from the exercise
of Stock Options or the vesting of Restricted Stock.)
• Tax Penalties can occur when Qualified and Tax-Deferred Assets are used prior to age 59½. If
there is a value in this column, it illustrates that you are using your assets in this Plan in a manner
that may incur tax penalties. Generally, it is better to avoid tax penalties whenever possible.
x - denotes shortfall
Worksheet Detail - Combined Details
09/10/2020
Prepared for : John and Jennifer Sample Company: Penobscot Financial Advisors Prepared by: Craig Joncas
Page 20 of 42
See Important Disclosure Information section in this Report for explanations of assumptions, limitations, methodologies, and a glossary.
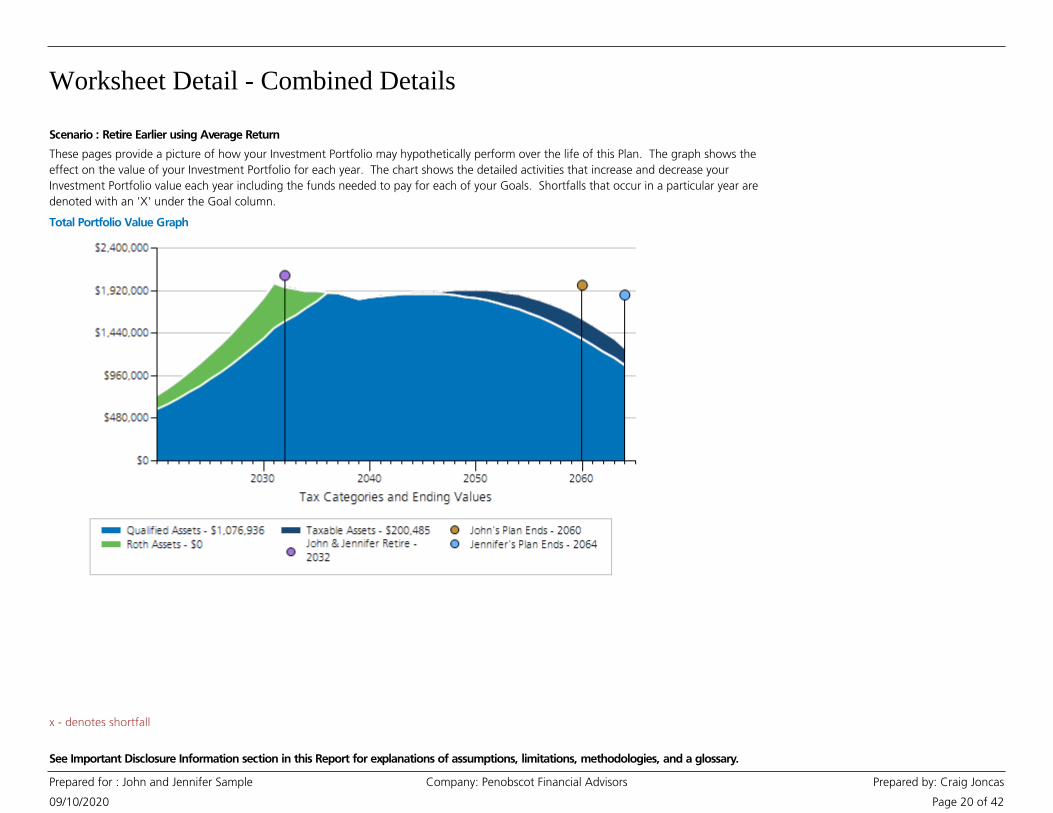
Total Portfolio Value Graph
These pages provide a picture of how your Investment Portfolio may hypothetically perform over the life of this Plan. The graph shows the
effect on the value of your Investment Portfolio for each year. The chart shows the detailed activities that increase and decrease your
Investment Portfolio value each year including the funds needed to pay for each of your Goals. Shortfalls that occur in a particular year are
denoted with an 'X' under the Goal column.
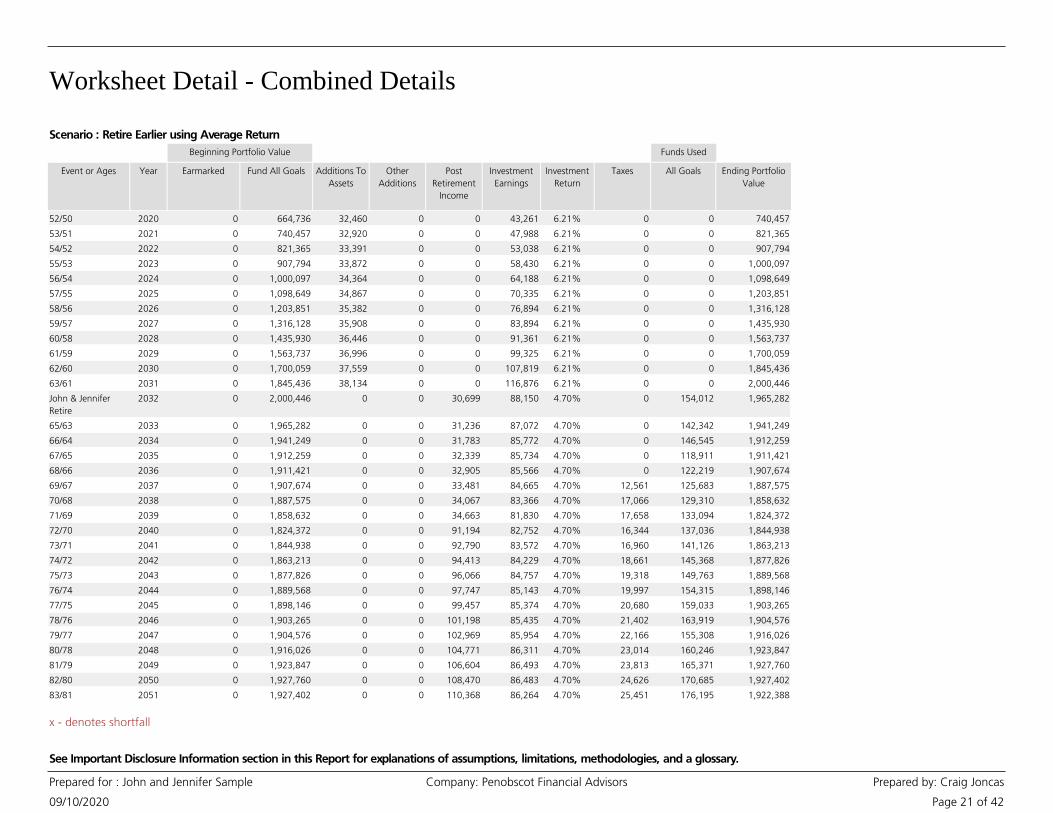
Scenario : Retire Earlier using Average Return
x - denotes shortfall
Worksheet Detail - Combined Details
09/10/2020
Prepared for : John and Jennifer Sample Company: Penobscot Financial Advisors Prepared by: Craig Joncas
Page 21 of 42
See Important Disclosure Information section in this Report for explanations of assumptions, limitations, methodologies, and a glossary.
Event or Ages Year
Beginning Portfolio Value
Earmarked Fund All Goals Additions To
Assets
Other
Additions
Post
Retirement
Income
Investment
Earnings
Investment
Return
Taxes
Funds Used
All Goals Ending Portfolio
Value
52/50 2020 0 664,736 32,460 0 0 43,261 6.21% 0 0 740,457
53/51 2021 0 740,457 32,920 0 0 47,988 6.21% 0 0 821,365
54/52 2022 0 821,365 33,391 0 0 53,038 6.21% 0 0 907,794
55/53 2023 0 907,794 33,872 0 0 58,430 6.21% 0 0 1,000,097
56/54 2024 0 1,000,097 34,364 0 0 64,188 6.21% 0 0 1,098,649
57/55 2025 0 1,098,649 34,867 0 0 70,335 6.21% 0 0 1,203,851
58/56 2026 0 1,203,851 35,382 0 0 76,894 6.21% 0 0 1,316,128
59/57 2027 0 1,316,128 35,908 0 0 83,894 6.21% 0 0 1,435,930
60/58 2028 0 1,435,930 36,446 0 0 91,361 6.21% 0 0 1,563,737
61/59 2029 0 1,563,737 36,996 0 0 99,325 6.21% 0 0 1,700,059
62/60 2030 0 1,700,059 37,559 0 0 107,819 6.21% 0 0 1,845,436
63/61 2031 0 1,845,436 38,134 0 0 116,876 6.21% 0 0 2,000,446
John & Jennifer
Retire
2032 0 2,000,446 0 0 30,699 88,150 4.70% 0 154,012 1,965,282
65/63 2033 0 1,965,282 0 0 31,236 87,072 4.70% 0 142,342 1,941,249
66/64 2034 0 1,941,249 0 0 31,783 85,772 4.70% 0 146,545 1,912,259
67/65 2035 0 1,912,259 0 0 32,339 85,734 4.70% 0 118,911 1,911,421
68/66 2036 0 1,911,421 0 0 32,905 85,566 4.70% 0 122,219 1,907,674
69/67 2037 0 1,907,674 0 0 33,481 84,665 4.70% 12,561 125,683 1,887,575
70/68 2038 0 1,887,575 0 0 34,067 83,366 4.70% 17,066 129,310 1,858,632
71/69 2039 0 1,858,632 0 0 34,663 81,830 4.70% 17,658 133,094 1,824,372
72/70 2040 0 1,824,372 0 0 91,194 82,752 4.70% 16,344 137,036 1,844,938
73/71 2041 0 1,844,938 0 0 92,790 83,572 4.70% 16,960 141,126 1,863,213
74/72 2042 0 1,863,213 0 0 94,413 84,229 4.70% 18,661 145,368 1,877,826
75/73 2043 0 1,877,826 0 0 96,066 84,757 4.70% 19,318 149,763 1,889,568
76/74 2044 0 1,889,568 0 0 97,747 85,143 4.70% 19,997 154,315 1,898,146
77/75 2045 0 1,898,146 0 0 99,457 85,374 4.70% 20,680 159,033 1,903,265
78/76 2046 0 1,903,265 0 0 101,198 85,435 4.70% 21,402 163,919 1,904,576
79/77 2047 0 1,904,576 0 0 102,969 85,954 4.70% 22,166 155,308 1,916,026
80/78 2048 0 1,916,026 0 0 104,771 86,311 4.70% 23,014 160,246 1,923,847
81/79 2049 0 1,923,847 0 0 106,604 86,493 4.70% 23,813 165,371 1,927,760
82/80 2050 0 1,927,760 0 0 108,470 86,483 4.70% 24,626 170,685 1,927,402
83/81 2051 0 1,927,402 0 0 110,368 86,264 4.70% 25,451 176,195 1,922,388
Scenario : Retire Earlier using Average Return
x - denotes shortfall
Worksheet Detail - Combined Details
09/10/2020
Prepared for : John and Jennifer Sample Company: Penobscot Financial Advisors Prepared by: Craig Joncas
Page 22 of 42
See Important Disclosure Information section in this Report for explanations of assumptions, limitations, methodologies, and a glossary.
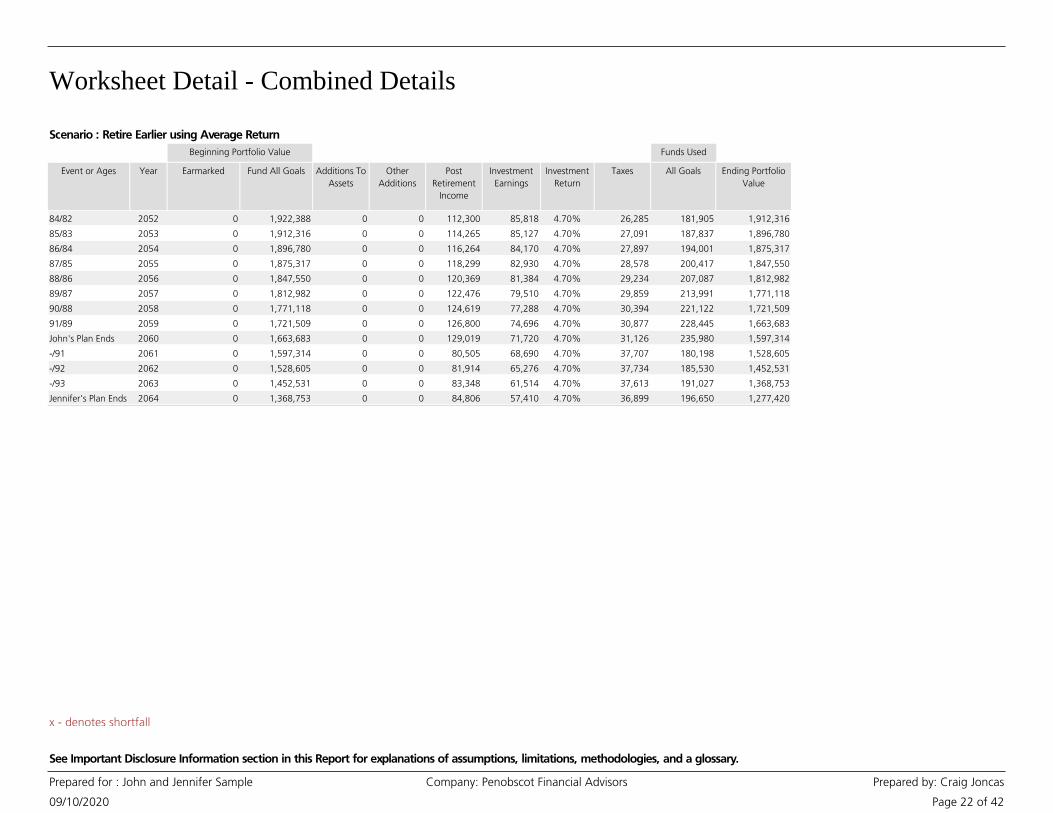
Event or Ages Year
Beginning Portfolio Value
Earmarked Fund All Goals Additions To
Assets
Other
Additions
Post
Retirement
Income
Investment
Earnings
Investment
Return
Taxes
Funds Used
All Goals Ending Portfolio
Value
84/82 2052 0 1,922,388 0 0 112,300 85,818 4.70% 26,285 181,905 1,912,316
85/83 2053 0 1,912,316 0 0 114,265 85,127 4.70% 27,091 187,837 1,896,780
86/84 2054 0 1,896,780 0 0 116,264 84,170 4.70% 27,897 194,001 1,875,317
87/85 2055 0 1,875,317 0 0 118,299 82,930 4.70% 28,578 200,417 1,847,550
88/86 2056 0 1,847,550 0 0 120,369 81,384 4.70% 29,234 207,087 1,812,982
89/87 2057 0 1,812,982 0 0 122,476 79,510 4.70% 29,859 213,991 1,771,118
90/88 2058 0 1,771,118 0 0 124,619 77,288 4.70% 30,394 221,122 1,721,509
91/89 2059 0 1,721,509 0 0 126,800 74,696 4.70% 30,877 228,445 1,663,683
John's Plan Ends 2060 0 1,663,683 0 0 129,019 71,720 4.70% 31,126 235,980 1,597,314
-/91 2061 0 1,597,314 0 0 80,505 68,690 4.70% 37,707 180,198 1,528,605
-/92 2062 0 1,528,605 0 0 81,914 65,276 4.70% 37,734 185,530 1,452,531
-/93 2063 0 1,452,531 0 0 83,348 61,514 4.70% 37,613 191,027 1,368,753
Jennifer's Plan Ends 2064 0 1,368,753 0 0 84,806 57,410 4.70% 36,899 196,650 1,277,420
Scenario : Retire Earlier using Average Return
x - denotes shortfall
Worksheet Detail - Combined Details
09/10/2020
Prepared for : John and Jennifer Sample Company: Penobscot Financial Advisors Prepared by: Craig Joncas
Page 23 of 42
See Important Disclosure Information section in this Report for explanations of assumptions, limitations, methodologies, and a glossary.
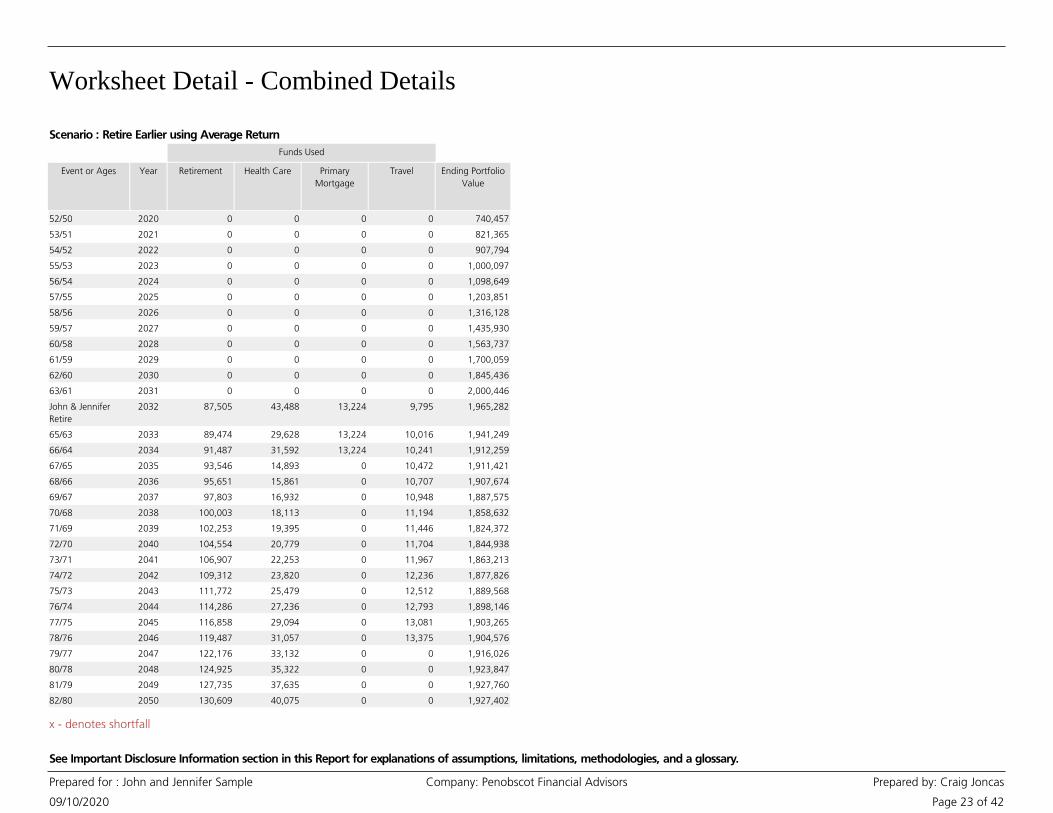
Scenario : Retire Earlier using Average Return
Event or Ages Year
Funds Used
Retirement Health Care Primary
Mortgage
Travel Ending Portfolio
Value
52/50 2020 0 0 0 0 740,457
53/51 2021 0 0 0 0 821,365
54/52 2022 0 0 0 0 907,794
55/53 2023 0 0 0 0 1,000,097
56/54 2024 0 0 0 0 1,098,649
57/55 2025 0 0 0 0 1,203,851
58/56 2026 0 0 0 0 1,316,128
59/57 2027 0 0 0 0 1,435,930
60/58 2028 0 0 0 0 1,563,737
61/59 2029 0 0 0 0 1,700,059
62/60 2030 0 0 0 0 1,845,436
63/61 2031 0 0 0 0 2,000,446
John & Jennifer
Retire
2032 87,505 43,488 13,224 9,795 1,965,282
65/63 2033 89,474 29,628 13,224 10,016 1,941,249
66/64 2034 91,487 31,592 13,224 10,241 1,912,259
67/65 2035 93,546 14,893 0 10,472 1,911,421
68/66 2036 95,651 15,861 0 10,707 1,907,674
69/67 2037 97,803 16,932 0 10,948 1,887,575
70/68 2038 100,003 18,113 0 11,194 1,858,632
71/69 2039 102,253 19,395 0 11,446 1,824,372
72/70 2040 104,554 20,779 0 11,704 1,844,938
73/71 2041 106,907 22,253 0 11,967 1,863,213
74/72 2042 109,312 23,820 0 12,236 1,877,826
75/73 2043 111,772 25,479 0 12,512 1,889,568
76/74 2044 114,286 27,236 0 12,793 1,898,146
77/75 2045 116,858 29,094 0 13,081 1,903,265
78/76 2046 119,487 31,057 0 13,375 1,904,576
79/77 2047 122,176 33,132 0 0 1,916,026
80/78 2048 124,925 35,322 0 0 1,923,847
81/79 2049 127,735 37,635 0 0 1,927,760
82/80 2050 130,609 40,075 0 0 1,927,402
x - denotes shortfall

Worksheet Detail - Combined Details
09/10/2020
Prepared for : John and Jennifer Sample Company: Penobscot Financial Advisors Prepared by: Craig Joncas
Page 24 of 42
See Important Disclosure Information section in this Report for explanations of assumptions, limitations, methodologies, and a glossary.
Scenario : Retire Earlier using Average Return
Event or Ages Year
Funds Used
Retirement Health Care Primary
Mortgage
Travel Ending Portfolio
Value
83/81 2051 133,548 42,647 0 0 1,922,388
84/82 2052 136,553 45,352 0 0 1,912,316
85/83 2053 139,625 48,212 0 0 1,896,780
86/84 2054 142,767 51,234 0 0 1,875,317
87/85 2055 145,979 54,438 0 0 1,847,550
88/86 2056 149,264 57,823 0 0 1,812,982
89/87 2057 152,622 61,369 0 0 1,771,118
90/88 2058 156,056 65,066 0 0 1,721,509
91/89 2059 159,567 68,878 0 0 1,663,683
John's Plan Ends 2060 163,158 72,822 0 0 1,597,314
-/91 2061 141,929 38,269 0 0 1,528,605
-/92 2062 145,122 40,407 0 0 1,452,531
-/93 2063 148,388 42,639 0 0 1,368,753
Jennifer's Plan Ends 2064 151,726 44,924 0 0 1,277,420
x - denotes shortfall

Worksheet Detail - Combined Details
09/10/2020
Prepared for : John and Jennifer Sample Company: Penobscot Financial Advisors Prepared by: Craig Joncas
Page 25 of 42
See Important Disclosure Information section in this Report for explanations of assumptions, limitations, methodologies, and a glossary.
Notes
• Calculations are based on a “Rolling Year” rather than a Calendar Year. The current date
begins the 365-day “Rolling Year”.
• Additions and withdrawals occur at the beginning of the year.
• Post Retirement Income includes the following: Social Security, pension, annuity, rental
property, royalty, alimony, part-time employment, trust, and any other retirement income as
entered in the Plan.
• Other Additions come from items entered in the Other Assets section and any applicable
proceeds from insurance policies.
• Stock Options and Restricted Stock values are after-tax.
• Strategy Income is based on the particulars of the Goal Strategies selected. Strategy Income
from immediate annuities, 72(t) distributions, and variable annuities with a guaranteed minimum
withdrawal benefit (GMWB) is pre-tax. Strategy Income from Net Unrealized Appreciation (NUA)
is after-tax.
• Investment Earnings are calculated on all assets after any withdrawals for 'Goal Expense', 'Taxes
on Withdrawals' and 'Tax Penalties' are subtracted.
• When married, if either Social Security Program Estimate or Use a Better Estimate of Annual
Benefits is selected for a participant, the program will default to the greater of the selected
benefit or the age adjusted spousal benefit, which is based on the other participant's benefit.
• Funds for each Goal Expense are first used from Earmarked Assets. If sufficient funds are not
available from Earmarked Assets, Fund All Goals Assets will be used to fund the remaining
portion of the Goal Expense, if available in that year.
• These calculations do not incorporate penalties associated with use of 529 Plan withdrawals for
non-qualified expenses.
• All funds needed for a Goal must be available in the year the Goal occurs. Funds from
Earmarked Assets that become available after the Goal year(s) have passed are not included in the
funding of that Goal, and accumulate until the end of the Plan.
• When married, ownership of qualified assets is assumed to roll over to the surviving co-client at
the death of the original owner. It is also assumed the surviving co-client inherits all assets of the
original owner.
• The taxes column is a sum of (1) taxes on retirement income, (2) taxes on strategy income, (3)
taxes on withdrawals from qualified assets for Required Minimum Distributions, (4) taxes on
withdrawals from taxable assets' untaxed gain used to fund Goals in that year, (5) taxes on
withdrawals from tax-deferred or qualified assets used to fund Goals in that year, and (6) taxes
on the investment earnings of taxable assets. Tax rates used are detailed in the Tax and Inflation
Options page. (Please note, the Taxes column does not include any taxes owed from the exercise
of Stock Options or the vesting of Restricted Stock.)
• Tax Penalties can occur when Qualified and Tax-Deferred Assets are used prior to age 59½. If
there is a value in this column, it illustrates that you are using your assets in this Plan in a manner
that may incur tax penalties. Generally, it is better to avoid tax penalties whenever possible.
x - denotes shortfall
Worksheet Detail - Combined Details
09/10/2020
Prepared for : John and Jennifer Sample Company: Penobscot Financial Advisors Prepared by: Craig Joncas
Page 26 of 42
See Important Disclosure Information section in this Report for explanations of assumptions, limitations, methodologies, and a glossary.
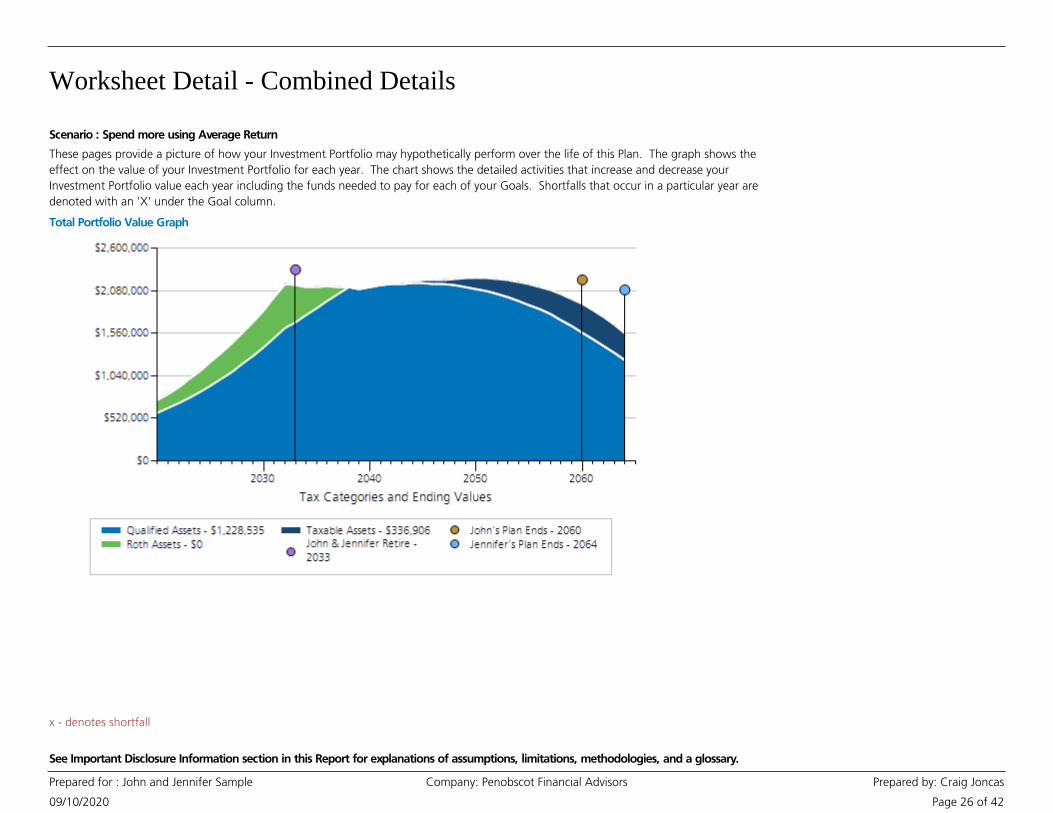
Total Portfolio Value Graph
These pages provide a picture of how your Investment Portfolio may hypothetically perform over the life of this Plan. The graph shows the
effect on the value of your Investment Portfolio for each year. The chart shows the detailed activities that increase and decrease your
Investment Portfolio value each year including the funds needed to pay for each of your Goals. Shortfalls that occur in a particular year are
denoted with an 'X' under the Goal column.
Scenario : Spend more using Average Return
x - denotes shortfall
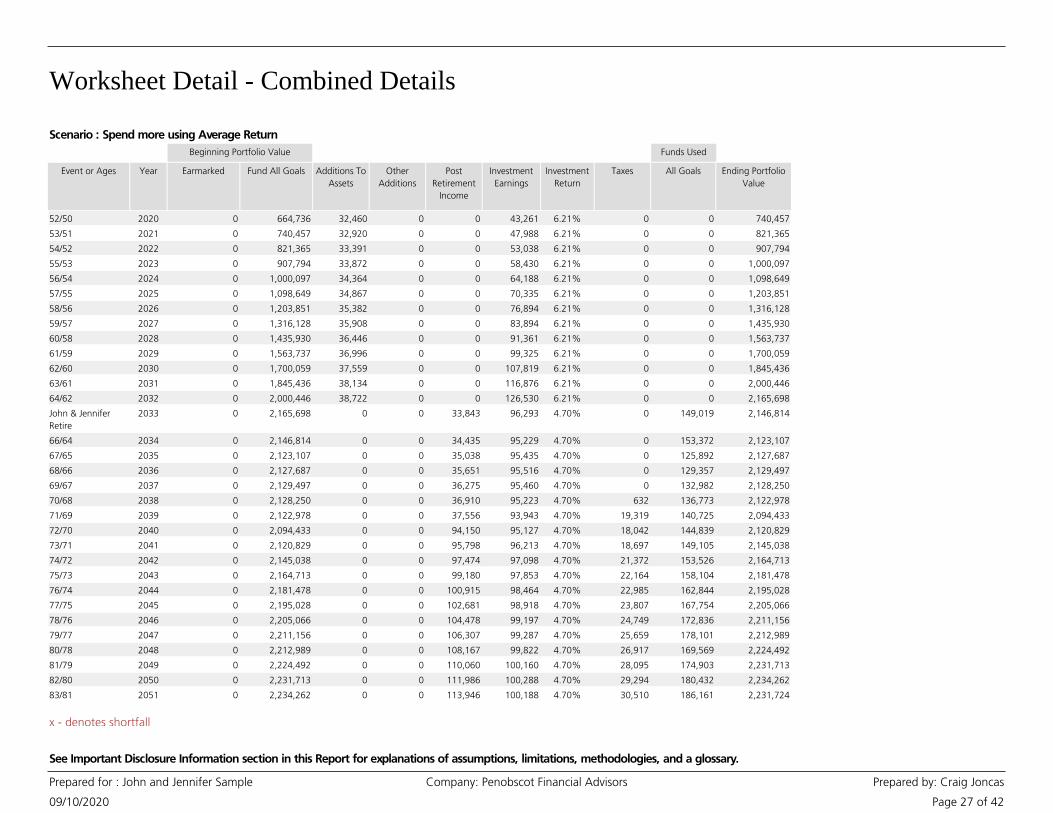
Worksheet Detail - Combined Details
09/10/2020
Prepared for : John and Jennifer Sample Company: Penobscot Financial Advisors Prepared by: Craig Joncas
Page 27 of 42
See Important Disclosure Information section in this Report for explanations of assumptions, limitations, methodologies, and a glossary.
Event or Ages Year
Beginning Portfolio Value
Earmarked Fund All Goals Additions To
Assets
Other
Additions
Post
Retirement
Income
Investment
Earnings
Investment
Return
Taxes
Funds Used
All Goals Ending Portfolio
Value
52/50 2020 0 664,736 32,460 0 0 43,261 6.21% 0 0 740,457
53/51 2021 0 740,457 32,920 0 0 47,988 6.21% 0 0 821,365
54/52 2022 0 821,365 33,391 0 0 53,038 6.21% 0 0 907,794
55/53 2023 0 907,794 33,872 0 0 58,430 6.21% 0 0 1,000,097
56/54 2024 0 1,000,097 34,364 0 0 64,188 6.21% 0 0 1,098,649
57/55 2025 0 1,098,649 34,867 0 0 70,335 6.21% 0 0 1,203,851
58/56 2026 0 1,203,851 35,382 0 0 76,894 6.21% 0 0 1,316,128
59/57 2027 0 1,316,128 35,908 0 0 83,894 6.21% 0 0 1,435,930
60/58 2028 0 1,435,930 36,446 0 0 91,361 6.21% 0 0 1,563,737
61/59 2029 0 1,563,737 36,996 0 0 99,325 6.21% 0 0 1,700,059
62/60 2030 0 1,700,059 37,559 0 0 107,819 6.21% 0 0 1,845,436
63/61 2031 0 1,845,436 38,134 0 0 116,876 6.21% 0 0 2,000,446
64/62 2032 0 2,000,446 38,722 0 0 126,530 6.21% 0 0 2,165,698
John & Jennifer
Retire
2033 0 2,165,698 0 0 33,843 96,293 4.70% 0 149,019 2,146,814
66/64 2034 0 2,146,814 0 0 34,435 95,229 4.70% 0 153,372 2,123,107
67/65 2035 0 2,123,107 0 0 35,038 95,435 4.70% 0 125,892 2,127,687
68/66 2036 0 2,127,687 0 0 35,651 95,516 4.70% 0 129,357 2,129,497
69/67 2037 0 2,129,497 0 0 36,275 95,460 4.70% 0 132,982 2,128,250
70/68 2038 0 2,128,250 0 0 36,910 95,223 4.70% 632 136,773 2,122,978
71/69 2039 0 2,122,978 0 0 37,556 93,943 4.70% 19,319 140,725 2,094,433
72/70 2040 0 2,094,433 0 0 94,150 95,127 4.70% 18,042 144,839 2,120,829
73/71 2041 0 2,120,829 0 0 95,798 96,213 4.70% 18,697 149,105 2,145,038
74/72 2042 0 2,145,038 0 0 97,474 97,098 4.70% 21,372 153,526 2,164,713
75/73 2043 0 2,164,713 0 0 99,180 97,853 4.70% 22,164 158,104 2,181,478
76/74 2044 0 2,181,478 0 0 100,915 98,464 4.70% 22,985 162,844 2,195,028
77/75 2045 0 2,195,028 0 0 102,681 98,918 4.70% 23,807 167,754 2,205,066
78/76 2046 0 2,205,066 0 0 104,478 99,197 4.70% 24,749 172,836 2,211,156
79/77 2047 0 2,211,156 0 0 106,307 99,287 4.70% 25,659 178,101 2,212,989
80/78 2048 0 2,212,989 0 0 108,167 99,822 4.70% 26,917 169,569 2,224,492
81/79 2049 0 2,224,492 0 0 110,060 100,160 4.70% 28,095 174,903 2,231,713
82/80 2050 0 2,231,713 0 0 111,986 100,288 4.70% 29,294 180,432 2,234,262
83/81 2051 0 2,234,262 0 0 113,946 100,188 4.70% 30,510 186,161 2,231,724
Scenario : Spend more using Average Return
x - denotes shortfall

Worksheet Detail - Combined Details
09/10/2020
Prepared for : John and Jennifer Sample Company: Penobscot Financial Advisors Prepared by: Craig Joncas
Page 28 of 42
See Important Disclosure Information section in this Report for explanations of assumptions, limitations, methodologies, and a glossary.
Event or Ages Year
Beginning Portfolio Value
Earmarked Fund All Goals Additions To
Assets
Other
Additions
Post
Retirement
Income
Investment
Earnings
Investment
Return
Taxes
Funds Used
All Goals Ending Portfolio
Value
84/82 2052 0 2,231,724 0 0 115,940 99,841 4.70% 31,740 192,096 2,223,669
85/83 2053 0 2,223,669 0 0 117,969 99,229 4.70% 32,897 198,257 2,209,713
86/84 2054 0 2,209,713 0 0 120,033 98,331 4.70% 34,048 204,655 2,189,374
87/85 2055 0 2,189,374 0 0 122,134 97,131 4.70% 34,995 211,311 2,162,333
88/86 2056 0 2,162,333 0 0 124,271 95,607 4.70% 35,894 218,226 2,128,091
89/87 2057 0 2,128,091 0 0 126,446 93,738 4.70% 36,735 225,381 2,086,160
90/88 2058 0 2,086,160 0 0 128,659 91,506 4.70% 37,386 232,768 2,036,170
91/89 2059 0 2,036,170 0 0 130,910 88,891 4.70% 37,940 240,353 1,977,678
John's Plan Ends 2060 0 1,977,678 0 0 133,201 85,884 4.70% 38,109 248,156 1,910,499
-/91 2061 0 1,910,499 0 0 80,523 82,568 4.70% 44,495 192,648 1,836,448
-/92 2062 0 1,836,448 0 0 81,933 78,889 4.70% 44,606 198,260 1,754,403
-/93 2063 0 1,754,403 0 0 83,366 74,832 4.70% 44,555 204,043 1,664,003
Jennifer's Plan Ends 2064 0 1,664,003 0 0 84,825 70,406 4.70% 43,834 209,959 1,565,441
Scenario : Spend more using Average Return
x - denotes shortfall
Worksheet Detail - Combined Details
09/10/2020
Prepared for : John and Jennifer Sample Company: Penobscot Financial Advisors Prepared by: Craig Joncas
Page 29 of 42
See Important Disclosure Information section in this Report for explanations of assumptions, limitations, methodologies, and a glossary.
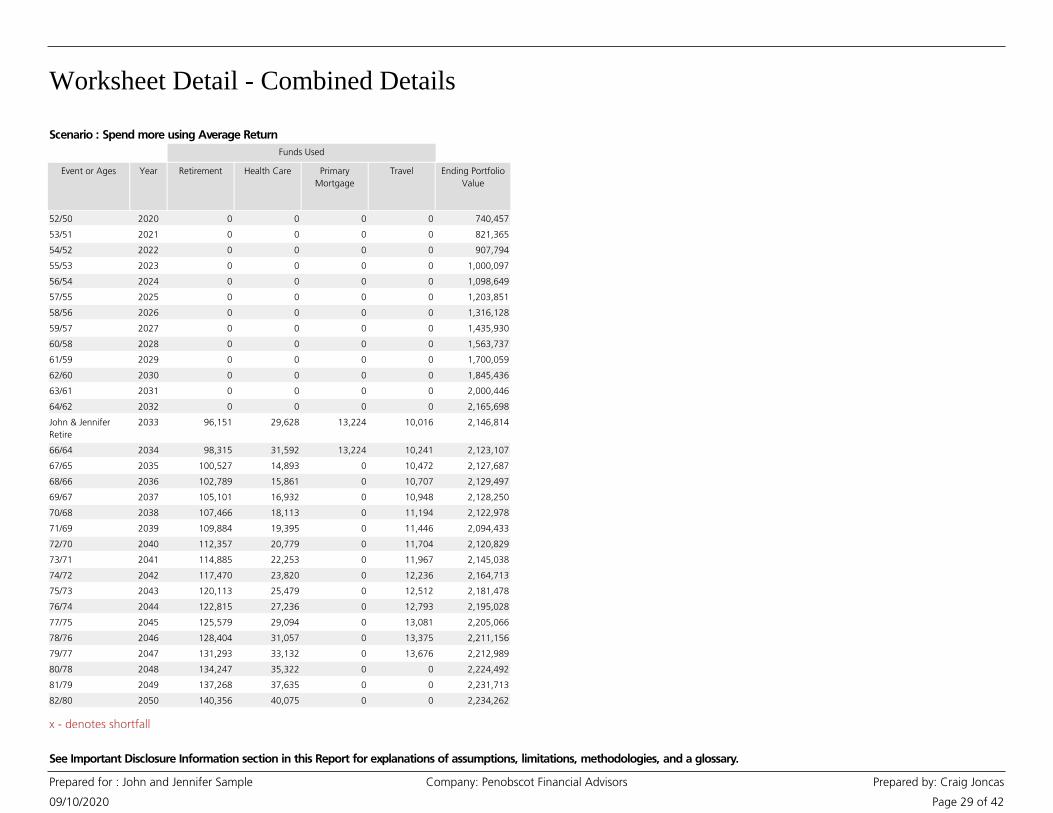
Scenario : Spend more using Average Return
Event or Ages Year
Funds Used
Retirement Health Care Primary
Mortgage
Travel Ending Portfolio
Value
52/50 2020 0 0 0 0 740,457
53/51 2021 0 0 0 0 821,365
54/52 2022 0 0 0 0 907,794
55/53 2023 0 0 0 0 1,000,097
56/54 2024 0 0 0 0 1,098,649
57/55 2025 0 0 0 0 1,203,851
58/56 2026 0 0 0 0 1,316,128
59/57 2027 0 0 0 0 1,435,930
60/58 2028 0 0 0 0 1,563,737
61/59 2029 0 0 0 0 1,700,059
62/60 2030 0 0 0 0 1,845,436
63/61 2031 0 0 0 0 2,000,446
64/62 2032 0 0 0 0 2,165,698
John & Jennifer
Retire
2033 96,151 29,628 13,224 10,016 2,146,814
66/64 2034 98,315 31,592 13,224 10,241 2,123,107
67/65 2035 100,527 14,893 0 10,472 2,127,687
68/66 2036 102,789 15,861 0 10,707 2,129,497
69/67 2037 105,101 16,932 0 10,948 2,128,250
70/68 2038 107,466 18,113 0 11,194 2,122,978
71/69 2039 109,884 19,395 0 11,446 2,094,433
72/70 2040 112,357 20,779 0 11,704 2,120,829
73/71 2041 114,885 22,253 0 11,967 2,145,038
74/72 2042 117,470 23,820 0 12,236 2,164,713
75/73 2043 120,113 25,479 0 12,512 2,181,478
76/74 2044 122,815 27,236 0 12,793 2,195,028
77/75 2045 125,579 29,094 0 13,081 2,205,066
78/76 2046 128,404 31,057 0 13,375 2,211,156
79/77 2047 131,293 33,132 0 13,676 2,212,989
80/78 2048 134,247 35,322 0 0 2,224,492
81/79 2049 137,268 37,635 0 0 2,231,713
82/80 2050 140,356 40,075 0 0 2,234,262
x - denotes shortfall

Worksheet Detail - Combined Details
09/10/2020
Prepared for : John and Jennifer Sample Company: Penobscot Financial Advisors Prepared by: Craig Joncas
Page 30 of 42
See Important Disclosure Information section in this Report for explanations of assumptions, limitations, methodologies, and a glossary.
Scenario : Spend more using Average Return
Event or Ages Year
Funds Used
Retirement Health Care Primary
Mortgage
Travel Ending Portfolio
Value
83/81 2051 143,514 42,647 0 0 2,231,724
84/82 2052 146,743 45,352 0 0 2,223,669
85/83 2053 150,045 48,212 0 0 2,209,713
86/84 2054 153,421 51,234 0 0 2,189,374
87/85 2055 156,873 54,438 0 0 2,162,333
88/86 2056 160,403 57,823 0 0 2,128,091
89/87 2057 164,012 61,369 0 0 2,086,160
90/88 2058 167,702 65,066 0 0 2,036,170
91/89 2059 171,475 68,878 0 0 1,977,678
John's Plan Ends 2060 175,334 72,822 0 0 1,910,499
-/91 2061 154,379 38,269 0 0 1,836,448
-/92 2062 157,852 40,407 0 0 1,754,403
-/93 2063 161,404 42,639 0 0 1,664,003
Jennifer's Plan Ends 2064 165,036 44,924 0 0 1,565,441
x - denotes shortfall

Worksheet Detail - Combined Details
09/10/2020
Prepared for : John and Jennifer Sample Company: Penobscot Financial Advisors Prepared by: Craig Joncas
Page 31 of 42
See Important Disclosure Information section in this Report for explanations of assumptions, limitations, methodologies, and a glossary.
Notes
• Calculations are based on a “Rolling Year” rather than a Calendar Year. The current date
begins the 365-day “Rolling Year”.
• Additions and withdrawals occur at the beginning of the year.
• Post Retirement Income includes the following: Social Security, pension, annuity, rental
property, royalty, alimony, part-time employment, trust, and any other retirement income as
entered in the Plan.
• Other Additions come from items entered in the Other Assets section and any applicable
proceeds from insurance policies.
• Stock Options and Restricted Stock values are after-tax.
• Strategy Income is based on the particulars of the Goal Strategies selected. Strategy Income
from immediate annuities, 72(t) distributions, and variable annuities with a guaranteed minimum
withdrawal benefit (GMWB) is pre-tax. Strategy Income from Net Unrealized Appreciation (NUA)
is after-tax.
• Investment Earnings are calculated on all assets after any withdrawals for 'Goal Expense', 'Taxes
on Withdrawals' and 'Tax Penalties' are subtracted.
• When married, if either Social Security Program Estimate or Use a Better Estimate of Annual
Benefits is selected for a participant, the program will default to the greater of the selected
benefit or the age adjusted spousal benefit, which is based on the other participant's benefit.
• Funds for each Goal Expense are first used from Earmarked Assets. If sufficient funds are not
available from Earmarked Assets, Fund All Goals Assets will be used to fund the remaining
portion of the Goal Expense, if available in that year.
• These calculations do not incorporate penalties associated with use of 529 Plan withdrawals for
non-qualified expenses.
• All funds needed for a Goal must be available in the year the Goal occurs. Funds from
Earmarked Assets that become available after the Goal year(s) have passed are not included in the
funding of that Goal, and accumulate until the end of the Plan.
• When married, ownership of qualified assets is assumed to roll over to the surviving co-client at
the death of the original owner. It is also assumed the surviving co-client inherits all assets of the
original owner.
• The taxes column is a sum of (1) taxes on retirement income, (2) taxes on strategy income, (3)
taxes on withdrawals from qualified assets for Required Minimum Distributions, (4) taxes on
withdrawals from taxable assets' untaxed gain used to fund Goals in that year, (5) taxes on
withdrawals from tax-deferred or qualified assets used to fund Goals in that year, and (6) taxes
on the investment earnings of taxable assets. Tax rates used are detailed in the Tax and Inflation
Options page. (Please note, the Taxes column does not include any taxes owed from the exercise
of Stock Options or the vesting of Restricted Stock.)
• Tax Penalties can occur when Qualified and Tax-Deferred Assets are used prior to age 59½. If
there is a value in this column, it illustrates that you are using your assets in this Plan in a manner
that may incur tax penalties. Generally, it is better to avoid tax penalties whenever possible.
x - denotes shortfall
Worksheet Detail - Combined Details
09/10/2020
Prepared for : John and Jennifer Sample Company: Penobscot Financial Advisors Prepared by: Craig Joncas
Page 32 of 42
See Important Disclosure Information section in this Report for explanations of assumptions, limitations, methodologies, and a glossary.
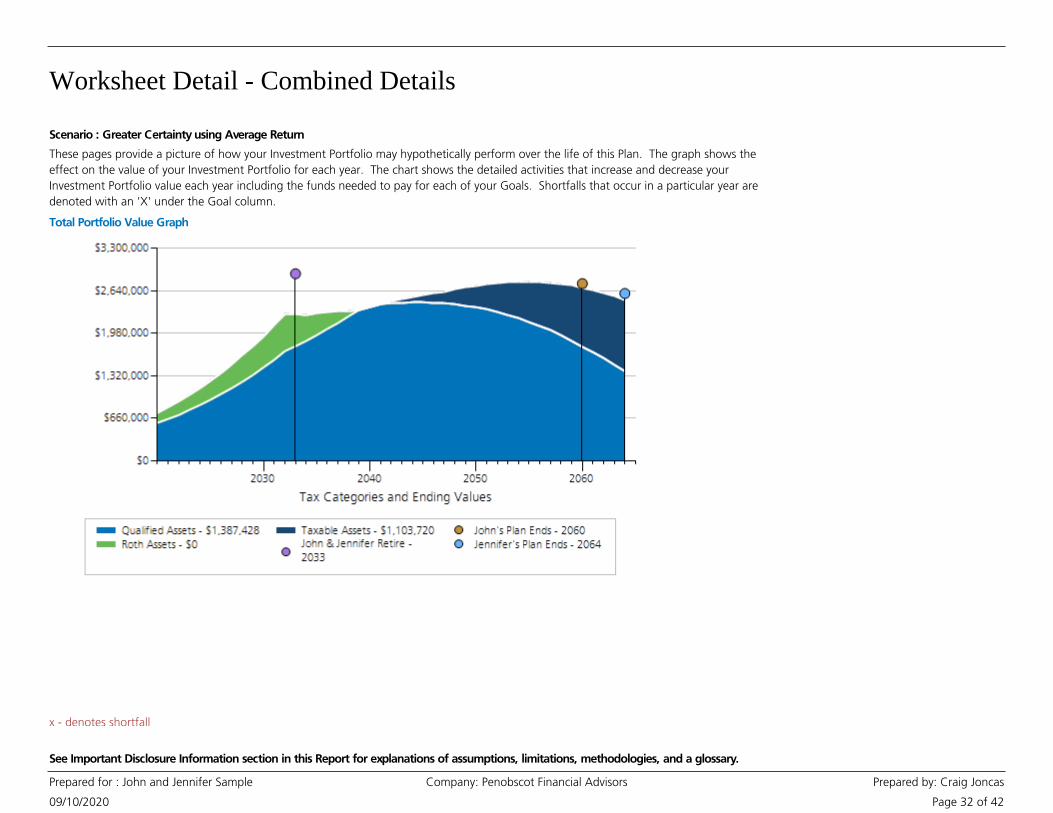
Total Portfolio Value Graph
These pages provide a picture of how your Investment Portfolio may hypothetically perform over the life of this Plan. The graph shows the
effect on the value of your Investment Portfolio for each year. The chart shows the detailed activities that increase and decrease your
Investment Portfolio value each year including the funds needed to pay for each of your Goals. Shortfalls that occur in a particular year are
denoted with an 'X' under the Goal column.
Scenario : Greater Certainty using Average Return
x - denotes shortfall

Worksheet Detail - Combined Details
09/10/2020
Prepared for : John and Jennifer Sample Company: Penobscot Financial Advisors Prepared by: Craig Joncas
Page 33 of 42
See Important Disclosure Information section in this Report for explanations of assumptions, limitations, methodologies, and a glossary.
Event or Ages Year
Beginning Portfolio Value
Earmarked Fund All Goals Additions To
Assets
Other
Additions
Post
Retirement
Income
Investment
Earnings
Investment
Return
Taxes
Funds Used
All Goals Ending Portfolio
Value
52/50 2020 0 664,736 37,820 0 0 43,594 6.21% 0 0 746,150
53/51 2021 0 746,150 38,356 0 0 48,679 6.21% 0 0 833,184
54/52 2022 0 833,184 38,904 0 0 54,113 6.21% 0 0 926,201
55/53 2023 0 926,201 39,464 0 0 59,920 6.21% 0 0 1,025,585
56/54 2024 0 1,025,585 40,037 0 0 66,122 6.21% 0 0 1,131,743
57/55 2025 0 1,131,743 40,623 0 0 72,745 6.21% 0 0 1,245,112
58/56 2026 0 1,245,112 41,222 0 0 79,817 6.21% 0 0 1,366,151
59/57 2027 0 1,366,151 41,835 0 0 87,365 6.21% 0 0 1,495,351
60/58 2028 0 1,495,351 42,461 0 0 95,421 6.21% 0 0 1,633,232
61/59 2029 0 1,633,232 43,101 0 0 104,017 6.21% 0 0 1,780,350
62/60 2030 0 1,780,350 43,756 0 0 113,186 6.21% 0 0 1,937,292
63/61 2031 0 1,937,292 44,426 0 0 122,966 6.21% 0 0 2,104,683
64/62 2032 0 2,104,683 45,110 0 0 133,395 6.21% 0 0 2,283,188
John & Jennifer
Retire
2033 0 2,283,188 0 0 33,843 102,123 4.70% 0 142,342 2,276,812
66/64 2034 0 2,276,812 0 0 34,435 101,654 4.70% 0 146,545 2,266,357
67/65 2035 0 2,266,357 0 0 35,038 102,489 4.70% 0 118,911 2,284,974
68/66 2036 0 2,284,974 0 0 35,651 103,237 4.70% 0 122,219 2,301,643
69/67 2037 0 2,301,643 0 0 36,275 103,887 4.70% 0 125,683 2,316,122
70/68 2038 0 2,316,122 0 0 36,910 104,426 4.70% 0 129,310 2,328,147
71/69 2039 0 2,328,147 0 0 37,556 104,843 4.70% 0 133,094 2,337,452
72/70 2040 0 2,337,452 0 0 94,150 106,990 4.70% 16,241 137,036 2,385,314
73/71 2041 0 2,385,314 0 0 95,798 109,094 4.70% 16,856 141,126 2,432,223
74/72 2042 0 2,432,223 0 0 97,474 110,842 4.70% 24,300 145,368 2,470,871
75/73 2043 0 2,470,871 0 0 99,180 112,485 4.70% 25,629 149,763 2,507,144
76/74 2044 0 2,507,144 0 0 100,915 114,008 4.70% 27,016 154,315 2,540,736
77/75 2045 0 2,540,736 0 0 102,681 115,399 4.70% 28,405 159,033 2,571,379
78/76 2046 0 2,571,379 0 0 104,478 116,642 4.70% 29,906 163,919 2,598,674
79/77 2047 0 2,598,674 0 0 106,307 117,726 4.70% 31,294 168,984 2,622,428
80/78 2048 0 2,622,428 0 0 108,167 119,287 4.70% 33,015 160,246 2,656,621
81/79 2049 0 2,656,621 0 0 110,060 120,692 4.70% 34,671 165,371 2,687,332
82/80 2050 0 2,687,332 0 0 111,986 121,927 4.70% 36,369 170,685 2,714,192
83/81 2051 0 2,714,192 0 0 113,946 122,971 4.70% 38,107 176,195 2,736,807
Scenario : Greater Certainty using Average Return
x - denotes shortfall

Worksheet Detail - Combined Details
09/10/2020
Prepared for : John and Jennifer Sample Company: Penobscot Financial Advisors Prepared by: Craig Joncas
Page 34 of 42
See Important Disclosure Information section in this Report for explanations of assumptions, limitations, methodologies, and a glossary.
Event or Ages Year
Beginning Portfolio Value
Earmarked Fund All Goals Additions To
Assets
Other
Additions
Post
Retirement
Income
Investment
Earnings
Investment
Return
Taxes
Funds Used
All Goals Ending Portfolio
Value
84/82 2052 0 2,736,807 0 0 115,940 123,808 4.70% 39,882 181,905 2,754,768
85/83 2053 0 2,754,768 0 0 117,969 124,422 4.70% 41,586 187,837 2,767,736
86/84 2054 0 2,767,736 0 0 120,033 124,792 4.70% 43,305 194,001 2,775,256
87/85 2055 0 2,775,256 0 0 122,134 124,906 4.70% 44,826 200,417 2,777,054
88/86 2056 0 2,777,054 0 0 124,271 124,743 4.70% 46,318 207,087 2,772,662
89/87 2057 0 2,772,662 0 0 126,446 124,282 4.70% 47,771 213,991 2,761,628
90/88 2058 0 2,761,628 0 0 128,659 123,509 4.70% 49,021 221,122 2,743,652
91/89 2059 0 2,743,652 0 0 130,910 122,406 4.70% 50,190 228,445 2,718,334
John's Plan Ends 2060 0 2,718,334 0 0 133,201 120,968 4.70% 50,964 235,980 2,685,558
-/91 2061 0 2,685,558 0 0 80,523 119,293 4.70% 58,148 180,198 2,647,028
-/92 2062 0 2,647,028 0 0 81,933 117,293 4.70% 58,859 185,530 2,601,865
-/93 2063 0 2,601,865 0 0 83,366 114,981 4.70% 59,405 191,027 2,549,780
Jennifer's Plan Ends 2064 0 2,549,780 0 0 84,825 112,371 4.70% 59,179 196,650 2,491,148
Scenario : Greater Certainty using Average Return
x - denotes shortfall
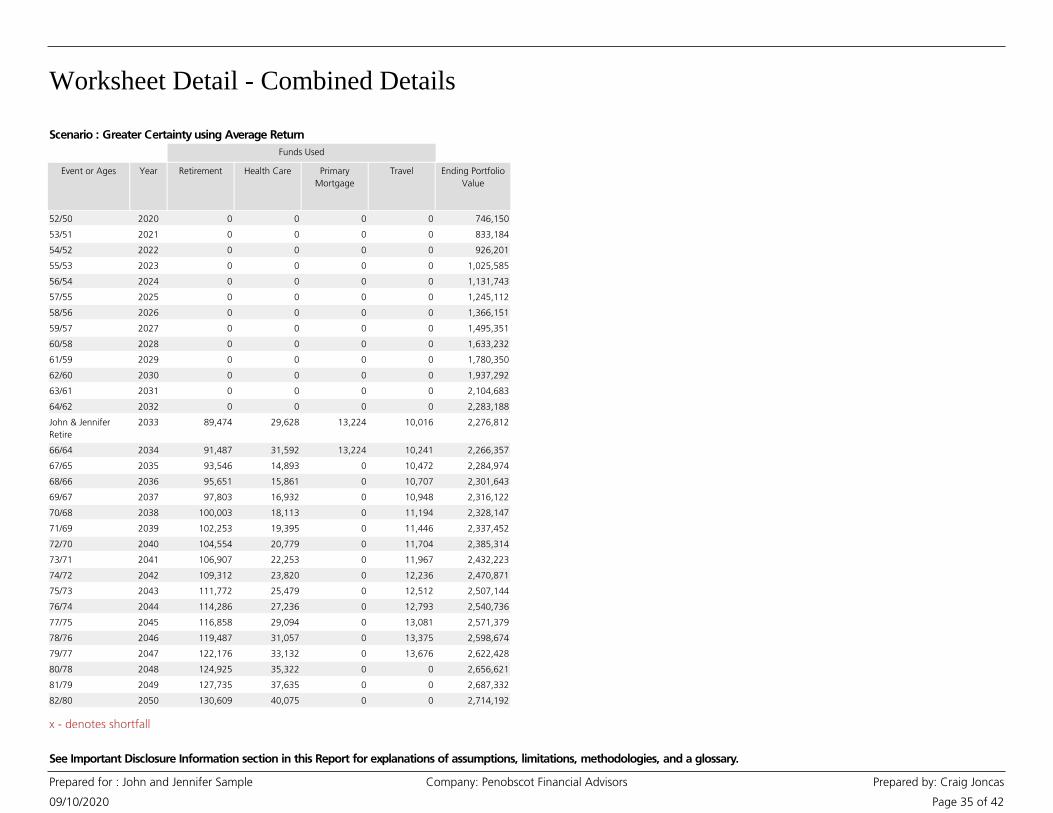
Worksheet Detail - Combined Details
09/10/2020
Prepared for : John and Jennifer Sample Company: Penobscot Financial Advisors Prepared by: Craig Joncas
Page 35 of 42
See Important Disclosure Information section in this Report for explanations of assumptions, limitations, methodologies, and a glossary.
Scenario : Greater Certainty using Average Return
Event or Ages Year
Funds Used
Retirement Health Care Primary
Mortgage
Travel Ending Portfolio
Value
52/50 2020 0 0 0 0 746,150
53/51 2021 0 0 0 0 833,184
54/52 2022 0 0 0 0 926,201
55/53 2023 0 0 0 0 1,025,585
56/54 2024 0 0 0 0 1,131,743
57/55 2025 0 0 0 0 1,245,112
58/56 2026 0 0 0 0 1,366,151
59/57 2027 0 0 0 0 1,495,351
60/58 2028 0 0 0 0 1,633,232
61/59 2029 0 0 0 0 1,780,350
62/60 2030 0 0 0 0 1,937,292
63/61 2031 0 0 0 0 2,104,683
64/62 2032 0 0 0 0 2,283,188
John & Jennifer
Retire
2033 89,474 29,628 13,224 10,016 2,276,812
66/64 2034 91,487 31,592 13,224 10,241 2,266,357
67/65 2035 93,546 14,893 0 10,472 2,284,974
68/66 2036 95,651 15,861 0 10,707 2,301,643
69/67 2037 97,803 16,932 0 10,948 2,316,122
70/68 2038 100,003 18,113 0 11,194 2,328,147
71/69 2039 102,253 19,395 0 11,446 2,337,452
72/70 2040 104,554 20,779 0 11,704 2,385,314
73/71 2041 106,907 22,253 0 11,967 2,432,223
74/72 2042 109,312 23,820 0 12,236 2,470,871
75/73 2043 111,772 25,479 0 12,512 2,507,144
76/74 2044 114,286 27,236 0 12,793 2,540,736
77/75 2045 116,858 29,094 0 13,081 2,571,379
78/76 2046 119,487 31,057 0 13,375 2,598,674
79/77 2047 122,176 33,132 0 13,676 2,622,428
80/78 2048 124,925 35,322 0 0 2,656,621
81/79 2049 127,735 37,635 0 0 2,687,332
82/80 2050 130,609 40,075 0 0 2,714,192
x - denotes shortfall
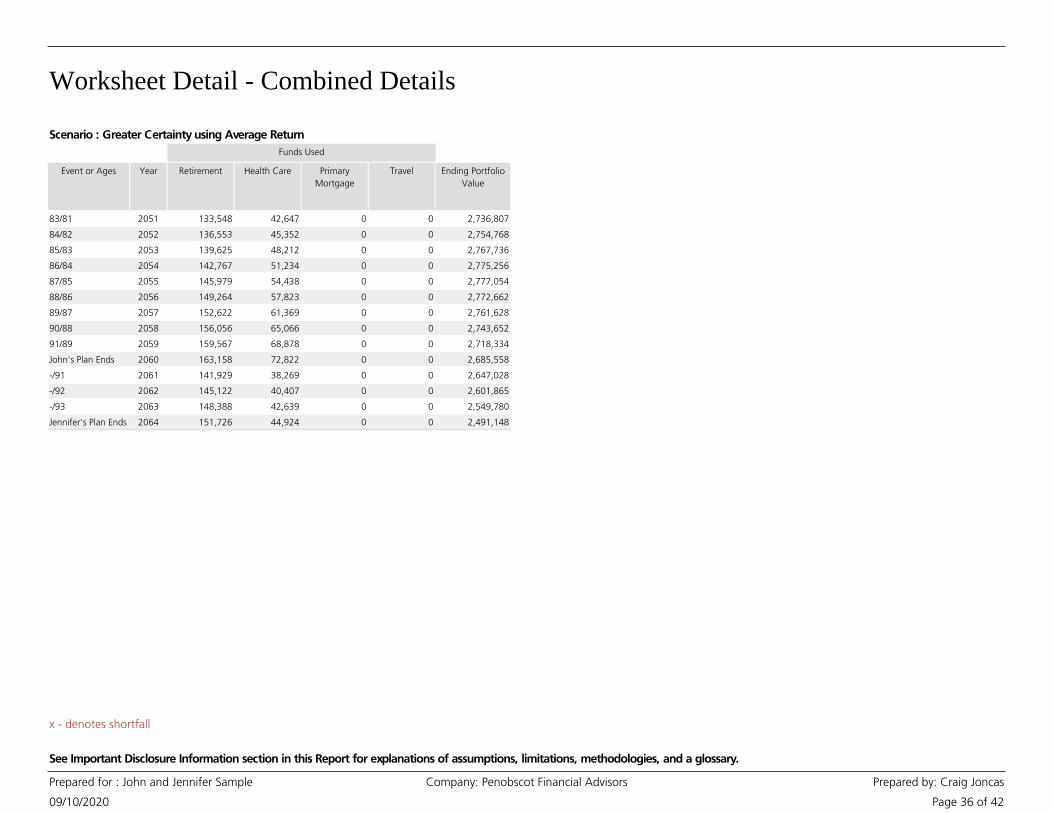
Worksheet Detail - Combined Details
09/10/2020
Prepared for : John and Jennifer Sample Company: Penobscot Financial Advisors Prepared by: Craig Joncas
Page 36 of 42
See Important Disclosure Information section in this Report for explanations of assumptions, limitations, methodologies, and a glossary.
Scenario : Greater Certainty using Average Return
Event or Ages Year
Funds Used
Retirement Health Care Primary
Mortgage
Travel Ending Portfolio
Value
83/81 2051 133,548 42,647 0 0 2,736,807
84/82 2052 136,553 45,352 0 0 2,754,768
85/83 2053 139,625 48,212 0 0 2,767,736
86/84 2054 142,767 51,234 0 0 2,775,256
87/85 2055 145,979 54,438 0 0 2,777,054
88/86 2056 149,264 57,823 0 0 2,772,662
89/87 2057 152,622 61,369 0 0 2,761,628
90/88 2058 156,056 65,066 0 0 2,743,652
91/89 2059 159,567 68,878 0 0 2,718,334
John's Plan Ends 2060 163,158 72,822 0 0 2,685,558
-/91 2061 141,929 38,269 0 0 2,647,028
-/92 2062 145,122 40,407 0 0 2,601,865
-/93 2063 148,388 42,639 0 0 2,549,780
Jennifer's Plan Ends 2064 151,726 44,924 0 0 2,491,148
x - denotes shortfall

Worksheet Detail - Combined Details
09/10/2020
Prepared for : John and Jennifer Sample Company: Penobscot Financial Advisors Prepared by: Craig Joncas
Page 37 of 42
See Important Disclosure Information section in this Report for explanations of assumptions, limitations, methodologies, and a glossary.
Notes
• Calculations are based on a “Rolling Year” rather than a Calendar Year. The current date
begins the 365-day “Rolling Year”.
• Additions and withdrawals occur at the beginning of the year.
• Post Retirement Income includes the following: Social Security, pension, annuity, rental
property, royalty, alimony, part-time employment, trust, and any other retirement income as
entered in the Plan.
• Other Additions come from items entered in the Other Assets section and any applicable
proceeds from insurance policies.
• Stock Options and Restricted Stock values are after-tax.
• Strategy Income is based on the particulars of the Goal Strategies selected. Strategy Income
from immediate annuities, 72(t) distributions, and variable annuities with a guaranteed minimum
withdrawal benefit (GMWB) is pre-tax. Strategy Income from Net Unrealized Appreciation (NUA)
is after-tax.
• Investment Earnings are calculated on all assets after any withdrawals for 'Goal Expense', 'Taxes
on Withdrawals' and 'Tax Penalties' are subtracted.
• When married, if either Social Security Program Estimate or Use a Better Estimate of Annual
Benefits is selected for a participant, the program will default to the greater of the selected
benefit or the age adjusted spousal benefit, which is based on the other participant's benefit.
• Funds for each Goal Expense are first used from Earmarked Assets. If sufficient funds are not
available from Earmarked Assets, Fund All Goals Assets will be used to fund the remaining
portion of the Goal Expense, if available in that year.
• These calculations do not incorporate penalties associated with use of 529 Plan withdrawals for
non-qualified expenses.
• All funds needed for a Goal must be available in the year the Goal occurs. Funds from
Earmarked Assets that become available after the Goal year(s) have passed are not included in the
funding of that Goal, and accumulate until the end of the Plan.
• When married, ownership of qualified assets is assumed to roll over to the surviving co-client at
the death of the original owner. It is also assumed the surviving co-client inherits all assets of the
original owner.
• The taxes column is a sum of (1) taxes on retirement income, (2) taxes on strategy income, (3)
taxes on withdrawals from qualified assets for Required Minimum Distributions, (4) taxes on
withdrawals from taxable assets' untaxed gain used to fund Goals in that year, (5) taxes on
withdrawals from tax-deferred or qualified assets used to fund Goals in that year, and (6) taxes
on the investment earnings of taxable assets. Tax rates used are detailed in the Tax and Inflation
Options page. (Please note, the Taxes column does not include any taxes owed from the exercise
of Stock Options or the vesting of Restricted Stock.)
• Tax Penalties can occur when Qualified and Tax-Deferred Assets are used prior to age 59½. If
there is a value in this column, it illustrates that you are using your assets in this Plan in a manner
that may incur tax penalties. Generally, it is better to avoid tax penalties whenever possible.
x - denotes shortfall
IMPORTANT DISCLOSURE INFORMATION
09/10/2020
Prepared for : John and Jennifer Sample Company: Penobscot Financial Advisors Prepared by: Craig Joncas
Page 38 of 42
The return assumptions in MoneyGuideElite are not reflective of any specific product, and
do not include any fees or expenses that may be incurred by investing in specific products.
The actual returns of a specific product may be more or less than the returns used in
MoneyGuideElite. It is not possible to directly invest in an index. Financial forecasts, rates
of return, risk, inflation, and other assumptions may be used as the basis for illustrations.
They should not be considered a guarantee of future performance or a guarantee of
achieving overall financial objectives. Past performance is not a guarantee or a predictor of
future results of either the indices or any particular investment.
IMPORTANT: The projections or other information generated by MoneyGuideElite regarding
the likelihood of various investment outcomes are hypothetical in nature, do not reflect
actual investment results, and are not guarantees of future results.
MoneyGuideElite results may vary with each use and over time.
Information Provided by You
MoneyGuideElite Assumptions and Limitations
Assumptions and Limitations
MoneyGuideElite offers several methods of calculating results, each of which provides one
outcome from a wide range of possible outcomes. All results in this Report are hypothetical
in nature, do not reflect actual investment results, and are not guarantees of future results.
All results use simplifying assumptions that do not completely or accurately reflect your
specific circumstances. No Plan or Report has the ability to accurately predict the future. As
investment returns, inflation, taxes, and other economic conditions vary from the
MoneyGuideElite assumptions, your actual results will vary (perhaps significantly) from those
presented in this Report.
All MoneyGuideElite calculations use asset class returns, not returns of actual investments.
The projected return assumptions used in this Report are estimates based on average annual
returns for each asset class. The portfolio returns are calculated by weighting individual
return assumptions for each asset class according to your portfolio allocation. The portfolio
returns may have been modified by including adjustments to the total return and the
inflation rate. The portfolio returns assume reinvestment of interest and dividends at net
asset value without taxes, and also assume that the portfolio has been rebalanced to reflect
the initial recommendation. No portfolio rebalancing costs, including taxes, if applicable,
are deducted from the portfolio value. No portfolio allocation eliminates risk or guarantees
investment results.
MoneyGuideElite does not provide recommendations for any products or securities.
Information that you provided about your assets, financial goals, and personal situation are
key assumptions for the calculations and projections in this Report. Please review the
Report sections titled "Personal Information and Summary of Financial Goals", "Current
Portfolio Allocation", and "Tax and Inflation Options" to verify the accuracy of these
assumptions. If any of the assumptions are incorrect, you should notify your Financial
Advisor. Even small changes in assumptions can have a substantial impact on the results
shown in this Report. The information provided by you should be reviewed periodically and
updated when either the information or your circumstances change.
All asset and net worth information included in this Report was provided by you or your
designated agents, and is not a substitute for the information contained in the official
account statements provided to you by custodians. The current asset data and values
contained in those account statements should be used to update the asset information
included in this Report, as necessary.
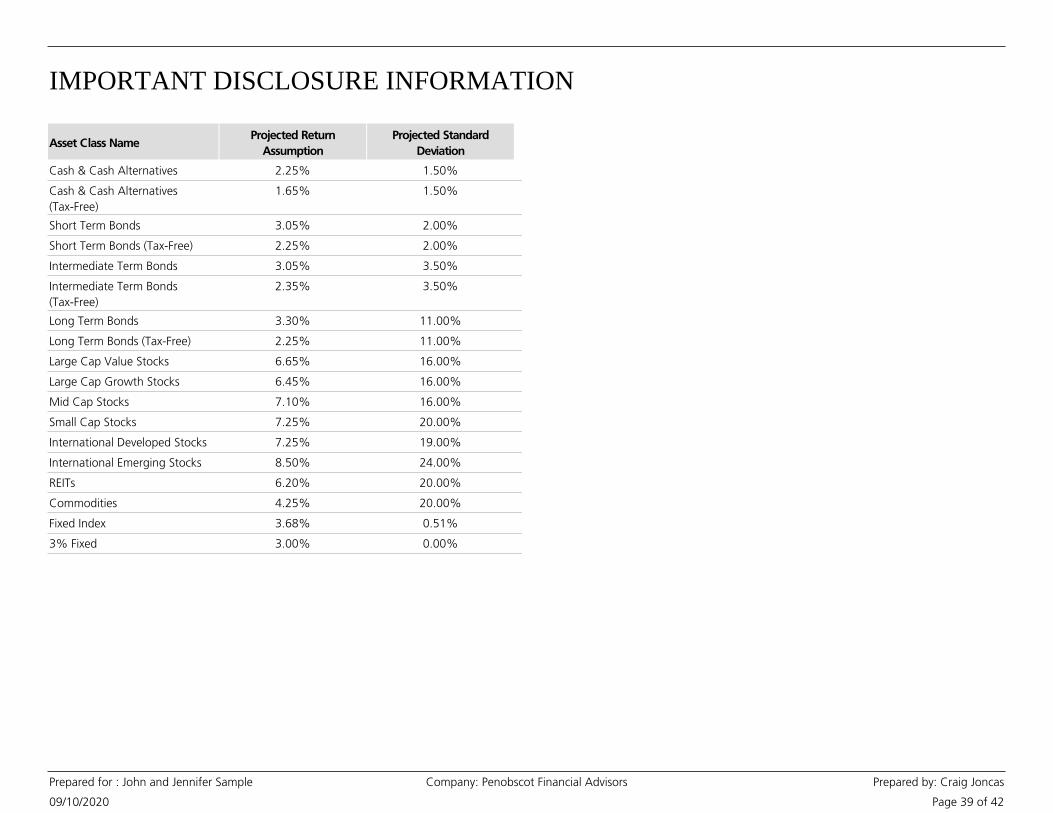
IMPORTANT DISCLOSURE INFORMATION
09/10/2020
Prepared for : John and Jennifer Sample Company: Penobscot Financial Advisors Prepared by: Craig Joncas
Page 39 of 42
Asset Class NameProjected Return
Assumption
Projected Standard
Deviation
Cash & Cash Alternatives 2.25% 1.50%
Cash & Cash Alternatives
(Tax-Free)
1.65% 1.50%
Short Term Bonds 3.05% 2.00%
Short Term Bonds (Tax-Free) 2.25% 2.00%
Intermediate Term Bonds 3.05% 3.50%
Intermediate Term Bonds
(Tax-Free)
2.35% 3.50%
Long Term Bonds 3.30% 11.00%
Long Term Bonds (Tax-Free) 2.25% 11.00%
Large Cap Value Stocks 6.65% 16.00%
Large Cap Growth Stocks 6.45% 16.00%
Mid Cap Stocks 7.10% 16.00%
Small Cap Stocks 7.25% 20.00%
International Developed Stocks 7.25% 19.00%
International Emerging Stocks 8.50% 24.00%
REITs 6.20% 20.00%
Commodities 4.25% 20.00%
Fixed Index 3.68% 0.51%
3% Fixed 3.00% 0.00%
IMPORTANT DISCLOSURE INFORMATION
09/10/2020
Prepared for : John and Jennifer Sample Company: Penobscot Financial Advisors Prepared by: Craig Joncas
Page 40 of 42
Risks Inherent in Investing
International investing involves additional risks including, but not limited to, changes in
currency exchange rates, differences in accounting and taxation policies, and political or
economic instabilities that can increase or decrease returns.
Report Is a Snapshot and Does Not Provide Legal, Tax, or Accounting Advice
Investing in fixed income securities involves interest rate risk, credit risk, and inflation risk.
Interest rate risk is the possibility that bond prices will decrease because of an interest rate
increase. When interest rates rise, bond prices and the values of fixed income securities fall.
When interest rates fall, bond prices and the values of fixed income securities rise. Credit
risk is the risk that a company will not be able to pay its debts, including the interest on its
bonds. Inflation risk is the possibility that the interest paid on an investment in bonds will
be lower than the inflation rate, decreasing purchasing power.
Cash alternatives typically include money market securities and U.S. treasury bills. Investing
in such cash alternatives involves inflation risk. In addition, investments in money market
securities may involve credit risk and a risk of principal loss. Because money market
securities are neither insured nor guaranteed by the Federal Deposit Insurance Corporation
or any other government agency, there is no guarantee the value of your investment will be
maintained at $1.00 per share, and your shares, when sold, may be worth more or less than
what you originally paid for them. U.S. Treasury bills are subject to market risk if sold prior
to maturity. Market risk is the possibility that the value, when sold, might be less than the
purchase price.
Investing in stock securities involves volatility risk, market risk, business risk, and industry
risk. The prices of most stocks fluctuate. Volatility risk is the chance that the value of a stock
will fall. Market risk is chance that the prices of all stocks will fall due to conditions in the
economic environment. Business risk is the chance that a specific company’s stock will fall
because of issues affecting it. Industry risk is the chance that a set of factors particular to an
industry group will adversely affect stock prices within the industry. (See “Asset Class –
Stocks” in the Glossary section of this Important Disclosure Information for a summary of
the relative potential volatility of different types of stocks.)
This Report provides a snapshot of your current financial position and can help you to focus
on your financial resources and goals, and to create a plan of action. Because the results
are calculated over many years, small changes can create large differences in future results.
You should use this Report to help you focus on the factors that are most important to you.
This Report does not provide legal, tax, or accounting advice. Before making decisions with
legal, tax, or accounting ramifications, you should consult appropriate professionals for
advice that is specific to your situation.
MoneyGuideElite Methodology
MoneyGuideElite offers several methods of calculating results, each of which provides one
outcome from a wide range of possible outcomes. The methods used are: “Average
Returns,” “Historical Test,” “Bad Timing,” “Class Sensitivity,” and “Monte Carlo
Simulations.” When using historical returns, the methodologies available are Average
Returns, Historical Test, Bad Timing, and Monte Carlo Simulations. When using projected
returns, the methodologies available are Average Returns, Bad Timing, Class Sensitivity, and
Monte Carlo Simulations.
Results Using Average Returns
The Results Using Average Returns are calculated using one average return for your
pre-retirement period and one average return for your post-retirement period. Average
Returns are a simplifying assumption. In the real world, investment returns can (and often
do) vary widely from year to year and vary widely from a long-term average return.
Results Using Historical Test
The Results Using Historical Test are calculated by using the actual historical returns and
inflation rates, in sequence, from a starting year to the present, and assumes that you
would receive those returns and inflation rates, in sequence, from this year through the end
of your Plan. If the historical sequence is shorter than your Plan, the average return for the
historical period is used for the balance of the Plan. The historical returns used are those of
the broad-based asset class indices listed in this Important Disclosure Information.
Results with Bad Timing
Results with Bad Timing are calculated by using low returns in one or two years, and
average returns for all remaining years of the Plan. For most Plans, the worst time for low
returns is when you begin taking substantial withdrawals from your portfolio. The Results
with Bad Timing assume that you earn a low return in the year(s) you select and then an
Adjusted Average Return in all other years. This Adjusted Average Return is calculated so
that the average return of the Results with Bad Timing is equal to the return(s) used in
calculating the Results Using Average Returns. This allows you to compare two results with
the same overall average return, where one (the Results with Bad Timing) has low returns in
one or two years.

IMPORTANT DISCLOSURE INFORMATION
09/10/2020
Prepared for : John and Jennifer Sample Company: Penobscot Financial Advisors Prepared by: Craig Joncas
Page 41 of 42
Results Using Class Sensitivity
The Results Using Class Sensitivity are calculated by using different return assumptions for
one or more asset classes during the years you select. These results show how your Plan
would be affected if the annual returns for one or more asset classes were different than
the average returns for a specified period in your Plan.
Results Using Monte Carlo Simulations
MoneyGuideElite Presentation of Results
The Results Using Average Returns, Historical Test, Bad Timing, and Class Sensitivity display
the results using an “Estimated % of Goal Funded” and a “Safety Margin.”
Monte Carlo simulations are used to show how variations in rates of return each year can
affect your results. A Monte Carlo simulation calculates the results of your Plan by running
it many times, each time using a different sequence of returns. Some sequences of returns
will give you better results, and some will give you worse results. These multiple trials
provide a range of possible results, some successful (you would have met all your goals) and
some unsuccessful (you would not have met all your goals). The percentage of trials that
were successful is the probability that your Plan, with all its underlying assumptions, could
be successful. In MoneyGuideElite, this is the Probability of Success. Analogously, the
percentage of trials that were unsuccessful is the Probability of Failure. The Results Using
Monte Carlo Simulations indicate the likelihood that an event may occur as well as the
likelihood that it may not occur. In analyzing this information, please note that the analysis
does not take into account actual market conditions, which may severely affect the
outcome of your goals over the long-term.
When using historical returns, the default for one year of low returns is the lowest annual
return in the historical period you are using, and the default for two years of low returns is
the lowest two-year sequence of returns in the historical period. When using projected
returns, the default for the first year of low returns is two standard deviations less than the
average return, and the default for the second year is one standard deviation less than the
average return.
Estimated % of Goal Funded
Safety Margin
The Safety Margin is the estimated value of your assets at the end of this Plan, based on all
the assumptions included in this Report. Only you can determine if that Safety Margin is
sufficient for your needs.
For each Goal, the “Estimated % of Goal Funded” is the sum of the assets used to fund the
Goal divided by the sum of the Goal’s expenses. All values are in current dollars. A result of
100% or more does not guarantee that you will reach a Goal, nor does a result under
100% guarantee that you will not. Rather, this information is meant to identify possible
shortfalls in this Plan, and is not a guarantee that a certain percentage of your Goals will be
funded. The percentage reflects a projection of the total cost of the Goal that was actually
funded based upon all the assumptions that are included in this Plan, and assumes that you
execute all aspects of the Plan as you have indicated.
Bear Market Loss and Bear Market Test
The Bear Market Loss shows how a portfolio would have been impacted during the worst
bear market since the Great Depression. Depending on the composition of the portfolio,
the worst bear market is either the "Great Recession" or the "Bond Bear Market."
The Great Recession, from November 2007 through February 2009, was the worst bear
market for stocks since the Great Depression. In MoneyGuideElite, the Great Recession
Return is the rate of return, during the Great Recession, for a portfolio comprised of cash,
bonds, stocks, alternatives, and other classes, with an asset mix equivalent to the portfolio
referenced.
The Bond Bear Market, from July 1979 through February 1980, was the worst bear market
for bonds since the Great Depression. In MoneyGuideElite, the Bond Bear Market Return is
the rate of return, for the Bond Bear Market period, for a portfolio comprised of cash,
bonds, stocks, alternatives, and other classes, with an asset mix equivalent to the portfolio
referenced.
The Bear Market Loss shows: 1) either the Great Recession Return or the Bond Bear Market
Return, whichever is lower, and 2) the potential loss, if you had been invested in this
cash-bond-stock-alternative-other portfolio during the period with the lower return. In
general, most portfolios with a stock allocation of 20% or more have a lower Great
Recession Return, and most portfolios with a combined cash and bond allocation of 80% or
more have a lower Bond Bear Market Return.
IMPORTANT DISCLOSURE INFORMATION
09/10/2020
Prepared for : John and Jennifer Sample Company: Penobscot Financial Advisors Prepared by: Craig Joncas
Page 42 of 42
Regardless of whether you are using Historical or Projected returns in your Plan, the Bear
Market Loss and Bear Market Test use returns calculated from historical indices where all
assets classes included in the referenced portfolio are rolled-up using only the groups below.
If you are using Historical returns in your Plan, the indices in the Bear Market Loss and the
Bear Market Test may be different from indices used in other calculations. The following
indexes are used to calculate the return during the Great Recession and the Bond Bear
Market:
Because the Bear Market Loss and Bear Market Test use the returns from asset class indices
rather than the returns of actual investments, they do not represent the performance for
any specific portfolio, and are not a guarantee of minimum or maximum levels of losses or
gains for any portfolio. The actual performance of your portfolio may differ substantially
from those shown in the Great Recession Return, the Bond Bear Market Return, the Bear
Market Loss, and the Bear Market Test.
The Bear Market Test, included in the Stress Tests, examines the impact on your Plan results
if an identical Great Recession or Bond Bear Market, whichever would be worse, occurred
this year. The Bear Market Test shows the likelihood that you could fund your Needs,
Wants and Wishes after experiencing such an event.
Asset Class Index Great Recession Return
11/2007 – 02/2009
Bond Bear Market
Return
07/1979 – 02/1980
Cash Ibbotson U.S. 30-day
Treasury Bills
2.31% 7.08%
Bond Ibbotson Intermediate-Term
Government Bonds – Total
Return
15.61% -8.89%
Stock S&P 500 – Total Return -50.95% 14.61%
Alternative HFRI FOF: Diversified
S&P GSCI Commodity - Total
Return
-19.87%
N/A
N/A
23.21%
Fixed Index Fixed Index 0% 0%
3% Fixed 3% Fixed 0% 0%
Notes
• HFRI FOF: Diversified stands for Hedge Fund Research Indices Fund of Funds
• S&P GSCI was formerly the Goldman Sachs Commodity Index
MoneyGuideElite Risk Assessment
The MoneyGuideElite Risk Assessment highlights some – but not all – of the trade-offs you
might consider when deciding how to invest your money. This approach does not provide a
comprehensive, psychometrically-based, or scientifically-validated profile of your risk
tolerance, loss tolerance, or risk capacity, and is provided for informational purposes only.
Based on your specific circumstances, you must decide the appropriate balance between
potential risks and potential returns. MoneyGuideElite does not and cannot adequately
understand or assess the appropriate risk/return balance for you. MoneyGuideElite requires
you to select a risk score. Once selected, three important pieces of information are available
to help you determine the appropriateness of your score: an appropriate portfolio for your
score, the impact of a Bear Market Loss (either the Great Recession or the Bond Bear
Market, whichever is lower) on this portfolio, and a compare button to show how your
score compares to the risk score of others in your age group.
MoneyGuideElite uses your risk score to select a risk-based portfolio on the Portfolio Table
page. This risk-based portfolio selection is provided for informational purposes only, and
you should consider it to be a starting point for conversations with your Advisor. It is your
responsibility to select the Target Portfolio you want MoneyGuideElite to use. The selection
of your Target Portfolio, and other investment decisions, should be made by you, after
discussions with your Advisor and, if needed, other financial and/or legal professionals.

Section4

Current vs. ProposedPrepared for John & Jennifer Sample by Penobscot Financial AdvisorsSeptember 10, 2020
For more information,contact 207-990-1901 or visit www.penobscotfa.com
2020 YCharts, Inc. All Rights Reserved. YCharts, Inc. ('YCharts') is not registered with the U.S. Securities and Exchange Commission (or with the securities regulatory authority or body of any state or any other jurisdiction) as an investmentadviser, broker-dealer or in any other capacity, and does not purport to provide investment advice or make investment recommendations. This report has been generated using data manually input by the creator of this report combined withdata and calculations from YCharts.com and is intended solely to assist you or your investment or other adviser(s) in conducting investment research. You should not construe this report as an offer to buy or sell, as a solicitation of an offer tobuy or sell, or as a recommendation to buy, sell, hold or trade, any security or other nancial instrument. THE IMPORTANT DISCLOSURES FOUND AT THE END OF THIS REPORT (WHICH INCLUDE DEFINITIONS OF CERTAIN TERMS USED IN THISREPORT) ARE AN INTEGRAL PART OF THIS REPORT AND MUST BE READ IN CONJUNCTION WITH YOUR REVIEW OF THIS REPORT. For further information regarding your use of this report, please go to: https://get.ycharts.com/disclosure/
Built with
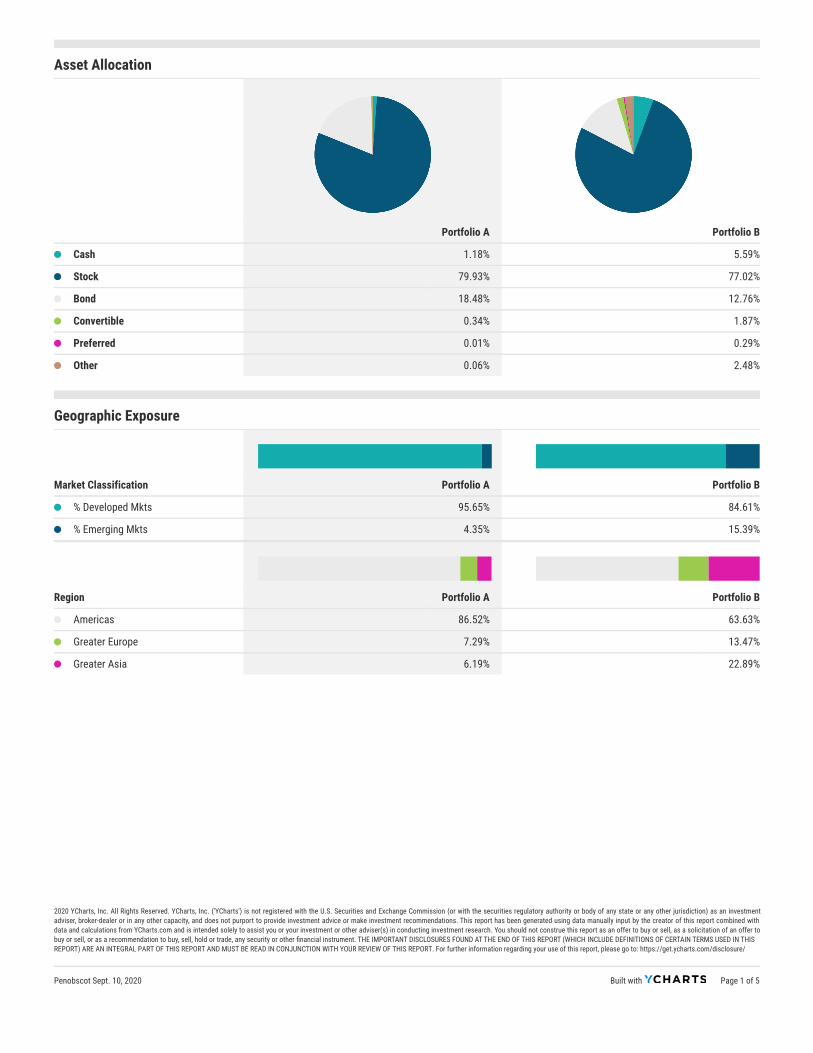
Asset Allocation
Portfolio A Portfolio B
Cash 1.18% 5.59%
Stock 79.93% 77.02%
Bond 18.48% 12.76%
Convertible 0.34% 1.87%
Preferred 0.01% 0.29%
Other 0.06% 2.48%
Geographic Exposure
Market Classification Portfolio A Portfolio B
% Developed Mkts 95.65% 84.61%
% Emerging Mkts 4.35% 15.39%
Region Portfolio A Portfolio B
Americas 86.52% 63.63%
Greater Europe 7.29% 13.47%
Greater Asia 6.19% 22.89%
Built with Page 1 of 5
2020 YCharts, Inc. All Rights Reserved. YCharts, Inc. ('YCharts') is not registered with the U.S. Securities and Exchange Commission (or with the securities regulatory authority or body of any state or any other jurisdiction) as an investmentadviser, broker-dealer or in any other capacity, and does not purport to provide investment advice or make investment recommendations. This report has been generated using data manually input by the creator of this report combined withdata and calculations from YCharts.com and is intended solely to assist you or your investment or other adviser(s) in conducting investment research. You should not construe this report as an offer to buy or sell, as a solicitation of an offer tobuy or sell, or as a recommendation to buy, sell, hold or trade, any security or other nancial instrument. THE IMPORTANT DISCLOSURES FOUND AT THE END OF THIS REPORT (WHICH INCLUDE DEFINITIONS OF CERTAIN TERMS USED IN THISREPORT) ARE AN INTEGRAL PART OF THIS REPORT AND MUST BE READ IN CONJUNCTION WITH YOUR REVIEW OF THIS REPORT. For further information regarding your use of this report, please go to: https://get.ycharts.com/disclosure/
Penobscot Sept. 10, 2020
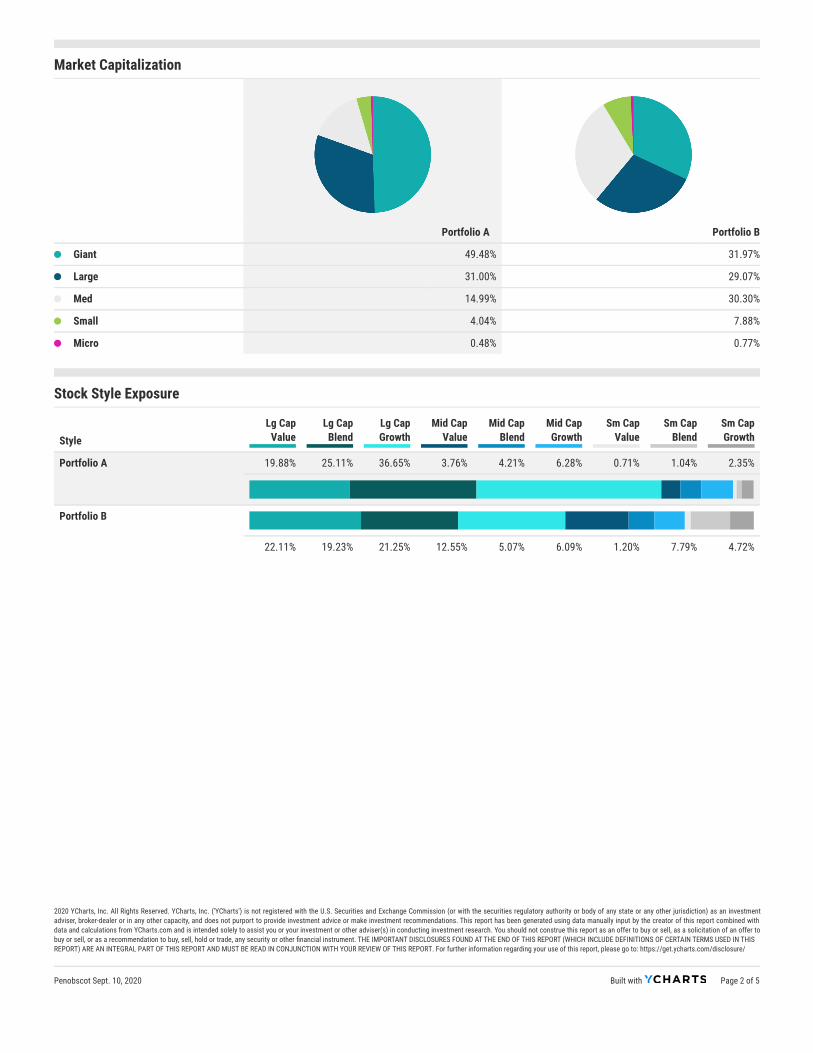
Market Capitalization
Portfolio A Portfolio B
Giant 49.48% 31.97%
Large 31.00% 29.07%
Med 14.99% 30.30%
Small 4.04% 7.88%
Micro 0.48% 0.77%
Stock Style Exposure
StyleLg Cap
ValueLg Cap
BlendLg CapGrowth
Mid CapValue
Mid CapBlend
Mid CapGrowth
Sm CapValue
Sm CapBlend
Sm CapGrowth
Portfolio A 19.88% 25.11% 36.65% 3.76% 4.21% 6.28% 0.71% 1.04% 2.35%
Portfolio B
22.11% 19.23% 21.25% 12.55% 5.07% 6.09% 1.20% 7.79% 4.72%
Built with Page 2 of 5
2020 YCharts, Inc. All Rights Reserved. YCharts, Inc. ('YCharts') is not registered with the U.S. Securities and Exchange Commission (or with the securities regulatory authority or body of any state or any other jurisdiction) as an investmentadviser, broker-dealer or in any other capacity, and does not purport to provide investment advice or make investment recommendations. This report has been generated using data manually input by the creator of this report combined withdata and calculations from YCharts.com and is intended solely to assist you or your investment or other adviser(s) in conducting investment research. You should not construe this report as an offer to buy or sell, as a solicitation of an offer tobuy or sell, or as a recommendation to buy, sell, hold or trade, any security or other nancial instrument. THE IMPORTANT DISCLOSURES FOUND AT THE END OF THIS REPORT (WHICH INCLUDE DEFINITIONS OF CERTAIN TERMS USED IN THISREPORT) ARE AN INTEGRAL PART OF THIS REPORT AND MUST BE READ IN CONJUNCTION WITH YOUR REVIEW OF THIS REPORT. For further information regarding your use of this report, please go to: https://get.ycharts.com/disclosure/
Penobscot Sept. 10, 2020
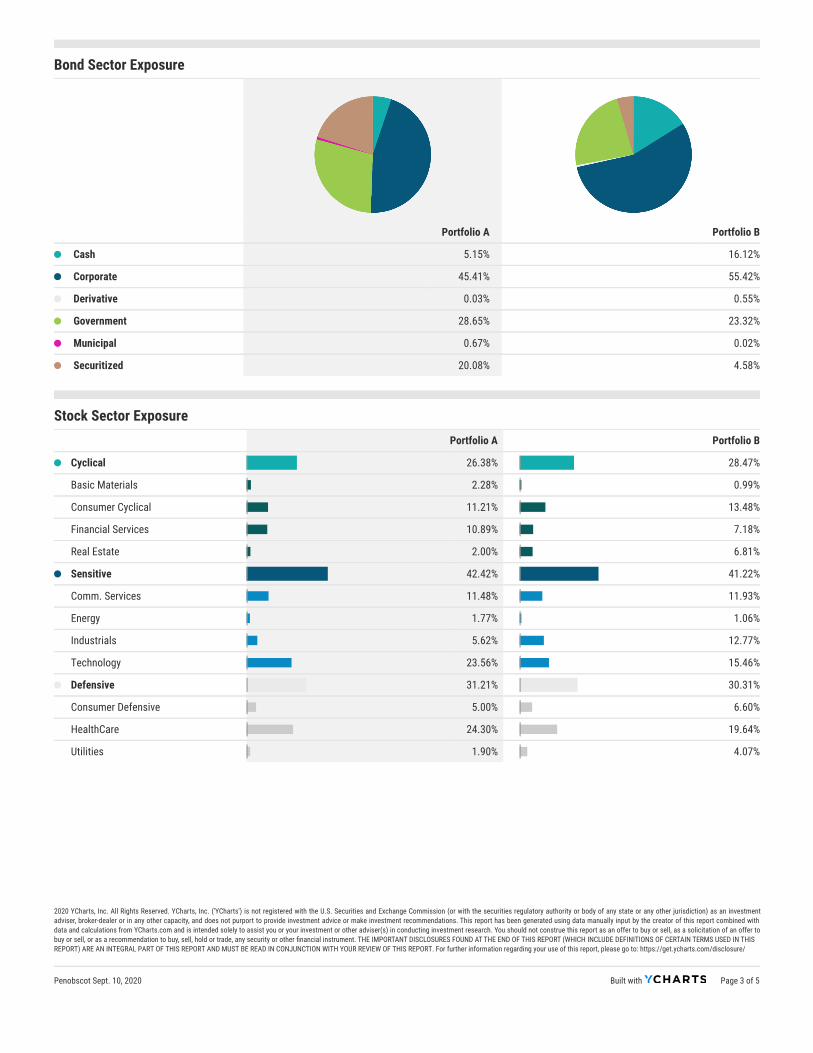
Bond Sector Exposure
Portfolio A Portfolio B
Cash 5.15% 16.12%
Corporate 45.41% 55.42%
Derivative 0.03% 0.55%
Government 28.65% 23.32%
Municipal 0.67% 0.02%
Securitized 20.08% 4.58%
Stock Sector Exposure Portfolio A Portfolio B
Cyclical 26.38% 28.47%
Basic Materials 2.28% 0.99%
Consumer Cyclical 11.21% 13.48%
Financial Services 10.89% 7.18%
Real Estate 2.00% 6.81%
Sensitive 42.42% 41.22%
Comm. Services 11.48% 11.93%
Energy 1.77% 1.06%
Industrials 5.62% 12.77%
Technology 23.56% 15.46%
Defensive 31.21% 30.31%
Consumer Defensive 5.00% 6.60%
HealthCare 24.30% 19.64%
Utilities 1.90% 4.07%
Built with Page 3 of 5
2020 YCharts, Inc. All Rights Reserved. YCharts, Inc. ('YCharts') is not registered with the U.S. Securities and Exchange Commission (or with the securities regulatory authority or body of any state or any other jurisdiction) as an investmentadviser, broker-dealer or in any other capacity, and does not purport to provide investment advice or make investment recommendations. This report has been generated using data manually input by the creator of this report combined withdata and calculations from YCharts.com and is intended solely to assist you or your investment or other adviser(s) in conducting investment research. You should not construe this report as an offer to buy or sell, as a solicitation of an offer tobuy or sell, or as a recommendation to buy, sell, hold or trade, any security or other nancial instrument. THE IMPORTANT DISCLOSURES FOUND AT THE END OF THIS REPORT (WHICH INCLUDE DEFINITIONS OF CERTAIN TERMS USED IN THISREPORT) ARE AN INTEGRAL PART OF THIS REPORT AND MUST BE READ IN CONJUNCTION WITH YOUR REVIEW OF THIS REPORT. For further information regarding your use of this report, please go to: https://get.ycharts.com/disclosure/
Penobscot Sept. 10, 2020
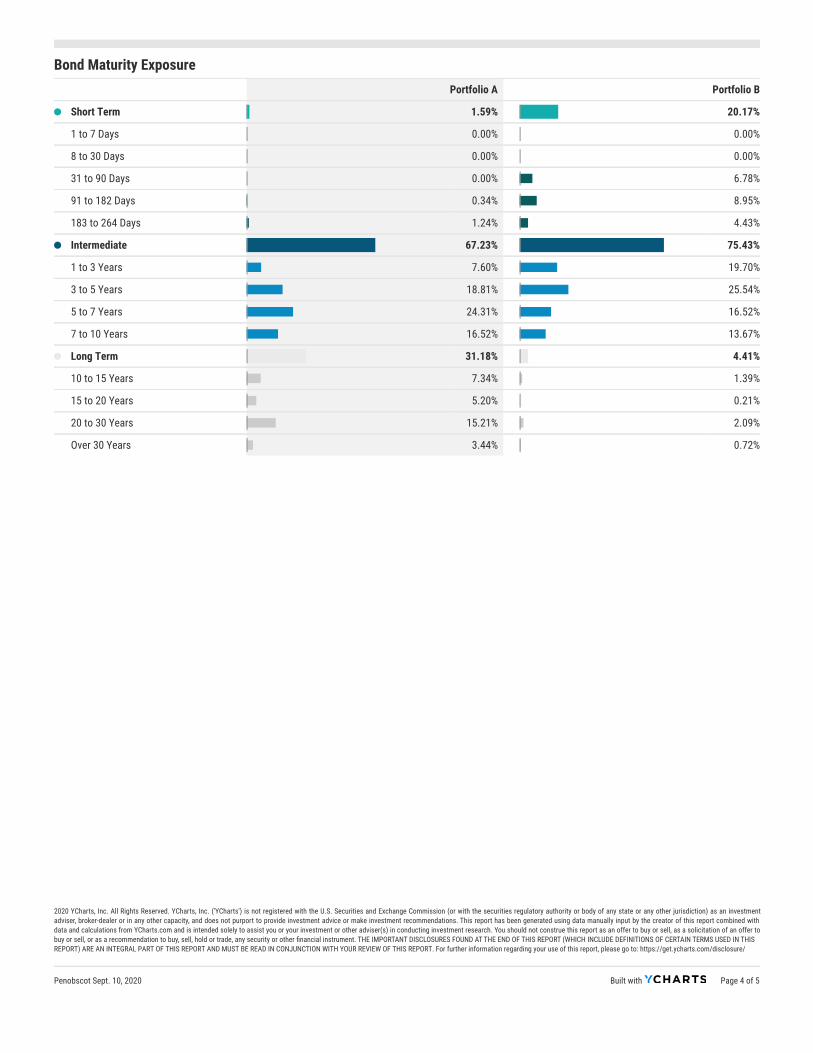
Bond Maturity Exposure Portfolio A Portfolio B
Short Term 1.59% 20.17%
1 to 7 Days 0.00% 0.00%
8 to 30 Days 0.00% 0.00%
31 to 90 Days 0.00% 6.78%
91 to 182 Days 0.34% 8.95%
183 to 264 Days 1.24% 4.43%
Intermediate 67.23% 75.43%
1 to 3 Years 7.60% 19.70%
3 to 5 Years 18.81% 25.54%
5 to 7 Years 24.31% 16.52%
7 to 10 Years 16.52% 13.67%
Long Term 31.18% 4.41%
10 to 15 Years 7.34% 1.39%
15 to 20 Years 5.20% 0.21%
20 to 30 Years 15.21% 2.09%
Over 30 Years 3.44% 0.72%
Built with Page 4 of 5
2020 YCharts, Inc. All Rights Reserved. YCharts, Inc. ('YCharts') is not registered with the U.S. Securities and Exchange Commission (or with the securities regulatory authority or body of any state or any other jurisdiction) as an investmentadviser, broker-dealer or in any other capacity, and does not purport to provide investment advice or make investment recommendations. This report has been generated using data manually input by the creator of this report combined withdata and calculations from YCharts.com and is intended solely to assist you or your investment or other adviser(s) in conducting investment research. You should not construe this report as an offer to buy or sell, as a solicitation of an offer tobuy or sell, or as a recommendation to buy, sell, hold or trade, any security or other nancial instrument. THE IMPORTANT DISCLOSURES FOUND AT THE END OF THIS REPORT (WHICH INCLUDE DEFINITIONS OF CERTAIN TERMS USED IN THISREPORT) ARE AN INTEGRAL PART OF THIS REPORT AND MUST BE READ IN CONJUNCTION WITH YOUR REVIEW OF THIS REPORT. For further information regarding your use of this report, please go to: https://get.ycharts.com/disclosure/
Penobscot Sept. 10, 2020

Section5

What Does Monte Carlo Have to do with Your Retirement?
August 3, 2018 PFA Ponderings
Monte Carlo, a ward in the Principality of Monaco, sits on the French Riviera. It occupies a mere quarter square mile, and from its perch on the coastal foothills of the Alps, it overlooks the stunning blue of the Mediterranean. The weather is temperate, only occasionally venturing above the 70s or below the 50s.
We all have an image of Monte Carlo in mind: Formula 1 Grand Prix, the Casino, the “extravagant display and reckless dispersion of wealth”, to quote Encyclopedia Britannica. Boasting some of the highest per-capita income and per-square-foot property values in the world, Monte Carlo is truly a playground for the rich.*
As such, many clients look at me askance when I bring up Monte Carlo as part of their retirement plan.
But before we get to that, let me bring you back about 20 years so that we can examine how most of the industry approached retirement planning: First, there was a general rule of thumb that said retirement would require 70 percent of pre-retirement income in order to be successful. Then, there would be an assumption made as to the rate of return on assets, and a projection about the resulting size of the asset base based upon the pre-determined retirement age. An adjustment for the rate of return in retirement would be made, and other variables, including the date(s) of death of each client and the rate of in�ation. The objective of the plan was simple: to have money left at the ‘end’ of the plan. Money at the end was success – and running out before was failure.
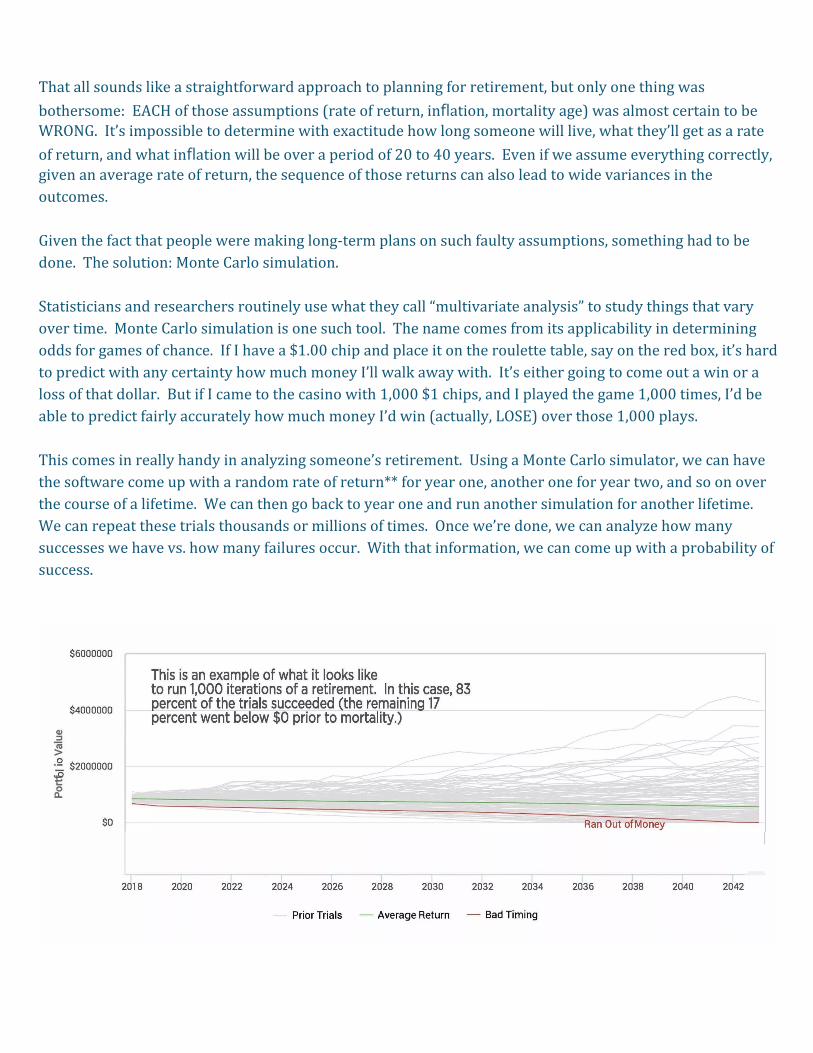
That all sounds like a straightforward approach to planning for retirement, but only one thing was bothersome: EACH of those assumptions (rate of return, in�ation, mortality age) was almost certain to be WRONG. It’s impossible to determine with exactitude how long someone will live, what they’ll get as a rate of return, and what in�ation will be over a period of 20 to 40 years. Even if we assume everything correctly, given an average rate of return, the sequence of those returns can also lead to wide variances in the outcomes.
Given the fact that people were making long-term plans on such faulty assumptions, something had to be done. The solution: Monte Carlo simulation.
Statisticians and researchers routinely use what they call “multivariate analysis” to study things that vary over time. Monte Carlo simulation is one such tool. The name comes from its applicability in determining odds for games of chance. If I have a $1.00 chip and place it on the roulette table, say on the red box, it’s hard to predict with any certainty how much money I’ll walk away with. It’s either going to come out a win or a loss of that dollar. But if I came to the casino with 1,000 $1 chips, and I played the game 1,000 times, I’d be able to predict fairly accurately how much money I’d win (actually, LOSE) over those 1,000 plays.
This comes in really handy in analyzing someone’s retirement. Using a Monte Carlo simulator, we can have the software come up with a random rate of return** for year one, another one for year two, and so on over the course of a lifetime. We can then go back to year one and run another simulation for another lifetime. We can repeat these trials thousands or millions of times. Once we’re done, we can analyze how many successes we have vs. how many failures occur. With that information, we can come up with a probability of success.
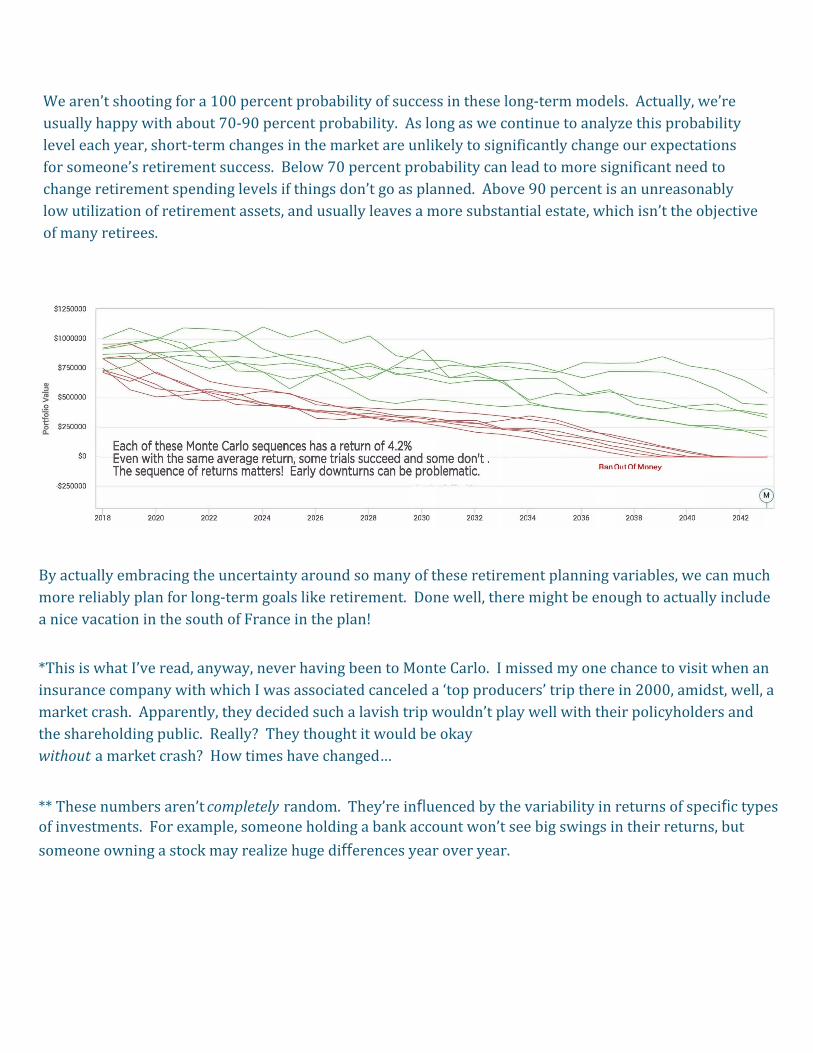
By actually embracing the uncertainty around so many of these retirement planning variables, we can much more reliably plan for long-term goals like retirement. Done well, there might be enough to actually include a nice vacation in the south of France in the plan!
*This is what I’ve read, anyway, never having been to Monte Carlo. I missed my one chance to visit when aninsurance company with which I was associated canceled a ‘top producers’ trip there in 2000, amidst, well, amarket crash. Apparently, they decided such a lavish trip wouldn’t play well with their policyholders andthe shareholding public. Really? They thought it would be okaywithout a market crash? How times have changed…
** These numbers aren’t completely random. They’re in�uenced by the variability in returns of speci�c types of investments. For example, someone holding a bank account won’t see big swings in their returns, but someone owning a stock may realize huge di�erences year over year.
We aren’t shooting for a 100 percent probability of success in these long-term models. Actually, we’re usually happy with about 70-90 percent probability. As long as we continue to analyze this probability level each year, short-term changes in the market are unlikely to significantly change our expectations for someone’s retirement success. Below 70 percent probability can lead to more significant need to change retirement spending levels if things don’t go as planned. Above 90 percent is an unreasonably low utilization of retirement assets, and usually leaves a more substantial estate, which isn’t the objective of many retirees.

Don’t Short-Change DiversificationJanuary 18, 2019 PFA Ponderings
When we talk about diversification, the general rule is ‘not wanting all your eggs in one basket.’ Obviously, it’s important that we not be in a position to lose the whole enchilada if a company goes out of business.
But actually, diversification plays more of a role than simply protecting us from disaster. Diversification is a tool that, used properly, can improve outcomes and increase the probability that we meet our goals.
We can take a portfolio with one risky asset, say an S&P 500 fund. We can add a MORE risky asset. Maybe a fund made up of stocks of small Taiwanese companies. How does that impact our original portfolio, formerly made up of just US stocks? The answer is that, in the majority of cases, the portfolio’s risk actually goes DOWN!
The quant geeks describe this e�ect as follows: TWO time series (of portfolio returns) added together will have a lower standard deviation (level of volatility) than either of the individual time series IF the two portfolios are not perfectly correlated.
Put another way, the less similar the di�erent investments in a portfolio are, the lower the likely volatility of the portfolio (and the higher the similarity, the higher the likely volatility).
This has some interesting implications for portfolio managers and individual investors alike. Looking at the chart below, we can see that individual portfolios of various investment types have a wide range of risk/return characteristics. Treasury bills have low levels of both risk and return. US stocks run with higher levels of both risk (volatility) and return. Non-US stocks, a little higher return, and higher volatility still.
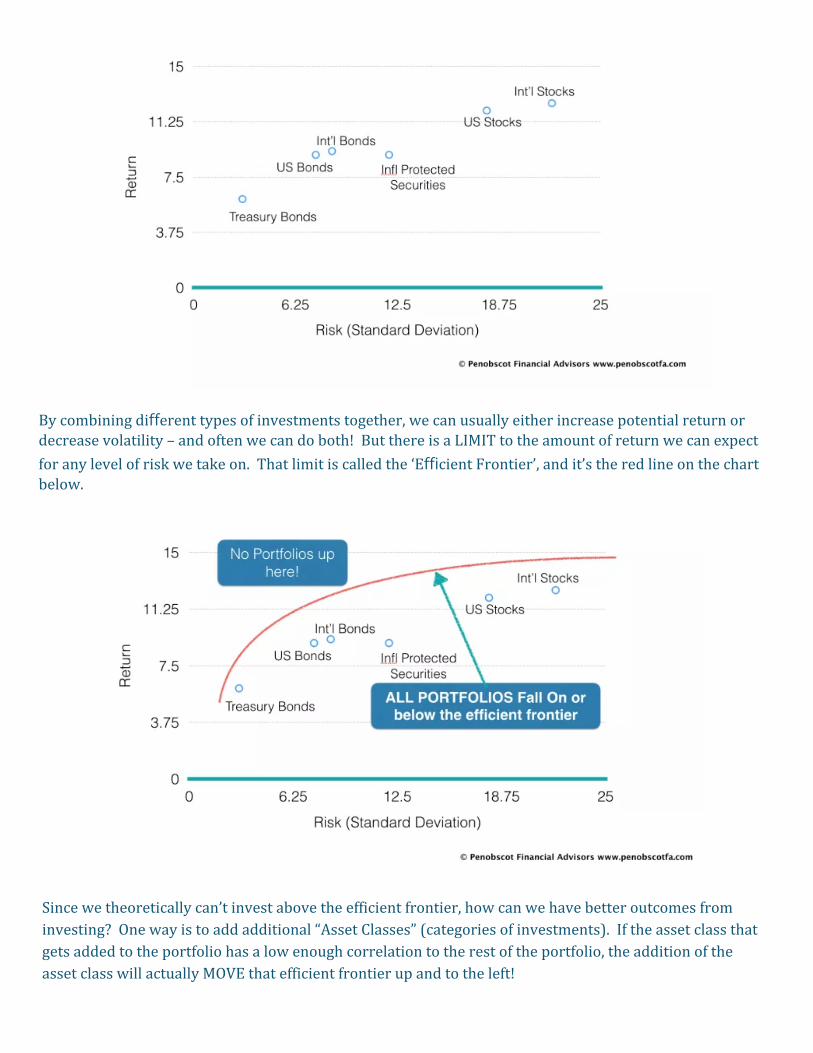
By combining di�erent types of investments together, we can usually either increase potential return or decrease volatility – and often we can do both! But there is a LIMIT to the amount of return we can expect for any level of risk we take on. That limit is called the ‘E�cient Frontier’, and it’s the red line on the chart below.
Since we theoretically can’t invest above the efficient frontier, how can we have better outcomes from investing? One way is to add additional “Asset Classes” (categories of investments). If the asset class that gets added to the portfolio has a low enough correlation to the rest of the portfolio, the addition of the asset class will actually MOVE that efficient frontier up and to the left!
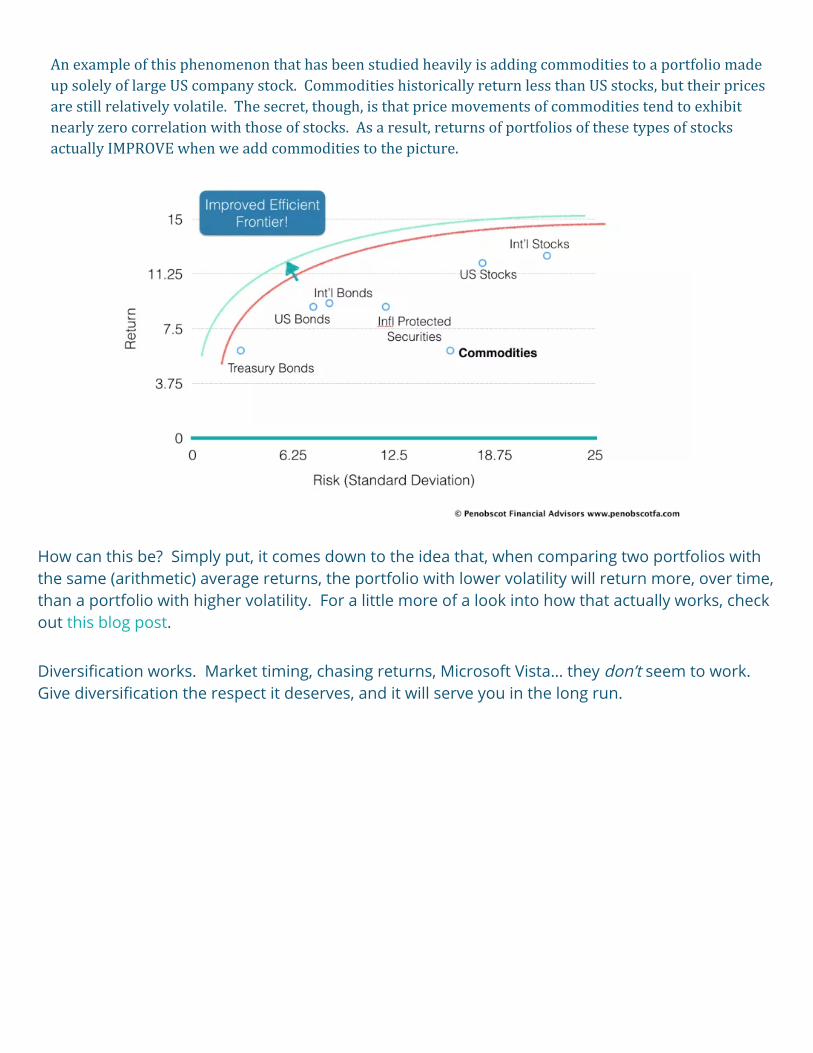
How can this be? Simply put, it comes down to the idea that, when comparing two portfolios withthe same (arithmetic) average returns, the portfolio with lower volatility will return more, over time,than a portfolio with higher volatility. For a little more of a look into how that actually works, checkout this blog post.
Diversi�cation works. Market timing, chasing returns, Microsoft Vista… they don’t seem to work. Give diversi�cation the respect it deserves, and it will serve you in the long run.
An example of this phenomenon that has been studied heavily is adding commodities to a portfolio made up solely of large US company stock. Commodities historically return less than US stocks, but their prices are still relatively volatile. The secret, though, is that price movements of commodities tend to exhibit nearly zero correlation with those of stocks. As a result, returns of portfolios of these types of stocks actually IMPROVE when we add commodities to the picture.

A Tale of Tax Efficient InvestingJuly 13, 2018 PFA Ponderings
This is the story of two friends. Let’s call them “Hannah” and “Julie.” Hannah and Julie are like peas in a pod. They listen to the same kind of music, they dress alike, they even invest alike. As a matter of fact, they have the same exact investment portfolio. Both of them have 100 shares of XYZ stock, and both of them have 10 bonds issued by ABC company.
Both Hannah and Julie bought the investments at the exact same time and at the exact same price. Both portfolios have
increased substantially and both are worth a tidy sum today. But here’s the thing. Later this year, when they sell their investment portfolios, Julie ends up with a significantly larger amount of money after taxes than Hannah does. This is despite the fact that Julie and Hannah are both (as you may expect) at the same exact tax bracket.
So how did Julie manage to beat Hannah? Before we get to the specifics, let’s review two things: the ‘magic’ of tax deferral, and a wonderful thing known as capital gains taxation.
THE MAGIC OF TAX DEFERRAL
Generally, deferring taxes is a good thing. Let’s say I have an investment that returns $1,000 per year. If I am in the 25% tax bracket, and have to pay taxes each year that thousand dollars, I’ll be left owing $250 per year in taxes. If I hold this investment in a tax deferred account, I get to hold onto that $250, and it continues to earn interest for me. If I’m not in a tax-deferred account, the interest that $250 is gone, since I had to use it to pay taxes. So, tax deferral, which can be obtained in a lot of ways, like through employer retirement plans and IRAs, can be helpful, especially with investments that pay a lot of interest.
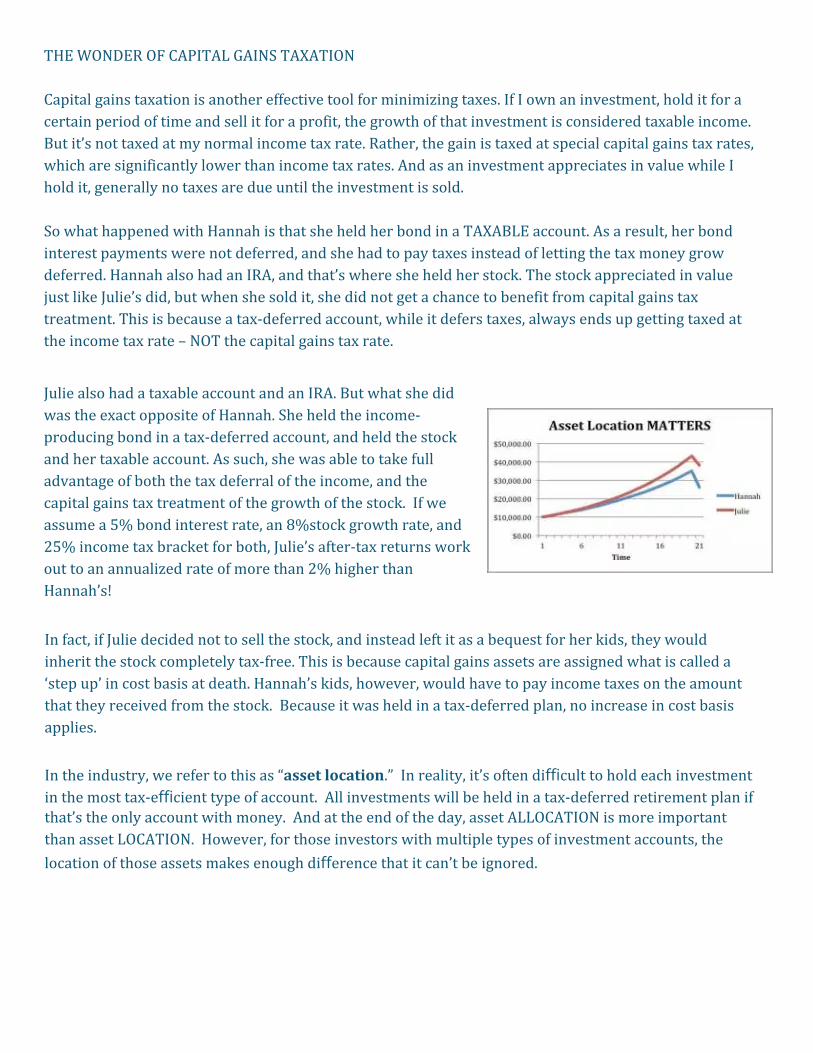
THE WONDER OF CAPITAL GAINS TAXATION
Capital gains taxation is another effective tool for minimizing taxes. If I own an investment, hold it for a certain period of time and sell it for a profit, the growth of that investment is considered taxable income. But it’s not taxed at my normal income tax rate. Rather, the gain is taxed at special capital gains tax rates, which are significantly lower than income tax rates. And as an investment appreciates in value while I hold it, generally no taxes are due until the investment is sold.
So what happened with Hannah is that she held her bond in a TAXABLE account. As a result, her bond interest payments were not deferred, and she had to pay taxes instead of letting the tax money grow deferred. Hannah also had an IRA, and that’s where she held her stock. The stock appreciated in value just like Julie’s did, but when she sold it, she did not get a chance to benefit from capital gains tax treatment. This is because a tax-deferred account, while it defers taxes, always ends up getting taxed at the income tax rate – NOT the capital gains tax rate.
Julie also had a taxable account and an IRA. But what she did was the exact opposite of Hannah. She held the income-producing bond in a tax-deferred account, and held the stock and her taxable account. As such, she was able to take full advantage of both the tax deferral of the income, and the capital gains tax treatment of the growth of the stock. If we assume a 5% bond interest rate, an 8%stock growth rate, and 25% income tax bracket for both, Julie’s after-tax returns work out to an annualized rate of more than 2% higher than Hannah’s!
In fact, if Julie decided not to sell the stock, and instead left it as a bequest for her kids, they would inherit the stock completely tax-free. This is because capital gains assets are assigned what is called a ‘step up’ in cost basis at death. Hannah’s kids, however, would have to pay income taxes on the amount that they received from the stock. Because it was held in a tax-deferred plan, no increase in cost basis applies.
In the industry, we refer to this as “asset location.” In reality, it’s often di�cult to hold each investment in the most tax-e�cient type of account. All investments will be held in a tax-deferred retirement plan if that’s the only account with money. And at the end of the day, asset ALLOCATION is more important than asset LOCATION. However, for those investors with multiple types of investment accounts, the location of those assets makes enough di�erence that it can’t be ignored.
The humble, inadequately appreciated, Health Savings Account
October 1, 2018 PFA Ponderings
Fifteen years after they were rolled out, Health Savings Accounts (HSAs) remain one of the least understood tax-advantaged savings vehicles in existence. They came into being as part of the 2003 Medicare Prescription Drug, Improvement and Modernization Act, signed into law by President George W. Bush. These plans allow certain people to save money through tax-deductible contributions. Estimates are that over 23 million of these accounts exist in 2018.
Participation in an HSA requires a few things. First of all, an employer must o�er it (although this has become more and more the norm over the past 10 years.) Beyond that, a participant in an HSA must:
1. Be a participant in a High Deductible Health Plan (HDHP). This is currently de�ned as a plan with adeductible of at least $1,350 for an individual or $2,700 for a family.
2. For the most part, not have health insurance outside of the HDHP. Some exceptions apply.3. Not be a Medicare participant.4. Not be eligible to be claimed as a dependent on someone else’s return.
The amount that can be contributed to an HSA annually is $3,450 for an individual and $6,900 for a family. Both of these numbers can be increased by $1,000 if the participant is over the age of 55.
Examples of quali�ed medical expenses include:
• Health insurance coinsurance and deductibles• Most medical and dental expenses• Vision care• Prescription drugs and insulin• Medicare premiums• A portion of the premiums for a tax-qualified long-term care policy
HSAs are limited by some common misconceptions. One of the most frequent is the idea that the assets deferred into an HSA need to be spent during the year of contribution, lest they be forfeited. This is simply a case of mistaking an HSA with an FSA (flexible spending account). The latter has been around longer, still exists, and does contain a ‘use-it-or-lose-it’ requirement. But, HSAs don’t have any such provision. You can contribute to an HSA each year, not spend assets and just continue to watch them grow. They won’t be forfeited! A growing number of HSAs have not only a savings component, but also allow for investment in securities, just like IRAs. To sweeten the pot, more employers are making HSA contributions for their employees, although interestingly, this growth has occurred mostly in smaller employer plans.
A second misconception is that the assets in an HSA must be used for qualifying medical expenses. While the use of the assets can impact the taxation (and potential penalties) of the distribution, how a person uses their assets is entirely up to them. Distributions at any age are tax-free, provided they’re used for qualifying healthcare expenses. Distributions for any other reason are taxable – and taxable distributions prior to age 65 are subject to an additional 20% tax.
That is where these accounts are really special! There really aren’t many opportunities to both deduct contributions to an investment AND take them out later, tax-free! Traditional IRAs may have deductible contributions – but they are taxed on distribution. And Roth IRA distributions may qualify for tax-free treatment, but you don’t get to deduct them on the way in. HSAs really have a component of having your cake and eating it, too!
Prudent planning for retirement, as a result, can very well include HSAs as part of the strategy. According to Fidelity an average couple both aged 65 will spend on average $275,000 on medical costs in retirement. This is up from $260,000 in 2016, $245,000 in 2015, $220,000 in 2014 and from $190,000 from their 2005 survey. Obviously, being able to deduct contributions to an HSA and paying those costs with tax-free distributions is a lot better than using other retirement plan assets.
Even if the HSA balances aren’t used for medical expenses in retirement, they still get tax-deferred growth until they’re taken out, putting them at least on equal footing with most any other retirement savings vehicle. AND – even in those situations where no allowance is made for qualified withdrawals, they still beat other tax-deferred retirement accounts, because they aren’t subject to Required Minimum Distributions, and are able to exploit tax-deferred growth for longer periods. When an account owner dies, a spouse can inherit the HSA without immediate taxation, and a non-spouse beneficiary can inherit the assets after taxation (but without penalty).
HSAs aren’t completely without controversy. Some argue – and I agree – that more emphasis should be put on making good preventative healthcare affordable to all, particularly those ill-equipped to afford it. The benefits of HSAs, given their lack of income restrictions, are largely afforded to higher income earners. But, they’re here – seemingly to stay – and prudent retirement investors should certainly use them accordingly!

Wicked Simple Estate PlanningJune 15, 2018 PFA Ponderings
Out of the main financial planning areas recognized by the CFP board, which include Cash Planning, Risk Management, Investment Planning, Tax Planning, Retirement Planning and Estate Planning, it’s Estate Planning that seems to be the most daunting. I’ve sat with estate planning attorneys who don’t have their own will, and talked with financial advisors who feel that this is the area they’re least comfortable with.
It may be that this perception arises from a wide swath of estate planning tools and techniques that arose in the 80s and 90s, most of them aiming to avoid estate taxation. For quite some time, estates above $600,000 were subject to federal estate taxes and attorneys and insurance companies spent a lot of time manufacturing products and strategies to help people pass on wealth outside of that taxation.
Starting in 2018, estates beneath $11.2 Million (or $22.4 Million for a married couple) essentially aren’t subject to federal estate taxation. Some states do levy state ‘death taxes’ at much lower levels, but many, including Maine tie their state exemptions to the federal level. This may change, but for now, estate taxation and all of the exotic schemes to avoid it, don’t need to be on the list of most people’s estate planning concerns.
Another potential cause of ‘Estate Angst’ may well come from the probate process. For most people who act as executor or personal representative, probate is new, seemingly complex, and often undertaken at a time of stress with the recent death of a loved one. Probate is an orderly process intended to disburse estate proceeds fairly, but at the end of the day it is also time consuming, public and in some areas, expensive. Avoiding probate is often one of the focuses of modern estate planning. Fortunately, there are estate-planning techniques that are astonishingly simple and that also keep assets out of probate.

PLANNING BY THE BOX
When you enroll in your employer’s retirement plan, start an IRA, or take out a life insurance policy, among other things, you fill in a ‘box’ asking you for your beneficiary information. Whether you know it or not, you’re doing some serious estate planning when you complete this box. Assets pass at death exactly as you specify in that box, and whether you’ve prepared a will or not doesn’t matter at all – because since you’ve designated a beneficiary, these assets do NOT go through probate (and a will is just a list of instructions to the probate court!) Beyond the simplicity this causes, you are executing on some significant tax planning strategies by filling in that box as well. Tax-deferred retirement plans create tax obligations for people who inherit them, but ‘designated beneficiaries’ are given more options on how to handle those tax obligations. Spousal beneficiaries may owe no taxes at all, and non-spousal beneficiaries may be able to spread taxation over a much longer period of time as a result of special treatment afforded to ‘designated beneficiaries.’ This can result in huge tax savings relative to if someone inherited these assets from the estate. So pat yourself on the back – by filling in the beneficiary box, you are already an estate-planning Ninja!
There are often ways of getting that beneficiary box filled in, even outside the normal retirement plan-insurance policy arena. Many non-retirement accounts (savings and checking accounts, mutual fund or brokerage accounts) can also be set up with beneficiary designations. This is accomplished by changing the registration of the account to a “TOD” (transfer on death) or “POD” (payable on death) registration. Just ask your bank, broker or advisor.
Keep in mind that since these beneficiary transfers move assets out of the estate before the Probate court, it’s important that they are reviewed and kept up-to-date. Designations made in your will do not impact these assets at all, because the will doesn’t come into play until the probate step.
PLANNING WITH OWNERSHIP
Lastly, how you own an asset can also be powerful when it comes to estate planning. If you own an asset, say an account or a house, along with someone else, the way that asset is titled can also help with probate avoidance, at least temporarily. By titling the asset as “Joint Tenants with Rights of Survivorship”, or JTWROS, you share ownership in an asset with someone else. At your death, your share of the ownership goes to the other owner. No probate. No hassle. Very powerful estate planning that’s as easy as falling off a log. It’s important to point out that this is very different from titling an asset as “Tenants In Common,” or TIC. With the TIC ownership structure, if you die, your portion of ownership remains a part of your estate instead of automatically going to the other owner. While this may be an appropriate ownership structure depending upon the situation, it’s not really an estate planning tool.
Sure, there are likely to be assets that have neither beneficiary designations nor JTWROS ownership, and at your death these will likely need to be probated… so having a will is still important, along with other things like a healthcare agent appointment and a living will. And, if you have special circumstances or want to control assets after you’re gone, other, more esoteric, tools might be appropriate. But for most people, their retirement plan assets, life insurance and their residence are the largest part of the estate, and paying close attention to the simple tools of “Planning by the Box” and “Planning with Ownership” puts you well down the road of having a proper estate plan.
Well done!