jm financial rural safari 2015 - jmfl research portal
TRANSCRIPT
Rural Safari A journey into India's rainbow economy cutting across “mini-Maharashtra” Nashik to “temple town” Varanasi to “Asia’s second largest grain market” Warangal to understand drivers for consumption and to engage in crystal ball gazing to identify likely growth trajectory. Our analysts covered 13 districts in six states that account for 45% of India's agri GDP. We present key findings and stock implications.
Stocks mentioned: Eicher Motors | Maruti Suzuki
Asian Paints | Berger Paints
Mahindra & Mahindra | Mahindra Finance
Cement Sector
JM Financial Institutional Securities Limited 6 April 2015
India Strategy 6 April 2015
JM Financial Institutional Securities Limited Page 2
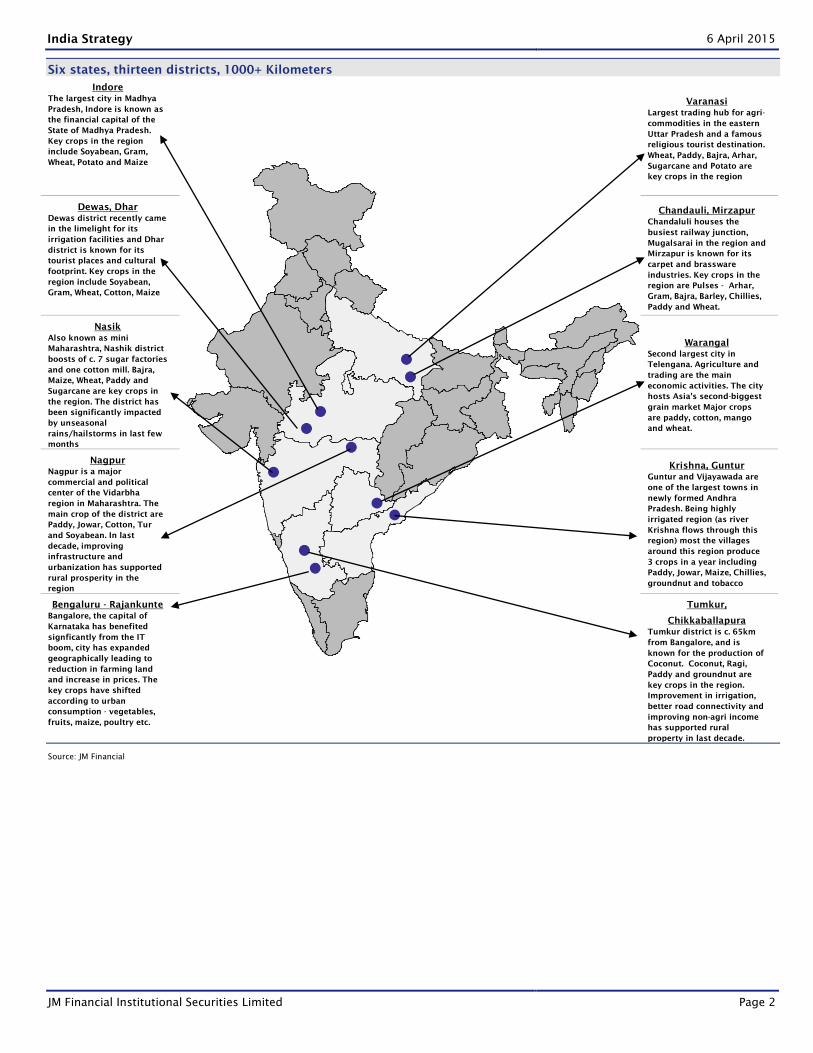
Six states, thirteen districts, 1000+ Kilometers
Indore
The largest city in Madhya
Pradesh, Indore is known as
the financial capital of the
State of Madhya Pradesh.
Key crops in the region
include Soyabean, Gram,
Wheat, Potato and Maize
Varanasi
Largest trading hub for agri-
commodities in the eastern
Uttar Pradesh and a famous
religious tourist destination.
Wheat, Paddy, Bajra, Arhar,
Sugarcane and Potato are
key crops in the region
Dewas, Dhar
Dewas district recently came
in the limelight for its
irrigation facilities and Dhar
district is known for its
tourist places and cultural
footprint. Key crops in the
region include Soyabean,
Gram, Wheat, Cotton, Maize
Chandauli, Mirzapur
Chandaluli houses the
busiest railway junction,
Mugalsarai in the region and
Mirzapur is known for its
carpet and brassware
industries. Key crops in the
region are Pulses - Arhar,
Gram, Bajra, Barley, Chillies,
Paddy and Wheat.
Nasik
Also known as mini
Maharashtra, Nashik district
boosts of c. 7 sugar factories
and one cotton mill. Bajra,
Maize, Wheat, Paddy and
Sugarcane are key crops in
the region. The district has
been significantly impacted
by unseasonal
rains/hailstorms in last few
months
Warangal
Second largest city in
Telengana. Agriculture and
trading are the main
economic activities. The city
hosts Asia's second-biggest
grain market Major crops
are paddy, cotton, mango
and wheat.
Nagpur
Nagpur is a major
commercial and political
center of the Vidarbha
region in Maharashtra. The
main crop of the district are
Paddy, Jowar, Cotton, Tur
and Soyabean. In last
decade, improving
infrastructure and
urbanization has supported
rural prosperity in the
region
Krishna, Guntur
Guntur and Vijayawada are
one of the largest towns in
newly formed Andhra
Pradesh. Being highly
irrigated region (as river
Krishna flows through this
region) most the villages
around this region produce
3 crops in a year including
Paddy, Jowar, Maize, Chillies,
groundnut and tobacco
Bengaluru - Rajankunte
Bangalore, the capital of
Karnataka has benefited
signficantly from the IT
boom, city has expanded
geographically leading to
reduction in farming land
and increase in prices. The
key crops have shifted
according to urban
consumption - vegetables,
fruits, maize, poultry etc.
Tumkur,
Chikkaballapura
Tumkur district is c. 65km
from Bangalore, and is
known for the production of
Coconut. Coconut, Ragi,
Paddy and groundnut are
key crops in the region.
Improvement in irrigation,
better road connectivity and
improving non-agri income
has supported rural
property in last decade.
Source: JM Financial
India Strategy 6 April 2015
JM Financial Institutional Securities Limited Page 3
Table of Contents
Contents Page No.
Rural Safari – Executive Summary 6
State wise drivers of rural ecosystem 14
Rural economic moderation in the last two years 15
About Rural Safari 18
Agri Income: Growth has moderated 20
Non-agri Income: Accounts for a significant share 31
Wealth effect of land 45
Near-term outlook: Weak agri/non-agri incomes 51
Medium-term outlook: Structural drivers intact 53
Automobiles
Tractors 59
Passenger Vehicles 62
Two Wheelers 64
Consumer Sector
Consumer Staples 67
Consumer Discretionary 69
Rural NBFC 71
Cement 74
Stocks 76
Annexure 92
India Strategy 6 April 2015
JM Financial Institutional Securities Limited Page 4
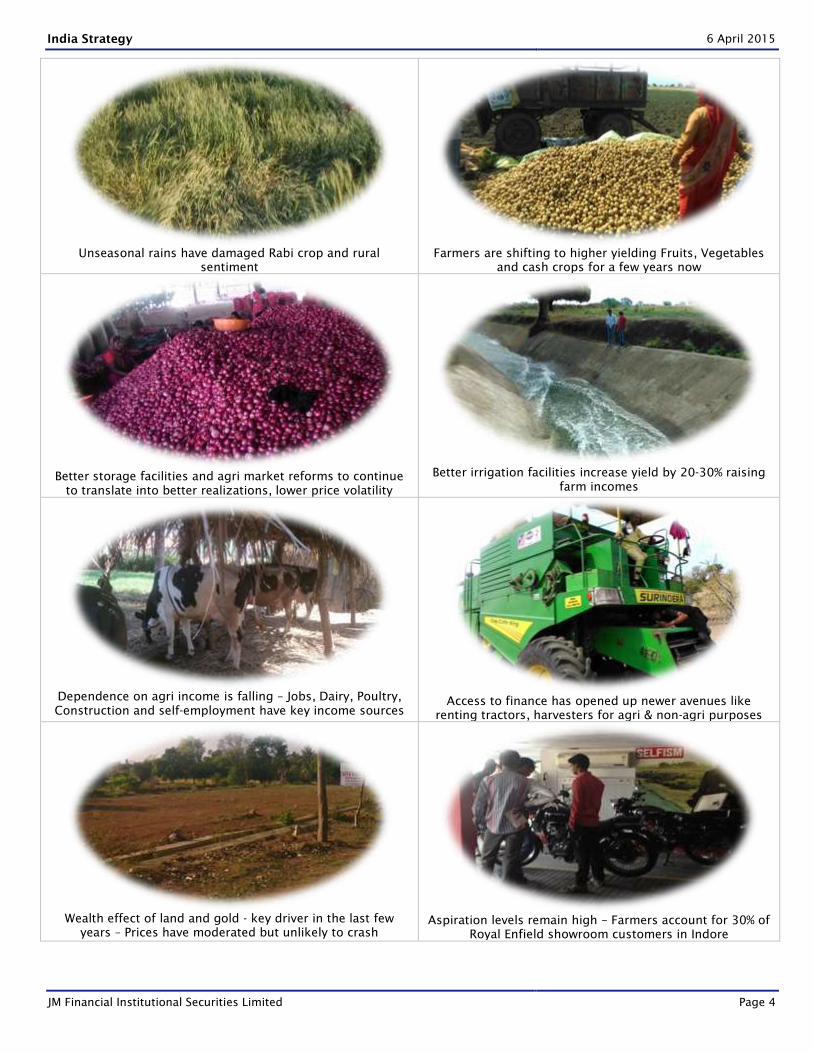
Unseasonal rains have damaged Rabi crop and rural
sentiment
Farmers are shifting to higher yielding Fruits, Vegetables
and cash crops for a few years now
Better storage facilities and agri market reforms to continue
to translate into better realizations, lower price volatility
Better irrigation facilities increase yield by 20-30% raising
farm incomes
Dependence on agri income is falling – Jobs, Dairy, Poultry,
Construction and self-employment have key income sources
Access to finance has opened up newer avenues like
renting tractors, harvesters for agri & non-agri purposes
Wealth effect of land and gold - key driver in the last few
years – Prices have moderated but unlikely to crash
Aspiration levels remain high – Farmers account for 30% of
Royal Enfield showroom customers in Indore
JM Financial Institutional Securities Limited
Rural India – More than a rainbow economy
In the backdrop of weakness in the rural economy, we visited states that
account for 45% of India’s agrarian GDP to assess triggers and timelines for
a likely revival. The recent erratic rainfall was on our minds when we set out
but we note that rains, while the single biggest factor, is only one of the
factors driving the rural economy today. Non-farm related income and
wealth effect are also significant drivers of consumption in rural areas. In
the near-term (FY16), though, all these drivers look weak to us and we see
little chances of positive earnings surprise in FY16 to stocks levered to the
rural economy. From a portfolio perspective, we recommend that in the near
term one should be underweight the plain vanilla rural plays. We
recommend adding to stocks which have “rural/semi-urban optionality”
even as near-term stock performance is driven by other factors. There are
many secular trends that make the rural economy a very attractive market in
the long run and we are tracking those trends closely for signs of revival.
Wealth has been a significant driver for rural consumption: The elasticity
of rural consumption to rural GDP growth had increased from <0.7x pre-2009
to close to 1x in years post 2009 highlighting that factors other than incomes
have driven the growth. In most places we visited, land prices have risen 5-7x
in past 5 years. The importance of the wealth effect can also be seen from the
fact that the asset (primarily land)/income ratio in rural India has increased
from the 7x levels we saw in ’10 to estimated double digits now.
Near-term drivers for consumption are weak: However, given that a) erratic
rainfall has damaged two crops in succession b) low levels of activity
(construction, mining) and rationalization of subsidies has impacted non-farm
incomes (64% of rural income) and c) land price increases have moderated
and fallen in a few places, we estimate the elasticity of consumption growth
to income growth would drop to pre-2009 levels in FY16. Hence, we see no
need to alter our FY16 estimates for companies with rural exposure.
Structural drivers intact, though rebound in economic activity critical:
Notwithstanding near term weakness, we noted secular growth drivers that
make the rural market attractive for the long term. These are a) shift towards
higher income crops b) disintermediation c) targeted direct benefit transfer,
d) more than doubling of spend on roads in FY16E, e) higher devolution to
states (recent state budgets have seen higher allocation to roads). A deeper
rural revival, though, is likely in FY17 and we watch for activity on following
areas: mining, construction in rural roads and rural infra, and manufacturing,
seventh pay commission hikes. We discuss all these factors in detail.
How to be positioned?:
a) Everyone we met wants to own a “Bullt” which reinforced our thesis on
Eicher (Capacity/distribution expansion, product line-up). Maruti is another
pick for similar reasons (competitive positioning, product launches, and
preference for petrol cars)
b) On valuations, M&M and Mahindra Finance are attractive. However, we
recommend only a gradual addition in the run up to the new product
launches for M&M in Sep’15 given that 1HFY16 is likely to be challenging
c) Consumer stocks where one can still be hedged are from the paints sector
(Asian Paints, Berger Paints)
Suhas Harinarayanan
Tel: (91 22) 66303037
Prasad Shahane
Tel: (91 22) 66303077
Ambrish Mishra
Tel: (91 22) 66303019
Himanshu Sharma
Tel: (91 22) 66303028
Richard Liu
Tel: (91 22) 6630 3064
Vicky Punjabi
Tel: (91 22) 6630 3065
Karan Uberoi
Tel: (91 22) 66303082
Amey Sathe
Tel: (91 22) 66303027
Sanketh Godha
Tel: (91 22) 66303080
Naveen Jain
Tel: (91 22) 66303074
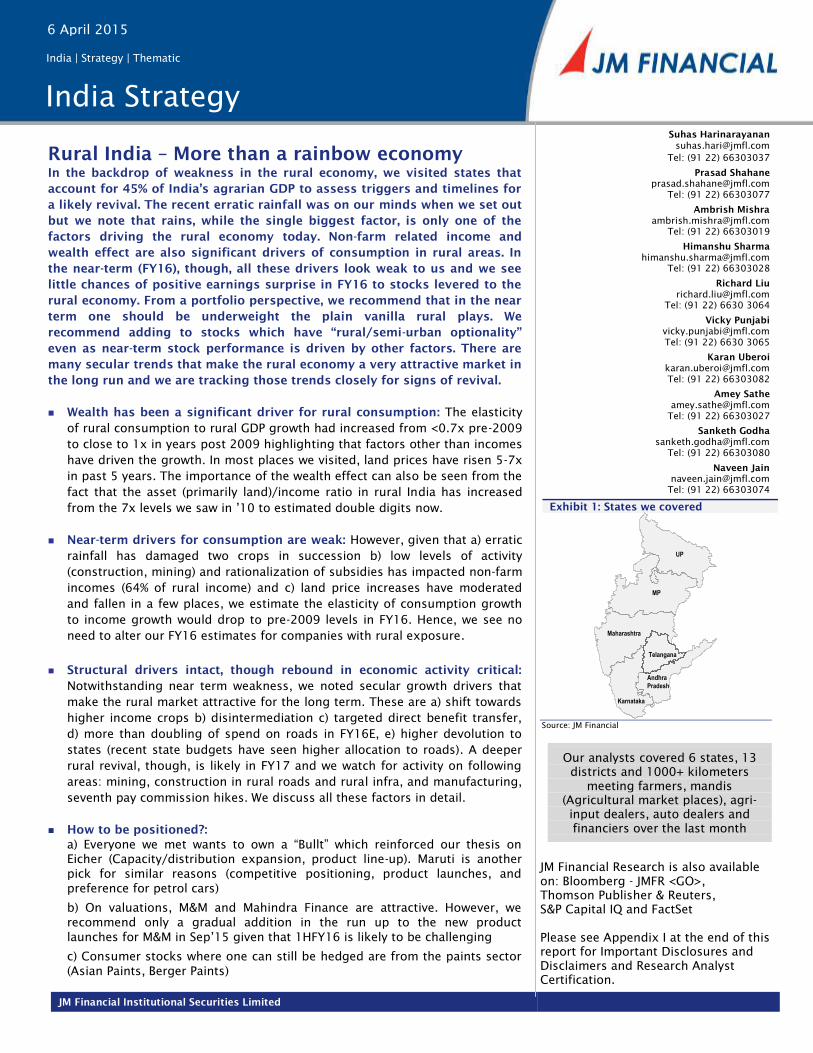
Exhibit 1: States we covered
Source: JM Financial
Our analysts covered 6 states, 13
districts and 1000+ kilometers
meeting farmers, mandis
(Agricultural market places), agri-
input dealers, auto dealers and
financiers over the last month
MP
Andhra
Pradesh
UP
Maharashtra
Karnataka
Telangana
India Strategy
India | Strategy | Thematic
JM Financial Research is also available
on: Bloomberg - JMFR <GO>,
Thomson Publisher & Reuters,
S&P Capital IQ and FactSet
Please see Appendix I at the end of this
report for Important Disclosures and
Disclaimers and Research Analyst
Certification.
6 April 2015
India Strategy 6 April 2015
JM Financial Institutional Securities Limited Page 6
Rural Safari – Executive Summary
6 States, 13 districts and 1000+ Kilometers
While all the indicators such as tractor sales, automobile sales, consumer
durables sales, rural inflation and rural wage growth have been pointing to a
weakness in the rural economy, we got onto the wayfaring path to understand
reasons and extent of weakness and likely timelines and triggers for revival.
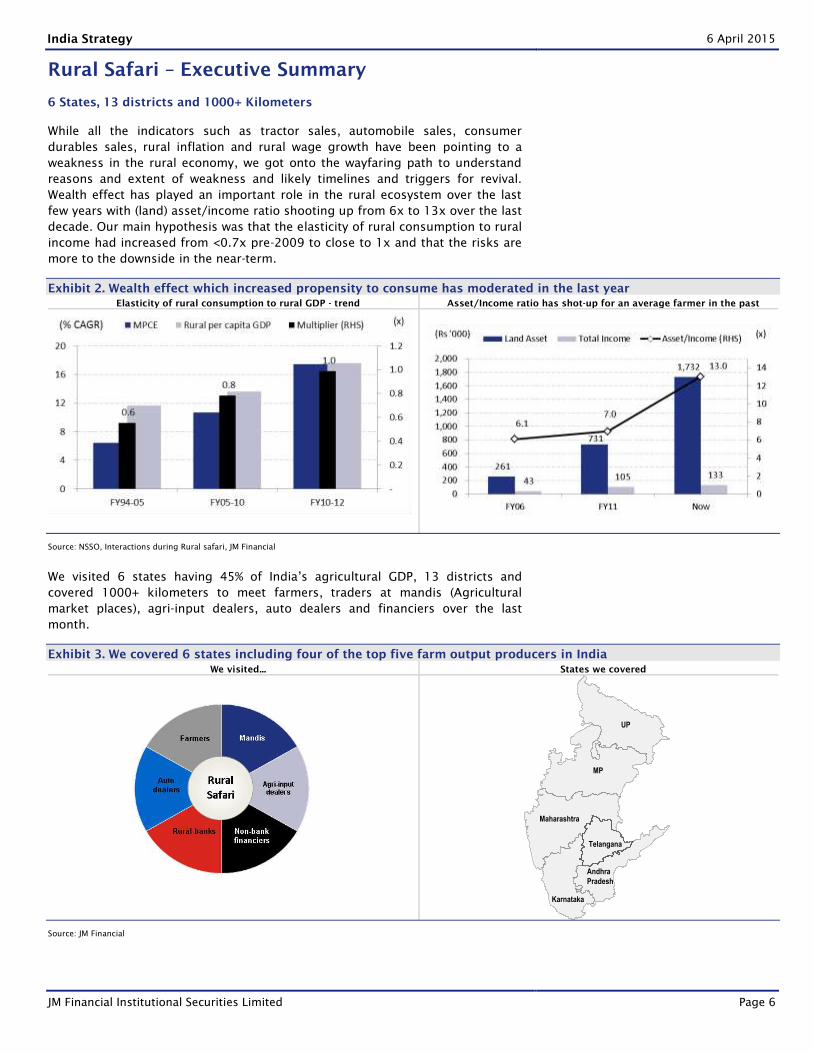
Wealth effect has played an important role in the rural ecosystem over the last
few years with (land) asset/income ratio shooting up from 6x to 13x over the last
decade. Our main hypothesis was that the elasticity of rural consumption to rural
income had increased from <0.7x pre-2009 to close to 1x and that the risks are
more to the downside in the near-term. 1.
Exhibit 2. Wealth effect which increased propensity to consume has moderated in the last year
Elasticity of rural consumption to rural GDP - trend Asset/Income ratio has shot-up for an average farmer in the past
Source: NSSO, Interactions during Rural safari, JM Financial
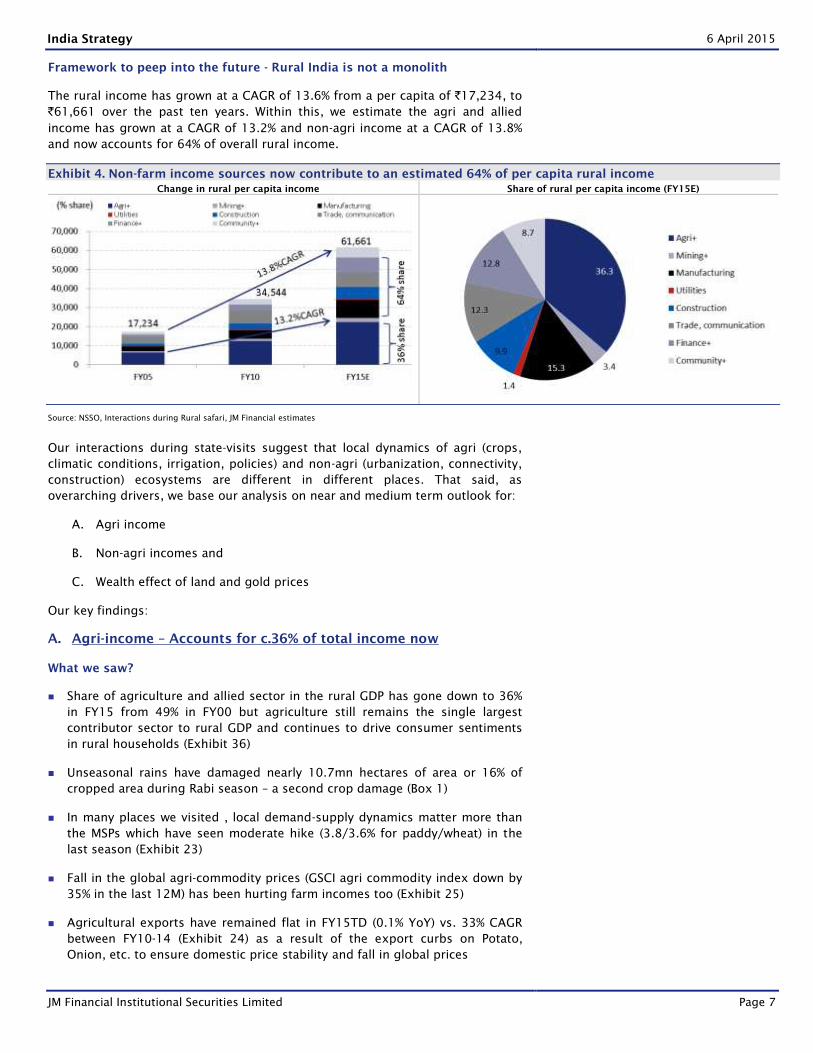
We visited 6 states having 45% of India’s agricultural GDP, 13 districts and
covered 1000+ kilometers to meet farmers, traders at mandis (Agricultural
market places), agri-input dealers, auto dealers and financiers over the last
month.
Exhibit 3. We covered 6 states including four of the top five farm output producers in India
We visited... States we covered
Source: JM Financial
MP
Andhra
Pradesh
UP
Maharashtra
Karnataka
Telangana
India Strategy 6 April 2015
JM Financial Institutional Securities Limited Page 7
Framework to peep into the future - Rural India is not a monolith
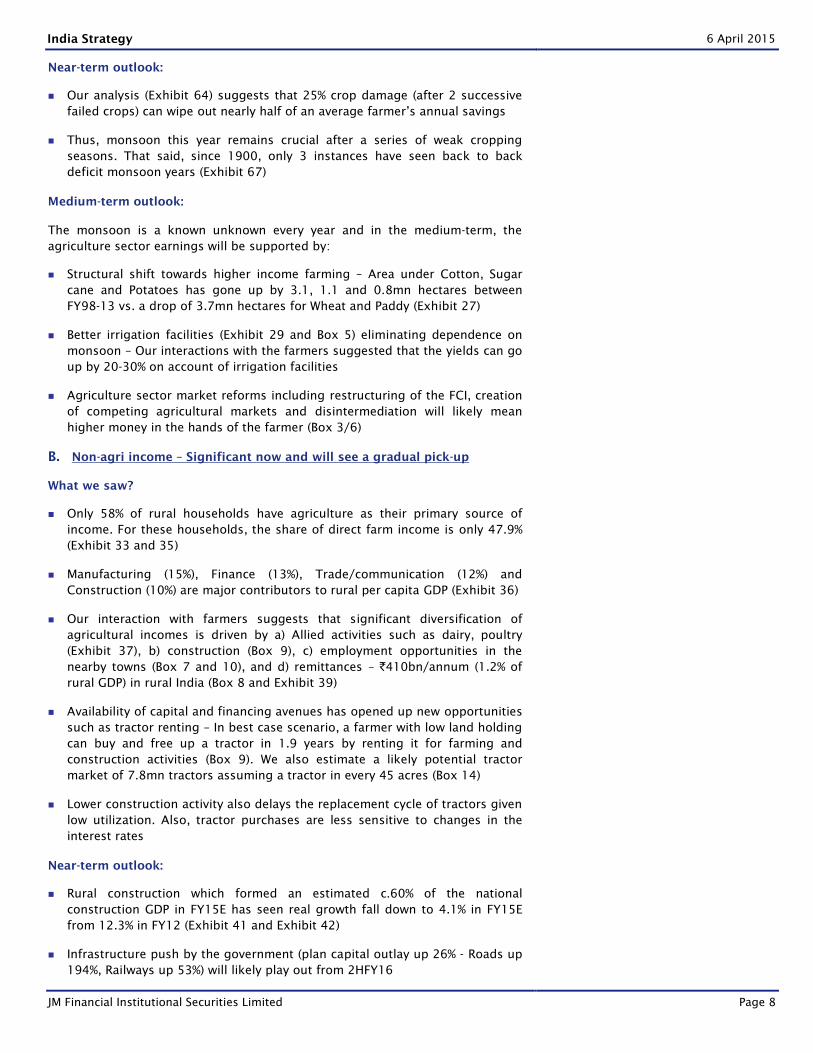
The rural income has grown at a CAGR of 13.6% from a per capita of `17,234, to
`61,661 over the past ten years. Within this, we estimate the agri and allied
income has grown at a CAGR of 13.2% and non-agri income at a CAGR of 13.8%
and now accounts for 64% of overall rural income.
Exhibit 4. Non-farm income sources now contribute to an estimated 64% of per capita rural income
Change in rural per capita income Share of rural per capita income (FY15E)
Source: NSSO, Interactions during Rural safari, JM Financial estimates
Our interactions during state-visits suggest that local dynamics of agri (crops,
climatic conditions, irrigation, policies) and non-agri (urbanization, connectivity,
construction) ecosystems are different in different places. That said, as
overarching drivers, we base our analysis on near and medium term outlook for:
A. Agri income
B. Non-agri incomes and
C. Wealth effect of land and gold prices
Our key findings:
A. Agri-income – Accounts for c.36% of total income now
What we saw?
Share of agriculture and allied sector in the rural GDP has gone down to 36%
in FY15 from 49% in FY00 but agriculture still remains the single largest
contributor sector to rural GDP and continues to drive consumer sentiments
in rural households (Exhibit 36)
Unseasonal rains have damaged nearly 10.7mn hectares of area or 16% of
cropped area during Rabi season – a second crop damage (Box 1)
In many places we visited , local demand-supply dynamics matter more than
the MSPs which have seen moderate hike (3.8/3.6% for paddy/wheat) in the
last season (Exhibit 23)
Fall in the global agri-commodity prices (GSCI agri commodity index down by
35% in the last 12M) has been hurting farm incomes too (Exhibit 25)
Agricultural exports have remained flat in FY15TD (0.1% YoY) vs. 33% CAGR
between FY10-14 (Exhibit 24) as a result of the export curbs on Potato,
Onion, etc. to ensure domestic price stability and fall in global prices
India Strategy 6 April 2015
JM Financial Institutional Securities Limited Page 8
Near-term outlook:
Our analysis (Exhibit 64) suggests that 25% crop damage (after 2 successive
failed crops) can wipe out nearly half of an average farmer’s annual savings
Thus, monsoon this year remains crucial after a series of weak cropping
seasons. That said, since 1900, only 3 instances have seen back to back
deficit monsoon years (Exhibit 67)
Medium-term outlook:
The monsoon is a known unknown every year and in the medium-term, the
agriculture sector earnings will be supported by:
Structural shift towards higher income farming – Area under Cotton, Sugar
cane and Potatoes has gone up by 3.1, 1.1 and 0.8mn hectares between
FY98-13 vs. a drop of 3.7mn hectares for Wheat and Paddy (Exhibit 27)
Better irrigation facilities (Exhibit 29 and Box 5) eliminating dependence on
monsoon – Our interactions with the farmers suggested that the yields can go
up by 20-30% on account of irrigation facilities
Agriculture sector market reforms including restructuring of the FCI, creation
of competing agricultural markets and disintermediation will likely mean
higher money in the hands of the farmer (Box 3/6)
B. Non-agri income – Significant now and will see a gradual pick-up
What we saw?
Only 58% of rural households have agriculture as their primary source of
income. For these households, the share of direct farm income is only 47.9%
(Exhibit 33 and 35)
Manufacturing (15%), Finance (13%), Trade/communication (12%) and
Construction (10%) are major contributors to rural per capita GDP (Exhibit 36)
Our interaction with farmers suggests that significant diversification of
agricultural incomes is driven by a) Allied activities such as dairy, poultry
(Exhibit 37), b) construction (Box 9), c) employment opportunities in the
nearby towns (Box 7 and 10), and d) remittances – `410bn/annum (1.2% of
rural GDP) in rural India (Box 8 and Exhibit 39)
Availability of capital and financing avenues has opened up new opportunities
such as tractor renting – In best case scenario, a farmer with low land holding
can buy and free up a tractor in 1.9 years by renting it for farming and
construction activities (Box 9). We also estimate a likely potential tractor
market of 7.8mn tractors assuming a tractor in every 45 acres (Box 14)
Lower construction activity also delays the replacement cycle of tractors given
low utilization. Also, tractor purchases are less sensitive to changes in the
interest rates
Near-term outlook:
Rural construction which formed an estimated c.60% of the national
construction GDP in FY15E has seen real growth fall down to 4.1% in FY15E
from 12.3% in FY12 (Exhibit 41 and Exhibit 42)
Infrastructure push by the government (plan capital outlay up 26% - Roads up
194%, Railways up 53%) will likely play out from 2HFY16
India Strategy 6 April 2015
JM Financial Institutional Securities Limited Page 9
Economic survey focuses on impact of rural road creation on rural economy
and accordingly roads is likely to be a thrust area of both the centre and the
states – Additional devolution from centre together with increase in direct
road allocation from centre will likely mean an additional `577bn for the
roads sector this year
Manufacturing sector has also seen moderation with investments going down
– Real Gross capital formation growth has moderated to 2.2% between FY12-
15E (new GDP series) vs. 11% between FY05-12 (Old GDP series) and is
unlikely to pick up sharply given moderate capacity utilization (c.71%)
Subsidies which saw a huge rise from 1.3% of GDP to 2.6% of GDP between
FY06-13 seem to be rationalizing now at 1.7% of GDP in FY16E (Exhibit 52)
Weak construction activity and a rub-off of weak agri income will ensure that
the near-term non-agri incomes remain flattish.
Medium-term outlook:
Non-agri income growth will be a function of government spending and overall
economic pick-up and is likely to be gradual in our opinion. Triggers could come
in the form of:
Pick-up in mining activity (beginning FY17 for Greenfield coal mining),
Targeted direct benefit transfer for subsidies in different forms which formed
nearly `3.8trn or 4.3% of GDP in FY12 (Exhibit 72) could plug the leakages (as
high as 15%/41%/54% in PDS Rice/Kerosene/Wheat)
Focus on affordable housing (over the course of the tenure of the
government)
C. Wealth effect from land/gold
What we saw?
Prime drivers of land price hike include urbanization demand, better road
connectivity, remittances and speculation among others
Wealth effect from sky-rocketing land prices has been instrumental in pushing
down rural debt/ land asset ratio from 4.1% in FY06 to 3% in FY15E and
increasing the land asset/income ratio from 6x in FY06 to 13x in FY15E
(Exhibit 64)
Agri lands away from urban areas with low income yields are most likely to
stagnate compared to still feasible hinterlands or sub-urban agri lands
(Exhibit 60)
Wealth effect increased propensity to consume in the past pushing
consumption elasticity of income to nearly 1 between FY10-12 from 0.6 in
FY94-05
Based on our interaction with the farmers, last 10 years saw 5-10x price rise
in different places based on location - Our interaction with NHAI indicated
that, in some cases, the cost of land acquired by NHAI rose 5x from
`3.5mn/ha in FY09 to `17.5mn/ha in FY14 and that the Greenfield projects
may not be feasible at these costs
Rural road connectivity through Pradhan Mantri Gram Sadak Yojana (PMGSY)
has accounted for nearly 42% of total rural road expansion between FY02-12.
India Strategy 6 April 2015
JM Financial Institutional Securities Limited Page 10
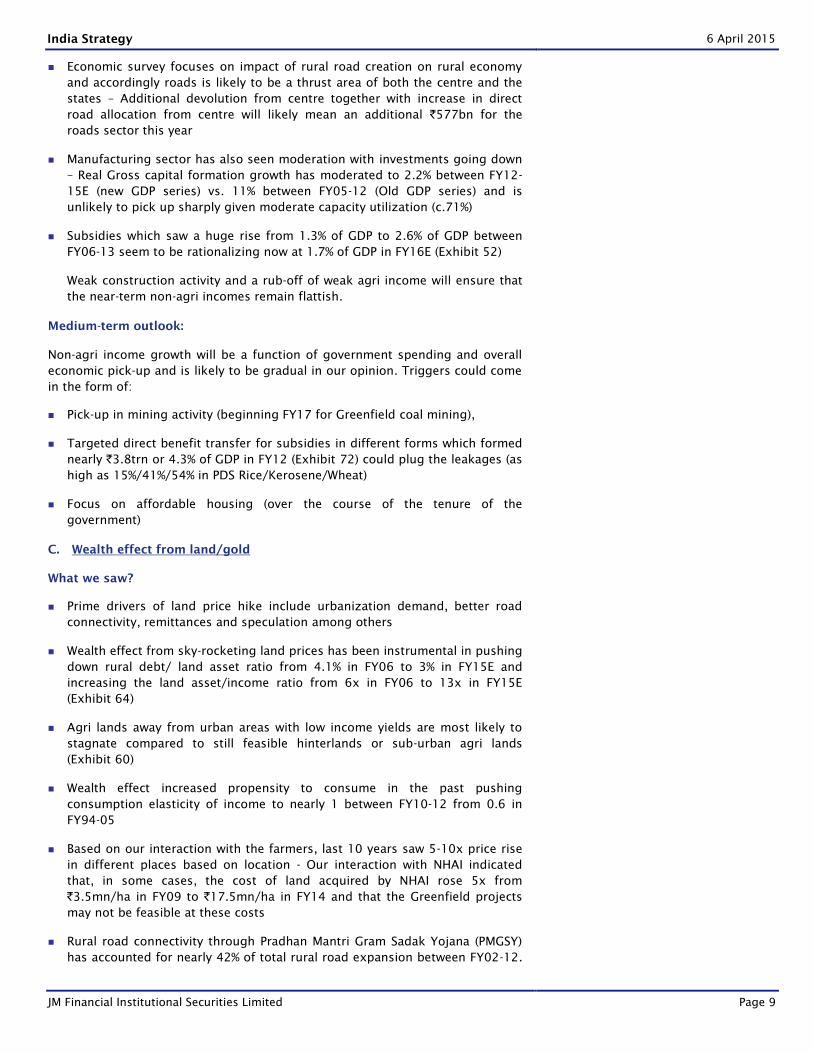
Our interactions suggest that connectivity instantly appreciates land prices by
100% (anecdotes suggest so) on improved access to mandi, etc.
Exhibit 5. But price rise has seen moderation in many places we visited as income yields fall
NHAI land acquisition Land prices and income yields in different parts we visited
Source: NHAI, JM Financial, The numbers do not match with the quoted number of `17.5mn/ha as some part of the land acquired by NHAI is government land which is free of cost
Exhibit 6. Land categories we came across during rural safari
Type Location Agri-income yield Price appreciation Comment
Land feasible for farming Hinterland 5%+ Moderate Unlike to see any correction given feasible agri-income yields
Candidate for stagnation 75km+ from towns 3-5% Steep Most likely candidates for stagnation as speculation about
urbanization has seen steep price appreciation
Sub-urban lands Near towns 0-2% Sharp Unlike to see sharp fall. Likely beneficiaries of next leg of
urbanization
Source: JM Financial
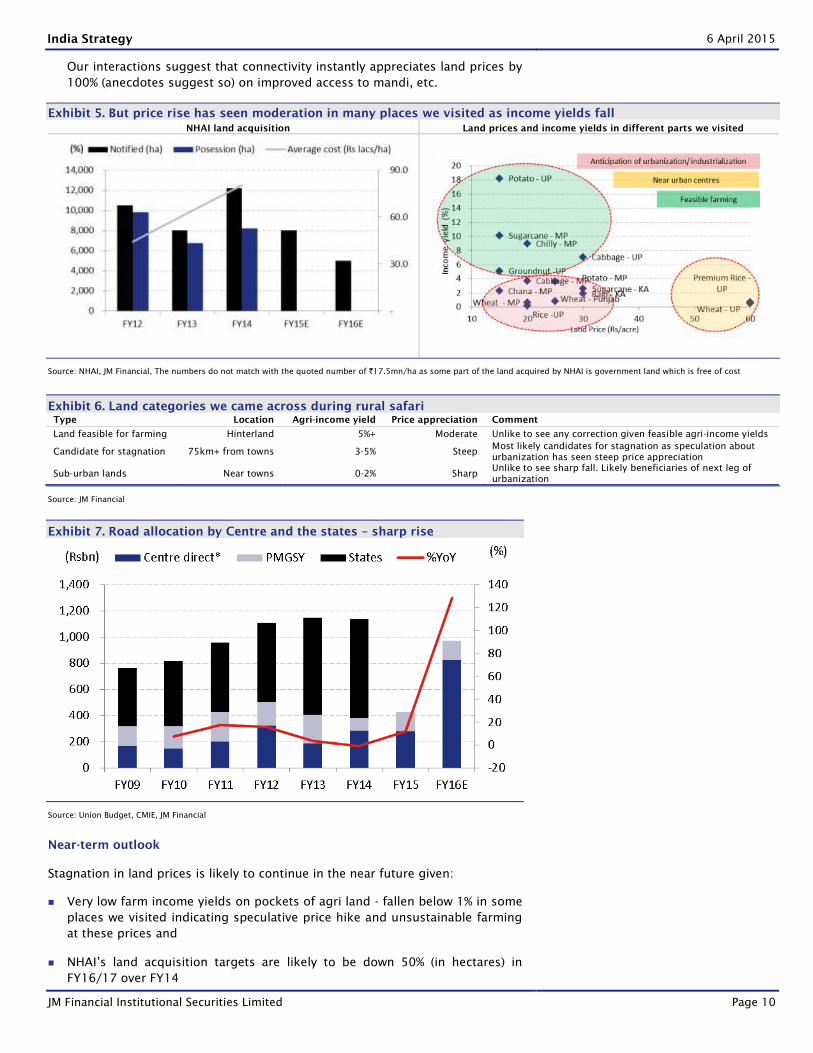
Exhibit 7. Road allocation by Centre and the states – sharp rise
Source: Union Budget, CMIE, JM Financial
Near-term outlook
Stagnation in land prices is likely to continue in the near future given:
Very low farm income yields on pockets of agri land - fallen below 1% in some
places we visited indicating speculative price hike and unsustainable farming
at these prices and
NHAI’s land acquisition targets are likely to be down 50% (in hectares) in
FY16/17 over FY14
India Strategy 6 April 2015
JM Financial Institutional Securities Limited Page 11
An event of outright nationwide sharp moderation, which may result into a
widespread negative wealth effect, looks unlikely given that actual market
tends to be illiquid due to general tendency of farmers to hold onto their
lands and complications regarding joint land holdings
Medium-term outlook
That said, transactions picking up is dependent on many factors which will play
out gradually over the medium term. These include:
government spending on infrastructure and gradual pick up in the economic
activity – mining, construction as mentioned in the earlier section,
acquisition by NHAI/states for road activity. Continued thrust on the PMGSY
(Exhibit 57)
The seventh pay commission could help support income growth - a 2.5x rise
(including arrears) in the general salary levels would mean an additional
`910bn (0.8% of FY15E GDP) for government employees (Exhibit 70)
Higher flexibility and resources for the state governments (to the tune of
`803bn) under the 14th finance commission. Total direct rural expenditure
and quality of direct rural expenditure of the states (18% of total) is better
with capital/revenue expenditure mix of 29/71% vs. 1/99% by the center (14%
of total expenditure). (Exhibit 68 and 69)
passage of land acquisition bill amendment in its current form without
consent clause and Social Impact Audit (SIA) in certain cases could make land
acquisition easier (could be tabled post the recess in the current session)
Continued urbanization (India’s current urbanization at 31% vs. 53% in China
and 81% in the US), fillip from seventh pay commission will further support
housing and construction activity (Exhibit 55).
We highlight some of the key triggers and possible timelines for a rural recovery:
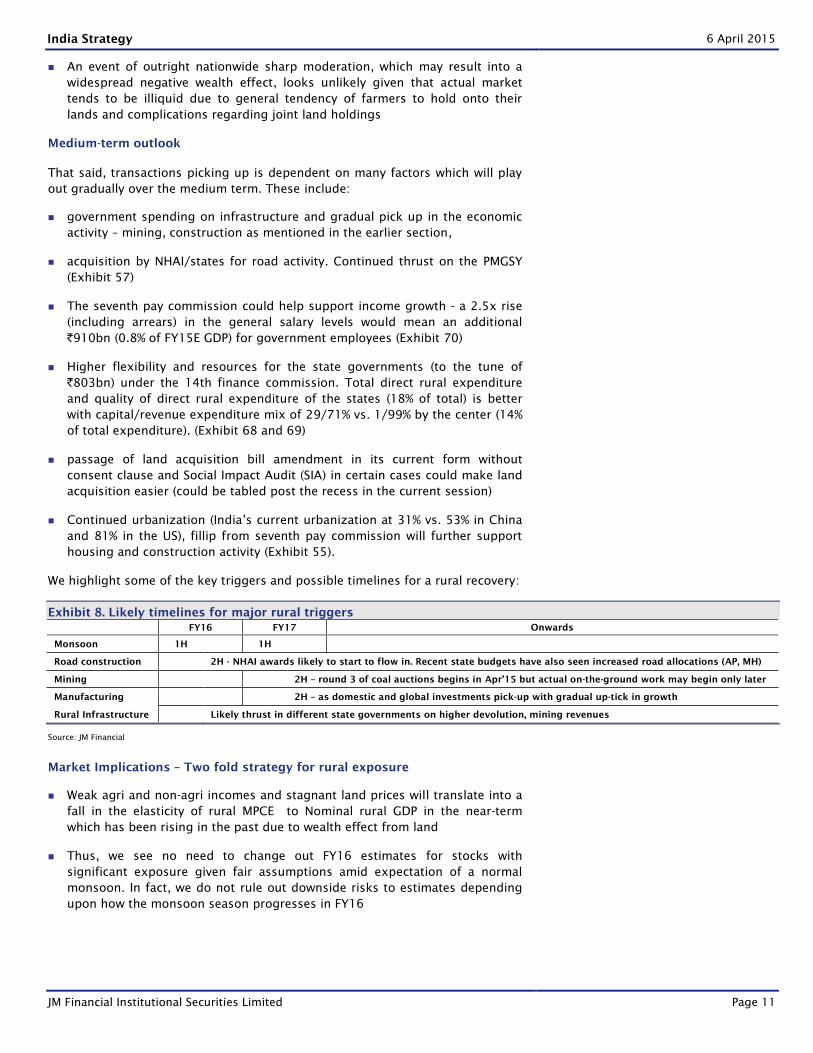
Exhibit 8. Likely timelines for major rural triggers
FY16 FY17 Onwards
Monsoon 1H
1H
Road construction 2H - NHAI awards likely to start to flow in. Recent state budgets have also seen increased road allocations (AP, MH)
Mining 2H – round 3 of coal auctions begins in Apr’15 but actual on-the-ground work may begin only later
Manufacturing 2H – as domestic and global investments pick-up with gradual up-tick in growth
Rural Infrastructure Likely thrust in different state governments on higher devolution, mining revenues
Source: JM Financial
Market Implications – Two fold strategy for rural exposure
Weak agri and non-agri incomes and stagnant land prices will translate into a
fall in the elasticity of rural MPCE to Nominal rural GDP in the near-term
which has been rising in the past due to wealth effect from land
Thus, we see no need to change out FY16 estimates for stocks with
significant exposure given fair assumptions amid expectation of a normal
monsoon. In fact, we do not rule out downside risks to estimates depending
upon how the monsoon season progresses in FY16
India Strategy 6 April 2015
JM Financial Institutional Securities Limited Page 12
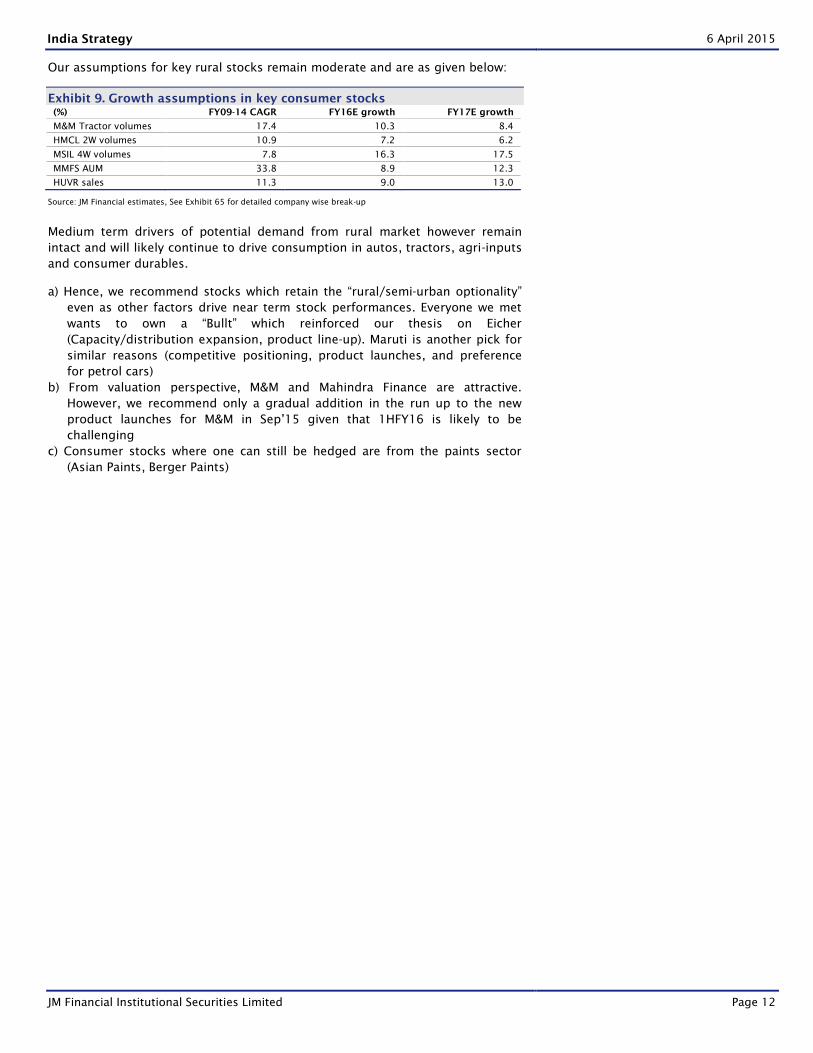
Our assumptions for key rural stocks remain moderate and are as given below:
Exhibit 9. Growth assumptions in key consumer stocks
(%) FY09-14 CAGR FY16E growth FY17E growth
M&M Tractor volumes 17.4 10.3 8.4
HMCL 2W volumes 10.9 7.2 6.2
MSIL 4W volumes 7.8 16.3 17.5
MMFS AUM 33.8 8.9 12.3
HUVR sales 11.3 9.0 13.0
Source: JM Financial estimates, See Exhibit 65 for detailed company wise break-up
Medium term drivers of potential demand from rural market however remain
intact and will likely continue to drive consumption in autos, tractors, agri-inputs
and consumer durables.
a) Hence, we recommend stocks which retain the “rural/semi-urban optionality”
even as other factors drive near term stock performances. Everyone we met
wants to own a “Bullt” which reinforced our thesis on Eicher
(Capacity/distribution expansion, product line-up). Maruti is another pick for
similar reasons (competitive positioning, product launches, and preference
for petrol cars)
b) From valuation perspective, M&M and Mahindra Finance are attractive.
However, we recommend only a gradual addition in the run up to the new
product launches for M&M in Sep’15 given that 1HFY16 is likely to be
challenging
c) Consumer stocks where one can still be hedged are from the paints sector
(Asian Paints, Berger Paints)
India Strategy 6 April 2015
JM Financial Institutional Securities Limited Page 13
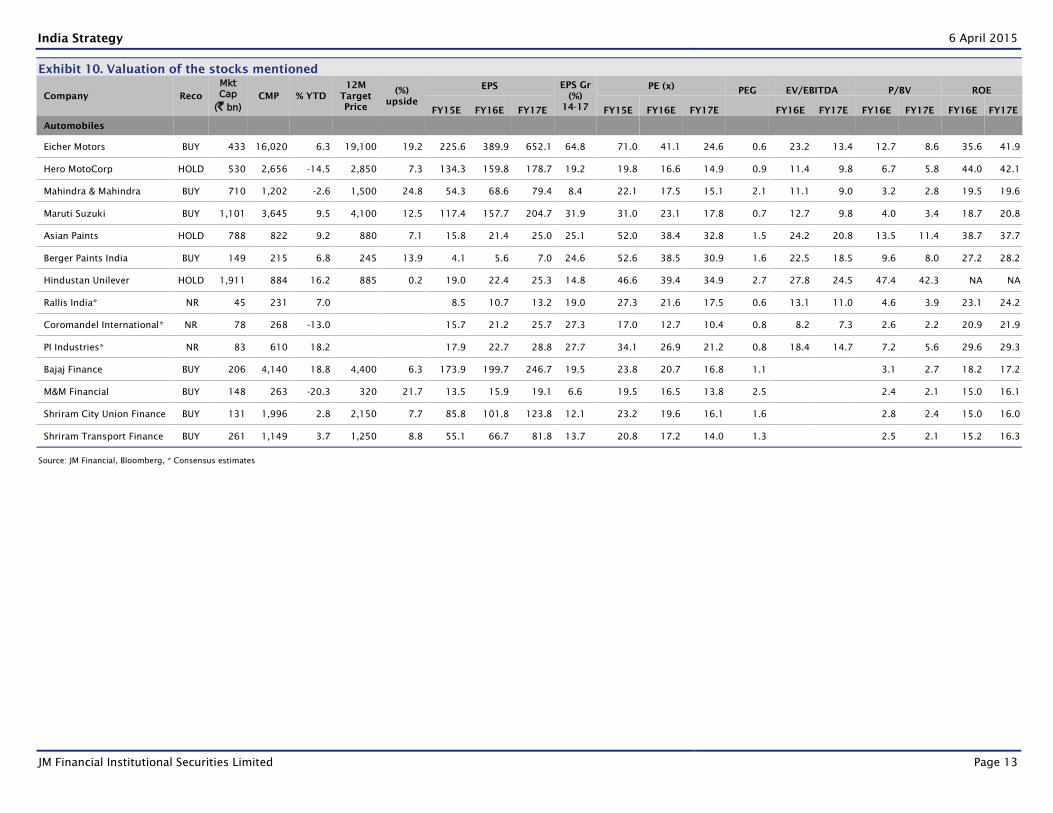
Exhibit 10. Valuation of the stocks mentioned
Company Reco
Mkt Cap
(` bn) CMP % YTD
12M
Target
Price
(%)
upside
EPS EPS Gr
(%)
14-17
PE (x) PEG EV/EBITDA P/BV ROE
FY15E FY16E FY17E FY15E FY16E FY17E FY16E FY17E FY16E FY17E FY16E FY17E
Automobiles
Eicher Motors BUY 433 16,020 6.3 19,100 19.2 225.6 389.9 652.1 64.8 71.0 41.1 24.6 0.6 23.2 13.4 12.7 8.6 35.6 41.9
Hero MotoCorp HOLD 530 2,656 -14.5 2,850 7.3 134.3 159.8 178.7 19.2 19.8 16.6 14.9 0.9 11.4 9.8 6.7 5.8 44.0 42.1
Mahindra & Mahindra BUY 710 1,202 -2.6 1,500 24.8 54.3 68.6 79.4 8.4 22.1 17.5 15.1 2.1 11.1 9.0 3.2 2.8 19.5 19.6
Maruti Suzuki BUY 1,101 3,645 9.5 4,100 12.5 117.4 157.7 204.7 31.9 31.0 23.1 17.8 0.7 12.7 9.8 4.0 3.4 18.7 20.8
Asian Paints HOLD 788 822 9.2 880 7.1 15.8 21.4 25.0 25.1 52.0 38.4 32.8 1.5 24.2 20.8 13.5 11.4 38.7 37.7
Berger Paints India BUY 149 215 6.8 245 13.9 4.1 5.6 7.0 24.6 52.6 38.5 30.9 1.6 22.5 18.5 9.6 8.0 27.2 28.2
Hindustan Unilever HOLD 1,911 884 16.2 885 0.2 19.0 22.4 25.3 14.8 46.6 39.4 34.9 2.7 27.8 24.5 47.4 42.3 NA NA
Rallis India* NR 45 231 7.0 8.5 10.7 13.2 19.0 27.3 21.6 17.5 0.6 13.1 11.0 4.6 3.9 23.1 24.2
Coromandel International* NR 78 268 -13.0 15.7 21.2 25.7 27.3 17.0 12.7 10.4 0.8 8.2 7.3 2.6 2.2 20.9 21.9
PI Industries* NR 83 610 18.2 17.9 22.7 28.8 27.7 34.1 26.9 21.2 0.8 18.4 14.7 7.2 5.6 29.6 29.3
Bajaj Finance BUY 206 4,140 18.8 4,400 6.3 173.9 199.7 246.7 19.5 23.8 20.7 16.8 1.1
3.1 2.7 18.2 17.2
M&M Financial BUY 148 263 -20.3 320 21.7 13.5 15.9 19.1 6.6 19.5 16.5 13.8 2.5
2.4 2.1 15.0 16.1
Shriram City Union Finance BUY 131 1,996 2.8 2,150 7.7 85.8 101.8 123.8 12.1 23.2 19.6 16.1 1.6
2.8 2.4 15.0 16.0
Shriram Transport Finance BUY 261 1,149 3.7 1,250 8.8 55.1 66.7 81.8 13.7 20.8 17.2 14.0 1.3
2.5 2.1 15.2 16.3
Source: JM Financial, Bloomberg, * Consensus estimates
India Strategy 6 April 2015
JM Financial Institutional Securities Limited Page 14
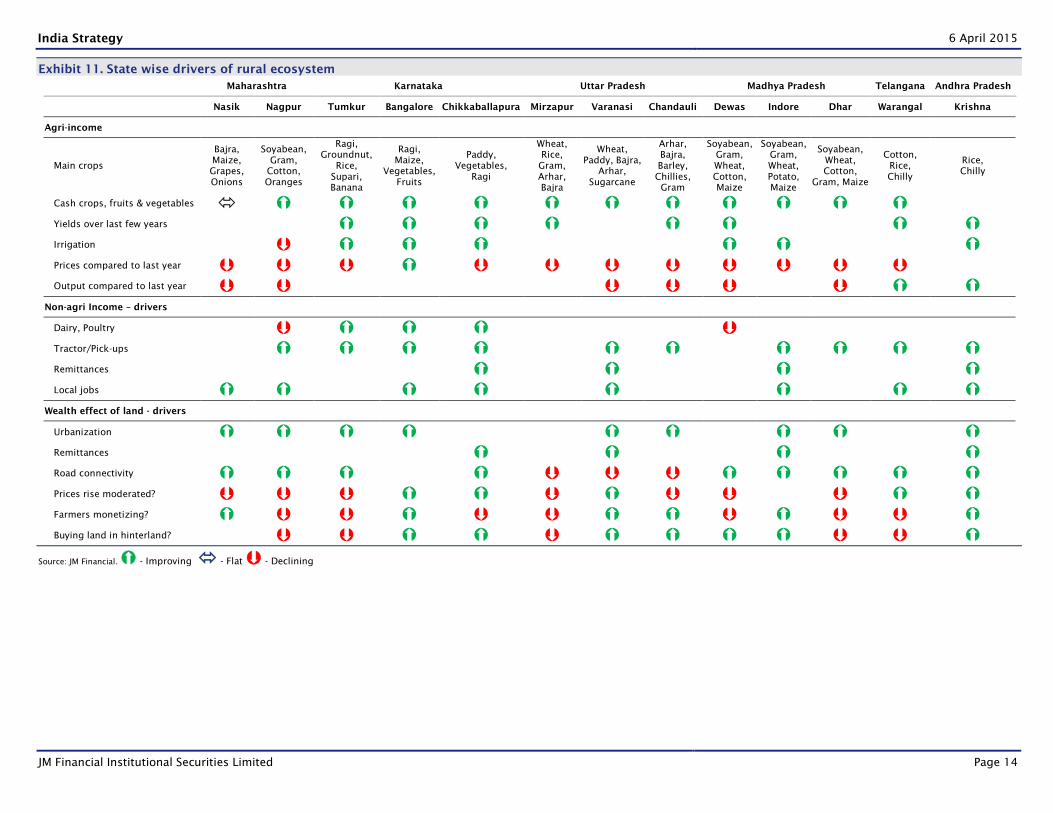
Exhibit 11. State wise drivers of rural ecosystem
Maharashtra Karnataka Uttar Pradesh Madhya Pradesh Telangana Andhra Pradesh
Nasik Nagpur Tumkur Bangalore Chikkaballapura Mirzapur Varanasi Chandauli Dewas Indore Dhar Warangal Krishna
Agri-income
Main crops
Bajra,
Maize,
Grapes,
Onions
Soyabean,
Gram,
Cotton,
Oranges
Ragi,
Groundnut,
Rice,
Supari,
Banana
Ragi,
Maize,
Vegetables,
Fruits
Paddy,
Vegetables,
Ragi
Wheat,
Rice,
Gram,
Arhar,
Bajra
Wheat,
Paddy, Bajra,
Arhar,
Sugarcane
Arhar,
Bajra,
Barley,
Chillies,
Gram
Soyabean,
Gram,
Wheat,
Cotton,
Maize
Soyabean,
Gram,
Wheat,
Potato,
Maize
Soyabean,
Wheat,
Cotton,
Gram, Maize
Cotton,
Rice,
Chilly
Rice,
Chilly
Cash crops, fruits & vegetables
Yields over last few years
Irrigation
Prices compared to last year
Output compared to last year
Non-agri Income – drivers
Dairy, Poultry
Tractor/Pick-ups
Remittances
Local jobs
Wealth effect of land - drivers
Urbanization
Remittances
Road connectivity
Prices rise moderated? Farmers monetizing?
Buying land in hinterland?
Source: JM Financial. - Improving - Flat - Declining
India Strategy 6 April 2015
JM Financial Institutional Securities Limited Page 15
Rural economic moderation in the last two years
Slowdown drivers – Crop losses, Construction activity
Rural GDP growth lent support to economic activity in the post-GFC world
Rural economy lent support to growth in the post Global Financial Crisis (GFC)
phase. While the official break-up of the Indian GDP into urban and rural incomes
is available latest for 2005, we use change in employment in different sectors as
inferred from various NSSO surveys to create an estimate of urban and rural
income break-up since 2005. Our analysis indicates that FY10-13 saw nominal
rural GDP CAGR of 15.4% vs. urban GDP CAGR of 14.4% during the same period.
We note that during this period, rural income growth outpaced urban income
growth in almost all the sectors including Agriculture+, Manufacturing,
Construction, Finance+ and Community+.
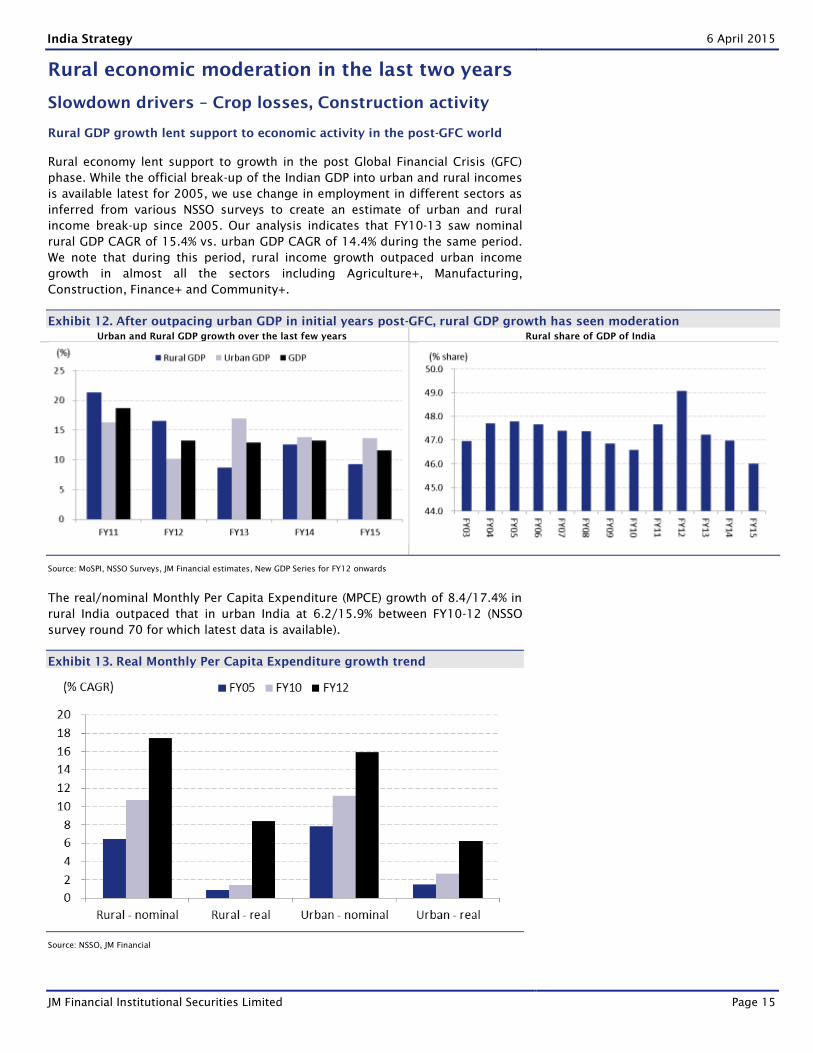
Exhibit 12. After outpacing urban GDP in initial years post-GFC, rural GDP growth has seen moderation
Urban and Rural GDP growth over the last few years Rural share of GDP of India
Source: MoSPI, NSSO Surveys, JM Financial estimates, New GDP Series for FY12 onwards
The real/nominal Monthly Per Capita Expenditure (MPCE) growth of 8.4/17.4% in
rural India outpaced that in urban India at 6.2/15.9% between FY10-12 (NSSO
survey round 70 for which latest data is available).
Exhibit 13. Real Monthly Per Capita Expenditure growth trend
Source: NSSO, JM Financial
India Strategy 6 April 2015
JM Financial Institutional Securities Limited Page 16
Moderation in the last couple of years
However, FY13-15 period saw some moderation in rural economy as rural
nominal growth rate dropped below the urban nominal growth rate. Led by
slowdown in Agriculture, Mining+ and Construction sectors, rural economy
witnessed 10.9% CAGR between FY13-15 compared to urban economy which saw
13.7% CAGR.
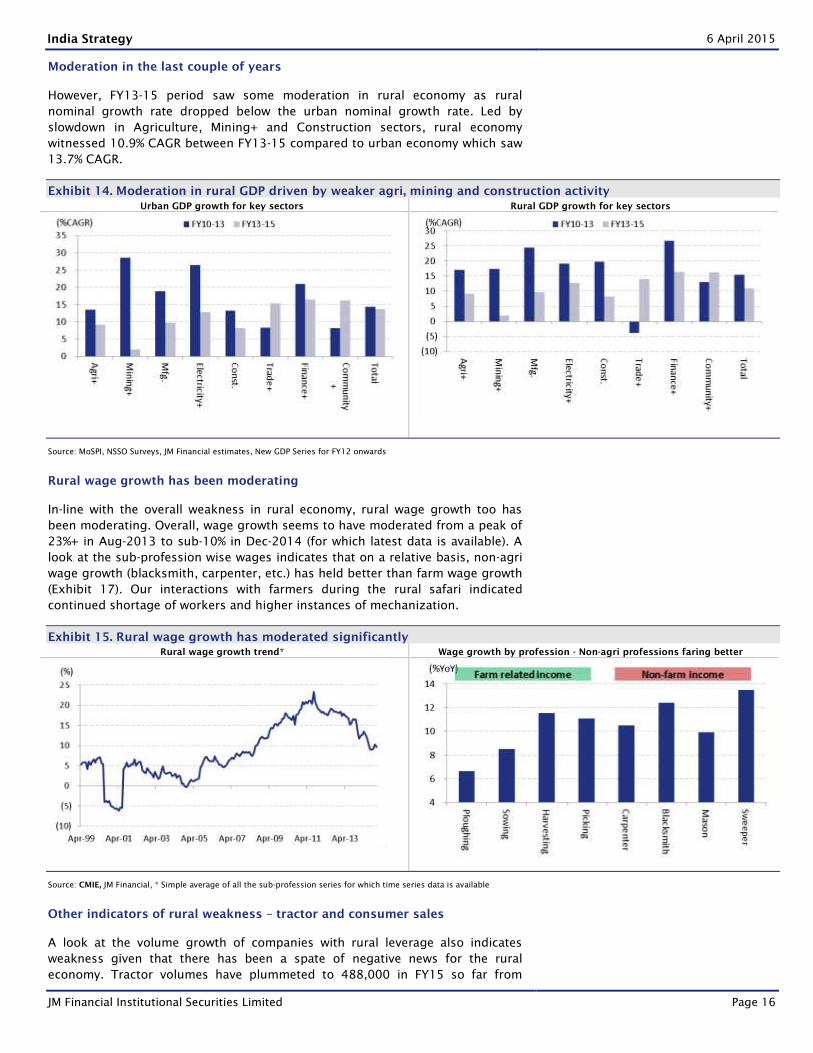
Exhibit 14. Moderation in rural GDP driven by weaker agri, mining and construction activity
Urban GDP growth for key sectors Rural GDP growth for key sectors
Source: MoSPI, NSSO Surveys, JM Financial estimates, New GDP Series for FY12 onwards
Rural wage growth has been moderating
In-line with the overall weakness in rural economy, rural wage growth too has
been moderating. Overall, wage growth seems to have moderated from a peak of
23%+ in Aug-2013 to sub-10% in Dec-2014 (for which latest data is available). A
look at the sub-profession wise wages indicates that on a relative basis, non-agri
wage growth (blacksmith, carpenter, etc.) has held better than farm wage growth
(Exhibit 17). Our interactions with farmers during the rural safari indicated
continued shortage of workers and higher instances of mechanization.
Exhibit 15. Rural wage growth has moderated significantly
Rural wage growth trend* Wage growth by profession - Non-agri professions faring better
Source: CMIE, JM Financial, * Simple average of all the sub-profession series for which time series data is available
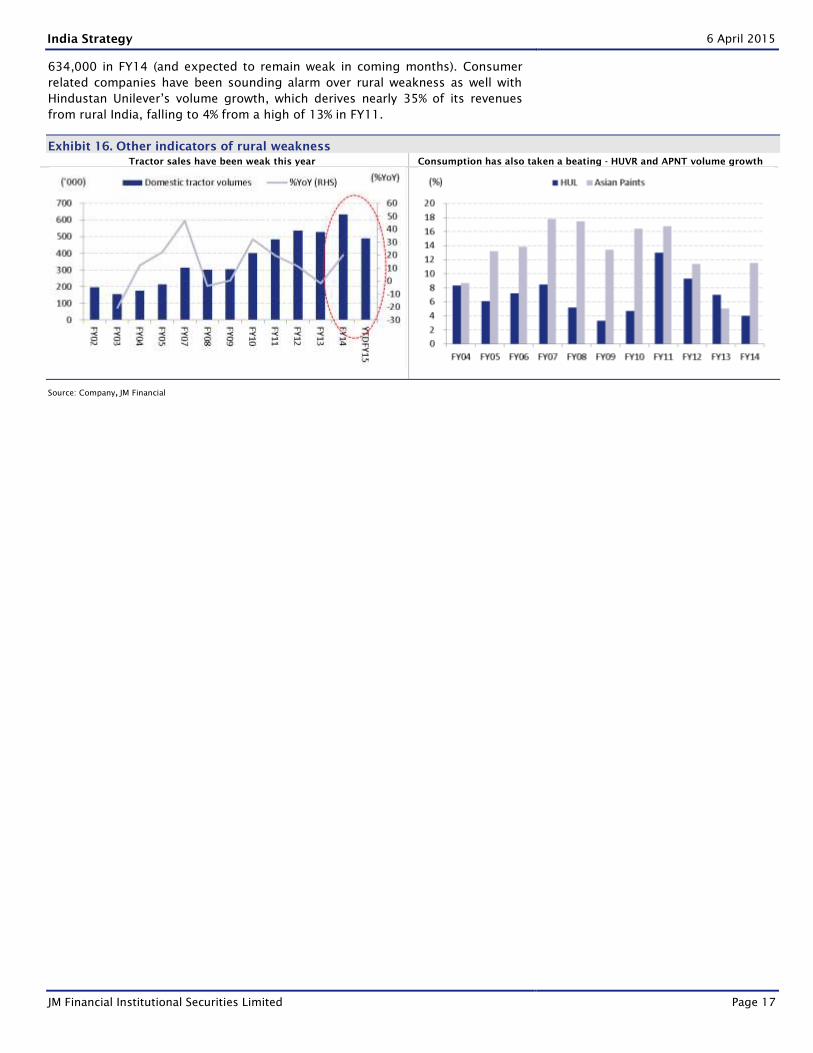
Other indicators of rural weakness – tractor and consumer sales
A look at the volume growth of companies with rural leverage also indicates
weakness given that there has been a spate of negative news for the rural
economy. Tractor volumes have plummeted to 488,000 in FY15 so far from
India Strategy 6 April 2015
JM Financial Institutional Securities Limited Page 17
634,000 in FY14 (and expected to remain weak in coming months). Consumer
related companies have been sounding alarm over rural weakness as well with
Hindustan Unilever’s volume growth, which derives nearly 35% of its revenues
from rural India, falling to 4% from a high of 13% in FY11.
Exhibit 16. Other indicators of rural weakness
Tractor sales have been weak this year Consumption has also taken a beating - HUVR and APNT volume growth
Source: Company, JM Financial
India Strategy 6 April 2015
JM Financial Institutional Securities Limited Page 18
About Rural Safari
Six states, 13 districts, 1000+ kms -- 45% of agri-GDP
Rural Safari - The genesis
We left our desks and got onto the field to understand the reasons for the
weakness and peep into the future of rural economy as it unfolds over the next
few years. We visited 6 states, 13 districts and covered 1000+ kilometers -- 45%
of India’s agricultural GDP – to meet farmers, traders at mandis (agricultural
market places), agri-input dealers, auto dealers and financiers over the last
month.
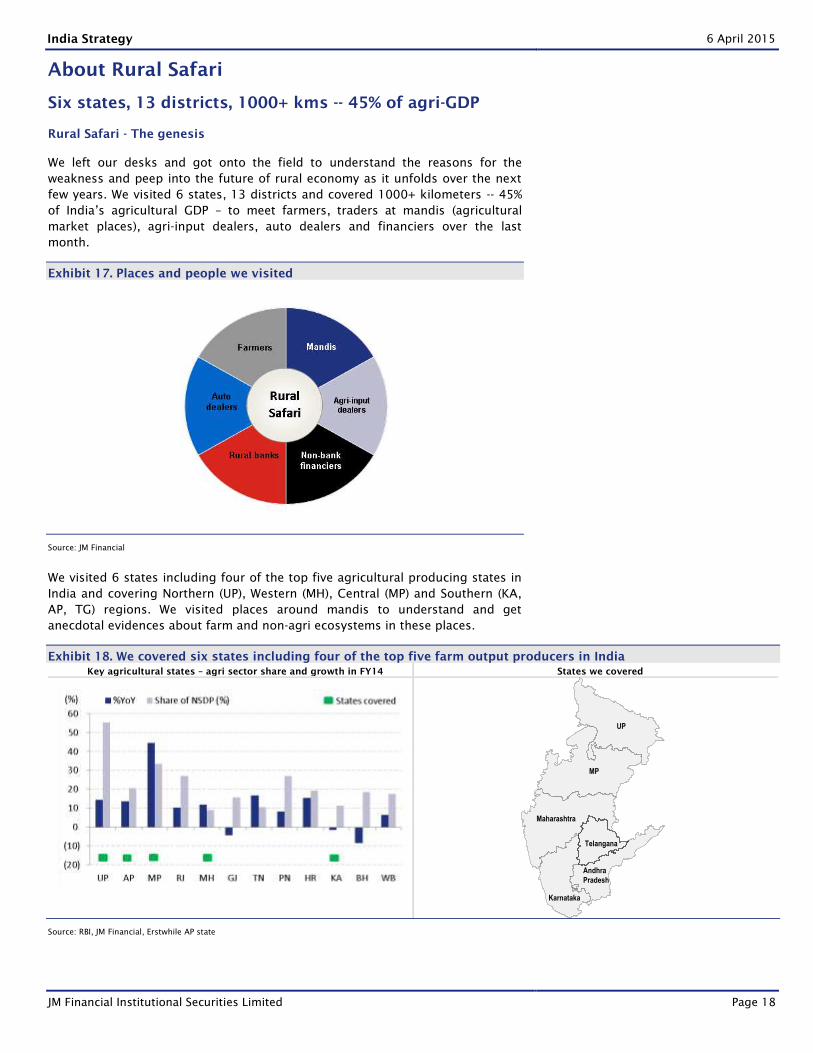
Exhibit 17. Places and people we visited
Source: JM Financial
We visited 6 states including four of the top five agricultural producing states in
India and covering Northern (UP), Western (MH), Central (MP) and Southern (KA,
AP, TG) regions. We visited places around mandis to understand and get
anecdotal evidences about farm and non-agri ecosystems in these places.
Exhibit 18. We covered six states including four of the top five farm output producers in India
Key agricultural states – agri sector share and growth in FY14 States we covered
Source: RBI, JM Financial, Erstwhile AP state
MP
Andhra
Pradesh
UP
Maharashtra
Karnataka
Telangana
India Strategy 6 April 2015
JM Financial Institutional Securities Limited Page 19
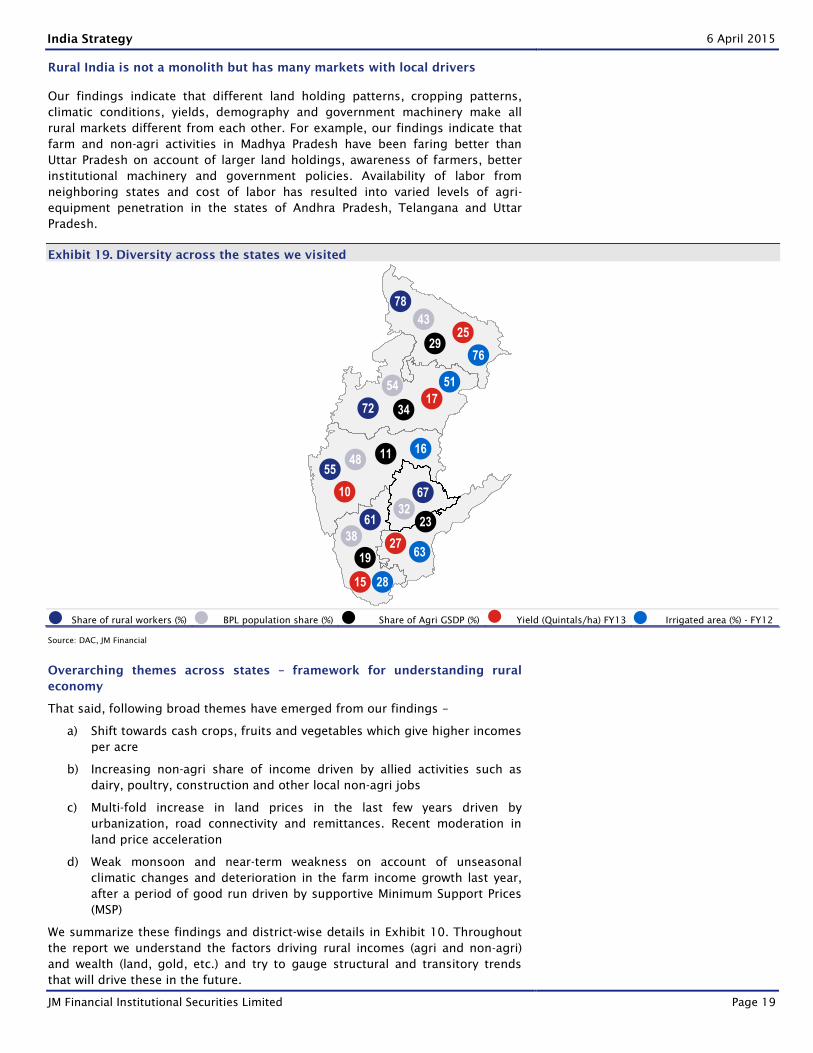
Rural India is not a monolith but has many markets with local drivers
Our findings indicate that different land holding patterns, cropping patterns,
climatic conditions, yields, demography and government machinery make all
rural markets different from each other. For example, our findings indicate that
farm and non-agri activities in Madhya Pradesh have been faring better than
Uttar Pradesh on account of larger land holdings, awareness of farmers, better
institutional machinery and government policies. Availability of labor from
neighboring states and cost of labor has resulted into varied levels of agri-
equipment penetration in the states of Andhra Pradesh, Telangana and Uttar
Pradesh.
Exhibit 19. Diversity across the states we visited
Share of rural workers (%) BPL population share (%) Share of Agri GSDP (%) Yield (Quintals/ha) FY13 Irrigated area (%) - FY12
Source: DAC, JM Financial
Overarching themes across states – framework for understanding rural
economy
That said, following broad themes have emerged from our findings –
a) Shift towards cash crops, fruits and vegetables which give higher incomes
per acre
b) Increasing non-agri share of income driven by allied activities such as
dairy, poultry, construction and other local non-agri jobs
c) Multi-fold increase in land prices in the last few years driven by
urbanization, road connectivity and remittances. Recent moderation in
land price acceleration
d) Weak monsoon and near-term weakness on account of unseasonal
climatic changes and deterioration in the farm income growth last year,
after a period of good run driven by supportive Minimum Support Prices
(MSP)
We summarize these findings and district-wise details in Exhibit 10. Throughout
the report we understand the factors driving rural incomes (agri and non-agri)
and wealth (land, gold, etc.) and try to gauge structural and transitory trends
that will drive these in the future.
78 43
29 25
76
72
54
34 17
51
55 48 11
10
16
61 38
19
15 28
67 32
23
27 63
India Strategy 6 April 2015
JM Financial Institutional Securities Limited Page 20
Agri Income - Growth has moderated
Deteriorating farm economics hurt by erratic weather
Our interaction with farmers indicates that the share of agri income in rural
areas has been declining over last few years (now 36%). That said, farm
income still drives the sentiment and purchasing decisions in many parts of
rural India. Many farmers we interacted seem to have deferred their
purchasing decisions owing to recent climatic uncertainties and resultant
crop losses. Farm income (and thus consumer sentiment) in rural areas is
affected due to a confluence of factors such as:
a) Erratic weather patterns with weak monsoon earlier this year followed
by unseasonal rains in the last few days – up to 16% of Rabi cropping
area affected due to unseasonal rains
b) Moderate rise in the Minimum Support Prices (MSPs)
c) Change in FCI procurement policies in certain states
d) Export restrictions and weakness in global agricultural commodity
markets
That said, there are structural factors such as shift towards high income
yielding fruits, vegetables and cash crops, improving irrigation facilities and
agri market place reforms which will continue to provide support to farm
incomes in the medium-term.
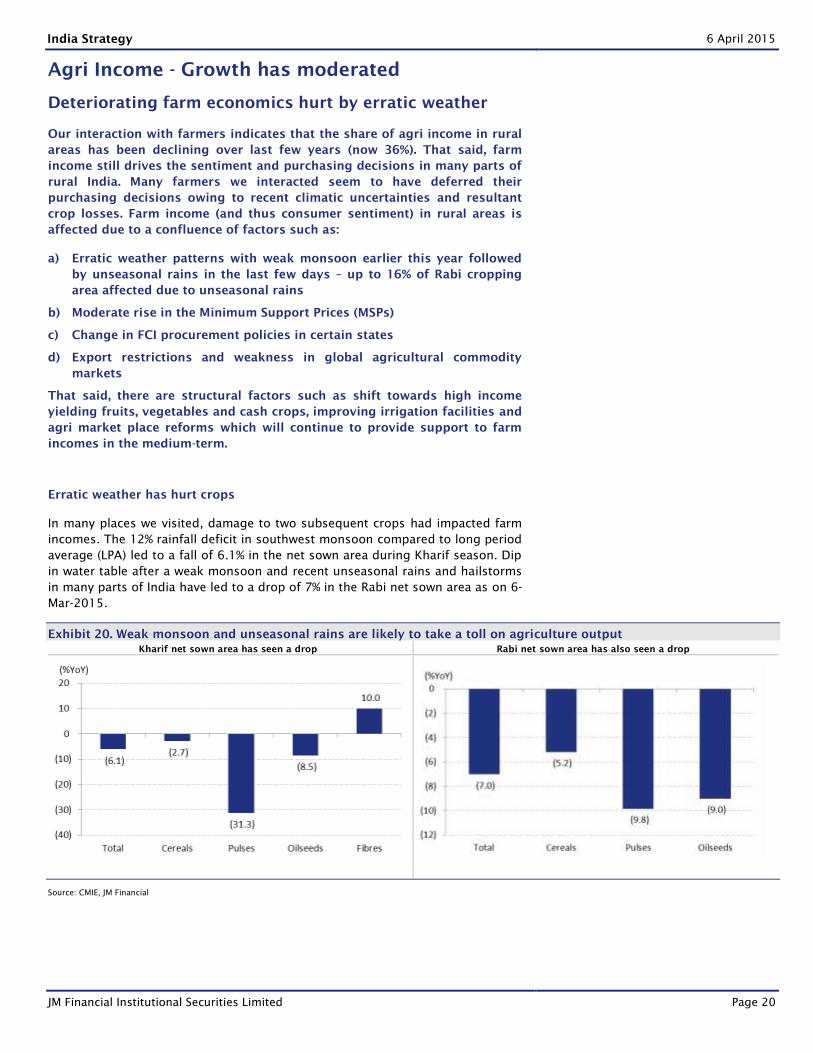
Erratic weather has hurt crops
In many places we visited, damage to two subsequent crops had impacted farm
incomes. The 12% rainfall deficit in southwest monsoon compared to long period
average (LPA) led to a fall of 6.1% in the net sown area during Kharif season. Dip
in water table after a weak monsoon and recent unseasonal rains and hailstorms
in many parts of India have led to a drop of 7% in the Rabi net sown area as on 6-
Mar-2015.
Exhibit 20. Weak monsoon and unseasonal rains are likely to take a toll on agriculture output
Kharif net sown area has seen a drop Rabi net sown area has also seen a drop
Source: CMIE, JM Financial
India Strategy 6 April 2015
JM Financial Institutional Securities Limited Page 21
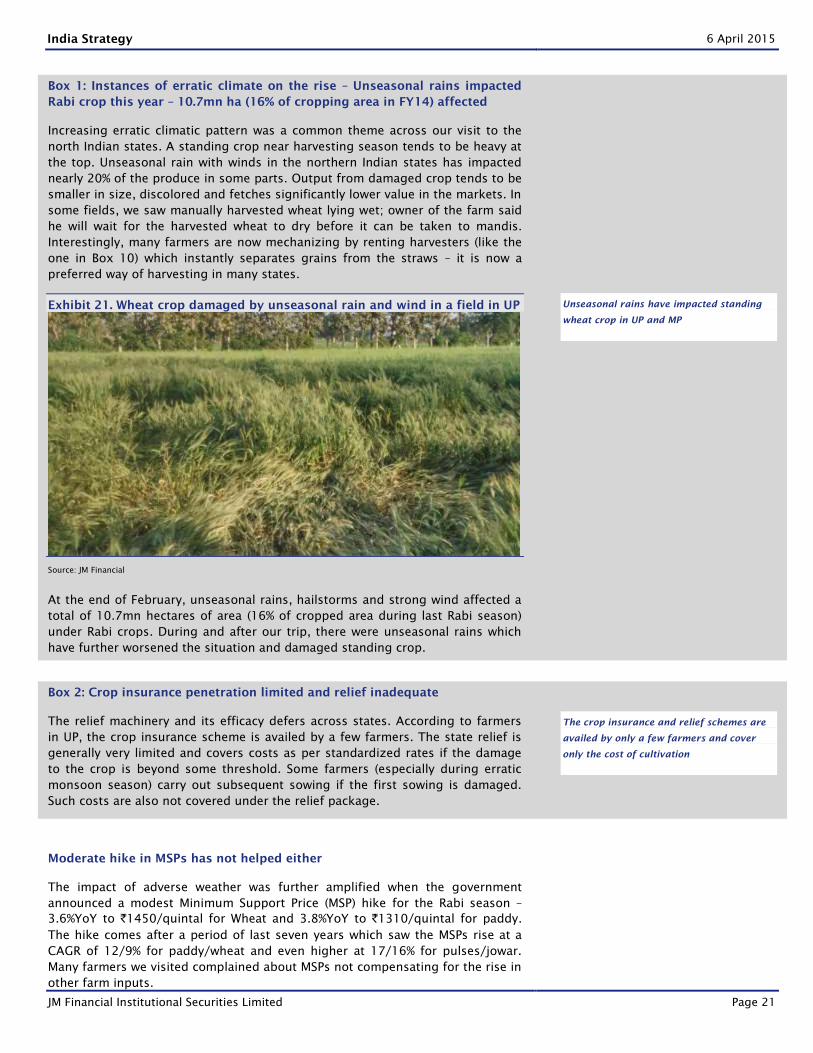
Box 1: Instances of erratic climate on the rise – Unseasonal rains impacted
Rabi crop this year – 10.7mn ha (16% of cropping area in FY14) affected
Increasing erratic climatic pattern was a common theme across our visit to the
north Indian states. A standing crop near harvesting season tends to be heavy at
the top. Unseasonal rain with winds in the northern Indian states has impacted
nearly 20% of the produce in some parts. Output from damaged crop tends to be
smaller in size, discolored and fetches significantly lower value in the markets. In
some fields, we saw manually harvested wheat lying wet; owner of the farm said
he will wait for the harvested wheat to dry before it can be taken to mandis.
Interestingly, many farmers are now mechanizing by renting harvesters (like the
one in Box 10) which instantly separates grains from the straws – it is now a
preferred way of harvesting in many states.
Exhibit 21. Wheat crop damaged by unseasonal rain and wind in a field in UP
Source: JM Financial
At the end of February, unseasonal rains, hailstorms and strong wind affected a
total of 10.7mn hectares of area (16% of cropped area during last Rabi season)
under Rabi crops. During and after our trip, there were unseasonal rains which
have further worsened the situation and damaged standing crop.
Box 2: Crop insurance penetration limited and relief inadequate
The relief machinery and its efficacy defers across states. According to farmers
in UP, the crop insurance scheme is availed by a few farmers. The state relief is
generally very limited and covers costs as per standardized rates if the damage
to the crop is beyond some threshold. Some farmers (especially during erratic
monsoon season) carry out subsequent sowing if the first sowing is damaged.
Such costs are also not covered under the relief package.
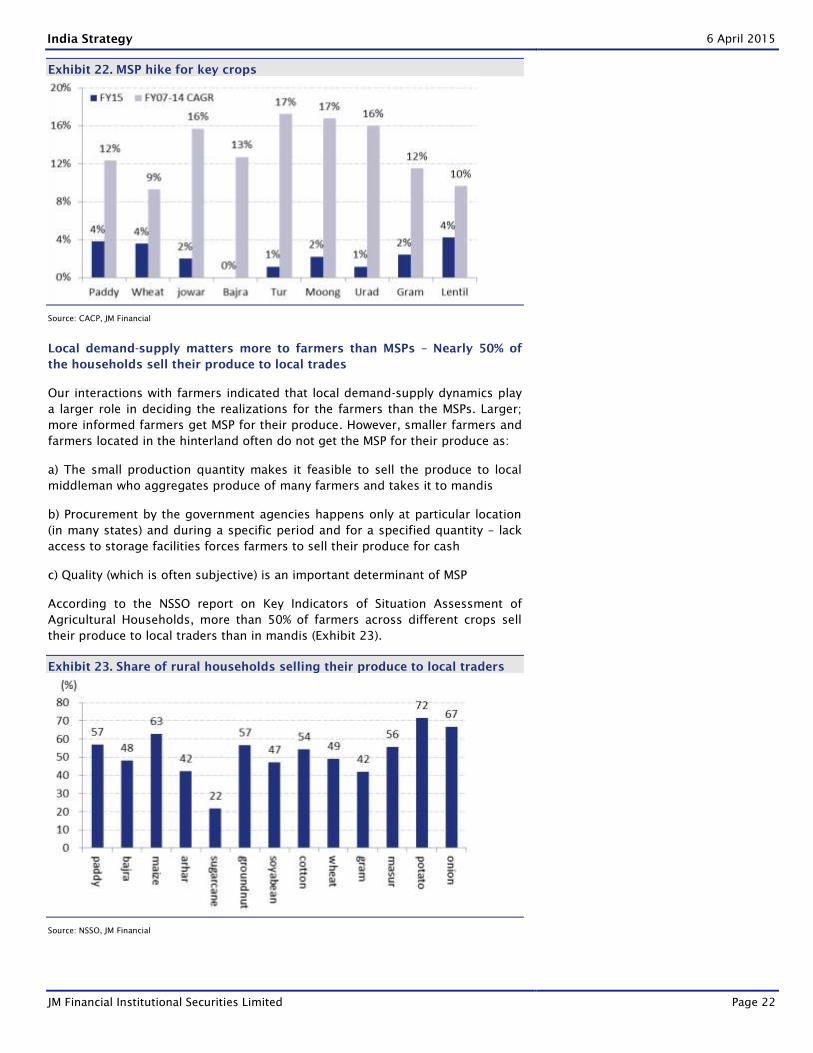
Moderate hike in MSPs has not helped either
The impact of adverse weather was further amplified when the government
announced a modest Minimum Support Price (MSP) hike for the Rabi season –
3.6%YoY to `1450/quintal for Wheat and 3.8%YoY to `1310/quintal for paddy.
The hike comes after a period of last seven years which saw the MSPs rise at a
CAGR of 12/9% for paddy/wheat and even higher at 17/16% for pulses/jowar.
Many farmers we visited complained about MSPs not compensating for the rise in
other farm inputs.
Unseasonal rains have impacted standing
wheat crop in UP and MP
The crop insurance and relief schemes are
availed by only a few farmers and cover
only the cost of cultivation
India Strategy 6 April 2015
JM Financial Institutional Securities Limited Page 22
Exhibit 22. MSP hike for key crops
Source: CACP, JM Financial
Local demand-supply matters more to farmers than MSPs – Nearly 50% of
the households sell their produce to local trades
Our interactions with farmers indicated that local demand-supply dynamics play
a larger role in deciding the realizations for the farmers than the MSPs. Larger;
more informed farmers get MSP for their produce. However, smaller farmers and
farmers located in the hinterland often do not get the MSP for their produce as:
a) The small production quantity makes it feasible to sell the produce to local
middleman who aggregates produce of many farmers and takes it to mandis
b) Procurement by the government agencies happens only at particular location
(in many states) and during a specific period and for a specified quantity – lack
access to storage facilities forces farmers to sell their produce for cash
c) Quality (which is often subjective) is an important determinant of MSP
According to the NSSO report on Key Indicators of Situation Assessment of
Agricultural Households, more than 50% of farmers across different crops sell
their produce to local traders than in mandis (Exhibit 23).
Exhibit 23. Share of rural households selling their produce to local traders
Source: NSSO, JM Financial
India Strategy 6 April 2015
JM Financial Institutional Securities Limited Page 23
Box 3: Declining role of the middle man in APMC market in Telangana and
Andhra Pradesh
Our interactions indicated that in Telangana/Andhra Pradesh, importance of
middle man’s role between the farmer and final purchaser of farmer’s produce is
gradually declining. Waranagal APMC office (locally called as Enumamula market
– Asia’s second biggest grain market) over the last 2-3 years has frozen the
number of licenses to middleman and is steadily increasingly final purchasers
licenses (15-20% growth in every year). Currently it has 426 licenses for middle
man and 527 licenses to final purchases. There are other markets like
Mahabubabad, Narsampet in Warangal district where there are no middle men in
mandis and farmers sell directly to final purchasers.
Change in the FCI policy for procurement without bonus payment is another
negative – No excess procurements from states giving bonus over MSPs
The decision of the FCI to stop procuring excess food grains from the states
which dole out additional bonus over and above the central MSP, has successfully
led to dropping of the practice of giving bonus over and above MSP in states like
Chhattisgarh and Madhya Pradesh. The procurement levels in KMS 2014-15 are
lower in both Chhattisgarh and Madhya Pradesh as compared to the previous
year and there is reemergence of competition in the market. While this practice
will help develop distortion free agricultural market across states in the medium
term, it will impact farm incomes and rural sentiment.
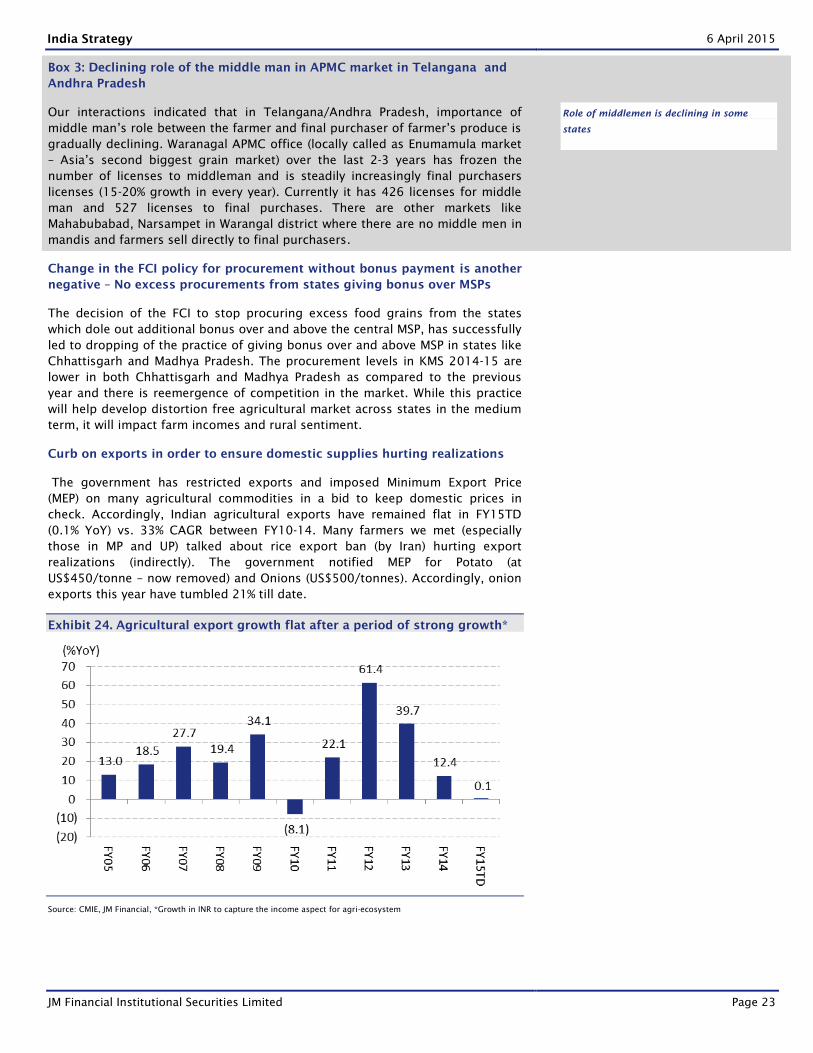
Curb on exports in order to ensure domestic supplies hurting realizations
The government has restricted exports and imposed Minimum Export Price
(MEP) on many agricultural commodities in a bid to keep domestic prices in
check. Accordingly, Indian agricultural exports have remained flat in FY15TD
(0.1% YoY) vs. 33% CAGR between FY10-14. Many farmers we met (especially
those in MP and UP) talked about rice export ban (by Iran) hurting export
realizations (indirectly). The government notified MEP for Potato (at
US$450/tonne – now removed) and Onions (US$500/tonnes). Accordingly, onion
exports this year have tumbled 21% till date.
Exhibit 24. Agricultural export growth flat after a period of strong growth*
Source: CMIE, JM Financial, *Growth in INR to capture the income aspect for agri-ecosystem
Role of middlemen is declining in some
states
India Strategy 6 April 2015
JM Financial Institutional Securities Limited Page 24
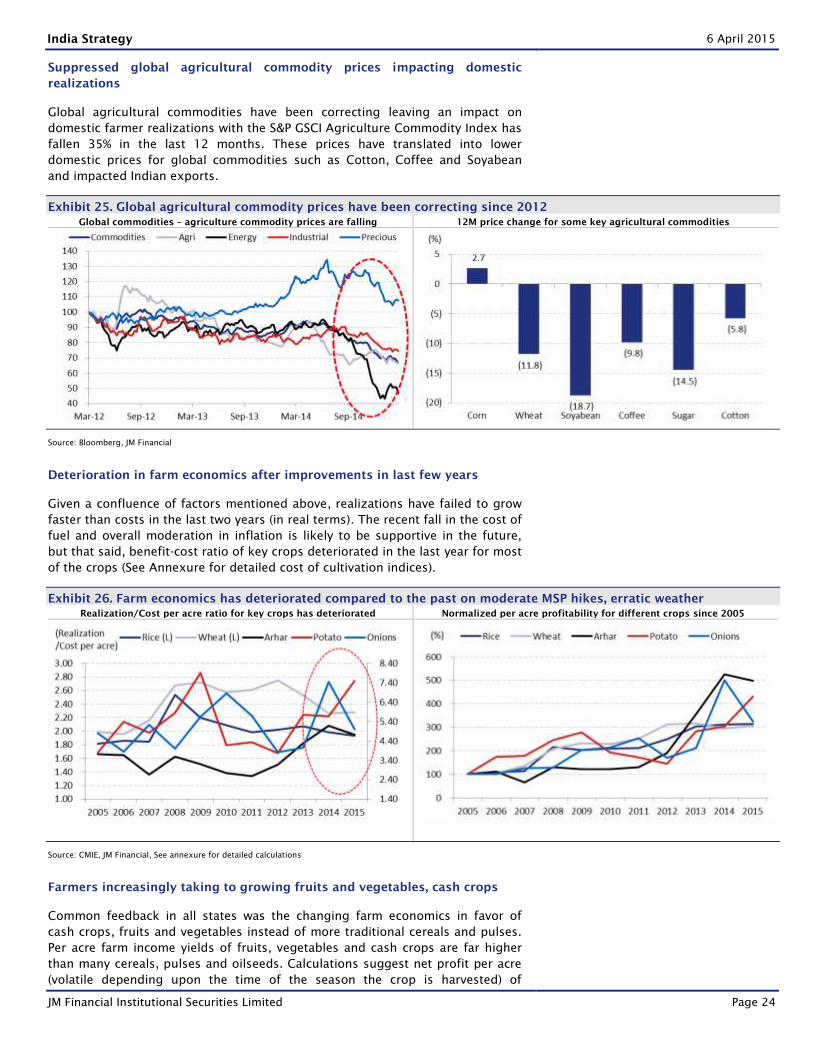
Suppressed global agricultural commodity prices impacting domestic
realizations
Global agricultural commodities have been correcting leaving an impact on
domestic farmer realizations with the S&P GSCI Agriculture Commodity Index has
fallen 35% in the last 12 months. These prices have translated into lower
domestic prices for global commodities such as Cotton, Coffee and Soyabean
and impacted Indian exports.
Exhibit 25. Global agricultural commodity prices have been correcting since 2012
Global commodities – agriculture commodity prices are falling 12M price change for some key agricultural commodities
Source: Bloomberg, JM Financial
Deterioration in farm economics after improvements in last few years
Given a confluence of factors mentioned above, realizations have failed to grow
faster than costs in the last two years (in real terms). The recent fall in the cost of
fuel and overall moderation in inflation is likely to be supportive in the future,
but that said, benefit-cost ratio of key crops deteriorated in the last year for most
of the crops (See Annexure for detailed cost of cultivation indices).
Exhibit 26. Farm economics has deteriorated compared to the past on moderate MSP hikes, erratic weather
Realization/Cost per acre ratio for key crops has deteriorated Normalized per acre profitability for different crops since 2005
Source: CMIE, JM Financial, See annexure for detailed calculations
Farmers increasingly taking to growing fruits and vegetables, cash crops
Common feedback in all states was the changing farm economics in favor of
cash crops, fruits and vegetables instead of more traditional cereals and pulses.
Per acre farm income yields of fruits, vegetables and cash crops are far higher
than many cereals, pulses and oilseeds. Calculations suggest net profit per acre
(volatile depending upon the time of the season the crop is harvested) of
India Strategy 6 April 2015
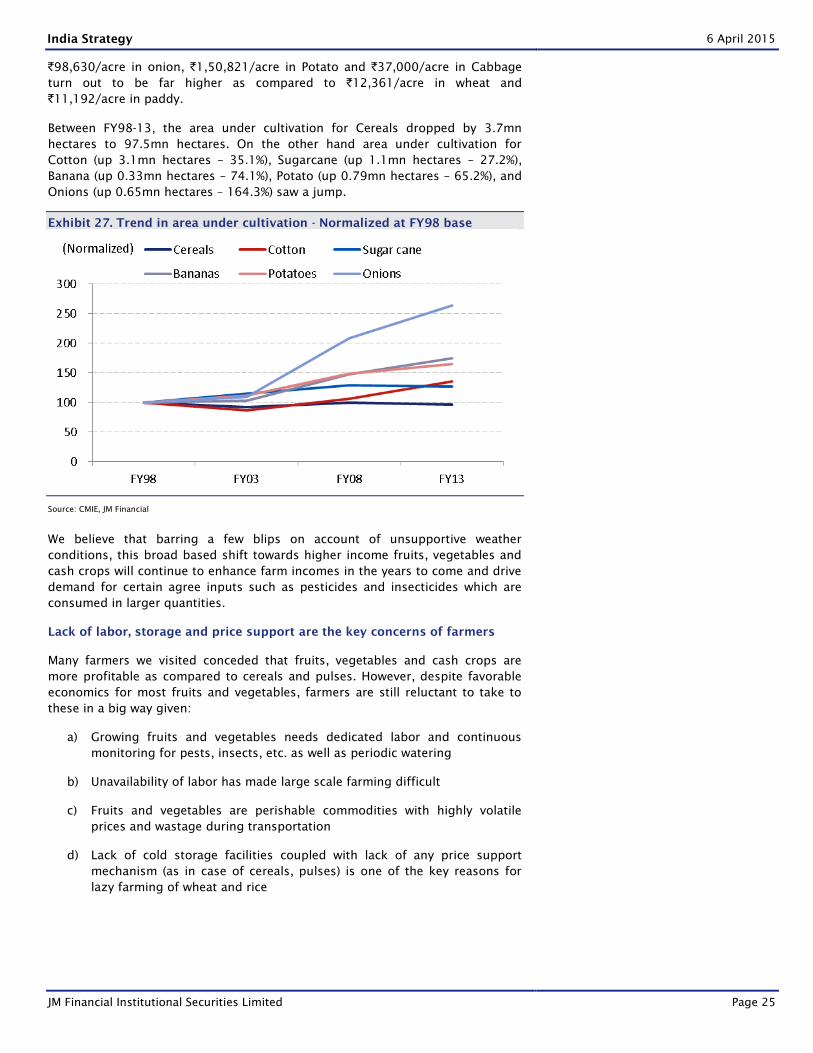
JM Financial Institutional Securities Limited Page 25
`98,630/acre in onion, `1,50,821/acre in Potato and `37,000/acre in Cabbage
turn out to be far higher as compared to `12,361/acre in wheat and
`11,192/acre in paddy.
Between FY98-13, the area under cultivation for Cereals dropped by 3.7mn
hectares to 97.5mn hectares. On the other hand area under cultivation for
Cotton (up 3.1mn hectares – 35.1%), Sugarcane (up 1.1mn hectares – 27.2%),
Banana (up 0.33mn hectares – 74.1%), Potato (up 0.79mn hectares – 65.2%), and
Onions (up 0.65mn hectares – 164.3%) saw a jump.
Exhibit 27. Trend in area under cultivation - Normalized at FY98 base
Source: CMIE, JM Financial
We believe that barring a few blips on account of unsupportive weather
conditions, this broad based shift towards higher income fruits, vegetables and
cash crops will continue to enhance farm incomes in the years to come and drive
demand for certain agree inputs such as pesticides and insecticides which are
consumed in larger quantities.
Lack of labor, storage and price support are the key concerns of farmers
Many farmers we visited conceded that fruits, vegetables and cash crops are
more profitable as compared to cereals and pulses. However, despite favorable
economics for most fruits and vegetables, farmers are still reluctant to take to
these in a big way given:
a) Growing fruits and vegetables needs dedicated labor and continuous
monitoring for pests, insects, etc. as well as periodic watering
b) Unavailability of labor has made large scale farming difficult
c) Fruits and vegetables are perishable commodities with highly volatile
prices and wastage during transportation
d) Lack of cold storage facilities coupled with lack of any price support
mechanism (as in case of cereals, pulses) is one of the key reasons for
lazy farming of wheat and rice
India Strategy 6 April 2015
JM Financial Institutional Securities Limited Page 26
Box 4: Need for mechanization - Get me a machine that can dig these carrots
and pack them
In Madhya Pradesh, some farmers are increasingly taking to cultivating
vegetables such as carrots. We visited a farmer with nearly 10 acres of land and a
carrot farm. The owner was worried since the carrots needed to be dug out and
picked up by the labor in large quantities. “Availability of food at cheap rates
and other means of income have led to drying up of farm labor these days.
Mostly women and children work in farms and we have to pay excess money to
get labor from hinterlands. Like we have harvesters for wheat, please get me a
machine that can dig these carrots and pack them”, said the farmer jokingly.
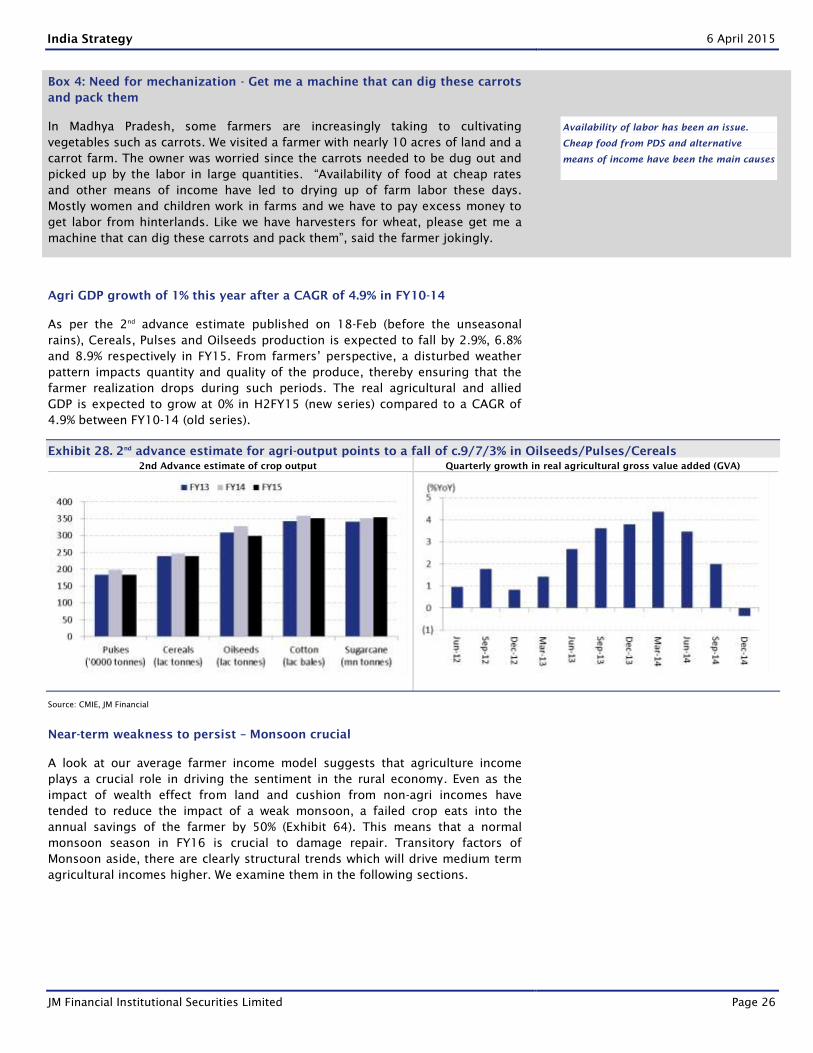
Agri GDP growth of 1% this year after a CAGR of 4.9% in FY10-14
As per the 2nd
advance estimate published on 18-Feb (before the unseasonal
rains), Cereals, Pulses and Oilseeds production is expected to fall by 2.9%, 6.8%
and 8.9% respectively in FY15. From farmers’ perspective, a disturbed weather
pattern impacts quantity and quality of the produce, thereby ensuring that the
farmer realization drops during such periods. The real agricultural and allied
GDP is expected to grow at 0% in H2FY15 (new series) compared to a CAGR of
4.9% between FY10-14 (old series).
Exhibit 28. 2nd
advance estimate for agri-output points to a fall of c.9/7/3% in Oilseeds/Pulses/Cereals
2nd Advance estimate of crop output Quarterly growth in real agricultural gross value added (GVA)
Source: CMIE, JM Financial
Near-term weakness to persist – Monsoon crucial
A look at our average farmer income model suggests that agriculture income
plays a crucial role in driving the sentiment in the rural economy. Even as the
impact of wealth effect from land and cushion from non-agri incomes have
tended to reduce the impact of a weak monsoon, a failed crop eats into the
annual savings of the farmer by 50% (Exhibit 64). This means that a normal
monsoon season in FY16 is crucial to damage repair. Transitory factors of
Monsoon aside, there are clearly structural trends which will drive medium term
agricultural incomes higher. We examine them in the following sections.
Availability of labor has been an issue.
Cheap food from PDS and alternative
means of income have been the main causes
India Strategy 6 April 2015
JM Financial Institutional Securities Limited Page 27
The role of state governments has been (and will continue to remain) the
single largest factor governing variations in welfare of farmers across the
states
A divergent trend that we witnessed across different states is the level of
scientific approach used in farming in different states. The administrative
machinery and policy efficacy was very different in different states. For example
few farmers we visited in the states of Uttar Pradesh and Maharashtra had carried
out soil tests from government laboratories and were awaiting results for many
months now. Another farmer told us that results from the state lab are often not
reliable and he prefers to get his soil tested from a university lab nearby for a
small fee. The procurement policies, rules for appropriating entitlements, and
consequently welfare of farmers and their opinion about the efficiency of
government have differed in many states.
For example, while wheat farmers in the state of Madhya Pradesh showed
concern over non availability of bonus over and above MSP this year, they
expressed support for a) procurement of produce by the FCI and related state
nodal agencies at the PDS outlets, b) procurement quantity from farmers based
on their land holdings (to avoid siphoning off of cereals from PDS and its re-
pumping in the FCI procurement).
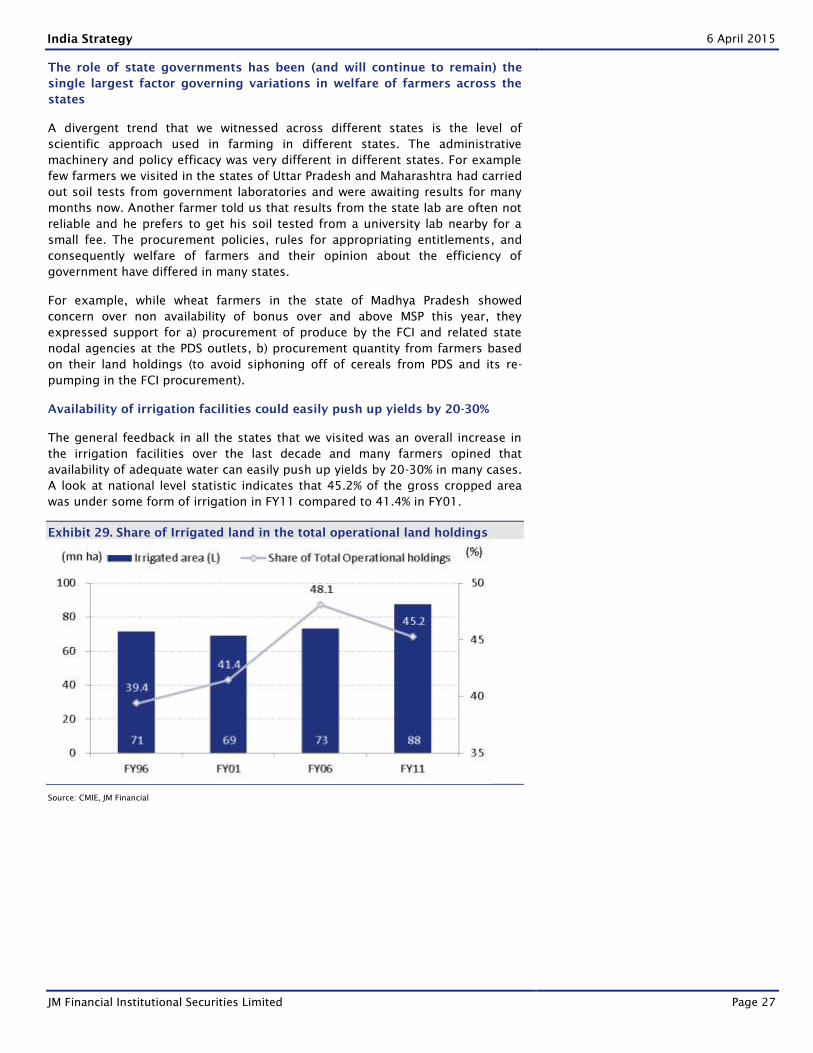
Availability of irrigation facilities could easily push up yields by 20-30%
The general feedback in all the states that we visited was an overall increase in
the irrigation facilities over the last decade and many farmers opined that
availability of adequate water can easily push up yields by 20-30% in many cases.
A look at national level statistic indicates that 45.2% of the gross cropped area
was under some form of irrigation in FY11 compared to 41.4% in FY01.
Exhibit 29. Share of Irrigated land in the total operational land holdings
Source: CMIE, JM Financial
India Strategy 6 April 2015
JM Financial Institutional Securities Limited Page 28
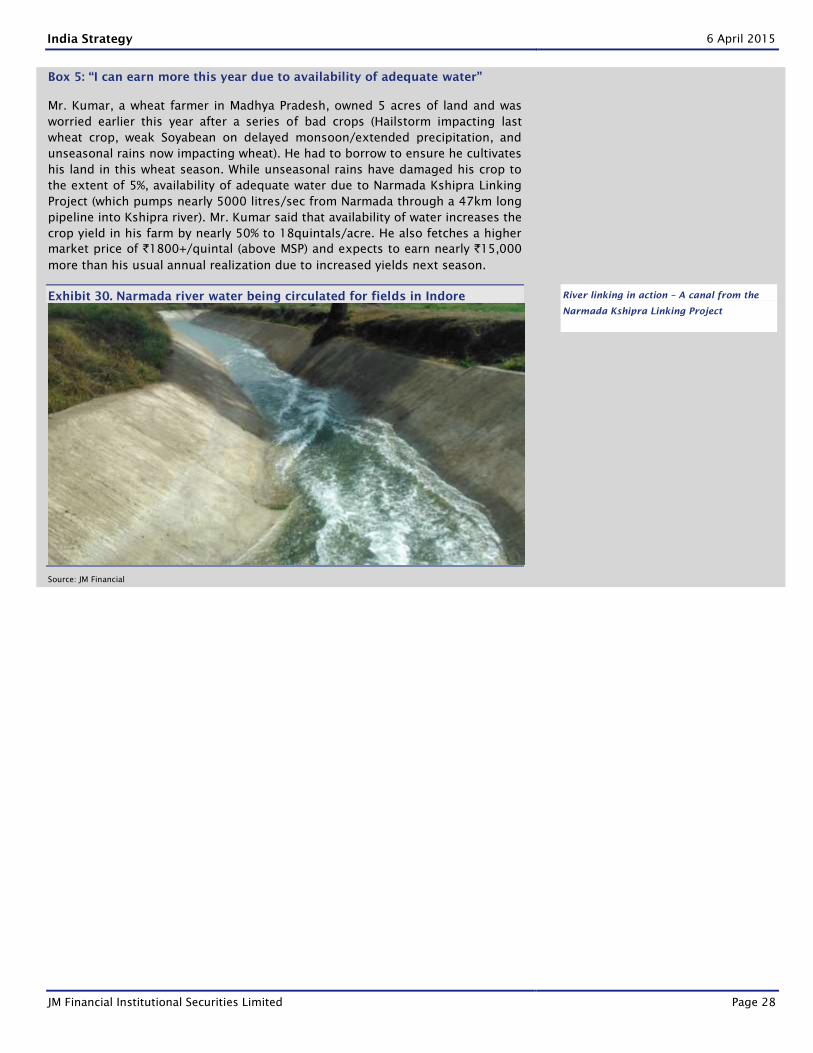
Box 5: “I can earn more this year due to availability of adequate water”
Mr. Kumar, a wheat farmer in Madhya Pradesh, owned 5 acres of land and was
worried earlier this year after a series of bad crops (Hailstorm impacting last
wheat crop, weak Soyabean on delayed monsoon/extended precipitation, and
unseasonal rains now impacting wheat). He had to borrow to ensure he cultivates
his land in this wheat season. While unseasonal rains have damaged his crop to
the extent of 5%, availability of adequate water due to Narmada Kshipra Linking
Project (which pumps nearly 5000 litres/sec from Narmada through a 47km long
pipeline into Kshipra river). Mr. Kumar said that availability of water increases the
crop yield in his farm by nearly 50% to 18quintals/acre. He also fetches a higher
market price of `1800+/quintal (above MSP) and expects to earn nearly `15,000
more than his usual annual realization due to increased yields next season.
Exhibit 30. Narmada river water being circulated for fields in Indore
Source: JM Financial
River linking in action – A canal from the
Narmada Kshipra Linking Project
India Strategy 6 April 2015
JM Financial Institutional Securities Limited Page 29
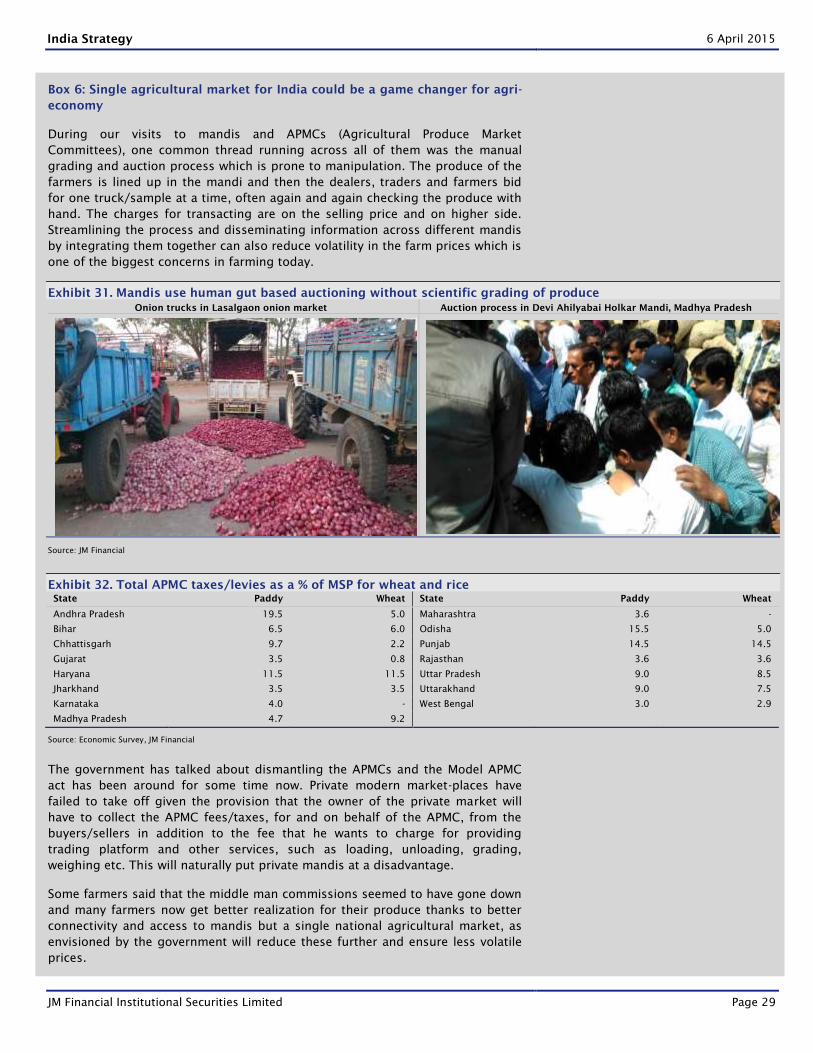
Box 6: Single agricultural market for India could be a game changer for agri-
economy
During our visits to mandis and APMCs (Agricultural Produce Market
Committees), one common thread running across all of them was the manual
grading and auction process which is prone to manipulation. The produce of the
farmers is lined up in the mandi and then the dealers, traders and farmers bid
for one truck/sample at a time, often again and again checking the produce with
hand. The charges for transacting are on the selling price and on higher side.
Streamlining the process and disseminating information across different mandis
by integrating them together can also reduce volatility in the farm prices which is
one of the biggest concerns in farming today.
Exhibit 31. Mandis use human gut based auctioning without scientific grading of produce
Onion trucks in Lasalgaon onion market Auction process in Devi Ahilyabai Holkar Mandi, Madhya Pradesh
Source: JM Financial
Exhibit 32. Total APMC taxes/levies as a % of MSP for wheat and rice
State Paddy Wheat State Paddy Wheat
Andhra Pradesh 19.5 5.0 Maharashtra 3.6 -
Bihar 6.5 6.0 Odisha 15.5 5.0
Chhattisgarh 9.7 2.2 Punjab 14.5 14.5
Gujarat 3.5 0.8 Rajasthan 3.6 3.6
Haryana 11.5 11.5 Uttar Pradesh 9.0 8.5
Jharkhand 3.5 3.5 Uttarakhand 9.0 7.5
Karnataka 4.0 - West Bengal 3.0 2.9
Madhya Pradesh 4.7 9.2
Source: Economic Survey, JM Financial
The government has talked about dismantling the APMCs and the Model APMC
act has been around for some time now. Private modern market-places have
failed to take off given the provision that the owner of the private market will
have to collect the APMC fees/taxes, for and on behalf of the APMC, from the
buyers/sellers in addition to the fee that he wants to charge for providing
trading platform and other services, such as loading, unloading, grading,
weighing etc. This will naturally put private mandis at a disadvantage.
Some farmers said that the middle man commissions seemed to have gone down
and many farmers now get better realization for their produce thanks to better
connectivity and access to mandis but a single national agricultural market, as
envisioned by the government will reduce these further and ensure less volatile
prices.
India Strategy 6 April 2015
JM Financial Institutional Securities Limited Page 30
Recommendations on the restructuring of the FCI
The NDA government has indicated that it wants to restructure FCI operations.
Report of the High Level Committee on Reorienting the Role and Restructuring of
Food Corporation of India chaired by Shanta Kumar put out in Jan 2015 makes
following recommendations which could address many of the problems
suggested by farmers during our visits:
FCI should hand over all procurement operations of wheat, paddy and rice to
states with sufficient experience and infrastructure (AP, CG, HR, MP, PD, PU)
for procurement
FCI should move on to help states where farmers are dominated by small
holdings and suffer from distress sales at prices below MSP (East UP, BH, WB,
AS)
Bring down the statutory levies including commissions (2% in GJ/WB - 14.5%
PU) to a uniform nationwide rate of 3-4% of MSP and included in MSP itself
In case of any bonus being given by the states on top of MSP, Centre should
not accept grains under the central pool beyond the quantity needed by the
state for its own PDS and OWS – already being implemented
Negotiable warehouse receipt system (NW`) - Under this system, farmers can
deposit their produce to the registered warehouses, and get say 80% advance
from banks against their produce valued at MSP. They can sell later when they
feel prices are good for them. This will bring back the private sector, reduce
massively the costs of storage to the government, and be more compatible
with a market economy
Despite announced MSPs for 23 commodities, effective price support
operates in wheat and rice and only in selected states creating highly skewed
incentive structures in favor of wheat and rice
Pulses and oilseeds deserve priority and government must provide better
price support operations for them, and dovetail their MSP policy with trade
policy so that their landed costs are not below their MSP
67% coverage of population is on much higher side, and should be brought
down to around 40%, which will comfortably cover BPL families and some
even above that
Pricing for priority households must be linked to MSP, (50% of MSP) to avoid
putting undue financial burden on the exchequer
Targeted beneficiaries under NFSA or TPDS are given 6 months ration
immediately after the procurement season ends. This will save the consumers
from various hassles of monthly arrivals at FPS and also save on the storage
costs of agencies
Gradual introduction of cash transfers in PDS, starting with large cities with
more than 1mn population; extending it to grain surplus states, and then
giving option to deficit states to opt for cash or physical grain distribution
A transparent liquidation policy for excess FCI stocks
India Strategy 6 April 2015
JM Financial Institutional Securities Limited Page 31
Non-agri Income: Accounts for a significant share
Weakness on low const., mining and economic activity
Share of non-agri income in rural economy has risen over the last few years.
The share of non-agri income has likely increased to 64% of total rural
income. Apart from agriculture, the rural economy is increasingly levered to
mining, manufacturing and construction sectors as well which have seen
their share of rural GDP rise in the last decade. Moderation in construction
activity, uncertainty on mining policy in many states and weakness in rural
agri-income has impacted non-agri incomes in the last two years.
Going forward, the government spending on infrastructure and pick up in
mining and construction activity is very important for rural non-agri
incomes. The new government is intent on rationalizing subsidies but
targeted subsidies through direct benefit transfer and higher devolution to
states (which tend to do higher capital rural expenditure than center) will
continue to support rural non-agri incomes in the medium term.
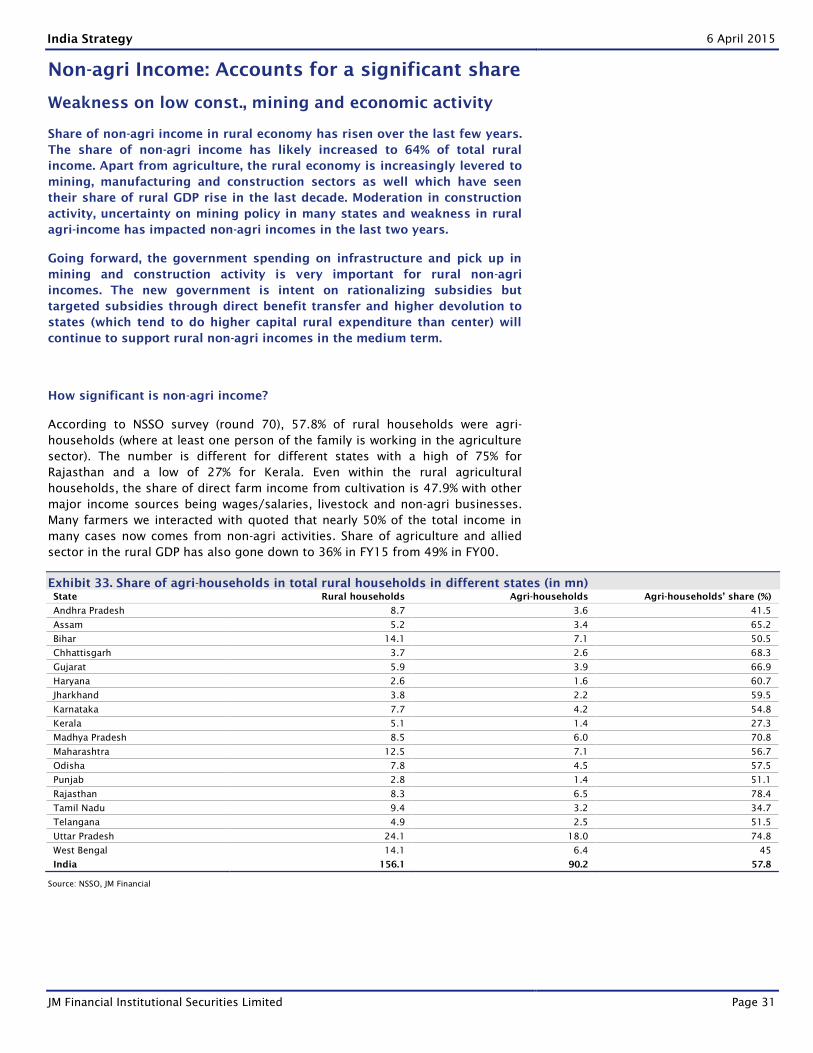
How significant is non-agri income?
According to NSSO survey (round 70), 57.8% of rural households were agri-
households (where at least one person of the family is working in the agriculture
sector). The number is different for different states with a high of 75% for
Rajasthan and a low of 27% for Kerala. Even within the rural agricultural
households, the share of direct farm income from cultivation is 47.9% with other
major income sources being wages/salaries, livestock and non-agri businesses.
Many farmers we interacted with quoted that nearly 50% of the total income in
many cases now comes from non-agri activities. Share of agriculture and allied
sector in the rural GDP has also gone down to 36% in FY15 from 49% in FY00.
Exhibit 33. Share of agri-households in total rural households in different states (in mn)
State Rural households Agri-households Agri-households’ share (%)
Andhra Pradesh 8.7 3.6 41.5
Assam 5.2 3.4 65.2
Bihar 14.1 7.1 50.5
Chhattisgarh 3.7 2.6 68.3
Gujarat 5.9 3.9 66.9
Haryana 2.6 1.6 60.7
Jharkhand 3.8 2.2 59.5
Karnataka 7.7 4.2 54.8
Kerala 5.1 1.4 27.3
Madhya Pradesh 8.5 6.0 70.8
Maharashtra 12.5 7.1 56.7
Odisha 7.8 4.5 57.5
Punjab 2.8 1.4 51.1
Rajasthan 8.3 6.5 78.4
Tamil Nadu 9.4 3.2 34.7
Telangana 4.9 2.5 51.5
Uttar Pradesh 24.1 18.0 74.8
West Bengal 14.1 6.4 45
India 156.1 90.2 57.8
Source: NSSO, JM Financial
India Strategy 6 April 2015
JM Financial Institutional Securities Limited Page 32
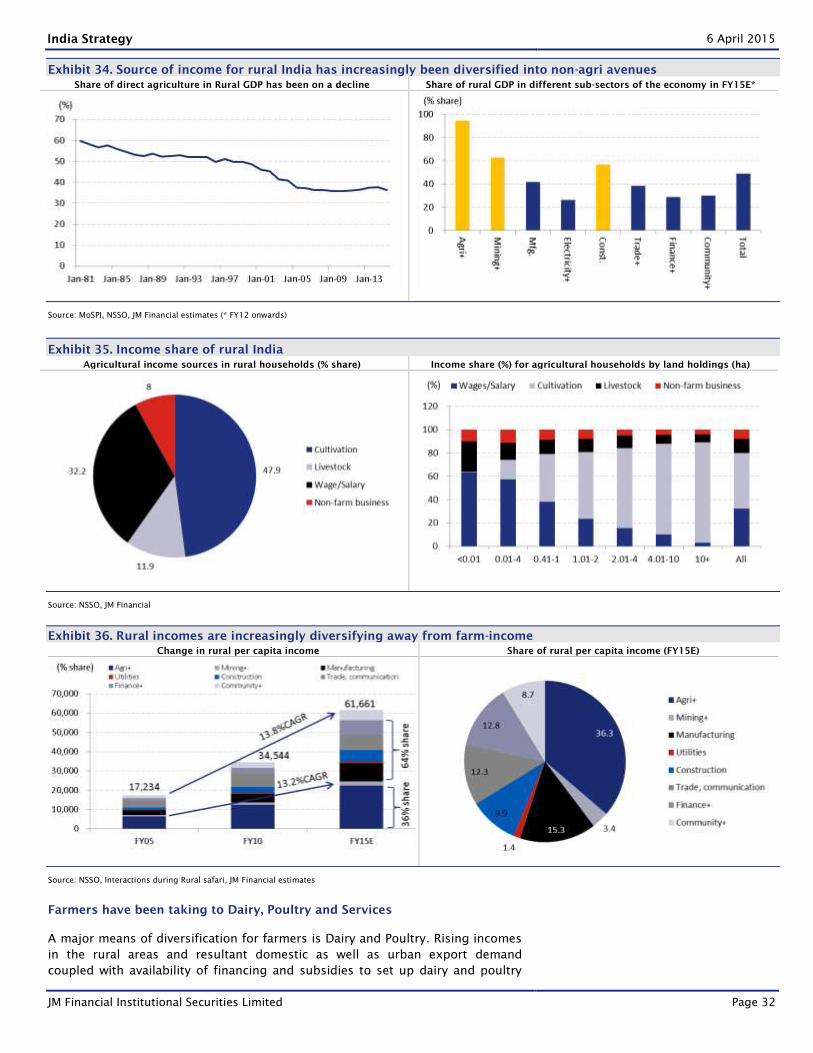
Exhibit 34. Source of income for rural India has increasingly been diversified into non-agri avenues
Share of direct agriculture in Rural GDP has been on a decline Share of rural GDP in different sub-sectors of the economy in FY15E*
Source: MoSPI, NSSO, JM Financial estimates (* FY12 onwards)
Exhibit 35. Income share of rural India
Agricultural income sources in rural households (% share) Income share (%) for agricultural households by land holdings (ha)
Source: NSSO, JM Financial
Exhibit 36. Rural incomes are increasingly diversifying away from farm-income
Change in rural per capita income Share of rural per capita income (FY15E)
Source: NSSO, Interactions during Rural safari, JM Financial estimates
Farmers have been taking to Dairy, Poultry and Services
A major means of diversification for farmers is Dairy and Poultry. Rising incomes
in the rural areas and resultant domestic as well as urban export demand
coupled with availability of financing and subsidies to set up dairy and poultry
India Strategy 6 April 2015
JM Financial Institutional Securities Limited Page 33
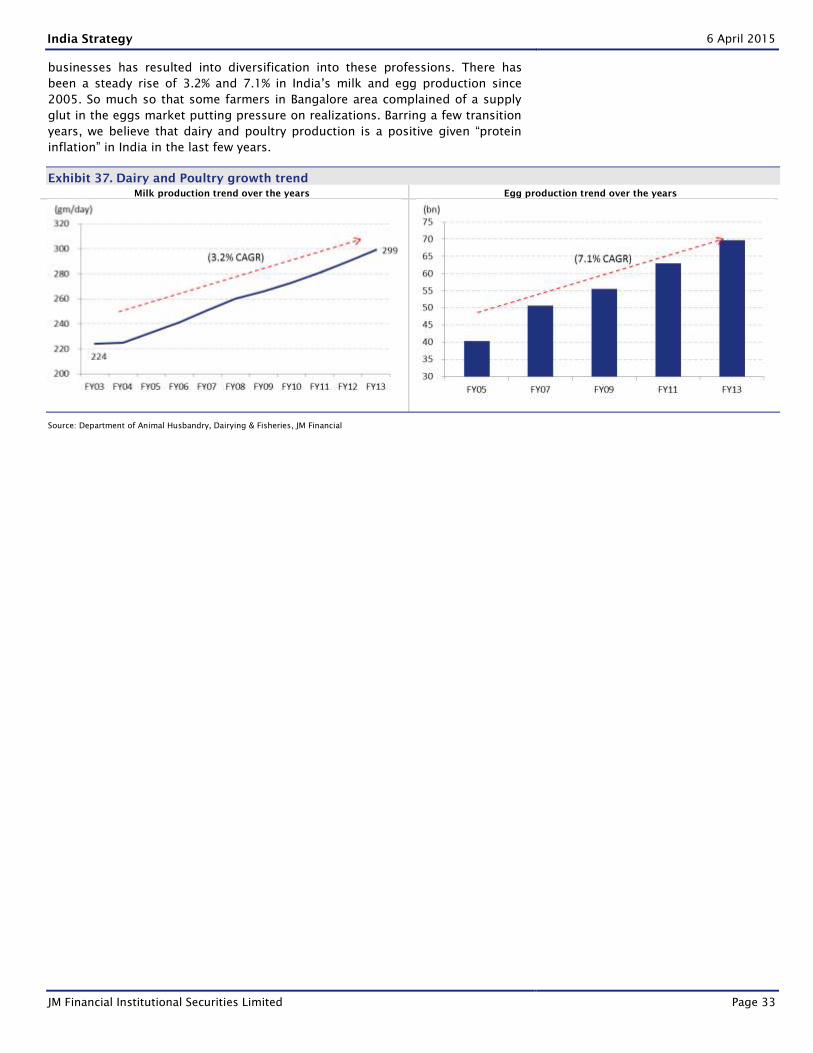
businesses has resulted into diversification into these professions. There has
been a steady rise of 3.2% and 7.1% in India’s milk and egg production since
2005. So much so that some farmers in Bangalore area complained of a supply
glut in the eggs market putting pressure on realizations. Barring a few transition
years, we believe that dairy and poultry production is a positive given “protein
inflation” in India in the last few years.
Exhibit 37. Dairy and Poultry growth trend
Milk production trend over the years Egg production trend over the years
Source: Department of Animal Husbandry, Dairying & Fisheries, JM Financial
India Strategy 6 April 2015
JM Financial Institutional Securities Limited Page 34
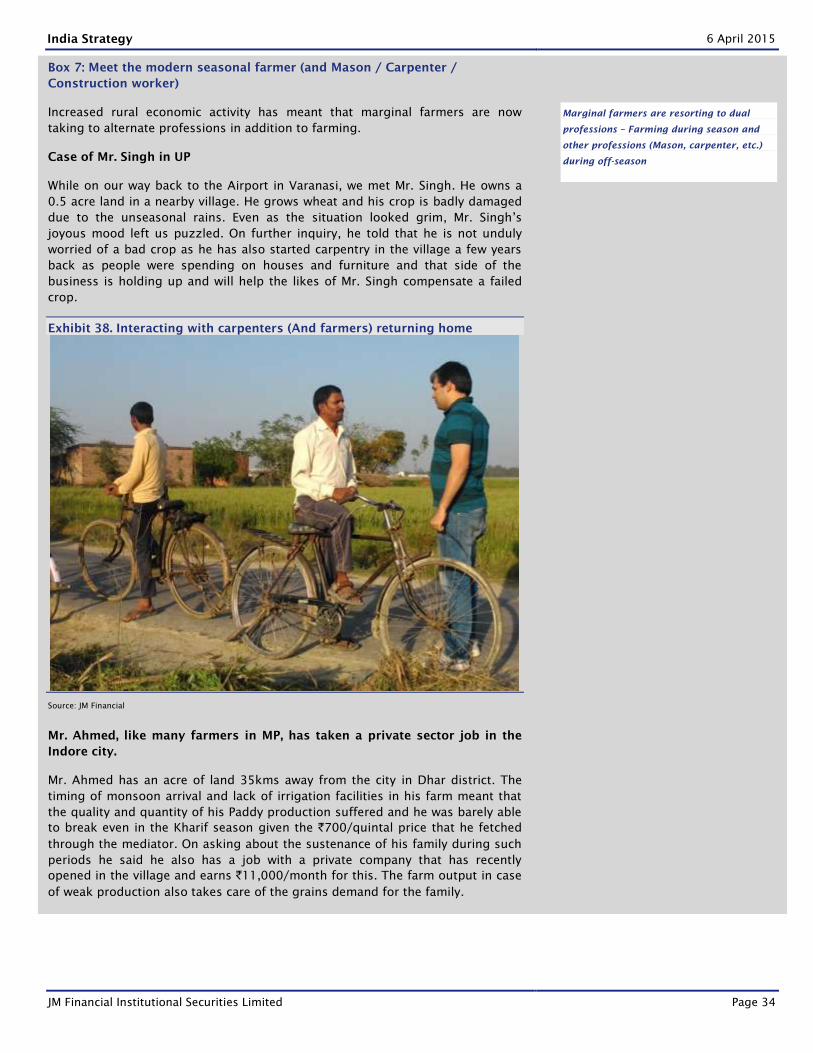
Box 7: Meet the modern seasonal farmer (and Mason / Carpenter /
Construction worker)
Increased rural economic activity has meant that marginal farmers are now
taking to alternate professions in addition to farming.
Case of Mr. Singh in UP
While on our way back to the Airport in Varanasi, we met Mr. Singh. He owns a
0.5 acre land in a nearby village. He grows wheat and his crop is badly damaged
due to the unseasonal rains. Even as the situation looked grim, Mr. Singh’s
joyous mood left us puzzled. On further inquiry, he told that he is not unduly
worried of a bad crop as he has also started carpentry in the village a few years
back as people were spending on houses and furniture and that side of the
business is holding up and will help the likes of Mr. Singh compensate a failed
crop.
Exhibit 38. Interacting with carpenters (And farmers) returning home
Source: JM Financial
Mr. Ahmed, like many farmers in MP, has taken a private sector job in the
Indore city.
Mr. Ahmed has an acre of land 35kms away from the city in Dhar district. The
timing of monsoon arrival and lack of irrigation facilities in his farm meant that
the quality and quantity of his Paddy production suffered and he was barely able
to break even in the Kharif season given the `700/quintal price that he fetched
through the mediator. On asking about the sustenance of his family during such
periods he said he also has a job with a private company that has recently
opened in the village and earns `11,000/month for this. The farm output in case
of weak production also takes care of the grains demand for the family.
Marginal farmers are resorting to dual
professions – Farming during season and
other professions (Mason, carpenter, etc.)
during off-season
India Strategy 6 April 2015
JM Financial Institutional Securities Limited Page 35
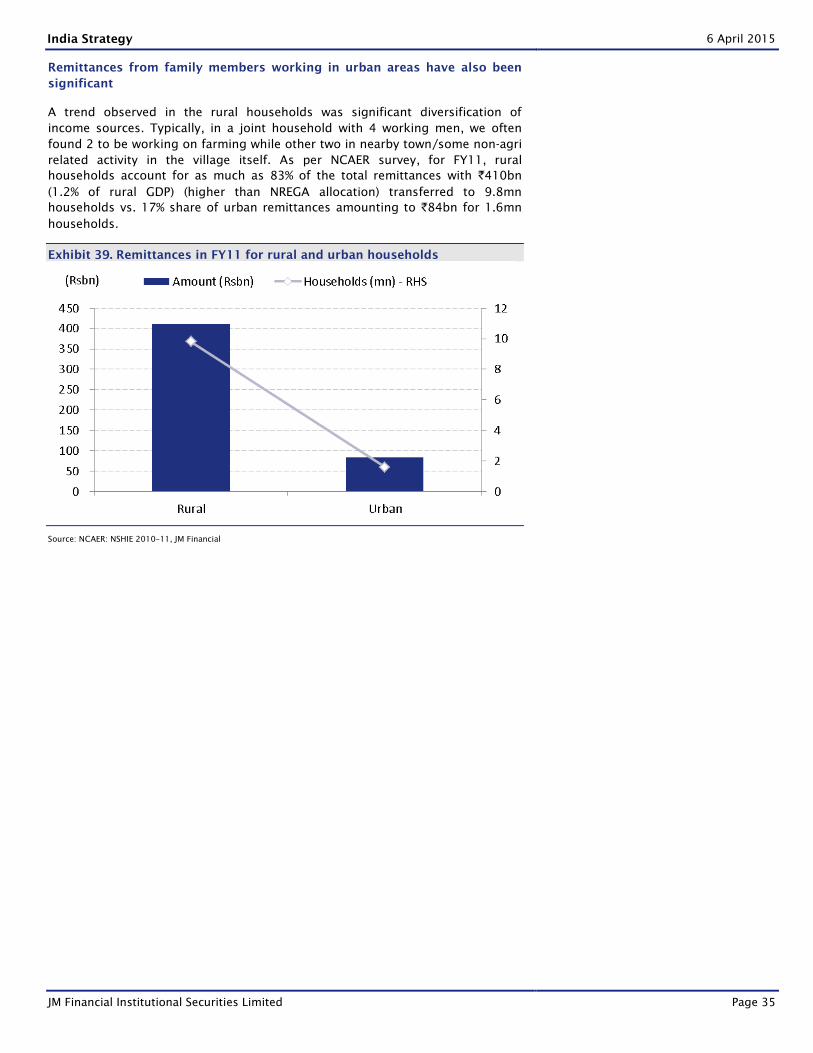
Remittances from family members working in urban areas have also been
significant
A trend observed in the rural households was significant diversification of
income sources. Typically, in a joint household with 4 working men, we often
found 2 to be working on farming while other two in nearby town/some non-agri
related activity in the village itself. As per NCAER survey, for FY11, rural
households account for as much as 83% of the total remittances with `410bn
(1.2% of rural GDP) (higher than NREGA allocation) transferred to 9.8mn
households vs. 17% share of urban remittances amounting to `84bn for 1.6mn
households.
Exhibit 39. Remittances in FY11 for rural and urban households
Source: NCAER: NSHIE 2010–11, JM Financial
India Strategy 6 April 2015
JM Financial Institutional Securities Limited Page 36
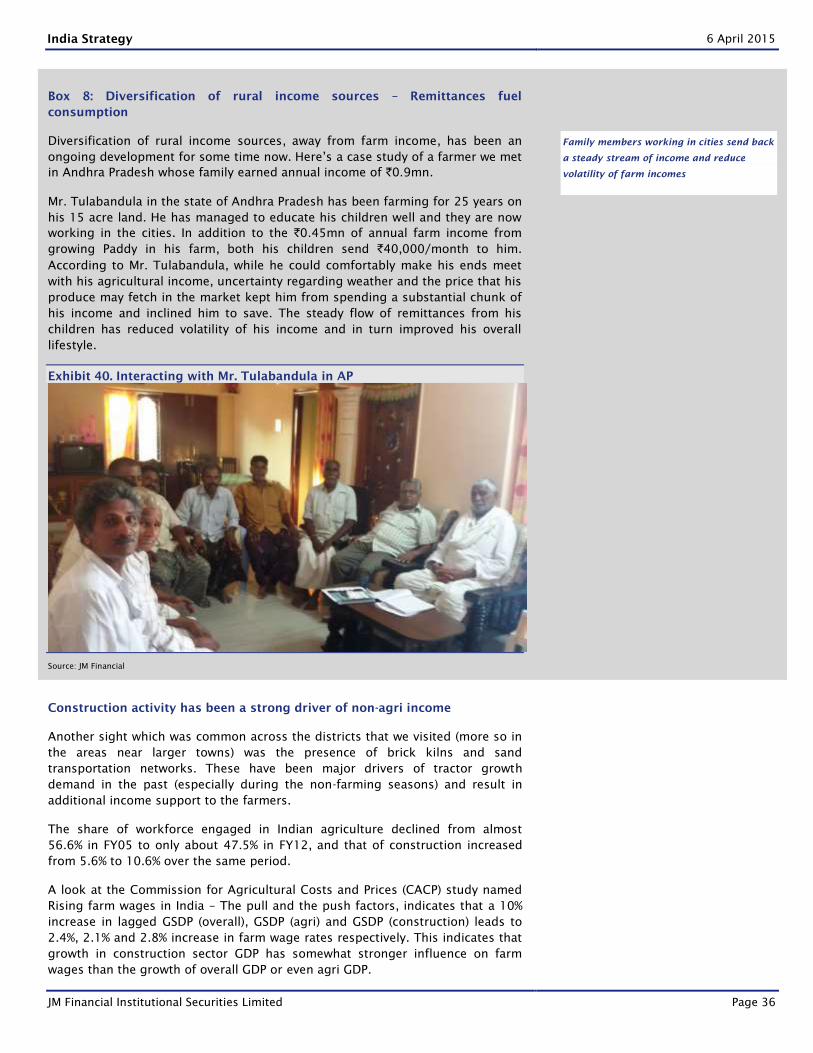
Box 8: Diversification of rural income sources – Remittances fuel
consumption
Diversification of rural income sources, away from farm income, has been an
ongoing development for some time now. Here’s a case study of a farmer we met
in Andhra Pradesh whose family earned annual income of `0.9mn.
Mr. Tulabandula in the state of Andhra Pradesh has been farming for 25 years on
his 15 acre land. He has managed to educate his children well and they are now
working in the cities. In addition to the `0.45mn of annual farm income from
growing Paddy in his farm, both his children send `40,000/month to him.
According to Mr. Tulabandula, while he could comfortably make his ends meet
with his agricultural income, uncertainty regarding weather and the price that his
produce may fetch in the market kept him from spending a substantial chunk of
his income and inclined him to save. The steady flow of remittances from his
children has reduced volatility of his income and in turn improved his overall
lifestyle.
Exhibit 40. Interacting with Mr. Tulabandula in AP
Source: JM Financial
Construction activity has been a strong driver of non-agri income
Another sight which was common across the districts that we visited (more so in
the areas near larger towns) was the presence of brick kilns and sand
transportation networks. These have been major drivers of tractor growth
demand in the past (especially during the non-farming seasons) and result in
additional income support to the farmers.
The share of workforce engaged in Indian agriculture declined from almost
56.6% in FY05 to only about 47.5% in FY12, and that of construction increased
from 5.6% to 10.6% over the same period.
A look at the Commission for Agricultural Costs and Prices (CACP) study named
Rising farm wages in India – The pull and the push factors, indicates that a 10%
increase in lagged GSDP (overall), GSDP (agri) and GSDP (construction) leads to
2.4%, 2.1% and 2.8% increase in farm wage rates respectively. This indicates that
growth in construction sector GDP has somewhat stronger influence on farm
wages than the growth of overall GDP or even agri GDP.
Family members working in cities send back
a steady stream of income and reduce
volatility of farm incomes
India Strategy 6 April 2015
JM Financial Institutional Securities Limited Page 37
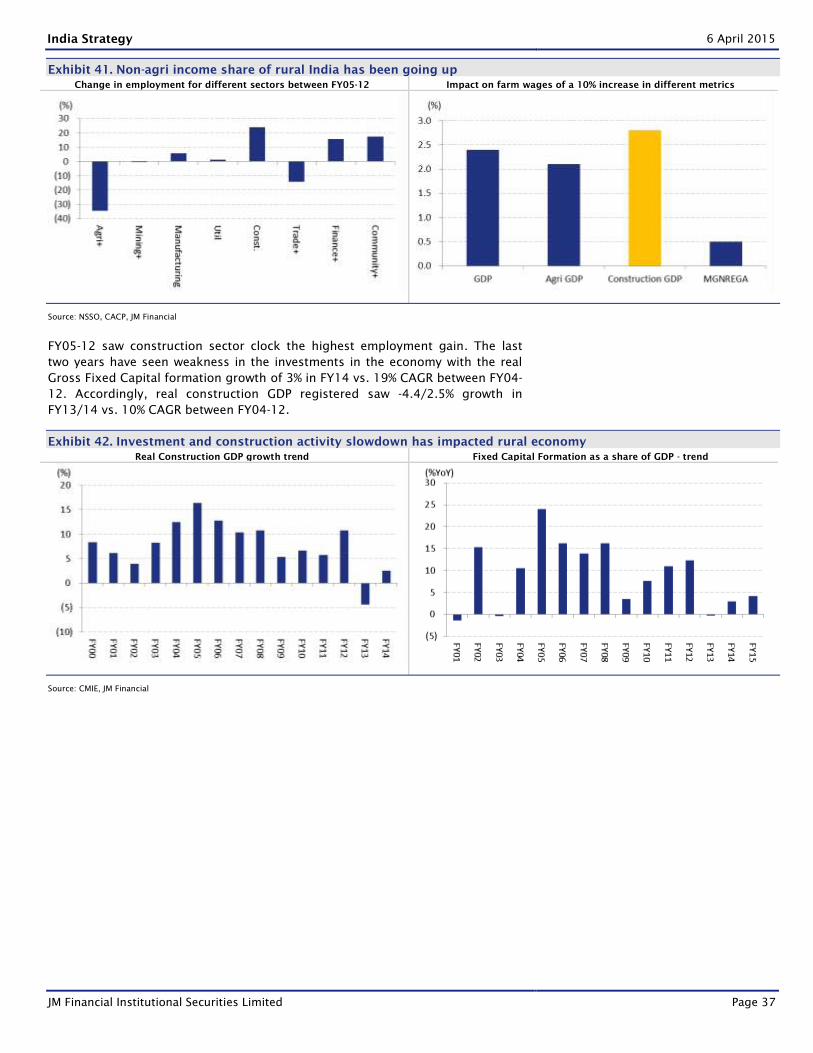
Exhibit 41. Non-agri income share of rural India has been going up
Change in employment for different sectors between FY05-12 Impact on farm wages of a 10% increase in different metrics
Source: NSSO, CACP, JM Financial
FY05-12 saw construction sector clock the highest employment gain. The last
two years have seen weakness in the investments in the economy with the real
Gross Fixed Capital formation growth of 3% in FY14 vs. 19% CAGR between FY04-
12. Accordingly, real construction GDP registered saw -4.4/2.5% growth in
FY13/14 vs. 10% CAGR between FY04-12.
Exhibit 42. Investment and construction activity slowdown has impacted rural economy
Real Construction GDP growth trend Fixed Capital Formation as a share of GDP - trend
Source: CMIE, JM Financial
India Strategy 6 April 2015
JM Financial Institutional Securities Limited Page 38
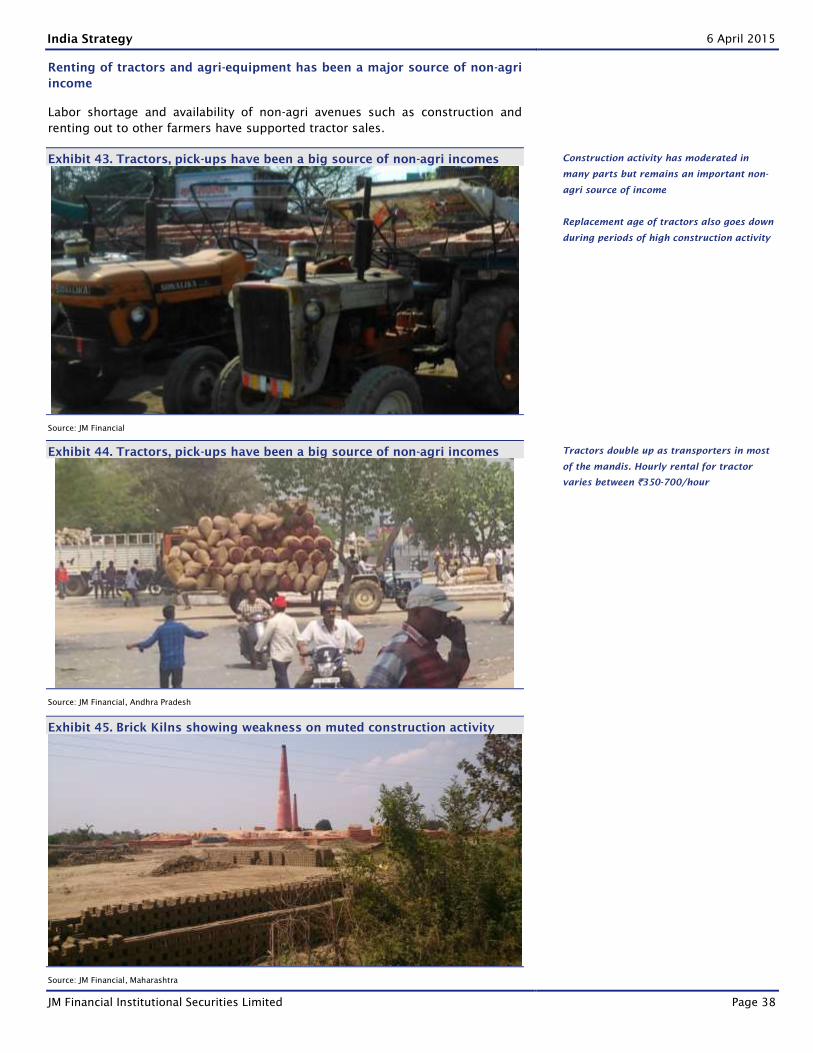
Renting of tractors and agri-equipment has been a major source of non-agri
income
Labor shortage and availability of non-agri avenues such as construction and
renting out to other farmers have supported tractor sales.
Exhibit 43. Tractors, pick-ups have been a big source of non-agri incomes
Source: JM Financial
Exhibit 44. Tractors, pick-ups have been a big source of non-agri incomes
Source: JM Financial, Andhra Pradesh
Exhibit 45. Brick Kilns showing weakness on muted construction activity
Source: JM Financial, Maharashtra
Construction activity has moderated in
many parts but remains an important non-
agri source of income
Replacement age of tractors also goes down
during periods of high construction activity
Tractors double up as transporters in most
of the mandis. Hourly rental for tractor
varies between `350-700/hour
India Strategy 6 April 2015
JM Financial Institutional Securities Limited Page 39
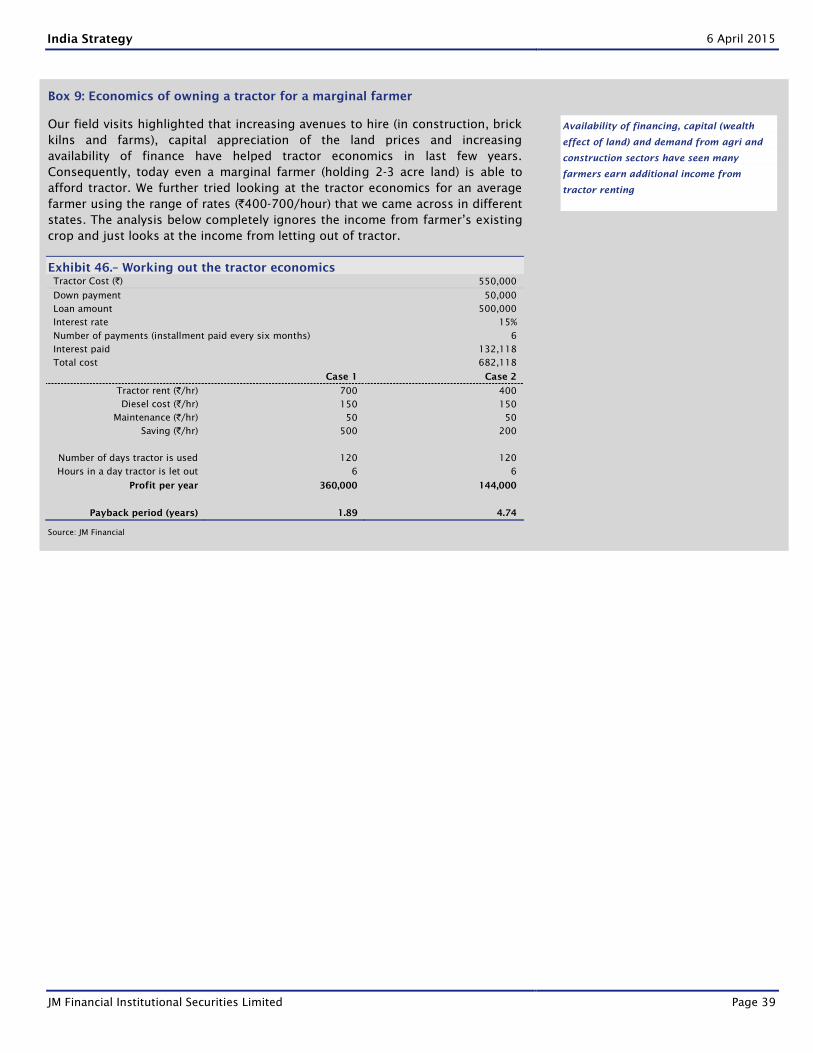
Box 9: Economics of owning a tractor for a marginal farmer
Our field visits highlighted that increasing avenues to hire (in construction, brick
kilns and farms), capital appreciation of the land prices and increasing
availability of finance have helped tractor economics in last few years.
Consequently, today even a marginal farmer (holding 2-3 acre land) is able to
afford tractor. We further tried looking at the tractor economics for an average
farmer using the range of rates (`400-700/hour) that we came across in different
states. The analysis below completely ignores the income from farmer’s existing
crop and just looks at the income from letting out of tractor.
Exhibit 46.– Working out the tractor economics
Tractor Cost (`) 550,000
Down payment 50,000
Loan amount 500,000
Interest rate 15%
Number of payments (installment paid every six months) 6
Interest paid 132,118
Total cost 682,118
Case 1 Case 2
Tractor rent (`/hr) 700 400
Diesel cost (`/hr) 150 150
Maintenance (`/hr) 50 50
Saving (`/hr) 500 200
Number of days tractor is used 120 120
Hours in a day tractor is let out 6 6
Profit per year 360,000 144,000
Payback period (years) 1.89 4.74
Source: JM Financial
Availability of financing, capital (wealth
effect of land) and demand from agri and
construction sectors have seen many
farmers earn additional income from
tractor renting
India Strategy 6 April 2015
JM Financial Institutional Securities Limited Page 40
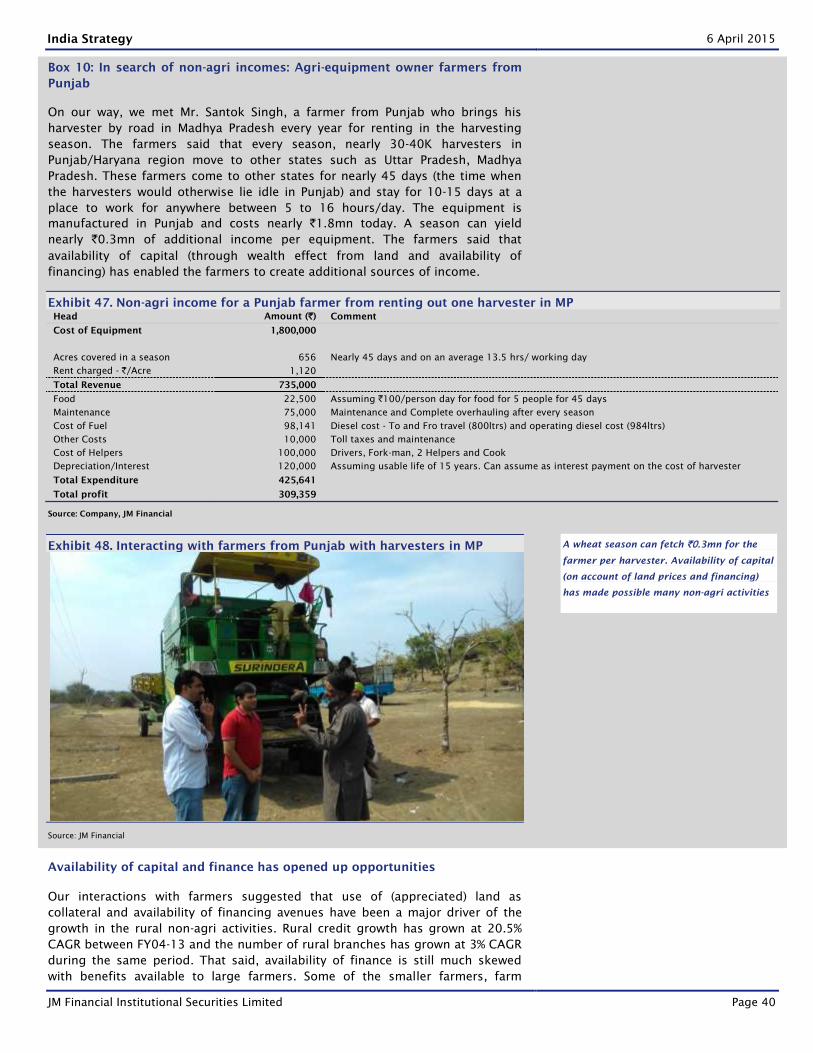
Box 10: In search of non-agri incomes: Agri-equipment owner farmers from
Punjab
On our way, we met Mr. Santok Singh, a farmer from Punjab who brings his
harvester by road in Madhya Pradesh every year for renting in the harvesting
season. The farmers said that every season, nearly 30-40K harvesters in
Punjab/Haryana region move to other states such as Uttar Pradesh, Madhya
Pradesh. These farmers come to other states for nearly 45 days (the time when
the harvesters would otherwise lie idle in Punjab) and stay for 10-15 days at a
place to work for anywhere between 5 to 16 hours/day. The equipment is
manufactured in Punjab and costs nearly `1.8mn today. A season can yield
nearly `0.3mn of additional income per equipment. The farmers said that
availability of capital (through wealth effect from land and availability of
financing) has enabled the farmers to create additional sources of income.
Exhibit 47. Non-agri income for a Punjab farmer from renting out one harvester in MP
Head Amount (`) Comment
Cost of Equipment 1,800,000
Acres covered in a season 656 Nearly 45 days and on an average 13.5 hrs/ working day
Rent charged - `/Acre 1,120
Total Revenue 735,000
Food 22,500 Assuming `100/person day for food for 5 people for 45 days
Maintenance 75,000 Maintenance and Complete overhauling after every season
Cost of Fuel 98,141 Diesel cost - To and Fro travel (800ltrs) and operating diesel cost (984ltrs)
Other Costs 10,000 Toll taxes and maintenance
Cost of Helpers 100,000 Drivers, Fork-man, 2 Helpers and Cook
Depreciation/Interest 120,000 Assuming usable life of 15 years. Can assume as interest payment on the cost of harvester
Total Expenditure 425,641
Total profit 309,359
Source: Company, JM Financial
Exhibit 48. Interacting with farmers from Punjab with harvesters in MP
Source: JM Financial
Availability of capital and finance has opened up opportunities
Our interactions with farmers suggested that use of (appreciated) land as
collateral and availability of financing avenues have been a major driver of the
growth in the rural non-agri activities. Rural credit growth has grown at 20.5%
CAGR between FY04-13 and the number of rural branches has grown at 3% CAGR
during the same period. That said, availability of finance is still much skewed
with benefits available to large farmers. Some of the smaller farmers, farm
A wheat season can fetch `0.3mn for the
farmer per harvester. Availability of capital
(on account of land prices and financing)
has made possible many non-agri activities
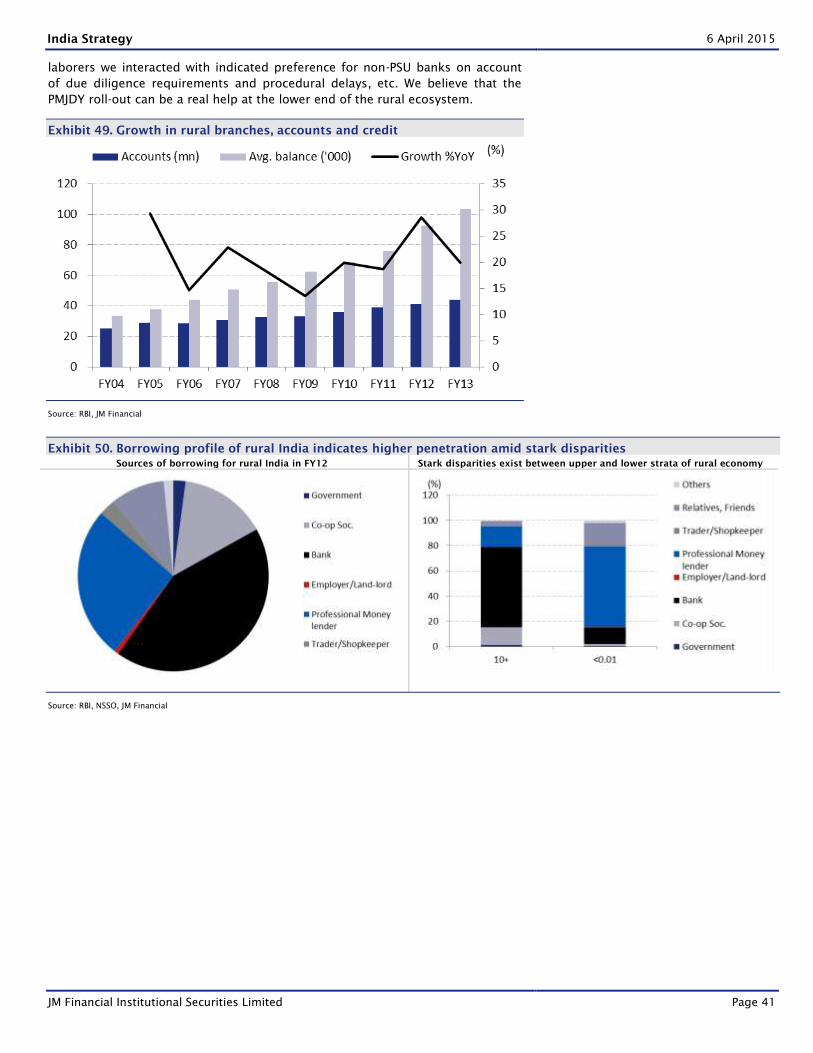
India Strategy 6 April 2015
JM Financial Institutional Securities Limited Page 41
laborers we interacted with indicated preference for non-PSU banks on account
of due diligence requirements and procedural delays, etc. We believe that the
PMJDY roll-out can be a real help at the lower end of the rural ecosystem.
Exhibit 49. Growth in rural branches, accounts and credit
Source: RBI, JM Financial
Exhibit 50. Borrowing profile of rural India indicates higher penetration amid stark disparities
Sources of borrowing for rural India in FY12 Stark disparities exist between upper and lower strata of rural economy
Source: RBI, NSSO, JM Financial
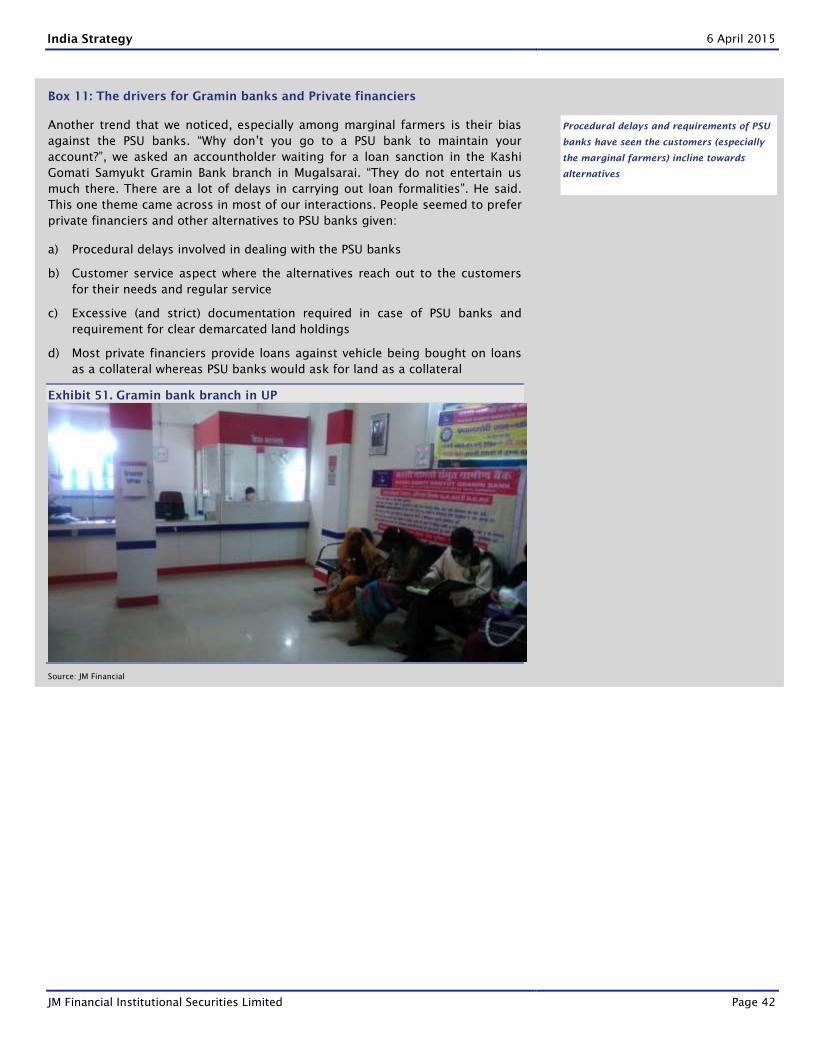
India Strategy 6 April 2015
JM Financial Institutional Securities Limited Page 42
Box 11: The drivers for Gramin banks and Private financiers
Another trend that we noticed, especially among marginal farmers is their bias
against the PSU banks. “Why don’t you go to a PSU bank to maintain your
account?”, we asked an accountholder waiting for a loan sanction in the Kashi
Gomati Samyukt Gramin Bank branch in Mugalsarai. “They do not entertain us
much there. There are a lot of delays in carrying out loan formalities”. He said.
This one theme came across in most of our interactions. People seemed to prefer
private financiers and other alternatives to PSU banks given:
a) Procedural delays involved in dealing with the PSU banks
b) Customer service aspect where the alternatives reach out to the customers
for their needs and regular service
c) Excessive (and strict) documentation required in case of PSU banks and
requirement for clear demarcated land holdings
d) Most private financiers provide loans against vehicle being bought on loans
as a collateral whereas PSU banks would ask for land as a collateral
Exhibit 51. Gramin bank branch in UP
Source: JM Financial
Procedural delays and requirements of PSU
banks have seen the customers (especially
the marginal farmers) incline towards
alternatives
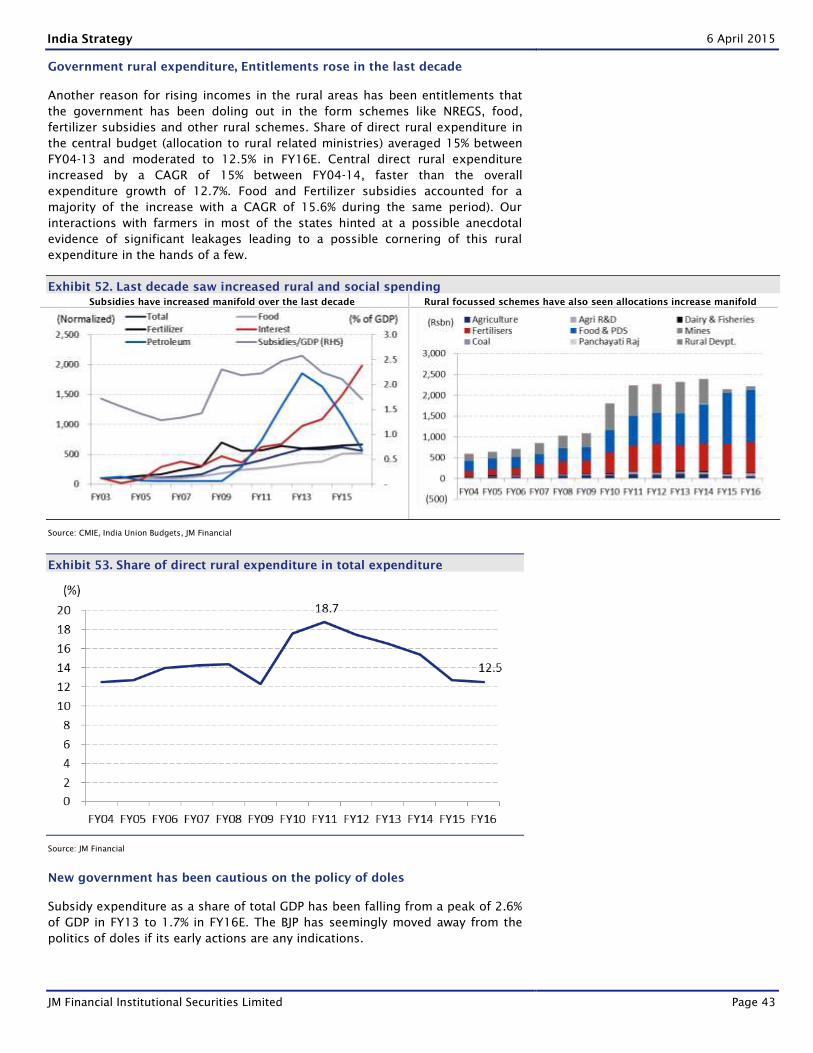
India Strategy 6 April 2015
JM Financial Institutional Securities Limited Page 43
Government rural expenditure, Entitlements rose in the last decade
Another reason for rising incomes in the rural areas has been entitlements that
the government has been doling out in the form schemes like NREGS, food,
fertilizer subsidies and other rural schemes. Share of direct rural expenditure in
the central budget (allocation to rural related ministries) averaged 15% between
FY04-13 and moderated to 12.5% in FY16E. Central direct rural expenditure
increased by a CAGR of 15% between FY04-14, faster than the overall
expenditure growth of 12.7%. Food and Fertilizer subsidies accounted for a
majority of the increase with a CAGR of 15.6% during the same period). Our
interactions with farmers in most of the states hinted at a possible anecdotal
evidence of significant leakages leading to a possible cornering of this rural
expenditure in the hands of a few.
Exhibit 52. Last decade saw increased rural and social spending
Subsidies have increased manifold over the last decade Rural focussed schemes have also seen allocations increase manifold
Source: CMIE, India Union Budgets, JM Financial
Exhibit 53. Share of direct rural expenditure in total expenditure
Source: JM Financial
New government has been cautious on the policy of doles
Subsidy expenditure as a share of total GDP has been falling from a peak of 2.6%
of GDP in FY13 to 1.7% in FY16E. The BJP has seemingly moved away from the
politics of doles if its early actions are any indications.
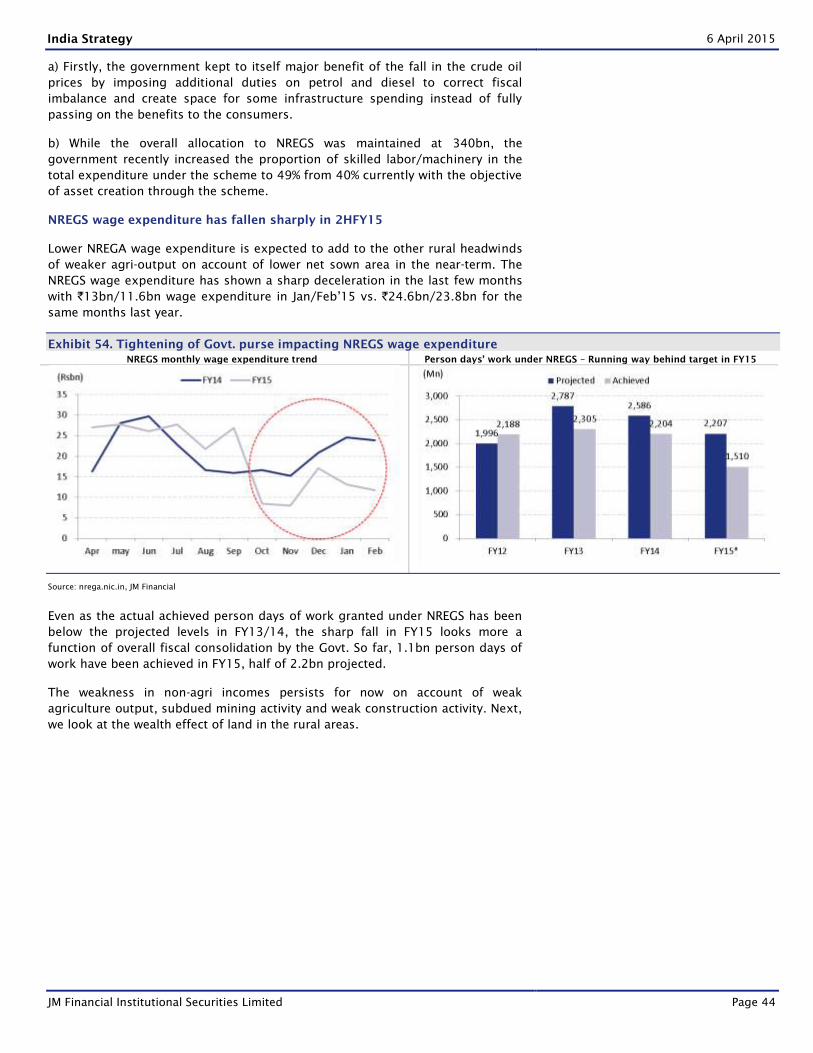
India Strategy 6 April 2015
JM Financial Institutional Securities Limited Page 44
a) Firstly, the government kept to itself major benefit of the fall in the crude oil
prices by imposing additional duties on petrol and diesel to correct fiscal
imbalance and create space for some infrastructure spending instead of fully
passing on the benefits to the consumers.
b) While the overall allocation to NREGS was maintained at 340bn, the
government recently increased the proportion of skilled labor/machinery in the
total expenditure under the scheme to 49% from 40% currently with the objective
of asset creation through the scheme.
NREGS wage expenditure has fallen sharply in 2HFY15
Lower NREGA wage expenditure is expected to add to the other rural headwinds
of weaker agri-output on account of lower net sown area in the near-term. The
NREGS wage expenditure has shown a sharp deceleration in the last few months
with `13bn/11.6bn wage expenditure in Jan/Feb’15 vs. `24.6bn/23.8bn for the
same months last year.
Exhibit 54. Tightening of Govt. purse impacting NREGS wage expenditure
NREGS monthly wage expenditure trend Person days’ work under NREGS – Running way behind target in FY15
Source: nrega.nic.in, JM Financial
Even as the actual achieved person days of work granted under NREGS has been
below the projected levels in FY13/14, the sharp fall in FY15 looks more a
function of overall fiscal consolidation by the Govt. So far, 1.1bn person days of
work have been achieved in FY15, half of 2.2bn projected.
The weakness in non-agri incomes persists for now on account of weak
agriculture output, subdued mining activity and weak construction activity. Next,
we look at the wealth effect of land in the rural areas.
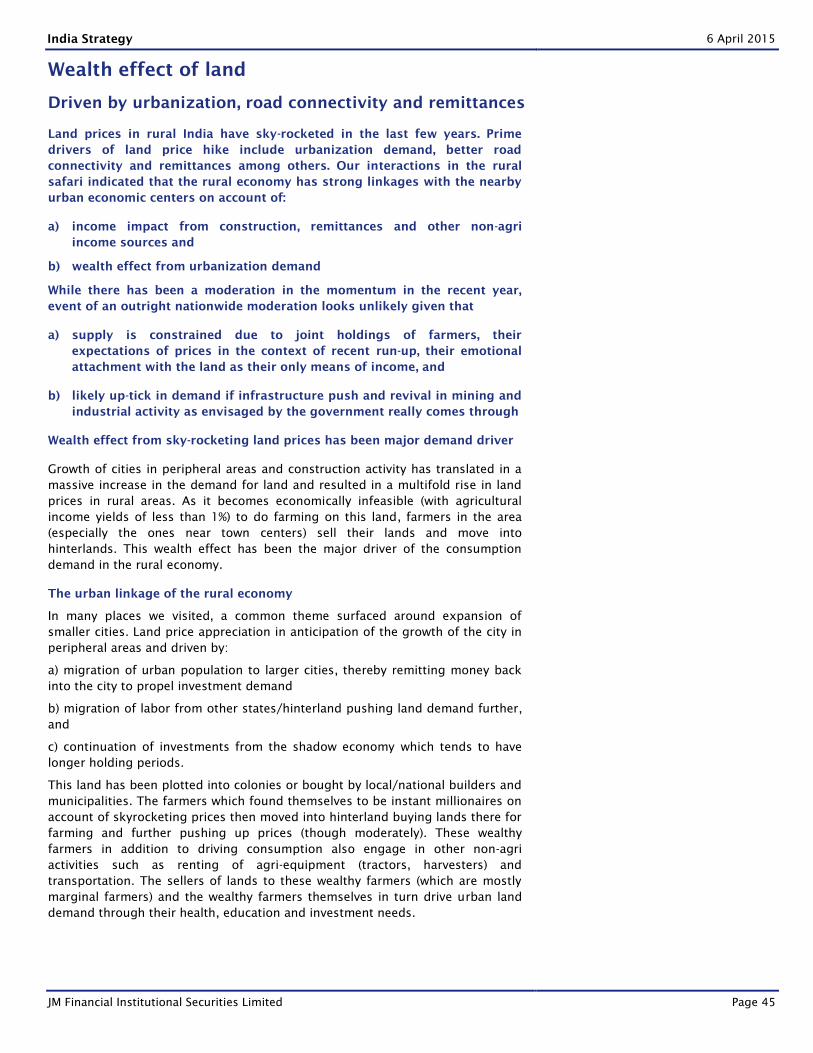
India Strategy 6 April 2015
JM Financial Institutional Securities Limited Page 45
Wealth effect of land
Driven by urbanization, road connectivity and remittances
Land prices in rural India have sky-rocketed in the last few years. Prime
drivers of land price hike include urbanization demand, better road
connectivity and remittances among others. Our interactions in the rural
safari indicated that the rural economy has strong linkages with the nearby
urban economic centers on account of:
a) income impact from construction, remittances and other non-agri
income sources and
b) wealth effect from urbanization demand
While there has been a moderation in the momentum in the recent year,
event of an outright nationwide moderation looks unlikely given that
a) supply is constrained due to joint holdings of farmers, their
expectations of prices in the context of recent run-up, their emotional
attachment with the land as their only means of income, and
b) likely up-tick in demand if infrastructure push and revival in mining and
industrial activity as envisaged by the government really comes through
Wealth effect from sky-rocketing land prices has been major demand driver
Growth of cities in peripheral areas and construction activity has translated in a
massive increase in the demand for land and resulted in a multifold rise in land
prices in rural areas. As it becomes economically infeasible (with agricultural
income yields of less than 1%) to do farming on this land, farmers in the area
(especially the ones near town centers) sell their lands and move into
hinterlands. This wealth effect has been the major driver of the consumption
demand in the rural economy.
The urban linkage of the rural economy
In many places we visited, a common theme surfaced around expansion of
smaller cities. Land price appreciation in anticipation of the growth of the city in
peripheral areas and driven by:
a) migration of urban population to larger cities, thereby remitting money back
into the city to propel investment demand
b) migration of labor from other states/hinterland pushing land demand further,
and
c) continuation of investments from the shadow economy which tends to have
longer holding periods.
This land has been plotted into colonies or bought by local/national builders and
municipalities. The farmers which found themselves to be instant millionaires on
account of skyrocketing prices then moved into hinterland buying lands there for
farming and further pushing up prices (though moderately). These wealthy
farmers in addition to driving consumption also engage in other non-agri
activities such as renting of agri-equipment (tractors, harvesters) and
transportation. The sellers of lands to these wealthy farmers (which are mostly
marginal farmers) and the wealthy farmers themselves in turn drive urban land
demand through their health, education and investment needs.
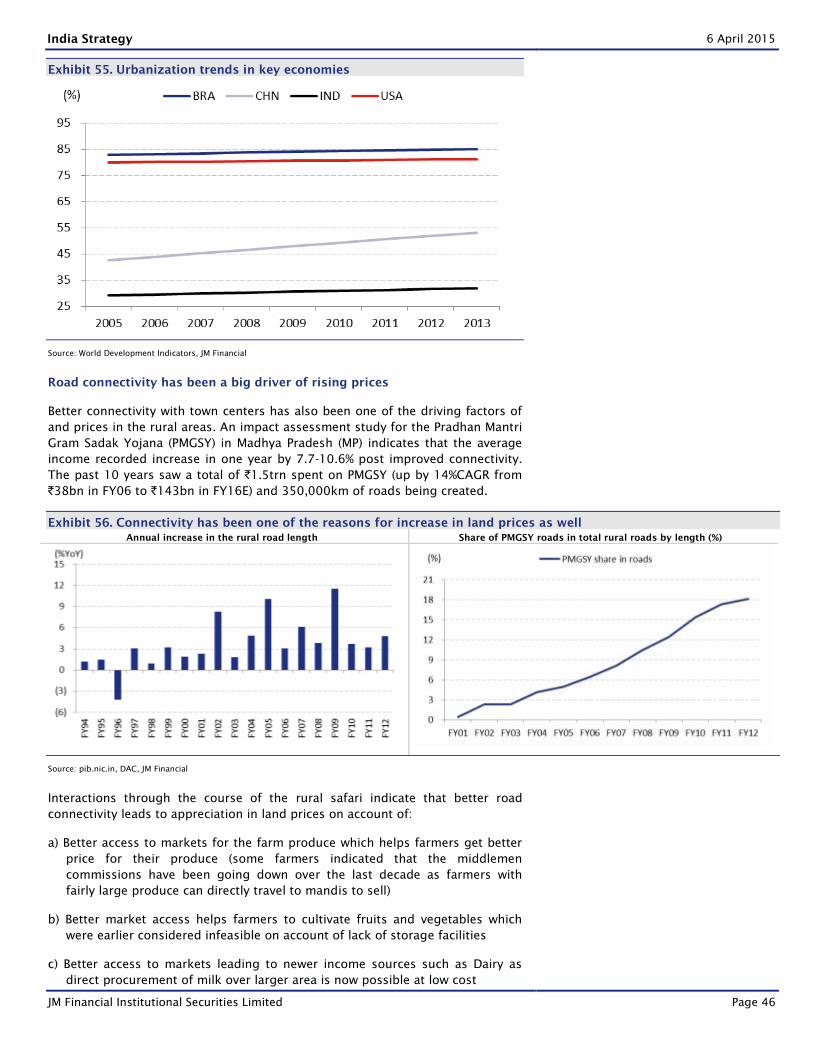
India Strategy 6 April 2015
JM Financial Institutional Securities Limited Page 46
Exhibit 55. Urbanization trends in key economies
Source: World Development Indicators, JM Financial
Road connectivity has been a big driver of rising prices
Better connectivity with town centers has also been one of the driving factors of
and prices in the rural areas. An impact assessment study for the Pradhan Mantri
Gram Sadak Yojana (PMGSY) in Madhya Pradesh (MP) indicates that the average
income recorded increase in one year by 7.7-10.6% post improved connectivity.
The past 10 years saw a total of `1.5trn spent on PMGSY (up by 14%CAGR from
`38bn in FY06 to `143bn in FY16E) and 350,000km of roads being created.
Exhibit 56. Connectivity has been one of the reasons for increase in land prices as well
Annual increase in the rural road length Share of PMGSY roads in total rural roads by length (%)
Source: pib.nic.in, DAC, JM Financial
Interactions through the course of the rural safari indicate that better road
connectivity leads to appreciation in land prices on account of:
a) Better access to markets for the farm produce which helps farmers get better
price for their produce (some farmers indicated that the middlemen
commissions have been going down over the last decade as farmers with
fairly large produce can directly travel to mandis to sell)
b) Better market access helps farmers to cultivate fruits and vegetables which
were earlier considered infeasible on account of lack of storage facilities
c) Better access to markets leading to newer income sources such as Dairy as
direct procurement of milk over larger area is now possible at low cost
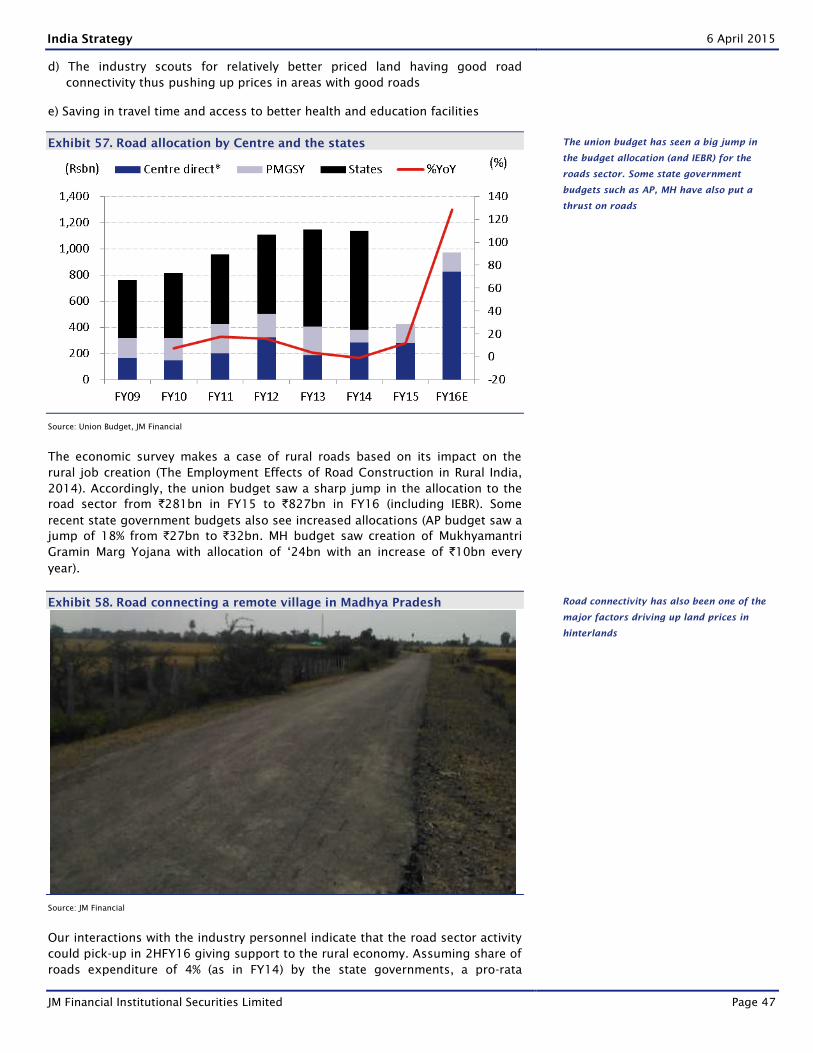
India Strategy 6 April 2015
JM Financial Institutional Securities Limited Page 47
d) The industry scouts for relatively better priced land having good road
connectivity thus pushing up prices in areas with good roads
e) Saving in travel time and access to better health and education facilities
Exhibit 57. Road allocation by Centre and the states
Source: Union Budget, JM Financial
The economic survey makes a case of rural roads based on its impact on the
rural job creation (The Employment Effects of Road Construction in Rural India,
2014). Accordingly, the union budget saw a sharp jump in the allocation to the
road sector from `281bn in FY15 to `827bn in FY16 (including IEBR). Some
recent state government budgets also see increased allocations (AP budget saw a
jump of 18% from `27bn to `32bn. MH budget saw creation of Mukhyamantri
Gramin Marg Yojana with allocation of ‘24bn with an increase of `10bn every
year).
Exhibit 58. Road connecting a remote village in Madhya Pradesh
Source: JM Financial
Our interactions with the industry personnel indicate that the road sector activity
could pick-up in 2HFY16 giving support to the rural economy. Assuming share of
roads expenditure of 4% (as in FY14) by the state governments, a pro-rata
The union budget has seen a big jump in
the budget allocation (and IEBR) for the
roads sector. Some state government
budgets such as AP, MH have also put a
thrust on roads
Road connectivity has also been one of the
major factors driving up land prices in
hinterlands
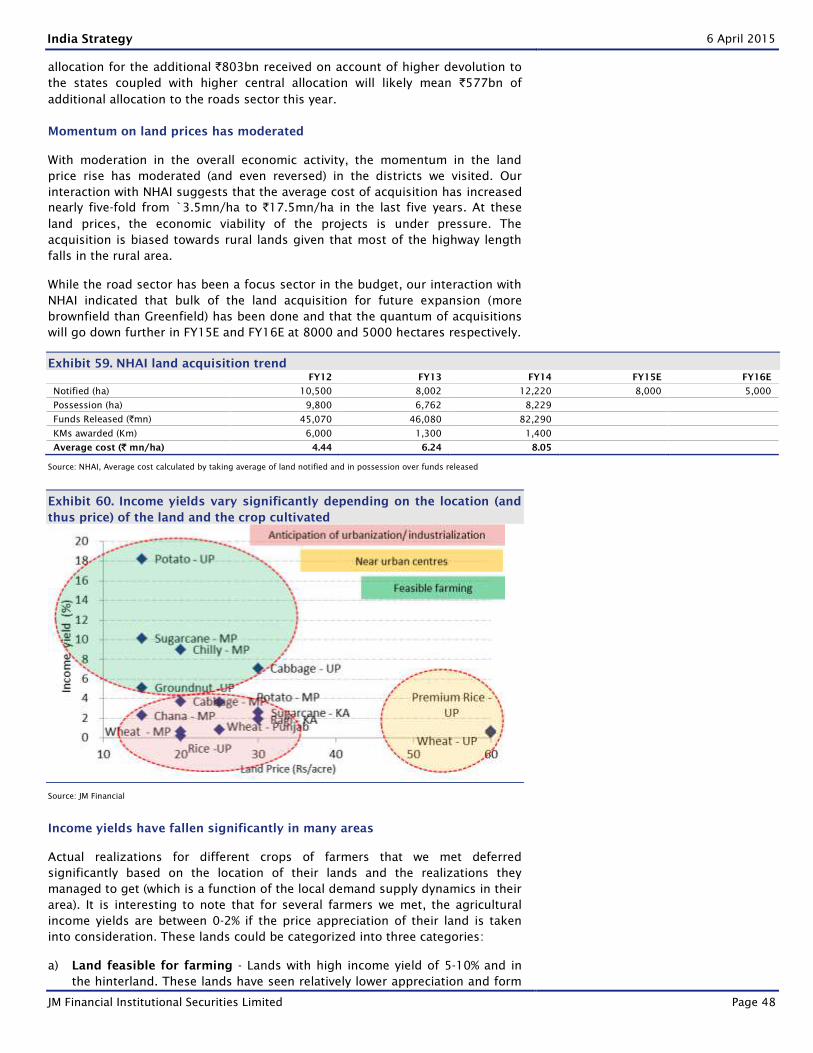
India Strategy 6 April 2015
JM Financial Institutional Securities Limited Page 48
allocation for the additional `803bn received on account of higher devolution to
the states coupled with higher central allocation will likely mean `577bn of
additional allocation to the roads sector this year.
Momentum on land prices has moderated
With moderation in the overall economic activity, the momentum in the land
price rise has moderated (and even reversed) in the districts we visited. Our
interaction with NHAI suggests that the average cost of acquisition has increased
nearly five-fold from `3.5mn/ha to `17.5mn/ha in the last five years. At these
land prices, the economic viability of the projects is under pressure. The
acquisition is biased towards rural lands given that most of the highway length
falls in the rural area.
While the road sector has been a focus sector in the budget, our interaction with
NHAI indicated that bulk of the land acquisition for future expansion (more
brownfield than Greenfield) has been done and that the quantum of acquisitions
will go down further in FY15E and FY16E at 8000 and 5000 hectares respectively.
Exhibit 59. NHAI land acquisition trend
FY12 FY13 FY14 FY15E FY16E
Notified (ha) 10,500 8,002 12,220 8,000 5,000
Possession (ha) 9,800 6,762 8,229
Funds Released (`mn) 45,070 46,080 82,290
KMs awarded (Km) 6,000 1,300 1,400
Average cost (` mn/ha) 4.44 6.24 8.05
Source: NHAI, Average cost calculated by taking average of land notified and in possession over funds released
Exhibit 60. Income yields vary significantly depending on the location (and
thus price) of the land and the crop cultivated
Source: JM Financial
Income yields have fallen significantly in many areas
Actual realizations for different crops of farmers that we met deferred
significantly based on the location of their lands and the realizations they
managed to get (which is a function of the local demand supply dynamics in their
area). It is interesting to note that for several farmers we met, the agricultural
income yields are between 0-2% if the price appreciation of their land is taken
into consideration. These lands could be categorized into three categories:
a) Land feasible for farming - Lands with high income yield of 5-10% and in
the hinterland. These lands have seen relatively lower appreciation and form
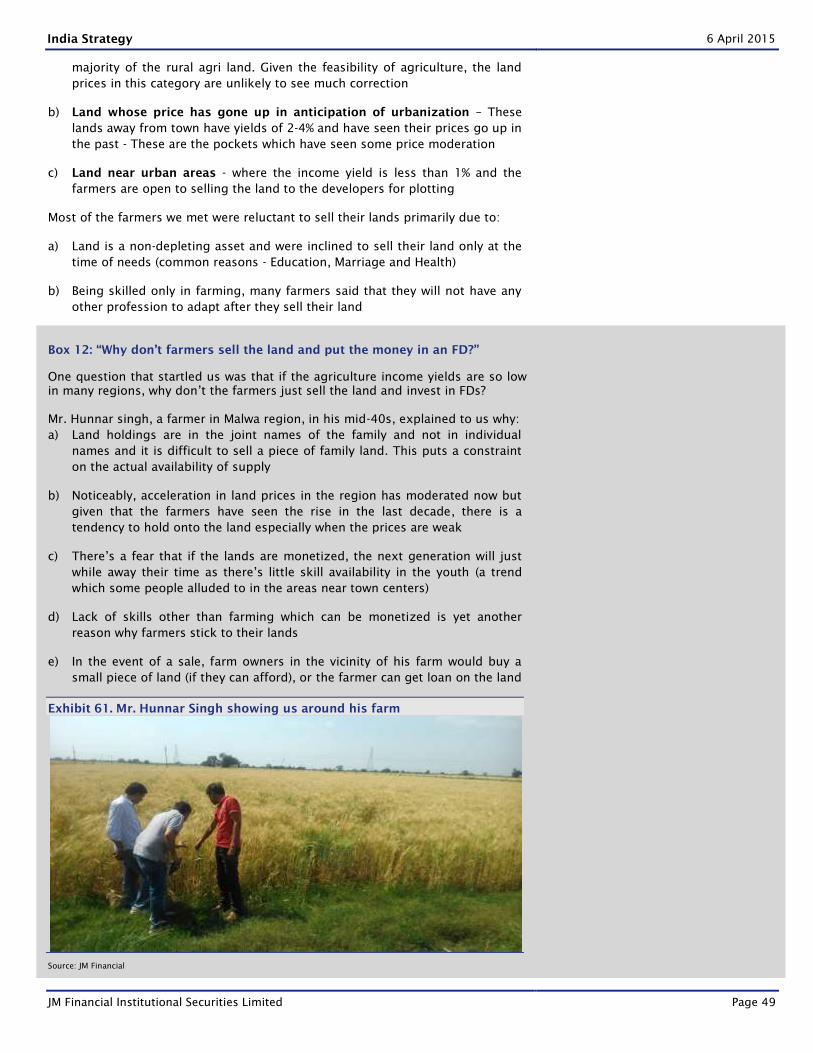
India Strategy 6 April 2015
JM Financial Institutional Securities Limited Page 49
majority of the rural agri land. Given the feasibility of agriculture, the land
prices in this category are unlikely to see much correction
b) Land whose price has gone up in anticipation of urbanization – These
lands away from town have yields of 2-4% and have seen their prices go up in
the past - These are the pockets which have seen some price moderation
c) Land near urban areas - where the income yield is less than 1% and the
farmers are open to selling the land to the developers for plotting
Most of the farmers we met were reluctant to sell their lands primarily due to:
a) Land is a non-depleting asset and were inclined to sell their land only at the
time of needs (common reasons - Education, Marriage and Health)
b) Being skilled only in farming, many farmers said that they will not have any
other profession to adapt after they sell their land
Box 12: “Why don’t farmers sell the land and put the money in an FD?”
One question that startled us was that if the agriculture income yields are so low
in many regions, why don’t the farmers just sell the land and invest in FDs?
Mr. Hunnar singh, a farmer in Malwa region, in his mid-40s, explained to us why:
a) Land holdings are in the joint names of the family and not in individual
names and it is difficult to sell a piece of family land. This puts a constraint
on the actual availability of supply
b) Noticeably, acceleration in land prices in the region has moderated now but
given that the farmers have seen the rise in the last decade, there is a
tendency to hold onto the land especially when the prices are weak
c) There’s a fear that if the lands are monetized, the next generation will just
while away their time as there’s little skill availability in the youth (a trend
which some people alluded to in the areas near town centers)
d) Lack of skills other than farming which can be monetized is yet another
reason why farmers stick to their lands
e) In the event of a sale, farm owners in the vicinity of his farm would buy a
small piece of land (if they can afford), or the farmer can get loan on the land
Exhibit 61. Mr. Hunnar Singh showing us around his farm
Source: JM Financial
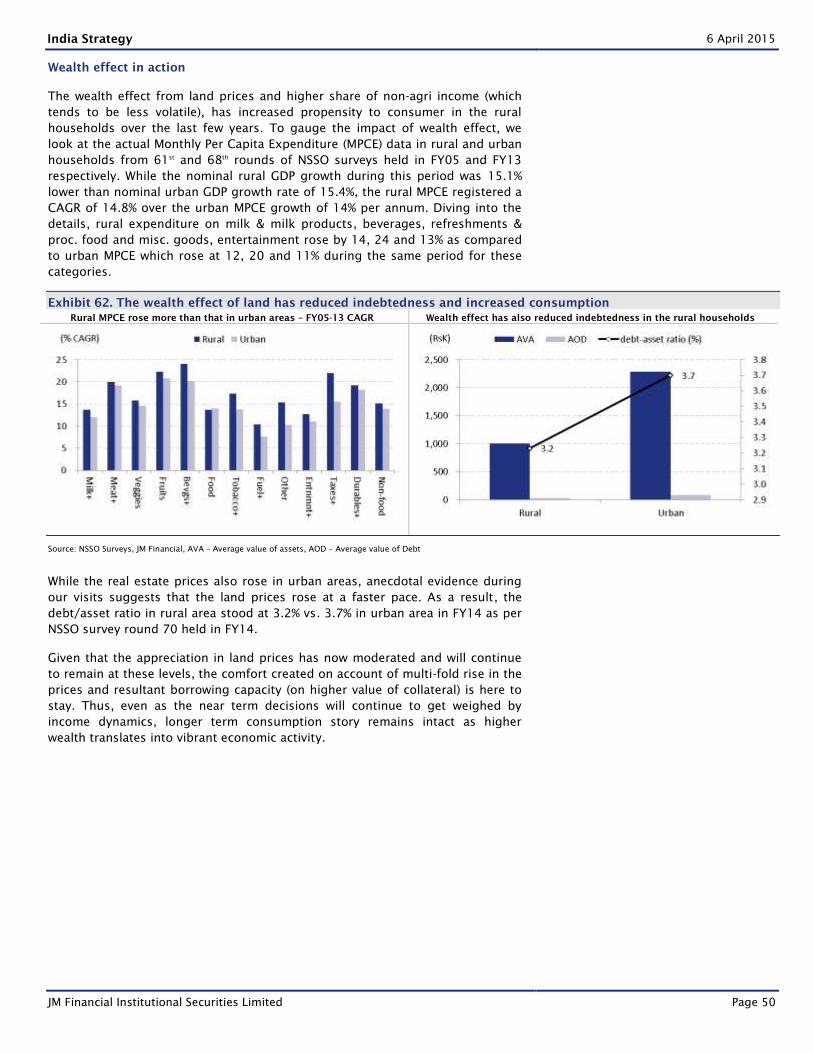
India Strategy 6 April 2015
JM Financial Institutional Securities Limited Page 50
Wealth effect in action
The wealth effect from land prices and higher share of non-agri income (which
tends to be less volatile), has increased propensity to consumer in the rural
households over the last few years. To gauge the impact of wealth effect, we
look at the actual Monthly Per Capita Expenditure (MPCE) data in rural and urban
households from 61st
and 68th
rounds of NSSO surveys held in FY05 and FY13
respectively. While the nominal rural GDP growth during this period was 15.1%
lower than nominal urban GDP growth rate of 15.4%, the rural MPCE registered a
CAGR of 14.8% over the urban MPCE growth of 14% per annum. Diving into the
details, rural expenditure on milk & milk products, beverages, refreshments &
proc. food and misc. goods, entertainment rose by 14, 24 and 13% as compared
to urban MPCE which rose at 12, 20 and 11% during the same period for these
categories.
Exhibit 62. The wealth effect of land has reduced indebtedness and increased consumption
Rural MPCE rose more than that in urban areas – FY05-13 CAGR Wealth effect has also reduced indebtedness in the rural households
Source: NSSO Surveys, JM Financial, AVA – Average value of assets, AOD – Average value of Debt
While the real estate prices also rose in urban areas, anecdotal evidence during
our visits suggests that the land prices rose at a faster pace. As a result, the
debt/asset ratio in rural area stood at 3.2% vs. 3.7% in urban area in FY14 as per
NSSO survey round 70 held in FY14.
Given that the appreciation in land prices has now moderated and will continue
to remain at these levels, the comfort created on account of multi-fold rise in the
prices and resultant borrowing capacity (on higher value of collateral) is here to
stay. Thus, even as the near term decisions will continue to get weighed by
income dynamics, longer term consumption story remains intact as higher
wealth translates into vibrant economic activity.
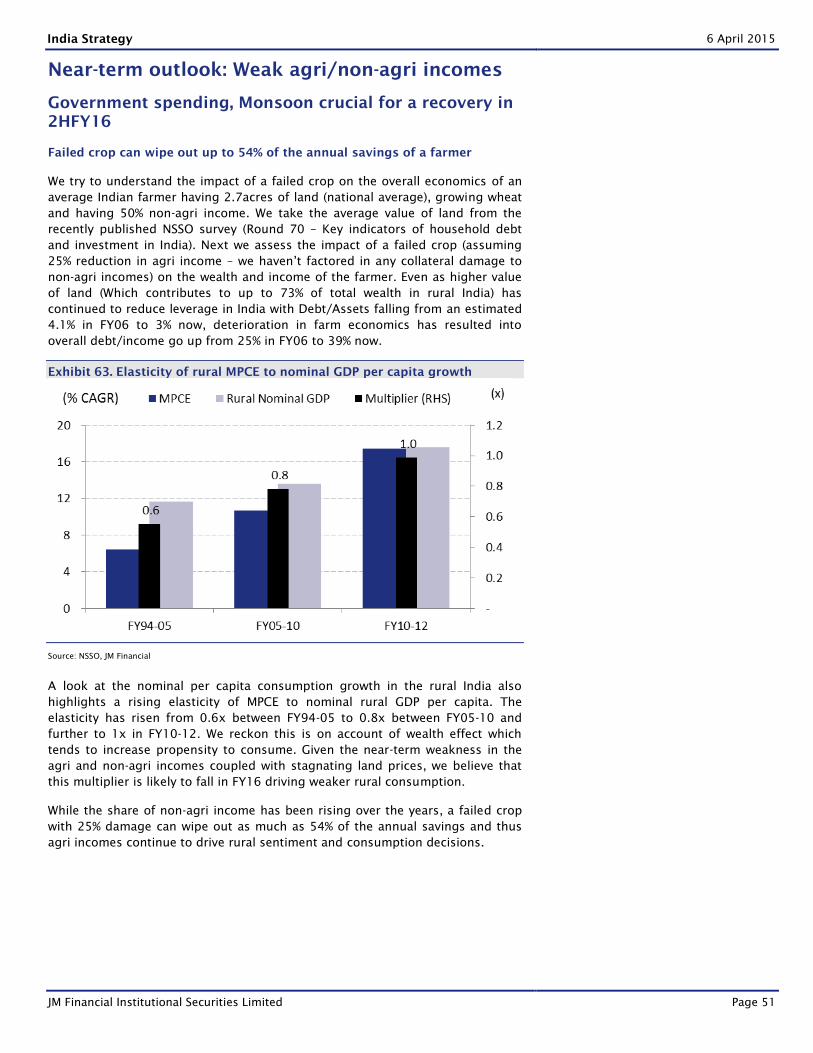
India Strategy 6 April 2015
JM Financial Institutional Securities Limited Page 51
Near-term outlook: Weak agri/non-agri incomes
Government spending, Monsoon crucial for a recovery in
2HFY16
Failed crop can wipe out up to 54% of the annual savings of a farmer
We try to understand the impact of a failed crop on the overall economics of an
average Indian farmer having 2.7acres of land (national average), growing wheat
and having 50% non-agri income. We take the average value of land from the
recently published NSSO survey (Round 70 – Key indicators of household debt
and investment in India). Next we assess the impact of a failed crop (assuming
25% reduction in agri income – we haven’t factored in any collateral damage to
non-agri incomes) on the wealth and income of the farmer. Even as higher value
of land (Which contributes to up to 73% of total wealth in rural India) has
continued to reduce leverage in India with Debt/Assets falling from an estimated
4.1% in FY06 to 3% now, deterioration in farm economics has resulted into
overall debt/income go up from 25% in FY06 to 39% now.
Exhibit 63. Elasticity of rural MPCE to nominal GDP per capita growth
Source: NSSO, JM Financial
A look at the nominal per capita consumption growth in the rural India also
highlights a rising elasticity of MPCE to nominal rural GDP per capita. The
elasticity has risen from 0.6x between FY94-05 to 0.8x between FY05-10 and
further to 1x in FY10-12. We reckon this is on account of wealth effect which
tends to increase propensity to consume. Given the near-term weakness in the
agri and non-agri incomes coupled with stagnating land prices, we believe that
this multiplier is likely to fall in FY16 driving weaker rural consumption.
While the share of non-agri income has been rising over the years, a failed crop
with 25% damage can wipe out as much as 54% of the annual savings and thus
agri incomes continue to drive rural sentiment and consumption decisions.
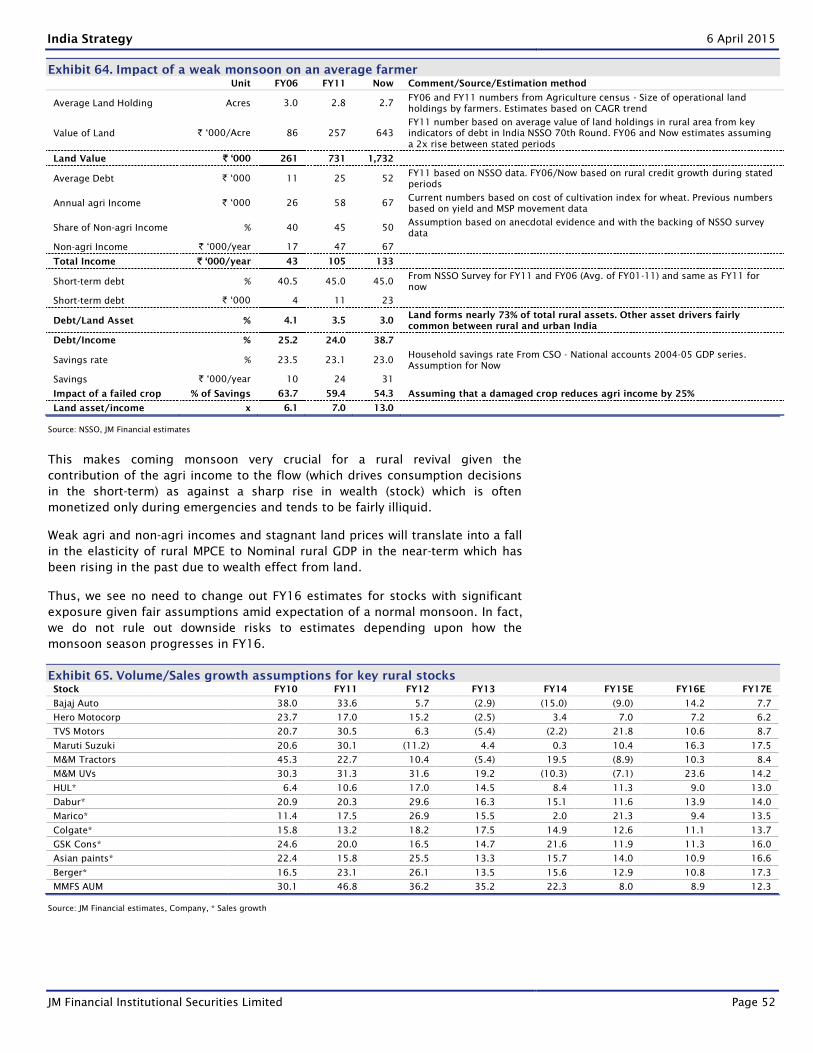
India Strategy 6 April 2015
JM Financial Institutional Securities Limited Page 52
Exhibit 64. Impact of a weak monsoon on an average farmer
Unit FY06 FY11 Now Comment/Source/Estimation method
Average Land Holding Acres 3.0 2.8 2.7 FY06 and FY11 numbers from Agriculture census - Size of operational land
holdings by farmers. Estimates based on CAGR trend
Value of Land ` ‘000/Acre 86 257 643
FY11 number based on average value of land holdings in rural area from key
indicators of debt in India NSSO 70th Round. FY06 and Now estimates assuming
a 2x rise between stated periods
Land Value ` ‘000 261 731 1,732
Average Debt ` ‘000 11 25 52 FY11 based on NSSO data. FY06/Now based on rural credit growth during stated
periods
Annual agri Income ` ‘000 26 58 67 Current numbers based on cost of cultivation index for wheat. Previous numbers
based on yield and MSP movement data
Share of Non-agri Income % 40 45 50 Assumption based on anecdotal evidence and with the backing of NSSO survey
data
Non-agri Income ` ‘000/year 17 47 67
Total Income ` ‘000/year 43 105 133
Short-term debt % 40.5 45.0 45.0 From NSSO Survey for FY11 and FY06 (Avg. of FY01-11) and same as FY11 for
now
Short-term debt ` ‘000 4 11 23
Debt/Land Asset % 4.1 3.5 3.0 Land forms nearly 73% of total rural assets. Other asset drivers fairly
common between rural and urban India
Debt/Income % 25.2 24.0 38.7
Savings rate % 23.5 23.1 23.0 Household savings rate From CSO - National accounts 2004-05 GDP series.
Assumption for Now
Savings ` ‘000/year 10 24 31
Impact of a failed crop % of Savings 63.7 59.4 54.3 Assuming that a damaged crop reduces agri income by 25%
Land asset/income x 6.1 7.0 13.0
Source: NSSO, JM Financial estimates
This makes coming monsoon very crucial for a rural revival given the
contribution of the agri income to the flow (which drives consumption decisions
in the short-term) as against a sharp rise in wealth (stock) which is often
monetized only during emergencies and tends to be fairly illiquid.
Weak agri and non-agri incomes and stagnant land prices will translate into a fall
in the elasticity of rural MPCE to Nominal rural GDP in the near-term which has
been rising in the past due to wealth effect from land.
Thus, we see no need to change out FY16 estimates for stocks with significant
exposure given fair assumptions amid expectation of a normal monsoon. In fact,
we do not rule out downside risks to estimates depending upon how the
monsoon season progresses in FY16.
Exhibit 65. Volume/Sales growth assumptions for key rural stocks
Stock FY10 FY11 FY12 FY13 FY14 FY15E FY16E FY17E
Bajaj Auto 38.0 33.6 5.7 (2.9) (15.0) (9.0) 14.2 7.7
Hero Motocorp 23.7 17.0 15.2 (2.5) 3.4 7.0 7.2 6.2
TVS Motors 20.7 30.5 6.3 (5.4) (2.2) 21.8 10.6 8.7
Maruti Suzuki 20.6 30.1 (11.2) 4.4 0.3 10.4 16.3 17.5
M&M Tractors 45.3 22.7 10.4 (5.4) 19.5 (8.9) 10.3 8.4
M&M UVs 30.3 31.3 31.6 19.2 (10.3) (7.1) 23.6 14.2
HUL* 6.4 10.6 17.0 14.5 8.4 11.3 9.0 13.0
Dabur* 20.9 20.3 29.6 16.3 15.1 11.6 13.9 14.0
Marico* 11.4 17.5 26.9 15.5 2.0 21.3 9.4 13.5
Colgate* 15.8 13.2 18.2 17.5 14.9 12.6 11.1 13.7
GSK Cons* 24.6 20.0 16.5 14.7 21.6 11.9 11.3 16.0
Asian paints* 22.4 15.8 25.5 13.3 15.7 14.0 10.9 16.6
Berger* 16.5 23.1 26.1 13.5 15.6 12.9 10.8 17.3
MMFS AUM 30.1 46.8 36.2 35.2 22.3 8.0 8.9 12.3
Source: JM Financial estimates, Company, * Sales growth
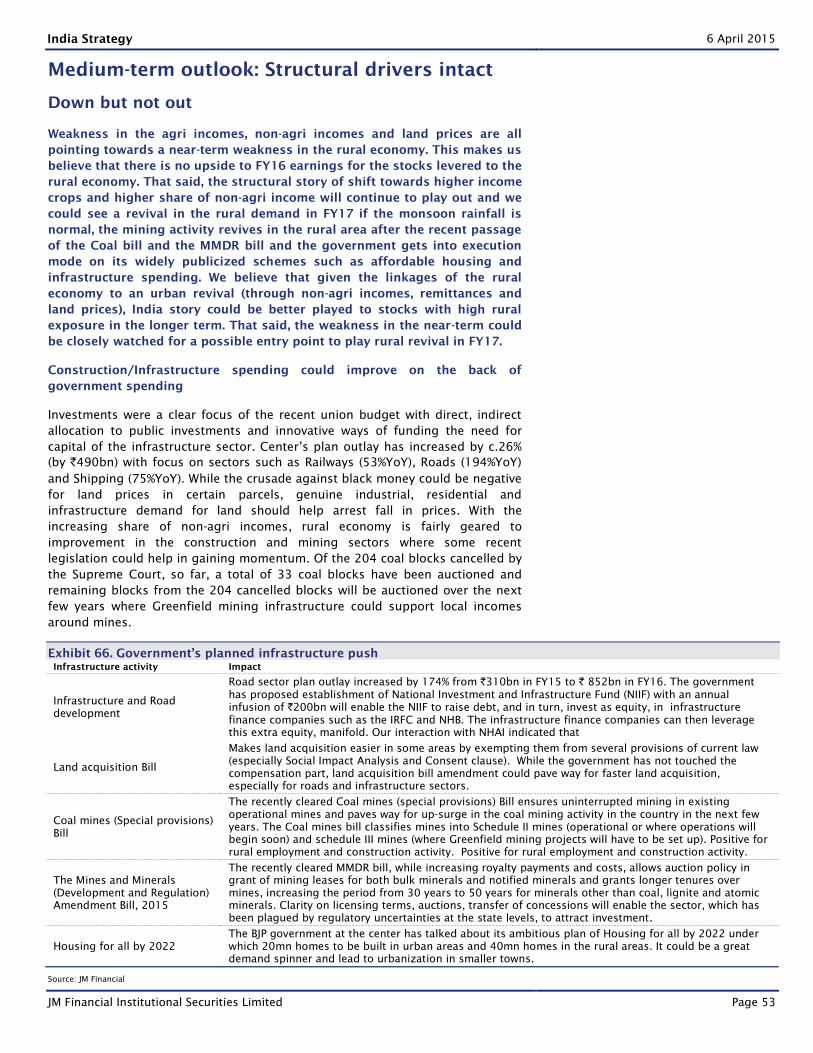
India Strategy 6 April 2015
JM Financial Institutional Securities Limited Page 53
Medium-term outlook: Structural drivers intact
Down but not out
Weakness in the agri incomes, non-agri incomes and land prices are all
pointing towards a near-term weakness in the rural economy. This makes us
believe that there is no upside to FY16 earnings for the stocks levered to the
rural economy. That said, the structural story of shift towards higher income
crops and higher share of non-agri income will continue to play out and we
could see a revival in the rural demand in FY17 if the monsoon rainfall is
normal, the mining activity revives in the rural area after the recent passage
of the Coal bill and the MMDR bill and the government gets into execution
mode on its widely publicized schemes such as affordable housing and
infrastructure spending. We believe that given the linkages of the rural
economy to an urban revival (through non-agri incomes, remittances and
land prices), India story could be better played to stocks with high rural
exposure in the longer term. That said, the weakness in the near-term could
be closely watched for a possible entry point to play rural revival in FY17.
Construction/Infrastructure spending could improve on the back of
government spending
Investments were a clear focus of the recent union budget with direct, indirect
allocation to public investments and innovative ways of funding the need for
capital of the infrastructure sector. Center’s plan outlay has increased by c.26%
(by `490bn) with focus on sectors such as Railways (53%YoY), Roads (194%YoY)
and Shipping (75%YoY). While the crusade against black money could be negative
for land prices in certain parcels, genuine industrial, residential and
infrastructure demand for land should help arrest fall in prices. With the
increasing share of non-agri incomes, rural economy is fairly geared to
improvement in the construction and mining sectors where some recent
legislation could help in gaining momentum. Of the 204 coal blocks cancelled by
the Supreme Court, so far, a total of 33 coal blocks have been auctioned and
remaining blocks from the 204 cancelled blocks will be auctioned over the next
few years where Greenfield mining infrastructure could support local incomes
around mines.
Exhibit 66. Government’s planned infrastructure push
Infrastructure activity Impact
Infrastructure and Road
development
Road sector plan outlay increased by 174% from `310bn in FY15 to ` 852bn in FY16. The government
has proposed establishment of National Investment and Infrastructure Fund (NIIF) with an annual
infusion of `200bn will enable the NIIF to raise debt, and in turn, invest as equity, in infrastructure
finance companies such as the IRFC and NHB. The infrastructure finance companies can then leverage
this extra equity, manifold. Our interaction with NHAI indicated that
Land acquisition Bill
Makes land acquisition easier in some areas by exempting them from several provisions of current law
(especially Social Impact Analysis and Consent clause). While the government has not touched the
compensation part, land acquisition bill amendment could pave way for faster land acquisition,
especially for roads and infrastructure sectors.
Coal mines (Special provisions)
Bill
The recently cleared Coal mines (special provisions) Bill ensures uninterrupted mining in existing
operational mines and paves way for up-surge in the coal mining activity in the country in the next few
years. The Coal mines bill classifies mines into Schedule II mines (operational or where operations will
begin soon) and schedule III mines (where Greenfield mining projects will have to be set up). Positive for
rural employment and construction activity. Positive for rural employment and construction activity.
The Mines and Minerals
(Development and Regulation)
Amendment Bill, 2015
The recently cleared MMDR bill, while increasing royalty payments and costs, allows auction policy in
grant of mining leases for both bulk minerals and notified minerals and grants longer tenures over
mines, increasing the period from 30 years to 50 years for minerals other than coal, lignite and atomic
minerals. Clarity on licensing terms, auctions, transfer of concessions will enable the sector, which has
been plagued by regulatory uncertainties at the state levels, to attract investment.
Housing for all by 2022
The BJP government at the center has talked about its ambitious plan of Housing for all by 2022 under
which 20mn homes to be built in urban areas and 40mn homes in the rural areas. It could be a great
demand spinner and lead to urbanization in smaller towns.
Source: JM Financial
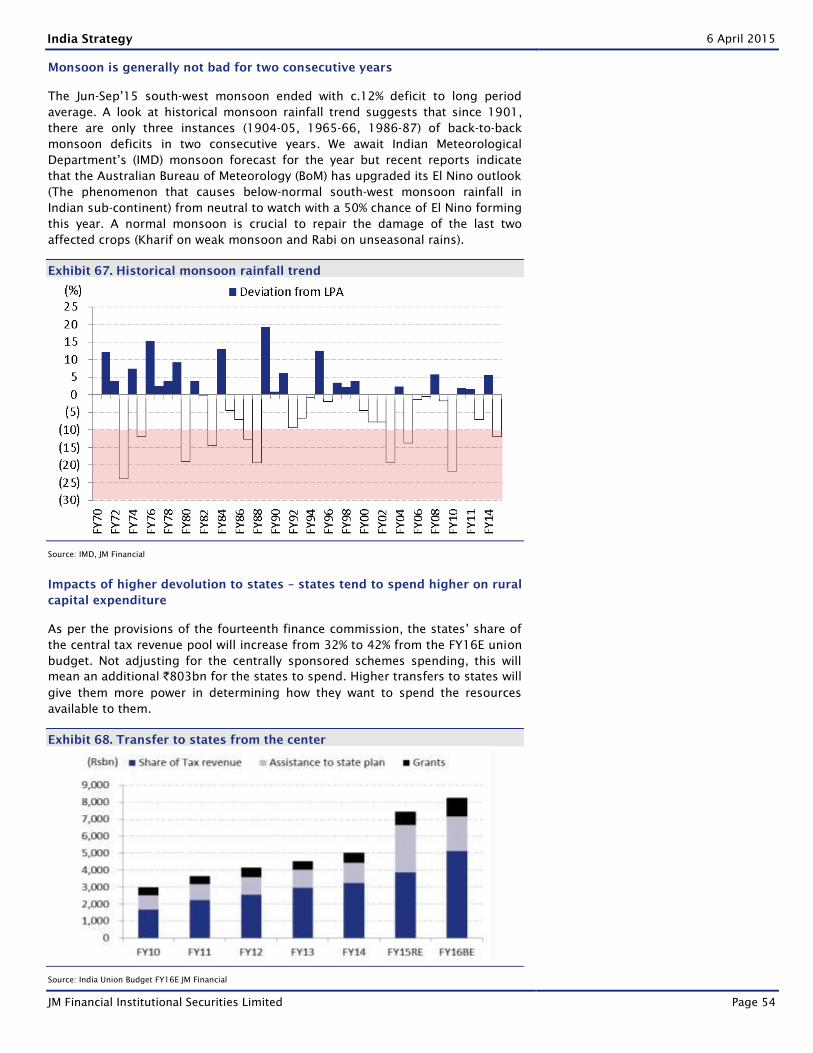
India Strategy 6 April 2015
JM Financial Institutional Securities Limited Page 54
Monsoon is generally not bad for two consecutive years
The Jun-Sep’15 south-west monsoon ended with c.12% deficit to long period
average. A look at historical monsoon rainfall trend suggests that since 1901,
there are only three instances (1904-05, 1965-66, 1986-87) of back-to-back
monsoon deficits in two consecutive years. We await Indian Meteorological
Department’s (IMD) monsoon forecast for the year but recent reports indicate
that the Australian Bureau of Meteorology (BoM) has upgraded its El Nino outlook
(The phenomenon that causes below-normal south-west monsoon rainfall in
Indian sub-continent) from neutral to watch with a 50% chance of El Nino forming
this year. A normal monsoon is crucial to repair the damage of the last two
affected crops (Kharif on weak monsoon and Rabi on unseasonal rains).
Exhibit 67. Historical monsoon rainfall trend
Source: IMD, JM Financial
Impacts of higher devolution to states – states tend to spend higher on rural
capital expenditure
As per the provisions of the fourteenth finance commission, the states’ share of
the central tax revenue pool will increase from 32% to 42% from the FY16E union
budget. Not adjusting for the centrally sponsored schemes spending, this will
mean an additional `803bn for the states to spend. Higher transfers to states will
give them more power in determining how they want to spend the resources
available to them.
Exhibit 68. Transfer to states from the center
Source: India Union Budget FY16E JM Financial
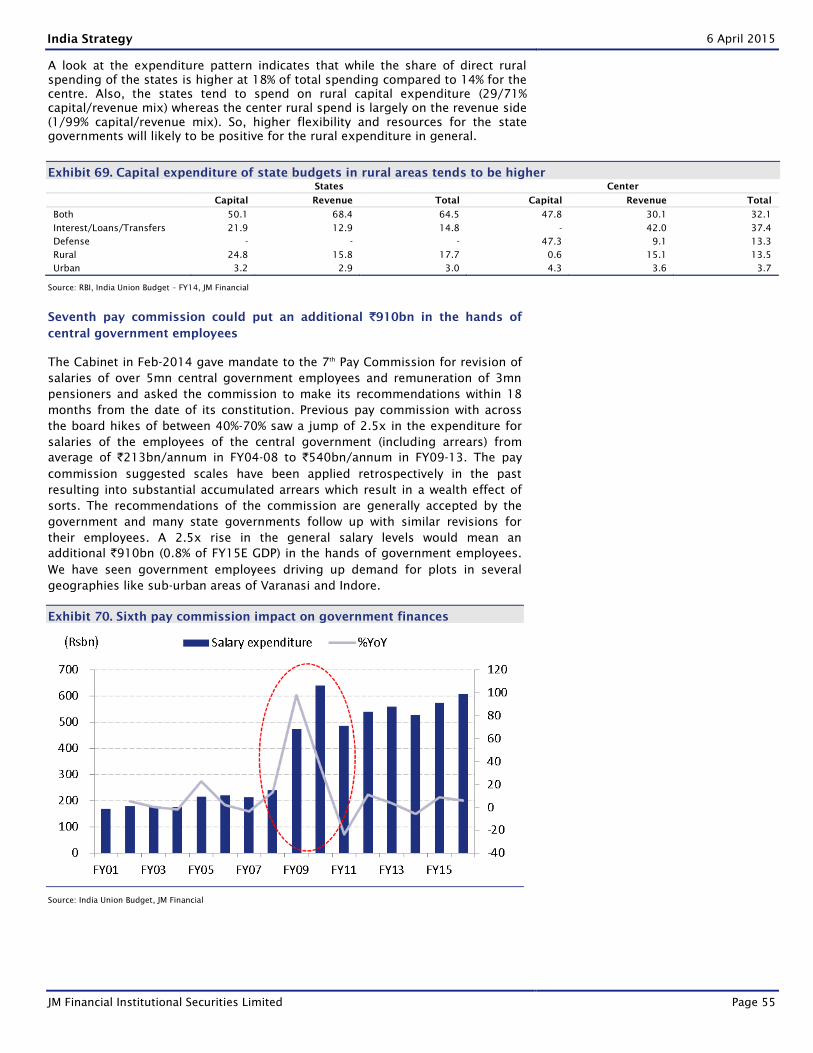
India Strategy 6 April 2015
JM Financial Institutional Securities Limited Page 55
A look at the expenditure pattern indicates that while the share of direct rural
spending of the states is higher at 18% of total spending compared to 14% for the
centre. Also, the states tend to spend on rural capital expenditure (29/71%
capital/revenue mix) whereas the center rural spend is largely on the revenue side
(1/99% capital/revenue mix). So, higher flexibility and resources for the state
governments will likely to be positive for the rural expenditure in general.
Exhibit 69. Capital expenditure of state budgets in rural areas tends to be higher
States Center
Capital Revenue Total Capital Revenue Total
Both 50.1 68.4 64.5 47.8 30.1 32.1
Interest/Loans/Transfers 21.9 12.9 14.8 - 42.0 37.4
Defense - - - 47.3 9.1 13.3
Rural 24.8 15.8 17.7 0.6 15.1 13.5
Urban 3.2 2.9 3.0 4.3 3.6 3.7
Source: RBI, India Union Budget – FY14, JM Financial
Seventh pay commission could put an additional `910bn in the hands of
central government employees
The Cabinet in Feb-2014 gave mandate to the 7th
Pay Commission for revision of
salaries of over 5mn central government employees and remuneration of 3mn
pensioners and asked the commission to make its recommendations within 18
months from the date of its constitution. Previous pay commission with across
the board hikes of between 40%-70% saw a jump of 2.5x in the expenditure for
salaries of the employees of the central government (including arrears) from
average of `213bn/annum in FY04-08 to `540bn/annum in FY09-13. The pay
commission suggested scales have been applied retrospectively in the past
resulting into substantial accumulated arrears which result in a wealth effect of
sorts. The recommendations of the commission are generally accepted by the
government and many state governments follow up with similar revisions for
their employees. A 2.5x rise in the general salary levels would mean an
additional `910bn (0.8% of FY15E GDP) in the hands of government employees.
We have seen government employees driving up demand for plots in several
geographies like sub-urban areas of Varanasi and Indore.
Exhibit 70. Sixth pay commission impact on government finances
Source: India Union Budget, JM Financial
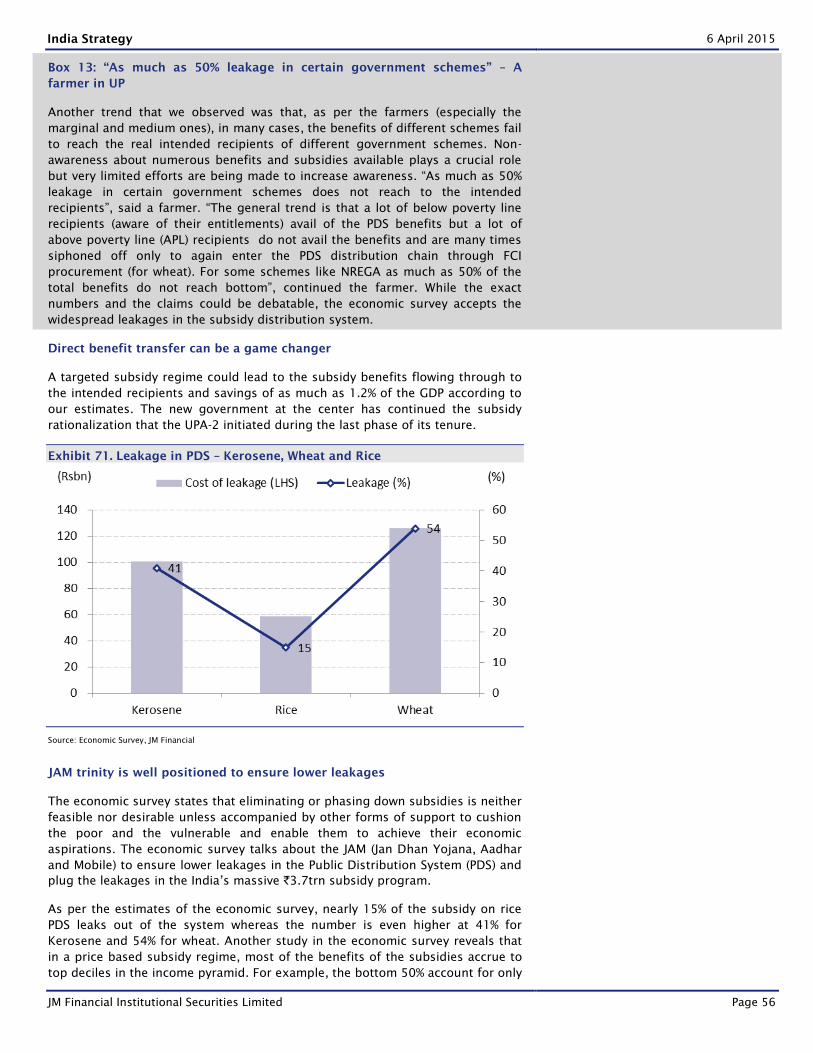
India Strategy 6 April 2015
JM Financial Institutional Securities Limited Page 56
Box 13: “As much as 50% leakage in certain government schemes” – A
farmer in UP
Another trend that we observed was that, as per the farmers (especially the
marginal and medium ones), in many cases, the benefits of different schemes fail
to reach the real intended recipients of different government schemes. Non-
awareness about numerous benefits and subsidies available plays a crucial role
but very limited efforts are being made to increase awareness. “As much as 50%
leakage in certain government schemes does not reach to the intended
recipients”, said a farmer. “The general trend is that a lot of below poverty line
recipients (aware of their entitlements) avail of the PDS benefits but a lot of
above poverty line (APL) recipients do not avail the benefits and are many times
siphoned off only to again enter the PDS distribution chain through FCI
procurement (for wheat). For some schemes like NREGA as much as 50% of the
total benefits do not reach bottom”, continued the farmer. While the exact
numbers and the claims could be debatable, the economic survey accepts the
widespread leakages in the subsidy distribution system.
Direct benefit transfer can be a game changer
A targeted subsidy regime could lead to the subsidy benefits flowing through to
the intended recipients and savings of as much as 1.2% of the GDP according to
our estimates. The new government at the center has continued the subsidy
rationalization that the UPA-2 initiated during the last phase of its tenure.
Exhibit 71. Leakage in PDS – Kerosene, Wheat and Rice
Source: Economic Survey, JM Financial
JAM trinity is well positioned to ensure lower leakages
The economic survey states that eliminating or phasing down subsidies is neither
feasible nor desirable unless accompanied by other forms of support to cushion
the poor and the vulnerable and enable them to achieve their economic
aspirations. The economic survey talks about the JAM (Jan Dhan Yojana, Aadhar
and Mobile) to ensure lower leakages in the Public Distribution System (PDS) and
plug the leakages in the India’s massive `3.7trn subsidy program.
As per the estimates of the economic survey, nearly 15% of the subsidy on rice
PDS leaks out of the system whereas the number is even higher at 41% for
Kerosene and 54% for wheat. Another study in the economic survey reveals that
in a price based subsidy regime, most of the benefits of the subsidies accrue to
top deciles in the income pyramid. For example, the bottom 50% account for only
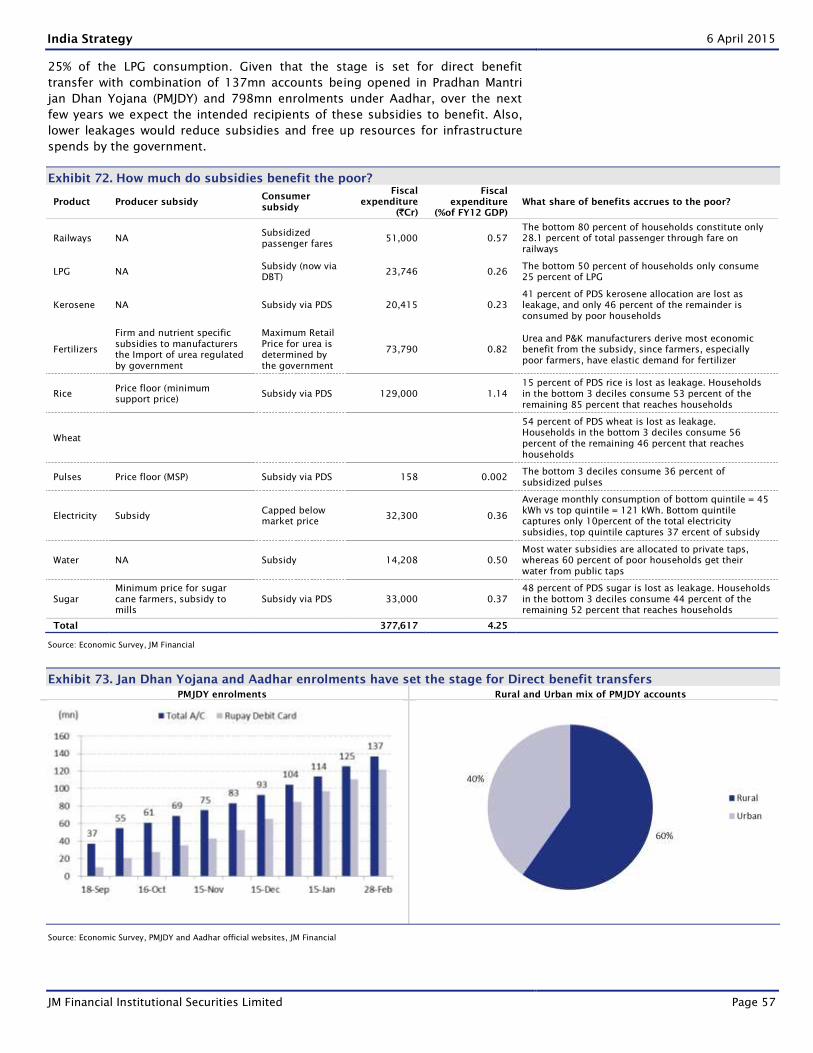
India Strategy 6 April 2015
JM Financial Institutional Securities Limited Page 57
25% of the LPG consumption. Given that the stage is set for direct benefit
transfer with combination of 137mn accounts being opened in Pradhan Mantri
jan Dhan Yojana (PMJDY) and 798mn enrolments under Aadhar, over the next
few years we expect the intended recipients of these subsidies to benefit. Also,
lower leakages would reduce subsidies and free up resources for infrastructure
spends by the government.
Exhibit 72. How much do subsidies benefit the poor?
Product Producer subsidy Consumer
subsidy
Fiscal
expenditure
(`Cr)
Fiscal
expenditure
(%of FY12 GDP)
What share of benefits accrues to the poor?
Railways NA Subsidized
passenger fares 51,000 0.57
The bottom 80 percent of households constitute only
28.1 percent of total passenger through fare on
railways
LPG NA Subsidy (now via
DBT) 23,746 0.26
The bottom 50 percent of households only consume
25 percent of LPG
Kerosene NA Subsidy via PDS 20,415 0.23
41 percent of PDS kerosene allocation are lost as
leakage, and only 46 percent of the remainder is
consumed by poor households
Fertilizers
Firm and nutrient specific
subsidies to manufacturers
the Import of urea regulated
by government
Maximum Retail
Price for urea is
determined by
the government
73,790 0.82
Urea and P&K manufacturers derive most economic
benefit from the subsidy, since farmers, especially
poor farmers, have elastic demand for fertilizer
Rice Price floor (minimum
support price) Subsidy via PDS 129,000 1.14
15 percent of PDS rice is lost as leakage. Households
in the bottom 3 deciles consume 53 percent of the
remaining 85 percent that reaches households
Wheat
54 percent of PDS wheat is lost as leakage.
Households in the bottom 3 deciles consume 56
percent of the remaining 46 percent that reaches
households
Pulses Price floor (MSP) Subsidy via PDS 158 0.002 The bottom 3 deciles consume 36 percent of
subsidized pulses
Electricity Subsidy Capped below
market price 32,300 0.36
Average monthly consumption of bottom quintile = 45
kWh vs top quintile = 121 kWh. Bottom quintile
captures only 10percent of the total electricity
subsidies, top quintile captures 37 ercent of subsidy
Water NA Subsidy 14,208 0.50
Most water subsidies are allocated to private taps,
whereas 60 percent of poor households get their
water from public taps
Sugar
Minimum price for sugar
cane farmers, subsidy to
mills
Subsidy via PDS 33,000 0.37
48 percent of PDS sugar is lost as leakage. Households
in the bottom 3 deciles consume 44 percent of the
remaining 52 percent that reaches households
Total 377,617 4.25
Source: Economic Survey, JM Financial
Exhibit 73. Jan Dhan Yojana and Aadhar enrolments have set the stage for Direct benefit transfers
PMJDY enrolments Rural and Urban mix of PMJDY accounts
Source: Economic Survey, PMJDY and Aadhar official websites, JM Financial
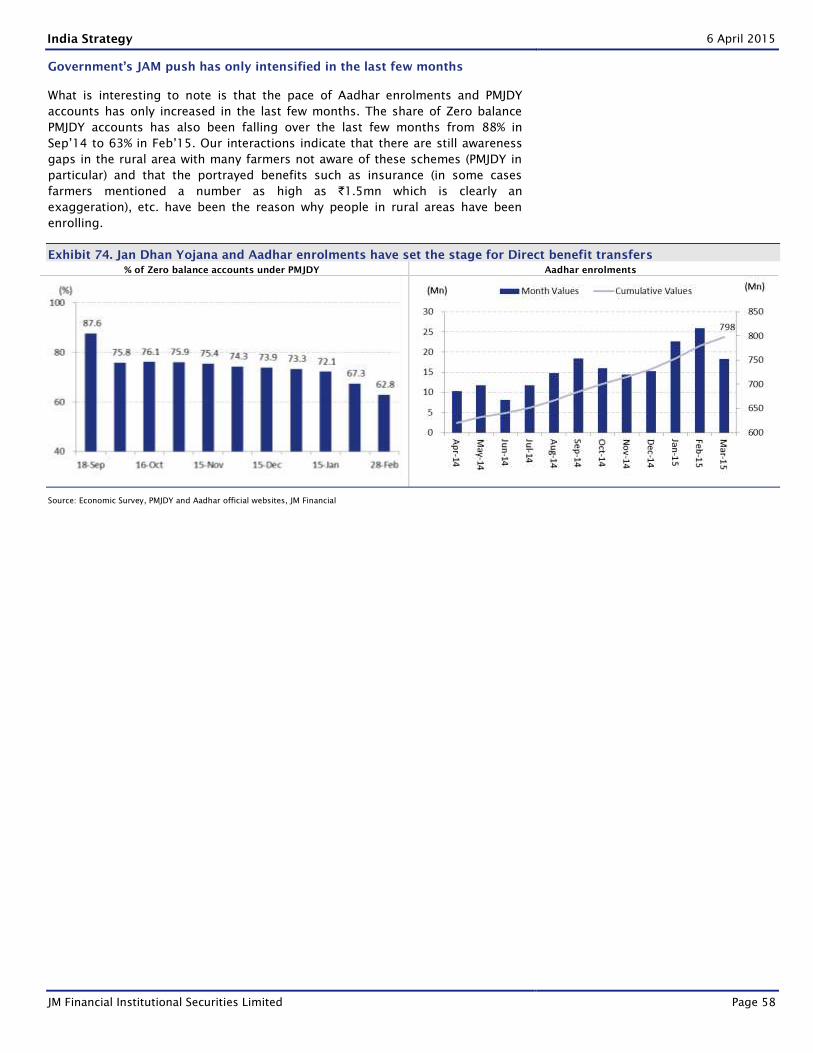
India Strategy 6 April 2015
JM Financial Institutional Securities Limited Page 58
Government’s JAM push has only intensified in the last few months
What is interesting to note is that the pace of Aadhar enrolments and PMJDY
accounts has only increased in the last few months. The share of Zero balance
PMJDY accounts has also been falling over the last few months from 88% in
Sep’14 to 63% in Feb’15. Our interactions indicate that there are still awareness
gaps in the rural area with many farmers not aware of these schemes (PMJDY in
particular) and that the portrayed benefits such as insurance (in some cases
farmers mentioned a number as high as `1.5mn which is clearly an
exaggeration), etc. have been the reason why people in rural areas have been
enrolling.
Exhibit 74. Jan Dhan Yojana and Aadhar enrolments have set the stage for Direct benefit transfers
% of Zero balance accounts under PMJDY Aadhar enrolments
Source: Economic Survey, PMJDY and Aadhar official websites, JM Financial
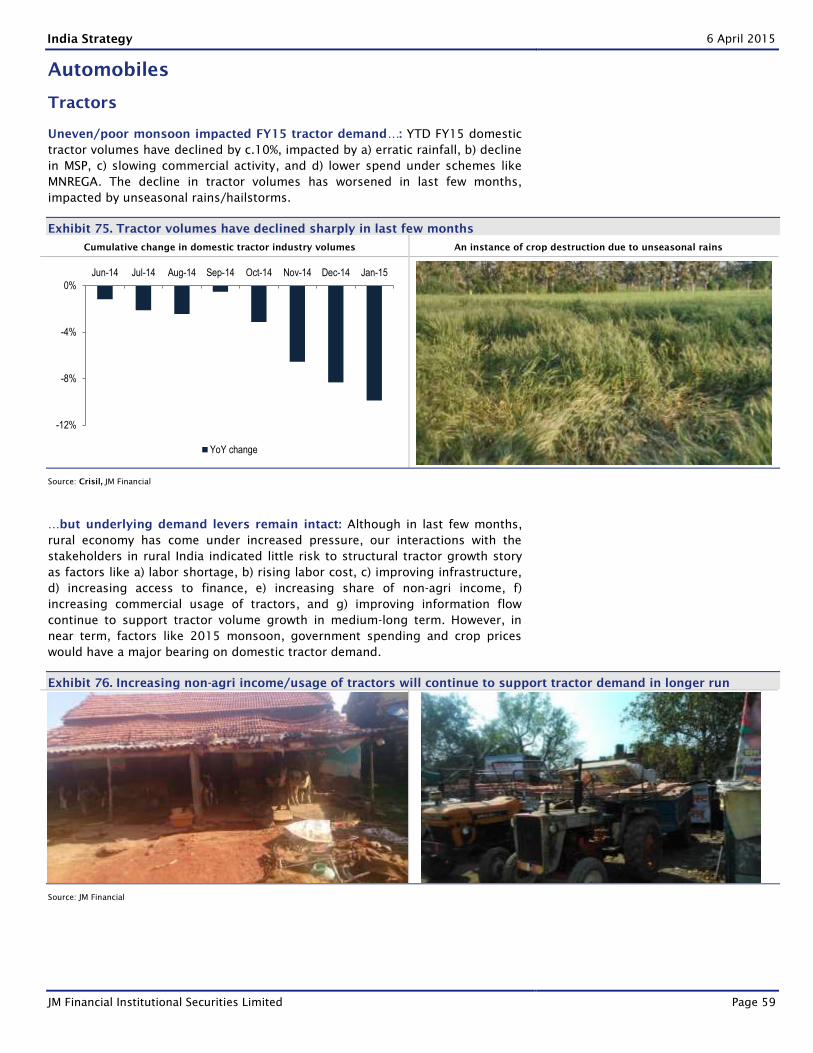
India Strategy 6 April 2015
JM Financial Institutional Securities Limited Page 59
Automobiles
Tractors
Uneven/poor monsoon impacted FY15 tractor demand…: YTD FY15 domestic
tractor volumes have declined by c.10%, impacted by a) erratic rainfall, b) decline
in MSP, c) slowing commercial activity, and d) lower spend under schemes like
MNREGA. The decline in tractor volumes has worsened in last few months,
impacted by unseasonal rains/hailstorms.
Exhibit 75. Tractor volumes have declined sharply in last few months
Cumulative change in domestic tractor industry volumes An instance of crop destruction due to unseasonal rains
Source: Crisil, JM Financial
…but underlying demand levers remain intact: Although in last few months,
rural economy has come under increased pressure, our interactions with the
stakeholders in rural India indicated little risk to structural tractor growth story
as factors like a) labor shortage, b) rising labor cost, c) improving infrastructure,
d) increasing access to finance, e) increasing share of non-agri income, f)
increasing commercial usage of tractors, and g) improving information flow
continue to support tractor volume growth in medium-long term. However, in
near term, factors like 2015 monsoon, government spending and crop prices
would have a major bearing on domestic tractor demand.
Exhibit 76. Increasing non-agri income/usage of tractors will continue to support tractor demand in longer run
Source: JM Financial
-12%
-8%
-4%
0%
Jun-14 Jul-14 Aug-14 Sep-14 Oct-14 Nov-14 Dec-14 Jan-15
YoY change
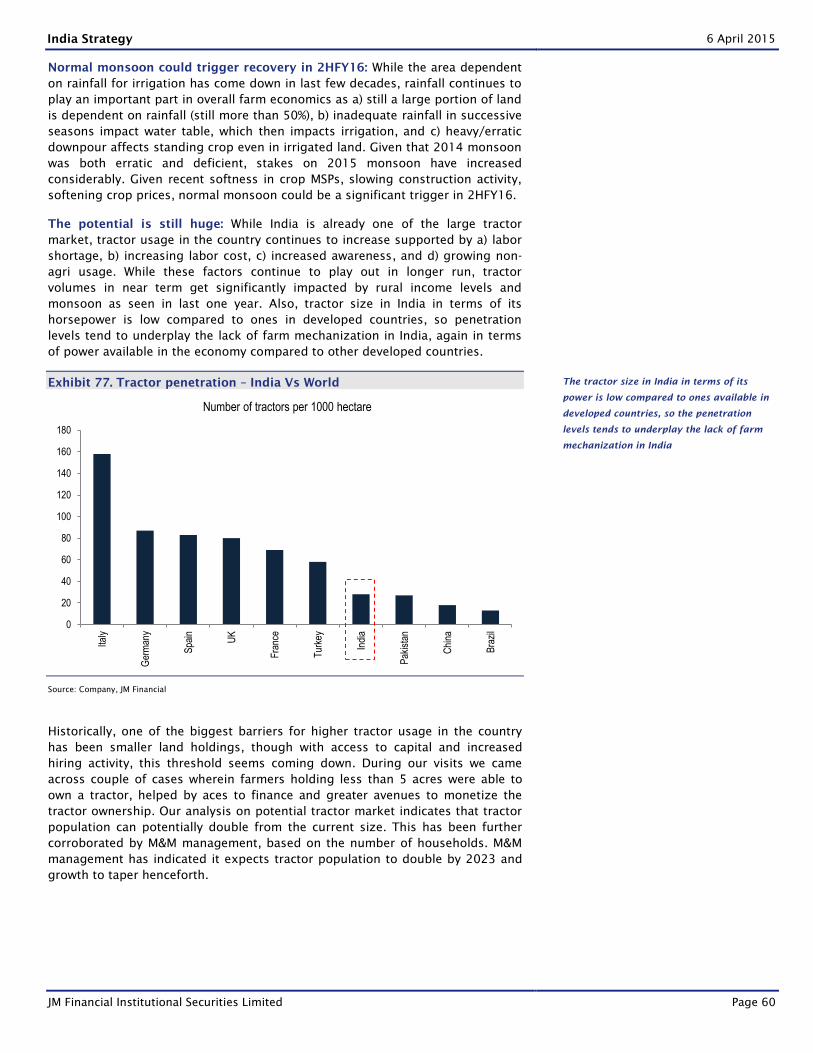
India Strategy 6 April 2015
JM Financial Institutional Securities Limited Page 60
Normal monsoon could trigger recovery in 2HFY16: While the area dependent
on rainfall for irrigation has come down in last few decades, rainfall continues to
play an important part in overall farm economics as a) still a large portion of land
is dependent on rainfall (still more than 50%), b) inadequate rainfall in successive
seasons impact water table, which then impacts irrigation, and c) heavy/erratic
downpour affects standing crop even in irrigated land. Given that 2014 monsoon
was both erratic and deficient, stakes on 2015 monsoon have increased
considerably. Given recent softness in crop MSPs, slowing construction activity,
softening crop prices, normal monsoon could be a significant trigger in 2HFY16.
The potential is still huge: While India is already one of the large tractor
market, tractor usage in the country continues to increase supported by a) labor
shortage, b) increasing labor cost, c) increased awareness, and d) growing non-
agri usage. While these factors continue to play out in longer run, tractor
volumes in near term get significantly impacted by rural income levels and
monsoon as seen in last one year. Also, tractor size in India in terms of its
horsepower is low compared to ones in developed countries, so penetration
levels tend to underplay the lack of farm mechanization in India, again in terms
of power available in the economy compared to other developed countries.
Exhibit 77. Tractor penetration – India Vs World
Source: Company, JM Financial
Historically, one of the biggest barriers for higher tractor usage in the country
has been smaller land holdings, though with access to capital and increased
hiring activity, this threshold seems coming down. During our visits we came
across couple of cases wherein farmers holding less than 5 acres were able to
own a tractor, helped by aces to finance and greater avenues to monetize the
tractor ownership. Our analysis on potential tractor market indicates that tractor
population can potentially double from the current size. This has been further
corroborated by M&M management, based on the number of households. M&M
management has indicated it expects tractor population to double by 2023 and
growth to taper henceforth.
0
20
40
60
80
100
120
140
160
180
Italy
Ger
man
y
Spa
in
UK
Fra
nce
Tur
key
Indi
a
Pak
ista
n
Chi
na
Bra
zil
Number of tractors per 1000 hectare
The tractor size in India in terms of its
power is low compared to ones available in
developed countries, so the penetration
levels tends to underplay the lack of farm
mechanization in India
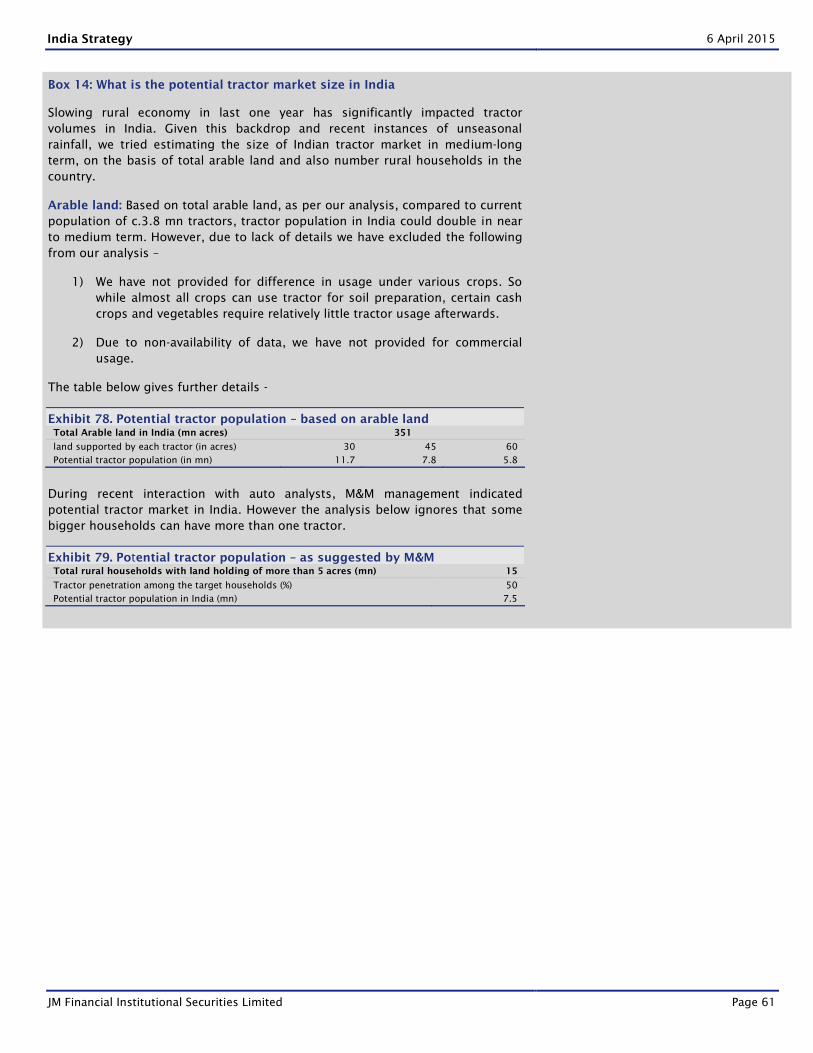
India Strategy 6 April 2015
JM Financial Institutional Securities Limited Page 61
Box 14: What is the potential tractor market size in India
Slowing rural economy in last one year has significantly impacted tractor
volumes in India. Given this backdrop and recent instances of unseasonal
rainfall, we tried estimating the size of Indian tractor market in medium-long
term, on the basis of total arable land and also number rural households in the
country.
Arable land: Based on total arable land, as per our analysis, compared to current
population of c.3.8 mn tractors, tractor population in India could double in near
to medium term. However, due to lack of details we have excluded the following
from our analysis –
1) We have not provided for difference in usage under various crops. So
while almost all crops can use tractor for soil preparation, certain cash
crops and vegetables require relatively little tractor usage afterwards.
2) Due to non-availability of data, we have not provided for commercial
usage.
The table below gives further details -
Exhibit 78. Potential tractor population – based on arable land
Total Arable land in India (mn acres) 351
land supported by each tractor (in acres) 30 45 60
Potential tractor population (in mn) 11.7 7.8 5.8
During recent interaction with auto analysts, M&M management indicated
potential tractor market in India. However the analysis below ignores that some
bigger households can have more than one tractor.
Exhibit 79. Potential tractor population – as suggested by M&M
Total rural households with land holding of more than 5 acres (mn) 15
Tractor penetration among the target households (%) 50
Potential tractor population in India (mn) 7.5
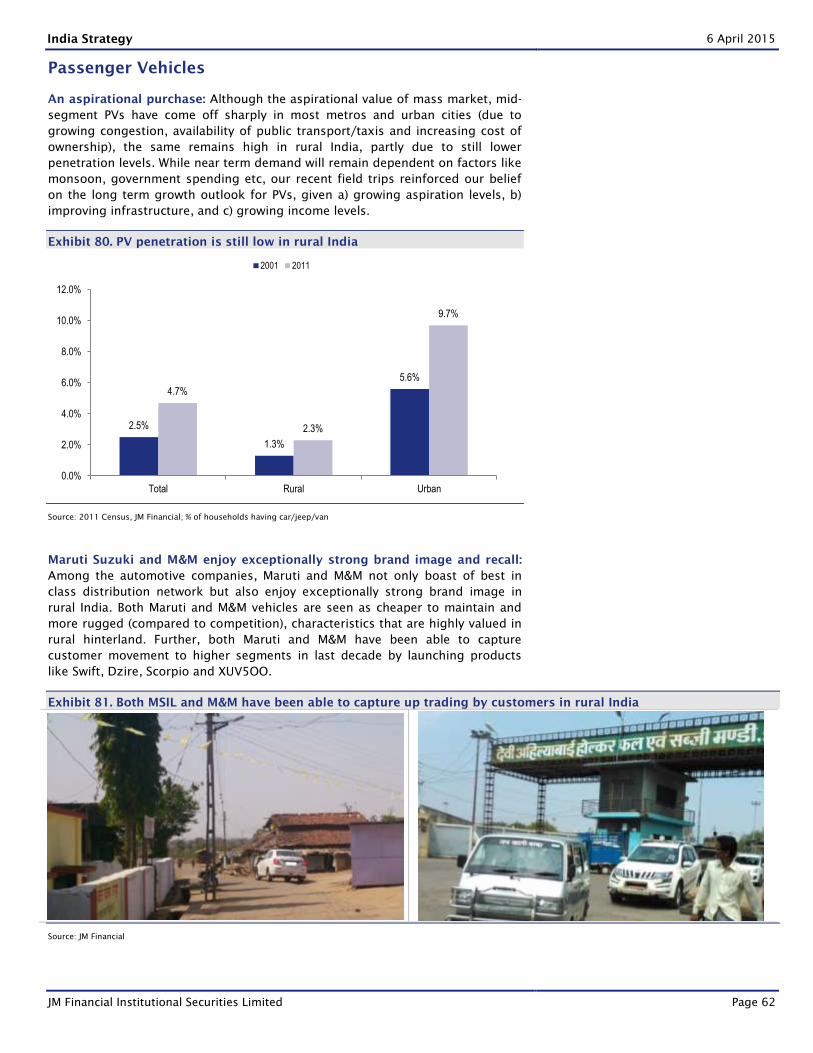
India Strategy 6 April 2015
JM Financial Institutional Securities Limited Page 62
Passenger Vehicles
An aspirational purchase: Although the aspirational value of mass market, mid-
segment PVs have come off sharply in most metros and urban cities (due to
growing congestion, availability of public transport/taxis and increasing cost of
ownership), the same remains high in rural India, partly due to still lower
penetration levels. While near term demand will remain dependent on factors like
monsoon, government spending etc, our recent field trips reinforced our belief
on the long term growth outlook for PVs, given a) growing aspiration levels, b)
improving infrastructure, and c) growing income levels.
Exhibit 80. PV penetration is still low in rural India
Source: 2011 Census, JM Financial; % of households having car/jeep/van
Maruti Suzuki and M&M enjoy exceptionally strong brand image and recall:
Among the automotive companies, Maruti and M&M not only boast of best in
class distribution network but also enjoy exceptionally strong brand image in
rural India. Both Maruti and M&M vehicles are seen as cheaper to maintain and
more rugged (compared to competition), characteristics that are highly valued in
rural hinterland. Further, both Maruti and M&M have been able to capture
customer movement to higher segments in last decade by launching products
like Swift, Dzire, Scorpio and XUV5OO.
Exhibit 81. Both MSIL and M&M have been able to capture up trading by customers in rural India
Source: JM Financial
2.5%
1.3%
5.6%
4.7%
2.3%
9.7%
0.0%
2.0%
4.0%
6.0%
8.0%
10.0%
12.0%
Total Rural Urban
2001 2011
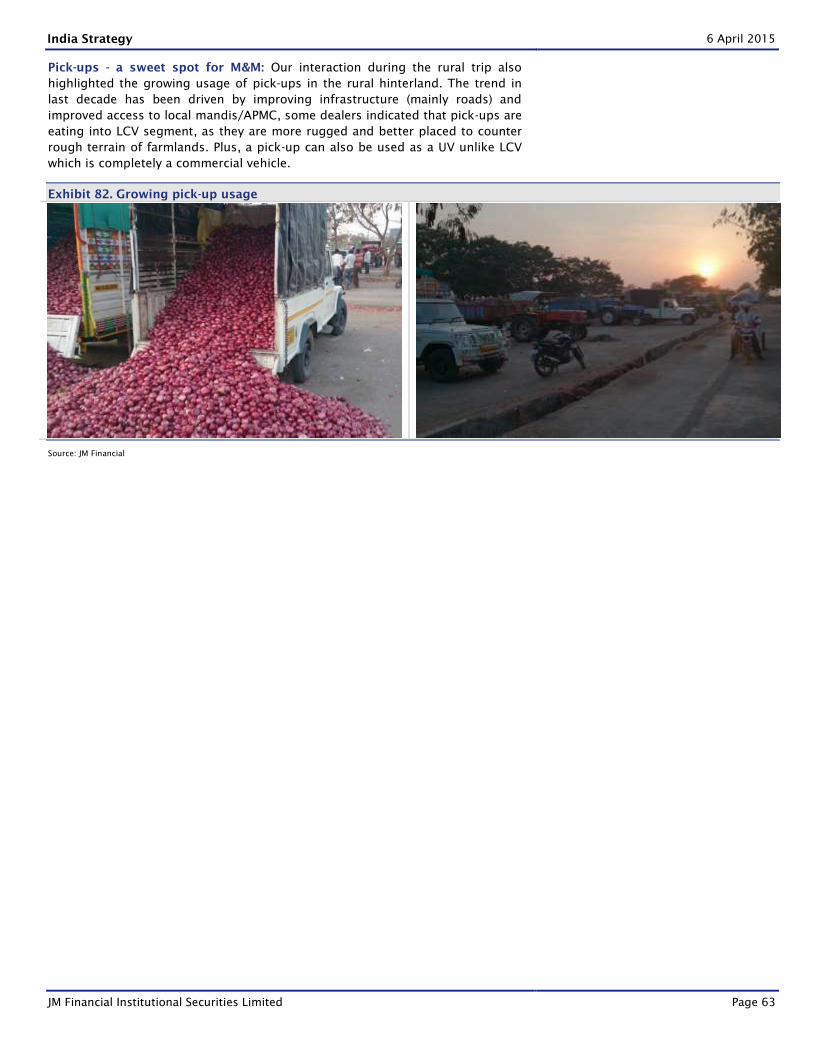
India Strategy 6 April 2015
JM Financial Institutional Securities Limited Page 63
Pick-ups - a sweet spot for M&M: Our interaction during the rural trip also
highlighted the growing usage of pick-ups in the rural hinterland. The trend in
last decade has been driven by improving infrastructure (mainly roads) and
improved access to local mandis/APMC, some dealers indicated that pick-ups are
eating into LCV segment, as they are more rugged and better placed to counter
rough terrain of farmlands. Plus, a pick-up can also be used as a UV unlike LCV
which is completely a commercial vehicle.
Exhibit 82. Growing pick-up usage
Source: JM Financial
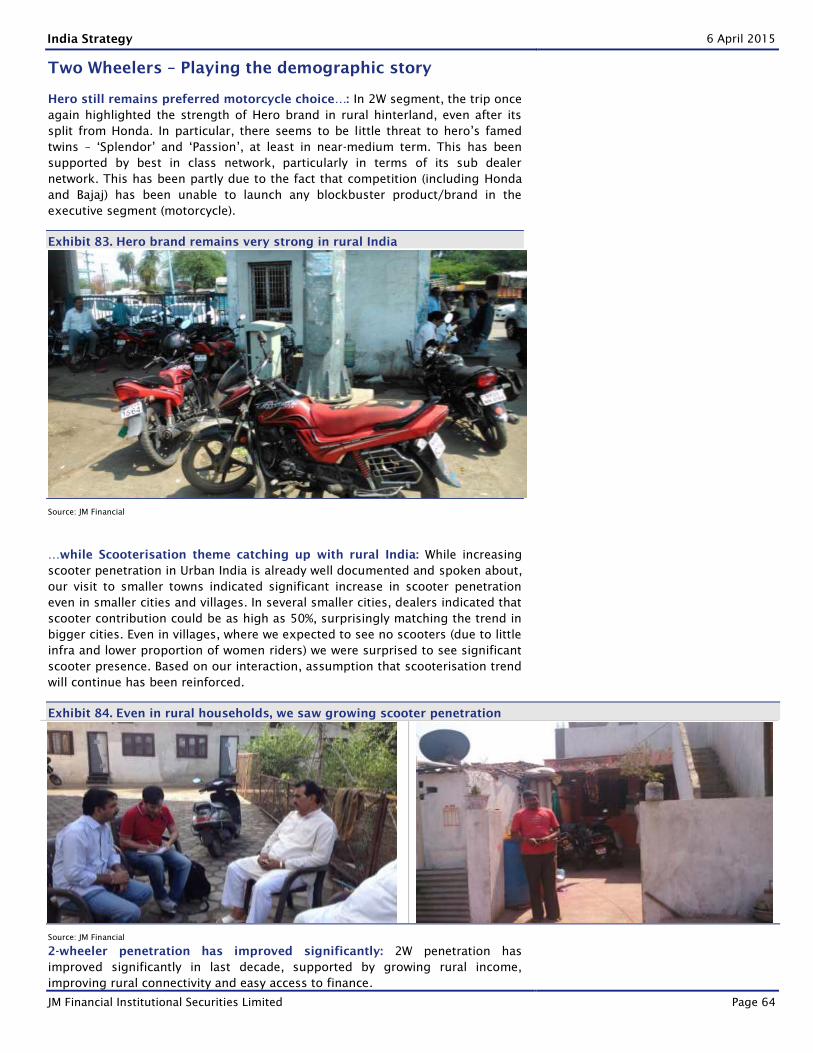
India Strategy 6 April 2015
JM Financial Institutional Securities Limited Page 64
Two Wheelers – Playing the demographic story
Hero still remains preferred motorcycle choice…: In 2W segment, the trip once
again highlighted the strength of Hero brand in rural hinterland, even after its
split from Honda. In particular, there seems to be little threat to hero’s famed
twins – ‘Splendor’ and ‘Passion’, at least in near-medium term. This has been
supported by best in class network, particularly in terms of its sub dealer
network. This has been partly due to the fact that competition (including Honda
and Bajaj) has been unable to launch any blockbuster product/brand in the
executive segment (motorcycle).
Exhibit 83. Hero brand remains very strong in rural India
Source: JM Financial
…while Scooterisation theme catching up with rural India: While increasing
scooter penetration in Urban India is already well documented and spoken about,
our visit to smaller towns indicated significant increase in scooter penetration
even in smaller cities and villages. In several smaller cities, dealers indicated that
scooter contribution could be as high as 50%, surprisingly matching the trend in
bigger cities. Even in villages, where we expected to see no scooters (due to little
infra and lower proportion of women riders) we were surprised to see significant
scooter presence. Based on our interaction, assumption that scooterisation trend
will continue has been reinforced.
Exhibit 84. Even in rural households, we saw growing scooter penetration
Source: JM Financial
2-wheeler penetration has improved significantly: 2W penetration has
improved significantly in last decade, supported by growing rural income,
improving rural connectivity and easy access to finance.
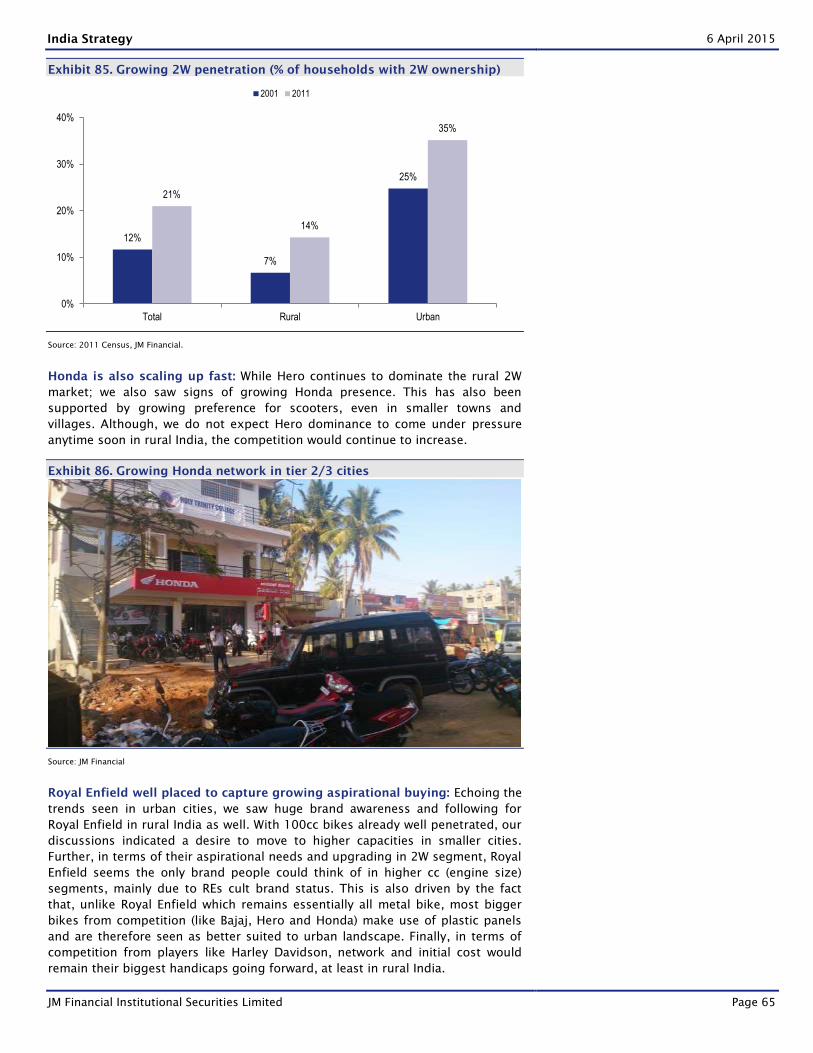
India Strategy 6 April 2015
JM Financial Institutional Securities Limited Page 65
Exhibit 85. Growing 2W penetration (% of households with 2W ownership)
Source: 2011 Census, JM Financial.
Honda is also scaling up fast: While Hero continues to dominate the rural 2W
market; we also saw signs of growing Honda presence. This has also been
supported by growing preference for scooters, even in smaller towns and
villages. Although, we do not expect Hero dominance to come under pressure
anytime soon in rural India, the competition would continue to increase.
Exhibit 86. Growing Honda network in tier 2/3 cities
Source: JM Financial
Royal Enfield well placed to capture growing aspirational buying: Echoing the
trends seen in urban cities, we saw huge brand awareness and following for
Royal Enfield in rural India as well. With 100cc bikes already well penetrated, our
discussions indicated a desire to move to higher capacities in smaller cities.
Further, in terms of their aspirational needs and upgrading in 2W segment, Royal
Enfield seems the only brand people could think of in higher cc (engine size)
segments, mainly due to REs cult brand status. This is also driven by the fact
that, unlike Royal Enfield which remains essentially all metal bike, most bigger
bikes from competition (like Bajaj, Hero and Honda) make use of plastic panels
and are therefore seen as better suited to urban landscape. Finally, in terms of
competition from players like Harley Davidson, network and initial cost would
remain their biggest handicaps going forward, at least in rural India.
12%
7%
25%
21%
14%
35%
0%
10%
20%
30%
40%
Total Rural Urban
2001 2011
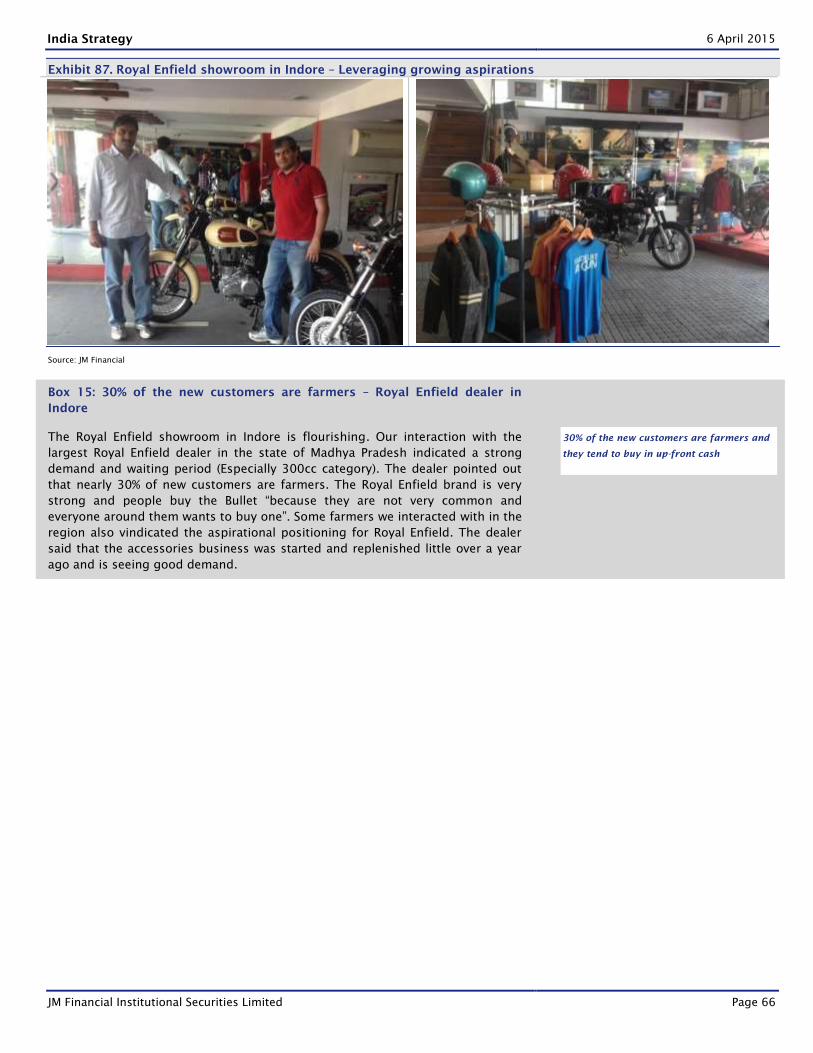
India Strategy 6 April 2015
JM Financial Institutional Securities Limited Page 66
Exhibit 87. Royal Enfield showroom in Indore – Leveraging growing aspirations
Source: JM Financial
Box 15: 30% of the new customers are farmers – Royal Enfield dealer in
Indore
The Royal Enfield showroom in Indore is flourishing. Our interaction with the
largest Royal Enfield dealer in the state of Madhya Pradesh indicated a strong
demand and waiting period (Especially 300cc category). The dealer pointed out
that nearly 30% of new customers are farmers. The Royal Enfield brand is very
strong and people buy the Bullet “because they are not very common and
everyone around them wants to buy one”. Some farmers we interacted with in the
region also vindicated the aspirational positioning for Royal Enfield. The dealer
said that the accessories business was started and replenished little over a year
ago and is seeing good demand.
30% of the new customers are farmers and
they tend to buy in up-front cash
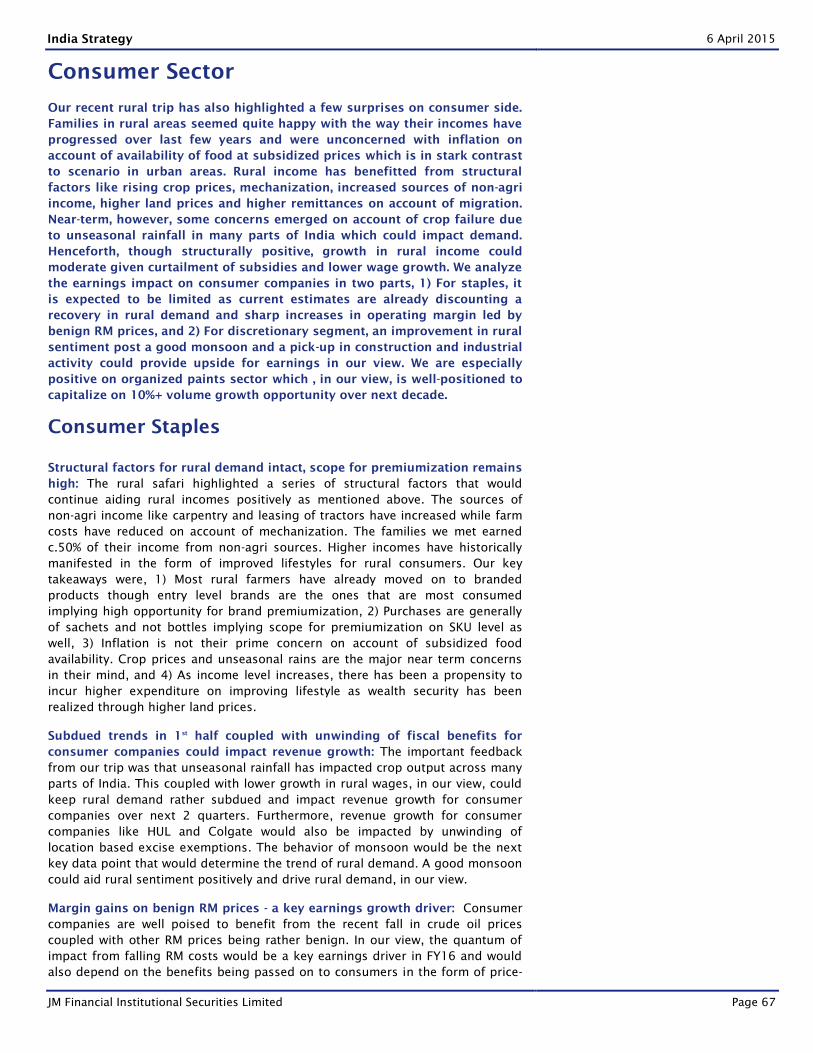
India Strategy 6 April 2015
JM Financial Institutional Securities Limited Page 67
Consumer Sector
Our recent rural trip has also highlighted a few surprises on consumer side.
Families in rural areas seemed quite happy with the way their incomes have
progressed over last few years and were unconcerned with inflation on
account of availability of food at subsidized prices which is in stark contrast
to scenario in urban areas. Rural income has benefitted from structural
factors like rising crop prices, mechanization, increased sources of non-agri
income, higher land prices and higher remittances on account of migration.
Near-term, however, some concerns emerged on account of crop failure due
to unseasonal rainfall in many parts of India which could impact demand.
Henceforth, though structurally positive, growth in rural income could
moderate given curtailment of subsidies and lower wage growth. We analyze
the earnings impact on consumer companies in two parts, 1) For staples, it
is expected to be limited as current estimates are already discounting a
recovery in rural demand and sharp increases in operating margin led by
benign RM prices, and 2) For discretionary segment, an improvement in rural
sentiment post a good monsoon and a pick-up in construction and industrial
activity could provide upside for earnings in our view. We are especially
positive on organized paints sector which , in our view, is well-positioned to
capitalize on 10%+ volume growth opportunity over next decade.
Consumer Staples
Structural factors for rural demand intact, scope for premiumization remains
high: The rural safari highlighted a series of structural factors that would
continue aiding rural incomes positively as mentioned above. The sources of
non-agri income like carpentry and leasing of tractors have increased while farm
costs have reduced on account of mechanization. The families we met earned
c.50% of their income from non-agri sources. Higher incomes have historically
manifested in the form of improved lifestyles for rural consumers. Our key
takeaways were, 1) Most rural farmers have already moved on to branded
products though entry level brands are the ones that are most consumed
implying high opportunity for brand premiumization, 2) Purchases are generally
of sachets and not bottles implying scope for premiumization on SKU level as
well, 3) Inflation is not their prime concern on account of subsidized food
availability. Crop prices and unseasonal rains are the major near term concerns
in their mind, and 4) As income level increases, there has been a propensity to
incur higher expenditure on improving lifestyle as wealth security has been
realized through higher land prices.
Subdued trends in 1st
half coupled with unwinding of fiscal benefits for
consumer companies could impact revenue growth: The important feedback
from our trip was that unseasonal rainfall has impacted crop output across many
parts of India. This coupled with lower growth in rural wages, in our view, could
keep rural demand rather subdued and impact revenue growth for consumer
companies over next 2 quarters. Furthermore, revenue growth for consumer
companies like HUL and Colgate would also be impacted by unwinding of
location based excise exemptions. The behavior of monsoon would be the next
key data point that would determine the trend of rural demand. A good monsoon
could aid rural sentiment positively and drive rural demand, in our view.
Margin gains on benign RM prices - a key earnings growth driver: Consumer
companies are well poised to benefit from the recent fall in crude oil prices
coupled with other RM prices being rather benign. In our view, the quantum of
impact from falling RM costs would be a key earnings driver in FY16 and would
also depend on the benefits being passed on to consumers in the form of price-
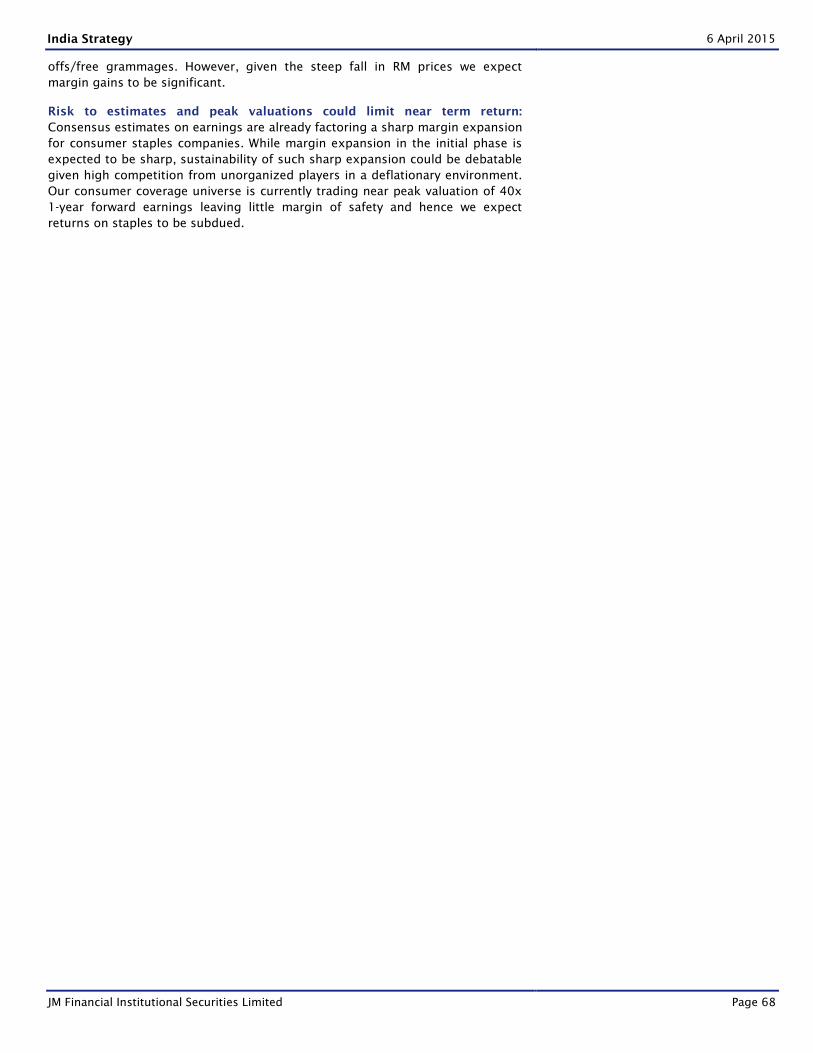
India Strategy 6 April 2015
JM Financial Institutional Securities Limited Page 68
offs/free grammages. However, given the steep fall in RM prices we expect
margin gains to be significant.
Risk to estimates and peak valuations could limit near term return:
Consensus estimates on earnings are already factoring a sharp margin expansion
for consumer staples companies. While margin expansion in the initial phase is
expected to be sharp, sustainability of such sharp expansion could be debatable
given high competition from unorganized players in a deflationary environment.
Our consumer coverage universe is currently trading near peak valuation of 40x
1-year forward earnings leaving little margin of safety and hence we expect
returns on staples to be subdued.
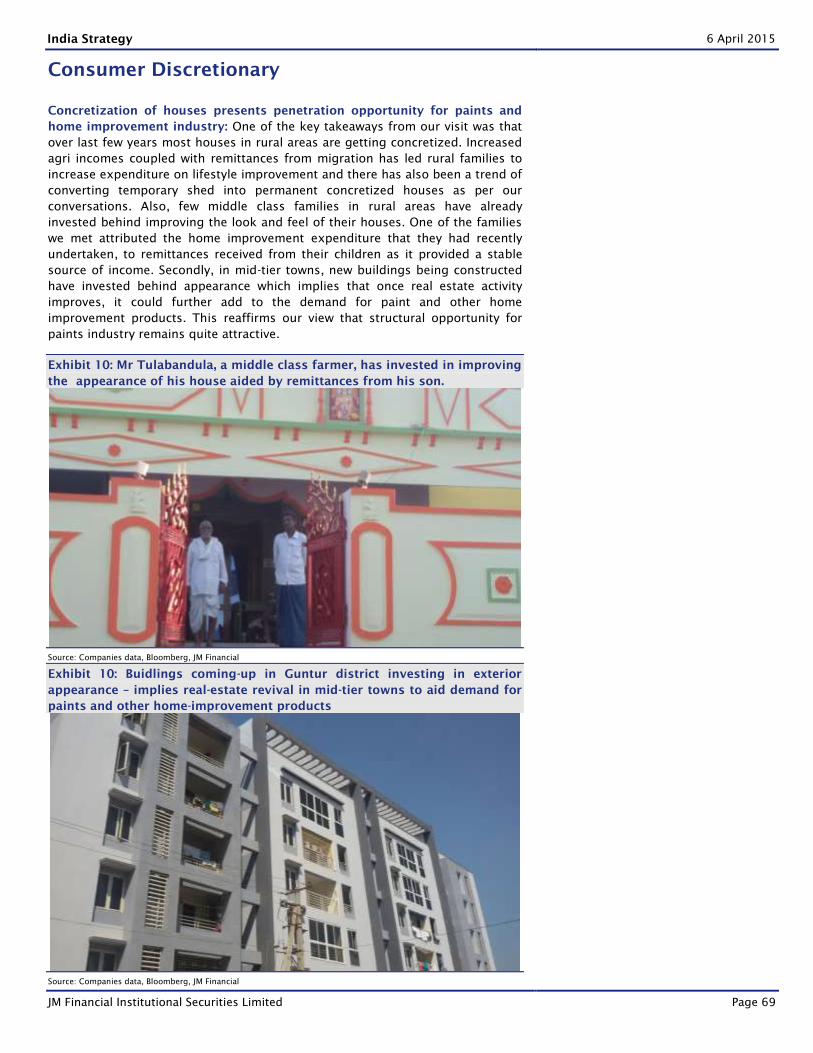
India Strategy 6 April 2015
JM Financial Institutional Securities Limited Page 69
Consumer Discretionary
Concretization of houses presents penetration opportunity for paints and
home improvement industry: One of the key takeaways from our visit was that
over last few years most houses in rural areas are getting concretized. Increased
agri incomes coupled with remittances from migration has led rural families to
increase expenditure on lifestyle improvement and there has also been a trend of
converting temporary shed into permanent concretized houses as per our
conversations. Also, few middle class families in rural areas have already
invested behind improving the look and feel of their houses. One of the families
we met attributed the home improvement expenditure that they had recently
undertaken, to remittances received from their children as it provided a stable
source of income. Secondly, in mid-tier towns, new buildings being constructed
have invested behind appearance which implies that once real estate activity
improves, it could further add to the demand for paint and other home
improvement products. This reaffirms our view that structural opportunity for
paints industry remains quite attractive.
Exhibit 10: Mr Tulabandula, a middle class farmer, has invested in improving
the appearance of his house aided by remittances from his son.
Source: Companies data, Bloomberg, JM Financial
Exhibit 10: Buidlings coming-up in Guntur district investing in exterior
appearance – implies real-estate revival in mid-tier towns to aid demand for
paints and other home-improvement products
Source: Companies data, Bloomberg, JM Financial
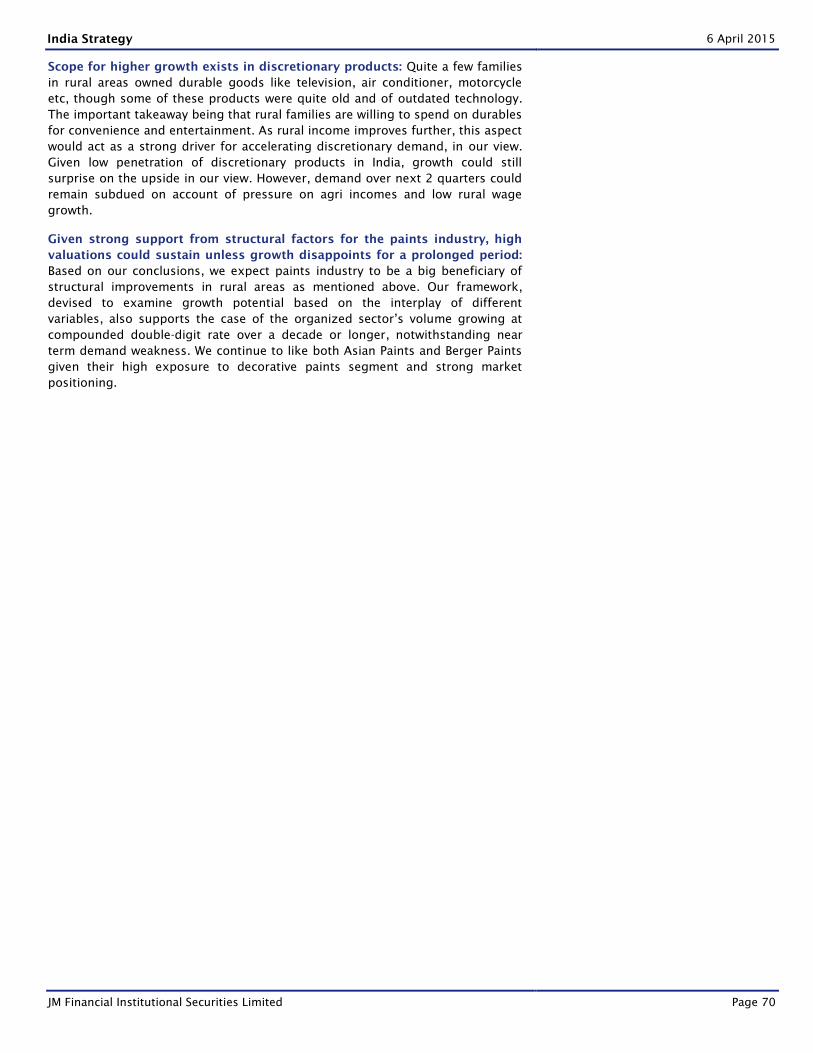
India Strategy 6 April 2015
JM Financial Institutional Securities Limited Page 70
Scope for higher growth exists in discretionary products: Quite a few families
in rural areas owned durable goods like television, air conditioner, motorcycle
etc, though some of these products were quite old and of outdated technology.
The important takeaway being that rural families are willing to spend on durables
for convenience and entertainment. As rural income improves further, this aspect
would act as a strong driver for accelerating discretionary demand, in our view.
Given low penetration of discretionary products in India, growth could still
surprise on the upside in our view. However, demand over next 2 quarters could
remain subdued on account of pressure on agri incomes and low rural wage
growth.
Given strong support from structural factors for the paints industry, high
valuations could sustain unless growth disappoints for a prolonged period:
Based on our conclusions, we expect paints industry to be a big beneficiary of
structural improvements in rural areas as mentioned above. Our framework,
devised to examine growth potential based on the interplay of different
variables, also supports the case of the organized sector’s volume growing at
compounded double-digit rate over a decade or longer, notwithstanding near
term demand weakness. We continue to like both Asian Paints and Berger Paints
given their high exposure to decorative paints segment and strong market
positioning.
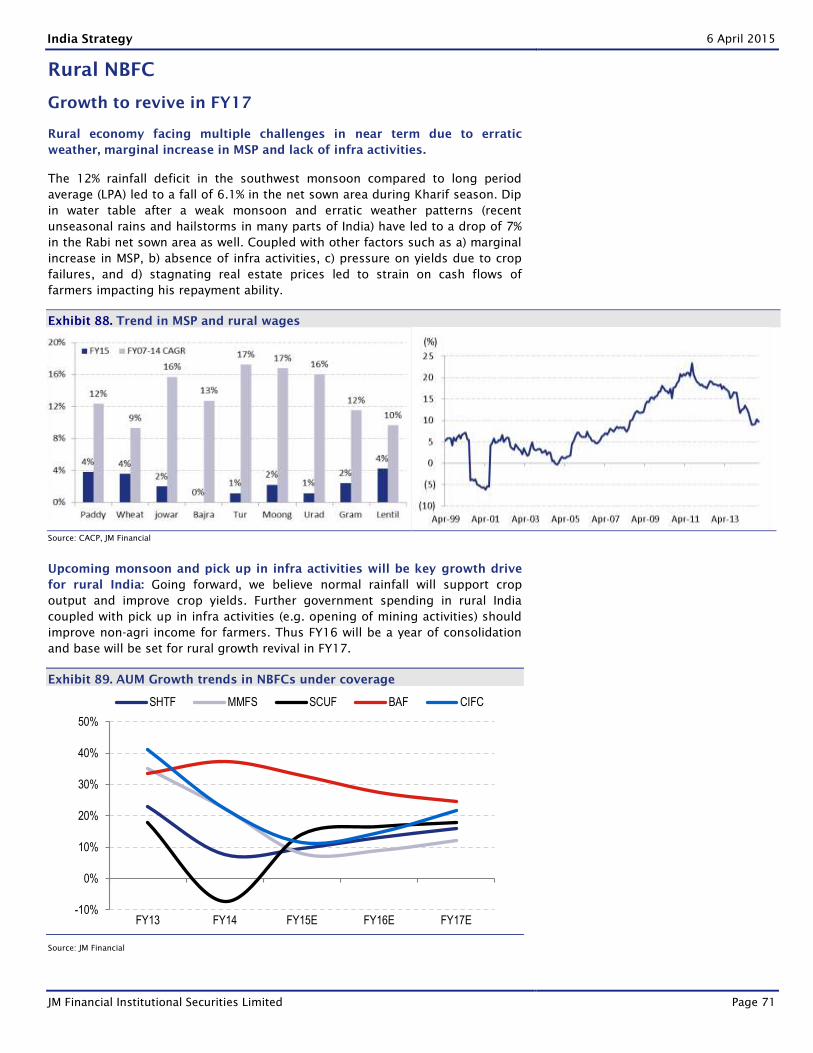
India Strategy 6 April 2015
JM Financial Institutional Securities Limited Page 71
Rural NBFC
Growth to revive in FY17
Rural economy facing multiple challenges in near term due to erratic
weather, marginal increase in MSP and lack of infra activities.
The 12% rainfall deficit in the southwest monsoon compared to long period
average (LPA) led to a fall of 6.1% in the net sown area during Kharif season. Dip
in water table after a weak monsoon and erratic weather patterns (recent
unseasonal rains and hailstorms in many parts of India) have led to a drop of 7%
in the Rabi net sown area as well. Coupled with other factors such as a) marginal
increase in MSP, b) absence of infra activities, c) pressure on yields due to crop
failures, and d) stagnating real estate prices led to strain on cash flows of
farmers impacting his repayment ability.
Exhibit 88. Trend in MSP and rural wages
Source: CACP, JM Financial
Upcoming monsoon and pick up in infra activities will be key growth drive
for rural India: Going forward, we believe normal rainfall will support crop
output and improve crop yields. Further government spending in rural India
coupled with pick up in infra activities (e.g. opening of mining activities) should
improve non-agri income for farmers. Thus FY16 will be a year of consolidation
and base will be set for rural growth revival in FY17.
Exhibit 89. AUM Growth trends in NBFCs under coverage
Source: JM Financial
-10%
0%
10%
20%
30%
40%
50%
FY13 FY14 FY15E FY16E FY17E
SHTF MMFS SCUF BAF CIFC
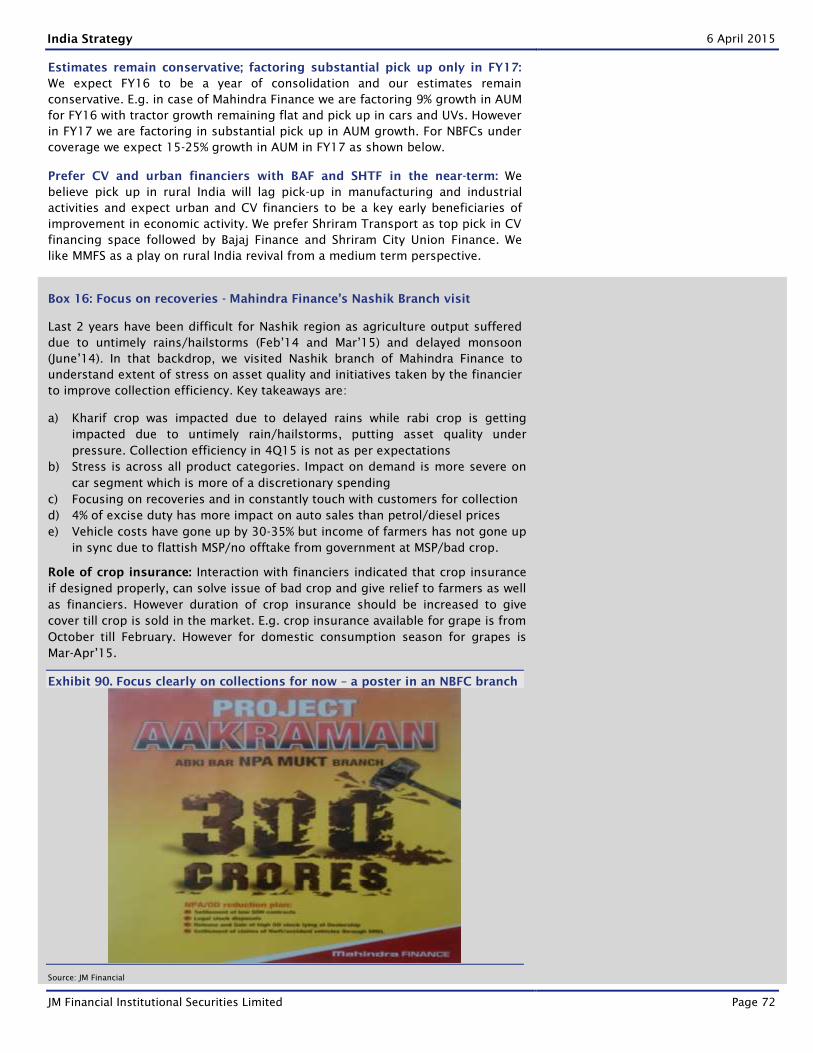
India Strategy 6 April 2015
JM Financial Institutional Securities Limited Page 72
Estimates remain conservative; factoring substantial pick up only in FY17:
We expect FY16 to be a year of consolidation and our estimates remain
conservative. E.g. in case of Mahindra Finance we are factoring 9% growth in AUM
for FY16 with tractor growth remaining flat and pick up in cars and UVs. However
in FY17 we are factoring in substantial pick up in AUM growth. For NBFCs under
coverage we expect 15-25% growth in AUM in FY17 as shown below.
Prefer CV and urban financiers with BAF and SHTF in the near-term: We
believe pick up in rural India will lag pick-up in manufacturing and industrial
activities and expect urban and CV financiers to be a key early beneficiaries of
improvement in economic activity. We prefer Shriram Transport as top pick in CV
financing space followed by Bajaj Finance and Shriram City Union Finance. We
like MMFS as a play on rural India revival from a medium term perspective.
Box 16: Focus on recoveries - Mahindra Finance’s Nashik Branch visit
Last 2 years have been difficult for Nashik region as agriculture output suffered
due to untimely rains/hailstorms (Feb’14 and Mar’15) and delayed monsoon
(June’14). In that backdrop, we visited Nashik branch of Mahindra Finance to
understand extent of stress on asset quality and initiatives taken by the financier
to improve collection efficiency. Key takeaways are:
a) Kharif crop was impacted due to delayed rains while rabi crop is getting
impacted due to untimely rain/hailstorms, putting asset quality under
pressure. Collection efficiency in 4Q15 is not as per expectations
b) Stress is across all product categories. Impact on demand is more severe on
car segment which is more of a discretionary spending
c) Focusing on recoveries and in constantly touch with customers for collection
d) 4% of excise duty has more impact on auto sales than petrol/diesel prices
e) Vehicle costs have gone up by 30-35% but income of farmers has not gone up
in sync due to flattish MSP/no offtake from government at MSP/bad crop.
Role of crop insurance: Interaction with financiers indicated that crop insurance
if designed properly, can solve issue of bad crop and give relief to farmers as well
as financiers. However duration of crop insurance should be increased to give
cover till crop is sold in the market. E.g. crop insurance available for grape is from
October till February. However for domestic consumption season for grapes is
Mar-Apr’15.
Exhibit 90. Focus clearly on collections for now – a poster in an NBFC branch
Source: JM Financial
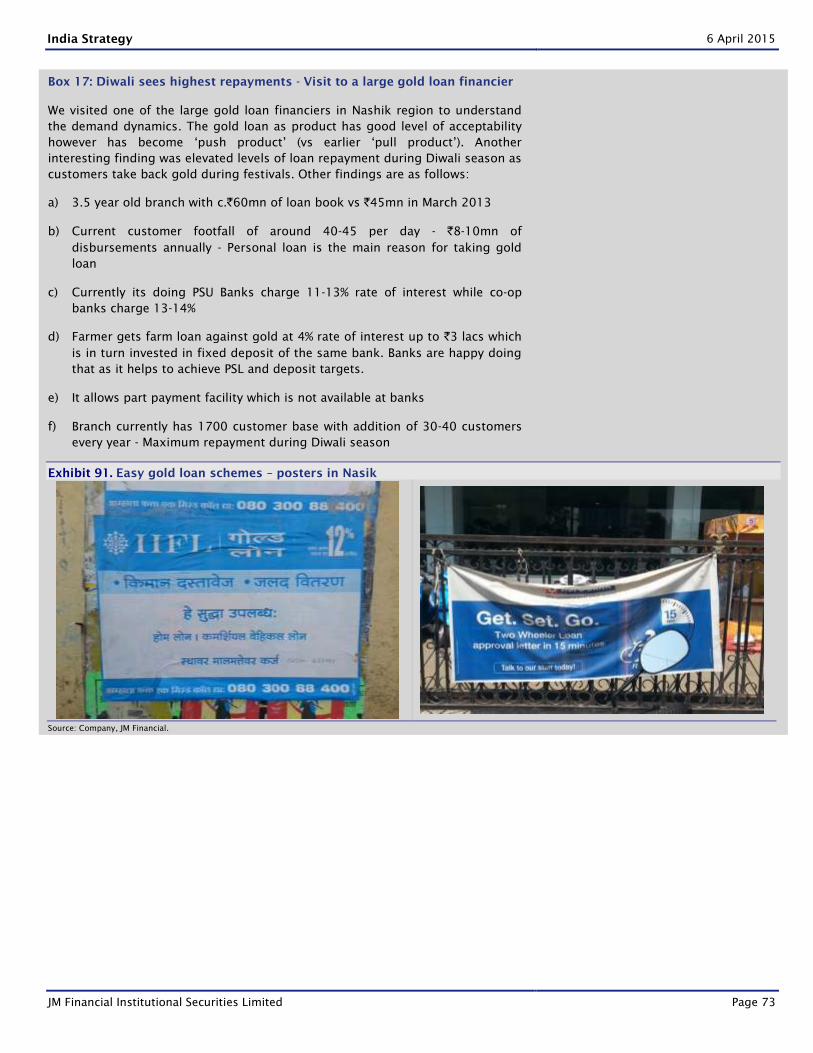
India Strategy 6 April 2015
JM Financial Institutional Securities Limited Page 73
Box 17: Diwali sees highest repayments - Visit to a large gold loan financier
We visited one of the large gold loan financiers in Nashik region to understand
the demand dynamics. The gold loan as product has good level of acceptability
however has become ‘push product’ (vs earlier ‘pull product’). Another
interesting finding was elevated levels of loan repayment during Diwali season as
customers take back gold during festivals. Other findings are as follows:
a) 3.5 year old branch with c.`60mn of loan book vs `45mn in March 2013
b) Current customer footfall of around 40-45 per day - `8-10mn of
disbursements annually - Personal loan is the main reason for taking gold
loan
c) Currently its doing PSU Banks charge 11-13% rate of interest while co-op
banks charge 13-14%
d) Farmer gets farm loan against gold at 4% rate of interest up to `3 lacs which
is in turn invested in fixed deposit of the same bank. Banks are happy doing
that as it helps to achieve PSL and deposit targets.
e) It allows part payment facility which is not available at banks
f) Branch currently has 1700 customer base with addition of 30-40 customers
every year - Maximum repayment during Diwali season
Exhibit 91. Easy gold loan schemes – posters in Nasik
Source: Company, JM Financial.
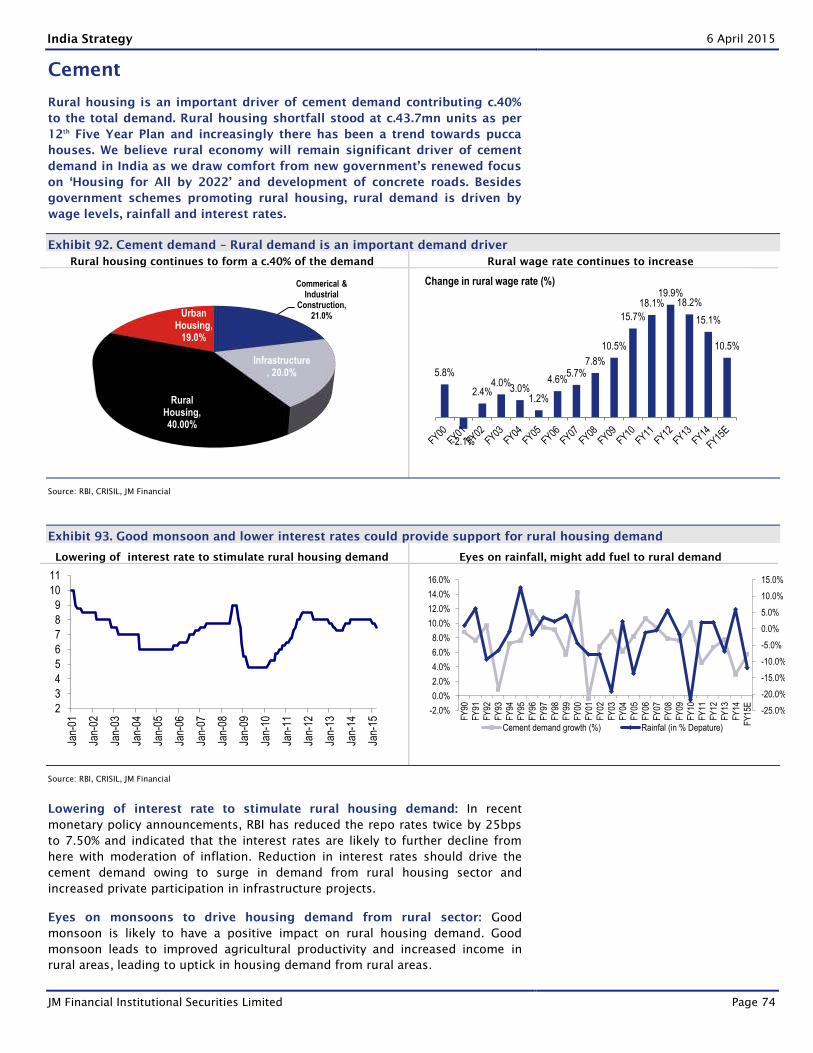
India Strategy 6 April 2015
JM Financial Institutional Securities Limited Page 74
Cement
Rural housing is an important driver of cement demand contributing c.40%
to the total demand. Rural housing shortfall stood at c.43.7mn units as per
12th
Five Year Plan and increasingly there has been a trend towards pucca
houses. We believe rural economy will remain significant driver of cement
demand in India as we draw comfort from new government’s renewed focus
on ‘Housing for All by 2022’ and development of concrete roads. Besides
government schemes promoting rural housing, rural demand is driven by
wage levels, rainfall and interest rates.
Exhibit 92. Cement demand – Rural demand is an important demand driver
Rural housing continues to form a c.40% of the demand Rural wage rate continues to increase
Source: RBI, CRISIL, JM Financial
Exhibit 93. Good monsoon and lower interest rates could provide support for rural housing demand
Lowering of interest rate to stimulate rural housing demand Eyes on rainfall, might add fuel to rural demand
Source: RBI, CRISIL, JM Financial
Lowering of interest rate to stimulate rural housing demand: In recent
monetary policy announcements, RBI has reduced the repo rates twice by 25bps
to 7.50% and indicated that the interest rates are likely to further decline from
here with moderation of inflation. Reduction in interest rates should drive the
cement demand owing to surge in demand from rural housing sector and
increased private participation in infrastructure projects.
Eyes on monsoons to drive housing demand from rural sector: Good
monsoon is likely to have a positive impact on rural housing demand. Good
monsoon leads to improved agricultural productivity and increased income in
rural areas, leading to uptick in housing demand from rural areas.
Commerical & Industrial
Construction, 21.0%
Infrastructure, 20.0%
Rural Housing, 40.00%
Urban Housing,
19.0%
5.8%
-2.1%
2.4%4.0%
3.0%1.2%
4.6%5.7%
7.8%
10.5%
15.7%
18.1%19.9%
18.2%
15.1%
10.5%
Change in rural wage rate (%)
2
3
4
5
6
7
8
9
10
11
Jan-
01
Jan-
02
Jan-
03
Jan-
04
Jan-
05
Jan-
06
Jan-
07
Jan-
08
Jan-
09
Jan-
10
Jan-
11
Jan-
12
Jan-
13
Jan-
14
Jan-
15
-25.0%
-20.0%
-15.0%
-10.0%
-5.0%
0.0%
5.0%
10.0%
15.0%
-2.0%
0.0%
2.0%
4.0%
6.0%
8.0%
10.0%
12.0%
14.0%
16.0%
FY
90
FY
91
FY
92
FY
93
FY
94
FY
95
FY
96
FY
97
FY
98
FY
99
FY
00
FY
01
FY
02
FY
03
FY
04
FY
05
FY
06
FY
07
FY
08
FY
09
FY
10
FY
11
FY
12
FY
13
FY
14
FY
15E
Cement demand growth (%) Rainfal (in % Depature)
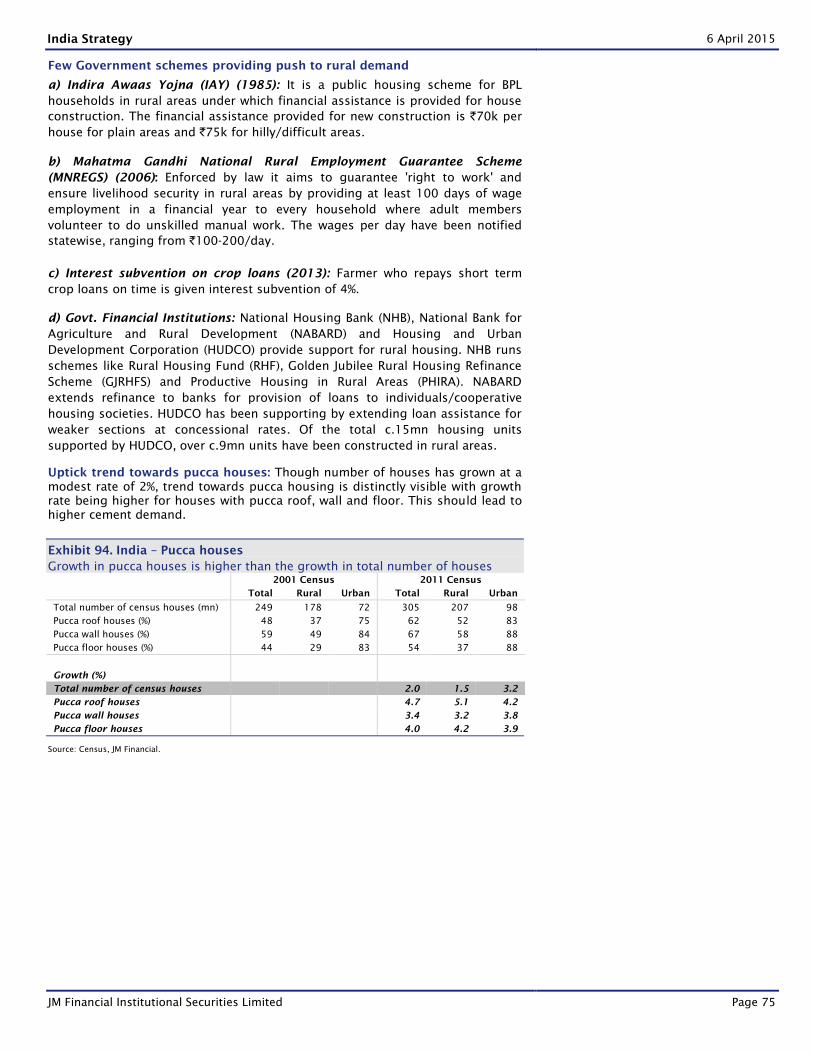
India Strategy 6 April 2015
JM Financial Institutional Securities Limited Page 75
Few Government schemes providing push to rural demand
a) Indira Awaas Yojna (IAY) (1985): It is a public housing scheme for BPL
households in rural areas under which financial assistance is provided for house
construction. The financial assistance provided for new construction is `70k per
house for plain areas and `75k for hilly/difficult areas.
b) Mahatma Gandhi National Rural Employment Guarantee Scheme
(MNREGS) (2006): Enforced by law it aims to guarantee 'right to work' and
ensure livelihood security in rural areas by providing at least 100 days of wage
employment in a financial year to every household where adult members
volunteer to do unskilled manual work. The wages per day have been notified
statewise, ranging from `100-200/day.
c) Interest subvention on crop loans (2013): Farmer who repays short term
crop loans on time is given interest subvention of 4%.
d) Govt. Financial Institutions: National Housing Bank (NHB), National Bank for
Agriculture and Rural Development (NABARD) and Housing and Urban
Development Corporation (HUDCO) provide support for rural housing. NHB runs
schemes like Rural Housing Fund (RHF), Golden Jubilee Rural Housing Refinance
Scheme (GJRHFS) and Productive Housing in Rural Areas (PHIRA). NABARD
extends refinance to banks for provision of loans to individuals/cooperative
housing societies. HUDCO has been supporting by extending loan assistance for
weaker sections at concessional rates. Of the total c.15mn housing units
supported by HUDCO, over c.9mn units have been constructed in rural areas.
Uptick trend towards pucca houses: Though number of houses has grown at a
modest rate of 2%, trend towards pucca housing is distinctly visible with growth
rate being higher for houses with pucca roof, wall and floor. This should lead to
higher cement demand.
Exhibit 94. India – Pucca houses
Growth in pucca houses is higher than the growth in total number of houses
2001 Census 2011 Census
Total Rural Urban Total Rural Urban
Total number of census houses (mn) 249 178 72 305 207 98
Pucca roof houses (%) 48 37 75 62 52 83
Pucca wall houses (%) 59 49 84 67 58 88
Pucca floor houses (%) 44 29 83 54 37 88
Growth (%)
Total number of census houses
2.0 1.5 3.2
Pucca roof houses
4.7 5.1 4.2
Pucca wall houses
3.4 3.2 3.8
Pucca floor houses
4.0 4.2 3.9
Source: Census, JM Financial.
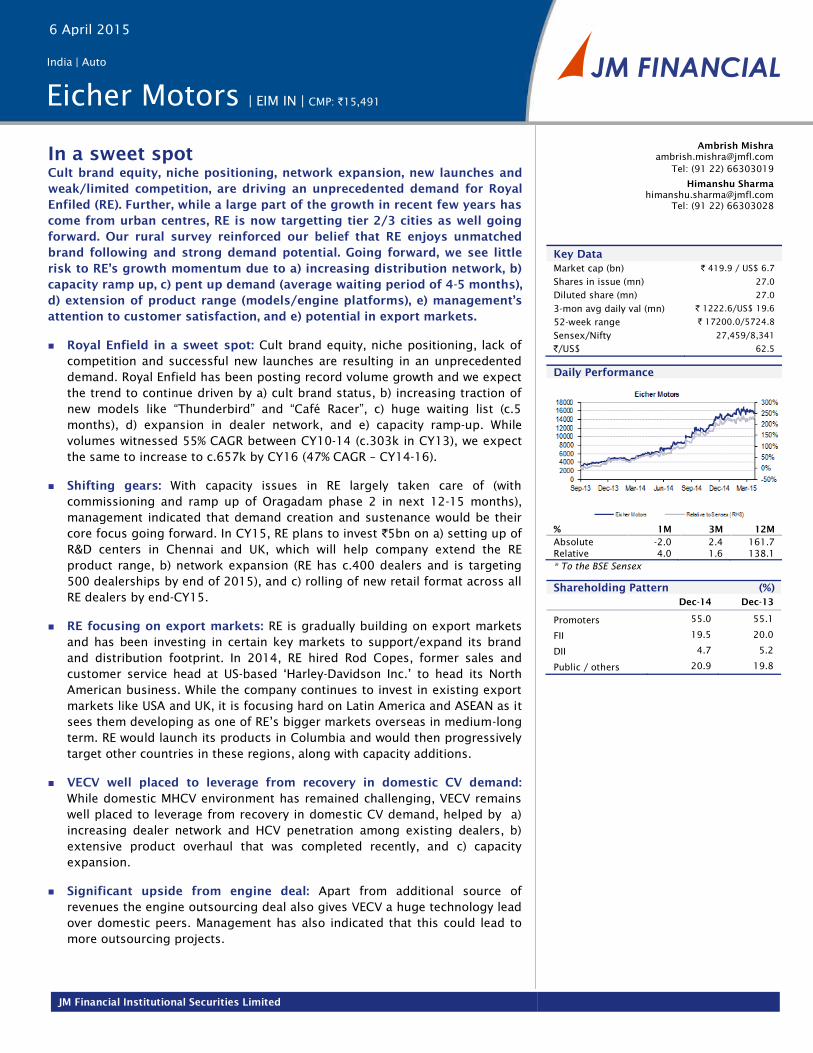
JM Financial Institutional Securities Limited
In a sweet spot
Cult brand equity, niche positioning, network expansion, new launches and
weak/limited competition, are driving an unprecedented demand for Royal
Enfiled (RE). Further, while a large part of the growth in recent few years has
come from urban centres, RE is now targetting tier 2/3 cities as well going
forward. Our rural survey reinforced our belief that RE enjoys unmatched
brand following and strong demand potential. Going forward, we see little
risk to RE’s growth momentum due to a) increasing distribution network, b)
capacity ramp up, c) pent up demand (average waiting period of 4-5 months),
d) extension of product range (models/engine platforms), e) management’s
attention to customer satisfaction, and e) potential in export markets.
Royal Enfield in a sweet spot: Cult brand equity, niche positioning, lack of
competition and successful new launches are resulting in an unprecedented
demand. Royal Enfield has been posting record volume growth and we expect
the trend to continue driven by a) cult brand status, b) increasing traction of
new models like “Thunderbird” and “Café Racer”, c) huge waiting list (c.5
months), d) expansion in dealer network, and e) capacity ramp-up. While
volumes witnessed 55% CAGR between CY10-14 (c.303k in CY13), we expect
the same to increase to c.657k by CY16 (47% CAGR – CY14-16).
Shifting gears: With capacity issues in RE largely taken care of (with
commissioning and ramp up of Oragadam phase 2 in next 12-15 months),
management indicated that demand creation and sustenance would be their
core focus going forward. In CY15, RE plans to invest `5bn on a) setting up of
R&D centers in Chennai and UK, which will help company extend the RE
product range, b) network expansion (RE has c.400 dealers and is targeting
500 dealerships by end of 2015), and c) rolling of new retail format across all
RE dealers by end-CY15.
RE focusing on export markets: RE is gradually building on export markets
and has been investing in certain key markets to support/expand its brand
and distribution footprint. In 2014, RE hired Rod Copes, former sales and
customer service head at US-based ‘Harley-Davidson Inc.’ to head its North
American business. While the company continues to invest in existing export
markets like USA and UK, it is focusing hard on Latin America and ASEAN as it
sees them developing as one of RE’s bigger markets overseas in medium-long
term. RE would launch its products in Columbia and would then progressively
target other countries in these regions, along with capacity additions.
VECV well placed to leverage from recovery in domestic CV demand:
While domestic MHCV environment has remained challenging, VECV remains
well placed to leverage from recovery in domestic CV demand, helped by a)
increasing dealer network and HCV penetration among existing dealers, b)
extensive product overhaul that was completed recently, and c) capacity
expansion.
Significant upside from engine deal: Apart from additional source of
revenues the engine outsourcing deal also gives VECV a huge technology lead
over domestic peers. Management has also indicated that this could lead to
more outsourcing projects.
India | Auto
Eicher Motors | EIM IN | CMP: `15,491
Ambrish Mishra
Tel: (91 22) 66303019
Himanshu Sharma
Tel: (91 22) 66303028
Key Data
Market cap (bn) ` 419.9 / US$ 6.7
Shares in issue (mn) 27.0
Diluted share (mn) 27.0
3-mon avg daily val (mn) ` 1222.6/US$ 19.6
52-week range ` 17200.0/5724.8
Sensex/Nifty 27,459/8,341
`/US$ 62.5
Daily Performance
% 1M 3M 12M
Absolute -2.0 2.4 161.7
Relative 4.0 1.6 138.1
* To the BSE Sensex
Shareholding Pattern (%)
Dec-14 Dec-13
Promoters 55.0 55.1
FII 19.5 20.0
DII 4.7 5.2
Public / others 20.9 19.8
6 April 2015
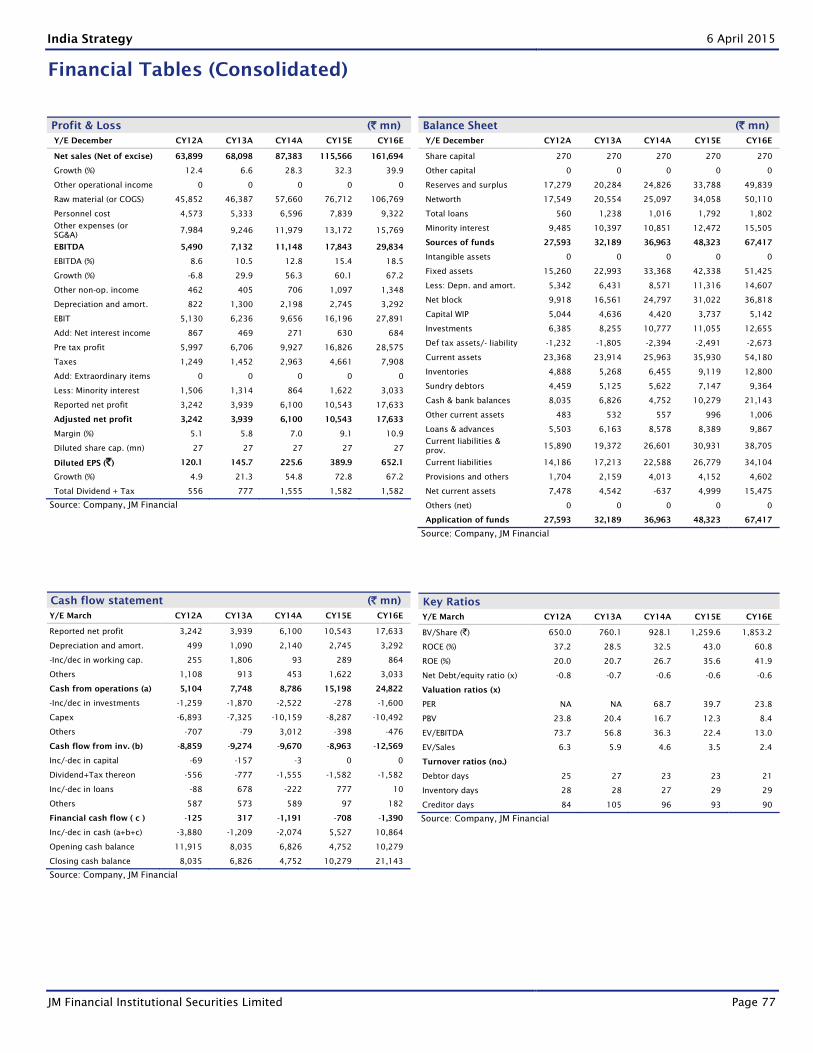
India Strategy 6 April 2015
JM Financial Institutional Securities Limited Page 77
Financial Tables (Consolidated)
Profit & Loss (` mn)
Y/E December CY12A CY13A CY14A CY15E CY16E
Net sales (Net of excise) 63,899 68,098 87,383 115,566 161,694
Growth (%) 12.4 6.6 28.3 32.3 39.9
Other operational income 0 0 0 0 0
Raw material (or COGS) 45,852 46,387 57,660 76,712 106,769
Personnel cost 4,573 5,333 6,596 7,839 9,322
Other expenses (or
SG&A) 7,984 9,246 11,979 13,172 15,769
EBITDA 5,490 7,132 11,148 17,843 29,834
EBITDA (%) 8.6 10.5 12.8 15.4 18.5
Growth (%) -6.8 29.9 56.3 60.1 67.2
Other non-op. income 462 405 706 1,097 1,348
Depreciation and amort. 822 1,300 2,198 2,745 3,292
EBIT 5,130 6,236 9,656 16,196 27,891
Add: Net interest income 867 469 271 630 684
Pre tax profit 5,997 6,706 9,927 16,826 28,575
Taxes 1,249 1,452 2,963 4,661 7,908
Add: Extraordinary items 0 0 0 0 0
Less: Minority interest 1,506 1,314 864 1,622 3,033
Reported net profit 3,242 3,939 6,100 10,543 17,633
Adjusted net profit 3,242 3,939 6,100 10,543 17,633
Margin (%) 5.1 5.8 7.0 9.1 10.9
Diluted share cap. (mn) 27 27 27 27 27
Diluted EPS (`) 120.1 145.7 225.6 389.9 652.1
Growth (%) 4.9 21.3 54.8 72.8 67.2
Total Dividend + Tax 556 777 1,555 1,582 1,582
Source: Company, JM Financial
Balance Sheet (` mn)
Y/E December CY12A CY13A CY14A CY15E CY16E
Share capital 270 270 270 270 270
Other capital 0 0 0 0 0
Reserves and surplus 17,279 20,284 24,826 33,788 49,839
Networth 17,549 20,554 25,097 34,058 50,110
Total loans 560 1,238 1,016 1,792 1,802
Minority interest 9,485 10,397 10,851 12,472 15,505
Sources of funds 27,593 32,189 36,963 48,323 67,417
Intangible assets 0 0 0 0 0
Fixed assets 15,260 22,993 33,368 42,338 51,425
Less: Depn. and amort. 5,342 6,431 8,571 11,316 14,607
Net block 9,918 16,561 24,797 31,022 36,818
Capital WIP 5,044 4,636 4,420 3,737 5,142
Investments 6,385 8,255 10,777 11,055 12,655
Def tax assets/- liability -1,232 -1,805 -2,394 -2,491 -2,673
Current assets 23,368 23,914 25,963 35,930 54,180
Inventories 4,888 5,268 6,455 9,119 12,800
Sundry debtors 4,459 5,125 5,622 7,147 9,364
Cash & bank balances 8,035 6,826 4,752 10,279 21,143
Other current assets 483 532 557 996 1,006
Loans & advances 5,503 6,163 8,578 8,389 9,867
Current liabilities &
prov. 15,890 19,372 26,601 30,931 38,705
Current liabilities 14,186 17,213 22,588 26,779 34,104
Provisions and others 1,704 2,159 4,013 4,152 4,602
Net current assets 7,478 4,542 -637 4,999 15,475
Others (net) 0 0 0 0 0
Application of funds 27,593 32,189 36,963 48,323 67,417
Source: Company, JM Financial
Cash flow statement (` mn)
Y/E March CY12A CY13A CY14A CY15E CY16E
Reported net profit 3,242 3,939 6,100 10,543 17,633
Depreciation and amort. 499 1,090 2,140 2,745 3,292
-Inc/dec in working cap. 255 1,806 93 289 864
Others 1,108 913 453 1,622 3,033
Cash from operations (a) 5,104 7,748 8,786 15,198 24,822
-Inc/dec in investments -1,259 -1,870 -2,522 -278 -1,600
Capex -6,893 -7,325 -10,159 -8,287 -10,492
Others -707 -79 3,012 -398 -476
Cash flow from inv. (b) -8,859 -9,274 -9,670 -8,963 -12,569
Inc/-dec in capital -69 -157 -3 0 0
Dividend+Tax thereon -556 -777 -1,555 -1,582 -1,582
Inc/-dec in loans -88 678 -222 777 10
Others 587 573 589 97 182
Financial cash flow ( c ) -125 317 -1,191 -708 -1,390
Inc/-dec in cash (a+b+c) -3,880 -1,209 -2,074 5,527 10,864
Opening cash balance 11,915 8,035 6,826 4,752 10,279
Closing cash balance 8,035 6,826 4,752 10,279 21,143
Source: Company, JM Financial
Key Ratios
Y/E March CY12A CY13A CY14A CY15E CY16E
BV/Share (`) 650.0 760.1 928.1 1,259.6 1,853.2
ROCE (%) 37.2 28.5 32.5 43.0 60.8
ROE (%) 20.0 20.7 26.7 35.6 41.9
Net Debt/equity ratio (x) -0.8 -0.7 -0.6 -0.6 -0.6
Valuation ratios (x)
PER NA NA 68.7 39.7 23.8
PBV 23.8 20.4 16.7 12.3 8.4
EV/EBITDA 73.7 56.8 36.3 22.4 13.0
EV/Sales 6.3 5.9 4.6 3.5 2.4
Turnover ratios (no.)
Debtor days 25 27 23 23 21
Inventory days 28 28 27 29 29
Creditor days 84 105 96 93 90
Source: Company, JM Financial

JM Financial Institutional Securities Limited
Long-term story intact
Amongst all 4-wheeler players, M&M enjoys some structural advantages like
– i) relatively low competitive intensity in core UV/tractor business, ii) rising
focus on farm mechanization, iii) very strong financing arm in Mahindra
Finance, and iv) higher reach and exposure to rural/semi-urban markets
(c.70% of domestic sales). However, our recent visits/interaction with
stakeholders in rural India highlighted sluggishness in rural economy,
impacted by unseasonal rains, lower support prices (MSP), slowing
construction/infrastructure activity and reduced government spending.
While we acknowledge the challenges in rural hinterland in near term, we
see little risk to our medium-long term thesis on M&M; reiterate +ve stance.
Tractor industry to see 7-8% CAGR over long term: FY15 is turning out to
be challenging for domestic tractor industry, however, our interaction with
the stakeholders across several rural cities/villages indicate little risk to farm
mechanisation trends in medium-long run (driven by improving
infrastructure, labor shortage, improving information flow and access to
finance). As per our analysis, tractor population in India can potentially
double (based on arable land in India) in medium term. However, volume
growth could be voltaile given that rural income in India is still significantly
dependent on yearly monsoons and local governent policies/execution.
Automotive volume outlook getting better: While in the last few quarters,
M&M suffered due to lack of products in compact UV segment, FY16
promises to be an exciting year for M&M, as it leverages its investment in
R&D and product development. In 9MFY16, M&M plans to launch three new
platforms, 3 major refreshes and 3 variants, making Apr’15 – Dec’15 an
interesting time for the company. M&M is also working on a 1.2ltr petrol
engine for its compact SUV segment, thereby attracting petrol customers.
Best placed to capitalize on India’s farm mechanization opportunity: M&M
plans to built upon its leadership in farm equipment by targeting the value
chain in farm mechanization. M&M estimates size of opportunity for farm
mechanization at `35bn and plans to focus on land preparation/harvesting.
M&M has already established presence in segments like crop care and micro
irrigation by organic efforts and acquisitions (like EPC Industries).
SsangYong (SYMC) to augment product range and new market access: In
our view, SYMC acquisition has been a strategic fit for M&M. Going forward,
SYMC will not only carry synergies on advance engine technologies and SUV
designing capabilities, but also create cross selling opportunities in
respective strong/growing markets. Ssangyong latest launch ‘Tivoli’ has been
well received in the market and company has sold more than 8k units in less
than a month. Going forward, M&M expects Ssangyong volumes to remain
healthy, despite weak demand in Russia (one of the largest market for the
company), helped by a) successful launch of ‘Tivoli’ across the world, b)
expansion in new markets like China and Western Europe, and c) aggressive
launch pipeline (working on two new products – Y400, C300).
India | Auto
Mahindra & Mahindra | MM IN | CMP: `1,189
Ambrish Mishra
Tel: (91 22) 66303019
Himanshu Sharma
Tel: (91 22) 66303028
Key Data
Market cap (bn) ` 738.2 / US$ 11.8
Shares in issue (mn) 590.3
Diluted share (mn) 590.3
3-mon avg daily val (mn) ` 1524.7/US$ 24.4
52-week range ` 1433.7/954.8
Sensex/Nifty 27,459/8,341
`/US$ 62.5
Daily Performance
% 1M 3M 12M
Absolute -7.2 -5.3 23.2
Relative -1.2 -6.1 -0.4
* To the BSE Sensex
Shareholding Pattern (%)
Dec-14 Dec-13
Promoters 25.7 25.2
FII 37.4 36.7
DII 17.6 16.0
Public / others 19.3 22.1
6 April 2015
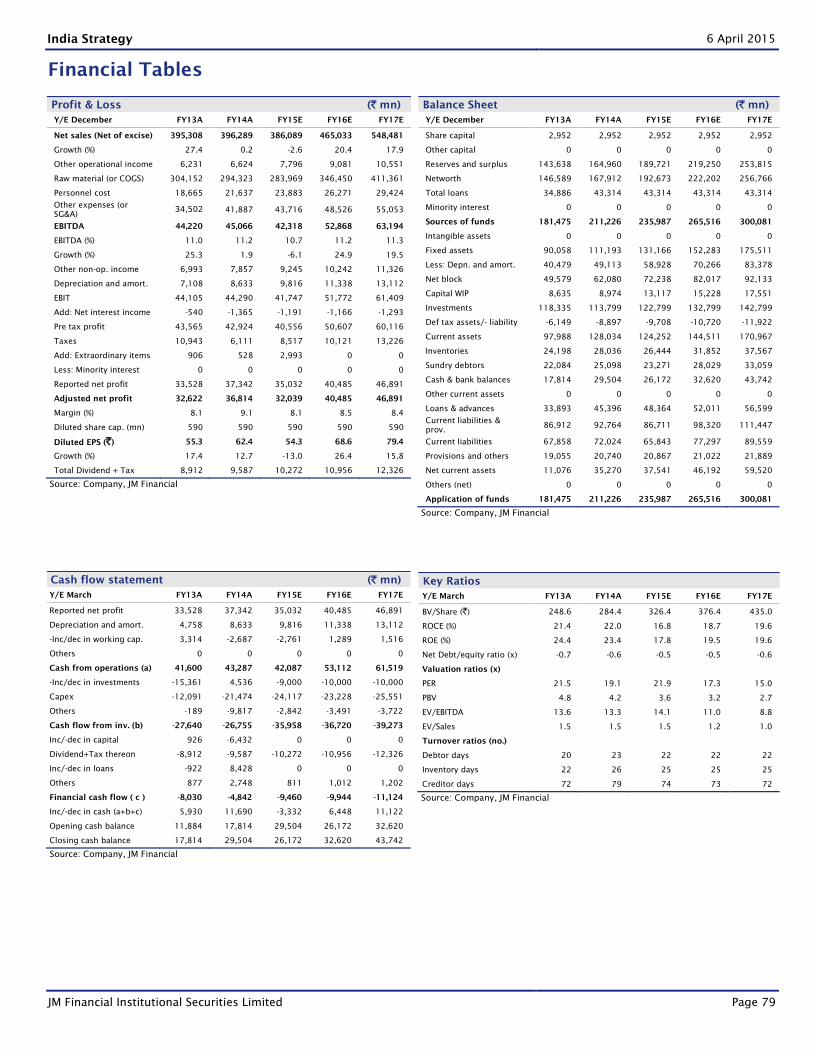
India Strategy 6 April 2015
JM Financial Institutional Securities Limited Page 79
Financial Tables
Profit & Loss (` mn)
Y/E December FY13A FY14A FY15E FY16E FY17E
Net sales (Net of excise) 395,308 396,289 386,089 465,033 548,481
Growth (%) 27.4 0.2 -2.6 20.4 17.9
Other operational income 6,231 6,624 7,796 9,081 10,551
Raw material (or COGS) 304,152 294,323 283,969 346,450 411,361
Personnel cost 18,665 21,637 23,883 26,271 29,424
Other expenses (or
SG&A) 34,502 41,887 43,716 48,526 55,053
EBITDA 44,220 45,066 42,318 52,868 63,194
EBITDA (%) 11.0 11.2 10.7 11.2 11.3
Growth (%) 25.3 1.9 -6.1 24.9 19.5
Other non-op. income 6,993 7,857 9,245 10,242 11,326
Depreciation and amort. 7,108 8,633 9,816 11,338 13,112
EBIT 44,105 44,290 41,747 51,772 61,409
Add: Net interest income -540 -1,365 -1,191 -1,166 -1,293
Pre tax profit 43,565 42,924 40,556 50,607 60,116
Taxes 10,943 6,111 8,517 10,121 13,226
Add: Extraordinary items 906 528 2,993 0 0
Less: Minority interest 0 0 0 0 0
Reported net profit 33,528 37,342 35,032 40,485 46,891
Adjusted net profit 32,622 36,814 32,039 40,485 46,891
Margin (%) 8.1 9.1 8.1 8.5 8.4
Diluted share cap. (mn) 590 590 590 590 590
Diluted EPS (`) 55.3 62.4 54.3 68.6 79.4
Growth (%) 17.4 12.7 -13.0 26.4 15.8
Total Dividend + Tax 8,912 9,587 10,272 10,956 12,326
Source: Company, JM Financial
Balance Sheet (` mn)
Y/E December FY13A FY14A FY15E FY16E FY17E
Share capital 2,952 2,952 2,952 2,952 2,952
Other capital 0 0 0 0 0
Reserves and surplus 143,638 164,960 189,721 219,250 253,815
Networth 146,589 167,912 192,673 222,202 256,766
Total loans 34,886 43,314 43,314 43,314 43,314
Minority interest 0 0 0 0 0
Sources of funds 181,475 211,226 235,987 265,516 300,081
Intangible assets 0 0 0 0 0
Fixed assets 90,058 111,193 131,166 152,283 175,511
Less: Depn. and amort. 40,479 49,113 58,928 70,266 83,378
Net block 49,579 62,080 72,238 82,017 92,133
Capital WIP 8,635 8,974 13,117 15,228 17,551
Investments 118,335 113,799 122,799 132,799 142,799
Def tax assets/- liability -6,149 -8,897 -9,708 -10,720 -11,922
Current assets 97,988 128,034 124,252 144,511 170,967
Inventories 24,198 28,036 26,444 31,852 37,567
Sundry debtors 22,084 25,098 23,271 28,029 33,059
Cash & bank balances 17,814 29,504 26,172 32,620 43,742
Other current assets 0 0 0 0 0
Loans & advances 33,893 45,396 48,364 52,011 56,599
Current liabilities &
prov. 86,912 92,764 86,711 98,320 111,447
Current liabilities 67,858 72,024 65,843 77,297 89,559
Provisions and others 19,055 20,740 20,867 21,022 21,889
Net current assets 11,076 35,270 37,541 46,192 59,520
Others (net) 0 0 0 0 0
Application of funds 181,475 211,226 235,987 265,516 300,081
Source: Company, JM Financial
Cash flow statement (` mn)
Y/E March FY13A FY14A FY15E FY16E FY17E
Reported net profit 33,528 37,342 35,032 40,485 46,891
Depreciation and amort. 4,758 8,633 9,816 11,338 13,112
-Inc/dec in working cap. 3,314 -2,687 -2,761 1,289 1,516
Others 0 0 0 0 0
Cash from operations (a) 41,600 43,287 42,087 53,112 61,519
-Inc/dec in investments -15,361 4,536 -9,000 -10,000 -10,000
Capex -12,091 -21,474 -24,117 -23,228 -25,551
Others -189 -9,817 -2,842 -3,491 -3,722
Cash flow from inv. (b) -27,640 -26,755 -35,958 -36,720 -39,273
Inc/-dec in capital 926 -6,432 0 0 0
Dividend+Tax thereon -8,912 -9,587 -10,272 -10,956 -12,326
Inc/-dec in loans -922 8,428 0 0 0
Others 877 2,748 811 1,012 1,202
Financial cash flow ( c ) -8,030 -4,842 -9,460 -9,944 -11,124
Inc/-dec in cash (a+b+c) 5,930 11,690 -3,332 6,448 11,122
Opening cash balance 11,884 17,814 29,504 26,172 32,620
Closing cash balance 17,814 29,504 26,172 32,620 43,742
Source: Company, JM Financial
Key Ratios
Y/E March FY13A FY14A FY15E FY16E FY17E
BV/Share (`) 248.6 284.4 326.4 376.4 435.0
ROCE (%) 21.4 22.0 16.8 18.7 19.6
ROE (%) 24.4 23.4 17.8 19.5 19.6
Net Debt/equity ratio (x) -0.7 -0.6 -0.5 -0.5 -0.6
Valuation ratios (x)
PER 21.5 19.1 21.9 17.3 15.0
PBV 4.8 4.2 3.6 3.2 2.7
EV/EBITDA 13.6 13.3 14.1 11.0 8.8
EV/Sales 1.5 1.5 1.5 1.2 1.0
Turnover ratios (no.)
Debtor days 20 23 22 22 22
Inventory days 22 26 25 25 25
Creditor days 72 79 74 73 72
Source: Company, JM Financial

JM Financial Institutional Securities Limited
Holding its fort
Over the last few years, Maruti Suzuki has consistently outgrown domestic
car industry, helped by increasing rural penetration and entry in new
segments. Although our recent rural survey indicated slowing rural
economy, we expect the same to be more than compensated by improving
demand in urban centers (still account for c.65% of volumes) and recent
launches. Going forward, we expect MSIL volume growth to remain healthy,
supported by a) aggressive launch pipeline (helping company target new
segments as well), b) increasing preference for gasoline cars, c) recovery in
demand from first time buyers, and d) introduction of AMT across more
models. Further, our interaction with rural stakeholders highlighted that
MSIL enjoys huge brand loyalty in rural India and would be a prime
beneficiary of increasing PV penetration in medium-long run.
MSIL at its competitive best in recent times: Compared to past few years,
we believe MSIL’s competitive positioning is far stronger today, driven by new
product launches (new segments), extensive product range and extensive
distribution network. In last few years we have seen quite a few global car
companies like Skoda, Volkswagon, Renault and Toyota scaling down their
India targets. This, we believe is an indication of maturing competitive
landscape. Consequently, we believe this would help MSIL maintain its market
leadership without compromising on profitability going forward.
Prime beneficiary of recovery in domestic demand: We believe MSIL
remains best placed to leverage recovery in domestic PV demand going
forward, given a) its extensive product range, specially in entry level segment
(would bebefit from recoevery in demand from first time buyers), b) growing
preference for gasoline cars, c) Recent launches like Celerio and Ciaz, d)
aggresive launch pipeline (including products in new segments like compact
UV and launch of AMT variants in existing models) and best in class network.
New launches in last decade have helped MSIL retain customers as they
upgrade to higher segments: New launches in last decade (like Wagon R,
Swift, Ciaz) have supported MSIL brand and helped company match growing
customer aspirations, thereby helping it retain exiting customers and
attracting new customers in higher segments. Over the years, MSIL has also
been quick in identifying gaps in the market and exploiting them (Dzire,
Ertiga). While MSIL already dominates the domestic hatchback segment (both
entry and premium) and compact sedan segment, its latest launch in sedan
segment - Ciaz, has also been well received. Going forward, company is
preparing to launch SX4 cross (to be positined above Ciaz) and an offering in
compact SUV segment.
Tailwinds to EBITDA margin, estimate c.150bps improvement: We expect
MSIL margins to remain steady on a) healthy volume performance (expect
volume CAGR of 17% over FY15-17E), b) economies of scale (MSIL will use
current facilities to meet domestic/export demand until FY17), c) stable RM
cost (as indicated by management), d) favorable currency (Yen exposure
stands at c.18%), and e) cost control.
India | Auto
Maruti Suzuki | MSIL IN | CMP: `3,610
Ambrish Mishra
Tel: (91 22) 66303019
Himanshu Sharma
Tel: (91 22) 66303028
Key Data
Market cap (bn) ` 1090.5 / US$
17.4
Shares in issue (mn) 302.0
Diluted share (mn) 302.0
3-mon avg daily val (mn) ` 1246.9/US$ 20.0
52-week range ` 3789.7/1866.0
Sensex/Nifty 27,459/8,341
`/US$ 62.5
Daily Performance
% 1M 3M 12M
Absolute 0.2 8.3 86.5
Relative 6.2 7.5 62.9
* To the BSE Sensex
Shareholding Pattern (%)
Dec-14 Dec-13
Promoters 56.2 56.2
FII 22.0 21.5
DII 14.9 14.0
Public / others 6.9 8.3
6 April 2015
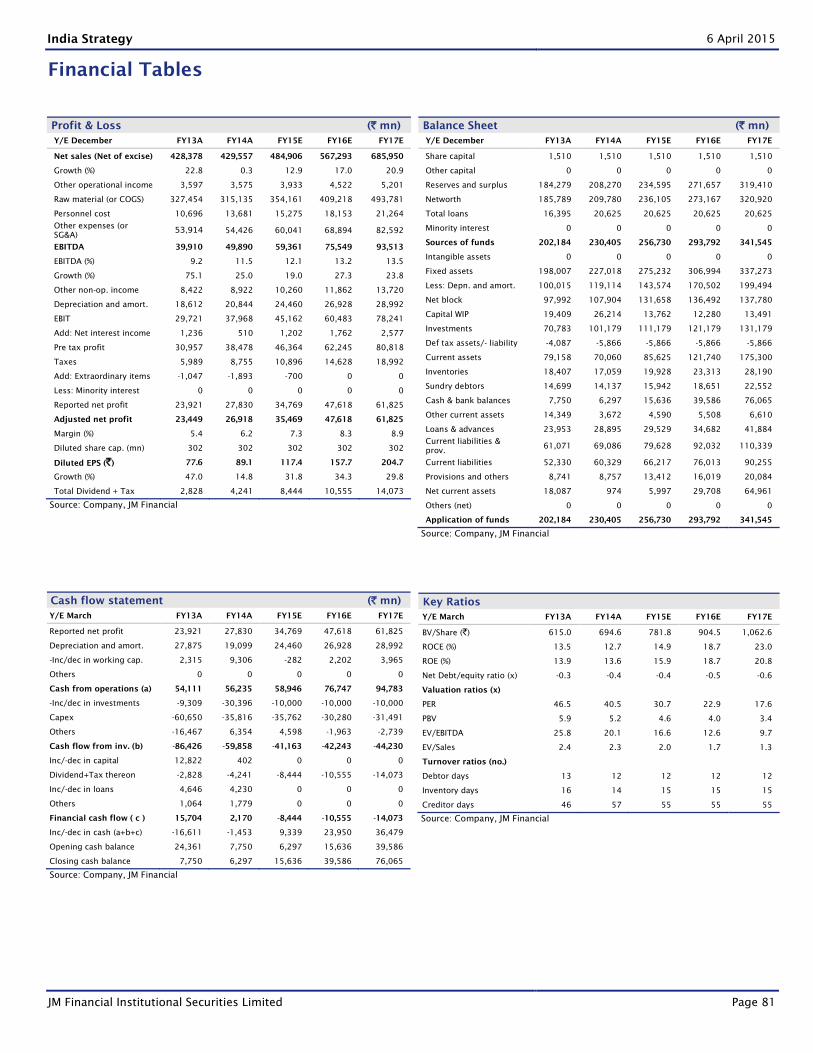
India Strategy 6 April 2015
JM Financial Institutional Securities Limited Page 81
Financial Tables
Profit & Loss (` mn)
Y/E December FY13A FY14A FY15E FY16E FY17E
Net sales (Net of excise) 428,378 429,557 484,906 567,293 685,950
Growth (%) 22.8 0.3 12.9 17.0 20.9
Other operational income 3,597 3,575 3,933 4,522 5,201
Raw material (or COGS) 327,454 315,135 354,161 409,218 493,781
Personnel cost 10,696 13,681 15,275 18,153 21,264
Other expenses (or
SG&A) 53,914 54,426 60,041 68,894 82,592
EBITDA 39,910 49,890 59,361 75,549 93,513
EBITDA (%) 9.2 11.5 12.1 13.2 13.5
Growth (%) 75.1 25.0 19.0 27.3 23.8
Other non-op. income 8,422 8,922 10,260 11,862 13,720
Depreciation and amort. 18,612 20,844 24,460 26,928 28,992
EBIT 29,721 37,968 45,162 60,483 78,241
Add: Net interest income 1,236 510 1,202 1,762 2,577
Pre tax profit 30,957 38,478 46,364 62,245 80,818
Taxes 5,989 8,755 10,896 14,628 18,992
Add: Extraordinary items -1,047 -1,893 -700 0 0
Less: Minority interest 0 0 0 0 0
Reported net profit 23,921 27,830 34,769 47,618 61,825
Adjusted net profit 23,449 26,918 35,469 47,618 61,825
Margin (%) 5.4 6.2 7.3 8.3 8.9
Diluted share cap. (mn) 302 302 302 302 302
Diluted EPS (`) 77.6 89.1 117.4 157.7 204.7
Growth (%) 47.0 14.8 31.8 34.3 29.8
Total Dividend + Tax 2,828 4,241 8,444 10,555 14,073
Source: Company, JM Financial
Balance Sheet (` mn)
Y/E December FY13A FY14A FY15E FY16E FY17E
Share capital 1,510 1,510 1,510 1,510 1,510
Other capital 0 0 0 0 0
Reserves and surplus 184,279 208,270 234,595 271,657 319,410
Networth 185,789 209,780 236,105 273,167 320,920
Total loans 16,395 20,625 20,625 20,625 20,625
Minority interest 0 0 0 0 0
Sources of funds 202,184 230,405 256,730 293,792 341,545
Intangible assets 0 0 0 0 0
Fixed assets 198,007 227,018 275,232 306,994 337,273
Less: Depn. and amort. 100,015 119,114 143,574 170,502 199,494
Net block 97,992 107,904 131,658 136,492 137,780
Capital WIP 19,409 26,214 13,762 12,280 13,491
Investments 70,783 101,179 111,179 121,179 131,179
Def tax assets/- liability -4,087 -5,866 -5,866 -5,866 -5,866
Current assets 79,158 70,060 85,625 121,740 175,300
Inventories 18,407 17,059 19,928 23,313 28,190
Sundry debtors 14,699 14,137 15,942 18,651 22,552
Cash & bank balances 7,750 6,297 15,636 39,586 76,065
Other current assets 14,349 3,672 4,590 5,508 6,610
Loans & advances 23,953 28,895 29,529 34,682 41,884
Current liabilities &
prov. 61,071 69,086 79,628 92,032 110,339
Current liabilities 52,330 60,329 66,217 76,013 90,255
Provisions and others 8,741 8,757 13,412 16,019 20,084
Net current assets 18,087 974 5,997 29,708 64,961
Others (net) 0 0 0 0 0
Application of funds 202,184 230,405 256,730 293,792 341,545
Source: Company, JM Financial
Cash flow statement (` mn)
Y/E March FY13A FY14A FY15E FY16E FY17E
Reported net profit 23,921 27,830 34,769 47,618 61,825
Depreciation and amort. 27,875 19,099 24,460 26,928 28,992
-Inc/dec in working cap. 2,315 9,306 -282 2,202 3,965
Others 0 0 0 0 0
Cash from operations (a) 54,111 56,235 58,946 76,747 94,783
-Inc/dec in investments -9,309 -30,396 -10,000 -10,000 -10,000
Capex -60,650 -35,816 -35,762 -30,280 -31,491
Others -16,467 6,354 4,598 -1,963 -2,739
Cash flow from inv. (b) -86,426 -59,858 -41,163 -42,243 -44,230
Inc/-dec in capital 12,822 402 0 0 0
Dividend+Tax thereon -2,828 -4,241 -8,444 -10,555 -14,073
Inc/-dec in loans 4,646 4,230 0 0 0
Others 1,064 1,779 0 0 0
Financial cash flow ( c ) 15,704 2,170 -8,444 -10,555 -14,073
Inc/-dec in cash (a+b+c) -16,611 -1,453 9,339 23,950 36,479
Opening cash balance 24,361 7,750 6,297 15,636 39,586
Closing cash balance 7,750 6,297 15,636 39,586 76,065
Source: Company, JM Financial
Key Ratios
Y/E March FY13A FY14A FY15E FY16E FY17E
BV/Share (`) 615.0 694.6 781.8 904.5 1,062.6
ROCE (%) 13.5 12.7 14.9 18.7 23.0
ROE (%) 13.9 13.6 15.9 18.7 20.8
Net Debt/equity ratio (x) -0.3 -0.4 -0.4 -0.5 -0.6
Valuation ratios (x)
PER 46.5 40.5 30.7 22.9 17.6
PBV 5.9 5.2 4.6 4.0 3.4
EV/EBITDA 25.8 20.1 16.6 12.6 9.7
EV/Sales 2.4 2.3 2.0 1.7 1.3
Turnover ratios (no.)
Debtor days 13 12 12 12 12
Inventory days 16 14 15 15 15
Creditor days 46 57 55 55 55
Source: Company, JM Financial
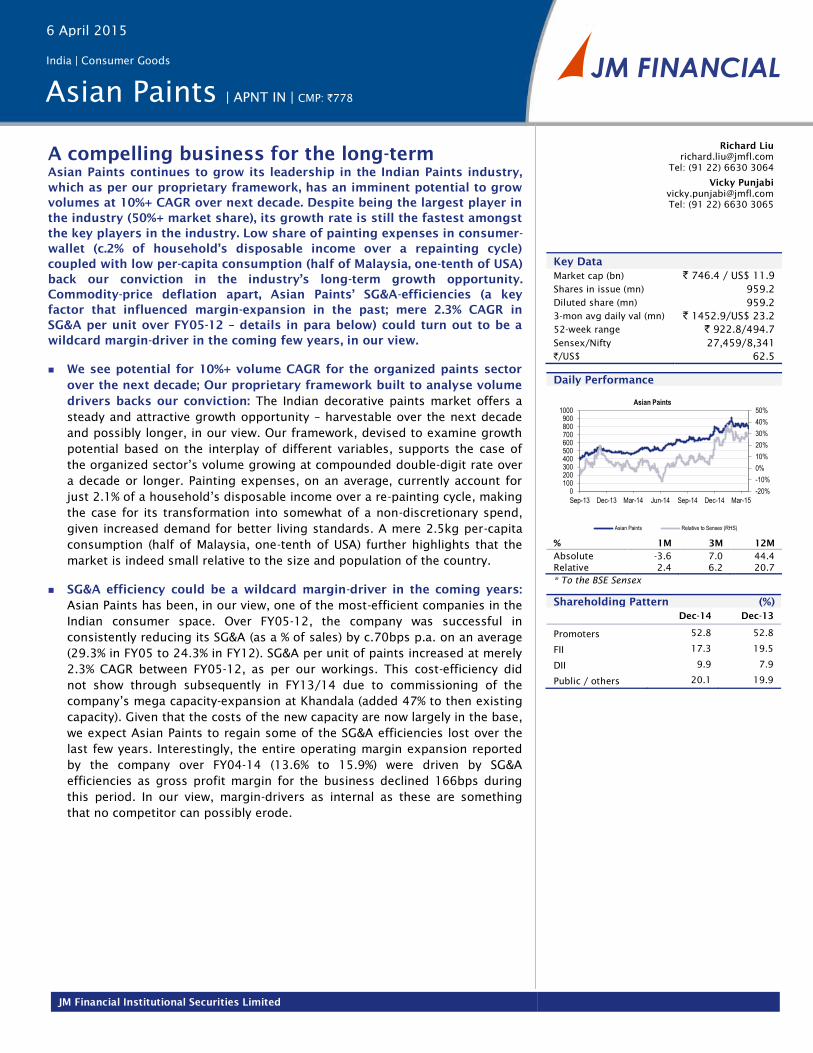
JM Financial Institutional Securities Limited
A compelling business for the long-term
Asian Paints continues to grow its leadership in the Indian Paints industry,
which as per our proprietary framework, has an imminent potential to grow
volumes at 10%+ CAGR over next decade. Despite being the largest player in
the industry (50%+ market share), its growth rate is still the fastest amongst
the key players in the industry. Low share of painting expenses in consumer-
wallet (c.2% of household’s disposable income over a repainting cycle)
coupled with low per-capita consumption (half of Malaysia, one-tenth of USA)
back our conviction in the industry’s long-term growth opportunity.
Commodity-price deflation apart, Asian Paints’ SG&A-efficiencies (a key
factor that influenced margin-expansion in the past; mere 2.3% CAGR in
SG&A per unit over FY05-12 – details in para below) could turn out to be a
wildcard margin-driver in the coming few years, in our view.
We see potential for 10%+ volume CAGR for the organized paints sector
over the next decade; Our proprietary framework built to analyse volume
drivers backs our conviction: The Indian decorative paints market offers a
steady and attractive growth opportunity – harvestable over the next decade
and possibly longer, in our view. Our framework, devised to examine growth
potential based on the interplay of different variables, supports the case of
the organized sector’s volume growing at compounded double-digit rate over
a decade or longer. Painting expenses, on an average, currently account for
just 2.1% of a household’s disposable income over a re-painting cycle, making
the case for its transformation into somewhat of a non-discretionary spend,
given increased demand for better living standards. A mere 2.5kg per-capita
consumption (half of Malaysia, one-tenth of USA) further highlights that the
market is indeed small relative to the size and population of the country.
SG&A efficiency could be a wildcard margin-driver in the coming years:
Asian Paints has been, in our view, one of the most-efficient companies in the
Indian consumer space. Over FY05-12, the company was successful in
consistently reducing its SG&A (as a % of sales) by c.70bps p.a. on an average
(29.3% in FY05 to 24.3% in FY12). SG&A per unit of paints increased at merely
2.3% CAGR between FY05-12, as per our workings. This cost-efficiency did
not show through subsequently in FY13/14 due to commissioning of the
company’s mega capacity-expansion at Khandala (added 47% to then existing
capacity). Given that the costs of the new capacity are now largely in the base,
we expect Asian Paints to regain some of the SG&A efficiencies lost over the
last few years. Interestingly, the entire operating margin expansion reported
by the company over FY04-14 (13.6% to 15.9%) were driven by SG&A
efficiencies as gross profit margin for the business declined 166bps during
this period. In our view, margin-drivers as internal as these are something
that no competitor can possibly erode.
India | Consumer Goods
Asian Paints | APNT IN | CMP: `778
Richard Liu
Tel: (91 22) 6630 3064
Vicky Punjabi
Tel: (91 22) 6630 3065
Key Data
Market cap (bn) ` 746.4 / US$ 11.9
Shares in issue (mn) 959.2
Diluted share (mn) 959.2
3-mon avg daily val (mn) ` 1452.9/US$ 23.2 52-week range ` 922.8/494.7
Sensex/Nifty 27,459/8,341
`/US$ 62.5
Daily Performance
% 1M 3M 12M
Absolute -3.6 7.0 44.4
Relative 2.4 6.2 20.7
* To the BSE Sensex
Shareholding Pattern (%)
Dec-14 Dec-13
Promoters 52.8 52.8
FII 17.3 19.5
DII 9.9 7.9
Public / others 20.1 19.9
-20%
-10%
0%
10%
20%
30%
40%
50%
0100200300400500600700800900
1000
Sep-13 Dec-13 Mar-14 Jun-14 Sep-14 Dec-14 Mar-15
Asian Paints
Asian Paints Relative to Sensex (RHS)
6 April 2015
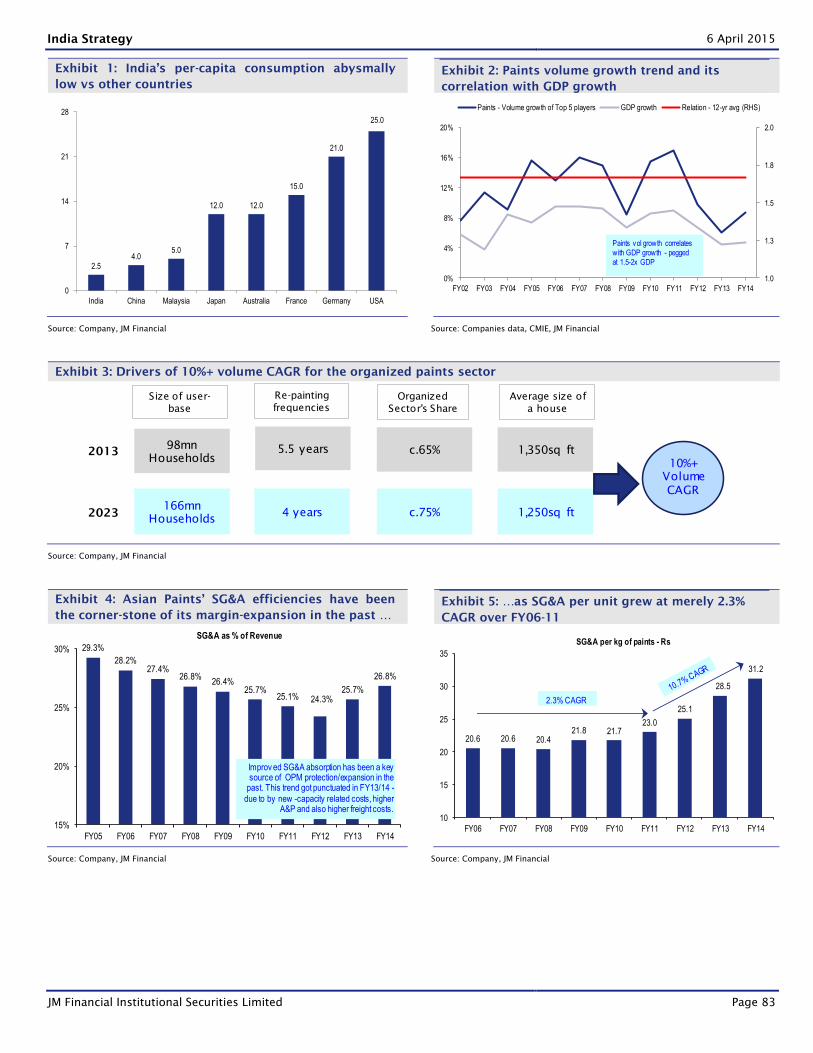
India Strategy 6 April 2015
JM Financial Institutional Securities Limited Page 83
Exhibit 1: India’s per-capita consumption abysmally
low vs other countries
Exhibit 2: Paints volume growth trend and its
correlation with GDP growth
Source: Company, JM Financial Source: Companies data, CMIE, JM Financial
Exhibit 3: Drivers of 10%+ volume CAGR for the organized paints sector
Source: Company, JM Financial
Exhibit 4: Asian Paints’ SG&A efficiencies have been
the corner-stone of its margin-expansion in the past …
Exhibit 5: …as SG&A per unit grew at merely 2.3%
CAGR over FY06-11
Source: Company, JM Financial Source: Company, JM Financial
2.54.0
5.0
12.0 12.0
15.0
21.0
25.0
0
7
14
21
28
India China Malaysia Japan Australia France Germany USA
1.0
1.3
1.5
1.8
2.0
0%
4%
8%
12%
16%
20%
FY02 FY03 FY04 FY05 FY06 FY07 FY08 FY09 FY10 FY11 FY12 FY13 FY14
Paints - Volume growth of Top 5 players GDP growth Relation - 12-yr avg (RHS)
Paints vol growth correlates with GDP growth - pegged at 1.5-2x GDP
98mn
2013 Households
2023
Size of user-
base
98mn
Households
166mn
Households
Average size of
a house
Re-painting
frequencies
Organized
Sector's Share
1,350sq ft5.5 years c.65%
1,250sq ft4 years c.75%
10%+
Volume
CAGR
29.3%
28.2%27.4%
26.8%26.4%
25.7%25.1% 24.3%
25.7%
26.8%
15%
20%
25%
30%
FY05 FY06 FY07 FY08 FY09 FY10 FY11 FY12 FY13 FY14
SG&A as % of Revenue
Improv ed SG&A absorption has been a key source of OPM protection/expansion in the
past. This trend got punctuated in FY13/14 -
due to by new -capacity related costs, higher A&P and also higher freight costs.
20.6 20.6 20.421.8 21.7
23.0
25.1
28.5
31.2
10
15
20
25
30
35
FY06 FY07 FY08 FY09 FY10 FY11 FY12 FY13 FY14
SG&A per kg of paints - Rs
2.3% CAGR
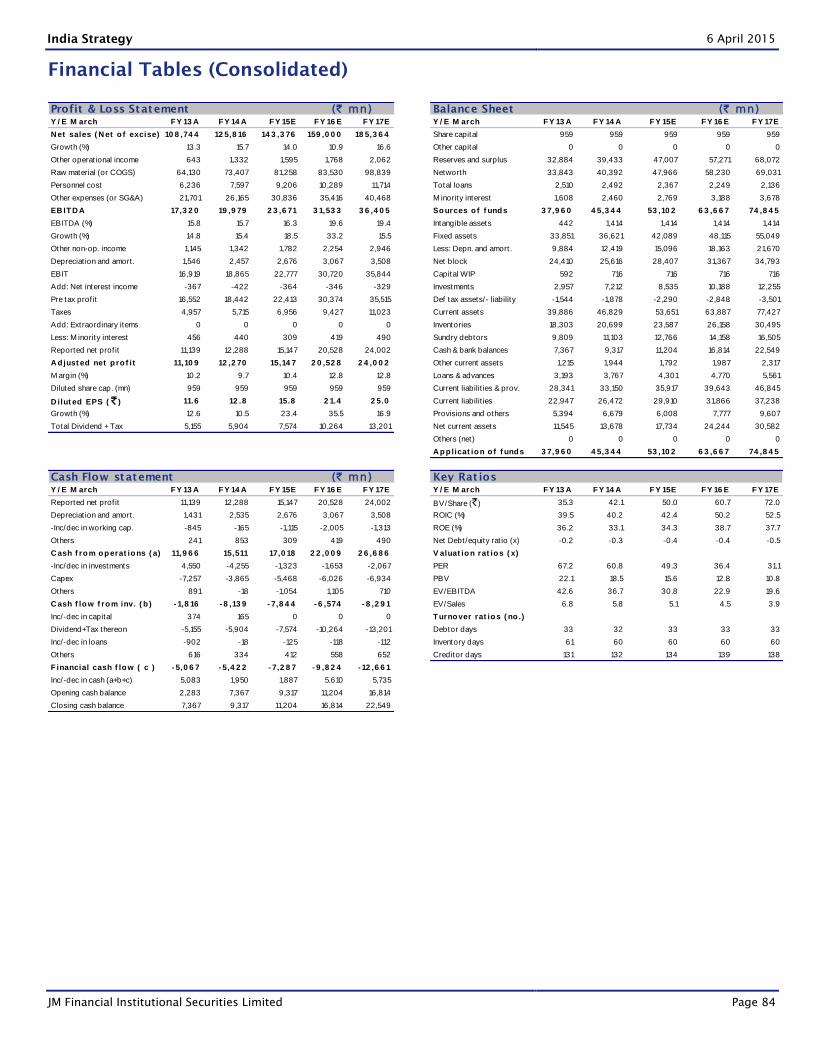
India Strategy 6 April 2015
JM Financial Institutional Securities Limited Page 84
Financial Tables (Consolidated)
Profit & Loss Statement (` mn) Balance Sheet (` mn)Y / E M arch FY 13 A FY 14 A FY 15E FY 16 E FY 17E Y / E M arch FY 13 A FY 14 A FY 15E FY 16 E FY 17E
N et sales ( N et o f excise) 10 8 ,74 4 12 5,8 16 14 3 ,3 76 159 ,0 0 0 18 5,3 6 4 Share capital 959 959 959 959 959
Growth (%) 13.3 15.7 14.0 10.9 16.6 Other capital 0 0 0 0 0
Other operat ional income 643 1,332 1,595 1,768 2,062 Reserves and surplus 32,884 39,433 47,007 57,271 68,072
Raw material (or COGS) 64,130 73,407 81,258 83,530 98,839 Networth 33,843 40,392 47,966 58,230 69,031
Personnel cost 6,236 7,597 9,206 10,289 11,714 Total loans 2,510 2,492 2,367 2,249 2,136
Other expenses (or SG&A) 21,701 26,165 30,836 35,416 40,468 M inority interest 1,608 2,460 2,769 3,188 3,678
EB ITD A 17,3 2 0 19 ,9 79 2 3 ,6 71 3 1,53 3 3 6 ,4 0 5 Sources o f f unds 3 7,9 6 0 4 5,3 4 4 53 ,10 2 6 3 ,6 6 7 74 ,8 4 5
EBITDA (%) 15.8 15.7 16.3 19.6 19.4 Intangible assets 442 1,414 1,414 1,414 1,414
Growth (%) 14.8 15.4 18.5 33.2 15.5 Fixed assets 33,851 36,621 42,089 48,115 55,049
Other non-op. income 1,145 1,342 1,782 2,254 2,946 Less: Depn. and amort. 9,884 12,419 15,096 18,163 21,670
Depreciat ion and amort. 1,546 2,457 2,676 3,067 3,508 Net block 24,410 25,616 28,407 31,367 34,793
EBIT 16,919 18,865 22,777 30,720 35,844 Capital WIP 592 716 716 716 716
Add: Net interest income -367 -422 -364 -346 -329 Investments 2,957 7,212 8,535 10,188 12,255
Pre tax prof it 16,552 18,442 22,413 30,374 35,515 Def tax assets/- liability -1,544 -1,878 -2,290 -2,848 -3,501
Taxes 4,957 5,715 6,956 9,427 11,023 Current assets 39,886 46,829 53,651 63,887 77,427
Add: Extraordinary items 0 0 0 0 0 Inventories 18,303 20,699 23,587 26,158 30,495
Less: M inority interest 456 440 309 419 490 Sundry debtors 9,809 11,103 12,766 14,158 16,505
Reported net prof it 11,139 12,288 15,147 20,528 24,002 Cash & bank balances 7,367 9,317 11,204 16,814 22,549
A djust ed net p ro f it 11,10 9 12 ,2 70 15,14 7 2 0 ,52 8 2 4 ,0 0 2 Other current assets 1,215 1,944 1,792 1,987 2,317
M argin (%) 10.2 9.7 10.4 12.8 12.8 Loans & advances 3,193 3,767 4,301 4,770 5,561
Diluted share cap. (mn) 959 959 959 959 959 Current liabilit ies & prov. 28,341 33,150 35,917 39,643 46,845
D ilut ed EPS ( ` ) 11.6 12 .8 15.8 2 1.4 2 5.0 Current liabilit ies 22,947 26,472 29,910 31,866 37,238
Growth (%) 12.6 10.5 23.4 35.5 16.9 Provisions and others 5,394 6,679 6,008 7,777 9,607
Total Dividend + Tax 5,155 5,904 7,574 10,264 13,201 Net current assets 11,545 13,678 17,734 24,244 30,582
Others (net) 0 0 0 0 0
A pp licat ion o f f unds 3 7,9 6 0 4 5,3 4 4 53 ,10 2 6 3 ,6 6 7 74 ,8 4 5
Cash Flow statement (` mn)Y / E M arch FY 13 A FY 14 A FY 15E FY 16 E FY 17E Y / E M arch FY 13 A FY 14 A FY 15E FY 16 E FY 17E
Reported net prof it 11,139 12,288 15,147 20,528 24,002 BV/Share (`) 35.3 42.1 50.0 60.7 72.0
Depreciat ion and amort. 1,431 2,535 2,676 3,067 3,508 ROIC (%) 39.5 40.2 42.4 50.2 52.5
-Inc/dec in working cap. -845 -165 -1,115 -2,005 -1,313 ROE (%) 36.2 33.1 34.3 38.7 37.7
Others 241 853 309 419 490 Net Debt/equity rat io (x) -0.2 -0.3 -0.4 -0.4 -0.5
C ash f rom operat ions ( a) 11,9 6 6 15,511 17,0 18 2 2 ,0 0 9 2 6 ,6 8 6 V aluat ion rat ios ( x)
-Inc/dec in investments 4,550 -4,255 -1,323 -1,653 -2,067 PER 67.2 60.8 49.3 36.4 31.1
Capex -7,257 -3,865 -5,468 -6,026 -6,934 PBV 22.1 18.5 15.6 12.8 10.8
Others 891 -18 -1,054 1,105 710 EV/EBITDA 42.6 36.7 30.8 22.9 19.6
C ash f low f rom inv. ( b ) - 1,8 16 - 8 ,13 9 - 7,8 4 4 - 6 ,574 - 8 ,2 9 1 EV/Sales 6.8 5.8 5.1 4.5 3.9
Inc/-dec in capital 374 165 0 0 0 Turnover rat ios ( no .)
Dividend+Tax thereon -5,155 -5,904 -7,574 -10,264 -13,201 Debtor days 33 32 33 33 33
Inc/-dec in loans -902 -18 -125 -118 -112 Inventory days 61 60 60 60 60
Others 616 334 412 558 652 Creditor days 131 132 134 139 138
F inancial cash f low ( c ) - 5,0 6 7 - 5,4 2 2 - 7,2 8 7 - 9 ,8 2 4 - 12 ,6 6 1
Inc/-dec in cash (a+b+c) 5,083 1,950 1,887 5,610 5,735
Opening cash balance 2,283 7,367 9,317 11,204 16,814
Closing cash balance 7,367 9,317 11,204 16,814 22,549
Key Rat ios
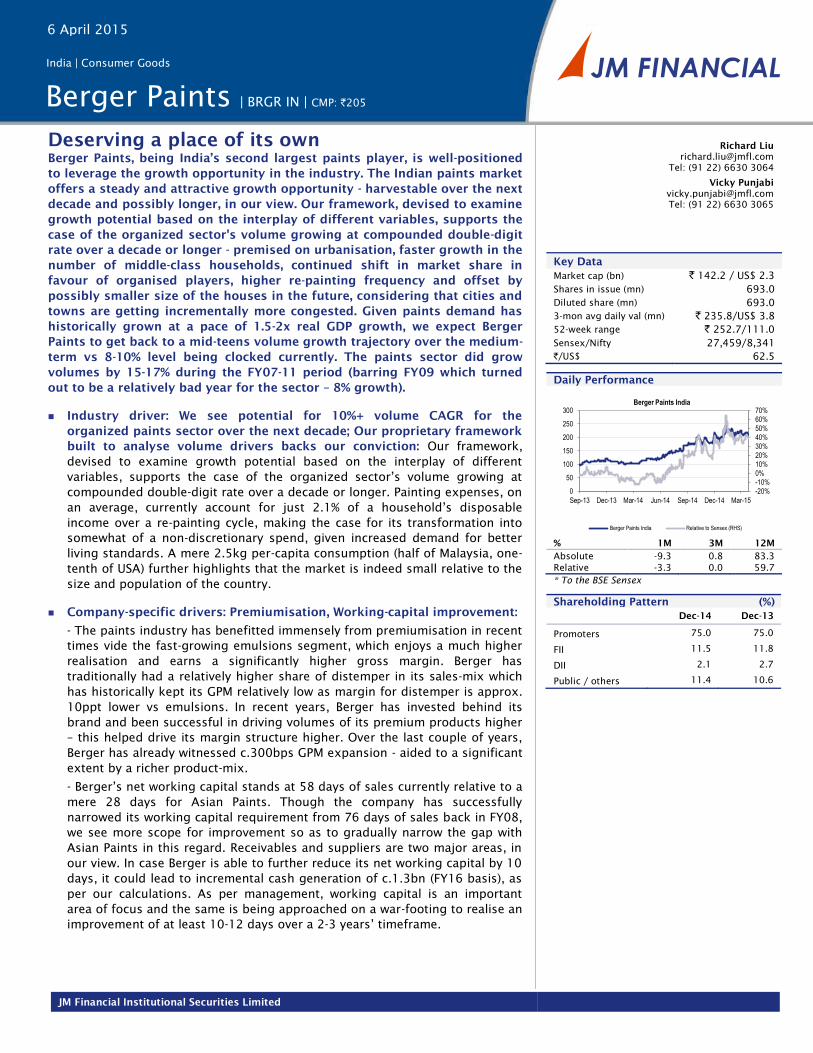
JM Financial Institutional Securities Limited
Deserving a place of its own
Berger Paints, being India’s second largest paints player, is well-positioned
to leverage the growth opportunity in the industry. The Indian paints market
offers a steady and attractive growth opportunity - harvestable over the next
decade and possibly longer, in our view. Our framework, devised to examine
growth potential based on the interplay of different variables, supports the
case of the organized sector's volume growing at compounded double-digit
rate over a decade or longer - premised on urbanisation, faster growth in the
number of middle-class households, continued shift in market share in
favour of organised players, higher re-painting frequency and offset by
possibly smaller size of the houses in the future, considering that cities and
towns are getting incrementally more congested. Given paints demand has
historically grown at a pace of 1.5-2x real GDP growth, we expect Berger
Paints to get back to a mid-teens volume growth trajectory over the medium-
term vs 8-10% level being clocked currently. The paints sector did grow
volumes by 15-17% during the FY07-11 period (barring FY09 which turned
out to be a relatively bad year for the sector – 8% growth).
Industry driver: We see potential for 10%+ volume CAGR for the
organized paints sector over the next decade; Our proprietary framework
built to analyse volume drivers backs our conviction: Our framework,
devised to examine growth potential based on the interplay of different
variables, supports the case of the organized sector’s volume growing at
compounded double-digit rate over a decade or longer. Painting expenses, on
an average, currently account for just 2.1% of a household’s disposable
income over a re-painting cycle, making the case for its transformation into
somewhat of a non-discretionary spend, given increased demand for better
living standards. A mere 2.5kg per-capita consumption (half of Malaysia, one-
tenth of USA) further highlights that the market is indeed small relative to the
size and population of the country.
Company-specific drivers: Premiumisation, Working-capital improvement:
- The paints industry has benefitted immensely from premiumisation in recent
times vide the fast-growing emulsions segment, which enjoys a much higher
realisation and earns a significantly higher gross margin. Berger has
traditionally had a relatively higher share of distemper in its sales-mix which
has historically kept its GPM relatively low as margin for distemper is approx.
10ppt lower vs emulsions. In recent years, Berger has invested behind its
brand and been successful in driving volumes of its premium products higher
– this helped drive its margin structure higher. Over the last couple of years,
Berger has already witnessed c.300bps GPM expansion - aided to a significant
extent by a richer product-mix.
- Berger’s net working capital stands at 58 days of sales currently relative to a
mere 28 days for Asian Paints. Though the company has successfully
narrowed its working capital requirement from 76 days of sales back in FY08,
we see more scope for improvement so as to gradually narrow the gap with
Asian Paints in this regard. Receivables and suppliers are two major areas, in
our view. In case Berger is able to further reduce its net working capital by 10
days, it could lead to incremental cash generation of c.1.3bn (FY16 basis), as
per our calculations. As per management, working capital is an important
area of focus and the same is being approached on a war-footing to realise an
improvement of at least 10-12 days over a 2-3 years’ timeframe.
India | Consumer Goods
Berger Paints | BRGR IN | CMP: `205
Richard Liu
Tel: (91 22) 6630 3064
Vicky Punjabi
Tel: (91 22) 6630 3065
Key Data
Market cap (bn) ` 142.2 / US$ 2.3
Shares in issue (mn) 693.0
Diluted share (mn) 693.0
3-mon avg daily val (mn) ` 235.8/US$ 3.8 52-week range ` 252.7/111.0
Sensex/Nifty 27,459/8,341
`/US$ 62.5
Daily Performance
% 1M 3M 12M
Absolute -9.3 0.8 83.3
Relative -3.3 0.0 59.7
* To the BSE Sensex
Shareholding Pattern (%)
Dec-14 Dec-13
Promoters 75.0 75.0
FII 11.5 11.8
DII 2.1 2.7
Public / others 11.4 10.6
-20%
-10%
0%
10%
20%
30%
40%
50%
60%
70%
0
50
100
150
200
250
300
Sep-13 Dec-13 Mar-14 Jun-14 Sep-14 Dec-14 Mar-15
Berger Paints India
Berger Paints India Relative to Sensex (RHS)
6 April 2015
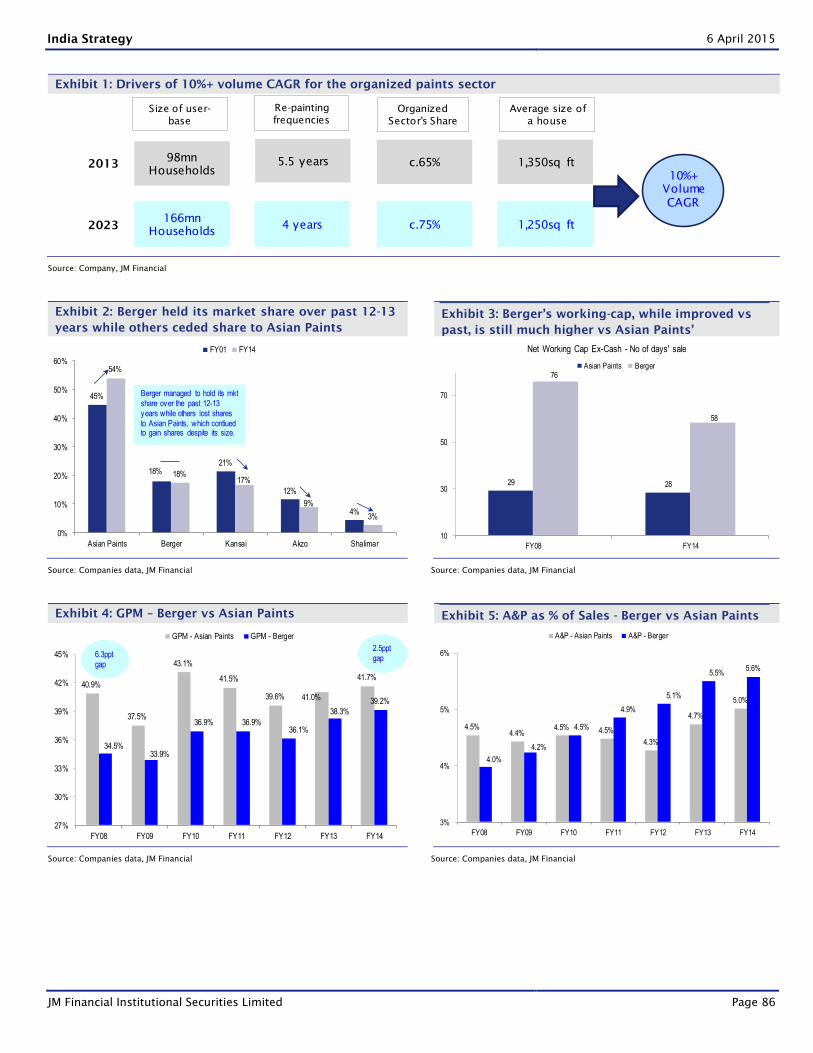
India Strategy 6 April 2015
JM Financial Institutional Securities Limited Page 86
Exhibit 1: Drivers of 10%+ volume CAGR for the organized paints sector
Source: Company, JM Financial
Exhibit 2: Berger held its market share over past 12-13
years while others ceded share to Asian Paints
Exhibit 3: Berger’s working-cap, while improved vs
past, is still much higher vs Asian Paints’
Source: Companies data, JM Financial Source: Companies data, JM Financial
Exhibit 4: GPM – Berger vs Asian Paints Exhibit 5: A&P as % of Sales - Berger vs Asian Paints
Source: Companies data, JM Financial Source: Companies data, JM Financial
98mn
2013 Households
2023
Size of user-
base
98mn
Households
166mn
Households
Average size of
a house
Re-painting
frequencies
Organized
Sector's Share
1,350sq ft5.5 years c.65%
1,250sq ft4 years c.75%
10%+
Volume
CAGR
45%
18%21%
12%
4%
54%
18%17%
9%
3%
0%
10%
20%
30%
40%
50%
60%
Asian Paints Berger Kansai Akzo Shalimar
FY01 FY14
Berger managed to hold its mkt share over the past 12-13 years while others lost shares to Asian Paints, which contiued to gain shares despite its size.
29 28
76
58
10
30
50
70
FY08 FY14
Net Working Cap Ex-Cash - No of days' sale
Asian Paints Berger
40.9%
37.5%
43.1%
41.5%
39.6% 41.0%
41.7%
34.5%33.9%
36.9% 36.9%36.1%
38.3%
39.2%
27%
30%
33%
36%
39%
42%
45%
FY08 FY09 FY10 FY11 FY12 FY13 FY14
GPM - Asian Paints GPM - Berger
6.3ppt gap
2.5ppt gap
4.5%4.4%
4.5% 4.5%
4.3%
4.7%
5.0%
4.0%
4.2%
4.5%
4.9%
5.1%
5.5%5.6%
3%
4%
5%
6%
FY08 FY09 FY10 FY11 FY12 FY13 FY14
A&P - Asian Paints A&P - Berger
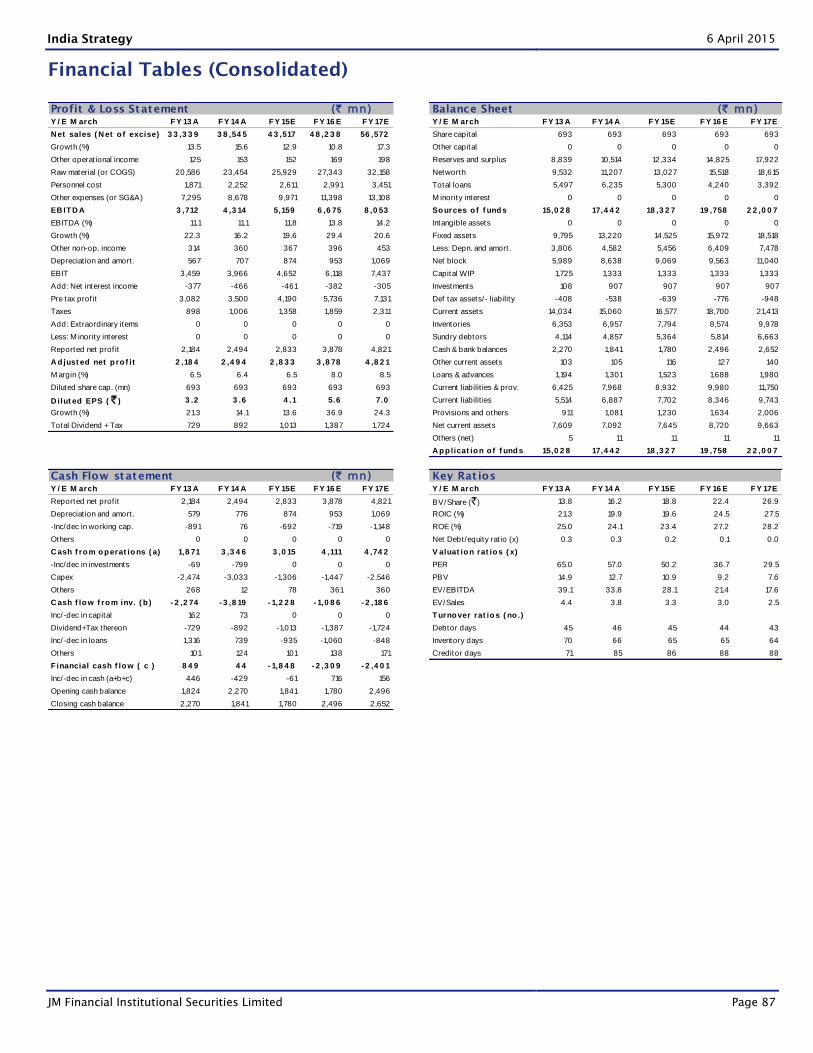
India Strategy 6 April 2015
JM Financial Institutional Securities Limited Page 87
Financial Tables (Consolidated)
Profit & Loss Statement (` mn) Balance Sheet (` mn)Y / E M arch FY 13 A FY 14 A FY 15E FY 16 E FY 17E Y / E M arch FY 13 A FY 14 A FY 15E FY 16 E FY 17E
N et sales ( N et o f excise) 3 3 ,3 3 9 3 8 ,54 5 4 3 ,517 4 8 ,2 3 8 56 ,572 Share capital 693 693 693 693 693
Growth (%) 13.5 15.6 12.9 10.8 17.3 Other capital 0 0 0 0 0
Other operat ional income 125 153 152 169 198 Reserves and surplus 8,839 10,514 12,334 14,825 17,922
Raw material (or COGS) 20,586 23,454 25,929 27,343 32,158 Networth 9,532 11,207 13,027 15,518 18,615
Personnel cost 1,871 2,252 2,611 2,991 3,451 Total loans 5,497 6,235 5,300 4,240 3,392
Other expenses (or SG&A) 7,295 8,678 9,971 11,398 13,108 M inority interest 0 0 0 0 0
EB ITD A 3 ,712 4 ,3 14 5,159 6 ,6 75 8 ,0 53 Sources o f f unds 15,0 2 8 17,4 4 2 18 ,3 2 7 19 ,758 2 2 ,0 0 7
EBITDA (%) 11.1 11.1 11.8 13.8 14.2 Intangible assets 0 0 0 0 0
Growth (%) 22.3 16.2 19.6 29.4 20.6 Fixed assets 9,795 13,220 14,525 15,972 18,518
Other non-op. income 314 360 367 396 453 Less: Depn. and amort. 3,806 4,582 5,456 6,409 7,478
Depreciat ion and amort. 567 707 874 953 1,069 Net block 5,989 8,638 9,069 9,563 11,040
EBIT 3,459 3,966 4,652 6,118 7,437 Capital WIP 1,725 1,333 1,333 1,333 1,333
Add: Net interest income -377 -466 -461 -382 -305 Investments 108 907 907 907 907
Pre tax prof it 3,082 3,500 4,190 5,736 7,131 Def tax assets/- liability -408 -538 -639 -776 -948
Taxes 898 1,006 1,358 1,859 2,311 Current assets 14,034 15,060 16,577 18,700 21,413
Add: Extraordinary items 0 0 0 0 0 Inventories 6,353 6,957 7,794 8,574 9,978
Less: M inority interest 0 0 0 0 0 Sundry debtors 4,114 4,857 5,364 5,814 6,663
Reported net prof it 2,184 2,494 2,833 3,878 4,821 Cash & bank balances 2,270 1,841 1,780 2,496 2,652
A djust ed net p ro f it 2 ,18 4 2 ,4 9 4 2 ,8 3 3 3 ,8 78 4 ,8 2 1 Other current assets 103 105 116 127 140
M argin (%) 6.5 6.4 6.5 8.0 8.5 Loans & advances 1,194 1,301 1,523 1,688 1,980
Diluted share cap. (mn) 693 693 693 693 693 Current liabilit ies & prov. 6,425 7,968 8,932 9,980 11,750
D ilut ed EPS ( ` ) 3 .2 3 .6 4 .1 5.6 7.0 Current liabilit ies 5,514 6,887 7,702 8,346 9,743
Growth (%) 21.3 14.1 13.6 36.9 24.3 Provisions and others 911 1,081 1,230 1,634 2,006
Total Dividend + Tax 729 892 1,013 1,387 1,724 Net current assets 7,609 7,092 7,645 8,720 9,663
Others (net) 5 11 11 11 11
A pp licat ion o f f unds 15,0 2 8 17,4 4 2 18 ,3 2 7 19 ,758 2 2 ,0 0 7
Cash Flow statement (` mn)Y / E M arch FY 13 A FY 14 A FY 15E FY 16 E FY 17E Y / E M arch FY 13 A FY 14 A FY 15E FY 16 E FY 17E
Reported net prof it 2,184 2,494 2,833 3,878 4,821 BV/Share (`) 13.8 16.2 18.8 22.4 26.9
Depreciat ion and amort. 579 776 874 953 1,069 ROIC (%) 21.3 19.9 19.6 24.5 27.5
-Inc/dec in working cap. -891 76 -692 -719 -1,148 ROE (%) 25.0 24.1 23.4 27.2 28.2
Others 0 0 0 0 0 Net Debt/equity rat io (x) 0.3 0.3 0.2 0.1 0.0
C ash f rom operat ions ( a) 1,8 71 3 ,3 4 6 3 ,0 15 4 ,111 4 ,74 2 V aluat ion rat ios ( x)
-Inc/dec in investments -69 -799 0 0 0 PER 65.0 57.0 50.2 36.7 29.5
Capex -2,474 -3,033 -1,306 -1,447 -2,546 PBV 14.9 12.7 10.9 9.2 7.6
Others 268 12 78 361 360 EV/EBITDA 39.1 33.8 28.1 21.4 17.6
C ash f low f rom inv. ( b ) - 2 ,2 74 - 3 ,8 19 - 1,2 2 8 - 1,0 8 6 - 2 ,18 6 EV/Sales 4.4 3.8 3.3 3.0 2.5
Inc/-dec in capital 162 73 0 0 0 Turnover rat ios ( no .)
Dividend+Tax thereon -729 -892 -1,013 -1,387 -1,724 Debtor days 45 46 45 44 43
Inc/-dec in loans 1,316 739 -935 -1,060 -848 Inventory days 70 66 65 65 64
Others 101 124 101 138 171 Creditor days 71 85 86 88 88
F inancial cash f low ( c ) 8 4 9 4 4 - 1,8 4 8 - 2 ,3 0 9 - 2 ,4 0 1
Inc/-dec in cash (a+b+c) 446 -429 -61 716 156
Opening cash balance 1,824 2,270 1,841 1,780 2,496
Closing cash balance 2,270 1,841 1,780 2,496 2,652
Key Rat ios
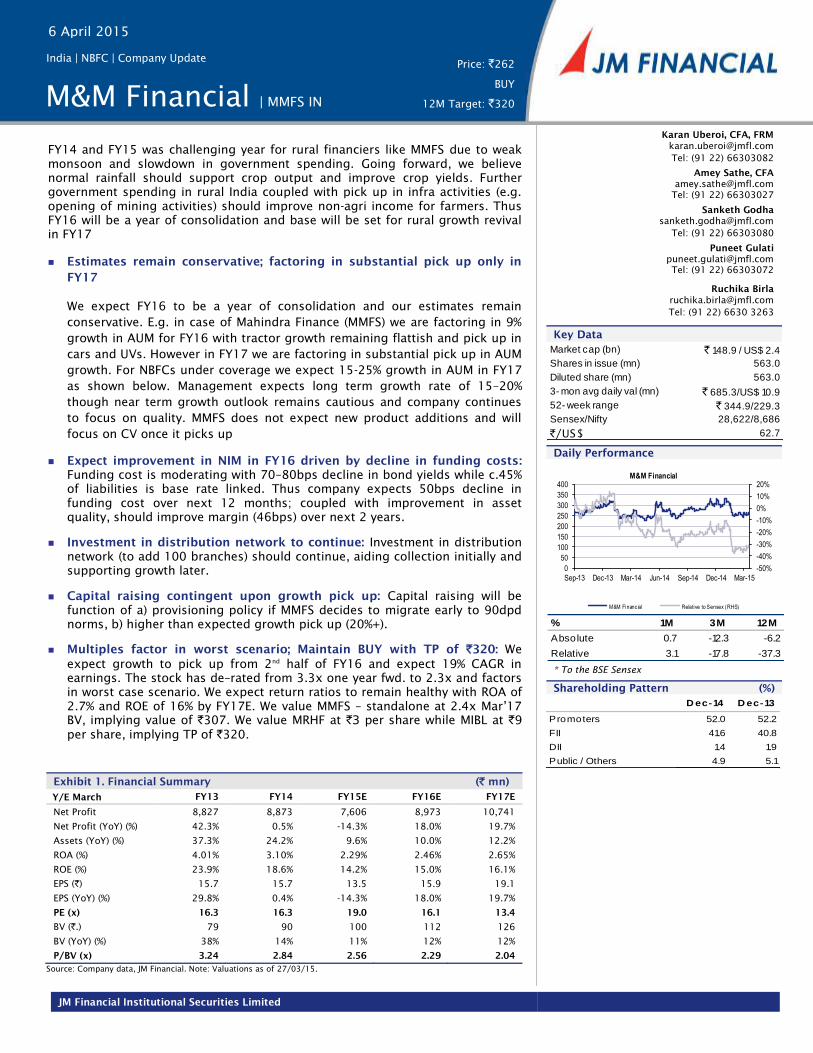
JM Financial Institutional Securities Limited
FY14 and FY15 was challenging year for rural financiers like MMFS due to weak
monsoon and slowdown in government spending. Going forward, we believe
normal rainfall should support crop output and improve crop yields. Further
government spending in rural India coupled with pick up in infra activities (e.g.
opening of mining activities) should improve non-agri income for farmers. Thus
FY16 will be a year of consolidation and base will be set for rural growth revival
in FY17
Estimates remain conservative; factoring in substantial pick up only in
FY17
We expect FY16 to be a year of consolidation and our estimates remain
conservative. E.g. in case of Mahindra Finance (MMFS) we are factoring in 9%
growth in AUM for FY16 with tractor growth remaining flattish and pick up in
cars and UVs. However in FY17 we are factoring in substantial pick up in AUM
growth. For NBFCs under coverage we expect 15-25% growth in AUM in FY17
as shown below. Management expects long term growth rate of 15–20%
though near term growth outlook remains cautious and company continues
to focus on quality. MMFS does not expect new product additions and will
focus on CV once it picks up
Expect improvement in NIM in FY16 driven by decline in funding costs:
Funding cost is moderating with 70–80bps decline in bond yields while c.45%
of liabilities is base rate linked. Thus company expects 50bps decline in
funding cost over next 12 months; coupled with improvement in asset
quality, should improve margin (46bps) over next 2 years.
Investment in distribution network to continue: Investment in distribution
network (to add 100 branches) should continue, aiding collection initially and
supporting growth later.
Capital raising contingent upon growth pick up: Capital raising will be
function of a) provisioning policy if MMFS decides to migrate early to 90dpd
norms, b) higher than expected growth pick up (20%+).
Multiples factor in worst scenario; Maintain BUY with TP of `320: We
expect growth to pick up from 2nd
half of FY16 and expect 19% CAGR in
earnings. The stock has de–rated from 3.3x one year fwd. to 2.3x and factors
in worst case scenario. We expect return ratios to remain healthy with ROA of
2.7% and ROE of 16% by FY17E. We value MMFS – standalone at 2.4x Mar’17
BV, implying value of `307. We value MRHF at `3 per share while MIBL at `9
per share, implying TP of `320.
E 95.Vicky
Karan Uberoi, CFA, FRM
Tel: (91 22) 66303082
Amey Sathe, CFA
Tel: (91 22) 66303027
Sanketh Godha
Tel: (91 22) 66303080
Puneet Gulati
Tel: (91 22) 66303072
Ruchika Birla
Tel: (91 22) 6630 3263
Key Data
Market cap (bn) ` 148.9 / US$ 2.4
Shares in issue (mn) 563.0
Diluted share (mn) 563.0
3- mon avg daily val (mn) ` 685.3/US$ 10.9
52- week range ` 344.9/229.3
Sensex/Nifty 28,622/8,686
`/US$ 62.7
Daily Performance
-50%
-40%
-30%
-20%
-10%
0%
10%
20%
0
50
100
150
200
250
300
350
400
Sep-13 Dec-13 Mar-14 Jun-14 Sep-14 Dec-14 Mar-15
M&M Financial
M&M Financial Relative to Sensex (RHS)
% 1M 3M 12M
Absolute 0.7 -12.3 -6.2
Relative 3.1 -17.8 -37.3
* To the BSE Sensex
Shareholding Pattern (%)
D ec-14 D ec-13
Promoters 52.0 52.2
FII 41.6 40.8
DII 1.4 1.9
Public / Others 4.9 5.1
M&M Financial | MMFS IN
India | NBFC | Company Update Price: `262
BUY
12M Target: `320
Exhibit 1. Financial Summary (` mn)
Y/E March FY13 FY14 FY15E FY16E FY17E
Net Profit 8,827 8,873 7,606 8,973 10,741
Net Profit (YoY) (%) 42.3% 0.5% -14.3% 18.0% 19.7%
Assets (YoY) (%) 37.3% 24.2% 9.6% 10.0% 12.2%
ROA (%) 4.01% 3.10% 2.29% 2.46% 2.65%
ROE (%) 23.9% 18.6% 14.2% 15.0% 16.1%
EPS (`) 15.7 15.7 13.5 15.9 19.1
EPS (YoY) (%) 29.8% 0.4% -14.3% 18.0% 19.7%
PE (x) 16.3 16.3 19.0 16.1 13.4
BV (`.) 79 90 100 112 126
BV (YoY) (%) 38% 14% 11% 12% 12%
P/BV (x) 3.24 2.84 2.56 2.29 2.04
Source: Company data, JM Financial. Note: Valuations as of 27/03/15.
6 April 2015
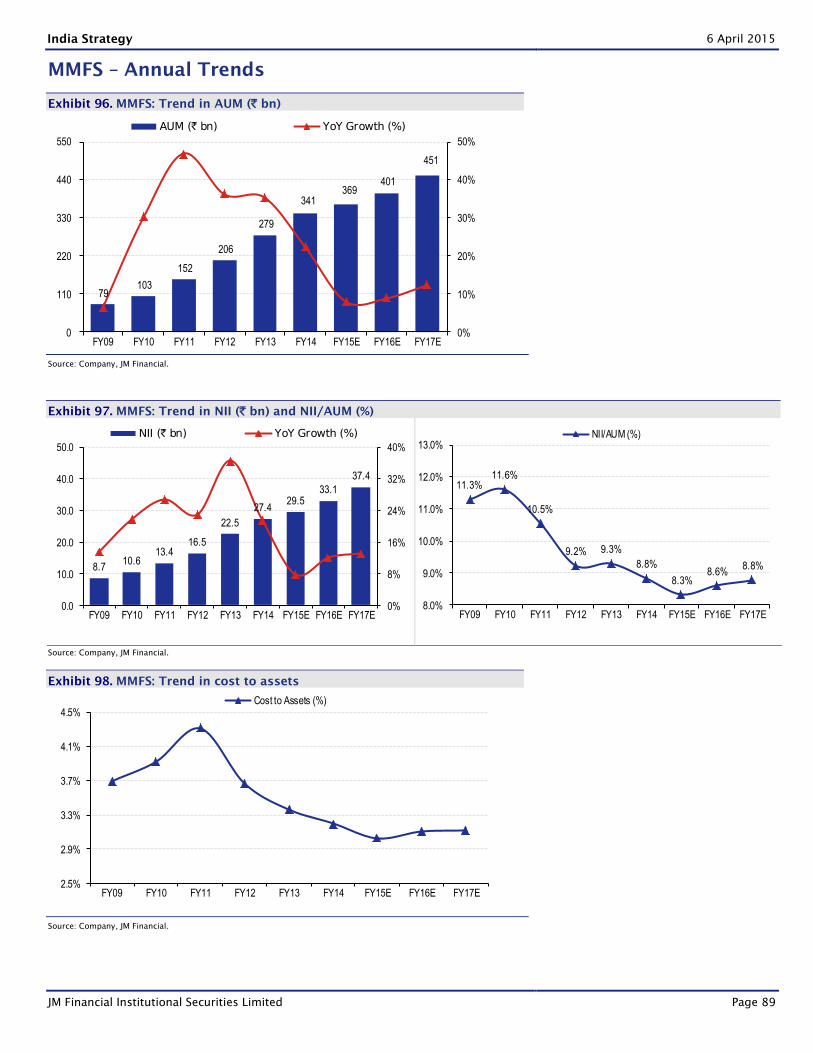
India Strategy 6 April 2015
JM Financial Institutional Securities Limited Page 89
MMFS – Annual Trends
Exhibit 96. MMFS: Trend in AUM (` bn)
79 103
152
206
279
341 369
401
451
0%
10%
20%
30%
40%
50%
0
110
220
330
440
550
FY09 FY10 FY11 FY12 FY13 FY14 FY15E FY16E FY17E
AUM (` bn) YoY Growth (%)
Source: Company, JM Financial.
Exhibit 97. MMFS: Trend in NII (` bn) and NII/AUM (%)
8.710.6
13.416.5
22.5
27.429.5
33.1
37.4
0%
8%
16%
24%
32%
40%
0.0
10.0
20.0
30.0
40.0
50.0
FY09 FY10 FY11 FY12 FY13 FY14 FY15E FY16E FY17E
NII ( ̀bn) YoY Growth (%)
11.3%11.6%
10.5%
9.2% 9.3%
8.8%
8.3%8.6%
8.8%
8.0%
9.0%
10.0%
11.0%
12.0%
13.0%
FY09 FY10 FY11 FY12 FY13 FY14 FY15E FY16E FY17E
NII/AUM (%)
Source: Company, JM Financial.
Exhibit 98. MMFS: Trend in cost to assets
2.5%
2.9%
3.3%
3.7%
4.1%
4.5%
FY09 FY10 FY11 FY12 FY13 FY14 FY15E FY16E FY17E
Cost to Assets (%)
Source: Company, JM Financial.
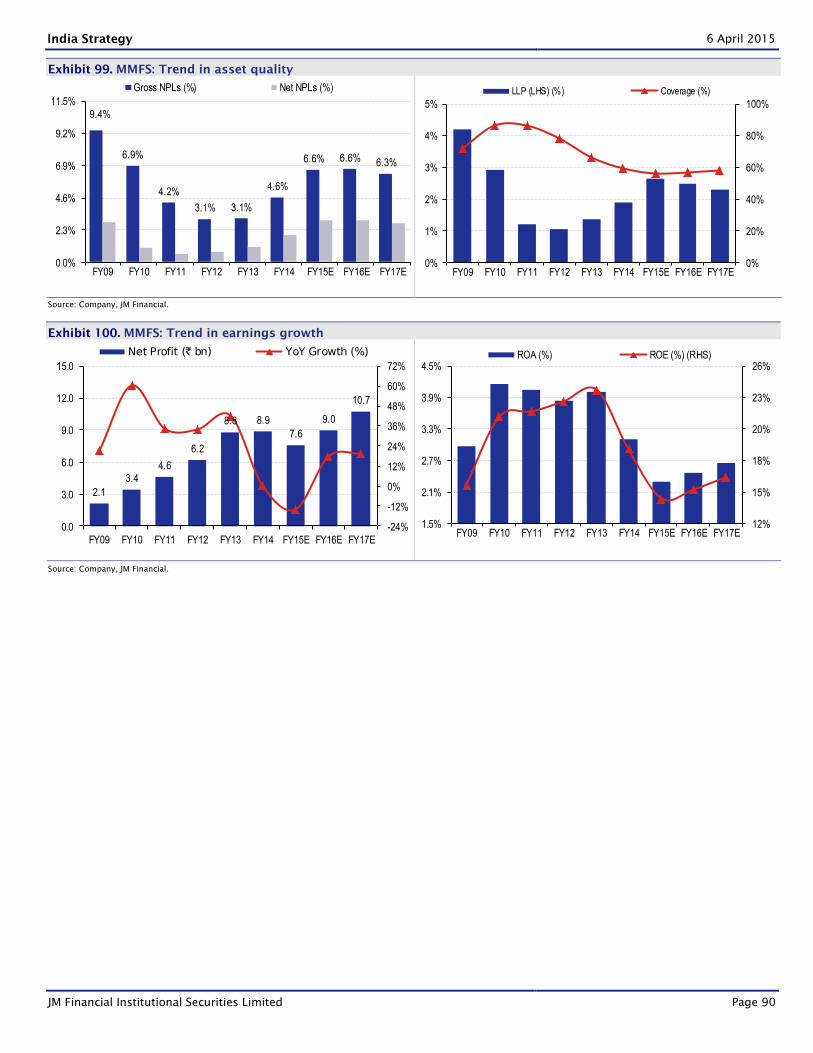
India Strategy 6 April 2015
JM Financial Institutional Securities Limited Page 90
Exhibit 99. MMFS: Trend in asset quality
9.4%
6.9%
4.2%
3.1% 3.1%
4.6%
6.6% 6.6% 6.3%
0.0%
2.3%
4.6%
6.9%
9.2%
11.5%
FY09 FY10 FY11 FY12 FY13 FY14 FY15E FY16E FY17E
Gross NPLs (%) Net NPLs (%)
0%
20%
40%
60%
80%
100%
0%
1%
2%
3%
4%
5%
FY09 FY10 FY11 FY12 FY13 FY14 FY15E FY16E FY17E
LLP (LHS) (%) Coverage (%)
Source: Company, JM Financial.
Exhibit 100. MMFS: Trend in earnings growth
2.1
3.44.6
6.2
8.8 8.9
7.6
9.0
10.7
-24%
-12%
0%
12%
24%
36%
48%
60%
72%
0.0
3.0
6.0
9.0
12.0
15.0
FY09 FY10 FY11 FY12 FY13 FY14 FY15E FY16E FY17E
Net Profit (` bn) YoY Growth (%)
12%
15%
18%
20%
23%
26%
1.5%
2.1%
2.7%
3.3%
3.9%
4.5%
FY09 FY10 FY11 FY12 FY13 FY14 FY15E FY16E FY17E
ROA (%) ROE (%) (RHS)
Source: Company, JM Financial.
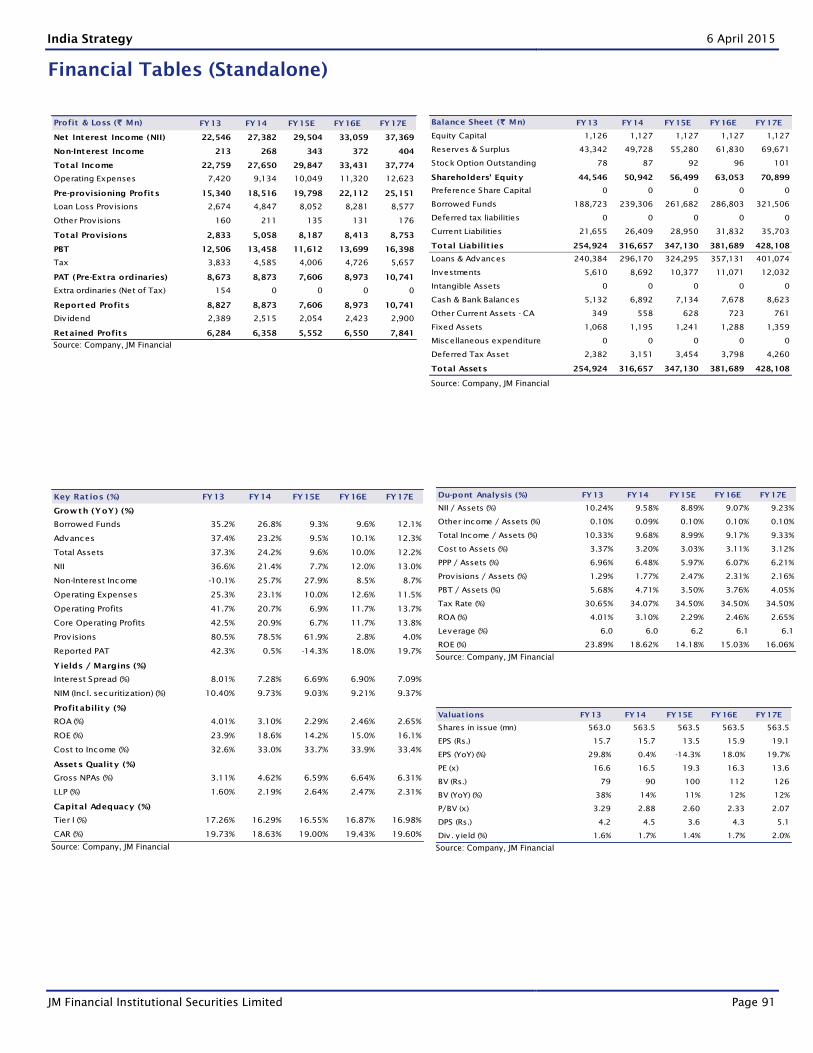
India Strategy 6 April 2015
JM Financial Institutional Securities Limited Page 91
Financial Tables (Standalone)
Profit & Loss (` Mn) FY13 FY14 FY15E FY16E FY17E
Net Interest Income (NII) 22,546 27,382 29,504 33,059 37,369
Non-Interest Income 213 268 343 372 404
Total Income 22,759 27,650 29,847 33,431 37,774
Operating Expenses 7,420 9,134 10,049 11,320 12,623
Pre-provisioning Profits 15,340 18,516 19,798 22,112 25,151
Loan Loss Provisions 2,674 4,847 8,052 8,281 8,577
Other Provisions 160 211 135 131 176
Total Provisions 2,833 5,058 8,187 8,413 8,753
PBT 12,506 13,458 11,612 13,699 16,398
Tax 3,833 4,585 4,006 4,726 5,657
PAT (Pre-Extra ordinaries) 8,673 8,873 7,606 8,973 10,741
Extra ordinaries (Net of Tax) 154 0 0 0 0
Reported Profits 8,827 8,873 7,606 8,973 10,741
Dividend 2,389 2,515 2,054 2,423 2,900
Retained Profits 6,284 6,358 5,552 6,550 7,841
Source: Company, JM Financial
Balance Sheet (` Mn) FY13 FY14 FY15E FY16E FY17E
Equity Capital 1,126 1,127 1,127 1,127 1,127
Reserves & Surplus 43,342 49,728 55,280 61,830 69,671
Stock Option Outstanding 78 87 92 96 101
Shareholders' Equity 44,546 50,942 56,499 63,053 70,899
Preference Share Capital 0 0 0 0 0
Borrowed Funds 188,723 239,306 261,682 286,803 321,506
Deferred tax liabilities 0 0 0 0 0
Current Liabilities 21,655 26,409 28,950 31,832 35,703
Total Liabilit ies 254,924 316,657 347,130 381,689 428,108
Loans & Advances 240,384 296,170 324,295 357,131 401,074
Investments 5,610 8,692 10,377 11,071 12,032
Intangible Assets 0 0 0 0 0
Cash & Bank Balances 5,132 6,892 7,134 7,678 8,623
Other Current Assets - CA 349 558 628 723 761
Fixed Assets 1,068 1,195 1,241 1,288 1,359
Miscellaneous expenditure 0 0 0 0 0
Deferred Tax Asset 2,382 3,151 3,454 3,798 4,260
Total Assets 254,924 316,657 347,130 381,689 428,108
Source: Company, JM Financial
Key Rat ios (%) FY13 FY14 FY15E FY16E FY17E
Growth (YoY) (%)
Borrowed Funds 35.2% 26.8% 9.3% 9.6% 12.1%
Advances 37.4% 23.2% 9.5% 10.1% 12.3%
Total Assets 37.3% 24.2% 9.6% 10.0% 12.2%
NII 36.6% 21.4% 7.7% 12.0% 13.0%
Non-Interest Income -10.1% 25.7% 27.9% 8.5% 8.7%
Operating Expenses 25.3% 23.1% 10.0% 12.6% 11.5%
Operating Profits 41.7% 20.7% 6.9% 11.7% 13.7%
Core Operating Profits 42.5% 20.9% 6.7% 11.7% 13.8%
Provisions 80.5% 78.5% 61.9% 2.8% 4.0%
Reported PAT 42.3% 0.5% -14.3% 18.0% 19.7%
Yields / Margins (%)
Interest Spread (%) 8.01% 7.28% 6.69% 6.90% 7.09%
NIM (Inc l. securitization) (%) 10.40% 9.73% 9.03% 9.21% 9.37%
Profitability (%)
ROA (%) 4.01% 3.10% 2.29% 2.46% 2.65%
ROE (%) 23.9% 18.6% 14.2% 15.0% 16.1%
Cost to Income (%) 32.6% 33.0% 33.7% 33.9% 33.4%
Assets Quality (%)
Gross NPAs (%) 3.11% 4.62% 6.59% 6.64% 6.31%
LLP (%) 1.60% 2.19% 2.64% 2.47% 2.31%
Capital Adequacy (%)
Tier I (%) 17.26% 16.29% 16.55% 16.87% 16.98%
CAR (%) 19.73% 18.63% 19.00% 19.43% 19.60%
Source: Company, JM Financial
Du-pont Analysis (%) FY13 FY14 FY15E FY16E FY17E
NII / Assets (%) 10.24% 9.58% 8.89% 9.07% 9.23%
Other income / Assets (%) 0.10% 0.09% 0.10% 0.10% 0.10%
Total Income / Assets (%) 10.33% 9.68% 8.99% 9.17% 9.33%
Cost to Assets (%) 3.37% 3.20% 3.03% 3.11% 3.12%
PPP / Assets (%) 6.96% 6.48% 5.97% 6.07% 6.21%
Provisions / Assets (%) 1.29% 1.77% 2.47% 2.31% 2.16%
PBT / Assets (%) 5.68% 4.71% 3.50% 3.76% 4.05%
Tax Rate (%) 30.65% 34.07% 34.50% 34.50% 34.50%
ROA (%) 4.01% 3.10% 2.29% 2.46% 2.65%
Leverage (%) 6.0 6.0 6.2 6.1 6.1
ROE (%) 23.89% 18.62% 14.18% 15.03% 16.06%
Source: Company, JM Financial
Valuat ions FY13 FY14 FY15E FY16E FY17E
Shares in issue (mn) 563.0 563.5 563.5 563.5 563.5
EPS (Rs.) 15.7 15.7 13.5 15.9 19.1
EPS (YoY) (%) 29.8% 0.4% -14.3% 18.0% 19.7%
PE (x) 16.6 16.5 19.3 16.3 13.6
BV (Rs.) 79 90 100 112 126
BV (YoY) (%) 38% 14% 11% 12% 12%
P/BV (x) 3.29 2.88 2.60 2.33 2.07
DPS (Rs.) 4.2 4.5 3.6 4.3 5.1
Div. y ield (%) 1.6% 1.7% 1.4% 1.7% 2.0%
Source: Company, JM Financial
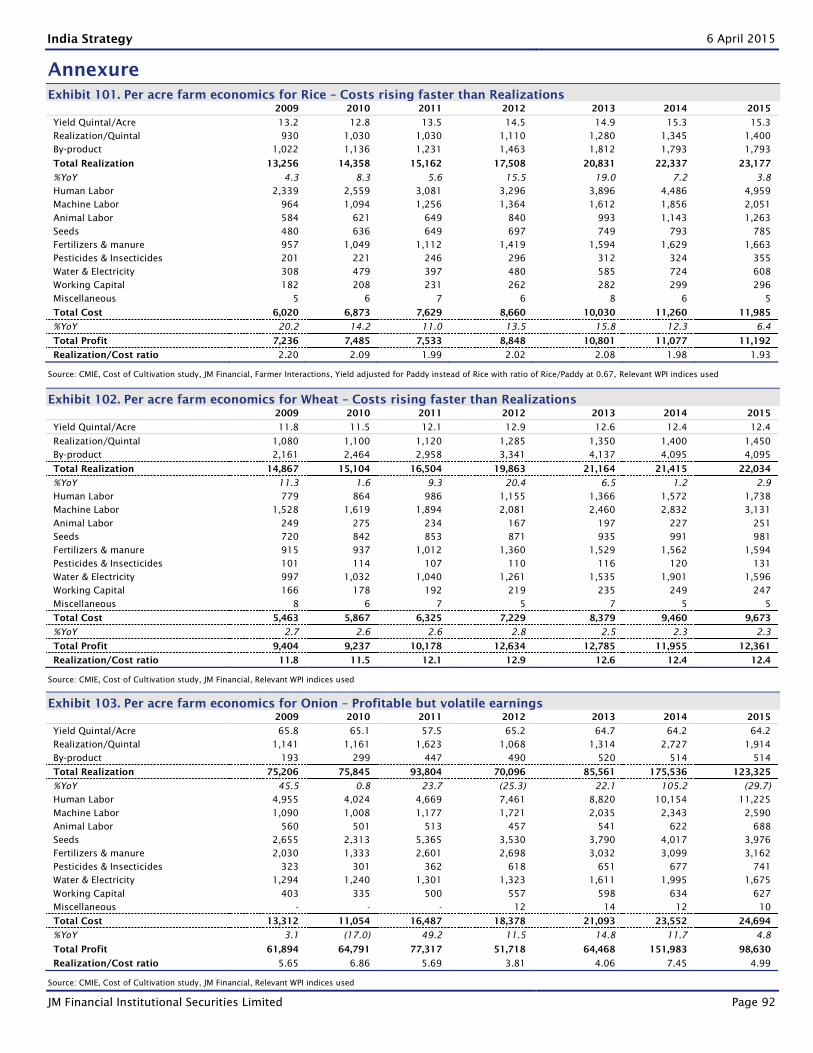
India Strategy 6 April 2015
JM Financial Institutional Securities Limited Page 92
Annexure
Exhibit 101. Per acre farm economics for Rice – Costs rising faster than Realizations
2009 2010 2011 2012 2013 2014 2015
Yield Quintal/Acre 13.2 12.8 13.5 14.5 14.9 15.3 15.3
Realization/Quintal 930 1,030 1,030 1,110 1,280 1,345 1,400
By-product 1,022 1,136 1,231 1,463 1,812 1,793 1,793
Total Realization 13,256 14,358 15,162 17,508 20,831 22,337 23,177
%YoY 4.3 8.3 5.6 15.5 19.0 7.2 3.8
Human Labor 2,339 2,559 3,081 3,296 3,896 4,486 4,959
Machine Labor 964 1,094 1,256 1,364 1,612 1,856 2,051
Animal Labor 584 621 649 840 993 1,143 1,263
Seeds 480 636 649 697 749 793 785
Fertilizers & manure 957 1,049 1,112 1,419 1,594 1,629 1,663
Pesticides & Insecticides 201 221 246 296 312 324 355
Water & Electricity 308 479 397 480 585 724 608
Working Capital 182 208 231 262 282 299 296
Miscellaneous 5 6 7 6 8 6 5
Total Cost 6,020 6,873 7,629 8,660 10,030 11,260 11,985
%YoY 20.2 14.2 11.0 13.5 15.8 12.3 6.4
Total Profit 7,236 7,485 7,533 8,848 10,801 11,077 11,192
Realization/Cost ratio 2.20 2.09 1.99 2.02 2.08 1.98 1.93
Source: CMIE, Cost of Cultivation study, JM Financial, Farmer Interactions, Yield adjusted for Paddy instead of Rice with ratio of Rice/Paddy at 0.67, Relevant WPI indices used
Exhibit 102. Per acre farm economics for Wheat – Costs rising faster than Realizations
2009 2010 2011 2012 2013 2014 2015
Yield Quintal/Acre 11.8 11.5 12.1 12.9 12.6 12.4 12.4
Realization/Quintal 1,080 1,100 1,120 1,285 1,350 1,400 1,450
By-product 2,161 2,464 2,958 3,341 4,137 4,095 4,095
Total Realization 14,867 15,104 16,504 19,863 21,164 21,415 22,034
%YoY 11.3 1.6 9.3 20.4 6.5 1.2 2.9
Human Labor 779 864 986 1,155 1,366 1,572 1,738
Machine Labor 1,528 1,619 1,894 2,081 2,460 2,832 3,131
Animal Labor 249 275 234 167 197 227 251
Seeds 720 842 853 871 935 991 981
Fertilizers & manure 915 937 1,012 1,360 1,529 1,562 1,594
Pesticides & Insecticides 101 114 107 110 116 120 131
Water & Electricity 997 1,032 1,040 1,261 1,535 1,901 1,596
Working Capital 166 178 192 219 235 249 247
Miscellaneous 8 6 7 5 7 5 5
Total Cost 5,463 5,867 6,325 7,229 8,379 9,460 9,673
%YoY 2.7 2.6 2.6 2.8 2.5 2.3 2.3
Total Profit 9,404 9,237 10,178 12,634 12,785 11,955 12,361
Realization/Cost ratio 11.8 11.5 12.1 12.9 12.6 12.4 12.4
Source: CMIE, Cost of Cultivation study, JM Financial, Relevant WPI indices used
Exhibit 103. Per acre farm economics for Onion – Profitable but volatile earnings
2009 2010 2011 2012 2013 2014 2015
Yield Quintal/Acre 65.8 65.1 57.5 65.2 64.7 64.2 64.2
Realization/Quintal 1,141 1,161 1,623 1,068 1,314 2,727 1,914
By-product 193 299 447 490 520 514 514
Total Realization 75,206 75,845 93,804 70,096 85,561 175,536 123,325
%YoY 45.5 0.8 23.7 (25.3) 22.1 105.2 (29.7)
Human Labor 4,955 4,024 4,669 7,461 8,820 10,154 11,225
Machine Labor 1,090 1,008 1,177 1,721 2,035 2,343 2,590
Animal Labor 560 501 513 457 541 622 688
Seeds 2,655 2,313 5,365 3,530 3,790 4,017 3,976
Fertilizers & manure 2,030 1,333 2,601 2,698 3,032 3,099 3,162
Pesticides & Insecticides 323 301 362 618 651 677 741
Water & Electricity 1,294 1,240 1,301 1,323 1,611 1,995 1,675
Working Capital 403 335 500 557 598 634 627
Miscellaneous - - - 12 14 12 10
Total Cost 13,312 11,054 16,487 18,378 21,093 23,552 24,694
%YoY 3.1 (17.0) 49.2 11.5 14.8 11.7 4.8
Total Profit 61,894 64,791 77,317 51,718 64,468 151,983 98,630
Realization/Cost ratio 5.65 6.86 5.69 3.81 4.06 7.45 4.99
Source: CMIE, Cost of Cultivation study, JM Financial, Relevant WPI indices used
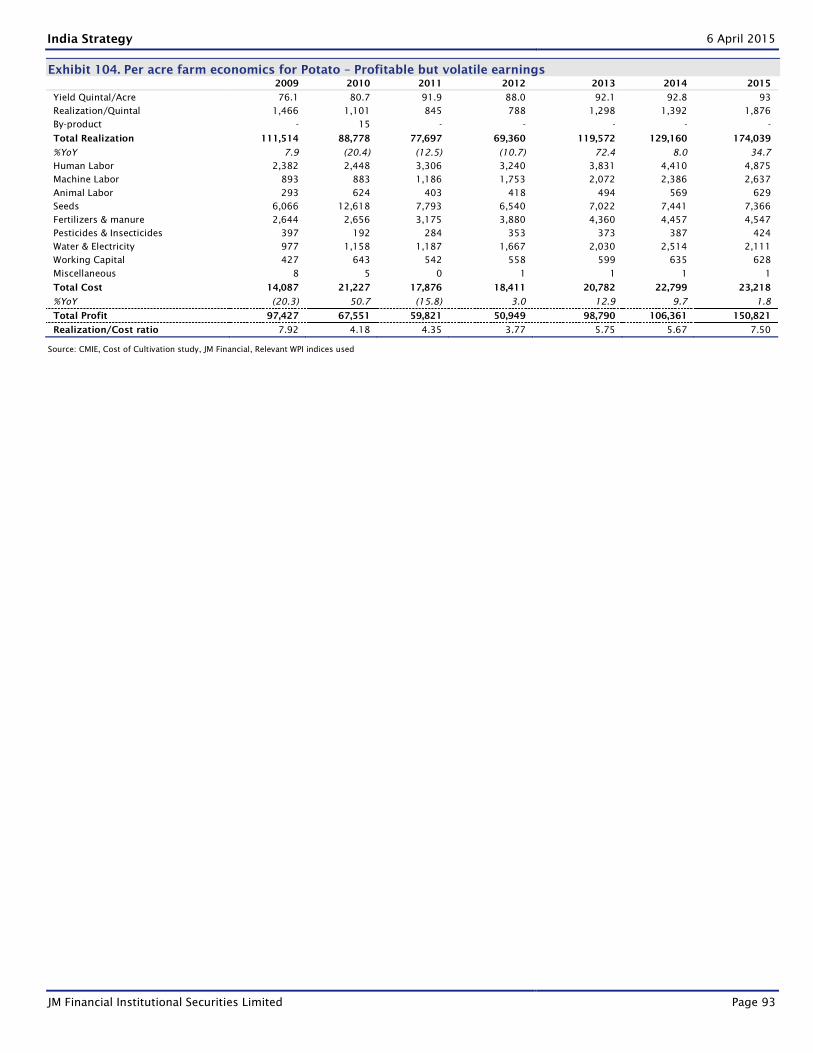
India Strategy 6 April 2015
JM Financial Institutional Securities Limited Page 93
Exhibit 104. Per acre farm economics for Potato – Profitable but volatile earnings
2009 2010 2011 2012 2013 2014 2015
Yield Quintal/Acre 76.1 80.7 91.9 88.0 92.1 92.8 93
Realization/Quintal 1,466 1,101 845 788 1,298 1,392 1,876
By-product - 15 - - - - -
Total Realization 111,514 88,778 77,697 69,360 119,572 129,160 174,039
%YoY 7.9 (20.4) (12.5) (10.7) 72.4 8.0 34.7
Human Labor 2,382 2,448 3,306 3,240 3,831 4,410 4,875
Machine Labor 893 883 1,186 1,753 2,072 2,386 2,637
Animal Labor 293 624 403 418 494 569 629
Seeds 6,066 12,618 7,793 6,540 7,022 7,441 7,366
Fertilizers & manure 2,644 2,656 3,175 3,880 4,360 4,457 4,547
Pesticides & Insecticides 397 192 284 353 373 387 424
Water & Electricity 977 1,158 1,187 1,667 2,030 2,514 2,111
Working Capital 427 643 542 558 599 635 628
Miscellaneous 8 5 0 1 1 1 1
Total Cost 14,087 21,227 17,876 18,411 20,782 22,799 23,218
%YoY (20.3) 50.7 (15.8) 3.0 12.9 9.7 1.8
Total Profit 97,427 67,551 59,821 50,949 98,790 106,361 150,821
Realization/Cost ratio 7.92 4.18 4.35 3.77 5.75 5.67 7.50
Source: CMIE, Cost of Cultivation study, JM Financial, Relevant WPI indices used

India Strategy 6 April 2015
JM Financial Institutional Securities Limited Page 94
Notes
India Strategy 6 April 2015
JM Financial Institutional Securities Limited Page 95
APPENDIX I
JM Financial Institutional Securities Limited
(Formerly known as JM Financial Institutional Securities Private Limited)
Corporate Identity Number: U65192MH1995PLC092522
Member of BSE Ltd. and National Stock Exchange of India Ltd. and MCX Stock Exchange Ltd.
SEBI Registration Nos.: BSE - INZ010012532, NSE - INZ230012536 and MCX-SX - INZ260012539
Registered Office: 7th Floor, Cnergy, Appasaheb Marathe Marg, Prabhadevi, Mumbai 400 025, India.
Board: +9122 6630 3030 | Fax: +91 22 6630 3488 | Email: [email protected] | www.jmfl.com
Analyst(s) Certification
The research analyst(s), with respect to each issuer and its securities covered by them in this research report, certify that:
All of the views expressed in this research report accurately reflect his or her or their personal views about all of the issuers
and their securities; and
No part of his or her or their compensation was, is, or will be directly or indirectly related to the specific recommendations or
views expressed in this research report.
Analyst(s) holding in the Stock(s): Nil
Important Disclosures
This research report has been prepared by JM Financial Institutional Securities Limited (JM Financial Institutional Securities) to
provide information about the company(ies) and sector(s), if any, covered in the report and may be distributed by it and/or its
affiliated company(ies) solely for the purpose of information of the select recipient of this report. This report and/or any part
thereof, may not be duplicated in any form and/or reproduced or redistributed without the prior written consent of JM
Financial Institutional Securities. This report has been prepared independent of the companies covered herein. JM Financial
Institutional Securities and its affiliated companies are part of a multi-service, integrated investment banking, investment
management, brokerage and financing group. JM Financial Institutional Securities and/or its affiliated company(ies) might
have provided or may provide services in respect of managing offerings of securities, corporate finance, investment banking,
mergers & acquisitions, financing or any other advisory services to the company(ies) covered herein. JM Financial Institutional
Securities and/or its affiliated company(ies) might have received or may receive compensation from the company(ies)
mentioned in this report for rendering any of the above services. Research analysts and sales persons of JM Financial
Institutional Securities may provide important inputs to its affiliated company(ies) associated with it.
While reasonable care has been taken in the preparation of this report, it does not purport to be a complete description of the
securities, markets or developments referred to herein, and JM Financial Institutional Securities does not warrant its accuracy
or completeness. JM Financial Institutional Securities may not be in any way responsible for any loss or damage that may arise
to any person from any inadvertent error in the information contained in this report. This report is provided for information
only and is not an investment advice and must not alone be taken as the basis for an investment decision. The investment
discussed or views expressed herein may not be suitable for all investors. The user assumes the entire risk of any use made of
this information. The information contained herein may be changed without notice and JM Financial Institutional Securities
reserves the right to make modifications and alterations to this statement as they may deem fit from time to time.
JM Financial Institutional Securities and its affiliated company(ies), their directors and employees may; (a) from time to time,
have a long or short position in, and buy or sell the securities of the company(ies) mentioned herein or (b) be engaged in any
other transaction involving such securities and earn brokerage or other compensation or act as a market maker in the
financial instruments of the company(ies) discussed herein or act as an advisor or lender/borrower to such company(ies) or
may have any other potential conflict of interests with respect to any recommendation and other related information and
opinions.
This report is neither an offer nor solicitation of an offer to buy and/or sell any securities mentioned herein and/or not an
official confirmation of any transaction.
This report is not directed or intended for distribution to, or use by any person or entity who is a citizen or resident of or
located in any locality, state, country or other jurisdiction, where such distribution, publication, availability or use would be
contrary to law, regulation or which would subject JM Financial Institutional Securities and/or its affiliated company(ies) to any
registration or licensing requirement within such jurisdiction. The securities described herein may or may not be eligible for
sale in all jurisdictions or to a certain category of investors. Persons in whose possession this report may come, are required
to inform themselves of and to observe such restrictions.
Persons who receive this report from JM Financial Singapore Pte Ltd may contact Ms. Rohinee Sharma
([email protected]) or Mr. Ruchir Jhunjhunwala ([email protected]) on +65 6422 1888 in respect of any
matters arising from, or in connection with, this report.
India Strategy 6 April 2015
JM Financial Institutional Securities Limited Page 96
Additional disclosure only for U.S. persons: JM Financial Institutional Securities has entered into an agreement with Enclave
Capital LLC ("Enclave Capital"), a U.S. registered broker-dealer and member of the Financial Industry Regulatory Authority
("FINRA") in order to conduct certain business in the United States in reliance on the exemption from U.S. broker-dealer
registration provided by Rule 15a-6, promulgated under the U.S. Securities Exchange Act of 1934 (the "Exchange Act"), as
amended, and as interpreted by the staff of the U.S. Securities and Exchange Commission ("SEC") (together "Rule 15a-6").
This research report is distributed in the United States by Enclave Capital in compliance with Rule 15a-6, and as a "third party
research report" for purposes of FINRA Rule 2711. In compliance with Rule 15a-6(a)(3) this research report is distributed only
to "major U.S. institutional investors" as defined in Rule 15a-6 and is not intended for use by any person or entity that is not a
major U.S. institutional investor. If you have received a copy of this research report and are not a major U.S. institutional
investor, you are instructed not to read, rely on, or reproduce the contents hereof, and to destroy this research or return it to
JM Financial Institutional Securities or to Enclave Capital.
This research report is a product of JM Financial Institutional Securities, which is the employer of the research analyst(s) solely
responsible for its content. The research analyst(s) preparing this research report is/are resident outside the United States
and are not associated persons or employees of any U.S. registered broker-dealer. Therefore, the analyst(s) are not subject to
supervision by a U.S. broker-dealer, or otherwise required to satisfy the regulatory licensing requirements of FINRA and may
not be subject to the Rule 2711 restrictions on communications with a subject company, public appearances and trading
securities held by a research analyst account.
JM Financial Institutional Securities only accepts orders from major U.S. institutional investors. Pursuant to its agreement with
JM Financial Institutional Securities, Enclave Capital effects the transactions for major U.S. institutional investors. Major U.S.
institutional investors may place orders with JM Financial Institutional Securities directly, or through Enclave Capital, in the
securities discussed in this research report.
Additional disclosure only for U.K. persons: Neither JM Financial Institutional Securities nor any of its affiliates is authorised
in the United Kingdom (U.K.) by the Financial Conduct Authority. As a result, this report is for distribution only to persons who
(i) have professional experience in matters relating to investments falling within Article 19(5) of the Financial Services and
Markets Act 2000 (Financial Promotion) Order 2005 (as amended, the "Financial Promotion Order"), (ii) are persons falling
within Article 49(2)(a) to (d) ("high net worth companies, unincorporated associations etc.") of the Financial Promotion Order,
(iii) are outside the United Kingdom, or (iv) are persons to whom an invitation or inducement to engage in investment activity
(within the meaning of section 21 of the Financial Services and Markets Act 2000) in connection with the matters to which this
report relates may otherwise lawfully be communicated or caused to be communicated (all such persons together being
referred to as "relevant persons"). This report is directed only at relevant persons and must not be acted on or relied on by
persons who are not relevant persons. Any investment or investment activity to which this report relates is available only to
relevant persons and will be engaged in only with relevant persons.