jll knows tech - annualreports.com
TRANSCRIPT
2015 Annual ReportJones Lang LaSalle Incorporated
JLLknows tech
Who we are
• With 2015 fee revenue of more than $5.2 billion, our 60,000 colleagues serve clients in over 80 countries from more than 280 corporate offices.
• We are an industry leader in property and corporate facility management services, with a portfolio of 4.0 billion square feet worldwide.
• During 2015, we completed 35,500 transactions for landlord and tenant clients, representing 1.1 billion square feet of space.
• We provided capital markets services for $138 billion of client transactions.
• LaSalle Investment Management, our investment management business, is one of the world’s largest and most diverse in real estate with $56.4 billion of assets under management.
On the cover:JLL Chile provided agency leasing services for Costanera Center, the largest mixed-use project in Santiago. Designed by world-renowned architect César Pelli and developed by Cencosud Chile, Costanera Center reflects the dynamism and stability of Chile, one of the most competitive and fastest growing countries in South America. Located in the heart of Santiago’s financial district, the Costanera Center Tower 2 is the tallest skyscraper in Latin America. Local JLL teams established strong relationships with the landlord’s team, executing commercial strategies to accomplish all project objectives for over 90,000 square meters of office space.
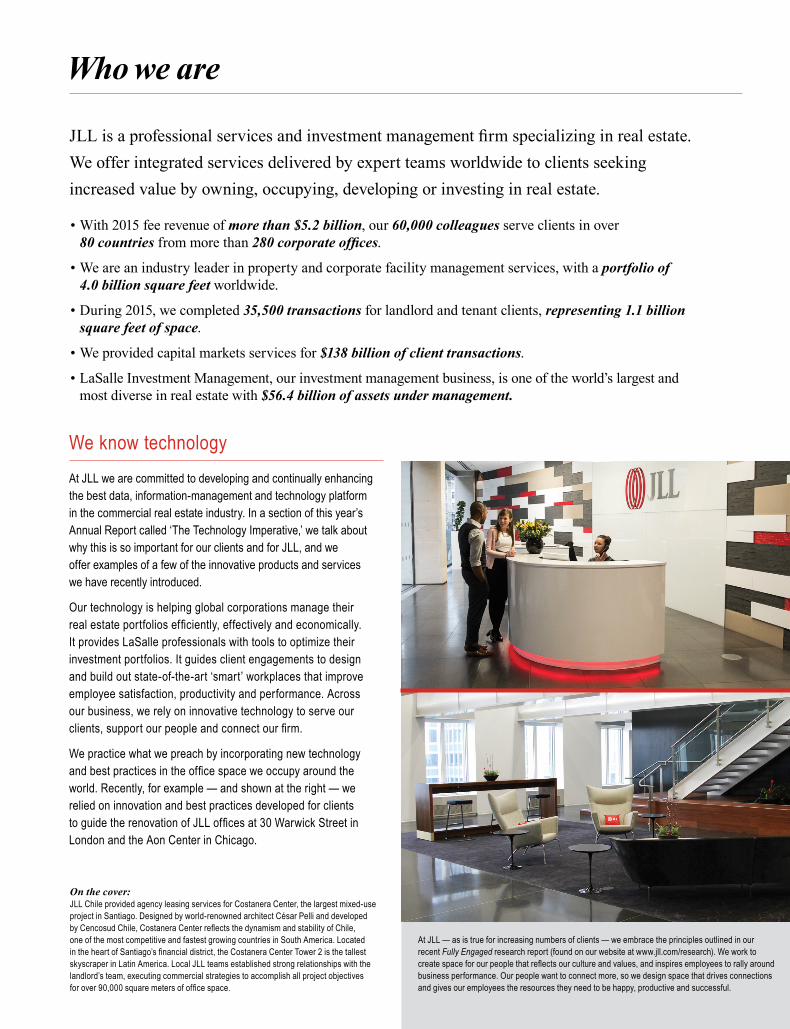
We know technologyAt JLL we are committed to developing and continually enhancing the best data, information-management and technology platform in the commercial real estate industry. In a section of this year’s Annual Report called ‘The Technology Imperative,’ we talk about why this is so important for our clients and for JLL, and we offer examples of a few of the innovative products and services we have recently introduced.
Our technology is helping global corporations manage their real estate portfolios efficiently, effectively and economically. It provides LaSalle professionals with tools to optimize their investment portfolios. It guides client engagements to design and build out state-of-the-art ‘smart’ workplaces that improve employee satisfaction, productivity and performance. Across our business, we rely on innovative technology to serve our clients, support our people and connect our firm.
We practice what we preach by incorporating new technology and best practices in the office space we occupy around the world. Recently, for example — and shown at the right — we relied on innovation and best practices developed for clients to guide the renovation of JLL offices at 30 Warwick Street in London and the Aon Center in Chicago.
JLL is a professional services and investment management firm specializing in real estate. We offer integrated services delivered by expert teams worldwide to clients seeking increased value by owning, occupying, developing or investing in real estate.
At JLL — as is true for increasing numbers of clients — we embrace the principles outlined in our recent Fully Engaged research report (found on our website at www.jll.com/research). We work to create space for our people that reflects our culture and values, and inspires employees to rally around business performance. Our people want to connect more, so we design space that drives connections and gives our employees the resources they need to be happy, productive and successful.
JLL 2015 Annual Report
• Long history of profitable growth– Achieved Fortune 500 status– 10-year compound annual fee revenue
growth = 14% – Growth = 70% organic and 30% from M&A
• Investment-grade financial strength for future growth – Ratings: S&P BBB+ (stable outlook) and Moody’s Baa2 (positive outlook)
• ~ 90 acquisitions– Approximately $2.5B of M&A contributing to margin accretion, market share expansion and profitable growth
• Experienced leadership creates value for clients and shareholders– Seven-member Global Executive
Board with combined 100+ years of experience
• LaSalle Investment Management grew assets under management to $56.4B while delivering strong client returns
What we have accomplished
1 Fee Revenue is total revenue excluding vendor and subcontractor costs that are included in both revenue and expense. We believe that excluding gross contract costs from revenue gives a more accurate picture of our revenue growth.
2 Adjusted Operating Income includes adjustments to Operating Income, calculated in accordance with U.S. generally accepted accounting principles (“U.S. GAAP”), to exclude the impact of restructuring and acquisition charges of $34.1 million, $42.5 million and $1.4 million for the years ended December 31, 2015, 2014 and 2005, respectively. Adjusted EBITDA includes adjustments to U.S. GAAP EBITDA for the restructuring and acquisitions charges noted above. We believe that excluding these items gives a more meaningful year-over-year comparison. Please see the accompanying Form 10-K for additional information.
3 Adjusted Net Income and Adjusted EPS (earnings per diluted average share) include adjustments to Net Income and EPS, calculated in accordance with U.S. GAAP, to exclude the impact of restructuring and acquisition charges of $16.1 million, $6.0 million and $1.0 million for the years ended December 31, 2015, 2014 and 2005, respectively. We believe that excluding these items gives a more meaningful year-over-year comparison. Please see the accompanying Form 10-K for additional information.
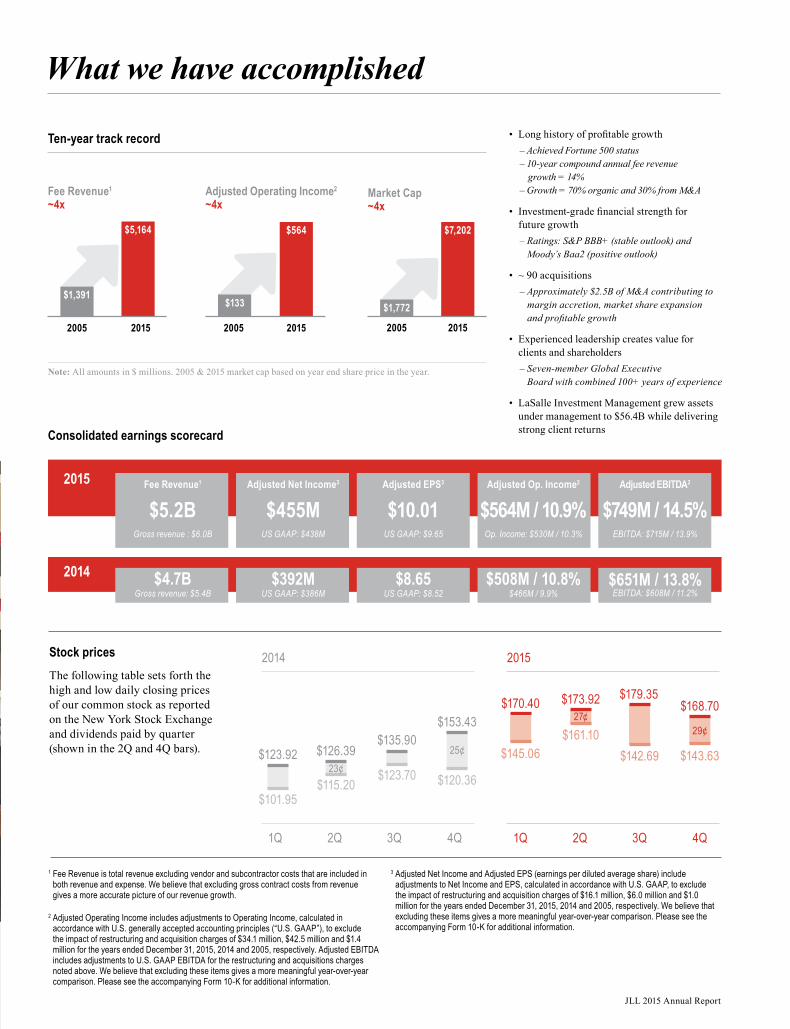
Fee Revenue1 ~4x
Adjusted Operating Income2 ~4x
Market Cap ~4x
Stock pricesThe following table sets forth the high and low daily closing prices of our common stock as reported on the New York Stock Exchange and dividends paid by quarter (shown in the 2Q and 4Q bars).
2005 2005 20052015 2015 2015
Ten-year track record
$1,391$133 $1,772
$5,164 $564 $7,202
Note: All amounts in $ millions. 2005 & 2015 market cap based on year end share price in the year.
Consolidated earnings scorecard
2015
2014
Fee Revenue1
$5.2BGross revenue : $6.0B
$4.7BGross revenue: $5.4B
$392MUS GAAP: $386M
$8.65US GAAP: $8.52
$508M / 10.8%$466M / 9.9%
$651M / 13.8%EBITDA: $608M / 11.2%
Adjusted Net Income3
$455MUS GAAP: $438M
Adjusted EPS3
$10.01US GAAP: $9.65
Adjusted Op. Income2
$564M / 10.9%Op. Income: $530M / 10.3%
Adjusted EBITDA2
$749M / 14.5%EBITDA: $715M / 13.9%
$142.69
$179.35
$145.06
$170.40
$143.63
$168.70
29¢$161.10
$173.9227¢
2015
1Q 3Q 4Q2Q
$123.70
$135.90
$101.95
$123.92
$120.36
$153.43
25¢
$115.20
$126.3923¢
2014
1Q 3Q 4Q2Q
To our stakeholders
Colin Dyer Chief Executive Officer
and President 2015 marked another outstanding year of record revenue and profit at JLL.
While real estate market conditions remained favorable in most parts of the world, success is never the product of healthy markets alone. We thank two groups for such a good year: our clients, who trusted us to represent them in all parts of the world, and our own staff, who earned that trust by delivering superior client service, advice and results.
We continued to invest in growth throughout 2015, accelerating the pace of investment across our firm to advance our strategy for focused growth. In doing so, we expanded both the quality and breadth of the services we provide to clients and the career opportunities we create for our own people. The year’s acquisitions included leading retail management and leasing companies in Istanbul and Tokyo; a U.S.-based pioneer in cloud-based facility management solutions; a U.S. multi-family and senior housing debt financing business; Australia’s largest privately-owned national valuations firm; and
design and fit-out companies in Germany and the UK.
JLL 2015 Annual Report
4

We continued to invest in growth throughout 2015, accelerating the pace of investment across our firm to advance our strategy for focused growth.
JLL 2015 Annual Report
5
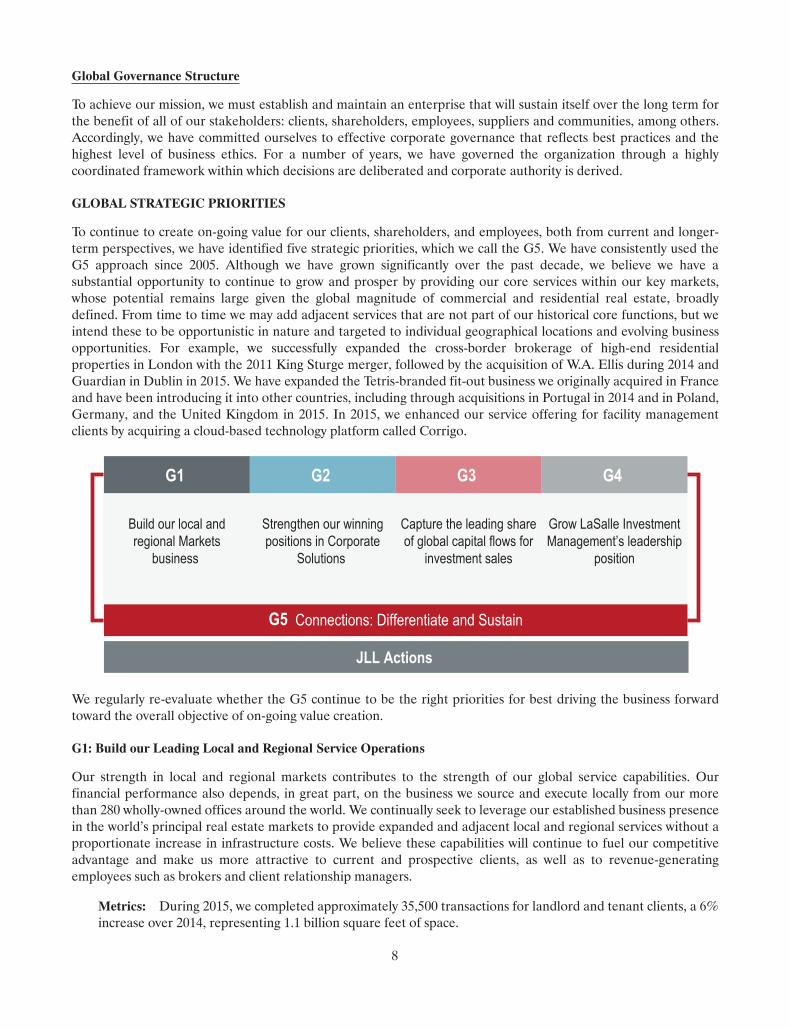
year’s report, our technology. Together the G5 make us more effective and efficient at serving clients, accelerating growth, increasing productivity, managing risk and, ultimately, promoting the long-term success and sustainability of JLL.
G1 Building our leading local and regional market positions
Our leading position as a global real estate services provider is driven by our service capabilities and competitive position in key regional and local real estate markets globally. So we constantly assess strategic opportunities to strengthen our capabilities in relevant markets geographically and in different industry segments and asset classes within markets. We reinvest more than 90 percent of JLL’s profits back into the business to create additional growth, improved client services and new opportunities for our employees.
In 2015, we attracted many talented individuals and teams to our ranks, including our new colleagues who joined JLL as part of the twenty acquisitions we closed. (They are listed in the accompanying 10-K and also at jll.com.) To date in 2016, we have completed another 11 acquisitions. Our approach in each instance has been to acquire selectively and with rigorous due diligence. We examine finances, operating risk and strategic, cultural and client fit. We maintain pricing discipline and focus on high-profit, high-margin opportunities. We minimize operational overlap that can destroy value. And we plan for and manage integration carefully as we welcome new colleagues to JLL.
G2 Strengthen our leading position in Corporate Solutions
In 2015, we continued to build our leading position delivering integrated real estate outsourcing services to corporate clients in
JLL 2015 Annual Report
6
Record financial results
The year’s financial results confirmed our ability to create long-term value. Fee revenue increased to $5.2 billion in 2015, 17 percent higher than the year before in local currency, while gross revenue reached $6 billion, an 18 percent increase in local currency. Adjusted earnings per share totaled $10.01, 26 percent above 2014 levels, despite an $0.87 foreign currency exchange headwind. Adjusted EBITDA margin calculated on a fee revenue basis in local currency was 14.6 percent for the year, compared with 13.8 percent in 2014. In December 2015, Moody’s revised its outlook up to Positive, acknowledging our strong cash generation. And our investment-grade balance sheet continues to position JLL for additional growth in the future.
Continued investments in our G5 global growth priorities
More than a decade ago, we began to focus our strategic investments on five growth priorities that cross service lines and geographies. We call them the G5. Not only have they made us a leader in the areas where we choose to compete, but they have also helped us generate long-term sustainable growth. They have added to the value we create for clients, employees, shareholders and other stakeholders. And they have produced potent competitive differentiators for us within our industry.
The first G focuses on our constant drive to build and strengthen our local and regional operations. G2 through G4 help us identify growth opportunities globally in outsourcing and related corporate real estate services, in real estate investment sales and in institutional funds management. G5 helps us accelerate and leverage growth across the first four priorities by strengthening connections between our markets, people, business lines, and as featured in this
all parts of the world. Corporate occupiers focused actively on restructuring their portfolios and leasing new space to attract and retain top talent in an increasingly competitive business environment. And businesses in all parts of the world worked to manage their real estate expenses more effectively by outsourcing real estate services to trusted advisors.
As just one example of the momentum and strong client relationships we have established in this business, banking and financial services firm HSBC extended our assignment to provide facilities management services across its 55 million-square-foot global real estate portfolio for an additional three years. We will remain HSBC's global provider until 2021.
During 2015, we provided corporate facility management services for 1.3 billion square feet of client real estate, a 17 percent increase from 2014. We had 137 new business wins, expanded existing relationships with 75 clients and won 35 contract renewals.
G3 Capture the leading share of global real estate capital flow for investment sales
Two market trends continue to drive our third strategic priority, which is to deliver capital markets services globally: first, increasingly international, cross-border flows of capital into real estate, and second, global marketing of prime real estate assets.
Since few competitors have the integrated service platform and worldwide market presence to match our reach and experience, this creates a distinct competitive advantage for JLL in an active investment sales market.
During 2015, we provided capital markets services for $138 billion of client transactions, a 17 percent increase from 2014. Our Capital Markets and Hotels revenues increased 25 percent in local currency for the year.
G4 Strengthen LaSalle Investment Management’s leadership positions
LaSalle continued to provide its clients with superior service and returns in 2015. Operating revenue for our institutional funds management business increased 16 percent in local currency for the year, as LaSalle generated double-digit increases in advisory, transaction and incentive fees, its three major fee categories.
During the year, LaSalle increased assets under management to $56.4 billion, 5 percent above the 2014 total, and raised $5 billion of capital. Confirming its industry-leading status, London’s Estates Gazette named LaSalle ‘Global Real Estate Company of the Year.’
G5 Differentiate and sustain the organization by connecting across the firm and with clients and other stakeholders
Throughout 2015, we continued to link different parts of our business more efficiently and productively. This allows us to leverage and accelerate our investments in the first four Gs, differentiate JLL from competitors, increase profitability and sustain the company over time.
Our clients look for partners who can deliver services that are both specialized and integrated. They want those partners to address their specific needs, which can change over time and from one geography to another. They require multiple approaches to serve those needs: from global to local and everywhere in between, perhaps with a single point of contact at the top, plus additional links at the local level. And they demand that their service partners always act with integrity and, increasingly, be able to demonstrate a commitment to the environment, citizenship, regulatory compliance, safety and cybersecurity.
JLL 2015 Annual Report
7
As we connect our people, systems, technologies, service lines and geographies more effectively, our client-service capabilities increase dramatically. Improved connections also contribute to increased productivity, and to greater profitability as a result. And our JLL culture supports connections: teamwork, ethics and excellence frame our culture, bringing us closer to each other and to the firm’s clients.
Our 2020 strategy for focused growth
To support and accelerate progress for each of our G5 priorities, four years ago we introduced an interrelated group of business and operational strategies to help us drive focused growth to 2020.
The 2020 strategy has confirmed that the G5 continue to contribute to our business and financial goals, guiding us to pursue them effectively. That includes identifying and investing in resources that help the strategy succeed:
Diverse talent equipped and motivated to accomplish our strategic objectives. To attract and retain talented individuals in all parts of our business, in 2015 we increased efforts to make JLL a more diverse and inclusive company. Led by our Board of Directors, Global Executive Board and senior leaders around the world, our goal is to prepare the company for the future business world, and for how much more diverse our clients will be in the coming years. So Diversity and Inclusiveness (D&I) is now a strategic priority at JLL. We are making progress. In 2015 Diversity MBA magazine named us one of its ‘Best Places for Women and Diverse Managers to Work.’ Later in the year, we earned a perfect score on the ‘2016 Corporate Equality Index,’ a benchmarking survey on corporate policy practices administered by
the Human Rights Campaign Foundation. And three out of the eight nominees for independent members of our Board of Directors this year are women, including the Chairman of the Board.
Our Employee Engagement Index, which measures the percentage of survey respondents reporting high levels of engagement with the firm and their work with us reached 76 percent as measured in 2015, up 3 percent from 2012, the last time we completed a full survey. Substantially all the survey results improved over 2012 and also were higher than the global norms reported by our independent survey provider.
Productivity measures to improve margins. Productivity also received increased attention and action in 2015. To counter the long-term fee pressures that affect all service businesses, we are driving productivity improvements in everything that we do: from the way we manage costs — both for ourselves and our clients — to the services we offer clients. We are making major investments in supply chain management and centralized procurement. We are investing heavily in data and information management to help us work more efficiently for clients. In essence, we are asking everyone at JLL to look for ways to work more effectively and efficiently as we continue to grow the company. We have even established a firm-wide ‘Productivity Prize Challenge’ that will assess and reward the best ideas our employees create, both for clients and in our own operations.
Investments in data and technology tools to help our people mine the depths of our intellectual property and help clients maximize the value of their real estate. Commercial real estate is in the midst of a digital revolution. Winning business and serving clients successfully depends increasingly on our digital, data and information-management capabilities. So, once again, we grew our technology and data investments and initiatives significantly in 2015. Our goal is to digitize all JLL data, work-flows and business applications by 2020.
JLL 2015 Annual Report
8
While quality data is the foundation of these efforts, IT applications take data and interpret it for our commercial applications. Last year we continued to work to bring IT systems developers closer to our business professionals and to develop practical business applications and make them work globally. By concentrating resources on universal, high-quality applications, we are reducing efforts to design and maintain large numbers of locally customized systems.
You will find examples of recent investments in data and technology later in this report.
Standardized tools and processes that make operations highly productive and minimize enterprise risk. Our Business Network teams — Legal, HR, Professional Standards, IT, Finance, Risk Management and Internal Audit — collaborate with their business line colleagues to balance the need for procedures that facilitate revenue generation — by making it easy for our clients to do business with us —against the need to protect the firm contractually and financially. Accordingly, we have built significant document management, knowledge management and tracking and training systems to manage the significant enterprise risks we face as a complex global organization.
A brand that differentiates JLL and LaSalle, and clearly reflects the breadth of our expertise, wisdom, governance and integrity. We continued to build our brand in 2015. In an industry characterized by consolidation and globalization, our goal is to set out our own position with clarity and consistency, defining our space in the market and unifying how we express our brand.
To support these efforts, we conducted a comprehensive, global image survey across all our client sectors. The survey measured how clients perceive both JLL (and separately LaSalle) and our principal competitors.
We are using the survey findings to define what we call ‘The JLL Way,’ highlighting our values of teamwork, ethics and excellence as points of differentiation for JLL and creating clear positioning messages that will make us stand out in the minds of clients and prospective employees alike.
An important element of the The JLL Way is our sustainability leadership agenda, which we call ‘Building a Better Tomorrow.’ At JLL, our commitment to sustaining our business over the long term, which we have done for more than 250 years, means successfully managing the financial, environmental and social risks and opportunities our complex organization faces, and helping our clients do the same.
Senior management changes at JLL
In February 2016, Alastair Hughes announced that he would leave JLL on June 30th of this year. Alastair joined the firm in London in 1988. Later he served as our UK Managing Director, as EMEA CEO and, starting in 2009, as CEO of Asia Pacific. He has also been a member of our Global Executive Board for 11 years. Everyone at JLL thanks Alastair for all that he has brought to our company over the years, and we wish him well in the future.
Anthony Couse has been named to succeed Alastair as Asia Pacific CEO, effective June 1st of this year Anthony joined the firm in London in 1989, moved to Hong Kong in 1993 and then to Shanghai in 2006 as Managing Director, Shanghai and East China. He has built an extensive network of Asian clients in 26 years at JLL, contributing to our rapid growth in East China. He has also provided strong leadership as head of D&I for Asia Pacific. We welcome Anthony to his new role.
9
JLL 2015 Annual Report
Later in February, we announced that Christian Ulbrich, currently CEO for our EMEA region, would become President of JLL on June 1st. In his new role, Christian will focus on managing our regional businesses in Asia Pacific, EMEA and the Americas. Our regional CEOs will report to Christian, and he will report to me. I will retain the Chief Executive Officer role following the June 1st transition. Christian has also been nominated for election at our 2016 Annual Meeting to become a member of our Board of Directors.
Christian joined JLL in 2005 as Managing Director of JLL Germany and became EMEA CEO in 2009. Throughout his JLL career, he has delivered sustained growth, earning the respect of clients and colleagues in the process. As one measure of the region’s recent growth, since 2010 our EMEA revenue has doubled and profits have risen fourfold.
Guy Grainger will replace Christian as CEO of EMEA on June 1st. Guy has served as UK Chief Executive since January, 2013, overseeing significant growth in revenue, profits and capabilities during that time. He played a leading role in developing our global Retail 2020 strategy, has championed efforts to grow our international Residential capabilities and led the UK’s significant sustainability efforts.
Chris Ireland will succeed Guy as UK Chief Executive. Chris joined JLL in 2011 as one of the joint managing partners of King Sturge. Following that successful merger, he took a dual role as JLL’s UK Chairman and Lead Director of UK Capital Markets.
These assignments demonstrate JLL’s commitment to careful succession planning and developing the firm’s future leaders. We are fortunate to have so many experienced senior managers who are prepared to take on increasingly important roles as our business continues to grow.
Changes on our Board of Directors
David B. Rickard and Roger T. Staubach have decided not to stand for re-election to our Board of Directors at our 2016 Annual Meeting. We are grateful for the significant value that each of them has contributed to the Board, Dave for nine years — including as Chairman of the Audit Committee — and Roger for eight. Roger will continue as Executive Chairman of our Americas business.
Moving forward with confidence
Three months into 2016, we continue to see positive momentum in most real estate markets, sectors and client segments worldwide, even as we face more challenging geopolitical and economic situations in some parts of the world. In this environment, we will continue to focus on generating additional growth at JLL and LaSalle. We will rely on the strength and depth of our client relationships, the depth and flexibility of our finances, and, above all, the skills and hard work of our people.
As I do each year, I want to end this letter by thanking our people for their unparalleled commitment to clients, colleagues and our firm.
To punctuate their contributions, consider some of the awards they helped us earn in 2015 and to date this year, listed on the next page. They are extraordinary for the diversity of what they honor and where they have come from, the best possible indication that The JLL Way is far more than words.
Thank you for your continued interest in JLL. Colin Dyer Chief Executive Officer and President April 2016
10
JLL 2015 Annual Report
11
JLL 2015 Annual Report
• World’s Best Property Consultancy, International Property Awards Grand Final
• Best Consultancy in Asia, International Property Awards Grand Final
• Global Real Estate Company of the Year (LaSalle), Estates Gazette
• Core Property Manager of the Year (LaSalle), Professional Pensions
• Pan-European Property Manager of the Year (LaSalle), Professional Pensions
• Japan Firm of the Year (LaSalle), Global PERE Awards
• One of the World's Most Ethical Companies, the Ethisphere Institute, for the eighth and ninth consecutive years (2015, 2016)
• 100 Best Corporate Citizens (#20), CR Magazine
• One of the Global Outsourcing 100, International Association of Outsourcing Professionals, for the seventh consecutive year
• World’s Most Admired Companies, Fortune magazine
• 50 Out Front for Diversity Leadership: Best Places for Women & Diverse Managers to Work, Diversity MBA magazine
• Perfect score on the Human Rights Campaign Foundation's Corporate Equality Index, a national benchmarking survey on corporate policies and practices related to LGBT workplace equality
• A Winning "W" Company and listing on the 2020 Honor Roll by the 2020 Women on Boards
• The Best Law Department in the U.S. real estate industry, The Legal 500
• One of the Best Places to Work in numerous local publications worldwide, including America’s Best Employers 2016, Forbes magazine
• Energy Star Sustained Excellence Award, U.S. Environmental Protection Agency
• Energy Star Climate Communications Award, U.S. Environmental Protection Agency
• Compliance Award for JLL Germany, dfv Mediengruppe (2016)
• Ethics Award for JLL Turkey, three years in a row, Edmer Institute
• Excellence in Global Corporate Governance, India Institute of Directors
Awards earned in 2015 and to date in 2016
12
JLL 2015 Annual Report
Board of Directors and Global Corporate Officers
Board of Directors
Richard Angliss Clark ArdernRon Bedard Pascal BoulicaultUte BraaschAllison CancioSteve CresswellJeff DeLaurentisKathryn DitmarsPeter Downie Pushpa GowdaMaria Grigorova Claire Handley Gayle Kantro Shahid JavedAgnes Lim Angie LimCiara Mason
Richard MowthorpeSarah NichollsJane NivenSusan NuccioJanice OchenkowskiAlbert Ovidi Betsy PeckMackenzie Phillips Theresa ReisGordon Repp Mike RickettsJoe RomaneskoWarwick SauerNicolas TaylorBill ThummelTed TomarasSeth Weinert
Global Executive Board
Louis F. Bowers Controller
Grace T. Chang Corporate Finance and Investor Relations
Charles J. DoyleChief Marketing and Communications Officer
Bryan J. Duncan Treasurer
Allan Frazier Chief Data Officer and Global Head of Data and Information Management
James S. Jasionowski Chief Tax Officer
David A. Johnson Chief Information Officer
Patricia Maxson Chief Human Resources Officer
Mark J. Ohringer General Counsel and Corporate Secretary
Parikshat Suri Director of Internal Audit
Colin DyerChief Executive Officer and President
Christie B. Kelly Chief Financial Officer
John Forrest Chief Executive Officer Corporate Solutions, Global and Americas
Alastair Hughes Chief Executive Officer Asia Pacific
Jeff A. Jacobson Chief Executive Officer LaSalle Investment Management
Gregory P. O’Brien Chief Executive Officer Americas
Christian Ulbrich Chief Executive Officer Europe, Middle East and Africa
Audit CommitteeMr. Rickard (Chair), Dame DeAnne, Mr. Nesbitt, Ms. Petach and Ms. Penrose
Compensation CommitteeMr. Lu (Chair), Mr. Bagué, Mr. Di Piazza, Dame DeAnne, Ms. Penrose, and Mr. Rao
Nominating and Governance CommitteeMs. Penrose (Chair), Mr. Bagué, Mr. DiPiazza, Dame DeAnne, Mr. Lu, Mr. Nesbitt, Ms. Petach, Mr. Rao and Mr. Rickard
Sheila A. PenroseChairman of the Board Jones Lang LaSalle Incorporated and Retired President Corporate and Institutional Services Northern Trust Corporation
Samuel A. Di Piazza, Jr. Retired Global Chief Executive Officer PricewaterhouseCoopers International Ltd.
Colin Dyer Chief Executive Officer and President Jones Lang LaSalle Incorporated
Hugo Bagué Group Executive Organisational Resources Rio Tinto plc
Dame DeAnne Julius Chairman University College London
Committees of the Board of Directors
As of April 15, 2016
Additional Global Corporate Officers Global Operating Board
Ming Lu Partner KKR & Co., L.P.
Martin H. Nesbitt Co-Chief Executive Officer The Vistria Group, LLC
Ann Marie Petach Retired Chief Financial Officer BlackRock, Inc.
Shailesh Rao Vice President Asia, Latin America and Emerging Markets Twitter Inc.
David B. Rickard Retired Executive Vice President, Chief Financial Officer and Chief Administrative Officer CVS Caremark Corporation
Roger T. Staubach Executive Chairman Jones Lang LaSalle Americas, Inc.
Joining our CFO and the Global Corporate Officers listed to the left:

JLL 2015 Annual Report
As of April 15, 2016
International Directors
Arthur Adler • Shobhit Agarwal • Robert Ageloff • Julian Agnew • Magnus Akerberg • Avi Alkas • Zelick Altman • Richard Angliss • Christopher Archibold
Pedro Azcué • Amy Aznar • Jacques Bagge • Stephan Barczy • Michael Batchelor • Richard Batten • Thomas Bayne-Jardine • Peter Belisle
Daniel Bellow • Thomas Beneville • Kristian Bjorson • Richard Bloxam • Robert Bonwell • Ian Bottrell • Charles Boudet • David Bowden • Karen Brennan
Benjamin Breslau • James Brown • Peter Bulgarelli • Herman Bulls • Dan Burn • Todd Burns • Tracey Byer • Edward Cannon • Ron Cariola • Samit Chopra
David Churton • Katherine Clemo • Craig Collins • Stephen Collins • Stephen Conry • Elizabeth Cooper • Damian Corbett • Ian Cornock • Anthony Couse
Graham Coutts • Steve Cresswell • Stuart Crow • Jeffrey
Davis • Kenneth Dayton • Arthur De Haast • David
Demarest • Ronald Deyo • Kathryn Ditmars James
Dobleske • James Dolphin • Barry Dorfman • Thomas
Doughty • David Doupe • Peter Downie • Charles Doyle
Francis Doyle • Benoit Du Passage • John Duckworth
David Dudley • Marshall Durston • Colin Dyer • Franck
Eburderie • Jan Eckert • Jeremy Eddy • Timothy Edghill
Maureen Ehrenberg • Michael Ellis • Carl Ewert • Rosemary
Feenan • Richard Fennell • Michael Fenton • Kevin Filter • Ernest Fiorante • Thomas Fish • Margaret Fleming • Jeffrey Flynn • John Forrest • Christopher
Fossick • Simon Foster • Allan Frazier • Andrew Frost • Shelley Frost • Lorena Fuertes • Kin Keung Fung (KK) • Mark Gabbay • Soma Garg • James Garvey
John Gates • Rebecca Gates • Joël Gervais de Lafond • Paul Glickman • Ted Glimp • Robin Goodchild • Jacques Gordon • Guy Grainger • Gregory Green
Ian Greenhalgh • Thomas Griffin • Maria Grigorova • Robert Hackett • Brian Hake • Christoph Härle • Kevin Hastings • Andrew Hawkins • Elizabeth
Hearle • Scott Hetherington • Stuart Hicks • Peter Hilderson • Philip Hillman • Martin Hinge • Neil Hitchen • Christopher Holmes • Martin Horner
Walter Howell • Richard Howling • Alastair Hughes • John Huguenard • Alasdair Humphery • Roger Humphrey • Christopher Hunt • James Hutchinson
Gregory Hyland • Andrew Hynard • Stephen Inglis • Christopher Ireland • David Ironside • Andy Irvine • Vance Jacobs • Jeff Jacobson • Naveen Jaggi
James Jasionowski • Emmanuel Joachim • Charles Johnson • David Johnson • Richard Jones • Steven Jones • Wade Judge • Yashdeep Kapila
Toshinobu Kasai • Lisa Kaufman • Brian Kelleher • Christie Kelly • Jason Kern • Lisa Kiell • Christopher Kiernan • Thomas Kirschbraun • Hector Klerian
Douglas Knaus • Keith Knox • David Kollmorgen • Mitchell Konsker • Katharine Kopec • Robert Kossar • James Koster • Susheel Koul • Jill Kouri
Stanley Kraska Jr. • Marina Krishnan • Santhosh Kumar • George Ladyman • Hon Ming Lai (William) • William Lammersen • David Lathwood
Chun Kong Lau (CK) • Ka Men Lau (Sylvia) • Todd Lauchlan • Ping Kee Lee (Eric) • Nick Lees • Phillip Leibow • Timothy Leonhard • James Lewis
Mei Lin Lim (Angelia) • Derek Lopez • Vincent Lottefier • Thierry Loué • Daniel Loughlin • Gregory Lubar • Marcus Luetgering • James Lyon • Fabio Maceira
Iain Mackenzie • Ian Mackie • William Maher • Gregory Maloney • Thomas Maloney • Pierre Marin • Simon Marrison • Philip Marsden • Jordi Martin
Patricia Maxson • Thomas McAdam • Richard McBlaine • Michael McCurdy • David McGarry • Elizabeth McGregor • Geoffrey McIntyre • Brian McMullan
Peter McWilliams • Alistair Meadows • Suphin Mechuchep • Michael Melody • Thomas Melody • Elaine Melonides • Simon Merry • Robert Metcalf • Craig Meyer
Brett Miller • Bruce Miller • Ethan Milley • Angus Minford • John Minks • Akihiko Mizuno • Marc Montanus • John Moran • Gavin Morgan • Lucy Morton
Kristin Mueller • Vivian Mumaw • Jane Murray • Peter Murray • Ramesh Nair • Julian Nairn • Yasuo Nakashima • Karamjit Narula • Seok Keow Ng (Angie Lim)
Peter Nicoletti • Jane Niven • George Noon • Christopher Northam • Richard Norton • Gregory O’Brien • Janice Ochenkowski • Meredith O’Connor
John O’Driscoll • Mark Ohringer • Kunihiko Okumura • Alberto Ovidi • Scott Panzer • Junbum Park • David Passaglia • Keith Pauley • Adrian Peachey
Elizabeth Peck • JC Pelusi • Jan Pope • Andrew Poppink • Frank Pörschke • Wesley Powell • Neil Prime • Daniel Probst • Daniel Pufunt • Anuj Puri
Vincent Querton • Elysia Ragusa • Stephen Ramseur • Brian Ranallo • Steven Ranck • Luc Renaudin • Andrew Renshaw • Gordon Repp • John Restivo
Adrienne Revai • Jeremy Richards • Matt Richards • Michael Ricketts • Peter Riguardi • Jörg Ritter • David Roberts • Alan Robertson • Christopher Roeder
William Rogers • Joseph Romenesko • Simon Rooney • Christopher Roth • Bruce Rutherford • Daniel Ryan • Felix Sanchez • Julian Sandbach • Stephen Schlegel
Paul Schliesman • Jeffrey Schuth • Cameron Scott • Barry Scribner • Agata Sekula • Erich Sengelmann • Robert Sewell • Joyce Shapiro • Douglas Sharp
Jeremy Sheldon • Kenneth Siegel • Gagan Singh • Michael Sivewright • Stephen Smith • Jeremy Snoad • Eng Beng Soh (Derek) • Richard Stanley
Jeffrey Staubach • Roger Staubach • Christopher Staveley • Joseph Stolarski • Steven Stratton • John Strauss • Mark Stupples • Allan Swaringen • Richard Sykes
John Talbot • Mary Taylor • Nicolas Taylor • William Teberg • Claus Thomas • James Thomas • Faron Thompson • Richard Thompson • William Thummel
Lynn Thurber • Alan Tripp • Derek Trulson • Tomasz Trzoslo • Hon Ping Tsang (Joseph) • Timo Tschammler • Bernard Tyler • Paul Uber
Christian Ulbrich • Jubeen Vaghefi • Timothy Vallance • Andrea Van Gelder • John Vinnicombe • Edward Wagoner • Megan Walters • Andrew Watson
Kevin Wayer • Nigel Wheeler • Paul Whitman • David Williams • Mark Wilson • Daniel Witte • Ngai Ching Wong (James) • Sing Ming Wong (Rita)
Giles Wrench • Tim Wright • Mark Wynne-Smith • Holly Yang • Jon Zehner • Ying Zhang (Julien) • Michael Zietsman • Chris Zissis • Stephen Zsigray Jr.
Our International Directors, joined by their 60,000 colleagues around the world, pursue our vision to be the real estate expert and strategic advisor of choice for leading owners, occupiers, developers and investors.
13
ArgentinaBuenos Aires
BrazilCuritibaRio de JaneiroSão Paulo
ChileSantiago
ColombiaBogotá
United StatesAllen, TXAlpharetta, GAAnn Arbor, MIAtlanta, GAAustin, TXBaltimore, MDBellevue, WABerwyn, PABethesda, MDBethlehem, PABirmingham, ALBoston, MABrookfield, WIBurbank, CACharleston, SCCharlotte, NCCherry Hill, NJChicago, ILChicago (O’Hare), ILCincinnati, OHClearwater, FLCleveland, OHColumbia, MDColumbus, OH
Coral Gables, FLDallas, TXDenver, CODes Moines, IADublin, OHEast Rutherford, NJEl Segundo, CAFort Lauderdale, FLFort Worth, TXGainesville, FLGrapevine, TXHartford, CTHonolulu, HIHouston, TXIndianapolis, INIrvine, CAIselin, NJJacksonville, FLLas Vegas, NVLombard, ILLos Angeles, CALos Angeles (West), CAMechanicsburg, PAMelville, NYMemphis, TN
Menlo Park, CAMiami, FLMill Valley, CAMinneapolis, MNMobile, ALMontgomery, ALNashville, TNNew York, NYNewport Beach, CANorfolk, VAOntario, CAOrlando, FLOverland Park, KSParsippany, NJPhiladelphia, PAPhoenix, AZPittsburgh, PAPortland, ORRaleigh, NCReno, NVRichmond, VARocklin, CARoyal Oak, MISacramento, CASalt Lake City, UT
San Antonio, TXSan Diego, CASan Francisco, CASan Jose, CASan Mateo, CASan Rafael, CASeattle, WASt. Louis, MOSt. Paul, MNStamford, CTStockton, CATampa, FLTempe, AZTualatin, ORVienna, VAWalnut Creek, CAWashington D.C.Westmont, ILWilmington, DEWinter Park, FL
CanadaCalgaryEdmontonMississaugaMontrealNorth TorontoOttawaTorontoVancouver
Costa RicaSan José
MexicoGuadalajaraMexico CityMonterreyTijuana
Puerto RicoSan Juan
EgyptCairo
KenyaNairobi
MoroccoCasablanca
NigeriaLagos
South AfricaJohannesburg
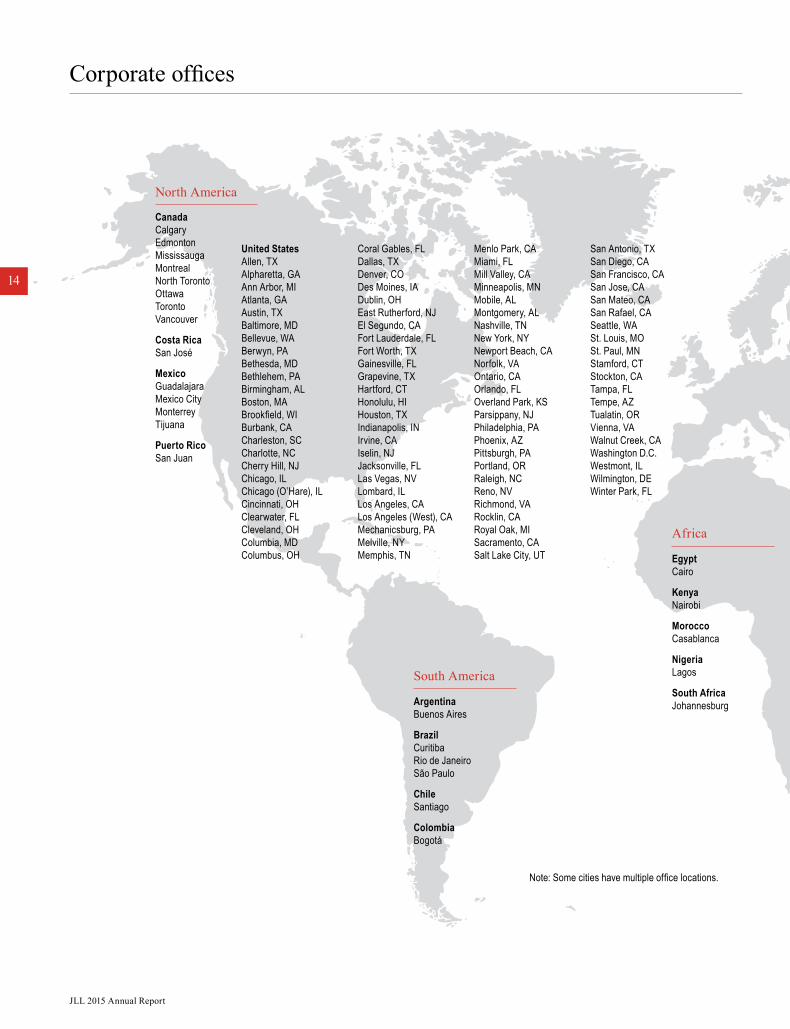
North America
South America
Africa
Note: Some cities have multiple office locations.
Corporate offices
14
JLL 2015 Annual Report
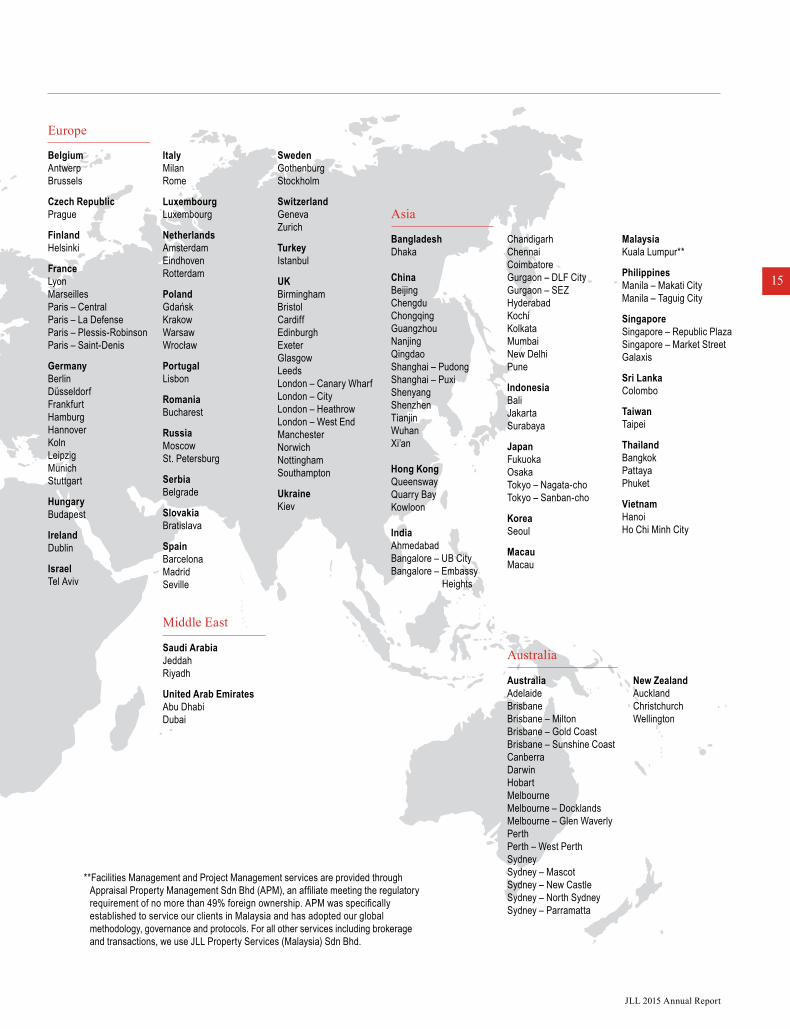
**Facilities Management and Project Management services are provided through Appraisal Property Management Sdn Bhd (APM), an affiliate meeting the regulatory requirement of no more than 49% foreign ownership. APM was specifically established to service our clients in Malaysia and has adopted our global methodology, governance and protocols. For all other services including brokerage and transactions, we use JLL Property Services (Malaysia) Sdn Bhd.
Saudi ArabiaJeddahRiyadh
United Arab EmiratesAbu DhabiDubai
BelgiumAntwerpBrussels
Czech RepublicPrague
FinlandHelsinki
FranceLyonMarseillesParis – CentralParis – La DefenseParis – Plessis-RobinsonParis – Saint-Denis
GermanyBerlinDüsseldorfFrankfurtHamburgHannoverKolnLeipzigMunichStuttgart
HungaryBudapest
IrelandDublin
IsraelTel Aviv
ItalyMilanRome
LuxembourgLuxembourg
NetherlandsAmsterdamEindhovenRotterdam
PolandGdanskKrakowWarsawWrocław
PortugalLisbon
RomaniaBucharest
RussiaMoscowSt. Petersburg
SerbiaBelgrade
SlovakiaBratislava
SpainBarcelonaMadridSeville
MalaysiaKuala Lumpur**
PhilippinesManila – Makati CityManila – Taguig City
SingaporeSingapore – Republic PlazaSingapore – Market StreetGalaxis
Sri LankaColombo
TaiwanTaipei
ThailandBangkokPattayaPhuket
VietnamHanoiHo Chi Minh City
AustraliaAdelaideBrisbaneBrisbane – MiltonBrisbane – Gold CoastBrisbane – Sunshine CoastCanberraDarwinHobartMelbourneMelbourne – DocklandsMelbourne – Glen WaverlyPerthPerth – West PerthSydneySydney – MascotSydney – New CastleSydney – North SydneySydney – Parramatta
New ZealandAucklandChristchurchWellington
ChandigarhChennaiCoimbatoreGurgaon – DLF CityGurgaon – SEZHyderabadKochiKolkataMumbaiNew DelhiPune
IndonesiaBaliJakartaSurabaya
JapanFukuokaOsakaTokyo – Nagata-choTokyo – Sanban-cho
KoreaSeoul
MacauMacau
BangladeshDhaka
ChinaBeijingChengduChongqingGuangzhouNanjingQingdaoShanghai – PudongShanghai – PuxiShenyangShenzhenTianjinWuhanXi’an
Hong KongQueenswayQuarry BayKowloon
IndiaAhmedabadBangalore – UB CityBangalore – Embassy
Heights
SwedenGothenburgStockholm
SwitzerlandGenevaZurich
TurkeyIstanbul
UKBirminghamBristolCardiffEdinburghExeterGlasgowLeedsLondon – Canary WharfLondon – CityLondon – HeathrowLondon – West EndManchesterNorwichNottinghamSouthampton
UkraineKiev
Middle East
Europe
Asia
Australia
JLL 2015 Annual Report
15
16
JLL 2015 Annual Report
Analytics & Insights
JLL
Data
Arc
hite
ctur
al St
rate
gy F
ound
atio
n
Data Management
Data Integration
A digital revolution is transforming the commercial real estate industry globally. To win business, serve clients successfully and manage our own operations effectively, JLL is investing heavily in digital, data and information-management capabilities.
We have set an ambitious goal: digitize all JLL data, workflows and business applications by 2020. This will allow us to employ technology to optimize our business functions. It demands a new understanding and approach to the way we conduct business, and, in particular, to the way we handle and analyze data and information across our company.
We seek to optimize our ability to connect clients with opportunities and to connect our own people with their colleagues around the world. The first objective improves our ability to serve clients. The second helps us continue to grow our business through cross-selling, knowledge sharing and improved productivity. To do both, we have committed to develop a technology platform that no competitor can duplicate.
The technology imperativeExcellence in data, analytics and advice
Superior client adviceOur ability to generate, integrate and manage data quickly and successfully drives our ability to deliver sound advice to clients. Collecting data is comparatively easy. Integrating it is more difficult, because it needs to be related to other data. Managing data is hardest of all, because that requires standardizing and aligning protocols and procedures to apply the data across the entire organization.
To address all three, we identified the real estate industry’s leading data strategy and integration platform, and adapted the software to our specific needs. During the customization process, we made sure that the system can be used effectively by all our service lines in all parts of the world.
Core and core+ applicationsOur data strategy allows us to focus resources on uniformly high-quality applications and reduce efforts to maintain a large array of systems developed locally. We think first in terms of core applications, standardized back-end systems we can use across the business. Then we develop core+ technology, customized applications that address specific needs and opportunities in regional, country and local markets. We leverage our industrial-strength back-end to build front-end applications quickly and economically. Our philosophy is “Build once; adapt and apply often.”
To get a sense of how our data collection, management and integration systems work together in the real world of clients, consider a few of the applications we have developed and recently launched.
17
JLL 2015 Annual Report
World-class data managementIn 2014, we began to build a best-in-class data management function at JLL. Today, a team of experienced data professionals is showing us how leading companies capture, manage and use data for maximum commercial benefit.
Quality data forms the foundation of our technology strategy. But it is our IT applications that take the data and interpret it for business success. So we have also been working to bring our IT developers closer to our business professionals and to develop practical business applications that we can apply globally.
‘Big’ and ‘dark’ data‘Big’ data is external, public data. Internal and ‘dark’ data is generated by employee interactions with clients and each other. It’s found in spreadsheets, document files, notes, as well as in sales and marketing materials. So it can be either proprietary or public data.
JLL has more than 60,000 employees worldwide, we manage 4 billion square feet of commercial space, last year we completed $138 billion in sales, acquisition and financing transactions, and LaSalle Investment Management had more than $56 billion of real estate assets under management at the end of 2015.
As a result, the data that our extended and integrated global platform gives us is a rare and precious asset. We can use analytics to mine, manage and relate it to other relevant data to help decision making in ways that few competitors can match.
18
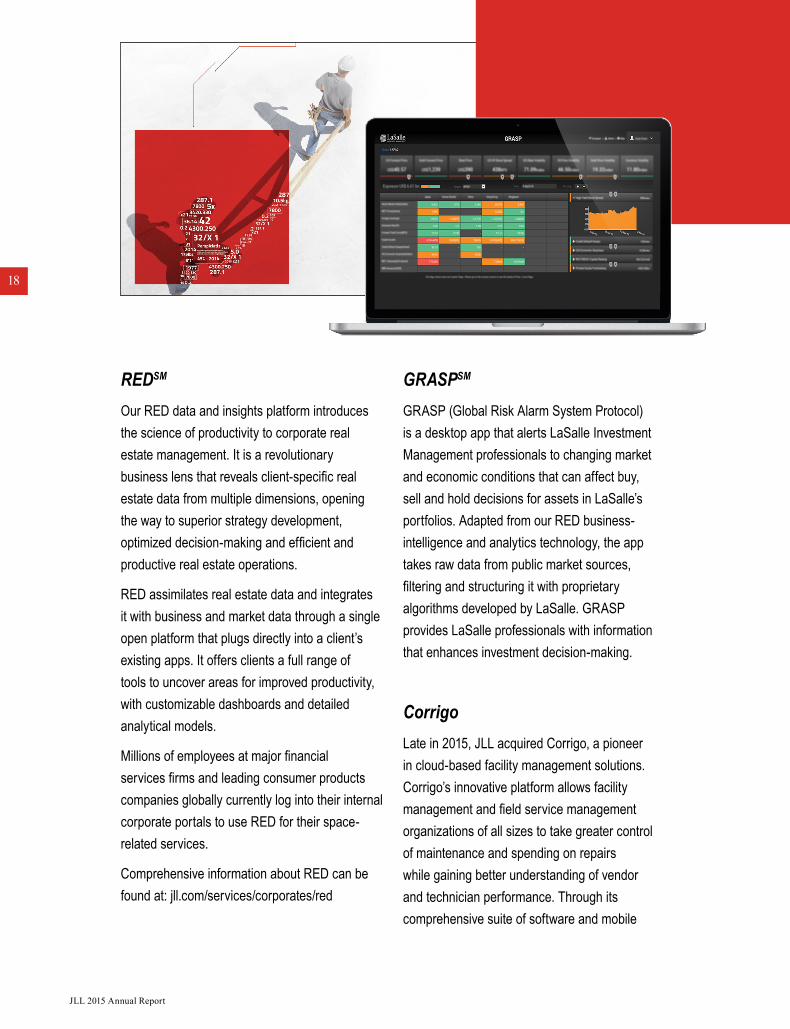
GRASPSM
GRASP (Global Risk Alarm System Protocol) is a desktop app that alerts LaSalle Investment Management professionals to changing market and economic conditions that can affect buy, sell and hold decisions for assets in LaSalle’s portfolios. Adapted from our RED business-intelligence and analytics technology, the app takes raw data from public market sources, filtering and structuring it with proprietary algorithms developed by LaSalle. GRASP provides LaSalle professionals with information that enhances investment decision-making.
CorrigoLate in 2015, JLL acquired Corrigo, a pioneer in cloud-based facility management solutions. Corrigo’s innovative platform allows facility management and field service management organizations of all sizes to take greater control of maintenance and spending on repairs while gaining better understanding of vendor and technician performance. Through its comprehensive suite of software and mobile
REDSM
Our RED data and insights platform introduces the science of productivity to corporate real estate management. It is a revolutionary business lens that reveals client-specific real estate data from multiple dimensions, opening the way to superior strategy development, optimized decision-making and efficient and productive real estate operations.
RED assimilates real estate data and integrates it with business and market data through a single open platform that plugs directly into a client’s existing apps. It offers clients a full range of tools to uncover areas for improved productivity, with customizable dashboards and detailed analytical models.
Millions of employees at major financial services firms and leading consumer products companies globally currently log into their internal corporate portals to use RED for their space-related services.
Comprehensive information about RED can be found at: jll.com/services/corporates/red
JLL 2015 Annual Report
JLL 2015 Annual Report
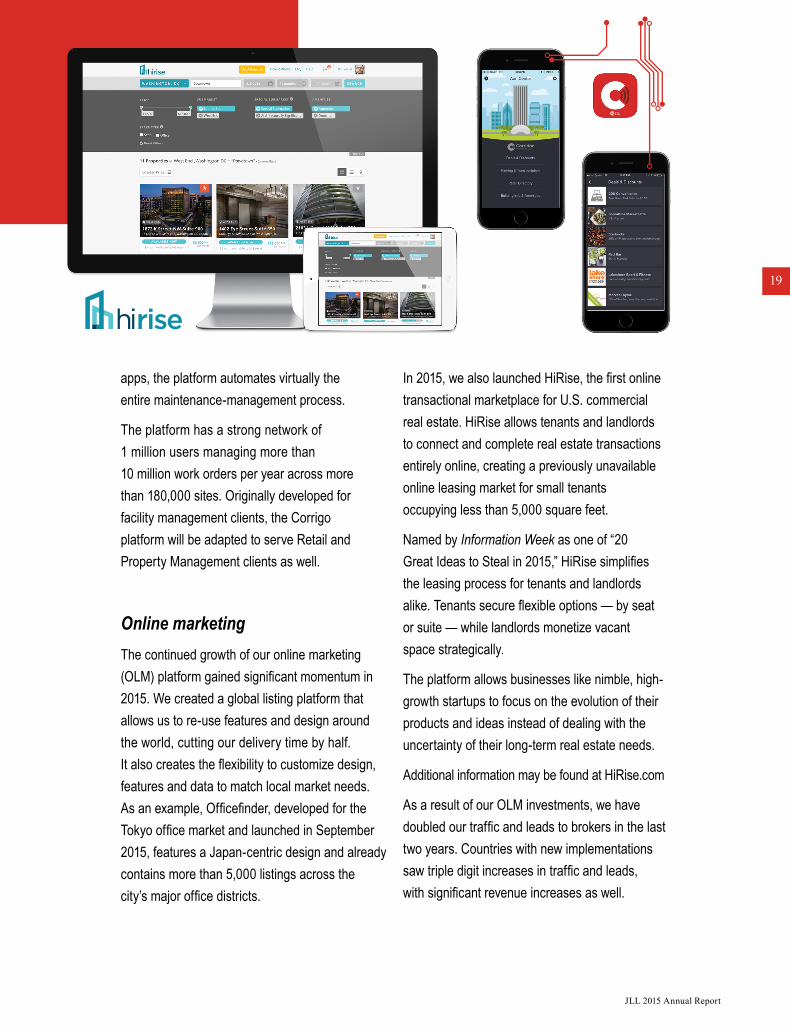
apps, the platform automates virtually the entire maintenance-management process.
The platform has a strong network of 1 million users managing more than 10 million work orders per year across more than 180,000 sites. Originally developed for facility management clients, the Corrigo platform will be adapted to serve Retail and Property Management clients as well.
Online marketingThe continued growth of our online marketing (OLM) platform gained significant momentum in 2015. We created a global listing platform that allows us to re-use features and design around the world, cutting our delivery time by half. It also creates the flexibility to customize design, features and data to match local market needs. As an example, Officefinder, developed for the Tokyo office market and launched in September 2015, features a Japan-centric design and already contains more than 5,000 listings across the city’s major office districts.
In 2015, we also launched HiRise, the first online transactional marketplace for U.S. commercial real estate. HiRise allows tenants and landlords to connect and complete real estate transactions entirely online, creating a previously unavailable online leasing market for small tenants occupying less than 5,000 square feet.
Named by Information Week as one of “20 Great Ideas to Steal in 2015,” HiRise simplifies the leasing process for tenants and landlords alike. Tenants secure flexible options — by seat or suite — while landlords monetize vacant space strategically.
The platform allows businesses like nimble, high-growth startups to focus on the evolution of their products and ideas instead of dealing with the uncertainty of their long-term real estate needs.
Additional information may be found at HiRise.com
As a result of our OLM investments, we have doubled our traffic and leads to brokers in the last two years. Countries with new implementations saw triple digit increases in traffic and leads, with significant revenue increases as well.
19
JLL 2015 Annual Report
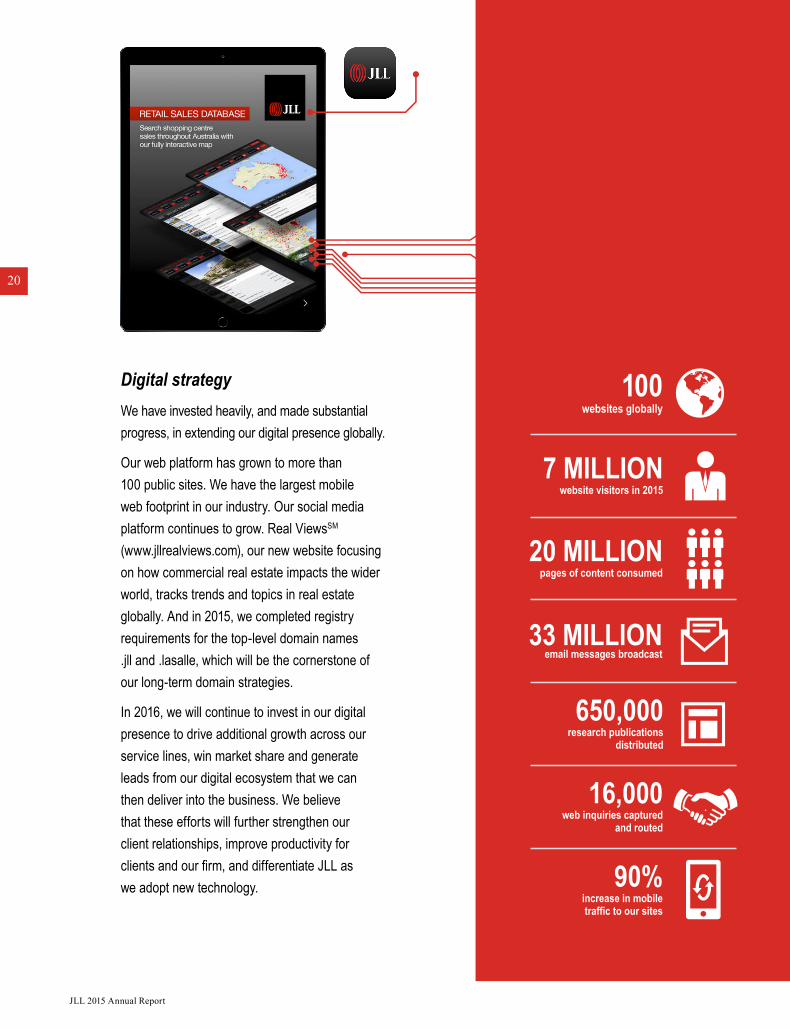
Digital strategyWe have invested heavily, and made substantial progress, in extending our digital presence globally.
Our web platform has grown to more than 100 public sites. We have the largest mobile web footprint in our industry. Our social media platform continues to grow. Real ViewsSM (www.jllrealviews.com), our new website focusing on how commercial real estate impacts the wider world, tracks trends and topics in real estate globally. And in 2015, we completed registry requirements for the top-level domain names .jll and .lasalle, which will be the cornerstone of our long-term domain strategies.
In 2016, we will continue to invest in our digital presence to drive additional growth across our service lines, win market share and generate leads from our digital ecosystem that we can then deliver into the business. We believe that these efforts will further strengthen our client relationships, improve productivity for clients and our firm, and differentiate JLL as we adopt new technology.
20
JLL 2015 Annual Report
Smart buildings and the ‘Internet of Things’The Internet of Things (IoT) is a simple concept with complex implications for the commercial real estate industry. IoT refers to networks of Internet-enabled devices or systems that communicate and share data with other smart devices. IoT turns buildings into ‘smart’ buildings by creating centralized networks that integrate building systems so they can share data and operate more efficiently. This transforms the way buildings respond to the real-time needs of occupants.
JLL’s smart building solutions take an integrated approach to incorporate multiple technologies, systems and strategies to deliver the greatest return on client investments. Our custom solutions improve strategic workplace planning, enhance the employee experience and, ultimately, increase employee productivity, engagement and satisfaction.
For example, as we planned the renovation of our corporate headquarters in Chicago, a survey revealed that employees thought they were mobile 30 percent of the time. But when seat-sensor data showed that they actually
spent nearly half their days away from their desks, we factored that information into our plans. Many of the features in the new space were driven by employee input. They asked for greater connection with their colleagues, more choices to address multiple work styles, and increased agility to respond quickly to immediate work needs. The new workspace uses technology to deliver all three.
Awards & independent recognitionOur data and technology initiatives continue to earn recognition with clients and independent third-party observers.
For example — and for the fifth consecutive year — JLL has been selected to the 2016 InformationWeek Elite 100, a list of the top business technology innovators in the United States. This time we have been recognized for the successful launch of RED and for innovation in delivering solutions that allow clients to maximize the value of their real estate portfolios.
And in 2015, we achieved ISO27001 certification for the RED platform. This certification, from
21

22
more profitable, company by increasing revenue per professional. It increases our competitive advantage by differentiating JLL in the marketplace.
Throughout 2016 and into the future, we will continue to invest in technology, data and analytics to continue to increase our client-service levels and capabilities.
the respected International Organization for Standardization, confirms our ability to provide stringent management of information security risks to our RED clients.
We have also filed patent applications for aspects of our technologies, including one relating to HiRise, another for a geospatial intelligence tool and a third for a cities comparison tool. These show how our technology is setting us apart by adding unusual value for clients.
Value creation for clients and for JLLThe common theme running through all our technology, data and analytics investment and innovation is value creation by digitizing and optimizing work processes to benefit clients, our own employees and our company as a whole.
Our technological innovations help clients identify the best opportunities and make the best decisions. It helps our people sell to, and then serve, those clients quickly and effectively. It makes JLL a more productive, and therefore a
JLL 2015 Annual Report
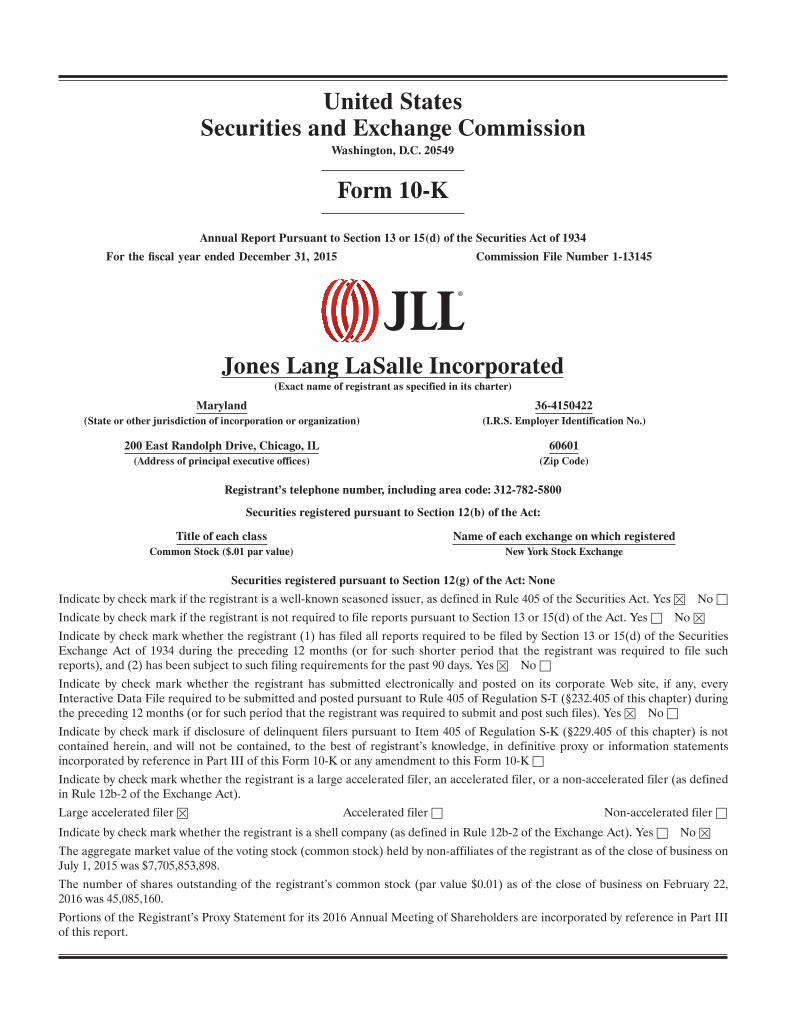
United StatesSecurities and Exchange Commission
Washington, D.C. 20549
Form 10-K
Annual Report Pursuant to Section 13 or 15(d) of the Securities Act of 1934
For the fiscal year ended December 31, 2015 Commission File Number 1-13145
Jones Lang LaSalle Incorporated(Exact name of registrant as specified in its charter)
Maryland 36-4150422(State or other jurisdiction of incorporation or organization) (I.R.S. Employer Identification No.)
200 East Randolph Drive, Chicago, IL 60601(Address of principal executive offices) (Zip Code)
Registrant’s telephone number, including area code: 312-782-5800
Securities registered pursuant to Section 12(b) of the Act:
Title of each class Name of each exchange on which registeredCommon Stock ($.01 par value) New York Stock Exchange
Securities registered pursuant to Section 12(g) of the Act: None
Indicate by check mark if the registrant is a well-known seasoned issuer, as defined in Rule 405 of the Securities Act. Yes � No □
Indicate by check mark if the registrant is not required to file reports pursuant to Section 13 or 15(d) of the Act. Yes □ No �
Indicate by check mark whether the registrant (1) has filed all reports required to be filed by Section 13 or 15(d) of the SecuritiesExchange Act of 1934 during the preceding 12 months (or for such shorter period that the registrant was required to file suchreports), and (2) has been subject to such filing requirements for the past 90 days. Yes � No □
Indicate by check mark whether the registrant has submitted electronically and posted on its corporate Web site, if any, everyInteractive Data File required to be submitted and posted pursuant to Rule 405 of Regulation S-T (§232.405 of this chapter) duringthe preceding 12 months (or for such period that the registrant was required to submit and post such files). Yes � No □
Indicate by check mark if disclosure of delinquent filers pursuant to Item 405 of Regulation S-K (§229.405 of this chapter) is notcontained herein, and will not be contained, to the best of registrant’s knowledge, in definitive proxy or information statementsincorporated by reference in Part III of this Form 10-K or any amendment to this Form 10-K □
Indicate by check mark whether the registrant is a large accelerated filer, an accelerated filer, or a non-accelerated filer (as definedin Rule 12b-2 of the Exchange Act).
Large accelerated filer � Accelerated filer □ Non-accelerated filer □
Indicate by check mark whether the registrant is a shell company (as defined in Rule 12b-2 of the Exchange Act). Yes □ No �
The aggregate market value of the voting stock (common stock) held by non-affiliates of the registrant as of the close of business onJuly 1, 2015 was $7,705,853,898.
The number of shares outstanding of the registrant’s common stock (par value $0.01) as of the close of business on February 22,2016 was 45,085,160.
Portions of the Registrant’s Proxy Statement for its 2016 Annual Meeting of Shareholders are incorporated by reference in Part IIIof this report.
TABLE OF CONTENTS
Item 1. Business 1
Item 1A. Risk Factors 39
Item 2. Properties 67
Item 3. Legal Proceedings 67
Item 4. Mine Safety Disclosures 67
Item 5. Market for Registrant’s Common Equity, Related Shareholder Matters and Issuer Purchaseof Equity Securities 68
Item 6. Selected Financial Data (Unaudited) 70
Item 7. Management’s Discussion and Analysis of Financial Conditions 73
Item 7A. Quantitative and Qualitative Disclosures About Market Risks 100
Item 8. Financial Statements and Supplementary Data 101
Item 9. Changes in and Disagreements with Accountants on Accounting and Financial Disclosures 146
Item 9A. Controls and Procedures 146
Item 9B. Other Information 146
Item 10. Directors and Executive Officers of the Registrant 146
Item 11. Executive Compensation 147
Item 12. Security Ownership of Certain Beneficial Owners andManagement and Related ShareholderMatters 147
Item 13. Certain Relationships and Related Transactions 147
Item 14. Principal Accountant Fees and Services 148
Item 15. Exhibits and Financial Statement Schedules 148
Power of Attorney 148
Signatures 149
Exhibit Index 150
International Integrated Reporting Council Cross Reference 153
ITEM 1. BUSINESS
COMPANY OVERVIEW
Jones Lang LaSalle Incorporated (‘‘Jones Lang LaSalle,’’ which we may refer to as ‘‘JLL,’’ ‘‘we,’’ ‘‘us,’’ ‘‘our,’’ the‘‘Company’’ or the ‘‘Firm’’) was incorporated in 1997. Our common stock is listed on The New York StockExchange under the symbol ‘‘JLL.’’
We are a Fortune 500 financial and professional services firm specializing in real estate. We offer comprehensiveintegrated services on a local, regional, and global basis to owner, occupier, investor, and developer clients seekingincreased value by owning, occupying, or investing in real estate. We have more than 280 corporate officesworldwide from which we provide services to clients in more than 80 countries. We have over 60,000 employees,including 32,700 employees whose costs our clients reimburse. Our issuer and senior unsecured ratings areinvestment grade: BBB+ (stable outlook) from Standard & Poor’s Ratings Services (‘‘S&P’’) and Baa2 (positiveoutlook) from Moody’s Investors Service, Inc. (‘‘Moody’s’’).
Over the ten years ended December 31, 2015, the fee revenue of the Firm has grown at a 14% compound annualgrowth rate. We have grown our business by expanding our client base and the range of our services and products,both organically and through a series of strategic acquisitions and mergers. Our extensive global platform and in-depth knowledge of local real estate markets enable us to serve as a single-source provider of solutions for the fullspectrum of our clients’ real estate needs. We began to establish this network of services across the globe throughthe 1999 merger of the Jones Lang Wootton companies (‘‘JLW’’, founded in England in 1783) with LaSallePartners Incorporated (‘‘LaSalle Partners’’, founded in the United States in 1968).
We use JLL as our principal trading name. Jones Lang LaSalle Incorporated remains our legal name. JLL is aregistered trademark in the countries in which we do business, as is our logo:
Using the shorter JLL name in the marketplace is a natural evolution of the firm’s historically rich brand,recognizing that it is a truly global company located in multiple markets, with a wide range of expertise appliedthrough many different client services. It also represents its adaptation to different communication styles indifferent countries, languages and channels, and especially the use of digital and online channels for marketing andcommunications.
JLL delivers an array of Real Estate Services (‘‘RES’’) across three geographic business segments: (1) theAmericas, (2) Europe, Middle East and Africa (‘‘EMEA’’) and (3) Asia Pacific.
LaSalle Investment Management, which uses LaSalle as its principal trading name, is a wholly-owned member ofthe Jones Lang LaSalle Incorporated group and our fourth business segment. LaSalle is one of the world’s largestand most diversified real estate investment management firms. Over the ten years ended December 31, 2015, theassets under management have grown from $30.0 million to $56.4 billion, a 6.5% compound annual growth rate.LaSalle is a registered trademark in the countries in which we conduct business, as is our logo:
In 2015, we generated record-setting fee revenue of $5.2 billion across our four business segments, a 17% increaseover 2014 in local currency. We believe we remain well-positioned to take advantage of the opportunities in aconsolidating industry and to navigate successfully the dynamic and challenging markets in which we competeworldwide.
1
We are proud to be a preferred provider of global real estate services, an employer of choice, a consistent winner ofindustry awards, and a valued partner to the largest and most successful companies and institutions in the globalmarketplace.
For discussion of our segment results, please see ‘‘Results of Operations’’ and ‘‘Market Risks’’ within Item 7,Management’s Discussion and Analysis of Financial Condition and Results of Operations, as well as Note 3,Business Segments, in the Notes to Consolidated Financial Statements.
Awards
We won numerous awards with respect to 2015, reflecting the quality of the services we provide to our clients, theintegrity of our people and our desirability as a place to work. As examples, we were named:
• World’s Best Property Consultancy, International Property Awards Grand Final 2015
• Best Consultancy in Asia, International Property Awards Grand Final 2015
• Global Real Estate Company of the Year (LaSalle), Estates Gazette
• Core Property Manager of the Year (LaSalle), Professional Pensions
• Pan-European Property Manager of the Year (LaSalle), Professional Pensions
• Japan Firm of the Year (LaSalle), 2015 Global PERE Awards
• For the eighth consecutive year, one of the World’s Most Ethical Companies, the Ethisphere Institute
• 100 Best Corporate Citizens (#20), CR Magazine
• For the seventh consecutive year, one of the Global Outsourcing 100 — International Association ofOutsourcing Professionals
• World’s Most Admired Companies, Fortune Magazine
• 50 Out Front for Diversity Leadership: Best Places for Women & Diverse Managers to Work, DiversityMBAMagazine
• As having a perfect score on the Human Rights Campaign Foundation’s 2015 Corporate Equality Index, anational benchmarking survey on corporate policies and practices related to LGBT workplace equality
• As a Winning ‘‘W’’ Company and were listed on the 2020 Honor Roll by the 2020 Women on Boards
• As having one of the Best Law Departments in the US real estate industry, by The Legal 500
• One of the Best Places to Work by a number of local publications world-wide
• 2015 Energy Star Sustained Excellence Award by the U.S. Environmental Protection Agency
• Energy Star Climate Communications Award, U.S. Environmental Protection Agency
• Excellence in Global Corporate Governance, India Institute of Directors
2
Services and Clientele
The broad range of real estate services we offer includes (in alphabetical order):
Agency Leasing Project and Development Management/ConstructionCapital Markets Property Management (Investors)Corporate Finance Real Estate Investment Banking/Merchant BankingEnergy and Sustainability Services ResearchFacility Management Outsourcing (Occupiers) Strategic Consulting and Advisory ServicesInvestment Management Tenant RepresentationLease Administration Transaction ManagementLogistics and Supply-Chain Management ValuationsMortgage Origination and Servicing Value Recovery and Receivership Services
We offer these services locally, regionally and globally to real estate owners, occupiers, investors and developers fora variety of property types, including (in alphabetical order):
Critical Environments and Data Centers Infrastructure ProjectsCultural Facilities Military HousingEducational Facilities Office PropertiesGovernment Facilities Residential Properties (Individual and Multifamily)Healthcare and Laboratory Facilities Retail Properties and Shopping MallsHotels and Hospitality Facilities Sports FacilitiesIndustrial and Warehouse Properties Transportation Centers
Individual regions and markets may focus on different property types to a greater or lesser extent depending on localrequirements, market conditions and the strength of the business opportunities we perceive from time to time.
We work for a broad range of clients. They represent a wide variety of industries in markets throughout the world.Our clients vary greatly in size and complexity. They include for-profit and not-for-profit entities of all kinds,public-private partnerships, and governmental (‘‘public sector’’) entities. Increasingly, we are also offering servicesto middle-market companies seeking to outsource real estate services. Through LaSalle, we invest for clients on aglobal basis in publicly traded real estate securities, private real estate assets, and debt obligations. As an exampleof the breadth and significance of our client base, we provide services to approximately half of the Fortune 500companies and approximately 75% of the Fortune 100 companies.
We believe our market reach strengthens the long-term value of the enterprise in a number of ways, including by:(1) reducing the potential impact of episodic volatility or disruption in any specific region; (2) enhancing theexpertise of our people through knowledge sharing among colleagues across the globe; and (3) allowing us toidentify and react to emerging trends and risks quickly.
3
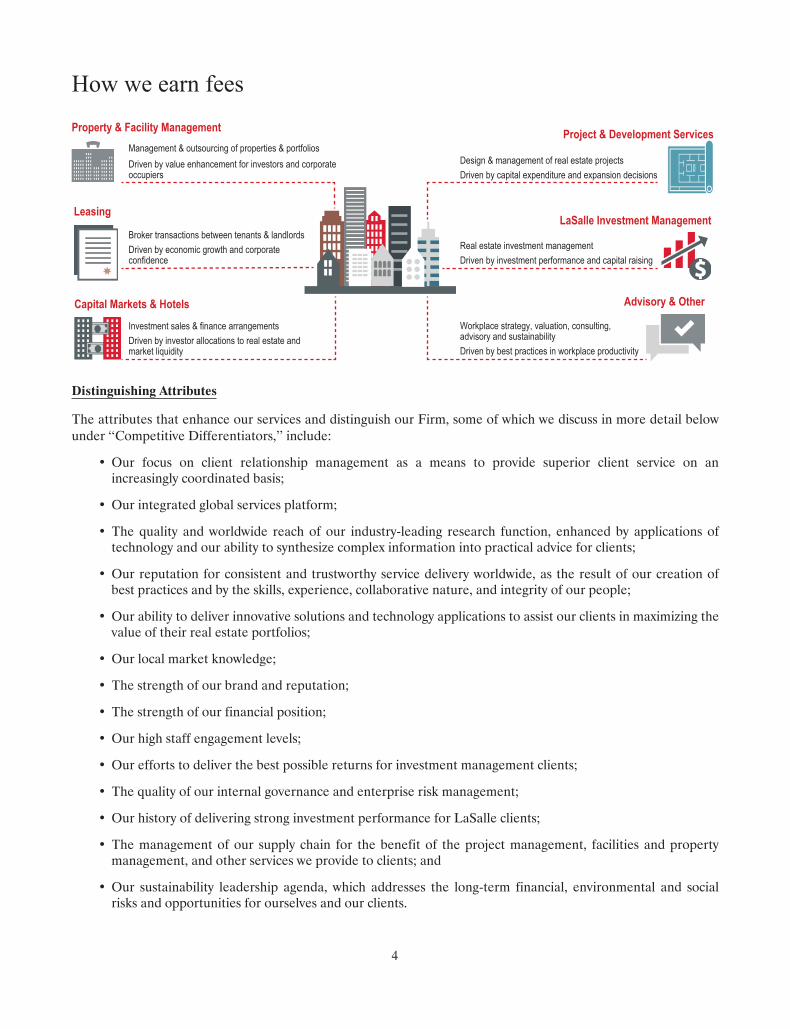
How we earn fees
Leasing
Capital Markets & Hotels
Property & Facility Management
Advisory & Other
LaSalle Investment Management
Project & Development ServicesManagement & outsourcing of properties & portfoliosDriven by value enhancement for investors and corporate occupiers
Broker transactions between tenants & landlordsDriven by economic growth and corporateconfidence
Investment sales & finance arrangementsDriven by investor allocations to real estate and market liquidity
Design & management of real estate projectsDriven by capital expenditure and expansion decisions
Real estate investment managementDriven by investment performance and capital raising
Workplace strategy, valuation, consulting, advisory and sustainability Driven by best practices in workplace productivity
Distinguishing Attributes
The attributes that enhance our services and distinguish our Firm, some of which we discuss in more detail belowunder ‘‘Competitive Differentiators,’’ include:
• Our focus on client relationship management as a means to provide superior client service on anincreasingly coordinated basis;
• Our integrated global services platform;
• The quality and worldwide reach of our industry-leading research function, enhanced by applications oftechnology and our ability to synthesize complex information into practical advice for clients;
• Our reputation for consistent and trustworthy service delivery worldwide, as the result of our creation ofbest practices and by the skills, experience, collaborative nature, and integrity of our people;
• Our ability to deliver innovative solutions and technology applications to assist our clients in maximizing thevalue of their real estate portfolios;
• Our local market knowledge;
• The strength of our brand and reputation;
• The strength of our financial position;
• Our high staff engagement levels;
• Our efforts to deliver the best possible returns for investment management clients;
• The quality of our internal governance and enterprise risk management;
• Our history of delivering strong investment performance for LaSalle clients;
• The management of our supply chain for the benefit of the project management, facilities and propertymanagement, and other services we provide to clients; and
• Our sustainability leadership agenda, which addresses the long-term financial, environmental and socialrisks and opportunities for ourselves and our clients.
4
JLL History and Acquisition Activities
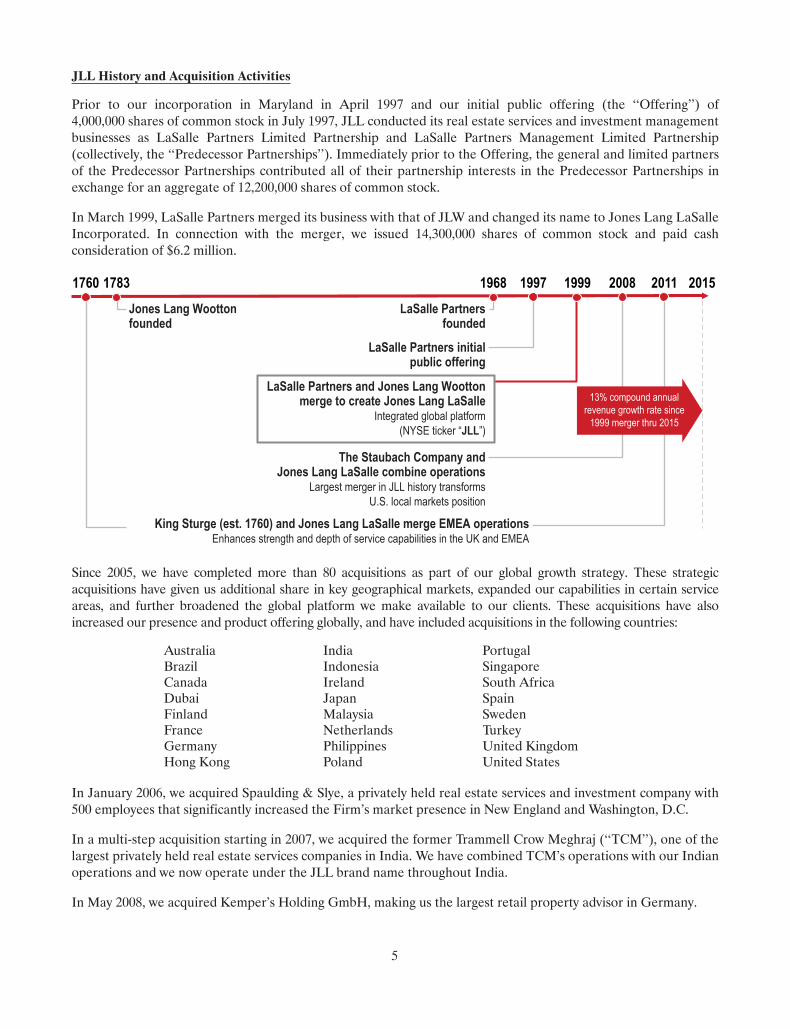
Prior to our incorporation in Maryland in April 1997 and our initial public offering (the ‘‘Offering’’) of4,000,000 shares of common stock in July 1997, JLL conducted its real estate services and investment managementbusinesses as LaSalle Partners Limited Partnership and LaSalle Partners Management Limited Partnership(collectively, the ‘‘Predecessor Partnerships’’). Immediately prior to the Offering, the general and limited partnersof the Predecessor Partnerships contributed all of their partnership interests in the Predecessor Partnerships inexchange for an aggregate of 12,200,000 shares of common stock.
In March 1999, LaSalle Partners merged its business with that of JLW and changed its name to Jones Lang LaSalleIncorporated. In connection with the merger, we issued 14,300,000 shares of common stock and paid cashconsideration of $6.2 million.
1783 1968 1997 1999 20081760 20152011Jones Lang Woottonfounded
LaSalle Partnersfounded
LaSalle Partners initialpublic offering
LaSalle Partners and Jones Lang Woottonmerge to create Jones Lang LaSalle
Integrated global platform(NYSE ticker “JLL”)
The Staubach Company andJones Lang LaSalle combine operations
Largest merger in JLL history transformsU.S. local markets position
King Sturge (est. 1760) and Jones Lang LaSalle merge EMEA operationsEnhances strength and depth of service capabilities in the UK and EMEA
13% compound annualrevenue growth rate since
1999 merger thru 2015
Since 2005, we have completed more than 80 acquisitions as part of our global growth strategy. These strategicacquisitions have given us additional share in key geographical markets, expanded our capabilities in certain serviceareas, and further broadened the global platform we make available to our clients. These acquisitions have alsoincreased our presence and product offering globally, and have included acquisitions in the following countries:
Australia India PortugalBrazil Indonesia SingaporeCanada Ireland South AfricaDubai Japan SpainFinland Malaysia SwedenFrance Netherlands TurkeyGermany Philippines United KingdomHong Kong Poland United States
In January 2006, we acquired Spaulding & Slye, a privately held real estate services and investment company with500 employees that significantly increased the Firm’s market presence in New England and Washington, D.C.
In a multi-step acquisition starting in 2007, we acquired the former Trammell Crow Meghraj (‘‘TCM’’), one of thelargest privately held real estate services companies in India. We have combined TCM’s operations with our Indianoperations and we now operate under the JLL brand name throughout India.
In May 2008, we acquired Kemper’s Holding GmbH, making us the largest retail property advisor in Germany.
5
In July 2008, we acquired Staubach Holdings Inc. (‘‘Staubach’’), a U.S. real estate services firm specializing intenant representation. Staubach, with 1,000 employees, significantly enhanced our presence in key markets acrossthe United States and made us an industry leader in local, national and global tenant representation. Theacquisition also established us as the market leader in public sector services and added scale to our industrialbrokerage, investment sales, corporate finance and project and development services.
In May 2011, we completed the acquisition of King Sturge, a United Kingdom-based international propertyconsultancy. The King Sturge acquisition, which extended our historical roots back to its founding in 1760,significantly enhanced the strength and depth of our service capabilities in the United Kingdom and in continentalEurope, adding approximately 1,400 employees.
Acquisitions from 2012 through 2014
During the period from January 1, 2012 through December 31, 2014, we completed 19 new acquisitions. The entirelist of the specific acquisitions is set forth in the About section of our public website.
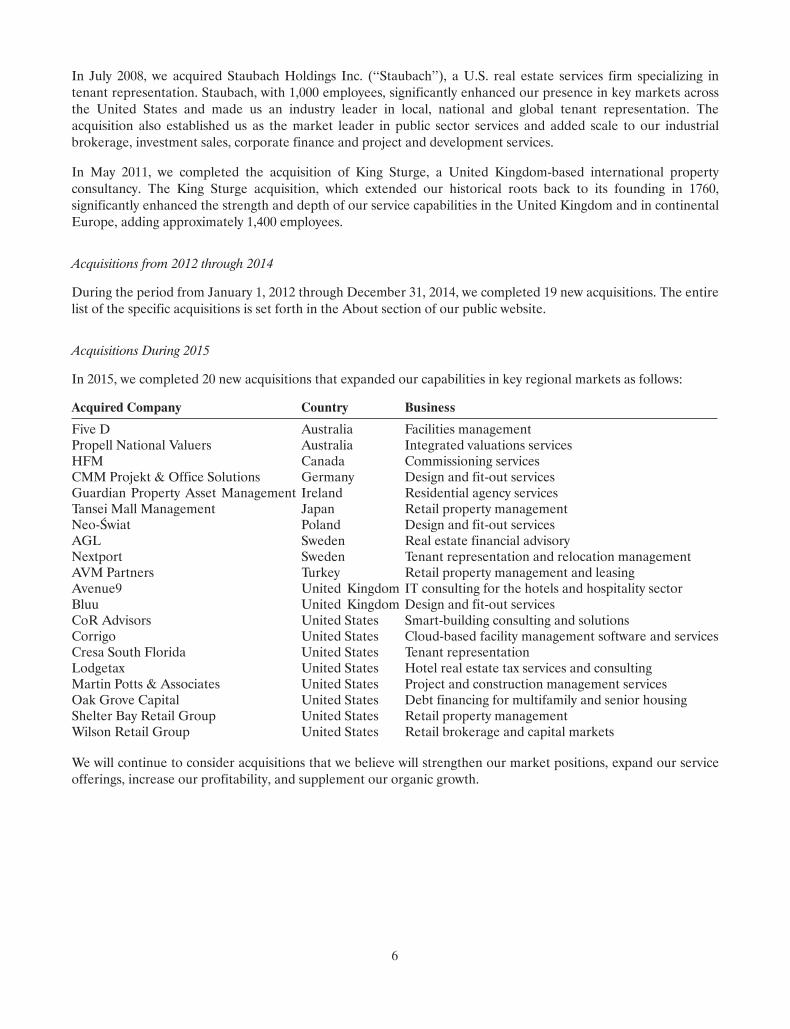
Acquisitions During 2015
In 2015, we completed 20 new acquisitions that expanded our capabilities in key regional markets as follows:
Acquired Company Country Business
Five D Australia Facilities managementPropell National Valuers Australia Integrated valuations servicesHFM Canada Commissioning servicesCMM Projekt & Office Solutions Germany Design and fit-out servicesGuardian Property Asset Management Ireland Residential agency servicesTansei Mall Management Japan Retail property managementNeo-Swiat Poland Design and fit-out servicesAGL Sweden Real estate financial advisoryNextport Sweden Tenant representation and relocation managementAVM Partners Turkey Retail property management and leasingAvenue9 United Kingdom IT consulting for the hotels and hospitality sectorBluu United Kingdom Design and fit-out servicesCoR Advisors United States Smart-building consulting and solutionsCorrigo United States Cloud-based facility management software and servicesCresa South Florida United States Tenant representationLodgetax United States Hotel real estate tax services and consultingMartin Potts & Associates United States Project and construction management servicesOak Grove Capital United States Debt financing for multifamily and senior housingShelter Bay Retail Group United States Retail property managementWilson Retail Group United States Retail brokerage and capital markets
We will continue to consider acquisitions that we believe will strengthen our market positions, expand our serviceofferings, increase our profitability, and supplement our organic growth.
6
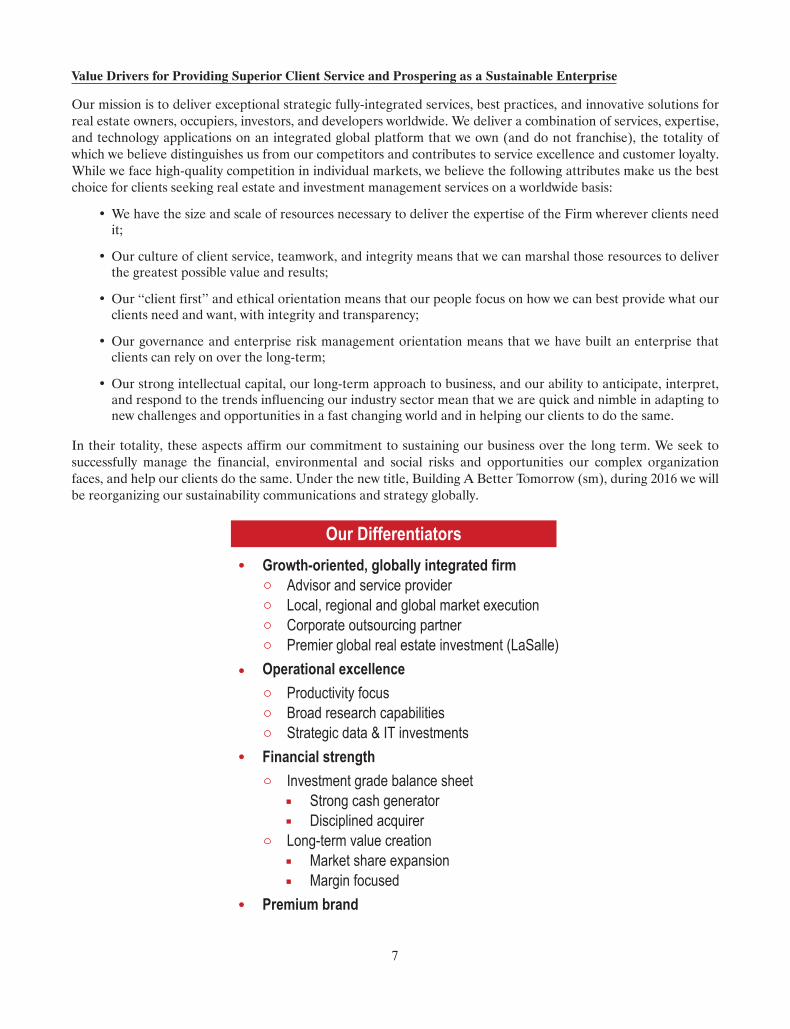
Value Drivers for Providing Superior Client Service and Prospering as a Sustainable Enterprise
Our mission is to deliver exceptional strategic fully-integrated services, best practices, and innovative solutions forreal estate owners, occupiers, investors, and developers worldwide. We deliver a combination of services, expertise,and technology applications on an integrated global platform that we own (and do not franchise), the totality ofwhich we believe distinguishes us from our competitors and contributes to service excellence and customer loyalty.While we face high-quality competition in individual markets, we believe the following attributes make us the bestchoice for clients seeking real estate and investment management services on a worldwide basis:
• We have the size and scale of resources necessary to deliver the expertise of the Firm wherever clients needit;
• Our culture of client service, teamwork, and integrity means that we can marshal those resources to deliverthe greatest possible value and results;
• Our ‘‘client first’’ and ethical orientation means that our people focus on how we can best provide what ourclients need and want, with integrity and transparency;
• Our governance and enterprise risk management orientation means that we have built an enterprise thatclients can rely on over the long-term;
• Our strong intellectual capital, our long-term approach to business, and our ability to anticipate, interpret,and respond to the trends influencing our industry sector mean that we are quick and nimble in adapting tonew challenges and opportunities in a fast changing world and in helping our clients to do the same.
In their totality, these aspects affirm our commitment to sustaining our business over the long term. We seek tosuccessfully manage the financial, environmental and social risks and opportunities our complex organizationfaces, and help our clients do the same. Under the new title, Building A Better Tomorrow (sm), during 2016 we willbe reorganizing our sustainability communications and strategy globally.
Our DifferentiatorsGrowth-oriented, globally integrated firm Advisor and service provider Local, regional and global market execution Corporate outsourcing partner Premier global real estate investment (LaSalle)Operational excellence Productivity focus Broad research capabilities Strategic data & IT investments Financial strength Investment grade balance sheet Strong cash generator Disciplined acquirer Long-term value creation Market share expansion Margin focusedPremium brand
7
Global Governance Structure
To achieve our mission, we must establish and maintain an enterprise that will sustain itself over the long term forthe benefit of all of our stakeholders: clients, shareholders, employees, suppliers and communities, among others.Accordingly, we have committed ourselves to effective corporate governance that reflects best practices and thehighest level of business ethics. For a number of years, we have governed the organization through a highlycoordinated framework within which decisions are deliberated and corporate authority is derived.
GLOBAL STRATEGIC PRIORITIES
To continue to create on-going value for our clients, shareholders, and employees, both from current and longer-term perspectives, we have identified five strategic priorities, which we call the G5. We have consistently used theG5 approach since 2005. Although we have grown significantly over the past decade, we believe we have asubstantial opportunity to continue to grow and prosper by providing our core services within our key markets,whose potential remains large given the global magnitude of commercial and residential real estate, broadlydefined. From time to time we may add adjacent services that are not part of our historical core functions, but weintend these to be opportunistic in nature and targeted to individual geographical locations and evolving businessopportunities. For example, we successfully expanded the cross-border brokerage of high-end residentialproperties in London with the 2011 King Sturge merger, followed by the acquisition of W.A. Ellis during 2014 andGuardian in Dublin in 2015. We have expanded the Tetris-branded fit-out business we originally acquired in Franceand have been introducing it into other countries, including through acquisitions in Portugal in 2014 and in Poland,Germany, and the United Kingdom in 2015. In 2015, we enhanced our service offering for facility managementclients by acquiring a cloud-based technology platform called Corrigo.
JLL Actions
G1 G2 G3 G4
G5 Connections: Differentiate and Sustain
Build our local andregional Markets
business
Strengthen our winningpositions in Corporate
Solutions
Capture the leading shareof global capital flows for
investment sales
Grow LaSalle InvestmentManagement’s leadership
position
We regularly re-evaluate whether the G5 continue to be the right priorities for best driving the business forwardtoward the overall objective of on-going value creation.
G1: Build our Leading Local and Regional Service Operations
Our strength in local and regional markets contributes to the strength of our global service capabilities. Ourfinancial performance also depends, in great part, on the business we source and execute locally from our morethan 280 wholly-owned offices around the world. We continually seek to leverage our established business presencein the world’s principal real estate markets to provide expanded and adjacent local and regional services without aproportionate increase in infrastructure costs. We believe these capabilities will continue to fuel our competitiveadvantage and make us more attractive to current and prospective clients, as well as to revenue-generatingemployees such as brokers and client relationship managers.
Metrics: During 2015, we completed approximately 35,500 transactions for landlord and tenant clients, a 6%increase over 2014, representing 1.1 billion square feet of space.
8
G2: Strengthen our Leading Position in Corporate Solutions
The accelerating trends of globalization, cost cutting, energy management and the outsourcing of real estateservices by corporate occupiers support our decision to emphasize a truly global Corporate Solutions business thatserves the comprehensive needs of corporate clients. This service delivery capability helps us create new clientrelationships, particularly as companies turn to outsourcing their real estate as a way to manage expenses and toimplement sustainable practices. These services have proved to be counter-cyclical, as we have seen demand forthem strengthen when the economy has weakened.
Metrics: During 2015, we provided corporate facility management services for 1.3 billion square feet ofclients’ real estate, a 17% increase from 2014. Over the same period, JLL had 137 new business wins, 75expansions of existing relationships and 35 contract renewals.
G3: Capture the Leading Share of Global Capital Flows for Investment Sales
Our focus on further developing our ability to provide global Capital Markets services reflects the increasinglyinternational nature of cross-border money flows into real estate and the global marketing of real estate assets.Our real estate investment banking capability helps provide capital and other financial solutions by which ourclients can maximize the value of their real estate.
Metrics: During 2015, we provided capital markets services for $138 billion of client transactions, a 17%increase from 2014.
G4: Strengthen LaSalle Investment Management’s Leadership Position
With its integrated global platform, LaSalle is well-positioned to serve institutional investors looking for attractivereal estate investment opportunities around the globe. LaSalle also continues to develop its ability to serveindividual retail investors, particularly in the U.S. and Japan. LaSalle develops and implements strategies based ona thorough understanding of investor objectives and knowledge of local market risks and rewards. We intend tocontinue to maintain strong offerings in core products to meet the demand from clients who seek lower riskinvestments in the most stable and mature real estate markets. In addition, we continue to strengthen ourcapabilities in value-add, opportunistic and debt strategies to meet the diverse range of our clients’ objectives.
Metrics: At the end of 2015, LaSalle had assets under management of $56.4 billion, an increase of 5% over2014, while raising $5.0 billion of capital.
G5: Connections: Differentiate and Sustain the Organization by Connecting Across the Firm and with Clients andother Stakeholders
Connecting. To create real value and new opportunities for our clients, shareholders, and employees, we regularlywork to strengthen and fully leverage the links between our people, service lines, and geographies to better connectwith our clients and put the Firm’s global expertise and experience to work for them. This includes constantlystriving to strengthen our data and analytics capabilities, and to leverage use of the Internet and emerging socialmedia to gather, analyze, and disseminate information that will be useful to our clients, employees, vendors, andother constituencies. Linking our operations effectively to make service delivery more efficient not only servesclient needs, it also contributes to our profitability and enhances our ability to identify and manage the enterpriserisks inherent in our business.
Differentiating and Sustaining. We also recognize that the value we deliver to our clients, shareholders, employees,and the global community closely relates to our Firm’s people, brand, ethics, and technology. As a professionalservices company, the focus on our people is paramount. Because our human capital contributes strongly to high-quality client service, this includes a focus on areas such as: employee satisfaction; health, safety and well-being;training and career development and rewards and recognition; and diversity and inclusion. Coupled with a strongbrand and high ethical standards, our active role as good corporate citizens enables our long-lasting presence. Ouruse of technology to provide information to our clients and to improve the ability of our people play an undeniablerole in maximizing our clients’ real estate value, shaping our industry’s response to global challenges such as
9
market risk, climate change and urbanization. These values and culture help us embed sustainability principlesthroughout the enterprise and successfully differentiate us from our competition, therefore ensuring we continueour more than 250-year history.
Metrics: Our Employee Engagement Index, which measures the percentage of survey respondents reportinghigh levels of engagement with the Firm and their work reached 76% as measured in 2015, up 3 percentagepoints from 2012, the last time we completed a full survey. Substantially all of the results in the surveyimproved over 2012 and also were higher than the global norms reported by our independent survey provider.
From Google Analytics, we understand our website received over 20.5 million page views by more than 4.8 millionvisitors in 2015.
Future Development of the G5
We have committed resources to each of the G5 priorities in past years and expect to continue to do so in thefuture. This strategy has helped us weather economic downturns, continue to grow market share, expand ourservices by developing adjacent offerings, and take advantage of new opportunities.
Our strategic review has validated the continued potential for our G5 priorities to drive the long-term sustainedgrowth of our firm and deliver real value to our clients. To derive the full advantage of that potential, we recognizethe need to accelerate the development of the G5 to meet the challenges of our dynamic markets and the specificthemes we have identified such as globalization and urbanization. We will do this by targeting our efforts andcapital resources to:
• Deploy innovative technology that allows our people to mine the depth of our intellectual property toprovide the most sophisticated possible advice and service to our clients.
Examples: HiRise (sm), Blackbird (sm) and RED systems bring digital capabilities for managing realestate needs directly to clients in multiple ways (all available on-line through our public website).
• Apply best practices in human resources to supply our businesses with well-trained, engaged and diverseemployees and create an overall culture that serves to retain our top talent.
Examples: Develop and implement a new electronic learning management system by Human Resourcesfor use globally.
• Promote an updated and modern brand that fully leverages our digital capabilities and clearly reflects thebreadth of our expertise, wisdom, governance and integrity.
Examples: Adapting the JLL and LaSalle names and refreshing their logos; acquiring the rights to thedot jll (.jll) and dot lasalle (.lasalle) top-level domain names.
• Establish and standardize tools and processes that make our operations highly productive and minimizelosses from enterprise risk.
Examples: Implementing significant new document management system for legal and other clientdocumentation in our Corporate Solutions business.
By continuing to invest in the future based on how our strengths can support the needs of our clients, we intend toenhance our position as an industry leader. Although we have validated our fundamental business strategies, eachof our businesses continually re-evaluates how it can best serve our clients as their needs change, as technologiesand the application of technologies evolve, and as real estate markets, credit markets, economies, and politicalenvironments exhibit changes, which in each case may be dramatic and unpredictable.
10
STRATEGY 2020: OUR FUTURE ORIENTATION
During 2015, we continued to implement our Strategy 2020, which we first launched to identify specific businessand operational strategies we believe will best drive the continued success of the G5 priorities over the longer term.They include:
• Employing an investment philosophy and filters that are focused on growth that will best meet client needsand concentrate on the most lucrative potential services, markets and cities;
• Establishing charters for internal business boards with responsibility for promoting more inter-connectedglobal approaches, where appropriate, to client services and delivery;
• Using technology, including emerging digital, Internet and social media capabilities, to provide informationto clients to help them maximize the value of their real estate portfolios and to mine and apply ourknowledge to improve the ability of our people to provide superior client services;
• Deploying additional tools and metrics that will make our people as productive and efficient as possible;
• Determining how best to marshal, train, recruit, motivate and retain the human resources that will have theskill sets, diversity and other abilities necessary to accomplish our strategic objectives;
• Continuing to develop our brand and reputation for high quality client service, integrity and intimate localand global market knowledge;
• Building our brand in digital and social media channels; and
• Continuing to promote best-in-class governance, compliance, enterprise risk management and professionalstandards to operate a sustainable organization capable of meeting the significant challenges and risksinherent in global markets and to minimize disruptions to, and distractions from, the accomplishment of ourcorporate mission.
Viewed as complementary strategies, the G5 and Strategy 2020 work in combination to provide bothshort- and long-term paths to sustained success for our Firm.
As a professional services organization, the principal capitals we deploy are (1) human resources enabled by(2) intellectual property in the form of market knowledge, technology, innovation, and a reputation for quality,expertise, and integrity that is reflected by the strength of our brand, and (3) financial resources. Our Strategy 2020review confirmed that the historical approach we have taken to our business should sustain us in the future. Webelieve there is ample room for growth within our core markets and competencies without having to resort toparticularly different business lines to continue to grow and prosper as a business organization. We will, however,maintain an open mind about moving into adjacent businesses where local teams identify specific opportunities, asour clients and industry evolve, and as new technologies develop that could support our business.
We also believe that our historical approach to growth through a combination of organic development of talent andopportunistic acquisitions continues to be the best overall approach for us. Our business model has natural riskmitigation benefits derived from the diversity of our geographic presence, asset classes served, and complementaryservice lines. This diversity also provides revenue streams that have both short-term transactional and longer-termannuity characteristics.
During 2015, we continued to devote significant efforts and resources to implement our 2020 strategies andpriorities through the deployment of cross-functional workstreams that have engaged our leadership globally. Weexpect these workstreams to continue for the foreseeable future and we have put a mechanism in place for bothour Board of Directors and our Global Executive Board to monitor and influence their progress on a regular basis.
11
Our Strategy 2020 identified particular challenges we will need to confront to successfully achieve its goals:
• In terms of our financial capital, we recognize the challenge of maintaining healthy short-term profitmargins while continuing to invest in the further growth of the business. As there is constant fee pressurefrom our clients that is inherent in a competitive professional services environment, we need to continue tofind new ways to increase the productivity of our people so that we can drive higher revenue per person.Additional productivity can be derived by improved application of technology, by continuous processimprovements, and through increased staff well-being and training and development, among othertechniques.
Example: We now report revenues per professional in our quarterly operating reviews to seniormanagement.
• In terms of our human capital, we recognize that our investments in talent will continue to be a primarymethod of creating long-term value and that continuing business growth will necessitate the growth andincreased flexibility and diversity of our workforce. This can be a challenge, particularly in emergingmarkets, where the available pool of talent does not necessarily have the skill sets we need. Consequently,we may need to establish our own training programs beyond what is typically required for companies indeveloped markets. Increased reliance on third-party suppliers may create challenges in terms of duediligence, performance management, and ensuring that third-party personnel have the same level ofcommitment and integrity as we demand from our own people. In developed markets, the challenge ofgrowing a workforce with the requisite skill sets can be frustrated by the targeted efforts of competitors tohire away our people, including sometimes by offering above-market compensation.
Example: We now report diversity statistics in our quarterly operating reviews to senior management.
• In terms of our intellectual capital, we recognize the challenge of continuing to identify innovations throughwhich we can provide increasingly valuable services to our clients, including as the result of developing,identifying, and successfully applying new technologies to our business processes. We also must confront thechallenges inherent in managing and mining the significant data in our systems so that it can be made usefulto our people and maximized in terms of our ability to analyze it in a sophisticated way for the benefit of ourclients. As we develop our intellectual capital, we need to make sure our brand, and the awareness itgenerates in the marketplace, keeps pace with our capabilities and the messages we want associated withthem in the minds of current and prospective clients, employees, and other third parties in the businesscommunity and society at large.
Example: Our U.S. business runs an annual innovation competition to identify cutting-edge approachesthat will benefit clients, which we then evaluate in terms of potential patent applications.
INTEGRATED REPORTING
Initially as a pilot company from 2012− 2014 and now as a part of the business network of the InternationalIntegrated Reporting Council (‘‘IIRC’’), we support the general principles designed to promote communicationsand integrated thinking about how an organization’s strategy, governance, and financial and non-financialperformance lead to the creation of value over the short, medium and long term. This Annual Report onForm 10-K focuses on our business strategy and our financial performance, including an initial attempt to illustratehow being a sustainable enterprise is integral to our success. Our citizenship and sustainability efforts for ourselvesand our clients are reflected primarily in our annual Global Sustainability Report.
12
Our governance and remuneration practices are reported primarily in the Proxy Statement for our AnnualMeeting of Shareholders. The mechanisms we use to provide confidence to our clients with respect to ourtransparency and fair dealing are summarized in our Transparency Report, which we first published in 2013. Thebehaviors and standards we expect of our employees and of the suppliers we engage for our own firm and on behalfof clients are presented in our Code of Business Ethics and our Vendor Code of Conduct. Our Corporate Factsdocument is intended to provide an overall summary of the information we believe will be of primary interest toour different stakeholders.
We intend this Annual Report to satisfy the requirements of the International <IR> Framework issued by theIIRC in December, 2013 (www.theiirc.org). Following the Exhibit Index, we present a tie-out sheet thatcross-references the requirements in the Framework and the locations of our responses within this Annual Report.
We have recently launched an electronic Integrated Report on our website which provides access to all of ourinformation embedded in the documents discussed above through one access portal.
Responsibility for Integrated Reporting. The Finance and Legal Services functions of our Company are primarilyresponsible for the integrity of our integrated reporting efforts and acknowledge that we have applied acollaborative approach in the preparation and presentation of this report. To do so, we have also engaged themembers of our Global Operating Board (‘‘GOB’’), which consists of the leaders of our corporate staff functions inaddition to others and is described below in more detail, with respect to the preparation of the informationpresented in Items 1 (Business) and 1A (Risk Factors). In our collective opinion, this report is presented inaccordance with the Framework. However, as our effort to comply with the Framework is done voluntarily, wedisclaim any legal liability to the extent that this report is deemed to not comply with the Framework.
Alignment with the Integrated Reporting Framework. Building on the Strategy 2020 and as an important part ofour aim to align more closely with the Integrated Reporting Framework, we began to identify the medium- to long-term global megatrends with the greatest potential to impact materially upon our business. To do this, we used the‘six capitals’ model advocated by the International Integrated Reporting Council, namely financial, human,intellectual, manufactured, social, and natural capitals.
While we are most heavily dependent on the financial, human, and intellectual capitals to execute our ownoperations successfully, we identified significant trends with implications for our business across all six capitals.Furthermore, changes in the availability of all six capitals impact our clients’ businesses, and by extension, ourservice provision. An example in 2015 was the effect of significantly lower oil prices on the financial ability ofenergy-related companies to improve their real estate assets. Through internal consultation, we identified anumber of trends as significant for our business in the medium to long term. All of these ‘‘Global Trends,’’ whichwe are tracking and/or actively managing, are illustrated below. The ‘‘JLL Activities,’’ which address these trends,are summarized in the table below primarily via a combination of references to (1) sections within Items 1 and 1Ain this Annual Report on Form 10-K and (2) resources we publish on our website, where we discuss relevant pointsin more detail.
13
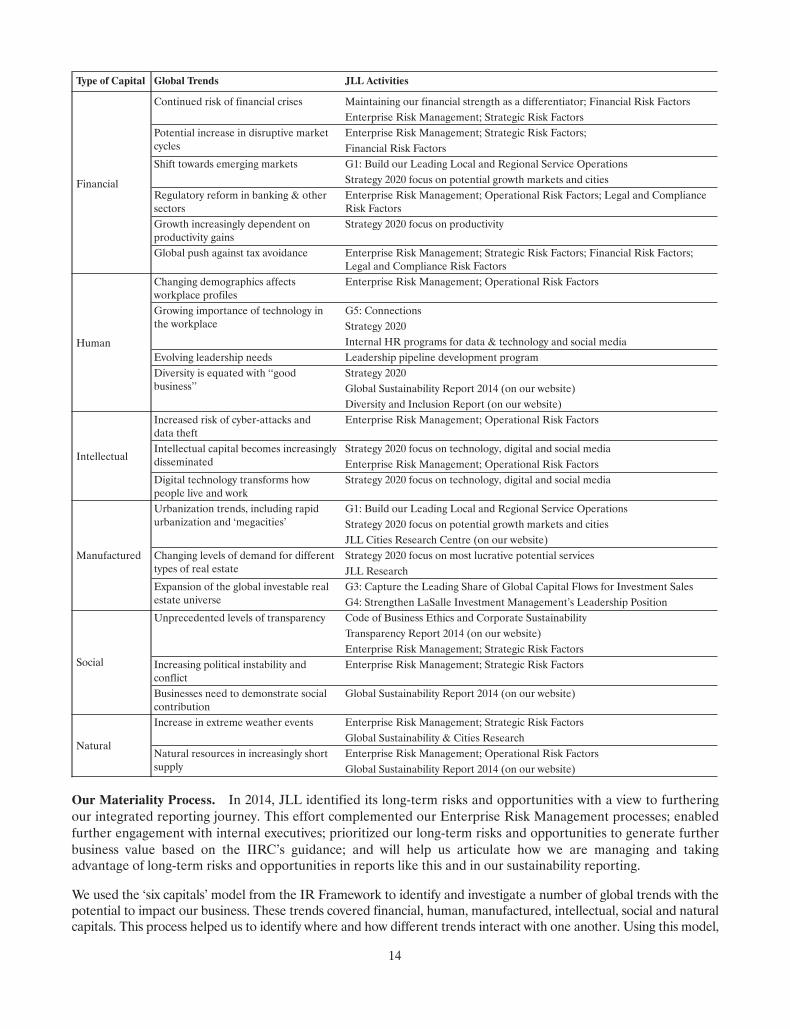
Type of Capital Global Trends JLL Activities
Financial
Continued risk of financial crises Maintaining our financial strength as a differentiator; Financial Risk FactorsEnterprise Risk Management; Strategic Risk Factors
Potential increase in disruptive marketcycles
Enterprise Risk Management; Strategic Risk Factors;Financial Risk Factors
Shift towards emerging markets G1: Build our Leading Local and Regional Service OperationsStrategy 2020 focus on potential growth markets and cities
Regulatory reform in banking & othersectors
Enterprise Risk Management; Operational Risk Factors; Legal and ComplianceRisk Factors
Growth increasingly dependent onproductivity gains
Strategy 2020 focus on productivity
Global push against tax avoidance Enterprise Risk Management; Strategic Risk Factors; Financial Risk Factors;Legal and Compliance Risk Factors
Human
Changing demographics affectsworkplace profiles
Enterprise Risk Management; Operational Risk Factors
Growing importance of technology inthe workplace
G5: ConnectionsStrategy 2020Internal HR programs for data & technology and social media
Evolving leadership needs Leadership pipeline development programDiversity is equated with ‘‘goodbusiness’’
Strategy 2020Global Sustainability Report 2014 (on our website)Diversity and Inclusion Report (on our website)
Intellectual
Increased risk of cyber-attacks anddata theft
Enterprise Risk Management; Operational Risk Factors
Intellectual capital becomes increasinglydisseminated
Strategy 2020 focus on technology, digital and social mediaEnterprise Risk Management; Operational Risk Factors
Digital technology transforms howpeople live and work
Strategy 2020 focus on technology, digital and social media
Manufactured
Urbanization trends, including rapidurbanization and ‘megacities’
G1: Build our Leading Local and Regional Service OperationsStrategy 2020 focus on potential growth markets and citiesJLL Cities Research Centre (on our website)
Changing levels of demand for differenttypes of real estate
Strategy 2020 focus on most lucrative potential servicesJLL Research
Expansion of the global investable realestate universe
G3: Capture the Leading Share of Global Capital Flows for Investment SalesG4: Strengthen LaSalle Investment Management’s Leadership Position
Social
Unprecedented levels of transparency Code of Business Ethics and Corporate SustainabilityTransparency Report 2014 (on our website)Enterprise Risk Management; Strategic Risk Factors
Increasing political instability andconflict
Enterprise Risk Management; Strategic Risk Factors
Businesses need to demonstrate socialcontribution
Global Sustainability Report 2014 (on our website)
Natural
Increase in extreme weather events Enterprise Risk Management; Strategic Risk FactorsGlobal Sustainability & Cities Research
Natural resources in increasingly shortsupply
Enterprise Risk Management; Operational Risk FactorsGlobal Sustainability Report 2014 (on our website)
Our Materiality Process. In 2014, JLL identified its long-term risks and opportunities with a view to furtheringour integrated reporting journey. This effort complemented our Enterprise Risk Management processes; enabledfurther engagement with internal executives; prioritized our long-term risks and opportunities to generate furtherbusiness value based on the IIRC’s guidance; and will help us articulate how we are managing and takingadvantage of long-term risks and opportunities in reports like this and in our sustainability reporting.
We used the ‘six capitals’ model from the IR Framework to identify and investigate a number of global trends with thepotential to impact our business. These trends covered financial, human, manufactured, intellectual, social and naturalcapitals. This process helped us to identify where and how different trends interact with one another. Using this model,
14
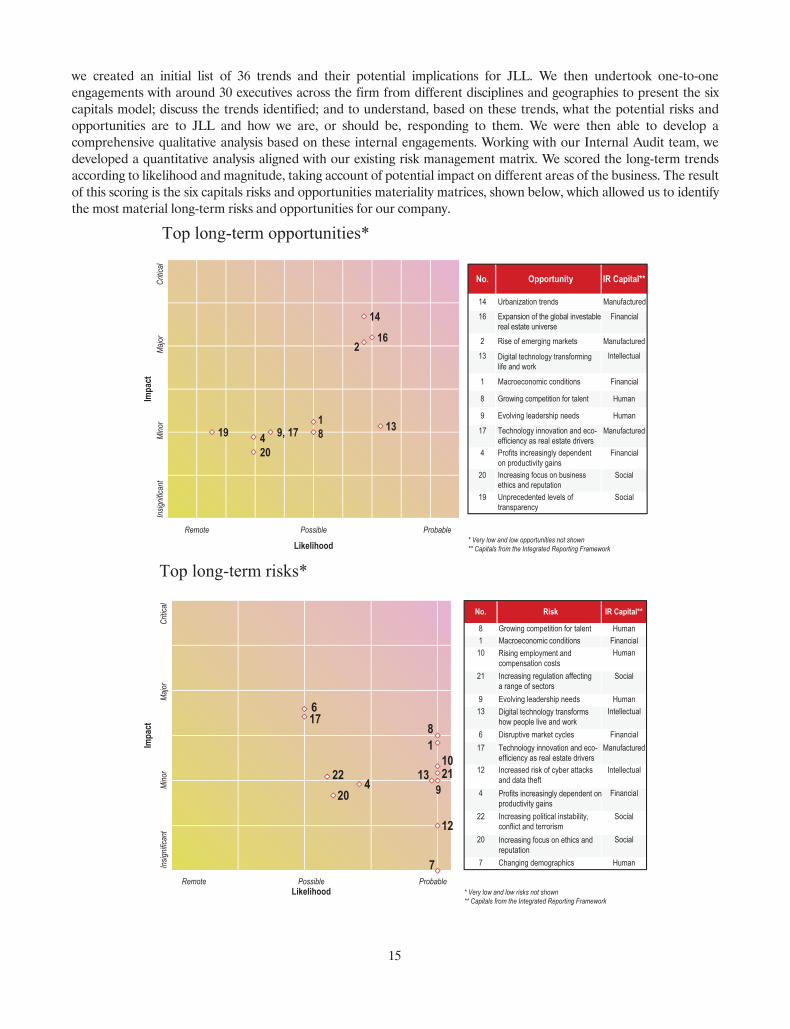
we created an initial list of 36 trends and their potential implications for JLL. We then undertook one-to-oneengagements with around 30 executives across the firm from different disciplines and geographies to present the sixcapitals model; discuss the trends identified; and to understand, based on these trends, what the potential risks andopportunities are to JLL and how we are, or should be, responding to them. We were then able to develop acomprehensive qualitative analysis based on these internal engagements. Working with our Internal Audit team, wedeveloped a quantitative analysis aligned with our existing risk management matrix. We scored the long-term trendsaccording to likelihood and magnitude, taking account of potential impact on different areas of the business. The resultof this scoring is the six capitals risks and opportunities materiality matrices, shown below, which allowed us to identifythe most material long-term risks and opportunities for our company.
20 SocialIncreasing focus on businessethics and reputation
17 ManufacturedTechnology innovation and eco-efficiency as real estate drivers
13 IntellectualDigital technology transforminglife and work
Top long-term opportunities*
14
162
13189, 174
2019
Impa
ct
Likelihood
Insig
nifica
ntM
ajor
Critic
al M
inor
Remote ProbablePossible
14 Urbanization trends Manufactured16 Financial
2 Rise of emerging markets Manufactured
1 Macroeconomic conditions Financial
8 Growing competition for talent Human
9 Evolving leadership needs Human
4 Financial
19 Social
No. Opportunity IR Capital**
Expansion of the global investablereal estate universe
Profits increasingly dependenton productivity gains
Unprecedented levels oftransparency
* Very low and low opportunities not shown** Capitals from the Integrated Reporting Framework
81
1021
913
617
12
42220
7
Impa
ct
Likelihood
No. Risk IR Capital**
Remote ProbablePossible
Insig
nifica
ntM
ajor
Critic
al
8 Growing competition for talent Human1 Macroeconomic conditions Financial10 Human
21 Increasing regulation affecting a range of sectors
Social
9 Evolving leadership needs Human13 Intellectual
6 Disruptive market cycles Financial17 Manufactured
12 Increased risk of cyber attacksand data theft
Intellectual
4 Financial
22 Social
20 Social
7 Changing demographics Human
Mino
r
* Very low and low risks not shown** Capitals from the Integrated Reporting Framework
Top long-term risks*
Digital technology transformshow people live and work
Rising employment andcompensation costs
Technology innovation and eco-efficiency as real estate drivers
Increasing political instability,conflict and terrorismIncreasing focus on ethics andreputation
Profits increasingly dependent onproductivity gains
15
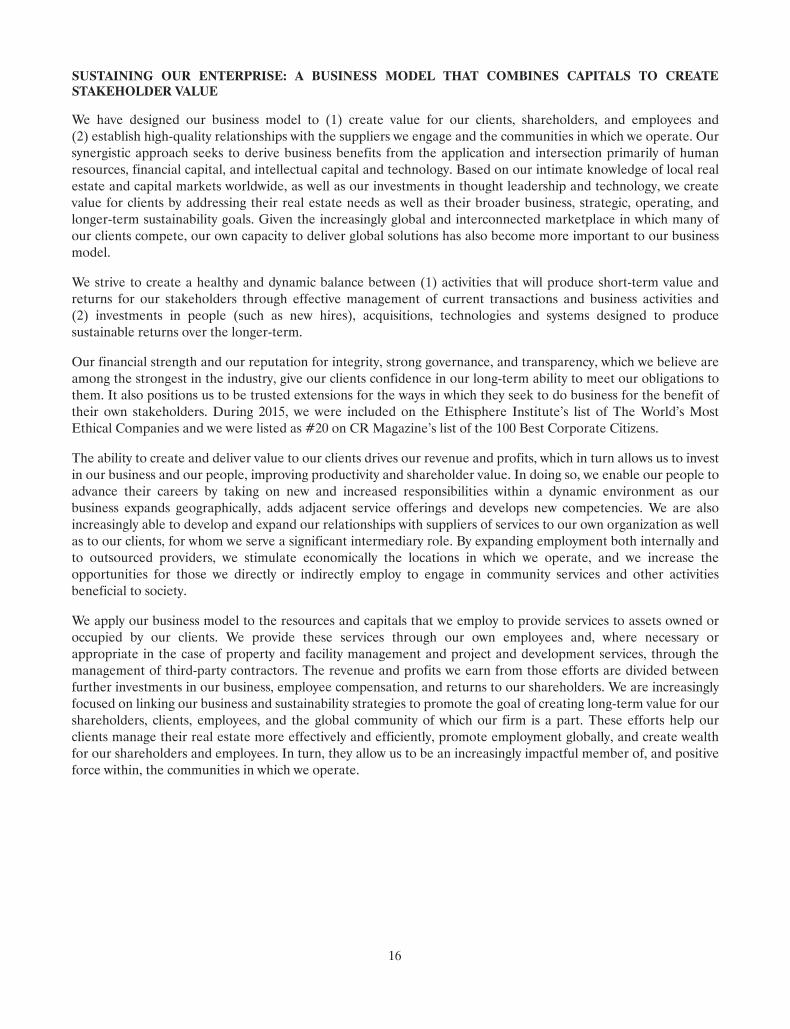
SUSTAINING OUR ENTERPRISE: A BUSINESS MODEL THAT COMBINES CAPITALS TO CREATESTAKEHOLDER VALUE
We have designed our business model to (1) create value for our clients, shareholders, and employees and(2) establish high-quality relationships with the suppliers we engage and the communities in which we operate. Oursynergistic approach seeks to derive business benefits from the application and intersection primarily of humanresources, financial capital, and intellectual capital and technology. Based on our intimate knowledge of local realestate and capital markets worldwide, as well as our investments in thought leadership and technology, we createvalue for clients by addressing their real estate needs as well as their broader business, strategic, operating, andlonger-term sustainability goals. Given the increasingly global and interconnected marketplace in which many ofour clients compete, our own capacity to deliver global solutions has also become more important to our businessmodel.
We strive to create a healthy and dynamic balance between (1) activities that will produce short-term value andreturns for our stakeholders through effective management of current transactions and business activities and(2) investments in people (such as new hires), acquisitions, technologies and systems designed to producesustainable returns over the longer-term.
Our financial strength and our reputation for integrity, strong governance, and transparency, which we believe areamong the strongest in the industry, give our clients confidence in our long-term ability to meet our obligations tothem. It also positions us to be trusted extensions for the ways in which they seek to do business for the benefit oftheir own stakeholders. During 2015, we were included on the Ethisphere Institute’s list of The World’s MostEthical Companies and we were listed as #20 on CR Magazine’s list of the 100 Best Corporate Citizens.
The ability to create and deliver value to our clients drives our revenue and profits, which in turn allows us to investin our business and our people, improving productivity and shareholder value. In doing so, we enable our people toadvance their careers by taking on new and increased responsibilities within a dynamic environment as ourbusiness expands geographically, adds adjacent service offerings and develops new competencies. We are alsoincreasingly able to develop and expand our relationships with suppliers of services to our own organization as wellas to our clients, for whom we serve a significant intermediary role. By expanding employment both internally andto outsourced providers, we stimulate economically the locations in which we operate, and we increase theopportunities for those we directly or indirectly employ to engage in community services and other activitiesbeneficial to society.
We apply our business model to the resources and capitals that we employ to provide services to assets owned oroccupied by our clients. We provide these services through our own employees and, where necessary orappropriate in the case of property and facility management and project and development services, through themanagement of third-party contractors. The revenue and profits we earn from those efforts are divided betweenfurther investments in our business, employee compensation, and returns to our shareholders. We are increasinglyfocused on linking our business and sustainability strategies to promote the goal of creating long-term value for ourshareholders, clients, employees, and the global community of which our firm is a part. These efforts help ourclients manage their real estate more effectively and efficiently, promote employment globally, and create wealthfor our shareholders and employees. In turn, they allow us to be an increasingly impactful member of, and positiveforce within, the communities in which we operate.
16
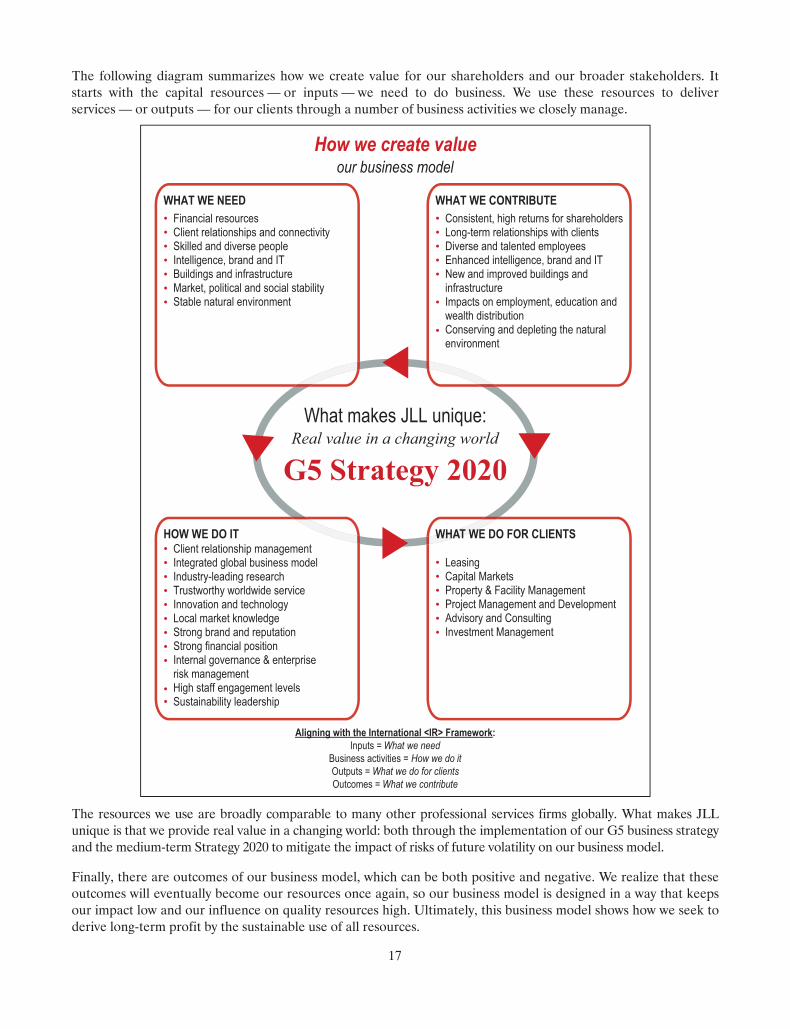
The following diagram summarizes how we create value for our shareholders and our broader stakeholders. Itstarts with the capital resources — or inputs — we need to do business. We use these resources to deliverservices — or outputs — for our clients through a number of business activities we closely manage.
What makes JLL unique:Real value in a changing world
G5 Strategy 2020
WHAT WE NEED •••••••
WHAT WE CONTRIBUTE •••••
•
•
HOW WE DO IT•••••••••
••
WHAT WE DO FOR CLIENTS
••••••
Aligning with the International <IR> Framework:Inputs = What we need
Business activities = How we do itOutputs = What we do for clientsOutcomes = What we contribute
How we create valueour business model
Consistent, high returns for shareholdersLong-term relationships with clientsDiverse and talented employeesEnhanced intelligence, brand and ITNew and improved buildings andinfrastructureImpacts on employment, education andwealth distributionConserving and depleting the naturalenvironment
Financial resourcesClient relationships and connectivitySkilled and diverse peopleIntelligence, brand and ITBuildings and infrastructure Market, political and social stabilityStable natural environment
Client relationship managementIntegrated global business modelIndustry-leading researchTrustworthy worldwide serviceInnovation and technologyLocal market knowledgeStrong brand and reputationStrong financial positionInternal governance & enterpriserisk managementHigh staff engagement levelsSustainability leadership
LeasingCapital MarketsProperty & Facility ManagementProject Management and DevelopmentAdvisory and ConsultingInvestment Management
The resources we use are broadly comparable to many other professional services firms globally. What makes JLLunique is that we provide real value in a changing world: both through the implementation of our G5 business strategyand the medium-term Strategy 2020 to mitigate the impact of risks of future volatility on our business model.
Finally, there are outcomes of our business model, which can be both positive and negative. We realize that theseoutcomes will eventually become our resources once again, so our business model is designed in a way that keepsour impact low and our influence on quality resources high. Ultimately, this business model shows how we seek toderive long-term profit by the sustainable use of all resources.
17
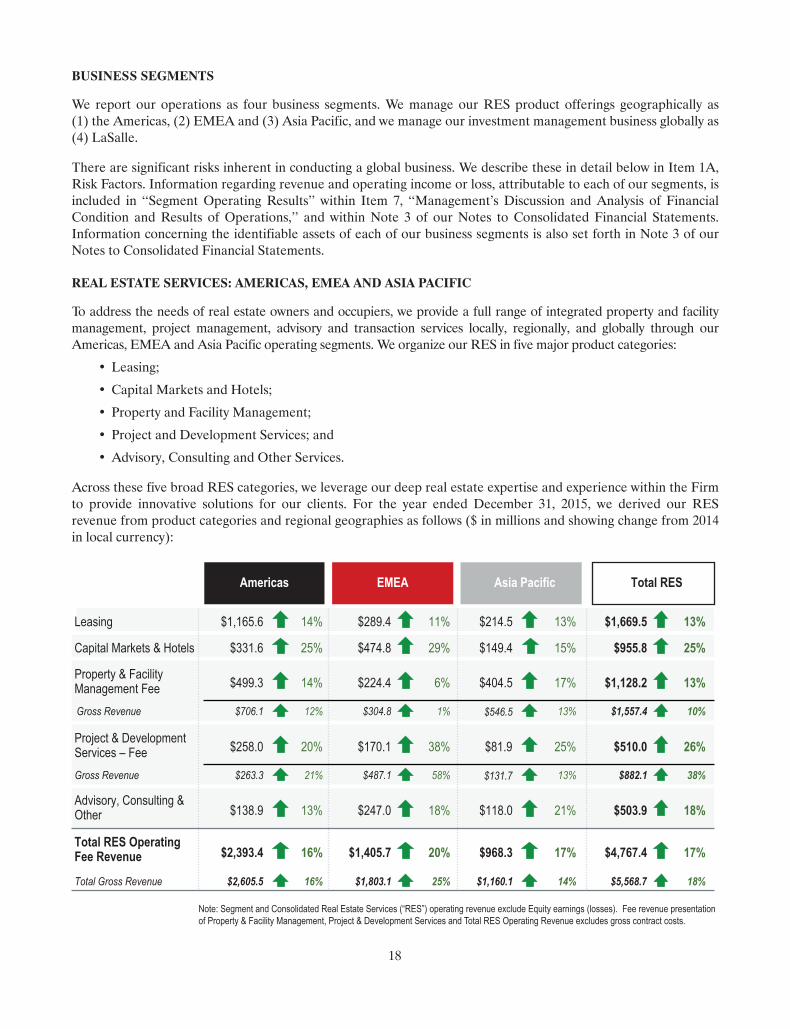
BUSINESS SEGMENTS
We report our operations as four business segments. We manage our RES product offerings geographically as(1) the Americas, (2) EMEA and (3) Asia Pacific, and we manage our investment management business globally as(4) LaSalle.
There are significant risks inherent in conducting a global business. We describe these in detail below in Item 1A,Risk Factors. Information regarding revenue and operating income or loss, attributable to each of our segments, isincluded in ‘‘Segment Operating Results’’ within Item 7, ‘‘Management’s Discussion and Analysis of FinancialCondition and Results of Operations,’’ and within Note 3 of our Notes to Consolidated Financial Statements.Information concerning the identifiable assets of each of our business segments is also set forth in Note 3 of ourNotes to Consolidated Financial Statements.
REAL ESTATE SERVICES: AMERICAS, EMEA AND ASIA PACIFIC
To address the needs of real estate owners and occupiers, we provide a full range of integrated property and facilitymanagement, project management, advisory and transaction services locally, regionally, and globally through ourAmericas, EMEA and Asia Pacific operating segments. We organize our RES in five major product categories:
• Leasing;
• Capital Markets and Hotels;
• Property and Facility Management;
• Project and Development Services; and
• Advisory, Consulting and Other Services.
Across these five broad RES categories, we leverage our deep real estate expertise and experience within the Firmto provide innovative solutions for our clients. For the year ended December 31, 2015, we derived our RESrevenue from product categories and regional geographies as follows ($ in millions and showing change from 2014in local currency):
Americas EMEA Asia Pacific Total RES
Leasing $1,165.6 14% $289.4 11% $214.5 13% $1,669.5 13%
Capital Markets & Hotels $331.6 25% $474.8 29% $149.4 15% $955.8 25%
$499.3 14% $224.4 6% $404.5 17% $1,128.2 13%
Gross Revenue $706.1 12% $304.8 1% $546.5 13% $1,557.4 10%
$258.0 20% $170.1 38% $81.9 25% $510.0 26%
Gross Revenue $263.3 21% $487.1 58% $131.7 13% $882.1 38%
Advisory, Consulting &Other $138.9 13% $247.0 18% $118.0 21% $503.9 18%
Total RES OperatingFee Revenue $2,393.4 16% $1,405.7 20% $968.3 17% $4,767.4 17%
Total Gross Revenue $2,605.5 16% $1,803.1 25% $1,160.1 14% $5,568.7 18%
Project & DevelopmentServices – Fee
Property & FacilityManagement Fee
Note: Segment and Consolidated Real Estate Services (“RES”) operating revenue exclude Equity earnings (losses). Fee revenue presentationof Property & Facility Management, Project & Development Services and Total RES Operating Revenue excludes gross contract costs.
18
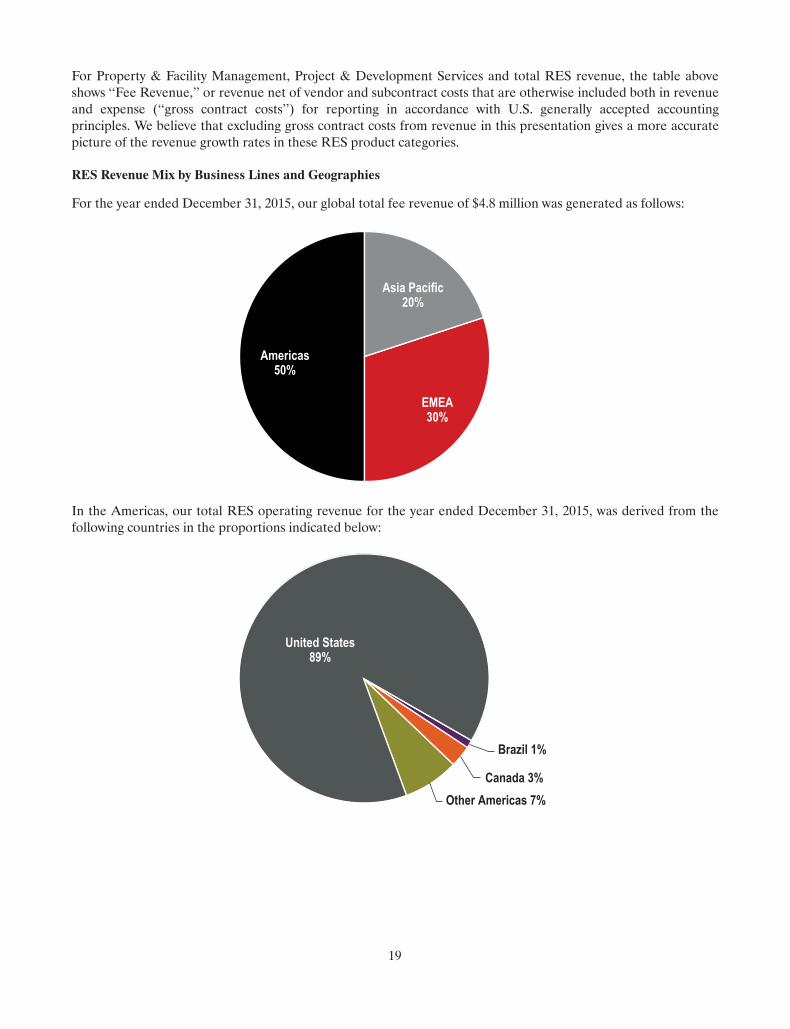
For Property & Facility Management, Project & Development Services and total RES revenue, the table aboveshows ‘‘Fee Revenue,’’ or revenue net of vendor and subcontract costs that are otherwise included both in revenueand expense (‘‘gross contract costs’’) for reporting in accordance with U.S. generally accepted accountingprinciples. We believe that excluding gross contract costs from revenue in this presentation gives a more accuratepicture of the revenue growth rates in these RES product categories.
RES Revenue Mix by Business Lines and Geographies
For the year ended December 31, 2015, our global total fee revenue of $4.8 million was generated as follows:
Americas50%
EMEA30%
Asia Pacific20%
In the Americas, our total RES operating revenue for the year ended December 31, 2015, was derived from thefollowing countries in the proportions indicated below:
United States89%
Brazil 1%
Canada 3%Other Americas 7%
19
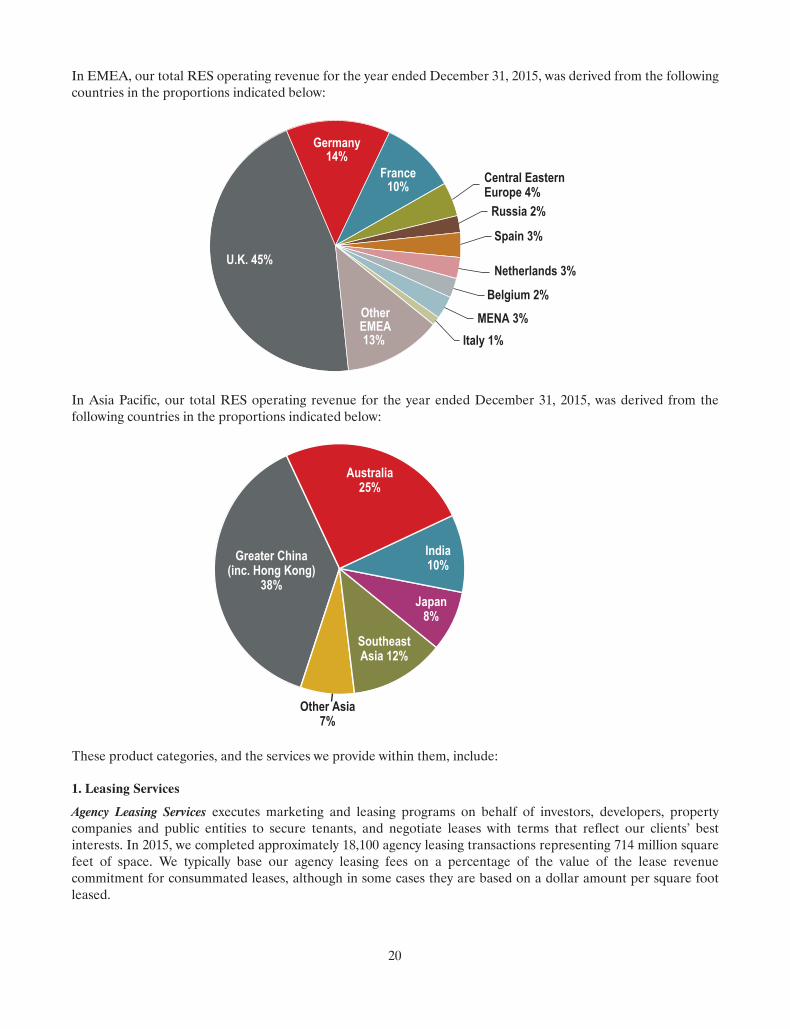
In EMEA, our total RES operating revenue for the year ended December 31, 2015, was derived from the followingcountries in the proportions indicated below:
U.K. 45%
Germany14%
France10%
Russia 2%
Spain 3%
Netherlands 3%
Belgium 2%MENA 3%
Italy 1%
OtherEMEA13%
Central EasternEurope 4%
In Asia Pacific, our total RES operating revenue for the year ended December 31, 2015, was derived from thefollowing countries in the proportions indicated below:
Australia25%
India10%
Japan8%
Other Asia7%
Greater China(inc. Hong Kong)
38%
SoutheastAsia 12%
These product categories, and the services we provide within them, include:
1. Leasing Services
Agency Leasing Services executes marketing and leasing programs on behalf of investors, developers, propertycompanies and public entities to secure tenants, and negotiate leases with terms that reflect our clients’ bestinterests. In 2015, we completed approximately 18,100 agency leasing transactions representing 714 million squarefeet of space. We typically base our agency leasing fees on a percentage of the value of the lease revenuecommitment for consummated leases, although in some cases they are based on a dollar amount per square footleased.
20
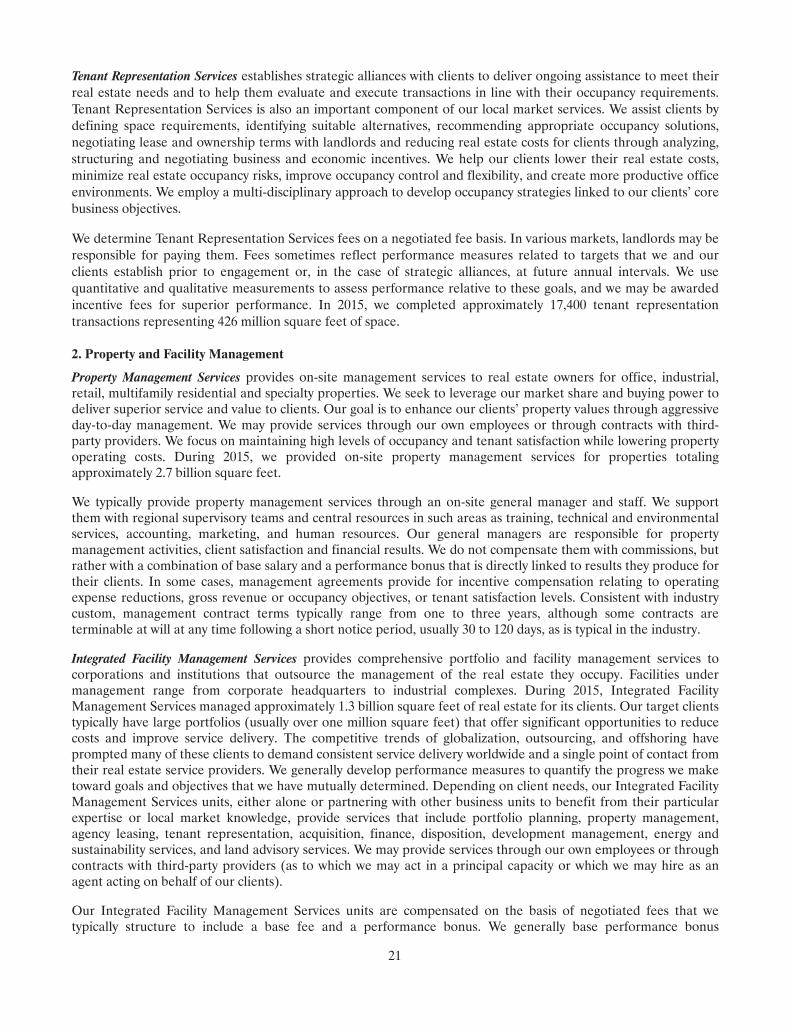
Tenant Representation Services establishes strategic alliances with clients to deliver ongoing assistance to meet theirreal estate needs and to help them evaluate and execute transactions in line with their occupancy requirements.Tenant Representation Services is also an important component of our local market services. We assist clients bydefining space requirements, identifying suitable alternatives, recommending appropriate occupancy solutions,negotiating lease and ownership terms with landlords and reducing real estate costs for clients through analyzing,structuring and negotiating business and economic incentives. We help our clients lower their real estate costs,minimize real estate occupancy risks, improve occupancy control and flexibility, and create more productive officeenvironments. We employ a multi-disciplinary approach to develop occupancy strategies linked to our clients’ corebusiness objectives.
We determine Tenant Representation Services fees on a negotiated fee basis. In various markets, landlords may beresponsible for paying them. Fees sometimes reflect performance measures related to targets that we and ourclients establish prior to engagement or, in the case of strategic alliances, at future annual intervals. We usequantitative and qualitative measurements to assess performance relative to these goals, and we may be awardedincentive fees for superior performance. In 2015, we completed approximately 17,400 tenant representationtransactions representing 426 million square feet of space.
2. Property and Facility Management
Property Management Services provides on-site management services to real estate owners for office, industrial,retail, multifamily residential and specialty properties. We seek to leverage our market share and buying power todeliver superior service and value to clients. Our goal is to enhance our clients’ property values through aggressiveday-to-day management. We may provide services through our own employees or through contracts with third-party providers. We focus on maintaining high levels of occupancy and tenant satisfaction while lowering propertyoperating costs. During 2015, we provided on-site property management services for properties totalingapproximately 2.7 billion square feet.
We typically provide property management services through an on-site general manager and staff. We supportthem with regional supervisory teams and central resources in such areas as training, technical and environmentalservices, accounting, marketing, and human resources. Our general managers are responsible for propertymanagement activities, client satisfaction and financial results. We do not compensate them with commissions, butrather with a combination of base salary and a performance bonus that is directly linked to results they produce fortheir clients. In some cases, management agreements provide for incentive compensation relating to operatingexpense reductions, gross revenue or occupancy objectives, or tenant satisfaction levels. Consistent with industrycustom, management contract terms typically range from one to three years, although some contracts areterminable at will at any time following a short notice period, usually 30 to 120 days, as is typical in the industry.
Integrated Facility Management Services provides comprehensive portfolio and facility management services tocorporations and institutions that outsource the management of the real estate they occupy. Facilities undermanagement range from corporate headquarters to industrial complexes. During 2015, Integrated FacilityManagement Services managed approximately 1.3 billion square feet of real estate for its clients. Our target clientstypically have large portfolios (usually over one million square feet) that offer significant opportunities to reducecosts and improve service delivery. The competitive trends of globalization, outsourcing, and offshoring haveprompted many of these clients to demand consistent service delivery worldwide and a single point of contact fromtheir real estate service providers. We generally develop performance measures to quantify the progress we maketoward goals and objectives that we have mutually determined. Depending on client needs, our Integrated FacilityManagement Services units, either alone or partnering with other business units to benefit from their particularexpertise or local market knowledge, provide services that include portfolio planning, property management,agency leasing, tenant representation, acquisition, finance, disposition, development management, energy andsustainability services, and land advisory services. We may provide services through our own employees or throughcontracts with third-party providers (as to which we may act in a principal capacity or which we may hire as anagent acting on behalf of our clients).
Our Integrated Facility Management Services units are compensated on the basis of negotiated fees that wetypically structure to include a base fee and a performance bonus. We generally base performance bonus
21
compensation on a quantitative evaluation of progress toward performance measures and regularly scheduledclient satisfaction surveys. Integrated Facility Management Services agreements are typically three to five years induration, although most contracts are terminable at will by the client upon a short notice period, usually 30 to60 days, as is typical in the industry.
We also provide Lease Administration and Auditing Services, helping clients centralize their lease managementprocesses. Whether clients have a small number of leases or a global portfolio, we assist them by reducing costsassociated with incorrect lease charges, right-sizing their portfolios through lease options, identifying underutilizedassets and ensuring regulatory compliance to mitigate risk.
In the United States, the United Kingdom and selected other countries, we provide Mobile Engineering Services toclients with large portfolios of sites or where we have multiple clients in proximity to each other. Rather than usingmultiple vendors to perform facility services, these companies hire JLL to provide HVAC, electrical and plumbingservices, and general interior repair and maintenance. Our multi-disciplined mobile engineers serve numerousclients in a specified geographic area, performing multiple tasks in a single visit and taking ownership of theoperational success of the sites they service. This service delivery model reduces clients’ operating costs bybundling on-site services, leveraging resources across multiple accounts and reducing travel time between sites.
3. Project and Development Services
Project and Development Services provides a variety of services to tenants of leased space, owners in self-occupiedbuildings, and owners of real estate investments. These include conversion management, move management,construction management, and strategic occupancy planning services. Project and Development Servicesfrequently manages relocation and build-out initiatives for clients of our Property Management Services,Integrated Facility Management Services, and Tenant Representation Services units. Project and DevelopmentServices also manages all aspects of development and renovation of commercial projects for our clients, serving asa general contractor in some cases. Additionally, we provide these services to public-sector clients, particularly tomilitary and government entities and educational institutions, primarily in the United States, and to a limited butgrowing extent in other countries.
Our Project and Development Services business is generally compensated on the basis of negotiated fees. Clientcontracts are typically multi-year in duration and may govern a number of discrete projects, with individual projectsbeing completed in less than one year.
In a growing number of countries, we provide fit-out and refurbishment services on a principal basis under theTetris brand, which is an outgrowth of a previous acquisition we completed through our French business.
4. Capital Markets and Hotels
Capital Markets and Hotels Services includes property sales and acquisitions, real estate financings, private equityplacements, portfolio advisory activities and corporate finance advice and execution. We provide these serviceswith respect to substantially all types of properties. In the United States, we operate a multifamily lending andcommercial loan servicing platform and for a number of years we have been a Freddie Mac Program Plus� Seller/Servicer. With our acquisition of Oak Grove Capital in 2015, we have added Fannie Mae and HUD/GNMAmultifamily lending services capabilities. Real Estate Investment Banking Services includes sourcing capital, bothin the form of equity and debt, derivatives structuring, and other traditional investment banking services designedto assist investor and corporate clients in maximizing the value of their real estate. To meet client demands formarketing real estate assets internationally and investing outside of their home markets, our Capital MarketsServices teams combine local market knowledge with our access to global capital sources to provide superiorexecution in raising capital for real estate transactions. By researching, developing, and introducing innovative newfinancial products and strategies, Capital Markets Services is also integral to the business development efforts ofour other businesses.
22
Clients typically compensate Capital Markets Services units on the basis of the value of transactions completed orsecurities placed. In certain circumstances, we receive retainer fees for portfolio advisory services. Real EstateInvestment Banking fees are generally transaction-specific and conditioned upon the successful completion of thetransaction.
We also deliver specialized Capital Markets Services for hotel and hospitality assets and portfolios on a globalbasis, including investment sales, mergers and acquisitions, and financing. We provide services to assets that spanthe hospitality spectrum: luxury properties; resorts; select service and budget hotels; golf courses; theme parks;casinos; spas; and pubs.
We provide Value Recovery Services to owners, investors and occupiers to help them analyze the impact of a possiblefinancial downturn on their assets and identify solutions that allow them to respond decisively. In this area, weaddress the operational and occupancy needs of banks and insurance companies that are merging with or acquiringother institutions. We assist banks and insurance companies with challenged assets and liabilities on their balancesheets by providing valuations, asset management, loan servicing, and disposition services. We provide receivershipservices and special asset servicing capabilities to lenders, loan servicers, and financial institutions that need helpmanaging defaulted real estate assets. In addition, we provide valuation, asset management, and dispositionservices to government entities to maximize the value of owned securities and assets acquired from failed financialinstitutions or from government relief programs. We also assist owners by identifying potentially distressedproperties and the major occupiers who are facing challenges.
5. Advisory, Consulting and Other Services
Valuation Services provides clients with professional valuation services to help them determine market values for office,retail, industrial, and mixed-use properties. Such services may involve valuing a single property or a global portfolio ofmultiple property types. We conduct valuations, which typically involve commercial property, for a variety of purposes,including acquisitions, dispositions, debt and equity financings, mergers and acquisitions, securities offerings (includinginitial public offerings), and privatization initiatives. Clients include occupiers, investors, and financing sources fromthe public and private sectors. For the most part, our valuation specialists provide services outside of the United States.We usually negotiate compensation for valuation services based on the scale and complexity of each assignment, andour fees typically relate in part to the value of the underlying assets.
Consulting Services delivers innovative, results-driven real estate solutions that align strategically and tactically withclients’ business objectives. We provide clients with specialized, value-added real estate consulting services in suchareas as mergers and acquisitions, occupier portfolio strategy, workplace solutions, location advisory, financialoptimization strategies, organizational strategy, and Six Sigma process solutions. Our professionals focus ontranslating global best practices into local real estate solutions, creating optimal financial and operational resultsfor our clients.
We also provide Advisory Services for hotels, including hotel valuations and appraisals, acquisition advice, assetmanagement, strategic planning, management contract negotiation, consulting, industry research and project anddevelopment services for asset types spanning the hospitality spectrum.
We typically negotiate compensation for Consulting Services based on work plans developed for advisory servicesthat vary based on the scope and complexity of projects. For transaction services, we generally base compensationon the value of transactions that close.
We provide Energy and Sustainability Services to occupiers and investors to help them develop their corporatesustainability strategies, green their real estate portfolios, reduce their energy consumption and carbon footprint,upgrade building performance by managing Leadership in Energy and Environmental Design (‘‘LEED’’)construction or retrofits and provide sustainable building operations management. We have more than 1,500energy and sustainability accredited professionals. In 2014 alone, we documented $47 million in estimated energysavings for our U.S. clients and reduced their greenhouse gas emissions by 278,000 tons. Our sustainability teamsworked on a total of 8,098 buildings in 2014.
23
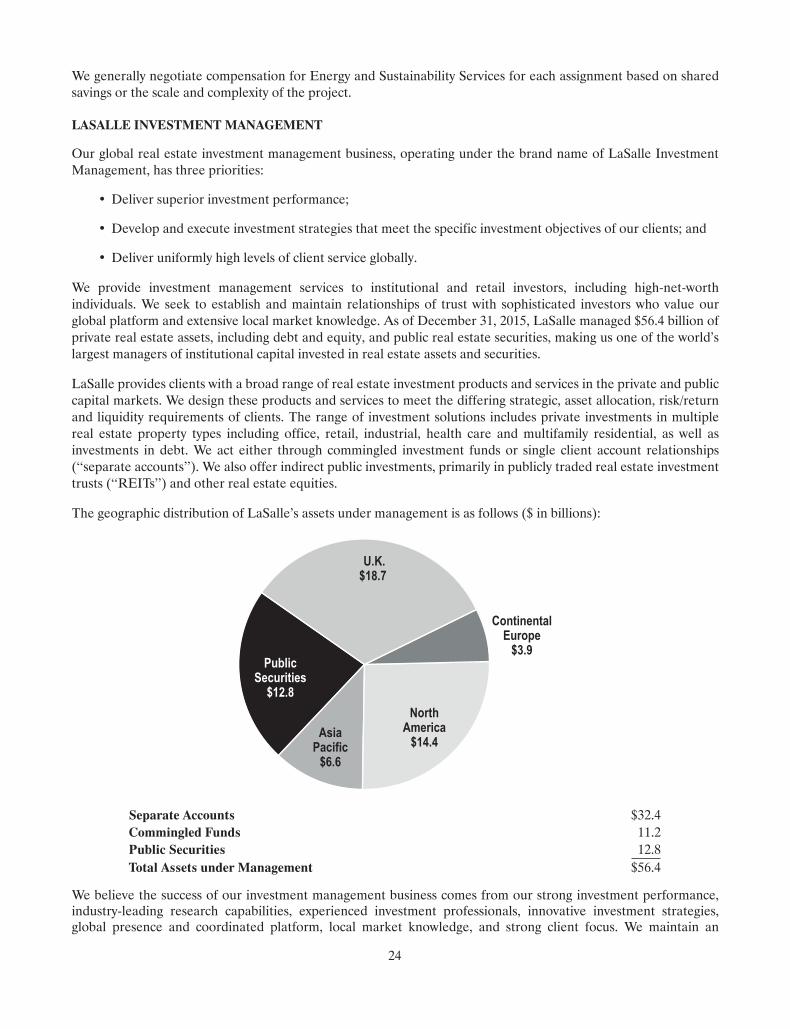
We generally negotiate compensation for Energy and Sustainability Services for each assignment based on sharedsavings or the scale and complexity of the project.
LASALLE INVESTMENT MANAGEMENT
Our global real estate investment management business, operating under the brand name of LaSalle InvestmentManagement, has three priorities:
• Deliver superior investment performance;
• Develop and execute investment strategies that meet the specific investment objectives of our clients; and
• Deliver uniformly high levels of client service globally.
We provide investment management services to institutional and retail investors, including high-net-worthindividuals. We seek to establish and maintain relationships of trust with sophisticated investors who value ourglobal platform and extensive local market knowledge. As of December 31, 2015, LaSalle managed $56.4 billion ofprivate real estate assets, including debt and equity, and public real estate securities, making us one of the world’slargest managers of institutional capital invested in real estate assets and securities.
LaSalle provides clients with a broad range of real estate investment products and services in the private and publiccapital markets. We design these products and services to meet the differing strategic, asset allocation, risk/returnand liquidity requirements of clients. The range of investment solutions includes private investments in multiplereal estate property types including office, retail, industrial, health care and multifamily residential, as well asinvestments in debt. We act either through commingled investment funds or single client account relationships(‘‘separate accounts’’). We also offer indirect public investments, primarily in publicly traded real estate investmenttrusts (‘‘REITs’’) and other real estate equities.
The geographic distribution of LaSalle’s assets under management is as follows ($ in billions):
U.K.$18.7
ContinentalEurope
$3.9
NorthAmerica
$14.4Asia
Pacific$6.6
PublicSecurities
$12.8
Separate Accounts $32.4Commingled Funds 11.2Public Securities 12.8Total Assets under Management $56.4
We believe the success of our investment management business comes from our strong investment performance,industry-leading research capabilities, experienced investment professionals, innovative investment strategies,global presence and coordinated platform, local market knowledge, and strong client focus. We maintain an
24
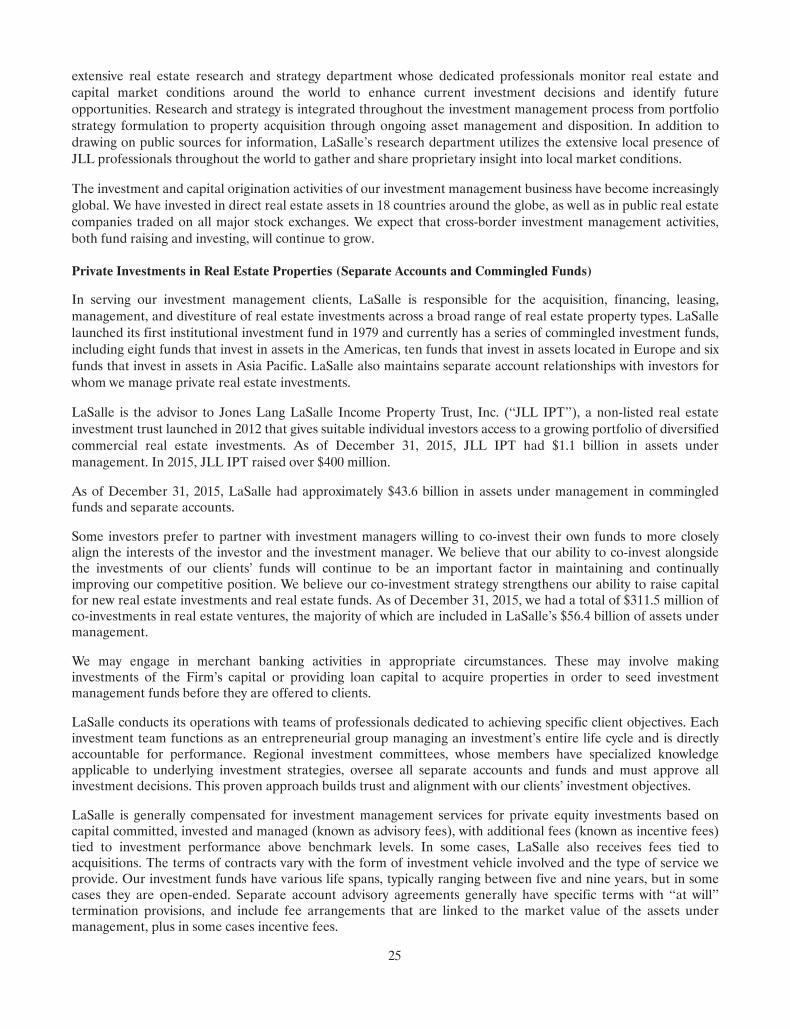
extensive real estate research and strategy department whose dedicated professionals monitor real estate andcapital market conditions around the world to enhance current investment decisions and identify futureopportunities. Research and strategy is integrated throughout the investment management process from portfoliostrategy formulation to property acquisition through ongoing asset management and disposition. In addition todrawing on public sources for information, LaSalle’s research department utilizes the extensive local presence ofJLL professionals throughout the world to gather and share proprietary insight into local market conditions.
The investment and capital origination activities of our investment management business have become increasinglyglobal. We have invested in direct real estate assets in 18 countries around the globe, as well as in public real estatecompanies traded on all major stock exchanges. We expect that cross-border investment management activities,both fund raising and investing, will continue to grow.
Private Investments in Real Estate Properties (Separate Accounts and Commingled Funds)
In serving our investment management clients, LaSalle is responsible for the acquisition, financing, leasing,management, and divestiture of real estate investments across a broad range of real estate property types. LaSallelaunched its first institutional investment fund in 1979 and currently has a series of commingled investment funds,including eight funds that invest in assets in the Americas, ten funds that invest in assets located in Europe and sixfunds that invest in assets in Asia Pacific. LaSalle also maintains separate account relationships with investors forwhom we manage private real estate investments.
LaSalle is the advisor to Jones Lang LaSalle Income Property Trust, Inc. (‘‘JLL IPT’’), a non-listed real estateinvestment trust launched in 2012 that gives suitable individual investors access to a growing portfolio of diversifiedcommercial real estate investments. As of December 31, 2015, JLL IPT had $1.1 billion in assets undermanagement. In 2015, JLL IPT raised over $400 million.
As of December 31, 2015, LaSalle had approximately $43.6 billion in assets under management in commingledfunds and separate accounts.
Some investors prefer to partner with investment managers willing to co-invest their own funds to more closelyalign the interests of the investor and the investment manager. We believe that our ability to co-invest alongsidethe investments of our clients’ funds will continue to be an important factor in maintaining and continuallyimproving our competitive position. We believe our co-investment strategy strengthens our ability to raise capitalfor new real estate investments and real estate funds. As of December 31, 2015, we had a total of $311.5 million ofco-investments in real estate ventures, the majority of which are included in LaSalle’s $56.4 billion of assets undermanagement.
We may engage in merchant banking activities in appropriate circumstances. These may involve makinginvestments of the Firm’s capital or providing loan capital to acquire properties in order to seed investmentmanagement funds before they are offered to clients.
LaSalle conducts its operations with teams of professionals dedicated to achieving specific client objectives. Eachinvestment team functions as an entrepreneurial group managing an investment’s entire life cycle and is directlyaccountable for performance. Regional investment committees, whose members have specialized knowledgeapplicable to underlying investment strategies, oversee all separate accounts and funds and must approve allinvestment decisions. This proven approach builds trust and alignment with our clients’ investment objectives.
LaSalle is generally compensated for investment management services for private equity investments based oncapital committed, invested and managed (known as advisory fees), with additional fees (known as incentive fees)tied to investment performance above benchmark levels. In some cases, LaSalle also receives fees tied toacquisitions. The terms of contracts vary with the form of investment vehicle involved and the type of service weprovide. Our investment funds have various life spans, typically ranging between five and nine years, but in somecases they are open-ended. Separate account advisory agreements generally have specific terms with ‘‘at will’’termination provisions, and include fee arrangements that are linked to the market value of the assets undermanagement, plus in some cases incentive fees.
25
Investments in Public Equity
LaSalle also offers clients the ability to invest in separate accounts focused on public real estate equities. We investthe capital of these clients principally in publicly traded securities of real estate investment trusts and propertycompanies. As of December 31, 2015, LaSalle had approximately $12.8 billion of assets under management inthese types of investments. LaSalle is typically compensated by securities investment clients on the basis of themarket value of assets under management.
REVENUE SUMMARY
For the year ended December 31, 2015, we generated a total of $5.2 billion of fee revenue, meaning revenue net ofgross contract costs for vendor and subcontract costs that are otherwise included in revenue and expense, from thefollowing RES product categories and LaSalle:
21%
Leasing
LaSalle Inv. Mgmt.Property &
Facility Mgmt.
Capital Markets 32%
10%
8%
10%
19%
Project &Development
Advisory &Other
COMPETITION
As the result of our significant growth over the last decade, and of our ability to take advantage of the significantconsolidation that has taken place in our industry, we are now one of the three largest real estate services andinvestment management providers on a global basis. We believe that other providers of real estate services aresignificantly smaller in terms of revenue than the three largest providers. We believe that JLL’s geographic reach,scope of services and scale of resources have become sufficient to provide substantially all of the services ourclients need, wherever they need them. To most effectively serve and retain current clients, and win new clients, westrive to be the best firm in our industry.
Although there has been, and we expect will continue to be, consolidation within our industry, the totality of realestate services constituting the industry remains very large, and as a whole the provision of these services remainshighly diverse and fragmented. Accordingly, since we provide a broad range of commercial real estate andinvestment management services across many geographies, we face significant competition at international,regional, and local levels. Depending on the service, we also face competition from other real estate serviceproviders, some of which may not traditionally be thought of as such, including institutional lenders, insurancecompanies, investment banking firms, investment managers, accounting firms, technology firms, firms providingoutsourcing services of various types (including technology or building products) and companies that self-providetheir real estate services with in-house capabilities. While these competitors may be global firms that claim to haveservice competencies similar to ours, many are local or regional firms which, although substantially smaller inoverall size, may be larger in a specific local or regional market.
26
Consultancy practices typically do not have our implementation expertise or local market awareness. Investmentbanking and investment management competitors generally possess neither our local market knowledge nor our realestate service capabilities. Traditional real estate firms lack our financial expertise and operating consistency. Otherglobal competitors, which we believe franchise at least some of their offices through separate owners, generally do nothave the same level of business coordination or consistency of delivery that we can provide through our network ofwholly-owned offices, directly-employed personnel, and integrated information technology, human resources, andfinancial systems. That network also permits us to promote a high level of governance, enterprise risk management,and integrity throughout the organization and to leverage our diverse and welcoming culture as a competitiveadvantage in developing clients, recruiting employees, and acquiring businesses.
COMPETITIVE DIFFERENTIATORS
We believe that the key value drivers we list below create several competitive differentiators. These form the basisof our market positioning, which starting in 2016 we are calling ‘‘The JLL Way,’’ as the firm of choice forsophisticated clients seeking an integrated financial and professional services firm specializing in real estate on aglobal basis.
Client Relationship Management. We support our ability to deliver superior service to our clients through ourongoing investments in client relationship management and account management. Our goal is to provide eachclient with a single point of contact at our firm, an individual who is answerable to, and accountable for, all theactivities we undertake for the client. We believe that we enhance superior client service through best practices inclient relationship management, the practice of seeking and acting on regular client feedback, and recognizingeach client’s own specific definition of excellence.
Our client-driven focus enables us to develop long-term relationships with real estate investors, occupiers, anddevelopers. By developing these relationships, we are able to generate repeat business and create recurringrevenue sources. In many cases, we establish strategic alliances with clients whose ongoing service needs mesh withour ability to deliver fully integrated real estate services across multiple business units and locations. We supportour relationship focus with an employee compensation and evaluation system designed to reward clientrelationship building, teamwork, and quality performance, in addition to revenue development.
Integrated Global Business Model. By combining a wide range of high-quality, complementary services anddelivering them at consistently high service levels globally through wholly-owned offices with directly employedpersonnel, we develop and implement real estate strategies that meet the increasingly complex and far-reachingneeds of our clients. We also believe that we have secured an established business presence in the world’s principalreal estate markets, with the result that we can grow revenue without a proportionate increase in infrastructurecosts. With operations on six continents and over 280 corporate offices, we have in-depth knowledge of local andregional markets and can provide a full range of real estate services around the globe. This geographic coverage,combined with the ability and willingness of our people to communicate and connect with each other across acommon global platform, positions us to serve the needs of our multinational clients and manage investmentcapital on a global basis. We anticipate that our cross-selling potential across geographies and product lines willcontinue to develop new revenue sources for multiple business units within JLL.
We also anticipate that over time we will continue to expand our service offerings that are complementary oradjacent to our current offerings. An example would be providing services to multifamily residential real estatethat complements our current services to commercial clients seeking to develop multi-use properties thatencompass office, retail and residential space.
Another example is that we have used our cross-border capabilities to expand the brokerage business, initiallyacquired from King Sturge in 2011, of high-end residential properties based in London and Dublin.
Industry-Leading Research Capabilities. We invest in and rely on comprehensive top-down and bottom-up researchto support and guide the development of real estate and investment strategy for our clients. With over 300 researchprofessionals who gather data and cover market and economic conditions around the world, we are an authority onthe economics of commercial real estate. Research also plays a key role in keeping colleagues throughout the
27
organization attuned to important trends and changing conditions in world markets. We facilitate thedissemination of this information to colleagues through our company-wide intranet. We are also devising newapproaches through technology, including the use of the Internet and social media techniques, to make ourresearch, services and property offerings more readily available to our people and our clients.
We believe that our investments in research, technology, people, and thought leadership position our Firm as aleading innovator in our industry. Our various research initiatives investigate emerging trends to help us anticipatefuture conditions and shape new services to benefit our clients. Professionals in our Consulting Services practiceidentify and respond to shifting market and business trends to address changing client needs and opportunities.LaSalle relies on our comprehensive understanding of global real estate and capital markets to develop newinvestment products and services tailored to the specific investment goals and risk/return objectives of our clients.We believe that our commitment to innovation and thought leadership in sustainability helps us secure andmaintain profitable long-term relationships with the clients we target: the world’s leading real estate owners,occupiers, investors, and developers.
Delivery of innovative solutions and consistent worldwide service (including through applications of technology). Webelieve that our globally-coordinated investments in research, technology, people, quality control, and innovation,combined with the fact that our offices are wholly-owned (rather than franchised), and our professionals aredirectly employed, enable us to develop, share, and continually evaluate best practices across our globalorganization. As a result, we are able to deliver the same consistently high levels of client service and operationalexcellence substantially wherever our clients’ real estate investment and services needs exist.
Based on our general industry knowledge and on specific client feedback, we believe we are recognized as an industryleader in technology and business intelligence. We possess the capability to provide sophisticated informationtechnology systems on a global basis to serve our clients and support our employees. For example, FutureView (sm),our global portfolio optimization tool, allows corporate real estate teams with geographically diverse portfolios toidentify potential rent savings by comparing their lease obligations to our firm’s sophisticated local market forecasts.OneView by JLL (sm), our client extranet technology, provides clients with detailed and comprehensive insight intotheir portfolios, the markets in which they operate, and the services we provide to them.
Connect (sm), our intranet technology, offers our employees easy access to the Firm’s policies, news, and collectivethinking regarding our experience, skills, and best practices. We also have implemented globally integrated systemsfor finance, human resources, and client relationship management, as well as securities management and tradingsystems for our investment management business.
We expect that we will continue to seek and implement additional ways in which we can develop and deploytechnology platforms, use the Internet and employ social media techniques as business tools that will proactivelymake our own services and the real estate properties we list on the Internet increasingly efficient and useful to ourconstituencies, and that will support our marketing and client development activities.
Maximizing Values of Real Estate Portfolios. To maximize the values of our real estate investments, LaSallecapitalizes on its strategic research insights and local market knowledge to develop an integrated approach thatleads to innovative solutions and value enhancement. Our global strategic perspective allows us to assess pricingtrends for real estate and know which investors worldwide are investing actively. This gives us an advantageousperspective on implementing buying and selling strategies.
During hold periods, our local market research allows us to assess the potential for cash flow enhancement in ourclients’ assets based on an informed opinion of rental-rate trends. When combined, these two perspectives provideus with an optimal view that leads to timely execution and translates into superior investment performance.
Strong Brand and Reputation. Based on evidence provided by marketing surveys we have commissioned, theextensive coverage we receive in top-tier business publications, the major awards we receive in many categories ofreal estate, sustainability, and ethics, as well as our significant, long-standing client relationships, we believe thatlarge corporations and institutional investors and occupiers of real estate recognize JLL’s ability to create valuereliably in changing market conditions. Our reputation is based on our deep industry knowledge, excellence in
28
service delivery, integrity, and our global provision of high-quality, professional real estate, and investmentmanagement services. We believe that the combined strength of the JLL and LaSalle brands represent a significantadvantage when we pursue new business opportunities and is also a major motivator for talented people to join usaround the world.
During 2014, we introduced the more formal use of the name ‘‘JLL,’’ together with refreshed logos for both JLLand LaSalle, across our businesses. The JLL name, which is also our New York Stock Exchange ticker symbol, hasbeen used informally for a number of years and will therefore be our primary trading name. Jones Lang LaSalleremains our legal name. Using the shorter JLL name facilitates its adaptation to different communication styles indifferent countries, languages, and channels, and especially to the use of digital and online channels for marketingand communications.
We believe we hold the necessary trademarks worldwide with respect to the ‘‘Jones Lang LaSalle,’’ ‘‘JLL’’ and‘‘LaSalle Investment Management’’ names and the related logos, which we expect to continue to renew asnecessary. We have obtained the right to use the top level domain names of each of ‘‘.jll’’ and ‘‘.lasalle’’ from theInternet Corporation for Assigned Names and Numbers (‘‘ICANN’’).
Financial Strength. We focus on maintaining financial performance metrics, particularly our leverage and interestcoverage ratios, that allow us to maintain investment grade financial ratings. We believe that confidence in thefinancial strength of long-term service providers has become increasingly important to our clients and they areincreasingly making financial strength an important criterion when they select real estate service providers.Accordingly, our ability to present a superior financial condition distinguishes us as we compete for business.
We also believe that our broad geographic reach and the range of our global service offerings diversify the sourcesof our revenue, reducing the overall inherent volatility of operating a real estate services business. This creates anadditional measure of financial stability relative to other firms with more limited service offerings or that are onlylocal or regional and therefore must rely on the strength of fewer diverse markets and services.
For a number of years, we have maintained investment grade ratings from S&P and Moody’s: our issuer and seniorunsecured ratings as of December 31, 2015: BBB+ (stable outlook) from S&P and Baa2 (positive outlook) fromMoody’s.
Our primary source of credit is our unsecured credit facility (the ‘‘Facility’’) provided by an international syndicateof banks, which as of December 31, 2015 had a maximum borrowing capacity of $2.0 billion and a maturity date ofFebruary 25, 2020. During 2012, both to diversify our sources of credit and take advantage of historically lowinterest rates, we issued $275 million of long-term senior notes with a ten-year maturity and a fixed interest rate of4.4% per annum.
Employee Engagement. As a business whose primary asset is the expertise and capabilities of its people, it isimportant to periodically measure and evaluate the level of our employee engagement, their performanceenablement, as defined below, and the effectiveness of our managers. We conducted our most recentcomprehensive survey during the fall of 2015. We used an outside provider to conduct the study and then assist usin evaluating the results and identifying opportunities for improvement.
Using our outside provider’s definitions:
• Employee engagement means the extent to which employees are motivated to contribute to organizationalsuccess and are willing to apply discretionary effort to accomplishing tasks important to the achievement oforganizational goals;
• Performance enablement means the extent to which an organization is committed to high levels of customerservice and relies upon continuous improvement practices to achieve superior organizational results; and
• Manager effectiveness means the extent to which supervisors are leaders, capable of facilitating teamperformance through effectively managing both the tasks and responsibilities as well as facilitatingteamwork and interpersonal relationships.
29
Our results indicated that our people reported an overall higher level of engagement, performance enablement,and manager effectiveness than the global norms. In all cases, our top quartile of most engaged employeesdemonstrated significantly higher results than the top quartile of the global norms. Our Employee EngagementIndex, which measures the percentage of survey respondents reporting high levels of engagement with the Firmand their work here reached 76%, an increase of 3% over 2012, the last time we did a full engagement survey.Virtually all of our scores increased over the 2012 results, in some cases significantly.
While we were pleased with the results, we are developing and intend to implement various actions to addressspecific areas where the data continued to indicate room for improvement or possible concerns. For example, webelieve there is a desire for a greater understanding in some units of the Firm for how compensation is determined.In any event, we believe that the quality of our people, and their commitment to our organization and to providinga high level of service to our clients, provides us with an important differentiator within the markets in which weoperate.
History of strong investment performance. Our LaSalle business has a history of delivering strong investmentperformance for clients who entrust them with investing their capital in real estate and real estate securities.
Strong governance, enterprise risk management and integrity. Our overlapping and communicative seniormanagement and Board of Directors structure promotes an environment of best practices in corporate governanceand controls. We believe that these attributes allow us to infuse a culture of internal communication andconnectivity throughout the organization that is unparalleled in our industry.
Successful management of any organization’s enterprise risks is critical to its long-term viability. We seek topromote, operate and continually improve a globally integrated enterprise risk management model that optimizesour overall risk/reward profile through the coordinated and sophisticated interaction of business and corporatestaff functions.
Related to our governance and enterprise risk management efforts, we believe in uncompromising integrity andthe highest ethical conduct. We are proud of the global reputation we have earned and are determined to protectand enhance it. The integrity our brand represents is one of our most valuable assets and a strong differentiator forour company. We have been recognized for eight years in a row as one of the World’s Most Ethical Companies bythe Ethisphere Institute and in 2015 we were listed as #20 on the roster of the 100 Best Corporate Citizens in theUnited States by CR Magazine.
Sustainability leadership. In 2014, we employed over 220 professionals dedicated to sustainability services for ourclients. Beyond this, we are increasingly integrating sustainability into our own operations as well as to the core realestate services we deliver across the Firm. An example is our sustainability experts in Project and DevelopmentServices who manage green building certifications and the creation of central sustainability roles to embedsustainability throughout the advice we give to clients and within our own operations. Another example is theefforts that LaSalle is making to solidify its leadership role in responsible investing and sustainable best practiceswith the assets it acquires and manages for clients. Our overall leadership in sustainability is evidenced by oursignificant thought leadership, technology, awards, and industry involvement. During 2015, we revisited oursustainability messaging and strategy. As a result of an internal consultation process, our sustainability leadershipagenda will now be called Building a Better Tomorrow (sm). Implementation of the agenda, which we arebeginning in 2016, includes four main areas: Clients, People, Workplaces and Communities.
With sustainability as a key focus, we invest heavily in our research and thought leadership to guide our clients’ realestate investment and occupation strategies. We continue to develop influential sustainability research thatsupports our clients and contributes to the wider industry. Our global publications serve as good examples of ourprogress, including the Global Sustainability Perspective, the Real Estate Sustainability Transparency Index, andthe Green Blog. We also maintain partnerships with nearly 50 sustainability organizations and initiatives to furtherboth our own and our clients’ sustainability commitments. These include global efforts such as the World GreenBuilding Council as well as numerous local green building councils.
30
In December 2015, members of our senior management team joined world leaders and experts from the privateand public sectors at the United Nations climate conference, known as ‘‘COP21,’’ held in Paris. As an organization,we support the Paris Agreement that resulted. Considering that buildings account for approximately 40% of globalenergy use, the real estate sector has a key role in helping make the transition to a low-carbon future. JLLunderstands it plays a significant role in making this vision a reality.
In our Energy and Sustainability Services business, we have developed industry leading technology platformsdesigned to help our clients reduce their environmental footprint and energy costs: (1) OneView Energy andSustainability Analytics help us manage an ever-increasing volume of sustainability data on behalf of our clientsaround the globe; (2) Portfolio Energy and Environmental Reporting System (‘‘PEERS’’), provides a web-basedplatform for ongoing energy and environmental measurement and reporting including carbon footprintassessment; (3) Environmental Sustainability Platform is a real-time metering and monitoring program thatenables on-line, real-time monitoring of building energy consumption; and (4) IntelliCommand is a powerfulplatform that combines smart technology with building operations expertise and execution to provide 24/7 real-time remote monitoring and control of facilities. These platforms demonstrate our global expertise in the provisionof technology solutions and advance our role in addressing such global challenges and opportunities as climatechange and smart buildings. Using our proprietary sustainability platforms, we helped our clients measure andimprove their environmental impact in approximately 160,000 buildings as of 2014.
Our sustainability consulting services benefit a wide range of clients including, for example, Leasing clients whocommission green leases, green interior design and green assessments of prospective buildings; Capital Marketsand Investment Management clients who want green building valuation assessments; and Project andDevelopment Services clients who request retrofits to existing buildings.
Internally, we have undertaken a materiality assessment to identify the key impacts underlying the four focus areasof Building A Better Tomorrow (sm). Our most material environmental issues are energy reduction for ourselvesand our clients; improving the energy efficiency of our buildings; and reducing the impact of our business travelactivities. In terms of our social impact, our most material issues are the ethics and integrity of our business; thehealth, safety and well-being of our employees; and the impact of our supply chain. Addressing these areas not onlyreduces our negative impact, but it also provides business benefits through reduced operating costs, employee well-being and retention, and reduced supply chain risk. We provide additional information in our latest GlobalSustainability Report on our website.
INDUSTRY TRENDS
Since 2010, commercial real estate markets have continued their broad recovery around the world, although atdifferent speeds and different levels of strength, and with some disruptions in countries and regions that have hadpolitical or economic challenges such as Brazil, Russia, China, and the Middle East. As indicated by the Property
31
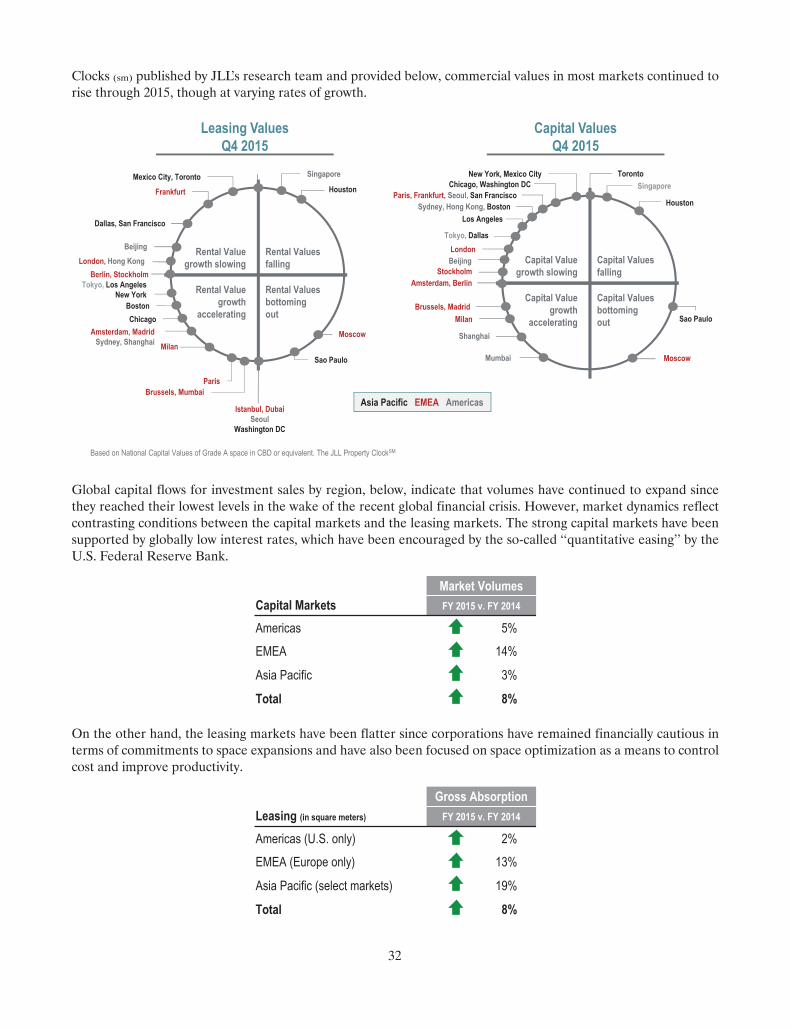
Clocks (sm) published by JLL’s research team and provided below, commercial values in most markets continued torise through 2015, though at varying rates of growth.
Asia Pacific EMEA Americas
Based on National Capital Values of Grade A space in CBD or equivalent. The JLL Property ClockSM
Singapore
Rental Value growth slowing
Rental Value growth
accelerating
Rental Values bottomingout
Rental Values falling
Sao Paulo
ChicagoBoston
Berlin, Stockholm
Frankfurt
Istanbul, DubaiSeoul
Washington DC
Paris
MilanMoscow
Brussels, Mumbai
Amsterdam, MadridSydney, Shanghai
Mexico City, Toronto
Dallas, San Francisco
Beijing
London, Hong Kong
Tokyo, Los AngelesNew York
Houston
Capital ValuesQ4 2015
Capital Value growth slowing
Capital Value growth
accelerating
Capital Values bottomingout
Capital Values falling
TorontoNew York, Mexico CityChicago, Washington DC
Amsterdam, Berlin
Milan
Mumbai
Shanghai
Paris, Frankfurt, Seoul, San FranciscoSydney, Hong Kong, Boston
Los Angeles
Tokyo, Dallas
Sao Paulo
Moscow
Singapore
Houston
Brussels, Madrid
StockholmBeijingLondon
Leasing ValuesQ4 2015
Global capital flows for investment sales by region, below, indicate that volumes have continued to expand sincethey reached their lowest levels in the wake of the recent global financial crisis. However, market dynamics reflectcontrasting conditions between the capital markets and the leasing markets. The strong capital markets have beensupported by globally low interest rates, which have been encouraged by the so-called ‘‘quantitative easing’’ by theU.S. Federal Reserve Bank.
Capital MarketsAmericas 5%
EMEA 14%
Asia Pacific 3%
Total 8%
Market VolumesFY 2015 v. FY 2014
On the other hand, the leasing markets have been flatter since corporations have remained financially cautious interms of commitments to space expansions and have also been focused on space optimization as a means to controlcost and improve productivity.
Leasing (in square meters)
Americas (U.S. only) 2%
EMEA (Europe only) 13%
Asia Pacific (select markets) 19%
Total 8%
Gross AbsorptionFY 2015 v. FY 2014
32
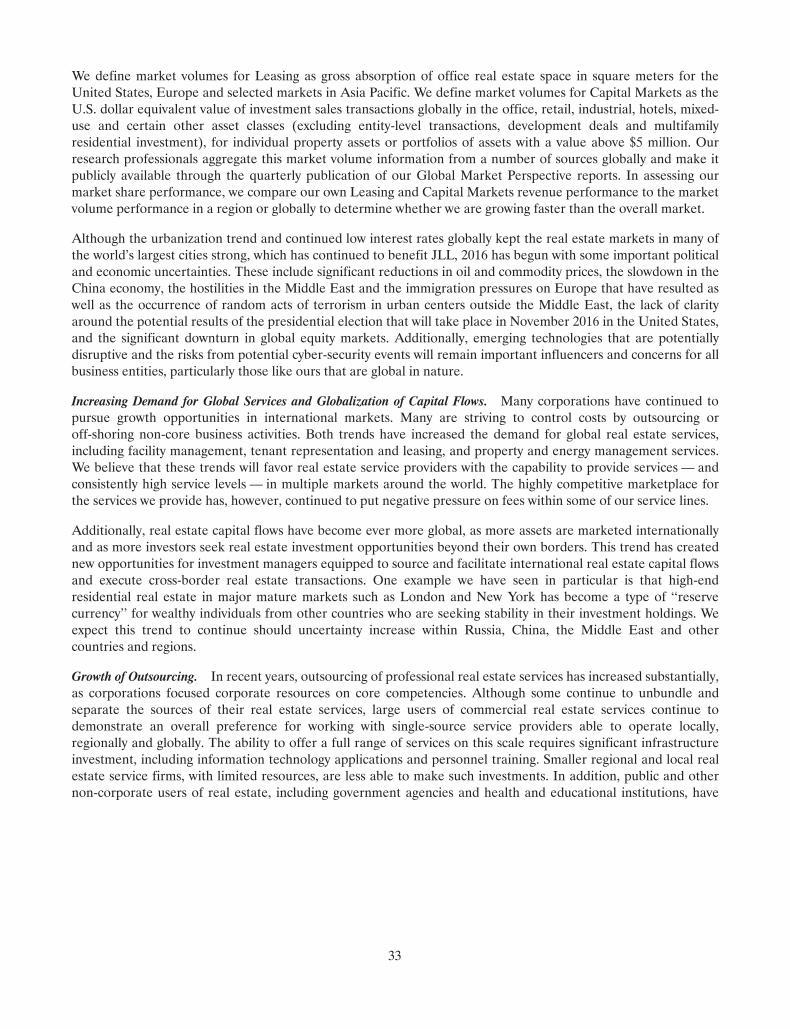
We define market volumes for Leasing as gross absorption of office real estate space in square meters for theUnited States, Europe and selected markets in Asia Pacific. We define market volumes for Capital Markets as theU.S. dollar equivalent value of investment sales transactions globally in the office, retail, industrial, hotels, mixed-use and certain other asset classes (excluding entity-level transactions, development deals and multifamilyresidential investment), for individual property assets or portfolios of assets with a value above $5 million. Ourresearch professionals aggregate this market volume information from a number of sources globally and make itpublicly available through the quarterly publication of our Global Market Perspective reports. In assessing ourmarket share performance, we compare our own Leasing and Capital Markets revenue performance to the marketvolume performance in a region or globally to determine whether we are growing faster than the overall market.
Although the urbanization trend and continued low interest rates globally kept the real estate markets in many ofthe world’s largest cities strong, which has continued to benefit JLL, 2016 has begun with some important politicaland economic uncertainties. These include significant reductions in oil and commodity prices, the slowdown in theChina economy, the hostilities in the Middle East and the immigration pressures on Europe that have resulted aswell as the occurrence of random acts of terrorism in urban centers outside the Middle East, the lack of clarityaround the potential results of the presidential election that will take place in November 2016 in the United States,and the significant downturn in global equity markets. Additionally, emerging technologies that are potentiallydisruptive and the risks from potential cyber-security events will remain important influencers and concerns for allbusiness entities, particularly those like ours that are global in nature.
Increasing Demand for Global Services and Globalization of Capital Flows. Many corporations have continued topursue growth opportunities in international markets. Many are striving to control costs by outsourcing oroff-shoring non-core business activities. Both trends have increased the demand for global real estate services,including facility management, tenant representation and leasing, and property and energy management services.We believe that these trends will favor real estate service providers with the capability to provide services — andconsistently high service levels — in multiple markets around the world. The highly competitive marketplace forthe services we provide has, however, continued to put negative pressure on fees within some of our service lines.
Additionally, real estate capital flows have become ever more global, as more assets are marketed internationallyand as more investors seek real estate investment opportunities beyond their own borders. This trend has creatednew opportunities for investment managers equipped to source and facilitate international real estate capital flowsand execute cross-border real estate transactions. One example we have seen in particular is that high-endresidential real estate in major mature markets such as London and New York has become a type of ‘‘reservecurrency’’ for wealthy individuals from other countries who are seeking stability in their investment holdings. Weexpect this trend to continue should uncertainty increase within Russia, China, the Middle East and othercountries and regions.
Growth of Outsourcing. In recent years, outsourcing of professional real estate services has increased substantially,as corporations focused corporate resources on core competencies. Although some continue to unbundle andseparate the sources of their real estate services, large users of commercial real estate services continue todemonstrate an overall preference for working with single-source service providers able to operate locally,regionally and globally. The ability to offer a full range of services on this scale requires significant infrastructureinvestment, including information technology applications and personnel training. Smaller regional and local realestate service firms, with limited resources, are less able to make such investments. In addition, public and othernon-corporate users of real estate, including government agencies and health and educational institutions, have
33
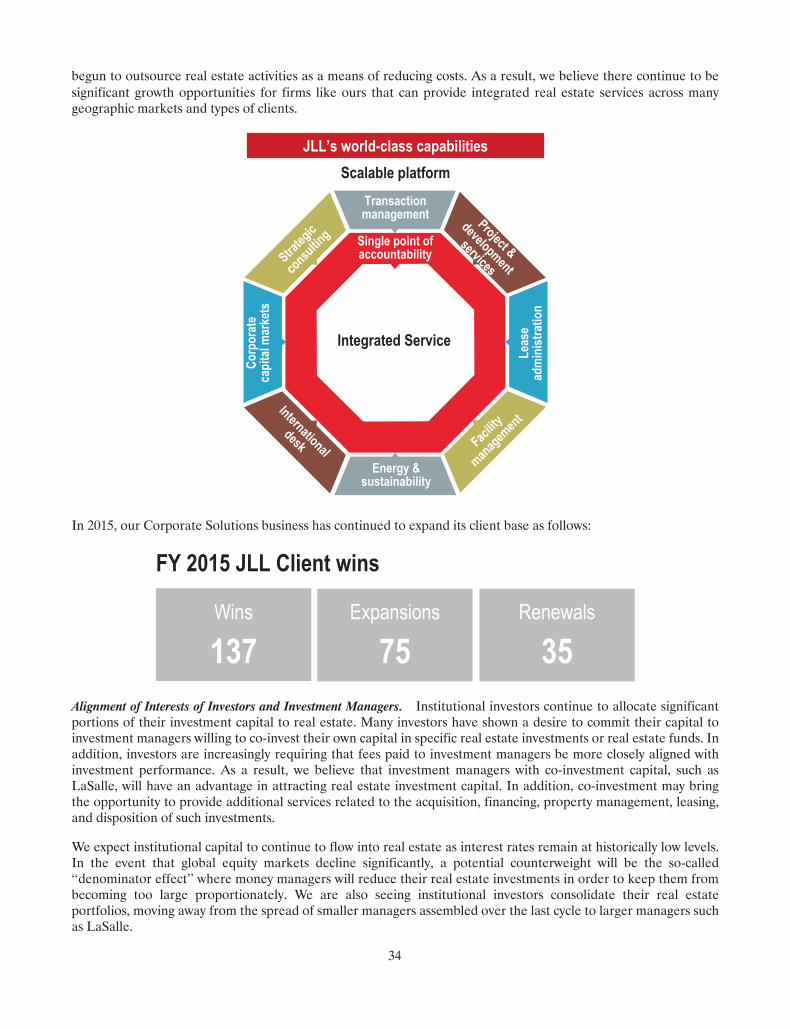
begun to outsource real estate activities as a means of reducing costs. As a result, we believe there continue to besignificant growth opportunities for firms like ours that can provide integrated real estate services across manygeographic markets and types of clients.
Facility
management
Energy &sustainability
Corp
orat
eca
pita
l mar
kets
Scalable platformJLL’s world-class capabilities
Integrated Service
Transactionmanagement
Single point ofaccountability
Leas
ead
min
istra
tion
Project &
development
servicesStrateg
ic
consulting
Internationaldesk
In 2015, our Corporate Solutions business has continued to expand its client base as follows:
Wins
137Expansions
75Renewals
35
FY 2015 JLL Client wins
Alignment of Interests of Investors and Investment Managers. Institutional investors continue to allocate significantportions of their investment capital to real estate. Many investors have shown a desire to commit their capital toinvestment managers willing to co-invest their own capital in specific real estate investments or real estate funds. Inaddition, investors are increasingly requiring that fees paid to investment managers be more closely aligned withinvestment performance. As a result, we believe that investment managers with co-investment capital, such asLaSalle, will have an advantage in attracting real estate investment capital. In addition, co-investment may bringthe opportunity to provide additional services related to the acquisition, financing, property management, leasing,and disposition of such investments.
We expect institutional capital to continue to flow into real estate as interest rates remain at historically low levels.In the event that global equity markets decline significantly, a potential counterweight will be the so-called‘‘denominator effect’’ where money managers will reduce their real estate investments in order to keep them frombecoming too large proportionately. We are also seeing institutional investors consolidate their real estateportfolios, moving away from the spread of smaller managers assembled over the last cycle to larger managers suchas LaSalle.
34
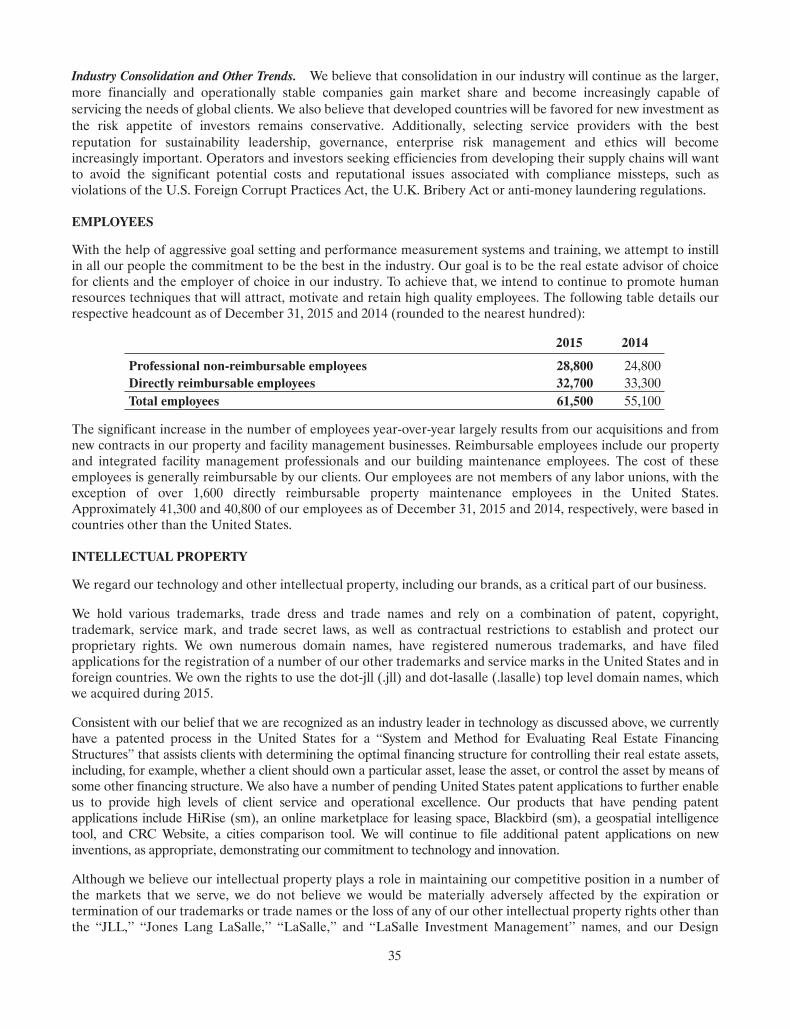
Industry Consolidation and Other Trends. We believe that consolidation in our industry will continue as the larger,more financially and operationally stable companies gain market share and become increasingly capable ofservicing the needs of global clients. We also believe that developed countries will be favored for new investment asthe risk appetite of investors remains conservative. Additionally, selecting service providers with the bestreputation for sustainability leadership, governance, enterprise risk management and ethics will becomeincreasingly important. Operators and investors seeking efficiencies from developing their supply chains will wantto avoid the significant potential costs and reputational issues associated with compliance missteps, such asviolations of the U.S. Foreign Corrupt Practices Act, the U.K. Bribery Act or anti-money laundering regulations.
EMPLOYEES
With the help of aggressive goal setting and performance measurement systems and training, we attempt to instillin all our people the commitment to be the best in the industry. Our goal is to be the real estate advisor of choicefor clients and the employer of choice in our industry. To achieve that, we intend to continue to promote humanresources techniques that will attract, motivate and retain high quality employees. The following table details ourrespective headcount as of December 31, 2015 and 2014 (rounded to the nearest hundred):
2015 2014
Professional non-reimbursable employees 28,800 24,800Directly reimbursable employees 32,700 33,300Total employees 61,500 55,100
The significant increase in the number of employees year-over-year largely results from our acquisitions and fromnew contracts in our property and facility management businesses. Reimbursable employees include our propertyand integrated facility management professionals and our building maintenance employees. The cost of theseemployees is generally reimbursable by our clients. Our employees are not members of any labor unions, with theexception of over 1,600 directly reimbursable property maintenance employees in the United States.Approximately 41,300 and 40,800 of our employees as of December 31, 2015 and 2014, respectively, were based incountries other than the United States.
INTELLECTUAL PROPERTY
We regard our technology and other intellectual property, including our brands, as a critical part of our business.
We hold various trademarks, trade dress and trade names and rely on a combination of patent, copyright,trademark, service mark, and trade secret laws, as well as contractual restrictions to establish and protect ourproprietary rights. We own numerous domain names, have registered numerous trademarks, and have filedapplications for the registration of a number of our other trademarks and service marks in the United States and inforeign countries. We own the rights to use the dot-jll (.jll) and dot-lasalle (.lasalle) top level domain names, whichwe acquired during 2015.
Consistent with our belief that we are recognized as an industry leader in technology as discussed above, we currentlyhave a patented process in the United States for a ‘‘System and Method for Evaluating Real Estate FinancingStructures’’ that assists clients with determining the optimal financing structure for controlling their real estate assets,including, for example, whether a client should own a particular asset, lease the asset, or control the asset by means ofsome other financing structure. We also have a number of pending United States patent applications to further enableus to provide high levels of client service and operational excellence. Our products that have pending patentapplications include HiRise (sm), an online marketplace for leasing space, Blackbird (sm), a geospatial intelligencetool, and CRC Website, a cities comparison tool. We will continue to file additional patent applications on newinventions, as appropriate, demonstrating our commitment to technology and innovation.
Although we believe our intellectual property plays a role in maintaining our competitive position in a number ofthe markets that we serve, we do not believe we would be materially adversely affected by the expiration ortermination of our trademarks or trade names or the loss of any of our other intellectual property rights other thanthe ‘‘JLL,’’ ‘‘Jones Lang LaSalle,’’ ‘‘LaSalle,’’ and ‘‘LaSalle Investment Management’’ names, and our Design
35
(Three Circles) mark that is also trademarked. Our trademark registrations have to be renewed every ten years.Based on our most recent trademark registrations, the JLL mark would expire in 2024, while the Jones LangLaSalle name would expire in 2022 and the Design (Three Circles) mark would expire in 2021. Since our LaSalleand LaSalle Investment Management marks will expire in 2016, these trademark registrations will be renewed withan expected expiration of 2026.
CORPORATE GOVERNANCE; CODE OF BUSINESS ETHICS; CORPORATE SUSTAINABILITY ANDRELATED MATTERS
We are committed to the values of effective corporate governance, operating our business to the highest ethicalstandards and conducting ourselves in an environmentally and socially responsible manner. We believe that thesevalues promote the best long-term performance of the Company for the benefit of our shareholders, clients, staffand other constituencies.
Corporate Governance. We believe our policies and practices reflect corporate governance initiatives that complywith:
• The listing requirements of the New York Stock Exchange (‘‘NYSE’’), on which our Common Stock istraded;
• The corporate governance requirements of the Sarbanes-Oxley Act of 2002, as currently in effect;
• U.S. Securities and Exchange Commission (‘‘SEC’’) regulations;
• The Dodd-Frank Wall Street Reform and Consumer Protection Act, as currently in effect; and
• The General Corporation Law of the State of Maryland, where Jones Lang LaSalle is incorporated.
Our Board of Directors regularly reviews corporate governance developments and modifies our By-Laws,Guidelines and Committee Charters accordingly. As a result, over the past years we have adopted the followingcorporate governance policies and approaches that are considered to be best practices in corporate governance:
• Annual elections of all members of our Board of Directors;
• Annual ‘‘say on pay’’ votes by shareholders with respect to executive compensation;
• Right of shareholders owning 30% of the outstanding shares of our Common Stock to call a special meetingof shareholders for any purpose;
• Majority voting in Director elections;
• Separation of Chairman and CEO roles, with the Chairman serving as Lead Independent Director;
• Required approval by the Nominating and Governance Committee of any related-party transactions;
• Executive session among the Non-Executive Directors at each in-person meeting;
• Annual self-assessment by the Board of Directors and each of its Committees; and
• Annual assessment by the Company’s senior executive management of the operation of the Board ofDirectors.
During 2015, we were recognized for excellence in global corporate governance by the India Institute of Directorsand for gender diversity on our Board of Directors by the 2020 Women on Boards.
Code of Business Ethics. The ethics principles that guide our operations globally are embodied in our Code ofBusiness Ethics, which applies to all employees of the Company, including our Chief Executive Officer, ChiefFinancial Officer, Global Controller and the members of our Board of Directors. The Code of Business Ethics is
36
the cornerstone of our Ethics Everywhere Program, by which we establish, communicate and monitor the overallelements of our efforts. We are proud of, and are determined to protect and enhance, the global reputation wehave established since, in a service business such as ours, the integrity that our brand represents is one of our mostvaluable assets. For a number of years we have applied for and received Ethics InsideTM certification from NYSEGovernance Services, a leading organization dedicated to best practices in ethics, compliance, corporategovernance and citizenship. We believe it is the only available independent verification of a company’s ethicsprogram. In 2015, for the eighth consecutive year, we were also named to the Ethisphere Institute’s list of theWorld’s Most Ethical Companies, and we were also placed as #20 on the list of the 100 Best Corporate Citizens byCR Magazine.
We support the principles of the United Nations Global Compact, the United Nations Principles of ResponsibleInvesting and, given that our clients include a number of the major companies within the electronic industry, theElectronic Industry Code of Conduct. We are also a member of the Partnering Against Corruption Initiativesponsored by the World Economic Forum.
Vendor Code of Conduct. JLL expects that each of its vendors, meaning any firm or individual providing a productor service to JLL or indirectly to our clients as a contractor or subcontractor, will share and embrace the letter andspirit of our commitment to integrity. While vendors are independent entities, their business practices maysignificantly reflect upon us, our reputation and our brand. Accordingly, we expect all vendors to adhere to the JLLVendor Code of Conduct, which we publish in multiple languages on our website, www.jll.com. We continue toevaluate and implement new ways to monitor the quality and integrity of our supply chain, including developingmeans by which we can efficiently survey and compare responses about the ethical environment and riskiness ofcurrent and potential suppliers that we engage both for our own firm and on behalf of clients.
Professional Standards Guide. Our guide to professional standards seeks to establish principles under which ourpeople will perform services for clients. It is published on our website.
Corporate Sustainability. We encourage and promote the principles of sustainability everywhere we operate,seeking to improve the communities and environment in which our people work and live. We design our corporatepolicies to reflect the highest standards of corporate governance and transparency, and we hold ourselvesresponsible for our social, environmental and economic performance. We seek to incorporate sustainabilitypractices and principles into our client investments and asset management. These priorities guide the interactionswe have with our shareholders, clients, employees, regulators, and vendors, as well as with all others with whom wecome into contact. We pursue our vision to lead the transformation of the real estate industry by making a positiveimpact both in and beyond our business.
We also work to foster an environment that values the richness of our differences and reflects the diverse world inwhich we live and work. By cultivating a dynamic mix of people and ideas, we enrich our Firm’s performance, thecommunities in which we operate and the lives of our employees. We seek to recruit a diverse workforce, developand promote exceptional talent from diverse backgrounds and embrace the varied experiences of all ouremployees.
We have begun to launch globally new internal branding around our overall sustainability program called Buildinga Better Tomorrow (sm).
Corporate Political Activities. Given the diversity of the Company’s clients, shareholders, staff, and otherconstituencies, the general approach of the Company is to not take positions as an organization on social orpolitical issues or on political campaigns. Accordingly, our use of corporate funds or other resources for politicalactivities has been negligible. From time to time, the Company may comment on proposed legislation orregulations that directly affect our business interests and therefore the interests of our shareholders. We may alsobelong to industry trade associations that do become involved in attempts to influence legislation in the interests ofthe industry generally.
Conflicts Minerals. Since we are not a manufacturer, nor do we contract to manufacture, we do not believe thatwe engage in the purchase or procurement of conflicts minerals, either for ourselves or our clients.
37
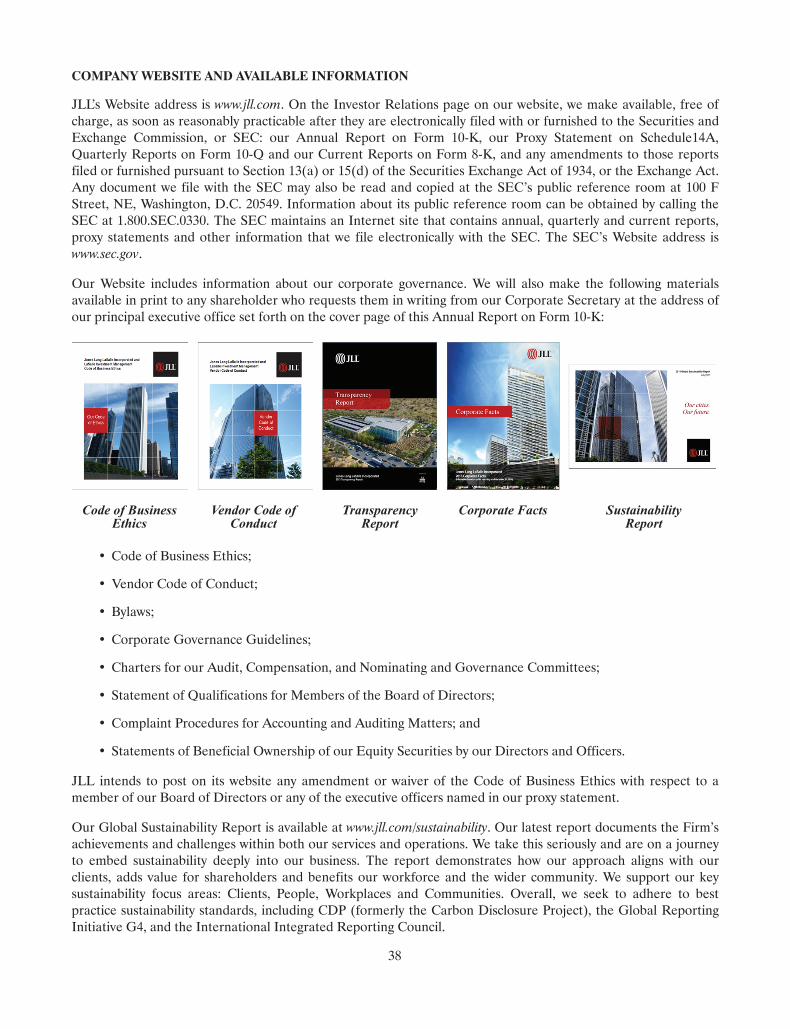
COMPANY WEBSITE AND AVAILABLE INFORMATION
JLL’s Website address is www.jll.com. On the Investor Relations page on our website, we make available, free ofcharge, as soon as reasonably practicable after they are electronically filed with or furnished to the Securities andExchange Commission, or SEC: our Annual Report on Form 10-K, our Proxy Statement on Schedule14A,Quarterly Reports on Form 10-Q and our Current Reports on Form 8-K, and any amendments to those reportsfiled or furnished pursuant to Section 13(a) or 15(d) of the Securities Exchange Act of 1934, or the Exchange Act.Any document we file with the SEC may also be read and copied at the SEC’s public reference room at 100 FStreet, NE, Washington, D.C. 20549. Information about its public reference room can be obtained by calling theSEC at 1.800.SEC.0330. The SEC maintains an Internet site that contains annual, quarterly and current reports,proxy statements and other information that we file electronically with the SEC. The SEC’s Website address iswww.sec.gov.
Our Website includes information about our corporate governance. We will also make the following materialsavailable in print to any shareholder who requests them in writing from our Corporate Secretary at the address ofour principal executive office set forth on the cover page of this Annual Report on Form 10-K:
Code of BusinessEthics
Vendor Code ofConduct
TransparencyReport
Corporate Facts SustainabilityReport
• Code of Business Ethics;
• Vendor Code of Conduct;
• Bylaws;
• Corporate Governance Guidelines;
• Charters for our Audit, Compensation, and Nominating and Governance Committees;
• Statement of Qualifications for Members of the Board of Directors;
• Complaint Procedures for Accounting and Auditing Matters; and
• Statements of Beneficial Ownership of our Equity Securities by our Directors and Officers.
JLL intends to post on its website any amendment or waiver of the Code of Business Ethics with respect to amember of our Board of Directors or any of the executive officers named in our proxy statement.
Our Global Sustainability Report is available at www.jll.com/sustainability. Our latest report documents the Firm’sachievements and challenges within both our services and operations. We take this seriously and are on a journeyto embed sustainability deeply into our business. The report demonstrates how our approach aligns with ourclients, adds value for shareholders and benefits our workforce and the wider community. We support our keysustainability focus areas: Clients, People, Workplaces and Communities. Overall, we seek to adhere to bestpractice sustainability standards, including CDP (formerly the Carbon Disclosure Project), the Global ReportingInitiative G4, and the International Integrated Reporting Council.
38
ITEM 1A. RISK FACTORS
General Overview. Our business is complex, dynamic, entrepreneurial, and international. Accordingly, it is subjectto a number of significant risks in the ordinary course of its operations. If we cannot or do not successfully managethe risks associated with the services we provide, our operations, business, operating results, reputation, and/orfinancial condition could be materially and adversely affected.
One of the challenges of a global business such as ours is to determine in a sophisticated manner the criticalenterprise risks that exist or may newly develop over time as our business evolves. We must then determine howbest to employ reasonably available resources to prevent, mitigate, and/or minimize those risks that we are able toidentify as having the greatest potential to cause significant damage from an operational, financial, or reputationalstandpoint. An important dynamic we must also consider and appropriately manage is how much and what types ofcommercial insurance to obtain and how much potential liability may remain uninsured consistent with theinfrastructure that is in place within the organization to identify and properly manage it.
Various factors over which we have no control significantly affect commercial real estate markets. These include:
• Macro movements of the stock, bond, currency and derivatives markets;
• The political environment;
• Government policy and regulations, in each case whether at local, national or international levels; and
• The cost and availability of natural and non-renewable resources used to operate real estate.
As an example, the severe financial disruption and global recession that occurred during 2008 and 2009 materiallyimpacted global real estate markets as the volume and pace of commercial real estate transactions contracted andreal estate pricing and leasing in many countries and markets fell substantially. More recently, politicaluncertainties in Russia, certain countries in the Middle East, and Brazil have diminished the willingness of multi-national companies to expand their businesses in those countries, which in each case has affected our business.Although commercial real estate markets in most major cities were stable to improved during 2015, primarily as aresult of the low interest rate environment that has been encouraged by the activities of various central banks, theircontinued strength has in some cases remained uncertain for various reasons. These include:
• The slowdown of the economy in China;
• The sharp drop in oil prices combined with increased actual and potential output from the United Statesand Iran, among other countries;
• The sharp drop in the prices of other commodities, partially as the result of the slowdown in demand fromChina;
• The significant decline in global equities markets that has continued into the early part of 2016;
• Uncertainties resulting from the randomness of terrorist acts, the effects of mass migration from countriesexperiencing hostilities in the Middle East, and the effects of climate change;
• Risks from potential cyber-attacks, the sophistication of which continues to grow;
• Uncertainties relating to the potential outcome of the November 2016 presidential election in the UnitedStates;
• The dynamic nature of government policy and regulations, in each case whether at local, national, orinternational levels; and
• The cost and availability of natural and non-renewable resources used to operate real estate.
39
Governments are addressing the different problematic situations in different and sometimes unpredictable andpolitically motivated ways. Accordingly, it is inherently difficult to make accurate predictions about the futuremovements in the markets in which we operate.
Governance over Enterprise Risk Management. We attempt to approach enterprise risk issues in a coordinated wayacross the globe. We govern our enterprise risk program primarily through our GOB, which includes our GlobalChief Financial Officer, our business segment Chief Operating and Financial Officers, and the leaders of ourprincipal corporate staff groups: Finance, Legal Services, Accounting, Insurance, Human Resources, Tax,Marketing, Information Technology, Business Resumption, Professional Standards, Communications, andCorporate Sustainability. The GOB coordinates its enterprise risk activities with our Internal Audit function,whose leader attends GOB meetings and facilitates quarterly risk assessments of our business to determine whereto focus auditing and advisory efforts.
Our Board of Directors and its Committees take active roles in overseeing management’s identification andmitigation of the Company’s enterprise risks. The Audit Committee focuses on the process by which managementcontinuously identifies its enterprise risks and monitors the mitigation efforts that have been established. TheBoard focuses on substantive aspects of management’s evaluation of our enterprise risks and the efforts we take tocontain and mitigate them. Each of the Compensation Committee and the Nominating and GovernanceCommittee also monitors and discusses with management those risks that are inherent in the matters that arewithin each such Committee’s purview.
As a standing agenda item for its quarterly meetings, the Audit Committee discusses with management the processthat has been followed in order to establish an enterprise risk management report. This report reflects: (1) the thencurrent most significant enterprise risks that management believes the Firm is facing; (2) the efforts management istaking to avoid or mitigate the identified risks; and (3) how the Firm’s internal audit function proposes to align itsactivities with the identified risks. The management representatives who regularly attend the Audit Committeemeetings and participate in the preparation of the report and the discussion include our (1) Chief FinancialOfficer, (2) General Counsel, and (3) Director of Internal Audit. At the meetings, the Director of Internal Auditreviews with the Committee how the report has informed the decisions about which aspects of the CompanyInternal Audit will review as part of its regular audit procedures, as well as how various programmatic activities byInternal Audit have been influenced by the conclusions drawn in the report.
The enterprise risk management report is provided to the full Board as a regular part of the materials for itsquarterly meetings. At those meetings, the Board asks questions of management about the conclusions drawn inthe enterprise risk management report and makes substantive comments and suggestions. Additionally, during thecourse of each year, the Audit Committee (or sometimes the full Board) meets directly on one or multipleoccasions with the senior-most leaders of our critical corporate functions to consider, among other topics, theenterprise risks those internal organizations face and how they are managing and addressing them. At each Boardmeeting, the Chairman of our Audit Committee reports to the full Board on the activities of the Audit Committee,including with respect to its oversight of the enterprise risk management process. Given our level of acquisitionactivities, our Board receives periodic updates on the status of integrating new businesses and how we areattempting to mitigate the enterprise risks inherent in making acquisitions. We also discuss with the Board anylessons learned from the acquisitions we have completed and any processes or approaches we have changed orimproved as a result.
As a regular part of its establishment of executive compensation, the Compensation Committee considers how thestructuring of our compensation programs will affect risk-taking and the extent to which they will drive alignmentwith the long-term success of the enterprise and the interests of our shareholders.
In the normal course of its activities, our Nominating and Governance Committee reviews emerging best practicesin corporate governance and stays abreast of changes in laws and regulations that affect the way we conduct ourcorporate governance, which represents another important aspect of overall enterprise risk management.
Risk Mitigation Efforts. We do not attempt to discuss in this section all of the various significant efforts we employto attempt to mitigate or contain the risks we identify, although we believe we have a robust program to do so in a
40
systematic way. These efforts include: (1) quarterly reviews by our GOB of operational errors and litigation eventsso that we can consider whether there are steps we can take, such as changes to policies or additional staff training,that will prevent similar issues from recurring; (2) monthly reviews by our global team of Ethics Officers of internalethics matters (starting in 2014, including the cost of investigating and resolving them) and general external ethicsissues as well as consideration of whether there are new or different activities we can establish within our EthicsEverywhere program in order to proactively address them; and (3) the activities by our Director of ProfessionalStandards to coordinate enterprise risk mitigation and prevention among the business, our internal auditors andour other corporate staff functions. One of the workstreams for the implementation of our Strategy 2020 Project,discussed in more detail above under ‘‘Company Overview,’’ is our ‘‘Getting Safely to 2020’’ Program, by which weare seeking to instill across all of our business lines more consistent approaches to certain risk mitigation andgovernance techniques.
Seeking Opportunities in Risks. Risks in business can also mean opportunity if they can be translated into servicesthat help clients mitigate their own risks and for which they are willing to pay fees that adequately compensate theprovider for the risks being absorbed. An example of how we may be able to monetize the absorption of risks is ourability to charge fees for taking on, as principal, the risks of performance of subcontractors so that our clients donot have to bear them directly. Another example is our experience and ability to conduct business with integrity inemerging markets that are generally perceived to be less transparent. This allows us to charge fees tomulti-national companies that want to expand their footprint into new markets with the assistance of serviceproviders they can trust to protect their interests and act according to ethical and other best practices.
Categorization of Enterprise Risks. This section reflects our current views concerning the most significant risks webelieve our business faces, both in the short term and the long term. We do not, however, purport to include everypossible risk from which we might sustain a loss. For purposes of the following analysis and discussion, we generallygroup the risks we face according to four principal categories:
• Strategic Risk Factors;
• Operational Risk Factors;
• Legal and Compliance Risk Factors; and
• Financial Risk Factors.
We could appropriately place some of the risks we identify in more than one category, but we have chosen the onewe view as primary. We do not necessarily present the risks below in their order of significance, the relativelikelihood that we will experience a loss or the magnitude of any such loss. Certain of these risks also may give riseto business opportunities for the Firm, but our discussion of risk factors in Item 1A is limited to the adverse effectsthe risks may have on our business.
Strategic Risk Factors
Strategic risk relates to JLL’s future business plans and strategies, including the risks associated with: the global macro-environment in which we operate; mergers and acquisitions and restructuring activity; intellectual property; and otherrisks, including the demand for our services, competitive threats, technology and innovation, and public policy.
GENERAL ECONOMIC CONDITIONS AND REAL ESTATE MARKET CONDITIONS CAN HAVE ANEGATIVE IMPACT ON OUR BUSINESS.
Real estate markets are inherently cyclical. They correlate strongly to local and national economic and politicalconditions or, at least, to the perceptions and confidence of investors and users as to the relevant economicoutlook. For example, corporations may be hesitant to expand space or enter into long-term commitments if theyare concerned about the general economic environment. Corporations that are under individual financial pressurefor any reason, or are attempting to more aggressively manage their expenses, may (1) reduce the size of their
41
workforces, (2) reduce spending on capital expenditures, including with respect to their offices, (3) permit more oftheir staff to work from home offices, and/or (4) seek corresponding reductions in office space and relatedmanagement services.
We have previously experienced, and expect in the future that we will be negatively impacted by, periods ofeconomic slowdown or recession and corresponding declines in the demand for real estate and related services.The global economic crisis during the 2007− 2009 period was extraordinary for its worldwide scope, severity andimpact on major financial institutions, as well as for the extent of governmental stimulus and regulatory responses.During the 2011− 2015 period, our core real estate markets in the major urban centers of most countries weresupported by the low interest rates promoted by central banks. These dynamics have been favorable to our LaSallebusiness too, particularly as they have helped us raise new capital to invest and sell properties into strong markets,which benefits our clients and generates incentive fees and equity earnings. However, many of our markets werealso affected generally by various geo-political and economic uncertainties, among them the slowdown in theChina economy, instability in the Middle East that has exacerbated the randomness in other parts of the world(such as France) of terrorism and caused pressures from an immigration perspective (such as in the EuropeanUnion countries), the significant decline in oil and commodity prices, the developing effects of climate change, andthe continuing uncertainty of the direction of the political environment in the United States as we approach thepresidential election in November 2016.
Although we have been able to continue to grow our business largely by gaining market share and as the result oftargeted acquisitions, it is inherently difficult for us to predict how these types of significant global forces will affectour business and whether we will continue to be able to generate revenue growth in the future to the same extentas we have in the past.
The speed with which markets change, both positively and negatively, has accelerated due to the increased globalinterconnectivity that has resulted from the immediacy and availability of information permitted by the Internetand social media, among other reasons. This has added to the challenges of anticipating and quickly adapting tochanges in business and revenue, particularly since real estate transactions are inherently complicated and longer-term in nature. A recent example has been the continued major decline in oil prices that occurred throughout 2015and has continued into 2016, which has complex potential ramifications in many of the countries in which weconduct business. Although it is unclear how they will ultimately filter through to our specific markets, we haveseen declines in our results in countries that are particularly affected, such as Brazil and Russia, although ourrevenues from those countries are relatively small.
Negative economic conditions and declines in demand for real estate and related services in several markets or insignificant markets could have a material adverse effect as a result of the following factors:
• Decline in Acquisition and Disposition Activity
A general decline in acquisition and disposition activity for commercial real estate can lead to a reduction in thefees and commissions we receive for arranging such transactions, as well as in fees and commissions we earn forarranging financing for acquirers. This can affect both our Capital Markets business in our RES segments as wellas our LaSalle business, although not necessarily always negatively. For example, major credit contractions, such asthose that took place during the recent global financial crisis, negatively impact real estate pricing and transactionvolumes, which reduces our Capital Markets fees. Additionally, a continued bias by investors toward conservatismmeans that their appetite for core investment products, which is a LaSalle strength, remains noticeably higher thanfor opportunistic or speculative products.
• Decline in the Real Estate Values and Performance, Leasing Activity and Rental Rates
A general decline in the value and performance of real estate and in rental rates can lead to a reduction in both(1) investment management fees, a significant portion of which are generally based on the performance ofinvestments and net asset values, and (2) the value of the co-investments we make with our investmentmanagement clients or merchant banking investments we have made for our own account. Additionally, suchdeclines can lead to a reduction in fees and commissions that are based on the value of, or revenue produced by,
42
the properties with respect to which we provide services. This may include fees and commissions (1) for propertymanagement and valuations, (2) generated by our Capital Markets, Hotels, and other businesses for arrangingacquisitions, dispositions, and financings, and (3) for arranging leasing transactions. Such declines can also lead toan unwillingness or inability of clients to make new (or honor existing) capital commitments to funds sponsored byour investment management business, which can result in a decline of both investment management fees andincentive fees, and can also restrict our ability to employ capital for new investments in current funds or establishnew funds.
The general decline in the value and performance of real estate negatively impacted the value of our ownco-investments during 2009 and 2010. As real estate markets have generally improved since 2010, we have seen thevalue of these investments return, as reflected in the increase in our equity earnings recognized over the lastfive years. The continued conservatism of corporate occupiers to commit to new space, and their desire to derivemore productivity from the same, or a sometimes reduced, real estate footprint, made our Agency Leasingbusiness more challenging during 2013 but it recovered during 2014 and 2015 as low interest rates and the strengthof the U.S. equity markets brought confidence back to corporate occupiers.
Historically for companies in our industry, a significant decline in real estate values in a given market has alsogenerally tended to result in increased litigation and claims regarding advisory and valuation work performed priorto the decline, as well as pressure from investment management clients regarding performance.
• Decline in Value of Real Estate Securities
A general decline in the value of real estate securities (for example, REITs) will have a negative effect on the valueof the portfolios that our LaSalle business manages, and any securities held in accounts that LaSalle manages, andtherefore the fees we earn on assets under management. In addition, a general decline in the value of real estatesecurities could negatively impact the amount of money that investors are willing to allocate to real estatesecurities and the pace of engaging new investor clients.
• Cyclicality in the Real Estate Markets; Lag in Recovery Relative to Broader Markets
Cyclicality in the real estate markets may lead to cyclicality in our earnings and significant volatility in our stockprice, which in recent years has continued to be highly sensitive to market perception of the global economygenerally and our industry specifically. This volatility has been evident during the significant stock market declineat the beginning of 2016, when JLL’s stock declined significantly even though our underlying business realizedrecord-setting performance in 2015. Real estate markets are also thought to ‘‘lag’’ the broader economy. Thismeans that even when underlying economic fundamentals improve in a given market, it may take additional timefor these improvements to translate into strength in real estate markets. This may be exacerbated when banksdelay their resolution of commercial real estate assets whose values are less than their associated loans.
• Effect of Changes in Non-Real Estate Markets
Changes in non-real estate markets can also affect our business in different ways for different types of investors.For example, relative strength in the equity markets can lead certain investors to lower the level of capital allocatedto real estate, which in turn can mean that our ability to generate fees from the operation of our investmentmanagement business will be negatively impacted. Strength in the equity markets can also negatively impact theperception of relative performance of real estate as an asset class, which in turn means that the incentive feesrelating to the performance of our investment funds may be negatively impacted. For those investors who seek tomaintain real estate as a relatively fixed percentage of their portfolios and will periodically rebalance in order to doso, the so-called ‘‘denominator effect’’ can lead to either (1) selling real estate when the equity markets are weaksince that can make real estate investments too great a proportion of their portfolios or (2) buying real estate whenequity markets are strong in order to maintain the desired percentage relative to other assets. A low interest rateenvironment, such as we have experienced in recent years, can make yields from real estate more attractivecompared to bonds, which has supported REIT stocks.
43
REAL ESTATE SERVICES AND INVESTMENT MANAGEMENT MARKETS ARE HIGHLY COMPETITIVE.
We provide a broad range of commercial real estate and investment management services. There is significantcompetition on international, regional and local levels with respect to many of these services and in commercialreal estate services generally. Depending on the service, we face competition from other real estate serviceproviders, institutional lenders, insurance companies, investment banking firms, investment managers, accountingfirms, technology firms, consulting firms, and firms providing outsourcing of various types (including technology,and building products), any of which may be a global, regional or local firm, and companies that self-provide theirreal estate services with in-house capabilities.
Many of our competitors are local or regional firms. Although they may be substantially smaller in overall size thanwe are, they may be larger than we are in a specific local or regional market. Some of our competitors haveexpanded the services they offer in an attempt to gain additional business. Some may be providing outsourcedfacility management services in order to sell clients products (such as HVAC systems) that we do not offer. In somesectors of our business, particularly Corporate Solutions, some of our competitors may have greater financial,technical and marketing resources, larger customer bases, and more established relationships with their customersand suppliers than we have. Larger or better-capitalized competitors in those sectors may be able to respond fasterto the need for technological changes, price their services more aggressively, compete more effectively for skilledprofessionals, finance acquisitions more easily, develop innovative products more effectively, and generallycompete more aggressively for market share. This can also lead to increasing commoditization of the services weprovide and increasing downward pressure on the fees we can charge.
New competitors, or alliances among competitors that increase their ability to service clients, could emerge andgain market share, develop a lower cost structure, adopt more aggressive pricing policies, aggressively recruit ourpeople at above-market compensation, or provide services that gain greater market acceptance than the serviceswe offer. Some of these may come from non-traditional sources, such as information aggregators. To respond toincreased competition and pricing pressure, we may have to lower our prices, loosen contractual terms (such asliability limitations), develop our own innovative approaches to mining data and using information, or increasecompensation, which may have an adverse effect on our revenue and profit margins. We may also need to becomeincreasingly productive and efficient in the way we deliver services or with respect to the cost structure supportingour businesses, which may in turn require more innovative uses of technology as well as data gathering and datamining.
Our industry has continued to consolidate, as evidenced by alliances in recent history that have resulted in theGrubb Newmark Knight Frank business and the merger first between DTZ and Cassidy Turley and then betweenDTZ and Cushman & Wakefield, all of which included firms that had previously had significant financial problemsbut were able to recapitalize and reposition themselves. During 2015, CBRE Group, Inc., acquired the facilitiesmanagement business of Johnson Controls, Inc., which materially increased CBRE’s revenues. There is aninherent risk that competitive firms may be more successful than we are at growing through merger and acquisitionactivity. While we have successfully grown organically and through a series of acquisitions, sourcing and completingacquisitions are complex and sensitive activities. In light of the continuing need to provide clients with morecomprehensive services on a more productive and cost efficient basis, we expect increasing acquisitionopportunities to emerge and may increase our acquisition activity compared to recent years. For example, in 2011we completed the significant acquisition of King Sturge in Europe after having considerably slowed our acquisitionactivity from 2008 through 2010. During 2012, 2013, 2014 and 2015, we completed four, five, ten and 20acquisitions, respectively. We are considering, and will continue to consider, acquisitions that we believe willstrengthen our market position, increase our profitability and supplement our organic growth. We have found itrelatively more challenging to identify appropriate acquisition candidates in our investment management businessthan we have been able to do in our RES business. In any event, there is no assurance that we will be able tocontinue our acquisition activity in the future at the same pace as we have in the past.
We believe we emerged from the global economic downturn in a stronger financial and market share positionrelative to certain of our traditional competitors. This may in some cases lead to a willingness on the part of acompetitor to engage in aggressive pricing, advertising or hiring practices in order to maintain market share orclient relationships. To the extent this occurs, it increases the competitive risks and the fee and compensation
44
pressures we face, although ramifications will differ from one competitor to another given their different positionswithin the marketplace and their different financial situations.
We are substantially dependent on long-term client relationships and on revenue received for services undervarious service agreements. Many of these agreements may be canceled by the client for any reason with as little as30 to 60 days’ notice, as is typical in the industry. In this competitive market, if we are unable to maintain theserelationships or are otherwise unable to retain existing clients and develop new clients, our business, results ofoperations and/or financial condition may be materially adversely affected. The global economic downturn andcontinued weaknesses in the markets in which they themselves compete have led to additional pricing pressurefrom clients as they themselves came under financial pressure, participated in governmental bail-out programs orfiled for bankruptcy or insolvency protection, as some significant clients did. These effects have continued tomoderate through 2015, but they could increase again in the wake of the continuing political and economicuncertainties within the European Union, the United States, China, India, Russia or the Middle East, including asa result of significantly lower oil and commodity prices.
THE SEASONALITY OF OUR REAL ESTATE SERVICES BUSINESS EXPOSES US TO RISKS.
Within our Real Estate Services business, our revenue and profits have historically grown progressively by quarterthroughout the year. This is a result of a general focus in the real estate industry on completing or documentingtransactions by fiscal year-end and the fact that certain of our expenses are constant through the year. Historically,we have reported a relatively smaller profit in the first quarter and then increasingly larger profit during each of thefollowing three quarters, excluding the recognition of investment-generated performance fees and co-investmentequity gains or losses (each of which can be particularly unpredictable).
The seasonality of our business makes it difficult to determine during the course of the year whether plannedresults will be achieved, and thus to adjust to changes in expectations. Additionally, negative economic or otherconditions that arise at a time when they impact performance in the fourth quarter, such as the particular timing ofwhen larger transactions close or changes in the value of the U.S. dollar against other currencies, may have a moresignificant impact than if they occurred earlier in the year. To the extent we are not able to identify and adjust forchanges in expectations or we are confronted with negative conditions that inordinately impact the fourth quarterof a calendar year, we could experience a material adverse effect on our financial performance.
As a result of growth in our property management and integrated facility management businesses and otherservices related to the growth of outsourcing of corporate real estate services, there has been somewhat lessseasonality in our revenue and profits during the past few years than there was historically, but we believe thatsome level of seasonality will always be inherent in our industry and outside of our control. We continued toexperience a level of seasonality in 2015 that was similar to previous years. We are unable to predict whether thedynamic nature of the markets in which we operate, or any change in their economic or political structures, willhave a material effect on the historical seasonality of our business in 2016 and beyond.
RISKS INHERENT IN MAKING ACQUISITIONS AND ENTERING INTO JOINT VENTURES.
Since 2005, we have completed over 80 acquisitions as part of our global growth strategy. Acquisitions subject us toa number of significant risks, any of which may prevent us from realizing the anticipated benefits or synergies ofthe acquisition. The integration of companies is a complex and time-consuming process that could significantlydisrupt the businesses of JLL and the acquired company. The challenges involved in integration and realizing thebenefits of an acquisition include:
• Diversion of management attention and financial resources from existing operations;
• Difficulties in integrating cultures, compensation structures, operations, existing contracts, accountingprocesses and methodologies, technology, and realizing the anticipated synergies of the combinedbusinesses;
• Failure to identify potential liabilities during the due diligence process;
45
• Failure to identify improper accounting practices during the due diligence process;
• Inability to retain the management, key personnel and other employees of the acquired business;
• Inability to retain clients of the acquired business;
• Exposure to legal, environmental, employment, professional standards, bribery, money-laundering, ethics,and other types of claims for improper activities of the acquired business prior to acquisition, includingthose that may not have been adequately identified during the pre-acquisition due diligence investigation orthose which the legal documentation associated with the transaction did not successfully terminate ortransfer;
• Addition of business lines in which we have not previously engaged (for example, general contractorservices for ‘‘ground-up’’ construction development projects); and
• Potential impairment of intangible assets, which could adversely affect our reported results.
Our failure to meet the challenges involved in successfully integrating our operations with those of anothercompany or otherwise to realize any of the anticipated benefits of an acquisition could have a materialadverse effect. Liabilities that we may either knowingly or inadvertently assume may not be fully insured.Additionally, the price we pay or other resources that we devote may exceed the value we realize, or the value wecould have realized if we had allocated the consideration payable for the acquisition or other resources to anotheropportunity.
To a much lesser degree, we have occasionally entered into joint ventures to conduct certain businesses or enternew geographies, and we will consider doing so in appropriate situations in the future. Joint ventures have many ofthe same risk characteristics as we discuss above with respect to acquisitions, particularly with respect to the duediligence and on-going relationship with the joint venture partner(s), given that each partner has inherently lesscontrol in a joint venture and will be subject to the authority and economics of the particular structure that isnegotiated. Given a particular structure, we may not have the authority to direct the management and policies ofthe joint venture. If a joint venture participant acts contrary to our interest, it could harm our brand, business,results of operations, and financial condition.
POLITICAL AND ECONOMIC INSTABILITY AND TRANSPARENCY: PROTECTIONISM; TERRORISTACTIVITIES; HEALTH EPIDEMICS.
We provide services in over 80 countries with varying degrees of political and economic stability and transparency.For example, within the past few years certain Middle Eastern, Asian, European, and South American countrieshave experienced serious political and economic instability that will likely continue to arise from time to time incountries in which we have operations. It is difficult for us to predict where or when a significant change in thepolitical leadership or regime within a given country may occur, or what the implications of such a change will beon our operations given that legislative, regulatory, tax and business environments can be altered quickly anddramatically. For example, continuing political activities in Russia, Brazil, and separately in various Middle Easterncountries, have significantly disrupted business activity in those countries. Also, in recent years there have beensignificant political changes in a number of countries, including the U.S. and India as examples, resulting inchanges to financial, tax, healthcare, governance, and other laws that may directly affect our business and continueto evolve.
Our ability to operate our business in the ordinary course and our willingness to commit new resources orinvestments may be affected or disrupted in one way or another, such as reductions in revenue, increases in taxes(due to more aggressive taxation policies), increases in other expenses (such as with respect to employeehealthcare), restrictions on repatriating funds, difficulties in collecting receivables from clients, difficulties inrecruiting staff, increased corruption, or other material adverse effects.
46
In the event that governments engage in protectionist policies which favor local firms over foreign firms or whichrestrict cross-border capital flows, our ability to utilize and benefit from our global platform and integratedbusiness model could be adversely affected. The global downturn significantly added to the deficit spending ofcertain governments in countries where we do business and called into question the creditworthiness of somecountries. This issue has still has not entirely gone away and more recently may have been exacerbated by thesignificant decline in oil and commodities prices. While the U.S. Federal Reserve loosened its monetary policiesthrough low interest rates and quantitative easing programs, European governments instituted austerity programsin an effort to contract spending and avoid defaults on sovereign debt, some of which resulted in social unrest. Thesocial unrest as the result of the implementation of the austerity programs has diminished, and some Europeancountries seem to have emerged successfully as they have also more recently loosened their own monetary policies.There has been some speculation that one or more European countries may stop using the Euro as their currencyor that some countries, notably England, may exit the European Union. The United States and the EuropeanUnion have instituted various sanctions against Russia as a result of that country’s actions with respect to Ukraineand Crimea, and have more recently loosened sanctions on Iran in the wake of an agreement regarding thatcountry’s nuclear program. The United States has begun to open formal relations with Cuba and has started toease certain trade sanctions. It is inherently difficult to predict what the consequences to our business may be fromthese situations as they develop further.
In addition, terrorist activities have escalated in recent years, have become increasingly unpredictable, and at timeshave affected cities in which we operate. The 2008 terrorist attack in Mumbai, India, where we have a presence, isan example and there have been serious situations in other cities where we have operations, including London,Boston, Paris, Sydney, Ottawa, Jakarta, and Moscow. To the extent that similar terrorist activities continue tooccur, they may adversely affect our business because they tend to target the same type of high-profile urban areasin which we do business.
Health epidemics that affect the general conduct of business in one or more urban areas (including as the result oftravel restrictions and the inability to conduct face-to-face meetings), such as occurred in the past from SARS andinfluenza, or may occur in the future from other types of outbreak, can also adversely affect the volume of businesstransactions, real estate markets and the cost of operating real estate or providing real estate services. During 2014,the Ebola epidemic in certain countries in Africa caused significant concern globally, although it was substantiallycontained within Africa. Outbreaks of the Zika virus in Central and South America, and more recently in the U.S.,are raising similar concerns.
The increasing globalization by our multi-national clients creates pressure to further expand our own geographicalreach into less developed countries, including for example within Africa, which tends to exacerbate the above risks.As we continue to provide services in countries that have relatively higher security risks and lower levels oftransparency, our exposure to the risks inherent in doing business in less developed markets increases.
ABILITY TO PROTECT INTELLECTUAL PROPERTY; INFRINGEMENT OF THIRD-PARTYINTELLECTUAL PROPERTY RIGHTS.
Our business depends, in part, on our ability to identify and protect proprietary information and other intellectualproperty such as our service marks, domain names, client lists and information, and business methods. Existinglaws of some countries in which we provide or intend to provide services, or the extent to which their laws areactually enforced, may offer only limited protections of our intellectual property rights. We rely on a combinationof trade secrets, confidentiality policies, non-disclosure and other contractual arrangements, and on patent,copyright and trademark laws to protect our intellectual property rights. In particular, we hold various trademarksand trade names, including our principal trade name, ‘‘JLL.’’ If our registered trade name were to expire orterminate, our competitive position in certain markets could be materially and adversely affected. Our inability todetect unauthorized use (for example, by current or former employees) or take appropriate or timely steps toenforce our intellectual property rights may have an adverse effect on our business.
We cannot be sure that the intellectual property that we may use in the course of operating our business or theservices we offer to clients do not infringe on the rights of third parties, although, in order to mitigate the risk, wedo obtain from the licensors representation and warranties, as well as indemnities, that they do not. We may have
47
infringement claims asserted against us or against our clients. These claims may harm our reputation, cost usmoney and prevent us from offering some services.
Confidential intellectual property is increasingly stored or carried on mobile devices, such as laptop computers,tablets and smartphones, which makes inadvertent disclosure more of a risk in the event the mobile devices are lostor stolen and the information has not been adequately safeguarded or encrypted. This also makes it easier forsomeone with access to our systems, or someone who gains unauthorized access by ‘‘hacking’’ or other type ofcyber-attack, to steal information and use it to the disadvantage of our Firm or our people. We believe that the riskfrom cyber-attacks has increased significantly as some major companies during the past few years reported thatthey had experienced broad-based theft of customer and internal data, with material financial and reputationalconsequences.
Advances in technology, which permit increasingly large amounts of information to be stored on smaller devices oron third-party ‘‘cloud’’ servers, as well as the proliferation of social media techniques, tend to exacerbate theserisks. On the other hand, cloud capabilities also allow us to conduct more monitoring of our email and otherknowledge storing mechanisms to pro-actively detect misuse of our intellectual property. We are also in the processof implementing certain additional monitoring systems, as well as various data analytics designed to detectpotential conflicts of interests and other inappropriate behaviors. While we believe these activities are beneficialfrom the perspective of protecting our assets, including clients’ intellectual property to which we may have access,these activities carry certain risks related to compliance with privacy and other applicable regulations in certaincountries.
CO-INVESTMENT, INVESTMENT, MERCHANT BANKING AND REAL ESTATE INVESTMENT BANKINGACTIVITIES.
An important part of our investment strategy includes investing in real estate, both individually and along with ourinvestment management clients. As of December 31, 2015, we have potential unfunded commitment obligations of$189.8 million to fund future co-investments. In order to remain competitive with well-capitalized financial servicesfirms, we also may make merchant banking investments for which we may use Firm capital to acquire propertiesbefore the related investment management funds have been established or investment commitments have beenreceived from third-party clients. A strategy that we have not pursued vigorously, but that still has potential, is tofurther engage in certain real estate investment banking activities in which we, either solely or with one or morejoint venture partners, would employ capital to assist our clients in maximizing the value of their real estate. Forexample, we might acquire a property from a client that wishes to dispose of it within a certain time frame, afterwhich we would market it for sale as the principal and therefore assume any related market risk.
We also operate business lines that have as part of their strategy the acquisition, development, management andsale of real estate. Investing in any of these types of situations exposes us to a number of risks.
Investing in real estate for the above reasons poses the following risks:
• We may lose some or all of the capital that we invest if the investments underperform. Real estateinvestments can underperform as the result of many factors outside of our control, including the generalreduction in asset values within a particular geography or asset class. Starting in 2007 and continuingthrough 2009, for example, real estate prices in many markets throughout the world declined generally asthe result of the significant tightening of the credit markets and the effects of recessionary economies andsignificant unemployment. We recognized impairment charges of $6.0 million, $2.4 million, $6.5 million,and $7.9 million for the years ended December 31, 2015, 2014, 2013, and 2012, respectively, primarilyrepresenting our co-investment share of the impairment charges against individual assets held by our realestate ventures. In contrast, as real estate investments benefited from benign interest rate environmentsglobally and continuing recovery in many of our markets, for the years ended December 31, 2015 and 2014we recognized equity earnings from our co-investments of $77.5 million and $48.3 million, respectively.
48

• We will have fluctuations in earnings and cash flow as we recognize gains or losses, and receive cash, uponthe disposition of investments, the timing of which is geared toward the benefit of our clients.
• We generally hold our investments in real estate through subsidiaries with limited liability; however, incertain circumstances, it is possible that this limited exposure may be expanded in the future based on,among other things, changes in applicable laws. To the extent this occurs, our liability could exceed theamount we have invested.
• We make co-investments in real estate in many countries, and this presents risks as described above. Thismay include changes to tax treaties, tax policy, foreign investment policy or other local political or legislativechanges that may adversely affect the performance of our co-investments. The global economic downturnincreases the chances of significant changes in government policies generally, the effects of which areinherently difficult to predict. We believe that the financial pressures on government entities that haveresulted from weak economies and deficit spending led taxing authorities to more aggressively pursue taxesand question tax strategies and positions.
• We generally make co-investments in the local currency of the country in which the investment asset exists.We will therefore be subject to the risks described below under ‘‘Currency Restrictions and Exchange RateFluctuations.’’
In certain situations, although they have been relatively limited historically, we raise funds from outside investorswhere we are the sponsor of real estate investments, developments or projects. To the extent we return less thanthe investors’ original investments because the investments, developments or projects have underperformedrelative to expectations, the investors could attempt to recoup the full amount of their investments under securitieslaw theories such as lack of adequate disclosure when funds were initially raised. Sponsoring funds into which retailinvestors are able to invest may increase this risk.
INFRASTRUCTURE DISRUPTIONS.
Our ability to conduct a global business may be adversely impacted by disruptions to the infrastructure thatsupports our businesses and the communities in which they are located. This may include disruptions involvingelectrical, communications, information technology, transportation, or other services used by JLL or third partieswith which we conduct business. It may also include disruptions as a result of natural disasters such as hurricanes,earthquakes, and floods, whether as a result of climate change or otherwise, political instability, general laborstrikes or turmoil, cyber-attacks or terrorist attacks. These disruptions may occur, for example, as a result of eventsaffecting only the buildings in which we operate (such as fires), or as a result of events with a broader impact on thecities where those buildings are located (including, potentially, the longer-term effects of global climate change).Nearly all of our employees in our primary locations, including Chicago, London, Singapore and Sydney, work inclose proximity to each other in one or more buildings. If a disruption occurs in one location and our employees inthat location are unable to communicate with or travel to other locations, our ability to service and interact withour clients may suffer, and we may not be able to successfully implement contingency plans that depend oncommunication or travel.
The infrastructure disruptions we describe above may also disrupt our ability to manage real estate for clients ormay adversely affect the value of real estate investments we make on behalf of clients. The buildings we manage forclients, which include some of the world’s largest office properties and retail centers, are used by many peopledaily. As a result, fires, earthquakes, floods, other natural disasters, and terrorist attacks can result in significantloss of life, and, to the extent we are held to have been negligent in connection with our management of theaffected properties, we could incur significant financial liabilities and reputational harm. An example during 2012was Hurricane Sandy, which disrupted our own operations in the Northeast United States and caused significantflooding damage to buildings we manage for clients in lower Manhattan, some of which took significant periods oftime to recover fully. During 2013 and 2014, Asia experienced significant, and in some cases unprecedented,typhoon activity.
49
The occurrence of natural disasters and terrorist attacks can also significantly impact the availability and/or cost ofcommercial insurance policies covering real estate, both for our own business and for those clients whoseproperties we manage and who may purchase their insurance through the insurance buying programs we makeavailable to them. Sometimes, even where policies are available, specific coverage for wind, flooding, earthquakes,or terrorism may not be available or may be very expensive.
There can be no assurance that the disaster recovery and crisis management procedures we employ will suffice inany particular situation to avoid a significant loss. Given that our staff is increasingly mobile and less reliant onphysical presence in a JLL office, our disaster recovery plans increasingly rely on the availability of the Internet(including ‘‘cloud’’ technology) and mobile phone technology, so the disruption of those systems, such as becauseof a cyber-attack, would likely affect our ability to recover promptly from a crisis situation. Additionally, our abilityto foresee or mitigate the potential consequences to managed properties, and real estate generally, from the effectsof climate change, may be limited. We have significant operations and client relationships in cities with coastalexposure, such as New York and Florida.
COMPETITION FOR TALENT.
We may experience skills gaps in particular service segments and geographies within the firm if we cannot attractthe right talent at the right time, thereby jeopardizing service delivery. There is a further risk of losing talent (andintellectual property and client contacts) to competitors, particularly in the context of increased use of social medianetworks. If we are unable to attract and retain qualified personnel, or to successfully plan for succession ofemployees holding key management positions, our growth may not be sustainable, and our business and operatingresults could suffer. These risks increase as we continue to grow as an organization and increase the number ofstaff, which has expanded significantly over the past decade. There may also be an increase in recruitment andcompensation costs.
EVOLUTION OF DIGITAL AND INFORMATION TECHNOLOGY.
The dynamic nature of the Internet and social media, which have substantially increased the availability andtransparency of information, could devalue the information that we gather and disseminate as part of our businessmodel and may harm certain aspects of our brokerage business in the event that principals of transactions prefer totransact directly with each other. In this regard, we face potential disintermediation challenges from companieswhose primary business is to aggregate and disseminate for compensation the listing information they obtain fromfirms like ours that represent commercial landlords offering space to let. We may also need to become increasinglyproductive and efficient in the way we deliver services or with respect to the cost structure supporting ourbusinesses, which may in turn require more innovative uses of technology as well as data gathering and datamining. The ability to protect our intellectual property electronically becomes more challenging as moreinformation becomes publicly available. Associated with this is the potential decline in demand for commercial realestate as flexible working practices increasingly become the norm.
Mobile technologies and online collaboration tools are transforming how business gets done. Informationtechnology is entering the big data era. Process power and data storage are becoming almost free; networks andthe cloud provide global access and a wide range of services; social media is pervasive in the global society, andwork and cybersecurity is increasingly important as hacking becomes more sophisticated. The evolution of digitaltechnology and information technology presents significant challenges for businesses and societies, which must findways to capture the benefits of new IT technologies while dealing with the new threats that those technologiespresent.
50
Operational Risk Factors
Operational risk relates to risks arising from systems, processes, people and external events that affect the operation ofour businesses. It includes information management and data protection and security, including cyber security; supplychain and business disruption; and other risks, including human resources and reputation.
REPUTATIONAL AND BRAND RISKS.
The value and premium status of our brand is one of our most important assets. An inherent risk in maintainingour brand is that we may fail to successfully differentiate the scope and quality of our service and product offeringsfrom those of our competitors, or that we may fail to sufficiently innovate or develop improved products or servicesthat will be attractive to our clients. Additionally, given the rigors of the competitive marketplace in which weoperate, there is the risk that we may not be able to continue to find ways to operate more productively and morecost-effectively, including by achieving economies of scale, or that we will be limited in our ability to further reducethe costs required to operate on a globally coordinated platform.
The rapid dissemination and increasing transparency of information, particularly for public companies, increasesthe risks to our business that could result from negative media or announcements about ethics lapses or otheroperational problems, which could lead clients to terminate or reduce their relationships with us. We are alsosubject to misappropriation of one of the names or trademarks we own by third parties that do not have the right touse them so that they can trade off of the goodwill we have built up in our intellectual property, and our efforts topolice usage of our intellectual property may not be successful in all situations.
TECHNOLOGY AND INFORMATION SYSTEMS; MANAGEMENT OF DATA.
Our business is highly dependent on our ability to process transactions, gather and disseminate information andmanage various types of client and other data across numerous and diverse markets in many currencies. If any ofour financial, accounting, human resources or other data processing, e-mail, client accounting, funds processing, orelectronic information management systems do not operate properly or are disabled, we could suffer a disruptionof our businesses, liability to clients, loss of client data, loss of employee data, regulatory intervention, breach ofconfidentiality or other contract provisions, or reputational damage. These systems may fail to operate properly orbecome disabled as a result of events that are wholly or partially beyond our control, including disruptions ofelectrical or communications services, disruptions caused by natural disasters, political instability, terrorist attacks,sabotage, computer viruses or problems with the Internet, deliberate attempts to disrupt our computer systemsthrough ‘‘hacking’’ or other forms of cyber-attack, or our inability to occupy one or more of our office buildings. Aswe outsource significant portions of our information technology functions to third-party providers, we bear the riskof having somewhat less direct control over the manner and quality of performance than we would if done by ourown employees. An example of this is the increasing use of ‘‘cloud’’ computing, whereby we outsource to thirdparties the maintenance of increasing amounts of our business records, including electronically maintaineddocuments and emails, rather than keeping them on our own servers.
We are exposed to the risk of cyber-attacks in the normal course of business. In general, cyber incidents can resultfrom deliberate attacks or unintentional events. We have observed an increased level of attention focused oncyber-attacks that include gaining unauthorized access to digital systems for purposes of misappropriating assets orsensitive information, corrupting data, or causing operational disruption. During the last few years, some majorcorporations reported that they had experienced broad-based theft of customer and internal data, with materialfinancial and reputational consequences. To the extent that our technology systems interact with those of ourclients, they may face similar potential problems and losses as the result of cyber-attacks through our systems thatthen impact their systems. Certain high-profile cyber-attacks at other companies have come through the systems ofsuppliers.
We are also increasingly recognizing both the challenges and opportunities involved in mining the data in oursystems so that we ‘‘know what we know’’ and can use that knowledge for the benefit of our clients and ourorganization in the most sophisticated possible ways.
51
While we have not incurred any material losses related to cyber-attacks, nor are we aware of any specific orthreatened cyber-incidents as of the date of this report, we may incur substantial costs and suffer other negativeconsequences if we fall victim to one or more successful cyber-attacks. Such negative consequences could include:remediation costs that may include liability for stolen assets or information and repairing system damage that mayhave been caused; increased cyber-security protection costs that may include organizational changes, deployingadditional personnel and protection technologies, training employees, and engaging third-party experts andconsultants; lost revenues resulting from unauthorized use of proprietary information or the failure to retain orattract clients following an attack; litigation; and reputational damage adversely affecting client or investorconfidence.
The development of new software systems used to operate one or more aspects of our business is complicated,particularly on a customized basis or in order to coordinate or consolidate financial, human resources or othertypes of infrastructure data reporting, client accounting or funds processing. Additionally, the effort may result incosts that we cannot recoup in the event of the failure to complete a planned software development. A newsoftware system that has defects may cause reputational issues and client or employee dissatisfaction and/ordamages, with our incurring liabilities and/or experiencing lost business as possible results. The acquisition ordevelopment of software systems is often dependent to one degree or another on the quality, ability and/orfinancial stability of one or more third-party vendors, over which we may not have control beyond the rights wenegotiate in our contracts. Different privacy regulations from one country to the next (or across a region such asthe European Union) may restrict our ability to share or collect data on a global basis, and this may limit the utilityof otherwise available technology. When we transfer data between countries and continents for the purpose ofmanaging and reporting on our global business, both internally within JLL systems and externally through third-party providers, we are exposed to the risk that our systems and operations may not meet all of the data privacyand protection laws of the countries from which the data originates. Furthermore, third-party providers whopreviously relied on the EU-U.S. Safe Harbor framework have now had to find alternative methods to meet EUstandards for data transfers in the wake of the European Commission’s invalidation of Safe Harbor in late 2015.Although we try to stay abreast of data privacy laws worldwide and keep track our data flows in order to assesswhere and what compliance requirements apply, the rapid development and changes in systems and technology,along with corresponding changes in laws and regulations, make this a difficult challenge.
CONCENTRATIONS OF BUSINESS WITH CORPORATE AND INVESTOR CLIENTS CAUSES INCREASEDCREDIT RISK AND GREATER IMPACT FROM THE LOSS OF CERTAIN CLIENTS; INCREASED RISKSFROM HIGHER LIMITATIONS OF LIABILITY IN CONTRACTS.
While our client base remains highly diversified across industries and geographies, we value the expansion ofbusiness relationships with individual corporate clients and institutional investors because of the increasedefficiency and economics (both to our clients and our Firm) that can result from developing repeat business fromthe same client and from performing an increasingly broad range of services for the same client. Havingincreasingly large and concentrated clients also can lead to greater or more concentrated risks of loss if, amongother possibilities, such a client (1) experiences its own financial problems, which can lead to larger individualcredit risks; (2) becomes bankrupt or insolvent, which can lead to our failure to be paid for services we havepreviously provided or funds we have previously advanced; (3) decides to reduce its operations or its real estatefacilities; (4) makes a change in its real estate strategy, such as no longer outsourcing its real estate operations;(5) decides to change its providers of real estate services; or (6) merges with another corporation or otherwiseundergoes a change of control, which may result in new management taking over with a different real estatephilosophy or in different relationships with other real estate providers. In the case of LaSalle, concentration ofinvestor clients can lead to fewer sources of investment capital, which can negatively affect assets undermanagement in case a higher-volume client withdraws its funds or does not re-invest them. This is also the casewithin LaSalle’s securities business and for Jones Lang LaSalle Income Property Trust, Inc., which are bothdependent on the continued ability and willingness of certain brokerage firms to attract investment funds fromtheir clients.
Additionally, competitive conditions, particularly in connection with increasingly large clients may require us tocompromise on certain contract terms with respect to the payment of fees, the extent of risk transfer, acting as
52
principal rather than agent in connection with supplier relationships, liability limitations, and other contractualterms, or in connection with disputes or potential litigation. Where competitive pressures result in higher levels ofpotential liability under our contracts, the cost of operational errors and other activities for which we haveindemnified our clients will be greater and may not be fully insured.
The global economic downturn provided an example of how risks to our organization increased as the result of thesignificant financial distress (which in some cases led to bankruptcy or insolvency) it placed on many organizations,including some that are clients of ours. Some of our largest clients include companies in the financial servicesindustry, such as commercial banks, investment banks, and insurance companies, and companies in the autoindustry, which were significantly impacted by the global economic downturn and took a number of years torecover. Political and financial issues in the European Union have continued to negatively impact the financialcondition of companies conducting significant operations in European countries as the result of contractions ingovernment spending, reduced liquidity from banks, and social unrest. More recently, actions taken by Russia withrespect to Crimea and Ukraine have led to economic sanctions by the United States and the European Unionagainst Russia, which have impacted the Russian economy and the ability and willingness of global and foreignbusinesses to continue to conduct business in Russia.
Where we provide services to firms in the financial services industry, including banks and investment banks, we areexperiencing indirectly the increasing extent of the regulatory environment to which they are subject in theaftermath of the global financial crisis. This increases the cost of doing business with them, which we are not alwaysable to pass on, as the result of the additional resources and processes we are required to provide as a criticalsupplier.
CONTRACTUAL LIABILITIES AS PRINCIPAL AND FOR WARRANTED PRICING.
We may, on behalf of our clients, hire and supervise third-party contractors to provide construction, engineering,maintenance and various other services for properties we are managing or developing on behalf of clients.Depending upon (1) the terms of our contracts with clients, which, for example, may place us in the position of aprincipal rather than an agent, or (2) the responsibilities we assume or are legally deemed to have assumed in thecourse of a client engagement (whether or not memorialized in a contract), we may be subjected to, or becomeliable for, claims for construction defects, negligent performance of work, or other similar actions by third partieswho we engage.
Adverse outcomes of property management disputes or litigation could negatively impact our business, operatingresults and/or financial condition, particularly if we have not limited in our contracts the extent of damages towhich we may be liable for the consequences of our actions, or if our liabilities exceed the amounts of thecommercial third-party insurance that we carry. Moreover, our clients may seek to hold us accountable for theactions of contractors because of our role as property manager even if we have technically disclaimed liability as alegal matter, in which case we may find it commercially prudent to participate in a financial settlement forpurposes of preserving the client relationship.
Acting as a principal may also mean that we pay a contractor before we have been reimbursed by the client, whichexposes us to additional risks of collection from the client in the event of a dispute with the client or an interveningbankruptcy or insolvency of the client. The reverse can occur as well, where a contractor we have paid filesbankruptcy or commits fraud with the funds before completing a project for which we have paid it in part or in full.As part of our project management business, we may enter into agreements with clients that provide for awarranted or guaranteed cost for a project that we manage. In these situations, we are responsible for managingthe various other contractors required for a project, including general contractors, in order to ensure that the costof a project does not exceed the contract price and that the project is completed on time. In the event that one ofthe other contractors on the project does not or cannot perform as a result of bankruptcy or for some other reason,we may be responsible for any cost overruns as well as the consequences for late delivery. In the event that forwhatever reason we have not accurately estimated our own costs of providing services under warranted orguaranteed cost contracts, we may lose money on such contracts until such time as we can legally terminate them.Also, the application of indirect taxes, such as sales taxes, goods and services taxes, and value added taxes may beless clear for these agreements, potentially impacting our margins.
53
During an economic downturn in a given country or region generally, we would expect to experience credit-relatedproblems at a higher level than usual with vendors and contractors due to their increased financial instability. Forexample, this became a reality during the global financial crisis.
PERFORMANCE AND FIDUCIARY OBLIGATIONS UNDER CLIENT CONTRACTS; REVENUERECOGNITION; SCOPE CREEP; RISING COST OF INSURANCE RESULTING FROM NEGLIGENCECLAIMS; RESPONSIBILITY FOR SAFETY OF CONTRACTORS.
In certain cases we are subject to fiduciary obligations to our clients, which may result in a higher level of legalobligation compared to basic contractual obligations. These relate to, among other matters, the decisions we makeon behalf of a client with respect to managing assets on its behalf or purchasing products or services from thirdparties or other divisions within our Firm. Our services may involve handling substantial amounts of client funds inconnection with managing their properties.
They may also involve complicated and high-profile transactions which involve significant amounts of money. Weface legal and reputational risks in the event we do not perform, or are perceived to have not performed, underthose contracts or in accordance with those obligations, or in the event we are negligent in the handling of clientfunds or in the way in which we have delivered our professional services.
We have certain business lines, such as valuations and lease administration, where the size of the transactions wehandle is much greater than the fees we generate from them. As a result, the consequences of errors that lead todamages can be disproportionately large in the event our contractual protections or our insurance coverage areinadequate to protect us fully.
The precautions we take to prevent these types of occurrences, which represent a significant commitment ofcorporate resources, may nevertheless be ineffective in certain cases. Unexpected costs or delays could make ourclient contracts or engagements less profitable than anticipated. Any increased or unexpected costs orunanticipated delays in connection with the performance of these engagements, including delays caused by factorsoutside our control, could have an adverse effect on profit margins.
In the event we perform services for clients without executing sufficient contractual documentation, we may beunable to realize our full compensation potential or recognize revenue for accounting purposes, and we may not beable to effectively limit our liability in the event of client disputes. If we perform services for clients that arebeyond, or different from, what were originally contemplated in the governing contracts (known as ‘‘scope creep’’),we may not be fully reimbursed for the services provided, or our potential liability in the case of a negligence claimmay not have been as limited as it normally would have been or may be unclear.
If we make a large insurance claim on our professional indemnity policy due to a situation involving ournegligence, we would expect subsequent premiums to increase materially, the size of deductibles we are required toretain could increase substantially, and the availability of future coverage could be negatively impacted.
Some current and prospective clients, particularly those in heavy industries and commodities, have more recentlybegun to seek data about the safety records of contractors we hire to do work on construction-related projects(such as electricians) and to impute their results to ours in evaluating our overall approach to safety. Historically,although we have always encouraged high levels of workplace safety by the contractors we have hired, we have notmandated particular protocols or gathered global data on safety incidents on projects being performed bycontractors. In light of the more recent client requests, we are evaluating our approach to safety requirements atcontractors and the data we gather. To the extent that our approach to contractor safety does not satisfy certainclients, we risk losing their business.
ABILITY TO CONTINUE TO MAINTAIN SATISFACTORY INTERNAL FINANCIAL REPORTINGCONTROLS AND PROCEDURES.
If we are not able to continue to successfully operate under the requirements of Section 404 of the United StatesSarbanes-Oxley Act of 2002, or if there is a failure of one or more controls over financial reporting due to fraud,
54
improper execution or the failure of such controls to adjust adequately as our business evolves, then ourreputation, financial results and the market price of our stock could suffer. Our accounting can be complex andrequires that management make judgments with respect to revenue recognition and other aspects of our business.While we believe that we have adequate internal financial reporting control procedures in place, we may beexposed to potential risks from this legislation, which requires companies to evaluate their internal controls andhave them attested to by their independent registered public accounting firm on an annual basis. We haveevaluated our internal control systems to allow our management to report on, and our independent registeredpublic accounting firm to attest to, our internal controls over financial reporting as required for purposes of thisAnnual Report on Form 10-K for the year ended December 31, 2015. However, there can be no assurance that wewill continue to receive a positive attestation in future years, particularly since standards continue to evolve and arenot necessarily being applied consistently from one independent registered public accounting firm to another. If weidentify one or more material weaknesses in our internal controls in the future that we cannot remediate in atimely fashion, we may be unable to receive a positive attestation at some time in the future from our independentregistered public accounting firm with respect to our internal controls over financial reporting.
CORPORATE CONFLICTS OF INTEREST.
All providers of professional services to clients, including our Firm, must manage potential conflicts of interest.This occurs principally where the primary duty of loyalty we owe to one client may potentially be weakened orcompromised by a relationship we also maintain with another client or third party. Corporate conflicts of interestarise in the context of the services we provide as a Firm to our different clients. Personal conflicts of interest on thepart of our employees are separately considered as issues within the context of our Code of Business Ethics. Thefailure or inability of the Firm to identify, disclose and resolve potential conflicts of interest in a significantsituation could have a material adverse effect.
An example of a potential conflict of interest situation is that in the ordinary course of its business, LaSalle hiresproperty managers for the investment properties it holds on behalf of clients. In that case, LaSalle may hire JLL toprovide such services or it may hire a firm that is a competitor of JLL. In the event it retains JLL, it may appear tohave a conflict of interest with respect to the selection. As a fiduciary with respect to its client funds, LaSalleresolves such potential conflicts by acting independently of JLL and following certain internal procedures designedto select the service provider that can best represent the interests of the investment management client or fund.
Another example is that in certain countries, based upon applicable regulations and local market dynamics, wehave established joint ventures or other arrangements with insurance brokers through which insurance coverage isoffered to clients, tenants in buildings we manage and vendors to those buildings. Although we fully disclose ourarrangements and do not require anyone to use the insurance services, JLL has a financial interest in theplacement of insurance with such third parties and therefore we may be deemed to have certain conflicts ofinterest.
There are occasions when one JLL team represents the landlord of a building in leasing its space and a separateJLL team represents a tenant that is considering, or selects, space in that building. In those situations, we fullydisclose our dual roles to both clients, obtain their informed consent to continue and put ‘‘ethical wall’’ and otherprotections in place (such as ring-fenced compensation protocols) so that each client benefits from the zealousrepresentation by its JLL team.
After reductions in the market values of the underlying properties, firms engaged in the business of providingvaluations are inherently subject to a higher risk of claims with respect to conflicts of interest based on thecircumstances of valuations they previously issued. Regardless of the ultimate merits of these claims, theallegations themselves can cause reputational damage and can be expensive to defend in terms of counsel fees andotherwise.
CLIENT AND VENDOR DUE DILIGENCE.
There are circumstances where the conduct or identity of our clients could cause us reputational damage orfinancial harm or could lead to our non-compliance with certain laws. An example would be the attempt by a client
55
to ‘‘launder’’ funds through its relationship with us, namely to disguise the illegal source of funds that are put intootherwise legitimate real estate investments. Additional examples are (1) our inadvertently doing business with aclient that has been listed on one of the ‘‘prohibited persons’’ lists now issued by many governments around theworld and (2) our inadvertently doing business with a private client or governmental entity within a country that isprohibited under applicable regulations such as those published in the United States by the Office of Foreign AssetControl (‘‘OFAC’’). We may also from time to time legally invest the sovereign wealth funds of a government entityclient which is subsequently deemed to be inappropriate either from a reputational or legal standpoint.
Similar problems can arise with respect to the vendors or suppliers we hire to provide services or products to us orfor our clients. In the normal course of business, we spend significant amounts in order to purchase goods andservices for the properties we manage on behalf of clients. A potential problem would be an intermediary thatmakes illegal payments on our behalf or on behalf of a client, even where contrary to our stated policies and to ourspecific agreement with such intermediary, under the U.S. Foreign Corrupt Practices Act or the U.K. Bribery Act.
Our efforts to evaluate clients, vendors and government entities before doing business with them to avoidconducting business with a prohibited party, or within a prohibited country, and to avoid attempts to laundermoney, make bribery payments or otherwise to exploit their relationship with us may not be successful in allsituations since compliance for a business such as ours is very complex and also since we take a risk-based approachto the procedures we have employed. The ability to conduct diligence is inherently diminished in less developedcountries with lower level of transparency and fewer public records.
Additionally, it is not always possible to accurately determine the ultimate owners or control persons within ourclients’ organizations or other entities with which we do business, particularly if they are actively attempting to hidesuch information from regulatory authorities. We may therefore unknowingly be doing business with entities thatare otherwise involved in illegal activities that do not involve us or that are ultimately controlled by persons withwhom engaging in business has been prohibited by applicable regulatory authorities.
DIFFICULTIES AND COSTS OF STAFFING AND MANAGING INTERNATIONAL OPERATIONS.
The coordination and management of international operations pose additional costs and difficulties. We mustmanage operations that are in many time zones and that involve people with language and cultural differences.Our success depends on finding and retaining people capable of dealing with these challenges effectively, who willrepresent the Firm with the highest levels of integrity and who will communicate and cooperate well withcolleagues and clients across multiple geographies. If we are unable to attract and retain qualified personnel, or tosuccessfully plan for succession of employees holding key management positions, our growth may not besustainable, and our business and operating results could suffer. These risks increase as we continue to grow as anorganization and increase the number of staff, which has expanded significantly over the past decade.
Among the challenges we face in retaining our people is maintaining a compensation system that rewards themconsistent with local market practices and with our profitability. This can be especially difficult where competitorsmay be attempting to gain market share by aggressively attempting to hire our best people at rates of compensationthat are well above the current market level. Another continuing challenge we have is to maintain compensationsystems that align financial incentives with our strategic goals as an organization and the business and ethicsbehaviors we want to drive among our people, while at the same time not creating incentives to engage in overlyrisky business pursuits or behaviors. Since compensation is our single biggest expense, its management cansignificantly affect our financial results. An example is the high cost that may be associated with employmenttermination in some countries.
We have committed resources to effectively coordinate our business activities around the world to meet our clients’needs, whether they are local, regional or global. We also consistently attempt to enhance the establishment,organization and communication of corporate policies, particularly where we determine that the nature of ourbusiness poses the greatest risk of noncompliance. The failure of our people to carry out their responsibilities inaccordance with our client contracts, our corporate and operating policies, or our standard operating procedures,or their negligence in doing so, could result in liability to clients or other third parties, which could have a material
56
adverse effect. This is true not only with respect to individuals we employ directly, but also individuals who workfor third-party vendors whom we hire on behalf of clients, especially where we are acting in a principal capacity.
We believe these risks may be higher for our company than for others given that the nature of our business requiresour people to be spread across numerous corporate offices and client facilities globally, which makescommunications and consistency of standards more challenging. Additionally, the nature of our global outsourcingbusiness means that we regularly must on-board significant numbers of new staff at one time as part of thetransition into our Firm of new global accounts, which again makes communications of our policies and drivingperformance consistency particularly challenging.
Employees we hire may be subject to restrictions under employment agreements with previous employers that canrestrict their activities, and therefore their contributions, for a period of time after they join us. For example, theymay be prohibited from soliciting business from certain clients, or from soliciting other individuals to join us asemployees.
The worldwide credit crisis and economic recession caused us to restructure certain parts of our business in 2009,and to a lesser degree during 2010, in order to size them properly relative to levels of business activity we expect inthe markets in which we compete. These types of activities, which may reoccur in the future, present additionalrisks to the business. When addressing staffing in connection with a restructuring of our organization or adownturn in economic conditions or activity, we must take into account the employment laws of the countries inwhich actions are contemplated. In some cases, this can result in significant costs, time delays in implementingheadcount reductions and, potentially, litigation regarding allegedly improper employment practices.
Labor costs are rising in emerging economies and expected to increase further. Corporate payrolls are projected toincrease as greater competition for labor and social pressure to raise salaries in line with productivity growth causeeven greater wage convergence. It is becoming increasingly challenging to predict regional and national laborpolicies and regulations are becoming increasingly hard to predict. The potential indirect implications of thesechanges are difficult to assess. For example, rising employment costs for clients could bring about an increase inoutsourcing that could benefit our business.
EMPLOYEE, VENDOR AND THIRD-PARTY MISCONDUCT.
Like any business, we run the risk that employee fraud or other misconduct could occur. In a company such as ourswith over 60,000 employees, it is not always possible to successfully deter employee misconduct, and theprecautions we take to prevent and detect this activity may not be effective in all cases. Employee misconduct,including fraud and involvement in incoming or outgoing bribery situations, can cause significant financial orreputational harm to any business, from which full recovery cannot be assured. We also may not have insurancethat covers any losses in full or that covers losses from particular criminal acts.
Because we often hire third-party vendors and suppliers to perform services for our own account or for clients, weare also subject to the consequences of fraud, bribery or misconduct by employees of our vendors, which also canresult in significant financial or reputational harm (even if we have been adequately protected from a legalstandpoint). We have instituted a Vendor Code of Conduct, which is published in multiple languages on our publicwebsite, and which is intended to communicate to our vendors the standards of conduct we expect them to uphold.Our contracts with vendors also generally impose a contractual obligation to comply with that Vendor Code. Inaddition, we are investing in technology to help us better screen vendors, with the aim of gaining a deeperunderstanding of the risks posed to our business by potential and existing vendors.
Anecdotally, the risk that the Company will be the victim of fraud, both from employees and third parties, isgenerally thought to increase during times of broad economic stress such as we experienced particularly during2008 and 2009. An example of a third-party fraud would be attempts to draw on bank accounts by way of forgedchecks or by corporate identity theft. We have increasingly experienced both types of attempts in recent yearsalthough none has caused us significant financial loss.
57
SCRUTINY OF EXECUTIVE COMPENSATION PROGRAMS; AND INFLUENCE OF SHAREHOLDERADVOCACY GROUPS.
In recent years, there has been increasing scrutiny of the executive compensation practices of all public companiesin the United States. Shareholders have been given increasing rights to vote on the acceptability of pay practicesand the issuance of equity compensation. Independent shareholder advocacy groups have also had increasinginfluence on the decisions of institutional investors on how to vote on executive compensation matters. In the eventthat these emerging circumstances result in changes to our pay practices or our ability to issue equity compensationto executives or otherwise to deduct executive compensation, we may have difficulty in retaining our executives orwe could experience additional tax costs with respect to our compensation programs.
Legal and Compliance Risk Factors
Legal and compliance risk relates to risks arising from the government and regulatory environment and action; and legalproceedings and compliance with integrity policies and procedures. Government and regulatory risk includes the riskthat the government or regulatory actions will impose additional cost on us or cause us to have to change our businessmodels or practices.
BURDEN OF COMPLYING WITH MULTIPLE AND POTENTIALLY CONFLICTING LAWS ANDREGULATIONS AND DEALING WITH CHANGES IN LEGAL AND REGULATORY REQUIREMENTS.
We face a broad range of legal and regulatory environments in the countries in which we do business. Coordinatingour activities to deal with these requirements presents significant challenges. For example, in the United Kingdom,the Financial Conduct Authority (‘‘FCA’’) regulates the conduct of investment businesses (often by implementingregulation imposed on it by the European Union) and the Royal Institute of Chartered Surveyors (‘‘RICS’’)regulates the profession of Chartered Surveyors, which is the professional qualification required for certain of theservices we provide in the United Kingdom, in each case through upholding standards of competence and conduct.As another example, activities associated with raising capital, offering investment funds and investment sales areregulated in the United States by the SEC and in other countries by similar securities regulatory authorities. Thereal estate investment trust managed by LaSalle that we launched during 2012 under the name of Jones LangLaSalle Income Property Trust, Inc. increased our exposure to these types of regulations.
As a publicly traded company, we are subject to various corporate governance and other requirements establishedby statute, pursuant to SEC regulations and under the rules of the New York Stock Exchange. During the pastdecade, the Sarbanes-Oxley and Dodd-Frank legislative initiatives in the United States have added significantrequirements to various aspects of our governance. Additionally, changes in legal and regulatory requirements canimpact our ability to engage in business in certain jurisdictions or increase the cost of doing so. The legalrequirements of U.S. statutes may also conflict with local legal requirements in a particular country, as, forexample, when anonymous hotlines required under U.S. law were construed to conflict in part with French privacylaws. Avoiding regulatory pitfalls as a result of conflicting laws will continue to be a key focus as non-U.S. statutorylaw and court decisions create more ambiguity. One example of this is the 2015 European Court of Justice ruling inShrems v. Data Protection Authority in which the court nullified the 15 year-old safe harbor agreement governinghow U.S. companies handle their European customers’ personal information. The jurisdictional reach of laws maybe unclear as well, as when laws in one country purport to regulate the behavior of affiliated corporations withinour group that are operating in other countries. There is some uncertainty, for example, in the jurisdictional reachof the U.K. Bribery Act, and the standards for illegal activity in that Act are in some ways higher than thoseestablished under the U.S. Foreign Corrupt Practices Act.
Identifying the regulations with which we must comply, and then complying with them is complex. We may not besuccessful in complying with regulations in all situations, as a result of which we could be subject to regulatoryactions and fines for non-compliance. The global economic crisis resulted in an unusual level of relatedgovernment and legislative activities, including for example the Dodd-Frank Wall Street Reform and ConsumerProtection Act, which we expect will continue into the future and which exacerbates these risks. We are also seeingincreasing levels of labor regulation in emerging markets, such as China, which affect our property managementbusiness.
58
The Iran Threat Reduction and Syria Human Rights Act of 2012 added Section 13(r) of the U.S. SecuritiesExchange Act of 1934, as amended (‘‘Section 13(r)’’). Section 13(r) requires disclosure where we or any of ouraffiliates have knowingly engaged, among other things, in certain transactions involving Iran, the Government ofIran, or persons or entities designated under certain executive orders. We must also file a notice with the SEC ifany disclosable activities under Section 13(r) have been included in an annual or quarterly report. Section 13(r)applies to all annual and quarterly reports required to be made after February 6, 2013, and applies to all contracts,including those in existence on or before that date.
U.S. laws and regulations govern the provision of products and services to, and other trade-related activitiesinvolving, certain targeted countries and parties. These measures include U.S. economic sanctions targeting Iran towhich the Company is subject. As a result, we have had longstanding policies and procedures to restrict or prohibitsales of our services into countries that are subject to embargoes and sanctions or to countries designated as statesponsors of terrorism, such as Iran. In conjunction with such policies, we have also implemented certainprocedures to evaluate whether existing or potential clients appear on the ‘‘Specially Designated Nationals andBlocked Persons List’’ (‘‘SDN List’’) maintained by the U.S. Treasury Department’s Office of Foreign AssetsControl (‘‘OFAC’’).
Changes in governments or majority political parties may result in significant changes in enforcement prioritieswith respect to employment, health and safety, tax, securities disclosure and other regulations, which in turn couldnegatively affect our business.
CIVIL AND REGULATORY CLAIMS; LITIGATING DISPUTES IN DIFFERENT JURISDICTIONS.
Substantial civil legal liability or a significant regulatory action against our Firm could have a material adversefinancial effect or cause us significant reputational harm, which in turn could seriously harm our businessprospects. Many legal systems, including in the United States, have fairly significant barriers against recoveringlegal fees from plaintiffs that file cases we consider frivolous, so the costs to us of defending such cases can besubstantial even if we prevail.
While we maintain commercial insurance in an amount we believe is appropriate, we also maintain a significantlevel of self-insurance for the liabilities we may incur. Although we place our commercial insurance with onlyhighly-rated companies, the value of otherwise valid claims we hold under insurance policies may becomeuncollectible due to the insolvency of the applicable insurance company.
Additionally, the claims we have can be complex and insurance companies can prove difficult or bureaucratic inresolving them, which may result in payments to us being delayed or reduced or that we must litigate in order toenforce an insurance policy claim.
Any disputes we have with third parties, or any government regulatory matters, generally must be adjudicatedwithin the jurisdiction in which the dispute arose. Therefore, our ability to resolve such disputes successfullydepends on the local laws that apply and the operation of the local judicial system. The timeliness, quality,transparency, integrity and sophistication of judicial systems vary widely from one jurisdiction to the next. Ourgeographic diversity therefore may expose us to disputes in certain jurisdictions that could be challenging toresolve efficiently and/or effectively, particularly as there appears to be an increasing tendency toward litigation inemerging markets, where the rule of law is less reliable, legal systems are less mature and transparent, and thepotential for judicial corruption remains a practical reality. It also may be more difficult to collect receivables fromclients who do not pay their bills in certain jurisdictions, since resorting to the judicial system in certain countriesmay not be an effective alternative given the delays and costs involved.
LICENSING AND REGULATORY REQUIREMENTS.
The brokerage of real estate sales and leasing transactions, property management, construction, mobileengineering, conducting valuations, trading in securities for clients, and the operation of the investment advisorybusiness, among other business lines, may require us to maintain licenses in various jurisdictions in which weoperate and to comply with particular regulations. We believe that licensing requirements have generally been
59
increasing in recent years. If we fail to maintain our licenses or conduct regulated activities without a license or incontravention of applicable regulations, we may be required to pay fines or return commissions or investmentcapital from investors. We may also have a given license suspended or revoked, meaning that we would need tosuspend or cease the business activities for which the license was required. Our acquisition activity increases theserisks, because we must successfully transfer licenses of the acquired entities and their staff, as appropriate.Licensing requirements may also preclude us from engaging in certain types of transactions or change the way inwhich we conduct business or the cost of doing so. In addition, because the size and scope of real estate salestransactions and the number of countries in which we operate or invest have increased significantly during the pastseveral years, both the difficulty of ensuring compliance with the numerous licensing regimes and the possible lossresulting from noncompliance have increased. To the extent we expand our service offerings further into moreheavily regulated sectors, such as healthcare, environmental, pharmaceutical, scientific and medical laboratories,airports, and industrial, the regulatory framework within which we operate may get more complicated and theconsequences of noncompliance more serious.
The regulatory environment facing the investment management industry has also grown significantly morecomplex in recent years. Countries are expanding the criteria requiring registration of investment advisors andfunds, whether based in their country or not, and expanding the rules applicable to those that are registered, all inan effort to provide more protection to investors located within their countries. In some cases, rules from differentcountries are applicable to more than one of our investment advisory companies and can conflict with those oftheir home countries. Although we believe we have good processes, policies, and controls in place to address thenew requirements, these additional registrations and increasingly complex rules increase the possibility thatviolations may occur.
These risks also apply separately to the real estate investment trust we launched during 2012 that is managed byLaSalle. That entity has registered the securities it is issuing with the SEC in the United States and is subject toregulation as a public company, albeit not one separately listed on a stock exchange.
Highly publicized accounting and investment management frauds that occurred in various businesses and countriesduring the financial crisis may result in significant changes in regulations that may affect our investmentmanagement business and our broker-dealer entities. Furthermore, the laws and regulations applicable to ourbusiness, both in the United States and in foreign countries, also may change in ways that materially increase thecosts of compliance. Particularly in emerging markets, there can be relatively less transparency around thestandards and conditions under which licenses are granted, maintained or renewed. It also may be difficult todefend against the arbitrary revocation of a license in a jurisdiction where the rule of law is less well developed.
As a licensed real estate service provider and advisor in various jurisdictions, we and our licensed employees maybe subject to various due diligence, disclosure, standard-of-care, anti-money laundering and other obligations inthe jurisdictions in which we operate. Failure to fulfill these obligations could subject us to litigation from partieswho purchased, sold or leased properties we brokered or managed, or who invested in our funds. We could becomesubject to claims by participants in real estate sales or other services claiming that we did not fulfill our obligationsas a service provider or broker. This may include claims with respect to conflicts of interest where we are acting, orare perceived to be acting, for two or more clients with potentially contrary interests.
Licensing requirements may also preclude us from engaging in certain types of transactions or change the way inwhich we conduct business or the cost of doing so. In addition, because the size and scope of real estate salestransactions and the number of countries in which we operate or invest have increased significantly during the pastseveral years, both the difficulty of ensuring compliance with the numerous licensing regimes and the possible lossresulting from noncompliance have increased. To the extent we expand our service offerings further into moreheavily regulated sectors, such as healthcare, environmental, pharmaceutical, scientific and medical laboratories,airports and industrial, the regulatory framework within which we operate may get more complicated and theconsequences of noncompliance more serious.
60
POTENTIALLY ADVERSE TAX CONSEQUENCES; CHANGEES IN TAX LEGISLATION AND TAX RATES.
We face a variety of risks of increased future taxation on our earnings as a corporate taxpayer in the countries inwhich we have operations. Moving funds between countries can produce adverse tax consequences in the countriesfrom which and to which funds are transferred, as well as in other countries, such as the United States, in which weare potentially subject to the taxation of earnings of other countries’ operations. Additionally, as our operations areglobal, we face challenges in effectively gaining a tax benefit for costs incurred in one country that benefit ouroperations in other countries.
Changes in tax legislation or tax rates may occur in one or more jurisdictions in which we operate that maymaterially increase the cost of operating our business. This includes the potential for significant legislative policychange in the taxation of multinational corporations, as has recently been the subject of the Base Erosion andProfit Shifting project of the Organization for Economic Co-operation and Development, and legislation inspiredby that initiative. It is also possible that some governments will make significant changes to their tax policies as partof their responses to their budgetary positions.
Further, interpretations of existing tax law in various countries may change due to the activities of tax authorities,which we believe are generally increasing the level of examination activities of major corporations, and thedecisions of courts. In addition, the views of the business community and the public on acceptable tax planningactivities, expressed through increased media scrutiny and the activities of non-governmental activist organizations,may influence further changes in tax law, affecting corporate taxpayers broadly.
We face such risks both in our own business and also in the investment funds that LaSalle operates. Adverse orunanticipated tax consequences to the funds can negatively impact fund performance, incentive fees and the valueof co-investments that we have made. We are uncertain as to the ultimate results of these potential changes or whattheir effects will be on our business in particular.
NONCOMPLIANCE WITH POLICIES; COMMUNICATIONS AND ENFORCEMENT OF OUR POLICIESAND OUR CODE OF BUSINESS ETHICS.
The geographic and cultural diversity in our organization makes it more challenging to communicate theimportance of adherence to our Code of Business Ethics and our Vendor Code of Conduct, to monitor and enforcecompliance with its provisions on a worldwide basis, and to ensure local compliance with United States and Englishlaws that apply globally in certain circumstances. These include the U.S. Foreign Corrupt Practices Act, the PatriotAct and the Sarbanes-Oxley Act of 2002 in the United States, the Bribery Act in the United Kingdom and theAnti-Corruption Law in Brazil.
Breaches of our Code of Business Ethics, particularly by our executive management, could have a material adverseeffect. Breaches of our Vendor Code of Conduct by vendors whom we retain as a principal for client engagementscan also lead to significant losses to clients from financial liabilities that might result.
ENVIRONMENTAL LIABILITIES AND REGULATIONS; CLIMATE CHANGE RISKS; AND AIR QUALITYRISKS.
The Firm’s operations are affected by federal, state and/or local environmental laws in the countries in which wemaintain office space for our own operations and where we manage properties for clients. We may face liabilitywith respect to environmental issues occurring at properties that we manage or occupy, or in which we invest.Various laws and regulations restrict the levels of certain substances that may be discharged into the environmentby properties, or they may impose liability on current or previous real estate owners or operators for the cost ofinvestigating, cleaning up or removing contamination caused by hazardous or toxic substances at the property. Wemay face costs or liabilities under these laws as a result of our role as an on-site property manager or a manager ofconstruction projects. Our risks for such liabilities may increase as we expand our services to include moreindustrial and/or manufacturing facilities than has been the case in the past. In addition, we may face liability if
61
such laws are applied to expand our limited liability with respect to our co-investments in real estate as discussedabove. Within our own operations, we face additional costs from rising fuel prices which make it more expensive topower our corporate offices.
Given that the Firm’s own operations are generally conducted within leased office building space, we do notcurrently anticipate that regulations restricting the emissions of greenhouse gases, or taxes that may be imposed ontheir release, would result in material costs or capital expenditures. However, we cannot be certain about theextent to which such regulations will develop, as there are higher levels of understanding and commitments bydifferent governments around the world regarding the risks of climate change and how they should be mitigated.Regulations relating to climate change may affect the scope of services we provide to clients in their managedproperties, but clients would typically bear any additional costs of doing so under their contracts with us. In anyevent, we anticipate that the burden and cost to the Firm of climate change disclosure and carbon reporting willincrease over time.
We are not aware of any material noncompliance with the environmental laws or regulations currently applicableto us, and we are not the subject of any material claim for liability with respect to contamination at any location.However, these laws and regulations may discourage sales and leasing activities and mortgage lending with respectto some properties, which may adversely affect both us and the commercial real estate services industry in general.Environmental contamination or other environmental liabilities may also negatively affect the value of commercialreal estate assets held by entities that are managed by our investment management business, which could adverselyaffect the results of operations of this business segment.
The impact of climate change presents a significant risk. Damage to assets caused by extreme weather eventslinked to climate change is becoming more evident, highlighting the fragility of global infrastructure. As anexample, there is a significant risk to coastal properties as sea levels rise. In the U.S., losses are likely to beconcentrated in specific regions, especially on the Southeast and Atlantic coasts.
We also anticipate that the potential effects of climate change will increasingly impact our own operations andthose of client properties we manage, especially when they are located in coastal cities. For example, during 2012our own operations and properties we manage for clients in the northeastern United States and in particular NewYork City, were impacted by Hurricane Sandy, in some cases significantly.
We anticipate that the potential effects of climate change will increasingly impact the decisions and analysis thatLaSalle makes with respect to the properties it considers for acquisition on behalf of clients since climate changeconsiderations can impact the relative desirability of locations and the cost of operating and insuring acquiredproperties. Future legislation that requires specific performance levels for building operations could make non-compliant buildings obsolete, which could materially affect investments in properties we have made on behalf ofclients, including those in which we may have co-invested. Climate change considerations will likely alsoincreasingly be part of the consulting work that JLL does for clients to the extent it is relevant to the decisions ourclients are seeking to make.
Around the world, many countries are enacting stricter regulations to protect the environment and preserve theirnatural resources. Those regulations are likely to become more rigorous over time. Companies also may faceseveral layers of national and regional regulations. In Europe, the EU’s Environmental Liability Directiveestablishes a comprehensive liability standard, but individual EU countries may have stricter regulations. The risksmay not be limited to fines and the costs of remediation. In Brazil, employees can risk jail time as well as fines inconnection with pollution incidents. In April 2014, China passed the biggest changes to its environmentalprotection laws in 25 years, outlining plans to punish polluters more severely as leaders work to limit contaminatedwater, air and soil linked to economic growth.
Declining air quality in major cities, Beijing being an example, may have consequences for our business in variousways, including the need to respond to new regulations that affect the management of buildings, declines in thedesire of investors or corporates to invest in or occupy properties in such cities, and our ability to retain staff inlocations that may be relatively undesirable as a place to live.
62
THE CHARTER AND THE BYLAWS OF JONES LANG LASALLE, OR THE MARYLAND GENERALCORPORATION LAW, COULD DELAY, DEFER OR PREVENT A CHANGE OF CONTROL.
The charter and bylaws of Jones Lang LaSalle include provisions that may discourage, delay, defer or prevent atakeover attempt that may be in the best interest of Jones Lang LaSalle shareholders and may adversely affect themarket price of our common stock.
The charter and bylaws provide for:
• The ability of the Board of Directors to establish one or more classes and series of capital stock includingthe ability to issue up to 10,000,000 shares of preferred stock, and to determine the price, rights, preferencesand privileges of such capital stock without any further shareholder approval;
• A requirement that any shareholder action taken without a meeting be pursuant to unanimous writtenconsent; and
• Certain advance notice procedures for Jones Lang LaSalle shareholders nominating candidates for electionto the Jones Lang LaSalle board of directors.
Under the Maryland General Corporation Law (the ‘‘MGCL’’), certain ‘‘Business Combinations’’ (including amerger, consolidation, share exchange or, in certain circumstances, an asset transfer or issuance or reclassificationof equity securities) between a Maryland corporation and any person who beneficially owns 10% or more of thevoting power of the corporation’s shares or an affiliate of the corporation who, at any time within the two-yearperiod prior to the date in question, was the beneficial owner of 10% or more of the voting power of the then-outstanding voting stock of the corporation (an ‘‘Interested Shareholder’’) or an affiliate of the InterestedShareholder are prohibited for five years after the most recent date on which the Interested Shareholder becamean Interested Shareholder. Thereafter, any such Business Combination must be recommended by the board ofdirectors of such corporation and approved by the affirmative vote of at least (1) 80% of the votes entitled to becast by holders of outstanding voting shares of the corporation and (2) 662⁄3% of the votes entitled to be cast byholders of outstanding voting shares of the corporation other than shares held by the Interested Shareholder withwhom the Business Combination is to be effected, unless, among other things, the corporation’s shareholdersreceive a minimum price (as defined in the MGCL) for their shares and the consideration is received in cash or inthe same form as previously paid by the Interested Shareholder for its shares. Pursuant to the MGCL, theseprovisions also do not apply to Business Combinations approved or exempted by the board of directors of thecorporation prior to the time that the Interested Shareholder becomes an Interested Shareholder.
Financial Risk Factors
Financial risk relates to our ability to meet financial obligations and mitigate exposure to broad market risks, includingvolatility in foreign currency exchange rates and interest rates; credit risk; and liquidity risk, including risk related to ourcredit ratings and our availability and cost of funding.
WE MAY HAVE INDEBTEDNESS WITH FIXED OR VARIABLE INTEREST RATES AND CERTAINCOVENANTS WITH WHICH WEMUST COMPLY.
As of December 31, 2015, we had the ability to borrow, from a syndicate of lenders, up to $2.0 billion on anunsecured revolving credit facility. Borrowings under our Facility bear variable interest rates ranging from LIBORplus 1.00% to 2.05%. As of December 31, 2015, we had outstanding borrowings under the Facility of $255.0 millionand outstanding letters of credit of $18.2 million. Our average outstanding borrowings under the Facility were$335.1 million during the year ended December 31, 2015 at an effective interest rate of 1.1%. In addition to theFacility, we also have $275.0 million of unsecured long-term senior notes (the ‘‘Notes’’) that are due in 2022. TheNotes bear an annual interest rate of 4.4%, subject to adjustment if a credit rating assigned to the Notes isdowngraded below an investment grade rating (or subsequently upgraded).
63
Our outstanding borrowings under the Facility fluctuate during the year primarily due to varying working capitalrequirements and acquisition activities. For example, payment of annual incentive compensation represents asignificant cash requirement commanding increased borrowings in the first half of the year, while historically theFirm’s seasonal earnings pattern provides more cash flow in the second half of the year. To the extent we continueour acquisition activities in the future, the level of our indebtedness could increase materially if we use the Facilityto fund such purchases.
The terms of the Facility, and to a lesser degree the Notes, contain a number of covenants that could restrict ourflexibility to finance future operations or capital needs, or to engage in other business activities that may be in ourbest interest. The debt covenants have the effect of limiting our ability, among other things, to encumber or disposeof assets and to make significant investments.
In addition, the Facility requires that we comply with various financial covenants, including minimum leverage andcash interest coverage ratios. If we are unable to make required payments under the Facility or required by theNotes, or if we breach any of the covenants, we will be in default, which could cause acceleration of repayment ofoutstanding amounts as well as defaults under other existing and future debt obligations.
DOWNGRADES IN OUR CREDIT RATINGS COULD INCREASE OUR BORROWING COSTS OR REDUCEOUR ACCESS TO FUNDING SOURCES IN THE CREDIT AND CAPITAL MARKETS.
We are currently assigned corporate credit ratings from Moody’s Investors Service, Inc. and Standard and Poor’sRatings Services based on their evaluation of our creditworthiness. All of our debt ratings remain investmentgrade, but there can be no assurance that we will not be downgraded or that any of our ratings will remaininvestment grade in the future. If our credit ratings are downgraded or other negative action is taken, we could berequired, among other things, to pay additional interest on our long-term senior notes. Credit rating reductions byone or more rating agencies could also adversely affect our access to funding sources, the cost and other terms ofobtaining funding as well as our overall financial condition, operating results and cash flow.
VOLATILITY IN LASALLE INVESTMENT MANAGEMENT INCENTIVE FEE REVENUE.
LaSalle’s portfolio is of sufficient size to periodically generate large incentive fees and equity losses and gains thatsignificantly influence our earnings and the changes in earnings from one year to the next. Volatility in thiscomponent of our earnings is inevitable due to the nature of this aspect of our business, and the amount ofincentive fees or equity gains or losses we may recognize in future quarters is inherently unpredictable and relatesto market and other dynamics in effect at the time. For example, underlying market conditions, particular decisionsregarding the acquisition and disposition of fund assets, and the specifics of client mandates will determine thetiming and size of incentive fees or equity gains or losses from one fund or investment to another. Further, as itrelates to portfolio-specific results, the record magnitude of the combined incentive fees and equity earningsrealized during 2015 and 2014 is expected to moderate in future years.
While LaSalle has focused over the past several years on developing more predictable annuity-type revenue,incentive fees should continue to be an important part of our revenue and earnings as long as real estate marketsremain healthy. However, it is likely that the volatility described above will continue, and competitive pressuresmay in some cases restrict our ability to negotiate incentive fees. Given the extraordinary fall in asset prices thatmany markets experienced starting in 2007, our incentive fees fell significantly through 2010, and since then haverebounded. Any declines may be partially offset by our ability to take advantage of lower asset prices as we makenew investments, although it is inherently difficult to predict with any confidence how all of these complicatedfactors will ultimately affect our future results.
Where incentive fees on a given transaction or portfolio are particularly large, certain clients have attempted torenegotiate fees even though contractually obligated to pay them, and we expect this to occur from time to time inthe future. Our efforts to collect our fees in these situations may lead to significant legal fees and/or significantdelays in collection due to extended negotiations, arbitration or litigation. They may also result in either negotiatedreductions in fees that take into account the future value of the relationship or loss of the client.
64
VOLATILITY IN HOTELS AND CAPITAL MARKETS FEES.
We have business lines other than LaSalle that also generate fees based on the timing, size and pricing of closedtransactions, and these fees may significantly contribute to our earnings and to changes in earnings from onequarter or year to the next. Volatility in this component of our earnings is inevitable due to the nature of thesebusinesses and the amount of the fees we will recognize in future quarters is inherently unpredictable.
LASALLE’S BANKING AND CLIENT RELATIONSHIPS.
Although not highly leveraged by general industry standards, the investment funds that LaSalle operates in theordinary course of business borrow money from a variety of institutional lenders. The loans typically are secured byliens on specific investment properties, but are otherwise non-recourse. During the global financial crisis, thevalues of specific properties were in some cases less than the amount of the outstanding loan on the property,which gave the lender the right to foreclose on the property, in which case the equity invested by the fund would bewithout value. These situations were typically addressed on a case-by-case basis and, because we generally maintaingood relationships with our lenders, we were generally successful in renegotiations to retain the management ofsubstantially all fund properties, which has given additional time for values to recover. A similar phenomenoncould occur in connection with future economic recessions or liquidity contractions.
Some clients of LaSalle that had open commitments to provide additional investments and that came under stressdue to the financial downturn became less able financially to honor their commitments and sought to renegotiatethe terms of their commitments or the fees that they pay. These activities did not result in materially adverseconsequences to LaSalle or any of its funds. Clients adversely affected due to a future downturn may reactsimilarly.
Within a difficult economic environment, raising new funds takes longer and may be less successful as current andprospective clients may be less able or willing to commit new funds to real estate investments, which are inherentlyless liquid than many competing investments. Additionally, certain clients may decide to manage all or a portion oftheir real estate investments with internal resources rather than hiring outside investment managers.
CURRENCY RESTRICTIONS AND EXCHANGE RATE FLUCTUATIONS.
We produce positive flows of cash in various countries and currencies that can be most effectively used to fundoperations in other countries or to repay our indebtedness, which is currently primarily denominated in U.S.dollars. We face restrictions in certain countries that limit or prevent the transfer of funds to other countries or theexchange of the local currency to other currencies. We also face risks associated with fluctuations in currencyexchange rates that may lead to a decline in the value of the funds produced in certain jurisdictions.
Additionally, although we operate globally, we report our results in U.S. dollars, and thus our reported results maybe positively or negatively impacted by the strengthening or weakening of currencies against the U.S. dollar. As anexample, the euro and the pound sterling, each a currency used in a significant portion of our operations, havefluctuated significantly in recent years. Our revenue from outside of the United States totaled 57% and 59% of ourtotal revenue for 2015 and 2014, respectively. In addition to the potential negative impact on reported earnings,fluctuations in currencies relative to the U.S. dollar may make it more difficult to perform period-to-periodcomparisons of the reported results of operations.
We are authorized to use currency-hedging instruments, including foreign currency forward contracts, purchasedcurrency options and borrowings in foreign currency. There can be no assurance that such hedging will beeconomically effective. We do not use hedging instruments for speculative purposes.
As currency forward and option contracts are generally conducted off-exchange or over-the-counter (‘‘OTC’’),many of the safeguards accorded to participants on organized exchanges, such as the performance guarantee of anexchange clearing house, are generally unavailable in connection with OTC transactions. In addition, there can beno guarantee that the counterparty will fulfill its obligations under the contractual agreement, especially in theevent of a bankruptcy or insolvency of the counterparty, which would effectively leave us unhedged.
65
In 2009 and 2010, many of the most significant governments worldwide enacted economic stimulus measures ofvarious types. In 2011 and 2012 some of these same governments, particularly within the European Union,instituted austerity measures designed to reduce sovereign indebtedness, although these have moderatedsubsequently. At the same time, the United States Federal Reserve has maintained very low interest rates althoughhas most recently begun to raise them. Additionally, certain questions have arisen about the viability of the euroand there has been speculation that some countries within the Eurozone may elect, or may be forced, to revert tothe currency they issued prior to the establishment of the euro. Due to these and other variables, it is inherentlydifficult to predict how and when these complicated factors will affect the relative values of currencies; and in anyevent we anticipate significant continuing volatility in currency exchange rates.
GREATER DIFFICULTY IN COLLECTING ACCOUNTS RECEIVABLE IN CERTAIN COUNTRIES ANDREGIONS.
We face challenges in our ability to efficiently and/or effectively collect accounts receivable in certain countries andregions. For example, various countries have underdeveloped insolvency laws, and clients often are slow to pay. Insome countries, clients typically tend to delay payments, reflecting a different business culture over which we donot necessarily have any control. Less-developed countries may have very lengthy or difficult judicial processes thatcan make collections through the court system more problematic than they would otherwise be. Additionally,weakness in the global economy can put additional financial stress on clients and landlords, who sometimes are theparties that pay our commissions where we have placed a tenant representation client into their buildings. This inturn can negatively impact our ability to collect our receivables fully or in a timely manner. We cannot be sure thatthe procedures we use to identify and rectify slowly paid receivables, and to protect ourselves against theinsolvencies or bankruptcies of clients, landlords and other third parties with which we do business, which mayinvolve placing liens on properties or litigating, will be effective in all cases.
INCREASING FINANCIAL RISK OF COUNTERPARTIES, INCLUDING REFINANCING RISK.
The unprecedented disruptions and dynamic changes in the financial markets, and particularly insofar as they haveled to major changes in the status and creditworthiness of some of the world’s largest banks, investment banks andinsurance companies, among others, have generally increased the counterparty risk to us from a financialstandpoint, including with respect to:
• Obtaining new credit commitments from lenders;
• Refinancing credit commitments or loans that have terminated or matured according to their terms,including funds sponsored by our investment management subsidiary which use leverage in the ordinarycourse of their investment activities;
• Placing insurance;
• Engaging in hedging transactions; and
• Maintaining cash deposits or other investments, both our own and those we hold for the benefit of clients,which are generally much larger than the maximum amount of government-sponsored deposit insurance ineffect for a particular account.
While these risks remain higher than they have been historically, we believe they have moderated as the financialmarkets have stabilized in recent years. During 2012, we also diversified some of the counterparty risk under theFacility by issuing the Notes, the proceeds of which were initially used to reduce the outstanding loans under theFacility. We believe counterparty financial risks still remain elevated due mainly to the potential liquidity issueswithin certain European financial institutions.
66
We generally attempt to conduct business with only the highest quality and most well-known counterparties, butthere can be no assurance (1) that our efforts to evaluate their creditworthiness will be effective in all cases(particularly as the quality of credit ratings provided by the nationally recognized rating agencies has been calledinto question), (2) that we will always be able to obtain the full benefit of the financial commitments made to us bylenders, insurance companies, hedging counterparties or other organizations with which we do business, or (3) thatwe will always be able to refinance existing indebtedness (or commitments to provide indebtedness) which hasmatured by its terms, including funds sponsored by our investment management subsidiary.
Additionally, the ability of government regulatory authorities to adequately monitor and regulate banks,investment banks, securities firms and insurance companies was significantly called into question during thedownturn (for example, in identifying and preventing ‘‘pyramid schemes,’’ ‘‘bubbles’’ in different asset classes andother potential systemic failures in a timely fashion), as the result of which the overall risk of unforeseeablefinancial loss from engaging in business with ostensibly regulated counterparties has increased.
ITEM 1B. UNRESOLVED STAFF COMMENTS
None.
ITEM 2. PROPERTIES
Our principal corporate holding company headquarters are located at 200 East Randolph Drive, Chicago, Illinois,where we currently occupy over 165,000 square feet of office space under a lease that expires in May 2032. Ourregional headquarters for our Americas, EMEA and Asia Pacific businesses are located in Chicago, London andSingapore, respectively. We have 287 corporate offices worldwide located in most major cities and metropolitanareas as follows: 135 offices in 8 countries in the Americas (including 115 in the United States), 71 offices in 30countries in EMEA, and 81 offices in 17 countries in Asia Pacific. In addition, we have on-site property andcorporate offices located throughout the world. On-site property management offices are generally located withinproperties we manage and are provided to us without cost.
ITEM 3. LEGAL PROCEEDINGS
The Company has contingent liabilities from various pending claims and litigation matters arising in the ordinarycourse of business, some of which involve claims for damages that are substantial in amount. Many of these mattersare covered by insurance (including insurance provided through a captive insurance company), although they maynevertheless be subject to large deductibles or retentions, and the amounts being claimed may exceed the availableinsurance. Although the ultimate liability for these matters cannot be determined, based upon informationcurrently available, we believe the ultimate resolution of such claims and litigation will not have a material adverseeffect on our financial position, results of operations or liquidity.
ITEM 4. MINE SAFETY DISCLOSURES
Not applicable.
67
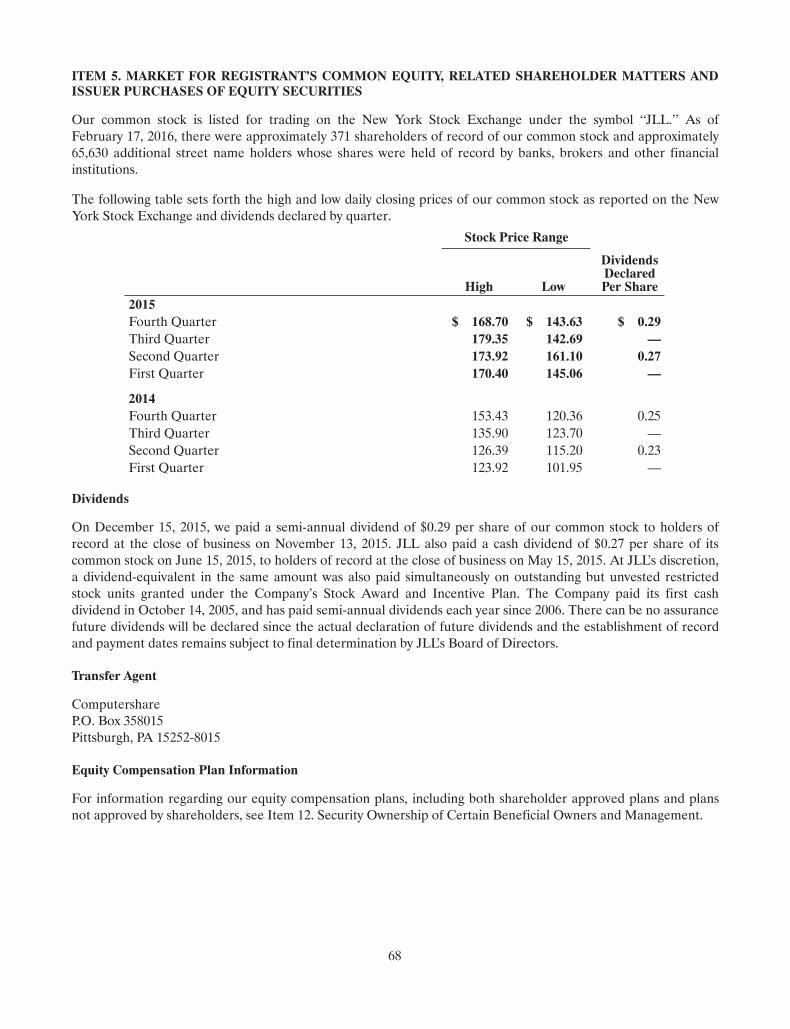
ITEM 5. MARKET FOR REGISTRANT’S COMMON EQUITY, RELATED SHAREHOLDER MATTERS ANDISSUER PURCHASES OF EQUITY SECURITIES
Our common stock is listed for trading on the New York Stock Exchange under the symbol ‘‘JLL.’’ As ofFebruary 17, 2016, there were approximately 371 shareholders of record of our common stock and approximately65,630 additional street name holders whose shares were held of record by banks, brokers and other financialinstitutions.
The following table sets forth the high and low daily closing prices of our common stock as reported on the NewYork Stock Exchange and dividends declared by quarter.
Stock Price Range
DividendsDeclaredPer ShareHigh Low
2015Fourth Quarter $ 168.70 $ 143.63 $ 0.29Third Quarter 179.35 142.69 —Second Quarter 173.92 161.10 0.27First Quarter 170.40 145.06 —
2014Fourth Quarter 153.43 120.36 0.25Third Quarter 135.90 123.70 —Second Quarter 126.39 115.20 0.23First Quarter 123.92 101.95 —
Dividends
On December 15, 2015, we paid a semi-annual dividend of $0.29 per share of our common stock to holders ofrecord at the close of business on November 13, 2015. JLL also paid a cash dividend of $0.27 per share of itscommon stock on June 15, 2015, to holders of record at the close of business on May 15, 2015. At JLL’s discretion,a dividend-equivalent in the same amount was also paid simultaneously on outstanding but unvested restrictedstock units granted under the Company’s Stock Award and Incentive Plan. The Company paid its first cashdividend in October 14, 2005, and has paid semi-annual dividends each year since 2006. There can be no assurancefuture dividends will be declared since the actual declaration of future dividends and the establishment of recordand payment dates remains subject to final determination by JLL’s Board of Directors.
Transfer Agent
ComputershareP.O. Box 358015Pittsburgh, PA 15252-8015
Equity Compensation Plan Information
For information regarding our equity compensation plans, including both shareholder approved plans and plansnot approved by shareholders, see Item 12. Security Ownership of Certain Beneficial Owners and Management.
68
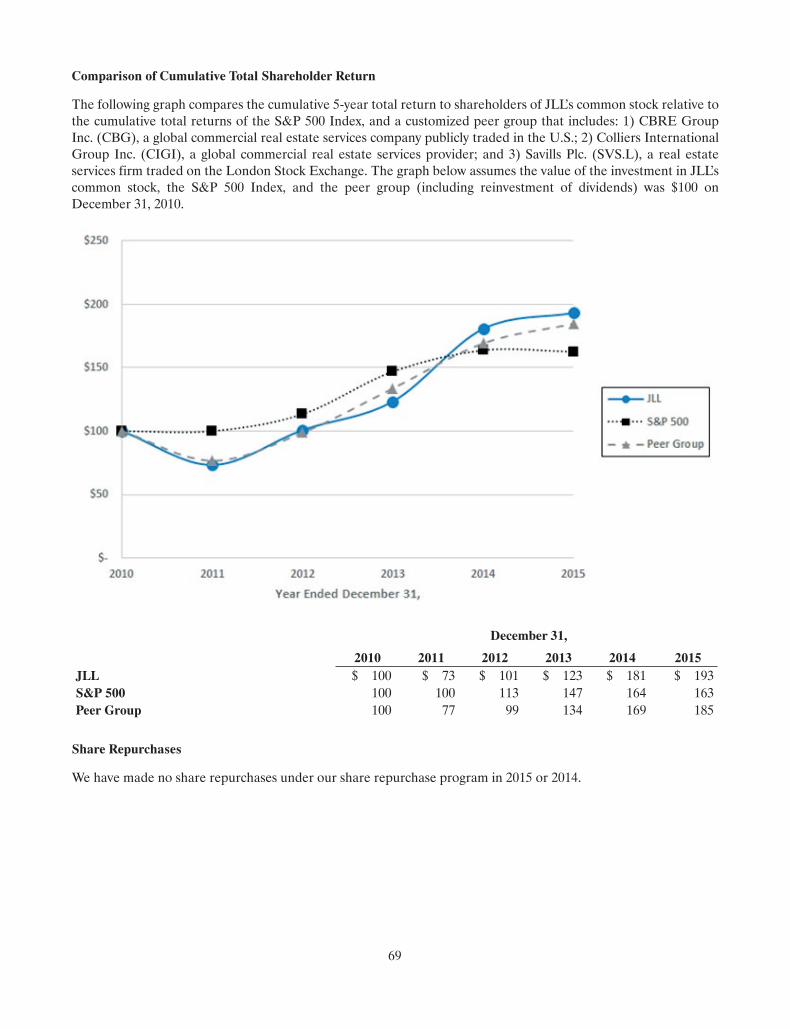
Comparison of Cumulative Total Shareholder Return
The following graph compares the cumulative 5-year total return to shareholders of JLL’s common stock relative tothe cumulative total returns of the S&P 500 Index, and a customized peer group that includes: 1) CBRE GroupInc. (CBG), a global commercial real estate services company publicly traded in the U.S.; 2) Colliers InternationalGroup Inc. (CIGI), a global commercial real estate services provider; and 3) Savills Plc. (SVS.L), a real estateservices firm traded on the London Stock Exchange. The graph below assumes the value of the investment in JLL’scommon stock, the S&P 500 Index, and the peer group (including reinvestment of dividends) was $100 onDecember 31, 2010.
December 31,
2010 2011 2012 2013 2014 2015JLL $ 100 $ 73 $ 101 $ 123 $ 181 $ 193S&P 500 100 100 113 147 164 163Peer Group 100 77 99 134 169 185
Share Repurchases
We have made no share repurchases under our share repurchase program in 2015 or 2014.
69
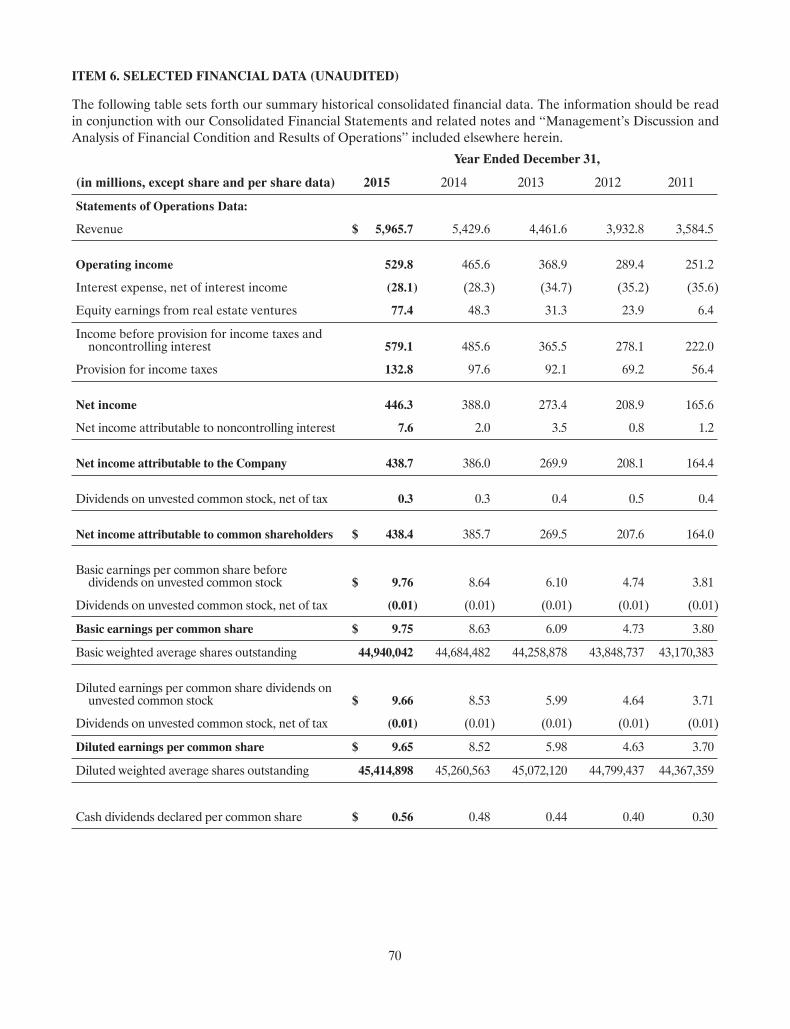
ITEM 6. SELECTED FINANCIAL DATA (UNAUDITED)
The following table sets forth our summary historical consolidated financial data. The information should be readin conjunction with our Consolidated Financial Statements and related notes and ‘‘Management’s Discussion andAnalysis of Financial Condition and Results of Operations’’ included elsewhere herein.
Year Ended December 31,
(in millions, except share and per share data) 2015 2014 2013 2012 2011
Statements of Operations Data:
Revenue $ 5,965.7 5,429.6 4,461.6 3,932.8 3,584.5
Operating income 529.8 465.6 368.9 289.4 251.2
Interest expense, net of interest income (28.1) (28.3) (34.7) (35.2) (35.6)
Equity earnings from real estate ventures 77.4 48.3 31.3 23.9 6.4
Income before provision for income taxes andnoncontrolling interest 579.1 485.6 365.5 278.1 222.0
Provision for income taxes 132.8 97.6 92.1 69.2 56.4
Net income 446.3 388.0 273.4 208.9 165.6
Net income attributable to noncontrolling interest 7.6 2.0 3.5 0.8 1.2
Net income attributable to the Company 438.7 386.0 269.9 208.1 164.4
Dividends on unvested common stock, net of tax 0.3 0.3 0.4 0.5 0.4
Net income attributable to common shareholders $ 438.4 385.7 269.5 207.6 164.0
Basic earnings per common share beforedividends on unvested common stock $ 9.76 8.64 6.10 4.74 3.81
Dividends on unvested common stock, net of tax (0.01) (0.01) (0.01) (0.01) (0.01)
Basic earnings per common share $ 9.75 8.63 6.09 4.73 3.80
Basic weighted average shares outstanding 44,940,042 44,684,482 44,258,878 43,848,737 43,170,383
Diluted earnings per common share dividends onunvested common stock $ 9.66 8.53 5.99 4.64 3.71
Dividends on unvested common stock, net of tax (0.01) (0.01) (0.01) (0.01) (0.01)
Diluted earnings per common share $ 9.65 8.52 5.98 4.63 3.70
Diluted weighted average shares outstanding 45,414,898 45,260,563 45,072,120 44,799,437 44,367,359
Cash dividends declared per common share $ 0.56 0.48 0.44 0.40 0.30
70
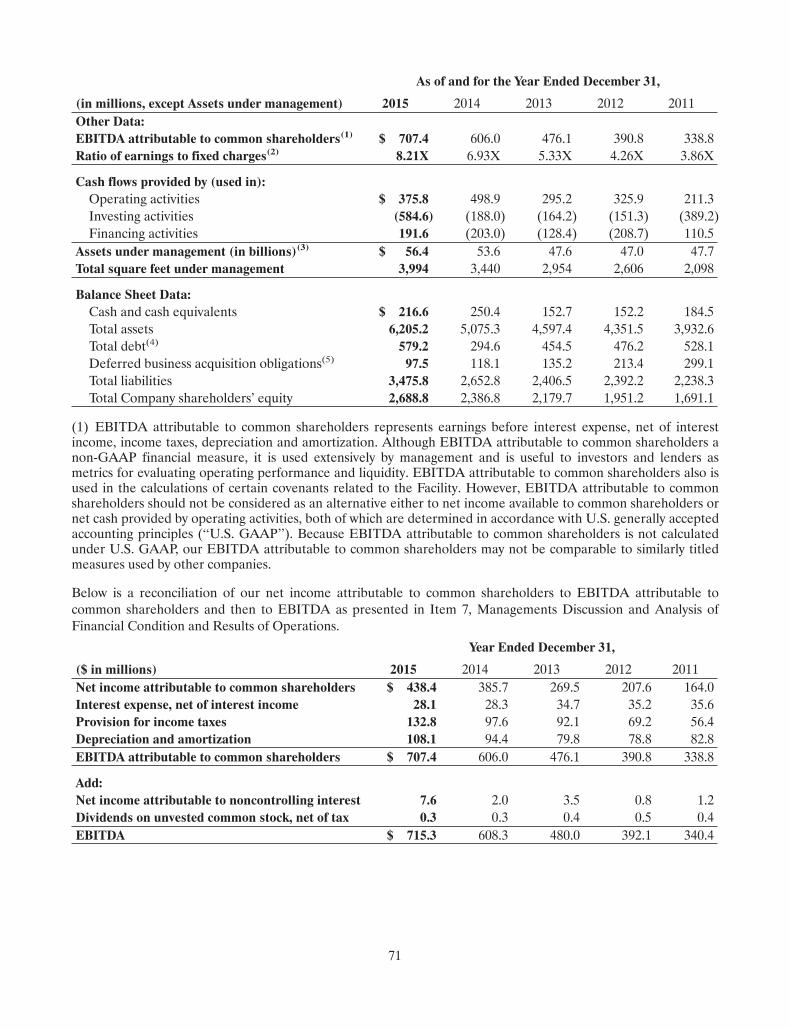
As of and for the Year Ended December 31,
(in millions, except Assets under management) 2015 2014 2013 2012 2011Other Data:EBITDA attributable to common shareholders(1) $ 707.4 606.0 476.1 390.8 338.8Ratio of earnings to fixed charges(2) 8.21X 6.93X 5.33X 4.26X 3.86X
Cash flows provided by (used in):Operating activities $ 375.8 498.9 295.2 325.9 211.3Investing activities (584.6) (188.0) (164.2) (151.3) (389.2)Financing activities 191.6 (203.0) (128.4) (208.7) 110.5
Assets under management (in billions)(3) $ 56.4 53.6 47.6 47.0 47.7Total square feet under management 3,994 3,440 2,954 2,606 2,098
Balance Sheet Data:Cash and cash equivalents $ 216.6 250.4 152.7 152.2 184.5Total assets 6,205.2 5,075.3 4,597.4 4,351.5 3,932.6Total debt(4) 579.2 294.6 454.5 476.2 528.1Deferred business acquisition obligations(5) 97.5 118.1 135.2 213.4 299.1Total liabilities 3,475.8 2,652.8 2,406.5 2,392.2 2,238.3Total Company shareholders’ equity 2,688.8 2,386.8 2,179.7 1,951.2 1,691.1
(1) EBITDA attributable to common shareholders represents earnings before interest expense, net of interestincome, income taxes, depreciation and amortization. Although EBITDA attributable to common shareholders anon-GAAP financial measure, it is used extensively by management and is useful to investors and lenders asmetrics for evaluating operating performance and liquidity. EBITDA attributable to common shareholders also isused in the calculations of certain covenants related to the Facility. However, EBITDA attributable to commonshareholders should not be considered as an alternative either to net income available to common shareholders ornet cash provided by operating activities, both of which are determined in accordance with U.S. generally acceptedaccounting principles (‘‘U.S. GAAP’’). Because EBITDA attributable to common shareholders is not calculatedunder U.S. GAAP, our EBITDA attributable to common shareholders may not be comparable to similarly titledmeasures used by other companies.
Below is a reconciliation of our net income attributable to common shareholders to EBITDA attributable tocommon shareholders and then to EBITDA as presented in Item 7, Managements Discussion and Analysis ofFinancial Condition and Results of Operations.
Year Ended December 31,
($ in millions) 2015 2014 2013 2012 2011Net income attributable to common shareholders $ 438.4 385.7 269.5 207.6 164.0Interest expense, net of interest income 28.1 28.3 34.7 35.2 35.6Provision for income taxes 132.8 97.6 92.1 69.2 56.4Depreciation and amortization 108.1 94.4 79.8 78.8 82.8EBITDA attributable to common shareholders $ 707.4 606.0 476.1 390.8 338.8
Add:Net income attributable to noncontrolling interest 7.6 2.0 3.5 0.8 1.2Dividends on unvested common stock, net of tax 0.3 0.3 0.4 0.5 0.4EBITDA $ 715.3 608.3 480.0 392.1 340.4
71
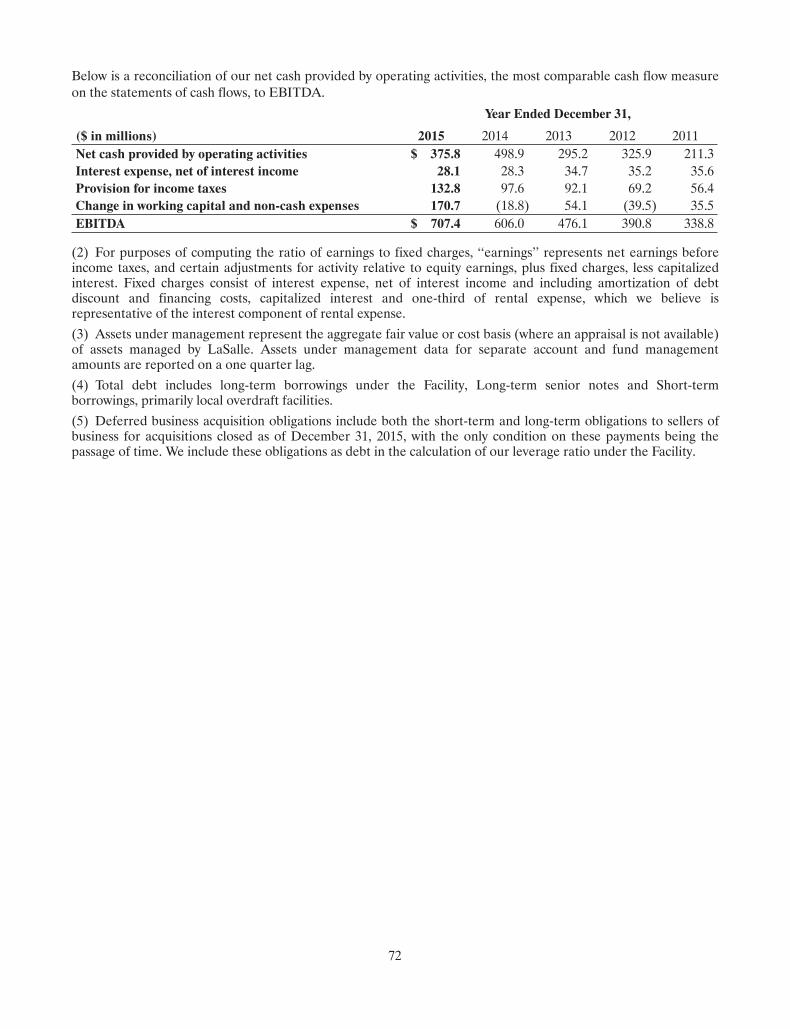
Below is a reconciliation of our net cash provided by operating activities, the most comparable cash flow measureon the statements of cash flows, to EBITDA.
Year Ended December 31,
($ in millions) 2015 2014 2013 2012 2011Net cash provided by operating activities $ 375.8 498.9 295.2 325.9 211.3Interest expense, net of interest income 28.1 28.3 34.7 35.2 35.6Provision for income taxes 132.8 97.6 92.1 69.2 56.4Change in working capital and non-cash expenses 170.7 (18.8) 54.1 (39.5) 35.5EBITDA $ 707.4 606.0 476.1 390.8 338.8
(2) For purposes of computing the ratio of earnings to fixed charges, ‘‘earnings’’ represents net earnings beforeincome taxes, and certain adjustments for activity relative to equity earnings, plus fixed charges, less capitalizedinterest. Fixed charges consist of interest expense, net of interest income and including amortization of debtdiscount and financing costs, capitalized interest and one-third of rental expense, which we believe isrepresentative of the interest component of rental expense.
(3) Assets under management represent the aggregate fair value or cost basis (where an appraisal is not available)of assets managed by LaSalle. Assets under management data for separate account and fund managementamounts are reported on a one quarter lag.
(4) Total debt includes long-term borrowings under the Facility, Long-term senior notes and Short-termborrowings, primarily local overdraft facilities.
(5) Deferred business acquisition obligations include both the short-term and long-term obligations to sellers ofbusiness for acquisitions closed as of December 31, 2015, with the only condition on these payments being thepassage of time. We include these obligations as debt in the calculation of our leverage ratio under the Facility.
72
ITEM 7. MANAGEMENT'S DISCUSSION AND ANALYSIS OF FINANCIAL CONDITION AND RESULTSOF OPERATIONS
The following discussion and analysis should be read in conjunction with our Selected Financial Data andConsolidated Financial Statements, including the notes thereto, appearing elsewhere in this Form 10-K. Thefollowing discussion and analysis contains certain forward-looking statements generally identified by the wordsanticipates, believes, estimates, expects, plans, intends and other similar expressions. Such forward-lookingstatements involve known and unknown risks, uncertainties and other factors that may cause JLL's actual results,performance, achievements, plans and objectives to be materially different from any future results, performance,achievements, plans and objectives expressed or implied by such forward-looking statements. See the CautionaryNote Regarding Forward-Looking Statements after Part IV, Item 15. Exhibits and Financial Statement Schedules.
We present our Management's Discussion and Analysis in the following sections:
(1) An executive summary of our business;
(2) A summary of our critical accounting policies and estimates;
(3) Certain items affecting the comparability of results;
(4) Certain market and other risks we face;
(5) The results of our operations, first on a consolidated basis and then for each of our business segments; and
(6) Liquidity and capital resources.
EXECUTIVE SUMMARY
JLL provides comprehensive integrated real estate and investment management expertise on a local, regional andglobal level to owner, occupier, and investor clients and developers. We are an industry leader in property andcorporate facility management services, with a portfolio of approximately 4.0 billion square feet worldwide. Wedeliver our array of RES product offerings across our three geographic business segments: (1) the Americas,(2) EMEA, and (3) Asia Pacific. Our fourth business segment, LaSalle, a member of the Jones Lang LaSallegroup, is one of the world's largest and most diversified real estate investment management firms, withapproximately $56.4 billion of assets under management across the globe.
In 2015, we generated revenue of $6.0 billion across our four business segments. In addition to U.S. dollars, we alsogenerated revenue in British pounds, euros, Australian dollars, Indian rupees, Hong Kong dollars, Chinese yuan,Japanese yen, Singapore dollars and a variety of other currencies.
The broad range of real estate services we offer includes (in alphabetical order):
Agency Leasing Project and Development Management/ConstructionCapital Markets Property Management (Investors)Corporate Finance Real Estate Investment Banking/Merchant BankingEnergy and Sustainability Services ResearchFacility Management Outsourcing (Occupiers) Strategic Consulting and Advisory ServicesInvestment Management Tenant RepresentationLease Administration Transaction ManagementLogistics and Supply-Chain Management ValuationsMortgage Origination and Servicing Value Recovery and Receivership Services
We work for a broad range of clients that represent a wide variety of industries and are based in marketsthroughout the world. Our clients vary greatly in size. They include for-profit and not-for-profit entities of allkinds, public-private partnerships and governmental (‘‘public sector’’) entities. Increasingly, we are offeringservices to smaller middle-market companies looking to outsource real estate services. Through our LaSallesegment, we invest for clients on a global basis in both publicly traded real estate securities and private assets.
73
See Item 1. Business for additional information on the services we provide, as well as our ‘‘Value Drivers forProviding Superior Client Service and Prospering as a Sustainable Enterprise,’’ our ‘‘Global Strategic Priorities,’’our ‘‘Competitive Differentiators,’’ and ‘‘Industry Trends.’’ See also Item 1A. Risk Factors, for the various riskfactors that impact our business.
SUMMARY OF CRITICAL ACCOUNTING POLICIES AND ESTIMATES
An understanding of our accounting policies is necessary for a complete analysis of our results, financial position,liquidity and trends. The preparation of our financial statements requires management to make certain criticalaccounting estimates and judgments that impact (1) the stated amount of assets and liabilities, (2) disclosure ofcontingent assets and liabilities at the date of the financial statements, and (3) the reported amounts of revenueand expenses during the reporting periods. These accounting estimates are based on management's judgment. Weconsider them to be critical because of their significance to the financial statements and the possibility futureevents may differ from current judgments, or that the use of different assumptions could result in materiallydifferent estimates. We review these estimates on a periodic basis to ensure reasonableness. Although actualamounts likely differ from such estimated amounts, we believe such differences are not likely to be material.
Revenue Recognition
The SEC's Staff Accounting Bulletin No. 101, Revenue Recognition in Financial Statements (‘‘SAB 101’’), asamended by SAB 104, provides guidance on the application of U.S. GAAP to selected revenue recognition issues.Additionally, the Financial Accounting Standards Board's (‘‘FASB’s’’) Accounting Standards Codification (‘‘ASC’’)605-45, Principal and Agent Considerations, provides guidance when accounting for reimbursements received fromclients.
We earn revenue from the following principal sources:
• Transaction commissions;
• Advisory and management fees;
• Incentive fees;
• Project and development management fees; and
• Construction management fees.
Some of the contractual terms related to the process of earning revenue from these sources, including potentiallycontingent events, can be complex and so require us to make judgments about the timing of when we shouldrecognize revenue. For a detailed discussion of our revenue recognition policies, see the Revenue Recognitionsection of Note 2, Summary of Significant Accounting Policies, of the Notes to Consolidated Financial Statements.
Allowance for Uncollectible Accounts Receivable
We estimate the allowance necessary to provide for uncollectible accounts receivable. This estimate includesspecific accounts from which payment has become unlikely. We also base this estimate on historical experience,combined with a careful review of current developments and with a strong focus on credit quality. The process bywhich we calculate the allowance begins with the individual business units where we identify specific uncertainaccounts. We then reserve for uncertain accounts as part of an overall reserve that is formulaic and driven by theage profile of the receivables and our historical experience. We review these allowances on a quarterly basis toensure they are appropriate. As part of this review, we develop a range of potential allowances on a consistentformulaic basis. Our allowance for uncollectible accounts receivable as determined under this methodology was$23.2 million and $17.9 million as of December 31, 2015 and 2014, respectively.
Bad debt expense was $14.5 million, $8.2 million and $8.7 million for the years ended December 31, 2015, 2014 and2013, respectively. We believe we have an adequate reserve for our accounts receivables as of December 31, 2015given the current economic conditions and the credit quality of our clients. However, changes in our estimates ofcollectability could significantly impact our bad debt expense in the future. For additional information on our
74
allowance for uncollectible accounts see the Financing Receivables section of Note 2, Summary of SignificantAccounting Policies, of the Notes to Consolidated Financial Statements.
Goodwill
Historically we have grown, in part, through a series of acquisitions. Consistent with the services natureof the businesses we have acquired, the largest asset on our balance sheet is goodwill. We do notamortize this goodwill; instead, we evaluate goodwill for impairment at least annually. ASC Topic 350,Intangibles-Goodwill and Other, permits an entity to first assess qualitative factors to determine whether it is morelikely than not the fair value of a reporting unit is less than its carrying amount as a basis for determining whether itis necessary to perform the two-step goodwill impairment test.
We have considered both quantitative and qualitative factors with respect to the performance of our annualimpairment tests of goodwill during the last three years. For each period tested, we determined the fair value ofour reporting units to be substantially in excess of the carrying value primarily considering (1) our marketcapitalization in relation to the aggregate carrying value of our net assets, (2) our overall annual financialperformance, and (3) near and longer-term forecasts of operating income and cash flows generated by ourreporting units in relation to the carrying values of the net assets of each reporting unit. In addition to our annualimpairment evaluation, we consider whether events or circumstances have occurred in the period subsequent toour annual impairment testing which indicate it is more likely than not an impairment loss has occurred.
For additional information on goodwill and intangible asset impairment testing see the Business Combinations,Goodwill and Other Intangible Assets section of Note 2, Summary of Significant Accounting Policies, of the Notesto Consolidated Financial Statements.
Investments in Real Estate Ventures
We invest in certain real estate ventures that own and operate commercial real estate. Historically, theseinvestments have primarily been co-investments in funds that LaSalle establishes in the ordinary course of businessfor its clients. These investments include non-controlling ownership interests generally ranging from less than 1%to 15% of the respective ventures. We account for these investments under the equity method of accounting or atfair value in the accompanying Consolidated Financial Statements considering the nature of our ownership andany other interests we hold in the investments.
We evaluate investments in real estate ventures, except for those reported at fair value, for indications of whether(1) we may not be able to recover the carrying value of our investments and (2) our equity investments are otherthan temporarily impaired. Our assessments consider the existence of impairment indicators at the underlying realestate assets that comprise the majority of our investments. We base such assessments, with regard to both theinvestment and underlying asset levels, on evaluations of regular updates to future cash flow models and on factorssuch as operational performance, market conditions, major tenancy matters, legal and environmental concerns andour ability and intent to continue to hold each investment. When events or changes in circumstances indicate thecarrying amount of one of our investments in real estate ventures may be other than temporarily impaired, weconsider the likelihood of recoverability of the carrying amount of our investment as well as the estimated fairvalue and record an impairment charge as applicable. Impairment charges to write down the carrying value of thereal estate assets underlying our investments, our proportionate share of which is recognized within Equityearnings from real estate ventures in the Consolidated Statements of Comprehensive Income, are generally theresult of completing discounted cash flow models to determine fair value. Additionally, we consider a number offactors, including our share of co-investment cash flows and the fair value of our investments, in determiningwhether or not our equity investment is other than temporarily impaired.
Impairment charges included within Equity earnings from real estate ventures aggregated to $6.0 million,$2.4 million, and $6.5 million for the years ended December 31, 2015, 2014, and 2013, respectively. It is reasonablypossible that if real estate values or the periods over which assets are held decline, we may sustain additionalimpairment charges on our Investments in real estate ventures in future periods.
75
For investments in real estate ventures reported at fair value, our investment is increased or decreased eachreporting period by the difference between the fair value of the investment and the carrying value at the balancesheet date. We reflect these fair value adjustments as gains or losses in our Consolidated Statements ofComprehensive Income within Equity earnings from real estate ventures. For the years ended December 31, 2015,2014, and 2013, we included fair value gains of $21.1 million, $7.1 million, and $5.1 million, respectively, in Equityearnings.
Income Taxes
We account for income taxes under the asset and liability method. We recognize deferred tax assets and liabilitiesfor the expected future tax consequences attributable to (1) differences between the financial statement carryingamounts of existing assets and liabilities and their respective tax bases and (2) operating loss and tax creditcarryforwards. We measure deferred tax assets and liabilities using the enacted tax rates expected to apply totaxable income in the years in which we expect those temporary differences to be recovered or settled. Werecognize into income the effect on deferred tax assets and liabilities of a change in tax rates in the periodincluding the enactment date.
Because of the global and cross-border nature of our business, our corporate tax position is complex. We generallyprovide for taxes in each tax jurisdiction in which we operate based on local tax regulations and rules. Such taxesare provided on net earnings and include the provision of taxes on substantively all differences between financialstatement amounts and amounts used in tax returns, excluding certain non-deductible items and permanentdifferences.
Our global effective tax rate is sensitive to the complexity of our operations as well as to changes in the mix of ourgeographic profitability. Local statutory tax rates range from 10% to 40% in the countries in which we havesignificant operations. We evaluate our estimated effective tax rate on a quarterly basis to reflect forecast changesin our geographic mix of income and legislative actions on statutory tax rates.
We provide for the effects of income taxes on interim financial statements based on our estimate of the effectivetax rate for the full year.
Our effective tax rates for years ended December 31, 2015, 2014, and 2013 were 22.9%, 20.1%, and 25.2%,respectively. Very low tax rate jurisdictions (those with effective national and local combined tax rates of 25% orlower) providing the most significant contributions to our effective tax rate include: Hong Kong (16.5%),Singapore (17%), the United Kingdom (20.25%), The People’s Republic of China (25%), and the Netherlands(25%). Other tax rate jurisdictions with effective rates of 25% or lower making meaningful contributions to ourglobal effective tax rate include: Cyprus (12.5%), Ireland (12.5%), Poland (19%), and Switzerland (21.2%).
Based on our historical experience and future business plans, we do not expect to repatriate our foreign sourceearnings to the U.S. As a result, we have not provided deferred taxes on such earnings or the difference betweentax rates in the U.S. and the various international jurisdictions where we earn such amounts. Further, there arevarious limitations on our ability to utilize foreign tax credits on such earnings when we repatriate them. As such,we could incur taxes in the U.S. upon repatriation without credits for foreign taxes paid on such earnings. We havenot provided a deferred U.S. tax liability on the unremitted earnings of international subsidiaries because it is ourintent to permanently reinvest such earnings outside of the U.S. If repatriation of all such earnings were to occur,we estimate our resulting U.S. tax liability would be approximately $235 million, net of the benefits of utilization offoreign tax credits and net operating loss carryovers. We believe our policy of permanently reinvesting earnings offoreign subsidiaries does not significantly impact our liquidity.
We have established valuation allowances against deferred tax assets where expected future taxable income doesnot support their realization on a more likely than not basis. We formally assess the likelihood of being able toutilize current tax losses in the future on a country-by-country basis, with the determination of each quarter’sincome tax provision. We establish or increase valuation allowances upon specific indications the carrying value ofa tax asset may not be recoverable. Alternatively, we reduce valuation allowances upon (1) specific indications the
76
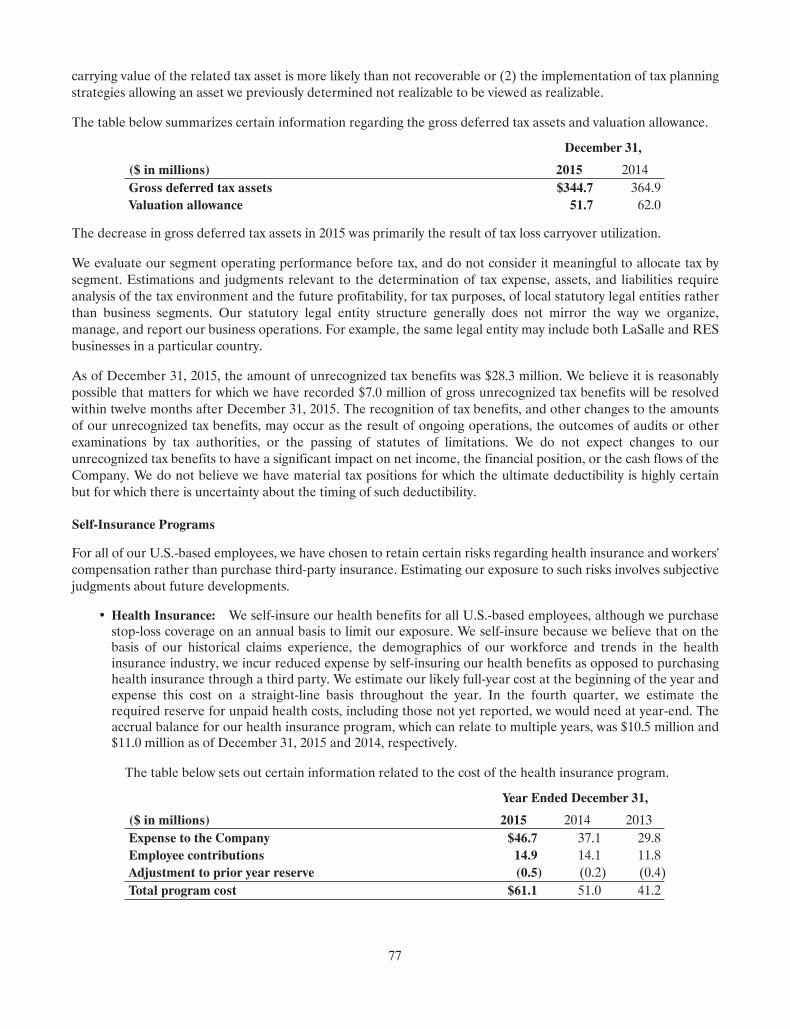
carrying value of the related tax asset is more likely than not recoverable or (2) the implementation of tax planningstrategies allowing an asset we previously determined not realizable to be viewed as realizable.
The table below summarizes certain information regarding the gross deferred tax assets and valuation allowance.
December 31,
($ in millions) 2015 2014Gross deferred tax assets $344.7 364.9Valuation allowance 51.7 62.0
The decrease in gross deferred tax assets in 2015 was primarily the result of tax loss carryover utilization.
We evaluate our segment operating performance before tax, and do not consider it meaningful to allocate tax bysegment. Estimations and judgments relevant to the determination of tax expense, assets, and liabilities requireanalysis of the tax environment and the future profitability, for tax purposes, of local statutory legal entities ratherthan business segments. Our statutory legal entity structure generally does not mirror the way we organize,manage, and report our business operations. For example, the same legal entity may include both LaSalle and RESbusinesses in a particular country.
As of December 31, 2015, the amount of unrecognized tax benefits was $28.3 million. We believe it is reasonablypossible that matters for which we have recorded $7.0 million of gross unrecognized tax benefits will be resolvedwithin twelve months after December 31, 2015. The recognition of tax benefits, and other changes to the amountsof our unrecognized tax benefits, may occur as the result of ongoing operations, the outcomes of audits or otherexaminations by tax authorities, or the passing of statutes of limitations. We do not expect changes to ourunrecognized tax benefits to have a significant impact on net income, the financial position, or the cash flows of theCompany. We do not believe we have material tax positions for which the ultimate deductibility is highly certainbut for which there is uncertainty about the timing of such deductibility.
Self-Insurance Programs
For all of our U.S.-based employees, we have chosen to retain certain risks regarding health insurance and workers'compensation rather than purchase third-party insurance. Estimating our exposure to such risks involves subjectivejudgments about future developments.
• Health Insurance: We self-insure our health benefits for all U.S.-based employees, although we purchasestop-loss coverage on an annual basis to limit our exposure. We self-insure because we believe that on thebasis of our historical claims experience, the demographics of our workforce and trends in the healthinsurance industry, we incur reduced expense by self-insuring our health benefits as opposed to purchasinghealth insurance through a third party. We estimate our likely full-year cost at the beginning of the year andexpense this cost on a straight-line basis throughout the year. In the fourth quarter, we estimate therequired reserve for unpaid health costs, including those not yet reported, we would need at year-end. Theaccrual balance for our health insurance program, which can relate to multiple years, was $10.5 million and$11.0 million as of December 31, 2015 and 2014, respectively.
The table below sets out certain information related to the cost of the health insurance program.
Year Ended December 31,
($ in millions) 2015 2014 2013Expense to the Company $46.7 37.1 29.8Employee contributions 14.9 14.1 11.8Adjustment to prior year reserve (0.5) (0.2) (0.4)Total program cost $61.1 51.0 41.2
77
• Workers' Compensation Insurance: We self-insure for workers' compensation insurance claims becauseour workforce has historically experienced fewer claims than is customary for our industry. We purchasestop-loss coverage to limit our exposure to large, individual claims. We accrue workers' compensationexpense based on applicable state rate and job classifications. On an annual basis in the third quarter, weengage in a comprehensive analysis to develop a range of potential exposure, and considering actualexperience, we reserve our best estimate of the liability based on that range. The changes in estimate(including expenses for reserve charges) for the years ended December 31, 2015, 2014 and 2013 were$9.6 million, $15.5 million, and $9.7 million. The accrual balance for workers' compensation insuranceclaims, which can relate to multiple years, was $37.4 million and $33.7 million as of December 31, 2015 and2014, respectively.
• Captive Insurance Company: In order to better manage our global insurance program and support ourrisk management efforts, we supplement our traditional insurance program by the use of a wholly-ownedcaptive insurance company to provide professional indemnity and employment practice liability insurancecoverage on a ‘‘claims made’’ basis. The level of risk retained by our captive insurance company, withrespect to professional indemnity claims, is up to $2.5 million per claim, inclusive of the deductible. Theaccrual balance for professional indemnity claims facilitated through our captive insurance company, whichcan relate to multiple years, was $19.2 million and $9.2 million, as of December 31, 2015 and 2014,respectively.
Professional indemnity insurance claims can be complex and take a number of years to resolve. Within ourcaptive insurance company, we estimate the ultimate cost of these claims by way of specific claim accrualsdeveloped through periodic reviews of the circumstances of individual claims. When a potential loss eventoccurs, management estimates the ultimate cost of the claim and accrues the related cost when probableand estimable.
NEW ACCOUNTING STANDARDS
See New Accounting Standards section of Note 2 of the Notes to Consolidated Financial Statements.
ITEMS AFFECTING COMPARABILITY
Macroeconomic Conditions
Our results of operations and the variability of these results are significantly influenced by (1) macroeconomictrends, (2) the geopolitical environment, (3) the global and regional real estate markets, and (4) the financial andcredit markets. These macroeconomic conditions have had, and we expect to continue to have, a significant impacton the variability of our results of operations.
LaSalle Investment Management Revenue
Our investment management business is in part compensated through the receipt of incentive fees whenperformance of underlying funds' investments exceeds agreed-to benchmark levels. Depending upon performance,disposition activity, as applicable, and the contractual timing of measurement periods with clients, these fees can besignificant and vary substantially from period to period.
Equity earnings from real estate ventures also may vary substantially from period to period for a variety of reasons,including as a result of (1) impairment charges, (2) gains (losses) on investments reported at fair value, (3) gains(losses) on asset dispositions, and (4) incentive fees recorded as Equity earnings. The timing of recognition of theseitems may impact comparability between quarters, in any one year, or compared to a prior year.
The comparability of these items can be seen in Note 3, Business Segments, of the Notes to Consolidated FinancialStatements and is discussed further in Segment Operating Results included herein.
78
Transactional-Based Revenue
Transactional-based fees for real estate investment banking, capital markets activities and other services within ourRES businesses increase the variability of the revenue we receive that relates to the size and timing of our clients'transactions. The timing and the magnitude of these fees can vary significantly from year to year and quarter toquarter, and from region to region.
Foreign Currency
We conduct business using a variety of currencies but we report our results in U.S. dollars. As a result, the volatilityof currencies against the U.S. dollar may positively or negatively impact our results. This volatility can make itmore difficult to perform period-to-period comparisons of the reported U.S. dollar results of operations, becausesuch results may indicate a growth or decline rate that might not have been consistent with the real underlyinggrowth or decline rate in the local operations. Consequently, we provide information about the impact of foreigncurrencies in the period-to-period comparisons of the reported results of operations in our discussion and analysisof financial condition in the Results of Operations section below.
MARKET RISKS
Market Risk
The principal market risks we face due to the risk of loss arising from adverse changes in market rates and pricesare:
• Interest rates on the Facility; and
• Foreign exchange risks.
In the normal course of business, we manage these risks through a variety of strategies, including hedgingtransactions using various derivative financial instruments such as foreign currency forward contracts. We enterinto derivative instruments with high credit-quality counterparties and diversify our positions across suchcounterparties in order to reduce our exposure to credit losses. We do not enter into derivative transactions fortrading or speculative purposes.
Interest Rates
We centrally manage our debt, considering investment opportunities and risks, tax consequences, and overallfinancing strategies. We are primarily exposed to interest rate risk on our Facility, which as of December 31, 2015had a maximum borrowing capacity of $2.0 billion and consisted of revolving credit available for working capital,investments, capital expenditures, and acquisitions. Our average outstanding borrowings under the Facility were$335.1 million during 2015, with an effective interest rate of 1.1%. We had outstanding borrowings of$255.0 million under the Facility and outstanding letters of credit of $18.2 million as of December 31, 2015. TheFacility bears a variable rate of interest based on market rates.
Our $275.0 million of Long-term senior notes due in November 2022 (the ‘‘Notes’’) bear interest at an annual rateof 4.4%, subject to adjustment if a credit rating assigned to the Notes is downgraded below an investment graderating (or subsequently upgraded). The issuance of these Notes at a fixed interest rate has helped to limit theCompany's exposure to future movements in interest rates.
Our overall interest rate risk management objective is to limit the impact of interest rate changes on earnings andcash flows and to lower our overall borrowing costs. To achieve this objective, in the past we have entered intoderivative financial instruments such as interest rate swap agreements when appropriate and we may do so in thefuture. We did not enter into any such agreements in the prior three years and we had no such agreementsoutstanding as of December 31, 2015.
79
Foreign Exchange
Foreign exchange risk is the risk we will incur economic losses due to adverse changes in foreign currency exchangerates. Our revenue from outside of the U.S. approximated 57% and 59% of our total revenue for 2015 and 2014,respectively. Operating in international markets means we are exposed to movements in foreign exchange rates,most significantly by the British pound (15% of revenue for 2015) and the euro (13% of revenue for 2015).
We mitigate our foreign currency exchange risk principally by (1) establishing local operations in the markets weserve and (2) invoicing customers in the same currency as the source of the costs. The impact of translatingexpenses incurred in foreign currencies into U.S. dollars reduces the impact of translating revenue earned inforeign currencies into U.S. dollars. In addition, British pound and Singapore dollar expenses incurred as a resultof our regional headquarters being located in London and Singapore, respectively, act as a partial operationalhedge against our translation exposures to British pounds and Singapore dollars.
We enter into forward foreign currency exchange contracts to manage currency risks associated with intercompanyloan balances. Generally, the maturity of these contracts is less than 60 days. As of December 31, 2015, we hadforward exchange contracts in effect with a gross notional value of $2.28 billion ($1.26 billion on a net basis) and anet fair value loss of $11.7 million. This net carrying loss is generally offset by a carrying gain in associatedintercompany loans.
Although we operate globally, we report our results in U.S. dollars. As a result, the strengthening or weakening ofthe U.S. dollar may positively or negatively impact our reported results. The following table sets forth the revenuederived from our most significant currencies.
Year Ended December 31,
($ in millions) 2015 % of Total 2014 % of TotalUnited States dollar $ 2,536.4 42.5% $ 2,214.1 40.8%British pound 915.5 15.3 833.4 15.3Euro 748.7 12.6 701.8 12.9Australian dollar 303.0 5.1 303.1 5.6Indian rupee 189.4 3.2 155.1 2.9Hong Kong dollar 186.7 3.1 170.5 3.1Chinese yuan 178.6 3.0 169.2 3.1Japanese yen 170.0 2.8 155.1 2.9Singapore dollar 123.2 2.1 157.7 2.9Other currencies 614.2 10.3 569.6 10.5Total revenue $ 5,965.7 100.0% $ 5,429.6 100.0%
Had Euro-to-U.S. dollar exchange rates been 10% higher throughout the course of 2015, we estimate our reportedoperating income would have increased by $10.7 million. Had the British pound-to-U.S. dollar exchange rates been10% higher throughout the course of 2015, we estimate our reported operating income would have increased by$2.3 million. These hypothetical calculations estimate the impact of translating results into U.S. dollars and do notinclude an estimate of the impact a 10% increase in the U.S. dollar against other currencies would have on ourforeign operations.
Seasonality
Our quarterly revenue and profits tend to grow progressively by quarter throughout the year. This is a result of ageneral focus in the real estate industry on completing or documenting transactions by fiscal-year-end and the factthat certain expenses are constant through the year. Historically, we have reported a relatively smaller profit in thefirst quarter and then increasingly larger profits during each of the following three quarters, excluding therecognition of investment-generated performance fees and co-investment equity gains or losses (each of which canbe unpredictable). We generally recognize such performance fees and realized co-investment equity gains or losses
80
when assets are sold, the timing of which is geared toward the benefit of our clients. Non-variable operatingexpenses, which we treat as expenses when incurred during the year, are relatively constant on a quarterly basis.
Inflation
Our operating expenses fluctuate with our revenue and general economic conditions including inflation. However,we do not believe inflation has had a material impact on our results of operations during the three year periodended December 31, 2015.
RESULTS OF OPERATIONS
We operate in a variety of currencies but report our results in U.S. dollars. As a result, the volatility of thesecurrencies against the U.S. dollar may positively or negatively impact our reported results. This volatility may resultin the reported U.S. dollar revenue and expenses showing increases or decreases between years that may not beconsistent with the real underlying increases or decreases in local currency operations. In order to provide moremeaningful year-to-year comparisons of our reported results, we have included detail of the movements in certainreported lines of the Consolidated Statements of Comprehensive Income in both U.S. dollars and in localcurrencies in the tables throughout this section.
We define market volumes for Leasing as gross absorption of office real estate space in square meters for the U.S.,Europe and selected markets in Asia Pacific. We define market volumes for Capital Markets as the U.S. dollarequivalent value of investment sales transactions globally.
Throughout Results of Operations, discussion of percentage changes and reported adjusted EBITDA margins arein local currency unless otherwise noted.
Reclassifications
We report Equity earnings (losses) from real estate ventures in the Consolidated Statements of ComprehensiveIncome after Operating income. However, for segment reporting we reflect Equity earnings (losses) from realestate ventures within Total revenue. See Note 3 of the Notes to Consolidated Financial Statements for Equityearnings (losses) reflected within segment revenue, as well as discussion of how the Chief Operating DecisionMaker (as defined in Note 3) measures segment results with Equity earnings (losses) included in segment revenue.Certain prior year amounts have been reclassified to conform to the current presentation. These reclassificationshave not been material and have not affected reported net income.
81
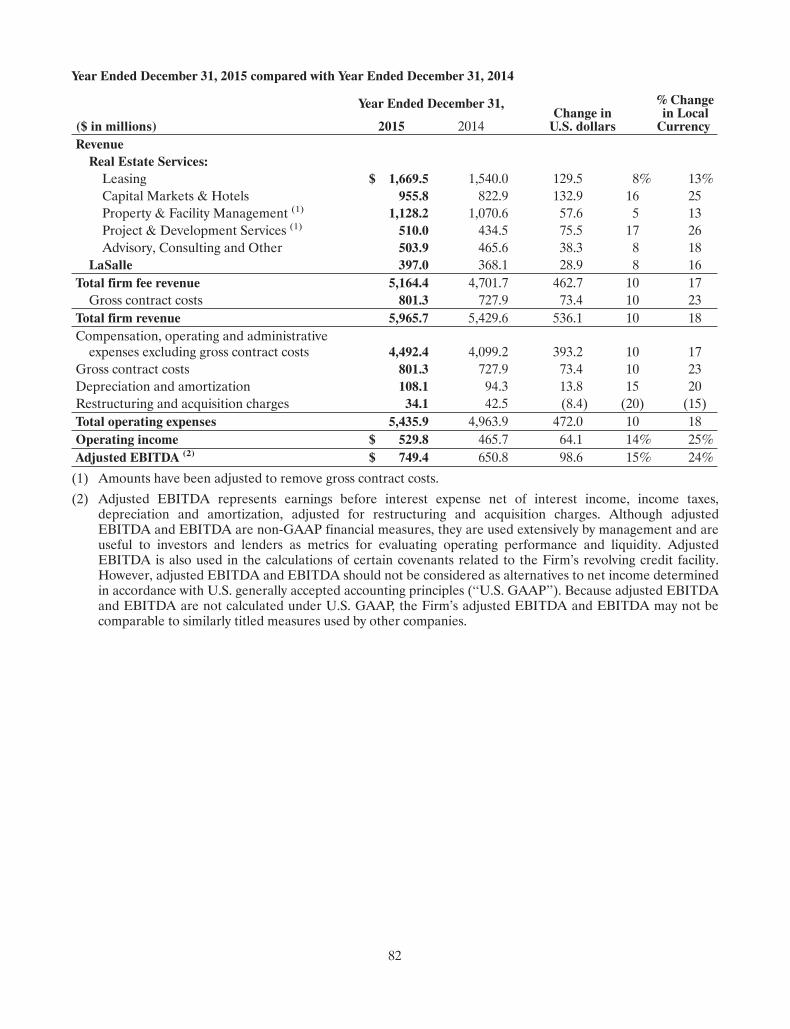
Year Ended December 31, 2015 compared with Year Ended December 31, 2014
($ in millions)
Year Ended December 31,Change inU.S. dollars
% Changein LocalCurrency2015 2014
RevenueReal Estate Services:Leasing $ 1,669.5 1,540.0 129.5 8% 13%Capital Markets & Hotels 955.8 822.9 132.9 16 25Property & Facility Management (1) 1,128.2 1,070.6 57.6 5 13Project & Development Services (1) 510.0 434.5 75.5 17 26Advisory, Consulting and Other 503.9 465.6 38.3 8 18
LaSalle 397.0 368.1 28.9 8 16Total firm fee revenue 5,164.4 4,701.7 462.7 10 17Gross contract costs 801.3 727.9 73.4 10 23
Total firm revenue 5,965.7 5,429.6 536.1 10 18Compensation, operating and administrativeexpenses excluding gross contract costs 4,492.4 4,099.2 393.2 10 17
Gross contract costs 801.3 727.9 73.4 10 23Depreciation and amortization 108.1 94.3 13.8 15 20Restructuring and acquisition charges 34.1 42.5 (8.4) (20) (15)Total operating expenses 5,435.9 4,963.9 472.0 10 18Operating income $ 529.8 465.7 64.1 14% 25%Adjusted EBITDA (2) $ 749.4 650.8 98.6 15% 24%
(1) Amounts have been adjusted to remove gross contract costs.
(2) Adjusted EBITDA represents earnings before interest expense net of interest income, income taxes,depreciation and amortization, adjusted for restructuring and acquisition charges. Although adjustedEBITDA and EBITDA are non-GAAP financial measures, they are used extensively by management and areuseful to investors and lenders as metrics for evaluating operating performance and liquidity. AdjustedEBITDA is also used in the calculations of certain covenants related to the Firm’s revolving credit facility.However, adjusted EBITDA and EBITDA should not be considered as alternatives to net income determinedin accordance with U.S. generally accepted accounting principles (‘‘U.S. GAAP’’). Because adjusted EBITDAand EBITDA are not calculated under U.S. GAAP, the Firm’s adjusted EBITDA and EBITDA may not becomparable to similarly titled measures used by other companies.
82
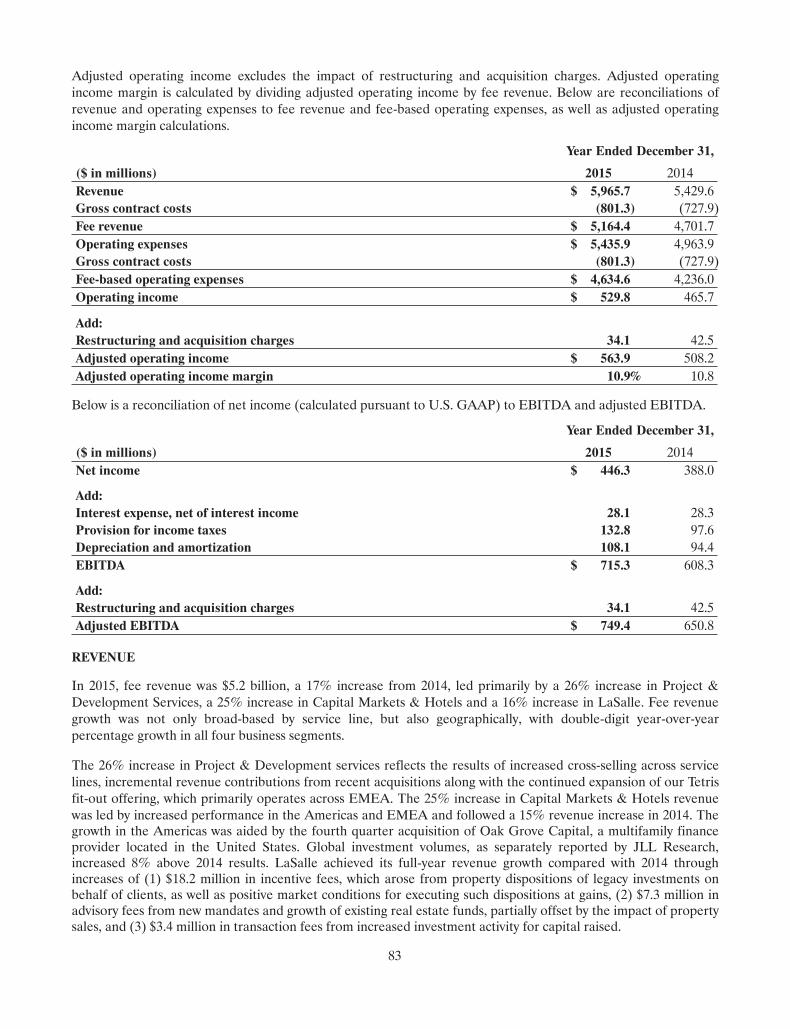
Adjusted operating income excludes the impact of restructuring and acquisition charges. Adjusted operatingincome margin is calculated by dividing adjusted operating income by fee revenue. Below are reconciliations ofrevenue and operating expenses to fee revenue and fee-based operating expenses, as well as adjusted operatingincome margin calculations.
Year Ended December 31,
($ in millions) 2015 2014Revenue $ 5,965.7 5,429.6Gross contract costs (801.3) (727.9)Fee revenue $ 5,164.4 4,701.7Operating expenses $ 5,435.9 4,963.9Gross contract costs (801.3) (727.9)Fee-based operating expenses $ 4,634.6 4,236.0Operating income $ 529.8 465.7
Add:Restructuring and acquisition charges 34.1 42.5Adjusted operating income $ 563.9 508.2Adjusted operating income margin 10.9% 10.8
Below is a reconciliation of net income (calculated pursuant to U.S. GAAP) to EBITDA and adjusted EBITDA.
Year Ended December 31,
($ in millions) 2015 2014Net income $ 446.3 388.0
Add:Interest expense, net of interest income 28.1 28.3Provision for income taxes 132.8 97.6Depreciation and amortization 108.1 94.4EBITDA $ 715.3 608.3
Add:Restructuring and acquisition charges 34.1 42.5Adjusted EBITDA $ 749.4 650.8
REVENUE
In 2015, fee revenue was $5.2 billion, a 17% increase from 2014, led primarily by a 26% increase in Project &Development Services, a 25% increase in Capital Markets & Hotels and a 16% increase in LaSalle. Fee revenuegrowth was not only broad-based by service line, but also geographically, with double-digit year-over-yearpercentage growth in all four business segments.
The 26% increase in Project & Development services reflects the results of increased cross-selling across servicelines, incremental revenue contributions from recent acquisitions along with the continued expansion of our Tetrisfit-out offering, which primarily operates across EMEA. The 25% increase in Capital Markets & Hotels revenuewas led by increased performance in the Americas and EMEA and followed a 15% revenue increase in 2014. Thegrowth in the Americas was aided by the fourth quarter acquisition of Oak Grove Capital, a multifamily financeprovider located in the United States. Global investment volumes, as separately reported by JLL Research,increased 8% above 2014 results. LaSalle achieved its full-year revenue growth compared with 2014 throughincreases of (1) $18.2 million in incentive fees, which arose from property dispositions of legacy investments onbehalf of clients, as well as positive market conditions for executing such dispositions at gains, (2) $7.3 million inadvisory fees from new mandates and growth of existing real estate funds, partially offset by the impact of propertysales, and (3) $3.4 million in transaction fees from increased investment activity for capital raised.
83
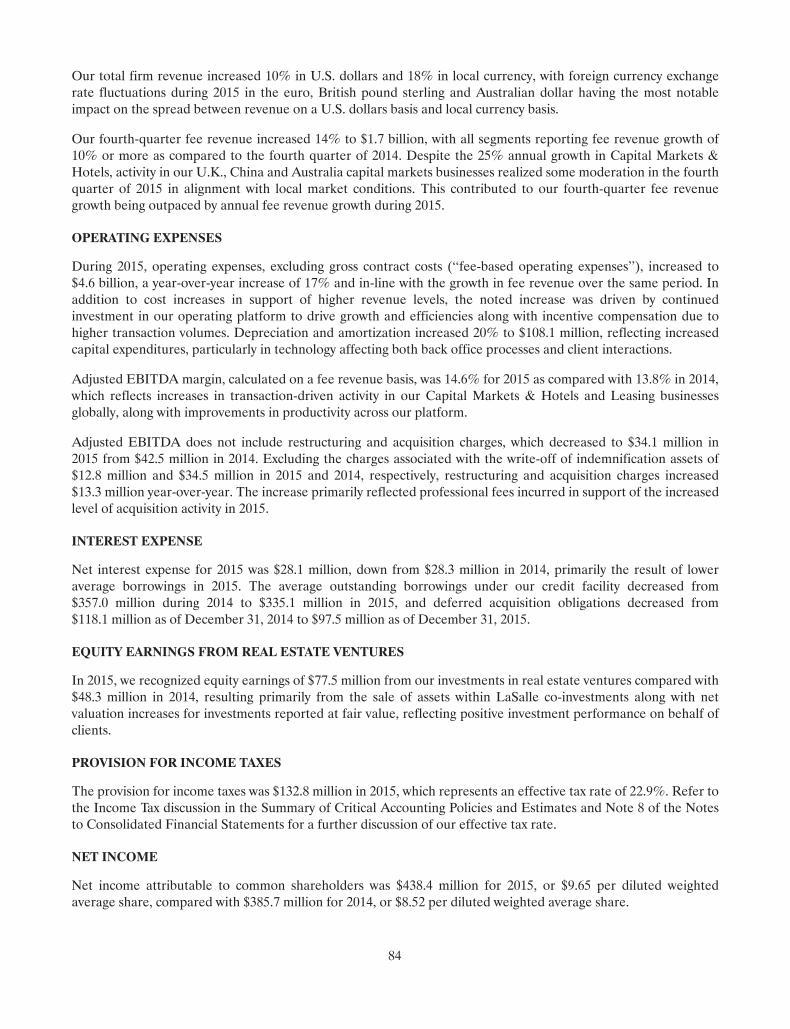
Our total firm revenue increased 10% in U.S. dollars and 18% in local currency, with foreign currency exchangerate fluctuations during 2015 in the euro, British pound sterling and Australian dollar having the most notableimpact on the spread between revenue on a U.S. dollars basis and local currency basis.
Our fourth-quarter fee revenue increased 14% to $1.7 billion, with all segments reporting fee revenue growth of10% or more as compared to the fourth quarter of 2014. Despite the 25% annual growth in Capital Markets &Hotels, activity in our U.K., China and Australia capital markets businesses realized some moderation in the fourthquarter of 2015 in alignment with local market conditions. This contributed to our fourth-quarter fee revenuegrowth being outpaced by annual fee revenue growth during 2015.
OPERATING EXPENSES
During 2015, operating expenses, excluding gross contract costs (‘‘fee-based operating expenses’’), increased to$4.6 billion, a year-over-year increase of 17% and in-line with the growth in fee revenue over the same period. Inaddition to cost increases in support of higher revenue levels, the noted increase was driven by continuedinvestment in our operating platform to drive growth and efficiencies along with incentive compensation due tohigher transaction volumes. Depreciation and amortization increased 20% to $108.1 million, reflecting increasedcapital expenditures, particularly in technology affecting both back office processes and client interactions.
Adjusted EBITDA margin, calculated on a fee revenue basis, was 14.6% for 2015 as compared with 13.8% in 2014,which reflects increases in transaction-driven activity in our Capital Markets & Hotels and Leasing businessesglobally, along with improvements in productivity across our platform.
Adjusted EBITDA does not include restructuring and acquisition charges, which decreased to $34.1 million in2015 from $42.5 million in 2014. Excluding the charges associated with the write-off of indemnification assets of$12.8 million and $34.5 million in 2015 and 2014, respectively, restructuring and acquisition charges increased$13.3 million year-over-year. The increase primarily reflected professional fees incurred in support of the increasedlevel of acquisition activity in 2015.
INTEREST EXPENSE
Net interest expense for 2015 was $28.1 million, down from $28.3 million in 2014, primarily the result of loweraverage borrowings in 2015. The average outstanding borrowings under our credit facility decreased from$357.0 million during 2014 to $335.1 million in 2015, and deferred acquisition obligations decreased from$118.1 million as of December 31, 2014 to $97.5 million as of December 31, 2015.
EQUITY EARNINGS FROM REAL ESTATE VENTURES
In 2015, we recognized equity earnings of $77.5 million from our investments in real estate ventures compared with$48.3 million in 2014, resulting primarily from the sale of assets within LaSalle co-investments along with netvaluation increases for investments reported at fair value, reflecting positive investment performance on behalf ofclients.
PROVISION FOR INCOME TAXES
The provision for income taxes was $132.8 million in 2015, which represents an effective tax rate of 22.9%. Refer tothe Income Tax discussion in the Summary of Critical Accounting Policies and Estimates and Note 8 of the Notesto Consolidated Financial Statements for a further discussion of our effective tax rate.
NET INCOME
Net income attributable to common shareholders was $438.4 million for 2015, or $9.65 per diluted weightedaverage share, compared with $385.7 million for 2014, or $8.52 per diluted weighted average share.
84
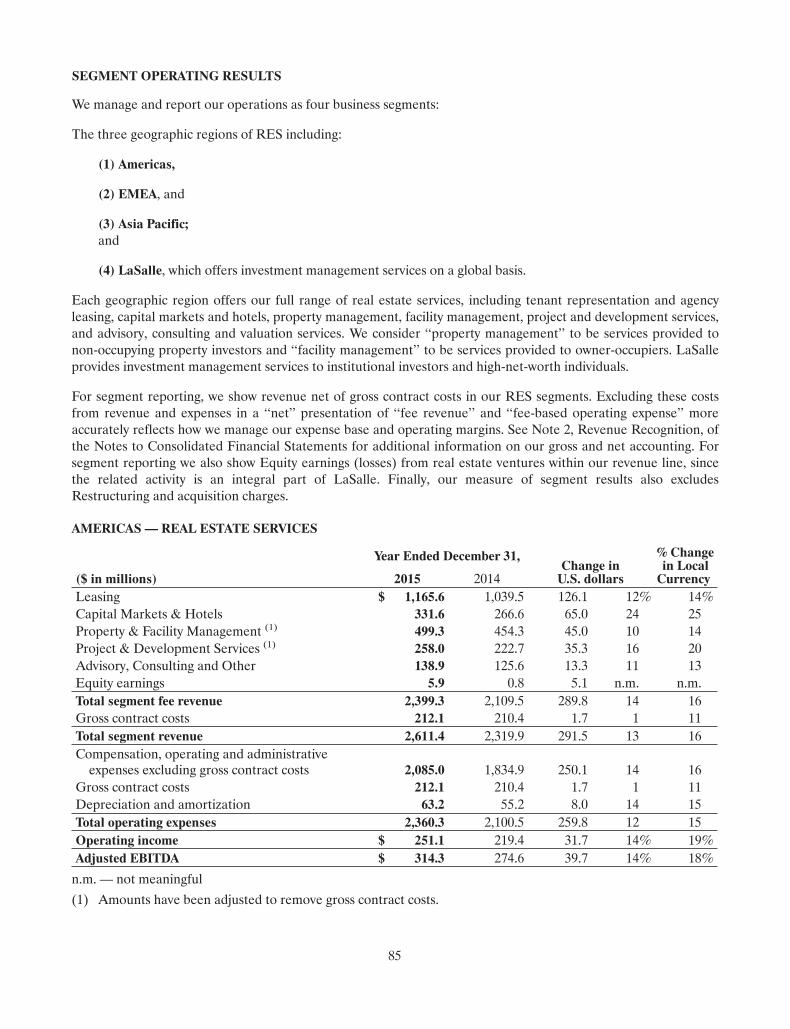
SEGMENT OPERATING RESULTS
We manage and report our operations as four business segments:
The three geographic regions of RES including:
(1) Americas,
(2) EMEA, and
(3) Asia Pacific;and
(4) LaSalle, which offers investment management services on a global basis.
Each geographic region offers our full range of real estate services, including tenant representation and agencyleasing, capital markets and hotels, property management, facility management, project and development services,and advisory, consulting and valuation services. We consider ‘‘property management’’ to be services provided tonon-occupying property investors and ‘‘facility management’’ to be services provided to owner-occupiers. LaSalleprovides investment management services to institutional investors and high-net-worth individuals.
For segment reporting, we show revenue net of gross contract costs in our RES segments. Excluding these costsfrom revenue and expenses in a ‘‘net’’ presentation of ‘‘fee revenue’’ and ‘‘fee-based operating expense’’ moreaccurately reflects how we manage our expense base and operating margins. See Note 2, Revenue Recognition, ofthe Notes to Consolidated Financial Statements for additional information on our gross and net accounting. Forsegment reporting we also show Equity earnings (losses) from real estate ventures within our revenue line, sincethe related activity is an integral part of LaSalle. Finally, our measure of segment results also excludesRestructuring and acquisition charges.
AMERICAS — REAL ESTATE SERVICES
($ in millions)
Year Ended December 31,Change inU.S. dollars
% Changein LocalCurrency2015 2014
Leasing $ 1,165.6 1,039.5 126.1 12% 14%Capital Markets & Hotels 331.6 266.6 65.0 24 25Property & Facility Management (1) 499.3 454.3 45.0 10 14Project & Development Services (1) 258.0 222.7 35.3 16 20Advisory, Consulting and Other 138.9 125.6 13.3 11 13Equity earnings 5.9 0.8 5.1 n.m. n.m.Total segment fee revenue 2,399.3 2,109.5 289.8 14 16Gross contract costs 212.1 210.4 1.7 1 11Total segment revenue 2,611.4 2,319.9 291.5 13 16Compensation, operating and administrativeexpenses excluding gross contract costs 2,085.0 1,834.9 250.1 14 16
Gross contract costs 212.1 210.4 1.7 1 11Depreciation and amortization 63.2 55.2 8.0 14 15Total operating expenses 2,360.3 2,100.5 259.8 12 15Operating income $ 251.1 219.4 31.7 14% 19%Adjusted EBITDA $ 314.3 274.6 39.7 14% 18%
n.m. — not meaningful
(1) Amounts have been adjusted to remove gross contract costs.
85
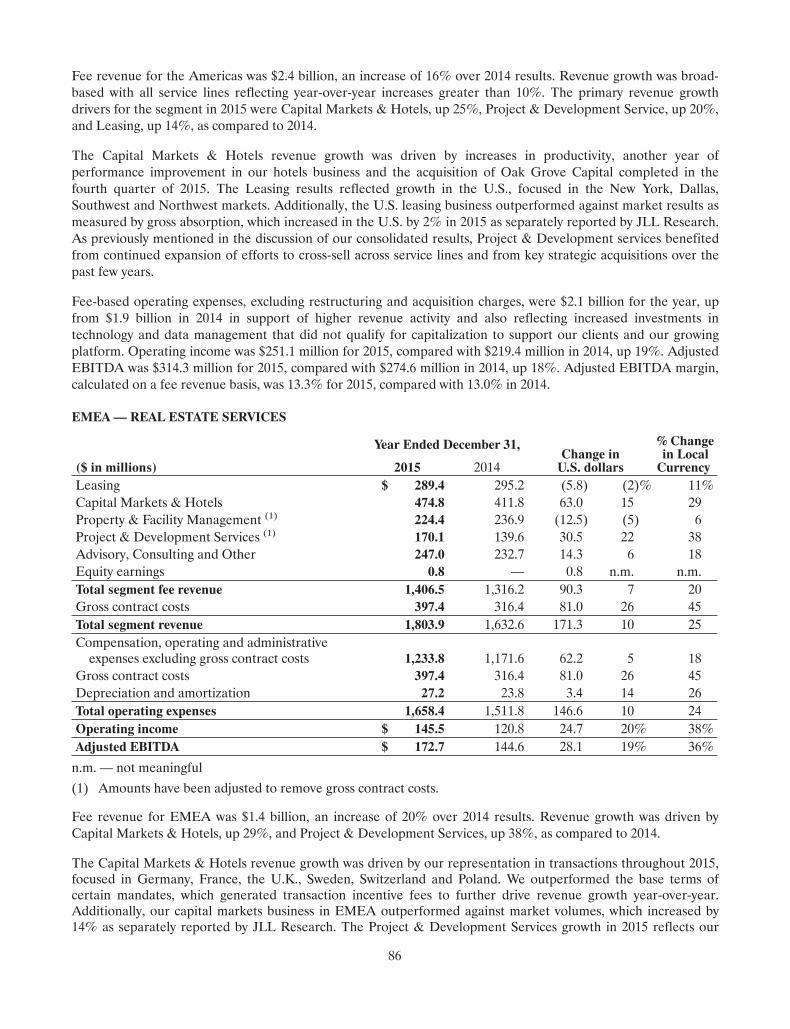
Fee revenue for the Americas was $2.4 billion, an increase of 16% over 2014 results. Revenue growth was broad-based with all service lines reflecting year-over-year increases greater than 10%. The primary revenue growthdrivers for the segment in 2015 were Capital Markets & Hotels, up 25%, Project & Development Service, up 20%,and Leasing, up 14%, as compared to 2014.
The Capital Markets & Hotels revenue growth was driven by increases in productivity, another year ofperformance improvement in our hotels business and the acquisition of Oak Grove Capital completed in thefourth quarter of 2015. The Leasing results reflected growth in the U.S., focused in the New York, Dallas,Southwest and Northwest markets. Additionally, the U.S. leasing business outperformed against market results asmeasured by gross absorption, which increased in the U.S. by 2% in 2015 as separately reported by JLL Research.As previously mentioned in the discussion of our consolidated results, Project & Development services benefitedfrom continued expansion of efforts to cross-sell across service lines and from key strategic acquisitions over thepast few years.
Fee-based operating expenses, excluding restructuring and acquisition charges, were $2.1 billion for the year, upfrom $1.9 billion in 2014 in support of higher revenue activity and also reflecting increased investments intechnology and data management that did not qualify for capitalization to support our clients and our growingplatform. Operating income was $251.1 million for 2015, compared with $219.4 million in 2014, up 19%. AdjustedEBITDA was $314.3 million for 2015, compared with $274.6 million in 2014, up 18%. Adjusted EBITDA margin,calculated on a fee revenue basis, was 13.3% for 2015, compared with 13.0% in 2014.
EMEA— REAL ESTATE SERVICES
($ in millions)
Year Ended December 31,Change inU.S. dollars
% Changein LocalCurrency2015 2014
Leasing $ 289.4 295.2 (5.8) (2)% 11%Capital Markets & Hotels 474.8 411.8 63.0 15 29Property & Facility Management (1) 224.4 236.9 (12.5) (5) 6Project & Development Services (1) 170.1 139.6 30.5 22 38Advisory, Consulting and Other 247.0 232.7 14.3 6 18Equity earnings 0.8 — 0.8 n.m. n.m.Total segment fee revenue 1,406.5 1,316.2 90.3 7 20Gross contract costs 397.4 316.4 81.0 26 45Total segment revenue 1,803.9 1,632.6 171.3 10 25Compensation, operating and administrativeexpenses excluding gross contract costs 1,233.8 1,171.6 62.2 5 18
Gross contract costs 397.4 316.4 81.0 26 45Depreciation and amortization 27.2 23.8 3.4 14 26Total operating expenses 1,658.4 1,511.8 146.6 10 24Operating income $ 145.5 120.8 24.7 20% 38%Adjusted EBITDA $ 172.7 144.6 28.1 19% 36%
n.m. — not meaningful
(1) Amounts have been adjusted to remove gross contract costs.
Fee revenue for EMEA was $1.4 billion, an increase of 20% over 2014 results. Revenue growth was driven byCapital Markets & Hotels, up 29%, and Project & Development Services, up 38%, as compared to 2014.
The Capital Markets & Hotels revenue growth was driven by our representation in transactions throughout 2015,focused in Germany, France, the U.K., Sweden, Switzerland and Poland. We outperformed the base terms ofcertain mandates, which generated transaction incentive fees to further drive revenue growth year-over-year.Additionally, our capital markets business in EMEA outperformed against market volumes, which increased by14% as separately reported by JLL Research. The Project & Development Services growth in 2015 reflects our
86
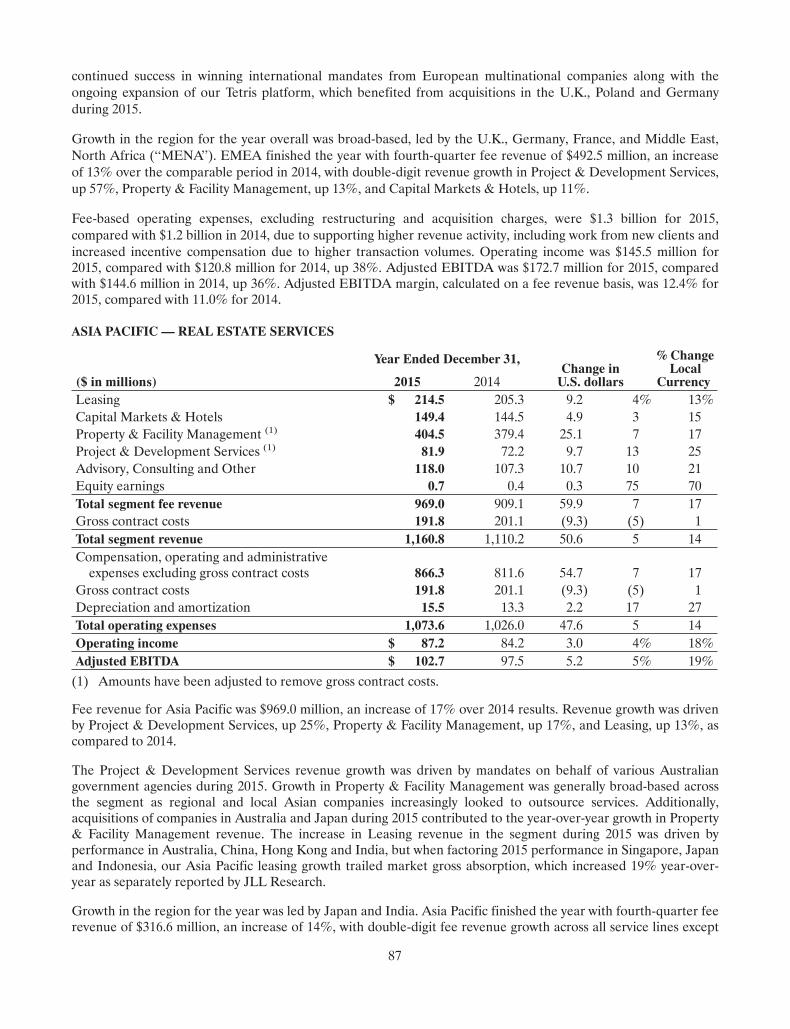
continued success in winning international mandates from European multinational companies along with theongoing expansion of our Tetris platform, which benefited from acquisitions in the U.K., Poland and Germanyduring 2015.
Growth in the region for the year overall was broad-based, led by the U.K., Germany, France, and Middle East,North Africa (‘‘MENA’’). EMEA finished the year with fourth-quarter fee revenue of $492.5 million, an increaseof 13% over the comparable period in 2014, with double-digit revenue growth in Project & Development Services,up 57%, Property & Facility Management, up 13%, and Capital Markets & Hotels, up 11%.
Fee-based operating expenses, excluding restructuring and acquisition charges, were $1.3 billion for 2015,compared with $1.2 billion in 2014, due to supporting higher revenue activity, including work from new clients andincreased incentive compensation due to higher transaction volumes. Operating income was $145.5 million for2015, compared with $120.8 million for 2014, up 38%. Adjusted EBITDA was $172.7 million for 2015, comparedwith $144.6 million in 2014, up 36%. Adjusted EBITDA margin, calculated on a fee revenue basis, was 12.4% for2015, compared with 11.0% for 2014.
ASIA PACIFIC — REAL ESTATE SERVICES
($ in millions)
Year Ended December 31,Change inU.S. dollars
% ChangeLocal
Currency2015 2014Leasing $ 214.5 205.3 9.2 4% 13%Capital Markets & Hotels 149.4 144.5 4.9 3 15Property & Facility Management (1) 404.5 379.4 25.1 7 17Project & Development Services (1) 81.9 72.2 9.7 13 25Advisory, Consulting and Other 118.0 107.3 10.7 10 21Equity earnings 0.7 0.4 0.3 75 70Total segment fee revenue 969.0 909.1 59.9 7 17Gross contract costs 191.8 201.1 (9.3) (5) 1Total segment revenue 1,160.8 1,110.2 50.6 5 14Compensation, operating and administrativeexpenses excluding gross contract costs 866.3 811.6 54.7 7 17
Gross contract costs 191.8 201.1 (9.3) (5) 1Depreciation and amortization 15.5 13.3 2.2 17 27Total operating expenses 1,073.6 1,026.0 47.6 5 14Operating income $ 87.2 84.2 3.0 4% 18%Adjusted EBITDA $ 102.7 97.5 5.2 5% 19%
(1) Amounts have been adjusted to remove gross contract costs.
Fee revenue for Asia Pacific was $969.0 million, an increase of 17% over 2014 results. Revenue growth was drivenby Project & Development Services, up 25%, Property & Facility Management, up 17%, and Leasing, up 13%, ascompared to 2014.
The Project & Development Services revenue growth was driven by mandates on behalf of various Australiangovernment agencies during 2015. Growth in Property & Facility Management was generally broad-based acrossthe segment as regional and local Asian companies increasingly looked to outsource services. Additionally,acquisitions of companies in Australia and Japan during 2015 contributed to the year-over-year growth in Property& Facility Management revenue. The increase in Leasing revenue in the segment during 2015 was driven byperformance in Australia, China, Hong Kong and India, but when factoring 2015 performance in Singapore, Japanand Indonesia, our Asia Pacific leasing growth trailed market gross absorption, which increased 19% year-over-year as separately reported by JLL Research.
Growth in the region for the year was led by Japan and India. Asia Pacific finished the year with fourth-quarter feerevenue of $316.6 million, an increase of 14%, with double-digit fee revenue growth across all service lines except
87
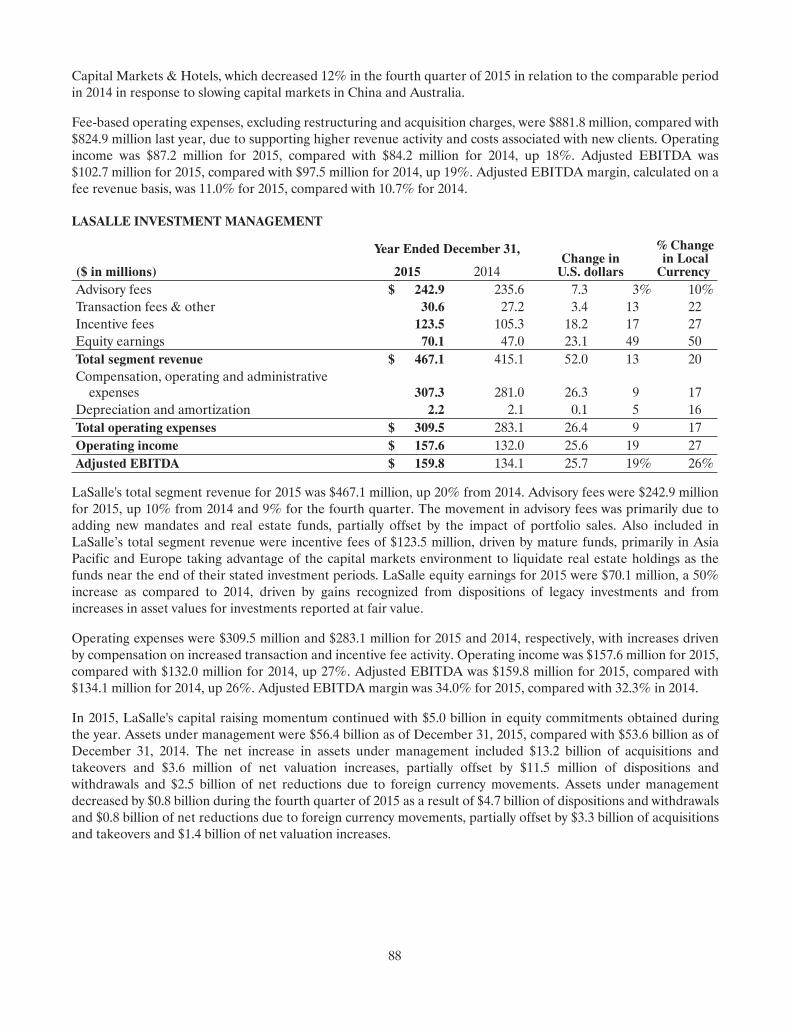
Capital Markets & Hotels, which decreased 12% in the fourth quarter of 2015 in relation to the comparable periodin 2014 in response to slowing capital markets in China and Australia.
Fee-based operating expenses, excluding restructuring and acquisition charges, were $881.8 million, compared with$824.9 million last year, due to supporting higher revenue activity and costs associated with new clients. Operatingincome was $87.2 million for 2015, compared with $84.2 million for 2014, up 18%. Adjusted EBITDA was$102.7 million for 2015, compared with $97.5 million for 2014, up 19%. Adjusted EBITDA margin, calculated on afee revenue basis, was 11.0% for 2015, compared with 10.7% for 2014.
LASALLE INVESTMENT MANAGEMENT
($ in millions)
Year Ended December 31,Change inU.S. dollars
% Changein LocalCurrency2015 2014
Advisory fees $ 242.9 235.6 7.3 3% 10%Transaction fees & other 30.6 27.2 3.4 13 22Incentive fees 123.5 105.3 18.2 17 27Equity earnings 70.1 47.0 23.1 49 50Total segment revenue $ 467.1 415.1 52.0 13 20Compensation, operating and administrativeexpenses 307.3 281.0 26.3 9 17
Depreciation and amortization 2.2 2.1 0.1 5 16Total operating expenses $ 309.5 283.1 26.4 9 17Operating income $ 157.6 132.0 25.6 19 27Adjusted EBITDA $ 159.8 134.1 25.7 19% 26%
LaSalle's total segment revenue for 2015 was $467.1 million, up 20% from 2014. Advisory fees were $242.9 millionfor 2015, up 10% from 2014 and 9% for the fourth quarter. The movement in advisory fees was primarily due toadding new mandates and real estate funds, partially offset by the impact of portfolio sales. Also included inLaSalle’s total segment revenue were incentive fees of $123.5 million, driven by mature funds, primarily in AsiaPacific and Europe taking advantage of the capital markets environment to liquidate real estate holdings as thefunds near the end of their stated investment periods. LaSalle equity earnings for 2015 were $70.1 million, a 50%increase as compared to 2014, driven by gains recognized from dispositions of legacy investments and fromincreases in asset values for investments reported at fair value.
Operating expenses were $309.5 million and $283.1 million for 2015 and 2014, respectively, with increases drivenby compensation on increased transaction and incentive fee activity. Operating income was $157.6 million for 2015,compared with $132.0 million for 2014, up 27%. Adjusted EBITDA was $159.8 million for 2015, compared with$134.1 million for 2014, up 26%. Adjusted EBITDA margin was 34.0% for 2015, compared with 32.3% in 2014.
In 2015, LaSalle's capital raising momentum continued with $5.0 billion in equity commitments obtained duringthe year. Assets under management were $56.4 billion as of December 31, 2015, compared with $53.6 billion as ofDecember 31, 2014. The net increase in assets under management included $13.2 billion of acquisitions andtakeovers and $3.6 million of net valuation increases, partially offset by $11.5 million of dispositions andwithdrawals and $2.5 billion of net reductions due to foreign currency movements. Assets under managementdecreased by $0.8 billion during the fourth quarter of 2015 as a result of $4.7 billion of dispositions and withdrawalsand $0.8 billion of net reductions due to foreign currency movements, partially offset by $3.3 billion of acquisitionsand takeovers and $1.4 billion of net valuation increases.
88
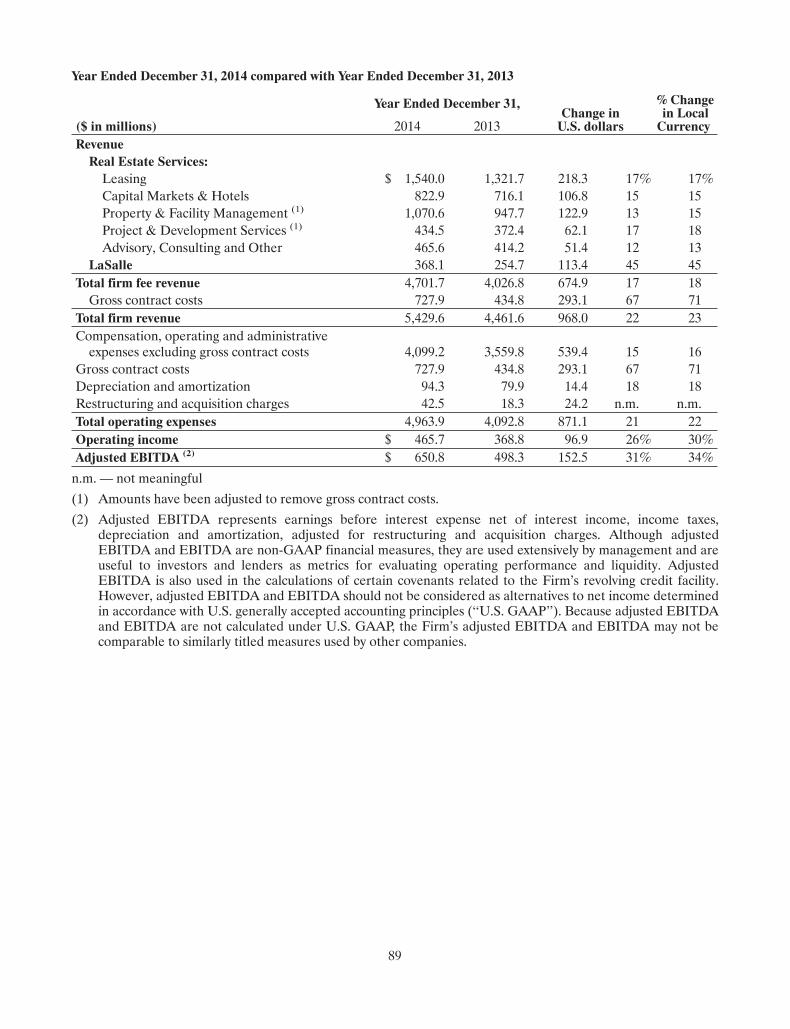
Year Ended December 31, 2014 compared with Year Ended December 31, 2013
($ in millions)
Year Ended December 31,Change inU.S. dollars
% Changein LocalCurrency2014 2013
RevenueReal Estate Services:Leasing $ 1,540.0 1,321.7 218.3 17% 17%Capital Markets & Hotels 822.9 716.1 106.8 15 15Property & Facility Management (1) 1,070.6 947.7 122.9 13 15Project & Development Services (1) 434.5 372.4 62.1 17 18Advisory, Consulting and Other 465.6 414.2 51.4 12 13
LaSalle 368.1 254.7 113.4 45 45Total firm fee revenue 4,701.7 4,026.8 674.9 17 18Gross contract costs 727.9 434.8 293.1 67 71
Total firm revenue 5,429.6 4,461.6 968.0 22 23Compensation, operating and administrativeexpenses excluding gross contract costs 4,099.2 3,559.8 539.4 15 16
Gross contract costs 727.9 434.8 293.1 67 71Depreciation and amortization 94.3 79.9 14.4 18 18Restructuring and acquisition charges 42.5 18.3 24.2 n.m. n.m.Total operating expenses 4,963.9 4,092.8 871.1 21 22Operating income $ 465.7 368.8 96.9 26% 30%Adjusted EBITDA (2) $ 650.8 498.3 152.5 31% 34%
n.m. — not meaningful
(1) Amounts have been adjusted to remove gross contract costs.
(2) Adjusted EBITDA represents earnings before interest expense net of interest income, income taxes,depreciation and amortization, adjusted for restructuring and acquisition charges. Although adjustedEBITDA and EBITDA are non-GAAP financial measures, they are used extensively by management and areuseful to investors and lenders as metrics for evaluating operating performance and liquidity. AdjustedEBITDA is also used in the calculations of certain covenants related to the Firm’s revolving credit facility.However, adjusted EBITDA and EBITDA should not be considered as alternatives to net income determinedin accordance with U.S. generally accepted accounting principles (‘‘U.S. GAAP’’). Because adjusted EBITDAand EBITDA are not calculated under U.S. GAAP, the Firm’s adjusted EBITDA and EBITDA may not becomparable to similarly titled measures used by other companies.
89
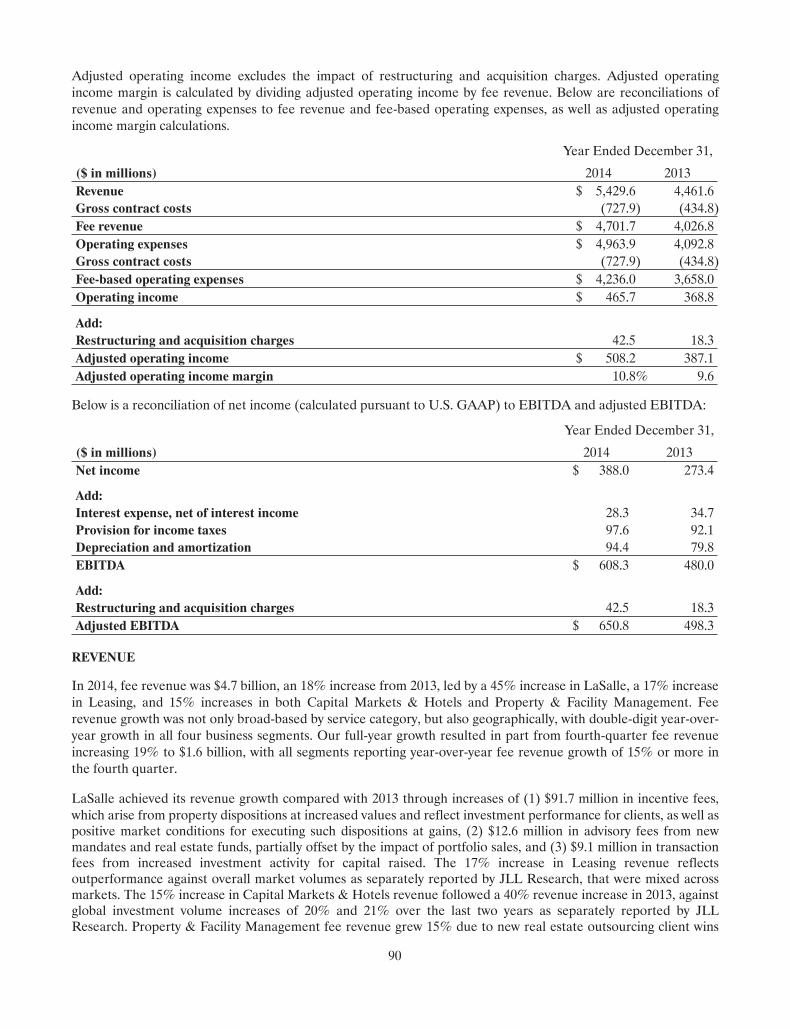
Adjusted operating income excludes the impact of restructuring and acquisition charges. Adjusted operatingincome margin is calculated by dividing adjusted operating income by fee revenue. Below are reconciliations ofrevenue and operating expenses to fee revenue and fee-based operating expenses, as well as adjusted operatingincome margin calculations.
Year Ended December 31,
($ in millions) 2014 2013Revenue $ 5,429.6 4,461.6Gross contract costs (727.9) (434.8)Fee revenue $ 4,701.7 4,026.8Operating expenses $ 4,963.9 4,092.8Gross contract costs (727.9) (434.8)Fee-based operating expenses $ 4,236.0 3,658.0Operating income $ 465.7 368.8
Add:Restructuring and acquisition charges 42.5 18.3Adjusted operating income $ 508.2 387.1Adjusted operating income margin 10.8% 9.6
Below is a reconciliation of net income (calculated pursuant to U.S. GAAP) to EBITDA and adjusted EBITDA:
Year Ended December 31,
($ in millions) 2014 2013Net income $ 388.0 273.4
Add:Interest expense, net of interest income 28.3 34.7Provision for income taxes 97.6 92.1Depreciation and amortization 94.4 79.8EBITDA $ 608.3 480.0
Add:Restructuring and acquisition charges 42.5 18.3Adjusted EBITDA $ 650.8 498.3
REVENUE
In 2014, fee revenue was $4.7 billion, an 18% increase from 2013, led by a 45% increase in LaSalle, a 17% increasein Leasing, and 15% increases in both Capital Markets & Hotels and Property & Facility Management. Feerevenue growth was not only broad-based by service category, but also geographically, with double-digit year-over-year growth in all four business segments. Our full-year growth resulted in part from fourth-quarter fee revenueincreasing 19% to $1.6 billion, with all segments reporting year-over-year fee revenue growth of 15% or more inthe fourth quarter.
LaSalle achieved its revenue growth compared with 2013 through increases of (1) $91.7 million in incentive fees,which arise from property dispositions at increased values and reflect investment performance for clients, as well aspositive market conditions for executing such dispositions at gains, (2) $12.6 million in advisory fees from newmandates and real estate funds, partially offset by the impact of portfolio sales, and (3) $9.1 million in transactionfees from increased investment activity for capital raised. The 17% increase in Leasing revenue reflectsoutperformance against overall market volumes as separately reported by JLL Research, that were mixed acrossmarkets. The 15% increase in Capital Markets & Hotels revenue followed a 40% revenue increase in 2013, againstglobal investment volume increases of 20% and 21% over the last two years as separately reported by JLLResearch. Property & Facility Management fee revenue grew 15% due to new real estate outsourcing client wins
90
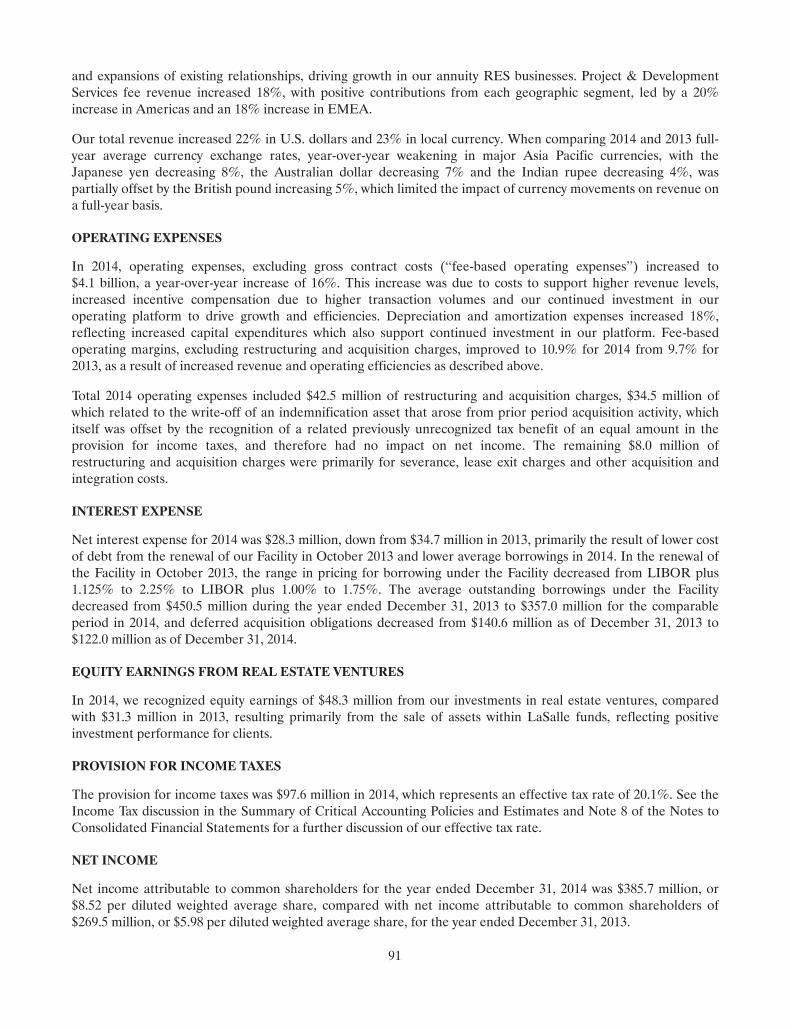
and expansions of existing relationships, driving growth in our annuity RES businesses. Project & DevelopmentServices fee revenue increased 18%, with positive contributions from each geographic segment, led by a 20%increase in Americas and an 18% increase in EMEA.
Our total revenue increased 22% in U.S. dollars and 23% in local currency. When comparing 2014 and 2013 full-year average currency exchange rates, year-over-year weakening in major Asia Pacific currencies, with theJapanese yen decreasing 8%, the Australian dollar decreasing 7% and the Indian rupee decreasing 4%, waspartially offset by the British pound increasing 5%, which limited the impact of currency movements on revenue ona full-year basis.
OPERATING EXPENSES
In 2014, operating expenses, excluding gross contract costs (‘‘fee-based operating expenses’’) increased to$4.1 billion, a year-over-year increase of 16%. This increase was due to costs to support higher revenue levels,increased incentive compensation due to higher transaction volumes and our continued investment in ouroperating platform to drive growth and efficiencies. Depreciation and amortization expenses increased 18%,reflecting increased capital expenditures which also support continued investment in our platform. Fee-basedoperating margins, excluding restructuring and acquisition charges, improved to 10.9% for 2014 from 9.7% for2013, as a result of increased revenue and operating efficiencies as described above.
Total 2014 operating expenses included $42.5 million of restructuring and acquisition charges, $34.5 million ofwhich related to the write-off of an indemnification asset that arose from prior period acquisition activity, whichitself was offset by the recognition of a related previously unrecognized tax benefit of an equal amount in theprovision for income taxes, and therefore had no impact on net income. The remaining $8.0 million ofrestructuring and acquisition charges were primarily for severance, lease exit charges and other acquisition andintegration costs.
INTEREST EXPENSE
Net interest expense for 2014 was $28.3 million, down from $34.7 million in 2013, primarily the result of lower costof debt from the renewal of our Facility in October 2013 and lower average borrowings in 2014. In the renewal ofthe Facility in October 2013, the range in pricing for borrowing under the Facility decreased from LIBOR plus1.125% to 2.25% to LIBOR plus 1.00% to 1.75%. The average outstanding borrowings under the Facilitydecreased from $450.5 million during the year ended December 31, 2013 to $357.0 million for the comparableperiod in 2014, and deferred acquisition obligations decreased from $140.6 million as of December 31, 2013 to$122.0 million as of December 31, 2014.
EQUITY EARNINGS FROM REAL ESTATE VENTURES
In 2014, we recognized equity earnings of $48.3 million from our investments in real estate ventures, comparedwith $31.3 million in 2013, resulting primarily from the sale of assets within LaSalle funds, reflecting positiveinvestment performance for clients.
PROVISION FOR INCOME TAXES
The provision for income taxes was $97.6 million in 2014, which represents an effective tax rate of 20.1%. See theIncome Tax discussion in the Summary of Critical Accounting Policies and Estimates and Note 8 of the Notes toConsolidated Financial Statements for a further discussion of our effective tax rate.
NET INCOME
Net income attributable to common shareholders for the year ended December 31, 2014 was $385.7 million, or$8.52 per diluted weighted average share, compared with net income attributable to common shareholders of$269.5 million, or $5.98 per diluted weighted average share, for the year ended December 31, 2013.
91
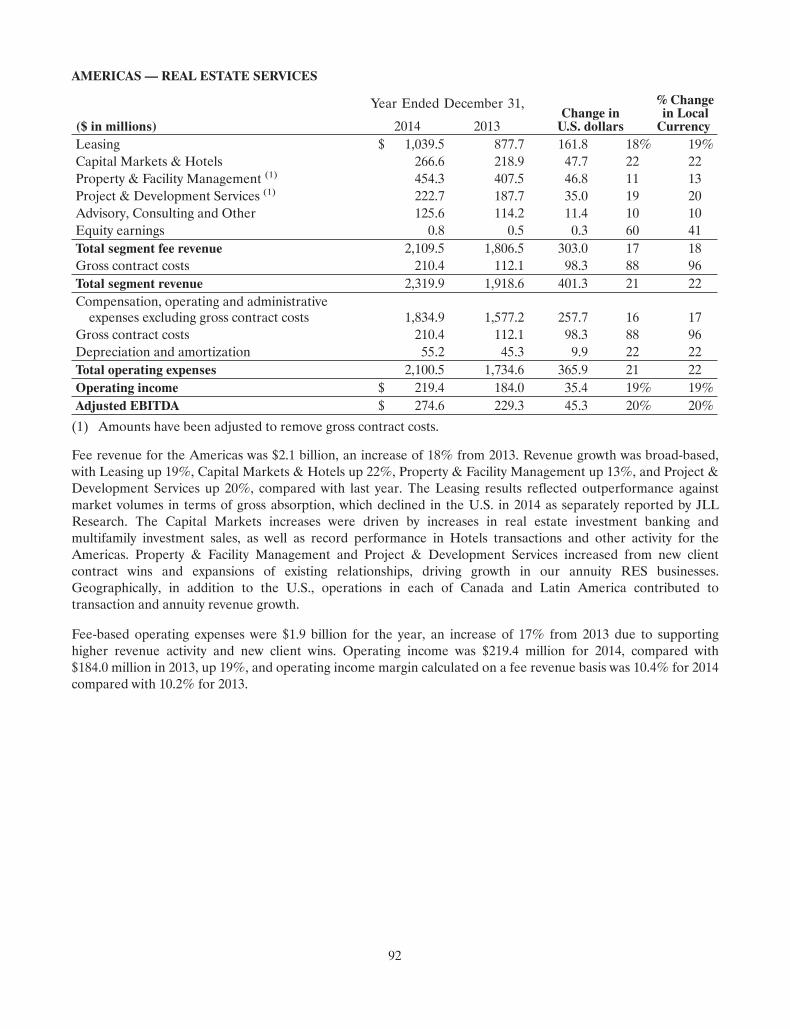
AMERICAS — REAL ESTATE SERVICES
($ in millions)
Year Ended December 31,Change inU.S. dollars
% Changein LocalCurrency2014 2013
Leasing $ 1,039.5 877.7 161.8 18% 19%Capital Markets & Hotels 266.6 218.9 47.7 22 22Property & Facility Management (1) 454.3 407.5 46.8 11 13Project & Development Services (1) 222.7 187.7 35.0 19 20Advisory, Consulting and Other 125.6 114.2 11.4 10 10Equity earnings 0.8 0.5 0.3 60 41Total segment fee revenue 2,109.5 1,806.5 303.0 17 18Gross contract costs 210.4 112.1 98.3 88 96Total segment revenue 2,319.9 1,918.6 401.3 21 22Compensation, operating and administrativeexpenses excluding gross contract costs 1,834.9 1,577.2 257.7 16 17
Gross contract costs 210.4 112.1 98.3 88 96Depreciation and amortization 55.2 45.3 9.9 22 22Total operating expenses 2,100.5 1,734.6 365.9 21 22Operating income $ 219.4 184.0 35.4 19% 19%Adjusted EBITDA $ 274.6 229.3 45.3 20% 20%
(1) Amounts have been adjusted to remove gross contract costs.
Fee revenue for the Americas was $2.1 billion, an increase of 18% from 2013. Revenue growth was broad-based,with Leasing up 19%, Capital Markets & Hotels up 22%, Property & Facility Management up 13%, and Project &Development Services up 20%, compared with last year. The Leasing results reflected outperformance againstmarket volumes in terms of gross absorption, which declined in the U.S. in 2014 as separately reported by JLLResearch. The Capital Markets increases were driven by increases in real estate investment banking andmultifamily investment sales, as well as record performance in Hotels transactions and other activity for theAmericas. Property & Facility Management and Project & Development Services increased from new clientcontract wins and expansions of existing relationships, driving growth in our annuity RES businesses.Geographically, in addition to the U.S., operations in each of Canada and Latin America contributed totransaction and annuity revenue growth.
Fee-based operating expenses were $1.9 billion for the year, an increase of 17% from 2013 due to supportinghigher revenue activity and new client wins. Operating income was $219.4 million for 2014, compared with$184.0 million in 2013, up 19%, and operating income margin calculated on a fee revenue basis was 10.4% for 2014compared with 10.2% for 2013.
92
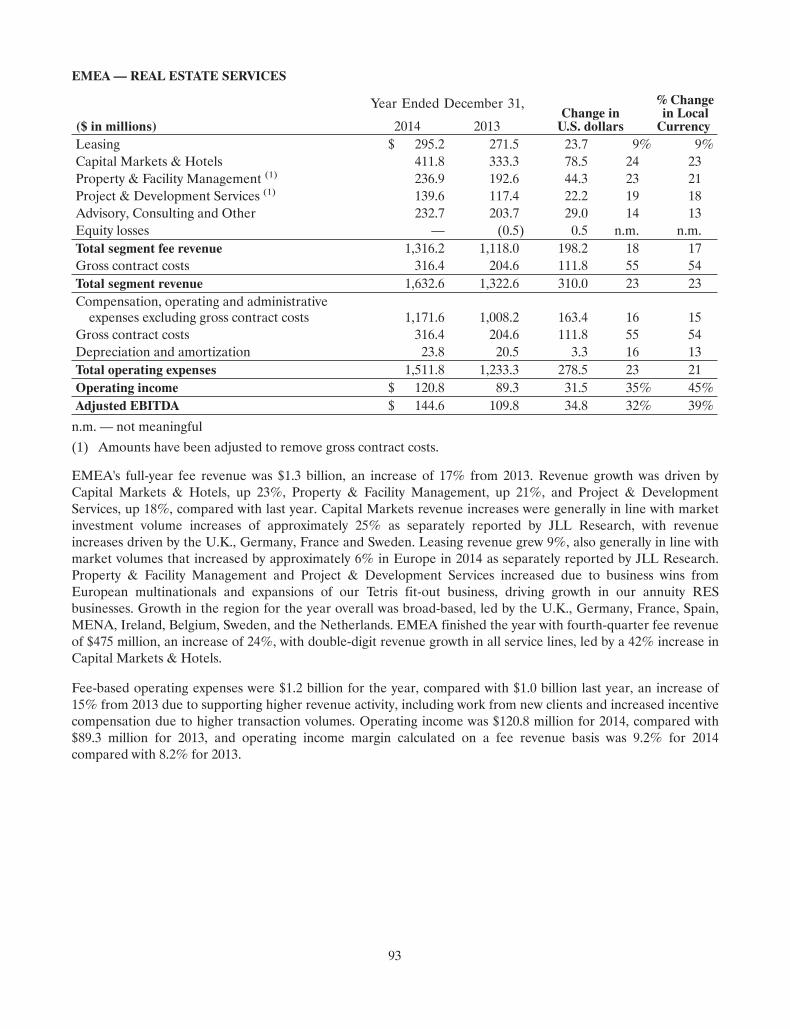
EMEA— REAL ESTATE SERVICES
($ in millions)
Year Ended December 31,Change inU.S. dollars
% Changein LocalCurrency2014 2013
Leasing $ 295.2 271.5 23.7 9% 9%Capital Markets & Hotels 411.8 333.3 78.5 24 23Property & Facility Management (1) 236.9 192.6 44.3 23 21Project & Development Services (1) 139.6 117.4 22.2 19 18Advisory, Consulting and Other 232.7 203.7 29.0 14 13Equity losses — (0.5) 0.5 n.m. n.m.Total segment fee revenue 1,316.2 1,118.0 198.2 18 17Gross contract costs 316.4 204.6 111.8 55 54Total segment revenue 1,632.6 1,322.6 310.0 23 23Compensation, operating and administrativeexpenses excluding gross contract costs 1,171.6 1,008.2 163.4 16 15
Gross contract costs 316.4 204.6 111.8 55 54Depreciation and amortization 23.8 20.5 3.3 16 13Total operating expenses 1,511.8 1,233.3 278.5 23 21Operating income $ 120.8 89.3 31.5 35% 45%Adjusted EBITDA $ 144.6 109.8 34.8 32% 39%
n.m. — not meaningful
(1) Amounts have been adjusted to remove gross contract costs.
EMEA's full-year fee revenue was $1.3 billion, an increase of 17% from 2013. Revenue growth was driven byCapital Markets & Hotels, up 23%, Property & Facility Management, up 21%, and Project & DevelopmentServices, up 18%, compared with last year. Capital Markets revenue increases were generally in line with marketinvestment volume increases of approximately 25% as separately reported by JLL Research, with revenueincreases driven by the U.K., Germany, France and Sweden. Leasing revenue grew 9%, also generally in line withmarket volumes that increased by approximately 6% in Europe in 2014 as separately reported by JLL Research.Property & Facility Management and Project & Development Services increased due to business wins fromEuropean multinationals and expansions of our Tetris fit-out business, driving growth in our annuity RESbusinesses. Growth in the region for the year overall was broad-based, led by the U.K., Germany, France, Spain,MENA, Ireland, Belgium, Sweden, and the Netherlands. EMEA finished the year with fourth-quarter fee revenueof $475 million, an increase of 24%, with double-digit revenue growth in all service lines, led by a 42% increase inCapital Markets & Hotels.
Fee-based operating expenses were $1.2 billion for the year, compared with $1.0 billion last year, an increase of15% from 2013 due to supporting higher revenue activity, including work from new clients and increased incentivecompensation due to higher transaction volumes. Operating income was $120.8 million for 2014, compared with$89.3 million for 2013, and operating income margin calculated on a fee revenue basis was 9.2% for 2014compared with 8.2% for 2013.
93
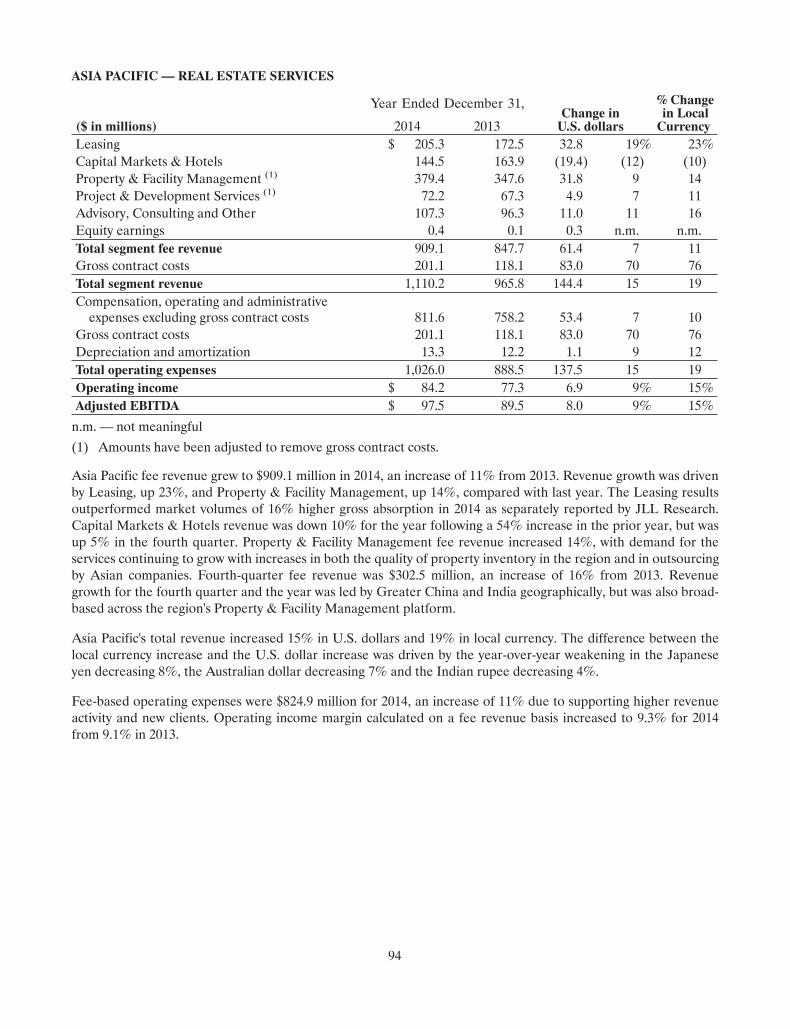
ASIA PACIFIC — REAL ESTATE SERVICES
($ in millions)
Year Ended December 31,Change inU.S. dollars
% Changein LocalCurrency2014 2013
Leasing $ 205.3 172.5 32.8 19% 23%Capital Markets & Hotels 144.5 163.9 (19.4) (12) (10)Property & Facility Management (1) 379.4 347.6 31.8 9 14Project & Development Services (1) 72.2 67.3 4.9 7 11Advisory, Consulting and Other 107.3 96.3 11.0 11 16Equity earnings 0.4 0.1 0.3 n.m. n.m.Total segment fee revenue 909.1 847.7 61.4 7 11Gross contract costs 201.1 118.1 83.0 70 76Total segment revenue 1,110.2 965.8 144.4 15 19Compensation, operating and administrativeexpenses excluding gross contract costs 811.6 758.2 53.4 7 10
Gross contract costs 201.1 118.1 83.0 70 76Depreciation and amortization 13.3 12.2 1.1 9 12Total operating expenses 1,026.0 888.5 137.5 15 19Operating income $ 84.2 77.3 6.9 9% 15%Adjusted EBITDA $ 97.5 89.5 8.0 9% 15%
n.m. — not meaningful
(1) Amounts have been adjusted to remove gross contract costs.
Asia Pacific fee revenue grew to $909.1 million in 2014, an increase of 11% from 2013. Revenue growth was drivenby Leasing, up 23%, and Property & Facility Management, up 14%, compared with last year. The Leasing resultsoutperformed market volumes of 16% higher gross absorption in 2014 as separately reported by JLL Research.Capital Markets & Hotels revenue was down 10% for the year following a 54% increase in the prior year, but wasup 5% in the fourth quarter. Property & Facility Management fee revenue increased 14%, with demand for theservices continuing to grow with increases in both the quality of property inventory in the region and in outsourcingby Asian companies. Fourth-quarter fee revenue was $302.5 million, an increase of 16% from 2013. Revenuegrowth for the fourth quarter and the year was led by Greater China and India geographically, but was also broad-based across the region's Property & Facility Management platform.
Asia Pacific's total revenue increased 15% in U.S. dollars and 19% in local currency. The difference between thelocal currency increase and the U.S. dollar increase was driven by the year-over-year weakening in the Japaneseyen decreasing 8%, the Australian dollar decreasing 7% and the Indian rupee decreasing 4%.
Fee-based operating expenses were $824.9 million for 2014, an increase of 11% due to supporting higher revenueactivity and new clients. Operating income margin calculated on a fee revenue basis increased to 9.3% for 2014from 9.1% in 2013.
94
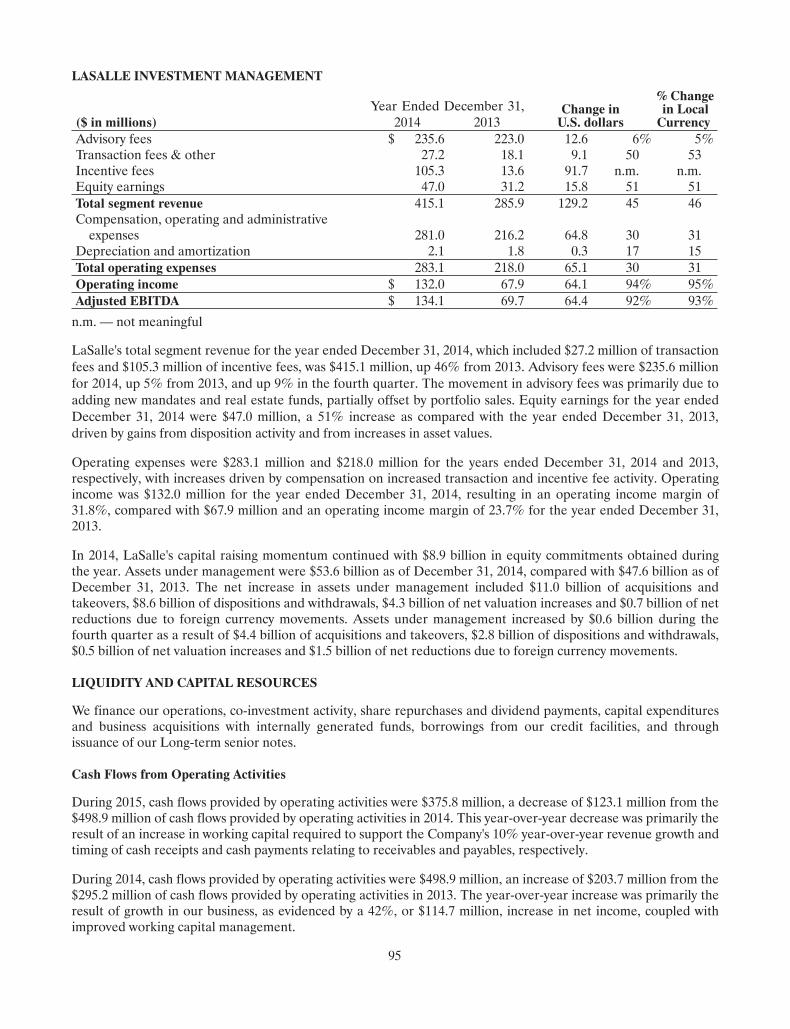
LASALLE INVESTMENT MANAGEMENT
($ in millions)Year Ended December 31, Change in
U.S. dollars
% Changein LocalCurrency2014 2013
Advisory fees $ 235.6 223.0 12.6 6% 5%Transaction fees & other 27.2 18.1 9.1 50 53Incentive fees 105.3 13.6 91.7 n.m. n.m.Equity earnings 47.0 31.2 15.8 51 51Total segment revenue 415.1 285.9 129.2 45 46Compensation, operating and administrativeexpenses 281.0 216.2 64.8 30 31
Depreciation and amortization 2.1 1.8 0.3 17 15Total operating expenses 283.1 218.0 65.1 30 31Operating income $ 132.0 67.9 64.1 94% 95%Adjusted EBITDA $ 134.1 69.7 64.4 92% 93%
n.m. — not meaningful
LaSalle's total segment revenue for the year ended December 31, 2014, which included $27.2 million of transactionfees and $105.3 million of incentive fees, was $415.1 million, up 46% from 2013. Advisory fees were $235.6 millionfor 2014, up 5% from 2013, and up 9% in the fourth quarter. The movement in advisory fees was primarily due toadding new mandates and real estate funds, partially offset by portfolio sales. Equity earnings for the year endedDecember 31, 2014 were $47.0 million, a 51% increase as compared with the year ended December 31, 2013,driven by gains from disposition activity and from increases in asset values.
Operating expenses were $283.1 million and $218.0 million for the years ended December 31, 2014 and 2013,respectively, with increases driven by compensation on increased transaction and incentive fee activity. Operatingincome was $132.0 million for the year ended December 31, 2014, resulting in an operating income margin of31.8%, compared with $67.9 million and an operating income margin of 23.7% for the year ended December 31,2013.
In 2014, LaSalle's capital raising momentum continued with $8.9 billion in equity commitments obtained duringthe year. Assets under management were $53.6 billion as of December 31, 2014, compared with $47.6 billion as ofDecember 31, 2013. The net increase in assets under management included $11.0 billion of acquisitions andtakeovers, $8.6 billion of dispositions and withdrawals, $4.3 billion of net valuation increases and $0.7 billion of netreductions due to foreign currency movements. Assets under management increased by $0.6 billion during thefourth quarter as a result of $4.4 billion of acquisitions and takeovers, $2.8 billion of dispositions and withdrawals,$0.5 billion of net valuation increases and $1.5 billion of net reductions due to foreign currency movements.
LIQUIDITY AND CAPITAL RESOURCES
We finance our operations, co-investment activity, share repurchases and dividend payments, capital expendituresand business acquisitions with internally generated funds, borrowings from our credit facilities, and throughissuance of our Long-term senior notes.
Cash Flows from Operating Activities
During 2015, cash flows provided by operating activities were $375.8 million, a decrease of $123.1 million from the$498.9 million of cash flows provided by operating activities in 2014. This year-over-year decrease was primarily theresult of an increase in working capital required to support the Company's 10% year-over-year revenue growth andtiming of cash receipts and cash payments relating to receivables and payables, respectively.
During 2014, cash flows provided by operating activities were $498.9 million, an increase of $203.7 million from the$295.2 million of cash flows provided by operating activities in 2013. The year-over-year increase was primarily theresult of growth in our business, as evidenced by a 42%, or $114.7 million, increase in net income, coupled withimproved working capital management.
95
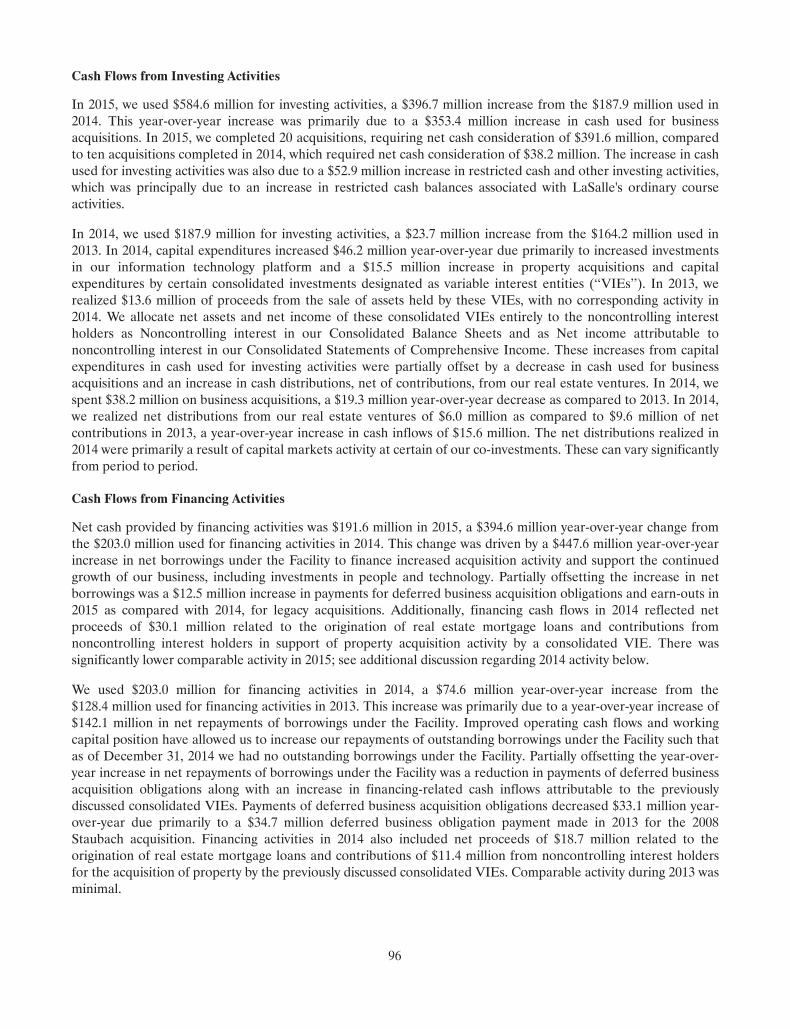
Cash Flows from Investing Activities
In 2015, we used $584.6 million for investing activities, a $396.7 million increase from the $187.9 million used in2014. This year-over-year increase was primarily due to a $353.4 million increase in cash used for businessacquisitions. In 2015, we completed 20 acquisitions, requiring net cash consideration of $391.6 million, comparedto ten acquisitions completed in 2014, which required net cash consideration of $38.2 million. The increase in cashused for investing activities was also due to a $52.9 million increase in restricted cash and other investing activities,which was principally due to an increase in restricted cash balances associated with LaSalle's ordinary courseactivities.
In 2014, we used $187.9 million for investing activities, a $23.7 million increase from the $164.2 million used in2013. In 2014, capital expenditures increased $46.2 million year-over-year due primarily to increased investmentsin our information technology platform and a $15.5 million increase in property acquisitions and capitalexpenditures by certain consolidated investments designated as variable interest entities (‘‘VIEs’’). In 2013, werealized $13.6 million of proceeds from the sale of assets held by these VIEs, with no corresponding activity in2014. We allocate net assets and net income of these consolidated VIEs entirely to the noncontrolling interestholders as Noncontrolling interest in our Consolidated Balance Sheets and as Net income attributable tononcontrolling interest in our Consolidated Statements of Comprehensive Income. These increases from capitalexpenditures in cash used for investing activities were partially offset by a decrease in cash used for businessacquisitions and an increase in cash distributions, net of contributions, from our real estate ventures. In 2014, wespent $38.2 million on business acquisitions, a $19.3 million year-over-year decrease as compared to 2013. In 2014,we realized net distributions from our real estate ventures of $6.0 million as compared to $9.6 million of netcontributions in 2013, a year-over-year increase in cash inflows of $15.6 million. The net distributions realized in2014 were primarily a result of capital markets activity at certain of our co-investments. These can vary significantlyfrom period to period.
Cash Flows from Financing Activities
Net cash provided by financing activities was $191.6 million in 2015, a $394.6 million year-over-year change fromthe $203.0 million used for financing activities in 2014. This change was driven by a $447.6 million year-over-yearincrease in net borrowings under the Facility to finance increased acquisition activity and support the continuedgrowth of our business, including investments in people and technology. Partially offsetting the increase in netborrowings was a $12.5 million increase in payments for deferred business acquisition obligations and earn-outs in2015 as compared with 2014, for legacy acquisitions. Additionally, financing cash flows in 2014 reflected netproceeds of $30.1 million related to the origination of real estate mortgage loans and contributions fromnoncontrolling interest holders in support of property acquisition activity by a consolidated VIE. There wassignificantly lower comparable activity in 2015; see additional discussion regarding 2014 activity below.
We used $203.0 million for financing activities in 2014, a $74.6 million year-over-year increase from the$128.4 million used for financing activities in 2013. This increase was primarily due to a year-over-year increase of$142.1 million in net repayments of borrowings under the Facility. Improved operating cash flows and workingcapital position have allowed us to increase our repayments of outstanding borrowings under the Facility such thatas of December 31, 2014 we had no outstanding borrowings under the Facility. Partially offsetting the year-over-year increase in net repayments of borrowings under the Facility was a reduction in payments of deferred businessacquisition obligations along with an increase in financing-related cash inflows attributable to the previouslydiscussed consolidated VIEs. Payments of deferred business acquisition obligations decreased $33.1 million year-over-year due primarily to a $34.7 million deferred business obligation payment made in 2013 for the 2008Staubach acquisition. Financing activities in 2014 also included net proceeds of $18.7 million related to theorigination of real estate mortgage loans and contributions of $11.4 million from noncontrolling interest holdersfor the acquisition of property by the previously discussed consolidated VIEs. Comparable activity during 2013 wasminimal.
96
Credit Facility
On February 25, 2015, we amended and renewed our credit facility (the ‘‘Facility’’), which resulted in (1) anincrease in our borrowing capacity from $1.2 billion to $2.0 billion, (2) an extension of the maturity date fromOctober 4, 2018 to February 25, 2020, (3) increases in certain add-backs to adjusted EBITDA (as defined in aFacility) for the calculation of the leverage ratio to provide additional operating flexibility and (4) a range ofpricing from LIBOR plus 1.00% to 2.05%. Additionally, the Facility cannot exceed a maximum cash flow leverageratio of 3.50 to 1, except immediately following a material acquisition, in which case, the leverage capital ratiomaximum is 4.00 to 1 for up to four consecutive quarters. Other key terms and conditions of the Facility wereunchanged.
We had outstanding borrowings under the Facility of $255.0 million and outstanding letters of credit of$18.2 million as of December 31, 2015. As of December 31, 2014, we had no outstanding borrowings under theFacility and outstanding letters of credit of $22.0 million. The average outstanding borrowings under the Facilitywere $335.1 million and $357.0 million during the years ended December 31, 2015 and 2014, respectively.
We will continue to use the Facility for working capital needs (including payment of accrued incentivecompensation), co-investment activities, dividend payments, share repurchases, capital expenditures andacquisitions.
Short-Term Borrowings
In addition to our Facility, we have the capacity to borrow up to an additional $42.1 million under local overdraftfacilities. We had short-term borrowings (including capital lease obligations, overdrawn bank accounts, and localoverdraft facilities) of $49.2 million and $19.6 million as of December 31, 2015 and 2014, respectively, of which$24.6 million and $14.6 million as of December 31, 2015 and 2014, respectively, were attributable to local overdraftfacilities.
Long-Term Senior Notes
In November 2012, in an underwritten public offering, we issued $275.0 million of Long-term senior notes dueNovember 2022 (the ‘‘Notes’’). The Notes bear interest at an annual rate of 4.4%, subject to adjustment if a creditrating assigned to the Notes is downgraded below an investment grade rating (or subsequently upgraded). Interestis payable semi-annually on May 15 and November 15 of each year.
See Note 10, Debt, of the Notes to Consolidated Financial Statements for additional information on the Facility,short-term borrowings and long-term senior notes.
Co-Investment Activity
As of December 31, 2015, we had total investments of $311.5 million in approximately 50 separate property or fundco-investments. Returns of capital exceeded fundings of co-investments by $1.6 million and $6.0 million forthe years ended December 31, 2015 and 2014, respectively. We expect to continue to pursue co-investmentopportunities with our investment management clients in the Americas, EMEA and Asia Pacific. Co-investmentremains important to the continued growth of LaSalle's business.
See Note 5, Investment in Real Estate Ventures, of the Notes to Consolidated Financial Statements for additionalinformation on our co-investment activity.
Share Repurchase and Dividend Programs
Since October 2002, our Board of Directors has approved five share repurchase programs. As of December 31,2015, we have 1,563,100 shares we remain authorized to repurchase under the current share repurchase program.We have made no share repurchases in the last three years under this authorization. Our current share repurchaseprogram allows JLL to purchase our common stock in the open market and in privately negotiated transactions.
97
Our Board declared and paid total annual dividends and dividend-equivalents of $0.56, $0.48 and $0.44 percommon share in 2015, 2014 and 2013, respectively. In December 2015, we declared and paid a semi-annual cashdividend of $0.29 per share. There can be no assurance we will declare dividends in the future since the actualdeclaration of future dividends and the establishment of record and payment dates remains subject to finaldetermination by the Company's Board of Directors.
Capital Expenditures
Capital expenditures for the years ended December 31, 2015 and 2014 were $149.1 million and $156.9 million,respectively. Our capital expenditures are primarily for information systems, computer hardware andimprovements to leased office space. Included in capital expenditures for the years ended December 31, 2015 and2014 are $1.3 million and $24.2 million, respectively, of property acquisitions and capital expenditures made bycertain VIEs for which we have determined we are the primary beneficiary and thus required to consolidate theunderlying entities (see Note 5, Investment in Real Estate Ventures, of the Notes to the Consolidated FinancialStatements for further information on our consolidated VIE investments). The net assets and net income of theconsolidated VIEs are allocated entirely to the noncontrolling interest holders as Noncontrolling interest on ourConsolidated Balance Sheets and as Net income attributable to noncontrolling interest in our ConsolidatedStatements of Comprehensive Income because we held no equity ownership interests.
Business Acquisitions
In 2015, we paid $391.6 million for acquisitions and we also paid deferred acquisition obligations and contingentearn-out considerations of $51.8 million, which included $29.0 million for the 2011 King Sturge acquisition.
Terms for our acquisitions have typically included cash paid at closing with provisions for additional considerationand earn-out payments subject to certain contract provisions and performance. Deferred business acquisitionobligations totaled $97.5 million and $118.1 million on our Consolidated Balance Sheets as of December 31, 2015and 2014, respectively. These obligations represent the current discounted values of payments to sellers ofbusinesses for which our acquisition has closed as of the balance sheet dates and for which the only remainingcondition on those payments is the passage of time. As of December 31, 2015, we had the potential to make earn-out payments for a maximum of $230.4 million (undiscounted) on 28 acquisitions subject to the achievement ofcertain performance conditions. We anticipate these earn-outs will come due at various times over the nextseven years, assuming the achievement of the applicable performance conditions.
Our 2014 acquisition of Tenzing, a Swedish commercial real estate services provider specializing in capital markets,included a redeemable noncontrolling interest in the form of an option agreement that allows us to purchase, andthe noncontrolling shareholder to put to us, this noncontrolling interest in the acquired company in annualincrements for the four years following acquisition at a price determined by the profit generated by the acquiree.This redeemable noncontrolling interest is reported on our Consolidated Balance Sheet as of December 31, 2015and 2014 at $11.1 million and $13.4 million, respectively, based on the estimated redemption price, increased forpost-acquisition earnings attributable to the noncontrolling interest holder and adjusted for foreign currencytranslation rates.
We are considering, and will continue to consider, acquisitions we believe will strengthen our market position,increase our profitability and supplement our organic growth.
Repatriation of Foreign Earnings
Based on our historical experience and future business plans, we do not expect to repatriate our foreign sourceearnings to the U.S. We believe our policy of permanently reinvesting earnings of foreign subsidiaries does notsignificantly impact our liquidity. As of December 31, 2015 and 2014, we had total cash and cash equivalents of$216.6 million and $250.4 million, respectively, of which approximately $175.4 million and $222.0 million,respectively, was held by our foreign subsidiaries.
98
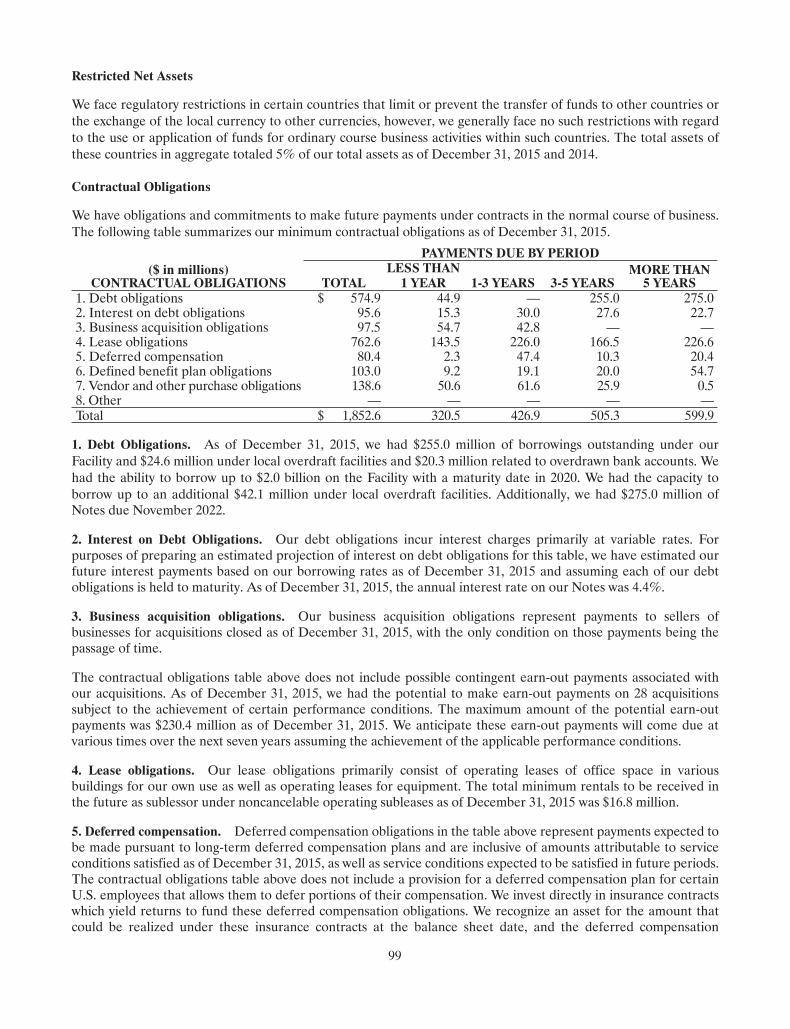
Restricted Net Assets
We face regulatory restrictions in certain countries that limit or prevent the transfer of funds to other countries orthe exchange of the local currency to other currencies, however, we generally face no such restrictions with regardto the use or application of funds for ordinary course business activities within such countries. The total assets ofthese countries in aggregate totaled 5% of our total assets as of December 31, 2015 and 2014.
Contractual Obligations
We have obligations and commitments to make future payments under contracts in the normal course of business.The following table summarizes our minimum contractual obligations as of December 31, 2015.
PAYMENTS DUE BY PERIOD($ in millions)
CONTRACTUAL OBLIGATIONSLESS THAN MORE THAN
5 YEARSTOTAL 1 YEAR 1-3 YEARS 3-5 YEARS1. Debt obligations $ 574.9 44.9 — 255.0 275.02. Interest on debt obligations 95.6 15.3 30.0 27.6 22.73. Business acquisition obligations 97.5 54.7 42.8 — —4. Lease obligations 762.6 143.5 226.0 166.5 226.65. Deferred compensation 80.4 2.3 47.4 10.3 20.46. Defined benefit plan obligations 103.0 9.2 19.1 20.0 54.77. Vendor and other purchase obligations 138.6 50.6 61.6 25.9 0.58. Other — — — — —Total $ 1,852.6 320.5 426.9 505.3 599.9
1. Debt Obligations. As of December 31, 2015, we had $255.0 million of borrowings outstanding under ourFacility and $24.6 million under local overdraft facilities and $20.3 million related to overdrawn bank accounts. Wehad the ability to borrow up to $2.0 billion on the Facility with a maturity date in 2020. We had the capacity toborrow up to an additional $42.1 million under local overdraft facilities. Additionally, we had $275.0 million ofNotes due November 2022.
2. Interest on Debt Obligations. Our debt obligations incur interest charges primarily at variable rates. Forpurposes of preparing an estimated projection of interest on debt obligations for this table, we have estimated ourfuture interest payments based on our borrowing rates as of December 31, 2015 and assuming each of our debtobligations is held to maturity. As of December 31, 2015, the annual interest rate on our Notes was 4.4%.
3. Business acquisition obligations. Our business acquisition obligations represent payments to sellers ofbusinesses for acquisitions closed as of December 31, 2015, with the only condition on those payments being thepassage of time.
The contractual obligations table above does not include possible contingent earn-out payments associated withour acquisitions. As of December 31, 2015, we had the potential to make earn-out payments on 28 acquisitionssubject to the achievement of certain performance conditions. The maximum amount of the potential earn-outpayments was $230.4 million as of December 31, 2015. We anticipate these earn-out payments will come due atvarious times over the next seven years assuming the achievement of the applicable performance conditions.
4. Lease obligations. Our lease obligations primarily consist of operating leases of office space in variousbuildings for our own use as well as operating leases for equipment. The total minimum rentals to be received inthe future as sublessor under noncancelable operating subleases as of December 31, 2015 was $16.8 million.
5. Deferred compensation. Deferred compensation obligations in the table above represent payments expected tobe made pursuant to long-term deferred compensation plans and are inclusive of amounts attributable to serviceconditions satisfied as of December 31, 2015, as well as service conditions expected to be satisfied in future periods.The contractual obligations table above does not include a provision for a deferred compensation plan for certainU.S. employees that allows them to defer portions of their compensation. We invest directly in insurance contractswhich yield returns to fund these deferred compensation obligations. We recognize an asset for the amount thatcould be realized under these insurance contracts at the balance sheet date, and the deferred compensation
99
obligation is adjusted to reflect the changes in the fair value of the amount owed to the employees. This plan isrecorded on our Consolidated Balance Sheet as of December 31, 2015 as Deferred compensation plan assets of$134.3 million and long-term Deferred compensation liabilities of $129.4 million. Additionally excluded from thetable above is a retirement benefits liability of $8.2 million, as the timing of payment of which is uncertain as ofDecember 31, 2015.
6. Defined benefit plan obligations. The defined benefit plan obligations represent estimates of the expectedbenefits to be paid out by our defined benefit plans over the next ten years. We will fund these obligations from theassets held by these plans. If the assets these plans hold are not sufficient to fund these payments, JLL will fund theremaining obligations. We have historically funded pension costs as actuarially determined and as applicable lawsand regulations require. We expect to contribute $11.1 million to our defined benefit pension plans in 2016.
7. Vendor and other purchase obligations. Our other purchase obligations primarily relate to various informationtechnology servicing agreements, telephone communications and other administrative support functions.
8. Other. We have made capital commitments to certain unconsolidated joint ventures entitled to call up to amaximum of $189.8 million as of December 31, 2015. We are not able to predict if, when, or in what amounts suchcapital calls will be made, and therefore we exclude such commitments from the above table. However, in relationto this activity, we made capital contributions and advances to investments in real estate ventures of $47.6 million,$56.4 million and $37.2 million in 2015, 2014 and 2013, respectively. Separately, our Consolidated Balance Sheet asof December 31, 2015 reflects $11.1 million of Redeemable noncontrolling interest, representing thenoncontrolling interest retained by the seller of a Swedish business we acquired during 2014. The acquisitiondocuments include an option agreement that allows the Company to purchase, and the noncontrolling interestholder to put to the Company, the noncontrolling interest in the acquired company in annual increments duringthe four years following the acquisition at a price determined by the profit generated by the acquireepost-acquisition.
For additional information on the contractual obligations presented above, see our discussion in Note 4, BusinessCombinations, Goodwill and Other Intangible Assets, Note 5, Investments in Real Estate Ventures, Note 7,Retirement Plans, Note 10, Debt and Note 11, Leases, in the Notes to Consolidated Financial Statements.
Off-Balance Sheet Arrangements
We have unfunded capital commitments to LIC II, an unconsolidated joint venture that serves as a vehicle for ourco-investment activity, and to direct investments for future fundings of co-investments in underlying funds, totalinga maximum of $189.8 million as of December 31, 2015. See our discussion of these unfunded commitments in Note5, Investments in Real Estate Ventures, of the Notes to Consolidated Financial Statements.
ITEM 7A. QUANTITATIVE AND QUALITATIVE DISCLOSURES ABOUT MARKET RISK
Information regarding market risk is included in Item 7. Management's Discussion and Analysis of FinancialCondition and Results of Operations under the caption ‘‘Market Risks’’ and is incorporated by reference herein.
Disclosure of Limitations
As the information presented above includes only those exposures that exist as of December 31, 2015, it does notconsider those exposures or positions that could arise after that date. The information represented herein haslimited predictive value. As a result, the ultimate realized gain or loss with respect to interest rate and foreigncurrency fluctuations will depend on the exposures that arise during the period, the hedging strategies at the timeand interest and foreign currency rates.
100
ITEM 8. FINANCIAL STATEMENTS AND SUPPLEMENTARY DATA
Index to Consolidated Financial Statements
Page
JONES LANG LASALLE INCORPORATED CONSOLIDATED FINANCIAL STATEMENTS
Report of Independent Registered Public Accounting Firm, KPMG LLP, on Consolidated FinancialStatements 102
Report of Independent Registered Public Accounting Firm, KPMG LLP, on Internal Control OverFinancial Reporting 103
Consolidated Balance Sheets as of December 31, 2015 and 2014 105
Consolidated Statements of Comprehensive Income for the Years Ended December 31, 2015, 2014 and2013 106
Consolidated Statements of Changes in Equity for the Years Ended December 31, 2015, 2014 and 2013 107
Consolidated Statements of Cash Flows for the Years Ended December 31, 2015, 2014 and 2013 108
Notes to Consolidated Financial Statements 109
Quarterly Results of Operations (Unaudited) 143
101
Report of Independent Registered Public Accounting Firm
The Board of Directors and ShareholdersJones Lang LaSalle Incorporated:
We have audited the accompanying consolidated balance sheets of Jones Lang LaSalle Incorporated andsubsidiaries (the Company) as of December 31, 2015 and 2014, and the related consolidated statements ofcomprehensive income, changes in equity, and cash flows for each of the years in the three-year period endedDecember 31, 2015. These consolidated financial statements are the responsibility of the Company's management.Our responsibility is to express an opinion on these consolidated financial statements based on our audits.
We conducted our audits in accordance with the standards of the Public Company Accounting Oversight Board(United States). Those standards require that we plan and perform the audit to obtain reasonable assurance aboutwhether the financial statements are free of material misstatement. An audit includes examining, on a test basis,evidence supporting the amounts and disclosures in the financial statements. An audit also includes assessing theaccounting principles used and significant estimates made by management, as well as evaluating the overallfinancial statement presentation. We believe that our audits provide a reasonable basis for our opinion.
In our opinion, the consolidated financial statements referred to above present fairly, in all material respects, thefinancial position of Jones Lang LaSalle Incorporated and subsidiaries as of December 31, 2015 and 2014, and theresults of their operations and their cash flows for each of the years in the three-year period ended December 31,2015, in conformity with U.S. generally accepted accounting principles.
We also have audited, in accordance with the standards of the Public Company Accounting Oversight Board(United States), the Company's internal control over financial reporting as of December 31, 2015, based on criteriaestablished in Internal Control — Integrated Framework (2013) issued by the Committee of SponsoringOrganizations of the Treadway Commission (COSO), and our report dated February 25, 2016 expressed anunqualified opinion on the effectiveness of the Company's internal control over financial reporting.
/s/ KPMG LLP
Chicago, IllinoisFebruary 25, 2016
102
Report of Independent Registered Public Accounting Firm
The Board of Directors and ShareholdersJones Lang LaSalle Incorporated:
We have audited Jones Lang LaSalle Incorporated and subsidiaries' internal control over financial reporting as ofDecember 31, 2015, based on criteria established in Internal Control — Integrated Framework (2013) issued by theCommittee of Sponsoring Organizations of the Treadway Commission (COSO). The Company's management isresponsible for maintaining effective internal control over financial reporting and for its assessment of theeffectiveness of internal control over financial reporting, included in the accompanying Management's Report onInternal Control Over Financial Reporting. Our responsibility is to express an opinion on the Company's internalcontrol over financial reporting based on our audit.
We conducted our audit in accordance with the standards of the Public Company Accounting Oversight Board(United States). Those standards require that we plan and perform the audit to obtain reasonable assurance aboutwhether effective internal control over financial reporting was maintained in all material respects. Our auditincluded obtaining an understanding of internal control over financial reporting, assessing the risk that a materialweakness exists, and testing and evaluating the design and operating effectiveness of internal control based on theassessed risk. Our audit also included performing such other procedures as we considered necessary in thecircumstances. We believe that our audit provides a reasonable basis for our opinion.
A company's internal control over financial reporting is a process designed to provide reasonable assuranceregarding the reliability of financial reporting and the preparation of financial statements for external purposes inaccordance with generally accepted accounting principles. A company's internal control over financial reportingincludes those policies and procedures that (1) pertain to the maintenance of records that, in reasonable detail,accurately and fairly reflect the transactions and dispositions of the assets of the company; (2) provide reasonableassurance that transactions are recorded as necessary to permit preparation of financial statements in accordancewith generally accepted accounting principles, and that receipts and expenditures of the company are being madeonly in accordance with authorizations of management and directors of the company; and (3) provide reasonableassurance regarding prevention or timely detection of unauthorized acquisition, use, or disposition of thecompany's assets that could have a material effect on the financial statements.
Because of its inherent limitations, internal control over financial reporting may not prevent or detectmisstatements. Also, projections of any evaluation of effectiveness to future periods are subject to the risk thatcontrols may become inadequate because of changes in conditions, or that the degree of compliance with thepolicies or procedures may deteriorate.
In our opinion, Jones Lang LaSalle Incorporated and subsidiaries maintained, in all material respects, effectiveinternal control over financial reporting as of December 31, 2015, based on criteria established in InternalControl — Integrated Framework (2013) issued by the Committee of Sponsoring Organizations of the TreadwayCommission (COSO).
Jones Lang LaSalle Incorporated acquired twenty companies during 2015 (the Acquisitions) as described in Note 4to the consolidated financial statements, and management excluded from its assessment of the effectiveness ofJones Lang LaSalle Incorporated and subsidiaries’ internal control over financial reporting as of December 31,2015, the Acquisitions’ internal control over financial reporting associated with total assets of $716 million andtotal revenues of $135 million included in the consolidated financial statements of Jones Lang LaSalleIncorporated and subsidiaries as of and for the year ended December 31, 2015. Our audit of internal control overfinancial reporting of Jones Lang LaSalle Incorporated and subsidiaries also excluded an evaluation of the internalcontrol over financial reporting of the Acquisitions.
103

We also have audited, in accordance with the standards of the Public Company Accounting Oversight Board(United States), the consolidated balance sheets of the Company as of December 31, 2015 and 2014, and therelated consolidated statements of comprehensive income, changes in equity, and cash flows for each of the yearsin the three-year period ended December 31, 2015, and our report dated February 25, 2016 expressed anunqualified opinion on those consolidated financial statements.
/s/ KPMG LLP
Chicago, IllinoisFebruary 25, 2016
104
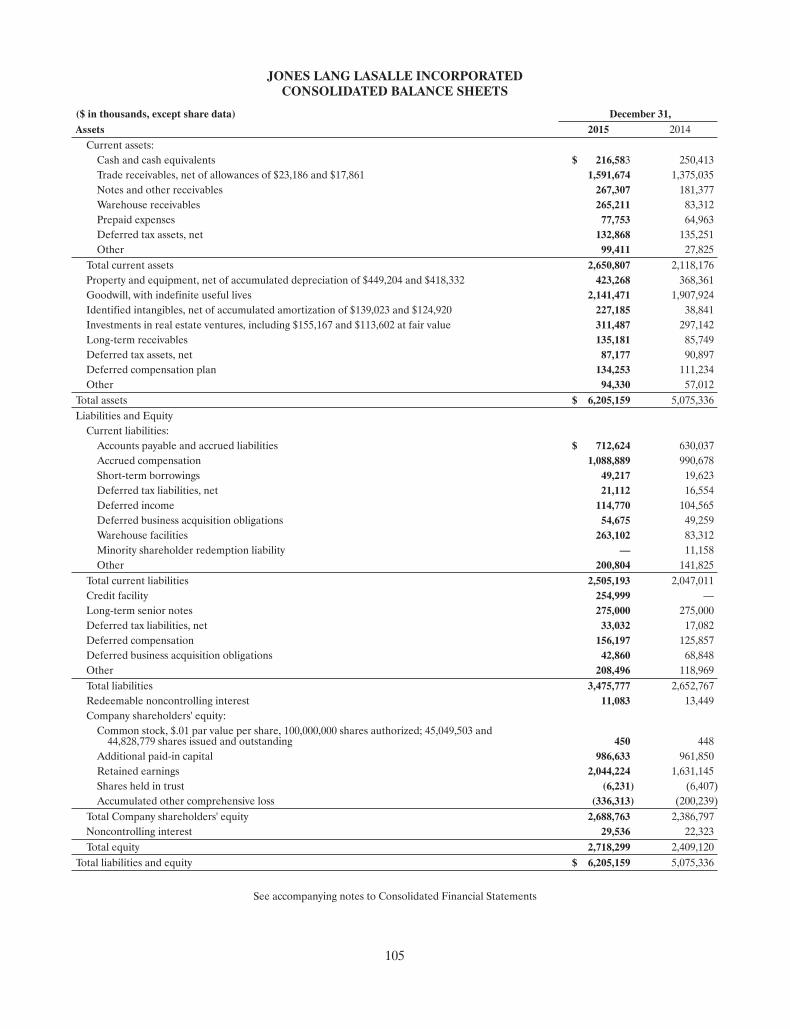
JONES LANG LASALLE INCORPORATEDCONSOLIDATED BALANCE SHEETS
($ in thousands, except share data) December 31,Assets 2015 2014Current assets:Cash and cash equivalents $ 216,583 250,413Trade receivables, net of allowances of $23,186 and $17,861 1,591,674 1,375,035Notes and other receivables 267,307 181,377Warehouse receivables 265,211 83,312Prepaid expenses 77,753 64,963Deferred tax assets, net 132,868 135,251Other 99,411 27,825
Total current assets 2,650,807 2,118,176Property and equipment, net of accumulated depreciation of $449,204 and $418,332 423,268 368,361Goodwill, with indefinite useful lives 2,141,471 1,907,924Identified intangibles, net of accumulated amortization of $139,023 and $124,920 227,185 38,841Investments in real estate ventures, including $155,167 and $113,602 at fair value 311,487 297,142Long-term receivables 135,181 85,749Deferred tax assets, net 87,177 90,897Deferred compensation plan 134,253 111,234Other 94,330 57,012
Total assets $ 6,205,159 5,075,336Liabilities and EquityCurrent liabilities:Accounts payable and accrued liabilities $ 712,624 630,037Accrued compensation 1,088,889 990,678Short-term borrowings 49,217 19,623Deferred tax liabilities, net 21,112 16,554Deferred income 114,770 104,565Deferred business acquisition obligations 54,675 49,259Warehouse facilities 263,102 83,312Minority shareholder redemption liability — 11,158Other 200,804 141,825
Total current liabilities 2,505,193 2,047,011Credit facility 254,999 —Long-term senior notes 275,000 275,000Deferred tax liabilities, net 33,032 17,082Deferred compensation 156,197 125,857Deferred business acquisition obligations 42,860 68,848Other 208,496 118,969Total liabilities 3,475,777 2,652,767Redeemable noncontrolling interest 11,083 13,449Company shareholders' equity:Common stock, $.01 par value per share, 100,000,000 shares authorized; 45,049,503 and44,828,779 shares issued and outstanding 450 448
Additional paid-in capital 986,633 961,850Retained earnings 2,044,224 1,631,145Shares held in trust (6,231) (6,407)Accumulated other comprehensive loss (336,313) (200,239)
Total Company shareholders' equity 2,688,763 2,386,797Noncontrolling interest 29,536 22,323Total equity 2,718,299 2,409,120
Total liabilities and equity $ 6,205,159 5,075,336
See accompanying notes to Consolidated Financial Statements
105
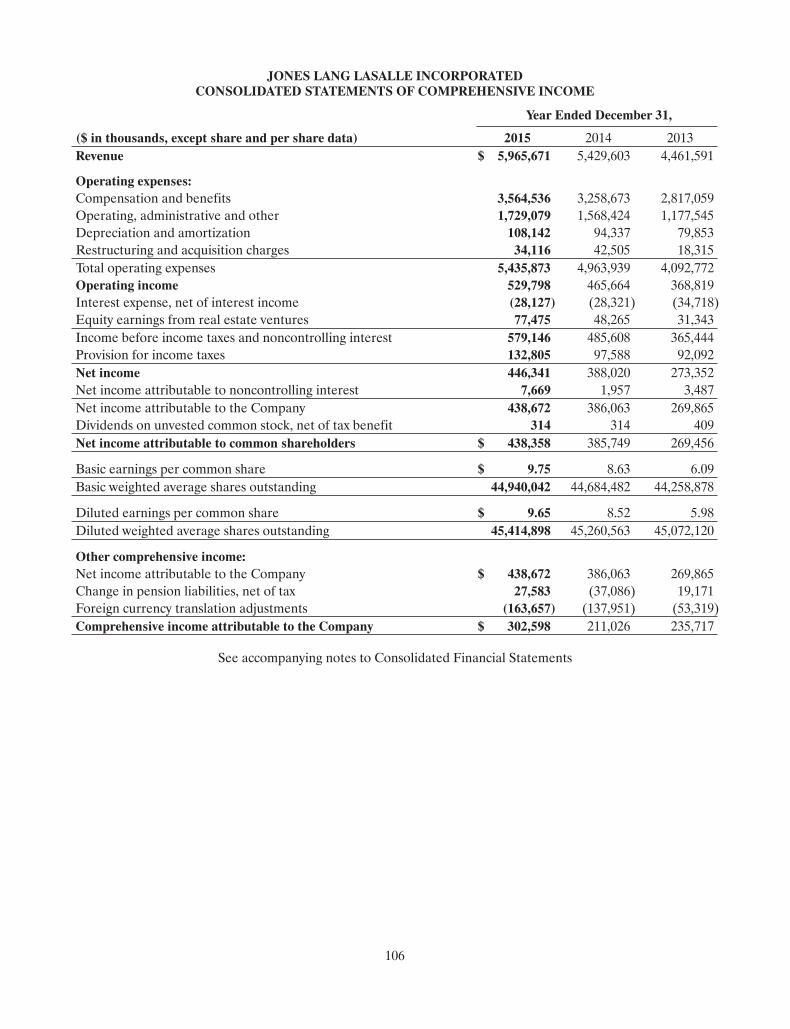
JONES LANG LASALLE INCORPORATEDCONSOLIDATED STATEMENTS OF COMPREHENSIVE INCOME
Year Ended December 31,
($ in thousands, except share and per share data) 2015 2014 2013Revenue $ 5,965,671 5,429,603 4,461,591
Operating expenses:Compensation and benefits 3,564,536 3,258,673 2,817,059Operating, administrative and other 1,729,079 1,568,424 1,177,545Depreciation and amortization 108,142 94,337 79,853Restructuring and acquisition charges 34,116 42,505 18,315Total operating expenses 5,435,873 4,963,939 4,092,772Operating income 529,798 465,664 368,819Interest expense, net of interest income (28,127) (28,321) (34,718)Equity earnings from real estate ventures 77,475 48,265 31,343Income before income taxes and noncontrolling interest 579,146 485,608 365,444Provision for income taxes 132,805 97,588 92,092Net income 446,341 388,020 273,352Net income attributable to noncontrolling interest 7,669 1,957 3,487Net income attributable to the Company 438,672 386,063 269,865Dividends on unvested common stock, net of tax benefit 314 314 409Net income attributable to common shareholders $ 438,358 385,749 269,456
Basic earnings per common share $ 9.75 8.63 6.09Basic weighted average shares outstanding 44,940,042 44,684,482 44,258,878
Diluted earnings per common share $ 9.65 8.52 5.98Diluted weighted average shares outstanding 45,414,898 45,260,563 45,072,120
Other comprehensive income:Net income attributable to the Company $ 438,672 386,063 269,865Change in pension liabilities, net of tax 27,583 (37,086) 19,171Foreign currency translation adjustments (163,657) (137,951) (53,319)Comprehensive income attributable to the Company $ 302,598 211,026 235,717
See accompanying notes to Consolidated Financial Statements
106
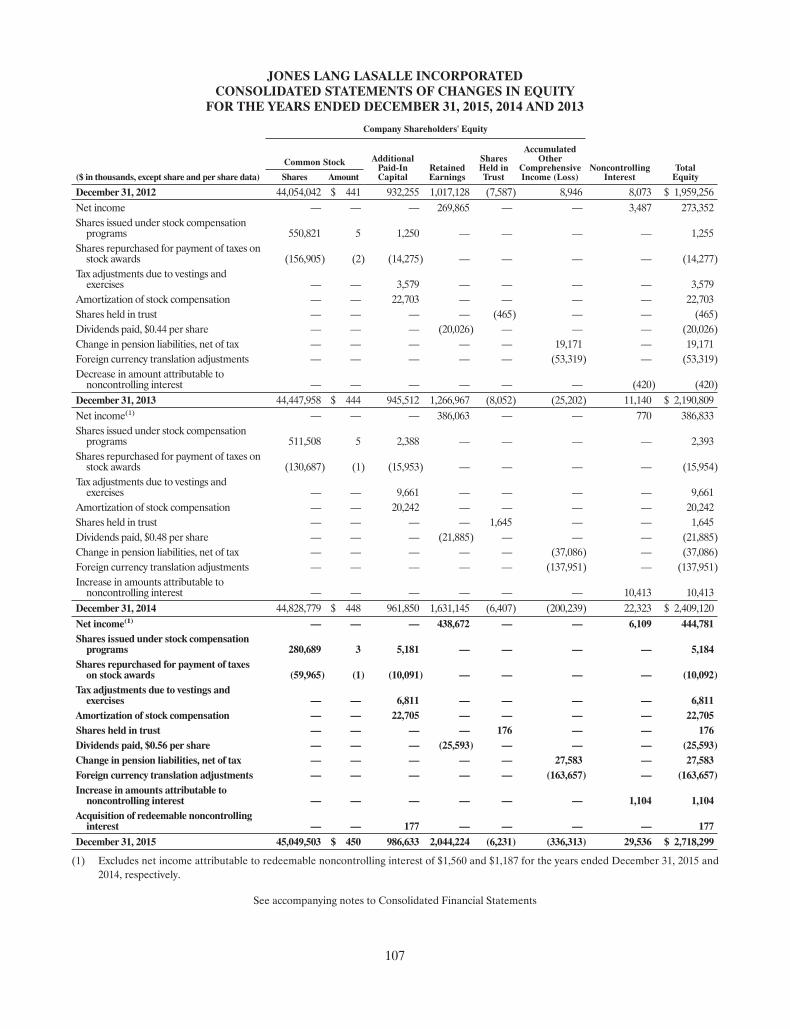
JONES LANG LASALLE INCORPORATEDCONSOLIDATED STATEMENTS OF CHANGES IN EQUITY
FOR THE YEARS ENDED DECEMBER 31, 2015, 2014 AND 2013
Company Shareholders' Equity
NoncontrollingInterest
TotalEquity
Common Stock AdditionalPaid-InCapital
RetainedEarnings
SharesHeld inTrust
AccumulatedOther
ComprehensiveIncome (Loss)($ in thousands, except share and per share data) Shares Amount
December 31, 2012 44,054,042 $ 441 932,255 1,017,128 (7,587) 8,946 8,073 $ 1,959,256Net income — — — 269,865 — — 3,487 273,352Shares issued under stock compensationprograms 550,821 5 1,250 — — — — 1,255
Shares repurchased for payment of taxes onstock awards (156,905) (2) (14,275) — — — — (14,277)
Tax adjustments due to vestings andexercises — — 3,579 — — — — 3,579
Amortization of stock compensation — — 22,703 — — — — 22,703Shares held in trust — — — — (465) — — (465)Dividends paid, $0.44 per share — — — (20,026) — — — (20,026)Change in pension liabilities, net of tax — — — — — 19,171 — 19,171Foreign currency translation adjustments — — — — — (53,319) — (53,319)Decrease in amount attributable tononcontrolling interest — — — — — — (420) (420)
December 31, 2013 44,447,958 $ 444 945,512 1,266,967 (8,052) (25,202) 11,140 $ 2,190,809Net income(1) — — — 386,063 — — 770 386,833Shares issued under stock compensationprograms 511,508 5 2,388 — — — — 2,393
Shares repurchased for payment of taxes onstock awards (130,687) (1) (15,953) — — — — (15,954)
Tax adjustments due to vestings andexercises — — 9,661 — — — — 9,661
Amortization of stock compensation — — 20,242 — — — — 20,242Shares held in trust — — — — 1,645 — — 1,645Dividends paid, $0.48 per share — — — (21,885) — — — (21,885)Change in pension liabilities, net of tax — — — — — (37,086) — (37,086)Foreign currency translation adjustments — — — — — (137,951) — (137,951)Increase in amounts attributable tononcontrolling interest — — — — — — 10,413 10,413
December 31, 2014 44,828,779 $ 448 961,850 1,631,145 (6,407) (200,239) 22,323 $ 2,409,120Net income(1) — — — 438,672 — — 6,109 444,781Shares issued under stock compensationprograms 280,689 3 5,181 — — — — 5,184
Shares repurchased for payment of taxeson stock awards (59,965) (1) (10,091) — — — — (10,092)
Tax adjustments due to vestings andexercises — — 6,811 — — — — 6,811
Amortization of stock compensation — — 22,705 — — — — 22,705Shares held in trust — — — — 176 — — 176Dividends paid, $0.56 per share — — — (25,593) — — — (25,593)Change in pension liabilities, net of tax — — — — — 27,583 — 27,583Foreign currency translation adjustments — — — — — (163,657) — (163,657)Increase in amounts attributable tononcontrolling interest — — — — — — 1,104 1,104
Acquisition of redeemable noncontrollinginterest — — 177 — — — — 177
December 31, 2015 45,049,503 $ 450 986,633 2,044,224 (6,231) (336,313) 29,536 $ 2,718,299
(1) Excludes net income attributable to redeemable noncontrolling interest of $1,560 and $1,187 for the years ended December 31, 2015 and2014, respectively.
See accompanying notes to Consolidated Financial Statements
107
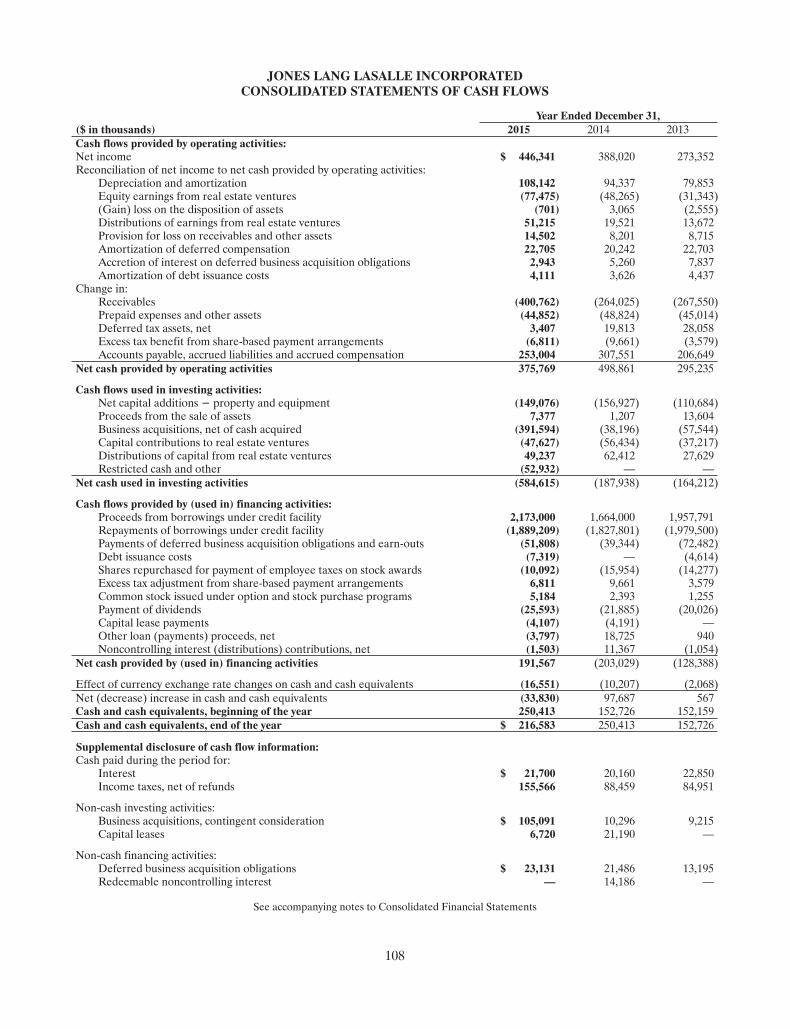
JONES LANG LASALLE INCORPORATEDCONSOLIDATED STATEMENTS OF CASH FLOWS
Year Ended December 31,($ in thousands) 2015 2014 2013Cash flows provided by operating activities:Net income $ 446,341 388,020 273,352Reconciliation of net income to net cash provided by operating activities:
Depreciation and amortization 108,142 94,337 79,853Equity earnings from real estate ventures (77,475) (48,265) (31,343)(Gain) loss on the disposition of assets (701) 3,065 (2,555)Distributions of earnings from real estate ventures 51,215 19,521 13,672Provision for loss on receivables and other assets 14,502 8,201 8,715Amortization of deferred compensation 22,705 20,242 22,703Accretion of interest on deferred business acquisition obligations 2,943 5,260 7,837Amortization of debt issuance costs 4,111 3,626 4,437
Change in:Receivables (400,762) (264,025) (267,550)Prepaid expenses and other assets (44,852) (48,824) (45,014)Deferred tax assets, net 3,407 19,813 28,058Excess tax benefit from share-based payment arrangements (6,811) (9,661) (3,579)Accounts payable, accrued liabilities and accrued compensation 253,004 307,551 206,649
Net cash provided by operating activities 375,769 498,861 295,235
Cash flows used in investing activities:Net capital additions − property and equipment (149,076) (156,927) (110,684)Proceeds from the sale of assets 7,377 1,207 13,604Business acquisitions, net of cash acquired (391,594) (38,196) (57,544)Capital contributions to real estate ventures (47,627) (56,434) (37,217)Distributions of capital from real estate ventures 49,237 62,412 27,629Restricted cash and other (52,932) — —
Net cash used in investing activities (584,615) (187,938) (164,212)
Cash flows provided by (used in) financing activities:Proceeds from borrowings under credit facility 2,173,000 1,664,000 1,957,791Repayments of borrowings under credit facility (1,889,209) (1,827,801) (1,979,500)Payments of deferred business acquisition obligations and earn-outs (51,808) (39,344) (72,482)Debt issuance costs (7,319) — (4,614)Shares repurchased for payment of employee taxes on stock awards (10,092) (15,954) (14,277)Excess tax adjustment from share-based payment arrangements 6,811 9,661 3,579Common stock issued under option and stock purchase programs 5,184 2,393 1,255Payment of dividends (25,593) (21,885) (20,026)Capital lease payments (4,107) (4,191) —Other loan (payments) proceeds, net (3,797) 18,725 940Noncontrolling interest (distributions) contributions, net (1,503) 11,367 (1,054)
Net cash provided by (used in) financing activities 191,567 (203,029) (128,388)
Effect of currency exchange rate changes on cash and cash equivalents (16,551) (10,207) (2,068)Net (decrease) increase in cash and cash equivalents (33,830) 97,687 567Cash and cash equivalents, beginning of the year 250,413 152,726 152,159Cash and cash equivalents, end of the year $ 216,583 250,413 152,726
Supplemental disclosure of cash flow information:Cash paid during the period for:
Interest $ 21,700 20,160 22,850Income taxes, net of refunds 155,566 88,459 84,951
Non-cash investing activities:Business acquisitions, contingent consideration $ 105,091 10,296 9,215Capital leases 6,720 21,190 —
Non-cash financing activities:Deferred business acquisition obligations $ 23,131 21,486 13,195Redeemable noncontrolling interest — 14,186 —
See accompanying notes to Consolidated Financial Statements
108
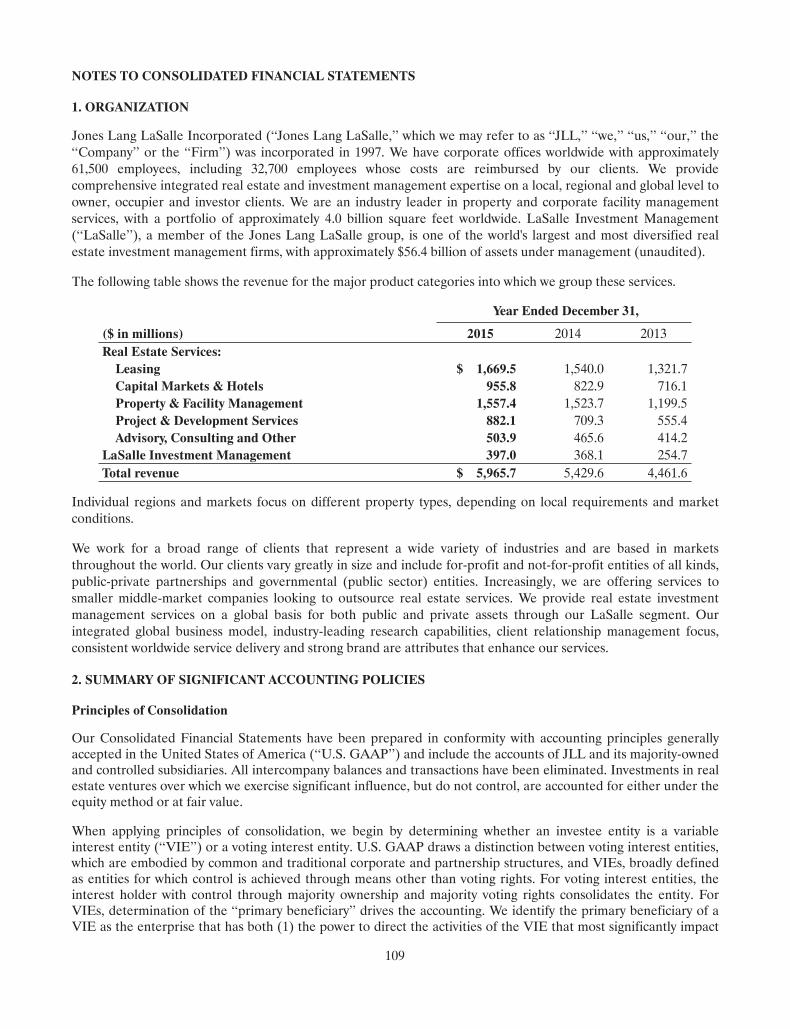
NOTES TO CONSOLIDATED FINANCIAL STATEMENTS
1. ORGANIZATION
Jones Lang LaSalle Incorporated (‘‘Jones Lang LaSalle,’’ which we may refer to as ‘‘JLL,’’ ‘‘we,’’ ‘‘us,’’ ‘‘our,’’ the‘‘Company’’ or the ‘‘Firm’’) was incorporated in 1997. We have corporate offices worldwide with approximately61,500 employees, including 32,700 employees whose costs are reimbursed by our clients. We providecomprehensive integrated real estate and investment management expertise on a local, regional and global level toowner, occupier and investor clients. We are an industry leader in property and corporate facility managementservices, with a portfolio of approximately 4.0 billion square feet worldwide. LaSalle Investment Management(‘‘LaSalle’’), a member of the Jones Lang LaSalle group, is one of the world's largest and most diversified realestate investment management firms, with approximately $56.4 billion of assets under management (unaudited).
The following table shows the revenue for the major product categories into which we group these services.
Year Ended December 31,
($ in millions) 2015 2014 2013Real Estate Services:Leasing $ 1,669.5 1,540.0 1,321.7Capital Markets & Hotels 955.8 822.9 716.1Property & Facility Management 1,557.4 1,523.7 1,199.5Project & Development Services 882.1 709.3 555.4Advisory, Consulting and Other 503.9 465.6 414.2
LaSalle Investment Management 397.0 368.1 254.7Total revenue $ 5,965.7 5,429.6 4,461.6
Individual regions and markets focus on different property types, depending on local requirements and marketconditions.
We work for a broad range of clients that represent a wide variety of industries and are based in marketsthroughout the world. Our clients vary greatly in size and include for-profit and not-for-profit entities of all kinds,public-private partnerships and governmental (public sector) entities. Increasingly, we are offering services tosmaller middle-market companies looking to outsource real estate services. We provide real estate investmentmanagement services on a global basis for both public and private assets through our LaSalle segment. Ourintegrated global business model, industry-leading research capabilities, client relationship management focus,consistent worldwide service delivery and strong brand are attributes that enhance our services.
2. SUMMARY OF SIGNIFICANT ACCOUNTING POLICIES
Principles of Consolidation
Our Consolidated Financial Statements have been prepared in conformity with accounting principles generallyaccepted in the United States of America (‘‘U.S. GAAP’’) and include the accounts of JLL and its majority-ownedand controlled subsidiaries. All intercompany balances and transactions have been eliminated. Investments in realestate ventures over which we exercise significant influence, but do not control, are accounted for either under theequity method or at fair value.
When applying principles of consolidation, we begin by determining whether an investee entity is a variableinterest entity (‘‘VIE’’) or a voting interest entity. U.S. GAAP draws a distinction between voting interest entities,which are embodied by common and traditional corporate and partnership structures, and VIEs, broadly definedas entities for which control is achieved through means other than voting rights. For voting interest entities, theinterest holder with control through majority ownership and majority voting rights consolidates the entity. ForVIEs, determination of the ‘‘primary beneficiary’’ drives the accounting. We identify the primary beneficiary of aVIE as the enterprise that has both (1) the power to direct the activities of the VIE that most significantly impact
109
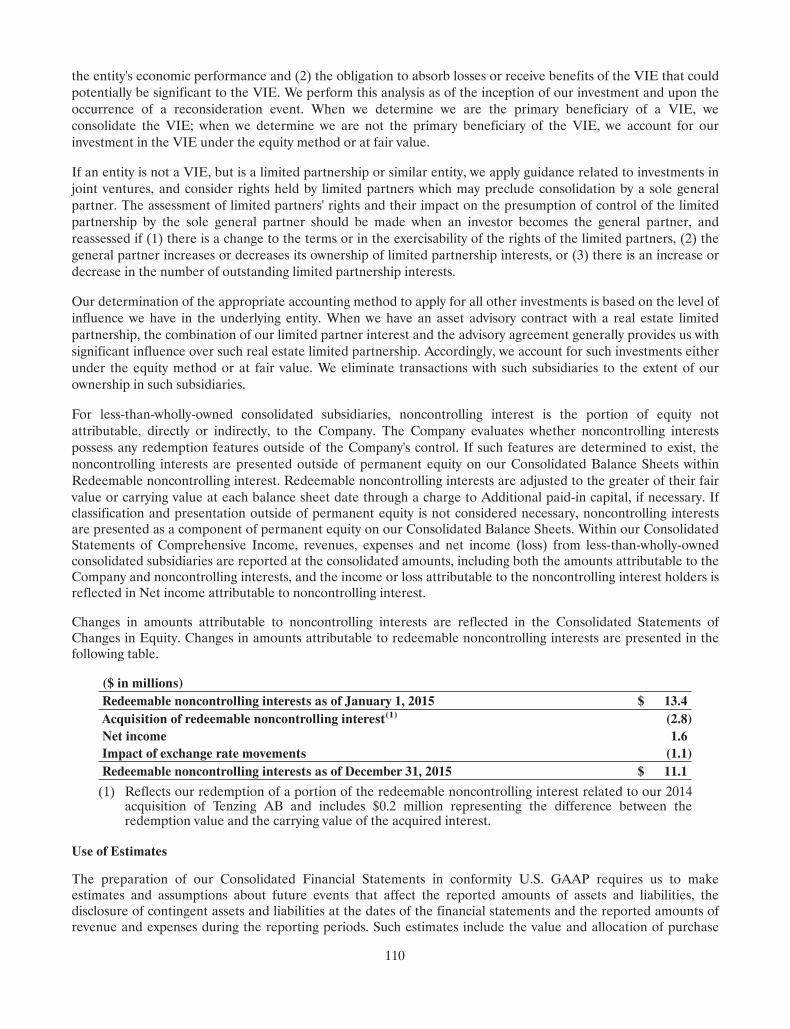
the entity's economic performance and (2) the obligation to absorb losses or receive benefits of the VIE that couldpotentially be significant to the VIE. We perform this analysis as of the inception of our investment and upon theoccurrence of a reconsideration event. When we determine we are the primary beneficiary of a VIE, weconsolidate the VIE; when we determine we are not the primary beneficiary of the VIE, we account for ourinvestment in the VIE under the equity method or at fair value.
If an entity is not a VIE, but is a limited partnership or similar entity, we apply guidance related to investments injoint ventures, and consider rights held by limited partners which may preclude consolidation by a sole generalpartner. The assessment of limited partners' rights and their impact on the presumption of control of the limitedpartnership by the sole general partner should be made when an investor becomes the general partner, andreassessed if (1) there is a change to the terms or in the exercisability of the rights of the limited partners, (2) thegeneral partner increases or decreases its ownership of limited partnership interests, or (3) there is an increase ordecrease in the number of outstanding limited partnership interests.
Our determination of the appropriate accounting method to apply for all other investments is based on the level ofinfluence we have in the underlying entity. When we have an asset advisory contract with a real estate limitedpartnership, the combination of our limited partner interest and the advisory agreement generally provides us withsignificant influence over such real estate limited partnership. Accordingly, we account for such investments eitherunder the equity method or at fair value. We eliminate transactions with such subsidiaries to the extent of ourownership in such subsidiaries.
For less-than-wholly-owned consolidated subsidiaries, noncontrolling interest is the portion of equity notattributable, directly or indirectly, to the Company. The Company evaluates whether noncontrolling interestspossess any redemption features outside of the Company's control. If such features are determined to exist, thenoncontrolling interests are presented outside of permanent equity on our Consolidated Balance Sheets withinRedeemable noncontrolling interest. Redeemable noncontrolling interests are adjusted to the greater of their fairvalue or carrying value at each balance sheet date through a charge to Additional paid-in capital, if necessary. Ifclassification and presentation outside of permanent equity is not considered necessary, noncontrolling interestsare presented as a component of permanent equity on our Consolidated Balance Sheets. Within our ConsolidatedStatements of Comprehensive Income, revenues, expenses and net income (loss) from less-than-wholly-ownedconsolidated subsidiaries are reported at the consolidated amounts, including both the amounts attributable to theCompany and noncontrolling interests, and the income or loss attributable to the noncontrolling interest holders isreflected in Net income attributable to noncontrolling interest.
Changes in amounts attributable to noncontrolling interests are reflected in the Consolidated Statements ofChanges in Equity. Changes in amounts attributable to redeemable noncontrolling interests are presented in thefollowing table.
($ in millions)Redeemable noncontrolling interests as of January 1, 2015 $ 13.4Acquisition of redeemable noncontrolling interest(1) (2.8)Net income 1.6Impact of exchange rate movements (1.1)Redeemable noncontrolling interests as of December 31, 2015 $ 11.1
(1) Reflects our redemption of a portion of the redeemable noncontrolling interest related to our 2014acquisition of Tenzing AB and includes $0.2 million representing the difference between theredemption value and the carrying value of the acquired interest.
Use of Estimates
The preparation of our Consolidated Financial Statements in conformity U.S. GAAP requires us to makeestimates and assumptions about future events that affect the reported amounts of assets and liabilities, thedisclosure of contingent assets and liabilities at the dates of the financial statements and the reported amounts ofrevenue and expenses during the reporting periods. Such estimates include the value and allocation of purchase
110
consideration, valuation of accounts receivable, investments in real estate ventures, goodwill, intangible assets,other long-lived assets, legal contingencies, assumptions used in the calculation of income taxes, incentivecompensation, self-insurance program liabilities, and retirement and other post-employment benefits, amongothers.
These estimates and assumptions are based on management's best estimate and judgment. We evaluate theseestimates and assumptions on an ongoing basis using historical experience and other factors, including the currenteconomic environment, which we believe to be reasonable under the circumstances. We adjust such estimates andassumptions when facts and circumstances dictate. Market factors, such as illiquid credit markets, volatile equitymarkets and foreign currency fluctuations can increase the uncertainty in such estimates and assumptions. Becausefuture events and their effects cannot be determined with precision, actual results could differ significantly fromthese estimates. Changes in those estimates resulting from continuing changes in the economic environment will bereflected in the financial statements in future periods. Although actual amounts will likely differ from suchestimated amounts, we believe such differences are not likely to be material.
Revenue Recognition
We earn revenue from the following principal sources:
• Transaction commissions;
• Advisory and management fees;
• Incentive fees;
• Project and development management fees; and
• Construction management fees.
We recognize transaction commissions related to leasing services and capital markets services as revenue when weprovide the related services unless future contingencies exist. Advisory and management fees related to propertyand facility management services, valuation services, corporate property services, consulting services andinvestment management are recognized in the period in which we perform the related services. We recognizeincentive fees in the period earned, based on the performance of funds' investments, contractual benchmarks andother contractual formulas. If future contingencies exist, we defer recognition of the related revenue until therespective contingencies have been satisfied.
We recognize project and development management and construction management fees by applyingthe percentage of completion method of accounting. The costs incurred to total estimated costs method is used todetermine the extent of progress towards completion.
Gross and Net Accounting
We follow the guidance of the Financial Accounting Standards Board's (‘‘FASB's’’) Accounting StandardsCodification (‘‘ASC’’) 605-45, Principal and Agent Considerations, when accounting for reimbursements receivedfrom clients. In certain of our businesses, primarily those involving management services, our clients reimburse usfor expenses incurred on their behalf. We base the treatment of reimbursable expenses for financial reportingpurposes upon the fee structure of the underlying contract. Accordingly, we report a contract that provides forfixed fees, fully inclusive of all personnel and other recoverable expenses, on a gross basis. When accounting on agross basis, our reported revenue comprises the entire amount billed to our client and our reported expensesinclude all costs associated with the client. Certain contractual arrangements in our project and developmentservices, including fit-out business activities and our facility management services, tend to have characteristics thatresult in accounting on a gross basis. In Note 3, Business Segments, for client assignments in property and facilitymanagement and in project and development services accounted for on a gross basis, we identify the reimbursablegross contract costs, including vendor and subcontractor costs (‘‘gross contract costs’’), and present separately their
111
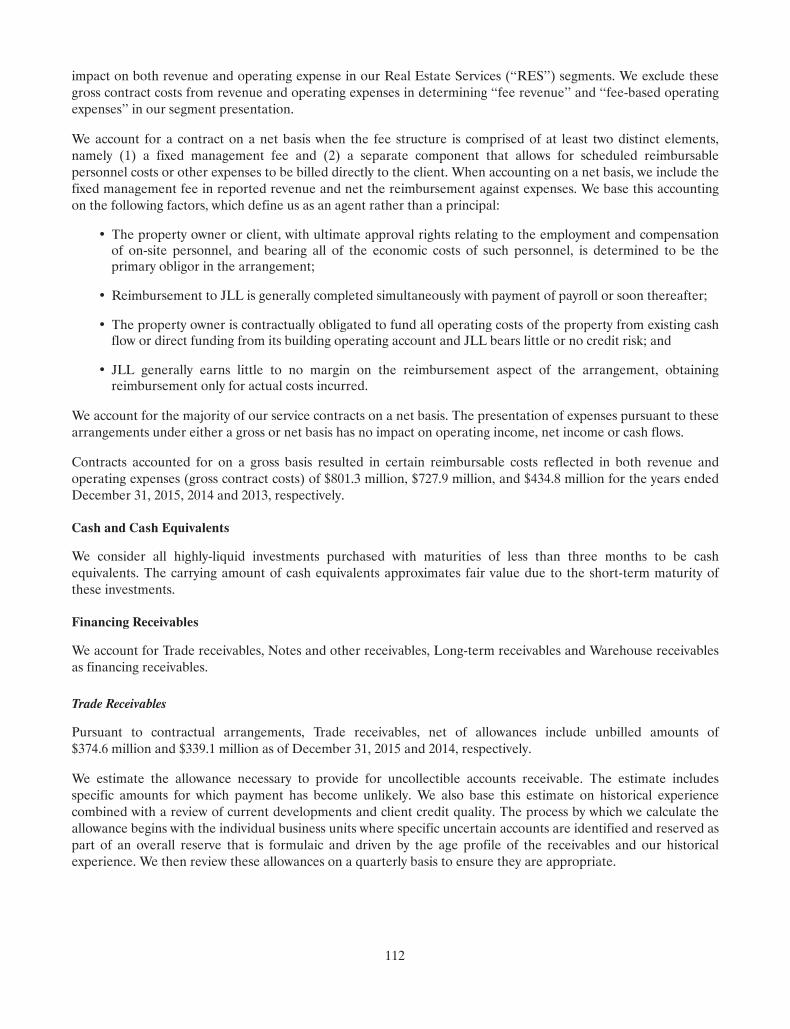
impact on both revenue and operating expense in our Real Estate Services (‘‘RES’’) segments. We exclude thesegross contract costs from revenue and operating expenses in determining ‘‘fee revenue’’ and ‘‘fee-based operatingexpenses’’ in our segment presentation.
We account for a contract on a net basis when the fee structure is comprised of at least two distinct elements,namely (1) a fixed management fee and (2) a separate component that allows for scheduled reimbursablepersonnel costs or other expenses to be billed directly to the client. When accounting on a net basis, we include thefixed management fee in reported revenue and net the reimbursement against expenses. We base this accountingon the following factors, which define us as an agent rather than a principal:
• The property owner or client, with ultimate approval rights relating to the employment and compensationof on-site personnel, and bearing all of the economic costs of such personnel, is determined to be theprimary obligor in the arrangement;
• Reimbursement to JLL is generally completed simultaneously with payment of payroll or soon thereafter;
• The property owner is contractually obligated to fund all operating costs of the property from existing cashflow or direct funding from its building operating account and JLL bears little or no credit risk; and
• JLL generally earns little to no margin on the reimbursement aspect of the arrangement, obtainingreimbursement only for actual costs incurred.
We account for the majority of our service contracts on a net basis. The presentation of expenses pursuant to thesearrangements under either a gross or net basis has no impact on operating income, net income or cash flows.
Contracts accounted for on a gross basis resulted in certain reimbursable costs reflected in both revenue andoperating expenses (gross contract costs) of $801.3 million, $727.9 million, and $434.8 million for the years endedDecember 31, 2015, 2014 and 2013, respectively.
Cash and Cash Equivalents
We consider all highly-liquid investments purchased with maturities of less than three months to be cashequivalents. The carrying amount of cash equivalents approximates fair value due to the short-term maturity ofthese investments.
Financing Receivables
We account for Trade receivables, Notes and other receivables, Long-term receivables and Warehouse receivablesas financing receivables.
Trade Receivables
Pursuant to contractual arrangements, Trade receivables, net of allowances include unbilled amounts of$374.6 million and $339.1 million as of December 31, 2015 and 2014, respectively.
We estimate the allowance necessary to provide for uncollectible accounts receivable. The estimate includesspecific amounts for which payment has become unlikely. We also base this estimate on historical experiencecombined with a review of current developments and client credit quality. The process by which we calculate theallowance begins with the individual business units where specific uncertain accounts are identified and reserved aspart of an overall reserve that is formulaic and driven by the age profile of the receivables and our historicalexperience. We then review these allowances on a quarterly basis to ensure they are appropriate.
112
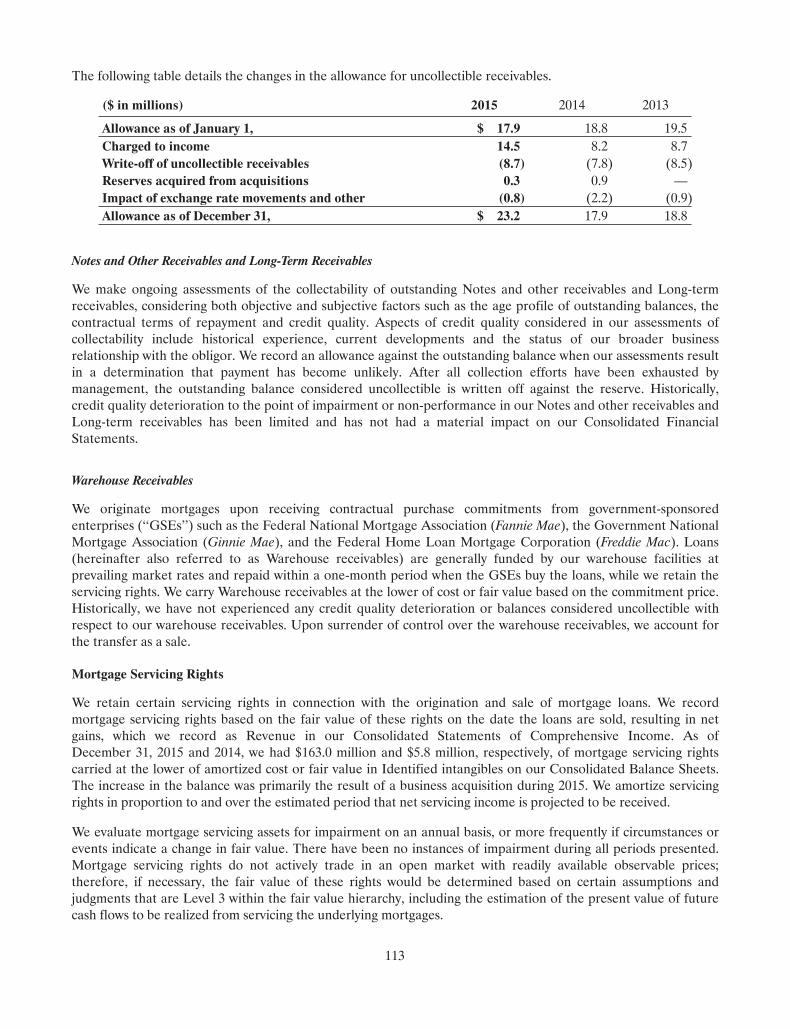
The following table details the changes in the allowance for uncollectible receivables.
($ in millions) 2015 2014 2013
Allowance as of January 1, $ 17.9 18.8 19.5Charged to income 14.5 8.2 8.7Write-off of uncollectible receivables (8.7) (7.8) (8.5)Reserves acquired from acquisitions 0.3 0.9 —Impact of exchange rate movements and other (0.8) (2.2) (0.9)Allowance as of December 31, $ 23.2 17.9 18.8
Notes and Other Receivables and Long-Term Receivables
We make ongoing assessments of the collectability of outstanding Notes and other receivables and Long-termreceivables, considering both objective and subjective factors such as the age profile of outstanding balances, thecontractual terms of repayment and credit quality. Aspects of credit quality considered in our assessments ofcollectability include historical experience, current developments and the status of our broader businessrelationship with the obligor. We record an allowance against the outstanding balance when our assessments resultin a determination that payment has become unlikely. After all collection efforts have been exhausted bymanagement, the outstanding balance considered uncollectible is written off against the reserve. Historically,credit quality deterioration to the point of impairment or non-performance in our Notes and other receivables andLong-term receivables has been limited and has not had a material impact on our Consolidated FinancialStatements.
Warehouse Receivables
We originate mortgages upon receiving contractual purchase commitments from government-sponsoredenterprises (‘‘GSEs’’) such as the Federal National Mortgage Association (Fannie Mae), the Government NationalMortgage Association (Ginnie Mae), and the Federal Home Loan Mortgage Corporation (Freddie Mac). Loans(hereinafter also referred to as Warehouse receivables) are generally funded by our warehouse facilities atprevailing market rates and repaid within a one-month period when the GSEs buy the loans, while we retain theservicing rights. We carry Warehouse receivables at the lower of cost or fair value based on the commitment price.Historically, we have not experienced any credit quality deterioration or balances considered uncollectible withrespect to our warehouse receivables. Upon surrender of control over the warehouse receivables, we account forthe transfer as a sale.
Mortgage Servicing Rights
We retain certain servicing rights in connection with the origination and sale of mortgage loans. We recordmortgage servicing rights based on the fair value of these rights on the date the loans are sold, resulting in netgains, which we record as Revenue in our Consolidated Statements of Comprehensive Income. As ofDecember 31, 2015 and 2014, we had $163.0 million and $5.8 million, respectively, of mortgage servicing rightscarried at the lower of amortized cost or fair value in Identified intangibles on our Consolidated Balance Sheets.The increase in the balance was primarily the result of a business acquisition during 2015. We amortize servicingrights in proportion to and over the estimated period that net servicing income is projected to be received.
We evaluate mortgage servicing assets for impairment on an annual basis, or more frequently if circumstances orevents indicate a change in fair value. There have been no instances of impairment during all periods presented.Mortgage servicing rights do not actively trade in an open market with readily available observable prices;therefore, if necessary, the fair value of these rights would be determined based on certain assumptions andjudgments that are Level 3 within the fair value hierarchy, including the estimation of the present value of futurecash flows to be realized from servicing the underlying mortgages.
113
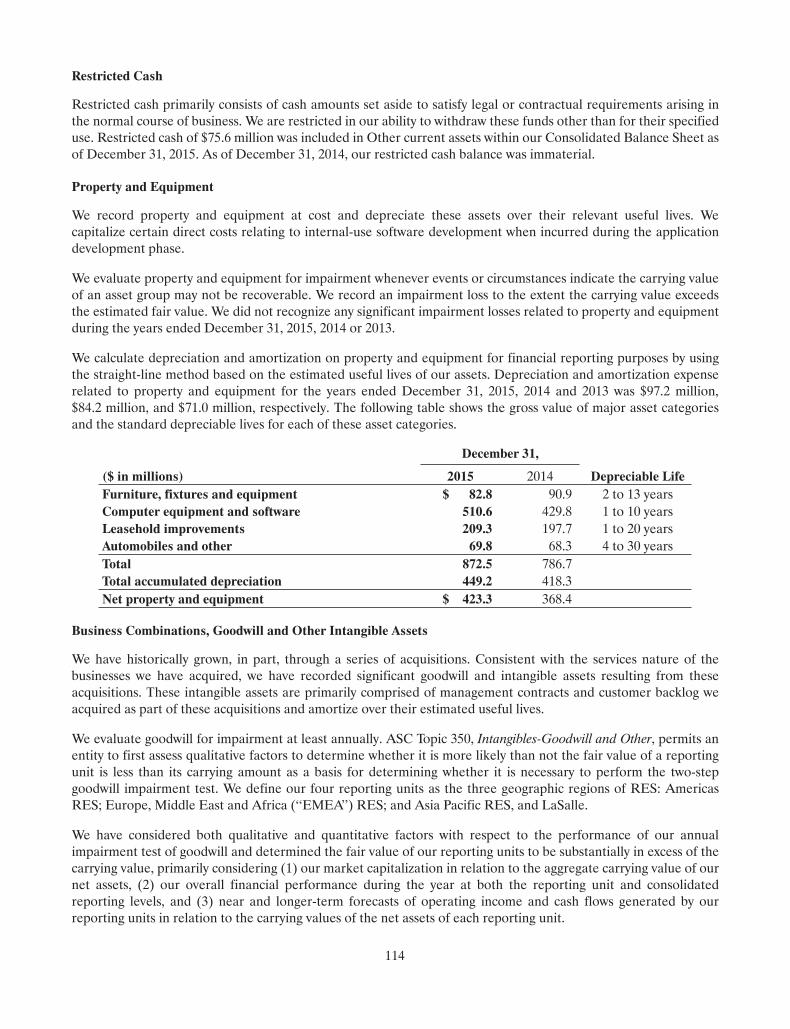
Restricted Cash
Restricted cash primarily consists of cash amounts set aside to satisfy legal or contractual requirements arising inthe normal course of business. We are restricted in our ability to withdraw these funds other than for their specifieduse. Restricted cash of $75.6 million was included in Other current assets within our Consolidated Balance Sheet asof December 31, 2015. As of December 31, 2014, our restricted cash balance was immaterial.
Property and Equipment
We record property and equipment at cost and depreciate these assets over their relevant useful lives. Wecapitalize certain direct costs relating to internal-use software development when incurred during the applicationdevelopment phase.
We evaluate property and equipment for impairment whenever events or circumstances indicate the carrying valueof an asset group may not be recoverable. We record an impairment loss to the extent the carrying value exceedsthe estimated fair value. We did not recognize any significant impairment losses related to property and equipmentduring the years ended December 31, 2015, 2014 or 2013.
We calculate depreciation and amortization on property and equipment for financial reporting purposes by usingthe straight-line method based on the estimated useful lives of our assets. Depreciation and amortization expenserelated to property and equipment for the years ended December 31, 2015, 2014 and 2013 was $97.2 million,$84.2 million, and $71.0 million, respectively. The following table shows the gross value of major asset categoriesand the standard depreciable lives for each of these asset categories.
($ in millions)
December 31,
Depreciable Life2015 2014Furniture, fixtures and equipment $ 82.8 90.9 2 to 13 yearsComputer equipment and software 510.6 429.8 1 to 10 yearsLeasehold improvements 209.3 197.7 1 to 20 yearsAutomobiles and other 69.8 68.3 4 to 30 yearsTotal 872.5 786.7Total accumulated depreciation 449.2 418.3Net property and equipment $ 423.3 368.4
Business Combinations, Goodwill and Other Intangible Assets
We have historically grown, in part, through a series of acquisitions. Consistent with the services nature of thebusinesses we have acquired, we have recorded significant goodwill and intangible assets resulting from theseacquisitions. These intangible assets are primarily comprised of management contracts and customer backlog weacquired as part of these acquisitions and amortize over their estimated useful lives.
We evaluate goodwill for impairment at least annually. ASC Topic 350, Intangibles-Goodwill and Other, permits anentity to first assess qualitative factors to determine whether it is more likely than not the fair value of a reportingunit is less than its carrying amount as a basis for determining whether it is necessary to perform the two-stepgoodwill impairment test. We define our four reporting units as the three geographic regions of RES: AmericasRES; Europe, Middle East and Africa (‘‘EMEA’’) RES; and Asia Pacific RES, and LaSalle.
We have considered both qualitative and quantitative factors with respect to the performance of our annualimpairment test of goodwill and determined the fair value of our reporting units to be substantially in excess of thecarrying value, primarily considering (1) our market capitalization in relation to the aggregate carrying value of ournet assets, (2) our overall financial performance during the year at both the reporting unit and consolidatedreporting levels, and (3) near and longer-term forecasts of operating income and cash flows generated by ourreporting units in relation to the carrying values of the net assets of each reporting unit.
114
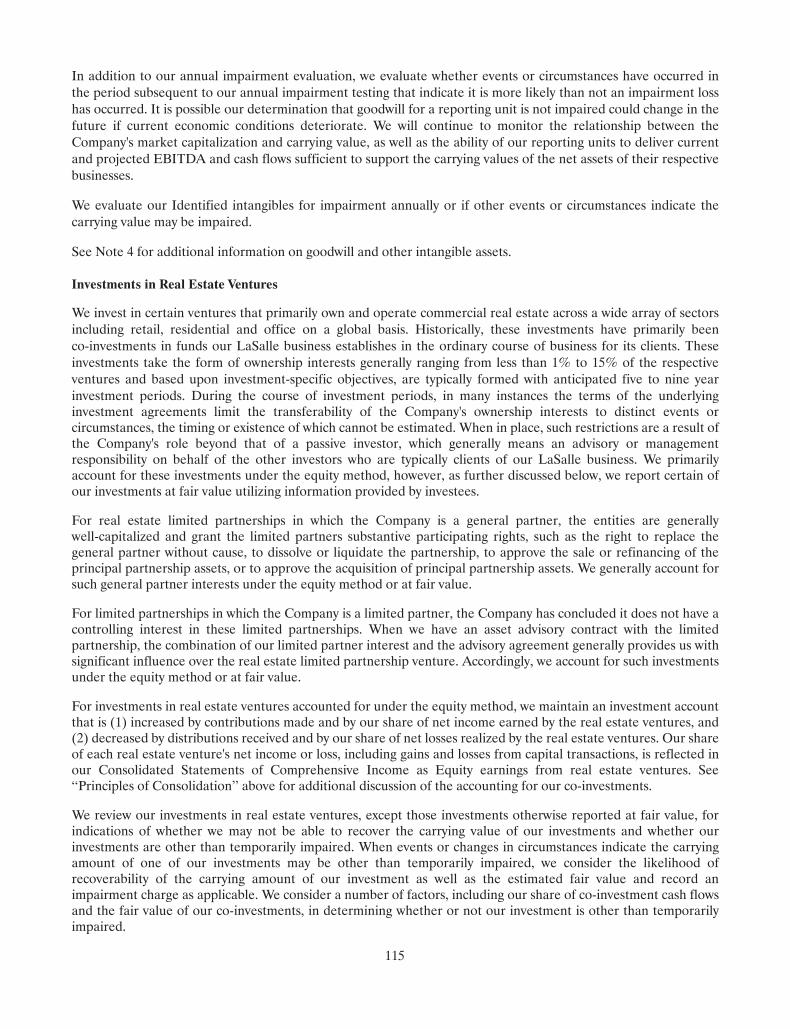
In addition to our annual impairment evaluation, we evaluate whether events or circumstances have occurred inthe period subsequent to our annual impairment testing that indicate it is more likely than not an impairment losshas occurred. It is possible our determination that goodwill for a reporting unit is not impaired could change in thefuture if current economic conditions deteriorate. We will continue to monitor the relationship between theCompany's market capitalization and carrying value, as well as the ability of our reporting units to deliver currentand projected EBITDA and cash flows sufficient to support the carrying values of the net assets of their respectivebusinesses.
We evaluate our Identified intangibles for impairment annually or if other events or circumstances indicate thecarrying value may be impaired.
See Note 4 for additional information on goodwill and other intangible assets.
Investments in Real Estate Ventures
We invest in certain ventures that primarily own and operate commercial real estate across a wide array of sectorsincluding retail, residential and office on a global basis. Historically, these investments have primarily beenco-investments in funds our LaSalle business establishes in the ordinary course of business for its clients. Theseinvestments take the form of ownership interests generally ranging from less than 1% to 15% of the respectiveventures and based upon investment-specific objectives, are typically formed with anticipated five to nine yearinvestment periods. During the course of investment periods, in many instances the terms of the underlyinginvestment agreements limit the transferability of the Company's ownership interests to distinct events orcircumstances, the timing or existence of which cannot be estimated. When in place, such restrictions are a result ofthe Company's role beyond that of a passive investor, which generally means an advisory or managementresponsibility on behalf of the other investors who are typically clients of our LaSalle business. We primarilyaccount for these investments under the equity method, however, as further discussed below, we report certain ofour investments at fair value utilizing information provided by investees.
For real estate limited partnerships in which the Company is a general partner, the entities are generallywell-capitalized and grant the limited partners substantive participating rights, such as the right to replace thegeneral partner without cause, to dissolve or liquidate the partnership, to approve the sale or refinancing of theprincipal partnership assets, or to approve the acquisition of principal partnership assets. We generally account forsuch general partner interests under the equity method or at fair value.
For limited partnerships in which the Company is a limited partner, the Company has concluded it does not have acontrolling interest in these limited partnerships. When we have an asset advisory contract with the limitedpartnership, the combination of our limited partner interest and the advisory agreement generally provides us withsignificant influence over the real estate limited partnership venture. Accordingly, we account for such investmentsunder the equity method or at fair value.
For investments in real estate ventures accounted for under the equity method, we maintain an investment accountthat is (1) increased by contributions made and by our share of net income earned by the real estate ventures, and(2) decreased by distributions received and by our share of net losses realized by the real estate ventures. Our shareof each real estate venture's net income or loss, including gains and losses from capital transactions, is reflected inour Consolidated Statements of Comprehensive Income as Equity earnings from real estate ventures. See‘‘Principles of Consolidation’’ above for additional discussion of the accounting for our co-investments.
We review our investments in real estate ventures, except those investments otherwise reported at fair value, forindications of whether we may not be able to recover the carrying value of our investments and whether ourinvestments are other than temporarily impaired. When events or changes in circumstances indicate the carryingamount of one of our investments may be other than temporarily impaired, we consider the likelihood ofrecoverability of the carrying amount of our investment as well as the estimated fair value and record animpairment charge as applicable. We consider a number of factors, including our share of co-investment cash flowsand the fair value of our co-investments, in determining whether or not our investment is other than temporarilyimpaired.
115
For investments in real estate ventures reported at fair value, we maintain an investment account that is increasedor decreased each reporting period by the difference between the fair value of the investment and the carryingvalue as of the balance sheet date. These fair value adjustments are reflected as gains or losses in our ConsolidatedStatements of Comprehensive Income within Equity earnings from real estate ventures. The fair value of theseinvestments as of the balance sheet date is determined generally using net asset value (‘‘NAV’’) per share (or itsequivalent), a Level 3 input in the fair value hierarchy, provided by the investee. Refer to Note 5 and Note 9 foradditional information regarding investments reported at fair value.
We report Equity earnings from real estate ventures in the Consolidated Statements of Comprehensive Incomeafter Operating income. However, for segment reporting we reflect Equity earnings (losses) from real estateventures as a component of revenue. See Note 3 for Equity earnings (losses) reflected within segment revenue, aswell as discussion of how the Chief Operating Decision Maker (as defined in Note 3) measures segment resultswith Equity earnings (losses) included in segment revenue.
See Note 5 for additional information on investments in real estate ventures.
Stock-Based Compensation
Stock-based compensation in the form of restricted stock units is a significant element of our compensationprograms. We determine the fair value of restricted stock units based on the market price of the Company'scommon stock on the grant date and amortize it on a straight-line basis over the associated vesting period for eachseparately vesting portion of an award. We reduce stock-based compensation expense for estimated forfeitureseach period and adjust expense accordingly upon vesting or actual forfeitures.
We also have a ‘‘noncompensatory’’ Employee Stock Purchase Plan (‘‘ESPP’’) for U.S. employees and a JonesLang LaSalle Savings Related Share Option Plan (‘‘Save As You Earn’’ or ‘‘SAYE’’) for U.K. employees. The fairvalue of options granted under the SAYE plan are determined on the grant date and amortized over the associatedvesting period.
See Note 6 for additional information on our stock compensation plans.
Income Taxes
We account for income taxes under the asset and liability method. We recognize deferred tax assets and liabilitiesfor the expected future tax consequences of events that have been included in our financial statements or taxreturns. Under this method, we determine deferred tax assets and liabilities based on the differences between thefinancial reporting and tax bases of assets and liabilities using enacted tax rates in effect for the year in which thedifferences are expected to reverse.
An increase or decrease in a deferred tax asset or liability that results from a change in circumstances, and thatcauses a change in our judgment about expected future tax consequences of events, would be included in the taxprovision when the changes in circumstances and our judgment occurs. Deferred income taxes also reflect theimpact of operating loss and tax credit carryforwards. A valuation allowance is established if we believe it is morelikely than not all or some portion of a deferred tax asset will not be realized. An increase or decrease in avaluation allowance that results from a change in circumstances, and that causes a change in our judgment aboutthe ability to realize the related deferred tax asset, would be included in the tax provision when the changes incircumstances and our judgment occurs.
See Note 8 for additional information on income taxes.
Derivatives and Hedging Activities
We do not enter into derivative financial instruments for trading or speculative purposes. However, in the normalcourse of business, we do use derivative financial instruments in the form of foreign currency forward contracts tomanage our foreign currency exchange rate risk. We currently do not use hedge accounting for these contracts,which are marked-to-market each period with changes in unrealized gains or losses recognized in earnings and
116

offset by foreign currency gains and losses on associated intercompany loans and other foreign currency balances.We include the gains and losses on these forward foreign currency exchange contracts as a component of ouroverall net foreign currency gains and losses included in Operating, administrative and other expense.
The revaluations of our foreign currency forward contracts resulted in net losses of $11.7 million, $7.7 million and$0.1 million, for the years ended December 31, 2015, 2014 and 2013, respectively. Gains and losses from therevaluation of these contracts are recognized as a component of Operating, administrative and other expense andare offset by the gains and losses recognized on the revaluation of intercompany loans and other foreign currencybalances such that the impact to net income was not significant for the three years ended December 31, 2015.
We have considered the counterparty credit risk related to these forward foreign currency exchange contracts anddo not deem any counterparty credit risk to be material as of December 31, 2015.
See Note 9 for additional information on derivative financial instruments.
Foreign Currency Translation
We prepare the financial statements of our subsidiaries located outside the U.S. using local currency as thefunctional currency. The assets and liabilities of these subsidiaries are translated to U.S. dollars at the rates ofexchange at the balance sheet date with the resulting translation adjustments included as a separate component ofequity in the Consolidated Balance Sheets (Accumulated other comprehensive loss) and in the ConsolidatedStatements of Comprehensive Income (Other comprehensive income-foreign currency translation adjustments).
See Note 15 for additional information on the components of Accumulated other comprehensive loss.
Income and expenses are translated at the average monthly rates of exchange. We include gains and losses fromforeign currency transactions in net earnings as a component of Operating, administrative and other expense. Netforeign currency losses were $2.0 million, $8.5 million, and $3.9 million for the years ended December 31, 2015,2014 and 2013, respectively.
The effect of currency exchange rate changes on Cash and cash equivalents is presented as a separate caption inthe Consolidated Statements of Cash Flows.
Cash Held for Others
We manage significant amounts of cash and cash equivalents in our role as agent for certain of our investment andproperty management clients. We do not include such amounts in our Consolidated Balance Sheets.
Taxes Collected from Clients and Remitted to Governmental Authorities
We account for tax assessed by a governmental authority that is based on a revenue or transaction value (i.e., sales,use, and value added taxes) on a net basis, excluded from revenue, and recorded as current liabilities until paid.
Commitments and Contingencies
We are subject to various claims and contingencies related to lawsuits and taxes as well as commitments undercontractual obligations. Many of these claims are covered under our current insurance programs, subject todeductibles. We recognize the liability associated with a loss contingency when a loss is probable and estimable.
See Note 13 for additional information on commitments and contingencies.
Earnings Per Share; Net Income Available to Common Shareholders
The difference between basic weighted average shares outstanding and diluted weighted average sharesoutstanding represents the dilutive impact of our common stock equivalents. Common stock equivalents consist ofshares to be issued under employee stock compensation programs.
117
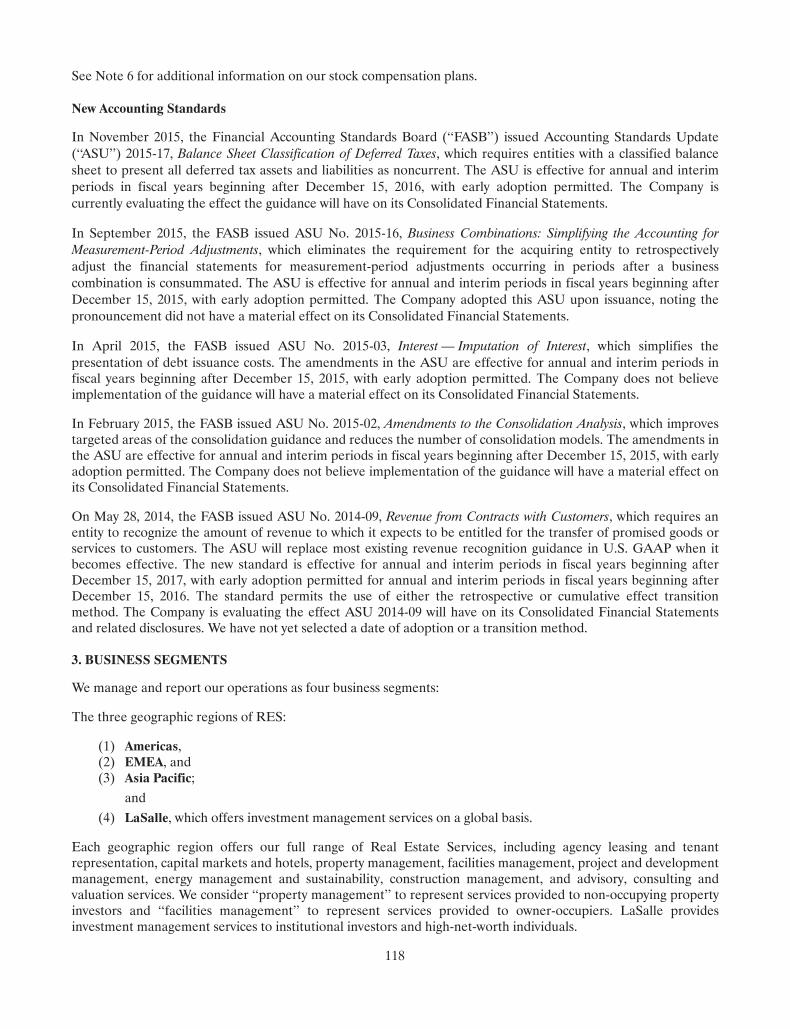
See Note 6 for additional information on our stock compensation plans.
New Accounting Standards
In November 2015, the Financial Accounting Standards Board (‘‘FASB’’) issued Accounting Standards Update(‘‘ASU’’) 2015-17, Balance Sheet Classification of Deferred Taxes, which requires entities with a classified balancesheet to present all deferred tax assets and liabilities as noncurrent. The ASU is effective for annual and interimperiods in fiscal years beginning after December 15, 2016, with early adoption permitted. The Company iscurrently evaluating the effect the guidance will have on its Consolidated Financial Statements.
In September 2015, the FASB issued ASU No. 2015-16, Business Combinations: Simplifying the Accounting forMeasurement-Period Adjustments, which eliminates the requirement for the acquiring entity to retrospectivelyadjust the financial statements for measurement-period adjustments occurring in periods after a businesscombination is consummated. The ASU is effective for annual and interim periods in fiscal years beginning afterDecember 15, 2015, with early adoption permitted. The Company adopted this ASU upon issuance, noting thepronouncement did not have a material effect on its Consolidated Financial Statements.
In April 2015, the FASB issued ASU No. 2015-03, Interest — Imputation of Interest, which simplifies thepresentation of debt issuance costs. The amendments in the ASU are effective for annual and interim periods infiscal years beginning after December 15, 2015, with early adoption permitted. The Company does not believeimplementation of the guidance will have a material effect on its Consolidated Financial Statements.
In February 2015, the FASB issued ASU No. 2015-02, Amendments to the Consolidation Analysis, which improvestargeted areas of the consolidation guidance and reduces the number of consolidation models. The amendments inthe ASU are effective for annual and interim periods in fiscal years beginning after December 15, 2015, with earlyadoption permitted. The Company does not believe implementation of the guidance will have a material effect onits Consolidated Financial Statements.
On May 28, 2014, the FASB issued ASU No. 2014-09, Revenue from Contracts with Customers, which requires anentity to recognize the amount of revenue to which it expects to be entitled for the transfer of promised goods orservices to customers. The ASU will replace most existing revenue recognition guidance in U.S. GAAP when itbecomes effective. The new standard is effective for annual and interim periods in fiscal years beginning afterDecember 15, 2017, with early adoption permitted for annual and interim periods in fiscal years beginning afterDecember 15, 2016. The standard permits the use of either the retrospective or cumulative effect transitionmethod. The Company is evaluating the effect ASU 2014-09 will have on its Consolidated Financial Statementsand related disclosures. We have not yet selected a date of adoption or a transition method.
3. BUSINESS SEGMENTS
We manage and report our operations as four business segments:
The three geographic regions of RES:
(1) Americas,(2) EMEA, and(3) Asia Pacific;
and(4) LaSalle, which offers investment management services on a global basis.
Each geographic region offers our full range of Real Estate Services, including agency leasing and tenantrepresentation, capital markets and hotels, property management, facilities management, project and developmentmanagement, energy management and sustainability, construction management, and advisory, consulting andvaluation services. We consider ‘‘property management’’ to represent services provided to non-occupying propertyinvestors and ‘‘facilities management’’ to represent services provided to owner-occupiers. LaSalle providesinvestment management services to institutional investors and high-net-worth individuals.
118
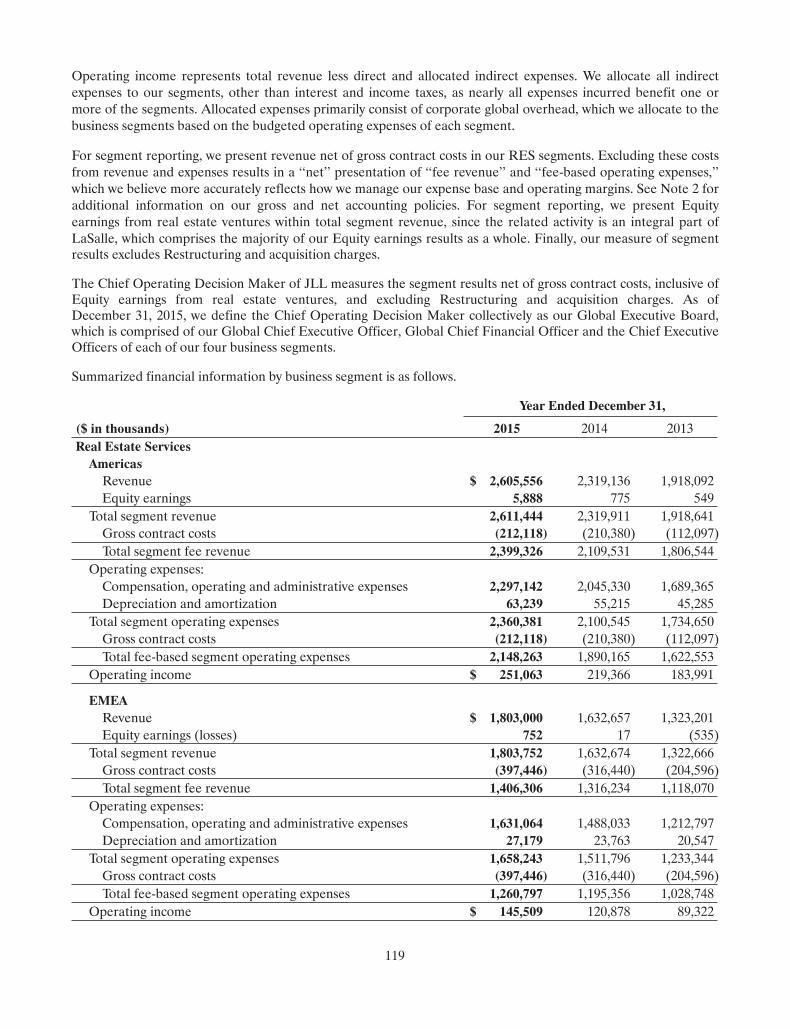
Operating income represents total revenue less direct and allocated indirect expenses. We allocate all indirectexpenses to our segments, other than interest and income taxes, as nearly all expenses incurred benefit one ormore of the segments. Allocated expenses primarily consist of corporate global overhead, which we allocate to thebusiness segments based on the budgeted operating expenses of each segment.
For segment reporting, we present revenue net of gross contract costs in our RES segments. Excluding these costsfrom revenue and expenses results in a ‘‘net’’ presentation of ‘‘fee revenue’’ and ‘‘fee-based operating expenses,’’which we believe more accurately reflects how we manage our expense base and operating margins. See Note 2 foradditional information on our gross and net accounting policies. For segment reporting, we present Equityearnings from real estate ventures within total segment revenue, since the related activity is an integral part ofLaSalle, which comprises the majority of our Equity earnings results as a whole. Finally, our measure of segmentresults excludes Restructuring and acquisition charges.
The Chief Operating Decision Maker of JLL measures the segment results net of gross contract costs, inclusive ofEquity earnings from real estate ventures, and excluding Restructuring and acquisition charges. As ofDecember 31, 2015, we define the Chief Operating Decision Maker collectively as our Global Executive Board,which is comprised of our Global Chief Executive Officer, Global Chief Financial Officer and the Chief ExecutiveOfficers of each of our four business segments.
Summarized financial information by business segment is as follows.
Year Ended December 31,
($ in thousands) 2015 2014 2013Real Estate ServicesAmericasRevenue $ 2,605,556 2,319,136 1,918,092Equity earnings 5,888 775 549
Total segment revenue 2,611,444 2,319,911 1,918,641Gross contract costs (212,118) (210,380) (112,097)Total segment fee revenue 2,399,326 2,109,531 1,806,544
Operating expenses:Compensation, operating and administrative expenses 2,297,142 2,045,330 1,689,365Depreciation and amortization 63,239 55,215 45,285
Total segment operating expenses 2,360,381 2,100,545 1,734,650Gross contract costs (212,118) (210,380) (112,097)Total fee-based segment operating expenses 2,148,263 1,890,165 1,622,553
Operating income $ 251,063 219,366 183,991
EMEARevenue $ 1,803,000 1,632,657 1,323,201Equity earnings (losses) 752 17 (535)
Total segment revenue 1,803,752 1,632,674 1,322,666Gross contract costs (397,446) (316,440) (204,596)Total segment fee revenue 1,406,306 1,316,234 1,118,070
Operating expenses:Compensation, operating and administrative expenses 1,631,064 1,488,033 1,212,797Depreciation and amortization 27,179 23,763 20,547
Total segment operating expenses 1,658,243 1,511,796 1,233,344Gross contract costs (397,446) (316,440) (204,596)Total fee-based segment operating expenses 1,260,797 1,195,356 1,028,748
Operating income $ 145,509 120,878 89,322
119
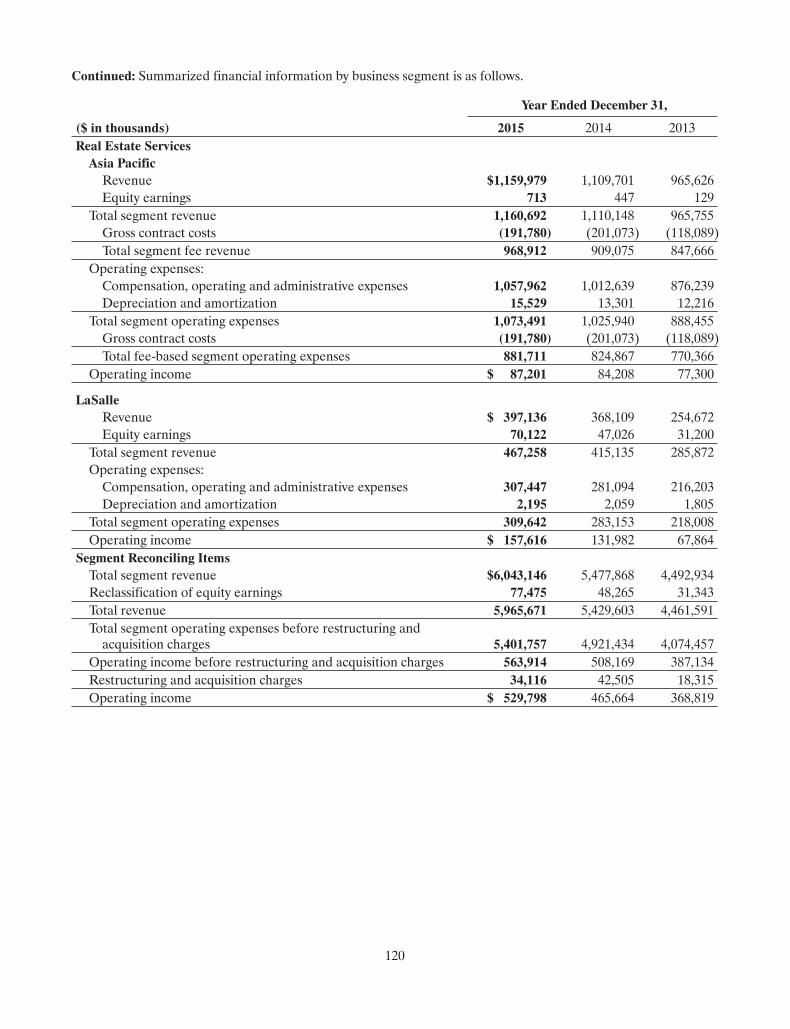
Continued: Summarized financial information by business segment is as follows.
Year Ended December 31,
($ in thousands) 2015 2014 2013Real Estate ServicesAsia PacificRevenue $1,159,979 1,109,701 965,626Equity earnings 713 447 129
Total segment revenue 1,160,692 1,110,148 965,755Gross contract costs (191,780) (201,073) (118,089)Total segment fee revenue 968,912 909,075 847,666
Operating expenses:Compensation, operating and administrative expenses 1,057,962 1,012,639 876,239Depreciation and amortization 15,529 13,301 12,216
Total segment operating expenses 1,073,491 1,025,940 888,455Gross contract costs (191,780) (201,073) (118,089)Total fee-based segment operating expenses 881,711 824,867 770,366
Operating income $ 87,201 84,208 77,300
LaSalleRevenue $ 397,136 368,109 254,672Equity earnings 70,122 47,026 31,200
Total segment revenue 467,258 415,135 285,872Operating expenses:Compensation, operating and administrative expenses 307,447 281,094 216,203Depreciation and amortization 2,195 2,059 1,805
Total segment operating expenses 309,642 283,153 218,008Operating income $ 157,616 131,982 67,864
Segment Reconciling ItemsTotal segment revenue $6,043,146 5,477,868 4,492,934Reclassification of equity earnings 77,475 48,265 31,343Total revenue 5,965,671 5,429,603 4,461,591Total segment operating expenses before restructuring andacquisition charges 5,401,757 4,921,434 4,074,457
Operating income before restructuring and acquisition charges 563,914 508,169 387,134Restructuring and acquisition charges 34,116 42,505 18,315Operating income $ 529,798 465,664 368,819
120
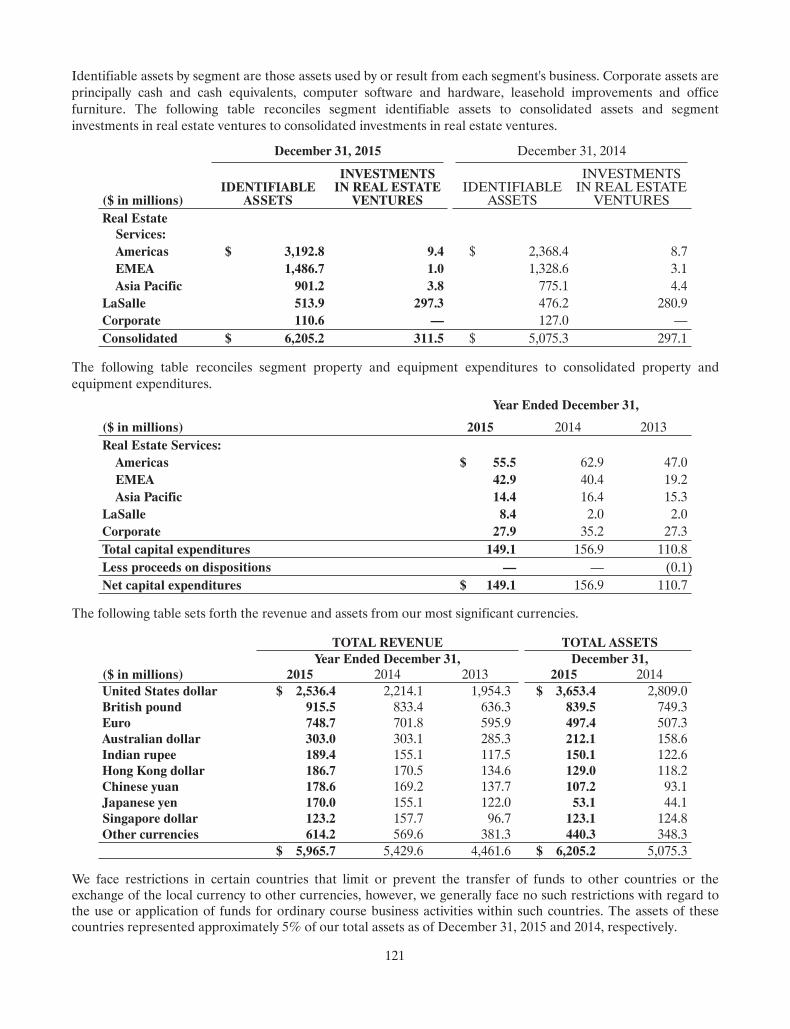
Identifiable assets by segment are those assets used by or result from each segment's business. Corporate assets areprincipally cash and cash equivalents, computer software and hardware, leasehold improvements and officefurniture. The following table reconciles segment identifiable assets to consolidated assets and segmentinvestments in real estate ventures to consolidated investments in real estate ventures.
December 31, 2015 December 31, 2014
($ in millions)IDENTIFIABLE
ASSETS
INVESTMENTSIN REAL ESTATE
VENTURESIDENTIFIABLE
ASSETS
INVESTMENTSIN REAL ESTATE
VENTURESReal EstateServices:Americas $ 3,192.8 9.4 $ 2,368.4 8.7EMEA 1,486.7 1.0 1,328.6 3.1Asia Pacific 901.2 3.8 775.1 4.4
LaSalle 513.9 297.3 476.2 280.9Corporate 110.6 — 127.0 —Consolidated $ 6,205.2 311.5 $ 5,075.3 297.1
The following table reconciles segment property and equipment expenditures to consolidated property andequipment expenditures.
Year Ended December 31,
($ in millions) 2015 2014 2013Real Estate Services:Americas $ 55.5 62.9 47.0EMEA 42.9 40.4 19.2Asia Pacific 14.4 16.4 15.3
LaSalle 8.4 2.0 2.0Corporate 27.9 35.2 27.3Total capital expenditures 149.1 156.9 110.8Less proceeds on dispositions — — (0.1)Net capital expenditures $ 149.1 156.9 110.7
The following table sets forth the revenue and assets from our most significant currencies.
TOTAL REVENUE TOTAL ASSETSYear Ended December 31, December 31,
($ in millions) 2015 2014 2013 2015 2014United States dollar $ 2,536.4 2,214.1 1,954.3 $ 3,653.4 2,809.0British pound 915.5 833.4 636.3 839.5 749.3Euro 748.7 701.8 595.9 497.4 507.3Australian dollar 303.0 303.1 285.3 212.1 158.6Indian rupee 189.4 155.1 117.5 150.1 122.6Hong Kong dollar 186.7 170.5 134.6 129.0 118.2Chinese yuan 178.6 169.2 137.7 107.2 93.1Japanese yen 170.0 155.1 122.0 53.1 44.1Singapore dollar 123.2 157.7 96.7 123.1 124.8Other currencies 614.2 569.6 381.3 440.3 348.3
$ 5,965.7 5,429.6 4,461.6 $ 6,205.2 5,075.3
We face restrictions in certain countries that limit or prevent the transfer of funds to other countries or theexchange of the local currency to other currencies, however, we generally face no such restrictions with regard tothe use or application of funds for ordinary course business activities within such countries. The assets of thesecountries represented approximately 5% of our total assets as of December 31, 2015 and 2014, respectively.
121
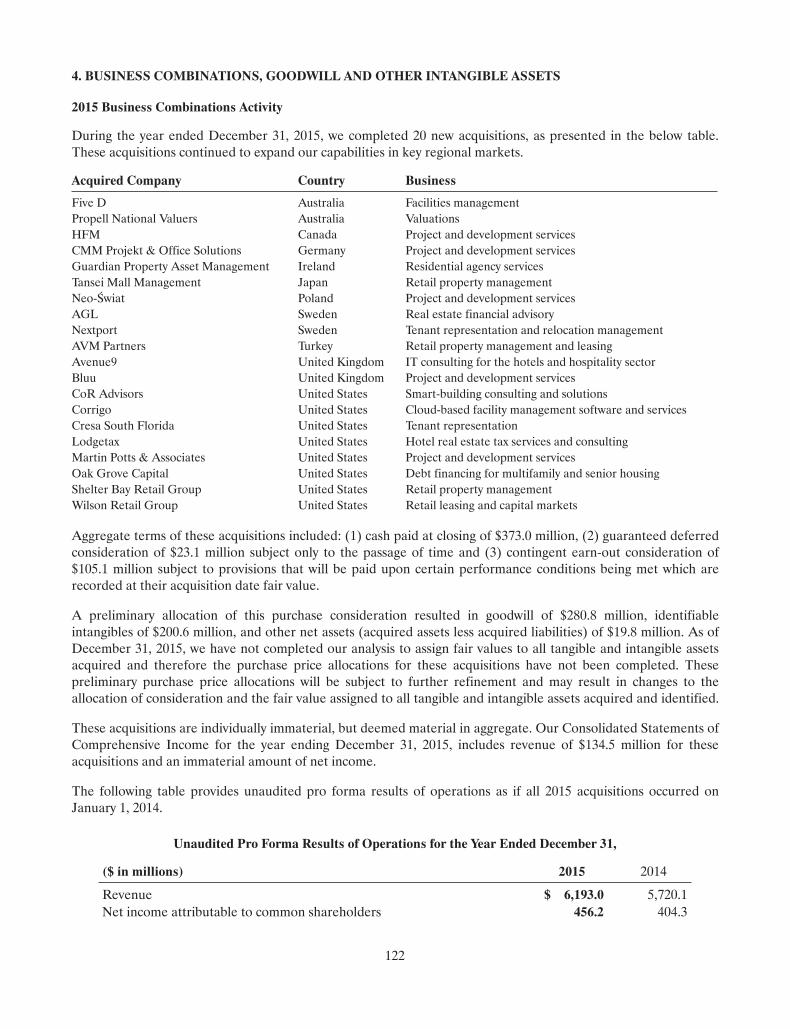
4. BUSINESS COMBINATIONS, GOODWILL AND OTHER INTANGIBLE ASSETS
2015 Business Combinations Activity
During the year ended December 31, 2015, we completed 20 new acquisitions, as presented in the below table.These acquisitions continued to expand our capabilities in key regional markets.
Acquired Company Country Business
Five D Australia Facilities managementPropell National Valuers Australia ValuationsHFM Canada Project and development servicesCMM Projekt & Office Solutions Germany Project and development servicesGuardian Property Asset Management Ireland Residential agency servicesTansei Mall Management Japan Retail property managementNeo-Swiat Poland Project and development servicesAGL Sweden Real estate financial advisoryNextport Sweden Tenant representation and relocation managementAVM Partners Turkey Retail property management and leasingAvenue9 United Kingdom IT consulting for the hotels and hospitality sectorBluu United Kingdom Project and development servicesCoR Advisors United States Smart-building consulting and solutionsCorrigo United States Cloud-based facility management software and servicesCresa South Florida United States Tenant representationLodgetax United States Hotel real estate tax services and consultingMartin Potts & Associates United States Project and development servicesOak Grove Capital United States Debt financing for multifamily and senior housingShelter Bay Retail Group United States Retail property managementWilson Retail Group United States Retail leasing and capital markets
Aggregate terms of these acquisitions included: (1) cash paid at closing of $373.0 million, (2) guaranteed deferredconsideration of $23.1 million subject only to the passage of time and (3) contingent earn-out consideration of$105.1 million subject to provisions that will be paid upon certain performance conditions being met which arerecorded at their acquisition date fair value.
A preliminary allocation of this purchase consideration resulted in goodwill of $280.8 million, identifiableintangibles of $200.6 million, and other net assets (acquired assets less acquired liabilities) of $19.8 million. As ofDecember 31, 2015, we have not completed our analysis to assign fair values to all tangible and intangible assetsacquired and therefore the purchase price allocations for these acquisitions have not been completed. Thesepreliminary purchase price allocations will be subject to further refinement and may result in changes to theallocation of consideration and the fair value assigned to all tangible and intangible assets acquired and identified.
These acquisitions are individually immaterial, but deemed material in aggregate. Our Consolidated Statements ofComprehensive Income for the year ending December 31, 2015, includes revenue of $134.5 million for theseacquisitions and an immaterial amount of net income.
The following table provides unaudited pro forma results of operations as if all 2015 acquisitions occurred onJanuary 1, 2014.
Unaudited Pro Forma Results of Operations for the Year Ended December 31,
($ in millions) 2015 2014
Revenue $ 6,193.0 5,720.1Net income attributable to common shareholders 456.2 404.3
122
These unaudited pro forma results of operations include adjustments for intangible amortization based on ourcurrent estimate of the fair value of identifiable intangibles acquired and their associated useful lives as well as aninterest expense adjustment based on our estimate of interest that would have been incurred had these acquisitionsoccurred on January 1, 2014. These unaudited pro forma adjustments are subject to change within themeasurement period because the fair value assessments these adjustments are based on are not finalized. Inaddition, these unaudited pro forma results do not reflect the cost of integration activities or benefits that mayresult from synergies that may be derived from these acquisitions. Accordingly, these unaudited pro forma resultsof operations are not necessarily indicative of the results which may occur in the future.
In 2015, we also purchased the remaining minority ownership in our Indian operations, which was reflected on ourConsolidated Balance Sheet as of December 31, 2014 as an $11.2 million Minority shareholder redemptionliability. During the year ended December 31, 2015, this liability increased by $5.5 million to the final settlementamount of $16.4 million paid in 2015. A corresponding adjustment of $5.5 million was recorded to goodwill.
During the year ended December 31, 2015, we also paid $51.8 million for deferred business acquisition and earn-out obligations for acquisitions completed in prior years. In addition, we paid $2.7 million to acquire a portion ofthe redeemable noncontrolling interest related to our 2014 acquisition of Tenzing AB, a Swedish real estateservices provider.
Of the $288.3 million of total additions to goodwill in 2015, we anticipated being able to amortize and deduct$104.1 million for tax purposes as of December 31, 2015.
2014 Business Combinations Activity
During the year ended December 31, 2014, we completed ten new acquisitions located in the U.S., Spain, Portugal,France, Sweden, England and Malaysia. These acquisitions included: (1) Tenzing, a Swedish commercial real estateservices provider specializing in capital markets, (2) W.A. Ellis, a London-based residential agency and valuationfirm, (3) CRESA Portland, a tenant representation and corporate services firm located in Portland, Oregon, and(4) CLEO Construction Management, a California-based project management services firm that specializes inmedical facilities. We also purchased a portion of the minority ownership in our Indian operations, for which wehad previously recorded a minority shareholder redemption liability on the Consolidated Balance Sheet, increasingour ownership from 90% to 95%.
The aggregate terms of these acquisitions included: (1) cash paid at closing of $38.2 million, (2) guaranteeddeferred consideration subject only to the passage of time of $21.5 million, (3) contingent earn-out considerationsubject to provisions that will be paid upon certain conditions being met, which was recorded at the acquisitiondate fair value of $10.3 million and (4) a redeemable noncontrolling interest of $14.2 million. The acquisition wecompleted in Sweden includes a redeemable noncontrolling interest in the form of an option agreement that allowsthe Company to purchase, and the noncontrolling shareholder to put to the Company, this noncontrolling interestin the acquired company in annual increments for the four years following acquisition at a price determined by theprofit generated by the acquiree. Of the $69.5 million of total additions to goodwill during the year endedDecember 31, 2014, we anticipated being able to amortize and deduct $13.6 million for tax purposes.
During the year ended December 31, 2014, we also paid $39.3 million for deferred business acquisition and earn-out obligations for acquisitions completed in prior years.
Earn-Out Payments
As of December 31, 2015, we had the potential to make a maximum of $230.4 million (undiscounted) in earn-outpayments on 28 completed acquisitions, subject to the achievement of certain performance criteria. We haveaccrued $127.3 million, representing the fair value of these obligations as of December 31, 2015, which is includedin Other current and Other long-term liabilities within our Consolidated Balance Sheet. Assuming theachievement of the applicable performance criteria, we anticipate these earn-out payments will be made over thenext seven years. Adjustments to earn-out liabilities in periods subsequent to the completion of acquisitions are
123
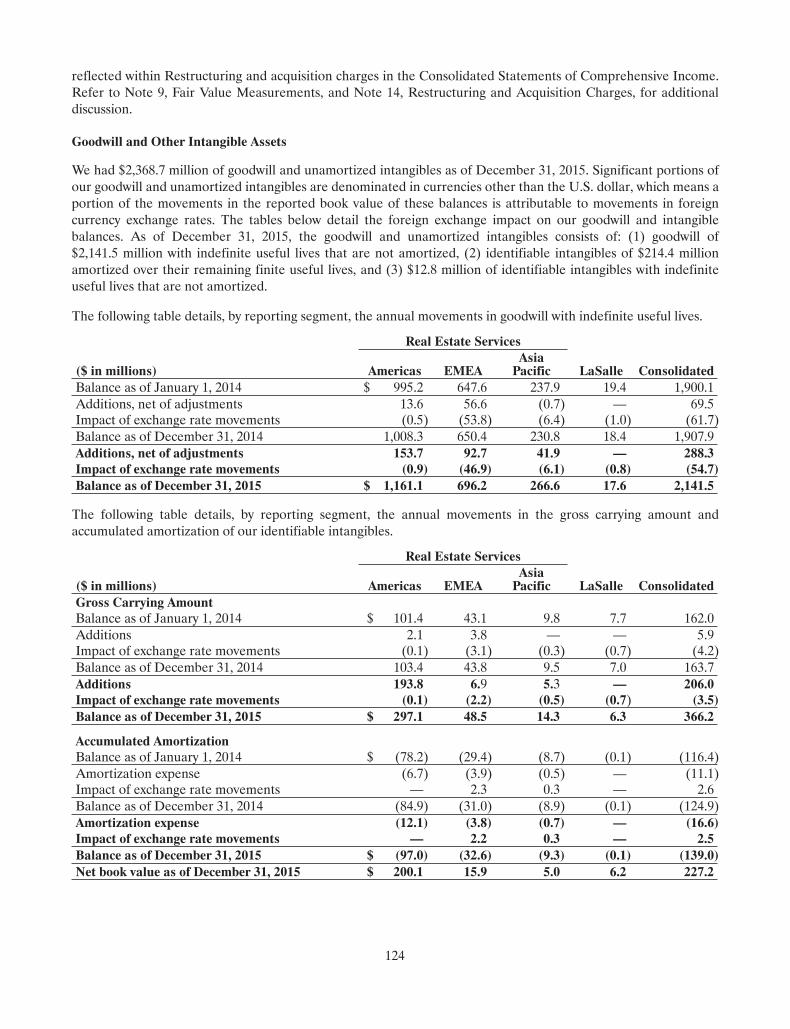
reflected within Restructuring and acquisition charges in the Consolidated Statements of Comprehensive Income.Refer to Note 9, Fair Value Measurements, and Note 14, Restructuring and Acquisition Charges, for additionaldiscussion.
Goodwill and Other Intangible Assets
We had $2,368.7 million of goodwill and unamortized intangibles as of December 31, 2015. Significant portions ofour goodwill and unamortized intangibles are denominated in currencies other than the U.S. dollar, which means aportion of the movements in the reported book value of these balances is attributable to movements in foreigncurrency exchange rates. The tables below detail the foreign exchange impact on our goodwill and intangiblebalances. As of December 31, 2015, the goodwill and unamortized intangibles consists of: (1) goodwill of$2,141.5 million with indefinite useful lives that are not amortized, (2) identifiable intangibles of $214.4 millionamortized over their remaining finite useful lives, and (3) $12.8 million of identifiable intangibles with indefiniteuseful lives that are not amortized.
The following table details, by reporting segment, the annual movements in goodwill with indefinite useful lives.
($ in millions)
Real Estate Services
LaSalle ConsolidatedAmericas EMEAAsiaPacific
Balance as of January 1, 2014 $ 995.2 647.6 237.9 19.4 1,900.1Additions, net of adjustments 13.6 56.6 (0.7) — 69.5Impact of exchange rate movements (0.5) (53.8) (6.4) (1.0) (61.7)Balance as of December 31, 2014 1,008.3 650.4 230.8 18.4 1,907.9Additions, net of adjustments 153.7 92.7 41.9 — 288.3Impact of exchange rate movements (0.9) (46.9) (6.1) (0.8) (54.7)Balance as of December 31, 2015 $ 1,161.1 696.2 266.6 17.6 2,141.5
The following table details, by reporting segment, the annual movements in the gross carrying amount andaccumulated amortization of our identifiable intangibles.
($ in millions)
Real Estate Services
LaSalle ConsolidatedAmericas EMEAAsiaPacific
Gross Carrying AmountBalance as of January 1, 2014 $ 101.4 43.1 9.8 7.7 162.0Additions 2.1 3.8 — — 5.9Impact of exchange rate movements (0.1) (3.1) (0.3) (0.7) (4.2)Balance as of December 31, 2014 103.4 43.8 9.5 7.0 163.7Additions 193.8 6.9 5.3 — 206.0Impact of exchange rate movements (0.1) (2.2) (0.5) (0.7) (3.5)Balance as of December 31, 2015 $ 297.1 48.5 14.3 6.3 366.2
Accumulated AmortizationBalance as of January 1, 2014 $ (78.2) (29.4) (8.7) (0.1) (116.4)Amortization expense (6.7) (3.9) (0.5) — (11.1)Impact of exchange rate movements — 2.3 0.3 — 2.6Balance as of December 31, 2014 (84.9) (31.0) (8.9) (0.1) (124.9)Amortization expense (12.1) (3.8) (0.7) — (16.6)Impact of exchange rate movements — 2.2 0.3 — 2.5Balance as of December 31, 2015 $ (97.0) (32.6) (9.3) (0.1) (139.0)Net book value as of December 31, 2015 $ 200.1 15.9 5.0 6.2 227.2
124
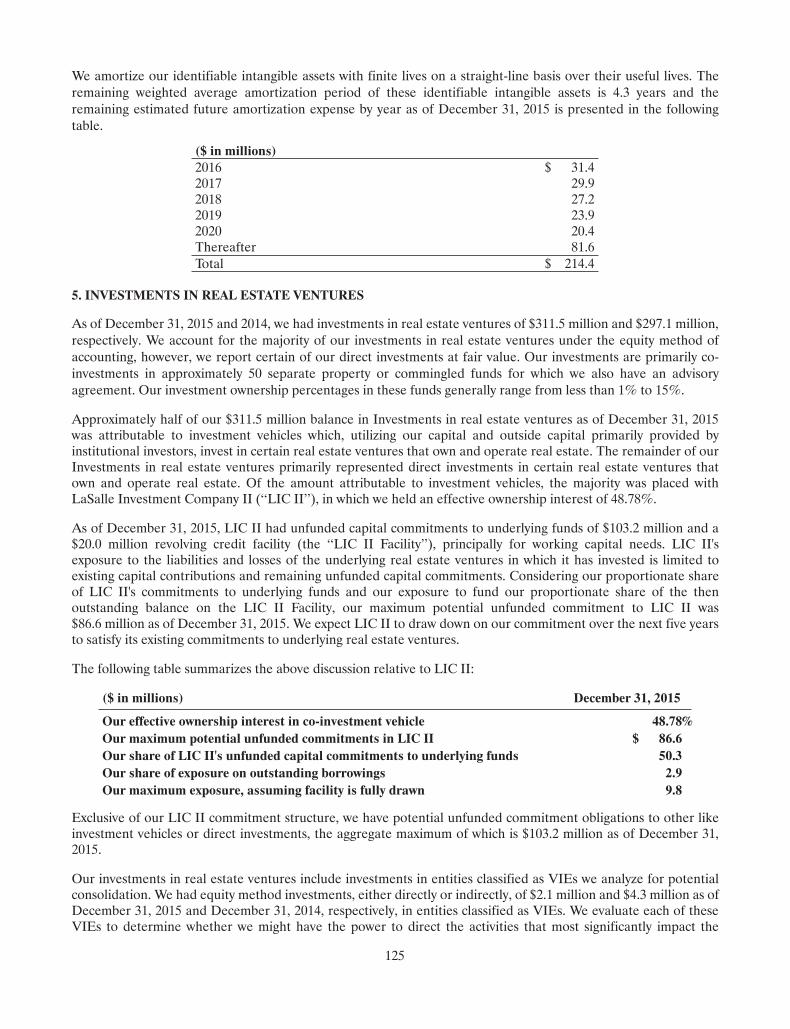
We amortize our identifiable intangible assets with finite lives on a straight-line basis over their useful lives. Theremaining weighted average amortization period of these identifiable intangible assets is 4.3 years and theremaining estimated future amortization expense by year as of December 31, 2015 is presented in the followingtable.
($ in millions)2016 $ 31.42017 29.92018 27.22019 23.92020 20.4Thereafter 81.6Total $ 214.4
5. INVESTMENTS IN REAL ESTATE VENTURES
As of December 31, 2015 and 2014, we had investments in real estate ventures of $311.5 million and $297.1 million,respectively. We account for the majority of our investments in real estate ventures under the equity method ofaccounting, however, we report certain of our direct investments at fair value. Our investments are primarily co-investments in approximately 50 separate property or commingled funds for which we also have an advisoryagreement. Our investment ownership percentages in these funds generally range from less than 1% to 15%.
Approximately half of our $311.5 million balance in Investments in real estate ventures as of December 31, 2015was attributable to investment vehicles which, utilizing our capital and outside capital primarily provided byinstitutional investors, invest in certain real estate ventures that own and operate real estate. The remainder of ourInvestments in real estate ventures primarily represented direct investments in certain real estate ventures thatown and operate real estate. Of the amount attributable to investment vehicles, the majority was placed withLaSalle Investment Company II (‘‘LIC II’’), in which we held an effective ownership interest of 48.78%.
As of December 31, 2015, LIC II had unfunded capital commitments to underlying funds of $103.2 million and a$20.0 million revolving credit facility (the ‘‘LIC II Facility’’), principally for working capital needs. LIC II'sexposure to the liabilities and losses of the underlying real estate ventures in which it has invested is limited toexisting capital contributions and remaining unfunded capital commitments. Considering our proportionate shareof LIC II's commitments to underlying funds and our exposure to fund our proportionate share of the thenoutstanding balance on the LIC II Facility, our maximum potential unfunded commitment to LIC II was$86.6 million as of December 31, 2015. We expect LIC II to draw down on our commitment over the next five yearsto satisfy its existing commitments to underlying real estate ventures.
The following table summarizes the above discussion relative to LIC II:
($ in millions) December 31, 2015
Our effective ownership interest in co-investment vehicle 48.78%Our maximum potential unfunded commitments in LIC II $ 86.6Our share of LIC II's unfunded capital commitments to underlying funds 50.3Our share of exposure on outstanding borrowings 2.9Our maximum exposure, assuming facility is fully drawn 9.8
Exclusive of our LIC II commitment structure, we have potential unfunded commitment obligations to other likeinvestment vehicles or direct investments, the aggregate maximum of which is $103.2 million as of December 31,2015.
Our investments in real estate ventures include investments in entities classified as VIEs we analyze for potentialconsolidation. We had equity method investments, either directly or indirectly, of $2.1 million and $4.3 million as ofDecember 31, 2015 and December 31, 2014, respectively, in entities classified as VIEs. We evaluate each of theseVIEs to determine whether we might have the power to direct the activities that most significantly impact the
125
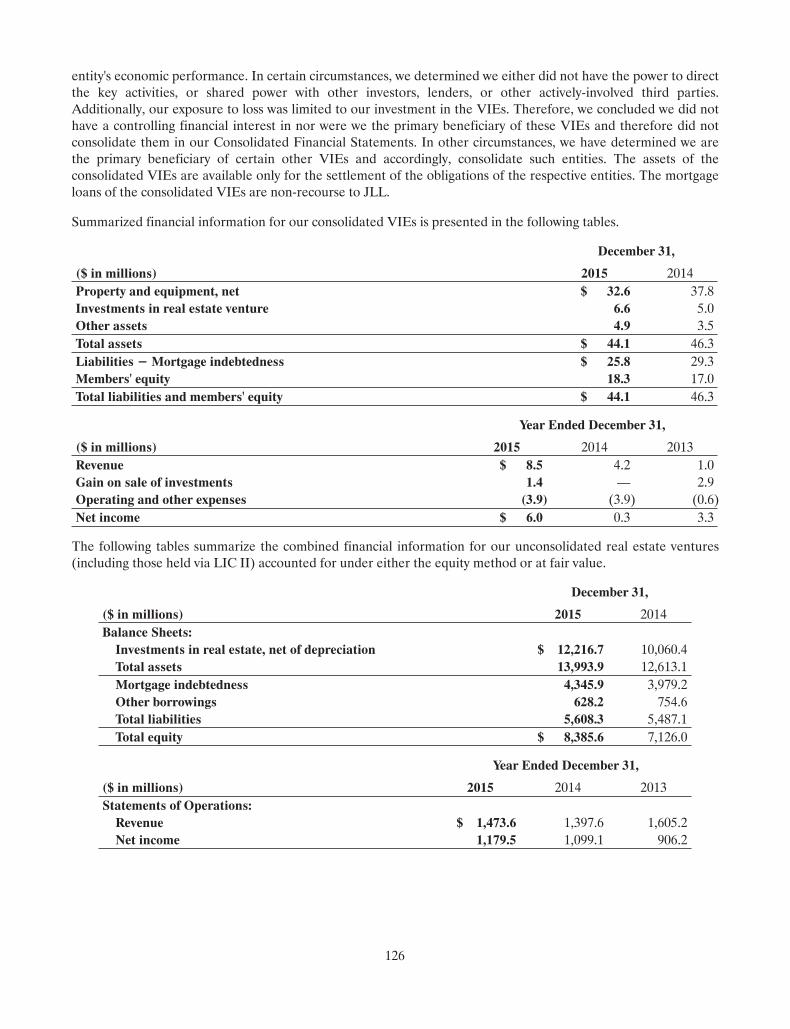
entity's economic performance. In certain circumstances, we determined we either did not have the power to directthe key activities, or shared power with other investors, lenders, or other actively-involved third parties.Additionally, our exposure to loss was limited to our investment in the VIEs. Therefore, we concluded we did nothave a controlling financial interest in nor were we the primary beneficiary of these VIEs and therefore did notconsolidate them in our Consolidated Financial Statements. In other circumstances, we have determined we arethe primary beneficiary of certain other VIEs and accordingly, consolidate such entities. The assets of theconsolidated VIEs are available only for the settlement of the obligations of the respective entities. The mortgageloans of the consolidated VIEs are non-recourse to JLL.
Summarized financial information for our consolidated VIEs is presented in the following tables.
December 31,
($ in millions) 2015 2014Property and equipment, net $ 32.6 37.8Investments in real estate venture 6.6 5.0Other assets 4.9 3.5Total assets $ 44.1 46.3Liabilities−Mortgage indebtedness $ 25.8 29.3Members' equity 18.3 17.0Total liabilities and members' equity $ 44.1 46.3
Year Ended December 31,
($ in millions) 2015 2014 2013Revenue $ 8.5 4.2 1.0Gain on sale of investments 1.4 — 2.9Operating and other expenses (3.9) (3.9) (0.6)Net income $ 6.0 0.3 3.3
The following tables summarize the combined financial information for our unconsolidated real estate ventures(including those held via LIC II) accounted for under either the equity method or at fair value.
December 31,
($ in millions) 2015 2014Balance Sheets:Investments in real estate, net of depreciation $ 12,216.7 10,060.4Total assets 13,993.9 12,613.1Mortgage indebtedness 4,345.9 3,979.2Other borrowings 628.2 754.6Total liabilities 5,608.3 5,487.1Total equity $ 8,385.6 7,126.0
Year Ended December 31,
($ in millions) 2015 2014 2013Statements of Operations:Revenue $ 1,473.6 1,397.6 1,605.2Net income 1,179.5 1,099.1 906.2
126
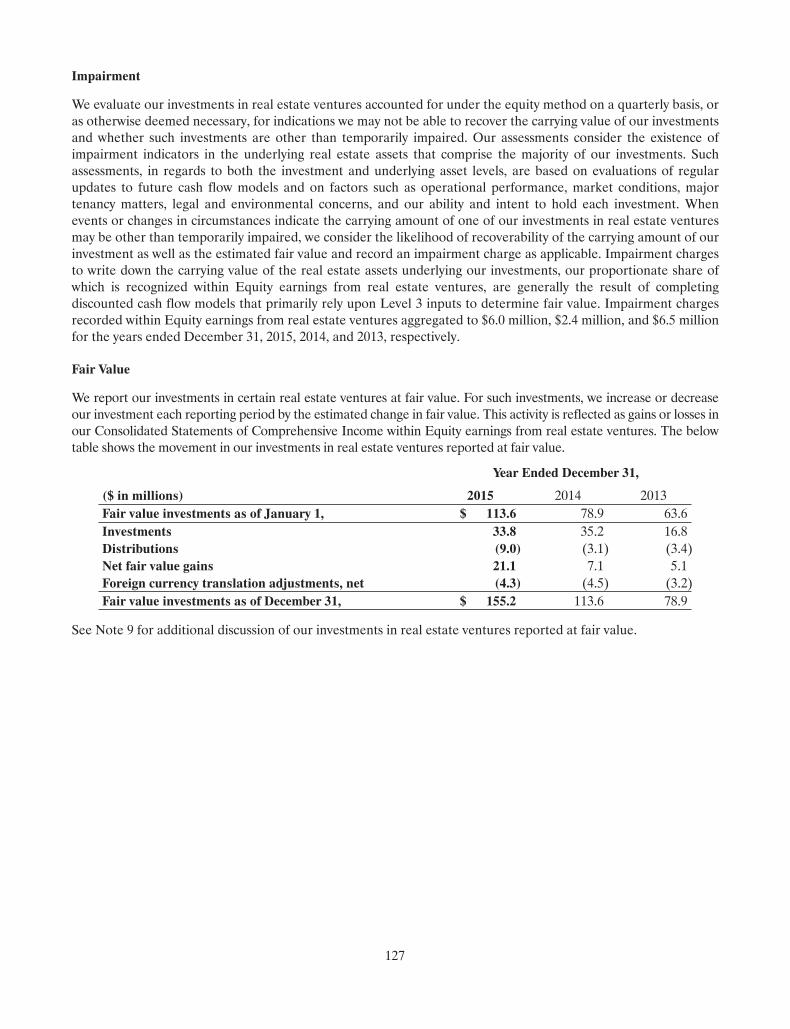
Impairment
We evaluate our investments in real estate ventures accounted for under the equity method on a quarterly basis, oras otherwise deemed necessary, for indications we may not be able to recover the carrying value of our investmentsand whether such investments are other than temporarily impaired. Our assessments consider the existence ofimpairment indicators in the underlying real estate assets that comprise the majority of our investments. Suchassessments, in regards to both the investment and underlying asset levels, are based on evaluations of regularupdates to future cash flow models and on factors such as operational performance, market conditions, majortenancy matters, legal and environmental concerns, and our ability and intent to hold each investment. Whenevents or changes in circumstances indicate the carrying amount of one of our investments in real estate venturesmay be other than temporarily impaired, we consider the likelihood of recoverability of the carrying amount of ourinvestment as well as the estimated fair value and record an impairment charge as applicable. Impairment chargesto write down the carrying value of the real estate assets underlying our investments, our proportionate share ofwhich is recognized within Equity earnings from real estate ventures, are generally the result of completingdiscounted cash flow models that primarily rely upon Level 3 inputs to determine fair value. Impairment chargesrecorded within Equity earnings from real estate ventures aggregated to $6.0 million, $2.4 million, and $6.5 millionfor the years ended December 31, 2015, 2014, and 2013, respectively.
Fair Value
We report our investments in certain real estate ventures at fair value. For such investments, we increase or decreaseour investment each reporting period by the estimated change in fair value. This activity is reflected as gains or losses inour Consolidated Statements of Comprehensive Income within Equity earnings from real estate ventures. The belowtable shows the movement in our investments in real estate ventures reported at fair value.
Year Ended December 31,
($ in millions) 2015 2014 2013Fair value investments as of January 1, $ 113.6 78.9 63.6Investments 33.8 35.2 16.8Distributions (9.0) (3.1) (3.4)Net fair value gains 21.1 7.1 5.1Foreign currency translation adjustments, net (4.3) (4.5) (3.2)Fair value investments as of December 31, $ 155.2 113.6 78.9
See Note 9 for additional discussion of our investments in real estate ventures reported at fair value.
127
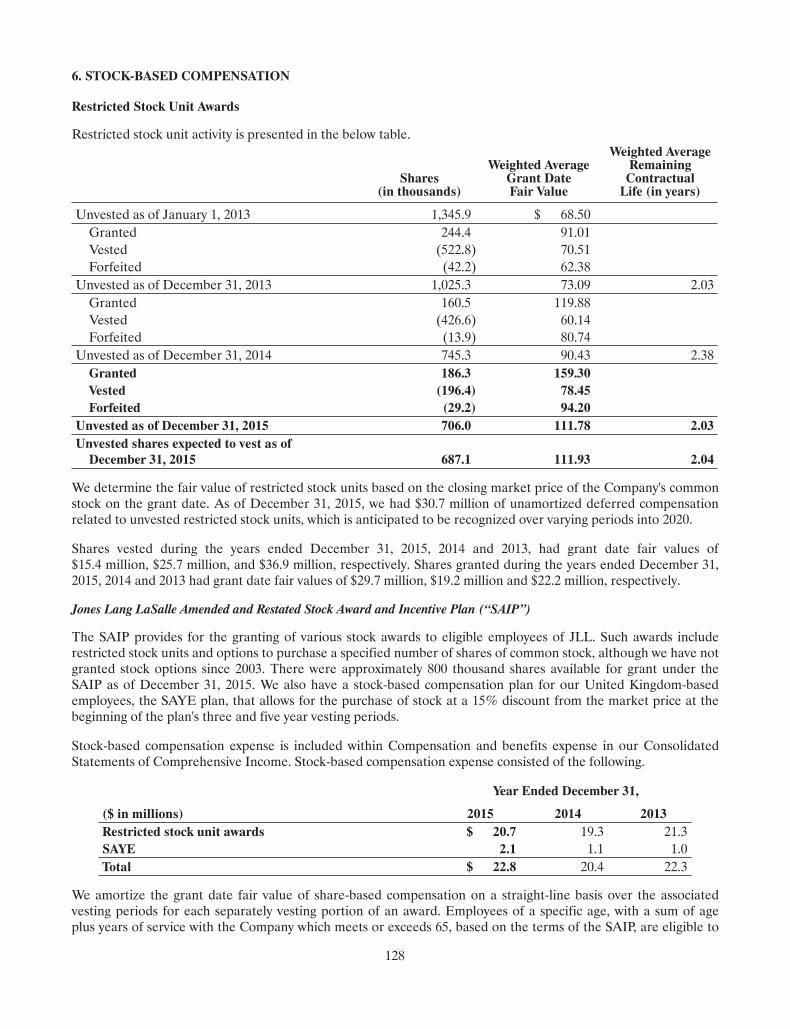
6. STOCK-BASED COMPENSATION
Restricted Stock Unit Awards
Restricted stock unit activity is presented in the below table.
Shares(in thousands)
Weighted AverageGrant DateFair Value
Weighted AverageRemainingContractualLife (in years)
Unvested as of January 1, 2013 1,345.9 $ 68.50Granted 244.4 91.01Vested (522.8) 70.51Forfeited (42.2) 62.38
Unvested as of December 31, 2013 1,025.3 73.09 2.03Granted 160.5 119.88Vested (426.6) 60.14Forfeited (13.9) 80.74
Unvested as of December 31, 2014 745.3 90.43 2.38Granted 186.3 159.30Vested (196.4) 78.45Forfeited (29.2) 94.20
Unvested as of December 31, 2015 706.0 111.78 2.03Unvested shares expected to vest as ofDecember 31, 2015 687.1 111.93 2.04
We determine the fair value of restricted stock units based on the closing market price of the Company's commonstock on the grant date. As of December 31, 2015, we had $30.7 million of unamortized deferred compensationrelated to unvested restricted stock units, which is anticipated to be recognized over varying periods into 2020.
Shares vested during the years ended December 31, 2015, 2014 and 2013, had grant date fair values of$15.4 million, $25.7 million, and $36.9 million, respectively. Shares granted during the years ended December 31,2015, 2014 and 2013 had grant date fair values of $29.7 million, $19.2 million and $22.2 million, respectively.
Jones Lang LaSalle Amended and Restated Stock Award and Incentive Plan (‘‘SAIP’’)
The SAIP provides for the granting of various stock awards to eligible employees of JLL. Such awards includerestricted stock units and options to purchase a specified number of shares of common stock, although we have notgranted stock options since 2003. There were approximately 800 thousand shares available for grant under theSAIP as of December 31, 2015. We also have a stock-based compensation plan for our United Kingdom-basedemployees, the SAYE plan, that allows for the purchase of stock at a 15% discount from the market price at thebeginning of the plan's three and five year vesting periods.
Stock-based compensation expense is included within Compensation and benefits expense in our ConsolidatedStatements of Comprehensive Income. Stock-based compensation expense consisted of the following.
Year Ended December 31,
($ in millions) 2015 2014 2013Restricted stock unit awards $ 20.7 19.3 21.3SAYE 2.1 1.1 1.0Total $ 22.8 20.4 22.3
We amortize the grant date fair value of share-based compensation on a straight-line basis over the associatedvesting periods for each separately vesting portion of an award. Employees of a specific age, with a sum of ageplus years of service with the Company which meets or exceeds 65, based on the terms of the SAIP, are eligible to
128
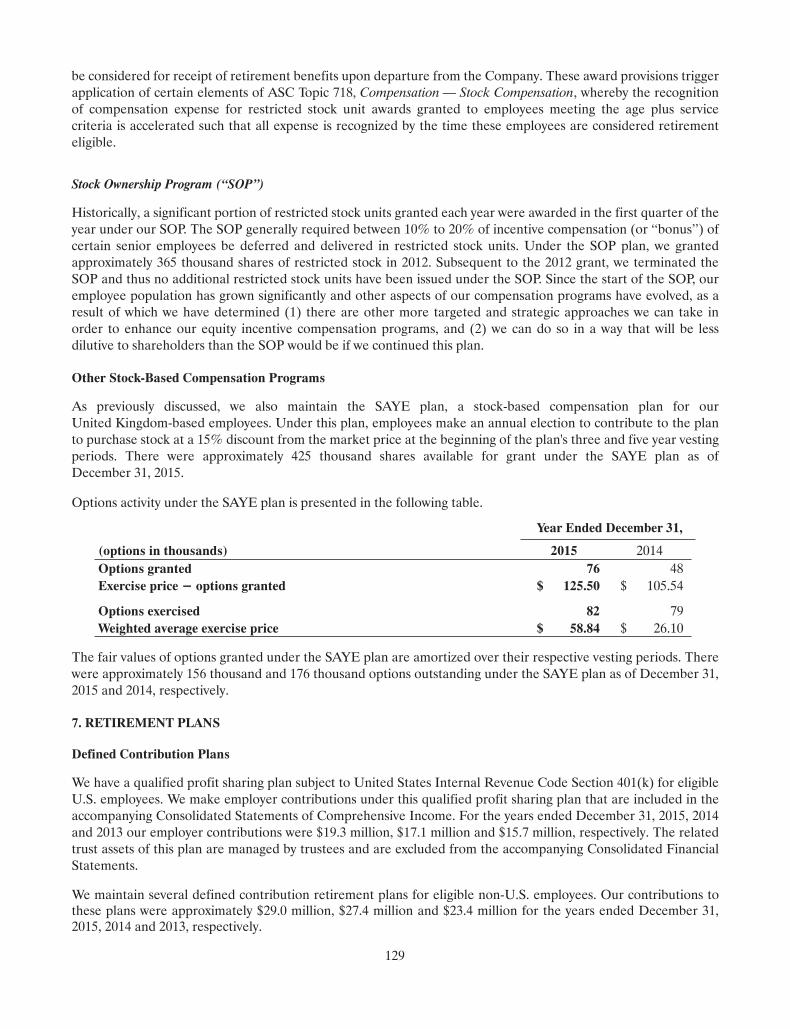
be considered for receipt of retirement benefits upon departure from the Company. These award provisions triggerapplication of certain elements of ASC Topic 718, Compensation — Stock Compensation, whereby the recognitionof compensation expense for restricted stock unit awards granted to employees meeting the age plus servicecriteria is accelerated such that all expense is recognized by the time these employees are considered retirementeligible.
Stock Ownership Program (‘‘SOP’’)
Historically, a significant portion of restricted stock units granted each year were awarded in the first quarter of theyear under our SOP. The SOP generally required between 10% to 20% of incentive compensation (or ‘‘bonus’’) ofcertain senior employees be deferred and delivered in restricted stock units. Under the SOP plan, we grantedapproximately 365 thousand shares of restricted stock in 2012. Subsequent to the 2012 grant, we terminated theSOP and thus no additional restricted stock units have been issued under the SOP. Since the start of the SOP, ouremployee population has grown significantly and other aspects of our compensation programs have evolved, as aresult of which we have determined (1) there are other more targeted and strategic approaches we can take inorder to enhance our equity incentive compensation programs, and (2) we can do so in a way that will be lessdilutive to shareholders than the SOP would be if we continued this plan.
Other Stock-Based Compensation Programs
As previously discussed, we also maintain the SAYE plan, a stock-based compensation plan for ourUnited Kingdom-based employees. Under this plan, employees make an annual election to contribute to the planto purchase stock at a 15% discount from the market price at the beginning of the plan's three and five year vestingperiods. There were approximately 425 thousand shares available for grant under the SAYE plan as ofDecember 31, 2015.
Options activity under the SAYE plan is presented in the following table.
Year Ended December 31,
(options in thousands) 2015 2014Options granted 76 48Exercise price − options granted $ 125.50 $ 105.54
Options exercised 82 79Weighted average exercise price $ 58.84 $ 26.10
The fair values of options granted under the SAYE plan are amortized over their respective vesting periods. Therewere approximately 156 thousand and 176 thousand options outstanding under the SAYE plan as of December 31,2015 and 2014, respectively.
7. RETIREMENT PLANS
Defined Contribution Plans
We have a qualified profit sharing plan subject to United States Internal Revenue Code Section 401(k) for eligibleU.S. employees. We make employer contributions under this qualified profit sharing plan that are included in theaccompanying Consolidated Statements of Comprehensive Income. For the years ended December 31, 2015, 2014and 2013 our employer contributions were $19.3 million, $17.1 million and $15.7 million, respectively. The relatedtrust assets of this plan are managed by trustees and are excluded from the accompanying Consolidated FinancialStatements.
We maintain several defined contribution retirement plans for eligible non-U.S. employees. Our contributions tothese plans were approximately $29.0 million, $27.4 million and $23.4 million for the years ended December 31,2015, 2014 and 2013, respectively.
129
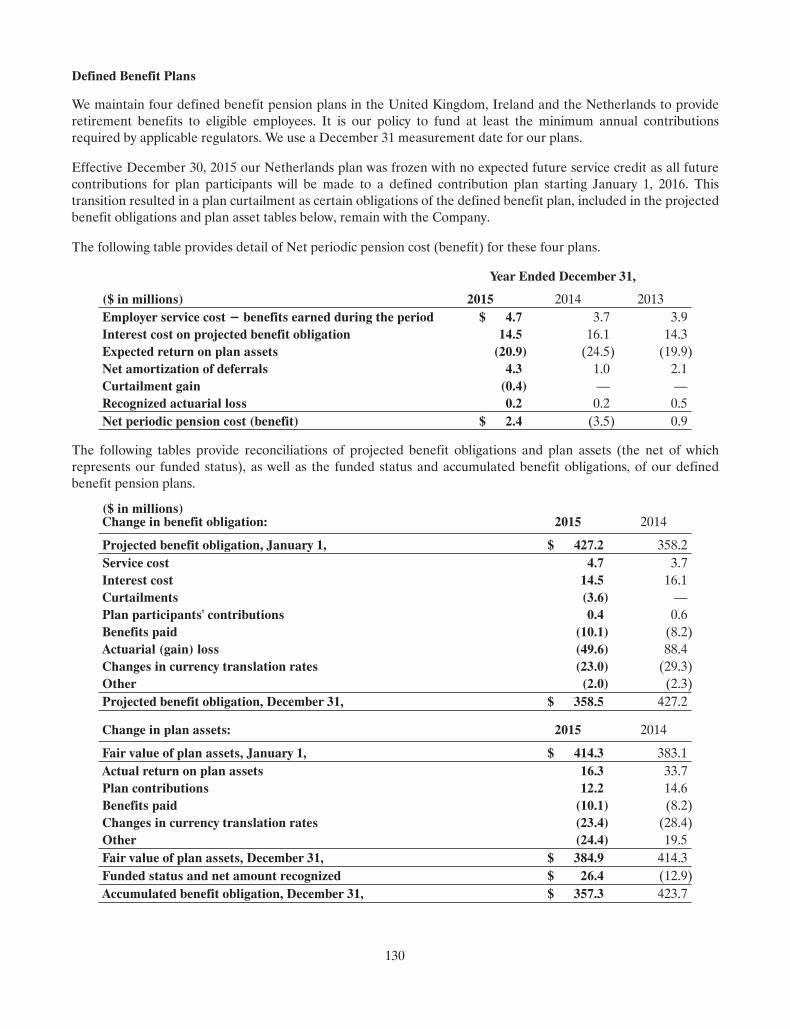
Defined Benefit Plans
We maintain four defined benefit pension plans in the United Kingdom, Ireland and the Netherlands to provideretirement benefits to eligible employees. It is our policy to fund at least the minimum annual contributionsrequired by applicable regulators. We use a December 31 measurement date for our plans.
Effective December 30, 2015 our Netherlands plan was frozen with no expected future service credit as all futurecontributions for plan participants will be made to a defined contribution plan starting January 1, 2016. Thistransition resulted in a plan curtailment as certain obligations of the defined benefit plan, included in the projectedbenefit obligations and plan asset tables below, remain with the Company.
The following table provides detail of Net periodic pension cost (benefit) for these four plans.
Year Ended December 31,
($ in millions) 2015 2014 2013Employer service cost − benefits earned during the period $ 4.7 3.7 3.9Interest cost on projected benefit obligation 14.5 16.1 14.3Expected return on plan assets (20.9) (24.5) (19.9)Net amortization of deferrals 4.3 1.0 2.1Curtailment gain (0.4) — —Recognized actuarial loss 0.2 0.2 0.5Net periodic pension cost (benefit) $ 2.4 (3.5) 0.9
The following tables provide reconciliations of projected benefit obligations and plan assets (the net of whichrepresents our funded status), as well as the funded status and accumulated benefit obligations, of our definedbenefit pension plans.
($ in millions)Change in benefit obligation: 2015 2014
Projected benefit obligation, January 1, $ 427.2 358.2Service cost 4.7 3.7Interest cost 14.5 16.1Curtailments (3.6) —Plan participants' contributions 0.4 0.6Benefits paid (10.1) (8.2)Actuarial (gain) loss (49.6) 88.4Changes in currency translation rates (23.0) (29.3)Other (2.0) (2.3)Projected benefit obligation, December 31, $ 358.5 427.2
Change in plan assets: 2015 2014
Fair value of plan assets, January 1, $ 414.3 383.1Actual return on plan assets 16.3 33.7Plan contributions 12.2 14.6Benefits paid (10.1) (8.2)Changes in currency translation rates (23.4) (28.4)Other (24.4) 19.5Fair value of plan assets, December 31, $ 384.9 414.3Funded status and net amount recognized $ 26.4 (12.9)Accumulated benefit obligation, December 31, $ 357.3 423.7
130
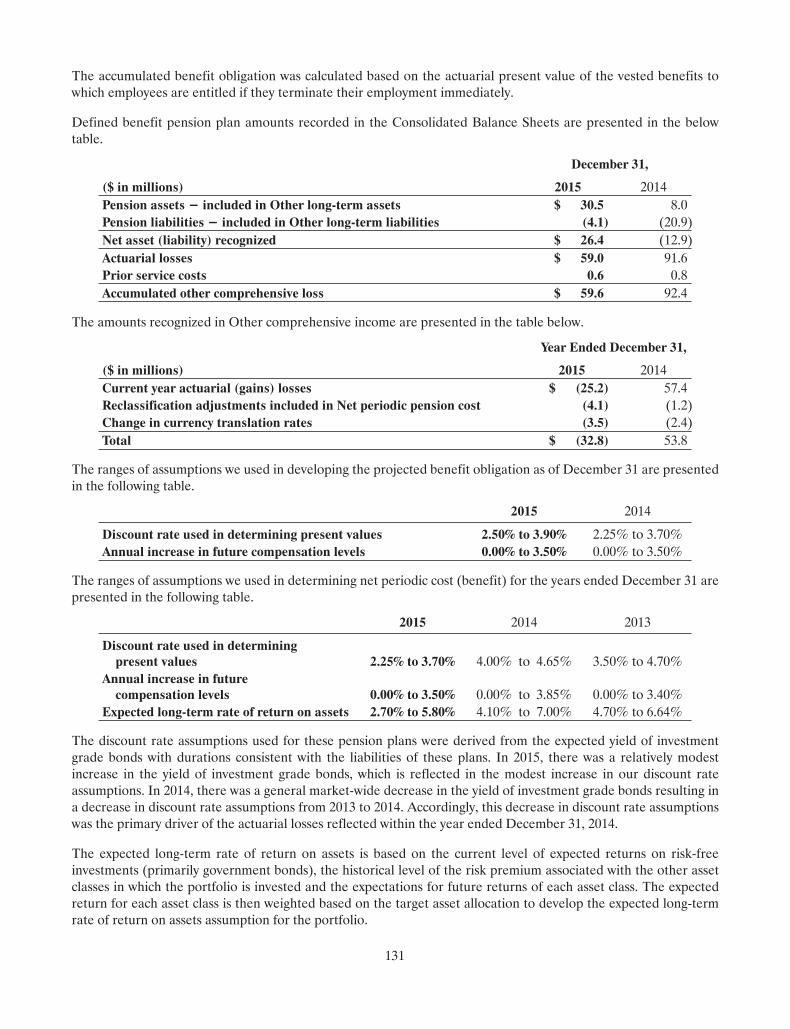
The accumulated benefit obligation was calculated based on the actuarial present value of the vested benefits towhich employees are entitled if they terminate their employment immediately.
Defined benefit pension plan amounts recorded in the Consolidated Balance Sheets are presented in the belowtable.
December 31,
($ in millions) 2015 2014Pension assets − included in Other long-term assets $ 30.5 8.0Pension liabilities − included in Other long-term liabilities (4.1) (20.9)Net asset (liability) recognized $ 26.4 (12.9)Actuarial losses $ 59.0 91.6Prior service costs 0.6 0.8Accumulated other comprehensive loss $ 59.6 92.4
The amounts recognized in Other comprehensive income are presented in the table below.
Year Ended December 31,
($ in millions) 2015 2014Current year actuarial (gains) losses $ (25.2) 57.4Reclassification adjustments included in Net periodic pension cost (4.1) (1.2)Change in currency translation rates (3.5) (2.4)Total $ (32.8) 53.8
The ranges of assumptions we used in developing the projected benefit obligation as of December 31 are presentedin the following table.
2015 2014
Discount rate used in determining present values 2.50% to 3.90% 2.25% to 3.70%Annual increase in future compensation levels 0.00% to 3.50% 0.00% to 3.50%
The ranges of assumptions we used in determining net periodic cost (benefit) for the years ended December 31 arepresented in the following table.
2015 2014 2013
Discount rate used in determiningpresent values 2.25% to 3.70% 4.00% to 4.65% 3.50% to 4.70%
Annual increase in futurecompensation levels 0.00% to 3.50% 0.00% to 3.85% 0.00% to 3.40%
Expected long-term rate of return on assets 2.70% to 5.80% 4.10% to 7.00% 4.70% to 6.64%
The discount rate assumptions used for these pension plans were derived from the expected yield of investmentgrade bonds with durations consistent with the liabilities of these plans. In 2015, there was a relatively modestincrease in the yield of investment grade bonds, which is reflected in the modest increase in our discount rateassumptions. In 2014, there was a general market-wide decrease in the yield of investment grade bonds resulting ina decrease in discount rate assumptions from 2013 to 2014. Accordingly, this decrease in discount rate assumptionswas the primary driver of the actuarial losses reflected within the year ended December 31, 2014.
The expected long-term rate of return on assets is based on the current level of expected returns on risk-freeinvestments (primarily government bonds), the historical level of the risk premium associated with the other assetclasses in which the portfolio is invested and the expectations for future returns of each asset class. The expectedreturn for each asset class is then weighted based on the target asset allocation to develop the expected long-termrate of return on assets assumption for the portfolio.
131
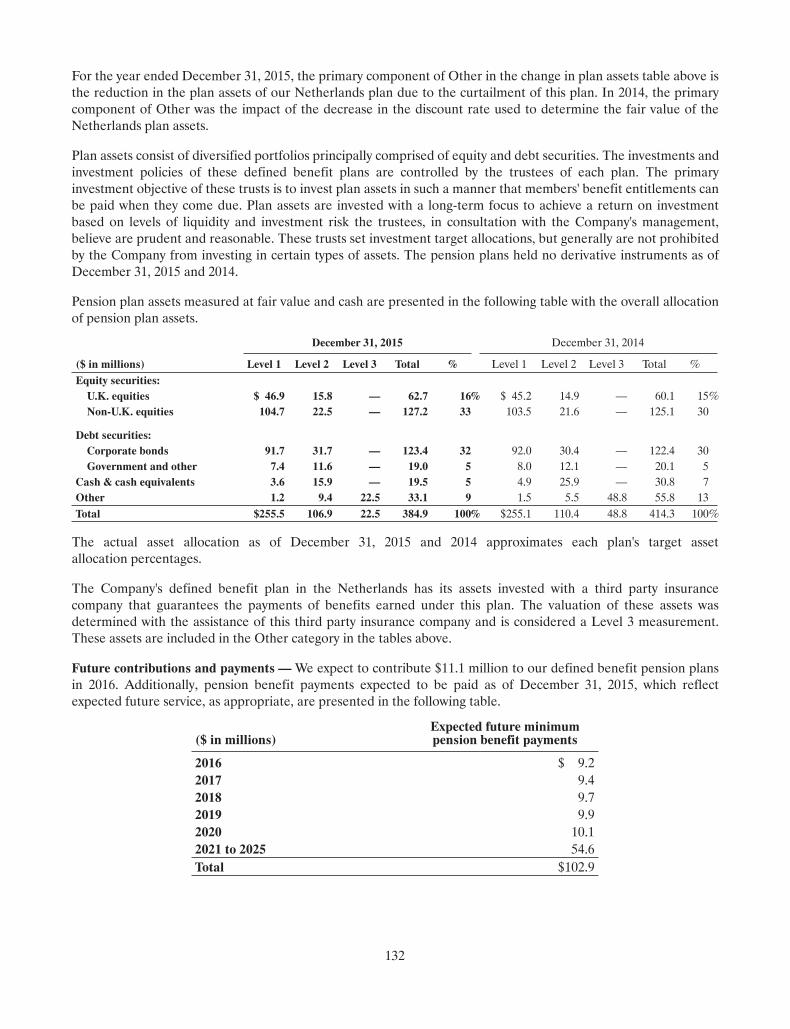
For the year ended December 31, 2015, the primary component of Other in the change in plan assets table above isthe reduction in the plan assets of our Netherlands plan due to the curtailment of this plan. In 2014, the primarycomponent of Other was the impact of the decrease in the discount rate used to determine the fair value of theNetherlands plan assets.
Plan assets consist of diversified portfolios principally comprised of equity and debt securities. The investments andinvestment policies of these defined benefit plans are controlled by the trustees of each plan. The primaryinvestment objective of these trusts is to invest plan assets in such a manner that members' benefit entitlements canbe paid when they come due. Plan assets are invested with a long-term focus to achieve a return on investmentbased on levels of liquidity and investment risk the trustees, in consultation with the Company's management,believe are prudent and reasonable. These trusts set investment target allocations, but generally are not prohibitedby the Company from investing in certain types of assets. The pension plans held no derivative instruments as ofDecember 31, 2015 and 2014.
Pension plan assets measured at fair value and cash are presented in the following table with the overall allocationof pension plan assets.
($ in millions)
December 31, 2015 December 31, 2014
Level 1 Level 2 Level 3 Total % Level 1 Level 2 Level 3 Total %Equity securities:U.K. equities $ 46.9 15.8 — 62.7 16% $ 45.2 14.9 — 60.1 15%Non-U.K. equities 104.7 22.5 — 127.2 33 103.5 21.6 — 125.1 30
Debt securities:Corporate bonds 91.7 31.7 — 123.4 32 92.0 30.4 — 122.4 30Government and other 7.4 11.6 — 19.0 5 8.0 12.1 — 20.1 5
Cash & cash equivalents 3.6 15.9 — 19.5 5 4.9 25.9 — 30.8 7Other 1.2 9.4 22.5 33.1 9 1.5 5.5 48.8 55.8 13Total $255.5 106.9 22.5 384.9 100% $255.1 110.4 48.8 414.3 100%
The actual asset allocation as of December 31, 2015 and 2014 approximates each plan's target assetallocation percentages.
The Company's defined benefit plan in the Netherlands has its assets invested with a third party insurancecompany that guarantees the payments of benefits earned under this plan. The valuation of these assets wasdetermined with the assistance of this third party insurance company and is considered a Level 3 measurement.These assets are included in the Other category in the tables above.
Future contributions and payments —We expect to contribute $11.1 million to our defined benefit pension plansin 2016. Additionally, pension benefit payments expected to be paid as of December 31, 2015, which reflectexpected future service, as appropriate, are presented in the following table.
($ in millions)Expected future minimumpension benefit payments
2016 $ 9.22017 9.42018 9.72019 9.92020 10.12021 to 2025 54.6Total $102.9
132
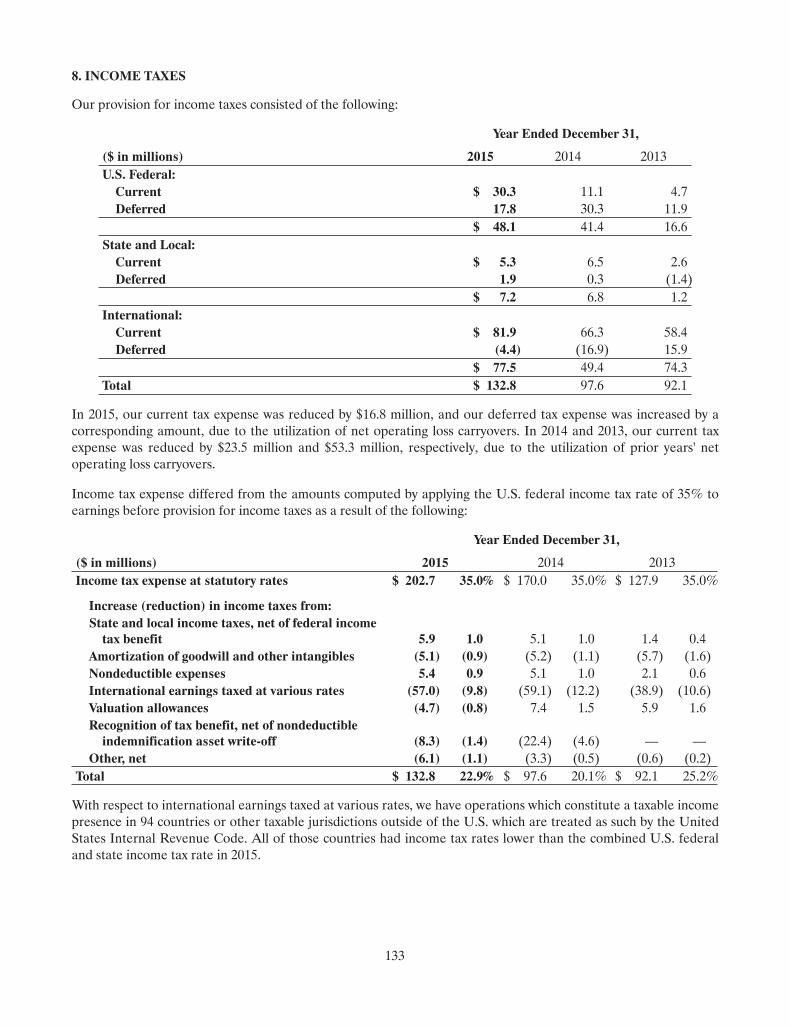
8. INCOME TAXES
Our provision for income taxes consisted of the following:
Year Ended December 31,
($ in millions) 2015 2014 2013U.S. Federal:Current $ 30.3 11.1 4.7Deferred 17.8 30.3 11.9
$ 48.1 41.4 16.6State and Local:Current $ 5.3 6.5 2.6Deferred 1.9 0.3 (1.4)
$ 7.2 6.8 1.2International:Current $ 81.9 66.3 58.4Deferred (4.4) (16.9) 15.9
$ 77.5 49.4 74.3Total $ 132.8 97.6 92.1
In 2015, our current tax expense was reduced by $16.8 million, and our deferred tax expense was increased by acorresponding amount, due to the utilization of net operating loss carryovers. In 2014 and 2013, our current taxexpense was reduced by $23.5 million and $53.3 million, respectively, due to the utilization of prior years' netoperating loss carryovers.
Income tax expense differed from the amounts computed by applying the U.S. federal income tax rate of 35% toearnings before provision for income taxes as a result of the following:
Year Ended December 31,
($ in millions) 2015 2014 2013Income tax expense at statutory rates $ 202.7 35.0% $ 170.0 35.0% $ 127.9 35.0%
Increase (reduction) in income taxes from:State and local income taxes, net of federal incometax benefit 5.9 1.0 5.1 1.0 1.4 0.4
Amortization of goodwill and other intangibles (5.1) (0.9) (5.2) (1.1) (5.7) (1.6)Nondeductible expenses 5.4 0.9 5.1 1.0 2.1 0.6International earnings taxed at various rates (57.0) (9.8) (59.1) (12.2) (38.9) (10.6)Valuation allowances (4.7) (0.8) 7.4 1.5 5.9 1.6Recognition of tax benefit, net of nondeductibleindemnification asset write-off (8.3) (1.4) (22.4) (4.6) — —
Other, net (6.1) (1.1) (3.3) (0.5) (0.6) (0.2)Total $ 132.8 22.9% $ 97.6 20.1% $ 92.1 25.2%
With respect to international earnings taxed at various rates, we have operations which constitute a taxable incomepresence in 94 countries or other taxable jurisdictions outside of the U.S. which are treated as such by the UnitedStates Internal Revenue Code. All of those countries had income tax rates lower than the combined U.S. federaland state income tax rate in 2015.
133
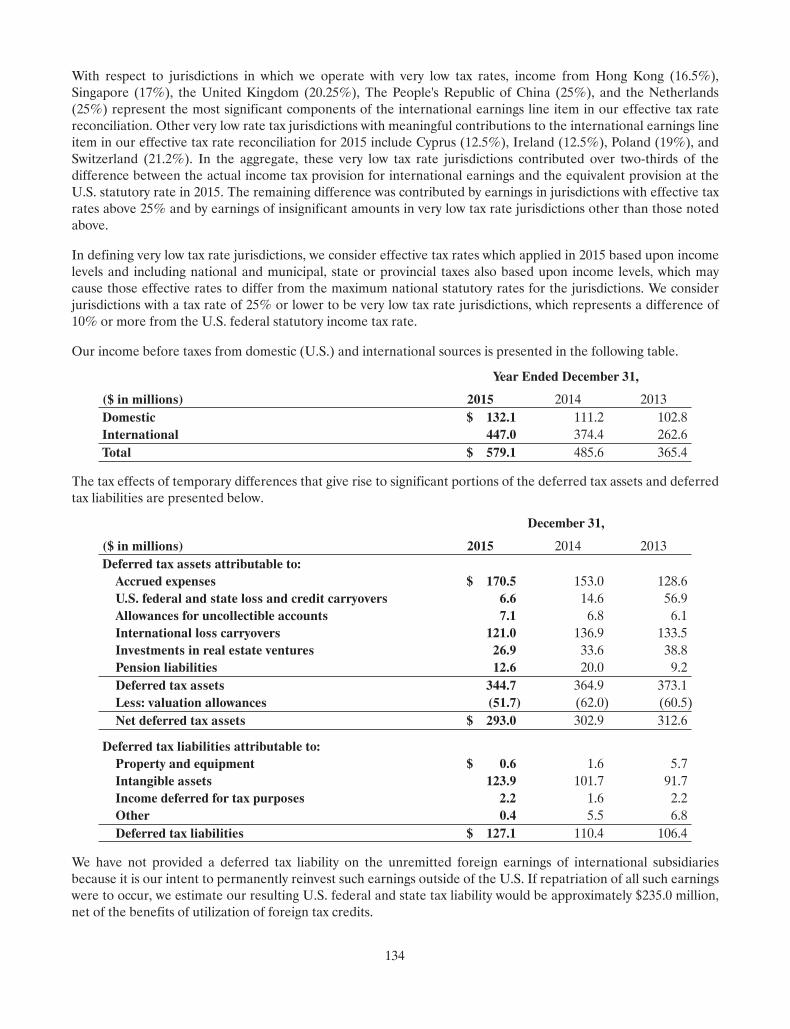
With respect to jurisdictions in which we operate with very low tax rates, income from Hong Kong (16.5%),Singapore (17%), the United Kingdom (20.25%), The People's Republic of China (25%), and the Netherlands(25%) represent the most significant components of the international earnings line item in our effective tax ratereconciliation. Other very low rate tax jurisdictions with meaningful contributions to the international earnings lineitem in our effective tax rate reconciliation for 2015 include Cyprus (12.5%), Ireland (12.5%), Poland (19%), andSwitzerland (21.2%). In the aggregate, these very low tax rate jurisdictions contributed over two-thirds of thedifference between the actual income tax provision for international earnings and the equivalent provision at theU.S. statutory rate in 2015. The remaining difference was contributed by earnings in jurisdictions with effective taxrates above 25% and by earnings of insignificant amounts in very low tax rate jurisdictions other than those notedabove.
In defining very low tax rate jurisdictions, we consider effective tax rates which applied in 2015 based upon incomelevels and including national and municipal, state or provincial taxes also based upon income levels, which maycause those effective rates to differ from the maximum national statutory rates for the jurisdictions. We considerjurisdictions with a tax rate of 25% or lower to be very low tax rate jurisdictions, which represents a difference of10% or more from the U.S. federal statutory income tax rate.
Our income before taxes from domestic (U.S.) and international sources is presented in the following table.
Year Ended December 31,
($ in millions) 2015 2014 2013Domestic $ 132.1 111.2 102.8International 447.0 374.4 262.6Total $ 579.1 485.6 365.4
The tax effects of temporary differences that give rise to significant portions of the deferred tax assets and deferredtax liabilities are presented below.
December 31,
($ in millions) 2015 2014 2013Deferred tax assets attributable to:Accrued expenses $ 170.5 153.0 128.6U.S. federal and state loss and credit carryovers 6.6 14.6 56.9Allowances for uncollectible accounts 7.1 6.8 6.1International loss carryovers 121.0 136.9 133.5Investments in real estate ventures 26.9 33.6 38.8Pension liabilities 12.6 20.0 9.2Deferred tax assets 344.7 364.9 373.1Less: valuation allowances (51.7) (62.0) (60.5)Net deferred tax assets $ 293.0 302.9 312.6
Deferred tax liabilities attributable to:Property and equipment $ 0.6 1.6 5.7Intangible assets 123.9 101.7 91.7Income deferred for tax purposes 2.2 1.6 2.2Other 0.4 5.5 6.8Deferred tax liabilities $ 127.1 110.4 106.4
We have not provided a deferred tax liability on the unremitted foreign earnings of international subsidiariesbecause it is our intent to permanently reinvest such earnings outside of the U.S. If repatriation of all such earningswere to occur, we estimate our resulting U.S. federal and state tax liability would be approximately $235.0 million,net of the benefits of utilization of foreign tax credits.
134
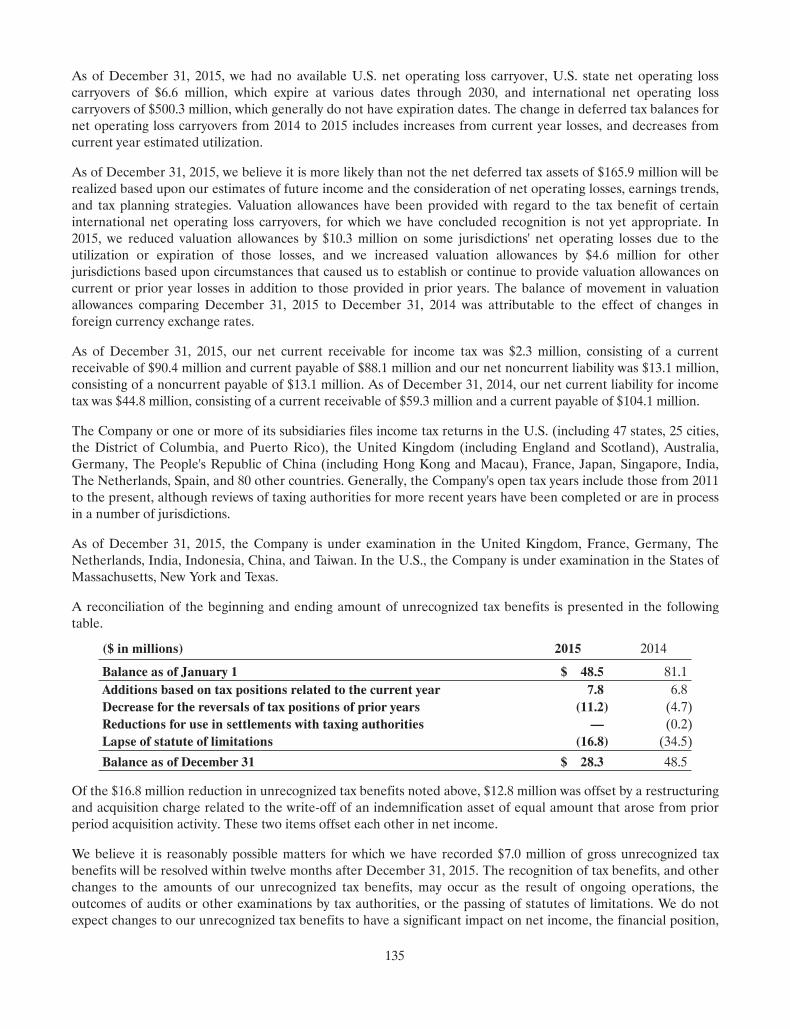
As of December 31, 2015, we had no available U.S. net operating loss carryover, U.S. state net operating losscarryovers of $6.6 million, which expire at various dates through 2030, and international net operating losscarryovers of $500.3 million, which generally do not have expiration dates. The change in deferred tax balances fornet operating loss carryovers from 2014 to 2015 includes increases from current year losses, and decreases fromcurrent year estimated utilization.
As of December 31, 2015, we believe it is more likely than not the net deferred tax assets of $165.9 million will berealized based upon our estimates of future income and the consideration of net operating losses, earnings trends,and tax planning strategies. Valuation allowances have been provided with regard to the tax benefit of certaininternational net operating loss carryovers, for which we have concluded recognition is not yet appropriate. In2015, we reduced valuation allowances by $10.3 million on some jurisdictions' net operating losses due to theutilization or expiration of those losses, and we increased valuation allowances by $4.6 million for otherjurisdictions based upon circumstances that caused us to establish or continue to provide valuation allowances oncurrent or prior year losses in addition to those provided in prior years. The balance of movement in valuationallowances comparing December 31, 2015 to December 31, 2014 was attributable to the effect of changes inforeign currency exchange rates.
As of December 31, 2015, our net current receivable for income tax was $2.3 million, consisting of a currentreceivable of $90.4 million and current payable of $88.1 million and our net noncurrent liability was $13.1 million,consisting of a noncurrent payable of $13.1 million. As of December 31, 2014, our net current liability for incometax was $44.8 million, consisting of a current receivable of $59.3 million and a current payable of $104.1 million.
The Company or one or more of its subsidiaries files income tax returns in the U.S. (including 47 states, 25 cities,the District of Columbia, and Puerto Rico), the United Kingdom (including England and Scotland), Australia,Germany, The People's Republic of China (including Hong Kong and Macau), France, Japan, Singapore, India,The Netherlands, Spain, and 80 other countries. Generally, the Company's open tax years include those from 2011to the present, although reviews of taxing authorities for more recent years have been completed or are in processin a number of jurisdictions.
As of December 31, 2015, the Company is under examination in the United Kingdom, France, Germany, TheNetherlands, India, Indonesia, China, and Taiwan. In the U.S., the Company is under examination in the States ofMassachusetts, New York and Texas.
A reconciliation of the beginning and ending amount of unrecognized tax benefits is presented in the followingtable.
($ in millions) 2015 2014
Balance as of January 1 $ 48.5 81.1Additions based on tax positions related to the current year 7.8 6.8Decrease for the reversals of tax positions of prior years (11.2) (4.7)Reductions for use in settlements with taxing authorities — (0.2)Lapse of statute of limitations (16.8) (34.5)
Balance as of December 31 $ 28.3 48.5
Of the $16.8 million reduction in unrecognized tax benefits noted above, $12.8 million was offset by a restructuringand acquisition charge related to the write-off of an indemnification asset of equal amount that arose from priorperiod acquisition activity. These two items offset each other in net income.
We believe it is reasonably possible matters for which we have recorded $7.0 million of gross unrecognized taxbenefits will be resolved within twelve months after December 31, 2015. The recognition of tax benefits, and otherchanges to the amounts of our unrecognized tax benefits, may occur as the result of ongoing operations, theoutcomes of audits or other examinations by tax authorities, or the passing of statutes of limitations. We do notexpect changes to our unrecognized tax benefits to have a significant impact on net income, the financial position,
135
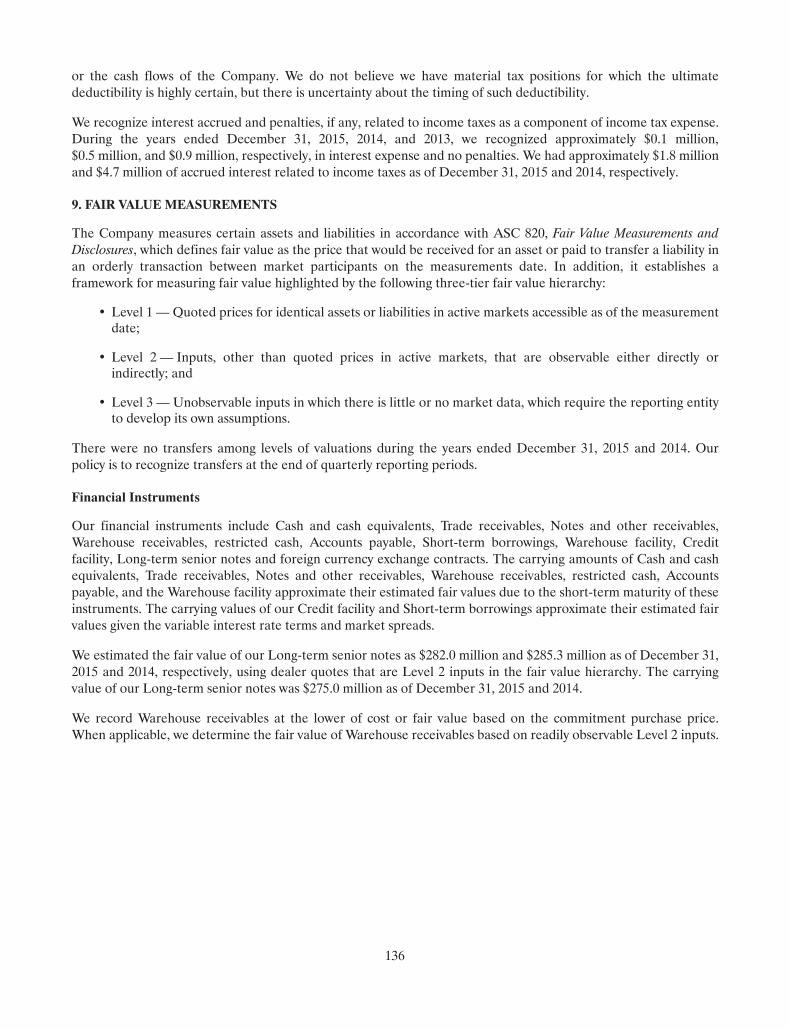
or the cash flows of the Company. We do not believe we have material tax positions for which the ultimatedeductibility is highly certain, but there is uncertainty about the timing of such deductibility.
We recognize interest accrued and penalties, if any, related to income taxes as a component of income tax expense.During the years ended December 31, 2015, 2014, and 2013, we recognized approximately $0.1 million,$0.5 million, and $0.9 million, respectively, in interest expense and no penalties. We had approximately $1.8 millionand $4.7 million of accrued interest related to income taxes as of December 31, 2015 and 2014, respectively.
9. FAIR VALUE MEASUREMENTS
The Company measures certain assets and liabilities in accordance with ASC 820, Fair Value Measurements andDisclosures, which defines fair value as the price that would be received for an asset or paid to transfer a liability inan orderly transaction between market participants on the measurements date. In addition, it establishes aframework for measuring fair value highlighted by the following three-tier fair value hierarchy:
• Level 1 — Quoted prices for identical assets or liabilities in active markets accessible as of the measurementdate;
• Level 2 — Inputs, other than quoted prices in active markets, that are observable either directly orindirectly; and
• Level 3 — Unobservable inputs in which there is little or no market data, which require the reporting entityto develop its own assumptions.
There were no transfers among levels of valuations during the years ended December 31, 2015 and 2014. Ourpolicy is to recognize transfers at the end of quarterly reporting periods.
Financial Instruments
Our financial instruments include Cash and cash equivalents, Trade receivables, Notes and other receivables,Warehouse receivables, restricted cash, Accounts payable, Short-term borrowings, Warehouse facility, Creditfacility, Long-term senior notes and foreign currency exchange contracts. The carrying amounts of Cash and cashequivalents, Trade receivables, Notes and other receivables, Warehouse receivables, restricted cash, Accountspayable, and the Warehouse facility approximate their estimated fair values due to the short-term maturity of theseinstruments. The carrying values of our Credit facility and Short-term borrowings approximate their estimated fairvalues given the variable interest rate terms and market spreads.
We estimated the fair value of our Long-term senior notes as $282.0 million and $285.3 million as of December 31,2015 and 2014, respectively, using dealer quotes that are Level 2 inputs in the fair value hierarchy. The carryingvalue of our Long-term senior notes was $275.0 million as of December 31, 2015 and 2014.
We record Warehouse receivables at the lower of cost or fair value based on the commitment purchase price.When applicable, we determine the fair value of Warehouse receivables based on readily observable Level 2 inputs.
136
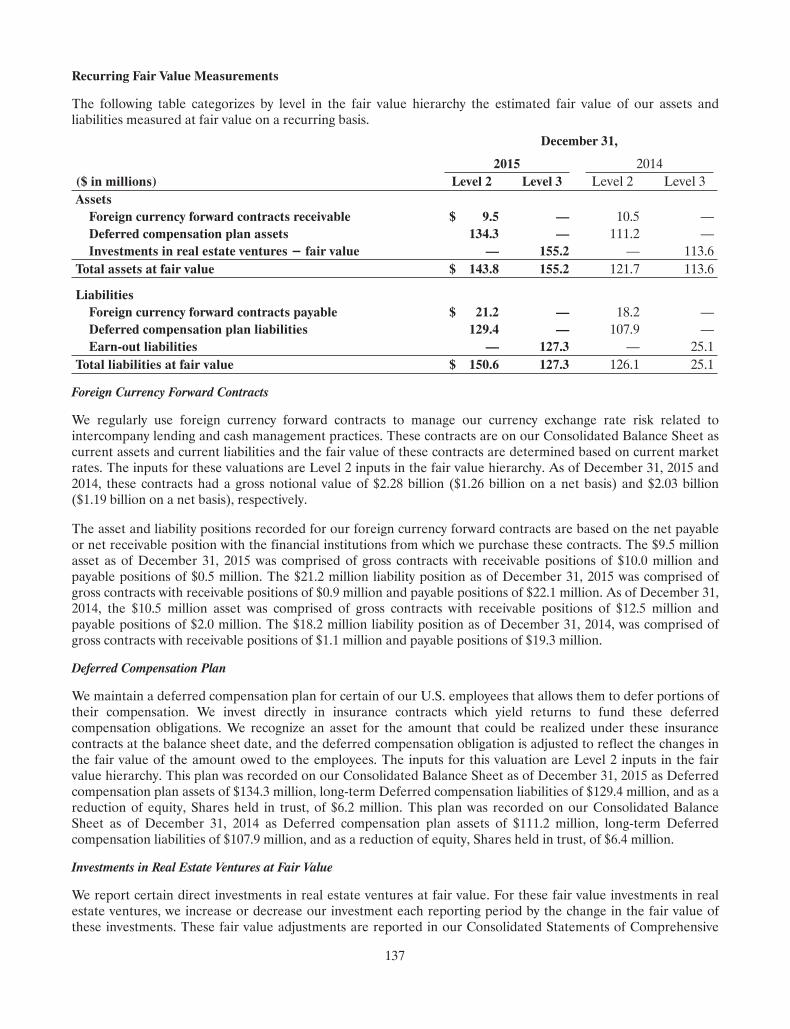
Recurring Fair Value Measurements
The following table categorizes by level in the fair value hierarchy the estimated fair value of our assets andliabilities measured at fair value on a recurring basis.
December 31,
2015 2014($ in millions) Level 2 Level 3 Level 2 Level 3AssetsForeign currency forward contracts receivable $ 9.5 — 10.5 —Deferred compensation plan assets 134.3 — 111.2 —Investments in real estate ventures − fair value — 155.2 — 113.6
Total assets at fair value $ 143.8 155.2 121.7 113.6
LiabilitiesForeign currency forward contracts payable $ 21.2 — 18.2 —Deferred compensation plan liabilities 129.4 — 107.9 —Earn-out liabilities — 127.3 — 25.1
Total liabilities at fair value $ 150.6 127.3 126.1 25.1
Foreign Currency Forward Contracts
We regularly use foreign currency forward contracts to manage our currency exchange rate risk related tointercompany lending and cash management practices. These contracts are on our Consolidated Balance Sheet ascurrent assets and current liabilities and the fair value of these contracts are determined based on current marketrates. The inputs for these valuations are Level 2 inputs in the fair value hierarchy. As of December 31, 2015 and2014, these contracts had a gross notional value of $2.28 billion ($1.26 billion on a net basis) and $2.03 billion($1.19 billion on a net basis), respectively.
The asset and liability positions recorded for our foreign currency forward contracts are based on the net payableor net receivable position with the financial institutions from which we purchase these contracts. The $9.5 millionasset as of December 31, 2015 was comprised of gross contracts with receivable positions of $10.0 million andpayable positions of $0.5 million. The $21.2 million liability position as of December 31, 2015 was comprised ofgross contracts with receivable positions of $0.9 million and payable positions of $22.1 million. As of December 31,2014, the $10.5 million asset was comprised of gross contracts with receivable positions of $12.5 million andpayable positions of $2.0 million. The $18.2 million liability position as of December 31, 2014, was comprised ofgross contracts with receivable positions of $1.1 million and payable positions of $19.3 million.
Deferred Compensation Plan
We maintain a deferred compensation plan for certain of our U.S. employees that allows them to defer portions oftheir compensation. We invest directly in insurance contracts which yield returns to fund these deferredcompensation obligations. We recognize an asset for the amount that could be realized under these insurancecontracts at the balance sheet date, and the deferred compensation obligation is adjusted to reflect the changes inthe fair value of the amount owed to the employees. The inputs for this valuation are Level 2 inputs in the fairvalue hierarchy. This plan was recorded on our Consolidated Balance Sheet as of December 31, 2015 as Deferredcompensation plan assets of $134.3 million, long-term Deferred compensation liabilities of $129.4 million, and as areduction of equity, Shares held in trust, of $6.2 million. This plan was recorded on our Consolidated BalanceSheet as of December 31, 2014 as Deferred compensation plan assets of $111.2 million, long-term Deferredcompensation liabilities of $107.9 million, and as a reduction of equity, Shares held in trust, of $6.4 million.
Investments in Real Estate Ventures at Fair Value
We report certain direct investments in real estate ventures at fair value. For these fair value investments in realestate ventures, we increase or decrease our investment each reporting period by the change in the fair value ofthese investments. These fair value adjustments are reported in our Consolidated Statements of Comprehensive
137
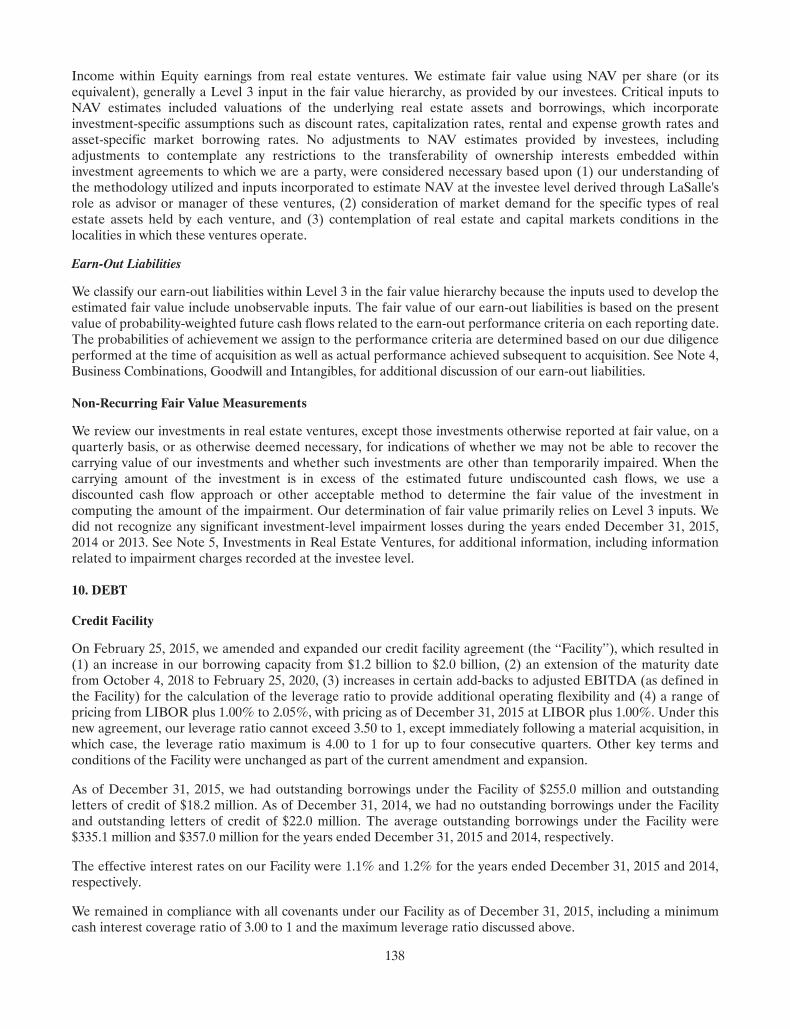
Income within Equity earnings from real estate ventures. We estimate fair value using NAV per share (or itsequivalent), generally a Level 3 input in the fair value hierarchy, as provided by our investees. Critical inputs toNAV estimates included valuations of the underlying real estate assets and borrowings, which incorporateinvestment-specific assumptions such as discount rates, capitalization rates, rental and expense growth rates andasset-specific market borrowing rates. No adjustments to NAV estimates provided by investees, includingadjustments to contemplate any restrictions to the transferability of ownership interests embedded withininvestment agreements to which we are a party, were considered necessary based upon (1) our understanding ofthe methodology utilized and inputs incorporated to estimate NAV at the investee level derived through LaSalle'srole as advisor or manager of these ventures, (2) consideration of market demand for the specific types of realestate assets held by each venture, and (3) contemplation of real estate and capital markets conditions in thelocalities in which these ventures operate.
Earn-Out Liabilities
We classify our earn-out liabilities within Level 3 in the fair value hierarchy because the inputs used to develop theestimated fair value include unobservable inputs. The fair value of our earn-out liabilities is based on the presentvalue of probability-weighted future cash flows related to the earn-out performance criteria on each reporting date.The probabilities of achievement we assign to the performance criteria are determined based on our due diligenceperformed at the time of acquisition as well as actual performance achieved subsequent to acquisition. See Note 4,Business Combinations, Goodwill and Intangibles, for additional discussion of our earn-out liabilities.
Non-Recurring Fair Value Measurements
We review our investments in real estate ventures, except those investments otherwise reported at fair value, on aquarterly basis, or as otherwise deemed necessary, for indications of whether we may not be able to recover thecarrying value of our investments and whether such investments are other than temporarily impaired. When thecarrying amount of the investment is in excess of the estimated future undiscounted cash flows, we use adiscounted cash flow approach or other acceptable method to determine the fair value of the investment incomputing the amount of the impairment. Our determination of fair value primarily relies on Level 3 inputs. Wedid not recognize any significant investment-level impairment losses during the years ended December 31, 2015,2014 or 2013. See Note 5, Investments in Real Estate Ventures, for additional information, including informationrelated to impairment charges recorded at the investee level.
10. DEBT
Credit Facility
On February 25, 2015, we amended and expanded our credit facility agreement (the ‘‘Facility’’), which resulted in(1) an increase in our borrowing capacity from $1.2 billion to $2.0 billion, (2) an extension of the maturity datefrom October 4, 2018 to February 25, 2020, (3) increases in certain add-backs to adjusted EBITDA (as defined inthe Facility) for the calculation of the leverage ratio to provide additional operating flexibility and (4) a range ofpricing from LIBOR plus 1.00% to 2.05%, with pricing as of December 31, 2015 at LIBOR plus 1.00%. Under thisnew agreement, our leverage ratio cannot exceed 3.50 to 1, except immediately following a material acquisition, inwhich case, the leverage ratio maximum is 4.00 to 1 for up to four consecutive quarters. Other key terms andconditions of the Facility were unchanged as part of the current amendment and expansion.
As of December 31, 2015, we had outstanding borrowings under the Facility of $255.0 million and outstandingletters of credit of $18.2 million. As of December 31, 2014, we had no outstanding borrowings under the Facilityand outstanding letters of credit of $22.0 million. The average outstanding borrowings under the Facility were$335.1 million and $357.0 million for the years ended December 31, 2015 and 2014, respectively.
The effective interest rates on our Facility were 1.1% and 1.2% for the years ended December 31, 2015 and 2014,respectively.
We remained in compliance with all covenants under our Facility as of December 31, 2015, including a minimumcash interest coverage ratio of 3.00 to 1 and the maximum leverage ratio discussed above.
138
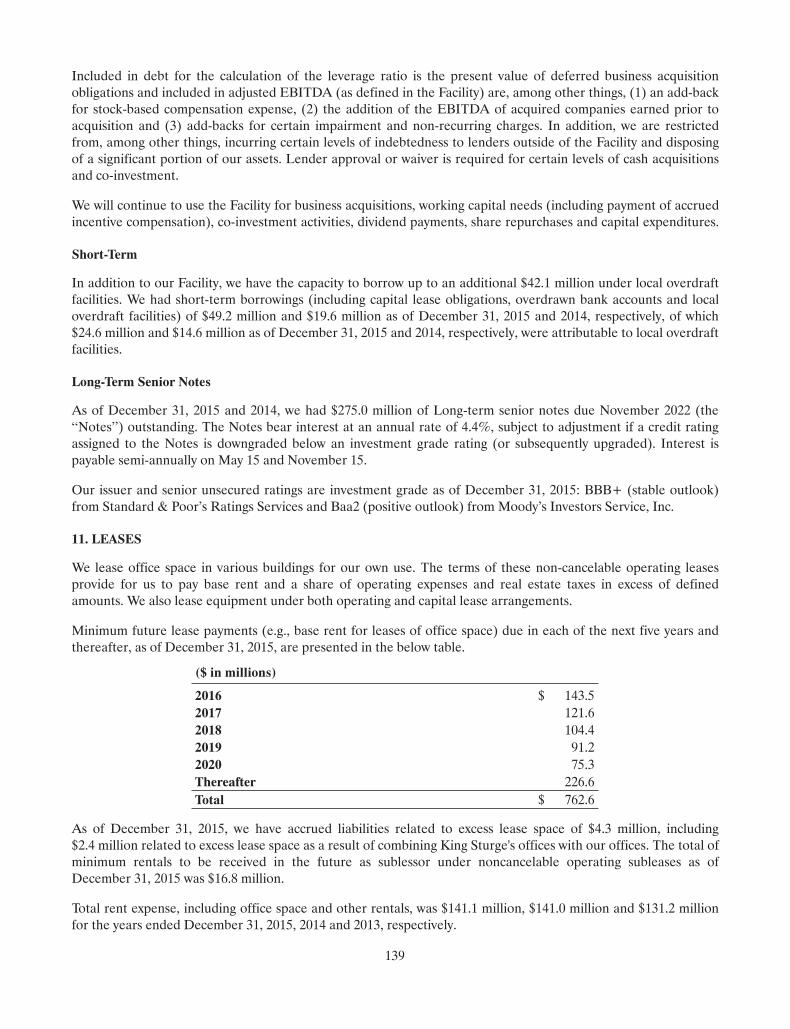
Included in debt for the calculation of the leverage ratio is the present value of deferred business acquisitionobligations and included in adjusted EBITDA (as defined in the Facility) are, among other things, (1) an add-backfor stock-based compensation expense, (2) the addition of the EBITDA of acquired companies earned prior toacquisition and (3) add-backs for certain impairment and non-recurring charges. In addition, we are restrictedfrom, among other things, incurring certain levels of indebtedness to lenders outside of the Facility and disposingof a significant portion of our assets. Lender approval or waiver is required for certain levels of cash acquisitionsand co-investment.
We will continue to use the Facility for business acquisitions, working capital needs (including payment of accruedincentive compensation), co-investment activities, dividend payments, share repurchases and capital expenditures.
Short-Term
In addition to our Facility, we have the capacity to borrow up to an additional $42.1 million under local overdraftfacilities. We had short-term borrowings (including capital lease obligations, overdrawn bank accounts and localoverdraft facilities) of $49.2 million and $19.6 million as of December 31, 2015 and 2014, respectively, of which$24.6 million and $14.6 million as of December 31, 2015 and 2014, respectively, were attributable to local overdraftfacilities.
Long-Term Senior Notes
As of December 31, 2015 and 2014, we had $275.0 million of Long-term senior notes due November 2022 (the‘‘Notes’’) outstanding. The Notes bear interest at an annual rate of 4.4%, subject to adjustment if a credit ratingassigned to the Notes is downgraded below an investment grade rating (or subsequently upgraded). Interest ispayable semi-annually on May 15 and November 15.
Our issuer and senior unsecured ratings are investment grade as of December 31, 2015: BBB+ (stable outlook)from Standard & Poor’s Ratings Services and Baa2 (positive outlook) from Moody’s Investors Service, Inc.
11. LEASES
We lease office space in various buildings for our own use. The terms of these non-cancelable operating leasesprovide for us to pay base rent and a share of operating expenses and real estate taxes in excess of definedamounts. We also lease equipment under both operating and capital lease arrangements.
Minimum future lease payments (e.g., base rent for leases of office space) due in each of the next five years andthereafter, as of December 31, 2015, are presented in the below table.
($ in millions)
2016 $ 143.52017 121.62018 104.42019 91.22020 75.3Thereafter 226.6Total $ 762.6
As of December 31, 2015, we have accrued liabilities related to excess lease space of $4.3 million, including$2.4 million related to excess lease space as a result of combining King Sturge's offices with our offices. The total ofminimum rentals to be received in the future as sublessor under noncancelable operating subleases as ofDecember 31, 2015 was $16.8 million.
Total rent expense, including office space and other rentals, was $141.1 million, $141.0 million and $131.2 millionfor the years ended December 31, 2015, 2014 and 2013, respectively.
139
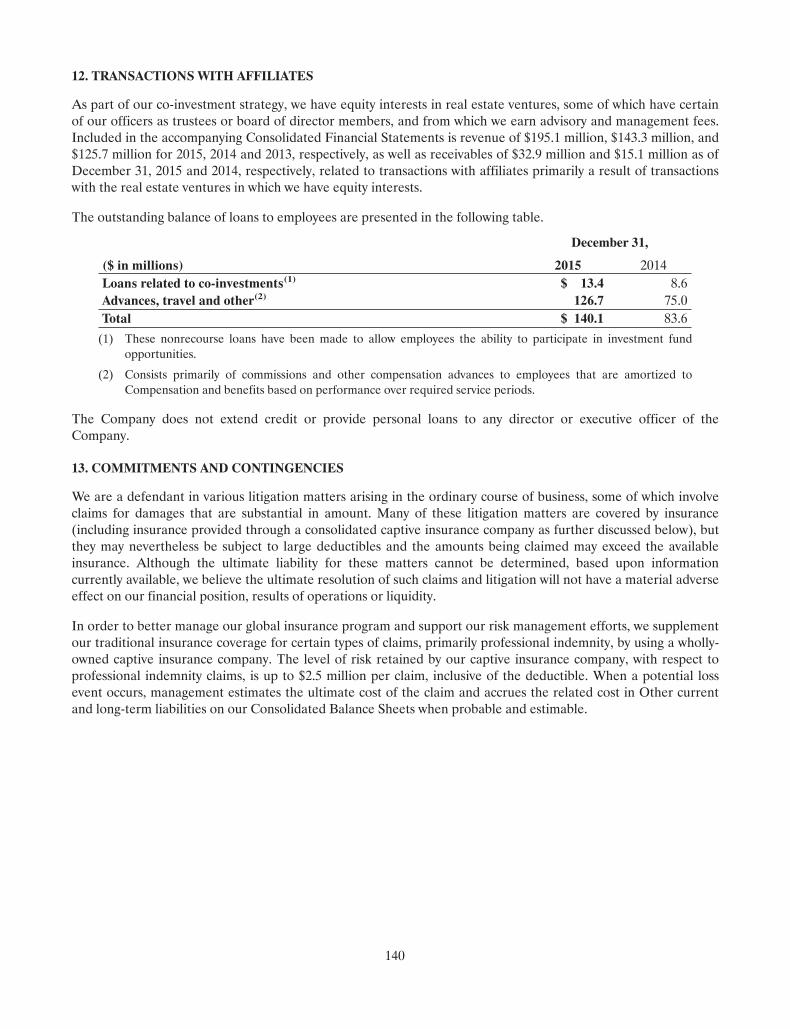
12. TRANSACTIONS WITH AFFILIATES
As part of our co-investment strategy, we have equity interests in real estate ventures, some of which have certainof our officers as trustees or board of director members, and from which we earn advisory and management fees.Included in the accompanying Consolidated Financial Statements is revenue of $195.1 million, $143.3 million, and$125.7 million for 2015, 2014 and 2013, respectively, as well as receivables of $32.9 million and $15.1 million as ofDecember 31, 2015 and 2014, respectively, related to transactions with affiliates primarily a result of transactionswith the real estate ventures in which we have equity interests.
The outstanding balance of loans to employees are presented in the following table.
December 31,
($ in millions) 2015 2014Loans related to co-investments(1) $ 13.4 8.6Advances, travel and other(2) 126.7 75.0Total $ 140.1 83.6(1) These nonrecourse loans have been made to allow employees the ability to participate in investment fund
opportunities.
(2) Consists primarily of commissions and other compensation advances to employees that are amortized toCompensation and benefits based on performance over required service periods.
The Company does not extend credit or provide personal loans to any director or executive officer of theCompany.
13. COMMITMENTS AND CONTINGENCIES
We are a defendant in various litigation matters arising in the ordinary course of business, some of which involveclaims for damages that are substantial in amount. Many of these litigation matters are covered by insurance(including insurance provided through a consolidated captive insurance company as further discussed below), butthey may nevertheless be subject to large deductibles and the amounts being claimed may exceed the availableinsurance. Although the ultimate liability for these matters cannot be determined, based upon informationcurrently available, we believe the ultimate resolution of such claims and litigation will not have a material adverseeffect on our financial position, results of operations or liquidity.
In order to better manage our global insurance program and support our risk management efforts, we supplementour traditional insurance coverage for certain types of claims, primarily professional indemnity, by using a wholly-owned captive insurance company. The level of risk retained by our captive insurance company, with respect toprofessional indemnity claims, is up to $2.5 million per claim, inclusive of the deductible. When a potential lossevent occurs, management estimates the ultimate cost of the claim and accrues the related cost in Other currentand long-term liabilities on our Consolidated Balance Sheets when probable and estimable.
140
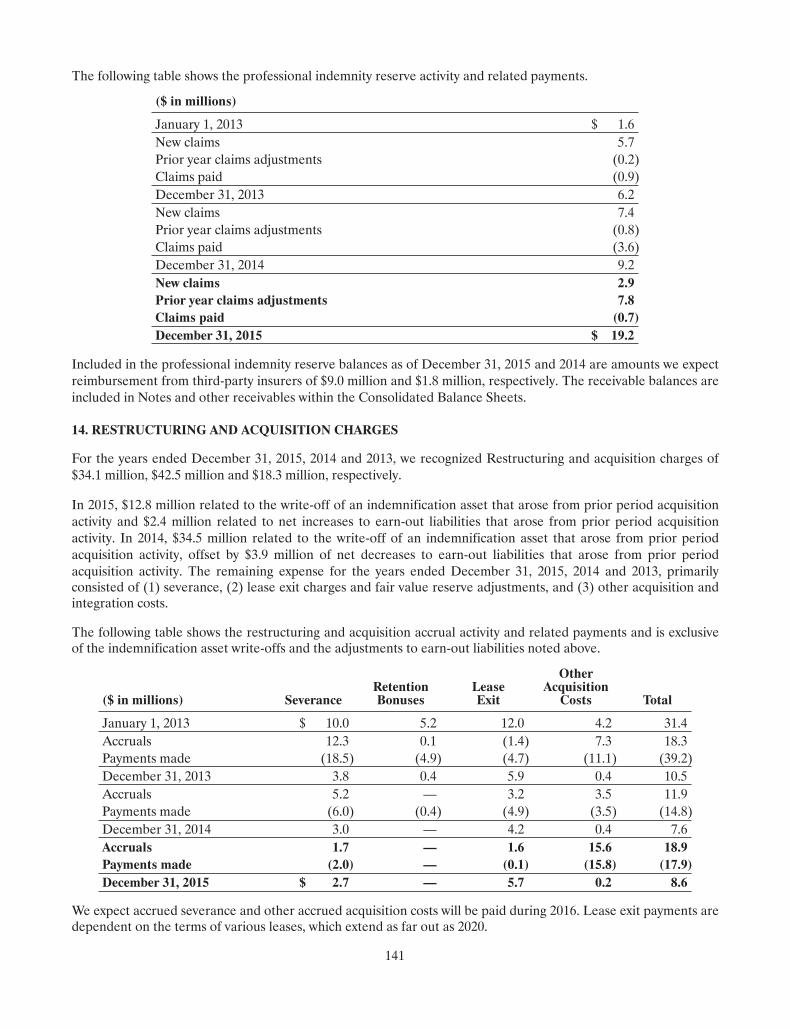
The following table shows the professional indemnity reserve activity and related payments.
($ in millions)
January 1, 2013 $ 1.6New claims 5.7Prior year claims adjustments (0.2)Claims paid (0.9)December 31, 2013 6.2New claims 7.4Prior year claims adjustments (0.8)Claims paid (3.6)December 31, 2014 9.2New claims 2.9Prior year claims adjustments 7.8Claims paid (0.7)December 31, 2015 $ 19.2
Included in the professional indemnity reserve balances as of December 31, 2015 and 2014 are amounts we expectreimbursement from third-party insurers of $9.0 million and $1.8 million, respectively. The receivable balances areincluded in Notes and other receivables within the Consolidated Balance Sheets.
14. RESTRUCTURING AND ACQUISITION CHARGES
For the years ended December 31, 2015, 2014 and 2013, we recognized Restructuring and acquisition charges of$34.1 million, $42.5 million and $18.3 million, respectively.
In 2015, $12.8 million related to the write-off of an indemnification asset that arose from prior period acquisitionactivity and $2.4 million related to net increases to earn-out liabilities that arose from prior period acquisitionactivity. In 2014, $34.5 million related to the write-off of an indemnification asset that arose from prior periodacquisition activity, offset by $3.9 million of net decreases to earn-out liabilities that arose from prior periodacquisition activity. The remaining expense for the years ended December 31, 2015, 2014 and 2013, primarilyconsisted of (1) severance, (2) lease exit charges and fair value reserve adjustments, and (3) other acquisition andintegration costs.
The following table shows the restructuring and acquisition accrual activity and related payments and is exclusiveof the indemnification asset write-offs and the adjustments to earn-out liabilities noted above.
($ in millions) SeveranceRetentionBonuses
LeaseExit
OtherAcquisition
Costs Total
January 1, 2013 $ 10.0 5.2 12.0 4.2 31.4Accruals 12.3 0.1 (1.4) 7.3 18.3Payments made (18.5) (4.9) (4.7) (11.1) (39.2)December 31, 2013 3.8 0.4 5.9 0.4 10.5Accruals 5.2 — 3.2 3.5 11.9Payments made (6.0) (0.4) (4.9) (3.5) (14.8)December 31, 2014 3.0 — 4.2 0.4 7.6Accruals 1.7 — 1.6 15.6 18.9Payments made (2.0) — (0.1) (15.8) (17.9)December 31, 2015 $ 2.7 — 5.7 0.2 8.6
We expect accrued severance and other accrued acquisition costs will be paid during 2016. Lease exit payments aredependent on the terms of various leases, which extend as far out as 2020.
141
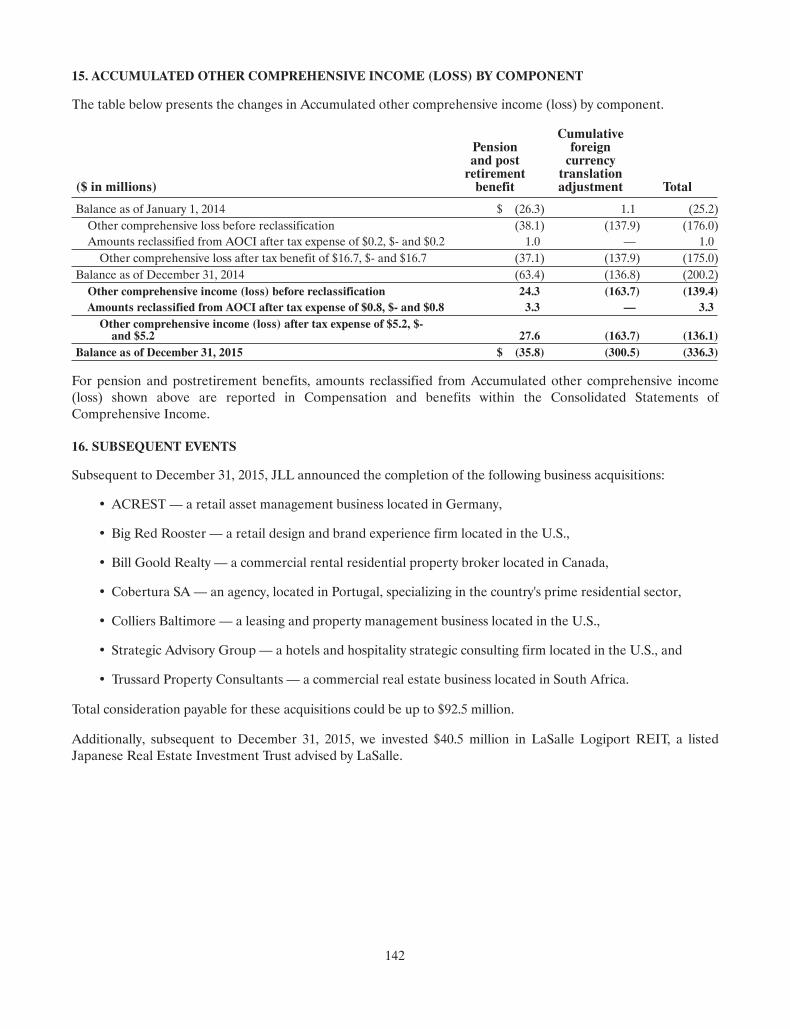
15. ACCUMULATED OTHER COMPREHENSIVE INCOME (LOSS) BY COMPONENT
The table below presents the changes in Accumulated other comprehensive income (loss) by component.
($ in millions)
Pensionand postretirementbenefit
Cumulativeforeigncurrencytranslationadjustment Total
Balance as of January 1, 2014 $ (26.3) 1.1 (25.2)Other comprehensive loss before reclassification (38.1) (137.9) (176.0)Amounts reclassified from AOCI after tax expense of $0.2, $- and $0.2 1.0 — 1.0Other comprehensive loss after tax benefit of $16.7, $- and $16.7 (37.1) (137.9) (175.0)
Balance as of December 31, 2014 (63.4) (136.8) (200.2)Other comprehensive income (loss) before reclassification 24.3 (163.7) (139.4)Amounts reclassified from AOCI after tax expense of $0.8, $- and $0.8 3.3 — 3.3Other comprehensive income (loss) after tax expense of $5.2, $-and $5.2 27.6 (163.7) (136.1)
Balance as of December 31, 2015 $ (35.8) (300.5) (336.3)
For pension and postretirement benefits, amounts reclassified from Accumulated other comprehensive income(loss) shown above are reported in Compensation and benefits within the Consolidated Statements ofComprehensive Income.
16. SUBSEQUENT EVENTS
Subsequent to December 31, 2015, JLL announced the completion of the following business acquisitions:
• ACREST — a retail asset management business located in Germany,
• Big Red Rooster — a retail design and brand experience firm located in the U.S.,
• Bill Goold Realty — a commercial rental residential property broker located in Canada,
• Cobertura SA — an agency, located in Portugal, specializing in the country's prime residential sector,
• Colliers Baltimore — a leasing and property management business located in the U.S.,
• Strategic Advisory Group — a hotels and hospitality strategic consulting firm located in the U.S., and
• Trussard Property Consultants — a commercial real estate business located in South Africa.
Total consideration payable for these acquisitions could be up to $92.5 million.
Additionally, subsequent to December 31, 2015, we invested $40.5 million in LaSalle Logiport REIT, a listedJapanese Real Estate Investment Trust advised by LaSalle.
142
QUARTERLY RESULTS OF OPERATIONS (UNAUDITED)
The tables on the following pages set forth certain unaudited consolidated statements of operations data for eachof our past eight quarters. In our opinion, this information has been presented on the same basis as the auditedConsolidated Financial Statements appearing elsewhere in this report, and includes all adjustments, consisting onlyof normal recurring adjustments and accruals, we consider necessary for a fair presentation. The unauditedconsolidated quarterly information should be read in conjunction with our Consolidated Financial Statements andthe notes thereto as well as the ‘‘Summary of Critical Accounting Policies and Estimates’’ section within‘‘Management's Discussion and Analysis of Financial Condition and Results of Operations.’’ The operating resultsfor any quarter are not necessarily indicative of the results for any future period.
We note the following points regarding how we prepare and present our financial statements on a periodic basis.
Periodic Accounting for Incentive Compensation
An important part of our overall compensation package is incentive compensation, which we typically pay toemployees in the year after it is earned. In our interim financial statements, we have accrued for incentivecompensation based on the percentage of compensation costs and adjusted operating income relative to forecastedcompensation costs and adjusted operating income for the full year, as substantially all incentive compensationpools are based upon full year results. The impact of this incentive compensation accrual methodology is that weaccrue less compensation in the first six months of the year, with the majority of our incentive compensationaccrued in the second half of the year, particularly in the fourth quarter, in line with the general trend of increasingrevenue and profit as the year progresses as further discussed below. We exclude from our standard accrualmethodology incentive compensation pools not subject to the normal performance criteria. These pools aregenerally accrued for on a straight-line basis.
Income Taxes
We provide for the effects of income taxes on interim financial statements based on our estimate of the effectivetax rate for the full year. We assess our effective tax rate on a quarterly basis and reflect the benefit from taxplanning actions when we believe it is probable they will be successful. We account for the cumulative catch-upimpact of any change in estimated effective tax rate our business realizes in the quarter a change is made.
Seasonality
Our quarterly revenue and profits tend to grow progressively by quarter throughout the year. This is a result of ageneral focus in the real estate industry on completing or documenting transactions by fiscal-year-end and the factthat certain expenses are constant through the year. Historically, we have reported a relatively smaller profit in thefirst quarter and then increasingly larger profits during each of the following three quarters, excluding therecognition of investment-generated performance fees and co-investment equity gains or losses (each of which canbe particularly unpredictable). Such performance fees and co-investment equity gains are generally recognizedwhen assets are sold, the timing of which is geared toward the benefit of our clients. Non-variable operatingexpenses, which are recognized as they are incurred throughout the year, are relatively constant on a quarterlybasis.
143
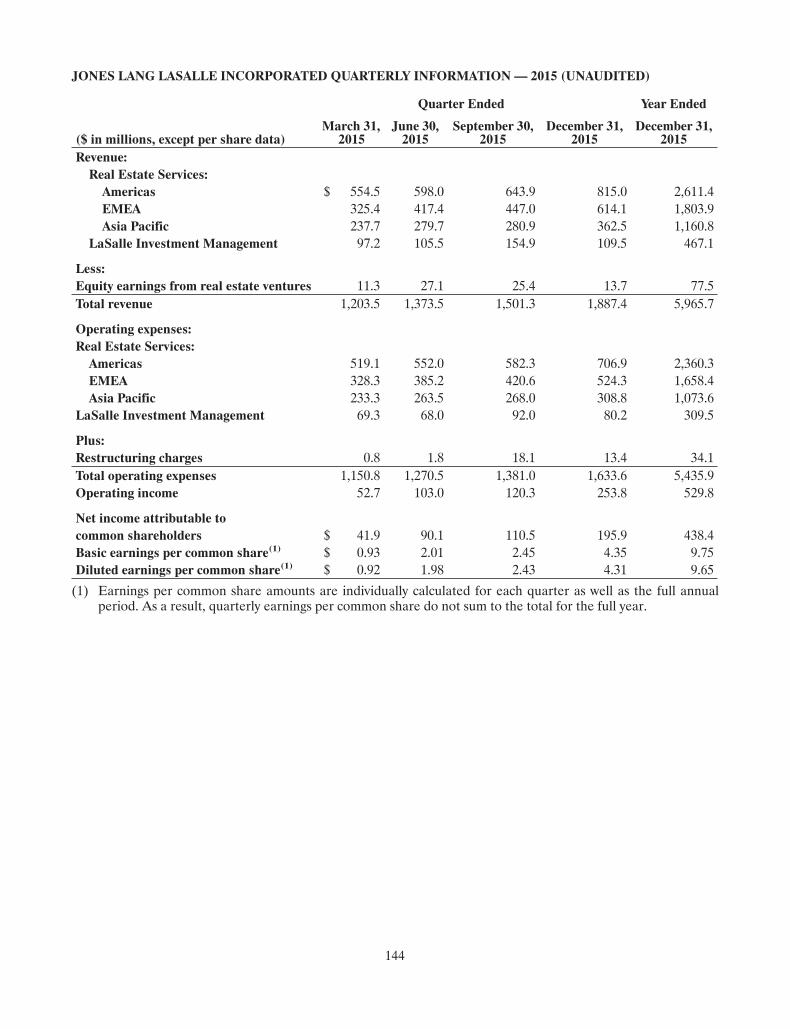
JONES LANG LASALLE INCORPORATED QUARTERLY INFORMATION— 2015 (UNAUDITED)
Quarter Ended Year Ended
($ in millions, except per share data)March 31,
2015June 30,2015
September 30,2015
December 31,2015
December 31,2015
Revenue:Real Estate Services:Americas $ 554.5 598.0 643.9 815.0 2,611.4EMEA 325.4 417.4 447.0 614.1 1,803.9Asia Pacific 237.7 279.7 280.9 362.5 1,160.8
LaSalle Investment Management 97.2 105.5 154.9 109.5 467.1
Less:Equity earnings from real estate ventures 11.3 27.1 25.4 13.7 77.5Total revenue 1,203.5 1,373.5 1,501.3 1,887.4 5,965.7
Operating expenses:Real Estate Services:Americas 519.1 552.0 582.3 706.9 2,360.3EMEA 328.3 385.2 420.6 524.3 1,658.4Asia Pacific 233.3 263.5 268.0 308.8 1,073.6
LaSalle Investment Management 69.3 68.0 92.0 80.2 309.5
Plus:Restructuring charges 0.8 1.8 18.1 13.4 34.1Total operating expenses 1,150.8 1,270.5 1,381.0 1,633.6 5,435.9Operating income 52.7 103.0 120.3 253.8 529.8
Net income attributable tocommon shareholders $ 41.9 90.1 110.5 195.9 438.4Basic earnings per common share(1) $ 0.93 2.01 2.45 4.35 9.75Diluted earnings per common share(1) $ 0.92 1.98 2.43 4.31 9.65
(1) Earnings per common share amounts are individually calculated for each quarter as well as the full annualperiod. As a result, quarterly earnings per common share do not sum to the total for the full year.
144
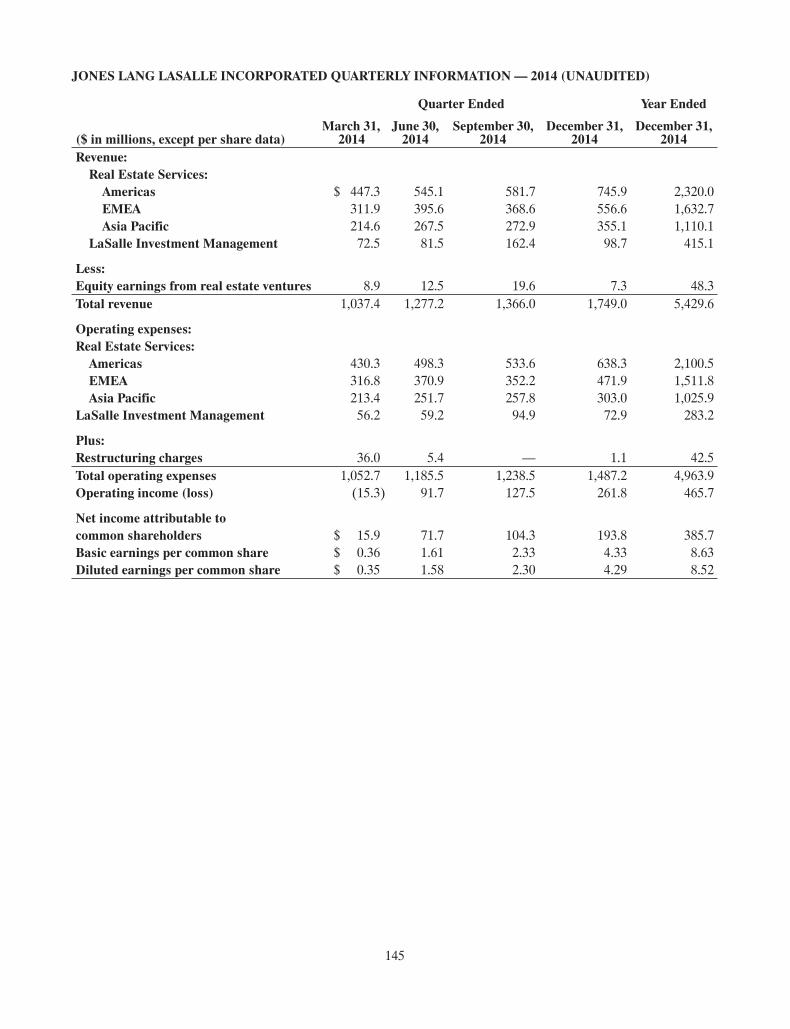
JONES LANG LASALLE INCORPORATED QUARTERLY INFORMATION— 2014 (UNAUDITED)
Quarter Ended Year Ended
($ in millions, except per share data)March 31,
2014June 30,2014
September 30,2014
December 31,2014
December 31,2014
Revenue:Real Estate Services:Americas $ 447.3 545.1 581.7 745.9 2,320.0EMEA 311.9 395.6 368.6 556.6 1,632.7Asia Pacific 214.6 267.5 272.9 355.1 1,110.1
LaSalle Investment Management 72.5 81.5 162.4 98.7 415.1
Less:Equity earnings from real estate ventures 8.9 12.5 19.6 7.3 48.3Total revenue 1,037.4 1,277.2 1,366.0 1,749.0 5,429.6
Operating expenses:Real Estate Services:Americas 430.3 498.3 533.6 638.3 2,100.5EMEA 316.8 370.9 352.2 471.9 1,511.8Asia Pacific 213.4 251.7 257.8 303.0 1,025.9
LaSalle Investment Management 56.2 59.2 94.9 72.9 283.2
Plus:Restructuring charges 36.0 5.4 — 1.1 42.5Total operating expenses 1,052.7 1,185.5 1,238.5 1,487.2 4,963.9Operating income (loss) (15.3) 91.7 127.5 261.8 465.7
Net income attributable tocommon shareholders $ 15.9 71.7 104.3 193.8 385.7Basic earnings per common share $ 0.36 1.61 2.33 4.33 8.63Diluted earnings per common share $ 0.35 1.58 2.30 4.29 8.52
145
ITEM 9. CHANGES IN AND DISAGREEMENTS WITH ACCOUNTANTS ON ACCOUNTING ANDFINANCIAL DISCLOSURE
None.
ITEM 9A. CONTROLS AND PROCEDURES EVALUATION OF DISCLOSURE CONTROLS ANDPROCEDURES
The Company has established disclosure controls and procedures to ensure material information relating to theCompany, including its consolidated subsidiaries, is made known to the officers who certify the Company'sfinancial reports and to the members of senior management and the Board of Directors.
Based on management's evaluation as of December 31, 2015, the principal executive officer and principal financialofficer of the Company have concluded the Company's disclosure controls and procedures (as defined in Rules13a-15(e) and 15d-15(e) under the Securities Exchange Act of 1934) are effective.
MANAGEMENT'S REPORT ON INTERNAL CONTROL OVER FINANCIAL REPORTING
The Company's management is responsible for establishing and maintaining adequate internal control overfinancial reporting, as such term is defined in Exchange Act Rules 13a-15(f) and 15d-15(f). Under the supervisionand with the participation of our management, including our principal executive officer, we conducted anevaluation of the effectiveness of our internal control over financial reporting based on the framework in InternalControl-Integrated Framework (2013) issued by the Committee of Sponsoring Organizations (‘‘COSO’’) of theTreadway Commission. Based on our evaluation under the framework in Internal Control-Integrated Framework,our management concluded our internal control over financial reporting was effective as of December 31, 2015.
Management elected to exclude all businesses acquired in 2015 from the Company's assessment of theeffectiveness of internal control over financial reporting as permitted under SEC rules. As of and for the yearended December 31, 2015, these acquisitions represented total assets of $716 million and total revenues of$135 million included in our Consolidated Financial Statements. Refer to Note 4 of the Notes to ConsolidatedFinancial Statements for the list of acquired businesses in 2015.
KPMG LLP, the Independent Registered Public Accounting Firm that audited the Consolidated FinancialStatements included in this Annual Report on Form 10-K, issued an audit report on the Company's internalcontrol over financial reporting. That Report of Independent Registered Public Accounting Firm is included inItem 8. Financial Statements and Supplementary Data.
CHANGES IN INTERNAL CONTROLS OVER FINANCIAL REPORTING
There were no changes to the Company's internal controls over financial reporting during the quarter endedDecember 31, 2015 that have materially affected, or are reasonably likely to materially affect, the Company'sinternal controls over financial reporting.
ITEM 9B. OTHER INFORMATION
Not applicable.
ITEM 10. DIRECTORS, EXECUTIVE OFFICERS AND CORPORATE GOVERNANCE
The information required by this item is incorporated by reference to the material in Jones Lang LaSalle's ProxyStatement for the 2016 Annual Meeting of Shareholders (the ‘‘Proxy Statement’’) under the captions ‘‘Directorsand Corporate Officers,’’ and ‘‘Section 16(a) Beneficial Ownership Reporting Compliance’’ and in Item 1 of thisAnnual Report on Form 10-K.
146
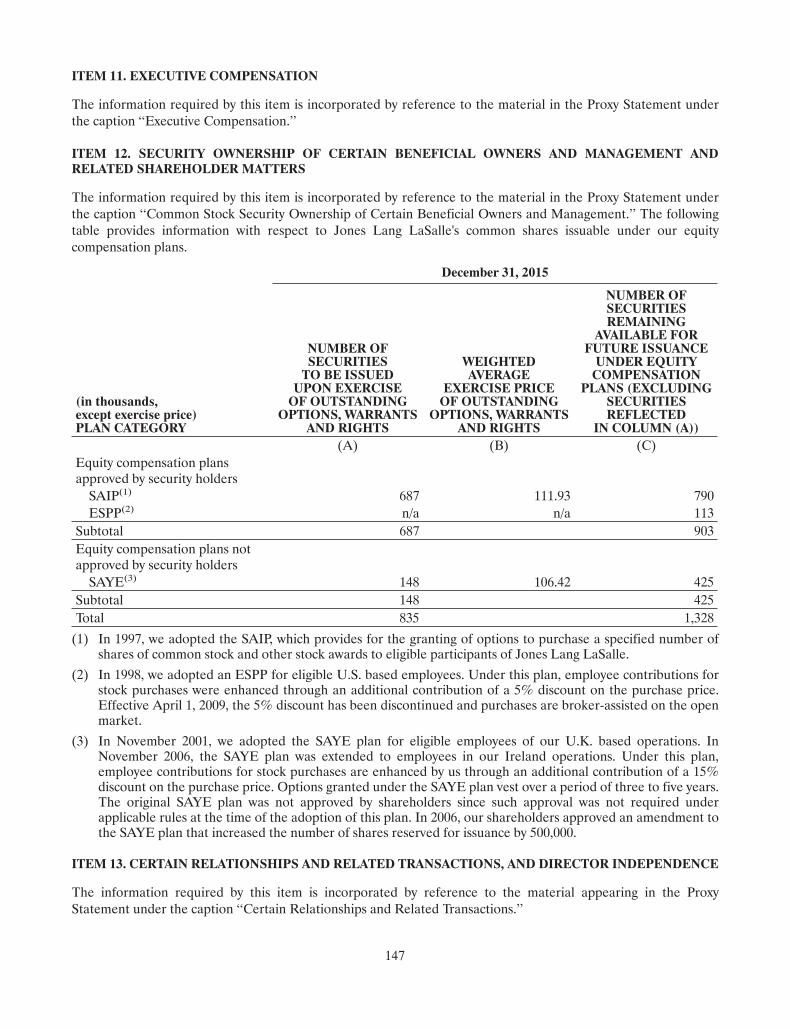
ITEM 11. EXECUTIVE COMPENSATION
The information required by this item is incorporated by reference to the material in the Proxy Statement underthe caption ‘‘Executive Compensation.’’
ITEM 12. SECURITY OWNERSHIP OF CERTAIN BENEFICIAL OWNERS AND MANAGEMENT ANDRELATED SHAREHOLDER MATTERS
The information required by this item is incorporated by reference to the material in the Proxy Statement underthe caption ‘‘Common Stock Security Ownership of Certain Beneficial Owners and Management.’’ The followingtable provides information with respect to Jones Lang LaSalle's common shares issuable under our equitycompensation plans.
(in thousands,except exercise price)PLAN CATEGORY
December 31, 2015
NUMBER OFSECURITIESTO BE ISSUED
UPON EXERCISEOF OUTSTANDING
OPTIONS, WARRANTSAND RIGHTS
WEIGHTEDAVERAGE
EXERCISE PRICEOF OUTSTANDING
OPTIONS, WARRANTSAND RIGHTS
NUMBER OFSECURITIESREMAINING
AVAILABLE FORFUTURE ISSUANCEUNDER EQUITYCOMPENSATION
PLANS (EXCLUDINGSECURITIESREFLECTED
IN COLUMN (A))(A) (B) (C)
Equity compensation plansapproved by security holdersSAIP(1) 687 111.93 790ESPP(2) n/a n/a 113
Subtotal 687 903Equity compensation plans notapproved by security holdersSAYE(3) 148 106.42 425
Subtotal 148 425Total 835 1,328
(1) In 1997, we adopted the SAIP, which provides for the granting of options to purchase a specified number ofshares of common stock and other stock awards to eligible participants of Jones Lang LaSalle.
(2) In 1998, we adopted an ESPP for eligible U.S. based employees. Under this plan, employee contributions forstock purchases were enhanced through an additional contribution of a 5% discount on the purchase price.Effective April 1, 2009, the 5% discount has been discontinued and purchases are broker-assisted on the openmarket.
(3) In November 2001, we adopted the SAYE plan for eligible employees of our U.K. based operations. InNovember 2006, the SAYE plan was extended to employees in our Ireland operations. Under this plan,employee contributions for stock purchases are enhanced by us through an additional contribution of a 15%discount on the purchase price. Options granted under the SAYE plan vest over a period of three to five years.The original SAYE plan was not approved by shareholders since such approval was not required underapplicable rules at the time of the adoption of this plan. In 2006, our shareholders approved an amendment tothe SAYE plan that increased the number of shares reserved for issuance by 500,000.
ITEM 13. CERTAIN RELATIONSHIPS AND RELATED TRANSACTIONS, AND DIRECTOR INDEPENDENCE
The information required by this item is incorporated by reference to the material appearing in the ProxyStatement under the caption ‘‘Certain Relationships and Related Transactions.’’
147
ITEM 14. PRINCIPAL ACCOUNTING FEES AND SERVICESThe information required by this item is incorporated by reference to the material appearing in the ProxyStatement under the caption ‘‘Information about the Independent Registered Public Accounting Firm.’’
ITEM 15. EXHIBITS AND FINANCIAL STATEMENT SCHEDULESThe following documents are filed as part of this report:
1. Financial Statements. See Index to Consolidated Financial Statements in Item 8 of this report.2. Financial Statement Schedules. No financial statement schedules are included because they are not
required or are not applicable, or the required information is set forth in the applicable statements orrelated notes.
3. Exhibits. A list of exhibits is set forth in the Exhibit Index, which immediately precedes the exhibits andis incorporated by reference herein.
Cautionary Note Regarding Forward-Looking StatementsCertain statements in this filing and elsewhere (such as in reports, other filings with the United States Securitiesand Exchange Commission, press releases, presentations and communications by JLL or its management andwritten and oral statements) regarding, among other things, future financial results and performance,achievements, plans and objectives, dividend payments and share repurchases may constitute forward-lookingstatements within the meaning of the Private Securities Litigation Reform Act of 1995. Such forward-lookingstatements involve known and unknown risks, uncertainties and other factors that may cause JLL's actual results,performance, achievements, plans and objectives to be materially different from any of the future results,performance, achievements, plans and objectives expressed or implied by such forward-looking statements.
We discuss those risks, uncertainties and other factors in this report in Item 1A. Risk Factors; Item 7.Management's Discussion and Analysis of Financial Condition and Results of Operations; Item 7A. Quantitativeand Qualitative Disclosures About Market Risk; Item 8. Financial Statements and Supplementary Data-Notes toConsolidated Financial Statements; and elsewhere, and the other reports we file with the United States Securitiesand Exchange Commission. Important factors that could cause actual results to differ from those in our forward-looking statements include (without limitation):
• The effect of political, economic and market conditions and geopolitical events;• The logistical and other challenges inherent in operating in numerous different countries;• The actions and initiatives of current and potential competitors;• The level and volatility of real estate prices, interest rates, currency values and other market indices;• The outcome of pending litigation; and• The impact of current, pending and future legislation and regulation.
Moreover, there can be no assurance future dividends will be declared since the actual declaration of futuredividends, and the establishment of record and payment dates, remain subject to final determination by theCompany's Board of Directors.
Accordingly, we caution our readers not to place undue reliance on forward-looking statements, which speak onlyas of the date on which they are made. Except to the extent required by applicable securities law, JLL expresslydisclaims any obligation or undertaking to publicly update or revise any forward-looking statements to reflect anychanges in events or circumstances or in its expectations or results.
Power of AttorneyKNOW ALL MEN BY THESE PRESENTS, that each of Jones Lang LaSalle Incorporated, a Marylandcorporation, and the undersigned Directors and officers of Jones Lang LaSalle Incorporated, herebyconstitutes and appoints Colin Dyer, Christie B. Kelly and Louis F. Bowers its, his or her true and lawful attorneys-in-fact and agents, for it, him or her and in its, his or her name, place and stead, in any and all capacities, with fullpower to act alone, to sign any and all amendments to this report, and to file each such amendment to this report,with all exhibits thereto, and any and all documents in connection therewith, with the Securities and ExchangeCommission, hereby granting unto said attorneys-in-fact and agents, and each of them, full power and authority todo and perform any and all acts and things requisite and necessary to be done in and about the premises, as fully toall intents and purposes as it, he or she might or could do in person, hereby ratifying and confirming all that saidattorneys-in-fact and agents, or any of them, may lawfully do or cause to be done by virtue hereof.
148
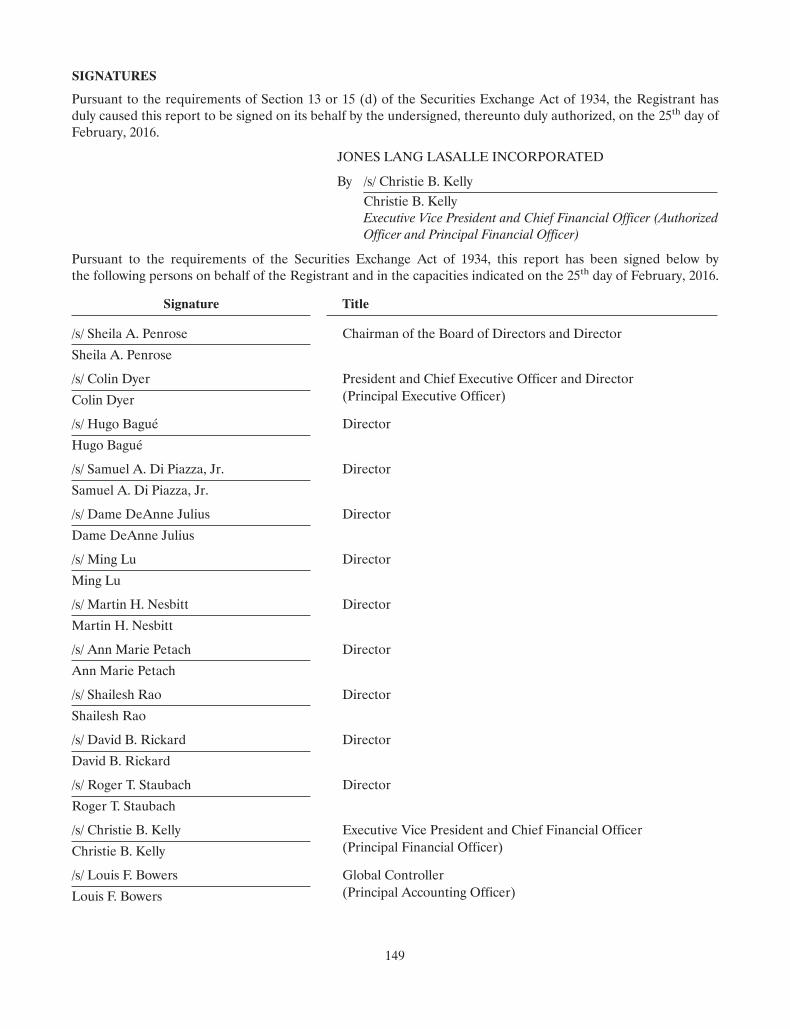
SIGNATURES
Pursuant to the requirements of Section 13 or 15 (d) of the Securities Exchange Act of 1934, the Registrant hasduly caused this report to be signed on its behalf by the undersigned, thereunto duly authorized, on the 25th day ofFebruary, 2016.
JONES LANG LASALLE INCORPORATED
By /s/ Christie B. KellyChristie B. KellyExecutive Vice President and Chief Financial Officer (AuthorizedOfficer and Principal Financial Officer)
Pursuant to the requirements of the Securities Exchange Act of 1934, this report has been signed below bythe following persons on behalf of the Registrant and in the capacities indicated on the 25th day of February, 2016.
Signature Title
/s/ Sheila A. Penrose
Sheila A. Penrose
Chairman of the Board of Directors and Director
/s/ Colin Dyer
Colin Dyer
President and Chief Executive Officer and Director(Principal Executive Officer)
/s/ Hugo Bagué
Hugo Bagué
Director
/s/ Samuel A. Di Piazza, Jr.
Samuel A. Di Piazza, Jr.
Director
/s/ Dame DeAnne Julius
Dame DeAnne Julius
Director
/s/ Ming Lu
Ming Lu
Director
/s/ Martin H. Nesbitt
Martin H. Nesbitt
Director
/s/ Ann Marie Petach
Ann Marie Petach
Director
/s/ Shailesh Rao
Shailesh Rao
Director
/s/ David B. Rickard
David B. Rickard
Director
/s/ Roger T. Staubach
Roger T. Staubach
Director
/s/ Christie B. Kelly
Christie B. Kelly
Executive Vice President and Chief Financial Officer(Principal Financial Officer)
/s/ Louis F. Bowers
Louis F. Bowers
Global Controller(Principal Accounting Officer)
149
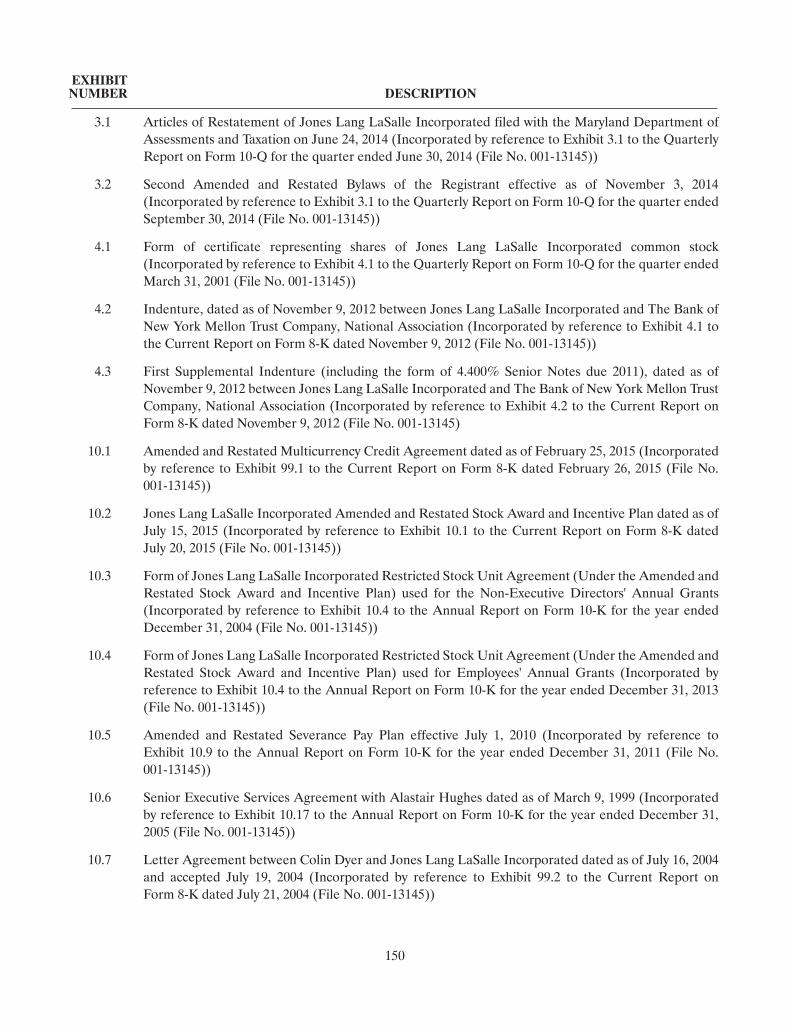
EXHIBITNUMBER DESCRIPTION
3.1 Articles of Restatement of Jones Lang LaSalle Incorporated filed with the Maryland Department ofAssessments and Taxation on June 24, 2014 (Incorporated by reference to Exhibit 3.1 to the QuarterlyReport on Form 10-Q for the quarter ended June 30, 2014 (File No. 001-13145))
3.2 Second Amended and Restated Bylaws of the Registrant effective as of November 3, 2014(Incorporated by reference to Exhibit 3.1 to the Quarterly Report on Form 10-Q for the quarter endedSeptember 30, 2014 (File No. 001-13145))
4.1 Form of certificate representing shares of Jones Lang LaSalle Incorporated common stock(Incorporated by reference to Exhibit 4.1 to the Quarterly Report on Form 10-Q for the quarter endedMarch 31, 2001 (File No. 001-13145))
4.2 Indenture, dated as of November 9, 2012 between Jones Lang LaSalle Incorporated and The Bank ofNew York Mellon Trust Company, National Association (Incorporated by reference to Exhibit 4.1 tothe Current Report on Form 8-K dated November 9, 2012 (File No. 001-13145))
4.3 First Supplemental Indenture (including the form of 4.400% Senior Notes due 2011), dated as ofNovember 9, 2012 between Jones Lang LaSalle Incorporated and The Bank of New York Mellon TrustCompany, National Association (Incorporated by reference to Exhibit 4.2 to the Current Report onForm 8-K dated November 9, 2012 (File No. 001-13145)
10.1 Amended and Restated Multicurrency Credit Agreement dated as of February 25, 2015 (Incorporatedby reference to Exhibit 99.1 to the Current Report on Form 8-K dated February 26, 2015 (File No.001-13145))
10.2 Jones Lang LaSalle Incorporated Amended and Restated Stock Award and Incentive Plan dated as ofJuly 15, 2015 (Incorporated by reference to Exhibit 10.1 to the Current Report on Form 8-K datedJuly 20, 2015 (File No. 001-13145))
10.3 Form of Jones Lang LaSalle Incorporated Restricted Stock Unit Agreement (Under the Amended andRestated Stock Award and Incentive Plan) used for the Non-Executive Directors' Annual Grants(Incorporated by reference to Exhibit 10.4 to the Annual Report on Form 10-K for the year endedDecember 31, 2004 (File No. 001-13145))
10.4 Form of Jones Lang LaSalle Incorporated Restricted Stock Unit Agreement (Under the Amended andRestated Stock Award and Incentive Plan) used for Employees' Annual Grants (Incorporated byreference to Exhibit 10.4 to the Annual Report on Form 10-K for the year ended December 31, 2013(File No. 001-13145))
10.5 Amended and Restated Severance Pay Plan effective July 1, 2010 (Incorporated by reference toExhibit 10.9 to the Annual Report on Form 10-K for the year ended December 31, 2011 (File No.001-13145))
10.6 Senior Executive Services Agreement with Alastair Hughes dated as of March 9, 1999 (Incorporatedby reference to Exhibit 10.17 to the Annual Report on Form 10-K for the year ended December 31,2005 (File No. 001-13145))
10.7 Letter Agreement between Colin Dyer and Jones Lang LaSalle Incorporated dated as of July 16, 2004and accepted July 19, 2004 (Incorporated by reference to Exhibit 99.2 to the Current Report onForm 8-K dated July 21, 2004 (File No. 001-13145))
150
EXHIBITNUMBER DESCRIPTION
10.8 Amendment No. 1 to Letter Agreement between Colin Dyer and Jones Lang LaSalle Incorporateddated as of August 30, 2004 (Incorporated by reference to Exhibit 10.19 to the Annual Report onForm 10-K for the year ended December 31, 2005 (File No. 001-13145))
10.9 Amendment No. 2 to Letter Agreement between Colin Dyer and Jones Lang LaSalle Incorporateddated as of December 1, 2005 (Incorporated by reference to Exhibit 10.20 to the Annual Report onForm 10-K for the year ended December 31, 2005 (File No. 001-13145))
10.10 Letter Agreement Regarding Compensation of the Chairman of the Board of Directors dated as ofJanuary 1, 2005 (Incorporated by reference to Exhibit 99.1 to the Current Report on Form 8-K datedJanuary 10, 2005 (File No. 001-13145))
10.11 LaSalle Investment Management Long Term Incentive Compensation Program, amended and restatedJanuary 1, 2013 (Incorporated by reference to Exhibit 10.12 to the Annual Report on Form 10-K forthe year ended December 31, 2013 (File No. 001-13145))
10.12 Jones Lang LaSalle Incorporated Deferred Compensation Plan, as amended and restated effectiveJanuary 1, 2009 (Incorporated by reference to Exhibit 10.25 to the Annual Report on Form 10-K forthe year ended December 31, 2008 (File No. 001-13145))
10.13 Jones Lang LaSalle Incorporated First Amendment to Deferred Compensation Plan dated as ofDecember 5, 2011 (Incorporated by reference to Exhibit 4.2 to the Registration Statement on Form S-8dated March 28, 2012 (File No. 333-180405))
10.14 Jones Lang LaSalle Incorporated Non-Executive Director Compensation Plan Summary of Terms andConditions, Amended and Restated as of January 1, 2012 (Incorporated by reference to Exhibit 10.19to the Annual Report on Form 10-K for the year ended December 31, 2011 (File No. 001-13145))
10.15 Jones Lang LaSalle Incorporated Stock Ownership Program, effective as of March 31, 2011(Incorporated by reference to Exhibit 10.22 to the Annual Report on Form 10-K for the year endedDecember 31, 2011 (File No. 001-13145))
10.16 Jones Lang LaSalle Incorporated GEB 2015-2020 Long-Term Incentive Compensation Programeffective as of January 1, 2015 (Incorporated by reference to Exhibit 10.2 to the Current Report onForm 8-K dated July 20, 2015 (File No. 001-13145))
10.17 CEO Performance Incentive Agreement dated as of April 19, 2012 between Jones Lang LaSalleIncorporated and Colin Dyer (Incorporated by reference to Exhibit 99.1 to the Current Report onForm 8-K dated April 19, 2012 (File No. 001-13145))
10.18 Letter Agreement dated May 15, 2013 between Jones Lang LaSalle Incorporated and Christie B. Kelly(Incorporated by reference to Exhibit 10.1 to the Current Report on Form 8-K dated May 16, 2013(File No. 001-13145))
10.19 Letter Agreement dated January 16, 2014 between Jones Lang LaSalle Incorporated and Gregory P.O'Brien (Incorporated by reference to Exhibit 10.1 to the Current Report on Form 8-K (File No.001-13145))
10.20 Letter Agreement dated April 15, 2014 between Jones Lang LaSalle Incorporated and Alastair Hughes(Incorporated by reference to Exhibit 10.1 to the Current Report on Form 8-K (File 001-13145))
151
EXHIBITNUMBER DESCRIPTION
10.21* Letter Agreement dated February 25, 2016 between Jones Lang LaSalle Incorporated and AlastairHughes
11 Statement concerning computation of per share earnings (filed in Item 8, Consolidated Statements ofComprehensive Income)
12.1* Computation of Ratio of Earnings to Fixed Charges
21.1* List of Subsidiaries
23.1* Consent of Independent Registered Public Accounting Firm
24.1* Power of Attorney (Set forth on page preceding signature page of this report)
31.1* Certification of Chief Executive Officer pursuant to Section 302 of the Sarbanes-Oxley Act of 2002
31.2* Certification of Chief Financial Officer pursuant to Section 302 of the Sarbanes-Oxley Act of 2002
32.1* Certification of Chief Executive Officer and Chief Financial Officer pursuant to 18 U.S.C.Section 1350, as adopted pursuant to Section 906 of the Sarbanes-Oxley Act of 2002
101* The following materials from the Company's Annual Report on Form 10-K for the year endedDecember 31, 2015, formatted in XBRL (eXtensible Business Reporting Language): (1) ConsolidatedBalance Sheets as of December 31, 2015 and 2014, (2) Consolidated Statements of ComprehensiveIncome for the years ended December 31, 2015, 2014 and 2013, (3) Consolidated Statements of Equityfor the years ended December 31, 2015, 2014 and 2013, (4) Consolidated Statements of Cash Flows forthe years ended December 31, 2015, 2014 and 2013, and (5) Notes to Consolidated FinancialStatements.
* Filed herewith
152
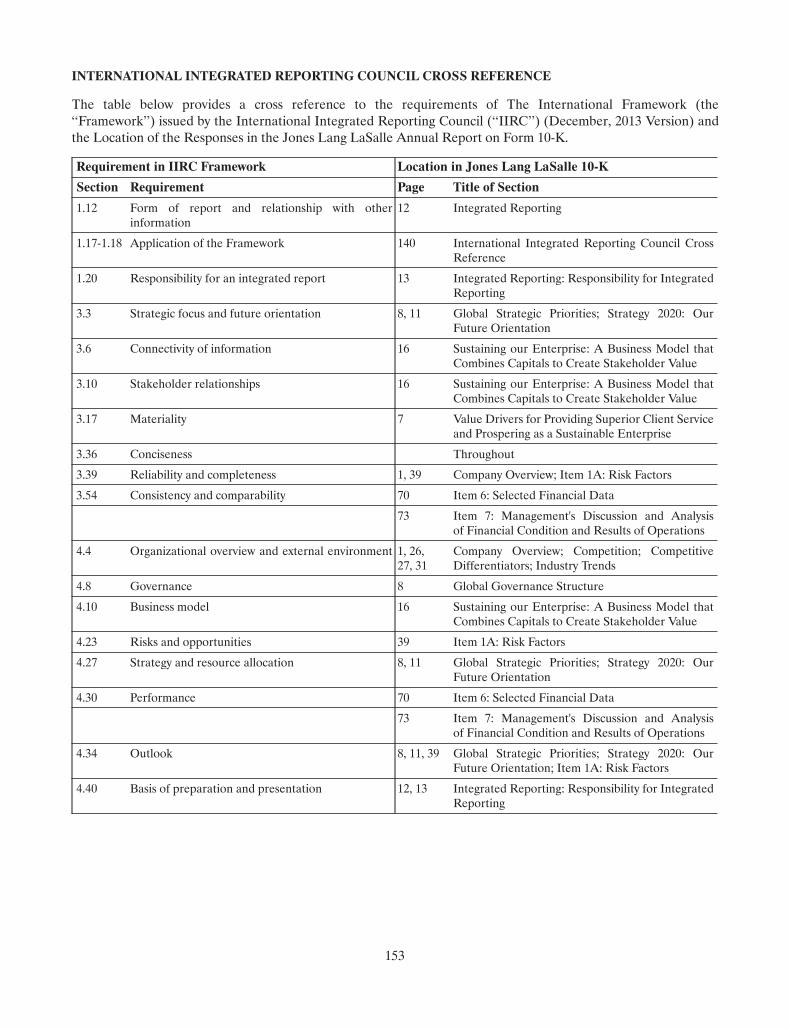
INTERNATIONAL INTEGRATED REPORTING COUNCIL CROSS REFERENCE
The table below provides a cross reference to the requirements of The International Framework (the‘‘Framework’’) issued by the International Integrated Reporting Council (‘‘IIRC’’) (December, 2013 Version) andthe Location of the Responses in the Jones Lang LaSalle Annual Report on Form 10-K.
Requirement in IIRC Framework Location in Jones Lang LaSalle 10-K
Section Requirement Page Title of Section
1.12 Form of report and relationship with otherinformation
12 Integrated Reporting
1.17-1.18 Application of the Framework 140 International Integrated Reporting Council CrossReference
1.20 Responsibility for an integrated report 13 Integrated Reporting: Responsibility for IntegratedReporting
3.3 Strategic focus and future orientation 8, 11 Global Strategic Priorities; Strategy 2020: OurFuture Orientation
3.6 Connectivity of information 16 Sustaining our Enterprise: A Business Model thatCombines Capitals to Create Stakeholder Value
3.10 Stakeholder relationships 16 Sustaining our Enterprise: A Business Model thatCombines Capitals to Create Stakeholder Value
3.17 Materiality 7 Value Drivers for Providing Superior Client Serviceand Prospering as a Sustainable Enterprise
3.36 Conciseness Throughout
3.39 Reliability and completeness 1, 39 Company Overview; Item 1A: Risk Factors
3.54 Consistency and comparability 70 Item 6: Selected Financial Data
73 Item 7: Management's Discussion and Analysisof Financial Condition and Results of Operations
4.4 Organizational overview and external environment 1, 26,27, 31
Company Overview; Competition; CompetitiveDifferentiators; Industry Trends
4.8 Governance 8 Global Governance Structure
4.10 Business model 16 Sustaining our Enterprise: A Business Model thatCombines Capitals to Create Stakeholder Value
4.23 Risks and opportunities 39 Item 1A: Risk Factors
4.27 Strategy and resource allocation 8, 11 Global Strategic Priorities; Strategy 2020: OurFuture Orientation
4.30 Performance 70 Item 6: Selected Financial Data
73 Item 7: Management's Discussion and Analysisof Financial Condition and Results of Operations
4.34 Outlook 8, 11, 39 Global Strategic Priorities; Strategy 2020: OurFuture Orientation; Item 1A: Risk Factors
4.40 Basis of preparation and presentation 12, 13 Integrated Reporting: Responsibility for IntegratedReporting
153

[This Page Intentionally Left Blank]
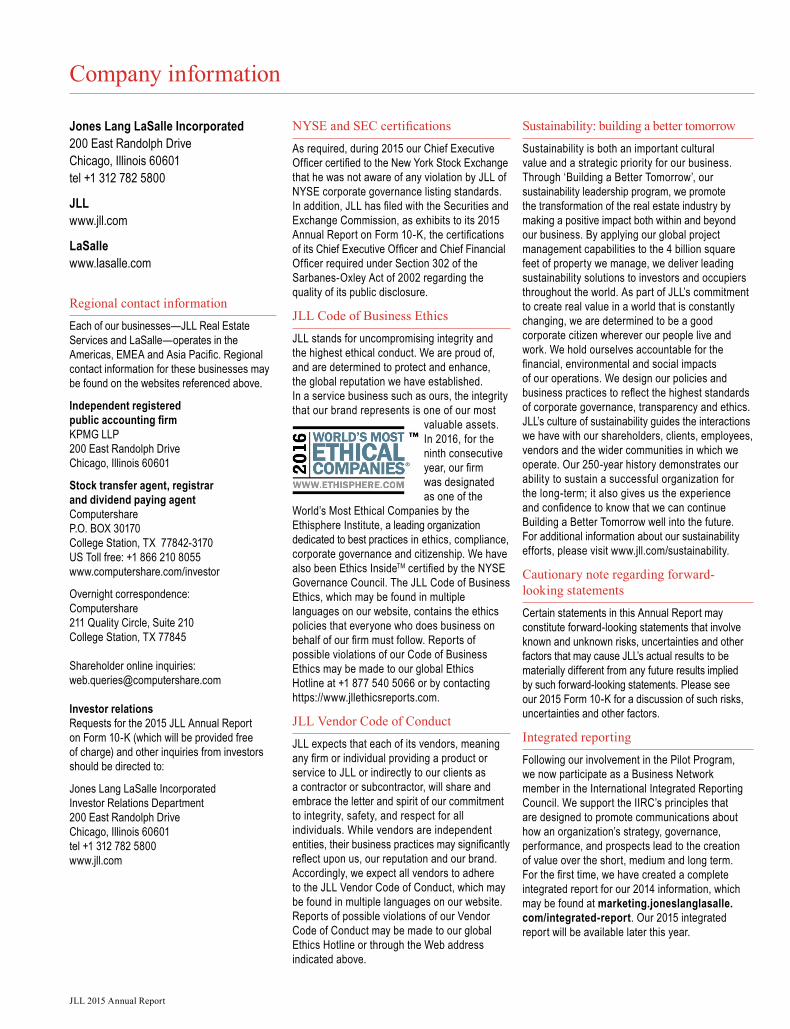
Company information
Jones Lang LaSalle Incorporated 200 East Randolph Drive Chicago, Illinois 60601 tel +1 312 782 5800
JLL www.jll.com
LaSalle www.lasalle.com
Regional contact information
Each of our businesses—JLL Real Estate Services and LaSalle—operates in the Americas, EMEA and Asia Pacific. Regional contact information for these businesses may be found on the websites referenced above.
Independent registered public accounting firm KPMG LLP 200 East Randolph Drive Chicago, Illinois 60601
Stock transfer agent, registrar and dividend paying agent Computershare P.O. BOX 30170 College Station, TX 77842-3170 US Toll free: +1 866 210 8055 www.computershare.com/investor
Overnight correspondence: Computershare 211 Quality Circle, Suite 210 College Station, TX 77845 Shareholder online inquiries: [email protected] Investor relations Requests for the 2015 JLL Annual Report on Form 10-K (which will be provided free of charge) and other inquiries from investors should be directed to:
Jones Lang LaSalle Incorporated Investor Relations Department 200 East Randolph Drive Chicago, Illinois 60601 tel +1 312 782 5800 www.jll.com
NYSE and SEC certifications
As required, during 2015 our Chief Executive Officer certified to the New York Stock Exchange that he was not aware of any violation by JLL of NYSE corporate governance listing standards. In addition, JLL has filed with the Securities and Exchange Commission, as exhibits to its 2015 Annual Report on Form 10-K, the certifications of its Chief Executive Officer and Chief Financial Officer required under Section 302 of the Sarbanes-Oxley Act of 2002 regarding the quality of its public disclosure.
JLL Code of Business Ethics
JLL stands for uncompromising integrity and the highest ethical conduct. We are proud of, and are determined to protect and enhance, the global reputation we have established. In a service business such as ours, the integrity that our brand represents is one of our most
valuable assets. In 2016, for the ninth consecutive year, our firm was designated as one of the
World’s Most Ethical Companies by the Ethisphere Institute, a leading organization dedicated to best practices in ethics, compliance, corporate governance and citizenship. We have also been Ethics InsideTM certified by the NYSE Governance Council. The JLL Code of Business Ethics, which may be found in multiple languages on our website, contains the ethics policies that everyone who does business on behalf of our firm must follow. Reports of possible violations of our Code of Business Ethics may be made to our global Ethics Hotline at +1 877 540 5066 or by contacting https://www.jllethicsreports.com.
JLL Vendor Code of Conduct
JLL expects that each of its vendors, meaning any firm or individual providing a product or service to JLL or indirectly to our clients as a contractor or subcontractor, will share and embrace the letter and spirit of our commitment to integrity, safety, and respect for all individuals. While vendors are independent entities, their business practices may significantly reflect upon us, our reputation and our brand. Accordingly, we expect all vendors to adhere to the JLL Vendor Code of Conduct, which may be found in multiple languages on our website. Reports of possible violations of our Vendor Code of Conduct may be made to our global Ethics Hotline or through the Web address indicated above.
Sustainability: building a better tomorrow
Sustainability is both an important cultural value and a strategic priority for our business. Through ‘Building a Better Tomorrow’, our sustainability leadership program, we promote the transformation of the real estate industry by making a positive impact both within and beyond our business. By applying our global project management capabilities to the 4 billion square feet of property we manage, we deliver leading sustainability solutions to investors and occupiers throughout the world. As part of JLL’s commitment to create real value in a world that is constantly changing, we are determined to be a good corporate citizen wherever our people live and work. We hold ourselves accountable for the financial, environmental and social impacts of our operations. We design our policies and business practices to reflect the highest standards of corporate governance, transparency and ethics. JLL’s culture of sustainability guides the interactions we have with our shareholders, clients, employees, vendors and the wider communities in which we operate. Our 250-year history demonstrates our ability to sustain a successful organization for the long-term; it also gives us the experience and confidence to know that we can continue Building a Better Tomorrow well into the future. For additional information about our sustainability efforts, please visit www.jll.com/sustainability.
Cautionary note regarding forward-looking statements
Certain statements in this Annual Report may constitute forward-looking statements that involve known and unknown risks, uncertainties and other factors that may cause JLL’s actual results to be materially different from any future results implied by such forward-looking statements. Please see our 2015 Form 10-K for a discussion of such risks, uncertainties and other factors.
Integrated reporting
Following our involvement in the Pilot Program, we now participate as a Business Network member in the International Integrated Reporting Council. We support the IIRC’s principles that are designed to promote communications about how an organization’s strategy, governance, performance, and prospects lead to the creation of value over the short, medium and long term. For the first time, we have created a complete integrated report for our 2014 information, which may be found at marketing.joneslanglasalle.com/integrated-report. Our 2015 integrated report will be available later this year.
JLL 2015 Annual Report

www.jll.com