janus discs
TRANSCRIPT
1
JANUS DISCS
Andreas Walther, Xavier André, Markus Drechsler,
Volker Abetz‡, Axel H. E. Müller*
Makromolekulare Chemie II and Bayreuther Zentrum für Kolloide und Grenzflächen,
Universität Bayreuth, D-95440 Bayreuth, Germany
‡ Institut für Polymerforschung, GKSS-Forschungszentrum Geesthacht GmbH, D-21502
Geesthacht, Germany
2
ABSTRACT. We describe the synthesis and the solution properties of sheet- and disc-like
Janus particles, containing an inner crosslinked polybutadiene (PB) layer and two different
outer sides of polystyrene (PS) and poly(tert-butyl methacrylate) (PtBMA). The structures
formed upon adsorption of the flat Janus particles onto solid substrates as well as in THF
solution are investigated. The Janus discs are obtained in a template-assisted synthetic
pathway followed by sonication. Selectively crosslinking the lamellar PB domains in a well-
ordered lamellar microphase-separated bulk morphology of PS-block-PB-block-PTBMA
(SBT) triblock block terpolymers leads to the conservation of the compartmentalization of the
two outer blocks. Sonication of the crosslinked block terpolymer templates renders soluble
sheet- and disc-like Janus particles, the size of which can be tuned from the micrometer range
down to the nanometer scale. Small-angle X-ray scattering, transmission electron microscopy,
dynamic light scattering, scanning force microscopy and scanning electron microscopy are
used to characterize the template-assisted synthetic process and the solution properties.
Cryogenic transmission electron microscopy in THF and TEM of particles, embedded into a
photo-crosslinkable silicon oil, indicate a supramolecular aggregation behaviour of the Janus
discs in concentrated solutions. Pendant drop tensiometry demonstrates that Janus sheets and
discs can be used to stabilize liquid-liquid interfaces, rendering these materials interesting for
future applications.
3
Introduction
In recent years, Janus particles have attracted much attention in nanoscience due to their
interesting properties, both for academic as well as for technological reasons.1-8 In general,
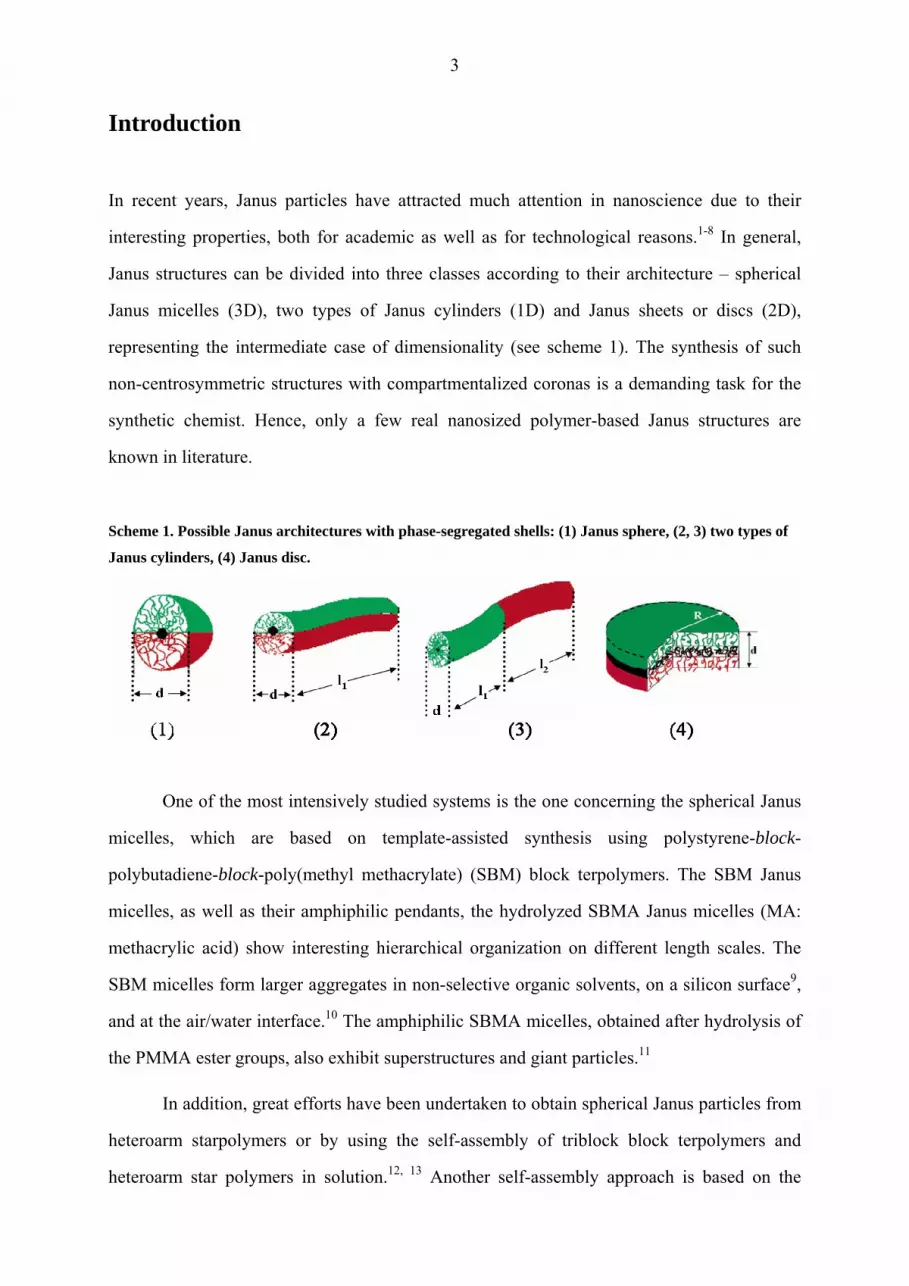
Janus structures can be divided into three classes according to their architecture – spherical
Janus micelles (3D), two types of Janus cylinders (1D) and Janus sheets or discs (2D),
representing the intermediate case of dimensionality (see scheme 1). The synthesis of such
non-centrosymmetric structures with compartmentalized coronas is a demanding task for the
synthetic chemist. Hence, only a few real nanosized polymer-based Janus structures are
known in literature.
Scheme 1. Possible Janus architectures with phase-segregated shells: (1) Janus sphere, (2, 3) two types of
Janus cylinders, (4) Janus disc.
One of the most intensively studied systems is the one concerning the spherical Janus
micelles, which are based on template-assisted synthesis using polystyrene-block-
polybutadiene-block-poly(methyl methacrylate) (SBM) block terpolymers. The SBM Janus
micelles, as well as their amphiphilic pendants, the hydrolyzed SBMA Janus micelles (MA:
methacrylic acid) show interesting hierarchical organization on different length scales. The
SBM micelles form larger aggregates in non-selective organic solvents, on a silicon surface9,
and at the air/water interface.10 The amphiphilic SBMA micelles, obtained after hydrolysis of
the PMMA ester groups, also exhibit superstructures and giant particles.11
In addition, great efforts have been undertaken to obtain spherical Janus particles from
heteroarm starpolymers or by using the self-assembly of triblock block terpolymers and
heteroarm star polymers in solution.12, 13 Another self-assembly approach is based on the
4
electrostatic interactions of AB and CD diblock copolymers where B and C form insoluble
complexes, e.g. inter-polyelectrolyte complexes, in a solvent for blocks A and D. The first
reported attempt has led to vesicles with an asymmetric wall rather than to Janus spheres.14
Voets et al.15 recently reported the formation of complex-coacervate core micelles with an
asymmetric corona and a slightly anisometric shape. One major drawback of all of these
approaches is the fact that the structures need to undergo micropohase segregation of the
corona in solution. Consequently, the compartmentalization is not predestined by the template
as it is the case for the template-assisted synthesis as presented herein.
Concerning non-spherical nanoscopic Janus architectures the literature is limited to
very few examples. For instance, Ishizu et al.16 synthesized amphiphilic brush-block-brush
AB-type polymer brushes by a combined grafting through and grafting from process. After
polymerizing a PEO macromonomer via ATRP, a second monomer (2-hydroxyethyl
methacrylate, HEMA) was added to form the second block. Subsequent esterification with an
ATRP initiator and an additional ATRP of HEMA rendered a Janus type polymer brush with
PEO and PHEMA side chains. The polymer brush showed an ellipsoidal shape rather than a
cylindrical one, as the degree of polymerization of the backbone was relatively low. A
successful approach towards the preparation of Janus cylinders with two hemicylinders of PS
and PMMA was reported by Liu et al.17 After crosslinking the lamella-cylinder (lc)
morphology of a suitable SBM block terpolymer and a sonication procedure, very long Janus
cylinders with compartmentalized sides could be obtained.
From a theoretical and particularly technological point of view, the remarkable
predicted surface activities of Janus structures are interesting. Binks and Fletcher2 calculated
an up to three times higher desorption energy for spherical Janus particles, as compared to
particles with a homogenous surface. In the same context, Nonomura et al.1 recently
published results of theoretical calculations about the effect of disc-shaped Janus beads on the
interfacial tension. The calculations demonstrated that the adsorption energy of Janus discs
can be higher by several orders of magnitude than for ordinary classic surfactants. The
promising predictions render Janus structures highly interesting as a novel class of future
surfactants, which is of great scientific and industrial interest.
5
Here, we present for the first time the synthesis of novel disc-shaped Janus particles,
composed of two different sides of polystyrene and poly(tert-butyl methacrylate). Using
scattering and imaging techniques, we show that the particle size can be tuned, that the
particles are of true Janus character and that they form supramolecular aggregates in good
solvents. Furthermore, the application of these particles to stabilize liquid-liquid interfaces
will be demonstrated.
Results and Discussion
Synthesis and Crosslinking
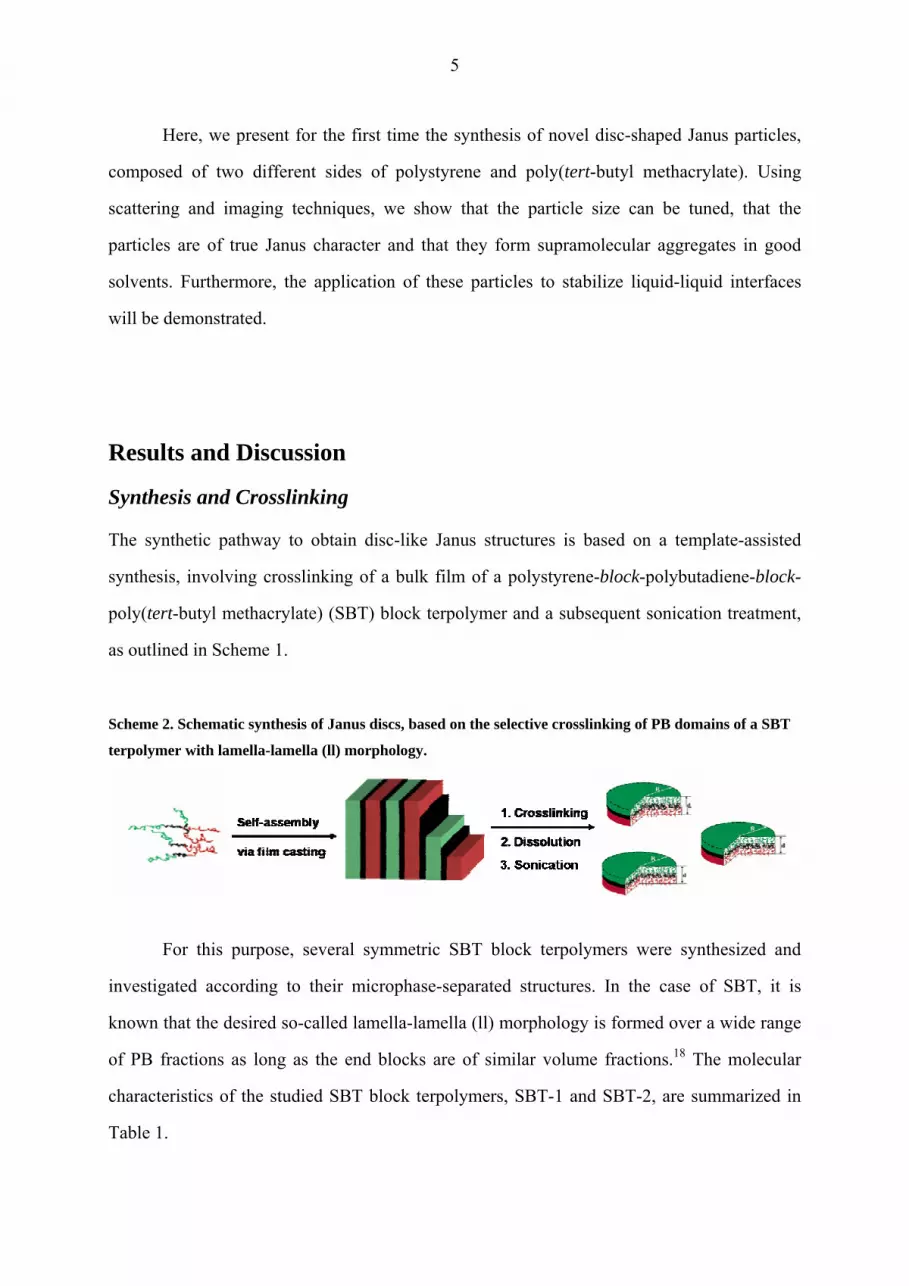
The synthetic pathway to obtain disc-like Janus structures is based on a template-assisted
synthesis, involving crosslinking of a bulk film of a polystyrene-block-polybutadiene-block-
poly(tert-butyl methacrylate) (SBT) block terpolymer and a subsequent sonication treatment,
as outlined in Scheme 1.
Scheme 2. Schematic synthesis of Janus discs, based on the selective crosslinking of PB domains of a SBT
terpolymer with lamella-lamella (ll) morphology.
For this purpose, several symmetric SBT block terpolymers were synthesized and
investigated according to their microphase-separated structures. In the case of SBT, it is
known that the desired so-called lamella-lamella (ll) morphology is formed over a wide range
of PB fractions as long as the end blocks are of similar volume fractions.18 The molecular
characteristics of the studied SBT block terpolymers, SBT-1 and SBT-2, are summarized in
Table 1.
6
Table 1. Molecular Characterization of the SBT block terpolymers.
Compositiona Block DPb 103 x Mn, MALS
(Mw/Mn) Rg,z [nm] (STD)c
SBT-1 S42B10T48 S536B246T449 133 (1.06) 18.6 (9%)
SBT-2 S45B5T50 S575B123T468 133 (1.03) 18.6 (13%)
a Indices correspond to the weight fractions (in %), as calculated from the 1H NMR spectra (S =
polystyrene, B = polybutadiene, T = tert-butyl methacrylate). b Number-average degree of
polymerization of each block. c z-average root means square radius of gyration as determined by
GPC-MALS measurements (STD = standard deviation).
The number-average molecular weights were kept constant for the two block
terpolymers, whereas the inner PB fraction was varied. It was desired to reduce the fraction of
PB, based on the assumption that less sonication energy is necessary for a thin inner
crosslinked layer in order to obtain soluble products after the crosslinking. The microphase
separation was analyzed by transmission electron microscopy (TEM) and small angle x-ray
scattering (SAXS). Both terpolymers exhibit lamellar morphologies in the bulk state with
alternating lamellae of PS and PtBMA, which are separated by a thin lamella of PB (see
figure 1).
(a) (b)
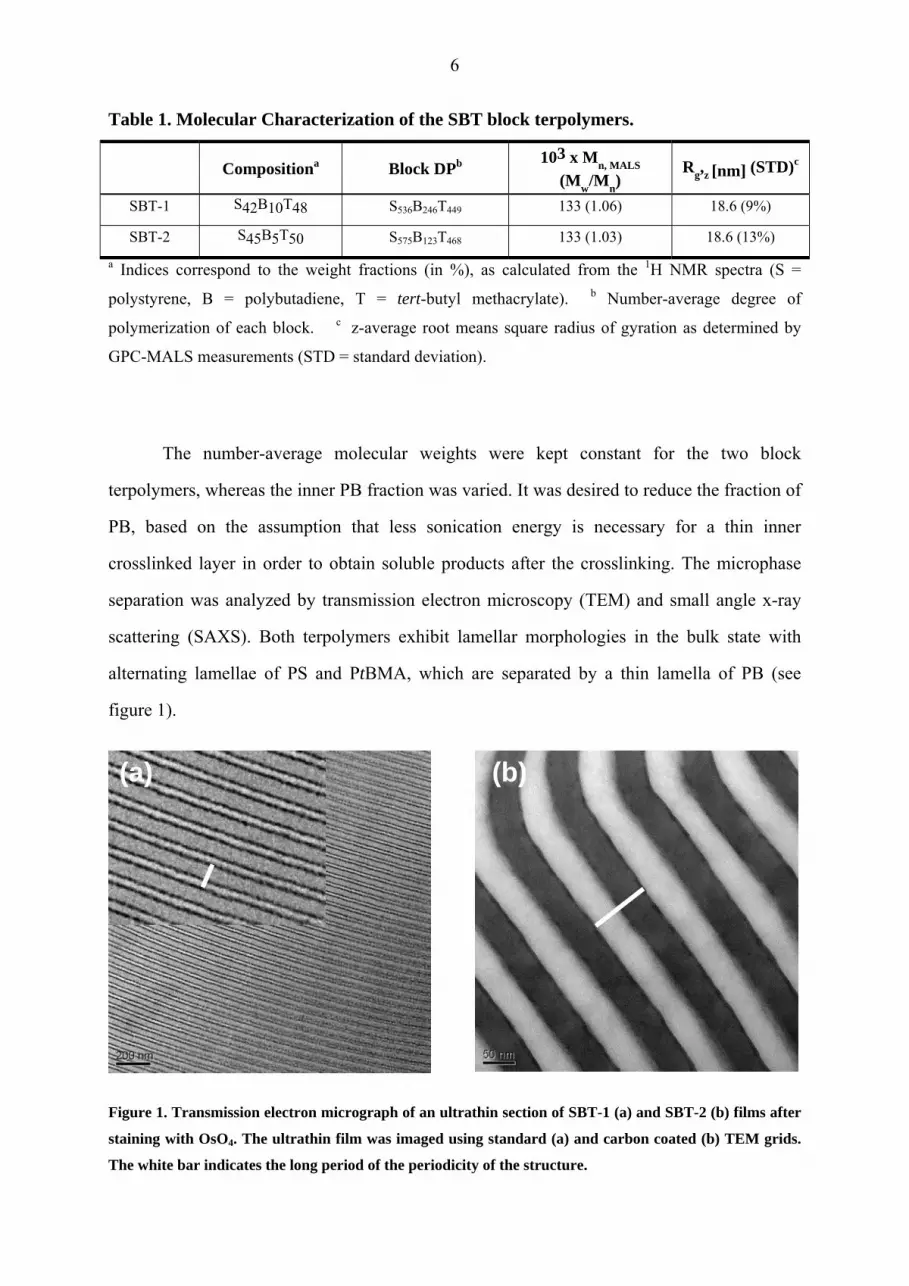
Figure 1. Transmission electron micrograph of an ultrathin section of SBT-1 (a) and SBT-2 (b) films after
staining with OsO4. The ultrathin film was imaged using standard (a) and carbon coated (b) TEM grids.
The white bar indicates the long period of the periodicity of the structure.
7
Small discontinuities within the PB lamella can be seen in the case of SBT-2 due to
the small fraction of PB of only 5 wt%. However, the lamella itself is still continuous and a
clear transition to a lamella-cylinder morphology or to a lamella-sphere morphology does not
occur. A higher periodicity of the perforations cannot be observed and thus the morphology is
best described as irregularly perforated lamella-lamella structure. A clear break-up of the PB
layer was observed in the case of a symmetric SBT block terpolymer having a fraction of only
4 wt% of PB (not shown here). The microphase-separated structure of SBT-1 can
unambiguously be assigned to a lamella-lamella (ll) morphology. Since it is known that TEM
micrographs may not always reflect the true dimensions of the long periods of the structures
due to electron-induced degradation and shrinkage of methacrylate blocks, SAXS
measurements were performed.19
0,0 0,1 0,2 0,3 0,4 0,5 0,6 0,7
300
SBT-1
700600500
400
SBT-2
200
log
(I)
q [nm-1]
100
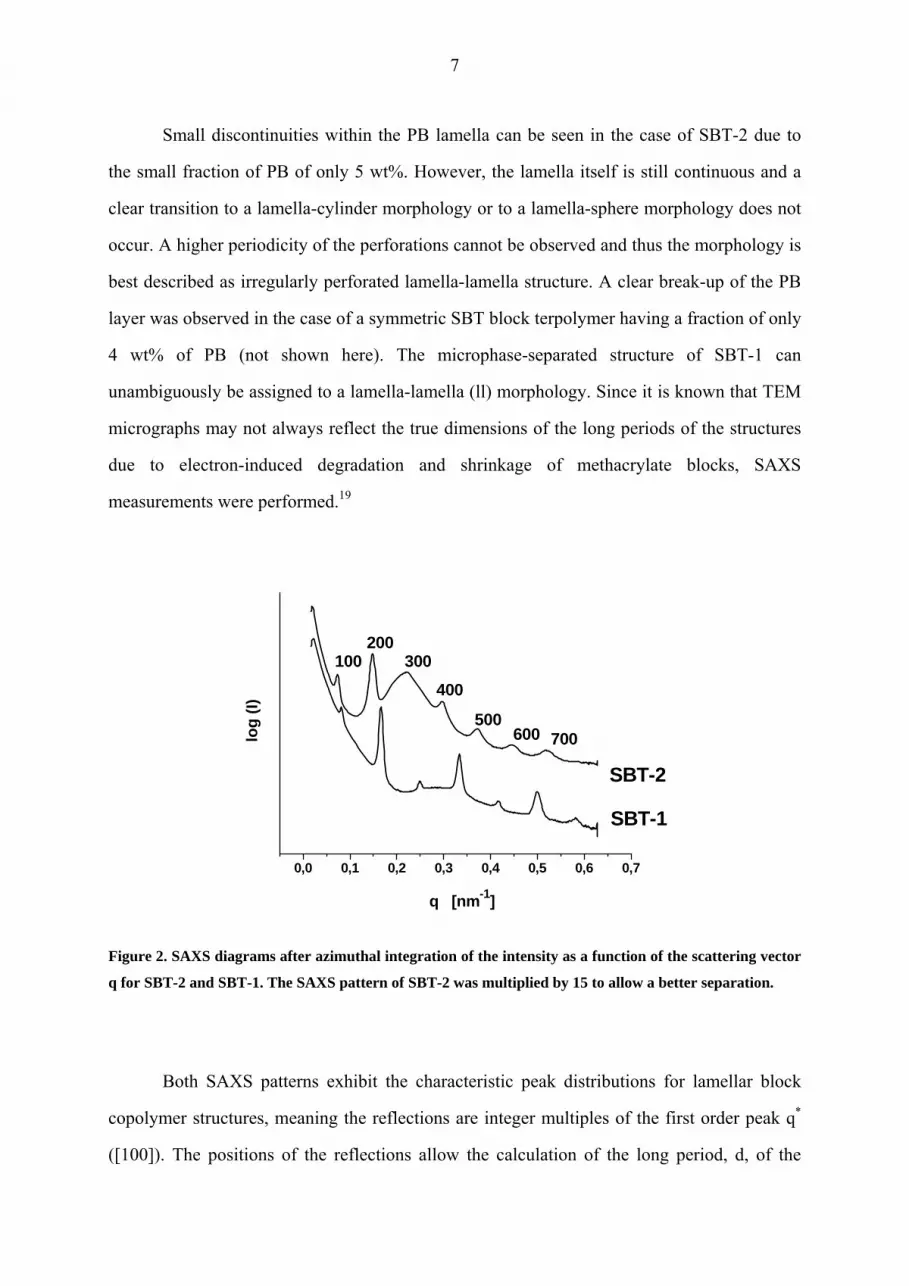
Figure 2. SAXS diagrams after azimuthal integration of the intensity as a function of the scattering vector
q for SBT-2 and SBT-1. The SAXS pattern of SBT-2 was multiplied by 15 to allow a better separation.
Both SAXS patterns exhibit the characteristic peak distributions for lamellar block
copolymer structures, meaning the reflections are integer multiples of the first order peak q*
([100]). The positions of the reflections allow the calculation of the long period, d, of the
8
structures via d = 2π/q*. The deduced values are d = 80 nm and d = 86 nm for SBT-1 and
SBT-2, corresponding to the ones which were determined by TEM investigations (SBT-1:
d = 78 nm; SBT-2: d = 86 nm), when carbon coated grids were used for the imaging process.
In conclusion, both SBT block terpolymers exhibit the desired lamella-lamella
morphology which is necessary for the preparation of the flat Janus particles.
The crosslinking of the inner polybutadiene layer preserves the preorientation of the
two outer non-centrosymmetric sides, PS and PtBMA. The desired Janus particles can be
obtained after dissolution of the crosslinked block terpolymer templates by means of
sonication. On basis of the determined long periods it is possible to estimate the sheet or disc
thickness to be around 35 – 45 nm, resembling a polymer brush-like flat particle.
Two strategies were employed for the crosslinking of the SBT block terpolymer
templates. Both “cold vulcanization” by S2Cl2, as well as radical crosslinking using AIBN -
and its optimization by the thiol-polyene procedure20-24 – have proven to be effective routes
for crosslinking polybutadiene microdomains. The success of the crosslinking strategies was
confirmed by TEM, which showed the clear persistence of the lamellar morphologies after
crosslinking (see Figure S-1, see supporting information for further details).
Sonication and Solution Properties
Dynamic Light Scattering. After successful crosslinking of the block terpolymer
templates with either of the methods mentioned above, the corresponding insoluble fractions
were subjected to a sonication procedure in order to obtain soluble Janus discs. Thus, the
solutions of swollen crosslinked gels were treated with high energy ultrasound in a
temperature-controlled cell until a semi-transparent solution was reached. The effective
crosslinking and the persistence of the chemical composition were verified after crosslinking
and sonication to coincide with the postulated mechanism of the template-assisted synthesis
towards Janus discs (see Supporting Figure S-2 for 1H-NMR characterization).
After this procedure, dynamic light scattering measurements were conducted in order
to investigate the sizes of the resulting flat Janus particles and their distribution. Since the
9
appearance of polydisperse and also multimodal distributions was expected using sonication
for homogenizing the solutions, the analysis of the normalized field auto-correlation function,
g1(t), was mainly restricted to the use of the CONTIN algorithm. The use of the classical
cumulant anaylsis25, which has the benefit of enabling an estimation of the sample
polydispersity via the second cumulant, μ2, is limited within this work. In the case of
multimodal samples or moderately to highly polydisperse samples the series expansion of the
cumulant analysis shows only a slow or no convergence at all26, leading to erroneous results.
It may only be applied for samples, whose CONTIN analysis had previously shown a
unimodal and relatively narrow distribution.
The investigation of angular dependent scattering data can be used to draw
conclusions about the actual shape of particles in solution, both in static as well as in dynamic
light scattering. An angular dependence may have several origins: large flexible molecules,
anisotropic shapes and polydispersity. For large anisotropic molecules, like rods and disc-
shaped molecules, flexion, bending and rotational diffusion occur in addition to the standard
translational diffusion. Their contributions to the scattered light are dependent on the wave
vector, q, thus inducing an angular dependence. Neither much theoretical nor much
experimental work has been reported in the case of disc-like scatterers, which is mainly due to
the limited access to free disc-like molecules. A formulation of the dynamic form factor for
the intensity of scattered light from thin discs was proposed by Fujime and Kubota and
applied to the study of membrane fragments.27-29 The theoretical expression for the average
decay rate for a disc-like scatterer with radius R is given by eq. 1.28
⎥⎦⎤
⎢⎣⎡ −′′−′+Θ+=
Γ31)()()()
4²(
² 21 qRgDDqRgRDq
(1)
Dqq
=Γ
→ ²lim
0 (2)
D, D´, D´´ and are the average translational diffusion coefficient, the diffusion
coefficients perpendicular and parallel to the disc plane, and the average rotational diffusion
coefficient of the disc, respectively. g1(qR) and g2(qR) are functions, which can be calculated
numerically and depend only on qR. The calculated values can be found elsewhere28, in the
Θ
10
limit of qR = 0, we find g1(qR) = 0 and g2(qR) = 1/3, so that Γ/q² provides the average
translational diffusion coefficient upon extrapolation to q = 0 (eq. 2). At larger qR, meaning
also larger q², additional modes are present.
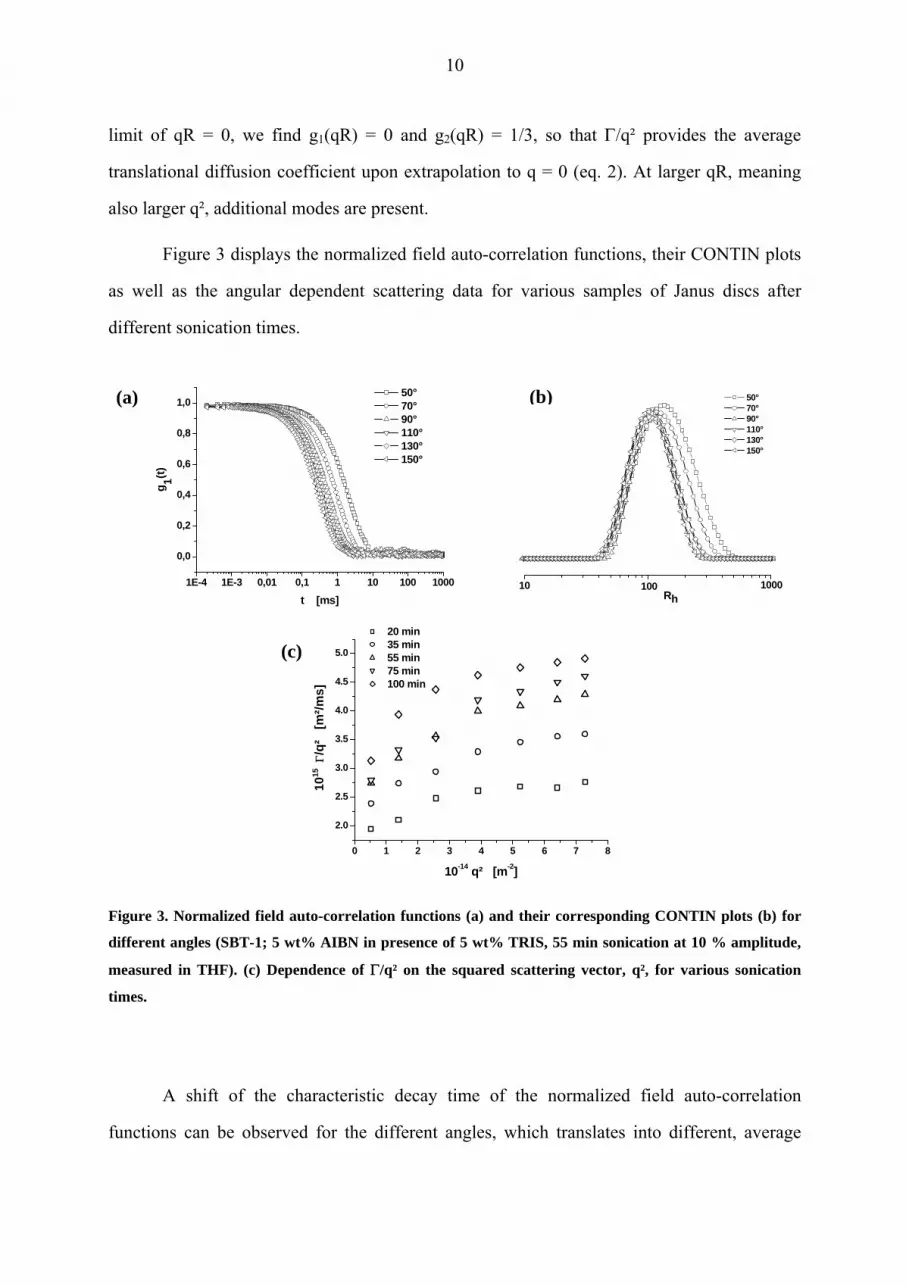
Figure 3 displays the normalized field auto-correlation functions, their CONTIN plots
as well as the angular dependent scattering data for various samples of Janus discs after
different sonication times.
1E-4 1E-3 0,01 0,1 1 10 100 1000
0,0
0,2
0,4
0,6
0,8
1,0
g 1(t)
t [ms]
50° 70° 90° 110° 130° 150°
10 1000Rh
50° 70° 90° 110° 130° 150°
100
(a) (b)
(c)
0 1 2 3 4 5 6 7 8
2.0
2.5
3.0
3.5
4.0
4.5
5.0
1015
Γ/q
² [m
²/ms]
10-14 q² [m-2]
20 min 35 min 55 min 75 min 100 min
Figure 3. Normalized field auto-correlation functions (a) and their corresponding CONTIN plots (b) for
different angles (SBT-1; 5 wt% AIBN in presence of 5 wt% TRIS, 55 min sonication at 10 % amplitude,
measured in THF). (c) Dependence of Γ/q² on the squared scattering vector, q², for various sonication
times.
A shift of the characteristic decay time of the normalized field auto-correlation
functions can be observed for the different angles, which translates into different, average
11
decay rates, Γ, diffusion coefficients or apparent hydrodynamic radii in the corresponding
CONTIN plots.
All curves presented in Figure 3c are typical of what one expects for disc-like
structures, meaning a curved increase of Γ/q² with the squared scattering vector, q². This
decrease is expected to level off slightly at higher q-values, depending of course on the values
of qR. It is worth noting that Kubota et al.27, 29 and van der Koji et al.30 found that the
polydispersity affects mainly the curvature of the plot of the angular dependent diffusion
coefficients of flexible and non-flexible disc-like scatterers, respectively. In conclusion, the
obtained scattering data strongly indicates the presence of disc-like scatterers in solution,
whose translational diffusion coefficients and apparent hydrodynamic radii can be calculated
after extrapolating to zero angle.
In order to further elucidate the size evolution in dependence of the crosslinking
method and the sonication energy and duration, DLS measurements at different stages of the
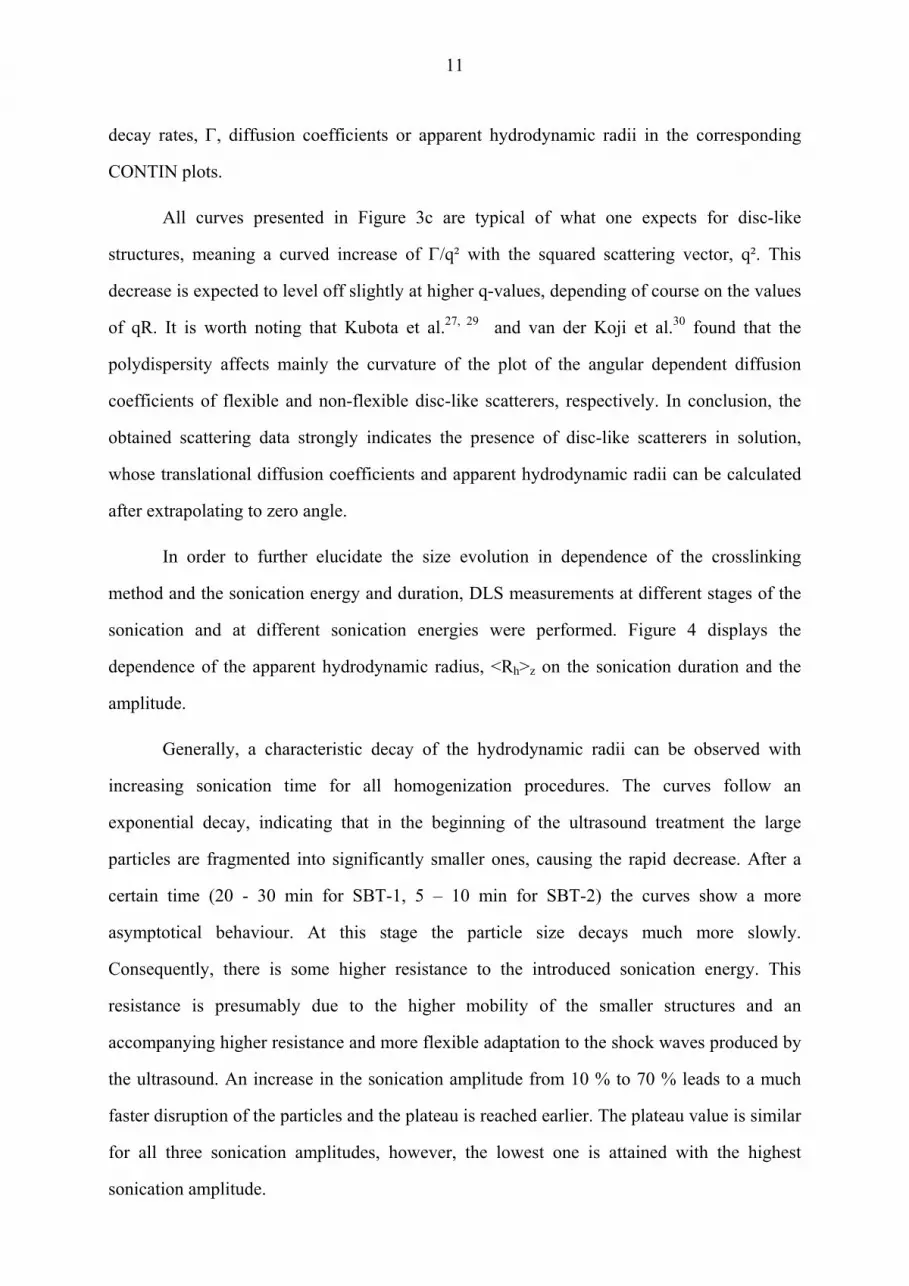
sonication and at different sonication energies were performed. Figure 4 displays the
dependence of the apparent hydrodynamic radius, <Rh>z on the sonication duration and the
amplitude.
Generally, a characteristic decay of the hydrodynamic radii can be observed with
increasing sonication time for all homogenization procedures. The curves follow an
exponential decay, indicating that in the beginning of the ultrasound treatment the large
particles are fragmented into significantly smaller ones, causing the rapid decrease. After a
certain time (20 - 30 min for SBT-1, 5 – 10 min for SBT-2) the curves show a more
asymptotical behaviour. At this stage the particle size decays much more slowly.
Consequently, there is some higher resistance to the introduced sonication energy. This
resistance is presumably due to the higher mobility of the smaller structures and an
accompanying higher resistance and more flexible adaptation to the shock waves produced by
the ultrasound. An increase in the sonication amplitude from 10 % to 70 % leads to a much
faster disruption of the particles and the plateau is reached earlier. The plateau value is similar
for all three sonication amplitudes, however, the lowest one is attained with the highest
sonication amplitude.
12
Figure 4. Dependence of <Rh>z, obtained after extrapolating the angular dependent data to q² 0, on the
sonication power and duration for differently crosslinked block terpolymer templates. Traces for SBT-1
(a) crosslinked with the thiol-polyene process (5 wt% AIBN in presence of 5 wt% TRIS) are shown for
different sonication amplitudes ( – 70%, – 30%, – 10%). (b) Size evolution for the sonication (30%
amplitude) of SBT-2 block terpolymers which were cold vulcanized with sulphur monochloride ( – 1.5
vol% S2Cl2) or crosslinked with the thiol-polyene process ( ).
The fits presented in Figure 4 were performed using a combination of two exponential
functions. The ratio of the two decay constants is about 14. Hence one may conclude a kind of
two-step mechanism for the particle disruption. The results demonstrate convincingly the
facile tunability of the size of the Janus discs. The particle sizes can be adjusted from the
micrometer range down to the nanometer level, thus covering a large mesoscopic length scale.
A more detailed look at the different curves reveals further peculiarities between the
two different block terpolymer templates. One of the characteristic differences for the
sonication of the templates, SBT-1 and SBT-2, is the fact that the former requires longer
durations and thus more energy for reaching a solution, which does not show any visible
sedimentation. For instance, 300 and 30 seconds are necessary to obtain homogeneous
solutions at a sonication amplitude of 30% for SBT-1 and SBT-2 templates, respectively.
Since the extent of crosslinking is similar for the radical crosslinking of the two block
terpolymer templates, this difference is related to the different fractions of crosslinkable
polybutadiene in the two block terpolymers. Secondly, the initial hydrodynamic radii after
reaching the solution state for the two kinds of crosslinked block terpolymers are remarkably
13
different, as can be seen from the values for the hydrodynamic radii at short sonication time
(0 – 10 min). The hydrodynamic radii for the SBT-2 based Janus particles (<Rh>z = 140 - 200
nm) are smaller by a factor of two to three than the sizes obtained for the crosslinked and
sonicated SBT-1 block terpolymers (<Rh>z = 330 - 470 nm). This can be explained
considering the very thin, partially discontinuous and not fully crosslinked polybutadiene
layer of the SBT-2 block terpolymer. Hence, this template needs much less energy and breaks
more frequently, leading to the observation of smaller disc sizes after short sonication time.
Values for the hydrodynamic radius much larger than 200 nm cannot be reached using SBT-2.
The crosslinked material starts to become soluble at sonication times around 30 s, where the
z-average hydrodynamic radius is around 140 - 200 nm, depending on the crosslinking
method. A minimum sonication duration of 30 s is yet required in order to solubilize some
bigger particles. In addition, the influence of the crosslinking agent, AIBN or S2Cl2, can be
compared in Figure 4b. The cold vulcanization leads to the observation of larger particles at
all stages of the ultrasound homogenization. This is presumably due to a larger extent of the
crosslinking in case of the cold vulcanization and reflects also the morphological changes
upon swelling the SBT-2 template in isooctane. TEM investigations had shown a
transformation of the perforated into a continuous lamella upon addition of isooctane.
Therefore, a more continuous crosslinking can take place during the cold vulcanization.
A further difference between the two block terpolymer templates can be
observed with respect to the plateau value. Whereas the hydrodynamic radius for the SBT-1
based flat Janus particle is in the region of 110 – 150 nm, it is only half of it for the SBT-2
based particles. This demonstrates that not only the size of the molecules is important to
withstand the mechanical forces of the sonication procedure, but also the thickness of the
inner crosslinked layer plays a role. If one assumes a kind of bending modulus for both kinds
of disc-like Janus particles, it is obvious that the SBT-1 based particles should have a higher
one as the higher content of polybutadiene leads to a tighter network layer within those.
Consequently, the mechanical strength and the resistance towards ultrasound are better,
explaining the higher value for the plateau.
14
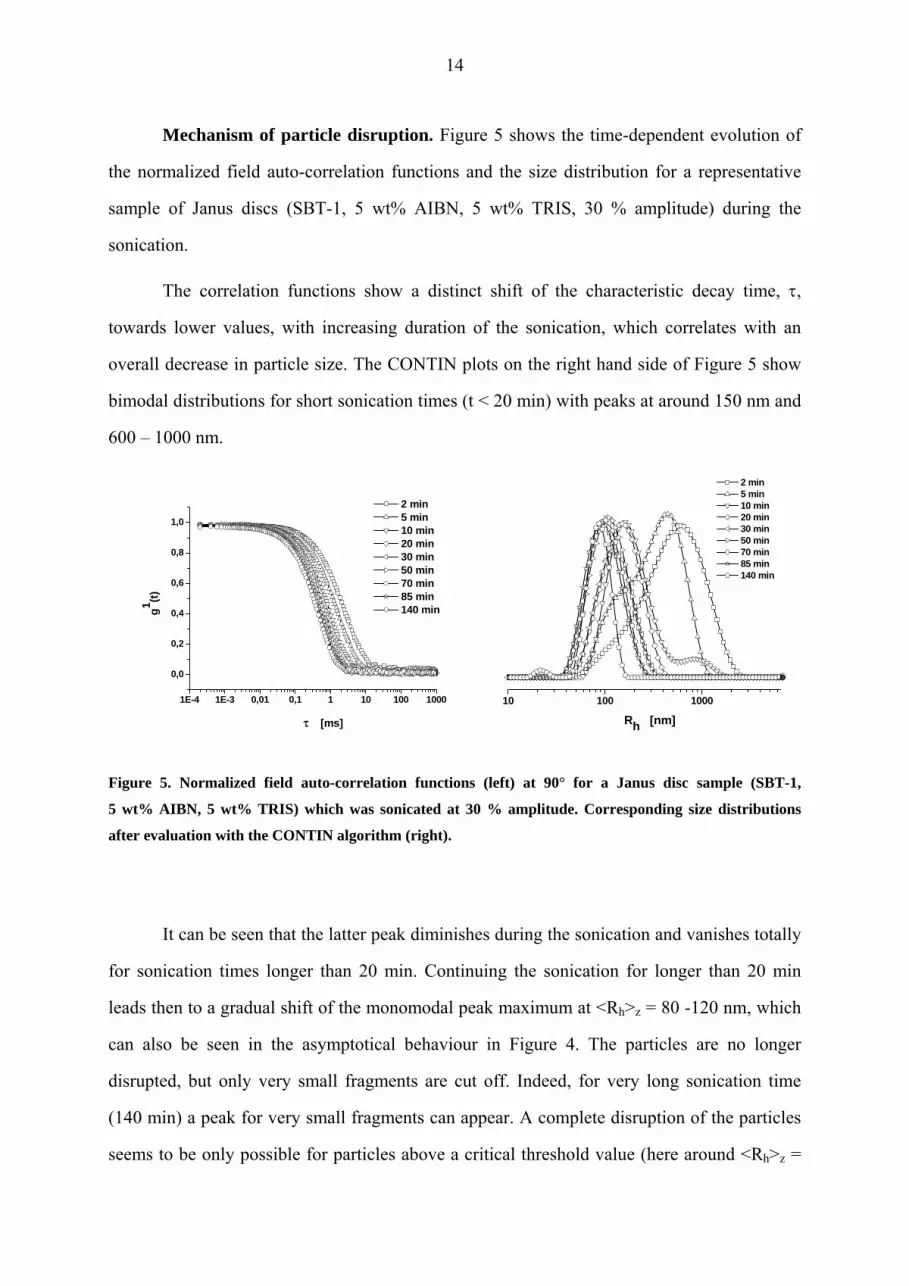
Mechanism of particle disruption. Figure 5 shows the time-dependent evolution of
the normalized field auto-correlation functions and the size distribution for a representative
sample of Janus discs (SBT-1, 5 wt% AIBN, 5 wt% TRIS, 30 % amplitude) during the
sonication.
The correlation functions show a distinct shift of the characteristic decay time, τ,
towards lower values, with increasing duration of the sonication, which correlates with an
overall decrease in particle size. The CONTIN plots on the right hand side of Figure 5 show
bimodal distributions for short sonication times (t < 20 min) with peaks at around 150 nm and
600 – 1000 nm.
Figure 5. Normalized field auto-correlation functions (left) at 90° for a Janus disc sample (SBT-1,
5 wt% AIBN, 5 wt% TRIS) which was sonicated at 30 % amplitude. Corresponding size distributions
after evaluation with the CONTIN algorithm (right).
It can be seen that the latter peak diminishes during the sonication and vanishes totally
for sonication times longer than 20 min. Continuing the sonication for longer than 20 min
leads then to a gradual shift of the monomodal peak maximum at <Rh>z = 80 -120 nm, which
can also be seen in the asymptotical behaviour in Figure 4. The particles are no longer
disrupted, but only very small fragments are cut off. Indeed, for very long sonication time
(140 min) a peak for very small fragments can appear. A complete disruption of the particles
seems to be only possible for particles above a critical threshold value (here around <Rh>z =
10 100 1000
Rh [nm]
2 min 5 min 10 min 20 min 30 min 50 min 70 min 85 min 140 min
1E-4 1E-3 0,01 0,1 1 10 100 1000
0,0
0,2
0,4
0,6
0,8
1,0
g1 (t)
τ [ms]
2 min 5 min 10 min 20 min 30 min 50 min 70 min 85 min 140 min
15
500). The loss of small fragments of the discs does certainly already occur during the early
stages of the sonication, but it is invisible as the rapid decrease due to the disruption of large
particles dominates the size distribution curves.
This observation is consistent with the above mentioned mechanism, that in the
beginning of the sonication the large particles are disrupted very quickly into significantly
smaller ones, i.e. they are divided into small parts. A splitting off of small splinters can clearly
not account for the rapid decay and the observation of a bimodal distribution of this kind.
Instead of the evolution of the size distribution determined here, a gradual shift of the peak
should occur and a peak corresponding to very small fragments should arise earlier.
Another phenomenon can be observed during continuing sonication in the
plateau region. It can be seen that the size distribution of the Janus discs narrows
progressively. Since unimodal distributions can be obtained for longer sonication times, the
cumulant analysis can be performed in order to obtain values for the polydispersity indices of
the structures. The calculated polydispersities are in the range of 1.3 – 1.1 for sonication times
between 20 and 85 min. Consequently, the size distribution is narrowed significantly and
Janus discs with moderate size distribution can be obtained by continued sonication.
Visualization
Several imaging techniques were used in order to visualize the resulting disc-like
Janus structures. The focus of these investigations was to address the issues, whether the
particles aggregate and how the actual shape looks like. In particular one might expect a back-
to-back stacking of the particles, i.e. an aggregation of two particles into dimeric
superstructures. Furthermore, it is interesting to know, whether the particles possess a more
sheet-like character with irregular edges or if they can reach a disc-like appearance.
In general, the particles show a very strong tendency to adsorb onto standard silicon
and mica substrates. It was found that the particles tend to aggregate strongly while depositing
on the surface. One driving force to create these assemblies is certainly the tendency to
16
minimize energetically unfavourable edges of the flat Janus particles. A good separation can
only be obtained when depositing the sample from an ultradilute solution.
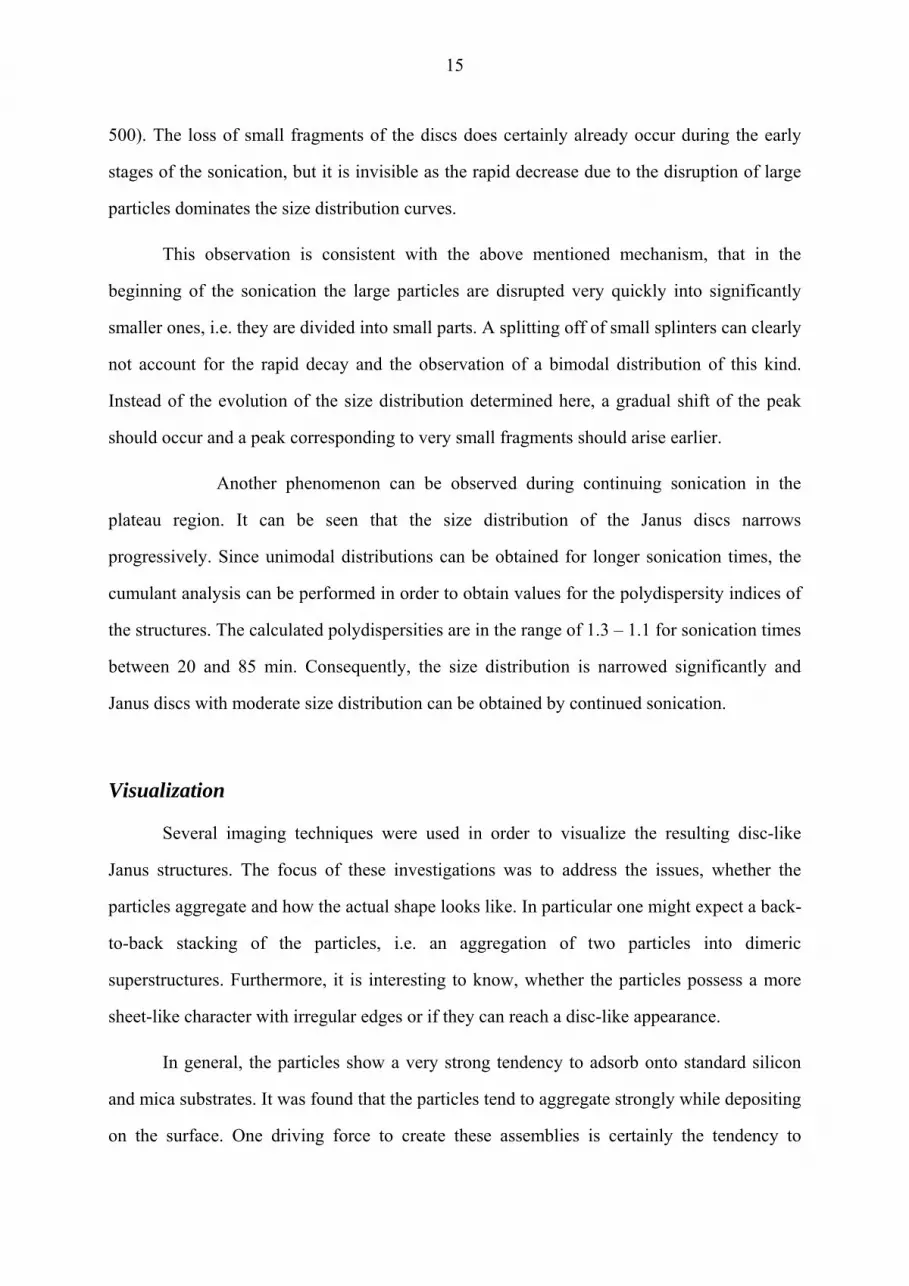
Scanning Electron Microscopy. Figure 6 shows a SEM image of flat Janus particles
deposited onto a silicon wafer from a very dilute (0.1 mg/L) CHCl3 solution.
2 µm
Figure 6. SEM images obtained from a dip-coated sample of Janus discs (c = 0.1 mg/L in CHCl3; SBT-1, 5
wt% AIBN, 5 wt% TRIS, sonication at 30% amplitude) on silicon (3 kV acceleration voltage).
Various discs tend to coalesce and form a continuous film as can be seen on the left-
hand side of the image. On the contrary, molecularly dispersed and well-separated particles
can be seen on the right-hand side. The size-distribution of these non-aggregated particles
resembles those in the solution as determined by DLS of this sample. The particles
themselves exhibit a surprisingly circular to ellipsoidal shape. On account of this observation,
more attention was drawn on the shape development of the particles on substrates, as well as
in solution. In order to gain further information about the particles, especially with respect to
17
their heights and detailed shapes, a thorough scanning force microscopy (SFM) investigation
was performed. SFM can further improve the resolution of the Janus particles and resolve
more structural details than SEM.
Scanning Force Microscopy. Several representative SFM images of disc-like Janus
structures obtained by crosslinking of the SBT templates via the cold vulcanization or the free
radical crosslinking process will be discussed in the following. To the best of our
knowledge, this is the first detailed investigation of semi-flexible flat polymeric nanoobjects
adsorbed onto surfaces by means of scanning force microscopy.
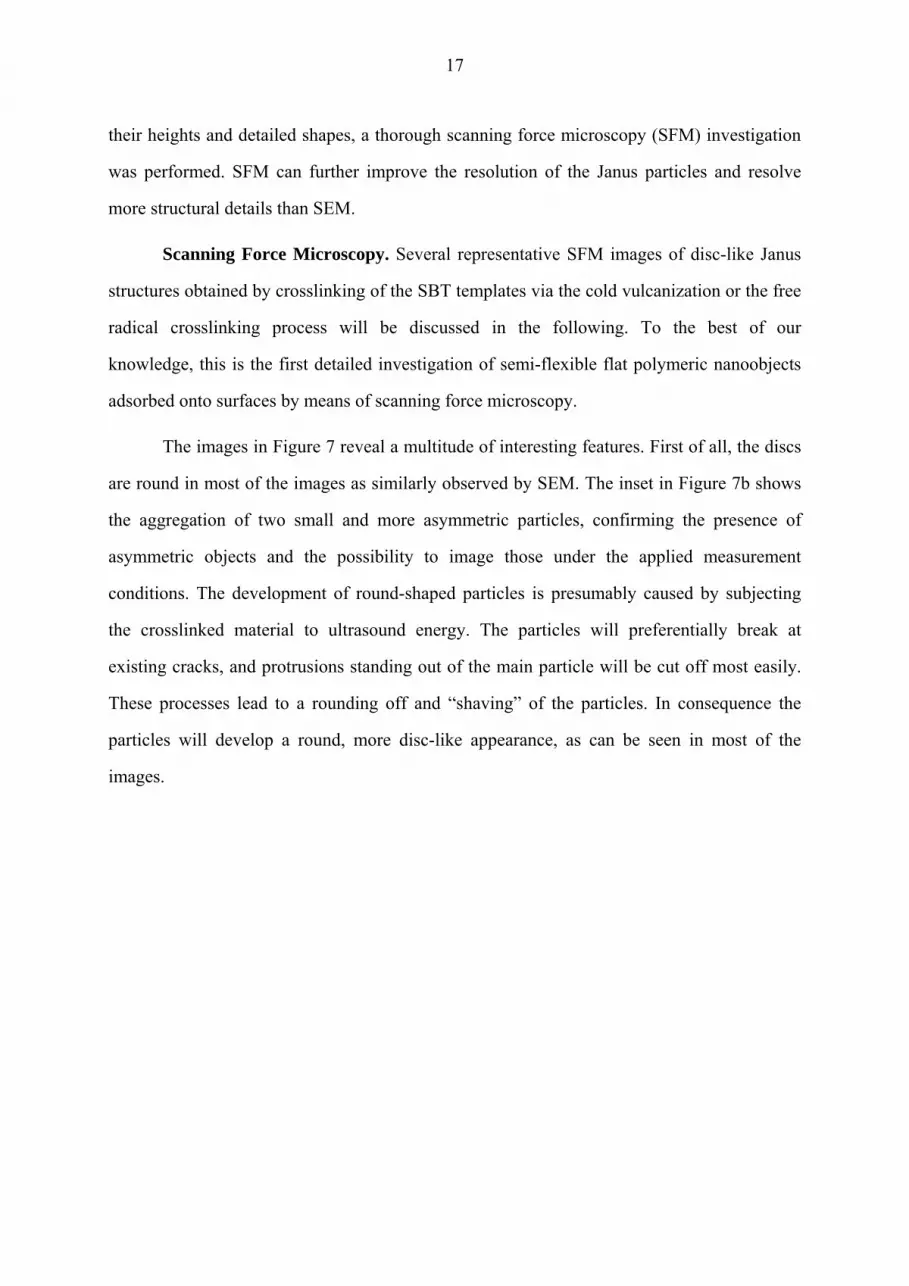
The images in Figure 7 reveal a multitude of interesting features. First of all, the discs
are round in most of the images as similarly observed by SEM. The inset in Figure 7b shows
the aggregation of two small and more asymmetric particles, confirming the presence of
asymmetric objects and the possibility to image those under the applied measurement
conditions. The development of round-shaped particles is presumably caused by subjecting
the crosslinked material to ultrasound energy. The particles will preferentially break at
existing cracks, and protrusions standing out of the main particle will be cut off most easily.
These processes lead to a rounding off and “shaving” of the particles. In consequence the
particles will develop a round, more disc-like appearance, as can be seen in most of the
images.
18
Height = 15 nm
(b)(a)
(f)(e)
(f)(e)
(c) (d)
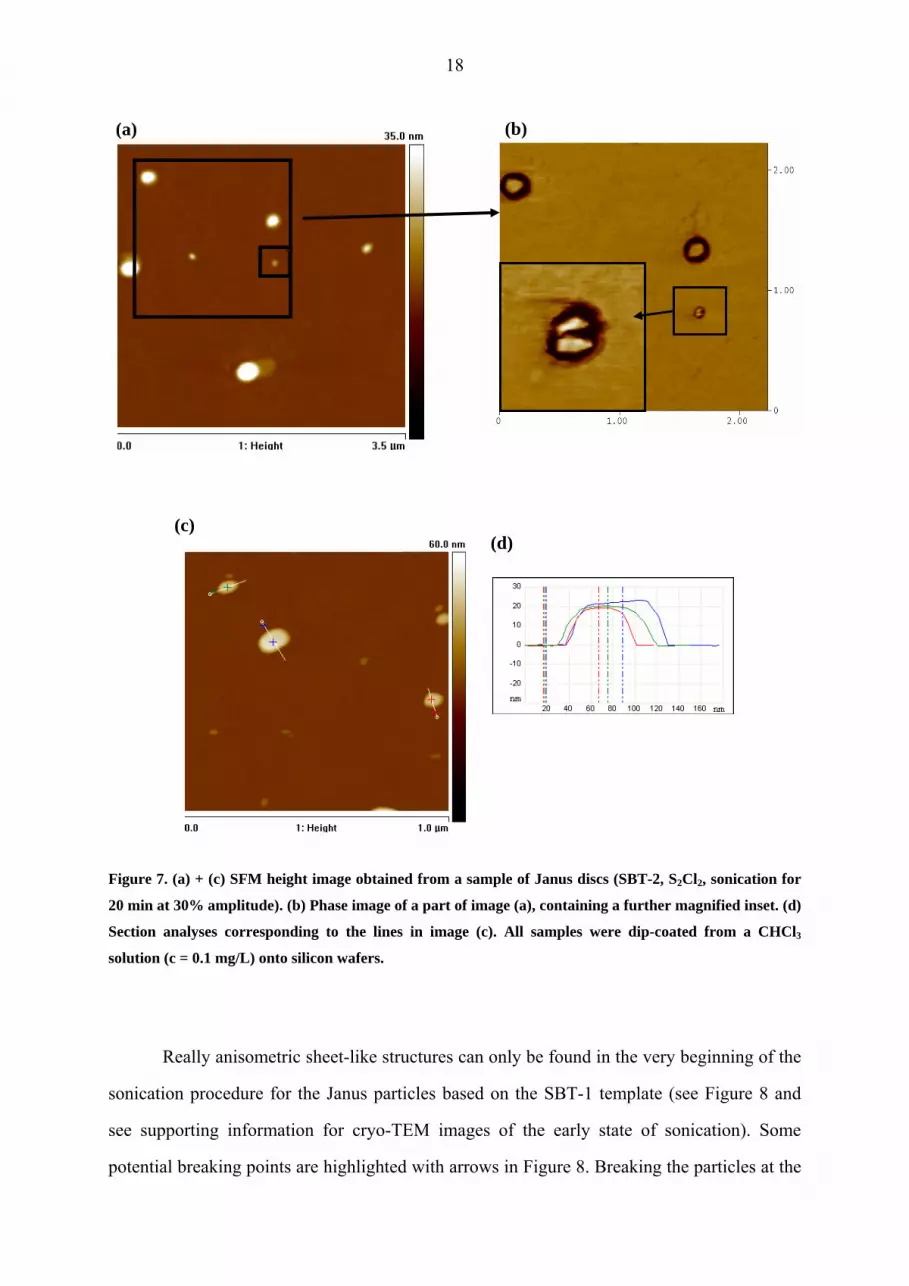
Figure 7. (a) + (c) SFM height image obtained from a sample of Janus discs (SBT-2, S2Cl2, sonication for
20 min at 30% amplitude). (b) Phase image of a part of image (a), containing a further magnified inset. (d)
Section analyses corresponding to the lines in image (c). All samples were dip-coated from a CHCl3
solution (c = 0.1 mg/L) onto silicon wafers.
Really anisometric sheet-like structures can only be found in the very beginning of the
sonication procedure for the Janus particles based on the SBT-1 template (see Figure 8 and
see supporting information for cryo-TEM images of the early state of sonication). Some
potential breaking points are highlighted with arrows in Figure 8. Breaking the particles at the
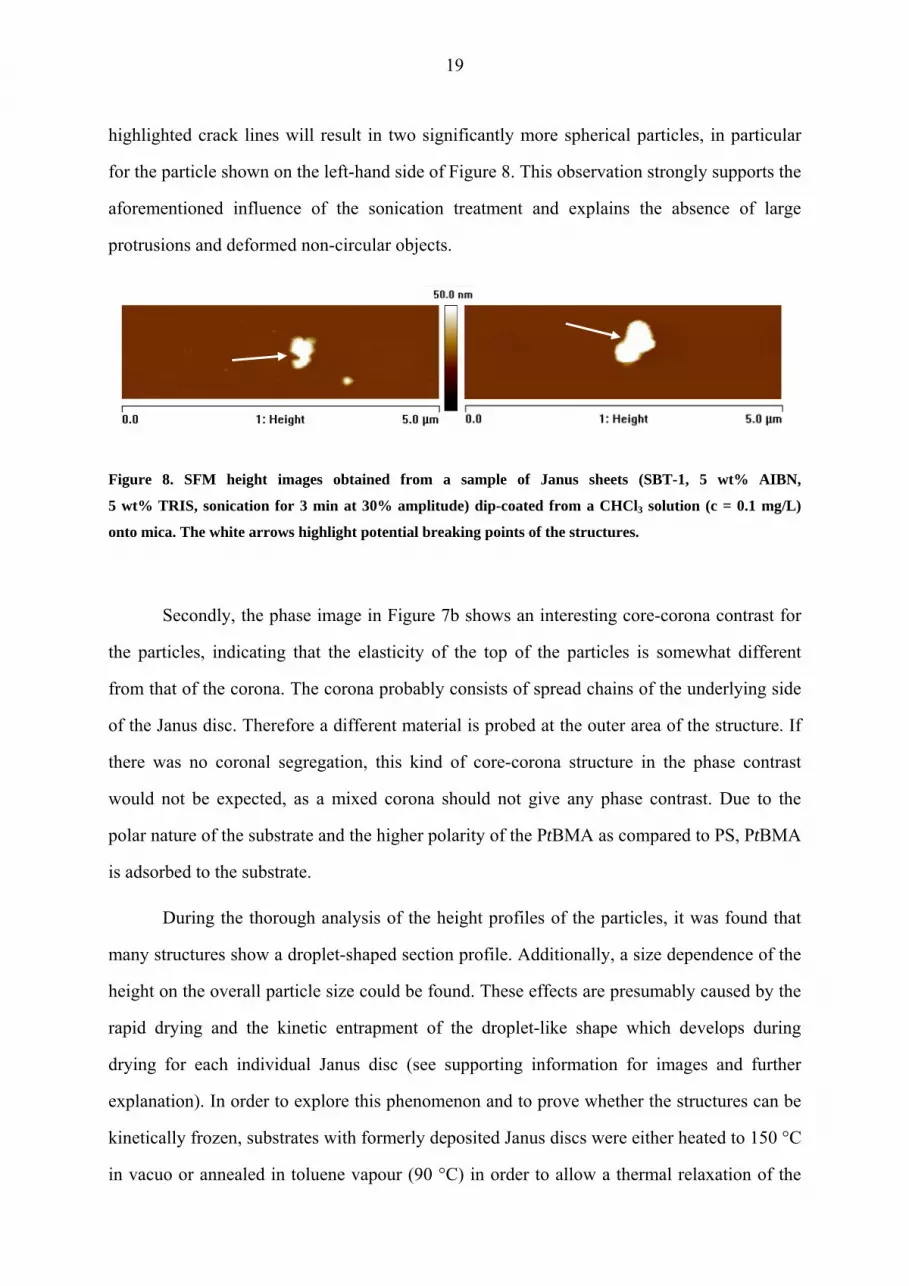
19
highlighted crack lines will result in two significantly more spherical particles, in particular
for the particle shown on the left-hand side of Figure 8. This observation strongly supports the
aforementioned influence of the sonication treatment and explains the absence of large
protrusions and deformed non-circular objects.
Figure 8. SFM height images obtained from a sample of Janus sheets (SBT-1, 5 wt% AIBN,
5 wt% TRIS, sonication for 3 min at 30% amplitude) dip-coated from a CHCl3 solution (c = 0.1 mg/L)
onto mica. The white arrows highlight potential breaking points of the structures.
Secondly, the phase image in Figure 7b shows an interesting core-corona contrast for
the particles, indicating that the elasticity of the top of the particles is somewhat different
from that of the corona. The corona probably consists of spread chains of the underlying side
of the Janus disc. Therefore a different material is probed at the outer area of the structure. If
there was no coronal segregation, this kind of core-corona structure in the phase contrast
would not be expected, as a mixed corona should not give any phase contrast. Due to the
polar nature of the substrate and the higher polarity of the PtBMA as compared to PS, PtBMA
is adsorbed to the substrate.
During the thorough analysis of the height profiles of the particles, it was found that
many structures show a droplet-shaped section profile. Additionally, a size dependence of the
height on the overall particle size could be found. These effects are presumably caused by the
rapid drying and the kinetic entrapment of the droplet-like shape which develops during
drying for each individual Janus disc (see supporting information for images and further
explanation). In order to explore this phenomenon and to prove whether the structures can be
kinetically frozen, substrates with formerly deposited Janus discs were either heated to 150 °C
in vacuo or annealed in toluene vapour (90 °C) in order to allow a thermal relaxation of the
20
particles. Both methods should provide enough energy to allow a segmental movement and a
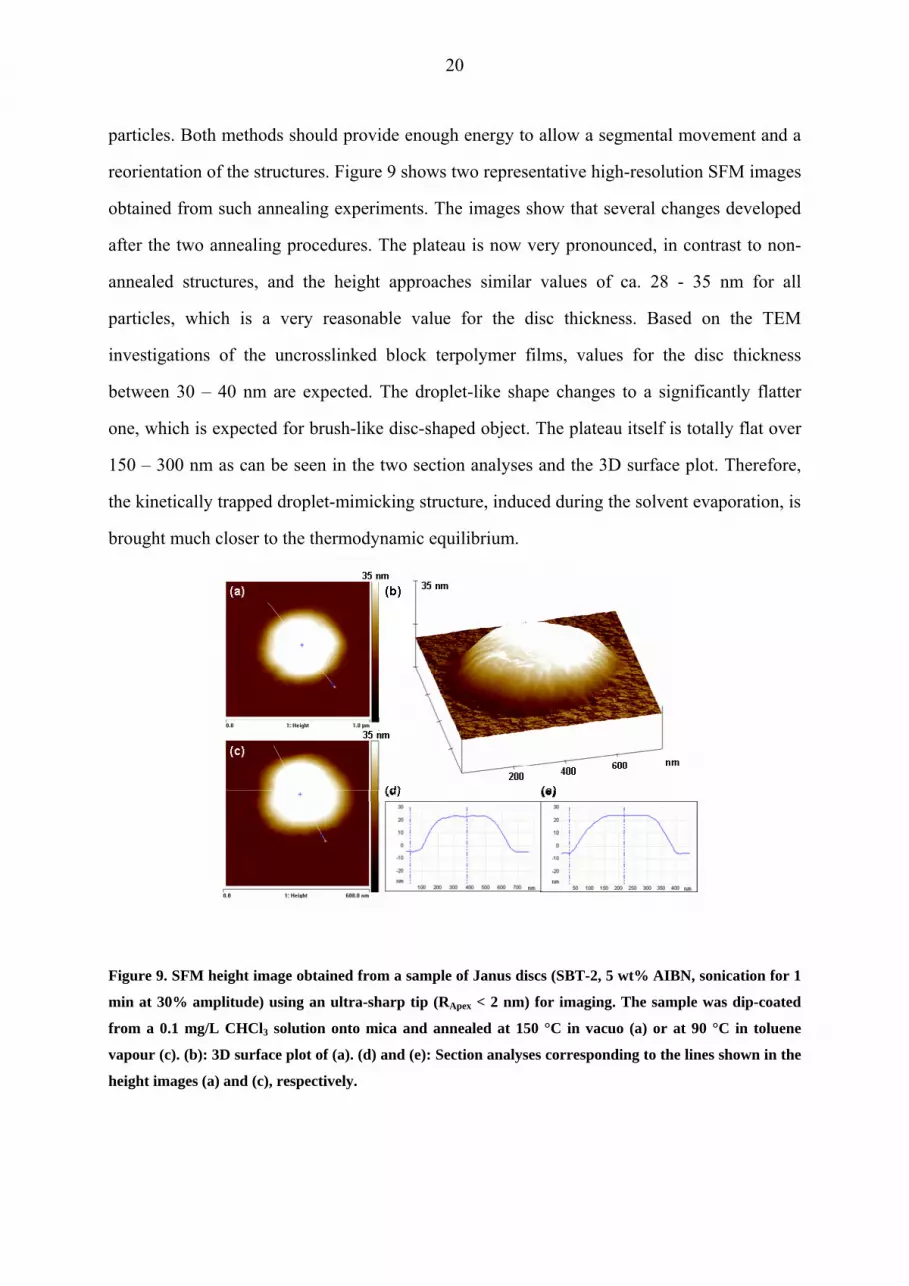
reorientation of the structures. Figure 9 shows two representative high-resolution SFM images
obtained from such annealing experiments. The images show that several changes developed
after the two annealing procedures. The plateau is now very pronounced, in contrast to non-
annealed structures, and the height approaches similar values of ca. 28 - 35 nm for all
particles, which is a very reasonable value for the disc thickness. Based on the TEM
investigations of the uncrosslinked block terpolymer films, values for the disc thickness
between 30 – 40 nm are expected. The droplet-like shape changes to a significantly flatter
one, which is expected for brush-like disc-shaped object. The plateau itself is totally flat over
150 – 300 nm as can be seen in the two section analyses and the 3D surface plot. Therefore,
the kinetically trapped droplet-mimicking structure, induced during the solvent evaporation, is
brought much closer to the thermodynamic equilibrium.
Figure 9. SFM height image obtained from a sample of Janus discs (SBT-2, 5 wt% AIBN, sonication for 1
min at 30% amplitude) using an ultra-sharp tip (RApex < 2 nm) for imaging. The sample was dip-coated
from a 0.1 mg/L CHCl3 solution onto mica and annealed at 150 °C in vacuo (a) or at 90 °C in toluene
vapour (c). (b): 3D surface plot of (a). (d) and (e): Section analyses corresponding to the lines shown in the
height images (a) and (c), respectively.
21
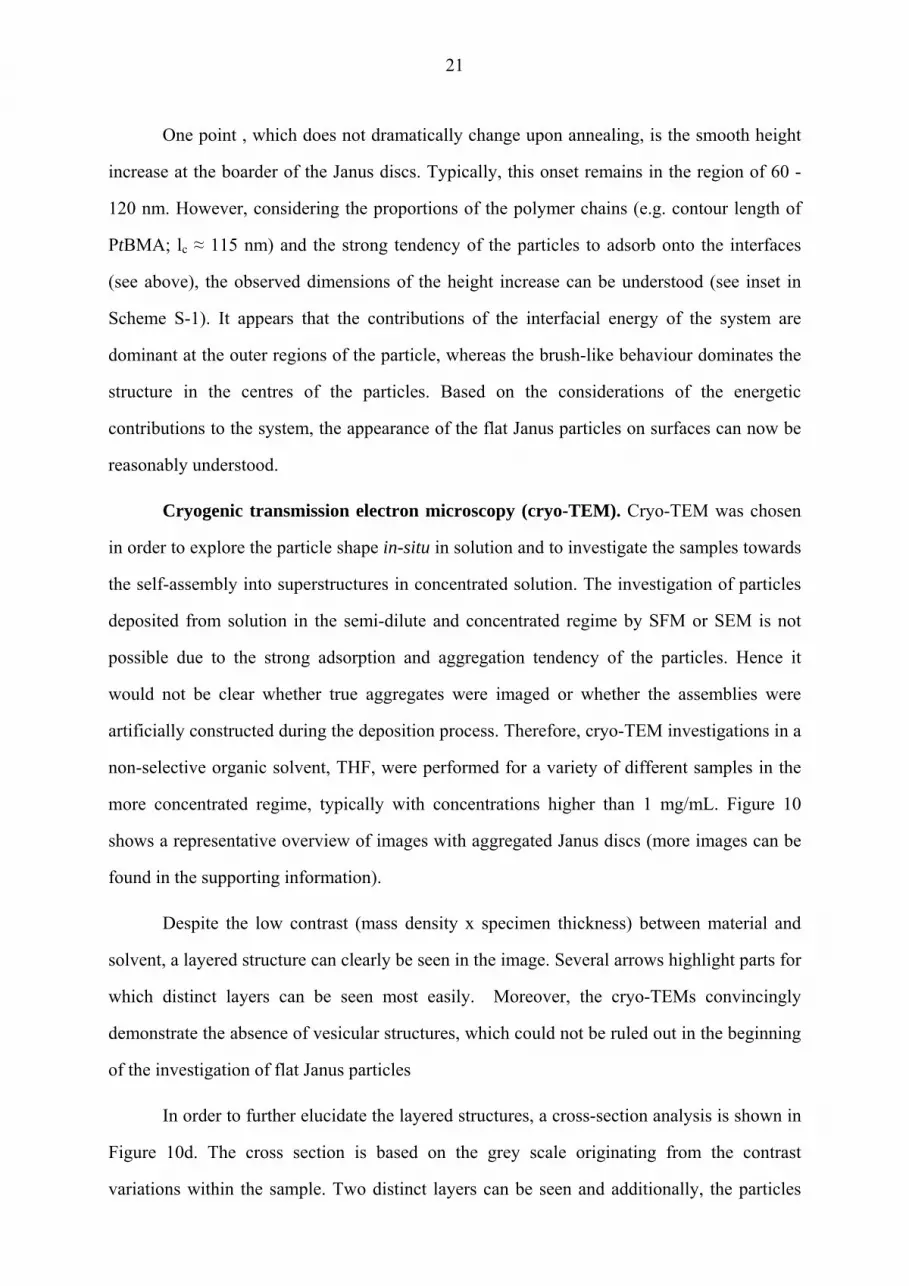
One point , which does not dramatically change upon annealing, is the smooth height
increase at the boarder of the Janus discs. Typically, this onset remains in the region of 60 -
120 nm. However, considering the proportions of the polymer chains (e.g. contour length of
PtBMA; lc ≈ 115 nm) and the strong tendency of the particles to adsorb onto the interfaces
(see above), the observed dimensions of the height increase can be understood (see inset in
Scheme S-1). It appears that the contributions of the interfacial energy of the system are
dominant at the outer regions of the particle, whereas the brush-like behaviour dominates the
structure in the centres of the particles. Based on the considerations of the energetic
contributions to the system, the appearance of the flat Janus particles on surfaces can now be
reasonably understood.
Cryogenic transmission electron microscopy (cryo-TEM). Cryo-TEM was chosen
in order to explore the particle shape in-situ in solution and to investigate the samples towards
the self-assembly into superstructures in concentrated solution. The investigation of particles
deposited from solution in the semi-dilute and concentrated regime by SFM or SEM is not
possible due to the strong adsorption and aggregation tendency of the particles. Hence it
would not be clear whether true aggregates were imaged or whether the assemblies were
artificially constructed during the deposition process. Therefore, cryo-TEM investigations in a
non-selective organic solvent, THF, were performed for a variety of different samples in the
more concentrated regime, typically with concentrations higher than 1 mg/mL. Figure 10
shows a representative overview of images with aggregated Janus discs (more images can be
found in the supporting information).
Despite the low contrast (mass density x specimen thickness) between material and
solvent, a layered structure can clearly be seen in the image. Several arrows highlight parts for
which distinct layers can be seen most easily. Moreover, the cryo-TEMs convincingly
demonstrate the absence of vesicular structures, which could not be ruled out in the beginning
of the investigation of flat Janus particles
In order to further elucidate the layered structures, a cross-section analysis is shown in
Figure 10d. The cross section is based on the grey scale originating from the contrast
variations within the sample. Two distinct layers can be seen and additionally, the particles
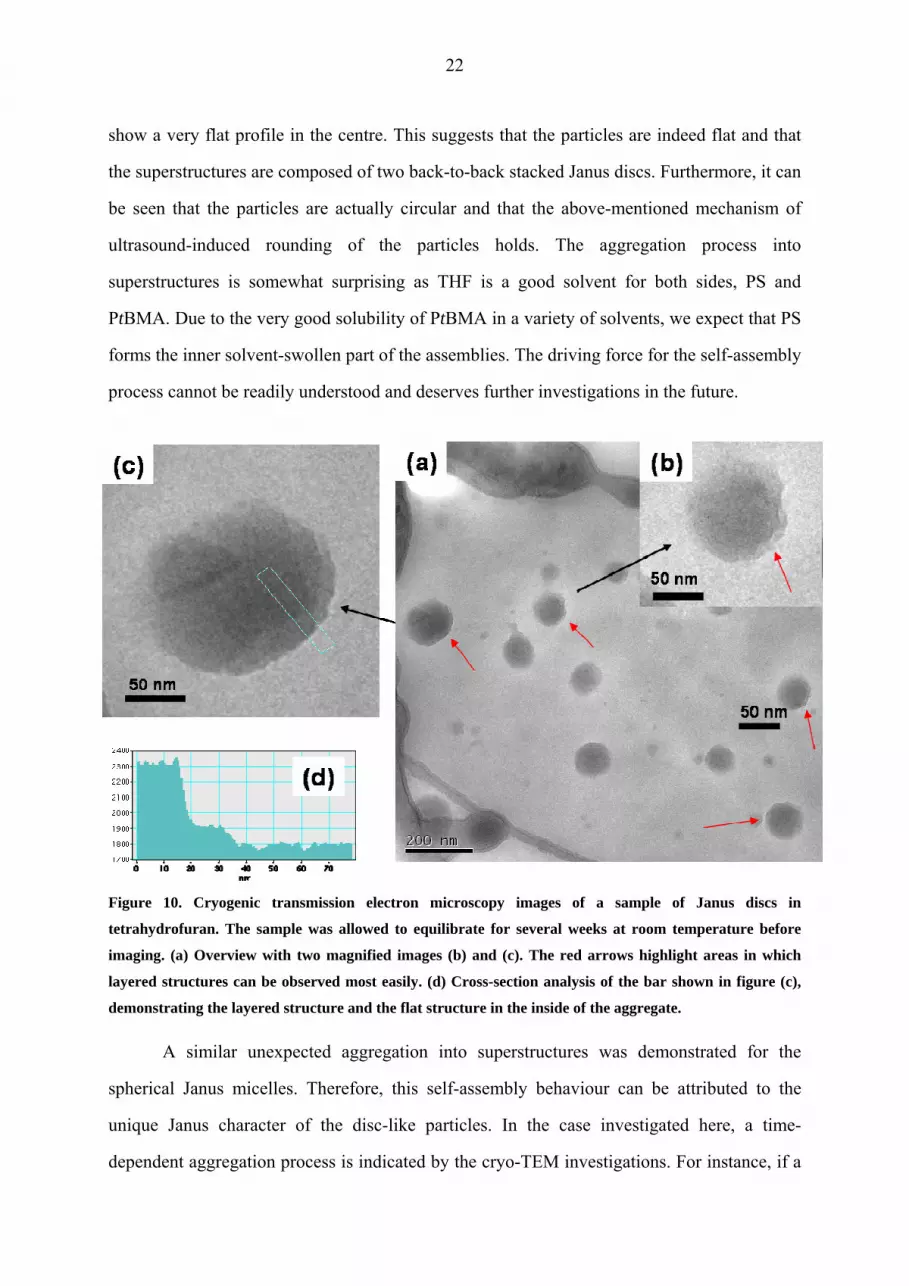
22
show a very flat profile in the centre. This suggests that the particles are indeed flat and that
the superstructures are composed of two back-to-back stacked Janus discs. Furthermore, it can
be seen that the particles are actually circular and that the above-mentioned mechanism of
ultrasound-induced rounding of the particles holds. The aggregation process into
superstructures is somewhat surprising as THF is a good solvent for both sides, PS and
PtBMA. Due to the very good solubility of PtBMA in a variety of solvents, we expect that PS
forms the inner solvent-swollen part of the assemblies. The driving force for the self-assembly
process cannot be readily understood and deserves further investigations in the future.
Figure 10. Cryogenic transmission electron microscopy images of a sample of Janus discs in
tetrahydrofuran. The sample was allowed to equilibrate for several weeks at room temperature before
imaging. (a) Overview with two magnified images (b) and (c). The red arrows highlight areas in which
layered structures can be observed most easily. (d) Cross-section analysis of the bar shown in figure (c),
demonstrating the layered structure and the flat structure in the inside of the aggregate.
A similar unexpected aggregation into superstructures was demonstrated for the
spherical Janus micelles. Therefore, this self-assembly behaviour can be attributed to the
unique Janus character of the disc-like particles. In the case investigated here, a time-
dependent aggregation process is indicated by the cryo-TEM investigations. For instance, if a
23
sample is analyzed directly after applying high shear stress via passing a 1 µm PTFE filter,
mainly molecularly dispersed Janus discs can be observed. In contrast, if the sample is
allowed to undergo an aging process (several days), the fraction of aggregates increases
significantly. Unfortunately, it is not straightforward to follow this time-dependent process,
e.g. by means of DLS or fluorescence correlation spectroscopy, as back-to-back stacking has
only a very small influence on the diffusion coefficient. This difference can hardly be
measured for a polydisperse system.
In conclusion, the cryo-TEM investigations show convincingly that the
particles exist as disc-like structures in solution. Moreover, the Janus discs tend to self-
assemble reversibly into loose solvent swollen superstructures in moderately concentrated
solution. The structure of those aggregates can be described by back-to-back stacking of the
Janus discs.
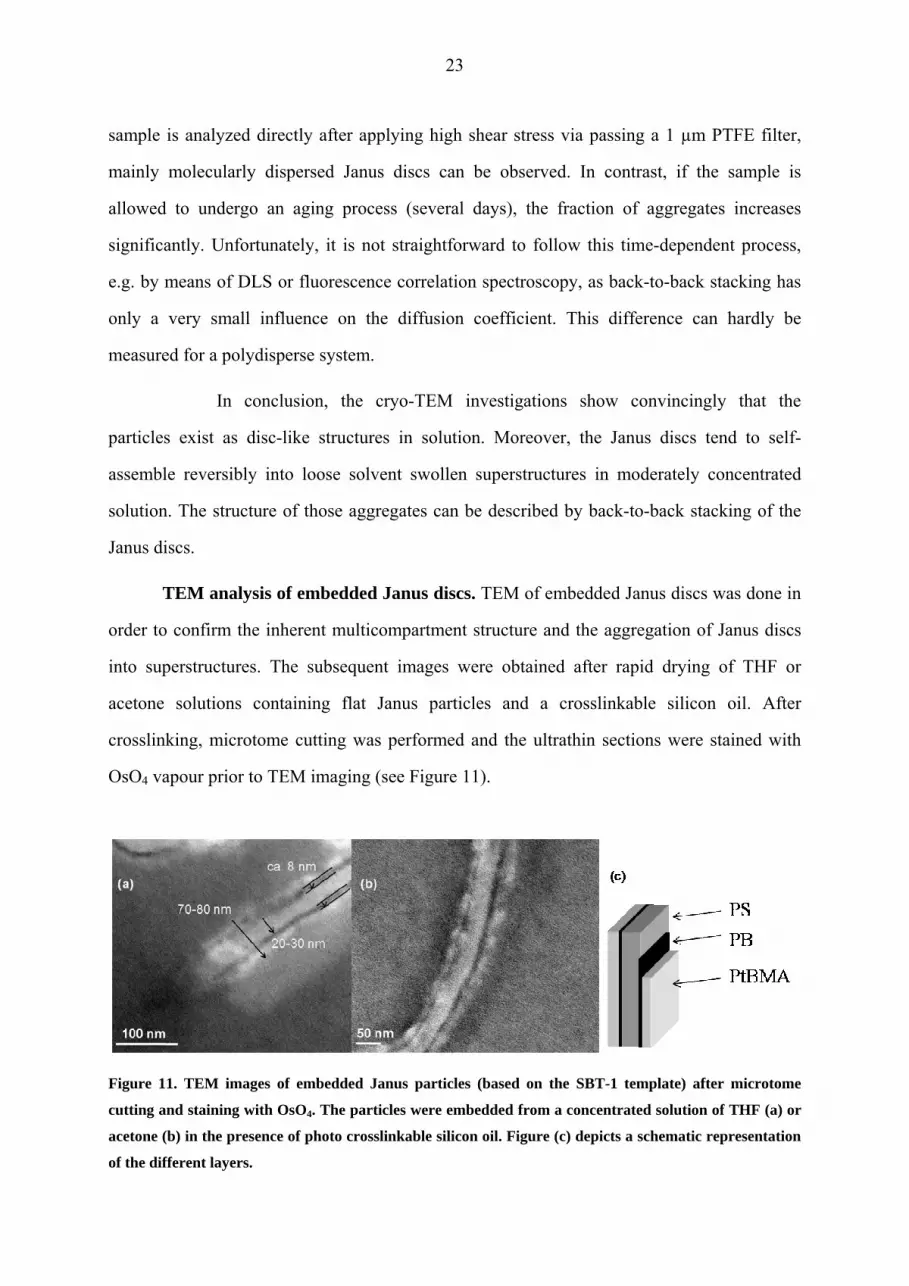
TEM analysis of embedded Janus discs. TEM of embedded Janus discs was done in
order to confirm the inherent multicompartment structure and the aggregation of Janus discs
into superstructures. The subsequent images were obtained after rapid drying of THF or
acetone solutions containing flat Janus particles and a crosslinkable silicon oil. After
crosslinking, microtome cutting was performed and the ultrathin sections were stained with
OsO4 vapour prior to TEM imaging (see Figure 11).
Figure 11. TEM images of embedded Janus particles (based on the SBT-1 template) after microtome
cutting and staining with OsO4. The particles were embedded from a concentrated solution of THF (a) or
acetone (b) in the presence of photo crosslinkable silicon oil. Figure (c) depicts a schematic representation
of the different layers.
24
Long cylindrical structures can be found within the ultrathin sections. Long cylinders
can only originate from flat structures embedded, thus confirming the presence of Janus discs
in the solution. A close look at the cross section of the structures reveals the presence of
several layers. The structure found corresponds to a back-to-back stacked assembly of the
Janus discs with the polystyrene part in the centre. This structure can be found independently
of the solvent used. Note that acetone is a non-solvent for polystyrene and thus forces
aggregation of the Janus discs into a layered assembly. Since exactly the same structure can
be found in the case of THF as solvent for the Janus discs, an aggregation of the Janus discs in
the THF solution appears most likely. The greyscales found for the different layers originate
from the elemental composition of the different parts. The thin crosslinked butadiene layer,
whose residual double bonds were stained with OsO4, appears very dark. In contrast, the inner
polystyrene layer appears much brighter as almost no OsO4 is present there. The overall
surrounding silicon oil appears slightly darker than the PS part due to the large content of
silicon. The PtBMA part at the outside is again bright, due to the decomposition of the
PtBMA in the electron beam. Thus an average contrast originating from degraded PtBMA and
surrounding silicon oil can be found.
The length scales, as indicated in image (a), correspond closely to what was found
from the initial SBT-1 template. Note that the height of the non-aggregated Janus discs was
found to be around 30 – 35 nm as imaged by SFM. Thus this value corresponds to half of the
thickness found for the back-to-back stacked assembly here. In the experiments it was not
possible to image single non-aggregated Janus dics, which is due to the fact that the
concentration of the solution is high, typically in the range of (10 – 30 mg/mL). Moreover,
during the evaporation of the solvent, the concentration increases dramatically above a critical
aggregation concentration. Non-aggregated Janus discs can only be imaged by SFM and SEM
at very high dilution.
Besides, image (a) shows the ends of two assembled structures (centre and upper right
corner). It can be seen that the assemblies are open at the end and that the polybutadiene layer
does not surround and cover the complete inner PS part.
25
In conclusion, the embedding experiments ultimately confirm a flat
multicompartment type architecture and give a strong indication for a self-assembly of the
Janus disc in THF.
Behaviour at Liquid-Liquid Interfaces
As already mentioned in the introduction, calculation show that Janus discs should
have a much stronger adsorption energy at liquid-liquid interfaces than ordinary low-
molecular weight surfactants of similar composition1 and most likely than homogenous
particles of similar size. The herein synthesized Janus discs are ideally suited for investigating
this phenomenon experimentally. The predictions for spherical Janus particles were recently
verified by Glaser et al.31 A remarkable decrease of the oil/water interfacial tension was found
upon introduction of Janus character into the surface active particles. Janus structures may
thus be of great importance as future surfactants.
One way of determining the influence of particles at liquid-liquid interfaces is to
analyze the interfacial tension isotherms of a solution of the desired material, e.g. via the
pendant drop method. Recording and analyzing the droplet shape of two immiscible liquids,
one containing the dissolved material, via a digital camera system provides the time-
dependent evolution of the change in interfacial tension. In order to allow a meaningful
comparison, the interfacial tension isotherms for the two block terpolymers, SBT-2 and SBT-
1, dissolved in cyclohexane, were determined at the immiscible phase boundary of water and
cyclohexane. Upon addition of the block terpolymer to the cyclohexane solution the
interfacial tension between cyclohexane and water is decreased from ca. 51 mN/m to ca. 30
mN/m. The determined interfacial tension of the pure cyclohexane/water system agrees well
with the literature values.32, 33 The values for both block terpolymers are very close and hence
it can be concluded that the inner fraction of polybutadiene plays only a minor role for the
reduction of the interfacial tension. In order to see an effect of the crosslinked architectures,
the interfacial tension isotherms of the Janus discs are compared to the ones obtained for the
block terpolymer solutions Figure 12.
26
(a) (b)
0 5000 10000 15000 20000 25000 30000 3500028
30
32
34
0 1000 2000 3000 4000 500028
30
32
34 SBT-9 JANUS - SBT-2 2min - 30%
σ [m
N/m
]
t [s]
SBT-2 JANUS - SBT-2 2 min - 30%
σ [m
N/m
]
t [s]0 10000 20000 30000 40000 50000 60000 70000
25
26
27
28
29
30
31
t [s]
σ [m
N/m
]
SBT-1Janus SBT-1 10 min - 30%Janus SBT-1 10 min - 70%
Rh = 130 nm Rh = 300 nm, bimodal
Rh = 252 nm
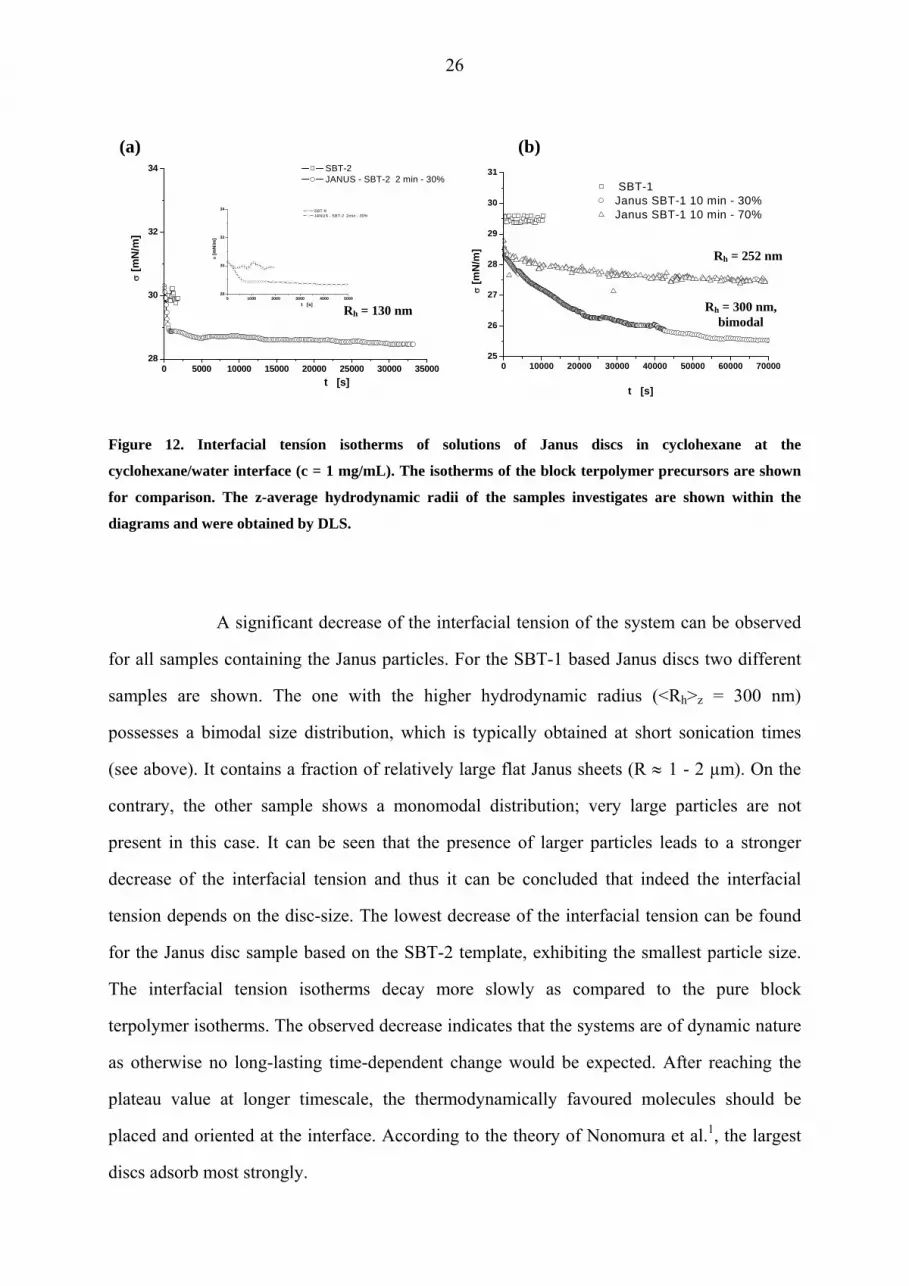
Figure 12. Interfacial tensíon isotherms of solutions of Janus discs in cyclohexane at the
cyclohexane/water interface (c = 1 mg/mL). The isotherms of the block terpolymer precursors are shown
for comparison. The z-average hydrodynamic radii of the samples investigates are shown within the
diagrams and were obtained by DLS.
A significant decrease of the interfacial tension of the system can be observed
for all samples containing the Janus particles. For the SBT-1 based Janus discs two different
samples are shown. The one with the higher hydrodynamic radius (<Rh>z = 300 nm)
possesses a bimodal size distribution, which is typically obtained at short sonication times
(see above). It contains a fraction of relatively large flat Janus sheets (R ≈ 1 - 2 µm). On the
contrary, the other sample shows a monomodal distribution; very large particles are not
present in this case. It can be seen that the presence of larger particles leads to a stronger
decrease of the interfacial tension and thus it can be concluded that indeed the interfacial
tension depends on the disc-size. The lowest decrease of the interfacial tension can be found
for the Janus disc sample based on the SBT-2 template, exhibiting the smallest particle size.
The interfacial tension isotherms decay more slowly as compared to the pure block
terpolymer isotherms. The observed decrease indicates that the systems are of dynamic nature
as otherwise no long-lasting time-dependent change would be expected. After reaching the
plateau value at longer timescale, the thermodynamically favoured molecules should be
placed and oriented at the interface. According to the theory of Nonomura et al.1, the largest
discs adsorb most strongly.
27
The presented results of the effect of Janus discs on the interfacial tension of a liquid-
liquid interface are remarkable and one of the unique features predicted for disc-like Janus
particles, in particular under the consideration that the particles themselves are only slightly
amphiphilic. Even stronger changes are expected for strongly amphiphilic Janus discs. This
novel class of particles is thus of high interest for studies concerning emulsion stabilization,
technological formulations or encapsulation of molecules.
Conclusions
We have been able to synthesize for the first time large sheet-like or disc-like Janus
particles, consisting of a crosslinked inner polybutadiene layer and two phase-segregated
sides of polystyrene and poly(tert-butyl methacrylate). The particles can be obtained via a
simple template-assisted approach and their size can be tuned from the mesoscopic level to
the nanometer scale, typically in the range of several micrometers to hundred nanometers. The
size distribution of the Janus discs narrows progressively to moderate values with prolonged
homogenization.
A detailed SFM investigation of these novel flat, brush-like polymeric nanoparticles
has given a deep insight into the surface structures formed. The appearance of the particles
adsorbed onto substrates is governed by a strong interplay between the brush-like behaviour
and the interfacial tensions of the system. Due to the introduced ultrasound energy, the sheet-
like particles get “shaved” and exhibit circular disc-like outer sides. By means of cryo-TEM,
which was applied for the first time in THF, it was possible to visualize the aggregation
behaviour of the Janus discs in-situ. The flat particles self-assemble into superstructures via
back-to-back stacking even in good solvents. The aggregation into superstructures and the
inherent multicompartment character of the structures could be demonstrated by embedding
the Janus discs into a photo-crosslinkable silicon oil and subsequent direct TEM observation
of the cross section after microtome cutting and staining.Finally, the effect of Janus discs on
the interfacial tension of liquid-liquid interfaces (oil/water) was highlighted, serving as a
model system for emulsion stabilization. The Janus particles show a distinct and significant
28
decrease of the interfacial tension as compared to their linear uncrosslinked block terpolymer
precursors and are therefore more efficient stabilizing agents. The decrease is most
pronounced for the Janus discs with the largest diameters.
Acknowledgments. The authors would like to thank Georg Krausch, Robert Magerle
and Nicole Glaser for fruitful discussions as well as Thorsten Goldacker for the synthesis of
SBT-2. Furthermore, we are indebted to Astrid Göldel and Clarissa Abetz for numerous TEM
and SEM images. Felix Schacher is acknowledged for the microtome cutting. This work was
supported by DFG within the ESF SONS-AMPHI Program and by the EU within the Marie
Curie RTN POLYAMPHI. A. W. thanks the Bavarian Graduate Support Program for a
scholarship.
Supporting Information Available. Experimental Part, NMR characterization, SFM
images before annealing, evidence for back-to-back stacking by cryo-TEM and SFM, cryo-
TEM images at low sonication times. This material is available free of charge at
http://pubs.acs.org.
References 1. Nonomura, Y.; Komura, S.; Tsujii, K., Langmuir 2004, 20, (26), 11821-11823.
2. Binks, B. P.; Fletcher, P. D. I., Langmuir 2001, 17, (16), 4708-4710.
3. Cates, M. E.; Poon, W. C. K.; Clegg, P. S.; Egelhaaf, S. U., 2005-GB2577, 2006003403, 20050701., 2006.
4. Vanakaras, A. G., Langmuir 2006, 22, (1), 88-93.
5. Roh, K.-H.; Martin, D. C.; Lahann, J., Nature Materials 2005, 4, (10), 759-763.
6. Perro, A.; Reculusa, S.; Ravaine, S.; Bourgeat-Lami, E.; Duguet, E., Journal of Materials Chemistry 2005, 15, (35-36), 3745-3760.
7. Li, Z.; Lee, D.; Rubner, M. F.; Cohen, R. E., Macromolecules 2005, 38, (19), 7876-7879.
8. Shepherd, R. F.; Conrad, J. C.; Rhodes, S. K.; Link, D. R.; Marquez, M.; Weitz, D. A.; Lewis, J. A., Langmuir 2006, 22, 8618-8622.
9. Erhardt, R.; Böker, A.; Zettl, H.; Kaya, H.; Pyckhout-Hintzen, W.; Krausch, G.; Abetz, V.; Müller, A. H. E., Macromolecules 2001, 34, (4), 1069-1075.
29
10. Xu, H.; Erhardt, R.; Abetz, V.; Müller, A. H. E.; Gödel, W. A., Langmuir 2001, 17, (22), 6787-6793.
11. Erhardt, R.; Zhang, M.; Böker, A.; Zettl, H.; Abetz, C.; Frederik, P.; Krausch, G.; Abetz, V.; Müller, A. H. E., Journal of the American Chemical Society 2003, 125, (11), 3260-3267.
12. Sfika, V.; Tsitsilianis, C.; Kiriy, A.; Gorodyska, G.; Stamm, M., Macromolecules 2004, 37, (25), 9551-9560.
13. Kiriy, A.; Gorodyska, G.; Minko, S.; Stamm, M.; Tsitsilianis, C., Macromolecules 2003, 36, (23), 8704-8711.
14. Schrage, S.; Sigel, R.; Schlaad, H., Macromolecules 2003, 36, (5), 1417-1420.
15. Voets, I. K.; de Keizer, A.; De Waard, P.; Frederik, P. M.; Bomans, P. H. H.; Schmalz, H.; Walther, A.; King, S. M.; Leermakers, F. A. M.; Cohen Stuart, M. A., Angew. Chem. Int. Ed. 2006, 45, 6673-6676.
16. Ishizu, K.; Satoh, J.; Toyoda, K.; Sogabe, A., Journal of Materials Science 2004, 39, (13), 4295-4300.
17. Liu, Y.; Abetz, V.; Müller, A. H. E., Macromolecules 2003, 36, (21), 7894-7898.
18. Goldacker, T., Dissertation, University Bayreuth, Bayreuth, 1999.
19. Breiner, U.; Krappe, U.; Thomas, E. L.; Stadler, R., Macromolecules 1998, 31, (1), 135-141.
20. Jacobine, A. F., Radiation Curing in Polymer Science and Technology. Elsevier Applied Science: London, 1993; Vol. 3, p 219.
21. Decker, C., Progress in Polymer Science 1996, 21, (4), 593-650.
22. Decker, C.; Nguyen Thi Viet, T., Macromolecular Chemistry and Physics 1999, 200, (8), 1965-1974.
23. Decker, C.; Nguyen Thi Viet, T., Macromolecular Chemistry and Physics 1999, 200, (2), 358-367.
24. Decker, C.; Nguyen Thi Viet, T.; Hien Le, X., Macromolecular Symposia 1996, 102, 63-71.
25. Koppel, D. E., Journal of Chemical Physics 1972, 57, (11), 4814-4820.
26. Brown, J. C.; Pusey, P. N., Journal of Chemical Physics 1975, 62, (3), 1136-1144.
27. Marque, J.; Ikegami, A.; Kubota, K.; Tominaga, Y.; Fujime, S., Biophysical Journal 1986, 50, (1), 139-144.
28. Fujime, S.; Kubota, K., Biophysical Chemistry 1985, 23, (1-2), 1-13.
29. Kubota, K.; Tominaga, Y.; Fujime, S.; Otomo, J.; Ikegami, A., Biophysical Chemistry 1985, 23, (1-2), 15-29.
30. van der Kooij, F. M.; Philipse, A. P.; Dhont, J. K. G., Langmuir 2000, 16, (12), 5317-5323.
31. Glaser, N.; Adams, D. J.; Böker, A.; Krausch, G., Langmuir 2006, 22, (12), 5227-5229.
32. Landfester, K.; Willert, M.; Antonietti, M., Macromolecules 2000, 33, (7), 2370-2376.
33. d'Ans, J.; Lax, E., Taschenbuch für Chemiker und Physiker. Springer: Berlin, 1992.
30
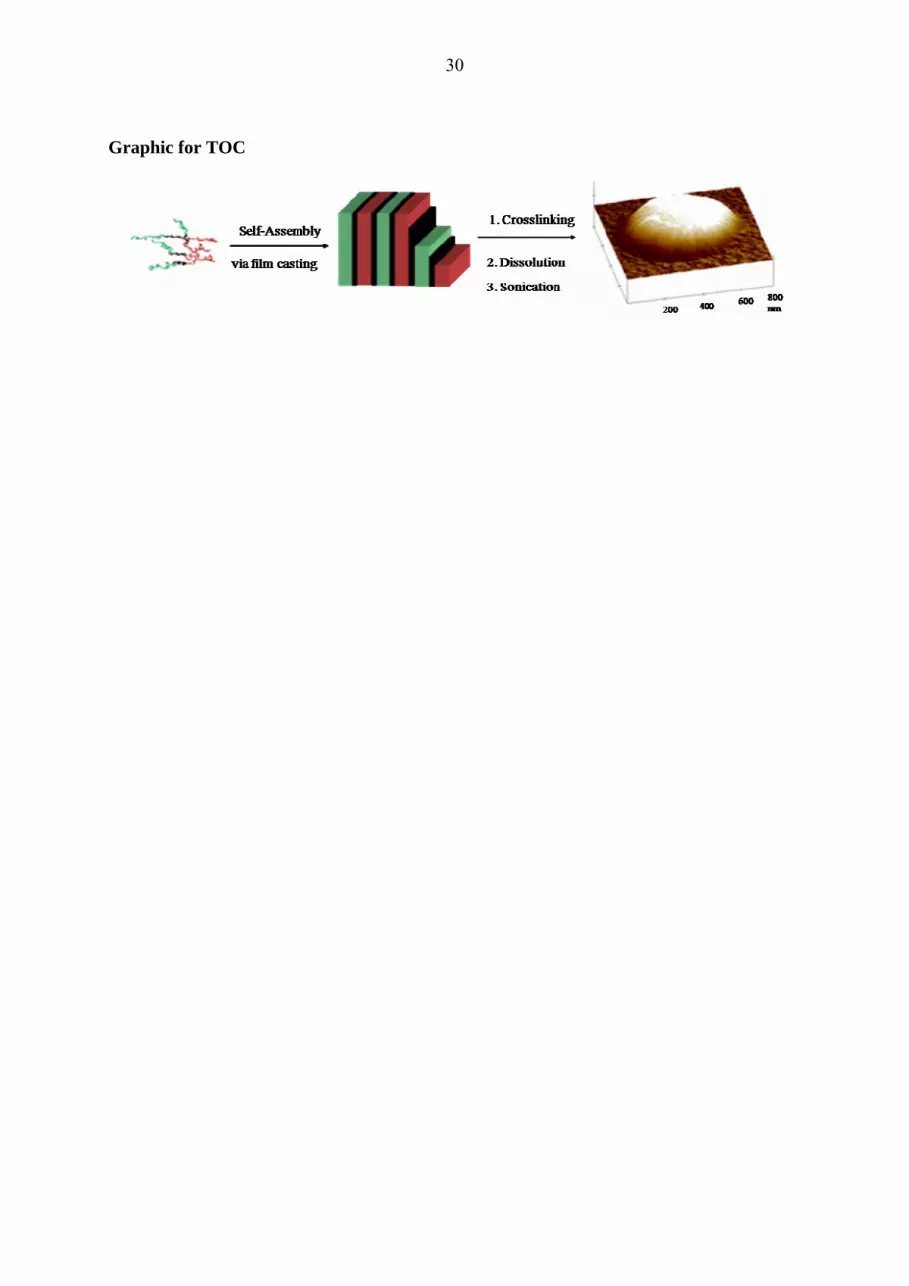
Graphic for TOC