ivory tower versus corporate lab: an empirical study of basic research and appropriability
TRANSCRIPT
NBER WORKING PAPER SERIES
IVORY TOWER VERSUS CORPORATE LAB:AN EMPIRICAL STUDY OF BASIC
RESEARCH AND APPROPRIABILITY
Manuel Trajtenberg
Rebecca Henderson
Adam Jaffe
Working Paper No. 4146
NATIONAL BUREAU OF ECONOMIC RESEARCH1050 Massachusetts Avenue
Cambridge, MA 02138August 1992
We gratefully acknowledge support from the National Science Foundation through grantSES91-10516, and from the Ameritech Foundation via the Ameritech Fellows programof the Center for Regional Economic Issues at Case-Western Reserve University.This paper is part of NBER's research program in Productivity. Any opinions expressed
are
those of the authors and not those of the National Bureau of Economic Research.

NBER Working Paper #4146August 1992
IVORY TOWER VERSUS CORPORATE LAB: AN EMPIRICAL STUDY OFBASIC RESEARCH AND APPROPRIABIUTY
ABSTRACT
We explore the use of patent citations to measure the "basicness' and appropriability of
inventions. We propose that the basicness of research underlying an invention can be
characterized by the nature of the previous patents cited by an invention; that the basicness of
research outcomes relates to the subsequent patents that cite an invention; and that the fraction
of citing patents that are assigned to the same organization as the original invention is a
measure of appropriabiity. We test the validity of these presumptions by comparing the value
of our measures for university and corporate patents, and find that many of the measures do
conform to our a priori belief that university research and research outcomes are more basic
and harder to appropriate than those of corporations. We also find some evidence that
basicness of outcomes is correlated with basicness of research, and that appropriability is lower
for basic outcomes.
Manuel Trajtenberg Rebecca Henderson
Tel Aviv University Sloan School of Management
Ramat Aviv MITTel Aviv 69978 Cambridge, MA 02139
ISRAEL and NBER
and NBER
Adam B. JaffeDepartment of EconomicsHarvard UniversityCambridge MA 02138and NBER

"It is the taste for the lifestyle of academic science, the compatibilityof research with teaching, and the persistence of public authorities insubsidizing science at a level to which none of the constituents wouldwillingly subscribe, that prevent the collapse of the economic structureerected upon a high level of scientific activity. If the support were tobe removed, the effects in our view would be quite disastrous."(Dasguptaand David, 1987)
1. Introduction
Economists have long understood that the peculiarities of information as
a commodity, and the resulting imperfections in the market for new knowledge,
severely limit the appropriability of the returns to innovation (Arrow, 1962,
Levin et at, 1987, Cohen and Levin, 1989). Although appropriability problems
plague all forms of research investment, they are thought to be more severe as
we move from applied to more basic research. This view has supported a partial
social division of labor whereby public institutions such as universities
perform most of.the basic research, and private firms do the R&D necessary to
commercialize the fruits of advances in scientific knowledge.
The unambiguous association of "basicness" with "low appropriability" is,
however, becoming increasingly untenable. First, there is the simple
observation that some profit-making firms do perform basic research, and the
empirical evidence indicates that it is very profitable (Griliches, 1986).
Either the motives of firms for performing basic research are more complex
than previously thought, or the nature of such research cannot be defined just
in terms of appropriability (Cohen and Levinthal, 1989, Mowery and Rosenberg,
1989). Second, there is much current interest in the role of universities in
explaining the technology-based growth of particular regions, such as Route
128 around Boston or Silicon Valley in California (Dorfman, 1988; Jaffe,
1989). This geographic localization of the benefits of university research
suggests that basic research results do not spill out as easily, as widely, or
as quickly as the traditional view would suggest.'
In our view, better understanding of these phenomena requires
'Our companion paper (Jaffe et al, 1992) looks explicitly at the extentof geographic localization of knowledge spillovers.
-2-
clarification of concepts that are often used interchangeably. The notion of
basicness of research relates to the kinds of questions that researchers ask,
and how their work relates to the pre- existing body of knowledge. The notion
of the basicness of research outcomes relates to the role of innovations as
stepping stones to subsequent technological developments. Appropriability, in
turn, relates to the attributes of innovations that make it easier for their
developer to convert social returns into private rents. Stated this way, the
conventional view of basic research rests on implicit assumptions that basic
innovations are produced by basic research, and that basic innovations are
relatively difficult to appropriate. These conjectures have important policy
implications, and yet they have never been subjected to rigorous empirical
scrutiny, probably because of the lack uf suitable empirical counterparts to
the concepts involved.
In this paper we intend to turn these assumptions into testable
hypotheses. This requires us to identify the attributes of research and of
research outcomes associated with basicness and with appropriability, to find
measurable proxies for these attributes, and to "validate" these measures
statistically. We can then investigate how the basicness of innovations
relates to the basicness of the underlying research, and how both influence
appropriability. We propose to do this using detailed patent data and patent
citations in particular, because these citations provide good evidence of the
links both between an innovation and the body of knowledge that preceded it,
and between an innovation and the technological developments that it led to.
We use matched samples of university and corporate patents to exploit our
prior that university research is more basic than corporate research, and rely
on the contrast between them to "validate" the measures.
The emphasis in the paper is thus on developing new ways to measure some
key but elusive concepts in the economics of technical change that have so far
defied systematic quantification. This paper can also be seen as a pilot
study, in that its empirical findings should help decide whether or not it
would be justified to pursue this line of research in "full scale". We begin
in section 2 with a background discussion of the different notions of basic

-3-
research, and the use of patent data in such context. In section 3 we
introduce the proposed measures of basicness and appropriability, and
elaborate on their construction and interpretation. Section 4 dwells on the
design of the sample, and the related validation procedure for these measures.
The empirical results are presented and analyzed in section 5. We find that
our measures capture indeed important aspects of basicness and of
appropriability; that there seem to exist "technological trajectories" showing
persistence and coherence; that some of the features of innovations are
related to some of the attributes of the underlying research, and similarly
that appropriability is associated just with some aspects of basicness - the
simplistic notion of a one-to-one equivalence between these concepts is
therefore not warranted. We summarize the findings in section 6, and suggest
various ways to further pursue this line of research.
2. Background
2.1 Definitions of Basic Iesearch
The distinction between basic and applied research is widely used and has
existed for a long time, and yet the underlying notions remain ill-defined.
Thus, for example, while economists tend to think of basic research in terms
of the difficulty with which it can be appropriated, scientists view it mostly
in terms of its relationship to prior research, or in terms of its scientific
and technological impact. The tacit assumption underlying most of this
literature is that these views are necessarily equivalent, but on close
examination the presumed equivalencies are far from certain.
The scientific and technological literature characterizes as "basic"
research that focuses on scientific rather than on technological questions;
that seeks to elucidate general laws rather than solving particular technical
• problems; that draws upon new scientific principles and offers original
solutions to old puzzles (e.g. Kuhn, 1962; Rosenberg,i982). Thus for example,
the research activities of the team headed by William Shockley at the Bell
Labs that led to the discovery of the transistor can be seen as basic in this
sense (Nelson, 1962).

-4-
This same literature, however, often defines what is basic according to
the nature of the outcomes of the research enterprise: research is regarded as
basic if it is uniquely innovative and represents breakthroughs relative to
existing knowledge; if its results have a major impact upon a given field
(e.g. Watson and Crick's discovery of DNA), or a diffused but significant
impact across a broad range of fields (e.g. the laws of thermodynamics, the
mathematics of chaos) ; if they turn out to be fundamental to much later work,
and are often referred to by scientists and practitioners in the same or other
fields.
The closest to an "official" definition of basic research is that of the
National Science Foundation, which bases it on the motivations and goals of
the researcher: research is defined as basic if it has as its objective "a
fuller knowledge or understanding of the subject under study, rather than a
practical application thereof"; conversely, applied research is seen as
directed toward gaining "knowledge or understanding necessary for determining
the means by which a recognized and specific need may be met" (NSF, 1985, p.
221) 2
Economists, in turn, tend to characterize basic research according to the
features of the outcomes of research that are of economic relevance, rather
than according to the features of research activities per se. Thus, basic
research is often defined implicitly as research that leads to basic
innovations, which are characterized in turn as generating benefits that are
exceedingly difficult to appropriate (in the sense of a low expected ratio of
private to social returns).3 Nelson (1959), for example, argued that firms
2These definitions are important in that they are used in the science andtechnology surveys conducted by the NSF, which constitute one of the mainsources of statistical information on the magnitude and composition ofresearch activities and R&D expenditures in the USA.
3To illustrate, consider the following quotes: "Its 'output' [of R&D] isthe flow of new information, both of general character (the result of'fundamental' or 'basic' research) and relating to specific applications('applied' research)." Freeman, 1982, p. 10; "Thus basic research, theoutput of which is only used as an informational input into other inventive
activities, is especially unlikely to be rewarded." Arrow (1962), p. 618;
-5-
would be able to reap only a small fraction of the benefits of basic research,
since they have difficulty commercializing results in fields other than or far
from their existing product line. Thus the nature of the results of basic
research makes it hard to establish property rights that would prevent their
exploitation by others. Similarly, basic research is thought to be riskier and
to have longer lead times than more applied research, which would also limit
its appropriability.
In order to prepare the ground for the actual measurement of basicness
and appropriability, and following Kuznets (1962), we would like to draw a
clear distinction between research on the one hand, and innovations (or
research outcomes) on the other, mimicking in this context the classic
input-output divide. From this follows an equally sharp distinction between
basicness of research as a characteristic of the activities leading to
innovations, and basicness of innoval.ions, which is a feature of the outcomes
of such activities.4
Moreover, these distinctions imply that the nature and strength of the
links between basicness of research and basicness of innovations are an open
empirical question, and not necessarily a one-to-one correspondence. This is
so because of the high degree of uncertainty that characterizes research, and
the serendipitous character of so many important innovations.5 Thus defining
"The payoff [to basic research] is uncertain and distant, and the knowledgequickly moves into the public domain"; "The output [of basic research] is apeculiar kind of good that may be used, not to produce a final good, but toplay some further role in the invention of a new final good". Mowery andRosenberg (1989), pp. 10 and 11.
41t should be clear that the "basic versus applied research" dichotomy isjust a coarse two-way partition of a composite attribute of research that isessentially continuous, and which we shall refer to as "basicness" (we usethis characterization also for innovations).
5There are plenty of historical examples of breakthroughs made byresearchers while pursuing research goals that would surely qualify as appliedresearch; see for example the cases of Pasteur, Carnot and Jansky as describedin Mowery and Rosenberg (1989). Although more difficult to document, it isequally clear that a great deal of what is regarded as "basic research" doesnot lead to important innovations: uncertainty works both ways.

-6-
the nature of research according to the nature of the outcomes begs the
question of what either of them truly is, at least for the purpose of
quantification. Similarly, the relationship between the degree of
appropriability of the benefits from innovations on the one hand, and thecharacteristics of the underlying research and of the innovation itself on the
other, is a compelling issue for investigation, not a foregone conclusion.
Finally, a word of caution: definitional matters can easily turn into
mine fields, where semantics overwhelms substance. We are not interested in
taxonomies or definitions per se; rather, we want to shed light on the
measurable characteristics of the process that leads to innovations, and their
relationship to the economically relevant attributes of the innovations
themselves, as these are revealed ex post. We intend also to clarify the links
between the concepts defined here and commonly held notions of basicness and
appropriability, hoping that this will facilitate the analysis of RkD and
innovation as empirical phenomena.
2.2 The Else of latent Data
The measures of basicness and appropriability that we put forward here
rely exclusively on information contained in patents. We are thus tapping one
of the richest source of data on innovations, and certainly the one with the
widest coverage. We intend to exploit detailed information that appears on
individual patents, and not just patent counts as has been comnion practice in
much of the research in this area.5'7
A great deal of research in economics has used patents as indicators ofvarious aspects of the innovation process, with varying degrees of success(see e.g. Griliches, 1984 and 1990; Jaffe, 1986) ; related work has shown thatpatent citations contain information about the value of patents and the links
among them (Carpenter et al, 1981; Carpenter and Narin, 1983; Trajtenberg,1990a and 1990b)
7Kuznets had foreseen long ago the potential of patents as a rich sourceof data far beyond mere patent counts: ". . .the mere number of patents, or eventheir classification.. . is only a fraction of the information in the files ofpatent offices.. .such information.. .is conceivably raw material for a moreintensive study of the output of inventive activity. .. [it] would permitindentification of the patentors, and provide an initial step in the study ofthe characteristics of inventors that is indispensable for a better analysis

-7-
A patent is a temporary monopoly awarded to inventors for the commercial
use of a newly invented device. For a patent to be granted, the invention must
be non-trivial, meaning that it would not appear obvious to a skilled
practitioner of the relevant technology, and it must be useful, meaning that
it has potential commercial value. If a patent is granted, an extensive public
document is created. The front page of a patent contains detailed information
about the innovation, the inventor, the assignee, the technological
antecedents of the invention, etc. all of which can be accessed in
computerized form (see figure 1).
An item of particular importance for our purposes is the citations to
previous patents (see item 56 on figure 1, "references cited"): we believe
that the notion of "basicness of research" is embodied in the relationship
between the innovation and its technological antecedents, and likewise that
the essence of "basicness of innovations" is embodied in the relationship of
the research outcomes to subsequent technological developments. Patent
citations, made and received, provide an effective means for identifying and
tracing these relationships.
Patent citations serve an important legal function, namely, they delimit
the scope of the property rights awarded by the patent. Thus, if patent 2
cites patent 1, that means that 1 represents a piece of previously existing
knowledge upon which patent 2 builds, and over which 2 cannot have a claim.
The applicant has a legal duty to disclose any knowledge of the prior art, but
the decision of which patents to cite ultimately rests with the patent
examiner, who is supposed to be an expert in the area and hence to be able to
identify relevant prior art that the applicant misses or conceals.8 The
of the supply side of inventive activity". Kuznets (1962), p. 40.
8Thus there is reason to believe that the use of patent citations totrace technological linkages is more "robust" and less "noisy" (in the senseof the role played by extraneous motives in the decision of what to cite) thanthe reliance upon other bibliographic data such as citations in the scientific
literature (Van Raan, 1988; Veingart et at, 1988). Moreover, these otherbibliometric techniques are of limited value in tracing the economic impact ofscientific results, since they are entirely self contained.

-8-
framework for the search is the patent classification system, which currently
consists of over 100,000 patent subclasses, aggregated into about 400 3-digit
patent classes. The combination of the citation information with detailed
information about each applicant provides a unique mechanism for placing
research and research results in their broader technological and economic
context.
Two important limitations of the reliance on patents for our purposes
should be mentioned: first, the range of patentable innovations constitutes
just a sub-set of all research outcomes, and second, patenting is a strategic
decision and hence not all patentable innovations are actually patented. As to
tbe first, consider Figure 2.a where we depict "basicness" as a measurable
feature of research outcomes, that ranges from the most applied on the left to
the most basic on the right. Clearly, neither end of the continuum is
patentable: "Maxwell's equations" could not be patented since they do not
constitute a device (ideas cannot be patented); on the other hand, a
marginally better mousetrap is not patentable either, because the innovation
has to be "non-trivial".
There is some internal range of unknown width that is patentable; within
it we believe that patents and patent citations can be used successfully to
measure the relative basicness of innovations. Obviously, research that
produces outcomes outside this range will not be picked up by our measures, at
least not right away. However, if unpatentable basic scientific discoveries
eventually do bring about technological advances of potential commercial
significance, at some point patents will be observed and hence measures of
this sort will probably pick them up. Thus, the patentability requirements
restrict the scope of our measures such that purely scientific advances,
devoid of immediate applicability are excluded, as well as run-of-the-mill
technological improvements that are too trite to pass for discrete, codifiable
innovations.
The second limitation has to do with the fact that, due to strategic or
other considerations (such as different motivations or reward systems),

-9-
inventors may decide not to apply for patents even though their innovations
would pass the patentability requirements. In other words, the "propensity to
patent" may vary across inventors, perhaps in a systematic way. For example,
until recently universities could not obtain patents based on federally funded
research (which is about 907. of university research), and hence it is likely
that many of their innovations were not patented. Firms, on the other hand,
may elect not to patent and rely instead on secrecy to protect their property
rights, and this practice may be more common in certain industries than in
others (see Levin et al, 1987). Aside from restricting the potential coverage
of our measures (again to an unknown extent), the question is whether these
limitations may affect the statistical properties of our measures; this issue
is discussed in section 4.2.
3. leasures of Basicness and Appropriability
The measures that we put forward here are grounded in a view of technical
advance as a process that unfolds over time, displaying coherence and
cumulativeness. Within such a framework each individual innovation is but a
node, a juncture alongside the innovational stream to which it belongs, that
builds upon what came before, and creates opportunities for future invention.
Thus each innovation has a past and a future: there is a body of knowledge
that precedes and feeds into it, and there are down-the-line technological
advances that stem from and build upon it. Clearly, basicness as discussed
above can be ascertained only as we look back and forth over time: a snapshot
of an innovation taken in isolation cannot reveal its impact or its standing
vis-a-vis past and future.
We propose, accordingly, two sets of measures:9 the first looks at
9Since this is virtually the first time that measures of this sort havebeen constructed (except for citation counts), we had to do a great deal ofsearch and experimentation until we "converged" to the set of measuresreported here. The measures discarded were statistically undistinguishablefrom the measures kept, and/or devoid of a clear interpretation. The good newsis that the final set appears to be "robust", in the sense that we keptgetting virtually the same results with the many variants that we tried.Still, this can only be regarded as a tentative set, and only further researchcan confirm its usefulness and significance.
- 10 -
basicness as an attribute of the research that lead to the patent being
evaluated (the "originating" patent),1O the second refers to the posterior
impact of the innovation. Thus, we base the former, which we refer to as
"backward-looking" measures ("B/measures" in short), upon the characteristics
of the patent's predecessors, both in themselves and vis a vis the attributes
of the originating patent. Similarly, we construct the "forward-looking"
("F/") measures on the basis of data on the patents that subsequently cite the
originating patent.
Aside from basicness proper, we compute measures of "distance" in time
and technology space both between the innovation and its predecessors, and
between the innovation and its offsprings. The presumption is that remoteness
in time and technology may be related to aspects of basicness or, more likely,
to the conditions of appropriability. Finally, we propose a measure of actual
(or ez post) appropriability, both F and B. For the definition and computation
of the measures we use the following notation (refer to figures 4 and 5):11
NCITING: number of patents citing the originating patent ("0-patent").
NCITED: number of patents cited by the 0-patent.
NPCITES: number of non-patent sources cited by the 0-patent.
NCLASS: 3-digit original patent class.
CATCODE: 2-digit "technological class", which aggregates up NCLASS
FIELD: 1-digit classification by main technological fields.
LAG: difference in years between the application date of a citing or
cited patent, and the application date of the 0-patent.
Index i corresponds to the 0-patent, i+l to citing patents, and i-i to
cited patents. All measures but one ("SCIENCE") will be defined and computed
'°For expositional convenience we shall use from now on the terms"patents" and "innovations" interchangeably, even though we are very mindfulof the fact that, as commonly understood, the overlap between them is by nomeans full.
''CATCDDE is taken from Jaffe (1986). The technological areas in FIELDare, 1: Drugs and Medical; 2: Chemical (except Drugs); 3: Electronics,

-11-
in equivalent ways backwards and forward; however, their precise meaning and
interpretation varies in some cases across the forward/backward (F/B) divide.
3.1 Ieastsres of liasicmess
Tbe first, and probably the key aspect of F/basicness is what we call the
overall "importance" of a patent, denoted IMPORTF (the F for forward), which
corresponds to the most intuitively appealing notion of what basic innovations
are all about. In the words of Kuznets (1962),
"Some inventions, representing as they do a breakthrough in a majorfield, have a wide technical potential in the sense that they provide abase for numerous subsequent technical changes [our emphasis] . . . the firststeam engine, which initiated a whole series of major technical changesand applications.. .is vastly different from the invention of the safetymatch or the pocket lighter. This wide range is for our purposes themajor characteristic relevant to the problem of measurement". (p. 26).
Thinking of citations to a patent as coming from follow-up advances that at
least in part build upon or stem from the originating patent, we would like
IMPORTF to reflect both the number of subsequent citations, and their
importance. Thus we define (see figure 4),12'13nci t ingj
IMPORTI. = NCITING. ÷ A NeTTING.1 1
jt4
where 0 < A < 1 is an arbitrary "discount factor" that is meant to
Optics and Nuclear; 4: Mechanical Arts; 5: Other.
L2As mentioned before, citations counts have been used in previousresearch as an indicator of the importance or value of patents; thus forexample, Trajtenberg (1990) found that patents weighted by citations arehighly correlated over time with the social gains from innovation in aparticular industry. The only difference is that here we augment IMPORTF with"second- eneration" citations, thus basing it on more extensive information on
the subsequent impact of the patent.
'3Notice that the unavoidable truncation of the data at the point in timewhen the data are collected (7) means that NCITTNG÷i (that is, the number
of citations to citing patents) is necessarily a partial measure of importanceof the citing patents; thus, IMPORTF should be taken to mean the "importance"of patent i as revealed - or realized - up to 7.
- 12 -
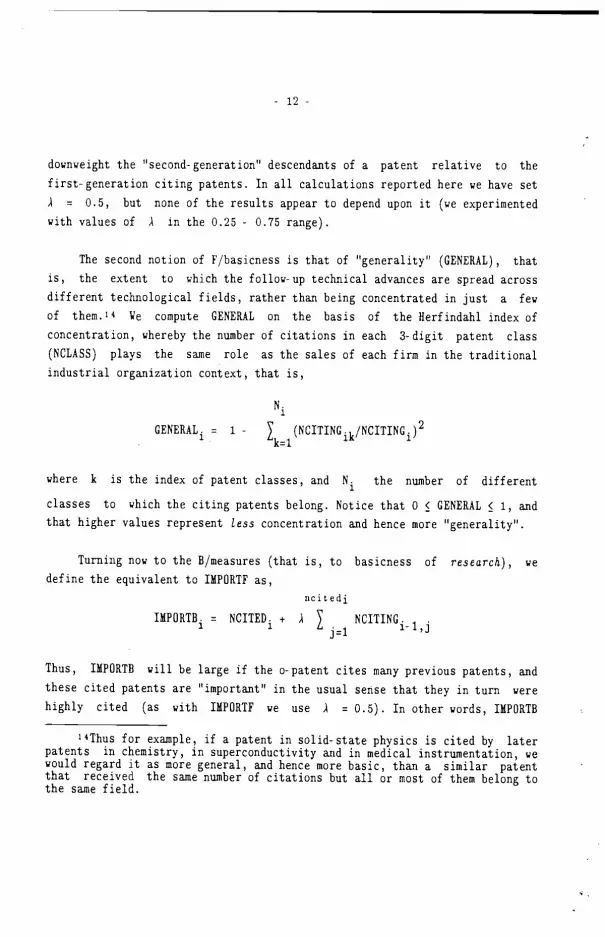
downweight the 'second-generation1' descendants of a patent relative to the
first-generation citing patents. In all calculations reported here we have set
A = 0.5, but none of the results appear to depend upon it (we experimented
with values of A in the 0.25 - 0.75 range).
The second notion of F/basicness is that of "generality' (GENERAL) , thatis, the extent to which the follow-up technical advances are spread across
different technological fields, rather than being concentrated in just a few
of them.'4 We compute GENERAL on the basis of the Herfindahl index of
concentration, whereby the number of citations in each 3-digit patent class
(NCLASS) plays the same role as the sales of each firm in the traditional
industrial organization context, that is,
NGENERAL. = 1 -
(NCITING.k/NCITTNG.)2k=l
i
where k is the index of patent classes, and N the number of different
classes to which the citing patents belong. Notice that 0 � GENERAL � 1, and
that higher values represent less concentration and hence more "generality".
Turning now to the B/measures (that is, to basicness of research), we
define the equivalent to IMPORTF as,
tic it ediTMPORTB. = NCITED. + A NCTTTNG. 1i
j=1
Thus, TMPORTB will be large if the 0-patent cites many previous patents, and
these cited patents are "important" in the usual sense that they in turn were
highly cited (as with IMPORTF we use A = 0.5). In other words, IMPDRTB
"Thus for example, if a patent in solid-state physics is cited by laterpatents in chemistry, in superconductivity and in medical instrumentation, wewould regard it as more general, and hence more basic, than a similar patentthat received the same number of citations but all or most of them belong tothe same field.
- 13 -
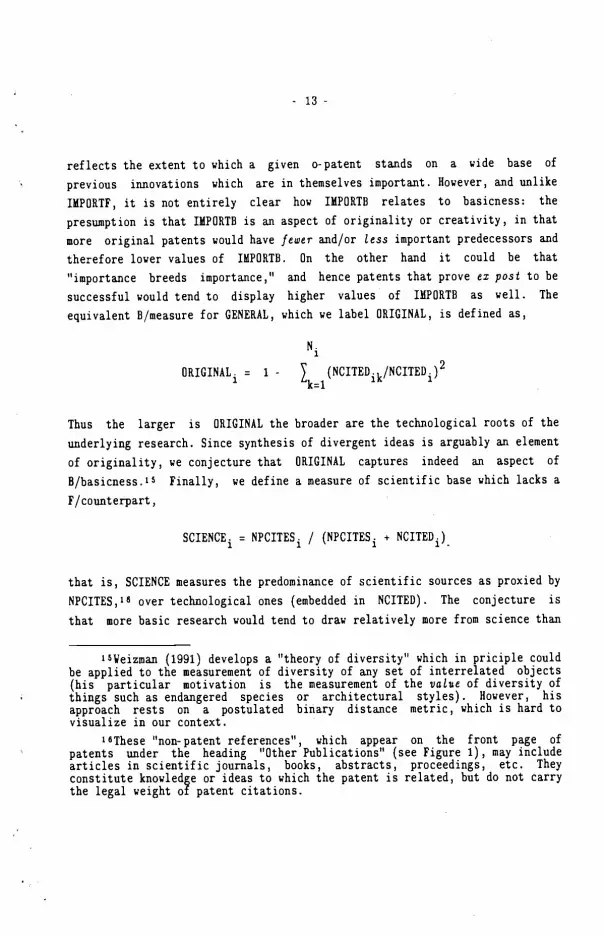
reflects the extent to which a given 0-patent stands on a wide base of
previous innovations which are in themselves important. However, and unlike
IMPORTF, it is not entirely clear how IMPORTB relates to basicness: the
presumption is that IMPORTB is an aspect of originality or creativity, in that
more original patents would have fewer and/or less important predecessors and
therefore lower values of IMPORTB. On the other hand it could be that
"importance breeds importance," and hence patents that prove cx post to be
successful would tend to display higher values of IMPORTS as well. The
equivalent B/measure for GENERAL, which we label ORIGINAL, is defined as,
NORIGINAL. = 1 - ) (NCITED.k/NCITED.)21 k=1
1 1
Thus the larger is ORIGINAL the broader are the technological roots of the
underlying research. Since synthesis of divergent ideas is arguably an element
of originality, we conjecture that ORIGINAL captures indeed an aspect of
B/basicness.tS Finally, we define a measure of scientific base which lacks a
F/counterpart,
SCIENCE = NPCITES / (NPCITES+ NCITED)
that is, SCIENCE measures the predominance of scientific sources as proxied by
NPCITES,'6 over technological ones (embedded in NCITED). The conjecture is
that more basic research would tend to draw relatively more from science than
'5Veizman (1991) develops a "theory of diversity" which in priciple couldbe applied to the measurement of diversity of any set of interrelated objects(his particular motivation is the measurement of the value of diversity ofthings such as endangered species or architectural styles). However, hisapproach rests on a postulated binary distance metric, which is hard tovisualize in our context.
lôThese "non-patent references", which appear on the front page ofpatents under the heading "Other Publications" (see Figure 1), may includearticles in scientific journals, books, abstracts, proceedings, etc. Theyconstitute knowledge or ideas to which the patent is related, but do not carry
the legal weight of patent citations.
- 14 -
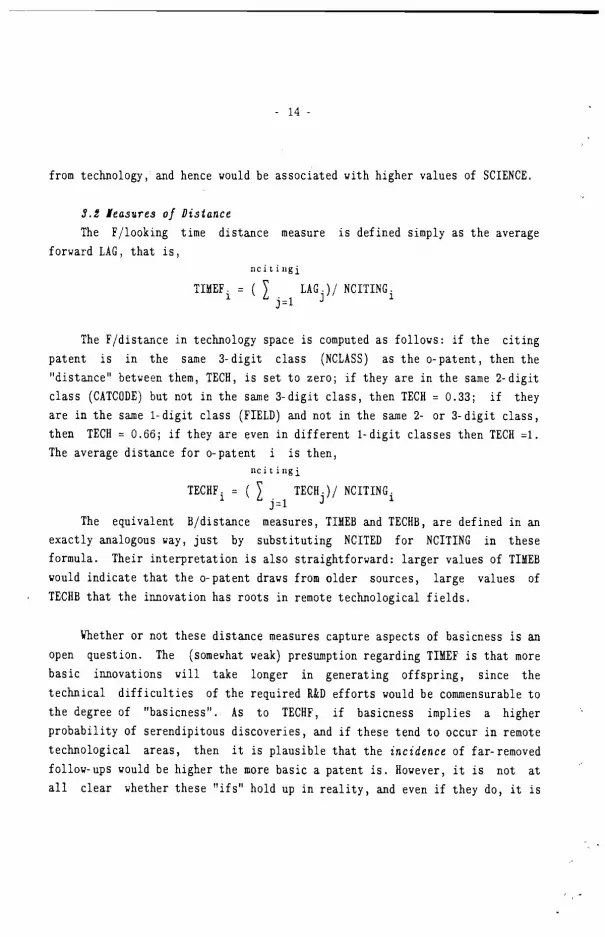
from technology, and hence would be associated with higher values of SCIENCE.
3.2 leasures of Distance
The F/looking time distance measure is defined simply as the average
forward LAG, that is,
nc it
TIMEF. = ( LAG.)/ NCITINGj=l
The F/distance in technology space is computed as follows: if the citing
patent is in the same 3-digit class (NCLASS) as the 0-patent, then the
"distance" between them, TECH, is set to zero; if they are in the same 2-digit
class (CATCODE) but not in the same 3-digit class, then TECH = 0.33; if they
are in the same 1-digit class (FIELD) and nut in the same 2- or 3-digit class,
then TECH = 0.66; if they are even in different 1-digit classes then TECH =1.
The average distance for 0-patent i is then,
nc it ing
TECHF1 = ( TECH)/ NCITING
The equivalent B/distance measures, TIMEB and TECHB, are defined in an
exactly analogous way, just by substituting NCITED for NCITING in these
formula. Their interpretation is also straightforward: larger values of TIMEB
would indicate that the 0-patent draws from older sources, large values of
TECHB that the innovation has roots in remote technological fields.
Vhether or not these distance measures capture aspects of basicness is an
open question. The (somewhat weak) presumption regarding TIMEF is that more
basic innovations will take longer in generating offspring, since the
technical difficulties of the required R&D efforts would be commensurable to
the degree of "basicness". As to TECHF, if basicness implies a higher
probability of serendipitous discoveries, and if these tend to occur in remote
technological areas, then it is plausible that the incidence of far-removed
follow-ups would be higher the more basic a patent is. However, it is not at
all clear whether these "ifs" hold up in reality, and even if they do, it is
- 15 -
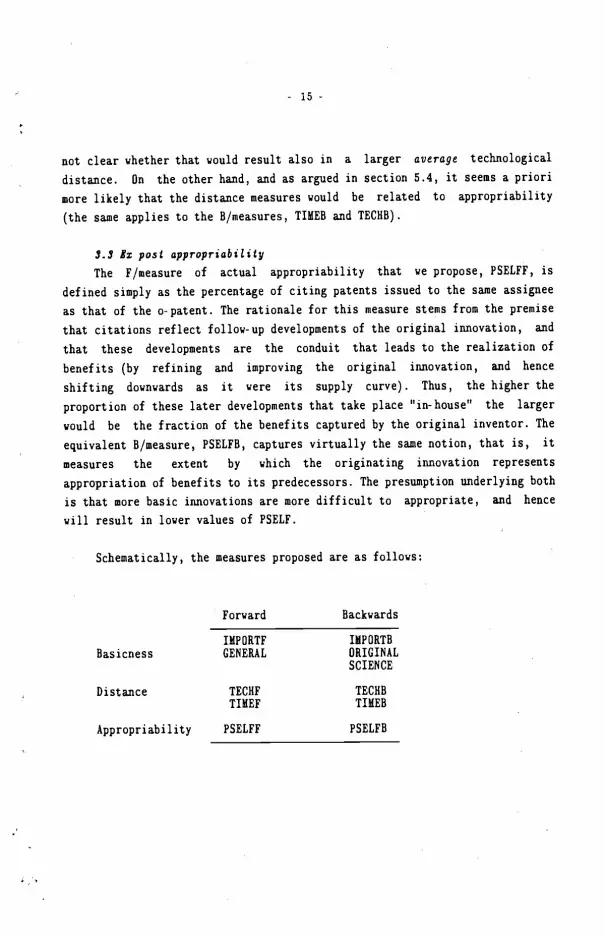
not clear whether that would result also in a larger average technological
distance. On the other hand, and as argued in section 5.4, it seems a priori
more likely that the distance measures would be related to appropriability
(the same applies to the B/measures, TIMEB and TECHB).
3.3 Ix post appropriability
The F/measure of actual appropriability that we propose, PSELFF, is
defined simply as the percentage of citing patents issued to the same assignee
as that of the o-patent. The rationale for this measure stems from the premise
that citations reflect follow-up developments of the original innovation, and
that these developments are the conduit that leads to the realization of
benefits (by refining and improving the original innovation, and hence
shifting downwards as it were its supply curve). Thus, the higher the
proportion of these later developments that take place "in-house" the larger
would be the fraction of the benefits captured by the original inventor. The
equivalent B/measure, PSELFB, captures virtually the same notion, that is, it
measures the extent by which the originating innovation represents
appropriation of benefits to its predecessors. The presumption underlying both
is that more basic innovations are more difficult to appropriate, and hence
will result in lower values of PSELF.
Schematically, the measures proposed are as follows:
Forward Backwards
Basicness
Distance
Appropriability
IMPORTFGENERAL
IMPORTBORIGINALSCIENCE
TECHFTIMEF
TECHBTIMEB
PSELFF PSELFB

- 16 -
4. Research Design
4.1 Sample Design and Data Gathering
Since this is essentially a pilot study (in that the emphasis is on
constructing the measures and exploring their "validity" and feasibility for
further research), we rely on a relatively small sample of patents, and hence
we had to exercise a great deal of care in designing the sampling scheme. The
main considerations were: (i) we wanted to maximize the chances of seeing
patents that span the patentable range illustrated in figure 2; (ii) since we
restricted ourselves to patent data, we wanted to be able to "validate" the
proposed measures relying only on priors about the institutional distribution
of basic research, that could be translated into the sampling scheme; (Hi) we
wanted to cover sufficiently long sequences of innovations so as to be able to
compute measures that rely on backward and forward linkages; (iv) we needed to
be able to control for technological areas, since citation practices may vary
systematically across them.
Requirements (i) and (H) led us to start from patents assigned to
universities, and contrast them to matched samples of patents assigned to
corporations: the presumption is that universities do more basic research, and
hence that their patents would help cover the upper segment of the patentable
range.17 More importantly, that same prior would enable us to "validate" the
proposed measures (see section 4.2). The drawback is that university patents
constitute a tiny fraction of the universe of patents issued in the 115 in any
given year (less than one percent), and cannot be regarded as representative
of patents at large. However, since we do not purport here to characterize the
"true" distribution of basicness across the whole population of patents, the
extent to which the sample is representative is not of much consequence.
In order to satisfy (Hi) we took all university patents applied for in
1975 (316 patents) and in 1980 (482 patents), which gave us substantial time
t7Total research spending at universities and federally funded researchand development centers was $12.1 billion in 1987 (NSF, 1989); private firmsreported that same year outlays of $2.7 billion in basic research.
- 17 -
horizons backwards and forward.l$'19 We identified and gathered data on each
of the (earlier) patents cited by these "originating" patents, and on each of
the (subsequent) patents citing them, thus forming a complete set which
encompasses three successive generations of related inventions (see figure 3)
We also obtained the number of citations made and received by each of the
cited and citing patents, which gave us some information about the
"grandparents" and the "grandchildren" as well. Rarely does empirical work
examine such long stretches of the innovational stream.
To give us a base of comparison and increase the chances of seeing a
substantial variance in the measures of basicness, we identified two samples
of corporate patents in parallel to the university patents. The first was
drawn from the universe of patents granted to the top 200 R&D-performing U.S.
firms in 1986, as reported in 10-K reports and coded by the Compustat data
service. We expect that at least some of these firms perform appreciable basic
research. The other corporate sample was drawn from the universe of patents
assigned to all other U.S. corporations, which are by definition "smaller" in
terms of R&D expenditures; presumably they engage in proportionally less basic
research.
In order to control for technological field, each of these samples was
drawn to match the university patent cohorts by patent class, application year
and grant date. That is, for each originating university patent, we selected a
corporate patent from each universe that had the same application year and
'81n principle there should always be enough of a backwards horizon, butin practice the availability of data declines dramatically as we go back intime, to the point that for the 1975 cohort, for example, a great deal of thedata of the cited patents are missing, and that created serious problems incomputing the measures. There is reason to believe though that this limitationwill soon vanish, as more and more patent data become computerized andavailable as such.
'We succeded in gathering forward patent data only up to 1989, primarilybecause we had to rely on "third parties" to obtain the data, and that meant
long delays. Again, availability is improving by leaps and bounds, and costsof retrieving patent data from computerized searches are declining, so that infuture research one should be able to obtain much more recent data.
- 18 -
(3-digit) patent class as the university patent, and was granted as close in
time as possible. This design allows us to compare averages of measures of
basicness across institutional groups, without worrying that the estimates
might differ only because universities and corporations exhibit different
distributions of patents across fields. We then collected data on the
predecessors and successors of these corporate patents, exactly in parallel to
the set of university patents. As figure 3 makes clear, this sampling scheme
lead to "explosive" data requirements: starting from just 319 university
patents applied for in 1975 we ended up collecting data on over 10,000
patents, and likewise starting from 482 patents in 1980 the number climbed to
over 15,000.
4.2 Validation and Selectivity
As mentioned above the choice of university patents as the "core sample"
was meant to allow us to validate statistically the measures of basicness
without having to resort to additional (external) information, but rather with
reference to commonly held priors. In this section we discuss the rationale
for this validation procedure, and the closely related issue of sample
selection bias.
University patents constitute a tiny fraction of all patents issued in
the U.S. and, given the institutional idiosyncrasies of universities they can
hardly be regarded as "representative" of the universe of all U.S. patents.
Moreover, the vast majority of research outcomes from universities do not lead
to patents, for three distinct reasons: (1) if university research is indeed
more basic, the distribution of outcomes will be located over the right-hand
segment of the continuum shown in figure 2, and therefore most of them will
not be patentable; (2) up to 1980 universities were precluded by law from
charging royalties for patents stemming from federally funded research, which
account for the bulk of university research; (3) the "propensity to patent"
of university researchers is probably lower than that of their counterparts in
corporations, since the incentives that they face (in terms of promotion,
prestige, etc.) encourage primarily publication of research outcomes in the
scientific literature.

- 19 -
The question is whether the (small) sample of outcomes captured by
university patents can be regarded as random or, if biased, whether the biases
might affect the validity of our intended statistical analysis. In order to
address this issue, we restate the research design in such a way as to clarify
the roles played by priors, samples, and selectivity. Suppose that basicness
is unidimensional, and that the goal is to find an indicator of basicness b
such that E(b) > E(b) c=> fl > fl, where the fl's are the unknown
parameters, E(.) denotes expected value, and and stand for different
types of assignees (e.g. university versus corporations). In order to
"validate" the use of b as an indicator we rely on the widely held prior
that the distribution of basicness of the whole population of research
outcomes from universities, F,,, lies to the right of the corresponding
distribution for corporations, F (see figure 2.a); thus, assuming that F,,
and F belong to the same family of distributions, the prior implies that
fl, > fl,. "Validation" of a particular measure b simply means in this context
that, given appropriate samples and statistical tests, one rejects the null
H: (flu - flu) 0 using as a statistic (b - be).
Notice that when focusing on validation the actual magnitudes of the
or the proper way to estimate them is not an issue: all that counts is
that there is a strong presumption that university research yields more basic
outcomes than corporate research. It is thus immaterial for our purposes
whether or not E(b1) = fl. Rather, the issue is whether the sampling scheme
affects the power of the test as described above. For it should be clear that,
most of all, we need to guard against a type II error, which in the present
context would mean accepting the null by virtue of a selectivity bias in the
measures.
How can that happen? Consider figure 2.b: if for example universities
were patenting research outcomes coming just from the shaded area of F,,
whereas corporate patents were drawn randomly from the whole distribution F,
such that E(b) >> fi,, and E(b) then it is clear that the proposed
validation procedure would not be valid: had the sample of university outcomes
- 20 -
been truly random, we may well have found that E(b) < E(b), in which case
b could not be regarded as a good proxy for basicness. Thus, it is clear that
the condition for the "validity" of the proposed test, in the sense of
yielding a small probability of type TI error, is
(1) E(b) - fi < E(b) - fi
Can we presume it to be fulfilled? Quite likely so, considering that the
reasons that account for the small number of research outcomes patented by
universities imply also that university patents are most likely drawn from an
area such as the shaded one in figure 2.c, and hence that E(b) << j3,.
Moreover, if university patents stem mostly from privately funded research, it
is quite likely that such research would be from the outset aimed at more
"applied" outcomes than research funded by the government, which is supposed
to advance precisely those areas of science that have no immediately apparent
commercial benefits. On the other hand, it is not clear whether and how the
incentives of corporations to patent may vary along the range of F. It is
quite likely that corporations also tend to patent less basic research
outcomes than their own mean, but it is highly implausible that they will
restrict themselves to a narrow segment far left as universities presumably
have been doing, at least until 1980.
To sum up: university patents constitute by no means a random sample of
university research outcomes, and probably corporate patents are not drawn
randomly from the distribution of corporate research either. However, there is
a strong presumption that condition (1) holds, and hence that the selectivity
biases inherent to the sample scheme are immaterial to the goal of validating
the measures of basicness. Notice though that not much can be said if the
results happen to be "weak" (i.e. if some of the differences between the be's
and the be's turn out to be not very significant): that may well be due to
the selectivity biases, which would translate into substantial probabilities
of type I error. Better that than risking over optimistic inferences as to the
effectiveness of the proposed indicators.

- 21 -
5. Statistical Analysis and Results
5.1 A first look at the measures
Tables 1 and 2 present descriptive statistics of the measures and Pearson
correlations between them, and figures 5 and 6 depict the empirical
distributions of some of them (see the appendix for additional details).
Notice first the striking similarity in the shape of the distributions of
IMPORTF and IMPORTB, and likewise for GENERAL and ORIGINAL; as it turns out,
this is true for all equivalent F/B measures, which is an interesting finding
that deserves further scrutiny (see below, and the appendix).
As figure 5 shows, the distribution of IMPORTF is extremely skewed (for
1980 the mean is 12.6 and the median just 5.5). If we interpret INPORTF as an
indicator of the "value" of patents, the observed skewness would fit nicely
with previous findings regarding the distribution of such values (e.g. Pakes
1986, Trajtenberg 1990): most patents turn out to be of very little value
(i.e. to have few if any "descendants"), and only a handful "make it big".IMPORTB is similarly skewed, which would mean that most patents come from"bumble origins", and few have important technological predecessors. Thusimportant innovations appear to be in very short supply as one looks either upor down the innovational stream.
The distributions of GENERAL and of ORIGINAL look much more "normal"
(bell- shaped), except for the large mass at zero. Sixty percent of the patentswith GENERAL=0 had just one citing patent, which means that GENERAL could only
be zero; an additional 257, of these patents had NCITING = 2, which are very
likely to render GENERAL=0. Still, the mass at zero is not an artifact:
patents that "fathered" just one or two further technological developments can
claim indeed little generality.20
20For ORIGINAL=0 the percentage of patents with NCITED=1 or NCITED=2 wasjust 397. (257. for 1975), thus it would seem that the finding of a large massat zero is more telling for ORIGINAL than for GENERAL. The only qualificationis that there are many missing backwards data, and thus many of the patentsfor which NCITED=l or 2 might have received a value of zero for ORIGINAL(rather than missing) if the data had been available.
- 22 -
Turning to the correlations between measures of the same type (F and B)
notice in table 2 that the various measures do capture different aspects of
the underlying phenomena:2' none of the correlations exceeds 0.5, most are
much smaller. The variables that exhibit the largest pairwise correlations are
GENERAL and TECHF and, in parallel, ORIGINAL and TECHB. This is not too
surprising, since both measures refer to the positioning of patents in
technology space.22 The other pair exhibiting a high correlation is IMPORTF
and GENERAL, and likewise IMPORTB and ORTGINAL (see the appendix).
5.2 "Validating" the measures: comparison of means
Table 3 presents simple comparisons of the sample means of the proposed
measures between university and corporate patents. To recall, our prior is
that research, and research outcomes from universities are "more basic" than
those from corporations, and therefore if our measures do capture aspects of
basicness university patents should rank higher than corporate patents along
those dimensions.
IMPORTF strongly backs the prior: university patents received
significantly more first- and second generation citations, and the difference
seems to increase over time (see the results for 1975 vis a vis 1980). The
figures for GENERAL indicate that the follow-up innovations from universities
spread indeed more widely over different technological areas, but the 1975
results suggest thatthese differences tend to narrow down over time. In fact,
we recomputed GENERAL for the 1975 cohort truncating the citation data in 1984
so as to replicate the time span of the 1980 sample, and the results are
almost identical to those for 1980. Thus at first the offsprings from
corporate patents tend to be more technologically concentrated, but eventually
these spillovers become more diffused, narrowing the gap in that respect
2lThe results for the 1975 sample are very similar in every respect,hence we chose to show just those for 1980.
22GENERAL (ORIGINAL) refer to the spread over patent classes of theciting (cited) patents regardless of where the originating patent is located,whereas TECB (F and B) measures the average "distance" in that same space fromthe originating patent to the citing (cited) patent.

- 23 -
between them and university patents. This fits nicely the common wisdom
regarding the way spillovers work, and goes in tandem with the finding in our
companion paper (Jaffe et al 1992) of diminishing geographic localization of
spillovers over time.
As conjectured, IMPORTB shows that corporate innovations rely on more
numerous and more "important" predecessors than universities (the differences
though are significant for 1975 but not for 1980). This suggests that
university research is located nearer the origins of innovational paths, and
that this may be an aspect of basicness. ORIGINAL does not live up to
expectations: there is a slight difference for 1980 but it lacks statistical
significance, and for 1975 the difference even has the "wrong" sign. SCIENCE
does conform with the prior, and strongly so: university patents do rely
relatively more on non-patent (i.e. scientific) sources than corporate patents
(recall that this is cannot a "field effect", since the samples are matched by
technology field) 23
The results for the distance measures are weak and inconclusive:
technological distance "works" for the 1980 sample but not for 1975, whereas
distance in time does not work at all. In fact, in most cases the results for
TIME (F and B) run contrary to the prior, that is, the follow-up innovations
of corporations appear to take longer than those of universities. In sharp
contrast to them, the appropriability measures do perform very well: PSELF (F
and B) is much larger for corporations than for universities, suggesting that
corporations are in fact more successful at reaping the benefits of their own
research.
In sum, with the exception of ORIGINAL, and with some reservation
It is possible though that this result reflects to some extentdifferences in citation practices between university and corporateresearchers, and not just genuine differences in the nature of their research(i.e. more "scientific"). Bowever, the fact that there are symbiotic linkagesbetween universities and corporations in fields such as biotechnology (wheremost of the NPCITES occur) would suggest that citation practices are actuallysimilar; unfortunately our data cannot discriminate between these effects.

- 24 -
regarding the time span of GENERAL, the contrast between universities and
corporations does "validate" the measures of basicness and of appropriability,
in the limited sense that we cannot reject with them the prior that
universities do perform more basic research. On the other hand, the conceptual
ambiguity of the distance measures surfaces also in the empirical results:
there is some evidence to the effect that the offsprings from university
innovations may be more remote in technology space, but certainly not in time.
In general F/measures perform somewhat better than B/measures, and the 1980
sample shows crisper results than 1975.
A subsidiary hypothesis was that the basicness measures would exhibit
higher values for patents of top corporations (i.e. those belonging to the 200
corporations with the largest R&D outlays) than for those of "other"
corporations: presumably the larger corporations can afford to invest in more
basic research, since they may be able to appropriate a larger fraction of the
benefits. Table 4 shows that there may be something to it, but the differences
are for the most part very slight; the one significant exception is
appropriability, and to a lesser extent IMPORTF. Thus top corporations seem to
generate more "important" innovations, and they do capture more of the
benefits from them, but otherwise their research and research outcomes look
similar to that of smaller R&D performers.
However, it is quite likely that the lack of contrast between them stems
simply from the particular sample chosen, which is by no means representative
of corporate research, hut rather replicates exactly the technological
composition of university (patentable) innovational efforts. Thus, it may well
be the case that in those particular fields there is little difference between
"small" and "big" firms, but that those differences do exist in the population
of corporate innovations at large. In fact, a large proportion of our sample
is in biotechnology, and we know that in this field small firms, both by
themselves and in cooperation with universities, are particularly innovative.2
24Tn particular, that may explain the significantly lower value ofIIPURTB for other- corp, which would imply that the smaller corporations engagein more "creative" research.
- 25 -
5-S The Links across the F/B divide: "technoLogicaL trajectories"?
Having shown that our measures capture indeed aspects of basicness, we
use them now to address the next set of issues: does basic research lead to
basic innovations? does the nature of the research efforts affect the features
of the resulting innovations? As a first cut at these questions (and
sidestepping causality) , we look for preliminary evidence of statistical
linkages between the characteristics of innovations and of research, by
scrutinizing the correlations within and between F/ and B/measures. Looking
once more at table 2, notice the similarity of the patterns of correlations of
the F/measures to those of the B/measures: virtually every association of a
pair of F/measures is replicated by its equivalent B/pair (e.g. the
correlation between GENERAL and TECHF mirrors that of ORIGINAL and TECHB,
IMPORTF and GENERAL mirrors IMPORTB and ORIGINAL, etc.). What we find then is
that equivalent F/H measures tend to replicate each other, both in the shape
of their distributions (recall the findings in section 5.1) and in relation to
others, suggesting that the features of research and the features of the
resulting innovations correspond to a common pattern.
Turning now to the correlations across the F/B divide, notice in table 5
that the largest correlations are along the main diagonal, that is, between
equivalent F/B measures.25 Thus it would seem that "importance breeds
importance", originality breeds generality, coming from far away in technology
space leads far away as well, etc. In that sense, then, the (ex post)
characteristics of patented innovations as they reveal themselves in the
F/measures appear to be related to the attributes of the research that lead to
them.26 These systematic linkages between equivalent F/B measures seem to
suggest that technical change takes place along certain "technological
trajectories", exhibiting coherence (in terms of the attributes of the
25The one exception is TIMEB which shows a higher correlation withIMPORTF (and sligthly higher with GENERAL) than with TIMEF; notice also thatSCIENCE does not have an equivalent F/measure.
26This echoes Kuznets' conjecture that "There is a positive correlationbetween the magnitude of the technical problem resolved by an invention andthe magnitude of its technical potential". Kuznets (1962), p. 26.
- 26 -
innovations that occur along them) and persistence (see Dosi 1982, 1988, and
Freeman, 1990)
In order to pursue this theme further we constructed the following
composite measures: IMPDRTT = (IMPORTF + IMPORTB)/2, GENERALT = (GENERAL +
ORIGINAL)/2, and TIMET = (THIEF + TIMEB)/2, and computed the correlations
between them (averages for the two samples): Corr(IMPDRTT, GENERALT) = .29,
Corr(IMPDRTT, TIMET) = - .17, Corr(GENERALT, TIMET) = - .11. Thus, certain
paths of innovative activity are more likely to render important and general
innovations over time, and these innovations would tend to follow each other
in quick succession. Dther paths are likely to result in run-of-the-mill and
technologically focused innovations, and the advance along them is likely to
be slow. In other words, there seem to be more and less "hot" innovational
tracks, that persist at least over decade-long periods (the average time span
in this study is of 14 years Mean(TECHB) + Mean(TECHF))
5.4 1 production function' for basicness, and institutional effects
Probing further into the links between basic research and basic
innovations, we run regressions of each of the F/variables on the B/measures,
dummies for technological fields, and dummies for corporations. The purpose
was twofold: first, to estimate a sort of production function whereby the
attributes of the patented innovations play the role of "outputs" and the
characteristics of the underlying research play the role of "inputs". Second,
to see whether the differences in the means of the F/measures between
universities and corporations remain there after controlling for the
characteristics of research and technological fields.
Table 6 shows the regressions of TMPORTF and GENERAL:27,28 in line with
"Since we use the same set of regressors in all regressions, there wasno point in estimating them jointly using Zellner's STiR.
2SVe run similar regressions for TECIIF and TTMEF as well, but virtuallythe only significant variable in each was the equivalent B/measure (TIMES inthe regression of TIMIEF, and TECHB in TECHF), and hence there was no point in
reporting them.
(I
- 27 -
the findings of table 5, the most significant coefficient in the regression of
IMPORTF is its equivalent B/measure, IMPORTB (and likewise ORIGINAL is the
most significant in the regression of GENERAL).29 Notice, however, that
smaller values of IMPORTB mean that the patent is more "basic" in the sense of
being closer to the roots of a given innovational path, and hence if hasicness
leads to basicness we would have expected a negative sign on the coefficient
of IMPORTB. The positive and highly significant coefficient that we obtained
may be seen instead as lending support to the notion of technological
trajectories suggested earlier. Here that could be interpreted as follows:
highly "creative" research (in the sense of small values of IMPDRTB) is most
likely to exhibit a large variance in terms of its outcomes - some may do
extremely well, others may fail miserably (i.e. high and low values of
IMPORTF) . On the other hand, once a research avenue has proven its worth (i.e.
high values of IMPORTB), further significant innovations along those lines are
very likely to come, showing up in high IMPORTF. If the latter effect
dominates, we will find indeed a positive association hetween IMPORTF and
IMP ORTB.
The results in GENERAL are well in line with conventional wisdom: more
original research, as well as research that draws from far removed
technological areas (high TECHB), lead to innovations of wider technological
significance. More reliance on scientific sources also enhances the generality
of the outcomes (this finding does not hold for the 1975 sample) . The negative
signs on TIMEB in both regressions imply that more important and more general
innovations stem from more recent (or up to date) research sources.
As to the second issue explored in these regressions, it is clear that
there does remain an "institutional effect" after controlling for the type of
research, meaning that even if universities and corporations were to engage in
29Since citation practices vary by technological fields, we suspectedthat these results might mean only that patents from citation-intensive fieldsget high values of IMPORIF and of IMPORTB. The results remain, however, evenif dummies for 49 technological fields ("CATCODE") are included in the
regressions.
- 28 -
research having similar characteristics, universities would still produce on
average more "basic" innovations. Finally we note that the R2's of about .10
obtained in these regressions should not be judged harshly, considering that
what we are trying to account for are attributes of innovations that have
defied quantification up to now.
5.5 Appropriability
Economists have long regarded appropriability as one of the key notions
in the economics of technical change, and yet its elusive nature has
frustrated recurrent attempts to quantify it and thus to incorporate it in
empirical studies of innovation (a notable exception is Levin et al 1987, and
subsequent studies that used the Yale survey).
The measure of (actual) appropriahility suggested here is PSELFF, defined
as the fraction of citing patents granted to the sane assignee as the one of
the originating patent, and a similarly defined B/measure, PSELFB. Clearly,
this is likely to be just a crude and partial measure: if for example the
down-the-line benefits from an innovation do not involve further technical
advances, or if they do but most of those subsequent innovations are not
patented, then PSELF will be widely off mark. Thus, one of the key issues is
whether or not the denominator of FSELF (i.e. the total number of citations)
is indicative of total realized benefits: if that is the case then the
fraction of self-citations may well be a good proxy for the ratio appropriated
by the inventor, otherwise it surely will not.
We have already seen that PSELF (F and B) is significantly higher for top
corporations than for other corporations, and higher for both vis a vis
universities. The question now is what are the attributes of innovations that
may influence actual appropriability, that is, what determines em ante
appropriability. Following the discussion in section 2.1, we suggest as
indicators of em ante appropriability the measures of distance and generality,
TIME? (B), TECHF (B), and GENERAL (ORIGINAL). High values of TIMEF (B) mean
that the follow-up innovations take long, and hence that the realization of
the benefits occur far in the future; thus the innovation would be perceived

-29-
ex ante as being "less appropriable", since it is less likely that the
(private) inventor will be able to retain control over the innovational path
long enough to enjoy the benefits. Similarly, suppose that the innovation
results in marketable products in a wide range of fields, or in
technologically distant fields. Presumably, it is more difficult to anticipate
these spinoffs than those within the same field; or, as Nelson (1959) argued,
if the firm is specialized it may not be able to take advantage of
technological "diffused" or "remote" spillovers. Thus, the potential benefits
associated with them would look ez ante less appropriable. As with time,
distance and generality are likely to affect the incentives to innovate, and
hence also the institutional distribution of research efforts.
A thorny problem is that these distance and generality measures are
computed ex post, and hence they could be regarded as indicators of ez ante
appropriability only if they are on average correctly anticipated by the
inventors. Some evidence to that effect are provided by the findings related
to technological trajectories: these suggest that the conditions of
appropriability have some degree of persistence along these trajectories, and
hence that inventors may be able to foresee to some extent the remoteness and
generality of the expected fruits of their innovations. In addition, we shall
use for this purpose a new variable, EAGENER ("ex ante generality"), defined
as the number of distinct 3-digit patent classes among the original and cross
classifications to which the originating patent was assigned.3° As it turns
out EAGENER is highly correlated with GENERAL, and also with TECHF. Since the
classification is done at the time when the patent is assigned, EAGENER is
certainly determined ex ante.
Table 7 shows regressions of PSELFF and PSELFB on these measures. The
strongest result is the negative and very significant coefficient of TIME, F
and B. A straightforward reading of this finding is simply that spillovers
30Pateots are assigned to an "original" classification, and to any numberof "cross" classifications: the former represents the main technological areawhich the innovation belongs to, the latter consist of additional areas whichthe patent examiner regards as related to the innovation.

- 30 -
tend to occur in-house faster than externally. Thus the same R&D organization
can recognize earlier the potential for further developments of a given
innovation, proceed along a pre-conceived research path that renders
interrelated innovations, etc. For the converse reasons outsiders would take
longer in benefiting from spillovers originating in labs other than their own.
The leap of faith from this interpretation to appropriability is that
inventors can somehow anticipate THIEF (perhaps on the basis of THIEB), and
behave accordingly.
GENERAL and ORIGINAL fit the conjecture but just with borderline
significance, and so does EAGENER. On the other hand TECHF and B do not at all
(TECHF even exhibits a puzzling positive and significant coefficient for
1975). Thus it seems that appropriability has to do more vith technological
"focus" than with technological "distance", at least as these are measuredbere. Notice also that the gap in the extent of actual appropriability betweenuniversities and corporations remains even after controlling for distance andgenerality, meaning that corporations are better at reaping the benefits fromtheir innovations regardless of which technological trajectories they choose.
Finally, we note that the results for 1980 are better than those for 1975,
which we take primarily as a reflection of data availability, both in the
sense of number of observations and in the extent of missing data.
6. Conclusions and Suggestions for Further Research
This paper is first and foremost and attempt to quantify and clarify
important aspects of the process of technical change (i.e. basicness and
appropriability), and explore the linkages between them. We rely for that
purpose on detailed patent data, thus awarding the proposed measures a very
wide coverage, limited only by the extent to which innovations manifest
themselves in patents: very basic scientific discoveries on the one hand, and
minor improvements on the other would not be captured by our measures.
Relying on the prior that universities perform more basic research than
corporations, we find that the forward-looking measures of importance and
generality do seem to capture aspects of the basicness of innovations;
31 -
similarly, the reliance on scientific versus technological sources, and (to a
less extent) the closeness to the origins of innovational paths, appear to
reflect aspects of the basicness of research. On the other hand the proposed
measure of originality does not seem at all able to discriminate between more
and less basic research.
The fraction of citations coming from patents awarded to the same
inventor was found to be much higher for corporations than for universities,
supporting the notion that FSELF may be indicative indeed of actual
appropriability. The measures of technological distance appear to be related
to basicness but the evidence is not clear-cut, whereas distance in time does
not conform at all with the prior. In all, then, the initial validation of the
measures rendered very satisfactory results for the F/basicness and for the
indicators of actual appropriability, less so for the measures of B/basicness,
and all but failed for the distance measures.
A second set of findings revealed interesting similarities between
equivalent F and B measures, suggesting that there are strong "family effects"
in successive generations of patents. Further work along these lines would
seek to identify and characterize more in detail different technological
trajectories, and relate them tQ conventional economic data. The analysis of
appropriability shows that it tends to diminish with distance in time and to a
lesser extent with the technological spread of research outcomes, but not with
technological distance. As an extension, it would be interesting to relate
these measures of appropriability to those obtained in the Yale Survey (Levin
et al, 1987).
The results are thus quite encouraging, particulary if viewed as those of
a pilot study. The next step would be to use these measures in tanden with
other economic data coming from independent sources, and see whether or not
they make a difference. The prime target would be to redo studies that have
used simple patent counts as indicators of innovation, usually with
disappointing results. In particular, we would like to re-examine the series
of studies by Griliches and associates at the NBER (Griliches, 1981; Pakes,
- 32 -
1985; Griliches and Cockburn, 1988) , which sought to identify the impact of
R&D and of patent counts on the market value of Compustat firms. Ye
hypothesize that if we were to use composite indicators based on our measures
instead of simple patent counts, the impact on stock market value would be
much more noticeable.
In particular, we expect that IMPORTF would have a very significant
effect, and that it will improve even further when adjusting it with PSELFF,
since what should influence the worth of the inventor is just the appropriable
rents, not the total. Likewise, we expect that GENERAL would have a negative
impact on the value of small firms, but not of highly diversified
corporations. Another hypothesis is that the B/measures of basicness would be
more closely related to R&D expenditures than to indicators of performance
such as market value. If these hypotheses are confirmed, that would pave the
way for the wide-scale use of the proposed measures as key variables in
empirical studies of innovation.

- 33 -
Appendix: Further Comments of Tables 1 - 3
Note in table 1 that the large difference in the means of IMPDRTF betweenthe two samples (13 for 1975 versus 7 for 1980) is due simply to the fact thatthe 1975 patents had a 5-year longer forward time horizon; the same accountsfor the differences in TIMEF. Even though the date of the originating patentsshould not matter for the availability of B/measures, in fact it does becauseof the higher fraction of missing data that we encounter the further back intime we go; that accounts for the difference in the means of TIMEB between thetwo cohorts, and may also explain in part the differences in IMPORTB.
Similarly to GENERAL and to ORIGINAL, there is also a large mass at zerofor SCIENCE, which reflects a very large proportion of zeros for NPCITES. Thisis related to same extent to the distribution of patents by technologicalfields: for the 1980 sample about 507, of the patents with non-zero NPCITESbelong to Drugs and Medical, whereas this field accounts for just 377. of thesample. Clearly, it is more of a common practice to cite non-patent sources inDrugs and Medicine than in say, Mechanical Arts or Electronics.
We noted that IMPORTF and GENERAL exhibit a significant correlation, andlikewise IMPORTB and ORIGINAL. One would probably expect a positivecorrelation between FICITI/IC and GENERAL simply because the distribution ofNCITING is very skewed, and few citations necessarily imply high concentrationand hence low values of GENERAL (the same for NCITED and ORIGINAL). In fact,the correlations between these variables are on the order of 0.33, which seemsto suggest that the "spurious" aspect of it does not dominate.3' MoreoverIMPORTF comprises also second-generation citations, and those do not enterinto the computation of GENERAL. Thus there is some indication that more"important" patents tend to be also more "general", and likewise thatinnovations stemming from more "important" origins tend to be aore "original".
We noted above the similarity in the distributions and correlationspatterns of equivalent F and B measures. It is quite clear that these resultsare not spurious, since the F/variables "occur" independently of the backwardones, and are literally ex post whereas the backward measures are set ex ante.Thus for example when an patent is issued, the value of ORIGINAL for it isalready determined; as time goes by the said patent may receive any number ofcitations, and these may be distributed in any way across patent classes, sothat T years later it will show a certain realized value of GENERAL. Fromthe point of view of the construction of these measures there is clearly noneed for them to exhibit similar distributions or patters of correlations withother variables. The fact that they do is then an empirical finding thatreflects something real about the underlying process of technical change.
'The logic of the relationship between NCITING and GENERAL is the sameas that between market size and the Herfindahl (one minus it) one wouldexpect very small markets to be highly concentrated, but for the rest of thedistribution it is not clear at all how the relationship goes (in fact itseems that very large markets are highly concentrated).

- 34 -
BIBLIOGRAPHY
Arrow, K.J.: "Economic Welfare and the Allocation of Resources forInventions," in It. Nelson (ed.) The Rate and Direction of Inventive Activity,Princeton University Press, 1962
Carpenter, M.P., Narin F. and Wolf P.,"Citation Rates to TechnologicallyImportant Patents." Vorid Patent Information, Vol. 3. No.4., 1981.
Carpenter, hi. and F. Narin.: "Validation Study: Patent Citations asIndicators of Science and Foreign Dependence," Vorld Patent Information,Vol.5, No. 3, pp. 180-185, 1983.
Cohen, V. hi. and R. C. Levin, "Empirical Studies of Innovation and MarketStructure". In R. Schmalansee and R. Willig (eds.), Handbook of Industrial
Organization, North-Holland, 1989.
Cohen, V. hi. and D. Levinthal: "Innovation and Learning: The Two Faces ofR&D." Economic Journal, 1989.
Cockburn, I. and Z. Griliches, "Industry Effects and AppropriabilityMeasures in the Stock Market's Valuation of R&D and Patents". AmericanEconomic Review, Papers and Proceedings, 1988 (78), pp. 419-423.
Dasgupta, P. and P. David.: "Information Disclosure and the Economics ofScience and Technology," Chapter 16 in G. Feiwel (ed.), Arrow and the Ascentof loden Economic Theory, NYU Press, 1987.
Dorfman, N: "Route 128: The Development of a Regional High-TechnologyEconomy" in D. Lampe (ed.), The Massachusetts Miracle: High Technology andEconomic Revitalization. Cambridge: MIT Press, 1988.
Dosi, C. "Technological Paradigms and Technological Trajectories: ASuggested Interpretation of the Determinants and Directions of TechnologicalChange", Research Policy, 1982, 11(5), pp. 147-62.
Dosi, C. "Sources, Procedures, and Microeconomic Effects of Innovation".Journal of Economic Literature, 1988, 56(5), pp.1120- 1171.
Freeman, C. The Economics of Industrial Innovation, 2nd ed. Cambridge:MIT Press, 1982.
Freeman, C. "Schumpeter's Business Cycles Revisited", in Heertje andPerlman (eds.), Evolving Technology and Market Structure, Studies inSchumpeterian Economics, Ann Arbor: The University of Michigan Press, 1990.
Griliches, Z., "Market Value, R&D and Patents". Economic Letters (1981)(7), pp. 183-87.
Griliches, Z. (ed.), R&D, Patents and Productivity. University of ChicagoPress, 1984
- 35 -
Griliches, Z.: "Productivity, R&D and Basic Research at the Firm Level in
the l970s.t1 American Economic Review, 1986
Griliches, Z. "Patent Statistics as Economic Indicators: a Survey,"
Journal of Economic Literature, 1990, 27, pp. 1661-1707.
Jaffe, A.: "Technological Opportunity and Spillovers of R&D: Evidence
from Firms' Patents, Profits and Market Value," American Economic Review,
1986, 76(5), pp.984-1001.
Jaffe, A.: "Real Effects of Academic Research," American Economic Review,
1989, 79(5), pp. 957-70.
Jaffe, A., Trajtenberg, M. and Berderson, R. "Geographic Localization of
Knowledge Spillovers, as Evidence by Patent Citations'. Quarterly Journal of
Economics, 1992 (forthcoming).
Kuhn, Thomas, The Stncture of Scientific Revolutions. Chicago:
University of Chicago Press, 1962
Kuznets, S. "Inventive Activity: Problems of Definition and Measurement,"
in R. Nelson (ed.) The Rate and Direction of Inventive Activity, Princeton,
NJ: Princeton University Press, 1962.
Levin, R., A. Klevorick, R.R. Nelson, and S.G. Winter, "Appropriating the
Returns from Industrial Research and Development," Brookings Papers onEconomic Activity, 1987, 5, 783-820.
Mowery, D.C. and Rosenberg, N. Technology and the Pursuit of Economic
Growth, Cambridge: Cambridge University Press, 1989.
National Science Foundation, Science and Technology Data Rook, Washington
D.C. NSF 1985.
National Science Foundation, Academic Science/Engineering R&D Funds,Fiscal Year 1987, 1989
Nelson, R. "The Simple Economics of Basic Scientific Research," Journal
of Political Economy, 1959
Nelson, R. "The link between science and invention: the case of thetransistor," in R. Nelson (ed.) The Rate and Direction of Inventive Activity,
Princeton University Press, 1962
Pakes, Ariel, "On Patents, R&D, and the Stock Market Rate of Return".
Journal of Political Economy, 1985, 95(2), pp. 390-409.
Pakes, Ariel, "Patents as Options: Sone Estimates of the Value of Holding
European Patent Stocks", Econometrica, 1986, 54(4), pp. 755-84.
Rosenberg, N. Inside the Black Box: Technology and Economics. Cambridge,

- 36 -
England: Cambridge University Press, 1982.
Trajtenberg, M. "A Penny for Your Quotes: Patent Citations and the Valueof Innovations," Rand Journal of Economics, 1990a, 21(1), pp 172- 187.
Trajtenherg, M. Economic Analysis of Product Innovation: The Case of CTScanners. Cambridge, MA: Harvard University Press, 1990b.
Van Raan (ed), Handbook of Quantitative Studies of Science andTechnology, Amsterdam: North Holland, 1988.
Weingart, P. R. Sehringer and hi. Winterhager. "Bibliometric Indicatorsfor Assessing Strengths and Weaknesses of West German Science," Chapter 13 inVan Raan (ed), Handbook of Quantitative Studies of Science and Technology,Amsterdam: North Holland, 1988.
Weizman, hi. "On Diversity", Harvard University, Department of Economics,Working Paper Series, 1991.

Table 1
Descriptive Statistics
(i) Basicness leasures:
Variable N lean Std 0ev Sum Minimum Maximum
IMPORTF 1975 948 12.5786 23.2100 11925 0 380.50001980 1446 6.9575 14.6781 10061 0 250.5000
GENERAL 806 0.3235 0.2872 260.7115 0 0.8750
1127 0.2693 0.2742 303.4474 0 0.8512
IMPORTB 763 21.3388 22.1050 16282 0 204.5000
1340 27.7608 33.3325 37200 0 393.5000
ORIGINAL 719 0.2247 0.2691 161.5900 0 0.8200
1261 0.2717 0.2736 342.5935 0 0.8819
SCIENCE 945 0.1355 0.2519 128.0122 0 1.0000
1446 0.2023 0.2962 292.4922 0 1.0000
(ii) Di3ianee Iea3ureS:
TECHF 791 0.3183 0.2983 251.7629 0 1.0000
1124 0.3164 0.3143 355.6418 0 1.0000
TIhEEF 811 7.2633 2.4875 5891 0 13.0000
1126 4.3754 1.r5501 4927 0 9.0000
TECHB 708 0.3141 0.3378 222.4072 0 1.0000
1261 0.3003 0.3081 378.6438 0 1.0000
TUEEE 909 7.6583 3.9544 6961 0 17.00001367 9.1720 4.8534 12538 0 22.0000
(iii) Appropriabiliiy Ieasures:
PSELFF 783 0.1069 0.2399 83.6737 0 1.00001061 0.1556 0.2920 165.1267 0 1.0000
PSELFB 719 0.1411 0.2981 101.4825 0 1.00001342 0.1259 0.2473 168.9854 0 1.0000
The top line of each variable corresponds to the 1975 sample, the bottom one tothe 1980 sample.

Table 2Correlationsa Between Measures of the saue Type - 1980 Saap1e
(i) Forward Measures
IJPORTF GENERAL TECRF TIMEF PSELFF
IIPORTF 1.000000.0
GENERAL 0.23884 1.000000.0001 0.0
TECIEF 0.00273 0.37257 1.000000.9271 0.0001 0.0
TIIEF -0.05065 0.01899 0.00585 1.000000.0893 0.5243 0.8448 0.0
PSELFF -0.01976 -0.07418 -0.03468 -0.16184 1.000000.5202 0.0157 0.2592 0.0001 0.0
(ii) Backwards Measures
IIPORTB ORIGINAL TECRB TIXEB PSELFB SCIENCE
JIPORTE 1.000000.0
ORIGINAL 0.30641 1.000000.0001 0.0
TECUB 0.01442 0.43794 1.000000.6090 0.0001 0.0
TIMEB -0.12605 -0.10846 0.04796 1.000000.0001 0.0001 0.0887 0.0
PSELFB -0.03578 -0.08317 -0.06184 -0.20613 1.000000.2042 0.0031 0.0282 0.0001 0.0
SCIENCE -0.16230 -0.06578 -0.00508 -0.17287 -0.02025 1.000000.0001 0.0195 0.8571 0.0001 0.4587 0.0
apearson correlation coefficients; significance probabilities right under.
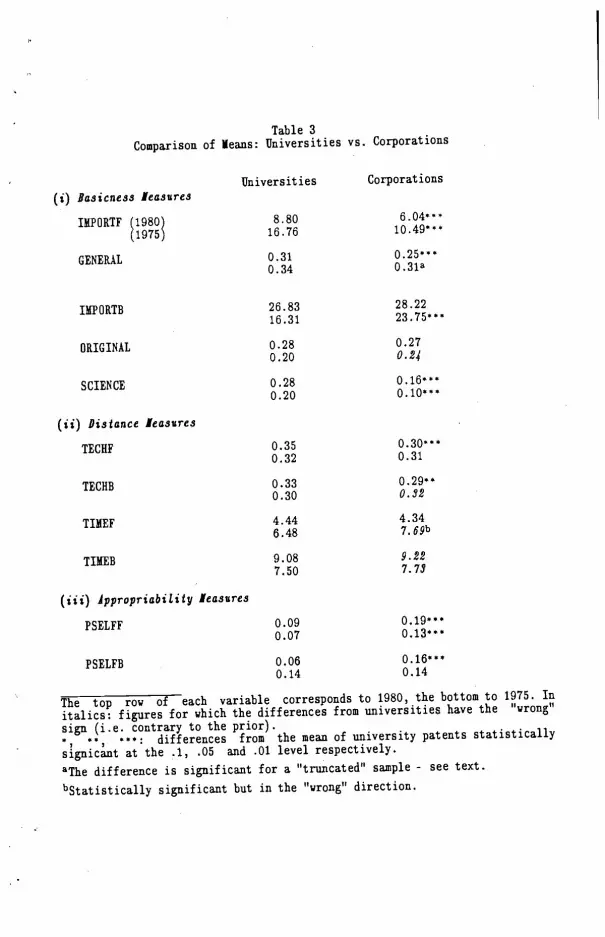
Table 3
Comparison of leans: lJniversities vs. Corporations
Universities Corporations
(i) Ba.sicnes3 Ieasttre3
I5PORTF (1980) 8.80 6.04"'
(1975)16.76 10.49*
GENERAL 0.31 0.250.34 0.31
ISEPORTB 26.83 28.22
16.31 23.75"
ORIGINAL 0.28 0.27
0.20 0.24
SCIENCE 0.28 0.16"0.20 0.10"
(ii) Dis1ance Iea.siires
TECh 0.35 0.30"0.32 0.31
TECHB 0.33 0.29"0.30 0.52
TB[EF 4.44 4.34
6.48 7.69b
TIMEB 9.08 9.22
7.50 7.75
(iii) Appropriabiliy Ieasure3
PSELFF 0.09 0.19"0.07 0.13*
PSELFB 0.06 0.16"0.14 0.14
The top row of each variable corresponds to 1980, the bottom to 1975. In
italics: figures for which the differences from universities have the "wrong"
sign (i.e. contrary to the prior).
•, , '": differences from the mean of university patents statistically
signicant at the .1, .05 and .01 level respectively.
aThe difference is significant for a "truncated" sanple - see text.
bStatistically significant but in the "wrong" direction.
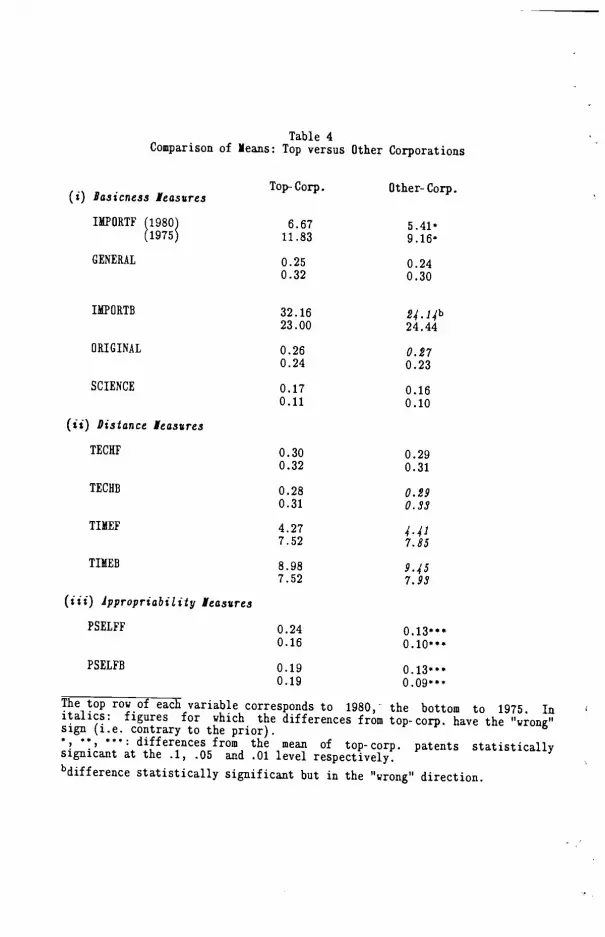
Table 4Comparison of leans: Top versus Other Corporations
Top- Corp. Other- Corp.(i) Iasicness leasures
IIIPORIF 1980) 6.67 5.4l1975) 11.83 9.16k
GENERAL 0.25 0.240.32 0.30
IMPORTB 32.16 24.14b23.00 24.44
ORIGINAL 0.26 0.270.24 0.23
SCIENCE 0.17 0.160.11 0.10
(ii) Distance leasures
TECIIF 0.30 0.290.32 0.31
TEC1IB 0.28 0.290.31 0.33
IIhEEF 4.27 4.417.52 7.85
TIMEB 8.98 9.457.52 7.93
(iii) Jppropriabiliiy leasures
PSELFF 0.24 0.13S•0.16 0.10"'
PSELFB 0.19 0.13"0.19 0.09"'
The top row of each variable corresponds to 1980, the bottom to 1975. Initalics: figures for which the differences from top-corp. have the
"wrong"sign (i.e. contrary to the prior).', ", "': differences from the mean of top-corp. patents statisticallysignicant at the .1, .05 and .01 level respectively.bdifference statistically significant but in the "wrong" direction.
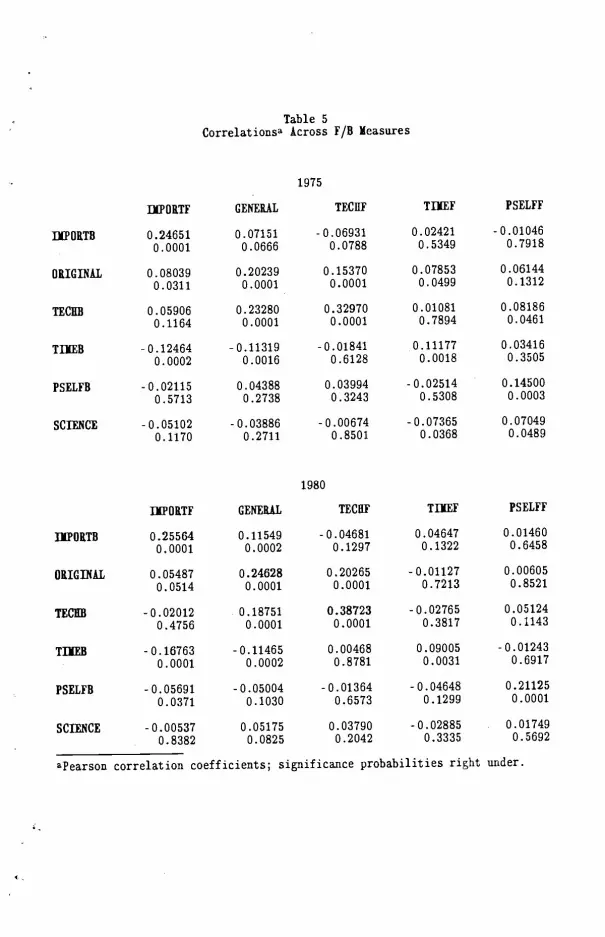
Table 5Correlationsa Across F/B easures
1975
IIFORTF GENERAL TECIIF TIJEF FSELFF
IIPORTB 0.24651 0.07151 -0.06931 0.02421 -0.010460.0001 0.0666 0.0788 0.5349 0.7918
ORIGINAL 0.08039 0.20239 0.15370 0.07853 0.061440.0311 0.0001 0.0001 0.0499 0.1312
TECIIB 0.05906 0.23280 0.32970 0.01081 0.08186
0.1164 0.0001 0.0001 0.7894 0.0461
TIJEB -0.12464 -0.11319 -0.01841 0.11177 0.034160.0002 0.0016 0.6128 0.0018 0.3505
PSELFB -0.02115 0.04388 0.03994 -0.02514 0.14500
0.5713 0.2738 0.3243 0.5308 0.0003
SCIENCE -0.05102 -0.03886 -0.00674 -0.07365 0.07049
0.1170 0.2711 0.8501 0.0368 0.0489
1980
IIPORTF GENERAL TECBF TIMEF PSELFE
IIPORTB 0.25564 0.11549 -0.04681 0.04647 0.01460
0.0001 0.0002 0.1297 0.1322 0.6458
ORIGINAL 0.05487 0.24628 0.20265 -0.01127 0.00605
0.0514 0.0001 0.0001 0.7213 0.8521
TECEB -0.02012 0.18751 0.38723 -0.02765 0.05124
0.4756 0.0001 0.0001 0.3817 0.1143
TIJEB -0.16763 -0.11465 0.00468 0.09005 -0.01243
0.0001 0.0002 0.8781 0.0031 0.6917
PSELFB -0.05691 -0.05004 -0.01364 —0.04648 0.21125
0.0371 0.1030 0.6573 0.1299 0.0001
SCIENCE -0.00537 0.05175 0.03790 -0.02885 0.01749
0.8382 0.0825 0.2042 0.3335 0.5692
apearson correlation coefficients; significance probabilities right under.
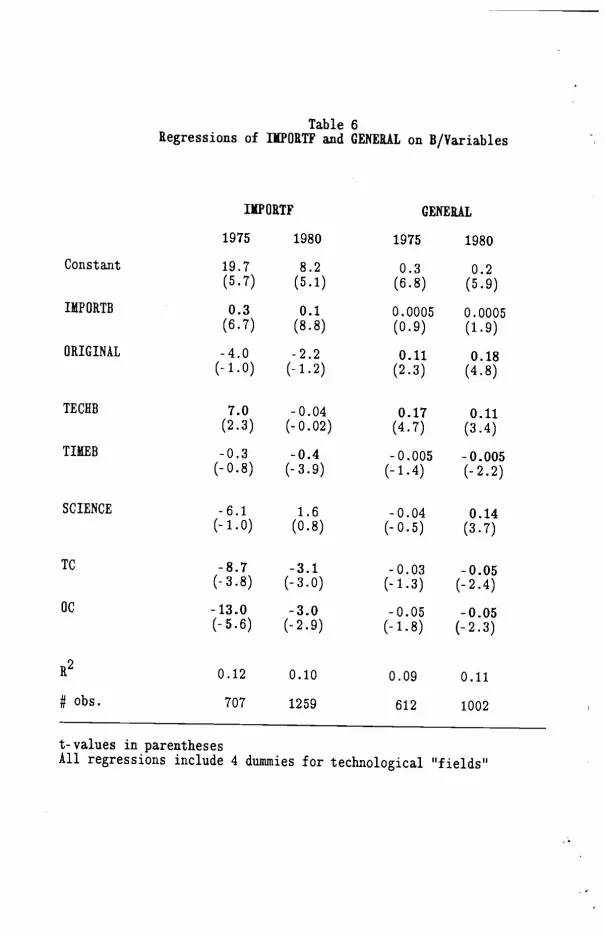
R2
# cbs.
Table 6Regressions of IXPORTF and GENERAL on B/Variables
IMP ORTI
1975
19.7
(5.7)
0.3(6.7)
-4.0(-1.0)
7.0(2.3)
-0.3
(-0.8)
-6.1 1.6
(-1.0) (0.8)
1980 1975 1980
8.2
(5.1)
0.3
(6.8)
0.2
(5.9)
0.1
(8.8)
0.0005
(0.9)
0.0005
(1.9)
-2.2
(-1.2)
0.11
(2.3)
0.18
(4.8)
-0.04
(-0.02)
0.17
(4.7)
0.11
(3.4)
-0.4
(-3.9)
-0.005
(-1.4)
-0.005
(-2.2)
Constant
IMPORTB
ORIGINAL
TECIIB
TIMEB
SCIENCE
TC
OC
-0.04 0.14
(-0.5) (3.7)
-8.7
(-3.8)
-13.0
(-5.6)
-3.1
(-3.0)
-3.0
(-2.9)
-0.03
(-1.3)
-0.05
(-1.8)
-0.05
(-2.4)
-0.05
(-2.3)
0.12 0.10 0.09 0.11
707 1259 612 1002
t-values in parentheses
All regressions include 4 dummies for technological "fields"
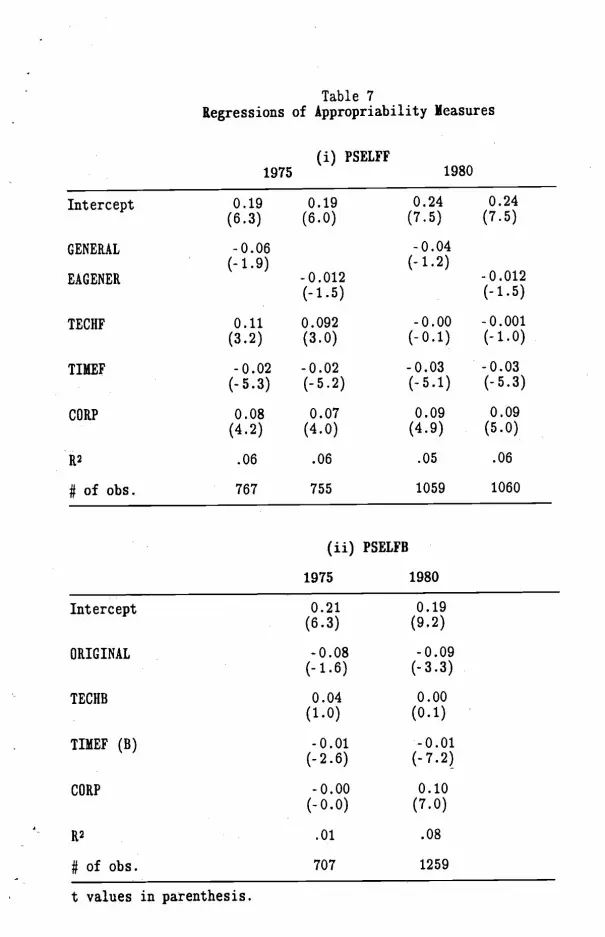
(ii) PSELFB
1975 1980
0.21 0.19
(6.3) (9.2)
-0.08 -0.09(-1.6) (-3.3)
0.04 0.00(1.0) (0.1)
-0.01 -0.01(-2.6) (-7.2)
-0.00 0.10(-0.0) (7.0)
.01 .08
707 1259
Table 7
Regressions of Appropriability Measures
(i) PSELFF1980
0.19
(6.0)
1975
0.19
(6.3)
-0.06(-1.9)
0.24(7.5)
0.24(7.5)-0.04(-1.2)
Intercept
GENERAL
EAGENER
TECIIF
TIMEF
CORP
R2
# of obs.
-0.012(- 1 .5)
0.092(3.0)
-0.02(- 5.2)
0.07(4.0)
.06
755
0.11(3.2)
-0.02
(-5.3)
0.08
(4.2)
.06
767
-0.012(-1.5)
-0.001(-1.0)
-0.03(-5.3)
0.09
(5.0)
.06
1060
-0.00(- 0.1)
-0.03(-5.1)
0.09(4.9)
.05
1059
Intercept
ORIGINAL
TECHB
TIMEF (B)
CORP
R2
# of obs.
t values in parenthesis.
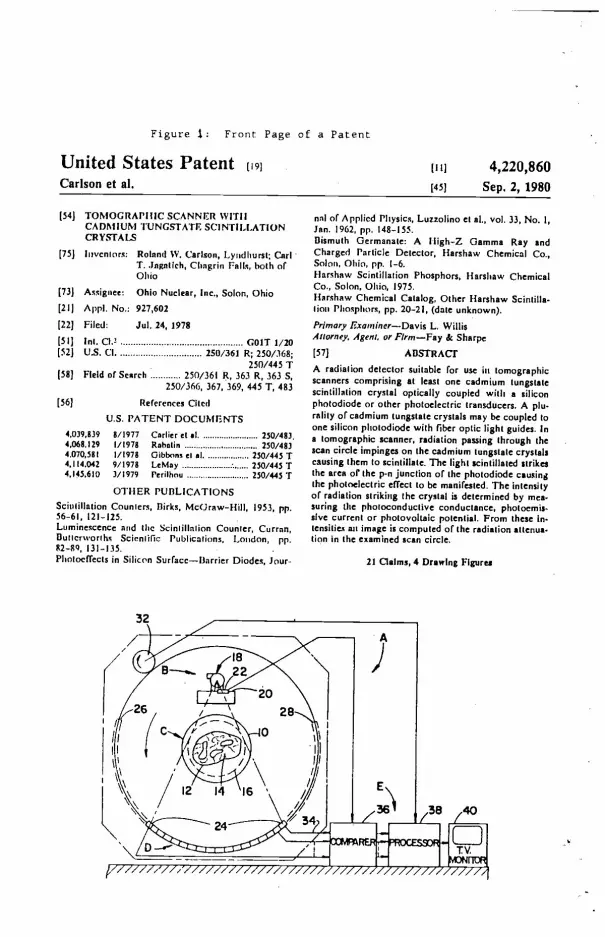
Figure : Front Page of a Patent
United States Patent [19]Carison et al.
[iii 4,220,860[451 Sep. 2, 1980
(54] TOMOGRAPI (IC SCANNER WIT! ICADMIUM TUNGSTATE SCINTILLATIONCRYSTALS
(75] Inventors. Roland W. Cannon, Lyndlturst; Carl -T. Jngstich, Cl,agrin Falls, both ofOhio
[73] Assignee: Ohio Nuclear, Inc., Solon, Ohio
(51] Int. Cl.1 GaIT 1/20(52] U.S. Cl 250/361 R; 250/368;
250/445 T(SI] Field of Starch 250/361 R, 363 R, 363 S,
250/366, 367, 369, 445 T, 483
(56] References Cited
U.S. I'ATENT DOCUMRNTS
4,039.8)9 8/1977 Curlier ci at 250/483.4.068.129 1/1978 Rahniin 250/40)4.070.581 1/1978 Gibbons ci at 250/445 T4,114.042 9/1978 LeMay 250/445T4,145.610 3/1979 Perithou 250/445 T
OTHER PUBLICATIONS
Scintillation Counters, Birks, McGraw—Hill, 1953, pp.56—61, 121—125.Luminescence and the Scintillxtion Counter, Curran,tluttcrrorihs Scientilic Publications, London, pp.82—89, 131—135.Pliniocifects in Silicon Surface—Barrier Diodes, Jour-
nal of Applied Physics, Luezohino et al., vol. 33, No. I,Jan. 1962, pp. 148—155.Bismuth Germanate: A Iligh—Z Gamma Ray andCharged Particle Detector, Harshaw Chemical Co.,Solon, Ohio, pp. 1—6.Harshaw Scintillation Phosphors, Harshaw ChemicalCo., Solon, Ohio, 1975.Harshuw Chemical Catalog, Other Harnhaw Scintilla-tion Phosphors, pp. 20—21, (date unknown).
Primary Examiner—Davis L. WillisAitorney, Agent, or Firm.—Fay & Sharpe
[57] ABSTRACT
A radiation detector suitable for use in tomographicscanners comprising at least one cadmium tungutatescintillation crystal optically coupled wittt a nihiconphotodiode or other photoelectric transducers. A plu-rality of cadmium tungstate crystals may be coupled toone silicon phiolodiode with, tiber optic lighl guides. Ina tomographic scanner, radiation passing through thescan circle impinges on the cadmium (ungstate crystalacausing them 10 scintillate. The light scintillated atrikesIhe area of the p.n junction of the photodiode causingthe photoelectric effect to be manifested. The intensityof radiation striking the crystal is determined by mea-suring the photoconductive conductance, photoemia-aive current or photovoltaic potential. From these In-tensities au image is computed of the radiation attenua-tion in the examined ucan circle.
21 Oglms, 4 DrawIng Flguru
[2l
[22]
AppI. No.: 927,602
Filed: Jul. 24, 1978

FIGURE 2
Distribution of Research Outcomes according to "Basicness"
a. The prior regarding the location of Universities (Fu) vs. Corporations (Fc)
b. Hypothetical selectivity bias leading to high prob. of type II error
13u E(b0)
MaxweIIsEquations
c. Selectivity bias which does not affect the validity(low prob. of type ii error)
of the indicators
E(bc) 13c E(b) '3
Fu
1¼ basicneSs
PATENTABLE RANGE
more basic——)
Fc Fu
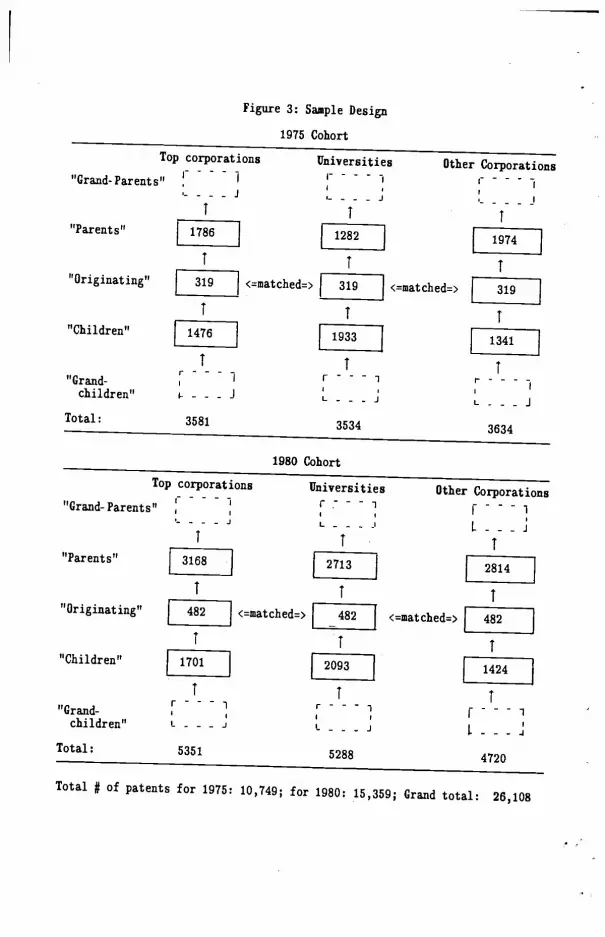
I[482 <=niatched=>
I
[ l7011
L..__j
Figure 3: Sample Design
1975 Cohort
Top corporations Universities Other Corporations
"Grand-Parents"I'-----I I
I I I"Parents"
L1282] [_I I I
"Originating" [_ 1 <matched=> [319 1 <=matched=>
I I I"Children"
!III 1 [ 193J [134_IJI I I
I r - - - 1"Grand-
I Ichildren" I- - - - L - - - J L - - - JTotal: 3581 3534 3634
1980 Cohort
Top corporations Universities Other Corporations
"Grand-Parents"- - - L - - - L - - -I I. I
___ [713 J [i____ I I
L48u1 <=matched> [ 482 1__________ I__ L 1 [24J
I Ir-—1 1-'"Grand-children" - - - - I. - - - -i
Total: 5351 5288 4720
Total # ofpatents for 1975: 10,749; for 1980: 15,359; Grand total:
26,108
"Parents"
"Originating"
"Children"
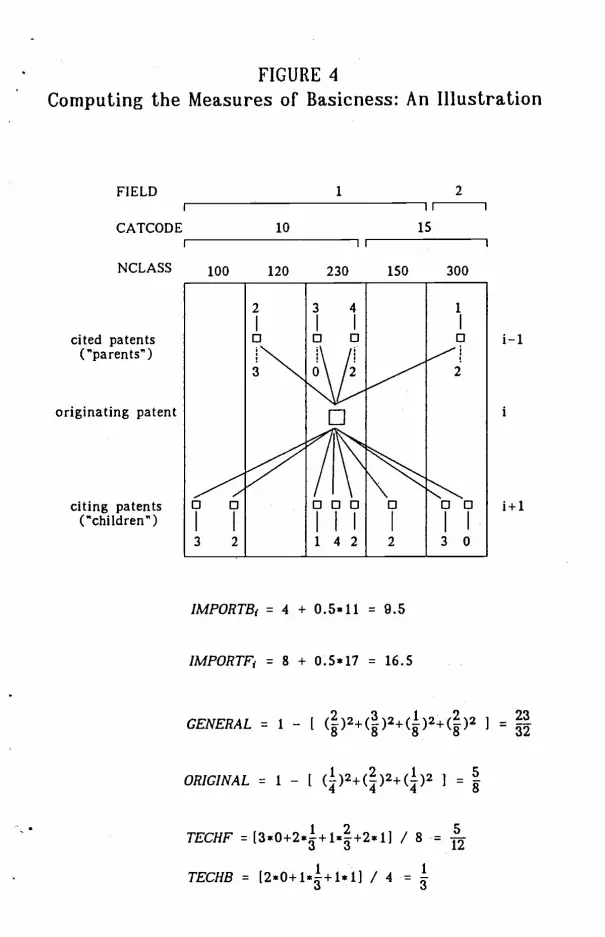
FIGURE 4Computing the Measures of Basicness: An Illustration
FIELD 1 2I II I
CATCODE 10 15I I
NCLASS 100 120 230 150 300
2 3 4 1
I I I Icited patents E1 0 0 0 i—i
("parents') —1
originating patent
citing patents 0 0 0 0 0 0 j+1("children")
I I I I I
3 2 142 2 30
IMPORTB1 = 4 + 0.5*11 = 9.5
IMPORTF1 = 8 ÷ 0.5*17 = 16.5
GENERAL = 1 -F ] =
ORIGINAL = 1 —F (I)2+()2÷()2 =
TECHF = [3*0+24+1*+2*1] / 8 =
TECHB = [2*0+14+1*1] / 4 =
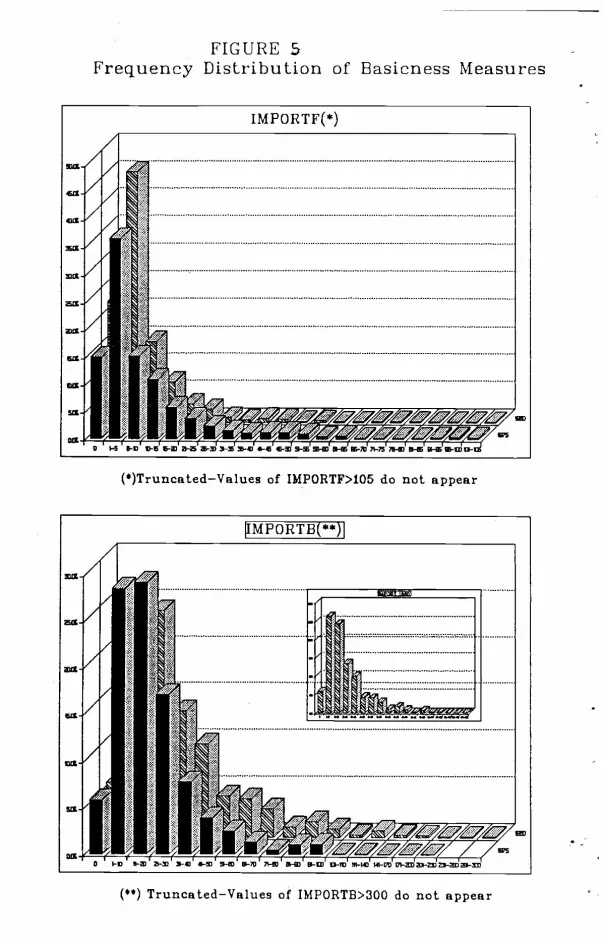
FIGURE 5Frequency Distribution of' Basicness Measures
(**) Truncated—Values of IMPORTB>300 do not appear
(')Truncated—Values of IMPORTF>105 do not appear
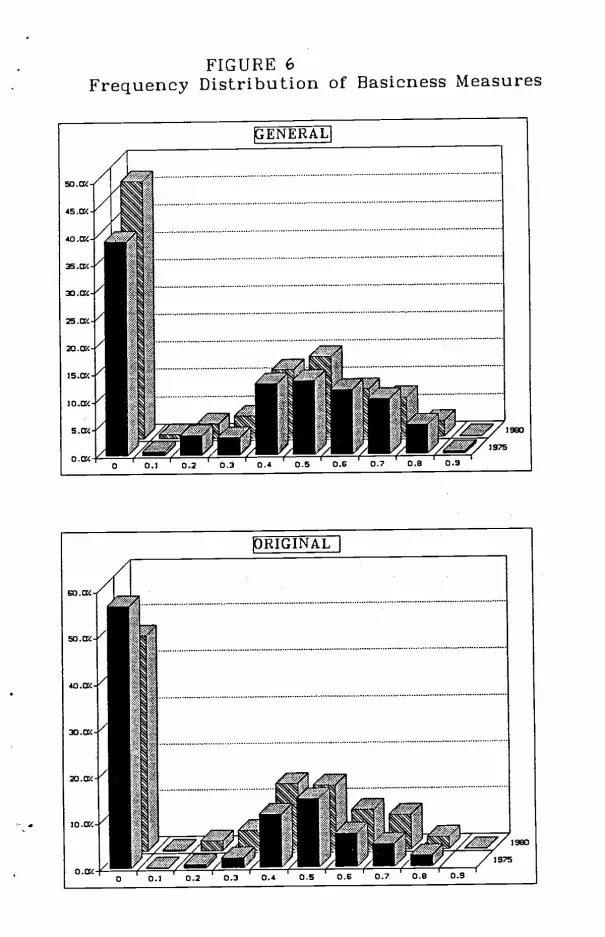
40.OZ
2O.
0 .0
FIGURE 'Frequency Distribution of Basicness Measures
R I G I N4JJ
4'I
I
I
'I
'I0 0.1 0.2 0.3 0.4 0.5 0.6 0.7 0.8 0.9
I. 1975