itc limited, pspd, unit - kovai - cii - sohrabji godrej green
TRANSCRIPT
CII National Award for
“Excellence in Energy Management - 2020”
ITC Limited, PSPD, Unit - Kovai
R.Muralidaran, Energy Manager
G.Srikanth, Energy Cell Member
N Gopal Chowdary, Energy Cell Member
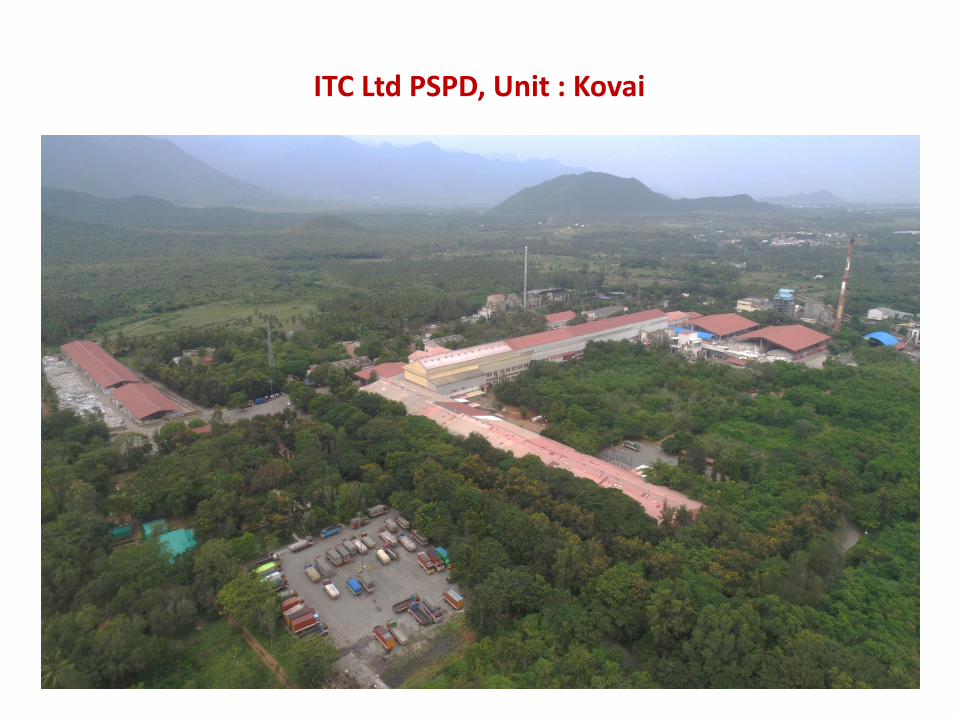
ITC Ltd PSPD, Unit : Kovai
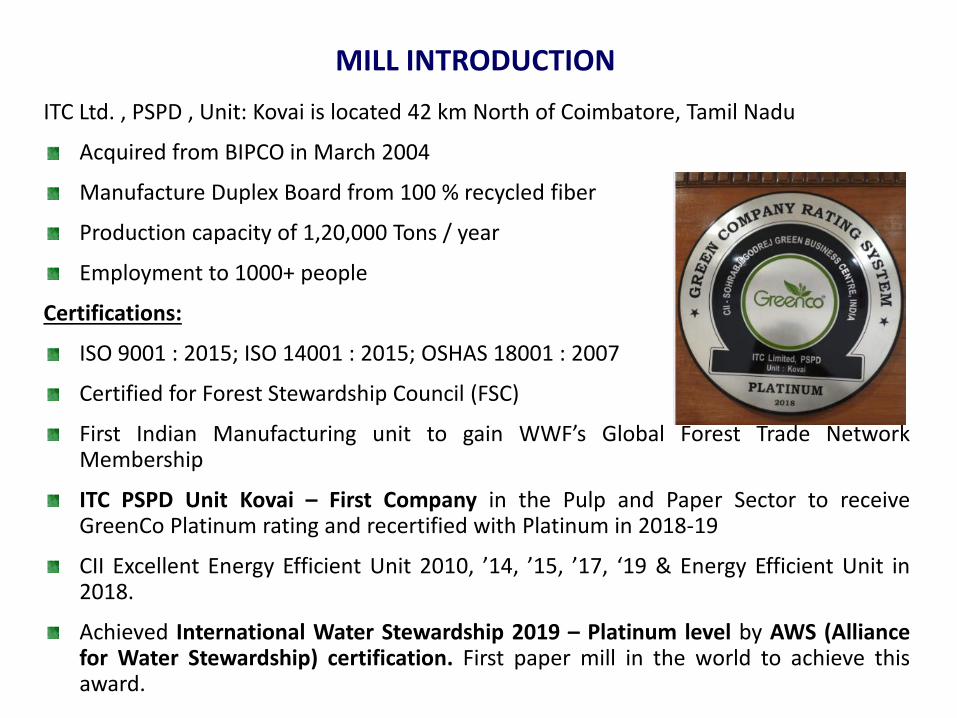
MILL INTRODUCTION
ITC Ltd. , PSPD , Unit: Kovai is located 42 km North of Coimbatore, Tamil Nadu
Acquired from BIPCO in March 2004
Manufacture Duplex Board from 100 % recycled fiber
Production capacity of 1,20,000 Tons / year
Employment to 1000+ people
Certifications:
ISO 9001 : 2015; ISO 14001 : 2015; OSHAS 18001 : 2007
Certified for Forest Stewardship Council (FSC)
First Indian Manufacturing unit to gain WWF’s Global Forest Trade NetworkMembership
ITC PSPD Unit Kovai – First Company in the Pulp and Paper Sector to receiveGreenCo Platinum rating and recertified with Platinum in 2018-19
CII Excellent Energy Efficient Unit 2010, ’14, ’15, ’17, ‘19 & Energy Efficient Unit in2018.
Achieved International Water Stewardship 2019 – Platinum level by AWS (Alliancefor Water Stewardship) certification. First paper mill in the world to achieve thisaward.
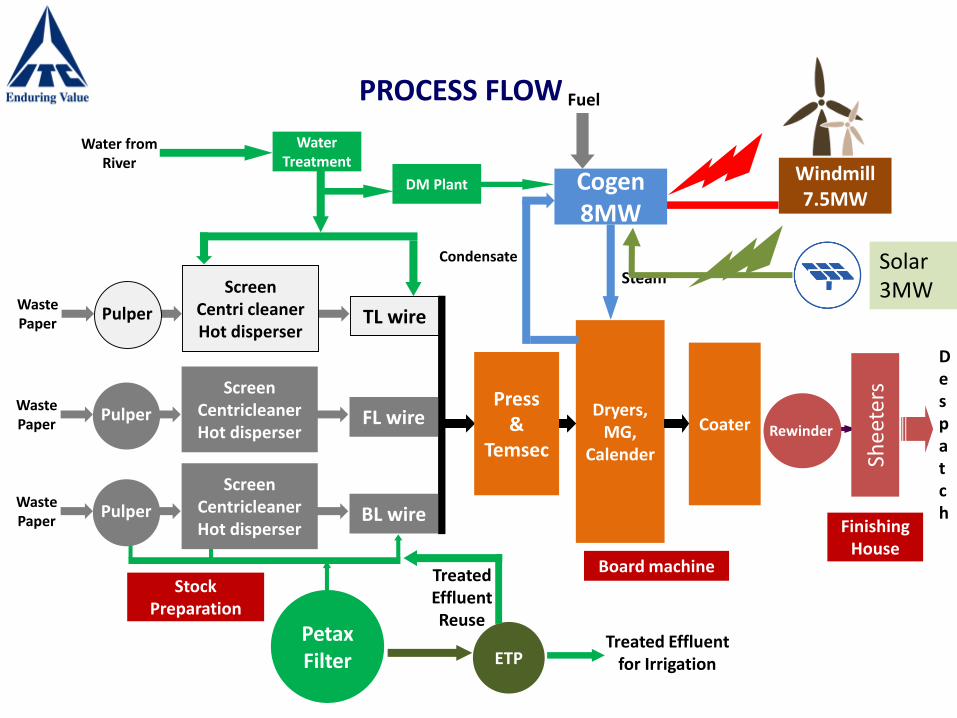
PROCESS FLOW
TL wire
Coater Dryers,
MG, Calender
Board machine
ETPTreated Effluent
for Irrigation
Petax Filter
Cogen 8MW
Steam
Water from River
Condensate
Fuel
Reel & Rewinder
She
eter
s
Finishing House
Despatch
Stock Preparation
PulperWaste Paper
ScreenCentri cleanerHot disperser
FL wirePulperWaste Paper
ScreenCentricleanerHot disperser
BL wirePulperWaste Paper
ScreenCentricleanerHot disperser
Water Treatment
DM Plant
Press&
TemsecRewinder
Treated Effluent Reuse
Windmill 7.5MW
Solar 3MW
ENERGY CONSUMPTION
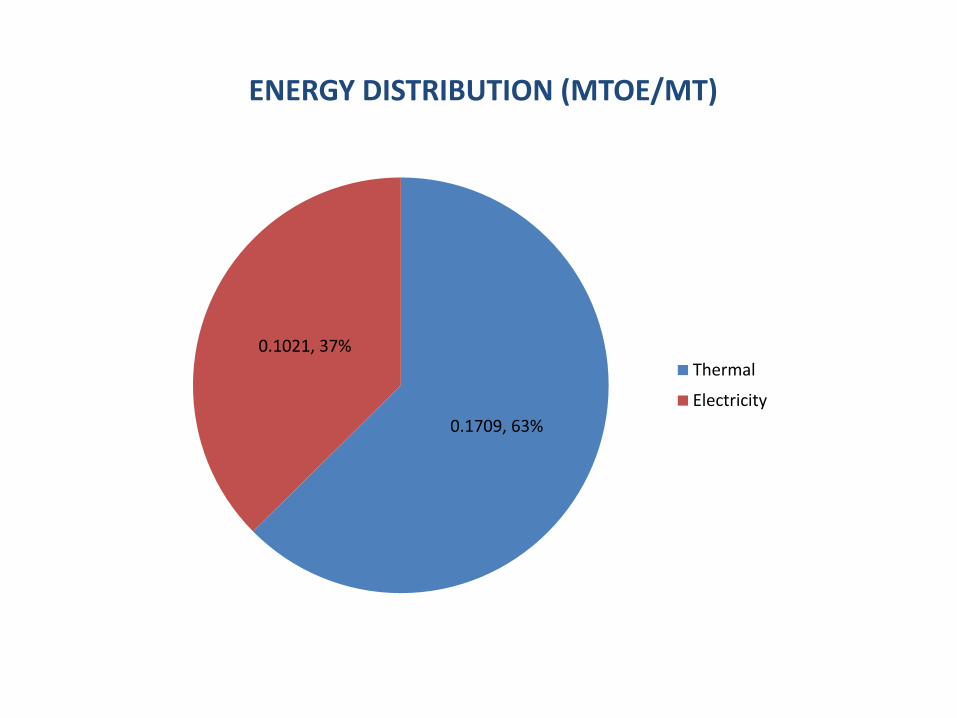
ENERGY DISTRIBUTION (MTOE/MT)
0.1709, 63%
0.1021, 37%
Thermal
Electricity
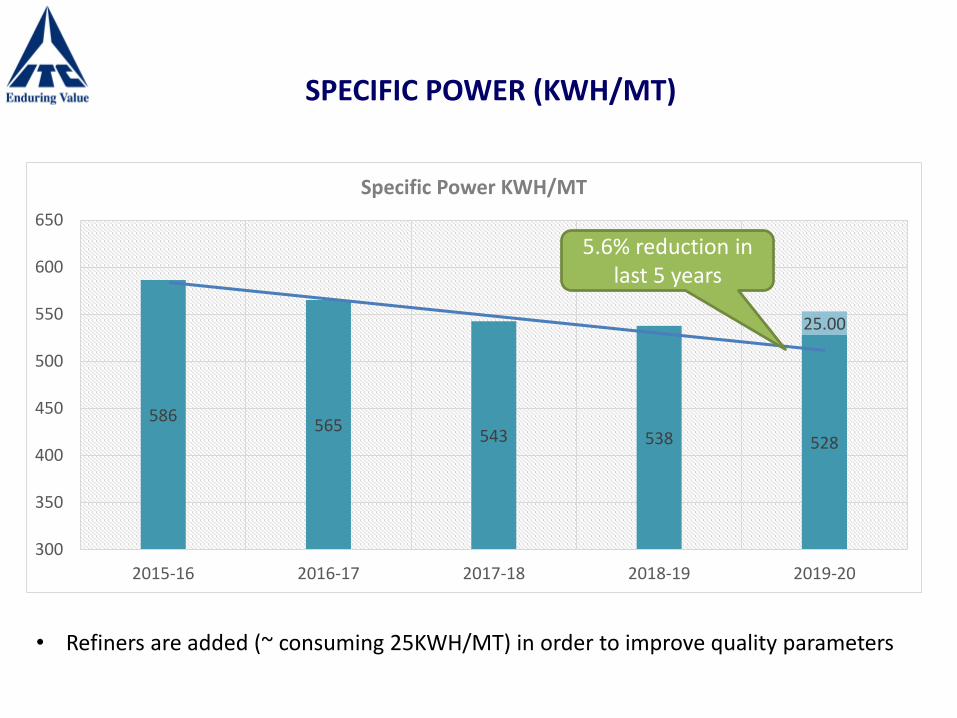
SPECIFIC POWER (KWH/MT)
586565
543 538 528
25.00
300
350
400
450
500
550
600
650
2015-16 2016-17 2017-18 2018-19 2019-20
Specific Power KWH/MT
5.6% reduction in last 5 years
• Refiners are added (~ consuming 25KWH/MT) in order to improve quality parameters
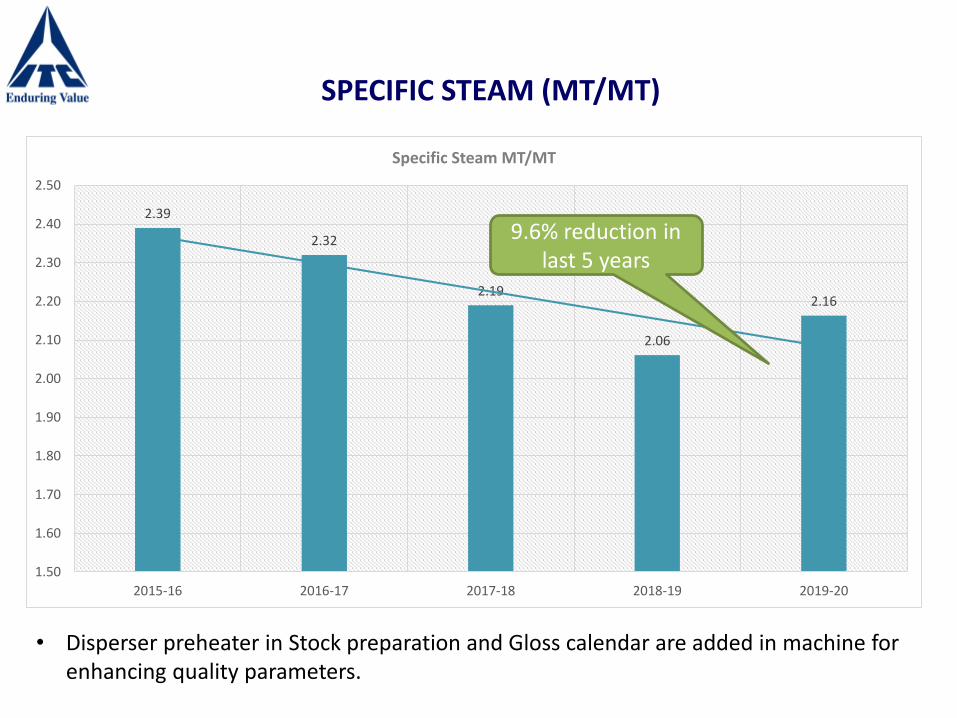
SPECIFIC STEAM (MT/MT)
2.39
2.32
2.19
2.06
2.16
1.50
1.60
1.70
1.80
1.90
2.00
2.10
2.20
2.30
2.40
2.50
2015-16 2016-17 2017-18 2018-19 2019-20
Specific Steam MT/MT
9.6% reduction in last 5 years
• Disperser preheater in Stock preparation and Gloss calendar are added in machine for enhancing quality parameters.
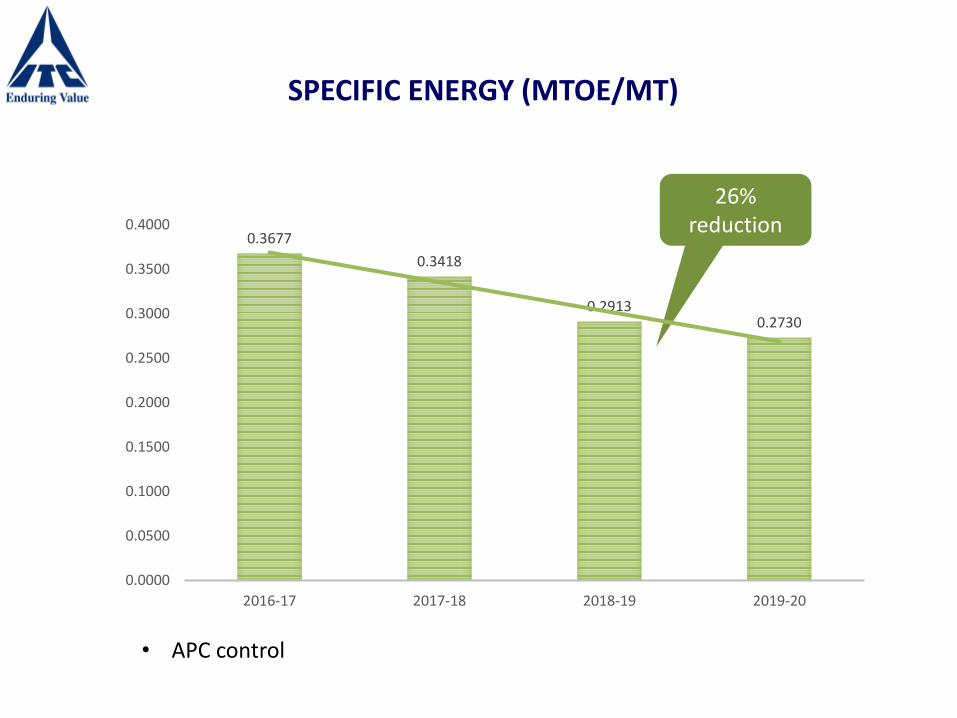
SPECIFIC ENERGY (MTOE/MT)
26% reduction
0.3677
0.3418
0.29130.2730
0.0000
0.0500
0.1000
0.1500
0.2000
0.2500
0.3000
0.3500
0.4000
2016-17 2017-18 2018-19 2019-20
• APC control
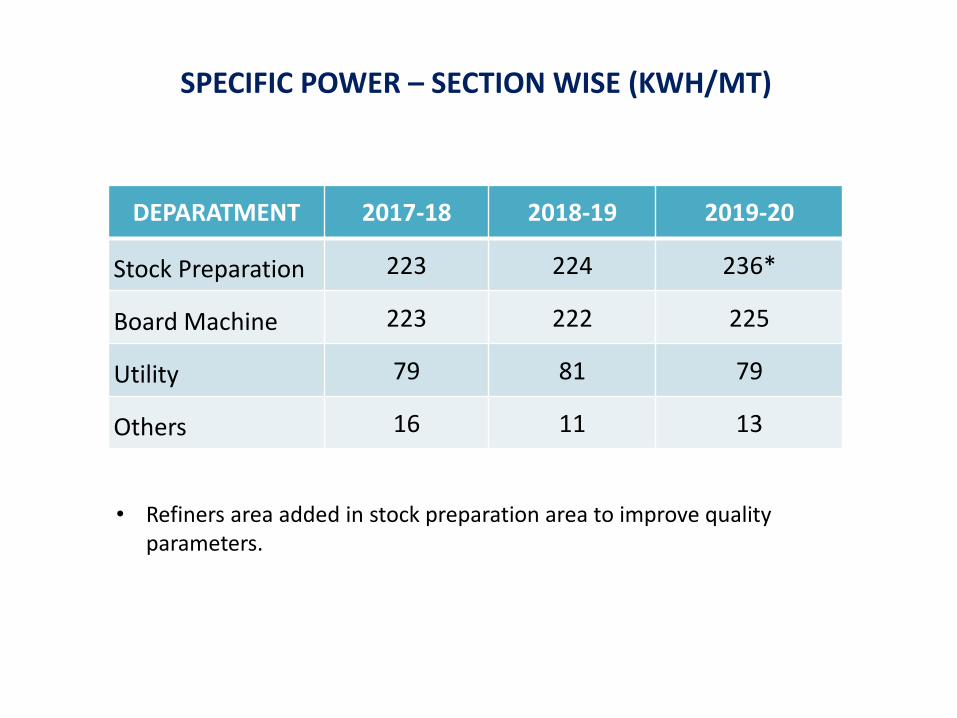
SPECIFIC POWER – SECTION WISE (KWH/MT)
DEPARATMENT 2017-18 2018-19 2019-20
Stock Preparation 223 224 236*
Board Machine 223 222 225
Utility 79 81 79
Others 16 11 13
• Refiners area added in stock preparation area to improve quality parameters.
GLOBAL BENCHMARK
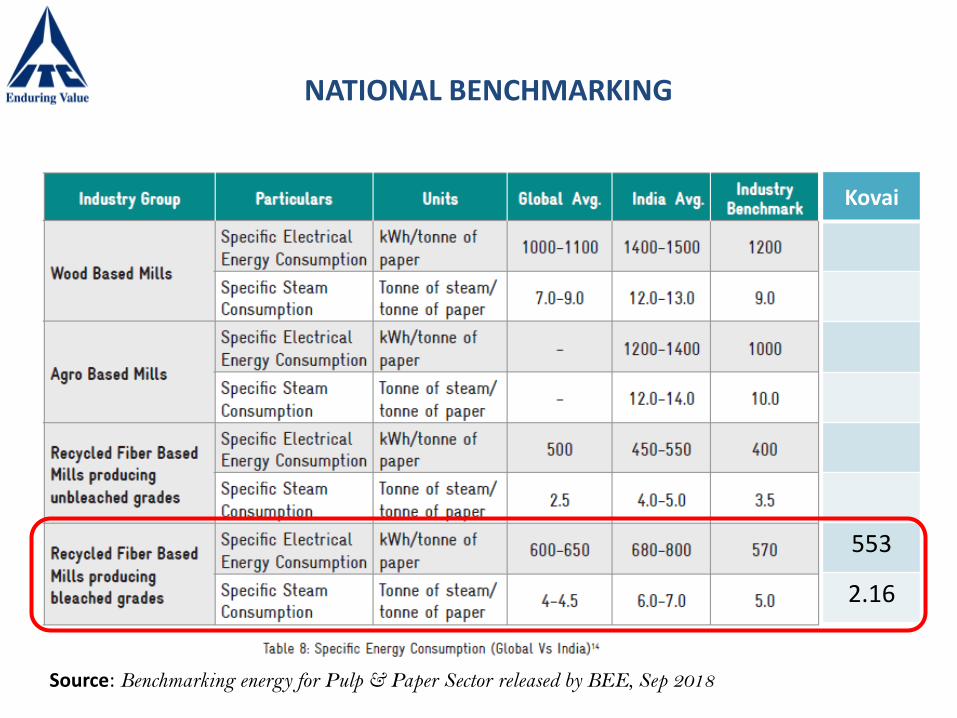
NATIONAL BENCHMARKING
Kovai
553
2.16
Source: Benchmarking energy for Pulp & Paper Sector released by BEE, Sep 2018
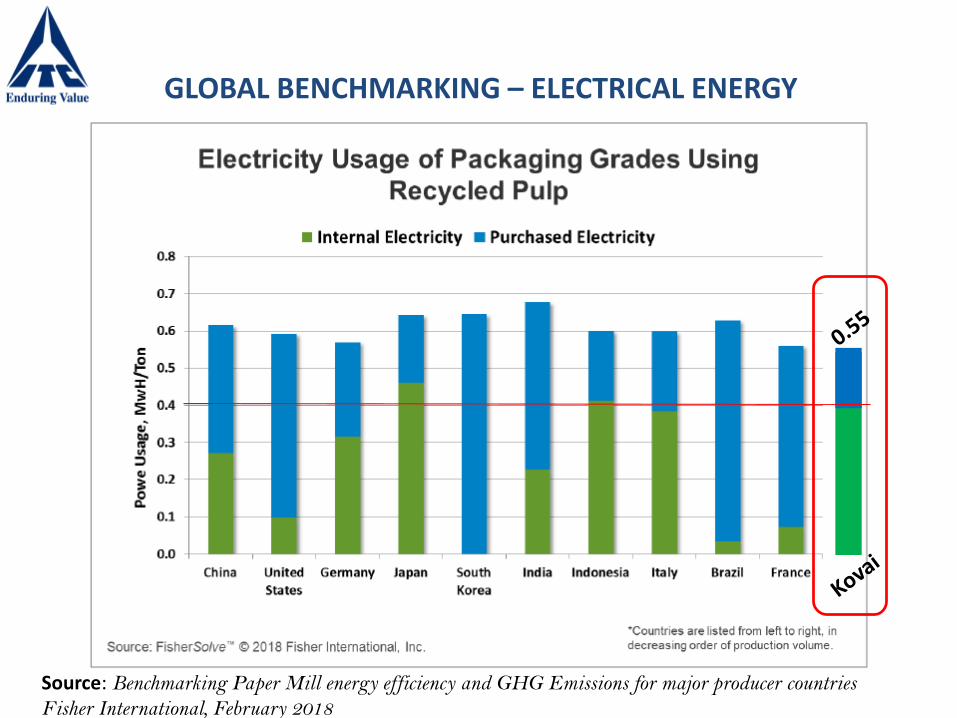
GLOBAL BENCHMARKING – ELECTRICAL ENERGY
Source: Benchmarking Paper Mill energy efficiency and GHG Emissions for major producer countries
Fisher International, February 2018
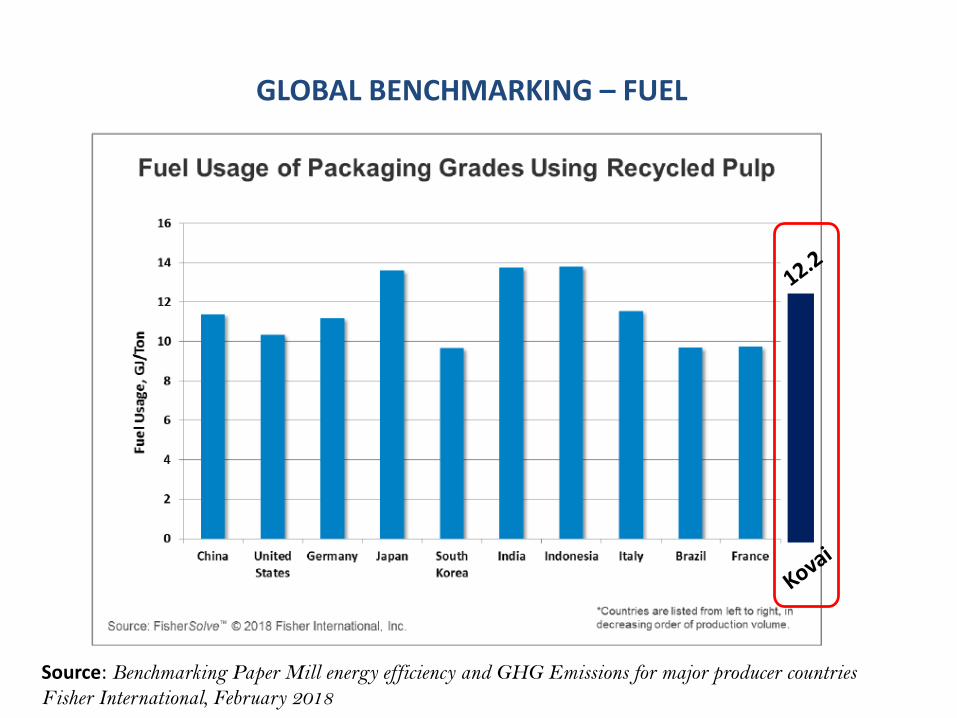
GLOBAL BENCHMARKING – FUEL
Source: Benchmarking Paper Mill energy efficiency and GHG Emissions for major producer countries
Fisher International, February 2018
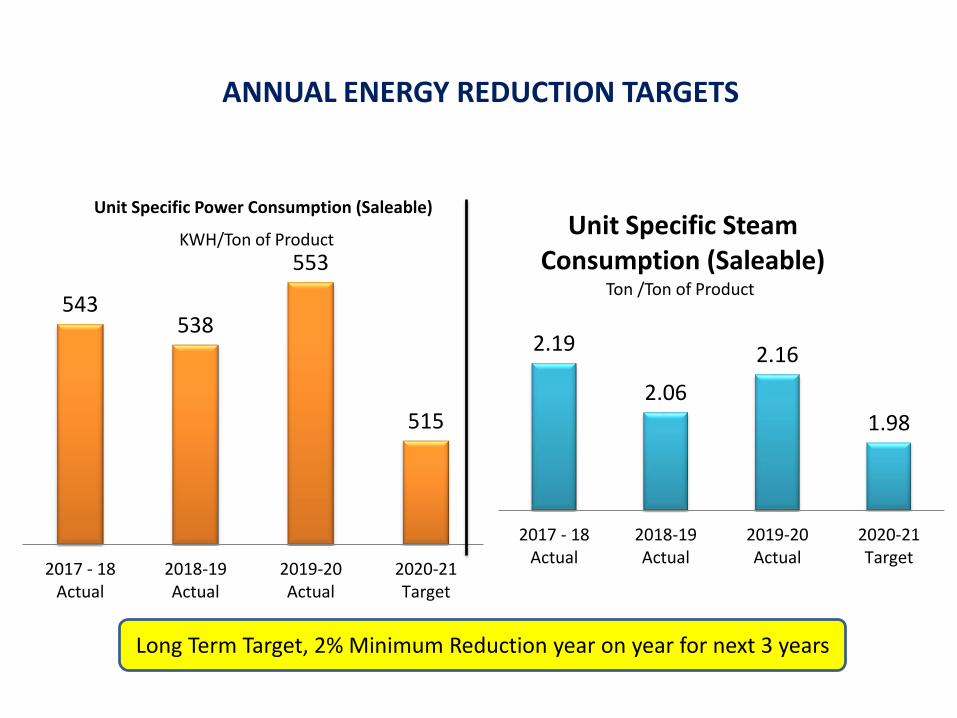
ANNUAL ENERGY REDUCTION TARGETS
543538
553
515
2017 - 18Actual
2018-19Actual
2019-20Actual
2020-21Target
Unit Specific Power Consumption (Saleable)
KWH/Ton of Product
2.19
2.06
2.16
1.98
2017 - 18Actual
2018-19Actual
2019-20Actual
2020-21Target
Unit Specific Steam Consumption (Saleable)
Ton /Ton of Product
Long Term Target, 2% Minimum Reduction year on year for next 3 years
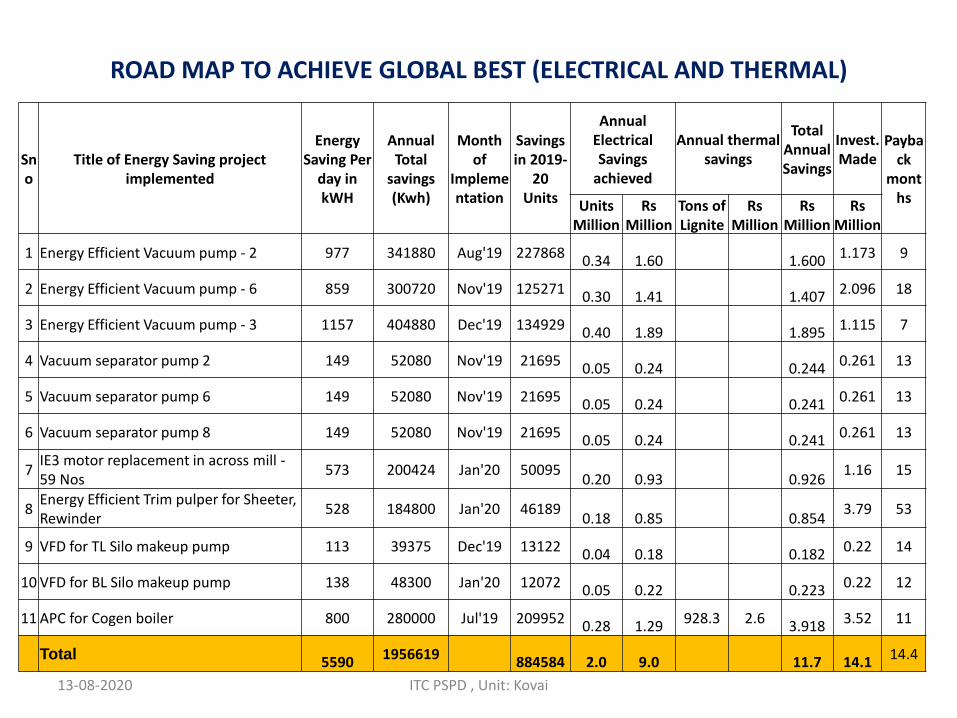
ROAD MAP TO ACHIEVE GLOBAL BEST (ELECTRICAL AND THERMAL)
13-08-2020 ITC PSPD , Unit: Kovai
Sno
Title of Energy Saving project implemented
Energy Saving Per
day in kWH
Annual Total
savings (Kwh)
Month of
Implementation
Savings in 2019-
20Units
Annual Electrical Savings
achieved
Annual thermal savings
Total Annual Savings
Invest. Made
Payback
monthsUnits
MillionRs
MillionTons of Lignite
Rs Million
Rs Million
Rs Million
1 Energy Efficient Vacuum pump - 2 977 341880 Aug'19 2278680.34 1.60 1.600
1.173 9
2 Energy Efficient Vacuum pump - 6 859 300720 Nov'19 1252710.30 1.41 1.407
2.096 18
3 Energy Efficient Vacuum pump - 3 1157 404880 Dec'19 134929 0.40 1.89 1.895 1.115 7
4 Vacuum separator pump 2 149 52080 Nov'19 21695 0.05 0.24 0.244 0.261 13
5 Vacuum separator pump 6 149 52080 Nov'19 21695 0.05 0.24 0.241 0.261 13
6 Vacuum separator pump 8 149 52080 Nov'19 21695 0.05 0.24 0.241 0.261 13
7IE3 motor replacement in across mill -59 Nos
573 200424 Jan'20 500950.20 0.93 0.926
1.16 15
8Energy Efficient Trim pulper for Sheeter, Rewinder
528 184800 Jan'20 461890.18 0.85 0.854
3.79 53
9 VFD for TL Silo makeup pump 113 39375 Dec'19 13122 0.04 0.18 0.182 0.22 14
10 VFD for BL Silo makeup pump 138 48300 Jan'20 12072 0.05 0.22 0.223 0.22 12
11 APC for Cogen boiler 800 280000 Jul'19 209952 0.28 1.29 928.3 2.6 3.918 3.52 11
Total 5590 1956619 884584 2.0 9.0 11.7 14.1 14.4
ENERGY SAVING PROJECTS
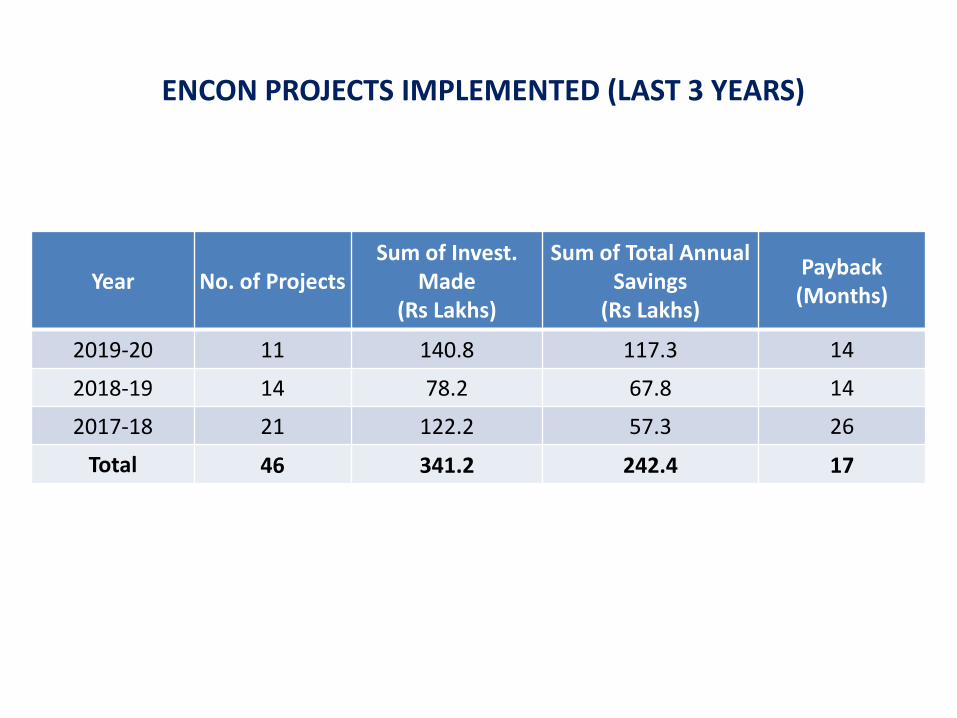
ENCON PROJECTS IMPLEMENTED (LAST 3 YEARS)
Year No. of ProjectsSum of Invest.
Made(Rs Lakhs)
Sum of Total Annual Savings
(Rs Lakhs)
Payback(Months)
2019-20 11 140.8 117.3 14
2018-19 14 78.2 67.8 14
2017-18 21 122.2 57.3 26
Total 46 341.2 242.4 17
INNOVATIVE PROJECT
Innovative Project - 1
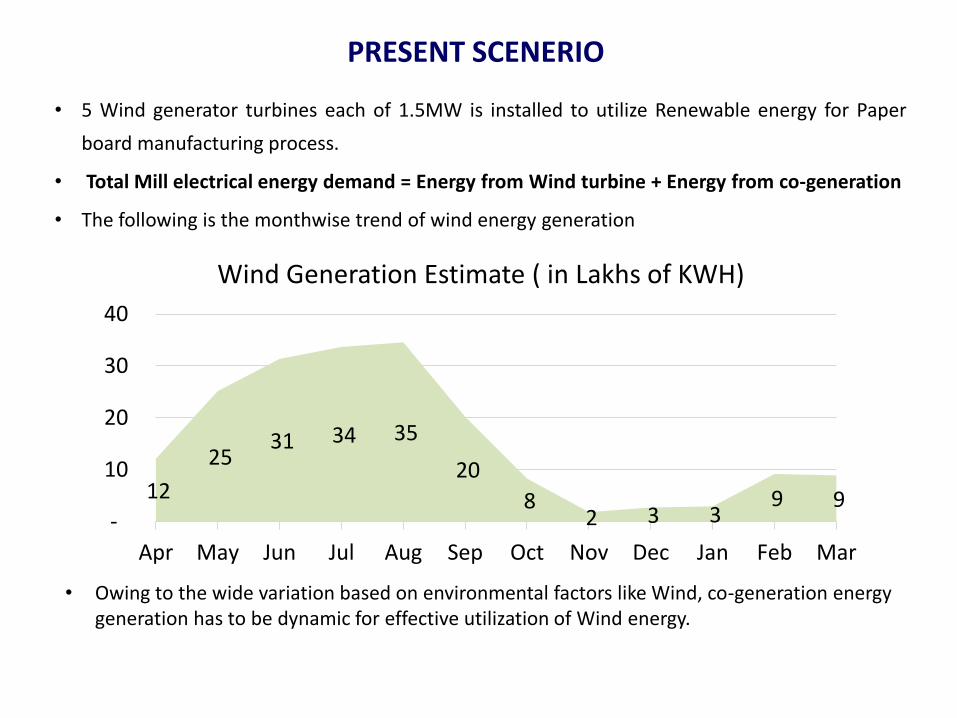
• 5 Wind generator turbines each of 1.5MW is installed to utilize Renewable energy for Paper
board manufacturing process.
• Total Mill electrical energy demand = Energy from Wind turbine + Energy from co-generation
• The following is the monthwise trend of wind energy generation
PRESENT SCENERIO
12
25 31 34 35
20
8 2 3 3
9 9 -
10
20
30
40
Apr May Jun Jul Aug Sep Oct Nov Dec Jan Feb Mar
Wind Generation Estimate ( in Lakhs of KWH)
• Owing to the wide variation based on environmental factors like Wind, co-generation energy generation has to be dynamic for effective utilization of Wind energy.
EFFECTIVE UTILISATION OF WIND AND CO-GENERATION VIA APC (ADVANCE PROCESS CONTROLLER)
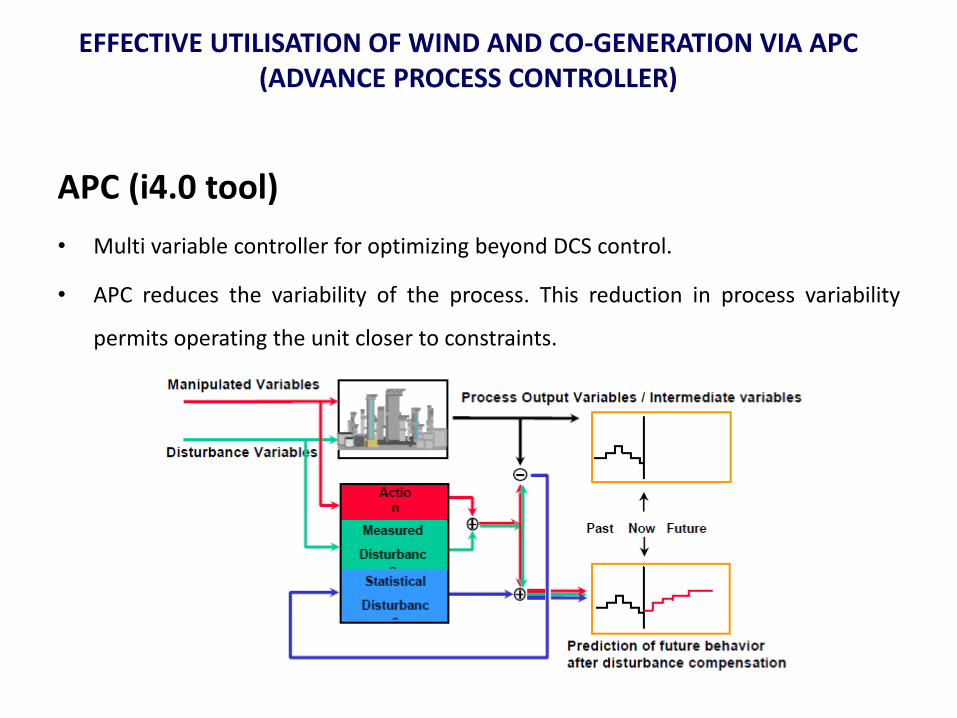
APC (i4.0 tool)
• Multi variable controller for optimizing beyond DCS control.
• APC reduces the variability of the process. This reduction in process variability
permits operating the unit closer to constraints.
EFFECTIVE WIND ENERGY UTILISATION
MP Steam
Condenser
5.5 MW
TG
LP Steam flow – 18 TPH to 24 TPH
APC
Total Demand of mill
Wind energy
APC Output – TG Control
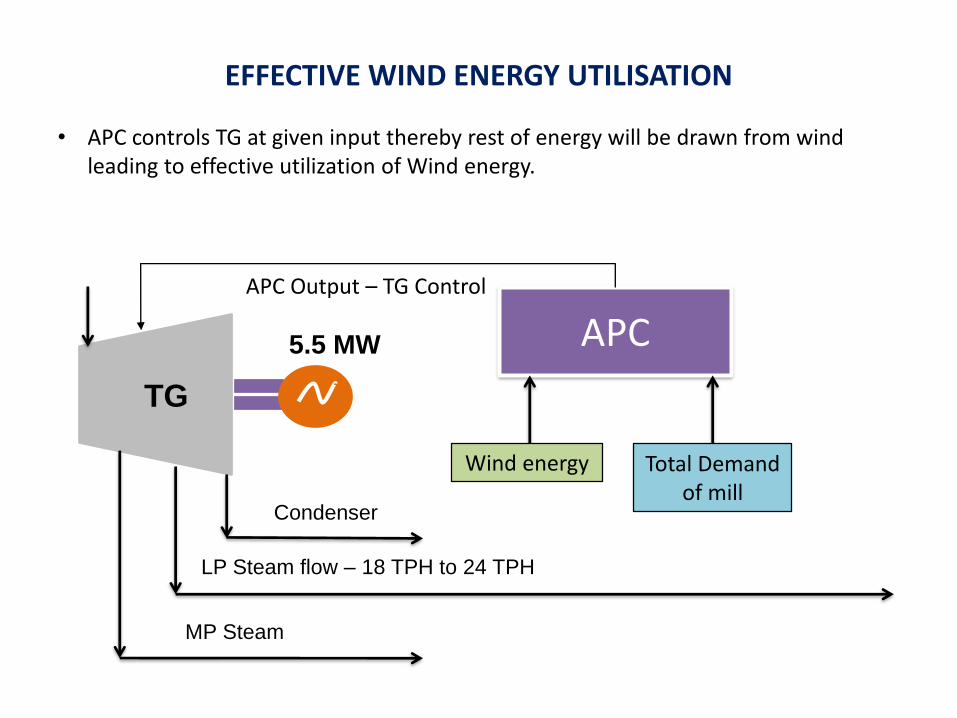
• APC controls TG at given input thereby rest of energy will be drawn from wind leading to effective utilization of Wind energy.
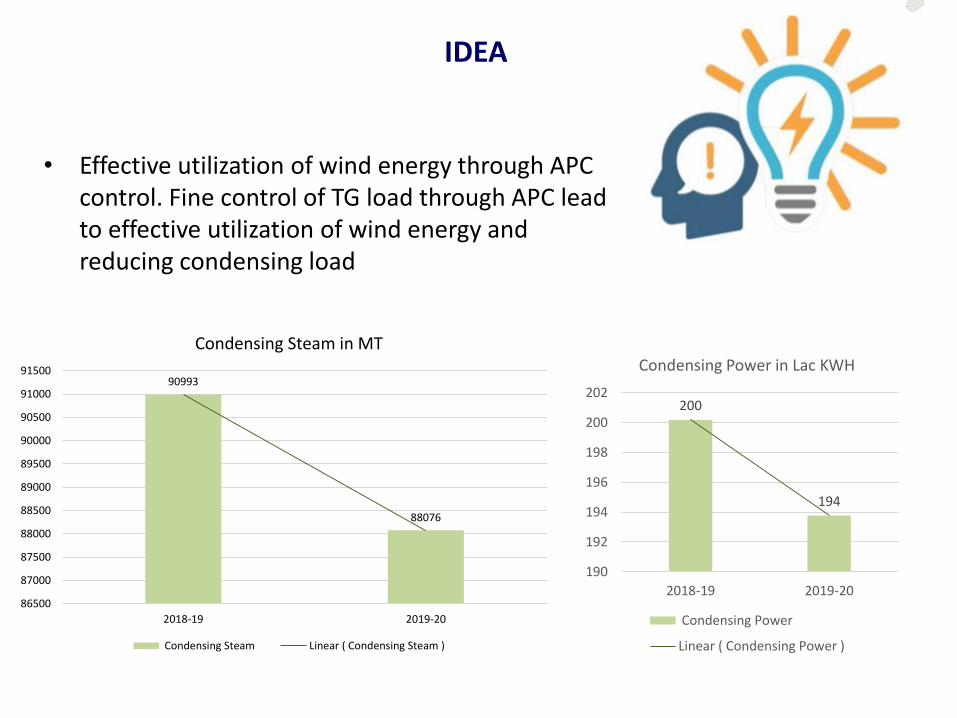
• Effective utilization of wind energy through APC control. Fine control of TG load through APC lead to effective utilization of wind energy and reducing condensing load
IDEA
200
194
190
192
194
196
198
200
202
2018-19 2019-20
Condensing Power in Lac KWH
Condensing Power
Linear ( Condensing Power )
90993
88076
86500
87000
87500
88000
88500
89000
89500
90000
90500
91000
91500
2018-19 2019-20
Condensing Steam in MT
Condensing Steam Linear ( Condensing Steam )
Innovative Project - 2
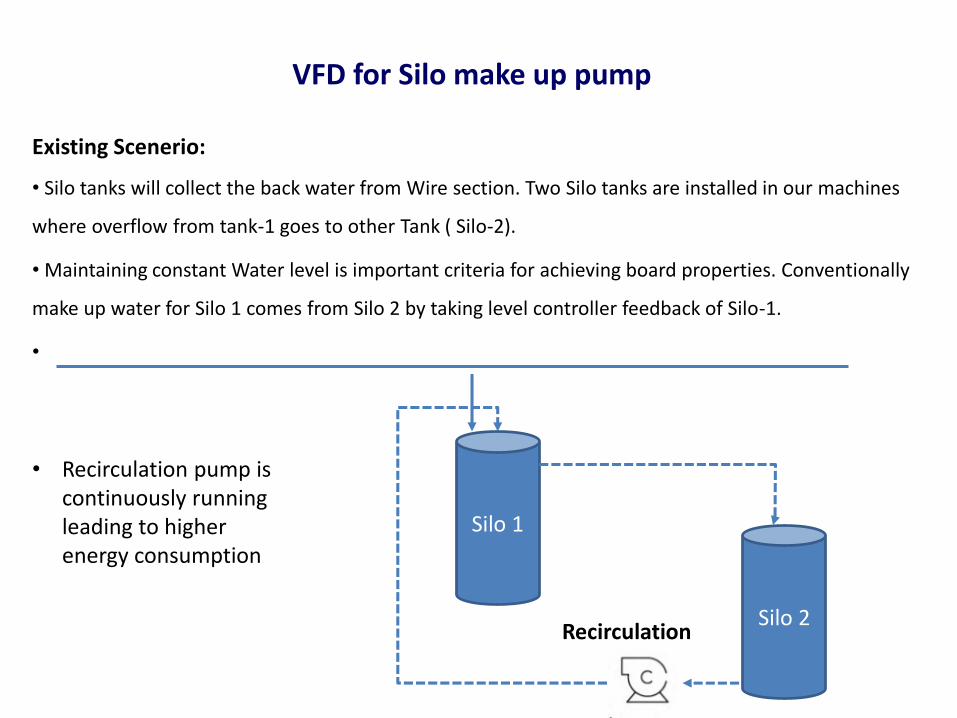
VFD for Silo make up pump
Existing Scenerio:
• Silo tanks will collect the back water from Wire section. Two Silo tanks are installed in our machines
where overflow from tank-1 goes to other Tank ( Silo-2).
• Maintaining constant Water level is important criteria for achieving board properties. Conventionally
make up water for Silo 1 comes from Silo 2 by taking level controller feedback of Silo-1.
•
Silo 1
Silo 2Recirculation
• Recirculation pump is continuously running leading to higher energy consumption
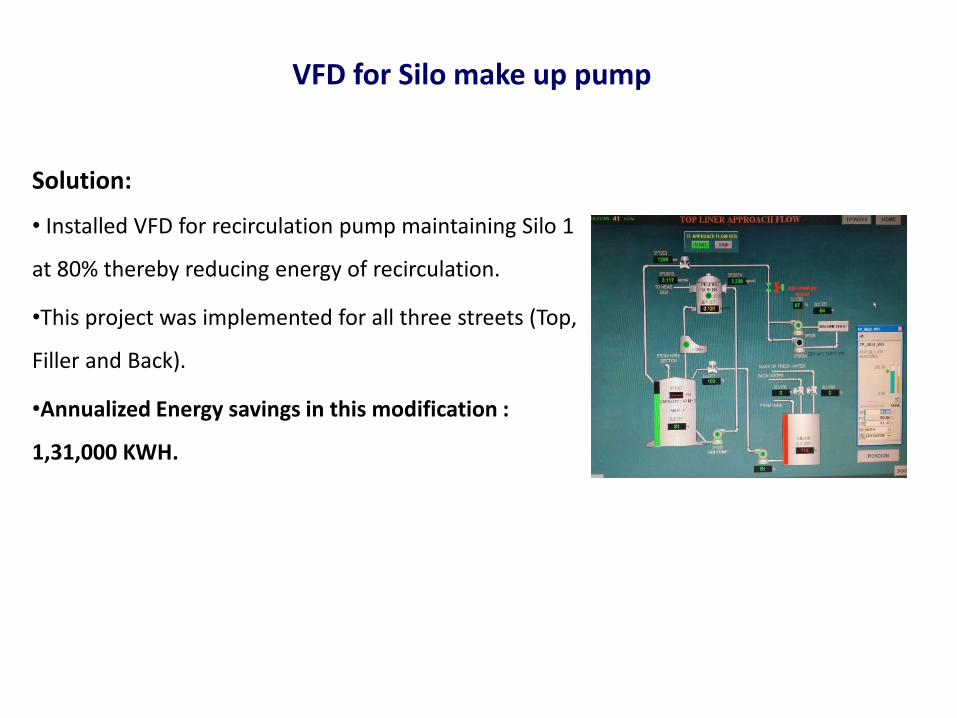
Solution:
• Installed VFD for recirculation pump maintaining Silo 1
at 80% thereby reducing energy of recirculation.
•This project was implemented for all three streets (Top,
Filler and Back).
•Annualized Energy savings in this modification :
1,31,000 KWH.
VFD for Silo make up pump
UTILISATION OF RENEWABLE ENERGY
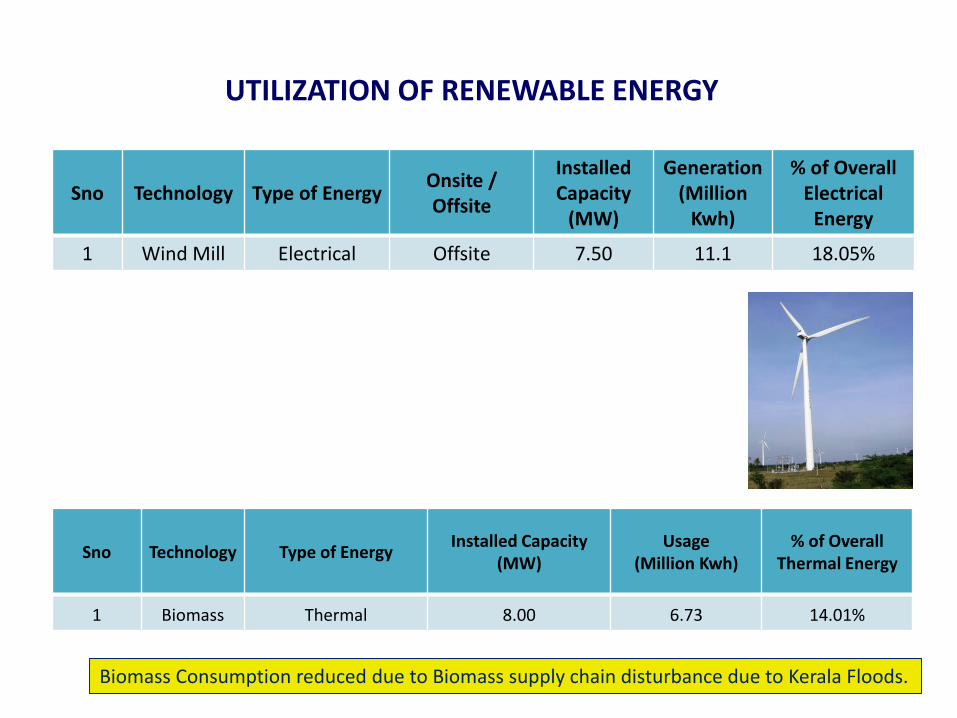
UTILIZATION OF RENEWABLE ENERGY
Sno Technology Type of EnergyOnsite / Offsite
Installed Capacity
(MW)
Generation(Million
Kwh)
% of Overall Electrical
Energy
1 Wind Mill Electrical Offsite 7.50 11.1 18.05%
Sno Technology Type of EnergyInstalled Capacity
(MW)Usage
(Million Kwh)% of Overall
Thermal Energy
1 Biomass Thermal 8.00 6.73 14.01%
Biomass Consumption reduced due to Biomass supply chain disturbance due to Kerala Floods.
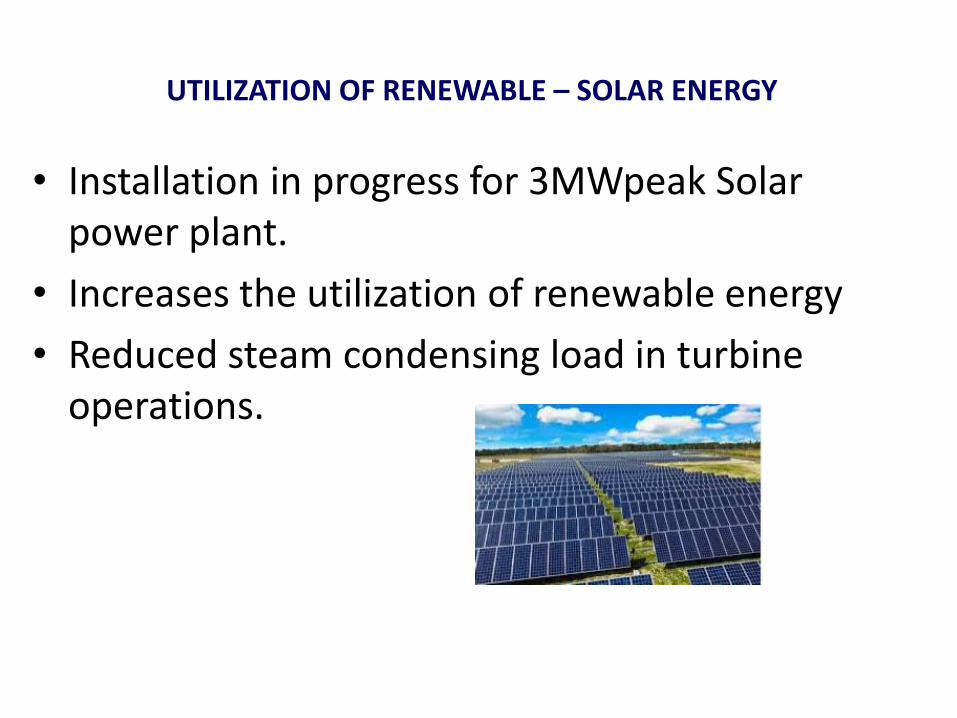
UTILIZATION OF RENEWABLE – SOLAR ENERGY
• Installation in progress for 3MWpeak Solar power plant.
• Increases the utilization of renewable energy
• Reduced steam condensing load in turbine operations.
UTILISATION OF WASTE MATERIAL AS FUEL
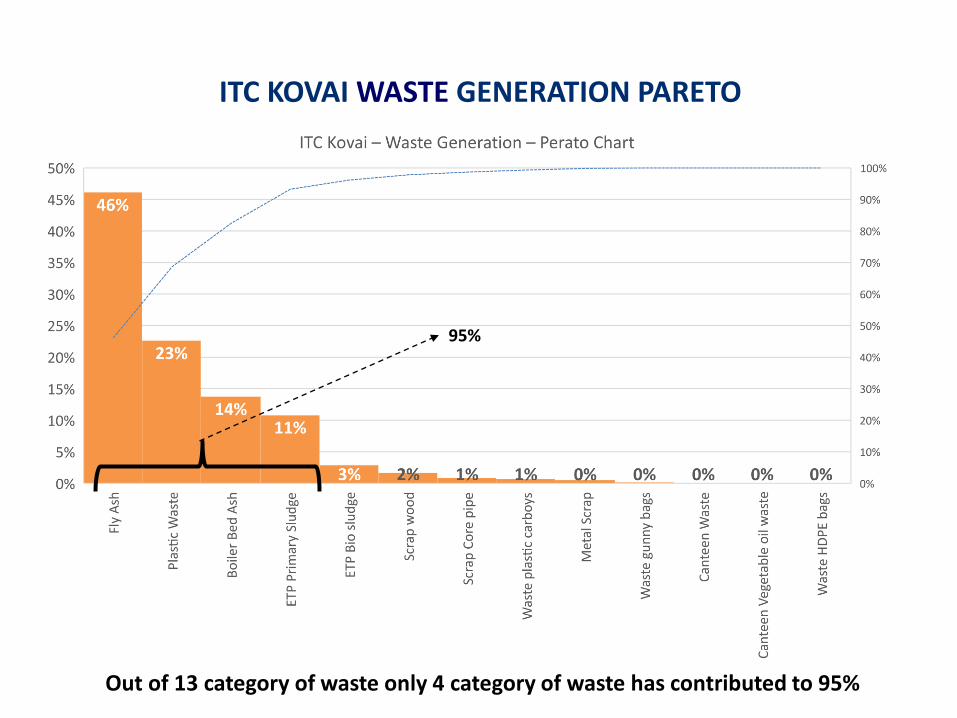
95%
ITC KOVAI WASTE GENERATION PARETO
Out of 13 category of waste only 4 category of waste has contributed to 95%
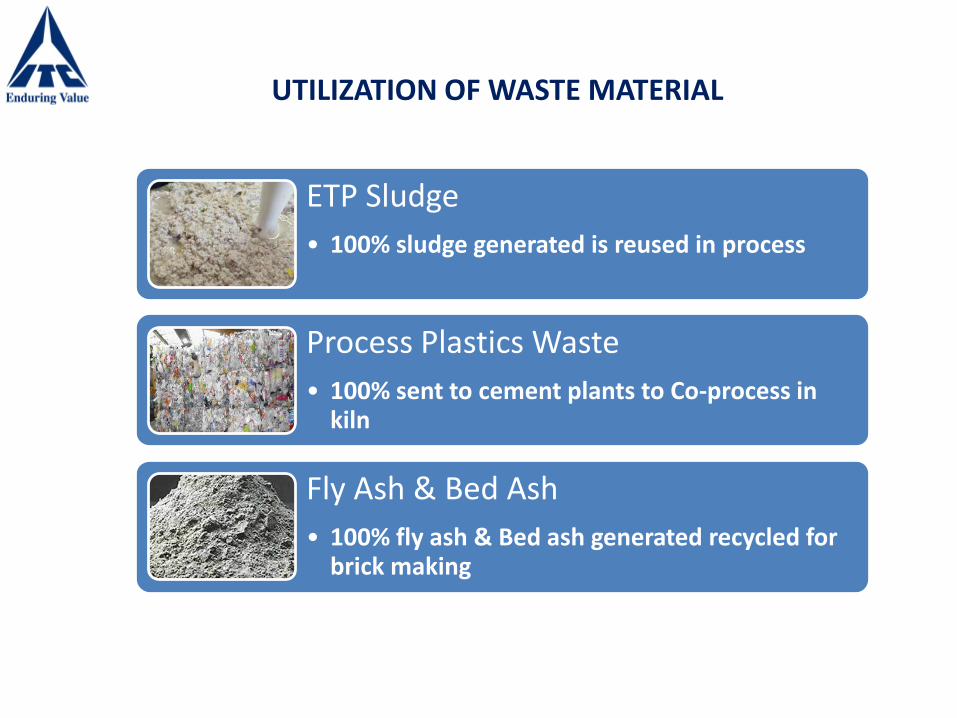
UTILIZATION OF WASTE MATERIAL
ETP Sludge
• 100% sludge generated is reused in process
Process Plastics Waste
• 100% sent to cement plants to Co-process in kiln
Fly Ash & Bed Ash
• 100% fly ash & Bed ash generated recycled for brick making
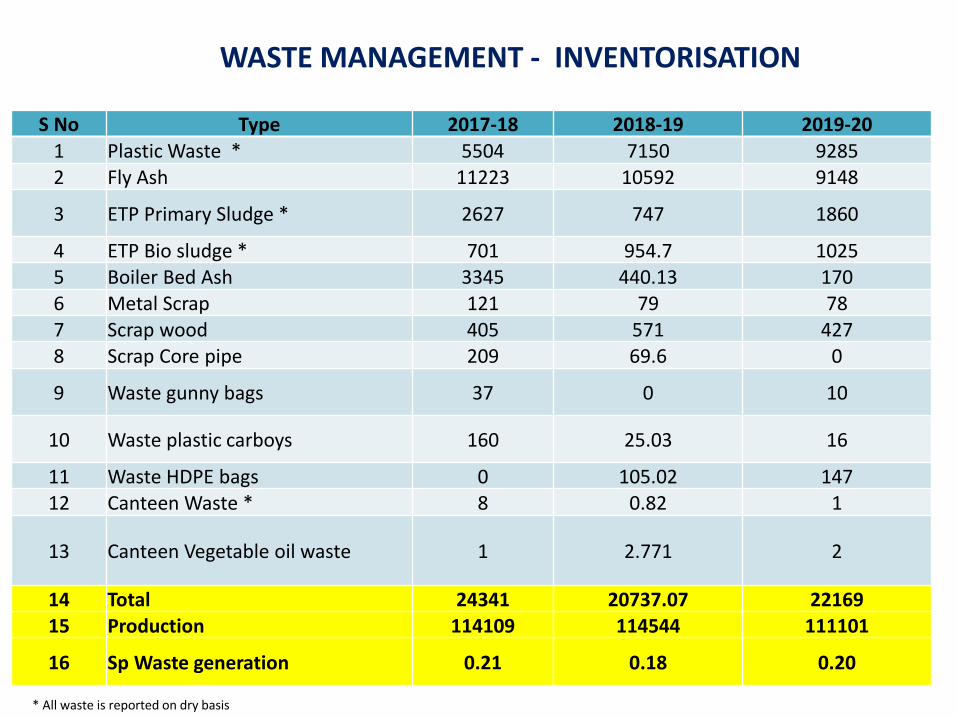
WASTE MANAGEMENT - INVENTORISATION
* All waste is reported on dry basis
S No Type 2017-18 2018-19 2019-20
1 Plastic Waste * 5504 7150 92852 Fly Ash 11223 10592 9148
3 ETP Primary Sludge * 2627 747 1860
4 ETP Bio sludge * 701 954.7 10255 Boiler Bed Ash 3345 440.13 1706 Metal Scrap 121 79 787 Scrap wood 405 571 4278 Scrap Core pipe 209 69.6 0
9 Waste gunny bags 37 0 10
10 Waste plastic carboys 160 25.03 16
11 Waste HDPE bags 0 105.02 14712 Canteen Waste * 8 0.82 1
13 Canteen Vegetable oil waste 1 2.771 2
14 Total 24341 20737.07 2216915 Production 114109 114544 111101
16 Sp Waste generation 0.21 0.18 0.20

SPECIFIC WASTE GENERATION DECLARATION
ITC’s Sustainability Report 2020 is yet to be declared
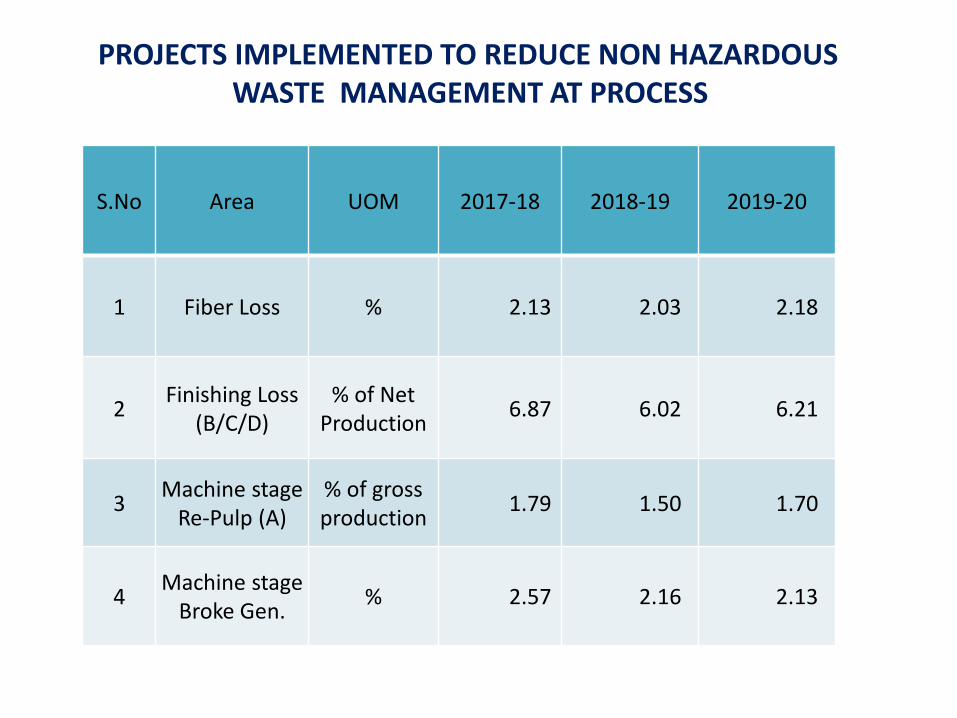
S.No Area UOM 2017-18 2018-19 2019-20
1 Fiber Loss % 2.13 2.03 2.18
2Finishing Loss
(B/C/D)% of Net
Production 6.87 6.02 6.21
3Machine stage
Re-Pulp (A)% of gross production
1.79 1.50 1.70
4Machine stage
Broke Gen.% 2.57 2.16 2.13
PROJECTS IMPLEMENTED TO REDUCE NON HAZARDOUS WASTE MANAGEMENT AT PROCESS
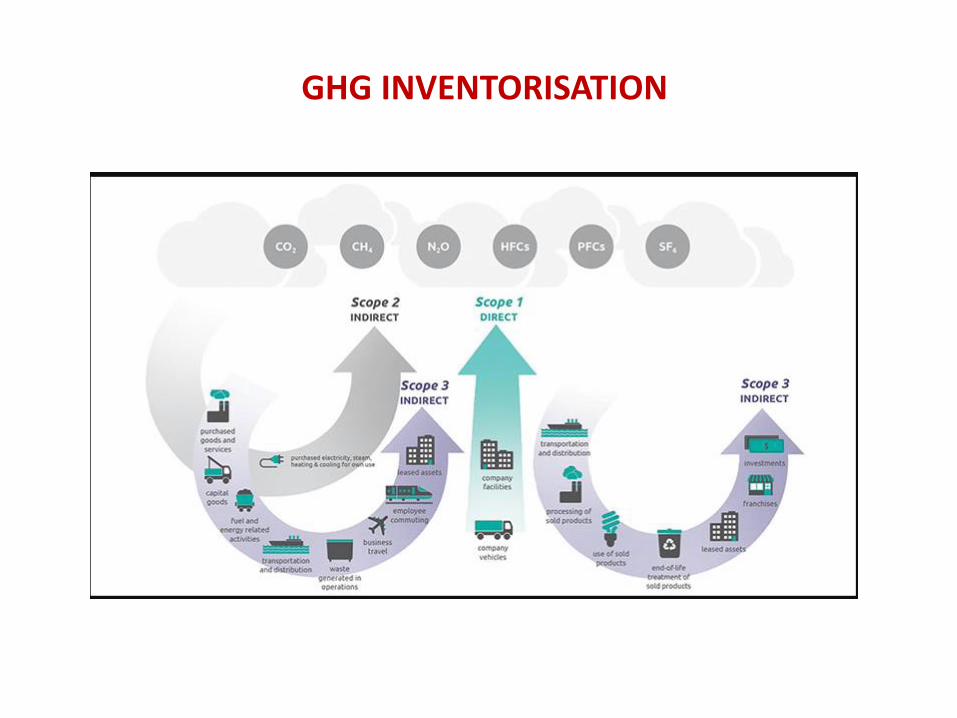
GHG INVENTORISATION
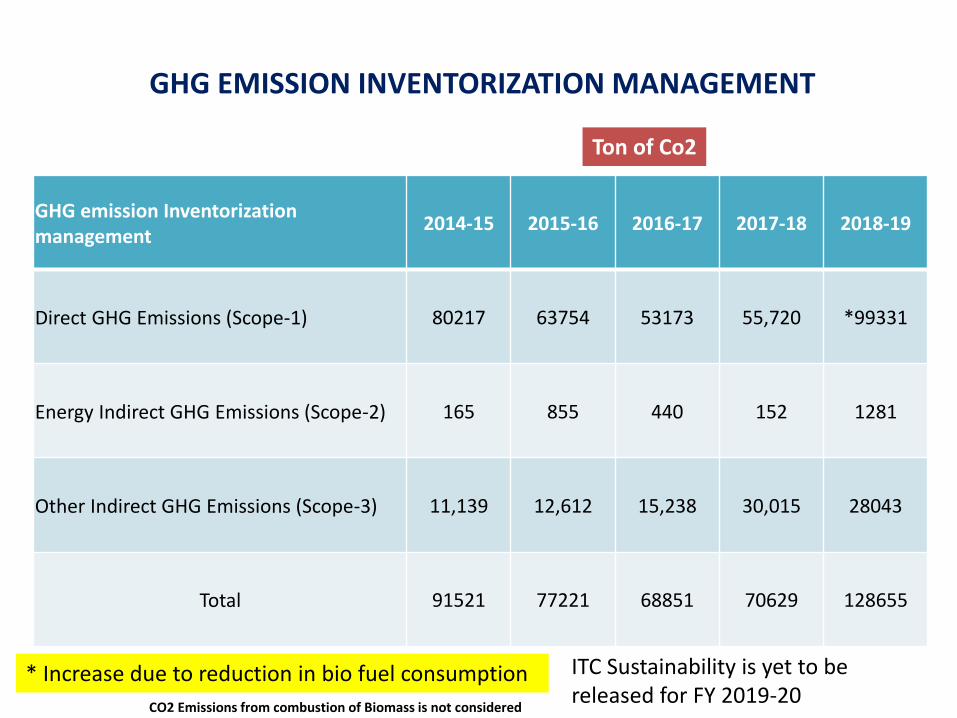
GHG EMISSION INVENTORIZATION MANAGEMENT
GHG emission Inventorization management
2014-15 2015-16 2016-17 2017-18 2018-19
Direct GHG Emissions (Scope-1) 80217 63754 53173 55,720 *99331
Energy Indirect GHG Emissions (Scope-2) 165 855 440 152 1281
Other Indirect GHG Emissions (Scope-3) 11,139 12,612 15,238 30,015 28043
Total 91521 77221 68851 70629 128655
* Increase due to reduction in bio fuel consumption
Ton of Co2
CO2 Emissions from combustion of Biomass is not considered
ITC Sustainability is yet to be released for FY 2019-20
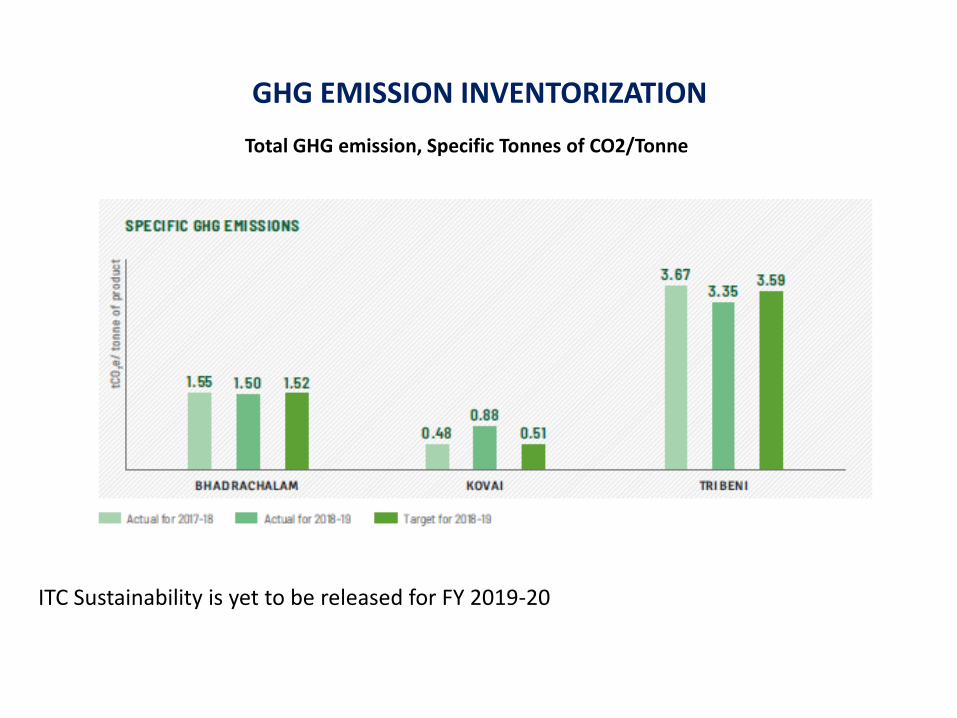
Total GHG emission, Specific Tonnes of CO2/Tonne
GHG EMISSION INVENTORIZATION
ITC Sustainability is yet to be released for FY 2019-20
GREEN SUPPLY CHAIN
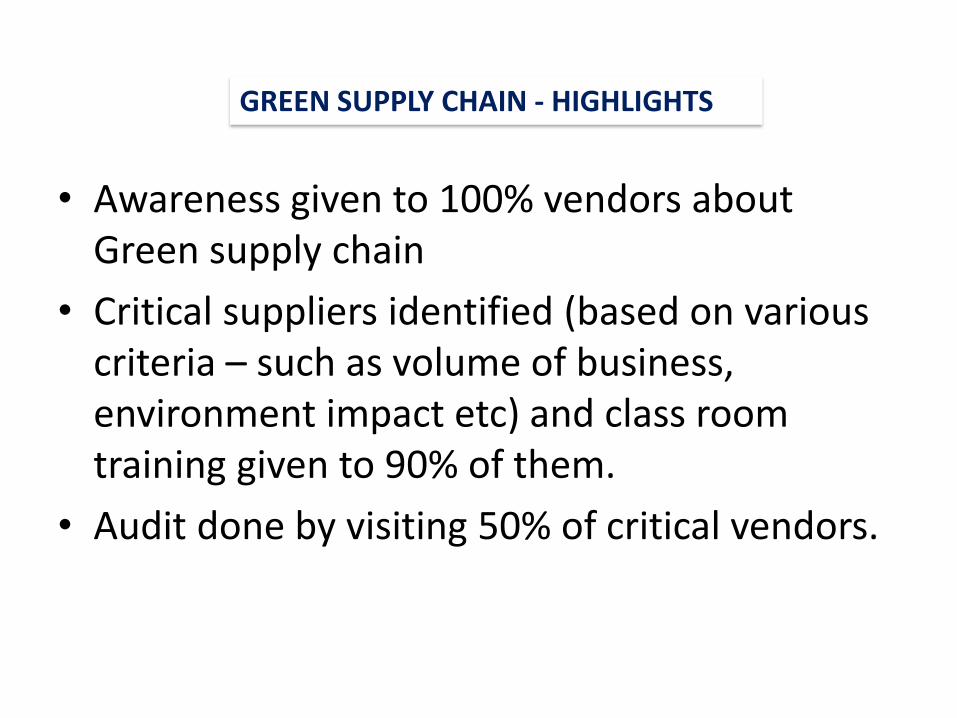
• Awareness given to 100% vendors about Green supply chain
• Critical suppliers identified (based on various criteria – such as volume of business, environment impact etc) and class room training given to 90% of them.
• Audit done by visiting 50% of critical vendors.
GREEN SUPPLY CHAIN - HIGHLIGHTS
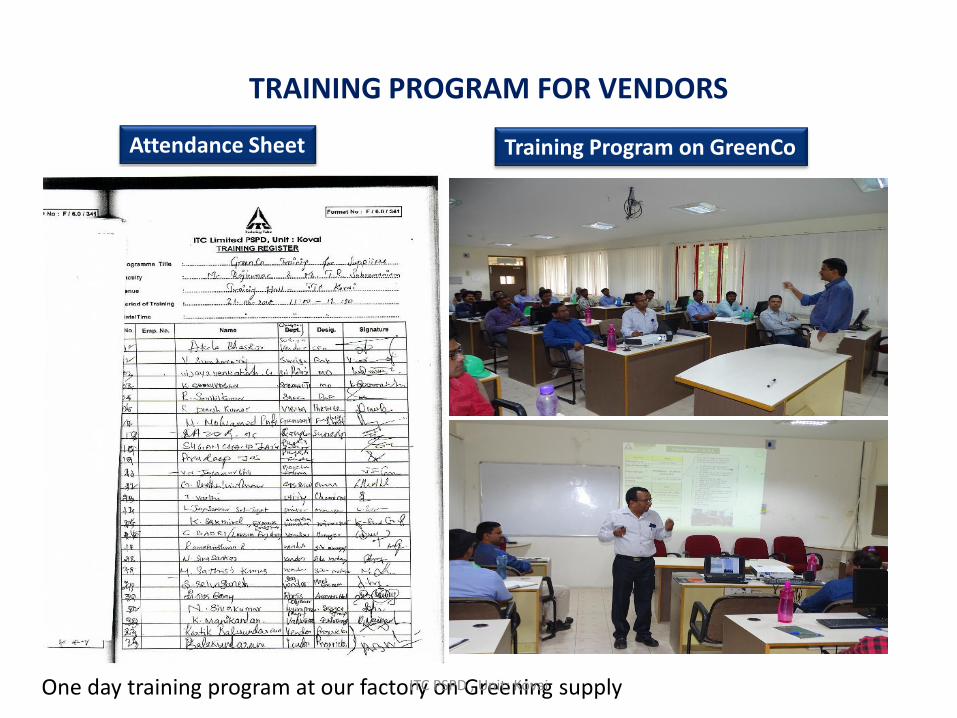
Attendance Sheet Training Program on GreenCo
One day training program at our factory on Greening supplyITC PSPD , Unit: Kovai
TRAINING PROGRAM FOR VENDORS
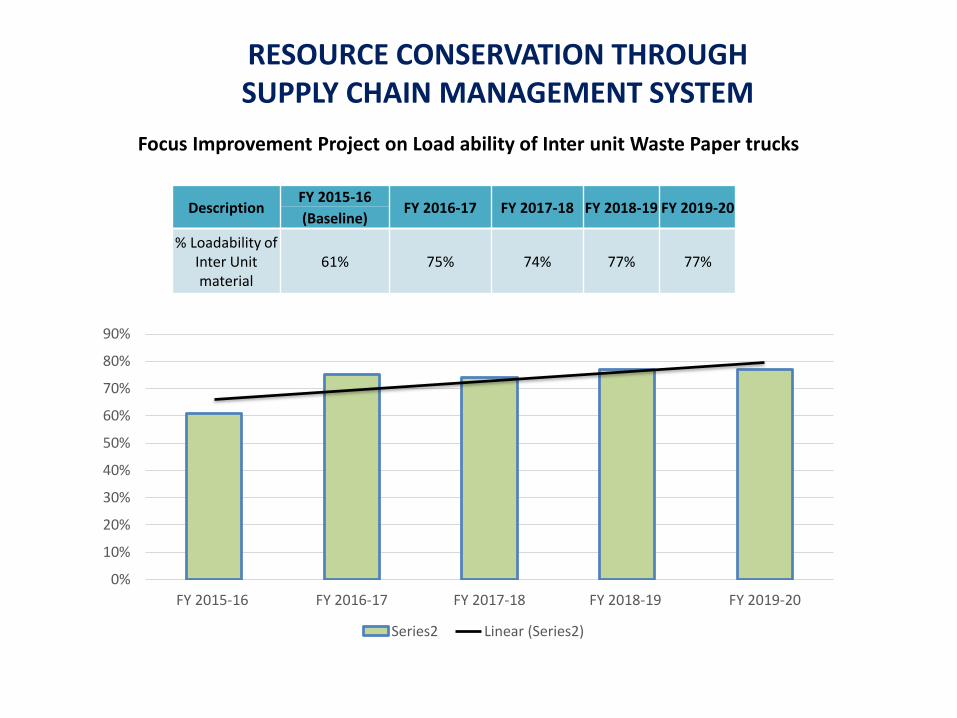
Focus Improvement Project on Load ability of Inter unit Waste Paper trucks
RESOURCE CONSERVATION THROUGH SUPPLY CHAIN MANAGEMENT SYSTEM
DescriptionFY 2015-16
FY 2016-17 FY 2017-18 FY 2018-19 FY 2019-20(Baseline)
% Loadability of Inter Unit material
61% 75% 74% 77% 77%
0%
10%
20%
30%
40%
50%
60%
70%
80%
90%
FY 2015-16 FY 2016-17 FY 2017-18 FY 2018-19 FY 2019-20
Series2 Linear (Series2)
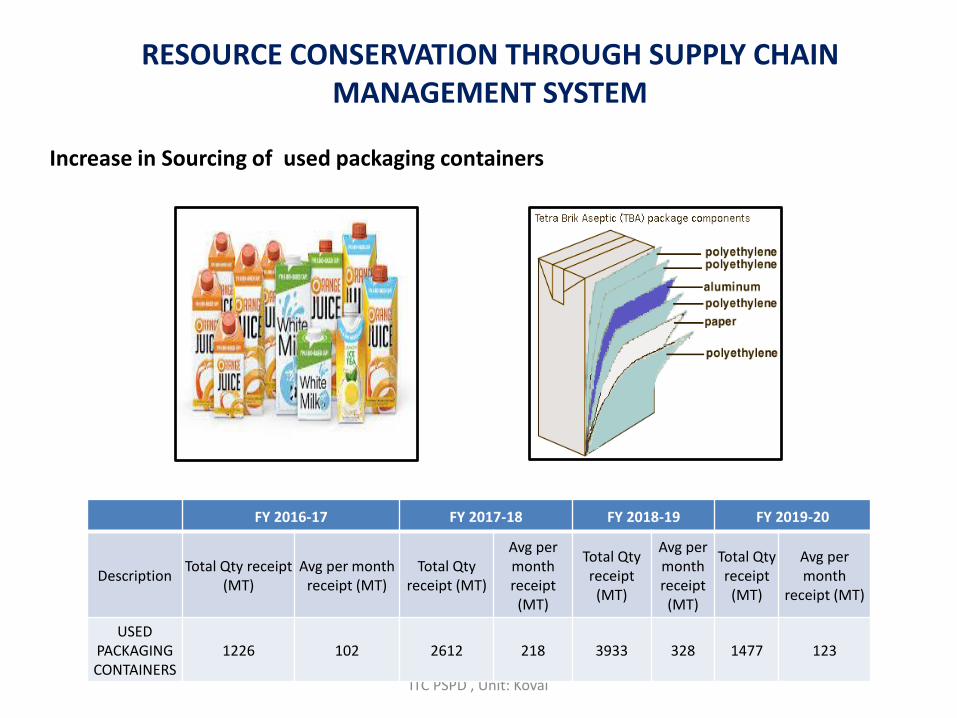
RESOURCE CONSERVATION THROUGH SUPPLY CHAIN MANAGEMENT SYSTEM
Increase in Sourcing of used packaging containers
ITC PSPD , Unit: Kovai
FY 2016-17 FY 2017-18 FY 2018-19 FY 2019-20
DescriptionTotal Qty receipt
(MT)Avg per month
receipt (MT)Total Qty
receipt (MT)
Avg per month receipt (MT)
Total Qty receipt (MT)
Avg per month receipt (MT)
Total Qty receipt (MT)
Avg per month
receipt (MT)
USED PACKAGING CONTAINERS
1226 102 2612 218 3933 328 1477 123
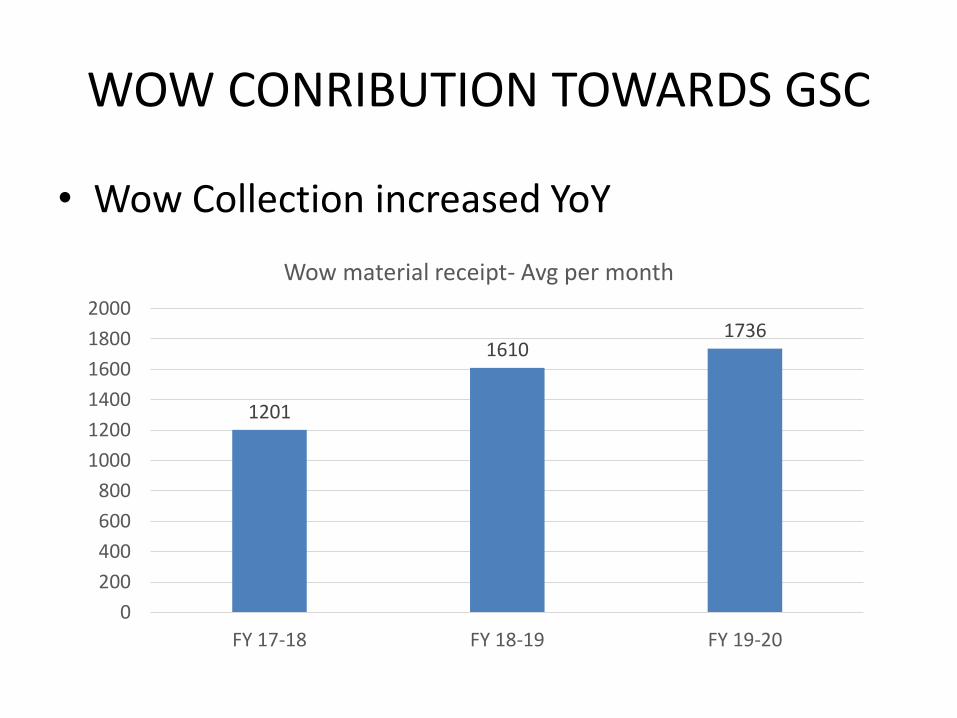
WOW CONRIBUTION TOWARDS GSC
• Wow Collection increased YoY
1201
16101736
0
200
400
600
800
1000
1200
1400
1600
1800
2000
FY 17-18 FY 18-19 FY 19-20
Wow material receipt- Avg per month
TEAM WORK, EMPLOYEE INVOLVEMENT & MONITORING
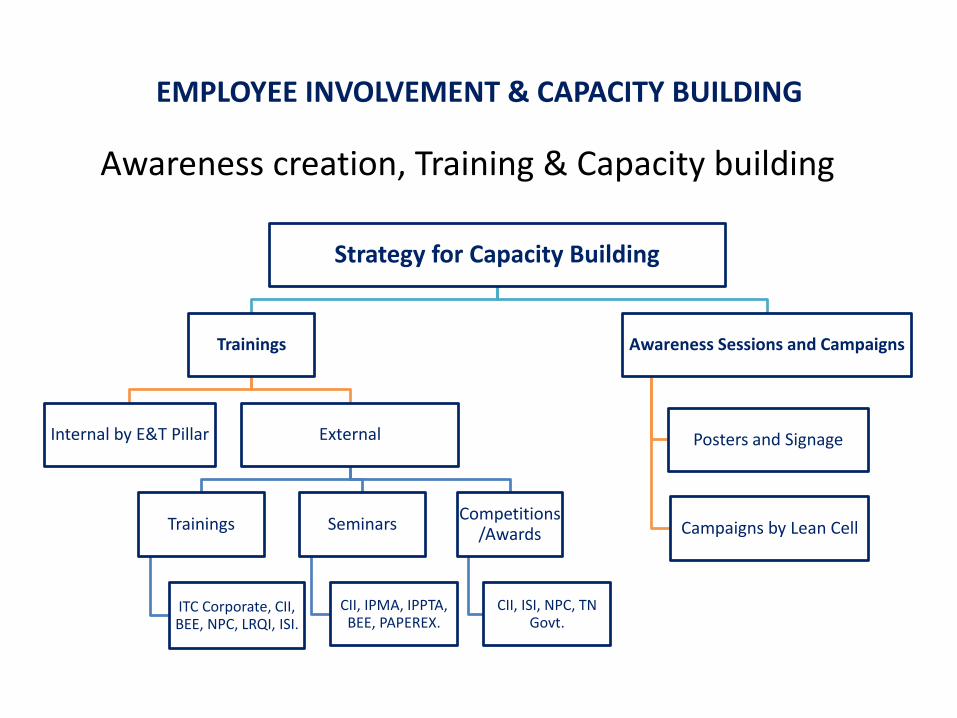
Strategy for Capacity Building
Trainings
Internal by E&T Pillar External
Trainings
ITC Corporate, CII, BEE, NPC, LRQI, ISI.
Seminars
CII, IPMA, IPPTA, BEE, PAPEREX.
Competitions/Awards
CII, ISI, NPC, TN Govt.
Awareness Sessions and Campaigns
Posters and Signage
Campaigns by Lean Cell
Awareness creation, Training & Capacity building
EMPLOYEE INVOLVEMENT & CAPACITY BUILDING
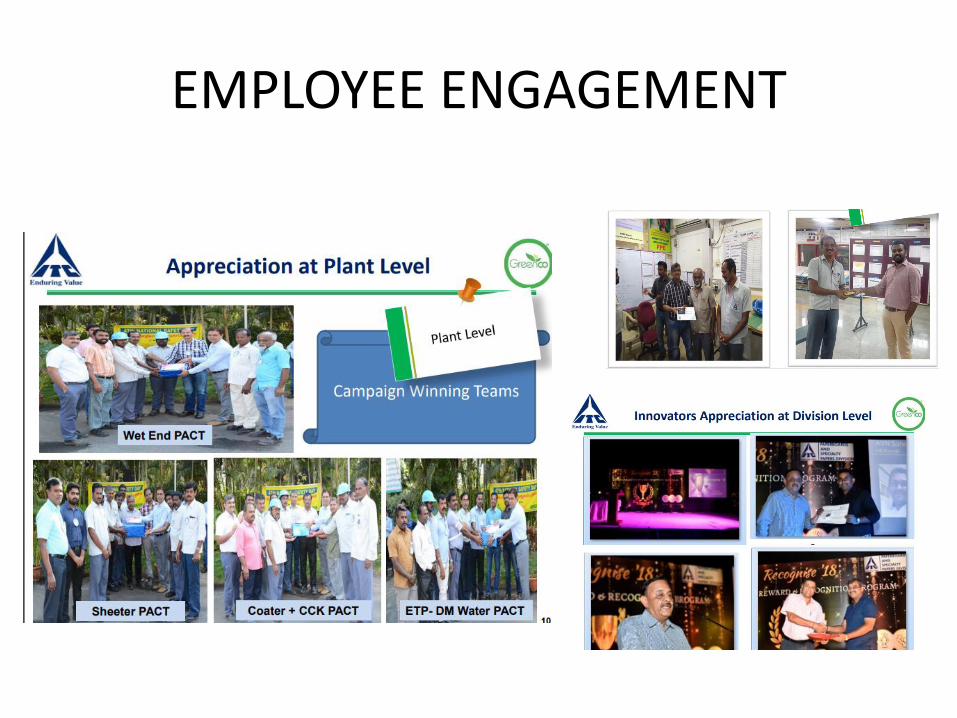
EMPLOYEE ENGAGEMENT
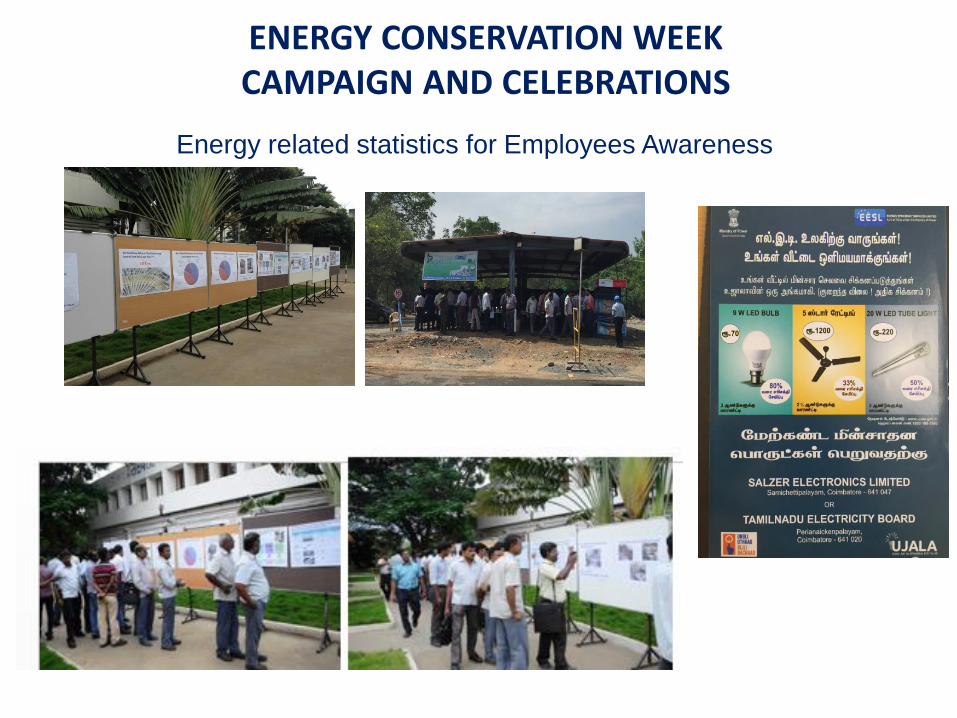
ENERGY CONSERVATION WEEK CAMPAIGN AND CELEBRATIONS
Energy related statistics for Employees Awareness
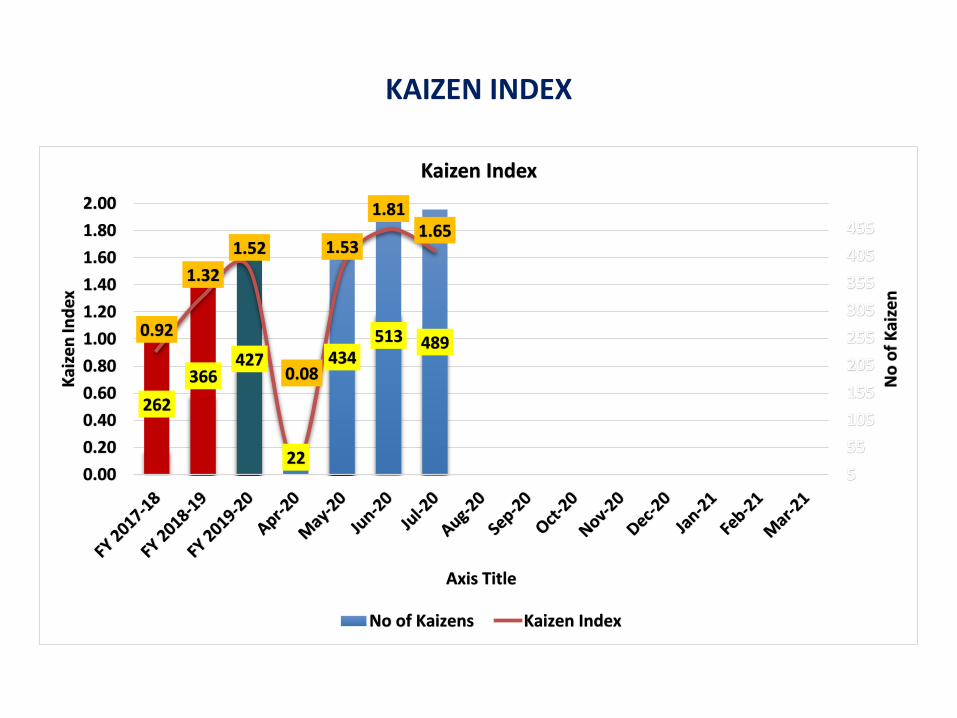
KAIZEN INDEX
262
366427
22
434513 489
0.92
1.32
1.52
0.08
1.53
1.811.65
5
55
105
155
205
255
305
355
405
455
0.00
0.20
0.40
0.60
0.80
1.00
1.20
1.40
1.60
1.80
2.00
No
of
Kai
zen
Kai
zen
Ind
ex
Axis Title
Kaizen Index
No of Kaizens Kaizen Index
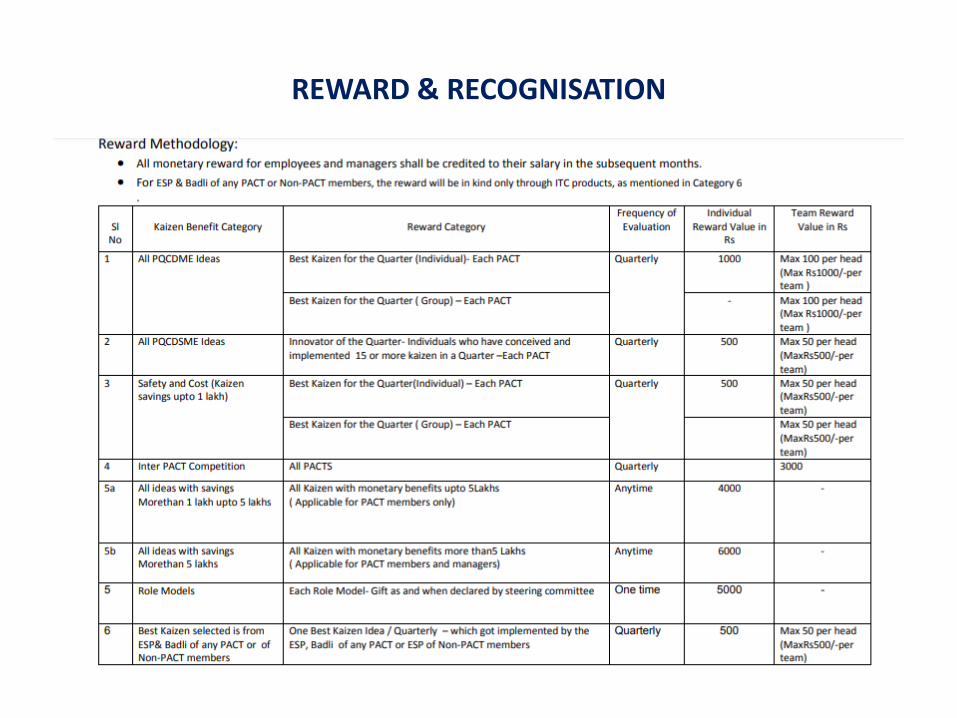
REWARD & RECOGNISATION
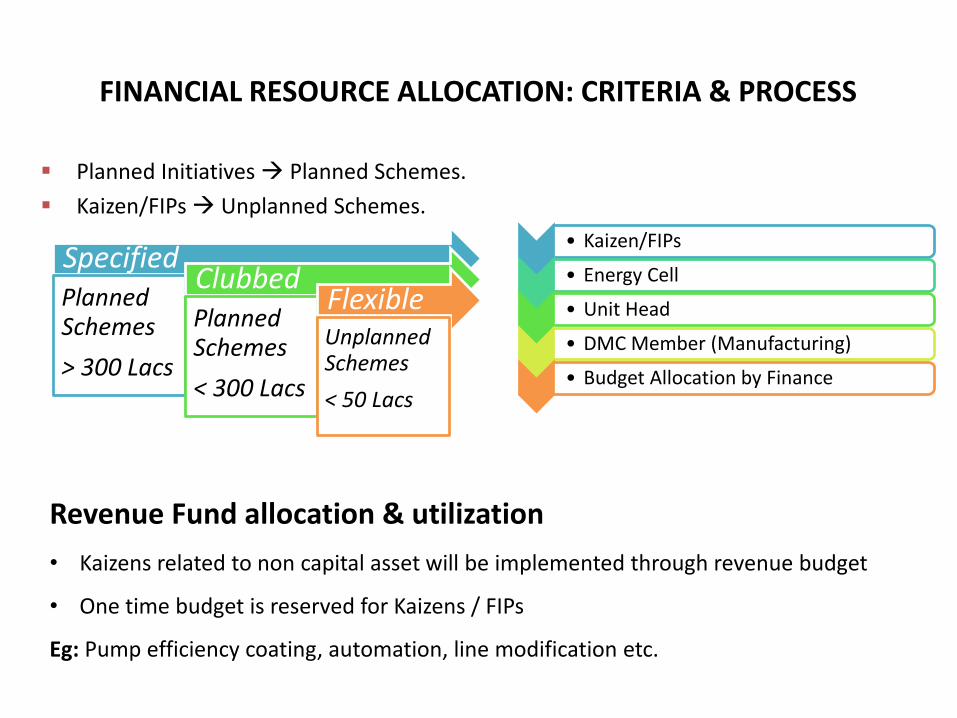
FINANCIAL RESOURCE ALLOCATION: CRITERIA & PROCESS
SpecifiedPlanned Schemes
> 300 Lacs
ClubbedPlanned Schemes
< 300 Lacs
FlexibleUnplanned Schemes
< 50 Lacs
▪ Planned Initiatives → Planned Schemes.
▪ Kaizen/FIPs → Unplanned Schemes.
• Kaizen/FIPs
• Energy Cell
• Unit Head
• DMC Member (Manufacturing)
• Budget Allocation by Finance
Revenue Fund allocation & utilization
• Kaizens related to non capital asset will be implemented through revenue budget
• One time budget is reserved for Kaizens / FIPs
Eg: Pump efficiency coating, automation, line modification etc.
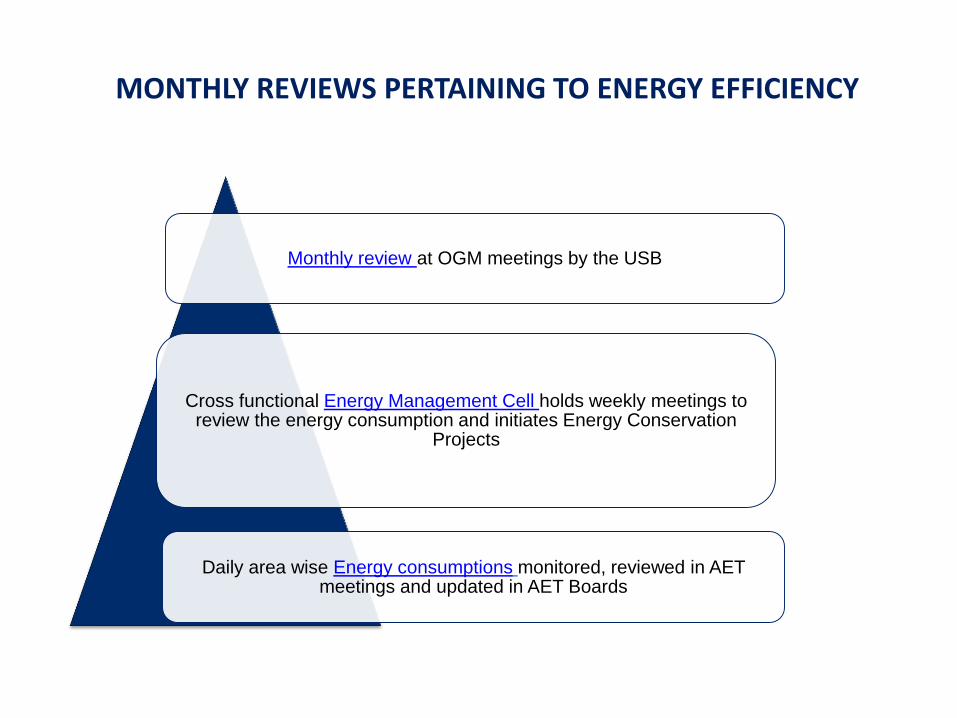
MONTHLY REVIEWS PERTAINING TO ENERGY EFFICIENCY
Monthly review at OGM meetings by the USB
Cross functional Energy Management Cell holds weekly meetings to review the energy consumption and initiates Energy Conservation
Projects
Daily area wise Energy consumptions monitored, reviewed in AET meetings and updated in AET Boards
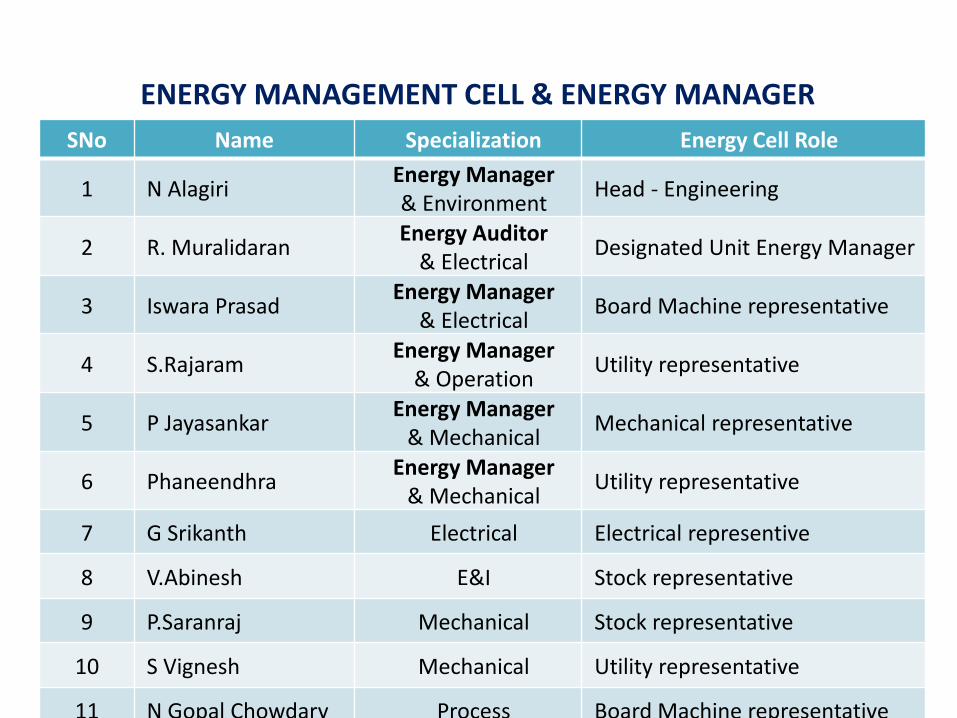
SNo Name Specialization Energy Cell Role
1 N AlagiriEnergy Manager & Environment
Head - Engineering
2 R. MuralidaranEnergy Auditor
& ElectricalDesignated Unit Energy Manager
3 Iswara PrasadEnergy Manager
& ElectricalBoard Machine representative
4 S.RajaramEnergy Manager
& OperationUtility representative
5 P JayasankarEnergy Manager
& MechanicalMechanical representative
6 PhaneendhraEnergy Manager
& MechanicalUtility representative
7 G Srikanth Electrical Electrical representive
8 V.Abinesh E&I Stock representative
9 P.Saranraj Mechanical Stock representative
10 S Vignesh Mechanical Utility representative
11 N Gopal Chowdary Process Board Machine representative
ENERGY MANAGEMENT CELL & ENERGY MANAGER
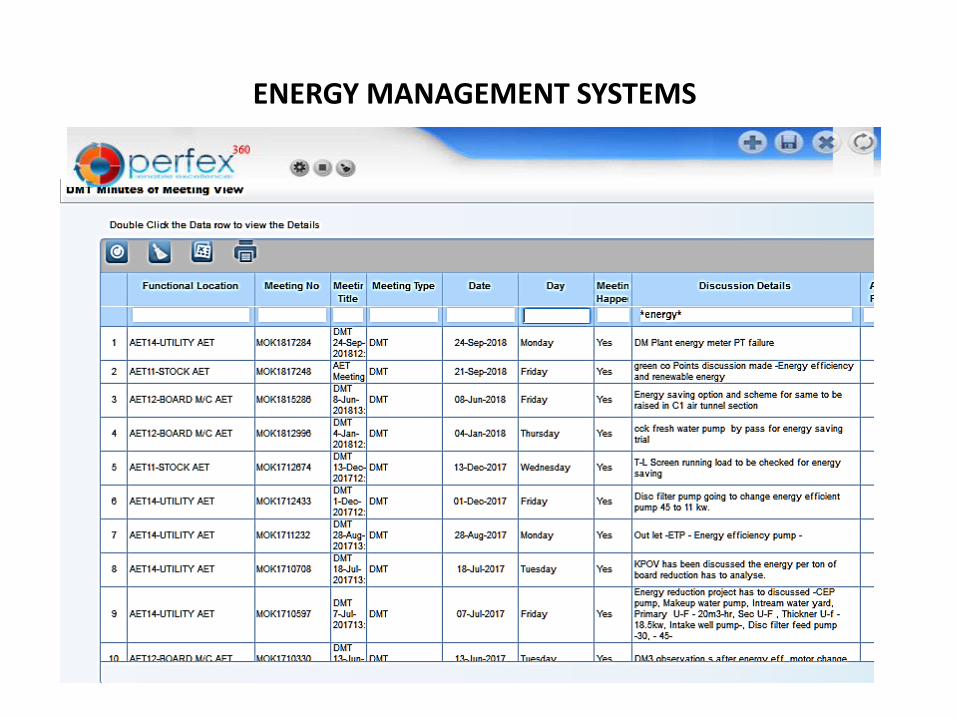
ENERGY MANAGEMENT SYSTEMS
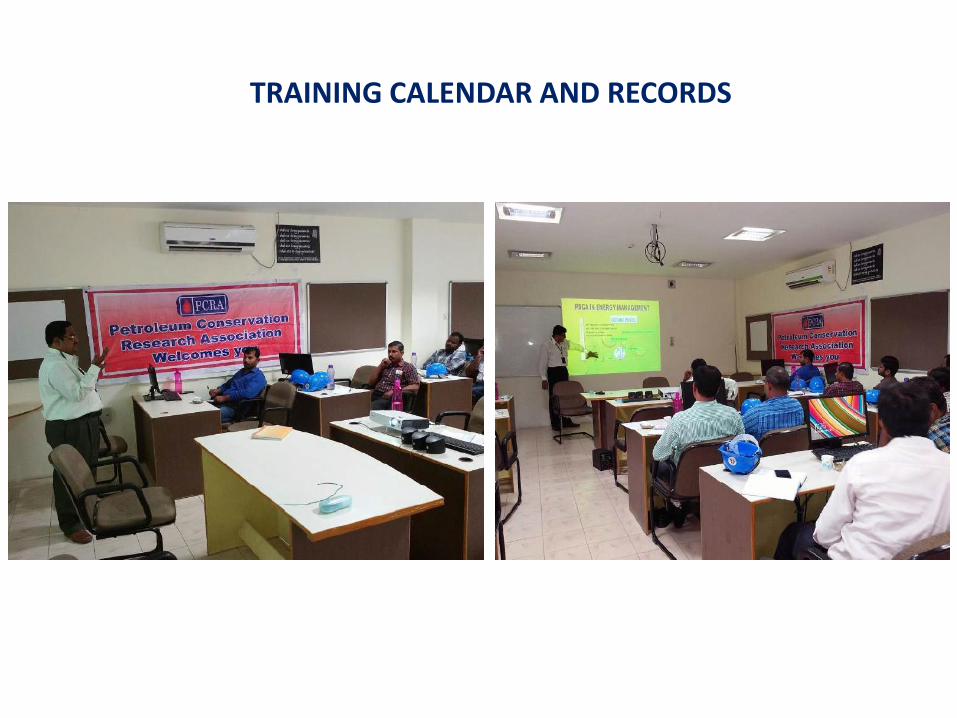
TRAINING CALENDAR AND RECORDS
IMPLEMENTATION OF ISO 50001/GREEN CO/IGBC RATING
AWS & ISO 50001• Unit Kovai is the First Paper Mill in the world to achieve platinum rating – the highest rating
– under the Alliance for Water Stewardship standards..
• ITC Kovai is the first site in India and only the second in the world to be awarded thiscertification based on international benchmarks in water stewardship. The fact that the ITCKovai was awarded the prestigious AWS Platinum level certification - only awarded to thosesites that meet the very highest standards - is testament to the extensive actions directedbeyond the site's own water use to supporting communities, vulnerable groups and localagencies to build a sustainable future.
ISO50001 preliminary audit completed, Stage 1 audit is planned in Aug 2020.
THANK YOU