issuer filing information santander consumer finance, s.a
TRANSCRIPT

Issuer Filing Information
Santander Consumer Finance, S.A.
i
ISSUER FILING INFORMATION
Type of Information: Issuer Filing Information
Date of Announcement: 6 May 2021
Issuer Name: Santander Consumer Finance, S.A. (the "Issuer")
Name and Title of Representative: Mr. Álvaro Soler Severino Head of Treasury
Mr. Eduardo Aguirre Director DCM / Financial Management
Address of Head Office: Ciudad Grupo Santander, Avda. de Cantabria s/n, 28660 Boadilla del Monte, Madrid, Spain
Telephone: +34 615 906 147
Email: [email protected]
Contact Person: Attorney-in-Fact: Hiroto Ando, Attorney-at-law Aina Ono, Attorney-at-law Kazuya Uryu, Attorney-at-law
Anderson Mori & Tomotsune Address: Otemachi Park Building 1-1, Otemachi 1-chome Chiyoda -ku, Tokyo
Telephone: +81-3-6775-1000
Matters related to Financial Instruments Exchange Market, etc.:
Not Applicable
Address of Website for Announcement: https://www.jpx.co.jp/english/equities/products/tpbm/announcement/index.html
Notes to Investors:
1. The TOKYO PRO-BOND Market is a market for professional investors, etc. (Tokutei Toushika tou) as defined in Article 2, Paragraph 3, Item 2(b)(2) of the Financial Instruments and Exchange Act of Japan (Act No. 25 of 1948, as amended, the "FIEA") (the "Professional Investors, Etc."). Notes listed on the market ("Listed
Notes") may involve high investment risk. Investors should be aware of the listing eligibility and timely disclosure requirements that apply to issuers of Listed Notes on the TOKYO PRO-BOND Market and associated risks such as the fluctuation of market prices and shall bear responsibility for their investments. Prospective investors should make investment decisions after having carefully considered the contents of this Issuer Filing Information.
2. Where this Issuer Filing Information (a) contains any false statement on important matters, or (b) lacks information on: (i) important matters that should be announced or (ii) a material fact that is necessary to avoid misleading content, a person who, at the time of announcement of this Issuer Filing Information, is an officer (meaning an officer stipulated in Article 21, Paragraph 1 of the FIEA (meaning a director (torishimari-yaku), accounting advisor (kaikei-sanyo), corporate auditor (kansa-yaku) or executive officer (shikkou-yaku), or a person equivalent to any of these) (each an "Officer") of the Issuer) that announced this Issuer Filing Information shall be liable to compensate persons who acquired the securities for any damage or loss arising from the false statement or lack of information in accordance with the provision of Article 22 of the FIEA applied mutatis mutandis in Article 27-34 of the FIEA. However, this shall not apply to cases where the person who acquired the securities was aware of the existence of the false statement or the lack of information at the time of subscription for acquisition of the securities. Additionally, such Officer shall not be required to
ii
assume the liability prescribed above, where he/she proves that he/she was not aware of, and was unable to obtain knowledge of, even with due care, the existence of the false statement or the lack of information.
3. The regulatory framework for the TOKYO PRO-BOND Market is different in fundamental aspects from the general regulatory framework applicable to other exchange markets in Japan. Investors should be aware of the rules and regulations of the TOKYO PRO-BOND Market, which are available on Japan Exchange Group, Inc. website.
4. Tokyo Stock Exchange, Inc. does not express opinions or issue guarantees, etc. regarding the content of this Issuer Filing Information (including but not limited to, whether this Issuer Filing Information (a) contains a false statement or (b) lacks information on: (i) important matters that should be announced or (ii) a material fact that is necessary to avoid misleading content) and shall not be liable for any damage or loss.
5. All prospective investors who consider purchasing the notes of the Issuer issued or to be issued under the Program Information dated 26 June 2020 (as amended and/or supplemented) (the "Notes") should read the relevant Specified Securities Information before making an investment decision. Among other things, all prospective investors should be aware that the Notes are subject to certain selling restriction as set forth in the relevant Specified Securities Information.

Santander Consumer Finance, S.A. and subsidiaries
Independent auditor´s report on the Consolidated annual accounts as at December 31, 2020 Consolidated Directors’ Report
PricewaterhouseCoopers Auditores, S.L., Torre PwC, Pº de la Castellana 259 B, 28046 Madrid, España
Tel.: +34 915 684 400 / +34 902 021 111, Fax: +34 915 685 400, www.pwc.es 1 R. M. Madrid, hoja 87.250-1, folio 75, tomo 9.267, libro 8.054, sección 3ª Inscrita en el R.O.A.C. con el número S0242 - CIF: B-79 031290
This version of our report is a free translation of the original, which was prepared in Spanish. All possible care has been taken to ensure that the translation is an accurate representation of the original. However,
in all matters of interpretation of information, views or opinions, the original language version of our report takes precedence over this translation
Independent auditor´s report on the consolidated annual accounts
To the shareholders of Santander Consumer Finance, S.A.:
Report on the consolidated annual accounts
Opinion
We have audited the consolidated annual accounts of Santander Consumer Finance, S.A. (the Parent company) and its subsidiaries (the Group), which comprise the balance sheet as at December 31, 2020, and the income statement, statement of recognised income and expense, statement of changes in total equity, statement of cash flows and related notes, all consolidated, for the year then ended. In our opinion, the accompanying consolidated annual accounts present fairly, in all material respects, the equity and financial position of the Group as at December 31, 2020, as well as its financial performance and cash flows, all consolidated, for the year then ended, in accordance with International Financial Reporting Standards as adopted by the European Union (IFRS-EU) and other provisions of the financial reporting framework applicable in Spain.
Basis for opinion
We conducted our audit in accordance with legislation governing the audit practice in Spain. Our responsibilities under those standards are further described in the Auditor's responsibilities for the audit of the consolidated annual accounts section of our report. We are independent of the Group in accordance with the ethical requirements, including those relating to independence, that are relevant to our audit of the consolidated annual accounts in Spain, in accordance with legislation governing the audit practice. In this regard, we have not rendered services other than those relating to the audit of the accounts, and situations or circumstances have not arisen that, in accordance with the provisions of the aforementioned legislation, have affected our necessary independence such that it has been compromised. We believe that the audit evidence we have obtained is sufficient and appropriate to provide a basis for our opinion.
Key audit matters
Key audit matters are those matters that, in our professional judgment, were of most significance in our audit of the consolidated annual accounts of the current period. These matters were addressed in the context of our audit of the consolidated annual accounts as a whole, and in forming our opinion thereon, and we do not provide a separate opinion on these matters.
Santander Consumer Finance, S.A. and subsidiaries
2
Key audit matter How our audit addressed the key audit matter
Estimation of the impairment of financial assets at amortised cost - loans and advances - customers The expected loss impairment calculation models required by International Financial Reporting Standard 9 (IFRS 9), together with related adaptations made in response to the COVID-19 crisis, have increased complexity by bringing in new estimates such as post-model adjustments, the consideration of certain flexibility measures to operations in the application of staging criteria or the consideration of guarantees in operations affected by the COVID-19. In this context, the main judgments and assumptions made by management during the year are the following:
• The definition and evaluation of adjustments to expected credit loss models ("Post - model adjustments") to reflect, regarding the estimation of impairment of financial assets at amortized cost, the effect of the macroeconomic outlook and expected credit losses for assets where credit risk is considered to have increased significantly due to the COVID-19 crisis.
• Asset identification and staging criteria, including those employed in assessing loans affected by COVID-19, including moratoriums granted.
• The determination of the main estimates employed in the calculation of Probability of Default (PD) and Loss Given Default (LGD) parameters.
• The main assumptions used in the determination of provisions for risks estimated on an individual basis.
We have performed, in collaboration with our credit risk specialists, an understanding of management's process to estimate the impairment of financial assets at amortised cost - loans and advances to customers, for both provisions estimated on a collective and an individual basis. With respect to internal control, we have performed an understanding and tested controls of the main phases of the estimation process, paying specific attention to processes based on the review of the main assumptions employed, the calculation and the approval of the adjustments to the model, as well as the process of review of the eligibility and follow-up of the loans subject to moratorium measures and, where applicable, government guarantees, in the framework of the COVID-19. In addition, we performed the following tests of details:
• Review of the methodology developed by management regarding the post model adjustments in the context of the COVID-19, and of the new scenarios and assumptions considered in the determination of such adjustments, as well as re-execution of their calculation in the different geographies.
• Verification, for the main models, with respect to: i) calculation and segmentation methods; ii) expected loss parameter estimation methods; iii) data and main estimates used; iv) criteria for the staging of loans; and v) scenario information, its related assumptions and sensibilities.
• Review of documentation for a sample of loans subject to moratoria, assessing the fulfilment of conditions to qualify for the flexibility measures to apply identification and staging criteria.
Santander Consumer Finance, S.A. and subsidiaries
3
Key audit matter How our audit addressed the key audit matter
These estimates involve a high judgment component from management in which there is a high degree of uncertainty as a result of the COVID-19 and are one of the most significant and complex estimates in the preparation of the accompanying consolidated annual accounts as of December 31, 2020. Therefore they have been considered as a key audit matter. See Notes 2 and 10 to the accompanying consolidated annual accounts at December 31, 2020.
• Recalculation of collective provisions based on the parameters obtained from the expected loss models, including, where applicable, any government guarantees in the calculation.
• Gathering of a sample of individual credit files to assess the adequacy of their accounting and classification, loss estimation methods and, if applicable, corresponding impairment.
The result of the procedures described shows that the models and methodologies used to calculate the impairment of financial assets at amortized cost – loans and advances are adequate, considering at the current date the level of uncertainty that exists due to the situation of crisis caused by Covid-19. Any difference obtained as a result of our procedures has been kept within a reasonable range in relation to the amount of impairment corrections of these assets included in the accompanying consolidated annual accounts.
Assessment of goodwill impairment The Group estimates, at least annually, the recoverable amount of each Cash-Generating Unit (CGU) to which goodwill has been assigned, mainly using independent expert valuations. Due to its relevance to the Group, management pays special attention to goodwill from the cash-generating units of Germany, Austria and Nordics (Scandinavia). During 2020, Group management has considered, in its estimation of the recoverable amount of the mentioned cash generating units when calculating their value-in-use by discounting projected cash flows, the economic context, market conditions and uncertainty resulting from the COVID-19. As a result, during 2020 the Group has registered an impairment of goodwill of 277 million euro assigned to the Nordics (Scandinavia) CGU.
We have obtained, with the assistance of our valuation experts, an understanding of the processes performed by management to estimate the recoverable amount and the calculation of goodwill impairment, considering the potential effect the COVID-19 could have on each of the CGUs. With respect to internal control, we have performed an understanding and tested controls of the phases of the goodwill valuation process, paying particular attention to the budget process on which the projections are based, the management ability to reliably predict, and the evaluation of the reasonableness of the discount rate and the growth rate in perpetuity used by management experts, as well as the evaluation of the annual valuation reports, carried out by management experts, on the deterioration in goodwill.
Santander Consumer Finance, S.A. and subsidiaries
4
Key audit matter How our audit addressed the key audit matter
The determination of the most relevant assumptions used in the impairment assessment of goodwill, such as the financial projections, specially of the first and second projected years, the discount rate and constant growth rates in the long term, require a complex estimate that includes a high degree of judgment from Management. Therefore, the assumptions made have been considered a key audit matter. See Notes 2 and 14 to the accompanying consolidated annual accounts.
In addition, and paying special attention to the valuation of impairment of the Nordics (Scandinavia) CGU performed by management, we have performed test of details consisting of:
• Evaluation of the reasonableness of the methodology and the main hypothesis used by management’s experts in the goodwill impairment assessment, including the financial projections, discount rate and growth rate, considering economic context, market conditions and uncertainty derived from the COVID-19.
• Verification of the mathematical accuracy of the goodwill impairment test, as well as the discounted cash flow projections.
• Specific sensitivity analysis of the key inputs, such as: i) financial projections for the coming years; ii) discount rate; and iii) perpetual growth rate.
• Check of the suitability of the information disclosed in the accompanying consolidated annual accounts with the applicable standards.
As a result of the above-mentioned procedures, we consider management's assessment to be reasonable and the management's main estimates remain within a reasonable range in the context in which the condensed consolidated annual accounts are prepared.
Information systems The Group’s financial information is highly dependent on information technology (IT) systems in the geographies in which it operates, so an adequate control of these systems is crucial to ensuring correct data processing. The technology environment has been developed mainly by the Group, although a part has also been developed by External Partners. In this context, it is vital to evaluate aspects such as the organisation of the Group’s Technology and Operations department and of the External Partners, controls over software maintenance and development, physical and logical security controls, and controls over computer operations.
With the collaboration of our IT systems specialists, our work consisted of assessing and verifying internal control over systems, databases and applications supporting the Group's financial information. For this purpose, internal control review procedures and substantive tests were carried out on the environment of both the Group and the External Partners, related to:
• The function of the IT governance framework.
Santander Consumer Finance, S.A. and subsidiaries
5
Key audit matter How our audit addressed the key audit matter
In this regard, management continues working to reinforce the internal controls over IT systems, improving the access control that supports the Group’s technology processes.
• Access and logical security controls over the applications, operating systems and databases that support relevant financial information.
• Change management and application development.
• Maintenance of computer operations. In addition, in view of the plan to improve the Group’s internal control, our audit approach and plan focused on the following aspects:
• Evaluation of the changes made as part of the enhancements implemented in the access control environment of the Group.
• Testing of the design and operating effectiveness of the controls implemented by management.
As a result of the above-mentioned procedures, no relevant observations were identified related to this matter.
Other information: Consolidated Director’s report
Other information comprises only the consolidated Director’s report for the 2020 financial year, the formulation of which is the responsibility of the Parent company’s directors and does not form an integral part of the consolidated annual accounts. Our audit opinion on the consolidated annual accounts does not cover the consolidated Director’s report. Our responsibility regarding the consolidated Director’s report, in accordance with legislation governing the audit practice, is to: a) Verify only that the statement of non-financial information, has been provided in the manner
required by applicable legislation and, if not, we are obliged to disclose that fact. b) Evaluate and report on the consistency between the rest of the information included in the
consolidated Directors’ report and the consolidated annual accounts as the result of our knowledge of the Group obtained during the audit of the aforementioned financial statements, as well as to evaluate and report on whether the content and presentation of this part of the consolidated Directors’ report is in accordance with applicable regulations. If, based on the work we have performed, we conclude that material misstatements exist, we are required to report that fact.
On the basis of the work performed, as described above, we have verified that the information mentioned in section a) above has been provided in the manner required by applicable legislation and that the rest of the information contained in the consolidated Directors’ report is consistent with that contained in the consolidated annual accounts for the 2020 financial year, and its content and presentation are in accordance with applicable regulations.
Santander Consumer Finance, S.A. and subsidiaries
6
Responsibility of the directors and the audit committee for the consolidated annual accounts
The Parent company´s Directors are responsible for the preparation of the accompanying consolidated annual accounts, such that they fairly present the consolidated equity, financial position and financial performance of the Group, in accordance with International Financial Reporting Standards as adopted by the European Union and other provisions of the financial reporting framework applicable to the Group in Spain, and for such internal control as the directors determine is necessary to enable the preparation of consolidated annual accounts that are free from material misstatement, whether due to fraud or error. In preparing the consolidated annual accounts, the Parent company´s directors are responsible for assessing the Group´s ability to continue as a going concern, disclosing, as applicable, matters related to going concern and using the going concern basis of accounting unless the directors either intend to liquidate the Group or to cease operations, or have no realistic alternative but to do so. The Parent company´s audit committee is responsible for overseeing the process of preparation and presentation of the consolidated annual accounts.
Auditor's responsibilities for the audit of the consolidated annual accounts
Our objectives are to obtain reasonable assurance about whether the consolidated annual accounts as a whole are free from material misstatement, whether due to fraud or error, and to issue an auditor´s report that includes our opinion. Reasonable assurance is a high level of assurance, but is not a guarantee that an audit conducted in accordance with legislation governing the audit practice in Spain will always detect a material misstatement when it exists. Misstatements can arise from fraud or error and are considered material if, individually or in the aggregate, they could reasonably be expected to influence the economic decisions of users taken on the basis of these consolidated annual accounts. As part of an audit in accordance with legislation governing the audit practice in Spain, we exercise professional judgment and maintain professional skepticism throughout the audit. We also:
• Identify and assess the risks of material misstatement of the consolidated annual accounts, whether due to fraud or error, design and perform audit procedures responsive to those risks, and obtain audit evidence that is sufficient and appropriate to provide a basis for our opinion. The risk of not detecting a material misstatement resulting from fraud is higher than for one resulting from error, as fraud may involve collusion, forgery, intentional omissions, misrepresentations, or the override of internal control.
• Obtain an understanding of internal control relevant to the audit in order to design audit procedures that are appropriate in the circumstances, but not for the purpose of expressing an opinion on the effectiveness of the Group´s internal control.
• Evaluate the appropriateness of accounting policies used and the reasonableness of accounting estimates and related disclosures made by the Parent company´s directors.
• Conclude on the appropriateness of the Parent company´s directors´ use of the going concern basis of accounting and, based on the audit evidence obtained, whether a material uncertainty exists related to events or conditions that may cast significant doubt on the Group´s ability to continue as a going concern. If we conclude that a material uncertainty exists, we are required to draw attention in our auditor´s report to the related disclosures in the consolidated annual accounts or, if such disclosures are inadequate, to modify our opinion. Our conclusions are based on the audit evidence obtained up to the date of our auditor´s report. However, future events or conditions may cause the Group to cease to continue as a going concern.
Santander Consumer Finance, S.A. and subsidiaries
7
• Evaluate the overall presentation, structure and content of the consolidated annual accounts, including the disclosures, and whether the consolidated annual accounts represent the underlying transactions and events in a manner that achieves fair presentation.
• Obtain sufficient appropriate audit evidence regarding the financial information of the entities or business activities within the Group to express an opinion on the consolidated annual accounts. We are responsible for the direction, supervision and performance of the group audit. We remain solely responsible for our audit opinion.
We communicate with the Parent company´s audit committee regarding, among other matters, the planned scope and timing of the audit and significant audit findings, including any significant deficiencies in internal control that we identify during our audit. We also provide the Parent company´s audit committee with a statement that we have complied with relevant ethical requirements, including those relating to independence, and we communicate with the audit committee those matters that may reasonably be thought to bear on our independence, and where applicable, the related safeguards. From the matters communicated with the Parent company´s audit committee, we determine those matters that were of most significance in the audit of the consolidated annual accounts of the current period and are therefore the key audit matters. We describe these matters in our auditor´s report unless law or regulation precludes public disclosure about the matter.
Report on other legal and regulatory requirements European single electronic format
We have examined the digital files of the European single electronic format (ESEF) of Santander Consumer Finance, S.A. and its subsidiaries for the 2020 financial year that comprise an XHTML file which includes the consolidated annual accounts for the financial year and XBRL files with tagging performed by the entity, which will form part of the annual financial report. The directors of Santander Consumer Finance, S.A. are responsible for presenting the annual financial report for the 2020 financial year in accordance with the formatting and markup requirements established in the Delegated Regulation (EU) 2019/815 of 17 December 2018 of the European Commission (hereinafter the ESEF Regulation). Our responsibility is to examine the digital files prepared by the Parent company’s directors, in accordance with legislation governing the audit practice in Spain. The legislation requires that we plan and execute our audit procedures in order to verify whether the content of the consolidated annual accounts included in the aforementioned digital files completely agrees with that of the consolidated annual accounts that we have audited, and whether the format and markup of these accounts and of the aforementioned files has been effected, in all material respects, in accordance with the requirements established in the ESEF Regulation. In our opinion, the digital files examined completely agree with the audited consolidated annual accounts, and these are presented and have been marked up, in all material respects, in accordance with the requirements established in the ESEF Regulation.
Santander Consumer Finance, S.A. and subsidiaries
8
Report to the Parent company’s audit committee
The opinion expressed in this report is consistent with the content of our additional report to the Parent company’s audit committee dated February 23, 2021.
Appointment period
The General Ordinary Shareholders' Meeting in its meeting held on May 28, 2020 appointed PricewaterhouseCoopers Auditores, S.L. as the Group´s auditor for a one-year period, as from the year ended on December 31, 2020. Previously, we were appointed by resolution of the General Shareholders´ Meeting for a period of three years and we have audited the accounts continuously since year ended December 31, 2016.
Services provided
The permitted services, other than audit services, which have been rendered to the Group, are detailed in Note 40 to the accompanying consolidated annual accounts.
PricewaterhouseCoopers Auditores, S.L. (S0242)
Original in Spanish signed by Ignacio Martínez Ortiz (23834) February 23, 2021
Santander Consumer
Finance, S.A. and Subsidiaries
composing the Santander
Consumer Finance Group
(Consolidated)
Consolidated Financial Statements
and Consolidated Directors’ Report
for the year ended 31 December 2020
Translation of consolidated financial statements originally issued in
Spanish and prepared in accordance with the regulatory financial
reporting framework applicable to the Group in Spain (see Notes 1
to 47). In the event of a discrepancy, the Spanish-language version
prevails.
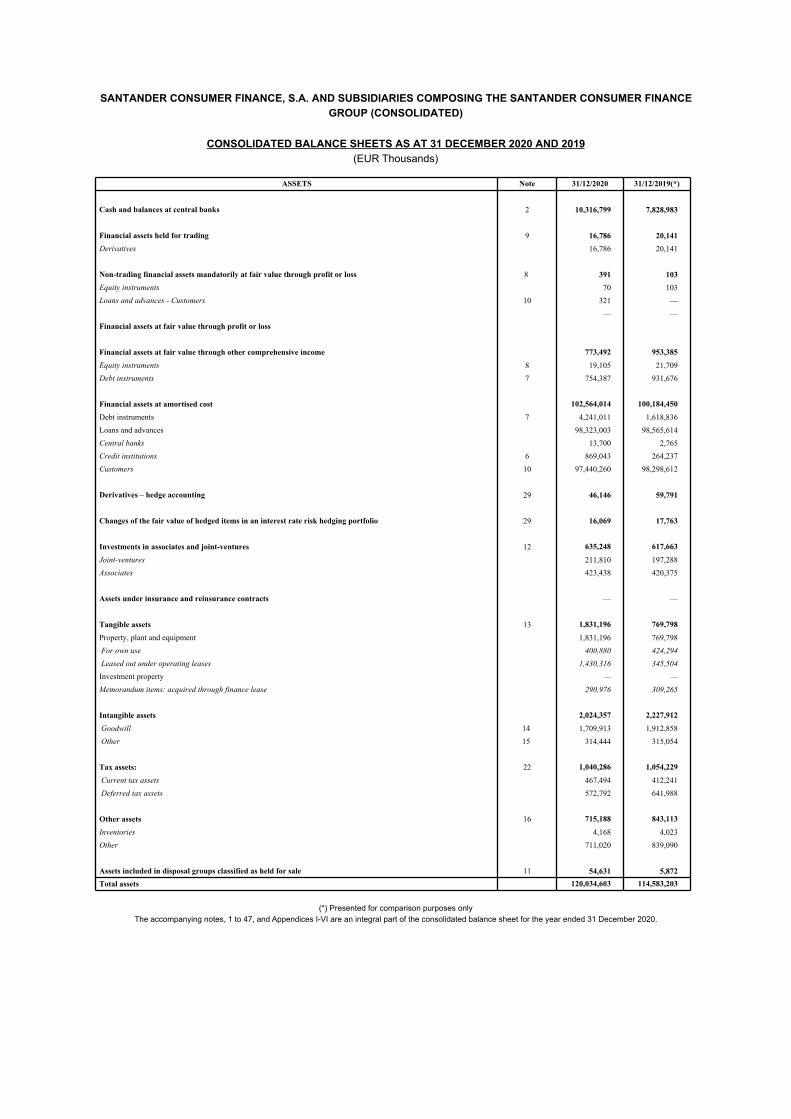
SANTANDER CONSUMER FINANCE, S.A. AND SUBSIDIARIES COMPOSING THE SANTANDER CONSUMER FINANCE
GROUP (CONSOLIDATED)
CONSOLIDATED BALANCE SHEETS AS AT 31 DECEMBER 2020 AND 2019
(EUR Thousands)
ASSETS Note 31/12/2020 31/12/2019(*)
Cash and balances at central banks 2 10,316,799 7,828,983
Financial assets held for trading 9 16,786 20,141
Derivatives 16,786 20,141
Non-trading financial assets mandatorily at fair value through profit or loss 8 391 103
Equity instruments 70 103
Loans and advances - Customers 10 321 —
— —
Financial assets at fair value through profit or loss
Financial assets at fair value through other comprehensive income 773,492 953,385
Equity instruments 8 19,105 21,709
Debt instruments 7 754,387 931,676
Financial assets at amortised cost 102,564,014 100,184,450
Debt instruments 7 4,241,011 1,618,836
Loans and advances 98,323,003 98,565,614
Central banks 13,700 2,765
Credit institutions 6 869,043 264,237
Customers 10 97,440,260 98,298,612
Derivatives – hedge accounting 29 46,146 59,791
Changes of the fair value of hedged items in an interest rate risk hedging portfolio 29 16,069 17,763
Investments in associates and joint-ventures 12 635,248 617,663
Joint-ventures 211,810 197,288
Associates 423,438 420,375
Assets under insurance and reinsurance contracts — —
Tangible assets 13 1,831,196 769,798
Property, plant and equipment 1,831,196 769,798
For own use 400,880 424,294
Leased out under operating leases 1,430,316 345,504
Investment property — —
Memorandum items: acquired through finance lease 290,976 309,265
Intangible assets 2,024,357 2,227,912
Goodwill 14 1,709,913 1,912,858
Other 15 314,444 315,054
Tax assets: 22 1,040,286 1,054,229
Current tax assets 467,494 412,241
Deferred tax assets 572,792 641,988
Other assets 16 715,188 843,113
Inventories 4,168 4,023
Other 711,020 839,090
Assets included in disposal groups classified as held for sale 11 54,631 5,872
Total assets 120,034,603 114,583,203
(*) Presented for comparison purposes only
The accompanying notes, 1 to 47, and Appendices I-VI are an integral part of the consolidated balance sheet for the year ended 31 December 2020.
SANTANDER CONSUMER FINANCE, S.A. AND SUBSIDIARIES COMPOSING THE SANTANDER CONSUMER FINANCE
GROUP (CONSOLIDATED)
CONSOLIDATED BALANCE SHEETS AS AT 31 DECEMBER 2020 AND 2019
(EUR Thousands)
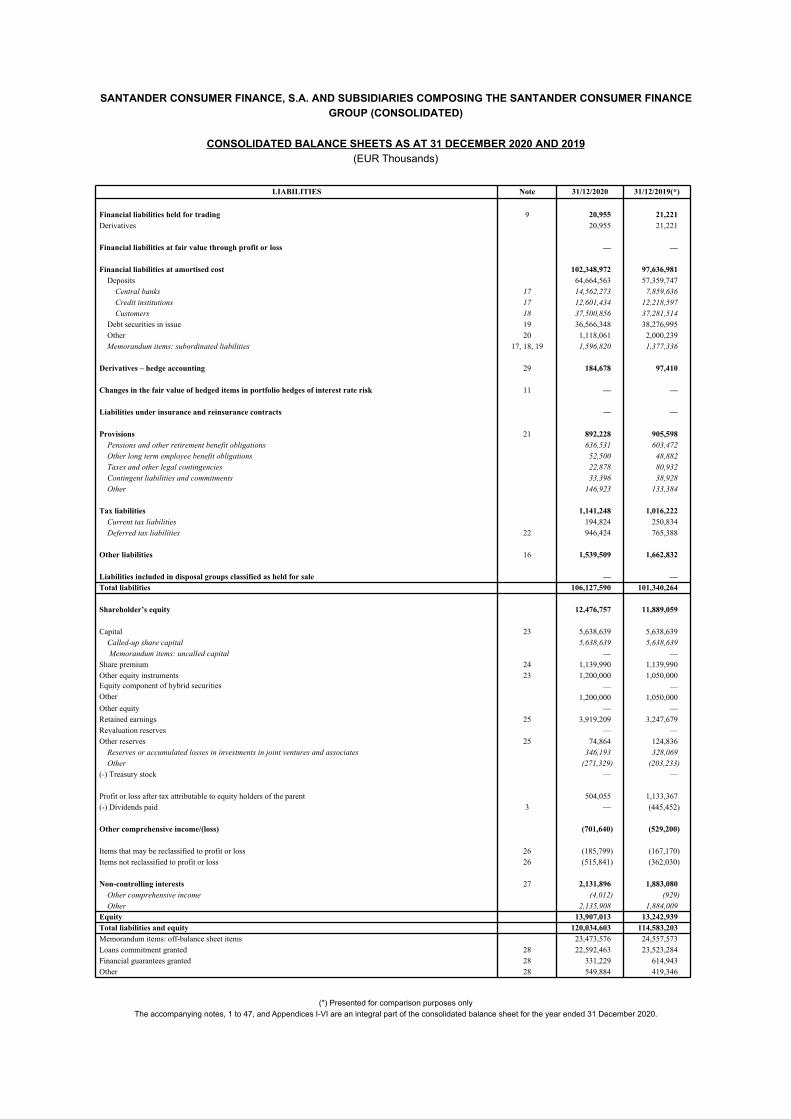
LIABILITIES Note 31/12/2020 31/12/2019(*)
Financial liabilities held for trading 9 20,955 21,221
Derivatives 20,955 21,221
Financial liabilities at fair value through profit or loss — —
Financial liabilities at amortised cost 102,348,972 97,636,981
Deposits 64,664,563 57,359,747
Central banks 17 14,562,273 7,859,636
Credit institutions 17 12,601,434 12,218,597
Customers 18 37,500,856 37,281,514
Debt securities in issue 19 36,566,348 38,276,995
Other 20 1,118,061 2,000,239
Memorandum items: subordinated liabilities 17, 18, 19 1,596,820 1,377,336
Derivatives – hedge accounting 29 184,678 97,410
Changes in the fair value of hedged items in portfolio hedges of interest rate risk 11 — —
Liabilities under insurance and reinsurance contracts — —
Provisions 21 892,228 905,598
Pensions and other retirement benefit obligations 636,531 603,472
Other long term employee benefit obligations 52,500 48,882
Taxes and other legal contingencies 22,878 80,932
Contingent liabilities and commitments 33,396 38,928
Other 146,923 133,384
Tax liabilities 1,141,248 1,016,222
Current tax liabilities 194,824 250,834
Deferred tax liabilities 22 946,424 765,388
Other liabilities 16 1,539,509 1,662,832
Liabilities included in disposal groups classified as held for sale — —
Total liabilities 106,127,590 101,340,264
Shareholder’s equity 12,476,757 11,889,059
Capital 23 5,638,639 5,638,639
Called-up share capital 5,638,639 5,638,639
Memorandum items: uncalled capital — —
Share premium 24 1,139,990 1,139,990
Other equity instruments 23 1,200,000 1,050,000 Equity component of hybrid securities — — Other 1,200,000 1,050,000
Other equity — —
Retained earnings 25 3,919,209 3,247,679
Revaluation reserves — —
Other reserves 25 74,864 124,836
Reserves or accumulated losses in investments in joint ventures and associates 346,193 328,069
Other (271,329) (203,233)
(-) Treasury stock — —
Profit or loss after tax attributable to equity holders of the parent 504,055 1,133,367
(-) Dividends paid 3 — (445,452)
Other comprehensive income/(loss) (701,640) (529,200)
Items that may be reclassified to profit or loss 26 (185,799) (167,170)
Items not reclassified to profit or loss 26 (515,841) (362,030)
Non-controlling interests 27 2,131,896 1,883,080
Other comprehensive income (4,012) (929)
Other 2,135,908 1,884,009
Equity 13,907,013 13,242,939
Total liabilities and equity 120,034,603 114,583,203
Memorandum items: off-balance sheet items 23,473,576 24,557,573
Loans commitment granted 28 22,592,463 23,523,284
Financial guarantees granted 28 331,229 614,943
Other 28 549,884 419,346
(*) Presented for comparison purposes only
The accompanying notes, 1 to 47, and Appendices I-VI are an integral part of the consolidated balance sheet for the year ended 31 December 2020.
SANTANDER CONSUMER FINANCE, S.A. AND SUBSIDIARIES COMPOSING THE SANTANDER CONSUMER FINANCE
GROUP (CONSOLIDATED)
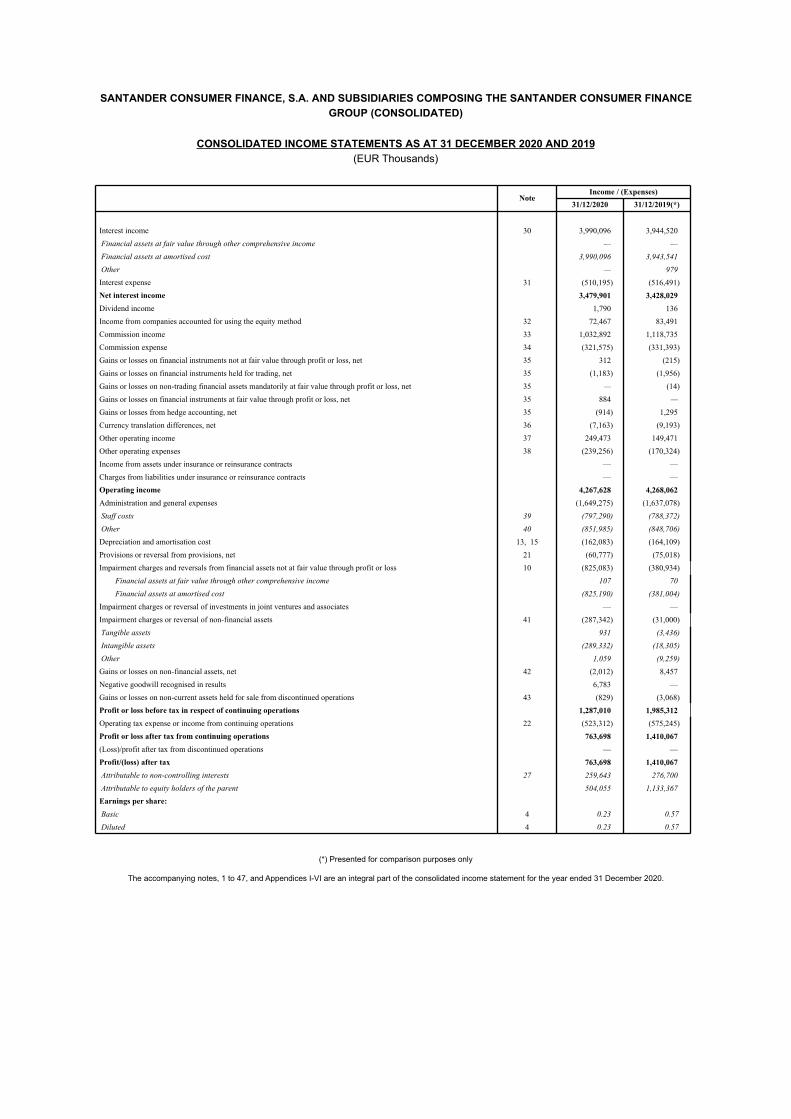
CONSOLIDATED INCOME STATEMENTS AS AT 31 DECEMBER 2020 AND 2019
(EUR Thousands)
NoteIncome / (Expenses)
31/12/2020 31/12/2019(*)
Interest income 30 3,990,096 3,944,520
Financial assets at fair value through other comprehensive income — —
Financial assets at amortised cost 3,990,096 3,943,541
Other — 979
Interest expense 31 (510,195) (516,491)
Net interest income 3,479,901 3,428,029
Dividend income 1,790 136
Income from companies accounted for using the equity method 32 72,467 83,491
Commission income 33 1,032,892 1,118,735
Commission expense 34 (321,575) (331,393)
Gains or losses on financial instruments not at fair value through profit or loss, net 35 312 (215)
Gains or losses on financial instruments held for trading, net 35 (1,183) (1,956)
Gains or losses on non-trading financial assets mandatorily at fair value through profit or loss, net 35 — (14)
Gains or losses on financial instruments at fair value through profit or loss, net 35 884 —
Gains or losses from hedge accounting, net 35 (914) 1,295
Currency translation differences, net 36 (7,163) (9,193)
Other operating income 37 249,473 149,471
Other operating expenses 38 (239,256) (170,324)
Income from assets under insurance or reinsurance contracts — —
Charges from liabilities under insurance or reinsurance contracts — —
Operating income 4,267,628 4,268,062
Administration and general expenses (1,649,275) (1,637,078)
Staff costs 39 (797,290) (788,372)
Other 40 (851,985) (848,706)
Depreciation and amortisation cost 13, 15 (162,083) (164,109)
Provisions or reversal from provisions, net 21 (60,777) (75,018)
Impairment charges and reversals from financial assets not at fair value through profit or loss 10 (825,083) (380,934)
Financial assets at fair value through other comprehensive income 107 70
Financial assets at amortised cost (825,190) (381,004)
Impairment charges or reversal of investments in joint ventures and associates — —
Impairment charges or reversal of non-financial assets 41 (287,342) (31,000)
Tangible assets 931 (3,436)
Intangible assets (289,332) (18,305)
Other 1,059 (9,259)
Gains or losses on non-financial assets, net 42 (2,012) 8,457
Negative goodwill recognised in results 6,783 —
Gains or losses on non-current assets held for sale from discontinued operations 43 (829) (3,068)
Profit or loss before tax in respect of continuing operations 1,287,010 1,985,312
Operating tax expense or income from continuing operations 22 (523,312) (575,245)
Profit or loss after tax from continuing operations 763,698 1,410,067
(Loss)/profit after tax from discontinued operations — —
Profit/(loss) after tax 763,698 1,410,067
Attributable to non-controlling interests 27 259,643 276,700
Attributable to equity holders of the parent 504,055 1,133,367
Earnings per share:
Basic 4 0.23 0.57
Diluted 4 0.23 0.57
(*) Presented for comparison purposes only
The accompanying notes, 1 to 47, and Appendices I-VI are an integral part of the consolidated income statement for the year ended 31 December 2020.
SANTANDER CONSUMER FINANCE, S.A. AND SUBSIDIARIES COMPOSING THE SANTANDER CONSUMER FINANCE
GROUP (CONSOLIDATED)
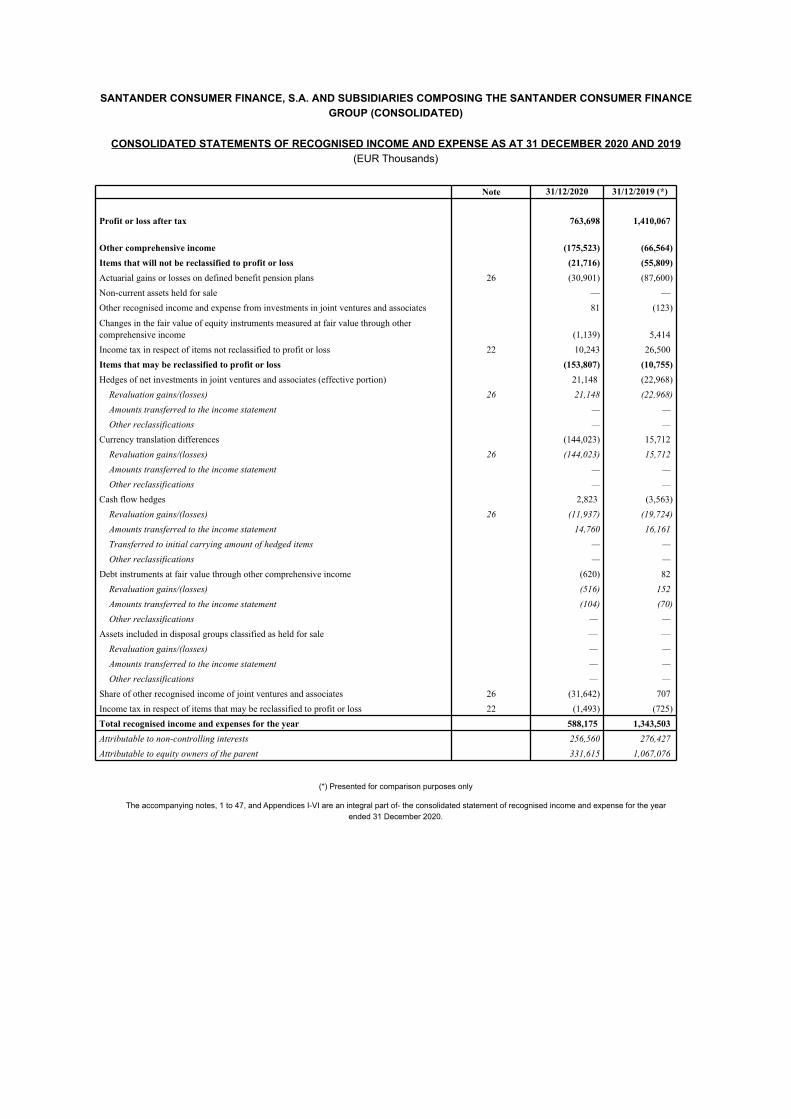
CONSOLIDATED STATEMENTS OF RECOGNISED INCOME AND EXPENSE AS AT 31 DECEMBER 2020 AND 2019
(EUR Thousands)
Note 31/12/2020 31/12/2019 (*)
Profit or loss after tax 763,698 1,410,067
Other comprehensive income (175,523) (66,564)
Items that will not be reclassified to profit or loss (21,716) (55,809)
Actuarial gains or losses on defined benefit pension plans 26 (30,901) (87,600)
Non-current assets held for sale — —
Other recognised income and expense from investments in joint ventures and associates 81 (123)
Changes in the fair value of equity instruments measured at fair value through other comprehensive income (1,139) 5,414
Income tax in respect of items not reclassified to profit or loss 22 10,243 26,500
Items that may be reclassified to profit or loss (153,807) (10,755)
Hedges of net investments in joint ventures and associates (effective portion) 21,148 (22,968)
Revaluation gains/(losses) 26 21,148 (22,968)
Amounts transferred to the income statement — —
Other reclassifications — —
Currency translation differences (144,023) 15,712
Revaluation gains/(losses) 26 (144,023) 15,712
Amounts transferred to the income statement — —
Other reclassifications — —
Cash flow hedges 2,823 (3,563)
Revaluation gains/(losses) 26 (11,937) (19,724)
Amounts transferred to the income statement 14,760 16,161
Transferred to initial carrying amount of hedged items — —
Other reclassifications — —
Debt instruments at fair value through other comprehensive income (620) 82
Revaluation gains/(losses) (516) 152
Amounts transferred to the income statement (104) (70)
Other reclassifications — —
Assets included in disposal groups classified as held for sale — —
Revaluation gains/(losses) — —
Amounts transferred to the income statement — —
Other reclassifications — —
Share of other recognised income of joint ventures and associates 26 (31,642) 707
Income tax in respect of items that may be reclassified to profit or loss 22 (1,493) (725)
Total recognised income and expenses for the year 588,175 1,343,503
Attributable to non-controlling interests 256,560 276,427
Attributable to equity owners of the parent 331,615 1,067,076
(*) Presented for comparison purposes only
The accompanying notes, 1 to 47, and Appendices I-VI are an integral part of- the consolidated statement of recognised income and expense for the year
ended 31 December 2020.
SANTANDER CONSUMER FINANCE, S.A. AND SUBSIDIARIES COMPOSING THE SANTANDER CONSUMER FINANCE GROUP (CONSOLIDATED)
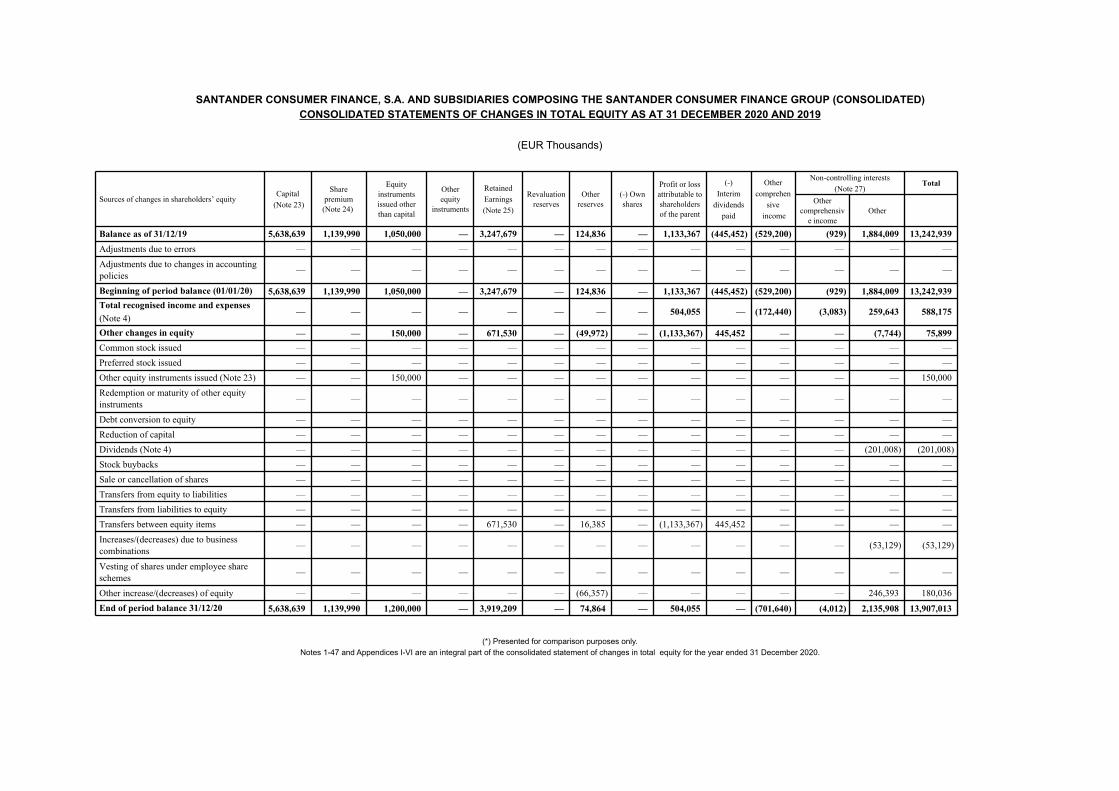
CONSOLIDATED STATEMENTS OF CHANGES IN TOTAL EQUITY AS AT 31 DECEMBER 2020 AND 2019
(EUR Thousands)
Sources of changes in shareholders’ equityCapital
(Note 23)
Share premium
(Note 24)
Equity instruments issued other than capital
Other equity
instruments
Retained
Earnings
(Note 25)
Revaluation reserves
Other reserves
(-) Own shares
Profit or loss attributable to shareholders of the parent
(-)
Interim
dividends
paid
Other
comprehen
sive
income
Non-controlling interests
(Note 27)Total
Other comprehensiv
e incomeOther
Balance as of 31/12/19 5,638,639 1,139,990 1,050,000 — 3,247,679 — 124,836 — 1,133,367 (445,452) (529,200) (929) 1,884,009 13,242,939
Adjustments due to errors — — — — — — — — — — — — — —
Adjustments due to changes in accounting policies
— — — — — — — — — — — — — —
Beginning of period balance (01/01/20) 5,638,639 1,139,990 1,050,000 — 3,247,679 — 124,836 — 1,133,367 (445,452) (529,200) (929) 1,884,009 13,242,939
Total recognised income and expenses
(Note 4)— — — — — — — — 504,055 — (172,440) (3,083) 259,643 588,175
Other changes in equity — — 150,000 — 671,530 — (49,972) — (1,133,367) 445,452 — — (7,744) 75,899
Common stock issued — — — — — — — — — — — — — —
Preferred stock issued — — — — — — — — — — — — — —
Other equity instruments issued (Note 23) — — 150,000 — — — — — — — — — — 150,000
Redemption or maturity of other equity instruments
— — — — — — — — — — — — — —
Debt conversion to equity — — — — — — — — — — — — — —
Reduction of capital — — — — — — — — — — — — — —
Dividends (Note 4) — — — — — — — — — — — — (201,008) (201,008)
Stock buybacks — — — — — — — — — — — — — —
Sale or cancellation of shares — — — — — — — — — — — — — —
Transfers from equity to liabilities — — — — — — — — — — — — — —
Transfers from liabilities to equity — — — — — — — — — — — — — —
Transfers between equity items — — — — 671,530 — 16,385 — (1,133,367) 445,452 — — — —
Increases/(decreases) due to business combinations
— — — — — — — — — — — — (53,129) (53,129)
Vesting of shares under employee share schemes
— — — — — — — — — — — — — —
Other increase/(decreases) of equity — — — — — — (66,357) — — — — — 246,393 180,036
End of period balance 31/12/20 5,638,639 1,139,990 1,200,000 — 3,919,209 — 74,864 — 504,055 — (701,640) (4,012) 2,135,908 13,907,013
(*) Presented for comparison purposes only.
Notes 1-47 and Appendices I-VI are an integral part of the consolidated statement of changes in total equity for the year ended 31 December 2020.
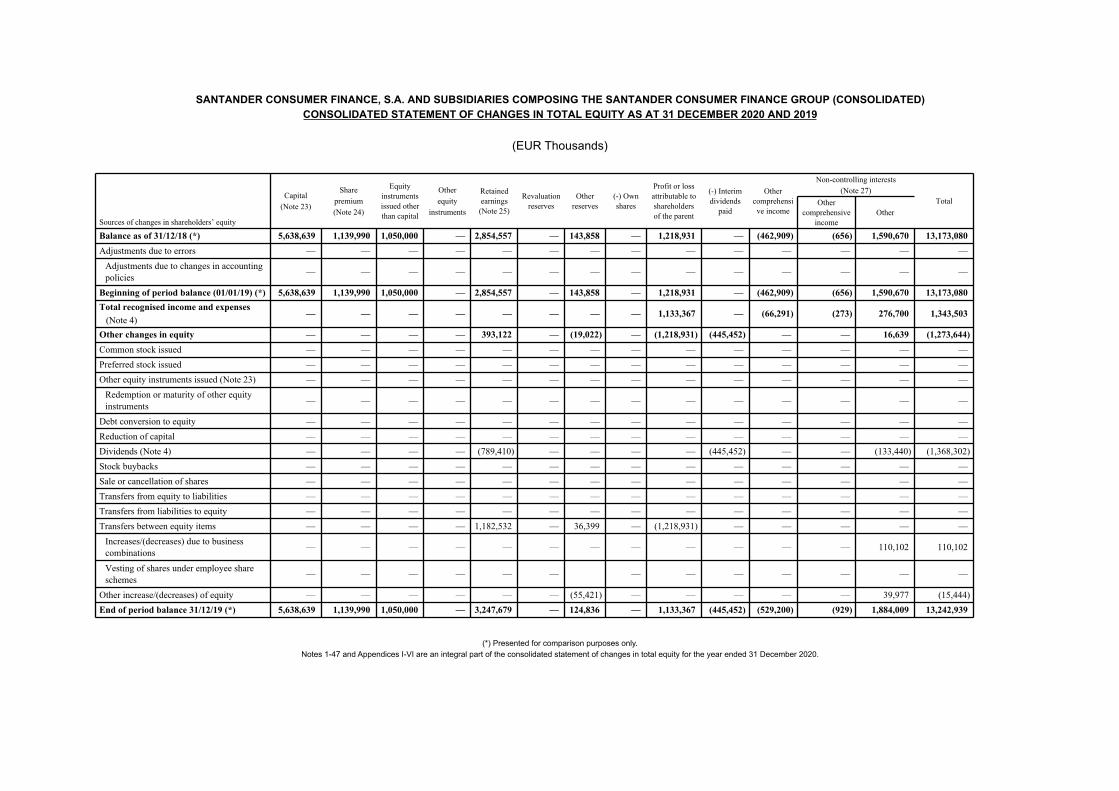
SANTANDER CONSUMER FINANCE, S.A. AND SUBSIDIARIES COMPOSING THE SANTANDER CONSUMER FINANCE GROUP (CONSOLIDATED)
CONSOLIDATED STATEMENT OF CHANGES IN TOTAL EQUITY AS AT 31 DECEMBER 2020 AND 2019
(EUR Thousands)
Sources of changes in shareholders’ equity
Capital
(Note 23)
Share
premium
(Note 24)
Equity instruments issued other than capital
Other
equity
instruments
Retained earnings (Note 25)
Revaluation reserves
Other reserves
(-) Own shares
Profit or loss attributable to shareholders of the parent
(-) Interim dividends
paid
Other comprehensive income
Non-controlling interests
(Note 27)TotalOther
comprehensive income
Other
Balance as of 31/12/18 (*) 5,638,639 1,139,990 1,050,000 — 2,854,557 — 143,858 — 1,218,931 — (462,909) (656) 1,590,670 13,173,080
Adjustments due to errors — — — — — — — — — — — — — —
Adjustments due to changes in accounting policies
— — — — — — — — — — — — — —
Beginning of period balance (01/01/19) (*) 5,638,639 1,139,990 1,050,000 — 2,854,557 — 143,858 — 1,218,931 — (462,909) (656) 1,590,670 13,173,080
Total recognised income and expenses
(Note 4)— — — — — — — — 1,133,367 — (66,291) (273) 276,700 1,343,503
Other changes in equity — — — — 393,122 — (19,022) — (1,218,931) (445,452) — — 16,639 (1,273,644)
Common stock issued — — — — — — — — — — — — — —
Preferred stock issued — — — — — — — — — — — — — —
Other equity instruments issued (Note 23) — — — — — — — — — — — — — —
Redemption or maturity of other equity instruments
— — — — — — — — — — — — — —
Debt conversion to equity — — — — — — — — — — — — — —
Reduction of capital — — — — — — — — — — — — — —
Dividends (Note 4) — — — — (789,410) — — — — (445,452) — — (133,440) (1,368,302)
Stock buybacks — — — — — — — — — — — — — —
Sale or cancellation of shares — — — — — — — — — — — — — —
Transfers from equity to liabilities — — — — — — — — — — — — — —
Transfers from liabilities to equity — — — — — — — — — — — — — —
Transfers between equity items — — — — 1,182,532 — 36,399 — (1,218,931) — — — — —
Increases/(decreases) due to business combinations
— — — — — — — — — — — — 110,102 110,102
Vesting of shares under employee share schemes
— — — — — — — — — — — — —
Other increase/(decreases) of equity — — — — — — (55,421) — — — — — 39,977 (15,444)
End of period balance 31/12/19 (*) 5,638,639 1,139,990 1,050,000 — 3,247,679 — 124,836 — 1,133,367 (445,452) (529,200) (929) 1,884,009 13,242,939
(*) Presented for comparison purposes only.
Notes 1-47 and Appendices I-VI are an integral part of the consolidated statement of changes in total equity for the year ended 31 December 2020.
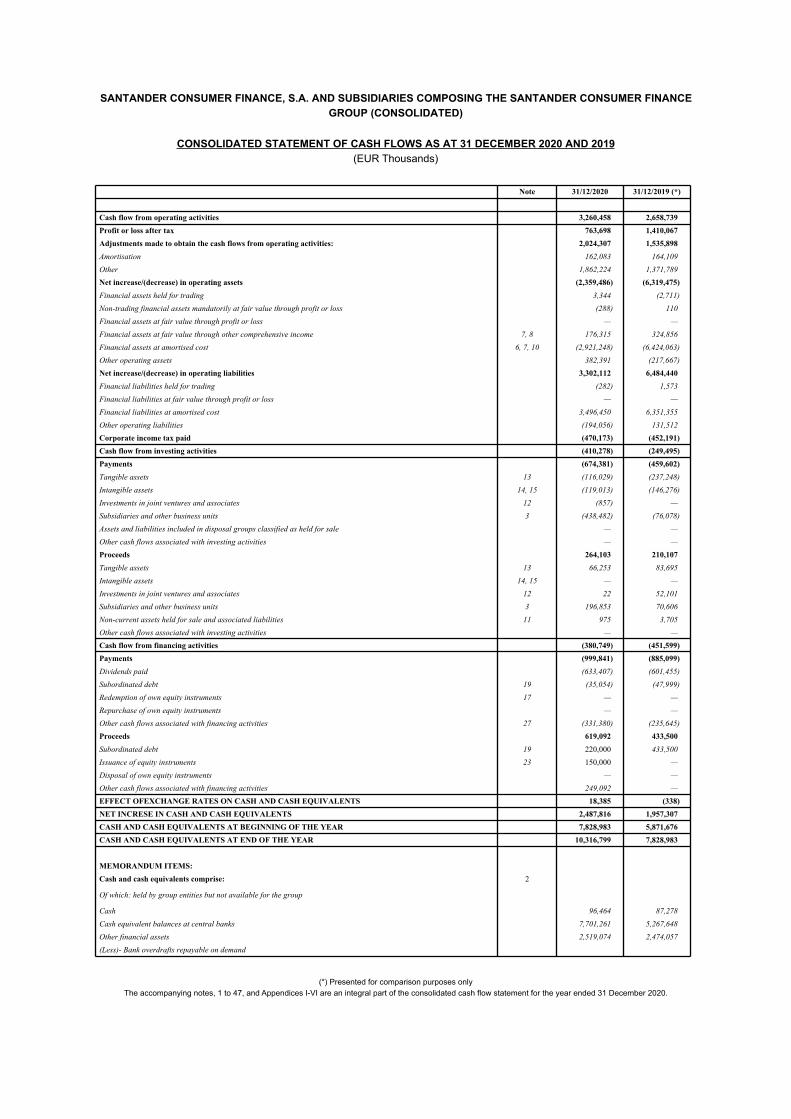
SANTANDER CONSUMER FINANCE, S.A. AND SUBSIDIARIES COMPOSING THE SANTANDER CONSUMER FINANCE
GROUP (CONSOLIDATED)
CONSOLIDATED STATEMENT OF CASH FLOWS AS AT 31 DECEMBER 2020 AND 2019
(EUR Thousands)
Note 31/12/2020 31/12/2019 (*)
Cash flow from operating activities 3,260,458 2,658,739
Profit or loss after tax 763,698 1,410,067
Adjustments made to obtain the cash flows from operating activities: 2,024,307 1,535,898
Amortisation 162,083 164,109
Other 1,862,224 1,371,789
Net increase/(decrease) in operating assets (2,359,486) (6,319,475)
Financial assets held for trading 3,344 (2,711)
Non-trading financial assets mandatorily at fair value through profit or loss (288) 110
Financial assets at fair value through profit or loss — —
Financial assets at fair value through other comprehensive income 7, 8 176,315 324,856
Financial assets at amortised cost 6, 7, 10 (2,921,248) (6,424,063)
Other operating assets 382,391 (217,667)
Net increase/(decrease) in operating liabilities 3,302,112 6,484,440
Financial liabilities held for trading (282) 1,573
Financial liabilities at fair value through profit or loss — —
Financial liabilities at amortised cost 3,496,450 6,351,355
Other operating liabilities (194,056) 131,512
Corporate income tax paid (470,173) (452,191)
Cash flow from investing activities (410,278) (249,495)
Payments (674,381) (459,602)
Tangible assets 13 (116,029) (237,248)
Intangible assets 14, 15 (119,013) (146,276)
Investments in joint ventures and associates 12 (857) —
Subsidiaries and other business units 3 (438,482) (76,078)
Assets and liabilities included in disposal groups classified as held for sale — —
Other cash flows associated with investing activities — —
Proceeds 264,103 210,107
Tangible assets 13 66,253 83,695
Intangible assets 14, 15 — —
Investments in joint ventures and associates 12 22 52,101
Subsidiaries and other business units 3 196,853 70,606
Non-current assets held for sale and associated liabilities 11 975 3,705
Other cash flows associated with investing activities — —
Cash flow from financing activities (380,749) (451,599)
Payments (999,841) (885,099)
Dividends paid (633,407) (601,455)
Subordinated debt 19 (35,054) (47,999)
Redemption of own equity instruments 17 — —
Repurchase of own equity instruments — —
Other cash flows associated with financing activities 27 (331,380) (235,645)
Proceeds 619,092 433,500
Subordinated debt 19 220,000 433,500
Issuance of equity instruments 23 150,000 —
Disposal of own equity instruments — —
Other cash flows associated with financing activities 249,092 —
EFFECT OFEXCHANGE RATES ON CASH AND CASH EQUIVALENTS 18,385 (338)
NET INCRESE IN CASH AND CASH EQUIVALENTS 2,487,816 1,957,307
CASH AND CASH EQUIVALENTS AT BEGINNING OF THE YEAR 7,828,983 5,871,676
CASH AND CASH EQUIVALENTS AT END OF THE YEAR 10,316,799 7,828,983
MEMORANDUM ITEMS:
Cash and cash equivalents comprise: 2
Of which: held by group entities but not available for the group
Cash 96,464 87,278
Cash equivalent balances at central banks 7,701,261 5,267,648
Other financial assets 2,519,074 2,474,057
(Less)- Bank overdrafts repayable on demand
(*) Presented for comparison purposes only
The accompanying notes, 1 to 47, and Appendices I-VI are an integral part of the consolidated cash flow statement for the year ended 31 December 2020.
Translation of consolidated financial statements originally issued in Spanish and prepared in accordance with the regulatory financial reporting
framework applicable to the Group in Spain (see Note 1 to 47). In the event of a discrepancy, the Spanish-language version prevails.
Santander Consumer Finance, S.A. and Subsidiaries composing the
Santander Consumer Finance Group
Notes to the Consolidated Financial Statements
for the year ended 31 December 2020
1. Introduction, basis of presentation of the consolidated financial statements, basis of consolidation
and other information
a) Introduction
Santander Consumer Finance, S.A. (“the Bank”) was incorporated in 1963 under the name of Banco de
Fomento, S.A.. It is a private-law entity subject to the rules and regulations applicable to banks operating
in Spain, and has its headquarters at Avenida de Cantabria s/n, Edificio Dehesa, Boadilla del Monte,
Madrid, where the bylaws and other public information on the Bank can be consulted. The Bank is
registered in the Official Register of Institutions of the Bank of Spain under code 0224.
The Bank’s object is to receive funds from the public in the form of deposits, loans, repos or other similar
transactions entailing the obligation to refund them, and to use these funds for its own account to grant
loans and credits or to perform similar transactions. Also, as the holding company of a finance group (the
Santander Consumer Finance Group, “the Group”), the Bank manages and handles the investments in its
subsidiaries.
The Bank is part of the Santander Group, the parent entity of which (Banco Santander, S.A.) owns,
directly or indirectly, all the share capital of the Bank at 31 December 2020 and 2019 (see Note 23).
Banco Santander, S.A. has its registered office at Paseo de Pereda 9-12, Santander. In this regard, the
Bank's activity should be considered to be carried on in the framework of its belonging to and the strategy
of the Santander Group, with which it performs transactions that are relevant to its activity (see Note 46).
The consolidated financial statements for 2019 of the Santander Group were authorised for issue by the
Directors of Banco Santander, S.A. at its Board of Directors Meeting on 27 February 2020, were approved
by the shareholders at the Annual General Meeting on 3 April 2020 and were filed at the Santander
Mercantile Registry. The consolidated financial statements of the Santander Group for 2020 are expected
to be authorised for issue by its Directors on 22 February 2021.
The Bank has one office (Madrid), is not listed and, in 2020, it carried on most of its direct business
activities in Spain.
Additionally, since December 2002 the Bank has been the head of a European corporate group,
consisting mainly of financial institutions, which engages in commercial banking, consumer finance,
operating and finance leasing, full-service leasing and other activities. As of 31 December 2020, the
Group had 256 offices distributed throughout Europe, 49 of which were located in Spain (31 December
2019: 264 branches, 51 of which were located in Spain).
During 2020, after obtaining authorization, a branch has been established in Greece for the purpose of
carrying out activities related to the financing of purchases of any type of consumer goods made by third
parties, leasing, renting and other activities
As required by Article 21 of Royal Decree 84/2015, of 13 February, implementing Law 10/2014, of 26
June, on the regulation, supervision and capital adequacy of credit institutions, the accompanying
Appendix IV lists the agents of the Group at 31 December 2020.
2
b) Basis of presentation of the consolidated financial statements
Under Regulation (EC) no. 1606/2002 of the European Parliament and of the Council of 19 July 2002, all
companies governed by the law of an EU member state and whose securities are admitted to trading on a
regulated market of any Member State must prepare their consolidated financial statements for the years
beginning on or after 1 January 2005 in accordance with the International Financial Reporting Standards
(hereinafter “IFRSs”) previously adopted by the European Union (hereinafter “EU-IFRSs”).
In order to adapt the accounting regime of Spanish credit institutions with the principles and criteria
established by the IFRS adopted by the European Union (IFRS-EU), the Bank of Spain issued Circular
4/2017, dated 27 November 2017, on Public and Reserved Financial Information Standards and Financial
Statements Formats.
During 2020, the Bank of Spain has published Circulars 2/2020 and 3/2020, dated June 11, amending
Circular 4/2017, dated November 27 to credit institutions on Public and Reserved Financial Information
Standards and Financial Statements Formats. The Group’s consolidated financial statements for 2020
were formally prepared by the Directors of the Bank, as Parent (at the Board Meeting of 18 February
2021), in accordance with the International Financial Reporting Standards as adopted by the European
Union, taking into account Bank of Spain Circular 4/2017 and its subsequent amendments, as well as the
regulatory financial reporting framework applicable to the Group using the basis of consolidation,
accounting policies and measurement basis set forth in Note 2 to these consolidated financial statements
and, accordingly, they presented fairly the Group’s consolidated equity and consolidated financial position
on 31 December 2020, and the consolidated results of its operations, income and expense recognised,
the changes in consolidated equity and its consolidated cash flows in the year then ended 2020. These
consolidated financial statements have been prepared from the accounting entries registered by the Bank
and the rest of the entities that conform the Group, and includes all adjustments and reclassifications
needed to standardise all accounting policies and valuation criteria applied by the Group.
These notes to the consolidated financial statements contain information in addition to that presented in
the accompanying consolidated balance sheet, consolidated income statement, consolidated statement of
recognised income and expense, consolidated statement of changes in total equity and consolidated
statement of cash flows for 2020.The notes provide, in a clear, relevant, reliable and comparable manner,
narrative descriptions and disaggregation of items presented in those statements.
The Group’s consolidated financial statements for 2019 were approved by the Shareholders at the Annual
General Meeting of the Bank on 28 May 2020 and filed at the Madrid Mercantile Registry. The 2020
consolidated financial statements of the Group and the 2020 financial statements of the Bank and of
substantially all the Group entities have not yet been approved by their Shareholders at the respective
Annual General Meetings. However, the Bank’s Board of Directors considers that the aforementioned
financial statements will be approved without any changes.
The following standards and amendments came into force and were adopted by the European Union in
2020:
• Modification of the IFRS Conceptual Framework: Amendments to the IFRS Conceptual
Framework, which sets out the fundamental concepts of financial reporting. The revised Framework
includes: a new chapter about measurement; guidance on financial reporting; improved definitions, in
particular the definition of assets and liabilities; and clarifications such as management functions,
prudence and measurement uncertainty in financial reporting.
• Modification of IAS1, Presentation of financial statements and IAS8, Accounting
Policies:changes in accounting estimates and errors, which use a consistent definition of materiality
3
for the purpose of making material judgements and deciding on the information to be included in the
financial statements.
• Modification of IFRS3, Business combinations: the amendments are intended to assist entities
to determine whether a transaction should be accounted for as a business combination or as an
asset acquisition. IFRS 3 continues to adopt a market participant’s perspective to determine whether
an acquired set of activities and assets is a business.
The amendments are mainly due to: clarify the minimum requirements for a business; remove the
assessment of whether market participants are capable of replacing any missing elements; add
guidance to help entities assess whether an acquired process is substantive; narrow the definitions
of a business and of outputs; and introduce an optional fair value concentration test.
• Amendments to IFRS 16, Leases: As a result of the covid-19 pandemic, IFRS 16 is amended
to allow the lessee to apply a practical alternative and not to consider rental concessions as a
modification of the lease agreement when the following requirements are met: the revised
consideration is the same or less than the consideration before the change, the affected payments
are prior to 30 June 2021, and there are no substantial changes to the remaining lease terms.
• Amendment to IFRS 9, IAS 39 and IFRS 7 on Reference Interest Rates (IBOR Reform - Phase
1) - The Group applies IAS 39 for hedge accounting and, therefore, the amendments to IFRS 9
referred to in this section are not applicable to it. The contractual cash flows of the accounting
hedges, both of the hedged items and of the hedging instruments, which are based on a reference
interest rate that currently exists, will be modified by the substitution of said rate by an alternative
interest rate or modification of its calculation methodology, in order to adapt it to the new regulatory
requirements. The amendments to the standard permit the temporary application of certain
exceptions to comply with hedge accounting requirements that may be directly affected by IBOR
reform.
Additional disclosures required by the amendments to IFRS 7 relating to hedging relationships are
included in note 29. These exceptions will no longer be applicable when cash flow uncertainties
disappear or the hedging relationship is discontinued. The amendments to IAS 39 are applicable
from 1 January 2020, with the possibility of early application. In this regard, the Group chose early
application in the financial statements for the year ended 31 December 2019. The main assumptions
or judgements made by the Group in applying the amendments to IAS 39 are detailed below:
– For cash flow hedges, the Group has assumed that the cash flows covered (which are based on the
benchmark index) are not modified as a result of the aforementioned reform, and therefore continue to
comply with the highly probable future transaction requirement.
– To determine the prospective effectiveness of hedges, the Group has assessed that the economic
relationship between the hedged item and the hedging instrument continues to exist since the interest
rate benchmark on which the hedged item and the hedging instrument are based is not changed as a
result of the IBOR reform.
• Amendments to IFRS 9, Financial Instruments, IAS 39, Financial Instruments: Recognition and
Measurement, IFRS 7, Financial Instruments: Disclosures, IFRS 4, Insurance Contracts and IFRS
16, Leases on Reference Interest Rates (IBOR Reform - Phase 2): the amendments allow for the
temporary application of certain exceptions to the requirements of (i) assessment of derecognition in
the event of changes in financial assets, financial liabilities and lease liabilities, (ii) exemptions from
hedge accounting requirements directly affected by the IBOR reform, (iii) exemptions for lease
modifications that allow the liability to be measured using the reformed interest rate curves against
the right-of-use. These new exemptions require additional disclosures. The amendments will become
effective as of 1 January 2021, with the possibility of early application and will cease to be applicable
when the uncertainties about the hedged risks, cash flows of the financial instruments affected or the
hedging relationship is terminated. In this regard, the Group has chosen to apply the amendments to
4
IFRS 9, IAS 39, IFRS 7, IFRS 4 and IFRS 16 in the preparation of the financial statements for the
year ending 31 December 2020.
The additional breakdowns required by the amendments to IFRS 7 relating to hedging relationships
are included in Note 29. A description of the Group’s management of the transition to alternative
reference rates, as well as the changes in risk management strategy is included in Note 47.
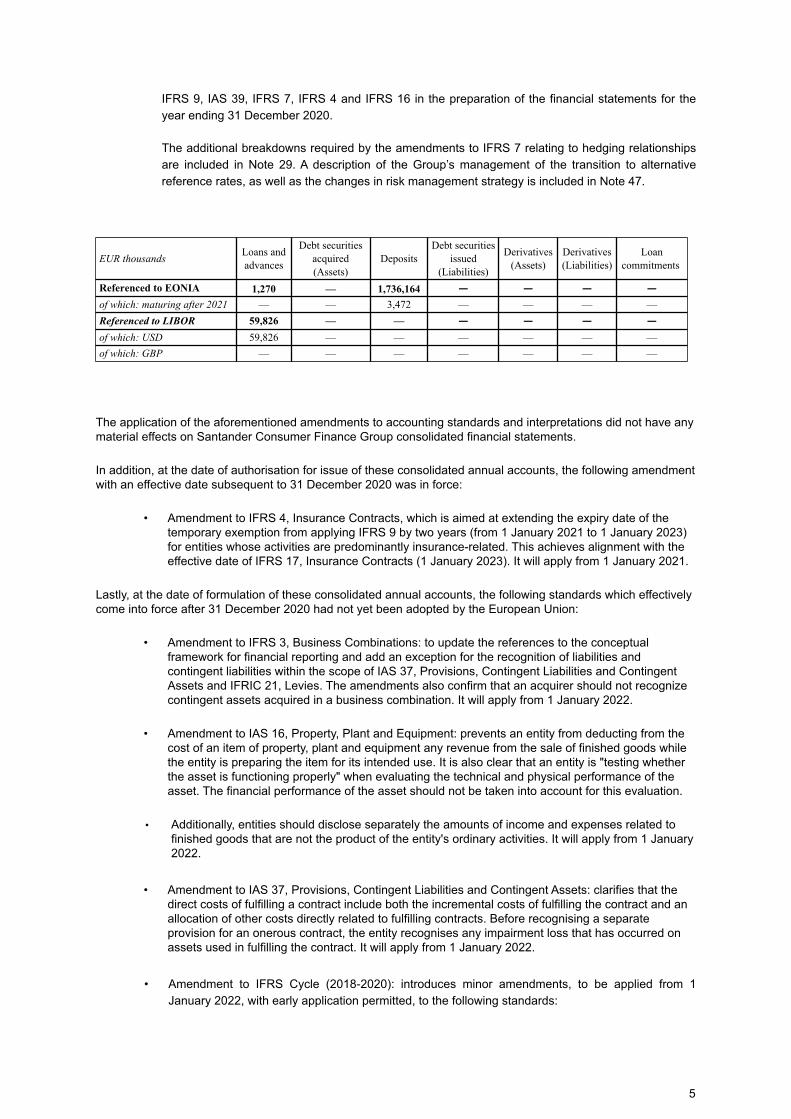
EUR thousandsLoans and advances
Debt securities acquired (Assets)
DepositsDebt securities
issued (Liabilities)
Derivatives (Assets)
Derivatives (Liabilities)
Loan commitments
Referenced to EONIA 1,270 — 1,736,164 — — — —
of which: maturing after 2021 — — 3,472 — — — —
Referenced to LIBOR 59,826 — — — — — —
of which: USD 59,826 — — — — — —
of which: GBP — — — — — — —
The application of the aforementioned amendments to accounting standards and interpretations did not have any
material effects on Santander Consumer Finance Group consolidated financial statements.
In addition, at the date of authorisation for issue of these consolidated annual accounts, the following amendment
with an effective date subsequent to 31 December 2020 was in force:
• Amendment to IFRS 4, Insurance Contracts, which is aimed at extending the expiry date of the
temporary exemption from applying IFRS 9 by two years (from 1 January 2021 to 1 January 2023)
for entities whose activities are predominantly insurance-related. This achieves alignment with the
effective date of IFRS 17, Insurance Contracts (1 January 2023). It will apply from 1 January 2021.
Lastly, at the date of formulation of these consolidated annual accounts, the following standards which effectively
come into force after 31 December 2020 had not yet been adopted by the European Union:
• Amendment to IFRS 3, Business Combinations: to update the references to the conceptual
framework for financial reporting and add an exception for the recognition of liabilities and
contingent liabilities within the scope of IAS 37, Provisions, Contingent Liabilities and Contingent
Assets and IFRIC 21, Levies. The amendments also confirm that an acquirer should not recognize
contingent assets acquired in a business combination. It will apply from 1 January 2022.
• Amendment to IAS 16, Property, Plant and Equipment: prevents an entity from deducting from the
cost of an item of property, plant and equipment any revenue from the sale of finished goods while
the entity is preparing the item for its intended use. It is also clear that an entity is "testing whether
the asset is functioning properly" when evaluating the technical and physical performance of the
asset. The financial performance of the asset should not be taken into account for this evaluation.
• Additionally, entities should disclose separately the amounts of income and expenses related to
finished goods that are not the product of the entity's ordinary activities. It will apply from 1 January
2022.
• Amendment to IAS 37, Provisions, Contingent Liabilities and Contingent Assets: clarifies that the
direct costs of fulfilling a contract include both the incremental costs of fulfilling the contract and an
allocation of other costs directly related to fulfilling contracts. Before recognising a separate
provision for an onerous contract, the entity recognises any impairment loss that has occurred on
assets used in fulfilling the contract. It will apply from 1 January 2022.
• Amendment to IFRS Cycle (2018-2020): introduces minor amendments, to be applied from 1
January 2022, with early application permitted, to the following standards:
5
– IFRS 9, Financial Instruments: clarifies which rates must be included in the 10% test for
derecognition of financial liabilities.
– IFRS 16, Leases: amendment to remove possible confusion regarding the treatment of leasing
incentives in the application of IFRS 16 Leases, as illustrated in example 13.
– IFRS 1, in relation to the first-time adoption of International Financial Reporting Standards,
allows entities that have measured their assets and liabilities at the carrying amounts recorded
in their parent's books to also measure any cumulative translation differences using the
amounts reported by the parent. This amendment also applies to associates and joint ventures
that have adopted the same exemption from IFRS 1.
• Classification of Liabilities, amendments to IAS 1, Presentation of Financial Statements, considering
noncurrent liabilities those in which the entity has the possibility of deferring payment for more than
12 months from the closing date of the reporting period. They must be applied retrospectively in
accordance with the normal requirements in IAS 8, accounting policies, changes in accounting
estimates and errors. It will apply from 1 January 2023.
• IFRS 17, Insurance Contracts: new general accounting standard for insurance contracts, which
includes the recognition, measurement, presentation and disclosure of information. Insurance
contracts combine financial and service provision features that, in many cases, generate variable
long-term cash flows. To properly reflect these characteristics, IFRS 17 combines the measurement
of future cash flows with the recording of the result of the contract during the period in which the
service is provided, presents separately the financial results from the results for the provision of the
service and allows entities, through the choice of an accounting policy option, to recognize the
financial results in the income statement or in other comprehensive income. It will apply from 1
January 2023.
The Group is currently analysing the possible effects of these new standards and interpretations; however, no
significant impacts have been identified.
All accounting policies and measurement bases with a material effect on the consolidated financial statements of
2020 were applied in the preparation of these consolidated annual accounts.
Applied estimates
The consolidated results and the determination of consolidated equity are sensitive to the accounting
policies, measurement bases and estimates used by the Board of Directors of the Bank in preparing the
consolidated financial statements. The information included in these statements is the responsibility of the
Bank’s Board of Directors (parent company).
The main accounting principles and policies and measurement basis are set forth in note 2.
In the Group’s consolidated financial statements of 2020, estimates were occasionally made by the senior
management of the Bank and of the consolidated entities in order to quantify certain of the assets,
liabilities, income, expenses and obligations reported herein. These estimates, which were made on the
basis of the best information available, relate basically to the following:
1. The impairment losses on certain financial assets at fair value through other comprehensive income,
non-current assets held for sale, financial assets at amortised cost, investments in joint ventures and
associates, tangible assets and intangible assets (see Notes 6, 7, 8, 10, 11, 12, 13, 14, 15 and 47);
2. The assumptions used in the actuarial calculation of the post-employment benefit liabilities and
commitments and other obligations (see Notes 2-r, 2-s and 21);
3. The useful life of tangible and intangible assets (see Notes 13 and 15);
4. The measurement of goodwill arising from consolidation (see Note 14);
5. The calculation of provisions and the consideration of contingent liabilities (see Note 21);
6
6. The fair value of certain unquoted assets and liabilities (see Notes 6, 7, 8, 9, 10, 11, 12, 17, 18 and
19).
7. The recoverability of deferred tax assets and the income tax expense (see Notes 2-t and 22);
8. The fair value of the identifiable assets acquired and liabilities assumed in business combinations (see
Note 3).
To update the estimates described above, the Group's Management has taken into account the current
situation as a result of covid-19, classified as a pandemic by the World Health Organization, which
significantly affects the economic activity worldwide and, as a result, the Group's operations and financial
results, and which generates uncertainty in the Group's estimates. Therefore, the Group's Management
has made an assessment of the current situation according to the best information available to date,
developing in the Notes of the main estimates made the potential impacts of covid-19 on the same during
the year ended 31 December 2020 (see Notes 14, 22 and 47).
Although these estimates were made on the basis of the best information available at the end of 2020 and
2019 on the events analysed and considering information updated at the date of preparation of these
consolidated annual accounts, future events might make it necessary to change these estimates (upper or
lower) in coming years, which, if necessary, would be done in accordance with current legislation
(prospectively, recognising any changes in estimates in the related consolidated income statements for
the future years affected).
c) Comparability of information presented
In July 2016, the IASB published IFRS 16, Leases, which was adopted by the Group in accordance with the
standard on 1 January 2019. IFRS 16 establishes the principles for the recognition, measurement,
presentation and breakdown of lease contracts, with the objective of ensuring reporting information that
faithfully represents the lease transactions.
The adoption of IFRS 16 has led to changes in the Group's accounting policies for the recognition,
measurement, presentation and breakdown of lease contracts.
The main aspects contained in the new regulations and the breakdowns relating to the impact of the adoption
of IFRS 16 in the Group are included below:
a) Lease accounting policy
Since 1 January 2019, when the Group acts as lessee, it recognises a right-of-use asset representing its
right to use the underlying leased asset with a corresponding lease liability on the date on which the
leased asset is available for use by the Group. Each lease payment is allocated between the liability and
the finance charge. The finance charge is allocated to the income statement during the term of the lease
in such a way as to produce a constant periodic interest rate on the remaining balance of the liability for
each year. The right-of-use asset is depreciated over the useful life of the asset or the lease term,
whichever is shorter, on a straight-line basis. If Santander Consumer Finance Group is reasonably certain
to exercise a purchase option, the right-of use asset is amortized over the useful life of the underlying
asset.
Assets and liabilities arising from a lease are initially measured at present value. Lease liabilities include
the net present value of the following lease payments:
– Fixed payments (including inflation-linked payments), less any lease incentive receivable,
– Variable lease payments that depend on an index or rate,
– The amounts expected to be paid by the lessee under residual value guarantees,
7
– The exercise price of a purchase option if the lessee is reasonably certain that it will exercise that
option, and
– Lease termination penalty payments, if the term of the lease reflects the lessee's exercise of that
option.
Lease payments are discounted using the interest rate implicit in the lease. Given in certain situations this
interest rate cannot be obtained, the discount rate used in these cases, is the lessee's incremental
borrowing rate at the related date. For this purpose, the entity has calculated this incremental borrowing
rate taking as reference the listed debt instruments issued by the Group; in this regard, the Group has
estimated different interest rate curves depending on the currency and economic environment in which the
contracts are located.
In order to construct the incremental borrowing rate, a methodology has been developed at the corporate
level. This methodology is based on the need for each Entity to consider its economic and financial
situation, for which the following factors must be considered:
– Economic and political situation (country risk).
– Credit risk of the company.
– Monetary policy.
– Volume and seniority of the company’s debt instrument issues.
The incremental borrowing rate is defined as the interest rate that a lessee would have to pay for
borrowing, given a similar period to the duration of the lease and with similar security, the funds necessary
to obtain an asset of similar value to the right-of-use asset in a similar economic environment. The Group
Entities have a wide stock and variety of financing instruments issued in different currencies to that of the
euro (pound, dollar, etc.) that provide sufficient information to be able to determine an "all in
rate" (reference rate plus adjustment for credit spread at different terms and in different currencies). In
circumstances, where the leasing company has its own financing, this has been used as the starting point
for determining the incremental borrowing rate. On the other hand, for those Grupo Santander entities that
do not have their own financing, the information from the financing of the consolidated subgroup to which
they belong was used as the starting point for estimating the entity's curve, analysing other factors to
assess whether it is necessary to make any type of negative or positive adjustment to the initially
estimated credit spread.
Right-of-use assets are valued at cost which includes the following:
– The amount of the initial measurement of the lease liability,
– Any lease payment made at or before the commencement date less any lease incentive received,
– Any initial direct costs, and
– Restoration costs.
The Group recognises the payments associated with short term leases and leases of low-value assets
on a straight-line basis as an expense in the income statement. Short-term leases are leases with a
lease term less than or equal to 12 months (a lease that contains a purchase option is not a short term
lease).
8
b) Recognised effects on the adoption of the standard
With the adoption of IFRS 16, the Group recognised lease liabilities in relation to leases previously
classified as "operating leases" under the principles of IAS 17, Leases, in force at 31 December 2018.
These liabilities were measured at the present value of the remaining lease payments, discounted using
the lessee's incremental borrowing rate at 1 January 2019.
For leases previously classified as finance leases, the Group recognised the carrying amount of the lease
asset and lease liability immediately before transition as the carrying amount of the right-of-use asset and
lease liability on the initial effective date. The measurement principles in IFRS 16 apply only after that
date.
As a result of the adoption of IFRS16, the impact of first application recorded by the Group corresponds
mainly to the recognition of right-of-use assets and a lease liability for an amount of EUR 269 million. The
right-of-use assets recorded correspond mainly to land and buildings recorded under "Tangible assets -
Property, plant and equipment - leased under operating leases".
The information contained in these notes to the financial statements for 2019 is presented solely and
exclusively for comparative purposes with the information for 2020 and, therefore, does not constitute the
Group's financial statements for 2019.
d) Basis of consolidation
i. Subsidiaries
Subsidiaries are defined as entities over which the Bank has the capacity to exercise control. The Bank
controls an entity when it is exposed, or has rights, to variable returns from its involvement with the
investee and has the ability to affect those returns through its power over the investee. This situation
generally occurs when the Bank has, directly or indirectly, over half of the voting rights in the investee or
situations where, without reaching that level of participation, agreement or other circumstances exist that
give the Bank control over the investee.
The financial statements of the subsidiaries are fully consolidated with those of the Bank. Accordingly, all
balances and effects of the transactions between consolidated companies are eliminated on
consolidation.
On acquisition of control of a subsidiary, its assets, liabilities and contingent liabilities are recognised at
their acquisition-date fair values. Any positive differences between the acquisition cost and the fair values
of the identifiable net assets acquired are recognised as goodwill (see Note 14). Negative differences are
recognised in profit or loss on the date of acquisition.
Additionally, the share of third parties of the Group's equity is presented under “Non-controlling interests”
in the consolidated balance sheet (see Note 27). Their share of the profit for the year is presented under
Profit attributable to non-controlling interests in the consolidated income statement.
The results of subsidiaries acquired during the year are included in the consolidated income statement
from the date of acquisition to year-end. Similarly, the results of subsidiaries for which control is lost during
the year are included in the consolidated income statement from the beginning of the year to the date of
disposal.
On 31 December 2020 and 2019, no entities were identified in which the Group did not hold at least 50%
of the voting power and were considered subsidiaries. With respect to those entities in which the Bank
does not reach this level of ownership and are still considered subsidiaries, and thus, consolidated in this
9
financial statements, agreements or other circumstances exist that give the Bank control over the
investees.
Similarly, on 31 December 2020 and 2019, no entities were identified in which the Group held over half of
the voting power and were not considered subsidiaries.
Appendix I to these consolidated financial statements contains relevant information on the Group’s
subsidiaries as of 31 December 2020.
ii. Interests in joint ventures
Joint ventures are deemed to be ventures that are not subsidiaries but which are jointly controlled by two
or more unrelated entities. This is evidenced by contractual arrangements whereby two or more entities
(ventures) have interests in entities (jointly controlled entities) or undertake operations or hold assets so
that strategic financial and operating decisions affecting the joint venture require the unanimous consent
of the ventures.
In the consolidated financial statements, joint ventures are accounted for using the equity method, i.e. at
the Group's share of net assets of the investee, after taking into account the dividends received therefrom
and other equity eliminations. The profits and losses resulting from transactions with a joint venture are
eliminated to the extent of the Group's interest in the jointly controlled entity.
Certain relevant information on joint ventures as of December 31, 2020 is provided in Appendix II to these
consolidated financial statements.
iii. Associates
“Associates” are entities over which the Bank is in a position to exercise significant influence, but not
control or joint control, usually because it holds 20% or more of the voting power of the investee.
In the consolidated financial statements, investments in associates are accounted for using the equity
method, i.e. at the Group's share of net assets of the investee, after taking into account the dividends
received therefrom and other equity eliminations. The profits and losses resulting from transactions with
an associate are eliminated to the extent of the Group's interest in the associate.
Appendix II to these consolidated financial statements contains relevant information on associates as of
31 December 2020.
iv. Structured entities
When the Group incorporates entities, or holds ownership interests therein, to enable its customers to
access certain investments, or for the transfer of risks or other purposes (also called structured entities
since the voting or similar power is not a key factor in deciding who controls the entity), the Group
determines, using internal criteria and procedures and taking into consideration the applicable legislation,
whether control (as defined above) exists and, therefore, whether these entities should be consolidated.
Specifically, for those entities to which this policy applies (mainly investment funds and pension funds), the
Group analyses the following factors:
– Percentage of ownership held by the Group; 20% is established as the general threshold.
Identification of the fund manager, and verification as to whether it is a company controlled by the Group
since this could affect the Group's ability to direct the relevant activities.
– Existence of agreements between investors that might require decisions to be taken jointly by the
investors, rather than by the fund manager.
10
– Existence of currently exercisable removal rights (possibility of removing the manager from his
position) since the existence of such rights might limit the manager's power over the fund, and it may
be concluded that the manager is acting as an agent of the investors.
– Analysis of the fund manager's remuneration regime, taking into consideration that a remuneration
regime that is proportionate to the service rendered does not, generally, create exposure of such
importance as to indicate that the manager is acting as the principal. Conversely, if the remuneration
regime is not proportionate to the service rendered, this might give rise to an exposure that would lead
the Group to a different conclusion.
These structured entities also include the asset securitisation funds which are consolidated in those cases
where, based on the above analysis, it is considered that the Group continues to exercise control.
The exposure associated with unconsolidated structured entities are not material with respect to the
Group’s consolidated financial statements.
Appendix I contains, amongst other information, the structured entities (Securitisation Funds) that are
subject to consolidation in these consolidated financial statements as at 31 December 2020.
v. Business combinations
A business combination is the bringing together of two or more separate entities or economic units into
one single entity or group of entities.
Business combinations whereby the Group obtains control over an entity or business are recognised for
accounting purposes as follows:
– The Group measures the cost of the business combination, defined as the fair value of the assets
transferred, the liabilities incurred and the equity instruments issued, if any, by the acquirer. The cost
of the business combination does not include any costs related to the combination, such as fees paid
to auditors involved in the transaction, legal advisers, investment banks and other consultants. If, prior
to the business combination, the Group already held an equity interest in the acquiree, this equity
interest is measured at its fair value and the difference between this fair value and its carrying amount
at the date of the business combination is recognised in profit or loss. This equity interest measured at
fair value forms part of the cost of the business combination.
– The fair value of the assets, liabilities and contingent liabilities of the acquired entity or business is
estimated, including those intangible assets identified in the business combination that might not be
recognised by the acquiree, which are included in the consolidated balance sheet at those values, as
well as the amount of the minority interests (non-controlling interests) and the fair value of the previous
interests in the acquire.
– The difference between these items is recorded in accordance with section k) of this Note 2 if it is
positive. If the difference is negative, it is recognised under "Negative Goodwill" in the consolidated
income statement.
Also, any acquisitions or disposals of non-controlling interests carried out after the date on which
control of the entity is obtained are accounted for as equity transactions, and, accordingly, the
difference between the price paid and the carrying amount of the percentage acquired of the non-
controlling interests is recognised directly with a charge or a credit to consolidated equity.
Goodwill is only recognised once, when control of a business is obtained.
11
vi. Changes in the levels of ownership interests in subsidiaries
Acquisitions and disposals not giving rise to a change in control are accounted for as equity transactions,
and no gain or loss is recognised in the consolidated income statement and the initially recognised
goodwill is not remeasured. The difference between the consideration transferred or received and the
decrease or increase in non-controlling interests, respectively, is recognised in reserves.
Similarly, when control over a subsidiary is lost, the assets, liabilities and non-controlling interests and any
other items recognised in valuation adjustments of that company are derecognised from the consolidated
balance sheet, and the fair value of the consideration received and of any remaining equity interest is
recognised. The difference between these amounts is recognised in consolidated profit or loss.
vii. Acquisitions and disposals
Note 3 to these consolidated financial statements provides information on the most significant acquisitions
and disposals in 2020 and 2019.
e) Capital and capital adequacy management
Management of the Bank's and the Group's capital should be understood within the framework of the
management performed by the Santander Group, of which they form part (see Note 1-a). The Santander
Group's capital management is performed at regulatory and economic levels.
The aim is to secure the Santander Group's solvency and guarantee its economic capital adequacy and
its compliance with regulatory requirements, as well as an efficient use of capital.
To this end, the regulatory and economic capital figures and their associated metrics -return on risk-
weighted assets (RORWA), return on risk-adjusted capital (RORAC) and value creation of each business
unit- are generated, analysed and reported to the relevant governing bodies on a regular basis.
Additionally, within the framework of the capital self-assessment process (to comply with Basel Pillar II
requirement), the Santander Group uses an economic capital measurement model with the objective of
ensuring that there is sufficient capital available to support all the risks of its activity in various economic
scenarios, with the solvency levels agreed upon by the Santander Group; at the same time the Group
assesses, also in the various scenarios, whether it meets the regulatory capital ratio requirements in the
different scenarios.
In order to adequately manage the Santander Group's capital, it is essential to estimate and analyse
future needs, in anticipation of the various phases of the economic cycle. Projections of regulatory and
economic capital are made based on the budgetary information (balance sheet, income statement, etc.)
and the macroeconomic scenarios defined by the Santander Group's economic research service. These
estimates are used by the Group as a reference when planning the management actions (issues,
securitisations, etc.) required to achieve its capital targets.
In addition, certain stress scenarios are simulated in order to assess the availability of capital in adverse
situations. These scenarios are based on sharp fluctuations in macroeconomic variables (GDP, interest
rates, housing prices, etc.) that mirror historical crises that could happen again or plausible but unlikely
stress situations.
Following is a brief description of the regulatory capital framework to which the Group is subject:
On 26 June 2013, the Basel III legal framework was included in European law through Directive 2013/36
(CRD IV), repealing Directives 2006/48 and 2006/49, and through Regulation 575/2013 on prudential
requirements for credit institutions and investment firms (Capital Requirements Regulation (CRR).
12
The CRD IV was transposed into Spanish legislation through Law 10/2014, on the regulation, supervision
and capital adequacy of credit institutions, and its subsequent implementing regulations contained in
Royal Decree-Law 84/2015 and Bank of Spain Circular 2/2016, which complete its adaptation to Spanish
regulation.
The CRR, of immediate application in each European country, contemplates a gradual implementation
calendar that allows a progressive adaptation to the new requirements in the European Union regarding
AT1 and T2 capital instruments. These calendars have been incorporated into Spanish regulation through
Bank of Spain Circular 2/2014, affecting both new deductions and those issues and equity elements that
with this new regulation are no longer eligible as such.
On 27 December 2017, Regulation 2017/2395 was published, amending the CRR with regard to
transitional provisions to mitigate the impact of the introduction of IFRS9, which took place on 1 January
2018. However, as a consequence of the Covid-19 health crisis, on June 24, 2020, the European
Commission published Regulation (EU) 2020/873, which amends the previous one regarding the
transitional adjustments arising from the application of IFRS 9 accounting standards.
The regulatory changes introduced in the new regulation are focused mainly on the dynamic approach
and the extension of the phase-in until 2024 in order to mitigate the impact of the increase in the volume
of provisions. In terms of how to determine their impact, the static and dynamic approach must be taken
into account:
Regarding the static approach, it would correspond to apply the factor of 0.7 expected for the year 2020
while the dynamic approaches should be distinguished between:
• Dynamic approach 1: it measures the evolution of non-default provisions from the date of first
application of IFRS 9 (January 1, 2018) to the reporting date (January 1, 2020), maintaining the
phase-in factors for 5 years (2018-2022) provided in the previous Regulation.
• Dynamic approach 2: it measures the evolution of non-default provisions from January 1, 2020
until the reporting date, applying new phase-in factors updated until 2024.
The main objective of this modification is to isolate the effect of the increase in non-default provisions
caused by the Covid-19 health crisis and thus not to harm the top-quality capital of credit institutions.
In addition, on 28 December 2017 Regulations 2017/2401 and 2017/2402 were published, incorporating
the new securitisation framework. The first regulation establishes a new methodology for calculating
capital requirements for securitisations and a transitional period ending on 31 December 2019, while the
second regulation defines a type of STS securitisation ('simple, transparent and standardised') which,
because of its characteristics of simplicity, of financing the real economy, etc., receives preferential
treatment in terms of lower capital requirements.
With regard to Non-Performing Exposures (NPEs), rules have been published with the aim of
implementing the "Action Plan for Non-Performing Exposures in Europe", published by the European
Council in July 2017. The most relevant are the following:
– The ECB's supervisory expectation to address the stock of NPEs through provisioning,
– European Central Bank Guidance on Non-performing loans to credit institutions, published in March
2017: the Appendix to this Guidance, published in March 2018, sets out timetables with quantitative
supervisory expectations for provisioning of this type of exposure. Applicable to exposures originated
prior to 26 April 2019 and which have become NPE on or after 1 April 2018. Non-compliance could
result in a higher charge for Pillar 2.
13
– Amendment of the RRC by Regulation 2019/630 regarding the minimum coverage of losses arising
from doubtful exposures (prudential backstop), published in April 2019: this regulation includes
timetables of quantitative requirements for minimum provisioning of NPE's. It applies to PPE's
originated after 26 April 2019 and failure to comply would result in a deduction from the institutions'
CET1.
On 20 May 2019 the new regulatory package was approved, which is articulated in Regulation 2019/876
(hereinafter CRR II) and Directive 2019/878 (hereinafter CRD V).
As a general rule, CRR II will enter into force on 28 June 2021, with some exceptions that will take effect
during a period of time that began on 1 January 2019 and will end on 28 June 2023.
Among these exceptions, we highlight the entry into force on 27 June 2019 of the main changes regarding
equity, capital deductions, standard and IRB credit risk and authorisations.
On 27 June 2019 CRD V entered into force, which is not yet applicable, as Member States have until 28
December 2020 to transpose it into national law. The CRD V includes significant changes such as the
Pillar 2G regulation ('guidance').
In the regulatory package published in June 2019, the TLAC Term Sheet set at international level by the
FSB (Financial Stability Board) has been incorporated into CRR II as a Pillar I of minimum equity and
computable liability requirements for GSIBs. This package of modifications also includes the modification
of the Resolution Directive (BRRD), replacing it with BRRD II, which establishes MREL requirements with
Pillar 2 for all resolution entities, whether systemic or not, in which the resolution authority will decide on
the requirements on a case-by-case basis.
This package of amendments also includes the modification of the Resolution Directive (BRRD), replacing
it with BRRD II, which establishes MREL requirements by Pillar 2 for all resolution entities, whether
systemic or not, in which the resolution authority will decide the requirements on a case-by-case basis.
For G-SIBs, CRR II introduces the minimum requirement established in the TLAC term sheet (16% /
18%), which must be made up of subordinated liabilities, with the exception of a percentage of senior debt
(2.5% / 3.5%). For large banks (defined as those with total assets exceeding EUR 100 billion) or those
which, without being large, are considered by the resolution authority to be potentially systemic, the BRRD
II establishes a minimum subordination requirement of 13.5% of risk-weighted assets, or 5% of the
leverage ratio exposure, whichever is higher. For other institutions, the subordination requirement will be
determined on a case-by-case basis by the resolution authority.
1. Plan for the roll-out of advanced approaches and authorisation from the supervisory authorities
Santander Consumer Finance Group, following Santander Group policies, continues with its proposal to
adopt, progressively, over the next few years, the advanced internal ratings-based (AIRB) approach for
substantially all its banks, until the percentage of exposure of the loan portfolio covered by this approach
exceeds 90%. The commitment assumed before the supervisor still implies the adaptation of advanced
models within the key markets where it operates.
Accordingly, the Group continued in 2020 with the project for the progressive implementation of the
technology platforms and methodological improvements required for the roll-out of the AIRB approaches
for regulatory capital calculation purposes at the various Group units.
The Group has obtained authorisation from the supervisory authorities to use the AIRB approach for the
calculation of regulatory capital requirements for credit risk for the Parent and the main subsidiaries in
Spain as well as for certain portfolios in Germany, the Nordic countries (Norway, Sweden and Finland),
and France.
14
With respect to operational risk, the Group currently uses the standardised approach for calculating
regulatory capital as foreseen in the Capital Requirements Regulation (CRR).
f) Deposit Guarantee Fund and Single Resolution Fund
The Bank and other consolidated entities participate in the Deposit Guarantee Fund, National Resolution
Fund or equivalent scheme in their respective countries.
i. Deposit Guarantee Fund
The Spanish Deposit Guarantee Fund (Fondo de Garantía de Depósitos, "FGD") was established by
Royal Decree-Law 16/2011, of 14 October, which was amended pursuant to the wording given in final
provision ten of Law 11/2015, of 18 June, on the recovery and resolution of credit institutions and
investment services companies (in force as from 20 June 2015). This Law transposes Directive 2014/49/
EU, of 16 April 2014, on deposit guarantee schemes into Spanish legislation. The annual contribution to
be made to the fund by Spanish institutions is determined by the FGD Management Committee.
Contributions are based on the amount of covered deposits, adjusted for the entity's risk profile, which
takes into account the phase in the economic cycle and the impact of pro-cyclical contributions, pursuant
to article 6,3 of Royal Decree-Law 16/2011.
The purpose of the FGD is to guarantee deposits at credit institutions, up to the limit foreseen in the
aforementioned Royal Decree-Law. To fulfil its objectives, the FGD is funded by the above-referenced
annual contributions, the extraordinary contributions the fund requires from its members and the
resources secured in securities markets and through loans or other financing operations.
Taking into account the foregoing and to strengthen the FGD, Royal Decree-Law 6/2013, of 22 March, on
the protection of holders of certain savings and investment products and other financial measures
established an extraordinary contribution equal to 3 per thousand of the institutions’ deposits at 31
December 2012. This extraordinary contribution was payable in two tranches:
i. Two-fifths to be paid within 20 business days from 31 December 2013.
ii. Three-fifths to be paid within a maximum of seven years in accordance with the payment schedule
set by the FGD Management Committee.
The notes to the Bank’s individual financial statements for 2020 include additional information on the
contributions of this nature made by the Bank in 2020 and 2019.
ii. Single Resolution Fund
In March 2014, a political agreement was reached between the European Parliament and Council on
establishing the second pillar of the Banking Union, the Single Resolution Mechanism (“SRM”). The main
objective of the SRM is to ensure that potential future bank failures in the banking union are managed
efficiently, with minimal costs to taxpayers and the real economy. The scope of the SRM mirrors that of the
SSM. This means that a central authority -the Single Resolution Board (“SRB”) is ultimately in charge of
the decision to initiate the resolution of a bank, while operationally the decision will be implemented in
cooperation with national resolution authorities. The SRB started its work as an independent EU agency
on 1 January 2015.
While the rules governing the banking union aim to ensure that any resolution is first financed by a bank’s
shareholders and, if necessary, also partly by a bank’s creditors, there is now another funding source
available that can step in if the contributions of shareholders and creditors are insufficient, namely the
Single Resolution Fund (“SRF”), which is administered by the SRB. The legislation establishes that
contributions to the SRF will be paid in by the banks over the course of eight years.
15
In this regard, the SRF, which was introduced by Regulation (EU) No 806/2014 of the European
Parliament and of the Council, became operational on 1 January 2016. The basis for the calculation of the
contributions that must be made by credit institutions and investment firms to the SRF lies with the SRB.
As from 2016, these contributions base on: (a) a flat contribution (or basic annual contribution), that is pro-
rata with respect to the total liabilities, excluding own funds and guaranteed deposits, of all of the
institutions authorised in the territories of the participating Member States; and (b) a risk-adjusted
contribution, that shall be based on the criteria laid down in Article 103(7) of Directive 2014/59/EU, taking
into account the principle of proportionality, without creating distortions between banking sector structures
of the Member States. The amount of these contributions accrues from 2016 in an annual basis.
The amount accrued for contributions to both funds stood at EUR 63,927 thousand as of 31 December
2020 (EUR 56,664 thousand as of 31 December 2019), recognised under “Other operating expenses” on
the accompanying income statement (see Note 38).
iii. National Resolution Fund
In 2015 Royal Decree 1012/2015 of 6 November was published, implementing Law 11/2015 of 18 June on
the recovery and resolution of credit institutions and investment service companies and amending Royal
Decree 2606/1996 of 20 December on deposit guarantee funds for credit institutions. The aforementioned
Law 11/2015 regulates the creation of the National Resolution Fund, whose financial resources should
reach 1% of the amount of guaranteed deposits by 31 December 2024, through contributions from credit
institutions and investment service companies established in Spain. The details of how the contributions to
this Fund are to be calculated are governed by the Delegated Regulation (EU) 2015/63 of the
Commission of 21 October 2014 and are calculated by the Fondo de Resolución Ordenada Bancaria
("FROB"), on the basis of the information provided by each institution.
The expense incurred for the contribution made by the Bank to the National Resolution Fund in 2020,
which amounted to EUR 229 thousand (EUR 229 thousand in 2019), is recognised under "Other
Operating Expenses" in the accompanying income statement (see Note 38).
g) Environmental impact
In view of the business activities carried on by the Group entities, they do not have any environmental
liability, expenses, assets, provisions or contingencies that might be material with respect to the Group’s
consolidated equity, financial position or results. Therefore, no specific disclosures relating to
environmental issues are included in these notes to the consolidated financial statements.
h) Events after the reporting period
Subsequent to the close of the fiscal year ended December 31, 2020 and up to the date of preparation of
these Consolidated Financial Statements for said fiscal year, no event has occurred that significantly
affects or modifies the information contained therein.
i) Customer Protection Service Annual Report
As required by Article 17 of Ministry of Economy Order ECO/734/2004, of 11 March, on Customer
Protection Departments and Services and Customer Ombudsmen of Financial Institutions, the Directors’
report summarizes the Annual Report to be presented by the head of the Service to the Board of Directors
in the first quarter of the year 2021.
Santander Consumer Finance, S.A.
As required by Law 44/2002 on Financial System Reform Measures, Ministry of Economy Order 734/2004
on the Departments and Customer Care Services and the Customer Ombudsman of Financial Institutions
and Article 37 of the Regulations of the Complaints and Customer Care and Defense Service of the
16
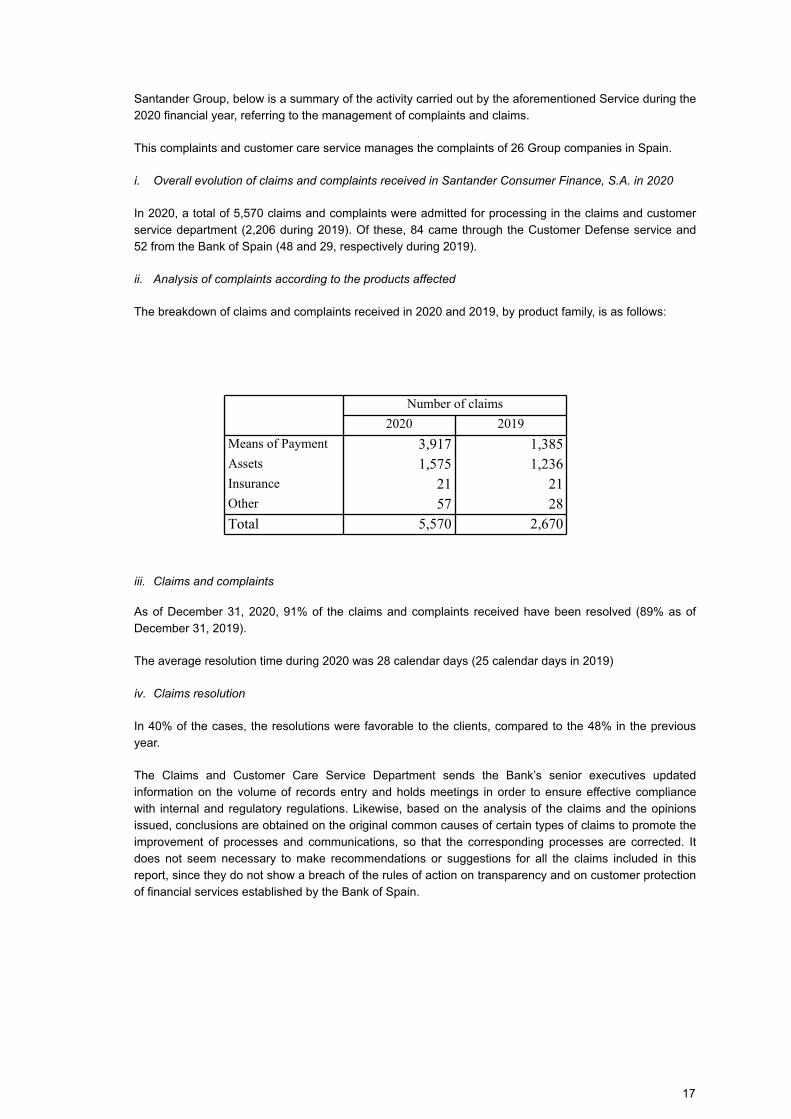
Santander Group, below is a summary of the activity carried out by the aforementioned Service during the
2020 financial year, referring to the management of complaints and claims.
This complaints and customer care service manages the complaints of 26 Group companies in Spain.
i. Overall evolution of claims and complaints received in Santander Consumer Finance, S.A. in 2020
In 2020, a total of 5,570 claims and complaints were admitted for processing in the claims and customer
service department (2,206 during 2019). Of these, 84 came through the Customer Defense service and
52 from the Bank of Spain (48 and 29, respectively during 2019).
ii. Analysis of complaints according to the products affected
The breakdown of claims and complaints received in 2020 and 2019, by product family, is as follows:
Number of claims
2020 2019
Means of Payment 3,917 1,385Assets 1,575 1,236Insurance 21 21Other 57 28Total 5,570 2,670
iii. Claims and complaints
As of December 31, 2020, 91% of the claims and complaints received have been resolved (89% as of
December 31, 2019).
The average resolution time during 2020 was 28 calendar days (25 calendar days in 2019)
iv. Claims resolution
In 40% of the cases, the resolutions were favorable to the clients, compared to the 48% in the previous
year.
The Claims and Customer Care Service Department sends the Bank’s senior executives updated
information on the volume of records entry and holds meetings in order to ensure effective compliance
with internal and regulatory regulations. Likewise, based on the analysis of the claims and the opinions
issued, conclusions are obtained on the original common causes of certain types of claims to promote the
improvement of processes and communications, so that the corresponding processes are corrected. It
does not seem necessary to make recommendations or suggestions for all the claims included in this
report, since they do not show a breach of the rules of action on transparency and on customer protection
of financial services established by the Bank of Spain.
17
Financiera El Corte Inglés, E.F.C., S.A.
i. Statistical summary of complaints and claims handled and decisions issued
In 2020, Financiera El Corte Inglés Customer Service Department received 231 complaints (157 in 2019),
and answered 230 complaints, with one pending resolution at year-end (157 complaints resolved and
none pending resolution at year-end 2019).
Of the total number of complaints received, 196 were admitted for processing and 35 were rejected (138
admitted and 19 rejected during 2019), as they did not comply with the requirements set forth in Order
ECO/734/2004, of March 11, of the Ministry of Economy, on the Departments and Services of Customer
Service and Customer Defender of Financial Institutions.
The complaints that have ended with a report in favor of the Company amounted to 174 and 21 have
been resolved in favor of the customer (126 and 12 have been resolved in favor of the customer during
2019), having adopted the necessary measures to rectify the disputed situation, informing in all cases in
writing to the customers of the decisions taken.
Likewise, 10 complaints have been filed with the Bank of Spain's Department of Conduct of Entities by
customers, having received the resolution of all of them during fiscal year 2020 (9 received during 2019).
Of the 10 resolutions, only 1 was decided against the entity (3 during 2019). In 5 of them, the Conduct
Department has not appreciated any breach of the rules of transparency and customer protection, in 3 of
them the complaint has been filed because in 2 of them the complaint was resolved when the customer
submitted it to the Department of Conduct of Entities and in another one because the entity accepted the
customer's claims. Another one has been rejected after the allegations of the entity.
ii. General criteria contained in the decisions
All the complaints were resolved by the Head of the Customer Service Department of Financiera El Corte
Inglés applying the criteria of the Bank of Spain with regard to good financial uses and practices, the
regulations in force, the regulations on transparency and customer information and the principles of
fairness.
The main principles governing the Customer Service Department are: to deal with the customer's
complaint, to analyze the causes that led to it and to take preventive and corrective measures to prevent
the situation from recurring.
The decision-making criteria used by the Service are based mainly on the knowledge of the Service's
experts, who have in-depth legal and regulatory knowledge of all aspects of the Company's activities and
proven experience in handling complaints.
iii. Complaints or suggestions derived from their experience, with a view to better achieving the
purposes that inform their actions.
The Customer Service Department, throughout the 2020 financial year, has continued with the actions
initiated in 2019 on measures and controls carried out in order to ensure compliance with current
regulations and good practice criteria with the aim of contributing to a better and more satisfactory
customer service.
In all replies, claimants are informed of their right to contact the Bank of Spain's Department of Conduct of
Entities, indicating its postal and e-mail address, in those cases in which the customer considers it
necessary to contact it due to disagreement with the resolution issued by the CCS or in which the
maximum term has elapsed without having received a response.
18
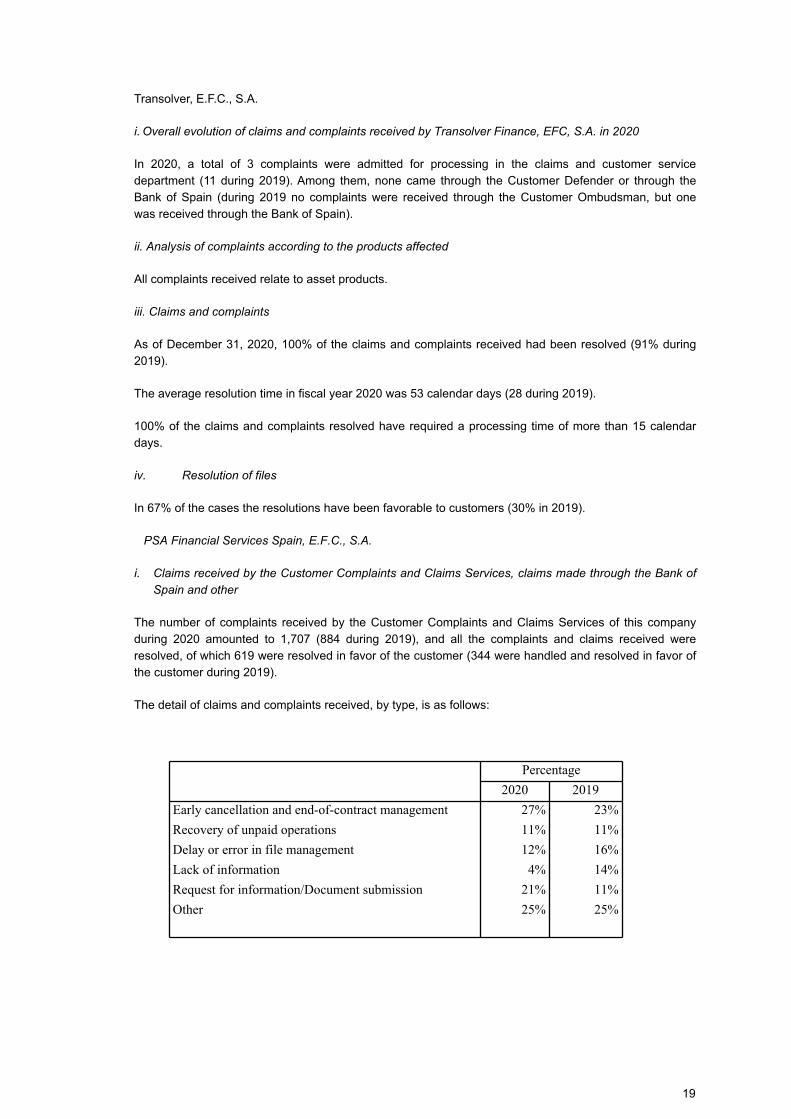
Transolver, E.F.C., S.A.
i. Overall evolution of claims and complaints received by Transolver Finance, EFC, S.A. in 2020
In 2020, a total of 3 complaints were admitted for processing in the claims and customer service
department (11 during 2019). Among them, none came through the Customer Defender or through the
Bank of Spain (during 2019 no complaints were received through the Customer Ombudsman, but one
was received through the Bank of Spain).
ii. Analysis of complaints according to the products affected
All complaints received relate to asset products.
iii. Claims and complaints
As of December 31, 2020, 100% of the claims and complaints received had been resolved (91% during
2019).
The average resolution time in fiscal year 2020 was 53 calendar days (28 during 2019).
100% of the claims and complaints resolved have required a processing time of more than 15 calendar
days.
iv. Resolution of files
In 67% of the cases the resolutions have been favorable to customers (30% in 2019).
PSA Financial Services Spain, E.F.C., S.A.
i. Claims received by the Customer Complaints and Claims Services, claims made through the Bank of
Spain and other
The number of complaints received by the Customer Complaints and Claims Services of this company
during 2020 amounted to 1,707 (884 during 2019), and all the complaints and claims received were
resolved, of which 619 were resolved in favor of the customer (344 were handled and resolved in favor of
the customer during 2019).
The detail of claims and complaints received, by type, is as follows:
Percentage
2020 2019
Early cancellation and end-of-contract management 27% 23%
Recovery of unpaid operations 11% 11%
Delay or error in file management 12% 16%
Lack of information 4% 14%
Request for information/Document submission 21% 11%
Other 25% 25%
19
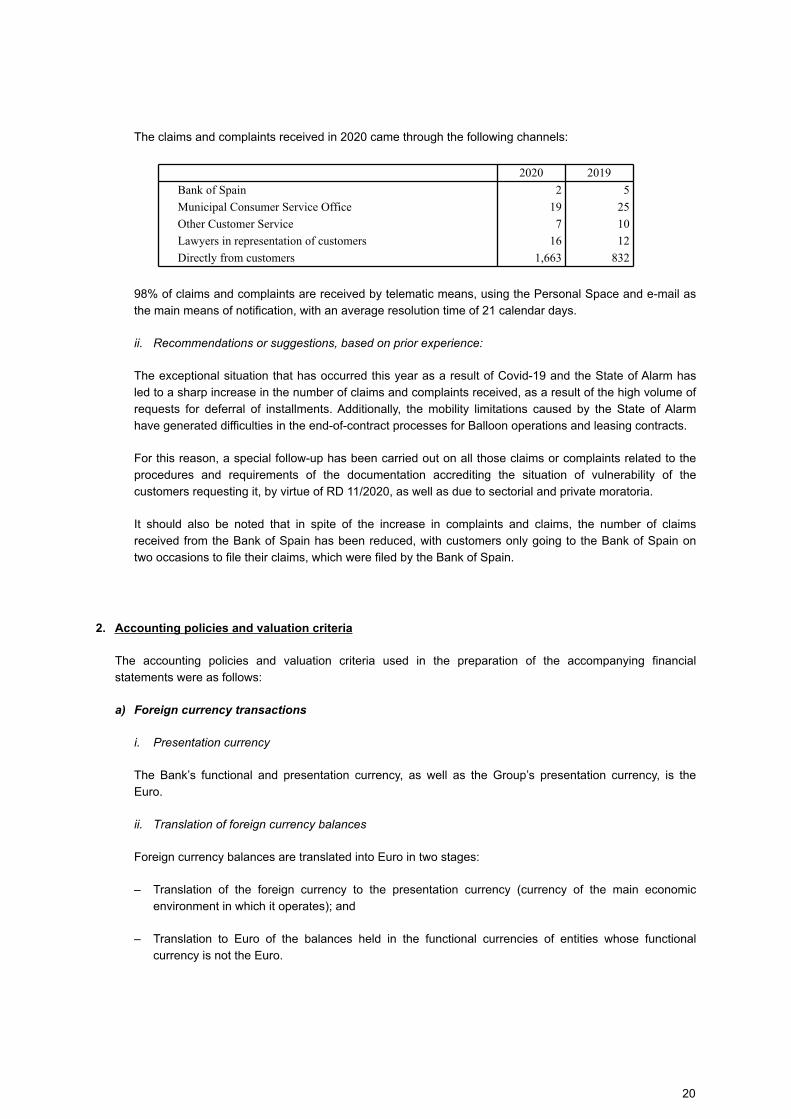
The claims and complaints received in 2020 came through the following channels:
2020 2019
Bank of Spain 2 5
Municipal Consumer Service Office 19 25
Other Customer Service 7 10
Lawyers in representation of customers 16 12
Directly from customers 1,663 832
98% of claims and complaints are received by telematic means, using the Personal Space and e-mail as
the main means of notification, with an average resolution time of 21 calendar days.
ii. Recommendations or suggestions, based on prior experience:
The exceptional situation that has occurred this year as a result of Covid-19 and the State of Alarm has
led to a sharp increase in the number of claims and complaints received, as a result of the high volume of
requests for deferral of installments. Additionally, the mobility limitations caused by the State of Alarm
have generated difficulties in the end-of-contract processes for Balloon operations and leasing contracts.
For this reason, a special follow-up has been carried out on all those claims or complaints related to the
procedures and requirements of the documentation accrediting the situation of vulnerability of the
customers requesting it, by virtue of RD 11/2020, as well as due to sectorial and private moratoria.
It should also be noted that in spite of the increase in complaints and claims, the number of claims
received from the Bank of Spain has been reduced, with customers only going to the Bank of Spain on
two occasions to file their claims, which were filed by the Bank of Spain.
2. Accounting policies and valuation criteria
The accounting policies and valuation criteria used in the preparation of the accompanying financial
statements were as follows:
a) Foreign currency transactions
i. Presentation currency
The Bank’s functional and presentation currency, as well as the Group’s presentation currency, is the
Euro.
ii. Translation of foreign currency balances
Foreign currency balances are translated into Euro in two stages:
– Translation of the foreign currency to the presentation currency (currency of the main economic
environment in which it operates); and
– Translation to Euro of the balances held in the functional currencies of entities whose functional
currency is not the Euro.
20
iii. Translation of foreign currency to the presentation currency
Foreign currency transactions performed by consolidated entities (or entities accounted for using the
equity method) not located in European Monetary Union countries are initially recognised in their
respective currencies. Monetary items in foreign currency are subsequently translated to their functional
currencies using the closing rate.
Furthermore:
– Non-monetary items measured at historical cost are translated to the presentation currency at the
exchange rate at the date of acquisition.
– Non-monetary items measured at fair value are translated at the exchange rate at the date when the
fair value was determined.
– Income and expenses are translated at the average exchange rates for the year for all the
transactions performed during the year. When applying this criterion, the Group considers whether
there have been significant changes in the exchange rates in the year which, in view of their
materiality with respect to the consolidated financial statements taken as a whole, would make it
necessary to use the exchange rates at the transaction date rather than the aforementioned average
exchange rates.
– The balances arising from non-hedging forward foreign currency/foreign currency and foreign
currency/euro purchase and sale transactions are translated at the closing rates prevailing in the
forward foreign currency market for the related maturity.
iv. Translation of functional currencies to Euro
The balances in the financial statements of consolidated entities (or entities accounted for using the equity
method) whose functional currency is not the euro are translated to euros as follows:
– Assets and liabilities, at the closing rates.
– Income and expenses, at the average exchange rates for the year.
– Equity items, at the historical exchange rates.
v. Recognition of exchange differences
The exchange differences arising from the translation of foreign currency balances to the presentation
currency are generally recognised at their net amount under Currency translation differences in the
consolidated income statement, except for exchange differences arising from financial instruments at fair
value through profit or loss, which are recognised in the consolidated income statement without
distinguishing them from other changes in fair value, and for exchange differences arising from non-
monetary items measured at fair value through equity, which are recognised under Other comprehensive
income – Items that may be reclassified to profit or loss – Currency translation differences, except for the
exchange differences of equity instruments, in which the option of irrevocably has been chosen, to be
valued at fair value with changes in other accumulated comprehensive income, which are recognized
under Other accumulated comprehensive income - Items that will not be reclassified into results -
Changes in the fair value of equity instruments measured at fair value with changes in other
comprehensive income (see Note 26)
The exchange differences arising from the translation to euros of the financial statements denominated in
functional currencies other than the euro are recognised in Other comprehensive income – Items that may
be reclassified to profit or loss- Currency translation differences in the consolidated balance sheet,
whereas those arising from the translation to euros of the financial statements of entities accounted for
21
using the equity method are recognised in equity under Other comprehensive income - Items that may be
reclassified to profit or loss and Items not reclassified to profit or loss - Other recognised income and
expense of investments in subsidiaries, joint ventures and associates, until the related item is
derecognised, at which time they are recognised in profit or loss, unless it is part of items not reclassified
to profit or loss.
Exchange differences arising from actuarial gains or losses when converting to euros the financial
statements denominated in the functional currencies of entities whose functional currency is different from
the euro are recognised under equity – Other comprehensive income – Items not reclassified to profit or
loss - Actuarial gains or (-) losses on defined benefit pension plans (see Note 21).
vi. Entities located in hyperinflationary economies
As at 31 December 2020 and 2019 none of the functional currencies of the consolidated entities and
associates located abroad related to hyperinflationary economies as defined by International Financial
Reporting Standards as adopted by the European Union. Accordingly, at the end of the last three reporting
periods it was not necessary to adjust the financial statements of any of the consolidated entities or
associates to correct for the effect of inflation.
vii. Exposure to foreign currency risk
The equivalent Euro value of the total assets and liabilities in foreign currency held by the Group as of 31
December 2020 amounted to EUR 16,093 million and EUR 12,018 million, respectively (EUR 15,667
million and EUR 11,468 million, respectively in 2019) –see Note 44.b.–. 98.93% (99.01% on 31 December
2019) of these assets and 100% of these liabilities (100% in 2019), approximately, correspond to,
Norwegian kroner, Swiss franc, Polish zloty and Swedish kronor. Virtually all the remainder relates to other
currencies traded in the Spanish market. The effect on the consolidated income statement and
consolidated equity of variations of 1% in the various foreign currencies in which the Group holds
significant balances, taking into account the exchange rate hedges arranged by the Group in this
connection, would not be significant.
b) Definitions and classification of financial instruments
i. Definitions
A “financial instrument” is any contract that gives rise to a financial asset of one entity and a financial
liability or equity instrument of another entity.
An “equity instrument” is a contract that evidences a residual interest in the assets of the issuing entity
after deducting all of its liabilities.
A “financial derivative” is a financial instrument whose value changes in response to the change in an
observable market variable (such as an interest rate, foreign exchange rate, financial instrument price,
market index or credit rating), whose initial investment is very small compared with the investment that
would have to be made in other financial instruments with a similar response to changes in market factors,
and which is generally settled at a future date.
“Hybrid financial instruments” are contracts that simultaneously include a non-derivative host contract
together with a derivative, known as an embedded derivative, that is not separately transferable and has
the effect that some of the cash flows of the hybrid contract vary in a way similar to a stand-alone
derivative.
Compound financial instruments are contracts that simultaneously create a financial liability and an equity
instrument for their issuer (such as convertible bonds that give the holder the right to convert them into
equity instruments of the issuing entity).
22
The preference shares contingently convertible into ordinary shares eligible as Additional Tier 1 capital
(“CCPSs”) -perpetual preference shares, which may be repurchased by the issuer in certain
circumstances, the interest on which is discretionary, and would convert into a variable number of newly
issued ordinary shares if the capital ratio of the Bank or its consolidated group falls below a given
percentage (trigger event), as those two terms are defined in the related issue prospectuses- are
recognised for accounting purposes by the Group as compound instruments. The liability component
reflects the issuer's obligation to deliver a variable number of shares and the equity component reflects
the issuer's discretion in relation to the payment of the related coupons. In order to effect the initial
allocation, the Group estimates the fair value of the liability as the amount that would have to be delivered
if the trigger event were to occur immediately and, accordingly, the equity component, calculated as the
residual amount, is zero. In view of the aforementioned discretionary nature of the payment of the
coupons, they are deducted directly from equity.
Also, the contingently redeemable perpetual debentures, which may be purchased by the issuer under
certain circumstances, whose remuneration is discretionary, and which will be redeemed, in whole or in
part, on a permanent basis if the Bank or its consolidable group has a capital ratio below a certain
percentage (trigger event), as defined in the related prospectuses, are accounted for by the Group as
equity instruments.
The following transactions are not treated for accounting purposes as financial instruments:
– Investments in joint ventures and associates (see Note 12).
– Rights and obligations under employee benefit plans (see Note 21).
ii. Classification of financial assets for measurement purposes
Financial assets are initially classified into the various categories used for management and measurement
purposes, unless they have to be presented as “Assets included in disposal groups classified as held for
sale” or they relate to “Cash and balances at central banks”, “Derivatives – hedge accounting” and
“Investments in joint ventures and associates”, which are reported separately.
The classification criteria for financial assets depends both on the business model underlying its
management and the characteristics of its cash flows.
The business models refer to the way the Group manages its financial assets to generate cash flows. To
define these models, the Group considers the following:
– How key management staff are assessed and reported on the performance of the business model and
the financial assets held in the business model.
– The risks that affect the performance of the business model (and the financial assets held in the
business model) and, specifically, the way in which these risks are managed.
– How business managers are remunerated.
– The frequency and volume of sales in previous years, as well as expectations of future sales.
23
The analysis of the characteristics of the contractual flows of financial assets requires the assessment of
the consistency of these flows with a basic loan agreement. The Group determines whether the
contractual cash flows of its financial assets are only payments of principal and interest on the amount of
principal outstanding at the beginning of the transaction. This analysis takes into consideration four factors
(performance, covenants, contractually linked products and currencies). In this regard, the most significant
judgements made by the Group in performing this analysis include the following:
• The return on the financial asset, specifically in cases of periodic interest rate adjustments where the
term of the reference interest rate does not coincide with the frequency of the adjustment. In these
cases, an assessment is made in order to determine whether the contractual cash flows differ
significantly from the flows without this change in the time value of money, establishing a tolerance
level of 2%.
• The contractual clauses that may modify the cash flows of the financial asset, for which purpose the
structure of the cash flows before and after the activation of such clauses is analysed.
• Financial assets whose cash flows have different priority for payment due to a contractual link to
underlying assets (e.g. securitisations) require a look-through analysis by the Group so as to review
that both the financial asset and the underlying assets are only principal and interest payments and
that the exposure to credit risk of the set of underlying assets belonging to the tranche analysed is less
than or equal to the exposure to credit risk of the set of underlying assets of the instrument.
On this basis, the asset can be measured at amortised cost, at fair value through other comprehensive
income or at fair value through profit or loss. IFRS 9 also provides the option to designate an
instrument as at fair value through profit or loss if doing so would eliminate or significantly reduce a
measurement or recognition inconsistency (sometimes referred to as 'accounting mismatch') that
would otherwise arise from measuring assets or liabilities or recognising gains and losses on them on
different bases. The Group uses the following criteria for the classification of debt instruments:
• Amortised cost: financial instruments under a business model whose objective is to collect
principal and interest flows, over which there is no significant unjustified sales and fair value is not
a key element in the management of these assets and contractual conditions they give rise to cash
flows on specific dates, which are only payments of principal and interest on the outstanding
principal amount. In this sense, unjustified sales are those other than those related to an increase
in the credit risk of the asset, unanticipated funding needs (stress case scenarios). Additionally, the
characteristics of its contractual flows represent substantially a "basic financing agreement".
• Fair value with changes in other comprehensive income: financial instruments held in a business
model whose objective is to collect principal and interest cash flows and the sale of these assets,
where fair value is a key factor in their management. Additionally, the contractual cash flow
characteristics substantially represent a “basic financing agreement”.
• Fair value with changes in profit or loss: financial instruments included in a business model whose
objective is not obtained through the models mentioned above, where fair value is a key factor in
managing of these assets, and financial instruments whose contractual cash flow characteristics
do not substantially represent a “basic financing agreement”. In this section it can be enclosed the
portfolios classified under “Financial assets held for trading”, “Non-trading financial assets
mandatorily at fair value through profit or loss” and “Financial assets at fair value through profit or
loss”.
Equity instruments will be classified at fair value under IFRS 9, with changes in profit or loss, unless the
Group decides, for non-trading assets, to classify them at fair value with changes in other comprehensive
income (irrevocably) in the initial moment.
24
iii. Classification of financial assets for presentation purposes
Financial assets are classified by nature into the following items in the consolidated balance sheet:
– Cash and balances at Central Banks: cash balances and balances receivable on demand relating to
deposits with central banks and credit institutions.
– Loans and advances: includes the debit balances of all credit and loans granted by the Group, other
than those represented by securities, as well as finance lease receivables and other debit balances of
a financial nature in favour of the Group, such as cheques drawn on credit institutions, balances
receivable from clearing houses and settlement agencies for transactions on the stock exchange and
organised markets, bonds given in cash, capital calls, fees and commissions receivable for financial
guarantees and debit balances arising from transactions not originating in banking transactions and
services, such as the collection of rentals and similar items. They are classified based on the
institutional sector to which the debtor belongs, into:
– Central banks: credit of any nature, including deposits and money market transactions received
from the Bank of Spain or other central banks.
– Credit institutions: credit of any nature, including deposits and money market transactions, in the
name of credit institutions.
– Customers: includes the remaining credit, including money market transactions through central
counterparties.
– Debt instruments: bonds and other securities that represent a debt for their issuer, that generate an
interest return, and that are in the form of certificates or book entries.
– Equity instruments: financial instruments issued by other entities, such as shares, which have the
nature of equity instruments for the issuer, other than investments in subsidiaries, joint ventures or
associates. Investment fund units are included in this item.
– Derivatives: includes the fair value in favour of the Group of derivatives which do not form part of
hedge accounting, including embedded derivatives separated from hybrid financial instruments.
– Changes in the fair value of hedged items in portfolio hedges of interest rate risk: this item is the
balancing entry for the amounts credited to the consolidated income statement in respect of the
measurement of the portfolios of financial instruments which are effectively hedged against interest
rate risk through fair value hedging derivatives.
– Derivatives – hedge accounting: Includes the fair value in favour of the Group of derivatives, including
embedded derivatives separated from hybrid financial instruments, designated as hedging instruments
in hedge accounting.
iv. Classification of financial liabilities for measurement purposes
Financial liabilities are initially classified into the various categories used for management and
measurement purposes, unless they must be presented as Liabilities associated with non-current assets
held for sale or they relate to hedging derivatives or Changes in the fair value of hedged items in portfolio
hedges of interest rate risk (liability side), which are reported separately.
25
Financial liabilities are included for measurement purposes in one of the following categories:
– Financial liabilities held for trading (at fair value through profit or loss): this category includes financial
liabilities incurred for the purpose of generating a profit in the near term from fluctuations in their
prices, financial derivatives not designated as hedging instruments, and financial liabilities arising from
the outright sale of financial assets acquired under reverse repurchase agreements ("reverse repos")
or borrowed (short positions).
– Financial liabilities at fair value through profit or loss: financial liabilities are included in this category
when they provide more relevant information, either because this eliminates or significantly reduces
recognition or measurement inconsistencies (accounting mismatches) that would otherwise arise from
measuring assets or liabilities or recognising the gains or losses on them on different bases, or
because a group of financial liabilities or financial assets and liabilities is managed and its
performance is evaluated on a fair value basis, in accordance with a documented risk management or
investment strategy, and information about the group is provided on that basis to the Group's key
management personnel. Liabilities may only be included in this category on the date when they are
incurred or originated.
– Financial liabilities at amortised cost: financial liabilities, irrespective of their instrumentation and
maturity, not included in any of the above-mentioned categories which arise from the ordinary
borrowing activities carried on by financial institutions.
v. Classification of financial liabilities for presentation purposes
Financial liabilities are classified by nature into the following items in the consolidated balance sheet:
– Deposits: includes all repayable balances received in cash by the Group –including subordinated
liabilities (amount of the loans received that rank below other loans or securities with regards to claims
on assets and earnings) - save for debt instruments in issue. This item also includes those cash bonds
and cash consignments received whose amount may be invested without restriction. Deposits are
classified based on the creditor's institutional sector into:
• Central banks: deposits of any nature, including credit received and money market transactions
received from the Bank of Spain or other central banks.
• Credit institutions: deposits of any nature, including credit received and money market transactions
in the name of credit institutions.
• Customer: includes the remaining deposits, including money market transactions through central
counterparties.
On June 6, 2019, the European Central Bank announced a new program of Targeted Longer-Term
Refinancing Operations (TLTRO III). Additionally, the conditions of the initial program were amended on
April 30, 2020, reducing by 25 b.p. the interest rate to -0.5% from June 2020 to June 2021 and, providing
that for banks meeting a certain volume of eligible loans, the interest rate may be -1% for the period from
June 2020 to June 2021, these conditions were extended on December 10, 2020 for operations
contracted between October 1, 2020 and December 31, 2021, including the option to cancel or reduce the
amount of financing before maturity in windows that coincide with the interest rate review and adjustment
periods.
The accounting standards indicate that for the recording of the amortized cost the entity "shall use a
shorter period when the fees, basis points paid or received, transaction costs, premiums or discounts refer
to it, this being the case when the variable to which the fees, basis points paid or received, transaction
costs, and discounts or premiums are related is adjusted to market rates before the expected maturity of
the financial instrument. In this case, the appropriate amortization period is the period to the next
adjustment date".
26
In this case, the applicable interest rate of 1% from June 2020 to June 2021 (derived from the amendment
of the March 2020 program) and from June 2021 to June 2022 (derived from the amendment of the
December 2020 program) corresponds to a specific period after which the financing is adjusted to market
rates (specifically, the average rate applied in the Eurosystem's main refinancing operations) and must
therefore be accrued until the next adjustment date. The early repayment windows of this funding program
are substantive terms, given that at that time of adjustment of the cost of funding to market, the entity may
opt for renewal or cancellation and obtain new funding at more favorable terms.
Santander Consumer Finance Group has opted to accrue interest according to the specific periods of
adjustment to market rates so that the interest corresponding to such period, 1%, will be recorded in the
income statement in the period from June 2020 to June 2022, assuming compliance with the threshold of
eligible loans that gives rise to the extra rate, which takes as a reference the budget for the year 2021 and
historical information of the entity.
– Debt securities in issue: includes the amount of bonds and other debt represented by marketable
securities, save for subordinated liabilities (amount of the loans received that rank below other loans or
securities with regard to claims on assets and earnings), and includes the amount of the financial
instruments issued by the Group which, having the legal nature of capital, do not meet the
requirements to qualify as equity, such as certain preferred shares issued. This item includes the
liability component of hybrid securities.
– Derivatives: includes the fair value, with a negative balance for the Group, of derivatives, including
embedded derivatives separated from the host contract, which do not form part of hedge accounting.
– Short positions: includes the amount of financial liabilities arising from the outright sale of financial
assets acquired under reverse repurchase agreements or borrowed.
– Other financial liabilities: includes the amount of payment obligations having the nature of financial
liabilities not included in other items, and liabilities under financial guarantee contracts, unless they
have been classified as non-performing.
– Changes in the fair value of hedged items in an interest rate risk hedging portfolio: this item is the
balancing entry for the amounts charged to the consolidated income statement in respect of the
measurement of the portfolios of financial instruments which are effectively hedged against interest
rate risk through fair value hedging derivatives.
– Derivatives – hedge accounting: includes the fair value of the Group’s liability in respect of derivatives,
including embedded derivatives separated from hybrid financial instruments, designated as hedging
instruments in hedge accounting.
c) Measurement of financial assets and liabilities and recognition of fair value changes
In general, financial assets and liabilities are initially recognised at fair value which, in the absence of
evidence to the contrary, is deemed to be the transaction price. Financial instruments not measured at fair
value through profit or loss are adjusted by the transaction costs. Financial assets and liabilities are
subsequently measured at each year-end as follows:
In this regard, IFRS 9 states that regular way purchases or sales of financial assets shall be recognised
and derecognised on the trade date or on the settlement date. The Group has opted to make such
recognition on the trading date or the settlement date, depending on the convention of each of the
markets in which the transactions take place. For example, in relation to the purchase or sale of debt
securities or equity instruments traded in the Spanish market, securities market regulations stipulate their
effective transfer at the time of settlement and, therefore, the same time has been established for the
accounting record to be made.
27
The fair value of instruments not measured at fair value with changes in profit or loss is adjusted for
transaction costs. Subsequently, at each accounting close, they are valued in accordance with the
following criteria:
i. Measurement of financial assets
Financial assets are measured at fair value are valued mainly at their fair value without deducting any
transaction cost for their sale.
The fair value of a financial instrument on a given date is taken to be the price that would be received to
sell an asset or paid to transfer a liability in an orderly transaction between market participants. The most
objective and common reference for the fair value of a financial instrument is the price that would be paid
for it on an active, transparent and deep market (quoted price or market price). At 31 December 2020
there were no significant investments in quoted financial instruments that had ceased to be recognised at
their quoted price because their market could not be deemed to be assets.
If there is no market price for a given financial instrument, its fair value is estimated on the basis of the
price established in recent transactions involving similar instruments and, in the absence thereof, of
valuation techniques commonly used by the international financial community, taking into account the
specific features of the instrument to be measured and, particularly, the various types of risk associated
with it.
All derivatives are recognised in the balance sheet at fair value from the trade date. If the fair value is
positive, they are recognised as an asset and if the fair value is negative, they are recognised as a liability.
The fair value on the trade date is deemed, in the absence of evidence to the contrary, to be the
transaction price. The changes in the fair value of derivatives designated as accounting hedges from the
trade date are recognised in Gains/losses on financial assets and liabilities held for trading (net) in the
consolidated income statement. Specifically, the fair value of financial derivatives traded in markets
included in the portfolios of financial assets or liabilities held for trading is deemed to be their daily quoted
price and if, for exceptional reasons, the quoted price cannot be determined on a given date, these
financial derivatives are measured using methods similar to those used to measure OTC derivatives.
The fair value of OTC derivatives is taken to be the sum of the future cash flows arising from the
instrument, discounted to present value at the date of measurement (present value or theoretical close)
using valuation techniques commonly used by the financial markets: net present value (NPV), option
pricing models and other methods.
The amount of debt securities and loans and advances under a business model whose objective is to
collect the principal and interest flows are valued at their amortised cost if they meet the SPPI test criteria,
using the effective interest rate method in their determination. Amortised cost refers to the acquisition cost
of a corrected financial asset or liability (more or less, as the case may be) for repayments of principal and
the part systematically charged to the consolidated income statement of the difference between the initial
cost and the corresponding reimbursement value at expiration. In the case of financial assets, the
amortised cost includes, in addition, the corrections to their value due to the impairment. In the loans and
advances covered in fair value hedging transactions, the changes that occur in their fair value related to
the risk or the risks covered in these hedging transactions are recorded.
The effective interest rate is the discount rate that exactly matches the carrying amount of a financial
instrument to all its estimated cash flows of all kinds over its remaining life. For fixed rate financial
instruments, the effective interest rate coincides with the contractual interest rate established on the
acquisition date plus, where applicable, the fees and transaction costs that, because of their nature, form
part of their financial return. In the case of floating rate financial instruments, the effective interest rate
coincides with the rate of return prevailing in all connections until the next benchmark interest reset date.
Equity instruments and contracts relating to those instruments should be measured at fair value. However,
in certain specific circumstances the Group considers that the cost is an adequate estimate of fair value.
28
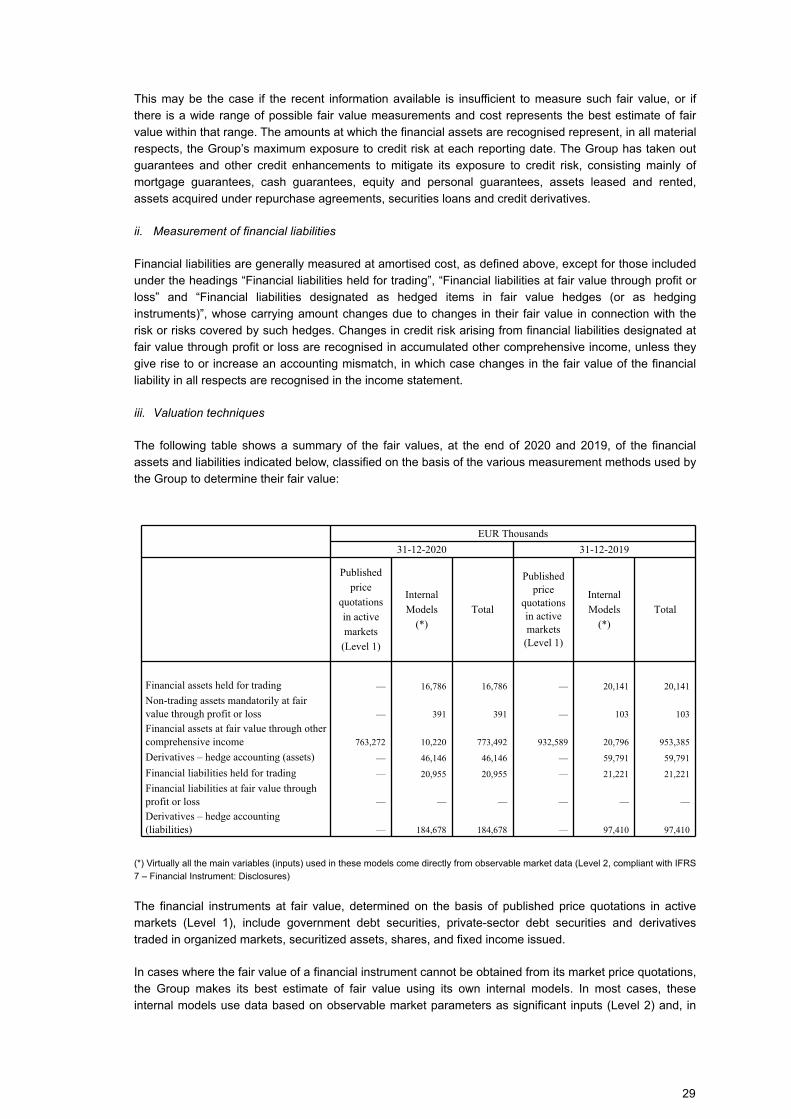
This may be the case if the recent information available is insufficient to measure such fair value, or if
there is a wide range of possible fair value measurements and cost represents the best estimate of fair
value within that range. The amounts at which the financial assets are recognised represent, in all material
respects, the Group’s maximum exposure to credit risk at each reporting date. The Group has taken out
guarantees and other credit enhancements to mitigate its exposure to credit risk, consisting mainly of
mortgage guarantees, cash guarantees, equity and personal guarantees, assets leased and rented,
assets acquired under repurchase agreements, securities loans and credit derivatives.
ii. Measurement of financial liabilities
Financial liabilities are generally measured at amortised cost, as defined above, except for those included
under the headings “Financial liabilities held for trading”, “Financial liabilities at fair value through profit or
loss” and “Financial liabilities designated as hedged items in fair value hedges (or as hedging
instruments)”, whose carrying amount changes due to changes in their fair value in connection with the
risk or risks covered by such hedges. Changes in credit risk arising from financial liabilities designated at
fair value through profit or loss are recognised in accumulated other comprehensive income, unless they
give rise to or increase an accounting mismatch, in which case changes in the fair value of the financial
liability in all respects are recognised in the income statement.
iii. Valuation techniques
The following table shows a summary of the fair values, at the end of 2020 and 2019, of the financial
assets and liabilities indicated below, classified on the basis of the various measurement methods used by
the Group to determine their fair value:
EUR Thousands
31-12-2020 31-12-2019
Published
price
quotations
in active
markets
(Level 1)
Internal
Models
(*)
Total
Published price
quotations in active markets
(Level 1)
Internal
Models
(*)
Total
Financial assets held for trading — 16,786 16,786 — 20,141 20,141
Non-trading assets mandatorily at fair value through profit or loss — 391 391 — 103 103
Financial assets at fair value through other comprehensive income 763,272 10,220 773,492 932,589 20,796 953,385
Derivatives – hedge accounting (assets) — 46,146 46,146 — 59,791 59,791
Financial liabilities held for trading — 20,955 20,955 — 21,221 21,221
Financial liabilities at fair value through profit or loss — — — — — —
Derivatives – hedge accounting (liabilities) — 184,678 184,678 — 97,410 97,410
(*) Virtually all the main variables (inputs) used in these models come directly from observable market data (Level 2, compliant with IFRS
7 – Financial Instrument: Disclosures)
The financial instruments at fair value, determined on the basis of published price quotations in active
markets (Level 1), include government debt securities, private-sector debt securities and derivatives
traded in organized markets, securitized assets, shares, and fixed income issued.
In cases where the fair value of a financial instrument cannot be obtained from its market price quotations,
the Group makes its best estimate of fair value using its own internal models. In most cases, these
internal models use data based on observable market parameters as significant inputs (Level 2) and, in
29
very specific cases, they use significant inputs not observable in market data (Level 3). In order to make
these estimates, various techniques are employed, including the extrapolation of observable market data.
The best evidence of the fair value of a financial instrument on initial recognition is the transaction price,
unless the fair value of the instrument can be obtained from other market transactions performed with the
same or similar instruments or can be measured by using a valuation technique in which the variables
used include only observable market data, mainly interest rates.
The Group did not make any material transfers of financial instruments between one measurement
method and another in 2020 or 2019. Also, there were no changes in the valuation techniques used to
measure financial instruments.
General measurement bases
The Santander Group, of which the Group is a part of, has developed a formal process for the systematic
valuation and management of financial instruments, which has been implemented worldwide across all
units, including the Santander Consumer Finance Group’s units. The governance scheme for this process
distributes responsibilities between two independent divisions: Treasury (development, marketing and
daily management of financial products and market data) and Risk (on a periodic basis, validation of
pricing models and market data, computation of risk metrics, new transaction approval policies,
management of market risk and implementation of fair value adjustment policies).
The approval of new products follows a sequence of steps (request, development, validation, integration
in corporate systems and quality assurance) before the product is brought into production. This process
ensures that pricing systems have been properly reviewed and are stable before they are used.
The following subsections set forth the most important products and families of derivatives, and the
related valuation techniques and inputs, by asset class:
Interest rate and fixed income
The interest rate asset class includes basic instruments such as interest rate forwards, interest rate swaps
and cross currency swaps, which are valued using the net present value of the estimated future cash
flows discounted taking into account basis swap and cross currency spreads determined on the basis of
the payment frequency and currency of each leg of the derivative. Vanilla options, including caps, floors
and swaptions, are priced using the Black-Scholes model, which is one of the benchmark industry
models. More exotic derivatives are priced using more complex models which are generally accepted as
standard across institutions.
These pricing models are fed with observable market data such as deposit interest rates, futures rates,
cross currency swap and constant maturity swap rates, and basis spreads, on the basis of which different
yield curves, depending on the payment frequency, and discounting curves are calculated for each
currency. In the case of options, implied volatilities are also used as model inputs. These volatilities are
observable in the market for cap and floor options and swaptions, and interpolation and extrapolation of
volatilities from the quoted ranges are carried out using generally accepted industry models. The pricing of
more exotic derivatives may require the use of non-observable data or parameters, such as correlation
(among interest rates and cross-asset), mean reversion rates and prepayment rates, which are usually
defined from historical data or through calibration.
Fixed-income instruments include products such as bonds, bills or notes whose valuation, as described
above, can be made through the observation of their price in quoted markets, models constructed from
observable data or other techniques in cases where neither of the above two alternatives is possible.
30
Equity and exchange rate
The most important products in these asset classes are forward and futures contracts, as well as single
derivatives (vanilla), listed and OTC (over-the-counter), on individual underlyings and asset baskets. Plain
vanilla options are valued using the standard Black-Scholes model, while more exotic derivatives,
involving forward yields, average yield or digital, barrier or callable features are valued using generally
accepted industry models or custom models, as appropriate. For illiquid equity derivatives, hedging is
performed considering liquidity constraints in the models.
The inputs to the equity models in general consider interest rate curves, spot prices, dividends, repo
margin spreads, implied volatilities, correlation between stocks and indices and cross-correlation between
assets. The implied volatilities are obtained from market prices of European and American call and put
options. Using various interpolation and extrapolation techniques, continuous areas of volatility are
obtained for illiquid stocks. Dividends are generally estimated in the medium and long term. Correlations
are obtained, where possible, implicitly from market quotations of correlation-dependent products; in other
cases, proxies are made to correlations between reference underlyings or are obtained from historical
data.
Inputs to exchange rate models include the interest rate curve of each currency, the spot rate and implied
volatilities and the correlation between assets of this type. The volatilities are obtained from European call
and put options that are quoted in the markets as at-the-money, risk reversal or butterfly options. Illiquid
currency pairs are generally treated using data from liquid pairs from which the illiquid currency can be
decomposed.
Credit
The most common instrument in this asset class is the credit default swap (CDS), which is used to hedge
credit exposure to third parties. In addition, models for first-to-default (FTD), N-to-default (NTD) and
single-tranche collateralized debt obligation (CDO) products are also available. These products are valued
with standard industry models, which estimate the probability of default of a single issuer (for CDS) or the
joint probability of default of more than one issuer for FTD, NTD and CDO.
Valuation inputs are the yield curve, the CDS spread curve and the recovery rate. For indices and
important individual issuers, the CDS spread curve is obtained in the market. For less liquid issuers, this
spread curve is estimated using proxies or other credit-dependent instruments. Recovery rates are usually
set to standard values. For listed single-tranche CDO, the correlation of joint default of several issuers is
implied from the market. For FTD, NTD and bespoke CDO, the correlation is estimated from proxies or
historical data when no other option is available.
Valuation adjustment for counterparty risk or default risk
The Credit valuation adjustment (CVA) is a valuation adjustment to OTC derivatives as a result of the risk
associated with the credit exposure assumed to each counterparty.
The CVA is calculated taking into account potential exposure to each counterparty in each future period.
The CVA for a specific counterparty is equal to the sum of the CVA for all the periods. The following inputs
are used to calculate the CVA:
– Expected exposure: including for each transaction the mark-to-market (MtM) value plus an add-on for
the potential future exposure for each period. Mitigating factors such as collateral and netting
agreements are taken into account, as well as a temporary impairment factor for derivatives with
interim payments.
31
– Loss Given Default: percentage of final loss assumed in a counterparty credit event/default.
– Probability of default: for cases where there is no market information (the CDS quoted spread curve,
etc.), proxies based on companies holding exchange-listed CDS, in the same industry and with the
same external rating as the counterparty, are used.
– Discount factor curve.
The debit valuation adjustment (DVA) is a valuation adjustment similar to the CVA but, in this case, it
arises as a result of the Group’s own risk assumed by its counterparties in OTC derivatives.
At the end of December 2020 and 2019, no CVA and DVA adjustments were recorded for significant
amounts.
In addition, the Group amounts the funding fair value adjustment (FFVA) is calculated by applying future
market funding spreads to the expected future funding exposure of any uncollateralized component of the
OTC derivative portfolio. This includes the uncollateralized component of uncollateralized derivatives in
addition to derivatives that are fully uncollateralized. The expected future funding exposure is calculated
by a simulation methodology, where available. The FFVA impact in the group is not material for the
consolidated financial statements as of 31 December 2020 and 2019.
Valuation adjustments for model risk
The fair value of financial instruments obtained from the aforementioned internal models takes into
account, inter alia, the contract terms and observable market data, which include interest rates, credit risk,
exchange rates and prepayments.
The valuation models described above do not entail a significant degree of subjectivity, given that the
methodologies may be adjusted and recalibrated, where needed, through the internal calculation of fair
value and the subsequent comparison with the corresponding actively-traded price. However, certain
valuation adjustments may be necessary when quoted market prices are not available for comparison
purposes.
Risk sources include uncertain model parameters, illiquid underlying issuers, poor quality market data or
missing risk factors (at times, the best option available is to use limited models with controllable risk). In
these situations, the Group calculates and applies valuation adjustments in accordance with common
industry practice. The main sources of model risk are as follows:
– In the fixed income markets, the sources of model risk include bond index correlations, basis spread
modelling, the risk of calibrating model parameters and the treatment of near-zero or negative interest
rates. Other sources of risk arise from the estimation of market data, such as volatilities or yield
curves, whether used for estimation or cash flow discounting purposes. The disparity of price
depending on the different market contributors, or the concentration of the asset, could also be
potential sources of risk to consider in the fixed income market.
– The currency markets are exposed to model risk resulting from forward skew modelling and the impact
of stochastic interest rate and correlation modelling for multi-asset instruments. Risk may also arise
from market data, due to the existence of specific illiquid foreign exchange pairs.
– The most important source of model risk for credit derivatives relates to the estimation of the
correlation between the probabilities of default of different underlying issuers. For illiquid underlying
issuers, the CDS spread may not be well defined.
32
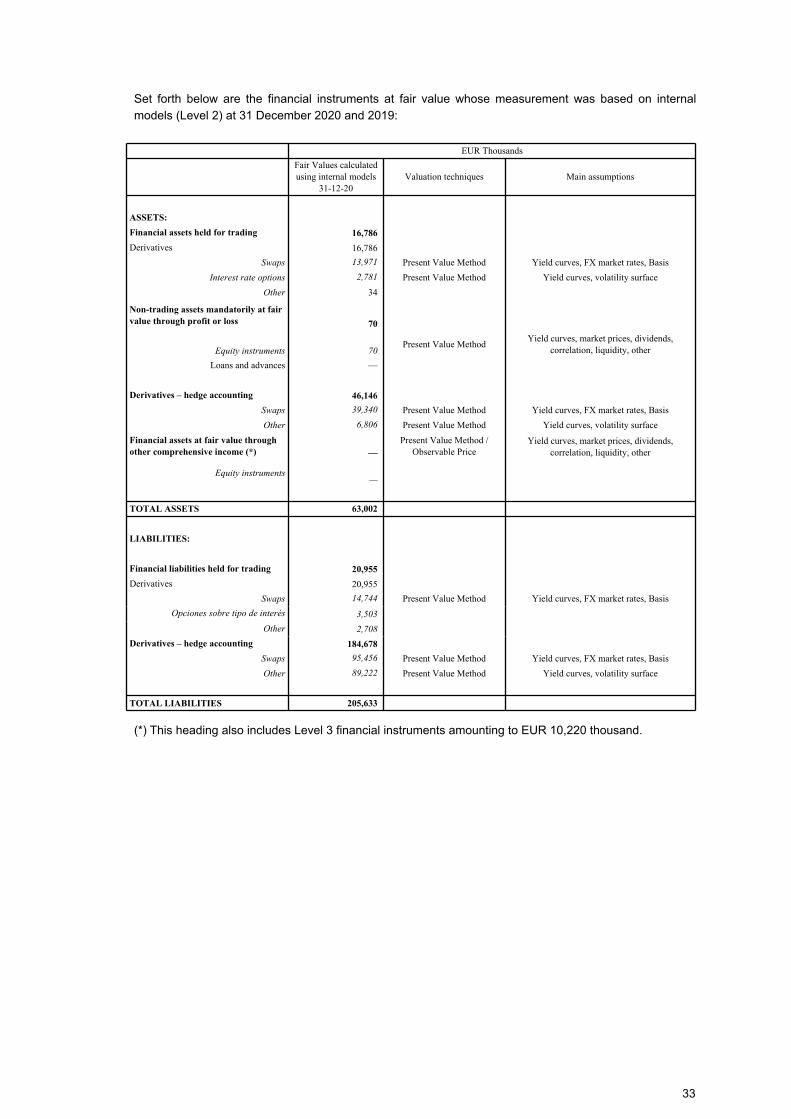
Set forth below are the financial instruments at fair value whose measurement was based on internal
models (Level 2) at 31 December 2020 and 2019:
EUR Thousands
Fair Values calculated using internal models
31-12-20Valuation techniques Main assumptions
ASSETS:
Financial assets held for trading 16,786
Derivatives 16,786
Swaps 13,971 Present Value Method Yield curves, FX market rates, Basis
Interest rate options 2,781 Present Value Method Yield curves, volatility surface
Other 34
Non-trading assets mandatorily at fair
value through profit or loss 70
Equity instruments 70 Present Value Method
Yield curves, market prices, dividends, correlation, liquidity, other
Loans and advances —
Derivatives – hedge accounting 46,146
Swaps 39,340 Present Value Method Yield curves, FX market rates, Basis
Other 6,806 Present Value Method Yield curves, volatility surface
Financial assets at fair value through
other comprehensive income (*) —
Present Value Method / Observable Price
Yield curves, market prices, dividends, correlation, liquidity, other
Equity instruments—
TOTAL ASSETS 63,002
LIABILITIES:
Financial liabilities held for trading 20,955
Derivatives 20,955
Swaps 14,744 Present Value Method Yield curves, FX market rates, Basis
Opciones sobre tipo de interés 3,503
Other 2,708
Derivatives – hedge accounting 184,678
Swaps 95,456 Present Value Method Yield curves, FX market rates, Basis
Other 89,222 Present Value Method Yield curves, volatility surface
TOTAL LIABILITIES 205,633
(*) This heading also includes Level 3 financial instruments amounting to EUR 10,220 thousand.
33
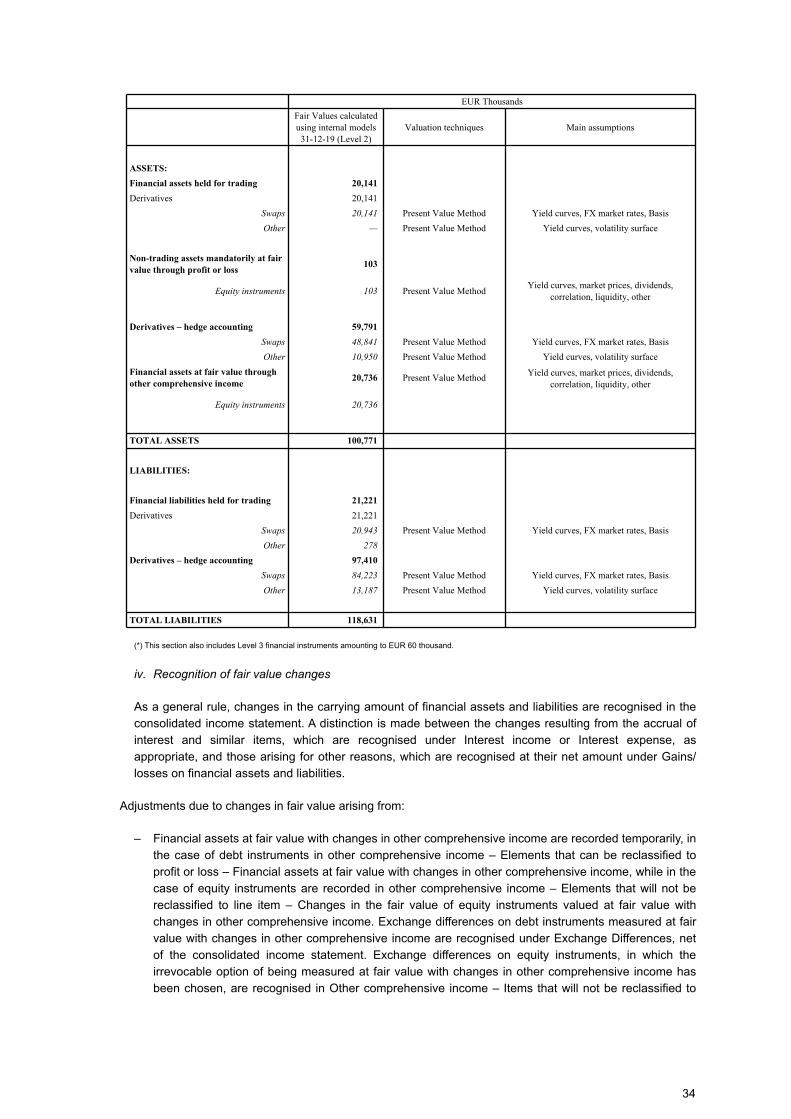
EUR Thousands
Fair Values calculated using internal models 31-12-19 (Level 2)
Valuation techniques Main assumptions
ASSETS:
Financial assets held for trading 20,141
Derivatives 20,141
Swaps 20,141 Present Value Method Yield curves, FX market rates, Basis
Other — Present Value Method Yield curves, volatility surface
Non-trading assets mandatorily at fair
value through profit or loss103
Equity instruments 103 Present Value MethodYield curves, market prices, dividends,
correlation, liquidity, other
Derivatives – hedge accounting 59,791
Swaps 48,841 Present Value Method Yield curves, FX market rates, Basis
Other 10,950 Present Value Method Yield curves, volatility surface
Financial assets at fair value through
other comprehensive income20,736 Present Value Method
Yield curves, market prices, dividends, correlation, liquidity, other
Equity instruments 20,736
TOTAL ASSETS 100,771
LIABILITIES:
Financial liabilities held for trading 21,221
Derivatives 21,221
Swaps 20,943 Present Value Method Yield curves, FX market rates, Basis
Other 278
Derivatives – hedge accounting 97,410
Swaps 84,223 Present Value Method Yield curves, FX market rates, Basis
Other 13,187 Present Value Method Yield curves, volatility surface
TOTAL LIABILITIES 118,631
(*) This section also includes Level 3 financial instruments amounting to EUR 60 thousand.
iv. Recognition of fair value changes
As a general rule, changes in the carrying amount of financial assets and liabilities are recognised in the
consolidated income statement. A distinction is made between the changes resulting from the accrual of
interest and similar items, which are recognised under Interest income or Interest expense, as
appropriate, and those arising for other reasons, which are recognised at their net amount under Gains/
losses on financial assets and liabilities.
Adjustments due to changes in fair value arising from:
– Financial assets at fair value with changes in other comprehensive income are recorded temporarily, in
the case of debt instruments in other comprehensive income – Elements that can be reclassified to
profit or loss – Financial assets at fair value with changes in other comprehensive income, while in the
case of equity instruments are recorded in other comprehensive income – Elements that will not be
reclassified to line item – Changes in the fair value of equity instruments valued at fair value with
changes in other comprehensive income. Exchange differences on debt instruments measured at fair
value with changes in other comprehensive income are recognised under Exchange Differences, net
of the consolidated income statement. Exchange differences on equity instruments, in which the
irrevocable option of being measured at fair value with changes in other comprehensive income has
been chosen, are recognised in Other comprehensive income – Items that will not be reclassified to
34
profit or loss – Changes in the fair value of equity instruments measured at fair value with changes in
other comprehensive income.
– Items charged or credited to Items that may be reclassified to profit or loss – Financial assets at fair
value through other comprehensive income and Other comprehensive income – Items that may be
reclassified to profit or loss – Exchange differences in equity remain in the Group’s consolidated equity
until the asset giving rise to them is impaired or derecognised, at which time they are recognised in the
consolidated income statement.
– Unrealised gains on Financial assets classified as Non-current assets held for sale because they form
part of a disposal group or a discontinued operation are recognised in Other comprehensive income
under Items that may be reclassified to profit or loss – Non-current assets held for sale.
v. Hedging transactions
The consolidated entities use financial derivatives to manage the risks of the Group entities’ own positions
and assets and liabilities (“hedging derivatives”) or for the purpose of obtaining gains from changes in the
prices of these derivatives.
Financial derivatives that do not qualify for hedge accounting are treated for accounting purposes as
trading derivatives.
A derivative qualifies for hedge accounting if all the following conditions are met:
1. The derivative hedges one of the following three types of exposure (and therefore can be classified in
one of the following categories):
– Changes in the fair value of assets and liabilities due to fluctuations, among others, in the interest
rate and/or exchange rate to which the position or balance to be hedged is subject (“fair value
hedge”);
– Changes in the estimated cash flows arising from the hedged financial assets and liabilities,
commitments and highly probable forecast transactions (“cash flow hedge”);
– The net investment in a foreign operation (“hedge of a net investment in a foreign operation”).
2. It is effective in offsetting exposure inherent in the hedged item or position throughout the expected
term of the hedge, which means that:
– At the date of arrangement, the hedge is expected under normal conditions, to be highly effective
(“prospective effectiveness”).
– There is sufficient evidence that the hedge was actually effective during the whole life of the
hedged item or position (“retrospective effectiveness”). To this end, the Group checks that the
results of the hedge were within a range of 80% to 125% of the results of the hedged item.
3. There must be adequate documentation of the hedging transaction that evidences the specific
designation of the financial derivative to hedge certain balances or transactions and how this hedge
was expected to be achieved and measured, provided that this is consistent with the Group’s
management of risks.
The changes in value of financial instruments qualifying for hedge accounting are recognised as follows:
– In fair value hedges, the gains or losses arising from both the hedging instruments and the hedged
items attributable to the type of risk being hedged are recognised directly in the consolidated
income statement.
35
– In fair value hedges of interest rate risk on a portfolio of financial instruments, the gains or losses
that arise on measuring the hedging instruments are recognised directly in the consolidated
income statement, whereas the gains or losses due to changes in the fair value of the hedged
amount (attributable to the hedged risk) are recognised in the consolidated income statement with
a balancing entry under “Changes in the Fair Value of Hedged Items in Portfolio Hedges of Interest
Rate Risk” on the asset or liability side of the consolidated balance sheet, as appropriate.
– In cash flow hedges, the effective portion of the change in fair value of the hedging instrument is
recognised temporarily under “Other comprehensive income – Items that may be reclassified to
profit or loss - Cash Flow Hedges” in the consolidated balance sheet until the forecast transactions
occur, when it is recognised in the consolidated income statement, unless, if the forecast
transactions result in the recognition of non-financial assets or liabilities, it is included in the cost of
the non-financial asset or liability. The ineffective portion, if any, of the change in value of hedging
derivatives is recognised under “Gains/Losses on Financial Assets and Liabilities (Net)” in the
consolidated income statement.
– In hedges of a net investment in a foreign operation, the gains or losses attributable to the portion
of the hedging instruments qualifying as an effective hedge are recognised temporarily in Other
comprehensive income under “Items that may be reclassified to profit or loss - Hedges of net
investments in foreign operations” until the gains or losses on the hedged item are recognised in
profit or loss.
– The ineffective portion of the gains or losses on the hedging instruments of cash flow hedges and
hedges of a net investment in a foreign operation is recognised directly under Gains/losses on
financial assets and liabilities (net) in the consolidated income statement, in “Gains or losses from
hedge accounting, net”.
If a derivative designated as a hedge no longer meets the requirements described above due to
expiration, ineffectiveness or for any other reason, the derivative is classified for accounting purposes as a
trading derivative.
When fair value hedge accounting is discontinued, the adjustments previously recognised as an
adjustment to the carrying amount of the hedged asset or liability are amortised to profit or loss at the
effective interest rate recalculated at the date of hedge discontinuation. The adjustments must be fully
amortised at maturity.
When cash flow hedge accounting is discontinued, any cumulative gain or loss on the hedging instrument
recognised in equity under “Other comprehensive income - Items that may be reclassified to profit or
loss” (from the period when the hedge was effective) remains in this equity item until the forecast
transaction occurs, at which time it is recognised in profit or loss, unless the transaction is no longer
expected to occur, in which case the cumulative gain or loss is recognised immediately in profit or loss.
vi. Derivatives embedded in hybrid financial instruments
Derivatives embedded in financial liabilities or in other host contracts are accounted for separately as
derivatives if their risks and characteristics are not closely related to those of the host contracts, provided
that the host contracts are not classified as financial liabilities designated at fair value through profit or
loss or as Financial assets/liabilities held for trading.
d) Derecognition of financial assets and liabilities
The accounting treatment of transfers of financial assets depends on the extent to which the risks and
rewards associated with the transferred assets are transferred to third parties:
– If the Group transfers substantially all the risks and rewards to third parties -unconditional sale of
financial assets, sale of financial assets under an agreement to repurchase them at their fair value at
36
the date of repurchase, sale of financial assets with a purchased call option or written put option that is
deeply out of the money, securitisation of assets in which the transferor does not retain a subordinated
debt or grant any credit enhancement to the new holders, and other similar cases-, the transferred
financial asset is derecognised and any rights and obligations created or retained in the transfer are
recognised simultaneously.
– If the Group retains substantially all the risks and rewards associated with the transferred financial
asset -sale of financial assets under an agreement to repurchase them at a fixed price or at the sale
price plus interest, a securities lending agreement in which the borrower undertakes to return the
same or similar assets, securitisation of assets in which the transferor retains a subordinated debt or
grants a credit enhancement to the new holders that entails assuming substantially all the credit risk of
the transferred assets, and other similar cases-, the transferred financial asset is not derecognised
and continues to be measured by the same criteria as those used before the transfer. However, the
following items are recognised:
– An associated financial liability, for an amount equal to the consideration received; this liability is, in
general, subsequently measured at amortised cost unless it meets the requirements for
classification under Financial liabilities designated at fair value through profit or loss.
– The income from the transferred financial asset not derecognised and any expense incurred on the
new financial liability.
– If the Group neither transfers nor retains substantially all the risks and rewards associated with the
transferred financial asset -sale of financial assets with a purchased call option or written put option
that is not deeply in or out of the money, securitisation of assets in which the transferor retains a
subordinated debt or other type of credit enhancement for a portion of the transferred asset, and other
similar cases- the following distinction is made:
– If the transferor does not retain control of the transferred financial asset, the asset is derecognised
and any rights and obligations created or retained in the transfer are recognised.
– If the transferor retains control of the transferred financial asset, it continues to recognise it for an
amount equal to its exposure to changes in value of the asset and recognises a financial liability
associated with the transferred financial asset. The net carrying amount of the transferred asset
and the associated liability is the amortised cost of the rights and obligations retained, if the
transferred asset is measured at amortised cost, or the fair value of the rights and obligations
retained, if the transferred asset is measured at fair value.
Accordingly, financial assets are only derecognised when the rights to the cash flows they generate have
expired or when substantially all the inherent risks and rewards have been transferred to third parties.
Similarly, financial liabilities are only derecognised when the obligations they generate have been
extinguished or when they are acquired with the intention either to cancel them or to resell them.
Regarding contractual modifications of financial assets, the Group has differentiated them into two main
categories in relation to the conditions under which a modification leads to a de-recognition or cancellation
of the financial asset (and the recognition of a new financial asset) and those under which the accounting
of the original financial instrument with the modified terms is maintained:
• Contractual modifications for commercial or market reasons, which are generally carried out at
the request of the debtor to apply current market conditions to the debt. The new contract is
considered a new transaction and, consequently, it is necessary to derecognize the original financial
asset and recognize a new financial asset subject to the classification and measurement
requirements established by IFRS 9. Also, the new financial asset will be recorded at fair value and,
if applicable, the difference between the carrying amount of the asset derecognized and the fair
value of the new asset will be recognized in profit or loss.
37
• Modifications due to refinancing or restructuring, in which the payment conditions are modified
to allow a customer that is experiencing financial difficulties (current or foreseeable) to meet its
payment obligations and that, if such modification had not been made, it would be reasonably
assured that it would not be able to meet such payment obligations. In this case, the modification
does not result in the derecognition of the financial asset, but rather the original financial asset is
maintained and does not require a new assessment of its classification and measurement. When
assessing credit impairment, the current credit risk (considering the modified cash flows) should be
compared with the credit risk at initial recognition. Finally, the gross carrying amount of the financial
asset (the present value of the renegotiated or modified contractual cash flows discounted at the
original effective interest rate of the financial asset) should be recalculated, with the difference
recognized as a gain or loss in profit or loss.
The Group habitually performs financial asset securitisation transactions in which it retains substantially all
the risks and rewards of ownership of the assets. The detail, by consolidated entity, of the securitised
assets retained on the consolidated balance sheets as at 31 December 2020 and 2019 is included in Note
10 to the accompanying consolidated financial statements.
e) Offsetting of financial instruments
Financial asset and liability balances are offset, i.e. reported in the consolidated balance sheet at their net
amount, only if the entities of the Group currently have a legally enforceable right to set off the recognised
amounts and intend either to settle on a net basis, or to realise the asset and settle the liability
simultaneously.
No material financial assets and liabilities were offset in the consolidated balance sheets as at 31
December 2020 and 2019.
f) Impairment of financial assets
i. Definition
The Group associates an impairment in the value to financial assets measured at amortised cost, debt
instruments measured at fair value with changes in other comprehensive income, lease receivables and
commitments and guarantees granted that are not measured at fair value.
The impairment for expected credit losses is recorded with a charge to the consolidated income statement
for the period in which the impairment arises. In the event of occurrence, the recoveries of previously
recognised impairment losses are recorded in the consolidated income statement for the period in which
the impairment no longer exists or is reduced.
In the case of purchased or originated credit-impaired assets, the Group only recognizes at the reporting
date the changes in the expected credit losses during the life of the asset since the initial recognition as a
credit loss. In the case of assets measured at fair value with changes in other comprehensive income, the
changes in the fair value due to expected credit losses are charged in the consolidated income statement
of the year where the change happened, reflecting the rest of the valuation in other comprehensive
income.
As a rule, the expected credit loss is estimated as the difference between the contractual cash flows to be
recovered and the expected cash flows discounted using the original effective interest rate. In the case of
purchased or originated credit-impaired assets, this difference is discounted using the effective interest
rate adjusted by credit rating.
38
Depending on the classification of financial instruments, which is mentioned in the following sections, the
expected credit losses may be along 12 months or during the life of the financial instrument:
– 12-month expected credit losses: arising from the potential default events, as defined in the following
sections that are estimated to be likely to occur within the 12 months following the reporting date.
These losses will be associated with financial assets classified as "normal risk" as defined in the
following sections.
– Expected credit losses over the life of the financial instrument: arising from the potential default events
that are estimated to be likely to occur throughout the life of the financial instruments. These losses
are associated with financial assets classified as "normal risk under watchlist" or "doubtful risk".
With the purpose of estimating the expected life of the financial instrument all the contractual terms have
been taken into account (e.g. prepayments, duration, purchase options, etc.), being the contractual period
(including extension options) the maximum period considered to measure the expected credit losses. In
the case of financial instruments with an uncertain maturity period and a component of undrawn
commitment (e.g.: credit cards), the expected life is estimated through quantitative analyses to determine
the period during which the entity is exposed to credit risk, also considering the effectiveness of
management procedures that mitigate such exposure (e.g. the ability to unilaterally cancel such financial
instruments, etc.).
The following constitute effective guarantees:
a) Mortgage guarantees on housing as long as they are first duly constituted and registered in favour of
the entity. The properties include:
i. Buildings and building elements, distinguishing among:
– Houses;
– Offices, stores and multi-purpose premises;
– Rest of buildings such as non-multi-purpose premises and hotels.
ii. Urban and developable ordered land.
iii. Rest of properties that classify as: buildings and building elements under construction, such as
property development in progress and halted development, and the rest of land types, such as
rustic lands.
b) Collateral guarantees on financial instruments in the form of cash deposits and debt securities issued
by creditworthy issuers.
c) Other types of real guarantees, including properties received in guarantee and second and
subsequent mortgages on properties, as long as the entity demonstrates its effectiveness. When
assessing the effectiveness of the second and subsequent mortgages on properties the entity will
implement particularly restrictive criteria. It will take into account, among others, whether the previous
charges are in favour of the entity itself or not and the relationship between the risk guaranteed by
them and the property value.
d) Personal guarantees, as well as the incorporation of new owners, covering the entire amount of the
financial instruments and implying direct and joint liability to the entity of persons or other entities
whose solvency is sufficiently proven to ensure the repayment of the loan on the agreed terms.
39
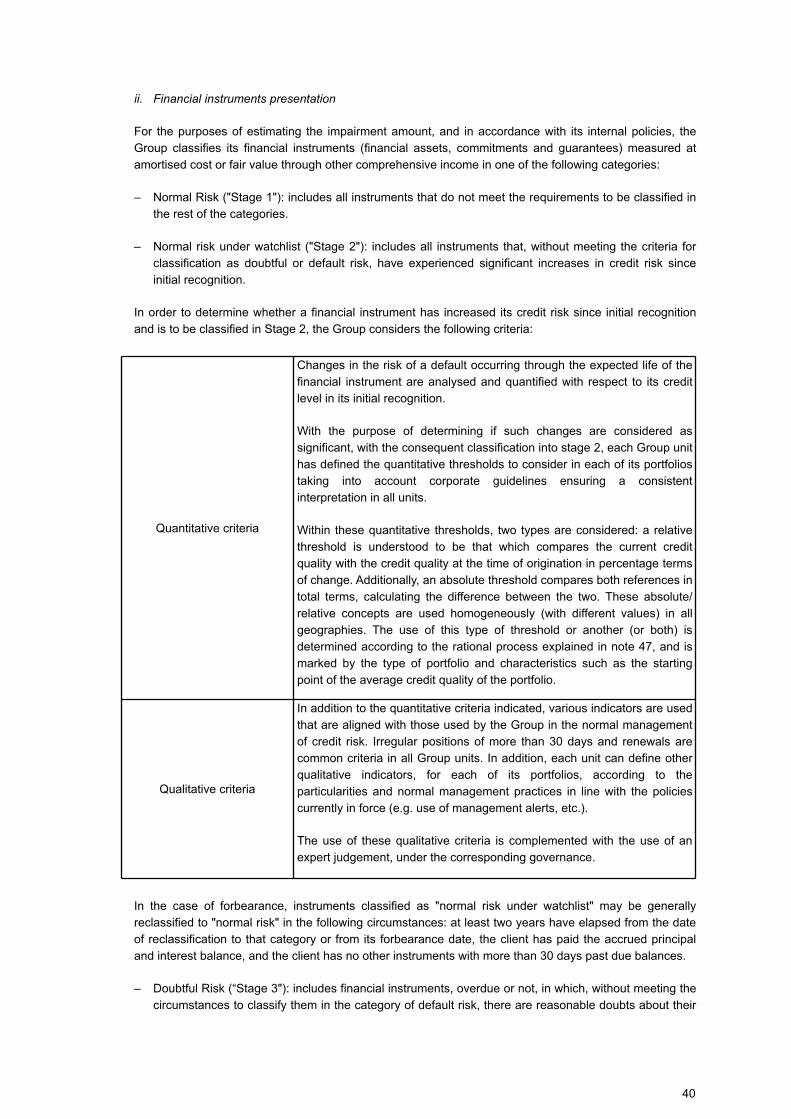
ii. Financial instruments presentation
For the purposes of estimating the impairment amount, and in accordance with its internal policies, the
Group classifies its financial instruments (financial assets, commitments and guarantees) measured at
amortised cost or fair value through other comprehensive income in one of the following categories:
– Normal Risk ("Stage 1"): includes all instruments that do not meet the requirements to be classified in
the rest of the categories.
– Normal risk under watchlist ("Stage 2"): includes all instruments that, without meeting the criteria for
classification as doubtful or default risk, have experienced significant increases in credit risk since
initial recognition.
In order to determine whether a financial instrument has increased its credit risk since initial recognition
and is to be classified in Stage 2, the Group considers the following criteria:
Quantitative criteria
Changes in the risk of a default occurring through the expected life of the
financial instrument are analysed and quantified with respect to its credit
level in its initial recognition.
With the purpose of determining if such changes are considered as
significant, with the consequent classification into stage 2, each Group unit
has defined the quantitative thresholds to consider in each of its portfolios
taking into account corporate guidelines ensuring a consistent
interpretation in all units.
Within these quantitative thresholds, two types are considered: a relative
threshold is understood to be that which compares the current credit
quality with the credit quality at the time of origination in percentage terms
of change. Additionally, an absolute threshold compares both references in
total terms, calculating the difference between the two. These absolute/
relative concepts are used homogeneously (with different values) in all
geographies. The use of this type of threshold or another (or both) is
determined according to the rational process explained in note 47, and is
marked by the type of portfolio and characteristics such as the starting
point of the average credit quality of the portfolio.
Qualitative criteria
In addition to the quantitative criteria indicated, various indicators are used
that are aligned with those used by the Group in the normal management
of credit risk. Irregular positions of more than 30 days and renewals are
common criteria in all Group units. In addition, each unit can define other
qualitative indicators, for each of its portfolios, according to the
particularities and normal management practices in line with the policies
currently in force (e.g. use of management alerts, etc.).
The use of these qualitative criteria is complemented with the use of an
expert judgement, under the corresponding governance.
In the case of forbearance, instruments classified as "normal risk under watchlist" may be generally
reclassified to "normal risk" in the following circumstances: at least two years have elapsed from the date
of reclassification to that category or from its forbearance date, the client has paid the accrued principal
and interest balance, and the client has no other instruments with more than 30 days past due balances.
– Doubtful Risk (“Stage 3"): includes financial instruments, overdue or not, in which, without meeting the
circumstances to classify them in the category of default risk, there are reasonable doubts about their
40
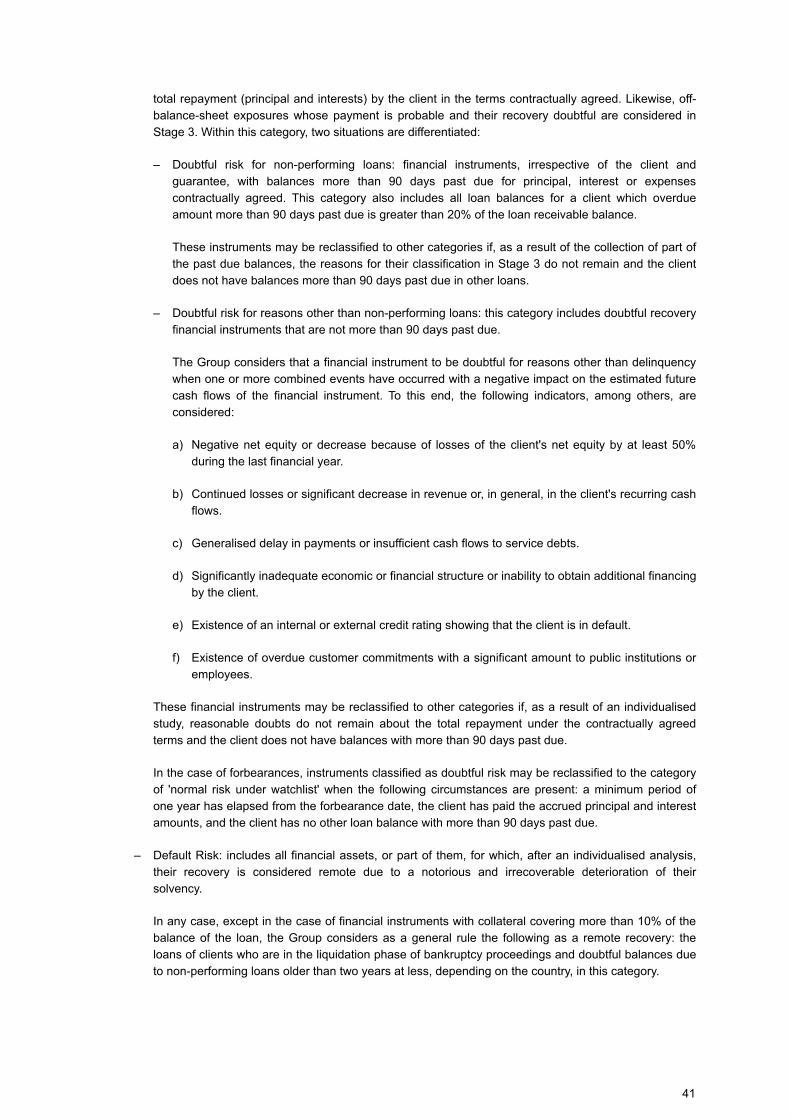
total repayment (principal and interests) by the client in the terms contractually agreed. Likewise, off-
balance-sheet exposures whose payment is probable and their recovery doubtful are considered in
Stage 3. Within this category, two situations are differentiated:
– Doubtful risk for non-performing loans: financial instruments, irrespective of the client and
guarantee, with balances more than 90 days past due for principal, interest or expenses
contractually agreed. This category also includes all loan balances for a client which overdue
amount more than 90 days past due is greater than 20% of the loan receivable balance.
These instruments may be reclassified to other categories if, as a result of the collection of part of
the past due balances, the reasons for their classification in Stage 3 do not remain and the client
does not have balances more than 90 days past due in other loans.
– Doubtful risk for reasons other than non-performing loans: this category includes doubtful recovery
financial instruments that are not more than 90 days past due.
The Group considers that a financial instrument to be doubtful for reasons other than delinquency
when one or more combined events have occurred with a negative impact on the estimated future
cash flows of the financial instrument. To this end, the following indicators, among others, are
considered:
a) Negative net equity or decrease because of losses of the client's net equity by at least 50%
during the last financial year.
b) Continued losses or significant decrease in revenue or, in general, in the client's recurring cash
flows.
c) Generalised delay in payments or insufficient cash flows to service debts.
d) Significantly inadequate economic or financial structure or inability to obtain additional financing
by the client.
e) Existence of an internal or external credit rating showing that the client is in default.
f) Existence of overdue customer commitments with a significant amount to public institutions or
employees.
These financial instruments may be reclassified to other categories if, as a result of an individualised
study, reasonable doubts do not remain about the total repayment under the contractually agreed
terms and the client does not have balances with more than 90 days past due.
In the case of forbearances, instruments classified as doubtful risk may be reclassified to the category
of 'normal risk under watchlist' when the following circumstances are present: a minimum period of
one year has elapsed from the forbearance date, the client has paid the accrued principal and interest
amounts, and the client has no other loan balance with more than 90 days past due.
– Default Risk: includes all financial assets, or part of them, for which, after an individualised analysis,
their recovery is considered remote due to a notorious and irrecoverable deterioration of their
solvency.
In any case, except in the case of financial instruments with collateral covering more than 10% of the
balance of the loan, the Group considers as a general rule the following as a remote recovery: the
loans of clients who are in the liquidation phase of bankruptcy proceedings and doubtful balances due
to non-performing loans older than two years at less, depending on the country, in this category.
41
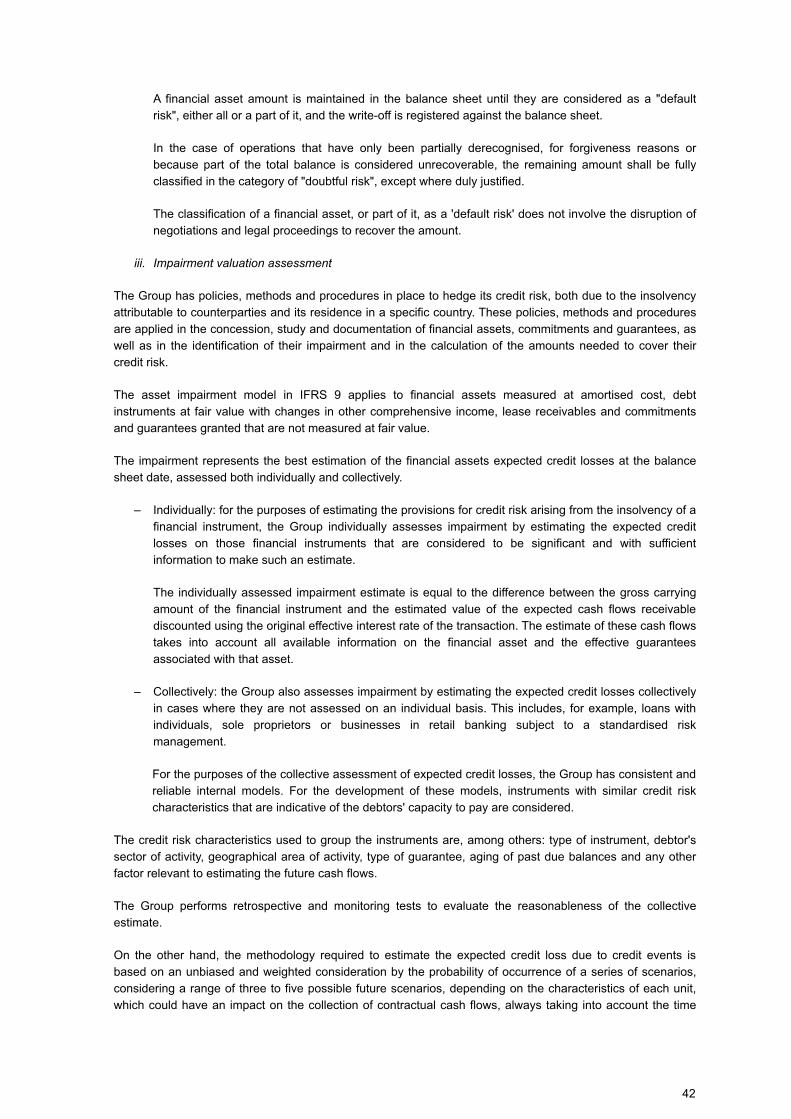
A financial asset amount is maintained in the balance sheet until they are considered as a "default
risk", either all or a part of it, and the write-off is registered against the balance sheet.
In the case of operations that have only been partially derecognised, for forgiveness reasons or
because part of the total balance is considered unrecoverable, the remaining amount shall be fully
classified in the category of "doubtful risk", except where duly justified.
The classification of a financial asset, or part of it, as a 'default risk' does not involve the disruption of
negotiations and legal proceedings to recover the amount.
iii. Impairment valuation assessment
The Group has policies, methods and procedures in place to hedge its credit risk, both due to the insolvency
attributable to counterparties and its residence in a specific country. These policies, methods and procedures
are applied in the concession, study and documentation of financial assets, commitments and guarantees, as
well as in the identification of their impairment and in the calculation of the amounts needed to cover their
credit risk.
The asset impairment model in IFRS 9 applies to financial assets measured at amortised cost, debt
instruments at fair value with changes in other comprehensive income, lease receivables and commitments
and guarantees granted that are not measured at fair value.
The impairment represents the best estimation of the financial assets expected credit losses at the balance
sheet date, assessed both individually and collectively.
– Individually: for the purposes of estimating the provisions for credit risk arising from the insolvency of a
financial instrument, the Group individually assesses impairment by estimating the expected credit
losses on those financial instruments that are considered to be significant and with sufficient
information to make such an estimate.
The individually assessed impairment estimate is equal to the difference between the gross carrying
amount of the financial instrument and the estimated value of the expected cash flows receivable
discounted using the original effective interest rate of the transaction. The estimate of these cash flows
takes into account all available information on the financial asset and the effective guarantees
associated with that asset.
– Collectively: the Group also assesses impairment by estimating the expected credit losses collectively
in cases where they are not assessed on an individual basis. This includes, for example, loans with
individuals, sole proprietors or businesses in retail banking subject to a standardised risk
management.
For the purposes of the collective assessment of expected credit losses, the Group has consistent and
reliable internal models. For the development of these models, instruments with similar credit risk
characteristics that are indicative of the debtors' capacity to pay are considered.
The credit risk characteristics used to group the instruments are, among others: type of instrument, debtor's
sector of activity, geographical area of activity, type of guarantee, aging of past due balances and any other
factor relevant to estimating the future cash flows.
The Group performs retrospective and monitoring tests to evaluate the reasonableness of the collective
estimate.
On the other hand, the methodology required to estimate the expected credit loss due to credit events is
based on an unbiased and weighted consideration by the probability of occurrence of a series of scenarios,
considering a range of three to five possible future scenarios, depending on the characteristics of each unit,
which could have an impact on the collection of contractual cash flows, always taking into account the time
42
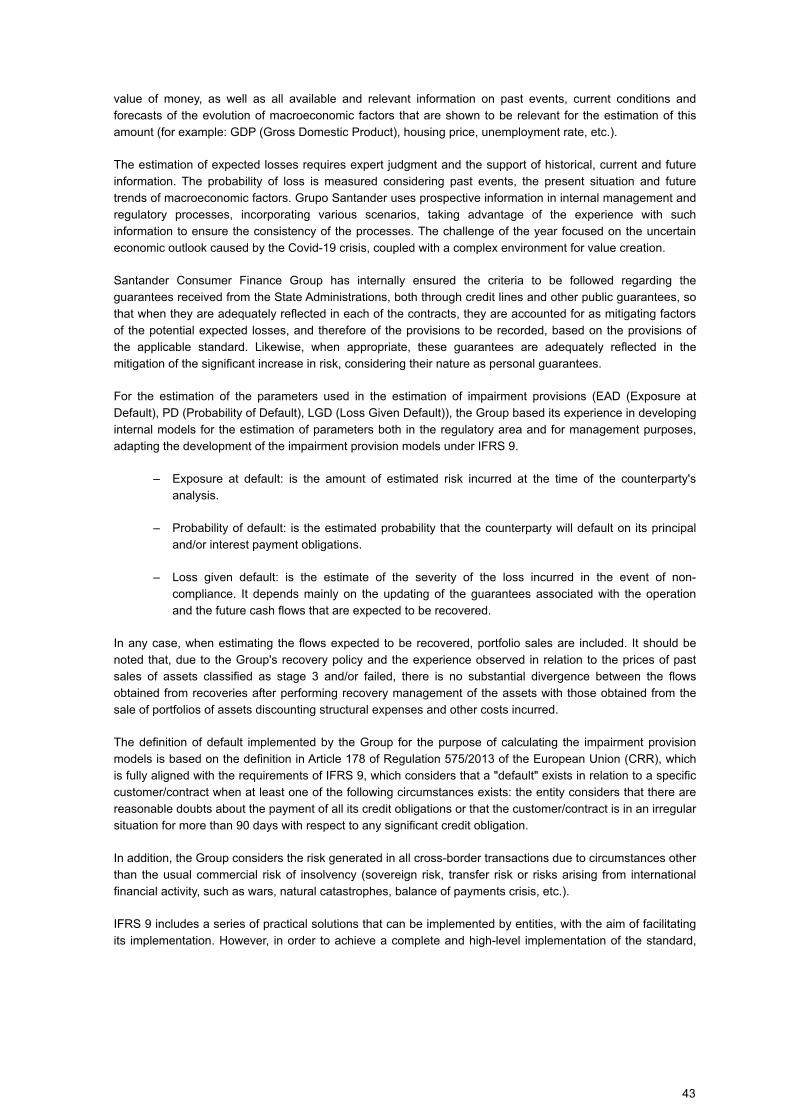
value of money, as well as all available and relevant information on past events, current conditions and
forecasts of the evolution of macroeconomic factors that are shown to be relevant for the estimation of this
amount (for example: GDP (Gross Domestic Product), housing price, unemployment rate, etc.).
The estimation of expected losses requires expert judgment and the support of historical, current and future
information. The probability of loss is measured considering past events, the present situation and future
trends of macroeconomic factors. Grupo Santander uses prospective information in internal management and
regulatory processes, incorporating various scenarios, taking advantage of the experience with such
information to ensure the consistency of the processes. The challenge of the year focused on the uncertain
economic outlook caused by the Covid-19 crisis, coupled with a complex environment for value creation.
Santander Consumer Finance Group has internally ensured the criteria to be followed regarding the
guarantees received from the State Administrations, both through credit lines and other public guarantees, so
that when they are adequately reflected in each of the contracts, they are accounted for as mitigating factors
of the potential expected losses, and therefore of the provisions to be recorded, based on the provisions of
the applicable standard. Likewise, when appropriate, these guarantees are adequately reflected in the
mitigation of the significant increase in risk, considering their nature as personal guarantees.
For the estimation of the parameters used in the estimation of impairment provisions (EAD (Exposure at
Default), PD (Probability of Default), LGD (Loss Given Default)), the Group based its experience in developing
internal models for the estimation of parameters both in the regulatory area and for management purposes,
adapting the development of the impairment provision models under IFRS 9.
– Exposure at default: is the amount of estimated risk incurred at the time of the counterparty's
analysis.
– Probability of default: is the estimated probability that the counterparty will default on its principal
and/or interest payment obligations.
– Loss given default: is the estimate of the severity of the loss incurred in the event of non-
compliance. It depends mainly on the updating of the guarantees associated with the operation
and the future cash flows that are expected to be recovered.
In any case, when estimating the flows expected to be recovered, portfolio sales are included. It should be
noted that, due to the Group's recovery policy and the experience observed in relation to the prices of past
sales of assets classified as stage 3 and/or failed, there is no substantial divergence between the flows
obtained from recoveries after performing recovery management of the assets with those obtained from the
sale of portfolios of assets discounting structural expenses and other costs incurred.
The definition of default implemented by the Group for the purpose of calculating the impairment provision
models is based on the definition in Article 178 of Regulation 575/2013 of the European Union (CRR), which
is fully aligned with the requirements of IFRS 9, which considers that a "default" exists in relation to a specific
customer/contract when at least one of the following circumstances exists: the entity considers that there are
reasonable doubts about the payment of all its credit obligations or that the customer/contract is in an irregular
situation for more than 90 days with respect to any significant credit obligation.
In addition, the Group considers the risk generated in all cross-border transactions due to circumstances other
than the usual commercial risk of insolvency (sovereign risk, transfer risk or risks arising from international
financial activity, such as wars, natural catastrophes, balance of payments crisis, etc.).
IFRS 9 includes a series of practical solutions that can be implemented by entities, with the aim of facilitating
its implementation. However, in order to achieve a complete and high-level implementation of the standard,
43
and following the best practices of the industry, the Group does not apply these practical solutions in a
generalised manner:
– Rebuttable presumption that the credit risk has increased significantly, when payments are more than
30 days past due: this threshold is used as an additional, but not primary, indicator of significant risk
increase. Additionally, there may be cases in the Group where its use has been rebutted as a result of
studies that show a low correlation of the significant risk increase with this past due threshold.
– Assets with low credit risk at the reporting date: the Group assesses the existence of significant risk
increase in all its financial instruments.
This information is provided in more detail in Note 47.c (Credit risk).
g) Details of the individualised estimate of the correction of impairment
For the individualised estimation of the correction for impairment of financial assets, the Group has a
specific methodology to estimate the value of the cash flows expected to be collected. Generally, this
recovery may be estimated on the basis of:
– Recovery via repayment of the debt for cash flows generated by the debtor's ordinary activities
("Going Concern" approach).
– Recovery through repayment of the debt by execution and subsequent sale of the collateral
guaranteeing the operations ("Gone Concern" approach).
If recovery is estimated using a "Gone Concern" approach, each of the Group's units has developed its
own methodology based on the following methodological principles:
a. Evaluation of the effectiveness of guarantees
The Group evaluates the effectiveness of all guarantees associated with the financial asset subject to an
individual impairment assessment. The following aspects are considered in making this assessment:
• The time required to execute these guarantees;
• The ability of the Group to enforce or value these guarantees in its favour;
• The existence of limitations imposed by the local regulation of each unit on the foreclosure of
guarantees.
Under no circumstances does the Group consider that a guarantee is effective if its effectiveness depends
substantially on the solvency of the debtor or its economic group, as could be the case:
• Promises of shares or other securities of the debtor himself when their valuation may be significantly
affected by a debtor's default.
• Personal cross-collateralisation: when the guarantor of a transaction is, at the same time, guaranteed
by the holder of that transaction.
On the basis of the foregoing, the Group considers the following types of guarantees to be effective:
• Mortgage guarantees on properties, which are first charge, provided that they are duly constituted and
registered in the Group's favour. Real estate includes:
– Buildings and finished building elements, distinguishing between: Dwellings; Offices and
commercial premises and multipurpose buildings; Other buildings such as non-multipurpose
buildings and hotels.
– Urban land and land for development.
44
– Rest of real estate where buildings and elements of buildings under construction would be
classified, among others, such as developments in progress and stopped developments, and the
rest of land, such as rustic properties.
• Pledges on financial instruments such as cash deposits, debt securities of recognised issuers or
equity instruments.
• Other types of security interests, including movable property received as security and second and
subsequent mortgages on real estate, provided that the entity demonstrates their effectiveness. In
assessing the effectiveness of second and subsequent mortgages on property, the Group applies
particularly restrictive criteria. It will take into account, inter alia, whether or not the foregoing charges
are in the Group's own favour and the relationship between the risk guaranteed by them and the value
of the property.
• Personal guarantees, as well as the incorporation of new owners, covering the entire amount of the
transaction and involving the direct and joint liability before the entity of persons or entities whose
equity solvency is sufficiently proven to ensure repayment of the transaction under the agreed terms.
b. Valuation of guarantees
In this regard, the Group will assess the guarantees associated with the financial instruments based on
the nature of the guarantees in accordance with the following:
• Mortgage guarantees on properties associated with financial instruments taking into account all
available information, using complete individual valuations made by independent valuation experts and
under generally accepted valuation standards. If it is not possible to obtain a complete individual
valuation, alternative valuations may be used provided that they have been carried out by duly
documented and approved internal valuation models.
• Personal guarantees will be individually assessed on the basis of updated information from the
guarantor.
• The rest of the guarantees will be valued on the basis of current market values if available or on the
basis of other management information.
c. Adjustments to the value of guarantees and estimation of future cash flow inflows and outflows
The Group applies a series of adjustments to the value of the guarantees which can be positive or
negative in order to adjust the reference values:
• Adjustments based on the historical sales experience of the local units for certain types of assets.
These adjustments will be made in the same way if the current valuations are not updated.
• Individual expert adjustments based on additional management information (e.g. if there is a binding
offer to acquire the asset or the asset is severely impaired).
In addition, the Group will take into account the time value of money when adjusting the value of the
guarantees. Basically, for this purpose and based on the historical experience of each of the units, it is
estimated:
• Period of adjudication.
• Estimated time of sale of the asset.
45
The Group must also take into account the cash inflows and outflows that would be generated by the
guarantee until it is sold. To this end, the Group considers the present value of the future cash flows of the
guarantee when estimating the value of the asset:
• Possible future income commitments in favour of the borrower which will be accessible after the award
of the asset.
• Estimated foreclosure costs.
• Asset maintenance costs, taxes and community costs.
• Estimated marketing or sales costs.
Finally, when it is considered that the guarantee will be sold in the future, the Group applies an additional
adjustment ("index forward") in order to adjust the value of the guarantees to future valuation
expectations. This adjustment is made on the basis of estimated future price indices or external
information.
d. Scope of application of the individual estimate of the assessment for impairment
Santander Consumer Finance Group determines the perimeter over which it makes an estimate of the
assessment for impairment on an individual basis based on a relevance threshold set by each of the
geographical areas and the stage in which the operations are located. In general, the Group applies the
individualised calculation of expected losses to the significant exposures classified in stage 3.
It should be noted that, in any case and irrespective of the stage in which their transactions are carried
out, for customers who do not receive standardised treatment, a relational risk management model is
applied, with individualised treatment and monitoring by the assigned risk analyst. In addition to large
companies, this relational management model also includes other segments of smaller companies for
which there is information and capacity for more personalised and expert analysis and monitoring. As
indicated in the Group's credit model, the individual treatment of the client facilitates the continuous
updating of information. The risk assumed must be followed and monitored throughout its life cycle,
enabling anticipation and action to be taken in the event of possible impairments. In this way, the
customer's credit quality is analysed individually, taking into account specific aspects such as his
competitive position, financial performance, management, etc. In the wholesale risk management model,
every customer with a credit risk position is assigned a rating, which has an associated probability of
customer default. Thus, individual analysis of the debtor triggers a specific rating for each customer, which
determines the appropriate parameters for calculating the expected loss, so that it is the rating itself that
initially modulates the necessary coverage, adjusting the severity of the possible loss to the guarantees
and other mitigating factors that the customer may have available. In addition, if as a result of this
individualised monitoring of the customer, the analyst finally considers that his coverage is not sufficient,
he has the necessary mechanisms to adjust it under his expert judgement, always under the appropriate
governance.
h) Repurchase agreements and reverse repurchase agreements
Any purchases (sales) of financial instruments under a non-optional resale (repurchase) agreement at a
fixed price (repos) are recognised, where appropriate, in the consolidated balance sheet as financing
granted (received), based on the nature of the debtor (creditor), under Loans and advances to central
banks, Loans and advances to credit institutions or Loans and advances to customers, Deposits from
central banks, Deposits from credit institutions or Customer deposits, if any.
Differences between the purchase and sale prices are recognised as interest over the contract term using
the effective interest method.
46
i) Assets and liabilities included in disposal groups classified as held for sale
“Assets included in disposal groups classified as held for sale” includes the carrying amount of any
individual items or integrated into a group (disposal group) or items that are part of a business unit
earmarked for disposal (“discontinued operations”) whose sale in their present condition is highly likely to
be completed within one year from the reporting date. Therefore, the carrying amount of these items -
which can be of a financial nature or otherwise- will foreseeably be recovered through the proceeds from
their disposal rather than through their continuing use.
Similarly, “Liabilities included in disposal groups classified as held for sale” includes the balances payable
relating to the assets held for sale or disposal groups and to discontinued operations.
Non-current assets held for sale -both individual items and disposal groups, if any- are generally
measured at the lower of fair value less costs to sell and their carrying amount at the date of classification
in this category. Non-current assets held for sale are not depreciated as long as they remain in this
category. However, any financial instruments, assets arising from employee benefits, deferred tax assets
and reinsurance assets classified as “Non-Current Assets Held for Sale” continue to be measured using
the methods described in this Note, with no changes being made thereto as a result of the classification of
these items as non-current assets held for sale. The Group measures foreclosed property assets located
in Spain by taking into consideration the appraisal value on the date of foreclosure and the length of time
each asset has been recognised in the consolidated balance sheet.
The Group has in place a corporate policy that ensures the professional competence and the
independence and objectivity of the external appraisal agencies, in accordance with the regulations, which
require appraisal agencies to meet neutrality and credibility requirements, so that the use of their
estimates does not reduce the reliability of its valuations. This policy establishes that all the appraisal
companies and agencies with which the Group works in Spain should be registered in the Official Register
of the Bank of Spain and that the appraisals performed by them should follow the methodology
established in Ministry of Economy Order ECO/805/2003, of 27 March. The main appraisal companies
and agencies with which the Group worked in Spain in 2020 are as follows: Arco Valoraciones, S.A.,
Agrupación técnica del valor, S.A., CBRE Valuation Advisory, S.A., Eurovaloraciones, S.A., Gestvalt
Sociedad de Tasación, S.A., Valtecnic, S.A., Grupo Tasvalor, S.A., Instituto de Valoraciones, S.A., JLL
Valoraciones S.A.U., Krata, S.A., Sociedad de Tasación, S.A., Tasibérica, S.A., Técnicos de Tasación,
S.A., Tinsa, Tasaciones Inmobiliarias, S.A., UVE Valoraciones, S.A., Valoraciones Mediterráneo, S.A.
Also, the aforementioned policy stipulates that the various subsidiaries abroad must work with appraisal
companies that have recent experience in the local area and with the type of asset under appraisal and
that meet the independence requirements established in the corporate policy. They should verify, that the
appraisal company is not a party related to the Group and that its billings to the Group in the last twelve
months do not exceed 15% of the appraisal company's total billings.
Impairment losses on an asset or disposal group resulting from the write-down of its carrying amount to its
fair value (less costs to sell) and gains or losses on the sale thereof are recognised under “Gains (Losses)
on Non-Current Assets Held for Sale Not Classified as Discontinued Operations” in the consolidated
income statement. Any gains on a non-current asset held for sale resulting from increases in fair value
(less costs to sell) subsequent to impairment increase its carrying amount and are recognised with a
credit to the consolidated income statement up to an amount equal to the impairment losses previously
recognised.
Assets and liabilities relating to discontinued operations are presented and measured in accordance with
the criteria indicated for disposal groups. Revenue and expenses arising from these assets and liabilities
are presented net of the related tax effect under “Profit or loss after tax from discontinued operations” in
the consolidated income statement.
47
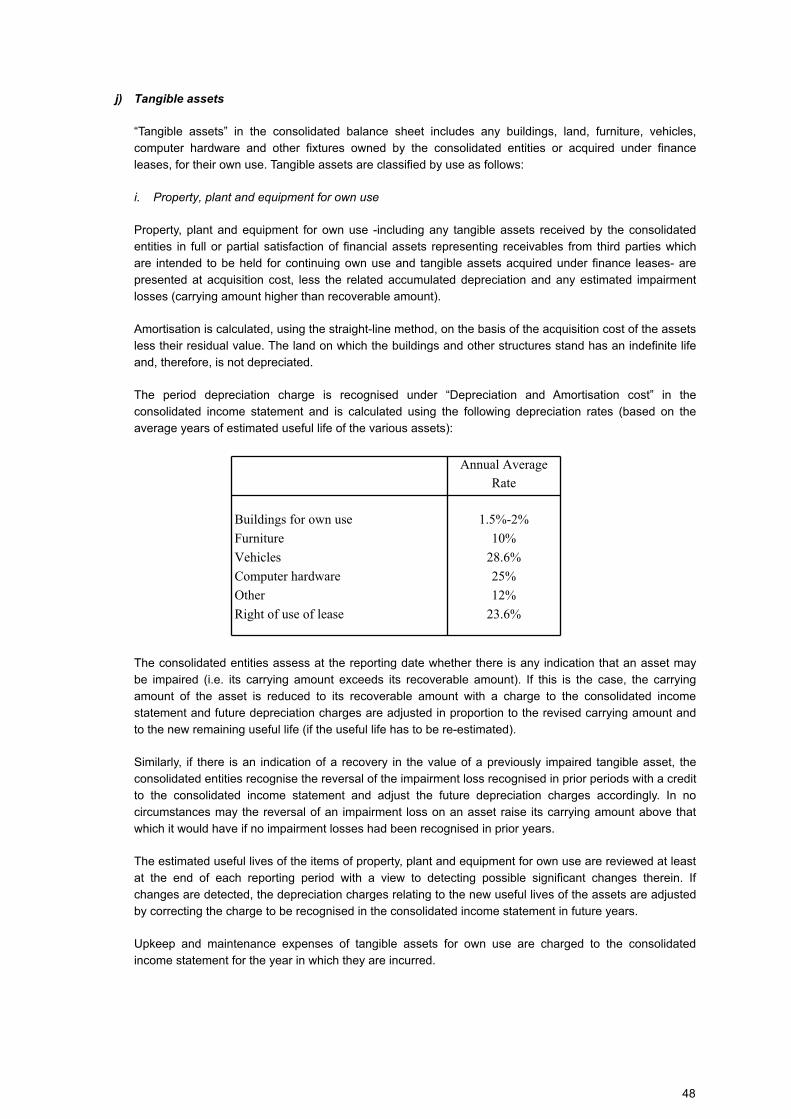
j) Tangible assets
“Tangible assets” in the consolidated balance sheet includes any buildings, land, furniture, vehicles,
computer hardware and other fixtures owned by the consolidated entities or acquired under finance
leases, for their own use. Tangible assets are classified by use as follows:
i. Property, plant and equipment for own use
Property, plant and equipment for own use -including any tangible assets received by the consolidated
entities in full or partial satisfaction of financial assets representing receivables from third parties which
are intended to be held for continuing own use and tangible assets acquired under finance leases- are
presented at acquisition cost, less the related accumulated depreciation and any estimated impairment
losses (carrying amount higher than recoverable amount).
Amortisation is calculated, using the straight-line method, on the basis of the acquisition cost of the assets
less their residual value. The land on which the buildings and other structures stand has an indefinite life
and, therefore, is not depreciated.
The period depreciation charge is recognised under “Depreciation and Amortisation cost” in the
consolidated income statement and is calculated using the following depreciation rates (based on the
average years of estimated useful life of the various assets):
Annual Average
Rate
Buildings for own use 1.5%-2%
Furniture 10%
Vehicles 28.6%
Computer hardware 25%
Other 12%
Right of use of lease 23.6%
The consolidated entities assess at the reporting date whether there is any indication that an asset may
be impaired (i.e. its carrying amount exceeds its recoverable amount). If this is the case, the carrying
amount of the asset is reduced to its recoverable amount with a charge to the consolidated income
statement and future depreciation charges are adjusted in proportion to the revised carrying amount and
to the new remaining useful life (if the useful life has to be re-estimated).
Similarly, if there is an indication of a recovery in the value of a previously impaired tangible asset, the
consolidated entities recognise the reversal of the impairment loss recognised in prior periods with a credit
to the consolidated income statement and adjust the future depreciation charges accordingly. In no
circumstances may the reversal of an impairment loss on an asset raise its carrying amount above that
which it would have if no impairment losses had been recognised in prior years.
The estimated useful lives of the items of property, plant and equipment for own use are reviewed at least
at the end of each reporting period with a view to detecting possible significant changes therein. If
changes are detected, the depreciation charges relating to the new useful lives of the assets are adjusted
by correcting the charge to be recognised in the consolidated income statement in future years.
Upkeep and maintenance expenses of tangible assets for own use are charged to the consolidated
income statement for the year in which they are incurred.
48
ii. Investment property
“Tangible Assets - Investment Property” reflects the net values of any land, buildings and other structures
held either to earn rentals or for capital appreciation.
The criteria used to recognise the acquisition cost of investment property, to calculate its depreciation and
its estimated useful life and to recognise any impairment losses thereon are consistent with those
described in relation to property, plant and equipment for own use.
iii. Assets leased out under an operating lease
“Tangible Assets - Property, Plant and Equipment - Leased out under an Operating Lease” in the
consolidated balance sheets includes the amount of the assets, other than land and buildings, leased out
under an operating lease.
The criteria used to recognise the acquisition cost of assets leased out under operating leases, to
calculate their depreciation and their respective estimated useful lives and to recognise the impairment
losses thereon are consistent with those described in relation to property, plant and equipment for own
use.
k) Leases
On 1 January 2019 the Group changed the accounting policy for leases when acting as a lessee (see
Note 1-b).
l) Intangible assets
“Intangible Assets” are identifiable non-monetary assets (separable from other assets) without physical
substance which arise as a result of a legal transaction or which are developed internally by the
consolidated entities and goodwill other than that arising from acquisition of entities accounted for using
the equity method. Only intangible assets whose cost can be estimated reliably and from which the
consolidated entities consider it probable that future economic benefits will be generated are recognised.
Intangible assets other than goodwill are recognised initially at acquisition or production cost and are
subsequently measured at cost less any accumulated amortisation and/or any accumulated impairment
losses.
i. Goodwill
Any excess of the cost of the investments in the consolidated entities and entities accounted for using the
equity method over the corresponding underlying carrying amounts acquired, adjusted at the date of first-
time consolidation, is allocated as follows:
– If it is attributable to specific assets and liabilities of the companies acquired, by increasing the value of
the assets (or reducing the value of the liabilities) whose fair values were higher (lower) than the
carrying amounts at which they had been recognised in the acquired entities' balance sheets.
– If it is attributable to specific intangible assets, by recognising it explicitly in the consolidated balance
sheet provided that the fair value of these assets within twelve months following the date of acquisition
can be measured reliably.
– The remaining amount is recognised as goodwill, which is allocated to one or more cash-generating
units (a cash-generating unit is the smallest identifiable group of assets that, as a result of continuing
operation, generates cash inflows that are largely independent of the cash inflows from other assets or
groups of assets). The cash-generating units represent the Group’s geographical and/or business
segments.
49
Goodwill is only recognised when it has been acquired for consideration and represents, therefore, a
payment made by the acquirer in anticipation of future economic benefits from assets of the acquired
entity or business that are not capable of being individually identified and separately recognised.
At the end of each annual reporting period or whenever there is any indication of impairment goodwill is
reviewed for impairment (i.e. a reduction in its recoverable amount to below its carrying amount) and, if
there is any impairment, the goodwill is written down with a charge to “Impairment on non financial assets
(net) - Intangible assets” in the consolidated income statement.
An impairment loss recognised for the goodwill is not reversed in a subsequent period.
ii. Other intangible assets
Intangible assets can have an indefinite useful life –when, based on an analysis of all the relevant factors,
it is concluded that there is no foreseeable limit to the period over which the asset is expected to generate
net cash inflows for the consolidated entities– or a finite useful life, in all other cases.
Intangible assets with indefinite useful lives are not amortised, but rather at the end of each reporting
period the consolidated entities review the remaining useful lives of the assets in order to determine
whether they continue to be indefinite and, if this is not the case, to take the appropriate steps.
Intangible assets with finite useful lives are amortised over those useful lives using methods similar to
those used to depreciate tangible assets. The intangible asset amortisation charge is recognised under
“Depreciation and Amortisation Charge” in the consolidated income statement.
In both cases the consolidated entities recognise any impairment loss on the carrying amount of these
assets with a charge to Impairment losses on other assets (net) in the consolidated income statement.
The criteria used to recognise the impairment losses on these assets and, where applicable, the reversal
of impairment losses recognised in prior years are similar to those used for tangible assets (See Note 2.i).
iii. Group internally developed computer software
Internally developed computer software is recognised as an intangible asset if, among other requisites
(basically the Group’s ability to use or sell it), it can be identified and its ability to generate future economic
benefits can be demonstrated.
Any expenses incurred during the research phase are recognised directly in the consolidated income
statement for the year in which they are incurred and cannot subsequently be included in the carrying
amount of the intangible asset.
m) Other assets and Other liabilities
“Other Assets” in the consolidated balance sheets includes the amount of any assets not recorded in other
items, the breakdown being as follows:
– Inventories: this item includes the amount of assets, other than financial instruments, that are held for
sale in the ordinary course of business, are in the process of production, construction or development
for such sale, or are to be consumed in the production process or in the rendering of services.
“Inventories” includes the assets that have been acquired for the purpose of leasing them to third and
for which the related operating lease agreements had not been formalised at the date of the
consolidated balance sheets.
Inventories are measured at the lower of cost and net realisable value, which is the amount expected
to be obtained from lease or sale thereof in the ordinary course of business, less the estimated costs
of completion and the estimated costs required for operation.
50
The amount of any write-down of inventories -such as that due to damage, obsolescence or reduction
of selling price- to net realisable value and all other losses of inventories are recognised as an
expense in the year in which the write-down or loss occurs. Subsequent reversals are recognised in
the consolidated income statement for the year in which they occur.
The carrying amount of inventories is derecognised and recognised as an expense in the period in
which the revenue from their sale is recognised.
– Other: this item includes, as the case may be, the balance of all prepayments and accrued income
(excluding accrued interest), the net amount of the difference between pension plan obligations and
the value of the plan assets with a balance in the Group’s favour, when this net amount is to be
reported in the consolidated balance sheet, and the amount of any other assets not included in other
items.
“Other Liabilities” in the consolidated balance sheets includes the balance of all accrued expenses and
deferred income, excluding accrued interest, and the amount of any other liabilities not included in other
consolidated balance sheet line items.
n) Provisions and contingent assets and liabilities
Provisions are present obligations at the reporting date arising from past events which could give rise to a
loss for the consolidated entities, which is considered to be likely to occur and certain as to its nature but
uncertain as to its amount and/or timing, and the consolidated entities expect that an outflow of resources
embodying economic benefits will be required to settle such obligations.
Contingent liabilities are possible obligations that arise from past events and whose existence will be
confirmed only by the occurrence or non-occurrence of one or more future events not wholly within the
control of the consolidated entities. They include present obligations of the consolidated entities when,
although possible, it is not considered probable that an outflow of resources embodying economic benefits
will be required to settle them and their amount cannot be measured with sufficient reliability. The Group
will disclose a contingent liability, unless the possibility of an outflow of resources embodying economic
benefits is remote.
Contingent assets are possible assets that arise from past events and whose existence is conditional on,
and will be confirmed only by, the occurrence or non-occurrence of events beyond the control of the
Group. Any contingent assets that arise are not recognised in the consolidated balance sheet or in the
consolidated income statement, but rather are disclosed in the notes, provided that it is probable that
these assets will give rise to an increase in resources embodying economic benefits.
The Group’s consolidated financial statements include all the material provisions with respect to which it is
considered that it is more likely than not that the obligation will have to be settled. In accordance with
current standards, contingent liabilities are not recognised in the consolidated financial statements, but
rather are disclosed in the notes thereto.
Provisions, which are quantified on the basis of the best information available on the consequences of the
event giving rise to them and are reviewed and adjusted at the end of each year, are used to cater for the
specific obligations for which they were originally recognised. Provisions are fully or partially reversed
when such obligations cease to exist or are reduced.
Provisions are classified according to the obligations covered as follows (see Note 21).
– Provisions for pensions and similar obligations: includes the amount of the provisions made to cover
defined-benefit post-employment benefits, commitments to pre-retirees and similar obligations (see
Note 21).
51
– Other long-term employee compensation: includes other obligations assumed with employees taking
early retirement (see Notes 2.r and 21).
– Provisions for taxes and other legal contingencies includes the amount of the provisions made to
cover tax and legal contingencies and litigation (see Note 21). Among other items, it includes
provisions for restructuring and environmental actions, if any.
– Provisions for contingent liabilities and commitments: includes the amount of the provisions made to
cover contingent liabilities -defined as those transactions in which the Group guarantees the
obligations of a third party, arising as a result of financial guarantees granted or contracts of another
kind- and contingent commitments -defined as irrevocable commitments that may give rise to the
recognition of financial assets (see Note 21).
– Other provisions: includes the amount of other provisions made by the Group (see Note 21).
The provisions considered necessary pursuant to the foregoing criteria are recognised or released, as
appropriate, with a charge or credit, respectively, to “Provisions (Net)” in the consolidated income
statement. The criteria applied to account for the provisions for pensions and similar obligations are
described in Notes 2-r and 2-s.
o) Court proceedings and/or claims in process
At the end of 2020 and 2019 certain court proceedings and claims were in process against the
consolidated entities arising from the ordinary course of their operations. The Group’s legal advisers and
the Bank’s Directors consider that any economic loss that might ultimately result from these court
proceedings and claims has been adequately provided for (see Note 21) and, therefore, will not have a
material effect on these consolidated financial statements.
p) Recognition of income and expenses
The most significant criteria used by the Group to recognise its income and expenses are summarised as
follows:
i. Interest income, interest expenses and similar items
Interest income, interest expenses and similar items are generally recognised on an accrual basis using
the effective interest method. Dividends received from companies other than subsidiaries, associates or
jointly ventures entities are recognised as income when the right to receive them arises.
ii. Commissions, fees and similar items
Fee and commission income and expenses are recognised in the consolidated income statement using
criteria that vary according to their nature. The main criteria are as follows:
– Fee and commission income and expenses relating to financial assets and financial liabilities
measured at fair value through profit or loss are recognised when paid.
– Those which meet the conditions to form part of the initial acquisition cost of the financial instruments
(other than those measured at fair value through profit or loss) are recognised in the income statement
using the effective interest method or at the time the instruments are sold, based on their nature.
– Those arising from transactions or services that are performed over a period of time are recognised
over the life of these transactions or services.
– Those relating to services provided in a single act are recognised when the single act is carried out.
52
iii. Non-financial income and expenses
They are recognised for accounting purposes when the good is delivered or the non-financial service is
rendered. To determine the amount and timing of recognition, a five-step model is followed: identification
of the contract with the customer, identification of the separate obligations of the contract, determination of
the transaction price, distribution of the transaction price among the identified obligations and finally
recording of income as the obligations are satisfied.
iv. Deferred collections and payments
These are recognised for accounting purposes at the amount resulting from discounting the expected
cash flows at market rates.
v. Loan arrangement fees
Loan arrangement fees, mainly loan origination and application fees, are credited to the consolidated
income statement, on a time-proportion basis, over the term of the loan. The related direct costs incurred
in the loan arrangement can be deducted from this amount.
q) Financial guarantees
“Financial guarantees” are defined as contracts whereby an entity undertakes to make specific payments
on behalf of a third party if the latter fails to do so, irrespective of the various legal forms they may have,
such as guarantees, insurance policies or credit derivatives.
The Group initially recognises financial guarantees provided on the liability side of the consolidated
balance sheet at fair value, which is generally the present value of the fees, commissions and interest
receivable from these contracts over the term thereof, and simultaneously the Group recognises, as a
balancing entry on the asset side of the consolidated balance sheet, the amount of the fees, commissions
and similar interest received at the inception of the transactions and an account receivable for the present
value of the fees, commissions and interest outstanding.
Financial guarantees, regardless of the guarantor, instrumentation or other circumstances, are reviewed
periodically so as to determine the credit risk to which they are exposed and, if appropriate, to consider
whether a provision is required. The credit risk is determined by application of criteria similar to those
established for quantifying impairment losses on debt instruments carried at amortised cost (described in
Note 2-f above).
The provisions made for these transactions are recognised under “Provisions - Provisions for
commitments and guarantees given” on the liability side of the consolidated balance sheet (see Note 21).
These provisions are recognised and reversed with a charge or credit, respectively, to “Provisions or
reversal of provisions” in the consolidated income statement.
If a provision is required for these financial guarantees, the unearned commissions recognised under
“Financial Liabilities at Amortised Cost - Other Financial Liabilities” in the consolidated balance sheet are
reclassified to the appropriate provision.
r) Post-employment benefits
Under the collective agreements currently in force, the financial institutions included in the Group and
certain other Spanish and foreign consolidated entities have undertaken to complement the public social
security system benefits accruing to certain employees, and to their beneficiary right holders, for
retirement, permanent disability or death, and other welfare benefits post-employment.
The Group’s post-employment obligations to its employees are deemed to be “defined contribution plans”
when the Group makes pre-determined contributions to a separate entity and will have no legal or
53
effective obligation to make further contributions if the separate entity cannot pay the employee benefits
relating to the service rendered in the current and prior periods. Post-employment obligations that do not
meet the aforementioned conditions are classified as “defined benefit plans” (see Note 21).
i) Defined contribution plans
The Group recognises the defined contributions accrued in the year under “Administrative Expenses -
Staff Costs” in the consolidated income statement. At year-end any amount not yet contributed to the
external plans funding the obligations is recognised at its present value under “Provisions - Provision for
pensions and other employment defined benefit obligations” on the liability side of the consolidated
balance sheet (see Note 21).
ii) Defined benefit plans
The Group recognises under “Provisions - Provisions for other long term employee benefits” on the
liability side of the consolidated balance sheet (or under “Other Assets” on the asset side, as appropriate)
the present value of its defined benefit post-employment obligations, net of the fair value of the plan
assets (see Note 21).
“Plan assets” are defined as those that will be used directly to settle the obligations and that meet the
following conditions:
– They are not owned by the consolidated entities, but by a legally separate third party that is not a party
related to the Group.
– They are only available to pay or fund post-employment benefits and they cannot be returned to the
consolidated entities unless the assets remaining in the plan are sufficient to meet all the benefit
obligations of the plan or of the entity to current and former employees, or they are returned to
reimburse employee benefits already paid by the Group.
If the Group can look to an insurer to pay part or all of the expenditure required to settle a defined benefit
obligation, and it is practically certain that said insurer will reimburse some or all of the expenditure
required to settle that obligation, but the insurance policy does not qualify as a plan asset, the Group
recognises its right to reimbursement -which, in all other respects, is treated as a plan asset- under
“Insurance Contracts Linked to Pensions” on the asset side of the consolidated balance sheet.
Post-employment benefits are recognised as follows:
– Service cost is recognised in the consolidated income statement and includes the following items:
– Current service cost, i.e. the increase in the present value of the obligations resulting from
employee service in the current period, is recognised under “Administrative Expenses - Staff
Costs” (see Notes 21 and 39).
– Any past service cost, which arises from changes to existing post-employment benefits or from the
introduction of new benefits and includes the cost of curtailments, is recognised under “Provisions
or reversal of provisions” (see Note 21).
– Any gain or loss arising from plan settlements is recognised under “Provisions or reversal of
provisions” (see Note 21).
– Net interest on the net defined benefit liability (asset), i.e. the change in the year in the net defined
benefit liability (asset) as a result of the passage of time, is recognised under “Interest
Expense” (“Interest Income” if it constitutes income) in the consolidated income statement (see
Notes 21 and 31).
54
The remeasurement of the net defined benefit liability (asset) recognised in equity under “Other
comprehensive income. Items not reclassified to profit or loss. Actuarial gains or (-) losses on defined
benefit pension plans” in the consolidated balance sheet includes:
– Actuarial gains and losses generated in the year, arising from the effects of differences between
the previous actuarial assumptions and what has actually occurred and from the effects of changes
in actuarial assumptions.
– The return on plan assets, excluding amounts included in net interest on the net defined benefit
liability (asset).
– Any change in the effect of the asset ceiling, excluding amounts included in net interest on the net
defined benefit liability (asset).
s) Other long-term benefits and other obligations
Other long-term employee benefits, defined as obligations to pre-retirees -taken to be those employees
who have ceased to render services at the consolidated entities but who, without being legally retired,
continue to have economic rights vis-à-vis the entities until they acquire the legal status of retiree- and
long-service bonuses assumed by the consolidated entities are treated for accounting purposes, where
applicable, as established above for defined benefit post-employment plans, except that actuarial gains
and losses which are recognised under Provisions or reversal of provisions in the consolidated income
statement (see Note 21).
Certain Spanish Group entities’ obligations for death or disability of current employees until they reach
retirement age are covered by an internal fund with renewable temporary annual coverage and, therefore,
no contributions are made to plans.
t) Termination benefits
Termination benefits are recognised when there is a detailed formal plan identifying the basic changes to
be made, provided that implementation of the plan has begun, its main features have been publicly
announced or objective facts concerning its implementation have been disclosed.
u) Income tax
The expense for Spanish income tax and other similar taxes applicable to the foreign consolidated entities
is recognised in the consolidated income statement, except when it results from a transaction recognised
directly in equity, in which case the tax effect is also recognised in equity – Modification to IFRS Cycle
2015-2017.
The current income tax expense is calculated as the sum of the current tax resulting from application of
the appropriate tax rate to the taxable profit for the year (net of any deductions allowable for tax
purposes), and of the changes in deferred tax assets and liabilities recognised in the consolidated income
statement.
Deferred tax assets and liabilities include temporary differences measured at the amount expected to be
payable or recoverable on differences between the carrying amounts of assets and liabilities and their
related tax bases, and any tax loss and tax credit carry forwards that have been recognised. These
amounts are measured at the tax rates that are expected to apply in the period when the asset is realised
or the liability is settled.
“Tax Assets” includes the amount of all tax assets, which are broken down into “current” -amounts of tax to
be recovered within the next twelve months- and “deferred” -amounts of tax to be recovered in future
years, including those arising from tax loss and tax credit carry forwards.
55
“Tax Liabilities” includes the amount of all tax liabilities (except provisions for taxes), which are broken
down into “current” -the amount payable in respect of the income tax on the taxable profit for the year and
other taxes in the next twelve months- and “deferred” -the amount of income tax payable in future years.
Deferred tax liabilities are recognised in respect of taxable temporary differences associated with
investments in subsidiaries, associates or joint ventures, except when the Group is able to control the
timing of the reversal of the temporary difference and, in addition, it is probable that the temporary
difference will not reverse in the foreseeable future.
Deferred tax assets are only recognised for temporary differences to the extent that it is considered
probable that the consolidated entities will have sufficient future taxable profits against which the deferred
tax assets can be utilised, and the deferred tax assets do not arise from the initial recognition (except in a
business combination) of other assets and liabilities in a transaction that affects neither taxable profit nor
accounting profit. Other deferred tax assets (tax loss and tax credit carry forwards) are only recognised if
it is considered probable that the consolidated entities will have sufficient future taxable profits against
which they can be utilised.
Income and expenses recognised directly in equity are accounted for as temporary differences.
The deferred tax assets and liabilities are reassessed at the reporting date in order to ascertain whether
any adjustments need to be made on the basis of the findings of the analyses performed.
v) Residual maturity periods and average interest rates
The analysis of the maturities of the balances of certain items in the consolidated balance sheets as at 31
December 2020 and 2019 and of the average annual interest rates in 2020 and 2019 is provided in Note
44.
w) Consolidated statement of recognised income and expense
This statement presents the income and expenses generated by the Group as a result of its business
activity in the year, and a distinction is made between the income and expenses recognised in the
consolidated income statement for the year and the other income and expenses recognised directly in
consolidated equity.
The statement presents the various items separately by nature, grouping them into those items which, in
accordance with the applicable accounting standards, will not be reclassified subsequently to profit or
loss, and those items which will be reclassified subsequently to profit or loss since the requirements
established by the corresponding accounting standards are met.
Accordingly, this statement presents:
a. Consolidated profit for the year.
b. The net amount of the income and expenses recognised temporarily in consolidated equity under
“Valuation Adjustments”.
c. The net amount of the income and expenses recognised definitively in consolidated equity.
d. The income tax incurred in respect of the items indicated in b) and c) above, except for the valuation
adjustments arising from investments in associates or joint ventures entities accounted for using the
equity method, which are presented net.
e. Total consolidated recognised income and expense, calculated as the sum of a) to d) above,
presenting separately the amount attributable to the Parent and the amount relating to non-controlling
interests.
56
The statement presents items separately by nature, grouping them into those that, in accordance with the
applicable accounting standards, will not be subsequently reclassified to profit and loss and those that will
be subsequently reclassified to profit and loss when the requirements established by the corresponding
accounting standards are met.
x) Consolidated statement of changes in total equity
This statement presents all the changes in consolidated equity, including those arising from changes in
accounting policies and from the correction of errors, if any. Accordingly, this statement presents a
reconciliation of the carrying amount at the beginning and end of the year of all the consolidated equity
items, and the changes are grouped together on the basis of their nature into the following items:
a. Adjustments due to changes in accounting policies and to errors: include the changes in consolidated
equity arising as a result of the retrospective restatement of the balances in the consolidated financial
statements due to changes in accounting policies or to the correction of errors, if any.
b. Income and expense recognised in the year: includes, in aggregate form, the total of the
aforementioned items recognised in the consolidated statement of recognised income and expense.
c. Other changes in equity: includes the remaining changes, if any, recognised in consolidated equity,
including, inter alia, increases and decreases in the Bank's capital, distribution of profit, transactions
involving own equity instruments, equity-instrument-based payments, transfers between equity items
and any other increases or decreases in consolidated equity
y) Consolidated statements of cash flows
The following terms are used in the consolidated statements of cash flows with the meanings specified:
– Cash flows: inflows and outflows of cash and cash equivalents, which are short-term, highly liquid
investments that are subject to an insignificant risk of changes in value.
– Operating activities: the principal revenue-producing activities of credit institutions and other activities
that are not investing or financing activities.
– Investing activities: the acquisition and disposal of long-term assets and other investments not
included in cash and cash equivalents.
– Financing activities: activities that result in changes in the size and composition of the consolidated
equity and liabilities that are not operating activities.
In addition, dividends received and paid by the Group are detailed in Notes 4 and 27, including dividends
paid to minority interests (non-controlling interests).
With regards to the cash flows from interests paid and collected, there are no significant differences with
those registered in the income statement, which is why they are not presented separately in the
consolidated statement of cash flows. Nevertheless, the cash flows from financing activities are presented
in Note 17, regardless of their significance.
For the purposes of preparing the consolidated statement of cash flows, “Cash and cash equivalents”
were considered to be short-term, highly liquid investments that are subject to an insignificant risk of
57
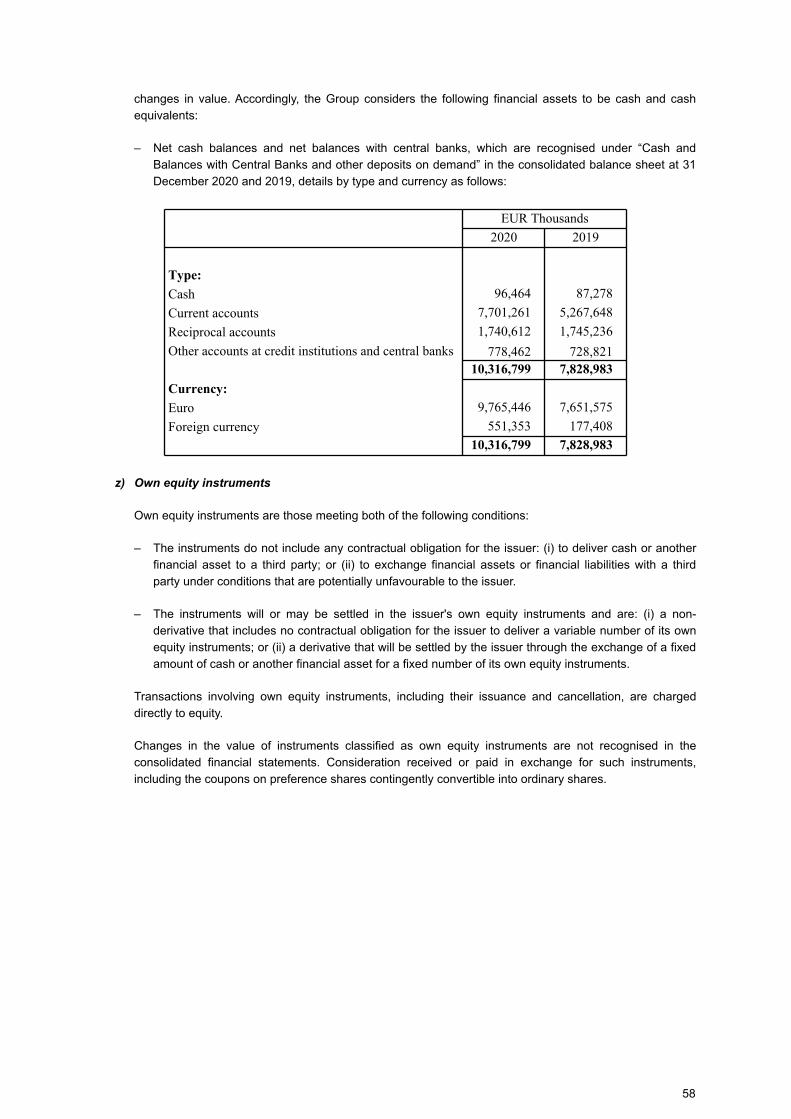
changes in value. Accordingly, the Group considers the following financial assets to be cash and cash
equivalents:
– Net cash balances and net balances with central banks, which are recognised under “Cash and
Balances with Central Banks and other deposits on demand” in the consolidated balance sheet at 31
December 2020 and 2019, details by type and currency as follows:
EUR Thousands
2020 2019
Type:
Cash 96,464 87,278
Current accounts 7,701,261 5,267,648
Reciprocal accounts 1,740,612 1,745,236
Other accounts at credit institutions and central banks 778,462 728,821
10,316,799 7,828,983
Currency:
Euro 9,765,446 7,651,575
Foreign currency 551,353 177,408
10,316,799 7,828,983
z) Own equity instruments
Own equity instruments are those meeting both of the following conditions:
– The instruments do not include any contractual obligation for the issuer: (i) to deliver cash or another
financial asset to a third party; or (ii) to exchange financial assets or financial liabilities with a third
party under conditions that are potentially unfavourable to the issuer.
– The instruments will or may be settled in the issuer's own equity instruments and are: (i) a non-
derivative that includes no contractual obligation for the issuer to deliver a variable number of its own
equity instruments; or (ii) a derivative that will be settled by the issuer through the exchange of a fixed
amount of cash or another financial asset for a fixed number of its own equity instruments.
Transactions involving own equity instruments, including their issuance and cancellation, are charged
directly to equity.
Changes in the value of instruments classified as own equity instruments are not recognised in the
consolidated financial statements. Consideration received or paid in exchange for such instruments,
including the coupons on preference shares contingently convertible into ordinary shares.
58
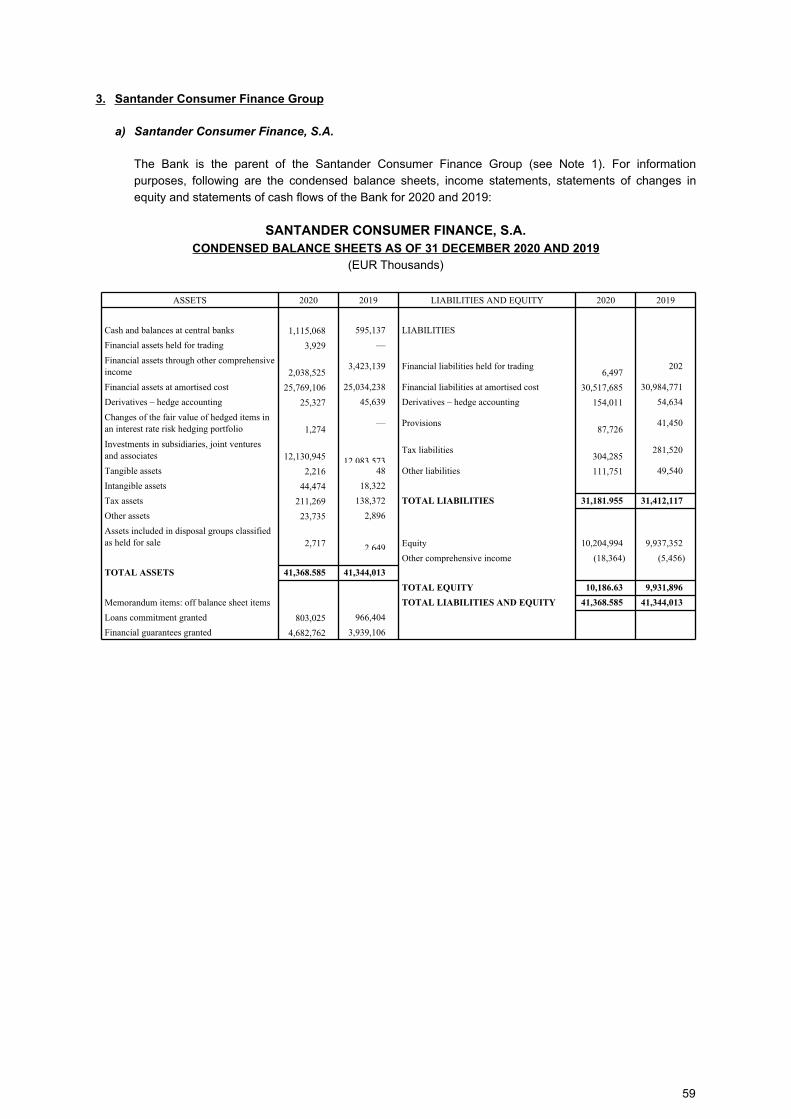
3. Santander Consumer Finance Group
a) Santander Consumer Finance, S.A.
The Bank is the parent of the Santander Consumer Finance Group (see Note 1). For information
purposes, following are the condensed balance sheets, income statements, statements of changes in
equity and statements of cash flows of the Bank for 2020 and 2019:
SANTANDER CONSUMER FINANCE, S.A.
CONDENSED BALANCE SHEETS AS OF 31 DECEMBER 2020 AND 2019
(EUR Thousands)
ASSETS 2020 2019 LIABILITIES AND EQUITY 2020 2019
Cash and balances at central banks 1,115,068 595,137 LIABILITIES
Financial assets held for trading 3,929 —
Financial assets through other comprehensive income 2,038,525
3,423,139 Financial liabilities held for trading6,497
202
Financial assets at amortised cost 25,769,106 25,034,238 Financial liabilities at amortised cost 30,517,685 30,984,771
Derivatives – hedge accounting 25,327 45,639 Derivatives – hedge accounting 154,011 54,634
Changes of the fair value of hedged items in an interest rate risk hedging portfolio 1,274
— Provisions87,726
41,450
Investments in subsidiaries, joint ventures and associates 12,130,945 12,083,573
Tax liabilities304,285
281,520
Tangible assets 2,216 48 Other liabilities 111,751 49,540
Intangible assets 44,474 18,322
Tax assets 211,269 138,372 TOTAL LIABILITIES 31,181.955 31,412,117
Other assets 23,735 2,896
Assets included in disposal groups classified as held for sale 2,717 2,649 Equity 10,204,994 9,937,352
Other comprehensive income (18,364) (5,456)
TOTAL ASSETS 41,368.585 41,344,013
TOTAL EQUITY 10,186.63 9,931,896
Memorandum items: off balance sheet items TOTAL LIABILITIES AND EQUITY 41,368.585 41,344,013
Loans commitment granted 803,025 966,404
Financial guarantees granted 4,682,762 3,939,106
59
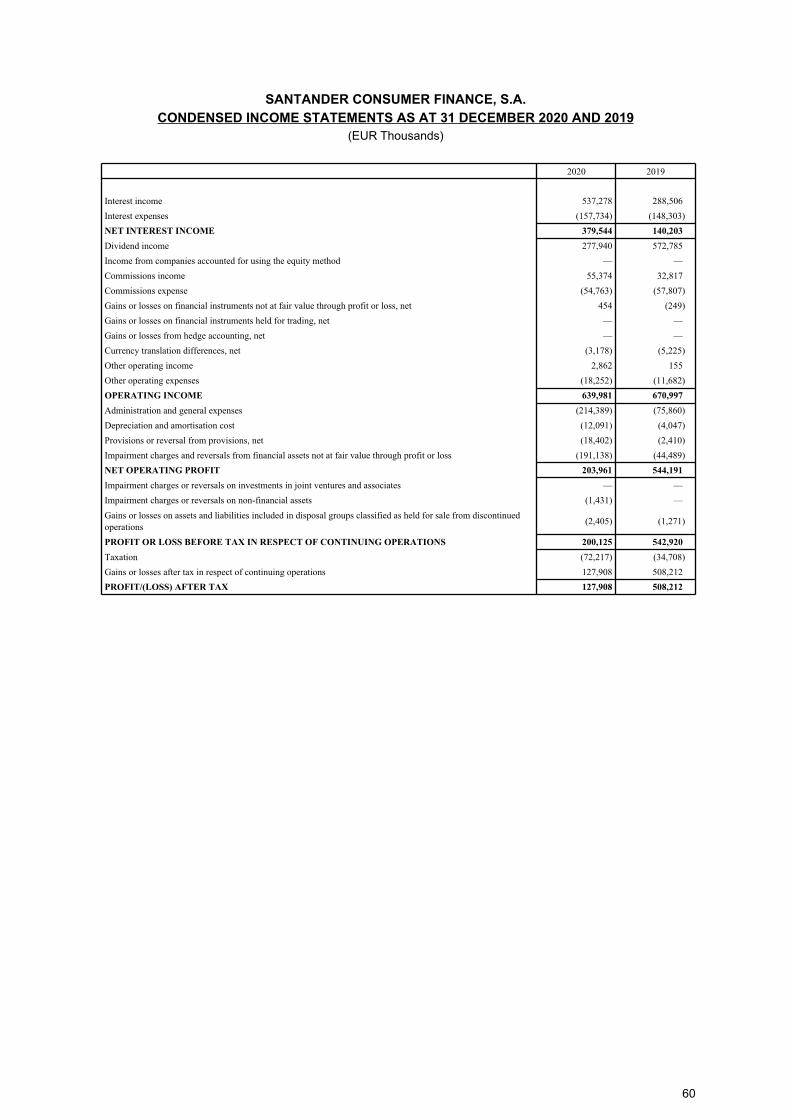
SANTANDER CONSUMER FINANCE, S.A.
CONDENSED INCOME STATEMENTS AS AT 31 DECEMBER 2020 AND 2019
(EUR Thousands)
2020 2019
Interest income 537,278 288,506
Interest expenses (157,734) (148,303)
NET INTEREST INCOME 379,544 140,203
Dividend income 277,940 572,785
Income from companies accounted for using the equity method — —
Commissions income 55,374 32,817
Commissions expense (54,763) (57,807)
Gains or losses on financial instruments not at fair value through profit or loss, net 454 (249)
Gains or losses on financial instruments held for trading, net — —
Gains or losses from hedge accounting, net — —
Currency translation differences, net (3,178) (5,225)
Other operating income 2,862 155
Other operating expenses (18,252) (11,682)
OPERATING INCOME 639,981 670,997
Administration and general expenses (214,389) (75,860)
Depreciation and amortisation cost (12,091) (4,047)
Provisions or reversal from provisions, net (18,402) (2,410)
Impairment charges and reversals from financial assets not at fair value through profit or loss (191,138) (44,489)
NET OPERATING PROFIT 203,961 544,191
Impairment charges or reversals on investments in joint ventures and associates — —
Impairment charges or reversals on non-financial assets (1,431) —
Gains or losses on assets and liabilities included in disposal groups classified as held for sale from discontinued operations
(2,405) (1,271)
PROFIT OR LOSS BEFORE TAX IN RESPECT OF CONTINUING OPERATIONS 200,125 542,920
Taxation (72,217) (34,708)
Gains or losses after tax in respect of continuing operations 127,908 508,212
PROFIT/(LOSS) AFTER TAX 127,908 508,212
60
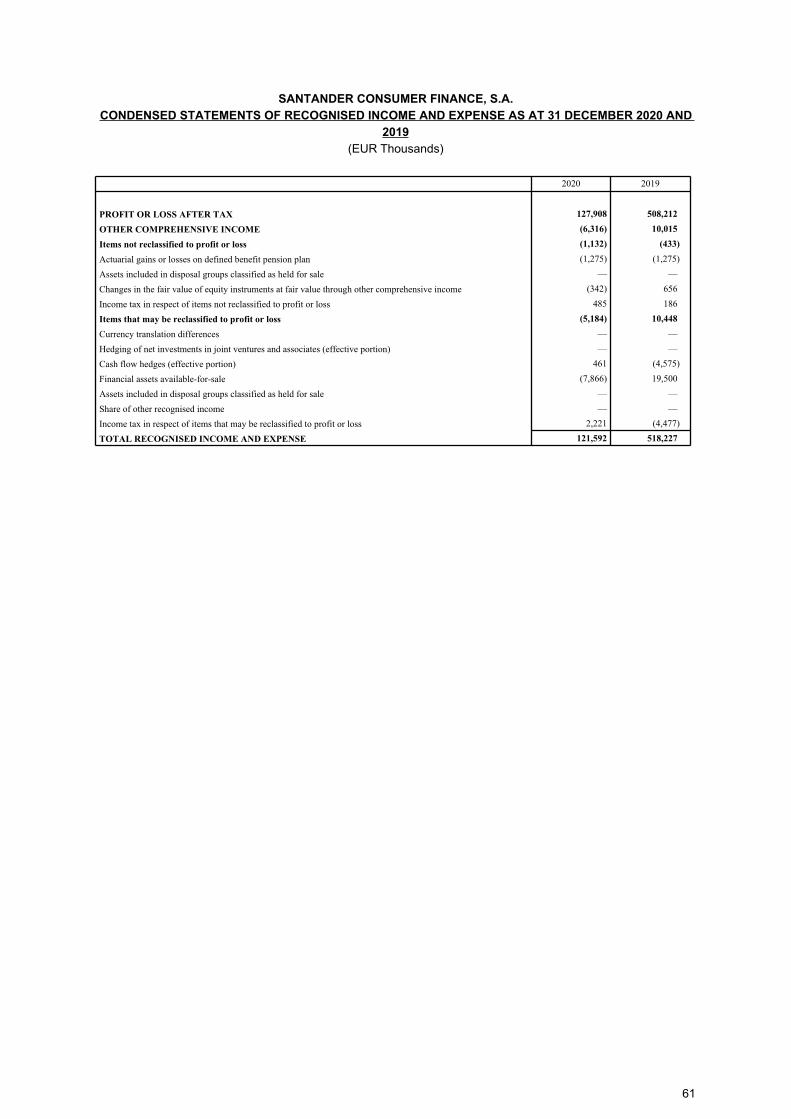
SANTANDER CONSUMER FINANCE, S.A.
CONDENSED STATEMENTS OF RECOGNISED INCOME AND EXPENSE AS AT 31 DECEMBER 2020 AND
2019
(EUR Thousands)
2020 2019
PROFIT OR LOSS AFTER TAX 127,908 508,212
OTHER COMPREHENSIVE INCOME (6,316) 10,015
Items not reclassified to profit or loss (1,132) (433)
Actuarial gains or losses on defined benefit pension plan (1,275) (1,275)
Assets included in disposal groups classified as held for sale — —
Changes in the fair value of equity instruments at fair value through other comprehensive income (342) 656
Income tax in respect of items not reclassified to profit or loss 485 186
Items that may be reclassified to profit or loss (5,184) 10,448
Currency translation differences — —
Hedging of net investments in joint ventures and associates (effective portion) — —
Cash flow hedges (effective portion) 461 (4,575)
Financial assets available-for-sale (7,866) 19,500
Assets included in disposal groups classified as held for sale — —
Share of other recognised income — —
Income tax in respect of items that may be reclassified to profit or loss 2,221 (4,477)
TOTAL RECOGNISED INCOME AND EXPENSE 121,592 518,227
61
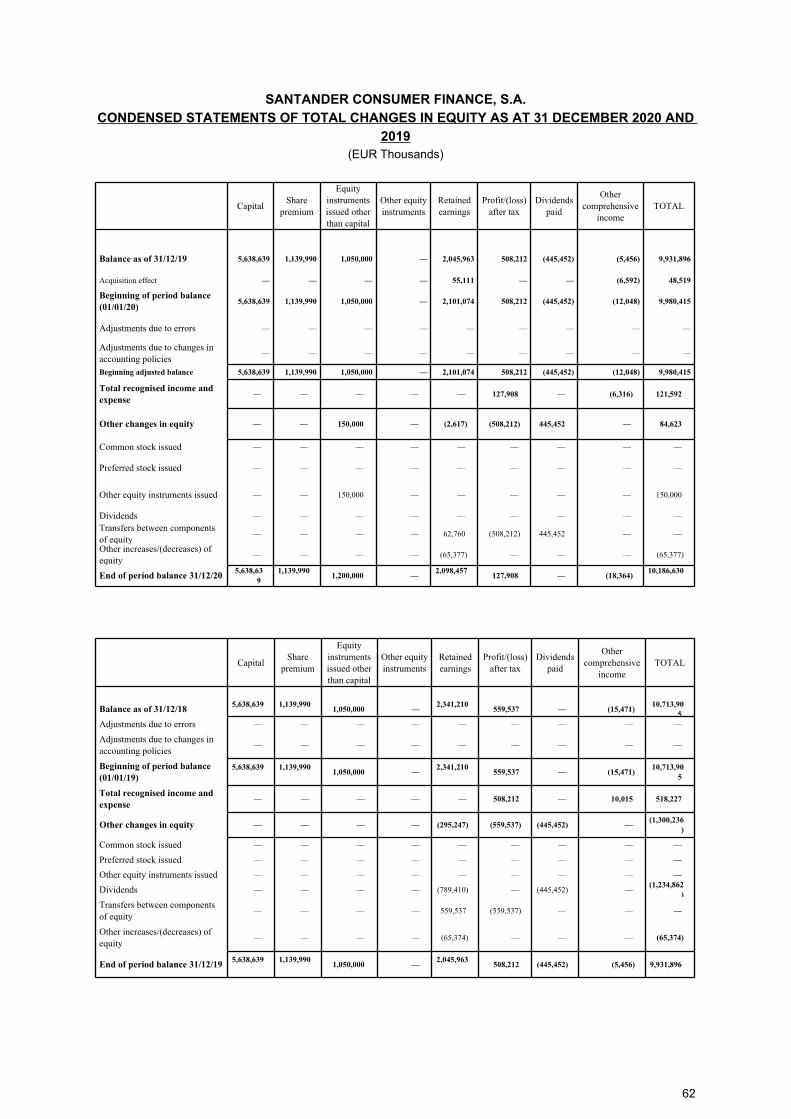
SANTANDER CONSUMER FINANCE, S.A.
CONDENSED STATEMENTS OF TOTAL CHANGES IN EQUITY AS AT 31 DECEMBER 2020 AND
2019
(EUR Thousands)
CapitalShare
premium
Equity instruments issued other than capital
Other equity instruments
Retained earnings
Profit/(loss) after tax
Dividends paid
Other comprehensive
incomeTOTAL
Balance as of 31/12/19 5,638,639 1,139,990 1,050,000 — 2,045,963 508,212 (445,452) (5,456) 9,931,896
Acquisition effect — — — — 55,111 — — (6,592) 48,519
Beginning of period balance
(01/01/20)5,638,639 1,139,990 1,050,000 — 2,101,074 508,212 (445,452) (12,048) 9,980,415
Adjustments due to errors — — — — — — — — —
Adjustments due to changes in accounting policies
— — — — — — — — —
Beginning adjusted balance 5,638,639 1,139,990 1,050,000 — 2,101,074 508,212 (445,452) (12,048) 9,980,415
Total recognised income and
expense— — — — — 127,908 — (6,316) 121,592
Other changes in equity — — 150,000 — (2,617) (508,212) 445,452 — 84,623
Common stock issued — — — — — — — — —
Preferred stock issued — — — — — — — — —
Other equity instruments issued — — 150,000 — — — — — 150,000
Dividends — — — — — — — — —
Transfers between components of equity
— — — — 62,760 (508,212) 445,452 — —
Other increases/(decreases) of equity
— — — — (65,377) — — — (65,377)
End of period balance 31/12/205,638,63
9
1,139,990
1,200,000 —
2,098,457
127,908 — (18,364)
10,186,630
CapitalShare
premium
Equity instruments issued other than capital
Other equity instruments
Retained earnings
Profit/(loss) after tax
Dividends paid
Other comprehensive
incomeTOTAL
Balance as of 31/12/185,638,639
1,139,990
1,050,000 —
2,341,210
559,537 — (15,471)
10,713,90
5
Adjustments due to errors — — — — — — — — —
Adjustments due to changes in accounting policies
— — — — — — — — —
Beginning of period balance
(01/01/19)
5,638,639
1,139,990
1,050,000 —
2,341,210
559,537 — (15,471)
10,713,90
5
Total recognised income and
expense— — — — — 508,212 — 10,015 518,227
Other changes in equity — — — — (295,247) (559,537) (445,452) — (1,300,236
)
Common stock issued — — — — — — — — —
Preferred stock issued — — — — — — — — —
Other equity instruments issued — — — — — — — — —
Dividends — — — — (789,410) — (445,452) — (1,234,862
)
Transfers between components of equity
— — — — 559,537 (559,537) — — —
Other increases/(decreases) of equity
— — — — (65,374) — — — (65,374)
End of period balance 31/12/195,638,639
1,139,990
1,050,000 —
2,045,963
508,212 (445,452) (5,456) 9,931,896
62
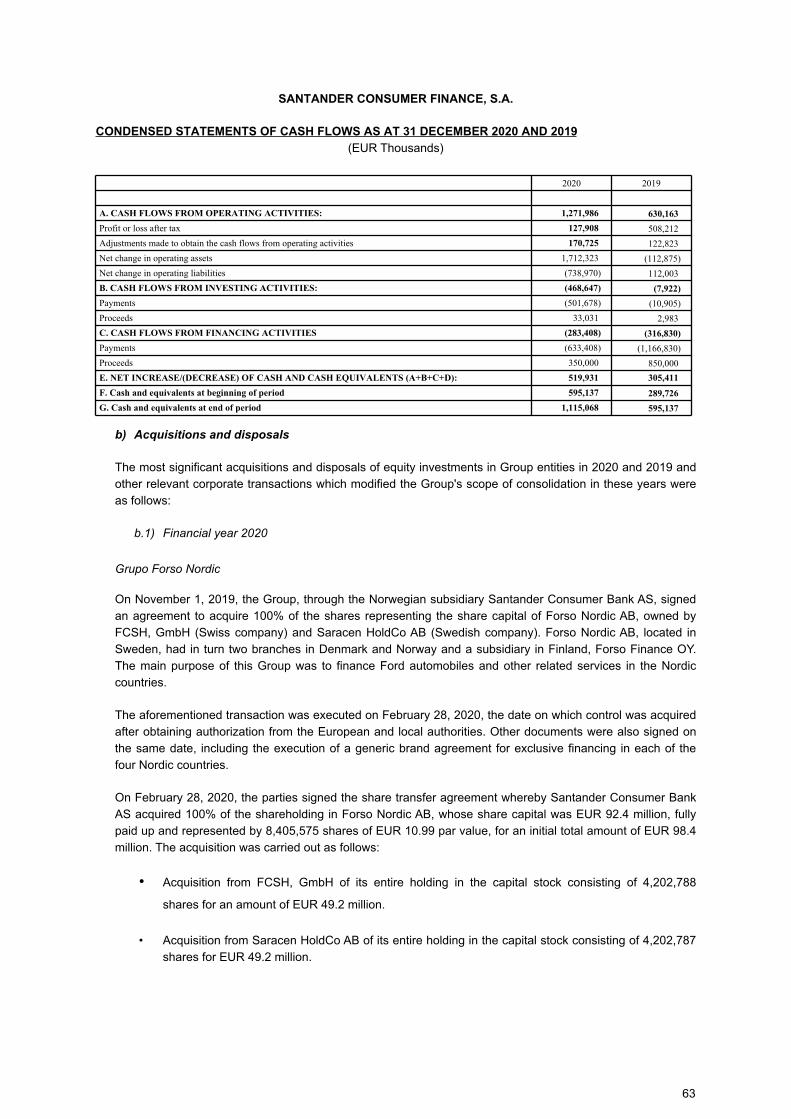
SANTANDER CONSUMER FINANCE, S.A.
CONDENSED STATEMENTS OF CASH FLOWS AS AT 31 DECEMBER 2020 AND 2019
(EUR Thousands)
2020 2019
A. CASH FLOWS FROM OPERATING ACTIVITIES: 1,271,986 630,163
Profit or loss after tax 127,908 508,212
Adjustments made to obtain the cash flows from operating activities 170,725 122,823
Net change in operating assets 1,712,323 (112,875)
Net change in operating liabilities (738,970) 112,003
B. CASH FLOWS FROM INVESTING ACTIVITIES: (468,647) (7,922)
Payments (501,678) (10,905)
Proceeds 33,031 2,983
C. CASH FLOWS FROM FINANCING ACTIVITIES (283,408) (316,830)
Payments (633,408) (1,166,830)
Proceeds 350,000 850,000
E. NET INCREASE/(DECREASE) OF CASH AND CASH EQUIVALENTS (A+B+C+D): 519,931 305,411
F. Cash and equivalents at beginning of period 595,137 289,726
G. Cash and equivalents at end of period 1,115,068 595,137
b) Acquisitions and disposals
The most significant acquisitions and disposals of equity investments in Group entities in 2020 and 2019 and
other relevant corporate transactions which modified the Group's scope of consolidation in these years were
as follows:
b.1) Financial year 2020
Grupo Forso Nordic
On November 1, 2019, the Group, through the Norwegian subsidiary Santander Consumer Bank AS, signed
an agreement to acquire 100% of the shares representing the share capital of Forso Nordic AB, owned by
FCSH, GmbH (Swiss company) and Saracen HoldCo AB (Swedish company). Forso Nordic AB, located in
Sweden, had in turn two branches in Denmark and Norway and a subsidiary in Finland, Forso Finance OY.
The main purpose of this Group was to finance Ford automobiles and other related services in the Nordic
countries.
The aforementioned transaction was executed on February 28, 2020, the date on which control was acquired
after obtaining authorization from the European and local authorities. Other documents were also signed on
the same date, including the execution of a generic brand agreement for exclusive financing in each of the
four Nordic countries.
On February 28, 2020, the parties signed the share transfer agreement whereby Santander Consumer Bank
AS acquired 100% of the shareholding in Forso Nordic AB, whose share capital was EUR 92.4 million, fully
paid up and represented by 8,405,575 shares of EUR 10.99 par value, for an initial total amount of EUR 98.4
million. The acquisition was carried out as follows:
• Acquisition from FCSH, GmbH of its entire holding in the capital stock consisting of 4,202,788
shares for an amount of EUR 49.2 million.
• Acquisition from Saracen HoldCo AB of its entire holding in the capital stock consisting of 4,202,787
shares for EUR 49.2 million.
63
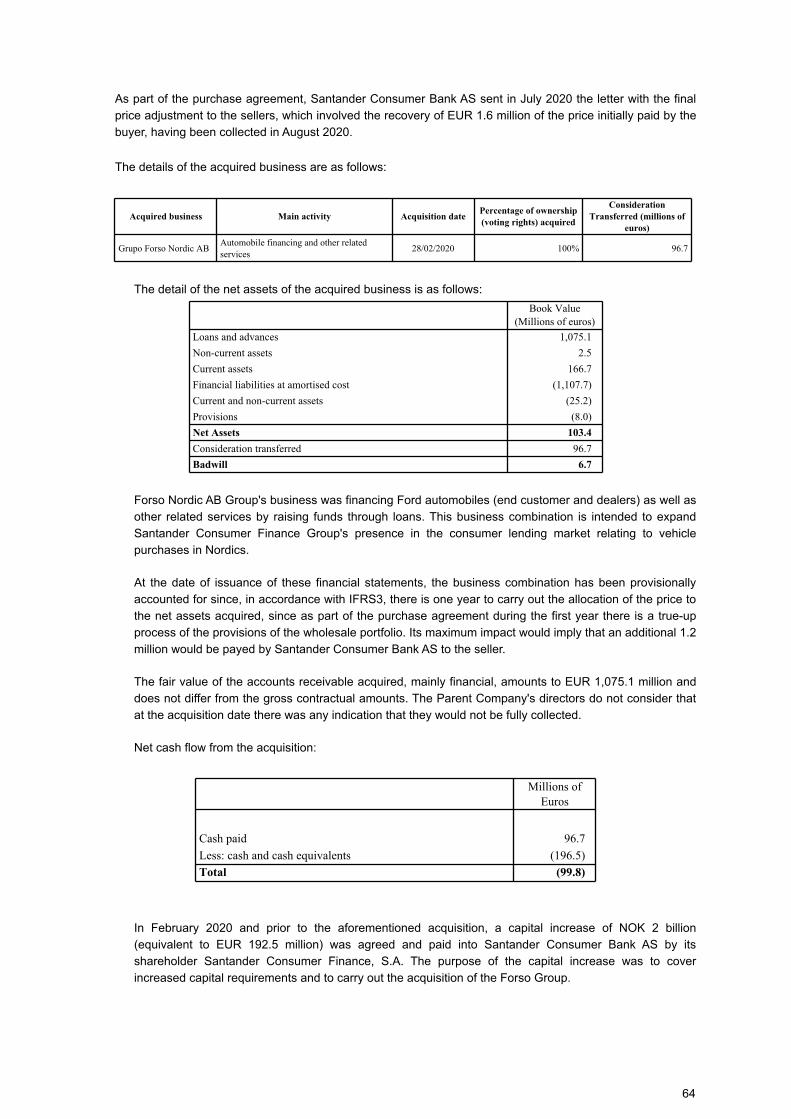
As part of the purchase agreement, Santander Consumer Bank AS sent in July 2020 the letter with the final
price adjustment to the sellers, which involved the recovery of EUR 1.6 million of the price initially paid by the
buyer, having been collected in August 2020.
The details of the acquired business are as follows:
Acquired business Main activity Acquisition datePercentage of ownership
(voting rights) acquired
Consideration
Transferred (millions of
euros)
Grupo Forso Nordic ABAutomobile financing and other related services
28/02/2020 100% 96.7
The detail of the net assets of the acquired business is as follows:
Book Value
(Millions of euros)
Loans and advances 1,075.1
Non-current assets 2.5
Current assets 166.7
Financial liabilities at amortised cost (1,107.7)
Current and non-current assets (25.2)
Provisions (8.0)
Net Assets 103.4
Consideration transferred 96.7
Badwill 6.7
Forso Nordic AB Group's business was financing Ford automobiles (end customer and dealers) as well as
other related services by raising funds through loans. This business combination is intended to expand
Santander Consumer Finance Group's presence in the consumer lending market relating to vehicle
purchases in Nordics.
At the date of issuance of these financial statements, the business combination has been provisionally
accounted for since, in accordance with IFRS3, there is one year to carry out the allocation of the price to
the net assets acquired, since as part of the purchase agreement during the first year there is a true-up
process of the provisions of the wholesale portfolio. Its maximum impact would imply that an additional 1.2
million would be payed by Santander Consumer Bank AS to the seller.
The fair value of the accounts receivable acquired, mainly financial, amounts to EUR 1,075.1 million and
does not differ from the gross contractual amounts. The Parent Company's directors do not consider that
at the acquisition date there was any indication that they would not be fully collected.
Net cash flow from the acquisition:
Millions of Euros
Cash paid 96.7
Less: cash and cash equivalents (196.5)
Total (99.8)
In February 2020 and prior to the aforementioned acquisition, a capital increase of NOK 2 billion
(equivalent to EUR 192.5 million) was agreed and paid into Santander Consumer Bank AS by its
shareholder Santander Consumer Finance, S.A. The purpose of the capital increase was to cover
increased capital requirements and to carry out the acquisition of the Forso Group.
64
In addition, on April 20, 2020, the Boards of Directors of Santander Consumer Bank AS and Forso Nordic
AB respectively approved the proposed merger by absorption. On May 8, 2020, the Norwegian Financial
Supervisory Authority approved the merger. On September 9, 2020, the merger was registered with a
retroactive accounting date of July 1, 2020.
On May 29, 2020, the Boards of Directors of Santander Consumer Finance OY (Finnish subsidiary fully
owned by Santander Consumer Bank AS) and Forso Finance OY (Finnish subsidiary fully owned by Forso
Nordic AB) respectively approved the merger by absorption on November 1, 2020 with a retroactive
accounting date of November 1, 2020.
TIM-SCB JV S.p.A.
On February 17, 2020, the Group, through its Italian subsidiary, Santander Consumer Bank, S.p.A. signed
an agreement for the creation of a joint venture with the Italian mobile, telecommunications and internet
company, TIM, S.p.A, with 51% and 49% holding percentages, respectively. The main purpose of this joint
venture is the financing of telecommunication devices as well as the sale of other financial products. The
company was established on February 19, 2020 subject to the approval of the European and local
authorities, which was received on November 4, 2020.
The company was incorporated with a share capital of EUR 2 million through the issuance of 2,000,000
shares with a par value of €1 par value. Each shareholder contributed the capital in accordance with their
holding percentage.
On October 29, 2020, a capital increase of 4 million euros was agreed, reaching a share capital of 6
million euros. This capital increase was subscribed and paid in by its shareholders in accordance with
their equity percentage. The capital increase was carried out by issuing 4 million shares with a par value
of 1 euro.
On January 4, 2021, the EUR 34 million capital increase was carried out to initiate the activity, reaching a
share capital of EUR 40 million. This capital increase was subscribed by its shareholders in accordance
with their percentage holdings. The capital increase was carried out by issuing 34 million shares with a par
value of 1 euro.
The company started operating in February 2021.
PSA Finance Suisse, S.A.
On June 30, 2020, Santander Consumer EFC, S.A. (previously 100% owned by Santander Consumer
Finance, S.A. and at the date of preparation of these financial statements merged by absorption with its
parent company Santander Consumer Finance, S.A.) acquired 100% of the shares of PSA Finance
Suisse, S.A., a company owned 100% by PSA Financial Services Spain EFC, S.A. Through this
acquisition, the Consumer Group went from owning 50% of PSA Finance Suisse, S.A. to a holding of
100%.
This acquisition was carried out through the purchase of 17,000 shares with a par value of 1,000 Swiss
francs each. The acquisition price was defined as the net book value of the company under IFRS at the
acquisition date, which was estimated at 62,325,449.15 Swiss francs (equivalent to 58,516,054.03 euros)
at the date of the sale and purchase. The sale and purchase agreement included a price adjustment
mechanism once the net book value under IFRS of the real company was obtained. As a consequence of
this adjustment mechanism, on September 17, 2020, Santander Consumer EFC, S.A. paid the seller an
additional amount of 2,128,626.63 Swiss francs (equivalent to 1,981,592.47 euros).
65
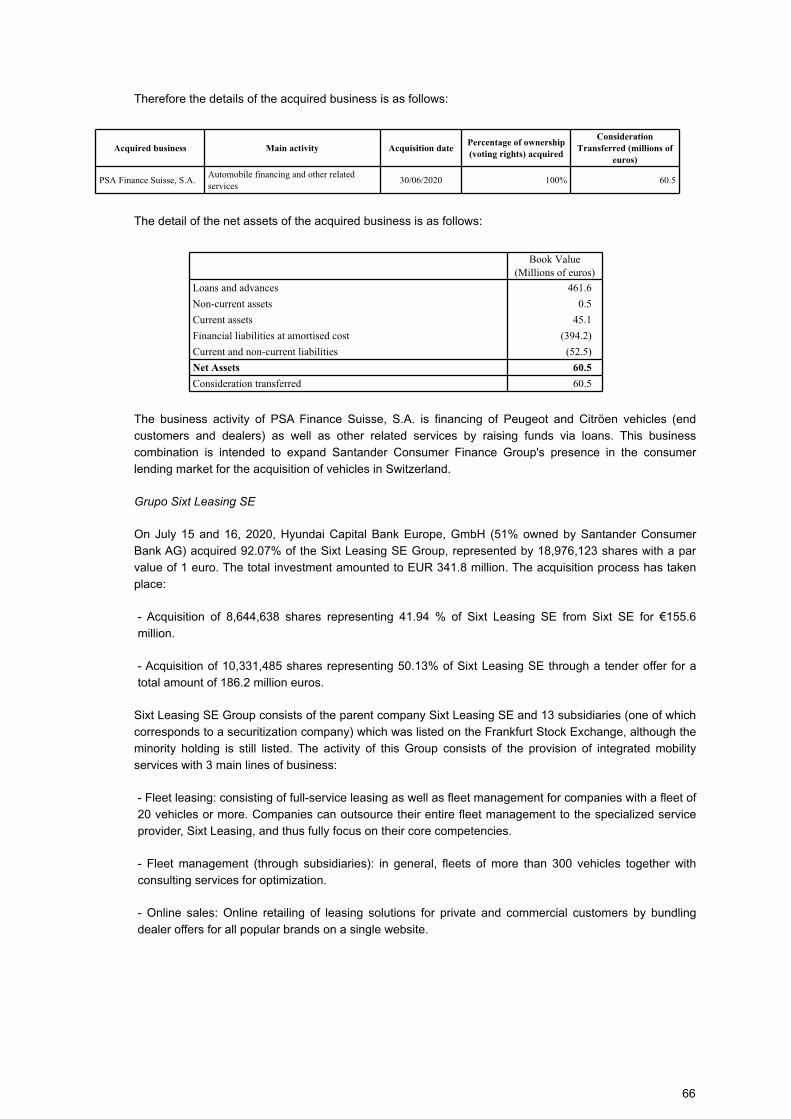
Therefore the details of the acquired business is as follows:
Acquired business Main activity Acquisition datePercentage of ownership
(voting rights) acquired
Consideration
Transferred (millions of
euros)
PSA Finance Suisse, S.A.Automobile financing and other related services
30/06/2020 100% 60.5
The detail of the net assets of the acquired business is as follows:
Book Value
(Millions of euros)
Loans and advances 461.6
Non-current assets 0.5
Current assets 45.1
Financial liabilities at amortised cost (394.2)
Current and non-current liabilities (52.5)
Net Assets 60.5
Consideration transferred 60.5
The business activity of PSA Finance Suisse, S.A. is financing of Peugeot and Citröen vehicles (end
customers and dealers) as well as other related services by raising funds via loans. This business
combination is intended to expand Santander Consumer Finance Group's presence in the consumer
lending market for the acquisition of vehicles in Switzerland.
Grupo Sixt Leasing SE
On July 15 and 16, 2020, Hyundai Capital Bank Europe, GmbH (51% owned by Santander Consumer
Bank AG) acquired 92.07% of the Sixt Leasing SE Group, represented by 18,976,123 shares with a par
value of 1 euro. The total investment amounted to EUR 341.8 million. The acquisition process has taken
place:
- Acquisition of 8,644,638 shares representing 41.94 % of Sixt Leasing SE from Sixt SE for €155.6
million.
- Acquisition of 10,331,485 shares representing 50.13% of Sixt Leasing SE through a tender offer for a
total amount of 186.2 million euros.
Sixt Leasing SE Group consists of the parent company Sixt Leasing SE and 13 subsidiaries (one of which
corresponds to a securitization company) which was listed on the Frankfurt Stock Exchange, although the
minority holding is still listed. The activity of this Group consists of the provision of integrated mobility
services with 3 main lines of business:
- Fleet leasing: consisting of full-service leasing as well as fleet management for companies with a fleet of
20 vehicles or more. Companies can outsource their entire fleet management to the specialized service
provider, Sixt Leasing, and thus fully focus on their core competencies.
- Fleet management (through subsidiaries): in general, fleets of more than 300 vehicles together with
consulting services for optimization.
- Online sales: Online retailing of leasing solutions for private and commercial customers by bundling
dealer offers for all popular brands on a single website.
66
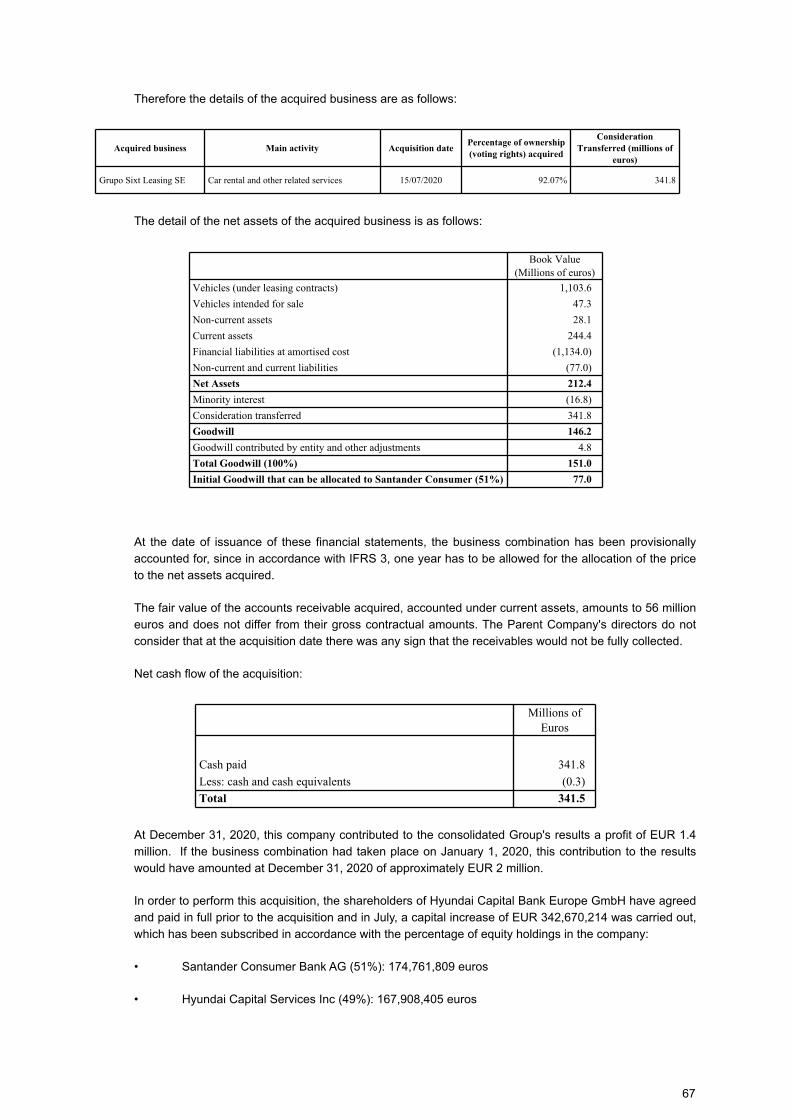
Therefore the details of the acquired business are as follows:
Acquired business Main activity Acquisition datePercentage of ownership
(voting rights) acquired
Consideration
Transferred (millions of
euros)
Grupo Sixt Leasing SE Car rental and other related services 15/07/2020 92.07% 341.8
The detail of the net assets of the acquired business is as follows:
Book Value
(Millions of euros)
Vehicles (under leasing contracts) 1,103.6
Vehicles intended for sale 47.3
Non-current assets 28.1
Current assets 244.4
Financial liabilities at amortised cost (1,134.0)
Non-current and current liabilities (77.0)
Net Assets 212.4
Minority interest (16.8)
Consideration transferred 341.8
Goodwill 146.2
Goodwill contributed by entity and other adjustments 4.8
Total Goodwill (100%) 151.0
Initial Goodwill that can be allocated to Santander Consumer (51%) 77.0
At the date of issuance of these financial statements, the business combination has been provisionally
accounted for, since in accordance with IFRS 3, one year has to be allowed for the allocation of the price
to the net assets acquired.
The fair value of the accounts receivable acquired, accounted under current assets, amounts to 56 million
euros and does not differ from their gross contractual amounts. The Parent Company's directors do not
consider that at the acquisition date there was any sign that the receivables would not be fully collected.
Net cash flow of the acquisition:
Millions of Euros
Cash paid 341.8
Less: cash and cash equivalents (0.3)
Total 341.5
At December 31, 2020, this company contributed to the consolidated Group's results a profit of EUR 1.4
million. If the business combination had taken place on January 1, 2020, this contribution to the results
would have amounted at December 31, 2020 of approximately EUR 2 million.
In order to perform this acquisition, the shareholders of Hyundai Capital Bank Europe GmbH have agreed
and paid in full prior to the acquisition and in July, a capital increase of EUR 342,670,214 was carried out,
which has been subscribed in accordance with the percentage of equity holdings in the company:
• Santander Consumer Bank AG (51%): 174,761,809 euros
• Hyundai Capital Services Inc (49%): 167,908,405 euros
67
Hyundai Capital Bank Europe, GmbH.
In February 2020, the shareholders of Hyundai Capital Bank Europe GmbH have agreed and fully paid up
a capital increase of EUR 160,000,000 with the objective of maintaining the regulatory capital ratios taking
into account the increased portfolio, having been subscribed in accordance with their percentage holdings
in the company:
• Santander Consumer Bank AG (51%): 81,600,00 euros
• Hyundai Capital Services Inc (49%): 78,400,000 euros
In addition, on November 4, 2020, Santander Consumer Bank AG, Hyundai Capital Services Inc. and
Hyundai Capital Bank Europe, GmbH, have signed a supplement to the original shareholders' agreement
for the creation of a branch of Hyundai Capital Bank Europe, GmbH in Italy in order to develop Hyundai
and Kia automobile financing (end customer and dealers) as well as other related services through raising
funds from the public via deposits and loans in the Italian market.
Work is currently in progress in order to obtain the corresponding regulatory authorizations.
Merger of Santander Consumer Finance, S.A. and Santander Consumer EFC, S.A.
On July 28, 2020, the members of the Boards of Directors of Santander Consumer, E.F.C., S.A., drafted
and approved the common merger plan between Santander Consumer Finance, S.A. (as the absorbing
company) and Santander Consumer, E.F.C., S.A. (as the absorbed company). Pursuant to article 40 of
Law 3/2009, of April 3, 2009, on structural modifications of commercial companies ("LME"), the merger
transaction described above was approved on the same date by the General Shareholders' Meeting of
Santander Consumer Finance, S.A. and the sole shareholder of Santander Consumer, E.F.C., S.A. (i.e.
Santander Consumer Finance, S.A.). (i.e. Santander Consumer Finance, S.A.).
The aforementioned transaction constitutes a merger as regulated in Article 76.1.c) of Law 27/2014, of
November 27, 2014, on Corporate Income Tax ("LIS"). The information required in Article 86.1 of the
aforementioned Law with respect to the merger is included in these notes to the consolidated financial
statements (Appendix V).
Once the mandatory authorization of the Ministry of Economic Affairs and Digital Transformation was
obtained for the merger (twelfth additional provision Law 10/2014, of June 26, on the regulation,
supervision and solvency of credit institutions), as well as the remaining regulatory authorizations to which
the merger was conditioned.
On December 22, 2020, the corresponding certificate of merger between Santander Consumer Finance,
S.A. and Santander Consumer, E.F.C., S.A. was issued, and was filed for registration with the Commercial
Registry of Madrid on the following day, December 23, 2020, and was registered on December 30, 2020.
Consequently, on the occasion of the registration of this merger, and with effect from December 23, 2020,
Santander Consumer, E.F.C., S.A. was terminated without liquidation and all its assets and liabilities were
transferred to Santander Consumer Finance, S.A., which acquired them by universal succession and
without solution of continuity.
Since the absorbed company was wholly owned by Santander Consumer Finance, S.A., in accordance
with Article 49.1, in connection with Article 26, of the LME, the Bank did not increase capital. Once the
merger became effective on December 22, 2020, all the shares of the absorbed companies were fully
amortized, extinguished and cancelled.
In accordance with the applicable accounting regulations, for accounting purposes, January 1, 2020 was
set as the date from which the operations of the absorbed company were to be considered as having
68
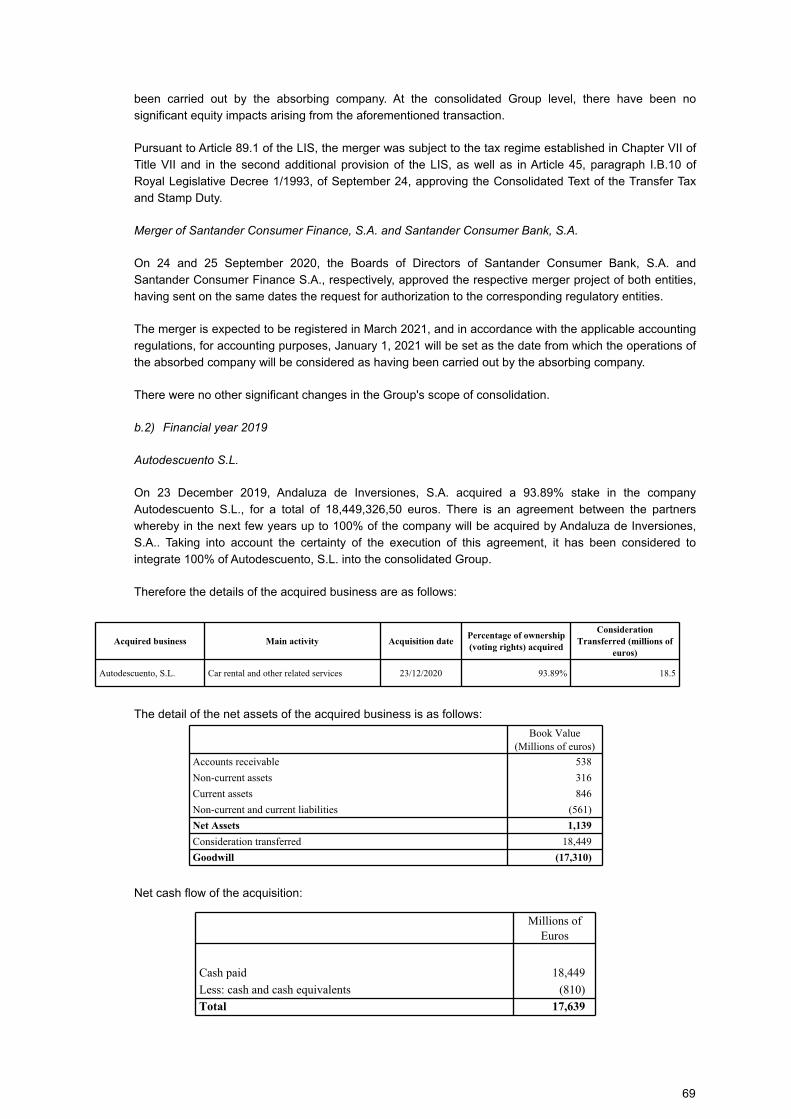
been carried out by the absorbing company. At the consolidated Group level, there have been no
significant equity impacts arising from the aforementioned transaction.
Pursuant to Article 89.1 of the LIS, the merger was subject to the tax regime established in Chapter VII of
Title VII and in the second additional provision of the LIS, as well as in Article 45, paragraph I.B.10 of
Royal Legislative Decree 1/1993, of September 24, approving the Consolidated Text of the Transfer Tax
and Stamp Duty.
Merger of Santander Consumer Finance, S.A. and Santander Consumer Bank, S.A.
On 24 and 25 September 2020, the Boards of Directors of Santander Consumer Bank, S.A. and
Santander Consumer Finance S.A., respectively, approved the respective merger project of both entities,
having sent on the same dates the request for authorization to the corresponding regulatory entities.
The merger is expected to be registered in March 2021, and in accordance with the applicable accounting
regulations, for accounting purposes, January 1, 2021 will be set as the date from which the operations of
the absorbed company will be considered as having been carried out by the absorbing company.
There were no other significant changes in the Group's scope of consolidation.
b.2) Financial year 2019
Autodescuento S.L.
On 23 December 2019, Andaluza de Inversiones, S.A. acquired a 93.89% stake in the company
Autodescuento S.L., for a total of 18,449,326,50 euros. There is an agreement between the partners
whereby in the next few years up to 100% of the company will be acquired by Andaluza de Inversiones,
S.A.. Taking into account the certainty of the execution of this agreement, it has been considered to
integrate 100% of Autodescuento, S.L. into the consolidated Group.
Therefore the details of the acquired business are as follows:
Acquired business Main activity Acquisition datePercentage of ownership
(voting rights) acquired
Consideration
Transferred (millions of
euros)
Autodescuento, S.L. Car rental and other related services 23/12/2020 93.89% 18.5
The detail of the net assets of the acquired business is as follows:
Book Value
(Millions of euros)
Accounts receivable 538
Non-current assets 316
Current assets 846
Non-current and current liabilities (561)
Net Assets 1,139
Consideration transferred 18,449
Goodwill (17,310)
Net cash flow of the acquisition:
Millions of Euros
Cash paid 18,449
Less: cash and cash equivalents (810)
Total 17,639
69
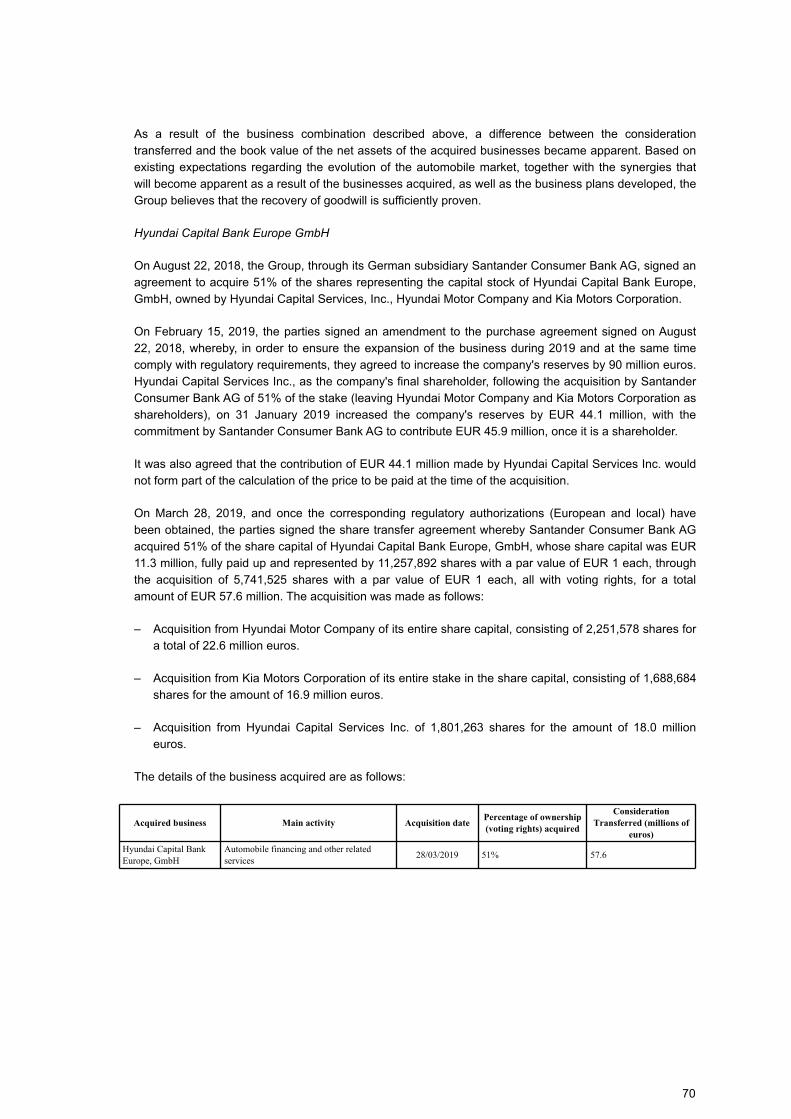
As a result of the business combination described above, a difference between the consideration
transferred and the book value of the net assets of the acquired businesses became apparent. Based on
existing expectations regarding the evolution of the automobile market, together with the synergies that
will become apparent as a result of the businesses acquired, as well as the business plans developed, the
Group believes that the recovery of goodwill is sufficiently proven.
Hyundai Capital Bank Europe GmbH
On August 22, 2018, the Group, through its German subsidiary Santander Consumer Bank AG, signed an
agreement to acquire 51% of the shares representing the capital stock of Hyundai Capital Bank Europe,
GmbH, owned by Hyundai Capital Services, Inc., Hyundai Motor Company and Kia Motors Corporation.
On February 15, 2019, the parties signed an amendment to the purchase agreement signed on August
22, 2018, whereby, in order to ensure the expansion of the business during 2019 and at the same time
comply with regulatory requirements, they agreed to increase the company's reserves by 90 million euros.
Hyundai Capital Services Inc., as the company's final shareholder, following the acquisition by Santander
Consumer Bank AG of 51% of the stake (leaving Hyundai Motor Company and Kia Motors Corporation as
shareholders), on 31 January 2019 increased the company's reserves by EUR 44.1 million, with the
commitment by Santander Consumer Bank AG to contribute EUR 45.9 million, once it is a shareholder.
It was also agreed that the contribution of EUR 44.1 million made by Hyundai Capital Services Inc. would
not form part of the calculation of the price to be paid at the time of the acquisition.
On March 28, 2019, and once the corresponding regulatory authorizations (European and local) have
been obtained, the parties signed the share transfer agreement whereby Santander Consumer Bank AG
acquired 51% of the share capital of Hyundai Capital Bank Europe, GmbH, whose share capital was EUR
11.3 million, fully paid up and represented by 11,257,892 shares with a par value of EUR 1 each, through
the acquisition of 5,741,525 shares with a par value of EUR 1 each, all with voting rights, for a total
amount of EUR 57.6 million. The acquisition was made as follows:
– Acquisition from Hyundai Motor Company of its entire share capital, consisting of 2,251,578 shares for
a total of 22.6 million euros.
– Acquisition from Kia Motors Corporation of its entire stake in the share capital, consisting of 1,688,684
shares for the amount of 16.9 million euros.
– Acquisition from Hyundai Capital Services Inc. of 1,801,263 shares for the amount of 18.0 million
euros.
The details of the business acquired are as follows:
Acquired business Main activity Acquisition datePercentage of ownership
(voting rights) acquired
Consideration
Transferred (millions of
euros)
Hyundai Capital Bank Europe, GmbH
Automobile financing and other related services
28/03/2019 51% 57.6
70
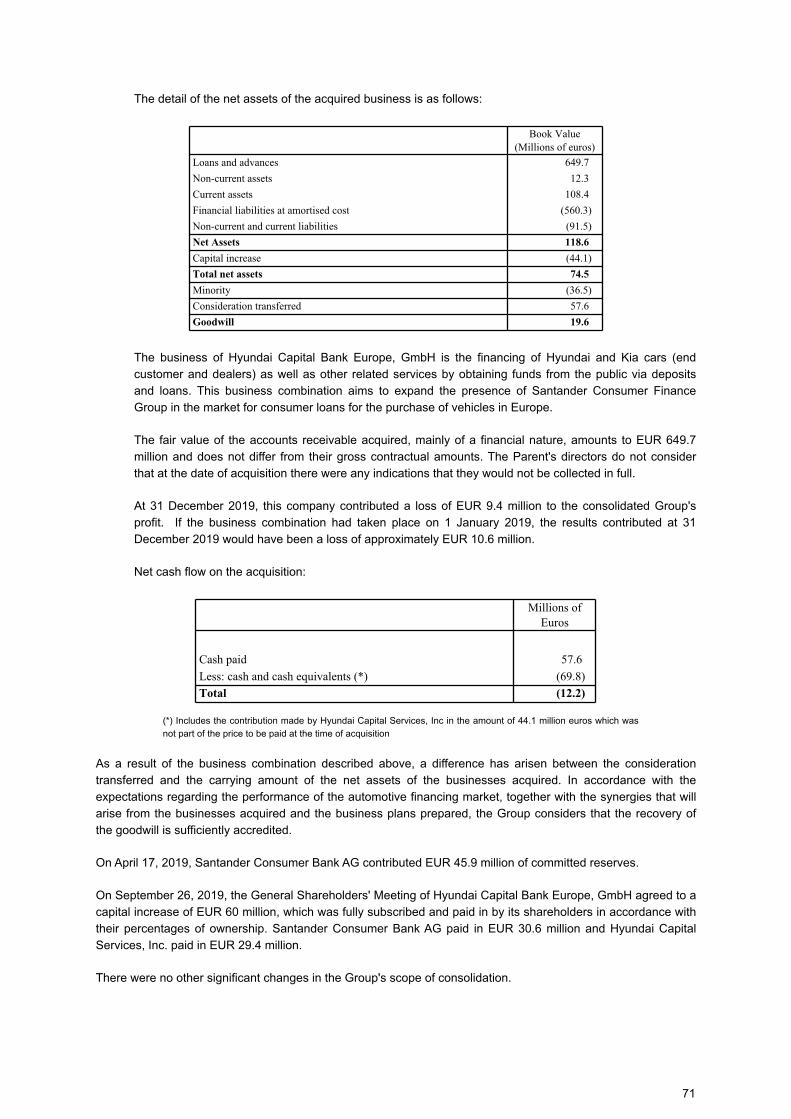
The detail of the net assets of the acquired business is as follows:
Book Value
(Millions of euros)
Loans and advances 649.7
Non-current assets 12.3
Current assets 108.4
Financial liabilities at amortised cost (560.3)
Non-current and current liabilities (91.5)
Net Assets 118.6
Capital increase (44.1)
Total net assets 74.5
Minority (36.5)
Consideration transferred 57.6
Goodwill 19.6
The business of Hyundai Capital Bank Europe, GmbH is the financing of Hyundai and Kia cars (end
customer and dealers) as well as other related services by obtaining funds from the public via deposits
and loans. This business combination aims to expand the presence of Santander Consumer Finance
Group in the market for consumer loans for the purchase of vehicles in Europe.
The fair value of the accounts receivable acquired, mainly of a financial nature, amounts to EUR 649.7
million and does not differ from their gross contractual amounts. The Parent's directors do not consider
that at the date of acquisition there were any indications that they would not be collected in full.
At 31 December 2019, this company contributed a loss of EUR 9.4 million to the consolidated Group's
profit. If the business combination had taken place on 1 January 2019, the results contributed at 31
December 2019 would have been a loss of approximately EUR 10.6 million.
Net cash flow on the acquisition:
Millions of Euros
Cash paid 57.6
Less: cash and cash equivalents (*) (69.8)
Total (12.2)
(*) Includes the contribution made by Hyundai Capital Services, Inc in the amount of 44.1 million euros which was
not part of the price to be paid at the time of acquisition
As a result of the business combination described above, a difference has arisen between the consideration
transferred and the carrying amount of the net assets of the businesses acquired. In accordance with the
expectations regarding the performance of the automotive financing market, together with the synergies that will
arise from the businesses acquired and the business plans prepared, the Group considers that the recovery of
the goodwill is sufficiently accredited.
On April 17, 2019, Santander Consumer Bank AG contributed EUR 45.9 million of committed reserves.
On September 26, 2019, the General Shareholders' Meeting of Hyundai Capital Bank Europe, GmbH agreed to a
capital increase of EUR 60 million, which was fully subscribed and paid in by its shareholders in accordance with
their percentages of ownership. Santander Consumer Bank AG paid in EUR 30.6 million and Hyundai Capital
Services, Inc. paid in EUR 29.4 million.
There were no other significant changes in the Group's scope of consolidation.
71
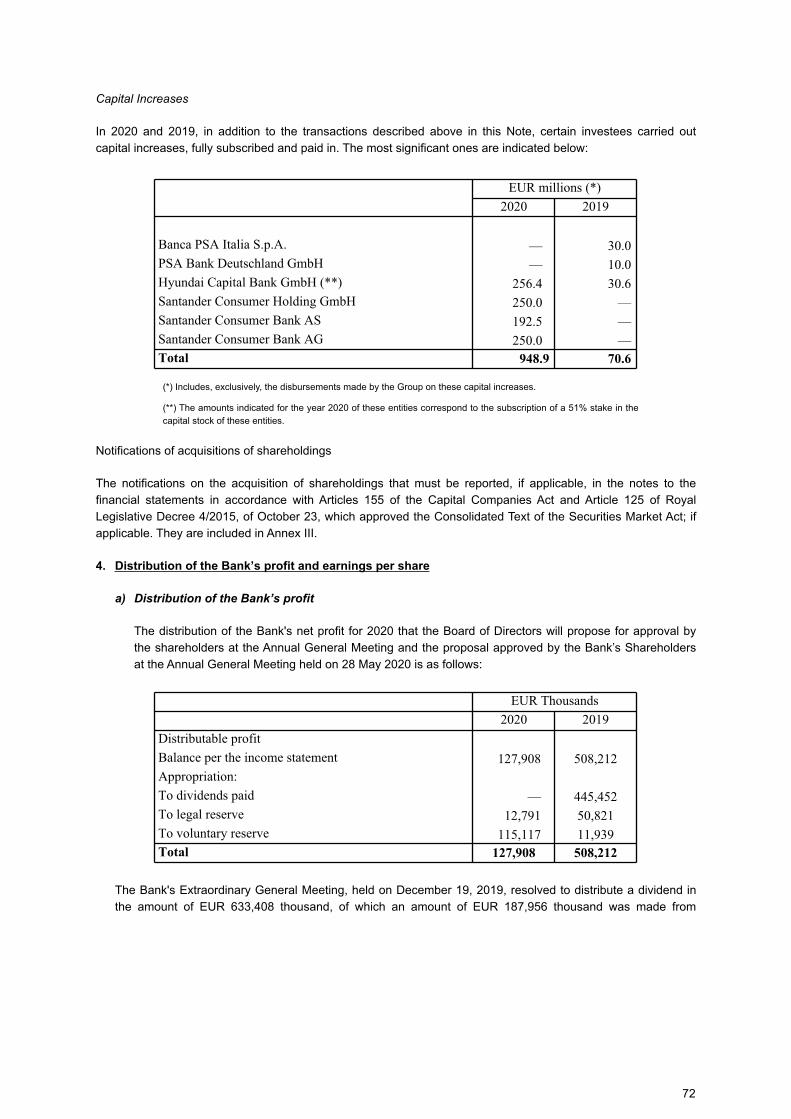
Capital Increases
In 2020 and 2019, in addition to the transactions described above in this Note, certain investees carried out
capital increases, fully subscribed and paid in. The most significant ones are indicated below:
EUR millions (*)
2020 2019
Banca PSA Italia S.p.A. — 30.0 PSA Bank Deutschland GmbH — 10.0 Hyundai Capital Bank GmbH (**) 256.4 30.6 Santander Consumer Holding GmbH 250.0 — Santander Consumer Bank AS 192.5 — Santander Consumer Bank AG 250.0 — Total 948.9 70.6
(*) Includes, exclusively, the disbursements made by the Group on these capital increases.
(**) The amounts indicated for the year 2020 of these entities correspond to the subscription of a 51% stake in the
capital stock of these entities.
Notifications of acquisitions of shareholdings
The notifications on the acquisition of shareholdings that must be reported, if applicable, in the notes to the
financial statements in accordance with Articles 155 of the Capital Companies Act and Article 125 of Royal
Legislative Decree 4/2015, of October 23, which approved the Consolidated Text of the Securities Market Act; if
applicable. They are included in Annex III.
4. Distribution of the Bank’s profit and earnings per share
a) Distribution of the Bank’s profit
The distribution of the Bank's net profit for 2020 that the Board of Directors will propose for approval by
the shareholders at the Annual General Meeting and the proposal approved by the Bank’s Shareholders
at the Annual General Meeting held on 28 May 2020 is as follows:
EUR Thousands
2020 2019
Distributable profit
Balance per the income statement 127,908 508,212Appropriation:
To dividends paid — 445,452To legal reserve 12,791 50,821To voluntary reserve 115,117 11,939Total 127,908 508,212
The Bank's Extraordinary General Meeting, held on December 19, 2019, resolved to distribute a dividend in
the amount of EUR 633,408 thousand, of which an amount of EUR 187,956 thousand was made from
72
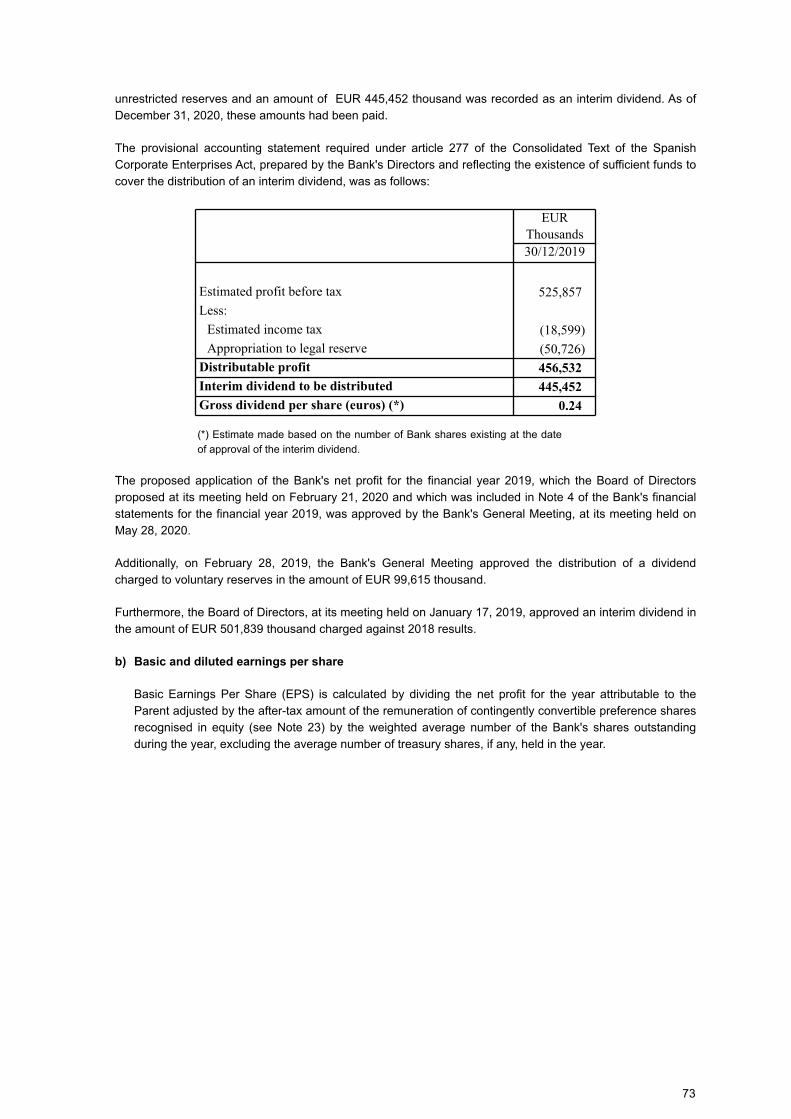
unrestricted reserves and an amount of EUR 445,452 thousand was recorded as an interim dividend. As of
December 31, 2020, these amounts had been paid.
The provisional accounting statement required under article 277 of the Consolidated Text of the Spanish
Corporate Enterprises Act, prepared by the Bank's Directors and reflecting the existence of sufficient funds to
cover the distribution of an interim dividend, was as follows:
EUR Thousands30/12/2019
Estimated profit before tax 525,857
Less:
Estimated income tax (18,599)
Appropriation to legal reserve (50,726)Distributable profit 456,532
Interim dividend to be distributed 445,452
Gross dividend per share (euros) (*) 0.24
(*) Estimate made based on the number of Bank shares existing at the date
of approval of the interim dividend.
The proposed application of the Bank's net profit for the financial year 2019, which the Board of Directors
proposed at its meeting held on February 21, 2020 and which was included in Note 4 of the Bank's financial
statements for the financial year 2019, was approved by the Bank's General Meeting, at its meeting held on
May 28, 2020.
Additionally, on February 28, 2019, the Bank's General Meeting approved the distribution of a dividend
charged to voluntary reserves in the amount of EUR 99,615 thousand.
Furthermore, the Board of Directors, at its meeting held on January 17, 2019, approved an interim dividend in
the amount of EUR 501,839 thousand charged against 2018 results.
b) Basic and diluted earnings per share
Basic Earnings Per Share (EPS) is calculated by dividing the net profit for the year attributable to the
Parent adjusted by the after-tax amount of the remuneration of contingently convertible preference shares
recognised in equity (see Note 23) by the weighted average number of the Bank's shares outstanding
during the year, excluding the average number of treasury shares, if any, held in the year.
73
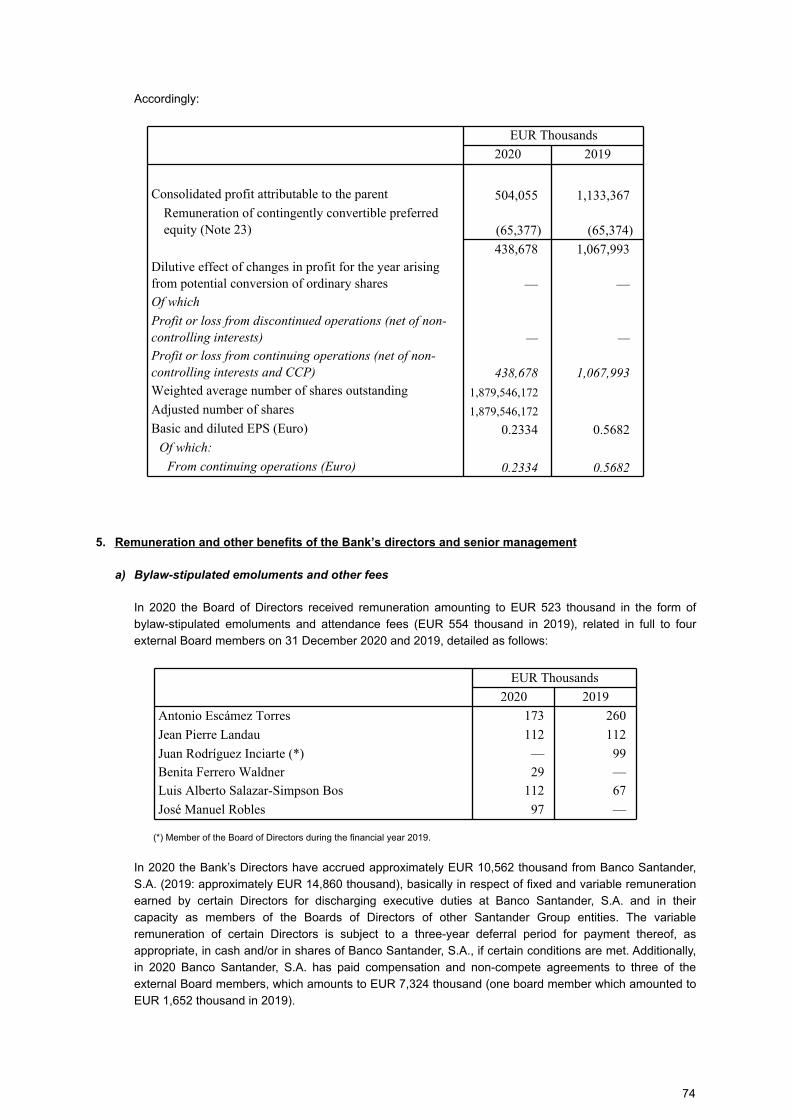
Accordingly:
EUR Thousands
2020 2019
Consolidated profit attributable to the parent 504,055 1,133,367 Remuneration of contingently convertible preferred equity (Note 23) (65,377) (65,374)
438,678 1,067,993 Dilutive effect of changes in profit for the year arising from potential conversion of ordinary shares — — Of which
Profit or loss from discontinued operations (net of non-
controlling interests) — —
Profit or loss from continuing operations (net of non-
controlling interests and CCP) 438,678 1,067,993
Weighted average number of shares outstanding 1,879,546,172
1,879,546,172
Adjusted number of shares 1,879,546,172
1,879,546,172
Basic and diluted EPS (Euro) 0.2334 0.5682 Of which:
From continuing operations (Euro) 0.2334 0.5682
5. Remuneration and other benefits of the Bank’s directors and senior management
a) Bylaw-stipulated emoluments and other fees
In 2020 the Board of Directors received remuneration amounting to EUR 523 thousand in the form of
bylaw-stipulated emoluments and attendance fees (EUR 554 thousand in 2019), related in full to four
external Board members on 31 December 2020 and 2019, detailed as follows:
EUR Thousands
2020 2019
Antonio Escámez Torres 173 260
Jean Pierre Landau 112 112
Juan Rodríguez Inciarte (*) — 99
Benita Ferrero Waldner 29 —
Luis Alberto Salazar-Simpson Bos 112 67
José Manuel Robles 97 —
(*) Member of the Board of Directors during the financial year 2019.
In 2020 the Bank’s Directors have accrued approximately EUR 10,562 thousand from Banco Santander,
S.A. (2019: approximately EUR 14,860 thousand), basically in respect of fixed and variable remuneration
earned by certain Directors for discharging executive duties at Banco Santander, S.A. and in their
capacity as members of the Boards of Directors of other Santander Group entities. The variable
remuneration of certain Directors is subject to a three-year deferral period for payment thereof, as
appropriate, in cash and/or in shares of Banco Santander, S.A., if certain conditions are met. Additionally,
in 2020 Banco Santander, S.A. has paid compensation and non-compete agreements to three of the
external Board members, which amounts to EUR 7,324 thousand (one board member which amounted to
EUR 1,652 thousand in 2019).
74
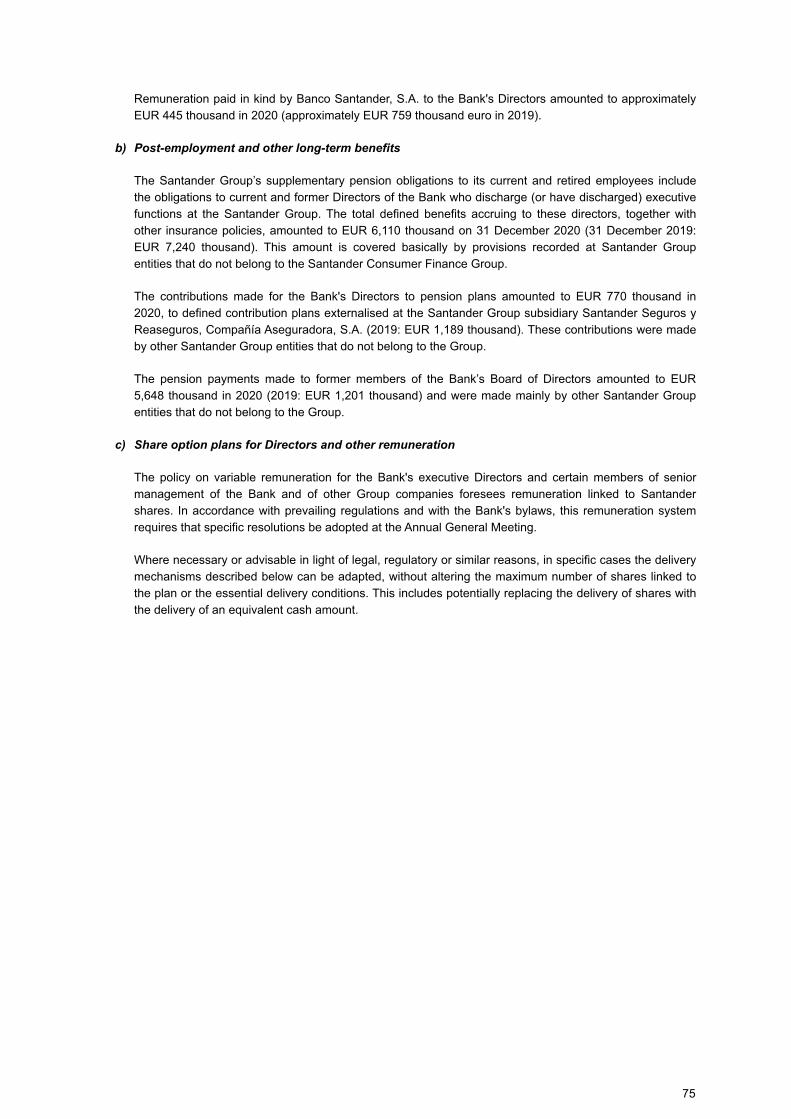
Remuneration paid in kind by Banco Santander, S.A. to the Bank's Directors amounted to approximately
EUR 445 thousand in 2020 (approximately EUR 759 thousand euro in 2019).
b) Post-employment and other long-term benefits
The Santander Group’s supplementary pension obligations to its current and retired employees include
the obligations to current and former Directors of the Bank who discharge (or have discharged) executive
functions at the Santander Group. The total defined benefits accruing to these directors, together with
other insurance policies, amounted to EUR 6,110 thousand on 31 December 2020 (31 December 2019:
EUR 7,240 thousand). This amount is covered basically by provisions recorded at Santander Group
entities that do not belong to the Santander Consumer Finance Group.
The contributions made for the Bank's Directors to pension plans amounted to EUR 770 thousand in
2020, to defined contribution plans externalised at the Santander Group subsidiary Santander Seguros y
Reaseguros, Compañía Aseguradora, S.A. (2019: EUR 1,189 thousand). These contributions were made
by other Santander Group entities that do not belong to the Group.
The pension payments made to former members of the Bank’s Board of Directors amounted to EUR
5,648 thousand in 2020 (2019: EUR 1,201 thousand) and were made mainly by other Santander Group
entities that do not belong to the Group.
c) Share option plans for Directors and other remuneration
The policy on variable remuneration for the Bank's executive Directors and certain members of senior
management of the Bank and of other Group companies foresees remuneration linked to Santander
shares. In accordance with prevailing regulations and with the Bank's bylaws, this remuneration system
requires that specific resolutions be adopted at the Annual General Meeting.
Where necessary or advisable in light of legal, regulatory or similar reasons, in specific cases the delivery
mechanisms described below can be adapted, without altering the maximum number of shares linked to
the plan or the essential delivery conditions. This includes potentially replacing the delivery of shares with
the delivery of an equivalent cash amount.
75
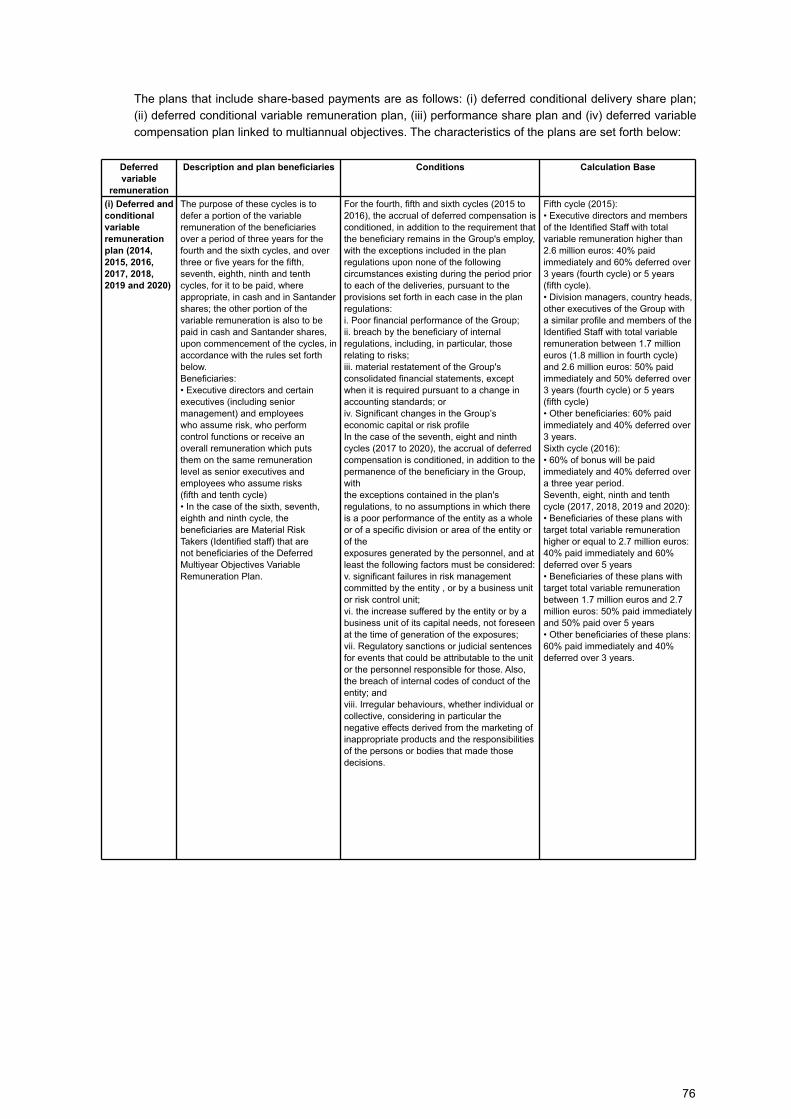
The plans that include share-based payments are as follows: (i) deferred conditional delivery share plan;
(ii) deferred conditional variable remuneration plan, (iii) performance share plan and (iv) deferred variable
compensation plan linked to multiannual objectives. The characteristics of the plans are set forth below:
Deferred
variable
remuneration
Description and plan beneficiaries Conditions Calculation Base
(i) Deferred and
conditional
variable
remuneration
plan (2014,
2015, 2016,
2017, 2018,
2019 and 2020)
The purpose of these cycles is to
defer a portion of the variable
remuneration of the beneficiaries
over a period of three years for the
fourth and the sixth cycles, and over
three or five years for the fifth,
seventh, eighth, ninth and tenth
cycles, for it to be paid, where
appropriate, in cash and in Santander
shares; the other portion of the
variable remuneration is also to be
paid in cash and Santander shares,
upon commencement of the cycles, in
accordance with the rules set forth
below.
Beneficiaries:
• Executive directors and certain
executives (including senior
management) and employees
who assume risk, who perform
control functions or receive an
overall remuneration which puts
them on the same remuneration
level as senior executives and
employees who assume risks
(fifth and tenth cycle)
• In the case of the sixth, seventh,
eighth and ninth cycle, the
beneficiaries are Material Risk
Takers (Identified staff) that are
not beneficiaries of the Deferred
Multiyear Objectives Variable
Remuneration Plan.
For the fourth, fifth and sixth cycles (2015 to
2016), the accrual of deferred compensation is
conditioned, in addition to the requirement that
the beneficiary remains in the Group's employ,
with the exceptions included in the plan
regulations upon none of the following
circumstances existing during the period prior
to each of the deliveries, pursuant to the
provisions set forth in each case in the plan
regulations:
i. Poor financial performance of the Group;
ii. breach by the beneficiary of internal
regulations, including, in particular, those
relating to risks;
iii. material restatement of the Group's
consolidated financial statements, except
when it is required pursuant to a change in
accounting standards; or
iv. Significant changes in the Group’s
economic capital or risk profile
In the case of the seventh, eight and ninth
cycles (2017 to 2020), the accrual of deferred
compensation is conditioned, in addition to the
permanence of the beneficiary in the Group,
with
the exceptions contained in the plan's
regulations, to no assumptions in which there
is a poor performance of the entity as a whole
or of a specific division or area of the entity or
of the
exposures generated by the personnel, and at
least the following factors must be considered:
v. significant failures in risk management
committed by the entity , or by a business unit
or risk control unit;
vi. the increase suffered by the entity or by a
business unit of its capital needs, not foreseen
at the time of generation of the exposures;
vii. Regulatory sanctions or judicial sentences
for events that could be attributable to the unit
or the personnel responsible for those. Also,
the breach of internal codes of conduct of the
entity; and
viii. Irregular behaviours, whether individual or
collective, considering in particular the
negative effects derived from the marketing of
inappropriate products and the responsibilities
of the persons or bodies that made those
decisions.
Fifth cycle (2015):
• Executive directors and members
of the Identified Staff with total
variable remuneration higher than
2.6 million euros: 40% paid
immediately and 60% deferred over
3 years (fourth cycle) or 5 years
(fifth cycle).
• Division managers, country heads,
other executives of the Group with
a similar profile and members of the
Identified Staff with total variable
remuneration between 1.7 million
euros (1.8 million in fourth cycle)
and 2.6 million euros: 50% paid
immediately and 50% deferred over
3 years (fourth cycle) or 5 years
(fifth cycle)
• Other beneficiaries: 60% paid
immediately and 40% deferred over
3 years.
Sixth cycle (2016):
• 60% of bonus will be paid
immediately and 40% deferred over
a three year period.
Seventh, eight, ninth and tenth
cycle (2017, 2018, 2019 and 2020):
• Beneficiaries of these plans with
target total variable remuneration
higher or equal to 2.7 million euros:
40% paid immediately and 60%
deferred over 5 years
• Beneficiaries of these plans with
target total variable remuneration
between 1.7 million euros and 2.7
million euros: 50% paid immediately
and 50% paid over 5 years
• Other beneficiaries of these plans:
60% paid immediately and 40%
deferred over 3 years.
76
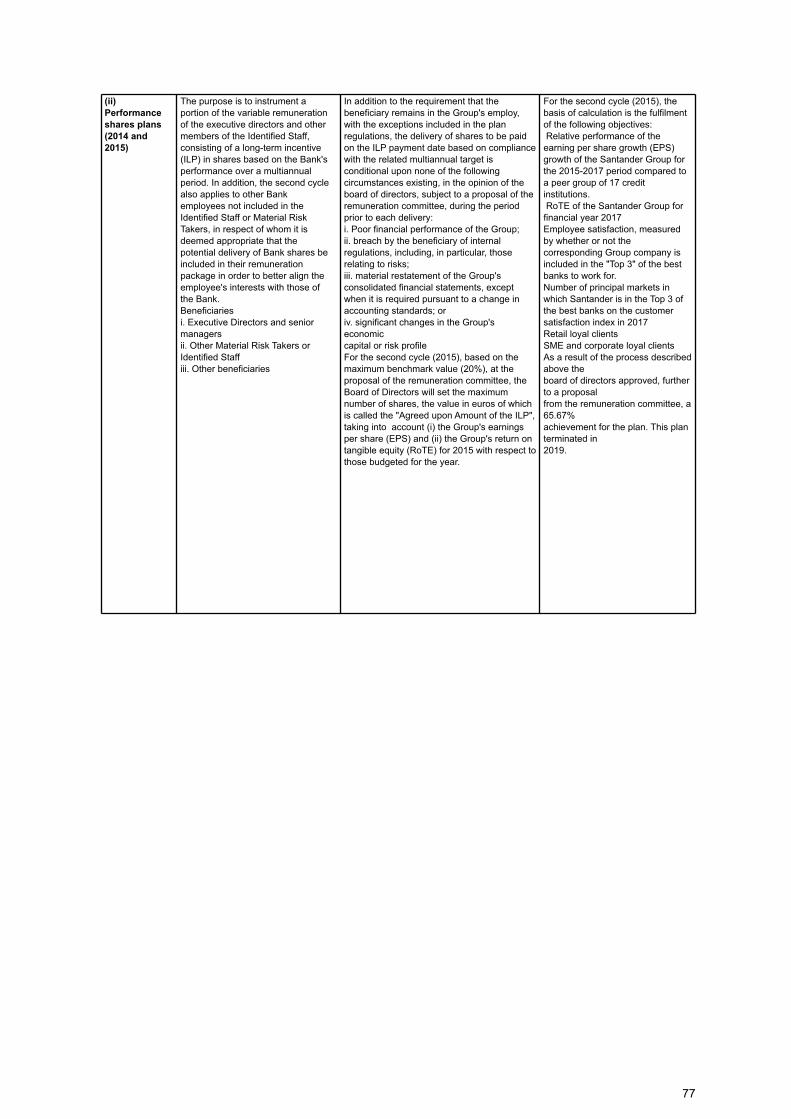
(ii)
Performance
shares plans
(2014 and
2015)
The purpose is to instrument a
portion of the variable remuneration
of the executive directors and other
members of the Identified Staff,
consisting of a long-term incentive
(ILP) in shares based on the Bank's
performance over a multiannual
period. In addition, the second cycle
also applies to other Bank
employees not included in the
Identified Staff or Material Risk
Takers, in respect of whom it is
deemed appropriate that the
potential delivery of Bank shares be
included in their remuneration
package in order to better align the
employee's interests with those of
the Bank.
Beneficiaries
i. Executive Directors and senior
managers
ii. Other Material Risk Takers or
Identified Staff
iii. Other beneficiaries
In addition to the requirement that the
beneficiary remains in the Group's employ,
with the exceptions included in the plan
regulations, the delivery of shares to be paid
on the ILP payment date based on compliance
with the related multiannual target is
conditional upon none of the following
circumstances existing, in the opinion of the
board of directors, subject to a proposal of the
remuneration committee, during the period
prior to each delivery:
i. Poor financial performance of the Group;
ii. breach by the beneficiary of internal
regulations, including, in particular, those
relating to risks;
iii. material restatement of the Group's
consolidated financial statements, except
when it is required pursuant to a change in
accounting standards; or
iv. significant changes in the Group's
economic
capital or risk profile
For the second cycle (2015), based on the
maximum benchmark value (20%), at the
proposal of the remuneration committee, the
Board of Directors will set the maximum
number of shares, the value in euros of which
is called the "Agreed upon Amount of the ILP",
taking into account (i) the Group's earnings
per share (EPS) and (ii) the Group's return on
tangible equity (RoTE) for 2015 with respect to
those budgeted for the year.
For the second cycle (2015), the
basis of calculation is the fulfilment
of the following objectives:
Relative performance of the
earning per share growth (EPS)
growth of the Santander Group for
the 2015-2017 period compared to
a peer group of 17 credit
institutions.
RoTE of the Santander Group for
financial year 2017
Employee satisfaction, measured
by whether or not the
corresponding Group company is
included in the "Top 3" of the best
banks to work for.
Number of principal markets in
which Santander is in the Top 3 of
the best banks on the customer
satisfaction index in 2017
Retail loyal clients
SME and corporate loyal clients
As a result of the process described
above the
board of directors approved, further
to a proposal
from the remuneration committee, a
65.67%
achievement for the plan. This plan
terminated in
2019.
77
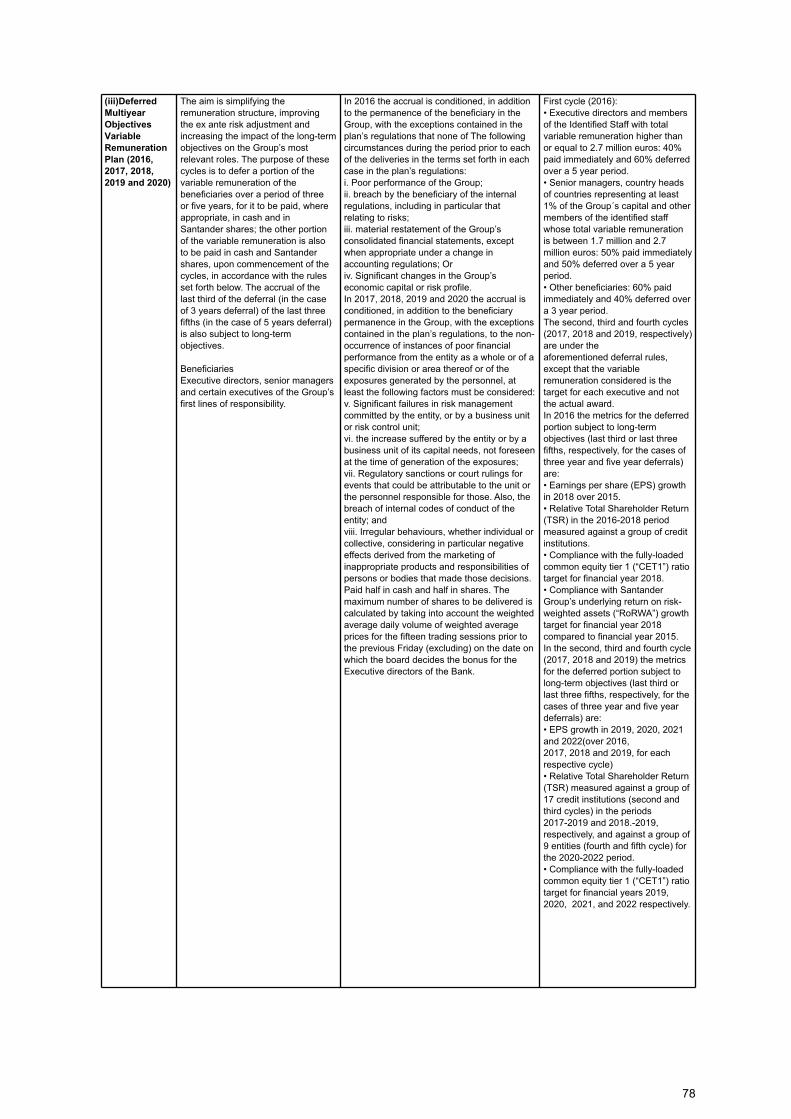
(iii)Deferred
Multiyear
Objectives
Variable
Remuneration
Plan (2016,
2017, 2018,
2019 and 2020)
The aim is simplifying the
remuneration structure, improving
the ex ante risk adjustment and
increasing the impact of the long-term
objectives on the Group’s most
relevant roles. The purpose of these
cycles is to defer a portion of the
variable remuneration of the
beneficiaries over a period of three
or five years, for it to be paid, where
appropriate, in cash and in
Santander shares; the other portion
of the variable remuneration is also
to be paid in cash and Santander
shares, upon commencement of the
cycles, in accordance with the rules
set forth below. The accrual of the
last third of the deferral (in the case
of 3 years deferral) of the last three
fifths (in the case of 5 years deferral)
is also subject to long-term
objectives.
Beneficiaries
Executive directors, senior managers
and certain executives of the Group’s
first lines of responsibility.
In 2016 the accrual is conditioned, in addition
to the permanence of the beneficiary in the
Group, with the exceptions contained in the
plan’s regulations that none of The following
circumstances during the period prior to each
of the deliveries in the terms set forth in each
case in the plan’s regulations:
i. Poor performance of the Group;
ii. breach by the beneficiary of the internal
regulations, including in particular that
relating to risks;
iii. material restatement of the Group’s
consolidated financial statements, except
when appropriate under a change in
accounting regulations; Or
iv. Significant changes in the Group’s
economic capital or risk profile.
In 2017, 2018, 2019 and 2020 the accrual is
conditioned, in addition to the beneficiary
permanence in the Group, with the exceptions
contained in the plan’s regulations, to the non-
occurrence of instances of poor financial
performance from the entity as a whole or of a
specific division or area thereof or of the
exposures generated by the personnel, at
least the following factors must be considered:
v. Significant failures in risk management
committed by the entity, or by a business unit
or risk control unit;
vi. the increase suffered by the entity or by a
business unit of its capital needs, not foreseen
at the time of generation of the exposures;
vii. Regulatory sanctions or court rulings for
events that could be attributable to the unit or
the personnel responsible for those. Also, the
breach of internal codes of conduct of the
entity; and
viii. Irregular behaviours, whether individual or
collective, considering in particular negative
effects derived from the marketing of
inappropriate products and responsibilities of
persons or bodies that made those decisions.
Paid half in cash and half in shares. The
maximum number of shares to be delivered is
calculated by taking into account the weighted
average daily volume of weighted average
prices for the fifteen trading sessions prior to
the previous Friday (excluding) on the date on
which the board decides the bonus for the
Executive directors of the Bank.
First cycle (2016):
• Executive directors and members
of the Identified Staff with total
variable remuneration higher than
or equal to 2.7 million euros: 40%
paid immediately and 60% deferred
over a 5 year period.
• Senior managers, country heads
of countries representing at least
1% of the Group´s capital and other
members of the identified staff
whose total variable remuneration
is between 1.7 million and 2.7
million euros: 50% paid immediately
and 50% deferred over a 5 year
period.
• Other beneficiaries: 60% paid
immediately and 40% deferred over
a 3 year period.
The second, third and fourth cycles
(2017, 2018 and 2019, respectively)
are under the
aforementioned deferral rules,
except that the variable
remuneration considered is the
target for each executive and not
the actual award.
In 2016 the metrics for the deferred
portion subject to long-term
objectives (last third or last three
fifths, respectively, for the cases of
three year and five year deferrals)
are:
• Earnings per share (EPS) growth
in 2018 over 2015.
• Relative Total Shareholder Return
(TSR) in the 2016-2018 period
measured against a group of credit
institutions.
• Compliance with the fully-loaded
common equity tier 1 (“CET1”) ratio
target for financial year 2018.
• Compliance with Santander
Group’s underlying return on risk-
weighted assets (“RoRWA”) growth
target for financial year 2018
compared to financial year 2015.
In the second, third and fourth cycle
(2017, 2018 and 2019) the metrics
for the deferred portion subject to
long-term objectives (last third or
last three fifths, respectively, for the
cases of three year and five year
deferrals) are:
• EPS growth in 2019, 2020, 2021
and 2022(over 2016,
2017, 2018 and 2019, for each
respective cycle)
• Relative Total Shareholder Return
(TSR) measured against a group of
17 credit institutions (second and
third cycles) in the periods
2017-2019 and 2018.-2019,
respectively, and against a group of
9 entities (fourth and fifth cycle) for
the 2020-2022 period.
• Compliance with the fully-loaded
common equity tier 1 (“CET1”) ratio
target for financial years 2019,
2020, 2021, and 2022 respectively.
78
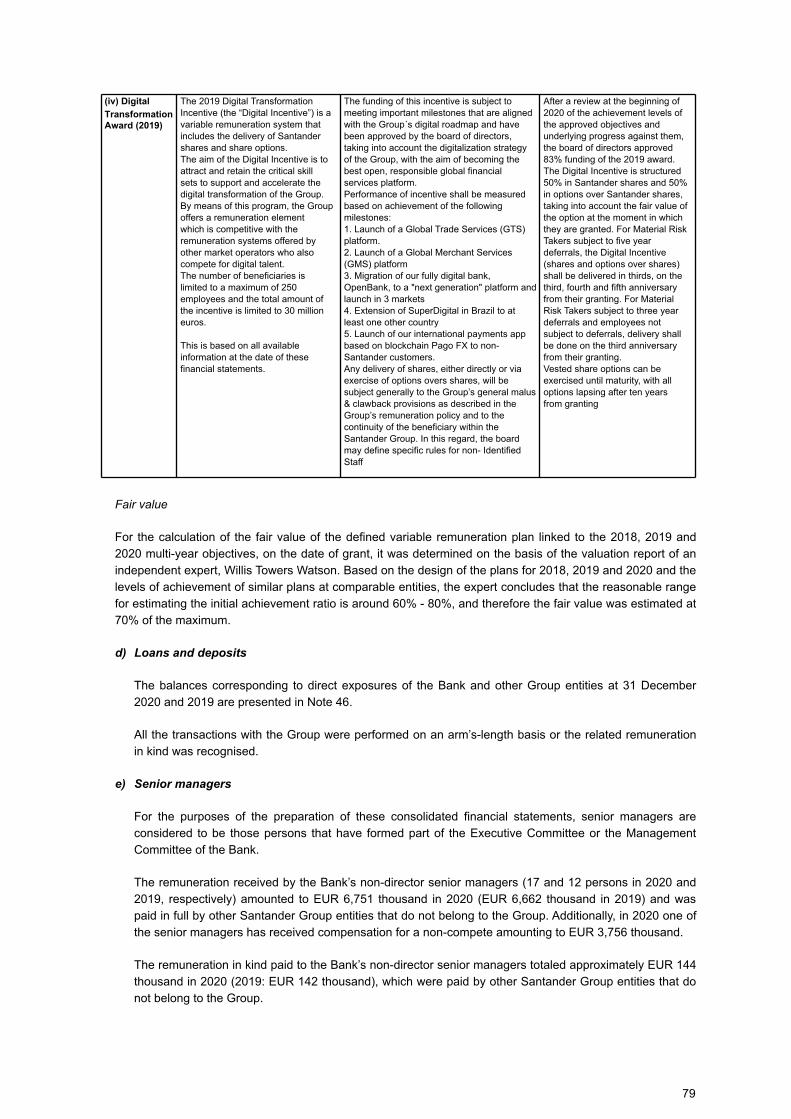
(iv) Digital
Transformation
Award (2019)
The 2019 Digital Transformation
Incentive (the “Digital Incentive”) is a
variable remuneration system that
includes the delivery of Santander
shares and share options.
The aim of the Digital Incentive is to
attract and retain the critical skill
sets to support and accelerate the
digital transformation of the Group.
By means of this program, the Group
offers a remuneration element
which is competitive with the
remuneration systems offered by
other market operators who also
compete for digital talent.
The number of beneficiaries is
limited to a maximum of 250
employees and the total amount of
the incentive is limited to 30 million
euros.
This is based on all available
information at the date of these
financial statements.
The funding of this incentive is subject to
meeting important milestones that are aligned
with the Group´s digital roadmap and have
been approved by the board of directors,
taking into account the digitalization strategy
of the Group, with the aim of becoming the
best open, responsible global financial
services platform.
Performance of incentive shall be measured
based on achievement of the following
milestones:
1. Launch of a Global Trade Services (GTS)
platform.
2. Launch of a Global Merchant Services
(GMS) platform
3. Migration of our fully digital bank,
OpenBank, to a "next generation" platform and
launch in 3 markets
4. Extension of SuperDigital in Brazil to at
least one other country
5. Launch of our international payments app
based on blockchain Pago FX to non-
Santander customers.
Any delivery of shares, either directly or via
exercise of options overs shares, will be
subject generally to the Group’s general malus
& clawback provisions as described in the
Group’s remuneration policy and to the
continuity of the beneficiary within the
Santander Group. In this regard, the board
may define specific rules for non- Identified
Staff
After a review at the beginning of
2020 of the achievement levels of
the approved objectives and
underlying progress against them,
the board of directors approved
83% funding of the 2019 award.
The Digital Incentive is structured
50% in Santander shares and 50%
in options over Santander shares,
taking into account the fair value of
the option at the moment in which
they are granted. For Material Risk
Takers subject to five year
deferrals, the Digital Incentive
(shares and options over shares)
shall be delivered in thirds, on the
third, fourth and fifth anniversary
from their granting. For Material
Risk Takers subject to three year
deferrals and employees not
subject to deferrals, delivery shall
be done on the third anniversary
from their granting.
Vested share options can be
exercised until maturity, with all
options lapsing after ten years
from granting
Fair value
For the calculation of the fair value of the defined variable remuneration plan linked to the 2018, 2019 and
2020 multi-year objectives, on the date of grant, it was determined on the basis of the valuation report of an
independent expert, Willis Towers Watson. Based on the design of the plans for 2018, 2019 and 2020 and the
levels of achievement of similar plans at comparable entities, the expert concludes that the reasonable range
for estimating the initial achievement ratio is around 60% - 80%, and therefore the fair value was estimated at
70% of the maximum.
d) Loans and deposits
The balances corresponding to direct exposures of the Bank and other Group entities at 31 December
2020 and 2019 are presented in Note 46.
All the transactions with the Group were performed on an arm’s-length basis or the related remuneration
in kind was recognised.
e) Senior managers
For the purposes of the preparation of these consolidated financial statements, senior managers are
considered to be those persons that have formed part of the Executive Committee or the Management
Committee of the Bank.
The remuneration received by the Bank’s non-director senior managers (17 and 12 persons in 2020 and
2019, respectively) amounted to EUR 6,751 thousand in 2020 (EUR 6,662 thousand in 2019) and was
paid in full by other Santander Group entities that do not belong to the Group. Additionally, in 2020 one of
the senior managers has received compensation for a non-compete amounting to EUR 3,756 thousand.
The remuneration in kind paid to the Bank’s non-director senior managers totaled approximately EUR 144
thousand in 2020 (2019: EUR 142 thousand), which were paid by other Santander Group entities that do
not belong to the Group.
79
In 2020 contributions amounting to EUR 505 thousand (EUR 869 thousand at 31 December 2019) were
made to defined contribution pension plans for the Bank’s non-director senior managers. These
contributions were made by other Santander Group entities that do not belong to the Group. In 2020 and
2019 no payments were made in this connection.
The principles governing the share options granted to the Bank’s senior managers, excluding Directors,
are the same as those explained in Note 5-c. The Bank's and other Group entities' direct risk exposure to
senior managers who, as of 31 December 2020 and 2019, are not Bank Directors are detailed in Note 46.
All the transactions with the Group were performed on an arm’s-length basis or the related remuneration
in kind was recognised.
f) Termination benefits
The executive Directors and senior executives at Santander Group entities have indefinite-term
employment contracts. Executive Directors or senior executives whose contracts are terminated
voluntarily or due to breach of duties are not entitled to receive any economic compensation. If the
contract is terminated for any other reason, they will be entitled only to the corresponding legally-
stipulated termination benefit.
Certain non-director members of the Bank's senior management have contracts which entitle them, in
certain circumstances, to an extraordinary contribution to their welfare benefit scheme in the event of
termination for reasons other than voluntary redundancy, retirement, disability or serious breach of duties.
These benefits are recognised as a provision for pensions and similar obligations and as a staff cost only
when the employment relationship between Banco Santander and its executives is terminated before the
normal retirement date.
g) Information on investments held by the directors in other companies and conflicts of interest
None of the members of the Board of Directors or persons related to them perform, as independent
professionals or as employees, activities that involve effective competition, be it present or potential, with
the activities of the Group, or that, in any other way, place the directors in an ongoing conflict with the
interests of the Group.
Without prejudice to the foregoing, following is a detail of the declarations by the Bank's Directors at 31
December 2020 with respect to their investments and the investments of persons related to them in the
80
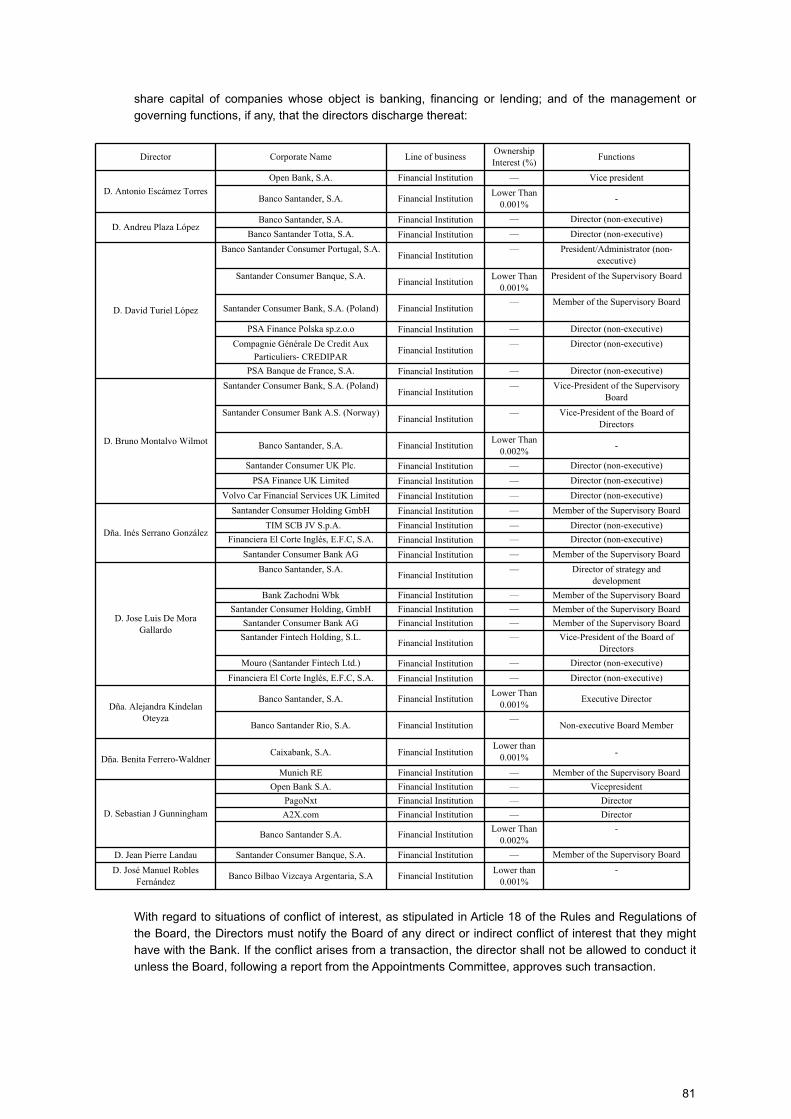
share capital of companies whose object is banking, financing or lending; and of the management or
governing functions, if any, that the directors discharge thereat:
Director Corporate Name Line of businessOwnership Interest (%)
Functions
D. Antonio Escámez Torres
Open Bank, S.A. Financial Institution — Vice president
Banco Santander, S.A. Financial InstitutionLower Than
0.001%-
D. Andreu Plaza LópezBanco Santander, S.A. Financial Institution — Director (non-executive)
Banco Santander Totta, S.A. Financial Institution — Director (non-executive)
D. David Turiel López
Banco Santander Consumer Portugal, S.A.Financial Institution
— President/Administrator (non-executive)
Santander Consumer Banque, S.A.Financial Institution
Lower Than 0.001%
President of the Supervisory Board
Santander Consumer Bank, S.A. (Poland) Financial Institution— Member of the Supervisory Board
PSA Finance Polska sp.z.o.o Financial Institution — Director (non-executive)
Compagnie Générale De Credit Aux
Particuliers- CREDIPARFinancial Institution
— Director (non-executive)
PSA Banque de France, S.A. Financial Institution — Director (non-executive)
D. Bruno Montalvo Wilmot
Santander Consumer Bank, S.A. (Poland)Financial Institution
— Vice-President of the Supervisory Board
Santander Consumer Bank A.S. (Norway)Financial Institution
— Vice-President of the Board of Directors
Banco Santander, S.A. Financial InstitutionLower Than
0.002%-
Santander Consumer UK Plc. Financial Institution — Director (non-executive)
PSA Finance UK Limited Financial Institution — Director (non-executive)
Volvo Car Financial Services UK Limited Financial Institution — Director (non-executive)
Dña. Inés Serrano González
Santander Consumer Holding GmbH Financial Institution — Member of the Supervisory Board
TIM SCB JV S.p.A. Financial Institution — Director (non-executive)
Financiera El Corte Inglés, E.F.C, S.A. Financial Institution — Director (non-executive)
Santander Consumer Bank AG Financial Institution — Member of the Supervisory Board
D. Jose Luis De Mora Gallardo
Banco Santander, S.A.Financial Institution
— Director of strategy and development
Bank Zachodni Wbk Financial Institution — Member of the Supervisory Board
Santander Consumer Holding, GmbH Financial Institution — Member of the Supervisory Board
Santander Consumer Bank AG Financial Institution — Member of the Supervisory Board
Santander Fintech Holding, S.L. Financial Institution
— Vice-President of the Board of Directors
Mouro (Santander Fintech Ltd.) Financial Institution — Director (non-executive)
Financiera El Corte Inglés, E.F.C, S.A. Financial Institution — Director (non-executive)
Dña. Alejandra Kindelan Oteyza
Banco Santander, S.A. Financial InstitutionLower Than
0.001%Executive Director
Banco Santander Rio, S.A. Financial Institution—
Non-executive Board Member
Dña. Benita Ferrero-WaldnerCaixabank, S.A. Financial Institution
Lower than 0.001%
-
Munich RE Financial Institution — Member of the Supervisory Board
D. Sebastian J Gunningham
Open Bank S.A. Financial Institution — Vicepresident
PagoNxt Financial Institution — Director
A2X.com Financial Institution — Director
Banco Santander S.A. Financial InstitutionLower Than
0.002%-
D. Jean Pierre Landau Santander Consumer Banque, S.A. Financial Institution — Member of the Supervisory Board
D. José Manuel Robles Fernández
Banco Bilbao Vizcaya Argentaria, S.A Financial InstitutionLower than
0.001%-
With regard to situations of conflict of interest, as stipulated in Article 18 of the Rules and Regulations of
the Board, the Directors must notify the Board of any direct or indirect conflict of interest that they might
have with the Bank. If the conflict arises from a transaction, the director shall not be allowed to conduct it
unless the Board, following a report from the Appointments Committee, approves such transaction.
81
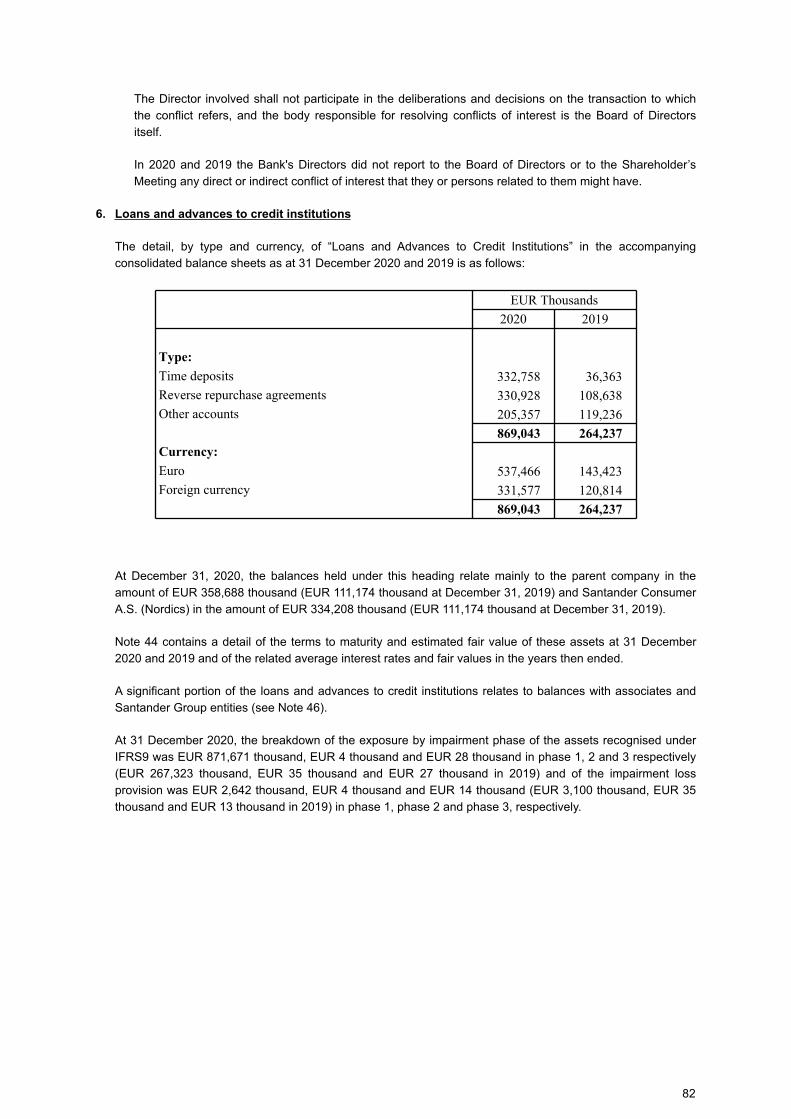
The Director involved shall not participate in the deliberations and decisions on the transaction to which
the conflict refers, and the body responsible for resolving conflicts of interest is the Board of Directors
itself.
In 2020 and 2019 the Bank's Directors did not report to the Board of Directors or to the Shareholder’s
Meeting any direct or indirect conflict of interest that they or persons related to them might have.
6. Loans and advances to credit institutions
The detail, by type and currency, of “Loans and Advances to Credit Institutions” in the accompanying
consolidated balance sheets as at 31 December 2020 and 2019 is as follows:
EUR Thousands
2020 2019
Type:
Time deposits 332,758 36,363
Reverse repurchase agreements 330,928 108,638
Other accounts 205,357 119,236
869,043 264,237
Currency:
Euro 537,466 143,423
Foreign currency 331,577 120,814
869,043 264,237
At December 31, 2020, the balances held under this heading relate mainly to the parent company in the
amount of EUR 358,688 thousand (EUR 111,174 thousand at December 31, 2019) and Santander Consumer
A.S. (Nordics) in the amount of EUR 334,208 thousand (EUR 111,174 thousand at December 31, 2019).
Note 44 contains a detail of the terms to maturity and estimated fair value of these assets at 31 December
2020 and 2019 and of the related average interest rates and fair values in the years then ended.
A significant portion of the loans and advances to credit institutions relates to balances with associates and
Santander Group entities (see Note 46).
At 31 December 2020, the breakdown of the exposure by impairment phase of the assets recognised under
IFRS9 was EUR 871,671 thousand, EUR 4 thousand and EUR 28 thousand in phase 1, 2 and 3 respectively
(EUR 267,323 thousand, EUR 35 thousand and EUR 27 thousand in 2019) and of the impairment loss
provision was EUR 2,642 thousand, EUR 4 thousand and EUR 14 thousand (EUR 3,100 thousand, EUR 35
thousand and EUR 13 thousand in 2019) in phase 1, phase 2 and phase 3, respectively.
82
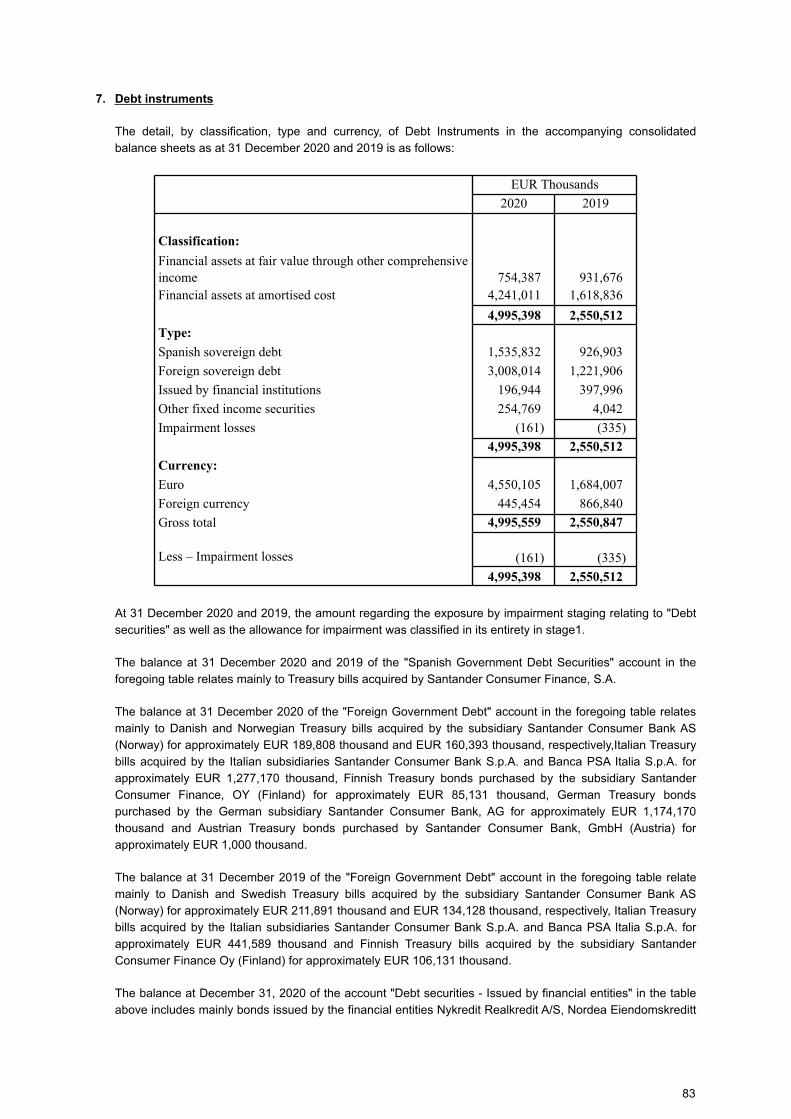
7. Debt instruments
The detail, by classification, type and currency, of Debt Instruments in the accompanying consolidated
balance sheets as at 31 December 2020 and 2019 is as follows:
EUR Thousands
2020 2019
Classification:
Financial assets at fair value through other comprehensive income 754,387 931,676 Financial assets at amortised cost 4,241,011 1,618,836
4,995,398 2,550,512
Type:
Spanish sovereign debt 1,535,832 926,903
Foreign sovereign debt 3,008,014 1,221,906
Issued by financial institutions 196,944 397,996
Other fixed income securities 254,769 4,042
Impairment losses (161) (335)
4,995,398 2,550,512
Currency:
Euro 4,550,105 1,684,007
Foreign currency 445,454 866,840
Gross total 4,995,559 2,550,847
Less – Impairment losses (161) (335)
4,995,398 2,550,512
At 31 December 2020 and 2019, the amount regarding the exposure by impairment staging relating to "Debt
securities" as well as the allowance for impairment was classified in its entirety in stage1.
The balance at 31 December 2020 and 2019 of the "Spanish Government Debt Securities" account in the
foregoing table relates mainly to Treasury bills acquired by Santander Consumer Finance, S.A.
The balance at 31 December 2020 of the "Foreign Government Debt" account in the foregoing table relates
mainly to Danish and Norwegian Treasury bills acquired by the subsidiary Santander Consumer Bank AS
(Norway) for approximately EUR 189,808 thousand and EUR 160,393 thousand, respectively,Italian Treasury
bills acquired by the Italian subsidiaries Santander Consumer Bank S.p.A. and Banca PSA Italia S.p.A. for
approximately EUR 1,277,170 thousand, Finnish Treasury bonds purchased by the subsidiary Santander
Consumer Finance, OY (Finland) for approximately EUR 85,131 thousand, German Treasury bonds
purchased by the German subsidiary Santander Consumer Bank, AG for approximately EUR 1,174,170
thousand and Austrian Treasury bonds purchased by Santander Consumer Bank, GmbH (Austria) for
approximately EUR 1,000 thousand.
The balance at 31 December 2019 of the "Foreign Government Debt" account in the foregoing table relate
mainly to Danish and Swedish Treasury bills acquired by the subsidiary Santander Consumer Bank AS
(Norway) for approximately EUR 211,891 thousand and EUR 134,128 thousand, respectively, Italian Treasury
bills acquired by the Italian subsidiaries Santander Consumer Bank S.p.A. and Banca PSA Italia S.p.A. for
approximately EUR 441,589 thousand and Finnish Treasury bills acquired by the subsidiary Santander
Consumer Finance Oy (Finland) for approximately EUR 106,131 thousand.
The balance at December 31, 2020 of the account "Debt securities - Issued by financial entities" in the table
above includes mainly bonds issued by the financial entities Nykredit Realkredit A/S, Nordea Eiendomskreditt
83
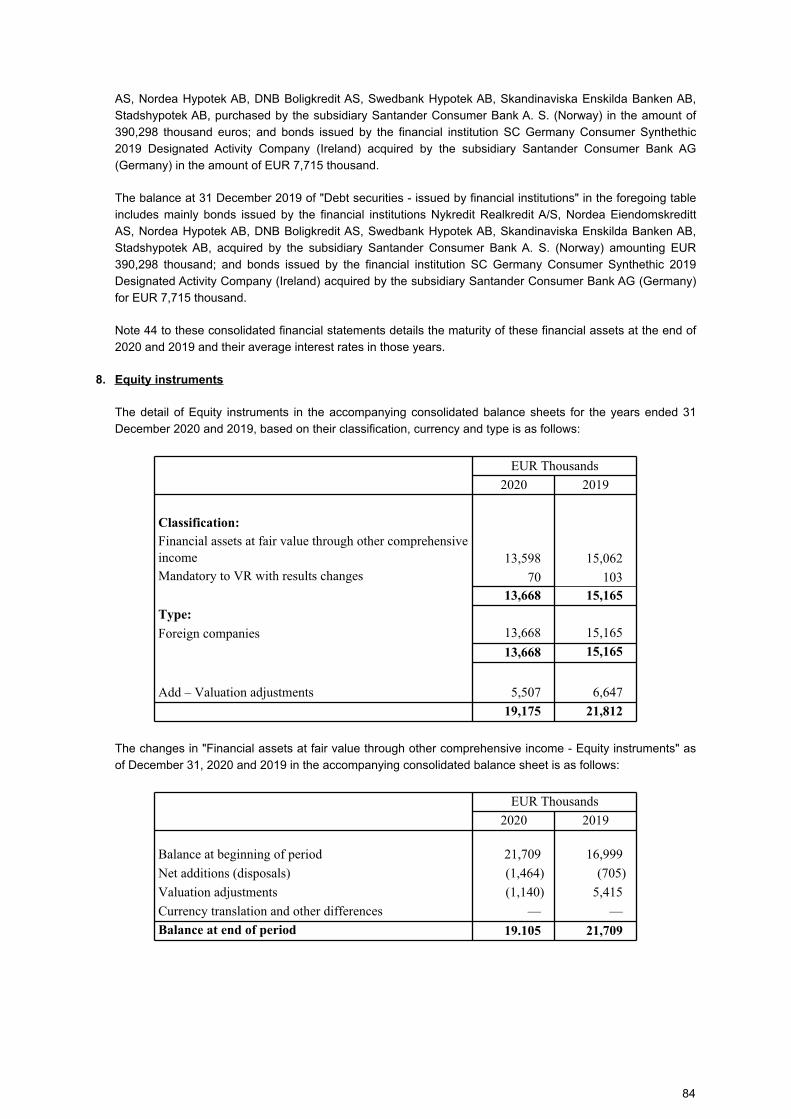
AS, Nordea Hypotek AB, DNB Boligkredit AS, Swedbank Hypotek AB, Skandinaviska Enskilda Banken AB,
Stadshypotek AB, purchased by the subsidiary Santander Consumer Bank A. S. (Norway) in the amount of
390,298 thousand euros; and bonds issued by the financial institution SC Germany Consumer Synthethic
2019 Designated Activity Company (Ireland) acquired by the subsidiary Santander Consumer Bank AG
(Germany) in the amount of EUR 7,715 thousand.
The balance at 31 December 2019 of "Debt securities - issued by financial institutions" in the foregoing table
includes mainly bonds issued by the financial institutions Nykredit Realkredit A/S, Nordea Eiendomskreditt
AS, Nordea Hypotek AB, DNB Boligkredit AS, Swedbank Hypotek AB, Skandinaviska Enskilda Banken AB,
Stadshypotek AB, acquired by the subsidiary Santander Consumer Bank A. S. (Norway) amounting EUR
390,298 thousand; and bonds issued by the financial institution SC Germany Consumer Synthethic 2019
Designated Activity Company (Ireland) acquired by the subsidiary Santander Consumer Bank AG (Germany)
for EUR 7,715 thousand.
Note 44 to these consolidated financial statements details the maturity of these financial assets at the end of
2020 and 2019 and their average interest rates in those years.
8. Equity instruments
The detail of Equity instruments in the accompanying consolidated balance sheets for the years ended 31
December 2020 and 2019, based on their classification, currency and type is as follows:
EUR Thousands
2020 2019
Classification:
Financial assets at fair value through other comprehensive income 13,598 15,062 Mandatory to VR with results changes 70 103
13,668 15,165
Type:
Foreign companies 13,668 15,165
13,668 15,165
Add – Valuation adjustments 5,507 6,647
19,175 21,812
The changes in "Financial assets at fair value through other comprehensive income - Equity instruments" as
of December 31, 2020 and 2019 in the accompanying consolidated balance sheet is as follows:
EUR Thousands
2020 2019
Balance at beginning of period 21,709 16,999
Net additions (disposals) (1,464) (705)
Valuation adjustments (1,140) 5,415
Currency translation and other differences — —
Balance at end of period 19.105 21,709
84
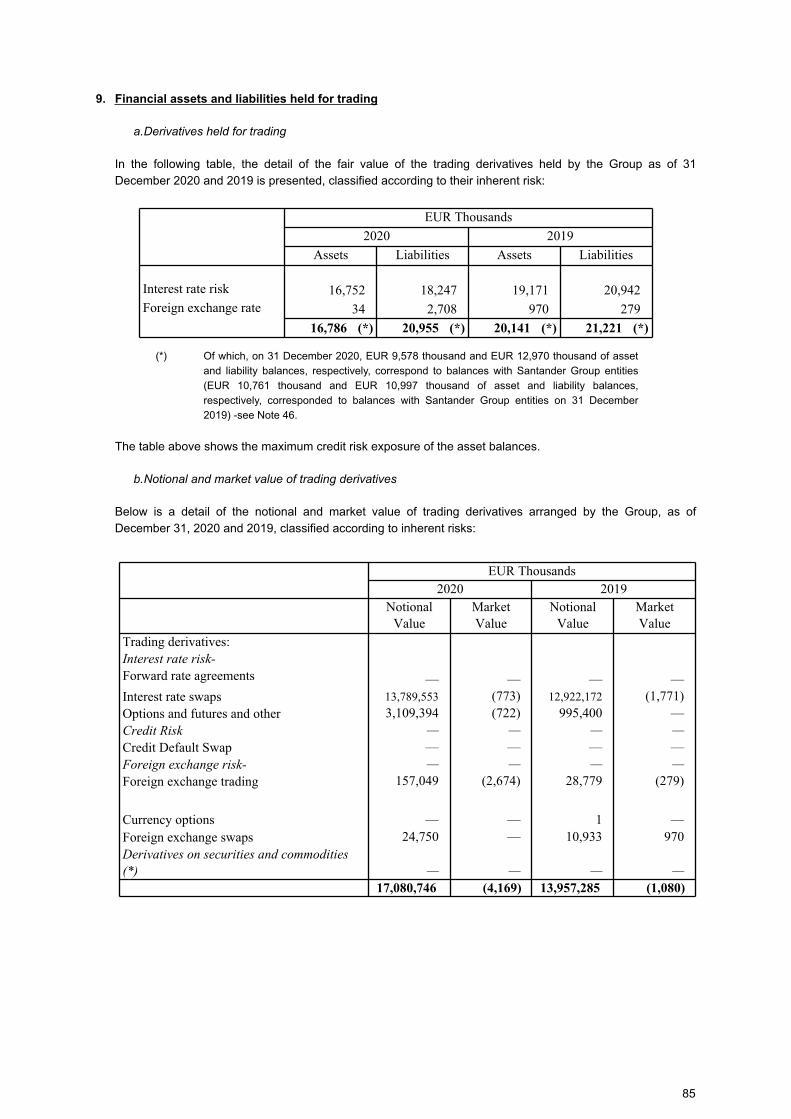
9. Financial assets and liabilities held for trading
a.Derivatives held for trading
In the following table, the detail of the fair value of the trading derivatives held by the Group as of 31
December 2020 and 2019 is presented, classified according to their inherent risk:
EUR Thousands
2020 2019
Assets Liabilities Assets Liabilities
Interest rate risk 16,752 18,247 19,171 20,942Foreign exchange rate 34 2,708 970 279
16,786 (*) 20,955 (*) 20,141 (*) 21,221 (*)
(*) Of which, on 31 December 2020, EUR 9,578 thousand and EUR 12,970 thousand of asset
and liability balances, respectively, correspond to balances with Santander Group entities
(EUR 10,761 thousand and EUR 10,997 thousand of asset and liability balances,
respectively, corresponded to balances with Santander Group entities on 31 December
2019) -see Note 46.
The table above shows the maximum credit risk exposure of the asset balances.
b.Notional and market value of trading derivatives
Below is a detail of the notional and market value of trading derivatives arranged by the Group, as of
December 31, 2020 and 2019, classified according to inherent risks:
EUR Thousands2020 2019
Notional Value
Market Value
Notional Value
Market Value
Trading derivatives:Interest rate risk-
Forward rate agreements — — — —Interest rate swaps 13,789,553 (773) 12,922,172 (1,771)Options and futures and other 3,109,394 (722) 995,400 —Credit Risk — — — —
Credit Default Swap — — — —Foreign exchange risk- — — — —
Foreign exchange trading 157,049 (2,674) 28,779 (279)
Currency options — — 1 —Foreign exchange swaps 24,750 — 10,933 970Derivatives on securities and commodities
(*) — — — —
17,080,746 (4,169) 13,957,285 (1,080)
85
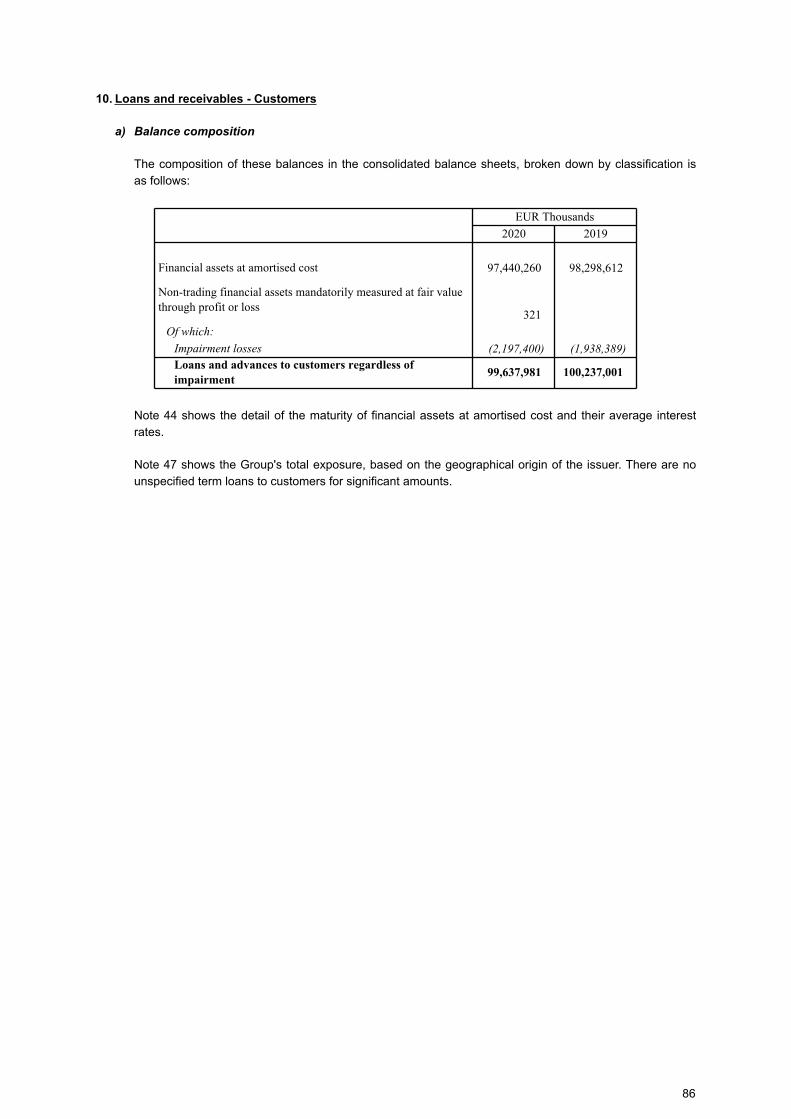
10. Loans and receivables - Customers
a) Balance composition
The composition of these balances in the consolidated balance sheets, broken down by classification is
as follows:
EUR Thousands
2020 2019
Financial assets at amortised cost 97,440,260 98,298,612
Non-trading financial assets mandatorily measured at fair value through profit or loss
321
Of which:
Impairment losses (2,197,400) (1,938,389)
Loans and advances to customers regardless of
impairment99,637,981 100,237,001
Note 44 shows the detail of the maturity of financial assets at amortised cost and their average interest
rates.
Note 47 shows the Group's total exposure, based on the geographical origin of the issuer. There are no
unspecified term loans to customers for significant amounts.
86
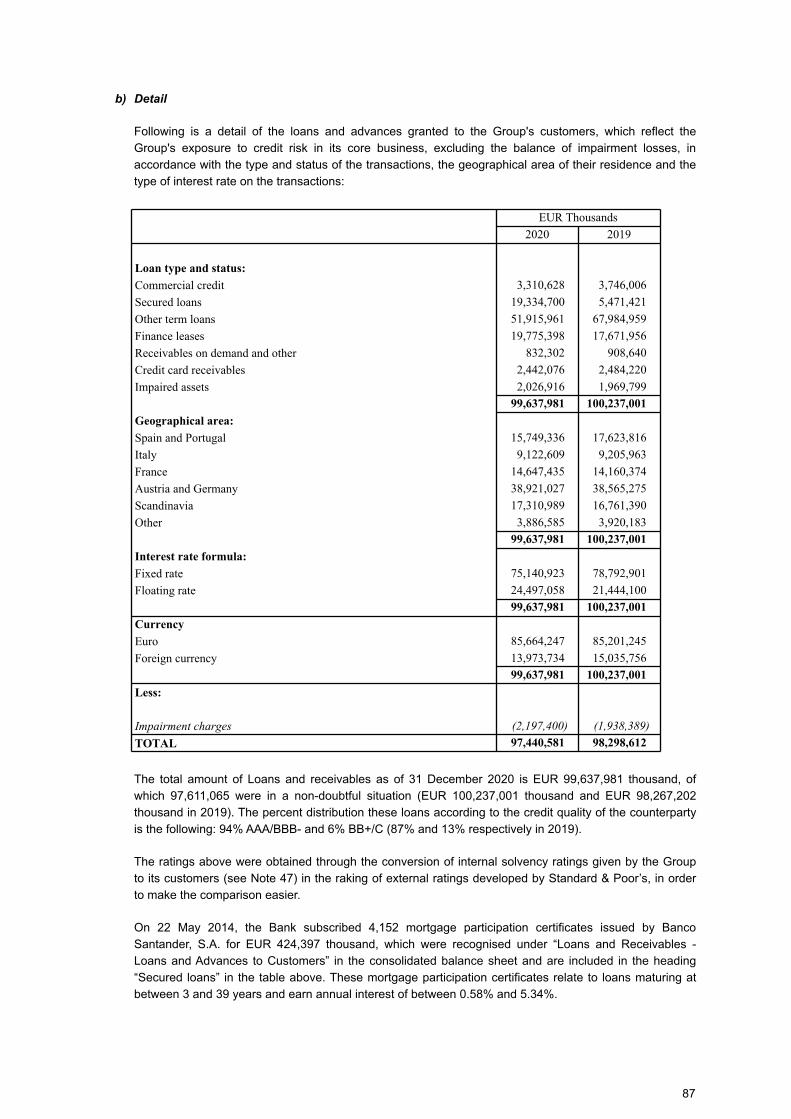
b) Detail
Following is a detail of the loans and advances granted to the Group's customers, which reflect the
Group's exposure to credit risk in its core business, excluding the balance of impairment losses, in
accordance with the type and status of the transactions, the geographical area of their residence and the
type of interest rate on the transactions:
EUR Thousands
2020 2019
Loan type and status:
Commercial credit 3,310,628 3,746,006
Secured loans 19,334,700 5,471,421
Other term loans 51,915,961 67,984,959
Finance leases 19,775,398 17,671,956
Receivables on demand and other 832,302 908,640
Credit card receivables 2,442,076 2,484,220
Impaired assets 2,026,916 1,969,799
99,637,981 100,237,001
Geographical area:
Spain and Portugal 15,749,336 17,623,816
Italy 9,122,609 9,205,963
France 14,647,435 14,160,374
Austria and Germany 38,921,027 38,565,275
Scandinavia 17,310,989 16,761,390
Other 3,886,585 3,920,183
99,637,981 100,237,001
Interest rate formula:
Fixed rate 75,140,923 78,792,901
Floating rate 24,497,058 21,444,100
99,637,981 100,237,001
Currency
Euro 85,664,247 85,201,245
Foreign currency 13,973,734 15,035,756
99,637,981 100,237,001
Less:
Impairment charges (2,197,400) (1,938,389)
TOTAL 97,440,581 98,298,612
The total amount of Loans and receivables as of 31 December 2020 is EUR 99,637,981 thousand, of
which 97,611,065 were in a non-doubtful situation (EUR 100,237,001 thousand and EUR 98,267,202
thousand in 2019). The percent distribution these loans according to the credit quality of the counterparty
is the following: 94% AAA/BBB- and 6% BB+/C (87% and 13% respectively in 2019).
The ratings above were obtained through the conversion of internal solvency ratings given by the Group
to its customers (see Note 47) in the raking of external ratings developed by Standard & Poor’s, in order
to make the comparison easier.
On 22 May 2014, the Bank subscribed 4,152 mortgage participation certificates issued by Banco
Santander, S.A. for EUR 424,397 thousand, which were recognised under “Loans and Receivables -
Loans and Advances to Customers” in the consolidated balance sheet and are included in the heading
“Secured loans” in the table above. These mortgage participation certificates relate to loans maturing at
between 3 and 39 years and earn annual interest of between 0.58% and 5.34%.
87
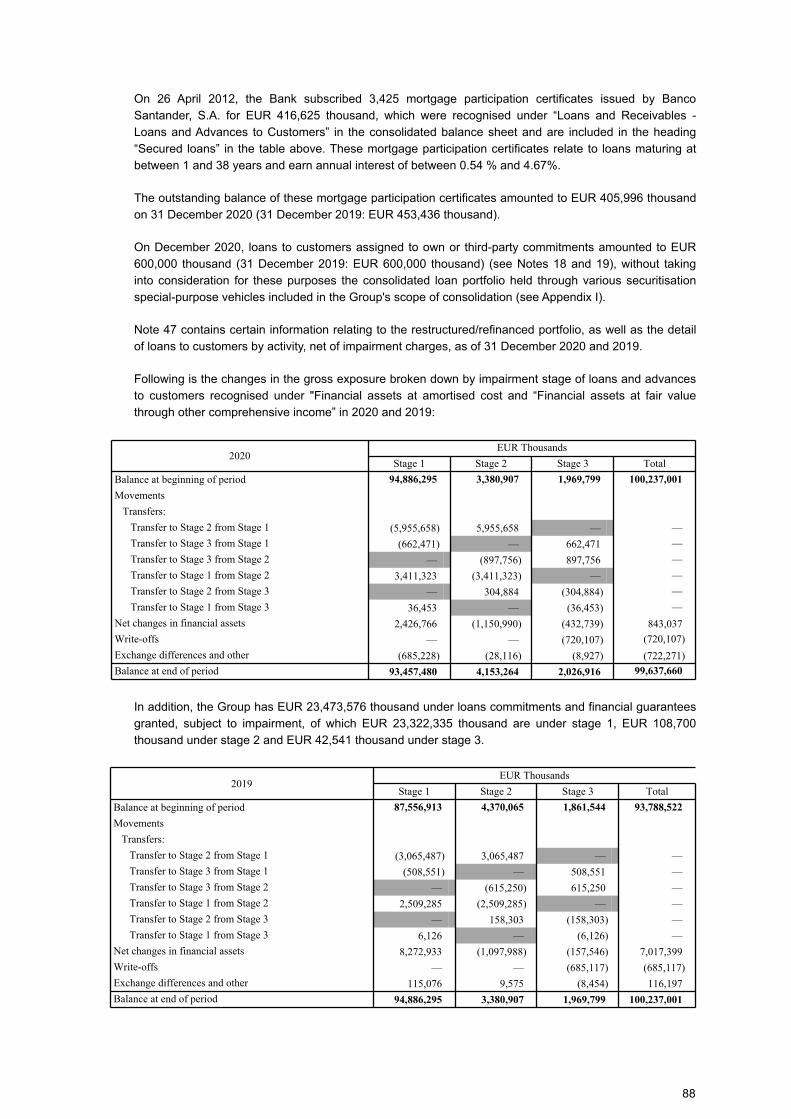
On 26 April 2012, the Bank subscribed 3,425 mortgage participation certificates issued by Banco
Santander, S.A. for EUR 416,625 thousand, which were recognised under “Loans and Receivables -
Loans and Advances to Customers” in the consolidated balance sheet and are included in the heading
“Secured loans” in the table above. These mortgage participation certificates relate to loans maturing at
between 1 and 38 years and earn annual interest of between 0.54 % and 4.67%.
The outstanding balance of these mortgage participation certificates amounted to EUR 405,996 thousand
on 31 December 2020 (31 December 2019: EUR 453,436 thousand).
On December 2020, loans to customers assigned to own or third-party commitments amounted to EUR
600,000 thousand (31 December 2019: EUR 600,000 thousand) (see Notes 18 and 19), without taking
into consideration for these purposes the consolidated loan portfolio held through various securitisation
special-purpose vehicles included in the Group's scope of consolidation (see Appendix I).
Note 47 contains certain information relating to the restructured/refinanced portfolio, as well as the detail
of loans to customers by activity, net of impairment charges, as of 31 December 2020 and 2019.
Following is the changes in the gross exposure broken down by impairment stage of loans and advances
to customers recognised under "Financial assets at amortised cost and “Financial assets at fair value
through other comprehensive income” in 2020 and 2019:
2020EUR Thousands
Stage 1 Stage 2 Stage 3 Total
Balance at beginning of period 94,886,295 3,380,907 1,969,799 100,237,001
Movements
Transfers:
Transfer to Stage 2 from Stage 1 (5,955,658) 5,955,658 — —
Transfer to Stage 3 from Stage 1 (662,471) — 662,471 —
Transfer to Stage 3 from Stage 2 — (897,756) 897,756 —
Transfer to Stage 1 from Stage 2 3,411,323 (3,411,323) — —
Transfer to Stage 2 from Stage 3 — 304,884 (304,884) —
Transfer to Stage 1 from Stage 3 36,453 — (36,453) —
Net changes in financial assets 2,426,766 (1,150,990) (432,739) 843,037
Write-offs — — (720,107) (720,107)
Exchange differences and other (685,228) (28,116) (8,927) (722,271)
Balance at end of period 93,457,480 4,153,264 2,026,916 99,637,660
In addition, the Group has EUR 23,473,576 thousand under loans commitments and financial guarantees
granted, subject to impairment, of which EUR 23,322,335 thousand are under stage 1, EUR 108,700
thousand under stage 2 and EUR 42,541 thousand under stage 3.
2019EUR Thousands
Stage 1 Stage 2 Stage 3 Total
Balance at beginning of period 87,556,913 4,370,065 1,861,544 93,788,522
Movements
Transfers:
Transfer to Stage 2 from Stage 1 (3,065,487) 3,065,487 — —
Transfer to Stage 3 from Stage 1 (508,551) — 508,551 —
Transfer to Stage 3 from Stage 2 — (615,250) 615,250 —
Transfer to Stage 1 from Stage 2 2,509,285 (2,509,285) — —
Transfer to Stage 2 from Stage 3 — 158,303 (158,303) —
Transfer to Stage 1 from Stage 3 6,126 — (6,126) —
Net changes in financial assets 8,272,933 (1,097,988) (157,546) 7,017,399
Write-offs — — (685,117) (685,117)
Exchange differences and other 115,076 9,575 (8,454) 116,197
Balance at end of period 94,886,295 3,380,907 1,969,799 100,237,001
88
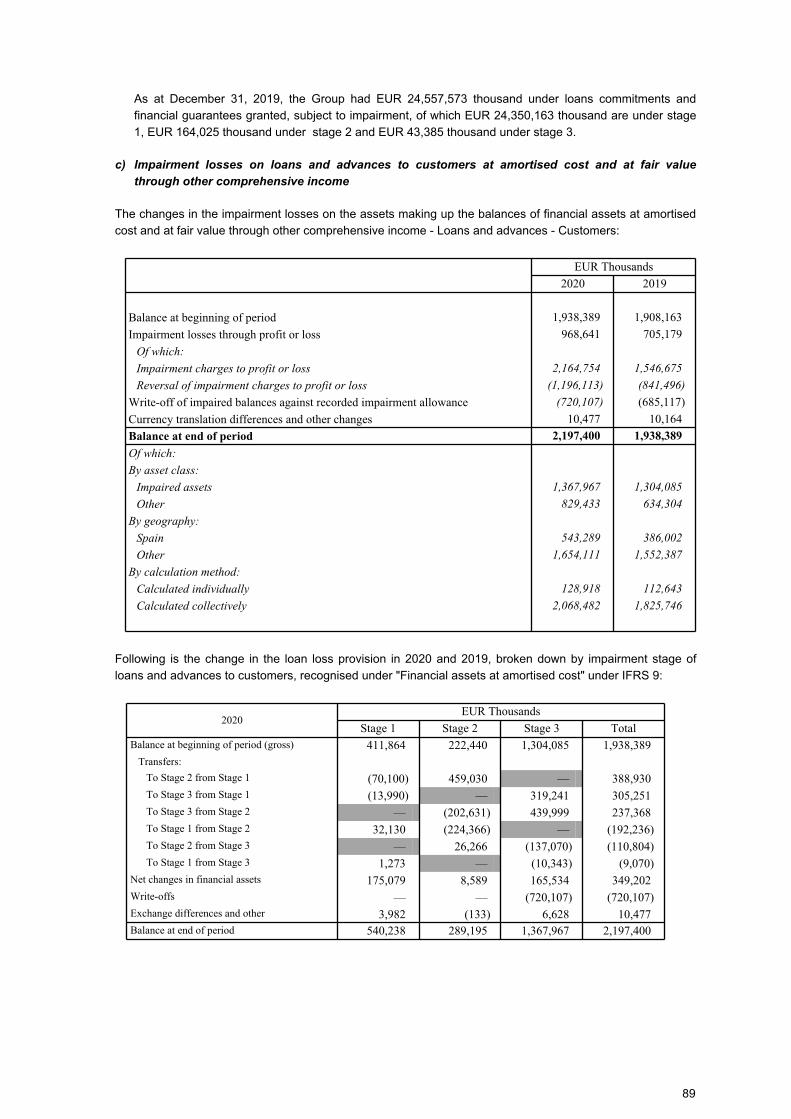
As at December 31, 2019, the Group had EUR 24,557,573 thousand under loans commitments and
financial guarantees granted, subject to impairment, of which EUR 24,350,163 thousand are under stage
1, EUR 164,025 thousand under stage 2 and EUR 43,385 thousand under stage 3.
c) Impairment losses on loans and advances to customers at amortised cost and at fair value
through other comprehensive income
The changes in the impairment losses on the assets making up the balances of financial assets at amortised
cost and at fair value through other comprehensive income - Loans and advances - Customers:
EUR Thousands
2020 2019
Balance at beginning of period 1,938,389 1,908,163
Impairment losses through profit or loss 968,641 705,179
Of which:
Impairment charges to profit or loss 2,164,754 1,546,675
Reversal of impairment charges to profit or loss (1,196,113) (841,496)
Write-off of impaired balances against recorded impairment allowance (720,107) (685,117)
Currency translation differences and other changes 10,477 10,164
Balance at end of period 2,197,400 1,938,389
Of which:
By asset class:
Impaired assets 1,367,967 1,304,085
Other 829,433 634,304
By geography:
Spain 543,289 386,002
Other 1,654,111 1,552,387
By calculation method:
Calculated individually 128,918 112,643
Calculated collectively 2,068,482 1,825,746
Following is the change in the loan loss provision in 2020 and 2019, broken down by impairment stage of
loans and advances to customers, recognised under "Financial assets at amortised cost" under IFRS 9:
2020EUR Thousands
Stage 1 Stage 2 Stage 3 TotalBalance at beginning of period (gross) 411,864 222,440 1,304,085 1,938,389
Transfers:
To Stage 2 from Stage 1 (70,100) 459,030 — 388,930 To Stage 3 from Stage 1 (13,990) — 319,241 305,251 To Stage 3 from Stage 2 — (202,631) 439,999 237,368 To Stage 1 from Stage 2 32,130 (224,366) — (192,236)To Stage 2 from Stage 3 — 26,266 (137,070) (110,804)To Stage 1 from Stage 3 1,273 — (10,343) (9,070)
Net changes in financial assets 175,079 8,589 165,534 349,202 Write-offs — — (720,107) (720,107)Exchange differences and other 3,982 (133) 6,628 10,477 Balance at end of period 540,238 289,195 1,367,967 2,197,400
89
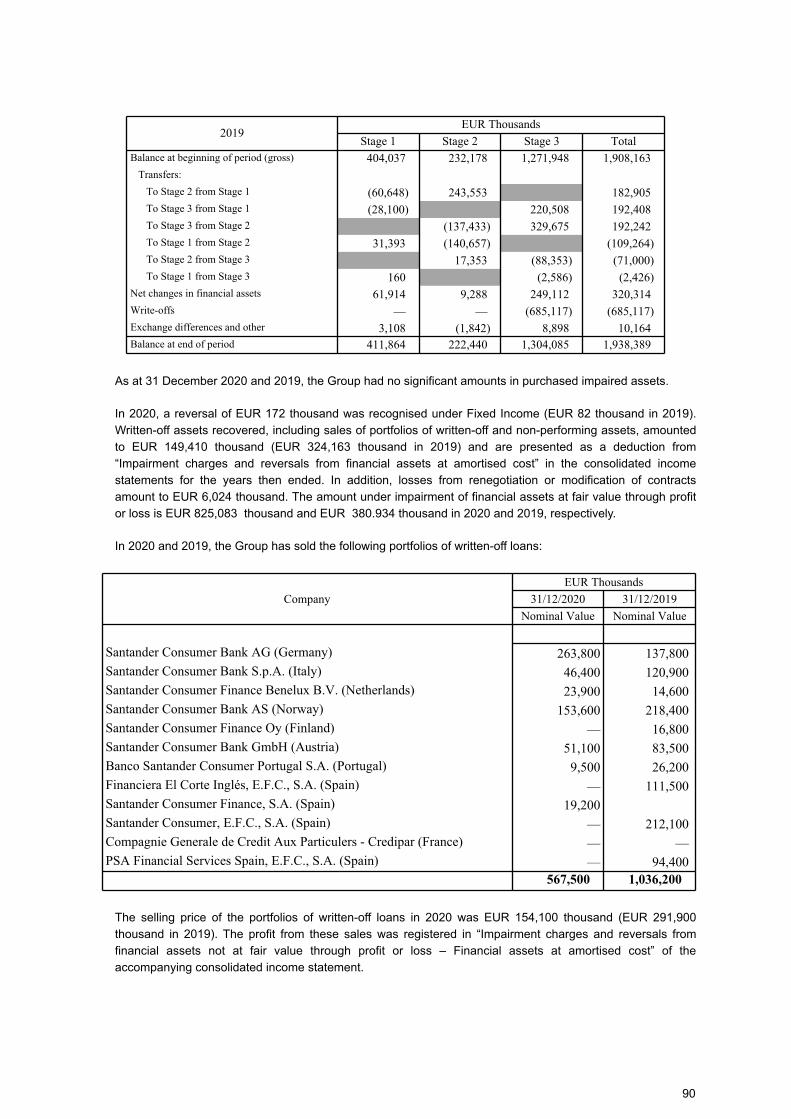
2019EUR Thousands
Stage 1 Stage 2 Stage 3 TotalBalance at beginning of period (gross) 404,037 232,178 1,271,948 1,908,163
Transfers:
To Stage 2 from Stage 1 (60,648) 243,553 182,905 To Stage 3 from Stage 1 (28,100) 220,508 192,408 To Stage 3 from Stage 2 (137,433) 329,675 192,242 To Stage 1 from Stage 2 31,393 (140,657) (109,264)To Stage 2 from Stage 3 17,353 (88,353) (71,000)To Stage 1 from Stage 3 160 (2,586) (2,426)
Net changes in financial assets 61,914 9,288 249,112 320,314 Write-offs — — (685,117) (685,117)Exchange differences and other 3,108 (1,842) 8,898 10,164 Balance at end of period 411,864 222,440 1,304,085 1,938,389
As at 31 December 2020 and 2019, the Group had no significant amounts in purchased impaired assets.
In 2020, a reversal of EUR 172 thousand was recognised under Fixed Income (EUR 82 thousand in 2019).
Written-off assets recovered, including sales of portfolios of written-off and non-performing assets, amounted
to EUR 149,410 thousand (EUR 324,163 thousand in 2019) and are presented as a deduction from
“Impairment charges and reversals from financial assets at amortised cost” in the consolidated income
statements for the years then ended. In addition, losses from renegotiation or modification of contracts
amount to EUR 6,024 thousand. The amount under impairment of financial assets at fair value through profit
or loss is EUR 825,083 thousand and EUR 380.934 thousand in 2020 and 2019, respectively.
In 2020 and 2019, the Group has sold the following portfolios of written-off loans:
Company
EUR Thousands
31/12/2020 31/12/2019
Nominal Value Nominal Value
Santander Consumer Bank AG (Germany) 263,800 137,800 Santander Consumer Bank S.p.A. (Italy) 46,400 120,900 Santander Consumer Finance Benelux B.V. (Netherlands) 23,900 14,600 Santander Consumer Bank AS (Norway) 153,600 218,400 Santander Consumer Finance Oy (Finland) — 16,800 Santander Consumer Bank GmbH (Austria) 51,100 83,500 Banco Santander Consumer Portugal S.A. (Portugal) 9,500 26,200 Financiera El Corte Inglés, E.F.C., S.A. (Spain) — 111,500 Santander Consumer Finance, S.A. (Spain) 19,200Santander Consumer, E.F.C., S.A. (Spain) — 212,100 Compagnie Generale de Credit Aux Particulers - Credipar (France) — — PSA Financial Services Spain, E.F.C., S.A. (Spain) — 94,400
567,500 1,036,200
The selling price of the portfolios of written-off loans in 2020 was EUR 154,100 thousand (EUR 291,900
thousand in 2019). The profit from these sales was registered in “Impairment charges and reversals from
financial assets not at fair value through profit or loss – Financial assets at amortised cost” of the
accompanying consolidated income statement.
90
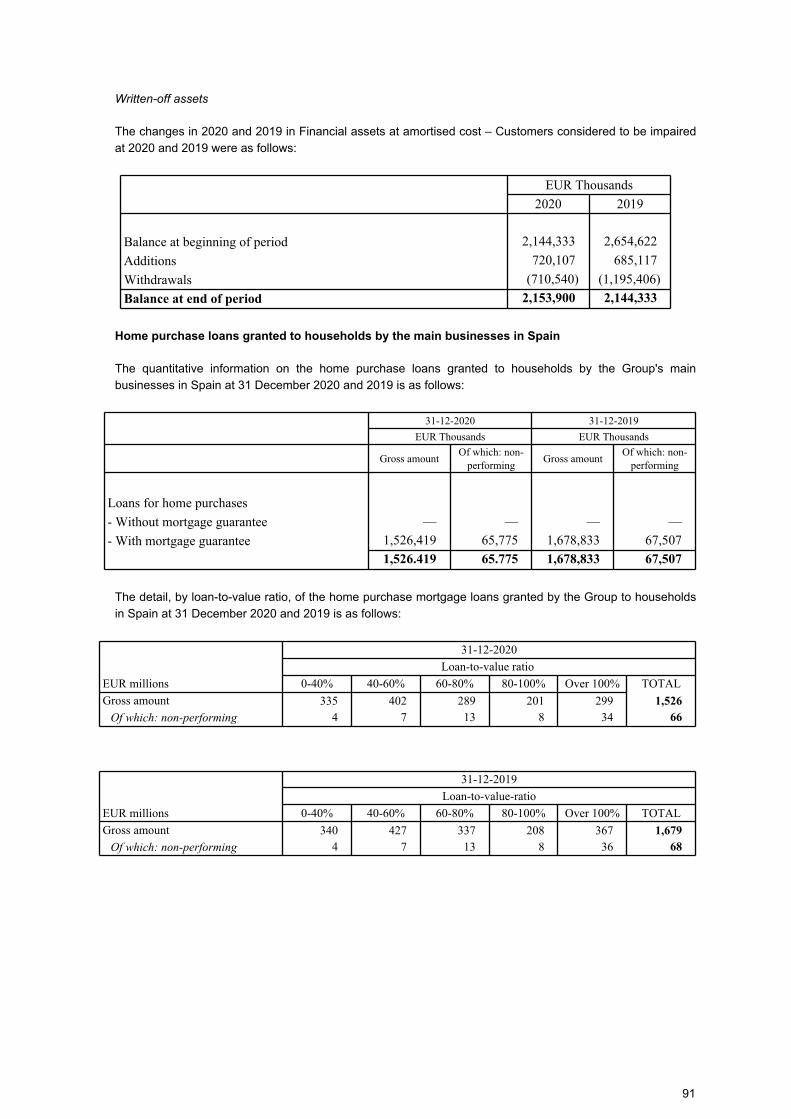
Written-off assets
The changes in 2020 and 2019 in Financial assets at amortised cost – Customers considered to be impaired
at 2020 and 2019 were as follows:
EUR Thousands
2020 2019
Balance at beginning of period 2,144,333 2,654,622
Additions 720,107 685,117
Withdrawals (710,540) (1,195,406)
Balance at end of period 2,153,900 2,144,333
Home purchase loans granted to households by the main businesses in Spain
The quantitative information on the home purchase loans granted to households by the Group's main
businesses in Spain at 31 December 2020 and 2019 is as follows:
31-12-2020 31-12-2019
EUR Thousands EUR Thousands
Gross amountOf which: non-
performingGross amount
Of which: non-performing
Loans for home purchases
- Without mortgage guarantee — — — —
- With mortgage guarantee 1,526,419 65,775 1,678,833 67,507
1,526.419 65.775 1,678,833 67,507
The detail, by loan-to-value ratio, of the home purchase mortgage loans granted by the Group to households
in Spain at 31 December 2020 and 2019 is as follows:
31-12-2020
Loan-to-value ratio
EUR millions 0-40% 40-60% 60-80% 80-100% Over 100% TOTAL
Gross amount 335 402 289 201 299 1,526
Of which: non-performing 4 7 13 8 34 66
31-12-2019
Loan-to-value-ratio
EUR millions 0-40% 40-60% 60-80% 80-100% Over 100% TOTAL
Gross amount 340 427 337 208 367 1,679
Of which: non-performing 4 7 13 8 36 68
91
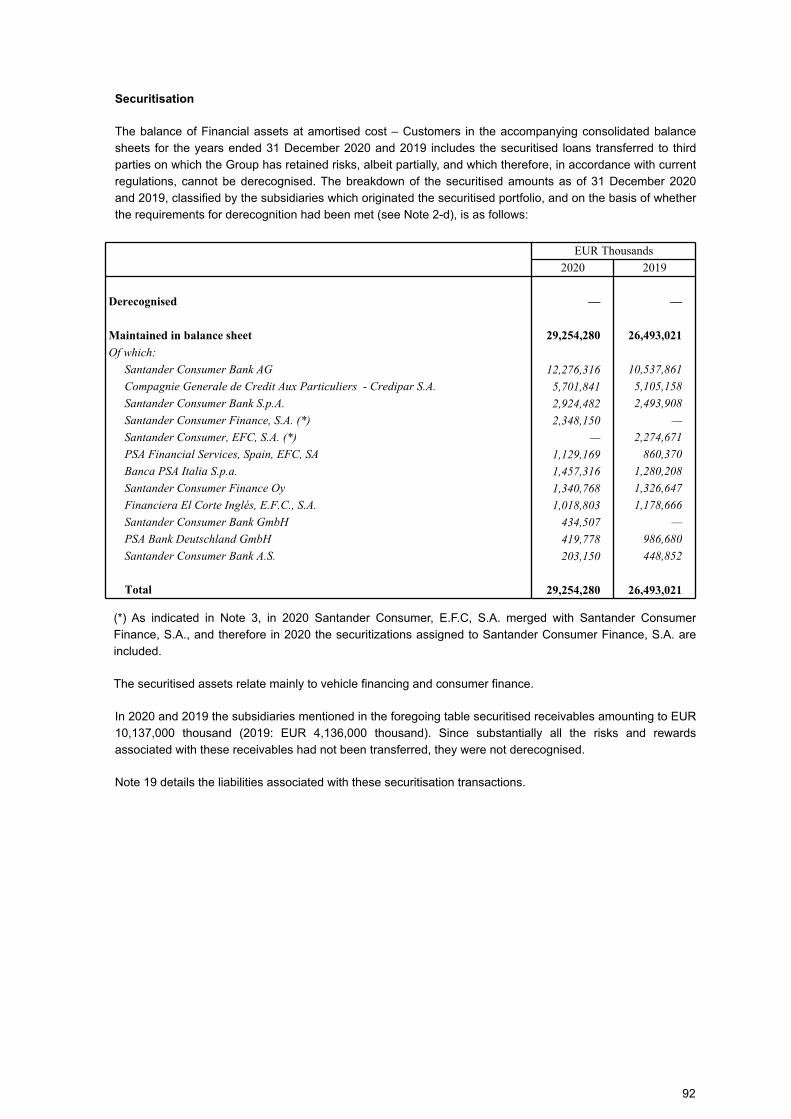
Securitisation
The balance of Financial assets at amortised cost – Customers in the accompanying consolidated balance
sheets for the years ended 31 December 2020 and 2019 includes the securitised loans transferred to third
parties on which the Group has retained risks, albeit partially, and which therefore, in accordance with current
regulations, cannot be derecognised. The breakdown of the securitised amounts as of 31 December 2020
and 2019, classified by the subsidiaries which originated the securitised portfolio, and on the basis of whether
the requirements for derecognition had been met (see Note 2-d), is as follows:
EUR Thousands
2020 2019
Derecognised — —
Maintained in balance sheet 29,254,280 26,493,021
Of which:
Santander Consumer Bank AG 12,276,316 10,537,861
Compagnie Generale de Credit Aux Particuliers - Credipar S.A. 5,701,841 5,105,158
Santander Consumer Bank S.p.A. 2,924,482 2,493,908
Santander Consumer Finance, S.A. (*) 2,348,150 —
Santander Consumer, EFC, S.A. (*) — 2,274,671
PSA Financial Services, Spain, EFC, SA 1,129,169 860,370
Banca PSA Italia S.p.a. 1,457,316 1,280,208
Santander Consumer Finance Oy 1,340,768 1,326,647
Financiera El Corte Inglés, E.F.C., S.A. 1,018,803 1,178,666
Santander Consumer Bank GmbH 434,507 —
PSA Bank Deutschland GmbH 419,778 986,680
Santander Consumer Bank A.S. 203,150 448,852
Total 29,254,280 26,493,021
(*) As indicated in Note 3, in 2020 Santander Consumer, E.F.C, S.A. merged with Santander Consumer
Finance, S.A., and therefore in 2020 the securitizations assigned to Santander Consumer Finance, S.A. are
included.
The securitised assets relate mainly to vehicle financing and consumer finance.
In 2020 and 2019 the subsidiaries mentioned in the foregoing table securitised receivables amounting to EUR
10,137,000 thousand (2019: EUR 4,136,000 thousand). Since substantially all the risks and rewards
associated with these receivables had not been transferred, they were not derecognised.
Note 19 details the liabilities associated with these securitisation transactions.
92
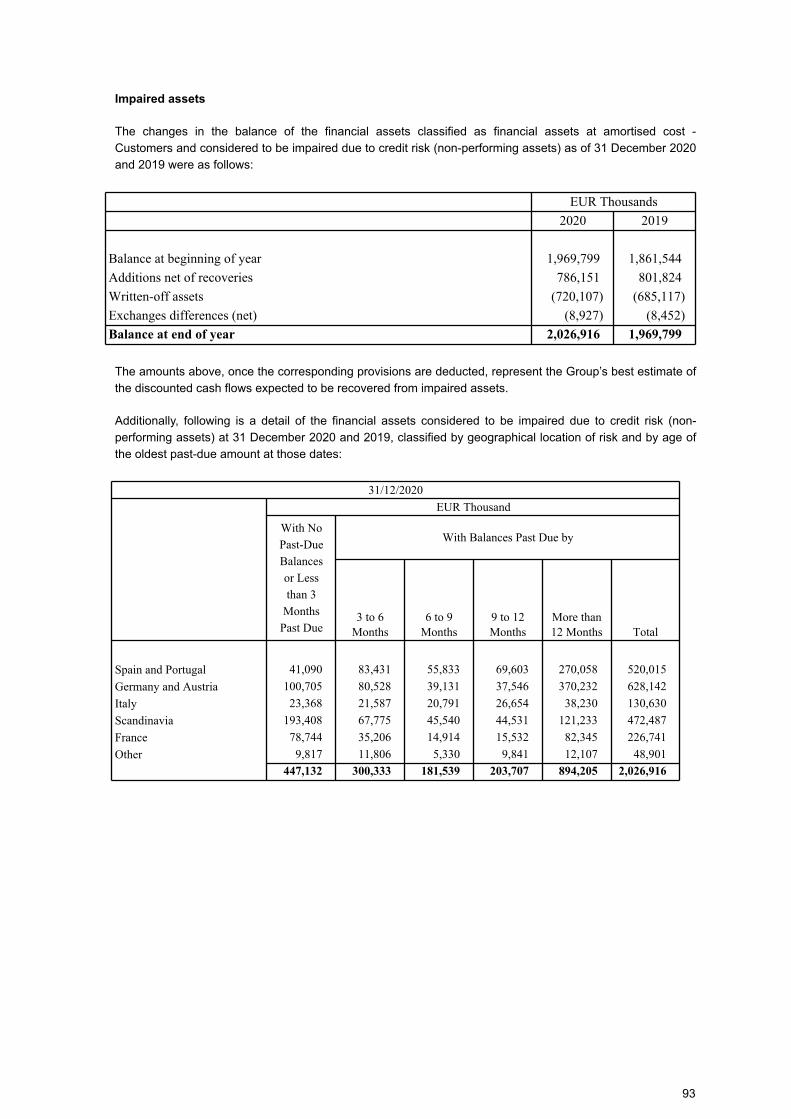
Impaired assets
The changes in the balance of the financial assets classified as financial assets at amortised cost -
Customers and considered to be impaired due to credit risk (non-performing assets) as of 31 December 2020
and 2019 were as follows:
EUR Thousands
2020 2019
Balance at beginning of year 1,969,799 1,861,544
Additions net of recoveries 786,151 801,824
Written-off assets (720,107) (685,117)
Exchanges differences (net) (8,927) (8,452)
Balance at end of year 2,026,916 1,969,799
The amounts above, once the corresponding provisions are deducted, represent the Group’s best estimate of
the discounted cash flows expected to be recovered from impaired assets.
Additionally, following is a detail of the financial assets considered to be impaired due to credit risk (non-
performing assets) at 31 December 2020 and 2019, classified by geographical location of risk and by age of
the oldest past-due amount at those dates:
31/12/2020
EUR Thousand
With No
Past-Due
Balances
or Less
than 3
Months
Past Due
With Balances Past Due by
3 to 6 Months
6 to 9 Months
9 to 12 Months
More than 12 Months Total
Spain and Portugal 41,090 83,431 55,833 69,603 270,058 520,015
Germany and Austria 100,705 80,528 39,131 37,546 370,232 628,142
Italy 23,368 21,587 20,791 26,654 38,230 130,630
Scandinavia 193,408 67,775 45,540 44,531 121,233 472,487
France 78,744 35,206 14,914 15,532 82,345 226,741
Other 9,817 11,806 5,330 9,841 12,107 48,901
447,132 300,333 181,539 203,707 894,205 2,026,916
93
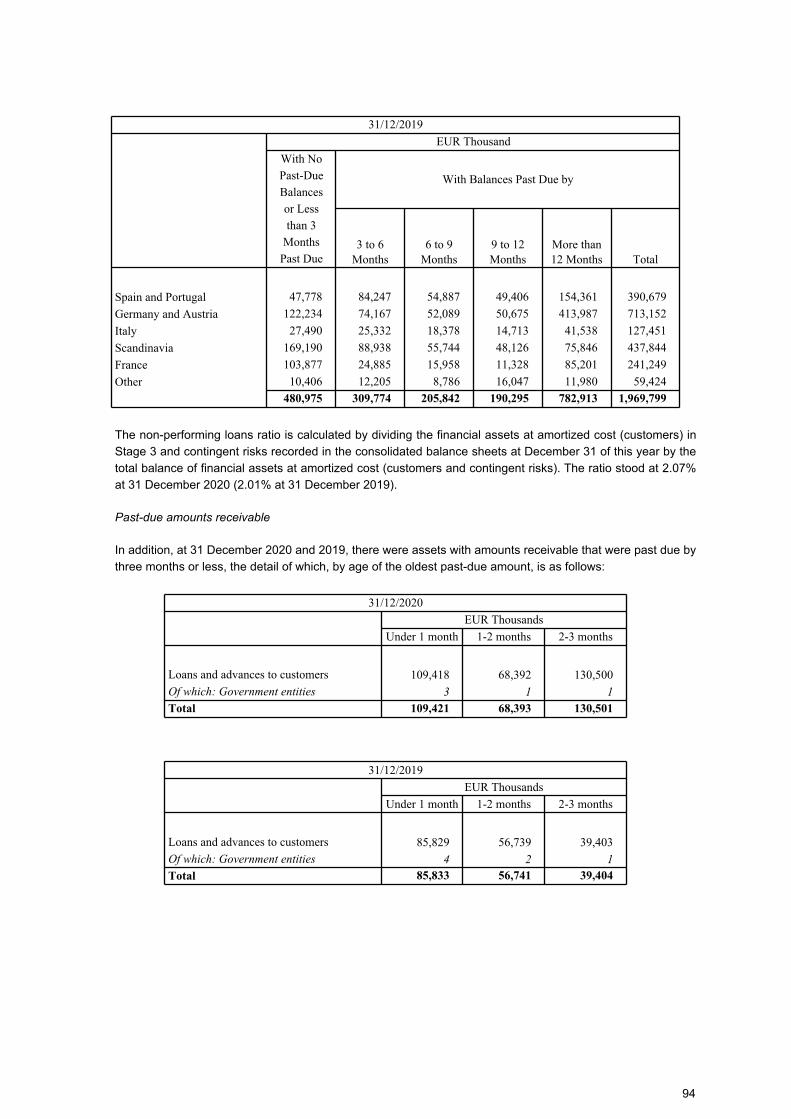
31/12/2019
EUR Thousand
With No
Past-Due
Balances
or Less
than 3
Months
Past Due
With Balances Past Due by
3 to 6 Months
6 to 9 Months
9 to 12 Months
More than 12 Months Total
Spain and Portugal 47,778 84,247 54,887 49,406 154,361 390,679
Germany and Austria 122,234 74,167 52,089 50,675 413,987 713,152
Italy 27,490 25,332 18,378 14,713 41,538 127,451
Scandinavia 169,190 88,938 55,744 48,126 75,846 437,844
France 103,877 24,885 15,958 11,328 85,201 241,249
Other 10,406 12,205 8,786 16,047 11,980 59,424
480,975 309,774 205,842 190,295 782,913 1,969,799
The non-performing loans ratio is calculated by dividing the financial assets at amortized cost (customers) in
Stage 3 and contingent risks recorded in the consolidated balance sheets at December 31 of this year by the
total balance of financial assets at amortized cost (customers and contingent risks). The ratio stood at 2.07%
at 31 December 2020 (2.01% at 31 December 2019).
Past-due amounts receivable
In addition, at 31 December 2020 and 2019, there were assets with amounts receivable that were past due by
three months or less, the detail of which, by age of the oldest past-due amount, is as follows:
31/12/2020
EUR Thousands
Under 1 month 1-2 months 2-3 months
Loans and advances to customers 109,418 68,392 130,500
Of which: Government entities 3 1 1
Total 109,421 68,393 130,501
31/12/2019
EUR Thousands
Under 1 month 1-2 months 2-3 months
Loans and advances to customers 85,829 56,739 39,403
Of which: Government entities 4 2 1
Total 85,833 56,741 39,404
94
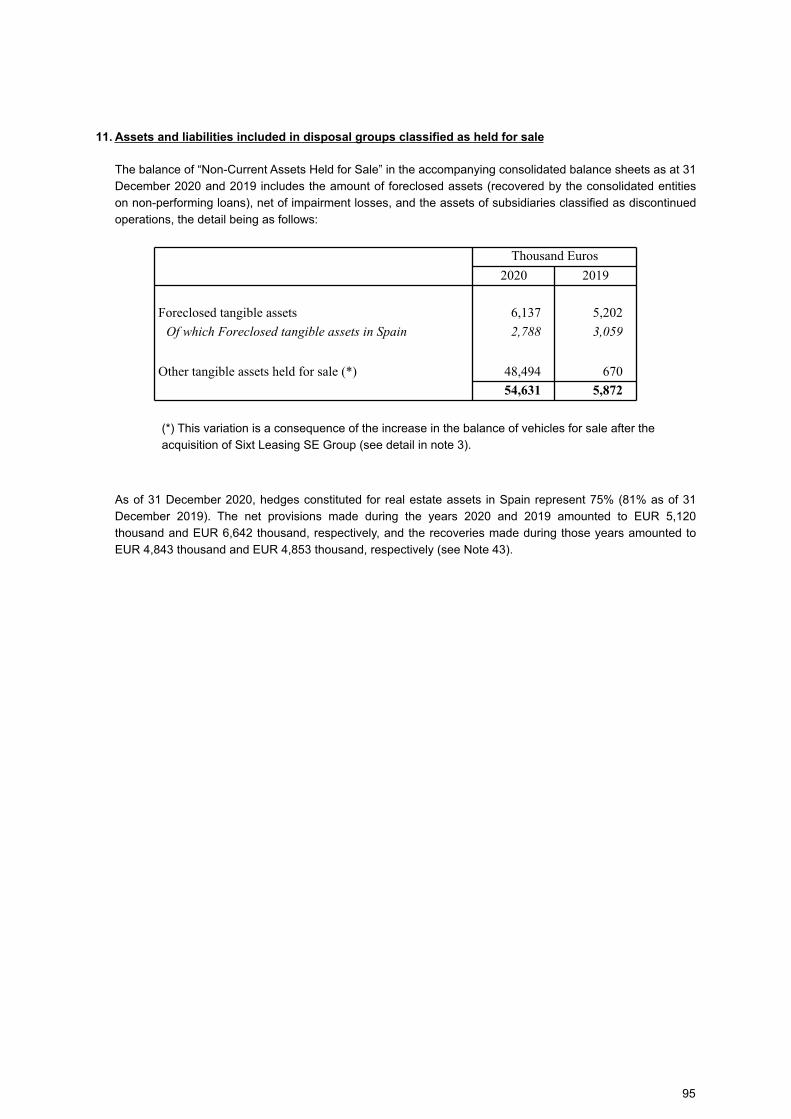
11. Assets and liabilities included in disposal groups classified as held for sale
The balance of “Non-Current Assets Held for Sale” in the accompanying consolidated balance sheets as at 31
December 2020 and 2019 includes the amount of foreclosed assets (recovered by the consolidated entities
on non-performing loans), net of impairment losses, and the assets of subsidiaries classified as discontinued
operations, the detail being as follows:
Thousand Euros
2020 2019
Foreclosed tangible assets 6,137 5,202
Of which Foreclosed tangible assets in Spain 2,788 3,059
Other tangible assets held for sale (*) 48,494 670
54,631 5,872
(*) This variation is a consequence of the increase in the balance of vehicles for sale after the
acquisition of Sixt Leasing SE Group (see detail in note 3).
As of 31 December 2020, hedges constituted for real estate assets in Spain represent 75% (81% as of 31
December 2019). The net provisions made during the years 2020 and 2019 amounted to EUR 5,120
thousand and EUR 6,642 thousand, respectively, and the recoveries made during those years amounted to
EUR 4,843 thousand and EUR 4,853 thousand, respectively (see Note 43).
95
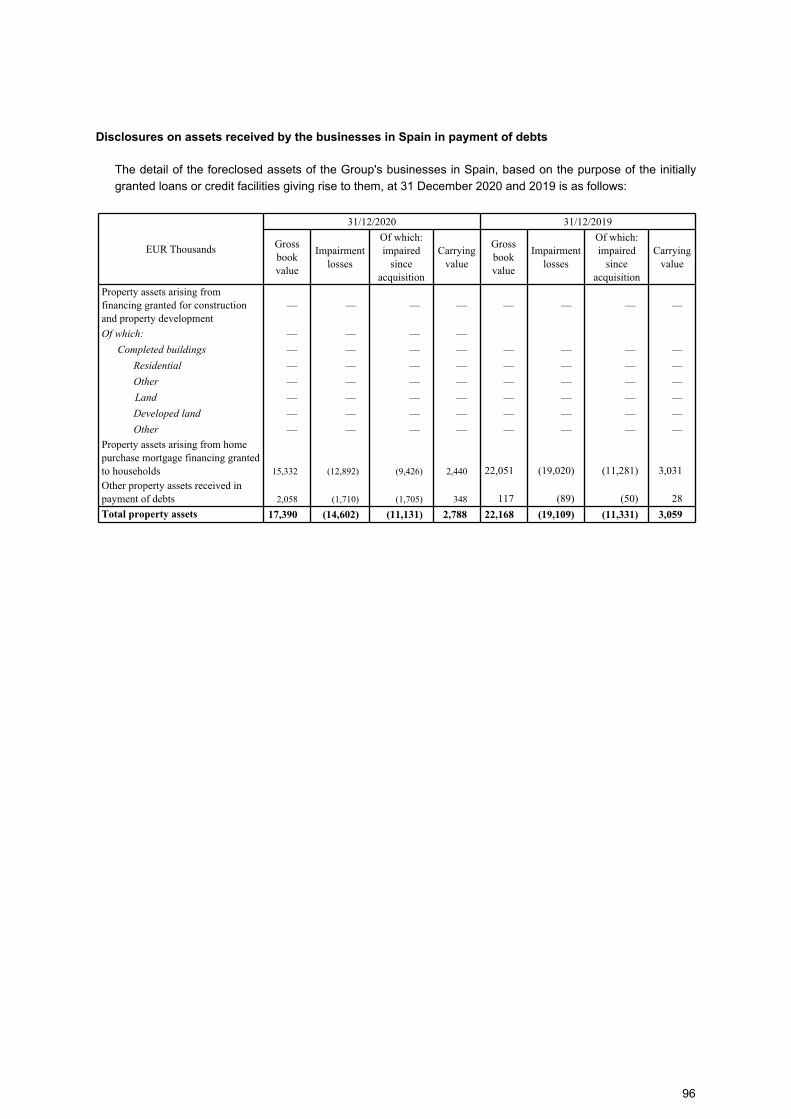
Disclosures on assets received by the businesses in Spain in payment of debts
The detail of the foreclosed assets of the Group's businesses in Spain, based on the purpose of the initially
granted loans or credit facilities giving rise to them, at 31 December 2020 and 2019 is as follows:
EUR Thousands
31/12/2020 31/12/2019
Gross book value
Impairment losses
Of which: impaired
since acquisition
Carrying value
Gross book value
Impairment losses
Of which: impaired
since acquisition
Carrying value
Property assets arising from financing granted for construction and property development
— — — — — — — —
Of which: — — — —
Completed buildings — — — — — — — —
Residential — — — — — — — —
Other — — — — — — — —
Land — — — — — — — —
Developed land — — — — — — — —
Other — — — — — — — —
Property assets arising from home purchase mortgage financing granted to households 15,332 (12,892) (9,426) 2,440 22,051 (19,020) (11,281) 3,031
Other property assets received in payment of debts 2,058 (1,710) (1,705) 348 117 (89) (50) 28
Total property assets 17,390 (14,602) (11,131) 2,788 22,168 (19,109) (11,331) 3,059
96
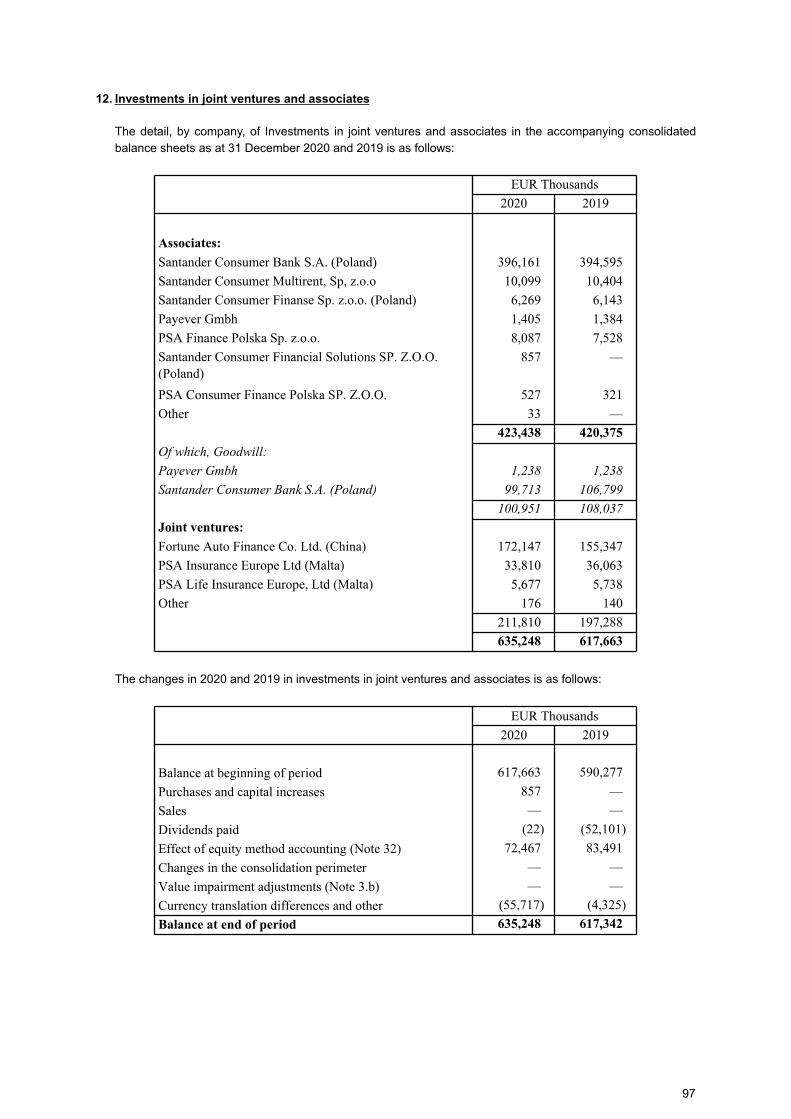
12. Investments in joint ventures and associates
The detail, by company, of Investments in joint ventures and associates in the accompanying consolidated
balance sheets as at 31 December 2020 and 2019 is as follows:
EUR Thousands
2020 2019
Associates:
Santander Consumer Bank S.A. (Poland) 396,161 394,595
Santander Consumer Multirent, Sp, z.o.o 10,099 10,404
Santander Consumer Finanse Sp. z.o.o. (Poland) 6,269 6,143
Payever Gmbh 1,405 1,384
PSA Finance Polska Sp. z.o.o. 8,087 7,528
Santander Consumer Financial Solutions SP. Z.O.O. (Poland)
857 —
PSA Consumer Finance Polska SP. Z.O.O. 527 321
Other 33 —
423,438 420,375
Of which, Goodwill:
Payever Gmbh 1,238 1,238
Santander Consumer Bank S.A. (Poland) 99,713 106,799
100,951 108,037
Joint ventures:
Fortune Auto Finance Co. Ltd. (China) 172,147 155,347
PSA Insurance Europe Ltd (Malta) 33,810 36,063
PSA Life Insurance Europe, Ltd (Malta) 5,677 5,738
Other 176 140
211,810 197,288
635,248 617,663
The changes in 2020 and 2019 in investments in joint ventures and associates is as follows:
EUR Thousands
2020 2019
Balance at beginning of period 617,663 590,277
Purchases and capital increases 857 —
Sales — —
Dividends paid (22) (52,101)
Effect of equity method accounting (Note 32) 72,467 83,491
Changes in the consolidation perimeter — —
Value impairment adjustments (Note 3.b) — —
Currency translation differences and other (55,717) (4,325)
Balance at end of period 635,248 617,342
97
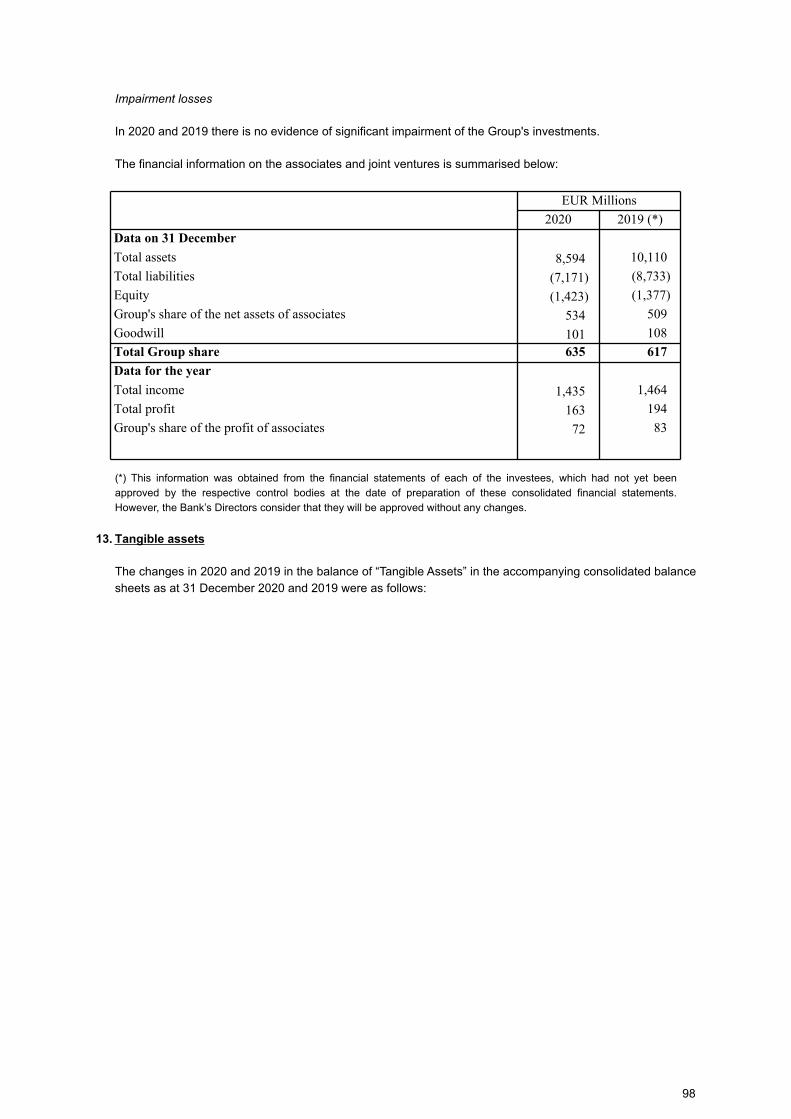
Impairment losses
In 2020 and 2019 there is no evidence of significant impairment of the Group's investments.
The financial information on the associates and joint ventures is summarised below:
EUR Millions
2020 2019 (*)
Data on 31 December
Total assets 8,594 10,110
Total liabilities (7,171) (8,733)
Equity (1,423) (1,377)
Group's share of the net assets of associates 534 509
Goodwill 101 108
Total Group share 635 617
Data for the year
Total income 1,435 1,464
Total profit 163 194
Group's share of the profit of associates 72 83
(*) This information was obtained from the financial statements of each of the investees, which had not yet been
approved by the respective control bodies at the date of preparation of these consolidated financial statements.
However, the Bank’s Directors consider that they will be approved without any changes.
13. Tangible assets
The changes in 2020 and 2019 in the balance of “Tangible Assets” in the accompanying consolidated balance
sheets as at 31 December 2020 and 2019 were as follows:
98
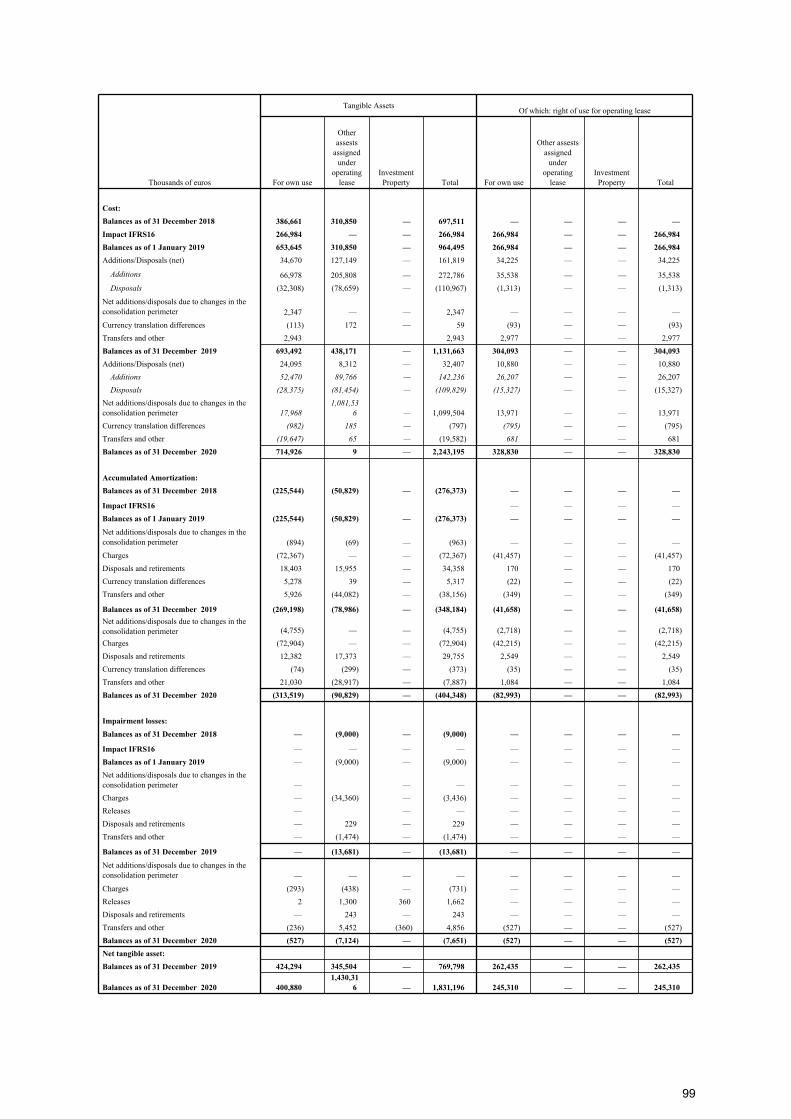
Tangible AssetsOf which: right of use for operating lease
Thousands of euros For own use
Other assests
assigned under
operating lease
Investment Property Total For own use
Other assests assigned
under operating
leaseInvestment Property Total
Cost:
Balances as of 31 December 2018 386,661 310,850 — 697,511 — — — —
Impact IFRS16 266,984 — — 266,984 266,984 — — 266,984
Balances as of 1 January 2019 653,645 310,850 — 964,495 266,984 — — 266,984
Additions/Disposals (net) 34,670 127,149 — 161,819 34,225 — — 34,225
Additions 66,978 205,808 — 272,786 35,538 — — 35,538
Disposals (32,308) (78,659) — (110,967) (1,313) — — (1,313)
Net additions/disposals due to changes in the consolidation perimeter 2,347 — — 2,347 — — — —
Currency translation differences (113) 172 — 59 (93) — — (93)
Transfers and other 2,943 2,943 2,977 — — 2,977
Balances as of 31 December 2019 693,492 438,171 — 1,131,663 304,093 — — 304,093
Additions/Disposals (net) 24,095 8,312 — 32,407 10,880 — — 10,880
Additions 52,470 89,766 — 142,236 26,207 — — 26,207
Disposals (28,375) (81,454) — (109,829) (15,327) — — (15,327)
Net additions/disposals due to changes in the consolidation perimeter 17,968
1,081,53
6 — 1,099,504 13,971 — — 13,971
Currency translation differences (982) 185 — (797) (795) — — (795)
Transfers and other (19,647) 65 — (19,582) 681 — — 681
Balances as of 31 December 2020 714,926
1,528,26
9 — 2,243,195 328,830 — — 328,830
Accumulated Amortization:
Balances as of 31 December 2018 (225,544) (50,829) — (276,373) — — — —
Impact IFRS16 — — — —
Balances as of 1 January 2019 (225,544) (50,829) — (276,373) — — — —
Net additions/disposals due to changes in the consolidation perimeter (894) (69) — (963) — — — —
Charges (72,367) — — (72,367) (41,457) — — (41,457)
Disposals and retirements 18,403 15,955 — 34,358 170 — — 170
Currency translation differences 5,278 39 — 5,317 (22) — — (22)
Transfers and other 5,926 (44,082) — (38,156) (349) — — (349)
Balances as of 31 December 2019 (269,198) (78,986) — (348,184) (41,658) — — (41,658)
Net additions/disposals due to changes in the consolidation perimeter (4,755) — — (4,755) (2,718) — — (2,718)
Charges (72,904) — — (72,904) (42,215) — — (42,215)
Disposals and retirements 12,382 17,373 — 29,755 2,549 — — 2,549
Currency translation differences (74) (299) — (373) (35) — — (35)
Transfers and other 21,030 (28,917) — (7,887) 1,084 — — 1,084
Balances as of 31 December 2020 (313,519) (90,829) — (404,348) (82,993) — — (82,993)
Impairment losses:
Balances as of 31 December 2018 — (9,000) — (9,000) — — — —
Impact IFRS16 — — — — — — — —
Balances as of 1 January 2019 — (9,000) — (9,000) — — — —
Net additions/disposals due to changes in the consolidation perimeter — — — — — — —
Charges — (34,360) — (3,436) — — — —
Releases — — — — — — —
Disposals and retirements — 229 — 229 — — — —
Transfers and other — (1,474) — (1,474) — — — —
Balances as of 31 December 2019 — (13,681) — (13,681) — — — —
Net additions/disposals due to changes in the consolidation perimeter — — — — — — — —
Charges (293) (438) — (731) — — — —
Releases 2 1,300 360 1,662 — — — —
Disposals and retirements — 243 — 243 — — — —
Transfers and other (236) 5,452 (360) 4,856 (527) — — (527)
Balances as of 31 December 2020 (527) (7,124) — (7,651) (527) — — (527)
Net tangible asset:
Balances as of 31 December 2019 424,294 345,504 — 769,798 262,435 — — 262,435
Balances as of 31 December 2020 400,880
1,430,31
6 — 1,831,196 245,310 — — 245,310
99
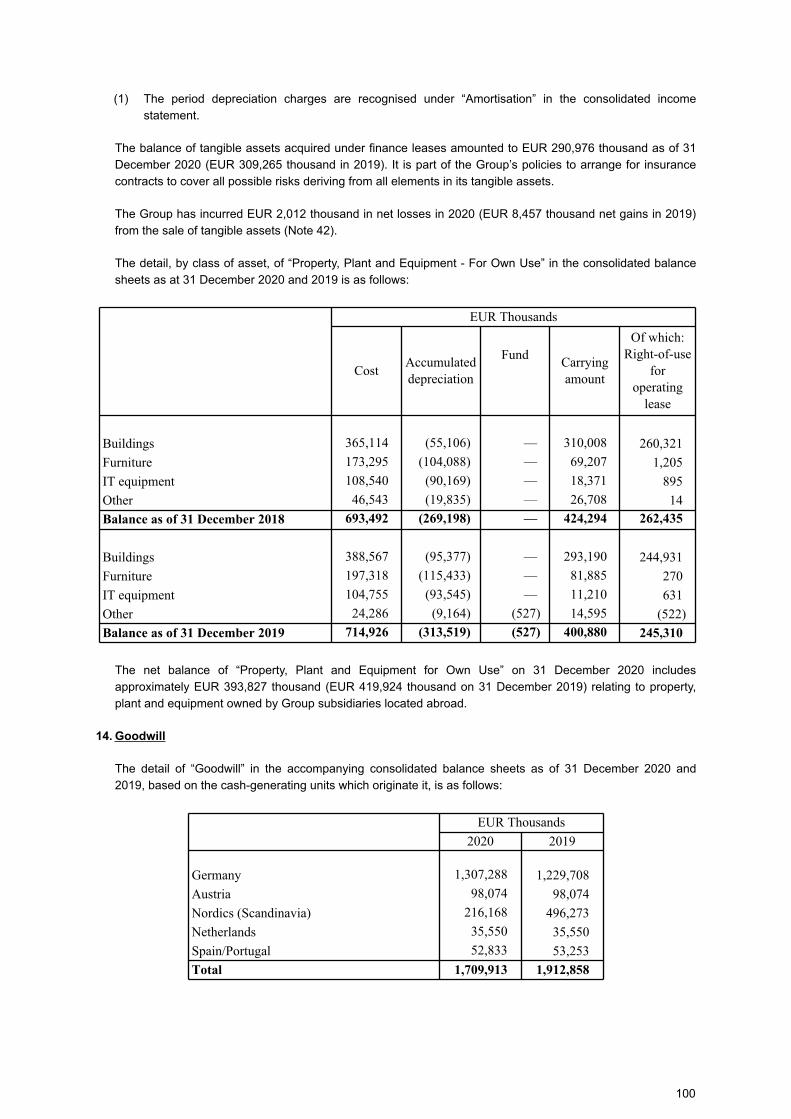
(1) The period depreciation charges are recognised under “Amortisation” in the consolidated income
statement.
The balance of tangible assets acquired under finance leases amounted to EUR 290,976 thousand as of 31
December 2020 (EUR 309,265 thousand in 2019). It is part of the Group’s policies to arrange for insurance
contracts to cover all possible risks deriving from all elements in its tangible assets.
The Group has incurred EUR 2,012 thousand in net losses in 2020 (EUR 8,457 thousand net gains in 2019)
from the sale of tangible assets (Note 42).
The detail, by class of asset, of “Property, Plant and Equipment - For Own Use” in the consolidated balance
sheets as at 31 December 2020 and 2019 is as follows:
EUR Thousands
CostAccumulated depreciation
Carrying amount
Of which: Right-of-use
for operating
lease
Fund
Buildings 365,114 (55,106) — 310,008 260,321
Furniture 173,295 (104,088) — 69,207 1,205
IT equipment 108,540 (90,169) — 18,371 895
Other 46,543 (19,835) — 26,708 14
Balance as of 31 December 2018 693,492 (269,198) — 424,294 262,435
Buildings 388,567 (95,377) — 293,190 244,931
Furniture 197,318 (115,433) — 81,885 270
IT equipment 104,755 (93,545) — 11,210 631
Other 24,286 (9,164) (527) 14,595 (522)
Balance as of 31 December 2019 714,926 (313,519) (527) 400,880 245,310
The net balance of “Property, Plant and Equipment for Own Use” on 31 December 2020 includes
approximately EUR 393,827 thousand (EUR 419,924 thousand on 31 December 2019) relating to property,
plant and equipment owned by Group subsidiaries located abroad.
14. Goodwill
The detail of “Goodwill” in the accompanying consolidated balance sheets as of 31 December 2020 and
2019, based on the cash-generating units which originate it, is as follows:
EUR Thousands
2020 2019
Germany 1,307,288 1,229,708
Austria 98,074 98,074
Nordics (Scandinavia) 216,168 496,273
Netherlands 35,550 35,550
Spain/Portugal 52,833 53,253
Total 1,709,913 1,912,858
100
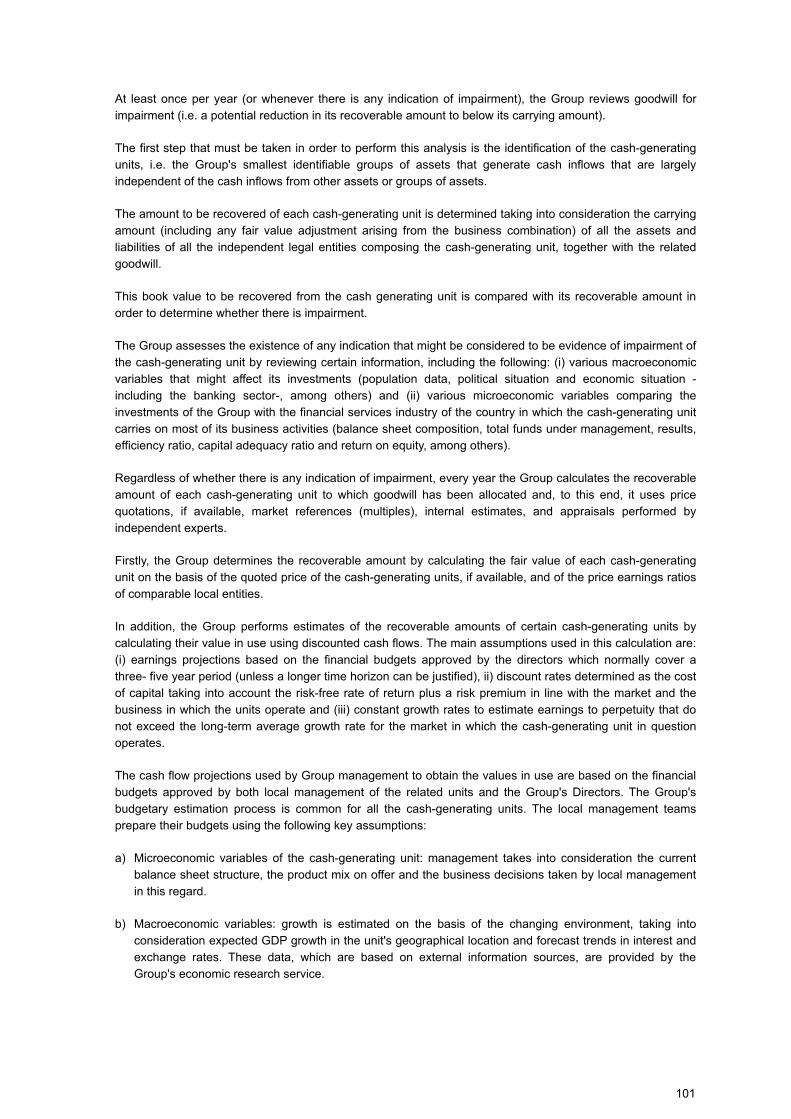
At least once per year (or whenever there is any indication of impairment), the Group reviews goodwill for
impairment (i.e. a potential reduction in its recoverable amount to below its carrying amount).
The first step that must be taken in order to perform this analysis is the identification of the cash-generating
units, i.e. the Group's smallest identifiable groups of assets that generate cash inflows that are largely
independent of the cash inflows from other assets or groups of assets.
The amount to be recovered of each cash-generating unit is determined taking into consideration the carrying
amount (including any fair value adjustment arising from the business combination) of all the assets and
liabilities of all the independent legal entities composing the cash-generating unit, together with the related
goodwill.
This book value to be recovered from the cash generating unit is compared with its recoverable amount in
order to determine whether there is impairment.
The Group assesses the existence of any indication that might be considered to be evidence of impairment of
the cash-generating unit by reviewing certain information, including the following: (i) various macroeconomic
variables that might affect its investments (population data, political situation and economic situation -
including the banking sector-, among others) and (ii) various microeconomic variables comparing the
investments of the Group with the financial services industry of the country in which the cash-generating unit
carries on most of its business activities (balance sheet composition, total funds under management, results,
efficiency ratio, capital adequacy ratio and return on equity, among others).
Regardless of whether there is any indication of impairment, every year the Group calculates the recoverable
amount of each cash-generating unit to which goodwill has been allocated and, to this end, it uses price
quotations, if available, market references (multiples), internal estimates, and appraisals performed by
independent experts.
Firstly, the Group determines the recoverable amount by calculating the fair value of each cash-generating
unit on the basis of the quoted price of the cash-generating units, if available, and of the price earnings ratios
of comparable local entities.
In addition, the Group performs estimates of the recoverable amounts of certain cash-generating units by
calculating their value in use using discounted cash flows. The main assumptions used in this calculation are:
(i) earnings projections based on the financial budgets approved by the directors which normally cover a
three- five year period (unless a longer time horizon can be justified), ii) discount rates determined as the cost
of capital taking into account the risk-free rate of return plus a risk premium in line with the market and the
business in which the units operate and (iii) constant growth rates to estimate earnings to perpetuity that do
not exceed the long-term average growth rate for the market in which the cash-generating unit in question
operates.
The cash flow projections used by Group management to obtain the values in use are based on the financial
budgets approved by both local management of the related units and the Group's Directors. The Group's
budgetary estimation process is common for all the cash-generating units. The local management teams
prepare their budgets using the following key assumptions:
a) Microeconomic variables of the cash-generating unit: management takes into consideration the current
balance sheet structure, the product mix on offer and the business decisions taken by local management
in this regard.
b) Macroeconomic variables: growth is estimated on the basis of the changing environment, taking into
consideration expected GDP growth in the unit's geographical location and forecast trends in interest and
exchange rates. These data, which are based on external information sources, are provided by the
Group's economic research service.
101
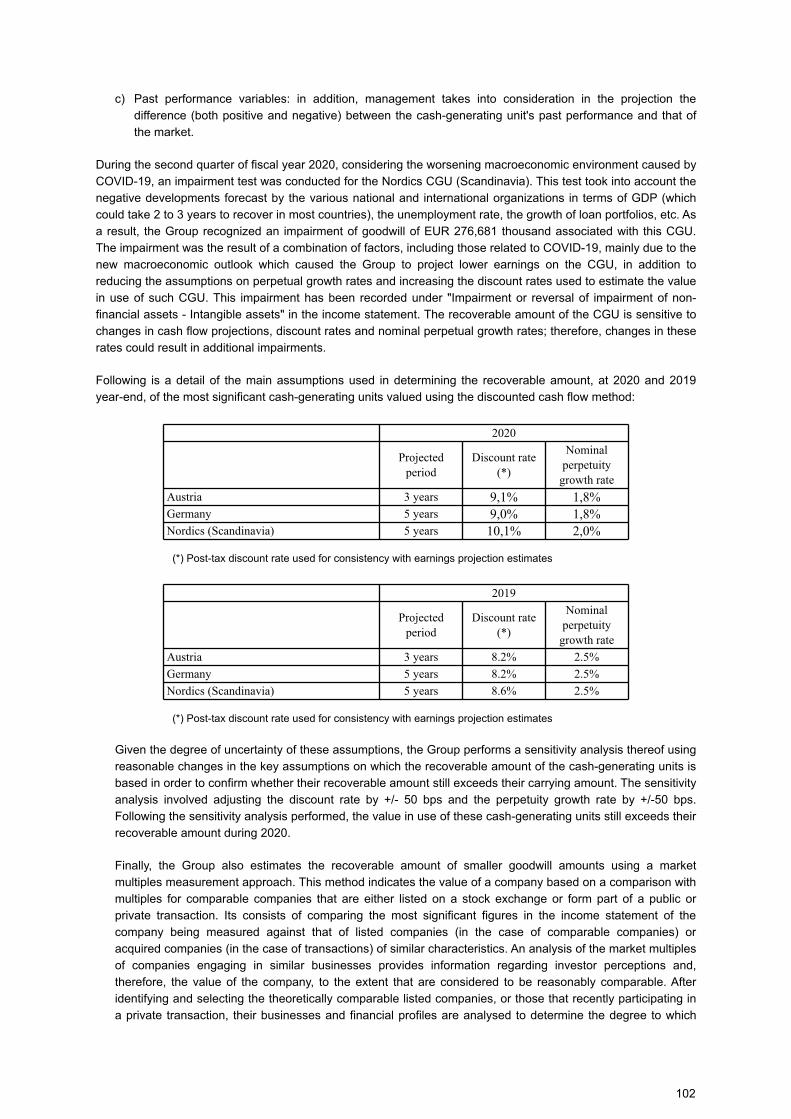
c) Past performance variables: in addition, management takes into consideration in the projection the
difference (both positive and negative) between the cash-generating unit's past performance and that of
the market.
During the second quarter of fiscal year 2020, considering the worsening macroeconomic environment caused by
COVID-19, an impairment test was conducted for the Nordics CGU (Scandinavia). This test took into account the
negative developments forecast by the various national and international organizations in terms of GDP (which
could take 2 to 3 years to recover in most countries), the unemployment rate, the growth of loan portfolios, etc. As
a result, the Group recognized an impairment of goodwill of EUR 276,681 thousand associated with this CGU.
The impairment was the result of a combination of factors, including those related to COVID-19, mainly due to the
new macroeconomic outlook which caused the Group to project lower earnings on the CGU, in addition to
reducing the assumptions on perpetual growth rates and increasing the discount rates used to estimate the value
in use of such CGU. This impairment has been recorded under "Impairment or reversal of impairment of non-
financial assets - Intangible assets" in the income statement. The recoverable amount of the CGU is sensitive to
changes in cash flow projections, discount rates and nominal perpetual growth rates; therefore, changes in these
rates could result in additional impairments.
Following is a detail of the main assumptions used in determining the recoverable amount, at 2020 and 2019
year-end, of the most significant cash-generating units valued using the discounted cash flow method:
2020
Projected period
Discount rate (*)
Nominal perpetuity
growth rate
Austria 3 years 9,1% 1,8%Germany 5 years 9,0% 1,8%Nordics (Scandinavia) 5 years 10,1% 2,0%
(*) Post-tax discount rate used for consistency with earnings projection estimates
2019
Projected period
Discount rate (*)
Nominal perpetuity
growth rate
Austria 3 years 8.2% 2.5%
Germany 5 years 8.2% 2.5%
Nordics (Scandinavia) 5 years 8.6% 2.5%
(*) Post-tax discount rate used for consistency with earnings projection estimates
Given the degree of uncertainty of these assumptions, the Group performs a sensitivity analysis thereof using
reasonable changes in the key assumptions on which the recoverable amount of the cash-generating units is
based in order to confirm whether their recoverable amount still exceeds their carrying amount. The sensitivity
analysis involved adjusting the discount rate by +/- 50 bps and the perpetuity growth rate by +/-50 bps.
Following the sensitivity analysis performed, the value in use of these cash-generating units still exceeds their
recoverable amount during 2020.
Finally, the Group also estimates the recoverable amount of smaller goodwill amounts using a market
multiples measurement approach. This method indicates the value of a company based on a comparison with
multiples for comparable companies that are either listed on a stock exchange or form part of a public or
private transaction. Its consists of comparing the most significant figures in the income statement of the
company being measured against that of listed companies (in the case of comparable companies) or
acquired companies (in the case of transactions) of similar characteristics. An analysis of the market multiples
of companies engaging in similar businesses provides information regarding investor perceptions and,
therefore, the value of the company, to the extent that are considered to be reasonably comparable. After
identifying and selecting the theoretically comparable listed companies, or those that recently participating in
a private transaction, their businesses and financial profiles are analysed to determine the degree to which
102
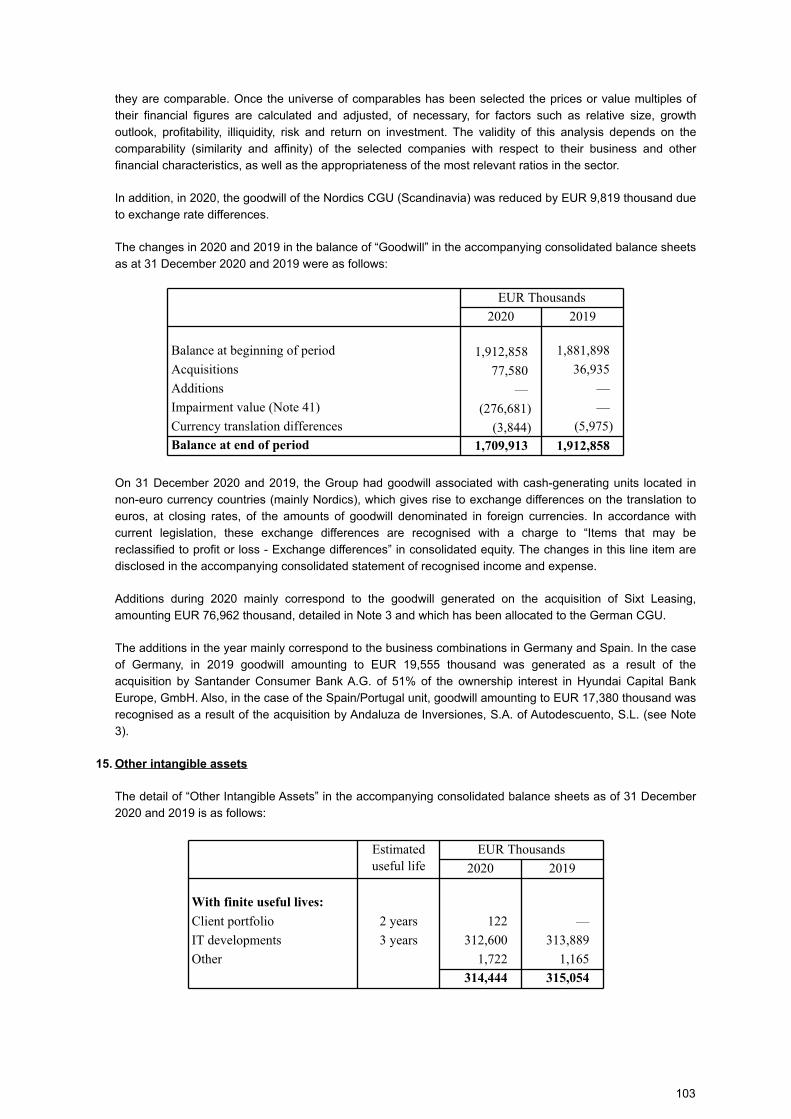
they are comparable. Once the universe of comparables has been selected the prices or value multiples of
their financial figures are calculated and adjusted, of necessary, for factors such as relative size, growth
outlook, profitability, illiquidity, risk and return on investment. The validity of this analysis depends on the
comparability (similarity and affinity) of the selected companies with respect to their business and other
financial characteristics, as well as the appropriateness of the most relevant ratios in the sector.
In addition, in 2020, the goodwill of the Nordics CGU (Scandinavia) was reduced by EUR 9,819 thousand due
to exchange rate differences.
The changes in 2020 and 2019 in the balance of “Goodwill” in the accompanying consolidated balance sheets
as at 31 December 2020 and 2019 were as follows:
EUR Thousands
2020 2019
Balance at beginning of period 1,912,858 1,881,898
Acquisitions 77,580 36,935
Additions — —
Impairment value (Note 41) (276,681) —
Currency translation differences (3,844) (5,975)
Balance at end of period 1,709,913 1,912,858
On 31 December 2020 and 2019, the Group had goodwill associated with cash-generating units located in
non-euro currency countries (mainly Nordics), which gives rise to exchange differences on the translation to
euros, at closing rates, of the amounts of goodwill denominated in foreign currencies. In accordance with
current legislation, these exchange differences are recognised with a charge to “Items that may be
reclassified to profit or loss - Exchange differences” in consolidated equity. The changes in this line item are
disclosed in the accompanying consolidated statement of recognised income and expense.
Additions during 2020 mainly correspond to the goodwill generated on the acquisition of Sixt Leasing,
amounting EUR 76,962 thousand, detailed in Note 3 and which has been allocated to the German CGU.
The additions in the year mainly correspond to the business combinations in Germany and Spain. In the case
of Germany, in 2019 goodwill amounting to EUR 19,555 thousand was generated as a result of the
acquisition by Santander Consumer Bank A.G. of 51% of the ownership interest in Hyundai Capital Bank
Europe, GmbH. Also, in the case of the Spain/Portugal unit, goodwill amounting to EUR 17,380 thousand was
recognised as a result of the acquisition by Andaluza de Inversiones, S.A. of Autodescuento, S.L. (see Note
3).
15. Other intangible assets
The detail of “Other Intangible Assets” in the accompanying consolidated balance sheets as of 31 December
2020 and 2019 is as follows:
Estimated useful life
EUR Thousands
2020 2019
With finite useful lives:
Client portfolio 2 years 122 —
IT developments 3 years 312,600 313,889
Other 1,722 1,165
314,444 315,054
103
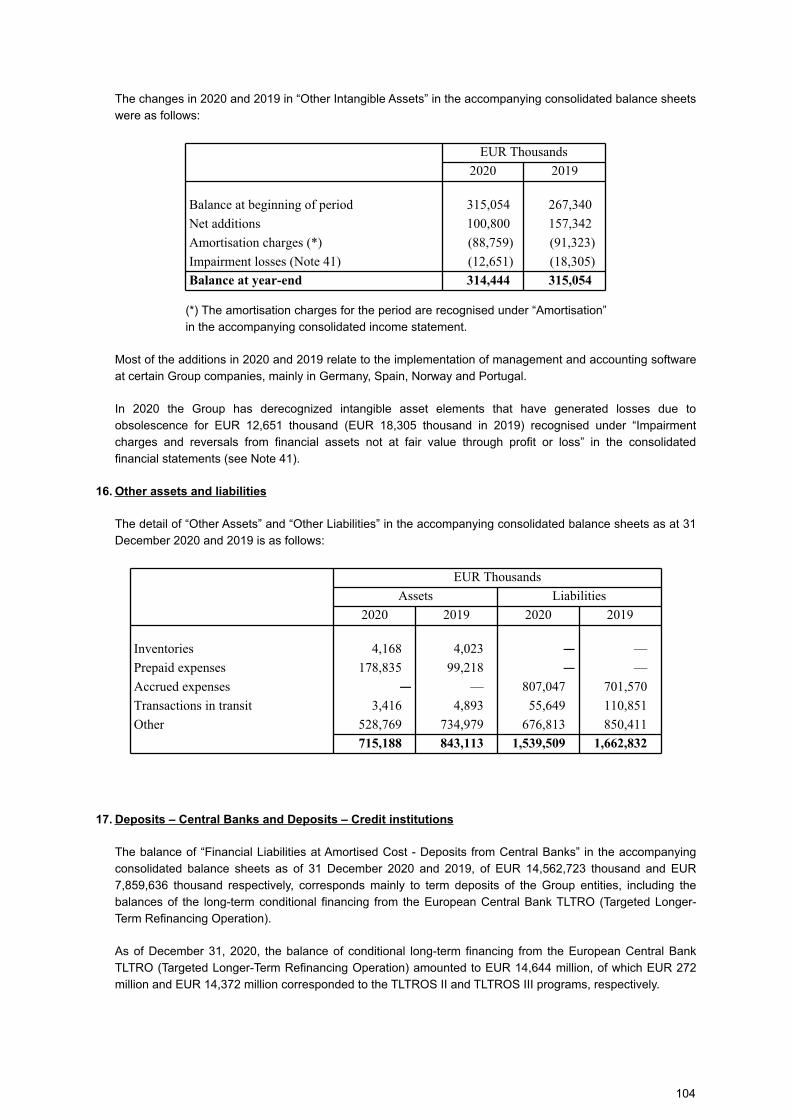
The changes in 2020 and 2019 in “Other Intangible Assets” in the accompanying consolidated balance sheets
were as follows:
EUR Thousands
2020 2019
Balance at beginning of period 315,054 267,340
Net additions 100,800 157,342
Amortisation charges (*) (88,759) (91,323)
Impairment losses (Note 41) (12,651) (18,305)
Balance at year-end 314,444 315,054
(*) The amortisation charges for the period are recognised under “Amortisation”
in the accompanying consolidated income statement.
Most of the additions in 2020 and 2019 relate to the implementation of management and accounting software
at certain Group companies, mainly in Germany, Spain, Norway and Portugal.
In 2020 the Group has derecognized intangible asset elements that have generated losses due to
obsolescence for EUR 12,651 thousand (EUR 18,305 thousand in 2019) recognised under “Impairment
charges and reversals from financial assets not at fair value through profit or loss” in the consolidated
financial statements (see Note 41).
16. Other assets and liabilities
The detail of “Other Assets” and “Other Liabilities” in the accompanying consolidated balance sheets as at 31
December 2020 and 2019 is as follows:
EUR Thousands
Assets Liabilities
2020 2019 2020 2019
Inventories 4,168 4,023 —
—
Prepaid expenses 178,835 99,218 —
—
Accrued expenses—
— 807,047 701,570
Transactions in transit 3,416 4,893 55,649 110,851
Other 528,769 734,979 676,813 850,411
715,188 843,113 1,539,509 1,662,832
17. Deposits – Central Banks and Deposits – Credit institutions
The balance of “Financial Liabilities at Amortised Cost - Deposits from Central Banks” in the accompanying
consolidated balance sheets as of 31 December 2020 and 2019, of EUR 14,562,723 thousand and EUR
7,859,636 thousand respectively, corresponds mainly to term deposits of the Group entities, including the
balances of the long-term conditional financing from the European Central Bank TLTRO (Targeted Longer-
Term Refinancing Operation).
As of December 31, 2020, the balance of conditional long-term financing from the European Central Bank
TLTRO (Targeted Longer-Term Refinancing Operation) amounted to EUR 14,644 million, of which EUR 272
million and EUR 14,372 million corresponded to the TLTROS II and TLTROS III programs, respectively.
104
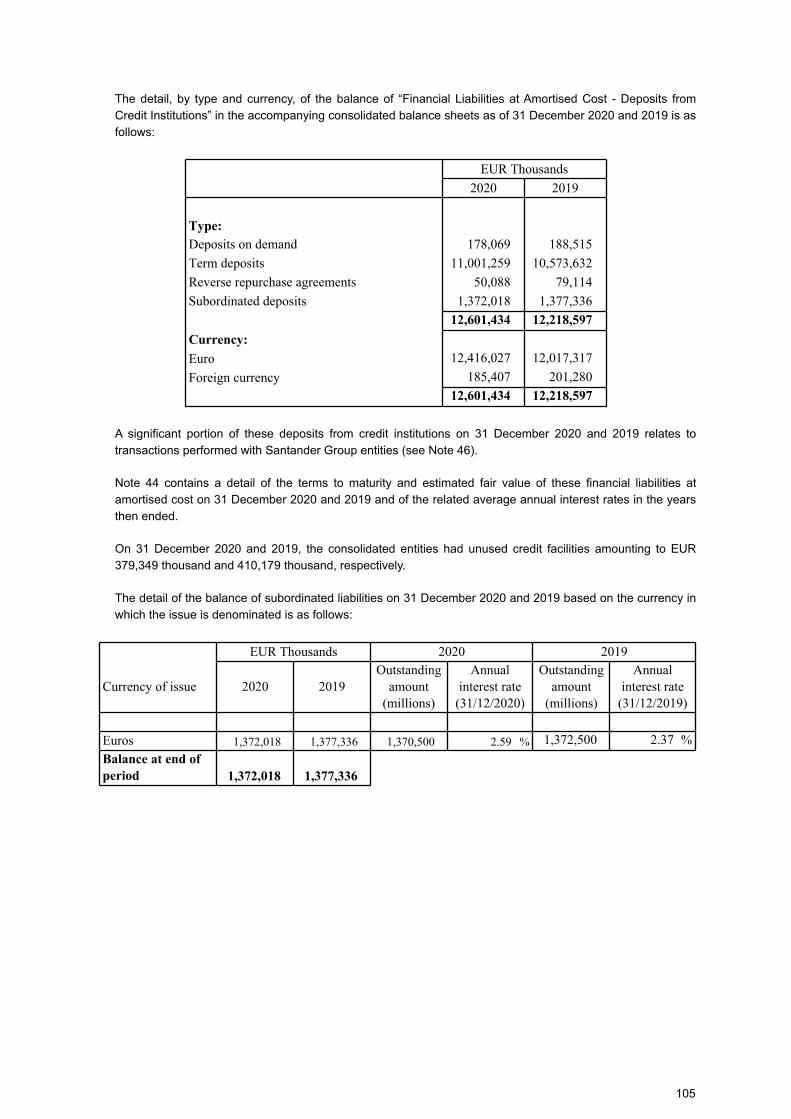
The detail, by type and currency, of the balance of “Financial Liabilities at Amortised Cost - Deposits from
Credit Institutions” in the accompanying consolidated balance sheets as of 31 December 2020 and 2019 is as
follows:
EUR Thousands
2020 2019
Type:
Deposits on demand 178,069 188,515
Term deposits 11,001,259 10,573,632
Reverse repurchase agreements 50,088 79,114
Subordinated deposits 1,372,018 1,377,336
12,601,434 12,218,597
Currency:
Euro 12,416,027 12,017,317
Foreign currency 185,407 201,280
12,601,434 12,218,597
A significant portion of these deposits from credit institutions on 31 December 2020 and 2019 relates to
transactions performed with Santander Group entities (see Note 46).
Note 44 contains a detail of the terms to maturity and estimated fair value of these financial liabilities at
amortised cost on 31 December 2020 and 2019 and of the related average annual interest rates in the years
then ended.
On 31 December 2020 and 2019, the consolidated entities had unused credit facilities amounting to EUR
379,349 thousand and 410,179 thousand, respectively.
The detail of the balance of subordinated liabilities on 31 December 2020 and 2019 based on the currency in
which the issue is denominated is as follows:
EUR Thousands 2020 2019
Currency of issue 2020 2019Outstanding
amount (millions)
Annual interest rate
(31/12/2020)
Outstanding amount
(millions)
Annual interest rate
(31/12/2019)
Euros 1,372,018 1,377,336 1,370,500 2.59 % 1,372,500 2.37 %
Balance at end of
period 1,372,018 1,377,336
105
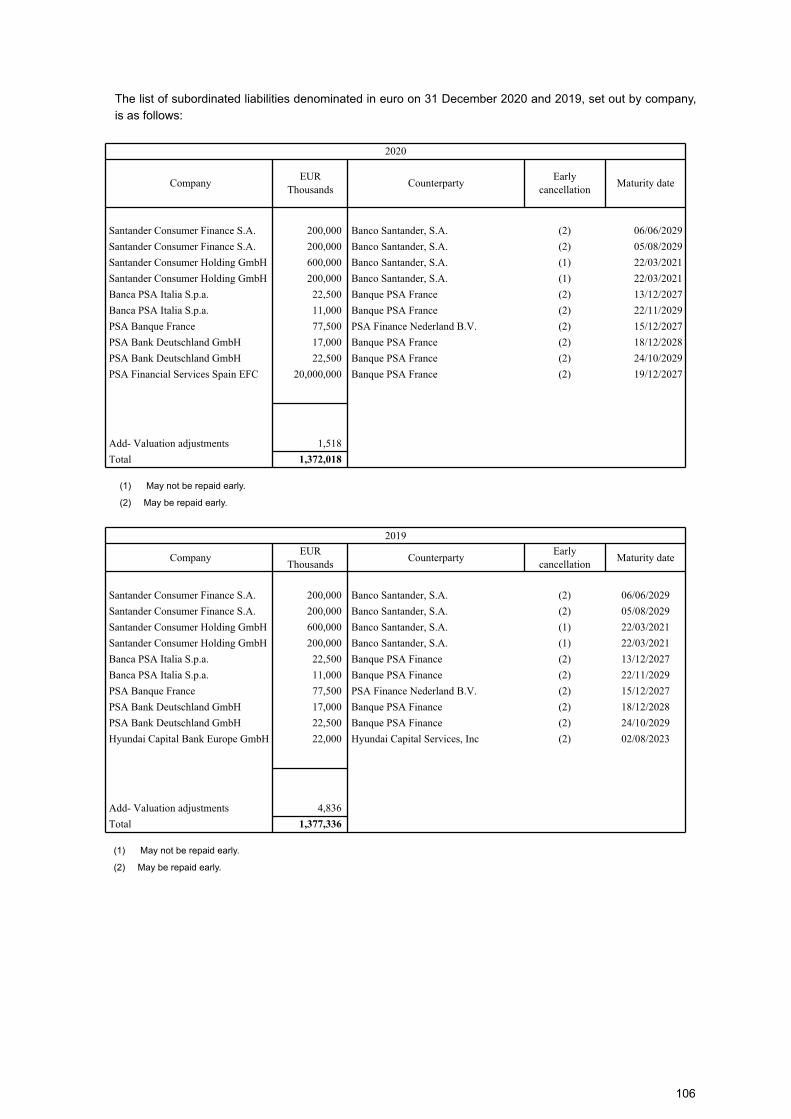
The list of subordinated liabilities denominated in euro on 31 December 2020 and 2019, set out by company,
is as follows:
2020
CompanyEUR
ThousandsCounterparty
Early cancellation
Maturity date
Santander Consumer Finance S.A. 200,000 Banco Santander, S.A. (2) 06/06/2029
Santander Consumer Finance S.A. 200,000 Banco Santander, S.A. (2) 05/08/2029
Santander Consumer Holding GmbH 600,000 Banco Santander, S.A. (1) 22/03/2021
Santander Consumer Holding GmbH 200,000 Banco Santander, S.A. (1) 22/03/2021
Banca PSA Italia S.p.a. 22,500 Banque PSA France (2) 13/12/2027
Banca PSA Italia S.p.a. 11,000 Banque PSA France (2) 22/11/2029
PSA Banque France 77,500 PSA Finance Nederland B.V. (2) 15/12/2027
PSA Bank Deutschland GmbH 17,000 Banque PSA France (2) 18/12/2028
PSA Bank Deutschland GmbH 22,500 Banque PSA France (2) 24/10/2029
PSA Financial Services Spain EFC 20,000,000 Banque PSA France (2) 19/12/2027
Add- Valuation adjustments 1,518
Total 1,372,018
(1) May not be repaid early.
(2) May be repaid early.
2019
CompanyEUR
ThousandsCounterparty
Early cancellation
Maturity date
Santander Consumer Finance S.A. 200,000 Banco Santander, S.A. (2) 06/06/2029
Santander Consumer Finance S.A. 200,000 Banco Santander, S.A. (2) 05/08/2029
Santander Consumer Holding GmbH 600,000 Banco Santander, S.A. (1) 22/03/2021
Santander Consumer Holding GmbH 200,000 Banco Santander, S.A. (1) 22/03/2021
Banca PSA Italia S.p.a. 22,500 Banque PSA Finance (2) 13/12/2027
Banca PSA Italia S.p.a. 11,000 Banque PSA Finance (2) 22/11/2029
PSA Banque France 77,500 PSA Finance Nederland B.V. (2) 15/12/2027
PSA Bank Deutschland GmbH 17,000 Banque PSA Finance (2) 18/12/2028
PSA Bank Deutschland GmbH 22,500 Banque PSA Finance (2) 24/10/2029
Hyundai Capital Bank Europe GmbH 22,000 Hyundai Capital Services, Inc (2) 02/08/2023
Add- Valuation adjustments 4,836
Total 1,377,336
(1) May not be repaid early.
(2) May be repaid early.
106
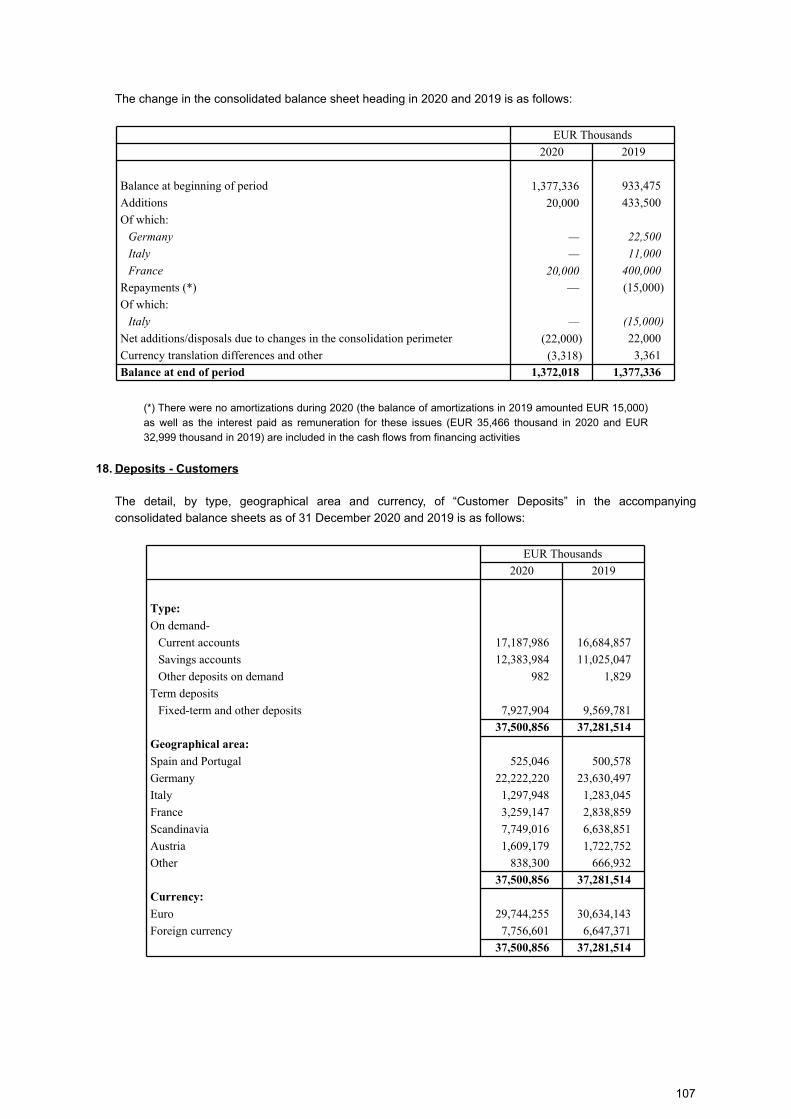
The change in the consolidated balance sheet heading in 2020 and 2019 is as follows:
EUR Thousands
2020 2019
Balance at beginning of period 1,377,336 933,475
Additions 20,000 433,500
Of which:
Germany — 22,500
Italy — 11,000
France 20,000 400,000
Repayments (*) — (15,000)
Of which:
Italy — (15,000)
Net additions/disposals due to changes in the consolidation perimeter (22,000) 22,000
Currency translation differences and other (3,318) 3,361
Balance at end of period 1,372,018 1,377,336
(*) There were no amortizations during 2020 (the balance of amortizations in 2019 amounted EUR 15,000)
as well as the interest paid as remuneration for these issues (EUR 35,466 thousand in 2020 and EUR
32,999 thousand in 2019) are included in the cash flows from financing activities
18. Deposits - Customers
The detail, by type, geographical area and currency, of “Customer Deposits” in the accompanying
consolidated balance sheets as of 31 December 2020 and 2019 is as follows:
EUR Thousands
2020 2019
Type:
On demand-
Current accounts 17,187,986 16,684,857
Savings accounts 12,383,984 11,025,047
Other deposits on demand 982 1,829
Term deposits
Fixed-term and other deposits 7,927,904 9,569,781
37,500,856 37,281,514
Geographical area:
Spain and Portugal 525,046 500,578
Germany 22,222,220 23,630,497
Italy 1,297,948 1,283,045
France 3,259,147 2,838,859
Scandinavia 7,749,016 6,638,851
Austria 1,609,179 1,722,752
Other 838,300 666,932
37,500,856 37,281,514
Currency:
Euro 29,744,255 30,634,143
Foreign currency 7,756,601 6,647,371
37,500,856 37,281,514
107
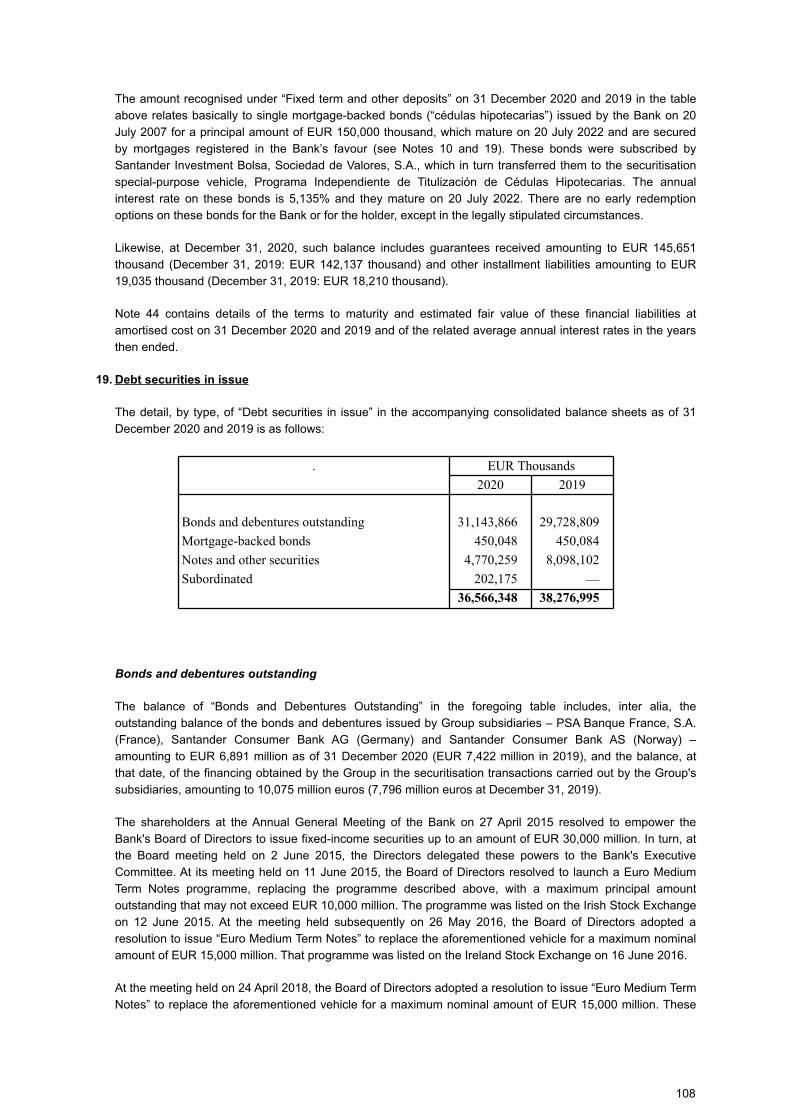
The amount recognised under “Fixed term and other deposits” on 31 December 2020 and 2019 in the table
above relates basically to single mortgage-backed bonds (“cédulas hipotecarias”) issued by the Bank on 20
July 2007 for a principal amount of EUR 150,000 thousand, which mature on 20 July 2022 and are secured
by mortgages registered in the Bank’s favour (see Notes 10 and 19). These bonds were subscribed by
Santander Investment Bolsa, Sociedad de Valores, S.A., which in turn transferred them to the securitisation
special-purpose vehicle, Programa Independiente de Titulización de Cédulas Hipotecarias. The annual
interest rate on these bonds is 5,135% and they mature on 20 July 2022. There are no early redemption
options on these bonds for the Bank or for the holder, except in the legally stipulated circumstances.
Likewise, at December 31, 2020, such balance includes guarantees received amounting to EUR 145,651
thousand (December 31, 2019: EUR 142,137 thousand) and other installment liabilities amounting to EUR
19,035 thousand (December 31, 2019: EUR 18,210 thousand).
Note 44 contains details of the terms to maturity and estimated fair value of these financial liabilities at
amortised cost on 31 December 2020 and 2019 and of the related average annual interest rates in the years
then ended.
19. Debt securities in issue
The detail, by type, of “Debt securities in issue” in the accompanying consolidated balance sheets as of 31
December 2020 and 2019 is as follows:
. EUR Thousands
2020 2019
Bonds and debentures outstanding 31,143,866 29,728,809
Mortgage-backed bonds 450,048 450,084
Notes and other securities 4,770,259 8,098,102
Subordinated 202,175 —
36,566,348 38,276,995
Bonds and debentures outstanding
The balance of “Bonds and Debentures Outstanding” in the foregoing table includes, inter alia, the
outstanding balance of the bonds and debentures issued by Group subsidiaries – PSA Banque France, S.A.
(France), Santander Consumer Bank AG (Germany) and Santander Consumer Bank AS (Norway) –
amounting to EUR 6,891 million as of 31 December 2020 (EUR 7,422 million in 2019), and the balance, at
that date, of the financing obtained by the Group in the securitisation transactions carried out by the Group's
subsidiaries, amounting to 10,075 million euros (7,796 million euros at December 31, 2019).
The shareholders at the Annual General Meeting of the Bank on 27 April 2015 resolved to empower the
Bank's Board of Directors to issue fixed-income securities up to an amount of EUR 30,000 million. In turn, at
the Board meeting held on 2 June 2015, the Directors delegated these powers to the Bank's Executive
Committee. At its meeting held on 11 June 2015, the Board of Directors resolved to launch a Euro Medium
Term Notes programme, replacing the programme described above, with a maximum principal amount
outstanding that may not exceed EUR 10,000 million. The programme was listed on the Irish Stock Exchange
on 12 June 2015. At the meeting held subsequently on 26 May 2016, the Board of Directors adopted a
resolution to issue “Euro Medium Term Notes” to replace the aforementioned vehicle for a maximum nominal
amount of EUR 15,000 million. That programme was listed on the Ireland Stock Exchange on 16 June 2016.
At the meeting held on 24 April 2018, the Board of Directors adopted a resolution to issue “Euro Medium Term
Notes” to replace the aforementioned vehicle for a maximum nominal amount of EUR 15,000 million. These
108
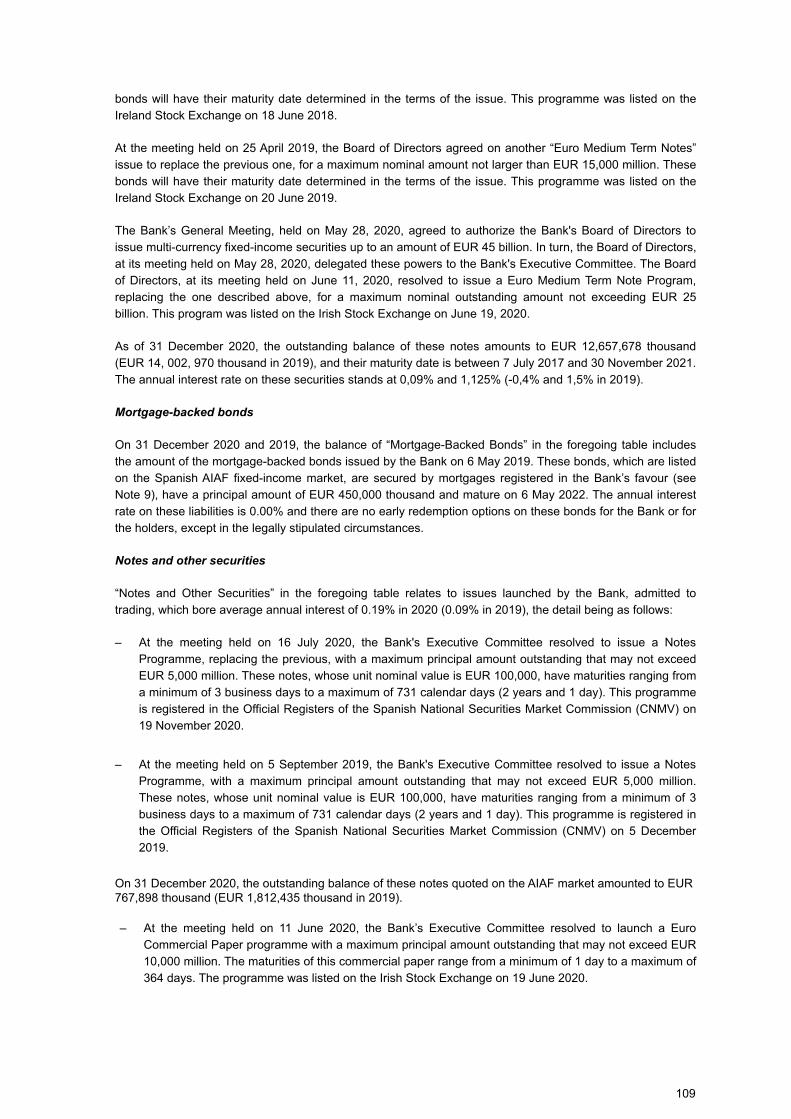
bonds will have their maturity date determined in the terms of the issue. This programme was listed on the
Ireland Stock Exchange on 18 June 2018.
At the meeting held on 25 April 2019, the Board of Directors agreed on another “Euro Medium Term Notes”
issue to replace the previous one, for a maximum nominal amount not larger than EUR 15,000 million. These
bonds will have their maturity date determined in the terms of the issue. This programme was listed on the
Ireland Stock Exchange on 20 June 2019.
The Bank’s General Meeting, held on May 28, 2020, agreed to authorize the Bank's Board of Directors to
issue multi-currency fixed-income securities up to an amount of EUR 45 billion. In turn, the Board of Directors,
at its meeting held on May 28, 2020, delegated these powers to the Bank's Executive Committee. The Board
of Directors, at its meeting held on June 11, 2020, resolved to issue a Euro Medium Term Note Program,
replacing the one described above, for a maximum nominal outstanding amount not exceeding EUR 25
billion. This program was listed on the Irish Stock Exchange on June 19, 2020.
As of 31 December 2020, the outstanding balance of these notes amounts to EUR 12,657,678 thousand
(EUR 14, 002, 970 thousand in 2019), and their maturity date is between 7 July 2017 and 30 November 2021.
The annual interest rate on these securities stands at 0,09% and 1,125% (-0,4% and 1,5% in 2019).
Mortgage-backed bonds
On 31 December 2020 and 2019, the balance of “Mortgage-Backed Bonds” in the foregoing table includes
the amount of the mortgage-backed bonds issued by the Bank on 6 May 2019. These bonds, which are listed
on the Spanish AIAF fixed-income market, are secured by mortgages registered in the Bank’s favour (see
Note 9), have a principal amount of EUR 450,000 thousand and mature on 6 May 2022. The annual interest
rate on these liabilities is 0.00% and there are no early redemption options on these bonds for the Bank or for
the holders, except in the legally stipulated circumstances.
Notes and other securities
“Notes and Other Securities” in the foregoing table relates to issues launched by the Bank, admitted to
trading, which bore average annual interest of 0.19% in 2020 (0.09% in 2019), the detail being as follows:
– At the meeting held on 16 July 2020, the Bank's Executive Committee resolved to issue a Notes
Programme, replacing the previous, with a maximum principal amount outstanding that may not exceed
EUR 5,000 million. These notes, whose unit nominal value is EUR 100,000, have maturities ranging from
a minimum of 3 business days to a maximum of 731 calendar days (2 years and 1 day). This programme
is registered in the Official Registers of the Spanish National Securities Market Commission (CNMV) on
19 November 2020.
– At the meeting held on 5 September 2019, the Bank's Executive Committee resolved to issue a Notes
Programme, with a maximum principal amount outstanding that may not exceed EUR 5,000 million.
These notes, whose unit nominal value is EUR 100,000, have maturities ranging from a minimum of 3
business days to a maximum of 731 calendar days (2 years and 1 day). This programme is registered in
the Official Registers of the Spanish National Securities Market Commission (CNMV) on 5 December
2019.
On 31 December 2020, the outstanding balance of these notes quoted on the AIAF market amounted to EUR
767,898 thousand (EUR 1,812,435 thousand in 2019).
– At the meeting held on 11 June 2020, the Bank’s Executive Committee resolved to launch a Euro
Commercial Paper programme with a maximum principal amount outstanding that may not exceed EUR
10,000 million. The maturities of this commercial paper range from a minimum of 1 day to a maximum of
364 days. The programme was listed on the Irish Stock Exchange on 19 June 2020.
109
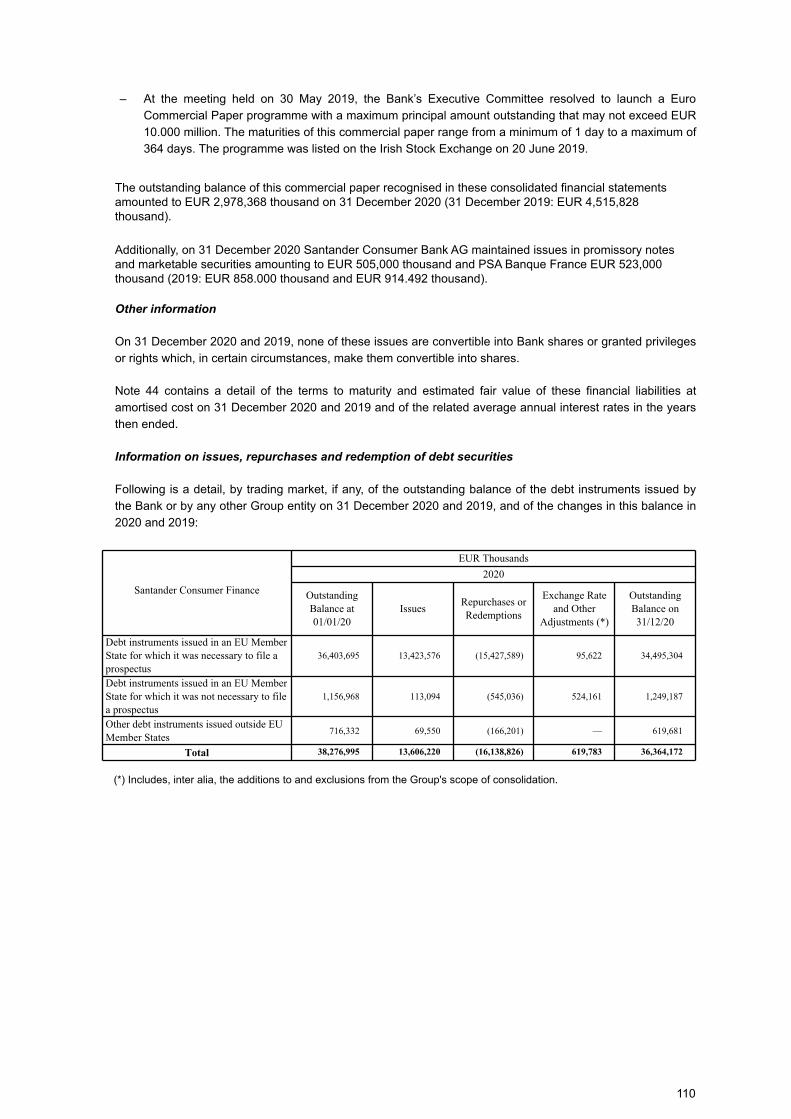
– At the meeting held on 30 May 2019, the Bank’s Executive Committee resolved to launch a Euro
Commercial Paper programme with a maximum principal amount outstanding that may not exceed EUR
10.000 million. The maturities of this commercial paper range from a minimum of 1 day to a maximum of
364 days. The programme was listed on the Irish Stock Exchange on 20 June 2019.
The outstanding balance of this commercial paper recognised in these consolidated financial statements
amounted to EUR 2,978,368 thousand on 31 December 2020 (31 December 2019: EUR 4,515,828
thousand).
Additionally, on 31 December 2020 Santander Consumer Bank AG maintained issues in promissory notes
and marketable securities amounting to EUR 505,000 thousand and PSA Banque France EUR 523,000
thousand (2019: EUR 858.000 thousand and EUR 914.492 thousand).
Other information
On 31 December 2020 and 2019, none of these issues are convertible into Bank shares or granted privileges
or rights which, in certain circumstances, make them convertible into shares.
Note 44 contains a detail of the terms to maturity and estimated fair value of these financial liabilities at
amortised cost on 31 December 2020 and 2019 and of the related average annual interest rates in the years
then ended.
Information on issues, repurchases and redemption of debt securities
Following is a detail, by trading market, if any, of the outstanding balance of the debt instruments issued by
the Bank or by any other Group entity on 31 December 2020 and 2019, and of the changes in this balance in
2020 and 2019:
EUR Thousands
2020
Santander Consumer Finance Outstanding Balance at 01/01/20
IssuesRepurchases or Redemptions
Exchange Rate and Other
Adjustments (*)
Outstanding Balance on 31/12/20
Debt instruments issued in an EU Member State for which it was necessary to file a prospectus
36,403,695 13,423,576 (15,427,589) 95,622 34,495,304
Debt instruments issued in an EU Member State for which it was not necessary to file a prospectus
1,156,968 113,094 (545,036) 524,161 1,249,187
Other debt instruments issued outside EU Member States
716,332 69,550 (166,201) — 619,681
Total 38,276,995 13,606,220 (16,138,826) 619,783 36,364,172
(*) Includes, inter alia, the additions to and exclusions from the Group's scope of consolidation.
110
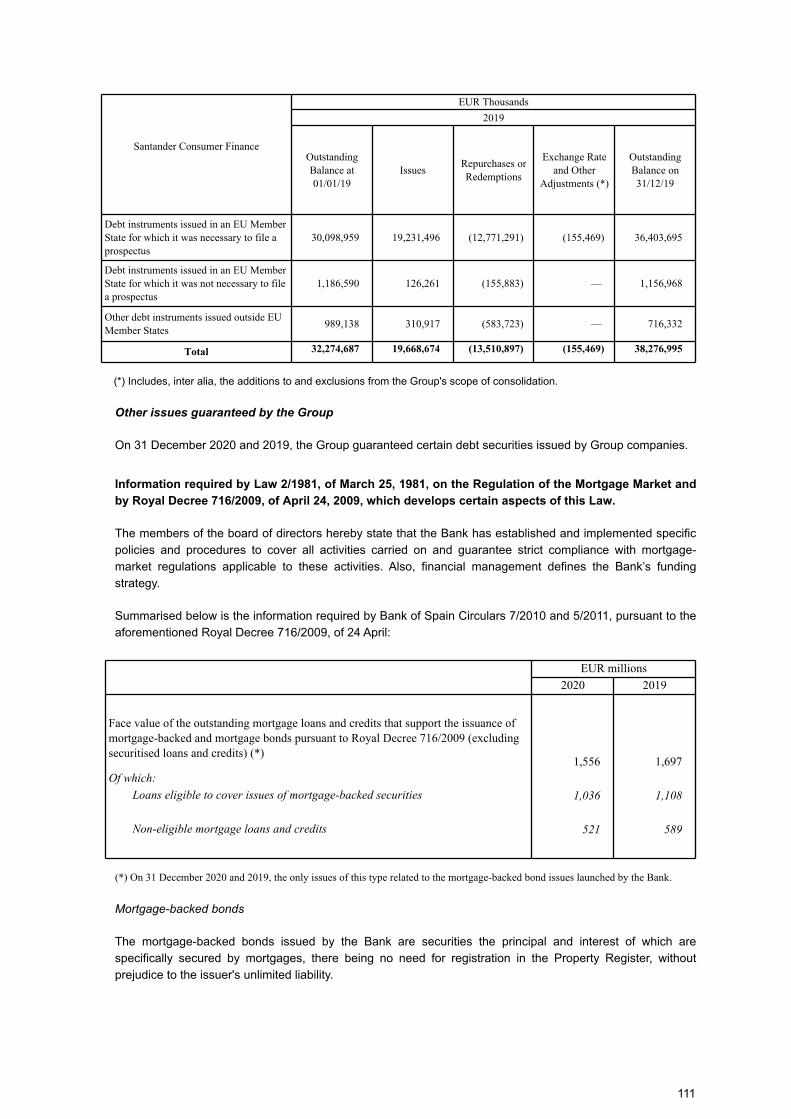
EUR Thousands
2019
Santander Consumer FinanceOutstanding Balance at 01/01/19
IssuesRepurchases or Redemptions
Exchange Rate and Other
Adjustments (*)
Outstanding Balance on 31/12/19
Debt instruments issued in an EU Member State for which it was necessary to file a prospectus
30,098,959 19,231,496 (12,771,291) (155,469) 36,403,695
Debt instruments issued in an EU Member State for which it was not necessary to file a prospectus
1,186,590 126,261 (155,883) — 1,156,968
Other debt instruments issued outside EU Member States
989,138 310,917 (583,723) — 716,332
Total 32,274,687 19,668,674 (13,510,897) (155,469) 38,276,995
(*) Includes, inter alia, the additions to and exclusions from the Group's scope of consolidation.
Other issues guaranteed by the Group
On 31 December 2020 and 2019, the Group guaranteed certain debt securities issued by Group companies.
Information required by Law 2/1981, of March 25, 1981, on the Regulation of the Mortgage Market and
by Royal Decree 716/2009, of April 24, 2009, which develops certain aspects of this Law.
The members of the board of directors hereby state that the Bank has established and implemented specific
policies and procedures to cover all activities carried on and guarantee strict compliance with mortgage-
market regulations applicable to these activities. Also, financial management defines the Bank’s funding
strategy.
Summarised below is the information required by Bank of Spain Circulars 7/2010 and 5/2011, pursuant to the
aforementioned Royal Decree 716/2009, of 24 April:
EUR millions
2020 2019
Face value of the outstanding mortgage loans and credits that support the issuance of mortgage-backed and mortgage bonds pursuant to Royal Decree 716/2009 (excluding securitised loans and credits) (*)
1,556 1,697
Of which:
Loans eligible to cover issues of mortgage-backed securities 1,036 1,108
Non-eligible mortgage loans and credits 521 589
(*) On 31 December 2020 and 2019, the only issues of this type related to the mortgage-backed bond issues launched by the Bank.
Mortgage-backed bonds
The mortgage-backed bonds issued by the Bank are securities the principal and interest of which are
specifically secured by mortgages, there being no need for registration in the Property Register, without
prejudice to the issuer's unlimited liability.
111
The mortgage-backed bonds include the holder’s financial claim on the issuer, secured as indicated in the
preceding paragraph, and may be enforced to claim payment from the issuer after maturity. The holders of
these securities have the status of special preferential creditors vis-à-vis all other creditors (established in
Article 1923,3 of the Spanish Civil Code) in relation to all the mortgage loans and credits registered in the
issuer's favour and, where appropriate, in relation to the cash flows generated by the derivative financial
instruments associated with the issues.
In the event of insolvency, the holders of mortgage-backed bonds will enjoy the special privilege established
in Article 90, 1.1 of Insolvency Law 22/2003, of 9 July. Without prejudice to the foregoing, in accordance with
Article 84, 2.7 of the Insolvency Law, during the insolvency proceedings, the payments relating to the
repayment of the principal and interest of the bonds issued and outstanding at the date of the insolvency filing
will be settled up to the amount of the income received by the insolvent party from the mortgage loans and
credits and, where appropriate, from the replacement assets backing the bonds and from the cash flows
generated by the financial instruments associated with the issues (Final Provision 19 of the Insolvency Law).
If, due to a timing mismatch, the income received by the insolvent party is insufficient to meet the payments
described in the preceding paragraph, the insolvency managers must settle them by realising the
replacement assets set aside to cover the issue and, if this is not sufficient, they must obtain financing to
meet the mandated payments to the holders of the mortgage-backed bonds, and the finance provider must be
subrogated to the position of the bond-holders.
In the event that the measure indicated in Article 155.3 of the Insolvency Law were to be adopted, the
payments to all holders of the mortgage-backed bonds issued would be made on a pro-rata basis,
irrespective of the issue dates of the bonds.
The Group has mortgage-backed bonds outstanding amounted to EUR 600 million, respectively, at 31
December 2020 and 2019 respectively.
Mortgage-backed bond issuers have an early redemption option solely for the purpose of complying with the
limits on the volume of outstanding mortgage-backed bonds stipulated by mortgage market regulations.
None of the mortgage-backed bonds issued by the Group entities had replacement assets assigned to them.
Appendix VI contains the additional disclosures required pursuant to Mortgage Market Law 2/1981, of 25
March, and to Royal Decree 716/2009, of 24 April, implementing certain provisions of the aforementioned
Law, implemented by Bank of Spain Circular 5/2011.
112
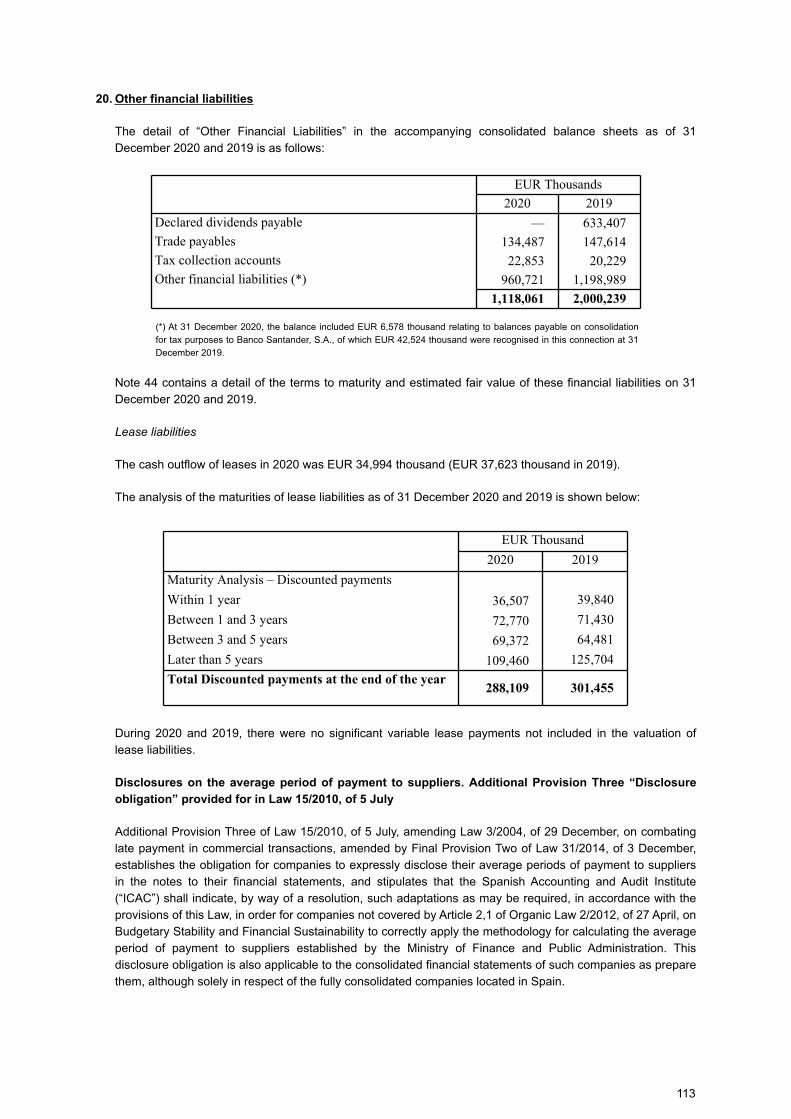
20. Other financial liabilities
The detail of “Other Financial Liabilities” in the accompanying consolidated balance sheets as of 31
December 2020 and 2019 is as follows:
EUR Thousands
2020 2019
Declared dividends payable — 633,407
Trade payables 134,487 147,614
Tax collection accounts 22,853 20,229
Other financial liabilities (*) 960,721 1,198,989
1,118,061 2,000,239
(*) At 31 December 2020, the balance included EUR 6,578 thousand relating to balances payable on consolidation
for tax purposes to Banco Santander, S.A., of which EUR 42,524 thousand were recognised in this connection at 31
December 2019.
Note 44 contains a detail of the terms to maturity and estimated fair value of these financial liabilities on 31
December 2020 and 2019.
Lease liabilities
The cash outflow of leases in 2020 was EUR 34,994 thousand (EUR 37,623 thousand in 2019).
The analysis of the maturities of lease liabilities as of 31 December 2020 and 2019 is shown below:
EUR Thousand
2020 2019
Maturity Analysis – Discounted payments
Within 1 year 36,507 39,840
Between 1 and 3 years 72,770 71,430
Between 3 and 5 years 69,372 64,481
Later than 5 years 109,460 125,704
Total Discounted payments at the end of the year288,109 301,455
During 2020 and 2019, there were no significant variable lease payments not included in the valuation of
lease liabilities.
Disclosures on the average period of payment to suppliers. Additional Provision Three “Disclosure
obligation” provided for in Law 15/2010, of 5 July
Additional Provision Three of Law 15/2010, of 5 July, amending Law 3/2004, of 29 December, on combating
late payment in commercial transactions, amended by Final Provision Two of Law 31/2014, of 3 December,
establishes the obligation for companies to expressly disclose their average periods of payment to suppliers
in the notes to their financial statements, and stipulates that the Spanish Accounting and Audit Institute
(“ICAC”) shall indicate, by way of a resolution, such adaptations as may be required, in accordance with the
provisions of this Law, in order for companies not covered by Article 2,1 of Organic Law 2/2012, of 27 April, on
Budgetary Stability and Financial Sustainability to correctly apply the methodology for calculating the average
period of payment to suppliers established by the Ministry of Finance and Public Administration. This
disclosure obligation is also applicable to the consolidated financial statements of such companies as prepare
them, although solely in respect of the fully consolidated companies located in Spain.
113
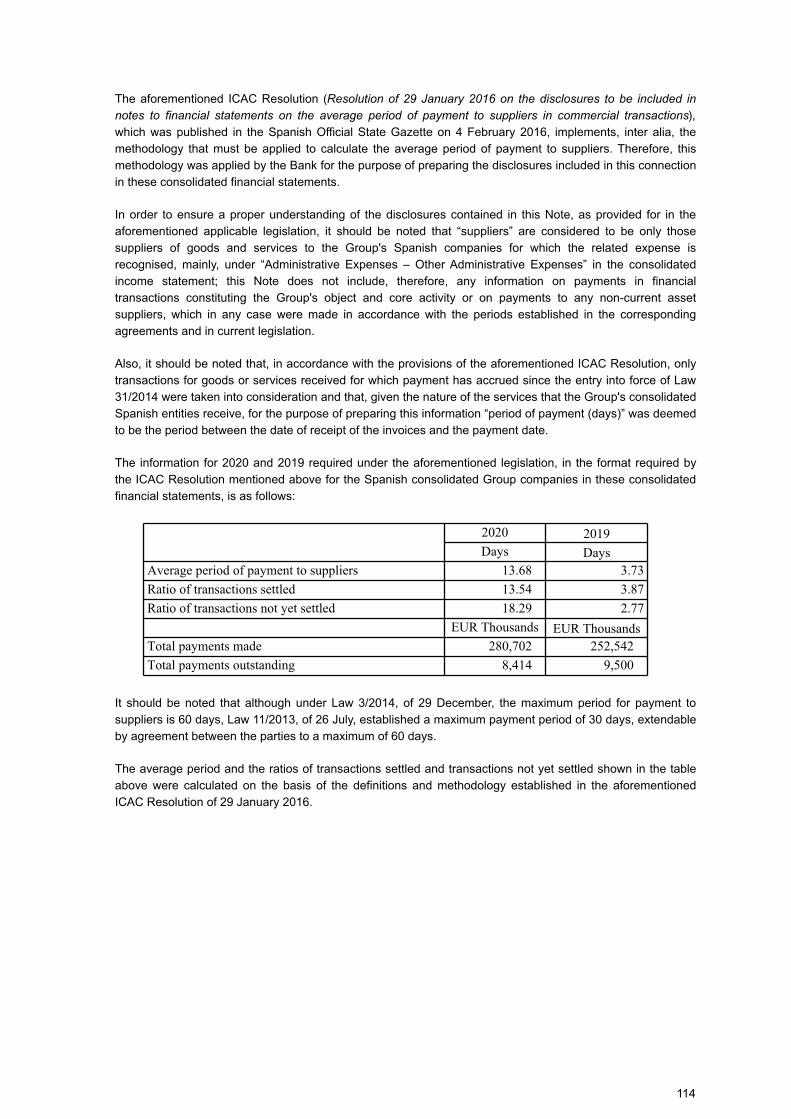
The aforementioned ICAC Resolution (Resolution of 29 January 2016 on the disclosures to be included in
notes to financial statements on the average period of payment to suppliers in commercial transactions),
which was published in the Spanish Official State Gazette on 4 February 2016, implements, inter alia, the
methodology that must be applied to calculate the average period of payment to suppliers. Therefore, this
methodology was applied by the Bank for the purpose of preparing the disclosures included in this connection
in these consolidated financial statements.
In order to ensure a proper understanding of the disclosures contained in this Note, as provided for in the
aforementioned applicable legislation, it should be noted that “suppliers” are considered to be only those
suppliers of goods and services to the Group's Spanish companies for which the related expense is
recognised, mainly, under “Administrative Expenses – Other Administrative Expenses” in the consolidated
income statement; this Note does not include, therefore, any information on payments in financial
transactions constituting the Group's object and core activity or on payments to any non-current asset
suppliers, which in any case were made in accordance with the periods established in the corresponding
agreements and in current legislation.
Also, it should be noted that, in accordance with the provisions of the aforementioned ICAC Resolution, only
transactions for goods or services received for which payment has accrued since the entry into force of Law
31/2014 were taken into consideration and that, given the nature of the services that the Group's consolidated
Spanish entities receive, for the purpose of preparing this information “period of payment (days)” was deemed
to be the period between the date of receipt of the invoices and the payment date.
The information for 2020 and 2019 required under the aforementioned legislation, in the format required by
the ICAC Resolution mentioned above for the Spanish consolidated Group companies in these consolidated
financial statements, is as follows:
2020 2019Days Days
Average period of payment to suppliers 13.68 3.73
Ratio of transactions settled 13.54 3.87
Ratio of transactions not yet settled 18.29 2.77
EUR Thousands EUR ThousandsTotal payments made 280,702 252,542
Total payments outstanding 8,414 9,500
It should be noted that although under Law 3/2014, of 29 December, the maximum period for payment to
suppliers is 60 days, Law 11/2013, of 26 July, established a maximum payment period of 30 days, extendable
by agreement between the parties to a maximum of 60 days.
The average period and the ratios of transactions settled and transactions not yet settled shown in the table
above were calculated on the basis of the definitions and methodology established in the aforementioned
ICAC Resolution of 29 January 2016.
114
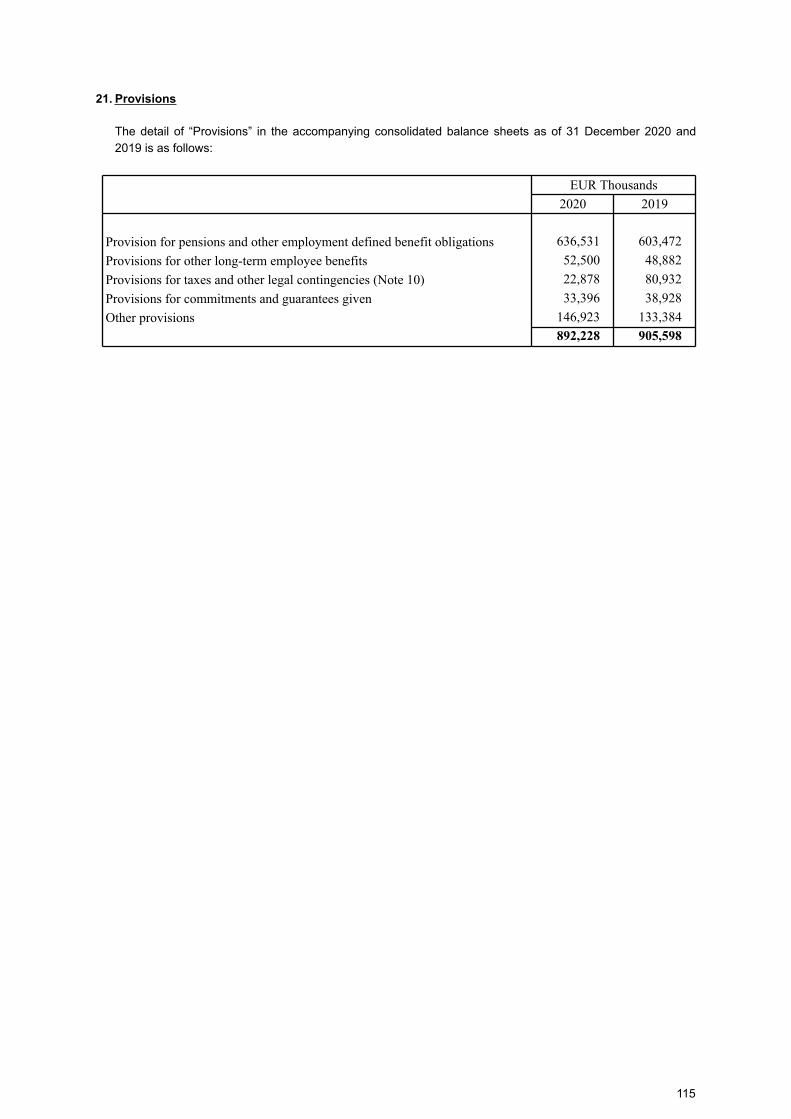
21. Provisions
The detail of “Provisions” in the accompanying consolidated balance sheets as of 31 December 2020 and
2019 is as follows:
EUR Thousands
2020 2019
Provision for pensions and other employment defined benefit obligations 636,531 603,472
Provisions for other long-term employee benefits 52,500 48,882
Provisions for taxes and other legal contingencies (Note 10) 22,878 80,932
Provisions for commitments and guarantees given 33,396 38,928
Other provisions 146,923 133,384
892,228 905,598
115
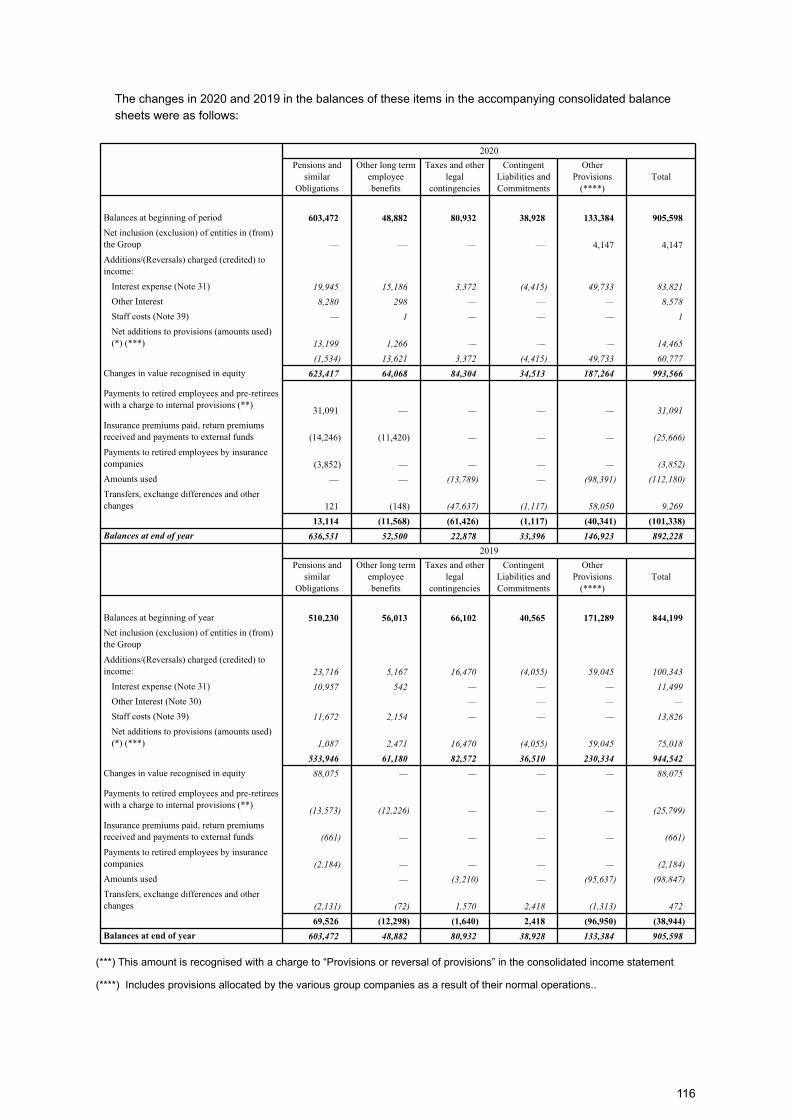
The changes in 2020 and 2019 in the balances of these items in the accompanying consolidated balance
sheets were as follows:
2020
Pensions and similar
Obligations
Other long term employee benefits
Taxes and other legal
contingencies
Contingent Liabilities and Commitments
Other Provisions
(****)Total
Balances at beginning of period 603,472 48,882 80,932 38,928 133,384 905,598
Net inclusion (exclusion) of entities in (from) the Group — — — — 4,147 4,147
Additions/(Reversals) charged (credited) to income:
Interest expense (Note 31) 19,945 15,186 3,372 (4,415) 49,733 83,821
Other Interest 8,280 298 — — — 8,578
Staff costs (Note 39) — 1 — — — 1
Net additions to provisions (amounts used) (*) (***) 13,199 1,266 — — — 14,465
(1,534) 13,621 3,372 (4,415) 49,733 60,777
Changes in value recognised in equity 623,417 64,068 84,304 34,513 187,264 993,566
Payments to retired employees and pre-retirees with a charge to internal provisions (**)
31,091 — — — — 31,091
Insurance premiums paid, return premiums received and payments to external funds (14,246) (11,420) — — — (25,666)
Payments to retired employees by insurance companies (3,852) — — — — (3,852)
Amounts used — — (13,789) — (98,391) (112,180)
Transfers, exchange differences and other changes 121 (148) (47,637) (1,117) 58,050 9,269
13,114 (11,568) (61,426) (1,117) (40,341) (101,338)
Balances at end of year 636,531 52,500 22,878 33,396 146,923 892,228
2019
Pensions and similar
Obligations
Other long term employee benefits
Taxes and other legal
contingencies
Contingent Liabilities and Commitments
Other Provisions
(****)Total
Balances at beginning of year 510,230 56,013 66,102 40,565 171,289 844,199
Net inclusion (exclusion) of entities in (from) the Group
Additions/(Reversals) charged (credited) to income: 23,716 5,167 16,470 (4,055) 59,045 100,343
Interest expense (Note 31) 10,957 542 — — — 11,499
Other Interest (Note 30) — — — —
Staff costs (Note 39) 11,672 2,154 — — — 13,826
Net additions to provisions (amounts used) (*) (***) 1,087 2,471 16,470 (4,055) 59,045 75,018
533,946 61,180 82,572 36,510 230,334 944,542
Changes in value recognised in equity 88,075 — — — — 88,075
Payments to retired employees and pre-retirees with a charge to internal provisions (**)
(13,573) (12,226) — — — (25,799)
Insurance premiums paid, return premiums received and payments to external funds (661) — — — — (661)
Payments to retired employees by insurance companies (2,184) — — — — (2,184)
Amounts used — (3,210) — (95,637) (98,847)
Transfers, exchange differences and other changes (2,131) (72) 1,570 2,418 (1,313) 472
69,526 (12,298) (1,640) 2,418 (96,950) (38,944)
Balances at end of year 603,472 48,882 80,932 38,928 133,384 905,598
(***) This amount is recognised with a charge to “Provisions or reversal of provisions” in the consolidated income statement
(****) Includes provisions allocated by the various group companies as a result of their normal operations..
116
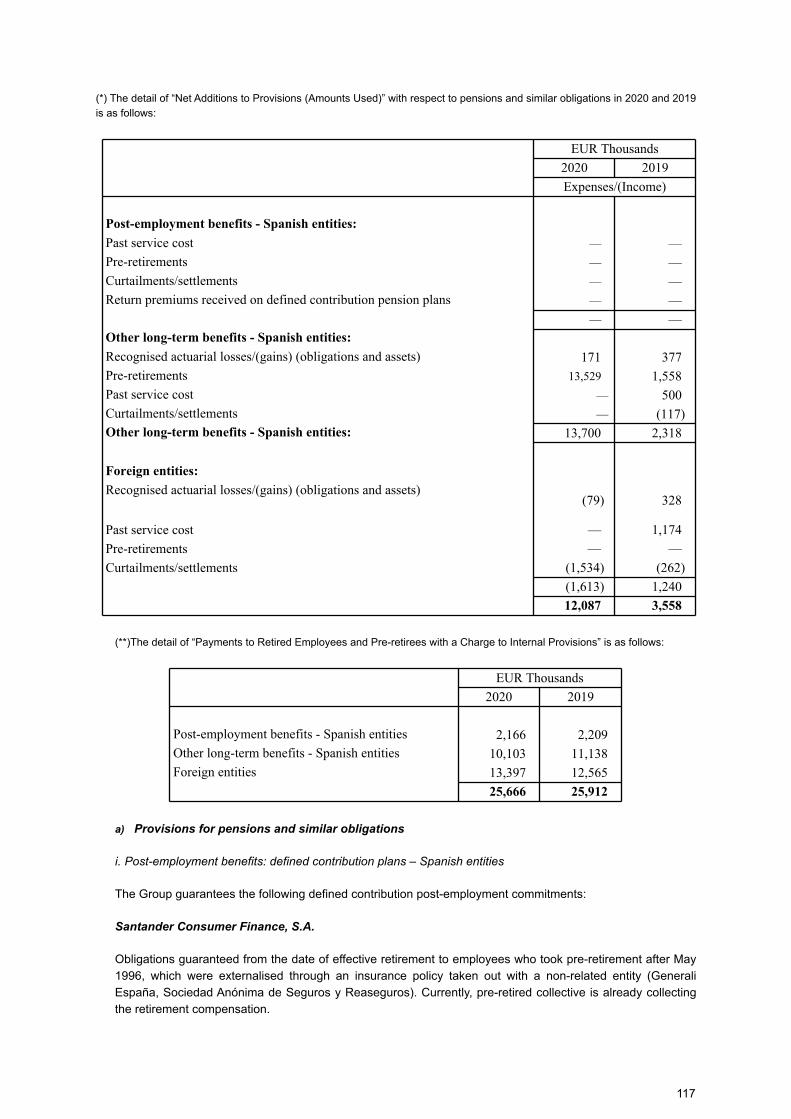
(*) The detail of “Net Additions to Provisions (Amounts Used)” with respect to pensions and similar obligations in 2020 and 2019
is as follows:
EUR Thousands
2020 2019
Expenses/(Income)
Post-employment benefits - Spanish entities:
Past service cost — —
Pre-retirements — —
Curtailments/settlements — —
Return premiums received on defined contribution pension plans — —
— — Other long-term benefits - Spanish entities:
Recognised actuarial losses/(gains) (obligations and assets) 171 377
Pre-retirements 13,529 1,558
Past service cost — 500
Curtailments/settlements — (117)Other long-term benefits - Spanish entities: 13,700 2,318
Foreign entities:
Recognised actuarial losses/(gains) (obligations and assets)(79) 328
Past service cost — 1,174
Pre-retirements — —
Curtailments/settlements (1,534) (262)
(1,613) 1,240
12,087 3,558
(**)The detail of “Payments to Retired Employees and Pre-retirees with a Charge to Internal Provisions” is as follows:
EUR Thousands
2020 2019
Post-employment benefits - Spanish entities 2,166 2,209
Other long-term benefits - Spanish entities 10,103 11,138
Foreign entities 13,397 12,565
25,666 25,912
a) Provisions for pensions and similar obligations
i. Post-employment benefits: defined contribution plans – Spanish entities
The Group guarantees the following defined contribution post-employment commitments:
Santander Consumer Finance, S.A.
Obligations guaranteed from the date of effective retirement to employees who took pre-retirement after May
1996, which were externalised through an insurance policy taken out with a non-related entity (Generali
España, Sociedad Anónima de Seguros y Reaseguros). Currently, pre-retired collective is already collecting
the retirement compensation.
117
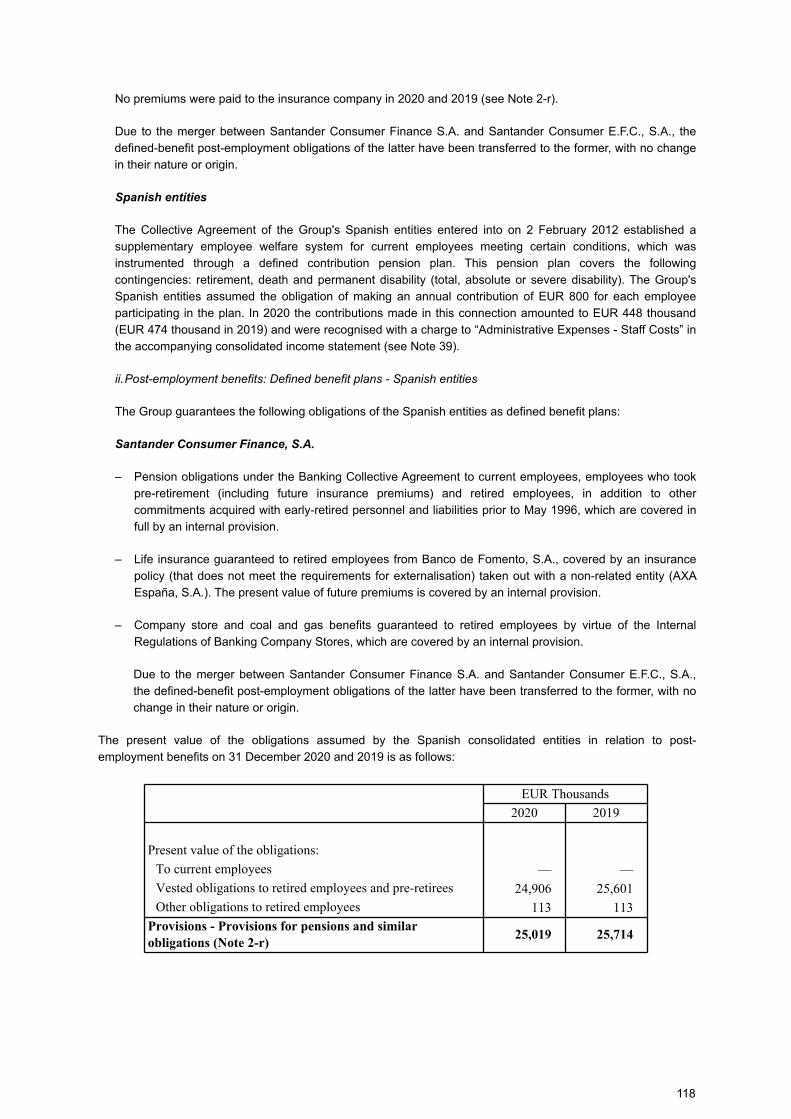
No premiums were paid to the insurance company in 2020 and 2019 (see Note 2-r).
Due to the merger between Santander Consumer Finance S.A. and Santander Consumer E.F.C., S.A., the
defined-benefit post-employment obligations of the latter have been transferred to the former, with no change
in their nature or origin.
Spanish entities
The Collective Agreement of the Group's Spanish entities entered into on 2 February 2012 established a
supplementary employee welfare system for current employees meeting certain conditions, which was
instrumented through a defined contribution pension plan. This pension plan covers the following
contingencies: retirement, death and permanent disability (total, absolute or severe disability). The Group's
Spanish entities assumed the obligation of making an annual contribution of EUR 800 for each employee
participating in the plan. In 2020 the contributions made in this connection amounted to EUR 448 thousand
(EUR 474 thousand in 2019) and were recognised with a charge to “Administrative Expenses - Staff Costs” in
the accompanying consolidated income statement (see Note 39).
ii.Post-employment benefits: Defined benefit plans - Spanish entities
The Group guarantees the following obligations of the Spanish entities as defined benefit plans:
Santander Consumer Finance, S.A.
– Pension obligations under the Banking Collective Agreement to current employees, employees who took
pre-retirement (including future insurance premiums) and retired employees, in addition to other
commitments acquired with early-retired personnel and liabilities prior to May 1996, which are covered in
full by an internal provision.
– Life insurance guaranteed to retired employees from Banco de Fomento, S.A., covered by an insurance
policy (that does not meet the requirements for externalisation) taken out with a non-related entity (AXA
España, S.A.). The present value of future premiums is covered by an internal provision.
– Company store and coal and gas benefits guaranteed to retired employees by virtue of the Internal
Regulations of Banking Company Stores, which are covered by an internal provision.
Due to the merger between Santander Consumer Finance S.A. and Santander Consumer E.F.C., S.A.,
the defined-benefit post-employment obligations of the latter have been transferred to the former, with no
change in their nature or origin.
The present value of the obligations assumed by the Spanish consolidated entities in relation to post-
employment benefits on 31 December 2020 and 2019 is as follows:
EUR Thousands
2020 2019
Present value of the obligations:
To current employees — —
Vested obligations to retired employees and pre-retirees 24,906 25,601
Other obligations to retired employees 113 113
Provisions - Provisions for pensions and similar
obligations (Note 2-r)25,019 25,714
118
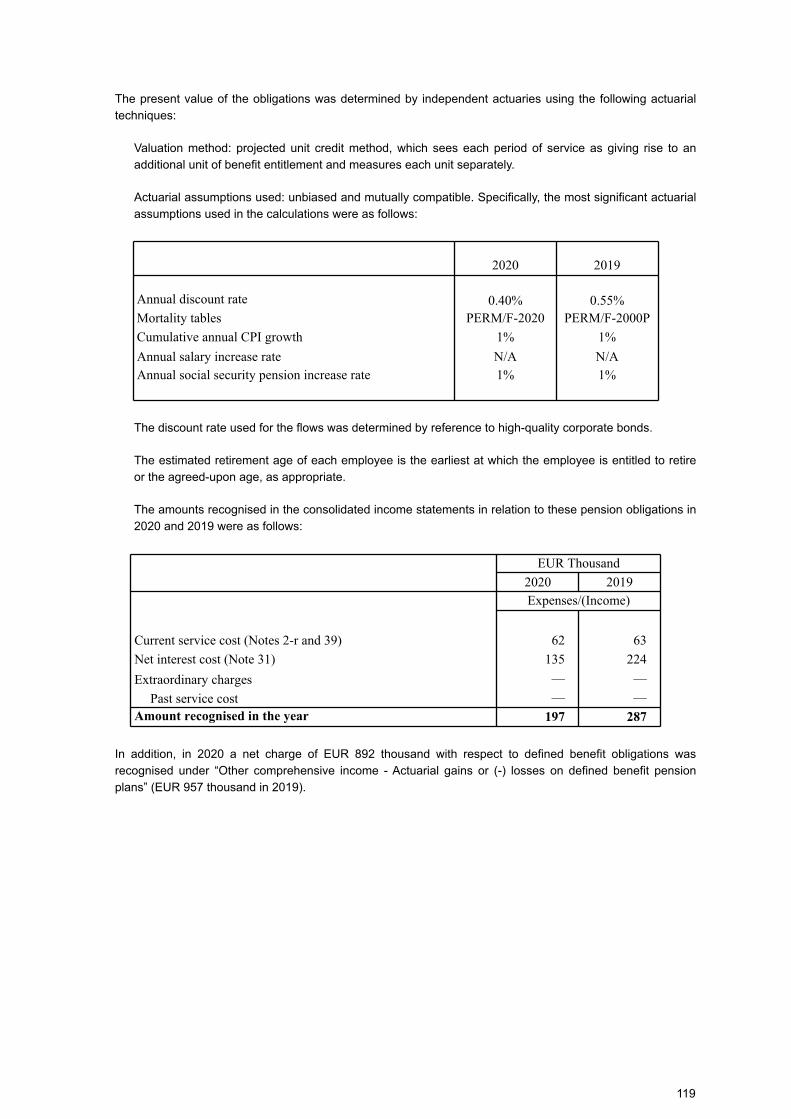
The present value of the obligations was determined by independent actuaries using the following actuarial
techniques:
Valuation method: projected unit credit method, which sees each period of service as giving rise to an
additional unit of benefit entitlement and measures each unit separately.
Actuarial assumptions used: unbiased and mutually compatible. Specifically, the most significant actuarial
assumptions used in the calculations were as follows:
2020 2019
Annual discount rate 0.40% 0.55%Mortality tables PERM/F-2020 PERM/F-2000P
Cumulative annual CPI growth 1% 1%
Annual salary increase rate N/A N/A
Annual social security pension increase rate 1% 1%
The discount rate used for the flows was determined by reference to high-quality corporate bonds.
The estimated retirement age of each employee is the earliest at which the employee is entitled to retire
or the agreed-upon age, as appropriate.
The amounts recognised in the consolidated income statements in relation to these pension obligations in
2020 and 2019 were as follows:
EUR Thousand
2020 2019
Expenses/(Income)
Current service cost (Notes 2-r and 39) 62 63
Net interest cost (Note 31) 135 224
Extraordinary charges — —
Past service cost — —
Amount recognised in the year 197 287
In addition, in 2020 a net charge of EUR 892 thousand with respect to defined benefit obligations was
recognised under “Other comprehensive income - Actuarial gains or (-) losses on defined benefit pension
plans” (EUR 957 thousand in 2019).
119
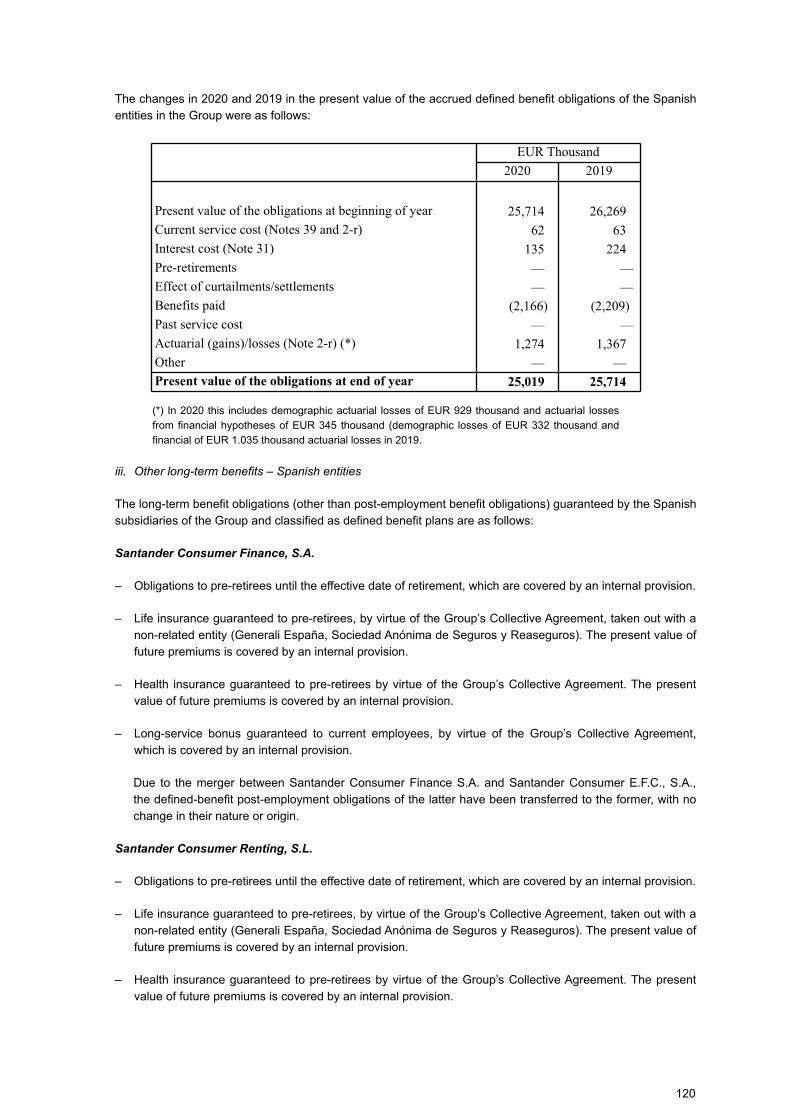
The changes in 2020 and 2019 in the present value of the accrued defined benefit obligations of the Spanish
entities in the Group were as follows:
EUR Thousand
2020 2019
Present value of the obligations at beginning of year 25,714 26,269
Current service cost (Notes 39 and 2-r) 62 63
Interest cost (Note 31) 135 224
Pre-retirements — —
Effect of curtailments/settlements — —
Benefits paid (2,166) (2,209)
Past service cost — —
Actuarial (gains)/losses (Note 2-r) (*) 1,274 1,367
Other — — Present value of the obligations at end of year 25,019 25,714
(*) In 2020 this includes demographic actuarial losses of EUR 929 thousand and actuarial losses
from financial hypotheses of EUR 345 thousand (demographic losses of EUR 332 thousand and
financial of EUR 1.035 thousand actuarial losses in 2019.
iii. Other long-term benefits – Spanish entities
The long-term benefit obligations (other than post-employment benefit obligations) guaranteed by the Spanish
subsidiaries of the Group and classified as defined benefit plans are as follows:
Santander Consumer Finance, S.A.
– Obligations to pre-retirees until the effective date of retirement, which are covered by an internal provision.
– Life insurance guaranteed to pre-retirees, by virtue of the Group’s Collective Agreement, taken out with a
non-related entity (Generali España, Sociedad Anónima de Seguros y Reaseguros). The present value of
future premiums is covered by an internal provision.
– Health insurance guaranteed to pre-retirees by virtue of the Group’s Collective Agreement. The present
value of future premiums is covered by an internal provision.
– Long-service bonus guaranteed to current employees, by virtue of the Group’s Collective Agreement,
which is covered by an internal provision.
Due to the merger between Santander Consumer Finance S.A. and Santander Consumer E.F.C., S.A.,
the defined-benefit post-employment obligations of the latter have been transferred to the former, with no
change in their nature or origin.
Santander Consumer Renting, S.L.
– Obligations to pre-retirees until the effective date of retirement, which are covered by an internal provision.
– Life insurance guaranteed to pre-retirees, by virtue of the Group’s Collective Agreement, taken out with a
non-related entity (Generali España, Sociedad Anónima de Seguros y Reaseguros). The present value of
future premiums is covered by an internal provision.
– Health insurance guaranteed to pre-retirees by virtue of the Group’s Collective Agreement. The present
value of future premiums is covered by an internal provision.
120
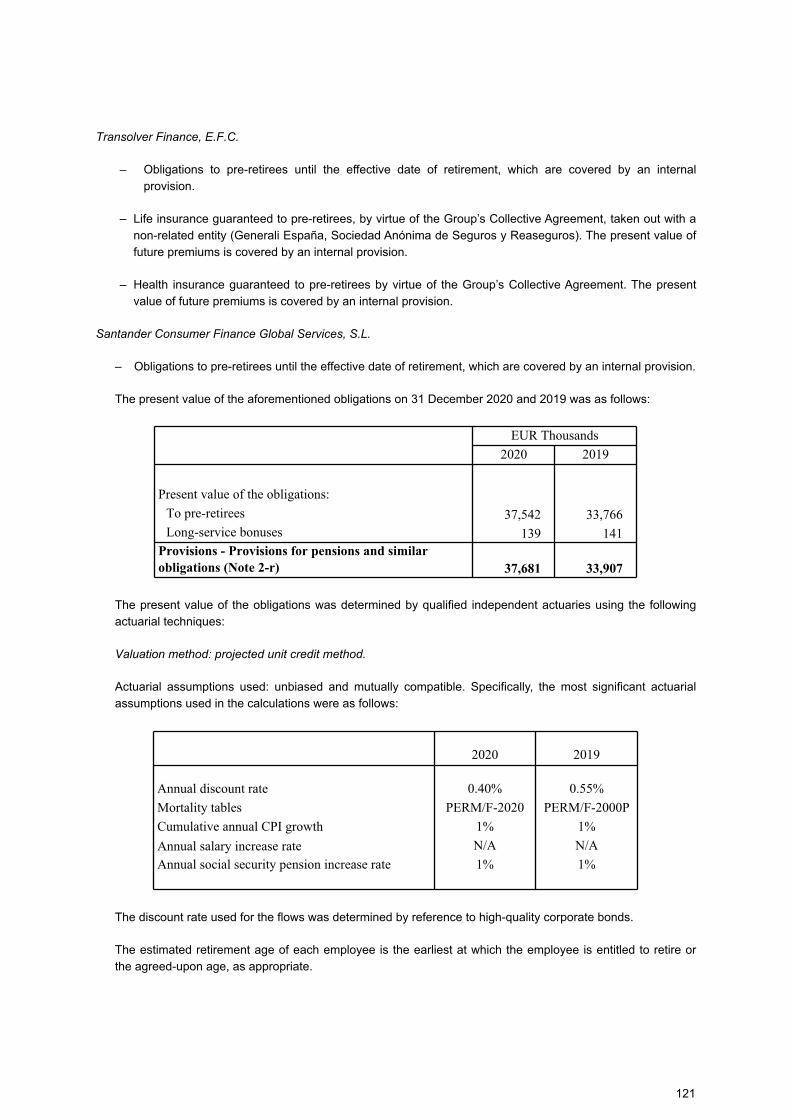
Transolver Finance, E.F.C.
– Obligations to pre-retirees until the effective date of retirement, which are covered by an internal
provision.
– Life insurance guaranteed to pre-retirees, by virtue of the Group’s Collective Agreement, taken out with a
non-related entity (Generali España, Sociedad Anónima de Seguros y Reaseguros). The present value of
future premiums is covered by an internal provision.
– Health insurance guaranteed to pre-retirees by virtue of the Group’s Collective Agreement. The present
value of future premiums is covered by an internal provision.
Santander Consumer Finance Global Services, S.L.
– Obligations to pre-retirees until the effective date of retirement, which are covered by an internal provision.
The present value of the aforementioned obligations on 31 December 2020 and 2019 was as follows:
EUR Thousands
2020 2019
Present value of the obligations:
To pre-retirees 37,542 33,766 Long-service bonuses 139 141
Provisions - Provisions for pensions and similar
obligations (Note 2-r) 37,681 33,907
The present value of the obligations was determined by qualified independent actuaries using the following
actuarial techniques:
Valuation method: projected unit credit method.
Actuarial assumptions used: unbiased and mutually compatible. Specifically, the most significant actuarial
assumptions used in the calculations were as follows:
2020 2019
Annual discount rate 0.40% 0.55%
Mortality tables PERM/F-2020 PERM/F-2000P
Cumulative annual CPI growth 1% 1%
Annual salary increase rate N/A N/A
Annual social security pension increase rate 1% 1%
The discount rate used for the flows was determined by reference to high-quality corporate bonds.
The estimated retirement age of each employee is the earliest at which the employee is entitled to retire or
the agreed-upon age, as appropriate.
121
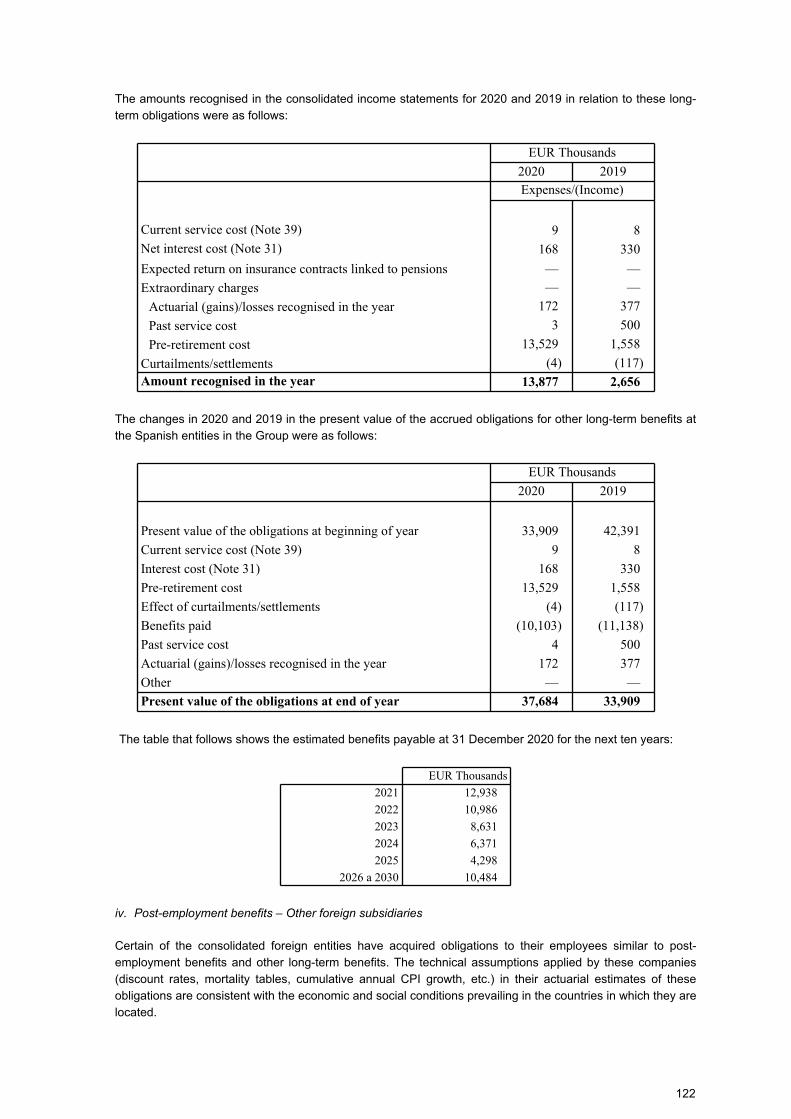
The amounts recognised in the consolidated income statements for 2020 and 2019 in relation to these long-
term obligations were as follows:
EUR Thousands
2020 2019
Expenses/(Income)
Current service cost (Note 39) 9 8
Net interest cost (Note 31) 168 330
Expected return on insurance contracts linked to pensions — —
Extraordinary charges — —
Actuarial (gains)/losses recognised in the year 172 377
Past service cost 3 500
Pre-retirement cost 13,529 1,558
Curtailments/settlements (4) (117)Amount recognised in the year 13,877 2,656
The changes in 2020 and 2019 in the present value of the accrued obligations for other long-term benefits at
the Spanish entities in the Group were as follows:
EUR Thousands
2020 2019
Present value of the obligations at beginning of year 33,909 42,391
Current service cost (Note 39) 9 8
Interest cost (Note 31) 168 330
Pre-retirement cost 13,529 1,558
Effect of curtailments/settlements (4) (117)
Benefits paid (10,103) (11,138)
Past service cost 4 500
Actuarial (gains)/losses recognised in the year 172 377
Other — —
Present value of the obligations at end of year 37,684 33,909
The table that follows shows the estimated benefits payable at 31 December 2020 for the next ten years:
EUR Thousands
2021 12,938
2022 10,986
2023 8,631
2024 6,371
2025 4,298
2026 a 2030 10,484
iv. Post-employment benefits – Other foreign subsidiaries
Certain of the consolidated foreign entities have acquired obligations to their employees similar to post-
employment benefits and other long-term benefits. The technical assumptions applied by these companies
(discount rates, mortality tables, cumulative annual CPI growth, etc.) in their actuarial estimates of these
obligations are consistent with the economic and social conditions prevailing in the countries in which they are
located.
122
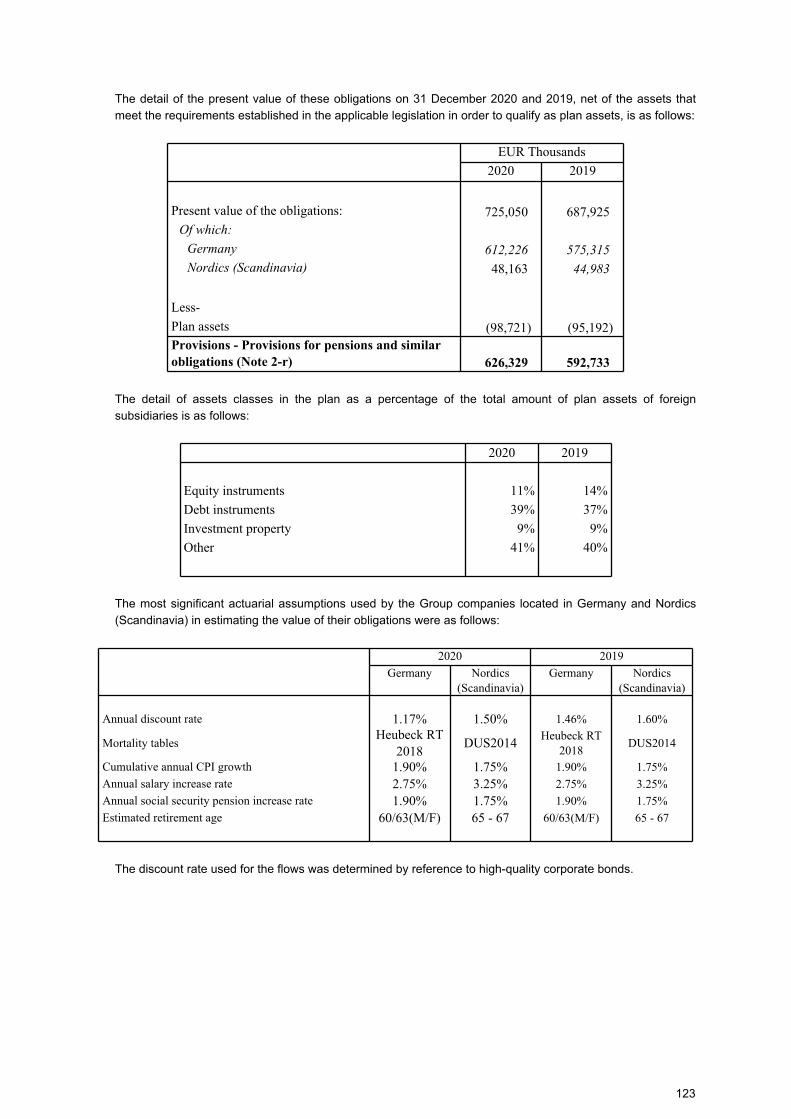
The detail of the present value of these obligations on 31 December 2020 and 2019, net of the assets that
meet the requirements established in the applicable legislation in order to qualify as plan assets, is as follows:
EUR Thousands
2020 2019
Present value of the obligations: 725,050 687,925 Of which:
Germany 612,226 575,315
Nordics (Scandinavia) 48,163 44,983
Less-
Plan assets (98,721) (95,192)Provisions - Provisions for pensions and similar
obligations (Note 2-r) 626,329 592,733
The detail of assets classes in the plan as a percentage of the total amount of plan assets of foreign
subsidiaries is as follows:
2020 2019
Equity instruments 11% 14%
Debt instruments 39% 37%
Investment property 9% 9%
Other 41% 40%
The most significant actuarial assumptions used by the Group companies located in Germany and Nordics
(Scandinavia) in estimating the value of their obligations were as follows:
2020 2019
Germany Nordics (Scandinavia)
Germany Nordics (Scandinavia)
Annual discount rate 1.17% 1.50% 1.46% 1.60%
Mortality tablesHeubeck RT
2018DUS2014
Heubeck RT 2018
DUS2014
Cumulative annual CPI growth 1.90% 1.75% 1.90% 1.75%
Annual salary increase rate 2.75% 3.25% 2.75% 3.25%
Annual social security pension increase rate 1.90% 1.75% 1.90% 1.75%
Estimated retirement age 60/63(M/F) 65 - 67 60/63(M/F) 65 - 67
The discount rate used for the flows was determined by reference to high-quality corporate bonds.
123
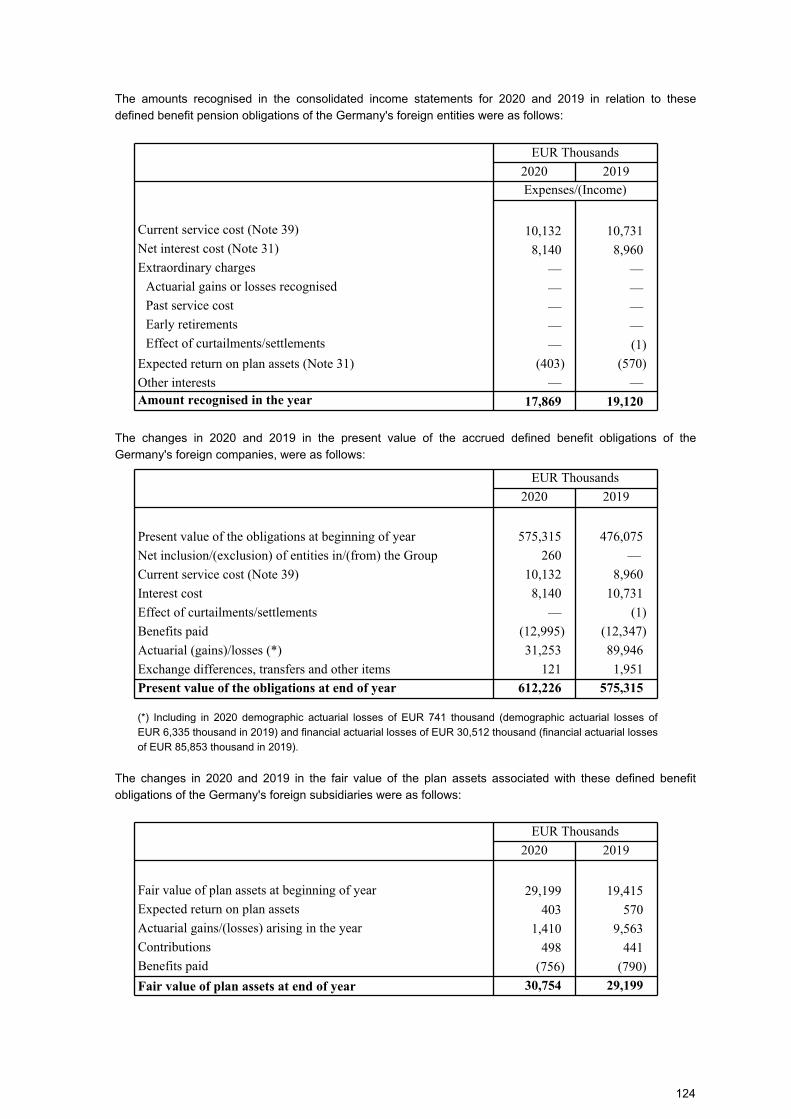
The amounts recognised in the consolidated income statements for 2020 and 2019 in relation to these
defined benefit pension obligations of the Germany's foreign entities were as follows:
EUR Thousands
2020 2019
Expenses/(Income)
Current service cost (Note 39) 10,132 10,731 Net interest cost (Note 31) 8,140 8,960 Extraordinary charges — —
Actuarial gains or losses recognised — — Past service cost — — Early retirements — — Effect of curtailments/settlements — (1)
Expected return on plan assets (Note 31) (403) (570)
Other interests — — Amount recognised in the year 17,869 19,120
The changes in 2020 and 2019 in the present value of the accrued defined benefit obligations of the
Germany's foreign companies, were as follows:
EUR Thousands
2020 2019
Present value of the obligations at beginning of year 575,315 476,075
Net inclusion/(exclusion) of entities in/(from) the Group 260 —
Current service cost (Note 39) 10,132 8,960
Interest cost 8,140 10,731
Effect of curtailments/settlements — (1)
Benefits paid (12,995) (12,347)
Actuarial (gains)/losses (*) 31,253 89,946
Exchange differences, transfers and other items 121 1,951
Present value of the obligations at end of year 612,226 575,315
(*) Including in 2020 demographic actuarial losses of EUR 741 thousand (demographic actuarial losses of
EUR 6,335 thousand in 2019) and financial actuarial losses of EUR 30,512 thousand (financial actuarial losses
of EUR 85,853 thousand in 2019).
The changes in 2020 and 2019 in the fair value of the plan assets associated with these defined benefit
obligations of the Germany's foreign subsidiaries were as follows:
EUR Thousands
2020 2019
Fair value of plan assets at beginning of year 29,199 19,415
Expected return on plan assets 403 570
Actuarial gains/(losses) arising in the year 1,410 9,563
Contributions 498 441
Benefits paid (756) (790)
Fair value of plan assets at end of year 30,754 29,199
124
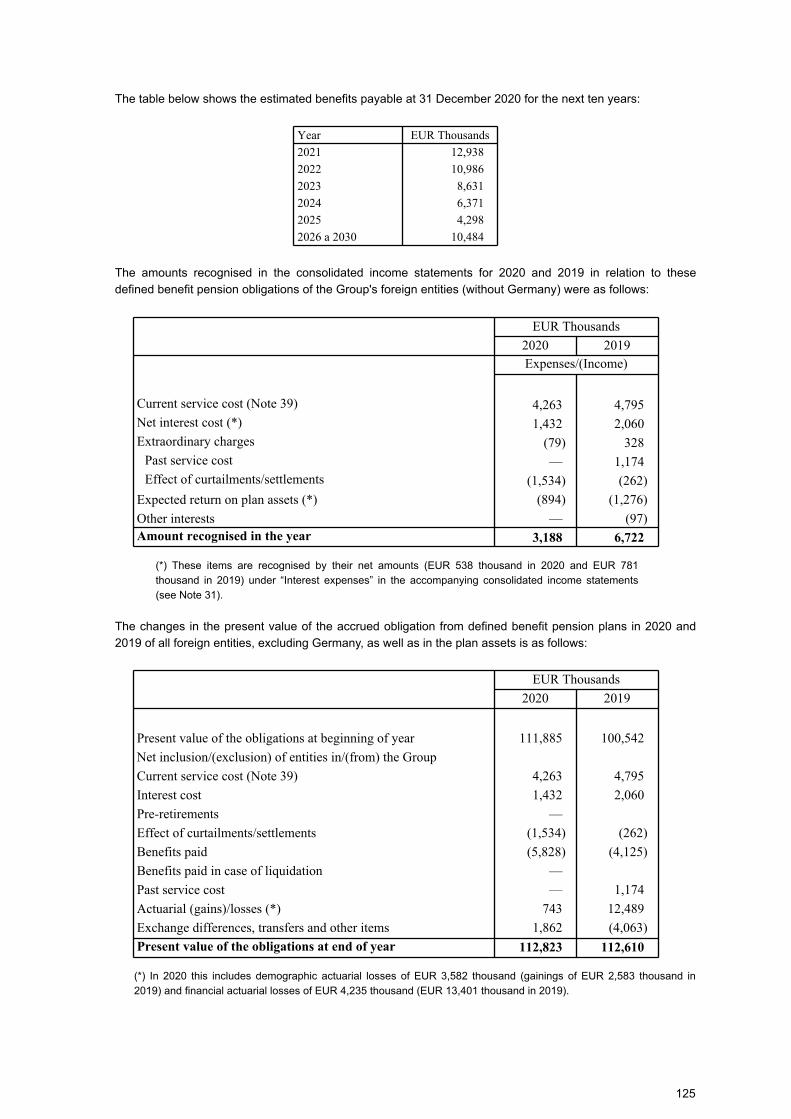
The table below shows the estimated benefits payable at 31 December 2020 for the next ten years:
Year EUR Thousands
2021 12,938
2022 10,986
2023 8,631
2024 6,371
2025 4,298
2026 a 2030 10,484
The amounts recognised in the consolidated income statements for 2020 and 2019 in relation to these
defined benefit pension obligations of the Group's foreign entities (without Germany) were as follows:
EUR Thousands
2020 2019
Expenses/(Income)
Current service cost (Note 39) 4,263 4,795 Net interest cost (*) 1,432 2,060 Extraordinary charges (79) 328
Past service cost — 1,174 Effect of curtailments/settlements (1,534) (262)
Expected return on plan assets (*) (894) (1,276)
Other interests — (97)Amount recognised in the year 3,188 6,722
(*) These items are recognised by their net amounts (EUR 538 thousand in 2020 and EUR 781
thousand in 2019) under “Interest expenses” in the accompanying consolidated income statements
(see Note 31).
The changes in the present value of the accrued obligation from defined benefit pension plans in 2020 and
2019 of all foreign entities, excluding Germany, as well as in the plan assets is as follows:
EUR Thousands
2020 2019
Present value of the obligations at beginning of year 111,885 100,542
Net inclusion/(exclusion) of entities in/(from) the Group
Current service cost (Note 39) 4,263 4,795
Interest cost 1,432 2,060
Pre-retirements —
Effect of curtailments/settlements (1,534) (262)
Benefits paid (5,828) (4,125)
Benefits paid in case of liquidation —
Past service cost — 1,174
Actuarial (gains)/losses (*) 743 12,489
Exchange differences, transfers and other items 1,862 (4,063)
Present value of the obligations at end of year 112,823 112,610
(*) In 2020 this includes demographic actuarial losses of EUR 3,582 thousand (gainings of EUR 2,583 thousand in
2019) and financial actuarial losses of EUR 4,235 thousand (EUR 13,401 thousand in 2019).
125
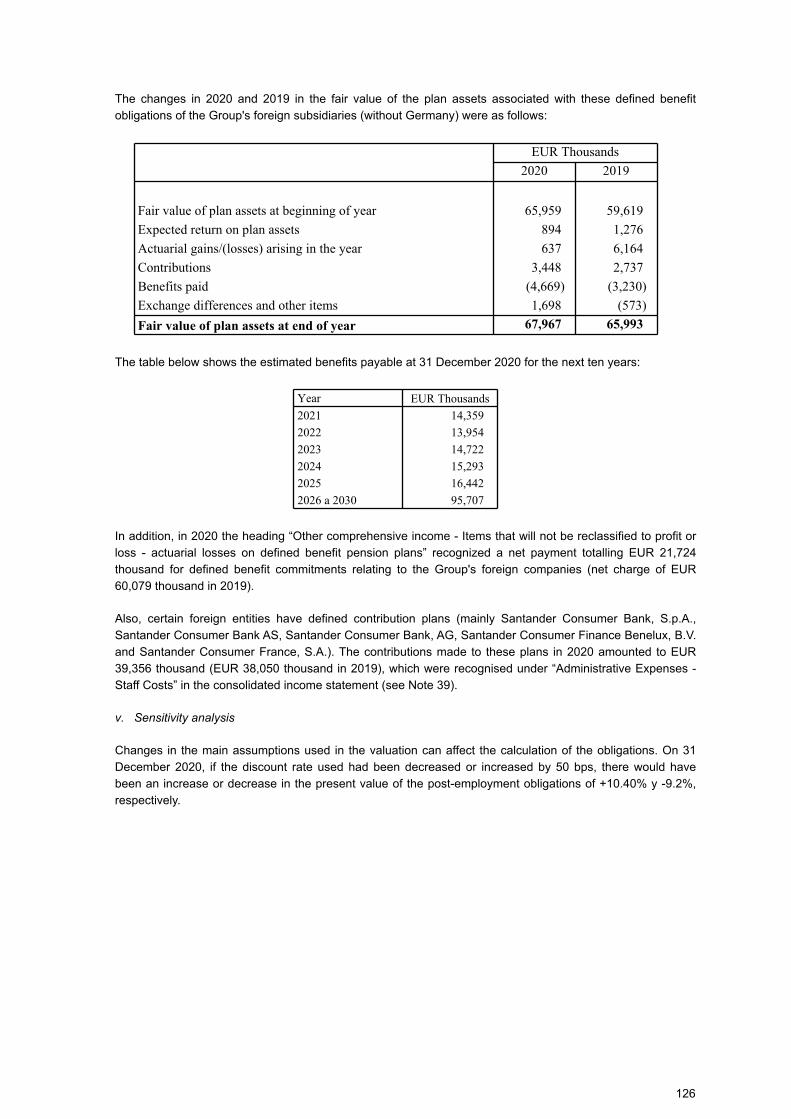
The changes in 2020 and 2019 in the fair value of the plan assets associated with these defined benefit
obligations of the Group's foreign subsidiaries (without Germany) were as follows:
EUR Thousands
2020 2019
Fair value of plan assets at beginning of year 65,959 59,619
Expected return on plan assets 894 1,276
Actuarial gains/(losses) arising in the year 637 6,164
Contributions 3,448 2,737
Benefits paid (4,669) (3,230)
Exchange differences and other items 1,698 (573)
Fair value of plan assets at end of year 67,967 65,993
The table below shows the estimated benefits payable at 31 December 2020 for the next ten years:
Year EUR Thousands
2021 14,359
2022 13,954
2023 14,722
2024 15,293
2025 16,442
2026 a 2030 95,707
In addition, in 2020 the heading “Other comprehensive income - Items that will not be reclassified to profit or
loss - actuarial losses on defined benefit pension plans” recognized a net payment totalling EUR 21,724
thousand for defined benefit commitments relating to the Group's foreign companies (net charge of EUR
60,079 thousand in 2019).
Also, certain foreign entities have defined contribution plans (mainly Santander Consumer Bank, S.p.A.,
Santander Consumer Bank AS, Santander Consumer Bank, AG, Santander Consumer Finance Benelux, B.V.
and Santander Consumer France, S.A.). The contributions made to these plans in 2020 amounted to EUR
39,356 thousand (EUR 38,050 thousand in 2019), which were recognised under “Administrative Expenses -
Staff Costs” in the consolidated income statement (see Note 39).
v. Sensitivity analysis
Changes in the main assumptions used in the valuation can affect the calculation of the obligations. On 31
December 2020, if the discount rate used had been decreased or increased by 50 bps, there would have
been an increase or decrease in the present value of the post-employment obligations of +10.40% y -9.2%,
respectively.
126
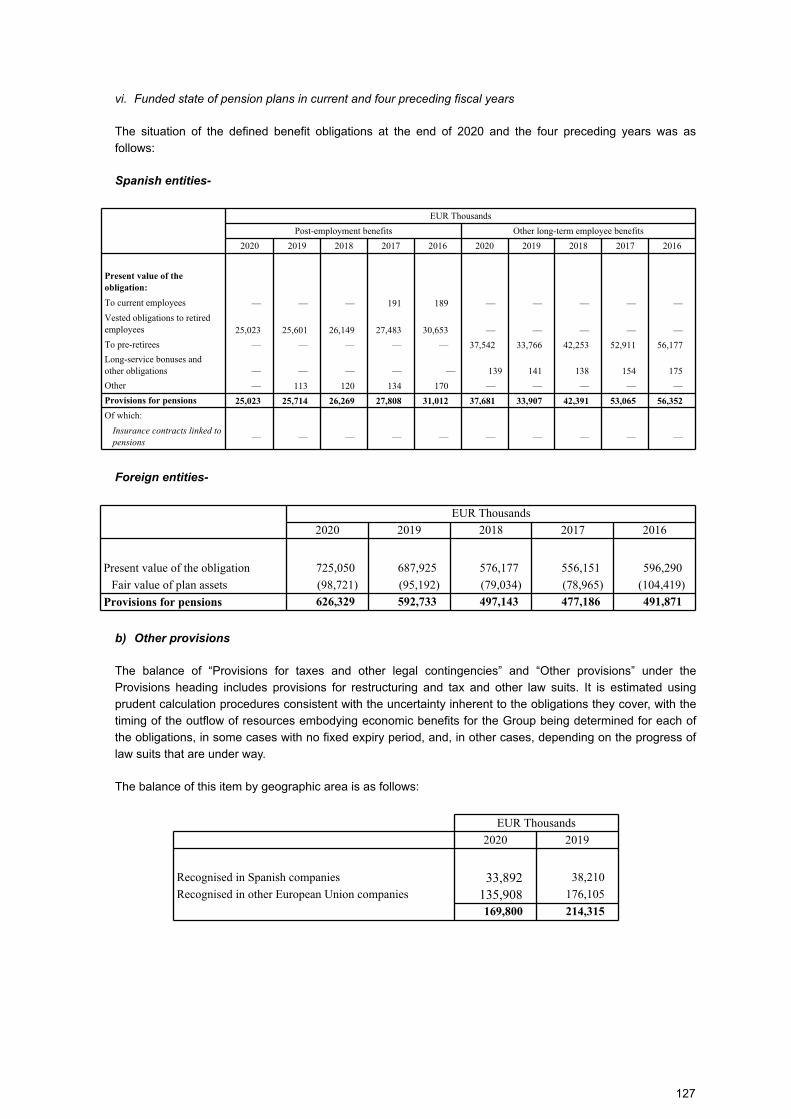
vi. Funded state of pension plans in current and four preceding fiscal years
The situation of the defined benefit obligations at the end of 2020 and the four preceding years was as
follows:
Spanish entities-
EUR Thousands
Post-employment benefits Other long-term employee benefits
2020 2019 2018 2017 2016 2020 2019 2018 2017 2016
Present value of the
obligation:
To current employees — — — 191 189 — — — — —
Vested obligations to retired employees 25,023 25,601 26,149 27,483 30,653 — — — — —
To pre-retirees — — — — — 37,542 33,766 42,253 52,911 56,177
Long-service bonuses and other obligations — — — — — 139 141 138 154 175
Other — 113 120 134 170 — — — — —
Provisions for pensions 25,023 25,714 26,269 27,808 31,012 37,681 33,907 42,391 53,065 56,352
Of which:
Insurance contracts linked to
pensions— — — — — — — — — —
Foreign entities-
EUR Thousands
2020 2019 2018 2017 2016
Present value of the obligation 725,050 687,925 576,177 556,151 596,290
Fair value of plan assets (98,721) (95,192) (79,034) (78,965) (104,419)
Provisions for pensions 626,329 592,733 497,143 477,186 491,871
b) Other provisions
The balance of “Provisions for taxes and other legal contingencies” and “Other provisions” under the
Provisions heading includes provisions for restructuring and tax and other law suits. It is estimated using
prudent calculation procedures consistent with the uncertainty inherent to the obligations they cover, with the
timing of the outflow of resources embodying economic benefits for the Group being determined for each of
the obligations, in some cases with no fixed expiry period, and, in other cases, depending on the progress of
law suits that are under way.
The balance of this item by geographic area is as follows:
EUR Thousands
2020 2019
Recognised in Spanish companies 33,892 38,210
Recognised in other European Union companies 135,908 176,105
169,800 214,315
127
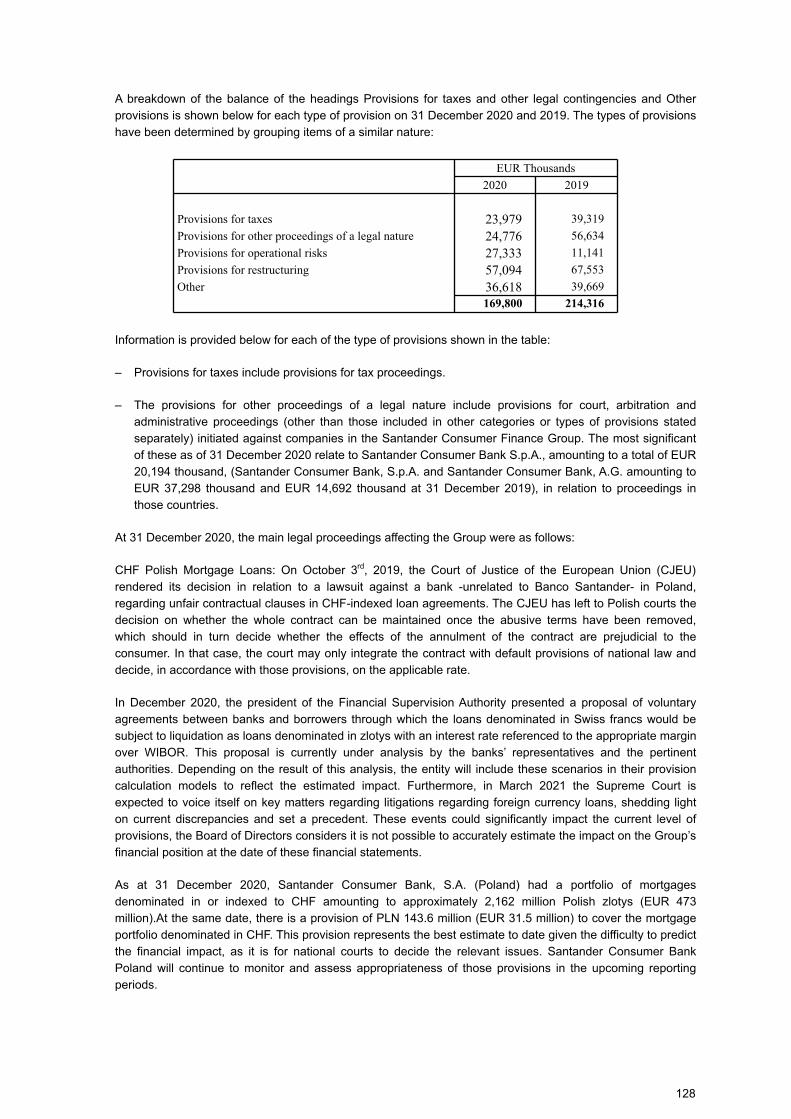
A breakdown of the balance of the headings Provisions for taxes and other legal contingencies and Other
provisions is shown below for each type of provision on 31 December 2020 and 2019. The types of provisions
have been determined by grouping items of a similar nature:
EUR Thousands
2020 2019
Provisions for taxes 23,979 39,319
Provisions for other proceedings of a legal nature 24,776 56,634
Provisions for operational risks 27,333 11,141
Provisions for restructuring 57,094 67,553
Other 36,618 39,669
169,800 214,316
Information is provided below for each of the type of provisions shown in the table:
– Provisions for taxes include provisions for tax proceedings.
– The provisions for other proceedings of a legal nature include provisions for court, arbitration and
administrative proceedings (other than those included in other categories or types of provisions stated
separately) initiated against companies in the Santander Consumer Finance Group. The most significant
of these as of 31 December 2020 relate to Santander Consumer Bank S.p.A., amounting to a total of EUR
20,194 thousand, (Santander Consumer Bank, S.p.A. and Santander Consumer Bank, A.G. amounting to
EUR 37,298 thousand and EUR 14,692 thousand at 31 December 2019), in relation to proceedings in
those countries.
At 31 December 2020, the main legal proceedings affecting the Group were as follows:
CHF Polish Mortgage Loans: On October 3rd, 2019, the Court of Justice of the European Union (CJEU)
rendered its decision in relation to a lawsuit against a bank -unrelated to Banco Santander- in Poland,
regarding unfair contractual clauses in CHF-indexed loan agreements. The CJEU has left to Polish courts the
decision on whether the whole contract can be maintained once the abusive terms have been removed,
which should in turn decide whether the effects of the annulment of the contract are prejudicial to the
consumer. In that case, the court may only integrate the contract with default provisions of national law and
decide, in accordance with those provisions, on the applicable rate.
In December 2020, the president of the Financial Supervision Authority presented a proposal of voluntary
agreements between banks and borrowers through which the loans denominated in Swiss francs would be
subject to liquidation as loans denominated in zlotys with an interest rate referenced to the appropriate margin
over WIBOR. This proposal is currently under analysis by the banks’ representatives and the pertinent
authorities. Depending on the result of this analysis, the entity will include these scenarios in their provision
calculation models to reflect the estimated impact. Furthermore, in March 2021 the Supreme Court is
expected to voice itself on key matters regarding litigations regarding foreign currency loans, shedding light
on current discrepancies and set a precedent. These events could significantly impact the current level of
provisions, the Board of Directors considers it is not possible to accurately estimate the impact on the Group’s
financial position at the date of these financial statements.
As at 31 December 2020, Santander Consumer Bank, S.A. (Poland) had a portfolio of mortgages
denominated in or indexed to CHF amounting to approximately 2,162 million Polish zlotys (EUR 473
million).At the same date, there is a provision of PLN 143.6 million (EUR 31.5 million) to cover the mortgage
portfolio denominated in CHF. This provision represents the best estimate to date given the difficulty to predict
the financial impact, as it is for national courts to decide the relevant issues. Santander Consumer Bank
Poland will continue to monitor and assess appropriateness of those provisions in the upcoming reporting
periods.
128
Furthermore, on 11 September 2019, the Court of Justice of the European Union decided on a preliminary
ruling from a Polish court on the interpretation of Article 16(1) of Directive 2008/48/EC ('the Directive') on
credit agreements for customers. The decision of the Court of Justice of the European Union concerns the
reduction of the total cost of customer credit due to the early repayment of such credit and in particular the
fees charged to customers, but does not conclude on certain aspects such as the method of calculating
the reduction in costs. The Group assessed the impact of the ruling of the European Court of Justice in the
various geographical areas in which it operates, mainly in the Italian and Polish units. At 2020 year-end the
provision registered by Santander Consumer Bank, S.p.A. (Italy) amounts to EUR 14,168 thousand,
whereas the provision registered by Santander Consumer Bank, S.A. (Poland) amounts to PLN 69 million
(EUR 15 million). This provision relates to the best estimate at this date based on the information
available.
The Group includes its investment in Santander Consumer Bank, S.A. (Poland) using the equity method,
and at 31 December 2020 and 2019 it held 40% of this company.
– The provisions for operational risks mainly relate to provisions for risks deriving from the
business activities of Group companies.
– Provisions for restructuring only include expenses deriving from restructuring processes carried
out by Group entities. The Group has carried out restructuring processes in some companies to adapt to
current market conditions in their countries. In these cases, the Group companies offer their employees
the option of early retirement or redundancy incentives. In 2020, the provision registered for this purpose
corresponds mainly to those registered by Santander Consumer Bank AG (Germany) and Santander
Consumer Bank AS (Nordics). With regards to Santander Consumer Bank AG, the existing provision of
EUR 40,354 thousand (EUR 53,051 thousand in 2019) corresponds to the restructuring plan started at
the end of 2017 currently undergoing its execution phase, which is expected to be completed during
FY21, for which a provision of EUR 23,276 thousand has been registered at the end of 2020. With
regards to Santander Consumer Bank, A.S., in 2020 there has been a restructuring within the
transformation and restructuring plan for the entity and its Danish and Swedish branches, for which a
provision has been registered which amounts to EUR 21,214 thousand. At 31 December 2020 the
provision corresponds to obligations and other expenses associated with said plan, for which the
company is expected to incur EUR 9,066 thousand (EUR 9,038 thousand in 2019).
The Group's general policy is to recognise provisions for fiscal and legal processes when it considers that the
risk of a loss is likely. No provisions are recognised when the risk of loss is possible or remote. Provisions are
calculated using the best estimate of the amount needed to settle the corresponding obligation, based on
individualised analysis of the events, supplemented by legal opinions from internal and external advisers, and
considering average historical losses in similar cases. The definitive date of the outflow of resources
embodying economic benefits for the Group depends on each of the obligations. In some cases, there are no
fixed settlement dates, while in others this depends on the progress of law suits.
22. Tax matters
a) Current tax receivables and payables
The balance of “Tax Assets – Current Tax Assets” in the consolidated balance sheets as of 31 December
2020 and 2019 includes basically income tax prepayments made by the consolidated entities to the public
authorities of the countries in which they reside. The balance of “Tax Liabilities – Current Tax Liabilities” in
the consolidated balance sheet includes the liability for the various taxes applicable to the Group.
129
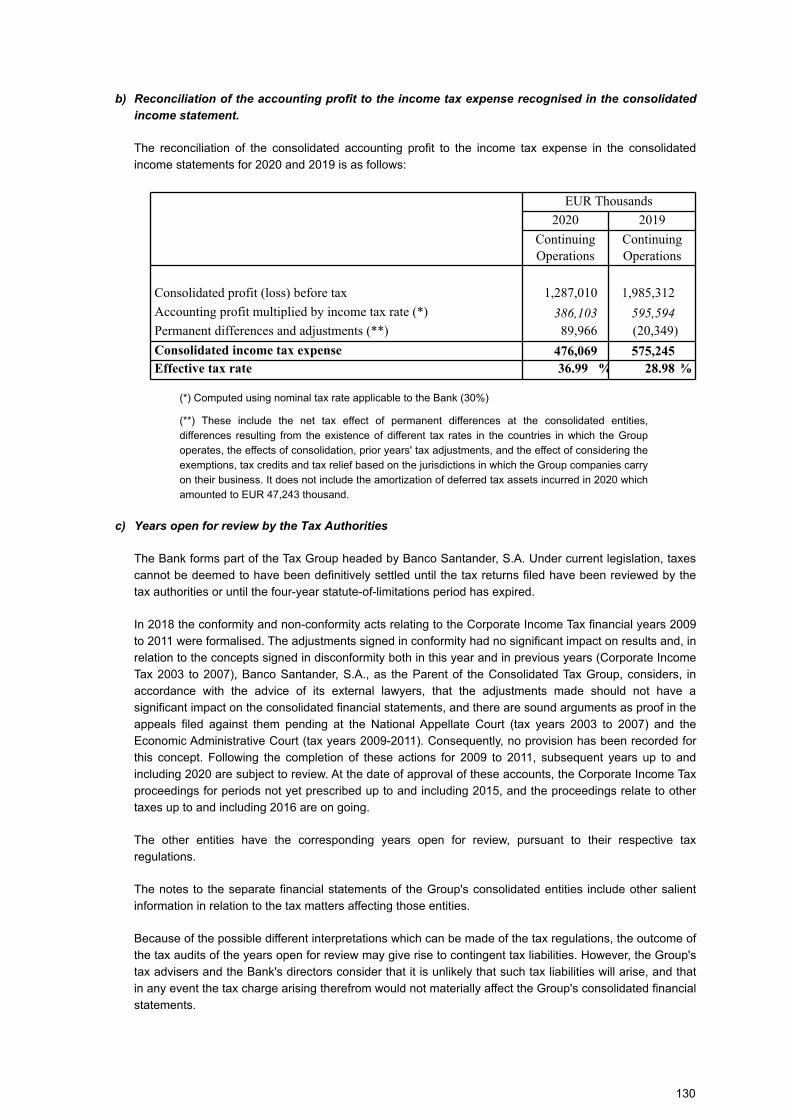
b) Reconciliation of the accounting profit to the income tax expense recognised in the consolidated
income statement.
The reconciliation of the consolidated accounting profit to the income tax expense in the consolidated
income statements for 2020 and 2019 is as follows:
EUR Thousands
2020 2019
Continuing Operations
Continuing Operations
Consolidated profit (loss) before tax 1,287,010 1,985,312
Accounting profit multiplied by income tax rate (*) 386,103 595,594
Permanent differences and adjustments (**) 89,966 (20,349)
Consolidated income tax expense 476,069 575,245
Effective tax rate 36.99 % 28.98 %
(*) Computed using nominal tax rate applicable to the Bank (30%)
(**) These include the net tax effect of permanent differences at the consolidated entities,
differences resulting from the existence of different tax rates in the countries in which the Group
operates, the effects of consolidation, prior years' tax adjustments, and the effect of considering the
exemptions, tax credits and tax relief based on the jurisdictions in which the Group companies carry
on their business. It does not include the amortization of deferred tax assets incurred in 2020 which
amounted to EUR 47,243 thousand.
c) Years open for review by the Tax Authorities
The Bank forms part of the Tax Group headed by Banco Santander, S.A. Under current legislation, taxes
cannot be deemed to have been definitively settled until the tax returns filed have been reviewed by the
tax authorities or until the four-year statute-of-limitations period has expired.
In 2018 the conformity and non-conformity acts relating to the Corporate Income Tax financial years 2009
to 2011 were formalised. The adjustments signed in conformity had no significant impact on results and, in
relation to the concepts signed in disconformity both in this year and in previous years (Corporate Income
Tax 2003 to 2007), Banco Santander, S.A., as the Parent of the Consolidated Tax Group, considers, in
accordance with the advice of its external lawyers, that the adjustments made should not have a
significant impact on the consolidated financial statements, and there are sound arguments as proof in the
appeals filed against them pending at the National Appellate Court (tax years 2003 to 2007) and the
Economic Administrative Court (tax years 2009-2011). Consequently, no provision has been recorded for
this concept. Following the completion of these actions for 2009 to 2011, subsequent years up to and
including 2020 are subject to review. At the date of approval of these accounts, the Corporate Income Tax
proceedings for periods not yet prescribed up to and including 2015, and the proceedings relate to other
taxes up to and including 2016 are on going.
The other entities have the corresponding years open for review, pursuant to their respective tax
regulations.
The notes to the separate financial statements of the Group's consolidated entities include other salient
information in relation to the tax matters affecting those entities.
Because of the possible different interpretations which can be made of the tax regulations, the outcome of
the tax audits of the years open for review may give rise to contingent tax liabilities. However, the Group's
tax advisers and the Bank's directors consider that it is unlikely that such tax liabilities will arise, and that
in any event the tax charge arising therefrom would not materially affect the Group's consolidated financial
statements.
130

Except for the above mentioned, in 2020 there were no developments with a significant impact in
connection with the tax disputes at various instances which were pending resolution on 31 December
2019.
131
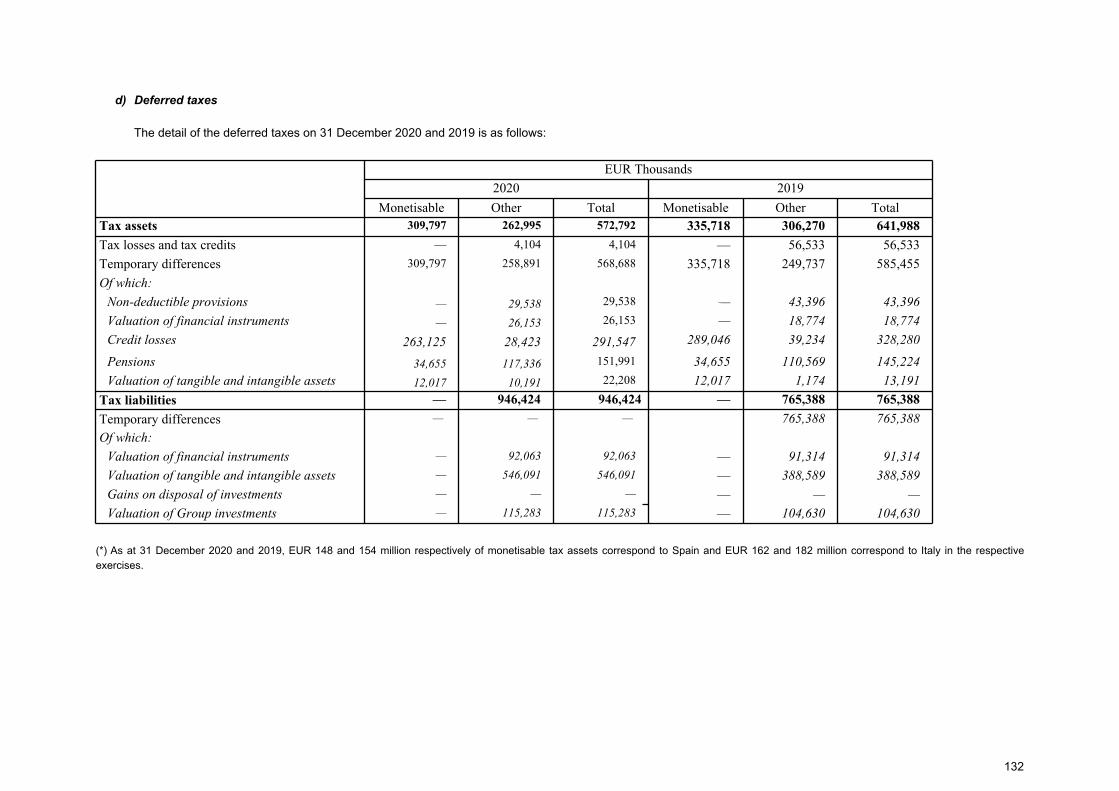
d) Deferred taxes
The detail of the deferred taxes on 31 December 2020 and 2019 is as follows:
EUR Thousands
2020 2019
Monetisable Other Total Monetisable Other TotalTax assets 309,797 262,995 572,792 335,718 306,270 641,988
Tax losses and tax credits — 4,104 4,104 — 56,533 56,533
Temporary differences 309,797 258,891 568,688 335,718 249,737 585,455
Of which:
Non-deductible provisions — 29,538 29,538 — 43,396 43,396
Valuation of financial instruments — 26,153 26,153 — 18,774 18,774
Credit losses 263,125 28,423 291,547 289,046 39,234 328,280
Pensions 34,655 117,336 151,991 34,655 110,569 145,224
Valuation of tangible and intangible assets 12,017 10,191 22,208 12,017 1,174 13,191
Tax liabilities — 946,424 946,424 — 765,388 765,388
Temporary differences — — — 765,388 765,388
Of which:
Valuation of financial instruments — 92,063 92,063 — 91,314 91,314
Valuation of tangible and intangible assets — 546,091 546,091 — 388,589 388,589
Gains on disposal of investments — — — — — —
Valuation of Group investments — 115,283 115,283 — 104,630 104,630
(*) As at 31 December 2020 and 2019, EUR 148 and 154 million respectively of monetisable tax assets correspond to Spain and EUR 162 and 182 million correspond to Italy in the respective
exercises.
132
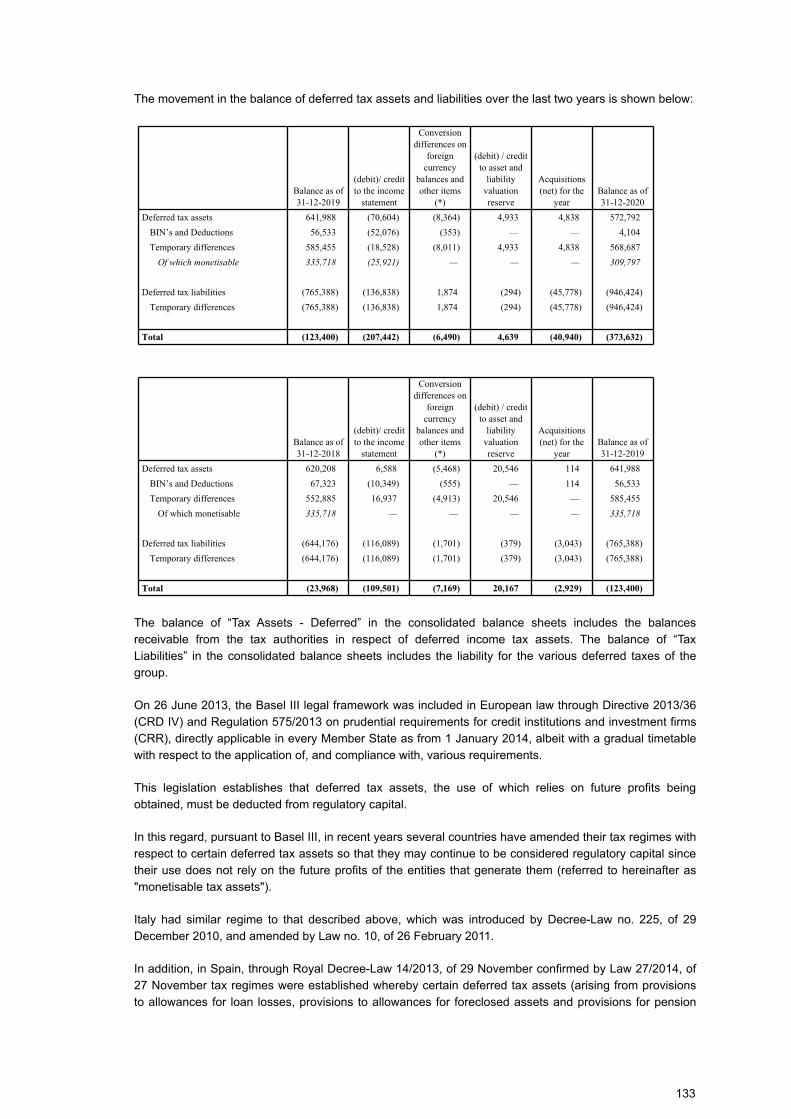
The movement in the balance of deferred tax assets and liabilities over the last two years is shown below:
Balance as of 31-12-2019
(debit)/ credit to the income
statement
Conversion differences on
foreign currency
balances and other items
(*)
(debit) / credit to asset and
liability valuation reserve
Acquisitions (net) for the
yearBalance as of 31-12-2020
Deferred tax assets 641,988 (70,604) (8,364) 4,933 4,838 572,792
BIN’s and Deductions 56,533 (52,076) (353) — — 4,104
Temporary differences 585,455 (18,528) (8,011) 4,933 4,838 568,687
Of which monetisable 335,718 (25,921) — — — 309,797
Deferred tax liabilities (765,388) (136,838) 1,874 (294) (45,778) (946,424)
Temporary differences (765,388) (136,838) 1,874 (294) (45,778) (946,424)
Total (123,400) (207,442) (6,490) 4,639 (40,940) (373,632)
Balance as of 31-12-2018
(debit)/ credit to the income
statement
Conversion differences on
foreign currency
balances and other items
(*)
(debit) / credit to asset and
liability valuation reserve
Acquisitions (net) for the
yearBalance as of 31-12-2019
Deferred tax assets 620,208 6,588 (5,468) 20,546 114 641,988
BIN’s and Deductions 67,323 (10,349) (555) — 114 56,533
Temporary differences 552,885 16,937 (4,913) 20,546 — 585,455
Of which monetisable 335,718 — — — — 335,718
Deferred tax liabilities (644,176) (116,089) (1,701) (379) (3,043) (765,388)
Temporary differences (644,176) (116,089) (1,701) (379) (3,043) (765,388)
Total (23,968) (109,501) (7,169) 20,167 (2,929) (123,400)
The balance of “Tax Assets - Deferred” in the consolidated balance sheets includes the balances
receivable from the tax authorities in respect of deferred income tax assets. The balance of “Tax
Liabilities” in the consolidated balance sheets includes the liability for the various deferred taxes of the
group.
On 26 June 2013, the Basel III legal framework was included in European law through Directive 2013/36
(CRD IV) and Regulation 575/2013 on prudential requirements for credit institutions and investment firms
(CRR), directly applicable in every Member State as from 1 January 2014, albeit with a gradual timetable
with respect to the application of, and compliance with, various requirements.
This legislation establishes that deferred tax assets, the use of which relies on future profits being
obtained, must be deducted from regulatory capital.
In this regard, pursuant to Basel III, in recent years several countries have amended their tax regimes with
respect to certain deferred tax assets so that they may continue to be considered regulatory capital since
their use does not rely on the future profits of the entities that generate them (referred to hereinafter as
"monetisable tax assets").
Italy had similar regime to that described above, which was introduced by Decree-Law no. 225, of 29
December 2010, and amended by Law no. 10, of 26 February 2011.
In addition, in Spain, through Royal Decree-Law 14/2013, of 29 November confirmed by Law 27/2014, of
27 November tax regimes were established whereby certain deferred tax assets (arising from provisions
to allowances for loan losses, provisions to allowances for foreclosed assets and provisions for pension
133
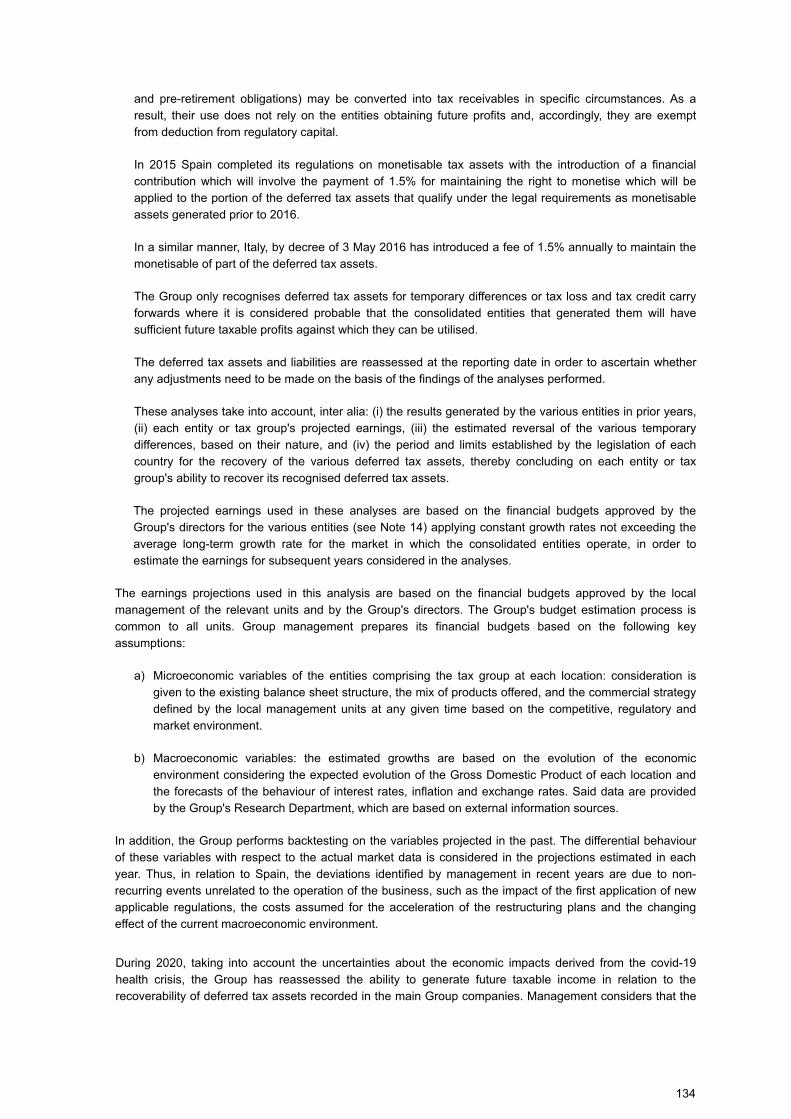
and pre-retirement obligations) may be converted into tax receivables in specific circumstances. As a
result, their use does not rely on the entities obtaining future profits and, accordingly, they are exempt
from deduction from regulatory capital.
In 2015 Spain completed its regulations on monetisable tax assets with the introduction of a financial
contribution which will involve the payment of 1.5% for maintaining the right to monetise which will be
applied to the portion of the deferred tax assets that qualify under the legal requirements as monetisable
assets generated prior to 2016.
In a similar manner, Italy, by decree of 3 May 2016 has introduced a fee of 1.5% annually to maintain the
monetisable of part of the deferred tax assets.
The Group only recognises deferred tax assets for temporary differences or tax loss and tax credit carry
forwards where it is considered probable that the consolidated entities that generated them will have
sufficient future taxable profits against which they can be utilised.
The deferred tax assets and liabilities are reassessed at the reporting date in order to ascertain whether
any adjustments need to be made on the basis of the findings of the analyses performed.
These analyses take into account, inter alia: (i) the results generated by the various entities in prior years,
(ii) each entity or tax group's projected earnings, (iii) the estimated reversal of the various temporary
differences, based on their nature, and (iv) the period and limits established by the legislation of each
country for the recovery of the various deferred tax assets, thereby concluding on each entity or tax
group's ability to recover its recognised deferred tax assets.
The projected earnings used in these analyses are based on the financial budgets approved by the
Group's directors for the various entities (see Note 14) applying constant growth rates not exceeding the
average long-term growth rate for the market in which the consolidated entities operate, in order to
estimate the earnings for subsequent years considered in the analyses.
The earnings projections used in this analysis are based on the financial budgets approved by the local
management of the relevant units and by the Group's directors. The Group's budget estimation process is
common to all units. Group management prepares its financial budgets based on the following key
assumptions:
a) Microeconomic variables of the entities comprising the tax group at each location: consideration is
given to the existing balance sheet structure, the mix of products offered, and the commercial strategy
defined by the local management units at any given time based on the competitive, regulatory and
market environment.
b) Macroeconomic variables: the estimated growths are based on the evolution of the economic
environment considering the expected evolution of the Gross Domestic Product of each location and
the forecasts of the behaviour of interest rates, inflation and exchange rates. Said data are provided
by the Group's Research Department, which are based on external information sources.
In addition, the Group performs backtesting on the variables projected in the past. The differential behaviour
of these variables with respect to the actual market data is considered in the projections estimated in each
year. Thus, in relation to Spain, the deviations identified by management in recent years are due to non-
recurring events unrelated to the operation of the business, such as the impact of the first application of new
applicable regulations, the costs assumed for the acceleration of the restructuring plans and the changing
effect of the current macroeconomic environment.
During 2020, taking into account the uncertainties about the economic impacts derived from the covid-19
health crisis, the Group has reassessed the ability to generate future taxable income in relation to the
recoverability of deferred tax assets recorded in the main Group companies. Management considers that the
134
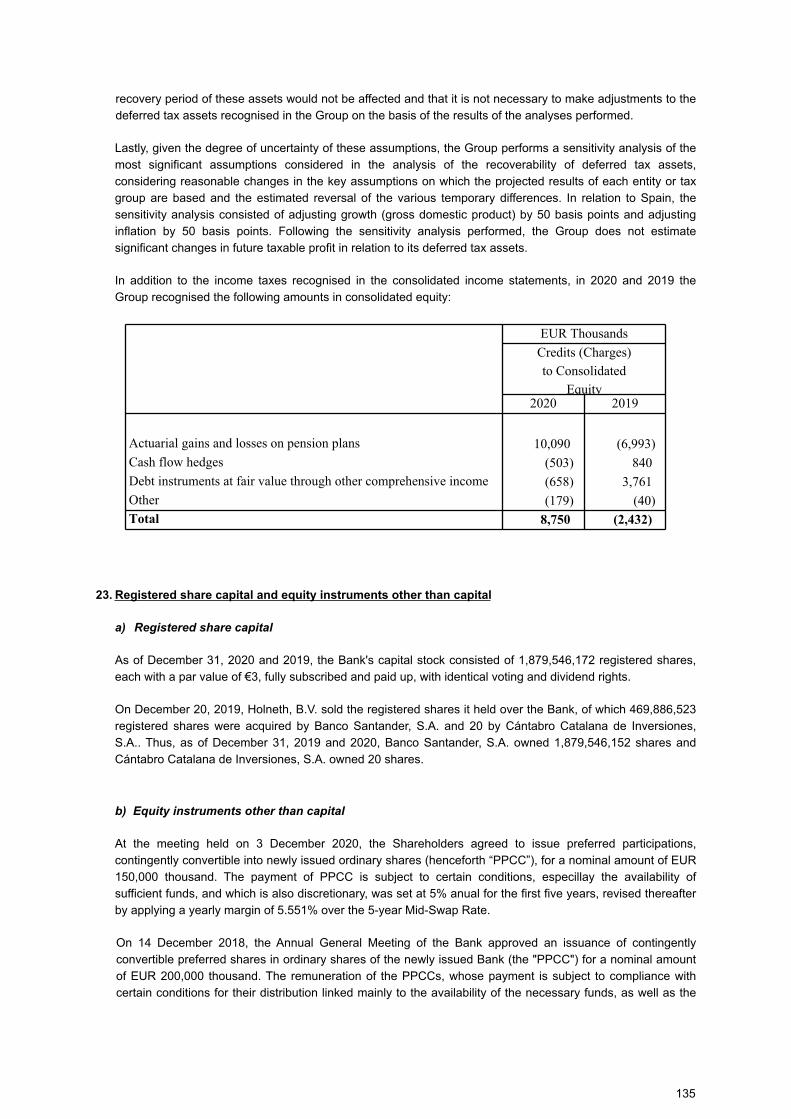
recovery period of these assets would not be affected and that it is not necessary to make adjustments to the
deferred tax assets recognised in the Group on the basis of the results of the analyses performed.
Lastly, given the degree of uncertainty of these assumptions, the Group performs a sensitivity analysis of the
most significant assumptions considered in the analysis of the recoverability of deferred tax assets,
considering reasonable changes in the key assumptions on which the projected results of each entity or tax
group are based and the estimated reversal of the various temporary differences. In relation to Spain, the
sensitivity analysis consisted of adjusting growth (gross domestic product) by 50 basis points and adjusting
inflation by 50 basis points. Following the sensitivity analysis performed, the Group does not estimate
significant changes in future taxable profit in relation to its deferred tax assets.
In addition to the income taxes recognised in the consolidated income statements, in 2020 and 2019 the
Group recognised the following amounts in consolidated equity:
EUR Thousands
Credits (Charges)
to Consolidated
Equity2020 2019
Actuarial gains and losses on pension plans 10,090 (6,993)
Cash flow hedges (503) 840
Debt instruments at fair value through other comprehensive income (658) 3,761
Other (179) (40)Total 8,750 (2,432)
23. Registered share capital and equity instruments other than capital
a) Registered share capital
As of December 31, 2020 and 2019, the Bank's capital stock consisted of 1,879,546,172 registered shares,
each with a par value of €3, fully subscribed and paid up, with identical voting and dividend rights.
On December 20, 2019, Holneth, B.V. sold the registered shares it held over the Bank, of which 469,886,523
registered shares were acquired by Banco Santander, S.A. and 20 by Cántabro Catalana de Inversiones,
S.A.. Thus, as of December 31, 2019 and 2020, Banco Santander, S.A. owned 1,879,546,152 shares and
Cántabro Catalana de Inversiones, S.A. owned 20 shares.
b) Equity instruments other than capital
At the meeting held on 3 December 2020, the Shareholders agreed to issue preferred participations,
contingently convertible into newly issued ordinary shares (henceforth “PPCC”), for a nominal amount of EUR
150,000 thousand. The payment of PPCC is subject to certain conditions, especillay the availability of
sufficient funds, and which is also discretionary, was set at 5% anual for the first five years, revised thereafter
by applying a yearly margin of 5.551% over the 5-year Mid-Swap Rate.
On 14 December 2018, the Annual General Meeting of the Bank approved an issuance of contingently
convertible preferred shares in ordinary shares of the newly issued Bank (the "PPCC") for a nominal amount
of EUR 200,000 thousand. The remuneration of the PPCCs, whose payment is subject to compliance with
certain conditions for their distribution linked mainly to the availability of the necessary funds, as well as the
135
decision by the Bank, was fixed at an annual 8.25% for the first five years, being revised thereafter applying a
margin of 8.22% per year plus the Mid-Swap rate to five years (5 year Mid-Swap Rate).
On 6 February 2019, the European Central Bank approved the computability of these PPCCs as Tier 1 capital
(additional tier 1) under the new European regulations on own resources of the European Regulation
575/2013. The PPCCs are perpetual, although they can be amortized early if the Bank or its consolidated
group presents a ratio of less than 5.125% of ordinary capital (common equity Tier 1 ratio) calculated
according to the applicable regulations. In this case and subject to compliance with certain requirements, the
shares would be converted into ordinary shares of new issue of Santander Consumer Finance, S.A. in
accordance with the value established in the brochure of issuance of the shares. In addition, these shares
may be redeemed by the Bank's decision only when there is a change in the rules for calculating regulatory
capital or the tax framework applicable to preferred shares, and with the prior approval of the European
Central Bank.
On 14 December 2017, the Annual General Meeting of the Bank approved an issuance of contingently
convertible preferred shares in ordinary shares of the newly issued Bank (the "PPCC") for a nominal amount
of EUR 850,000 thousand. The remuneration of the PPCCs, whose payment is subject to compliance with
certain conditions for their distribution linked mainly to the availability of the necessary funds, as well as the
decision by the Bank, was fixed at an annual 5.75% for the first five years, being revised thereafter applying a
margin of 5.545% per year plus the Mid-Swap rate to five years (5 year Mid-Swap Rate).
On 7 February 2018, the European Central Bank has approved the computability of these PPCCs as Tier 1
capital (additional tier 1) under the new European regulations on own resources of the European Regulation
575/2013. The PPCCs are perpetual, although they can be amortized early if the Bank or its consolidated
group presents a ratio of less than 5.125% of ordinary capital (common equity Tier 1 ratio) calculated
according to the applicable regulations. In this case and subject to compliance with certain requirements, the
shares would be converted into ordinary shares of new issue of Santander Consumer Finance, S.A. in
accordance with the value established in the brochure of issuance of the shares. In addition, these shares
may be redeemed by the Bank's decision only when there is a change in the rules for calculating regulatory
capital or the tax framework applicable to preferred shares, and with the prior approval of the European
Central Bank. PPCCs are traded on the Frankfurt Stock Exchange. All of the preferred shares have been fully
subscribed by Banco Santander, S.A. as of 31 December 2018 and 2017.
The accrued income on the shares issued at 31 December 2020 and 31 December 2019 amounted to EUR
179,627 thousand and EUR 114,250 thousand, respectively, and was recognised under "Retained
Earnings" (see Note 25).
In the years ended 31 December 2020 and 2019, the income earned on the shares issued amounted to EUR
65,377 thousand and EUR 65,374 thousand, respectively.
24. Share premium
The balance of “Share Premium” in the accompanying consolidated balance sheets as of 31 December 2020
and 2019 includes the amount paid up by the Bank's shareholders in capital issues in excess of the par value.
The Consolidated Spanish Limited Liability Companies Law expressly permits the use of the share premium
account balance to increase capital at the entities at which it is recognised and does not establish any specific
restrictions as to its use.
25. Retained earnings and other reserves
The balance of “Shareholders’ Equity - Reserves - Retained Earnings” in the accompanying consolidated
balance sheets includes the net amount of the accumulated profit or loss attributable to the Group recognised
in previous years through the consolidated income statement that, in the distribution of profit, was
appropriated to consolidated equity, as well as any own equity instrument issuance expenses and the
differences between the selling price of treasury shares and the cost of acquisition thereof, should the Bank
136
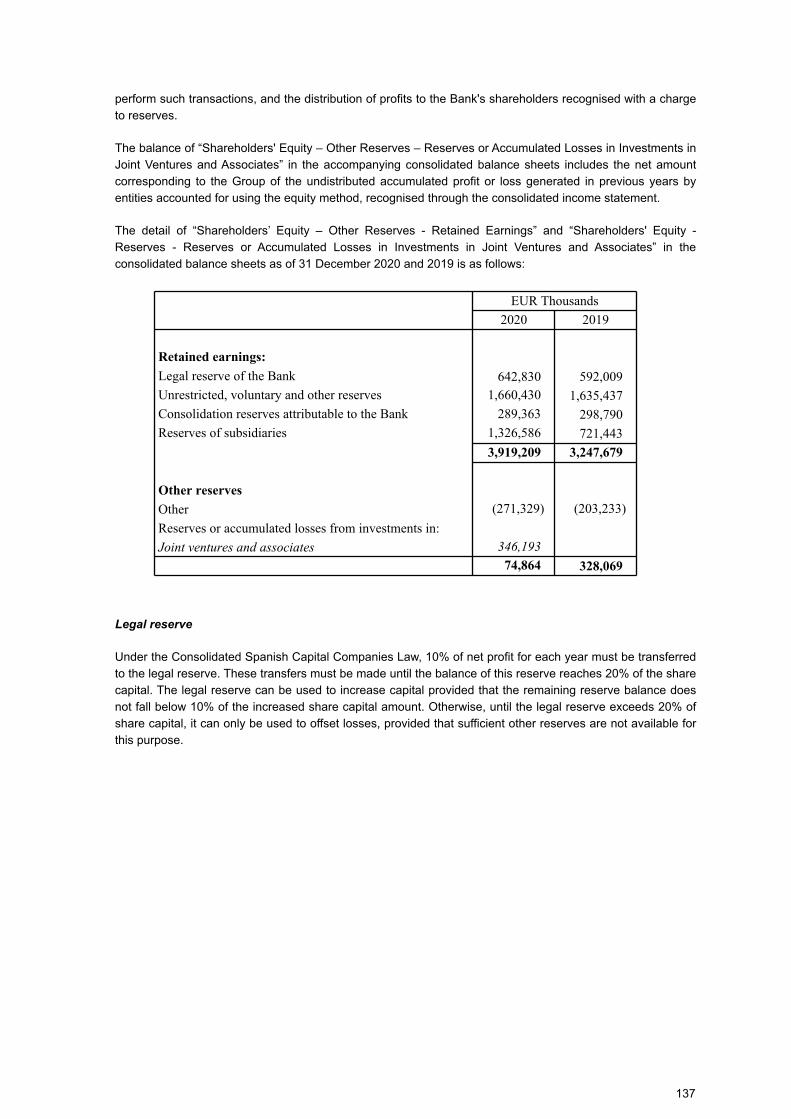
perform such transactions, and the distribution of profits to the Bank's shareholders recognised with a charge
to reserves.
The balance of “Shareholders' Equity – Other Reserves – Reserves or Accumulated Losses in Investments in
Joint Ventures and Associates” in the accompanying consolidated balance sheets includes the net amount
corresponding to the Group of the undistributed accumulated profit or loss generated in previous years by
entities accounted for using the equity method, recognised through the consolidated income statement.
The detail of “Shareholders’ Equity – Other Reserves - Retained Earnings” and “Shareholders' Equity -
Reserves - Reserves or Accumulated Losses in Investments in Joint Ventures and Associates” in the
consolidated balance sheets as of 31 December 2020 and 2019 is as follows:
EUR Thousands
2020 2019
Retained earnings:
Legal reserve of the Bank 642,830 592,009
Unrestricted, voluntary and other reserves 1,660,430 1,635,437
Consolidation reserves attributable to the Bank 289,363 298,790
Reserves of subsidiaries 1,326,586 721,443
3,919,209 3,247,679
Other reserves
Other (271,329) (203,233)
Reserves or accumulated losses from investments in:
Joint ventures and associates 346,193
74,864 328,069
Legal reserve
Under the Consolidated Spanish Capital Companies Law, 10% of net profit for each year must be transferred
to the legal reserve. These transfers must be made until the balance of this reserve reaches 20% of the share
capital. The legal reserve can be used to increase capital provided that the remaining reserve balance does
not fall below 10% of the increased share capital amount. Otherwise, until the legal reserve exceeds 20% of
share capital, it can only be used to offset losses, provided that sufficient other reserves are not available for
this purpose.
137
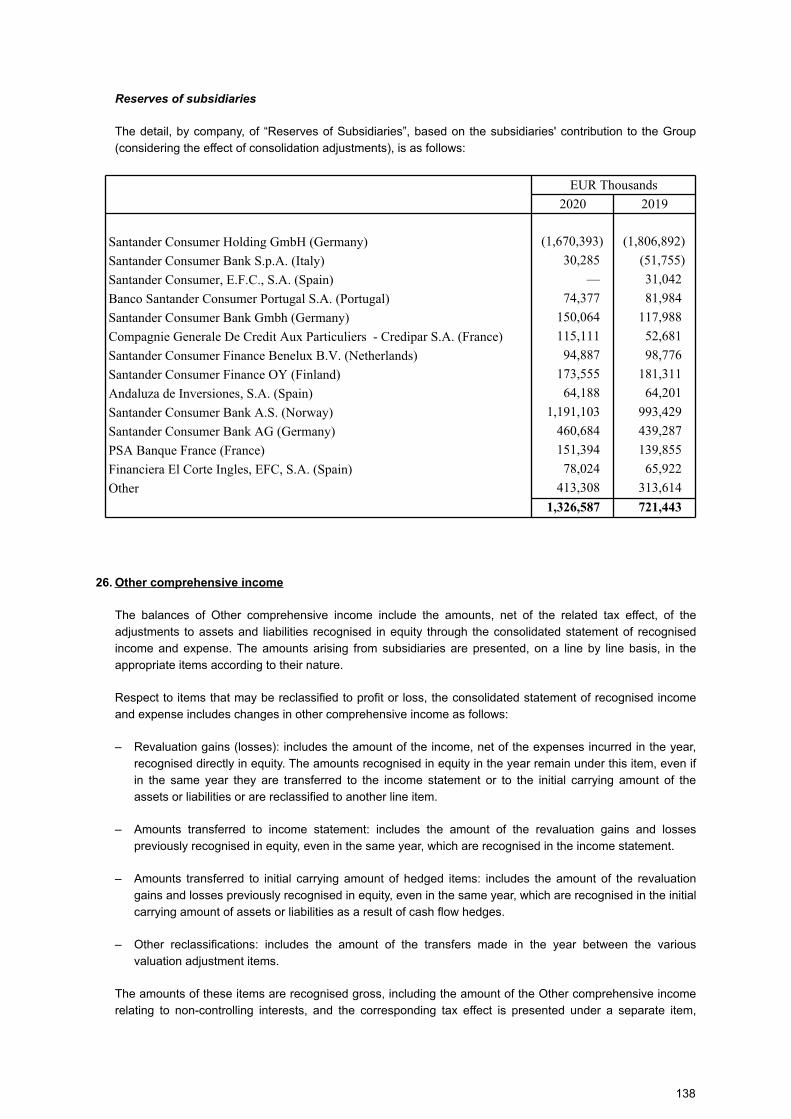
Reserves of subsidiaries
The detail, by company, of “Reserves of Subsidiaries”, based on the subsidiaries' contribution to the Group
(considering the effect of consolidation adjustments), is as follows:
EUR Thousands
2020 2019
Santander Consumer Holding GmbH (Germany) (1,670,393) (1,806,892)
Santander Consumer Bank S.p.A. (Italy) 30,285 (51,755)
Santander Consumer, E.F.C., S.A. (Spain) — 31,042
Banco Santander Consumer Portugal S.A. (Portugal) 74,377 81,984
Santander Consumer Bank Gmbh (Germany) 150,064 117,988
Compagnie Generale De Credit Aux Particuliers - Credipar S.A. (France) 115,111 52,681
Santander Consumer Finance Benelux B.V. (Netherlands) 94,887 98,776
Santander Consumer Finance OY (Finland) 173,555 181,311
Andaluza de Inversiones, S.A. (Spain) 64,188 64,201
Santander Consumer Bank A.S. (Norway) 1,191,103 993,429
Santander Consumer Bank AG (Germany) 460,684 439,287
PSA Banque France (France) 151,394 139,855
Financiera El Corte Ingles, EFC, S.A. (Spain) 78,024 65,922
Other 413,308 313,614
1,326,587 721,443
26. Other comprehensive income
The balances of Other comprehensive income include the amounts, net of the related tax effect, of the
adjustments to assets and liabilities recognised in equity through the consolidated statement of recognised
income and expense. The amounts arising from subsidiaries are presented, on a line by line basis, in the
appropriate items according to their nature.
Respect to items that may be reclassified to profit or loss, the consolidated statement of recognised income
and expense includes changes in other comprehensive income as follows:
– Revaluation gains (losses): includes the amount of the income, net of the expenses incurred in the year,
recognised directly in equity. The amounts recognised in equity in the year remain under this item, even if
in the same year they are transferred to the income statement or to the initial carrying amount of the
assets or liabilities or are reclassified to another line item.
– Amounts transferred to income statement: includes the amount of the revaluation gains and losses
previously recognised in equity, even in the same year, which are recognised in the income statement.
– Amounts transferred to initial carrying amount of hedged items: includes the amount of the revaluation
gains and losses previously recognised in equity, even in the same year, which are recognised in the initial
carrying amount of assets or liabilities as a result of cash flow hedges.
– Other reclassifications: includes the amount of the transfers made in the year between the various
valuation adjustment items.
The amounts of these items are recognised gross, including the amount of the Other comprehensive income
relating to non-controlling interests, and the corresponding tax effect is presented under a separate item,
138
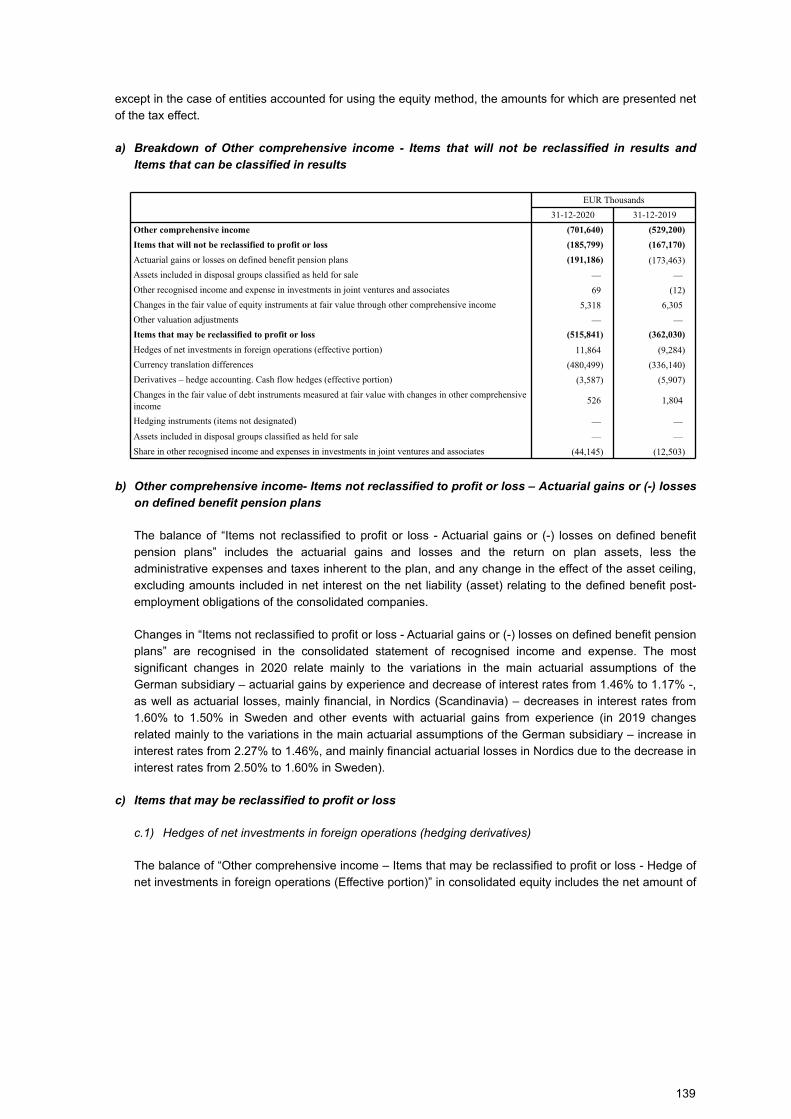
except in the case of entities accounted for using the equity method, the amounts for which are presented net
of the tax effect.
a) Breakdown of Other comprehensive income - Items that will not be reclassified in results and
Items that can be classified in results
EUR Thousands
31-12-2020 31-12-2019
Other comprehensive income (701,640) (529,200)
Items that will not be reclassified to profit or loss (185,799) (167,170)
Actuarial gains or losses on defined benefit pension plans (191,186) (173,463)
Assets included in disposal groups classified as held for sale — —
Other recognised income and expense in investments in joint ventures and associates 69 (12)
Changes in the fair value of equity instruments at fair value through other comprehensive income 5,318 6,305
Other valuation adjustments — —
Items that may be reclassified to profit or loss (515,841) (362,030)
Hedges of net investments in foreign operations (effective portion) 11,864 (9,284)
Currency translation differences (480,499) (336,140)
Derivatives – hedge accounting. Cash flow hedges (effective portion) (3,587) (5,907)
Changes in the fair value of debt instruments measured at fair value with changes in other comprehensive income
526 1,804
Hedging instruments (items not designated) — —
Assets included in disposal groups classified as held for sale — —
Share in other recognised income and expenses in investments in joint ventures and associates (44,145) (12,503)
b) Other comprehensive income- Items not reclassified to profit or loss – Actuarial gains or (-) losses
on defined benefit pension plans
The balance of “Items not reclassified to profit or loss - Actuarial gains or (-) losses on defined benefit
pension plans” includes the actuarial gains and losses and the return on plan assets, less the
administrative expenses and taxes inherent to the plan, and any change in the effect of the asset ceiling,
excluding amounts included in net interest on the net liability (asset) relating to the defined benefit post-
employment obligations of the consolidated companies.
Changes in “Items not reclassified to profit or loss - Actuarial gains or (-) losses on defined benefit pension
plans” are recognised in the consolidated statement of recognised income and expense. The most
significant changes in 2020 relate mainly to the variations in the main actuarial assumptions of the
German subsidiary – actuarial gains by experience and decrease of interest rates from 1.46% to 1.17% -,
as well as actuarial losses, mainly financial, in Nordics (Scandinavia) – decreases in interest rates from
1.60% to 1.50% in Sweden and other events with actuarial gains from experience (in 2019 changes
related mainly to the variations in the main actuarial assumptions of the German subsidiary – increase in
interest rates from 2.27% to 1.46%, and mainly financial actuarial losses in Nordics due to the decrease in
interest rates from 2.50% to 1.60% in Sweden).
c) Items that may be reclassified to profit or loss
c.1) Hedges of net investments in foreign operations (hedging derivatives)
The balance of “Other comprehensive income – Items that may be reclassified to profit or loss - Hedge of
net investments in foreign operations (Effective portion)” in consolidated equity includes the net amount of
139
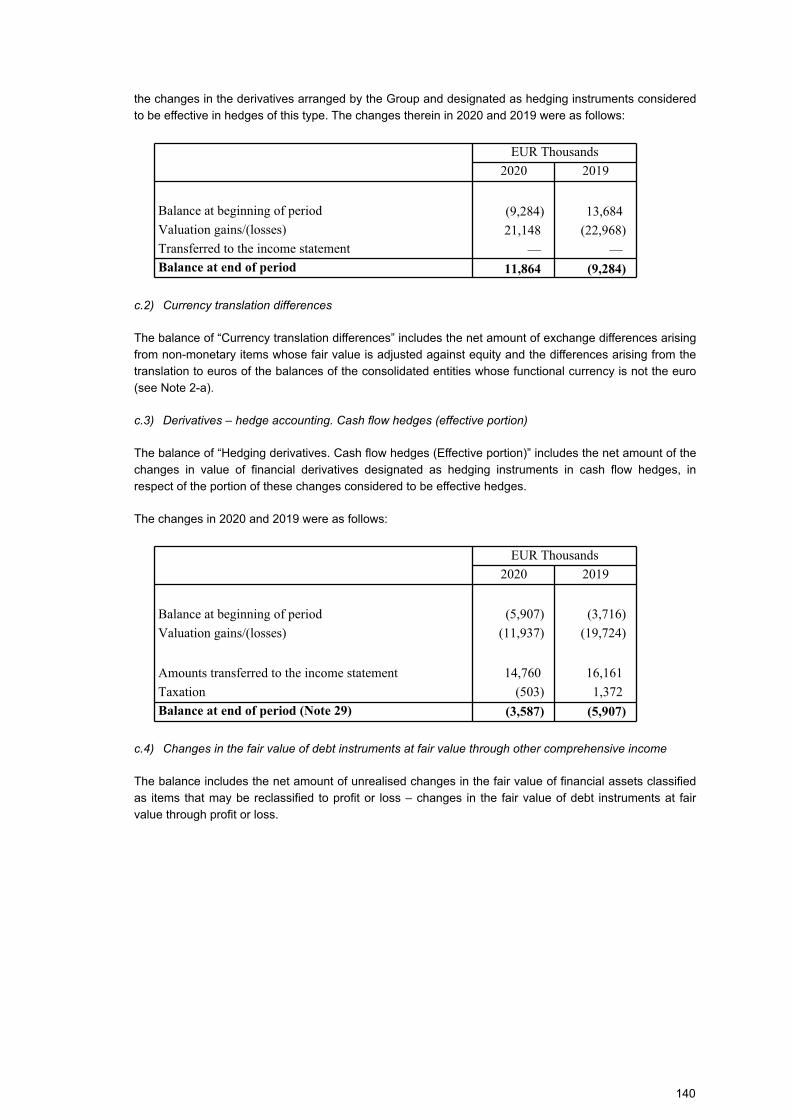
the changes in the derivatives arranged by the Group and designated as hedging instruments considered
to be effective in hedges of this type. The changes therein in 2020 and 2019 were as follows:
EUR Thousands
2020 2019
Balance at beginning of period (9,284) 13,684
Valuation gains/(losses) 21,148 (22,968)
Transferred to the income statement — — Balance at end of period 11,864 (9,284)
c.2) Currency translation differences
The balance of “Currency translation differences” includes the net amount of exchange differences arising
from non-monetary items whose fair value is adjusted against equity and the differences arising from the
translation to euros of the balances of the consolidated entities whose functional currency is not the euro
(see Note 2-a).
c.3) Derivatives – hedge accounting. Cash flow hedges (effective portion)
The balance of “Hedging derivatives. Cash flow hedges (Effective portion)” includes the net amount of the
changes in value of financial derivatives designated as hedging instruments in cash flow hedges, in
respect of the portion of these changes considered to be effective hedges.
The changes in 2020 and 2019 were as follows:
EUR Thousands
2020 2019
Balance at beginning of period (5,907) (3,716)
Valuation gains/(losses) (11,937) (19,724)
—
Amounts transferred to the income statement 14,760 16,161
Taxation (503) 1,372
Balance at end of period (Note 29) (3,587) (5,907)
c.4) Changes in the fair value of debt instruments at fair value through other comprehensive income
The balance includes the net amount of unrealised changes in the fair value of financial assets classified
as items that may be reclassified to profit or loss – changes in the fair value of debt instruments at fair
value through profit or loss.
140
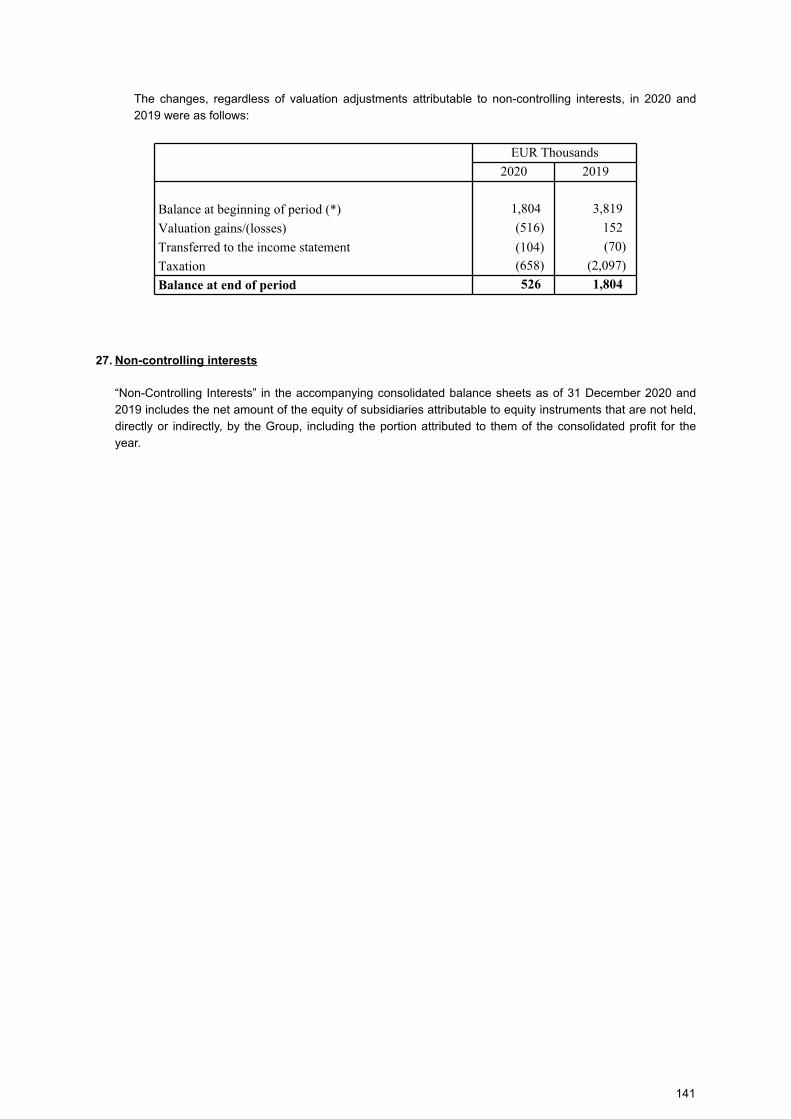
The changes, regardless of valuation adjustments attributable to non-controlling interests, in 2020 and
2019 were as follows:
EUR Thousands
2020 2019
Balance at beginning of period (*) 1,804 3,819
Valuation gains/(losses) (516) 152
Transferred to the income statement (104) (70)
Taxation (658) (2,097)
Balance at end of period 526 1,804
27. Non-controlling interests
“Non-Controlling Interests” in the accompanying consolidated balance sheets as of 31 December 2020 and
2019 includes the net amount of the equity of subsidiaries attributable to equity instruments that are not held,
directly or indirectly, by the Group, including the portion attributed to them of the consolidated profit for the
year.
141
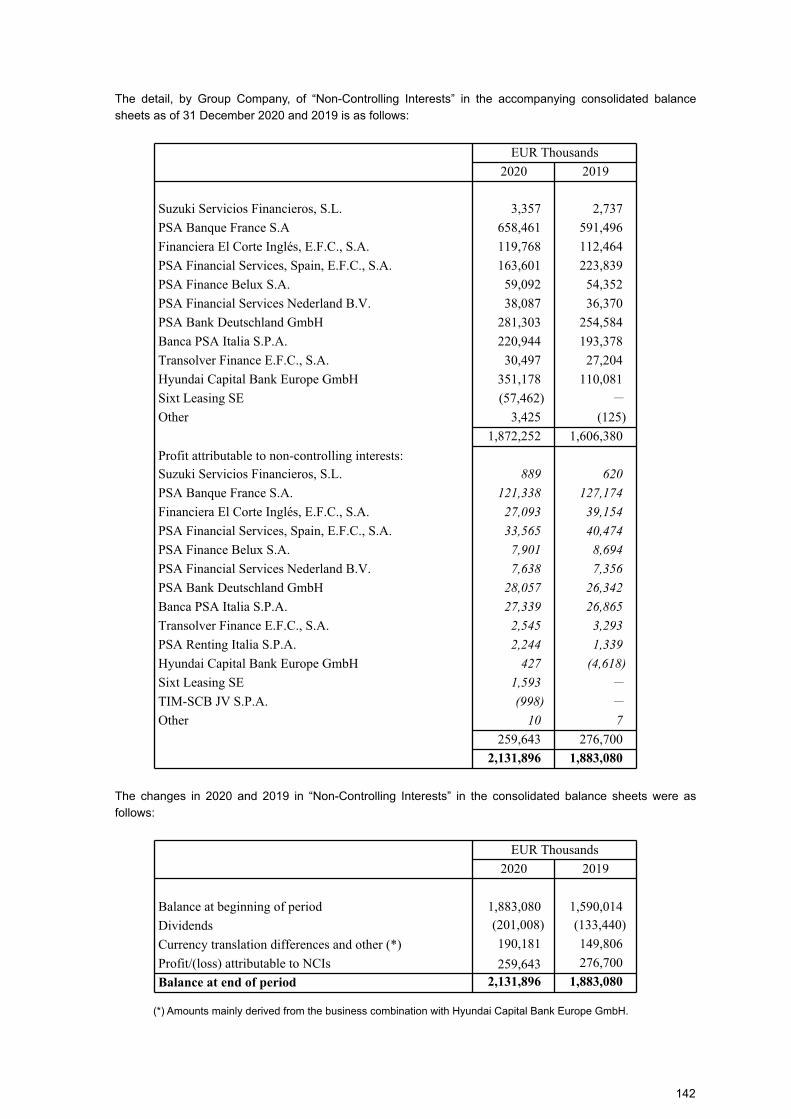
The detail, by Group Company, of “Non-Controlling Interests” in the accompanying consolidated balance
sheets as of 31 December 2020 and 2019 is as follows:
EUR Thousands
2020 2019
Suzuki Servicios Financieros, S.L. 3,357 2,737
PSA Banque France S.A 658,461 591,496
Financiera El Corte Inglés, E.F.C., S.A. 119,768 112,464
PSA Financial Services, Spain, E.F.C., S.A. 163,601 223,839
PSA Finance Belux S.A. 59,092 54,352
PSA Financial Services Nederland B.V. 38,087 36,370
PSA Bank Deutschland GmbH 281,303 254,584
Banca PSA Italia S.P.A. 220,944 193,378
Transolver Finance E.F.C., S.A. 30,497 27,204
Hyundai Capital Bank Europe GmbH 351,178 110,081
Sixt Leasing SE (57,462) —
Other 3,425 (125)
1,872,252 1,606,380
Profit attributable to non-controlling interests:
Suzuki Servicios Financieros, S.L. 889 620
PSA Banque France S.A. 121,338 127,174
Financiera El Corte Inglés, E.F.C., S.A. 27,093 39,154
PSA Financial Services, Spain, E.F.C., S.A. 33,565 40,474
PSA Finance Belux S.A. 7,901 8,694
PSA Financial Services Nederland B.V. 7,638 7,356
PSA Bank Deutschland GmbH 28,057 26,342
Banca PSA Italia S.P.A. 27,339 26,865
Transolver Finance E.F.C., S.A. 2,545 3,293
PSA Renting Italia S.P.A. 2,244 1,339
Hyundai Capital Bank Europe GmbH 427 (4,618)
Sixt Leasing SE 1,593 —
TIM-SCB JV S.P.A. (998) —
Other 10 7
259,643 276,700
2,131,896 1,883,080
The changes in 2020 and 2019 in “Non-Controlling Interests” in the consolidated balance sheets were as
follows:
EUR Thousands
2020 2019
Balance at beginning of period 1,883,080 1,590,014
Dividends (201,008) (133,440)
Currency translation differences and other (*) 190,181 149,806
Profit/(loss) attributable to NCIs 259,643 276,700
Balance at end of period 2,131,896 1,883,080
(*) Amounts mainly derived from the business combination with Hyundai Capital Bank Europe GmbH.
142
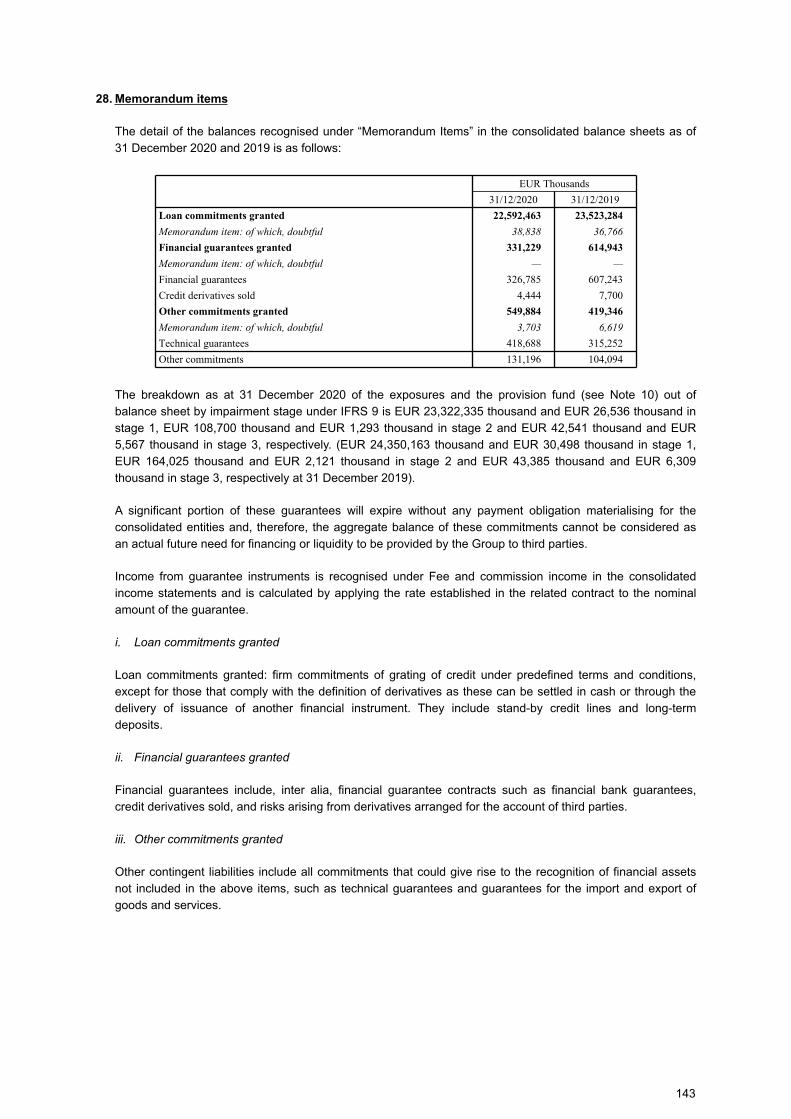
28. Memorandum items
The detail of the balances recognised under “Memorandum Items” in the consolidated balance sheets as of
31 December 2020 and 2019 is as follows:
EUR Thousands
31/12/2020 31/12/2019
Loan commitments granted 22,592,463 23,523,284
Memorandum item: of which, doubtful 38,838 36,766
Financial guarantees granted 331,229 614,943
Memorandum item: of which, doubtful — —
Financial guarantees 326,785 607,243
Credit derivatives sold 4,444 7,700
Other commitments granted 549,884 419,346
Memorandum item: of which, doubtful 3,703 6,619
Technical guarantees 418,688 315,252
Other commitments 131,196 104,094
The breakdown as at 31 December 2020 of the exposures and the provision fund (see Note 10) out of
balance sheet by impairment stage under IFRS 9 is EUR 23,322,335 thousand and EUR 26,536 thousand in
stage 1, EUR 108,700 thousand and EUR 1,293 thousand in stage 2 and EUR 42,541 thousand and EUR
5,567 thousand in stage 3, respectively. (EUR 24,350,163 thousand and EUR 30,498 thousand in stage 1,
EUR 164,025 thousand and EUR 2,121 thousand in stage 2 and EUR 43,385 thousand and EUR 6,309
thousand in stage 3, respectively at 31 December 2019).
A significant portion of these guarantees will expire without any payment obligation materialising for the
consolidated entities and, therefore, the aggregate balance of these commitments cannot be considered as
an actual future need for financing or liquidity to be provided by the Group to third parties.
Income from guarantee instruments is recognised under Fee and commission income in the consolidated
income statements and is calculated by applying the rate established in the related contract to the nominal
amount of the guarantee.
i. Loan commitments granted
Loan commitments granted: firm commitments of grating of credit under predefined terms and conditions,
except for those that comply with the definition of derivatives as these can be settled in cash or through the
delivery of issuance of another financial instrument. They include stand-by credit lines and long-term
deposits.
ii. Financial guarantees granted
Financial guarantees include, inter alia, financial guarantee contracts such as financial bank guarantees,
credit derivatives sold, and risks arising from derivatives arranged for the account of third parties.
iii. Other commitments granted
Other contingent liabilities include all commitments that could give rise to the recognition of financial assets
not included in the above items, such as technical guarantees and guarantees for the import and export of
goods and services.
143
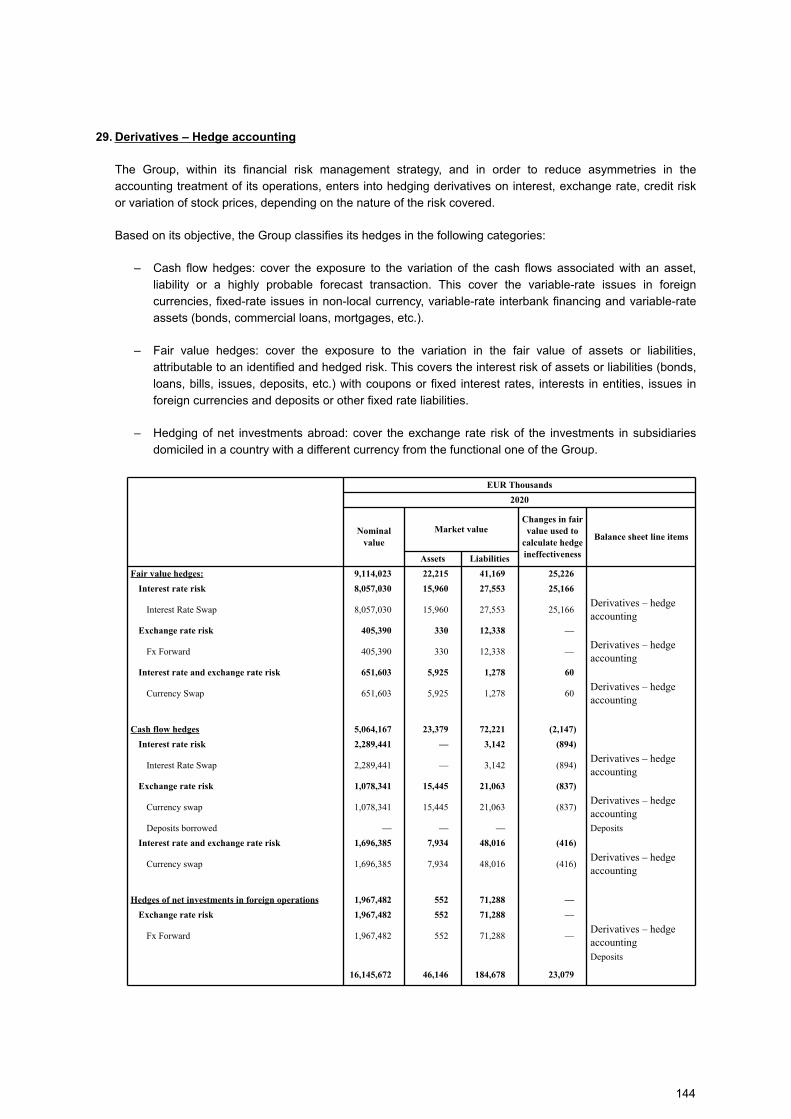
29. Derivatives – Hedge accounting
The Group, within its financial risk management strategy, and in order to reduce asymmetries in the
accounting treatment of its operations, enters into hedging derivatives on interest, exchange rate, credit risk
or variation of stock prices, depending on the nature of the risk covered.
Based on its objective, the Group classifies its hedges in the following categories:
– Cash flow hedges: cover the exposure to the variation of the cash flows associated with an asset,
liability or a highly probable forecast transaction. This cover the variable-rate issues in foreign
currencies, fixed-rate issues in non-local currency, variable-rate interbank financing and variable-rate
assets (bonds, commercial loans, mortgages, etc.).
– Fair value hedges: cover the exposure to the variation in the fair value of assets or liabilities,
attributable to an identified and hedged risk. This covers the interest risk of assets or liabilities (bonds,
loans, bills, issues, deposits, etc.) with coupons or fixed interest rates, interests in entities, issues in
foreign currencies and deposits or other fixed rate liabilities.
– Hedging of net investments abroad: cover the exchange rate risk of the investments in subsidiaries
domiciled in a country with a different currency from the functional one of the Group.
EUR Thousands
2020
Nominal
value
Market valueChanges in fair
value used to
calculate hedge
ineffectiveness
Balance sheet line items
Assets Liabilities
Fair value hedges: 9,114,023 22,215 41,169 25,226
Interest rate risk 8,057,030 15,960 27,553 25,166
Interest Rate Swap 8,057,030 15,960 27,553 25,166 Derivatives – hedge accounting
Exchange rate risk 405,390 330 12,338 —
Fx Forward 405,390 330 12,338 — Derivatives – hedge accounting
Interest rate and exchange rate risk 651,603 5,925 1,278 60
Currency Swap 651,603 5,925 1,278 60 Derivatives – hedge accounting
Cash flow hedges 5,064,167 23,379 72,221 (2,147)
Interest rate risk 2,289,441 — 3,142 (894)
Interest Rate Swap 2,289,441 — 3,142 (894)Derivatives – hedge accounting
Exchange rate risk 1,078,341 15,445 21,063 (837)
Currency swap 1,078,341 15,445 21,063 (837)Derivatives – hedge accounting
Deposits borrowed — — — Deposits
Interest rate and exchange rate risk 1,696,385 7,934 48,016 (416)
Currency swap 1,696,385 7,934 48,016 (416)Derivatives – hedge accounting
Hedges of net investments in foreign operations 1,967,482 552 71,288 —
Exchange rate risk 1,967,482 552 71,288 —
Fx Forward 1,967,482 552 71,288 — Derivatives – hedge accounting
Deposits
16,145,672 46,146 184,678 23,079
144
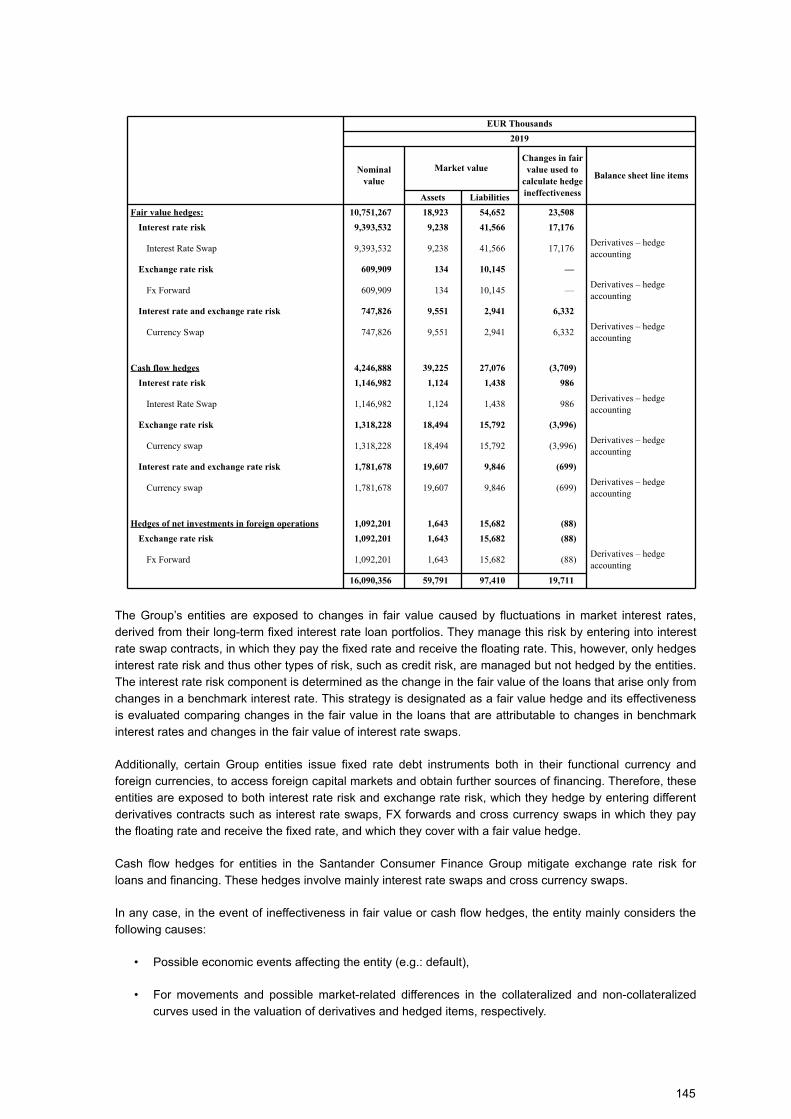
EUR Thousands
2019
Nominal
value
Market valueChanges in fair
value used to
calculate hedge
ineffectiveness
Balance sheet line items
Assets Liabilities
Fair value hedges: 10,751,267 18,923 54,652 23,508
Interest rate risk 9,393,532 9,238 41,566 17,176
Interest Rate Swap 9,393,532 9,238 41,566 17,176 Derivatives – hedge accounting
Exchange rate risk 609,909 134 10,145 —
Fx Forward 609,909 134 10,145 — Derivatives – hedge accounting
Interest rate and exchange rate risk 747,826 9,551 2,941 6,332
Currency Swap 747,826 9,551 2,941 6,332 Derivatives – hedge accounting
Cash flow hedges 4,246,888 39,225 27,076 (3,709)
Interest rate risk 1,146,982 1,124 1,438 986
Interest Rate Swap 1,146,982 1,124 1,438 986 Derivatives – hedge accounting
Exchange rate risk 1,318,228 18,494 15,792 (3,996)
Currency swap 1,318,228 18,494 15,792 (3,996)Derivatives – hedge accounting
Interest rate and exchange rate risk 1,781,678 19,607 9,846 (699)
Currency swap 1,781,678 19,607 9,846 (699)Derivatives – hedge accounting
Hedges of net investments in foreign operations 1,092,201 1,643 15,682 (88)
Exchange rate risk 1,092,201 1,643 15,682 (88)
Fx Forward 1,092,201 1,643 15,682 (88)Derivatives – hedge accounting
16,090,356 59,791 97,410 19,711
The Group’s entities are exposed to changes in fair value caused by fluctuations in market interest rates,
derived from their long-term fixed interest rate loan portfolios. They manage this risk by entering into interest
rate swap contracts, in which they pay the fixed rate and receive the floating rate. This, however, only hedges
interest rate risk and thus other types of risk, such as credit risk, are managed but not hedged by the entities.
The interest rate risk component is determined as the change in the fair value of the loans that arise only from
changes in a benchmark interest rate. This strategy is designated as a fair value hedge and its effectiveness
is evaluated comparing changes in the fair value in the loans that are attributable to changes in benchmark
interest rates and changes in the fair value of interest rate swaps.
Additionally, certain Group entities issue fixed rate debt instruments both in their functional currency and
foreign currencies, to access foreign capital markets and obtain further sources of financing. Therefore, these
entities are exposed to both interest rate risk and exchange rate risk, which they hedge by entering different
derivatives contracts such as interest rate swaps, FX forwards and cross currency swaps in which they pay
the floating rate and receive the fixed rate, and which they cover with a fair value hedge.
Cash flow hedges for entities in the Santander Consumer Finance Group mitigate exchange rate risk for
loans and financing. These hedges involve mainly interest rate swaps and cross currency swaps.
In any case, in the event of ineffectiveness in fair value or cash flow hedges, the entity mainly considers the
following causes:
• Possible economic events affecting the entity (e.g.: default),
• For movements and possible market-related differences in the collateralized and non-collateralized
curves used in the valuation of derivatives and hedged items, respectively.
145
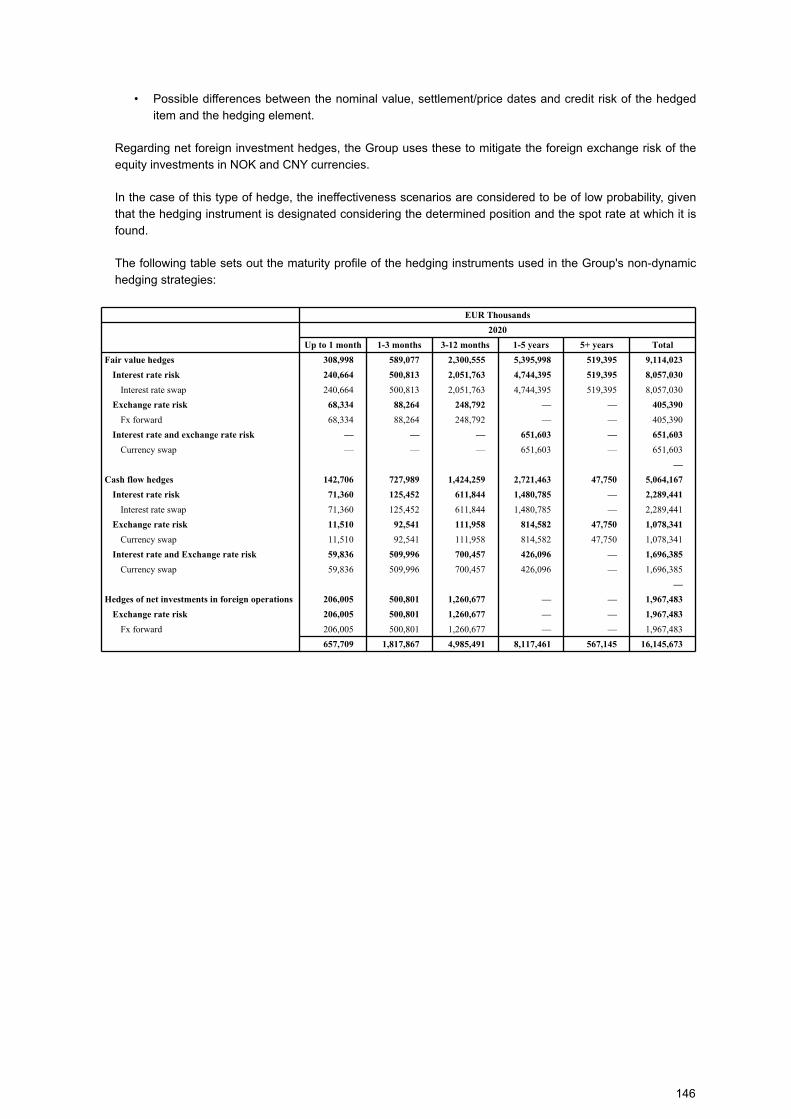
• Possible differences between the nominal value, settlement/price dates and credit risk of the hedged
item and the hedging element.
Regarding net foreign investment hedges, the Group uses these to mitigate the foreign exchange risk of the
equity investments in NOK and CNY currencies.
In the case of this type of hedge, the ineffectiveness scenarios are considered to be of low probability, given
that the hedging instrument is designated considering the determined position and the spot rate at which it is
found.
The following table sets out the maturity profile of the hedging instruments used in the Group's non-dynamic
hedging strategies:
EUR Thousands
2020
Up to 1 month 1-3 months 3-12 months 1-5 years 5+ years Total
Fair value hedges 308,998 589,077 2,300,555 5,395,998 519,395 9,114,023
Interest rate risk 240,664 500,813 2,051,763 4,744,395 519,395 8,057,030
Interest rate swap 240,664 500,813 2,051,763 4,744,395 519,395 8,057,030
Exchange rate risk 68,334 88,264 248,792 — — 405,390
Fx forward 68,334 88,264 248,792 — — 405,390
Interest rate and exchange rate risk — — — 651,603 — 651,603
Currency swap — — — 651,603 — 651,603
—
Cash flow hedges 142,706 727,989 1,424,259 2,721,463 47,750 5,064,167
Interest rate risk 71,360 125,452 611,844 1,480,785 — 2,289,441
Interest rate swap 71,360 125,452 611,844 1,480,785 — 2,289,441
Exchange rate risk 11,510 92,541 111,958 814,582 47,750 1,078,341
Currency swap 11,510 92,541 111,958 814,582 47,750 1,078,341
Interest rate and Exchange rate risk 59,836 509,996 700,457 426,096 — 1,696,385
Currency swap 59,836 509,996 700,457 426,096 — 1,696,385
—
Hedges of net investments in foreign operations 206,005 500,801 1,260,677 — — 1,967,483
Exchange rate risk 206,005 500,801 1,260,677 — — 1,967,483
Fx forward 206,005 500,801 1,260,677 — — 1,967,483
657,709 1,817,867 4,985,491 8,117,461 567,145 16,145,673
146
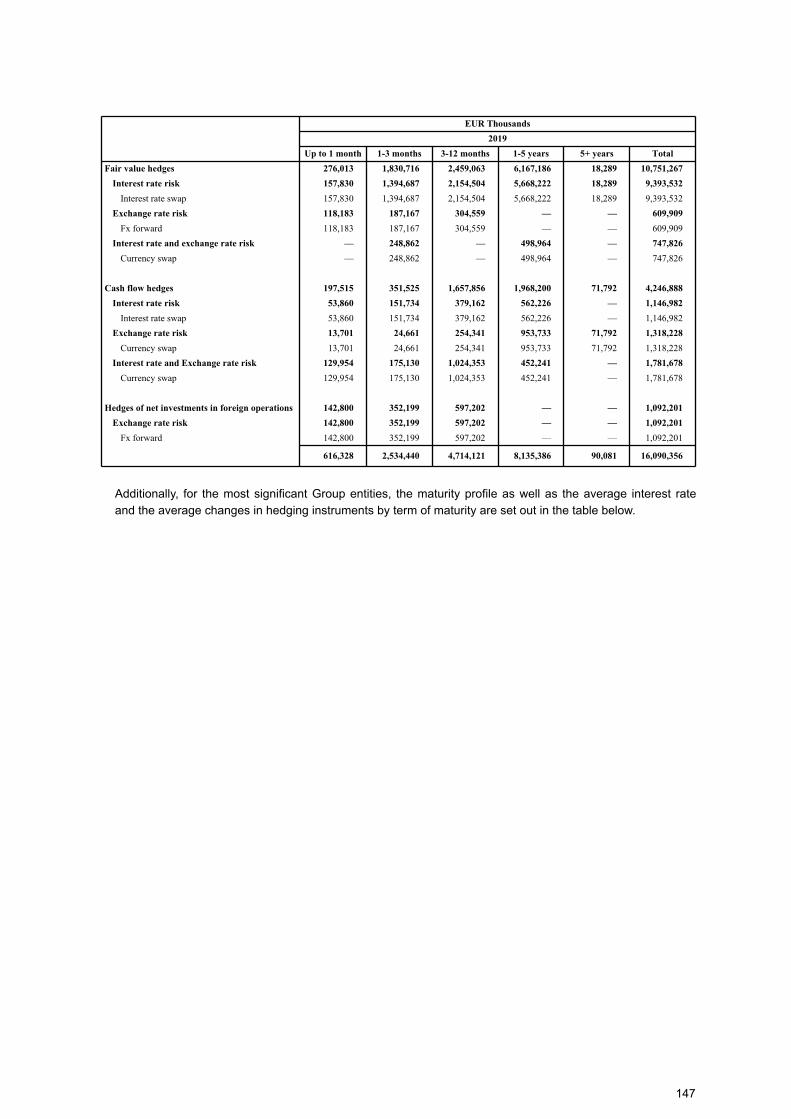
EUR Thousands
2019
Up to 1 month 1-3 months 3-12 months 1-5 years 5+ years Total
Fair value hedges 276,013 1,830,716 2,459,063 6,167,186 18,289 10,751,267
Interest rate risk 157,830 1,394,687 2,154,504 5,668,222 18,289 9,393,532
Interest rate swap 157,830 1,394,687 2,154,504 5,668,222 18,289 9,393,532
Exchange rate risk 118,183 187,167 304,559 — — 609,909
Fx forward 118,183 187,167 304,559 — — 609,909
Interest rate and exchange rate risk — 248,862 — 498,964 — 747,826
Currency swap — 248,862 — 498,964 — 747,826
Cash flow hedges 197,515 351,525 1,657,856 1,968,200 71,792 4,246,888
Interest rate risk 53,860 151,734 379,162 562,226 — 1,146,982
Interest rate swap 53,860 151,734 379,162 562,226 — 1,146,982
Exchange rate risk 13,701 24,661 254,341 953,733 71,792 1,318,228
Currency swap 13,701 24,661 254,341 953,733 71,792 1,318,228
Interest rate and Exchange rate risk 129,954 175,130 1,024,353 452,241 — 1,781,678
Currency swap 129,954 175,130 1,024,353 452,241 — 1,781,678
Hedges of net investments in foreign operations 142,800 352,199 597,202 — — 1,092,201
Exchange rate risk 142,800 352,199 597,202 — — 1,092,201
Fx forward 142,800 352,199 597,202 — — 1,092,201
616,328 2,534,440 4,714,121 8,135,386 90,081 16,090,356
Additionally, for the most significant Group entities, the maturity profile as well as the average interest rate
and the average changes in hedging instruments by term of maturity are set out in the table below.
147
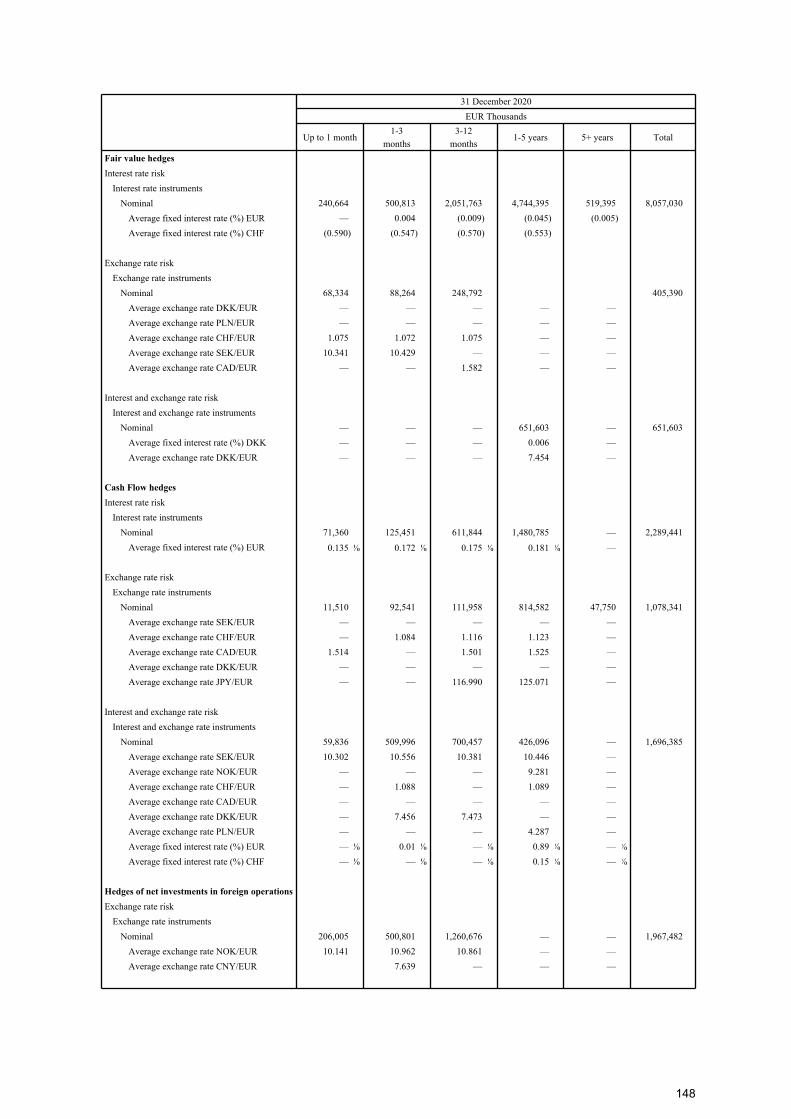
31 December 2020
EUR Thousands
Up to 1 month
1-3
months
3-12
months1-5 years 5+ years Total
Fair value hedges
Interest rate risk
Interest rate instruments
Nominal 240,664 500,813 2,051,763 4,744,395 519,395 8,057,030
Average fixed interest rate (%) EUR — 0.004 (0.009) (0.045) (0.005)
Average fixed interest rate (%) CHF (0.590) (0.547) (0.570) (0.553)
Exchange rate risk
Exchange rate instruments
Nominal 68,334 88,264 248,792 405,390
Average exchange rate DKK/EUR — — — — —
Average exchange rate PLN/EUR — — — — —
Average exchange rate CHF/EUR 1.075 1.072 1.075 — —
Average exchange rate SEK/EUR 10.341 10.429 — — —
Average exchange rate CAD/EUR — — 1.582 — —
Interest and exchange rate risk
Interest and exchange rate instruments
Nominal — — — 651,603 — 651,603
Average fixed interest rate (%) DKK — — — 0.006 —
Average exchange rate DKK/EUR — — — 7.454 —
Cash Flow hedges
Interest rate risk
Interest rate instruments
Nominal 71,360 125,451 611,844 1,480,785 — 2,289,441
Average fixed interest rate (%) EUR 0.135 % 0.172 % 0.175 % 0.181 % —
Exchange rate risk
Exchange rate instruments
Nominal 11,510 92,541 111,958 814,582 47,750 1,078,341
Average exchange rate SEK/EUR — — — — —
Average exchange rate CHF/EUR — 1.084 1.116 1.123 —
Average exchange rate CAD/EUR 1.514 — 1.501 1.525 —
Average exchange rate DKK/EUR — — — — —
Average exchange rate JPY/EUR — — 116.990 125.071 —
Interest and exchange rate risk
Interest and exchange rate instruments
Nominal 59,836 509,996 700,457 426,096 — 1,696,385
Average exchange rate SEK/EUR 10.302 10.556 10.381 10.446 —
Average exchange rate NOK/EUR — — — 9.281 —
Average exchange rate CHF/EUR — 1.088 — 1.089 —
Average exchange rate CAD/EUR — — — — —
Average exchange rate DKK/EUR — 7.456 7.473 — —
Average exchange rate PLN/EUR — — — 4.287 —
Average fixed interest rate (%) EUR — % 0.01 % — % 0.89 % — %
Average fixed interest rate (%) CHF — % — % — % 0.15 % — %
Hedges of net investments in foreign operations
Exchange rate risk
Exchange rate instruments
Nominal 206,005 500,801 1,260,676 — — 1,967,482
Average exchange rate NOK/EUR 10.141 10.962 10.861 — —
Average exchange rate CNY/EUR 7.639 — — —
148
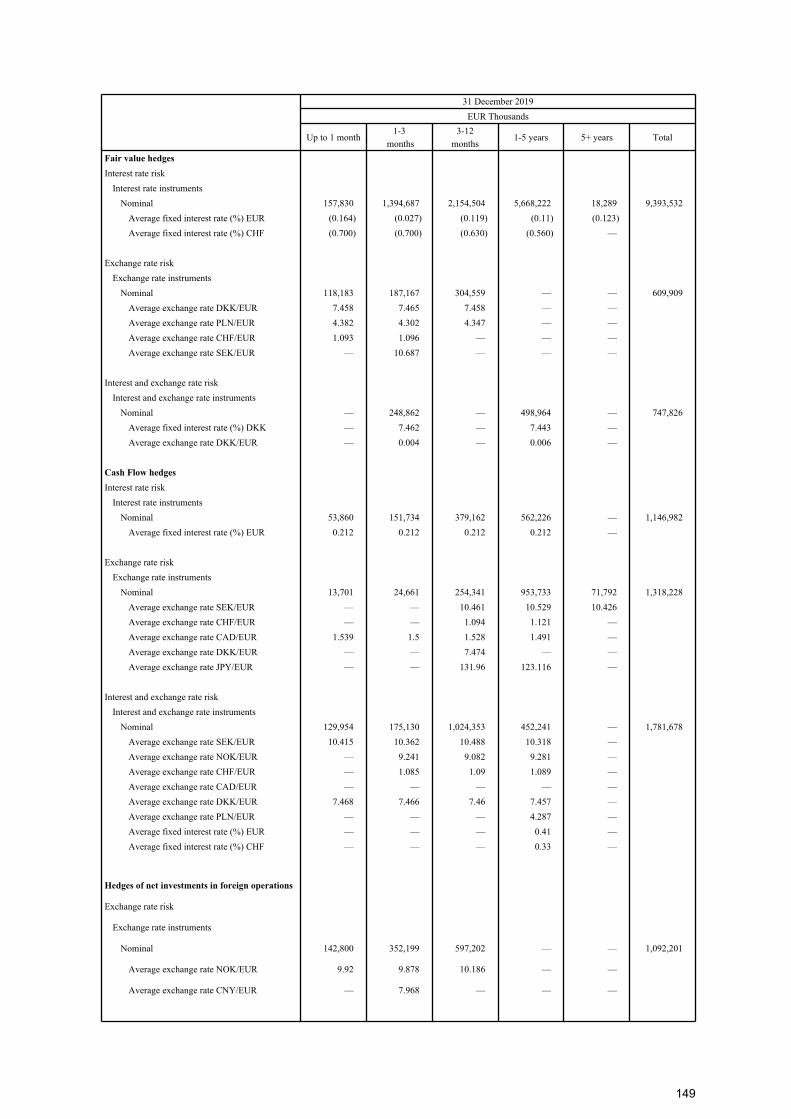
31 December 2019
EUR Thousands
Up to 1 month
1-3
months
3-12
months1-5 years 5+ years Total
Fair value hedges
Interest rate risk
Interest rate instruments
Nominal 157,830 1,394,687 2,154,504 5,668,222 18,289 9,393,532
Average fixed interest rate (%) EUR (0.164) (0.027) (0.119) (0.11) (0.123)
Average fixed interest rate (%) CHF (0.700) (0.700) (0.630) (0.560) —
Exchange rate risk
Exchange rate instruments
Nominal 118,183 187,167 304,559 — — 609,909
Average exchange rate DKK/EUR 7.458 7.465 7.458 — —
Average exchange rate PLN/EUR 4.382 4.302 4.347 — —
Average exchange rate CHF/EUR 1.093 1.096 — — —
Average exchange rate SEK/EUR — 10.687 — — —
Interest and exchange rate risk
Interest and exchange rate instruments
Nominal — 248,862 — 498,964 — 747,826
Average fixed interest rate (%) DKK — 7.462 — 7.443 —
Average exchange rate DKK/EUR — 0.004 — 0.006 —
Cash Flow hedges
Interest rate risk
Interest rate instruments
Nominal 53,860 151,734 379,162 562,226 — 1,146,982
Average fixed interest rate (%) EUR 0.212 0.212 0.212 0.212 —
Exchange rate risk
Exchange rate instruments
Nominal 13,701 24,661 254,341 953,733 71,792 1,318,228
Average exchange rate SEK/EUR — — 10.461 10.529 10.426
Average exchange rate CHF/EUR — — 1.094 1.121 —
Average exchange rate CAD/EUR 1.539 1.5 1.528 1.491 —
Average exchange rate DKK/EUR — — 7.474 — —
Average exchange rate JPY/EUR — — 131.96 123.116 —
Interest and exchange rate risk
Interest and exchange rate instruments
Nominal 129,954 175,130 1,024,353 452,241 — 1,781,678
Average exchange rate SEK/EUR 10.415 10.362 10.488 10.318 —
Average exchange rate NOK/EUR — 9.241 9.082 9.281 —
Average exchange rate CHF/EUR — 1.085 1.09 1.089 —
Average exchange rate CAD/EUR — — — — —
Average exchange rate DKK/EUR 7.468 7.466 7.46 7.457 —
Average exchange rate PLN/EUR — — — 4.287 —
Average fixed interest rate (%) EUR — — — 0.41 —
Average fixed interest rate (%) CHF — — — 0.33 —
Hedges of net investments in foreign operations
Exchange rate risk
Exchange rate instruments
Nominal 142,800 352,199 597,202 — — 1,092,201
Average exchange rate NOK/EUR 9.92 9.878 10.186 — —
Average exchange rate CNY/EUR — 7.968 — — —
149
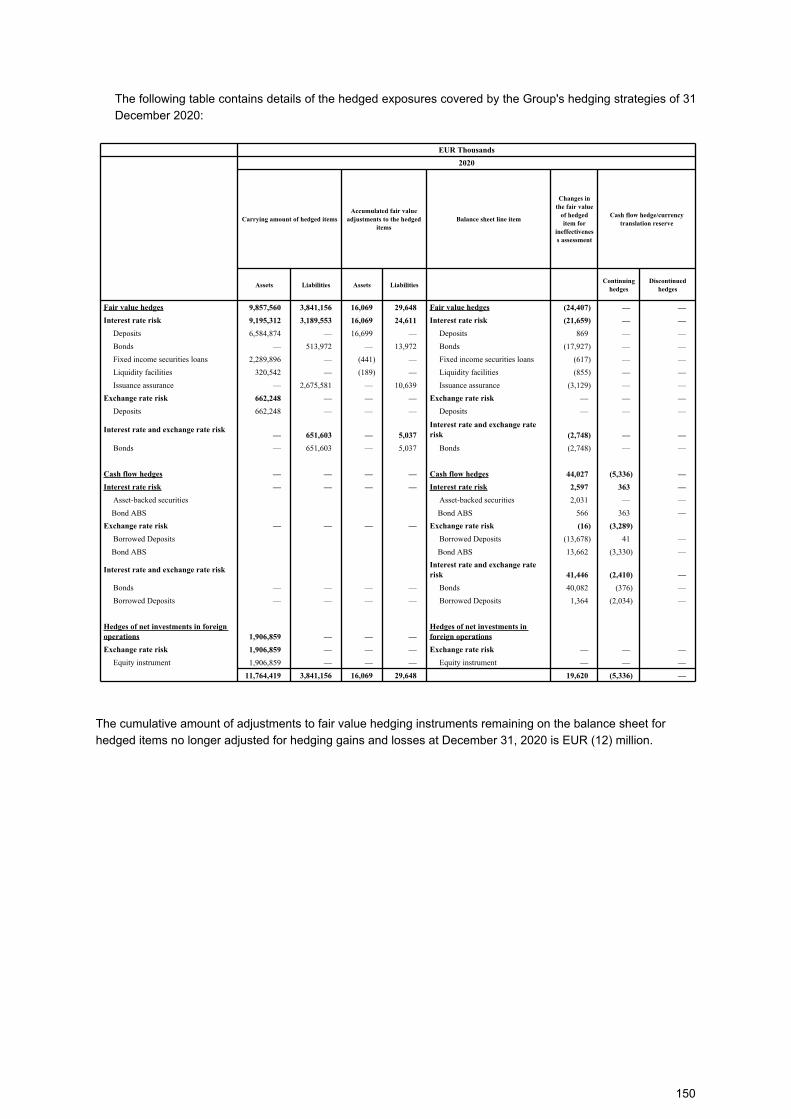
The following table contains details of the hedged exposures covered by the Group's hedging strategies of 31
December 2020:
EUR Thousands
2020
Carrying amount of hedged items
Accumulated fair value
adjustments to the hedged
items
Balance sheet line item
Changes in
the fair value
of hedged
item for
ineffectivenes
s assessment
Cash flow hedge/currency
translation reserve
Assets Liabilities Assets LiabilitiesContinuing
hedges
Discontinued
hedges
Fair value hedges 9,857,560 3,841,156 16,069 29,648 Fair value hedges (24,407) — —
Interest rate risk 9,195,312 3,189,553 16,069 24,611 Interest rate risk (21,659) — —
Deposits 6,584,874 — 16,699 — Deposits 869 — —
Bonds — 513,972 — 13,972 Bonds (17,927) — —
Fixed income securities loans 2,289,896 — (441) — Fixed income securities loans (617) — —
Liquidity facilities 320,542 — (189) — Liquidity facilities (855) — —
Issuance assurance — 2,675,581 — 10,639 Issuance assurance (3,129) — —
Exchange rate risk 662,248 — — — Exchange rate risk — — —
Deposits 662,248 — — — Deposits — — —
Interest rate and exchange rate risk — 651,603 — 5,037
Interest rate and exchange rate
risk (2,748) — —
Bonds — 651,603 — 5,037 Bonds (2,748) — —
Cash flow hedges — — — — Cash flow hedges 44,027 (5,336) —
Interest rate risk — — — — Interest rate risk 2,597 363 —
Asset-backed securities Asset-backed securities 2,031 — —
Bond ABS Bond ABS 566 363 —
Exchange rate risk — — — — Exchange rate risk (16) (3,289)
Borrowed Deposits Borrowed Deposits (13,678) 41 —
Bond ABS Bond ABS 13,662 (3,330) —
Interest rate and exchange rate risk
Interest rate and exchange rate
risk 41,446 (2,410) —
Bonds — — — — Bonds 40,082 (376) —
Borrowed Deposits — — — — Borrowed Deposits 1,364 (2,034) —
Hedges of net investments in foreign
operations 1,906,859 — — —
Hedges of net investments in
foreign operations
Exchange rate risk 1,906,859 — — — Exchange rate risk — — —
Equity instrument 1,906,859 — — — Equity instrument — — —
11,764,419 3,841,156 16,069 29,648 19,620 (5,336) —
The cumulative amount of adjustments to fair value hedging instruments remaining on the balance sheet for
hedged items no longer adjusted for hedging gains and losses at December 31, 2020 is EUR (12) million.
150
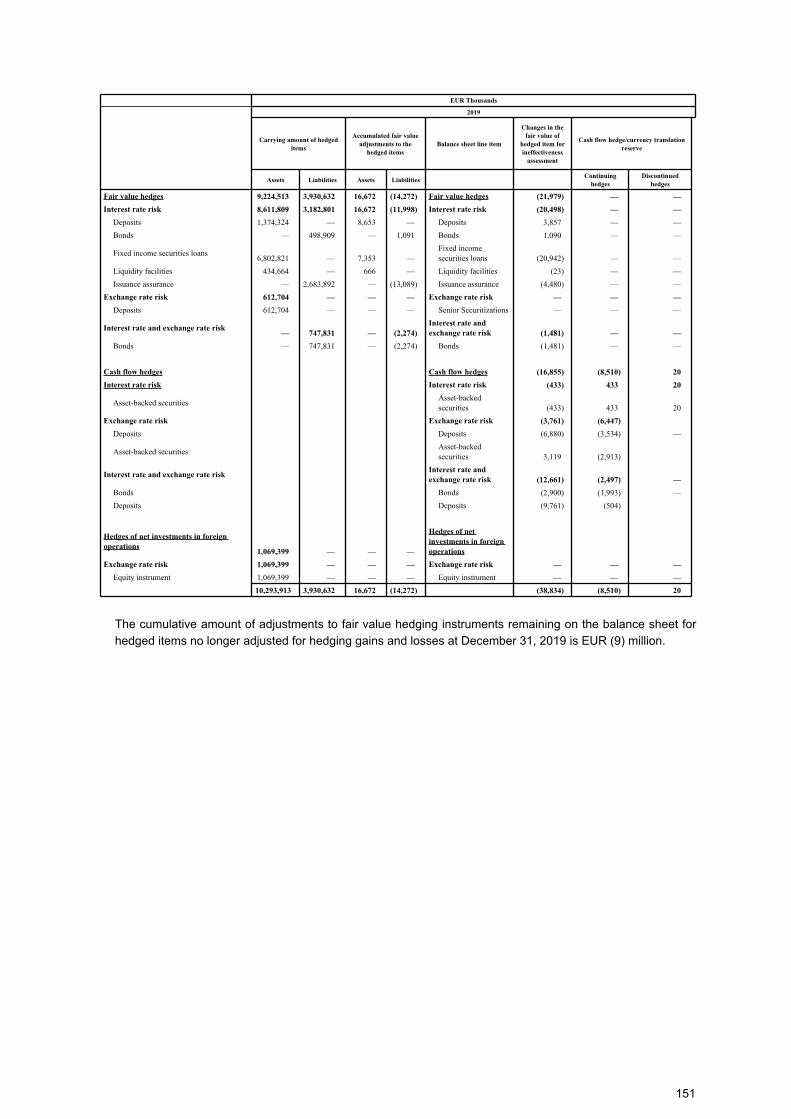
EUR Thousands
2019
Carrying amount of hedged
items
Accumulated fair value
adjustments to the
hedged items
Balance sheet line item
Changes in the
fair value of
hedged item for
ineffectiveness
assessment
Cash flow hedge/currency translation
reserve
Assets Liabilities Assets Liabilities
Continuing
hedges
Discontinued
hedges
Fair value hedges 9,224,513 3,930,632 16,672 (14,272) Fair value hedges (21,979) — —
Interest rate risk 8,611,809 3,182,801 16,672 (11,998) Interest rate risk (20,498) — —
Deposits 1,374,324 — 8,653 — Deposits 3,857 — —
Bonds — 498,909 — 1,091 Bonds 1,090 — —
Fixed income securities loans 6,802,821 — 7,353 —
Fixed income securities loans (20,942) — —
Liquidity facilities 434,664 — 666 — Liquidity facilities (23) — —
Issuance assurance — 2,683,892 — (13,089) Issuance assurance (4,480) — —
Exchange rate risk 612,704 — — — Exchange rate risk — — —
Deposits 612,704 — — — Senior Securitizations — — —
Interest rate and exchange rate risk — 747,831 — (2,274)
Interest rate and
exchange rate risk (1,481) — —
Bonds — 747,831 — (2,274) Bonds (1,481) — —
Cash flow hedges Cash flow hedges (16,855) (8,510) 20
Interest rate risk Interest rate risk (433) 433 20
Asset-backed securities
Asset-backed securities (433) 433 20
Exchange rate risk Exchange rate risk (3,761) (6,447)
Deposits Deposits (6,880) (3,534) —
Asset-backed securities
Asset-backed securities 3,119 (2,913)
Interest rate and exchange rate risk
Interest rate and
exchange rate risk (12,661) (2,497) —
Bonds Bonds (2,900) (1,993) —
Deposits Deposits (9,761) (504)
Hedges of net investments in foreign
operations 1,069,399 — — —
Hedges of net
investments in foreign
operations
Exchange rate risk 1,069,399 — — — Exchange rate risk — — —
Equity instrument 1,069,399 — — — Equity instrument — — —
10,293,913 3,930,632 16,672 (14,272) (38,834) (8,510) 20
The cumulative amount of adjustments to fair value hedging instruments remaining on the balance sheet for
hedged items no longer adjusted for hedging gains and losses at December 31, 2019 is EUR (9) million.
151
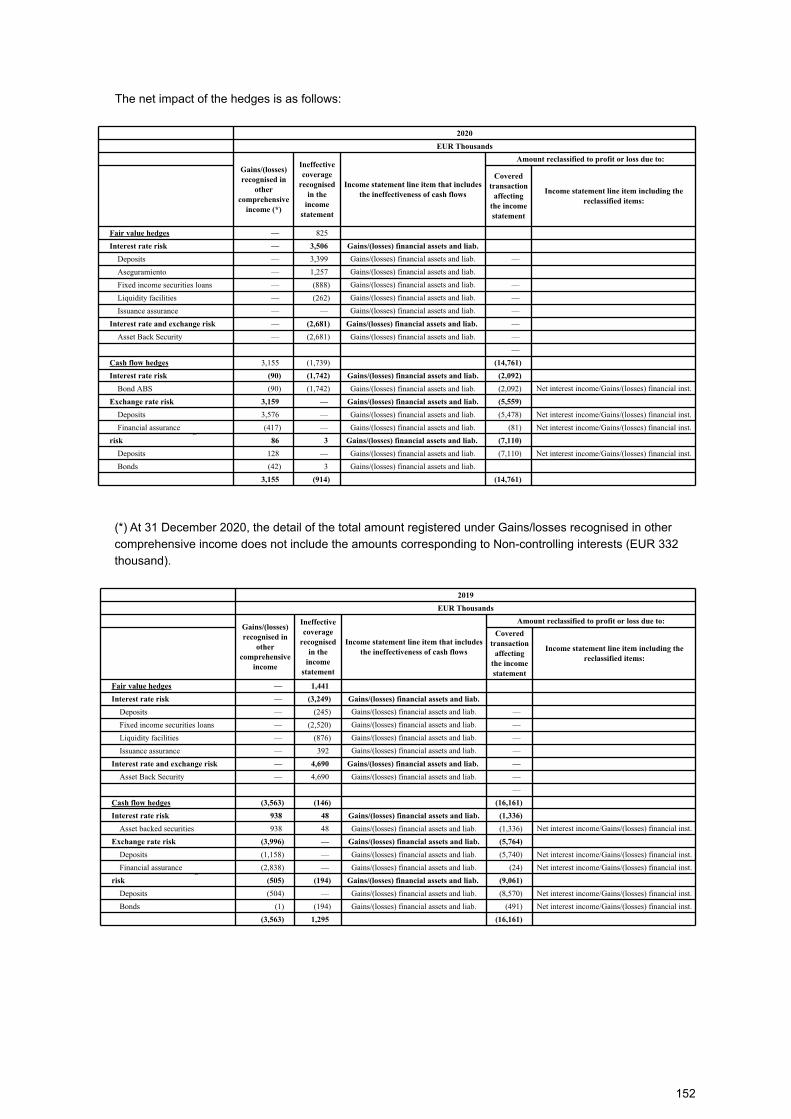
The net impact of the hedges is as follows:
2020
EUR Thousands
Gains/(losses)
recognised in
other
comprehensive
income (*)
Ineffective
coverage
recognised
in the
income
statement
Income statement line item that includes
the ineffectiveness of cash flows
Amount reclassified to profit or loss due to:
Covered
transaction
affecting
the income
statement
Income statement line item including the
reclassified items:
Fair value hedges — 825
Interest rate risk — 3,506 Gains/(losses) financial assets and liab.
Deposits — 3,399 Gains/(losses) financial assets and liab. —
Aseguramiento — 1,257 Gains/(losses) financial assets and liab.
Fixed income securities loans — (888) Gains/(losses) financial assets and liab. —
Liquidity facilities — (262) Gains/(losses) financial assets and liab. —
Issuance assurance — — Gains/(losses) financial assets and liab. —
Interest rate and exchange risk — (2,681) Gains/(losses) financial assets and liab. —
Asset Back Security — (2,681) Gains/(losses) financial assets and liab. —
—
Cash flow hedges 3,155 (1,739) (14,761)
Interest rate risk (90) (1,742) Gains/(losses) financial assets and liab. (2,092)
Bond ABS (90) (1,742) Gains/(losses) financial assets and liab. (2,092) Net interest income/Gains/(losses) financial inst.
Exchange rate risk 3,159 — Gains/(losses) financial assets and liab. (5,559)
Deposits 3,576 — Gains/(losses) financial assets and liab. (5,478) Net interest income/Gains/(losses) financial inst.
Financial assurance (417) — Gains/(losses) financial assets and liab. (81) Net interest income/Gains/(losses) financial inst.Interest rate and exchange rate
risk 86 3 Gains/(losses) financial assets and liab. (7,110)
Deposits 128 — Gains/(losses) financial assets and liab. (7,110) Net interest income/Gains/(losses) financial inst.
Bonds (42) 3 Gains/(losses) financial assets and liab.
3,155 (914) (14,761)
(*) At 31 December 2020, the detail of the total amount registered under Gains/losses recognised in other
comprehensive income does not include the amounts corresponding to Non-controlling interests (EUR 332
thousand).
2019
EUR Thousands
Gains/(losses)
recognised in
other
comprehensive
income
Ineffective
coverage
recognised
in the
income
statement
Income statement line item that includes
the ineffectiveness of cash flows
Amount reclassified to profit or loss due to:
Covered
transaction
affecting
the income
statement
Income statement line item including the
reclassified items:
Fair value hedges — 1,441
Interest rate risk — (3,249) Gains/(losses) financial assets and liab.
Deposits — (245) Gains/(losses) financial assets and liab. —
Fixed income securities loans — (2,520) Gains/(losses) financial assets and liab. —
Liquidity facilities — (876) Gains/(losses) financial assets and liab. —
Issuance assurance — 392 Gains/(losses) financial assets and liab. —
Interest rate and exchange risk — 4,690 Gains/(losses) financial assets and liab. —
Asset Back Security — 4,690 Gains/(losses) financial assets and liab. —
—
Cash flow hedges (3,563) (146) (16,161)
Interest rate risk 938 48 Gains/(losses) financial assets and liab. (1,336)
Asset backed securities 938 48 Gains/(losses) financial assets and liab. (1,336) Net interest income/Gains/(losses) financial inst.
Exchange rate risk (3,996) — Gains/(losses) financial assets and liab. (5,764)
Deposits (1,158) — Gains/(losses) financial assets and liab. (5,740) Net interest income/Gains/(losses) financial inst.
Financial assurance (2,838) — Gains/(losses) financial assets and liab. (24) Net interest income/Gains/(losses) financial inst.Interest rate and exchange rate
risk (505) (194) Gains/(losses) financial assets and liab. (9,061)
Deposits (504) — Gains/(losses) financial assets and liab. (8,570) Net interest income/Gains/(losses) financial inst.
Bonds (1) (194) Gains/(losses) financial assets and liab. (491) Net interest income/Gains/(losses) financial inst.
(3,563) 1,295 (16,161)
152
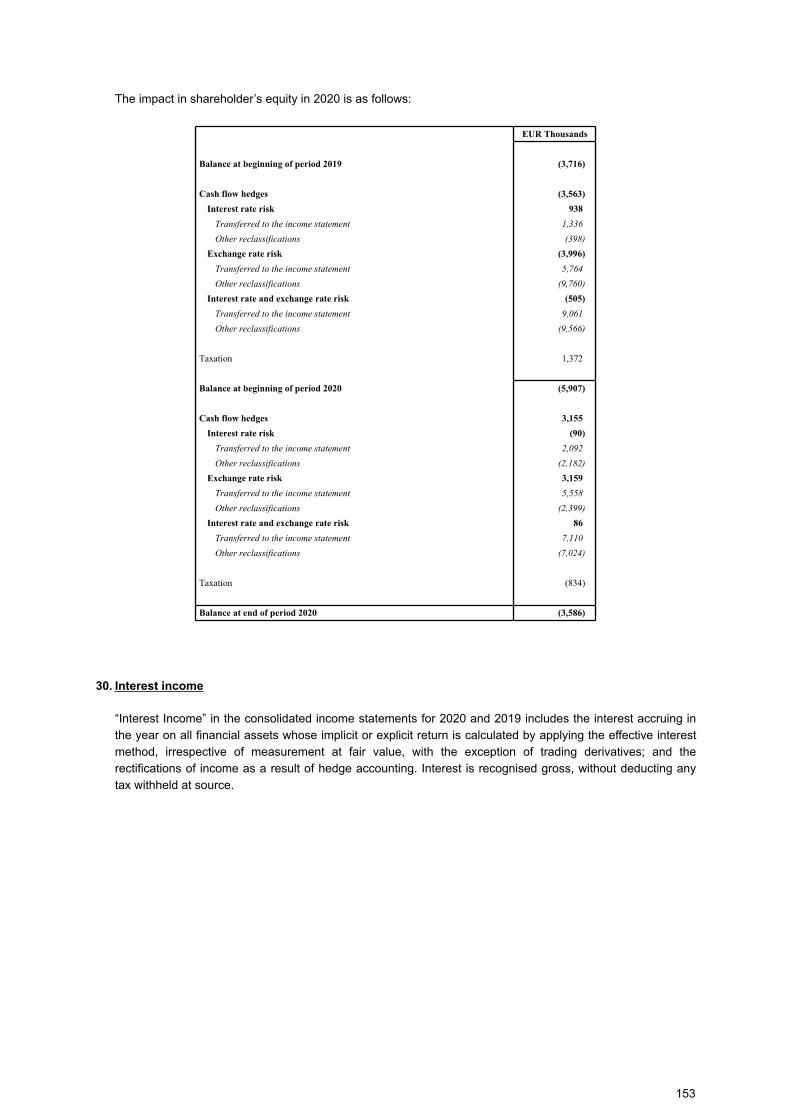
The impact in shareholder’s equity in 2020 is as follows:
EUR Thousands
Balance at beginning of period 2019 (3,716)
Cash flow hedges (3,563)
Interest rate risk 938
Transferred to the income statement 1,336
Other reclassifications (398)
Exchange rate risk (3,996)
Transferred to the income statement 5,764
Other reclassifications (9,760)
Interest rate and exchange rate risk (505)
Transferred to the income statement 9,061
Other reclassifications (9,566)
Taxation 1,372
Balance at beginning of period 2020 (5,907)
Cash flow hedges 3,155
Interest rate risk (90)
Transferred to the income statement 2,092
Other reclassifications (2,182)
Exchange rate risk 3,159
Transferred to the income statement 5,558
Other reclassifications (2,399)
Interest rate and exchange rate risk 86
Transferred to the income statement 7,110
Other reclassifications (7,024)
Taxation (834)
Balance at end of period 2020 (3,586)
30. Interest income
“Interest Income” in the consolidated income statements for 2020 and 2019 includes the interest accruing in
the year on all financial assets whose implicit or explicit return is calculated by applying the effective interest
method, irrespective of measurement at fair value, with the exception of trading derivatives; and the
rectifications of income as a result of hedge accounting. Interest is recognised gross, without deducting any
tax withheld at source.
153
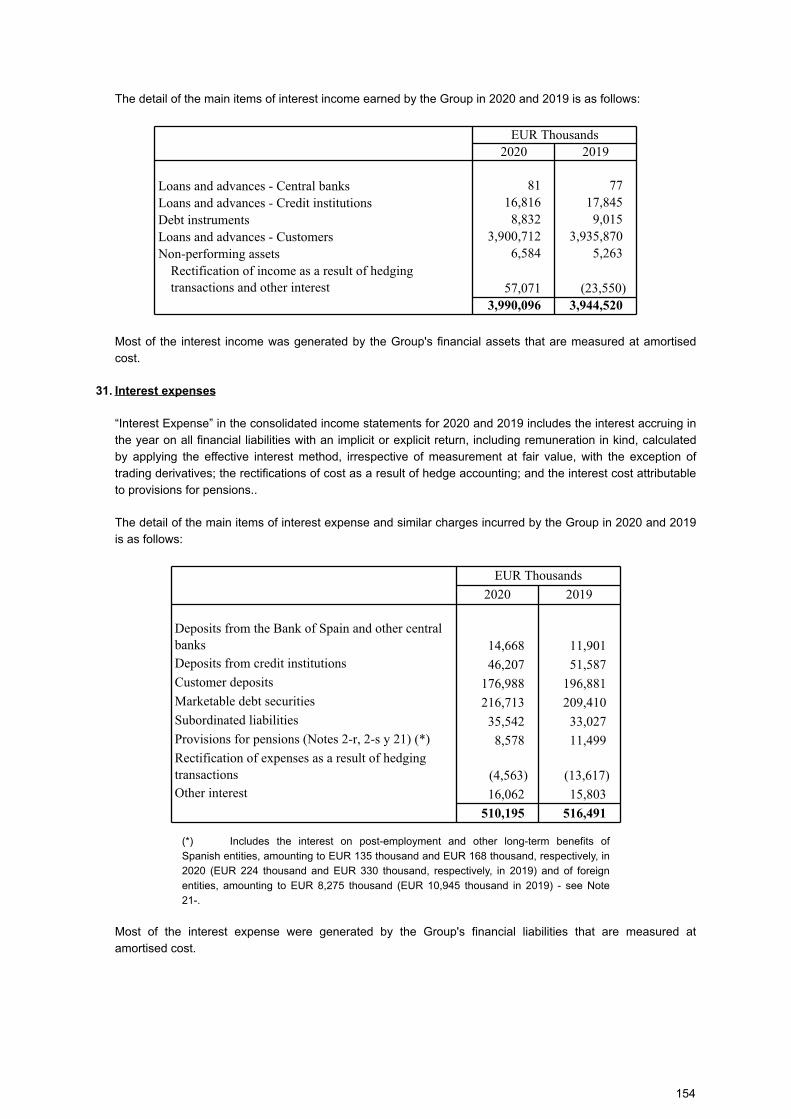
The detail of the main items of interest income earned by the Group in 2020 and 2019 is as follows:
EUR Thousands2020 2019
Loans and advances - Central banks 81 77 Loans and advances - Credit institutions 16,816 17,845 Debt instruments 8,832 9,015 Loans and advances - Customers 3,900,712 3,935,870 Non-performing assets 6,584 5,263
Rectification of income as a result of hedging transactions and other interest 57,071 (23,550)
3,990,096 3,944,520
Most of the interest income was generated by the Group's financial assets that are measured at amortised
cost.
31. Interest expenses
“Interest Expense” in the consolidated income statements for 2020 and 2019 includes the interest accruing in
the year on all financial liabilities with an implicit or explicit return, including remuneration in kind, calculated
by applying the effective interest method, irrespective of measurement at fair value, with the exception of
trading derivatives; the rectifications of cost as a result of hedge accounting; and the interest cost attributable
to provisions for pensions..
The detail of the main items of interest expense and similar charges incurred by the Group in 2020 and 2019
is as follows:
EUR Thousands
2020 2019
Deposits from the Bank of Spain and other central banks 14,668 11,901 Deposits from credit institutions 46,207 51,587 Customer deposits 176,988 196,881 Marketable debt securities 216,713 209,410 Subordinated liabilities 35,542 33,027 Provisions for pensions (Notes 2-r, 2-s y 21) (*) 8,578 11,499 Rectification of expenses as a result of hedging transactions (4,563) (13,617)Other interest 16,062 15,803
510,195 516,491
(*) Includes the interest on post-employment and other long-term benefits of
Spanish entities, amounting to EUR 135 thousand and EUR 168 thousand, respectively, in
2020 (EUR 224 thousand and EUR 330 thousand, respectively, in 2019) and of foreign
entities, amounting to EUR 8,275 thousand (EUR 10,945 thousand in 2019) - see Note
21-.
Most of the interest expense were generated by the Group's financial liabilities that are measured at
amortised cost.
154
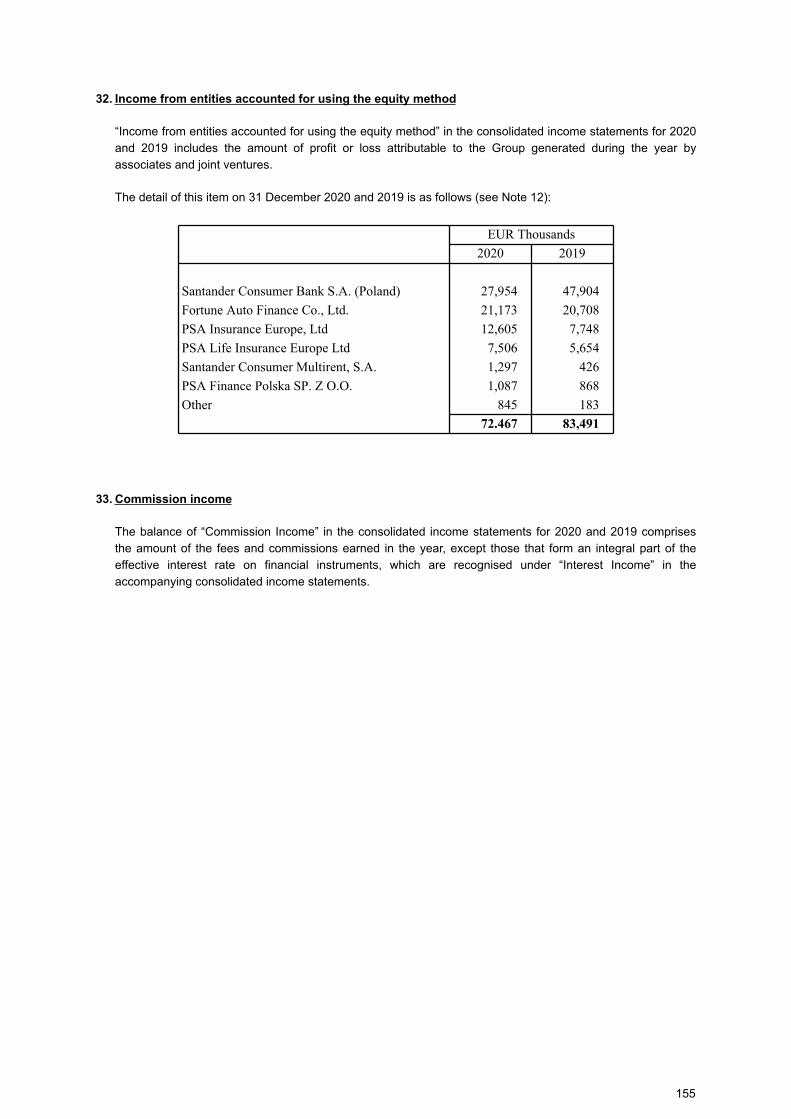
32. Income from entities accounted for using the equity method
“Income from entities accounted for using the equity method” in the consolidated income statements for 2020
and 2019 includes the amount of profit or loss attributable to the Group generated during the year by
associates and joint ventures.
The detail of this item on 31 December 2020 and 2019 is as follows (see Note 12):
EUR Thousands
2020 2019
Santander Consumer Bank S.A. (Poland) 27,954 47,904
Fortune Auto Finance Co., Ltd. 21,173 20,708
PSA Insurance Europe, Ltd 12,605 7,748
PSA Life Insurance Europe Ltd 7,506 5,654
Santander Consumer Multirent, S.A. 1,297 426
PSA Finance Polska SP. Z O.O. 1,087 868
Other 845 183
72.467 83,491
33. Commission income
The balance of “Commission Income” in the consolidated income statements for 2020 and 2019 comprises
the amount of the fees and commissions earned in the year, except those that form an integral part of the
effective interest rate on financial instruments, which are recognised under “Interest Income” in the
accompanying consolidated income statements.
155
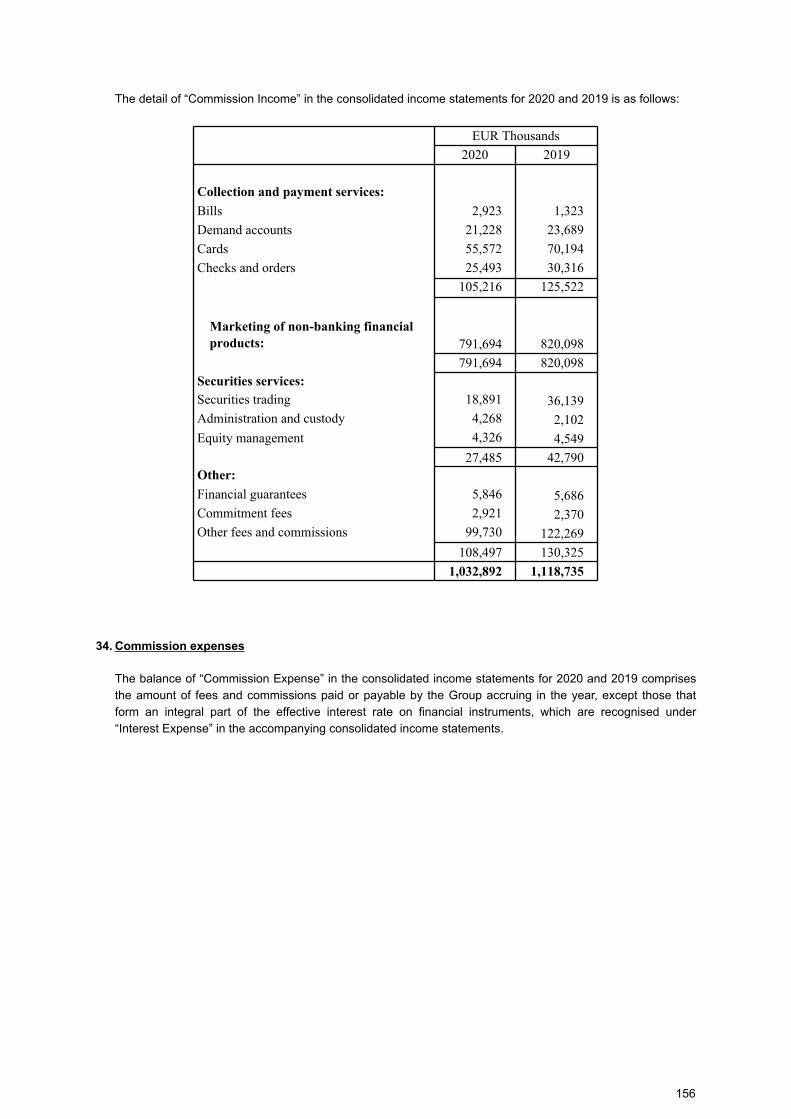
The detail of “Commission Income” in the consolidated income statements for 2020 and 2019 is as follows:
EUR Thousands
2020 2019
Collection and payment services:
Bills 2,923 1,323
Demand accounts 21,228 23,689
Cards 55,572 70,194
Checks and orders 25,493 30,316
105,216 125,522
Marketing of non-banking financial
products: 791,694 820,098
791,694 820,098
Securities services:
Securities trading 18,891 36,139 Administration and custody 4,268 2,102
Equity management 4,326 4,549
27,485 42,790 Other:
Financial guarantees 5,846 5,686 Commitment fees 2,921 2,370 Other fees and commissions 99,730 122,269
108,497 130,325
1,032,892 1,118,735
34. Commission expenses
The balance of “Commission Expense” in the consolidated income statements for 2020 and 2019 comprises
the amount of fees and commissions paid or payable by the Group accruing in the year, except those that
form an integral part of the effective interest rate on financial instruments, which are recognised under
“Interest Expense” in the accompanying consolidated income statements.
156
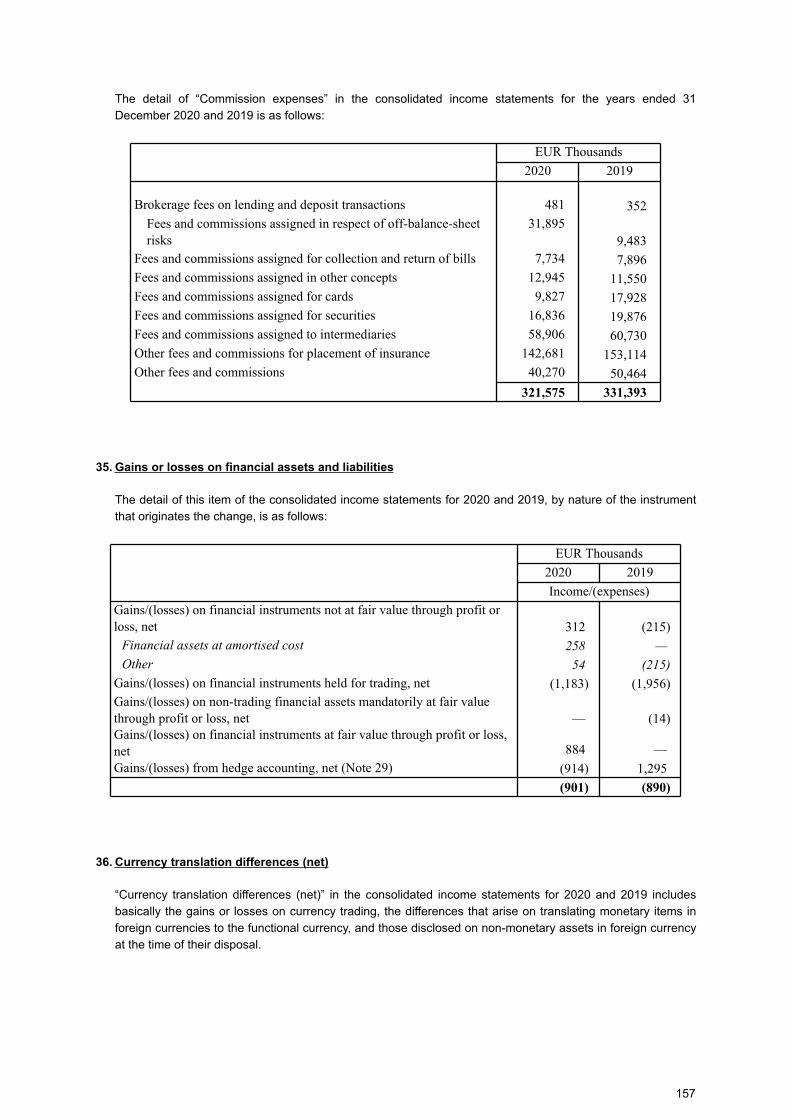
The detail of “Commission expenses” in the consolidated income statements for the years ended 31
December 2020 and 2019 is as follows:
EUR Thousands
2020 2019
Brokerage fees on lending and deposit transactions 481 352 Fees and commissions assigned in respect of off-balance-sheet risks
31,895 9,483
Fees and commissions assigned for collection and return of bills 7,734 7,896 Fees and commissions assigned in other concepts 12,945 11,550 Fees and commissions assigned for cards 9,827 17,928 Fees and commissions assigned for securities 16,836 19,876 Fees and commissions assigned to intermediaries 58,906 60,730 Other fees and commissions for placement of insurance 142,681 153,114 Other fees and commissions 40,270 50,464
321,575 331,393
35. Gains or losses on financial assets and liabilities
The detail of this item of the consolidated income statements for 2020 and 2019, by nature of the instrument
that originates the change, is as follows:
EUR Thousands
2020 2019
Income/(expenses)
Gains/(losses) on financial instruments not at fair value through profit or loss, net 312 (215)
Financial assets at amortised cost 258 —
Other 54 (215)
Gains/(losses) on financial instruments held for trading, net (1,183) (1,956)Gains/(losses) on non-trading financial assets mandatorily at fair value through profit or loss, net — (14)Gains/(losses) on financial instruments at fair value through profit or loss, net 884 —
Gains/(losses) from hedge accounting, net (Note 29) (914) 1,295
(901) (890)
36. Currency translation differences (net)
“Currency translation differences (net)” in the consolidated income statements for 2020 and 2019 includes
basically the gains or losses on currency trading, the differences that arise on translating monetary items in
foreign currencies to the functional currency, and those disclosed on non-monetary assets in foreign currency
at the time of their disposal.
157
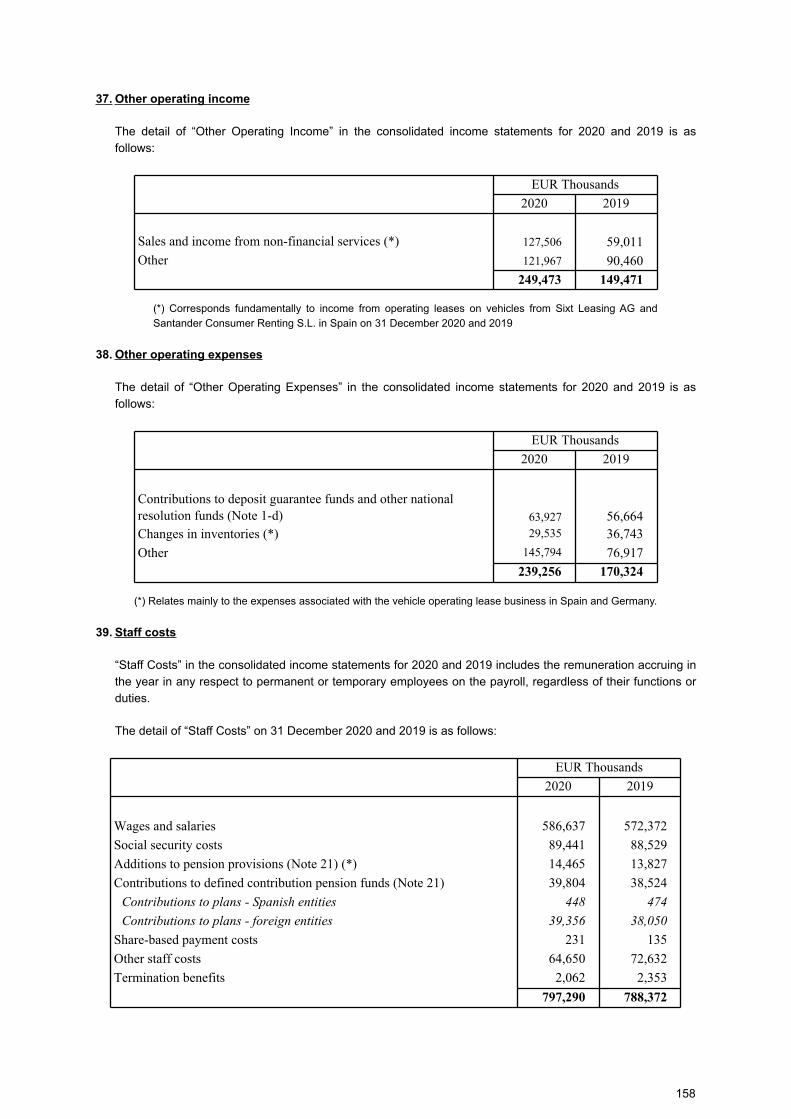
37. Other operating income
The detail of “Other Operating Income” in the consolidated income statements for 2020 and 2019 is as
follows:
EUR Thousands
2020 2019
Sales and income from non-financial services (*) 127,506 59,011
Other 121,967 90,460
249,473 149,471
(*) Corresponds fundamentally to income from operating leases on vehicles from Sixt Leasing AG and
Santander Consumer Renting S.L. in Spain on 31 December 2020 and 2019
38. Other operating expenses
The detail of “Other Operating Expenses” in the consolidated income statements for 2020 and 2019 is as
follows:
EUR Thousands
2020 2019
Contributions to deposit guarantee funds and other national resolution funds (Note 1-d) 63,927 56,664 Changes in inventories (*) 29,535 36,743
Other 145,794 76,917
239,256 170,324
(*) Relates mainly to the expenses associated with the vehicle operating lease business in Spain and Germany.
39. Staff costs
“Staff Costs” in the consolidated income statements for 2020 and 2019 includes the remuneration accruing in
the year in any respect to permanent or temporary employees on the payroll, regardless of their functions or
duties.
The detail of “Staff Costs” on 31 December 2020 and 2019 is as follows:
EUR Thousands
2020 2019
Wages and salaries 586,637 572,372
Social security costs 89,441 88,529
Additions to pension provisions (Note 21) (*) 14,465 13,827
Contributions to defined contribution pension funds (Note 21) 39,804 38,524
Contributions to plans - Spanish entities 448 474
Contributions to plans - foreign entities 39,356 38,050
Share-based payment costs 231 135
Other staff costs 64,650 72,632
Termination benefits 2,062 2,353
797,290 788,372
158
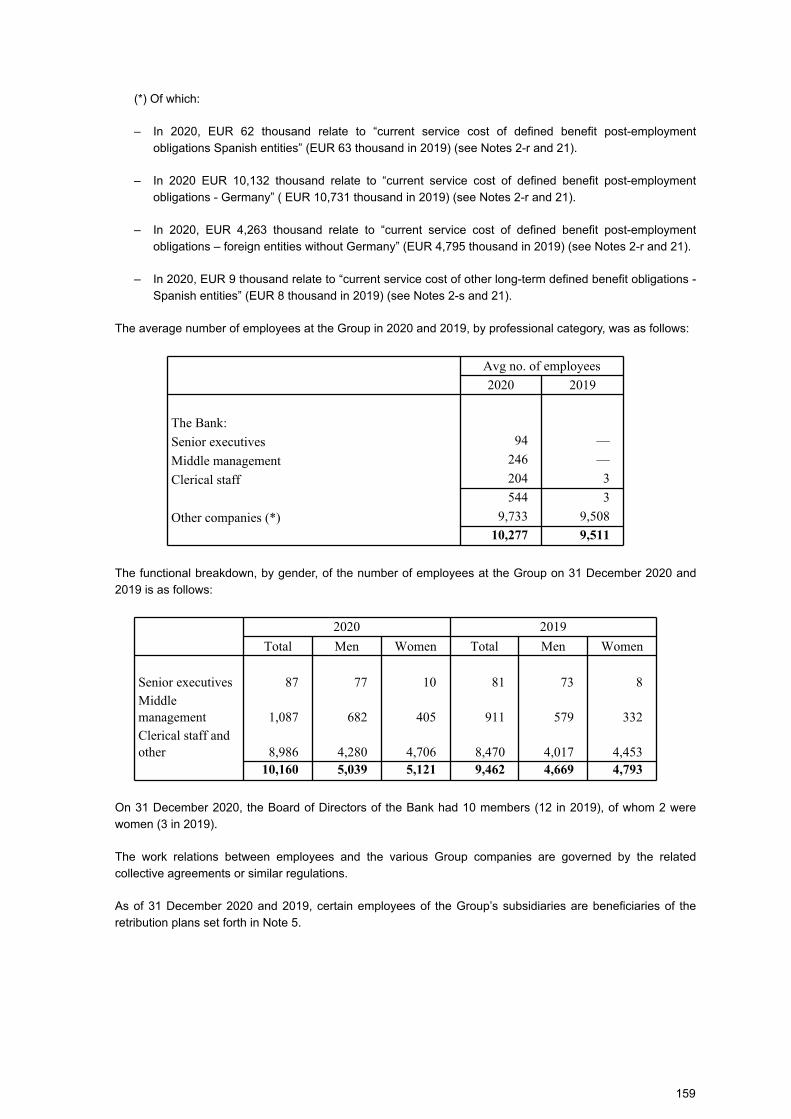
(*) Of which:
– In 2020, EUR 62 thousand relate to “current service cost of defined benefit post-employment
obligations Spanish entities” (EUR 63 thousand in 2019) (see Notes 2-r and 21).
– In 2020 EUR 10,132 thousand relate to “current service cost of defined benefit post-employment
obligations - Germany” ( EUR 10,731 thousand in 2019) (see Notes 2-r and 21).
– In 2020, EUR 4,263 thousand relate to “current service cost of defined benefit post-employment
obligations – foreign entities without Germany” (EUR 4,795 thousand in 2019) (see Notes 2-r and 21).
– In 2020, EUR 9 thousand relate to “current service cost of other long-term defined benefit obligations -
Spanish entities” (EUR 8 thousand in 2019) (see Notes 2-s and 21).
The average number of employees at the Group in 2020 and 2019, by professional category, was as follows:
Avg no. of employees
2020 2019
The Bank:
Senior executives 94 —
Middle management 246 —
Clerical staff 204 3
544 3
Other companies (*) 9,733 9,508
10,277 9,511
The functional breakdown, by gender, of the number of employees at the Group on 31 December 2020 and
2019 is as follows:
2020 2019
Total Men Women Total Men Women
Senior executives 87 77 10 81 73 8
Middle management 1,087 682 405 911 579 332
Clerical staff and other 8,986 4,280 4,706 8,470 4,017 4,453
10,160 5,039 5,121 9,462 4,669 4,793
On 31 December 2020, the Board of Directors of the Bank had 10 members (12 in 2019), of whom 2 were
women (3 in 2019).
The work relations between employees and the various Group companies are governed by the related
collective agreements or similar regulations.
As of 31 December 2020 and 2019, certain employees of the Group’s subsidiaries are beneficiaries of the
retribution plans set forth in Note 5.
159
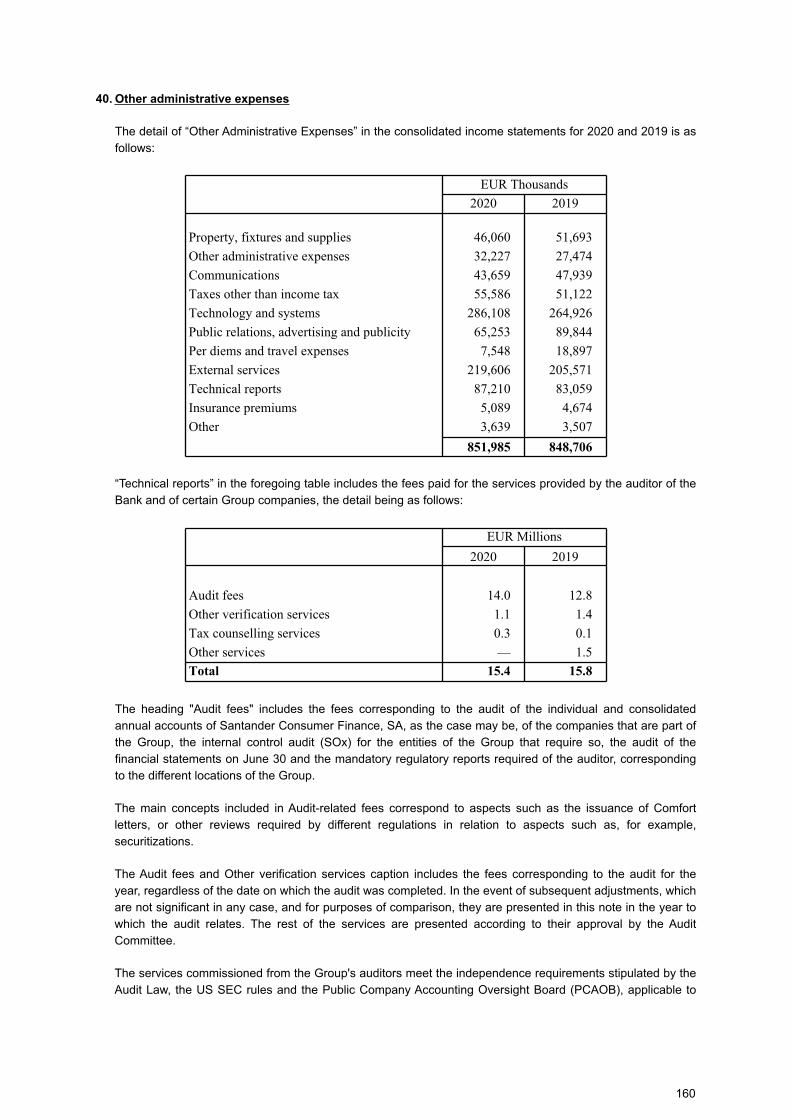
40. Other administrative expenses
The detail of “Other Administrative Expenses” in the consolidated income statements for 2020 and 2019 is as
follows:
EUR Thousands
2020 2019
Property, fixtures and supplies 46,060 51,693
Other administrative expenses 32,227 27,474
Communications 43,659 47,939
Taxes other than income tax 55,586 51,122
Technology and systems 286,108 264,926
Public relations, advertising and publicity 65,253 89,844
Per diems and travel expenses 7,548 18,897
External services 219,606 205,571
Technical reports 87,210 83,059
Insurance premiums 5,089 4,674
Other 3,639 3,507
851,985 848,706
“Technical reports” in the foregoing table includes the fees paid for the services provided by the auditor of the
Bank and of certain Group companies, the detail being as follows:
EUR Millions
2020 2019
Audit fees 14.0 12.8
Other verification services 1.1 1.4
Tax counselling services 0.3 0.1
Other services — 1.5
Total 15.4 15.8
The heading "Audit fees" includes the fees corresponding to the audit of the individual and consolidated
annual accounts of Santander Consumer Finance, SA, as the case may be, of the companies that are part of
the Group, the internal control audit (SOx) for the entities of the Group that require so, the audit of the
financial statements on June 30 and the mandatory regulatory reports required of the auditor, corresponding
to the different locations of the Group.
The main concepts included in Audit-related fees correspond to aspects such as the issuance of Comfort
letters, or other reviews required by different regulations in relation to aspects such as, for example,
securitizations.
The Audit fees and Other verification services caption includes the fees corresponding to the audit for the
year, regardless of the date on which the audit was completed. In the event of subsequent adjustments, which
are not significant in any case, and for purposes of comparison, they are presented in this note in the year to
which the audit relates. The rest of the services are presented according to their approval by the Audit
Committee.
The services commissioned from the Group's auditors meet the independence requirements stipulated by the
Audit Law, the US SEC rules and the Public Company Accounting Oversight Board (PCAOB), applicable to
160
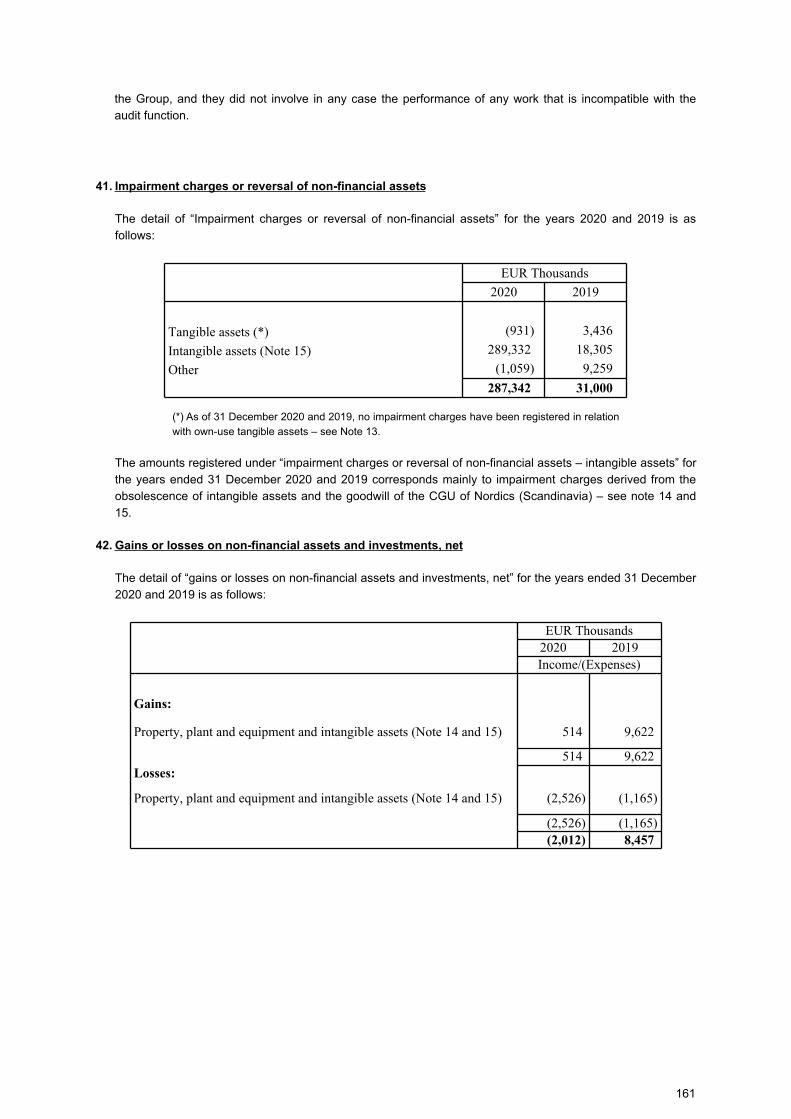
the Group, and they did not involve in any case the performance of any work that is incompatible with the
audit function.
41. Impairment charges or reversal of non-financial assets
The detail of “Impairment charges or reversal of non-financial assets” for the years 2020 and 2019 is as
follows:
EUR Thousands
2020 2019
Tangible assets (*) (931) 3,436
Intangible assets (Note 15) 289,332 18,305
Other (1,059) 9,259
287,342 31,000
(*) As of 31 December 2020 and 2019, no impairment charges have been registered in relation
with own-use tangible assets – see Note 13.
The amounts registered under “impairment charges or reversal of non-financial assets – intangible assets” for
the years ended 31 December 2020 and 2019 corresponds mainly to impairment charges derived from the
obsolescence of intangible assets and the goodwill of the CGU of Nordics (Scandinavia) – see note 14 and
15.
42. Gains or losses on non-financial assets and investments, net
The detail of “gains or losses on non-financial assets and investments, net” for the years ended 31 December
2020 and 2019 is as follows:
EUR Thousands
2020 2019Income/(Expenses)
Gains:
Property, plant and equipment and intangible assets (Note 14 and 15) 514 9,622
514 9,622 Losses:
Property, plant and equipment and intangible assets (Note 14 and 15) (2,526) (1,165)
(2,526) (1,165) (2,012) 8,457
161

43. Gains or losses on non-current assets not classified as held for sale from discontinued operations
The detail of this line item in the consolidated income statements for the years ended 31 December 2020 and
2019 is as follows:
EUR Thousands
2020 2019
Income/(Expenses)
Net gains/(losses) on disposals: (552) (1,279)
Impairment losses (net) (Note 11) (277) (1,789)
(829) (3,068)
162
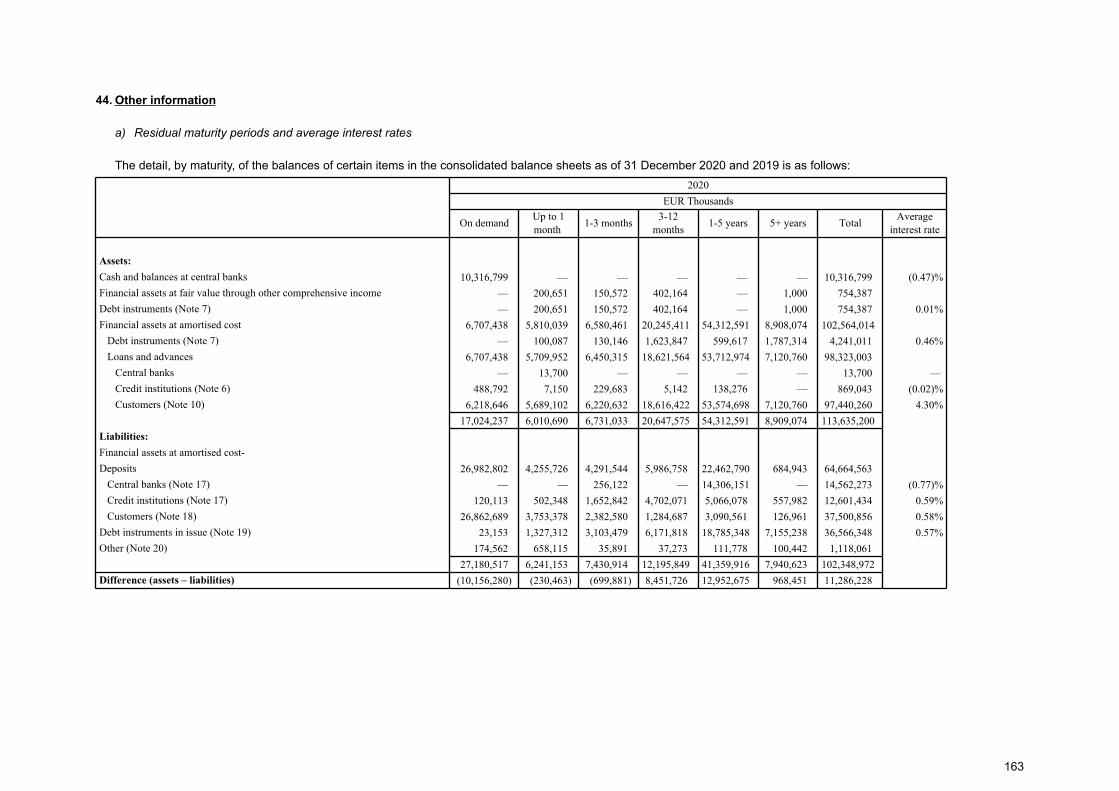
44. Other information
a) Residual maturity periods and average interest rates
The detail, by maturity, of the balances of certain items in the consolidated balance sheets as of 31 December 2020 and 2019 is as follows:
2020
EUR Thousands
On demandUp to 1 month
1-3 months3-12
months1-5 years 5+ years Total
Average interest rate
Assets:
Cash and balances at central banks 10,316,799 — — — — — 10,316,799 (0.47)%
Financial assets at fair value through other comprehensive income — 200,651 150,572 402,164 — 1,000 754,387
Debt instruments (Note 7) — 200,651 150,572 402,164 — 1,000 754,387 0.01%
Financial assets at amortised cost 6,707,438 5,810,039 6,580,461 20,245,411 54,312,591 8,908,074 102,564,014
Debt instruments (Note 7) — 100,087 130,146 1,623,847 599,617 1,787,314 4,241,011 0.46%
Loans and advances 6,707,438 5,709,952 6,450,315 18,621,564 53,712,974 7,120,760 98,323,003
Central banks — 13,700 — — — — 13,700 —
Credit institutions (Note 6) 488,792 7,150 229,683 5,142 138,276 — 869,043 (0.02)%
Customers (Note 10) 6,218,646 5,689,102 6,220,632 18,616,422 53,574,698 7,120,760 97,440,260 4.30%
17,024,237 6,010,690 6,731,033 20,647,575 54,312,591 8,909,074 113,635,200
Liabilities:
Financial assets at amortised cost-
Deposits 26,982,802 4,255,726 4,291,544 5,986,758 22,462,790 684,943 64,664,563
Central banks (Note 17) — — 256,122 — 14,306,151 — 14,562,273 (0.77)%
Credit institutions (Note 17) 120,113 502,348 1,652,842 4,702,071 5,066,078 557,982 12,601,434 0.59%
Customers (Note 18) 26,862,689 3,753,378 2,382,580 1,284,687 3,090,561 126,961 37,500,856 0.58%
Debt instruments in issue (Note 19) 23,153 1,327,312 3,103,479 6,171,818 18,785,348 7,155,238 36,566,348 0.57%
Other (Note 20) 174,562 658,115 35,891 37,273 111,778 100,442 1,118,061
27,180,517 6,241,153 7,430,914 12,195,849 41,359,916 7,940,623 102,348,972
Difference (assets – liabilities) (10,156,280) (230,463) (699,881) 8,451,726 12,952,675 968,451 11,286,228
163
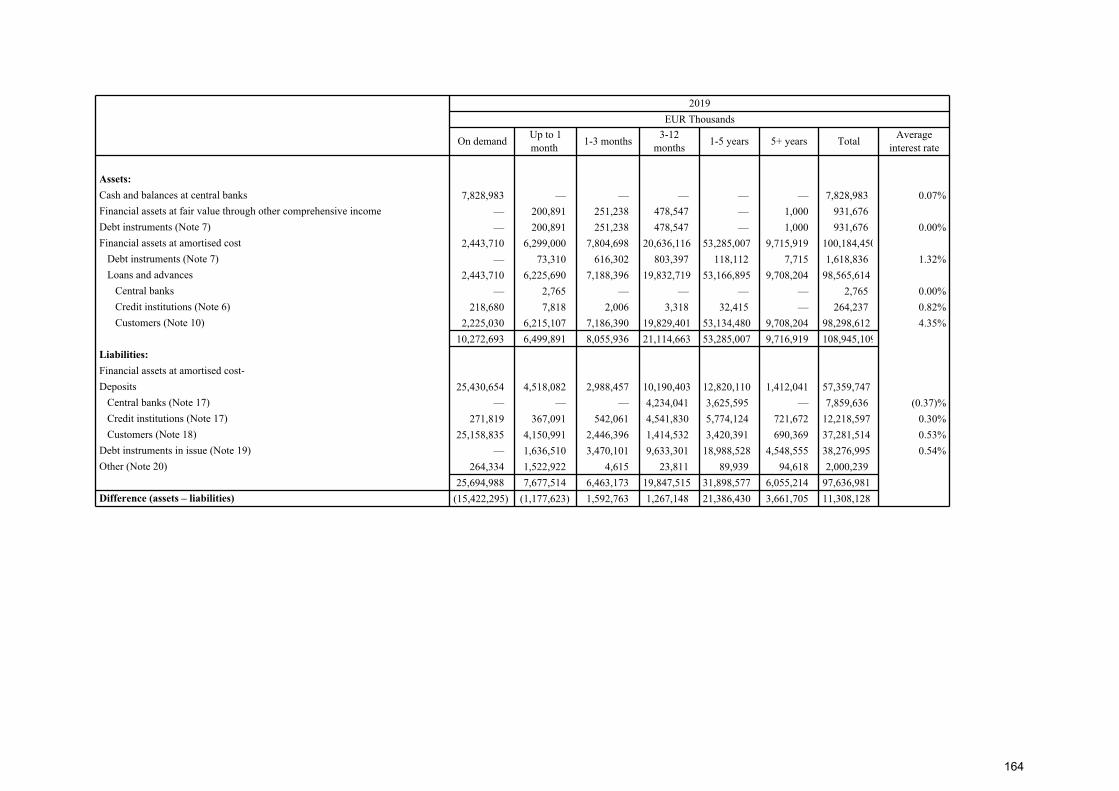
2019
EUR Thousands
On demandUp to 1 month
1-3 months3-12
months1-5 years 5+ years Total
Average interest rate
Assets:
Cash and balances at central banks 7,828,983 — — — — — 7,828,983 0.07%
Financial assets at fair value through other comprehensive income — 200,891 251,238 478,547 — 1,000 931,676
Debt instruments (Note 7) — 200,891 251,238 478,547 — 1,000 931,676 0.00%
Financial assets at amortised cost 2,443,710 6,299,000 7,804,698 20,636,116 53,285,007 9,715,919 100,184,450
Debt instruments (Note 7) — 73,310 616,302 803,397 118,112 7,715 1,618,836 1.32%
Loans and advances 2,443,710 6,225,690 7,188,396 19,832,719 53,166,895 9,708,204 98,565,614
Central banks — 2,765 — — — — 2,765 0.00%
Credit institutions (Note 6) 218,680 7,818 2,006 3,318 32,415 — 264,237 0.82%
Customers (Note 10) 2,225,030 6,215,107 7,186,390 19,829,401 53,134,480 9,708,204 98,298,612 4.35%
10,272,693 6,499,891 8,055,936 21,114,663 53,285,007 9,716,919 108,945,109
Liabilities:
Financial assets at amortised cost-
Deposits 25,430,654 4,518,082 2,988,457 10,190,403 12,820,110 1,412,041 57,359,747
Central banks (Note 17) — — — 4,234,041 3,625,595 — 7,859,636 (0.37)%
Credit institutions (Note 17) 271,819 367,091 542,061 4,541,830 5,774,124 721,672 12,218,597 0.30%
Customers (Note 18) 25,158,835 4,150,991 2,446,396 1,414,532 3,420,391 690,369 37,281,514 0.53%
Debt instruments in issue (Note 19) — 1,636,510 3,470,101 9,633,301 18,988,528 4,548,555 38,276,995 0.54%
Other (Note 20) 264,334 1,522,922 4,615 23,811 89,939 94,618 2,000,239
25,694,988 7,677,514 6,463,173 19,847,515 31,898,577 6,055,214 97,636,981
Difference (assets – liabilities) (15,422,295) (1,177,623) 1,592,763 1,267,148 21,386,430 3,661,705 11,308,128
164
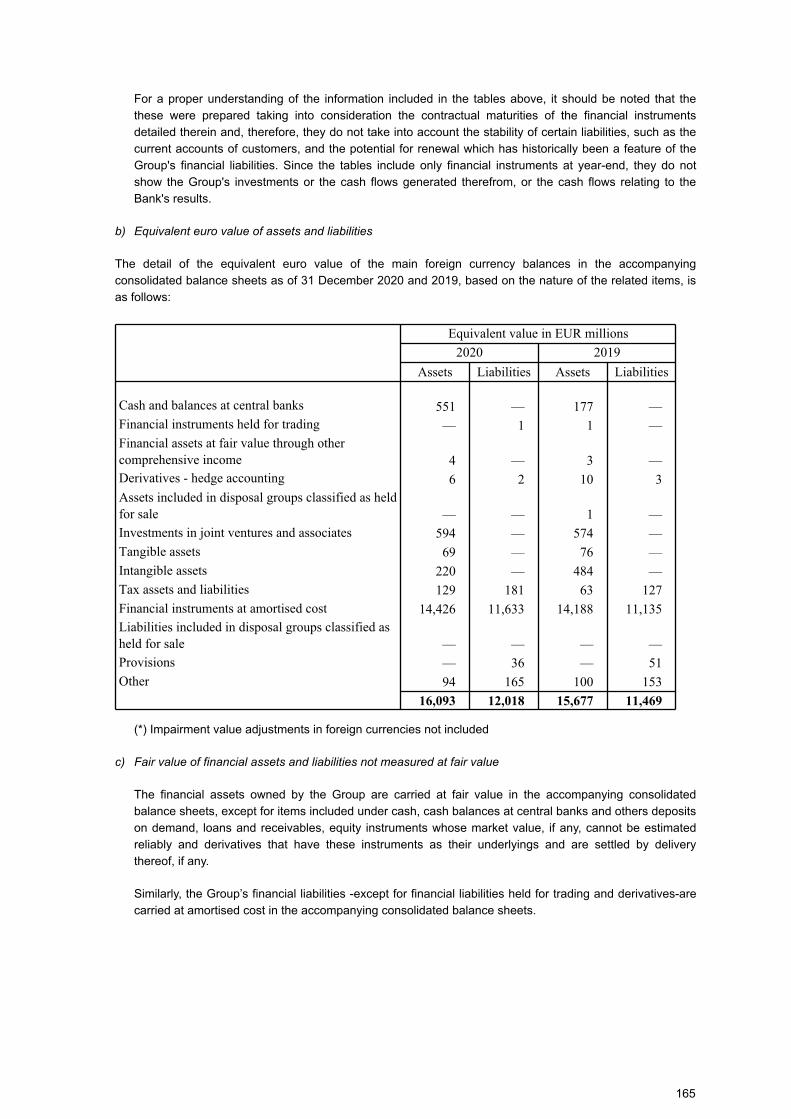
For a proper understanding of the information included in the tables above, it should be noted that the
these were prepared taking into consideration the contractual maturities of the financial instruments
detailed therein and, therefore, they do not take into account the stability of certain liabilities, such as the
current accounts of customers, and the potential for renewal which has historically been a feature of the
Group's financial liabilities. Since the tables include only financial instruments at year-end, they do not
show the Group's investments or the cash flows generated therefrom, or the cash flows relating to the
Bank's results.
b) Equivalent euro value of assets and liabilities
The detail of the equivalent euro value of the main foreign currency balances in the accompanying
consolidated balance sheets as of 31 December 2020 and 2019, based on the nature of the related items, is
as follows:
Equivalent value in EUR millions
2020 2019
Assets Liabilities Assets Liabilities
Cash and balances at central banks 551 — 177 — Financial instruments held for trading — 1 1 — Financial assets at fair value through other comprehensive income 4 — 3 — Derivatives - hedge accounting 6 2 10 3 Assets included in disposal groups classified as held for sale — — 1 —
Investments in joint ventures and associates 594 — 574 —
Tangible assets 69 — 76 —
Intangible assets 220 — 484 —
Tax assets and liabilities 129 181 63 127
Financial instruments at amortised cost 14,426 11,633 14,188 11,135 Liabilities included in disposal groups classified as held for sale — — — —
Provisions — 36 — 51
Other 94 165 100 153
16,093 12,018 15,677 11,469
(*) Impairment value adjustments in foreign currencies not included
c) Fair value of financial assets and liabilities not measured at fair value
The financial assets owned by the Group are carried at fair value in the accompanying consolidated
balance sheets, except for items included under cash, cash balances at central banks and others deposits
on demand, loans and receivables, equity instruments whose market value, if any, cannot be estimated
reliably and derivatives that have these instruments as their underlyings and are settled by delivery
thereof, if any.
Similarly, the Group’s financial liabilities -except for financial liabilities held for trading and derivatives-are
carried at amortised cost in the accompanying consolidated balance sheets.
165
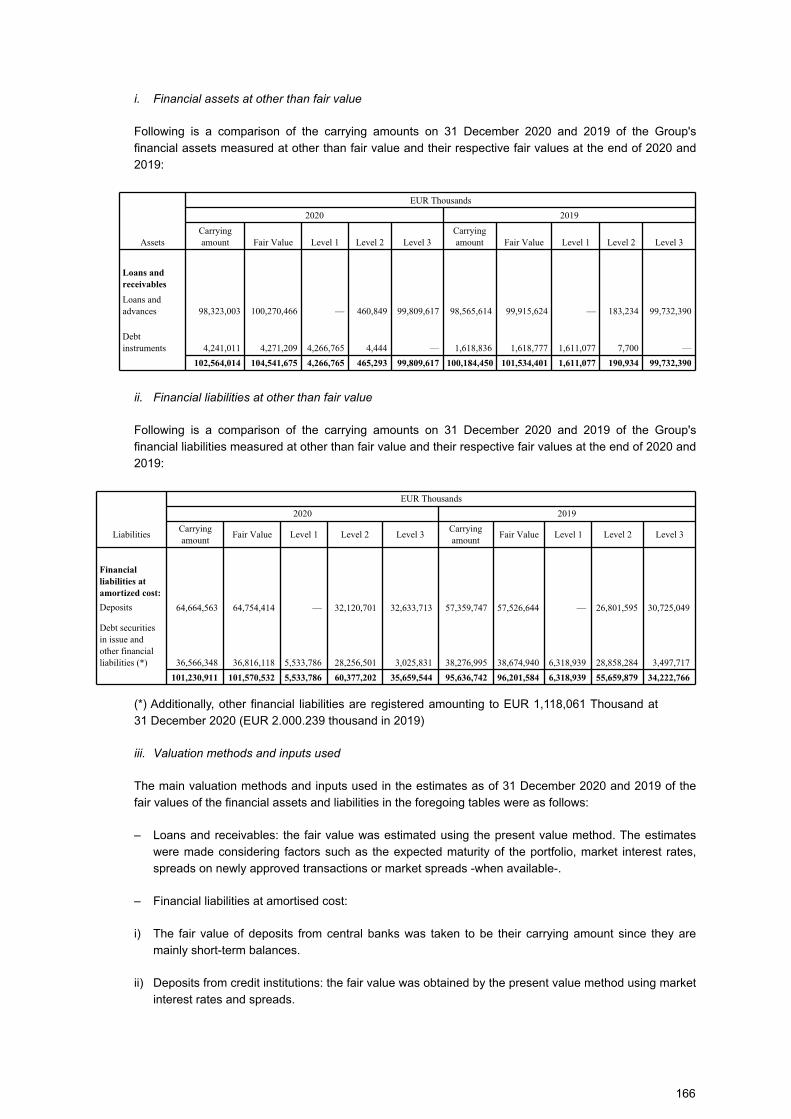
i. Financial assets at other than fair value
Following is a comparison of the carrying amounts on 31 December 2020 and 2019 of the Group's
financial assets measured at other than fair value and their respective fair values at the end of 2020 and
2019:
EUR Thousands
2020 2019
AssetsCarrying amount Fair Value Level 1 Level 2 Level 3
Carrying amount Fair Value Level 1 Level 2 Level 3
Loans and
receivables
Loans and advances 98,323,003 100,270,466 — 460,849 99,809,617 98,565,614 99,915,624 — 183,234 99,732,390
Debt instruments 4,241,011 4,271,209 4,266,765 4,444 — 1,618,836 1,618,777 1,611,077 7,700 —
102,564,014 104,541,675 4,266,765 465,293 99,809,617 100,184,450 101,534,401 1,611,077 190,934 99,732,390
ii. Financial liabilities at other than fair value
Following is a comparison of the carrying amounts on 31 December 2020 and 2019 of the Group's
financial liabilities measured at other than fair value and their respective fair values at the end of 2020 and
2019:
EUR Thousands
2020 2019
LiabilitiesCarrying amount
Fair Value Level 1 Level 2 Level 3Carrying amount
Fair Value Level 1 Level 2 Level 3
Financial
liabilities at
amortized cost:
Deposits 64,664,563 64,754,414 — 32,120,701 32,633,713 57,359,747 57,526,644 — 26,801,595 30,725,049
Debt securities in issue and other financial liabilities (*) 36,566,348 36,816,118 5,533,786 28,256,501 3,025,831 38,276,995 38,674,940 6,318,939 28,858,284 3,497,717
101,230,911 101,570,532 5,533,786 60,377,202 35,659,544 95,636,742 96,201,584 6,318,939 55,659,879 34,222,766
(*) Additionally, other financial liabilities are registered amounting to EUR 1,118,061 Thousand at
31 December 2020 (EUR 2.000.239 thousand in 2019)
iii. Valuation methods and inputs used
The main valuation methods and inputs used in the estimates as of 31 December 2020 and 2019 of the
fair values of the financial assets and liabilities in the foregoing tables were as follows:
– Loans and receivables: the fair value was estimated using the present value method. The estimates
were made considering factors such as the expected maturity of the portfolio, market interest rates,
spreads on newly approved transactions or market spreads -when available-.
– Financial liabilities at amortised cost:
i) The fair value of deposits from central banks was taken to be their carrying amount since they are
mainly short-term balances.
ii) Deposits from credit institutions: the fair value was obtained by the present value method using market
interest rates and spreads.
166
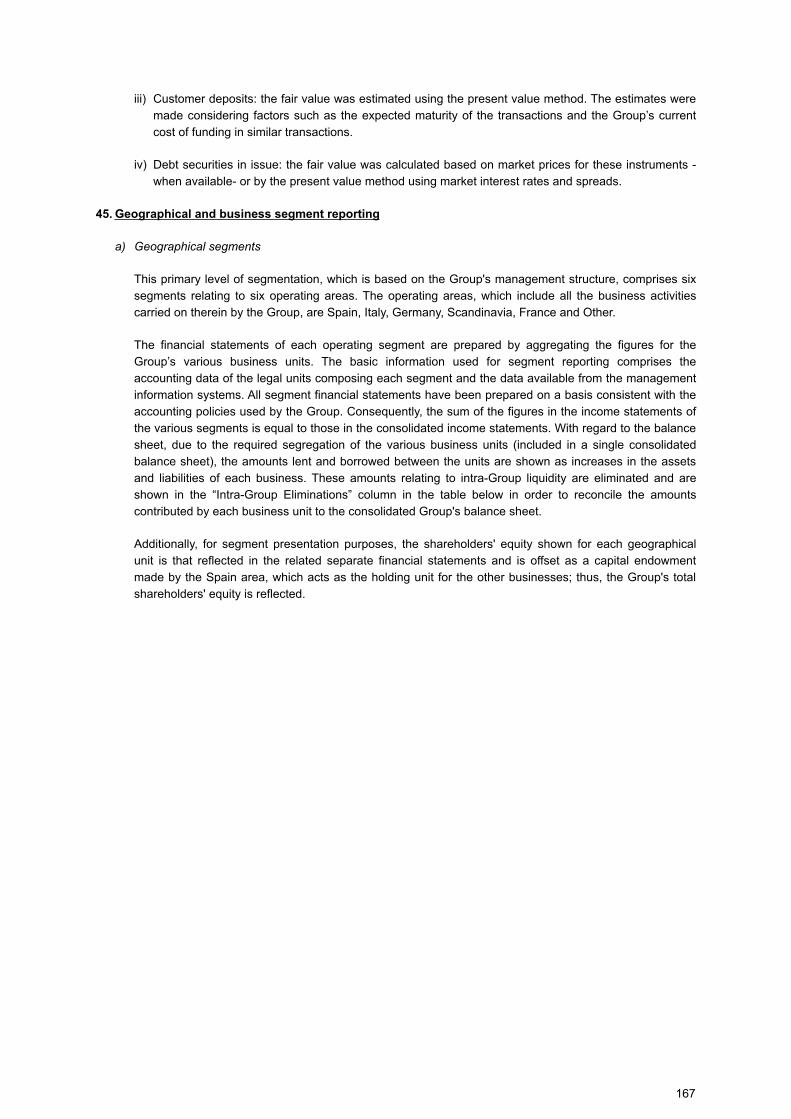
iii) Customer deposits: the fair value was estimated using the present value method. The estimates were
made considering factors such as the expected maturity of the transactions and the Group’s current
cost of funding in similar transactions.
iv) Debt securities in issue: the fair value was calculated based on market prices for these instruments -
when available- or by the present value method using market interest rates and spreads.
45. Geographical and business segment reporting
a) Geographical segments
This primary level of segmentation, which is based on the Group's management structure, comprises six
segments relating to six operating areas. The operating areas, which include all the business activities
carried on therein by the Group, are Spain, Italy, Germany, Scandinavia, France and Other.
The financial statements of each operating segment are prepared by aggregating the figures for the
Group’s various business units. The basic information used for segment reporting comprises the
accounting data of the legal units composing each segment and the data available from the management
information systems. All segment financial statements have been prepared on a basis consistent with the
accounting policies used by the Group. Consequently, the sum of the figures in the income statements of
the various segments is equal to those in the consolidated income statements. With regard to the balance
sheet, due to the required segregation of the various business units (included in a single consolidated
balance sheet), the amounts lent and borrowed between the units are shown as increases in the assets
and liabilities of each business. These amounts relating to intra-Group liquidity are eliminated and are
shown in the “Intra-Group Eliminations” column in the table below in order to reconcile the amounts
contributed by each business unit to the consolidated Group's balance sheet.
Additionally, for segment presentation purposes, the shareholders' equity shown for each geographical
unit is that reflected in the related separate financial statements and is offset as a capital endowment
made by the Spain area, which acts as the holding unit for the other businesses; thus, the Group's total
shareholders' equity is reflected.
167
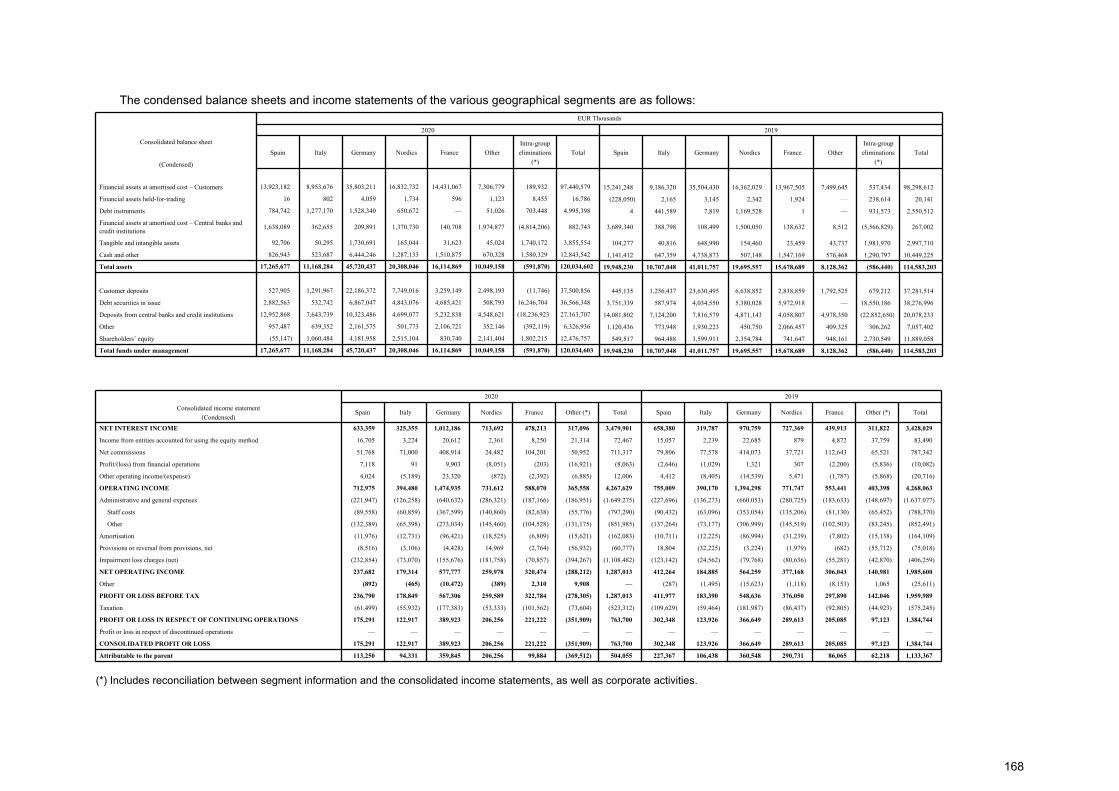
The condensed balance sheets and income statements of the various geographical segments are as follows:
EUR Thousands
2020 2019
Consolidated balance sheet
(Condensed)
Spain Italy Germany Nordics France Other
Intra-group
eliminations
(*)
Total Spain Italy Germany Nordics France Other
Intra-group
eliminations
(*)
Total
Financial assets at amortised cost – Customers 13,923,182 8,953,676 35,803,211 16,832,732 14,431,067 7,306,779 189,932 97,440,579 15,241,248 9,186,320 35,504,430 16,362,029 13,967,505 7,499,645 537,434 98,298,612
Financial assets held-for-trading 16 802 4,059 1,734 596 1,123 8,455 16,786 (228,050) 2,165 3,145 2,342 1,924 — 238,614 20,141
Debt instruments 784,742 1,277,170 1,528,340 650,672 — 51,026 703,448 4,995,398 4 441,589 7,819 1,169,528 1 — 931,573 2,550,512
Financial assets at amortised cost – Central banks and credit institutions
1,638,089 362,655 209,891 1,370,730 140,708 1,974,877 (4,814,206) 882,743 3,689,340 388,798 108,499 1,500,050 138,632 8,512 (5,566,829) 267,002
Tangible and intangible assets 92,706 50,295 1,730,691 165,044 31,623 45,024 1,740,172 3,855,554 104,277 40,816 648,990 154,460 23,459 43,737 1,981,970 2,997,710
Cash and other 826,943 523,687 6,444,246 1,287,133 1,510,875 670,328 1,580,329 12,843,542 1,141,412 647,359 4,738,873 507,148 1,547,169 576,468 1,290,797 10,449,225
Total assets 17,265,677 11,168,284 45,720,437 20,308,046 16,114,869 10,049,158 (591,870) 120,034,602 19,948,230 10,707,048 41,011,757 19,695,557 15,678,689 8,128,362 (586,440) 114,583,203
Customer deposits 527,905 1,291,967 22,186,372 7,749,016 3,259,149 2,498,193 (11,746) 37,500,856 445,135 1,256,437 23,630,495 6,638,852 2,838,859 1,792,525 679,212 37,281,514
Debt securities in issue 2,882,563 532,742 6,867,047 4,843,076 4,685,421 508,793 16,246,704 36,566,348 3,751,339 587,974 4,034,550 5,380,028 5,972,918 — 18,550,186 38,276,996
Deposits from central banks and credit institutions 12,952,868 7,643,739 10,323,486 4,699,077 5,232,838 4,548,621 (18,236,923) 27,163,707 14,081,802 7,124,200 7,816,579 4,871,143 4,058,807 4,978,350 (22,852,650) 20,078,233
Other 957,487 639,352 2,161,575 501,773 2,106,721 352,146 (392,119) 6,326,936 1,120,436 773,948 1,930,223 450,750 2,066,457 409,325 306,262 7,057,402
Shareholders’ equity (55,147) 1,060,484 4,181,958 2,515,104 830,740 2,141,404 1,802,215 12,476,757 549,517 964,488 3,599,911 2,354,784 741,647 948,161 2,730,549 11,889,058
Total funds under management 17,265,677 11,168,284 45,720,437 20,308,046 16,114,869 10,049,158 (591,870) 120,034,603 19,948,230 10,707,048 41,011,757 19,695,557 15,678,689 8,128,362 (586,440) 114,583,203
2020 2019
Consolidated income statement
(Condensed)Spain Italy Germany Nordics France Other (*) Total Spain Italy Germany Nordics France Other (*) Total
NET INTEREST INCOME 633,359 325,355 1,012,186 713,692 478,213 317,096 3,479,901 658,380 319,787 970,759 727,369 439,913 311,822 3,428,029
Income from entities accounted for using the equity method 16,705 3,224 20,612 2,361 8,250 21,314 72,467 15,057 2,239 22,685 879 4,872 37,759 83,490
Net commissions 51,768 71,000 408,914 24,482 104,201 50,952 711,317 79,806 77,578 414,073 37,721 112,643 65,521 787,342
Profit/(loss) from financial operations 7,118 91 9,903 (8,051) (203) (16,921) (8,063) (2,646) (1,029) 1,321 307 (2,200) (5,836) (10,082)
Other operating income/(expense) 4,024 (5,189) 23,320 (872) (2,392) (6,885) 12,006 4,412 (8,405) (14,539) 5,471 (1,787) (5,868) (20,716)
OPERATING INCOME 712,975 394,480 1,474,935 731,612 588,070 365,558 4,267,629 755,009 390,170 1,394,298 771,747 553,441 403,398 4,268,063
Administrative and general expenses (221,947) (126,258) (640,632) (286,321) (187,166) (186,951) (1.649.275) (227,696) (136,273) (660,053) (280,725) (183,633) (148,697) (1.637.077)
Staff costs (89,558) (60,859) (367,599) (140,860) (82,638) (55,776) (797,290) (90,432) (63,096) (353,054) (135,206) (81,130) (65,452) (788,370)
Other (132,389) (65,398) (273,034) (145,460) (104,528) (131,175) (851,985) (137,264) (73,177) (306,999) (145,519) (102,503) (83,245) (852,491)
Amortisation (11,976) (12,731) (96,421) (18,525) (6,809) (15,621) (162,083) (10,711) (12,225) (86,994) (31,239) (7,802) (15,138) (164,109)
Provisions or reversal from provisions, net (8,516) (3,106) (4,428) 14,969 (2,764) (56,932) (60,777) 18,804 (32,225) (3,224) (1,979) (682) (55,712) (75,018)
Impairment loss charges (net) (232,854) (73,070) (155,676) (181,758) (70,857) (394,267) (1.108.482) (123,142) (24,562) (79,768) (80,636) (55,281) (42,870) (406,259)
NET OPERATING INCOME 237,682 179,314 577,777 259,978 320,474 (288,212) 1,287,013 412,264 184,885 564,259 377,168 306,043 140,981 1,985,600
Other (892) (465) (10,472) (389) 2,310 9,908 — (287) (1,495) (15,623) (1,118) (8,153) 1,065 (25,611)
PROFIT OR LOSS BEFORE TAX 236,790 178,849 567,306 259,589 322,784 (278,305) 1,287,013 411,977 183,390 548,636 376,050 297,890 142,046 1,959,989
Taxation (61,499) (55,932) (177,383) (53,333) (101,562) (73,604) (523,312) (109,629) (59,464) (181,987) (86,437) (92,805) (44,923) (575,245)
PROFIT OR LOSS IN RESPECT OF CONTINUING OPERATIONS 175,291 122,917 389,923 206,256 221,222 (351,909) 763,700 302,348 123,926 366,649 289,613 205,085 97,123 1,384,744
Profit or loss in respect of discontinued operations — — — — — — — — — — — — — —
CONSOLIDATED PROFIT OR LOSS 175,291 122,917 389,923 206,256 221,222 (351,909) 763,700 302,348 123,926 366,649 289,613 205,085 97,123 1,384,744
Attributable to the parent 113,250 94,331 359,845 206,256 99,884 (369,512) 504,055 227,367 106,438 360,548 290,731 86,065 62,218 1,133,367
(*) Includes reconciliation between segment information and the consolidated income statements, as well as corporate activities.
168
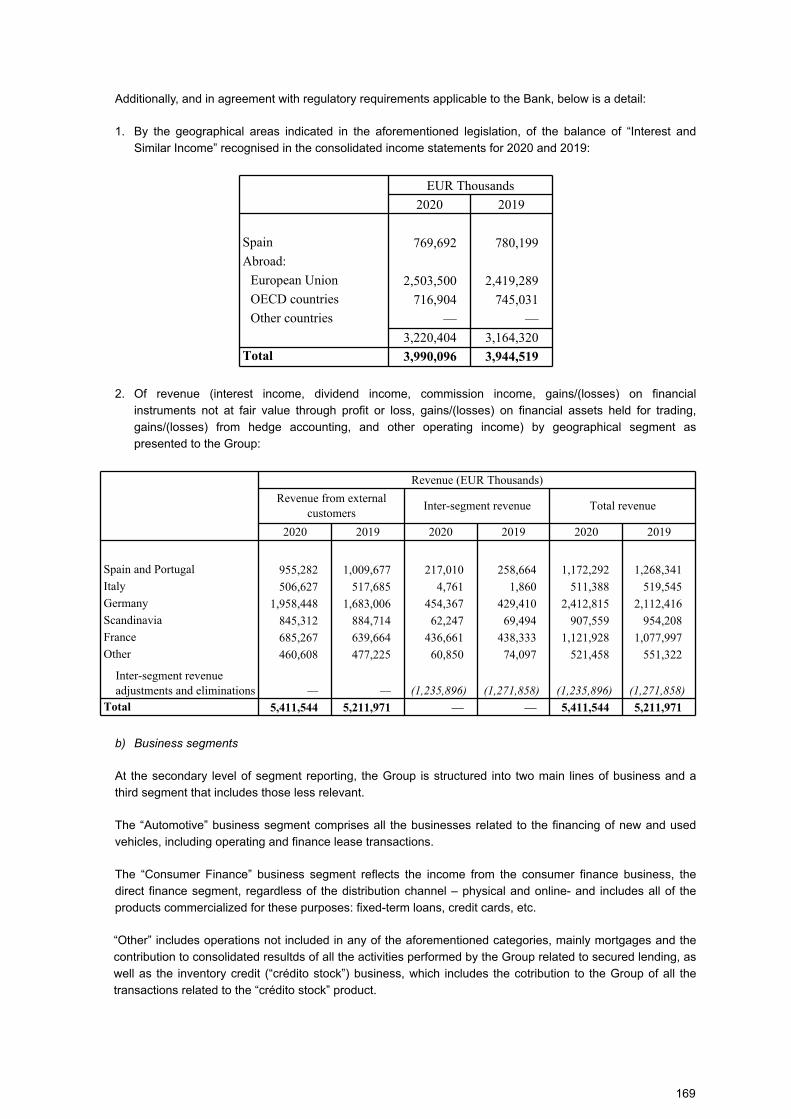
Additionally, and in agreement with regulatory requirements applicable to the Bank, below is a detail:
1. By the geographical areas indicated in the aforementioned legislation, of the balance of “Interest and
Similar Income” recognised in the consolidated income statements for 2020 and 2019:
EUR Thousands
2020 2019
Spain 769,692 780,199
Abroad:
European Union 2,503,500 2,419,289
OECD countries 716,904 745,031
Other countries — —
3,220,404 3,164,320 Total 3,990,096 3,944,519
2. Of revenue (interest income, dividend income, commission income, gains/(losses) on financial
instruments not at fair value through profit or loss, gains/(losses) on financial assets held for trading,
gains/(losses) from hedge accounting, and other operating income) by geographical segment as
presented to the Group:
Revenue (EUR Thousands)
Revenue from external customers
Inter-segment revenue Total revenue
2020 2019 2020 2019 2020 2019
Spain and Portugal 955,282 1,009,677 217,010 258,664 1,172,292 1,268,341
Italy 506,627 517,685 4,761 1,860 511,388 519,545
Germany 1,958,448 1,683,006 454,367 429,410 2,412,815 2,112,416
Scandinavia 845,312 884,714 62,247 69,494 907,559 954,208
France 685,267 639,664 436,661 438,333 1,121,928 1,077,997
Other 460,608 477,225 60,850 74,097 521,458 551,322
Inter-segment revenue adjustments and eliminations — — (1,235,896) (1,271,858) (1,235,896) (1,271,858)
Total 5,411,544 5,211,971 — — 5,411,544 5,211,971
b) Business segments
At the secondary level of segment reporting, the Group is structured into two main lines of business and a
third segment that includes those less relevant.
The “Automotive” business segment comprises all the businesses related to the financing of new and used
vehicles, including operating and finance lease transactions.
The “Consumer Finance” business segment reflects the income from the consumer finance business, the
direct finance segment, regardless of the distribution channel – physical and online- and includes all of the
products commercialized for these purposes: fixed-term loans, credit cards, etc.
“Other” includes operations not included in any of the aforementioned categories, mainly mortgages and the
contribution to consolidated resultds of all the activities performed by the Group related to secured lending, as
well as the inventory credit (“crédito stock”) business, which includes the cotribution to the Group of all the
transactions related to the “crédito stock” product.
169
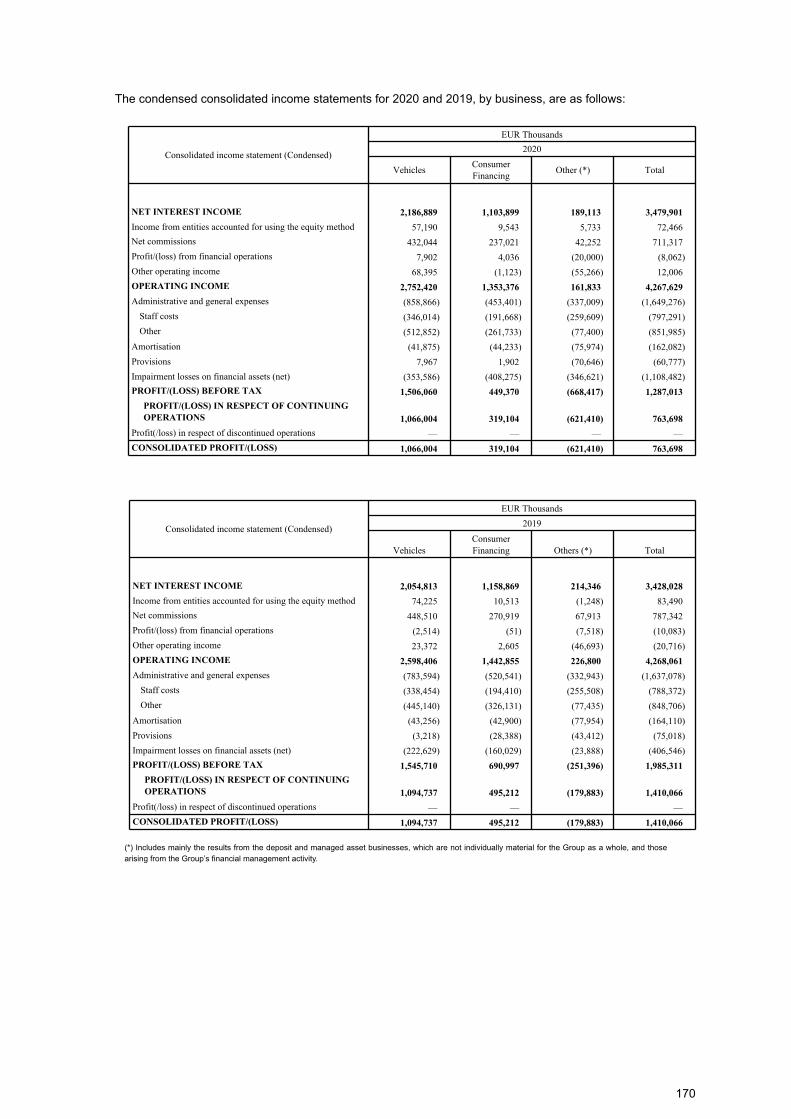
The condensed consolidated income statements for 2020 and 2019, by business, are as follows:
Consolidated income statement (Condensed)
EUR Thousands
2020
VehiclesConsumer Financing
Other (*) Total
NET INTEREST INCOME 2,186,889 1,103,899 189,113 3,479,901
Income from entities accounted for using the equity method 57,190 9,543 5,733 72,466
Net commissions 432,044 237,021 42,252 711,317
Profit/(loss) from financial operations 7,902 4,036 (20,000) (8,062)
Other operating income 68,395 (1,123) (55,266) 12,006
OPERATING INCOME 2,752,420 1,353,376 161,833 4,267,629
Administrative and general expenses (858,866) (453,401) (337,009) (1,649,276)
Staff costs (346,014) (191,668) (259,609) (797,291)
Other (512,852) (261,733) (77,400) (851,985)
Amortisation (41,875) (44,233) (75,974) (162,082)
Provisions 7,967 1,902 (70,646) (60,777)
Impairment losses on financial assets (net) (353,586) (408,275) (346,621) (1,108,482)
PROFIT/(LOSS) BEFORE TAX 1,506,060 449,370 (668,417) 1,287,013
PROFIT/(LOSS) IN RESPECT OF CONTINUING
OPERATIONS 1,066,004 319,104 (621,410) 763,698
Profit(/loss) in respect of discontinued operations — — — —
CONSOLIDATED PROFIT/(LOSS) 1,066,004 319,104 (621,410) 763,698
Consolidated income statement (Condensed)
EUR Thousands
2019
VehiclesConsumer Financing Others (*) Total
NET INTEREST INCOME 2,054,813 1,158,869 214,346 3,428,028
Income from entities accounted for using the equity method 74,225 10,513 (1,248) 83,490
Net commissions 448,510 270,919 67,913 787,342
Profit/(loss) from financial operations (2,514) (51) (7,518) (10,083)
Other operating income 23,372 2,605 (46,693) (20,716)
OPERATING INCOME 2,598,406 1,442,855 226,800 4,268,061
Administrative and general expenses (783,594) (520,541) (332,943) (1,637,078)
Staff costs (338,454) (194,410) (255,508) (788,372)
Other (445,140) (326,131) (77,435) (848,706)
Amortisation (43,256) (42,900) (77,954) (164,110)
Provisions (3,218) (28,388) (43,412) (75,018)
Impairment losses on financial assets (net) (222,629) (160,029) (23,888) (406,546)
PROFIT/(LOSS) BEFORE TAX 1,545,710 690,997 (251,396) 1,985,311
PROFIT/(LOSS) IN RESPECT OF CONTINUING
OPERATIONS 1,094,737 495,212 (179,883) 1,410,066
Profit(/loss) in respect of discontinued operations — — —
CONSOLIDATED PROFIT/(LOSS) 1,094,737 495,212 (179,883) 1,410,066
(*) Includes mainly the results from the deposit and managed asset businesses, which are not individually material for the Group as a whole, and those
arising from the Group’s financial management activity.
170
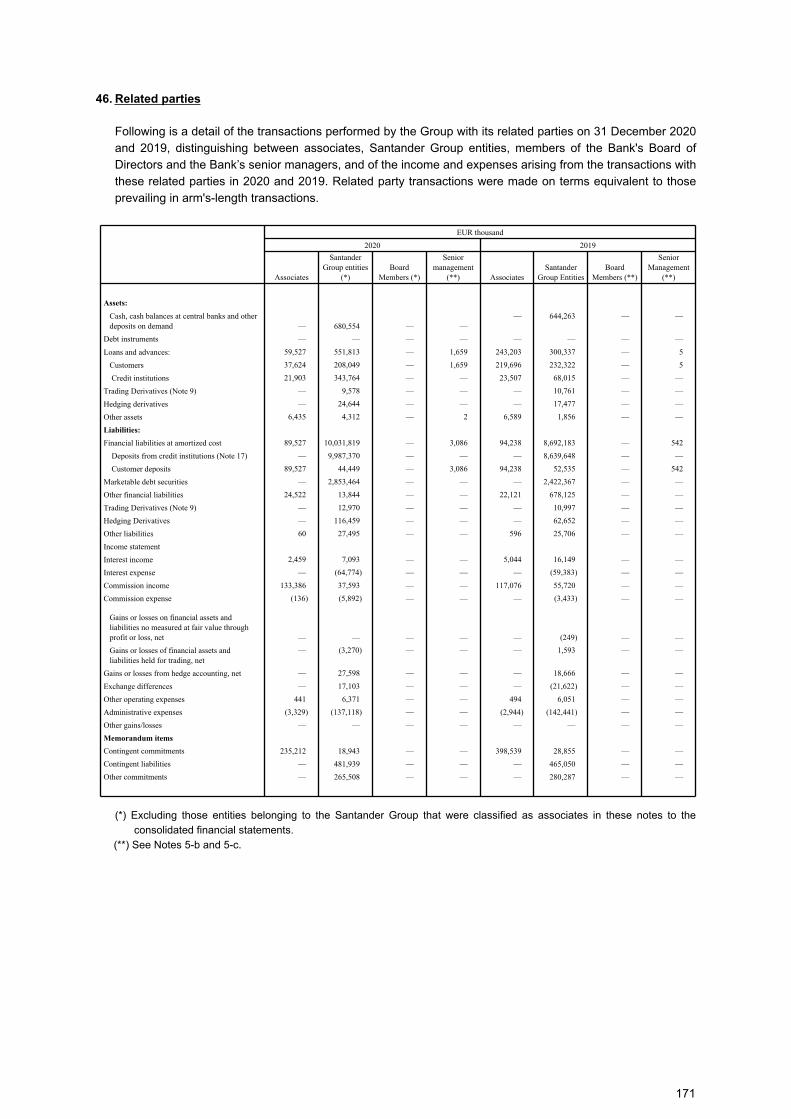
46. Related parties
Following is a detail of the transactions performed by the Group with its related parties on 31 December 2020
and 2019, distinguishing between associates, Santander Group entities, members of the Bank's Board of
Directors and the Bank’s senior managers, and of the income and expenses arising from the transactions with
these related parties in 2020 and 2019. Related party transactions were made on terms equivalent to those
prevailing in arm's-length transactions.
EUR thousand
2020 2019
Associates
Santander Group entities
(*)Board
Members (*)
Senior management
(**) AssociatesSantander
Group EntitiesBoard
Members (**)
Senior Management
(**)
Assets:
Cash, cash balances at central banks and other deposits on demand — 680,554 — —
— 644,263 — —
Debt instruments — — — — — — — —
Loans and advances: 59,527 551,813 — 1,659 243,203 300,337 — 5
Customers 37,624 208,049 — 1,659 219,696 232,322 — 5
Credit institutions 21,903 343,764 — — 23,507 68,015 — —
Trading Derivatives (Note 9) — 9,578 — — — 10,761 — —
Hedging derivatives — 24,644 — — — 17,477 — —
Other assets 6,435 4,312 — 2 6,589 1,856 — —
Liabilities:
Financial liabilities at amortized cost 89,527 10,031,819 — 3,086 94,238 8,692,183 — 542
Deposits from credit institutions (Note 17) — 9,987,370 — — — 8,639,648 — —
Customer deposits 89,527 44,449 — 3,086 94,238 52,535 — 542
Marketable debt securities — 2,853,464 — — — 2,422,367 — —
Other financial liabilities 24,522 13,844 — — 22,121 678,125 — —
Trading Derivatives (Note 9) — 12,970 — — — 10,997 — —
Hedging Derivatives — 116,459 — — — 62,652 — —
Other liabilities 60 27,495 — — 596 25,706 — —
Income statement
Interest income 2,459 7,093 — — 5,044 16,149 — —
Interest expense — (64,774) — — — (59,383) — —
Commission income 133,386 37,593 — — 117,076 55,720 — —
Commission expense (136) (5,892) — — — (3,433) — —
Gains or losses on financial assets and liabilities no measured at fair value through profit or loss, net — — — — — (249) — —
Gains or losses of financial assets and liabilities held for trading, net
— (3,270) — — — 1,593 — —
Gains or losses from hedge accounting, net — 27,598 — — — 18,666 — —
Exchange differences — 17,103 — — — (21,622) — —
Other operating expenses 441 6,371 — — 494 6,051 — —
Administrative expenses (3,329) (137,118) — — (2,944) (142,441) — —
Other gains/losses — — — — — — — —
Memorandum items
Contingent commitments 235,212 18,943 — — 398,539 28,855 — —
Contingent liabilities — 481,939 — — — 465,050 — —
Other commitments — 265,508 — — — 280,287 — —
(*) Excluding those entities belonging to the Santander Group that were classified as associates in these notes to the
consolidated financial statements.
(**) See Notes 5-b and 5-c.
171
47. Risk management
I. Risk management
Corporate principles
Santander Group, which is part Santander Consumer Finance Group, has set itself the strategic objective of
achieving excellence in risk management. This has been a focal point of the Santander Group's activities
throughout its history spanning more than 150 years.
During the last few years, the pace of change in risk management has increased in order to anticipate and
meet the main challenges presented by a constantly changing economic, social and regulatory environment.
Consequently, the risk function is of greater significance than ever so as to make the Santander Group is to
continue to be a solid, safe and sustainable bank, an example for all the financial sector and a reference point
for all who aspire to convert leadership in risks into a competitive advantage.
Santander Consumer Finance Group aims to build a future based on advance management of all risks and
protect its present through a robust control environment. Accordingly, the Group has determined that the risk
function should be based on the following cornerstones, which are in line with the Santander Group's strategy
and business model and take into account the recommendations of the supervisory and regulatory bodies
and the best market practices:
1. The business strategy is defined by the risk appetite. The Santander Consumer Finance Group's board
determines the amount and type of risk that it considers reasonable to assume in implementing and
developing its business strategy, in the form of objective verifiable limits that are consistent with the risk
appetite for each significant activity.
2. All risks must be managed by the units that generate them using advanced models and tools that are
integrated in the various businesses. The Santander Consumer Finance Group is fostering advanced risk
management, using innovative models and metrics together with a control, reporting and escalation
framework to ensure that risks are identified and managed from different perspectives.
3. A forward-looking vision of all types of risks should be included in the risk identification, assessment and
management processes.
4. The independence of the risk function encompasses all risks and establishes an appropriate separation of
the risk generating units from those responsible for risk control. Implies having sufficient authority and
direct access to management and governing bodies responsible for setting and supervising risk strategy
and policies.
5. The best processes and infrastructure must be used for risk management. Santander Consumer Finance
aims to be a reference model in the development of infrastructures and processes supporting risk
management.
6. A risk culture integrated throughout the organisation, consisting of a series of attitudes, values, skills and
guidelines for action vis-à-vis all risks. Santander Consumer Finance understands that advanced risk
management cannot be achieved without a strong and stable risk culture being present in each of its
activities.
172
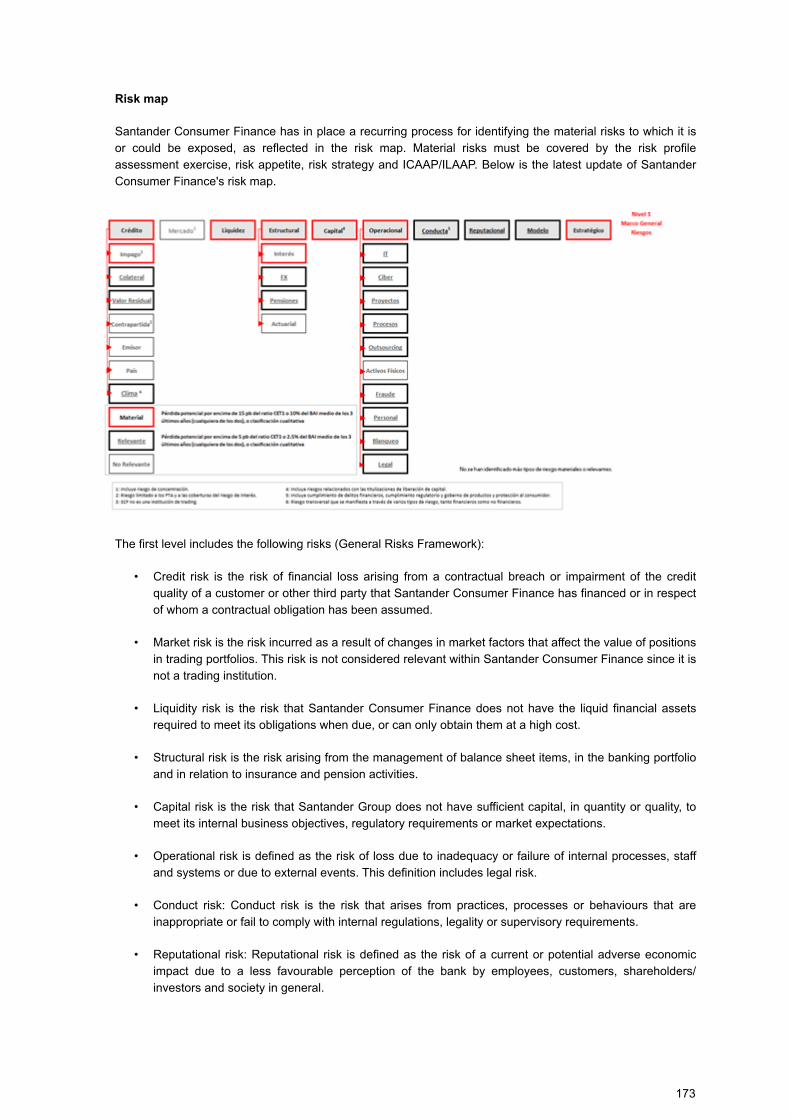
Risk map
Santander Consumer Finance has in place a recurring process for identifying the material risks to which it is
or could be exposed, as reflected in the risk map. Material risks must be covered by the risk profile
assessment exercise, risk appetite, risk strategy and ICAAP/ILAAP. Below is the latest update of Santander
Consumer Finance's risk map.
The first level includes the following risks (General Risks Framework):
• Credit risk is the risk of financial loss arising from a contractual breach or impairment of the credit
quality of a customer or other third party that Santander Consumer Finance has financed or in respect
of whom a contractual obligation has been assumed.
• Market risk is the risk incurred as a result of changes in market factors that affect the value of positions
in trading portfolios. This risk is not considered relevant within Santander Consumer Finance since it is
not a trading institution.
• Liquidity risk is the risk that Santander Consumer Finance does not have the liquid financial assets
required to meet its obligations when due, or can only obtain them at a high cost.
• Structural risk is the risk arising from the management of balance sheet items, in the banking portfolio
and in relation to insurance and pension activities.
• Capital risk is the risk that Santander Group does not have sufficient capital, in quantity or quality, to
meet its internal business objectives, regulatory requirements or market expectations.
• Operational risk is defined as the risk of loss due to inadequacy or failure of internal processes, staff
and systems or due to external events. This definition includes legal risk.
• Conduct risk: Conduct risk is the risk that arises from practices, processes or behaviours that are
inappropriate or fail to comply with internal regulations, legality or supervisory requirements.
• Reputational risk: Reputational risk is defined as the risk of a current or potential adverse economic
impact due to a less favourable perception of the bank by employees, customers, shareholders/
investors and society in general.
173
• Model risk is the risk of loss arising from misuse of a model or inaccurate predictions that may result in
sub-optimal decisions by the Bank.
• Strategic risk is the risk of loss or detriment arising from strategic decisions, or poor implementation of
such decisions, affecting the long-term interests of our main stakeholders; or from an inability to adapt
to the changing environment.
The material risks at Santander Consumer Finance are: credit, default (including concentration), liquidity,
structural, structural interest rate, capital, operational and strategic.
The significant risks at Santander Consumer Finance are: collateral/residual value, structural exchange rate,
pensions, IT, cyber, processes, outsourcing, fraud, personnel, money laundering, legal, conduct, reputational
and model.
Residual Value Risk is defined as the risk of loss that an entity may have if at any time during the life of an
automobile contract (loan, lease, etc.) the customer has the option or obligation to return the vehicle as full
and final settlement, due to uncertainty about the sale price of the vehicle at that time
Corporate Risk Governance
The objective of the governance of the risk function is to ensure adequate and efficient decision-making and
effective risk control, and to ensure that these functions are managed in accordance with the risk appetite
defined by the senior management of Santander Consumer Finance and its units.
The following principles have been established for this purpose:
• Segregation between risk decisions and control.
• Enhancing the responsibility of risk generating functions in the decision-making process.
• Ensuring that all risk decisions have a formal approval process.
• Ensuring an aggregate overview of all risk types.
• Bolstering risk control committees.
• Maintaining a responsive and efficient committee structure, ensuring:
– Participation and involvement of the governance bodies and senior management in all risk
decisions, and supervision and control.
– Coordination between the lines of defence in risk-management and control functions.
– Alignment of objectives, monitoring to ensure they are being achieved and implementing corrective
measures when necessary.
– The existence of an adequate management and control environment for all risks.
To achieve these objectives, the Committee structure in the management model must ensure an adequate:
• Structure, with stratification by levels of relevance, balanced delegation capacity and protocols for
escalating incidents.
• Composition, with members of sufficient rank and representation of business and support areas.
• Operations, i.e. frequency, minimum attendance levels and appropriate procedures.
174
The governance of risk activity must establish and facilitate coordination channels between the units and
Santander Consumer Finance, together with alignment of management models and risk control.
The governance bodies of Santander Consumer Finance, S.A. units are set up in accordance with local legal
and regulatory requirements, considering the complexity of each unit.
Furthermore, Santander Consumer Finance has established additional governing measure for special
situations.
The Gold and Silver Committee in Santander Consumer Finance spearheaded the crisis; specialized
committees (business continuity, HR committees, risks committees, etc.) covered the impact of the COVID-19
pandemic in their agendas to gauge future repercussions. Their conclusions were shared within the
organization's highest committees. The crisis management governance has become less strict over the
second and third waves, as opposed to the beginning of the pandemic. The frequency of these committees
has been established in line with the severity of the pandemic and the impact on the entity. In many
instances, activating extraordinary mechanisms not previously defined has been necessary to deal with the
effects on the business, the assets and the people.
Roles and responsibilities
The risk function is built around three lines of defence. The roles and responsibilities of these lines form an
integral part of the management and control of market, structural and liquidity risk, as explained below.
– First line of defence
This comprises the departments, business lines and activities that generate risk exposure. In the scope of this
framework, this involves those responsible for management of the trading and balance sheet management
portfolios.
This line of defence must ensure at all times:
– That all risks that might have a material impact are identified.
– Recurrent assessment of existing risks.
– The information needed to assess risks is available.
– The limits established for their activities are observed and respected.
– Second line of defence
This involves the specialist teams involved in risk control and monitoring. In the scope of this framework, this
involves those responsible for monitoring activities involving the entity's portfolios and the performance and
management of the risks assumed.
The second line of defence is an independent function within the risk function that complements the
management and control functions of the first line of defence, ensuring at all times that:
– Limits are established and approved by the entity's governance bodies or their delegated bodies.
– The first line of defence understands and complies with these limits.
– The policies, procedures and limits established for trading activities and balance sheet management
are respected.
– Systematic reviews are carried out of exposure to market, structural and liquidity risks.
175
– Robust, reliable and adequate mechanisms are in place for these activities.
The second line of defence must provide a consolidated overview of market, structural and liquidity risks.
– Third line of defence
As the final layer of control in the Group, Internal Audit regularly checks that policies, methods and
procedures are adequate and applied effectively in management.
Structure of Risk Committees
The board of directors is ultimately responsible for risk control and management, delegating these powers to
commissions and committees. In Santander Consumer Finance, the Board is supported by the Risk,
Regulation and Compliance Supervision Commission, which is an independent risk control and monitoring
committee. These bylaw-mandated bodies form the highest level of risk governance:
Independent control bodies
– Risk, Regulation and Compliance Supervision Commission
This Committee's role is to assist the Board of Directors in the monitoring and control or risks, defining
and assessing risk policies, and determining the risk propensity and strategy.
It is made up of external or non-executive directors (mostly independent) and is chaired by an
independent Board member.
The main duties of the Risk, Regulation and Compliance Supervision Commission are:
– To support and advise the Board of Directors in defining and assessing Santander Consumer
Finance's risk policies and determining its risk propensity and risk strategy.
– To ensure that the pricing policy for assets and liabilities offered to customers fully respects the
business model and risk strategy.
– To understand and assess the management tools, ideas for improvement, progress with projects and
any other relevant activity relating to risk control.
– To determine with the Board of Directors the nature, amount, format and frequency of the risk
information to be received by the Committee and the Board.
– To help establish rational and practical remuneration policies. For this purpose, without prejudice to the
duties of the Remunerations Committee, the Risk Committee examines whether the incentives policy
planned for the remuneration scheme considers risk, capital, liquidity and the likelihood and suitability
of profits.
– Executive Risk Control Committee (ERCC):
This collegial body is responsible for overall monitoring and control of Santander Consumer Finance's
risks, pursuant to the powers delegated to it by the Board of Directors of Santander Consumer Finance,
S.A.
Its objectives are:
• To provide a tool for effective risk control, ensuring that risks are managed in accordance with the
Bank's risk appetite, as approved by the Board of Directors of Santander Consumer Finance, S.A.,
providing an overview of all of the risks identified in the risk map in the general risk framework,
176
including identification and monitoring of actual and emerging risks and their impact on the risk profile
of the Santander Consumer Finance Group.
• To ensure the best estimate of provisions and that they are recognized correctly.
This Committee is chaired by the Santander Consumer Finance's Chief Risk Officer (CRO) and is made up of
members of its senior management. In addition to the risk function, which chairs the Committee, the
compliance, finance and management control functions are also represented. The CROs of local entities can
take part on a regular basis to report on the risk profile of the entities and other tasks.
The Executive Risk Control Committee reports to the Risk, Regulation and Compliance Supervision
Commission, which it assists in its function of supporting the Board.
Decision-making bodies
– Executive Risk Committee (ERC):
The Executive Risk Committee is the collegiate body responsible for overall risk management pursuant to
the powers delegated to it by the Board of Directors of Santander Consumer Finance S.A., monitoring all
the risks identified in the Bank that fall within its remit.
Its objective is to provide a tool for decisions on accepting risks at the highest level, ensuring that risk
decisions are within the limits set by the Santander Consumer Finance Group's risk appetite. It reports on
its activity to the Board or its committees, as required.
This Committee is chaired by the Head of Santander Consumer Finance and is made up of executive
directors and other executive of Santander Consumer Finance. The risk, financial, management control
and compliance function are also represented, among others. The Bank's CRO is entitled to veto the
Committee's decisions.
– Proposal Sub-committee (RPSc):
The Santander Consumer Finance Risk Proposal Sub-committee is a collegiate body in charge of making
decisions regarding business and country transactions, credit risk, market, liquidity and structural issues,
guaranteeing that the decisions made comply with the limits established in the appetite risk framework of
Santander Consumer Finance, as well as informing of its activity to the Risk Executive Committee when it
is required so.
This Committee is chaired by Santander Consumer Finance’s CRO, and it comprises Santander
Consumer Finance executive positions including but not limited to the risk, financial, management control
and compliance functions.
– Credit Committee:
The Credit Committee is the collegiate decision-making body responsible for recommending and
validating credit risk proposals, ensuring that this respect the limits set in the risk appetite, reporting to the
Executive Risk Committee, as required.
This Committee is chaired by the Santander Consumer Finance's CRO and its members are senior
managers. The risk and business functions are also represented.
– Provisions Committee:
The Provisions Committee is the decision-making body responsible for overall management of provisions
in accordance with the powers delegated by the Executive Risk Committee of Santander Consumer
Finance S.A., and supervises, within its sphere of action and decision, all matters relating to provisions in
177
Santander Consumer Finance. Its purpose is to be the instrument for decision-making, ensuring that
decisions are consistent with the governance of provisions established at Santander Consumer Finance,
and reporting to the Board of Directors or its committees on its activities when required.
Structural organisation of the risk function
The Group Chief Risk Officer (GCRO) is responsible for the risk function in Santander Consumer Finance and
reports to the Head of Santander Consumer Finance, who is a member of the Board.
The GCRO advises and challenges the executive line and also reports independently to the Risk, Regulatory
and Compliance Committee and to the Board.
Advanced risk management is based on a holistic, forward-looking approach to risks, based on intensive use
of models, to foster a robust control environment that meets the requirements of the regulator and the
supervisor.
Santander Consumer Finance's risk management and control model shares certain core principles via its
corporate frameworks. These frameworks are established by the Group and Santander Consumer Finance
adheres to them through its management bodies. They shape the relationship between the subsidiaries and
Santander Consumer Finance, including the role played by the latter in validating important decisions.
The Group-Subsidiaries Governance Model and good governance practices for subsidiaries recommend that
each subsidiary should have a bylaw-mandated risk committee and an executive risk committee chaired by
the Chief Executive Officer (CEO). This is in line with best corporate governance practices and consistent with
those already in place in the Group, as set out in the corporate framework, to which Santander Consumer
Finance has signed up.
Under the Group's internal governance framework, the management bodies of Santander Consumer Finance
have their own model of risk powers (both quantitative and qualitative), which must follow the principles set
out in the benchmark models and frameworks developed at the corporate level.
Given its capacity for comprehensive and aggregated oversight of all risks, the corporation exercises a
validation and questioning role with regard to the operations and management policies of the units, insofar as
they affect the Group’s risk profile.
Identifying and evaluating risks is a cornerstone for controlling and managing risk. The main risk types to
which the Group is exposed are credit risk, market risk, operational risk and compliance and conduct risk.
Santander Consumer Finance has taken several initiatives to improve the relationship between Santander
Consumer Finance and its subsidiaries, and to improve the model of advanced risk management.
It is worth mentioning the tight collaborative efforts in light of the crisis derived from the COVID-19 pandemic
to share best practices, aid in the development of scenarios, estimation of additional provisions, etc.
As the main initiatives in 2020, Santander Consumer Finance has -and will continue to- meticulously revise
the impact of the COVID-19 pandemic and the appropriateness of the risk appetite to face the new
environment. The risk appetite limits have been practically unchanged despite the extraordinarily challenging
conditions. Management focused on improving the control over market volatility, better representation and
visibility of the emerging risks including cybersecurity and other non-financial risks.
Scenario analysis
In the context of the coronavirus pandemic and in line with the regulator's indications, the Service of Studies
department elaborated a set of additional scenarios under a stable perspective, long-run approach in order to
analyze the deterioration observed in most macroeconomic indicators and evaluate the expected losses. The
178
Santander Group has developed these scenarios through a robust process and with great effort from the
teams involved, ensuring their coherence.
In response to the health crisis of the COVID-19, the reporting function increased the frequency and adapted
the existing reports to generate new ones for the Board and senior committees. These were focused on
critical issues, making the monitoring of the situation and the decision-making process easier.
II. Credit Risk
Credit risk stems from the possibility of losses arising from the failure of clients or counterparties to meet their
financial obligations with the Group, in full or in part.
The risk function in Santander Consumer Finance is organised by customer type, distinguishing between
individualised and standard customers throughout the risk-management process:
– Individualised customers are those assigned to a risk analyst, mainly because of the risk they entail. This
category includes Wholesale Banking companies and some Retail Banking companies. Risk management
involves expert analysis, complemented by decision-making support tools based on internal risk-
assessment models.
– Standard risks are those customers to whom no risk analyst is expressly assigned. They generally include
risk with individuals, individual businesspeople and non-individualised retail banking companies.
Management of these risks is based on internal-assessment and automatic-decision models,
complemented by teams of analysts specialized in specific risk types when the model does not cover the
risk or is not sufficiently accurate.
Key figures in 2020
The evolution of non-performing assets and the cost of credit reflect the impact of the deterioration of the
economic environment, mitigated by prudent risk management, which has generally made it possible to
maintain said data at levels lower than those of our competitors in recent years. As a result, Santander
Consumer Finance maintains an adequate level of coverage to face the expected loss of the credit risk
portfolios it manages.
As of December 2020, the default rate was 2.04%, because our risk performance has been aligned with
Santander Consumer Finance's risk appetite. NPLs (€ 2.02bn) distributed by units are: Germany represents
25% of the total, the Nordic countries 23%, Spain 24%, France 11%, Italy 6%, Austria 6% and 4 others %.
Regarding products, Auto represents 42% of the total, Direct 33%, Mortgages 4%, Durables 13%, Stock
Finance 4% and others 4%.
The delinquency ratio has shown a downward trend in recent years, the lowest figure being that of December
2019, where it reached 1.98%. However, in 2020 there has been a change in trend with an increase in the
delinquency rate explained by the higher entries in arrears as a result of the Covid impact on the portfolios of
Santander Consumer Finance units, which caused the delinquency rate to close at 2.04%. The increase in
the default rate occurred in the majority of Santander Consumer Finance countries and mainly in the used
car, durable and credit card portfolios.
In terms of Cost of Credit, this ratio has a low risk profile thanks to the granularity and predictability of
Santander Consumer Finance's portfolios. The 12-month cost of credit at the end of December 2020 was
0.8%. Throughout 2020, an increase in Provisions was carried out in all Santander Consumer Finance
portfolios due to the provision for macroeconomic adjustment of Provisions in accordance with the
recommendations of the ECB and aligned with the Corporate criteria of the Santander Group, where required
entities to choose to avoid procyclical assumptions in their IFRS9 models to determine their provision
estimates during the COVID-19 pandemic using long-term macroeconomic forecasts.
179
Key figures and change over time
Santander Consumer Finance's credit risk portfolio is characterised by its diversified geographic distribution
and predominance of retail banking activity.
a) Global credit risk map 2020
The following table details the global map of SCF's gross credit risk exposure by geographic area:
SCF Group - Gross credit risk exposure
2020
(€ million)Change on
December 2019% portfolio
Spain and Portugal 15,749 (10.64) % 15.81 %
Italy 9,123 (0.91) % 9.16 %
France 14,647 3.44 % 14.70 %
Germany and Austria 38,921 0.92 % 39.06 %
Scandinavia 17,311 3.28 % 17.37 %
Other 3,887 (0.88) % 3.90 %
Total 99,638 (0.60) % 100.00 %
Santander Consumer's activity in 2020 has developed in a challenging economic environment derived from
the Covid pandemic. The results mainly translated into lower volumes especially during the months of March
to June, and with different impacts depending on the geographies.
As a consequence of the above, the gross exposure to credit risk shows a year-on-year decrease of 0.60% (+
6.9% in 2019). This decrease is mainly due to a drop in the origination of new business during the first half of
the year due to the credit environment. In terms of product vision, Automobile represents 63% of the total,
Direct 11%, Mortgages 4%, Durables 5%, Stock Finance 11% and Others 5%. Germany concentrates the
highest percentage of the portfolio with 39% together with Austria and their respective JVs. On the other
hand, the Nordic countries represent 17%, and include the units of Norway, Denmark, Sweden and Finland.
Spain, Portugal and their respective JVs represent 16% of the total.
Information on the estimation of impairment losses
Calculation of expected credit losses:
The covid-19 health crisis has been unexpected, unpredictable and severe, but it is estimated to be
temporary. Santander Consumer Finance's priority in these circumstances has been to ensure the health of
its employees, customers and shareholders, but also to contribute to alleviating the economic impact of the
pandemic. This includes trying to offer the best solutions to help customers.
Conceptually, the phases in managing the effects of covid-19 have been:
- Identification of clients or groups affected or potentially affected by the pandemic.
- Early relief of temporary financial difficulties caused by covid-19 through the granting of measures promoted
by governments, central banks, and financial institutions and the Santander Group.
- Monitoring the evolution of clients, to ensure that they continue to be provided with the best solution for their
situation, and also ensure that its potential deterioration is correctly reflected in Santander Consumer
Finance's risk management and associated accounting. This point takes on special relevance at the
expiration of the possible measures of moratorium or liquidity support that clients may have availed of.
- Monitoring is accompanied by recovery management activities when necessary.
180
These conceptual phases do not occur sequentially, but overlap in time. Additionally, the continuous
interaction and coordination with all Santander Consumer Finance units is proving to be a fundamental asset
in the management of this crisis. The experience obtained in the fight against the health crisis and its financial
consequences in our different geographies, and the different speeds at which it has been developed in each
one of them, allow us to share the best practices identified and implement in an agile and efficient way. those
specific strategies and actions that have been most successful, always adapted to the local reality of each
market.
Measures to support the economy
In accordance with the aforementioned in relation to alleviating our clients 'temporary financial difficulties
caused by the pandemic, Santander Consumer Finance has adopted measures to promote clients' economic
resilience during the crisis in all geographies. The most prominent include the following:
- Provide liquidity and credit facilities to clients facing difficulties.
- Facilitate grace periods or moratoriums in many of its markets.
- Support clients with possible difficulties being proactive, trying to meet their needs and advising through
specialized teams.
Santander Consumer Finance has implemented measures to provide liquidity and credit facilities in all its
units, in addition to facilitating payment deferrals for individuals and companies experiencing difficulties.
Regarding the specific measures of liquidity, deficiencies or moratoriums, a series of support programs have
been implemented in accordance with the guidelines set by the Santander Group, the regulatory and
supervisory authorities, as well as by governments, central banks and supranational entities. of those markets
in which it operates. The main objective is to mitigate the temporary impact on customer activity. The absence
of the appropriate measures, and of their adequate prudential and accounting treatment, could aggravate the
economic consequences of the crisis, generating pro-cyclical effects that would lengthen its duration and
impact.
The different measures offered can be grouped into the following categories:
- Government liquidity measures: In general terms, these are loan facilities granted by Santander Consumer
Finance units and aimed at clients at the request of government bodies to grant liquidity facilities, although in
the case of these measures in particular, for the consumer case, they have been insignificant.
- Government moratorium measures: In this case, the government authorities define a series of requirements,
which, if satisfied by the beneficiary, entail the granting of moratoriums by the Santander Consumer Finance
unit on the payment of capital and / or interests of the different credit operations that clients may have
contracted. The general expiration of the moratorium measures is short-term. Some governments and
institutions are re-extending the initial terms, especially those that were launched in the very short term in the
initial phases of the pandemic, with less visibility of the potential duration of the crisis, but the re-extensions
are also being short term.
- The specific characteristics of these programs vary depending on their definition by the national
governments of those countries in which Santander Consumer Finance operates. Regarding the criteria
followed for their concession, they also depend on those requirements established by the authorities of each
country in accordance with the legislation in force in each case.
- Internal / sectorial moratorium measures: Broadly speaking, these are the moratoriums granted by
Santander Consumer Finance units on the payment of capital and/or interests of the different credit
operations that customers may have contracted. In this case, the specific characteristics of these measures,
in terms of maturity, amounts, etc. vary according to each geography, product or customer segment in order
to adapt them in the best possible way to the reality of the local market and its regulation as well as to the
181
needs of the customer and the product that they have contracted. In many cases the general conditions of
application have been agreed at sector level through, for example, national associations of credit institutions.
- Other types of internal measures: This category would include all those measures not included in the
previous sections.
With regards to moratoria, 7,667.7 million euros have been formalized, of which 412.9 million euros are
outstanding. The total formalized is divided into:
• 1,961 million Euros originating from government programs.
• 5,706 million Euros originating from non-governmental programs.
Of these totals, in the case of the retail portfolio that represents more than half of the moratoriums, as of
December 31, 2020, 98% of the formalized portfolio had expired and of this percentage, 87% had paid while
7 % had requested a new moratorium and the remaining 6% had been managed by the recovery
departments.
Regarding the Wholesale Portfolio, 90.7% of the formalized portfolio had expired and of this 98.7% had paid
and 1.3% had requested a new moratorium.
In the case of the most significant units, in Germany 758 million euros of retail portfolio were formalized, of
which 739 million euros had expired at the end of the year. Of the total expired, 88.6% had paid, 4.9% had
requested an extension and 6.5% were under recovery management. Regarding the wholesale portfolio, 460
million euros were formalized, of which all had expired at the end of the year with 100% payment.
In the Nordic countries unit, 1,056 million euros of retail portfolio were formalized, of which 1,053 million euros
had expired at the end of the year. Of the total expired, 86.4% had paid, 5.9% had requested an extension
and 7.7% were under recovery management. The wholesale moratoriums for the Nordic units did not
represent a significant volume (22 million euros formalized and 100% paid at year-end).
Finally, in Spain, 496 million euros of retail portfolio were formalized, of which 476 million euros had expired at
the end of the year. Of the total expired, 73.4% had paid, 6.9% had requested an extension and 19.6% were
under recovery management. The wholesale moratoriums for this unit did not represent a significant volume
(66 million euros formalized, of which 76.4% had been paid and practically the entire remaining percentage
had requested an extension).
The Group estimates impairment losses by calculating the expected loss at 12 months or for the entire life of
the transaction, based on the stage in which each financial asset is classified in accordance with IFRS9.
In the context described in the previous sections, many regulators and supervisors have highlighted the
uncertainties surrounding the economic impacts of the health crisis. This is also evident in the frequent
updates of the macroeconomic forecasts, with different perspectives and visions regarding the depth and
duration of the crisis. Thus, the generalized recommendation (including the IASB, ESMA, EBA and ECB) has
been the mechanistic non-application of the usual techniques for calculating expected losses under IFRS 9,
to avoid that this variability of economic conditions translates into unwanted volatility in the results, with their
potential pro-cyclical effects on the economy.
In this way, Santander Consumer Finance analyzes losses under IFRS 9 according to 3 types of elements:
1. Continuous monitoring of customers
Monitoring the credit quality of clients may be more complex in current circumstances, in the absence of
certain contractual payments on operations subject to moratorium, although the total amount of loans that are
still subject to these measures has been significantly reduced during the year.
182

For such monitoring, and in a complementary way to the application of internal customer monitoring policies,
all available information must be used. The availability of information and its relevance is different in the
different portfolios of the different countries in which Santander Consumer Finance operates, but in a non-
exhaustive way it may include: - The payment of interest in the case of deficiencies only in principal. - The
payment of other operations of the same client in the entity (not subject to moratorium). - Information on the
payment of loans in other entities (through credit bureaus). - Customer financial information: average
balances in checking accounts, availability/use of limits, etc. - The behavioral elements available (variables
that feed the behavior scores, etc.). - Information collected from contacts with the client (surveys, calls,
questionnaires, etc.) Among other data, it may include: clients subject to temporary employment suspensions
(ERTEs in Spanish), direct aid from governments, etc.
2. Prospective vision
As has been reflected by the IASB, macroeconomic uncertainty makes it difficult to regularly apply the
expected loss calculation models of IFRS 9, but it does not exempt the incorporation of the prospective
characteristic of the standard. For this, the European Central Bank has recommended using a stable and
long-run view of the macroeconomic forecasts, which considers in the evaluation the multiple support
measures explained above.
3. Additional elements
When they are necessary for not having been captured under the two previous elements. This includes,
among others, the analysis of sectors most affected by the pandemic if its impacts are not sufficiently
captured by macroeconomic scenarios. Also collective analysis techniques, when the potential deterioration in
a group of clients cannot be identified individually. With the elements indicated above, Santander Consumer
Finance evaluates the evolution of the credit quality of its clients in each of the geographies, for the purposes
of its classification in stages and consequently the calculation of the expected loss. In terms of classification,
Santander Consumer Finance has generally maintained the criteria and thresholds for classification during
the pandemic, incorporating regulatory interpretations of the effect of moratoriums on classification (in
particular, the 'Guidelines on legislative and non-legislative moratoriums of loan repayments applied in light of
the covid-19 crisis, from the European Banking Authority).
In this way, moratorium measures that meet the specifications of these guidelines are not considered as
automatic indicators to identify these contractual modifications as refinancing (forbearance) or classify them in
stage 2. However, this does not exempt from a rigorous application of IFRS 9 in monitoring the credit quality
of clients and, by means of individual or collective analysis techniques, the timely detection of the significant
increase in risk in certain operations or groups of operations. Santander Consumer Finance estimates the
impairment losses by calculating the expected loss, at 12 months or for the entire life of the operation,
depending on the stage in which each financial asset is classified in accordance with IFRS 9 .
The detail of exposure and impairment losses associated to each stage as of 31 December 2020 is as
follows. Additionally, in line with its current credit quality, the exposure is classified in three grades
(investment, speculation and default):
Exposure and impairment losses by stage 2020 (EUR Millions)
Credit quality (*) Stage 1 Stage 2 Stage 3 Total
Investment grade 108,618 — — 108,618
Speculation grade 8,162 4,262 — 12,424
Default — — 2,070 2,070
Total Risk (**) 116,780 4,262 2,070 123,112
Impairment losses 540 289 1,368 2,197
183
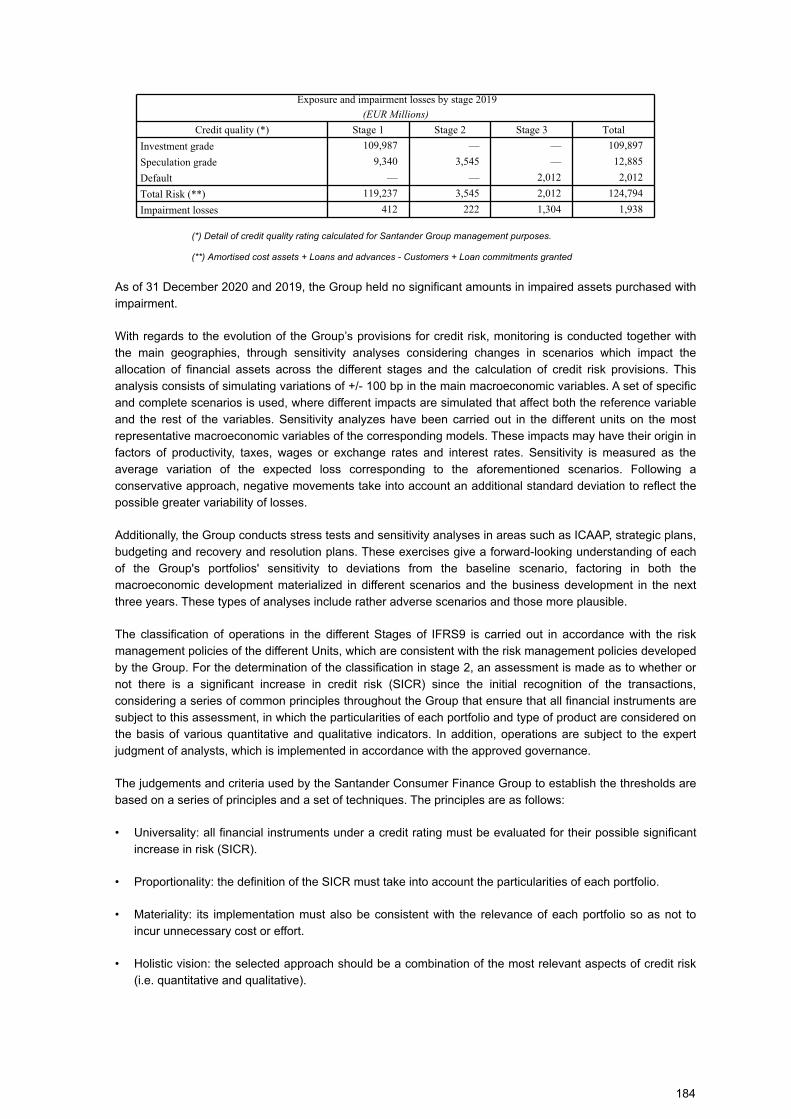
Exposure and impairment losses by stage 2019
(EUR Millions)
Credit quality (*) Stage 1 Stage 2 Stage 3 Total
Investment grade 109,987 — — 109,897
Speculation grade 9,340 3,545 — 12,885
Default — — 2,012 2,012
Total Risk (**) 119,237 3,545 2,012 124,794
Impairment losses 412 222 1,304 1,938
(*) Detail of credit quality rating calculated for Santander Group management purposes.
(**) Amortised cost assets + Loans and advances - Customers + Loan commitments granted
As of 31 December 2020 and 2019, the Group held no significant amounts in impaired assets purchased with
impairment.
With regards to the evolution of the Group’s provisions for credit risk, monitoring is conducted together with
the main geographies, through sensitivity analyses considering changes in scenarios which impact the
allocation of financial assets across the different stages and the calculation of credit risk provisions. This
analysis consists of simulating variations of +/- 100 bp in the main macroeconomic variables. A set of specific
and complete scenarios is used, where different impacts are simulated that affect both the reference variable
and the rest of the variables. Sensitivity analyzes have been carried out in the different units on the most
representative macroeconomic variables of the corresponding models. These impacts may have their origin in
factors of productivity, taxes, wages or exchange rates and interest rates. Sensitivity is measured as the
average variation of the expected loss corresponding to the aforementioned scenarios. Following a
conservative approach, negative movements take into account an additional standard deviation to reflect the
possible greater variability of losses.
Additionally, the Group conducts stress tests and sensitivity analyses in areas such as ICAAP, strategic plans,
budgeting and recovery and resolution plans. These exercises give a forward-looking understanding of each
of the Group's portfolios' sensitivity to deviations from the baseline scenario, factoring in both the
macroeconomic development materialized in different scenarios and the business development in the next
three years. These types of analyses include rather adverse scenarios and those more plausible.
The classification of operations in the different Stages of IFRS9 is carried out in accordance with the risk
management policies of the different Units, which are consistent with the risk management policies developed
by the Group. For the determination of the classification in stage 2, an assessment is made as to whether or
not there is a significant increase in credit risk (SICR) since the initial recognition of the transactions,
considering a series of common principles throughout the Group that ensure that all financial instruments are
subject to this assessment, in which the particularities of each portfolio and type of product are considered on
the basis of various quantitative and qualitative indicators. In addition, operations are subject to the expert
judgment of analysts, which is implemented in accordance with the approved governance.
The judgements and criteria used by the Santander Consumer Finance Group to establish the thresholds are
based on a series of principles and a set of techniques. The principles are as follows:
• Universality: all financial instruments under a credit rating must be evaluated for their possible significant
increase in risk (SICR).
• Proportionality: the definition of the SICR must take into account the particularities of each portfolio.
• Materiality: its implementation must also be consistent with the relevance of each portfolio so as not to
incur unnecessary cost or effort.
• Holistic vision: the selected approach should be a combination of the most relevant aspects of credit risk
(i.e. quantitative and qualitative).
184
• Application of IFRS 9: the approach must consider the characteristics of IFRS 9, focusing on a
comparison with credit risk on initial recognition, in addition to considering forward-looking information.
• Integration of risk management: the criteria must be consistent with those metrics considered in day-to-
day risk management.
• Documentation: adequate documentation must be prepared. The techniques are summarized below:
• Stability of stage 2: in the absence of relevant changes in the credit quality of the portfolios, the volume of
assets in stage 2 should maintain some stability as a whole.
• Economic reasonableness: at the operation level, stage 2 is expected to be a transitory classification for
exposures that could eventually go into a state of credit impairment at some point or stage 3, as well as
for exposures that have suffered credit impairment and whose quality credit is improving.
• Predictive power: the SICR definition is expected to avoid direct migrations from stage 1 to stage 3 as far
as possible without having previously been classified in stage 2.
• Time in stage 2: It is expected that exposures will not remain marked as stage 2 for an excessive time.
The application of several of the previous techniques concludes in the setting of one or more thresholds for
each portfolio in each geography. Likewise, these thresholds are subject to periodic review through calibration
tests, which may lead to updating the types of thresholds or their values.
Covid-19 credit risk management and customer support programs
In the context of Santander Consumer Finance's general response to the covid-19 pandemic, and specifically
in order to help customers from a credit perspective and promote economic resilience during the crisis, they
were launched in addition to the measures indicated above, the following:
• The severity of the effects of the pandemic has differed significantly by sector. For this reason, Santander
Consumer Finance launched a process to identify those who could be most affected in order to correctly
focus credit risk management.
• Due to the covid-19 crisis, the preparation of the recovery management in Santander Consumer Finance as
a whole has become a main focus, with a view to managing the expected impact on their portfolios once the
recovery measures have been completed. support for.
Quantification of additional provisions for covid-19
Numerous international organizations and supervisors have pointed out the importance of responsibly
adapting and applying accounting and prudential policies to the containment measures put in place to combat
the effects of the Covid-19 health crisis, which are temporary and exceptional in nature. Considering these
observations, deviations in local accounting have been taken into account based on stable long-term
macroeconomic forecasts through a subsequent adjustment of the model complemented by a collective and /
or individual evaluation in order to reflect a more realistic situation, specifically to recognize Expected credit
losses for assets that have suffered a significant increase in credit risk (SICR) without the need to identify
which individual financial instruments have suffered such SICR.
The overlay was considered the best option to recognize the expected loss increase, since a mechanical
application of the expected credit loss methodology (ECL) in the current context could have led to unexpected
results. The additional provisions associated with different macroeconomic scenarios have been calculated
using internal models; however, it has been considered as an overlay (adjustment) with respect to the
monthly calculation of IFRS 9 to improve the control and supervision of the accuracy of the estimate of
expected credit losses.
185
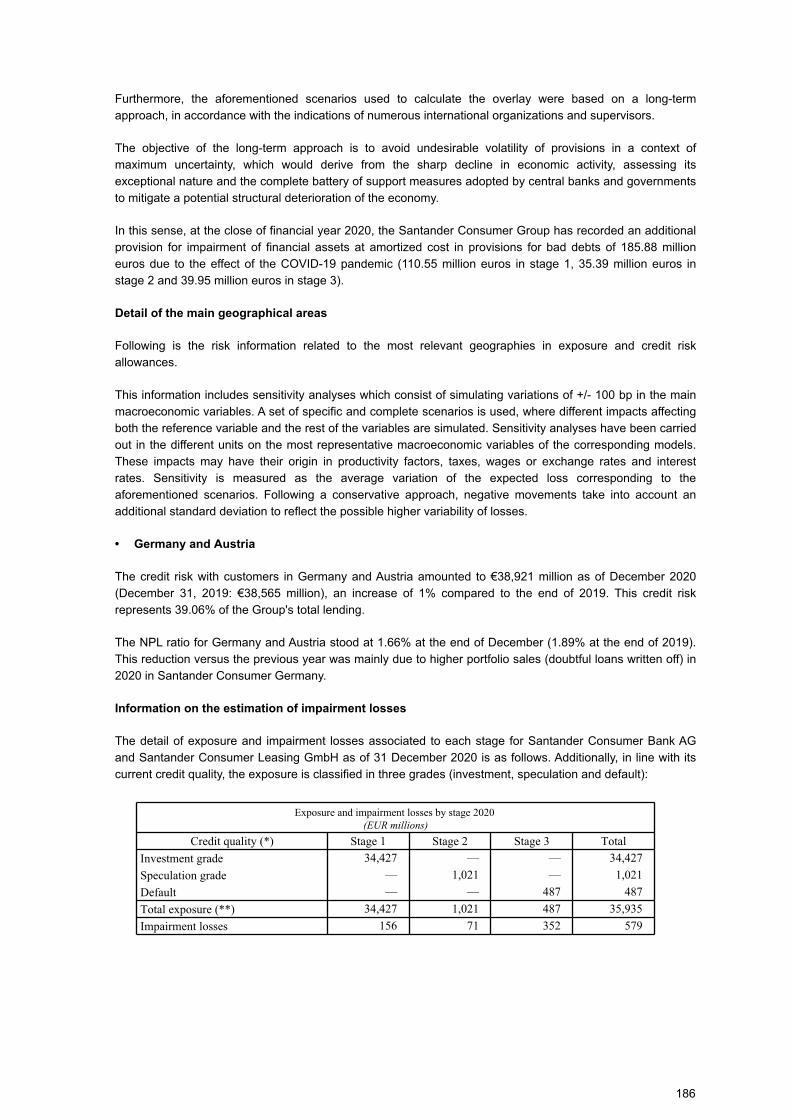
Furthermore, the aforementioned scenarios used to calculate the overlay were based on a long-term
approach, in accordance with the indications of numerous international organizations and supervisors.
The objective of the long-term approach is to avoid undesirable volatility of provisions in a context of
maximum uncertainty, which would derive from the sharp decline in economic activity, assessing its
exceptional nature and the complete battery of support measures adopted by central banks and governments
to mitigate a potential structural deterioration of the economy.
In this sense, at the close of financial year 2020, the Santander Consumer Group has recorded an additional
provision for impairment of financial assets at amortized cost in provisions for bad debts of 185.88 million
euros due to the effect of the COVID-19 pandemic (110.55 million euros in stage 1, 35.39 million euros in
stage 2 and 39.95 million euros in stage 3).
Detail of the main geographical areas
Following is the risk information related to the most relevant geographies in exposure and credit risk
allowances.
This information includes sensitivity analyses which consist of simulating variations of +/- 100 bp in the main
macroeconomic variables. A set of specific and complete scenarios is used, where different impacts affecting
both the reference variable and the rest of the variables are simulated. Sensitivity analyses have been carried
out in the different units on the most representative macroeconomic variables of the corresponding models.
These impacts may have their origin in productivity factors, taxes, wages or exchange rates and interest
rates. Sensitivity is measured as the average variation of the expected loss corresponding to the
aforementioned scenarios. Following a conservative approach, negative movements take into account an
additional standard deviation to reflect the possible higher variability of losses.
• Germany and Austria
The credit risk with customers in Germany and Austria amounted to €38,921 million as of December 2020
(December 31, 2019: €38,565 million), an increase of 1% compared to the end of 2019. This credit risk
represents 39.06% of the Group's total lending.
The NPL ratio for Germany and Austria stood at 1.66% at the end of December (1.89% at the end of 2019).
This reduction versus the previous year was mainly due to higher portfolio sales (doubtful loans written off) in
2020 in Santander Consumer Germany.
Information on the estimation of impairment losses
The detail of exposure and impairment losses associated to each stage for Santander Consumer Bank AG
and Santander Consumer Leasing GmbH as of 31 December 2020 is as follows. Additionally, in line with its
current credit quality, the exposure is classified in three grades (investment, speculation and default):
Exposure and impairment losses by stage 2020(EUR millions)
Credit quality (*) Stage 1 Stage 2 Stage 3 Total
Investment grade 34,427 — — 34,427
Speculation grade — 1,021 — 1,021
Default — — 487 487
Total exposure (**) 34,427 1,021 487 35,935
Impairment losses 156 71 352 579
186
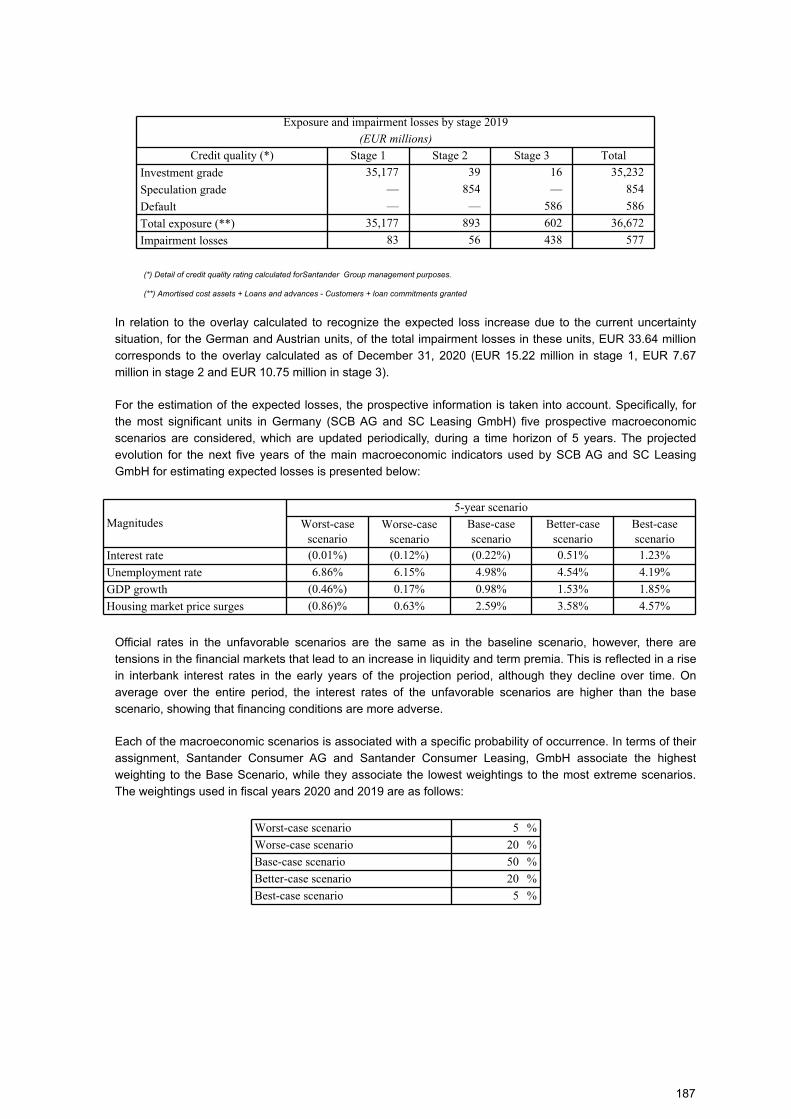
Exposure and impairment losses by stage 2019
(EUR millions)
Credit quality (*) Stage 1 Stage 2 Stage 3 Total
Investment grade 35,177 39 16 35,232
Speculation grade — 854 — 854
Default — — 586 586
Total exposure (**) 35,177 893 602 36,672
Impairment losses 83 56 438 577
(*) Detail of credit quality rating calculated forSantander Group management purposes.
(**) Amortised cost assets + Loans and advances - Customers + loan commitments granted
In relation to the overlay calculated to recognize the expected loss increase due to the current uncertainty
situation, for the German and Austrian units, of the total impairment losses in these units, EUR 33.64 million
corresponds to the overlay calculated as of December 31, 2020 (EUR 15.22 million in stage 1, EUR 7.67
million in stage 2 and EUR 10.75 million in stage 3).
For the estimation of the expected losses, the prospective information is taken into account. Specifically, for
the most significant units in Germany (SCB AG and SC Leasing GmbH) five prospective macroeconomic
scenarios are considered, which are updated periodically, during a time horizon of 5 years. The projected
evolution for the next five years of the main macroeconomic indicators used by SCB AG and SC Leasing
GmbH for estimating expected losses is presented below:
Magnitudes5-year scenario
Worst-case scenario
Worse-case scenario
Base-case scenario
Better-case scenario
Best-case scenario
Interest rate (0.01%) (0.12%) (0.22%) 0.51% 1.23%
Unemployment rate 6.86% 6.15% 4.98% 4.54% 4.19%
GDP growth (0.46%) 0.17% 0.98% 1.53% 1.85%
Housing market price surges (0.86)% 0.63% 2.59% 3.58% 4.57%
Official rates in the unfavorable scenarios are the same as in the baseline scenario, however, there are
tensions in the financial markets that lead to an increase in liquidity and term premia. This is reflected in a rise
in interbank interest rates in the early years of the projection period, although they decline over time. On
average over the entire period, the interest rates of the unfavorable scenarios are higher than the base
scenario, showing that financing conditions are more adverse.
Each of the macroeconomic scenarios is associated with a specific probability of occurrence. In terms of their
assignment, Santander Consumer AG and Santander Consumer Leasing, GmbH associate the highest
weighting to the Base Scenario, while they associate the lowest weightings to the most extreme scenarios.
The weightings used in fiscal years 2020 and 2019 are as follows:
Worst-case scenario 5 %
Worse-case scenario 20 %
Base-case scenario 50 %
Better-case scenario 20 %
Best-case scenario 5 %
187
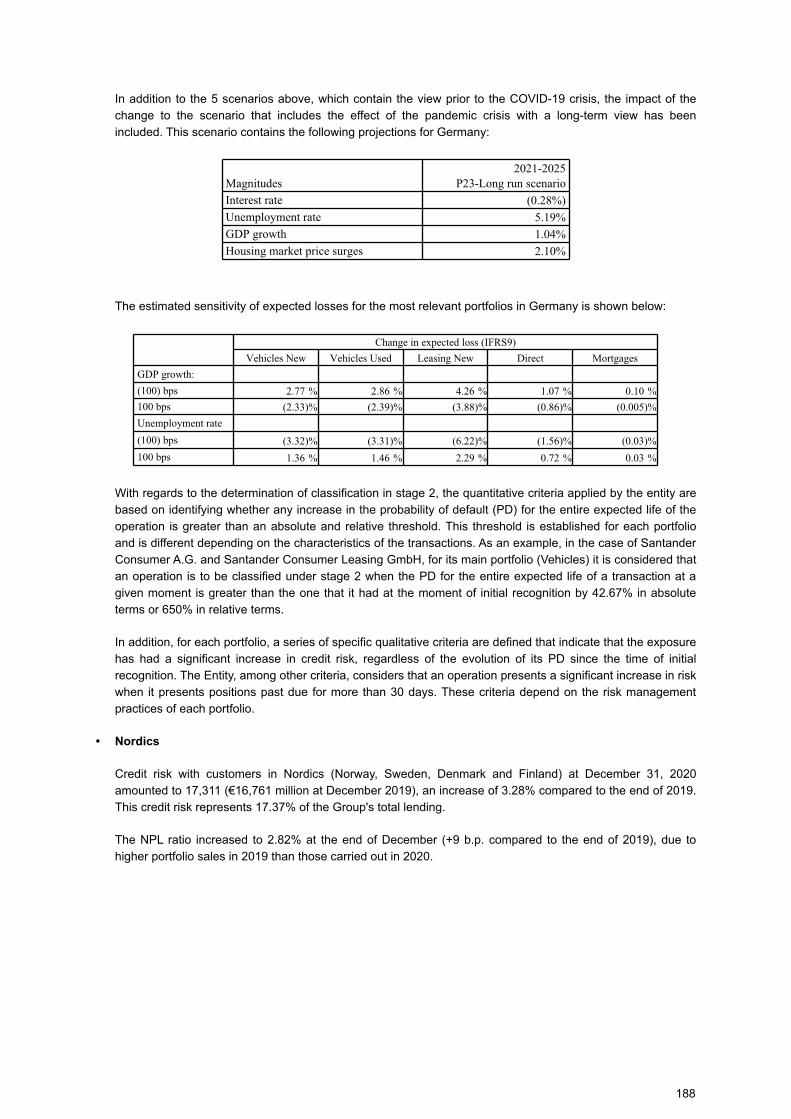
In addition to the 5 scenarios above, which contain the view prior to the COVID-19 crisis, the impact of the
change to the scenario that includes the effect of the pandemic crisis with a long-term view has been
included. This scenario contains the following projections for Germany:
Magnitudes2021-2025
P23-Long run scenario
Interest rate (0.28%)
Unemployment rate 5.19%
GDP growth 1.04%
Housing market price surges 2.10%
The estimated sensitivity of expected losses for the most relevant portfolios in Germany is shown below:
Change in expected loss (IFRS9)
Vehicles New Vehicles Used Leasing New Direct Mortgages
GDP growth:
(100) bps 2.77 % 2.86 % 4.26 % 1.07 % 0.10 %
100 bps (2.33) % (2.39) % (3.88) % (0.86) % (0.005) %
Unemployment rate
(100) bps (3.32) % (3.31) % (6.22) % (1.56) % (0.03) %
100 bps 1.36 % 1.46 % 2.29 % 0.72 % 0.03 %
With regards to the determination of classification in stage 2, the quantitative criteria applied by the entity are
based on identifying whether any increase in the probability of default (PD) for the entire expected life of the
operation is greater than an absolute and relative threshold. This threshold is established for each portfolio
and is different depending on the characteristics of the transactions. As an example, in the case of Santander
Consumer A.G. and Santander Consumer Leasing GmbH, for its main portfolio (Vehicles) it is considered that
an operation is to be classified under stage 2 when the PD for the entire expected life of a transaction at a
given moment is greater than the one that it had at the moment of initial recognition by 42.67% in absolute
terms or 650% in relative terms.
In addition, for each portfolio, a series of specific qualitative criteria are defined that indicate that the exposure
has had a significant increase in credit risk, regardless of the evolution of its PD since the time of initial
recognition. The Entity, among other criteria, considers that an operation presents a significant increase in risk
when it presents positions past due for more than 30 days. These criteria depend on the risk management
practices of each portfolio.
• Nordics
Credit risk with customers in Nordics (Norway, Sweden, Denmark and Finland) at December 31, 2020
amounted to 17,311 (€16,761 million at December 2019), an increase of 3.28% compared to the end of 2019.
This credit risk represents 17.37% of the Group's total lending.
The NPL ratio increased to 2.82% at the end of December (+9 b.p. compared to the end of 2019), due to
higher portfolio sales in 2019 than those carried out in 2020.
188
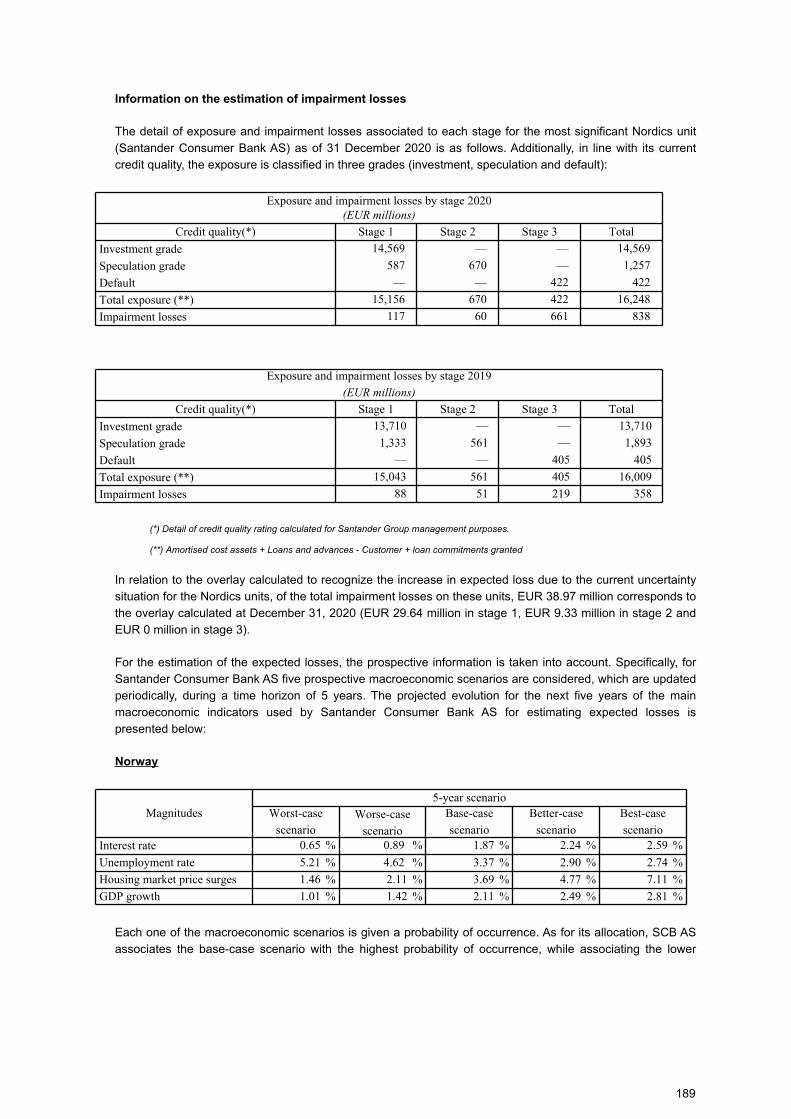
Information on the estimation of impairment losses
The detail of exposure and impairment losses associated to each stage for the most significant Nordics unit
(Santander Consumer Bank AS) as of 31 December 2020 is as follows. Additionally, in line with its current
credit quality, the exposure is classified in three grades (investment, speculation and default):
Exposure and impairment losses by stage 2020(EUR millions)
Credit quality(*) Stage 1 Stage 2 Stage 3 Total
Investment grade 14,569 — — 14,569
Speculation grade 587 670 — 1,257
Default — — 422 422
Total exposure (**) 15,156 670 422 16,248
Impairment losses 117 60 661 838
Exposure and impairment losses by stage 2019
(EUR millions)
Credit quality(*) Stage 1 Stage 2 Stage 3 Total
Investment grade 13,710 — — 13,710
Speculation grade 1,333 561 — 1,893
Default — — 405 405
Total exposure (**) 15,043 561 405 16,009
Impairment losses 88 51 219 358
(*) Detail of credit quality rating calculated for Santander Group management purposes.
(**) Amortised cost assets + Loans and advances - Customer + loan commitments granted
In relation to the overlay calculated to recognize the increase in expected loss due to the current uncertainty
situation for the Nordics units, of the total impairment losses on these units, EUR 38.97 million corresponds to
the overlay calculated at December 31, 2020 (EUR 29.64 million in stage 1, EUR 9.33 million in stage 2 and
EUR 0 million in stage 3).
For the estimation of the expected losses, the prospective information is taken into account. Specifically, for
Santander Consumer Bank AS five prospective macroeconomic scenarios are considered, which are updated
periodically, during a time horizon of 5 years. The projected evolution for the next five years of the main
macroeconomic indicators used by Santander Consumer Bank AS for estimating expected losses is
presented below:
Norway
Magnitudes5-year scenario
Worst-case
scenarioWorse-case
scenario
Base-case
scenario
Better-case
scenario
Best-case
scenarioInterest rate 0.65 % 0.89 % 1.87 % 2.24 % 2.59 %
Unemployment rate 5.21 % 4.62 % 3.37 % 2.90 % 2.74 %
Housing market price surges 1.46 % 2.11 % 3.69 % 4.77 % 7.11 %
GDP growth 1.01 % 1.42 % 2.11 % 2.49 % 2.81 %
Each one of the macroeconomic scenarios is given a probability of occurrence. As for its allocation, SCB AS
associates the base-case scenario with the highest probability of occurrence, while associating the lower
189
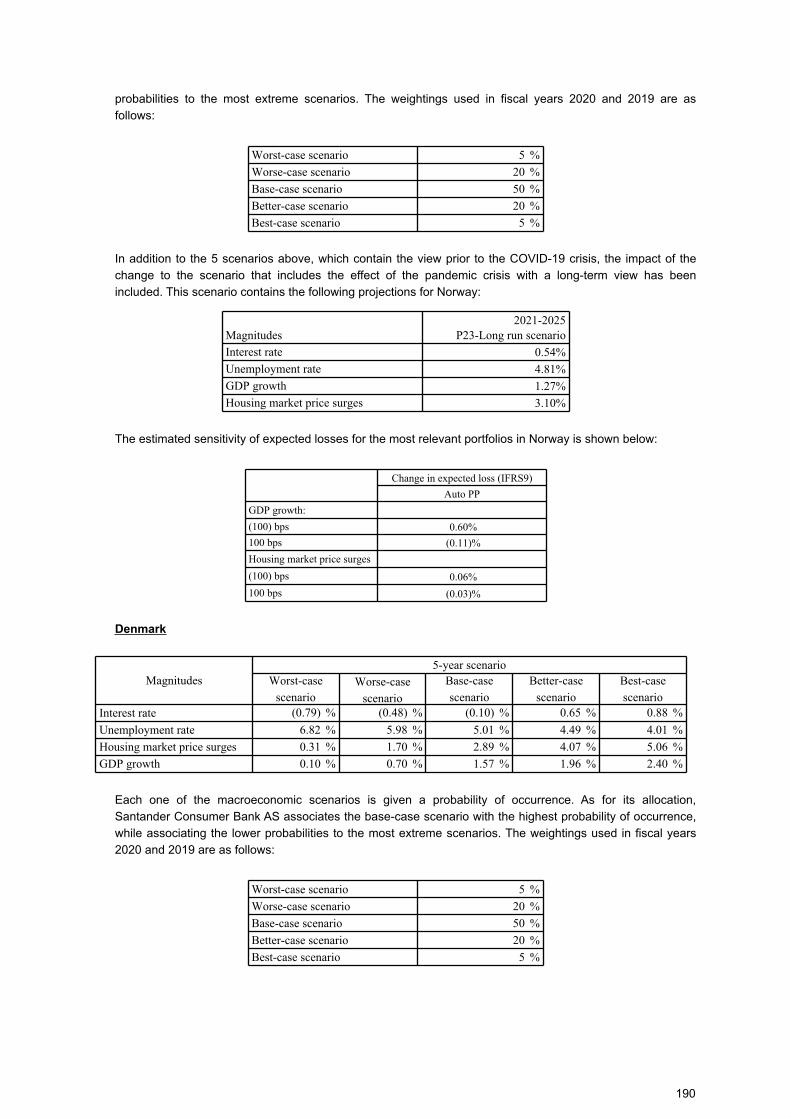
probabilities to the most extreme scenarios. The weightings used in fiscal years 2020 and 2019 are as
follows:
Worst-case scenario 5 %
Worse-case scenario 20 %
Base-case scenario 50 %
Better-case scenario 20 %
Best-case scenario 5 %
In addition to the 5 scenarios above, which contain the view prior to the COVID-19 crisis, the impact of the
change to the scenario that includes the effect of the pandemic crisis with a long-term view has been
included. This scenario contains the following projections for Norway:
Magnitudes2021-2025
P23-Long run scenario
Interest rate 0.54%
Unemployment rate 4.81%
GDP growth 1.27%
Housing market price surges 3.10%
The estimated sensitivity of expected losses for the most relevant portfolios in Norway is shown below:
Change in expected loss (IFRS9)
Auto PP
GDP growth:
(100) bps 0.60%
100 bps (0.11)%
Housing market price surges
(100) bps 0.06%
100 bps (0.03)%
Denmark
Magnitudes5-year scenario
Worst-case
scenarioWorse-case
scenario
Base-case
scenario
Better-case
scenario
Best-case
scenarioInterest rate (0.79) % (0.48) % (0.10) % 0.65 % 0.88 %
Unemployment rate 6.82 % 5.98 % 5.01 % 4.49 % 4.01 %
Housing market price surges 0.31 % 1.70 % 2.89 % 4.07 % 5.06 %
GDP growth 0.10 % 0.70 % 1.57 % 1.96 % 2.40 %
Each one of the macroeconomic scenarios is given a probability of occurrence. As for its allocation,
Santander Consumer Bank AS associates the base-case scenario with the highest probability of occurrence,
while associating the lower probabilities to the most extreme scenarios. The weightings used in fiscal years
2020 and 2019 are as follows:
Worst-case scenario 5 %
Worse-case scenario 20 %
Base-case scenario 50 %
Better-case scenario 20 %
Best-case scenario 5 %
190
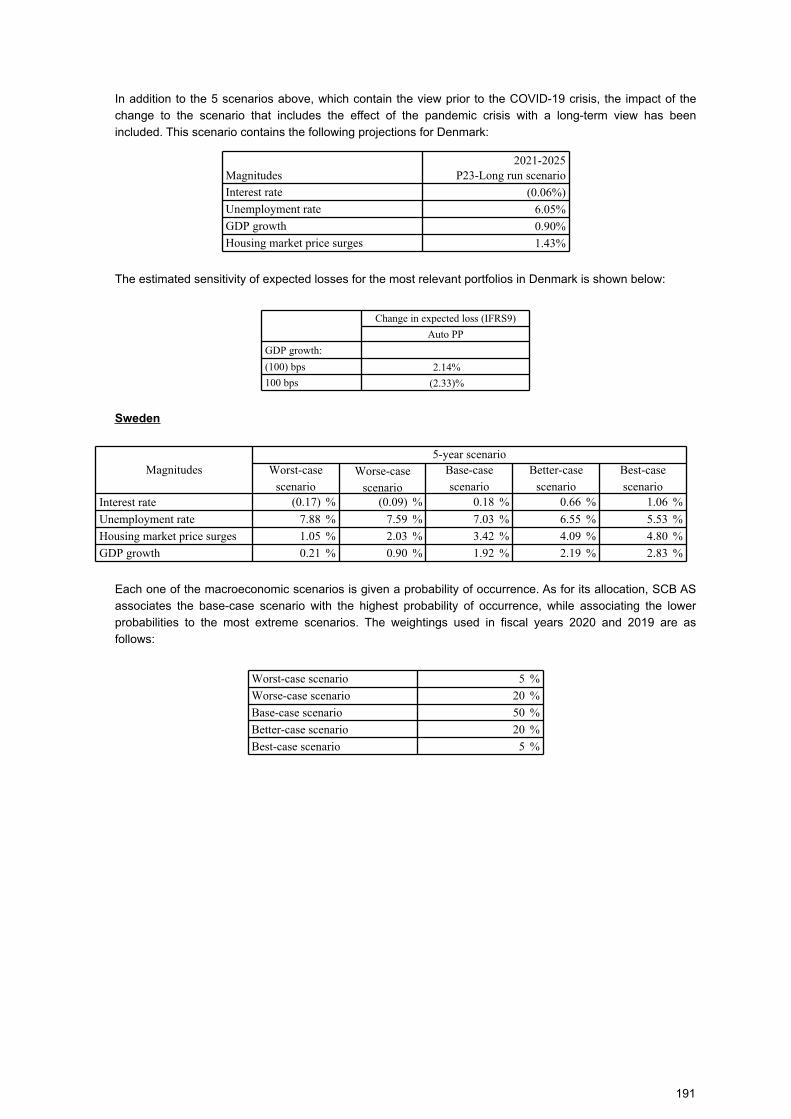
In addition to the 5 scenarios above, which contain the view prior to the COVID-19 crisis, the impact of the
change to the scenario that includes the effect of the pandemic crisis with a long-term view has been
included. This scenario contains the following projections for Denmark:
Magnitudes2021-2025
P23-Long run scenario
Interest rate (0.06%)
Unemployment rate 6.05%
GDP growth 0.90%
Housing market price surges 1.43%
The estimated sensitivity of expected losses for the most relevant portfolios in Denmark is shown below:
Change in expected loss (IFRS9)
Auto PP
GDP growth:
(100) bps 2.14%
100 bps (2.33)%
Sweden
Magnitudes5-year scenario
Worst-case
scenarioWorse-case
scenario
Base-case
scenario
Better-case
scenario
Best-case
scenarioInterest rate (0.17) % (0.09) % 0.18 % 0.66 % 1.06 %
Unemployment rate 7.88 % 7.59 % 7.03 % 6.55 % 5.53 %
Housing market price surges 1.05 % 2.03 % 3.42 % 4.09 % 4.80 %
GDP growth 0.21 % 0.90 % 1.92 % 2.19 % 2.83 %
Each one of the macroeconomic scenarios is given a probability of occurrence. As for its allocation, SCB AS
associates the base-case scenario with the highest probability of occurrence, while associating the lower
probabilities to the most extreme scenarios. The weightings used in fiscal years 2020 and 2019 are as
follows:
Worst-case scenario 5 %
Worse-case scenario 20 %
Base-case scenario 50 %
Better-case scenario 20 %
Best-case scenario 5 %
191
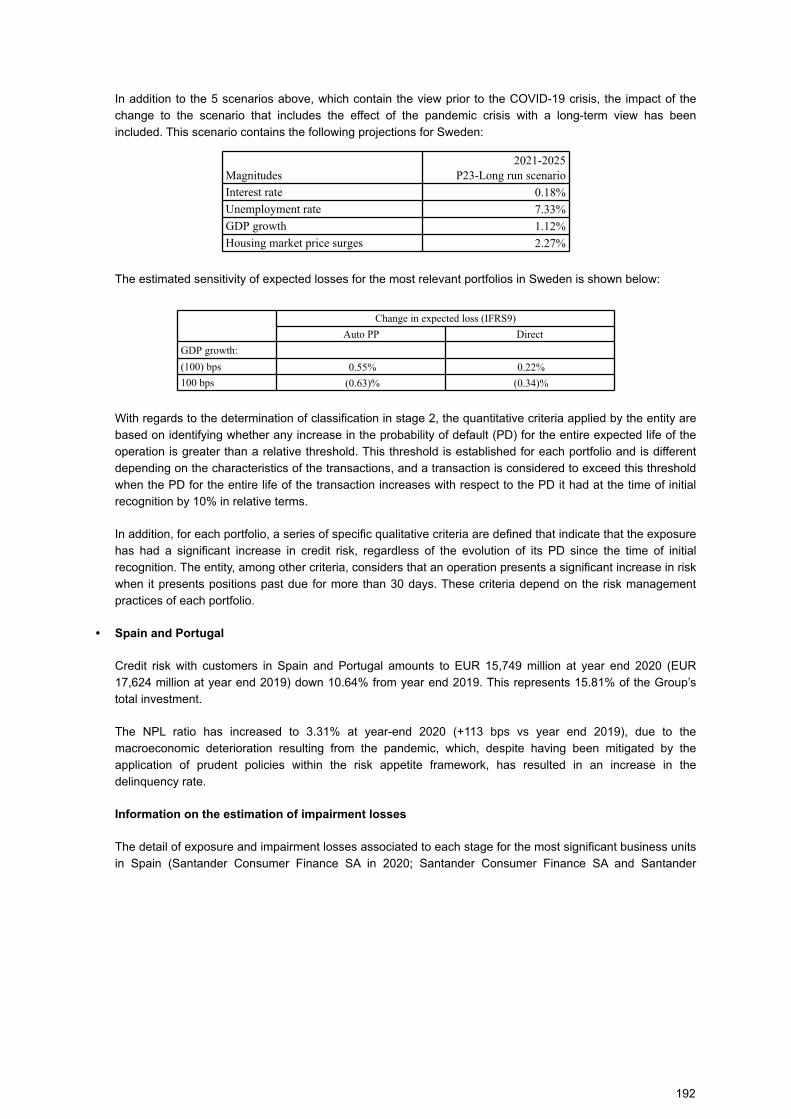
In addition to the 5 scenarios above, which contain the view prior to the COVID-19 crisis, the impact of the
change to the scenario that includes the effect of the pandemic crisis with a long-term view has been
included. This scenario contains the following projections for Sweden:
Magnitudes2021-2025
P23-Long run scenario
Interest rate 0.18%
Unemployment rate 7.33%
GDP growth 1.12%
Housing market price surges 2.27%
The estimated sensitivity of expected losses for the most relevant portfolios in Sweden is shown below:
Change in expected loss (IFRS9)
Auto PP Direct
GDP growth:
(100) bps 0.55% 0.22%
100 bps (0.63)% (0.34)%
With regards to the determination of classification in stage 2, the quantitative criteria applied by the entity are
based on identifying whether any increase in the probability of default (PD) for the entire expected life of the
operation is greater than a relative threshold. This threshold is established for each portfolio and is different
depending on the characteristics of the transactions, and a transaction is considered to exceed this threshold
when the PD for the entire life of the transaction increases with respect to the PD it had at the time of initial
recognition by 10% in relative terms.
In addition, for each portfolio, a series of specific qualitative criteria are defined that indicate that the exposure
has had a significant increase in credit risk, regardless of the evolution of its PD since the time of initial
recognition. The entity, among other criteria, considers that an operation presents a significant increase in risk
when it presents positions past due for more than 30 days. These criteria depend on the risk management
practices of each portfolio.
• Spain and Portugal
Credit risk with customers in Spain and Portugal amounts to EUR 15,749 million at year end 2020 (EUR
17,624 million at year end 2019) down 10.64% from year end 2019. This represents 15.81% of the Group’s
total investment.
The NPL ratio has increased to 3.31% at year-end 2020 (+113 bps vs year end 2019), due to the
macroeconomic deterioration resulting from the pandemic, which, despite having been mitigated by the
application of prudent policies within the risk appetite framework, has resulted in an increase in the
delinquency rate.
Information on the estimation of impairment losses
The detail of exposure and impairment losses associated to each stage for the most significant business units
in Spain (Santander Consumer Finance SA in 2020; Santander Consumer Finance SA and Santander
192
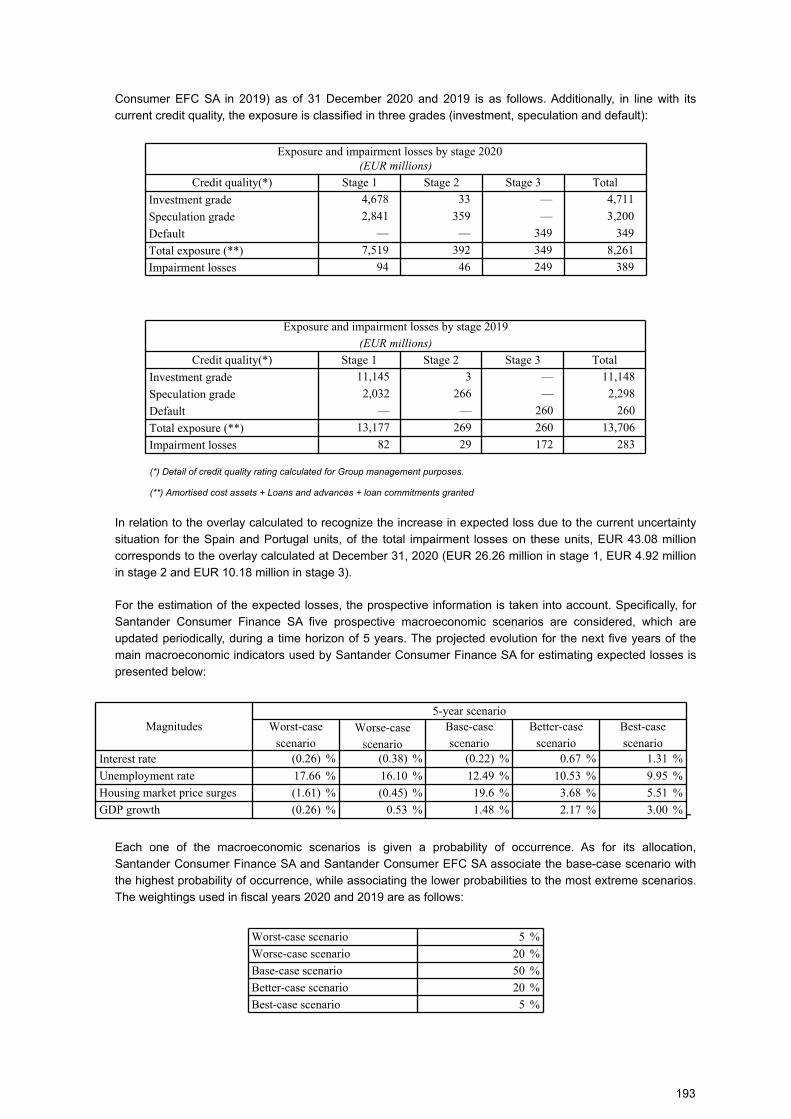
Consumer EFC SA in 2019) as of 31 December 2020 and 2019 is as follows. Additionally, in line with its
current credit quality, the exposure is classified in three grades (investment, speculation and default):
Exposure and impairment losses by stage 2020(EUR millions)
Credit quality(*) Stage 1 Stage 2 Stage 3 Total
Investment grade 4,678 33 — 4,711
Speculation grade 2,841 359 — 3,200
Default — — 349 349
Total exposure (**) 7,519 392 349 8,261
Impairment losses 94 46 249 389
Exposure and impairment losses by stage 2019
(EUR millions)
Credit quality(*) Stage 1 Stage 2 Stage 3 Total
Investment grade 11,145 3 — 11,148
Speculation grade 2,032 266 — 2,298
Default — — 260 260
Total exposure (**) 13,177 269 260 13,706
Impairment losses 82 29 172 283
(*) Detail of credit quality rating calculated for Group management purposes.
(**) Amortised cost assets + Loans and advances + loan commitments granted
In relation to the overlay calculated to recognize the increase in expected loss due to the current uncertainty
situation for the Spain and Portugal units, of the total impairment losses on these units, EUR 43.08 million
corresponds to the overlay calculated at December 31, 2020 (EUR 26.26 million in stage 1, EUR 4.92 million
in stage 2 and EUR 10.18 million in stage 3).
For the estimation of the expected losses, the prospective information is taken into account. Specifically, for
Santander Consumer Finance SA five prospective macroeconomic scenarios are considered, which are
updated periodically, during a time horizon of 5 years. The projected evolution for the next five years of the
main macroeconomic indicators used by Santander Consumer Finance SA for estimating expected losses is
presented below:
-
Magnitudes5-year scenario
Worst-case
scenarioWorse-case
scenario
Base-case
scenario
Better-case
scenario
Best-case
scenarioInterest rate (0.26) % (0.38) % (0.22) % 0.67 % 1.31 %
Unemployment rate 17.66 % 16.10 % 12.49 % 10.53 % 9.95 %
Housing market price surges (1.61) % (0.45) % 19.6 % 3.68 % 5.51 %
GDP growth (0.26) % 0.53 % 1.48 % 2.17 % 3.00 %
Each one of the macroeconomic scenarios is given a probability of occurrence. As for its allocation,
Santander Consumer Finance SA and Santander Consumer EFC SA associate the base-case scenario with
the highest probability of occurrence, while associating the lower probabilities to the most extreme scenarios.
The weightings used in fiscal years 2020 and 2019 are as follows:
Worst-case scenario 5 %
Worse-case scenario 20 %
Base-case scenario 50 %
Better-case scenario 20 %
Best-case scenario 5 %
193
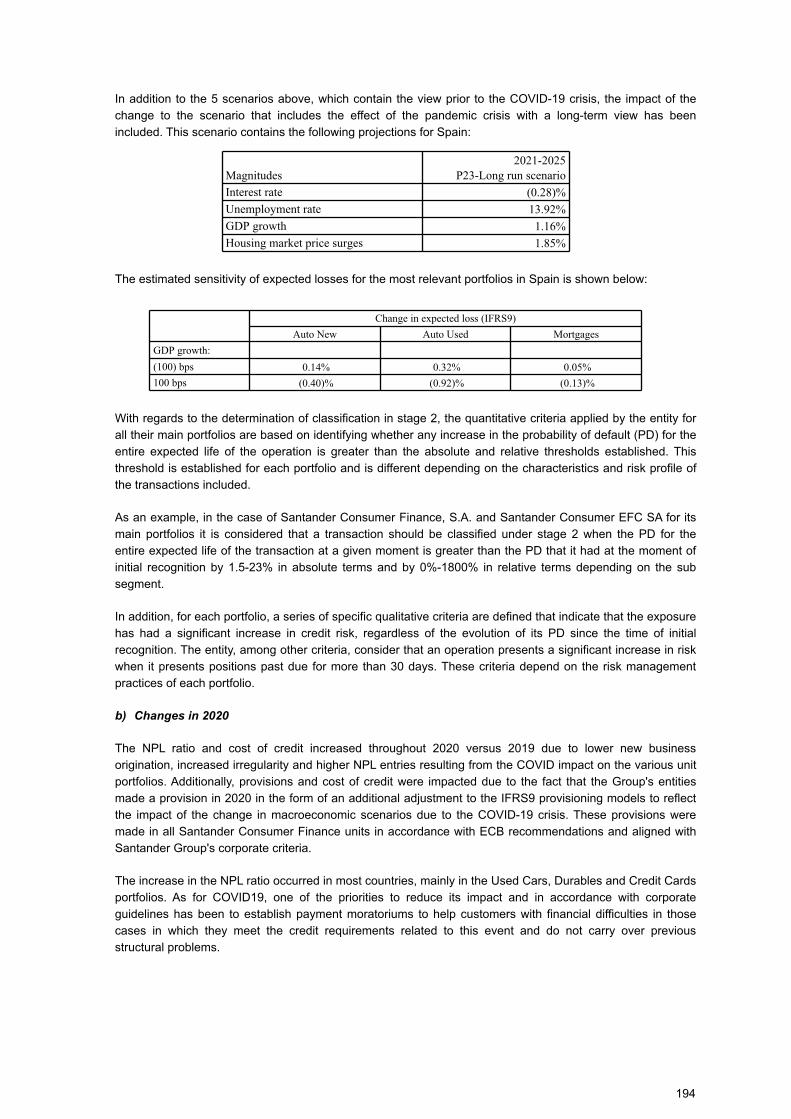
In addition to the 5 scenarios above, which contain the view prior to the COVID-19 crisis, the impact of the
change to the scenario that includes the effect of the pandemic crisis with a long-term view has been
included. This scenario contains the following projections for Spain:
Magnitudes2021-2025
P23-Long run scenario
Interest rate (0.28)%
Unemployment rate 13.92%
GDP growth 1.16%
Housing market price surges 1.85%
The estimated sensitivity of expected losses for the most relevant portfolios in Spain is shown below:
Change in expected loss (IFRS9)
Auto New Auto Used Mortgages
GDP growth:
(100) bps 0.14% 0.32% 0.05%
100 bps (0.40)% (0.92)% (0.13)%
With regards to the determination of classification in stage 2, the quantitative criteria applied by the entity for
all their main portfolios are based on identifying whether any increase in the probability of default (PD) for the
entire expected life of the operation is greater than the absolute and relative thresholds established. This
threshold is established for each portfolio and is different depending on the characteristics and risk profile of
the transactions included.
As an example, in the case of Santander Consumer Finance, S.A. and Santander Consumer EFC SA for its
main portfolios it is considered that a transaction should be classified under stage 2 when the PD for the
entire expected life of the transaction at a given moment is greater than the PD that it had at the moment of
initial recognition by 1.5-23% in absolute terms and by 0%-1800% in relative terms depending on the sub
segment.
In addition, for each portfolio, a series of specific qualitative criteria are defined that indicate that the exposure
has had a significant increase in credit risk, regardless of the evolution of its PD since the time of initial
recognition. The entity, among other criteria, consider that an operation presents a significant increase in risk
when it presents positions past due for more than 30 days. These criteria depend on the risk management
practices of each portfolio.
b) Changes in 2020
The NPL ratio and cost of credit increased throughout 2020 versus 2019 due to lower new business
origination, increased irregularity and higher NPL entries resulting from the COVID impact on the various unit
portfolios. Additionally, provisions and cost of credit were impacted due to the fact that the Group's entities
made a provision in 2020 in the form of an additional adjustment to the IFRS9 provisioning models to reflect
the impact of the change in macroeconomic scenarios due to the COVID-19 crisis. These provisions were
made in all Santander Consumer Finance units in accordance with ECB recommendations and aligned with
Santander Group's corporate criteria.
The increase in the NPL ratio occurred in most countries, mainly in the Used Cars, Durables and Credit Cards
portfolios. As for COVID19, one of the priorities to reduce its impact and in accordance with corporate
guidelines has been to establish payment moratoriums to help customers with financial difficulties in those
cases in which they meet the credit requirements related to this event and do not carry over previous
structural problems.
194
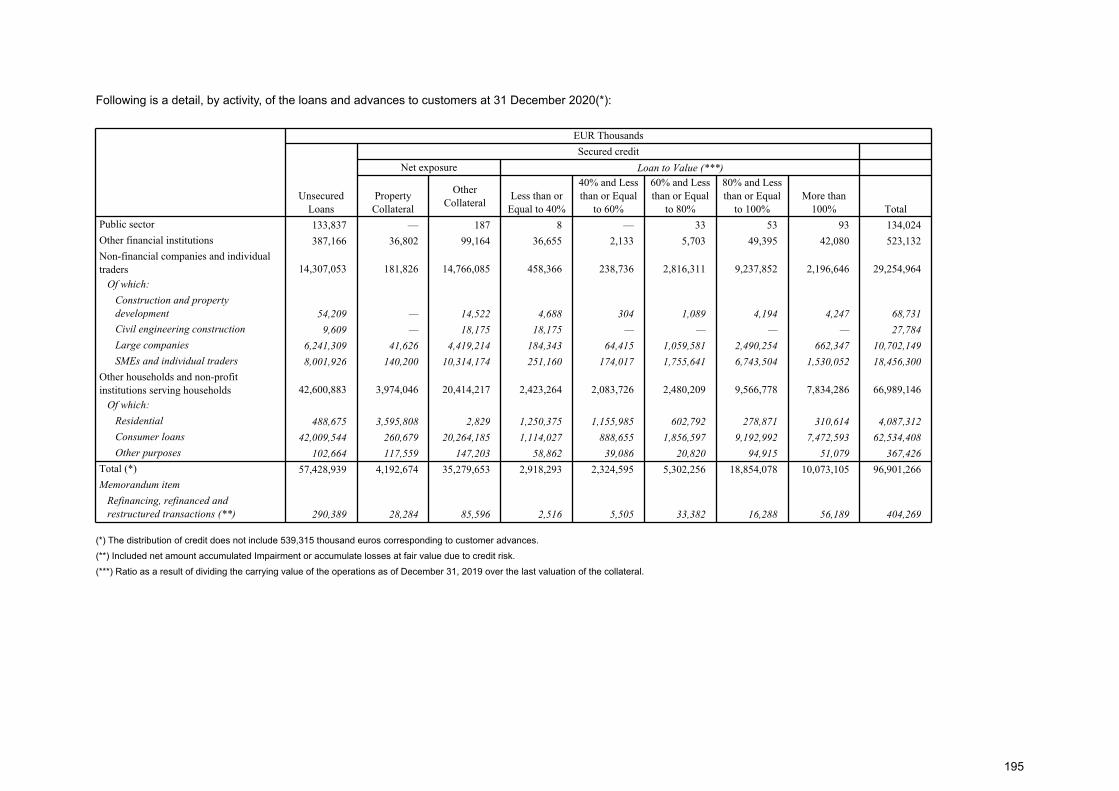
Following is a detail, by activity, of the loans and advances to customers at 31 December 2020(*):
EUR Thousands
Unsecured Loans
Secured credit
Net exposure Loan to Value (***)
Property Collateral
Other Collateral
Less than or Equal to 40%
40% and Less than or Equal
to 60%
60% and Less than or Equal
to 80%
80% and Less than or Equal
to 100%More than
100% Total
Public sector 133,837 — 187 8 — 33 53 93 134,024
Other financial institutions 387,166 36,802 99,164 36,655 2,133 5,703 49,395 42,080 523,132
Non-financial companies and individual traders 14,307,053 181,826 14,766,085 458,366 238,736 2,816,311 9,237,852 2,196,646 29,254,964
Of which:
Construction and property
development 54,209 — 14,522 4,688 304 1,089 4,194 4,247 68,731
Civil engineering construction 9,609 — 18,175 18,175 — — — — 27,784
Large companies 6,241,309 41,626 4,419,214 184,343 64,415 1,059,581 2,490,254 662,347 10,702,149
SMEs and individual traders 8,001,926 140,200 10,314,174 251,160 174,017 1,755,641 6,743,504 1,530,052 18,456,300
Other households and non-profit institutions serving households 42,600,883 3,974,046 20,414,217 2,423,264 2,083,726 2,480,209 9,566,778 7,834,286 66,989,146
Of which:
Residential 488,675 3,595,808 2,829 1,250,375 1,155,985 602,792 278,871 310,614 4,087,312
Consumer loans 42,009,544 260,679 20,264,185 1,114,027 888,655 1,856,597 9,192,992 7,472,593 62,534,408
Other purposes 102,664 117,559 147,203 58,862 39,086 20,820 94,915 51,079 367,426
Total (*) 57,428,939 4,192,674 35,279,653 2,918,293 2,324,595 5,302,256 18,854,078 10,073,105 96,901,266
Memorandum item
Refinancing, refinanced and
restructured transactions (**) 290,389 28,284 85,596 2,516 5,505 33,382 16,288 56,189 404,269
(*) The distribution of credit does not include 539,315 thousand euros corresponding to customer advances.
(**) Included net amount accumulated Impairment or accumulate losses at fair value due to credit risk.
(***) Ratio as a result of dividing the carrying value of the operations as of December 31, 2019 over the last valuation of the collateral.
195
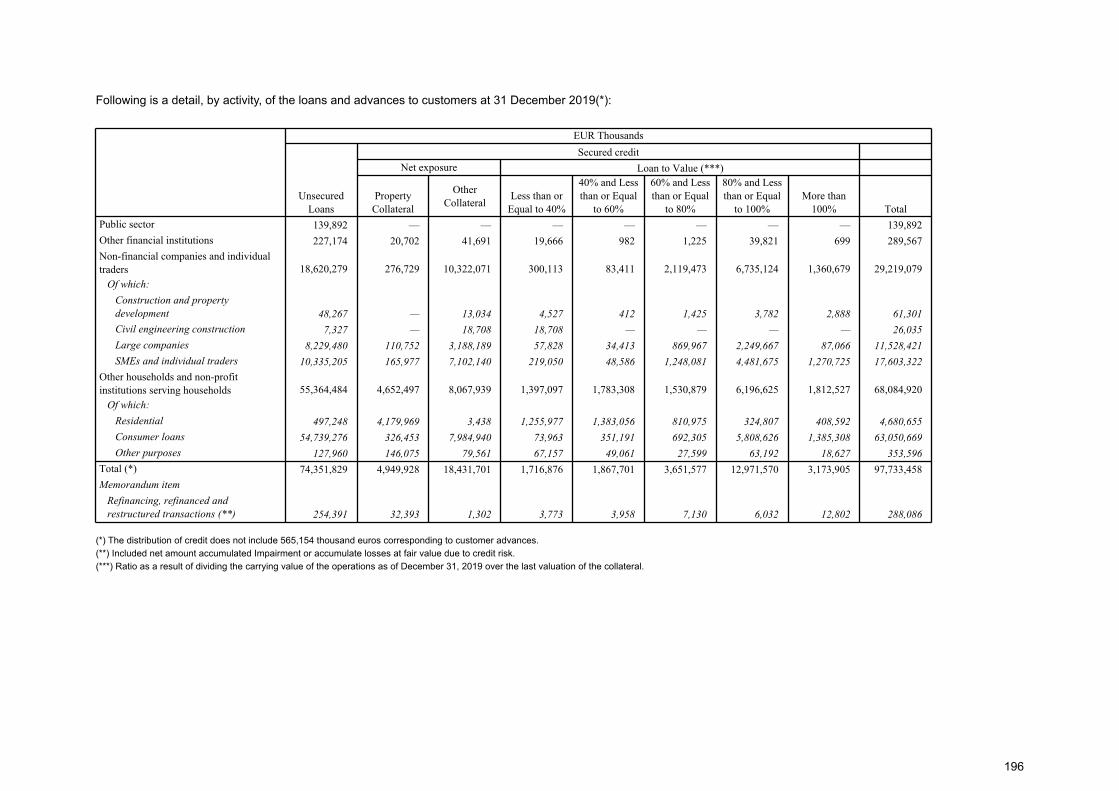
Following is a detail, by activity, of the loans and advances to customers at 31 December 2019(*):
EUR Thousands
Unsecured Loans
Secured credit
Net exposure Loan to Value (***)
Property Collateral
Other Collateral
Less than or Equal to 40%
40% and Less than or Equal
to 60%
60% and Less than or Equal
to 80%
80% and Less than or Equal
to 100%More than
100% Total
Public sector 139,892 — — — — — — — 139,892
Other financial institutions 227,174 20,702 41,691 19,666 982 1,225 39,821 699 289,567
Non-financial companies and individual traders 18,620,279 276,729 10,322,071 300,113 83,411 2,119,473 6,735,124 1,360,679 29,219,079
Of which:
Construction and property
development 48,267 — 13,034 4,527 412 1,425 3,782 2,888 61,301
Civil engineering construction 7,327 — 18,708 18,708 — — — — 26,035
Large companies 8,229,480 110,752 3,188,189 57,828 34,413 869,967 2,249,667 87,066 11,528,421
SMEs and individual traders 10,335,205 165,977 7,102,140 219,050 48,586 1,248,081 4,481,675 1,270,725 17,603,322
Other households and non-profit institutions serving households 55,364,484 4,652,497 8,067,939 1,397,097 1,783,308 1,530,879 6,196,625 1,812,527 68,084,920
Of which:
Residential 497,248 4,179,969 3,438 1,255,977 1,383,056 810,975 324,807 408,592 4,680,655
Consumer loans 54,739,276 326,453 7,984,940 73,963 351,191 692,305 5,808,626 1,385,308 63,050,669
Other purposes 127,960 146,075 79,561 67,157 49,061 27,599 63,192 18,627 353,596
Total (*) 74,351,829 4,949,928 18,431,701 1,716,876 1,867,701 3,651,577 12,971,570 3,173,905 97,733,458
Memorandum item
Refinancing, refinanced and
restructured transactions (**) 254,391 32,393 1,302 3,773 3,958 7,130 6,032 12,802 288,086
(*) The distribution of credit does not include 565,154 thousand euros corresponding to customer advances.
(**) Included net amount accumulated Impairment or accumulate losses at fair value due to credit risk.
(***) Ratio as a result of dividing the carrying value of the operations as of December 31, 2019 over the last valuation of the collateral.
196
Forborne loan portfolio
The term “forborne loan portfolio” refers, for the purposes of the Group's risk management, to those
transactions in which the customer has, or might foreseeably have, financial difficulty in meeting its payment
obligations under the terms and conditions of the current agreement and, accordingly, the agreement has
been modified or cancelled or even a new transaction has been entered into.
The Santander Group, which Santander Consumer Finance Group belongs to, has a detailed customer debt
forbearance policy that serves as a reference for the various local adaptations made for all the financial
institutions forming part of the Group. This policy shares the principles laid down in both Bank of Spain
Circular 4/2017 of 27 November 2017, which it develops in greater detail based on the level of customer
impairment.
This policy establishes strict prudential criteria for the assessment of these loans:
– The use of this practice is restricted, and any actions that might defer the recognition of impairment
must be avoided.
– The main aim must be to recover the amounts owed, and any amounts deemed unrecoverable must
be recognised as soon as possible.
– Forbearance must always envisage maintaining the existing guarantees and, if possible, enhance
them. Not only can effective guarantees serve to mitigate losses given default, but they might also
reduce the probability of default.
– This practice must not give rise to the granting of additional funding or be used to refinance debt of
other entities or as a cross-selling instrument.
– All the alternatives to forbearance and their impacts must be assessed, making sure that the results of
this practice will exceed those which would foreseeably be obtained if it were not performed.
– Forborne transactions are classified using more stringent criteria which prudentially ensure that the
customer's ability to pay is restored from the date of forbearance and for an adequate period of time
thereafter.
– In addition, in the case of customers that have been assigned a risk analyst, it is particularly important
to conduct an individual analysis of each specific case, for both the proper identification of the
transaction and its subsequent classification, monitoring and adequate provisioning.
The forbearance policy also sets out various criteria for determining the scope of transactions qualifying as
forborne exposures by defining a detailed series of objective indicators that permit identification of situations
of financial difficulty.
Accordingly, transactions not classified as non-performing at the date of forbearance are generally considered
to be experiencing financial difficulty if at that date, they were more than one month past due. Where no
payments have been missed or there are no payments more than one month past due, other indicators of
financial difficulty are taken into account, including most notably the following:
– Transactions with customers who are already experiencing difficulties in other transactions.
– Situations where a transaction has to be modified prematurely, and the Group has not yet had a
previous satisfactory experience with the customer.
– Cases in which the necessary modifications entail the grant of special conditions, such as the
establishment of a grace period, or where these new conditions are deemed to be more favourable for
the customer than those which would have been granted for an ordinary loan approval.
197

– Where a customer submits successive loan modification requests at unreasonable time intervals.
– In any case, if once the modification has been made any payment irregularity arises during a given
probation period (as evidenced by back testing), even in the absence of any other symptoms, the
transaction will be deemed to be within the scope of forborne exposures.
Once it has been determined that the reasons for the modification of the customer’s debt conditions are due
to financial difficulties, regardless of whether or not the customer has outstanding payments and the number
of days payment has been outstanding, and the customer will be considered to be under monitoring for all
purposes and, as such, will be manages in accordance with this policy.
Once forbearance measures have been adopted, transactions that have to remain classified as non-
performing because at the date of forbearance they do not meet the regulatory requirements to be
reclassified to a different category must comply with a continuous prudential payment schedule in order to
assure reasonable certainty as to the recovery of the ability to pay.
If there is any (non-technical) default in payments during that period, the aforementioned payment schedule
starts again.
On successful completion of the period, the duration of which depends on the customer's situation and the
transaction features (term and guarantees provided), the transaction is no longer considered to be non-
performing, although it continues to be subject to a probation period during which it undergoes special
monitoring.
This monitoring continues until a series of requirements have been met, including most notably: a minimum
observation period of 24 months; repayment of a substantial percentage of the outstanding amounts; and
settlement of the amounts that were past due at the time of forbearance.
When forbearance is applied to a transaction classified as non-performing, the original default dates continue
to be considered for all purposes, irrespective of whether as a result of forbearance the transaction becomes
current in its payments. Also, the forbearance of a transaction classified as non-performing does not give rise
to any release of the related provisions.
Set forth below is the quantitative information required by Bank of Spain Circular 4/2017 on the restructured
transactions in force at 31 December 2020 and 2019, taking into consideration the above criteria:
198
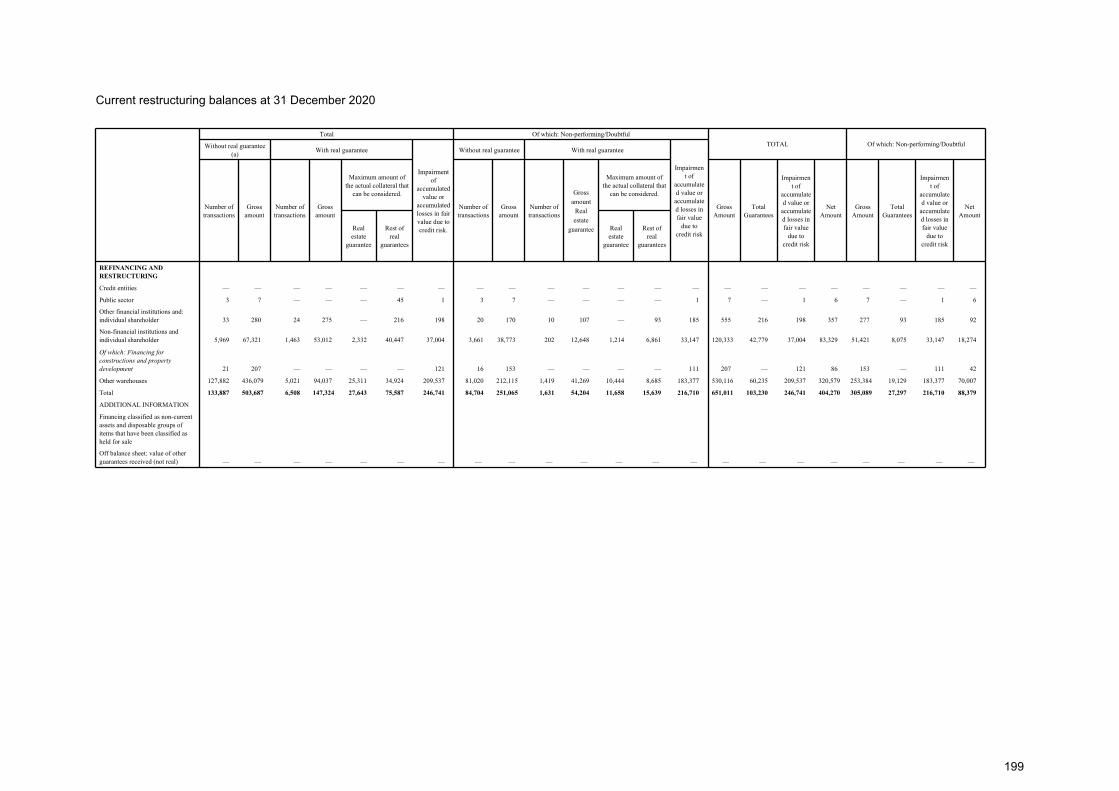
Current restructuring balances at 31 December 2020
Total Of which: Non-performing/Doubtful
TOTAL Of which: Non-performing/DoubtfulWithout real guarantee (a)
With real guarantee
Impairment of
accumulated value or
accumulated losses in fair value due to credit risk.
Without real guarantee With real guarantee
Impairment of
accumulated value or
accumulated losses in fair value
due to credit risk
Number of transactions
Gross amount
Number of transactions
Gross amount
Maximum amount of the actual collateral that
can be considered.
Number of transactions
Gross amount
Number of transactions
Gross
amount
Real
estate
guarantee
Maximum amount of the actual collateral that
can be considered.
Gross Amount
Total Guarantees
Impairment of
accumulated value or
accumulated losses in fair value
due to credit risk
Net Amount
Gross Amount
Total Guarantees
Impairment of
accumulated value or
accumulated losses in fair value
due to credit risk
Net Amount
Real estate
guarantee
Rest of real
guarantees
Real estate
guarantee
Rest of real
guarantees
REFINANCING AND
RESTRUCTURING
Credit entities — — — — — — — — — — — — — — — — — — — — — —
Public sector 3 7 — — — 45 1 3 7 — — — — 1 7 — 1 6 7 — 1 6
Other financial institutions and: individual shareholder 33 280 24 275 — 216 198 20 170 10 107 — 93 185 555 216 198 357 277 93 185 92
Non-financial institutions and individual shareholder 5,969 67,321 1,463 53,012 2,332 40,447 37,004 3,661 38,773 202 12,648 1,214 6,861 33,147 120,333 42,779 37,004 83,329 51,421 8,075 33,147 18,274
Of which: Financing for
constructions and property
development 21 207 — — — — 121 16 153 — — — — 111 207 — 121 86 153 — 111 42
Other warehouses 127,882 436,079 5,021 94,037 25,311 34,924 209,537 81,020 212,115 1,419 41,269 10,444 8,685 183,377 530,116 60,235 209,537 320,579 253,384 19,129 183,377 70,007
Total 133,887 503,687 6,508 147,324 27,643 75,587 246,741 84,704 251,065 1,631 54,204 11,658 15,639 216,710 651,011 103,230 246,741 404,270 305,089 27,297 216,710 88,379
ADDITIONAL INFORMATION
Financing classified as non-current assets and disposable groups of items that have been classified as held for sale
Off balance sheet: value of other guarantees received (not real) — — — — — — — — — — — — — — — — — — — — — —
199
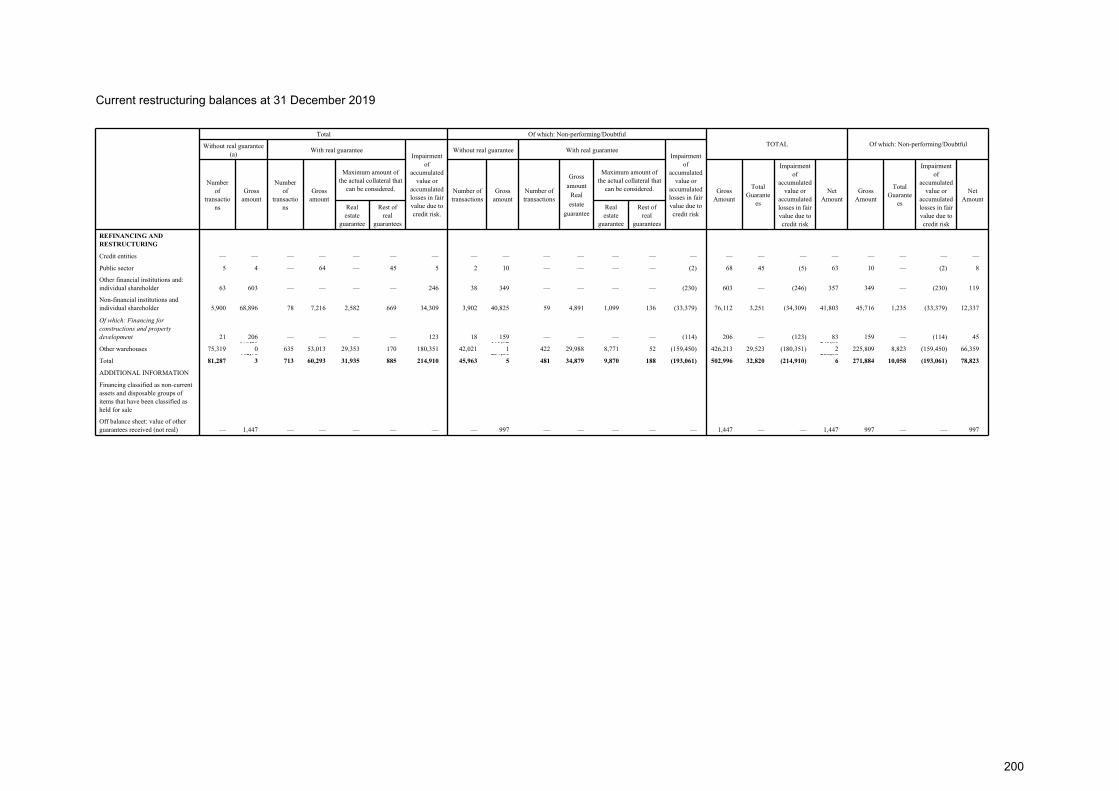
Current restructuring balances at 31 December 2019
Total Of which: Non-performing/Doubtful
TOTAL Of which: Non-performing/DoubtfulWithout real guarantee (a)
With real guaranteeImpairment
of accumulated
value or accumulated losses in fair value due to credit risk.
Without real guarantee With real guaranteeImpairment
of accumulated
value or accumulated losses in fair value due to credit risk
Number of
transactions
Gross amount
Number of
transactions
Gross amount
Maximum amount of the actual collateral that
can be considered. Number of transactions
Gross amount
Number of transactions
Gross
amount
Real
estate
guarantee
Maximum amount of the actual collateral that
can be considered. Gross Amount
Total Guarante
es
Impairment of
accumulated value or
accumulated losses in fair value due to credit risk
Net Amount
Gross Amount
Total Guarante
es
Impairment of
accumulated value or
accumulated losses in fair value due to credit risk
Net Amount
Real estate
guarantee
Rest of real
guarantees
Real estate
guarantee
Rest of real
guarantees
REFINANCING AND
RESTRUCTURING
Credit entities — — — — — — — — — — — — — — — — — — — — — —
Public sector 5 4 — 64 — 45 5 2 10 — — — — (2) 68 45 (5) 63 10 — (2) 8
Other financial institutions and: individual shareholder 63 603 — — — — 246 38 349 — — — — (230) 603 — (246) 357 349 — (230) 119
Non-financial institutions and individual shareholder 5,900 68,896 78 7,216 2,582 669 34,309 3,902 40,825 59 4,891 1,099 136 (33,379) 76,112 3,251 (34,309) 41,803 45,716 1,235 (33,379) 12,337
Of which: Financing for
constructions and property
development 21 206 — — — — 123 18 159 — — — — (114) 206 — (123) 83 159 — (114) 45
Other warehouses 75,319373,20
0 635 53,013 29,353 170 180,351 42,021195,82
1 422 29,988 8,771 52 (159,450) 426,213 29,523 (180,351)245,86
2 225,809 8,823 (159,450) 66,359
Total 81,287
442,70
3 713 60,293 31,935 885 214,910 45,963
237,00
5 481 34,879 9,870 188 (193,061) 502,996 32,820 (214,910)
288,08
6 271,884 10,058 (193,061) 78,823
ADDITIONAL INFORMATION
Financing classified as non-current assets and disposable groups of items that have been classified as held for sale
Off balance sheet: value of other guarantees received (not real) — 1,447 — — — — — — 997 — — — — — 1,447 — — 1,447 997 — — 997
200
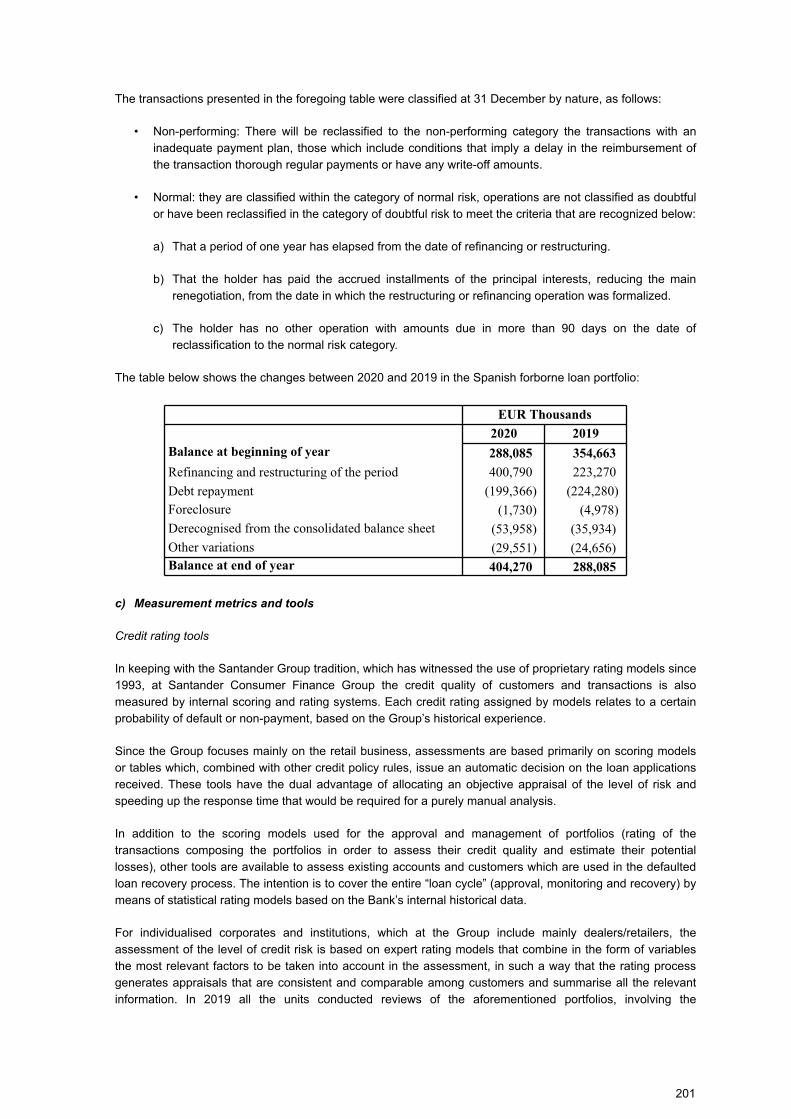
The transactions presented in the foregoing table were classified at 31 December by nature, as follows:
• Non-performing: There will be reclassified to the non-performing category the transactions with an
inadequate payment plan, those which include conditions that imply a delay in the reimbursement of
the transaction thorough regular payments or have any write-off amounts.
• Normal: they are classified within the category of normal risk, operations are not classified as doubtful
or have been reclassified in the category of doubtful risk to meet the criteria that are recognized below:
a) That a period of one year has elapsed from the date of refinancing or restructuring.
b) That the holder has paid the accrued installments of the principal interests, reducing the main
renegotiation, from the date in which the restructuring or refinancing operation was formalized.
c) The holder has no other operation with amounts due in more than 90 days on the date of
reclassification to the normal risk category.
The table below shows the changes between 2020 and 2019 in the Spanish forborne loan portfolio:
EUR Thousands
2020 2019
Balance at beginning of year 288,085 354,663
Refinancing and restructuring of the period 400,790 223,270
Debt repayment (199,366) (224,280)
Foreclosure (1,730) (4,978)
Derecognised from the consolidated balance sheet (53,958) (35,934)
Other variations (29,551) (24,656)Balance at end of year 404,270 288,085
c) Measurement metrics and tools
Credit rating tools
In keeping with the Santander Group tradition, which has witnessed the use of proprietary rating models since
1993, at Santander Consumer Finance Group the credit quality of customers and transactions is also
measured by internal scoring and rating systems. Each credit rating assigned by models relates to a certain
probability of default or non-payment, based on the Group’s historical experience.
Since the Group focuses mainly on the retail business, assessments are based primarily on scoring models
or tables which, combined with other credit policy rules, issue an automatic decision on the loan applications
received. These tools have the dual advantage of allocating an objective appraisal of the level of risk and
speeding up the response time that would be required for a purely manual analysis.
In addition to the scoring models used for the approval and management of portfolios (rating of the
transactions composing the portfolios in order to assess their credit quality and estimate their potential
losses), other tools are available to assess existing accounts and customers which are used in the defaulted
loan recovery process. The intention is to cover the entire “loan cycle” (approval, monitoring and recovery) by
means of statistical rating models based on the Bank’s internal historical data.
For individualised corporates and institutions, which at the Group include mainly dealers/retailers, the
assessment of the level of credit risk is based on expert rating models that combine in the form of variables
the most relevant factors to be taken into account in the assessment, in such a way that the rating process
generates appraisals that are consistent and comparable among customers and summarise all the relevant
information. In 2019 all the units conducted reviews of the aforementioned portfolios, involving the
201
participation of all areas of the Group. The review meetings covered the largest exposures, companies under
special surveillance and the main credit indicators of these portfolios.
Ratings assigned to customers are reviewed periodically to include any new financial information available
and the experience in the banking relationship. The frequency of the reviews is increased in the case of
customers that reach certain levels in the automatic warning systems and of customers classified as requiring
special monitoring. The rating tools themselves are also reviewed in order to progressively fine-tune the
ratings they provide.
To a lesser extent, certain exposures are also assessed using the global rating tools which cover the global
wholesale banking segment. Management of this segment is centralised at the Risk Division of the Santander
Group, for both rating calculation and risk monitoring purposes. These tools assign a rating to each customer,
which is obtained from a quantitative or automatic module, based on balance sheet ratios or macroeconomic
variables, supplemented by the analyst’s expert judgement.
The Group’s portfolio of individualised corporates is scarcely representative of the total risks managed, since
it relates mainly to vehicle dealer stock financing.
d) Credit risk parameters
The assessment of customers or transactions using rating or scoring systems constitutes a judgement of their
credit quality, which is quantified through the probability of default (PD).
In addition to customer assessment, the quantification of credit risk requires the estimation of other
parameters, such as exposure at default (EAD) and the percentage of EAD that will not be recovered (loss
given default or LGD). Therefore, other relevant aspects are taken into account in estimating the risk involved
in transactions, such as the quantification of off-balance-sheet exposures, which depends on the type of
product, or the analysis of expected recoveries, which is related to the guarantees provided and other
characteristics of the transaction: type of product, term, etc.
These factors are the main credit risk parameters. Their combination facilitates calculation of the probable
loss or expected loss (EL). This loss is considered to be an additional cost of the activity which is reflected in
the risk premium and must be charged in the transaction price.
These risk parameters also make it possible to calculate regulatory capital in accordance with the regulations
deriving from the new Basel Capital Accord (BIS III). Regulatory capital is determined as the difference
between unexpected loss and expected loss.
Unexpected loss is the basis for the capital calculation and refers to a very high, albeit scantly probable, level
of loss, which is not deemed to be recurring and must be catered for using capital.
Observed loss: measurement of cost of credit
To supplement the predictiveness provided by the advanced models described above, other habitual metrics
are used to facilitate prudent and effective management of credit risk based on observed loss.
In terms of recognition of losses, the cost of credit risk in Santander Consumer Finance is measured using
different approaches: Change in non-performing loans (new defaults – cures – recovery of assets written off),
net loan-loss provisions (gross provisions - recovery of assets written off), net losses (failures - recovery of
losses) and expected loss. In order to obtain a monitoring ratio, the first two indicators (in 12 months) are
divided by the average of 12 months of the total portfolio to obtain the risk premium and the cost of credit.
These gives the manager ta full insight into the evolution and future prospects of the portfolio.
It should be noted that unlike default, change in non-performing loans (dubious end - initial doubtful + failed -
recovery of failures) refers to the total of the impaired portfolio in a period, regardless of the situation in which
202
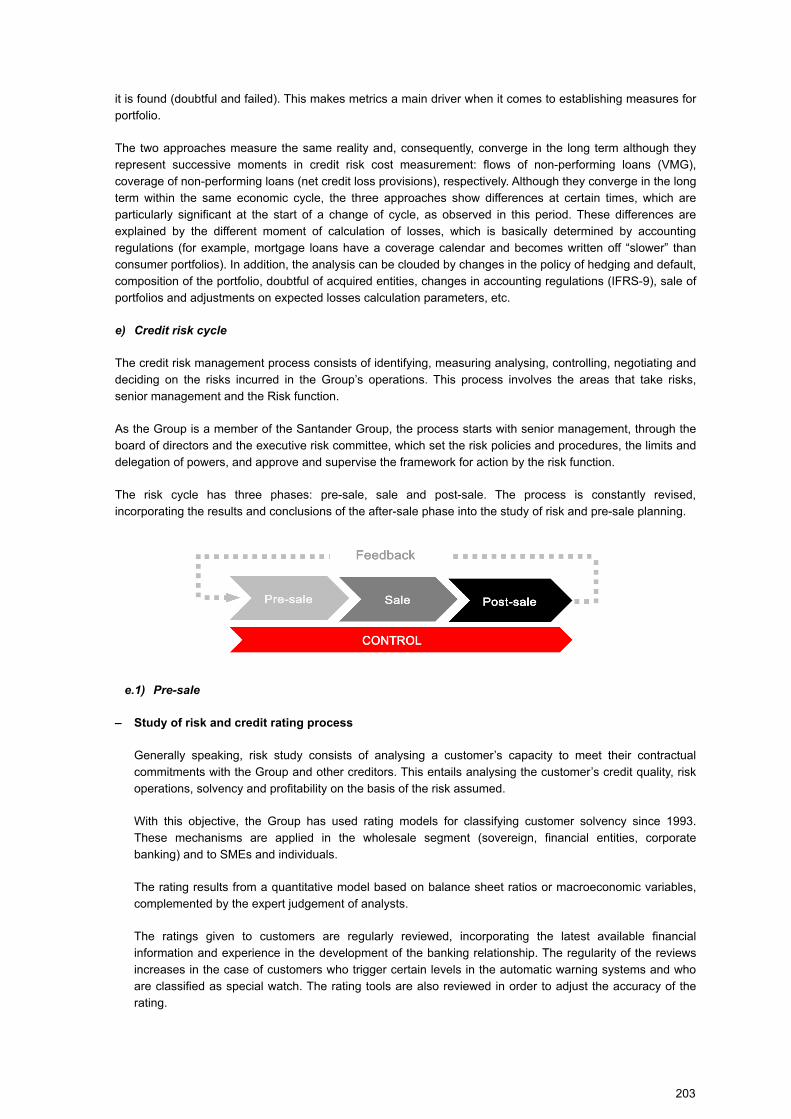
it is found (doubtful and failed). This makes metrics a main driver when it comes to establishing measures for
portfolio.
The two approaches measure the same reality and, consequently, converge in the long term although they
represent successive moments in credit risk cost measurement: flows of non-performing loans (VMG),
coverage of non-performing loans (net credit loss provisions), respectively. Although they converge in the long
term within the same economic cycle, the three approaches show differences at certain times, which are
particularly significant at the start of a change of cycle, as observed in this period. These differences are
explained by the different moment of calculation of losses, which is basically determined by accounting
regulations (for example, mortgage loans have a coverage calendar and becomes written off “slower” than
consumer portfolios). In addition, the analysis can be clouded by changes in the policy of hedging and default,
composition of the portfolio, doubtful of acquired entities, changes in accounting regulations (IFRS-9), sale of
portfolios and adjustments on expected losses calculation parameters, etc.
e) Credit risk cycle
The credit risk management process consists of identifying, measuring analysing, controlling, negotiating and
deciding on the risks incurred in the Group’s operations. This process involves the areas that take risks,
senior management and the Risk function.
As the Group is a member of the Santander Group, the process starts with senior management, through the
board of directors and the executive risk committee, which set the risk policies and procedures, the limits and
delegation of powers, and approve and supervise the framework for action by the risk function.
The risk cycle has three phases: pre-sale, sale and post-sale. The process is constantly revised,
incorporating the results and conclusions of the after-sale phase into the study of risk and pre-sale planning.
e.1) Pre-sale
– Study of risk and credit rating process
Generally speaking, risk study consists of analysing a customer’s capacity to meet their contractual
commitments with the Group and other creditors. This entails analysing the customer’s credit quality, risk
operations, solvency and profitability on the basis of the risk assumed.
With this objective, the Group has used rating models for classifying customer solvency since 1993.
These mechanisms are applied in the wholesale segment (sovereign, financial entities, corporate
banking) and to SMEs and individuals.
The rating results from a quantitative model based on balance sheet ratios or macroeconomic variables,
complemented by the expert judgement of analysts.
The ratings given to customers are regularly reviewed, incorporating the latest available financial
information and experience in the development of the banking relationship. The regularity of the reviews
increases in the case of customers who trigger certain levels in the automatic warning systems and who
are classified as special watch. The rating tools are also reviewed in order to adjust the accuracy of the
rating.
203
While ratings are used in the wholesale sector and for companies and institutions, scoring techniques
predominate for individuals and smaller companies. In general, these techniques automatically assign a
score to the customer for decision-making purposes, as explained in the Decisions on operations section.
– Planning and setting limits
The purpose of this phase is to limit the levels of risk assumed by the Group, efficiently and
comprehensively. The credit risk planning process serves to set the budgets and limits at the portfolio
level for subsidiaries. Planning is carried out through a dashboard that ensures that the business plan and
lending policy are achieved, and that the resources needed to achieve these are available. This arose as
a joint initiative between the Sales area and the Risk function, providing a management tool and a way of
working as a team.
Incorporating the volatility of macroeconomic variables that affect portfolio performance is a key aspect in
planning. The Group simulates this performance under a range of adverse and stressed scenarios (stress
testing), enabling assessment of the Group's solvency in specific situations.
Scenario analysis enables senior management to understand the portfolio's evolution in the face of market
conditions and changes in the environment. It is a key tool for assessing the sufficiency of provisions in
stress scenarios.
Limits are planned and established using documents agreed between the Business and Risk areas and
approved by the Group, setting out the expected business results in terms of risk and return, the limits to
which this activity is subject and management of the associated risks, by group or customer.
e.2) Sales
– Decisions on operations
The sales phase consists of the decision-making process, analysing and deciding on operations. Approval
by the risk area is a prior requirement before the contracting of any risk. This process must take into
account the policies defined for approving operations, the risk appetite and the elements of the operation
that are relevant to the search for the right balance between risk and profitability.
In the sphere of standardised customers (individuals and businesses and SMEs with low turnover), large
volumes of credit operations can be managed more easily by using automatic decision models for
classifying the customer/transaction pair. The ratings these models give to transactions enable lending to
be classified consistently into homogeneous risk groups, based on information on the characteristics of
the transaction and its owner.
e.3) After-sales
– Monitoring
The Monitoring function is based on a continuous process of ongoing observation, enabling early
detection of changes that could affect the credit quality of customers, in order to take measures to correct
deviations with a negative impact.
This monitoring is based on customer segmentation, and is carried out by dedicated local and global risk
teams, supplemented by internal audit.
This function involves identifying and tracking customers under special surveillance, reviewing ratings and
continuously monitoring indicators.
The customers under special surveillance (FEVE) system has four tiers based on the degree of
concern about observed circumstances (terminate, secure, reduce, monitor). The inclusion of a position in
204
FEVE does not mean that default has occurred, but does indicate that it would be advisable to adopt a
specific policy for that position, establishing the person responsible for it and the appropriate time frame.
Customers classified in FEVE are reviewed at least every six months, and every quarter in the most
serious cases. The Monitoring Function is based on a process of continuous observation, which allows for
the early detection of variations that may occur in the credit quality of customers in order to take actions
aimed at correcting deviations that may have a negative impact.
Monitoring is based on customer segmentation, and is carried out by dedicated local and global risk
teams, complemented by internal audit work.
The function includes, among other tasks, the identification, monitoring and assignment of policies at
customer level to anticipate surprises and manage them in the most appropriate way for their situation,
credit policies, rating reviews and continuous monitoring of indicators.
The system called Santander Customer Assessment Notes (SCAN) distinguishes between four levels
depending on the level of concern of the circumstances observed (Specialized Follow-up, Intensive
Follow-up, Ordinary Follow-up, Do Not Attend). The inclusion of a position in SCAN does not imply that
non-compliance has been recorded, but rather the convenience of adopting a specific policy with the
same, determining the person responsible and the time frame in which it must be carried out. SCAN-
qualified clients are reviewed at least semi-annually, being such review quarterly and/or monthly for the
most serious grades. The ways in which a firm qualifies in SCAN are the monitoring work itself, the review
carried out by the internal audit, the decision of the commercial manager who oversees the firm or the
entry into operation of the established system of automatic alarms.
Ratings are reviewed at least every year, but this may be more frequent if weaknesses are detected or
based on the rating itself.
The main risk indicators for individual customers, businesses and SMEs with low turnover are monitored
to detect changes in the performance of the loan portfolio with respect to the projections in the commercial
strategic plans (CSPs).
f) Measurement and control
In addition to monitoring the customers' credit quality, the Group puts in place the necessary control
procedures to analyse the current credit risk portfolio and its performance throughout the different stages
of credit risk.
This function assesses risks from a range of interrelated standpoints. The key vectors of control are
geographies, business areas, management models, products, etc. The approach allows for early detection
of specific focal points, and the framing of action plans to correct any impairment.
Each control axis supports two types of analysis:
1. Quantitative and qualitative portfolio analysis
Portfolio analysis continuously and systematically monitors changes in risk with respect to budgets, limits
and benchmark standards, evaluating the effects with a view to future situations driven by external factors
or arising from strategic decisions, so as to establish measures that place the profile and volume of the
risk portfolio within the parameters set by the Group.
In the credit risk control phase, the following metrics, among others, are used in addition to the
conventional ones:
205
– MDV (change in managed NPLs)
CMN measures how NPLs change over a period, stripping out write-offs and including recoveries. It is
an aggregate metric at the portfolio level that enables us to react to any impairments seen in the
behaviour of non-performing loans.
– EL (expected loss) and capital
Expected loss is an estimate of the financial loss that will occur over the next year from the portfolio
existing at the given time. It is a further cost of business, and must be reflected in the pricing of
transactions.
2. Evaluation of control processes
A systematic scheduled review of procedures and methods, implemented throughout the entire credit risk
cycle, to ensure control process effectiveness and validity.
In 2006, within the corporate framework established across the Group for compliance with the Sarbanes-
Oxley Act, a corporate methodology was created for the documentation and certification of the Control
Model, specified in terms of tasks, operating risks and controls. The risk division annually evaluates the
efficiency of internal control of its activities.
Moreover, the internal validation function, as part of its mission to supervise the quality of the Group's risk
management, ensures that the management and control systems for the different risks inherent in the
Group's business comply with the most stringent criteria and best practices seen in the industry and/or
required by regulators. In addition, internal audit is responsible for ensuring that policies, methods and
procedures are adequate, effectively implemented and regularly reviewed.
g) Recoveries management
Recovery activity is an important function within the Group's risk management area. The area responsible
is Collection and Recoveries, which frames a global strategy and a comprehensive approach to recovery
management.
The Group combines a global model with local execution, taking account of the specific features of the
business in each area.
The main objective of the recovery activity is to recover outstanding debts and obligations by managing
our customers, thus contributing to a lesser need for provisions and a lower cost of risk.
The specific targets of the recovery process are guided as follows:
– Achieve collection or regularisation of outstanding balances, so that an account returns to its normal
state; if this is not possible, the objective is total or partial recovery of debts, whatever their accounting
or management status.
– Maintain and strengthen our relationship with the customer by addressing their behaviour with an offer
of management tools, such as refinancing products according to their needs, consistently with careful
corporate policies of approval and control, as established by the risk areas.
In the recovery activity, Standardised customers and Individually Managed customers are segmented or
differentiated with specific and comprehensive management models in each case, according to basic
specialisation criteria.
Management is articulated through a multichannel customer relationship strategy. The telephone channel
is oriented towards standardised management, with a focus on achieving contact with customers and
206
monitoring payment agreements, prioritising and adapting management actions based on the state of
progress of their situation of "in arrears", "doubtful" or "in default", their balance sheet and their payment
commitments.
The commercial network of recovery management operates alongside the telephone channel. It is a
means of developing a closer relationship with selected customers, and is composed of teams of agents
with a highly commercial focus, specific training and strong negotiation skills. They conduct personalised
management of their own portfolios of high-impact customers (large balance sheets, special products,
customers requiring special management).
Recovery activities at advanced stages of non-performance are guided by a dual judicial and extra judicial
management approach. Commercial and follow-up activities by telephone and via agent networks are
continued, applying strategies and practices specific to the state of progress.
The management model encourages proactivity and targeted management through continuous recovery
campaigns with specific approaches for customer groups and non-performance states, acting with
predefined goals through specific strategies and intensive activities via appropriate channels within limited
time frames.
Suitable local production and analysis of daily and monthly management information, aligned with
corporate models, have been defined as the basis of business intelligence for ongoing decision-making
for management guidance and results monitoring.
g) Concentration risk
Concentration risk is a key component of credit risk management. The Santander Group, which Santander
Consumer Finance Group belongs, continuously monitors the degree of credit risk concentration, by
geographical area/country, economic sector, product and customer group.
The Board of Directors, by reference to the risk appetite, determines the maximum levels of concentration,
and the executive risk committee establishes the risk policies and reviews the appropriate exposure limits
to ensure the adequate management of credit risk concentration.
Santander Consumer Finance is subject to Bank of Spain regulations on large exposures contained in the
fourth part of the CRR (Regulation UE No.575 / 2013), according to which the exposure contracted by an
entity with respect to a client or related group of clients will be considered 'great exposure' when its value
is equal or greater than 10% of its computable capital. Additionally, to limit large exposures, no entity may
assume against a client or group of clients linked to each other an exposure whose value exceeds 25% of
its eligible capital, after taking into account the effect of credit risk reduction under rule.
The Santander Consumer Finance Group’s Risk Division works closely with the Finance Division in the
active management of credit portfolios, which includes reducing the concentration of exposures through
several techniques, such as the arrangement of credit derivatives for hedging purposes or the
performance of securitisation transactions, in order to optimise the risk/return ratio of the total portfolio.
The detail, by activity and geographical area of the counterparty, of the concentration of the Group's risk
(*) at 31 December 2020 and 2019 is as follows:
207
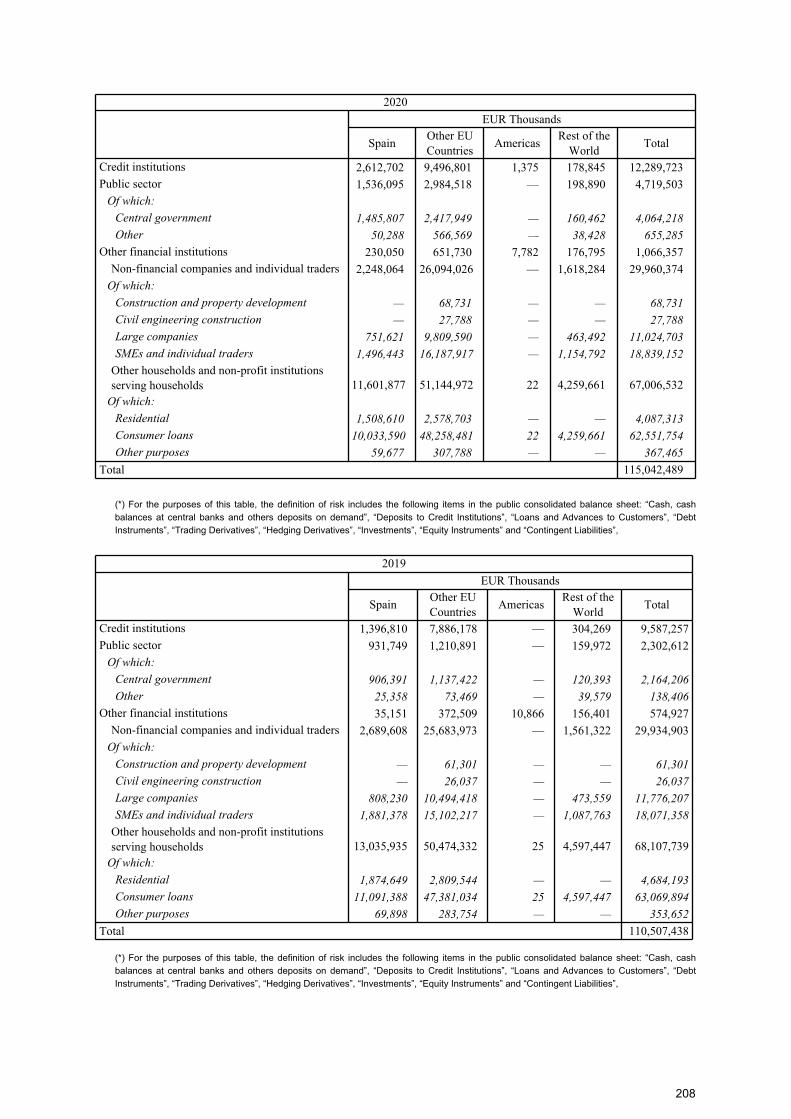
2020
EUR Thousands
SpainOther EU Countries
AmericasRest of the
WorldTotal
Credit institutions 2,612,702 9,496,801 1,375 178,845 12,289,723
Public sector 1,536,095 2,984,518 — 198,890 4,719,503
Of which:
Central government 1,485,807 2,417,949 — 160,462 4,064,218
Other 50,288 566,569 — 38,428 655,285
Other financial institutions 230,050 651,730 7,782 176,795 1,066,357
Non-financial companies and individual traders 2,248,064 26,094,026 — 1,618,284 29,960,374
Of which:
Construction and property development — 68,731 — — 68,731
Civil engineering construction — 27,788 — — 27,788
Large companies 751,621 9,809,590 — 463,492 11,024,703
SMEs and individual traders 1,496,443 16,187,917 — 1,154,792 18,839,152
Other households and non-profit institutions serving households 11,601,877 51,144,972 22 4,259,661 67,006,532
Of which:
Residential 1,508,610 2,578,703 — — 4,087,313
Consumer loans 10,033,590 48,258,481 22 4,259,661 62,551,754
Other purposes 59,677 307,788 — — 367,465
Total 115,042,489
(*) For the purposes of this table, the definition of risk includes the following items in the public consolidated balance sheet: “Cash, cash
balances at central banks and others deposits on demand”, “Deposits to Credit Institutions”, “Loans and Advances to Customers”, “Debt
Instruments”, “Trading Derivatives”, “Hedging Derivatives”, “Investments”, “Equity Instruments” and “Contingent Liabilities”,
2019
EUR Thousands
SpainOther EU Countries
AmericasRest of the
WorldTotal
Credit institutions 1,396,810 7,886,178 — 304,269 9,587,257
Public sector 931,749 1,210,891 — 159,972 2,302,612
Of which:
Central government 906,391 1,137,422 — 120,393 2,164,206
Other 25,358 73,469 — 39,579 138,406
Other financial institutions 35,151 372,509 10,866 156,401 574,927
Non-financial companies and individual traders 2,689,608 25,683,973 — 1,561,322 29,934,903
Of which:
Construction and property development — 61,301 — — 61,301
Civil engineering construction — 26,037 — — 26,037
Large companies 808,230 10,494,418 — 473,559 11,776,207
SMEs and individual traders 1,881,378 15,102,217 — 1,087,763 18,071,358
Other households and non-profit institutions serving households 13,035,935 50,474,332 25 4,597,447 68,107,739
Of which:
Residential 1,874,649 2,809,544 — — 4,684,193
Consumer loans 11,091,388 47,381,034 25 4,597,447 63,069,894
Other purposes 69,898 283,754 — — 353,652
Total 110,507,438
(*) For the purposes of this table, the definition of risk includes the following items in the public consolidated balance sheet: “Cash, cash
balances at central banks and others deposits on demand”, “Deposits to Credit Institutions”, “Loans and Advances to Customers”, “Debt
Instruments”, “Trading Derivatives”, “Hedging Derivatives”, “Investments”, “Equity Instruments” and “Contingent Liabilities”,
208
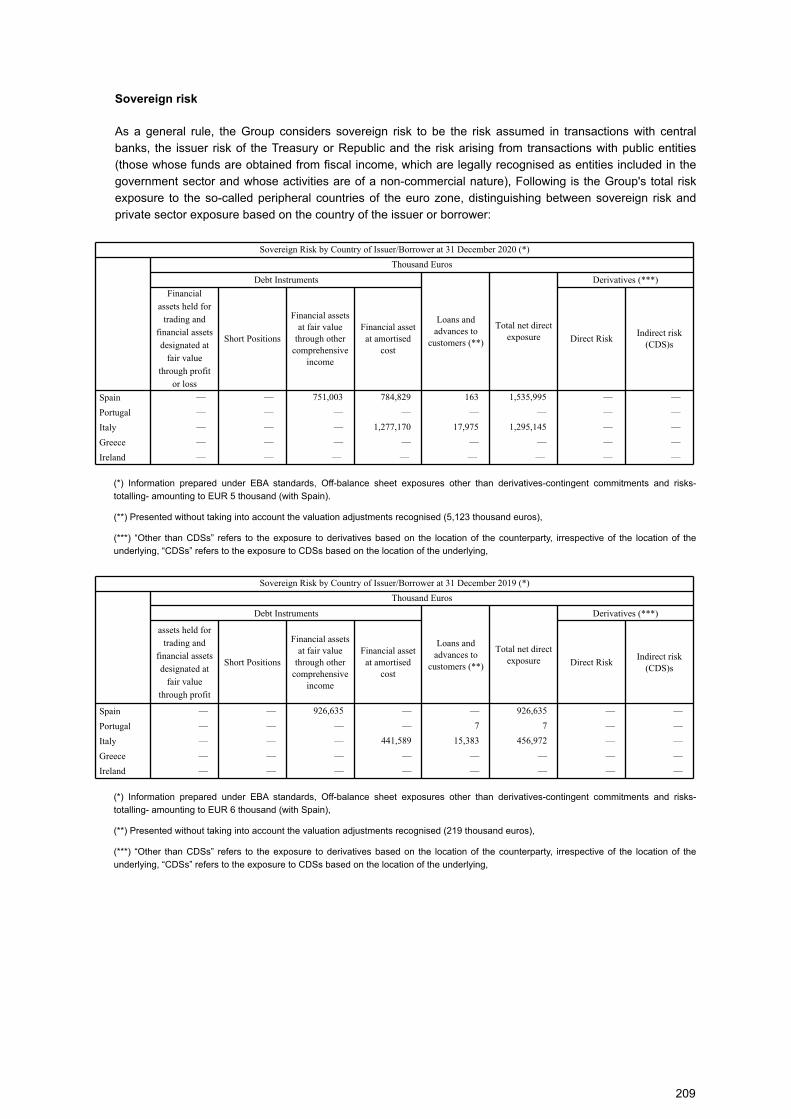
Sovereign risk
As a general rule, the Group considers sovereign risk to be the risk assumed in transactions with central
banks, the issuer risk of the Treasury or Republic and the risk arising from transactions with public entities
(those whose funds are obtained from fiscal income, which are legally recognised as entities included in the
government sector and whose activities are of a non-commercial nature), Following is the Group's total risk
exposure to the so-called peripheral countries of the euro zone, distinguishing between sovereign risk and
private sector exposure based on the country of the issuer or borrower:
Sovereign Risk by Country of Issuer/Borrower at 31 December 2020 (*)
Thousand Euros
Debt Instruments
Loans and advances to
customers (**)
Total net direct exposure
Derivatives (***)
Financial
assets held for
trading and
financial assets
designated at
fair value
through profit
or loss
Short Positions
Financial assets at fair value
through other comprehensive
income
Financial asset at amortised
costDirect Risk
Indirect risk (CDS)s
Spain — — 751,003 784,829 163 1,535,995 — —
Portugal — — — — — — — —
Italy — — — 1,277,170 17,975 1,295,145 — —
Greece — — — — — — — —
Ireland — — — — — — — —
(*) Information prepared under EBA standards, Off-balance sheet exposures other than derivatives-contingent commitments and risks-
totalling- amounting to EUR 5 thousand (with Spain).
(**) Presented without taking into account the valuation adjustments recognised (5,123 thousand euros),
(***) “Other than CDSs” refers to the exposure to derivatives based on the location of the counterparty, irrespective of the location of the
underlying, “CDSs” refers to the exposure to CDSs based on the location of the underlying,
Sovereign Risk by Country of Issuer/Borrower at 31 December 2019 (*)
Thousand Euros
Debt Instruments
Loans and advances to
customers (**)
Total net direct exposure
Derivatives (***)Financial
assets held for
trading and
financial assets
designated at
fair value
through profit
Short Positions
Financial assets at fair value
through other comprehensive
income
Financial asset at amortised
costDirect Risk
Indirect risk (CDS)s
Spain — — 926,635 — — 926,635 — —
Portugal — — — — 7 7 — —
Italy — — — 441,589 15,383 456,972 — —
Greece — — — — — — — —
Ireland — — — — — — — —
(*) Information prepared under EBA standards, Off-balance sheet exposures other than derivatives-contingent commitments and risks-
totalling- amounting to EUR 6 thousand (with Spain),
(**) Presented without taking into account the valuation adjustments recognised (219 thousand euros),
(***) “Other than CDSs” refers to the exposure to derivatives based on the location of the counterparty, irrespective of the location of the
underlying, “CDSs” refers to the exposure to CDSs based on the location of the underlying,
209
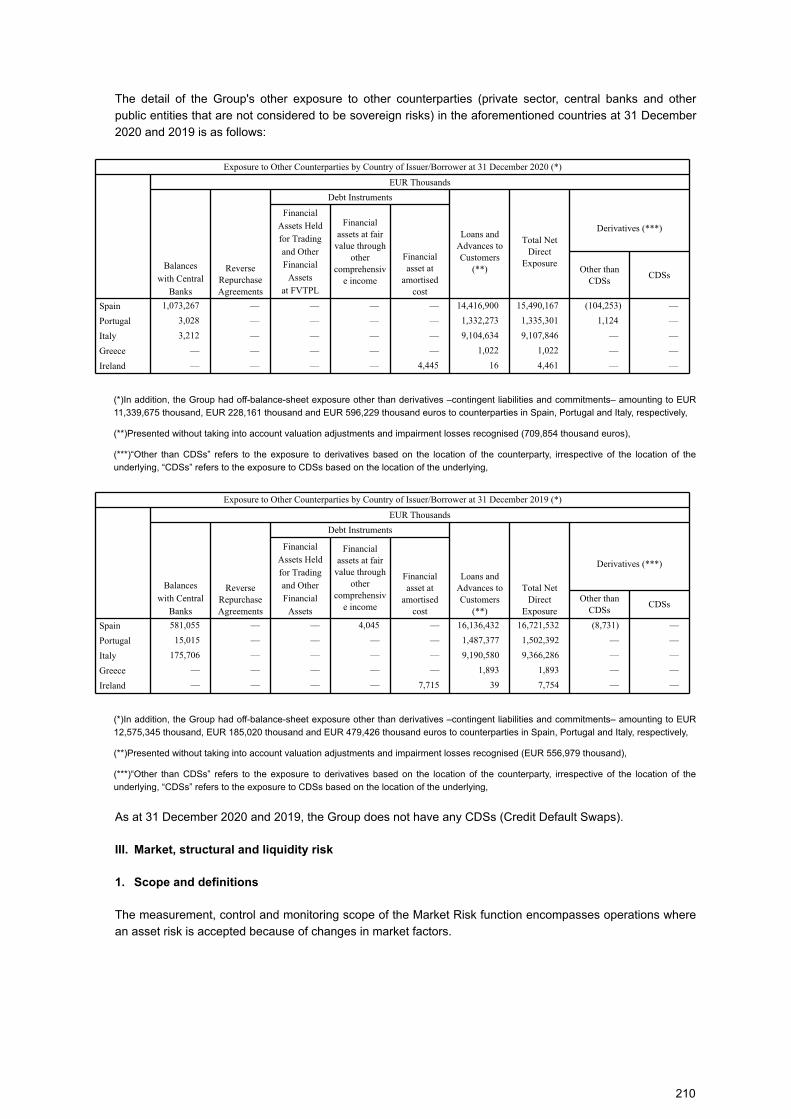
The detail of the Group's other exposure to other counterparties (private sector, central banks and other
public entities that are not considered to be sovereign risks) in the aforementioned countries at 31 December
2020 and 2019 is as follows:
Exposure to Other Counterparties by Country of Issuer/Borrower at 31 December 2020 (*)
EUR Thousands
Debt Instruments
Balances
with Central
Banks
Reverse Repurchase Agreements
Financial
Assets Held
for Trading
and Other
Financial
Assets
at FVTPL
Financial assets at fair
value through other
comprehensive income
Financial asset at
amortised cost
Loans and Advances to Customers
(**)
Total Net Direct
Exposure
Derivatives (***)
Other than CDSs
CDSs
Spain 1,073,267 — — — — 14,416,900 15,490,167 (104,253) —
Portugal 3,028 — — — — 1,332,273 1,335,301 1,124 —
Italy 3,212 — — — — 9,104,634 9,107,846 — —
Greece — — — — — 1,022 1,022 — —
Ireland — — — — 4,445 16 4,461 — —
(*)In addition, the Group had off-balance-sheet exposure other than derivatives –contingent liabilities and commitments– amounting to EUR
11,339,675 thousand, EUR 228,161 thousand and EUR 596,229 thousand euros to counterparties in Spain, Portugal and Italy, respectively,
(**)Presented without taking into account valuation adjustments and impairment losses recognised (709,854 thousand euros),
(***)“Other than CDSs” refers to the exposure to derivatives based on the location of the counterparty, irrespective of the location of the
underlying, “CDSs” refers to the exposure to CDSs based on the location of the underlying,
Exposure to Other Counterparties by Country of Issuer/Borrower at 31 December 2019 (*)
EUR Thousands
Debt Instruments
Balances
with Central
Banks
Reverse Repurchase Agreements
Financial
Assets Held
for Trading
and Other
Financial
Assets
Financial assets at fair
value through other
comprehensive income
Financial asset at
amortised cost
Loans and Advances to Customers
(**)
Total Net Direct
Exposure
Derivatives (***)
Other than CDSs
CDSs
Spain 581,055 — — 4,045 — 16,136,432 16,721,532 (8,731) —
Portugal 15,015 — — — — 1,487,377 1,502,392 — —
Italy 175,706 — — — — 9,190,580 9,366,286 — —
Greece — — — — — 1,893 1,893 — —
Ireland — — — — 7,715 39 7,754 — —
(*)In addition, the Group had off-balance-sheet exposure other than derivatives –contingent liabilities and commitments– amounting to EUR
12,575,345 thousand, EUR 185,020 thousand and EUR 479,426 thousand euros to counterparties in Spain, Portugal and Italy, respectively,
(**)Presented without taking into account valuation adjustments and impairment losses recognised (EUR 556,979 thousand),
(***)“Other than CDSs” refers to the exposure to derivatives based on the location of the counterparty, irrespective of the location of the
underlying, “CDSs” refers to the exposure to CDSs based on the location of the underlying,
As at 31 December 2020 and 2019, the Group does not have any CDSs (Credit Default Swaps).
III. Market, structural and liquidity risk
1. Scope and definitions
The measurement, control and monitoring scope of the Market Risk function encompasses operations where
an asset risk is accepted because of changes in market factors.
210
Such risks are generated through two types of basic activities:
– Trading, which includes both the rendering of financial services on markets for clients, where the bank
is the counterparty, and proprietary sales, purchases and positioning, mainly in fixed income, equities
and foreign currency products.
The Group does not carry out trading, as its treasury activity is limited to management and hedging of
the structural risk of its balance sheet, and to management of liquidity as needed to fund its business.
– Balance sheet management or ALM, which involves management of inherent risks in the entity's
balance sheet, not including the trading portfolio.
The risks generated in these activities are:
– Trading market: Risk resulting from the possibility of changes in market factors affecting the value of
positions held by the entity in its trading book.
– Structural: Risk arising from management of different balance sheet items. This risk includes both
losses owing to price variations affecting available-for-sale and held-to-maturity portfolios (banking
book), and losses arising from the management of the Group’s assets and liabilities measured at
amortised cost.
– Liquidity: Risk of payment obligations not being met on a timely basis or being met at an excessive
cost. The types of losses that this risk triggers include losses on the forced selling of assets or impacts
on the margin because of the mismatch of forecast cash outflows and inflows.
Trading market and structural risks, depending on the market variable that triggers them, may be classified
as:
– Interest rate risk: Identifies the possibility that interest rate variations may have a negative impact on
the value of a financial instrument, a portfolio or the Group as a whole.
– Credit spread risk: Identifies the possibility that variations in credit risk curves associated with issues
and specific types of debt may have an adverse effect on a financial instrument, a portfolio or the
Group as a whole. The spread is a differential between financial instruments listed at a margin over
other benchmark instruments, basically the Internal Rate of Return (IRR) of government securities and
interbank interest rates.
– Exchange rate risk: Identifies the possibility that variations in the value of a position in a currency other
than the base currency can have an adverse effect on the value of a financial instrument, a portfolio or
the Group as a whole.
– Inflation risk: This identifies the possibility that changes in inflation rates could adversely affect the
value of a financial instrument, a portfolio or the Group as a whole.
– Volatility risk: Identifies the possibility that variations in the listed volatility of market variables may have
an adverse effect on the value of a financial instrument, a portfolio or the Group as a whole.
– Market liquidity risk: Identifies the possibility that an entity or Group as a whole is unable to unwind or
close a position on a timely basis without impacting the market price or transaction cost.
– Risk of early payment or cancellation: Identifies the possibility of early cancellation without negotiation
on operations where the contractual relationship so allows explicitly or implicitly, generating cash flows
that should be reinvested at a potentially lower interest rate.
211
There are other variables that only impact trading market risk (and not structural risk), meaning that market
risk can also be classified as follows:
– Equity risk: Identifies the possibility that changes in the value of prices or dividend expectations from
equity instruments can have an adverse effect on the value of a financial instrument, a portfolio or the
Group as a whole.
– Commodity price risk: Identifies the possibility that changes in commodity prices may have an adverse
effect on the value of a financial instrument, a portfolio or the Group as a whole.
– Correlation risk: Identifies the possibility that changes in the correlation between variables, either of
the same or a different type, listed in the market, could adversely affect the value of a financial
instrument, a portfolio or the Group as a whole.
– Underwriting risk: Identifies the possibility that placement targets for securities or other types of debt
are not reached when the entity participates in underwriting them.
Liquidity risk may also be classified in the following categories:
– Funding risk: Identifies the possibility that the entity is unable to meet its obligations owing to its
inability to sell assets or secure funding.
– Mismatch risk: Identifies the possibility that differences between the maturity structures of assets and
liabilities will generate an additional cost to the entity.
– Contingency risk: Identifies the possibility that adequate management levers will be unavailable to
raise liquidity as a result of an outlier event that entails greater funding needs or more strict collateral
requirements to raise funds.
2. Measurement and methods
1. Structural interest-rate risk
The Group analyses the sensitivity of net interest income and of equity to interest rate fluctuations. This
sensitivity is determined by mismatches in the maturity and review dates of interest rates of different balance
sheet items.
According to the interest rate positioning of the balance sheet, and considering the situation and perspectives
of the market, financial measures are adopted to adjust the positioning to that sought by the Bank. These
measures may range from taking up positions in markets to the specification of interest rate characteristics of
commercial products.
The metrics used to control de interest rate risk in these activities are the interest rate gap, financial margin
sensibility and equity in the levels of interest rate.
– Interest rate gap
Analysis of the interest rate gap deals with the mismatch between the timing of re-pricing of on and off-
balance aggregates of assets and liabilities and of memorandum accounts (off-balance sheet). It provides a
basic profile of the balance sheet structure and can detect concentrations of interest rate risk at different
terms. It is also a useful tool for estimates of the potential impact of interest rate movements on net interest
income and the equity of the entity.
All on- and off-balance sheet aggregates have to be broken down so that they can be placed in the point of
repricing/maturity. For aggregates that do not have a contractual maturity, the Santander Group's internal
model for analysis and estimation of their durations and sensitivity is used.
212
– Sensitivity of Net Interest Income (NII)
The sensitivity of net interest income measures the change in expected accruals for a certain period (12
months) in the event of a shift in the interest rate curve.
– Sensitivity of Economic Value of Equity (EVE)
This measures the implied interest rate risk in the economic value of equity which, for the purposes of interest
rate risk, is defined as the difference between the net present value of assets minus the net present value of
liabilities, based on the effect of a change in interest rates on such present values.
2. Liquidity risk
Management of structural liquidity aims to fund the recurring activity of the Santander Consumer Finance
Group in optimal conditions of term and cost, while avoiding undesired liquidity risks.
The measures used for the control of liquidity risk are the liquidity gap, liquidity ratios, the statement of
structural liquidity, liquidity stress tests, the financial plan, the liquidity contingency plan and regulatory
reporting.
– Liquidity gap
The liquidity gap provides information on contractual and expected cash inflows and outflows for a given
period in each of the currencies in which the Santander Consumer Finance Group operates. The gap
measures the net cash needed or the surplus at a given date and reflects the liquidity level maintained under
normal market conditions.
In the contractual liquidity gap, all balance sheet items that generate cash flows are analysed and placed at
their point of contractual maturity. For assets and liabilities with no contractual maturity, the Santander
Group's internal analysis model is used. It is based on a statistical study of products' time series, and the so-
called stable and unstable balance is determined for liquidity purposes.
– Liquidity ratios
The minimum liquidity ratio compares liquid assets available for sale or transfer (after the relevant discounts
and adjustments have been applied) and assets at less than twelve months with liabilities of up to twelve
months.
The Net Stable Funding Ratio measures the extent to which assets that require structural funding are being
funded by structural liabilities.
– Structural Liquidity
The purpose of this analysis is to determine the structural liquidity position according to the liquidity profile
(greater or lesser stability) of different asset and liability instruments.
– Liquidity stress tests
The purpose of the liquidity stress tests conducted by the Santander Consumer Finance Group is to
determine the impact of a severe, but plausible, liquidity crisis. In such stress scenarios, a simulation is made
of internal factors that may affect Group liquidity, such as, inter alia, a credit rating downgrade of the
institution, a fall in the value of balance sheet assets, banking crises, regulatory factors, a change in
consumer trends and/or a loss of depositor confidence.
213
Every month, four liquidity stress scenarios (banking crisis in Spain, idiosyncratic crisis at the Santander
Consumer Finance Group, global crisis and a combined scenario) are simulated by stressing these factors,
and the results are used to establish early warning levels.
– Financial plan
Every year, a liquidity plan is prepared based on the funding needs arising from the business budgets of all
the Group's subsidiaries. Based on these liquidity requirements, an analysis is made of limits on new
securitisation considering eligible assets available, in addition to potential growth in customer deposits. This
information is used to establish an issue and securitisation plan for the year. Throughout the year, regular
monitoring is carried out of actual trends in funding requirements, thus giving rise to the revisions of the plan.
– Contingency Funding Plan
The purpose of the Liquidity Contingency Plan is to set out the processes (governance structure) to be
followed in the event of a potential or real liquidity crisis, as well as the analysis of contingency actions or
levers available to Management should such a situation arise.
The Liquidity Contingency Plan is underpinned by, and must be designed in line with, two key elements:
liquidity stress tests and the early warning indicator (EWI) system. Stress tests and different scenarios are
used as the basis for analysing available contingency actions and for determining such actions are sufficient.
The EWI system monitors and potentially triggers the escalation mechanism for activating the plan and
subsequently monitoring the situation.
– Regulatory reporting
Santander Consumer Finance applies the Liquidity Coverage Ratio (LCR) as required by the European
Banking Authority (EBA) for the consolidated sub-group on a monthly basis, and the net stable funding ratio
(NSFR) on a quarterly basis.
In addition, Santander Consumer Finance has produced an annual Internal Liquidity Adequacy and
Assessment Process (ILAAP) report as part of the consolidated document of the Santander Group, although
the supervisor does not require this report at sub-group level.
3. Structural change risk
Structural change risk is managed centrally, as part of the general corporate procedures of the Santander
Group.
3. Limits
Limits are set for balance sheet structural risks as part of the framework of the annual limits plan, responding
to the Santander Consumer Finance Group’s risk appetite.
The limit structure involves a process that considers:
– Efficient and comprehensive identification and delimitation of the main types of market risk incurred,
consistently with the management of the business and the strategy defined.
– Quantification and communication of the risk levels and profile considered acceptable by senior
management to the business areas, so that undesired risks are not incurred.
– Providing flexibility for the business areas in the acceptance of risks, responding efficiently and
appropriately to developments in the market and changes in business strategies, within the risk limits
considered acceptable by the entity.
214
– Enabling business generators to take sufficient prudent risks to achieve their budgeted results.
– Delimiting the range of products and underlying assets in which each Treasury unit can operate,
considering characteristics such as the model and assessment systems, the liquidity of the
instruments involved, etc.
In the event of exceeding one of these limits or their sub-limits, the risk management officers involved must
explain the reasons and facilitate an action plan to correct it.
The main management limits for structural risk at the consolidated Santander Consumer level are:
– One-year net interest income sensitivity limit.
– Equity value sensitivity limit.
The limits are compared to the sensitivity that would result in the largest loss among those calculated under
eight scenarios (parallel 25, 50, 75 and 100 basis point increases and decreases in the interest rate curve).
Using a range of scenarios fosters improved control of interest rate risk. The downward scenarios consider
negative interest rates, with a defined floor (defined at -0.75% for EUR currency). In 2020, the exposure of the
net interest margin and economic value was moderate compared to the budget and the value of own funds,
respectively, being within the limits set for the legal scope.
At the end of 2020, the risk on the financial margin at one year, measured as its sensitivity to a parallel fall of
75 basis points, was -6.42 million euros.
With respect to liquidity risk, the main limits at the Santander Consumer Finance Group level include
regulatory liquidity metrics such as the LCR and the NSFR (for which there is not yet a regulatory limit in
force), as well as the liquidity stress tests under different adverse scenarios mentioned above.
At the end of December 2020, all liquidity metrics are above the internal limits in force, as well as the
regulatory requirements. Both the LCR and NSFR at the consolidated Group level were above 115% and
103% throughout the year.
3. Management
Balance sheet management entails the analysis, projection and simulation of structural risks, along with the
design, proposal and execution of transactions and strategies to manage this risk. Finance Management is
responsible for this process, and it takes a projection-based approach where and when this is applicable or
feasible. A high-level description of the main processes and/or responsibilities in managing structural risks is
as follows:
– Analysis of the balance sheet and its structural risks.
– Monitoring of movements in the most relevant markets for asset and liability management (ALM) for
the Group.
– Planning. Design, maintenance and monitoring of certain planning instruments. Finance Management
is responsible for preparing, following and maintaining the financial plan, the funding plan and the
liquidity contingency plan.
– Strategy proposals. Design of strategies aimed at funding the SCF sub-group's business by securing
the best available market conditions or by managing the balance sheet and its exposure to structural
risks, thereby avoiding unnecessary risks, preserving net interest income and safeguarding the market
value of equity and capital.
215
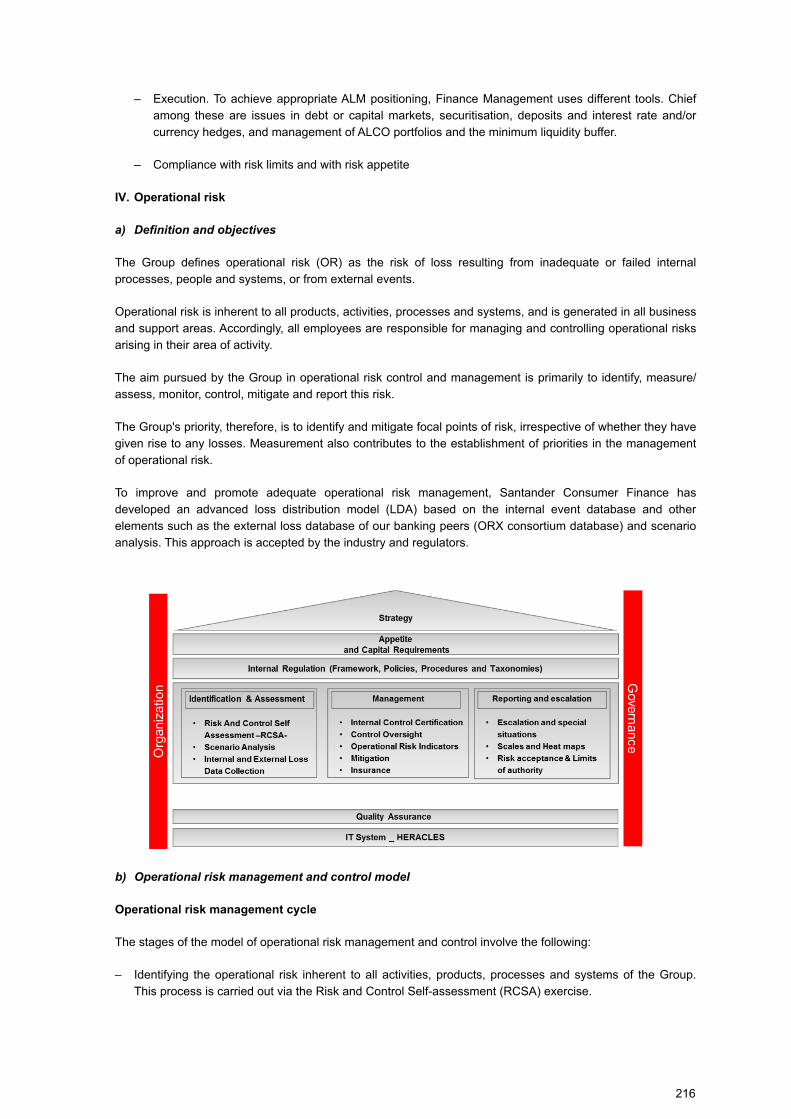
– Execution. To achieve appropriate ALM positioning, Finance Management uses different tools. Chief
among these are issues in debt or capital markets, securitisation, deposits and interest rate and/or
currency hedges, and management of ALCO portfolios and the minimum liquidity buffer.
– Compliance with risk limits and with risk appetite
IV. Operational risk
a) Definition and objectives
The Group defines operational risk (OR) as the risk of loss resulting from inadequate or failed internal
processes, people and systems, or from external events.
Operational risk is inherent to all products, activities, processes and systems, and is generated in all business
and support areas. Accordingly, all employees are responsible for managing and controlling operational risks
arising in their area of activity.
The aim pursued by the Group in operational risk control and management is primarily to identify, measure/
assess, monitor, control, mitigate and report this risk.
The Group's priority, therefore, is to identify and mitigate focal points of risk, irrespective of whether they have
given rise to any losses. Measurement also contributes to the establishment of priorities in the management
of operational risk.
To improve and promote adequate operational risk management, Santander Consumer Finance has
developed an advanced loss distribution model (LDA) based on the internal event database and other
elements such as the external loss database of our banking peers (ORX consortium database) and scenario
analysis. This approach is accepted by the industry and regulators.
b) Operational risk management and control model
Operational risk management cycle
The stages of the model of operational risk management and control involve the following:
– Identifying the operational risk inherent to all activities, products, processes and systems of the Group.
This process is carried out via the Risk and Control Self-assessment (RCSA) exercise.
216
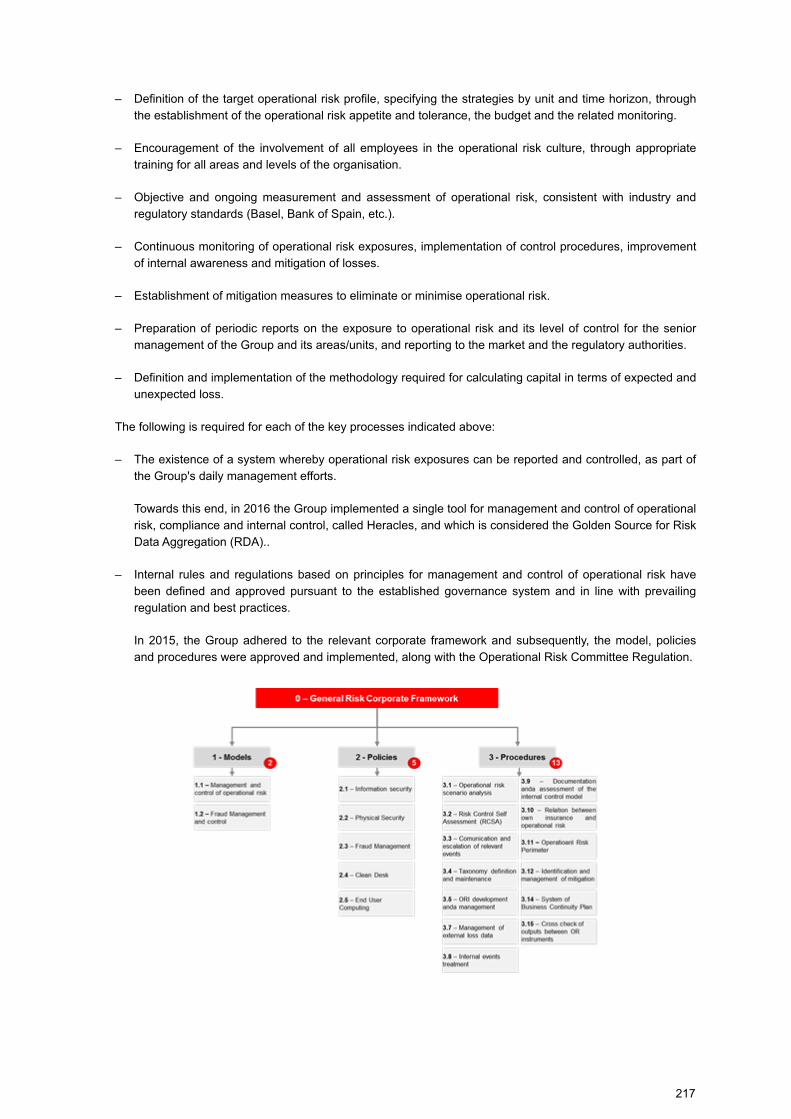
– Definition of the target operational risk profile, specifying the strategies by unit and time horizon, through
the establishment of the operational risk appetite and tolerance, the budget and the related monitoring.
– Encouragement of the involvement of all employees in the operational risk culture, through appropriate
training for all areas and levels of the organisation.
– Objective and ongoing measurement and assessment of operational risk, consistent with industry and
regulatory standards (Basel, Bank of Spain, etc.).
– Continuous monitoring of operational risk exposures, implementation of control procedures, improvement
of internal awareness and mitigation of losses.
– Establishment of mitigation measures to eliminate or minimise operational risk.
– Preparation of periodic reports on the exposure to operational risk and its level of control for the senior
management of the Group and its areas/units, and reporting to the market and the regulatory authorities.
– Definition and implementation of the methodology required for calculating capital in terms of expected and
unexpected loss.
The following is required for each of the key processes indicated above:
– The existence of a system whereby operational risk exposures can be reported and controlled, as part of
the Group's daily management efforts.
Towards this end, in 2016 the Group implemented a single tool for management and control of operational
risk, compliance and internal control, called Heracles, and which is considered the Golden Source for Risk
Data Aggregation (RDA)..
– Internal rules and regulations based on principles for management and control of operational risk have
been defined and approved pursuant to the established governance system and in line with prevailing
regulation and best practices.
In 2015, the Group adhered to the relevant corporate framework and subsequently, the model, policies
and procedures were approved and implemented, along with the Operational Risk Committee Regulation.
217
The model of operational risk management and control implemented by the Group provides the following
benefits:
– It promotes the development of an operational risk culture.
– It allows for comprehensive and effective management of operational risk (identification, measurement /
assessment, control / mitigation, and reporting).
– It improves knowledge of both actual and potential operational risks and their assignment to businesses
and support lines.
– Information on operational risk helps improve processes and controls and reduce losses and income
volatility.
– It facilitates the setting of limits for operational risk appetite.
c) Risk identification, measurement and assessment model
In November 2014, the Group adopted the new management system of the Santander Group, in which three
lines of defence are defined:
– 1st line of defence: integrated in areas of business or support areas. Its tasks are to identify, measure or
assess, control (primary control) mitigate and report the risks inherent to the activity or function for which it
is responsible.
Given the complexity and heterogeneous nature of Operational Risk within a large-scale organization with
various lines of business, appropriate risk management is carried out in two axes:
(1) Operational Risk Management: each business unit and support function of the Santander Group is
responsible for the Operational Risks arising within its scope, as well as for their management. This
particularly affects the heads of the business units and support functions, but also the coordinator (or OR
team) in the 1LoD.
(2) Management of specialized Operational Risk controls: there are some functions that tend to manage
specialized controls for certain risks where they have greater visibility and specialization. Such functions have
a global view of the specific Operational Risk exposure in all areas. We can also refer to them as Subject
Matter Experts or SME.
OR Managers:
Operational Risk management is the responsibility of all staff in their respective areas of activity.
Consequently, the Head of each division or area has the ultimate responsibility for Operational Risk in its
scope.
OR Coordinators:
RO coordinators are actively involved in Operational Risk management and support the RO managers in their
own areas of OR management and control. Each coordinator has a certain scope for action, which does not
necessarily coincide with organizational units or areas, and has an in-depth knowledge of the activities within
their scope. Their roles and responsibilities include:
– Interaction Undertake interaction with the second line of defense in day-to-day operations and
communication to Operational Risk Management in their scope.
– Facilitate integration in the management of OR in each scope.
218
– Support the implementation of qualitative and quantitative methodologies and tools for
operations management and control.
– Provide support and advice on Operational Risk within its scope.
– Maintain an overview of risk exposure in scope.
– Ensure the quality and consistency of data and information reported to 2LoD, identifying and
monitoring the implementation of relevant controls.
– Review and monitor results provided by business units and support functions related to controls
testing.
– Support in sign-off and certification of controls (control testing).
– Monitor mitigation plans in your area.
– Coordinate the definition of business continuity plans in your area.
– 2nd line of defence: performed by the Non-Financial Risks Department, reporting to the CRO. Its functions
are to design, maintain and develop the local adaptation of the Operational Risk Management Framework
(BIS), and to control and challenge the first line of defence against operational risk. Main responsibilities
include:
– Design, maintain and develop the Operational Risk management and control model, promoting
the development of an operational risk culture across the Group.
– Safeguard the proper design, maintenance and implementation of Operational Risk regulations.
– Drive the business units to effectively monitor identified risks.
– Ensure that each key risk affecting the entity is identified and properly managed by the relevant
units.
– Ensure that the Group has implemented effective OR management processes.
– Prepare Operational Risk appetite tolerance proposals and monitor risk limits in the Group and in
the different local units.
– Ensure that Top Management receives an overview of all relevant risks, ensuring adequate
communication and reporting to Senior Management and the Board of Directors, through the
established governance bodies.
In addition, 2LoD will provide the necessary information for consolidation, together with the remaining risks, to
the Risk Supervision and Consolidation function.
To ensure adequate oversight, a sound knowledge of the activities of the Business Units / Support Functions
is required, as well as a specific understanding of the risk event categories (IT, Compliance, etc.) and a
Capacity and Capability Local Plan. In that context, the RO control function (2LOD function) needs to
leverage specific profiles that can support the implementation of the RO framework in the 1LOD, but also
provide specific business and risk exposure information, to ensure that the related RO profile is well managed
and reported. Business Risk Managers (BRMs) as commercial knowledge specialists (e.g. Global Corporate
Banking) and Specialized Risk Managers (SRMs) as OR control specialists (e.g. IT and cyber risks) perform
these functions within OR 2LOD and are positioned as key points of contact for 1LOD business units and
operations management support functions
219
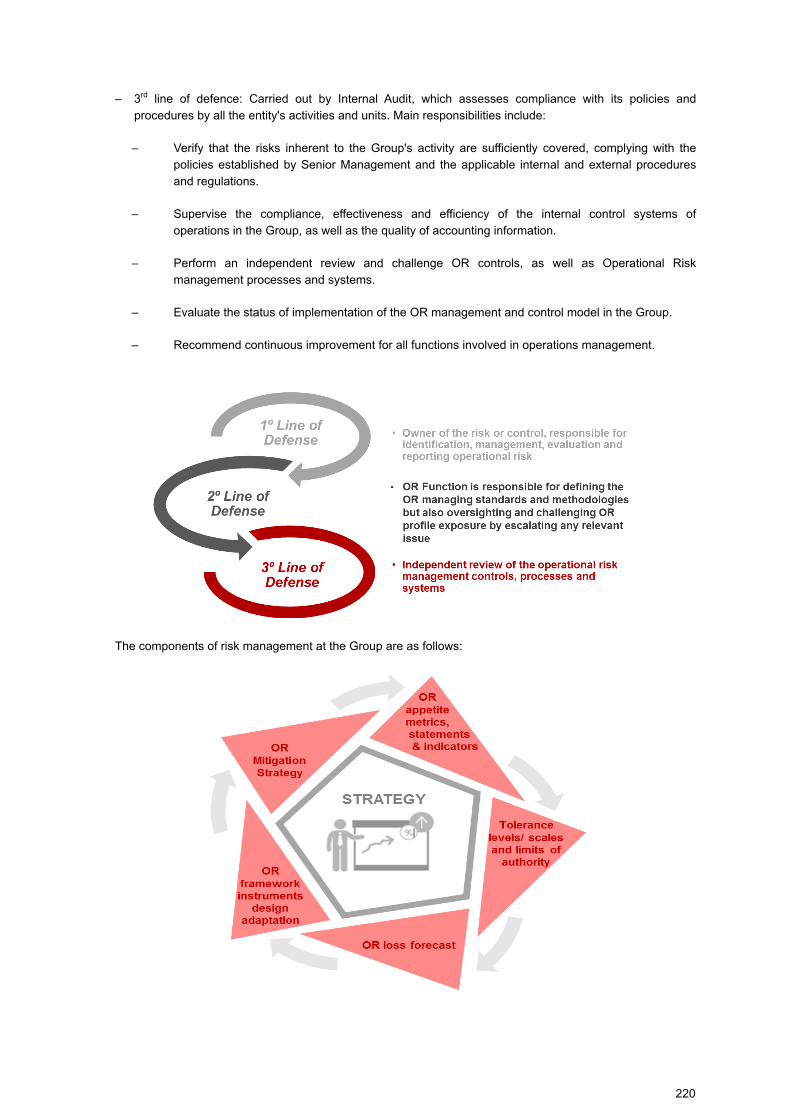
– 3rd line of defence: Carried out by Internal Audit, which assesses compliance with its policies and
procedures by all the entity's activities and units. Main responsibilities include:
– Verify that the risks inherent to the Group's activity are sufficiently covered, complying with the
policies established by Senior Management and the applicable internal and external procedures
and regulations.
– Supervise the compliance, effectiveness and efficiency of the internal control systems of
operations in the Group, as well as the quality of accounting information.
– Perform an independent review and challenge OR controls, as well as Operational Risk
management processes and systems.
– Evaluate the status of implementation of the OR management and control model in the Group.
– Recommend continuous improvement for all functions involved in operations management.
The components of risk management at the Group are as follows:
220
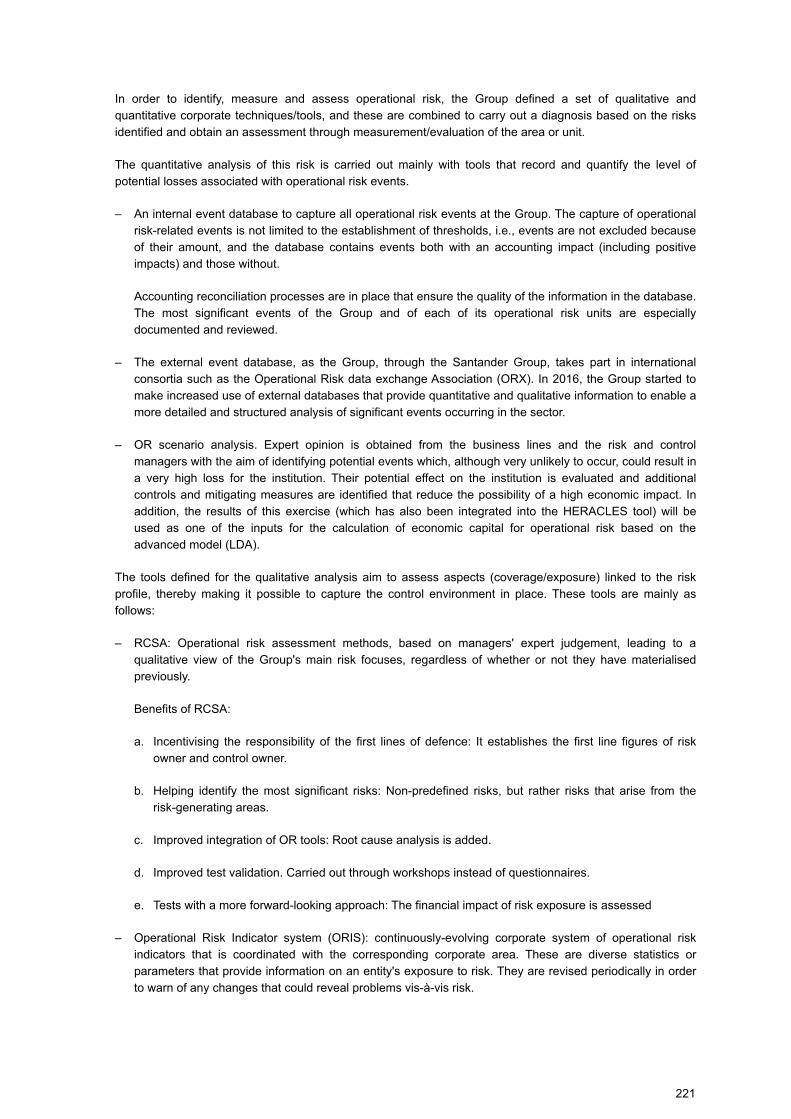
In order to identify, measure and assess operational risk, the Group defined a set of qualitative and
quantitative corporate techniques/tools, and these are combined to carry out a diagnosis based on the risks
identified and obtain an assessment through measurement/evaluation of the area or unit.
The quantitative analysis of this risk is carried out mainly with tools that record and quantify the level of
potential losses associated with operational risk events.
– An internal event database to capture all operational risk events at the Group. The capture of operational
risk-related events is not limited to the establishment of thresholds, i.e., events are not excluded because
of their amount, and the database contains events both with an accounting impact (including positive
impacts) and those without.
Accounting reconciliation processes are in place that ensure the quality of the information in the database.
The most significant events of the Group and of each of its operational risk units are especially
documented and reviewed.
– The external event database, as the Group, through the Santander Group, takes part in international
consortia such as the Operational Risk data exchange Association (ORX). In 2016, the Group started to
make increased use of external databases that provide quantitative and qualitative information to enable a
more detailed and structured analysis of significant events occurring in the sector.
– OR scenario analysis. Expert opinion is obtained from the business lines and the risk and control
managers with the aim of identifying potential events which, although very unlikely to occur, could result in
a very high loss for the institution. Their potential effect on the institution is evaluated and additional
controls and mitigating measures are identified that reduce the possibility of a high economic impact. In
addition, the results of this exercise (which has also been integrated into the HERACLES tool) will be
used as one of the inputs for the calculation of economic capital for operational risk based on the
advanced model (LDA).
The tools defined for the qualitative analysis aim to assess aspects (coverage/exposure) linked to the risk
profile, thereby making it possible to capture the control environment in place. These tools are mainly as
follows:
– RCSA: Operational risk assessment methods, based on managers' expert judgement, leading to a
qualitative view of the Group's main risk focuses, regardless of whether or not they have materialised
previously.
Benefits of RCSA:
a. Incentivising the responsibility of the first lines of defence: It establishes the first line figures of risk
owner and control owner.
b. Helping identify the most significant risks: Non-predefined risks, but rather risks that arise from the
risk-generating areas.
c. Improved integration of OR tools: Root cause analysis is added.
d. Improved test validation. Carried out through workshops instead of questionnaires.
e. Tests with a more forward-looking approach: The financial impact of risk exposure is assessed
– Operational Risk Indicator system (ORIS): continuously-evolving corporate system of operational risk
indicators that is coordinated with the corresponding corporate area. These are diverse statistics or
parameters that provide information on an entity's exposure to risk. They are revised periodically in order
to warn of any changes that could reveal problems vis-à-vis risk.
221
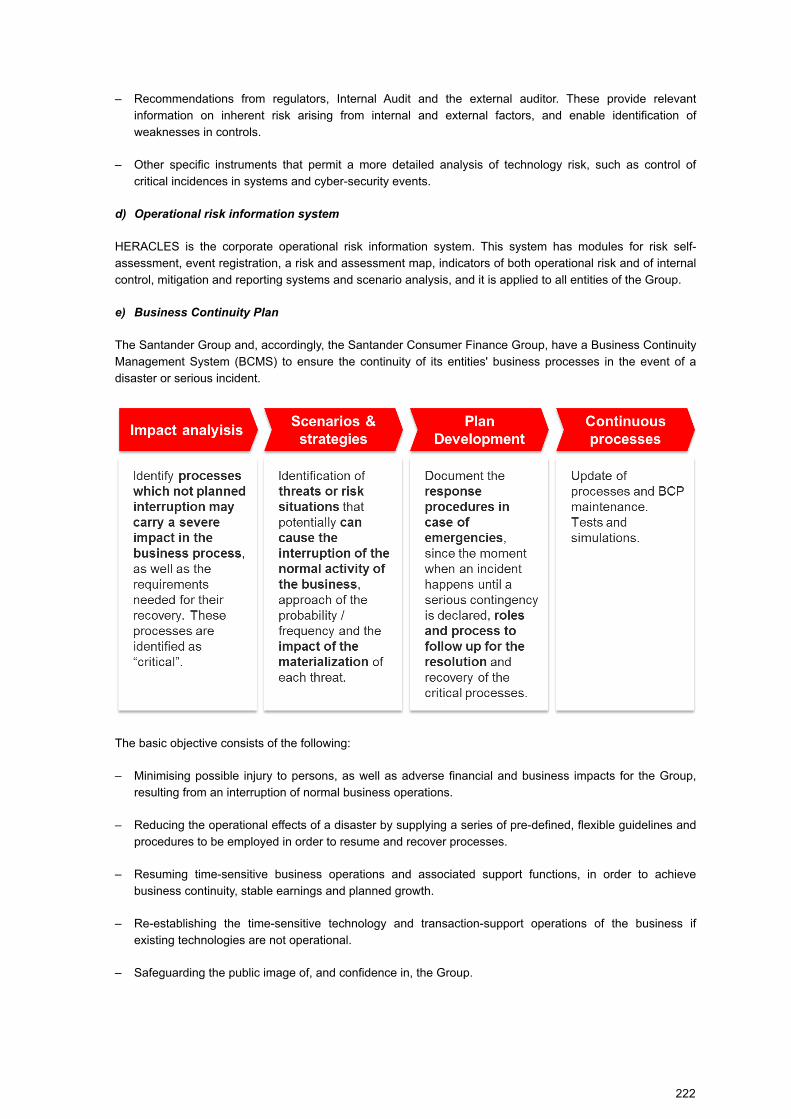
– Recommendations from regulators, Internal Audit and the external auditor. These provide relevant
information on inherent risk arising from internal and external factors, and enable identification of
weaknesses in controls.
– Other specific instruments that permit a more detailed analysis of technology risk, such as control of
critical incidences in systems and cyber-security events.
d) Operational risk information system
HERACLES is the corporate operational risk information system. This system has modules for risk self-
assessment, event registration, a risk and assessment map, indicators of both operational risk and of internal
control, mitigation and reporting systems and scenario analysis, and it is applied to all entities of the Group.
e) Business Continuity Plan
The Santander Group and, accordingly, the Santander Consumer Finance Group, have a Business Continuity
Management System (BCMS) to ensure the continuity of its entities' business processes in the event of a
disaster or serious incident.
The basic objective consists of the following:
– Minimising possible injury to persons, as well as adverse financial and business impacts for the Group,
resulting from an interruption of normal business operations.
– Reducing the operational effects of a disaster by supplying a series of pre-defined, flexible guidelines and
procedures to be employed in order to resume and recover processes.
– Resuming time-sensitive business operations and associated support functions, in order to achieve
business continuity, stable earnings and planned growth.
– Re-establishing the time-sensitive technology and transaction-support operations of the business if
existing technologies are not operational.
– Safeguarding the public image of, and confidence in, the Group.
222
– Meeting the Group's obligations to its employees, customers, shareholders and other third-party
stakeholders.
d) Corporate information
The Santander Group's corporate operational risk control area has an operational risk management
information system that provides data on the Group's main risk elements. The information available from each
country/unit in the operational risk sphere is consolidated to obtain a global view with the following features:
– Two levels of information: a corporate level, with consolidated information, and an individual level
containing information for each country/unit.
– Dissemination of best practices among the Santander Group countries/units, obtained from the combined
study of the results of quantitative and qualitative analyses of operational risk.
Specifically, information is prepared on the following subjects:
– The operational risk management model in the Bank and the main units and geographic areas of the
Group.
– The scope of operational risk management.
– The monitoring of appetite metrics
– Analysis of internal event database and of significant external events.
– Analysis of most significant risks detected using various information sources, such as operational and
technology risk self-assessment processes.
– Evaluation and analysis of risk indicators.
– Mitigation measures/active management.
– Business continuity plans and contingency plans.
This information is used as the basis for meeting reporting requirements to the Executive Risk Committee, the
Risk Supervision, Regulation and Compliance Committee, the Operational Risk Committee, senior
management, regulators, credit rating agencies, etc.
The role of insurance in operational risk management
The Santander Consumer Finance Group considers insurance to be a key tool in the management of
operational risk. Since 2014, common guidelines have been in place for coordination between the different
functions involved in the management cycle of operational risk-mitigating insurance, mainly the areas of
proprietary insurance and operational risk control, but also different areas of first line risk management.
These guidelines include the following activities:
– Identification of all risks at the Group that could be covered by insurance, as well as new insurance cover
for risks already identified in the market.
– Establishment and implementation of criteria for quantifying insurable risk, based on the analysis of losses
and in loss scenarios that make it possible to determine the Group's level of exposure to each risk.
– Analysis of the cover available in the insurance market, as well as preliminary design of the terms and
conditions that best suit the requirements previously identified and evaluated.
223
– Technical assessment of the level of protection provided by a policy, the cost and levels of retention that
would be assumed by the Group (deductibles and other items borne by the insured) for the purpose of
deciding whether to contract it.
– Negotiation with suppliers and contract awards in accordance with the relevant procedures established by
the Group.
– Monitoring of claims reported under the policies, as well as those not reported or not recovered due to
incorrect reporting.
– Analysis of the appropriateness of the Group's policies for the risks covered, taking the necessary
measures to correct any shortcomings detected.
– Close cooperation between local operational risk officers and local insurance coordinators in order to
enhance operational risk mitigation.
– Regular meetings to inform on the specific activities, situation and projects of the two areas.
– Active participation of both areas in the global insurance sourcing desk, the Group's highest technical
body for the definition of insurance cover and arrangement strategies.
Cyber risk
Cybersecurity risk (also known as cyber-risk) is defined as any risk that results in financial loss, business
interruption or damage to Santander Consumer Finance's reputation resulting from the destruction, misuse,
theft or abuse of systems or information. This risk comes from inside and outside the corporation.
In the event of a cyber incident, the main cyber risks for Santander Consumer Finance consist of three
elements:
– Unauthorized access to or misuse of information or systems (e.g., theft of business or personal
information).
– Theft and financial fraud.
– Business interruption (e.g., sabotage, extortion, denial of service).
In 2020, Santander Consumer Finance has continued to devote its full attention to risks related to cyber-
security, which affect our units in different geographical areas. This situation, which is causing concern among
entities and regulators, is leading to the adoption of preventive measures to be prepared for attacks of this
nature.
The Group has further developed its cyber regulations with the approval of a new cyber-security framework
and the cyber-risk supervisory model, and new polices related to this area.
Also, a new organisational structure has been defined, and governance for the management and control of
this risk has been strengthened. For this purpose, specific committees have been set up and cyber-security
metrics have been incorporated to the Group's risk appetite. These metrics have been monitored and
reported both in different geographical areas and at a Global level.
The main instruments and processes established for the control of cybersecurity risk are:
– Compliance with cyber-risk appetite: the objective of this process is to ensure that the cyber-risk profile is
in line with the risk appetite. Cyber-risk appetite is defined by a series of metrics, risk statements and
indicators with corresponding tolerance thresholds and where existing governance structures are used for
monitoring and escalation, including risk committees and cybersecurity committees.
224
– Identification and assessment of cybersecurity risk: The cyber-risk identification and assessment process
is a key process for anticipating and determining the risk factors that could cause cyber-risk and
estimating likelihood and impact. Cyber risks are identified and classified in line with the control categories
defined in the latest industry-relevant security standards (such as ISO 27k, NIST Cybersecurity
Framework, etc.). The methodological catalogue includes methods used to identify, qualify and quantify
cyber-risks, and to evaluate the controls and corrective measures taken by the first line of defence.
Cyber-risk assessment tests are a key tool for identifying and assessing cybersecurity risks at Santander
Consumer Finance entities. Cybersecurity and technology risk assessment must be updated when
reasonably necessary, taking into account changes in information systems, confidential or business
information, and the entity's business operations.
– Cyber-risk control and mitigation processes relating to assessing the effectiveness of risk control and
mitigation. Once cyber risks have been assessed and mitigation measures defined, these measures are
included in a Santander Consumer Finance cybersecurity risk mitigation plan. Residual risks are identified
and formally accepted. Due to the nature of cyber-risks, risk mitigation plans are regularly reassessed. A
key process in the face of a successful cybersecurity attack is the business continuity plan. Santander
Consumer Finance has mitigation strategies and measures in place in connection with business continuity
management plans and disaster recovery. These measures also address cyberattacks, based on defined
policies, methods and procedures.
– Monitoring, supervision and reporting of cyber-risk: Santander Consumer Finance controls and monitors
cyber-risk in order to regularly analyse the information available on the risks accepted in the course of the
Group's activities. For this purpose, Key Risk Indicators (KRIs) and Key Performance Indicators (KPIs) are
monitored to assess whether risk exposure is in line with authorised risk appetite.
– Escalation and reporting: Proper escalation and reporting of cyber threats and cyberattacks is another key
process. Santander Consumer Finance has tools and processes for detecting internal threats and
potential hazards in its infrastructure, servers, applications and databases. Reporting encompasses the
preparation of reports and submission to the relevant committees of information required to assess
exposure to cyber-risk, analyse the cyber-risk profile and take the necessary decisions and measures.
Appropriate cyber-risk situation reports are produced for management committees accordingly. There are
also mechanisms in place for independent internal escalation of technological and cybersecurity incidents
to the bank's management team and, if necessary, to the appropriate regulator.
Other Emerging Risks
In addition to the aforementioned Cyber Risk, Santander Consumer Group is increasingly strengthening the
monitoring of new emerging risks arising from 1) supplier management and 2) transformation projects.
- With respect to supplier management risks, the focus is on the quality and continuity of the services
provided to SCF, but also on ensuring compliance with the new EBA Guidelines through the implementation
of specific risk instruments throughout the different phases of the supplier's life cycle
- Transformational risk is defined as any risk arising from material changes to SCF's organization, products,
services or processes due to imperfect design, construction, testing, implementation and/or rollout of projects
and initiatives, and transition to business as usual (BAU ) Transformation constitutes a root cause, which can
manifest itself in a variety of risks and impacts, not restricted to Operational Risk, (e.g. Credit, Market,
Financial Crime...)
- COVID 19 Crisis: In terms of BCP and Operational Risk measures carried out, critical processes were
identified and key and alternative personnel performing their work without incident. Home working was
implemented as the main driver to prevent employee infection. Collection and customer service call centers
and relevant suppliers remained in operation. Special monitoring was also carried out for possible cyber-
attacks, fraud and other operational risks within the normal range. Coordination between the Corporation and
local units was strengthened to apply lessons learned according to the situation in each country.
225
Compliance and conduct risk
The compliance function includes all issues relating to regulatory compliance, prevention of money laundering
and terrorist financing, governance of products and consumer protection, and reputational risk according to
the General Corporate Compliance and Conduct Framework (Marco Corporativo General de Cumplimiento y
Conducta).
The compliance function promotes the adhesion of Santander Consumer Finance, S.A. ("SCF") to standards,
supervisory requirements, and the principles and values of good conduct by setting standards, debating,
advising and reporting, in the interest of employees, customers, shareholders and the wider community. In
accordance with the current corporate configuration of the Santander Group's three lines of defence, the
compliance function is a second-line independent control function that reports directly to the Board of
Directors and its committees through the CCO. This configuration is aligned with the requirements of banking
regulation and with the expectations of supervisors.
The SCF Group's objective in the area of compliance and conduct risk is to minimise the probability that non-
compliance and irregularities occur and that any that should occur are identified, assessed, reported and
quickly resolved.
The main tools used by the Compliance function in order to meet their objectives are (among others):
establishment and coordination with the Compliance Program, coordination of the Risk Assessments of all the
areas of Compliance and Conduct, definition and monitoring of the Compliance Metrics that participate in the
SCF Appetite Risk Framework and monitoring of the Norms of Obligatory Compliance.
d) Compliance with regulatory framework
The Basel III regulations came into effect in 2014, setting new global standards for the capital, liquidity and
leverage of financial entities.
From the capital perspective, Basel III redefines what is considered available capital for financial entities
(including new deductions and increasing requirements for eligible capital instruments); increases minimum
capital requirements; requires financial entities to always hold capital buffers; and adds new requirements for
the risks considered.
These regulations were implemented in Europe through Directive 2013/36/EU, known as ‘CRD IV’, and its
regulations, 575/2013 (CRR), which apply directly in all EU member states (Single Rule Book). These rules
are currently subject to regulatory development by the European Banking Authority (EBA).
CRD IV was introduced into Spanish law through Act 10/2014, on the ordering, supervision and solvency of
credit institutions, and its subsequent regulatory implementation through Royal Decree Act 84/2015. The CRR
is directly applicable to member states from 1 January 2014 and repeals lower-ranking standards that entail
additional capital requirements.
The CRR provides for a phase-in period that will allow institutions to adapt gradually to the new requirements
in the European Union. The phase-in arrangements have been introduced into Spanish law through Bank of
Spain Circular 2/2014. The phase-in affects both the new deductions from capital and the capital instruments
and elements that cease to be eligible as capital under the new regulations. The capital conservation buffers
provided for in CRD IV are also being phased in gradually, starting in 2016 and reaching full implementation in
2019.
In 2020, the Santander Consumer Finance Group must maintain a minimum capital ratio of 8.55% CET1
phase-in (4.5% for Pillar I, 1.5% for Pillar II, 2.5% for the capital conservation buffer, and 0.5% for the anti-
cyclical buffer), This requirement includes: (i) the minimum Common Equity Tier 1 requirement to be
maintained at all times under Section 92(1)(a) of Regulation (EU) No 575/2013 (ii) the Common Equity Tier 1
requirement to be maintained in excess at all times under Section 16(2)(a) of Regulation (EU) No 1024/2013;
and (iii) the capital conservation buffer under Section 129 of Directive 2013/36/EU. In addition, the Santander
226
Consumer Finance Group must maintain a minimum capital ratio of 10.05% of Q1 phase-in as well as a
minimum Total Ratio of 12.05% phase-in.
Reconciliation of accounting capital with regulatory capital (Millions of euros)
2020 2019
Subscribed capital 5,639 5,639
Share premium account 1,140 1,140
Reserves 3,994 3,373
Other equity instruments 1,200 1,050
Attributable profit 504 1,133
Approved dividend — —
Interim dividend — (445)
Shareholders’ equity on public balance sheet 12,477 11,890
Valuation adjustments (702) (529)
Non- controlling interests 2,132 1,883
Total Equity on public balance sheet 13,907 13,244
Goodwill and intangible assets (1,804) (2,228)
Accrued dividend (504) —
Eligible preference shares and participating securities — —
Other adjustments (*) (1,019) (866)
Tier 1 (Phase-in) 10,580 10,150
(*) The distribution of the result obtained in fiscal year 2020 has not been submitted to the General Shareholders' Meeting for
approval, however, a dividend distribution is proposed.
(*) Fundamentally for non-computable non-controlling interests and deductions and reasonable filters in compliance with CRR.
The following table shows the Phase-in capital coefficients and a detail of the eligible internal resources of the
Group:
2020 2019Capital coefficients
Level 1 ordinary eligible capital (millions of euros) 9,202 9,023
Level 1 additional eligible capital (millions of euros) 1,378 1,128
Level 2 eligible capital (millions of euros) 934 809
Risk-weighted assets (millions of euros) 69,653 71,957
Level 1 ordinary capital coefficient (CET 1) 13.21 % 12.54 %
Level 1 additional capital coefficient (AT1) 1.98 % 1.57 %
Level 1 capital coefficient (TIER1) 15.19 % 14.11 %
Level 2 capital coefficient (TIER 2) 1.34 % 1.12 %
Total capital coefficient 16.53% 15.23%
227
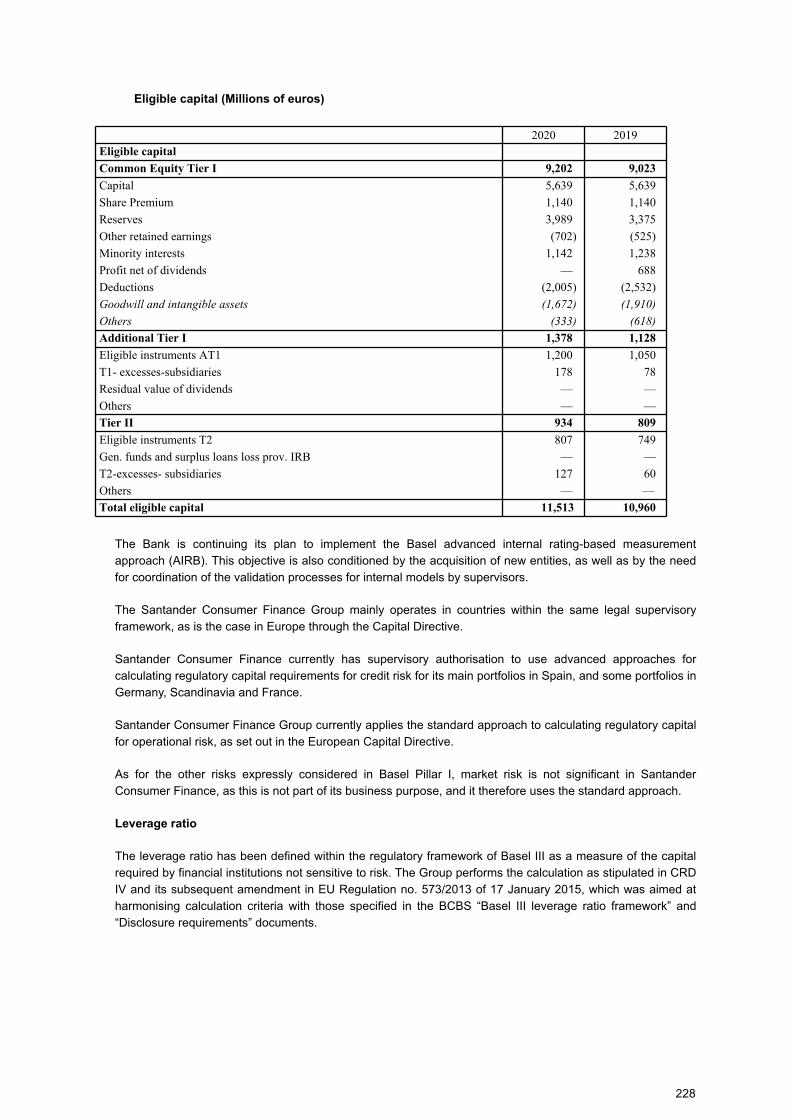
Eligible capital (Millions of euros)
2020 2019Eligible capital
Common Equity Tier I 9,202 9,023
Capital 5,639 5,639
Share Premium 1,140 1,140
Reserves 3,989 3,375
Other retained earnings (702) (525)
Minority interests 1,142 1,238
Profit net of dividends — 688
Deductions (2,005) (2,532)
Goodwill and intangible assets (1,672) (1,910)
Others (333) (618)
Additional Tier I 1,378 1,128
Eligible instruments AT1 1,200 1,050
T1- excesses-subsidiaries 178 78
Residual value of dividends — —
Others — —
Tier II 934 809
Eligible instruments T2 807 749
Gen. funds and surplus loans loss prov. IRB — —
T2-excesses- subsidiaries 127 60
Others — —
Total eligible capital 11,513 10,960
The Bank is continuing its plan to implement the Basel advanced internal rating-based measurement
approach (AIRB). This objective is also conditioned by the acquisition of new entities, as well as by the need
for coordination of the validation processes for internal models by supervisors.
The Santander Consumer Finance Group mainly operates in countries within the same legal supervisory
framework, as is the case in Europe through the Capital Directive.
Santander Consumer Finance currently has supervisory authorisation to use advanced approaches for
calculating regulatory capital requirements for credit risk for its main portfolios in Spain, and some portfolios in
Germany, Scandinavia and France.
Santander Consumer Finance Group currently applies the standard approach to calculating regulatory capital
for operational risk, as set out in the European Capital Directive.
As for the other risks expressly considered in Basel Pillar I, market risk is not significant in Santander
Consumer Finance, as this is not part of its business purpose, and it therefore uses the standard approach.
Leverage ratio
The leverage ratio has been defined within the regulatory framework of Basel III as a measure of the capital
required by financial institutions not sensitive to risk. The Group performs the calculation as stipulated in CRD
IV and its subsequent amendment in EU Regulation no. 573/2013 of 17 January 2015, which was aimed at
harmonising calculation criteria with those specified in the BCBS “Basel III leverage ratio framework” and
“Disclosure requirements” documents.
228
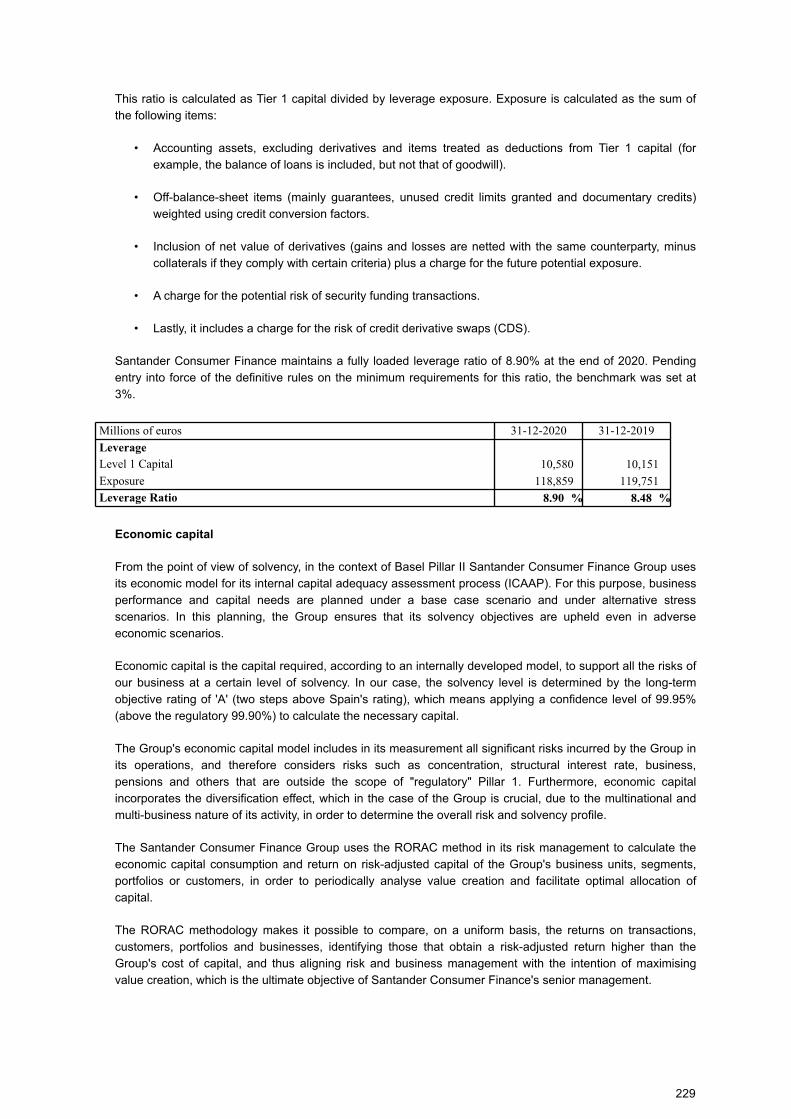
This ratio is calculated as Tier 1 capital divided by leverage exposure. Exposure is calculated as the sum of
the following items:
• Accounting assets, excluding derivatives and items treated as deductions from Tier 1 capital (for
example, the balance of loans is included, but not that of goodwill).
• Off-balance-sheet items (mainly guarantees, unused credit limits granted and documentary credits)
weighted using credit conversion factors.
• Inclusion of net value of derivatives (gains and losses are netted with the same counterparty, minus
collaterals if they comply with certain criteria) plus a charge for the future potential exposure.
• A charge for the potential risk of security funding transactions.
• Lastly, it includes a charge for the risk of credit derivative swaps (CDS).
Santander Consumer Finance maintains a fully loaded leverage ratio of 8.90% at the end of 2020. Pending
entry into force of the definitive rules on the minimum requirements for this ratio, the benchmark was set at
3%.
Millions of euros 31-12-2020 31-12-2019
Leverage
Level 1 Capital 10,580 10,151
Exposure 118,859 119,751
Leverage Ratio 8.90 % 8.48 %
Economic capital
From the point of view of solvency, in the context of Basel Pillar II Santander Consumer Finance Group uses
its economic model for its internal capital adequacy assessment process (ICAAP). For this purpose, business
performance and capital needs are planned under a base case scenario and under alternative stress
scenarios. In this planning, the Group ensures that its solvency objectives are upheld even in adverse
economic scenarios.
Economic capital is the capital required, according to an internally developed model, to support all the risks of
our business at a certain level of solvency. In our case, the solvency level is determined by the long-term
objective rating of 'A' (two steps above Spain's rating), which means applying a confidence level of 99.95%
(above the regulatory 99.90%) to calculate the necessary capital.
The Group's economic capital model includes in its measurement all significant risks incurred by the Group in
its operations, and therefore considers risks such as concentration, structural interest rate, business,
pensions and others that are outside the scope of "regulatory" Pillar 1. Furthermore, economic capital
incorporates the diversification effect, which in the case of the Group is crucial, due to the multinational and
multi-business nature of its activity, in order to determine the overall risk and solvency profile.
The Santander Consumer Finance Group uses the RORAC method in its risk management to calculate the
economic capital consumption and return on risk-adjusted capital of the Group's business units, segments,
portfolios or customers, in order to periodically analyse value creation and facilitate optimal allocation of
capital.
The RORAC methodology makes it possible to compare, on a uniform basis, the returns on transactions,
customers, portfolios and businesses, identifying those that obtain a risk-adjusted return higher than the
Group's cost of capital, and thus aligning risk and business management with the intention of maximising
value creation, which is the ultimate objective of Santander Consumer Finance's senior management.
229
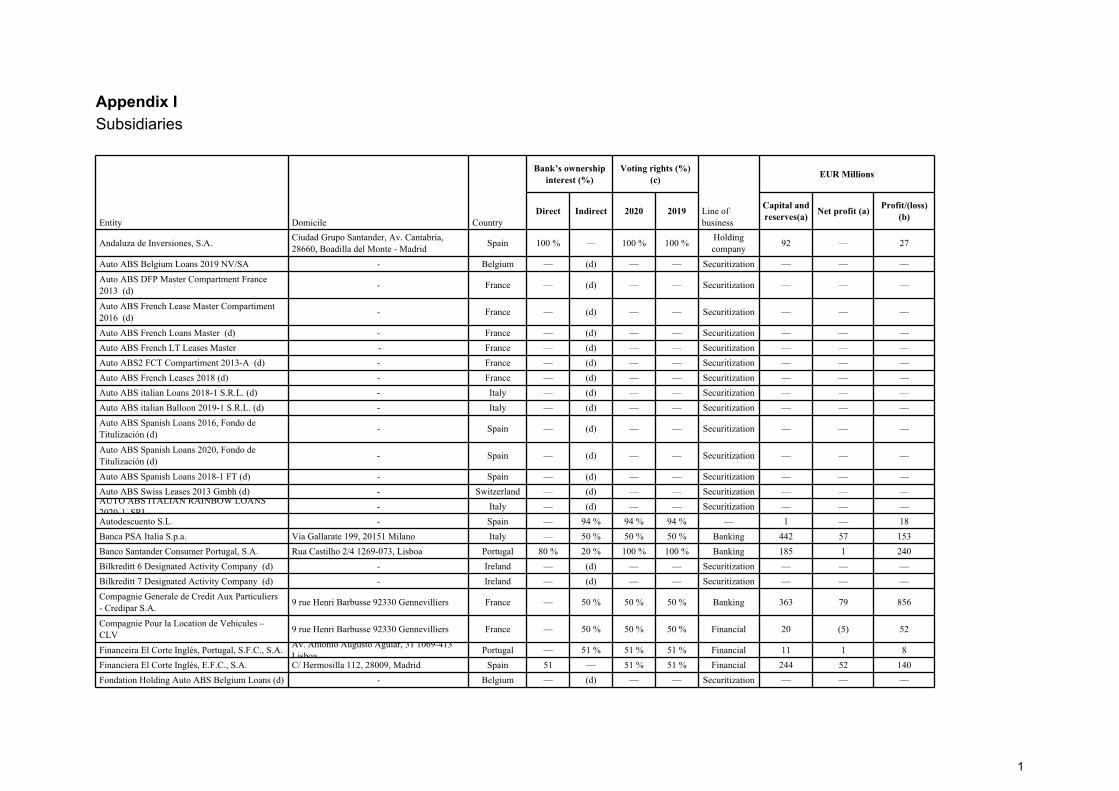
Appendix I
Subsidiaries
Entity Domicile Country
Bank’s ownership
interest (%)
Voting rights (%)
(c)
Line of business
EUR Millions
Direct Indirect 2020 2019Capital and
reserves(a)Net profit (a)
Profit/(loss)
(b)
Andaluza de Inversiones, S.A.Ciudad Grupo Santander, Av. Cantabria, 28660, Boadilla del Monte - Madrid
Spain 100 % — 100 % 100 %Holding company
92 — 27
Auto ABS Belgium Loans 2019 NV/SA - Belgium — (d) — — Securitization — — —
Auto ABS DFP Master Compartment France 2013 (d)
- France — (d) — — Securitization — — —
Auto ABS French Lease Master Compartiment 2016 (d)
- France — (d) — — Securitization — — —
Auto ABS French Loans Master (d) - France — (d) — — Securitization — — —
Auto ABS French LT Leases Master - France — (d) — — Securitization — — —
Auto ABS2 FCT Compartiment 2013-A (d) - France — (d) — — Securitization — — —
Auto ABS French Leases 2018 (d) - France — (d) — — Securitization — — —
Auto ABS italian Loans 2018-1 S.R.L. (d) - Italy — (d) — — Securitization — — —
Auto ABS italian Balloon 2019-1 S.R.L. (d) - Italy — (d) — — Securitization — — —
Auto ABS Spanish Loans 2016, Fondo de Titulización (d)
- Spain — (d) — — Securitization — — —
Auto ABS Spanish Loans 2020, Fondo de Titulización (d)
- Spain — (d) — — Securitization — — —
Auto ABS Spanish Loans 2018-1 FT (d) - Spain — (d) — — Securitization — — —
Auto ABS Swiss Leases 2013 Gmbh (d) - Switzerland — (d) — — Securitization — — —AUTO ABS ITALIAN RAINBOW LOANS 2020-1 SRL
- Italy — (d) — — Securitization — — —
Autodescuento S.L - Spain — 94 % 94 % 94 % — 1 — 18
Banca PSA Italia S.p.a. Via Gallarate 199, 20151 Milano Italy — 50 % 50 % 50 % Banking 442 57 153
Banco Santander Consumer Portugal, S.A. Rua Castilho 2/4 1269-073, Lisboa Portugal 80 % 20 % 100 % 100 % Banking 185 1 240
Bilkreditt 6 Designated Activity Company (d) - Ireland — (d) — — Securitization — — —
Bilkreditt 7 Designated Activity Company (d) - Ireland — (d) — — Securitization — — —
Compagnie Generale de Credit Aux Particuliers - Credipar S.A.
9 rue Henri Barbusse 92330 Gennevilliers France — 50 % 50 % 50 % Banking 363 79 856
Compagnie Pour la Location de Vehicules – CLV
9 rue Henri Barbusse 92330 Gennevilliers France — 50 % 50 % 50 % Financial 20 (5) 52
Financeira El Corte Inglés, Portugal, S.F.C., S.A.Av. António Augusto Aguiar, 31 1069-413 Lisboa
Portugal — 51 % 51 % 51 % Financial 11 1 8
Financiera El Corte Inglés, E.F.C., S.A. C/ Hermosilla 112, 28009, Madrid Spain 51 — 51 % 51 % Financial 244 52 140
Fondation Holding Auto ABS Belgium Loans (d) - Belgium — (d) — — Securitization — — —
1
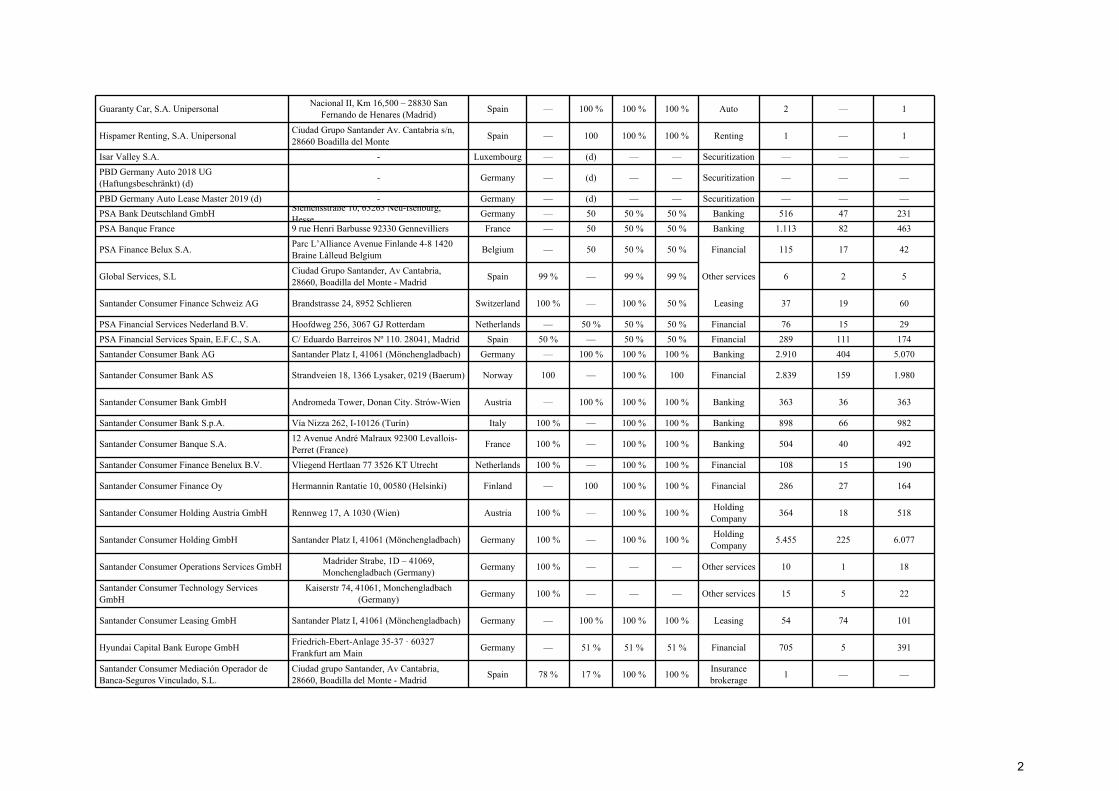
Guaranty Car, S.A. UnipersonalNacional II, Km 16,500 – 28830 San
Fernando de Henares (Madrid)Spain — 100 % 100 % 100 % Auto 2 — 1
Hispamer Renting, S.A. UnipersonalCiudad Grupo Santander Av. Cantabria s/n, 28660 Boadilla del Monte
Spain — 100 100 % 100 % Renting 1 — 1
Isar Valley S.A. - Luxembourg — (d) — — Securitization — — —
PBD Germany Auto 2018 UG (Haftungsbeschränkt) (d)
- Germany — (d) — — Securitization — — —
PBD Germany Auto Lease Master 2019 (d) - Germany — (d) — — Securitization — — —
PSA Bank Deutschland GmbHSiemensstraße 10, 63263 Neu-Isenburg, Hesse
Germany — 50 50 % 50 % Banking 516 47 231
PSA Banque France 9 rue Henri Barbusse 92330 Gennevilliers France — 50 50 % 50 % Banking 1.113 82 463
PSA Finance Belux S.A.Parc L’Alliance Avenue Finlande 4-8 1420 Braine Làlleud Belgium
Belgium — 50 50 % 50 % Financial 115 17 42
Global Services, S.LCiudad Grupo Santander, Av Cantabria, 28660, Boadilla del Monte - Madrid
Spain 99 % — 99 % 99 % Other services 6 2 5
Santander Consumer Finance Schweiz AG Brandstrasse 24, 8952 Schlieren Switzerland 100 % — 100 % 50 % Leasing 37 19 60
PSA Financial Services Nederland B.V. Hoofdweg 256, 3067 GJ Rotterdam Netherlands — 50 % 50 % 50 % Financial 76 15 29
PSA Financial Services Spain, E.F.C., S.A. C/ Eduardo Barreiros Nº 110. 28041, Madrid Spain 50 % — 50 % 50 % Financial 289 111 174
Santander Consumer Bank AG Santander Platz I, 41061 (Mönchengladbach) Germany — 100 % 100 % 100 % Banking 2.910 404 5.070
Santander Consumer Bank AS Strandveien 18, 1366 Lysaker, 0219 (Baerum) Norway 100 — 100 % 100 Financial 2.839 159 1.980
Santander Consumer Bank GmbH Andromeda Tower, Donan City. Strów-Wien Austria — 100 % 100 % 100 % Banking 363 36 363
Santander Consumer Bank S.p.A. Vía Nizza 262, I-10126 (Turín) Italy 100 % — 100 % 100 % Banking 898 66 982
Santander Consumer Banque S.A.12 Avenue André Malraux 92300 Levallois-Perret (France)
France 100 % — 100 % 100 % Banking 504 40 492
Santander Consumer Finance Benelux B.V. Vliegend Hertlaan 77 3526 KT Utrecht Netherlands 100 % — 100 % 100 % Financial 108 15 190
Santander Consumer Finance Oy Hermannin Rantatie 10, 00580 (Helsinki) Finland — 100 100 % 100 % Financial 286 27 164
Santander Consumer Holding Austria GmbH Rennweg 17, A 1030 (Wien) Austria 100 % — 100 % 100 %Holding
Company364 18 518
Santander Consumer Holding GmbH Santander Platz I, 41061 (Mönchengladbach) Germany 100 % — 100 % 100 %Holding
Company5.455 225 6.077
Santander Consumer Operations Services GmbHMadrider Strabe, 1D – 41069, Monchengladbach (Germany)
Germany 100 % — — — Other services 10 1 18
Santander Consumer Technology Services GmbH
Kaiserstr 74, 41061, Monchengladbach (Germany)
Germany 100 % — — — Other services 15 5 22
Santander Consumer Leasing GmbH Santander Platz I, 41061 (Mönchengladbach) Germany — 100 % 100 % 100 % Leasing 54 74 101
Hyundai Capital Bank Europe GmbHFriedrich-Ebert-Anlage 35-37 · 60327 Frankfurt am Main
Germany — 51 % 51 % 51 % Financial 705 5 391
Santander Consumer Mediación Operador de Banca-Seguros Vinculado, S.L.
Ciudad grupo Santander, Av Cantabria, 28660, Boadilla del Monte - Madrid
Spain 78 % 17 % 100 % 100 %Insurance brokerage
1 — —
2
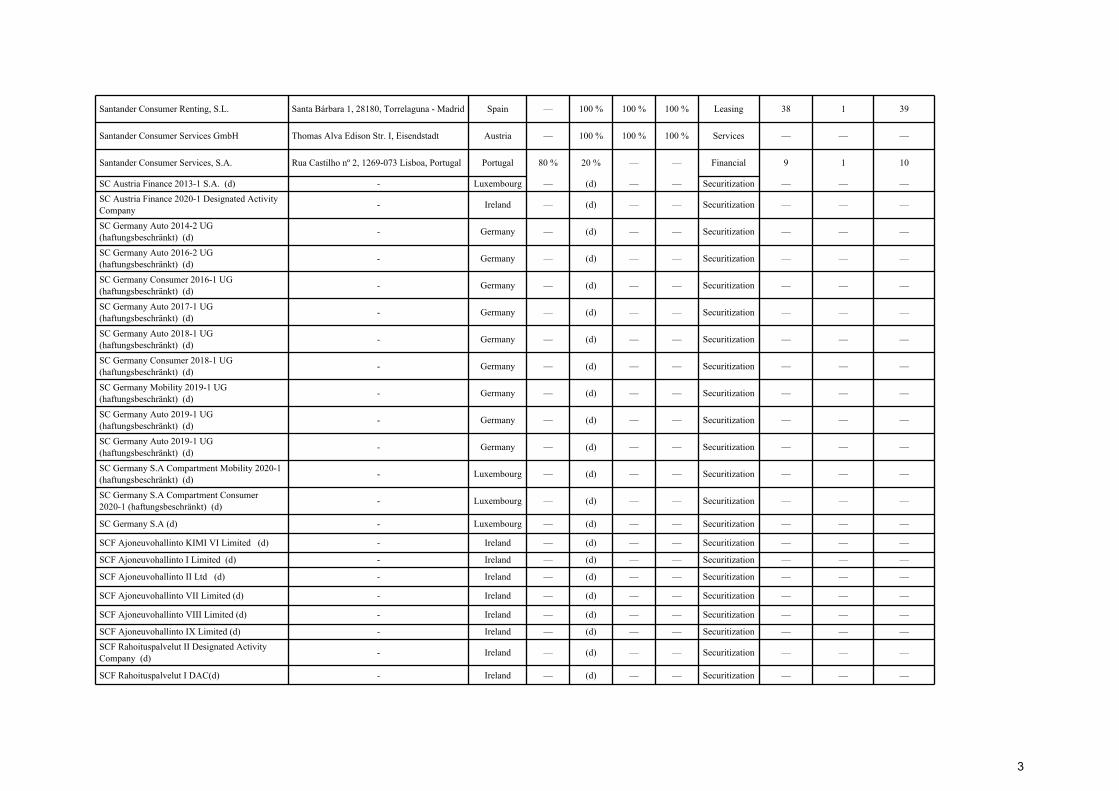
Santander Consumer Renting, S.L. Santa Bárbara 1, 28180, Torrelaguna - Madrid Spain — 100 % 100 % 100 % Leasing 38 1 39
Santander Consumer Services GmbH Thomas Alva Edison Str. I, Eisendstadt Austria — 100 % 100 % 100 % Services — — —
Santander Consumer Services, S.A. Rua Castilho nº 2, 1269-073 Lisboa, Portugal Portugal 80 % 20 % — — Financial 9 1 10
SC Austria Finance 2013-1 S.A. (d) - Luxembourg — (d) — — Securitization — — —
SC Austria Finance 2020-1 Designated Activity Company
- Ireland — (d) — — Securitization — — —
SC Germany Auto 2014-2 UG (haftungsbeschränkt) (d)
- Germany — (d) — — Securitization — — —
SC Germany Auto 2016-2 UG (haftungsbeschränkt) (d)
- Germany — (d) — — Securitization — — —
SC Germany Consumer 2016-1 UG (haftungsbeschränkt) (d)
- Germany — (d) — — Securitization — — —
SC Germany Auto 2017-1 UG (haftungsbeschränkt) (d)
- Germany — (d) — — Securitization — — —
SC Germany Auto 2018-1 UG (haftungsbeschränkt) (d)
- Germany — (d) — — Securitization — — —
SC Germany Consumer 2018-1 UG (haftungsbeschränkt) (d)
- Germany — (d) — — Securitization — — —
SC Germany Mobility 2019-1 UG (haftungsbeschränkt) (d)
- Germany — (d) — — Securitization — — —
SC Germany Auto 2019-1 UG (haftungsbeschränkt) (d)
- Germany — (d) — — Securitization — — —
SC Germany Auto 2019-1 UG (haftungsbeschränkt) (d)
- Germany — (d) — — Securitization — — —
SC Germany S.A Compartment Mobility 2020-1 (haftungsbeschränkt) (d)
- Luxembourg — (d) — — Securitization — — —
SC Germany S.A Compartment Consumer 2020-1 (haftungsbeschränkt) (d)
- Luxembourg — (d) — — Securitization — — —
SC Germany S.A (d) - Luxembourg — (d) — — Securitization — — —
SCF Ajoneuvohallinto KIMI VI Limited (d) - Ireland — (d) — — Securitization — — —
SCF Ajoneuvohallinto I Limited (d) - Ireland — (d) — — Securitization — — —
SCF Ajoneuvohallinto II Ltd (d) - Ireland — (d) — — Securitization — — —
SCF Ajoneuvohallinto VII Limited (d) - Ireland — (d) — — Securitization — — —
SCF Ajoneuvohallinto VIII Limited (d) - Ireland — (d) — — Securitization — — —
SCF Ajoneuvohallinto IX Limited (d) - Ireland — (d) — — Securitization — — —
SCF Rahoituspalvelut II Designated Activity Company (d)
- Ireland — (d) — — Securitization — — —
SCF Rahoituspalvelut I DAC(d) - Ireland — (d) — — Securitization — — —
3
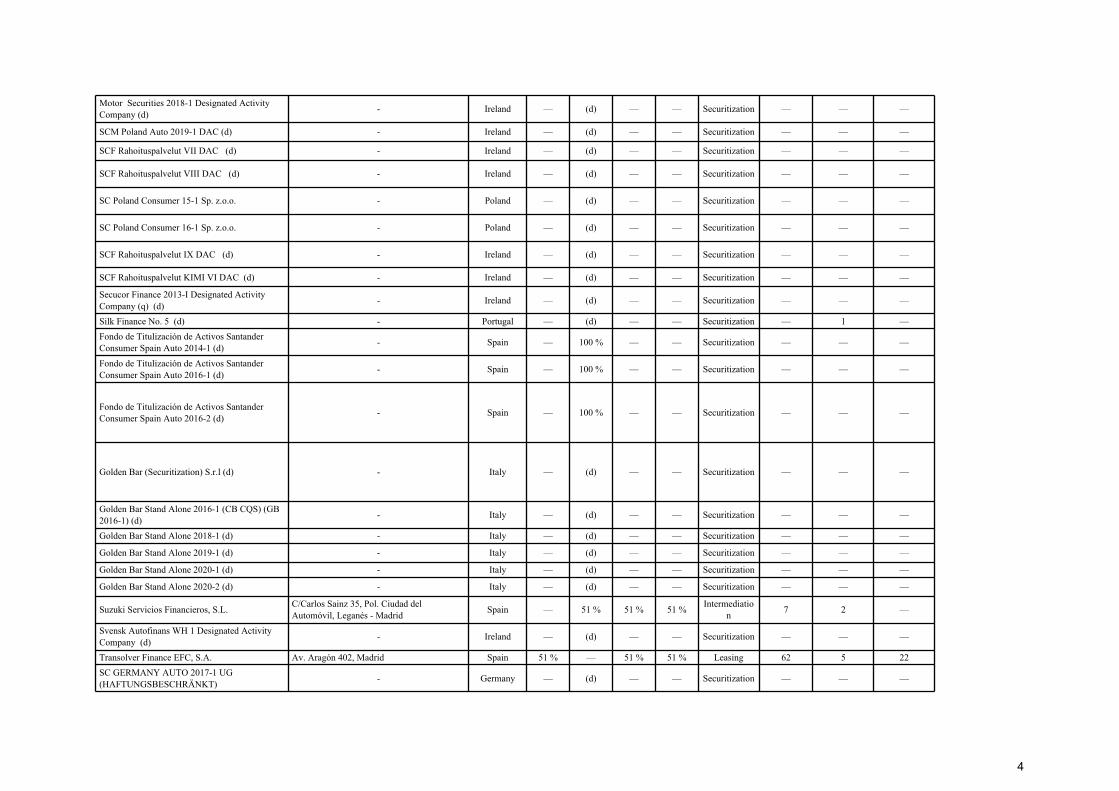
Motor Securities 2018-1 Designated Activity Company (d)
- Ireland — (d) — — Securitization — — —
SCM Poland Auto 2019-1 DAC (d) - Ireland — (d) — — Securitization — — —
SCF Rahoituspalvelut VII DAC (d) - Ireland — (d) — — Securitization — — —
SCF Rahoituspalvelut VIII DAC (d) - Ireland — (d) — — Securitization — — —
SC Poland Consumer 15-1 Sp. z.o.o. - Poland — (d) — — Securitization — — —
SC Poland Consumer 16-1 Sp. z.o.o. - Poland — (d) — — Securitization — — —
SCF Rahoituspalvelut IX DAC (d) - Ireland — (d) — — Securitization — — —
SCF Rahoituspalvelut KIMI VI DAC (d) - Ireland — (d) — — Securitization — — —
Secucor Finance 2013-I Designated Activity Company (q) (d)
- Ireland — (d) — — Securitization — — —
Silk Finance No. 5 (d) - Portugal — (d) — — Securitization — 1 —
Fondo de Titulización de Activos Santander Consumer Spain Auto 2014-1 (d)
- Spain — 100 % — — Securitization — — —
Fondo de Titulización de Activos Santander Consumer Spain Auto 2016-1 (d)
- Spain — 100 % — — Securitization — — —
Fondo de Titulización de Activos Santander Consumer Spain Auto 2016-2 (d)
- Spain — 100 % — — Securitization — — —
Golden Bar (Securitization) S.r.l (d) - Italy — (d) — — Securitization — — —
Golden Bar Stand Alone 2016-1 (CB CQS) (GB 2016-1) (d)
- Italy — (d) — — Securitization — — —
Golden Bar Stand Alone 2018-1 (d) - Italy — (d) — — Securitization — — —
Golden Bar Stand Alone 2019-1 (d) - Italy — (d) — — Securitization — — —
Golden Bar Stand Alone 2020-1 (d) - Italy — (d) — — Securitization — — —
Golden Bar Stand Alone 2020-2 (d) - Italy — (d) — — Securitization — — —
Suzuki Servicios Financieros, S.L.C/Carlos Sainz 35, Pol. Ciudad del Automóvil, Leganés - Madrid
Spain — 51 % 51 % 51 %Intermediatio
n7 2 —
Svensk Autofinans WH 1 Designated Activity Company (d)
- Ireland — (d) — — Securitization — — —
Transolver Finance EFC, S.A. Av. Aragón 402, Madrid Spain 51 % — 51 % 51 % Leasing 62 5 22
SC GERMANY AUTO 2017-1 UG (HAFTUNGSBESCHRÄNKT)
- Germany — (d) — — Securitization — — —
4
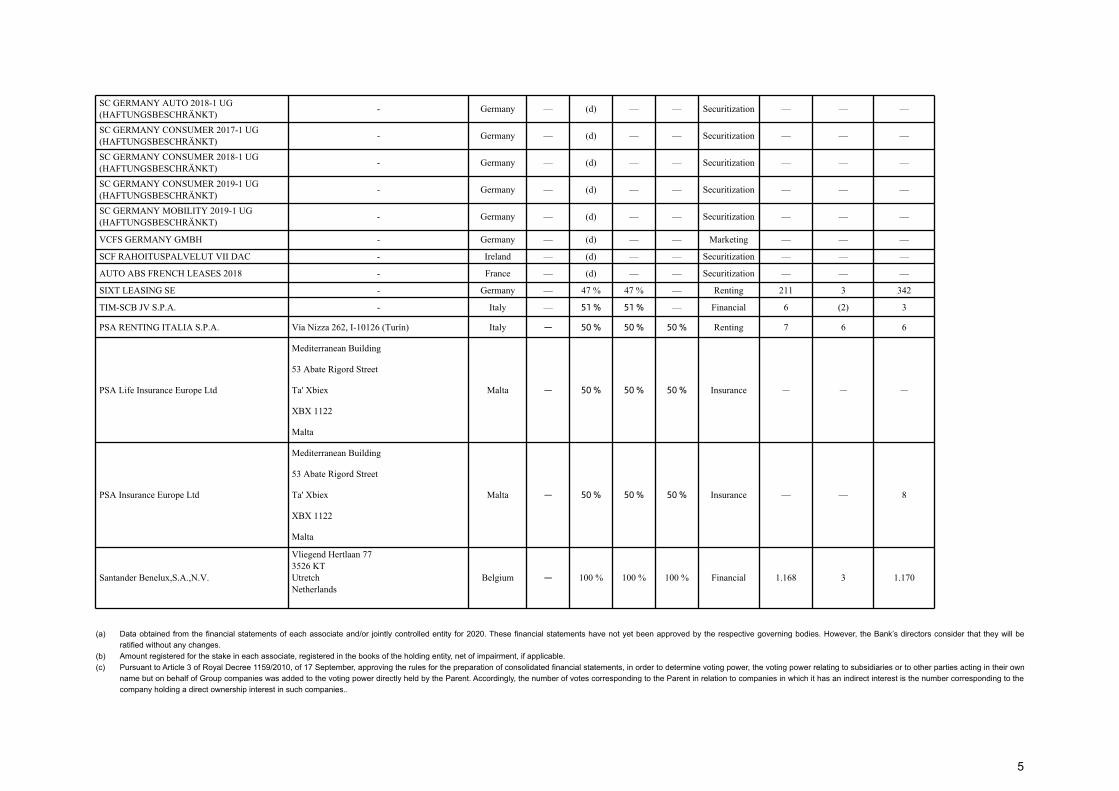
SC GERMANY AUTO 2018-1 UG (HAFTUNGSBESCHRÄNKT)
- Germany — (d) — — Securitization — — —
SC GERMANY CONSUMER 2017-1 UG (HAFTUNGSBESCHRÄNKT)
- Germany — (d) — — Securitization — — —
SC GERMANY CONSUMER 2018-1 UG (HAFTUNGSBESCHRÄNKT)
- Germany — (d) — — Securitization — — —
SC GERMANY CONSUMER 2019-1 UG (HAFTUNGSBESCHRÄNKT)
- Germany — (d) — — Securitization — — —
SC GERMANY MOBILITY 2019-1 UG (HAFTUNGSBESCHRÄNKT)
- Germany — (d) — — Securitization — — —
VCFS GERMANY GMBH - Germany — (d) — — Marketing — — —
SCF RAHOITUSPALVELUT VII DAC - Ireland — (d) — — Securitization — — —
AUTO ABS FRENCH LEASES 2018 - France — (d) — — Securitization — — —
SIXT LEASING SE - Germany — 47 % 47 % — Renting 211 3 342
TIM-SCB JV S.P.A. - Italy — 51 % 51 % — Financial 6 (2) 3
PSA RENTING ITALIA S.P.A. Vía Nizza 262, I-10126 (Turín) Italy — 50 % 50 % 50 % Renting 7 6 6
PSA Life Insurance Europe Ltd
Mediterranean Building
Malta — 50 % 50 % 50 % Insurance — — —
53 Abate Rigord Street
Ta' Xbiex
XBX 1122
Malta
PSA Insurance Europe Ltd
Mediterranean Building
Malta — 50 % 50 % 50 % Insurance — — 8
53 Abate Rigord Street
Ta' Xbiex
XBX 1122
Malta
Santander Benelux,S.A.,N.V.
Vliegend Hertlaan 773526 KTUtretchNetherlands
Belgium — 100 % 100 % 100 % Financial 1.168 3 1.170
(a) Data obtained from the financial statements of each associate and/or jointly controlled entity for 2020. These financial statements have not yet been approved by the respective governing bodies. However, the Bank’s directors consider that they will be
ratified without any changes.
(b) Amount registered for the stake in each associate, registered in the books of the holding entity, net of impairment, if applicable.
(c) Pursuant to Article 3 of Royal Decree 1159/2010, of 17 September, approving the rules for the preparation of consolidated financial statements, in order to determine voting power, the voting power relating to subsidiaries or to other parties acting in their own
name but on behalf of Group companies was added to the voting power directly held by the Parent. Accordingly, the number of votes corresponding to the Parent in relation to companies in which it has an indirect interest is the number corresponding to the
company holding a direct ownership interest in such companies..
5
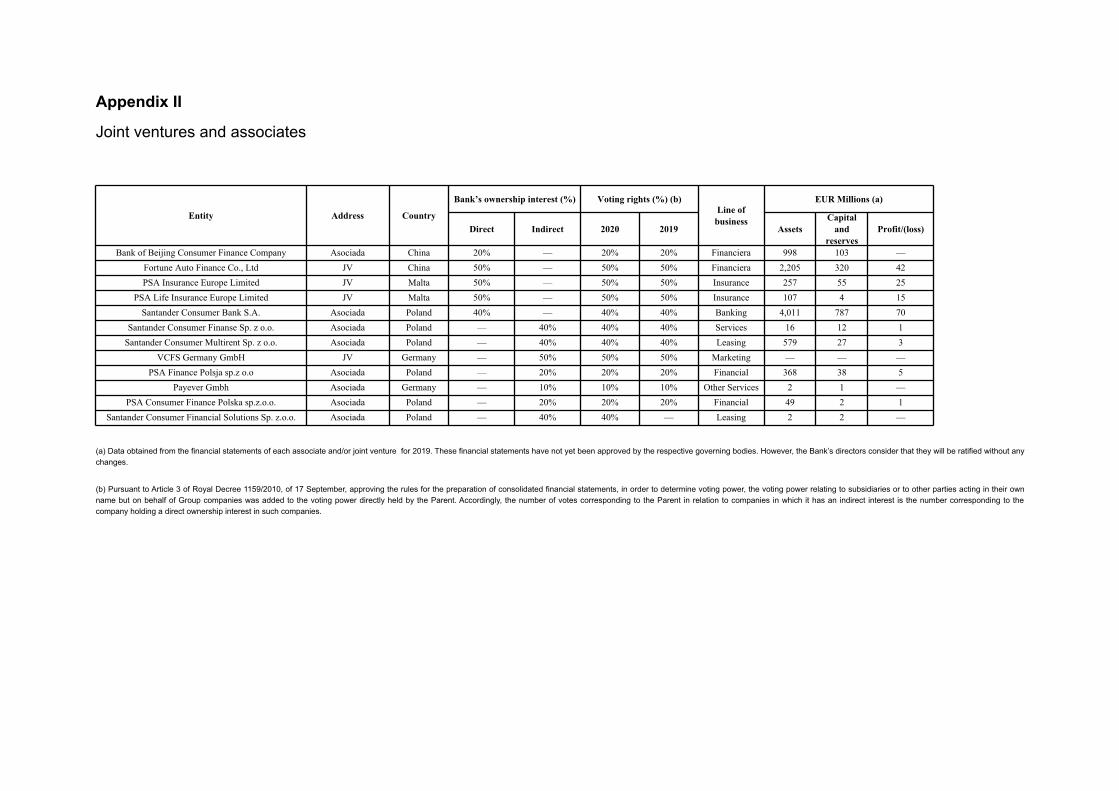
Appendix II
Joint ventures and associates
Entity Address Country
Bank’s ownership interest (%) Voting rights (%) (b)
Line of
business
EUR Millions (a)
Direct Indirect 2020 2019 Assets
Capital
and
reserves
Profit/(loss)
Bank of Beijing Consumer Finance Company Asociada China 20% — 20% 20% Financiera 998 103 —
Fortune Auto Finance Co., Ltd JV China 50% — 50% 50% Financiera 2,205 320 42
PSA Insurance Europe Limited JV Malta 50% — 50% 50% Insurance 257 55 25
PSA Life Insurance Europe Limited JV Malta 50% — 50% 50% Insurance 107 4 15
Santander Consumer Bank S.A. Asociada Poland 40% — 40% 40% Banking 4,011 787 70
Santander Consumer Finanse Sp. z o.o. Asociada Poland — 40% 40% 40% Services 16 12 1
Santander Consumer Multirent Sp. z o.o. Asociada Poland — 40% 40% 40% Leasing 579 27 3
VCFS Germany GmbH JV Germany — 50% 50% 50% Marketing — — —
PSA Finance Polsja sp.z o.o Asociada Poland — 20% 20% 20% Financial 368 38 5
Payever Gmbh Asociada Germany — 10% 10% 10% Other Services 2 1 —
PSA Consumer Finance Polska sp.z.o.o. Asociada Poland — 20% 20% 20% Financial 49 2 1
Santander Consumer Financial Solutions Sp. z.o.o. Asociada Poland — 40% 40% — Leasing 2 2 —
(a) Data obtained from the financial statements of each associate and/or joint venture for 2019. These financial statements have not yet been approved by the respective governing bodies. However, the Bank’s directors consider that they will be ratified without any
changes.
(b) Pursuant to Article 3 of Royal Decree 1159/2010, of 17 September, approving the rules for the preparation of consolidated financial statements, in order to determine voting power, the voting power relating to subsidiaries or to other parties acting in their own
name but on behalf of Group companies was added to the voting power directly held by the Parent. Accordingly, the number of votes corresponding to the Parent in relation to companies in which it has an indirect interest is the number corresponding to the
company holding a direct ownership interest in such companies.
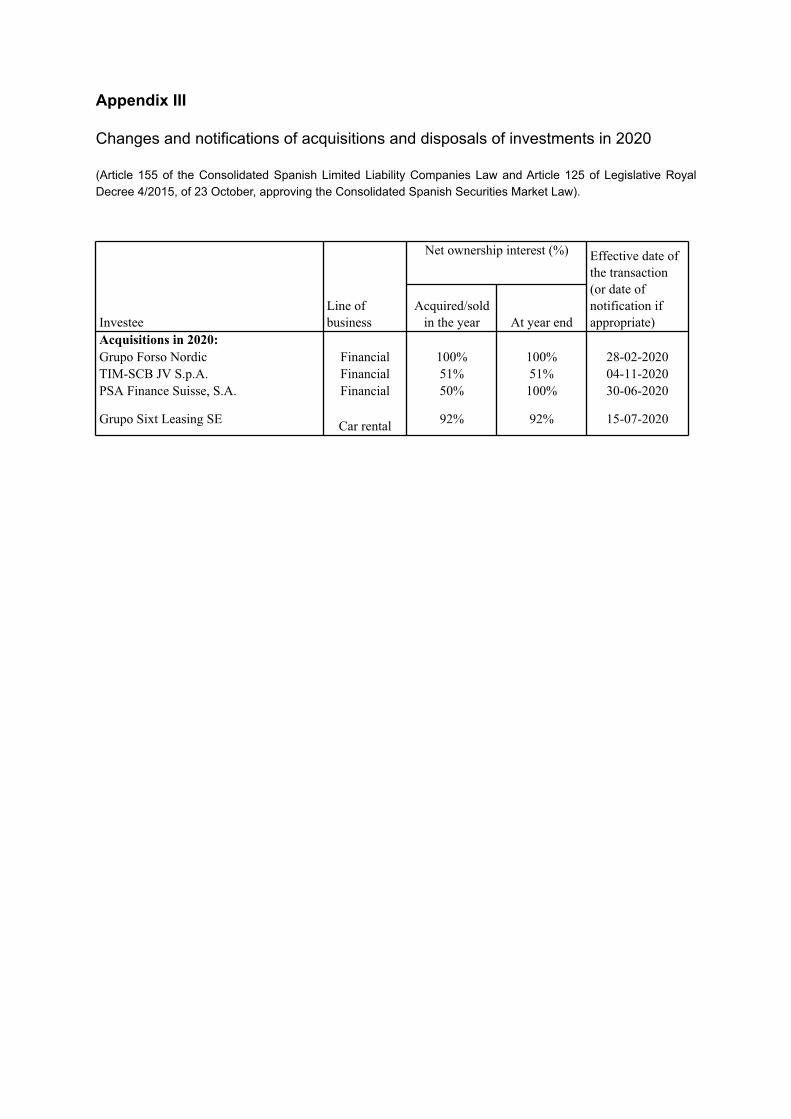
Appendix III
Changes and notifications of acquisitions and disposals of investments in 2020
(Article 155 of the Consolidated Spanish Limited Liability Companies Law and Article 125 of Legislative Royal
Decree 4/2015, of 23 October, approving the Consolidated Spanish Securities Market Law).
InvesteeLine of business
Net ownership interest (%) Effective date of the transaction (or date of notification if appropriate)
Acquired/sold in the year At year end
Acquisitions in 2020:
Grupo Forso Nordic Financial 100% 100% 28-02-2020TIM-SCB JV S.p.A. Financial 51% 51% 04-11-2020PSA Finance Suisse, S.A. Financial 50% 100% 30-06-2020
Grupo Sixt Leasing SE Car rental 92% 92% 15-07-2020
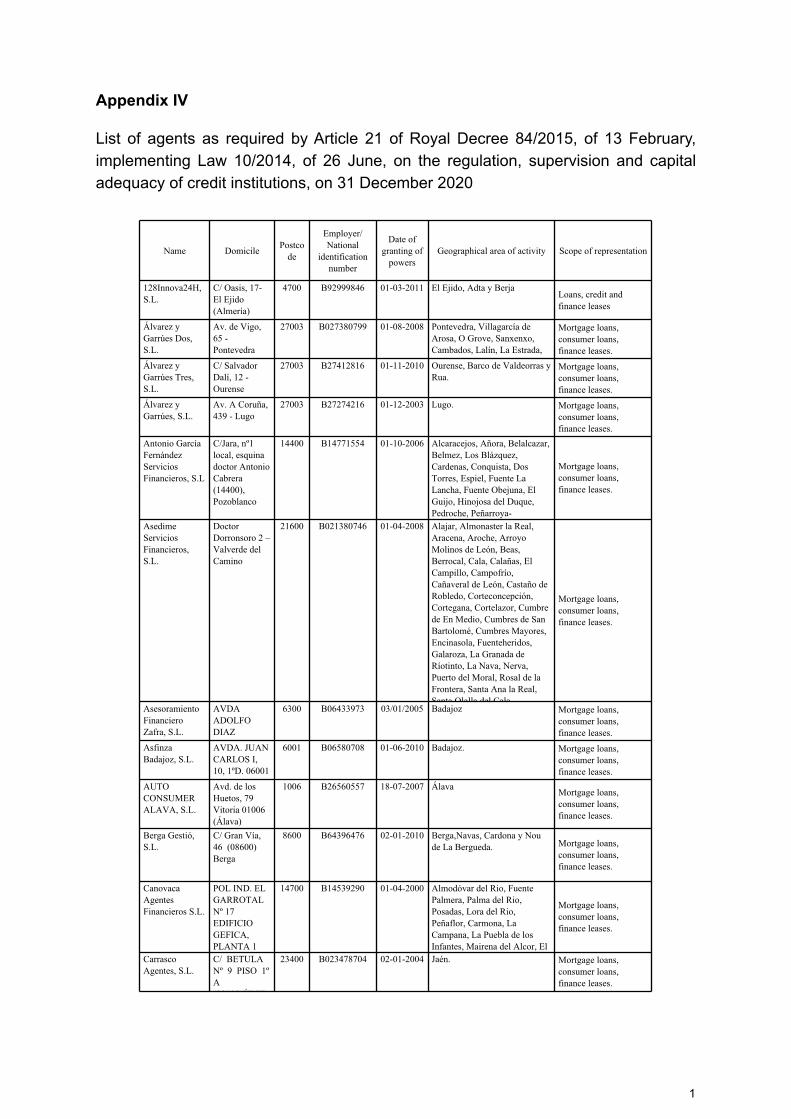
Appendix IV
List of agents as required by Article 21 of Royal Decree 84/2015, of 13 February,
implementing Law 10/2014, of 26 June, on the regulation, supervision and capital
adequacy of credit institutions, on 31 December 2020
Name DomicilePostco
de
Employer/National
identification number
Date of granting of
powersGeographical area of activity Scope of representation
128Innova24H, S.L.
C/ Oasis, 17- El Ejido (Almería)
4700 B92999846 01-03-2011 El Ejido, Adta y BerjaLoans, credit and finance leases
Álvarez y Garrúes Dos, S.L.
Av. de Vigo, 65 - Pontevedra
27003 B027380799 01-08-2008 Pontevedra, Villagarcía de Arosa, O Grove, Sanxenxo, Cambados, Lalín, La Estrada, Silleda y Caldas de Rey
Mortgage loans, consumer loans, finance leases.
Álvarez y Garrúes Tres, S.L.
C/ Salvador Dalí, 12 - Ourense
27003 B27412816 01-11-2010 Ourense, Barco de Valdeorras y Rua.
Mortgage loans, consumer loans, finance leases.
Álvarez y Garrúes, S.L.
Av. A Coruña, 439 - Lugo
27003 B27274216 01-12-2003 Lugo. Mortgage loans, consumer loans, finance leases.
Antonio García Fernández Servicios Financieros, S.L
C/Jara, nº1 local, esquina doctor Antonio Cabrera (14400), Pozoblanco
14400 B14771554 01-10-2006 Alcaracejos, Añora, Belalcazar, Belmez, Los Blázquez, Cardenas, Conquista, Dos Torres, Espiel, Fuente La Lancha, Fuente Obejuna, El Guijo, Hinojosa del Duque, Pedroche, Peñarroya-
Mortgage loans, consumer loans, finance leases.
Asedime Servicios Financieros, S.L.
Doctor Dorronsoro 2 – Valverde del Camino
21600 B021380746 01-04-2008 Alajar, Almonaster la Real, Aracena, Aroche, Arroyo Molinos de León, Beas, Berrocal, Cala, Calañas, El Campillo, Campofrío, Cañaveral de León, Castaño de Robledo, Corteconcepción, Cortegana, Cortelazor, Cumbre de En Medio, Cumbres de San Bartolomé, Cumbres Mayores, Encinasola, Fuenteheridos, Galaroza, La Granada de Ríotinto, La Nava, Nerva, Puerto del Moral, Rosal de la Frontera, Santa Ana la Real, Santa Olalla del Cala,
Mortgage loans, consumer loans, finance leases.
Asesoramiento Financiero Zafra, S.L.
AVDA ADOLFO DIAZ AMBRONA ,
6300 B06433973 03/01/2005 Badajoz Mortgage loans, consumer loans, finance leases.
Asfinza Badajoz, S.L.
AVDA. JUAN CARLOS I, 10, 1ºD. 06001 BADAJOZ)
6001 B06580708 01-06-2010 Badajoz. Mortgage loans, consumer loans, finance leases.
AUTO CONSUMER ALAVA, S.L.
Avd. de los Huetos, 79 Vitoria 01006 (Álava)
1006 B26560557 18-07-2007 ÁlavaMortgage loans, consumer loans, finance leases.
Berga Gestió, S.L.
C/ Gran Vía, 46 (08600) Berga
8600 B64396476 02-01-2010 Berga,Navas, Cardona y Nou de La Bergueda. Mortgage loans,
consumer loans, finance leases.
Canovaca Agentes Financieros S.L.
POL IND. EL GARROTAL Nº 17 EDIFICIO GEFICA, PLANTA 1
14700 B14539290 01-04-2000 Almodóvar del Rio, Fuente Palmera, Palma del Rio, Posadas, Lora del Rio, Peñaflor, Carmona, La Campana, La Puebla de los Infantes, Mairena del Alcor, El
Mortgage loans, consumer loans, finance leases.
Carrasco Agentes, S.L.
C/ BETULA Nº 9 PISO 1º A (23400)ÚBED
23400 B023478704 02-01-2004 Jaén. Mortgage loans, consumer loans, finance leases.
1
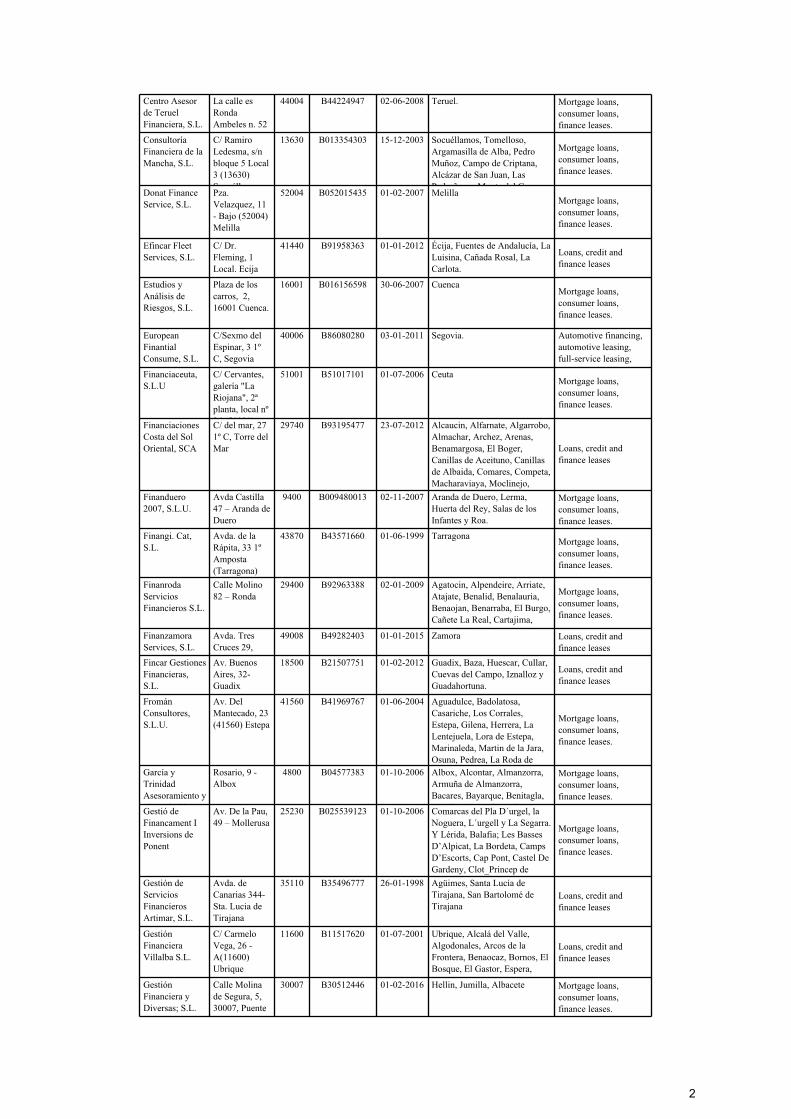
Centro Asesor de Teruel Financiera, S.L.
La calle es Ronda Ambeles n. 52 (44004) Teruel
44004 B44224947 02-06-2008 Teruel. Mortgage loans, consumer loans, finance leases.
Consultoría Financiera de la Mancha, S.L.
C/ Ramiro Ledesma, s/n bloque 5 Local 3 (13630) Socuéllamos
13630 B013354303 15-12-2003 Socuéllamos, Tomelloso, Argamasilla de Alba, Pedro Muñoz, Campo de Criptana, Alcázar de San Juan, Las Pedroñeras, Monta del Cuervo,
Mortgage loans, consumer loans, finance leases.
Donat Finance Service, S.L.
Pza. Velazquez, 11 - Bajo (52004) Melilla
52004 B052015435 01-02-2007 MelillaMortgage loans, consumer loans, finance leases.
Efincar Fleet Services, S.L.
C/ Dr. Fleming, 1 Local. Ecija (Sevilla)
41440 B91958363 01-01-2012 Écija, Fuentes de Andalucía, La Luisina, Cañada Rosal, La Carlota.
Loans, credit and finance leases
Estudios y Análisis de Riesgos, S.L.
Plaza de los carros, 2, 16001 Cuenca.
16001 B016156598 30-06-2007 CuencaMortgage loans, consumer loans, finance leases.
European Finantial Consume, S.L.
C/Sexmo del Espinar, 3 1º C, Segovia
40006 B86080280 03-01-2011 Segovia. Automotive financing, automotive leasing, full-service leasing, consumer lending, co-Financiaceuta,
S.L.UC/ Cervantes, galería "La Riojana", 2ª planta, local nº 26 (51001)
51001 B51017101 01-07-2006 CeutaMortgage loans, consumer loans, finance leases.
Financiaciones Costa del Sol Oriental, SCA
C/ del mar, 27 1º C, Torre del Mar
29740 B93195477 23-07-2012 Alcaucin, Alfarnate, Algarrobo, Almachar, Archez, Arenas, Benamargosa, El Boger, Canillas de Aceituno, Canillas de Albaida, Comares, Competa, Macharaviaya, Moclinejo,
Loans, credit and finance leases
Finanduero 2007, S.L.U.
Avda Castilla 47 – Aranda de Duero
9400 B009480013 02-11-2007 Aranda de Duero, Lerma, Huerta del Rey, Salas de los Infantes y Roa.
Mortgage loans, consumer loans, finance leases.
Finangi. Cat, S.L.
Avda. de la Rápita, 33 1º Amposta (Tarragona)
43870 B43571660 01-06-1999 TarragonaMortgage loans, consumer loans, finance leases.
Finanroda Servicios Financieros S.L.
Calle Molino 82 – Ronda
29400 B92963388 02-01-2009 Agatocin, Alpendeire, Arriate, Atajate, Benalid, Benalauria, Benaojan, Benarraba, El Burgo, Cañete La Real, Cartajima, Cortes de la Frontera, Cuevas
Mortgage loans, consumer loans, finance leases.
Finanzamora Services, S.L.
Avda. Tres Cruces 29, Zamora
49008 B49282403 01-01-2015 Zamora Loans, credit and finance leases
Fincar Gestiones Financieras, S.L.
Av. Buenos Aires, 32- Guadix
18500 B21507751 01-02-2012 Guadix, Baza, Huescar, Cullar, Cuevas del Campo, Iznalloz y Guadahortuna.
Loans, credit and finance leases
Fromán Consultores, S.L.U.
Av. Del Mantecado, 23 (41560) Estepa
41560 B41969767 01-06-2004 Aguadulce, Badolatosa, Casariche, Los Corrales, Estepa, Gilena, Herrera, La Lentejuela, Lora de Estepa, Marinaleda, Martin de la Jara, Osuna, Pedrea, La Roda de
Mortgage loans, consumer loans, finance leases.
García y Trinidad Asesoramiento y Financiación,
Rosario, 9 - Albox
4800 B04577383 01-10-2006 Albox, Alcontar, Almanzorra, Armuña de Almanzorra, Bacares, Bayarque, Benitagla, Bezalon, Cantoria, Cobrar,
Mortgage loans, consumer loans, finance leases.
Gestió de Financament I Inversions de Ponent
Av. De la Pau, 49 – Mollerusa
25230 B025539123 01-10-2006 Comarcas del Pla D´urgel, la Noguera, L´urgell y La Segarra. Y Lérida, Balafia; Les Basses D’Alpicat, La Bordeta, Camps D’Escorts, Cap Pont, Castel De Gardeny, Clot_Princep de
Mortgage loans, consumer loans, finance leases.
Gestión de Servicios Financieros Artimar, S.L.
Avda. de Canarias 344- Sta. Lucia de Tirajana
35110 B35496777 26-01-1998 Agüimes, Santa Lucía de Tirajana, San Bartolomé de Tirajana
Loans, credit and finance leases
Gestión Financiera Villalba S.L.
C/ Carmelo Vega, 26 - A(11600) Ubrique
11600 B11517620 01-07-2001 Ubrique, Alcalá del Valle, Algodonales, Arcos de la Frontera, Benaocaz, Bornos, El Bosque, El Gastor, Espera, Grazalema, Olivera, Prado del
Loans, credit and finance leases
Gestión Financiera y Diversas; S.L.
Calle Molina de Segura, 5, 30007, Puente Tocinos
30007 B30512446 01-02-2016 Hellin, Jumilla, Albacete Mortgage loans, consumer loans, finance leases.
2

GEYBA Servicios Financieros, S.L.
Avda. La Libertad nº 2 Local (41980) La Algaba
41980 B91385377 01-09-2004 Arevalillo de Cega, Alacala del Rio, Alcolea del Rio, La Algaba, Almaden de la Plata, Brenes, Burguillos, Cantillana, Castilblanco de los Arroyos, El
Mortgage loans, consumer loans, finance leases.
Hermanos P.Q. Servicios Financieros S.L.
Pasaje
Neptuno, local
7 (Junto a
BBVA) Vera
(04620).
Domicilio
4820 B04678348 01-09-2009 Vera
Mortgage loans, consumer loans, finance leases.
Indastec Asociados, S.L.
Madrid, 20 - Ibiza
7800 B57150310 01-01-2004 Eivissa, Sant Antoni de Portmany, Santa Eulalia del Rio San Jose Formentera
Mortgage loans, consumer loans, finance leases.
Insema Inversiones, S.L.
Av. Andalucía 11 – Planta 1- Puente Genil (Córdoba)
14500 B14840896 19-12-2008 Aguilar de la Frontera, Benameji, Castro del Río, Espejo, Fernan Nuñez, Montalbal de Córdoba,
Mortgage loans, consumer loans, finance leases.
Intermediación y Servicios Junval, S.L.
C/ BEBRICIO , 39, Pasaje Local nº 7
26500 B26319178 01-12-2003 CalahorraMortgage loans, consumer loans, finance leases.
Inversiones Financieras Bilegui, S.L.
C/ Artiz Bidea, 48- Mungía
48100 B95659579 01-10-2012 Eibar, Mondragón, Genika - Lumo Loans, credit and
finance leases
Juan Jiménez Gestión Financiera, S.L.
C/ BARTOLOME DE MEDINA ,
41004 B91167973 01-02-2002 Bormujos, Coria del Río, Gelves, Gines, Pilas, Sanlucar la Mayor, Umbrete, Villamanrique de la Condesa,
Loans, credit and finance leases
L'Eliana Finance, S.L.
Av. Cortes Valencianes 35 - L'Eliana
46183 B097639462 01-10-2005 Riba - Roja de Turia, Lliria, Betera, Buñol, Requena, Utiel, L'Eliana, La Pobla de Vallbona
Mortgage loans, consumer loans, finance leases.
M&G Figueres Associats S.L.
C/ Col·legi, 54 Bajo- Figueres
17600 B17673823 01-01-2011 Agullana, Albanya, Arrentera, Bascara, Biure, Boadella i les Escaudes, Cebanes, Cantallaps, Capmany, Cistella, Escada, Empolla,Figueres, Garniguelia,
Mortgage loans, consumer loans, finance leases.
Martín & Castilla Servicios Financieros, S.L.
Fray Diego de Cádiz,163 - Morón de la Frontera
41530 B91369231 01-06-2004 Algamitas, Arahal, Caripe, El Coronil, Marchena, Montellano, Morón de la Frontera, Paradas, Pruna, La Puebla de Cazalla, Villanueva
Mortgage loans, consumer loans, finance leases.
Medifirent, S.L. C/ LA ESTACION, 1, ENTREPLANTA, OF. 9 (9200)
9200 B09410572 01-03-2004 Miranda de EbroMortgage loans, consumer loans, finance leases.
Noguer Bau, S.L.
Sant Fidel, 5. Vic
8500 B64018179 31-08-2007 Aiguafreda, Alpens, El Brull, Calldetenes, Centelles, Collsuspina, Espinelves, Folgueroles, Gurb, Els
Mortgage loans, consumer loans, finance leases.
Orges-Fin Gestiones 2018, s.l. Unipersonal
SA ROVELLADA DE DALT 38 bajos izq 07702
7702 B55733471 25-12-2020 Isla de MenorcaMortgage loans, consumer loans, finance leases.
Praga Services 64, S.L.
C/ De Alicante 70 28939 - (Arroyomolinos) - Madrid
28939 B85464402 01-03-2014 AranjuezLoans, credit and finance leases
Ramsa Servicios Financieros y Empresariales, S.L.
Blas Infante, 7 - Lepe
21440 B21347190 02-01-2004 Punta Umbría, Cartaya, Lepe, Isla Cristina y Ayamonte
Mortgage loans, consumer loans, finance leases.
Servicios Financieros Jienenses, S.L.
Plaza del Camping, 4 Local 10- Andujar
23740 B86340767 01-12-2011 Aldeaquemada, Andújar, Arjona, Arjonilla, Bailén, Baños de Quemada, Carboneros, La Carolina, Cazalilla, Espeluy, Higuera de Arjona, Lopera, Marmolejo, Santa Elena, Villanueva de la
Loans, credit and finance leases
Servicios Financieros Quintanar, S.L.
C/ Vicente Gálvez Villarejo, 12. (45800)
45800 B45545167 01-12-2003 Quintanar de la Orden, Madridejos
Mortgage loans, consumer loans, finance leases.
Servicios Financieros Sorianos, S.L.
C/Del Ferial , 4 Oficina 3 B2 4200 Soria
42002 B42180927 02-01-2006 SoriaMortgage loans, consumer loans, finance leases.
3
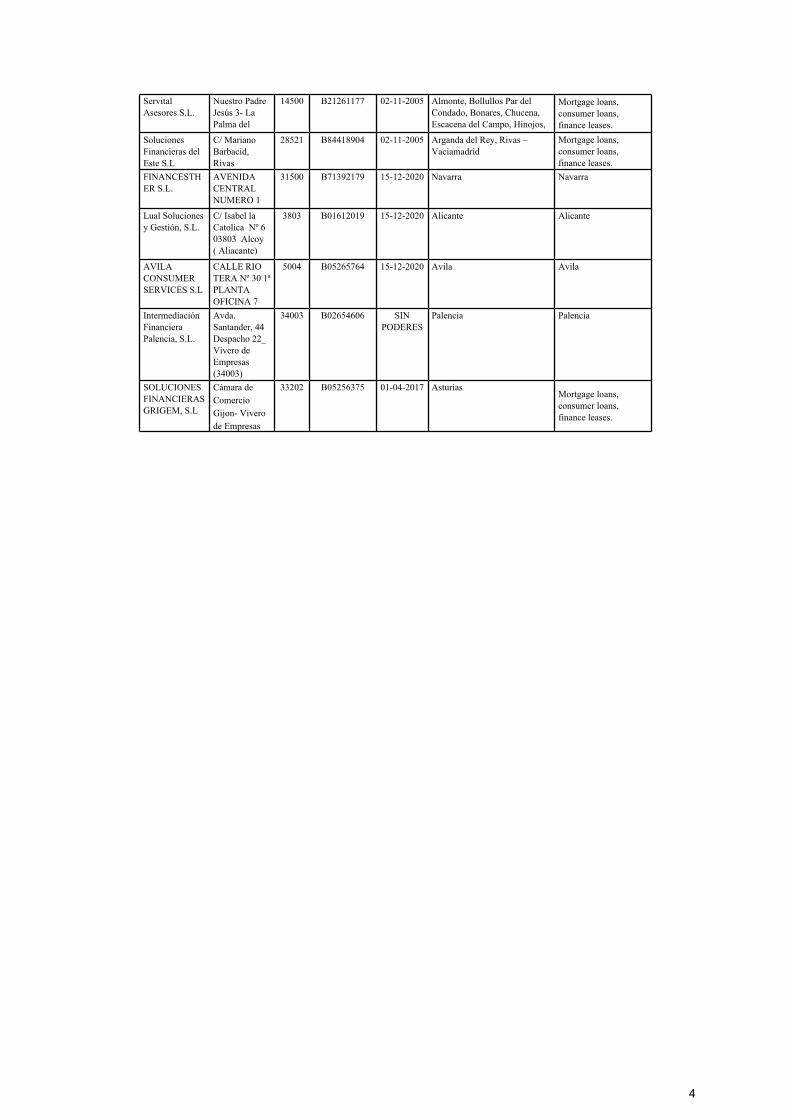
Servital Asesores S.L.
Nuestro Padre Jesús 3- La Palma del Condado
14500 B21261177 02-11-2005 Almonte, Bollullos Par del Condado, Bonares, Chucena, Escacena del Campo, Hinojos, Lucena del Puerto, Manzanilla,
Mortgage loans, consumer loans, finance leases.
Soluciones Financieras del Este S.L
C/ Mariano Barbacid, Rivas
28521 B84418904 02-11-2005 Arganda del Rey, Rivas – Vaciamadrid
Mortgage loans, consumer loans, finance leases.
FINANCESTHER S.L.
AVENIDA CENTRAL NUMERO 1 OFICINA 1
31500 B71392179 15-12-2020 Navarra Navarra
Lual Soluciones y Gestión, S.L.
C/ Isabel la Catolica Nº 6 03803 Alcoy ( Aliacante)
3803 B01612019 15-12-2020 Alicante Alicante
AVILA CONSUMER SERVICES S.L
CALLE RIO TERA Nº 30 1ª PLANTA OFICINA 7
5004 B05265764 15-12-2020 Avila Avila
Intermediación Financiera Palencia, S.L.
Avda. Santander, 44 Despacho 22_ Vivero de Empresas (34003)
34003 B02654606 SIN PODERES
Palencia Palencia
SOLUCIONES FINANCIERAS GRIGEM, S.L
Cámara de
Comercio
Gijon- Vivero
de Empresas
33202 B05256375 01-04-2017 AsturiasMortgage loans, consumer loans, finance leases.
4
Appendix V
Annual Banking Report
This Annual Banking Report was prepared in compliance with Article 87 of Law 10/2014, of 26 June, on the
regulation, supervision and capital adequacy of credit institutions.
Pursuant to the aforementioned Article, from 1 January 2015, credit institutions must send the Bank of Spain
and publish annually a report as an appendix to the financial statements audited in accordance with the
legislation regulating audits of financial statements, which specifies, by country in which they are established,
the following information on a consolidated basis for each year:
a) Name(s), nature of activities and geographical location.
b) Turnover.
c) Number of employees on a full time equivalent basis.
d) Gross profit or loss before tax.
e) Tax on profit or loss.
f) Public subsidies received.
Following is a detail of the criteria used to prepare the annual banking report for 2020:
a) Name(s), nature of activities and geographical location
The aforementioned information is available in Appendices I and II to the Group's consolidated financial
statements, which contain details of the companies operating in each jurisdiction, including, among other
information, their name(s), geographical location and the nature of their activities.
As can be seen in the aforementioned Appendices, the main activity carried on by the Group in the
various jurisdictions in which it operates is commercial banking. The Group operates mainly in ten markets
through a model of subsidiaries that are autonomous in capital and liquidity terms, which has clear
strategic and regulatory advantages, since it limits the risk of contagion between Group units, imposes a
double layer of global and local oversight and facilitates crisis management and resolution. The Group has
256 branches in total, which provide its customers with all their basic financial requirements.
b) Turnover
For the purposes of this report, turnover is considered to be gross income, as defined and presented in
the consolidated income statement that forms part of the Group's consolidated financial statements.
The data on turnover by country were obtained from the statutory accounting records of the Group
companies with the corresponding geographical location and translated to euros. Accordingly, this is
aggregate information from the separate financial statements of the companies that operate in each
jurisdiction, reconciliation of which with the information from the Group's consolidated financial statements
requires a series of unifying adjustments and the elimination of transactions between the various Group
companies, such as those relating to the distribution of dividends by subsidiaries to their respective
parents.
c) Number of employees on a full time equivalent basis
The data on employees on a full time equivalent basis were obtained from the average headcount of each
jurisdiction.
1

d) Tax on profit or loss
In the absence of specific criteria, this is the amount of tax effectively paid in respect of the taxes the
effect of which is recognised in Income tax in the consolidated income statement.
Taxes effectively paid in the year by each of the companies in each jurisdiction include:
• Supplementary payments relating to income tax returns, normally for prior years.
• Advances, prepayments, withholdings made or borne in respect of tax on profit or loss for the year.
Given their scantly representative amount, it was decided that taxes borne abroad would be
included in the jurisdiction of the company that bore them.
• Refunds collected in the year with respect to returns for prior years that resulted in a refund.
• Where appropriate, the tax payable arising from tax assessments and litigation relating to these
taxes.
The foregoing amounts are part of the statement of cash flows (EUR 430,139 thousand in 2020, which
implies an effective tax rate of 36.5%) and, therefore, differ from the income tax expense recognised in the
consolidated income statement (EUR 452.191 thousand in 2020, which implies an effective tax rate of
22.8%). Such is the case because the tax legislation of each country establishes:
* The time at which taxes must be paid. Normally, there is a timing mismatch between the dates of
payment and the date of generation of the income bearing the tax.
Its own criteria for calculating the tax and establishes temporary or permanent restrictions on
expense deduction, exemptions, relief or deferrals of certain income, etc., thereby generating the
related differences between the accounting profit (or loss) and taxable profit (or tax loss) which is
ultimately taxed; tax loss carryforwards from prior years, tax credits and/or relief, etc. must also be
added to this. Also, in certain cases special regimes are established, such as the tax consolidation
of companies in the same jurisdiction, etc.
e) Public subsidies received
In the context of the disclosures required by current legislation, this term was interpreted to mean any aid
or subsidy in line with the European Commission's State Aid Guide and, in such context, the Group
companies did not receive public subsidies in 2020.
2
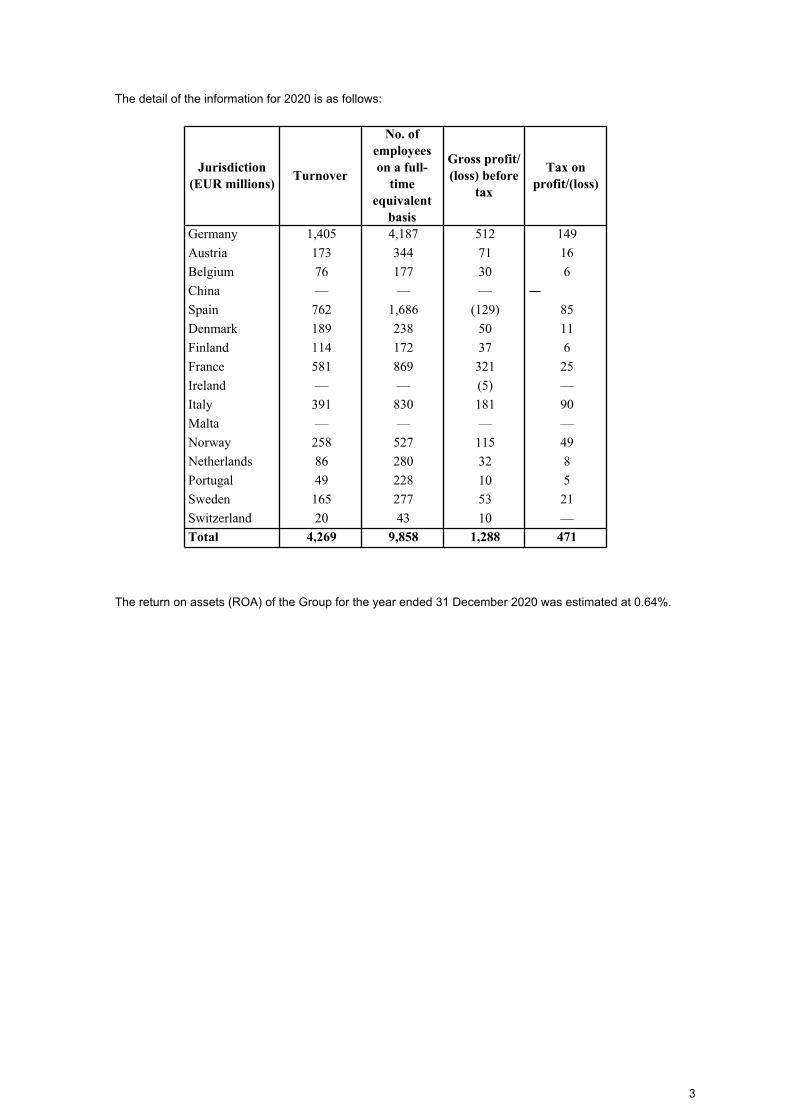
The detail of the information for 2020 is as follows:
Jurisdiction
(EUR millions)Turnover
No. of
employees
on a full-
time
equivalent
basis
Gross profit/
(loss) before
tax
Tax on
profit/(loss)
Germany 1,405 4,187 512 149
Austria 173 344 71 16
Belgium 76 177 30 6
China — — ——
Spain 762 1,686 (129) 85
Denmark 189 238 50 11
Finland 114 172 37 6
France 581 869 321 25
Ireland — — (5) —
Italy 391 830 181 90
Malta — — — —
Norway 258 527 115 49
Netherlands 86 280 32 8
Portugal 49 228 10 5
Sweden 165 277 53 21
Switzerland 20 43 10 —
Total 4,269 9,858 1,288 471
The return on assets (ROA) of the Group for the year ended 31 December 2020 was estimated at 0.64%.
3
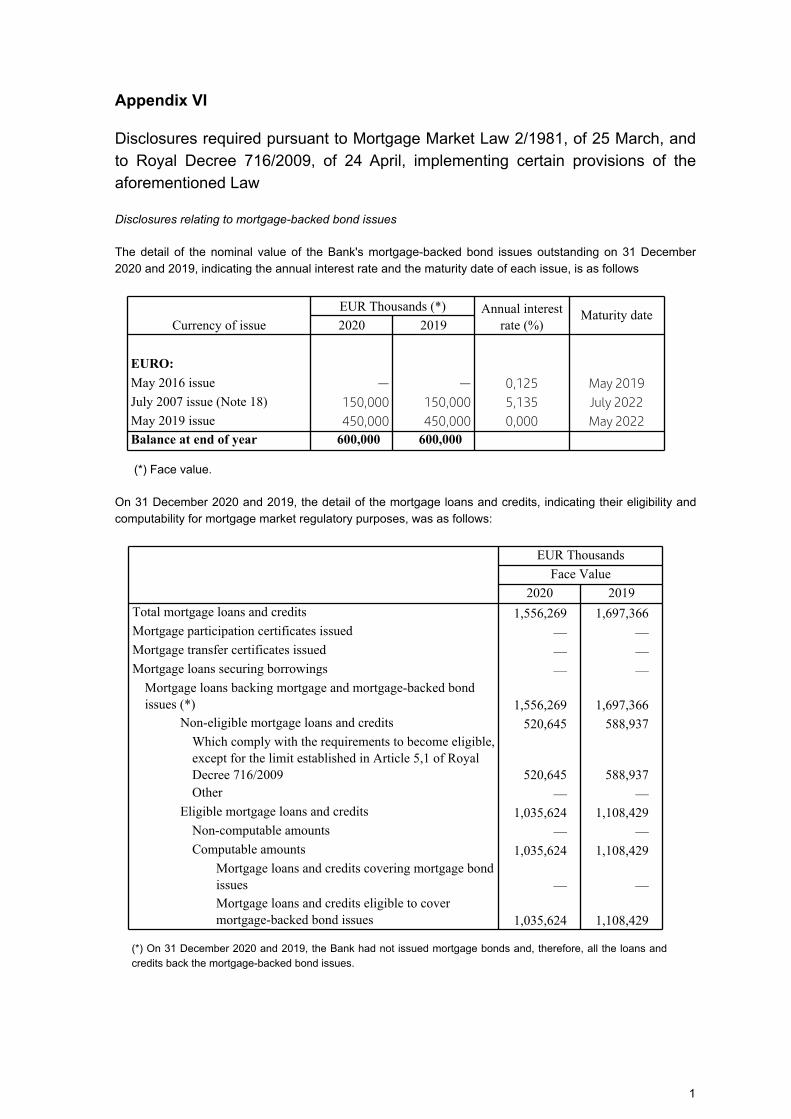
Appendix VI
Disclosures required pursuant to Mortgage Market Law 2/1981, of 25 March, and
to Royal Decree 716/2009, of 24 April, implementing certain provisions of the
aforementioned Law
Disclosures relating to mortgage-backed bond issues
The detail of the nominal value of the Bank's mortgage-backed bond issues outstanding on 31 December
2020 and 2019, indicating the annual interest rate and the maturity date of each issue, is as follows
EUR Thousands (*) Annual interest rate (%)
Maturity dateCurrency of issue 2020 2019
EURO:
May 2016 issue — — 0,125 May 2019
July 2007 issue (Note 18) 150,000 150,000 5,135 July 2022
May 2019 issue 450,000 450,000 0,000 May 2022
Balance at end of year 600,000 600,000
(*) Face value.
On 31 December 2020 and 2019, the detail of the mortgage loans and credits, indicating their eligibility and
computability for mortgage market regulatory purposes, was as follows:
EUR Thousands
Face Value
2020 2019
Total mortgage loans and credits 1,556,269 1,697,366 Mortgage participation certificates issued — — Mortgage transfer certificates issued — — Mortgage loans securing borrowings — —
Mortgage loans backing mortgage and mortgage-backed bond issues (*) 1,556,269 1,697,366
Non-eligible mortgage loans and credits 520,645 588,937 Which comply with the requirements to become eligible, except for the limit established in Article 5,1 of Royal Decree 716/2009 520,645 588,937 Other — —
Eligible mortgage loans and credits 1,035,624 1,108,429 Non-computable amounts — — Computable amounts 1,035,624 1,108,429
Mortgage loans and credits covering mortgage bond issues — — Mortgage loans and credits eligible to cover mortgage-backed bond issues 1,035,624 1,108,429
(*) On 31 December 2020 and 2019, the Bank had not issued mortgage bonds and, therefore, all the loans and
credits back the mortgage-backed bond issues.
1
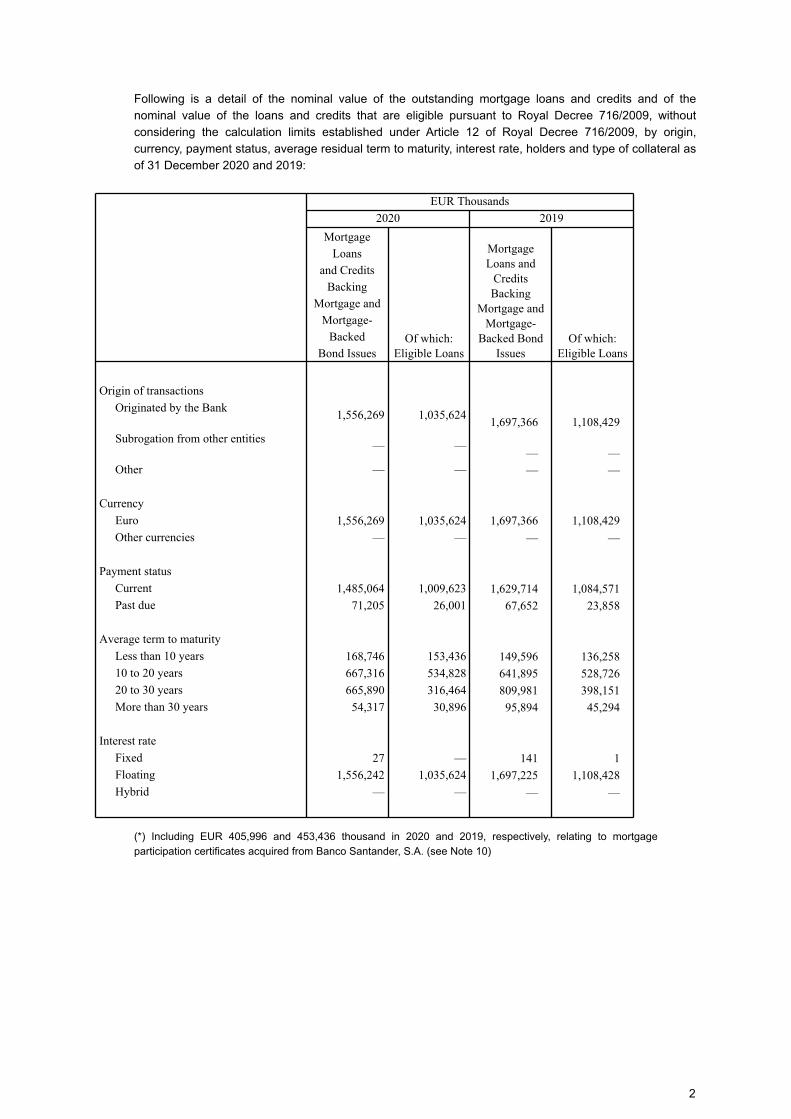
Following is a detail of the nominal value of the outstanding mortgage loans and credits and of the
nominal value of the loans and credits that are eligible pursuant to Royal Decree 716/2009, without
considering the calculation limits established under Article 12 of Royal Decree 716/2009, by origin,
currency, payment status, average residual term to maturity, interest rate, holders and type of collateral as
of 31 December 2020 and 2019:
EUR Thousands
2020 2019
Mortgage
Loans
and Credits
Backing
Mortgage and
Mortgage-
Backed
Bond IssuesOf which:
Eligible Loans
Mortgage Loans and
Credits Backing
Mortgage and Mortgage-
Backed Bond Issues
Of which: Eligible Loans
Origin of transactions
Originated by the Bank1,556,269 1,035,624
1,697,366 1,108,429
Subrogation from other entities— —
— —
Other — — — —
Currency
Euro 1,556,269 1,035,624 1,697,366 1,108,429
Other currencies — — — —
Payment status
Current 1,485,064 1,009,623 1,629,714 1,084,571
Past due 71,205 26,001 67,652 23,858
Average term to maturity
Less than 10 years 168,746 153,436 149,596 136,258
10 to 20 years 667,316 534,828 641,895 528,726
20 to 30 years 665,890 316,464 809,981 398,151
More than 30 years 54,317 30,896 95,894 45,294
Interest rate
Fixed 27 — 141 1
Floating 1,556,242 1,035,624 1,697,225 1,108,428
Hybrid — — — —
(*) Including EUR 405,996 and 453,436 thousand in 2020 and 2019, respectively, relating to mortgage
participation certificates acquired from Banco Santander, S.A. (see Note 10)
2
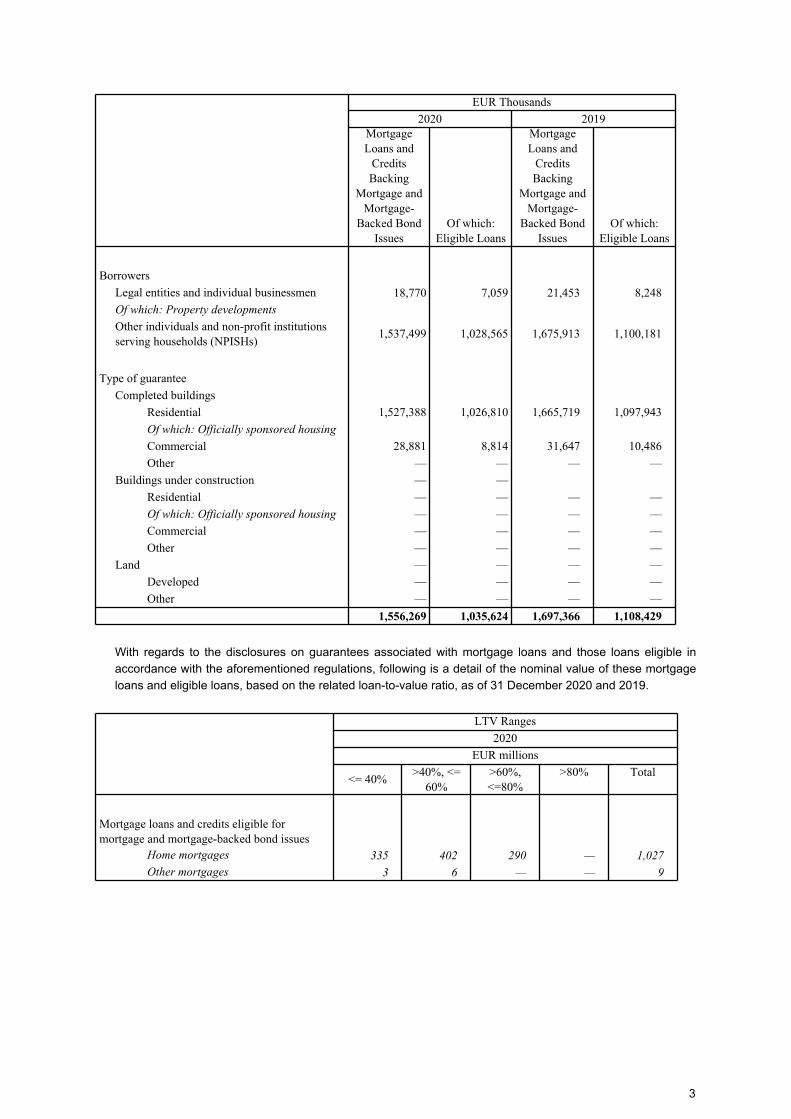
EUR Thousands
2020 2019Mortgage Loans and
Credits Backing
Mortgage and Mortgage-
Backed Bond Issues
Of which: Eligible Loans
Mortgage Loans and
Credits Backing
Mortgage and Mortgage-
Backed Bond Issues
Of which: Eligible Loans
Borrowers
Legal entities and individual businessmen 18,770 7,059 21,453 8,248
Of which: Property developments
Other individuals and non-profit institutions serving households (NPISHs)
1,537,499 1,028,565 1,675,913 1,100,181
Type of guarantee
Completed buildings
Residential 1,527,388 1,026,810 1,665,719 1,097,943
Of which: Officially sponsored housing
Commercial 28,881 8,814 31,647 10,486
Other — — — —
Buildings under construction — —
Residential — — — —
Of which: Officially sponsored housing — — — —
Commercial — — — —
Other — — — —
Land — — — —
Developed — — — —
Other — — — —
1,556,269 1,035,624 1,697,366 1,108,429
With regards to the disclosures on guarantees associated with mortgage loans and those loans eligible in
accordance with the aforementioned regulations, following is a detail of the nominal value of these mortgage
loans and eligible loans, based on the related loan-to-value ratio, as of 31 December 2020 and 2019.
LTV Ranges
2020
EUR millions
<= 40%>40%, <=
60%>60%, <=80%
>80% Total
Mortgage loans and credits eligible for mortgage and mortgage-backed bond issues
Home mortgages 335 402 290 — 1,027
Other mortgages 3 6 — — 9
3
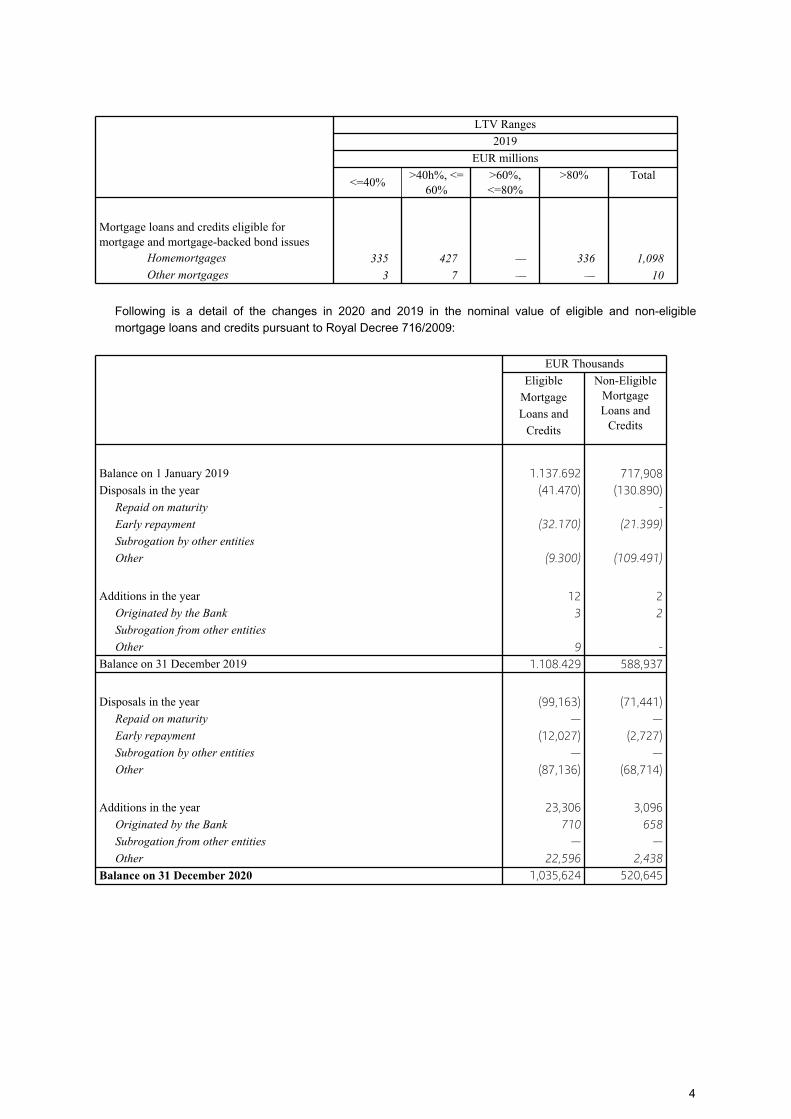
LTV Ranges
2019
EUR millions
<=40%>40h%, <=
60%>60%, <=80%
>80% Total
Mortgage loans and credits eligible for mortgage and mortgage-backed bond issues
Homemortgages 335 427 — 336 1,098
Other mortgages 3 7 — — 10
Following is a detail of the changes in 2020 and 2019 in the nominal value of eligible and non-eligible
mortgage loans and credits pursuant to Royal Decree 716/2009:
EUR Thousands
Eligible
Mortgage
Loans and
Credits
Non-Eligible Mortgage Loans and
Credits
Balance on 1 January 2019 1.137.692 717,908
Disposals in the year (41.470) (130.890)
Repaid on maturity -
Early repayment (32.170) (21.399)
Subrogation by other entities
Other (9.300) (109.491)
Additions in the year 12 2
Originated by the Bank 3 2
Subrogation from other entities
Other 9 -
Balance on 31 December 2019 1.108.429 588,937
Disposals in the year (99,163) (71,441)
Repaid on maturity — —
Early repayment (12,027) (2,727)
Subrogation by other entities — —
Other (87,136) (68,714)
Additions in the year 23,306 3,096
Originated by the Bank 710 658
Subrogation from other entities — —
Other 22,596 2,438
Balance on 31 December 2020 1,035,624 520,645
4
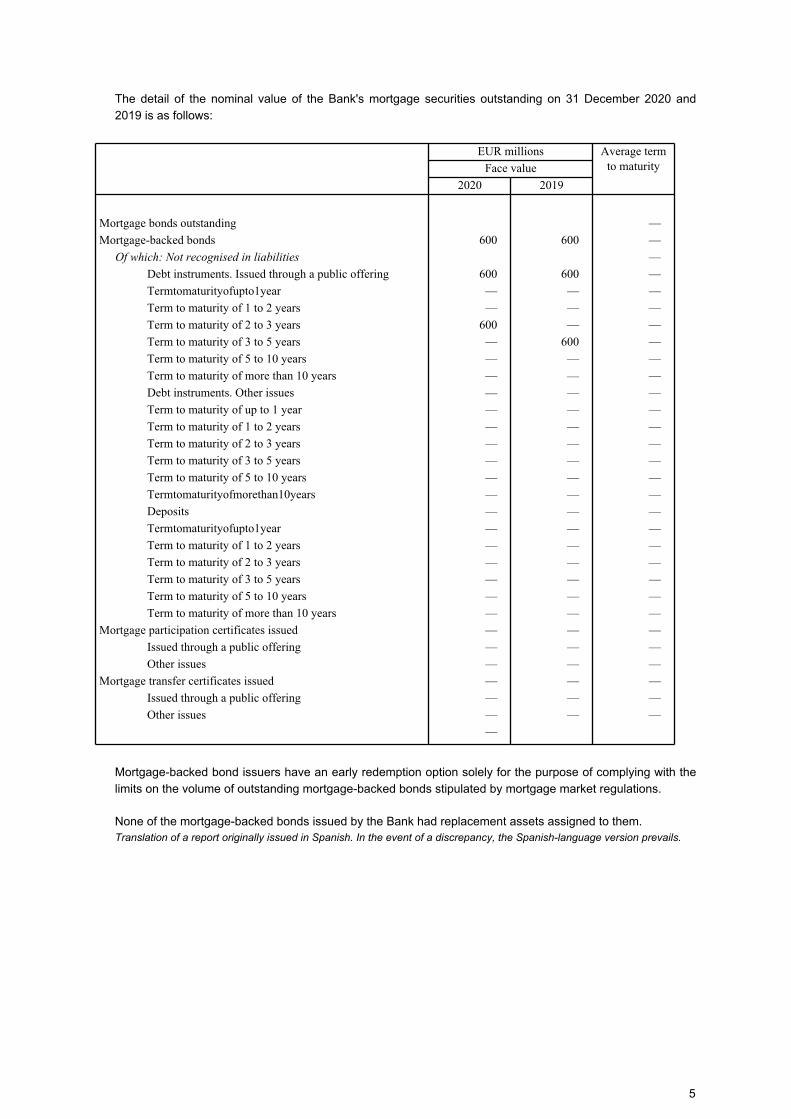
The detail of the nominal value of the Bank's mortgage securities outstanding on 31 December 2020 and
2019 is as follows:
EUR millions Average term to maturityFace value
2020 2019
Mortgage bonds outstanding —
Mortgage-backed bonds 600 600 —
Of which: Not recognised in liabilities —
Debt instruments. Issued through a public offering 600 600 —
Termtomaturityofupto1year — — —
Term to maturity of 1 to 2 years — — —
Term to maturity of 2 to 3 years 600 — —
Term to maturity of 3 to 5 years — 600 —
Term to maturity of 5 to 10 years — — —
Term to maturity of more than 10 years — — —
Debt instruments. Other issues — — —
Term to maturity of up to 1 year — — —
Term to maturity of 1 to 2 years — — —
Term to maturity of 2 to 3 years — — —
Term to maturity of 3 to 5 years — — —
Term to maturity of 5 to 10 years — — —
Termtomaturityofmorethan10years — — —
Deposits — — —
Termtomaturityofupto1year — — —
Term to maturity of 1 to 2 years — — —
Term to maturity of 2 to 3 years — — —
Term to maturity of 3 to 5 years — — —
Term to maturity of 5 to 10 years — — —
Term to maturity of more than 10 years — — —
Mortgage participation certificates issued — — —
Issued through a public offering — — —
Other issues — — —
Mortgage transfer certificates issued — — —
Issued through a public offering — — —
Other issues — — —
—
Mortgage-backed bond issuers have an early redemption option solely for the purpose of complying with the
limits on the volume of outstanding mortgage-backed bonds stipulated by mortgage market regulations.
None of the mortgage-backed bonds issued by the Bank had replacement assets assigned to them.
Translation of a report originally issued in Spanish. In the event of a discrepancy, the Spanish-language version prevails.
5
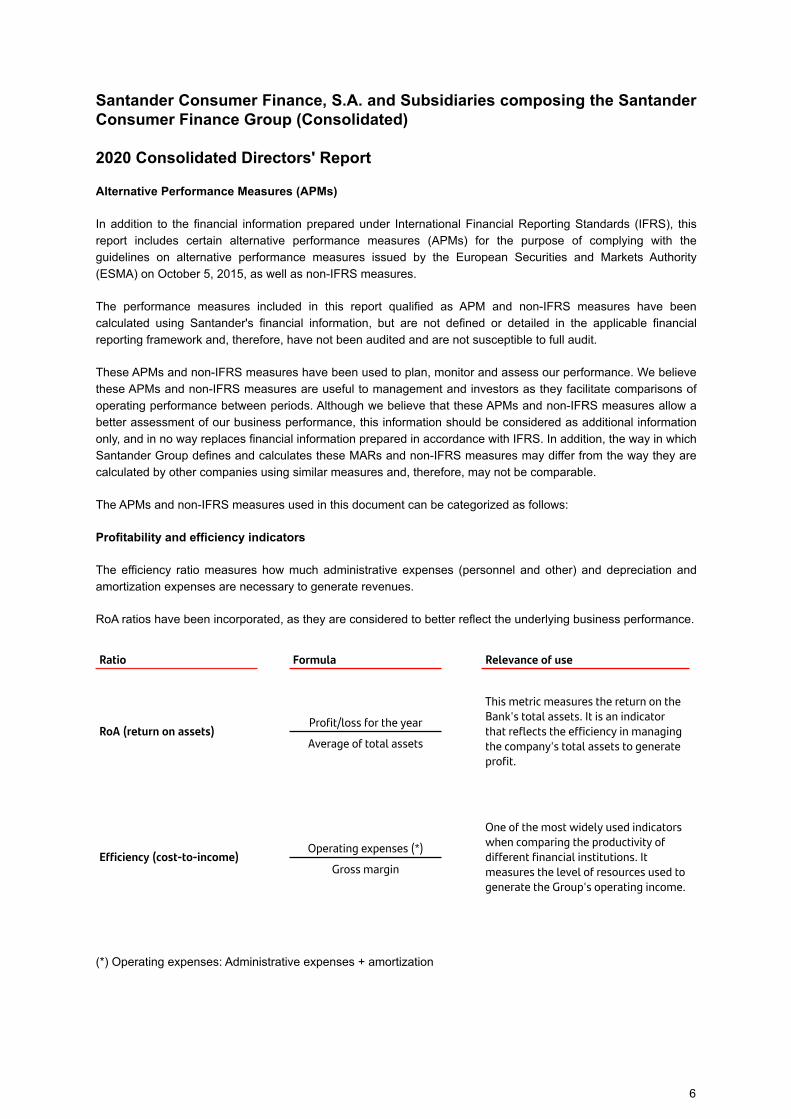
Santander Consumer Finance, S.A. and Subsidiaries composing the Santander
Consumer Finance Group (Consolidated)
2020 Consolidated Directors' Report
Alternative Performance Measures (APMs)
In addition to the financial information prepared under International Financial Reporting Standards (IFRS), this
report includes certain alternative performance measures (APMs) for the purpose of complying with the
guidelines on alternative performance measures issued by the European Securities and Markets Authority
(ESMA) on October 5, 2015, as well as non-IFRS measures.
The performance measures included in this report qualified as APM and non-IFRS measures have been
calculated using Santander's financial information, but are not defined or detailed in the applicable financial
reporting framework and, therefore, have not been audited and are not susceptible to full audit.
These APMs and non-IFRS measures have been used to plan, monitor and assess our performance. We believe
these APMs and non-IFRS measures are useful to management and investors as they facilitate comparisons of
operating performance between periods. Although we believe that these APMs and non-IFRS measures allow a
better assessment of our business performance, this information should be considered as additional information
only, and in no way replaces financial information prepared in accordance with IFRS. In addition, the way in which
Santander Group defines and calculates these MARs and non-IFRS measures may differ from the way they are
calculated by other companies using similar measures and, therefore, may not be comparable.
The APMs and non-IFRS measures used in this document can be categorized as follows:
Profitability and efficiency indicators
The efficiency ratio measures how much administrative expenses (personnel and other) and depreciation and
amortization expenses are necessary to generate revenues.
RoA ratios have been incorporated, as they are considered to better reflect the underlying business performance.
Ratio Formula Relevance of use
RoA (return on assets)
This metric measures the return on the Bank's total assets. It is an indicator that reflects the efficiency in managing the company's total assets to generate profit.
Profit/loss for the year
Average of total assets
Efficiency (cost-to-income)
One of the most widely used indicators when comparing the productivity of different financial institutions. It measures the level of resources used to generate the Group's operating income.
Operating expenses (*)
Gross margin
(*) Operating expenses: Administrative expenses + amortization
6
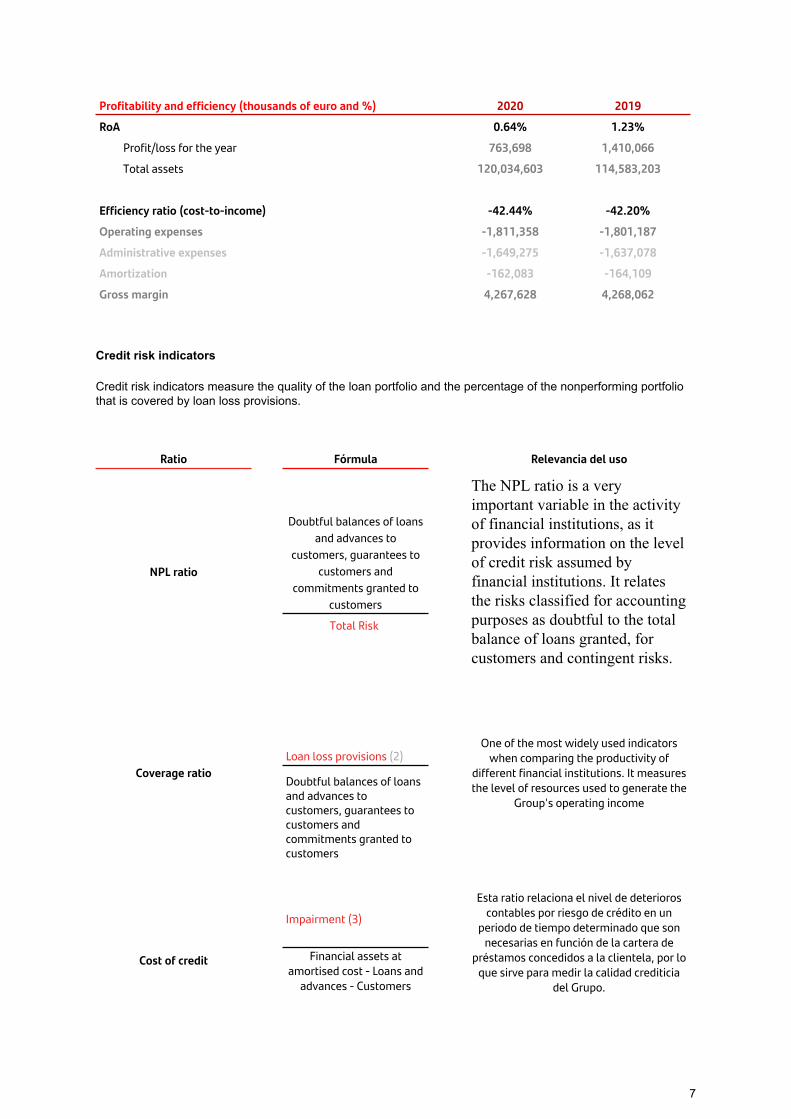
Profitability and efficiency (thousands of euro and %) 2020 2019
RoA 0.64% 1.23%
Profit/loss for the year 763,698 1,410,066
Total assets 120,034,603 114,583,203
Efficiency ratio (cost-to-income) -42.44% -42.20%
Operating expenses -1,811,358 -1,801,187
Administrative expenses -1,649,275 -1,637,078
Amortization -162,083 -164,109
Gross margin 4,267,628 4,268,062
Credit risk indicators
Credit risk indicators measure the quality of the loan portfolio and the percentage of the nonperforming portfolio
that is covered by loan loss provisions.
Ratio Fórmula Relevancia del uso
NPL ratio
The NPL ratio is a very important variable in the activity of financial institutions, as it provides information on the level of credit risk assumed by financial institutions. It relates the risks classified for accounting purposes as doubtful to the total balance of loans granted, for customers and contingent risks.
Doubtful balances of loans
and advances to
customers, guarantees to
customers and
commitments granted to
customers
Total Risk
Coverage ratio
One of the most widely used indicators when comparing the productivity of
different financial institutions. It measures the level of resources used to generate the
Group's operating income
Loan loss provisions (2)
Doubtful balances of loans and advances to customers, guarantees to customers and commitments granted to customers
Impairment (3)
Esta ratio relaciona el nivel de deterioros contables por riesgo de crédito en un
periodo de tiempo determinado que son necesarias en función de la cartera de
préstamos concedidos a la clientela, por lo que sirve para medir la calidad crediticia
del Grupo.
Cost of credit
Financial assets at
amortised cost - Loans and advances - Customers
7
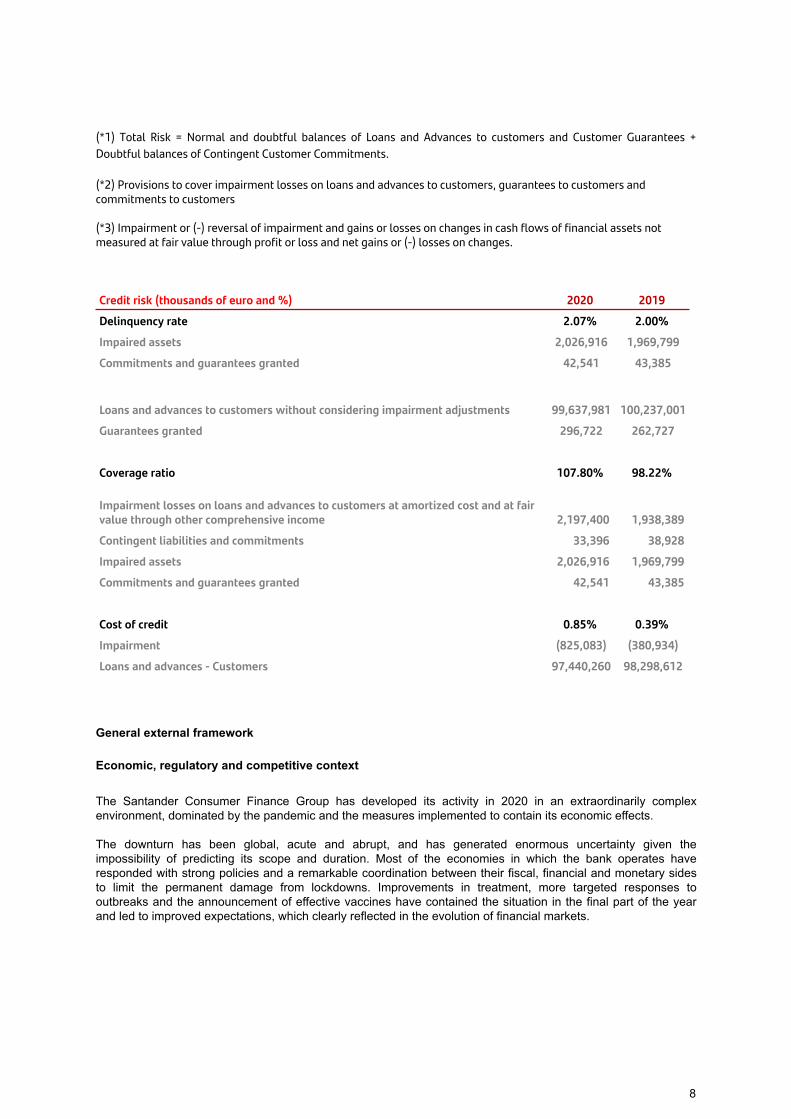
(*1) Total Risk = Normal and doubtful balances of Loans and Advances to customers and Customer Guarantees +
Doubtful balances of Contingent Customer Commitments.
(*2) Provisions to cover impairment losses on loans and advances to customers, guarantees to customers and commitments to customers
(*3) Impairment or (-) reversal of impairment and gains or losses on changes in cash flows of financial assets not measured at fair value through profit or loss and net gains or (-) losses on changes.
Credit risk (thousands of euro and %) 2020 2019
Delinquency rate 2.07% 2.00%
Impaired assets 2,026,916 1,969,799
Commitments and guarantees granted 42,541 43,385
Loans and advances to customers without considering impairment adjustments 99,637,981 100,237,001
Guarantees granted 296,722 262,727
Coverage ratio 107.80% 98.22%
Impairment losses on loans and advances to customers at amortized cost and at fair value through other comprehensive income 2,197,400 1,938,389
Contingent liabilities and commitments 33,396 38,928
Impaired assets 2,026,916 1,969,799
Commitments and guarantees granted 42,541 43,385
Cost of credit 0.85% 0.39%
Impairment (825,083) (380,934)
Loans and advances - Customers 97,440,260 98,298,612
General external framework
Economic, regulatory and competitive context
The Santander Consumer Finance Group has developed its activity in 2020 in an extraordinarily complex
environment, dominated by the pandemic and the measures implemented to contain its economic effects.
The downturn has been global, acute and abrupt, and has generated enormous uncertainty given the
impossibility of predicting its scope and duration. Most of the economies in which the bank operates have
responded with strong policies and a remarkable coordination between their fiscal, financial and monetary sides
to limit the permanent damage from lockdowns. Improvements in treatment, more targeted responses to
outbreaks and the announcement of effective vaccines have contained the situation in the final part of the year
and led to improved expectations, which clearly reflected in the evolution of financial markets.
8
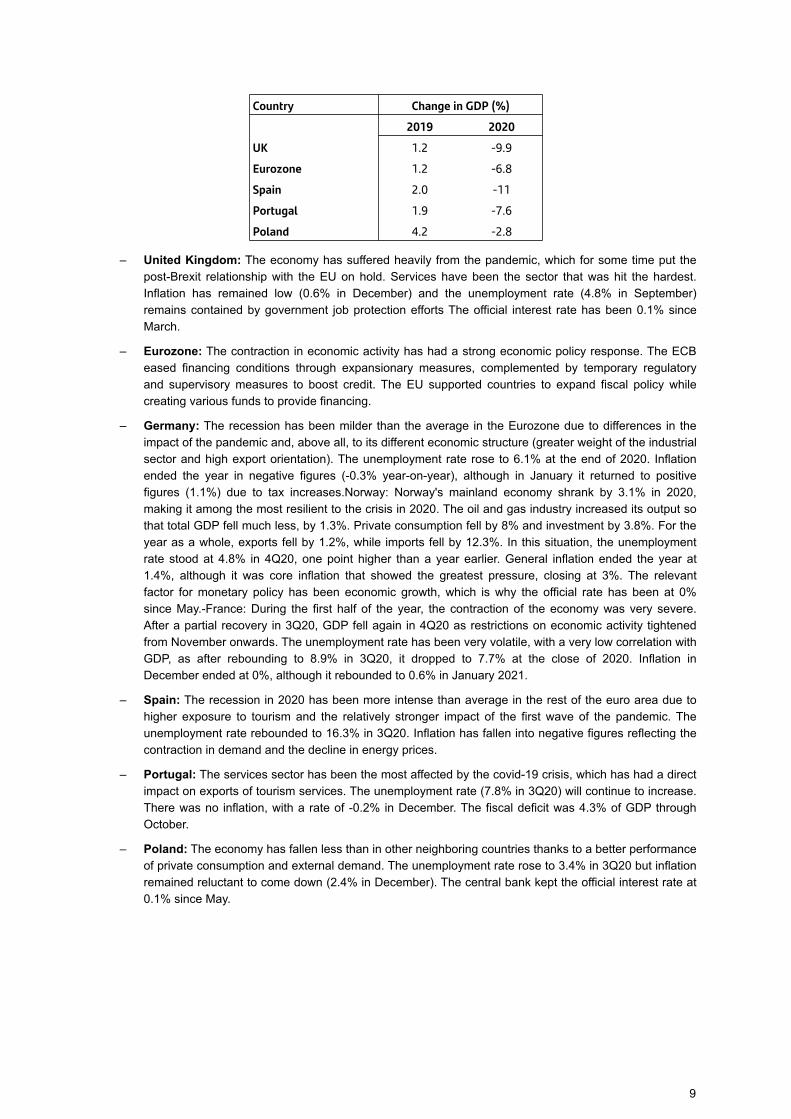
Country Change in GDP (%)
2019 2020
UK 1.2 -9.9
Eurozone 1.2 -6.8
Spain 2.0 -11
Portugal 1.9 -7.6
Poland 4.2 -2.8
– United Kingdom: The economy has suffered heavily from the pandemic, which for some time put the
post-Brexit relationship with the EU on hold. Services have been the sector that was hit the hardest.
Inflation has remained low (0.6% in December) and the unemployment rate (4.8% in September)
remains contained by government job protection efforts The official interest rate has been 0.1% since
March.
– Eurozone: The contraction in economic activity has had a strong economic policy response. The ECB
eased financing conditions through expansionary measures, complemented by temporary regulatory
and supervisory measures to boost credit. The EU supported countries to expand fiscal policy while
creating various funds to provide financing.
– Germany: The recession has been milder than the average in the Eurozone due to differences in the
impact of the pandemic and, above all, to its different economic structure (greater weight of the industrial
sector and high export orientation). The unemployment rate rose to 6.1% at the end of 2020. Inflation
ended the year in negative figures (-0.3% year-on-year), although in January it returned to positive
figures (1.1%) due to tax increases.Norway: Norway's mainland economy shrank by 3.1% in 2020,
making it among the most resilient to the crisis in 2020. The oil and gas industry increased its output so
that total GDP fell much less, by 1.3%. Private consumption fell by 8% and investment by 3.8%. For the
year as a whole, exports fell by 1.2%, while imports fell by 12.3%. In this situation, the unemployment
rate stood at 4.8% in 4Q20, one point higher than a year earlier. General inflation ended the year at
1.4%, although it was core inflation that showed the greatest pressure, closing at 3%. The relevant
factor for monetary policy has been economic growth, which is why the official rate has been at 0%
since May.-France: During the first half of the year, the contraction of the economy was very severe.
After a partial recovery in 3Q20, GDP fell again in 4Q20 as restrictions on economic activity tightened
from November onwards. The unemployment rate has been very volatile, with a very low correlation with
GDP, as after rebounding to 8.9% in 3Q20, it dropped to 7.7% at the close of 2020. Inflation in
December ended at 0%, although it rebounded to 0.6% in January 2021.
– Spain: The recession in 2020 has been more intense than average in the rest of the euro area due to
higher exposure to tourism and the relatively stronger impact of the first wave of the pandemic. The
unemployment rate rebounded to 16.3% in 3Q20. Inflation has fallen into negative figures reflecting the
contraction in demand and the decline in energy prices.
– Portugal: The services sector has been the most affected by the covid-19 crisis, which has had a direct
impact on exports of tourism services. The unemployment rate (7.8% in 3Q20) will continue to increase.
There was no inflation, with a rate of -0.2% in December. The fiscal deficit was 4.3% of GDP through
October.
– Poland: The economy has fallen less than in other neighboring countries thanks to a better performance
of private consumption and external demand. The unemployment rate rose to 3.4% in 3Q20 but inflation
remained reluctant to come down (2.4% in December). The central bank kept the official interest rate at
0.1% since May.
9
Economic outlook
Financial markets
The cyclical recovery we expect in 2021 will guide the behavior of financial markets. The unprecedented injection
of liquidity by central banks will continue to support all risk assets, together with the favorable conclusion of some
risk sources: i) The arrival of the vaccine has diminished global uncertainty about the economic recovery,
relativizing the fact that worsening contagion data and health pressures are still leading to tighter containments. ii)
The control of both Chambers by the Democrats in the US means that the new executive has greater discretion
to carry out its fiscal stimulus plans. iii) The UK's negotiated exit from the EU has avoided a chaotic exit in
January and normalizes relations between the two regions.
In this context, risk-free rates will rise slowly due to a continued improvement in economic and inflation
expectations, and more in the long maturities than in the short maturities, leading to a steepening of the yield
curve. Some Fed members are beginning to talk about the possibility of initiating balance reduction later this year,
but official rates will remain unchanged for a long time.
The dollar, which depreciated against the euro in the latter part of 2020, is expected to regain ground in 2021 on
the back of an earlier recovery in the US in the face of further fiscal stimulus.
During the coming year, the banking environment, as well as the economic environment, will be marked by the
evolution of the pandemic, the speed of vaccination and the rate at which public sector aid to families and
companies is phased out. The end of the flexibility measures and moratoriums will be accompanied by an
increase in delinquency, which will depend on the degree of economic normalization achieved at that time and
will affect the different economic sectors unevenly, affecting more those that have suffered the greatest
permanent effects.
In general, the banking sector is facing this increase in non-performing loans from a more solid position than in
past crises, as shown by the stress tests carried out by different organizations such as the IMF. However,
difficulties in some institutions, both in developed and emerging banking systems, cannot be ruled out.
The digital challenge and the pressure of profitability, in a scenario of very low rates and low business growth, will
continue to encourage bank consolidation, especially in the most fragmented systems, as well as adjustments in
search of efficiency gains.
Financial Regulation
In 2021 financial and prudential regulation will continue to reflect the materialization of different multi-year
solvency and resolution initiatives combined with the measures that authorities will continue to take or keep in
place to manage the harsh effects of the pandemic.
Supervisors and regulators believe that the policy response should be tailored to the specific needs of this new
phase. In addition, they consider that banks must address medium-term challenges, including their low
profitability at both the European and national levels. In this regard, the European Banking Authority concluded in
its 2020 transparency report the solid capital and liquidity positions of banks but warns about the outlook for asset
quality and structural low profitability.
The European Central Bank itself emphasized that uncertainty remains high, also with regard to pandemic
developments and vaccine distribution dates. As a sign the ECB is extending until June 2022 the duration of the
10
easing of the collateral eligibility criteria it adopted in April 2020 to ensure that all banks in all countries can obtain
liquidity to support credit to all sectors of the economy.
Additionally, the ECB has broadened the spectrum of marketable assets eligible by the Eurosystem with its
decision to admit bonds with coupon structures linked to certain sustainability targets as collateral as of January
1, 2021, demonstrating the Eurosystem's support for innovation in the field of sustainable finance.
With regard to the regulation on capital requirements, it is expected that during 2021, CRR2 will generally come
into force, with most of the points that had not yet entered during 2019 and 2020 being applicable. During 2021,
the Commission is expected to propose CRR3. This milestone marks the completion of the implementation of the
Basel framework in Europe, which significantly modifies, among other things, the credit risk framework. Work is
also underway on a quick fix to the CRR on the securitization framework, which would include STS treatment for
synthetic securitizations.
Regarding resolution legislation, the transposition of the Bank Recovery and Resolution Directive (BRRD 2) will
be completed during 2021. In this regard, in response to covid-19, the SRB has stated its intention to adopt a
forward-looking approach to the currently existing MREL requirements. In addition, the SRB has stated that for
the 2020 resolution cycle decisions have taken into consideration the transitional periods between 2022 and 2024
set out in BRRD 2.
During 2021, European Banking Association guidelines of particular relevance will apply:
- Guidelines on lending and monitoring (EBA/GL/2020/06) will apply from June 2021.This guidance covers from
governance processes to lending, pricing for new business, collateral valuation (movable and immovable) and
monitoring and reporting framework.
- Also of particular relevance are the Guidelines on the application of the definition of default in accordance with
Article 178 of Regulation (EU) No 575/2013. From January 2021 the EBA includes in its guidelines that
institutions must incorporate the requirements of these guidelines in their internal procedures and IT systems
before that date; however, competent authorities may accelerate the timing of this transition at their own
discretion.
Strategy
Santander Consumer Finance continues to focus on a solid business model backed by:
– Broad geographic diversification with strong commercial strength in key products.
– A leading position in profitability and efficiency compared to pan-European competitors.
– A risk management and recovery system that enables it to maintain strong credit quality.
Management continues to focus on:
– Improving capital efficiency, in a competitive environment characterized by the emergence of new
competitors, surplus liquidity in the markets and slow GDP growth.
– Strengthening the leadership position in auto finance, gaining leadership in consumer finance through the
global insurance model and by expanding into new markets and expanding agreements with major
distributors/brands.
– The creation of Digital Consumer Bank, a new business with the mission to build a global digital consumer
finance business based on SCF and Openbank's digital platform technology. It has a full suite of banking
11
services in addition to its unique, scalable and efficient software package, which will result in an even more
powerful business.
Simplification, digitization and transformation projects to maximize efficiency in all geographies.
Business development
In this year marked by the pandemic, credit has a slight decrease of 1%, impacting the Covid19 situation on new
production which falls by 12% compared to 2019, mainly affecting consumer business loans.
Regarding liabilities, there is a slight increase of 1% in customer deposits. The volume of wholesale funding was
€13,423 million, via senior issues, securitizations and other long-term issues.
At the end of December, customer deposits and medium- and long-term securitization-issues placed in the
market covered 76% of net lending.
Results
In 2020, attributable profit amounted to €504.1 million, a decrease of 56% compared to 2019. It should be noted,
in addition to the impact of Covid19, that 2020 contains an extraordinary amortization of the Goodwill of the Cash
Generating Unit (CGU) of Nordics (Scandinavia) in the amount of 277 million and tax losses mainly in Santander
Consumer S.A with an impact of 47.2 million.
Analyzing the income statement by lines:
- Gross income remained in line with the previous year despite the pandemic, with an increase in net interest
income (+1.5%) and other operating income, which mitigated the fall in fees and commissions (9.7%) caused by
the lower volume of new production during the pandemic.
- Costs barely grew by 0.6%, absorbing practically all of the new acquisitions of Sixt Leasing and Ford Finance in
the Nordics, as well as the start-up of TimFin in Italy (joint venture with TIM Italia) in 2020. Cost to income stood
at 42.4%.
- Provisions increased compared to 2019 due to the adjustment of expected loss models, which incorporate
information reflecting the prospective macroeconomic environment and lower sales of doubtful portfolios and
write-offs. The cost of credit stood at 0.85% compared to 0.39% in the previous year. The NPL ratio was 2.07%
and coverage was 107.8%.
In short, the Santander Consumer Finance Group continues to demonstrate its capacity to generate revenues
while maintaining high profitability, good efficiency and controlled NPLs. Expectations for 2021 are positive in all
the territories where it operates.
IMPLICATIONS OF THE COVID-19 PANDEMIC
Both the global economic activity and the financial sector have been very significantly affected during the fiscal
year by the spread of COVID-19, which has caused an unprecedented global health crisis.
Since December 2019, a new strain of coronavirus or COVID-19 has progressively spread around the world,
initially in part of Asia, from where it moved to Europe, the United States and Latin America, among others. The
outbreak has been declared an international public health emergency and a global pandemic by the World Health
Organization.
Countries around the world have responded to the COVID-19 pandemic by adopting various measures to try to
contain its spread and impact, including the implementation of strict lockdowns or other containment measures,
travel restrictions, limitation of public gatherings and temporary suspension of a large part of economic activities.
These measures have resulted in a significant decline in global economic activity, falls in production and demand,
12
resulting in sharp declines in GDP in most countries, rising unemployment levels, sharp declines and high
volatility in stock markets, volatility in exchange rates, etc.
These measures have had a negative impact and could continue to negatively affect companies, market
participants, our counterparties and customers in the coming quarters.
Many governments and regulatory authorities, including central banks, have acted to mitigate the economic and
market disruptions resulting from the pandemic. In this regard, fiscal and monetary stimulus measures have been
taken, interest rates have been reduced and partial or full deferral (grace period) of principal and/or interest
payments due on loans have been favored, while some regulatory requirements on financial institutions related to
capital, liquidity and risk have been relaxed.
At this time, it is difficult to predict the effectiveness of these and other measures taken to mitigate the economic
effects of the pandemic.
Within this global environment, the current COVID-19 pandemic has affected our business primarily in the first
half of the year, and the continuation of this pandemic, or any future outbreak, could have a material and adverse
impact on our business, financial condition, liquidity and results.
To mitigate these impacts, since the beginning of the crisis, and with some anticipation, we have been
implementing specific measures in the corporation and in all our geographies for our employees, customers,
shareholders and investors to protect their health and mitigate the economic and social impact of the economic
downturn.
The Santander Consumer Finance Group has contingency plans, which include simulations of stress situations
and which have allowed us to face the current situation with a sufficient degree of preparation and knowledge.
Within the Integral Framework for Special Situations, in February the highest-ranking Corporate Special
Situations Committees were activated in order to respond early and coordinate the responses of the geographies.
Local Committees were activated in these geographies based on the degree of pandemic progress and local
government responses. Through these bodies, Contingency Plans were established involving Local Senior
Management (Country Heads, Local Special Situations Management Directors, Local Area Directors, etc.).
The Contingency Plans have ensured the operational continuity of the businesses in all units, identifying their
critical businesses, and among other actions, segregating equipment and technological infrastructure,
establishing shifts between critical employees and their alternates, as well as increasing the capacity of the
systems and lines by Technology and Operations. In this sense, the bandwidth and capacity of the remote
connection was increased, increasing the maximum number of users supported from 20,000 to more than
30,000, while providing the appropriate equipment to adapt the organization to the new situation of remote work.
As a result, no unit's operational continuity has been compromised and no significant incidents have been
recorded. At the same time, our customers continued to receive the utmost attention.
With regard to employee protection, several actions have been carried out, including communication campaigns
with the necessary hygiene guidelines, the limitation from the outset of travel and face-to-face meetings, as well
as the massive introduction of telecommuting in all geographies so that up to 85% of the workforce (more than
8,800 employees), came to be working remotely, a percentage that reached in some geographies almost 100% of
the professionals of the central services.
Since the end of May, employees have been progressively returning to their usual positions, in line with the
Corporation's guidelines and communications, however allowing flexibility to adjust to the governments' own
Local De-escalation Plans.
Depending on the different evolution of the pandemic, the Group reassesses the situation and takes measures in
line with customer needs, specific to each country and each particular market.
13

Numerous measures have been taken to support customers and promote their economic resilience during the
health crisis and to deal with its consequences, including the following:
- Providing liquidity and credit facilities
- With regard to the moratoriums, in accordance with the report sent to the regulator and limited to the perimeter
agreed with the ECB, 7,667.7 million euros have been formalized, of which 412.9 million euros are outstanding.
The total formalized is divided into:
◦ €1,961 million whose origin is government programs.
◦ 5,706 million Euros whose origin is non-governmental programs.
Of these totals, for the case of the retail portfolio which represents more than half of the moratoriums, as of
December 31, 2020 98% of the formalized portfolio had expired and of this percentage, 87% had paid while 7%
had requested a new moratorium and the remaining 6% had passed to be managed by the collection teams.
With respect to the Wholesale Portfolio, 90.7% of the formalized portfolio had expired and of this 98.7% had paid
and 1.3% had requested a new moratorium.
Regarding the impact on the Consumer group's business, the markets and the consumer finance activity in 2020
have been marked by the Covid-19 pandemic.
The first two months pointed to a year that would improve the activity and results of 2019 but as soon as the
lockdowns and restriction of activities began most of the economic activities were affected being even closed.
Santander Consumer's geographic diversification and the different impact of the pandemic resulted in a
staggered drop in activity, mitigating to some extent the earliest and most severe effects originated in China, Italy
and Spain, but which gradually spread to the geographies of northern and central Europe.
Our main indicator, being the reference for the core business, showed that at the end of the first quarter,
passenger car registrations fell 25.6% in Europe compared to 2019 with March falling 55.1%.
Physical stores had to close and the population was confined so sectors traditionally linked to the display and
sale of goods, such as electronics, furniture and even travel agencies saw their activity and consequently the
financing of their sales diminished. However, during the months of confinement there was an acceleration of the
change in consumer habits with an increase in commercial activity and financing through digital channels.
However, from April onwards, commercial activity resumed, which also brought a recovery in financing, with
growth in volumes of 40%, 48% and 12% up to July, although the levels of 2019 were not reached, as was also
shown by the passenger car registrations indicator, which at that time was 35.13% below the previous year.
The online activity and the reinforcement of used car sales, in whose financing Santander Consumer has a
relevant position, kept the business at levels similar to 2019, but the arrival of the second wave of the pandemic
with the strict mobility measures and generalized closures of activity throughout Europe have marked a last
quarter of extremely reduced economic activity with the consequent effect in the financing of consumer goods.
Once again, the last quarter's registrations indicator stood at -9% to close a year in which 24.32% has been lost
over the previous year, a situation that has been reflected in the year's production of the main geographies with
Germany -4.0%, Italy -16.0%, and Spain -31.4%.
Regarding liquidity specifcally, when the health crisis began, there were moments of uncertainty and initial
concern in the markets, banks and regulators about the possibility of stress situations.
In the first days/weeks of March, the long-term issue markets were closed, there was tension in the short-term
markets (money markets) which was reflected in high volatility in both prices and exchange rates and spreads
began to widen, reflecting uncertainty about the authorities' fiscal and monetary policies.
14
In this environment, SCF Subgroup established as a priority to preserve a solid liquidity position in the parent
company SCF S.A. and in the different subsidiaries and established a series of management measures and
actions.
In addition, there was a rapid decision making process by governments and central banks to increase the liquidity
available in the market. Some of these measures were: PELTROs (Pandemic Emergency Longer Term
Refinancing Operations) announced in April, modification of the conditions of the third TLTROs program, the
temporary lowering of the LCR ratio requirements below 100% or the extension of the dollar liquidity lines offered
by the Fed, among others. All of this helped soothe the markets and avoid episodes of stress.
Among the measures adopted by SCF Subgroup, the daily monitoring of the liquidity situation was immediately
reinforced. This was presented on a regular basis at the monitoring committees, which became an essential part
of it, as well as at the meetings held since then by the Executive Committee and the Group's Board of Directors.
Subsequently, following the worsening of the pandemic in the last quarter of 2020, in the face of new upturns and
the prospect of a possible deterioration of the economy in 2021, in December the ECB decided to adopt a series
of new measures in order to mitigate its possible negative effects. Mainly among others: extension of the
PELTROs as well as of the third TLTROs program and its concessional conditions, including additional
enhancements.
Additionally, and although most units had sufficient liquidity buffers to cover a horizon of 60 days or more in an
aggressive scenario, during 2020, SCF Subgroup has implemented a series of mitigating measures including
among others:
• The generation of collateral in all units in order to maximize access to central bank facilities.
• The appeal to the ECB through the TLTRO program has been increased to €14,644 million in December
2020 (€7,900 million in December 2019). Additionally, in March, the entity made use of the terms of the
Central Bank of Norway (Norges Bank) through its F-Loan offering, obtaining NOK 1.0 billion.
As a result, the liquidity position has remained solid at all times and has not generated strong additional liquidity
needs, derived from the evolution of deposits, drawdowns of wholesale lines or the commercial portfolio.
Liquidity metrics have remained above their internal limits and in compliance with regulatory levels. At the end of
December, SCF Subgroup's consolidated LCR was 314% and the NSFR for the same perimeter as of December
2020 was 114%.
In terms of the issuance plan, SCF Subgroup accelerated operations in the first quarter in which it issued mainly
senior debt for 2.9 billion, which represented approximately half of the plan for the entire year for this type of
instrument. In the second quarter, SCF Subgroup, due to lower funding requirements mainly as a result of a
reduction in new business generation, as well as higher intra-group funding, has reduced its issuance levels,
limiting its issuance to securitization. The total volume of all SCF Subgroup issuance during 2020 amounts to
€11.0 billion (€14.1 billion in 2019).
SCF Subgroup's access to the wholesale funding markets, as well as the cost of issuances depends, in part, on
the ratings of the rating agencies.
During the year, the three main rating agencies have revised their ratings. Fitch has maintained its ratings (long-
term at A- and short-term at F2), as has Standard & Poor's (long-term at A- and short-term at A-2); in both cases,
the outlook has changed from stable to negative due to the economic consequences that the coronavirus crisis
may have on the long-term rating. Moody's has maintained both its long-term rating at A2 and its short-term rating
at P1, as well as its stable outlook.
In short, SCF Subgroup, during the 2020 financial year and taking into account the implications of the COVID 19
pandemic, has maintained and managed its liquidity position and its financing structure at comfortable levels,
appropriate to its financing needs, mainly through the use of central bank facilities, an optimal mix of issues
(mainly senior debt and securitizations) and increased intragroup financing.
15
In terms of capital management, SCF maintains its growth path. Specifically, the CET1 ratio has increased 67
basis points since the end of 2019, mostly due to:
– Positive impact of bringing forward the measures envisaged in the European capital requirements
regulation (CRR2 quick fix), which represents an increase of 38 basis points.
– The reduction of Nordic goodwill, which had a positive impact of 41 basis points.
In summary, the group ended the half-year with a total capital ratio of 16.53% and a CET1 ratio of 13.21%,
comfortably meeting the minimum ratios required by the European Central Bank on a consolidated basis, which
are 12.05% for the total capital ratio and 7.89% for CET1.
With respect to risk management, in order to contribute to mitigating the possible economic and financial
impact of the crisis, several lines of work have been activated to reconcile support for our customers with
preserving the Bank's strength and solvency:
– Identification of customers, groups and vulnerable sectors that are or could be affected by the effects of the
pandemic.
– Continued monitoring of their situation and needs arising from the pandemic and market evolution.
– Scenario analysis to assess potential impacts and define action plans if necessary.
– Evaluation of the risk control framework, risk appetite, management limits and policies to ensure their
adequacy in the current circumstances.
– Reinforcement of recovery teams in all our geographies.
Both the board of directors and senior management have been regularly informed by continuous reporting of key
risk indicators to facilitate the decision-making process.
Loan loss provisions in 2020 were €968.6 million, up significantly from the previous year, mainly due to additional
provisions to deal with the potential consequences of the pandemic:
– Initial signs of impairment in the portfolios as a result of the impact of COVID-19. This deterioration has not
materialized in a relevant way so far, due to the mitigating effect of the support measures put in place.
– Additional provisions made reflecting the IFRS 9 forward looking view, based on a long-term approach,
recognized by the International Accounting Standards Board (IASB) and other regulators and supervisors,
of possible macroeconomic scenarios in the context of COVID-19.
– Collective and individual assessment to reflect expected credit losses on assets whose credit risk is
increasing.
– Year-to-date loan growth, driven by economic support programs.As a result, the cost of credit stood at
0.85%, an increase of 46 basis points compared to 2019.
The NPL ratio, calculated as the result of dividing the financial assets at amortized cost (customers) in Phase 3
and contingent risks recorded in the consolidated balance sheets at December 31 of this year by the total
balance of financial assets at amortized cost (customers and contingent risks), amounted to 2.07% due to the
increase in credit volumes and the mitigation measures implemented.
The bad debt fund amounts to EUR 2,197 million, with an NPL coverage of 107.80%, calculated with accounting
provisions on total impaired assets due to credit risk (doubtful assets), whether in simple default, pre-contentious,
contentious or doubtful non-precontentious. It has increased by more than eight hundred basis points compared
to December 2019, due to the provisions made.
16
Regarding the evolution of exposure and coverage per stage on an IFRS 9 basis, the increase observed in stage
2 of the second quarter is in line with the aforementioned collective and individual assessments aimed at
quantifying the assets where credit risk is estimated to have increased. Consumer is strictly following regulatory
and supervisory guidelines that underline the importance of responsibly adapting and applying its accounting and
prudential policies to temporary and exceptional containment measures.
The evolution of exposure and coverage in stage 1 is driven by the loan growth observed in the period. For stage
3, the alignment with regulatory and supervisory guidelines issued to address the effects of the pandemic helps
explain the performance observed during the period.
With regard to market risk, and after the spike in volatility caused by the COVID-19 crisis in the first quarter, it
stabilized in the second quarter, closing with low figures in relation to the Group's balance sheet and activity.
In relation to operational risk, the Group has established additional controls in order to maintain pre-COVID-19
risk levels, in addition to reinforcing those already in place. The following aspects have been closely monitored:
– Business continuity plans to support our employees, customers and businesses.
– The pandemic scenario and remote working has a direct impact on the cyber threat environment and its
associated risks. In addition, we are strengthening control mechanisms to further support the control
environment (patching, browsing control, data protection controls, etc.).
– Increased technological support to ensure adequate customer service and the correct provision of
services, especially in online banking and call centers.
– Transaction processing risk increases due to the volume of new loans and multiple changes in existing
portfolios resulting from public aid programs and internal policies. Additional controls have been
implemented to minimize incidents.
Ongoing monitoring of other risk areas, such as external suppliers, fraud, conduct and money laundering
prevention.
In order to reinforce control over the calculation and allocation of overlay provisions by COVID and the effects on
the classification of operations and portfolio performance, the following actions were carried out:
– Transposition of corporate guidelines and in compliance with EBA guidelines for the application of
measures to our clients affected by the health crisis. This SCF guide was validated by the Santander
Group, approved in the SCF RCC, and SCF validated the transpositions of the entities under SCF
management when they required a different approach due to local specificities.
– Monitoring of the evolution of volumes and behavior of the moratoriums granted in accordance with the
aforementioned guidelines. Weekly in the SCF Management Committee, monthly in the RCC of SCF and
the Santander Group and quarterly in the RSRCC and BoD of SCF.
– Data quality controls on information reported by the entities on Covid moratoriums.
Internal audit to verify the correct processes applied by the entities in the application of the measures associated
with the Covid crisis.
Regarding the evolution of the year, the levels of losses, in relative terms, by Basel categories are aligned with
the 2019 year and are similar to those of the previous semester. There have been no major events related to the
COVID-19 situation.
In terms of results, the healthcare crisis is having an impact throughout the income statement. Firstly, due to the
depreciation of the Norwegian market currencies. Thus, the impact of exchange rates can be quantified at
approximately 10MM negative in revenues and costs when compared to the previous year.
17

Eliminating this effect, the most significant impacts are:
- Net interest income has been affected by the decrease in volumes, this impact has been offset by a reduction in
interest rates by the various central banks in recent months. As a result, net interest income improved slightly
despite the crisis in the first half of the year.
- As regards fees and commissions, they were impacted by the lower levels of activity, mainly in those related to
insurance.
- In terms of operating costs, the efficiency plan defined for the year continued to be implemented in 2020,
although during the first few months there was a certain slowdown in obtaining the savings envisaged in the
optimization plans, mainly due to the effect of the COVID 19 pandemic. However, since the beginning of the
pandemic, a series of cost optimization measures were implemented to mitigate its impact, such as the
elimination of travel, the reduction of consulting and marketing expenses, non-strategic projects, as well as the
adjustment of the variable remuneration of the workforce, among others, which together with the structural
savings measures initially defined, has allowed the Division to reduce its costs by 100 million euros in the current
fiscal year.
- With regard to loan-loss provisions, as mentioned in the risks section, they are higher than those made in
previous periods, which has been reflected in the aforementioned increase in the cost of credit.
To conclude and if we look to the future, Santander Consumer entered this health crisis in a very strong position:
a solid profit before provisions (2.5 billion at the end of 2019), a well-diversified portfolio with high collateral and
capital and liquidity positions appropriate for our type of business. All of these are key levers for managing an
economic downturn.
Our priority remains to protect all our stakeholders, because we believe this is the best way to accelerate the
recovery and exit the crisis as quickly as possible to give our shareholders an adequate return.
We are confident in our strengths and business model to mitigate the impact of COVID-19, at Santander
Consumer: we have the necessary scale, a broad customer base and good geographic and business
diversification.
We also maintain the pillars on which the group's strategy is based: improving operating performance, optimizing
the allocation of capital to the regions and businesses that generate the highest profits and accelerating the
group's transformation through greater digitalization.
On the other hand, cost management actions are being activated to mitigate the negative impacts of COVID-19:
- Adjust the compensation variable in line with business evolution expectations.
- Postpone investments and optimize the project portfolio for 2020 and consequently optimize consulting
expenses.
- Reduce travel spending.
- Optimize marketing expenditure.
- Digitization of contracting and transaction registration processes.
18
I. Risk management
Corporate principles
Santander Group, which is part Santander Consumer Finance Group, has set itself the strategic objective of
achieving excellence in risk management. This has been a focal point of the Santander Group's activities
throughout its history spanning more than 150 years.
During the last few years, the pace of change in risk management has increased in order to anticipate and
meet the main challenges presented by a constantly changing economic, social and regulatory environment.
Consequently, the risk function is of greater significance than ever so as to make the Santander Group is to
continue to be a solid, safe and sustainable bank, an example for all the financial sector and a reference point
for all who aspire to convert leadership in risks into a competitive advantage.
Santander Consumer Finance Group aims to build a future based on advance management of all risks and
protect its present through a robust control environment. Accordingly, the Group has determined that the risk
function should be based on the following cornerstones, which are in line with the Santander Group's strategy
and business model and take into account the recommendations of the supervisory and regulatory bodies and
the best market practices:
1. The business strategy is defined by the risk appetite. The Santander Consumer Finance Group's board
determines the amount and type of risk that it considers reasonable to assume in implementing and
developing its business strategy, in the form of objective verifiable limits that are consistent with the risk
appetite for each significant activity.
2. All risks must be managed by the units that generate them using advanced models and tools that are
integrated in the various businesses. The Santander Consumer Finance Group is fostering advanced risk
management, using innovative models and metrics together with a control, reporting and escalation
framework to ensure that risks are identified and managed from different perspectives.
3. A forward-looking vision of all types of risks should be included in the risk identification, assessment and
management processes.
4. The independence of the risk function encompasses all risks and establishes an appropriate separation of
the risk generating units from those responsible for risk control. Implies having sufficient authority and
direct access to management and governing bodies responsible for setting and supervising risk strategy
and policies.
5. The best processes and infrastructure must be used for risk management. Santander Consumer Finance
aims to be a reference model in the development of infrastructures and processes supporting risk
management.
6. A risk culture integrated throughout the organisation, consisting of a series of attitudes, values, skills and
guidelines for action vis-à-vis all risks. Santander Consumer Finance understands that advanced risk
management cannot be achieved without a strong and stable risk culture being present in each of its
activities.
Risk map
Santander Consumer Finance has in place a recurring process for identifying the material risks to which it is
or could be exposed, as reflected in the risk map. Material risks must be covered by the risk profile
19
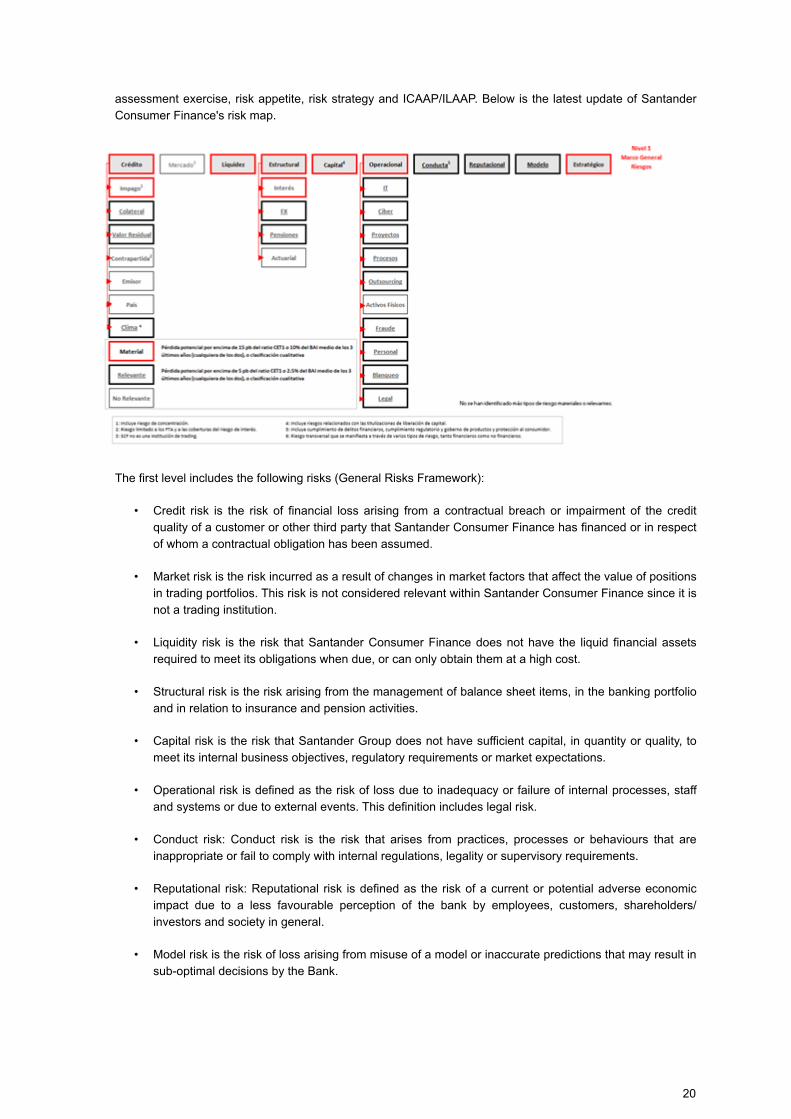
assessment exercise, risk appetite, risk strategy and ICAAP/ILAAP. Below is the latest update of Santander
Consumer Finance's risk map.
The first level includes the following risks (General Risks Framework):
• Credit risk is the risk of financial loss arising from a contractual breach or impairment of the credit
quality of a customer or other third party that Santander Consumer Finance has financed or in respect
of whom a contractual obligation has been assumed.
• Market risk is the risk incurred as a result of changes in market factors that affect the value of positions
in trading portfolios. This risk is not considered relevant within Santander Consumer Finance since it is
not a trading institution.
• Liquidity risk is the risk that Santander Consumer Finance does not have the liquid financial assets
required to meet its obligations when due, or can only obtain them at a high cost.
• Structural risk is the risk arising from the management of balance sheet items, in the banking portfolio
and in relation to insurance and pension activities.
• Capital risk is the risk that Santander Group does not have sufficient capital, in quantity or quality, to
meet its internal business objectives, regulatory requirements or market expectations.
• Operational risk is defined as the risk of loss due to inadequacy or failure of internal processes, staff
and systems or due to external events. This definition includes legal risk.
• Conduct risk: Conduct risk is the risk that arises from practices, processes or behaviours that are
inappropriate or fail to comply with internal regulations, legality or supervisory requirements.
• Reputational risk: Reputational risk is defined as the risk of a current or potential adverse economic
impact due to a less favourable perception of the bank by employees, customers, shareholders/
investors and society in general.
• Model risk is the risk of loss arising from misuse of a model or inaccurate predictions that may result in
sub-optimal decisions by the Bank.
20
• Strategic risk is the risk of loss or detriment arising from strategic decisions, or poor implementation of
such decisions, affecting the long-term interests of our main stakeholders; or from an inability to adapt
to the changing environment.
The material risks at Santander Consumer Finance are: credit, default (including concentration), liquidity,
structural, structural interest rate, capital, operational and strategic.
The significant risks at Santander Consumer Finance are: collateral/residual value, structural exchange rate,
pensions, IT, cyber, processes, outsourcing, fraud, personnel, money laundering, legal, conduct, reputational
and model.
Residual Value Risk is defined as the risk of loss that an entity may have if at any time during the life of an
automobile contract (loan, lease, etc.) the customer has the option or obligation to return the vehicle as full
and final settlement, due to uncertainty about the sale price of the vehicle at that time
Corporate Risk Governance
The objective of the governance of the risk function is to ensure adequate and efficient decision-making and
effective risk control, and to ensure that these functions are managed in accordance with the risk appetite
defined by the senior management of Santander Consumer Finance and its units.
The following principles have been established for this purpose:
• Segregation between risk decisions and control.
• Enhancing the responsibility of risk generating functions in the decision-making process.
• Ensuring that all risk decisions have a formal approval process.
• Ensuring an aggregate overview of all risk types.
• Bolstering risk control committees.
• Maintaining a responsive and efficient committee structure, ensuring:
– Participation and involvement of the governance bodies and senior management in all risk
decisions, and supervision and control.
– Coordination between the lines of defence in risk-management and control functions.
– Alignment of objectives, monitoring to ensure they are being achieved and implementing corrective
measures when necessary.
– The existence of an adequate management and control environment for all risks.
To achieve these objectives, the Committee structure in the management model must ensure an adequate:
• Structure, with stratification by levels of relevance, balanced delegation capacity and protocols for
escalating incidents.
• Composition, with members of sufficient rank and representation of business and support areas.
• Operations, i.e. frequency, minimum attendance levels and appropriate procedures.
The governance of risk activity must establish and facilitate coordination channels between the units and
Santander Consumer Finance, together with alignment of management models and risk control.
21
The governance bodies of Santander Consumer Finance, S.A. units are set up in accordance with local legal
and regulatory requirements, considering the complexity of each unit.
Furthermore, Santander Consumer Finance has established additional governing measure for special
situations.
The Gold and Silver Committee in Santander Consumer Finance spearheaded the crisis; specialized
committees (business continuity, HR committees, risks committees, etc.) covered the impact of the COVID-19
pandemic in their agendas to gauge future repercussions. Their conclusions were shared within the
organization's highest committees. The crisis management governance has become less strict over the
second and third waves, as opposed to the beginning of the pandemic. The frequency of these committees
has been established in line with the severity of the pandemic and the impact on the entity. In many instances,
activating extraordinary mechanisms not previously defined has been necessary to deal with the effects on
the business, the assets and the people.
Roles and responsibilities
The risk function is built around three lines of defence. The roles and responsibilities of these lines form an
integral part of the management and control of market, structural and liquidity risk, as explained below.
– First line of defence
This comprises the departments, business lines and activities that generate risk exposure. In the scope of this
framework, this involves those responsible for management of the trading and balance sheet management
portfolios.
This line of defence must ensure at all times:
– That all risks that might have a material impact are identified.
– Recurrent assessment of existing risks.
– The information needed to assess risks is available.
– The limits established for their activities are observed and respected.
– Second line of defence
This involves the specialist teams involved in risk control and monitoring. In the scope of this framework, this
involves those responsible for monitoring activities involving the entity's portfolios and the performance and
management of the risks assumed.
The second line of defence is an independent function within the risk function that complements the
management and control functions of the first line of defence, ensuring at all times that:
– Limits are established and approved by the entity's governance bodies or their delegated bodies.
– The first line of defence understands and complies with these limits.
– The policies, procedures and limits established for trading activities and balance sheet management
are respected.
– Systematic reviews are carried out of exposure to market, structural and liquidity risks.
– Robust, reliable and adequate mechanisms are in place for these activities.
22
The second line of defence must provide a consolidated overview of market, structural and liquidity risks.
– Third line of defence
As the final layer of control in the Group, Internal Audit regularly checks that policies, methods and
procedures are adequate and applied effectively in management.
Structure of Risk Committees
The board of directors is ultimately responsible for risk control and management, delegating these powers to
commissions and committees. In Santander Consumer Finance, the Board is supported by the Risk,
Regulation and Compliance Supervision Commission, which is an independent risk control and monitoring
committee. These bylaw-mandated bodies form the highest level of risk governance:
Independent control bodies
– Risk, Regulation and Compliance Supervision Commission
This Committee's role is to assist the Board of Directors in the monitoring and control or risks, defining and
assessing risk policies, and determining the risk propensity and strategy.
It is made up of external or non-executive directors (mostly independent) and is chaired by an
independent Board member.
The main duties of the Risk, Regulation and Compliance Supervision Commission are:
– To support and advise the Board of Directors in defining and assessing Santander Consumer
Finance's risk policies and determining its risk propensity and risk strategy.
– To ensure that the pricing policy for assets and liabilities offered to customers fully respects the
business model and risk strategy.
– To understand and assess the management tools, ideas for improvement, progress with projects and
any other relevant activity relating to risk control.
– To determine with the Board of Directors the nature, amount, format and frequency of the risk
information to be received by the Committee and the Board.
– To help establish rational and practical remuneration policies. For this purpose, without prejudice to the
duties of the Remunerations Committee, the Risk Committee examines whether the incentives policy
planned for the remuneration scheme considers risk, capital, liquidity and the likelihood and suitability
of profits.
– Executive Risk Control Committee (ERCC):
This collegial body is responsible for overall monitoring and control of Santander Consumer Finance's
risks, pursuant to the powers delegated to it by the Board of Directors of Santander Consumer Finance,
S.A.
Its objectives are:
• To provide a tool for effective risk control, ensuring that risks are managed in accordance with the
Bank's risk appetite, as approved by the Board of Directors of Santander Consumer Finance, S.A.,
providing an overview of all of the risks identified in the risk map in the general risk framework,
including identification and monitoring of actual and emerging risks and their impact on the risk profile
of the Santander Consumer Finance Group.
23
• To ensure the best estimate of provisions and that they are recognized correctly.
This Committee is chaired by the Santander Consumer Finance's Chief Risk Officer (CRO) and is made up of
members of its senior management. In addition to the risk function, which chairs the Committee, the
compliance, finance and management control functions are also represented. The CROs of local entities can
take part on a regular basis to report on the risk profile of the entities and other tasks.
The Executive Risk Control Committee reports to the Risk, Regulation and Compliance Supervision
Commission, which it assists in its function of supporting the Board.
Decision-making bodies
– Executive Risk Committee (ERC):
The Executive Risk Committee is the collegiate body responsible for overall risk management pursuant to
the powers delegated to it by the Board of Directors of Santander Consumer Finance S.A., monitoring all
the risks identified in the Bank that fall within its remit.
Its objective is to provide a tool for decisions on accepting risks at the highest level, ensuring that risk
decisions are within the limits set by the Santander Consumer Finance Group's risk appetite. It reports on
its activity to the Board or its committees, as required.
This Committee is chaired by the Head of Santander Consumer Finance and is made up of executive
directors and other executive of Santander Consumer Finance. The risk, financial, management control
and compliance function are also represented, among others. The Bank's CRO is entitled to veto the
Committee's decisions.
– Proposal Sub-committee (RPSc):
The Santander Consumer Finance Risk Proposal Sub-committee is a collegiate body in charge of making
decisions regarding business and country transactions, credit risk, market, liquidity and structural issues,
guaranteeing that the decisions made comply with the limits established in the appetite risk framework of
Santander Consumer Finance, as well as informing of its activity to the Risk Executive Committee when it
is required so.
This Committee is chaired by Santander Consumer Finance’s CRO, and it comprises Santander
Consumer Finance executive positions including but not limited to the risk, financial, management control
and compliance functions.
– Credit Committee:
The Credit Committee is the collegiate decision-making body responsible for recommending and
validating credit risk proposals, ensuring that this respect the limits set in the risk appetite, reporting to the
Executive Risk Committee, as required.
This Committee is chaired by the Santander Consumer Finance's CRO and its members are senior
managers. The risk and business functions are also represented.
– Provisions Committee:
The Provisions Committee is the decision-making body responsible for overall management of provisions
in accordance with the powers delegated by the Executive Risk Committee of Santander Consumer
Finance S.A., and supervises, within its sphere of action and decision, all matters relating to provisions in
Santander Consumer Finance. Its purpose is to be the instrument for decision-making, ensuring that
decisions are consistent with the governance of provisions established at Santander Consumer Finance,
and reporting to the Board of Directors or its committees on its activities when required.
24
Structural organisation of the risk function
The Group Chief Risk Officer (GCRO) is responsible for the risk function in Santander Consumer Finance and
reports to the Head of Santander Consumer Finance, who is a member of the Board.
The GCRO advises and challenges the executive line and also reports independently to the Risk, Regulatory
and Compliance Committee and to the Board.
Advanced risk management is based on a holistic, forward-looking approach to risks, based on intensive use
of models, to foster a robust control environment that meets the requirements of the regulator and the
supervisor.
Santander Consumer Finance's risk management and control model shares certain core principles via its
corporate frameworks. These frameworks are established by the Group and Santander Consumer Finance
adheres to them through its management bodies. They shape the relationship between the subsidiaries and
Santander Consumer Finance, including the role played by the latter in validating important decisions.
The Group-Subsidiaries Governance Model and good governance practices for subsidiaries recommend that
each subsidiary should have a bylaw-mandated risk committee and an executive risk committee chaired by
the Chief Executive Officer (CEO). This is in line with best corporate governance practices and consistent with
those already in place in the Group, as set out in the corporate framework, to which Santander Consumer
Finance has signed up.
Under the Group's internal governance framework, the management bodies of Santander Consumer Finance
have their own model of risk powers (both quantitative and qualitative), which must follow the principles set
out in the benchmark models and frameworks developed at the corporate level.
Given its capacity for comprehensive and aggregated oversight of all risks, the corporation exercises a
validation and questioning role with regard to the operations and management policies of the units, insofar as
they affect the Group’s risk profile.
Identifying and evaluating risks is a cornerstone for controlling and managing risk. The main risk types to
which the Group is exposed are credit risk, market risk, operational risk and compliance and conduct risk.
Santander Consumer Finance has taken several initiatives to improve the relationship between Santander
Consumer Finance and its subsidiaries, and to improve the model of advanced risk management.
It is worth mentioning the tight collaborative efforts in light of the crisis derived from the COVID-19 pandemic
to share best practices, aid in the development of scenarios, estimation of additional provisions, etc.
As the main initiatives in 2020, Santander Consumer Finance has -and will continue to- meticulously revise
the impact of the COVID-19 pandemic and the appropriateness of the risk appetite to face the new
environment. The risk appetite limits have been practically unchanged despite the extraordinarily challenging
conditions. Management focused on improving the control over market volatility, better representation and
visibility of the emerging risks including cybersecurity and other non-financial risks.
Scenario analysis
In the context of the coronavirus pandemic and in line with the regulator's indications, the Service of Studies
department elaborated a set of additional scenarios under a stable perspective, long-run approach in order to
analyze the deterioration observed in most macroeconomic indicators and evaluate the expected losses. The
Santander Group has developed these scenarios through a robust process and with great effort from the
teams involved, ensuring their coherence.
25
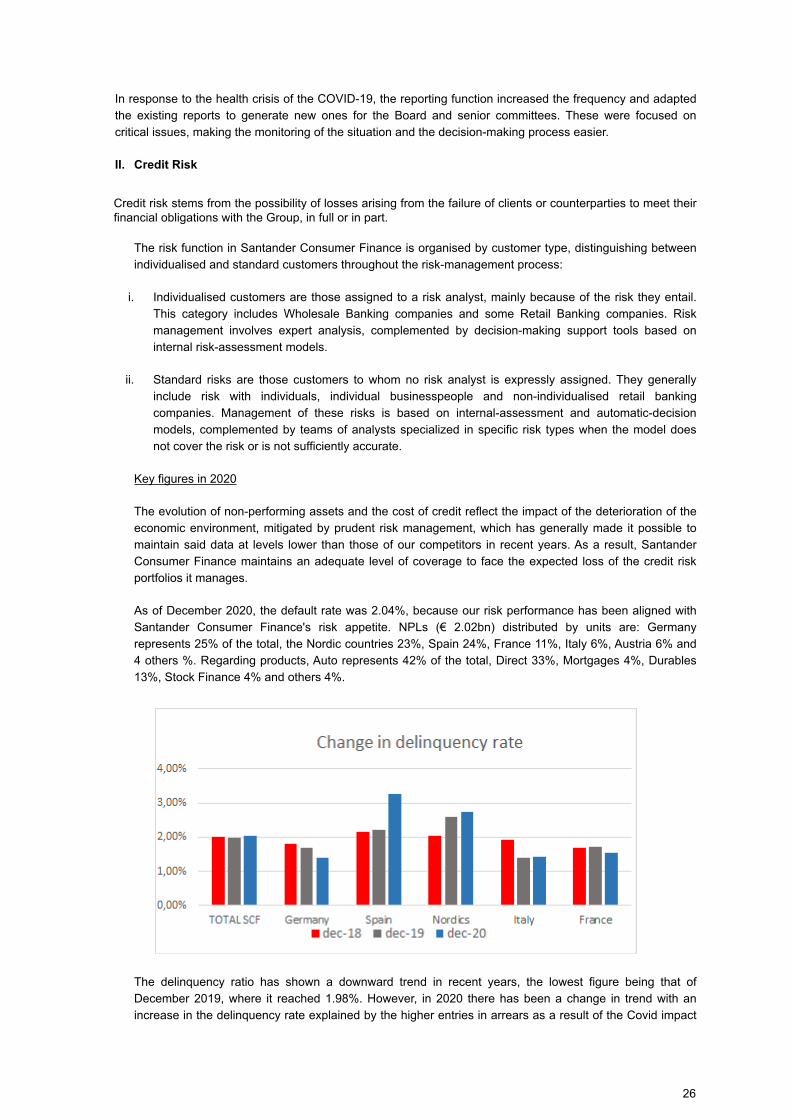
In response to the health crisis of the COVID-19, the reporting function increased the frequency and adapted
the existing reports to generate new ones for the Board and senior committees. These were focused on
critical issues, making the monitoring of the situation and the decision-making process easier.
II. Credit Risk
Credit risk stems from the possibility of losses arising from the failure of clients or counterparties to meet their
financial obligations with the Group, in full or in part.
The risk function in Santander Consumer Finance is organised by customer type, distinguishing between
individualised and standard customers throughout the risk-management process:
i. Individualised customers are those assigned to a risk analyst, mainly because of the risk they entail.
This category includes Wholesale Banking companies and some Retail Banking companies. Risk
management involves expert analysis, complemented by decision-making support tools based on
internal risk-assessment models.
ii. Standard risks are those customers to whom no risk analyst is expressly assigned. They generally
include risk with individuals, individual businesspeople and non-individualised retail banking
companies. Management of these risks is based on internal-assessment and automatic-decision
models, complemented by teams of analysts specialized in specific risk types when the model does
not cover the risk or is not sufficiently accurate.
Key figures in 2020
The evolution of non-performing assets and the cost of credit reflect the impact of the deterioration of the
economic environment, mitigated by prudent risk management, which has generally made it possible to
maintain said data at levels lower than those of our competitors in recent years. As a result, Santander
Consumer Finance maintains an adequate level of coverage to face the expected loss of the credit risk
portfolios it manages.
As of December 2020, the default rate was 2.04%, because our risk performance has been aligned with
Santander Consumer Finance's risk appetite. NPLs (€ 2.02bn) distributed by units are: Germany
represents 25% of the total, the Nordic countries 23%, Spain 24%, France 11%, Italy 6%, Austria 6% and
4 others %. Regarding products, Auto represents 42% of the total, Direct 33%, Mortgages 4%, Durables
13%, Stock Finance 4% and others 4%.
The delinquency ratio has shown a downward trend in recent years, the lowest figure being that of
December 2019, where it reached 1.98%. However, in 2020 there has been a change in trend with an
increase in the delinquency rate explained by the higher entries in arrears as a result of the Covid impact
26
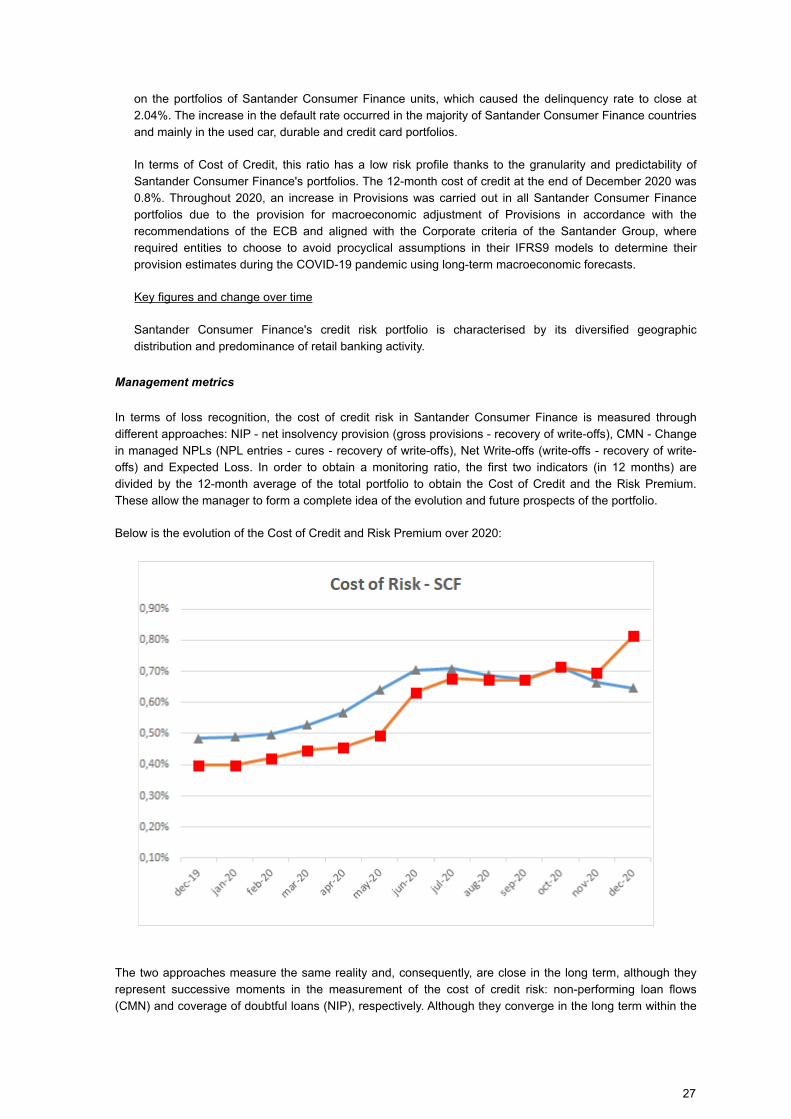
on the portfolios of Santander Consumer Finance units, which caused the delinquency rate to close at
2.04%. The increase in the default rate occurred in the majority of Santander Consumer Finance countries
and mainly in the used car, durable and credit card portfolios.
In terms of Cost of Credit, this ratio has a low risk profile thanks to the granularity and predictability of
Santander Consumer Finance's portfolios. The 12-month cost of credit at the end of December 2020 was
0.8%. Throughout 2020, an increase in Provisions was carried out in all Santander Consumer Finance
portfolios due to the provision for macroeconomic adjustment of Provisions in accordance with the
recommendations of the ECB and aligned with the Corporate criteria of the Santander Group, where
required entities to choose to avoid procyclical assumptions in their IFRS9 models to determine their
provision estimates during the COVID-19 pandemic using long-term macroeconomic forecasts.
Key figures and change over time
Santander Consumer Finance's credit risk portfolio is characterised by its diversified geographic
distribution and predominance of retail banking activity.
Management metrics
In terms of loss recognition, the cost of credit risk in Santander Consumer Finance is measured through
different approaches: NIP - net insolvency provision (gross provisions - recovery of write-offs), CMN - Change
in managed NPLs (NPL entries - cures - recovery of write-offs), Net Write-offs (write-offs - recovery of write-
offs) and Expected Loss. In order to obtain a monitoring ratio, the first two indicators (in 12 months) are
divided by the 12-month average of the total portfolio to obtain the Cost of Credit and the Risk Premium.
These allow the manager to form a complete idea of the evolution and future prospects of the portfolio.
Below is the evolution of the Cost of Credit and Risk Premium over 2020:
The two approaches measure the same reality and, consequently, are close in the long term, although they
represent successive moments in the measurement of the cost of credit risk: non-performing loan flows
(CMN) and coverage of doubtful loans (NIP), respectively. Although they converge in the long term within the
27
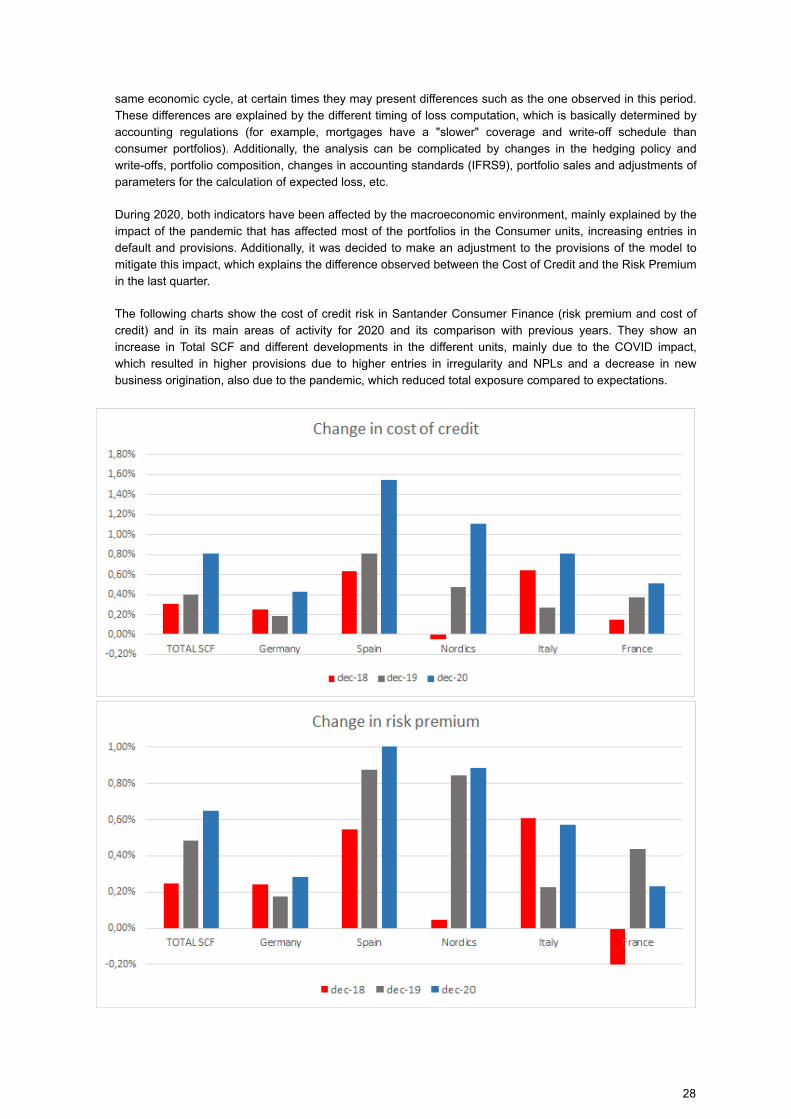
same economic cycle, at certain times they may present differences such as the one observed in this period.
These differences are explained by the different timing of loss computation, which is basically determined by
accounting regulations (for example, mortgages have a "slower" coverage and write-off schedule than
consumer portfolios). Additionally, the analysis can be complicated by changes in the hedging policy and
write-offs, portfolio composition, changes in accounting standards (IFRS9), portfolio sales and adjustments of
parameters for the calculation of expected loss, etc.
During 2020, both indicators have been affected by the macroeconomic environment, mainly explained by the
impact of the pandemic that has affected most of the portfolios in the Consumer units, increasing entries in
default and provisions. Additionally, it was decided to make an adjustment to the provisions of the model to
mitigate this impact, which explains the difference observed between the Cost of Credit and the Risk Premium
in the last quarter.
The following charts show the cost of credit risk in Santander Consumer Finance (risk premium and cost of
credit) and in its main areas of activity for 2020 and its comparison with previous years. They show an
increase in Total SCF and different developments in the different units, mainly due to the COVID impact,
which resulted in higher provisions due to higher entries in irregularity and NPLs and a decrease in new
business origination, also due to the pandemic, which reduced total exposure compared to expectations.
28
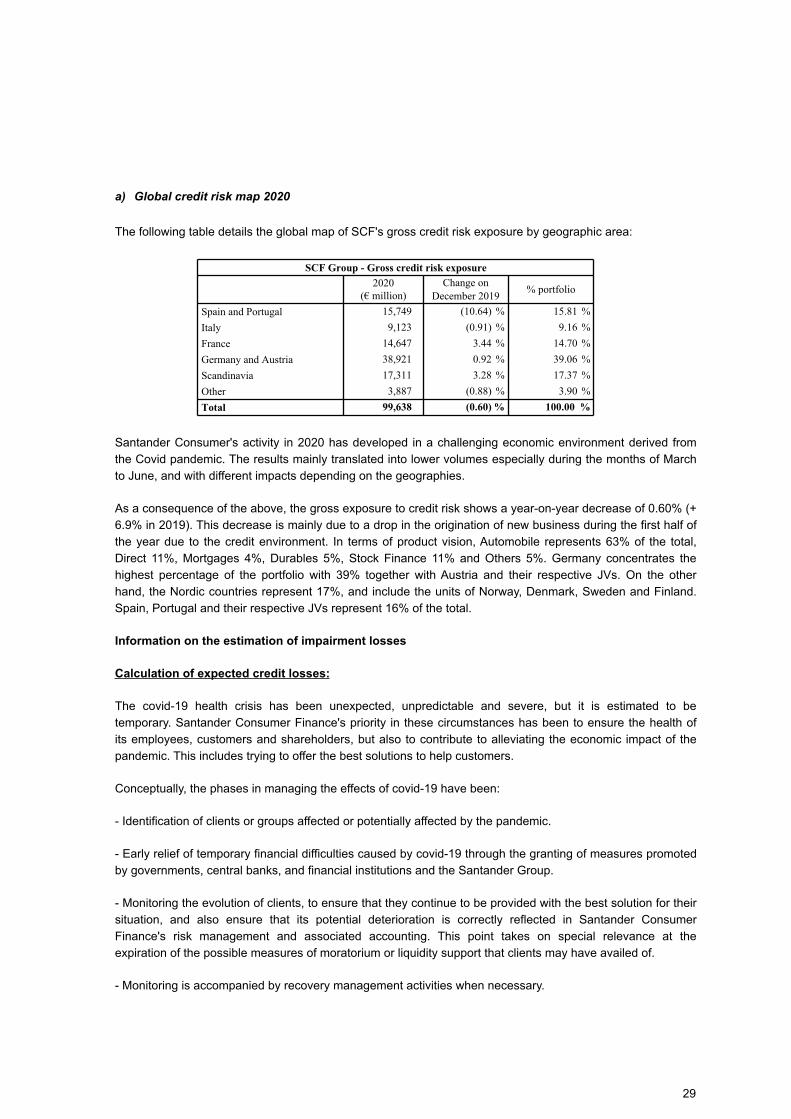
a) Global credit risk map 2020
The following table details the global map of SCF's gross credit risk exposure by geographic area:
SCF Group - Gross credit risk exposure
2020
(€ million)Change on
December 2019% portfolio
Spain and Portugal 15,749 (10.64) % 15.81 %
Italy 9,123 (0.91) % 9.16 %
France 14,647 3.44 % 14.70 %
Germany and Austria 38,921 0.92 % 39.06 %
Scandinavia 17,311 3.28 % 17.37 %
Other 3,887 (0.88) % 3.90 %
Total 99,638 (0.60) % 100.00 %
Santander Consumer's activity in 2020 has developed in a challenging economic environment derived from
the Covid pandemic. The results mainly translated into lower volumes especially during the months of March
to June, and with different impacts depending on the geographies.
As a consequence of the above, the gross exposure to credit risk shows a year-on-year decrease of 0.60% (+
6.9% in 2019). This decrease is mainly due to a drop in the origination of new business during the first half of
the year due to the credit environment. In terms of product vision, Automobile represents 63% of the total,
Direct 11%, Mortgages 4%, Durables 5%, Stock Finance 11% and Others 5%. Germany concentrates the
highest percentage of the portfolio with 39% together with Austria and their respective JVs. On the other
hand, the Nordic countries represent 17%, and include the units of Norway, Denmark, Sweden and Finland.
Spain, Portugal and their respective JVs represent 16% of the total.
Information on the estimation of impairment losses
Calculation of expected credit losses:
The covid-19 health crisis has been unexpected, unpredictable and severe, but it is estimated to be
temporary. Santander Consumer Finance's priority in these circumstances has been to ensure the health of
its employees, customers and shareholders, but also to contribute to alleviating the economic impact of the
pandemic. This includes trying to offer the best solutions to help customers.
Conceptually, the phases in managing the effects of covid-19 have been:
- Identification of clients or groups affected or potentially affected by the pandemic.
- Early relief of temporary financial difficulties caused by covid-19 through the granting of measures promoted
by governments, central banks, and financial institutions and the Santander Group.
- Monitoring the evolution of clients, to ensure that they continue to be provided with the best solution for their
situation, and also ensure that its potential deterioration is correctly reflected in Santander Consumer
Finance's risk management and associated accounting. This point takes on special relevance at the
expiration of the possible measures of moratorium or liquidity support that clients may have availed of.
- Monitoring is accompanied by recovery management activities when necessary.
29

These conceptual phases do not occur sequentially, but overlap in time. Additionally, the continuous
interaction and coordination with all Santander Consumer Finance units is proving to be a fundamental asset
in the management of this crisis. The experience obtained in the fight against the health crisis and its financial
consequences in our different geographies, and the different speeds at which it has been developed in each
one of them, allow us to share the best practices identified and implement in an agile and efficient way. those
specific strategies and actions that have been most successful, always adapted to the local reality of each
market.
Measures to support the economy
In accordance with the aforementioned in relation to alleviating our clients 'temporary financial difficulties
caused by the pandemic, Santander Consumer Finance has adopted measures to promote clients' economic
resilience during the crisis in all geographies. The most prominent include the following:
- Provide liquidity and credit facilities to clients facing difficulties.
- Facilitate grace periods or moratoriums in many of its markets.
- Support clients with possible difficulties being proactive, trying to meet their needs and advising through
specialized teams.
Santander Consumer Finance has implemented measures to provide liquidity and credit facilities in all its
units, in addition to facilitating payment deferrals for individuals and companies experiencing difficulties.
Regarding the specific measures of liquidity, deficiencies or moratoriums, a series of support programs have
been implemented in accordance with the guidelines set by the Santander Group, the regulatory and
supervisory authorities, as well as by governments, central banks and supranational entities. of those markets
in which it operates. The main objective is to mitigate the temporary impact on customer activity. The absence
of the appropriate measures, and of their adequate prudential and accounting treatment, could aggravate the
economic consequences of the crisis, generating pro-cyclical effects that would lengthen its duration and
impact.
The different measures offered can be grouped into the following categories:
- Government liquidity measures: In general terms, these are loan facilities granted by Santander Consumer
Finance units and aimed at clients at the request of government bodies to grant liquidity facilities, although in
the case of these measures in particular, for the consumer case, they have been insignificant.
- Government moratorium measures: In this case, the government authorities define a series of requirements,
which, if satisfied by the beneficiary, entail the granting of moratoriums by the Santander Consumer Finance
unit on the payment of capital and / or interests of the different credit operations that clients may have
contracted. The general expiration of the moratorium measures is short-term. Some governments and
institutions are re-extending the initial terms, especially those that were launched in the very short term in the
initial phases of the pandemic, with less visibility of the potential duration of the crisis, but the re-extensions
are also being short term.
- The specific characteristics of these programs vary depending on their definition by the national
governments of those countries in which Santander Consumer Finance operates. Regarding the criteria
followed for their concession, they also depend on those requirements established by the authorities of each
country in accordance with the legislation in force in each case.
- Internal / sectorial moratorium measures: Broadly speaking, these are the moratoriums granted by
Santander Consumer Finance units on the payment of capital and/or interests of the different credit
operations that customers may have contracted. In this case, the specific characteristics of these measures,
in terms of maturity, amounts, etc. vary according to each geography, product or customer segment in order
to adapt them in the best possible way to the reality of the local market and its regulation as well as to the
30
needs of the customer and the product that they have contracted. In many cases the general conditions of
application have been agreed at sector level through, for example, national associations of credit institutions.
- Other types of internal measures: This category would include all those measures not included in the
previous sections.
With regards to moratoria, 7,667.7 million euros have been formalized, of which 412.9 million euros are
outstanding. The total formalized is divided into:
• 1,961 million Euros originating from government programs.
• 5,706 million Euros originating from non-governmental programs.
Of these totals, in the case of the retail portfolio that represents more than half of the moratoriums, as of
December 31, 2020, 98% of the formalized portfolio had expired and of this percentage, 87% had paid while 7
% had requested a new moratorium and the remaining 6% had been managed by the recovery departments.
Regarding the Wholesale Portfolio, 90.7% of the formalized portfolio had expired and of this 98.7% had paid
and 1.3% had requested a new moratorium.
In the case of the most significant units, in Germany 758 million euros of retail portfolio were formalized, of
which 739 million euros had expired at the end of the year. Of the total expired, 88.2% had paid, 5.3% had
requested an extension and 6.4% were under recovery management. Regarding the wholesale portfolio,
1,460 million euros were formalized, of which all had expired at the end of the year with 100% payment.
In the Nordic countries unit, 1,056 million euros of retail portfolio were formalized, of which 1,053 million euros
had expired at the end of the year. Of the total expired, 86.4% had paid, 5.9% had requested an extension
and 7.7% were under recovery management. The wholesale moratoriums for the Nordic units did not
represent a significant volume (22 million euros formalized and 100% paid at year-end).
Finally, in Spain, 496 million euros of retail portfolio were formalized, of which 476 million euros had expired at
the end of the year. Of the total expired, 73.4% had paid, 6.9% had requested an extension and 19.6% were
under recovery management. The wholesale moratoriums for this unit did not represent a significant volume
(66 million euros formalized, of which 76.4% had been paid and practically the entire remaining percentage
had requested an extension).
The Group estimates impairment losses by calculating the expected loss at 12 months or for the entire life of
the transaction, based on the stage in which each financial asset is classified in accordance with IFRS9.
In the context described in the previous sections, many regulators and supervisors have highlighted the
uncertainties surrounding the economic impacts of the health crisis. This is also evident in the frequent
updates of the macroeconomic forecasts, with different perspectives and visions regarding the depth and
duration of the crisis. Thus, the generalized recommendation (including the IASB, ESMA, EBA and ECB) has
been the mechanistic non-application of the usual techniques for calculating expected losses under IFRS 9, to
avoid that this variability of economic conditions translates into unwanted volatility in the results, with their
potential pro-cyclical effects on the economy.
In this way, Santander Consumer Finance analyzes losses under IFRS 9 according to 3 types of elements:
1. Continuous monitoring of customers
Monitoring the credit quality of clients may be more complex in current circumstances, in the absence of
certain contractual payments on operations subject to moratorium, although the total amount of loans that are
still subject to these measures has been significantly reduced during the year.
31
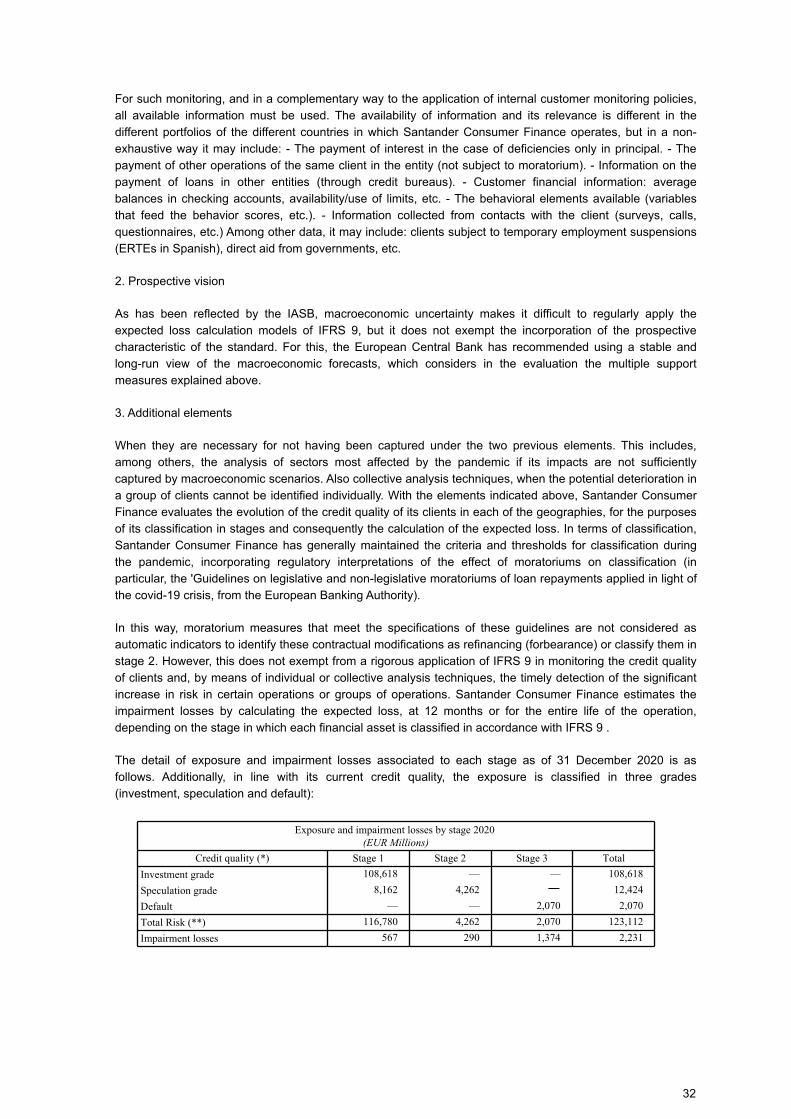
For such monitoring, and in a complementary way to the application of internal customer monitoring policies,
all available information must be used. The availability of information and its relevance is different in the
different portfolios of the different countries in which Santander Consumer Finance operates, but in a non-
exhaustive way it may include: - The payment of interest in the case of deficiencies only in principal. - The
payment of other operations of the same client in the entity (not subject to moratorium). - Information on the
payment of loans in other entities (through credit bureaus). - Customer financial information: average
balances in checking accounts, availability/use of limits, etc. - The behavioral elements available (variables
that feed the behavior scores, etc.). - Information collected from contacts with the client (surveys, calls,
questionnaires, etc.) Among other data, it may include: clients subject to temporary employment suspensions
(ERTEs in Spanish), direct aid from governments, etc.
2. Prospective vision
As has been reflected by the IASB, macroeconomic uncertainty makes it difficult to regularly apply the
expected loss calculation models of IFRS 9, but it does not exempt the incorporation of the prospective
characteristic of the standard. For this, the European Central Bank has recommended using a stable and
long-run view of the macroeconomic forecasts, which considers in the evaluation the multiple support
measures explained above.
3. Additional elements
When they are necessary for not having been captured under the two previous elements. This includes,
among others, the analysis of sectors most affected by the pandemic if its impacts are not sufficiently
captured by macroeconomic scenarios. Also collective analysis techniques, when the potential deterioration in
a group of clients cannot be identified individually. With the elements indicated above, Santander Consumer
Finance evaluates the evolution of the credit quality of its clients in each of the geographies, for the purposes
of its classification in stages and consequently the calculation of the expected loss. In terms of classification,
Santander Consumer Finance has generally maintained the criteria and thresholds for classification during
the pandemic, incorporating regulatory interpretations of the effect of moratoriums on classification (in
particular, the 'Guidelines on legislative and non-legislative moratoriums of loan repayments applied in light of
the covid-19 crisis, from the European Banking Authority).
In this way, moratorium measures that meet the specifications of these guidelines are not considered as
automatic indicators to identify these contractual modifications as refinancing (forbearance) or classify them in
stage 2. However, this does not exempt from a rigorous application of IFRS 9 in monitoring the credit quality
of clients and, by means of individual or collective analysis techniques, the timely detection of the significant
increase in risk in certain operations or groups of operations. Santander Consumer Finance estimates the
impairment losses by calculating the expected loss, at 12 months or for the entire life of the operation,
depending on the stage in which each financial asset is classified in accordance with IFRS 9 .
The detail of exposure and impairment losses associated to each stage as of 31 December 2020 is as
follows. Additionally, in line with its current credit quality, the exposure is classified in three grades
(investment, speculation and default):
Exposure and impairment losses by stage 2020 (EUR Millions)
Credit quality (*) Stage 1 Stage 2 Stage 3 Total
Investment grade 108,618 — — 108,618
Speculation grade 8,162 4,262 — 12,424
Default — — 2,070 2,070
Total Risk (**) 116,780 4,262 2,070 123,112
Impairment losses 567 290 1,374 2,231
32

Exposure and impairment losses by stage 2019
(EUR Millions)
Credit quality (*) Stage 1 Stage 2 Stage 3 Total
Investment grade 109,987 — — 109,897
Speculation grade 9,340 3,545 — 12,885
Default — — 2,012 2,012
Total Risk (**) 119,237 3,545 2,012 124,794
Impairment losses 412 222 1,304 1,938
(*) Detail of credit quality rating calculated for Santander Group management purposes.
(**) Amortised cost assets + Loans and advances - Customers + Loan commitments granted
As of 31 December 2020 and 2019, the Group held no significant amounts in impaired assets purchased with
impairment.
With regards to the evolution of the Group’s provisions for credit risk, monitoring is conducted together with
the main geographies, through sensitivity analyses considering changes in scenarios which impact the
allocation of financial assets across the different stages and the calculation of credit risk provisions. This
analysis consists of simulating variations of +/- 100 bp in the main macroeconomic variables. A set of specific
and complete scenarios is used, where different impacts are simulated that affect both the reference variable
and the rest of the variables. Sensitivity analysis have been carried out in the different units on the most
representative macroeconomic variables of the corresponding models. These impacts may have their origin in
factors of productivity, taxes, wages or exchange rates and interest rates. Sensitivity is measured as the
average variation of the expected loss corresponding to the aforementioned scenarios. Following a
conservative approach, negative movements take into account an additional standard deviation to reflect the
possible greater variability of losses.
Additionally, the Group conducts stress tests and sensitivity analyses in areas such as ICAAP, strategic plans,
budgeting and recovery and resolution plans. These exercises give a forward-looking understanding of each
of the Group's portfolios' sensitivity to deviations from the baseline scenario, factoring in both the
macroeconomic development materialized in different scenarios and the business development in the next
three years. These types of analyses include rather adverse scenarios and those more plausible.
The classification of operations in the different Stages of IFRS9 is carried out in accordance with the risk
management policies of the different Units, which are consistent with the risk management policies developed
by the Group. For the determination of the classification in stage 2, an assessment is made as to whether or
not there is a significant increase in credit risk (SICR) since the initial recognition of the transactions,
considering a series of common principles throughout the Group that ensure that all financial instruments are
subject to this assessment, in which the particularities of each portfolio and type of product are considered on
the basis of various quantitative and qualitative indicators. In addition, operations are subject to the expert
judgment of analysts, which is implemented in accordance with the approved governance.
The judgements and criteria used by the Santander Consumer Finance Group to establish the thresholds are
based on a series of principles and a set of techniques. The principles are as follows:
• Universality: all financial instruments under a credit rating must be evaluated for their possible significant
increase in risk (SICR).
• Proportionality: the definition of the SICR must take into account the particularities of each portfolio.
• Materiality: its implementation must also be consistent with the relevance of each portfolio so as not to
incur unnecessary cost or effort.
• Holistic vision: the selected approach should be a combination of the most relevant aspects of credit risk
(i.e. quantitative and qualitative).
33
• Application of IFRS 9: the approach must consider the characteristics of IFRS 9, focusing on a
comparison with credit risk on initial recognition, in addition to considering forward-looking information.
• Integration of risk management: the criteria must be consistent with those metrics considered in day-to-
day risk management.
• Documentation: adequate documentation must be prepared. The techniques are summarized below:
• Stability of stage 2: in the absence of relevant changes in the credit quality of the portfolios, the volume
of assets in stage 2 should maintain some stability as a whole.
• Economic reasonableness: at the operation level, stage 2 is expected to be a transitory classification for
exposures that could eventually go into a state of credit impairment at some point or stage 3, as well as
for exposures that have suffered credit impairment and whose quality credit is improving.
• Predictive power: the SICR definition is expected to avoid direct migrations from stage 1 to stage 3 as
far as possible without having previously been classified in stage 2.
• Time in stage 2: It is expected that exposures will not remain marked as stage 2 for an excessive time.
The application of several of the previous techniques concludes in the setting of one or more thresholds for
each portfolio in each geography. Likewise, these thresholds are subject to periodic review through calibration
tests, which may lead to updating the types of thresholds or their values.
Covid-19 credit risk management and customer support programs
In the context of Santander Consumer Finance's general response to the covid-19 pandemic, and specifically
in order to help customers from a credit perspective and promote economic resilience during the crisis, they
were launched in addition to the measures indicated above, the following:
• The severity of the effects of the pandemic has differed significantly by sector. For this reason, Santander
Consumer Finance launched a process to identify those who could be most affected in order to correctly
focus credit risk management.
• Due to the covid-19 crisis, the preparation of the recovery management in Santander Consumer Finance as
a whole has become a main focus, with a view to managing the expected impact on their portfolios once the
recovery measures have been completed.
Quantification of additional provisions for covid-19
Numerous international organizations and supervisors have pointed out the importance of responsibly
adapting and applying accounting and prudential policies to the containment measures put in place to combat
the effects of the Covid-19 health crisis, which are temporary and exceptional in nature. Considering these
observations, deviations in local accounting have been taken into account based on stable long-term
macroeconomic forecasts through a subsequent adjustment of the model complemented by a collective and /
or individual evaluation in order to reflect a more realistic situation, specifically to recognize Expected credit
losses for assets that have suffered a significant increase in credit risk (SICR) without the need to identify
which individual financial instruments have suffered such SICR.
The overlay was considered the best option to recognize the expected loss increase, since a mechanical
application of the expected credit loss methodology (ECL) in the current context could have led to unexpected
results. The additional provisions associated with different macroeconomic scenarios have been calculated
using internal models; however, it has been considered as an overlay (adjustment) with respect to the monthly
calculation of IFRS 9 to improve the control and supervision of the accuracy of the estimate of expected credit
losses.
34
Furthermore, the aforementioned scenarios used to calculate the overlay were based on a long-term
approach, in accordance with the indications of numerous international organizations and supervisors.
The objective of the long-term approach is to avoid undesirable volatility of provisions in a context of
maximum uncertainty, which would derive from the sharp decline in economic activity, assessing its
exceptional nature and the complete battery of support measures adopted by central banks and governments
to mitigate a potential structural deterioration of the economy.
Accordingly, at 2020 year-end, the Santander Consumer Group has recorded an additional provision for
impairment of financial assets at amortized cost in non-performing loan provisions of 185.88 million euros due
to the effect of the COVID-19 pandemic (110.55 million euros in stage 1, 35.39 million euros in stage 2 and
39.95 million euros in stage 3).
b. Changes in 2020
The NPL ratio and cost of credit increased throughout 2020 versus 2019 due to lower new business
origination, increased irregularity and higher NPL entries resulting from the COVID impact on the various unit
portfolios. Additionally, provisions and cost of credit were impacted due to the fact that the Group's entities
booked a provision in 2020 in the form of an additional adjustment to the IFRS9 impairment models to reflect
the impact of the change in macroeconomic scenarios due to the COVID-19 crisis. These provisions were
made in all Santander Consumer Finance units in accordance with ECB recommendations and aligned with
Santander Group's corporate criteria.
The increase in the NPL ratio occurred in most countries, mainly in the Used Cars, Durables and Credit Cards
portfolios. As for COVID19, one of the priorities to reduce its impact and in accordance with corporate
guidelines has been to establish payment moratoriums to help customers with financial difficulties in those
cases in which they meet the credit requirements related to this event and do not carry over previous
structural problems.
Forborne loan portfolio
The term “forborne loan portfolio” refers, for the purposes of the Group's risk management, to those
transactions in which the customer has, or might foreseeably have, financial difficulty in meeting its payment
obligations under the terms and conditions of the current agreement and, accordingly, the agreement has
been modified or cancelled or even a new transaction has been entered into.
The Santander Group, which Santander Consumer Finance Group belongs to, has a detailed customer debt
forbearance policy that serves as a reference for the various local adaptations made for all the financial
institutions forming part of the Group. This policy shares the principles laid down in both Bank of Spain
Circular 4/2017 of 27 November 2017, which it develops in greater detail based on the level of customer
impairment.
This policy establishes strict prudential criteria for the assessment of these loans:
– The use of this practice is restricted, and any actions that might defer the recognition of impairment
must be avoided.
– The main aim must be to recover the amounts owed, and any amounts deemed unrecoverable must
be recognised as soon as possible.
– Forbearance must always envisage maintaining the existing guarantees and, if possible, enhance
them. Not only can effective guarantees serve to mitigate losses given default, but they might also
reduce the probability of default.
– This practice must not give rise to the granting of additional funding or be used to refinance debt of
other entities or as a cross-selling instrument.
35
– All the alternatives to forbearance and their impacts must be assessed, making sure that the results of
this practice will exceed those which would foreseeably be obtained if it were not performed.
– Forborne transactions are classified using more stringent criteria which prudentially ensure that the
customer's ability to pay is restored from the date of forbearance and for an adequate period of time
thereafter.
– In addition, in the case of customers that have been assigned a risk analyst, it is particularly important
to conduct an individual analysis of each specific case, for both the proper identification of the
transaction and its subsequent classification, monitoring and adequate provisioning.
The forbearance policy also sets out various criteria for determining the scope of transactions qualifying as
forborne exposures by defining a detailed series of objective indicators that permit identification of situations
of financial difficulty.
Accordingly, transactions not classified as non-performing at the date of forbearance are generally considered
to be experiencing financial difficulty if at that date, they were more than one month past due. Where no
payments have been missed or there are no payments more than one month past due, other indicators of
financial difficulty are taken into account, including most notably the following:
– Transactions with customers who are already experiencing difficulties in other transactions.
– Situations where a transaction has to be modified prematurely, and the Group has not yet had a
previous satisfactory experience with the customer.
– Cases in which the necessary modifications entail the grant of special conditions, such as the
establishment of a grace period, or where these new conditions are deemed to be more favourable for
the customer than those which would have been granted for an ordinary loan approval.
– Where a customer submits successive loan modification requests at unreasonable time intervals.
– In any case, if once the modification has been made any payment irregularity arises during a given
probation period (as evidenced by back testing), even in the absence of any other symptoms, the
transaction will be deemed to be within the scope of forborne exposures.
Once it has been determined that the reasons for the modification of the customer’s debt conditions are due
to financial difficulties, regardless of whether or not the customer has outstanding payments and the number
of days payment has been outstanding, and the customer will be considered to be under monitoring for all
purposes and, as such, will be manages in accordance with this policy.
Once forbearance measures have been adopted, transactions that have to remain classified as non-
performing because at the date of forbearance they do not meet the regulatory requirements to be reclassified
to a different category must comply with a continuous prudential payment schedule in order to assure
reasonable certainty as to the recovery of the ability to pay.
If there is any (non-technical) default in payments during that period, the aforementioned payment schedule
starts again.
On successful completion of the period, the duration of which depends on the customer's situation and the
transaction features (term and guarantees provided), the transaction is no longer considered to be non-
performing, although it continues to be subject to a probation period during which it undergoes special
monitoring.
This monitoring continues until a series of requirements have been met, including most notably: a minimum
observation period of 24 months; repayment of a substantial percentage of the outstanding amounts; and
settlement of the amounts that were past due at the time of forbearance.
36
When forbearance is applied to a transaction classified as non-performing, the original default dates continue
to be considered for all purposes, irrespective of whether as a result of forbearance the transaction becomes
current in its payments. Also, the forbearance of a transaction classified as non-performing does not give rise
to any release of the related provisions.
Set forth below is the quantitative information required by Bank of Spain Circular 4/2017 on the restructured
transactions in force at 31 December 2020 and 2019, taking into consideration the above criteria:
c) Measurement metrics and tools
Credit rating tools
Following the Santander Group tradition, which used its own rating models since 1993, at Santander
Consumer Finance Group the credit quality of customers and transactions is also measured by internal
scoring and rating systems. Each credit rating assigned by models relates to a certain probability of default
or non-payment, based on the Group’s historical experience.
Since the Group focuses mainly on the retail business, assessments are based primarily on scoring models
or tables which, combined with other credit policy rules, issue an automatic decision on the loan
applications received. These tools have the dual advantage of allocating an objective valuation of the level
of risk and improve the response time that would be required for a purely manual analysis.
In addition to the scoring models used for the approval and management of portfolios (rating of the
transactions composing the portfolios in order to assess their credit quality and estimate their potential
losses), other tools are available to assess existing accounts and customers which are used in the defaulted
loan recovery process. The intention is to cover the entire “loan cycle” (approval, monitoring and recovery)
by means of statistical rating models based on the Bank’s internal historical data.
Regarding corporates and institutions, which at the Group include mainly dealers/retailers, the assessment
of the level of credit risk is based on expert rating models that combine in the form of variables regarding
the most relevant factors to be taken into account in the assessment, in such a way that the rating process
generates consistent valuations, which are comparable among customers and summarise all the relevant
information. In 2020 all the units conducted reviews of the aforementioned portfolios, involving the
participation of all areas of the Group. In those meetings, the largest exposures, companies under special
surveillance and the main credit indicators of these portfolios were included.
Ratings assigned to customers are reviewed periodically to include any new financial information available
and the experience relationship with the bank. The frequency of the reviews is increased in the case of
customers that reach certain levels in the automatic warning systems and of customers classified as
requiring special monitoring. The rating tools themselves are also reviewed in order to progressively fine-
tune the ratings they provide.
To a lesser extent, certain exposures are also assessed using the global rating tools which cover the global
wholesale banking segment. Management of this segment is centralised at the Risk Division of the
Santander Group, for both rating calculation and risk monitoring purposes. These tools assign a rating to
each customer, which is obtained from a quantitative or automatic module, based on balance sheet ratios or
macroeconomic variables, supplemented by the analyst’s expert judgement.
The Group’s portfolio of individualised corporates is scarcely representative of the total risks managed,
since it relates mainly to vehicle dealer stock financing.
d) Credit risk parameters
The assessment of customers or transactions using rating or scoring systems constitutes a judgement of
their credit quality, which is quantified through the probability of default (PD).
37
In addition to customer assessment, the quantification of credit risk requires the estimation of other
parameters, such as exposure at default (EAD) and the percentage of EAD that will not be recovered (loss
given default or LGD). Therefore, other relevant aspects are taken into account in estimating the risk
involved in transactions, such as the quantification of off-balance-sheet exposures, which depends on the
type of product, or the analysis of expected recoveries, which is related to the guarantees provided and
other characteristics of the transaction: type of product, term, etc.
These factors are the main credit risk parameters. Their combination facilitates calculation of the probable
loss or expected loss (EL). This loss is considered to be an additional cost of the activity which is reflected
in the risk premium and must be charged in the transaction price.
These risk parameters also make it possible to calculate regulatory capital in accordance with the
regulations deriving from the new Basel Capital Accord (BIS III). Regulatory capital is determined as the
difference between unexpected loss and expected loss.
Unexpected loss is the basis for the capital calculation and refers to a very high, albeit scantly probable,
level of loss, which is not deemed to be recurring and must be catered to using capital.
Observed loss: measurement of cost of credit
To complement the predictive aspects provided by the advanced models described above, other commonly
used metrics are used to facilitate prudent and effective management of credit risk based on observed loss.
In terms of recognition of losses, the cost of credit risk in Santander Consumer Finance is measured using
different approaches: Change in non-performing loans (new defaults – cures – recovery of assets written
off), net loan-loss provisions (gross provisions - recovery of assets written off), net losses (failures -
recovery of losses) and expected loss. In order to obtain a monitoring ratio, the first two indicators (in 12
months) are divided by the average of 12 months of the total portfolio to obtain the risk premium and the
cost of credit. These give the manager a full insight into the evolution and future prospects of the portfolio.
It should be noted that unlike default, change in non-performing loans (end-non-performing - initial non-
performing + written-off - recovery of write-offs) refers to the total of the impaired portfolio in a period,
regardless of the situation in which it is found (non-performing and written off). This makes metrics a main
driver when it comes to establishing measures for portfolio.
The two approaches measure the same reality and, consequently, converge in the long term although they
represent successive moments in credit risk cost measurement: flows of non-performing loans (VMG),
coverage of non-performing loans (net credit loss provisions), respectively. Although they converge in the
long term within the same economic cycle, the three approaches show differences at certain times, which
are particularly significant at the start of a change of cycle, as observed in this period. These differences are
explained by the different moment of calculation of losses, which is basically determined by accounting
regulations (for example, mortgage loans have a coverage calendar and becomes written off “slower” than
consumer portfolios). In addition, the analysis can be clouded by changes in the policy of hedging and
default, composition of the portfolio, doubtful of acquired entities, changes in accounting regulations
(IFRS-9), sale of portfolios and adjustments on expected losses calculation parameters, etc.
Credit risk cycle
The credit risk management process consists of identifying, measuring analysing, controlling, negotiating
and deciding on the risks incurred in the Group’s operations. This process involves the areas that take risks,
senior management and the Risk function.
As the Group is a member of the Santander Group, the process starts with senior management, through the
board of directors and the executive risk committee, which set the risk policies and procedures, the limits
and delegation of powers, and approve and supervise the framework for action by the risk function.
38
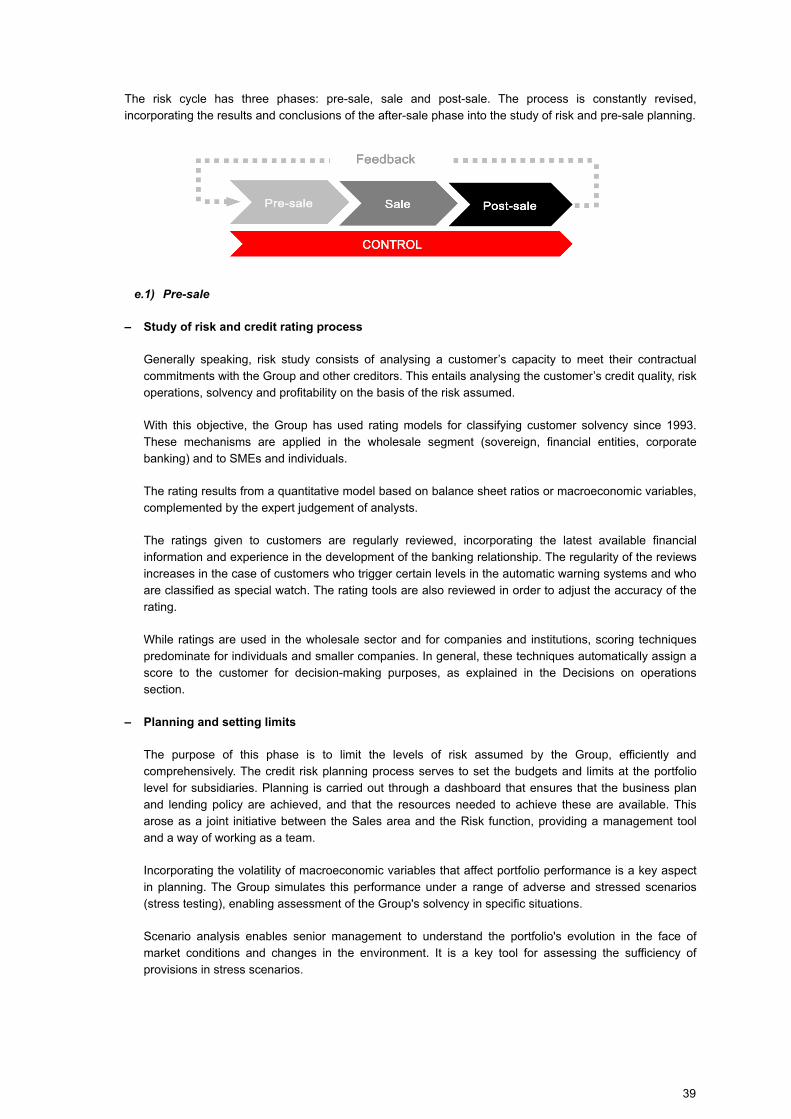
The risk cycle has three phases: pre-sale, sale and post-sale. The process is constantly revised,
incorporating the results and conclusions of the after-sale phase into the study of risk and pre-sale planning.
e.1) Pre-sale
– Study of risk and credit rating process
Generally speaking, risk study consists of analysing a customer’s capacity to meet their contractual
commitments with the Group and other creditors. This entails analysing the customer’s credit quality, risk
operations, solvency and profitability on the basis of the risk assumed.
With this objective, the Group has used rating models for classifying customer solvency since 1993.
These mechanisms are applied in the wholesale segment (sovereign, financial entities, corporate
banking) and to SMEs and individuals.
The rating results from a quantitative model based on balance sheet ratios or macroeconomic variables,
complemented by the expert judgement of analysts.
The ratings given to customers are regularly reviewed, incorporating the latest available financial
information and experience in the development of the banking relationship. The regularity of the reviews
increases in the case of customers who trigger certain levels in the automatic warning systems and who
are classified as special watch. The rating tools are also reviewed in order to adjust the accuracy of the
rating.
While ratings are used in the wholesale sector and for companies and institutions, scoring techniques
predominate for individuals and smaller companies. In general, these techniques automatically assign a
score to the customer for decision-making purposes, as explained in the Decisions on operations
section.
– Planning and setting limits
The purpose of this phase is to limit the levels of risk assumed by the Group, efficiently and
comprehensively. The credit risk planning process serves to set the budgets and limits at the portfolio
level for subsidiaries. Planning is carried out through a dashboard that ensures that the business plan
and lending policy are achieved, and that the resources needed to achieve these are available. This
arose as a joint initiative between the Sales area and the Risk function, providing a management tool
and a way of working as a team.
Incorporating the volatility of macroeconomic variables that affect portfolio performance is a key aspect
in planning. The Group simulates this performance under a range of adverse and stressed scenarios
(stress testing), enabling assessment of the Group's solvency in specific situations.
Scenario analysis enables senior management to understand the portfolio's evolution in the face of
market conditions and changes in the environment. It is a key tool for assessing the sufficiency of
provisions in stress scenarios.
39
Limits are planned and established using documents agreed between the Business and Risk areas and
approved by the Group, setting out the expected business results in terms of risk and return, the limits to
which this activity is subject and management of the associated risks, by group or customer.
e.2) Sales
– Decisions on operations
The sales phase consists of the decision-making process, analysing and deciding on operations.
Approval by the risk area is a prior requirement before the contracting of any risk. This process must
take into account the policies defined for approving operations, the risk appetite and the elements of the
operation that are relevant to the search for the right balance between risk and profitability.
In the sphere of standardised customers (individuals and businesses and SMEs with low turnover), large
volumes of credit operations can be managed more easily by using automatic decision models for
classifying the customer/transaction pair. The ratings these models give to transactions enable lending
to be classified consistently into homogeneous risk groups, based on information on the characteristics
of the transaction and its owner.
e.3) After-sales
– Monitoring
The Monitoring function is based on a continuous process of ongoing observation, enabling early
detection of changes that could affect the credit quality of customers, in order to take measures to
correct deviations with a negative impact.
This monitoring is based on customer segmentation, and is carried out by dedicated local and global risk
teams, supplemented by internal audit.
This function involves identifying and tracking customers under special surveillance, reviewing ratings
and continuously monitoring indicators.
The customers under special surveillance (FEVE) system has four tiers based on the degree of
concern about observed circumstances (terminate, secure, reduce, monitor). The inclusion of a position
in FEVE does not mean that default has occurred, but does indicate that it would be advisable to adopt
a specific policy for that position, establishing the person responsible for it and the appropriate time
frame. Customers classified in FEVE are reviewed at least every six months, and every quarter in the
most serious cases. The Monitoring Function is based on a process of continuous observation, which
allows for the early detection of variations that may occur in the credit quality of customers in order to
take actions aimed at correcting deviations that may have a negative impact.
Monitoring is based on customer segmentation, and is carried out by dedicated local and global risk
teams, complemented by internal audit work.
The function includes, among other tasks, the identification, monitoring and assignment of policies at
customer level to anticipate surprises and manage them in the most appropriate way for their situation,
credit policies, rating reviews and continuous monitoring of indicators.
The system called Santander Customer Assessment Notes (SCAN) distinguishes between four levels
depending on the level of concern of the circumstances observed (Specialized Follow-up, Intensive
Follow-up, Ordinary Follow-up, Do Not Attend). The inclusion of a position in SCAN does not imply that
non-compliance has been recorded, but rather the convenience of adopting a specific policy with the
same, determining the person responsible and the time frame in which it must be carried out. SCAN-
qualified clients are reviewed at least semi-annually, being such review quarterly and/or monthly for the
most serious grades. The ways in which a firm qualifies in SCAN are the monitoring work itself, the
40
review carried out by the internal audit, the decision of the commercial manager who oversees the firm
or the entry into operation of the established system of automatic alarms.
Ratings are reviewed at least every year, but this may be more frequent if weaknesses are detected or
based on the rating itself.
The main risk indicators for individual customers, businesses and SMEs with low turnover are monitored
to detect changes in the performance of the loan portfolio with respect to the projections in the
commercial strategic plans (CSPs).
f) Measurement and control
In addition to monitoring the customers' credit quality, the Group puts in place the necessary control
procedures to analyse the current credit risk portfolio and its performance throughout the different
stages of credit risk.
This function assesses risks from a range of interrelated standpoints. The key vectors of control are
geographies, business areas, management models, products, etc. The approach allows for early
detection of specific focal points, and the framing of action plans to correct any impairment.
Each control axis supports two types of analysis:
a. Quantitative and qualitative portfolio analysis
Portfolio analysis continuously and systematically monitors changes in risk with respect to budgets,
limits and benchmark standards, evaluating the effects with a view to future situations driven by external
factors or arising from strategic decisions, so as to establish measures that place the profile and volume
of the risk portfolio within the parameters set by Santander Consumer Finance.
In the credit risk control phase, the following metrics, among others, are used in addition to the
conventional ones:
a. MDV (change in managed NPLs)
MDV measures how NPLs change over a period, stripping out write-offs and including recoveries. It
is an aggregate metric at the portfolio level that enables us to react to any impairments seen in the
behaviour of non-performing loans.
b. EL (expected loss) and capital
Expected loss is an estimate of the financial loss that will occur over the next year from the portfolio
existing at the given time. It is a further cost of business, and must be reflected in the pricing of
transactions.
c. Evaluation of control processes
A systematic scheduled review of procedures and methods, implemented throughout the entire credit
risk cycle, to ensure control process effectiveness and validity.
In 2006, within the corporate framework established across the Group for compliance with the
Sarbanes-Oxley Act, a corporate methodology was created for the documentation and certification of the
Control Model, specified in terms of tasks, operating risks and controls. The risk division annually
evaluates the efficiency of internal control of its activities.
Moreover, the internal validation function, as part of its mission to supervise the quality of the Group's
risk management, ensures that the management and control systems for the different risks inherent in
the Group's business comply with the most stringent criteria and best practices seen in the industry and/
41
or required by regulators. In addition, internal audit is responsible for ensuring that policies, methods and
procedures are adequate, effectively implemented and regularly reviewed.
g) Recoveries management
Recovery activity is an important function within the Group's risk management area. The area
responsible is Collection and Recoveries, which frames a global strategy and a comprehensive
approach to recovery management.
The Group combines a global model with local execution, taking account of the specific features of the
business in each area.
The main objective of the recovery activity is to recover outstanding debts and obligations by managing
our customers, thus contributing to a lesser need for provisions and a lower cost of risk.
The specific targets of the recovery process are guided as follows:
a. Achieve collection or regularisation of outstanding balances, so that an account returns to its normal
state; if this is not possible, the objective is total or partial recovery of debts, whatever their
accounting or management status.
b. Maintain and strengthen our relationship with the customer by addressing their behaviour with an
offer of management tools, such as refinancing products according to their needs, consistently with
careful corporate policies of approval and control, as established by the risk areas.
In the recovery activity, Standardised customers and Individually Managed customers are segmented or
differentiated with specific and comprehensive management models in each case, according to basic
specialisation criteria.
Management is articulated through a multichannel customer relationship strategy. The telephone
channel is oriented towards standardised management, with a focus on achieving contact with
customers and monitoring payment agreements, prioritising and adapting management actions based
on the state of progress of their situation of "in arrears", "doubtful" or "in default", their balance sheet and
their payment commitments.
The commercial network of recovery management operates alongside the telephone channel. It is a
means of developing a closer relationship with selected customers, and is composed of teams of agents
with a highly commercial focus, specific training and strong negotiation skills. They conduct personalised
management of their own portfolios of high-impact customers (large balance sheets, special products,
customers requiring special management).
Recovery activities at advanced stages of non-performance are guided by a dual judicial and extra
judicial management approach. Commercial and follow-up activities by telephone and via agent
networks are continued, applying strategies and practices specific to the state of progress.
The management model encourages proactivity and targeted management through continuous recovery
campaigns with specific approaches for customer groups and non-performance states, acting with
predefined goals through specific strategies and intensive activities via appropriate channels within
limited time frames.
Suitable local production and analysis of daily and monthly management information, aligned with
corporate models, have been defined as the basis of business intelligence for ongoing decision-making
for management guidance and results monitoring.
42
III. Market, structural and liquidity risk
a. Scope and definitions
The measurement, control and monitoring scope of the Market Risk function encompasses operations where
an asset risk is accepted because of changes in market factors.
Such risks are generated through two types of basic activities:
– Trading, which includes both the rendering of financial services on markets for clients, where the bank
is the counterparty, and proprietary sales, purchases and positioning, mainly in fixed income, equities
and foreign currency products.
Santander Consumer Finance does not carry out trading, as its treasury activity is limited to
management and hedging of the structural risk of its balance sheet, and to management of liquidity as
needed to fund its business.
– Balance sheet management or ALM, which involves management of inherent risks in the entity's
balance sheet, not including the trading portfolio.
The risks generated in these activities are:
– Trading market: Risk resulting from the possibility of changes in market factors affecting the value of
positions held by the entity in its trading book.
– Structural: Risk arising from management of different balance sheet items. This risk includes both
losses owing to price variations affecting available-for-sale and held-to-maturity portfolios (banking
book), and losses arising from the management of the Group’s assets and liabilities measured at
amortised cost.
– Liquidity: Risk of payment obligations not being met on a timely basis or being met at an excessive
cost. The types of losses that this risk triggers include losses on the forced selling of assets or impacts
on the margin because of the mismatch of forecast cash outflows and inflows.
Trading market and structural risks, depending on the market variable that triggers them, may be classified
as:
– Interest rate risk: Identifies the possibility that interest rate variations may have a negative impact on
the value of a financial instrument, a portfolio or the Group as a whole.
– Credit spread risk: Identifies the possibility that variations in credit risk curves associated with issues
and specific types of debt may have an adverse effect on a financial instrument, a portfolio or the
Group as a whole. The spread is a differential between financial instruments listed at a margin over
other benchmark instruments, basically the Internal Rate of Return (IRR) of government securities and
interbank interest rates.
– Exchange rate risk: Identifies the possibility that variations in the value of a position in a currency other
than the base currency can have an adverse effect on the value of a financial instrument, a portfolio or
the Group as a whole.
– Inflation risk: This identifies the possibility that changes in inflation rates could adversely affect the
value of a financial instrument, a portfolio or the Group as a whole.
– Volatility risk: Identifies the possibility that variations in the listed volatility of market variables may have
an adverse effect on the value of a financial instrument, a portfolio or the Group as a whole.
43
– Market liquidity risk: Identifies the possibility that an entity or Group as a whole is unable to unwind or
close a position on a timely basis without impacting the market price or transaction cost.
– Risk of early payment or cancellation: Identifies the possibility of early cancellation without negotiation
on operations where the contractual relationship so allows explicitly or implicitly, generating cash flows
that should be reinvested at a potentially lower interest rate.
There are other variables that only impact trading market risk (and not structural risk), meaning that market
risk can also be classified as follows:
– Equity risk: Identifies the possibility that changes in the value of prices or dividend expectations from
equity instruments can have an adverse effect on the value of a financial instrument, a portfolio or the
Group as a whole.
– Commodity price risk: Identifies the possibility that changes in commodity prices may have an adverse
effect on the value of a financial instrument, a portfolio or the Group as a whole.
– Correlation risk: Identifies the possibility that changes in the correlation between variables, either of
the same or a different type, listed in the market, could adversely affect the value of a financial
instrument, a portfolio or the Group as a whole.
– Underwriting risk: Identifies the possibility that placement targets for securities or other types of debt
are not reached when the entity participates in underwriting them.
Liquidity risk may also be classified in the following categories:
– Funding risk: Identifies the possibility that the entity is unable to meet its obligations owing to its
inability to sell assets or secure funding.
– Mismatch risk: Identifies the possibility that differences between the maturity structures of assets and
liabilities will generate an additional cost to the entity.
– Contingency risk: Identifies the possibility that adequate management levers will be unavailable to
raise liquidity as a result of an outlier event that entails greater funding needs or more strict collateral
requirements to raise funds.
b. Measurement and methods
2.1. Structural interest-rate risk
The Group analyses the sensitivity of net interest income and of equity to interest rate fluctuations. This
sensitivity is determined by mismatches in the maturity and review dates of interest rates of different balance
sheet items.
According to the interest rate positioning of the balance sheet, and considering the situation and perspectives
of the market, financial measures are adopted to adjust the positioning to that sought by the Bank. These
measures may range from taking up positions in markets to the specification of interest rate characteristics of
commercial products.
The metrics used to control de interest rate risk in these activities are the interest rate gap, financial margin
sensibility and equity in the levels of interest rate.
– Interest rate gap
Analysis of the interest rate gap deals with the mismatch between the timing of re-pricing of on and off-
balance aggregates of assets and liabilities and of memorandum accounts (off-balance sheet). It provides a
44
basic profile of the balance sheet structure and can detect concentrations of interest rate risk at different
terms. It is also a useful tool for estimates of the potential impact of interest rate movements on net interest
income and the equity of the entity.
All on- and off-balance sheet aggregates have to be broken down so that they can be placed in the point of
repricing/maturity. For aggregates that do not have a contractual maturity, the Santander Group's internal
model for analysis and estimation of their durations and sensitivity is used.
– Sensitivity of Net Interest Income (NII)
The sensitivity of net interest income measures the change in expected accruals for a certain period (12
months) in the event of a shift in the interest rate curve.
– Sensitivity of Economic Value of Equity (EVE)
This measures the implied interest rate risk in the economic value of equity which, for the purposes of interest
rate risk, is defined as the difference between the net present value of assets minus the net present value of
liabilities, based on the effect of a change in interest rates on such present values.
2.2. Liquidity risk
Management of structural liquidity aims to fund the recurring activity of the Santander Consumer Finance
Group in optimal conditions of term and cost, while avoiding undesired liquidity risks.
The measures used for the control of liquidity risk are the liquidity gap, liquidity ratios, the statement of
structural liquidity, liquidity stress tests, the financial plan, the liquidity contingency plan and regulatory
reporting.
– Liquidity gap
The liquidity gap provides information on contractual and expected cash inflows and outflows for a given
period in each of the currencies in which the Santander Consumer Finance Group operates. The gap
measures the net cash needed or the surplus at a given date and reflects the liquidity level maintained under
normal market conditions.
In the contractual liquidity gap, all balance sheet items that generate cash flows are analysed and placed at
their point of contractual maturity. For assets and liabilities with no contractual maturity, the Santander
Group's internal analysis model is used. It is based on a statistical study of products' time series, and the so-
called stable and unstable balance is determined for liquidity purposes.
– Liquidity ratios
The minimum liquidity ratio compares liquid assets available for sale or transfer (after the relevant discounts
and adjustments have been applied) and assets at less than twelve months with liabilities of up to twelve
months.
The Net Stable Funding Ratio measures the extent to which assets that require structural funding are being
funded by structural liabilities.
– Structural Liquidity
The purpose of this analysis is to determine the structural liquidity position according to the liquidity profile
(greater or lesser stability) of different asset and liability instruments.
45
– Liquidity stress tests
The purpose of the liquidity stress tests conducted by the Santander Consumer Finance Group is to
determine the impact of a severe, but plausible, liquidity crisis. In such stress scenarios, a simulation is made
of internal factors that may affect Group liquidity, such as, inter alia, a credit rating downgrade of the
institution, a fall in the value of balance sheet assets, banking crises, regulatory factors, a change in
consumer trends and/or a loss of depositor confidence.
Every month, four liquidity stress scenarios (banking crisis in Spain, idiosyncratic crisis at the Santander
Consumer Finance Group, global crisis and a combined scenario) are simulated by stressing these factors,
and the results are used to establish early warning levels.
– Financial plan
Every year, a liquidity plan is prepared based on the funding needs arising from the business budgets of all
the Group's subsidiaries. Based on these liquidity requirements, an analysis is made of limits on new
securitisation considering eligible assets available, in addition to potential growth in customer deposits. This
information is used to establish an issue and securitisation plan for the year. Throughout the year, regular
monitoring is carried out of actual trends in funding requirements, thus giving rise to the revisions of the plan.
– Contingency Funding Plan
The purpose of the Liquidity Contingency Plan is to set out the processes (governance structure) to be
followed in the event of a potential or real liquidity crisis, as well as the analysis of contingency actions or
levers available to Management should such a situation arise.
The Liquidity Contingency Plan is underpinned by, and must be designed in line with, two key elements:
liquidity stress tests and the early warning indicator (EWI) system. Stress tests and different scenarios are
used as the basis for analysing available contingency actions and for determining such actions are sufficient.
The EWI system monitors and potentially triggers the escalation mechanism for activating the plan and
subsequently monitoring the situation.
– Regulatory reporting
Santander Consumer Finance applies the Liquidity Coverage Ratio (LCR) as required by the European
Banking Authority (EBA) for the consolidated sub-group on a monthly basis, and the net stable funding ratio
(NSFR) on a quarterly basis.
In addition, Santander Consumer Finance has produced an annual Internal Liquidity Adequacy and
Assessment Process (ILAAP) report as part of the consolidated document of the Santander Group, although
the supervisor does not require this report at sub-group level.
2.3. Structural change risk
Structural change risk is managed centrally, as part of the general corporate procedures of the Santander
Group.
c. Limits
Limits are set for balance sheet structural risks as part of the framework of the annual limits plan, responding
to the Santander Consumer Finance Group’s risk appetite.
The limit structure involves a process that considers:
– Efficient and comprehensive identification and delimitation of the main types of market risk incurred,
consistently with the management of the business and the strategy defined.
46
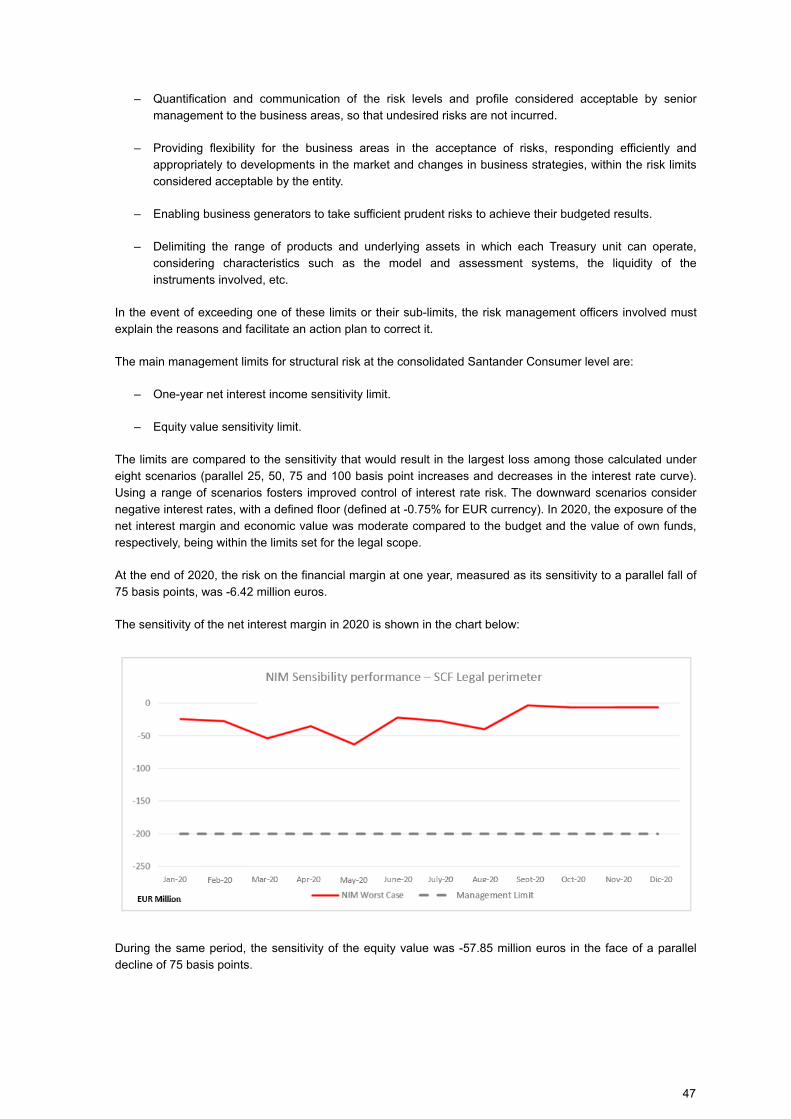
– Quantification and communication of the risk levels and profile considered acceptable by senior
management to the business areas, so that undesired risks are not incurred.
– Providing flexibility for the business areas in the acceptance of risks, responding efficiently and
appropriately to developments in the market and changes in business strategies, within the risk limits
considered acceptable by the entity.
– Enabling business generators to take sufficient prudent risks to achieve their budgeted results.
– Delimiting the range of products and underlying assets in which each Treasury unit can operate,
considering characteristics such as the model and assessment systems, the liquidity of the
instruments involved, etc.
In the event of exceeding one of these limits or their sub-limits, the risk management officers involved must
explain the reasons and facilitate an action plan to correct it.
The main management limits for structural risk at the consolidated Santander Consumer level are:
– One-year net interest income sensitivity limit.
– Equity value sensitivity limit.
The limits are compared to the sensitivity that would result in the largest loss among those calculated under
eight scenarios (parallel 25, 50, 75 and 100 basis point increases and decreases in the interest rate curve).
Using a range of scenarios fosters improved control of interest rate risk. The downward scenarios consider
negative interest rates, with a defined floor (defined at -0.75% for EUR currency). In 2020, the exposure of the
net interest margin and economic value was moderate compared to the budget and the value of own funds,
respectively, being within the limits set for the legal scope.
At the end of 2020, the risk on the financial margin at one year, measured as its sensitivity to a parallel fall of
75 basis points, was -6.42 million euros.
The sensitivity of the net interest margin in 2020 is shown in the chart below:
During the same period, the sensitivity of the equity value was -57.85 million euros in the face of a parallel
decline of 75 basis points.
47
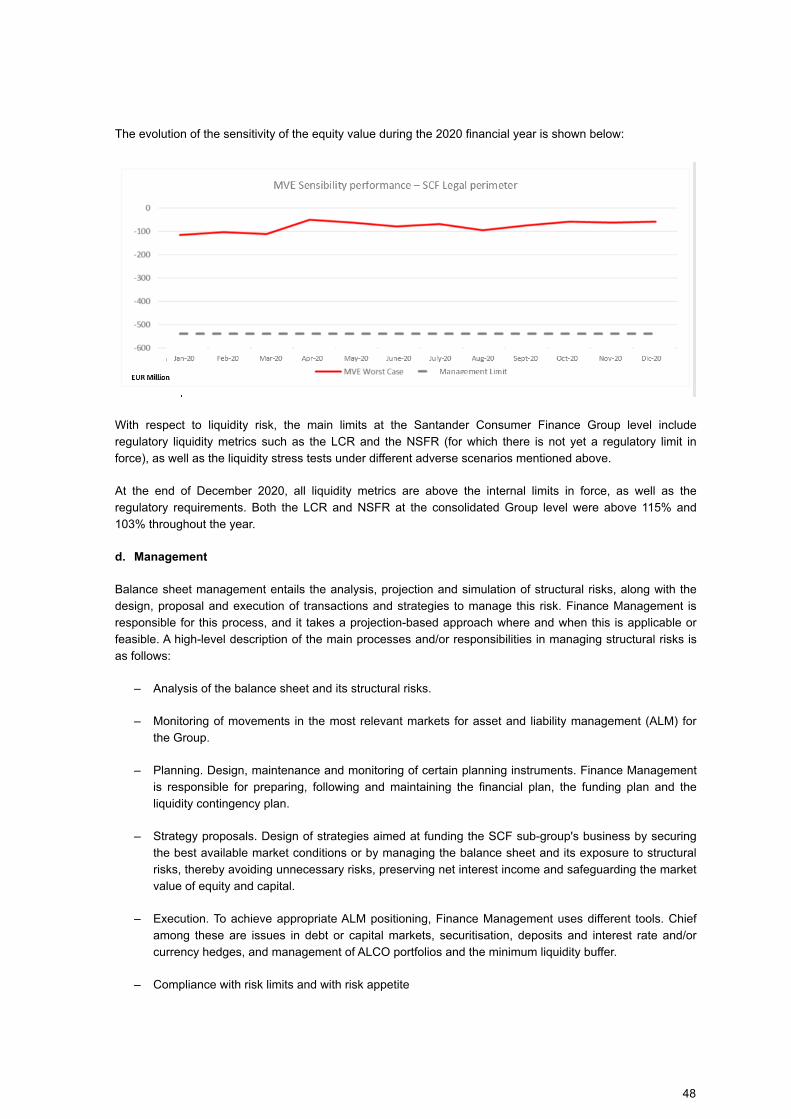
The evolution of the sensitivity of the equity value during the 2020 financial year is shown below:
With respect to liquidity risk, the main limits at the Santander Consumer Finance Group level include
regulatory liquidity metrics such as the LCR and the NSFR (for which there is not yet a regulatory limit in
force), as well as the liquidity stress tests under different adverse scenarios mentioned above.
At the end of December 2020, all liquidity metrics are above the internal limits in force, as well as the
regulatory requirements. Both the LCR and NSFR at the consolidated Group level were above 115% and
103% throughout the year.
d. Management
Balance sheet management entails the analysis, projection and simulation of structural risks, along with the
design, proposal and execution of transactions and strategies to manage this risk. Finance Management is
responsible for this process, and it takes a projection-based approach where and when this is applicable or
feasible. A high-level description of the main processes and/or responsibilities in managing structural risks is
as follows:
– Analysis of the balance sheet and its structural risks.
– Monitoring of movements in the most relevant markets for asset and liability management (ALM) for
the Group.
– Planning. Design, maintenance and monitoring of certain planning instruments. Finance Management
is responsible for preparing, following and maintaining the financial plan, the funding plan and the
liquidity contingency plan.
– Strategy proposals. Design of strategies aimed at funding the SCF sub-group's business by securing
the best available market conditions or by managing the balance sheet and its exposure to structural
risks, thereby avoiding unnecessary risks, preserving net interest income and safeguarding the market
value of equity and capital.
– Execution. To achieve appropriate ALM positioning, Finance Management uses different tools. Chief
among these are issues in debt or capital markets, securitisation, deposits and interest rate and/or
currency hedges, and management of ALCO portfolios and the minimum liquidity buffer.
– Compliance with risk limits and with risk appetite
48
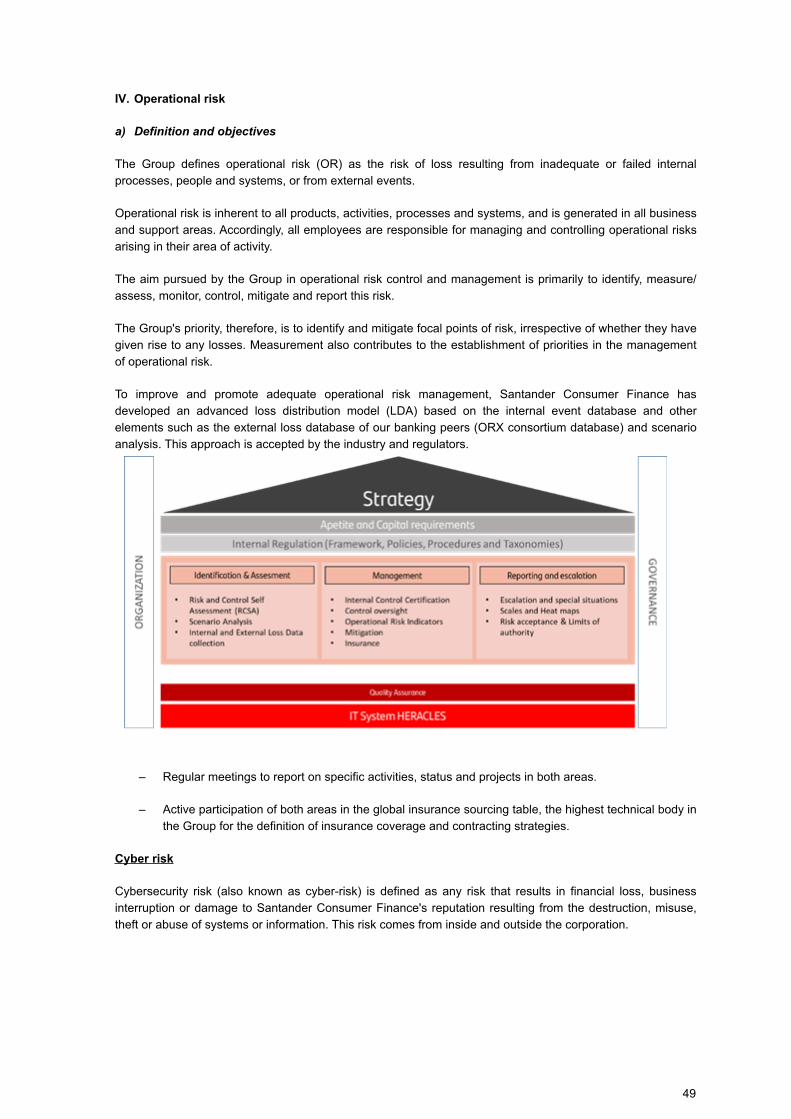
IV. Operational risk
a) Definition and objectives
The Group defines operational risk (OR) as the risk of loss resulting from inadequate or failed internal
processes, people and systems, or from external events.
Operational risk is inherent to all products, activities, processes and systems, and is generated in all business
and support areas. Accordingly, all employees are responsible for managing and controlling operational risks
arising in their area of activity.
The aim pursued by the Group in operational risk control and management is primarily to identify, measure/
assess, monitor, control, mitigate and report this risk.
The Group's priority, therefore, is to identify and mitigate focal points of risk, irrespective of whether they have
given rise to any losses. Measurement also contributes to the establishment of priorities in the management
of operational risk.
To improve and promote adequate operational risk management, Santander Consumer Finance has
developed an advanced loss distribution model (LDA) based on the internal event database and other
elements such as the external loss database of our banking peers (ORX consortium database) and scenario
analysis. This approach is accepted by the industry and regulators.
– Regular meetings to report on specific activities, status and projects in both areas.
– Active participation of both areas in the global insurance sourcing table, the highest technical body in
the Group for the definition of insurance coverage and contracting strategies.
Cyber risk
Cybersecurity risk (also known as cyber-risk) is defined as any risk that results in financial loss, business
interruption or damage to Santander Consumer Finance's reputation resulting from the destruction, misuse,
theft or abuse of systems or information. This risk comes from inside and outside the corporation.
49
In the event of a cyber incident, the main cyber risks for Santander Consumer Finance consist of three
elements:
– Unauthorized access to or misuse of information or systems (e.g., theft of business or personal
information).
– Theft and financial fraud.
– Business interruption (e.g., sabotage, extortion, denial of service).
In 2020, Santander Consumer Finance has continued to devote its full attention to risks related to cyber-
security, which affect our units in different geographical areas. This situation, which is causing concern among
entities and regulators, is leading to the adoption of preventive measures to be prepared for attacks of this
nature.
The Group has further developed its cyber regulations with the approval of a new cyber-security framework
and the cyber-risk supervisory model, and new polices related to this area.
Also, a new organisational structure has been defined, and governance for the management and control of
this risk has been strengthened. For this purpose, specific committees have been set up and cyber-security
metrics have been incorporated to the Group's risk appetite. These metrics have been monitored and
reported both in different geographical areas and at a Global level.
The main instruments and processes established for the control of cybersecurity risk are:
– Compliance with cyber-risk appetite: the objective of this process is to ensure that the cyber-risk profile is
in line with the risk appetite. Cyber-risk appetite is defined by a series of metrics, risk statements and
indicators with corresponding tolerance thresholds and where existing governance structures are used for
monitoring and escalation, including risk committees and cybersecurity committees.
– Identification and assessment of cybersecurity risk: The cyber-risk identification and assessment process
is a key process for anticipating and determining the risk factors that could cause cyber-risk and
estimating likelihood and impact. Cyber risks are identified and classified in line with the control categories
defined in the latest industry-relevant security standards (such as ISO 27k, NIST Cybersecurity
Framework, etc.). The methodological catalogue includes methods used to identify, qualify and quantify
cyber-risks, and to evaluate the controls and corrective measures taken by the first line of defence.
Cyber-risk assessment tests are a key tool for identifying and assessing cybersecurity risks at Santander
Consumer Finance entities. Cybersecurity and technology risk assessment must be updated when
reasonably necessary, taking into account changes in information systems, confidential or business
information, and the entity's business operations.
– Cyber-risk control and mitigation processes relating to assessing the effectiveness of risk control and
mitigation. Once cyber risks have been assessed and mitigation measures defined, these measures are
included in a Santander Consumer Finance cybersecurity risk mitigation plan. Residual risks are identified
and formally accepted. Due to the nature of cyber-risks, risk mitigation plans are regularly reassessed. A
key process in the face of a successful cybersecurity attack is the business continuity plan. Santander
Consumer Finance has mitigation strategies and measures in place in connection with business continuity
management plans and disaster recovery. These measures also address cyberattacks, based on defined
policies, methods and procedures.
– Monitoring, supervision and reporting of cyber-risk: Santander Consumer Finance controls and monitors
cyber-risk in order to regularly analyse the information available on the risks accepted in the course of the
Group's activities. For this purpose, Key Risk Indicators (KRIs) and Key Performance Indicators (KPIs) are
monitored to assess whether risk exposure is in line with authorised risk appetite.
50
– Escalation and reporting: Proper escalation and reporting of cyber threats and cyberattacks is another key
process. Santander Consumer Finance has tools and processes for detecting internal threats and
potential hazards in its infrastructure, servers, applications and databases. Reporting encompasses the
preparation of reports and submission to the relevant committees of information required to assess
exposure to cyber-risk, analyse the cyber-risk profile and take the necessary decisions and measures.
Appropriate cyber-risk situation reports are produced for management committees accordingly. There are
also mechanisms in place for independent internal escalation of technological and cybersecurity incidents
to the bank's management team and, if necessary, to the appropriate regulator.
Other Emerging Risks
In addition to the aforementioned Cyber Risk, Santander Consumer Group is increasingly strengthening the
monitoring of new emerging risks arising from 1) supplier management and 2) transformation projects.
- With respect to supplier management risks, the focus is on the quality and continuity of the services
provided to SCF, but also on ensuring compliance with the new EBA Guidelines through the implementation of
specific risk instruments throughout the different phases of the supplier's life cycle
- Transformational risk is defined as any risk arising from material changes to SCF's organization, products,
services or processes due to imperfect design, construction, testing, implementation and/or rollout of projects
and initiatives, and transition to business as usual (BAU ) Transformation constitutes a root cause, which can
manifest itself in a variety of risks and impacts, not restricted to Operational Risk, (e.g. Credit, Market,
Financial Crime...)
- COVID 19 Crisis: In terms of BCP and Operational Risk measures carried out, critical processes were
identified and key and alternative personnel performing their work without incident. Home working was
implemented as the main driver to prevent employee infection. Collection and customer service call centers
and relevant suppliers remained in operation. Special monitoring was also carried out for possible cyber-
attacks, fraud and other operational risks within the normal range. Coordination between the Corporation and
local units was strengthened to apply lessons learned according to the situation in each country.
Compliance and conduct risk
The compliance function includes all issues relating to regulatory compliance, prevention of money laundering
and terrorist financing, governance of products and consumer protection, and reputational risk according to
the General Corporate Compliance and Conduct Framework (Marco Corporativo General de Cumplimiento y
Conducta).
The compliance function promotes the adhesion of Santander Consumer Finance, S.A. ("SCF") to standards,
supervisory requirements, and the principles and values of good conduct by setting standards, debating,
advising and reporting, in the interest of employees, customers, shareholders and the wider community. In
accordance with the current corporate configuration of the Santander Group's three lines of defence, the
compliance function is a second-line independent control function that reports directly to the Board of
Directors and its committees through the CCO. This configuration is aligned with the requirements of banking
regulation and with the expectations of supervisors.
The SCF Group's objective in the area of compliance and conduct risk is to minimise the probability that non-
compliance and irregularities occur and that any that should occur are identified, assessed, reported and
quickly resolved.
The main tools used by the Compliance function in order to meet their objectives are (among others):
establishment and coordination with the Compliance Program, coordination of the Risk Assessments of all the
areas of Compliance and Conduct, definition and monitoring of the Compliance Metrics that participate in the
SCF Appetite Risk Framework and monitoring of the Norms of Obligatory Compliance.
51
d. Compliance with regulatory framework
The Basel III regulations came into effect in 2014, setting new global standards for the capital, liquidity and
leverage of financial entities.
From the capital perspective, Basel III redefines what is considered available capital for financial entities
(including new deductions and increasing requirements for eligible capital instruments); increases minimum
capital requirements; requires financial entities to always hold capital buffers; and adds new requirements for
the risks considered.
These regulations were implemented in Europe through Directive 2013/36/EU, known as ‘CRD IV’, and its
regulations, 575/2013 (CRR), which apply directly in all EU member states (Single Rule Book). These rules
are currently subject to regulatory development by the European Banking Authority (EBA).
CRD IV was introduced into Spanish law through Act 10/2014, on the ordering, supervision and solvency of
credit institutions, and its subsequent regulatory implementation through Royal Decree Act 84/2015. The CRR
is directly applicable to member states from 1 January 2014 and repeals lower-ranking standards that entail
additional capital requirements.
The CRR provides for a phase-in period that will allow institutions to adapt gradually to the new requirements
in the European Union. The phase-in arrangements have been introduced into Spanish law through Bank of
Spain Circular 2/2014. The phase-in affects both the new deductions from capital and the capital instruments
and elements that cease to be eligible as capital under the new regulations. The capital conservation buffers
provided for in CRD IV are also being phased in gradually, starting in 2016 and reaching full implementation in
2019.
In 2020, the Santander Consumer Finance Group must maintain a minimum capital ratio of 7.89% CET1
phase-in (4.5% for Pillar I, 1.5% for Pillar II, 2.5% for the capital conservation buffer, and 0.0476% for the anti-
cyclical buffer), This requirement includes: (i) the minimum Common Equity Tier 1 requirement to be
maintained at all times under Section 92(1)(a) of Regulation (EU) No 575/2013 (ii) the Common Equity Tier 1
requirement to be maintained in excess at all times under Section 16(2)(a) of Regulation (EU) No 1024/2013;
and (iii) the capital conservation buffer under Section 129 of Directive 2013/36/EU. In addition, the Santander
Consumer Finance Group must maintain a minimum capital ratio of 9.67% of Q1 phase-in as well as a
minimum Total Ratio of 12.05% phase-in.
At the end of 2020, the Bank exceeds the prudential requirement defined by the ECB, with a CET1 (Fully
Loaded) ratio of 13.21% and a total capital ratio of 16.53% (Fully Loaded).
Regarding credit risk, the Bank continues its plan to implement the advanced internal models approach
(AIRB) of Basel. This progress is also conditioned by the acquisitions of new entities, as well as by the need
for coordination between supervisors of the internal model validation processes.
The Santander Consumer Finance Group is mainly present in geographies where the legal framework
between supervisors is the same, as is the case in Europe through the Capital Directive.
Currently, the Santander Consumer Finance Group has supervisory authorization for the use of advanced
approaches for the calculation of regulatory capital requirements for credit risk for its main portfolios in Spain,
certain portfolios in Germany, the Nordic countries and France.
With regard to operational risk, the Santander Consumer Finance Group currently uses the standard
approach for calculating regulatory capital provided for in the European Capital Directive.
In relation to the other risks explicitly contemplated in Pillar I of Basel, market risk is not significant in
Santander Consumer Finance since it is not the object of the business, and the standard approach is used.
52
Leverage ratio
The leverage ratio has been defined within the regulatory framework of Basel III as a measure of the capital
required by financial institutions not sensitive to risk. The Group performs the calculation as stipulated in CRD
IV and its subsequent amendment in EU Regulation no. 573/2013 of 17 January 2015, which was aimed at
harmonising calculation criteria with those specified in the BCBS “Basel III leverage ratio framework” and
“Disclosure requirements” documents. This ratio is calculated as Tier 1 capital divided by leverage exposure.
Santander Consumer Finance maintains a fully loaded leverage ratio of 8.90% at the end of 2020. Pending
entry into force of the definitive rules on the minimum requirements for this ratio, the benchmark was set at
3%, to be complied with starting June 28th, 2021.
Economic capital
From the point of view of solvency, in the context of Basel Pillar II Santander Consumer Finance Group uses
its economic model for its internal capital adequacy assessment process (ICAAP). For this purpose, business
performance and capital needs are planned under a base case scenario and under alternative stress
scenarios.
In this planning, the Group ensures that its solvency objectives are upheld even in adverse economic
scenarios.
Economic capital is the capital required, according to an internally developed model, to support all the risks of
our business at a certain level of solvency. In our case, the solvency level is determined by the long-term
objective rating of 'A' (two steps above Spain's rating), which means applying a confidence level of 99.95%
(above the regulatory 99.90%) to calculate the necessary capital.
The Group's economic capital model includes in its measurement all significant risks incurred by the Group in
its operations, and therefore considers risks such as concentration, structural interest rate, business,
pensions and others that are outside the scope of "regulatory" Pillar 1. Furthermore, economic capital
incorporates the diversification effect, which in the case of the Group is crucial, due to the multinational and
multi-business nature of its activity, in order to determine the overall risk and solvency profile.
The Santander Consumer Finance Group uses the RORAC method in its risk management to calculate the
economic capital consumption and return on risk-adjusted capital of the Group's business units, segments,
portfolios or customers, in order to periodically analyse value creation and allow optimal allocation of capital.
The RORAC methodology makes it possible to compare, on a homogenous basis, the returns on
transactions, customers, portfolios and businesses, identifying those that obtain a risk-adjusted return higher
than the Group's cost of capital, and thus aligning risk and business management with the intention of
maximising value creation, which is the ultimate objective of Santander Consumer Finance's senior
management.
Proposed appropriation of profit or loss
The appropriation of profit obtained by the Bank in 2020, amounting EUR 127.908 thousand, will be submitted for
approval by the shareholders at the Annual General Shareholder’s Meeting in accordance with the following
proposal:
Legal reserve: EUR 12.791 thousand
Voluntary reserve: EUR 115.117 thousand
53
Capital and treasury shares
In 2020 the Group did not conclude any transactions involving treasury shares/own shares. There was no
treasury share balance on its balance sheet at 31 December 2020.
Research and Development
Grupo Santander understands innovation and technological development as a key anchor point of the corporate
strategy, and seeks to take advantage of the opportunities offered by digitalization. Aligned with the Santander
Consumer Finance Group's technology and innovation strategy, it leverages global capabilities and incorporates
local particularities to maximize the development of its business and stay ahead of its competitors.
It is crucial for Technology and Operations to support the needs of the business, with specific value-added
proposals for the value offer of consumer finance, focusing on the point of sale, customer management and the
design of specialized products, guaranteeing optimal management of the process to maintain good efficiency
ratios and ensure control of technological and operational security.
On the other hand, like the rest of the Santander Group's units, Santander Consumer Finance is coming under
increasing pressure from ever more demanding regulatory requirements that impact the systems model and
underlying technology, and require additional investments to ensure compliance and legal certainty.
Events after the reporting date
Events occurring after the 2020 year-end are disclosed in Note 1-i to the consolidated financial statements.
Outlook
The directors' report contains certain forward-looking information that reflects the directors' plans, forecasts or
estimates, which are based on assumptions that are believed to be reasonable by the directors. However, the
user of this report should bear in mind that forward-looking information should not be taken as a guarantee of the
entity's future performance, since such plans, forecasts or estimates are subject to numerous risks and
uncertainties that mean that the entity's future performance may not necessarily coincide with that initially
expected. These risks and uncertainties are described in the risk management chapter of this management report
and in note 47 to the consolidated financial statements.
The announcement of a series of highly effective vaccines for the prevention of covid-19 has led to a significant
improvement in expectations for 2021, and above all has reduced the probability of the most adverse scenarios.
However, the increase in infections in early 2021 and the consequent restrictions may have appreciable effects
on the economy in the first months of the year, even if the experience of the second wave shows that the public
and private sector have learned to contain the effects on activity based on what happened in the spring.
The expected acceleration in vaccination rates, especially in the at-risk population, in the main countries where
the group operates and the continuation of expansionary economic policies suggest that the economies will see a
significant recovery, although in general we believe that we will have to wait until 2022 to return to pre-crisis
levels. The macroeconomic forecast for 2021 is as follows, broken down by geography:
Eurozone
Economic expansion in 2021 will be linked to the spread of vaccines and the degree of implementation of the EU
recovery plan. The consensus is for vaccination to have reached a sufficiently high percentage of the population
by mid-year for much of the economic activity to normalize. In any case, some sectors will take time to achieve
full recovery (depending on how they are affected by international mobility, which will continue to be affected). We
believe that monetary policy will continue to be expansionary, but the way out of the crisis is conditioned to a
greater extent by fiscal policy and economic reforms. The EU recovery plan, on which much of the countries'
proposed fiscal expansion depends, should be the basis for a modernization of the economies, reinforcing
potential growth, sustainability and digitalization.
54
Financial markets
We believe that the cyclical recovery we expect in 2021 will guide the behavior of financial markets.
The unprecedented injection of liquidity by central banks will continue to support all risk assets, along with the
favorable conclusion of some risk factors: i) The arrival of the vaccine has diminished uncertainty globally about
the economic recovery, relativizing the fact that worsening contagion data and health pressure are still leading to
tighter lockdowns. ii) The control of both houses by the Democrats in the US may give the new executive greater
discretion to carry out its fiscal stimulus plans. iii) The UK's negotiated exit from the EU has avoided a chaotic exit
in January and normalizes relations between the two regions.
In this context, risk-free rates will rise slowly due to a continued improvement in economic and inflation
expectations, and more in the long maturities than in the short maturities, leading to a steepening of the yield
curve. Some Fed members are beginning to talk about the possibility of initiating balance sheet reduction later
this year, but official rates will remain unchanged for a long time.
We believe that during this year, the banking environment, like the economic environment, will be shaped by the
evolution of the pandemic, the speed of vaccination and the pace of the exit of public sector support for
households and businesses. The end of the support and moratoriums will be accompanied by an increase in non-
performing loans, which will depend on the degree of economic normalization achieved at that time and will affect
the different economic sectors unevenly, affecting more those that have suffered the greatest permanent effects.
In general, the banking sector is facing this increase in non-performing loans from a more solid position than in
past crises, as shown by the stress tests carried out by different organizations, such as the IMF. However, it is not
out of the question that difficulties may arise in some institutions, both in developed and emerging banking
systems.
The digital challenge and the pressure of profitability, in a scenario of very low rates and low business growth, will
continue to encourage bank consolidation, especially in the most fragmented systems, as well as adjustments in
search of efficiency gains.
Financial regulation
In 2021, financial and prudential regulation will continue to reflect the materialization of various multi-year
solvency and resolution initiatives combined with the measures that authorities will continue to take or keep in
place to manage the harsh effects of the pandemic.
Supervisors and regulators believe that the policy response must be tailored to the specific needs of this new
phase. In addition, they consider that banks must address medium-term challenges, including their low
profitability at both the European and national levels. In this regard, the European Banking Authority concluded in
its 2020 transparency report the solid capital and liquidity positions of banks, but warns about the outlook for
asset quality and structurally low profitability.
The European Central Bank itself emphasized that uncertainty remains high, also with regard to pandemic
developments and vaccine distribution dates. As a sign, the ECB is extending until June 2022 the duration of the
easing of collateral eligibility criteria it adopted in April 2020 to ensure that all banks in all countries can obtain
liquidity to support credit to all sectors of the economy.
Additionally, the ECB has broadened the spectrum of marketable assets eligible by the Eurosystem with its
decision to admit bonds with coupon structures linked to certain sustainability targets as collateral as of January
1, 2021, demonstrating the Eurosystem's support for innovation in the field of sustainable finance.
With regard to the regulation on capital requirements, it is expected that, during 2021, CRR2 will generally enter
into force, with most of the items that had not yet entered during 2019 and 2020 being applicable. During 2021,
the Commission is expected to propose RRC3. This milestone marks the completion of the implementation of the
Basel framework in Europe, which modifies, among other things, the credit risk framework very significantly. A
55
quick fix to the CRR on the securitization framework, including the STS treatment for synthetic securitizations,
comes into force at the beginning of the year.
Regarding resolution legislation, the transposition of the Bank Recovery and Resolution Directive (BRRD 2) will
be completed during 2021.
Resolution Directive (BRRD 2) will be completed during 2021. In this regard, in response to covid-19, the
European resolution authority has stated its intention to adopt a forward-looking approach to the currently existing
MREL requirements. Additionally, the SRB has stated that for the 2020 resolution cycle decisions have taken into
consideration the transitional periods between 2022 and 2024 set out in BRRD 2.
During 2021, European Banking Association guidelines of particular relevance will apply:
- Guidelines on lending and monitoring (EBA/GL/2020/06) will apply from June 2021.This guidance covers from
governance processes to lending, pricing for new business, collateral valuation (movable and immovable) and
monitoring and reporting framework.
- Also of particular relevance are the guidelines on the application of the definition of default in accordance with
Article 178 of Regulation (EU) No. 575/2013. Effective January 2021, the EBA includes in its guidelines that
institutions must incorporate the requirements of these guidelines in their internal procedures and technological
systems.
Annual corporate governance report
Pursuant to article 9,4 of Order ECC/461/2013, of 20 March, from the Ministry of Economy and Competitiveness,
the Bank, an entity domiciled in Spain with voting rights belonging, directly and/or indirectly, to Banco Santander,
S.A., has not prepared an annual corporate governance report, as this is drawn up and filed with the CNMV by
Banco Santander, S.A. as the parent of the Santander Group.
Non-financial information
On 28 December 2018, the Council of Ministers approved Law 11/2018 amending the Commercial Code, the
consolidated text of the Companies Law approved by Royal Legislative Decree 1/2010 of 2 July and Law 22/2015
of 20 July on account auditing, non-financial reporting and diversity.
The statement of non-financial information shall contain the following: a brief description of the group's business
model, the group's relevant policies and their outcomes, the principal risks related to its business, in addition to
non-financial key performance indicators on matters relating to the environment, employees, human rights, the
fight against corruption and bribery and diversity.
The Directive applies to entities whose average number of employees in the financial year exceeds 500 and
which are either considered to be public-interest entities in accordance with auditing legislation or, for two
consecutive financial years, at the closing date of each year engage at least two of the circumstances indicated in
the Law. However, subsidiaries belonging to a group are exempt from this obligation if the company and its
subsidiaries are included in another company's consolidated management report.
In this regard, as a subsidiary of Banco Santander S.A, Santander Consumer Finance, S.A. and the companies
in the Consumer Finance Group (consolidated) have included this information in the management report of
Banco Santander S.A. and subsidiaries for the year ended 31 December 2020, which has been filed with the
Companies' Registry of Santander, together with the consolidated financial statements of the Banco Santander
Group and subsidiaries, as set out in note 1 to the accompanying Notes. These are also available at
www.santander.com
56

Capital structure and significant shareholders
Banco Santander, S.A. 1,879,546,152 Ownership: 99.99%
Cántabro Catalana de Inversiones, S.A. 20 Ownership: 0.00000106%
Total number of shares outstanding 1,879,546,172
Par value 3.00
Shareholders' equity 5,638,638,516
At 31 December 2020, the Bank’s share capital consisted of 1,879,546,172 registered shares, with a par value of
EUR 3 each, all fully subscribed and paid up, and with equal dividend and voting rights.
Restrictions on the transferability of shares
Not applicable.
Restrictions on voting rights
The shareholders attending the Annual General Meeting will have one vote for each share that they hold or
represent.
Only the holders of 20 or more shares will be entitled to attend the Annual General Meeting, provided that they
are registered in their name in the share register.
Side agreements
Not applicable.
Appointment and replacement of members of the Board of Directors and amendment of the bylaws
The representation of the Bank is the responsibility of the Board of Directors, which will comprise no fewer than 5
and no more than 15 members, who will be appointed by the Annual General Meeting for a period of three years,
although they may be re-elected, as many times as may be desired, for further three-year periods.
It is not necessary to be a shareholder of the Bank in order to be a director.
Powers of the members of the Board of Directors
On 24 May 2012, the Bank granted powers of attorney to the General Managing Director Ms. Inés Serrano
González and to the General Managing Director Mr. Bruno Montalvo Wilmot. Furthermore, on 18 July 2019, the
Bank made Don David Turiel López General Director granting him powers of attorney. Either of them, acting
jointly and severally, for and on behalf of the Bank, can exercise the powers detailed below:
a) To manage, control and govern all manner of properties now or hereafter owned by the principal, to perform
the improvements, repairs and work thereon that they deem appropriate, to lease them for the period, price
and terms they consider appropriate, to evict tenants or dwellers and approve new ones, to collect rent,
interest, dividends and lease payments, and to give the corresponding receipts and invoices.
To enter into, modify, subrogate and terminate finance leases on all manner of real and movable properties,
upon the terms and conditions that they may freely determine, and to acquire the properties held under such
finance leases, the only limit being that when the acquisition amount exceeds EUR 300,507 it must have been
approved by the Board of Directors or the Executive Committee, and this approval must be supported by the
appropriate certificate issued by the Secretary to the Board or to the Executive Committee, or by the acting
Secretary to said Board or Committee, with the approval of the Chairman or of his assignee.
b) To verify groupings or subdivisions of properties, demarcations and deeds of declaration of new construction.
57
c) To submit accounts and request them, approve them, adjust or challenge them, to provide and receive the
amounts of the resulting balances and sign and receive final settlements.
d) To use, with full powers, the signature of the principal bank in all banking transactions, acts and agreements
to which the principal bank is party, subject to the limits indicated for the transactions referred to in sections e)
and j), and to sign all manner of correspondence.
e) To acquire and dispose of, at the price and under the terms that they may freely stipulate, including resale and
repurchase agreements and by any other means permitted by law, all manner of movable and immovable
property, not excluding rights in personal and rights in rem, the only limit being that when the transaction
arranged in exercise of this power exceeds EUR 300,507 it must have been approved by the Board of
Directors or the Executive Committee, and this approval must be supported by the appropriate certificate
issued by the Secretary to the Board or to the Executive Committee or by the acting Secretary to said Board
or Committee, with the approval of the Chairman or of his assignee.
Notwithstanding the provisions of the preceding paragraph, the limitation will not exist when the acquisition
relates to loans that other financial institutions (banks, savings banks, credit cooperatives and similar entities
registered with the Bank of Spain) have granted to their customers, i.e. the loans included in the loan portfolio
of the entity in question, even if the latter, in turn, had acquired the loans from another financial institution and
they were not originally granted by said entity; or when the disposal relates to loans in the Bank's portfolio,
whether these be loans granted to its customers or loans that the Bank had acquired previously from another
financial institution; all the foregoing irrespective of whether these acquisitions or disposals relating to the loan
or loans in question are full or partial, and irrespective of the type of the loans themselves, in terms of either
the form of instrumentation (agreement, deed, bills, promissory notes or by another other means) or of the
additional guarantees they might have (all manner of security interest, mortgages, etc.).
f) To arrange in favour of the Bank mortgages and other encumbrances on immovable property to secure the
loan transactions to which it is party or to underwrite guarantees and other obligations which, with respect to
these transactions, are outstanding, and they will stipulate the periods, interest and distribution of charges
and any other terms inherent to the agreements in question at their own discretion.
g) To modify, transfer or subrogate and terminate mortgages and other in rem rights, including entries in the
Land Registry, held by the Bank, and to grant and release, in the Bank's name, tax payment documents and
final account settlements, or declare that the obligations related to the encumbrances have been
extinguished.
h) To reach a settlement on properties and rights and submit any questions and discrepancies affecting the Bank
to the decision of arbitrators or honest brokers.
i) To appear in the hereditary successions of debtors, at administration and insolvency proceedings and in
bankruptcies, to approve inventories and arrangements and contest them; to take part in and vote at the
meetings held for such purposes, whether they be in or out of court; to accept or reject such agreements as
are adopted for the purpose; to sign arrangements in or out of court, to provide the guarantees that may be
required, and to accept attached assets.
j) As security for the obligations of third parties and on their behalf, whether said parties be individuals or legal
entities, and under the terms and clauses deemed appropriate, they may arrange, modify and withdraw or
terminate guarantees and all other types of collateral before all manner of departments, bodies and agencies
at central, provincial or municipal government level, autonomous community governments and their
dependent agencies, autonomous community or semi-public agencies, ordinary and special tribunals and
courts, including the economic-administrative and judicial review jurisdictions, employment courts, official
banks and savings banks and, in general, before any public body, and before any type of company or
individual, placing, as the case may be, the required deposits in cash or securities, with or without transfer of
possession, and they may bind the Bank, even jointly and severally with the principal debtor, therefore
waiving the benefits of order, discussion and division, the only limit being that, if the obligation undertaken by
way of guarantee exceeds EUR 3,005,060, the transaction must have been approved by the Board of
Directors or the Executive Committee, and this approval must be supported by the appropriate certificate
issued by the Secretary to the Board or to the Executive Committee or by the acting Secretary to said Board
or Committee, with the approval of the Chairman or of his assignee.
k) Without any limitations, to perform all manner of actions and to file claims and appeals at the courts and
tribunals of any jurisdiction, including the Constitutional Court, and most particularly the judicial review
jurisdiction; to answer interrogatories; to give court depositions; to file complaints and criminal complaints and
to ratify them.
To request from the ministries, directorates general, units and offices of central government, from autonomous
community governments, provincial, municipal and any other level of public corporations, and from authorities
and civil servants, such action as is deemed appropriate in the interests of the principal, by filing economic-
administrative claims, appeals to superior administrative bodies and claims of any other nature and class,
58
which they will conduct through all stages and levels; to request payment orders/releases, and to present
affidavits and supporting evidence.
To confer legal and court-case powers on court procedural representatives ("attorneys") if the principal
requires such legal representation, and to perform in the Bank's name all manner of actions and exceptions
which might be available to the former, conducting the proceedings through all stages and appeals, including
appeals to the Constitutional Court and extraordinary cassation and judicial review appeals, and to withdraw,
settle and stay such proceedings.
l) To pledge securities belonging to the Bank's portfolio in sufficient quantity so as to arrange credit account
facilities, pledging the amount deemed appropriate in each case, and to sign the documents required for this
purpose, and for the arrangement, drawdown and cancellation of the aforementioned accounts and of their
related guarantees and the renewal thereof upon expiry of each facility.
m) To present, at any central government offices, banks (including the Bank of Spain), companies,
establishments and private individuals, shares or securities for conversion or exchange purposes,
withdrawing or collecting the new certificates, receipts, securities or bills resulting from the exchange or
conversion, with current or in-arrears coupons, and in general carrying out any transactions required to this
end.
n) To arrange policies with insurance companies that cover all manner of movable or immovable property owned
by the Bank or pledged or mortgaged in its favour against the risks of fire, catastrophic damage or third-party
liability, being able to establish such terms and conditions of the policies as they see fit.
o) To authorise certifications of the company's accounting ledgers and documents.
p) To grant and sign the public deeds and private documents required to execute the aforementioned acts and
agreements.
q) To take part in Annual General Meetings and meetings of the Board of Directors in the name and on behalf of
the Bank at companies in which the Bank holds an ownership interest.
The Board of Directors of Santander Consumer Finance, S.A., held on December 17, 2020, accepted the
resignation presented by Ms. Inés Serrano González and Mr. David Turiel from their positions as Directors,
General Managers and members of the Executive Committee, as well as their corresponding resignation from the
powers conferred by the company, referred to above, and therefore proceeded to revoke them.
The Bank does not grant the power to issue or buy back treasury shares, which corresponds to the Annual
General Meeting or the Board of Directors, as appropriate.
Significant agreements which will be modified or terminated in the event of a change in control of
the Company
Not applicable.
Agreements between the Company and the directors, executives or employees which provide for
termination benefits if the relationship with the Company ends as a result of a takeover bid
Not applicable.
59