irrigated agriculture water needs and management in the
TRANSCRIPT
Irrigated Agriculture Water Needs and Management in the Mendocino County Portion of the Russian River Watershed
Prepared for the Mendocino County Water Agency
July 2008
UCCE County of Mendocino ii Meeting Agricultural Water Needs
Project Team David Lewis, Advisor U.C. Cooperative Extension Glenn McGourty, Advisor U.C. Cooperative Extension John Harper, Advisor U.C. Cooperative Extension Rachel Elkins, Advisor U.C. Cooperative Extension Juliet Christian-Smith, Study Coordinator U.C. Cooperative Extension Jim Nosera, Agricultural Technologist U.C. Cooperative Extension Prahlada Papper, Project Technician U.C. Cooperative Extension Sarah Baker, Viticulture Intern U.C. Cooperative Extension Roland Sanford, General Manager Mendocino County Water Agency Larry Schwankl, Irrigation Specialist UC Kearny Agricultural Center Terry Prichard, Irrigation Specialist UC Davis Land Air and Water Resources Department Reference as: Lewis, D. J., G. McGourty, J. Harper, R. Elkins, J. Christian-Smith, J. Nosera, P. Papper, R. Sanford, L. Schwankl, and T. Prichard. 2008. Meeting irrigated agriculture water needs in the Mendocino County portion of the Russian River. University of California Cooperative Extension Mendocino County, University of California Davis Department of Land Air and Water Resources, and University of California Kearny Agricultural Center. 56 pgs. Acknowledgements: We want to thank the cooperating growers who gave of their time and granted farm access to make field evaluations of irrigation systems. Cover Photographs taken by Juliet Christian-Smith, Jack Kelly-Clark, and Joe Pecharich.
UCCE County of Mendocino iii Meeting Agricultural Water Needs
Executive Summary
The availability of water for all rural and urban water users in Mendocino County, and the Russian River Watershed specifically, is an increasingly contentious and acute issue. Legislation such as California Assembly Bill 2121 and resulting policies are requiring evaluation of water allocation to meet environmental needs. Resulting regulations, such as the Policy for Maintaining Instream Flows in Northern California Coastal Streams by the State Water Resources Control Board, will make specific directives about the timing and amount of withdrawals for all users. Such pressure requires all users to weigh a list of options and alternatives to meet their respective water needs including water conservation and use of alternative water sources.
Working with Mendocino County agriculture to first understand its current and future water demand and then evaluate the existing and potential options for meeting this need, is the best opportunity to relieve the pressure that competition for water is creating for all users and in particular for agriculture users. The University of California Cooperative Extension (UCCE) Mendocino County office was contracted by the Mendocino County Water Agency to conduct an estimate of agricultural water demand in the Mendocino County portion of the Russian River watershed.
This study was conducted using aerial photograph interpretation, geographic information system analysis, on-farm irrigation system evaluation, and grower focus groups and surveys to document irrigated agriculture acreage and water demand. Additionally, information was gathered on the history of water resource management and opinions and attitudes towards water conservation and alternative water sources. Major study findings include:
• Irrigated agriculture acreage totals 20,614 acres including, 15,539 acres in wine grapes, 3,144 in irrigated pasture, 1,845 acres in pears and another 86 acres in other various crops.
• Total water demand for irrigated agriculture is 25,669 acre-feet per annum including
approximately 4,891 acre-feet per annum for frost protection and heat suppression for all crops requiring protection and 620 acre-feet per annum for post harvest application for grapes. A total of 13,569 acre-feet is needed for grapes, 5,684 acre-feet for pears, 6,287 acre-feet for irrigated pasture, and 129 acre-feet for other crops.
• The total annual estimate of water needed for crop production was 10% of the 2007 total
annual discharge in the Russian River near Hopland, California and 5% of the total precipitation that fell in 2007.
• The amount of water that growers applied is based upon site specific conditions, crop
specific cultural objectives, an understanding of the link between energy and water costs to deliver water to crops, and water resources reliability to which growers have access.
• Growers have adopted and adapted improved irrigation technologies and methods over
the last three decades, realizing significant water conservation through the use of industry standards. This includes installation of drip irrigation systems in grape vineyards, under
UCCE County of Mendocino iv Meeting Agricultural Water Needs
canopy sprinkler systems in pear orchards, and gravity type underground pipe and valve or sprinkler delivery systems in irrigated pastures.
• Average irrigation system distribution uniformity for grape vineyards and pear orchards
was 88%, a high value indicating systems are distributing water evenly and efficiently.
• Growers have participated in conservation programs. This includes water quality planning short courses, USDA Natural Resources Conservation Service’s Environmental Quality Incentives Program, and Fish Friendly Farming. Key reasons for this participation are stewardship values and farm costs for both water and energy.
Next steps to continue the efforts and measures growers have already taken to effectively
manage water resources are as follows:
• Establish a program to provide growers with irrigation system evaluation service. This will provide the insurance that properly functioning irrigation systems continue to operate in that fashion and that those that require attention and improvements are identified and addressed.
• Research post-harvest application in wine grape vineyards. Currently approximately 620
acre-feet/year are applied to wine grapes in the Fall with little to no confirmation of the returns this water brings in terms of crop yield or quality.
• Develop and implement options for frost and heat protection. Alternatives to these uses
will contribute to instream flows during biologically critical periods for area streams and aquatic organisms and relieve the mounting regulatory pressure being placed upon area farmers.
• Develop and implement a program to deliver crop needs and irrigation program design to
irrigated pasture managers. Such programs have improved both the efficiency of water use and quality of forage produced in other irrigated pasture regions of California and will support Mendocino pasture managers to continue their production of a critical local source of forage for the County.
• Replicate this study in other watersheds in Mendocino County. Generating an up-to-date
estimate of irrigated agriculture water demand throughout the County will assist agriculture producers in meeting their needs while contributing to solutions for other needs such as instream flows.
• Form partnerships between agriculture and other water users in the study area that have a
shared interest in reviewing and providing input on California State policy towards viable solutions for securing water sources and their timing of use.
• Investigate alternative water sources and solutions to relieve the pressure from summer
diversions, including the feasibility for small scale private winter flow storage and opportunities for water reuse.
UCCE County of Mendocino v Meeting Agricultural Water Needs
Table of Contents Executive Summary ....................................................................................................................... iii Table of Contents............................................................................................................................ v Introduction..................................................................................................................................... 6 Methods........................................................................................................................................... 9
Phase I......................................................................................................................................... 9 Phase II........................................................................................................................................ 9
Acreage Assignment ............................................................................................................... 9 Grower Focus Group and Survey ........................................................................................... 9 Irrigation System Evaluation ................................................................................................ 10 Consumptive Use and Distribution Uniformity.................................................................... 10 Frost Protection..................................................................................................................... 10 Heat Protection...................................................................................................................... 11 Post-Harvest Application ...................................................................................................... 12
Results........................................................................................................................................... 13 2007 and the Historical Record................................................................................................. 13 Phase I....................................................................................................................................... 17 Phase II...................................................................................................................................... 17
Evaluation of Acreage and Crop Designations..................................................................... 17 Grower Focus Group and Survey ......................................................................................... 18 Irrigation System Evaluations............................................................................................... 21 Distribution Uniformity ........................................................................................................ 22 Consumptive Use .................................................................................................................. 22 Frost Protection..................................................................................................................... 27 Heat Protection...................................................................................................................... 27 Post Harvest Application ...................................................................................................... 27 Water Demand ...................................................................................................................... 27
Discussion..................................................................................................................................... 29 Acreage ..................................................................................................................................... 29 Water Use.................................................................................................................................. 31 Phase I Estimates and Phase II Calculations............................................................................. 36 Conservation and Alternatives.................................................................................................. 36
Conclusions and Next Steps.......................................................................................................... 38 References..................................................................................................................................... 40 Appendix A: Phase I Maps .......................................................................................................... 44 Appendix B: Grower Survey ....................................................................................................... 47 Appendix C: Total Annual Discharge Values ............................................................................. 55

UCCE County of Mendocino 6 Meeting Agricultural Water Needs
Introduction
The last estimate of water demand, including agricultural use, in the Mendocino County portion of the Russian River was conducted in 1986 by Dr. Sari Sommarstrom. More than twenty years later, that inventory needs to be reviewed and updated in the current context of water availability and use. The Mendocino County Water Agency (MCWA) is initiating this inventory through a number of studies and partnerships to document the current and future water needs for all users including agriculture, domestic, and commercial users in rural and urban areas of the County.
The availability of water for all rural and urban water users in Mendocino County is an increasingly contentious and acute issue. Users are or will be presented with elevated competition for available water. This was evidenced by the 15 percent reduction in use required of water purveyors in the Russian River by the California State Water Resources Control Board (SWRCB) in 2007. Longer term policies to regulate water allocations include Assembly Bill 2121 passed in 2004 (stats.203, ch.943, §3). This legislation added Water Code section 1259.4 and required SWRCB to implement guidelines for maintaining instream flows in northern California coastal streams (SWRCB, 2007). Such policies and actions are partially in response to critical habitat designation for Chinook salmon and steelhead trout in the Russian River watershed made by the National Marine Fisheries Service (70 FR 52488). Implementation of these regulatory requirements to reduce impacts to instream habitat requires all water users to weigh a list of options and alternatives for meeting their respective water needs including water conservation and use of alternative water sources.
This is true for agriculture, a dominant water user in the watershed. Agricultural applications for water rights have been delayed, in some cases, for over a decade by the SWRCB Division of Water Rights. These delays result from concern that the basin is at least fully allocated, with no remaining water for pending applications. Currently, SWRCB is developing the Policy for Maintaining Instream Flows in Northern California Coastal Streams (SWRCB, 2007), as mandated by Assembly Bill 2121 and resulting Water Code section 1259.4. These new and pending policies and guidelines will direct the review and approval of water rights applications through regulation of withdrawal timing and amounts that meet stringent minimum by-pass flow requirements.
Completed and ongoing studies in the larger Russian River watershed are generating water budgets and insight into the relationships between water use and stream flows. There are indications that subsurface and ground water stores have been depleted over the last two decades in both mainstem reaches of the Russian River (Constantz et al. 2003) and tributary watersheds like Alexander Valley (Metzger et al., 2006). Additionally, changes in stream flow correlated to agricultural water use have been documented on a daily basis (Dietch, 2006).
The most significant ongoing study that will have bearing on water allocations in the Russian River watershed is the Section 7 consultation for endangered salmon species that the Russian River Flood Control District, Sonoma County Water Agency and the US Army Corps of Engineers are conducting for continued operation of Coyote and Warm Springs Dams, as well as other flood control responsibilities. Because the objectives of these studies are to understand the availability of water to meet the multiple demands placed upon the Basin, they require an understanding of the impacts agricultural water use has on habitat needs and the solutions available to reversing any negative impacts identified. As an example of a solution, reuse of treated wastewater from residential sources to irrigate crops is being explored. Outside of

UCCE County of Mendocino 7 Meeting Agricultural Water Needs
Mendocino County such systems and programs have been implemented. Working with Mendocino County agriculture to first understand its current and future
water demand and then evaluate the existing and potential options for meeting this need, is the best opportunity to relieve the pressure that competition for water is creating for all users and in particular for agriculture users. The Mendocino County office of the University of California Cooperative Extension (UCCE) was contracted by MCWA to conduct an estimate of agricultural water demand in the Mendocino County portion of the Russian River (Figure 1). Additionally, the study was designed and implemented to assess the needs for irrigation technology and practices and alternative water sources. It is important to again note that this effort is part of a larger process directed by MCWA to estimate water demand for water use countywide. Our goals in estimating agricultural water demand were to:
• Improve the understanding of agricultural water needs and uses within the Russian River Watershed.
• Facilitate feasible and sustainable means of water use on the part of agriculture.

UCCE County of Mendocino 8 Meeting Agricultural Water Needs
Figure 1: Study area included the approximately 362 square miles of the Russian River
watershed in Mendocino County.

UCCE County of Mendocino 9 Meeting Agricultural Water Needs
Methods We conducted this study in two phases. In Phase I, we used aerial photographs and geographic information system analysis to generate an initial estimate of water demand. In Phase II of the study, we conducted irrigation system field measurements and evaluations, grower surveys and focus groups on irrigation management to refine the Phase I estimate.
Phase I
In Phase I of the Project, we identified irrigated agricultural acreage by crop through interpretation of aerial photographs. We divided the study area into three reaches: Upper Reach or West Fork from the headwaters to the East Fork confluence; Middle Reach from Coyote Dam to Hopland; and Lower Reach from Hopland to the Mendocino and Sonoma County border (Appendix A). Phase I did not encompass Potter Valley or any portion of the East Fork, upstream of Coyote Dam. The photographs we used were published by AirPhoto USA and taken from August to September 2004. These late summer and early fall images provided a stark and effective contrast between the green color of irrigated crops and the gold and yellow colors of dry annual grasses in the surrounding oak woodlands. Using this contrast, we visually designated acreage into five crop designations: grapes; orchards; row crops; pasture; and unknown. We also made a visual determination of potentially irrigable lands for irrigated agriculture to understand future water demands base upon the slope and landscape position of the acreage analyzed. These designated crop acreages were multiplied by generally accepted and literature documented annual rates of applied water per crop for a “normal” rainfall year (DWR, 1986 and 2001).
Phase II
Phase II analysis included field evaluation of acreage assignments and irrigation system assessment on a subset of grape vineyard and pear orchard blocks to measure consumptive water use and calculate water applied for heat protection, frost protection, and post harvest. Phase II also included a grower focus group and survey to further document past and present on-farm water resource management. Potter Valley was added to the study area during Phase II.
Acreage Assignment The initial estimate of acreage by crop made in Phase I was confirmed through visual confirmation of crop designation in the field. Specifically, project team members traveled through the watershed checking and revising the crop designation of each farm and ranch. In addition, the study area was expanded to include irrigated agriculture acreage in Potter Valley and all portions of the East Fork, upstream of Coyote Dam.
Grower Focus Group and Survey A group of growers, representing a significant portion of the irrigated agriculture acreage in the study area, were invited to participate in a focus group and complete a survey (Appendix
UCCE County of Mendocino 10 Meeting Agricultural Water Needs
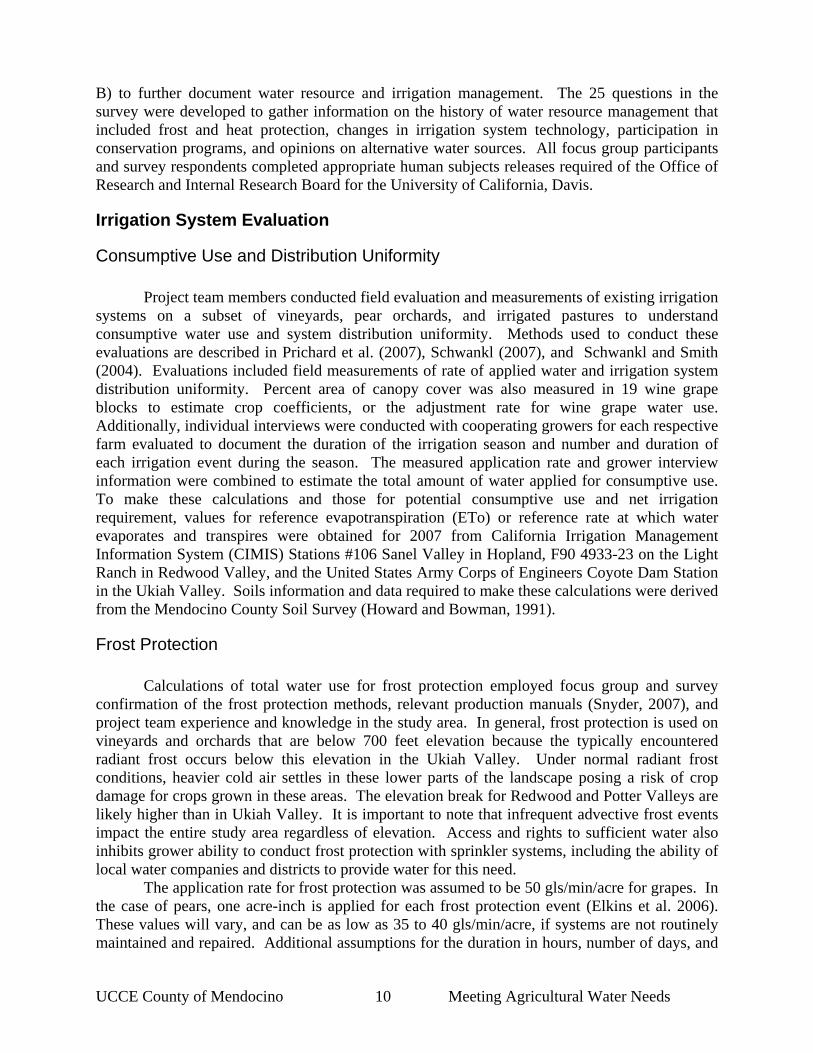
B) to further document water resource and irrigation management. The 25 questions in the survey were developed to gather information on the history of water resource management that included frost and heat protection, changes in irrigation system technology, participation in conservation programs, and opinions on alternative water sources. All focus group participants and survey respondents completed appropriate human subjects releases required of the Office of Research and Internal Research Board for the University of California, Davis.
Irrigation System Evaluation
Consumptive Use and Distribution Uniformity Project team members conducted field evaluation and measurements of existing irrigation systems on a subset of vineyards, pear orchards, and irrigated pastures to understand consumptive water use and system distribution uniformity. Methods used to conduct these evaluations are described in Prichard et al. (2007), Schwankl (2007), and Schwankl and Smith (2004). Evaluations included field measurements of rate of applied water and irrigation system distribution uniformity. Percent area of canopy cover was also measured in 19 wine grape blocks to estimate crop coefficients, or the adjustment rate for wine grape water use. Additionally, individual interviews were conducted with cooperating growers for each respective farm evaluated to document the duration of the irrigation season and number and duration of each irrigation event during the season. The measured application rate and grower interview information were combined to estimate the total amount of water applied for consumptive use. To make these calculations and those for potential consumptive use and net irrigation requirement, values for reference evapotranspiration (ETo) or reference rate at which water evaporates and transpires were obtained for 2007 from California Irrigation Management Information System (CIMIS) Stations #106 Sanel Valley in Hopland, F90 4933-23 on the Light Ranch in Redwood Valley, and the United States Army Corps of Engineers Coyote Dam Station in the Ukiah Valley. Soils information and data required to make these calculations were derived from the Mendocino County Soil Survey (Howard and Bowman, 1991).
Frost Protection Calculations of total water use for frost protection employed focus group and survey confirmation of the frost protection methods, relevant production manuals (Snyder, 2007), and project team experience and knowledge in the study area. In general, frost protection is used on vineyards and orchards that are below 700 feet elevation because the typically encountered radiant frost occurs below this elevation in the Ukiah Valley. Under normal radiant frost conditions, heavier cold air settles in these lower parts of the landscape posing a risk of crop damage for crops grown in these areas. The elevation break for Redwood and Potter Valleys are likely higher than in Ukiah Valley. It is important to note that infrequent advective frost events impact the entire study area regardless of elevation. Access and rights to sufficient water also inhibits grower ability to conduct frost protection with sprinkler systems, including the ability of local water companies and districts to provide water for this need.
The application rate for frost protection was assumed to be 50 gls/min/acre for grapes. In the case of pears, one acre-inch is applied for each frost protection event (Elkins et al. 2006). These values will vary, and can be as low as 35 to 40 gls/min/acre, if systems are not routinely maintained and repaired. Additional assumptions for the duration in hours, number of days, and
UCCE County of Mendocino 11 Meeting Agricultural Water Needs
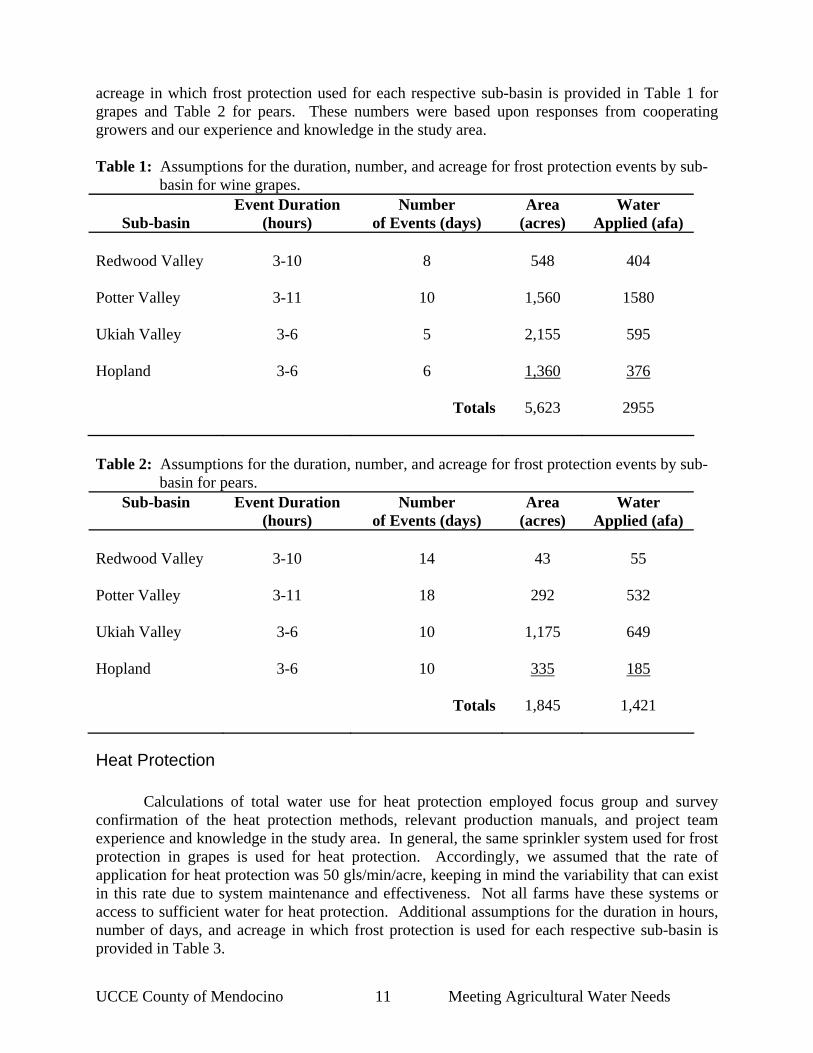
acreage in which frost protection used for each respective sub-basin is provided in Table 1 for grapes and Table 2 for pears. These numbers were based upon responses from cooperating growers and our experience and knowledge in the study area. Table 1: Assumptions for the duration, number, and acreage for frost protection events by sub-
basin for wine grapes.
Sub-basin Event Duration
(hours) Number
of Events (days) Area
(acres) Water
Applied (afa) Redwood Valley 3-10 8 548 404 Potter Valley 3-11 10 1,560 1580 Ukiah Valley 3-6 5 2,155 595 Hopland 3-6 6 1,360 376 Totals 5,623 2955 Table 2: Assumptions for the duration, number, and acreage for frost protection events by sub-
basin for pears. Sub-basin Event Duration
(hours) Number
of Events (days) Area
(acres) Water
Applied (afa) Redwood Valley 3-10 14 43 55 Potter Valley 3-11 18 292 532 Ukiah Valley 3-6 10 1,175 649 Hopland 3-6 10 335 185 Totals 1,845 1,421
Heat Protection Calculations of total water use for heat protection employed focus group and survey confirmation of the heat protection methods, relevant production manuals, and project team experience and knowledge in the study area. In general, the same sprinkler system used for frost protection in grapes is used for heat protection. Accordingly, we assumed that the rate of application for heat protection was 50 gls/min/acre, keeping in mind the variability that can exist in this rate due to system maintenance and effectiveness. Not all farms have these systems or access to sufficient water for heat protection. Additional assumptions for the duration in hours, number of days, and acreage in which frost protection is used for each respective sub-basin is provided in Table 3.
UCCE County of Mendocino 12 Meeting Agricultural Water Needs
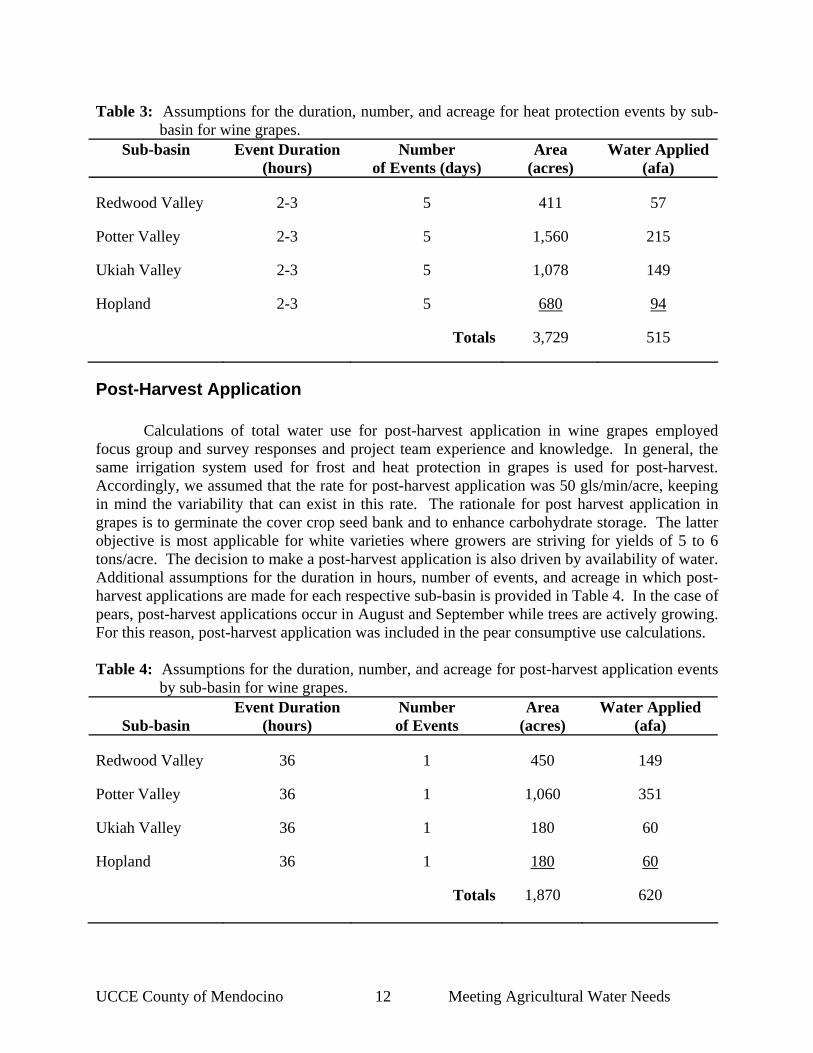
Table 3: Assumptions for the duration, number, and acreage for heat protection events by sub-
basin for wine grapes. Sub-basin Event Duration
(hours) Number
of Events (days) Area
(acres) Water Applied
(afa) Redwood Valley 2-3 5 411 57 Potter Valley 2-3 5 1,560 215 Ukiah Valley 2-3 5 1,078 149 Hopland 2-3 5 680 94 Totals 3,729 515
Post-Harvest Application Calculations of total water use for post-harvest application in wine grapes employed focus group and survey responses and project team experience and knowledge. In general, the same irrigation system used for frost and heat protection in grapes is used for post-harvest. Accordingly, we assumed that the rate for post-harvest application was 50 gls/min/acre, keeping in mind the variability that can exist in this rate. The rationale for post harvest application in grapes is to germinate the cover crop seed bank and to enhance carbohydrate storage. The latter objective is most applicable for white varieties where growers are striving for yields of 5 to 6 tons/acre. The decision to make a post-harvest application is also driven by availability of water. Additional assumptions for the duration in hours, number of events, and acreage in which post-harvest applications are made for each respective sub-basin is provided in Table 4. In the case of pears, post-harvest applications occur in August and September while trees are actively growing. For this reason, post-harvest application was included in the pear consumptive use calculations. Table 4: Assumptions for the duration, number, and acreage for post-harvest application events
by sub-basin for wine grapes.
Sub-basin Event Duration
(hours) Number of Events
Area (acres)
Water Applied (afa)
Redwood Valley 36 1 450 149 Potter Valley 36 1 1,060 351 Ukiah Valley 36 1 180 60 Hopland 36 1 180 60 Totals 1,870 620
UCCE County of Mendocino 13 Meeting Agricultural Water Needs
Results
2007 and the Historical Record
Long-term measurements of stream discharge by the United States Geological Survey (USGS) provide a historical record and context for 2007 and this study. To build this context, data from the following stream gauging stations was compiled and analyzed: • Russian River near Ukiah Station #11461000 • East Fork of Russian River near Ukiah, California Station # 11462000 • Russian River near Hopland, California Station #11462500
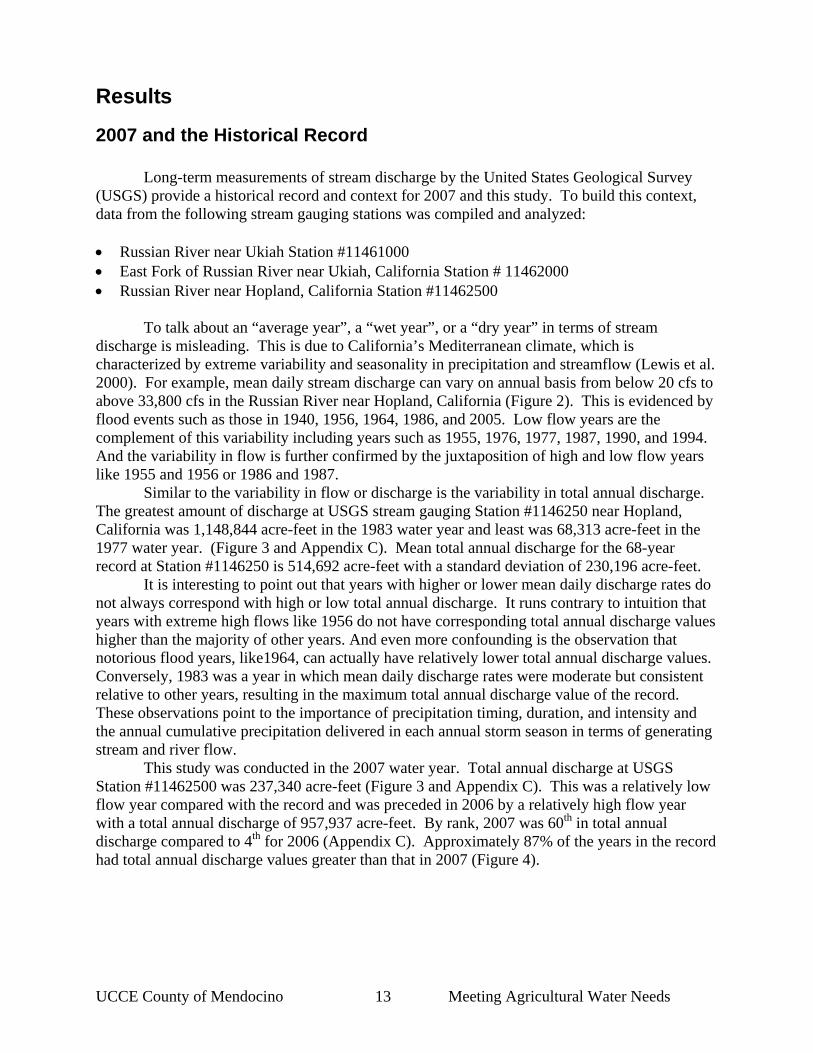
To talk about an “average year”, a “wet year”, or a “dry year” in terms of stream
discharge is misleading. This is due to California’s Mediterranean climate, which is characterized by extreme variability and seasonality in precipitation and streamflow (Lewis et al. 2000). For example, mean daily stream discharge can vary on annual basis from below 20 cfs to above 33,800 cfs in the Russian River near Hopland, California (Figure 2). This is evidenced by flood events such as those in 1940, 1956, 1964, 1986, and 2005. Low flow years are the complement of this variability including years such as 1955, 1976, 1977, 1987, 1990, and 1994. And the variability in flow is further confirmed by the juxtaposition of high and low flow years like 1955 and 1956 or 1986 and 1987.
Similar to the variability in flow or discharge is the variability in total annual discharge. The greatest amount of discharge at USGS stream gauging Station #1146250 near Hopland, California was 1,148,844 acre-feet in the 1983 water year and least was 68,313 acre-feet in the 1977 water year. (Figure 3 and Appendix C). Mean total annual discharge for the 68-year record at Station #1146250 is 514,692 acre-feet with a standard deviation of 230,196 acre-feet.
It is interesting to point out that years with higher or lower mean daily discharge rates do not always correspond with high or low total annual discharge. It runs contrary to intuition that years with extreme high flows like 1956 do not have corresponding total annual discharge values higher than the majority of other years. And even more confounding is the observation that notorious flood years, like1964, can actually have relatively lower total annual discharge values. Conversely, 1983 was a year in which mean daily discharge rates were moderate but consistent relative to other years, resulting in the maximum total annual discharge value of the record. These observations point to the importance of precipitation timing, duration, and intensity and the annual cumulative precipitation delivered in each annual storm season in terms of generating stream and river flow.
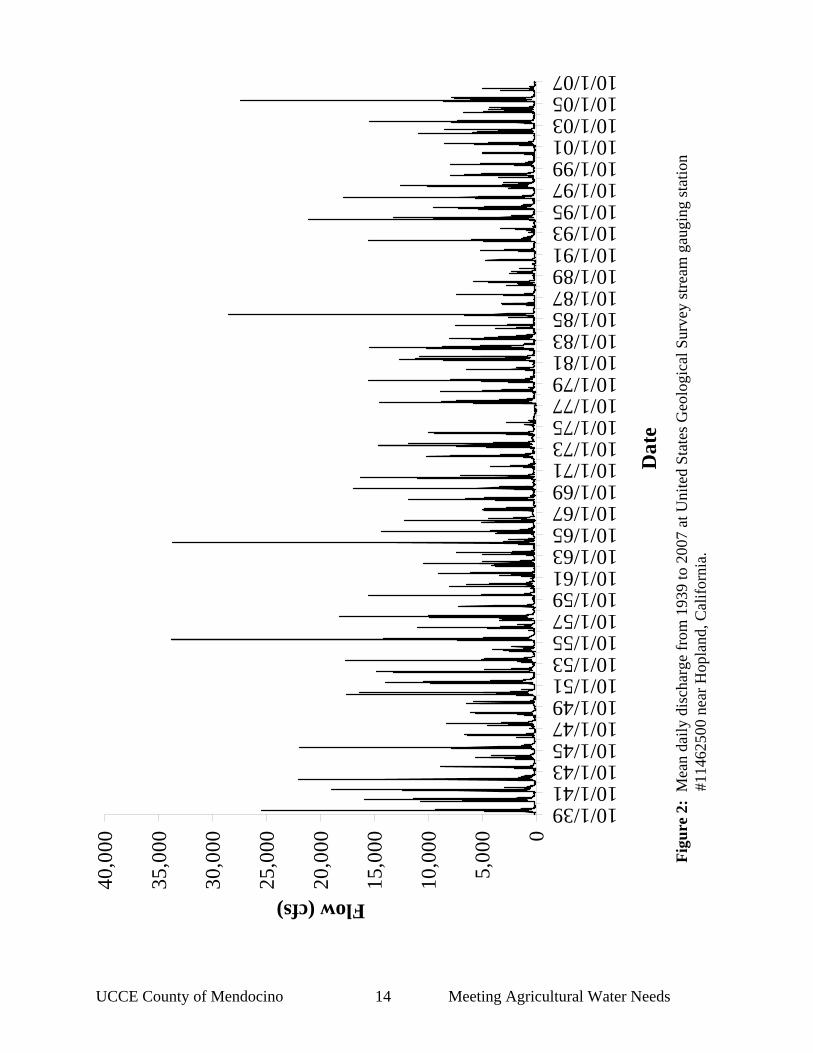
This study was conducted in the 2007 water year. Total annual discharge at USGS Station #11462500 was 237,340 acre-feet (Figure 3 and Appendix C). This was a relatively low flow year compared with the record and was preceded in 2006 by a relatively high flow year with a total annual discharge of 957,937 acre-feet. By rank, 2007 was 60th in total annual discharge compared to 4th for 2006 (Appendix C). Approximately 87% of the years in the record had total annual discharge values greater than that in 2007 (Figure 4).
UCCE County of Mendocino 14 Meeting Agricultural Water Needs
0
5,00
0
10,0
00
15,0
00
20,0
00
25,0
00
30,0
00
35,0
00
40,0
00
10/1/3910/1/4110/1/4310/1/4510/1/4710/1/4910/1/5110/1/5310/1/5510/1/5710/1/5910/1/6110/1/6310/1/6510/1/6710/1/6910/1/7110/1/7310/1/7510/1/7710/1/7910/1/8110/1/8310/1/8510/1/8710/1/8910/1/9110/1/9310/1/9510/1/9710/1/9910/1/0110/1/0310/1/0510/1/07
Dat
e
Flow (cfs)
Figu
re 2
: M
ean
daily
dis
char
ge fr
om 1
939
to 2
007
at U
nite
d St
ates
Geo
logi
cal S
urve
y st
ream
gau
ging
stat
ion
#114
6250
0 ne
ar H
opla
nd, C
alifo
rnia
.

UCCE County of Mendocino 15 Meeting Agricultural Water Needs
0
200,
000
400,
000
600,
000
800,
000
1,00
0,00
0
1,20
0,00
0
1,40
0,00
0
19401941194219431944194519461947194819491950195119521953195419551956195719581959196019611962196319641965196619671968196919701971197219731974197519761977197819791980198119821983198419851986198719881989199019911992199319941995199619971998199920002001200220032004200520062007
Yea
r
Annual Discharge (acre-feet)
Figu
re 3
: To
tal a
nnua
l dis
char
ge fr
om 1
939
to 2
007
at U
nite
d St
ates
Geo
logi
cal S
urve
y st
ream
gau
ging
stat
ion
#114
6250
0 ne
ar H
o pla
nd. C
alifo
rnia
.
UCCE County of Mendocino 16 Meeting Agricultural Water Needs
020406080100
120
020
0,00
040
0,00
060
0,00
080
0,00
01,
000,
000
1,20
0,00
01,
400,
000
Tot
al A
nnua
l Dis
char
ge (a
fa)
Years greater than (%)
2007
1983
1977
2006
Figu
re 4
: Fr
eque
ncy
dist
ribut
ion
of to
tal a
nnua
l dis
char
ge (a
cre-
feet
) in
the
Rus
sian
Riv
er fr
om th
e 19
40 to
the
2007
wat
er y
ear a
t the
Uni
ted
Stat
es G
eolo
gica
l Sur
vey
stre
am g
augi
ng st
atio
n #1
1462
500
near
H
opla
nd, C
alifo
rnia
.
UCCE County of Mendocino 17 Meeting Agricultural Water Needs
Phase I
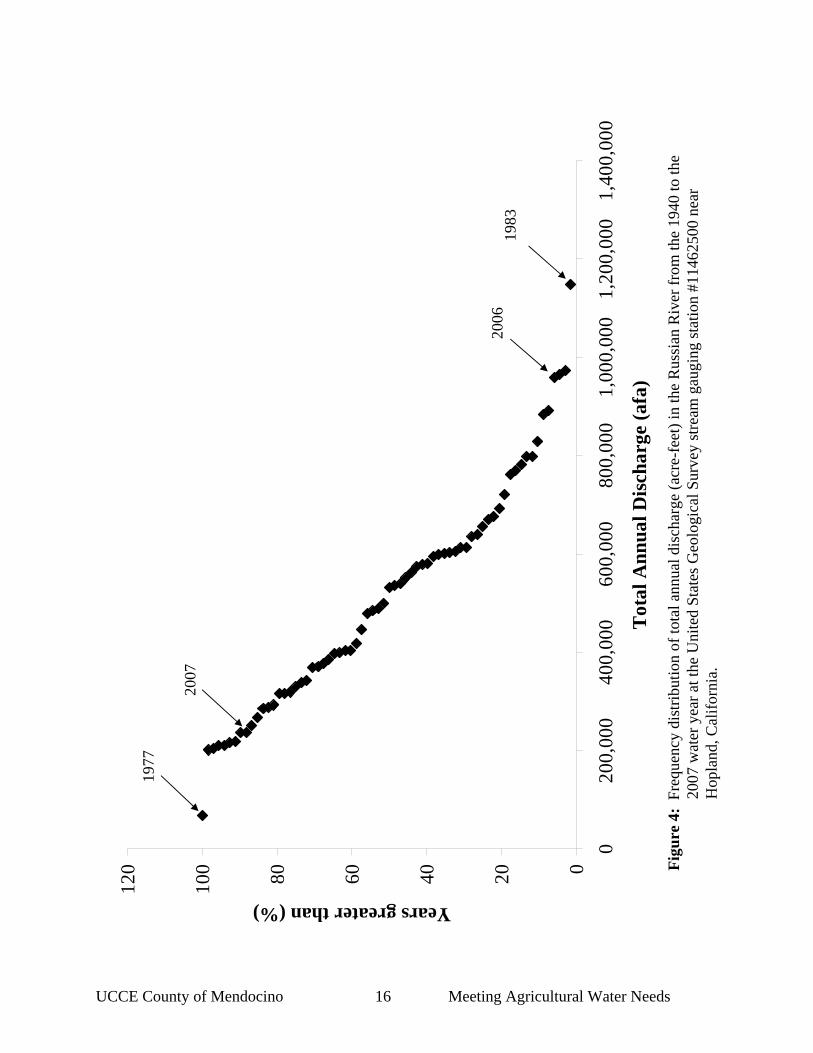
Phase I estimates of water use by irrigated agriculture totaled 16,984 acre-feet for an estimated 16,031 acres of irrigated agriculture, excluding Potter Valley and the East Fork, upstream of Coyote Dam (Table 5). Adding the additional 524 acres of potentially irrigable land increased the initial estimate of water use to 17,770 acre-feet. Table 5: Phase I estimates of current acreage and water demand by crop type in the Mendocino
County portion of the Russian River Watershed. Acreage Water Demand
Crop Upper Middle Lower Totals*Rate (af/ac)
% Irrigated
Annual Total (afa)
Grapes 3,987 9,615 106 13,708 1.0 90 12,337Orchards 126 1,543 0 1,669 2.0 100 3,338Pastures 242 92 124 458 2.0 100 916Row Crops 0 9 0 9 2.0 100 19Unidentified 185 2 0 187 2.0 100 374
Subtotals 4,540 11,261 230 16,031 16,984
Potentially Irrigable Lands
278 246 0 524 1.5 100 786
Totals 4,818 11,507 230 16,555 17,770
Note: * Based upon California Department of Water Resources values (DWR, 1986 and DWR, 2001).
Phase II
Evaluation of Acreage and Crop Designations Irrigated agriculture in the Mendocino County portion of the Russian River watershed totals approximately 20,614 acres (Table 6). Grapes make up 77 % of this value followed by irrigated pasture, pears, and less than 1% in other vegetable and unconfirmed crops. Over 10,400 acres are below and 5,680 acres above 700 feet of elevation. There are also 517 acres of land that could be put into irrigated agriculture within the study area, representing a potential increase of 2.6 % over current estimates.

UCCE County of Mendocino 18 Meeting Agricultural Water Needs
Table 6: Acreage of irrigated agriculture in the Mendocino County portion of the Russian River watershed by crop and sub-basin (Difference in subtotals of results from rounding values).
Crop Redwood
Valley Potter Valley
Ukiah Valley
Hopland Valley Subtotals
Grapes 3,048 1,828 5,808 4,856 15,539Pasture 219 2,607 105 213 3,144Pears 43 292 1,175 335 1,845Other 12 4 10 0 26Unidentified 60 0 0 0 60
Subtotals 3,382 4,731 7,098 5,403 20,614
Potential 122 5 230 160 517
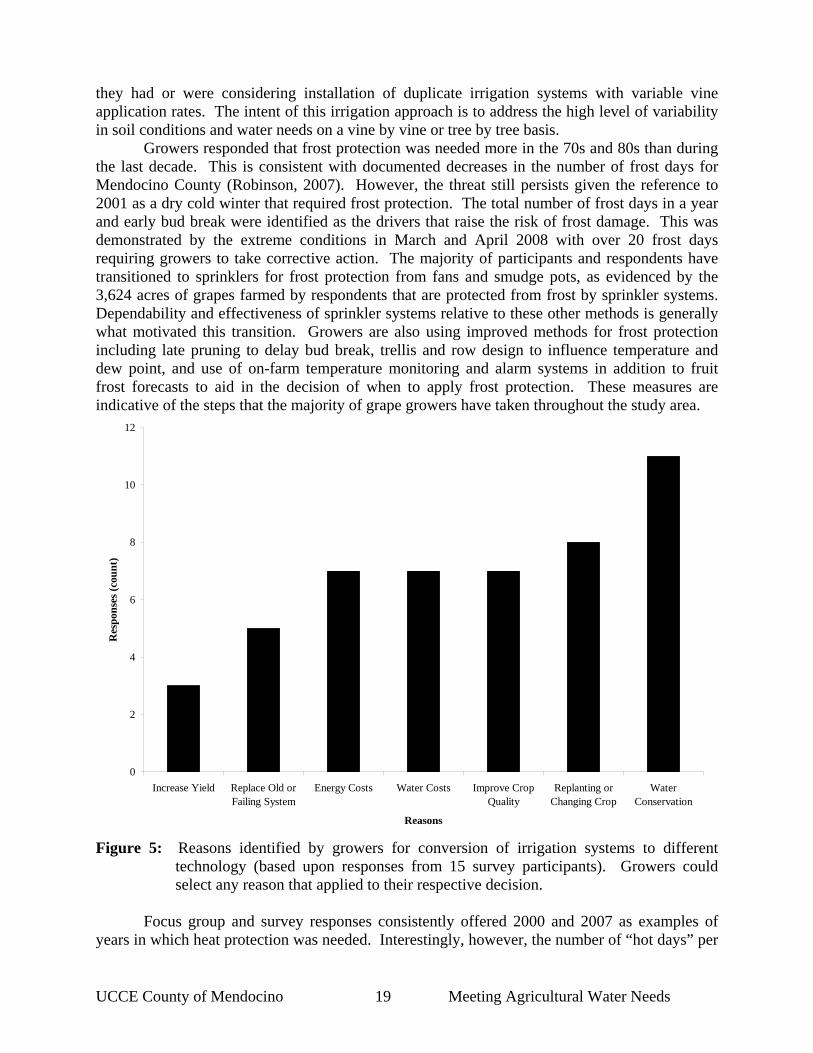
Grower Focus Group and Survey A total of 11 grape and pear growers attended grower focus groups to participate in discussions and complete a guided survey on water resources and irrigation management in the study area. Four additional farmers completed the survey but did not participate in a focus group. Combined these participants and respondents have over 480 years of experience in irrigating crops in the study area. Individual experience ranged from 12 to 50 years. Participants and respondents included growers from Redwood, Potter, Ukiah, and Hopland Valleys. Responses from the survey and focus group represent the perception and experience of the participating growers at that point in time. They farm a combined acreage of 6,415 acres. This includes 3,875 acres of grapes, 420 acres of pears, 128 acres of irrigated pasture, and 33 acres in other crops for a total of 4,456 acres of irrigated lands. This is approximately 22% of the irrigated agriculture acreage identified in the study area encompassing the cultural practices currently employed by growers within the same area. Accordingly, the responses and input from these growers is representative of current state of operation for irrigated agriculture in Mendocino County. Survey and focus group responses provide an anecdotal description of the history of water resource management during the last four decades. Growers consistently identified 1977, 2002, and 2007 as years in which meeting crop consumptive use was difficult. Low rainfall years and low stream flow were the two most frequently identified conditions that contribute to this problem. Paralleling this history is documentation that conversion from impact sprinklers or other systems to drip irrigation for grapes and below canopy sprinklers for pears began in the 70s with near full conversion obtained by the 90s. Thirteen of the 15 survey respondents had changed their irrigation systems citing multiple reasons for these conversions (Figure 5). The most commonly cited reason was water conservation and the least identified reason was to increase yield. Evidence of this conversion is that 3,494 acres or 90% of the total grape acreage farmed by respondents is irrigated with drip irrigation systems. Extrapolation of this system conversion to the entire acreage of grapes grown in the study area indicates that significant savings in water use has already been made. Additionally, more than one participant indicated
UCCE County of Mendocino 19 Meeting Agricultural Water Needs
they had or were considering installation of duplicate irrigation systems with variable vine application rates. The intent of this irrigation approach is to address the high level of variability in soil conditions and water needs on a vine by vine or tree by tree basis.
Growers responded that frost protection was needed more in the 70s and 80s than during the last decade. This is consistent with documented decreases in the number of frost days for Mendocino County (Robinson, 2007). However, the threat still persists given the reference to 2001 as a dry cold winter that required frost protection. The total number of frost days in a year and early bud break were identified as the drivers that raise the risk of frost damage. This was demonstrated by the extreme conditions in March and April 2008 with over 20 frost days requiring growers to take corrective action. The majority of participants and respondents have transitioned to sprinklers for frost protection from fans and smudge pots, as evidenced by the 3,624 acres of grapes farmed by respondents that are protected from frost by sprinkler systems. Dependability and effectiveness of sprinkler systems relative to these other methods is generally what motivated this transition. Growers are also using improved methods for frost protection including late pruning to delay bud break, trellis and row design to influence temperature and dew point, and use of on-farm temperature monitoring and alarm systems in addition to fruit frost forecasts to aid in the decision of when to apply frost protection. These measures are indicative of the steps that the majority of grape growers have taken throughout the study area.
0
2
4
6
8
10
12
Increase Yield Replace Old orFailing System
Energy Costs Water Costs Improve CropQuality
Replanting orChanging Crop
WaterConservation
Reasons
Res
pons
es (c
ount
)
Figure 5: Reasons identified by growers for conversion of irrigation systems to different
technology (based upon responses from 15 survey participants). Growers could select any reason that applied to their respective decision.
Focus group and survey responses consistently offered 2000 and 2007 as examples of
years in which heat protection was needed. Interestingly, however, the number of “hot days” per

UCCE County of Mendocino 20 Meeting Agricultural Water Needs
year has decreased over the last five decades (Robinson, 2007). The five group participants and survey respondents that conduct overhead sprinkler heat suppression explained that they have transitioned to pulsing to protect crops. The approach used is to turn the irrigation system on for an hour and off for two hours, repeating this cycle two to three times during the span of the day when air temperatures are at or above 100°F. This method was accounted for in the estimates of water use for heat protection. Additional comments shared by participants and respondents included energy costs as disincentive to operate their irrigation systems for heat protection. Responses indicate that growers use a diversity of information sources, and 12 of the participants and respondents have participated in conservation programs including the Natural Resources Conservation Service Environmental Quality Incentives Program, UCCE Water Quality Planning, and Fish Friendly Farming. The reasons for participating in such programs that had the greatest number of “very important” responses included natural resource stewardship, lower farm costs for energy and water, and personal values and beliefs (Figure 6). The reason with the greatest number of “not important responses” was to provide water for urban growth and development.
0
2
4
6
8
10
12
Tax
Reb
ates
and
Ince
ntiv
es
Prov
ide
for
Dev
elop
men
t
Mar
ketin
g an
d C
rop
Prem
ium
Mai
ntai
n St
ream
Flow
s for
Hab
itat
Low
er W
ater
Cos
ts
Com
ply
With
Reg
ulat
ions
Pers
onal
Val
ues a
ndB
elie
fs
Low
er E
nerg
y C
osts
Nat
ural
Res
ourc
eSt
ewar
dshi
p
Obstacles
Res
pons
e(co
unts
)
Not ImportantSomewhat ImportantVery Important
Figure 6: Indication of importance for reasons growers would participate in on-farm water
conservation (based upon responses from 15 survey participants).
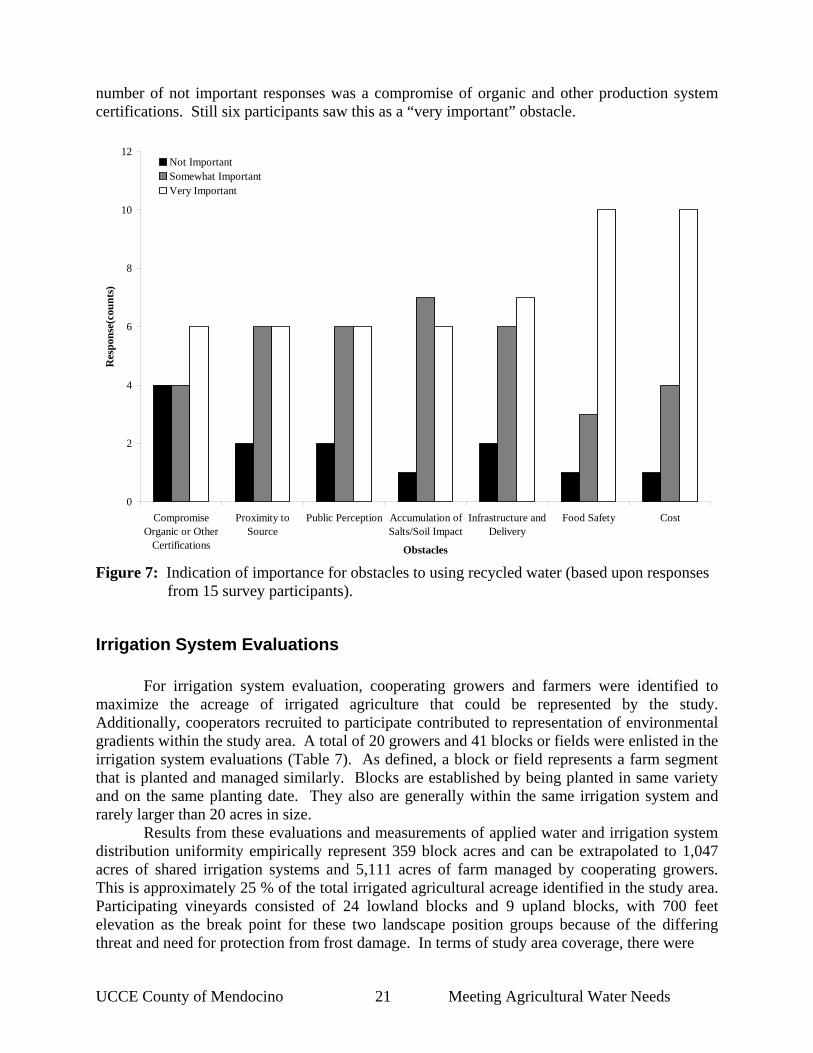
Regarding the use of recycled or treated waste water, 12 participants and respondents indicated they would be willing to use such water for crop irrigation. All the obstacles to such sources of water that were discussed were consistently identified as very important (Figure 7). The two highest ranked obstacles were food safety and costs. The obstacle with the greatest
UCCE County of Mendocino 21 Meeting Agricultural Water Needs
number of not important responses was a compromise of organic and other production system certifications. Still six participants saw this as a “very important” obstacle.
0
2
4
6
8
10
12
CompromiseOrganic or Other
Certifications
Proximity toSource
Public Perception Accumulation ofSalts/Soil Impact
Infrastructure andDelivery
Food Safety Cost
Obstacles
Res
pons
e(co
unts
)
Not ImportantSomewhat ImportantVery Important
Figure 7: Indication of importance for obstacles to using recycled water (based upon responses
from 15 survey participants).
Irrigation System Evaluations For irrigation system evaluation, cooperating growers and farmers were identified to maximize the acreage of irrigated agriculture that could be represented by the study. Additionally, cooperators recruited to participate contributed to representation of environmental gradients within the study area. A total of 20 growers and 41 blocks or fields were enlisted in the irrigation system evaluations (Table 7). As defined, a block or field represents a farm segment that is planted and managed similarly. Blocks are established by being planted in same variety and on the same planting date. They also are generally within the same irrigation system and rarely larger than 20 acres in size.
Results from these evaluations and measurements of applied water and irrigation system distribution uniformity empirically represent 359 block acres and can be extrapolated to 1,047 acres of shared irrigation systems and 5,111 acres of farm managed by cooperating growers. This is approximately 25 % of the total irrigated agricultural acreage identified in the study area. Participating vineyards consisted of 24 lowland blocks and 9 upland blocks, with 700 feet elevation as the break point for these two landscape position groups because of the differing threat and need for protection from frost damage. In terms of study area coverage, there were

UCCE County of Mendocino 22 Meeting Agricultural Water Needs
Table 7: Summary of the number of growers and blocks or pastures enlisted in irrigation system evaluation, and the corresponding percentage of acreage by crop that these farms represent of the total irrigated acreage in the study area for each respective crop.
Acreage Crop Growers No. of Blocks Block Irrigation
System Total
Grapes 15 33 300 (2%) 926 (6%) 4,681 (30%) Pears 4 7 58 (3%) 120 (7%) 426 (24%) Pasture 1 1 1 (<1%) 1 (<1%) 4 (<1%) four wine grape blocks evaluated in Redwood Valley, 14 in Ukiah Valley, six in the Hopland area, and three in Potter Valley. Blocks for pear orchards were evaluated in both Potter and Ukiah Valleys. Accordingly, as a group they represent the current state of grape and pear production within the study area affording broader extrapolation of the results to the entire irrigated agricultural acreage in those two crops.
Only one irrigated pasture was evaluated. This limits fuller extrapolation. As a result, we consulted the literature and gathered input from local pasture farmers and water purveyors that provide water to them.
Distribution Uniformity System distribution uniformity evaluated in grape vineyards and pear orchards was very good with averages above 85% (Table 8). In some cases it was even above 95%. There were instances wherein it was poor with values below 65%. System uniformity was not measured for the irrigated pasture that was evaluated. Table 8: Summary results for irrigation system uniformity in grape vineyards and pear orchards.
Crop Mean Standard Deviation
Minimum Maximum
Grapes (n=33) 88.8 7.5 64.3 96.0 Pears (n=7) 88.4 5.5 81.9 94.3
Consumptive Use Calculated values for water applied to meet crop consumptive use differed by crop (Table 9). On average grapes receive less than one af/acre while pears receive more than two af/acre. The value for grapes is similar to the 0.6 af/acre/year application rate determined through

UCCE County of Mendocino 23 Meeting Agricultural Water Needs
Table 9: Summary of water applied (acre-feet per annum) to meet consumptive use for wine grapes and pears.
Crop Mean (afa) Standard Deviation Minimum Maximum Grapes (n=33) 0.61 0.25 0.19 1.31 Pears (n=7) 2.31 0.81 1.42 3.44 interviews with growers in Alexander Valley (Wagner & Bonsignore, 2006). Additionally, the range of water applied for consumptive use for pears is greater than that for grapes. For the one irrigated pasture we evaluated the estimate of applied water to meet consumptive use was 3.31 acre-feet. This is inconsistent with estimated amounts needed for irrigation of pastures in the Central Valley of California (Fulton et al. 2007). It is also consistent with an average use of 4.13 af/ac/yr documented by the Potter Valley Irrigation District (PVID, 2008). Measured ETo was consistently highest at Coyote Dam followed by the Light Ranch in Redwood Valley and Sanel Valley site near Hopland (Figure 8). This translated to total annual ETo of 58.77, 52.26, and 51.85 inches, respectively. Potential consumptive use and net irrigation requirement calculations used cumulative weekly ETo values from July 1 to November 4, 2007. Total ETo for this time period was 28.98, 25.63, and 22.93 inches for Coyote Dam, Light Ranch, and Sanel Valley, respectively.
Figure 8: Cumulative weekly evapotranspiration (inches) in 2007. Canopy shade averaged 40.6% (SD=9.2) in the 19 grapes blocks in which it was measured, equating to an average crop coefficient of 0.69 (SD=0.16). Combining these
0.00
0.50
1.00
1.50
2.00
2.50
3.00
1/1/07 1/31/07 3/2/07 4/1/07 5/1/07 5/31/07 6/30/07 7/30/07 8/29/07 9/28/07 10/28/07 11/27/07 12/27/07
Date
Cum
ulat
ive
Wee
kly
ET
o (in
ches
)
Light RanchCoyote DamSanel Valley

UCCE County of Mendocino 24 Meeting Agricultural Water Needs
respective crop coefficient estimates with ETo values, and an assumed soil contribution of 1.5 acre-inches for upland sites with shallow soils and 2.5 acre-inches for lowland sites with deeper soils to meet consumptive use from July 1 to November 4, 2007, resulted in potential consumptive use values from 0.7 to 1.8 acre-feet (Figure 9). This is the estimated value required of the vine to produce an acceptable yield. Calculations of net irrigation requirement, excluding any reductions from regulated deficit irrigation (RDI), ranged from 0.5 to 1.6 acre-feet. This is the anticipated amount needed to meet the potential consumptive use minus the amount provided by soil moisture content. The actual amount of water applied to meet consumptive use was less than the net irrigation requirement in all but one of the 19 studied blocks. In the most extreme case net irrigation requirement equaled 1.4 acre-feet and water applied equaled 0.34 acre-feet or a 76% difference.
Figure 9: Range of calculated values for potential consumptive use (white bars), net irrigation requirement (gray bars), and applied water (black bars) for 19 wine grape blocks during the 2007 growing season. Results organized from least to greatest potential consumptive use values.
Applied water to meet consumptive use decreased significantly (p<0.01) with increases in available water capacity in the first 3.3 feet (1 meter) of soil, based upon values from the Mendocino County Soil Survey (Howard and Bowman, 1991). This finding illustrates that growers are applying water to meet crop needs based upon an understanding of site specific soil water contributions to meet that demand. This relationship was stronger in upland blocks compared to lowland blocks (Figure 10). Incidentally, the average applied amount for upland
0
0.2
0.4
0.6
0.8
1
1.2
1.4
1.6
1.8
2
1 2 3 4 5 6 7 8 9 10 11 12 13 14 15 16 17 18 19
Wine Grape Block
Wat
er (a
cre-
feet
)
Potential Consumptive UseNet Irrigation RequirementApplied Water

UCCE County of Mendocino 25 Meeting Agricultural Water Needs
Figure 10: Applied water (inches) to meet consumptive use as a function of soil available water
capacity for upland (top) and lowland (bottom) wine grape blocks.
y = -0.03x + 1.10R2 = 0.19
0
0.2
0.4
0.6
0.8
1
1.2
1.4
0 1 2 3 4 5 6 7 8Soil Available Water Capacity (inches/3.3 feet)
App
lied
Wat
er (a
cre-
foot
/acr
e)
y = -0.09x + 0.96R2 = 0.51
0
0.2
0.4
0.6
0.8
1
1.2
1.4A
pplie
d W
ater
(acr
e-fo
ot/a
cre)
UCCE County of Mendocino 26 Meeting Agricultural Water Needs
blocks was 0.49 acre-feet (SD = 0.10, n = 9) compared with 0.65 acre-feet (SD = 0.27, n = 24) for lowland blocks. In general, red varieties are grown in the uplands and have smaller vines, less crop, and less canopy than the white varieties grown in the lowlands.
Water application for consumptive use was not significantly different statistically for white and red varieties. This is likely because of the influence soil water holding capacity and landscape position have on variety selection. White varieties are grown on deep lowland soils with higher water holding capacity than upland soils. Red varieties are grown on thin upland soils with lower water holding capacity. White varieties require more water than red varieties because of yield objectives. However, a greater amount is provided by the soils where white varieties are cultivated. Conversely, red varieties require less water than whites, but this requirement is less met by available soil water requiring more irrigation. The result is that the amount of water applied for the two varietal groups and landscape positions converge.

UCCE County of Mendocino 27 Meeting Agricultural Water Needs
Frost Protection Estimates of the water needed to provide for maximum frost protection totaled 4,376 acre-feet (Table 10). Calculations are based on the assumptions presented in Tables 1 and 2. On a frost event basis, we estimate that approximately 402 af are needed for wine grapes and 117 af are needed for pears. This is the next greatest use of water for irrigated agriculture crop production after consumptive use. How much of this water makes it back to the stream and river system either as surface or subsurface flow is not clear. Conjecture is that this water at least contributes to increases in soil available water that vines and trees use later in the year when temperatures warm and fuller canopies are established. Saturation of underlying soils and generation of surface runoff or subsurface flow will be dependent upon the number of days of frost protection and the amount of water applied.
Heat Protection Estimates of the water needed to provide for maximum heat protection totaled 515 acre-feet (Table 10). Calculations are based upon the assumptions presented in Table 3. In general, heat protection is done where there is a sprinkler irrigation system and where the grower has access and rights to sufficient water.
Post Harvest Application Estimates of water needed to provide for post-harvest applications in wine grapes totaled 620 acre-feet (Table 10). Post-harvest application for pears is included in consumptive use because of the stage of growth the crop is at when these applications are made in August and September. Calculations are based upon the assumptions in Table 4. In general, post-harvest application is done in vineyards with white fruit that has overhead sprinklers and that are cropped at five to six tons/acre, double the cropping level of red varieties.
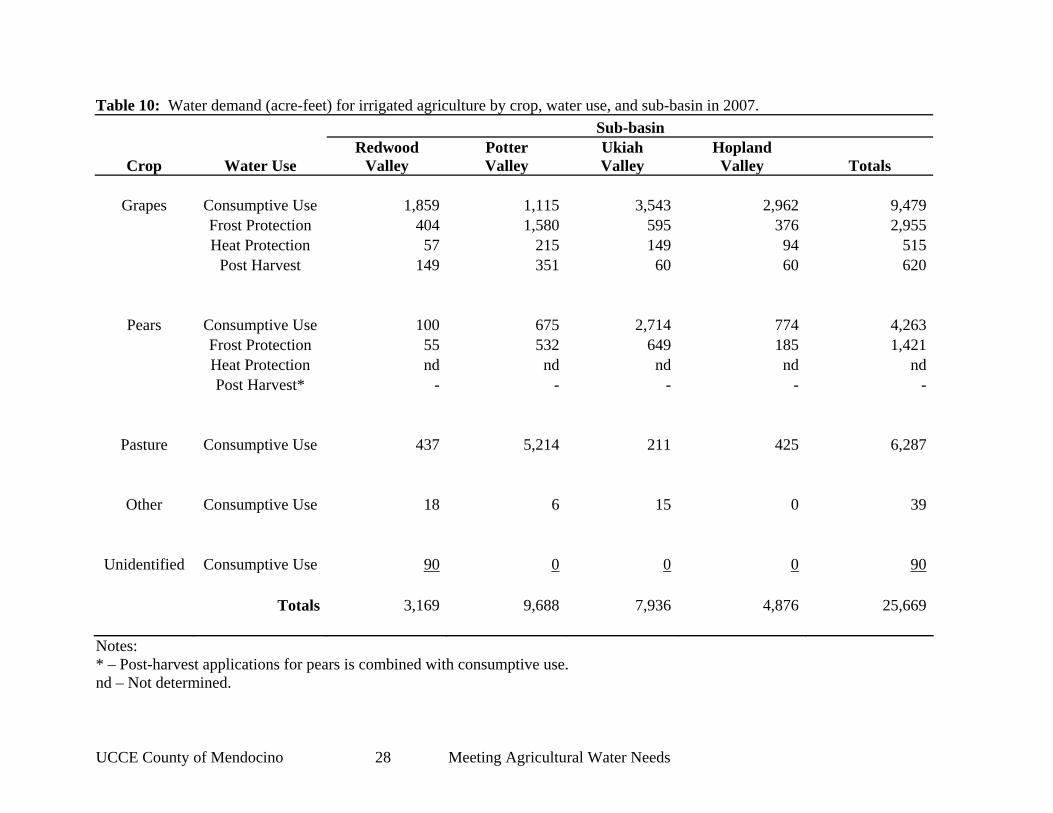
Water Demand The results for acreage determination, irrigation system evaluation, growers’ focus group and survey, and calculations of frost and heat protection and post-harvest application were combined to make the Phase II and final estimate of annual water use for irrigated agriculture in the study area (Table 10). The estimate of 25,669 acre-feet presented in Table 10 represents a scenario that includes 4,891 acre-feet needed to provide frost and heat protection for all crops and an additional 620 acre-feet for post harvest applications in grape vineyards. A year in which these protections and applications are not needed or made will experience a reduction in the use of water by irrigated agriculture to approximately 20,778 acre-feet.
.
UCCE County of Mendocino 28 Meeting Agricultural Water Needs
Table 10: Water demand (acre-feet) for irrigated agriculture by crop, water use, and sub-basin in 2007. Sub-basin
Crop Water Use Redwood
Valley Potter Valley
Ukiah Valley
Hopland Valley Totals
Grapes Consumptive Use 1,859 1,115 3,543 2,962 9,479
Frost Protection 404 1,580 595 376 2,955 Heat Protection 57 215 149 94 515 Post Harvest 149 351 60 60 620
Pears Consumptive Use 100 675 2,714 774 4,263 Frost Protection 55 532 649 185 1,421 Heat Protection nd nd nd nd nd Post Harvest* - - - - -
Pasture Consumptive Use 437 5,214 211 425 6,287
Other Consumptive Use 18 6 15 0 39
Unidentified Consumptive Use 90 0 0 0 90 Totals 3,169 9,688 7,936 4,876 25,669
Notes: * – Post-harvest applications for pears is combined with consumptive use. nd – Not determined.
UCCE County of Mendocino 29 Meeting Agricultural Water Needs
Discussion
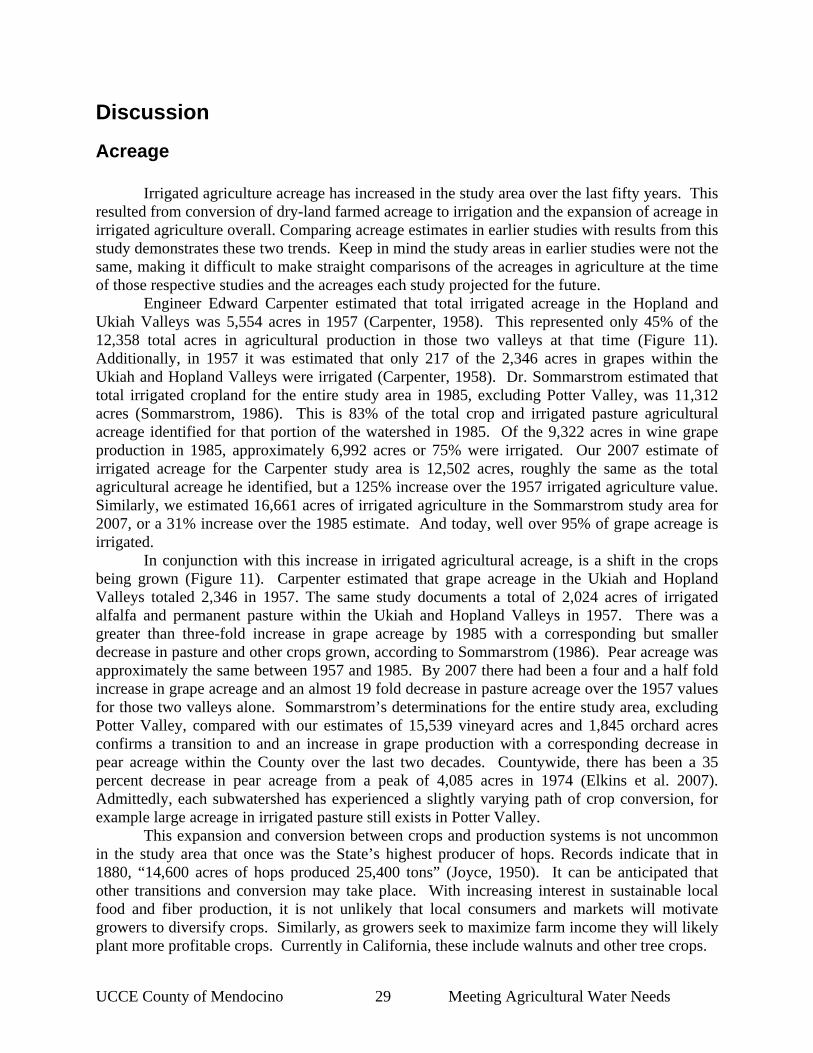
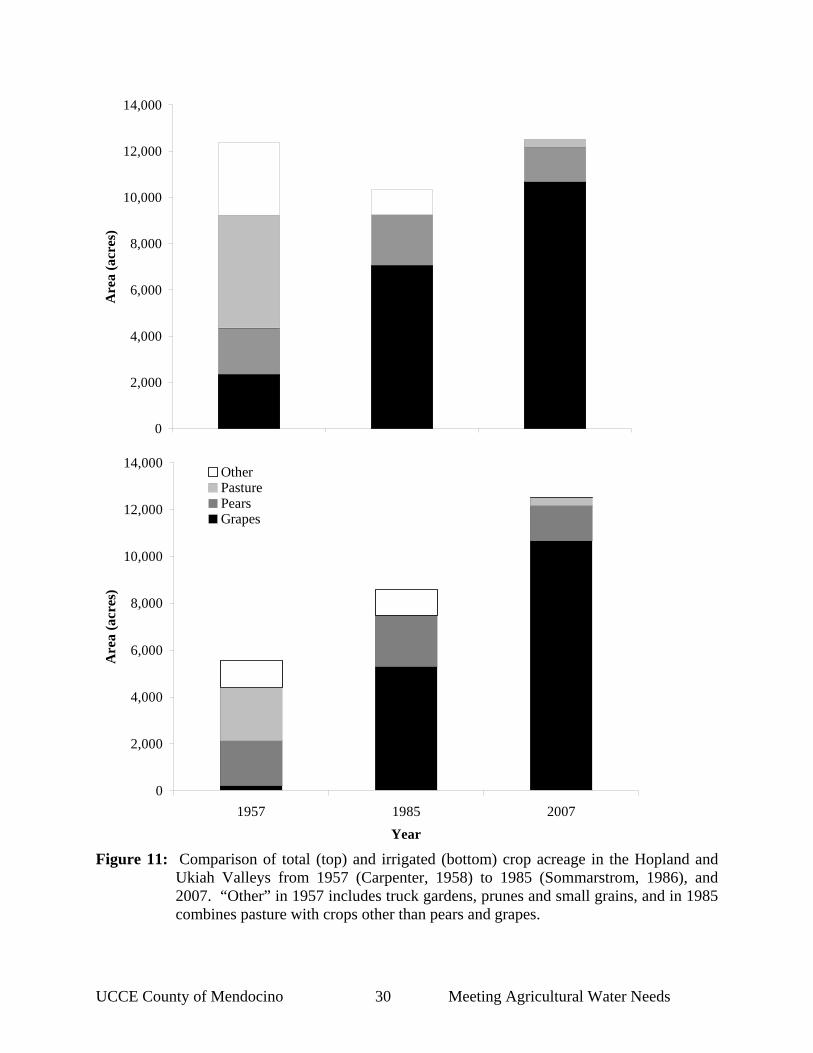
Acreage Irrigated agriculture acreage has increased in the study area over the last fifty years. This resulted from conversion of dry-land farmed acreage to irrigation and the expansion of acreage in irrigated agriculture overall. Comparing acreage estimates in earlier studies with results from this study demonstrates these two trends. Keep in mind the study areas in earlier studies were not the same, making it difficult to make straight comparisons of the acreages in agriculture at the time of those respective studies and the acreages each study projected for the future.
Engineer Edward Carpenter estimated that total irrigated acreage in the Hopland and Ukiah Valleys was 5,554 acres in 1957 (Carpenter, 1958). This represented only 45% of the 12,358 total acres in agricultural production in those two valleys at that time (Figure 11). Additionally, in 1957 it was estimated that only 217 of the 2,346 acres in grapes within the Ukiah and Hopland Valleys were irrigated (Carpenter, 1958). Dr. Sommarstrom estimated that total irrigated cropland for the entire study area in 1985, excluding Potter Valley, was 11,312 acres (Sommarstrom, 1986). This is 83% of the total crop and irrigated pasture agricultural acreage identified for that portion of the watershed in 1985. Of the 9,322 acres in wine grape production in 1985, approximately 6,992 acres or 75% were irrigated. Our 2007 estimate of irrigated acreage for the Carpenter study area is 12,502 acres, roughly the same as the total agricultural acreage he identified, but a 125% increase over the 1957 irrigated agriculture value. Similarly, we estimated 16,661 acres of irrigated agriculture in the Sommarstrom study area for 2007, or a 31% increase over the 1985 estimate. And today, well over 95% of grape acreage is irrigated. In conjunction with this increase in irrigated agricultural acreage, is a shift in the crops being grown (Figure 11). Carpenter estimated that grape acreage in the Ukiah and Hopland Valleys totaled 2,346 in 1957. The same study documents a total of 2,024 acres of irrigated alfalfa and permanent pasture within the Ukiah and Hopland Valleys in 1957. There was a greater than three-fold increase in grape acreage by 1985 with a corresponding but smaller decrease in pasture and other crops grown, according to Sommarstrom (1986). Pear acreage was approximately the same between 1957 and 1985. By 2007 there had been a four and a half fold increase in grape acreage and an almost 19 fold decrease in pasture acreage over the 1957 values for those two valleys alone. Sommarstrom’s determinations for the entire study area, excluding Potter Valley, compared with our estimates of 15,539 vineyard acres and 1,845 orchard acres confirms a transition to and an increase in grape production with a corresponding decrease in pear acreage within the County over the last two decades. Countywide, there has been a 35 percent decrease in pear acreage from a peak of 4,085 acres in 1974 (Elkins et al. 2007). Admittedly, each subwatershed has experienced a slightly varying path of crop conversion, for example large acreage in irrigated pasture still exists in Potter Valley.
This expansion and conversion between crops and production systems is not uncommon in the study area that once was the State’s highest producer of hops. Records indicate that in 1880, “14,600 acres of hops produced 25,400 tons” (Joyce, 1950). It can be anticipated that other transitions and conversion may take place. With increasing interest in sustainable local food and fiber production, it is not unlikely that local consumers and markets will motivate growers to diversify crops. Similarly, as growers seek to maximize farm income they will likely plant more profitable crops. Currently in California, these include walnuts and other tree crops.
UCCE County of Mendocino 30 Meeting Agricultural Water Needs
Figure 11: Comparison of total (top) and irrigated (bottom) crop acreage in the Hopland and Ukiah Valleys from 1957 (Carpenter, 1958) to 1985 (Sommarstrom, 1986), and 2007. “Other” in 1957 includes truck gardens, prunes and small grains, and in 1985 combines pasture with crops other than pears and grapes.
0
2,000
4,000
6,000
8,000
10,000
12,000
14,000
1957 1985 2007
Are
a (a
cres
)
0
2,000
4,000
6,000
8,000
10,000
12,000
14,000
1957 1985 2007Year
Are
a (a
cres
)
OtherPasturePearsGrapes
UCCE County of Mendocino 31 Meeting Agricultural Water Needs
Past projections of current irrigated agriculture acreage includes 10,500 acres by 2007 in Ukiah and Hopland Valleys (Carpenter, 1958) and 12,712 for everything except Potter Valley by 2020 (Sommarstrom, 1986). Our current estimates of irrigated agriculture acreage for the same areas are 12,502 and 15,884 acres, respectively.
California Department of Food and Agricultural (CDFA) crop acreage statistics identify 14,212 acres in wine grape vineyards and 1,867 acres in pear orchards within the study area (Bengston, 2008). These values are 9% less for grapes and 1% more for pear orchards compared with our values. These differences are negligible when considering the margin of error and are largely the result of the different methods.
An important element for estimating irrigated agriculture acreage in the future is to account for conversion of crop land to other uses including housing and developments. Build-out estimates from the Ukiah Valley Area and Mendocino County General Plan Update processes identify approximately 515 acres projected to transition from agriculture to development in the next 20 years (Pers. Comm. Ford, 2007). This represents 2.6% of the total and 7% of the Ukiah Valley irrigated agriculture acreage identified in this study. Conversely, we estimate that there are approximately 517 acres with the potential to be put into irrigated agricultural production, a potential increase of 2.6% within the study area.
Water Use Previous predictions of water demand for irrigated agriculture include 17,500 af/year for
the Ukiah and Hopland Valleys by 2007 (Carpenter, 1958) and 17,034 af/year for the entire study area, except Potter Valley, by 2020 (Sommarstrom, 1986). Analogous results from our study are 13,854 af/year and 17,053 af/year, respectively. On a per acre application rate basis, Carpenter projected 1.69 af/acre for 2007 and Sommarstrom 1.34 af/acre. In comparison, our results indicate that irrigated agriculture application rates are 1.25 af/acre for total water demand and 0.98 af/acre for consumptive use water demand.
The total estimated demand for irrigated agriculture in the Mendocino County portion of the Russian River is 25,669 af/year. Subtracting water use for frost protection and heat suppression in all crops and post-harvest in grapes results in a demand of 20,778 af/acre for consumptive use.
These amounts for total and consumptive use water demand were 11% and 9% of the total annual discharge for 2007 in the Russian River near Hopland California (Appendix C) and 5 % and 4 % of the total annual precipitation (UFD, 2008) for the 2007 water year. In high flow and wetter water years these percentages will be lower, and in low flow and dryer water years they will be greater. On an annual basis the amount of water used for crop production in the study area is small relative to the entire water budget.
In addition to this annual relationship, it is important to compare the estimated daily uses of water to the mean daily discharge rates in the Russian River. Such an analysis offers the opportunity to understand irrigated agriculture’s seasonal water needs versus seasonal variability in stream discharge. The four primary water needs for irrigated agriculture are: post harvest application; frost protection; consumptive use; and heat protection. These needs occur at times when mean daily discharge is lowest (Figure 12). In dryer water years like 2007, the rates of daily use for irrigated agriculture can approach, equal, or potentially be greater than mean daily discharge rates. Irrigated agriculture is meeting its water needs with multiple sources of water that include groundwater, springs, and riparian water rights. Even so, it will need additional

UCCE County of Mendocino 32 Meeting Agricultural Water Needs
assistance to reduce any potential impacts it may have on instream flows resulting from water demand that is synchronous with the lowest seasonal values for stream discharge.
Our results document that growers’ water use decisions for irrigated agriculture are based upon a number of issues and factors. These include the cultural objectives for each specific crop, soil and landscape position factors, the costs of energy and infrastructure to move and apply water, and resource stewardship considerations.
The conversion and expansion of irrigated agriculture acreage, discussed previously, also influences the trends and changes in water demand. This happens because of the changes in cultural objectives and land area in irrigated agriculture. Using winegrape and pear production as an example, will clearly illustrate these influencing factors.
Wine grape production requires the greatest volume of water using 13,568 af/year. This is followed by irrigated pasture using 6,288 af/year and orchards using 5,684 af/year. Understanding what is influencing growers’ decisions to apply water will facilitate identifying opportunities for increasing the efficiency of their water use.
In the case of wine grapes, growers generally seek to optimize fruit quality with less emphasis placed on yield. This can often result in reductions in the amount of water applied for consumptive use through regulated deficit irrigation. This is likely the reason that the documented amount of water applied for consumptive use in the evaluated wine grape blocks was consistently below net irrigation requirement as discussed earlier.
Figure 12: Mean daily discharge (grey) from 10/1/2006 to 9/30/2007 at the USGS stream gauging station #11462500 near Hopland, California and estimated daily rates of water applied (black) to meet irrigated agriculture’s water demand in the Mendocino County Portion of the Russian River Watershed.
0
1,000
2,000
3,000
4,000
5,000
6,000
9/30/2006 11/30/2006 1/30/2007 3/30/2007 5/30/2007 7/30/2007 9/30/2007
Date/Time
Mea
n da
ily d
isch
arge
(cfs
)
Russian River Near HoplandIrrigated Agriculture
Post
har
vest
Fros
t pro
tect
ion
Con
sum
ptiv
e us
e w
ith h
eat s
uppr
essio
n
UCCE County of Mendocino 33 Meeting Agricultural Water Needs
Balancing between wine grape quality and yield is influenced by the varieties being grown, with pursuit of 5 to 6 tons/acre for white varieties compared with 2 to 3 tons/acre for red varieties. One way growers will achieve increased yield in white varieties is to make post-harvest water applications. It should be noted that the benefits of post-harvest applications are not clear. Several survey respondents and focus group participants identified this as the reason why they do not use post-harvest applications. This points to the need for research on this topic that can guide grower decision making and water use.
Pear cultural objectives are orientated towards high yields because these growers are price takers. Currently, the annual yield required for a grower to cover costs is 22 tons/acre. Obtaining such high yields requires a number of inputs including two to three af/year of water for consumptive use. Growers could take advantage of local weather data and well documented information on water needs for California orchards (Schwankl et al. 2007) to improve upon the timing and amount of water applied to meet crop needs.
The amount of water applied for consumptive use is indirectly related to the available water capacity of the soils being farmed. The inference that can be drawn from this relationship is that growers are responding to site conditions and an inherent understanding of crop water needs as dictated by those conditions. That some growers have or are considering duplicate irrigation systems that will increase their precision in water application is further indication of their knowledge and adaptation to site specific conditions. Adaptation and more universal adoption of these methods, including use of local weather stations, will improve water use for all crops produced in the study area.
In both evaluated wine grape blocks and pear orchards, irrigation system distribution uniformity was good. There were, in both crops, isolated systems that had low values indicating system maintenance and upkeep were needed. However, averages above 88% in systems for both crops speak to efficient water use by these farmers to meet their respective cultural objectives. This observation combined with the documented transition to drip systems in grapes and under canopy sprinkler systems in pears through the last three decades leaves little room for gains in conservation through system updates.
The need to protect crops from both frost and heat damage occurs on a limited amount of the total irrigated agriculture acreage in the study area, but it still represents the next greatest need of water for irrigated agriculture. A total of 1,763 acres of pears and 5,623 acres of grapes require frost protection. There are also approximately 3,729 acres of grapes in which heat suppression is used. Combined, these uses total approximately 4,891 acre-feet a year. There is a biological imperative to finding alternatives for these needs that conserve this water. That is, they correspond with critical salmon life stages and challenging stream conditions. Frost season, or March, April, and May of each year, is when young smolts migrate downstream to the ocean and young-of-the-year move downstream to large tributary streams. Heat storms occurring in July and August match up with the greatest stream water temperatures during critical rearing periods for young-of-the-year. In both cases, reductions in flows can prevent movement, increase stream temperatures, and potentially result in increased mortality rates.
In the case of grape production, growers participating in our focus group and responding to our survey indicated they had transitioned to large volume solid set sprinkler systems that deliver 50 gallons/min/acre. This is because these systems are more reliable relative to other systems. There is the potential to use low volume systems that deliver 12 gallons/min/acre. However, the availability and durability of these systems are limited, requiring innovation and improvement prior to grower adoption. This and other alternative options for heat protection need to be explored and implemented where they appropriately lead to reductions in water use.

UCCE County of Mendocino 34 Meeting Agricultural Water Needs
Grower responses during the focus group and to survey questions document that they have evolved in their understanding of crop protection for frost and heat damage. The increase in knowledge has resulted in a reduction in the amount of water used during each threatening event. For frost, growers explained they run their systems for shorter durations that closely match the timing of climatic threats for frost damage. They do this by intensively tracking dew point and ambient temperature through frost warning services and weather stations within specific vineyard blocks. Similarly, growers that protect against heat damage are switching from continual system operation when temperatures are at or above 100°F. They now pulse their systems, resulting in the system operating for two to three hours over the course of an event instead of a solid six to twelve hours. Facilitating these decisions with more local weather data, perhaps on-line decision support tools, and other varietal choices and planting approaches will contribute to the efficiency with which water is used for these purposes.
An interesting parallel to grower’s increased knowledge and/or evolution in methods to protect crops from frost and heat damage is the documented change in the number of “cold” and “hot” days within the study area. In their responses during the focus group and to survey questions, growers consistently explained there were fewer days now requiring frost and heat protection than in the past. This is consistent with documented trends in temperatures from 1955 to 2005 (Robinson, 2007). These observations and trends suggest a reduction in the use of water for crop protection. However, as 2007 demonstrated for heat protection, growers still need to be prepared to protect crops. A word of caution was also offered with these observations, that both extremely hot and extremely cold conditions are never further than one season away. And this was profoundly demonstrated in March and April 2008 with over 20 nights of frost protection in Redwood and Potter Valleys and more than 10 in Ukiah and Hopland Valleys.
With regard to irrigated pasture, there is the potential to increase the consistency in the timing and amount of water applied to meet crop demand that will lead to greater efficiencies. Before discussing these opportunities, it is important to point out that irrigated pasture managers have also participated in Natural Resource Conservation Service sponsored programs to improve water delivery infrastructure since 1989. The result has been the conversion of over 80% of irrigated pasture from open-ditch to gravity type underground pipe and valve and sprinkler systems to reduce water loss and channel erosion. In looking for additional opportunities to improve irrigated pasture water use, recent research in other California irrigated pasture systems has identified high variability in the amount of water applied (Hanson et al. 2000). This included both over and under application of water to meet crop demand. Providing Mendocino pasture managers with this information and facilitating their use of nearby measurements of evapotranspiration to estimate water needed to grow forage will contribute to their water resource management efforts. Additional steps could include on-farm measurements of soil moisture (Hanson et al. 2000) and forage production to generate more precise measurements and direction on water application rates and amounts.
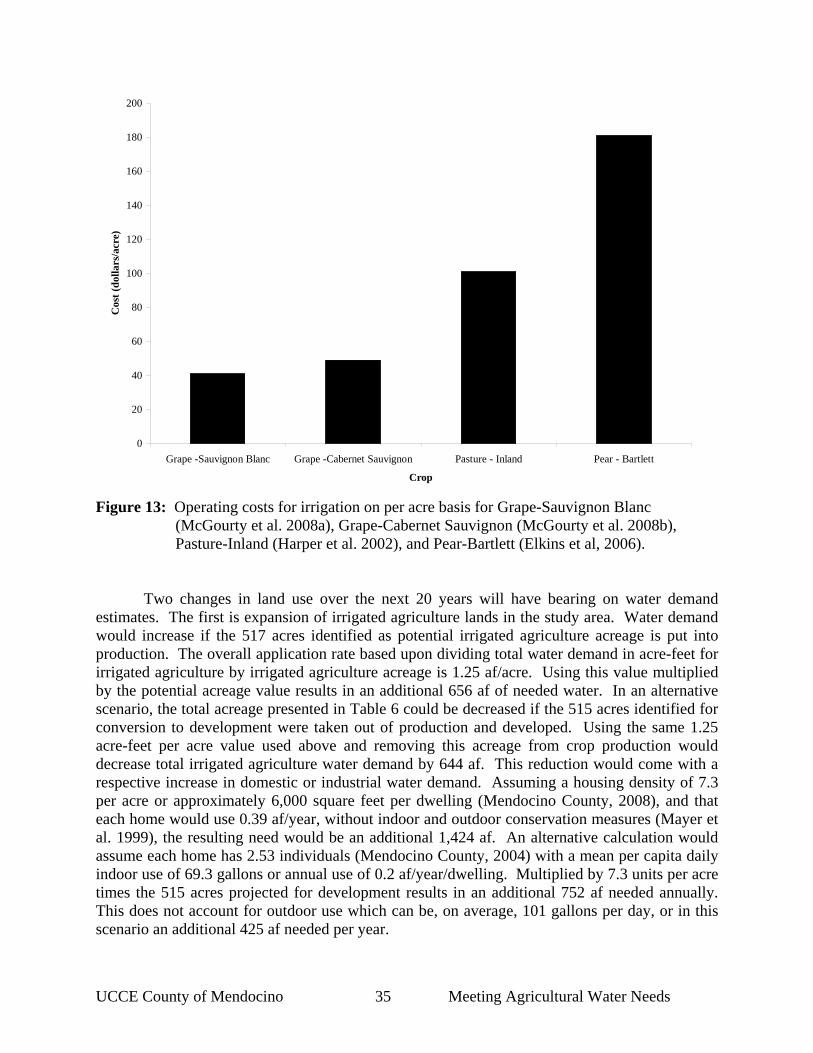
The impact that energy and pumping costs have on grower decision making for water use was repeated several times. On a per acre basis the operating expenses, which consist of energy and other costs, are not trivial (Figure 13). And these do not include the initial capital investments for irrigation infrastructure when establishing a vineyard, orchard, or pasture.
UCCE County of Mendocino 35 Meeting Agricultural Water Needs
0
20
40
60
80
100
120
140
160
180
200
Grape -Sauvignon Blanc Grape -Cabernet Sauvignon Pasture - Inland Pear - Bartlett
Crop
Cos
t (do
llars
/acr
e)
Figure 13: Operating costs for irrigation on per acre basis for Grape-Sauvignon Blanc
(McGourty et al. 2008a), Grape-Cabernet Sauvignon (McGourty et al. 2008b), Pasture-Inland (Harper et al. 2002), and Pear-Bartlett (Elkins et al, 2006).
Two changes in land use over the next 20 years will have bearing on water demand estimates. The first is expansion of irrigated agriculture lands in the study area. Water demand would increase if the 517 acres identified as potential irrigated agriculture acreage is put into production. The overall application rate based upon dividing total water demand in acre-feet for irrigated agriculture by irrigated agriculture acreage is 1.25 af/acre. Using this value multiplied by the potential acreage value results in an additional 656 af of needed water. In an alternative scenario, the total acreage presented in Table 6 could be decreased if the 515 acres identified for conversion to development were taken out of production and developed. Using the same 1.25 acre-feet per acre value used above and removing this acreage from crop production would decrease total irrigated agriculture water demand by 644 af. This reduction would come with a respective increase in domestic or industrial water demand. Assuming a housing density of 7.3 per acre or approximately 6,000 square feet per dwelling (Mendocino County, 2008), and that each home would use 0.39 af/year, without indoor and outdoor conservation measures (Mayer et al. 1999), the resulting need would be an additional 1,424 af. An alternative calculation would assume each home has 2.53 individuals (Mendocino County, 2004) with a mean per capita daily indoor use of 69.3 gallons or annual use of 0.2 af/year/dwelling. Multiplied by 7.3 units per acre times the 515 acres projected for development results in an additional 752 af needed annually. This does not account for outdoor use which can be, on average, 101 gallons per day, or in this scenario an additional 425 af needed per year.
UCCE County of Mendocino 36 Meeting Agricultural Water Needs
Phase I Estimates and Phase II Calculations
Comparisons of crop acreage estimates from Phase I and Phase II for the entire study area minus Potter Valley, are similar. Phase II total acreage is only 148 acres less than the Phase I estimate. One interpretation of this result is that the aerial image and GIS analysis is appropriately accurate in estimating crop acreage and therein a cost-effective approach. Field confirmation of desktop analyses does increase the accuracy of the results and catches potential changes that may have occurred since the time that aerial images were taken. This is demonstrated by the reduction in unidentified crop and orchard acreage between Phase I and Phase II estimates. In our case we were using images taken in August 2004. Between that time and our 2007 field confirmation activities some changes in crop coverage occurred within the study area that would have been missed.
The difference in water demand estimates between Phase I and Phase II for the study area, excluding Potter Valley, is 622 acre-feet or a 4% reduction. This difference in the overall estimate of water demand can be considered minimal and supports the use of Phase I methods to achieve a reasonable estimate. There are, however, more pronounced differences for a number of the specific crops that were documented with the Phase II methods. For example, the Phase II estimate for wine grape total water demand was 10,308 acre-feet, again excluding Potter Valley. This is 16% less than the Phase I estimate. Similarly, the Phase II estimate for pears and pastures, excluding Potter Valley, was 5,684 and 1,074 af, 34% and 17% increases over the Phase I estimates, respectively. These differences result from both the refinement in acreage assignments through field confirmation and the field measurement of water applied for consumptive use and estimation of frost and heat protection water use. Phase II analysis also provides greater detail with regard to the other water use needs for crop production including direction on the season of use for these needs.
Conservation and Alternatives Meeting the agricultural, municipal, industrial, and environmental water needs within the study area will require a combination of solutions and options for conserving and securing alternative sources of water. This will include continuation of on-farm conservation and water-use efficiency, connections between agriculture and recycled water, and other potential policy changes and more novel programs to afford winter storage. Focus group and survey responses about water conservation, coupled with the overall results for irrigation system efficiency, suggest that the participating growers are making efforts to be efficient water resource managers. They have participated in many educational and conservation cost-share programs. They are making decisions for water use based upon the links between energy costs, operation of irrigation systems, and the amount of water used to produce crops. Reasons to conserve water further include personal values and ideals of resource stewardship. Growers are open and knowledgeable about alternative water sources, as evidenced by responses to the use of recycled water. These perspectives shared by participating growers offer points of agreement and commonality on water resource issues that should help to resolve conflicts over water availability and use. Opportunities may exist to conserve agricultural water use through reductions in post-harvest applications. The merits and benefits to achieving cultural objectives for respective crops needs to be carefully evaluated for this use of water. However, if this use does not provide

UCCE County of Mendocino 37 Meeting Agricultural Water Needs
a benefit, the savings in water used would be significant relative the need for instream flows during the time of the year that post-harvest applications are made. One alternative with increasing potential is the use of recycled water. From 1997 to 2006, The City of Ukiah has generated an average of 3,982 acre-feet (minimum 3,755 and maximum 4,226) of water for residential and industrial uses (Burton, 2007). The inference can be made that this generates approximately the same amount in wastewater that is currently treated at the Ukiah wastewater treatment facility. Dividing this amount by 1.25, the ratio of total water demand for irrigated agriculture to irrigated agriculture acreage, indicates that water demand for approximately 3,185 acres of irrigated agriculture could be met with recycled water. This acreage would be increased or decreased depending upon the crops and cropping systems selected. The potential for use of this water by irrigated agriculture is initially dependent upon a reliable delivery system that is in close proximity to acreage that can and is willing to use the water. Where irrigated agriculture acreage is in close proximity to this source of water, there appears to be guarded willingness to use this water based upon survey and focus group responses. Precedent for this type of use has already been set in other nearby regions both outside (Weber et al. 2006) and inside (Winzler & Kelly, 2007) the Russian River Watershed. Dialogue with Mendocino growers on the concerns they have for using this water and exploration of infrastructure needs could move this opportunity for water use efficiency one step closer to fruition. If winter storage is going to be one of the viable alternatives, policy changes will be required. This will include changes to the pending Policy for Maintaining Instream Flows in Northern California Coastal Streams (SWRCB, 2007) that discourage private ponds to capture winter flows. There are also creative programs in California that could be replicated in the study area to provide growers with alternative sources of water. The underlying approach to these programs is to provide storage infrastructure and appropriative water rights in place of riparian rights and summer diversions.
UCCE County of Mendocino 38 Meeting Agricultural Water Needs
Conclusions and Next Steps Farming and crop production is an endeavor of planning for and responding to multiple contingencies. Put another way, it requires having access to the resources and tools to avert risk. This includes water for consumptive use as well as other crop needs such as protection against frost and heat damage. It also includes the ability to transition and convert to different crops and cultural objectives. Growers farming 20,614 acres of wine grapes, irrigated pasture, pears, and other crops in the Mendocino County portion of the Russian River in 2007 used approximately 25,669 acre-feet or 1.25 af/acre to meet these needs and achieve their production goals. The use of this water on an acre by acre basis is related to site specific conditions, crop specific cultural objectives, an understanding of the link between energy and water costs to deliver water to crops, and water availability. Because of these drivers, growers continue to learn and apply new information for crop production and water conservation. In many ways, that impetus to become effective water resource managers has resulted in realized efficiencies through the use of water saving irrigation systems that are maintained to provide high values of distribution uniformity. It also has resulted in adoption and adaptation of alternative techniques for frost protection as well as more conservative use of water for both frost and heat protection. Furthermore, in the case of grapes, growers are almost universally applying less water for consumptive demand than crop growth characteristics and water resource management agencies would predict. The combination of these implemented management measures and water savings indicates that any additional conservation of water in irrigated agricultural production will not come easy. However, there are a number of next steps and recommendations to improve irrigated agriculture’s water resource management that complements this general appraisal of irrigated agriculture water demand in the study area. These include:
• Establish a program to provide growers with irrigation system evaluation service. This will provide the insurance that properly functioning irrigation systems continue to operate in that fashion and that those that require attention and improvements are identified and improved.
• Research post-harvest application in wine grape vineyards. Currently approximately 620
acre-feet per year are applied to wine grapes in the fall with little to no confirmation of the returns this water generates in terms of crop yield or quality.
• Develop and implement new options for frost and heat protection. Alternatives to these
uses will contribute to instream flows during biologically critical periods for area streams and aquatic organisms and relieve the mounting regulatory pressure being placed upon area farmers.
• Develop and implement a program to deliver crop needs and irrigation program design to
irrigated pasture managers. Such programs have improved both the efficiency of water use and quality of forage produced in other irrigated pasture regions of California and will support Mendocino pasture managers to continue their production of a critical local source of forage for the County.
UCCE County of Mendocino 39 Meeting Agricultural Water Needs
• Replicate this study in other watersheds in Mendocino County. Generating an up-to-date estimate of irrigated agriculture water demand throughout the County will assist agriculture producers in meeting their needs while contributing to solutions for other needs such as instream flows.
• Formation of partnerships between agriculture and other water users in the study area that
have a shared interest in reviewing and providing input on California State policy towards viable solutions of water resource management.
• Investigate alternative water sources and solutions to relieve the pressure from summer
diversions, including the feasibility for small scale private winter flow storage and opportunities for water reuse.
Addressing and carrying-out these measures will require leadership and partnering from any
number of local organizations including grower groups, Natural Resources Conservation Service, City of Ukiah, MCWA, and others.
UCCE County of Mendocino 40 Meeting Agricultural Water Needs
References Bengston, D. 2004. Mendocino County crop report. Mendocino County Agricultural Commissioner and California Department of Food and Agriculture. Ukiah, California. 17 pgs. Burton, B.H. 2007. Drinking water adequacy assessment. Ukiah Valley, Mendocino County. Department of Public Health, Drinking Water Field Operations Branch, Mendocino District. Ukiah, California. 75 pgs. Carpenter, E.F. 1958. Water use survey on the Russian River in southern Mendocino County. Prepared for the Mendocino County Board of Supervisors and the Mendocino County Russian River Flood Control and Water Conservation Improvement District. 51 pgs and appendices. Constantz, J., J. Jasperse, D. Seymour, and G.W. Su. 2003. Heat tracing in streambed along the Russian River of northern California. Pages 19-20 In: Stonestrom, D.A. and J. Constantz. Heat as a tools for studying the movement of ground water near streams. U.S. Department of Interior and U.S. Geological Survey. Cicular 1260. http://pubs.usgs.gov/circ/2003/circ1260/pdf/Circ1260.pdf. Deitch, M.J. 2006. Scientific and institutional complexities of managing surface water for beneficial human and ecosystem uses under a seasonally variable flow regime in Mediterranean-Climate northern California. Ph.D. Dissertation. University of California, Berkeley. 323 pgs. http://www.lib.berkeley.edu/WRCA/restoration/pdfs/MDeitch_phd06.pdf. DWR. 1986. Crop water use in California. California Department of Water Resources Bulletin 113-4, Sacramento, California. 116p. DWR. 2001. Crop water use in California. California Department of Water Resources. http://www.landwateruse.water.ca.gov/annualdata/datalevels.cfm Elkins, R.B., K.M. Klonsky, and R.L. De Moura. 2006. Sample costs to establish and produce pears. Green Bartlett. North Coast Region. Lake and Mendocino Counties. University of California Cooperative Extension and UC Davis Department of Agriculture and Resource Economics. 26 pgs. Elkins, R.B., M.S. Moratorio, R. McClain, and J.B. Siebert. 2007. History and overview of the California pear industry. Pages 3-12. In E.J. Mitcham and R.B. Elkins (eds.). Pear production and handling manual. University of California Agriculture and Natural Resources. Publication 3483. 215 pgs. Fulton, A., B. Reed, and L. Forero. 2007. Irrigation. Pages 31-36 In: Reed. B, and L. Forero (editors). Irrigated pasture production in the Central Valley of California. 69 pgs. Hanson, B.R., S. Orloff, and D. Peters. 2000. Monitoring soil moisture helps refine irrigation management. California Agriculture V54(N3):38-42.
UCCE County of Mendocino 41 Meeting Agricultural Water Needs
Harper, J.M., K.M. Klonsky, and R.L. De Moura. 2002. Sample costs to establish and produce pasture. North Coast Mendocino County. University of California Cooperative Extension and UC Davis Department of Agriculture and Resource Economics. 20 pgs. Howard, R.F. and R.H. Bowman. 1991. Soil survey of Mendocino County, eastern part, and Trinity County, southwestern part, California. United States Department of Agriculture, Soil Conservation Service, in cooperation with USDA Forest Service; United States Department of Interior, Bureau of Land Management and Bureau of Indian Affairs; and Regents of the University of California (Agriculture Experiment Station). 419 pgs. plus maps. Joyce, Neil. Hop ranching in Mendocino County is large business. Redwood Journal-The Press Dispatch. p. 7. Page 35 In: Chocholak, D. 1994. Newspaper timeline: A history of the upper Russian River watershed and construction of Coyote Dam. Mendocino County Water Agency. Ukiah, California. 61 pgs. Lewis, D.J., M.J. Singer, K.W. Tate, and R.A. Dahlgren. 2000. Hydrology in a California oak woodland watershed: Journal of Hydrology, 240:106-117. Mayer, P.W., W.B DeOreo, E.M. Opitz, J.C. Kiefer, W.Y. Davis, B. Dziegielwski, and J. O. Nelson. 1999. Resdential end uses of water. AWWA Research Foundation and American Water Works Association. 310 pgs. McGourty, G.T., K.M. Klonsky, and R.L. De Moura. 2008a. Sample costs to establish a vineyard and produce wine grapes. White varieties – sauvignon blanc. North Coast Lake County. University of California Cooperative Extension and UC Davis Department of Agriculture and Resource Economics. 23 pgs. McGourty, G.T., K.M. Klonsky, and R.L. De Moura. 2008b. Sample costs to establish a vineyard and produce wine grapes. Red varieties – cabernet sauvignon. North Coast Lake County. University of California Cooperative Extension and UC Davis Department of Agriculture and Resource Economics. 20 pgs. Mendocino County. 2004. Mendocino County housing element. Mendocino County, Ukiah California. http://www.co.mendocino.ca.us/planning/GenPlan/Housing/housing12142004.htm. Mendocino County. 2008. Land use element of the Mondocino County General Plan. Mendocino County, Ukiah California. http://www.co.mendocino.ca.us/planning/GenPlan/LandUse/F.htm. Metzger, L.R., C.D. Farra, K.M. Koczot, and E.G. Reichard. 2006. Geohydrology and water chemistry of the Alexander Valley, Sonoma County, California. U.S. Geological Survey Scientific Investigations Report 2006-5115. 95 pgs. Prichard, T.L., R.J. Smith, and P.S. Verdegaal. 2007. Regulated deficit irrigation management for winegrapes. UC Davis Department of Land, Air, and Water Resources and UC Cooperative Extension. Davis, California. 23 pgs.
UCCE County of Mendocino 42 Meeting Agricultural Water Needs
PVID. 2008. Information regarding water use in Potter Valley. Potter Valley Irrigation District. Potter Valley, California. 4 pages. Robinson, Zac. 2007. Climate is changing in North Coast grape growing region. Practical Winery & Vineyard. May/June: 5 pgs. Schwankl, L.J. 2007. Irrigation systems. Pages 113-116. In E.J. Mitcham and R.B. Elkins (eds.). Pear production and handling manual. University of California Division of Agriculture and Natural Resources. Publication 3483. 215 pgs. Schwankl, L.J., T.L. Prichard, B.R. Hanson, R.B. Elkins. 2007. Understanding your orchard’s water requirements. University of California Division of Agriculture and Natural Resources Publication 8212. 10 pgs. Schwankl, L.J. and R.J. Smith. 2004. Determining the irrigation amount: How to calculate the number of hours to run your drip system in order to apply a net amount of gallons per vine. UC Davis Land Air and Water Resources and University of California Cooperative Extension Sonoma County. 10 pgs. Smith, R.J., and L. Prichard. 2007. Version 2.1. Using historical ETo to determine how much water to apply. UC Cooperative Extension and UC Davis Land Air and Water Resources Department. Santa Rosa, California. 3 pgs. Snyder, R.L. 2007. Frost protection. Pages 117-123. In E.J. Mitcham and R.B. Elkins (eds.). Pear production and handling manual. University of California Agriculture and Natural Resources. Publication 3483. 215 pg. Sommarstrom, S. 1986. An inventory of water use and future needs in the Russian River Basin of Mendocino County. Mendocino County Flood Control and Water Conservation District, Ukiah, California. 69p. SWRCB. 2007. Policy for maintaining instream flows in northern California coastal streams. Division of Water Rights, State Water Resources Control Board. California Environmental Protection Agency. Sacramento, California. 43 pgs and appendices. UFD. 2008. Rainfall data recorded at the Ukiah Fire Department Headquarters. Ukiah, California. Wagnor & Bonsignore. 2006. Volume I – Draft Report: North Sonoma County agricultural reuse project. Feasibility Study. Prepared for the Sonoma County Water Agency. Santa Rosa, California. 84 pgs. Weber, E., S. Gratton, B. Hanson, R.D Meyer, T. Prichard, and L. Schwankl. 2006. Suitability study of Napa Sanitation District recycled water for vineyard irrigation. University of California Division of Agriculture and Natural Resources. Napa, California. 33 pgs.
UCCE County of Mendocino 43 Meeting Agricultural Water Needs
Winzler&Kelly. 2007. Incremental recycled water program: 2007 update to the recycled water master plan. Prepared for the City of Santa Rosa Utilities Department. Santa Rosa, California. 77 pgs. 70 FR 52488. Endangered and Threatened species: Designation of critical habitat for seven evolutionary significant units of pacific salmon and steelhead in California; Final rule. September 2, 2005. United States Commerce, National Oceanic and Atmospheric Administration, National Marine Fisheries Service. Federal Register, Volume 70 pages 52488-52627.

UCCE County of Mendocino 44 Meeting Agricultural Water Needs
Appendix A: Phase I Maps
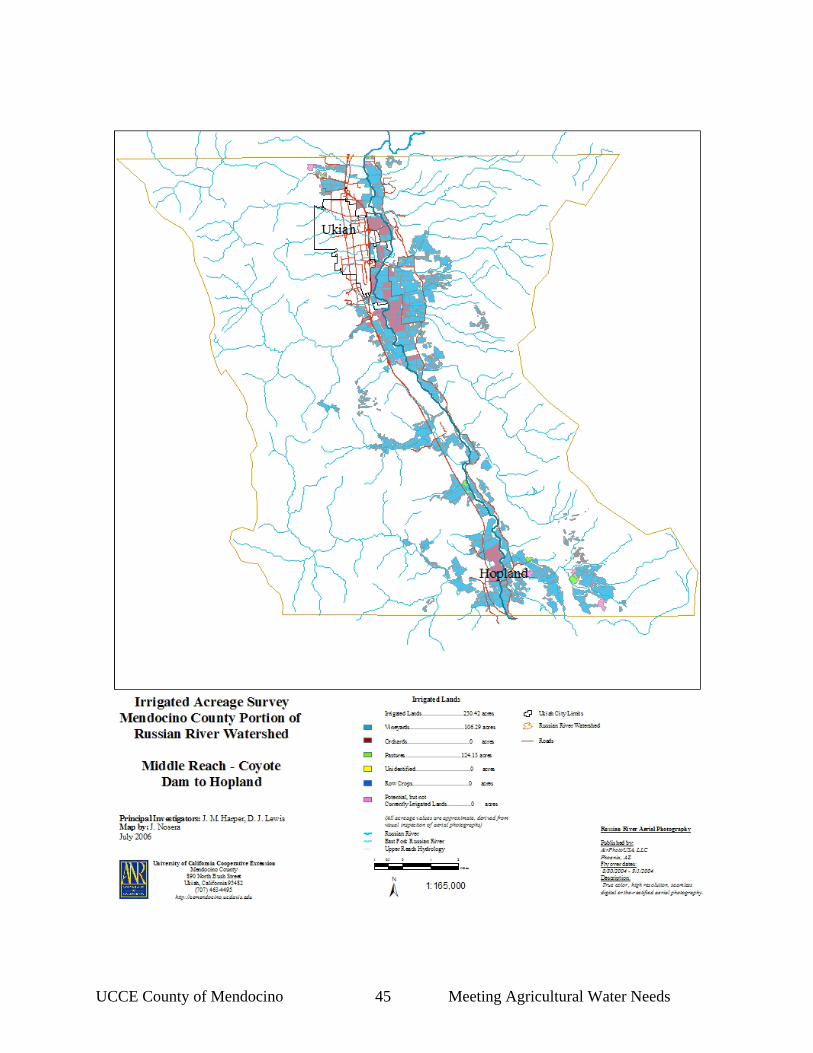
UCCE County of Mendocino 45 Meeting Agricultural Water Needs

UCCE County of Mendocino 46 Meeting Agricultural Water Needs
UCCE County of Mendocino 47 Meeting Agricultural Water Needs
Appendix B: Grower Survey
Water Wise Agriculture Survey of growers in the Mendocino Portion of the Russian River
Instructions: Please answer all of the questions. Your personal information will not be released and no individual will be identified in our reports of this survey. We need to ask for personal information because if we have questions regarding your responses we will need to contact you. Once the responses are entered into the database your name will be deleted. If you need clarification on any of the questions please call us at 463-4495 or email us at [email protected]. If you would like to complete this survey electronically you can find it on our website site located at http://cemendocino.ucdavis.edu/Watershed-Natural_Resources/. Thanks again for your time! (Please print your responses.) First Name: Last Name: City or Town/Zip: Phone: Email: Section 1: General Irrigation and Water Use History
1. How many years have you irrigated crops in the Mendocino County portion of the Russian River?
2. Have you ever had difficulty meeting the irrigation needs of your crops? If so, please check
the reasons below that apply to your situation. Reasons (check all that apply)
Irrigation system failure Well(s) dry Low rainfall Creek or stream dry High climatic demand Establishing crop
In which years have you had difficulty meeting water needs? Your comments: 3. Have you ever had difficulty meeting the frost protection needs of your crop? If so, please
check the reasons below that apply to your situation.
Reasons (check all that apply) Irrigation system failure Well(s) dry
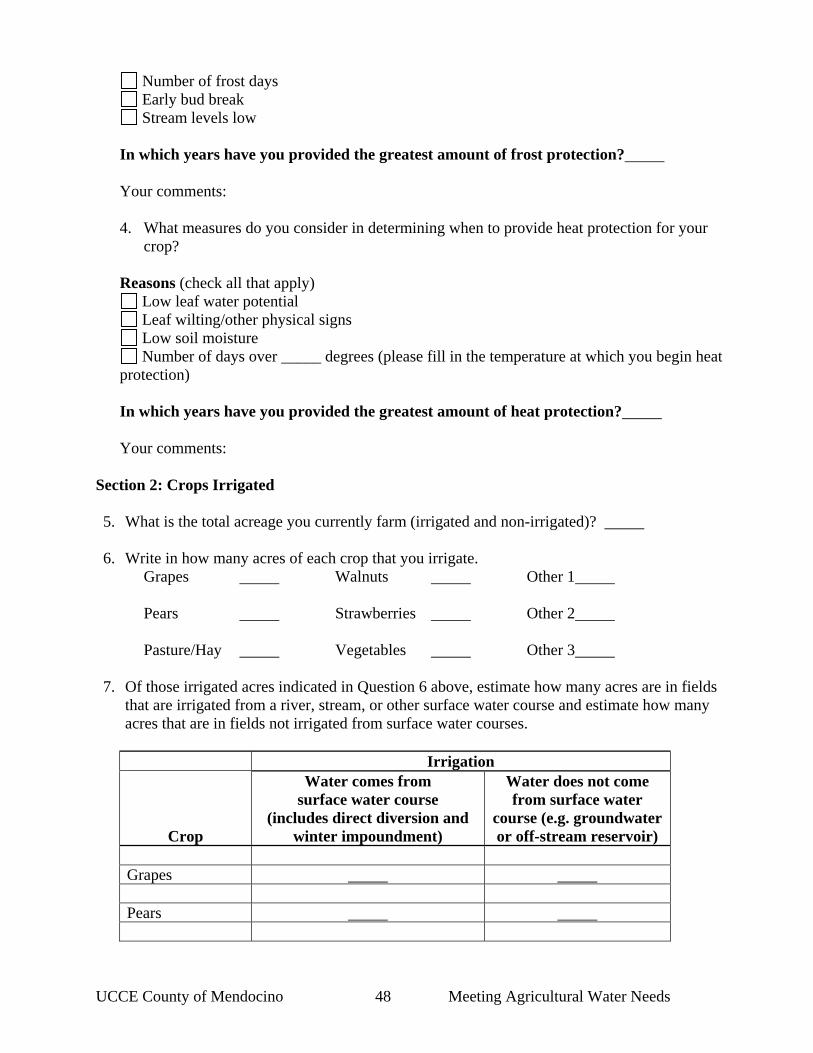
UCCE County of Mendocino 48 Meeting Agricultural Water Needs
Number of frost days Early bud break Stream levels low
In which years have you provided the greatest amount of frost protection? Your comments: 4. What measures do you consider in determining when to provide heat protection for your
crop? Reasons (check all that apply)
Low leaf water potential Leaf wilting/other physical signs Low soil moisture Number of days over _____ degrees (please fill in the temperature at which you begin heat
protection) In which years have you provided the greatest amount of heat protection? Your comments:
Section 2: Crops Irrigated 5. What is the total acreage you currently farm (irrigated and non-irrigated)? 6. Write in how many acres of each crop that you irrigate.
Grapes Walnuts Other 1 Pears Strawberries Other 2 Pasture/Hay Vegetables Other 3
7. Of those irrigated acres indicated in Question 6 above, estimate how many acres are in fields that are irrigated from a river, stream, or other surface water course and estimate how many acres that are in fields not irrigated from surface water courses.
Irrigation
Crop
Water comes from surface water course
(includes direct diversion and winter impoundment)
Water does not come from surface water
course (e.g. groundwater or off-stream reservoir)
Grapes Pears
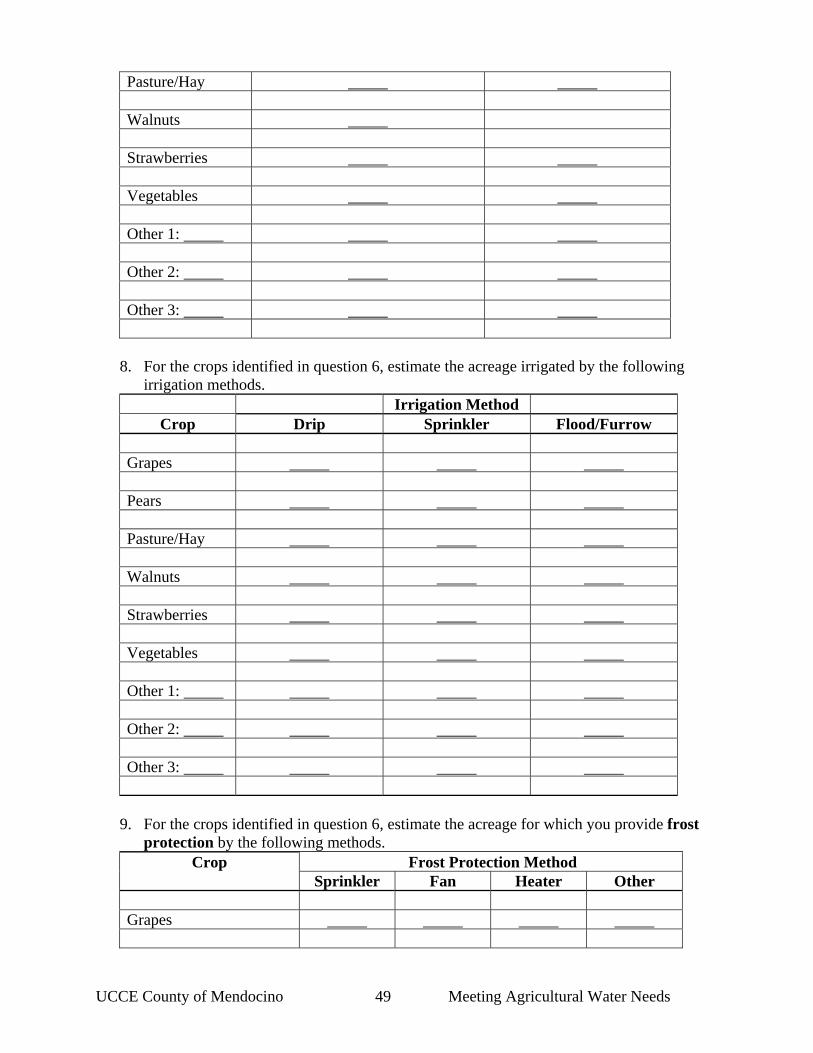
UCCE County of Mendocino 49 Meeting Agricultural Water Needs
Pasture/Hay Walnuts Strawberries Vegetables Other 1: Other 2: Other 3:
8. For the crops identified in question 6, estimate the acreage irrigated by the following
irrigation methods. Irrigation Method
Crop Drip Sprinkler Flood/Furrow Grapes Pears Pasture/Hay Walnuts Strawberries Vegetables Other 1: Other 2: Other 3:
9. For the crops identified in question 6, estimate the acreage for which you provide frost
protection by the following methods. Frost Protection Method Crop
Sprinkler Fan Heater Other Grapes
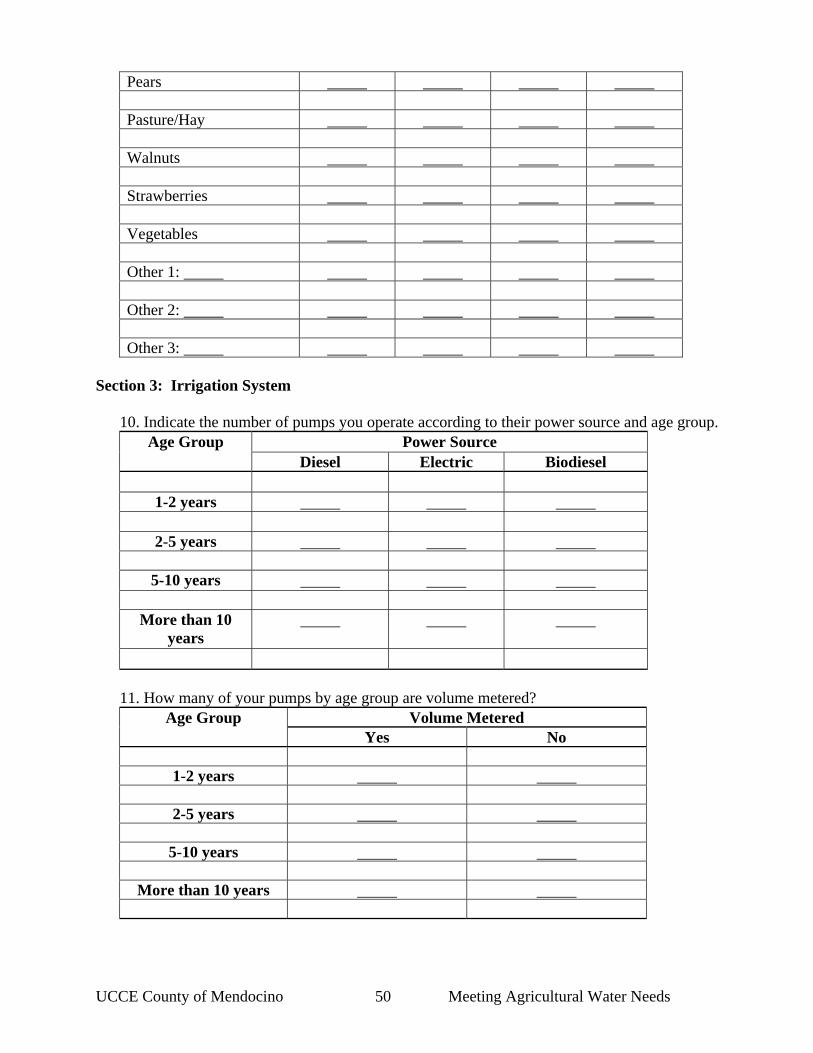
UCCE County of Mendocino 50 Meeting Agricultural Water Needs
Pears Pasture/Hay Walnuts Strawberries Vegetables Other 1: Other 2: Other 3:
Section 3: Irrigation System
10. Indicate the number of pumps you operate according to their power source and age group.
Power Source Age Group Diesel Electric Biodiesel
1-2 years
2-5 years
5-10 years
More than 10
years
11. How many of your pumps by age group are volume metered?
Volume Metered Age Group Yes No
1-2 years
2-5 years
5-10 years
More than 10 years
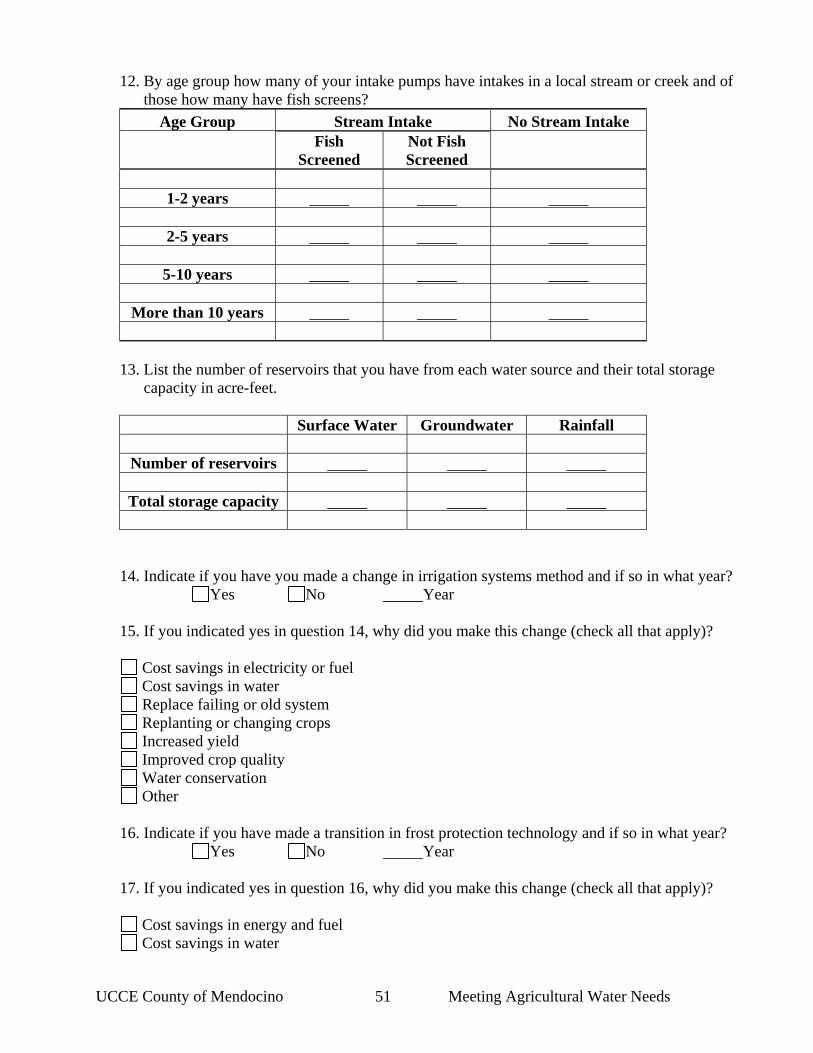
UCCE County of Mendocino 51 Meeting Agricultural Water Needs
12. By age group how many of your intake pumps have intakes in a local stream or creek and of those how many have fish screens?
Age Group Stream Intake No Stream Intake
Fish
Screened Not Fish Screened
1-2 years
2-5 years
5-10 years
More than 10 years
13. List the number of reservoirs that you have from each water source and their total storage capacity in acre-feet.
Surface Water Groundwater Rainfall
Number of reservoirs
Total storage capacity
14. Indicate if you have you made a change in irrigation systems method and if so in what year? Yes No Year
15. If you indicated yes in question 14, why did you make this change (check all that apply)?
Cost savings in electricity or fuel Cost savings in water Replace failing or old system Replanting or changing crops Increased yield Improved crop quality Water conservation Other
16. Indicate if you have made a transition in frost protection technology and if so in what year?
Yes No Year
17. If you indicated yes in question 16, why did you make this change (check all that apply)?
Cost savings in energy and fuel Cost savings in water

UCCE County of Mendocino 52 Meeting Agricultural Water Needs
Replace failing or old system Replanting or changing crops Water conservation Other
Section 4: Irrigation Decisions
18. Rank in order of use your primary sources of information for irrigation system design (1 = the source you most often use, 10 = a source rarely or never used).
Rank Crop buyer Farm Advisor Farm Manager Growers Irrigation Consultant Irrigation equipment supplier/designer NRCS (Soil Conservation Service Self Water District Wine makers Other:
19. Rank in order of use your primary sources of information for crop water requirements and application rates (1 = the source you most often use, 10 = a source rarely or never used). Rank Crop buyer Farm Advisor Farm Manager Growers Irrigation Consultant Irrigation equipment supplier/designer NRCS (Soil Conservation Service Self Water District Wine makers Other: 20. Do you know of and use the following in your decisions of when and how much water to apply for crop production?
Tool or Resource Know of Use CIMIS
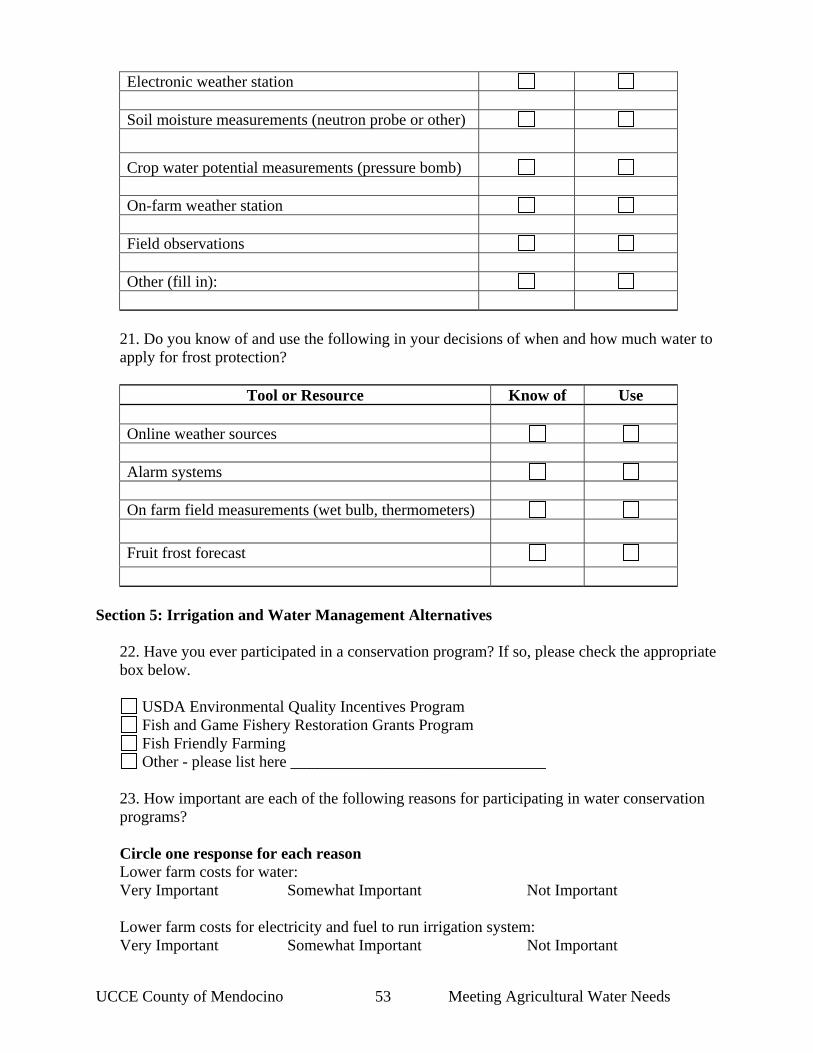
UCCE County of Mendocino 53 Meeting Agricultural Water Needs
Electronic weather station Soil moisture measurements (neutron probe or other) Crop water potential measurements (pressure bomb) On-farm weather station Field observations Other (fill in):
21. Do you know of and use the following in your decisions of when and how much water to apply for frost protection?
Tool or Resource Know of Use Online weather sources Alarm systems On farm field measurements (wet bulb, thermometers) Fruit frost forecast
Section 5: Irrigation and Water Management Alternatives
22. Have you ever participated in a conservation program? If so, please check the appropriate box below.
USDA Environmental Quality Incentives Program Fish and Game Fishery Restoration Grants Program Fish Friendly Farming Other - please list here ________________________________
23. How important are each of the following reasons for participating in water conservation programs? Circle one response for each reason Lower farm costs for water: Very Important Somewhat Important Not Important Lower farm costs for electricity and fuel to run irrigation system: Very Important Somewhat Important Not Important
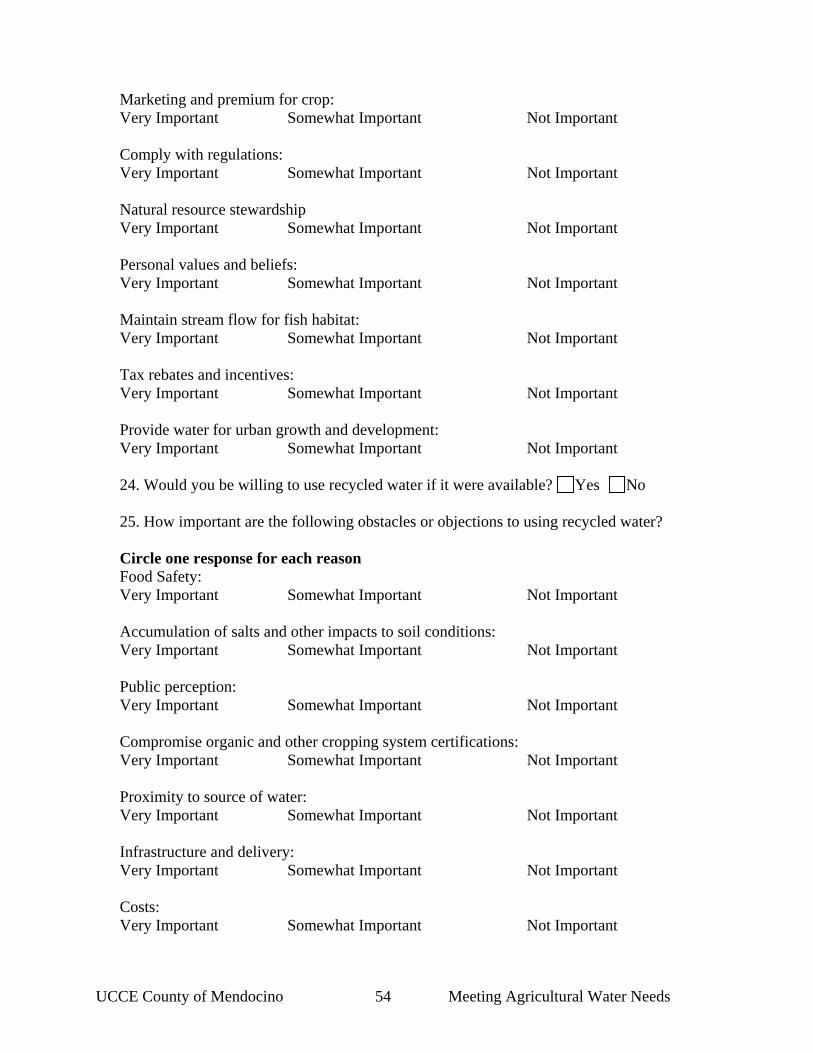
UCCE County of Mendocino 54 Meeting Agricultural Water Needs
Marketing and premium for crop: Very Important Somewhat Important Not Important Comply with regulations: Very Important Somewhat Important Not Important Natural resource stewardship Very Important Somewhat Important Not Important Personal values and beliefs: Very Important Somewhat Important Not Important Maintain stream flow for fish habitat: Very Important Somewhat Important Not Important Tax rebates and incentives: Very Important Somewhat Important Not Important Provide water for urban growth and development: Very Important Somewhat Important Not Important 24. Would you be willing to use recycled water if it were available? Yes No
25. How important are the following obstacles or objections to using recycled water?
Circle one response for each reason Food Safety: Very Important Somewhat Important Not Important Accumulation of salts and other impacts to soil conditions: Very Important Somewhat Important Not Important Public perception: Very Important Somewhat Important Not Important Compromise organic and other cropping system certifications: Very Important Somewhat Important Not Important Proximity to source of water: Very Important Somewhat Important Not Important Infrastructure and delivery: Very Important Somewhat Important Not Important Costs: Very Important Somewhat Important Not Important
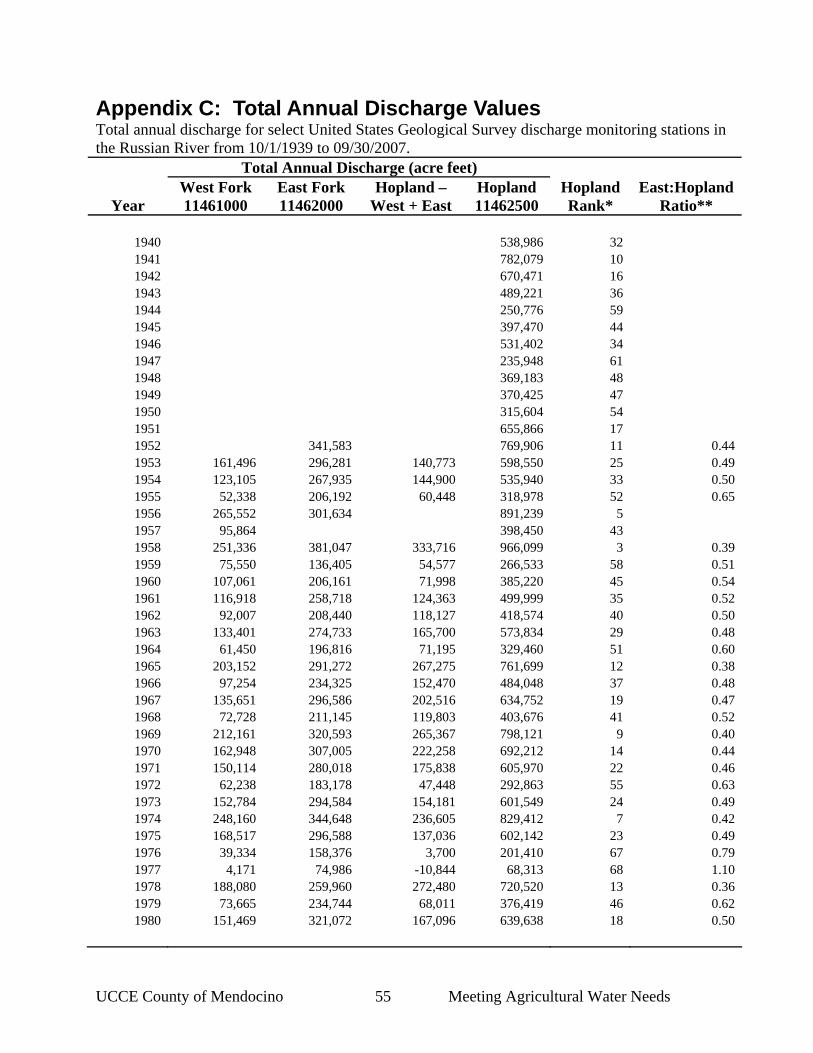
UCCE County of Mendocino 55 Meeting Agricultural Water Needs
Appendix C: Total Annual Discharge Values Total annual discharge for select United States Geological Survey discharge monitoring stations in the Russian River from 10/1/1939 to 09/30/2007. Total Annual Discharge (acre feet)
Year West Fork 11461000
East Fork 11462000
Hopland – West + East
Hopland 11462500
Hopland Rank*
East:HoplandRatio**
1940 538,986 32 1941 782,079 10 1942 670,471 16 1943 489,221 36 1944 250,776 59 1945 397,470 44 1946 531,402 34 1947 235,948 61 1948 369,183 48 1949 370,425 47 1950 315,604 54 1951 655,866 17 1952 341,583 769,906 11 0.44 1953 161,496 296,281 140,773 598,550 25 0.49 1954 123,105 267,935 144,900 535,940 33 0.50 1955 52,338 206,192 60,448 318,978 52 0.65 1956 265,552 301,634 891,239 5 1957 95,864 398,450 43 1958 251,336 381,047 333,716 966,099 3 0.39 1959 75,550 136,405 54,577 266,533 58 0.51 1960 107,061 206,161 71,998 385,220 45 0.54 1961 116,918 258,718 124,363 499,999 35 0.52 1962 92,007 208,440 118,127 418,574 40 0.50 1963 133,401 274,733 165,700 573,834 29 0.48 1964 61,450 196,816 71,195 329,460 51 0.60 1965 203,152 291,272 267,275 761,699 12 0.38 1966 97,254 234,325 152,470 484,048 37 0.48 1967 135,651 296,586 202,516 634,752 19 0.47 1968 72,728 211,145 119,803 403,676 41 0.52 1969 212,161 320,593 265,367 798,121 9 0.40 1970 162,948 307,005 222,258 692,212 14 0.44 1971 150,114 280,018 175,838 605,970 22 0.46 1972 62,238 183,178 47,448 292,863 55 0.63 1973 152,784 294,584 154,181 601,549 24 0.49 1974 248,160 344,648 236,605 829,412 7 0.42 1975 168,517 296,588 137,036 602,142 23 0.49 1976 39,334 158,376 3,700 201,410 67 0.79 1977 4,171 74,986 -10,844 68,313 68 1.10 1978 188,080 259,960 272,480 720,520 13 0.36 1979 73,665 234,744 68,011 376,419 46 0.62 1980 151,469 321,072 167,096 639,638 18 0.50
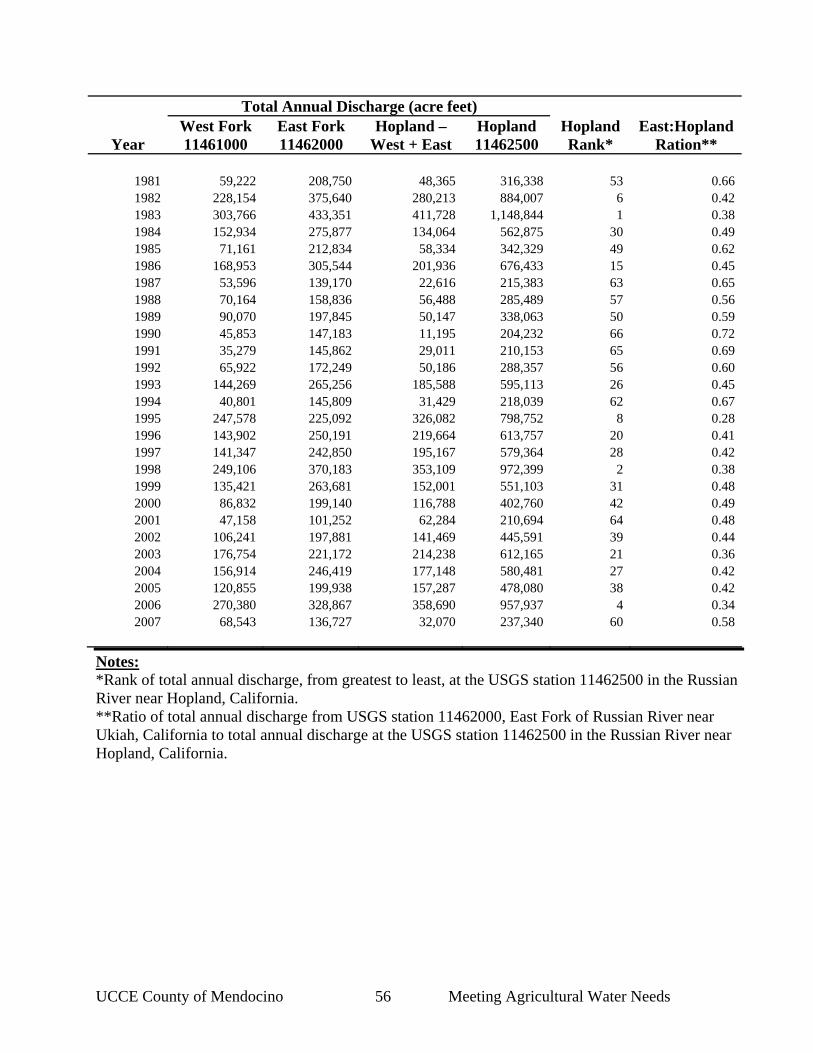
UCCE County of Mendocino 56 Meeting Agricultural Water Needs
Total Annual Discharge (acre feet)
Year West Fork 11461000
East Fork 11462000
Hopland – West + East
Hopland 11462500
Hopland Rank*
East:HoplandRation**
1981 59,222 208,750 48,365 316,338 53 0.66 1982 228,154 375,640 280,213 884,007 6 0.42 1983 303,766 433,351 411,728 1,148,844 1 0.38 1984 152,934 275,877 134,064 562,875 30 0.49 1985 71,161 212,834 58,334 342,329 49 0.62 1986 168,953 305,544 201,936 676,433 15 0.45 1987 53,596 139,170 22,616 215,383 63 0.65 1988 70,164 158,836 56,488 285,489 57 0.56 1989 90,070 197,845 50,147 338,063 50 0.59 1990 45,853 147,183 11,195 204,232 66 0.72 1991 35,279 145,862 29,011 210,153 65 0.69 1992 65,922 172,249 50,186 288,357 56 0.60 1993 144,269 265,256 185,588 595,113 26 0.45 1994 40,801 145,809 31,429 218,039 62 0.67 1995 247,578 225,092 326,082 798,752 8 0.28 1996 143,902 250,191 219,664 613,757 20 0.41 1997 141,347 242,850 195,167 579,364 28 0.42 1998 249,106 370,183 353,109 972,399 2 0.38 1999 135,421 263,681 152,001 551,103 31 0.48 2000 86,832 199,140 116,788 402,760 42 0.49 2001 47,158 101,252 62,284 210,694 64 0.48 2002 106,241 197,881 141,469 445,591 39 0.44 2003 176,754 221,172 214,238 612,165 21 0.36 2004 156,914 246,419 177,148 580,481 27 0.42 2005 120,855 199,938 157,287 478,080 38 0.42 2006 270,380 328,867 358,690 957,937 4 0.34 2007 68,543 136,727 32,070 237,340 60 0.58
Notes: *Rank of total annual discharge, from greatest to least, at the USGS station 11462500 in the Russian River near Hopland, California. **Ratio of total annual discharge from USGS station 11462000, East Fork of Russian River near Ukiah, California to total annual discharge at the USGS station 11462500 in the Russian River near Hopland, California.