iridovirus and microsporidian linked to honey bee colony decline
TRANSCRIPT
Iridovirus and Microsporidian Linked to Honey BeeColony DeclineJerry J. Bromenshenk1,7*, Colin B. Henderson2,7, Charles H. Wick3, Michael F. Stanford3, Alan W. Zulich3,
Rabih E. Jabbour4, Samir V. Deshpande5,13, Patrick E. McCubbin6, Robert A. Seccomb7, Phillip M. Welch7,
Trevor Williams8, David R. Firth9, Evan Skowronski3, Margaret M. Lehmann10, Shan L. Bilimoria11,14,
Joanna Gress12, Kevin W. Wanner12, Robert A. Cramer Jr.10
1 Division of Biological Sciences, The University of Montana, Missoula, Montana, United States of America, 2 College of Technology, The University of Montana, Missoula,
Montana, United States of America, 3 US Army Edgewood Chemical Biological Center, Aberdeen Proving Ground, Edgewood Area, Maryland, United States of America,
4 Science Applications International Corporation, Abingdon, Maryland, United States of America, 5 Science Technology Corporation, Edgewood, Maryland, United States
of America, 6 OptiMetrics, Inc., Abingdon, Maryland, United States of America, 7 Bee Alert Technology, Inc., Missoula, Montana, United States of America, 8 Instituto de
Ecologia AC, Xalapa, Veracruz, Mexico, 9 Department of Information Systems and Technology, The University of Montana, Missoula, Montana, United States of America,
10 Department of Veterinary Molecular Biology, Montana State University, Bozeman, Montana, United States of America, 11 Department of Biological Sciences, Texas Tech
University, Lubbock, Texas, United States of America, 12 Department of Plant Sciences and Plant Pathology, Montana State University, Bozeman, Montana, United States
of America, 13 Department of Computer and Information Sciences, Towson University, Towson, Maryland, United States of America, 14 Center for Biotechnology and
Genomics, Texas Tech University, Lubbock, Texas, United States of America
Abstract
Background: In 2010 Colony Collapse Disorder (CCD), again devastated honey bee colonies in the USA, indicating that theproblem is neither diminishing nor has it been resolved. Many CCD investigations, using sensitive genome-based methods,have found small RNA bee viruses and the microsporidia, Nosema apis and N. ceranae in healthy and collapsing coloniesalike with no single pathogen firmly linked to honey bee losses.
Methodology/Principal Findings: We used Mass spectrometry-based proteomics (MSP) to identify and quantify thousandsof proteins from healthy and collapsing bee colonies. MSP revealed two unreported RNA viruses in North American honeybees, Varroa destructor-1 virus and Kakugo virus, and identified an invertebrate iridescent virus (IIV) (Iridoviridae) associatedwith CCD colonies. Prevalence of IIV significantly discriminated among strong, failing, and collapsed colonies. In addition,bees in failing colonies contained not only IIV, but also Nosema. Co-occurrence of these microbes consistently marked CCDin (1) bees from commercial apiaries sampled across the U.S. in 2006–2007, (2) bees sequentially sampled as the disorderprogressed in an observation hive colony in 2008, and (3) bees from a recurrence of CCD in Florida in 2009. The pathogenpairing was not observed in samples from colonies with no history of CCD, namely bees from Australia and a large, non-migratory beekeeping business in Montana. Laboratory cage trials with a strain of IIV type 6 and Nosema ceranae confirmedthat co-infection with these two pathogens was more lethal to bees than either pathogen alone.
Conclusions/Significance: These findings implicate co-infection by IIV and Nosema with honey bee colony decline, givingcredence to older research pointing to IIV, interacting with Nosema and mites, as probable cause of bee losses in the USA,Europe, and Asia. We next need to characterize the IIV and Nosema that we detected and develop management practices toreduce honey bee losses.
Citation: Bromenshenk JJ, Henderson CB, Wick CH, Stanford MF, Zulich AW, et al. (2010) Iridovirus and Microsporidian Linked to Honey Bee Colony Decline. PLoSONE 5(10): e13181. doi:10.1371/journal.pone.0013181
Editor: Walter S. Leal, University of California Davis, United States of America
Received April 29, 2010; Accepted August 24, 2010; Published October 6, 2010
This is an open-access article distributed under the terms of the Creative Commons Public Domain declaration which stipulates that, once placed in the publicdomain, this work may be freely reproduced, distributed, transmitted, modified, built upon, or otherwise used by anyone for any lawful purpose.
Funding: Proteomics analysis was provided by the Point Detection Branch of ECBC under the auspices of the basic science program of the Defense ThreatReduction Agency (DTRA). Sampling and analysis was supported by the National Honey Board, California Almond Board (06-POLL8-Bromenshenk, 09-POLL10-Bromenshenk), The Foundation for the Preservation of the Honey Bee, and the US Army Medical Research and Material Command (W81XWH-04-C-0013), withdata processing and statistical analysis by the US Army Night Vision Laboratory (W909MY-06-C-0037). Project Apis m. is funding confirmatory inoculation studies.Work related to these studies was supported by the California Beekeepers Association and the Montana Agricultural Experiment Station in the laboratory of RAC.These companies and the other listed funders had no role in study design, data collection and analysis, decision to publish, or preparation of the manuscript.
Competing Interests: Jerry J. Bromenshenk is CEO and a co-owner of Bee Alert Technology, Inc., Missoula, MT; a Montana Board of Regents’ ApprovedTechnology transfer company affiliated with The University of Montana. Colin Henderson is a co-owner and Research Vice President of Bee Alert, and RobertSeccomb is a co-owner and Chief Financial Officer of this company. Rabbih E. Jabbour is employed by Science Applications International Corporation, Abingdon,MD; Samir V. Deshpande is employed by Science Technology Corporation, Edgewood, MD; and Patrick E. McCubbin is employed by OptiMetrics, Inc., Abingdon,MD. These latter three companies provide contract research personnel to the US Army. For all four companies, financial support was in the form of salaries forcontracted research. This does not alter the authors’ adherence to all the PLoS ONE policies on sharing data and materials, as detailed online in our guide forauthors.
* E-mail: [email protected]
PLoS ONE | www.plosone.org 1 October 2010 | Volume 5 | Issue 10 | e13181
Introduction
Honey Bee Colony Health in the USAColony Collapse Disorder (CCD) continues to impact bee
colonies in the USA in 2010 at levels seemingly equal to, or
exceeding that of 2007, when this unusual syndrome first received
worldwide press coverage [1,2]. The disorder is characterized by
sudden losses of bees. This results in nearly empty beehives that, at
best, may harbor a queen and a small worker bee population. A
vexing aspect of the disorder is that there are ample resources left
in the hive, and few or no dead bees in or near the hive. Bees seem
to disappear without a trace [2,3].
An unabated reappearance of CCD year on year demonstrates
lack of progress toward solving the problem. Metagenomics
initially identified Israeli acute paralysis virus (IAPV) as a potential
marker or cause of CCD [4], yet a subsequent study demonstrated
that IAPV was in the USA long before the recent CCD outbreaks
[5]. While IAPV can affect honey bee health, the role of IAPV in
CCD remains inconclusive. Proteomics analysis of other samples
of bees from CCD colonies, conducted by the U.S. Army, yielded
one of the earliest reports of Nosema ceranae and of Varroa
destructor virus-1 (VDV-1) [6], as well as an RNA virus that was
later identified as IAPV [7], in North American bees. Contrary to
earlier indications, Army results indicated that IAPV was not
present in all CCD-affected samples. RNA treatments have
recently been reported to control IAPV and implied control of
CCD [8], but it is not known whether IAPV causes CCD. A recent
study failed to confirm a link between CCD and IAPV [9], and
while IAPV can contribute to honey bee mortality, the signs are
not consistent with CCD [10].
Other studies pointed to a variety of additional possible markers
of CCD. A transcriptome study used gene expression-based
techniques and identified an abundance and variety of RNA
fragments in the gut of bees from CCD colonies. The authors
suggested that these fragments were possible markers of CCD.
Whether these RNA fragments were from the host or RNA bee
viruses is unknown [11]. A survey of bee samples from across the
USA revealed traces of pesticides in many bee samples, but none
were shown to correlate with CCD [12]. Klee et al. [13] detected
the microsporidian Nosema ceranae in bees from many countries,
and scientists in Spain concluded that N. ceranae causes CCD [14].
USA researchers, on the other hand, have concluded that N.
ceranae does not contribute significantly to CCD [3,9]. N. ceranae
has often been found in both healthy and failing colonies and its
role in CCD in the USA remains unclear.
Given the diversity of potential microbes found in CCD colonies
to date, and acknowledged environmental stresses faced by honey
bees, some investigators have concluded that CCD is not a specific
disease. It is rather a characteristic of colonies collapsing from an
assortment of pathogens, physiological stress, or intoxications [9].
Still, this hypothesis fails to explain how or why these factors
suddenly produce such a prevalent, highly distinctive, and unusual
disorder. In addition, and perhaps importantly, whereas CCD has
a precise set of signs in the USA [2,3], it is not clear whether these
are the same signs or causes of bee losses observed in other
countries [15].
In this study, we used mass spectrometry-based proteomics
(MSP) and a rigorous sampling method in an attempt to identify
potential markers of CCD. MSP offered an orthogonal and
complementary approach [16,17] to gene-based techniques used
in previous CCD studies for pathogen screening and classification.
Mass spectrometry yielded unambiguous peptide fragment data
that was processed by bioinformatics tools against the full library of
peptide sequences based on both genomic and proteomic research.
Consequently peptide fragment data acquired by MSP allowed
identification and classification of microorganisms from the
environment that was unrestricted by the need for amplification,
probes, or primers. Furthermore, this approach allowed for the
detection, quantification, and classification of fungi, bacteria, and
viruses in a single analytical pass [18–19]. Classification can be to
strain level and is limited only by the level of precision within the
proteomic and genomic databases.
Our MSP analyses revealed the presence of two RNA viruses
not previously reported in North American bee populations, as
well as a highly significant and also unreported co-occurrence of
strains of DNA invertebrate iridescent viruses (IIV) with a
microsporidian of the genus Nosema in CCD colonies. The two
RNA viruses were only seen occasionally, but the finding of the
DNA virus in virtually all CCD samples establishes a new avenue
for CCD research, as nearly all previous viral work to date in
honey bees has focused on RNA viruses.
Results
MSP analysis was used to survey microbes in bee samples from:
(1) CCD colonies from the original event in 2006–2007 from
widespread locations in eastern and western parts of the USA
(2006–2007 CCD Colonies), (2) a collapsing colony in an
observation hive fitted with a bi-directional flight counter and
sampled through time as it failed in 2008 (2008 Observation
Colony), (3) an independent collapse of bee colonies from CCD in
Florida in 2009 (2009 Florida CCD), (4) packages of Australian
honey bees delivered to the USA (2007 Australian Reference
Group), (5) an isolated non-migratory beekeeping operation in
Montana with no history of CCD (Montana Reference Group),
and (6) dead bees recovered from inoculation feeding trials with N.
ceranae alone, IIV alone, a mixture comprising N. ceranae plus IIV,
and controls that were fed syrup alone in 2009–2010 (Inoculations
Recovery Group).
MSP analysis resulted in a database of more than 3,000
identifiable peptides, representing more than 900 different species
of invertebrate-associated microbes. An extensive summary of
detected peptides and microbes is presented in a recently
completed technical report [20]. We narrowed the list of suspect
microbes to those infecting bees and insects, 121 in all. Of these,
only 29 were specific to bees or occurred in more than one percent
of the colonies sampled. These formed the subset of pathogens that
we used for subsequent analyses. We focused our search on
viruses, fungi, and microsporidia in the genus Nosema. We did not
include well known bacterial infections of honey bees that are
easily recognized, with visible signs that differ from CCD. We also
observed Varroa mites in some, but not all of the CCD colonies.
Peptides were identified from nine of the approximately 20
known honey bee viruses in the initial sample set (Table 1). The
isolated, non-migratory, Montana colonies that we included as a
reference group were unique in that they were nearly virus-free
except for a single colony that was positive for a low level of
SacBrood virus (SBV) infection.
The recently-described Varroa destructor virus 1 (VDV-1) [21]
was detected in two colonies from the 2006–2007 CCD colonies;
one from an eastern, and one from a western location [6,20].
Peptides of Kakugo virus [22,23], which previously has not been
reported in North American bees, were detected in two colonies
from a single west-coast location in this same CCD group of
colonies.
IAPV did not occur frequently and was distributed approxi-
mately equally among strong and failing colonies (Table 1). It was
Iridovirus and Colony Decline
PLoS ONE | www.plosone.org 2 October 2010 | Volume 5 | Issue 10 | e13181
more prevalent in colonies that originated from the East Coast of
the USA (four of ten) and Australia (three of ten).
The most prevalent viral peptides we detected were identified as
invertebrate iridescent viruses (IIV), large double-stranded DNA
viruses of the Iridoviridae family. We detected 139 unique peptides
in west- and east-coast colonies that were attributed only to IIV
type 6 (IIV-6, also known as Chilo iridescent virus) with high
confidence ($0.99).
IIV appeared with 100 percent frequency and at higher peptide
counts in failing and collapsed colonies. IIV also occurred in
nearly 75 percent of strong colonies, although invariably at lower
concentrations. Numerous peptides for Nosema species were
detected in collapsed and failing colonies. Peptides attributed to
ten species of Nosema were represented, but because of high cross-
correlations among the different peptides within the genus these
were aggregated based on cluster analysis into two distinct
groupings.
Using those groupings we observed that one group of Nosema
peptides paralleled the pattern of occurrence for IIV (r = 0.90,
n = 31, P,0.001) and was present at higher frequency more often
in failing and collapsed colonies than in strong colonies (Table 1).
Further suggestive correlations with other microbes included the
co-occurrence of Black queen cell virus (BQCV) and IIV (r = 0.71,
n = 31, P,0.001) and concordantly the same Nosema group
(r = 0.73, n = 31, P,0.001).
Count-weighted occurrence data were subjected to stepwise
discriminate function analysis to assess whether strong, failing, or
collapsed colonies could be differentiated by specific patterns of
pathogen occurrence. The isolated Montana apiary was included
as a non-CCD reference group for this analysis. The colonies in
this group served as an external control group that was
complementary to the strong colonies within the CCD apiaries
that served as internal controls.
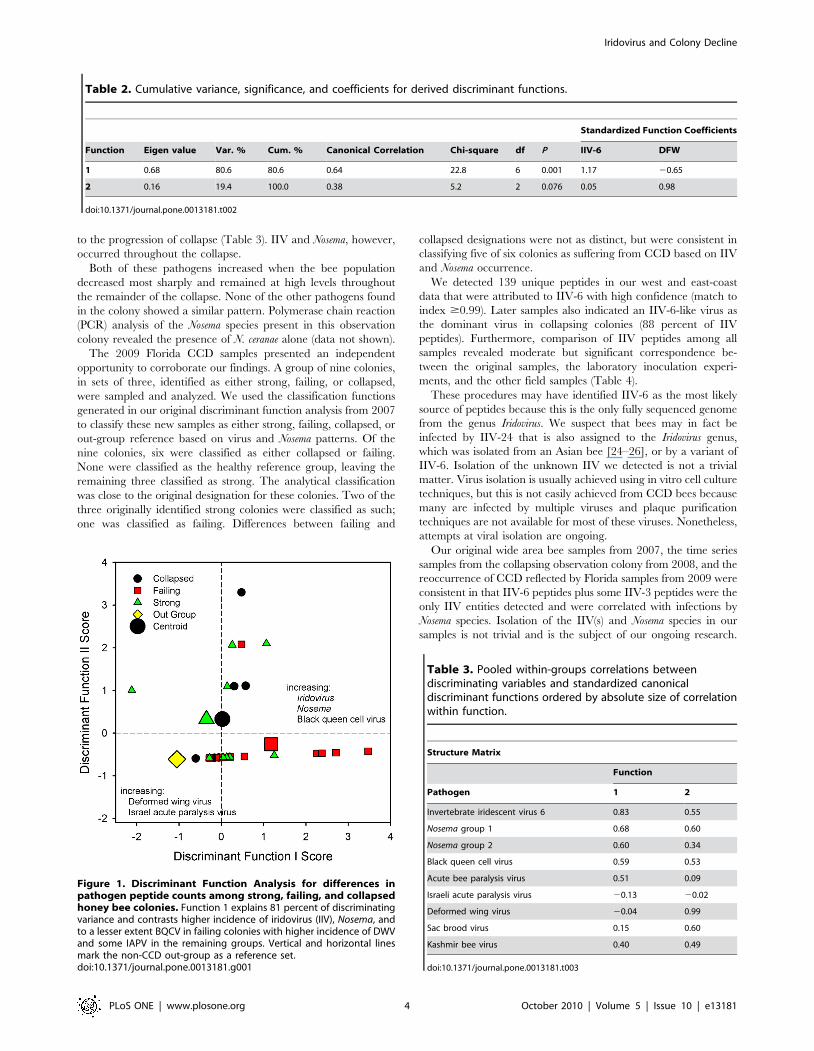
Discriminate analysis indicated that only two pathogens, IIV
and Deformed wing virus (DWV) were necessary for significant
discrimination among different colony groups (Table 2). The first
function contrasted higher incidence of IIV in failing colonies with
higher incidence of DWV in the remaining groups (Figure 1). The
structure matrix (correlations with discriminant functions) showed
that Nosema 1 was the highest correlated variable among those not
included with the discriminant functions (Table 3, r = 0.69). This
indicates that the incidence of IIV and Nosema 1 were strongly
associated with group scores on the discriminant functions.
As expected, the Montana reference group was most distinct
and significantly different from the strong condition colonies
(Pout – strong = 0.06, F = 5.5, df = 2,33; Pout – failing,0.001, F = 17.3,
df = 2,33; Pout – collapsed = 0.04, F = 7.5, df = 2,33). Failing colonies
were distinct from both good and reference colonies (Pfailing-strong
= 0.002, F = 7.4, df = 2,33; Pfailing-out = 0.001, F = 10.1, df = 2,33)
based mostly on differences in IIV peptide abundance. The only
anomaly was that collapsed and strong colonies were not
significantly different (Pcollapse-strong = 0.71, F = 0.3, df = 2,33). This
similarity between collapsed and strong colonies seems contradic-
tory at first.
It is, however, likely that the few bees left in colonies at the final
stages of collapse are those that are not infected, and thus would be
expected to be similar to uninfected bees in strong colonies. Nosema
species by themselves were not a significant predictor of colony
condition, but Nosema group 1 was highly correlated with IIV
(r = 0.901, n = 31, P,0.001), and so was not selected by the
stepwise procedure because of its statistical association with IIV.
In the 2008 observation colony, as CCD progressed, flight
activity exhibited several peaks and crashes until it declined by
approximate geometric decay to extinction (Figure 2). Only nine
common RNA bee viruses were identified by proteomics, and
most occurred in only one or a few samples, with little correlation
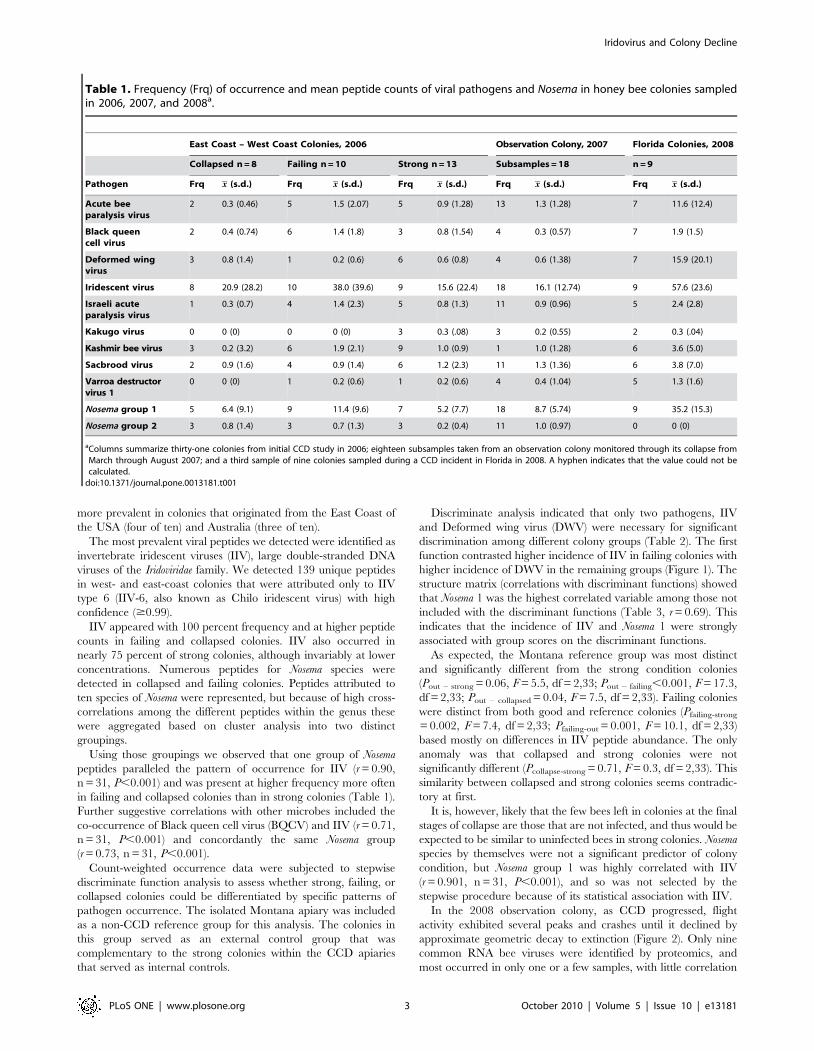
Table 1. Frequency (Frq) of occurrence and mean peptide counts of viral pathogens and Nosema in honey bee colonies sampledin 2006, 2007, and 2008a.
East Coast – West Coast Colonies, 2006 Observation Colony, 2007 Florida Colonies, 2008
Collapsed n = 8 Failing n = 10 Strong n = 13 Subsamples = 18 n = 9
Pathogen Frq x (s.d.) Frq x (s.d.) Frq x (s.d.) Frq x (s.d.) Frq x (s.d.)
Acute beeparalysis virus
2 0.3 (0.46) 5 1.5 (2.07) 5 0.9 (1.28) 13 1.3 (1.28) 7 11.6 (12.4)
Black queencell virus
2 0.4 (0.74) 6 1.4 (1.8) 3 0.8 (1.54) 4 0.3 (0.57) 7 1.9 (1.5)
Deformed wingvirus
3 0.8 (1.4) 1 0.2 (0.6) 6 0.6 (0.8) 4 0.6 (1.38) 7 15.9 (20.1)
Iridescent virus 8 20.9 (28.2) 10 38.0 (39.6) 9 15.6 (22.4) 18 16.1 (12.74) 9 57.6 (23.6)
Israeli acuteparalysis virus
1 0.3 (0.7) 4 1.4 (2.3) 5 0.8 (1.3) 11 0.9 (0.96) 5 2.4 (2.8)
Kakugo virus 0 0 (0) 0 0 (0) 3 0.3 (.08) 3 0.2 (0.55) 2 0.3 (.04)
Kashmir bee virus 3 0.2 (3.2) 6 1.9 (2.1) 9 1.0 (0.9) 1 1.0 (1.28) 6 3.6 (5.0)
Sacbrood virus 2 0.9 (1.6) 4 0.9 (1.4) 6 1.2 (2.3) 11 1.3 (1.36) 6 3.8 (7.0)
Varroa destructorvirus 1
0 0 (0) 1 0.2 (0.6) 1 0.2 (0.6) 4 0.4 (1.04) 5 1.3 (1.6)
Nosema group 1 5 6.4 (9.1) 9 11.4 (9.6) 7 5.2 (7.7) 18 8.7 (5.74) 9 35.2 (15.3)
Nosema group 2 3 0.8 (1.4) 3 0.7 (1.3) 3 0.2 (0.4) 11 1.0 (0.97) 0 0 (0)
aColumns summarize thirty-one colonies from initial CCD study in 2006; eighteen subsamples taken from an observation colony monitored through its collapse fromMarch through August 2007; and a third sample of nine colonies sampled during a CCD incident in Florida in 2008. A hyphen indicates that the value could not becalculated.
doi:10.1371/journal.pone.0013181.t001
Iridovirus and Colony Decline
PLoS ONE | www.plosone.org 3 October 2010 | Volume 5 | Issue 10 | e13181
to the progression of collapse (Table 3). IIV and Nosema, however,
occurred throughout the collapse.
Both of these pathogens increased when the bee population
decreased most sharply and remained at high levels throughout
the remainder of the collapse. None of the other pathogens found
in the colony showed a similar pattern. Polymerase chain reaction
(PCR) analysis of the Nosema species present in this observation
colony revealed the presence of N. ceranae alone (data not shown).
The 2009 Florida CCD samples presented an independent
opportunity to corroborate our findings. A group of nine colonies,
in sets of three, identified as either strong, failing, or collapsed,
were sampled and analyzed. We used the classification functions
generated in our original discriminant function analysis from 2007
to classify these new samples as either strong, failing, collapsed, or
out-group reference based on virus and Nosema patterns. Of the
nine colonies, six were classified as either collapsed or failing.
None were classified as the healthy reference group, leaving the
remaining three classified as strong. The analytical classification
was close to the original designation for these colonies. Two of the
three originally identified strong colonies were classified as such;
one was classified as failing. Differences between failing and
collapsed designations were not as distinct, but were consistent in
classifying five of six colonies as suffering from CCD based on IIV
and Nosema occurrence.
We detected 139 unique peptides in our west and east-coast
data that were attributed to IIV-6 with high confidence (match to
index $0.99). Later samples also indicated an IIV-6-like virus as
the dominant virus in collapsing colonies (88 percent of IIV
peptides). Furthermore, comparison of IIV peptides among all
samples revealed moderate but significant correspondence be-
tween the original samples, the laboratory inoculation experi-
ments, and the other field samples (Table 4).
These procedures may have identified IIV-6 as the most likely
source of peptides because this is the only fully sequenced genome
from the genus Iridovirus. We suspect that bees may in fact be
infected by IIV-24 that is also assigned to the Iridovirus genus,
which was isolated from an Asian bee [24–26], or by a variant of
IIV-6. Isolation of the unknown IIV we detected is not a trivial
matter. Virus isolation is usually achieved using in vitro cell culture
techniques, but this is not easily achieved from CCD bees because
many are infected by multiple viruses and plaque purification
techniques are not available for most of these viruses. Nonetheless,
attempts at viral isolation are ongoing.
Our original wide area bee samples from 2007, the time series
samples from the collapsing observation colony from 2008, and the
reoccurrence of CCD reflected by Florida samples from 2009 were
consistent in that IIV-6 peptides plus some IIV-3 peptides were the
only IIV entities detected and were correlated with infections by
Nosema species. Isolation of the IIV(s) and Nosema species in our
samples is not trivial and is the subject of our ongoing research.
Figure 1. Discriminant Function Analysis for differences inpathogen peptide counts among strong, failing, and collapsedhoney bee colonies. Function 1 explains 81 percent of discriminatingvariance and contrasts higher incidence of iridovirus (IIV), Nosema, andto a lesser extent BQCV in failing colonies with higher incidence of DWVand some IAPV in the remaining groups. Vertical and horizontal linesmark the non-CCD out-group as a reference set.doi:10.1371/journal.pone.0013181.g001
Table 2. Cumulative variance, significance, and coefficients for derived discriminant functions.
Standardized Function Coefficients
Function Eigen value Var. % Cum. % Canonical Correlation Chi-square df P IIV-6 DFW
1 0.68 80.6 80.6 0.64 22.8 6 0.001 1.17 20.65
2 0.16 19.4 100.0 0.38 5.2 2 0.076 0.05 0.98
doi:10.1371/journal.pone.0013181.t002
Table 3. Pooled within-groups correlations betweendiscriminating variables and standardized canonicaldiscriminant functions ordered by absolute size of correlationwithin function.
Structure Matrix
Function
Pathogen 1 2
Invertebrate iridescent virus 6 0.83 0.55
Nosema group 1 0.68 0.60
Nosema group 2 0.60 0.34
Black queen cell virus 0.59 0.53
Acute bee paralysis virus 0.51 0.09
Israeli acute paralysis virus 20.13 20.02
Deformed wing virus 20.04 0.99
Sac brood virus 0.15 0.60
Kashmir bee virus 0.40 0.49
doi:10.1371/journal.pone.0013181.t003
Iridovirus and Colony Decline
PLoS ONE | www.plosone.org 4 October 2010 | Volume 5 | Issue 10 | e13181

Isolates, however, of a strain of IIV-6 and N. ceranae were
immediately available. Thus, to test our MSP generated hypothesis
that an interaction between N. ceranae and IIV leads to increased bee
mortality we conducted inoculation cage-trial experiments.
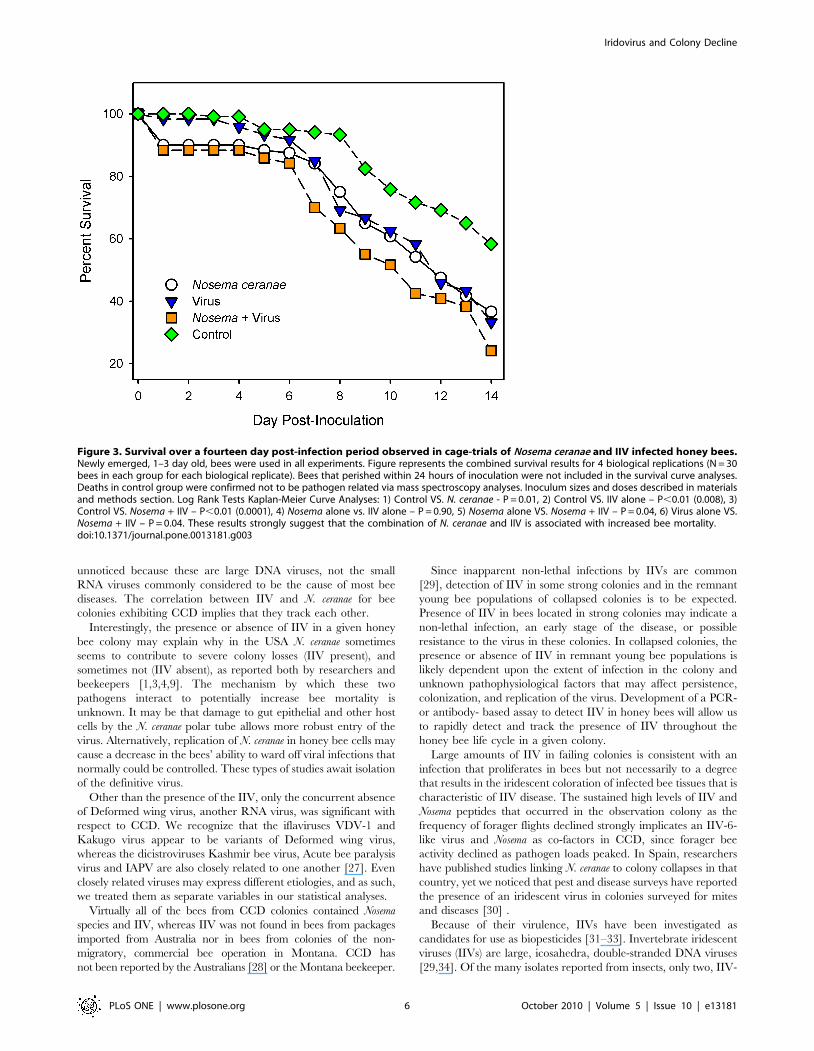
Cage trials of 1–3 day old newly-emerged bees demonstrated
increased mortality in the experimental group fed both N. ceranae
and IIV-6 in comparison with the control group (P = 0.0001) and
bees fed only N. ceranae (P = 0.04) or only IIV-6 (P = 0.04, Figure 3).
As the actual infectious dose of N. ceranae or IIV that occurs in the
field is currently unknown, we chose to utilize a relatively low
infectious dose for both pathogens in our experiments. As is
common in cage bee trials, mortality was observed in the control
groups in all four biological replicates. To confirm that the
controls likely died from a non-infectious cause, deceased bees
from all treatment groups were further screened with MSP. The
controls did not have any detectable IIVs, but did show some
evidence of Nosema, which was not apparent from PCR analysis of
the same samples.
These results revealed mostly an absence of pathogens in the
control bees, and the presence of peptides related to IIV-6 or N.
ceranae in the appropriate groups (data not shown). Importantly, no
statistical difference in survival was observed between the bees fed
N. ceranae or the virus alone. These results support the correlation
observed by the MSP data that suggests than an interaction
between N. ceranae and an IIV-6-like virus may be involved in bee
mortality. Whether an additive or synergistic interaction would be
observed between N. ceranae and other bee viruses is currently
unknown, but merits further study.
Discussion
MS-based proteomics provided an unrestricted and unbiased
approach for surveying pathogens in honey bee colonies. Our
results detected a DNA virus and two RNA viruses that had not
been previously reported in honey bees from the USA. The
potential correlation of IIV with CCD may previously have gone
Figure 2. Decline in forager flights in conjunction with increasing counts of iridovirus (IIV) and Nosema peptides. The peptides weredetected in dead worker honey bee samples collected from a single collapsing observation hive at the University of Montana, Missoula. Foragerflights are absolute counts per day, tabulated by an automated honey bee counter. Peptide counts are the summed counts by day of collection for allunique IIV Nosema peptides in each sample. We suspended sampling in mid-August, as the bee population was too weak to sample without affectingthe colony. We collected the queen and last few bees for a final sample in early September. Sample size varied from about ten bees to more than 100per sample interval, depending on how many dead bees were obtained from the entrance tube.doi:10.1371/journal.pone.0013181.g002
Table 4. Similarity in occurrence of specific iridescent virus peptides among different samples analyzed for evidence of pathogensassociated with CCD.
Sample Florida Collapse Inoculation Trial Collapsing Colony
Inoculation Trial Rhoa(Ptwo-tailed) 0.26 (0.00)
Sorensen’s Indexb 0.18
Collapsing Colony Rho (Ptwo-tailed) 0.08 (0.21) 0.11 (0.07)
Sorensen’s Index 0.21 0.18
East-West CCD Colonies Rho (Ptwo-tailed) 0.30 (0.00) 0.22 (0.00) 0.03 (0.66)
Sorensen’s Index 0.58 0.20 0.17
aSpearman’s rank correlation (rho; n = 266).bSorensen’s index of similarity were calculated for each pairwise comparison. East-, West-CCD colonies sampled 2007–2008; Collapsing Observation Colony, 2008;
Florida Collapse, 2009; Inoculation Trials, 2009–2010.doi:10.1371/journal.pone.0013181.t004
Iridovirus and Colony Decline
PLoS ONE | www.plosone.org 5 October 2010 | Volume 5 | Issue 10 | e13181
unnoticed because these are large DNA viruses, not the small
RNA viruses commonly considered to be the cause of most bee
diseases. The correlation between IIV and N. ceranae for bee
colonies exhibiting CCD implies that they track each other.
Interestingly, the presence or absence of IIV in a given honey
bee colony may explain why in the USA N. ceranae sometimes
seems to contribute to severe colony losses (IIV present), and
sometimes not (IIV absent), as reported both by researchers and
beekeepers [1,3,4,9]. The mechanism by which these two
pathogens interact to potentially increase bee mortality is
unknown. It may be that damage to gut epithelial and other host
cells by the N. ceranae polar tube allows more robust entry of the
virus. Alternatively, replication of N. ceranae in honey bee cells may
cause a decrease in the bees’ ability to ward off viral infections that
normally could be controlled. These types of studies await isolation
of the definitive virus.
Other than the presence of the IIV, only the concurrent absence
of Deformed wing virus, another RNA virus, was significant with
respect to CCD. We recognize that the iflaviruses VDV-1 and
Kakugo virus appear to be variants of Deformed wing virus,
whereas the dicistroviruses Kashmir bee virus, Acute bee paralysis
virus and IAPV are also closely related to one another [27]. Even
closely related viruses may express different etiologies, and as such,
we treated them as separate variables in our statistical analyses.
Virtually all of the bees from CCD colonies contained Nosema
species and IIV, whereas IIV was not found in bees from packages
imported from Australia nor in bees from colonies of the non-
migratory, commercial bee operation in Montana. CCD has
not been reported by the Australians [28] or the Montana beekeeper.
Since inapparent non-lethal infections by IIVs are common
[29], detection of IIV in some strong colonies and in the remnant
young bee populations of collapsed colonies is to be expected.
Presence of IIV in bees located in strong colonies may indicate a
non-lethal infection, an early stage of the disease, or possible
resistance to the virus in these colonies. In collapsed colonies, the
presence or absence of IIV in remnant young bee populations is
likely dependent upon the extent of infection in the colony and
unknown pathophysiological factors that may affect persistence,
colonization, and replication of the virus. Development of a PCR-
or antibody- based assay to detect IIV in honey bees will allow us
to rapidly detect and track the presence of IIV throughout the
honey bee life cycle in a given colony.
Large amounts of IIV in failing colonies is consistent with an
infection that proliferates in bees but not necessarily to a degree
that results in the iridescent coloration of infected bee tissues that is
characteristic of IIV disease. The sustained high levels of IIV and
Nosema peptides that occurred in the observation colony as the
frequency of forager flights declined strongly implicates an IIV-6-
like virus and Nosema as co-factors in CCD, since forager bee
activity declined as pathogen loads peaked. In Spain, researchers
have published studies linking N. ceranae to colony collapses in that
country, yet we noticed that pest and disease surveys have reported
the presence of an iridescent virus in colonies surveyed for mites
and diseases [30] .
Because of their virulence, IIVs have been investigated as
candidates for use as biopesticides [31–33]. Invertebrate iridescent
viruses (IIVs) are large, icosahedra, double-stranded DNA viruses
[29,34]. Of the many isolates reported from insects, only two, IIV-
Figure 3. Survival over a fourteen day post-infection period observed in cage-trials of Nosema ceranae and IIV infected honey bees.Newly emerged, 1–3 day old, bees were used in all experiments. Figure represents the combined survival results for 4 biological replications (N = 30bees in each group for each biological replicate). Bees that perished within 24 hours of inoculation were not included in the survival curve analyses.Deaths in control group were confirmed not to be pathogen related via mass spectroscopy analyses. Inoculum sizes and doses described in materialsand methods section. Log Rank Tests Kaplan-Meier Curve Analyses: 1) Control VS. N. ceranae - P = 0.01, 2) Control VS. IIV alone – P,0.01 (0.008), 3)Control VS. Nosema + IIV – P,0.01 (0.0001), 4) Nosema alone vs. IIV alone – P = 0.90, 5) Nosema alone VS. Nosema + IIV – P = 0.04, 6) Virus alone VS.Nosema + IIV – P = 0.04. These results strongly suggest that the combination of N. ceranae and IIV is associated with increased bee mortality.doi:10.1371/journal.pone.0013181.g003
Iridovirus and Colony Decline
PLoS ONE | www.plosone.org 6 October 2010 | Volume 5 | Issue 10 | e13181
3 and IIV-6 [29,35,36] have been subjected to complete genome
sequencing and an additional 24 have been partially characterized
[29,37,38]. Historically, IIVs were numbered according to date of
isolation [37,38]. Uniformly packed particle arrays [34,40] of these
viruses produce opalescent colors in the tissues of heavily infected
hosts, particularly in insects in damp or aquatic habitats. These
viruses have been shown to alter insect growth, longevity, and
reproduction, and induce cell apoptosis [29,34,39,40–46]. In
silkworms, IIV-1 can induce epidermal tumors [47].
Patent IIV infections are almost invariably lethal but inapparent
or covert infections may be common [29,34]. Inapparent
infections may not be lethal, but may affect the reproduction
and longevity of covertly infected hosts [42]. IIV-3 is thought to be
restricted to a single species of mosquito [34,36], although we
found peptides close to those of IIV-3 in bees from an observation
hive. These bee samples were hand-picked with forceps, so we are
confident that our observation hive samples did not include
mosquitoes or other insects.
Other IIVs, such as IIV-6, naturally infect various species of
Lepidoptera and commercial colonies of Orthoptera. There is
evidence that hymenopteran endoparasitoids can become infected
if they develop in an infected caterpillar [45]. IIVs have also been
studied for control of mosquitoes [32,33] and boll weevil [31], the
latter work examined the virus itself, with an emphasis on the
proteins that it produces as the basis for a possible biopesticide. A
U.S. Patent has already been awarded [31].
There is one known iridescent virus in bees. IIV-24, originally
isolated from the Asiatic honey bee Apis cerana, severely affects bee
colonies, causing inactivity, crawling, and clustering disease [24–26].
Proteomics could not identify IIV-24 in any of our samples because
there are no IIV-24 sequences in the current databases. Thus, thus
the identity of the IIV in our samples remains undetermined.
Based on the sequence data generated from MSP, the IIV
identified appears to be closely related to IIV-6, possibly because
this is the only IIV in the Iridovirus genus that has been completely
sequenced. The major capsid protein represents approximately 40
percent of the total particle polypeptide and is highly conserved, so
sequencing peptide fragments may frequently identify IIV-6 as
being the most likely candidate [37,40]. This argument is
reinforced by some results coming back as IIV-3, which is
presently assigned to a different genus in the family (Chloriridovirus)
and only reported to occur in a mosquito [36].
There is little information about IIVs in bees, although there are
historical reports associating IIVs with severe bee losses in India
[24–26], the U.S. [48], and possibly Spain [30]. In the 1970s, in
northern India, almost every bee was infected with IIV-24, with
25–40 percent annual colony loss [25,26]. The disease was
manifested by inactivity, clustering, and crawling sickness.
Transmission of IIV-24 is suspected to occur via eggs, feces, or
glandular secretions in food [25,26]. Evidence that IIV-24 was the
cause of Indian bee losses was based on turquoise and blue
iridescence seen in affected bees and tissues, serological tests, and
microscopic examination of sick bees. IIV was the only
recognizable parasite in all samples. IIV-24 was strongly correlated
with co-infective Nosema species and tracheal mites in diseased
colonies of Apis cerana [25,26]. Tracheal mites were found in some,
but not all of the sick colonies [24,26]. The fat body was always
attacked by the virus, and other tissues and organs, including the
ovaries were frequently infected [24,26].
In addition, an iridescent virus has also been associated with
mites, which may act as vectors, and has been implicated in bee
losses in the United States. While investigating unusually high
losses of bees in the northeastern United States, Camazine and Liu
[48] extracted a putative iridovirus from Varroa mites collected
from a colony that perished four weeks later. They concluded that
viral transmission within the colony might kill both mites and bees,
but they were not able to discover the virus in time to determine
whether bees in the colony were infected, and they were unable to
purify the virus or determine whether the virus could be
transmitted to bees by inoculation.
One or more species of external mites were suspected of being
carriers of the virus in Indian bees [24–26], as was also the case in
the U.S., with Varroa acting as the vector [48]. The need for a
better knowledge of the ecology of IIVs has been emphasized in
order that preventive measures could be taken to not only offset
damage to Apis cerana but also to reduce the chance that Apis
mellifera could become infected by this pathogen [26]. Indeed, IIV-
24 was experimentally inoculated and found to lethally infect A.
mellifera, forming cytoplasmic quasi-crystalline aggregates of virus
particles in cells of the fat body, hypopharyngeal glands, the gut
wall, and proximal ends of the Malpighian tubules [24,26].
These historical findings of IIV, mites, and Nosema species are
intriguing since researchers studying both Nosema ceranae and CCD in
Spain observed IIV-like particles in bee samples by electron
microscopy [30]. U.S. investigators studying CCD observed structures
in thoraxes of bees described as ‘peculiar white nodules’, resembling
tumors, that contained crystalline arrays [3], similar to those described
for IIV infections. Also, it appears that the IIV-6 genome encodes for
one or more polypeptides that can produce insect mortality by
inducing apoptosis without the need for viral replication [43].
The suspected source of Nosema ceranae in Apis mellifera is the
Asian bee Apis cerana [49]. This bee species is also known to be
infected by Thai sacbrood virus and by Kashmir bee virus.
Kashmir virus was first detected as a contaminant in a sample of
iridescent virus from India, as well as IIV-24 [50]. The same virus
was linked to bee losses in Canada in the early 1990s [51]. This
suggests that perhaps not only the microsporidium N. ceranae, but
other pathogens as well may have jumped from Apis cerana to Apis
mellifera, as predicted by Bailey and Ball in 1978 [26].
It also implies that if Kashmir bee virus has been in North
America for more than twenty years, so might IIV and Nosema
ceranae. That would fit the time line of the first observations of this
complex of pathogens, and of severe bee losses in India in the
1970s. It also leads us to ask whether the first widespread losses of
bees in the USA, described as Disappearing Disease in the 1970s
[52], may have been early outbreaks of CCD.
Our own work, described here, provides multiple lines of
correlative evidence from MSP analysis that associate IIVs and
Nosema with CCD in the USA. We conclude with results of
laboratory inoculations of caged bees with IIV and Nosema that
demonstrate the potential for increased lethality of mixed
infections of these two pathogens. Our study strongly suggests a
correlation between an iridescent virus, Nosema, and CCD. Our
inoculation experiments confirmed greater lethality of an IIV/
Nosema co-infection compared to infections involving each
pathogen alone. Future research using the specific strains of IIV
isolated from infected bees will surely confirm whether a
synergistic or additive interaction between these two pathogens
results in the signs and symptoms of CCD.
The fact that IIV-6 inoculated bees experienced increased
mortality in the presence of Nosema clearly strengthens the
significance of all lines of evidence pointing to an interaction
between an IIV and Nosema ceranae. Lack of a stronger effect by
preparations containing IIV-6 may be due to the possibility that
the IIV detected by proteomics is either a strain of IIV-24 or a
strain of IIV-6 that is more specifically adapted to honey bees, and
consequently more virulent than the strain of lepidopteran origin
used in our inoculation experiments. It is, of course, critical to
Iridovirus and Colony Decline
PLoS ONE | www.plosone.org 7 October 2010 | Volume 5 | Issue 10 | e13181

isolate the IIV from CCD populations, compare it to known IIVs
and particularly IIV-24, and then challenge CCD populations
with this strain. This work is in progress.
Moreover, we used a fairly low dose of IIV-6 and Nosema ceranae
spores. For example, IIVs are generally not highly infectious by
ingestion. Similarly, virulence studies on N. ceranae have reported
using over 200,000 spores per bee in cage trials whereas we used a
four-fold lower dose. It will also be interesting to test whether the
interaction between IIV and N. ceranae is specific, or a general
‘‘stress’’ phenomenon that could also be reproduced by addition of
N. ceranae and any additional bee virus.
In our studies, we applied six independent scenarios to the
assessment of potential causes or markers of CCD and got the
same answer, giving us confidence in the results, since this
inference approach is approximately analogous to applying the
same technique to six different assessments [53]. Our results also
provide credibility to older, often overlooked work by others that
associated IIV with bees, tracheal and Varroa mites, Nosema species
and severe bee losses. In our samples, Varroa mites were seen in
many CCD colonies, but not in all. Importantly, our limited results
do not completely fulfill the requirements of risk characterization,
nor do they clearly define whether the occurrence of IIV and N.
ceranae in CCD colonies is a marker, a cause, or a consequence of
CCD. Our findings do make a strong case for a link between an
Iridescent virus and Nosema with CCD and provide a clear
direction for additional research to answer these questions.
We anticipate that there also may be questions as to why IIV was
detected in our study, but has not been found in any current published
research on CCD. And, if these viruses were present, why weren’t they
seen in infected tissues of the European honey bee, Apis mellifera?
First, iridescent viruses have been seen before in Apis mellifera,
both in Europe and in the USA. Researchers in Spain reported
seeing iridescent virus in honey bees [30], and Camazine [48] saw
a putative iridescent virus in Varroa mites following a collapse of
colonies in the northeastern part of the U.S. in the 1990s. Also,
inapparent infections by iridescent viruses may involve a low
density of IIV particles in infected host cells [46], so without
sensitive techniques such as MSP, it is not surprising that infections
in CCD bee colonies were previously missed.
The large number of IIV proteins that we identified, 139 in all,
represent a significant fraction of the total IIV proteome. The
recently published genome for IIV-6 [54] suggests a total
proteome of 137 unique proteins. The 139 polypeptides identified
for the IIV strain in our study must therefore represent a near
complete sample of the total viral proteome belying any criticism
that our identification of IIV may be a spurious consequence of
accidental matching of a few peptide fragments.
We conclude that the IIV/Nosema association may be critical in
honey bee mortality linked to CCD. Although viral diseases are
currently manageable only by culling, Nosema infections are
treatable with several current management techniques. We suggest
that for beekeepers suffering from colony losses, disruption of the
potential IIV/Nosema relationship using treatments that are
available to control Nosema species may be one option to help
reduce honey bee mortality. Again, whether this identified bee IIV
and its potential interaction with Nosema species is the cause or
marker of CCD, is unknown, but our results clearly suggest that
further research in this area is urgently required.
Methods
Wide Area Bee SamplingWe collected sample sets of adult worker honey bees from
several areas and years: (1–2) Two initial sample sets of adult
honey bees from CCD colonies were obtained in 2006–2007 from
twelve beekeeping operations from western, northeastern, and
southeastern regions of the USA, (3) Samples from packages of
imported Australian bees provided a non-CCD 2007 reference, (4)
bees sampled in 2008 from a large, non-migratory beekeeping
operation in northwestern Montana with no history of CCD
provided a second reference set, (5) bee samples obtained in 2009
from a Florida apiary when 500 colonies suddenly collapsed
constituted an independent CCD sample set by location and year.
In each apiary investigated and sampled for this study, based on
visible signs of CCD as described by the CCD Working Group [3],
samples of 200–500 bees were collected from each of nine colonies
judged to represent the three most populous, three failing, and
three collapsed colonies. Our team was part of the CCD Working
Group that investigated and sampled the first reported colonies
with CCD in the USA [3]. We later published an expanded
description of the signs of CCD and variations that occur with
season and geographical area, and we have continued to inspect
and sample colonies showing signs of CCD from many areas of the
U.S. from December of 2006 to the present. As such, we are well
familiar with the signs and stages of CCD.
Typically, the largest colony populations had 10–14 frames of
adult bees or more, and two or more frames of brood. The
collapsed colonies had less than a frame of bees, often no more
than the queen and a fist-sized cluster of very young bees. Failing
colonies were defined as those that had no more than half the
number of bees as the most populous colonies. These colonies
often had an excess of bees, and had had far more bees just days or
a few weeks before the samples were taken, according to the
beekeeper accounts.
Additional reference bees were obtained from packages shipped
from Australia to the USA and from the most populous to the
weakest colonies from apiaries of a large, commercial beekeeping
operation in Montana that is geographically isolated and has no
history of CCD. In this case, the weakest bee populations were
only about 20 percent smaller than the largest bee populations.
All of the CCD operations were large, migratory beekeeping
businesses that transported bees across state borders and rented
colonies for pollination of almonds in California. The migratory
colonies sampled in 2006 and 2007 represented two different
migratory routes, one from the east coast to California, the other from
North Dakota to California. In addition, when in California, the east
coast and the mid-western colonies were separated by approximately
400 kilometers, so that there was no overlap of either the apiary
locations or highways of these two different migratory routes.
Bees were shaken directly into new, clean one quart ZiplocH or
one liter Whirl-Pac H bags. The bags were sealed, placed in a
cooler with frozen gel packs, and shipped by overnight express to
the U.S. Army Edgewood Chemical and Biological Center
(ECBC) laboratory. Bees were often alive when received and
were analyzed immediately. In a few cases, bee samples were
frozen and stored in a 280uC freezer until analyzed.
Following the same sampling methods, we sampled a repeat of
CCD in Florida, where 500 honey bee colonies started from
packages in October of 2008, collapsed in January of 2009. As
mentioned before, the beekeeper who owned the colonies had
experienced CCD in 2006–2007, and had been one of the original
beekeeping operations sampled by members of the CCD Working
Group. As in 2006–2007, the colonies suddenly collapsed,
demonstrating the characteristic signs of CCD [2,3].
Time Sequence Bee SamplingWe also observed the progression of CCD in a collapsing colony
in an observation hive, taking 18 bee samples of approximately
Iridovirus and Colony Decline
PLoS ONE | www.plosone.org 8 October 2010 | Volume 5 | Issue 10 | e13181
10–60 bees per sample interval, over a three month period, ending
when only a queen and four workers remained.
In the spring of 2008, we lost more than more than 50 of our
research colonies to CCD. We took the frames, queen, and the
small, surviving population of young bees from one of these
collapsed colonies, put them in a five-frame observation hive, and
fed them sucrose syrup. This colony soon produced a second
queen, and both queens co-existed in the same colony, one on
each side of the glass hive, together producing a rapidly increasing
combined population of bees. The forager bees had access to both
syrup and to abundant food resources from the University of
Montana campus, UM’s arboretum, and surrounding residential
flower gardens. By mid-summer, this bee colony collapsed for the
second time. We then began to sample bees from those remaining
in the hive.
The number of bees sampled at each time point varied with the
health of the colony. We attempted to collect at least 60 bees per
sample interval, until the end, when too few bees remained to take
even ten bees, which is the minimum sample size used for
proteomics analysis. We also recorded forager flight activity and
forager losses using a bi-directional digital bee-counter mounted at
the entrance of the observation colony.
Inoculation ExperimentsWe are working on isolating the IIV that infects CCD bees for
use in inoculations to perform Koch’s Postulates. For our
preliminary experiments, and because of the high degree of
similarity between the CCD-related IIV and IIV-6, based on the
MSP data, we elected to conduct inoculation trials using IIV-6 and
Nosema ceranae to observe how these two pathogens may interact.
Bees were obtained from non-CCD colonies with no detectable
levels of Nosema, as confirmed by PCR, from the MSU apiary.
Nosema ceranae was obtained from local colonies known to be
infected by the microsporidian. The New Zealand strain of IIV-6
was obtained from Dr. James Kalmakoff, reared in Galleria
mellonella larvae, and purified on sucrose density gradients as
described previously [55].
Following emergence from brood frames in an incubator, 1–3
day old bees were placed into sterile cardboard cups in a plant
growth chamber with controlled temperature (28uC, relative
humidity, and light). Using a 10 ml pipette, each bee was
inoculated by feeding it a total of 2 ml in sugar water containing
one of four treatments. Only bees that ingested the entire
inoculum were used.
The following treatments were given: 1) Controls = Sugar
Water/PBS 1:1, 2) Nosema ceranae – 2 ml containing 50,000
spores, 3) Virus – 2 ml of 0.25 mg/ml IIV-6 suspension in PBS/
Sugar Water 1:1 (0.25 ug Virus), and 4) N. ceranae + Virus- 2 ml containing 50,000 spores+0.25 mg of virus in PBS/Sugar
Water 1:1.
Thirty bees were inoculated in each group and the experiment
was repeated four separate times for a total of 120 bees in each
group. Bees that perished 24 hours after the inoculation were not
included in the statistical analysis. Bees were then monitored daily
for a period of 14 days. Dead bees were removed immediately
upon discovery and frozen at 280uC.
Dead bees from the inoculation experiments were analyzed by
PCR and proteomics to detect and confirm infections by N. ceranae
and virus. We used Kaplan-Meier Curve analyses and Log-Rank
Test statistics to determine the significance of the mortality results.
MSP protocols for double-blinded samplesBee samples were homogenized in 100 mM of ammonium
acetate buffer using a tissue homogenizer. The supernatant was
filtered to remove large particulates, followed by ultrafiltration at
300 kDa. All filtered bee samples were lysed using an ultra-
sonication probe at settings of 20 seconds pulse-ON, 5 seconds
pulse-OFF, and 25 percent amplitude for 5 minutes duration. To
verify cells were appropriately disrupted, a small portion of lysates
was subjected to 1-D gel analysis. The lysates were centrifuged at
14,1006 g for 30 minutes to remove all cellular debris. Super-
natant was then added to a Microcon YM-3 filter unit (Millipore;
USA) and centrifuged at 14,1006 g for 30 minutes. Effluent was
discarded and the filtrate were denatured by adding 8 M urea and
3mg/ml dithiothreitol (DTT) and incubated for two hours in an
orbital shaker set to 50uC and 60 rpm.
A 10 mL volume of 100 percent acetonitrile (ACN) was added to
tubes and allowed to sit at room temperature for 5 minutes. Tubes
were washed using 100 mM ABC solution and then spun down at
14,1006 g for 30–40 minutes. The isolated proteins were then
digested with 5 ml trypsin at a solution of 1 mg/ml (Promega, USA)
in 240 ml of ABC solution + 5 ml ACN. Digestion was performed
overnight at 37uC in an orbital shaker set to 60 rpm. Sixty
microliters of 5 percent ACN/0.5 percent formic acid (FA) was
added to each filter and vortex mixed gently for 10 minutes.
Tubes were centrifuged for 20–30 minutes at 14,1006 g. An
additional 60 ml 5 percent ACN/0.5 percent FA mixture was
added to filter and spun. Effluent was then analyzed using the LC-
MS/MS technique.
A protein database was constructed in a FASTA format using the
annotated bacterial and viral proteome sequences derived from all
fully sequenced chromosomes of bacteria and viruses, including
their sequenced plasmids (as of September 2008) [16,17]. A PERL
program (http://www.activestate.com/Products/ActivePerl) was
written to automatically download these sequences from the
National Institutes of Health National Center for Biotechnology
(NCBI) site (http://www.ncbi.nlm.nih.gov).
Each database protein sequence was supplemented with
information about a source organism and a genomic position of
the respective ORF embedded into a header line. The database of
bacterial proteomes was constructed by translating putative
protein-coding genes and consists of tens of millions of amino
acid sequences of potential tryptic peptides obtained by the in silico
digestion of all proteins (assuming up to two missed cleavages).
The experimental MS/MS spectral data of bacterial peptides were
searched using the SEQUESTH (Thermofisher Scientific, USA)
algorithm against a constructed proteome database of microorgan-
isms. SEQUEST thresholds for searching the product ion mass
spectra of peptides were Xcorr, deltaCn, Sp, RSp and deltaMpep.
These parameters provided a uniform matching score of all candidate
peptides [17,18]. The generated outfiles of these candidate peptides
were then validated using peptide prophet algorithm.
This validating and verification approach uses an expectation-
maximization algorithm as described by the Keller et al. [18], the
creators of PeptideProphet. The algorithm calculates a statistical
score that reflects the confidence of the match to each peptide
identified. Peptides identified are eliminated if they are below a
selected threshold. In our case, the threshold was set at 95 percent.
Peptides that were identified with less than 95 percent confidence
were removed from the final data set.
Peptide sequences with probability score of 95 percent and higher
were retained in the dataset and used to generate a binary matrix of
sequence-to-microbe assignments. The binary matrix assignment
was populated by matching the peptides with corresponding
proteins in the database and assigned a score of 0 (no-match) or 1
(match). The column in the binary matrix represented the proteome
of a given microbe and each row represented a tryptic peptide
sequence from the LC-MS/MS analysis.
Iridovirus and Colony Decline
PLoS ONE | www.plosone.org 9 October 2010 | Volume 5 | Issue 10 | e13181
Bee samples were identified with the virus/bacterium/fungi
proteome based on the number of unique peptides that remained
after removal of degenerate peptides from the binary matrix. This
approach was successfully used for the double-blind characteriza-
tion of non-genome-sequenced bacteria by mass-spectrometry-
based protoemics [19].
Proteomics identified peptides described from a variety of bee
viruses, as well nine species of Nosema: N. apis, N. bombycis, N. locustae
(now known as Antonospora locustae), N. tricoplusiae, N. BZ-2006B, N.
BZ-2006d, N. granulosis, N. empoascae, N. putellae, plus a collection of
unspecified Nosema peptides. At the time that our proteomics
analyses were conducted, the N. ceranae genome sequence was not
available and only one N. ceranae sequence was available in the
database.
It is almost certain that the diversity of Nosema represented in the
proteomics results was not attributable to multiple infections by all
the species identified. Rather, the taxonomic diversity in the data
reflects historical precedent in the Nosema research that added
different proteins to the genomic and proteomic libraries.
Assuming that the Nosema proteome described in our data
indicated one or at most a few species, we entered total peptide
counts for each species into a hierarchical cluster analysis using
average Chi-squared distance between species. The analysis
produced two primary groupings of Nosema peptides: Group 1
which contained N. apis, N. bombycis, and N. locustae; and Group 2
which contained all of the remaining Nosema species.
We performed forward, stepwise discriminant analysis on
square-root or log transformed pathogen counts for Nosema species
and for all of the bee virus species. Counts were calculated by
weighting each pathogen occurrence by the total number of its
peptides that were detected. The specific transform performed on
each variable was the one that best normalized the distribution of
individual variables.
Use of peptide counts as a weighting factor stems from the
observation that as total pathogen titer in a sample increases, the
number of different peptides that can be identified by proteomics
increases in a predictable manner [18]. Thus, the number of
peptides observed for each pathogen served as a relative measure
of its abundance in the sample.
Four colony groups were discriminated: strong, failing,
collapsed, and the Montana reference group. Selection method
for variable entry was largest univariate F-value; F to enter was set
at 2.0. Equal probability of group membership was assumed.
The analysis was completed after two steps including only IIV-6
and DFW as significant discriminating variables (Final Wilks’
lambda = 0.679; F = 2.881; df = 2, 54; P = 0.031; Table 2). None of
the Nosema groups were selected for the discriminant functions, but
Nosema 1 was strongly correlated with IIV; the pooled within
groups correlation matrix from which the discriminant functions
were extracted showed the highest among groups correlation was
between IIV and Nosema 1 (r = 0.89). Because IIV and Nosema 1
conveyed the same discriminating information, only one was
included.
Acknowledgments
The authors thank Dave Wick of BVS, Inc. for introducing us to the Army
team and their advanced analytical technologies and the U.S. beekeepers
who allowed us to sample their bees. UM and Bee Alert Technology, Inc.
researchers put a tremendous amount of time and energy into the project.
Stacy Potter annotated the proteomics database; while Scott Debnam
contacted beekeepers and traveled across the U.S. inspecting and collecting
bee samples from CCD colonies. Sarah Red-Laird conducted final edits of
the manuscript.
Author Contributions
Conceived and designed the experiments: JJB CBH CHW RAC.
Performed the experiments: JJB REJ SVD PEM MML JCG RAC.
Analyzed the data: JJB CBH PEM PMW RAC. Contributed reagents/
materials/analysis tools: SLB KWW RAC. Wrote the paper: JJB CBH
CHW MFS AWZ REJ SVD PEM RAS TW DRF SLB RAC. Coordinated
overall research team: JJB. Conducted statistical analyses: CBH.
Coordinated Army (ECBC) research: CHW. Directed proteomics research:
MFS. Organized Army research contribution: AWZ. Conducted proteo-
mics analysis: REJ SVD. Analyzed results using bioinformatics: REJ SVD.
Contributed Information Technology guidance: RAS. Set up and
annotated proteomics data base: PMW. Consulted on all aspects of
Iridoviruses: TW. Coordinated efforts with US Army: DRF. Guided
epidemiology approach: EWS. Directed graduate student research: KWW.
References
1. Bromenshenk JJ (2010) Colony collapse disorder (CCD) is alive and well. Bee
Culture 138: 51.
2. Debnam S, Westervelt D, Bromenshenk J, Oliver R (2008) Colony collapse
disorder: symptoms change with seasons and are different with various locations.
Bee Culture 137: 30–32.
3. CCD Working Group (2006) Colony Collapse Disorder (CCD). Available:
http://maarec.cas.psu.edu/pressReleases/FallDwindleUpdate0107.pdf. Ac-
cessed 2010 Jan 15.
4. Cox-Foster DL, Conlan S, Holmes EC, Palacious G, Evans JD, et al. (2007) A
metagenomic survey of microbes in honey bee colony collapse disorder. Science
318: 283–287.
5. Chen YP, Evans JD, Smith IB, Pettis JS (2008) Nosema ceranae is a long-present
and wide-spread microsporidian infection of the European honey bee (Apis
mellifera) in the United States. J Invertebr Pathol 92: 152–159.
6. Michel Joan (2008) Scientists Discover New Virus Invading US Honeybees,
U.S. Army Edgewood Chemical Biological Center, Public Affairs Office. News
Release. Available: http://www.ecbc.army.mil/pr/download/VDV-1_
Discvery.pdf. Accessed 2010 April 20.
7. Edgewood Chemical Biological Center (2007) Scientists Identify Pathogens That
May Be Causing Global Honey-Bee Deaths. Science Daily. Available: http://www.
sciencedaily.com/releases/2007/04/070426100117.htm. Accessed 2010 August 9.
8. Maori E, Paldi N, Shafir S, Kalev H, Tsur E, et al. (2009) IAPV, a bee-affecting
virus associated with colony collapse disorder can be silenced by dsRNA
ingestion. Insect Mol Biol 18: 55–60.
9. van Engelsdorp D, Evans JD, Saegerman C, Mullin C, Haubruge E, et al. (2009)
Colony Collapse Disorder: A Descriptive Study. PLoS ONE 4(8): e6481.
10. Maori E, Lavi S, Mozes-Koch R, Gantman Y, Peretz Y, et al. (2007) Isolation
and characterization of Israeli acute paralysis virus, a dicistrovirus affecting
honey bees in Israel: evidence for diversity due to intra- and inter-species
recombination. J Gen Virol 88: 3428–3438.
11. Johnson RM, Evans JD, Robinson GE, Berenbaum MR (2009) Changes in
transcript abundance relating to colony collapse disorder in honey bees (Apis
mellifera). Proc Nat Acad Sci USA 106: 14790–14795.
12. Mullin CA, Frazier M, Frazier JL, Ashcraft S, Simonds R, et al. (2010) High
levels of miticides and agrochemicals in North American apiaries: Implications
for honey bee health. PLoS ONE 5: e9754.
13. Klee J, Besana AM, Genersch E, Gisder S, Nanetti A, et al. (2007) Widespread
dispersal of the microsporidian Nosema ceranae, an emergent pathogen of the
western honey bee, Apis mellifera. J Invertebr Pathol 96: 1–10.
14. Higes M, Martın-Hernandez R, Garrido-Bailon E, Gonzalez-Porto AV, Garcıa-
Palencia P, et al. (2009) Honey bee colony collapse due to Nosema ceranae in
professional apiaries. Environ Microbiol Reports 1: 110–113.
15. Neumann P, Carreck NL (2010) Honey bee colony losses. J Apicult Res 49: 1–6.
16. Dworzanski JP, Deshpande SV, Chen R, Jabbour RE, Snyder AP, et al. (2006)
Mass Spectrometry-based proteomics combined with informatics tools for
bacterial classification. J Proteome Res 5: 76–87.
17. Aebersold R, Mann M (2003) Mass spectrometry-based proteomics. Nature 13:
198–207.
18. Keller A, Nesvizhskii AI, Kolker E, Aebersold R (2002) Empirical statistical
model to estimate the accuracy of peptide identifications made by MS/MS and
database search. Anal Chem 74: 5383–92.
19. Jabbour RE, Deshpande SV, Wade MM, Stanford MF, Wick CH, et al. (2010)
Double-blind characterization of non-genome-sequenced bacteria by mass
spectrometry-based proteomics. Appl Environ Microbiol 76: 3637–3644.
20. Wick CH, Stanford MF, Zulich AW, Skowronski E, Bromenshenk JJ, et al.
(2010) Iridescent virus and Nosema ceranae linked to honey bee Colony Collapse
Iridovirus and Colony Decline
PLoS ONE | www.plosone.org 10 October 2010 | Volume 5 | Issue 10 | e13181
Disorder (CCD). Edgewood Chemical Biological Center Technical Report: TR-
814, July 2010.
21. Ongus JR, Roode EC, Pleij CWA, Vlak JM, van Oers MM (2006) The 59 non-
translated region of Varroa destructor virus 1 (genus Iflavirus): structure
prediction and IRES activity in Lymantria dispar cells. J Gen Virol 87: 3397–3407.
22. Fujiyuki T, Ohka S, Takeuchi H, Ono M, Nomoto A, et al. (2006) Prevalence
and phylogeny of Kakugo virus, a novel insect picorna-like virus that infects the
honey bee (Apis mellifera L.), under various colony conditions. J Virol 80:
11528–11538.
23. Terio V, Martella V, Camero M, Decaro N, Testini G, et al. (2008) Detection of
a honey bee iflavirus with intermediate characteristics between KaKugo Virus
and Deformed Wing Virus. New Microbiol 31: 439–444.
24. Bailey L, Ball BV, Woods RD (1976) An iridovirus from bees. J Gen Virol 31:
459–461.
25. Verma S, Phogat KPS (1982) Seasonal incidence of Apis iridescent virus in Apis
cerana indica. Fab. in Uttar Pradesh, India. Indian Bee J 44: 36–37.
26. Bailey L, Ball BV (1978) Apis iridescent virus and ‘‘clustering disease’’ of Apis
cerana. J Invertebr Pathol 31: 368–371.
27. Baker AC, Schroeder C (2008) The use of RNA-dependent RNA polymerase for
the taxonomic assignment of picorna-like viruses (order Picornavirales) infecting
Apis mellifera L. populations. Virol J 5: 10.
28. Anderson D, East IJ (2008) The latest buzz about colony collapse disorder.
Science 319: 724–725.
29. Williams T (1998) Invertebrate iridescent viruses. In: The Insect Viruses
Miller LK, Ball LA, eds. New York: Springer. pp 31–68.
30. Anonymous (2000 Dec 13) Analysis Informativo (Laboratory analysis of bees
from Guadalajara, Spain, December 13, 2000). Available: Servicio de
Investigacion Agraria, Bee Pathology Laboratory, Central Apicola Regional,
Marchamalo, Spain. Provided by M. Higes.
31. Bilimoria SL (2001) Use of viral proteins for controlling the boll weevil and other
insect pests. (U.S. Patent 6,200,561, Bl 2001).
32. Marina CF, Fernandez-Salas I, Ibarra JE, Arrendondo-Jimenez JI, Valle J, et al.
(2005) Transmission dynamics of an iridescent virus in an experimental
mosquito population: the role of host density. Ecol Entomol 30: 376–382.
33. Becnel JJ, White SE (2007) Mosquito pathogenic viruses—the last 20 years. J Am
Mosq Control Assoc 23: 36–49.
34. Williams T (2008) Natural invertebrate hosts of iridoviruses (Iridoviridae).
Neotrop Entomol 37: 615–632.
35. Jakob NJ, Muller K, Bahr U, Darai G (2001) Analysis of the first complete DNA
sequence of an invertebrate iridovirus: coding strategy of the genome of Chilo
iridescent virus. Virology 286: 182–196.
36. Delhon G, Tulman ER, Afonso CL, Becnel JJ, Moser BA, et al. (2006) Genome
of Invertebrate iridescent virus type 3 (Mosquito iridescent virus). J Virol 80:
8439–8449.
37. Tinsley TW, Kelly DC (1970) An interim nomenclature system for the iridescent
group of viruses. J Invertebr Pathol 16: 470–472.38. Williams T, Cory JS (1994) Proposals for a new classification of iridescent virus.
J Gen Virol 75: 1291–1301.
39. Cole A, Morris TJ (1980) A new iridovirus of two species of terrestrial isopods,Armadillidium vulgare and Porcellio scaber. Intervirol 137: 14:21–30.
40. Webby R, Kalmakoff J (1998) Sequence comparison of the major capsid proteingene from 18 diverse iridoviruses. Arch Virol 143: 1940–1966.
41. Marina CF, Ibarra JE, Arredondo-Jimenez JI, Fernandez-Salas I, Liedo P, et al.
(2003) Adverse effects of covert iridovirus infection on the life history anddemographic parameters of Aedes aegypti. Entomol Exp Appl 106: 53–61.
42. Marina CF, Arredondo-Jimenez J, Castillo A, Williams T (1999) Sublethaleffects of iridovirus disease in a mosquito. Oecologia 119: 383–388.
43. Paul ER, Chitnis NS, Henderson CW, Kaul RJ, D’Costa SM, et al. (2007)Induction of apoptosis by iridovirus protein extract. Arch Virol 152: 1353–1364.
44. Chitnis NS, D’Costa SM, Paul ER, Bilimoria SL (2008) Modulation of
iridovirus-induced apoptosis by endocytosis, early expression, JNK, and apicalcaspase. Virology 370: 333–342.
45. Lopez M, Rojas JC, Vandame R, Williams T (2002) Parasitoid-mediatedtransmission of an iridescent virus. J Invertebr Pathol 80: 160–170.
46. Tonka T, Weiser J (2000) Iridovirus infection in mayfly larvae. J Invertebr
Pathol 76: 229–231.47. Hukuhara T (1964) Induction of epidermal tumor in Bombyx mori (Linnaeus) with
Tipula iridescent virus. J Insect Pathol 6: 246–248.48. Camazine S, Liu TP (1998) A putative iridovirus from the honey bee mite, Varroa
jacobsoni Oudemans. J Invertebr Pathol 71: 177–178.49. Fries I, Feng F, Da Silva A, Slemenda SB, Pieniazek NJ (1996) Nosema ceranae n.
sp. (Microspora, Nosematidae), morphological and molecular characterization of
a microsporidian parasite of the Asian honey bee Apis cerana (Hymenoptera,Apidae). Eur J Protistol 32: 356–365.
50. de Miranda JR, Drebot M, Tyler S, Shen M, Cameron CE, et al. (2004)Complete nucleotide sequence of Kashmir bee virus and comparison with Acute
bee paralysis virus. J Gen Virol 85: 2263–2270.
51. Bruce WA, Anderson DL, Calderone NW, Shimanuki H (1995) A survey forKashmir bee virus in honey bee colonies in United States. Am Bee J 135:
352–355.52. Wilson WT, Menapace DM (1979) Disappearing disease of honey bees: A survey
of the United States. Am Bee J. pp 184–186, 217.53. Suter GW II (2007) Ecological Risk Assessment, 2nd edition. Boca Raton: CRC
Press, Taylor and Francis Group. 643 p.
54. D’Costa SM, Yao HJ, Bilimoria SL (2004) Transcriptional mapping in Chiloiridescent virus infections. Arch Virol 149: 723–742.
55. Henderson CW, Johnson CL, Lodhi SA, Bilimoria SL (2001) Replication ofChilo iridescent virus in the cotton boll weevil, Anthonomus grandis, and
development of an infectivity assay. Arch Virol 146: 767–775.
Iridovirus and Colony Decline
PLoS ONE | www.plosone.org 11 October 2010 | Volume 5 | Issue 10 | e13181