ion transport across the epithelium of the rabbit caecum
TRANSCRIPT
Biochimica et Biophysica Acta, 1175 (1992) 27-36 27 © 1992 Elsevier Science Publishers B.V. All rights reserved 0167-4889/92/$05.00
BBAMCR 13291
Ion transport across the epithelium of the rabbit caecum
Karin T. Gil Ferreira, P.L. Fernandes and H.G. Ferreira Laboratory of Physiology, Gulbenkian Institute of Science, Oeiras (Portugal)
(Received 3 April 1992) (Revised manuscript received 14 July 1992)
Key words: Ion transport; Ion-sensitive microelectrode; Isotope flux; (Rabbit caecum)
The isolated rabbit caecum was studied in vitro. Under our experimental conditions, the rabbit caecum secreted potassium and chloride and absorbed sodium. To characterize the transport properties of the apical and the basolateral barriers, transepithelial electrical and flux (22Na, 36C1 and 86Rb) measurements and their sensitivity to transport inhibitors (furosemide, DIDS, ouabain and barium) are presented together with intracellular measurements with double-barrelled microelectrodes of intracellular electrical potentials and ionic activities. The fluxes of sodium and chloride were insensitive to DIDS and furosemide. The secretion of potassium and the absorption of sodium were both inhibited by ouabain, indicating that they are coupled through the sodium pump. Ouabain induced a slow fall in the chloride net fluxes, suggesting that these fluxes are also driven by the sodium pump, albeit indirectly. The basolateral to apical fluxes of potassium are insensitive to barium added to the apical side, but are accelerated by the replacement of chloride by gluconate on the apical side, suggesting the presence of a K+/CI - symport in the apical barrier.
Introduction
The rabbit caecum, a well-developed organ when compared with the colon of the same animal [1,2] and with the caecum of other mammals, performs, in vitro, a large absorption of sodium [3-6] and a net secretion of potassium [3-5]. Reports on chloride absorption have been less consistent, ranging from less than 10% [5] to more than 50% [3] of the sodium net fluxes.
The use of transport inhibitors has shown the pres- ence of the N a + / K + - p u m p in the basolateral barrier [5,7] and probably a low-affinity amiloride-sensitive channel on the apical barrier [3,5]. Ion-substitution experiments indicated that the net sodium fluxes and the Short-circuit current fell in chloride- or bicarbon- ate-free solutions [3-5] and the experiments also showed that the net chloride fluxes became negligible in sodium-free solutions [3,4]. Bumetanide [3] or furosemide [4] did not affect the sodium or chloride net fluxes, while DIDS was reported to decrease the net chloride fluxes and to increase the short-circuit current and the net sodium fluxes [3].
No Ussing-type model of the rabbit caecum in which specific transport systems are allocated to the two
Correspondence to: K.T.G. Ferreira, Laboratory of Physiology, Gul- benkian Institute of Science, Apartado 14, 2781 Oeiras Codex, Portugal.
cell-barriers was proposed until now. Producing such a model is a necessary step towards the quantitative description of any epithelium and depends on the determination of the intracellular potential and elec- trochemical potentials of the main ions that are trans- ported and on separate characterization of the two cell barriers. The present work was undertaken with that aim in mind, thus extending the work of Clauss et al. [5], who measured intracellular electrical potentials but did not measure intracellular ionic electrochemical po- tentials. In addition we at tempt to quantify the sodium-, potassium- and chloride-fluxes across the apical and the basolateral barriers.
Materials and Methods
Animals and tissue handling
Rabbits from a local supplier weighing from 1.5 to 2 kg were bought on the eve or the day of the experi- ment. The animals were killed by cervical dislocation always at the same time of the day (11 a.m.), corre- sponding to the period when the caecum content is soft. The abdomen was quickly opened by a mid-line incision. The corpus of the caecum was removed avoid- ing the first two or three folds and opened along the mesenteric border. The caecal content was carefully removed by flushing with oxygenated Ringer 's solution at room temperature. After careful removal of most of the subepithelial layers, pieces of the preparat ion were
28
cut from in between the spiral folds and mounted in the appropriate chambers.
Solutions The control Ringer's solution had the following
composition in mmol per litre: Na +, 140; K +, 5; CI-, 125; Ca 2+, 1.2; Mg 2+, 1.2; SO 2-, 1.2; HCO3, 20; glucose, 10. The following ion substitutions were used when specified: gluconate replaced chloride, sodium replaced potassium and N-methyl-D-glucamine (NMG) replaced sodium. All experiments were performed at room temperature. The solutions were kept at pH 7.4 by constant bubbling with 95% 02 + 5% CO 2. The osmolality of the solutions was 290 mosm/kg. The following transport inhibitors were used: furosemide (Hoechst) 1 mM, DIDS (4,4'-diisothiocyanatostilbene- 2,2'-disulfonic acid) (Sigma) 0.1 mM, ouabain 1 mM.
Transepithelial electrical parameters For transepithelial measurements, six pieces from
each caecum were mounted in Ussing-type chambers with an exposed area of 3.14 cm 2, clamped between two neoprene O-rings to reduced edge damage. To obtain adequate stirring, the solutions in the chambers were aerated through thin polyethene tubing from the bottom with a mixture of 95% 0 2 + 5% CO2 saturated with water vapour. To compensate for the electrical potential drop across the solution layers between the tips of the voltage bridges and the preparation, the resistance between the tips of the voJtage bridges was measured for each chamber filled with control solution before mounting the preparation. When ion-substitu- tion experiments were performed, the resistivity of all the solutions was measured with a conductimeter and ratios between the resistivity of every solution and the control solution were calculated. This factor was used to compute the resistances between the tips of the voltage bridges for each solution. The preparation was kept at room temperature and continuously short cir- cuited by an automatic voltage-clamp system which compensated for Ringer resistance. Total conductance was measured by displacing the transepithelial poten- tial by 1 mV and measuring the corresponding deflec- tion of the current. Experiments were performed only after steady-state was reached.
Transepithelial isotopic flux measurements 22Na, 36C1 and 86Rb (as a potassium marker) were
used. In each experiment, the influx and backflux mea- surements were performed using preparations with matched conductances. The preparations were incu- bated for 1.5 h after adding the isotope (+ 2 p~Ci) to one of the half-chambers. The liquid in the unlabelled half chamber was collected into scintillation vials every 20 min. 0.1 ml of the labelled side from each chamber were sampled at the beginning and end of each experi-
ment. Individual ionic conductances were computed by the expression
Gi = Jbackflux" F2/(R'T) (1)
easily derived for the short-circuit condition from the Goldman-Hodgkin-Katz equation.
Intracellular potentials and ion contents Double barrelled C1--, K +- and Na+-sensitive mi-
croelectrodes were constructed according to the method described by Zeuthen [8]. Two borosilicate glass tubes (1.2 mm o.d.) were glued, twisted (360 °) and pulled on a horizontal puller. The ion-selective barrel was silanized (dichlorodimethylsilane) for 1 min and backed for 2 h at 180°C. Slight variations of this tech- nique had to be introduced according to atmospheric humidity. All electrodes were first calibrated in pure solutions to ensure that they exhibited an adequate Nernstian slope (56-58 mV/decade) in the concentra- tion range used. The tips of the chloride-sensitive microelectrodes were filled with Corning 477913 liquid ion-exchanger and then backfilled with 100 mM KC1. The reference barrel was filled with 0.5 M potassium acetate plus 10 mM KC1. These electrodes were cali- brated in bicarbonate-containing solutions similar to the control solution with one decade range in chloride concentration and gave an average slope of 52 mV per decade in the range of 5 to 100 mM chloride concen- tration. The tips of the potassium-sensitive microelec- trodes were filled with Coming 477317 liquid ion-ex- changer and then backfilled with 100 mM KCI. These electrodes were calibrated in mixed solutions, all con- taining 20 mM NaC1 and different potassium concen- trations ranging from 5 to 100 mM. They gave a slope of 50 mV per decade. The tips of the sodium-sensitive microelectrodes were filled with Na-ligand ETH 227 (from Fluka 71732) and then 100 mM NaC1. Measure- ments of intracellular Na + were carried out after an average value for the concentration of intracellular K + (60 mM) was obtained from measurements performed with K+-sensitive microelectrodes. The Na+-electrodes were calibrated in mixed solutions, all containing 60 mM of KCI and different sodium concentrations rang- ing from 5 to 100 mM. They gave a slope of 46 mV per decade.
The two barrels were connected to the electrome- ters by means of silver/silver chloride wires. The signal of the reference barrel was electronically subtracted from the signal of the ion-selective barrel and the difference together with the signal of the reference electrode and of the transepithelial current under volt- age-clamp were continuously monitored on a multi- channel chart recorder and stored in digital form after A / D conversion. The resistance of the reference elec- trode was between 50 and 100 MI2 and the ion-selec- tive microelectrode was larger than 1 GO.
The impalements were performed under short-cir- cuit conditions on a horizontal Ussing-type chamber fixed on an antivibration table. The preparation was mounted with the apical side upwards. The bathing solutions flowed by gravity and were gassed with 95% O z + 5% CO 2 saturated with water vapour. The micro- electrodes were mounted on a hydraulic micromanipu- lator. Before each impalement and with the double- barrelled microelectrode dipped in the upper bath, the outputs of the ion-sensitive and reference microelec- trode amplifiers were adjusted to zero. Impalements were considered good when there were: rapid changes of voltages on entering and leaving the cells; stable recordings for at least 5 min, and an acceptable differ- ence between the electrode tip potentials before and after withdrawal from the cells (less than 5 mV). In addition, the calibration of the electrodes at the end of the experiment had to reproduce the calibration before the experiment [9].
The transepithelial potential was periodically dis- placed by 1 mV during 15 s. The voltage-divider ratio (VDR, ratio between the voltage pulse across the baso- lateral membrane and the transepithelial applied pulse) and the transepithelial conductance were obtained.
To obtain a semiquantitative estimate of the ion fluxes across the apical and basolateral barriers, the intracellular concentration of sodium, potassium or chloride were monitored while the concentrations of these ions in the external baths were suddenly changed. Changes in the external concentrations of sodium or chloride consisted of the complete substitution of ei- ther of these ions (during 2 to 10 min), respectively, by NMG or gluconate. The movements of each ion (i) across the epithelial cells may be analytically described by the equation
d Q i / d t = J.c - Jca -- Job + Jbc (2 )
where the left-hand side represents the rate of change of the intracellular content of ion i (per cm 2) and the terms on the right-hand side are the unidirectional fluxes across the apical (Jac and Jea) and the basolat- eral (Job and Jbc) barriers. Under steady-state condi- tions, dQi/dt is zero. Immediately after ion i is re- moved from the apical side, we have
d Q ( / d t = - Jca - J c b + Jbc (3)
or, subtracting (3) from (2)
d Q i ' / d t = - Jac (4 )
Assuming an exponential decay of Q~ initially at constant volume, we can write
d Q i ' / d t = v d C i ' / d t (5 )
where v is the cell volume per c m 2 and
l / C i ~ o ~ d C i ' / d t = - k at t = 0 (6 )
29
where Ci' and Ci<0) are the intracellular concentrations of ion i at times t and 0, respectively, and k is the rate constant of the decay.
Semilog plots of the initial fall of the intracellular concentrations of sodium or chloride thus induced were consistently linear and were used to compute, by least-square fitting, the initial rate of loss (k) of the two ions from the cell compartment. The fall in intra- cellular potassium concentration induced by the re- placement of this ion in the external solutions was so slow that we decided to estimate the rate of rise of intracellular potassium caused by an increase in extra- cellular potassium (from 5 to 50 mM) instead. In these experiments, 45 mM of NaCI was first replaced by an equimolar amount of NMGCI and then the NMG was replaced by potassium. To a first approximation, the initial rate of potassium influx per unit of cell volume is then given by the product kACK(i), in which k is the rate of rise of intracellular potassium and ACv~i) is the total induced change in intracellular potassium. The value of the product kACK(i) was obtained by linear fitting of the initial rise in intracellular potassium con- centration and the value of ACK(i) was estimated from the measured values of intracellular potassium before and after raising the concentration of this ion in the external solutions. Although the rate constants thus obtained could be used to compute the corresponding unidirectional fluxes if we assume a given volume for the cell compartment, we decided not to do it because the epithelium has a very pronounced folding which varies from place to place.
Measurement of the volume of the cell compartment The volume of the cell compartment was assumed to
correspond to the difference between the total water of the preparation (difference between wet and dry weights) and the extracellular volume determined using [14C]inulin as an extracellular marker. Pieces of the tissue were incubated during 1 h at room temperature under constant agitation in control solution gassed with 95% 0 2 and 5% CO2 and containing 0.2 /~Ci/ml of [14C]inulin. The pieces were then removed, rinsed in ice-cold isotonic sucrose for 1 s, blotted with filter paper, placed in tared aluminium-foil boxes, weighed and dried to constant weight at 100°C. For extraction of inulin, the pieces were then placed in vials contain- ing suitable amounts of 0.1 M HNO3, which were maintained for 24 h under slow agitation at room temperature. After proper dilution of this fluid and of the Ringer the [14C]inulin content was measured by liquid scintillation. For further details, see Ferreira and Swenson [10]. In 34 pieces of 4 cmz of the same caecum, intracellular volume and the dry weight were 22.4 + 1.19 /zl/cm 2 and 3.8 + 0.16 mg/cm 2, respec- tively. Individual values ranged from 10 to 45/xl/cm 2 and from 2.5 to 7 mg/cm 2, respectively. These results
30
suggest that large variations in the amount of trans- porting tissue may exist from preparation to prepara- tion.
Isotope efflux experiments Effluxes from the intracellular compartment to ei-
ther side of the preparation were performed by preloading this compartment with 22Na, 36C1 or 86Rb. The preparations were mounted in Ussing-type cham- bers and incubated for 1 to 3 h, according to the isotope used. The isotope containing Ringer was then removed, the chambers quickly washed (for about 1 min) 8 to 10 times before the washout procedure started. The two half-chambers were first emptied and refilled five times every 2 min and then every 10 min for 2 to 3 h. At the end of the experiments, the preparation was carefully cut out of the chamber, blot- ted, weighed and put into vials with 0.1 M HNO 3 for extraction of the isotope during 24 h. All the washout samples and the tissue extract had the same volume and were counted. Suitable dilutions of the loading Ringers were counted as well. The total amount of the counts in the preparation at the beginning of each collection period was calculated by adding back the counts lost in successive washout samples. The time function of the total remaining counts in the prepara- tion vs. time was fitted with two exponentials using the Nelder-Meade simplex algorithm implemented by the PC-MATLAB software package. The larger time-con- stant was assumed to correspond to the washout of the extracellular space. Extrapolation to zero time of the slower exponential provided an estimate of the intra- cellular pool of the ion. For further details, see Fer- reira and Ferreira [11].
Statistical methods Results are presented as means and standard errors
of the mean. All statistical tests were Student's t-tests [12]. The hypothesis tested in each case was that the difference between two mean values was different from zero. The P values reported in the text correspond to ~,rrors of the second kind.
Results
Transepithelial electrical measurements When mounted in vitro under the conditions de-
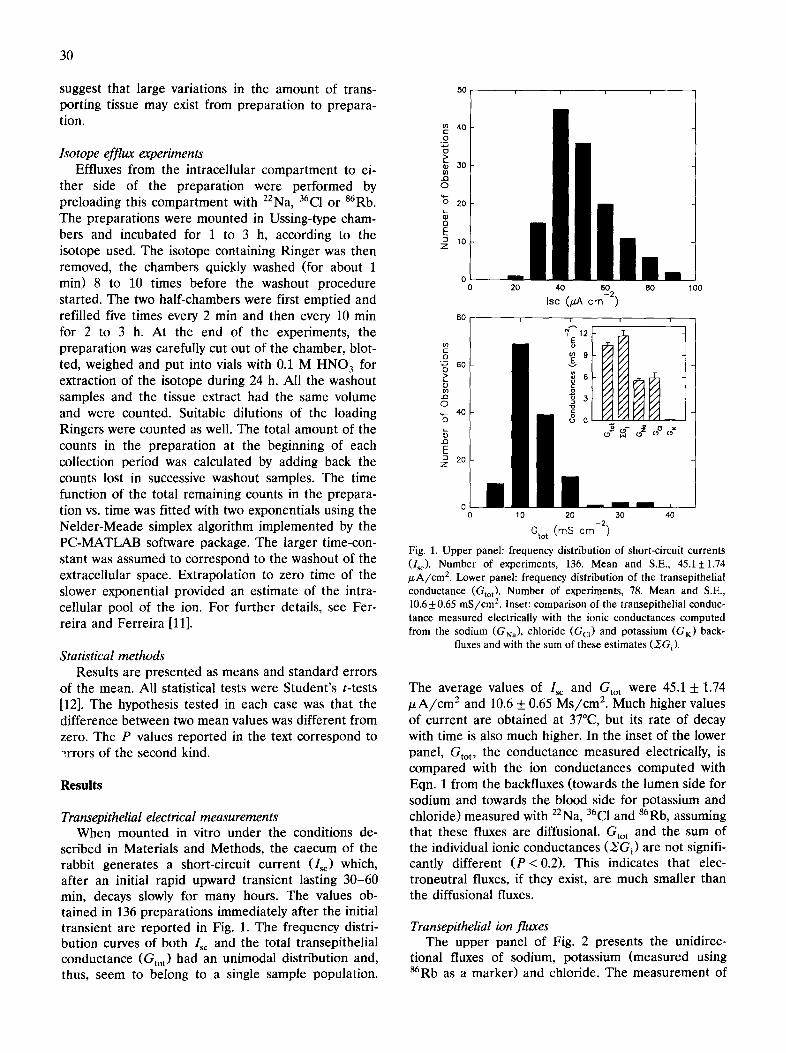
scribed in Materials and Methods, the caecum of the rabbit generates a short-circuit current (I~) which, after an initial rapid upward transient lasting 30-60 min, decays slowly for many hours. The values ob- tained in 136 preparations immediately after the initial transient are reported in Fig. 1. The frequency distri- bution curves of both Isc and the total transepithelial conductance (Gto t) had an unimodal distribution and, thus, seem to belong to a single sample population.
5 0
0~ 4 0 c O
o
o 3 0
0
~d 2o
e~
-~ 1 0 , z
0 L 0
8 0
O 60
t3
o
0 ~._ 4 0 0
E ~ 2O
Z
20 40 60 80
rsc (#A crn -2)
i i i
~ O " ~
0 ~ 0 10 20 30 40
Gto t (mS cm -2)
100
Fig. 1. Upper panel: frequency distribution of short-circuit currents (I~). Number of experiments, 136. Mean and S.E., 45.15:1.74 ~A/cm 2. Lower panel: frequency distribution of the transepithelial conductance (Gtot). Number Of experiments, 78. Mean and S.E., 10.6 +0.65 mS/cm 2. Inset: comparison of the transepithelial conduc- tance measured electrically with the ionic conductances computed from the sodium (GNa), chloride (G a ) and potassium (GK) back-
fluxes and with the sum of these estimates (~Gi).
The average values of Isc and Gto t were 45.1 + 1.74 ~ A / c m 2 and 10.6 + 0.65 Ms/cm 2. Much higher values of current are obtained at 37°C, but its rate of decay with time is also much higher. In the inset of the lower panel, Gtot, the conductance measured electrically, is compared with the ion conductances computed with Eqn. 1 from the backfluxes (towards the lumen side for sodium and towards the blood side for potassium and chloride) measured with Z2Na, 36C1 and 86Rb, assuming that these fluxes are diffusional. Gto t and the sum of the individual ionic conductances (~Gi) are not signifi- cantly different (P<0.2). This indicates that elec- troneutral fluxes, if they exist, are much smaller than the diffusional fluxes,
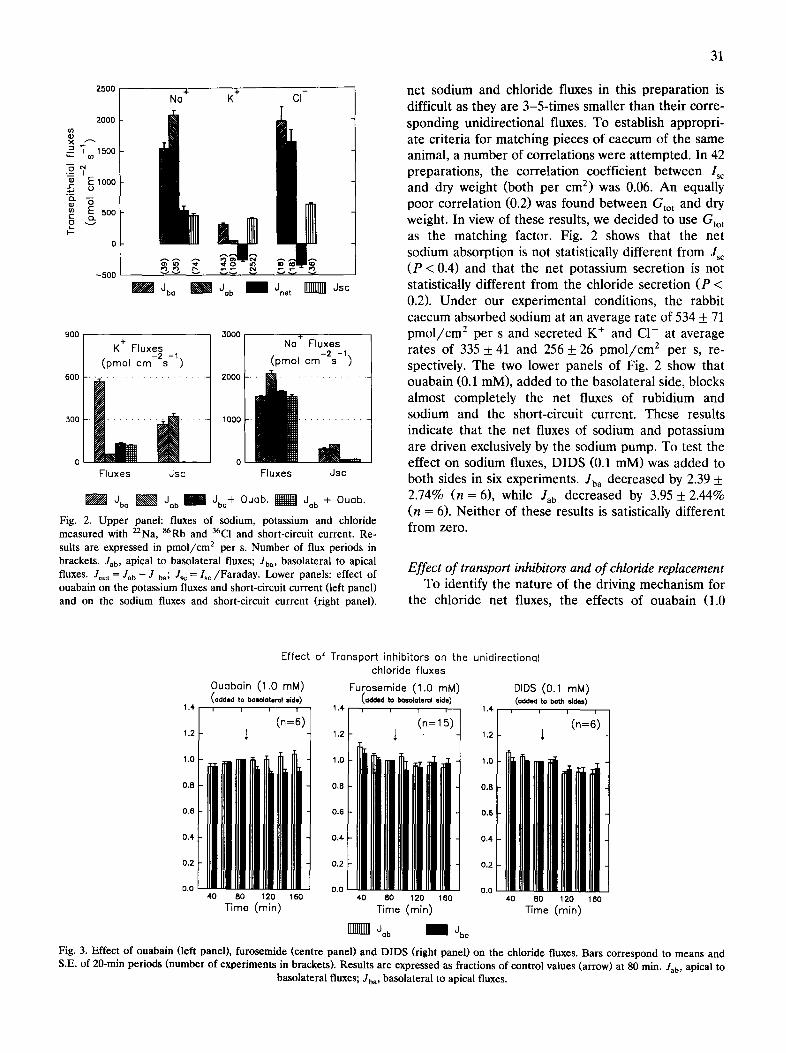
Transepithelial ion fluxes The upper panel of Fig. 2 presents the unidirec-
tional fluxes of sodium, potassium (measured using 86Rb as a marker) and chloride. The measurement of
2500
2000
~15oo
£ E ° lOOO
"EL
~ soo c 8 ~ I--
0
-500
+ + - Na K Cl
dbo ~ Job I dnet ~ d s c
900
600
300
3000 t Na Fluxes
(pmol cm-2s -1) 2000
K + Fluxes (pmol cm-2s -1
Fluxes Jsc
1000
0 0 Fluxes Jsc
Jba ~ Jab I Jbo + Ouab. ~ Job + Ouab.
Fig. 2. Upper panel: fluxes of sodium, potassium and chloride measured with 22Na, 86Rb and 36C1 and short-circuit current. Re- suits are expressed in pmol/cm z per s. Number of flux periods in brackets. Jab, apical to basolateral fluxes; Jba, basolateral to apical fluxes. Jnet = Jab -- J ba; Jsc = Isc/Faraday. Lower panels: effect of ouabain on the potassium fluxes and short-circuit current (left panel) and on the sodium fluxes and short-circuit current (right panel).
31
net sodium and chloride fluxes in this preparation is difficult as they are 3-5-times smaller than their corre- sponding unidirectional fluxes. To establish appropri- ate criteria for matching pieces of caecum of the same animal, a number of correlations were attempted. In 42 preparations, the correlation coefficient between Isc and dry weight (both per cm 2) was 0.06. An equally poor correlation (0.2) was found between Gto t and dry weight. In view of these results, we decided to u s e Gto t
as the matching factor. Fig. 2 shows that the net sodium absorption is not statistically different from Jsc (P < 0.4) and that the net potassium secretion is not statistically different from the chloride secretion (P < 0.2). Under our experimental conditions, the rabbit caecum absorbed sodium at an average rate of 534 + 71 pmol / cm 2 per s and secreted K ÷ and C1- at average rates of 335 + 41 and 256 + 26 pmol / cm 2 per s, re- spectively. The two lower panels of Fig. 2 show that ouabain (0.1 mM), added to the basolateral side, blocks almost completely the net fluxes of rubidium and sodium and the short-circuit current. These results indicate that the net fluxes of sodium and potassium are driven exclusively by the sodium pump. To test the effect on sodium fluxes, DIDS (0.1 mM) was added to both sides in six experiments. Jba decreased by 2.39 + 2.74% (n = 6), while Jab decreased by 3.95 + 2.44% (n = 6). Neither of these results is satistically different from zero.
Effect of transport inhibitors and of chloride replacement To identify the nature of the driving mechanism for
the chloride net fluxes, the effects of ouabain (1.0
0.8
0.6
0.4
0.2
0.0
Effect of Transport inhibitors on the unidirectional chloride fluxes
Ouabain (1.0 mM) added to bo lo la tero l l i d ° )
1.4 , , , ,
(n=6) 1.2
1.0
40 80 120 160 Time (rain)
1.4
1.2
1.0
0.8
0.6
0.4-
0.2
0.0
Furosemide, (1.0 mM DIDS (0.1 raM) {,added to boso~oterol sidl (oddee to both sides) , , , , 1 . 4 , , ,
(n = 1 5) ( n = 6 ) - ~ 1.2 1
- 1.0
0.8
0.6
0.4
0.2
0.0 4 0 8 0 1 2 0 1 6 0 4 0 8 0 1 2 0 1 6 0
Time (min) Time (rain)
Job I Jba
Fig. 3. Effect of ouabain (left panel), furosemide (centre panel) and DIDS (right panel) on the chloride fluxes. Bars correspond to means and S.E. of 20-min periods (number of experiments in brackets). Results are expressed as fractions of control values (arrow) at 80 min. Jab, apical to
basolateral fluxes; Jba, basolateral to apical fluxes.
32
mM), furosemide (1.0 raM) and DIDS (0.1 mM) on the chloride unidirectional fluxes were studied. Since the coupling between the operation of the sodium pump and these fluxes can only be indirect, through a co- transport between sodium, potassium or both and chlo- ride, these effects, if existent, must result from a dissi- pation of the gradients of those cations, a slow process which may be masked by the natural time drift of the chloride fluxes. Because of this, the results, presented in Fig. 3 are displayed as the averages ( + S.E.) of the
ratios between the value of the fluxes at any given time and the value of the flux measured immediately before the drug was added. As can be seen, the unidirectional fluxes of chloride are insensitive to DIDS added to both sides and to furosemide added to the basolateral side. Ouabain causes a slight increase in the apical to basolateral fluxes and a decrease in the fluxes in the opposite direction, the overall effect being a progres- sive decrease of the net flux. In the same experiments, furosemide cause Isc to fall to 80 + 1.7% while DIDS
1000
Io~ ? 8 0 o
E
E "-" 600 q)
x
E "~ 4 0 0
£ 0
200 0
i
o 1.8
x 1.6
.~_ 1.4.
1.2
-~ 1.o
-~ 0.8
i
/ 300 • 1, 2 (control)
I 3 , 4 - 5 , 6
~- o,6 ' Borium + / V - - - - - . - ~ . - . . . . _ . ~
Borium (3,4,5,6) 0 Cl(apt (5/6)
I
50 1 O0 150 200 250 Time (min)
300
3.0
2.5
2.0 E O3
0 1.5
Q .
0 1.0
u_ 0.5
0 Cl(op) (3,4,5,6) 0 Cl(,p) + BoHum (5,6)
_ ~ • 1, 2 (control) - 3 , 4 B 5 , 6
0 , 0 I 0 I I I I 0 ,5 ! O0 1,50 200 2,50 .300
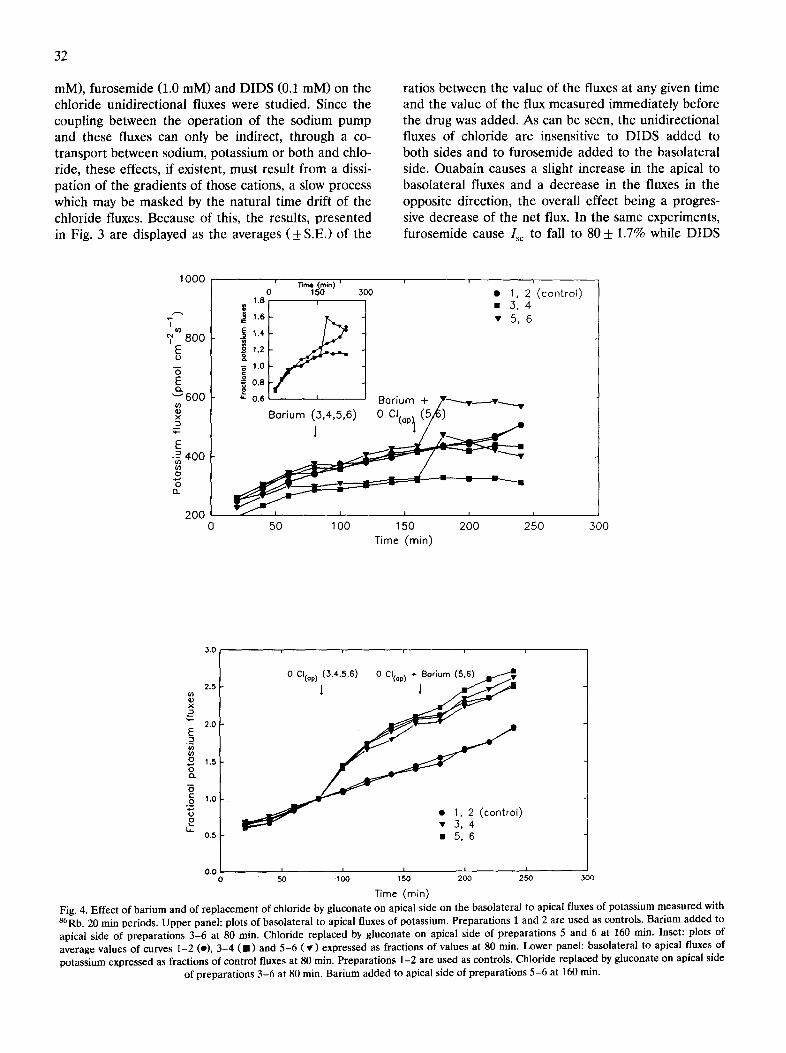
Time (rain) Fig. 4. Effect of barium and of replacement of chloride by gluconate on apical side on the basolateral to apical fluxes of potassium measured with 86Rb. 20 min periods. Upper panel: plots of basolateral to apical fluxes of potassium. Preparations 1 and 2 are used as controls. Barium added to apical side of preparations 3 -6 at 80 min. Chloride replaced by gluconate on apical side of preparations 5 and 6 at 160 min. Inset: plots of average values of curves 1-2 (e), 3 -4 ( • ) and 5 - 6 ( • ) expressed as fractions of values at 80 min. Lower panel: basolateral to apical fluxes of potassium expressed as fractions of control fluxes at 80 min. Preparations 1-2 are used as controls. Chloride replaced by gluconate on apical side
of preparations 3 -6 at 80 min. Barium added to apical side of preparations 5 -6 at 160 rain.
produced an increase to 119 + 2.2% of the correspond- ing control values.
To characterize the potassium fluxes, the effect of barium (5 mM added as barium acetate) was studied. Added to the apical side, it induced a fall in I~ to 76 + 2.1% (n = 6) of the control value. Added to the basolateral side (two experiments), it also induced a fall in Isc (to 70 + 7% of the control value). These results can be explained by the depolarization of the intracellular electrical potential of around 77 and 80%, respectively, that we observed in an experiment with microelectrodes. Fig. 4 describes two groups of experi- ments in which the effect of barium from the apical side and of the replacement of chloride by gluconate in apical solution were studied following the protocol by Ellison et al. [13]. The upper panel shows what hap- pens when barium is added first (to preparations 3-6) followed, after 80 min (four 20-min periods) by the chloride replacement (preparations 5 and 6). The preparations treated with barium are indistinguishable from the controls. Replacement of chloride by glu- conate (preparations 5 and 6) induces an immediate acceleration of the potassium effiux to the apical side. In the lower panel, corresponding to another set of experiments, we can see that the replacement of chlo- ride by gluconate (preparations 3-6) accelerated im- mediately the potassium effiux into the apical compart- ment, while subsequent addition of barium to the api- cal side had no effect (preparation 5 and 6).
Measurements of intracellular electrical potential and ion concentrations
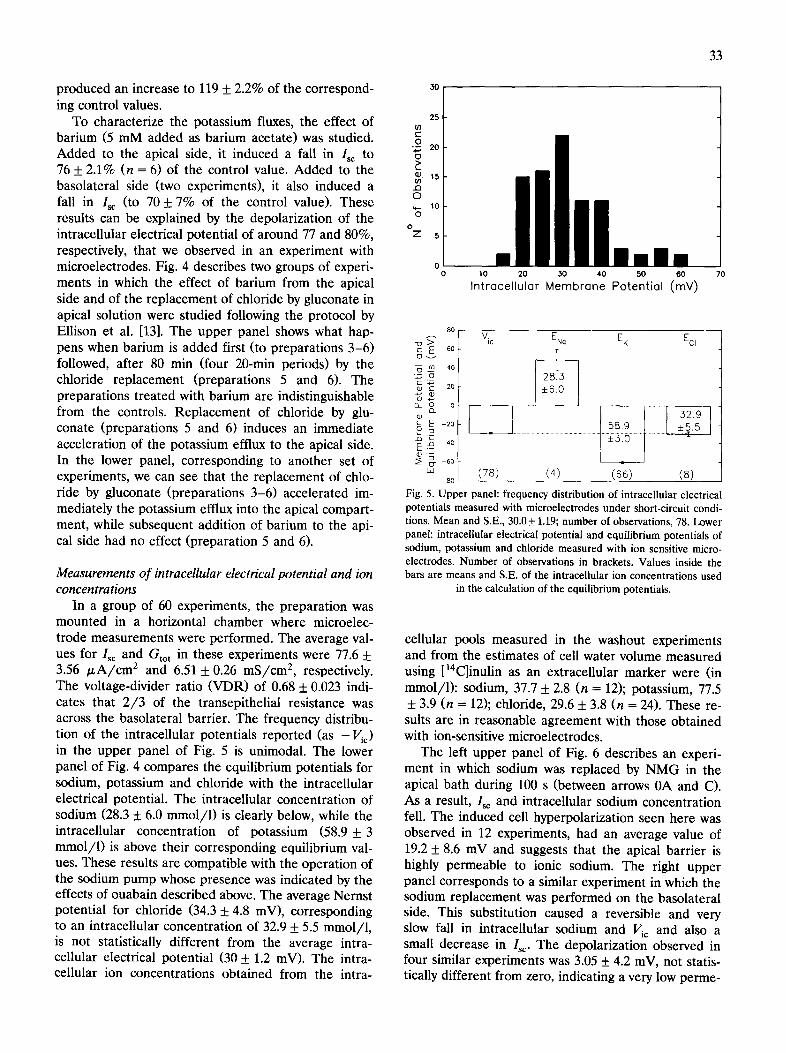
In a group of 60 experiments, the preparation was mounted in a horizontal chamber where microelec- trode measurements were performed. The average val- ues for ls~ and Gto t in these experiments were 77.6 5: 3.56 ~ A / c m 2 and 6.51 +_ 0.26 mS/cm 2, respectively. The voltage-divider ratio (VDR) of 0.68 + 0.023 indi- cates that 2/3 of the transepithelial resistance was across the basolateral barrier. The frequency distribu- tion of the intracellular potentials reported (as -V~¢) in the upper panel of Fig. 5 is unimodal. The lower panel of Fig. 4 compares the equilibrium potentials for sodium, potassium and chloride with the intracellular electrical potential. The intracellular concentration of sodium (28.3 +_ 6.0 mmol/1) is clearly below, while the intracellular concentration of potassium (58.9 _+ 3 mmol/l) is above their corresponding equilibrium val- ues. These results are compatible with the operation of the sodium pump whose presence was indicated by the effects of ouabain described above. The average Nernst potential for chloride (34.3 +_ 4.8 mV), corresponding to an intracellular concentration of 32.9 _+ 5.5 retool/l, is not statistically different from the average intra- cellular electrical potential (30 _+ 1.2 mV). The intra- cellular ion concentrations obtained from the intra-
2 5 ,
33
t- O
k~ 20 0
if) ..o 0 ,._ 10 0
o Z 5
0 ~ 0 10 20 .30 40 50 60 70
Intracellular Membrane Potential (mY)
• "a ~ " Vic ENo EK ECI
(~ 40
C) C 20
_o0
"' (78) (4) (6e) (8) -80
Fig. 5. Upper panel: frequency distribution of intracellular electrical potentials measured with microelectrodes under short-circuit condi- tions. Mean and S.E., 30.0+ 1.19; number of observations, 78. Lower panel: intracellular electrical potential and equilibrium potentials of sodium, potassium and chloride measured with ion sensitive micro- electrodes. Number of observations in brackets. Values inside the bars are means and S,E. of the intraceUular ion concentrations used
in the calculation of the equilibrium potentials.
cellular pools measured in the washout experiments and from the estimates of cell water volume measured using [14C]inulin as an extracellular marker were (in mmol/l): sodium, 37.7 + 2.8 (n = 12); potassium, 77.5 + 3.9 (n = 12); chloride, 29.6 + 3.8 (n = 24). These re- suits are in reasonable agreement with those obtained with ion-sensitive microelectrodes.
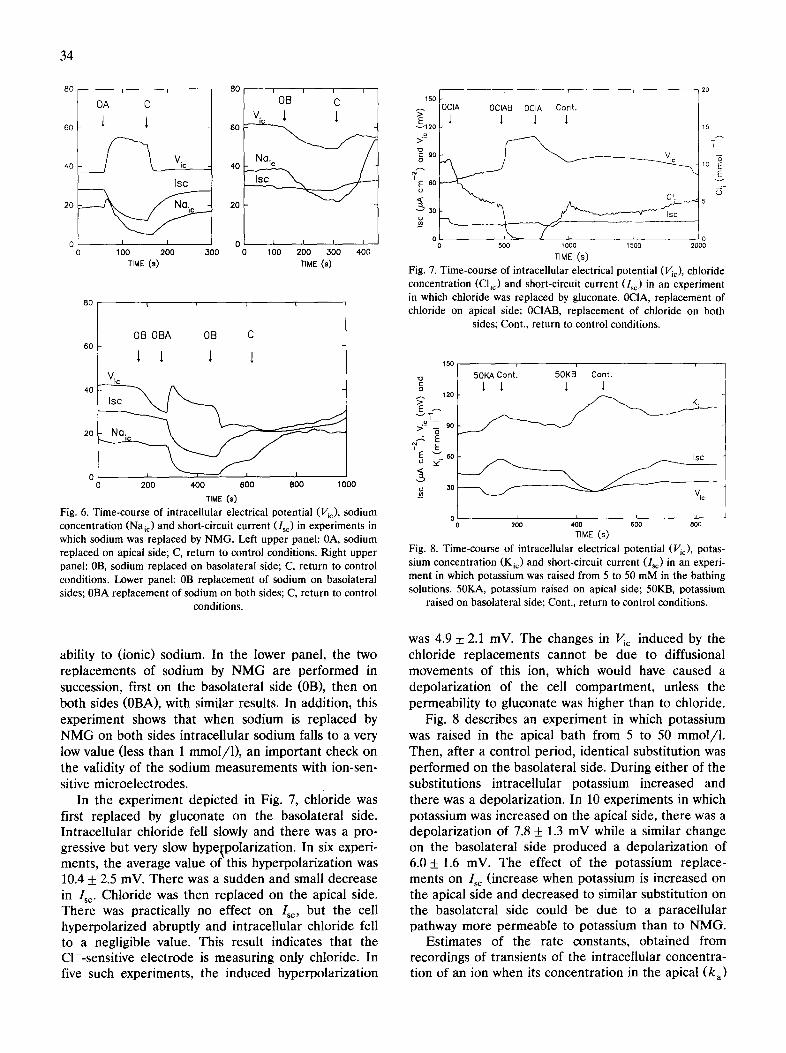
The left upper panel of Fig. 6 describes an experi- ment in which sodium was replaced by NMG in the apical bath during 100 s (between arrows 0A and C). As a result, Isc and intracellular sodium concentration fell. The induced cell hyperpolarization seen here was observed in 12 experiments, had an average value of 19.2 + 8.6 mV and suggests that the apical barrier is highly permeable to ionic sodium. The right upper panel corresponds to a similar experiment in which the sodium replacement was performed on the basolateral side. This substitution caused a reversible and very slow fall in intracellular sodium and Vic and also a small decrease in Is~. The depolarization observed in four similar experiments was 3.05 + 4.2 mV, not statis- tically different from zero, indicating a very low perme-
3 4
80 80
60
40
20
60
i i
0A C
~ V i c .
[SC
I I
100 200 300 TIME (s)
40
20
i i i i
0[3 C
0 0 I i i i 0 0 100 200 300 400
~ME (,)
8 0
013 0BA OB C 6o
V. ic
0 I ~ I I
o 200 400 soo eoo lOOO TIME (s)
Fig. 6. Time-course of intracellular electrical potential (Vic), sodium concentration (Naic) and short-circuit current (l~c) in experiments in which sodium was replaced by NMG. Left upper panel: 0A, sodium replaced on apical side; C, return to control conditions. Right upper panel: 0B, sodium replaced on basolateral side; C, return to control conditions. Lower panel: 0B replacement of sodium on basolateral sides; 0BA replacement of sodium on both sides; C, return to control
conditions.
150
> E
~ 1 2 0
~ 9 0 '
~,o o
~ 3 o i
i
OClA 0ClAB OClA Cont .
1 1 1 1
i ~ z i i 500 1000 1500
TIME (s)
15
7
10 E
s 8-
5
0 2000
Fig. 7. Time-course of intracellular electrical potential (Vie), chloride concentration (Clic) and short-circuit current (Is~) in an experiment in which chloride was replaced by gluconate. 0CIA, replacement of chloride on apical side; 0CIAB, replacement of chloride on both
sides; Cont., return to control conditions.
150
o 120
"- 'T 2 - 0 - 9o
"5
~ ~o
50KA Cont'. 50KB' Cont.
Isc
v~c
i t i i 200 400 600 800
TIME (s)
Fig. 8. Time-course of intracellular electrical potential (Vie), potas- sium concentration (Kit) and short-circuit current (ls~) in an experi- ment in which potassium was raised from 5 to 50 mM in the bathing solutions. 50KA, potassium raised on apical side; 50KB, potassium
raised on basolateral side; Cont., return to control conditions.
ability to (ionic) sodium. In the lower panel, the two replacements of sodium by NMG are performed in succession, first on the basolateral side (0B), then on both sides (0BA), with similar results. In addition, this experiment shows that when sodium is replaced by NMG on both sides intracellular sodium falls to a very low value (less than 1 mmol/1), an important check on the validity of the sodium measurements with ion-sen- sitive microelectrodes.
In the experiment depicted in Fig. 7, chloride was first replaced by gluconate on the basolateral side. Intracellular chloride fell slowly and there was a pro- gressive but very slow hype{polarization. In six experi- ments, the average value o f this hyperpolarization was 10.4 + 2.5 mV. There was a sudden and small decrease in Isc. Chloride was then replaced on the apical side. There was practically no effect on I~c, but the cell hyperpolarized abruptly and intracellular chloride fell to a negligible value. This result indicates that the C1--sensitive electrode is measuring only chloride. In five such experiments, the induced hyperpolarization
was 4.9 + 2.1 mV. The changes in Vic induced by the chloride replacements cannot be due to diffusional movements of this ion, which would have caused a depolarization of the cell compartment, unless the permeability to gluconate was higher than to chloride.
Fig. 8 describes an experiment in which potassium was raised in the apical bath from 5 to 50 mmol/ l . Then, after a control period, identical substitution was performed on the basolateral side. During either of the substitutions intracellular potassium increased and there was a depolarization. In 10 experiments in which potassium was increased on the apical side, there was a depolarization of 7.8 + 1.3 mV while a similar change on the basolateral side produced a depolarization of 6.0 + 1.6 mV. The effect of the potassium replace- ments on I~c (increase when potassium is increased on the apical side and decreased to similar substitution on the basolateral side could be due to a paracellular pathway more permeable to potassium than to NMG.
Estimates of the rate constants, obtained from recordings of transients of the intracellular concentra- tion of an ion when its concentration in the apical (k , )
35
or the basolateral (k b) baths was suddenly changed, are proportional to the corresponding unidirectional fluxes (Jac and Jbc).
In four experiments in which the rate constant of the fall of intracellular chloride concentration to a replacement of chloride in the apical (k a) and basolat- eral (k b) solution was done in succession while the microelectrode was maintained in the same cell, the ratio ka /k b was 0.51 + 0.43, not statistically different from zero, indicating that k a is very small, as com- pared to kb. These results are in agreement with those reported above, pertaining to the effect on V~c of identical substitutions. Similar experiments in which sodium was replaced by NMG gave a ratio of ka /k b of 2.71 + 0.02 obtained in two different cells, in agree- ment with the observed effects on Vic of identical experiments. Finally, in eight experiments in which potassium was raised from 5 to 50 mmol/1 in succes- sion on the apical side and on the basolateral side, gave a ratio of ka /k b of 2.76 + 0.42. Overall, these experiments show that the permeability of the apical barrier to chloride is much lower than that of the basolateral barrier, and the opposite obtains in relation to sodium and potassium.
Discussion
The electrophysiological measurements described here, as well as the flux measurements with 22Na and 86Rb, are in good qualitative agreement with those previously reported by other authors [3-5,7]. Isc in our preparations was systematically lower, which is proba- bly due to the fact that our experiments were per- formed at room temperature instead of 37°C. Under our experimental conditions, there was a net chloride secretion while Sellin et al. [4], Hatch and Freel [3], Clauss et al. [5] and Tay et al. [6] observed net absorp- tions of chloride ranging from 0.8 + 0.4 /xequiv/cm 2 per h [5] to 3 .4+0 .5 /zequiv/cm 2 per h [3]. This variation in the chloride net fluxes may reflect on one hand the physiological state of the animal when the tissue was collected, and on the other hand the diffi- culty in obtaining adequate matching of the pieces of epithelium used in flux measurements. In most of our experiments, sodium and chloride fluxes were mea- sured in the same preparations and yet the net fluxes of the two ions were consistently in opposite directions. Should a mismatch arise, as a result of an unequal leakiness between the two 'matched' pieces, it should affect both ions in a qualitatively similar way.
The comparison between the total epithelial con- ductance measured electrically and the conductance computed from the ionic backfluxes, suggests that the chloride and sodium backfluxes are mainly diffusional. The permeabilities computed from the backfluxes for sodium, potassium and chloride are 1.1.10 -5, 0.98.
10 -5 and 1.32.10 -5 cm/s , respectively, suggesting a poorly selective, probably paracellular, leakage path- way.
The net fluxes of both sodium and potassium can be directly linked to the operation of the sodium pump, because they are both quickly abolished by ouabain. The sodium pump produces a driving Nernst potential for sodium of 42.7 mV towards the cytoplasm. The higher permeability of the apical barrier (in relation to that of the basolateral barrier) to sodium is consistent with a mechanism of transepithelial translocation, in- volving a passive entry step across the apical barrier and an uphill exit through the sodium pump across the basolateral barrier. A Nernst potential of 60 mV out- wards for potassium is again consistent with an intra- cellular accumulation of the ion by the sodium pump and an exit across an apical barrier highly permeable to potassium. The depolarization induced by barium from either side indicates that at least part of the move- ments of potassium across the apical and the basolat- eral barriers are through barium-sensitive ionic chan- nels. These barium-sensitive movements are probably very small, since no effect of barium was detected on the basolateral to apical potassium fluxes.
Our results do not allow us to propose a mechanism for the chloride secretion with any degree of certainty. Hatch and Freel [3] showed that total replacement of sodium in the bathing solutions abolished the net chlo- ride absorption. In our preparations, the trans- epithelial movements of chloride were not driven by an anion-exchanger (such as a C 1 - / H C O 3 antiport), since they were insensitive to DIDS. On the other hand, the chloride secretion was at least partially linked to the operation of the sodium pump, since the net flux of chloride towards the apical side measured with 36C1 fell gradually after the addition of ouabain to the basolateral side. At least two mechanisms linking indi- rectly the net fluxes of chloride to the operation of the sodium pump can be proposed: a Na+/K+/2C1 - sym- port or a K+/C1 - symport. If the Na+/K+/2C1 - symport is responsible for the net chloride transport, it must be located at the basolateral barrier, because as a result of the concentration distribution of the three ions, it drives chloride towards the cell compartment. By a similar reasoning, should a K+/CI - symport be the linking translocator, it must be located in the apical barrier. We have shown that furosemide (an inhibitor of the N a + / K + / 2 C I - symport) has no effect on the unidirectional chloride fluxes when added to the baso- lateral side, and Hatch and Freel [3] showed that bumetanide is also ineffective from the apical side. The potassium fluxes towards the apical side were insensi- tive to barium and were accelerated by the replace- ment of chloride by gluconate on that side. This effect is not due to a cell depolarization because our micro- electrode measurements showed that an hyperpolariza-
36
tion is observed under those conditions and suggests the presence of a K+/CI - symport in the apical bar- rier. An obvious indication of the location of the uphill step responsible for the chloride secretion, would be the finding of an intracellular chloride concentration clearly away from equilibrium. However, our results show that chloride is very near equilibrium. This obser- vation does not rule out either of the mechanisms, since the unbalance in the electrochemical potential of chloride (required to maintain the net flux) depends on the permeability of the barrier across which the move- ments of this ion are unlinked.
As a tentative model, we suggest that Na + enters the cell compartment driven by its electrochemical gradient across the apical barrier and is driven across the basolateral barrier by the Na+/K+-pump. The net transepithelial potassium transport towards the apical side involves an entry step through the Na+/K+-pump across the basolateral barrier and and effiux across the apical barrier mainly through a K+/C1 - symport. We are not able to propose a mechanism for the trans- epithelial CI- movements, because of the large fluctua- tions in the C1- net fluxes measured and of the lack of response to blockers of coupling transporting systems.
Acknowledgements
This work was partially supported by Junta Nacional de Investiga~j~o Cientlfica e Tecnol6gica (JNICT), Por-
tugal, project No. 368/90. The authors wish to thank A. Rebelo, L. Santos and U. Santos for their constant help.
References
1 Snipes, R.L. (1978) Anat. Embryol. 155, 57-80. 2 Ross, J.A., Scott, A. and Gardner, I.C. (1989) J. Anat. 164,
165-173. 3 Hatch, M. and Freel, R.W. (1988) Pflugers Arch. 411,333-338. 4 Sellin, J.H., Oyarzabal, H. and Cragoe, E.J. (1988) J. Clin. Invest.
81, 1275-1283. 5 Clauss, W., Hoffmann, B., Schafer, H. and Hornicke, H. (1989)
Am. J. Physiol. 256, G1090-G1099. 6 Tai, Y., Gage, T.P., McQueen, C., Formal, S.B. and Boedeker,
E.C. (1989). Am. J. Physiol. 256, G721-G726. 7 Clauss, W., Schafer, H., Horch, I. and Hornicke, H. (1985)
Pflugers Arch. 403, 278-282. 8 Zeuthen, T. (1980) in Current Topics in Membrane Transport,
Vol. 13 (Boulpaep, E., ed.), pp. 31-47, Academic Press, New York.
9 Fernandes, P.L., Ferreira, H.G. and Ferreira, K.T.G. (1989) J. Physiol. 416, 403-420.
10 Ferreira, K.T.G. and Swensson, W.M. (1979) Biochim. Biophys. Acta 552, 178-182.
11 Ferreira, K.T.G. and Ferreira, H.G. (1981) Biochim. Biophys. Acta 646, 193-202.
12 Hald, A. (1952) Statistical Theory with Engineering Applications, pp. 391-394, Wiley, New York.
13 Ellison, D.H., Velazquez, H. and Wright, F.S. (1985) Am. J. Physiol. 248, F638-F649.