investigation of compacted hydrophilic and hydrophobic colloidal silicon dioxides as glidants for...
TRANSCRIPT

www.elsevier.com/locate/powtec
Powder Technology 141 (2004) 31–43
Investigation of compacted hydrophilic and hydrophobic colloidal silicon
dioxides as glidants for pharmaceutical excipients
S. Jonata, S. Hasenzahlb, M. Drechslerb, P. Albersb, K.G. Wagnera, P.C. Schmidta,*
aDepartment of Pharmaceutical Technology, Eberhard-Karls-University of Tubingen, Auf der Morgenstelle 8, D-72076 Tubingen, GermanybDegussa AG, D-63403 Hanau, Wolfgang, Germany
Received 20 August 2003; accepted 27 January 2004
Available online 1 April 2004
Abstract
The glidant properties of compacted hydrophilic and hydrophobic colloidal silicon dioxides were compared with respect to mixing time
and mixer type using microcrystalline cellulose, pregelatinized starch and a-lactose-monohydrate as model excipients. Flowability studies,
including angle of repose measurements and a novel dynamic conveyor belt method, showed differences in the flow enhancement between
the colloidal silicon dioxide types. An influence of mixing conditions on flowability was also observed for hydrophilic colloidal silicon
dioxide. These differences could be explained by SEM and XPS investigations, indicating the importance of a uniform coverage of the
glidant particles on the excipient’s surface. The influence of size and distribution of the colloidal silicon dioxide particles on the surface of the
excipient, mixing time, mixer type are described in detail. In addition, moisture studies showed that colloidal silicon dioxide protects the
excipients against a flowability decrease caused by humidity.
D 2004 Elsevier B.V. All rights reserved.
Keywords: Colloidal silicon dioxide; Flowability studies; Mixing process; Moisture studies; Scanning electron microscopy; X-ray photoelectron spectroscopy
1. Introduction layer on the powder or granulate particles causing them to
Glidants are incorporated into solid dosage forms to
improve the flow properties of cohesive powders and
granulates. When applied to tableting operations, glidants
improve flow into the hopper and the die cavities of the
tablet press. They increase the tablet weight, decrease the
weight variation and minimize the tendency of powder or
granule components to separate or segregate due to exces-
sive vibrations. For capsules, addition of glidants ensures a
high accuracy of metering and a uniform distribution of
active ingredients. The mode of action is not yet well
understood, but two theories have been described [1]. The
fine glidant particles adhere to the surface of the powders or
granulates, increasing the distance between two particles,
which in turn leads to a reduction of the attraction forces
between them. The second theory can be described as a ball
bearing type of action. Glidants form a monoparticulate
0032-5910/$ - see front matter D 2004 Elsevier B.V. All rights reserved.
doi:10.1016/j.powtec.2004.01.020
* Corresponding author. Tel.: +49-70-71-29-24-62; fax: +49-70-71-59-
55-31.
E-mail address: [email protected]
(P.C. Schmidt).
roll over one another. The rough surface is thus smoothed
out, reducing the frictional and adhesive forces that operate
between the surfaces.
Glidants used in pharmacy include talc, colloidal silicon
dioxide, calcium phosphates and various metallic stearates
[2]. Several groups have investigated the addition of gli-
dants to a variety of powders and noted that the silica-type
glidants are the most efficient because of their small particle
size [1–3]. AEROSILR 200 (Degussa, Dusseldorf, Ger-
many) is a highly disperse or colloidal silicon dioxide (also
referred to as fumed silica) that is commonly used to
improve flowability [4]. This conventional colloidal silicon
dioxide has low bulk and tapped densities and can produce
dust if handled improperly. Furthermore, it requires consid-
erable storage space and is relatively complex to process. In
order to improve the handling of colloidal silicon dioxide,
special mechanical processes were developed for the homo-
geneous compaction of colloidal silicon dioxide [5]. As a
result, two new products have been recently introduced:
AEROSILR 200 VV Pharma, which is especially designed
for the pharmaceutical industry, and AEROSILR R 972 V.
AEROSILR 200 VV Pharma is hydrophilic and chemically

Table 1
Comparison of the physicochemical properties of hydrophilic and
hydrophobic colloidal silicon dioxide types used in the study
Properties AEROSILR200 (hydrophilic,
non-compacted)
AEROSILR200 VV Pharma
(hydrophilic,
compacted)
AEROSILRR972 V
(hydrophobic,
compacted)
Average primary
particle size (nm)
12 12 16
BET surface
area (m2/g)
200F 25 200F 25 110F 20
Tapped density
(g/cm3)
approx. 0.05 approx. 0.12 approx. 0.09
Silanol group
density (nm� 2)
approx. 2 approx. 2 approx. 0.75
S. Jonat et al. / Powder Technology 141 (2004) 31–4332
identical to AEROSILR 200. It differs from conventional
colloidal silicon dioxide only in its higher tapped density
and its larger secondary agglomerates. The compacted
product AEROSILR R 972 V is hydrophobic, a result of
dimethyl silyl groups chemically bound to the silica surface
[6]. The hydrophobic nature of AEROSILR R 972 V gives
it superiority over water-wettable conventional colloidal
silicon dioxide in a range of pharmaceutical applications
including slow-release formulations and W/O emulsions.
Gstirner and Pick first compared hydrophobic and hydro-
philic AEROSILR products in the late 1960s, evaluating
their effect on the flowability of zinc oxide and their
influence on the water absorption of various powders
[7,8]. They showed that AEROSILR R 972 enhanced the
flowability of zinc oxide and reduced the water uptake of
powders to a greater extent than did the hydrophilic type
AEROSILR 200. With the introduction of the compacted
hydrophobic and hydrophilic AEROSILR products, their
effects on the flowability and water absorption of typical
tableting excipients seemed to be an interesting topic.
Physical test methods for powder flow characterization
described in the literature are numerous and exist in many
variations [9–11]. Amidon et al. [12] have recommended
several procedures for the measurement of flow properties.
However, individual tests are not always able to measure
small differences in flow between similar powders and to
rank their flow properties [13]. Generally, it is not possible
to characterize powder flow by one single test methodology.
Thus the combination of various tests is a better approach to
achieve reliable data. Two methods were chosen for this
work: the classical static angle of repose and a dynamic
conveyor belt method.
The primary particles of colloidal silicon dioxide are
linked into relatively stable aggregates that can range up to
several hundred nanometers in size. The aggregates in turn
form larger agglomerates, which can be broken down by the
shear forces that occur during powder processing. The
mixing time and the mixer type can therefore influence
the size of the agglomerates and as a result the flowability.
The effect of mixer type and mixing time on pharmaceutical
mixtures has been described in the literature [14–16]. The
purpose of this work was to compare the flow-enhancing
properties of conventional colloidal silicon dioxide to the
new compacted hydrophilic and hydrophobic types with
respect to mixing time, mixer type and relative humidity.
2. Experimental procedures
2.1. Materials
All colloidal silicon dioxide types were obtained from
Degussa. Their physico-chemical properties are summarized
in Table 1 [6].
Three excipients used as filler/binders for direct compres-
sion of tablets were selected for their different structures, flow
properties and compressibility behavior: Microcrystalline
cellulose (AvicelR PH 101, FMC Biopolymer, Cork, Ire-
land), pregelatinized starch (Starch 1500R, Colorcon, Kent,England) and agglomerated a-lactose-monohydrate (Tab-
lettoseR 80, Meggle, Wasserburg, Germany).
Potassium acetate, magnesium chloride, potassium car-
bonate, sodium bromide, sodium nitrite, sodium chloride,
potassium chloride and potassium nitrate (Merck, Darm-
stadt, Germany) were of analytical grade and used as
saturated salt solutions.
2.2. Methods
2.2.1. Mixing process
To assess the influence of the mixing time and the mixer
type on the flowability of the mixtures, different mixers and
mixing conditions were chosen, as shown in Fig. 1 using
Starch 1500R as an example: a free-fall mixer (Turbula, W.A.
Bachofen, Basel, Switzerland), with a 2 l vessel volume, a
maximum filling degree of 75% and a rotational speed of 42
rpm; a high speed mixer based on the plowshare principle
(SW 1/S, Erweka, Heusenstamm, Germany), with a 5 l drum,
a filling degree of 70% and a rotary speed of 2400 rpm; and a
pin mill (160 Z, Alpine, Augsburg, Germany) with a rotary
speed of 14,000 rpm. Based on previous investigations the
amount of colloidal silicon dioxide was set at 0.5 wt.%
AEROSILR based on the total formulation.
2.2.2. Determination of flowability
2.2.2.1. Angle of repose. The angle of repose was mea-
sured using a sieve-cone-method according to DIN ISO
4324. The distance between the sieve and the metal cone
was 10 cm. First, 100 g of material were sieved through an
800 Am sieve onto a metal cylinder with a radius (r) of 25
mm to determine the exact distance between the cone and
the sieve. The sieve was then fixed 3 cm above the top of
the powder cone and 100 g material were sieved through an
800 Am sieve onto the metal cylinder. The height (h) of the
powder cone was measured and the angle of repose (a) wascalculated using the following equation: tana = h/r. The
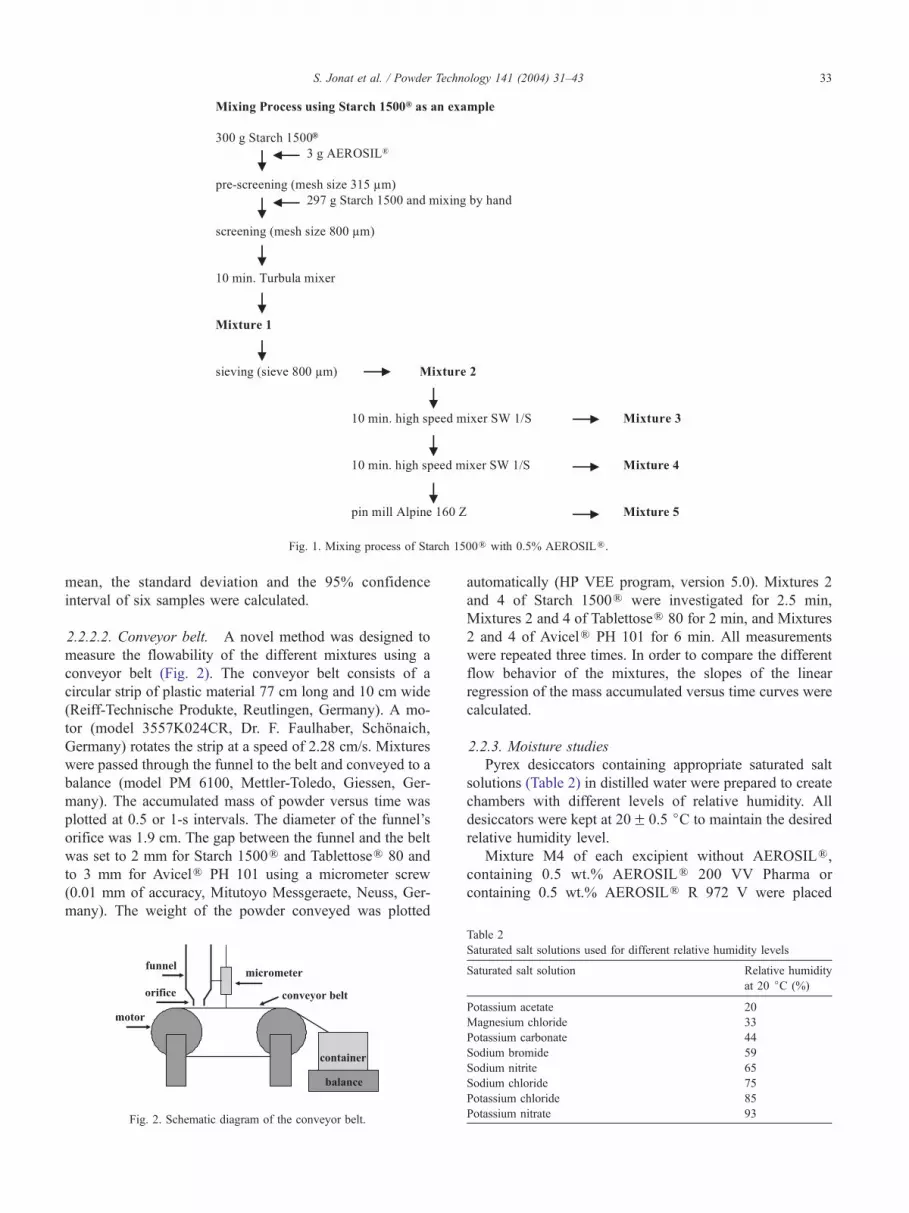
Fig. 1. Mixing process of Starch 1500R with 0.5% AEROSILR.
S. Jonat et al. / Powder Technology 141 (2004) 31–43 33
mean, the standard deviation and the 95% confidence
interval of six samples were calculated.
2.2.2.2. Conveyor belt. A novel method was designed to
measure the flowability of the different mixtures using a
conveyor belt (Fig. 2). The conveyor belt consists of a
circular strip of plastic material 77 cm long and 10 cm wide
(Reiff-Technische Produkte, Reutlingen, Germany). A mo-
tor (model 3557K024CR, Dr. F. Faulhaber, Schonaich,
Germany) rotates the strip at a speed of 2.28 cm/s. Mixtures
were passed through the funnel to the belt and conveyed to a
balance (model PM 6100, Mettler-Toledo, Giessen, Ger-
many). The accumulated mass of powder versus time was
plotted at 0.5 or 1-s intervals. The diameter of the funnel’s
orifice was 1.9 cm. The gap between the funnel and the belt
was set to 2 mm for Starch 1500R and TablettoseR 80 and
to 3 mm for AvicelR PH 101 using a micrometer screw
(0.01 mm of accuracy, Mitutoyo Messgeraete, Neuss, Ger-
many). The weight of the powder conveyed was plotted
Fig. 2. Schematic diagram of the conveyor belt.
automatically (HP VEE program, version 5.0). Mixtures 2
and 4 of Starch 1500R were investigated for 2.5 min,
Mixtures 2 and 4 of TablettoseR 80 for 2 min, and Mixtures
2 and 4 of AvicelR PH 101 for 6 min. All measurements
were repeated three times. In order to compare the different
flow behavior of the mixtures, the slopes of the linear
regression of the mass accumulated versus time curves were
calculated.
2.2.3. Moisture studies
Pyrex desiccators containing appropriate saturated salt
solutions (Table 2) in distilled water were prepared to create
chambers with different levels of relative humidity. All
desiccators were kept at 20F 0.5 jC to maintain the desired
relative humidity level.
Mixture M4 of each excipient without AEROSILR,containing 0.5 wt.% AEROSILR 200 VV Pharma or
containing 0.5 wt.% AEROSILR R 972 V were placed
Table 2
Saturated salt solutions used for different relative humidity levels
Saturated salt solution Relative humidity
at 20 jC (%)
Potassium acetate 20
Magnesium chloride 33
Potassium carbonate 44
Sodium bromide 59
Sodium nitrite 65
Sodium chloride 75
Potassium chloride 85
Potassium nitrate 93

S. Jonat et al. / Powder Technology 141 (2004) 31–4334
in each of the eight desiccators (24 samples total) for 18
days. The study was divided into two parts: water uptake
and flowability. For the water uptake, 90 ml samples of
each mixture were accurately weighed (model PG 5002-S,
Mettler-Toledo, Giessen, Germany) into 14 cm diameter
Petri dishes and then placed in the dessicators. After 3, 7,
12 and 18 days, the samples were again accurately
weighed. The water uptake was calculated and expressed
in %. For the flowability, the angle of repose was mea-
sured before and after 18 days storage in the dessicators.
For Starch 1500R, the experiment was performed three
times in order to evaluate the reproducibility.
2.2.4. Particle size analysis
The particle size distributions of AvicelR PH 101, Starch
1500R and TablettoseR 80 were measured by laser diffrac-
tion spectrometry (Mastersizer 2000, Malvern Instruments,
Herrenberg, Germany) using the dry-dispersing system
Scirocco 2000 (Malvern Instruments). The dispersing air
pressure was 3 bar for AvicelR PH 101, no dispersing air
pressure was used for Starch 1500R and TablettoseR 80.
Data were directly collected by means of the system
software (Malvern Instruments). The mean value of three
measurements was calculated.
2.2.5. Scanning electron microscopy (SEM)
The powder mixture was examined using a Zeiss DSM
940 A SEM (Carl Zeiss, Oberkochen, Germany) equipped
with a Contax M 167 MT camera (Yashica-Kyocera,
Hamburg, Germany). Each mixture was fixed on an
aluminium sample holder using a double-adhesive tape
(Tempfix) and coated with a thin gold layer prior to
examination using a Sputter Coater E 1500 (Bio-Rad,
Munich, Germany). The samples were sputtered four
times for 60 s and exposed to 20 mA current and 2.1
kV acceleration voltage in a vacuum of 2–3 Pa. The
micrographs were taken at 5 kV and at a magnification of
5000 and 20,000.
2.2.6. X-ray photoelectron spectroscopy (XPS)
The samples were measured as loose powders without
any pretreatment such as compressing. They were sup-
ported by a tantalum sample container and were transferred
into the XPS instrument by means of a differential pump-
ing stage. After evacuation, a sample was transferred into
the main spectrometer chamber and was measured at about
5� 10� 8 mbar. Broad area XPS conditions were adjusted
to obtain information on the surface properties of about 0.5
cm2 of the material in a single spectrum. The XPS
measurements were performed using MgKa radiation at a
power of 150 W. The electron energy analyzer (Leybold
EA11A, Cologne, Germany) was operated at a pass-energy
of 75 eV in the fixed analyzer transmission mode. Addi-
tional details are given in Ref. [17]. The spectra were
treated as follows: subtraction of the X-ray satellites,
smoothing by polynomial fits, Shirley-type background
subtraction [18], peak integration and correction by sensi-
tivity factors according to the elemental ionization cross
sections and the transmission function of the electron
energy analyzer. The elemental sensitivity factors for the
quantitative evaluation were: Si 2p 0.4, O 1s 0.78 and C 1s
0.34. The binding energy scale of the spectrometer was
referenced to the Au 4f7/2 signal at 84.0 eV.
3. Results and discussions
3.1. Flowability studies
3.1.1. Angle of repose method
The dependence of the angle of repose of AvicelRPH 101 and Starch 1500R mixtures on the AEROSILR-type, the mixing time and the mixer type is shown in
Fig. 3. As expected, each type of colloidal silicon
dioxide clearly improved the flowability of AvicelR PH
101 and Starch 1500R for all mixtures. According to the
classification of Carr [12], which relates the flow prop-
erties to the angles of repose, AvicelR PH 101 became
by the addition of 0.5% AEROSILR a fairly (36–40j)or a passably (41–45j) flowing material and Starch
1500R showed good (31–35j) or fairly good (36–40j)flow properties. A statistical analysis (ANOVA and
Newman–Keuls test) was used to rank the increase in
flowability: for mixtures M1, M2 and M3, AEROSILRR 972 V improved the flowabilty most, followed by
AEROSILR 200 VV Pharma and AEROSILR 200. For
mixture M4, there was no statistically significant differ-
ence between AEROSILR 200 VV Pharma and AERO-
SILR R 972 V. Under these mixing conditions, the two
AEROSILR types improved the flowability to the same
extent, whereas AEROSILR 200 showed again the
lowest flowability enhancement.
The flowability of mixtures containing AEROSILR 200
or AEROSILR 200 VV Pharma were strongly influenced
by the mixing conditions. Flowability increased with mix-
ing time and energy, reaching an optimum at mixture M4.
The results of the ANOVA test for AvicelR PH 101
mixtures with AEROSILR R 972 V, however, indicated
that there were no differences in the angles of repose of
mixtures M1, M2, M3 and M4 (Fig. 3a). The flowability
increase obtained with 0.5% AEROSILR R 972 V was
influenced neither by the free-fall nor by the high speed
mixer. This means that the flowability optimum was
obtained directly after gentle mixing (M2) and remained
constant until mixture M4.
For Starch 1500R, from step 1 to step 4, the angle of
repose of AEROSILR 200, AEROSILR 200 VV Pharma
and AEROSILR R 972 V mixtures decreased from 39.2j to
35.1j, from 35.2j to 32.7j and from 34.1j to 32.4j,respectively (Fig. 3b). Again, the highest flowability was
obtained with and the mixing conditions had the lowest
influence on AEROSILR R 972 V. As a glidant, hydropho-

Fig. 3. The effect of AEROSILR-type, mixer type and mixing time on the angle of repose of AvicelR PH 101 (a), Starch 1500R (b) and TablettoseR 80
(c) mixtures. Error bars indicate the 95% confidence interval of six measurements.
S. Jonat et al. / Powder Technology 141 (2004) 31–43 35
bic AEROSILR R 972 V seems to be less sensitive with
respect to the mixing steps.
Fig. 3c depicts the angle of repose of TablettoseR 80
mixtures as a function of colloidal silicon dioxide type and
the mixing steps. TablettoseR 80 is already a free-flowing
material, nevertheless its flowability was further improved
by the addition of 0.5% AEROSILR. However, the angle ofrepose increased with increasing mixing steps for all mix-
tures. This observation can be explained by the reduction of
the particle size during the mixing process, as shown in

Table 3
The influence of mixer type and mixing time on the mean particle diameter
of AvicelR PH 101, Starch 1500R, and TablettoseR 80
Sample AvicelR PH
101 (Am)
Starch 1500R(Am)
TablettoseR80 (Am)
Bulk 48.8 73.3 159.9
M2 49.5 74.4 149.0
M4 49.7 75.4 130.6
M5 28.8 49.5 23.8
Table 4
Analysis of mass accumulation curves of AvicelR PH 101, Starch 1500Rand Tablettose 80 containing 0.5% AEROSILR R 972 V, 0.5% AEROSILR200 VV Pharma, 0.5% AEROSILR 200, and without AEROSILR
AEROSILRR 972 V
AEROSILR200 VV
Pharma
AEROSILR200
No
AEROSILR
AvicelR M2 0.3813 0.3500 0.3397 0.2878
PH 101 slopeF s 0.0017 0.0027 0.0027 0.0010
M4 0.3947 0.3971 0.3810 0.2661
slopeF s 0.0068 0.0093 0.0057 0.0228
Starch M2 0.3915 0.3566 0.3377 –
1500R slopeF s 0.0038 0.0098 0.0040 –
M4 0.3872 0.3707 0.3696 –
slopeF s 0.0065 0.0050 0.0032 –
TablettoseR M2 0.3545 0.3576 0.3707 0.3182
80 slopeF s 0.0042 0.0107 0.0044 0.0064
M4 0.3623 0.3623 0.3737 0.3265
slopeF s 0.0035 0.0035 0.0029 0.0046
S. Jonat et al. / Powder Technology 141 (2004) 31–4336
Table 3. The agglomerates of TablettoseR 80 were
destroyed in the plowshare-mixer and in the pin mill,
leading to an increase in the adhesion forces between lactose
particles, which decreased the flowability and overshad-
owed the action of AEROSILR [19]. Moreover, the ag-
glomerate structure of the TablettoseR 80, which has many
irregularities and cavities, leads to a reduction of the
AEROSILR action in general due to the settling of AERO-
SILR particles into the cavities. The ANOVA results
revealed that there were no statistically significant differ-
ences between the AEROSILR-types.For each preparation, mixture M5 resulted in the highest
angle of repose, that is to say it had the poorest flowability.
The pin mill decreased flowability by reducing the particle
size of the materials (Table 3).
3.1.2. Dynamic conveyor belt method
The flow properties of each mixture were also studied
using the dynamic conveyor belt method. This method was
chosen to simulate the filling process of a die on a rotary
tablet press, where the vertical powder flow is superimposed
by a horizontal movement by the moving die table. The
powder mass accumulating on the balance was plotted
versus time for mixtures M2 and M4. The flow profiles of
AvicelR PH 101 mixtures were linear within 6 min indicat-
Fig. 4. Mass accumulated vs. time for mixtures M2 (left) and mixtures M4 (rig
AEROSILR 200 VV Pharma (2), 0.5% AEROSILR 200 (3) and without AERO
ing that the sample flowed continuously out of the funnel
(Fig. 4). Starch 1500R without AEROSILR blocked the
orifice of the funnel and therefore no slope was calculated.
A statistical analysis (ANOVA and Newman–Keuls test) of
the slope of the curves of AvicelR PH 101 and Starch
1500R confirmed the angle of repose results with respect to
both the influence of the AEROSILR-type and the mixing
conditions. For mixtures M2 the flowability improvement
ranking for AvicelR PH 101 and Starch 1500R was: AERO-
SILR R972 V>AEROSILR 200 VV Pharma>AEROSILR200>no AEROSILR (Table 4). For mixtures M4 the slopes
were significantly higher compared to mixtures M2 for
AEROSILR 200 VV Pharma and AEROSILR 200, while
no further increase in flowability was observed for AERO-
SILR R 972 V. This reveals again that the flowability of
mixtures with AEROSILR 200 VV Pharma and AEROSILR200 were strongly influenced by the mixing conditions, a
ht) of AvicelR PH 101 containing 0.5% AEROSILR R 972 V (1), 0.5%
SILR (4).

Fig. 5. SEM images of AvicelR PH 101 containing 0.5% AEROSILR R 972 V M2 (a), 0.5% AEROSILR 200 M2 (b), 0.5% AEROSILR 200 VV Pharma M2
(c and d) and AEROSILR 200 M4 (e), and 0.5% AEROSILR 200 VV Pharma M4 (f). The bars represent 500 nm and 2 Am for images a, b, c, e, f and for
image d, respectively.
S. Jonat et al. / Powder Technology 141 (2004) 31–43 37

Table 5
XPS-Spectra of AvicelR PH 101 alone and of mixtures containing 0.5% of
AEROSILR R 972 V, AEROSILR 200 VV Pharma, and AEROSILR 200
AvicelRPH 101
containing
AEROSILRR 972 V
AEROSILR200 VV
Pharma
AEROSILR200
No
AEROSILR
M2 M4 M2 M4 M2 M4 Bulk
C 1 s 29.8 39.5 37.7 27.2 37.0 25.8 43.4
O 1 s 63.0 50.2 59.6 64.6 59.8 64.9 56.6
Si 2p 7.22 10.3 2.76 8.25 3.25 9.21 0.0
S. Jonat et al. / Powder Technology 141 (2004) 31–4338
longer mixing time resulting in better powder flow, whereas
AEROSILR R 972 V is almost independent of mixing time
and energy. As with the angle of repose method, no
differences between the three AEROSILR types were
found in the conveyor belt experiments for TablettoseR80 (Table 4).
3.1.3. Surface analysis by SEM/XPS
In order to elucidate the differences in the influence of
the AEROSILR-types on powder flowability, scanning
electron microscopy (SEM) studies were performed to
visualize the degree of AEROSILR particle coverage and
distribution on the AvicelR PH 101 surface. Fig. 5 depicts
the corresponding SEM images. Samples were carefully
checked to make sure that the differences observed are
representative for each particular mixture. The comparison
of Fig. 5a, b and c shows that the surface of the substrates
was covered with small particles of colloidal silicon dioxide
(aggregates and agglomerates), however, to varying
degrees. The distribution of AEROSILR R 972 V on the
surface of AvicelR PH 101 was regular and homogeneous
without enrichment of AEROSILR particles at edges or in
cavities of the substrate (Fig. 5a). Although every sample
contained the same amount of AEROSILR, the coverage ofAvicelR PH 101 was less extensive and the distribution less
homogeneous for mixtures containing AEROSILR 200
Fig. 6. Correlation of angle of repose and XPS Si 2p signa
(Fig. 5b) and AEROSILR 200 VV Pharma (Fig. 5c). In
addition, large AEROSILR particles of up to 500 nm in size
could be detected on the surface of the substrate (Fig. 5d)
indicating that not all particles were sufficiently broken up
in M2. As Fig. 5e and f shows, higher energy mixing
conditions 4 are necessary to achieve a homogeneous
distribution of AEROSILR 200 and AEROSILR 200 VV
Pharma particles, as it is already achieved by the more
gentle mixing conditions 2 for AEROSILR R 972 V. The
degree of coverage qualitatively correlated to the flow-
enhancement ranking.
While SEM studies only allow for a qualitative assess-
ment, X-ray photoelectron spectrometry (XPS) enables a
quantitative measure of the degree of dispersion of AERO-
SILR on AvicelR PH 101 by detecting the surface coverage.
The evaluation of Si 2p photoelectron signals allowed a
quantitative comparison on the shielding of the substrate by
AEROSILR particles [17].
Table 5 shows the results of the quantitative evaluations
of the XPS spectra. In spite of the given bulk concentra-
tion of SiO2 (0.5%), the values for 0.5 cm2 of powder
surface ranged between 2.76 and 10.3 at.%. Due to the
high surface selectivity of XPS, the samples showing the
best dispersion of the colloidal silicon dioxide particles to
the substrate could be identified. All M4 samples and the
samples with hydrophobic AEROSILR R 972V showed
much higher concentrations of Si than the M2 samples.
The qualitative impressions and trends as suggested by
SEM (Fig. 5) were confirmed by quantitative XPS meas-
urements (Table 5).
Although there was no linear correlation between the
angle of repose and the Si 2p values, two clusters were
formed when correlating the two parameters as shown in
Fig. 6. One cluster contained the M2-mixtures with AERO-
SILR 200 and AEROSILR 200 VV Pharma at high angles
of repose and low Si 2p values, while the other represented
the M4-mixtures and the M2-mixtures of AEROSILR R
l intensity of AvicelR PH 101/AEROSILR mixtures.

Table 6
Results of Gaussian/Lorentzian line shape analyses of the C1s signal of
AvicelR PH 101 containing 0.5 wt % of AEROSILR R 972 V and without
AEROSILR
AvicelR PH 101 No AEROSILR AEROSILR R 972 V
containingEv % eV %
C1s peak 1 285.3 7 284.5 46
C1s peak 2 286.8 83 285.9 41
C1s peak 3 288.8 10 288.0 13
S. Jonat et al. / Powder Technology 141 (2004) 31–43 39
972 V at low angles of repose and increased AEROSILRcoverage (higher Si 2p values).
The actual degree of surface coverage was even higher
than shown by the XPS Si 2p signals in Table 5. It is also
necessary to take into consideration the corresponding
inorganic oxygen of the SiO2 particles covering the
oxygen- and carbon-containing structures of the organic
substrate. This means that in Table 5 the inorganic oxygen
signal contribution of the SiO2 particles and the organi-
cally bound oxygen of the AvicelR PH 101 added up to
the complete O1s signal. The same holds for the carbo-
naceous species. Since XPS was not only able to identify
and to quantify the presence of different elements but also
to identify the different types of chemical bonds, addi-
tional information was obtained. Fig. 7 compares the C1s
signals of the pure cellulose substrate and of a sample
covered with AEROSILR R 972 V (Si value: 10.3%,
Table 5). Table 6 shows the corresponding binding energy
values.
With respect to reference data on various materials
[20,21], it was evident that the binding energy value of
the C1s signal of AvicelR PH 101 was dominated by the
peak around 286.8 eV according to the –C–O–C– and
Fig. 7. Binding energy values of the carbon atoms of AvicelR PH 101 cont
–C–O–C–O–C– functions with different substitutional
patterns. Furthermore, and with respect to high resolution
XPS data reported by Beamson [22] for different kinds of
cellulose, it follows that the signal at about 285/286 eV was
due to CHx-type functions in side chains such as �CH2 �CH3 as known from ethylcellulose or the O� CH2 � CH2–
CH2–OH in hydroxypropylcellulose, the signal at about
286/287 eV was due to the C atoms in the ring which are
directly connected to the OH-groups in cellulose (or the
alkoxy functions of ethylcellulose) and the signal at about
287/288 eV showed the bridging oxygen atoms between the
rings. This indicates that the binding energy values for the
aliphatic carbon species in cellulose were enhanced due to
aining 0.5 wt.% of AEROSILR R 972 V (a) and no AEROSILR (b).

S. Jonat et al. / Powder Technology 141 (2004) 31–4340
the numerous adjacent electronegative oxygen entities. On
the other hand, for the case of the AEROSILR R 972 V-
covered material, the aliphatic components which were
enriched in the topmost atomic layers of the silica particles
that shield the AvicelR PH 101 substrate were selectively
detected by means of XPS. The binding energy values of
these carbon atoms were detected at lower binding energy
(Fig. 7). The Gaussian/Lorentzian line shape analyses, as
summarized in Table 6, show that 46% of the detected
surface-carbon on the AvicelR PH 101/AEROSILR R 972
V sample was purely aliphatic (–CH3).
XPS could not only detect the varying degree of surface
coverage of AvicelR PH 101 by measuring the Si 2p signal
but could also differentiate between aliphatic carbon entities
of the cellulose substrate and the aliphatic chains in the
topmost atomic layers of the finely dispersed particles of
silanized silica such as AEROSILR R 972 V. It can be
measured how much of the aliphatic carbon at the surfaces
of the modified AvicelR PH 101 samples may contribute to
hydrophobic conditions (CH2-chains without adjacent oxy-
gen atoms, at 285 eV binding energy and less) and to
hydrophilic conditions (CH2-entities of the cellulose rings).
So the difference between the C1s peak 2 of AvicelR PH
101 and AvicelR PH 101 containing 0.5% AEROSILR R
972 V gave the exact surface coverage of AEROSILR R972
V on AvicelR PH 101, i.e. 42%, corresponding to a 10.3%
surface coverage given by Si 2p (Table 5) and to the
qualitative impression of Fig. 5a.
SEM and XPS studies provide an explanation for the
flow-enhancement and the sensitivity of the various AERO-
SILR-types to the mixing steps. AEROSILR R 972 V
resulted in the best flow-enhancement of AvicelR PH 101
compared to AEROSILR 200 VV Pharma and AEROSILR200 due to its high degree of dispersion. A higher degree of
Fig. 8. Water uptake of mixtures M4 of Starch 1500R, AvicelR PH 101 and Table
VV Pharma or AEROSILR R 972 V, after 18 days storage at different (constant) le
confidence interval of three measurements.
coverage allowed a better action of the glidant particles.
AvicelR PH 101 containing 0.5% AEROSILR R 972 V
showed equal angle of repose values for Mixture M2 and
Mixture M4, as the degree of coverage of AEROSILR R
972 V in both mixtures was the same. Under mixing
conditions 2, the agglomerates of AEROSILR R 972 V
have reached their final size and optimal distribution; hence
the high speed mixer (Mixture M4) showed no increase in
the degree of coverage. The hydrophobic agglomerates were
rapidly broken down and a stable distribution of AERO-
SILR R 972 V resulted.
3.2. Moisture studies
One of the advantages of hydrophobic colloidal silicon
dioxide, such as AEROSILR R 972 V, is its low and
relatively constant water content at all humidity levels,
while the hydrophilic types adsorb water at increasing
relative humidity [6]. Because of the low AEROSILRconcentration of 0.5%, this property could not be dem-
onstrated in this investigation (Fig. 8). Rather, the water
uptake was characteristic for each excipient and ranged
from � 0.5% to 9.5% for Starch 1500R, from � 0.5% to
7.3% for AvicelR PH 101 and from � 0.2% to 0.2% for
TablettoseR 80, independent of the addition of AERO-
SILR or the AEROSILR type used.
In spite of this, the angle of repose revealed an interesting
positive effect for all AEROSILR types with respect to
humidity (Fig. 9). For each excipient, mixtures without
AEROSILR always showed a higher angle of repose after
18 days in the humidity chamber, i.e. the flowability
decreased. Moreover, the higher the relative humidity, the
larger the increase in the angle of repose. This can be
correlated to the variation of interparticulate forces with
ttoseR 80, without AEROSILR or containing 0.5 wt.% of AEROSILR 200
vels of relative humidity and room temperature. Error bars indicate the 95%

Fig. 9. The effect of relative humidity on the angle of repose of AvicelR PH 101 (a), Starch 1500R (b), and TablettoseR 80 (c), without AEROSILR or
containing 0.5 wt.% AEROSILR 200 VV Pharma or AEROSILR R 972 Vafter 18 days at different levels of humidity. Error bars for Starch 1500R indicate the
95% confidence interval of three measurements.
S. Jonat et al. / Powder Technology 141 (2004) 31–43 41

S. Jonat et al. / Powder Technology 141 (2004) 31–4342
humidity. Adhesion forces increase as humidity increases
resulting in larger angles of repose [23–25]. On the other
hand, the angles of repose of mixtures containing 0.5%
AEROSILR were hardly influenced by increasing the rela-
tive humidity, even though their water uptake was the same
as of mixtures without AEROSILR. In fact, AEROSILRreduced or avoided, depending on the type of excipient, the
increase in interparticulate forces. For AvicelR PH 101 and
Starch 1500R, there was no difference before and after 18
days in the chambers, even at high humidity (Fig. 9a and b).
For TablettoseR 80, angles of repose of mixtures containing
0.5% AEROSILR were mostly larger after 18 days, but this
increase was smaller when compared to the mixtures with-
out AEROSILR (Fig. 9c). These results confirmed that
AEROSILR protects the three excipients from a flowability
decrease under humid conditions [26]. Except for the best
flow enhancement, the hydrophobic colloidal silicon diox-
ide did not show further advantages over the hydrophilic
types under the experimental conditions chosen. Smaller
angles of repose were observed for Starch 1500R and
TablettoseR 80 mixtures containing the hydrophobic
AEROSILR R 972 V at some relative humidity levels, but
the differences were not statistically significant.
The decreasing flowability of the pure excipients at
increasing humidity can possibly be explained as the result
of the formation of a water film or an increase in the
capillary condensation between the excipient particles. The
addition of colloidal silicon dioxide increases the surface
roughness of the exipient particles and quite likely also the
average distance between them. Therefore capillary conden-
sation would not play an important role even at high relative
humidity levels, and the mixtures containing colloidal
silicon dioxide would retain good flow properties indepen-
dent of atmospheric moisture.
4. Conclusions
The results of our investigation of the glidant properties
of compacted hydrophilic and hydrophobic colloidal silicon
dioxides using microcrystalline cellulose, pregelatinized
starch and a-lactose-monohydrate as model excipients can
be summarized as follows:
(1) The novel types AEROSILR R 972 V and AEROSILR200 VV Pharma are efficient glidants. Apart from their
handling advantages, compacted colloidal silicon diox-
ides are even superior to the non-compacted AERO-
SILR 200 with respect to their powder flow enhancing
properties.
(2) Among the colloidal silicon dioxide types investigated
here, AEROSIL R 972 V is the most efficient glidant.
While already gentle mixing conditions are sufficient to
achieve high flowability enhancement with hydrophobic
AEROSILR R 972 V, the flowability increase obtain-
able with hydrophilic AEROSILR 200 VV Pharma and
AEROSILR 200 strongly depends on the mixing
conditions. Generally, the flowability of microcrystal-
line cellulose and pregelatinized starch mixtures con-
taining hydrophilic colloidal silicon dioxide increases
with higher mixing time and energy. Furthermore, the
angles of repose correlate well with the mass accumu-
lation curves obtained by the novel conveyor belt
method.
(3) SEM and XPS analyses of mixtures of microcrystalline
cellulose and AEROSILR show a clear correlation
between the degree and uniformity of coverage of the
colloidal silicon dioxide particles on the excipient’s
surface and the flow enhancement exerted by the
glidant. While the soft agglomerates of AEROSILR R
972 V reach their final size and optimal distribution
already under gentle mixing conditions, higher mixing
energies are required to break up the agglomerates of
both AEROSILR 200 and AEROSILR 200 VV Pharma
and to achieve a uniform coverage. Mixing conditions
generally need to be adjusted in a way to ensure an
optimum dispersion of the glidant particles on the
excipient surface. Severe mixing conditions must be
avoided since they may reduce the excipient particle
size, resulting in decreased flowability.
(4) At low glidant concentrations, the moisture uptake of the
excipients is not influenced by any of the colloidal
silicon dioxide types used. Rather the water adsorption
is characteristic of the pure excipients. However, even
after equilibrating at high humidity levels, all excipient
mixtures containing AEROSILR maintained a good
flowability, while the flowability of the pure excipients
turned strongly cohesive. This proves that the com-
pacted colloidal silicon dioxide types are at least as
efficient anti-caking agents as their non-compacted
counterparts.
Acknowledgements
We would like to thank Ann Gray for carefully reviewing
this text and giving valuable advice.
References
[1] B.B. Sheth, F.J. Bandelin, R.F. Shangraw, in: Pharmaceutical Dosage
Forms: Tablets, vol. 1. Marcel Dekker, New York, 1980, pp. 141–143.
[2] S. Varthalis, N. Pilpel, The action of colloidal silicone dioxide as a
glidant for lactose, paracetamol, oxytetracycline and their mixtures,
J. Pharm. Pharmacol. (1977) 37–40.
[3] W.A. Ritschel, A. Bauer-Brandl, Die Tablette, Editio-Cantor-Ver-
lag, Aulendorf, 2002, pp. 144–146.
[4] Technical Information No. 1237, AEROSILR 200 Pharma: A Versa-
tile Excipient for the Pharmaceutical Industry, Degussa, Dusseldorf,
2001, p. 3.
[5] Technical Information No. 1247, AEROSILR 200 VV Pharma: A
New Excipient for the Pharmaceutical Industry, Degussa, Dusseldorf,
2002, p. 5.

S. Jonat et al. / Powder Technology 141 (2004) 31–43 43
[6] Technical Bulletin Fine Particles No. 11, Basic Characteristics of
AEROSILR, Degussa, Dusseldorf, 2003, p. 12.[7] F. Gstirner, C. Pick, Der Einfluß von AEROSILR und ‘‘Fullstoff R
972’’ auf die Fließeigenschaft von Zinkoxid, Arch. Pharm. 800 (1967)
757–765.
[8] F. Gstirner, C. Pick, Einfluß von AEROSILR und AEROSILR R 972
auf das Wasseraufnahmevermogen von Puderrohstoffen, Arch.
Pharm. 800 (1969) 590–604.
[9] R.L. Carr, Evaluating flow properties of solids, Chem. Eng. 18 (1965)
163–168.
[10] D. Schulze, Zur Fließfahigkeit von Schuttgutern—Definition und
Meßverfahren, Chem. Eng. Technol. 67 (1995) 60–68.
[11] W.J. Ullrich, Powder flow measurement techniques. What’s new?
Adv. Powder Metall. Part. Mat. 1 (1998) 107–127.
[12] G.E. Amidon, L.L. Ausburger, H.G. Brittain, S.R. Byrn, C.D. Fox,
G.E. Peck, D.E. Wurster, Physical test methods for powder flow
characterization of pharmaceutical materials: a review of methods,
Pharmacop. Forum 25 (3) (1999) 8298–8308.
[13] M.K. Taylor, J. Ginsburg, A.J. Hickey, F. Gheyas, Composite method
to quantify powder flow as a screeningmethod in early tablet or capsule
formulation development, AAPS PharmSciTech 1 (3) (2000) article 18.
[14] M. Poux, P. Fayolle, J. Bertrand, Powder mixing: some practical rules
applied to agitated systems, Powder Technol. 68 (1991) 213–234.
[15] W. Muller, H. Rumpf, Das mischen von pulvern in mischern mit
axialer mischbewegung, Chem. Eng. Technol. 39 (1967) 365–374.
[16] U. Sindel, A. Schweiger, I. Zimmermann, Determination of the opti-
mum mixing time for a mixture of lactose and colloidal silicon diox-
ide, J. Pharm. Sci. 4 (67) (1998) 524–526.
[17] P. Albers, K. Seibold, T. Haas, G. Prescher, W.F. Holderich, SIMS/
XPS study on the deactivation and reactivation of B-MFI catalysts
used in the vapour-phase Beckmann rearrangement, J. Catal. 176 (2)
(1998) 561–568.
[18] D.A. Shirley, Phys. Rev. B5 (1972) 4709.
[19] F. Podczeck, Particle–Particle Adhesion in Pharmaceutical Powder
Handling, Imperial College Press, London, 1998, pp. 111–114.
[20] G. Beamson, D. Briggs, High Resolution XPS of Organic Polymers,
Wiley, Chichester, 1992.
[21] C.D.Wagner, W.M. Riggs, L.E. Davis, J.F. Moulder, G.E. Muilenberg,
Handbook of X-ray Photoelectron Spectroscopy, Perkin Elmer, Phys-
ical Electronics Division, Eden Prairie, MN, USA, 1978.
[22] G. Beamson, D. Briggs, High Resolution XPS of Organic Polymers,
Wiley, Chichester, 1992, p. 158.
[23] P.L. Stephenson, W.J. Thiel, The effect of humidity on the production
of ordered mixtures, Powder Technol. 25 (1980) 115–119.
[24] H. Schubert, Haftung zwischen Feststoffteilchen aufgrund von Flus-
sigkeitsbrucken, Chem. Eng. Technol. 46 (1974) 333–334.
[25] A.D. Zimon, Adhesion of Dust and Powder, Plenum, New York,
1969, p. 84.
[26] R.K. Chang, M. Leonzio, M.A. Hussain, Effect of colloidal silicon
dioxide on flowing and tableting properties of an experimental, cross-
linked polyalkylammonium polymer, Pharm. Dev. Technol. 4 (2)
(1999) 285–289.