investigating the genetic basis of ivermectin resistance in
TRANSCRIPT
University of Calgary
PRISM: University of Calgary's Digital Repository
Graduate Studies The Vault: Electronic Theses and Dissertations
2018-04-30
Investigating the genetic basis of ivermectin
resistance in Haemonchus contortus
Rezansoff, Andrew Mischa
Rezansoff, A. M. (2018). Investigating the genetic basis of ivermectin resistance in Haemonchus
contortus (Unpublished doctoral thesis). University of Calgary, Calgary, AB.
doi:10.11575/PRISM/31897
http://hdl.handle.net/1880/106615
doctoral thesis
University of Calgary graduate students retain copyright ownership and moral rights for their
thesis. You may use this material in any way that is permitted by the Copyright Act or through
licensing that has been assigned to the document. For uses that are not allowable under
copyright legislation or licensing, you are required to seek permission.
Downloaded from PRISM: https://prism.ucalgary.ca
UNIVERSITY OF CALGARY
Investigating the genetic basis of ivermectin resistance in Haemonchus contortus
by
Andrew Mischa Rezansoff
A THESIS
SUBMITTED TO THE FACULTY OF GRADUATE STUDIES
IN PARTIAL FULFILMENT OF THE REQUIREMENTS FOR THE
DEGREE OF DOCTOR OF PHILOSOPHY
GRADUATE PROGRAM IN VETERINARY MEDICAL SCIENCES
CALGARY, ALBERTA
APRIL, 2018
© Andrew Mischa Rezansoff 2018
ii
Abstract
Parasitic nematodes have a major impact on human and animal health and their control is
threatened by the emergence of resistance to the anthelmintic drugs on which control depends.
Although resistance to ivermectin is widespread in many livestock parasites, the genetic
mechanisms remain elusive. In this thesis, a number of approaches are undertaken to investigate
the genetics of ivermectin resistance in Haemonchus contortus, an important parasitic nematode
research model. A transcriptomic comparison of the susceptible MHco3(ISE) and two ivermectin
resistant strains, MHco4(WRS) and MHco10(CAVR), was undertaken to investigate if
differences in gene expression revealed insights into ivermectin resistance mechanisms.
Although this approach did not reveal clear ivermectin resistance gene candidates, the results
have some important implications for RNAseq analysis in genetically diverse organisms. First,
extremely high levels of genetic diversity in H. contortus had a major impact on RNAseq
analysis and needed to be accounted for reliable identification of differentially expressed genes.
Second, there were a remarkably large number of genes differentially expressed between the
three H. contortus strains. In a novel genetic crossing approach, two independent serially
backcrossed H. contortus populations were utilized in which ivermectin resistance loci had been
introgressed into the MHco3(ISE) genome. Markers for six leading candidate ivermectin
resistance genes from the literature were examined and none were found to show evidence of
introgression in the backcross populations. A seventh marker, Hcms8a20 showed clear evidence
of introgression and was later confirmed by collaborators using a whole genome sequencing
approach to show its location in a 11.2 Mb introgressed region. A set of 25 in vivo or in vitro
phenotyped ivermectin resistant H. contortus field populations were then used to investigate
evidence of selection on the Hcms8a20 marker and four other loci distributed across the 11.2 Mb
introgressed region. A deep amplicon sequencing approach revealed that, of the loci tested, only
Hcms8a20 showed consistent evidence of purifying selection in the ivermectin resistant field
populations. Overall, the results provide strong evidence that a major ivermectin resistance locus
is located within a few megabases of the Hcms8a20 locus in many different ivermectin resistant
H. contortus field populations.
iii
Preface
Chapter 1. Numerous tables and figures from independent publications were included in the
General Introduction. Permissions for use of these tables and figures can be found in Copyright
Permissions. In order presented, these include:
Table 1.1, from “Hotez, P.J., Brindley, P.J., Bethony, J.M., King, C.H., Pearce, E.J., Jacobson, J.,
2008. Helminth infections: the great neglected tropical diseases. J. Clin. Invest. 118, 1311–21.
doi:10.1172/JCI34261”
Figure 1.1, adapted from “Zarowiecki, M., Berriman, M., 2015. What helminth genomes have
taught us about parasite evolution. Parasitology. doi:10.1017/S0031182014001449”
Table 1.2, adapted from “Dent, J.A., Smith, M.M., Vassilatis, D.K., Avery, L., 2000. The
genetics of ivermectin resistance in Caenorhabditis elegans. Proc. Natl. Acad. Sci. 97, 2674–
2679. doi:10.1073/pnas.97.6.2674”
Table 1.3, adapted from both “McKellar, Q.A., Jackson, F., 2004. Veterinary anthelmintics: old
and new. Trends Parasitol. 20, 456–461. doi:10.1016/j.pt.2004.08.002”, and “Waller, P.J., 1997.
Anthelmintic resistance. Vet. Parasitol. 72, 391–412. doi:10.1016/S0304-4017(97)00107-6”
Figure 1.2, from “Doyle, S.R., Laing, R., Bartley, D.J., Britton, C., Chaudhry, U., Gilleard, J.S.,
Holroyd, N., Mable, B.K., Maitland, K., Morrison, A.A., Tait, A., Tracey, A., Berriman, M.,
Devaney, E., Cotton, J.A., Sargison, N.D., 2018. A genome resequencing-based genetic map
reveals the recombination landscape of an outbred parasitic nematode in the presence of
polyploidy and polyandry. Genome Biol. Evol. 10, 396–409. doi:10.1093/gbe/evx269”
Figure 1.3, panel A, from “Gilleard, J.S., 2013. Haemonchus contortus as a paradigm and model
to study anthelmintic drug resistance. Parasitology 140, 1506–1522.
doi:10.1017/S0031182013001145”
iv
Figure 1.4 adapted from “Doyle, S., Illingworth, C., Laing, R., Redman, L., Martinelli, A.,
Cotton, J., and Gilleard, J.S., manuscript in preparation”, access courtesy of personal
communication with Stephen Doyle.
Chapter 2. This chapter has been written in manuscript form with the intension to submit for
publication with the following author list: “Andrew M. Rezansoff, Roz Laing, Axel Martinelli,
Elizabeth Redman, Dave Bartley, Matt Berriman, James Cotton, and John S. Gilleard”. DB and
ER maintained the H. contortus strains assessed in the study and harvested the worms for
sequencing. RL prepared worm isolates for sequencing and conducted the actual sequencing.
AM provided the whole genome sequence alignments and respective SNP calls from which gene
specific SNP rates were obtained. MB, JC, and JSG provided the resources and facilities to
create the datasets assessed and were co-last authors on the project. The research questions and
analyses conducted in this chapter were conceived together with JSG. JSG also provided
comments and edits to the text of this chapter.
Chapter 3. This chapter has been published as “Rezansoff, A.M., Laing, R., Gilleard, J.S., 2016.
Evidence from two independent backcross experiments supports genetic linkage of microsatellite
Hcms8a20, but not other candidate loci, to a major ivermectin resistance locus in Haemonchus
contortus. Int. J. Parasitol. 46, 653–661. doi:10.1016/j.ijpara.2016.04.007”. RLs co-author
permission form can be viewed in Copyright Permissions. RL provided advice and help in
identifying appropriate ivermectin resistance candidate gene loci to be assessed in the study. The
research questions and analyses conducted in this chapter were conceived together with JSG.
JSG also provided comments and edits to the text of this publication. We are grateful for funding
from the Canadian Institutes of Health Research (CIHR) grant 230927 and to the NSERC-
CREATE Host Pathogen Interactions (HPI) graduate training program at the University of
Calgary. RL acknowledges funding from the Scottish Government through the Strategic
Partnership for Animal Science Excellence (SPASE) and BBRSC Strategic Lola grant
(BB/M003949/1). We also thank Libby Redman for access to samples and Umer Chaudhry and
Susan Stasiuk for guidance with laboratory techniques and protocols.
v
Chapter 4. This chapter has been written in manuscript form with the intension to submit for
publication with the following author list: “Andrew M. Rezansoff, Janneke Wit, Elizabeth
Redman, Camila Quieroz, Ray Kaplan, Adrian Wolstenholme, and John S. Gilleard”. JW
provided advice for sample amplification. She also guided and helped with the quantification and
preparation of all samples for sequencing. ER and CQ conducted all FECRT and OFDA
experiments and sample processing, as well as harvested and lysed all respected H. contortus
samples. RK and AW provided the in vitro phenotyped American and Colombian samples for
sequencing. The research questions and analyses conducted in this chapter were conceived
together with JSG. JSG also provided comments and edits to the text of this chapter.
Chapter 5. The SNP data presented in Table 5.2 of the General Discussion were obtained with
the help of Axel Martinelli who at the time was employed at the Wellcome Trust Sanger
Institute.

vi
Acknowledgements
I would first like to thank my supervisor John Gilleard, who was a fantastic mentor
scientifically but also personally, through his advice and guidance in how to approach the critical
thinking, communicational, and organizational challenges faced as a doctoral student. As a
supervisor, John somehow managed to strike the difficult balance between providing me enough
control over my thesis work to allow me to expand my skill sets and improve my scientific
judgement, balanced with enough guidance such that I always remained on the right course. As a
result, I think John allowed me to take the most out of my PhD experience and to learn as much
as I could from the inevitable obstacles I faced along the way.
I would also like to thank the members of my PhD committee. James Wasmuth provided
many hours of help and advice, particularly early in my project when he helped me address
uncertainties surrounding the analysis of my data and to decipher the appropriate directions to
take. At a time when almost no other bioinformatic or genomic data researchers were established
in Veterinary Medicine he was one of the few people to look to for guidance. I also thank Sean
Rogers who was my original mentor in genetics and academic research in general as my
undergraduate supervisor. As a member of my committee he continued to push me to be a better
scientist and to always stay aware of the biological relevance and most intriguing aspects of the
research that as a student it’s easy to lose sight of. Finally, I thank Paul Mains who, as a C.
elegans researcher, provided a valuable perspective on my research. Paul helped me keep sight
of the interesting components of my research as well as the strengths and weaknesses of my
approaches in a context outside the sometimes isolated world of parasitic nematode genetics.
The members of the Gilleard Lab group, past and present, also deserve my heartfelt
thanks for making my experience as a graduate student in Veterinary Medicine a good one and a
great place to be. Jumping into a multi-year degree program can sometimes be a tough and
alienating experience and so I feel very fortunate to have been surrounded by such a diverse and
friendly group of people over the years. Regarding actual work, I specifically thank Umer
Chaudhry and Susan Stasiuk for my initial training on the ins and outs of how to be a molecular
geneticist without breaking things. I also thank Libby Redman, Janneke Wit, Russell
Avramenko, and Camila Queiroz for much appreciated help and guidance with a formidable
next-generation sequencing project. Finally, I thank the many other people surrounding me not
vii
from the Gilleard lab group that I have come to know as good friends over the years. One of the
great benefits of being a graduate student is that you get to be thrown into a cauldron with a
bunch of other weird people from around the world and suffer together through a chain of
terrifying events. Out of it comes a hell of a lot of good memories.
The Host-Parasite Interactions training and research group also deserves my many thanks
for being arguably the best collaborative research group that a student could ask for. There’s a lot
to learn outside of the actual research as a grad student, and HPI provided exceptional access to
other types of training and collaboration with other students and experts.
Last but not least, I would like to thank my friends and family, and especially my
amazing partner Michela. Michela has truly made the last six years an awesome moment of my
life, despite the ups and downs of graduate studies which can sometimes be tough. Her help and
support as a fellow graduate student going through the same experiences as me made the tough
days that much easier, and the good days that much better. I also thank my parents Alex and Ella,
and my sibs Natalie, Alexander, and Cathy, for always being there to humor me and remind me
that there’s a lot of life, and a lot to look forward to outside of the graduate program. Finally,
thanks to all my great friends and family, old and new, who have made the last few years a great
time to be a graduate student. See you all, who knows where in the world.
viii
Table of Contents
Abstract .............................................................................................................................. ii Preface ............................................................................................................................... iii Acknowledgements .......................................................................................................... vi Table of Contents ........................................................................................................... viii List of Tables .................................................................................................................. xiii
List of Figures and Illustrations .....................................................................................xv List of Symbols, Abbreviations and Nomenclature ................................................... xvii
Chapter One: General Introduction ................................................................................1 1.1 Nematodes .................................................................................................................4 1.2 The impact of parasitic nematodes .........................................................................6
1.3 Anti-parasitic drugs: Anthelmintics .......................................................................7 1.4 Prevalence and mechanisms of anthelmintic resistance .......................................8
1.5 Haemonchus contortus and its conventional use as a model for the study of
anthelmintic resistance ........................................................................................11
1.6 Challenges and limitations of traditional anthelmintic resistance research ....13 1.7 Genome wide high-throughput (next-generation) sequencing approaches to
investigate the genetics of anthelmintic resistance in H. contortus ..................15
1.8 Genetic crossing in H. contortus ...........................................................................17 1.9 A novel backcross experiment to interrogate ivermectin resistance in H. contortus
................................................................................................................................19 1.10 Thesis overview ....................................................................................................22
Chapter Two: Determining the True Extent of Transcriptional Diversity Between H.
contortus Strains and the Confounding Effect of Sequence Polymorphism on
Differential Expression Analysis ...........................................................................25 Abstract .........................................................................................................................26 2.1 Introduction ............................................................................................................28
2.2 Materials & Methods .............................................................................................30 2.2.1 H. contortus strains, sample preparation, and sequencing. .......................30 2.2.2 Sequence quality control and read mapping...............................................31
2.2.3 RNAseq processing and analysis. .................................................................32 2.2.4 Quantifying the effect of sequence polymorphism on read-mapping efficiency
and on differential expression. ......................................................................33 2.2.5 Assessment of transcriptomic variation between the strains. ...................34
2.3 Results .....................................................................................................................35
2.3.1 Coding sequence polymorphism affects RNAseq read mapping against the
MHco3(ISE) reference assembly for the three different H. contortus strains.
..........................................................................................................................35 2.3.2 Change in the SNP allowance has a greater effect on RNAseq read mapping
for gene models with higher levels of sequence polymorphism. ................37 2.3.3 High levels of sequence polymorphism artificially inflate between-strain
RNAseq differential expression results. .......................................................41 2.3.4 Minimizing the effect of sequence polymorphism differences on differential
expression analysis in pairwise strain comparisons. ...................................47

ix
2.3.5 Investigating transcriptional differences between H. contortus strains. ..51
2.3.6 Investigating the effect of sequence polymorphism on differential expression
analysis of two gene families of relevance to ivermectin resistance research.
..........................................................................................................................57 2.4 Discussion ...............................................................................................................61
2.4.1 Rationale for the study. .................................................................................61 2.4.2 Differences in CDS polymorphism rates lead to biases in RNAseq differential
expression results for many gene models in all three pairwise strain
comparisons. ...................................................................................................61 2.4.3 Differential expression biases can be mitigated by adjusting the RNAseq
read mapping SNP allowance and by removing the most highly polymorphic
gene models from the dataset. .......................................................................63
2.4.4 Many genes are differentially expressed between the genetically divergent H.
contortus strains. ............................................................................................64 2.4.5 Implications for anthelmintic resistance research. .....................................65
2.6 Supplementary Data ..............................................................................................68
Chapter Three: Evidence from Two Independent Backcross Experiments Supports
Genetic Linkage of Microsatellite Hcms8a20, but not Other Candidate Loci, to a
Major Ivermectin Resistance Locus in H. contortus ............................................72
Abstract .........................................................................................................................73 3.1 Introduction ............................................................................................................74
3.2 Materials & Methods .............................................................................................77 3.2.1 Parasite populations and preparation of genomic DNA. ...........................77 3.2.2 PCR Amplification. .......................................................................................78
3.2.3. Cloning and sequencing of PCR amplicons. ..............................................78
3.2.4 DNA sequence analysis. .................................................................................79 3.2.5 Chromosomal assignments for each amplicon maker. ..............................79
3.3 Results .....................................................................................................................81
3.3.1 Amplicon markers for all the candidate loci show a high level of genetic
differentiation between the H. contortus parental strains used in the two
independent backcross experiments. ............................................................81
3.3.2 The amplicon marker adjacent to microsatellite Hcms8a20 shows strong
evidence of haplotype introgression from the ivermectin resistant parental
strain in both independent backcross populations. ....................................83 3.3.3. The amplicon markers within the Hco-glc-5, Hco-avr-14, Hco-pgp-9, and
Hco-dyf-7 genes show no evidence of haplotype introgression from the
ivermectin resistant parental strain in either of the independent backcross
populations......................................................................................................83
3.3.4 The amplicon markers within the Hco-lgc-37 and Hco-pgp-2 genes show
weak evidence of haplotype introgression from the ivermectin resistant
parental strain in the MHco3/4.BC backcross but not the MHco3/10.BC
backcross populations. ...................................................................................85 3.4 Discussion ...............................................................................................................88
3.6 Supplementary Data ..............................................................................................93
x
Chapter Four: Deep Amplicon Sequencing of Multiple Ivermectin Resistance Linked
Loci on an Extensive Panel of Independent Ivermectin Resistant H. contortus Field
Populations ..............................................................................................................94 Abstract .........................................................................................................................95 4.1 Introduction ............................................................................................................97 4.2 Materials & Methods ...........................................................................................101
4.2.1 Parasite populations. ...................................................................................101
4.2.2 Genetic loci examined. .................................................................................105 4.2.3 DNA preparation, primer design, PCR amplification, and deep amplicon
sequencing. ....................................................................................................108 4.2.4 Sequencing output and processing. ............................................................109 4.2.5 Population genetic analyses. .......................................................................111
4.3 Results ...................................................................................................................113
4.3.1 Overview of experimental design. ..............................................................113 4.3.1.1 Sample set 1 - Two previously characterised H. contortus backcross
experiments MHco3/4.BC and MHco3/10.BC. ...................................113
4.3.1.2 Sample set 2 - H. contortus populations in vitro phenotyped for
ivermectin resistance. ...........................................................................114 4.3.1.3 Sample set 3 - H. contortus populations from “Fecal Egg Count
Reduction Tests” (FECRTs) conducted in Alberta, Canada. .............114 4.3.1.4 Sample set 4 - H. contortus populations from “On Farm Deworming
Assays” (OFDAs) conducted in Western Canada...............................114 4.3.2 Overview of data quality and analysis. ......................................................115 4.3.3 Analysis of the genetic differentiation of the candidate loci in the different
sample sets. ...................................................................................................118 4.3.3.1 The genetic differentiation of the candidate loci in the
MHco3(ISE)/MHco4(WRS) and MHco3(ISE)/MHco10(CAVR) parental
and backcross populations is consistent with previous analysis. .......118
4.3.3.2 Genetic differentiation among the in vitro phenotyped H. contortus field
isolates derived from different regions of USA is very low. ...............120
4.3.3.3 A low level of genetic differentiation of H. contortus populations is
discernable between the different Alberta FECRT farms. .................120 4.3.3.4. A low level of genetic differentiation of H. contortus populations is
discernable between the different Western Canadian OFDA farms. .123 4.3.4 Investigation of evidence of selection at the candidate loci for each of the four
sample sets. ...................................................................................................123
4.3.4.1 Genetic diversity and departures from neutrality for the candidate loci in
the MHco3(ISE)/MHco4(WRS) and MHco3(ISE)/MHco10(CAVR)
parental and backcross populations. ...................................................123 4.3.4.2 Genetic diversity and departures from neutrality for the candidate loci for
the in vitro phenotyped ivermectin resistant H. contortus isolates. ...126 4.3.4.3 Genetic diversity and departures from neutrality for the candidate loci for
the Fecal Egg Count Reduction Test (FECRT) H. contortus populations
from Alberta, Canada...........................................................................128
xi
4.3.4.4 Genetic diversity and departures from neutrality for the candidate loci for
the On-Farm Deworming Assay (OFDA) H. contortus populations from
Western Canada. ..................................................................................131 4.3.5 Analysis of candidate gene haplotype profiles in the different sample sets.131
4.3.5.1 Haplotype profile analysis of the candidate gene loci in the parental and
backcross strains is consistent with previous genetic analyses. .........131 4.3.5.2 Haplotype profile analysis of the candidate gene loci in in vitro
phenotyped ivermectin resistant H. contortus isolates. ......................133 4.3.5.3 Haplotype profile analysis of the candidate gene loci in the Fecal Egg
Count Reduction Test (FECRT) populations. ....................................137 4.4 Discussion .............................................................................................................142
4.4.1 Deep amplicon sequencing confirms and extends the evidence supporting the
introgression of the Hcms8a20 locus under the influence of ivermectin
selection in two independent serial backcross experiments. ....................142 4.4.2 The genetic differentiation of the seven sequenced loci in the Canadian and
US field populations reflects previous understanding of H. contortus
population structure. ...................................................................................143 4.4.3 Hcms8a20 is the only marker in the introgressed region to show evidence of
selection in the in vitro phenotyped ivermectin resistant H. contortus isolates
from the USA. ...............................................................................................144 4.4.4 Hcms8a20 has evidence of positive selection in multiple H. contortus
population samples from the FECRT and OFDA farms from Western
Canada. .........................................................................................................146 4.4.5 The signature of selection at the Hcms8a20 locus suggests a “soft selective
sweep”. ..........................................................................................................147 4.4.6 Evidence of selection on Hcms8a20 in ivermectin resistant H. contortus field
populations further narrows the location of a major causal resistance
mutation. .......................................................................................................148
Chapter Five: General Discussion ................................................................................150 5.1 The significance of these research findings........................................................151
5.2 RNAseq reveals high transcriptomic diversity in H. contortus, and the associated
challenges in quantifying expression as a result..............................................151 5.3 Advancing RNAseq based approaches in H. contortus ....................................153
5.3.1 Improvement of the functional annotation of the H. contortus genome
assembly. .......................................................................................................153 5.3.2. Future uses of RNAseq to interrogate the genetics of ivermectin resistance in
H. contortus. ..................................................................................................158
5.4. Advancing the search for the ivermectin selected locus on H. contortus
chromosome 5 .....................................................................................................160 5.4.1 Limitations of the deep amplicon sequencing experiment of Chapter 4.162 5.4.2 Next steps in the search for ivermectin resistance conferring mutations in H.
contortus. .......................................................................................................163 5.4.3. Future challenges in identifying an ivermectin resistance mutations. ...164
5.5. Heterologous expression of future H. contortus ivermectin resistance candidate
genes in the C. elegans model system ...............................................................165
xii
5.6. Application of high-throughput sequencing techniques beyond the interrogation
of ivermectin resistance in H. contortus ...........................................................168
References .......................................................................................................................170
Appendices ......................................................................................................................183 Appendix A .................................................................................................................184
a. Genes > log2 2X fold-change up-regulated in MHco4(WRS) vs. MHco3(ISE).
........................................................................................................................184
b. Genes > log2 2X fold-change down-regulated in MHco4(WRS) vs. MHco3(ISE).
........................................................................................................................186 c. Genes > log2 2X fold-change up-regulated in MHco10(CAVR) vs. MHco3(ISE).
........................................................................................................................190 d. Genes > log2 2X fold-change down-regulated in MHco10(CAVR) vs.
MHco3(ISE). .................................................................................................194 e. Genes > log2 2X fold-change up-regulated in MHco4(WRS) vs.
MHco10(CAVR). ..........................................................................................199 f. Genes > log2 2X fold-change down-regulated in MHco4(WRS) vs
MHco10(CAVR). ..........................................................................................201 Appendix B .................................................................................................................204
a. Genes shared up-regulated in MHco4(WRS) and MHco10(CAVR) vs.
MHco3(ISE). .................................................................................................204 b. Genes shared down-regulated in MHco4(WRS) and MHco10(CAVR) vs.
MHco3(ISE). .................................................................................................205 c. Genes shared up-regulated in MHco3(ISE) and MHco4(WRS) vs.
MHco10(CAVR). ..........................................................................................206
d. Genes shared down-regulated in MHco3(ISE) and MHco4(WRS) vs.
MHco10(CAVR). ..........................................................................................207 e. Genes shared up-regulated in MHco3(ISE) and MHco10(CAVR) vs.
MHco4(WRS). ..............................................................................................208
f. Genes shared down-regulated in MHco3(ISE) and MHco10(CAVR) vs.
MHco4(WRS). ..............................................................................................208 Appendix C .................................................................................................................209
Appendix D .................................................................................................................220 Appendix E: Copyright Permissions ........................................................................249
xiii
List of Tables
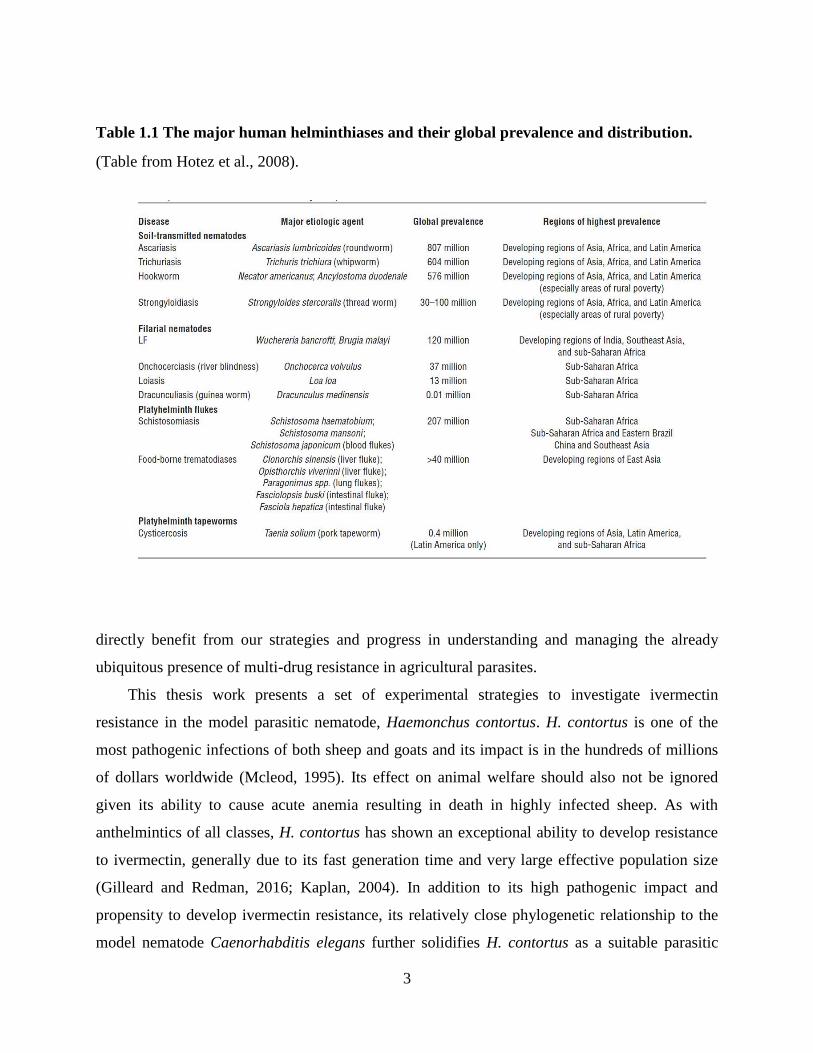
Table 1.1 The major human helminthiases and their global prevalence and distribution. ............. 3
Table 1.2. Resistance phenotype scores of C. elegans strains with varying combinations of
wild-type and mutant knockout alleles. ................................................................................ 11
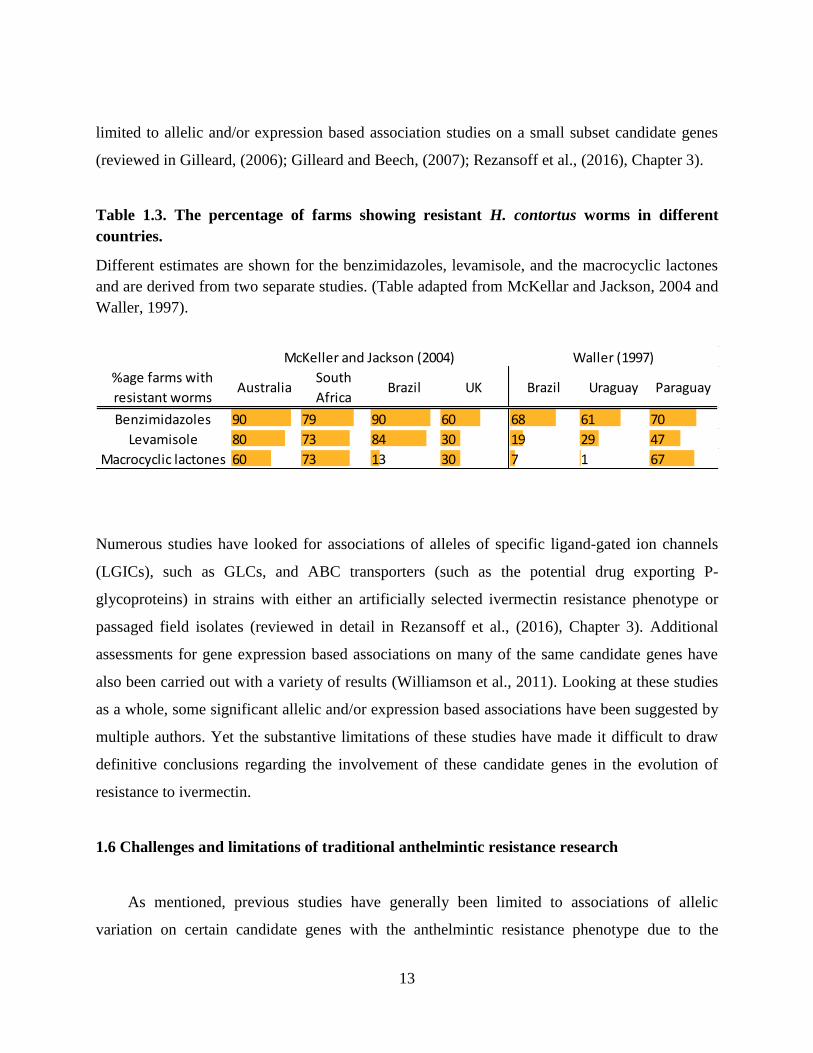
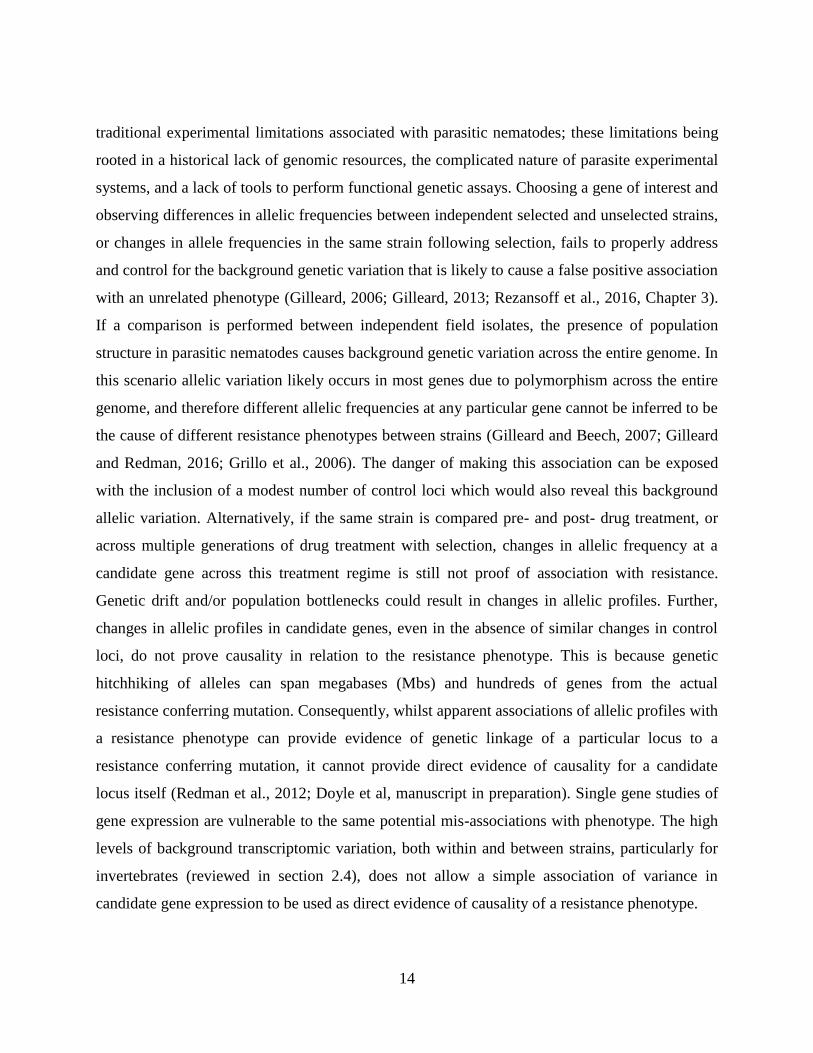
Table 1.3. The percentage of farms showing resistant H. contortus worms in different
countries. ............................................................................................................................... 13
Table 2.1. Total number of differentially expressed genes (with adjusted p-values < 0.05 as
determined by DESeq2) observed in each pairwise strain comparison, at each of the
three different map allowances (N2, N5, N10). .................................................................... 48
Table 2.2. Differentially expressed genes of ivermectin resistance candidate gene families,
the ligand-gated ion channels (LGICs) (panels A and B), and ABC transporters (panels
C and D). ............................................................................................................................... 58
Supplementary Table 2.1. ............................................................................................................. 68
Supplementary Table 2.2. ............................................................................................................. 69
Supplementary Table 2.3. ............................................................................................................. 71
Table 3.1: Summary of cloning and sequencing of amplicon markers. ........................................ 82
Table 3.2: Pairwise Fst values between the susceptible MHco3(ISE) parental strain and
MHco4(WRS) and MHco10(CAVR) resistant parental strains. ........................................... 82
Table 3.3: Pairwise Fst values between the susceptible MHco3(ISE) parental strain and
MHco3/4.BC and MHco3/10.BC backcross strains. ............................................................ 84
Supplementary Table 3.1 .............................................................................................................. 93
Supplementary Table 3.2 .............................................................................................................. 93
Table 4.1. IDs, origins, and ivermectin resistance phenotype data for the in vitro and in vivo
phenotyped population samples (sample sets 2, 3, 4). ........................................................ 102
Table 4.2. Associated H. contortus gene IDs, amplicon lengths in the MHco3(ISE) reference
genome assembly, and respective primers of each locus sequenced. ................................. 106
Table 4.3. Total number of reads from each sample re-mapped at 100% identity to denoised
correct biological haplotypes of each of the seven loci. ..................................................... 116
Table 4.4. Pairwise Fst values between each backcross and parental experimental strain
calculated for each locus. .................................................................................................... 119
Table 4.5. Mean Pairwise Fst values between the in vitro phenotyped isolates. ........................ 121
xiv
Table 4.6. Mean pairwise Fst values between FECRT population samples. .............................. 122
Table 4.7. Mean pairwise Fst values between OFDA population samples. ............................... 124
Table 4.8. Shannon alpha (intra-strain) diversities (panel A), and Tajima’s D scores (panel B)
for the five loci within and two control loci outside the introgressed region for the
backcross and respective backcross parental strains. .......................................................... 125
Table 4.9. Shannon alpha (intra-isolate) diversities (panel A), and Tajima’s D scores (panel
B) for the five loci within and two control loci outside the introgressed region for all in
vitro phenotyped H. contortus field isolates. ...................................................................... 127
Table 4.10. Shannon alpha (intra-sample) diversities (panel A), and Tajima’s D scores (panel
B) for the five loci within and two control loci outside the introgressed region for all
FECRT samples. ................................................................................................................. 129
Table 4.11. Shannon alpha (intra-sample) diversities (panel A), and Tajima’s D scores (panel
B) for the five loci within and two control loci outside the introgressed region for all
OFDA samples. ................................................................................................................... 132
Table 5.1. The most up-regulated and down-regulated genes in both ivermectin resistant
strains MHco4(WRS) and MHco10(CAVR) vs. the ivermectin susceptible MHco3(ISE)
strain. ................................................................................................................................... 155
Table 5.2 Non-synonymous SNP frequencies in genes of the 11.2 Mb introgressed region. .... 166
xv
List of Figures and Illustrations
Figure 1.1. A phylogenetic tree of select nematode species. .......................................................... 5
Figure 1.2 The five fully assembled autosomal chromosomes of the H. contortus genome
assembly. ............................................................................................................................... 18
Figure 1.3. Steps and genetic introgression achieved in the backcross experiment. .................... 20
Figure 1.4. Identification of an introgressed region in both backcross strains. ............................ 23
Figure 2.1. The percentage of RNAseq reads that mapped to the MHco3(ISE) reference
genome assembly at different Tophat2 SNP (polymorphism) allowances (N2 to N10)
shown for each of the three H. contortus strains. ................................................................. 36
Figure 2.2. The number of genes with increased and decreased reads mapped with changes in
SNP allowance. ..................................................................................................................... 38
Figure 2.3. The number of gene models in each SNP rate category for the H. contortus strains
MHco3(ISE), MHco4(WRS), and MHco10(CAVR). .......................................................... 39
Figure 2.4. Ratios of the total number of RNAseq reads mapping to gene models in each SNP
rate category at two different SNP mapping allowances for H. contortus strains
MHco3(ISE), MHco4(WRS), and MHco10(CAVR). .......................................................... 40
Figure 2.5. Scatter plots of the differential expression of gene models, as determined by
DESeq2 (X-axis), plotted against their difference in SNP rate percentage between the
two strains being compared (Y-axis). ................................................................................... 45
Figure 2.6. The percentage of expressed gene models in each SNP rate difference category
that are differentially expressed between MHco3(ISE) and MHco4(WRS) (log2 fold-
change > 1X; adjusted p-value < 0.05) for each of the three SNP mapping allowances –
N2, N5, and N10. .................................................................................................................. 46
Figure 2.7. Volcano plots showing differential expression of gene models at three different
SNP allowances in Tophap2’s mapping parameters (N2, N5, N10) are shown for each
pairwise strain comparison. .................................................................................................. 49
Figure 2.8. The net log2 fold differences in expression (NDE) of all expressed genes in each
SNP rate difference category. ............................................................................................... 50
Figure 2.9. Venn diagram showing the numbers of gene models qualifying as low-
polymorphic genes to be included in the different pairwise strain comparisons. ................. 52
Figure 2.10. A PCA plot representing the variance in log gene expression of low-
polymorphic genes of each triplicate dataset for each of the three populations when
mapped at the N5 mapping allowance. ................................................................................. 54
xvi
Figure 2.11. The total number of differentially expressed low-polymorphic genes observed in
each pairwise strain comparison at the N5 mapping allowance. .......................................... 55
Figure 2.12. Venn diagrams showing the numbers of genes differentially expressed in each
pairwise strain comparison and shared between different pairwise strain comparisons....... 56
Figure 3.1. Frequency histograms of haplotypes of the amplicon marker adjacent to
microsatellite Hcms8a20. ...................................................................................................... 84
Figure 3.2. Haplotype distributions for the candidate loci in the MHco4(WRS) x
MHco3(ISE) backcross. ........................................................................................................ 86
Figure 3.3. Haplotype distributions for the candidate loci in the MHco10(CAVR) x
MHco3(ISE) backcross. ........................................................................................................ 87
Figure 3.4. ..................................................................................................................................... 89
Figure 4.1. Schematic of the ivermectin selected introgressed region of both backcross
populations. ........................................................................................................................... 99
Figure 4.2. Schematic of the FECRT experimental design. ....................................................... 103
Figure 4.3. Haplotype profiles of backcross and parental strains for loci in the introgressed
region (panel A) and two control loci outside the introgressed region (panel B). .............. 135
Figure 4.4. Haplotype profiles of the in vitro phenotyped H. contortus population isolates for
loci in the introgressed region (panel A) and two control loci outside the introgressed
region (panel B). ................................................................................................................. 137
Figure 4.5. Haplotype profiles of all FECRT population samples are shown for each locus in
the introgressed region (panels A-E), and the two control loci outside the introgressed
region (panel F, G). ............................................................................................................. 141
xvii
List of Symbols, Abbreviations and Nomenclature
avr Avermectin resistant
BLAST Basic Local Alignment Search Tool
Bp Base pair
BZs Benzimidazoles
CDS Coding Sequence
C. elegans Caenorhabditis elegans
Cel Caenorhabditis elegans
ChIPseq Chromatin immunoprecipitation sequencing
dyf Dye filling
FECRT Fecal egg count reduction test
Fst Fixation index
GABA gamma-aminobutyric acid
gDNA Genomic DNA
GLC/glc Glutamate-gated chloride channel
Hcms8a20 Haemonchus contortus microsatellite 8a20
H. contortus Haemonchus contortus
Hco Haemonchus contortus
IMs Imidazothiazoles
ITS-2 Internal transcribed spacer 2
Kb Kilobase
LDA Larval development assay
LGIC/lgc Ligand-gated ion channel
LPG Low-polymorphic gene
Mb Megabase
MHco3(ISE) Moredun H. contortus 3 (Inbred Susceptible Isolate)
MHco4(WRS) Moredun H. contortus 4 (White River Strain)
MHco10(CAVR) Moredun H. contortus 10 (Chiswick Avermectin Resistant)
MHco3/4.BC Moredun H. contortus 3/4 Backcross
MHco3/10.BC Moredun H. contortus 3/10 Backcross
xviii
MLs Macrocyclic lactones
mtDNA Mitochondrial DNA
MUSCLE Multiple Sequence Comparison by Log-Expectation
NDE Net difference in expression
nAChR Nicotinic acetylcholine receptor
OFDA On farm deworming assay
PCA Principal component analysis
PCR Polymerase Chain Reaction
PGP/pgp P-glycoprotein
RADseq Restriction site associated DNA sequencing
rDNA Ribosomal DNA
RNAi RNA interference
RNAseq RNA sequencing
SNP Single Nucleotide Polymorphism
WGS Whole genome sequencing

1
Chapter One: General Introduction
2
Parasitic nematodes, both of humans and livestock, are highly pathogenic to the hosts that
they infect. Paradoxically, these pathogens receive much more attention for their impact in the
agricultural realm than for their impact on human health. The societal reasons for this should be
considered unjust by many metrics (Hotez, 2009). Multiple human nematode infections are
classified as neglected tropical diseases by the World Health Organization, undoubtedly because
these worms primarily infect persons of the developing world. Due to this reality, the generally
profit driven forces that guide the healthcare and pharmaceutical industries have historically
allowed little incentive to invest in anthelmintic drug research and their application for humans.
As a result, to this day many parasitic diseases have been allowed to persist at a level where over
a billion people worldwide are infected by some form of parasitic nematode disease (Table 1.1)
(Hotez et al., 2008). Given that most nematode infections are relatively economically feasible to
control, the staggering negative effect on humanity that their neglect has permitted is arguably
one the most notable human rights failures of our time (Hunt, 2006; Molyneux et al., 2005).
In contrast to the overall neglect of human parasitic diseases, the substantial economic
impact of parasitic roundworms on modern livestock production in the developed world has
incentivised substantial investment in the development of anthelmintic pharmaceuticals intended
for use in livestock (Mcleod, 1995; Stromberg and Gasbarre, 2006). Thankfully, this investment
has provided a positive spillover of anthelmintics that are also available for use in humans, which
is now considered a good example of successful comparative medicine. Every anthelmintic
certified for use in humans was originally developed for agricultural industry (Geary et al.,
2010). The expansive use of anthelmintics to combat the detrimental impact of parasitic diseases
on modern intensive livestock practices has led to the initial development of anthelmintic
resistance for every anthelmintic class in an agricultural setting (Kaplan, 2004). As a result,
much like the initial investment in the development of anthelmintics for use in agriculture, the
initial research into understanding and combating anthelmintic resistance has again taken place
predominantly by veterinary researchers. Indeed, anthelmintic resistance in human parasites is
now beginning to show signs of development coinciding with the growing availability of
anthelmintics to populations of high risk (Doyle et al., 2017; Lustigman and McCarter, 2007;
Osei-Atweneboana et al., 2011; Vercruysse et al., 2011). Thus, it seems that the extent to which
we will be able to manage the inevitable spread of anthelmintic resistance in human parasites will
3
Table 1.1 The major human helminthiases and their global prevalence and distribution.
(Table from Hotez et al., 2008).
directly benefit from our strategies and progress in understanding and managing the already
ubiquitous presence of multi-drug resistance in agricultural parasites.
This thesis work presents a set of experimental strategies to investigate ivermectin
resistance in the model parasitic nematode, Haemonchus contortus. H. contortus is one of the
most pathogenic infections of both sheep and goats and its impact is in the hundreds of millions
of dollars worldwide (Mcleod, 1995). Its effect on animal welfare should also not be ignored
given its ability to cause acute anemia resulting in death in highly infected sheep. As with
anthelmintics of all classes, H. contortus has shown an exceptional ability to develop resistance
to ivermectin, generally due to its fast generation time and very large effective population size
(Gilleard and Redman, 2016; Kaplan, 2004). In addition to its high pathogenic impact and
propensity to develop ivermectin resistance, its relatively close phylogenetic relationship to the
model nematode Caenorhabditis elegans further solidifies H. contortus as a suitable parasitic
4
nematode model to study the genetics of anthelmintic mode of action and anthelmintic resistance
(Gilleard, 2013). Though the direct implications of the experiments presented here will help
inform sustainable parasite control in livestock, the indirect implications of this research for
other parasitic nematodes, including those of humans are also important.
1.1 Nematodes
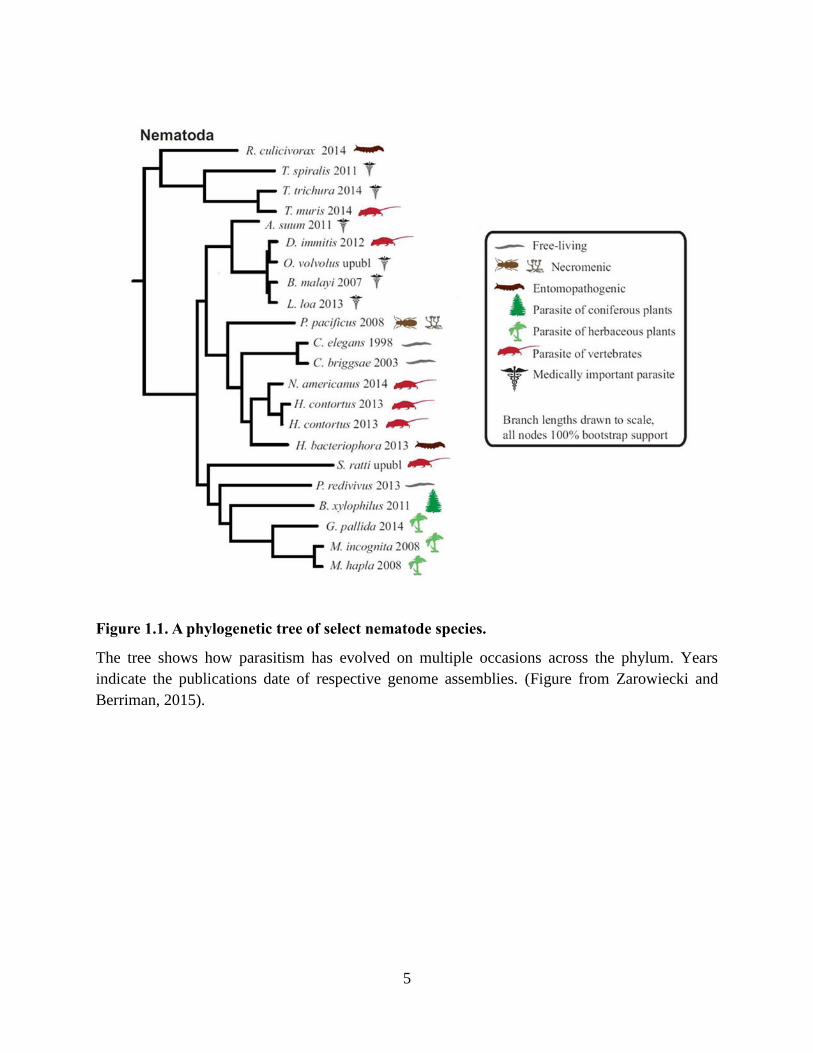
Nematodes are ubiquitous across all ecosystems on Earth. Yet despite their ability to
adapt to all environments, the morphological characters across the Nematoda phylum remain
relatively similar. The features showing largest variance are 1) their size, existing on a
microscopic scale to large sized parasites of whales spanning meters, and 2) their propensity to
have evolved a parasitic life cycle on multiple occasions throughout evolutionary history
(Blaxter et al., 1998; Zarowiecki and Berriman, 2015) (Figure 1.1). These parasitic lifecycles and
life histories are arguably some of the most fascinating in nature, often involving more than one
host and extreme behavioral and morphological diversity between life stages (De Ley, 2006).
This diversity is contrasted by the almost universal condition of four developmental life stages
(intersected by moulting), and a fifth reproductively mature adult life stage across the phyla.
Massive reproductive potential (brood sizes) and effective population sizes are common across
many diverse ecological niches for nematodes, which has allowed the development of some of
the most genetically diverse animals in nature, with genetic diversity within many nematode
species being orders of magnitude higher than entire groups of vertebrate species (Dey et al.,
2013; Gilleard and Redman, 2016). The important ecological role that nematodes play in their
communities has also come to the forefront over the last few decades, with nematodes
accounting for key roles in the soil ecosystems, and parasites stabilizing population dynamics of
larger animal communities (Lafferty et al., 2008). Thus, nematode research should not simply be
considered important in its ability to inform us about parasitic nematode diseases of humans and
livestock, but also to enhance our understanding of biological and ecological systems in their
own right.
5
Figure 1.1. A phylogenetic tree of select nematode species.
The tree shows how parasitism has evolved on multiple occasions across the phylum. Years
indicate the publications date of respective genome assemblies. (Figure from Zarowiecki and
Berriman, 2015).
6
1.2 The impact of parasitic nematodes
Despite the development of three major, and multiple new classes of anthelmintic drugs,
parasitic nematodes have maintained themselves as a persistent threat and substantial detriment
to human and domestic animal health worldwide. It is estimated that over a billion human beings
are infected with some variety of parasitic nematode (Hall et al., 2008). Yet parasitic nematodes
generally do not receive the same attention or investment in research as other high profile global
diseases such as malaria or AIDS, relative to the disease burden they cause, which generally
show less acute effects, such as inhibition of proper development in infected children (Hotez,
2009; Molyneux et al., 2005). A relatively low economic incentive to invest in research and
public health programs has contributed to human parasitic nematodes making up six of the 17
neglected tropical diseases (Hotez et al., 2008). This neglect of parasitic nematodes contrasts
with the attention received by animal parasitic nematodes, whose study comprises the largest
component of the $16 billion global animal health sector (Campbell et al., 2009).
In livestock, the detrimental impact of parasitic nematodes is substantial through all the
major ruminants. In the North American cattle industry alone, the cost of these diseases is
estimated at two billion dollars annually (Stromberg and Gasbarre, 2006), and the detrimental
effect of H. contortus on small ruminant livestock in Australia alone was estimated at over 200
million per annum (Mcleod, 1995). Yet despite acute infections causing ruminant death, a large
portion of production losses from helminth infection are undoubtedly sub-clinical, manifesting as
subtle decreases in the rate of weight gain (Dimander et al., 2003; Forbes et al., 2000). This
suggests that estimates of production loss in livestock are far understated. Estimates of nematode
impact on crops are even more alarming ranging upwards of 80 - 118 billion dollars per year in
damage across the globe, including an estimated 10 - 25% reduction in global rice yield per year
(Bernard et al., 2017; Nicol et al., 2011). The social ramifications of these losses shouldn’t be
understated, particularly for subsistence farmers in the developing world, where fluctuating yield
losses in crops due to parasitic nematodes can cause reduced yields of up to 80%, for example
(Bernard et al., 2017). The immeasurable impact on the standard of living of subsistence farmers
in developing countries due to parasitic nematode infections of family owned livestock or crop
7
plots may affect far more people that the monetary losses incurred by high intensity industrial
farming and livestock would suggest.
1.3 Anti-parasitic drugs: Anthelmintics
As discussed above, all anthelmintics were originally developed for use in livestock.
Widespread use of anthelmintics to treat parasite infections began in the early 1960s with the
introduction of thiabendazole as the first broad spectrum anthelmintic with low toxicity (Kaplan,
2004; McKellar and Jackson, 2004). This was followed by the development of numerous other
anthelmintics of multiple different classes over the following two decades. Since the inception of
the study of anthelmintics, much progress has been made in the area of anthelmintic mode of
action, and the discovery of drug targets in general (Martin, 1997). Anthelmintics fall into three
major classes, categorized primarily on each groups mode of action. The benzimidazoles (BZs)
(thiabendazole being one of them) target β-tubulin subunits preventing subunit binding in the
formation of microtubules within the cell (Lacey, 1990). Imidazothiazoles (IMs), such as
levamisole and pyrantel, were developed and released in the 1970s and target nicotinic
acetylcholine receptors (nAChRs) causing irreversible muscle contraction (Martin, 1997). Lastly,
the most recent major class of anthelmintics are the macrocyclic lactones (MLs), which include
ivermectin and moxidectin released in 1981 and 1991 respectively which target glutamate-gated
chloride channels (GLCs) causing hyperpolarization through pharyngeal muscle cells, leading to
paralysis (Martin, 1997). These three classes generally encompassed all anthelmintics used for
the treatment for parasitic nematodes up until recently with the release of three new
anthelmintics of different classes: derquantel, monepantel, and emodepside; the former two
being released for use in sheep and the third for companion animals respectively (Bull et al.,
2007; Kaminsky et al., 2008; Little et al., 2010). The usage of all these classes of anthelmintics
varies widely across target parasites and respective hosts. Most parasites can be treated with a
variety of anthelmintics however, and often multiple anthelmintics are used concurrently to treat
an infected host that could also be infected by more than one parasite (Kaplan and Vidyashankar,
2012).
8
Ivermectin, the anthelmintic of primary focus in this thesis, is a derivative of avermectin
and is the most important and widely used of the macrocyclic lactones (Campbell et al., 1983).
Its safety to hosts and effectiveness on a wide variety of parasitic nematodes, as well as some
ectoparasites, in both animals and humans has caused it to be hailed as a "wonder drug" (Crump
and Ōmura, 2011). Its small effective dose, relatively low cost, and low toxicity have made it one
of the most popular anthelmintics in the world (Crump and Ōmura, 2011). Ivermectin has been
shown to target three specific GLCs in C. elegans (Dent et al., 2000), but the specific GLCs
targeted by ivermectin in parasitic nematodes have remained less clear (Wolstenholme and
Rogers, 2005). The drug has also historically shown relatively higher resilience to resistance
development in many parasites, this especially in comparison to the BZs, in which resistance has
generally progressed more rapidly (Kaplan, 2004). Yet regardless of slower resistance
development, resistance to ivermectin has now progressed such that it is a significant problem on
all continents (Kaplan and Vidyashankar, 2012). Consequently, the need to understand
ivermectin’s mode of action, how resistance develops, and the best management strategies in
important host-parasite systems is of high concern.
1.4 Prevalence and mechanisms of anthelmintic resistance
With application of anthelmintics on a massive scale across livestock industries,
development of resistance to one or more anthelmintic classes across all major groups of
livestock has been well documented, and increasing in prevalence for decades (Geary et al.,
2010; Kaplan, 2004; Kaplan and Vidyashankar, 2012; Molento, 2009; Prichard, 2001).
Resistance is now the norm instead of the exception in many parasitic worms, and multi-drug
resistance in certain species, one of them being H. contortus, is a frequent reality (Kaplan and
Vidyashankar, 2012). Recent mass drug administration programs in humans have also led to
justified concern with the first reports of reduced efficacy of select anthelmintics for humans
being observed, including with ivermectin for treatment of Onchocerciasis (Doyle et al., 2017;
Lustigman and McCarter, 2007; Osei-Atweneboana et al., 2011; Vercruysse et al., 2011).
Target gene families of all three classes of anthelmintics have been determined to some
degree, in at least a subset of nematode species (Martin, 1997). In contrast, elucidating the
9
molecular basis of anthelmintic drug resistance has proven more challenging. The notable
exception to this has been with the successful identification of functional mutations conferring
BZ resistance in β-tubulin genes (Kotze et al., 2014; Prichard, 2001). Identification of the key
genes/loci responsible for conferring resistance is the first step to obtain valuable molecular
markers to aid in the diagnosis and surveillance of resistance in parasitic nematode populations,
as well as studying its emergence and spread (Coles et al., 2006; Gilleard, 2013, 2006; Samson-
Himmelstjerna, 2006). Achieving this should help increase the ease with which resistant parasite
populations can be monitored and controlled, and appropriate targeted treatment regimes applied
(Cabaret, 2008; Kenyon et al., 2009). Further, research into the genetic basis of anthelmintic
resistance can help increase our functional understanding of the resistance phenotype, and how
this resistance evolves in the field (Kotze et al., 2014). Genetic knowledge should also aid future
development of drug synergists to help counter the progression of resistance (Jones et al., 2009;
Lespine et al., 2008; Wolstenholme, 2011), and in the development of new drugs based on the
better understanding of potential drug targets (Wolstenholme, 2011).
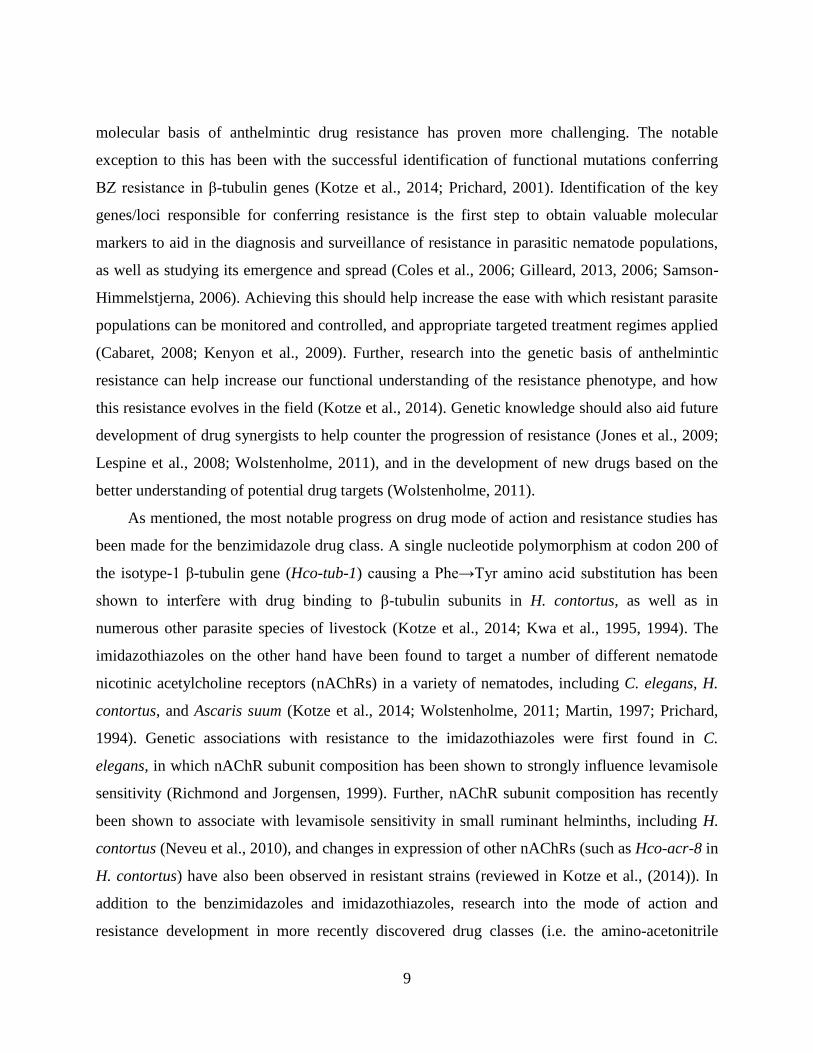
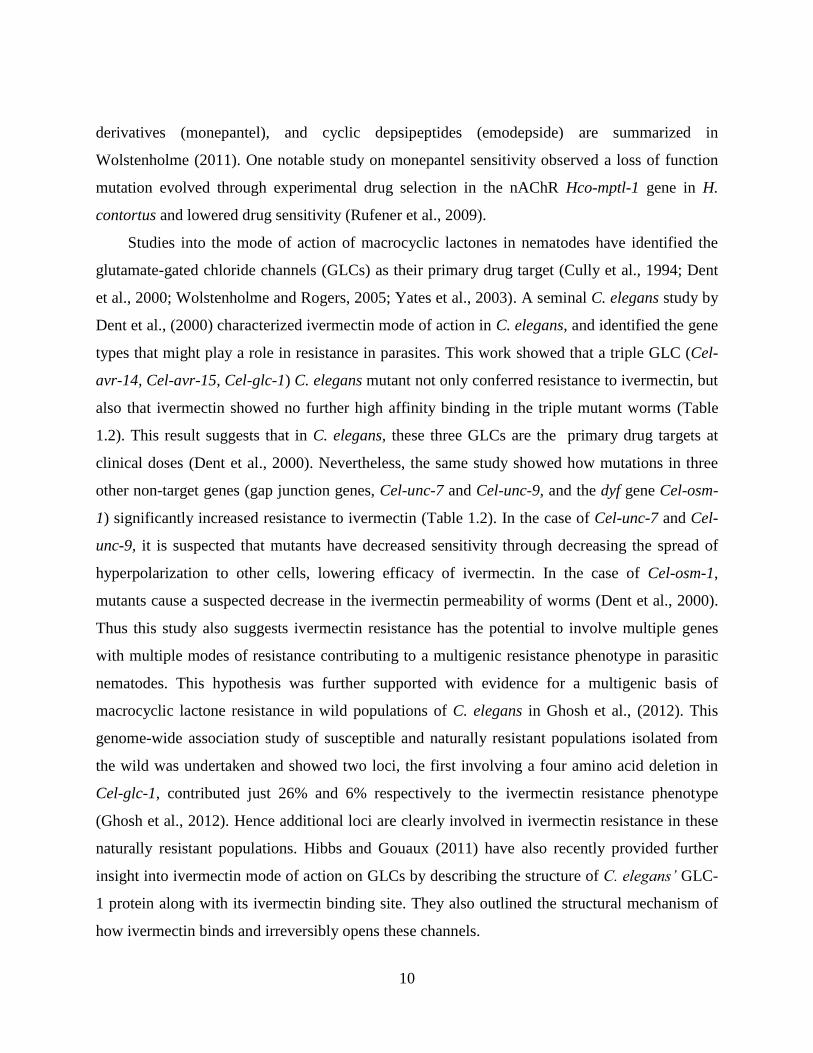
As mentioned, the most notable progress on drug mode of action and resistance studies has
been made for the benzimidazole drug class. A single nucleotide polymorphism at codon 200 of
the isotype-1 β-tubulin gene (Hco-tub-1) causing a Phe→Tyr amino acid substitution has been
shown to interfere with drug binding to β-tubulin subunits in H. contortus, as well as in
numerous other parasite species of livestock (Kotze et al., 2014; Kwa et al., 1995, 1994). The
imidazothiazoles on the other hand have been found to target a number of different nematode
nicotinic acetylcholine receptors (nAChRs) in a variety of nematodes, including C. elegans, H.
contortus, and Ascaris suum (Kotze et al., 2014; Wolstenholme, 2011; Martin, 1997; Prichard,
1994). Genetic associations with resistance to the imidazothiazoles were first found in C.
elegans, in which nAChR subunit composition has been shown to strongly influence levamisole
sensitivity (Richmond and Jorgensen, 1999). Further, nAChR subunit composition has recently
been shown to associate with levamisole sensitivity in small ruminant helminths, including H.
contortus (Neveu et al., 2010), and changes in expression of other nAChRs (such as Hco-acr-8 in
H. contortus) have also been observed in resistant strains (reviewed in Kotze et al., (2014)). In
addition to the benzimidazoles and imidazothiazoles, research into the mode of action and
resistance development in more recently discovered drug classes (i.e. the amino-acetonitrile
10
derivatives (monepantel), and cyclic depsipeptides (emodepside) are summarized in
Wolstenholme (2011). One notable study on monepantel sensitivity observed a loss of function
mutation evolved through experimental drug selection in the nAChR Hco-mptl-1 gene in H.
contortus and lowered drug sensitivity (Rufener et al., 2009).
Studies into the mode of action of macrocyclic lactones in nematodes have identified the
glutamate-gated chloride channels (GLCs) as their primary drug target (Cully et al., 1994; Dent
et al., 2000; Wolstenholme and Rogers, 2005; Yates et al., 2003). A seminal C. elegans study by
Dent et al., (2000) characterized ivermectin mode of action in C. elegans, and identified the gene
types that might play a role in resistance in parasites. This work showed that a triple GLC (Cel-
avr-14, Cel-avr-15, Cel-glc-1) C. elegans mutant not only conferred resistance to ivermectin, but
also that ivermectin showed no further high affinity binding in the triple mutant worms (Table
1.2). This result suggests that in C. elegans, these three GLCs are the primary drug targets at
clinical doses (Dent et al., 2000). Nevertheless, the same study showed how mutations in three
other non-target genes (gap junction genes, Cel-unc-7 and Cel-unc-9, and the dyf gene Cel-osm-
1) significantly increased resistance to ivermectin (Table 1.2). In the case of Cel-unc-7 and Cel-
unc-9, it is suspected that mutants have decreased sensitivity through decreasing the spread of
hyperpolarization to other cells, lowering efficacy of ivermectin. In the case of Cel-osm-1,
mutants cause a suspected decrease in the ivermectin permeability of worms (Dent et al., 2000).
Thus this study also suggests ivermectin resistance has the potential to involve multiple genes
with multiple modes of resistance contributing to a multigenic resistance phenotype in parasitic
nematodes. This hypothesis was further supported with evidence for a multigenic basis of
macrocyclic lactone resistance in wild populations of C. elegans in Ghosh et al., (2012). This
genome-wide association study of susceptible and naturally resistant populations isolated from
the wild was undertaken and showed two loci, the first involving a four amino acid deletion in
Cel-glc-1, contributed just 26% and 6% respectively to the ivermectin resistance phenotype
(Ghosh et al., 2012). Hence additional loci are clearly involved in ivermectin resistance in these
naturally resistant populations. Hibbs and Gouaux (2011) have also recently provided further
insight into ivermectin mode of action on GLCs by describing the structure of C. elegans’ GLC-
1 protein along with its ivermectin binding site. They also outlined the structural mechanism of
how ivermectin binds and irreversibly opens these channels.
11
Table 1.2. Resistance phenotype scores of C. elegans strains with varying combinations of
wild-type and mutant knockout alleles.
The triple GLC mutant shows by far the strongest resistance phenotype, both Cel-unc-9 and Cel-
osm-1 knockouts increases the phenotypic score independently. This shows ivermectin resistance
to be a multi-genic, quantitative trait. (Table adapted from Dent et al., 2000).
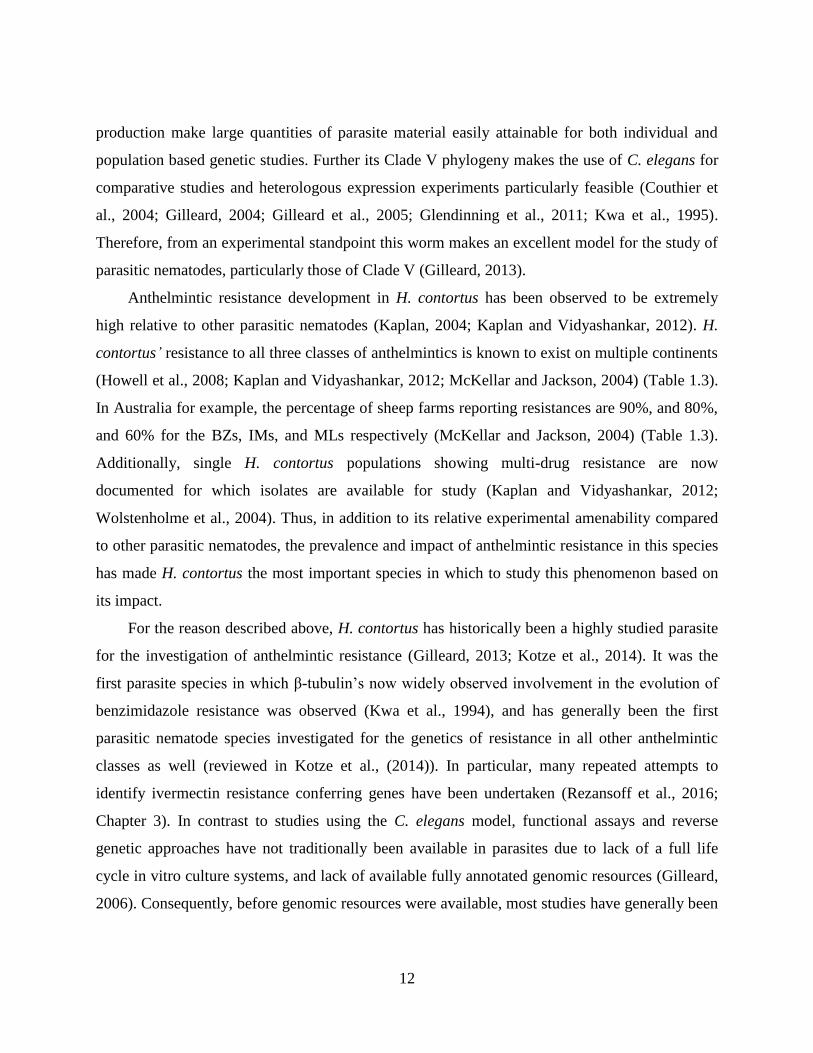
1.5 Haemonchus contortus and its conventional use as a model for the study of anthelmintic
resistance
Haemonchus contortus is a Clade V trichostrongylid nematode (Blaxter et al., 1998) that is
one of the most common parasitic nematodes of small ruminant livestock throughout the world
(Lichtenfels et al., 1994). Although H. contortus is thought to have originally evolved in Sub-
Saharan Africa, livestock movement translocated it around the world and it is now ubiquitously
present in all temperate regions, and even many sub-arctic regions of the world (Gilleard, 2013;
Urquhart, G. M., Armour, J., Duncan, J. L., Dunn, A. and Jennings, 1996). Its ecological niche as
a blood feeder makes infection highly pathogenic, causing substantial negative effect on small
ruminant agricultural industries (Mcleod, 1995). It is sexually dioecious with a direct life cycle
within a single host. H. contortus can complete its life cycle within six weeks and adult females
can produce over 4,000 eggs per day (Coyne and Smith, 1992). These characteristics make H.
contortus particularly amenable for use in studies of parasitic nematode biology and genetics.
The dioecious nature of breeding and its direct lifestyle also make it possible to use in genetic
crossing experiments (Redman et al., 2008a). Its adult size of around 2 cm and daily egg
avr-14 avr-15 glc-1
wt wt wt wt
mutant wt wt wt
wt mutant wt wt
wt mutant mutant wt
mutant mutant wt wt
wt mutant wt mutant
mutant mutant mutant wt 4,264 (1,750)
2.6 (0.2)
2.5 (0.1)
8.2 (0.4)
10.6 (1.3)
59 (8.4)
32.8 (1.2)
5,490 (2,270)
1.1 (0.1)
0.6 (0.1)
1.0 (0.1)
1.1 (0.1)
13.8 (1.0)
10.3 (1.2)
GLCs
unc-9
Wild-type osm-1 Mutant osm-1
EC37 ng/ml (error) EC37 ng/ml (error)
12
production make large quantities of parasite material easily attainable for both individual and
population based genetic studies. Further its Clade V phylogeny makes the use of C. elegans for
comparative studies and heterologous expression experiments particularly feasible (Couthier et
al., 2004; Gilleard, 2004; Gilleard et al., 2005; Glendinning et al., 2011; Kwa et al., 1995).
Therefore, from an experimental standpoint this worm makes an excellent model for the study of
parasitic nematodes, particularly those of Clade V (Gilleard, 2013).
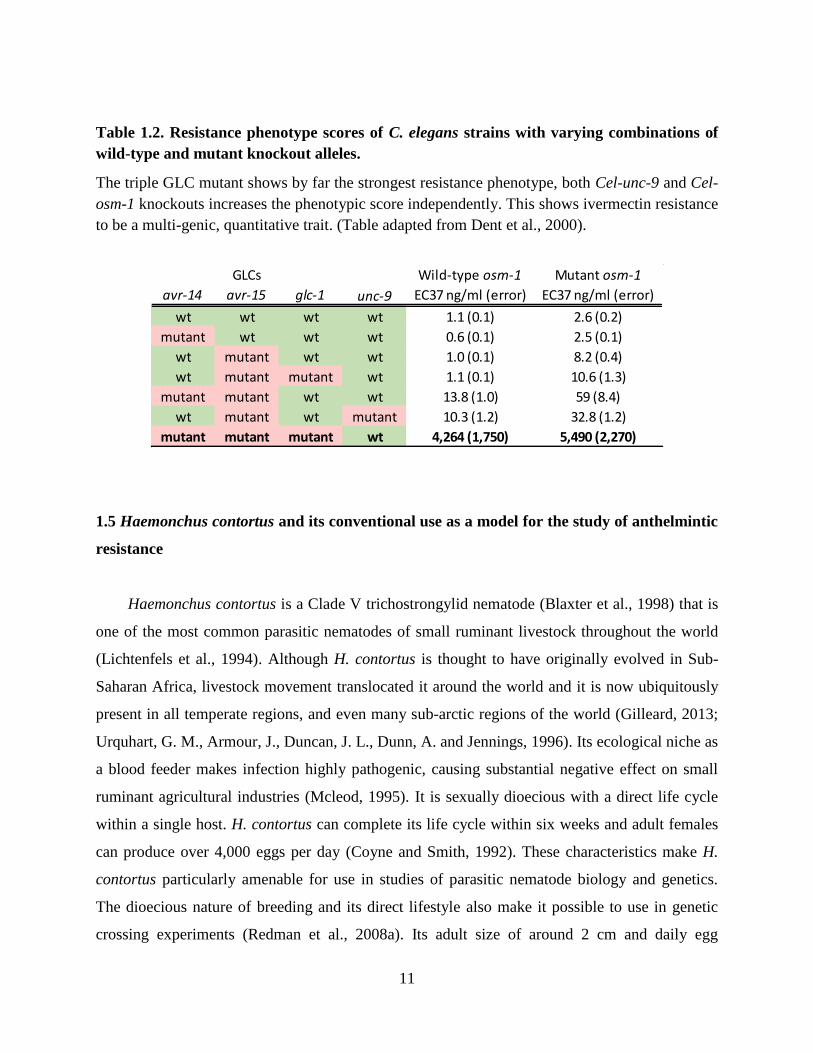
Anthelmintic resistance development in H. contortus has been observed to be extremely
high relative to other parasitic nematodes (Kaplan, 2004; Kaplan and Vidyashankar, 2012). H.
contortus’ resistance to all three classes of anthelmintics is known to exist on multiple continents
(Howell et al., 2008; Kaplan and Vidyashankar, 2012; McKellar and Jackson, 2004) (Table 1.3).
In Australia for example, the percentage of sheep farms reporting resistances are 90%, and 80%,
and 60% for the BZs, IMs, and MLs respectively (McKellar and Jackson, 2004) (Table 1.3).
Additionally, single H. contortus populations showing multi-drug resistance are now
documented for which isolates are available for study (Kaplan and Vidyashankar, 2012;
Wolstenholme et al., 2004). Thus, in addition to its relative experimental amenability compared
to other parasitic nematodes, the prevalence and impact of anthelmintic resistance in this species
has made H. contortus the most important species in which to study this phenomenon based on
its impact.
For the reason described above, H. contortus has historically been a highly studied parasite
for the investigation of anthelmintic resistance (Gilleard, 2013; Kotze et al., 2014). It was the
first parasite species in which β-tubulin’s now widely observed involvement in the evolution of
benzimidazole resistance was observed (Kwa et al., 1994), and has generally been the first
parasitic nematode species investigated for the genetics of resistance in all other anthelmintic
classes as well (reviewed in Kotze et al., (2014)). In particular, many repeated attempts to
identify ivermectin resistance conferring genes have been undertaken (Rezansoff et al., 2016;
Chapter 3). In contrast to studies using the C. elegans model, functional assays and reverse
genetic approaches have not traditionally been available in parasites due to lack of a full life
cycle in vitro culture systems, and lack of available fully annotated genomic resources (Gilleard,
2006). Consequently, before genomic resources were available, most studies have generally been
13
limited to allelic and/or expression based association studies on a small subset candidate genes
(reviewed in Gilleard, (2006); Gilleard and Beech, (2007); Rezansoff et al., (2016), Chapter 3).
Table 1.3. The percentage of farms showing resistant H. contortus worms in different
countries.
Different estimates are shown for the benzimidazoles, levamisole, and the macrocyclic lactones
and are derived from two separate studies. (Table adapted from McKellar and Jackson, 2004 and
Waller, 1997).
Numerous studies have looked for associations of alleles of specific ligand-gated ion channels
(LGICs), such as GLCs, and ABC transporters (such as the potential drug exporting P-
glycoproteins) in strains with either an artificially selected ivermectin resistance phenotype or
passaged field isolates (reviewed in detail in Rezansoff et al., (2016), Chapter 3). Additional
assessments for gene expression based associations on many of the same candidate genes have
also been carried out with a variety of results (Williamson et al., 2011). Looking at these studies
as a whole, some significant allelic and/or expression based associations have been suggested by
multiple authors. Yet the substantive limitations of these studies have made it difficult to draw
definitive conclusions regarding the involvement of these candidate genes in the evolution of
resistance to ivermectin.
1.6 Challenges and limitations of traditional anthelmintic resistance research
As mentioned, previous studies have generally been limited to associations of allelic
variation on certain candidate genes with the anthelmintic resistance phenotype due to the
%age farms with
resistant wormsAustralia
South
AfricaBrazil UK Brazil Uraguay Paraguay
Benzimidazoles 90 79 90 60 68 61 70
Levamisole 80 73 84 30 19 29 47
Macrocyclic lactones 60 73 13 30 7 1 67
McKeller and Jackson (2004) Waller (1997)
14
traditional experimental limitations associated with parasitic nematodes; these limitations being
rooted in a historical lack of genomic resources, the complicated nature of parasite experimental
systems, and a lack of tools to perform functional genetic assays. Choosing a gene of interest and
observing differences in allelic frequencies between independent selected and unselected strains,
or changes in allele frequencies in the same strain following selection, fails to properly address
and control for the background genetic variation that is likely to cause a false positive association
with an unrelated phenotype (Gilleard, 2006; Gilleard, 2013; Rezansoff et al., 2016, Chapter 3).
If a comparison is performed between independent field isolates, the presence of population
structure in parasitic nematodes causes background genetic variation across the entire genome. In
this scenario allelic variation likely occurs in most genes due to polymorphism across the entire
genome, and therefore different allelic frequencies at any particular gene cannot be inferred to be
the cause of different resistance phenotypes between strains (Gilleard and Beech, 2007; Gilleard
and Redman, 2016; Grillo et al., 2006). The danger of making this association can be exposed
with the inclusion of a modest number of control loci which would also reveal this background
allelic variation. Alternatively, if the same strain is compared pre- and post- drug treatment, or
across multiple generations of drug treatment with selection, changes in allelic frequency at a
candidate gene across this treatment regime is still not proof of association with resistance.
Genetic drift and/or population bottlenecks could result in changes in allelic profiles. Further,
changes in allelic profiles in candidate genes, even in the absence of similar changes in control
loci, do not prove causality in relation to the resistance phenotype. This is because genetic
hitchhiking of alleles can span megabases (Mbs) and hundreds of genes from the actual
resistance conferring mutation. Consequently, whilst apparent associations of allelic profiles with
a resistance phenotype can provide evidence of genetic linkage of a particular locus to a
resistance conferring mutation, it cannot provide direct evidence of causality for a candidate
locus itself (Redman et al., 2012; Doyle et al, manuscript in preparation). Single gene studies of
gene expression are vulnerable to the same potential mis-associations with phenotype. The high
levels of background transcriptomic variation, both within and between strains, particularly for
invertebrates (reviewed in section 2.4), does not allow a simple association of variance in
candidate gene expression to be used as direct evidence of causality of a resistance phenotype.
15
Further the traditional use of artificial selection regimes can result in selection of traits that:
1) are not related to resistance, but are favorable under the particular artificial experimental
conditions, e.g. a faster generation time, 2) have fitness costs that survive in an artificial selection
system but would not realistically survive in a field setting, or 3) are weak resistance conferring
traits that require a sub-clinical dose regime over many generations to contribute additively with
other loci to a significant resistance phenotype (Gilleard and Beech, 2007). Hence, the mutations
responsible for resistance as a result of artificial selection regimes may not be the same as those
that are selected in the field (Gilleard and Beech, 2007). A final limitation of the candidate gene
approach is the unavoidable bias of its practice. In only assessing genes that are hypothesized to
be involved in the evolution of resistance, we are essentially ruling out any chance of identifying
resistance conferring genes that have not been previously implicated or suspected.
1.7 Genome wide high-throughput (next-generation) sequencing approaches to investigate
the genetics of anthelmintic resistance in H. contortus
The advent of high-throughput sequencing technology in the second half of last decade, and
subsequent development of bioinformatic approaches to process the large amounts of data
produced, opened new opportunities across the life sciences (Goodwin et al., 2016). This
disruptive set of new technologies has allowed new applications across very diverse research
fields from medical and developmental genetics, through to the ecological and evolutionary
biological sciences (Goodwin et al., 2016). Conventional genetic research required large
investments of time and resources to achieve orders of magnitude less data, usually from single,
or a few loci under one kilobase (kb) in length. High-throughput sequencing projects, such as
those using Illumina based platforms, now allow the sequencing of whole genomes on a much
larger and flexible scale, from a few hundred Mb of data (e.g. the iSeq 100 system), up to 750
Gb of sequence data on a single platform run (http://www.illumina.com/systems/sequencing-
platforms.html). Despite the high-throughput nature of next-generation sequencing technology,
the high flexibility in scale facilitates the ease with which single labs can now embrace these
technologies. Independent of scale, a diverse set of high-throughput applications are now
available to interrogate an array of different types of genetic data. Many of these different

16
applications have potential value for anthelmintic resistance research, from whole genome
sequencing for assembling and comparing full genomes, RNAseq to build transcriptomes and
assay for differential expression, ChIP-seq to assess for epigenetic protein interaction with
genomic DNA, RADseq to sequence a random selection of markers from across a genome, and
deep amplicon sequencing to assess a particular locus of interest at high depth in many isolates
(van Dijk et al., 2014).
The parasitic nematode and anthelmintic research community are a good example of a
research field that now have a multitude of opportunities to address research questions that were
not possible only a few years ago when the technologies described above weren’t available
(Gilleard, 2013; Kotze et al., 2014). The relatively affordable cost of whole genome sequencing
has allowed the sequencing of a large number of parasite genomes that would not have been
possible previously. One hundred and one nematode, and 33 platyhelminth genomes are now
publicly available for download and use on Wormbase Parasite by researchers
(https://parasite.wormbase.org/species.html). Two of these genomes are for H. contortus. The
Wellcome Trust Sanger Institute (WTSI), in collaboration with the Gilleard Lab published an
annotated draft assembly of the H. contortus genome in 2013 (Laing et al., 2013). This was
published in parallel with another assembly using a different strain of H. contortus (Schwarz et
al., 2013) (though this genome has not received regular updates to its assembly quality). The
original published Laing et al. genome assembly was 370 Mb in length, assembled onto 26,044
scaffolds, a size which at the time was the largest assembled genome of any nematode. This
assembly was relatively fragmented with an assembly N50 of 83,287 bp and average scaffold
length of 14,206 bp (Laing et al., 2013). Nevertheless, it was relatively complete containing
roughly 93% of conserved eukaryotic genes (CEGs) in the assembly. Gene models of the
assembly were also annotated with RNAseq completed across all H. contortus life stages. A
moderately comprehensive functional ontological annotation was also created for these gene
models primarily aided by the close phylogenetic relation of H. contortus to C. elegans, with C.
elegans orthologues being identified for > 5,937 H. contortus gene models (Laing et al., 2013).
Since its initial publication, the Laing et al. H. contortus assembly has been vastly improved over
the last few years (Doyle et al., 2018; Laing et al., 2016). Though an intermediate version of the
H. contortus genome assembly and annotation were used in the analyses of Chapters 2 and 4 of
17
this thesis (a version informally labelled “v2.5” with an N50 of 5.5 Mb), the genome has very
recently been assembled fully into six chromosomes with a length of 279 Mb (Doyle et al., 2018)
(Figure 1.2). This makes it one of the best assembled parasitic nematode reference genomes
currently available.
With this resource now available, the assessment of full regions of the H. contortus genome,
as opposed to examining small numbers of candidate and control genes, are now possible to
perform. Analysis of Illumina whole genome, whole transcriptome, and deep amplicon
sequenced datasets are utilized in this thesis, coupled with the genomic and transcriptomic
information produced in the ongoing H. contortus genome project. This new potential to expand
beyond single gene assays will help us interrogate the entire genome of H. contortus for the loci
involved in the ivermectin resistance phenotype.
1.8 Genetic crossing in H. contortus
In parallel to the development of the reference genome resource, techniques for undertaking
genetic crosses and mapping have been steadily refined in trichostrongyloid nematodes,
particularly in H. contortus (Le Jambre et al., 1995, 2000, 1999, 1979; Martin and McKenzie,
1990; Sangster et al., 1998). Though the high levels of genetic diversity seen in parasitic
nematodes have inhibited the ease with which mapping can be carried out on these crosses,
single pair mating have recently been shown to be possible in H. contortus (Sargison et al.,
2018). The progress that has been made in overcoming the challenges associated with genetic
crossing in parasitic nematodes has made possible forward genetic mapping to identify loci
involved in phenotypes of interest in these worms. In particular, anthelmintic resistance
phenotypes can be interrogated using genetic crossing, and together with genomic resources now
available that enable the investigation of whole regions of the genome, the potential to identify
anthelmintic resistance markers is substantially more feasible.
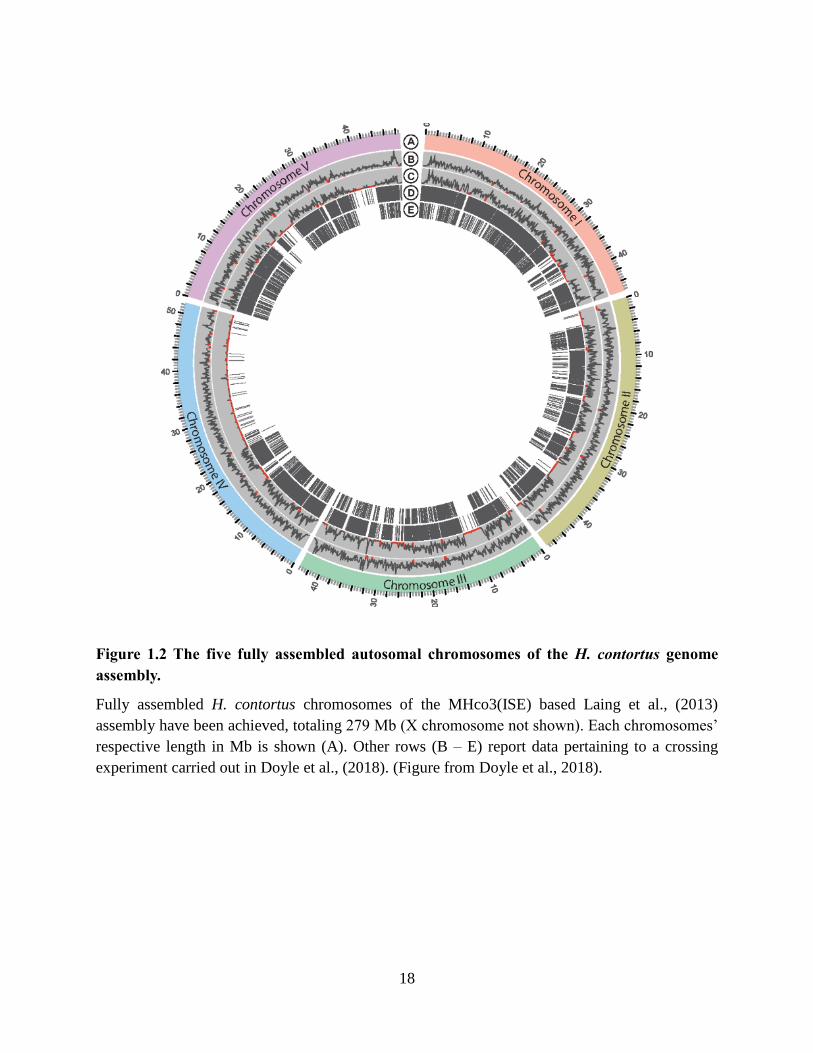
18
Figure 1.2 The five fully assembled autosomal chromosomes of the H. contortus genome
assembly.
Fully assembled H. contortus chromosomes of the MHco3(ISE) based Laing et al., (2013)
assembly have been achieved, totaling 279 Mb (X chromosome not shown). Each chromosomes’
respective length in Mb is shown (A). Other rows (B – E) report data pertaining to a crossing
experiment carried out in Doyle et al., (2018). (Figure from Doyle et al., 2018).
19
1.9 A novel backcross experiment to interrogate ivermectin resistance in H. contortus
As a new approach to investigate the genetic basis of ivermectin resistance, our lab in
collaboration with researchers at the Moredun Research Institute, conducted a novel serial
backcross experiment using the ivermectin susceptible MHco3(ISE) reference genome strain,
and two independent ivermectin resistant isolates of H. contortus originally isolated from the
field from two different continents (Redman et al., 2012). The full details of this published
experiment can be found in Redman et al., (2012), however a brief summary of its rationale and
design is outlined here. The experiment utilized two independent ivermectin resistant strains of
H. contortus – denoted MHco4(WRS), and MHco10(CAVR) – field isolates derived from South
Africa and Australia respectively. These were both crossed with the susceptible genome
reference strain, MHco3(ISE) in two independent serial backcross experiments.
Fifty male worms of the MHco3(ISE) strain were crossed with fifty female worms of the
resistant strain – either MHco4(WRS) or MHco10(CAVR) – by direct surgical transplantation
into the recipient sheep abomasum (Figure 1.3, panel A). The progeny of each cross were then
used to infect a new donor sheep which was subsequently administered a therapeutic dose of
ivermectin (0.1 mg/kg) 10-11 days post infection. Sexually immature female progeny that
survived drug treatment (backcross MHco3/4 or backcross MHco3/10) were then surgically
extracted 14 days post infection and crossed again with males of the susceptible parental isolate
(MHco3(ISE)) by surgical implantation into another donor sheep. Progeny of this backcross
(MHco3/4.BC1) were collected and infected using the same method as for the original cross,
once again treated with ivermectin, after which the MHco3/4.BC1 drug survivors were
recovered. This process of drug selection and backcrossing of drug surviving progeny against the
MHco3(ISE) susceptible parental strain was repeated three more times (four backcrosses in
total). After crossing was completed, we possessed two independent 4th generation backcross
populations, denoted MHco3/4.BC4 and MHco3/10.BC4 (or just MHco3/4.BC and
MHco3/10.BC throughout the rest of the thesis). These were derived from two independently
resistant field strains (Figure 1.3). A controlled efficacy test of the drug surviving BC4 strains
was conducted to determine the ivermectin resistance phenotype of the backcrosses, and so
confirm that ivermectin resistance conferring loci had been retained (Redman et al., 2012).

20
Figure 1.3. Steps and genetic introgression achieved in the backcross experiment.
Panel A shows the steps of the in vivo crossing and ivermectin selection regime (figure from
Gilleard, 2013). Panel B shows a conceptual representation of the introgression of an ivermectin
selected region from the resistant parental strain (red) into a genetic background of the
susceptible parental strain (blue) over the course of four generations of backcrossing with
ivermectin treatment.
A
B
21
The value of these serially backcrossed strains is enhanced by the high level of genome-
wide genetic variation observed between the resistant and susceptible parental strains (Redman et
al., 2012). The aim of the backcross experiment was to introgress regions of the genome that
harbour resistance loci, from the resistant parental strains into the genetic background of the
susceptible MHco3(ISE) genome reference strain (Figure 1.3, panel B). These strains could then
be interrogated to identify the regions introgressed, which should be the genomic regions containing
the important ivermectin resistance conferring loci of MHco4(WRS) and MHco10(CAVR). The
high genetic differentiation between the parental strains is critical to this approach as it is
essential to be able to distinguish the genetics of the two parental strains to identify introgressed
regions. In the original work, the success of the backcross was monitored and validated using a
panel of 18 microsatellite markers (Redman et al., 2012). 17 out of 18 markers showed allele
frequencies in the backcrossed populations that were very similar to those found in the
susceptible MHco3(ISE) population, as would be expected after four rounds of serial
backcrossing against MHco3(ISE) (Redman et al., 2012). Interestingly, one marker, Hcms8a20,
showed evidence of introgression from resistant parental strains in both backcrosses, i.e. a
genotype specific to the resistant parental strain was retained at high frequency in populations of
backcrossed worms that survived ivermectin drug treatment (Redman et al., 2012). Two different
genomic loci adjacent to this microsatellite were assessed in more detail to test linkage to an
ivermectin resistance conferring locus in chapters 3 and 4 respectively.
Following the original backcross experiments, the 4th generation backcrosses have
subsequently been put through four additional rounds of experimental in vivo passage with
ivermectin selection, allowing further recombination and homozygosity of resistance conferring
alleles to occur. Whole genome sequencing (WGS) of the three parental strains, both backcross
strains, and the backcross strains after four rounds of passage with treatment, has been performed.
Sliding window Fst (Fixation index) values between all resistant strains vs. the susceptible
MHco3(ISE) genome reference strain were calculated across the genome using the WGS
alignments of each strain (Doyle, S., Illingworth, C., Laing, R., Redman, L., Martinelli, A., Cotton,
J., and Gilleard, J.S., manuscript in preparation). The goal of this was to determine the location and
extent of any introgressed regions within the backcross genomes (Doyle et al., manuscript in
preparation). A ~11.2 Mb region of chromosome 5 was discovered as being introgressed in both
22
independent backcross strains, as represented by a region of high Fst values between the backcross
strains and the MHco3(ISE) parental strain (Figure 1.4) (Doyle et al., manuscript in preparation).
The introgressed Hcms8a20 locus was subsequently determined to be located within this selected
locus, validating the previous finding in the original backcross experiment using a microsatellite
analysis (Doyle et al., manuscript in preparation). This introgressed locus is a central focus of
chapters 3 and 4 of this thesis, though it should be noted that the experiments of chapter 3 were
carried out before knowledge of the region.
1.10 Thesis overview
The central aim of this thesis work was to identify genetic loci linked to ivermectin
resistance conferring mutation(s) in H. contortus. The approaches we use to do this represent an
expansion beyond traditional candidate gene based approaches that have generally failed to
identify reliable markers for ivermectin resistance in this important parasite species. These
expansions have been facilitated by 1) the creation of a novel pair of serial backcrossed
populations that through a genetic approach allowed the identification of a region of the H.
contortus genome in which one or more important ivermectin resistance conferring loci are
located in two field derived strains, and 2) the use of high-throughput sequencing technology,
coupled with the creation of a high quality annotated H. contortus genome assembly, that now
allows the interrogation of the whole genome and transcriptome of H. contortus at a scale vastly
larger than possible with conventional sequencing.
Chapter 2 represents the first whole-transcriptomic inter-strain comparison ever
conducted in a parasitic nematode. RNAseq data was acquired from populations of adult worms
of the ivermectin susceptible genome reference parental strain – MHco3(ISE) – and the two
ivermectin resistant parental strains – MHco4(WRS) and MHco10(CAVR) – of the backcross
experiment. Global transcriptomic differences were compared between the strains in order to
investigate the extent of transcriptomic differences between them, and identify differentially
expressed genes that might be involved in the ivermectin resistance phenotype. We found that
many hundreds of genes are differentially expressed, highlighting the high level of
transcriptomic variation that exists among different H. contortus strains, and complicating the
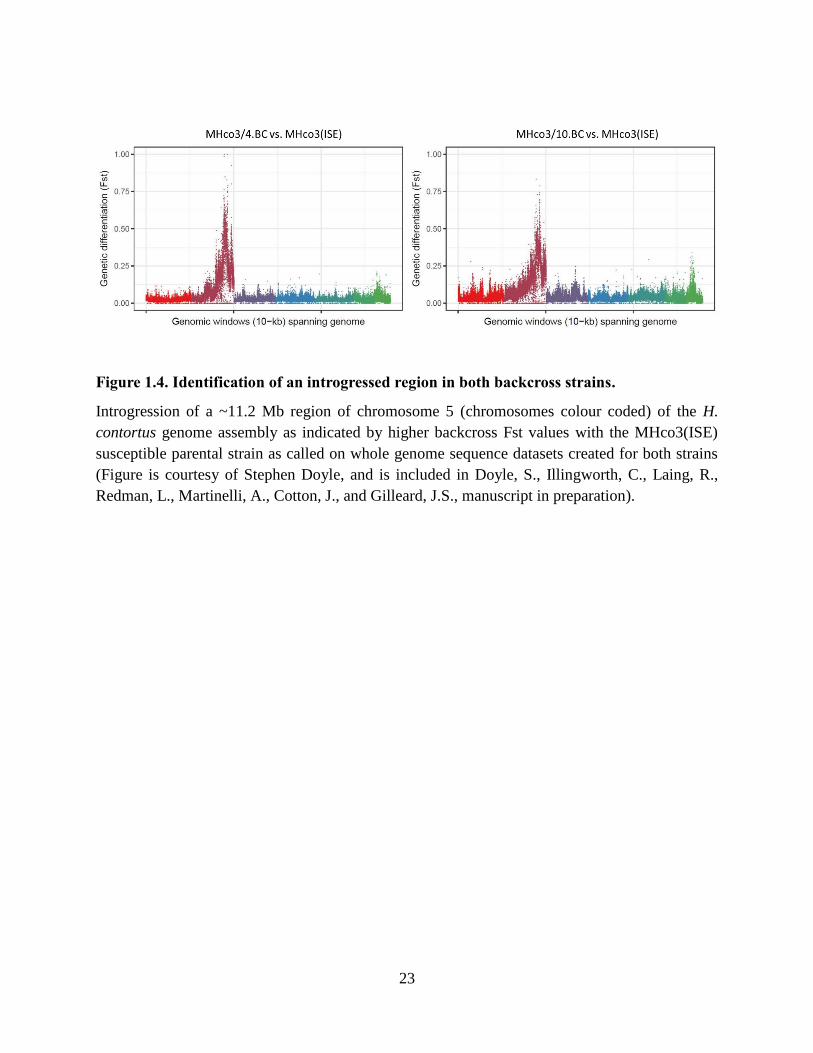
23
Figure 1.4. Identification of an introgressed region in both backcross strains.
Introgression of a ~11.2 Mb region of chromosome 5 (chromosomes colour coded) of the H.
contortus genome assembly as indicated by higher backcross Fst values with the MHco3(ISE)
susceptible parental strain as called on whole genome sequence datasets created for both strains
(Figure is courtesy of Stephen Doyle, and is included in Doyle, S., Illingworth, C., Laing, R.,
Redman, L., Martinelli, A., Cotton, J., and Gilleard, J.S., manuscript in preparation).
24
identification of expression differences that may be associated with the resistance phenotype. We
also found that differences in polymorphism rates between the strains can directly influence and
confound differential expression reports between them at the gene level, and further show that
adjustment of SNP allowance parameters in mapping software can substantially reduce this bias.
These results are particularly relevant for future transcriptomic studies of highly genetically
diverse species. Chapter 3 presents our published initial genetic analysis of the backcross strains
in which we examined candidate genes previously implicated for involvement in ivermectin
resistance for evidence of linkage to ivermectin resistance conferring loci (Rezansoff et al.,
2016). Five of the most high-profile candidate genes from the published literature were
interrogated in the backcrosses and no evidence that any of these genes were linked to an
ivermectin resistance conferring locus in the MHco4(WRS) and MHco10(CAVR) strains was
found. In contrast, there was strong evidence of genetic linkage observed for the Hcms8a20
locus. The results of this chapter highlight the dangers of conducting isolated associations of
allelic variation with the resistance phenotype and provided further evidence of Hcms8a20 as a
marker linked to an important ivermectin resistance locus in the two parental ivermectin resistant
strains. Chapter 4 presents the use of deep amplicon sequencing to investigate evidence of
linkage of Hcms8a20, and a number of other loci in the backcross introgressed region, to loci
under selection in a large number of ivermectin resistant field populations from the US and
Canada. Seven different loci were sequenced in 53 samples of H. contortus derived from 25
different field populations from across North America. Five of the loci assessed, including
Hcms8a20 (italicized to denote were now referring to a gene locus adjacent to the microsatellite),
are located across the 11.2 Mb introgressed region of the backcross strains. The Hcms8a20 locus
was the only locus to show consistent evidence of selection in the majority of the ivermectin
resistant field populations. This result suggests the ivermectin resistant locus identified in the
backcross experiments is common in ivermectin resistant H. contortus field populations, and
narrows the region of the introgressed region in which the causal mutation is located. An overall
discussion of the results of this thesis work, and the potential directions of future research on this
locus, is carried out in chapter 5.
25
Chapter Two: Determining the True Extent of Transcriptional Diversity Between H.
contortus Strains and the Confounding Effect of Sequence Polymorphism on Differential
Expression Analysis
26
Abstract
Global transcriptomic analysis is a powerful tool to uncover phenotypic differences between
individuals, groups, or strains of organisms. RNAseq analysis is the standard approach for whole
transcriptomic studies across the life sciences and is generally performed using default
parameters originally optimized for vertebrates or model organisms with relatively low levels of
genetic diversity. Haemonchus contortus is a leading model to study parasitic nematode biology
in which differential gene expression is commonly used to infer the potential involvement of
candidate genes in anthelmintic resistance and other phenotypes. However, the effect on read
quantification of extremely high levels of genetic diversity in this organism (SNP rates at
upwards of 5% of base sites) have not been taken into account when undertaking gene
expression or whole transcriptomic studies. The objective of this study was two-fold: First, to
assess the impact of sequence polymorphism when comparing the transcriptomes of different H.
contortus strains, and second, to determine the extent of genuine transcriptional differences
between genetically divergent H. contortus strains when the biases related to sequence
polymorphism were accounted for.
We investigated three genetically divergent H. contortus strains commonly used in
anthelmintic resistance research; MHco3(ISE), MHco4(WRS), and MHco10(CAVR). We found
that high rates of coding sequence (CDS) polymorphism in RNAseq reads were associated with
lower read mapping efficiency to gene models derived from the MHco3(ISE) reference genome
assembly. This resulted in large biases in differential gene expression determined by the widely
used DESeq2 program: genes with large differences in observed SNP rates between strains had
higher than the overall rates of differential expression. Further, there was a strong bias for such
genes to be determined as having reduced expression in the strain with the highest levels of
polymorphism with respect to the reference genome. It was possible to largely compensate for
this bias, by a combination of optimizing the read mapping SNP (polymorphism) allowance and
by discarding genes which had a greater than 2% difference in SNP rate between these strains.
Once biases due to sequence polymorphism were largely removed, high levels of transcriptional
diversity remained between the three strains, with ≥ 824 differentially expressed genes identified
across all three pairwise strain comparisons. To highlight the practical implication of failing to
27
compensate for sequence polymorphism in RNAseq analysis, we analyzed two gene families of
relevance to the investigation of ivermectin drug resistance; ABC transporters and ligand-gated
ion channels (LGICs). We found that over half of all genes identified as differentially expressed
using default Tophat2 parameters were due to sequence polymorphism biases, which could lead
to erroneous implications regarding their potential roles in ivermectin resistance. This work
illustrates the critical importance of taking sequence polymorphism into account when
undertaking RNAseq analysis, and before inferring biological significance of apparent
differences in gene expression between strains or isolates of organisms with high levels of
genetic diversity.
28
2.1 Introduction
RNAseq has become the standard approach for the genome-wide analysis and quantification
of gene expression across the life sciences (Conesa et al., 2016; Wang et al., 2009). Established
sequence aligners used in RNAseq analysis pipelines, such as Tophat2 and its faster successor
HiSat2 were developed, and their default mapping parameters set, primarily for use on vertebrate
species such as humans, mouse, and zebrafish, which have relatively low levels of both intra-
and inter-population genetic diversity (Baruzzo et al., 2017; Guryev et al., 2006; Lindblad-Toh et
al., 2000; Wang et al., 2007). Further, until relatively recently, applications of RNAseq to non-
vertebrate species were largely confined to laboratory strains of model organisms such as
Drosophila melanogaster and Caenorhabditis elegans, which also have low levels of genetic
diversity (Andersen et al., 2012; Cingolani et al., 2012). Consequently, most publications make
little or no acknowledgement of the potentially confounding effects of sequence polymorphism
on the mapping efficiency of RNAseq reads and the calling of differentially expressed genes
(Baruzzo et al., 2017). RNAseq analysis pipelines are generally applied to non-model organisms
simply using established default parameters, with no consideration given the level and
distribution of sequence polymorphism within, and between the strains or populations being
compared (Antony et al., 2016; Croken et al., 2014; Edwards et al., 2013; Fiebig et al., 2015;
Papenfort et al., 2015). However, many taxa show high levels and complex patterns of intra-
species genetic diversity (Blumenthal and Davis, 2004; Dey et al., 2013; Redman et al., 2015;
Romiguier et al., 2014). This is a concern since standard RNAseq alignment benchmarking
studies have shown that the performance of different sequence aligners varies with the genome
complexity and levels of sequence polymorphism when using simulated sequence data (Baruzzo
et al., 2017). However, no published experimental studies directly examine the effects of
sequence polymorphism on differential expression analyses using commonly applied RNAseq
analysis pipelines.
A good example of the application of RNAseq analysis to non-model organisms is for the
investigation of differential expression of candidate genes potentially involved in anthelmintic
drug resistance in parasitic nematodes (Dicker et al., 2011; El-Abdellati et al., 2011; Urdaneta-
Marquez et al., 2014; Williamson et al., 2011; Xu et al., 1998). Haemonchus contortus is
29
arguably the most established parasitic nematode model used for such studies (Gilleard, 2013). It
has a good quality reference genome and has extremely high levels of sequence polymorphism
(upwards of 5% SNP rates), both within and between strains or geographical isolates (Gilleard
and Redman, 2016; Laing et al., 2013). Consequently, it is an excellent system in which to study
the potentially confounding effects of sequence polymorphism on differential expression
analysis. In this chapter, we use three well characterized laboratory passaged strains of H.
contortus to examine how differences in CDS polymorphism rates, with respect to the
MHco3(ISE) genome reference strain, directly affect read mapping and so bias differential
expression results. We show how these confounding effects can be reduced and demonstrate that,
even when the effects of sequence polymorphism are minimized, there are still a large number of
differentially expressed genes between these three strains. These results have important
implications not only for studies examining the relationship between gene expression and
anthelmintic drug resistance, but more widely for the application of RNAseq analysis to non-
model organisms.
30
2.2 Materials & Methods
2.2.1 H. contortus strains, sample preparation, and sequencing.
The MHco3(ISE), MHco4(WRS) and MHco10(CAVR) H. contortus strains have been
previously characterised and are described in detail elsewhere (Laing et al., 2013; Redman et al.,
2012, 2008b). Briefly, the MHco3(ISE) strain was derived from the ISE strain (Roos et al., 2004)
and has been used as the genome reference strain (Laing et al., 2013). MHco3(ISE) is a version
of the ISE strain that is passaged at the Moredun Institute, Edinburgh, UK. The ISE strain was
derived by multiple rounds of inbreeding from progeny of a single adult female worm of a field
isolate (ISE) thought to have been derived from East Africa in the 1950s (although records of
this are poor) (Otsen et al., 2001). The MHco3(ISE) is susceptible to all main classes of
anthelmintic and has been used as the reference genome strain (Laing et al., 2013). The
MHco4(WRS) strain is derived from the White River Strain (WRS) that was isolated as an
ivermectin resistant field isolate from South Africa (Van Wyk and Malan, 1988). The
MHco10(CAVR) strain is derived from the Chiswick Avermectin Resistant Strain (CAVR)
which was originally isolated as an ivermectin resistant strain from the field in Australia (Le
Jambre et al., 1995).
Three sets of 20 adult female worms were recovered on necropsy at 28 days post
experimental infection from the abomasa of three different individual sheep for each H.
contortus strain; MHco3(ISE), MHco4(WRS), and MHco10(CAVR). Each set of 20 adult
females served as one of three biological replicates for RNAseq analysis for each strain. Adult
worms recovered from the abomasum were cleaned, and snap frozen before total RNA was
isolated from each pool of 20 worms using a standard Trizol protocol as described in Laing et al.,
(2011). RNA samples were assessed on a Bioanalyser 2100 (Agilent) and Illumina transcriptome
libraries were prepared as previously described (Laing et al., 2011). Sequencing of transcriptome
libraries was performed on an Illumina HiSeq platform to generate 100 bp paired-end reads.
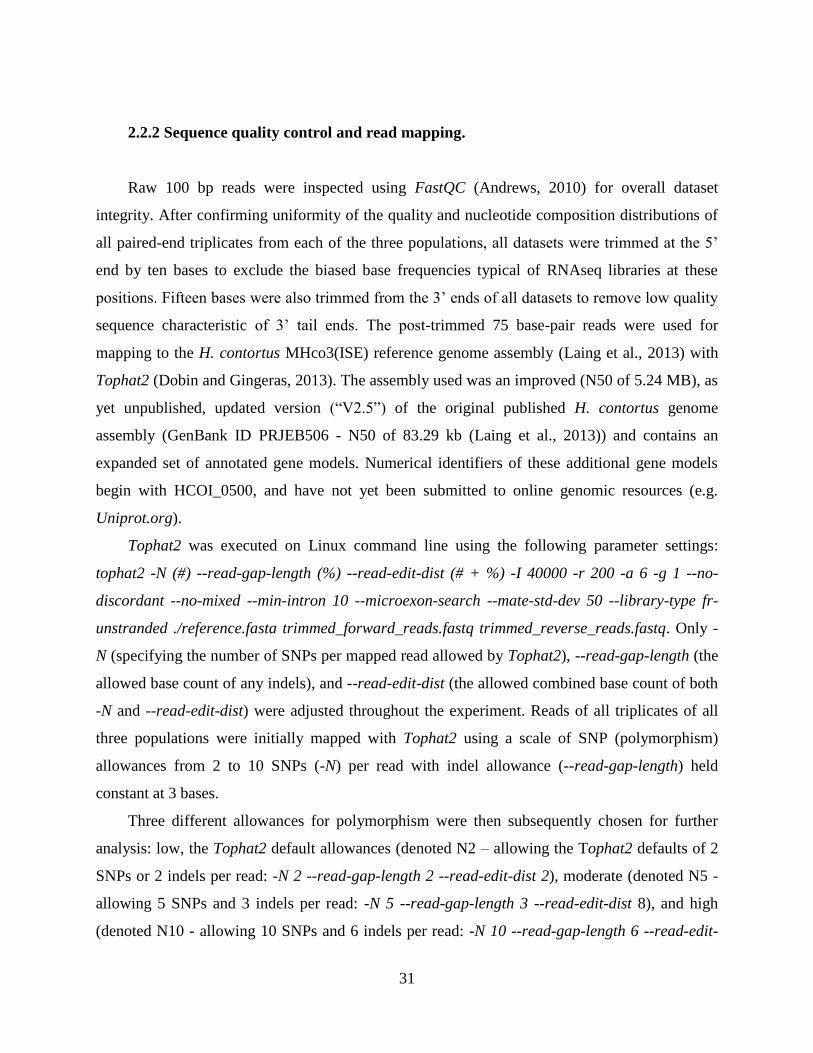
31
2.2.2 Sequence quality control and read mapping.
Raw 100 bp reads were inspected using FastQC (Andrews, 2010) for overall dataset
integrity. After confirming uniformity of the quality and nucleotide composition distributions of
all paired-end triplicates from each of the three populations, all datasets were trimmed at the 5’
end by ten bases to exclude the biased base frequencies typical of RNAseq libraries at these
positions. Fifteen bases were also trimmed from the 3’ ends of all datasets to remove low quality
sequence characteristic of 3’ tail ends. The post-trimmed 75 base-pair reads were used for
mapping to the H. contortus MHco3(ISE) reference genome assembly (Laing et al., 2013) with
Tophat2 (Dobin and Gingeras, 2013). The assembly used was an improved (N50 of 5.24 MB), as
yet unpublished, updated version (“V2.5”) of the original published H. contortus genome
assembly (GenBank ID PRJEB506 - N50 of 83.29 kb (Laing et al., 2013)) and contains an
expanded set of annotated gene models. Numerical identifiers of these additional gene models
begin with HCOI_0500, and have not yet been submitted to online genomic resources (e.g.
Uniprot.org).
Tophat2 was executed on Linux command line using the following parameter settings:
tophat2 -N (#) --read-gap-length (%) --read-edit-dist (# + %) -I 40000 -r 200 -a 6 -g 1 --no-
discordant --no-mixed --min-intron 10 --microexon-search --mate-std-dev 50 --library-type fr-
unstranded ./reference.fasta trimmed_forward_reads.fastq trimmed_reverse_reads.fastq. Only -
N (specifying the number of SNPs per mapped read allowed by Tophat2), --read-gap-length (the
allowed base count of any indels), and --read-edit-dist (the allowed combined base count of both
-N and --read-edit-dist) were adjusted throughout the experiment. Reads of all triplicates of all
three populations were initially mapped with Tophat2 using a scale of SNP (polymorphism)
allowances from 2 to 10 SNPs (-N) per read with indel allowance (--read-gap-length) held
constant at 3 bases.
Three different allowances for polymorphism were then subsequently chosen for further
analysis: low, the Tophat2 default allowances (denoted N2 – allowing the Tophat2 defaults of 2
SNPs or 2 indels per read: -N 2 --read-gap-length 2 --read-edit-dist 2), moderate (denoted N5 -
allowing 5 SNPs and 3 indels per read: -N 5 --read-gap-length 3 --read-edit-dist 8), and high
(denoted N10 - allowing 10 SNPs and 6 indels per read: -N 10 --read-gap-length 6 --read-edit-

32
dist 16) allowances for polymorphism respectively. Varying the indel allowances (--read-gap-
length) had very little effect on the percentage of reads mapping to the reference genome (data
not shown). Samtools’ flagstat tool (Li et al., 2009) was used to determine the proportion of
reads mapped at each allowance for each strain.
2.2.3 RNAseq processing and analysis.
Reads mapped to each gene model were sorted with samtools sort, and counted for each of
the three bioreplicates for each strain at the three different SNP allowances – N2, N5, N10 –
using the following command in HTseq-count: htseq-count -i parent -q -s no -f bam -t cds
./sorted_accepted_hits.bam ./genome_annotation_file.gff3 (Anders et al., 2014). Raw mapped
read counts for each gene-model of each bioreplicate of each strain were compiled and used as
input for DESeq2.
DESeq2 was used to call normalized gene expression values of each gene-model in each
strain (Love et al., 2014). Rstudio (2015) utilizing R version 3 was used to execute DESeq2
features. Recommended instructions for DESeq2’s featured tools – DESeqDataSetFromMatrix,
DESeq, results – were used in succession to call differential expression between the three strains
at each of the three different allowances for polymorphism. DESeq2’s plotPCA tool was used to
plot segregation of triplicates based on gene expression of the top 15,000 expressed low-
polymorphic genes at the moderate N5 allowance. DESeq2 result tables were exported and
manipulated in MS Excel. Genes were only called as differentially expressed in this analysis if
they 1) showed a greater than 2 fold-change difference in expression between the strains
compared, and 2) yielded associated adjusted p-values in DESeq2 of less than 0.05. The number
of genes both up- and down-regulated in each strain comparison were totaled at both a 2X and
4X fold-change expression threshold at the N2, N5 and N10 allowances.

33
2.2.4 Quantifying the effect of sequence polymorphism on read-mapping efficiency
and on differential expression.
Separate from the RNAseq analysis, SNPs within coding regions (CDS) were called using
samtools mpileup on whole genome sequence (WGS) datasets created for each of the strains
against the MHco3(ISE) genome assembly. SNPs present at > 40% frequency were totaled per
gene-model for each of the strains. 40% was chosen as a SNP threshold as it approximates to the
average frequency of CDS SNPs in all three strains (data not shown). The SNP rate was
calculated for each gene in each strain by dividing the total number of SNPs in the gene by the
respective gene-model CDS length. The genes were then categorized into one of six SNP rate
categories for each strain: 0%, 0-0.5%, 0.5-1%, 1-2%, 2-5%, and > 5%. Z-test statistics were
called on the difference in proportions of genes observed in the 0% and 0-0.5% categories in
MHco3(ISE) compared to the two non-reference strains. For each strain, the total number of
reads that mapped to all genes within each of these SNP rate categories was calculated at each of
three polymorphism mapping allowances; N2, N5, N10. In addition, the ratios of the total
number of reads mapped at N5 relative to N2, and N10 relative to N5 were calculated for each of
the six SNP rate categories for each strain.
Genes were also categorized by the magnitude of the difference of SNP rates observed for
each gene in each of the three strain comparisons (e.g. the SNP rate observed for a gene in
MHco4(WRS) subtracted by the SNP rate observed in MHco3(ISE)). For the MHco4(WRS) vs.
MHco3(ISE) pairwise strain comparison, genes were categorized into seven SNP rate difference
groups from > 5 - 15%, > 2 - 5%, > 0 - 2%, 0%, and respective negative difference classes of the
same magnitude. 62 genes showed a > 15% difference and were not categorized due to
annotation errors and/or overly short CDS lengths. The number of genes within each SNP rate
difference class that were expressed, showed low counts, or were not expressed, were counted at
each map allowance (N2, N5, N10). Expressed genes within each difference category were then
classified based on the magnitude of their differential expression in MHco4(WRS) vs.
MHco3(ISE). Rates of differential expression in each category were then calculated. Finally, the
overall (net) log2 fold difference in expression (NDE) of all expressed genes in each SNP rate
difference category was calculated at each of the three map allowances.
34
2.2.5 Assessment of transcriptomic variation between the strains.
Differential expression statistics were called with DESeq2 for each of the three pairwise
strain comparisons at each of the three map allowances. In each pairwise strain comparison at the
N5 allowance, genes showing low SNP rate differences (less than 2%) were denoted as low-
polymorphic genes (LPGs). The number of N5 low-polymorphic genes up- and down-regulated
in each strain comparison, and shared up- or down-regulated in two strains vs. the third strain,
were totaled at both a log2 1X and log2 2X fold-change expression threshold. Candidate
anthelmintic resistance gene families, as defined by the published H. contortus genome
annotation (Laing et al., 2013), were specifically identified for differential expression and
compared at the N2 and N5 allowances, and exclusively low-polymorphic genes at the N5
allowance.
Gene ontological classifications were obtained from UniProt.org (The UniProt Consortium,
2015) for H. contortus gene models of the originally published annotation (Laing et al., 2013).
Low polymorphic genes with ontological classifications were used as the reference gene set
against which enrichment was assessed. Functional enrichment was called in genes > log 2 1X
fold-change differentially expressed in each pairwise, and each shared strain comparison.
FunRich (Pathan et al., 2015) was used to call enriched gene ontological classes using a
statistical significance threshold of Benjamini-Hochberg corrected FDR adjusted p-values <
0.05.
35
2.3 Results
2.3.1 Coding sequence polymorphism affects RNAseq read mapping against the
MHco3(ISE) reference assembly for the three different H. contortus strains.
The total combined read counts of the triplicate RNAseq datasets were similar among the
three strains at 36,175,121, 36,025,170, and 37,584,775 reads for MHco3(ISE), MHco4(WRS),
and MHco10(CAVR) respectively. We determined the total number of CDS SNPs present at >
40% frequency, relative to the MHco3(ISE) reference genome assembly, using whole genome
sequence datasets independently created for each strain. A total of 701,715, 1,121,242 and
1,143,102 CDS SNPs, representing polymorphism rates of 2.97%, 4.74% and 4.84% for the
23.63 Mb H. contortus reference CDS annotation, were present for MHco3(ISE), MHco4(WRS),
and MHco10(CAVR) respectively.
The percentage of RNAseq reads that mapped to the MHco3(ISE) reference genome
assembly, using the default SNP (polymorphism) allowance (N2) in Tophat2, was 60.7%, 44.8%
and 47.1% for the MHco3(ISE), MHco4(WRS) and MHco10(CAVR) strains respectively
(Figure 2.1). Increasing the Tophat2 SNP allowance parameter changed the percentage of
RNAseq reads that mapped (Figure 2.1). For the MHco3(ISE) strain, the percentage of RNAseq
reads mapping to the reference genome increased as the polymorphism allowance was increased
from N2 to N5 and then decreased as the allowance was further increased to N10 (Figure 2.1).
This pattern was very similar for the MHco4(WRS) and MHco10(CAVR) strains but the
maximum percentage of reads mapping occurred at the N6 allowance, albeit at rates only 0.1%
greater than at N5 (Figure 2.1). The percentage of RNAseq reads that mapped to the reference
MHco3(ISE) genome assembly was greater for the MHco3(ISE) strain than for the other two
strains at all polymorphism allowances, although the magnitude of this difference decreased
from the N2 to N10 allowance (Figure 2.1).
A more detailed analysis was undertaken for the N2, N5 and N10 polymorphism allowances
at the level of gene models. Increasing the polymorphism allowance from N2 to N5 resulted in
12,778, 11,101, and 11,324 gene models having an increased number of mapped RNAseq reads
36
Figure 2.1. The percentage of RNAseq reads that mapped to the MHco3(ISE) reference genome assembly at different Tophat2
SNP (polymorphism) allowances (N2 to N10) shown for each of the three H. contortus strains.
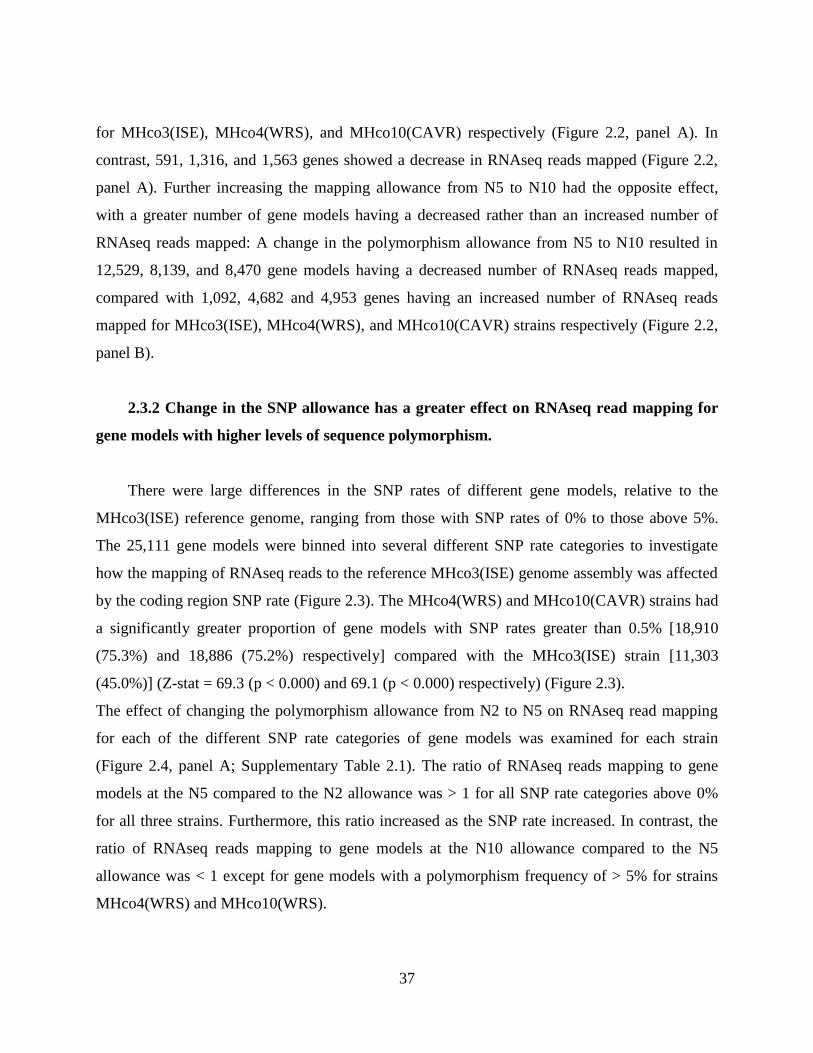
37
for MHco3(ISE), MHco4(WRS), and MHco10(CAVR) respectively (Figure 2.2, panel A). In
contrast, 591, 1,316, and 1,563 genes showed a decrease in RNAseq reads mapped (Figure 2.2,
panel A). Further increasing the mapping allowance from N5 to N10 had the opposite effect,
with a greater number of gene models having a decreased rather than an increased number of
RNAseq reads mapped: A change in the polymorphism allowance from N5 to N10 resulted in
12,529, 8,139, and 8,470 gene models having a decreased number of RNAseq reads mapped,
compared with 1,092, 4,682 and 4,953 genes having an increased number of RNAseq reads
mapped for MHco3(ISE), MHco4(WRS), and MHco10(CAVR) strains respectively (Figure 2.2,
panel B).
2.3.2 Change in the SNP allowance has a greater effect on RNAseq read mapping for
gene models with higher levels of sequence polymorphism.
There were large differences in the SNP rates of different gene models, relative to the
MHco3(ISE) reference genome, ranging from those with SNP rates of 0% to those above 5%.
The 25,111 gene models were binned into several different SNP rate categories to investigate
how the mapping of RNAseq reads to the reference MHco3(ISE) genome assembly was affected
by the coding region SNP rate (Figure 2.3). The MHco4(WRS) and MHco10(CAVR) strains had
a significantly greater proportion of gene models with SNP rates greater than 0.5% [18,910
(75.3%) and 18,886 (75.2%) respectively] compared with the MHco3(ISE) strain [11,303
(45.0%)] (Z-stat = 69.3 (p < 0.000) and 69.1 (p < 0.000) respectively) (Figure 2.3).
The effect of changing the polymorphism allowance from N2 to N5 on RNAseq read mapping
for each of the different SNP rate categories of gene models was examined for each strain
(Figure 2.4, panel A; Supplementary Table 2.1). The ratio of RNAseq reads mapping to gene
models at the N5 compared to the N2 allowance was > 1 for all SNP rate categories above 0%
for all three strains. Furthermore, this ratio increased as the SNP rate increased. In contrast, the
ratio of RNAseq reads mapping to gene models at the N10 allowance compared to the N5
allowance was < 1 except for gene models with a polymorphism frequency of > 5% for strains
MHco4(WRS) and MHco10(WRS).
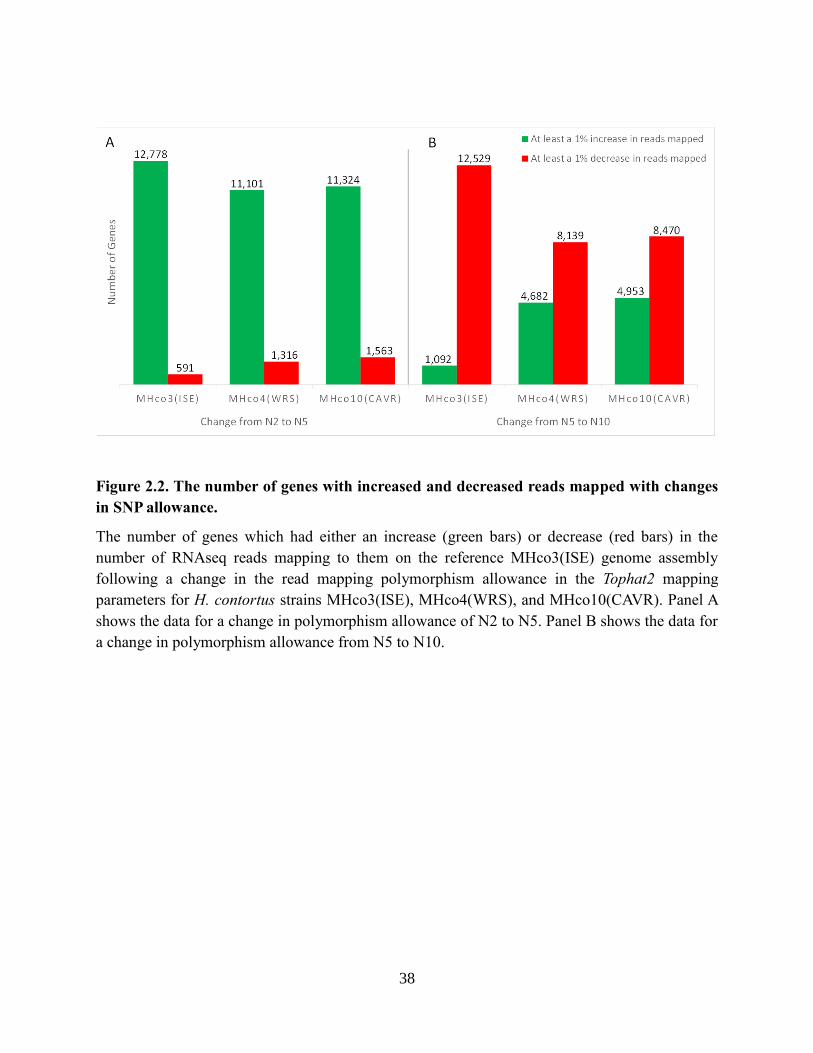
38
Figure 2.2. The number of genes with increased and decreased reads mapped with changes
in SNP allowance.
The number of genes which had either an increase (green bars) or decrease (red bars) in the
number of RNAseq reads mapping to them on the reference MHco3(ISE) genome assembly
following a change in the read mapping polymorphism allowance in the Tophat2 mapping
parameters for H. contortus strains MHco3(ISE), MHco4(WRS), and MHco10(CAVR). Panel A
shows the data for a change in polymorphism allowance of N2 to N5. Panel B shows the data for
a change in polymorphism allowance from N5 to N10.
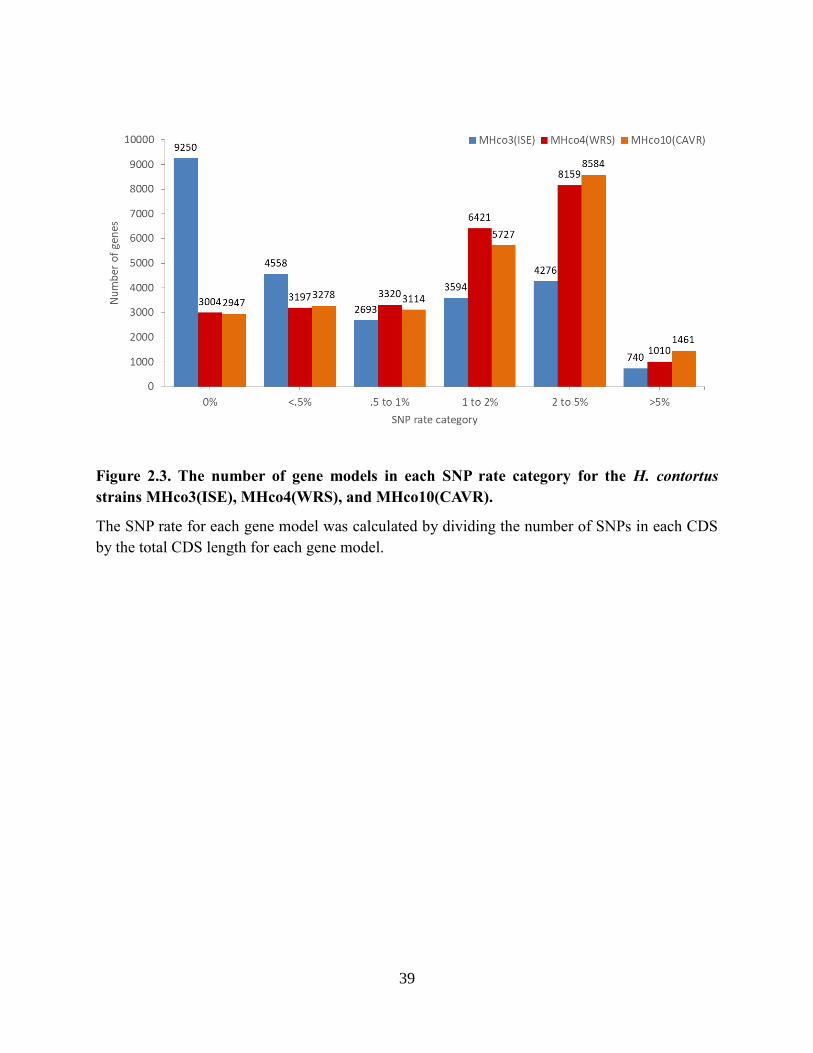
39
Figure 2.3. The number of gene models in each SNP rate category for the H. contortus
strains MHco3(ISE), MHco4(WRS), and MHco10(CAVR).
The SNP rate for each gene model was calculated by dividing the number of SNPs in each CDS
by the total CDS length for each gene model.

40
Figure 2.4. Ratios of the total number of RNAseq reads mapping to gene models in each SNP rate category at two different
SNP mapping allowances for H. contortus strains MHco3(ISE), MHco4(WRS), and MHco10(CAVR).
Panel A shows the N5 : N2 ratio. Panel B shows the N10 : N5 ratio. Counts of reads mapped were totalled for all genes within each
SNP rate category of each strain (colour coded).
A B
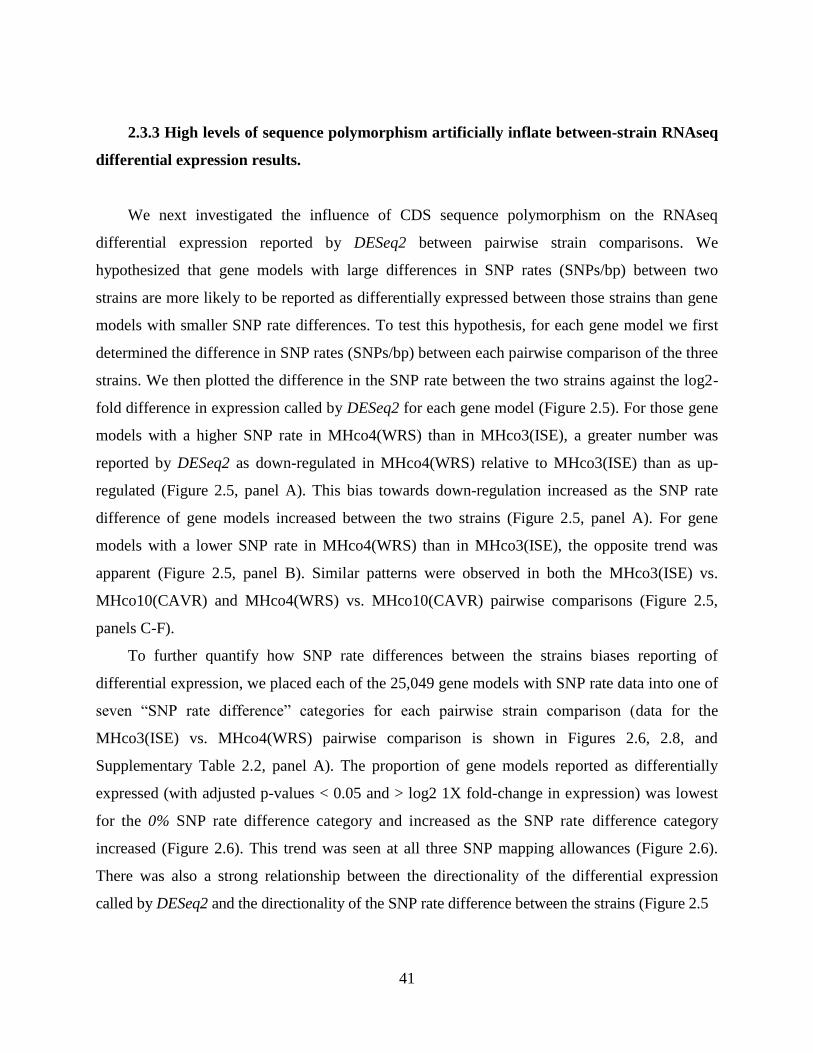
41
2.3.3 High levels of sequence polymorphism artificially inflate between-strain RNAseq
differential expression results.
We next investigated the influence of CDS sequence polymorphism on the RNAseq
differential expression reported by DESeq2 between pairwise strain comparisons. We
hypothesized that gene models with large differences in SNP rates (SNPs/bp) between two
strains are more likely to be reported as differentially expressed between those strains than gene
models with smaller SNP rate differences. To test this hypothesis, for each gene model we first
determined the difference in SNP rates (SNPs/bp) between each pairwise comparison of the three
strains. We then plotted the difference in the SNP rate between the two strains against the log2-
fold difference in expression called by DESeq2 for each gene model (Figure 2.5). For those gene
models with a higher SNP rate in MHco4(WRS) than in MHco3(ISE), a greater number was
reported by DESeq2 as down-regulated in MHco4(WRS) relative to MHco3(ISE) than as up-
regulated (Figure 2.5, panel A). This bias towards down-regulation increased as the SNP rate
difference of gene models increased between the two strains (Figure 2.5, panel A). For gene
models with a lower SNP rate in MHco4(WRS) than in MHco3(ISE), the opposite trend was
apparent (Figure 2.5, panel B). Similar patterns were observed in both the MHco3(ISE) vs.
MHco10(CAVR) and MHco4(WRS) vs. MHco10(CAVR) pairwise comparisons (Figure 2.5,
panels C-F).
To further quantify how SNP rate differences between the strains biases reporting of
differential expression, we placed each of the 25,049 gene models with SNP rate data into one of
seven “SNP rate difference” categories for each pairwise strain comparison (data for the
MHco3(ISE) vs. MHco4(WRS) pairwise comparison is shown in Figures 2.6, 2.8, and
Supplementary Table 2.2, panel A). The proportion of gene models reported as differentially
expressed (with adjusted p-values < 0.05 and > log2 1X fold-change in expression) was lowest
for the 0% SNP rate difference category and increased as the SNP rate difference category
increased (Figure 2.6). This trend was seen at all three SNP mapping allowances (Figure 2.6).
There was also a strong relationship between the directionality of the differential expression
called by DESeq2 and the directionality of the SNP rate difference between the strains (Figure 2.5

42
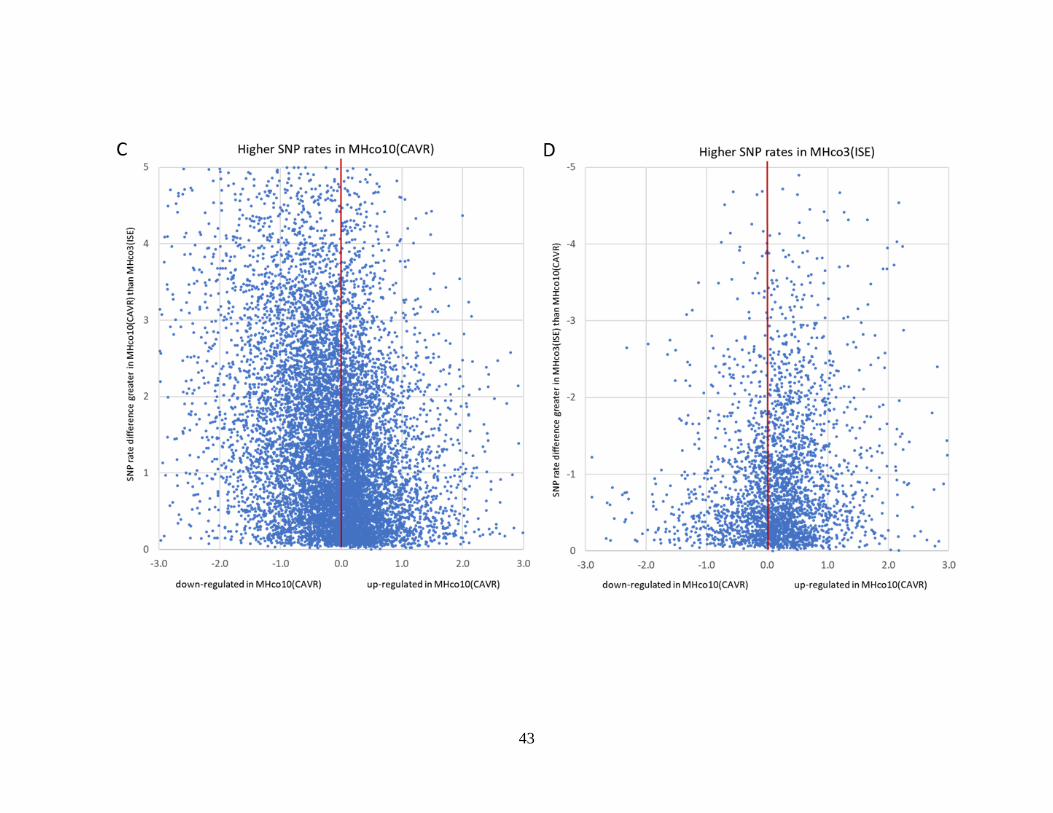
43
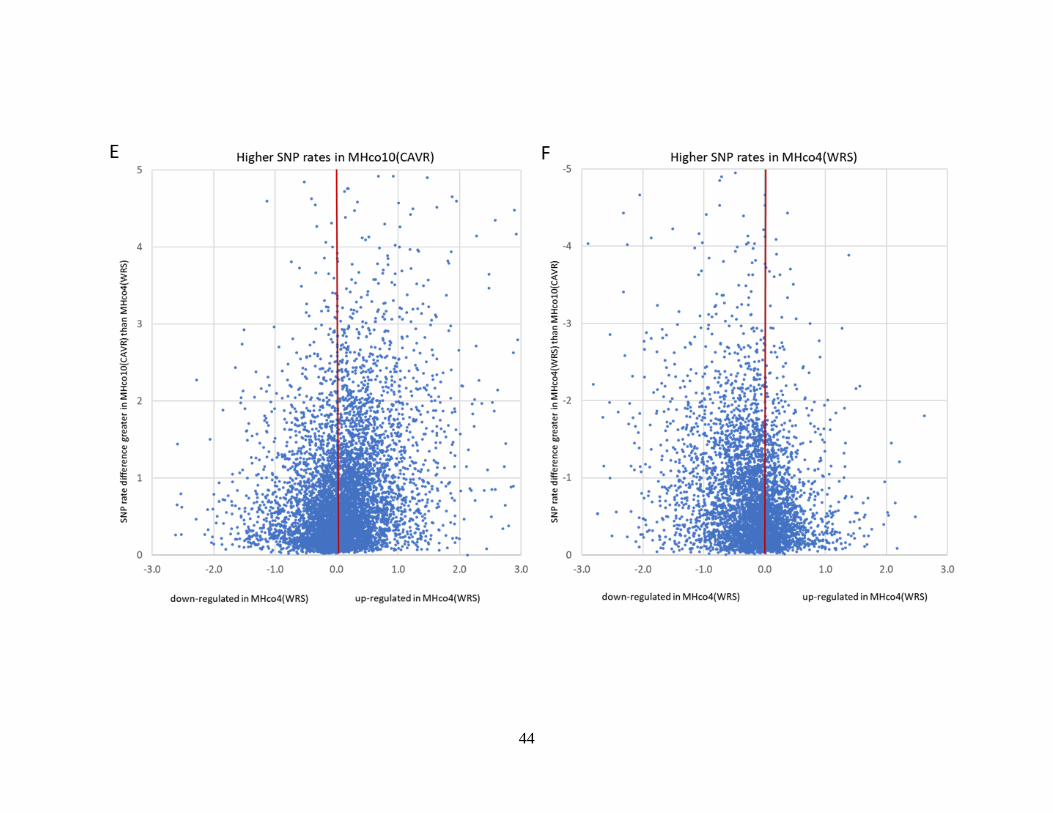
44
45
Figure 2.5. Scatter plots of the differential expression of gene models, as determined by DESeq2 (X-axis), plotted against their
difference in SNP rate percentage between the two strains being compared (Y-axis).
Gene model data points in each pairwise comparison are split into two panels, the left panel showing the gene models with higher SNP
rates in one strain of each pairwise comparison and the right panel showing the gene models with higher SNP rates in the other
pairwise strain. Panels A and B show the MHco4(WRS) vs. MHco3(ISE) comparison, panels C and D show the MHco10(CAVR) vs.
MHco3(ISE) comparison, and panels E and F show the MHco4(WRS) vs. MHco10(CAVR) comparison. The difference in the SNP
rate percentage between the two strains is shown on the y-axis and plotted against reported log2 fold-change differential expression for
each gene. The red lines represent zero differential expression.
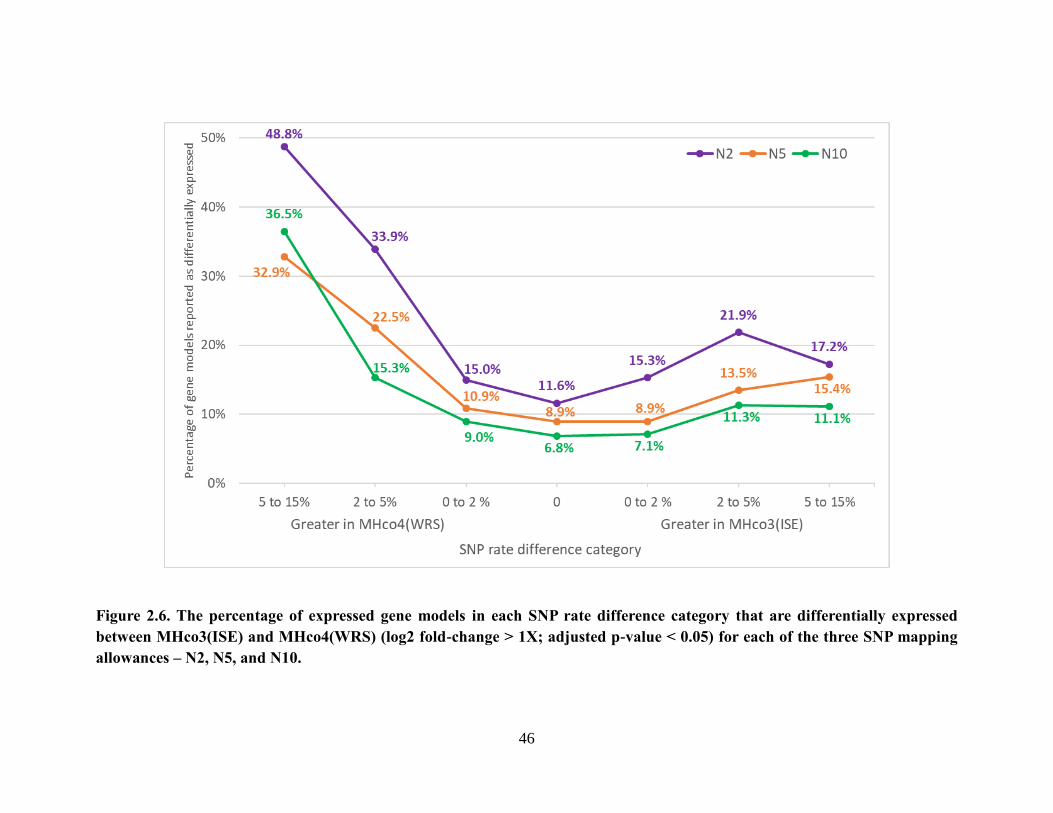
46
Figure 2.6. The percentage of expressed gene models in each SNP rate difference category that are differentially expressed
between MHco3(ISE) and MHco4(WRS) (log2 fold-change > 1X; adjusted p-value < 0.05) for each of the three SNP mapping
allowances – N2, N5, and N10.
47
and Figure 2.6). For SNP rate difference categories where the SNP rate was greater in
MHco4(WRS) than in MHco3(ISE) by at least 2%, the large majority of gene models reported as
differentially expressed were down-regulated in MHco4(WRS) relative to MHco3(ISE) (396/425
(93.2%)) (Supplementary Table 2.2). The reverse trend was true for gene models with SNP rates
at least 2% lower in MHco4(WRS) than in MHco3(ISE), the large majority of them being up-
regulated (21/27 (77.8%)) (Supplementary Table 2.2).
2.3.4 Minimizing the effect of sequence polymorphism differences on differential
expression analysis in pairwise strain comparisons.
We next investigated ways to minimize the effect of sequence polymorphism on global
transcriptomic differential expression analysis in pairwise strain comparisons. We first examined
the effect of changing the read mapping polymorphism allowance on the number and bias of the
differentially expressed genes reported by DESeq2 in pairwise strain comparisons. When the
polymorphism allowance was changed from N2 to N5 or from N5 to N10, there was an overall
decrease in the total number of differentially expressed genes reported in all three pairwise strain
comparisons (Table 2.1). This trend was generally observed for genes in all SNP rate difference
categories (see example of MHco3(ISE) vs. MHco4(WRS) pairwise comparison in Figure 2.6).
At the default N2 polymorphism allowance, DESeq2 reported more genes down-regulated than
up-regulated in both MHco4(WRS) and MHco10(CAVR) when each was compared to
MHco3(ISE) (Figure 2.7; Table 2.1). This bias was reduced as the mapping allowance was
increased to N5 and then N10 (Figure 2.7; Table 2.1). In contrast, the MHco4(WRS) and
MHco10(CAVR) pairwise comparison showed a relatively equal ratio of down-regulated and up-
regulated gene numbers even at the default N2 polymorphism allowance (Figure 2.7; Table 2.1).
We then calculated the net (overall mean) differential expression (NDE) of all gene models
in each of the seven “SNP rate difference” categories for each of the pairwise strain comparisons
to see if there was an overall directional bias to the data (data for the MHco4(WRS) and
MHco3(ISE) pairwise strain comparison is shown in Figure 2.8). The NDE in the direction
MHco4(WRS) > MHco3(ISE) was greatest for those gene models in the 5 - 15% MHco4(WRS)
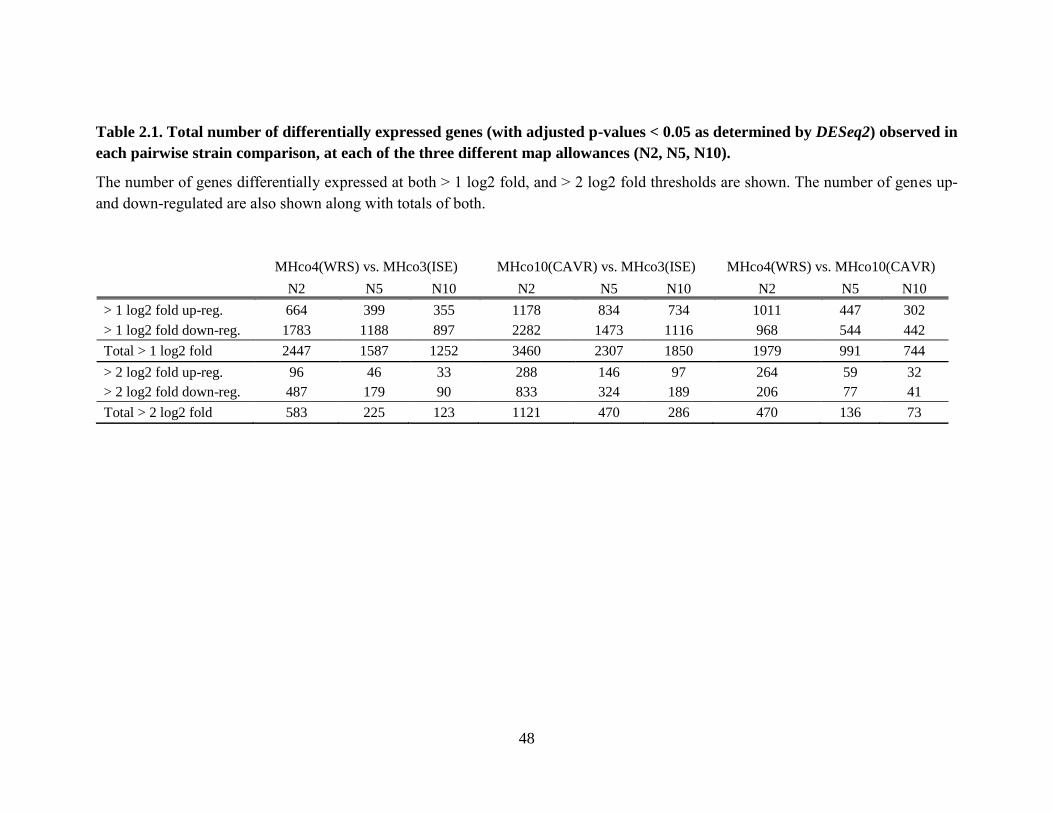
48
Table 2.1. Total number of differentially expressed genes (with adjusted p-values < 0.05 as determined by DESeq2) observed in
each pairwise strain comparison, at each of the three different map allowances (N2, N5, N10).
The number of genes differentially expressed at both > 1 log2 fold, and > 2 log2 fold thresholds are shown. The number of genes up-
and down-regulated are also shown along with totals of both.
MHco4(WRS) vs. MHco3(ISE) MHco10(CAVR) vs. MHco3(ISE) MHco4(WRS) vs. MHco10(CAVR)
N2 N5 N10 N2 N5 N10 N2 N5 N10
> 1 log2 fold up-reg. 664 399 355 1178 834 734 1011 447 302
> 1 log2 fold down-reg. 1783 1188 897 2282 1473 1116 968 544 442
Total > 1 log2 fold 2447 1587 1252 3460 2307 1850 1979 991 744
> 2 log2 fold up-reg. 96 46 33 288 146 97 264 59 32
> 2 log2 fold down-reg. 487 179 90 833 324 189 206 77 41
Total > 2 log2 fold 583 225 123 1121 470 286 470 136 73

49
Figure 2.7. Volcano plots showing differential expression of gene models at three different
SNP allowances in Tophap2’s mapping parameters (N2, N5, N10) are shown for each
pairwise strain comparison.
Log2 fold-change difference in expression from -4 to 4 is represented along the x-axis of each
chart, and DESeq2 -log10 adjusted p-values of the differential expression calls from 0 to 30 are
represented along the y-axis of each chart. Genes exceeding a maximum value on either axis are
placed at max value on that axis. Red points on the right and left sides of each plot represent
genes differentially expressed at > 1X and < -1X log2 fold-change respectively with adjusted p-
values < 0.05. Blue points represent genes significantly differentially expressed but at less than
1X log2 fold-change in either direction.
Log2 fold-change difference in expression
-4 0 4 -2 2 -4 0 4 -2 2 -4 0 4 -2 2 0
15
30
0
15
30
0
15
30
N2 N5 N10
MHco4(WRS) vs.
MHco3(ISE)
MHco10(CAVR) vs.
MHco3(ISE)
MHco4(WRS) vs.
MHco10(CAVR)
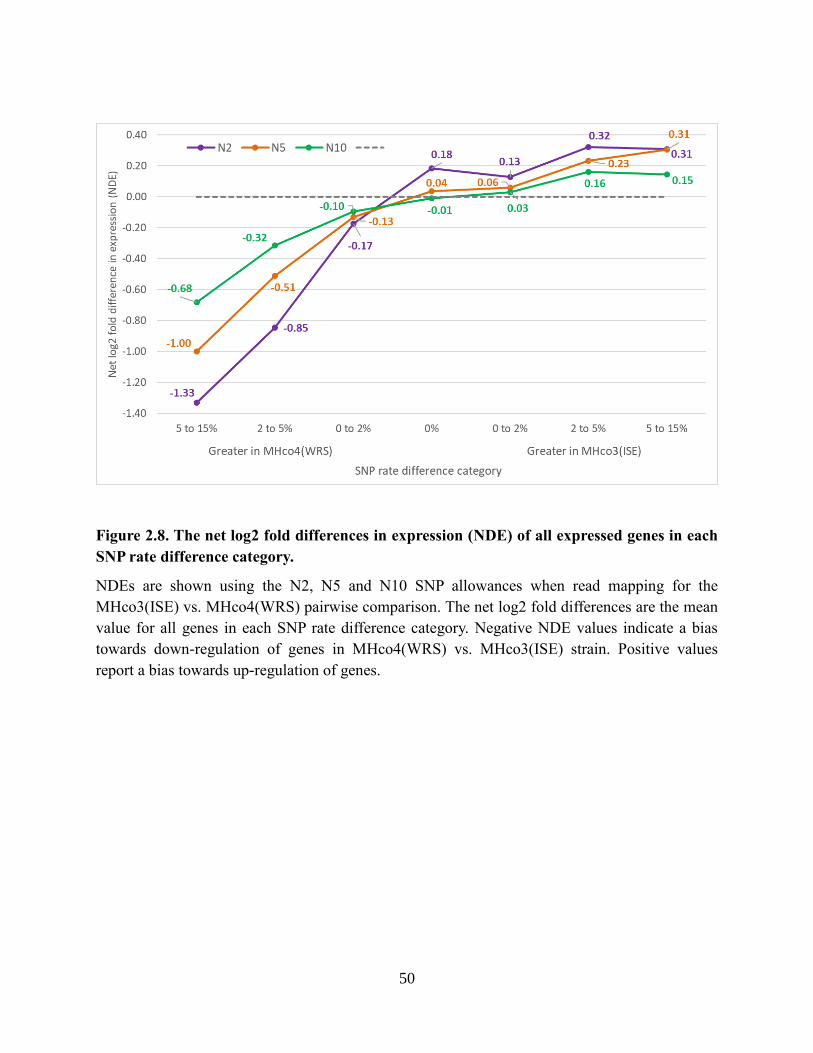
50
Figure 2.8. The net log2 fold differences in expression (NDE) of all expressed genes in each
SNP rate difference category.
NDEs are shown using the N2, N5 and N10 SNP allowances when read mapping for the
MHco3(ISE) vs. MHco4(WRS) pairwise comparison. The net log2 fold differences are the mean
value for all genes in each SNP rate difference category. Negative NDE values indicate a bias
towards down-regulation of genes in MHco4(WRS) vs. MHco3(ISE) strain. Positive values
report a bias towards up-regulation of genes.
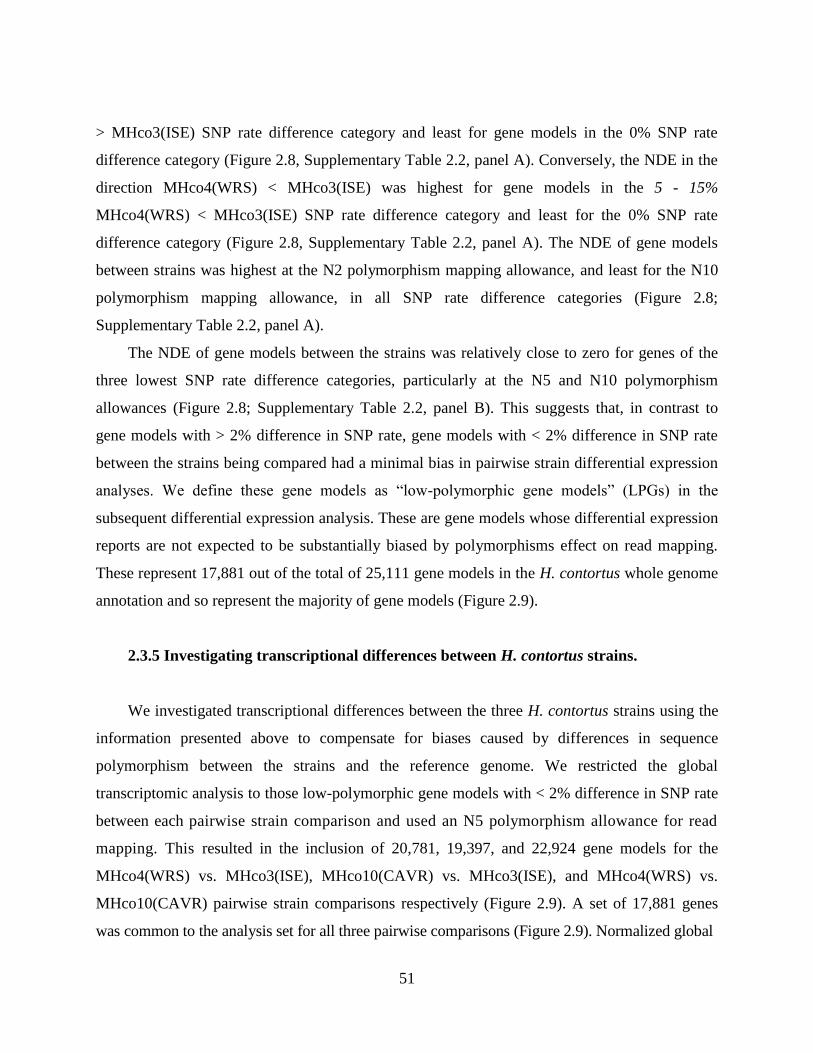
51
> MHco3(ISE) SNP rate difference category and least for gene models in the 0% SNP rate
difference category (Figure 2.8, Supplementary Table 2.2, panel A). Conversely, the NDE in the
direction MHco4(WRS) < MHco3(ISE) was highest for gene models in the 5 - 15%
MHco4(WRS) < MHco3(ISE) SNP rate difference category and least for the 0% SNP rate
difference category (Figure 2.8, Supplementary Table 2.2, panel A). The NDE of gene models
between strains was highest at the N2 polymorphism mapping allowance, and least for the N10
polymorphism mapping allowance, in all SNP rate difference categories (Figure 2.8;
Supplementary Table 2.2, panel A).
The NDE of gene models between the strains was relatively close to zero for genes of the
three lowest SNP rate difference categories, particularly at the N5 and N10 polymorphism
allowances (Figure 2.8; Supplementary Table 2.2, panel B). This suggests that, in contrast to
gene models with > 2% difference in SNP rate, gene models with < 2% difference in SNP rate
between the strains being compared had a minimal bias in pairwise strain differential expression
analyses. We define these gene models as “low-polymorphic gene models” (LPGs) in the
subsequent differential expression analysis. These are gene models whose differential expression
reports are not expected to be substantially biased by polymorphisms effect on read mapping.
These represent 17,881 out of the total of 25,111 gene models in the H. contortus whole genome
annotation and so represent the majority of gene models (Figure 2.9).
2.3.5 Investigating transcriptional differences between H. contortus strains.
We investigated transcriptional differences between the three H. contortus strains using the
information presented above to compensate for biases caused by differences in sequence
polymorphism between the strains and the reference genome. We restricted the global
transcriptomic analysis to those low-polymorphic gene models with < 2% difference in SNP rate
between each pairwise strain comparison and used an N5 polymorphism allowance for read
mapping. This resulted in the inclusion of 20,781, 19,397, and 22,924 gene models for the
MHco4(WRS) vs. MHco3(ISE), MHco10(CAVR) vs. MHco3(ISE), and MHco4(WRS) vs.
MHco10(CAVR) pairwise strain comparisons respectively (Figure 2.9). A set of 17,881 genes
was common to the analysis set for all three pairwise comparisons (Figure 2.9). Normalized global
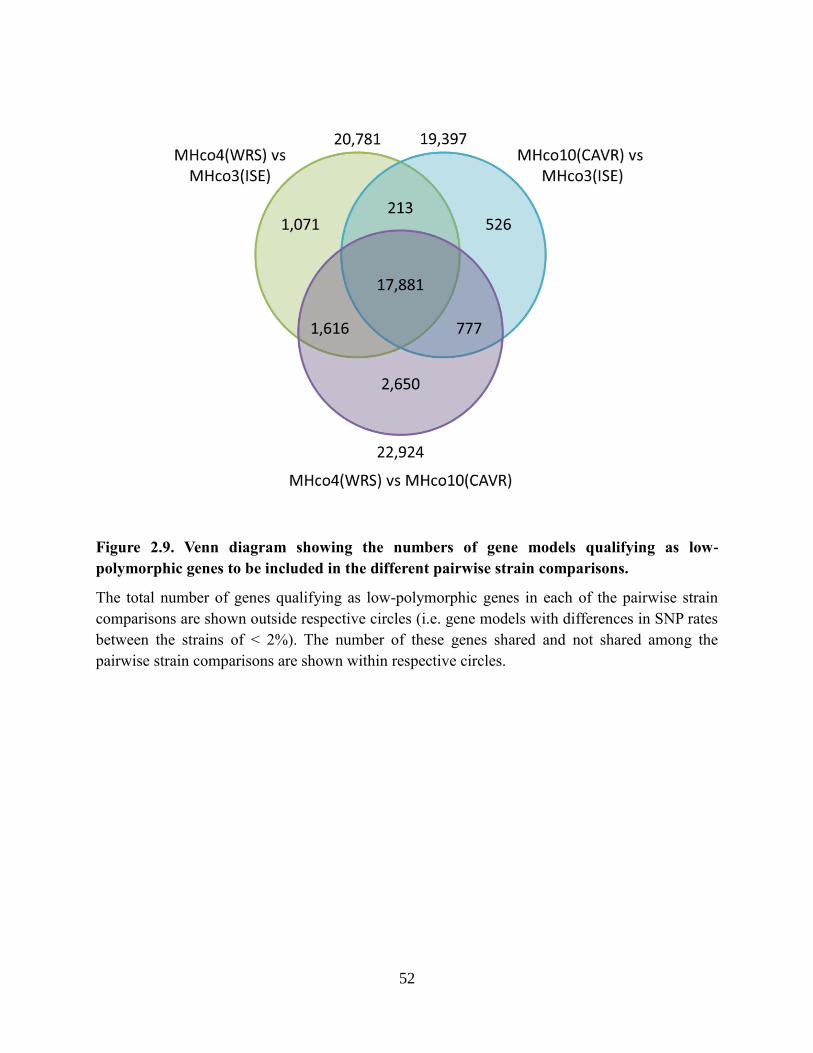
52
Figure 2.9. Venn diagram showing the numbers of gene models qualifying as low-
polymorphic genes to be included in the different pairwise strain comparisons.
The total number of genes qualifying as low-polymorphic genes in each of the pairwise strain
comparisons are shown outside respective circles (i.e. gene models with differences in SNP rates
between the strains of < 2%). The number of these genes shared and not shared among the
pairwise strain comparisons are shown within respective circles.
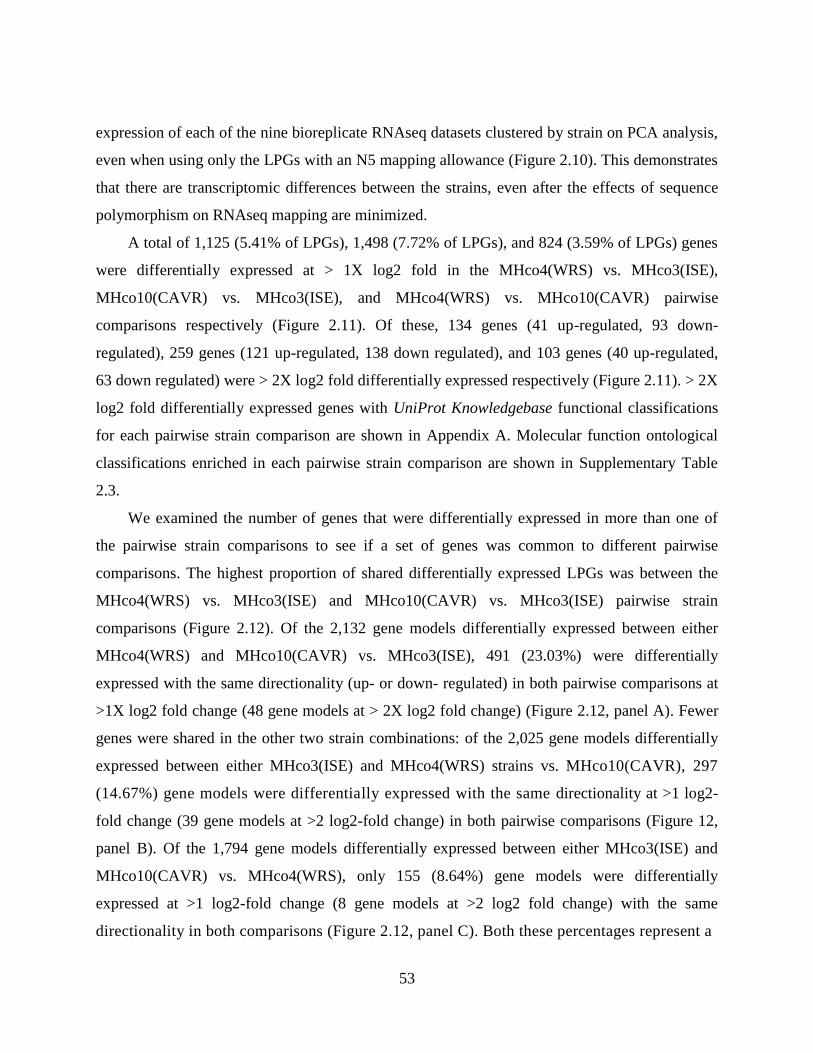
53
expression of each of the nine bioreplicate RNAseq datasets clustered by strain on PCA analysis,
even when using only the LPGs with an N5 mapping allowance (Figure 2.10). This demonstrates
that there are transcriptomic differences between the strains, even after the effects of sequence
polymorphism on RNAseq mapping are minimized.
A total of 1,125 (5.41% of LPGs), 1,498 (7.72% of LPGs), and 824 (3.59% of LPGs) genes
were differentially expressed at > 1X log2 fold in the MHco4(WRS) vs. MHco3(ISE),
MHco10(CAVR) vs. MHco3(ISE), and MHco4(WRS) vs. MHco10(CAVR) pairwise
comparisons respectively (Figure 2.11). Of these, 134 genes (41 up-regulated, 93 down-
regulated), 259 genes (121 up-regulated, 138 down regulated), and 103 genes (40 up-regulated,
63 down regulated) were > 2X log2 fold differentially expressed respectively (Figure 2.11). > 2X
log2 fold differentially expressed genes with UniProt Knowledgebase functional classifications
for each pairwise strain comparison are shown in Appendix A. Molecular function ontological
classifications enriched in each pairwise strain comparison are shown in Supplementary Table
2.3.
We examined the number of genes that were differentially expressed in more than one of
the pairwise strain comparisons to see if a set of genes was common to different pairwise
comparisons. The highest proportion of shared differentially expressed LPGs was between the
MHco4(WRS) vs. MHco3(ISE) and MHco10(CAVR) vs. MHco3(ISE) pairwise strain
comparisons (Figure 2.12). Of the 2,132 gene models differentially expressed between either
MHco4(WRS) and MHco10(CAVR) vs. MHco3(ISE), 491 (23.03%) were differentially
expressed with the same directionality (up- or down- regulated) in both pairwise comparisons at
>1X log2 fold change (48 gene models at > 2X log2 fold change) (Figure 2.12, panel A). Fewer
genes were shared in the other two strain combinations: of the 2,025 gene models differentially
expressed between either MHco3(ISE) and MHco4(WRS) strains vs. MHco10(CAVR), 297
(14.67%) gene models were differentially expressed with the same directionality at >1 log2-
fold change (39 gene models at >2 log2-fold change) in both pairwise comparisons (Figure 12,
panel B). Of the 1,794 gene models differentially expressed between either MHco3(ISE) and
MHco10(CAVR) vs. MHco4(WRS), only 155 (8.64%) gene models were differentially
expressed at >1 log2-fold change (8 gene models at >2 log2 fold change) with the same
directionality in both comparisons (Figure 2.12, panel C). Both these percentages represent a
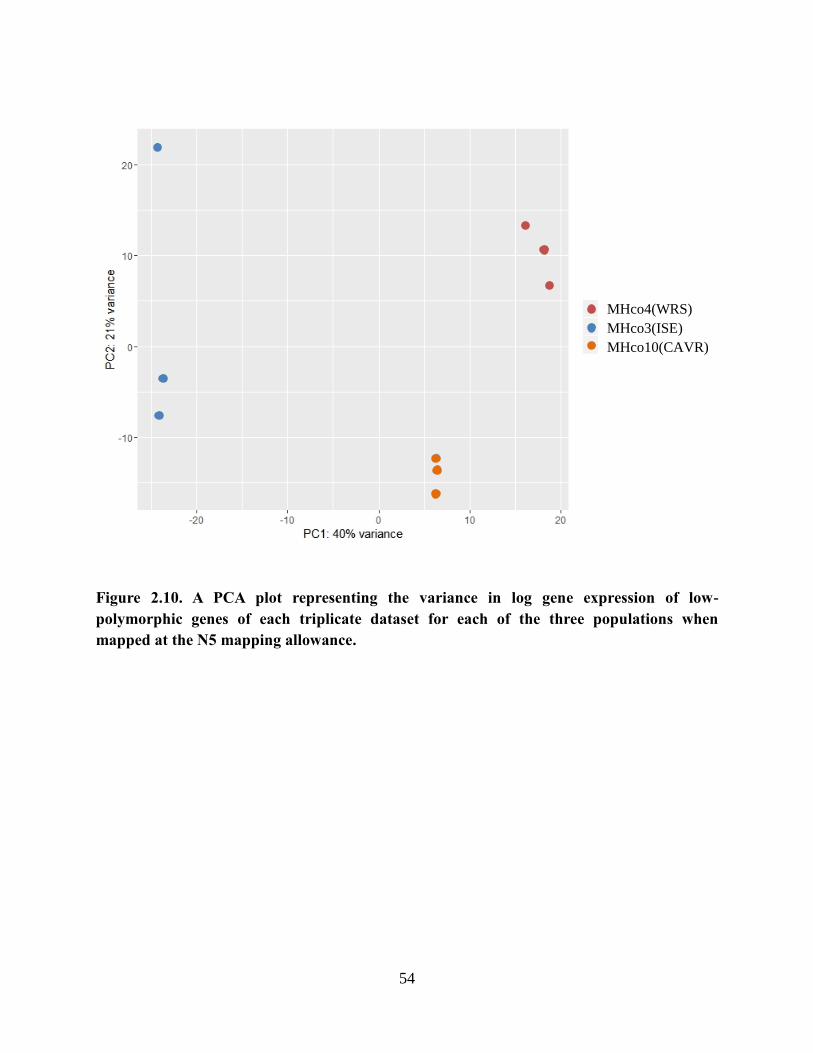
54
Figure 2.10. A PCA plot representing the variance in log gene expression of low-
polymorphic genes of each triplicate dataset for each of the three populations when
mapped at the N5 mapping allowance.
MHco4(WRS)
MHco3(ISE)
MHco10(CAVR)
55
Figure 2.11. The total number of differentially expressed low-polymorphic genes observed
in each pairwise strain comparison at the N5 mapping allowance.
Gene counts at both > 1X log2 fold-change (orange dots), and > 2X log2 fold-change (red dots)
thresholds are shown. The blue line on the y-axis represents an adjusted p-value of 0.05.
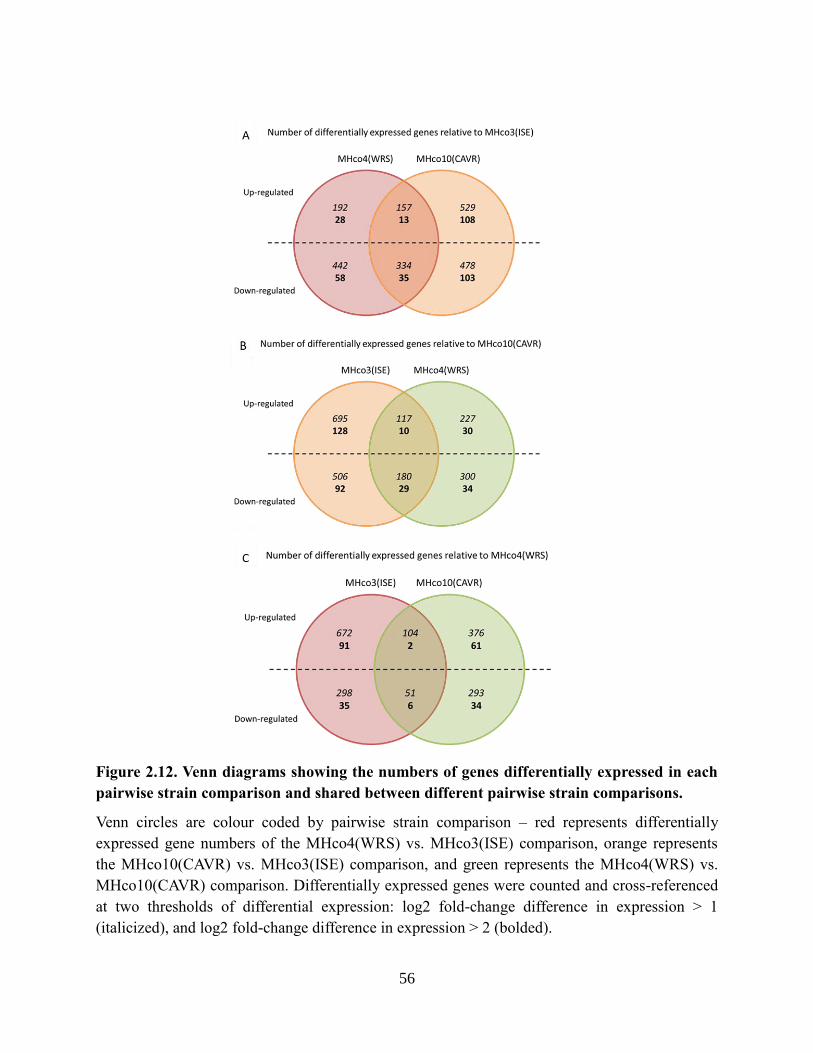
56
Figure 2.12. Venn diagrams showing the numbers of genes differentially expressed in each
pairwise strain comparison and shared between different pairwise strain comparisons.
Venn circles are colour coded by pairwise strain comparison – red represents differentially
expressed gene numbers of the MHco4(WRS) vs. MHco3(ISE) comparison, orange represents
the MHco10(CAVR) vs. MHco3(ISE) comparison, and green represents the MHco4(WRS) vs.
MHco10(CAVR) comparison. Differentially expressed genes were counted and cross-referenced
at two thresholds of differential expression: log2 fold-change difference in expression > 1
(italicized), and log2 fold-change difference in expression > 2 (bolded).
57
significantly lower proportion of differentially expressed genes shared than were observed
shared in MHco4(WRS) and MHco10(CAVR) vs. MHco3(ISE) (Z-stats = 6.8 (p < 0.000), and
12.1 (p < 0.000) respectively). UniProt Knowledgebase functional classifications of the shared
differentially expressed genes showing > 2 log2-fold differential expression between the
different sets of pairwise strain comparisons are shown in Appendix B and C. A summary of the
molecular functional gene ontological classifications (reported on the UniProt Knowledgebase
for the H. contortus gene models) enriched in each of the three pairwise strain comparisons and
shared between combinations of pairwise strain comparisons is presented in Supplementary
Table 2.3.
2.3.6 Investigating the effect of sequence polymorphism on differential expression
analysis of two gene families of relevance to ivermectin resistance research.
67 ligand-gated chloride channels (LGICs) and 86 ABC transporters identified in the published
H. contortus draft genome (Laing et al, 2013) were examined for differential expression between
the MHco4(WRS) and MHco10(CAVR) ivermectin resistant strains and the susceptible
MHco3(ISE) strain. Differential expression analysis undertaken using the default N2 SNP
allowance on all 25,111 gene models was compared to the N5 SNP allowance differential
expression analysis on all 25,111 genes, and also on the set of 17,881 low-polymorphic genes
(LPGs). 45 and 58 of the LGICs and ABC transporters qualified as LPGs respectively. There
was a substantial reduction in the total number of differentially expressed genes reported using
the N5 allowance on the LPG gene set compared with the N2 default allowance on the full gene
set (Table 2.2). The number of differentially expressed LGICs and ABC transporters first
dropped from 18 to 8, and 16 to 9 respectively in the MHco4(WRS) vs. MHco3(ISE)
comparison, and 21 to 13 and 21 to 11 in the MHco10(CAVR) vs. MHco3(ISE) comparison
respectively at N5 relative to N2 SNP allowance (Table 2.2). The number of differentially
expressed LGICs and ABC transporters was further reduced from 8 to 5, and 9 to 5 respectively
in the MHco4(WRS) vs. MHco3(ISE) comparison, and 13 to 10, and 11 to 7 respectively in the
MHco10(CAVR) vs. MHco3(ISE) comparison when limiting the analysis to the low-
polymorphic gene set at the N5 SNP allowance (Table 2.2). When comparing the two ivermectin
58
resistant strains with the ivermectin sensitive strain, only three of the low-polymorphic genes –
Hco-lgc-55, Hco-pmp-6, and Hco-lgc-44 – showed differential expression at the N5 allowance in
both the MHco4(WRS) and MHco10(CAVR) vs. MHco3(ISE) pairwise comparisons. Hco-lgc-
55 had > 2X log2 fold up-regulation in both cases (Table 2.2).
Table 2.2. Differentially expressed genes of ivermectin resistance candidate gene families,
the ligand-gated ion channels (LGICs) (panels A and B), and ABC transporters (panels C
and D).
The respective log2 fold-change differences in expression are shown for both of the ivermectin
resistant strains – MHco4(WRS) (panels A and C) and MHco10(CAVR) (panels B and D)
relative to the ivermectin susceptible reference strain – MHco3(ISE). In each panel, all genes
differentially expressed at the default N2 SNP allowance are shown (left column), at the N5 SNP
allowance (middle column), and at the N5 SNP allowance with the highly polymorphic gene set
removed (right column). The highly polymorphic genes removed from the analysis in column 3
comprise those genes with a > 2% difference in SNP rate between the two strains. Underlined N5
LPGs are those differentially expressed in both resistant strains.
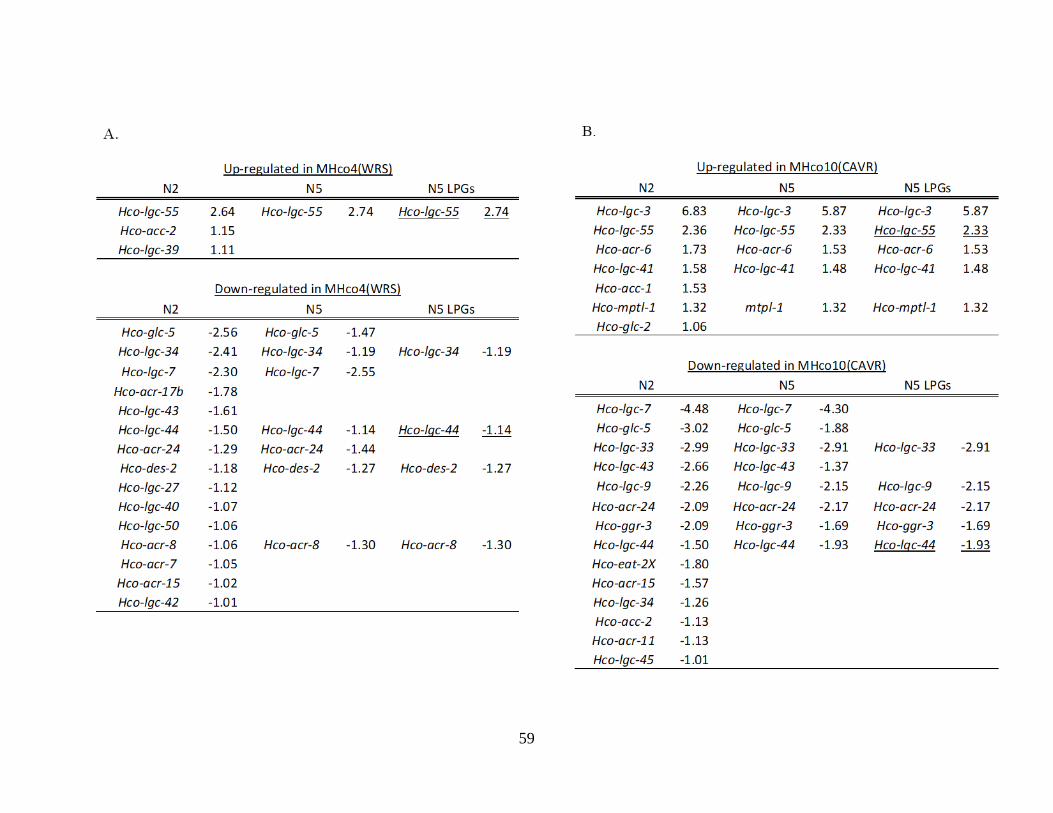
59
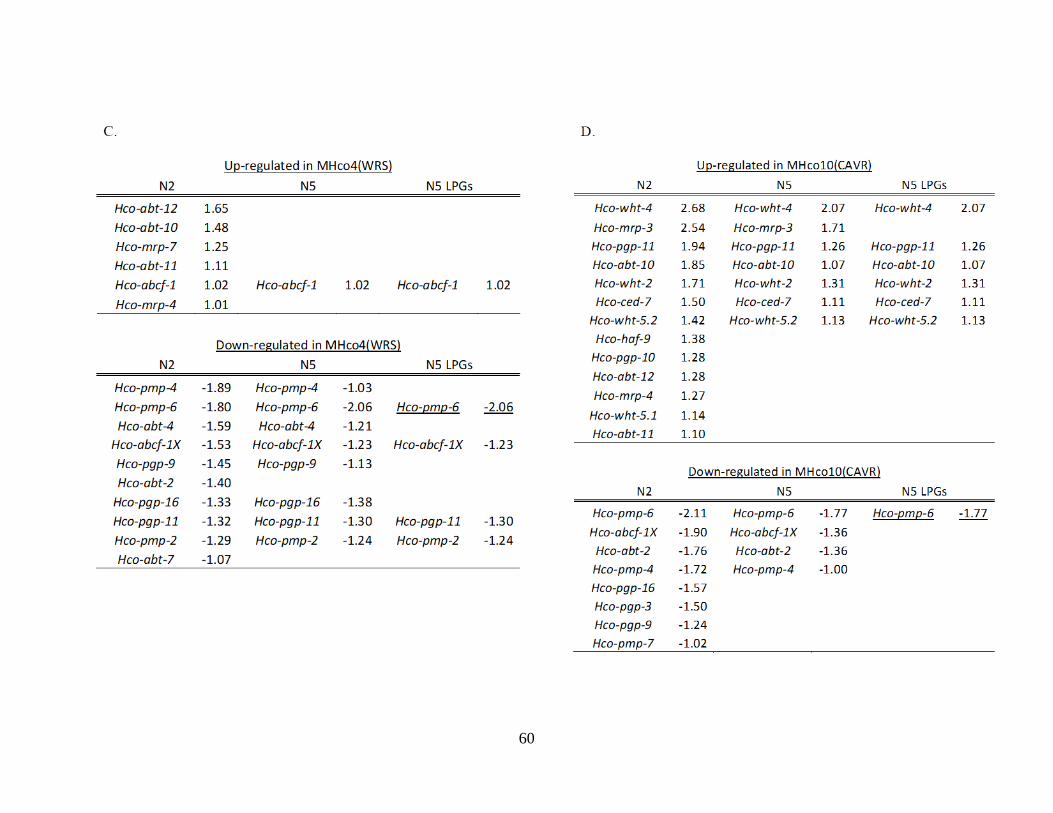
60
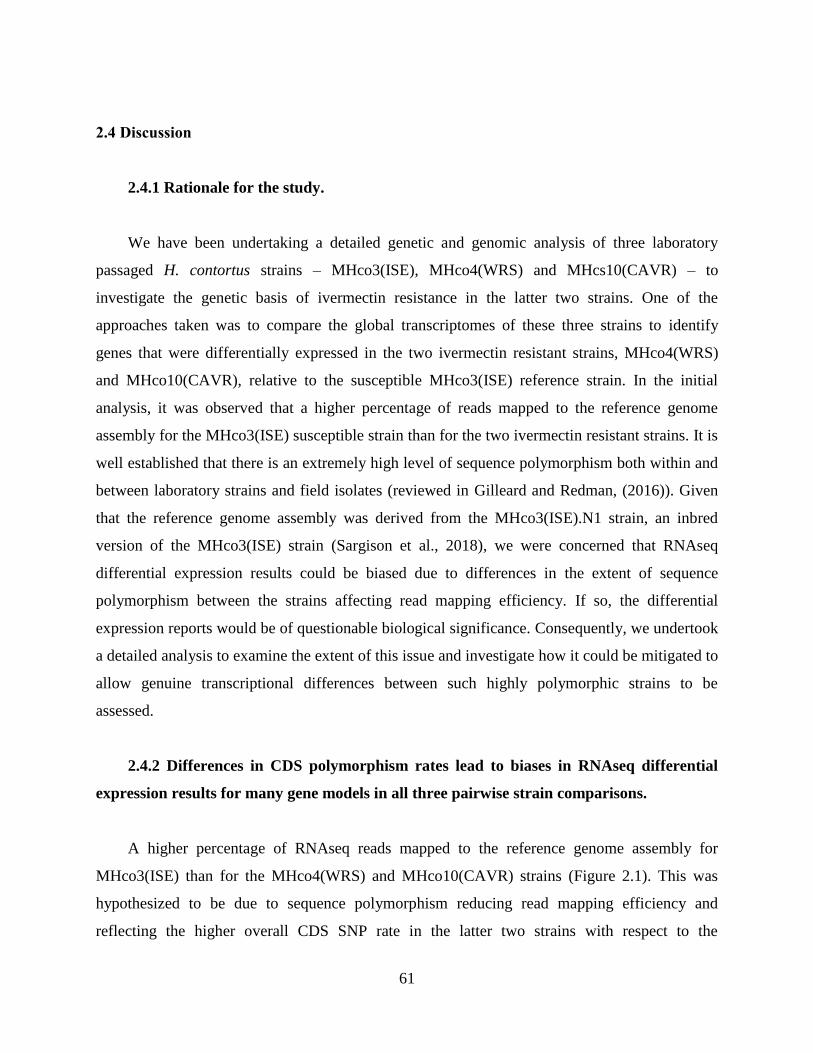
61
2.4 Discussion
2.4.1 Rationale for the study.
We have been undertaking a detailed genetic and genomic analysis of three laboratory
passaged H. contortus strains – MHco3(ISE), MHco4(WRS) and MHcs10(CAVR) – to
investigate the genetic basis of ivermectin resistance in the latter two strains. One of the
approaches taken was to compare the global transcriptomes of these three strains to identify
genes that were differentially expressed in the two ivermectin resistant strains, MHco4(WRS)
and MHco10(CAVR), relative to the susceptible MHco3(ISE) reference strain. In the initial
analysis, it was observed that a higher percentage of reads mapped to the reference genome
assembly for the MHco3(ISE) susceptible strain than for the two ivermectin resistant strains. It is
well established that there is an extremely high level of sequence polymorphism both within and
between laboratory strains and field isolates (reviewed in Gilleard and Redman, (2016)). Given
that the reference genome assembly was derived from the MHco3(ISE).N1 strain, an inbred
version of the MHco3(ISE) strain (Sargison et al., 2018), we were concerned that RNAseq
differential expression results could be biased due to differences in the extent of sequence
polymorphism between the strains affecting read mapping efficiency. If so, the differential
expression reports would be of questionable biological significance. Consequently, we undertook
a detailed analysis to examine the extent of this issue and investigate how it could be mitigated to
allow genuine transcriptional differences between such highly polymorphic strains to be
assessed.
2.4.2 Differences in CDS polymorphism rates lead to biases in RNAseq differential
expression results for many gene models in all three pairwise strain comparisons.
A higher percentage of RNAseq reads mapped to the reference genome assembly for
MHco3(ISE) than for the MHco4(WRS) and MHco10(CAVR) strains (Figure 2.1). This was
hypothesized to be due to sequence polymorphism reducing read mapping efficiency and
reflecting the higher overall CDS SNP rate in the latter two strains with respect to the
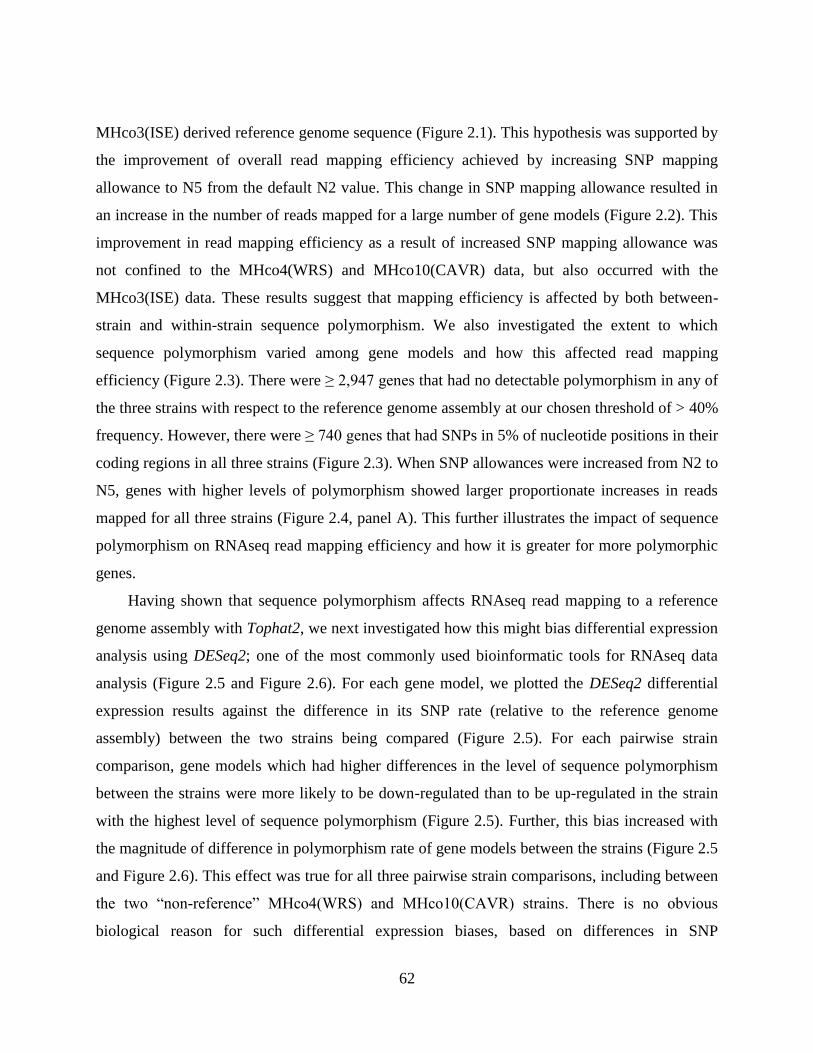
62
MHco3(ISE) derived reference genome sequence (Figure 2.1). This hypothesis was supported by
the improvement of overall read mapping efficiency achieved by increasing SNP mapping
allowance to N5 from the default N2 value. This change in SNP mapping allowance resulted in
an increase in the number of reads mapped for a large number of gene models (Figure 2.2). This
improvement in read mapping efficiency as a result of increased SNP mapping allowance was
not confined to the MHco4(WRS) and MHco10(CAVR) data, but also occurred with the
MHco3(ISE) data. These results suggest that mapping efficiency is affected by both between-
strain and within-strain sequence polymorphism. We also investigated the extent to which
sequence polymorphism varied among gene models and how this affected read mapping
efficiency (Figure 2.3). There were ≥ 2,947 genes that had no detectable polymorphism in any of
the three strains with respect to the reference genome assembly at our chosen threshold of > 40%
frequency. However, there were ≥ 740 genes that had SNPs in 5% of nucleotide positions in their
coding regions in all three strains (Figure 2.3). When SNP allowances were increased from N2 to
N5, genes with higher levels of polymorphism showed larger proportionate increases in reads
mapped for all three strains (Figure 2.4, panel A). This further illustrates the impact of sequence
polymorphism on RNAseq read mapping efficiency and how it is greater for more polymorphic
genes.
Having shown that sequence polymorphism affects RNAseq read mapping to a reference
genome assembly with Tophat2, we next investigated how this might bias differential expression
analysis using DESeq2; one of the most commonly used bioinformatic tools for RNAseq data
analysis (Figure 2.5 and Figure 2.6). For each gene model, we plotted the DESeq2 differential
expression results against the difference in its SNP rate (relative to the reference genome
assembly) between the two strains being compared (Figure 2.5). For each pairwise strain
comparison, gene models which had higher differences in the level of sequence polymorphism
between the strains were more likely to be down-regulated than to be up-regulated in the strain
with the highest level of sequence polymorphism (Figure 2.5). Further, this bias increased with
the magnitude of difference in polymorphism rate of gene models between the strains (Figure 2.5
and Figure 2.6). This effect was true for all three pairwise strain comparisons, including between
the two “non-reference” MHco4(WRS) and MHco10(CAVR) strains. There is no obvious
biological reason for such differential expression biases, based on differences in SNP
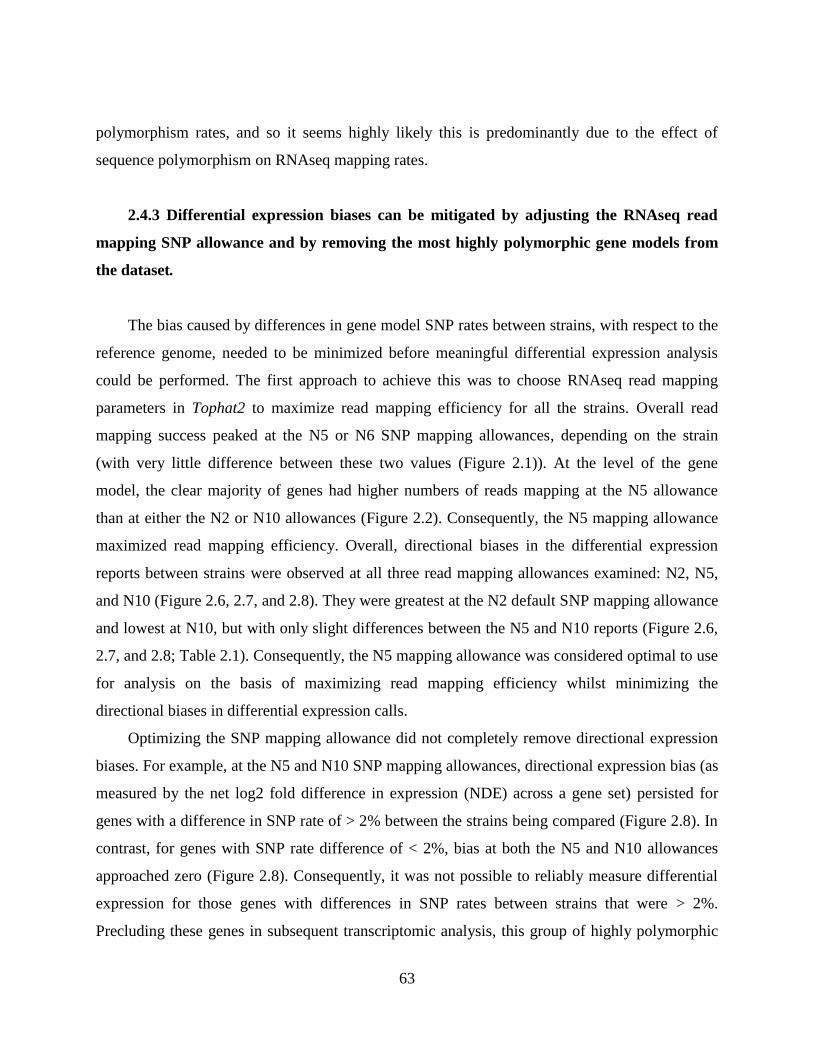
63
polymorphism rates, and so it seems highly likely this is predominantly due to the effect of
sequence polymorphism on RNAseq mapping rates.
2.4.3 Differential expression biases can be mitigated by adjusting the RNAseq read
mapping SNP allowance and by removing the most highly polymorphic gene models from
the dataset.
The bias caused by differences in gene model SNP rates between strains, with respect to the
reference genome, needed to be minimized before meaningful differential expression analysis
could be performed. The first approach to achieve this was to choose RNAseq read mapping
parameters in Tophat2 to maximize read mapping efficiency for all the strains. Overall read
mapping success peaked at the N5 or N6 SNP mapping allowances, depending on the strain
(with very little difference between these two values (Figure 2.1)). At the level of the gene
model, the clear majority of genes had higher numbers of reads mapping at the N5 allowance
than at either the N2 or N10 allowances (Figure 2.2). Consequently, the N5 mapping allowance
maximized read mapping efficiency. Overall, directional biases in the differential expression
reports between strains were observed at all three read mapping allowances examined: N2, N5,
and N10 (Figure 2.6, 2.7, and 2.8). They were greatest at the N2 default SNP mapping allowance
and lowest at N10, but with only slight differences between the N5 and N10 reports (Figure 2.6,
2.7, and 2.8; Table 2.1). Consequently, the N5 mapping allowance was considered optimal to use
for analysis on the basis of maximizing read mapping efficiency whilst minimizing the
directional biases in differential expression calls.
Optimizing the SNP mapping allowance did not completely remove directional expression
biases. For example, at the N5 and N10 SNP mapping allowances, directional expression bias (as
measured by the net log2 fold difference in expression (NDE) across a gene set) persisted for
genes with a difference in SNP rate of > 2% between the strains being compared (Figure 2.8). In
contrast, for genes with SNP rate difference of < 2%, bias at both the N5 and N10 allowances
approached zero (Figure 2.8). Consequently, it was not possible to reliably measure differential
expression for those genes with differences in SNP rates between strains that were > 2%.
Precluding these genes in subsequent transcriptomic analysis, this group of highly polymorphic

64
genes represented a minority of the gene models in the dataset, with 17,881 (71.2%) of gene
models qualified as low-polymorphic genes in all three pairwise strains comparisons (Figure
2.9).
These results have important implications for RNAseq based studies that examine
transcriptional differences between different strains or isolates of organisms, particularly for
those with high levels of genetic diversity. An evaluation of genetic diversity within and between
strains being compared, relative to the reference genome used for mapping, is recommended
before RNAseq data analysis is performed. This should include an assessment of the parameter
settings, particularly the sequence polymorphism allowances of the analysis software used, and
how these affect mapping efficiencies and overall biases in the differential expression results. In
addition, it may be necessary to exclude a minority of highly polymorphic genes from the
analysis to produce reliable differential expression datasets. Addressing the potential effect of
genetic polymorphism on differential expression reporting should be considered best practice in
RNAseq studies, in addition to more commonly considered aspects such as sample and library
preparation, and replications and controls.
2.4.4 Many genes are differentially expressed between the genetically divergent H.
contortus strains.
Pairwise comparisons of three genetically divergent strains of H. contortus revealed large
numbers of differentially expressed genes, even after the confounding effects of sequence
polymorphism were removed (Figure 2.11; Appendix A and Appendix D). The proportion of
differentially expressed genes between the H. contortus strains far exceed those previously
observed in inter-population studies of vertebrate species such as human and mouse (Bottomly et
al., 2011; Li et al., 2014), and it is greater than has been reported between different strains of C.
elegans (N2/Bristol and CB4856/Hawaiian strains) (Capra et al., 2008; Francesconi and Lehner,
2014).
This large number of differentially expressed genes between H. contortus strains reflects the
high genetic diversity of this parasitic nematode and of these particular strains. MHco3(ISE),
MHco4(WRS), and MHco10(CAVR) are derived from field isolates obtained from different
65
continents and are highly genetically divergent (Gilleard and Redman, 2016; Redman et al.,
2012, 2008b). For example, the levels of genetic diversity (Fst values) between strains based on
microsatellite genotyping ranged from 0.1530 to 0.2696 which is as high or higher than some
closely related species in some cases (Prado-Martinez et al., 2013; Redman et al., 2008b;
Romiguier et al., 2014). Further, although the nematode body plan is by comparison simple, a
variety of morphological and morphometric traits vary between these three strains, including
vulval morphology, oesophagus length, and spicule length in males as well as the extent of the
synlophe cuticular ridges in females (Gilleard and Redman, (2016); and Hoberg, E., Redman, E.,
Gilleard, J., unpublished data). Also, there is evidence of lethality of some hybrid progeny
resulting from experimental dual infections between MHco3(ISE) and MHco10(CAVR), and
MHco4(WRS) and MHco10(CAVR) (Sargison, N., Redman E., Gilleard, J., Manuscript in
preparation). Consequently, it is perhaps unsurprising that there are such large differences in the
transcriptomes of these three strains. H. contortus field isolates from within the same region or
country are generally less genetically divergent than the three strains examined here (Chaudhry
et al., 2015; Gilleard and Redman, 2016; Redman et al., 2015). One would predict fewer
transcriptomic differences between more geographically related isolates. Nevertheless, the
results presented here emphasize the need to be aware that different H. contortus isolates and
strains may have many different phenotypic traits which could have a variety of implications for
their life history traits, epidemiology, pathogenicity, and susceptibility to drugs and/or vaccines.
2.4.5 Implications for anthelmintic resistance research.
The results of this study have important implications for anthelmintic resistance research
which, until very recently, has been dominated by candidate gene studies (Gilleard, 2013, 2006;
Rezansoff et al., 2016). In the case of ivermectin resistance, such studies have failed to identify
the key loci or genes involved in resistance for any parasitic nematode, including H. contortus
(Gilleard, 2013). One common component of candidate gene studies has been to compare the
expression levels of specific candidate genes between a small number of ivermectin resistant and
susceptible parasite strains (Dicker et al., 2011; El-Abdellati et al., 2011; Williamson et al., 2011;
Xu et al., 1998). It is common for such studies to report differences in expression between
66
resistant and susceptible strains for candidate genes such as P-glycoproteins (PGPs) or ligand-
gated ion channels (LGICs). These differences are commonly used as circumstantial evidence for
a role in resistance. Our results show that many genes are differentially expressed in pairwise
comparisons of genetically divergent H. contortus strains (Figure 2.11). Indeed, 824 - 1,498 low-
polymorphic genes were differentially expressed between the strains in the study at a level of 2-
fold and an adjusted statistical significance of p < 0.05 (as called by DESeq2). This highlights the
inherently high levels of “background” transcriptomic variation that occur between H. contortus
strains. Consequently, care must be taken when interpreting a suggested association of
differential expression of a gene with a drug resistance phenotype when a small number of genes
are compared between a small number of drug resistant and susceptible strains. This is
particularly the case when the degree of genetic differentiation or the general level of
transcriptomic difference that exists between the strains has not been assessed.
Recently, studies analyzing the expression of small numbers of candidate genes are being
replaced with more global transcriptomic studies. The draft H. contortus genome and its recent
improvement into a chromosomal level assembly is making such studies increasingly feasible on
a genome-wide scale (Doyle et al., 2018; Laing et al., 2013). The work presented here has
important implications for global transcriptomic comparisons of drug resistant and susceptible
strains. A combination of computational genome annotation with the program Augustus (Stanke
and Morgenstern, 2005), and manual curation involving comparative analysis with the well
annotated C. elegans genome for select gene families, has provided the first draft annotation of
the H. contortus genome (Laing et al., 2013). Two gene families often suggested to be involved
in ivermectin resistance are the LGICs and ABC transporter genes (Laing et al., 2013). We used
corresponding gene models in the H. contortus draft annotation to assess how many members of
these gene families were differentially expressed between the Mhco4(WRS) and
MHco10(CAVR) ivermectin resistant strains and the MHco3(ISE) susceptible strain using the
default polymorphism allowance (N2), the optimized polymorphism allowance (N5), and the
polymorphism allowance (N5) but removing the highly polymorphic gene set (Table 2.2). We
showed a dramatic reduction in the number of members of these genes families that were
determined to be differentially expressed when polymorphism allowance was increased to the
67
optimal N5 allowance (Table 2.2). A further reduction was apparent when the most highly
polymorphic genes were discarded from the analysis (Table 2.2).
These results first highlight the high number of differentially expressed genes that can exist
between H. contortus strains even at the specific level of a gene family of interest. They also
highlight the fact that a substantial number of such reports are likely to be artifacts related to
differences in the levels of sequence polymorphism of particular candidate genes between the
strains being compared. In the case of this analysis, adjustment of SNP mapping allowance and
discarding highly polymorphic genes reveals a smaller number of candidate genes that are
perhaps worthy of further investigation. The ABC transporter Hco-pmp-6, and two LGICs –
Hco-lgc-55 and Hco-lgc-44 – were differentially expressed with the same directionality in both
ivermectin resistant strains relative to the MHco3(ISE) strain. Hco-lgc-55 is a tyramine-gated
chloride channel whose C. elegans homologue Cel-lgc-55 is expressed in the pharynx and is
involved in worm motility (Rao et al., 2010; Ringstad et al., 2009). The ABC transporter Hco-
wht-4, and the LGICs Hco-lgc-3, Hco-lgc-33, Hco-lgc-9, and Hco-acr-24 were other genes with
a > 2X log2 fold-change differential expression in the MHco10(CAVR) strain, although these
genes were not differentially expressed in the other resistant strain, MHco4(WRS). Hco-lgc-3
was the gene with the highest level of up-regulation across both these gene families, being
differentially expressed at greater than 50-fold in MHco3(CAVR) relative to MHco3(ISE) (Table
2.2). The gene may be considered of interest given its homology to a paralogous pair of C.
elegans proton-gated ion channels, Cel-pbo-5 and Cel-pbo-6, which are required for normal
posterior muscle function (Beg et al., 2008). However, further functional and genetic studies are
required before making any inferences of the potential role of these genes in mediating the
ivermectin resistance phenotype of H. contortus.
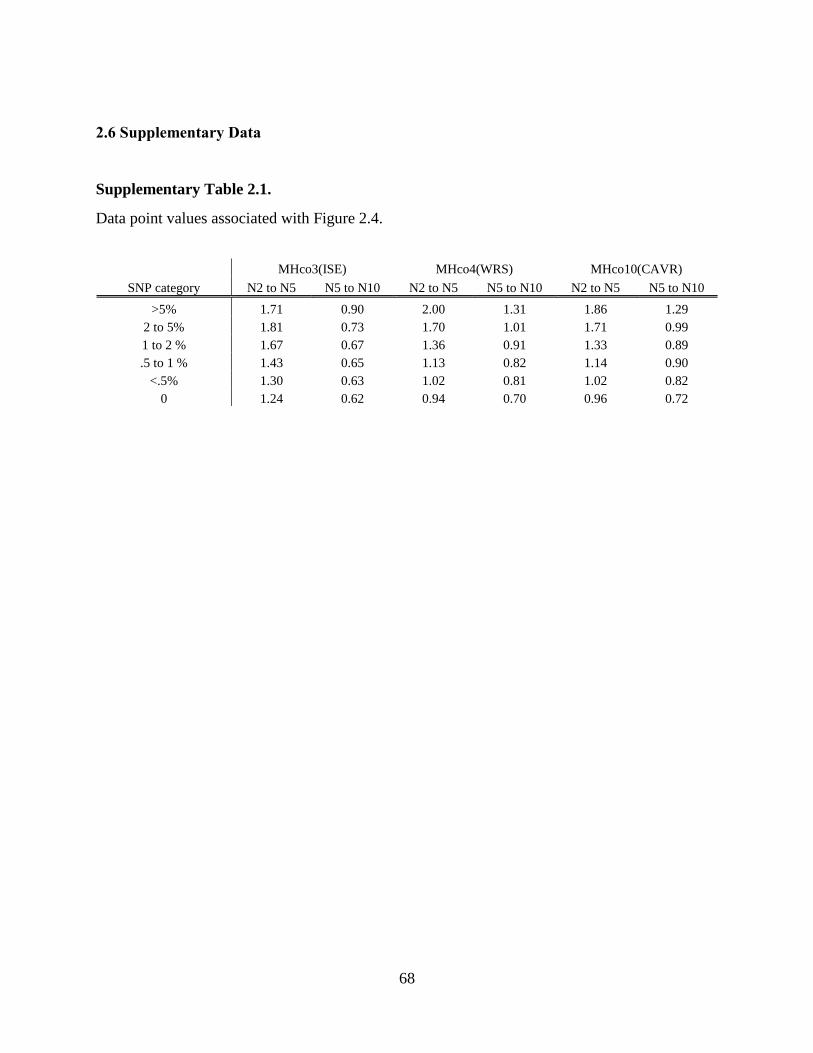
68
2.6 Supplementary Data
Supplementary Table 2.1.
Data point values associated with Figure 2.4.
MHco3(ISE) MHco4(WRS) MHco10(CAVR)
SNP category N2 to N5 N5 to N10 N2 to N5 N5 to N10 N2 to N5 N5 to N10
>5% 1.71 0.90 2.00 1.31 1.86 1.29
2 to 5% 1.81 0.73 1.70 1.01 1.71 0.99
1 to 2 % 1.67 0.67 1.36 0.91 1.33 0.89
.5 to 1 % 1.43 0.65 1.13 0.82 1.14 0.90
<.5% 1.30 0.63 1.02 0.81 1.02 0.82
0 1.24 0.62 0.94 0.70 0.96 0.72
69
Supplementary Table 2.2.
A) Genes were classified based on their SNP rate difference in MHco4(WRS) relative to MHco3(ISE). Genes were grouped into seven
SNP rate difference categories from extreme rates of 5 to 15% in both directions, to genes showing SNP rate differences of zero. The
total number of genes, and the numbers within this total classified by DESeq2 as: unexpressed, showing low counts, and the number
expressed are shown for genes of each SNP rate difference category at SNP mapping allowances N2, N5, N10. Of expressed genes,
the number of genes showing no differential expression (DE) in MHco4(WRS) vs. MHco3(ISE), and the number of genes
differentially expressed in each of five different magnitudes - from > log2 2X fold-change up-regulated, to > log2 2X fold-change
down-regulated - are shown. The mean (net) log2 fold-difference in expression (NDE), representing the average of difference in
expression values of all expressed genes in each SNP rate difference category are shown at all SNP mapping allowances N2, N5, N10.
B) Compiled numbers for genes of all categories are shown, contrasted by compiled numbers for genes of only the low-polymorphic
gene categories, i.e. both 0 to 2% categories and the 0% category.
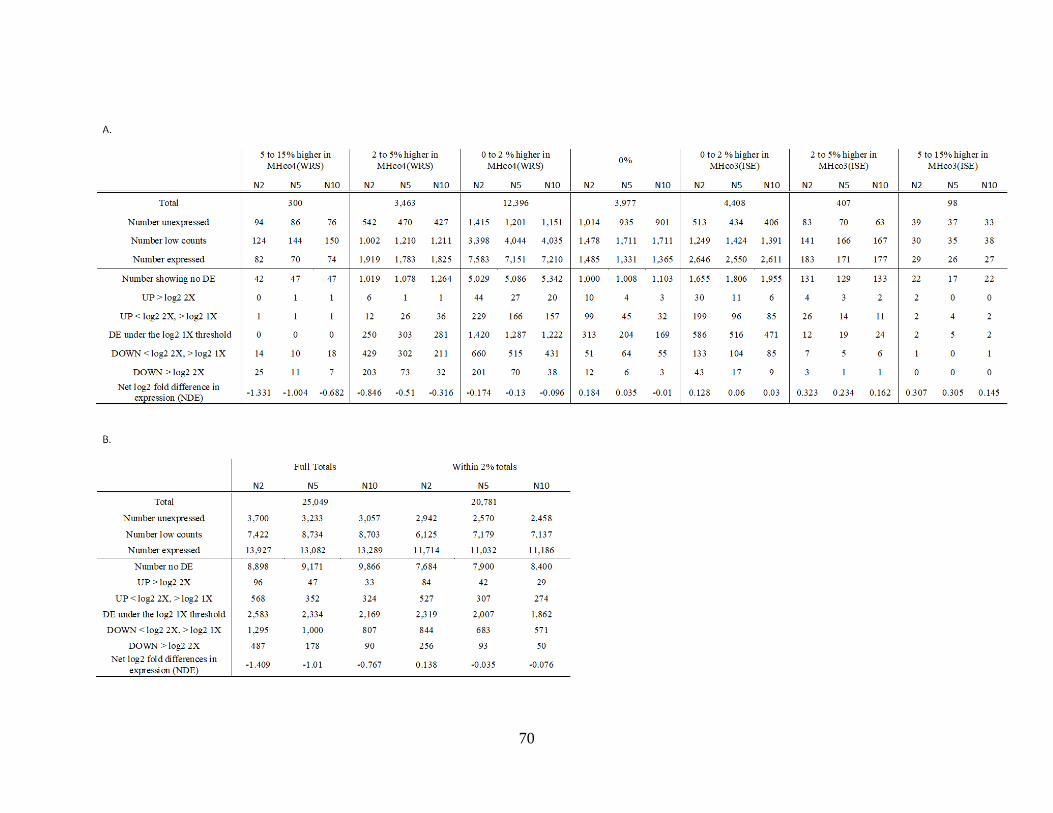
70
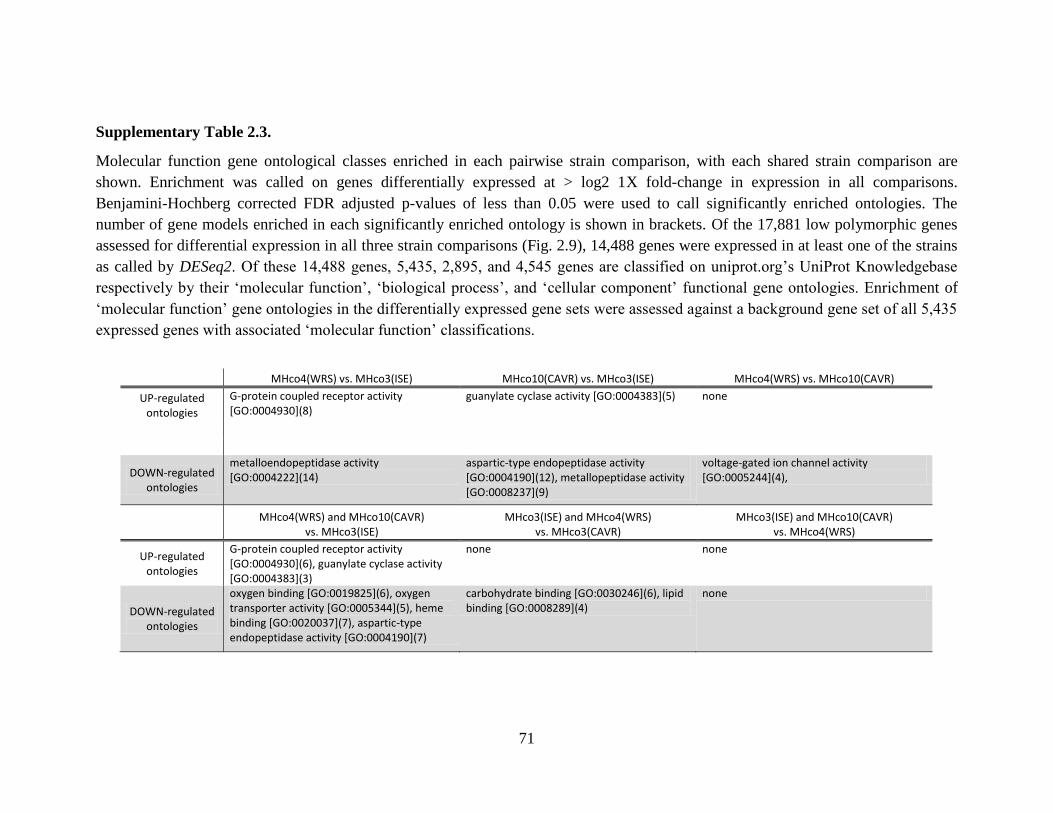
71
Supplementary Table 2.3.
Molecular function gene ontological classes enriched in each pairwise strain comparison, with each shared strain comparison are
shown. Enrichment was called on genes differentially expressed at > log2 1X fold-change in expression in all comparisons.
Benjamini-Hochberg corrected FDR adjusted p-values of less than 0.05 were used to call significantly enriched ontologies. The
number of gene models enriched in each significantly enriched ontology is shown in brackets. Of the 17,881 low polymorphic genes
assessed for differential expression in all three strain comparisons (Fig. 2.9), 14,488 genes were expressed in at least one of the strains
as called by DESeq2. Of these 14,488 genes, 5,435, 2,895, and 4,545 genes are classified on uniprot.org’s UniProt Knowledgebase
respectively by their ‘molecular function’, ‘biological process’, and ‘cellular component’ functional gene ontologies. Enrichment of
‘molecular function’ gene ontologies in the differentially expressed gene sets were assessed against a background gene set of all 5,435
expressed genes with associated ‘molecular function’ classifications.
MHco4(WRS) vs. MHco3(ISE) MHco10(CAVR) vs. MHco3(ISE) MHco4(WRS) vs. MHco10(CAVR)
UP-regulated ontologies
G-protein coupled receptor activity [GO:0004930](8)
guanylate cyclase activity [GO:0004383](5) none
DOWN-regulated ontologies
metalloendopeptidase activity [GO:0004222](14)
aspartic-type endopeptidase activity [GO:0004190](12), metallopeptidase activity [GO:0008237](9)
voltage-gated ion channel activity [GO:0005244](4),
MHco4(WRS) and MHco10(CAVR)
vs. MHco3(ISE) MHco3(ISE) and MHco4(WRS)
vs. MHco3(CAVR) MHco3(ISE) and MHco10(CAVR)
vs. MHco4(WRS)
UP-regulated ontologies
G-protein coupled receptor activity [GO:0004930](6), guanylate cyclase activity [GO:0004383](3)
none none
DOWN-regulated ontologies
oxygen binding [GO:0019825](6), oxygen transporter activity [GO:0005344](5), heme binding [GO:0020037](7), aspartic-type endopeptidase activity [GO:0004190](7)
carbohydrate binding [GO:0030246](6), lipid binding [GO:0008289](4)
none

72
Chapter Three: Evidence from Two Independent Backcross Experiments Supports Genetic
Linkage of Microsatellite Hcms8a20, but not Other Candidate Loci, to a Major Ivermectin
Resistance Locus in H. contortus
73
Abstract
Haemonchus contortus is the leading parasitic nematode species used to study anthelmintic
drug resistance. A variety of candidate loci have been implicated as being associated with
ivermectin resistance in this parasite but definitive evidence of their importance is still lacking.
We have previously performed two independent serial backcross experiments to introgress
ivermectin resistance loci from two H. contortus ivermectin resistant strains – MHco4(WRS) and
MHco10(CAVR) – into the genetic background of the ivermectin susceptible genome reference
strain MHco3(ISE). We have interrogated a number of candidate ivermectin resistance loci in the
resulting backcross populations and assessed the evidence for their genetic linkage to an
ivermectin resistance locus. These include the microsatellite marker Hcms8a20 and six candidate
genes Hco-glc-5, Hco-avr-14, Hco-lgc-37 (previously designated Hco-hg-1), Hco-pgp-9
(previously designated Hco-pgp-1), Hco-pgp-2, and Hco-dyf-7. We have sampled the haplotype
diversity of amplicon markers within, or adjacent to, each of these loci in the parental strains and
4th generation backcross populations to assess the evidence for haplotype introgression from the
resistant parental strain into the genomic background of the susceptible parental strain in each
backcross. The microsatellite Hcms8a20 locus showed strong evidence of such introgression in
both independent backcrosses suggesting it is linked to an important ivermectin resistance
mutation in both the MHco4(WRS) and MHco10(CAVR) strains. In contrast, Hco-glc-5, Hco-
avr-14, Hco-pgp-9, and Hco-dyf-7 showed no evidence of introgression in either backcross. Hco-
lgc-37 and Hco-pgp-2 showed only weak evidence of introgression in the MHco3/4 backcross
but not in the MHco3/10 backcross. Overall, these results suggest that microsatellite marker
Hcms8a20, but not the other candidate genes tested, is linked to a major ivermectin resistance
locus in the MHco4(WRS) and MHco10(CAVR) strains. This work also emphasizes the need for
genome-wide approaches to identify mutations responsible for the ivermectin resistance in this
parasite.

74
3.1 Introduction
Identifying genetic markers of anthelmintic resistance is a key research priority in order to
provide tools to monitor and manage its emergence and spread (James et al., 2009; Beech et al.,
2011). Anthelmintic resistance is widespread in Haemonchus contortus, a parasitic nematode of
small ruminants that has been a leading model for the study of resistance to ivermectin, one of
the most important drugs used in human and animal helminth control (Gilleard, 2013; Kaplan
and Vidyashankar, 2012). There have been many efforts over the last two decades to test specific
candidate genes for associations with ivermectin resistance in H. contortus (Gilleard, 2013).
These candidate genes have been chosen largely on the basis of having potential roles as drug
targets or in drug efflux (Gilleard, 2006; Gilleard and Beech, 2007). Although evidence of
selection by ivermectin treatment has been suggested for a number of such loci, their roles in
resistance have not yet been conclusively demonstrated (Gilleard, 2006; Gilleard and Beech,
2007).
In the study presented here, we examine seven genetic loci previously suggested to be
associated with ivermectin resistance in H. contortus; a microsatellite marker Hcms8a20 and six
candidate genes Hco-avr-14, Hco-glc-5, Hco-lgc-37, Hco-pgp-9, Hco-pgp-2 and Hco-dyf-7. For
each of these loci, we have investigated evidence for genetic linkage to a major ivermectin
resistance locus in two ivermectin resistant strains; MHco4(WRS) and MHco10(CAVR). These
strains are commonly used in resistance studies and were originally derived as field populations
from different continents (Redman et al., 2008b). We have used two previously characterised
ivermectin resistant H. contortus populations - MHco3/4.BC and MHco3/10.BC - that were
independently derived by serial backcrossing of the MHco4(WRS) and MHco10(CAVR)
resistant strains against the MHco3(ISE) susceptible strain respectively (Redman et al., 2012).
For each of the candidate loci, we have evaluated the evidence for introgression of haplotypes
from the resistant parental strains into the 4th generation backcross populations in order to
determine whether they are located in a region of the genome linked to a major ivermectin
resistance locus (Redman et al., 2012).
The basis on which each of the candidate loci have been previously implicated in ivermectin
resistance is briefly explained here. The Hcms8a20 microsatellite was the only one out of
75
eighteen microsatellite loci that showed evidence of genetic introgression in the two independent
backcross experiments undertaken to map ivermectin resistance loci in the MHco4(WRS) and
MHco10(CAVR) strain (Redman et al., 2012). Hco-avr-14 and Hco-glc-5 are members of the H.
contortus glutamate-gated chloride channel (GLC) family (Wolstenholme and Rogers, 2005;
McCavera et al., 2007; Laing et al., 2013). Three members of this family in C. elegans - Cel-glc-
1, Cel-avr-14 and Cel-avr-15 - have been shown to be ivermectin targets by genetic mutation and
complementation studies (Dent et al., 2000; Ghosh et al., 2012). The H. contortus homologue of
Cel-avr-14 - Hco-avr-14 - was implicated in ivermectin resistance by its ability to rescue
ivermectin susceptibility when heterologously expressed in C. elegans, suggesting it is an
ivermectin target in the parasite (McCavera et al., 2007; Mccavera et al., 2009; Glendinning et
al., 2011). Hco-glc-5 was implicated by the observation of haplotype frequency changes during
experimental passage of an H. contortus strain under ivermectin selection (Blackhall et al.,
1998a). Hco-lgc-37 - a GABA-gated chloride channel renamed from Hco-hg-1 (Beech et al.,
2010a) - was also implicated using the exact same approach and strains (Blackhall et al., 2003).
A subsequent study has also presented evidence that certain alleles of both Hco-glc-5 and Hco-
lgc-37, were associated with reduced sensitivity of adult feeding and larval movement to
moxidectin (Beech et al., 2010b).
Hco-pgp-9 and Hco-pgp-2 are members of the P-glycoprotein (PGP) trans-membrane
transporter family. Hco-pgp-9 and Hco-pgp-2, were originally designated as Hco-pgp-1 and Hco-
pgp-A respectively (Le Jambre et al., 1999; Xu et al., 1998) but were subsequently re-named
based on the identification of their respective C. elegans orthologues (Williamson and
Wolstenholme, 2012). This gene family, known to be involved in ivermectin efflux in mammals
(Schinkel, 1999), has been suggested to be involved in ivermectin resistance in parasitic
nematodes in a number of studies and reviews (Blackhall et al., 1998b; Xu et al., 1998; Le
Jambre et al., 1999, Sangster et al., 1999; Bartley et al., 2009; Williamson and Wolstenholme,
2012). In the case of Hco-pgp-2, Blackhall et al. (1998b) used the same methodology and strains
as used for Hco-glc-5 and Hco-lgc-37. As with the two previously examined candidate genes,
they showed that a single Hco-pgp-2 haplotype had a significantly higher frequency in the
ivermectin selected population compared with the non-selected population (Blackhall et al.,
1998b). Hco-pgp-9 was independently implicated in ivermectin resistance by the observation that
76
populations of H. contortus/H. placei hybrid F1 progeny that survived ivermectin treatment
contained a higher frequency of Hco-pgp-9 alleles derived from the resistant H. contortus
parental strain than from the susceptible H. placei parental strain (Le Jambre et al., 1999).
The most recent candidate gene to be implicated in ivermectin resistance is Hco-dyf-7, a gene
which encodes a protein required for proper dendritic anchoring and migration of amphid
neurons (Heiman and Shaham, 2009). This gene has recently been proposed to have an
important, and possibly global, role in ivermectin resistance (Urdaneta-Marquez et al., 2014).
Classical genetic mapping and transgenic rescue experiments showed that loss-of-function of the
Cel-dyf-7 gene confers ivermectin resistance in C. elegans (Urdaneta-Marquez et al., 2014). In
the same study, an orthologue of this C. elegans gene was identified in H. contortus; Hco-dyf-7.
A specific haplotype of this H. contortus gene, defined by 15 SNPs, was shown to increase in
frequency during ivermectin selection using the same parasite strains as had been previously
used by Blackhall et al. (1998a, 1998b, 2003) for Hco-glc-5, Hco-lgc-37 and Hco-pgp-2. In
addition, several - although not all - of the SNPs that defined this haplotype, were reported to
occur more frequently in a panel of ivermectin resistant H. contortus field populations compared
with several susceptible populations (Urdaneta-Marquez et al., 2014).
In summary, there is circumstantial, but not conclusive, evidence for the potential
association of a number of different H. contortus candidate loci with ivermectin resistance. In
this paper, we interrogate two previously validated independent backcross experiments for
evidence of genetic linkage of each of these candidate loci to a major ivermectin resistance
mutation. Our results, support previous evidence that the microsatellite marker Hcms8a20 is
linked to a major ivermectin resistance locus in the two ivermectin resistant parental strains used
in each backcross. In contrast, our results do not provide similar support for any of the other
candidate loci tested.
77
3.2 Materials & Methods
3.2.1 Parasite populations and preparation of genomic DNA.
The backcross populations used in this study were derived from two independent backcross
experiments between the susceptible genome reference strain - MHco3(ISE) (Laing et al., 2013)
- and each of two independent ivermectin resistant strains; MHco4(WRS) and MHco10(CAVR)
(Redman et al., 2012). The MHco3(ISE) strain is susceptible to all the major anthelmintic classes
and was originally derived from the ISE strain by multiple rounds of inbreeding before the
genome project was commenced (Roos et al., 2004; Laing et al., 2013). MHco4(WRS) is derived
from the White River Strain (WRS) originally isolated as an ivermectin resistant field strain from
South Africa (Van Wyk and Malan, 1988). MHco10(CAVR) is derived from the Chiswick
Avermectin Resistant Strain (CAVR) strain originally isolated as an avermectin resistant strain
from the field in Australia (Le Jambre et al., 1995). Details of the genetic backcrossing strategy
have been previously reported in Redman et al. (2012) and so only a brief overview is given
here. F1 progeny of parental crosses were exposed to ivermectin by oral dosing and the survivors
were then backcrossed against the susceptible MHco3(ISE) parental strain. Subsequent
backcrossing of drug survivors was repeated for three more generations such that phenotypically
resistant 4th generation backcross populations were obtained (MHco3/4.BC and MHco3/10.BC).
These populations have an overall genetic background of the susceptible parental MHco3(ISE)
strain as previously validated with microsatellite markers. However, they are phenotypically
resistant to ivermectin showing that ivermectin resistance loci have been introgressed from the
original resistant parental strains (Redman et al., 2012). There was no evidence of sex-linkage of
the resistance trait from the backcrossing experiments. Pools of genomic DNA were created by
combining lysates from the heads of 20 males and 20 females for each of the three parental
populations - MHco3(ISE), MHco4(WRS) and MHco10(CAVR). The DNA lysis protocol has
been previously described (Redman et al., 2008b). The fourth generation backcrosses were
experimentally passaged for one generation to increase worm numbers (Redman et al., 2012).
Progeny of this passage (F2s of the 4th generation backcrosses) were selected with 0.1 mg/kg
ivermectin in vivo in a controlled efficacy test (Redman et al., 2012) from which drug surviving
78
females were used to create lysate pools of the MHco3/4.BC and MHco3/10.BC backcrosses
assessed in this study. Pools were created by combining gDNA of 33 and 26 drug surviving
females of the MHco3/4.BC and MHco3/10.BC strains respectively.
3.2.2 PCR Amplification.
Test PCR amplifications were carried out on the six candidate genes using primer pairs
reported in previously published studies (Blackhall et al. 1998a; Jagannathan et al., 1999;
Blackhall et al., 2003; Blackhall et al., 1998b; Le Jambre et al., 1999; Urdaneta-Marquez et al.,
2014). Only the Hco-lgc-37 primer pair from Blackhall et al. (2003) amplified sufficiently
robustly in all five populations and so were used in this study. Geneious Pro v. 6.1.6, was used to
design new primer pairs for the other loci (http://www.geneious.com, Kearse et al., 2012)
(Supplementary Table 3.1). These spanned at least one intron to ensure sufficient polymorphism
was obtained in the amplified sequence. Primers were also designed to amplify a non-coding 725
bp fragment 1032 bases away from Hcms8a20, a microsatellite for which there was previous
evidence of genetic linkage to an ivermectin resistance locus (Redman et al., 2012). PCRs were
performed in 50μl reactions using 0.5μl of pooled gDNA template and Phusion High-Fidelity HF
DNA Polymerase (New England Biolabs). The following thermocycling conditions were used;
98ºC for 2m, (98ºC for 10s, 60ºC for 30s, and 72ºC for 30s) X 35, 72ºC for 5m.
3.2.3. Cloning and sequencing of PCR amplicons.
PCR products were gel purified using e.Z.N.A MicroElute® Gel Extraction Kit (Omega
Biotek) and then cloned into the pJET1.2/blunt cloning vector using CloneJET PCR Cloning Kit
(ThermoFisher Scientific). For each cloning plate, corresponding to each population/locus
combination, 24 colonies were randomly selected and plasmid DNA purified using the e.Z.N.A
Plasmid Mini-Kit I (Omega Biotek) (20 colonies were selected in the case of Hco-dyf-7).
Plasmid clones were then sequenced using the T7(5’-TAATACGACTCACTATAGGG-3’)
forward primer on a BigDye Terminator Cycle Sequencing platform (Applied Biosystems). Hco-
79
pgp-9 clones required an additional (reverse) primer to sequence given its longer amplicon
length (pJET1.2 reverse primer: 5’-AAGAACATCGATTTTCCATGGCAG-3’).
3.2.4 DNA sequence analysis.
All sequences were aligned using the MUSCLE alignment tool (Edgar, 2004) at default
settings in Geneious Pro v. 6.1.6. Primer sequences were trimmed and the sequences were re-
aligned. Polymorphisms appearing more than once in the sequence data set are expected to be
real, whereas polymorphisms that only occur once are possible artefacts due to polymerase
induced errors (Redman et al., 2015; Chaudhry et al., 2015). Consequently, we only considered
SNPs occurring more than once in the entire dataset in order to take a conservative approach and
ensure only real polymorphisms were considered.
The frequency of each haplotype was determined at each locus for each population and this
is referred to as the “haplotype profile”. Haplotypes were labelled alphabetically for each locus
based on their rank frequency observed in the MHco3(ISE) population (see Figure 3.1 – Figure
3.3). Remaining haplotypes not observed in MHco3(ISE) were labelled arbitrarily. The number
of clones successfully sequenced and the number of different haplotypes observed at each locus
were recorded for each strain. For each locus, the number of haplotypes shared by the parental
strains of a cross, along with the number of haplotypes unique to each parental strain of a cross
was also recorded. Pairwise Fst values (calculated in Arlequin v. 3.1 at default settings; Excoffier
et al., 2005) were used to quantify the level of similarity between haplotype profiles between
parental and backcross populations for each amplicon marker.
3.2.5 Chromosomal assignments for each amplicon maker.
Chromosomal synteny is high between H. contortus and C. elegans (although gene order on
a chromosome is generally poorly conserved) (Laing et al., 2011). Consequently, we have
inferred the chromosomal assignment for each amplicon marker based on the syntenic
relationships with the C. elegans orthologues of gene models present on the same H. contortus
genomic scaffold. The closest 14 gene models on the same genome scaffold as each amplicon

80
marker (a total of 15 gene models including the candidate gene) were assessed for orthology with
C. elegans genes where possible. Scaffolds containing the Hcms8a20 and Hco-lgc-37 amplicon
markers were small and so all gene models on each scaffold were assessed (1 and 6 –
respectively). A custom BLAST search (Zhang et al., 2000) [blastn -task dc-megablast -query
H.contortus_genes.fa -db C.elegans_CDSs.fa -out outfile] was used to identify orthologues in the
most current ensembl.org C. elegans CDS database downloaded at
ftp://ftp.ensembl.org/pub/release-83/fasta/caenorhabditis_elegans/cds/. Only unambiguous
orthologues were used in the analysis of synteny. Identification of a C. elegans orthologue was
considered unambiguous, if the H. contortus query gene model identified a C. elegans gene
model with an e-value of 1e-9 or less and with no other hits on different chromosomes having an
e-value within one order of magnitude. Hco-glc-5, Hco-avr-14, and Hco-pgp-2 are located on
chromosome 1, Hco-lgc-37 on chromosome 3, and Hco-dyf-7 on the X chromosome
(Supplementary Table 3.2). A chromosomal assignment could not be made for Hco-pgp-9 due to
mixed chromosomal synteny with C. elegans orthologues, nor for Hcms8a20 due to the lack of
adjacent gene models on the relatively short scaffold on which it was located (27 kb).
81
3.3 Results
3.3.1 Amplicon markers for all the candidate loci show a high level of genetic
differentiation between the H. contortus parental strains used in the two independent
backcross experiments.
In order to investigate haplotype introgression between parental genomes during a serial
backcross, markers with a high level of genetic differentiation between parental strains are
needed. In this particular case, haplotypes unique to the ivermectin resistant parental strain, or
those present at very different frequencies in the two parental strains, are the most informative
for assessing haplotype introgression from each resistant parental strain into the backcross
populations. Consequently, we first assessed the haplotype diversity of the seven amplicon
markers within and among the parental strains used in the two backcrosses. We PCR amplified
and sequenced between 14 and 24 clones for each marker from the MHco3(ISE), MHco4(WRS)
and MHco10(CAVR) parental strains (Table 3.1). A high level of sequence diversity was
observed for all seven loci (Table 3.1). The mean number of haplotypes for the seven markers
was 3.5, 8.33 and 5.83 haplotypes per locus for MHco3(ISE), MHco4(WRS) and
MHco10(CAVR) parental strains respectively (Table 3.1).
Although some shared haplotypes were present, the majority were not shared between the
parental strains used in each backcross (Table 3.1). Pairwise Fst values were used to quantify the
genetic differentiation for each amplicon marker between the parental strains (Table 3.2). There
was a high level of genetic differentiation between the MHco3(ISE) susceptible parental strain
and both resistant parental strains, MHco4(WRS) and MHco10(CAVR) for all seven amplicon
markers. Pairwise Fst values ranged between 0.078 and 0.533 and all were statistically
significantly different from zero at p <0.01 (Table 3.2).
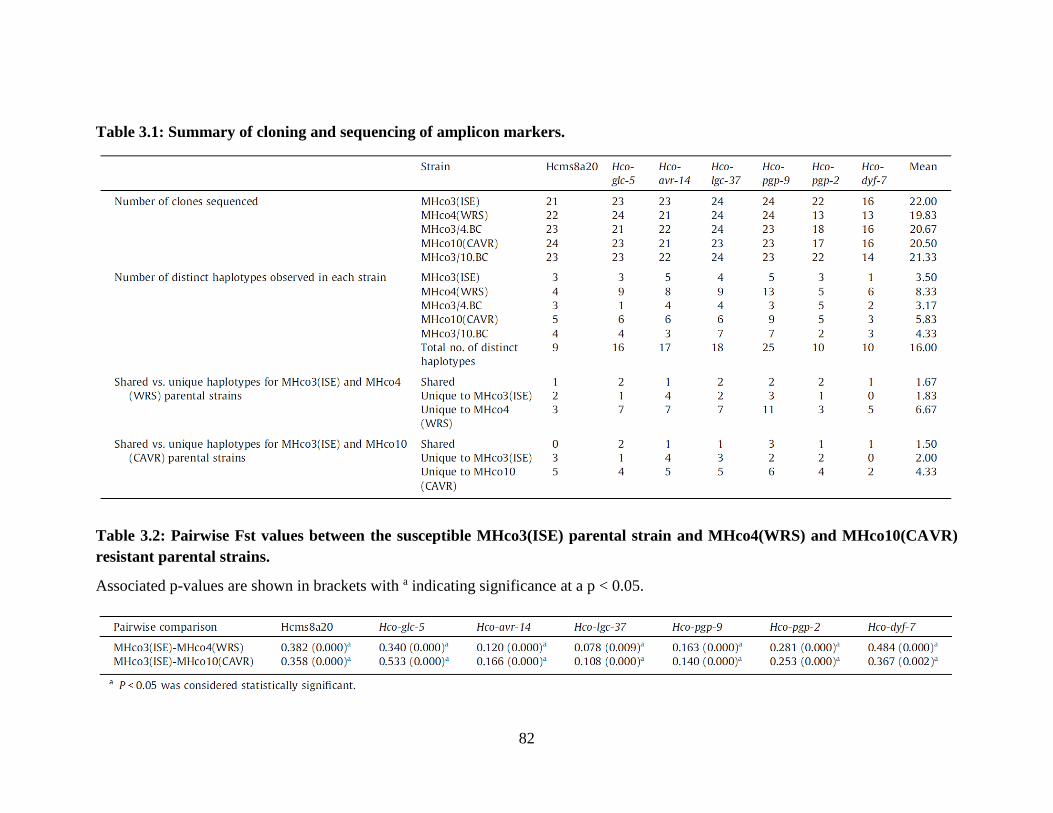
82
Table 3.1: Summary of cloning and sequencing of amplicon markers.
Table 3.2: Pairwise Fst values between the susceptible MHco3(ISE) parental strain and MHco4(WRS) and MHco10(CAVR)
resistant parental strains.
Associated p-values are shown in brackets with a indicating significance at a p < 0.05.
83
3.3.2 The amplicon marker adjacent to microsatellite Hcms8a20 shows strong
evidence of haplotype introgression from the ivermectin resistant parental strain in both
independent backcross populations.
We investigated the evidence for haplotype introgression from the resistant parental strains
into the two independent backcross populations for an amplicon marker adjacent to microsatellite
Hmcs8a20. This marker was PCR amplified, cloned and sequenced from the MHco3/4.BC and
MHco3/10.BC backcross populations and the haplotype profiles compared to those of the
parental strains (Table 3.1). In both these backcross populations this marker showed a high
degree of genetic differentiation from the MHco3(ISE) susceptible parental strain; Fst values
were high, and statistically significantly different from zero, for both the MHco3(ISE) -
MHco3/4.BC and MHco3(ISE) - MHco3/10.BC pairwise comparisons (Fst = 0.383, p = 0.000
and Fst = 0.512, p = 0.000 respectively) (Table 3.3). The most frequent haplotypes of this marker
in the two backcross populations were haplotype-D in MHco3/4.BC and haplotype-E in
MHco3/10.BC at 60.9% and 78.3% frequencies respectively. These haplotypes were not detected
in the MHco3(ISE) susceptible parental isolate but were present in respective resistant parental
strains used in each backcross (Figure 3.1). These results suggest haplotype introgression from
each resistant parental strain into the MHco3(ISE) susceptible parental background during both
independent the backcrossing experiments.
3.3.3. The amplicon markers within the Hco-glc-5, Hco-avr-14, Hco-pgp-9, and Hco-
dyf-7 genes show no evidence of haplotype introgression from the ivermectin resistant
parental strain in either of the independent backcross populations.
Amplicon markers within the Hco-glc-5, Hco-avr-14, Hco-pgp-9, and Hco-dyf-7 genes
were PCR amplified, cloned and sequenced from the MHco3/4.BC and MHco3/10.BC backcross
populations and the haplotype profiles compared to those present in the parental strains (Table
3.1). We measured the level of pairwise genetic differentiation for each of these markers between
the MHco3(ISE) parental strain and each of the MHco3/4.BC and MHco3/10.BC backcross
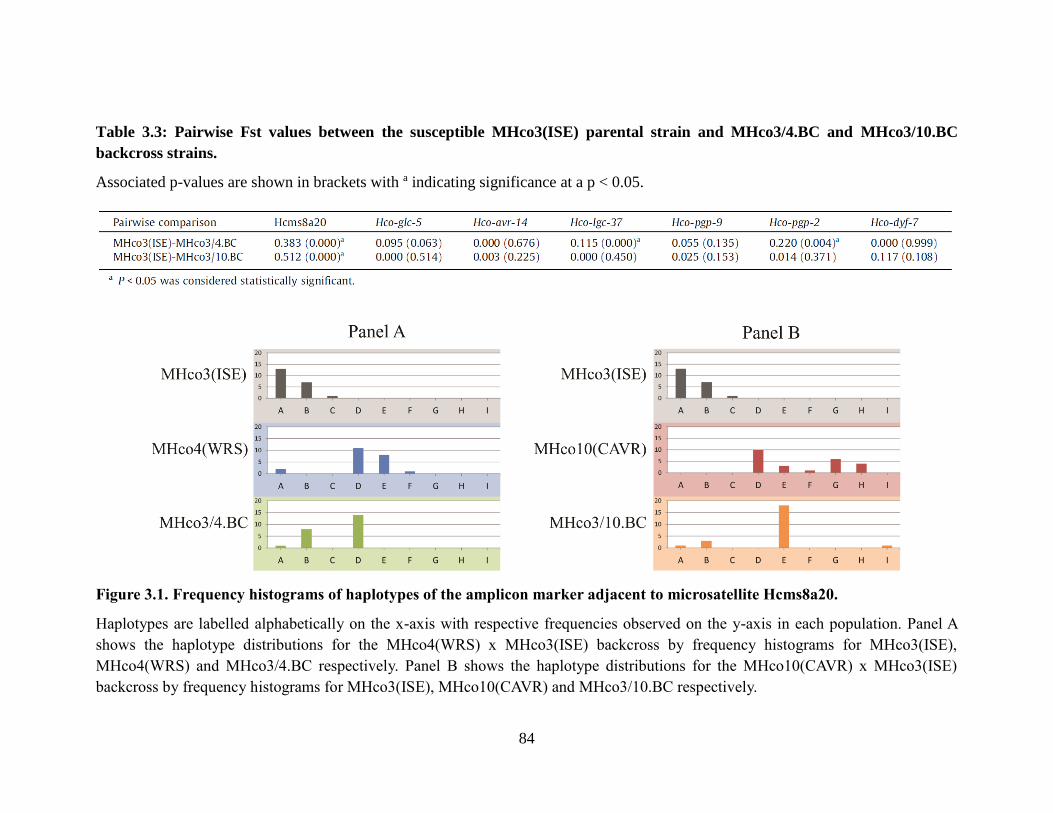
84
Table 3.3: Pairwise Fst values between the susceptible MHco3(ISE) parental strain and MHco3/4.BC and MHco3/10.BC
backcross strains.
Associated p-values are shown in brackets with a indicating significance at a p < 0.05.
Figure 3.1. Frequency histograms of haplotypes of the amplicon marker adjacent to microsatellite Hcms8a20.
Haplotypes are labelled alphabetically on the x-axis with respective frequencies observed on the y-axis in each population. Panel A
shows the haplotype distributions for the MHco4(WRS) x MHco3(ISE) backcross by frequency histograms for MHco3(ISE),
MHco4(WRS) and MHco3/4.BC respectively. Panel B shows the haplotype distributions for the MHco10(CAVR) x MHco3(ISE)
backcross by frequency histograms for MHco3(ISE), MHco10(CAVR) and MHco3/10.BC respectively.
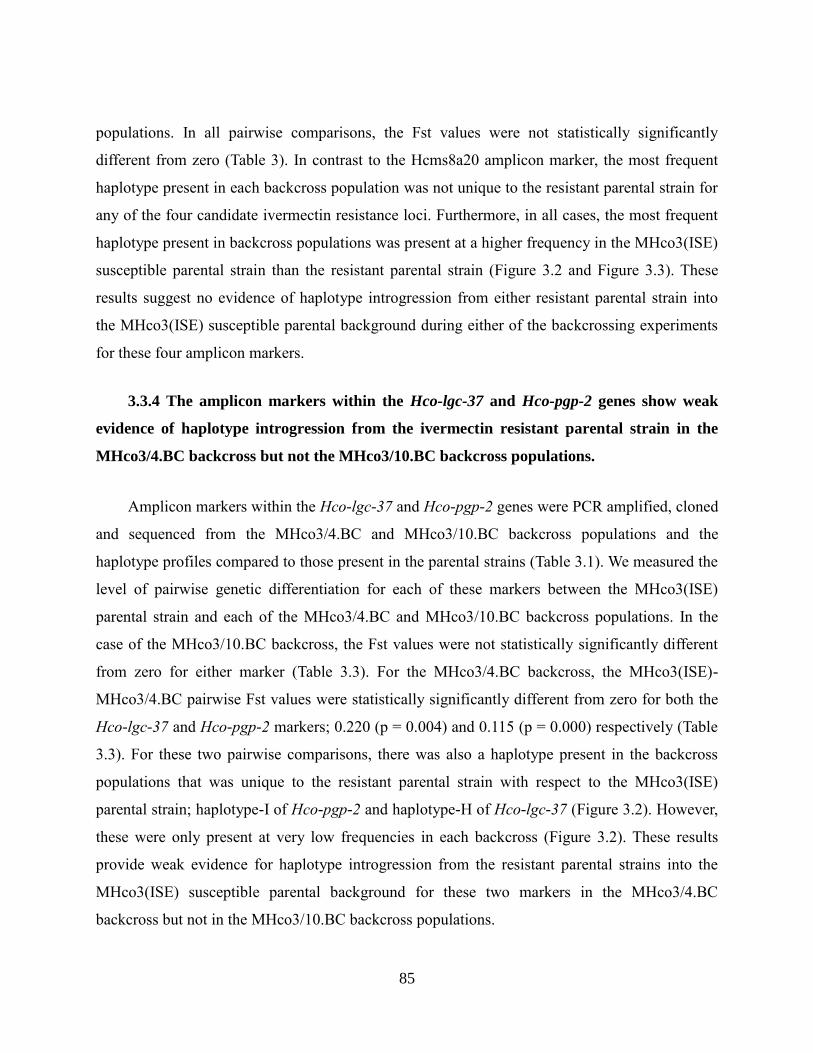
85
populations. In all pairwise comparisons, the Fst values were not statistically significantly
different from zero (Table 3). In contrast to the Hcms8a20 amplicon marker, the most frequent
haplotype present in each backcross population was not unique to the resistant parental strain for
any of the four candidate ivermectin resistance loci. Furthermore, in all cases, the most frequent
haplotype present in backcross populations was present at a higher frequency in the MHco3(ISE)
susceptible parental strain than the resistant parental strain (Figure 3.2 and Figure 3.3). These
results suggest no evidence of haplotype introgression from either resistant parental strain into
the MHco3(ISE) susceptible parental background during either of the backcrossing experiments
for these four amplicon markers.
3.3.4 The amplicon markers within the Hco-lgc-37 and Hco-pgp-2 genes show weak
evidence of haplotype introgression from the ivermectin resistant parental strain in the
MHco3/4.BC backcross but not the MHco3/10.BC backcross populations.
Amplicon markers within the Hco-lgc-37 and Hco-pgp-2 genes were PCR amplified, cloned
and sequenced from the MHco3/4.BC and MHco3/10.BC backcross populations and the
haplotype profiles compared to those present in the parental strains (Table 3.1). We measured the
level of pairwise genetic differentiation for each of these markers between the MHco3(ISE)
parental strain and each of the MHco3/4.BC and MHco3/10.BC backcross populations. In the
case of the MHco3/10.BC backcross, the Fst values were not statistically significantly different
from zero for either marker (Table 3.3). For the MHco3/4.BC backcross, the MHco3(ISE)-
MHco3/4.BC pairwise Fst values were statistically significantly different from zero for both the
Hco-lgc-37 and Hco-pgp-2 markers; 0.220 (p = 0.004) and 0.115 (p = 0.000) respectively (Table
3.3). For these two pairwise comparisons, there was also a haplotype present in the backcross
populations that was unique to the resistant parental strain with respect to the MHco3(ISE)
parental strain; haplotype-I of Hco-pgp-2 and haplotype-H of Hco-lgc-37 (Figure 3.2). However,
these were only present at very low frequencies in each backcross (Figure 3.2). These results
provide weak evidence for haplotype introgression from the resistant parental strains into the
MHco3(ISE) susceptible parental background for these two markers in the MHco3/4.BC
backcross but not in the MHco3/10.BC backcross populations.

86
Figure 3.2. Haplotype distributions for the candidate loci in the MHco4(WRS) x MHco3(ISE) backcross.
Frequency histograms of haplotypes of the six candidate gene loci assessed in this study are shown for the MHco3(ISE),
MHco4(WRS) and MHco3/4.BC backcross strains. Haplotypes are labelled alphabetically on the x-axis with respective frequencies
observed on the y-axis in each population.
87
Figure 3.3. Haplotype distributions for the candidate loci in the MHco10(CAVR) x MHco3(ISE) backcross.
Frequency histograms of haplotypes of the six candidate gene loci assessed in this study are shown for the MHco3(ISE),
MHco10(CAVR) and MHco3/10.BC backcross strains. Haplotypes are labelled alphabetically on the x-axis with respective
frequencies observed on the y-axis in each population.
88
3.4 Discussion
The objective of this work was to investigate a number of leading candidate loci for
evidence of genetic linkage to a major ivermectin resistance locus in two ivermectin resistant H.
contortus strains; MHco4(WRS) and MHco10(CAVR). These two strains have previously been
serially backcrossed against the ivermectin susceptible H. contortus genome reference strain
MHco3(ISE) with ivermectin selection applied at each generation (Redman et al., 2012). The
resulting 4th generation backcross populations (MHco3/4.BC and MHco3/10.BC) have been
previously genetically and phenotypically validated (Redman et al., 2012). In that study, 17 out
of 18 microsatellite markers were found to have allelic profiles in the MHco3/4.BC and
MHco3/10.BC populations that were similar to those of the MHco3(ISE) susceptible parental
strain. This demonstrated that the genetic background of these backcross populations was
predominantly derived from the MHco3(ISE) susceptible parental strain as expected from the
serial backcrossing regime. In the original published study, just one of the eighteen microsatellite
markers, Hcms8a20, had an allele at high frequency in the backcross populations (following
ivermectin treatment) that was derived from the resistant parental strains in both serial backcross
experiments (Redman et al., 2012). This result suggested that this microsatellite marker is linked
to an important ivermectin resistance locus in both the MHco4(WRS) and MHco10(CAVR)
ivermectin resistant strains.
In the work presented here, we aimed to test the hypothesis that the Hcms8a20
microsatellite was linked to an important ivermectin resistant locus in the MHoc4(WRS) and
MHco10(CAVR) strains and, at the same time, test the other leading candidate ivermectin
resistance loci from the peer-reviewed literature. Figure 3.4 illustrates the conceptual approach
we adopted. We examined the haplotype profiles of PCR amplicon markers located within, or
close to, our loci of interest in the parental and backcross populations of both serial backcross
experiments. If a genetic marker is closely linked to an important ivermectin resistance locus,
haplotypes of that marker that are present in the ivermectin resistant parental strain, and linked to
the ivermectin resistance mutation, should be inherited through the backcross due to the
ivermectin selection applied at each generation; by so called “genetic hitchhiking” (Figure 3.4,
panel A). Consequently, such haplotypes will be introgressed from the ivermectin resistant
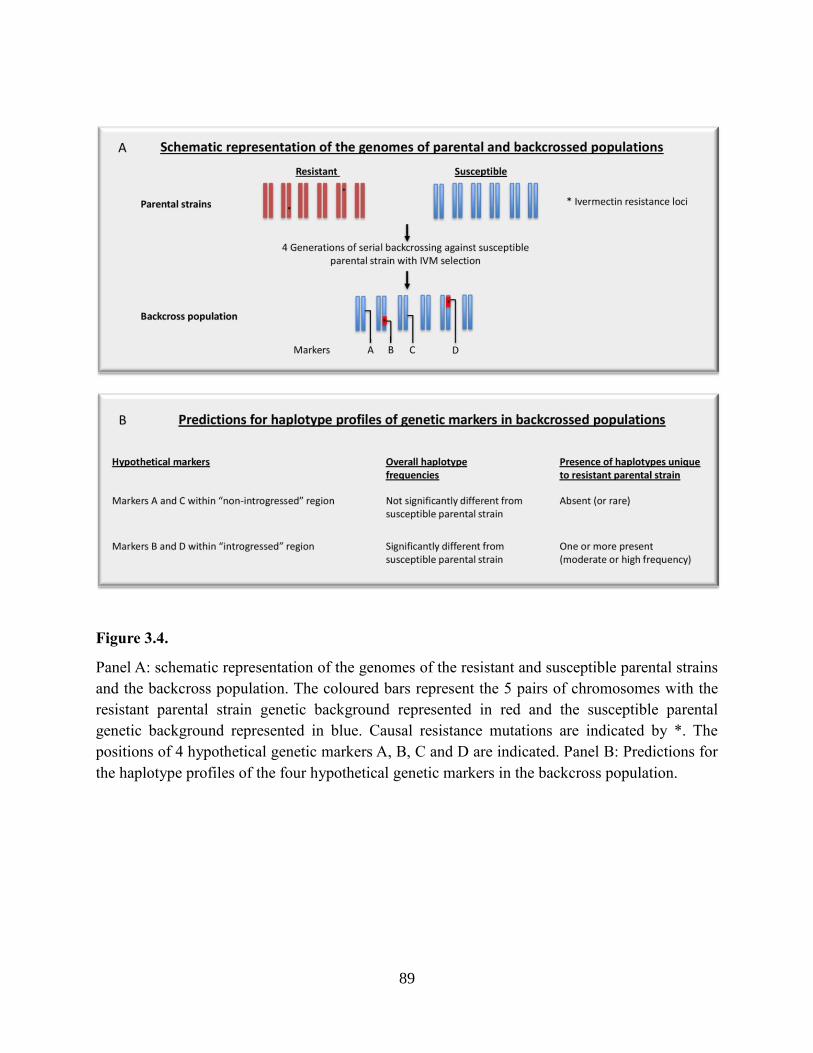
89
Figure 3.4.
Panel A: schematic representation of the genomes of the resistant and susceptible parental strains
and the backcross population. The coloured bars represent the 5 pairs of chromosomes with the
resistant parental strain genetic background represented in red and the susceptible parental
genetic background represented in blue. Causal resistance mutations are indicated by *. The
positions of 4 hypothetical genetic markers A, B, C and D are indicated. Panel B: Predictions for
the haplotype profiles of the four hypothetical genetic markers in the backcross population.
90
parental strain into the predominantly MHco3(ISE) genetic background during the backcrossing
procedure (Figure 3.4, panel A). Hence, it is possible to make predictions regarding the
haplotype profiles of markers in the backcross populations depending on whether they are linked
to an important ivermectin resistance mutation or not (Figure 3.4, panel B). The presence and
frequency of haplotypes for a marker that is not linked to an important ivermectin resistance
locus should be very similar to those found in the MHco3(ISE) parental strain and haplotypes
that are unique to the resistant parental strain should be absent (or rare) in the backcross
populations. This is because there will be no introgression of haplotypes from the ivermectin
resistant parental strain into the backcross populations in that region of the genome (markers A
and C in Figure 3.4). Conversely, the presence and frequency of haplotypes for a marker that is
linked to an important ivermectin resistance locus should differ significantly from those in the
MHco3(ISE) parental strain due to the presence of one or more haplotypes that have been
introgressed from the resistant parental strain (markers B and D in Figure 3.4). The extent of this
difference will depend on how closely linked the marker is to the loci under selection.
The haplotype profiles of the amplicon marker located 17.8kb away from the Hcms8a20
microsatellite marker locus clearly fit the predictions for a marker linked to an important
ivermectin resistance locus. In both the MHco3/4.BC and MHco3/10.BC backcross populations,
the haplotype profiles of the Hcms8a20 amplicon marker were significantly different to the
haplotype profile that was present in the MHco3(ISE) susceptible reference strain (Table 3.3,
Figure 3.1). This is indicated by the high Fst values observed between both backcross
populations and the MHco3(ISE) strain; by far the highest values for any of the seven loci
examined (Table 3.3). Furthermore, in both backcross populations, the most frequent haplotype
for the Hcms8a20 amplicon marker was one which was present in each ivermectin resistant
parental strain but absent from the MHco3(ISE) susceptible parental strain; haplotype-D in
MHco3/4.BC and haplotype-E in MHco3/10.BC (Figure 3.1). This suggests that these
haplotypes have been inherited from the resistant parental strains during the serial backcrosses
under the influence of the ivermectin selection applied at each generation. Interestingly, a
different haplotype has been introgressed from each resistant parental strain in the two
independent backcross experiments. This is consistent with the previously published results
using the allele profiles of the Hcms8a20 microsatellite marker itself (Redman et al., 2012). In
91
that case, for each separate backcross experiment, a different microsatellite allele, specific to
each ivermectin resistant parental strain, was introgressed into the backcross populations. This is
not necessarily surprising since the MHco4(WRS) and MHco10(CAVR) are originally derived
from different continents - South Africa and Australia respectively - and so the causal ivermectin
resistance mutation(s) may well have originated independently in the two strains. In that case,
they would be expected to be present on different haplotype background in each strain.
In contrast to the Hcms8a20 marker, the haplotype profiles of the amplicon markers within
the candidate ivermectin resistance genes Hco-glc-5, Hco-avr-14, Hco-pgp-9, and Hco-dyf-7
clearly fit the predictions for markers that are not linked to an important ivermectin resistance
locus in the MHco4(WRS) and MHco10(CAVR) resistant strains. For these markers, there was
no significant difference in the haplotypes present in either of the independent backcross
populations as compared to the susceptible MHco3(ISE) population. Furthermore, unlike for the
Hcms8a20 amplicon marker, there were no haplotypes unique to either resistant parental strain
present in either of the backcross populations for any of these genes. This was also the case for
the amplicon markers within the Hco-lgc-37 and Hco-pgp-2 genes for the MHco3/10.BC
backcross population suggesting these genes are also not linked to an important ivermectin
resistance locus in the MHco10(CAVR) strain. However, the result for these two markers was
less clear cut in the other backcross experiment; there was a statistically significant difference in
the haplotypes present in the MHco3/4.BC backcross population as compared to the susceptible
MHco3(ISE) population. Also, for each of these two markers, there was a haplotype present in
the MHco3/4.BC backcross population that was unique to the MHco4(WRS) resistant parental
strain (haplotype-I for Hco-pgp-2 and haplotype-H for Hco-lgc-37). However, these haplotypes
were present at very low frequencies in the MHco3/4.BC population. Overall, we conclude there
is weak but inconclusive evidence of linkage of the Hco-lgc-37 and Hco-pgp-2 genes to an
important ivermectin resistance locus in the MHco4(WRS) but not the MHco10(CAVR) strain.
This more ambiguous result could potentially be due to these genes being distantly linked to an
important ivermectin resistance locus on the same chromosome or tightly linked to a locus with a
minor effect.
Although the results presented here provide additional evidence that the Hcms8a20 marker
is genetically linked to an important ivermectin resistance locus in the MHco4(WRS) and

92
MHco10(CAVR) strains, this is not the case for the other leading candidate ivermectin resistance
loci. It is possible that these loci are not associated with ivermectin resistance given they have
been implicated largely on the basis of single studies using a small number of populations and
often a small number of individuals within each population. Other, recent work has also found no
evidence of selection for the Hco-lgc-37, Hco-glc-5, Hco-avr-14 and Hco-dyf-7 loci when
comparing H. contortus from UK farms with a history of ivermectin treatment to those without
(Laing R, Maitland K, Lecová L, Skuce P, Tait A, Devaney E; submitted). Alternatively, it may
be that these loci are linked to an important ivermectin loci in some strains but not in
MHco4(WRS) and MHco10(CAVR). This is possible since the previous published work
implicating these candidate loci was not conducted on these particular strains.
Although, this and previous work provides strong evidence that the Hcms8a20
microsatellite marker is genetically linked to an important ivermectin resistance locus in the
MHco4(WRS) and MHco10(CAVR) strains, it could be still be relatively distant from the causal
mutation(s). Only limited genetic recombination will have occurred in four generations of
backcrossing. Consequently, the genomic region(s) introgressed into the backcross populations
from the resistant parental strains is expected to be large. This is supported by recent genome-
wide SNP analysis of the backcross and parental populations that has identified several genomic
scaffolds that have a strong signal of introgression, some of which are several Mb in length
(Doyle, S., Illingworth, C., Laing, R., Redman, L., Martinelli, A., Cotton, J., and Gilleard, J.S.,
manuscript in preparation). The Hcms8a20 marker is located on one of these scaffolds providing
further support for its linkage to an important ivermectin resistance locus (Doyle, S., Illingworth,
C., Laing, R., Redman, L., Martinelli, A., Cotton, J., and Gilleard, J.S., manuscript in
preparation). Further interrogation of the H. contortus MHco3(ISE) reference genome as the
assembly improves will help locate the genomic position of the causal mutations to which the
Hcms8a20 locus is linked (http://www.sanger.ac.uk/resources/downloads/helminths/
haemonchus-contortus.html).
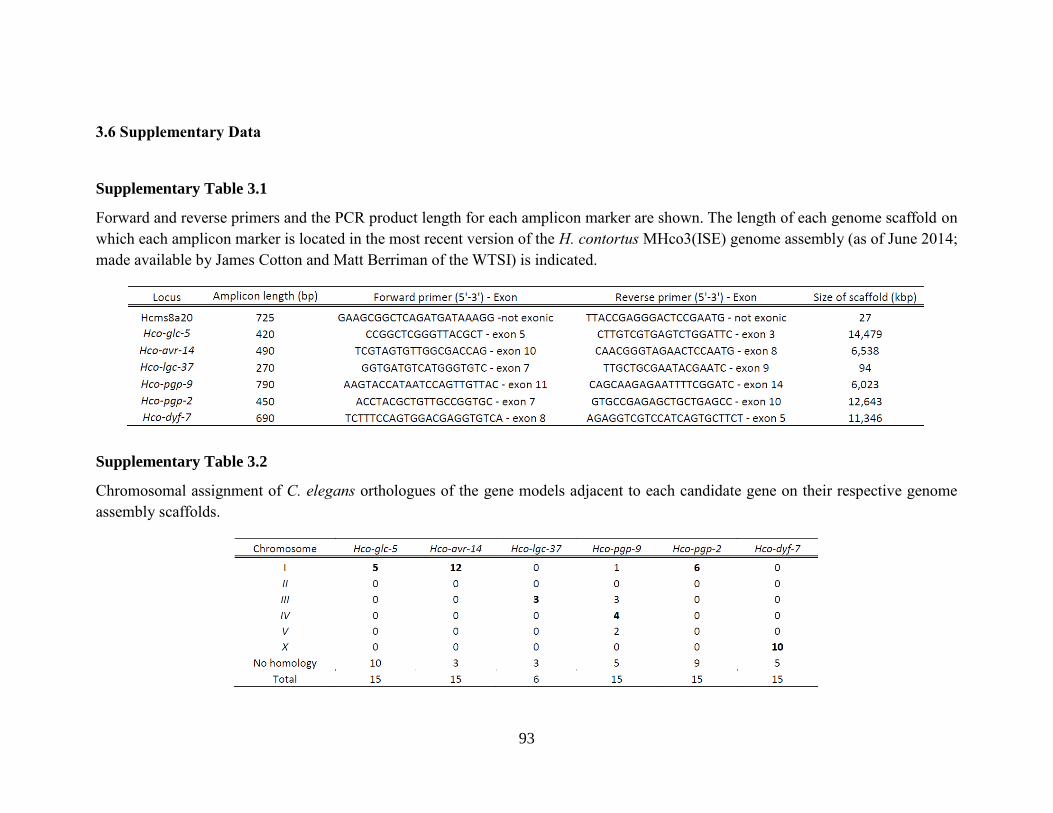
93
3.6 Supplementary Data
Supplementary Table 3.1
Forward and reverse primers and the PCR product length for each amplicon marker are shown. The length of each genome scaffold on
which each amplicon marker is located in the most recent version of the H. contortus MHco3(ISE) genome assembly (as of June 2014;
made available by James Cotton and Matt Berriman of the WTSI) is indicated.
Supplementary Table 3.2
Chromosomal assignment of C. elegans orthologues of the gene models adjacent to each candidate gene on their respective genome
assembly scaffolds.

94
Chapter Four: Deep Amplicon Sequencing of Multiple Ivermectin Resistance Linked Loci
on an Extensive Panel of Independent Ivermectin Resistant H. contortus Field Populations
95
Abstract
Serial backcrossing experiments have previously shown the microsatellite marker
Hcms8a20 is linked to a major ivermectin resistance locus in two different ivermectin resistant
H. contortus strains, MHco4(WRS) and MHco10(CAVR) (Redman et al., (2012)). Analysis of
whole genome sequence data from these backcross experiments has recently determined that the
Hcms8a20 locus is located within an 11.2 Mb region on H. contortus chromosome 5 that was
introgressed from the resistant into the susceptible parental genomic background during the
backcrossing experiments under the influence of ivermectin selection (Doyle, S., Illingworth, C.,
Laing, R., Redman, L., Martinelli, A., Cotton, J., and Gilleard, J.S., manuscript in preparation).
The backcross experiments involve only four generations of backcrossing and four generations
of additional experimental passages, limiting the amount of genetic recombination that can
occur. Consequently, the size of the introgressed region in the backcrossed populations is large
and further interrogation of the backcross strains is unlikely to more accurately locate the causal
ivermectin resistance mutation. The objective of this chapter was to investigate the evidence of
selection of five markers across the introgressed region in over twenty different ivermectin
resistant H. contortus populations from the field. The rationale for this approach was that the
region of the genome showing a signature of ivermectin selection in field populations should be
much narrower than in the backcross populations due to the greater opportunity for genetic
recombination to occur. We used a deep amplicon sequencing approach to examine the sequence
diversity of five loci in the introgressed region on chromosome 5 and two markers from different
chromosomes as controls in a panel of 53 samples derived from 25 different field populations.
The samples analysed comprise: 1) The original backcross populations to confirm and extend
previous results and to validate the deep amplicon sequencing approach; 2) A panel of ten field
isolates from the USA that have been in vitro phenotyped for ivermectin resistance using the
larval development assay; 3) A set of 27 samples from seven ivermectin resistant H. contortus
populations from Alberta, Canada that have in vivo phenotype data based on the fecal egg count
reduction test (FECRT); 4) A set of sixteen samples from nine Western Canadian farms with on-
farm response to treatment data (OFDAs). The sequence diversity of the Hcms8a20 marker
shows a consistent departure from evolutionary neutrality in the resistant isolates across these
96
different sample sets. This is not the case for the other four loci tested in the introgressed region
or for the two control loci. Overall, these results suggest that the Hcms8a20 locus is linked to an
important ivermectin resistance mutation in many ivermectin resistant field populations from
Canada and the USA. Further, the results narrow the region of interest within the 11.2 Mb
introgressed region in which the causal mutation is located.
97
4.1 Introduction
The genetics of ivermectin (IVM) resistance in H. contortus has remained elusive despite
decades of research (reviewed in Chapter 3, section 3.1). Though multiple studies have
associated background genetic variation in candidate genes with ivermectin resistance
phenotypes, the limitations of this approach and its tendency to produce false positive
associations were outlined in our assessment of the most promising of these candidate genes in
the backcross strains (Rezansoff et al., 2016, Chapter 3). This is partly due to the technical
challenges associated with working with parasitic nematodes, including H. contortus, coupled
with the risk of false positive associations with the high levels of sequence polymorphism that
occurs both within and between parasite populations when lacking a genome wide context
(Gilleard, 2006). This latter point makes simple comparisons of genetic diversity and haplotype
frequencies of candidate genes between resistant and susceptible strains unlikely to be a
sufficient approach in itself to identify causal resistance loci. In addition, it is likely that
ivermectin resistance in nematodes is a quantitative trait influenced by multiple loci rendering
the traditional approaches, predominantly based on candidate gene studies, insufficient in
identifying the causal mutations (Dent et al., 2000; Ghosh et al., 2012; Redman et al., 2012).
Previous success identifying important benzimidazole (BZ) resistance conferring mutations in H.
contortus encouraged researchers to carry out similar approaches in the search for ivermectin
resistance associated mutations (Gilleard, 2006; Kwa et al., 1994), (reviewed in Chapter 3,
section 3.1). Individual genes deemed to be good candidates for involvement in resistance based
on their function, such as glutamate-gated chloride channels and P-glycoproteins, have been
compared between resistant and susceptible H. contortus strains, and associations with resistance
inferred based on the differences in frequencies of specific SNPs or haplotypes (reviewed in
Chapter 3, section 3.1) (Lespine et al., 2012; Wolstenholme, 2011). The evidence for these loci
playing an important role in ivermectin resistance is equivocal at best and the results presented in
Chapter 3 suggest they do not play a major role in ivermectin resistance in the MHco4(WRS) or
MHco10(CAVR) laboratory passaged strains. In contrast, the marker Hcms8a20 shows good
evidence of genetic linkage to an ivermectin resistance locus in those two strains (Rezansoff et
al., 2016, Chapter 3).
98
The linkage of the Hcms8a20 marker to an ivermectin resistance locus was first indicated
through two independent serial backcross experiments originally described by Redman et al.
(2012) and discussed in some detail in Chapter 3 (Rezansoff et al., 2016). The power of this
approach, compared with the previous candidate gene based studies, is that it is not based on
“best guess” hypotheses regarding the likely mechanism of resistance. Instead, it is a neutral
approach not based on prior assumptions. In these experiments, two independent ivermectin
resistant strains – MHco4(WRS) and MHco10(CAVR) – were serially backcrossed against the
MHco3(ISE) susceptible genome reference strain for four generations with ivermectin selection
applied at each round (Redman et al., 2012). To identify regions of the genome in which
important ivermectin resistance loci are located, whole genome sequencing was performed on
pools of 30-50 worms (per triplicate) from the three parental strains – MHco3(ISE),
MHco10(CAVR) & MHco4(WRS) – and on each backcross population before and after
ivermectin treatment following the four rounds of backcrossing (Doyle, S., Illingworth, C.,
Laing, R., Redman, L., Martinelli, A., Cotton, J., and Gilleard, J.S., manuscript in preparation).
The whole genome sequencing data were originally analysed using the published draft H.
contortus genome assembly (Laing et al., 2013). Several different analyses were performed but
essentially, SNP allele frequencies were compared between the backcross populations and the
susceptible MHco3(ISE) strain in a 10 Kb sliding window throughout the genome and Fst values
were determined. The concept was that non-introgressed regions of the genome should have low
Fst values between the backcross and the susceptible MHco3(ISE) parental strain, whereas
region(s) introgressed from the resistant parental strains should have higher Fst values. This
analysis identified multiple genomic scaffolds that showed clear signals of introgression in both
independent backcrosses (Doyle et al., manuscript in preparation). More recently, the H.
contortus genome assembly has been substantially improved, providing a chromosomal level
assembly (Doyle et al., 2018). The whole genome sequence analyses described above have been
repeated using this new reference genome assembly and a signal of introgression was then
confined to a single large genomic region of about ~11.2 Mb on chromosome 5 in both
independent backcross experiments (Figure 4.1). Whole genome sequencing has also been
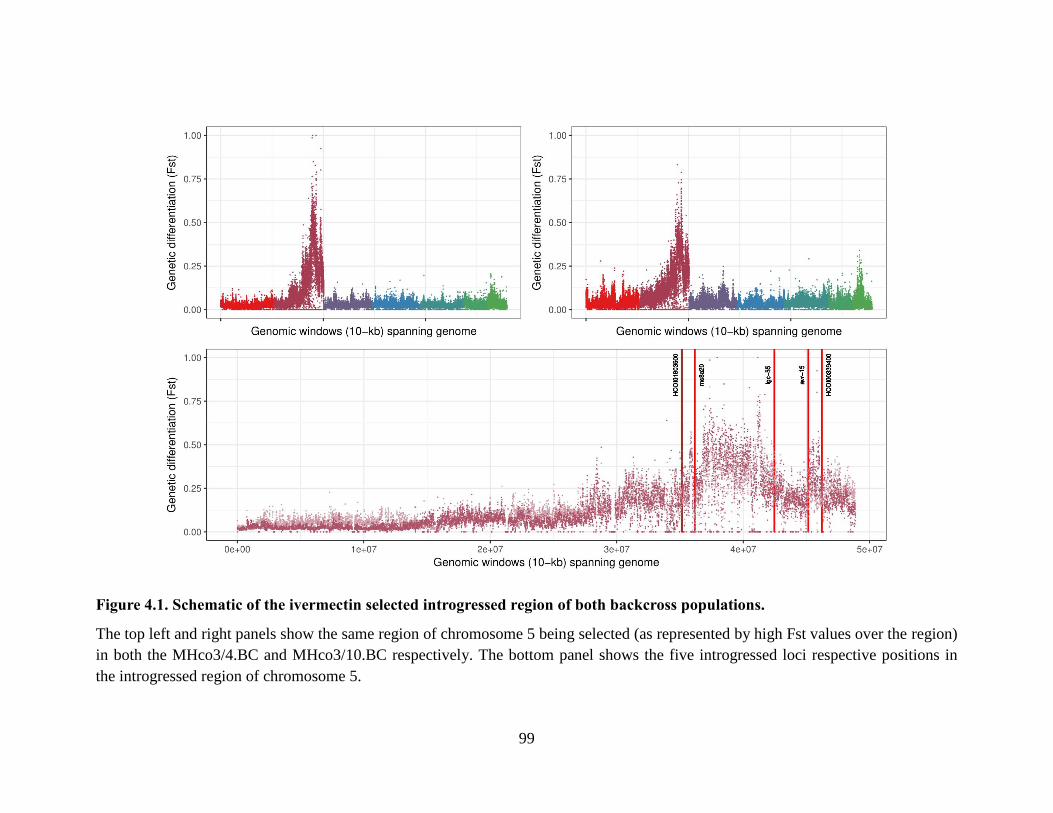
99
Figure 4.1. Schematic of the ivermectin selected introgressed region of both backcross populations.
The top left and right panels show the same region of chromosome 5 being selected (as represented by high Fst values over the region)
in both the MHco3/4.BC and MHco3/10.BC respectively. The bottom panel shows the five introgressed loci respective positions in
the introgressed region of chromosome 5.
100
performed on samples of 30 worms after three and four rounds of additional ivermectin selection
through experimental passage after both of the backcrosses. The strength of the signal of
introgression in the 11.2 Mb region on chromosome 5 increased with each round of selection in
both cases (Doyle et al., manuscript in preparation). This work suggests that the major locus (or
loci) responsible for the ivermectin resistance phenotype in the MHco4(WRS) and
MHco10(CAVR) strains is located in this region. One limitation of the backcrossing approach is
the limited number of recombination events that will occur through four rounds of backcrossing
and even the subsequent four rounds of passage and selection. Consequently, the region of
introgression will be large, which limits how finely the causal ivermectin resistance locus can be
mapped using these backcross populations.
In this chapter, we use a deep amplicon sequencing approach to investigate the signature of
selection of five loci chosen from across the 11.2 Mb introgressed region on chromosome 5 in a
number of different H. contortus field populations that are ivermectin resistant. Two additional
loci from other chromosomes were included as controls (Hco-dyf -7 on the X-chromosome, and a
“core eukaryotic gene” (CEG) on chromosome 4). The rationale behind this approach is that
there is more opportunity for genetic recombination to occur around a selected locus in field
populations than there is in populations derived from a limited number of experimental
backcrosses. The large effective population size of H. contortus, together with the multiple
generations that have occurred since the first appearance of a resistance allele(s), leads us to
predict that the region of the genome showing a signature of selection around a locus under
selection will be relatively narrow. Ideally, whole genome sequencing of such populations would
allow the resistance locus (or loci) to be more finely mapped but such an approach is still too
expensive for us to apply to a relatively large number of field populations. The deep amplicon
sequencing of targeted loci allows a greater number of populations to be examined in a cost-
effective manner. We used a number of different field populations in this study which are
described in further detail below.
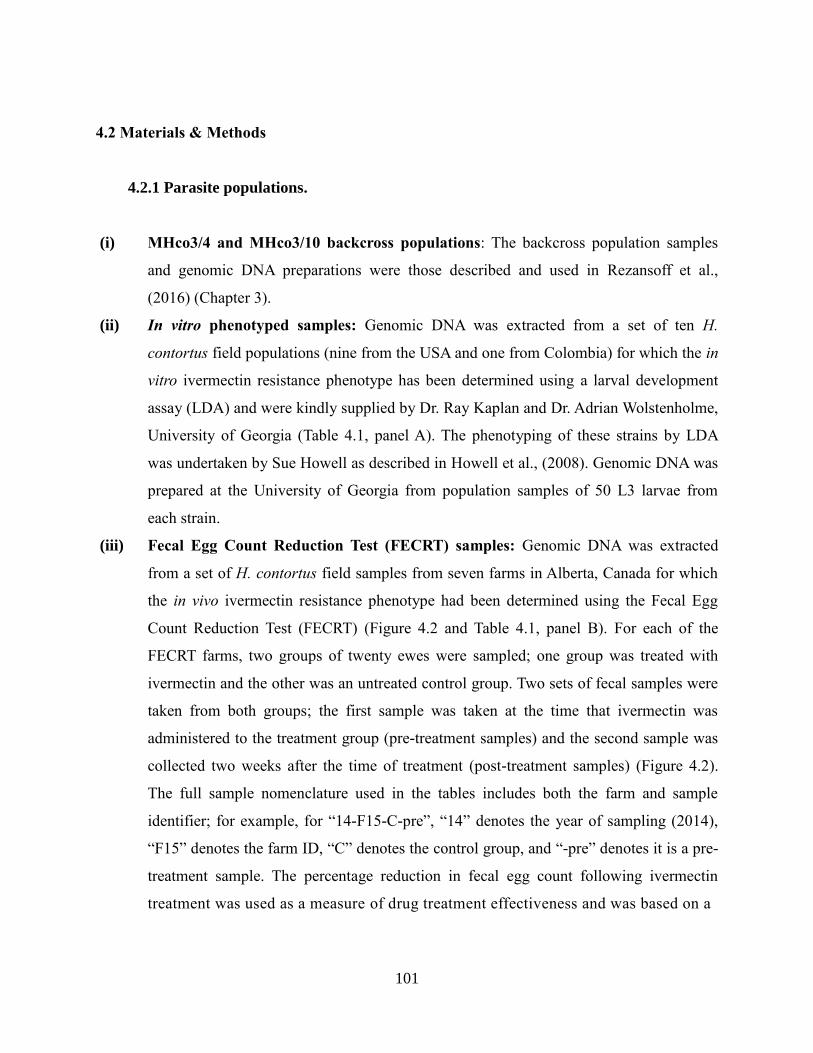
101
4.2 Materials & Methods
4.2.1 Parasite populations.
(i) MHco3/4 and MHco3/10 backcross populations: The backcross population samples
and genomic DNA preparations were those described and used in Rezansoff et al.,
(2016) (Chapter 3).
(ii) In vitro phenotyped samples: Genomic DNA was extracted from a set of ten H.
contortus field populations (nine from the USA and one from Colombia) for which the in
vitro ivermectin resistance phenotype has been determined using a larval development
assay (LDA) and were kindly supplied by Dr. Ray Kaplan and Dr. Adrian Wolstenholme,
University of Georgia (Table 4.1, panel A). The phenotyping of these strains by LDA
was undertaken by Sue Howell as described in Howell et al., (2008). Genomic DNA was
prepared at the University of Georgia from population samples of 50 L3 larvae from
each strain.
(iii) Fecal Egg Count Reduction Test (FECRT) samples: Genomic DNA was extracted
from a set of H. contortus field samples from seven farms in Alberta, Canada for which
the in vivo ivermectin resistance phenotype had been determined using the Fecal Egg
Count Reduction Test (FECRT) (Figure 4.2 and Table 4.1, panel B). For each of the
FECRT farms, two groups of twenty ewes were sampled; one group was treated with
ivermectin and the other was an untreated control group. Two sets of fecal samples were
taken from both groups; the first sample was taken at the time that ivermectin was
administered to the treatment group (pre-treatment samples) and the second sample was
collected two weeks after the time of treatment (post-treatment samples) (Figure 4.2).
The full sample nomenclature used in the tables includes both the farm and sample
identifier; for example, for “14-F15-C-pre”, “14” denotes the year of sampling (2014),
“F15” denotes the farm ID, “C” denotes the control group, and “-pre” denotes it is a pre-
treatment sample. The percentage reduction in fecal egg count following ivermectin
treatment was used as a measure of drug treatment effectiveness and was based on a
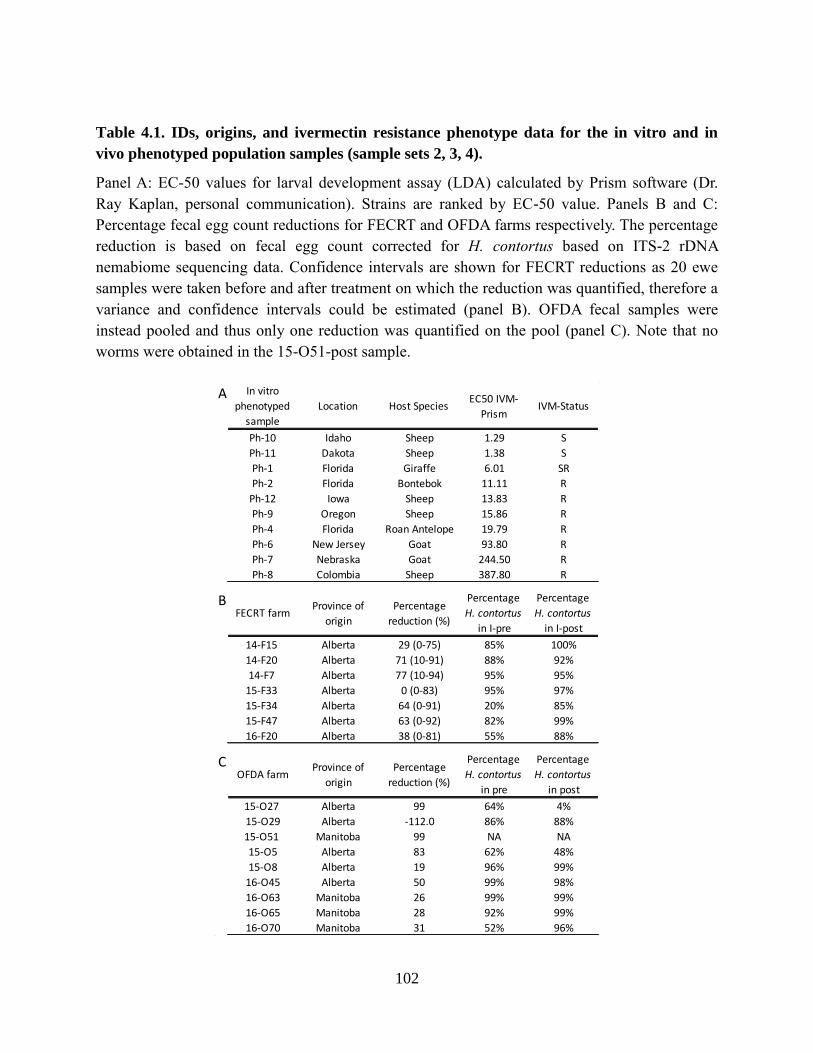
102
Table 4.1. IDs, origins, and ivermectin resistance phenotype data for the in vitro and in
vivo phenotyped population samples (sample sets 2, 3, 4).
Panel A: EC-50 values for larval development assay (LDA) calculated by Prism software (Dr.
Ray Kaplan, personal communication). Strains are ranked by EC-50 value. Panels B and C:
Percentage fecal egg count reductions for FECRT and OFDA farms respectively. The percentage
reduction is based on fecal egg count corrected for H. contortus based on ITS-2 rDNA
nemabiome sequencing data. Confidence intervals are shown for FECRT reductions as 20 ewe
samples were taken before and after treatment on which the reduction was quantified, therefore a
variance and confidence intervals could be estimated (panel B). OFDA fecal samples were
instead pooled and thus only one reduction was quantified on the pool (panel C). Note that no
worms were obtained in the 15-O51-post sample.
A In vitro
phenotyped
sample
Location Host SpeciesEC50 IVM-
PrismIVM-Status
Ph-10 Idaho Sheep 1.29 S
Ph-11 Dakota Sheep 1.38 S
Ph-1 Florida Giraffe 6.01 SR
Ph-2 Florida Bontebok 11.11 R
Ph-12 Iowa Sheep 13.83 R
Ph-9 Oregon Sheep 15.86 R
Ph-4 Florida Roan Antelope 19.79 R
Ph-6 New Jersey Goat 93.80 R
Ph-7 Nebraska Goat 244.50 R
Ph-8 Colombia Sheep 387.80 R
BFECRT farm
Province of
origin
Percentage
reduction (%)
Percentage
H. contortus
in I-pre
Percentage
H. contortus
in I-post
14-F15 Alberta 29 (0-75) 85% 100%
14-F20 Alberta 71 (10-91) 88% 92%
14-F7 Alberta 77 (10-94) 95% 95%
15-F33 Alberta 0 (0-83) 95% 97%
15-F34 Alberta 64 (0-91) 20% 85%
15-F47 Alberta 63 (0-92) 82% 99%
16-F20 Alberta 38 (0-81) 55% 88%
COFDA farm
Province of
origin
Percentage
reduction (%)
Percentage
H. contortus
in pre
Percentage
H. contortus
in post
15-O27 Alberta 99 64% 4%
15-O29 Alberta -112.0 86% 88%
15-O51 Manitoba 99 NA NA
15-O5 Alberta 83 62% 48%
15-O8 Alberta 19 96% 99%
16-O45 Alberta 50 99% 98%
16-O63 Manitoba 26 99% 99%
16-O65 Manitoba 28 92% 99%
16-O70 Manitoba 31 52% 96%
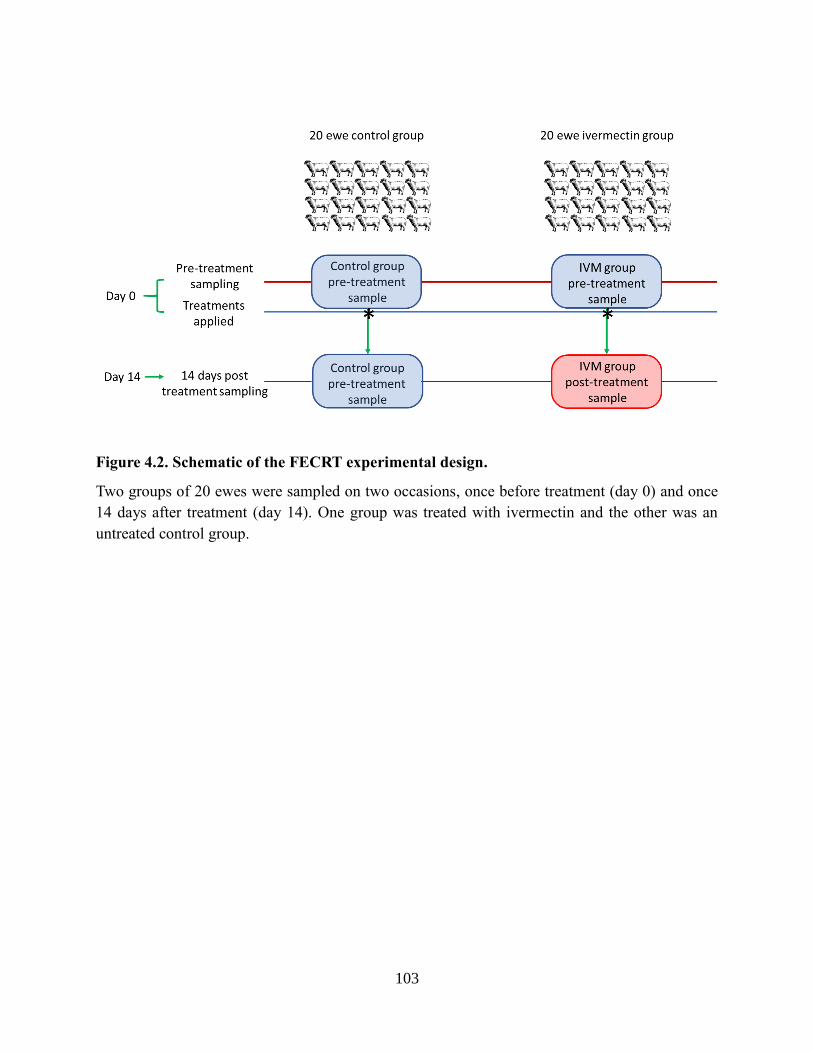
103
Figure 4.2. Schematic of the FECRT experimental design.
Two groups of 20 ewes were sampled on two occasions, once before treatment (day 0) and once
14 days after treatment (day 14). One group was treated with ivermectin and the other was an
untreated control group.
104
comparison of the fecal egg count (eggs per gram) of the ivermectin pre- and post-
treatment samples using the World Association for the Advancement of Veterinary
parasitology (WAAVP) guidelines (Coles et al., 1992). Fecal egg counts were determined
using the McMaster method (Coles et al., 1992). Because the infections consist of mixed
parasite species, egg counts were corrected to represent only H. contortus counts, using
nemabiome ITS-2 rDNA sequence data that provided the parasite species proportions in
each sample (Queiroz C., and Gilleard J.S., personal communication). Results for the
FECRT farms are given in Table 4.1, panel B. H. contortus populations were deemed to
be ivermectin resistant on all seven farms based on a < 90% reduction in fecal egg
counts with an upper 95% confidence interval of < 95% as recommended by the WAAVP
guidelines (Coles et al., 1992) (Table 4.1, panel B). For genomic DNA preparation, equal
amounts of feces from all 20 animals in each group were pooled and L1 larvae harvested
following flotation of eggs and hatching (Queiroz, C., personal communication).
Genomic DNA preparations were then made from ~500 L1 larvae per group, which were
lysed (as described in Avramenko et al., 2015) and DNA purified with Qiagen’s
QIAamp® DNA Mini Kit (Cat No. 51304) following the manufacturers guidelines.
Purified DNA was diluted to ~10 ng/μl before addition to PCR reactions.
(iv) On Farm Deworming Assay Samples (OFDAs): The OFDA samples were obtained
from fecal samples sent in by farmers from nine farms in Alberta and Manitoba.
Individual fecal samples were collected by the farmer from 20 ewes on the day of
ivermectin treatment. A second set of 20 samples was collected by the farmer two weeks
after treatment. On arrival at the laboratory, an equal mass of feces (6 g) was taken from
each of the 20 samples to form a pool for the group. The fecal egg count (eggs per gram)
for the group was calculated from the arithmetic mean of the counts from four aliquots of
5 g taken at random from these pools. The fecal egg counts were determined by the
McMaster method (Coles et al., 1992). The percentage reduction in each post-treatment
sample relative to the pre-treatment sample for each farm was calculated from these
mean egg counts following correction for H. contortus counts using nemabiome ITS-2
rDNA data (Table 4.1, panel C). DNA was extracted from pools of ~ 500 L1 or L3 stage
larvae which were lysed (as described in Avramenko et al., 2015) and DNA purified with
105
Qiagen’s QIAamp® DNA Mini Kit (Cat No. 51304) following the manufacturer’s
guidelines. Purified DNA was diluted to ~10 ng/μl before addition to PCR reactions.
4.2.2 Genetic loci examined.
Five loci were examined across the 11.2 Mb region of interest on chromosome 5 of the H.
contortus genome following examination of the annotated sequence of this scaffold of the H.
contortus assembly “v2.5”. These were chosen partly because of their relative positions across
the 11.2 Mb region, and partly because of their homology to C. elegans genes that we considered
might make them potential candidate resistance loci (Figure 4.1):
IR-start: This locus was within gene model HCOI_01803500, located 159,779 bp from the
central end of the of the 11.2 Mb region (i.e. chosen for its proximity near the centromeric end)
(coordinates 35,160,246 on chromosome 5). Primers were designed on exons spanning an
intronic region within the gene model HCOI_01803500 (Figure 4.1, and Table 4.2).
Hcms8a20: this locus was within gene model HCOI_00680800, located 1,159,406 bp from the
central end of the of the 11.2 Mb region. Hcms8a20 was shown to be introgressed in both
independent backcross experiments using a microsatellite as well as Sanger sequencing of an
adjacent sequence tag (Redman et al., 2012; Rezansoff et al., 2016, Chapter 3). The position of
this microsatellite locus is now accurately known in the new H. contortus genome assembly
(coordinates 36,159,873 on Chromosome 5) (Doyle et al., manuscript in preparation) (Figure
4.1). The nearest H. contortus gene model to the microsatellite Hcms8a20 – HCOI_00680800 –
was used to select intron-spanning exonic primers similar to the other loci (this amplified locus
will be called Hcms8a20 for consistency) (Figure 4.1, and Table 4.2).
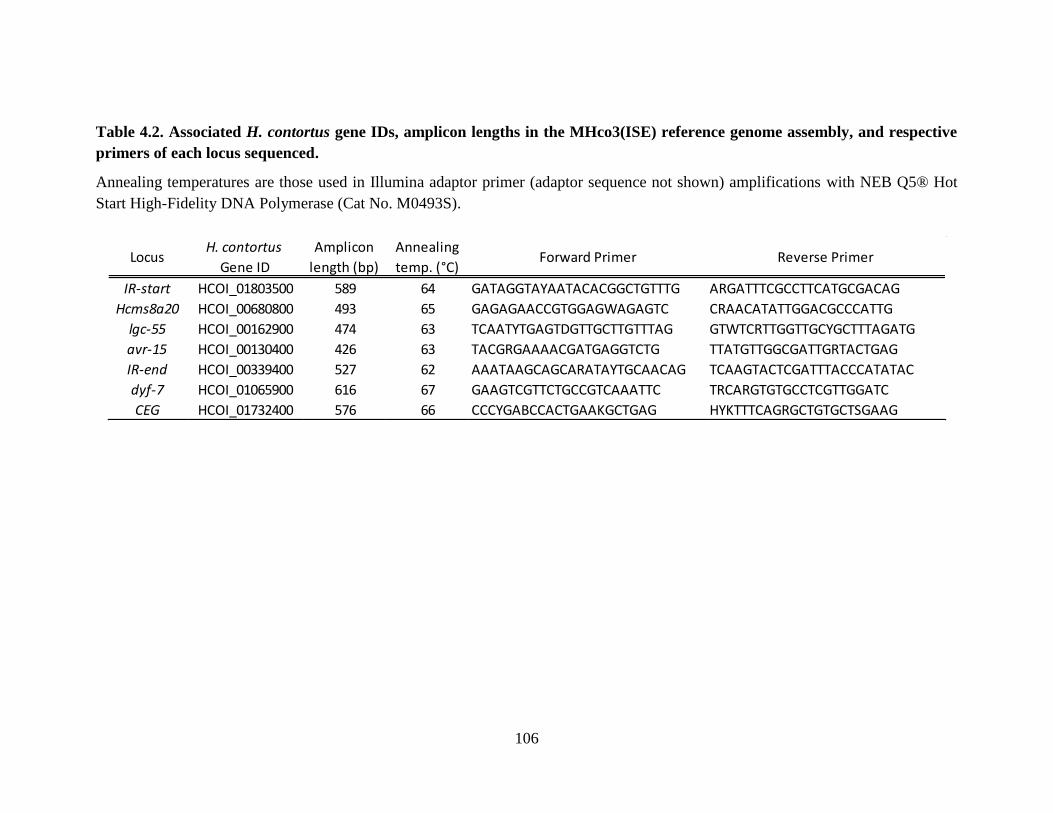
106
Table 4.2. Associated H. contortus gene IDs, amplicon lengths in the MHco3(ISE) reference genome assembly, and respective
primers of each locus sequenced.
Annealing temperatures are those used in Illumina adaptor primer (adaptor sequence not shown) amplifications with NEB Q5® Hot
Start High-Fidelity DNA Polymerase (Cat No. M0493S).
LocusH. contortus
Gene ID
Amplicon
length (bp)
Annealing
temp. (°C)Forward Primer Reverse Primer
IR-start HCOI_01803500 589 64 GATAGGTAYAATACACGGCTGTTTG ARGATTTCGCCTTCATGCGACAG
Hcms8a20 HCOI_00680800 493 65 GAGAGAACCGTGGAGWAGAGTC CRAACATATTGGACGCCCATTG
lgc-55 HCOI_00162900 474 63 TCAATYTGAGTDGTTGCTTGTTTAG GTWTCRTTGGTTGCYGCTTTAGATG
avr-15 HCOI_00130400 426 63 TACGRGAAAACGATGAGGTCTG TTATGTTGGCGATTGRTACTGAG
IR-end HCOI_00339400 527 62 AAATAAGCAGCARATAYTGCAACAG TCAAGTACTCGATTTACCCATATAC
dyf-7 HCOI_01065900 616 67 GAAGTCGTTCTGCCGTCAAATTC TRCARGTGTGCCTCGTTGGATC
CEG HCOI_01732400 576 66 CCCYGABCCACTGAAKGCTGAG HYKTTTCAGRGCTGTGCTSGAAG
107
Hco-lgc-55: gene model HCOI_00162900, located 7,362,251 bp from the central end of the of
the 11.2 Mb introgressed region, is the H. contortus homologue of the C. elegans amine-gated
chloride channel Cel-lgc-55 required for proper muscle control (Ringstad et al., 2009). This gene
was observed to be the most strongly up-regulated gene in both ivermectin resistant backcross
parental strains MHco4(WRS) and MHco10(CAVR) relative to the susceptible MHco3(ISE)
parental strain (Chapter 2). Primers were designed on exons spanning an intronic region within
this gene model (coordinates 42,453,418 on chromosome 5) (Figure 4.1, and Table 4.2).
Hco-avr-15: gene model HCOI_00130400, located 10,057,009 bp from the central end of the of
the 11.2 Mb region, is the H. contortus homologue of the C. elegans glutamate-gated chloride
channel Cel-avr-15. This gene results in an ivermectin resistance phenotype when mutated in C.
elegans (Dent et al., 2000). Primers were designed on exons spanning an intronic region within
this gene model (coordinates 45,141,968 on chromosome 5) (Figure 4.1, and Table 4.2).
IR-end: This locus was within HCOI_00339400, located 11,108,692 bp from the central end of
the of the 11.2 Mb region (i.e. chosen for its proximity near the telomeric end). Primers were
designed on exons spanning an intronic region within this gene model (coordinates 46,214,287
on chromosome 5) (Figure 4.1, and Table 4.2).
In addition, two loci were chosen on other chromosomes as controls:
Hco-dyf-7: gene model HCOI_01065900 has been previously implicated for involvement in
ivermectin resistance (Urdaneta-Marquez et al., 2014) and is located on the X-chromosome.
Primers were designed on exons spanning an intronic region in this gene model (Figure 4.1, and
Table 4.2).
CEG: gene model HCOI_01732400 was chosen for its status as a “core eukaryotic gene” and its
location on a different chromosome than the introgressed region (chromosome 4). Primers were
designed on exons spanning an intronic region within this gene model (Figure 4.1, and Table
4.2).
108
4.2.3 DNA preparation, primer design, PCR amplification, and deep amplicon
sequencing.
Genomic DNA lysates were prepared from ~500 L1 or L3 larvae of the FECRT and OFDA
samples using the methods described in Avramenko et al., (2015). Primers were designed using
previously constructed whole genome sequence (WGS) alignments derived from population
samples of the MHco3(ISE), MHco4(WRS), and MHco10(CAVR) backcross parental strains
aligned to an unpublished updated version of the MHco3(ISE) reference genome assembly
(Laing et al., 2013). Primers were designed on exonic regions of gene models using the criteria
that they span at least one intron, and amplify a locus no larger than 550 bases and no shorter
than 350 bases. Primers were designed to avoid as much population level polymorphism in
binding sites as possible (observed in the WGS alignments). No degenerate sites were allowed in
the first 5 bases of 3’ ends of primers, and 3’ end bases were set on the first base of a codon when
possible, and at G/C sites only. Forward and reverse primers along with respective amplicon
lengths and annealing temperatures used for amplification are shown in Table 4.2. Illumina
adaptors were added to the primers but with four single base length variants of each primer
pooled together to increase nucleotide diversity at the start of sequencing (as described in
Avramenko et al., 2015).
All loci were amplified with Q5® Hot Start High-Fidelity DNA Polymerase (Cat No.
M0493S) with adaptor primers under the following PCR reaction conditions: 5 μl 5X Q5
reaction buffer, 0.75 μl dNTPs (10 mM), 1.25 μl each of F and R Primers (10 μM), 0.25 μl Q5®
Hot Start High-Fidelity Polymerase, 14.5 μl ddH2O, and 2 μl purified DNA. The following
thermocycling parameters were used: 98°C for 30 seconds, followed by 32 cycles of (98°C for 8
seconds, locus annealing °C (Table 4.2) for 20 seconds, 72°C for 20 seconds), followed by a 2-
minute final extension of 72°C. Beckman Coulter’s AMPure XP Magnetic Bead Purification (Cat
No. A63881) of amplified product was carried out to remove PCR impurities and reagents from
amplified samples for all loci using the manufacturers recommended protocol.
Illumina index amplifications were carried out on purified samples under the following PCR
reaction conditions: 5 μl 5X Q5 reaction buffer, 0.75 μl dNTPs (10 mM), 1.25 μl of each F and R
index primers (10 μM), 0.25 μl Q5® Hot Start High-Fidelity Polymerase, 14.5 μl ddH2O, and 2
109
μl purified DNA. The following thermocycling parameters were used: 98°C for 45 seconds,
followed by 8 cycles of (98°C for 20 seconds, 63 °C for 20 seconds, 72°C for 2 minutes). This
was followed by a second round of bead purifications of indexed amplicons. Purified Index PCR
products were quantified with an Implen NP80 NanoPhotometer (Serial No: M80701) and the
final sequencing library was created by combining ~50 ng of each amplicon of each sample.
PCR negative controls were carried out for each locus and were given their own index
combination. The concentration of the pooled library was quantified with KAPA Biosystems
KAPA qPCR Library Quantification Kit (Cat No. KR0405) after which the library was
sequenced on an Illumina MiSeq Desktop Sequencer with a MiSeq Reagent Kit v3 (600 cycle)
(Cat No. MS-102-3003) following Illumina’s recommended MiSeq protocol.
4.2.4 Sequencing output and processing.
From the sequencing of the pooled library of all samples, the total number of reads
produced by the MiSeq sequencer was 18,398,398. 75.49% (13,889,165 reads) were identified
and assigned to one of the 58 experimental samples, 15 index negative control samples, or the
single combined (from all loci) PCR negative control sample. The index negative control
samples are index combinations not used on any sample but called by the sequencer to inform on
the level of “index switching” in the pooled library. The number of reads passing filter that were
assigned to each experimental sample ranged from 91,590 to 460,465 with an average of 238,786
reads per sample. The 15 index negative control samples averaged 1,482 reads per sample. The
combined PCR negative control samples of all seven loci yielded 17,312 reads in total. Overall,
the percentage of all bases showing ≥ Q30 quality was 80.07% for forward reads, and 59.03%
for reverse reads.
Reads were processed, assembled, and remapped using drive5’s USEARCH (version 9.1)
bioinformatic suite (https://www.drive5.com/usearch/) following recommended guidelines to
attain unique, “denoised” correct biological haplotypes from the sequence datasets. First,
unpaired sequences were merged to generate consensus sequences for each read pair when
possible. A total of 7,133,861 (51.36%) of 13,889,165 read pairs were merged with
fastq_mergepairs across the entire dataset. In the case of the Hco-avr-15, Hco-lgc-55,
110
Hcms8a20, and IR-end loci, where the amplicons were short enough (426, 474, 493, and 527
respectively) for sufficient overlap, a high proportion of read pairs were merged. In the case of
the IR-start, Hco-dyf-7 and CEG loci, the amplicons were longer than expected (589, 616 and
576 respectively) and so only a small fraction (none in the case of Hco-dyf-7) of reads were
merged in each case. Consequently, for these three loci, the forward reads were trimmed to 225
base pairs and processed alone to maximize the read depth for subsequent analysis.
The next step was to process the dataset to remove artefactual haplotypes produced by
amplification (due to polymerase error) and sequencing (due to MiSeq miscalls) errors such that
only genuine haplotypes were included in the subsequent analysis. In the merged paired-end read
processing pipeline (used to obtain haplotypes for Hco-avr-15, Hco-lgc-55, Hcms8a20, and IR-
end), after primer trimming with fastx_truncate, 4,189,537 (58.7%) of 7,133,861 merged reads
passed quality filtering with fastq_filter at a threshold of one expected error or less per read.
Within these 4,189,537 reads, 846,665 unique haplotypes were identified with fastx_uniques,
664,917 (78.5%) of which were found as “singletons”, being observed only once, and are
removed from the unique haplotype set by the USEARCH pipeline due to their high likelihood of
being unique due to either amplification or sequencing error. The maximum number of merged
reads corresponding to a single haplotype was 26,541, with the mean of number of merged reads
being 4.95 for each unique haplotype. Denoising with unoise2 resulted in 1,428 of the unique
haplotypes qualifying as haplotypes derived from amplicons based on the criteria of base
differences and frequency as is standard in denoising. Of these 1,428 unique haplotypes, 934
were assessed as correct biological haplotypes, with 494 assessed as amplification chimeras.
These 934 haplotypes served as the reference haplotype sequence set onto which all merged
reads were remapped with usearch_global to attain respective haplotype frequencies for each
sample in the dataset. In total, 36.6% (2,610,210) of merged reads remapped at 100% identity to
922 of the 934 genuine biological haplotypes from all seven loci.
In the case of the forward read only dataset to attain data for the three loci (Start, CEG, and
Hco-dyf-7) for which only forward reads could be assessed, 9,101,279 (65.5%) of the 13,889,165
trimmed 225 bp forward reads passed filtering at a threshold of one expected error per read.
Within these 9,101,279 reads, 802,003 unique haplotypes were found with fastx_uniques,
617,585 (77.0%) of which were found as “singletons”. The maximum number of forward reads
111
corresponding to a single haplotype was 132,377, with the mean of number of reads being 11.35
for each unique haplotype. Denoising with unoise2 resulted in 2,420 of these unique haplotypes
qualifying as correct haplotypes derived from amplicons. Of these 2,420 unique haplotypes,
1,840 were assessed as correct biological haplotypes, with 580 assessed as amplification
chimeras. These 1,840 haplotypes served as the reference haplotype sequence set onto which all
forward reads were remapped with usearch_global to attain respective haplotype frequencies for
each sample in the dataset. In total, 46.6% (6,466,774) of forward reads remapped at 100%
identity to 1,840 correct biological haplotypes from all seven loci.
The 934 and 1,840 genuine biological haplotypes of the merged paired-end and forward
read only datasets were remapped to the reference sequences of the seven loci to segregate
haplotypes by locus in both datasets, respectively. The observed number of correct biological
haplotypes of the Hco-avr-15, Hco-lgc-55, Hcms8a20, and the IR-end loci was 166, 268, 129,
and 75 respectively in the paired-end merged dataset. The observed number of haplotypes for the
IR-start, CEG, and Hco-dyf-7 loci was 149, 57, and 50 respectively in the forward read only
dataset. Genetic and frequency data from the paired-end merged read dataset for the Hco-avr-15,
Hco-lgc-55, Hcms8a20, and the IR-end loci, and forward read only dataset for the IR-start, CEG,
and Hco-dyf-7 loci were combined and used as the basis for the remaining analyses.
4.2.5 Population genetic analyses.
Four sets of analyses were carried out on the haplotypes assigned to each sample derived from
each locus:
(i) Population pairwise Fst values were determined for all pairwise sample comparisons
within each of the four experimental datasets. For each locus, an Arlequin (.arp) format
file containing the nucleotide sequence and frequency of all haplotypes of that locus
present in each sample was uploaded into DnaSP6 (Rozas et al., 2017). DnaSP6 was
used via its haplotype frequency file analysis to determine population pairwise Fst values
(Hudson et al., 1992) for all pairwise sample comparisons.
112
(ii) Shannon(e) alpha diversities, scoring the level of genetic diversity within a population
sample, were determined for all samples for each locus using the alpha_div command in
USEARCH (version 9.1).
(iii) Tajima’s D (Tajima, 1989) scores, scoring departures from neutral evolution, were
determined for all samples for each locus via DnaSP6’s haplotype frequency file
analysis. Confidence intervals of Tajima’s D test statistics were estimated by coalescent
simulation in DnaSP6 using Theta(θ) estimates attained for each locus based on the
average number of nucleotide differences(k) averaged across all samples.
(iv) Haplotype frequency profiles were determined for all samples for each of the loci. All
sample profiles of each locus are sorted based on the total number observed across all
samples.
A few of the FECRT and OFDA samples had insufficient read coverage at some loci for
meaningful analysis. A criterion was used for data not to be included in the analysis when either
1) < 20% the number of reads of compared samples of the same farm were observed for a
sample at a locus, or 2) < 1,000 total reads and < 50% the number of reads of compared samples
of the same farm was observed for a sample at a locus. These samples are denoted as NA in
respective Fst value, Shannon(e) alpha diversity, and Tajima’s D statistic summary tables for the
FECRT and OFDA experimental samples (see Tables 4.6, 4.7, 4.10, 4.11).
113
4.3 Results
4.3.1 Overview of experimental design.
Deep amplicon sequence data were derived from four independent sample sets chosen to
investigate evidence of selection related to ivermectin treatment and/or resistance at a number of
candidate loci in field populations. The choice of candidate loci was guided by the results of a
previous whole genome sequencing analysis of two independent backcross experiments that
implicated an 11.2 Mb region on chromosome 5 as encompassing the location of a major
ivermectin resistance conferring locus (Doyle et al., manuscript in preparation). Five linked loci
distributed across the 11.2 Mb region on chromosome 5 were examined; loci (IR-start,
Hcms8a20, Hco-lgc-55, Hco-avr-15 and IR-end (Figure 4.1)). Two additional loci outside of this
region were also examined; “CEG” on chromosome 4, and Hco-dyf-7 on chromosome X. The
rationale for inclusion of each of the four independent sets of samples examined in this chapter is
explained below:
4.3.1.1 Sample set 1 - Two previously characterised H. contortus backcross
experiments MHco3/4.BC and MHco3/10.BC.
Sample set 1 consisted of genomic DNA samples from the MHco3(ISE), MHco4(WRS) and
MHco10(CAVR) parental strains, and the MHco3/4.BC and MHco3/10.BC backcross strains.
These were included as a positive control to evaluate the ability of deep amplicon sequencing of
specific loci to detect evidence of introgression of the IR-start, Hcms8a20, Hco-lgc-55, Hco-avr-
15, and IR-end loci in the backcross experiments, and for further confirmation of the results of
introgression of the Hcms8a20 marker in Chapter 3.
114
4.3.1.2 Sample set 2 - H. contortus populations in vitro phenotyped for ivermectin
resistance.
Sample set 2 consisted of genomic DNA samples prepared from 50 L3 larvae from ten H.
contortus populations (nine from the USA and one from Colombia) for which we have
phenotypic data on ivermectin resistance based on larval development assays (Table 4.1, panel
A). The EC-50 values from the LDAs of these populations range over two orders of magnitude
(Table 4.1, panel A). These samples were included to investigate which loci showed evidence of
selection in parasite populations that were ivermectin resistant based on in vitro assays.
4.3.1.3 Sample set 3 - H. contortus populations from “Fecal Egg Count Reduction
Tests” (FECRTs) conducted in Alberta, Canada.
Sample set 3 consisted of genomic DNA samples prepared from pools of ~500 H. contortus
L1 or L3 larvae harvested from pre- and post-ivermectin treatment and untreated control groups
of FECRTs conducted on seven sheep farms from Alberta, Canada (Table 4.1, panel B). These
samples were included to investigate which loci showed evidence of selection in natural field
populations of H. contortus that have been confirmed as ivermectin resistant based on the in vivo
FECRT test.
4.3.1.4 Sample set 4 - H. contortus populations from “On Farm Deworming Assays”
(OFDAs) conducted in Western Canada.
Sample set 4 consisted of genomic DNA samples prepared from ~500 H. contortus L1
larvae isolated from fecal samples sent in by farmers pre- and post- ivermectin treatment (Table
4.1, panel C). These samples were included to investigate which loci showed evidence of
selection in natural field populations of H. contortus that showed reduced efficacy to ivermectin
treatment.

115
4.3.2 Overview of data quality and analysis.
Each of the seven loci were amplified from each of the four sample sets described above
and sequenced in a single MiSeq run. The run generated 13,889,165 reads of which 4,220,789
remapped to the reference haplotypes of all loci across all samples at 100% identity (Table 4.3).
This averaged 10,447 reads per sample, per locus (Table 4.3). Relatively high variance was
observed in the total number of reads remapping for each sample (total of all seven loci): the
highest being 142,156 remapped reads for sample “14-F15-I-pre” and the lowest being 11,734
remapped reads for sample “16-O63-pos” (Table 4.3). High variance was also observed in the
number of reads from each sample that remapped to each of the seven loci (Table 4.3).
First, we examined the genetic structure and sub-structure of each locus by investigating the
genetic differentiation within and between H. contortus populations for the four sample sets
based on Fst values. Next, we examined the loci for evidence of selection by investigating
potential reductions in genetic diversity (Shannon(e) alpha diversities) that should indicate
selection by ivermectin treatment on one or a few haplotypes, which therefore increase in
frequency in a resistant population. In addition, Tajima’s D values were calculated to investigate
departures from neutral evolution that may indicate a history of purifying selection at a locus.
Finally, haplotype profiles for each locus were compared between samples to look for the
inheritance of specific haplotypes from resistant parental strains into the backcross populations
(sample set 1), differences in frequency of specific haplotypes associated with the in vitro
ivermectin resistance phenotype (sample set 2), or changes in frequency of specific haplotypes
following ivermectin treatment in the FECRT and OFDA samples (sample sets 3 and 4).
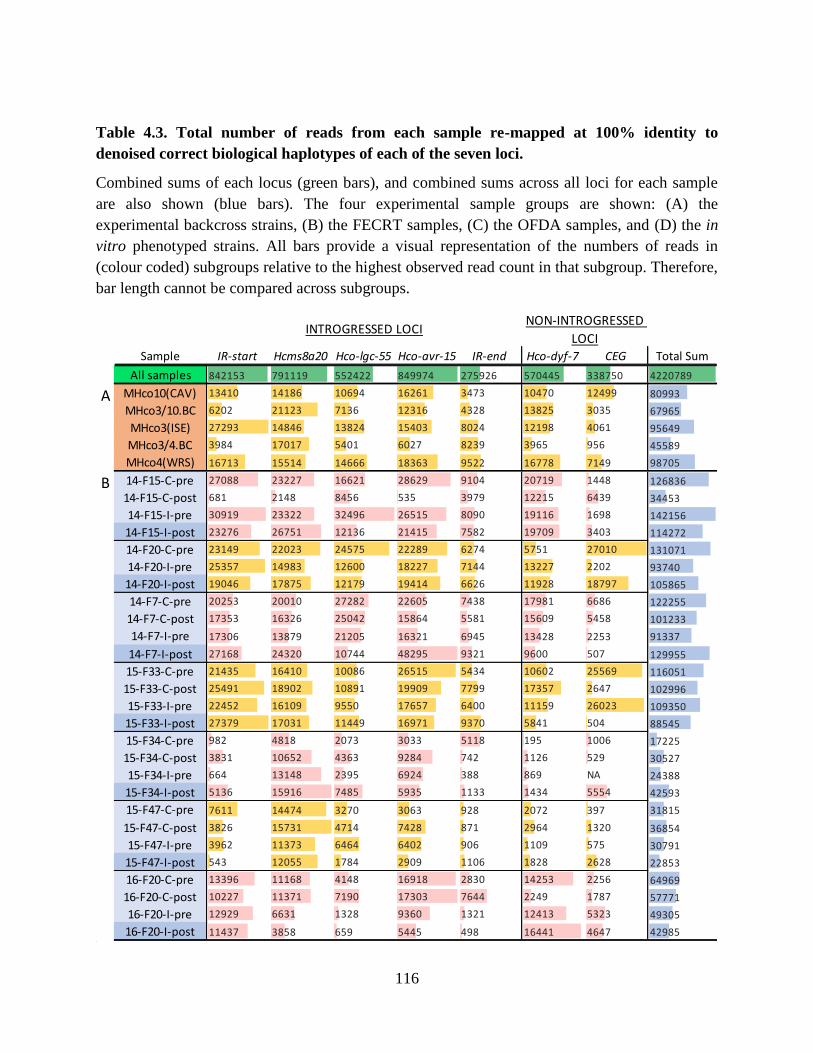
116
Table 4.3. Total number of reads from each sample re-mapped at 100% identity to
denoised correct biological haplotypes of each of the seven loci.
Combined sums of each locus (green bars), and combined sums across all loci for each sample
are also shown (blue bars). The four experimental sample groups are shown: (A) the
experimental backcross strains, (B) the FECRT samples, (C) the OFDA samples, and (D) the in
vitro phenotyped strains. All bars provide a visual representation of the numbers of reads in
(colour coded) subgroups relative to the highest observed read count in that subgroup. Therefore,
bar length cannot be compared across subgroups.
Sample IR-start Hcms8a20 Hco-lgc-55 Hco-avr-15 IR-end Hco-dyf-7 CEG Total Sum
All samples 842153 791119 552422 849974 275926 570445 338750 4220789
MHco10(CAV) 13410 14186 10694 16261 3473 10470 12499 80993
MHco3/10.BC 6202 21123 7136 12316 4328 13825 3035 67965
MHco3(ISE) 27293 14846 13824 15403 8024 12198 4061 95649
MHco3/4.BC 3984 17017 5401 6027 8239 3965 956 45589
MHco4(WRS) 16713 15514 14666 18363 9522 16778 7149 98705
14-F15-C-pre 27088 23227 16621 28629 9104 20719 1448 126836
14-F15-C-post 681 2148 8456 535 3979 12215 6439 34453
14-F15-I-pre 30919 23322 32496 26515 8090 19116 1698 142156
14-F15-I-post 23276 26751 12136 21415 7582 19709 3403 114272
14-F20-C-pre 23149 22023 24575 22289 6274 5751 27010 131071
14-F20-I-pre 25357 14983 12600 18227 7144 13227 2202 93740
14-F20-I-post 19046 17875 12179 19414 6626 11928 18797 105865
14-F7-C-pre 20253 20010 27282 22605 7438 17981 6686 122255
14-F7-C-post 17353 16326 25042 15864 5581 15609 5458 101233
14-F7-I-pre 17306 13879 21205 16321 6945 13428 2253 91337
14-F7-I-post 27168 24320 10744 48295 9321 9600 507 129955
15-F33-C-pre 21435 16410 10086 26515 5434 10602 25569 116051
15-F33-C-post 25491 18902 10891 19909 7799 17357 2647 102996
15-F33-I-pre 22452 16109 9550 17657 6400 11159 26023 109350
15-F33-I-post 27379 17031 11449 16971 9370 5841 504 88545
15-F34-C-pre 982 4818 2073 3033 5118 195 1006 17225
15-F34-C-post 3831 10652 4363 9284 742 1126 529 30527
15-F34-I-pre 664 13148 2395 6924 388 869 NA 24388
15-F34-I-post 5136 15916 7485 5935 1133 1434 5554 42593
15-F47-C-pre 7611 14474 3270 3063 928 2072 397 31815
15-F47-C-post 3826 15731 4714 7428 871 2964 1320 36854
15-F47-I-pre 3962 11373 6464 6402 906 1109 575 30791
15-F47-I-post 543 12055 1784 2909 1106 1828 2628 22853
16-F20-C-pre 13396 11168 4148 16918 2830 14253 2256 64969
16-F20-C-post 10227 11371 7190 17303 7644 2249 1787 57771
16-F20-I-pre 12929 6631 1328 9360 1321 12413 5323 49305
16-F20-I-post 11437 3858 659 5445 498 16441 4647 42985
A
B
INTROGRESSED LOCINON-INTROGRESSED
LOCI

117
Sample IR-start Hcms8a20 Hco-lgc-55 Hco-avr-15 IR-end Hco-dyf-7 CEG Total Sum
15-O51-pre 2491 9059 6827 14638 2619 2133 1012 38779
15-O27-post 8503 7170 4196 12772 5605 785 2842 41873
15-O5-pre 7528 2093 696 3023 244 2278 NA 15862
15-O5-post 4883 11709 7804 10057 700 3097 602 38852
15-O8-pre 13167 10164 7261 15226 3739 819 4240 54616
15-O8-post 11059 8146 8119 12866 4956 3413 3613 52172
15-O29-pre 24560 15464 13628 24088 6863 15340 16378 116321
15-O29-post 27230 17206 14424 22380 7012 16579 20055 124886
16-O45-pre 806 14111 5054 9544 1 54914 1043 85473
16-O45-post 17294 9298 11887 13114 7984 5394 4760 69731
16-O63-pre 8084 11147 5309 5819 3235 3629 531 37754
16-O63-post 5416 1459 1270 2038 707 28 816 11734
16-O65-pre 13914 15355 8600 13626 5113 7098 3944 67650
16-O65-post 1476 9658 3228 5423 1602 15033 313 36733
16-O70-pre 454 5305 1811 2953 5253 3800 1341 20917
16-O70-post 19344 13656 11374 17624 5862 2616 1260 71736
Ph-10 18536 12837 12327 13591 7052 8142 4302 76787
Ph-11 19342 8537 7184 14618 4079 12678 6354 72792
Ph-1 21561 14158 12119 27456 3956 15651 11978 106879
Ph-2 20531 10059 8442 23811 2093 13255 13740 91931
Ph-12 20095 13241 9289 12794 5252 10556 5711 76938
Ph-9 30664 12191 8892 17235 5996 9445 4265 88688
Ph-4 11722 15276 9770 10415 2388 7814 2537 59922
Ph-6 22663 20339 10784 19237 5894 16893 13484 109294
Ph-7 18083 23047 6728 17536 5902 6123 1532 78951
Ph-8 22248 13237 12493 24555 7661 14501 27731 122426
INTROGRESSED LOCINON-INTROGRESSED
LOCI
C
D
118
4.3.3 Analysis of the genetic differentiation of the candidate loci in the different sample
sets.
4.3.3.1 The genetic differentiation of the candidate loci in the
MHco3(ISE)/MHco4(WRS) and MHco3(ISE)/MHco10(CAVR) parental and
backcross populations is consistent with previous analysis.
The availability of genomic DNA from the two previous independent backcross
experiments provided us with an opportunity to test the validity of the deep amplicon sequencing
data and respective data processing pipelines (Redman et al., 2012; Rezansoff et al., 2016).
Genetic differentiation of the backcross and parental strains has been previously compared. High
pairwise Fst values are expected for all loci assessed here between the parental strains, given the
previous findings of high genetic differentiation between these strains (Redman et al., 2012;
Rezansoff et al., 2016). High Fst values were confirmed between each pair of parental strains
used in the two backcrosses – MHco3(ISE) compared to MHco4(WRS), and MHco3(ISE)
compared to MHco10(CAVR) – when averaged across all loci at 0.254 and 0.316, respectively
(Table 4.4, panel C). These were higher averages than were found between either parental strain
and their respective backcross populations (Table 4.4, panel C). As explained in Chapter 3
(Figure 3.4), for loci within the introgressed region, we expect a high pairwise Fst value between
the backcross population and the MHco3(ISE) susceptible parent. For the data here, in both
backcrosses, the loci in the introgressed region (IR-start, Hcms8a20, Hco-lgc-55, Hco-avr-15,
and IR-end) did have a high pairwise Fst value between the backcross populations and the
MHco3(ISE) parental strain (Table 4.4, panel A, green bars). In most cases this was higher than
with their respective resistant parental strain, MHco4(WRS) or MHco10(CAVR) (Table 4.4,
panel A, red bars). The only exceptions were the IR-start locus in MHco3/10.BC and IR-end
locus in MHco3/4.BC. In contrast, both loci not located in the introgressed region (Hco-dyf-7
and CEG) had very low Fst values between both backcross strains and the MHco3(ISE) parental
strain and these were much lower than with their respective resistant parental strains (Table 4.4,
panel B, green bars and red bars respectively). These results are generally consistent with expectations
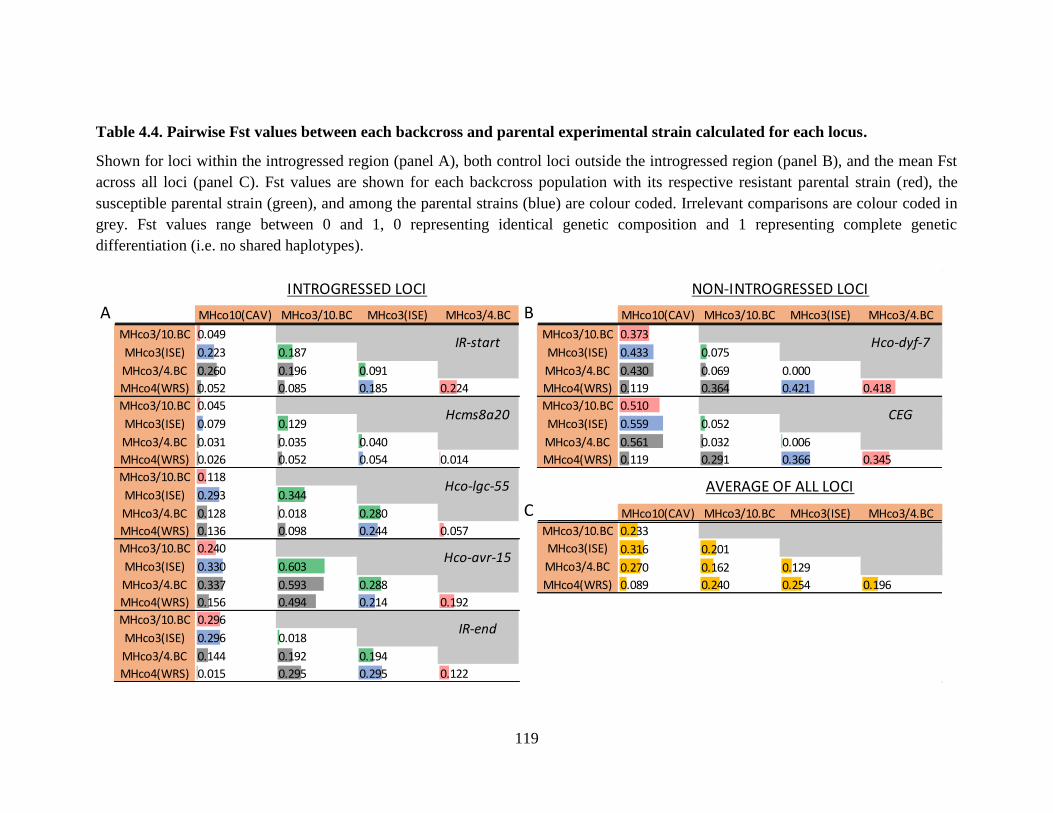
119
Table 4.4. Pairwise Fst values between each backcross and parental experimental strain calculated for each locus.
Shown for loci within the introgressed region (panel A), both control loci outside the introgressed region (panel B), and the mean Fst
across all loci (panel C). Fst values are shown for each backcross population with its respective resistant parental strain (red), the
susceptible parental strain (green), and among the parental strains (blue) are colour coded. Irrelevant comparisons are colour coded in
grey. Fst values range between 0 and 1, 0 representing identical genetic composition and 1 representing complete genetic
differentiation (i.e. no shared haplotypes).
MHco10(CAV) MHco3/10.BC MHco3(ISE) MHco3/4.BC MHco10(CAV) MHco3/10.BC MHco3(ISE) MHco3/4.BC
MHco3/10.BC 0.049 MHco3/10.BC 0.373
MHco3(ISE) 0.223 0.187 MHco3(ISE) 0.433 0.075
MHco3/4.BC 0.260 0.196 0.091 MHco3/4.BC 0.430 0.069 0.000
MHco4(WRS) 0.052 0.085 0.185 0.224 MHco4(WRS) 0.119 0.364 0.421 0.418
MHco3/10.BC 0.045 MHco3/10.BC 0.510
MHco3(ISE) 0.079 0.129 MHco3(ISE) 0.559 0.052
MHco3/4.BC 0.031 0.035 0.040 MHco3/4.BC 0.561 0.032 0.006
MHco4(WRS) 0.026 0.052 0.054 0.014 MHco4(WRS) 0.119 0.291 0.366 0.345
MHco3/10.BC 0.118
MHco3(ISE) 0.293 0.344
MHco3/4.BC 0.128 0.018 0.280 MHco10(CAV) MHco3/10.BC MHco3(ISE) MHco3/4.BC
MHco4(WRS) 0.136 0.098 0.244 0.057 MHco3/10.BC 0.233
MHco3/10.BC 0.240 MHco3(ISE) 0.316 0.201
MHco3(ISE) 0.330 0.603 MHco3/4.BC 0.270 0.162 0.129
MHco3/4.BC 0.337 0.593 0.288 MHco4(WRS) 0.089 0.240 0.254 0.196
MHco4(WRS) 0.156 0.494 0.214 0.192
MHco3/10.BC 0.296
MHco3(ISE) 0.296 0.018
MHco3/4.BC 0.144 0.192 0.194
MHco4(WRS) 0.015 0.295 0.295 0.122
AVERAGE OF ALL LOCI
INTROGRESSED LOCI NON-INTROGRESSED LOCI
BA
C
Hco-dyf-7
CEG
IR-start
Hcms8a20
Hco-lgc-55
Hco-avr-15
IR-end
120
based on the genomic location of the candidate loci and their previously determined patterns of
genetic differentiation within the introgressed region relative to the rest of the H. contortus
genome (Rezansoff et al., 2016).
4.3.3.2 Genetic differentiation among the in vitro phenotyped H. contortus field
isolates derived from different regions of USA is very low.
Although the in vitro phenotyped samples from the USA (sample set 2) were obtained from
geographically disparate locations and from multiple different host species (Table 4.1, panel A),
the pairwise Fst values averaged across all loci were relatively low, ranging between 0.041 and
0.146, averaging 0.084 across all sample comparisons (Table 4.5).
4.3.3.3 A low level of genetic differentiation of H. contortus populations is discernable
between the different Alberta FECRT farms.
Using data from all seven loci, we compared the genetic differentiation for the H. contortus
populations of the Alberta field samples collected in the FECRT survey (samples set 3). The
availability of four samples for six of the seven FECRT farms provides a particularly useful
experimental dataset with which to compare within and between farm genetic differentiation. For
each FECRT farm and for each locus, we determined, 1) the mean pairwise Fst values among the
three population samples not exposed to drug, 2) the mean pairwise Fst values between the three
untreated samples and the one ivermectin-treated sample, and 3) the mean pairwise Fst values of
the four samples on a farm with all other samples from all other farms (Table 4.6). Mean
pairwise Fst values across all loci and across all farms averaged 0.020 among untreated samples
of all farms, and 0.031 between the untreated samples and the treated sample of all farms,
respectively (Table 4.6, panel C). This increased to an average of 0.075 for all inter-farm
pairwise Fst values (Table 4.6, panel C). Consequently, the data suggest there is a low but
detectable population structure of H. contortus populations across Alberta since there is more
genetic differentiation among H. contortus populations than between different samples of the
same farm (Table 4.6, Panel C).
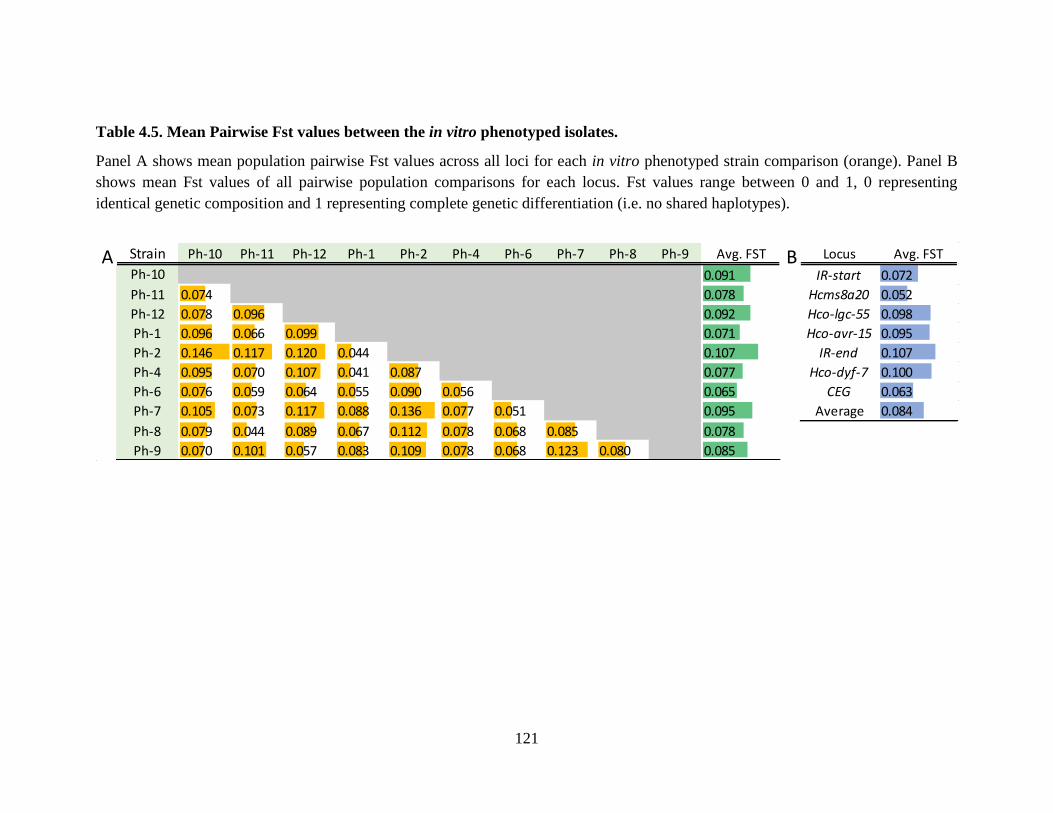
121
Table 4.5. Mean Pairwise Fst values between the in vitro phenotyped isolates.
Panel A shows mean population pairwise Fst values across all loci for each in vitro phenotyped strain comparison (orange). Panel B
shows mean Fst values of all pairwise population comparisons for each locus. Fst values range between 0 and 1, 0 representing
identical genetic composition and 1 representing complete genetic differentiation (i.e. no shared haplotypes).
Strain Ph-10 Ph-11 Ph-12 Ph-1 Ph-2 Ph-4 Ph-6 Ph-7 Ph-8 Ph-9 Avg. FST Locus Avg. FST
Ph-10 0.091 IR-start 0.072
Ph-11 0.074 0.078 Hcms8a20 0.052
Ph-12 0.078 0.096 0.092 Hco-lgc-55 0.098
Ph-1 0.096 0.066 0.099 0.071 Hco-avr-15 0.095
Ph-2 0.146 0.117 0.120 0.044 0.107 IR-end 0.107
Ph-4 0.095 0.070 0.107 0.041 0.087 0.077 Hco-dyf-7 0.100
Ph-6 0.076 0.059 0.064 0.055 0.090 0.056 0.065 CEG 0.063
Ph-7 0.105 0.073 0.117 0.088 0.136 0.077 0.051 0.095 Average 0.084
Ph-8 0.079 0.044 0.089 0.067 0.112 0.078 0.068 0.085 0.078
Ph-9 0.070 0.101 0.057 0.083 0.109 0.078 0.068 0.123 0.080 0.085
BA
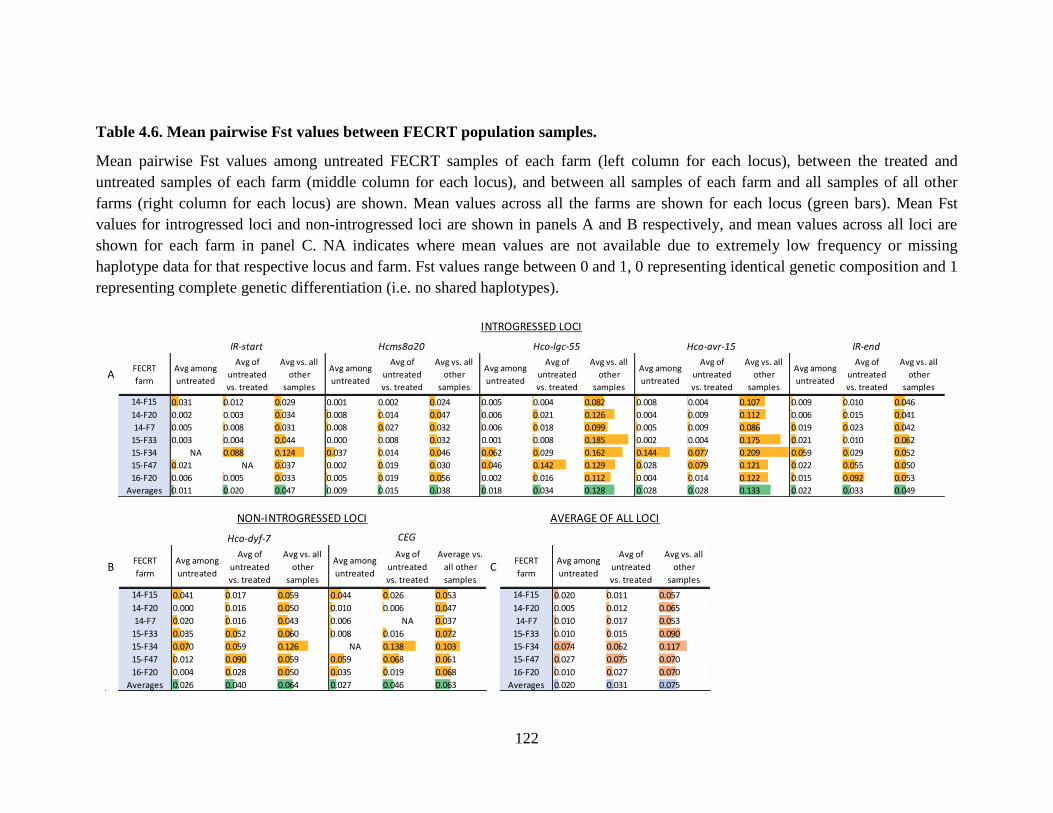
122
Table 4.6. Mean pairwise Fst values between FECRT population samples.
Mean pairwise Fst values among untreated FECRT samples of each farm (left column for each locus), between the treated and
untreated samples of each farm (middle column for each locus), and between all samples of each farm and all samples of all other
farms (right column for each locus) are shown. Mean values across all the farms are shown for each locus (green bars). Mean Fst
values for introgressed loci and non-introgressed loci are shown in panels A and B respectively, and mean values across all loci are
shown for each farm in panel C. NA indicates where mean values are not available due to extremely low frequency or missing
haplotype data for that respective locus and farm. Fst values range between 0 and 1, 0 representing identical genetic composition and 1
representing complete genetic differentiation (i.e. no shared haplotypes).
AFECRT
farm
Avg among
untreated
Avg of
untreated
vs. treated
Avg vs. all
other
samples
Avg among
untreated
Avg of
untreated
vs. treated
Avg vs. all
other
samples
Avg among
untreated
Avg of
untreated
vs. treated
Avg vs. all
other
samples
Avg among
untreated
Avg of
untreated
vs. treated
Avg vs. all
other
samples
Avg among
untreated
Avg of
untreated
vs. treated
Avg vs. all
other
samples
14-F15 0.031 0.012 0.029 0.001 0.002 0.024 0.005 0.004 0.082 0.008 0.004 0.107 0.009 0.010 0.046
14-F20 0.002 0.003 0.034 0.008 0.014 0.047 0.006 0.021 0.126 0.004 0.009 0.112 0.006 0.015 0.041
14-F7 0.005 0.008 0.031 0.008 0.027 0.032 0.006 0.018 0.099 0.005 0.009 0.086 0.019 0.023 0.042
15-F33 0.003 0.004 0.044 0.000 0.008 0.032 0.001 0.008 0.185 0.002 0.004 0.175 0.021 0.010 0.062
15-F34 NA 0.088 0.124 0.037 0.014 0.046 0.062 0.029 0.162 0.144 0.077 0.209 0.059 0.029 0.052
15-F47 0.021 NA 0.037 0.002 0.019 0.030 0.046 0.142 0.129 0.028 0.079 0.121 0.022 0.055 0.050
16-F20 0.006 0.005 0.033 0.005 0.019 0.056 0.002 0.016 0.112 0.004 0.014 0.122 0.015 0.092 0.053
Averages 0.011 0.020 0.047 0.009 0.015 0.038 0.018 0.034 0.128 0.028 0.028 0.133 0.022 0.033 0.049
INTROGRESSED LOCI
IR-start Hco-lgc-55 Hco-avr-15Hcms8a20 IR-end
BFECRT
farm
Avg among
untreated
Avg of
untreated
vs. treated
Avg vs. all
other
samples
Avg among
untreated
Avg of
untreated
vs. treated
Average vs.
all other
samples
CFECRT
farm
Avg among
untreated
Avg of
untreated
vs. treated
Avg vs. all
other
samples
14-F15 0.041 0.017 0.059 0.044 0.026 0.053 14-F15 0.020 0.011 0.057
14-F20 0.000 0.016 0.050 0.010 0.006 0.047 14-F20 0.005 0.012 0.065
14-F7 0.020 0.016 0.043 0.006 NA 0.037 14-F7 0.010 0.017 0.053
15-F33 0.035 0.052 0.060 0.008 0.016 0.072 15-F33 0.010 0.015 0.090
15-F34 0.070 0.059 0.126 NA 0.138 0.103 15-F34 0.074 0.062 0.117
15-F47 0.012 0.090 0.059 0.059 0.068 0.061 15-F47 0.027 0.075 0.070
16-F20 0.004 0.028 0.050 0.035 0.019 0.068 16-F20 0.010 0.027 0.070
Averages 0.026 0.040 0.064 0.027 0.046 0.063 Averages 0.020 0.031 0.075
NON-INTROGRESSED LOCI AVERAGE OF ALL LOCI
CEGHco-dyf-7
123
4.3.3.4. A low level of genetic differentiation of H. contortus populations is discernable
between the different Western Canadian OFDA farms.
The samples obtained from the OFDA survey (sample set 4) showed a similar trend to those
of the FECRT farms but with greater Fst values for both within and between farm comparisons
(Table 4.7). The average within farm pairwise Fst values across all loci was 0.098 (i.e. between
pre- and post-treatment samples taken from the same farm) compared with an average of 0.128
for all inter-farm pairwise Fst values (Table 4.7, panel C). Therefore, both the FECRT and OFDA
sample sets suggest a low but discernable population differentiation of H. contortus between
farms based on the seven loci.
4.3.4 Investigation of evidence of selection at the candidate loci for each of the four
sample sets.
4.3.4.1 Genetic diversity and departures from neutrality for the candidate loci in the
MHco3(ISE)/MHco4(WRS) and MHco3(ISE)/MHco10(CAVR) parental and
backcross populations.
Overall, the average within strain (Shannon(e) alpha) diversity for the seven loci was lower in
the MHco3(ISE) susceptible parental strain and the two backcross populations than in the
MHco4(WRS) and MHco10(CAVR) ivermectin resistant parental strains (Table 4.8, panel A).
Notably, the Hco-dyf-7 and CEG loci had extremely low levels of genetic diversity in the
MHco3(ISE) and two backcross populations (although not in the two ivermectin resistant parental
strains) (Table 4.8, panel A). Values of Tajima’s D were positive for most loci in most populations
(Table 4.8, panel B) with the notable exception of Hco-dyf-7 and CEG in the MHco3(ISE) and the
two backcross strains reflecting the extremely low genetic diversity in these cases (Table 4.8, panel
B). Hcms8a20 was the only locus out of the seven for which the value of Tajima’s D was lower in
all of the four ivermectin resistant strains – MHco4(WRS), MHco10(CAVR), MHco3/4.BC, and
MHco3/10.BC – than in the susceptible parental strain MHco3(ISE) (Table 4.8, panel B).
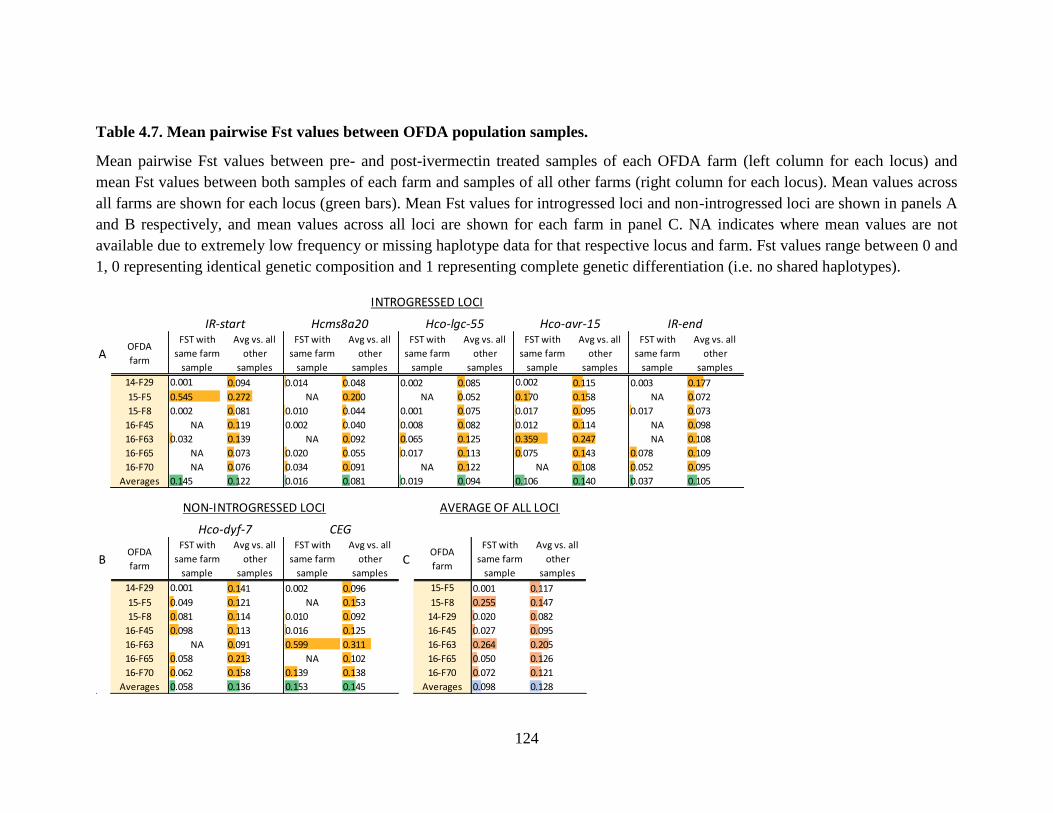
124
Table 4.7. Mean pairwise Fst values between OFDA population samples.
Mean pairwise Fst values between pre- and post-ivermectin treated samples of each OFDA farm (left column for each locus) and
mean Fst values between both samples of each farm and samples of all other farms (right column for each locus). Mean values across
all farms are shown for each locus (green bars). Mean Fst values for introgressed loci and non-introgressed loci are shown in panels A
and B respectively, and mean values across all loci are shown for each farm in panel C. NA indicates where mean values are not
available due to extremely low frequency or missing haplotype data for that respective locus and farm. Fst values range between 0 and
1, 0 representing identical genetic composition and 1 representing complete genetic differentiation (i.e. no shared haplotypes).
AOFDA
farm
FST with
same farm
sample
Avg vs. all
other
samples
FST with
same farm
sample
Avg vs. all
other
samples
FST with
same farm
sample
Avg vs. all
other
samples
FST with
same farm
sample
Avg vs. all
other
samples
FST with
same farm
sample
Avg vs. all
other
samples
14-F29 0.001 0.094 0.014 0.048 0.002 0.085 0.002 0.115 0.003 0.177
15-F5 0.545 0.272 NA 0.200 NA 0.052 0.170 0.158 NA 0.072
15-F8 0.002 0.081 0.010 0.044 0.001 0.075 0.017 0.095 0.017 0.073
16-F45 NA 0.119 0.002 0.040 0.008 0.082 0.012 0.114 NA 0.098
16-F63 0.032 0.139 NA 0.092 0.065 0.125 0.359 0.247 NA 0.108
16-F65 NA 0.073 0.020 0.055 0.017 0.113 0.075 0.143 0.078 0.109
16-F70 NA 0.076 0.034 0.091 NA 0.122 NA 0.108 0.052 0.095
Averages 0.145 0.122 0.016 0.081 0.019 0.094 0.106 0.140 0.037 0.105
Hcms8a20
INTROGRESSED LOCI
Hco-lgc-55 Hco-avr-15 IR-endIR-start
BOFDA
farm
FST with
same farm
sample
Avg vs. all
other
samples
FST with
same farm
sample
Avg vs. all
other
samplesC
OFDA
farm
FST with
same farm
sample
Avg vs. all
other
samples
14-F29 0.001 0.141 0.002 0.096 15-F5 0.001 0.117
15-F5 0.049 0.121 NA 0.153 15-F8 0.255 0.147
15-F8 0.081 0.114 0.010 0.092 14-F29 0.020 0.082
16-F45 0.098 0.113 0.016 0.125 16-F45 0.027 0.095
16-F63 NA 0.091 0.599 0.311 16-F63 0.264 0.205
16-F65 0.058 0.213 NA 0.102 16-F65 0.050 0.126
16-F70 0.062 0.158 0.139 0.138 16-F70 0.072 0.121
Averages 0.058 0.136 0.153 0.145 Averages 0.098 0.128
CEGHco-dyf-7
NON-INTROGRESSED LOCI AVERAGE OF ALL LOCI
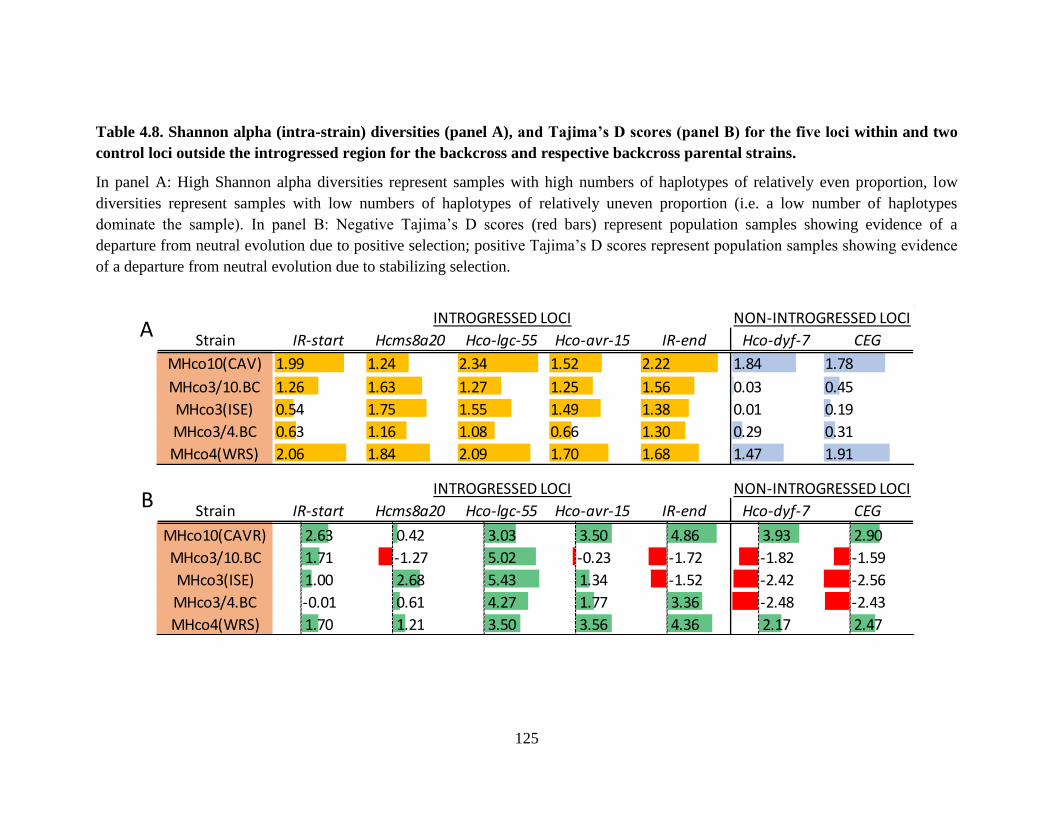
125
Table 4.8. Shannon alpha (intra-strain) diversities (panel A), and Tajima’s D scores (panel B) for the five loci within and two
control loci outside the introgressed region for the backcross and respective backcross parental strains.
In panel A: High Shannon alpha diversities represent samples with high numbers of haplotypes of relatively even proportion, low
diversities represent samples with low numbers of haplotypes of relatively uneven proportion (i.e. a low number of haplotypes
dominate the sample). In panel B: Negative Tajima’s D scores (red bars) represent population samples showing evidence of a
departure from neutral evolution due to positive selection; positive Tajima’s D scores represent population samples showing evidence
of a departure from neutral evolution due to stabilizing selection.
Strain IR-start Hcms8a20 Hco-lgc-55 Hco-avr-15 IR-end Hco-dyf-7 CEG
MHco10(CAV) 1.99 1.24 2.34 1.52 2.22 1.84 1.78
MHco3/10.BC 1.26 1.63 1.27 1.25 1.56 0.03 0.45
MHco3(ISE) 0.54 1.75 1.55 1.49 1.38 0.01 0.19
MHco3/4.BC 0.63 1.16 1.08 0.66 1.30 0.29 0.31
MHco4(WRS) 2.06 1.84 2.09 1.70 1.68 1.47 1.91
Strain IR-start Hcms8a20 Hco-lgc-55 Hco-avr-15 IR-end Hco-dyf-7 CEG
MHco10(CAVR) 2.63 0.42 3.03 3.50 4.86 3.93 2.90
MHco3/10.BC 1.71 -1.27 5.02 -0.23 -1.72 -1.82 -1.59
MHco3(ISE) 1.00 2.68 5.43 1.34 -1.52 -2.42 -2.56
MHco3/4.BC -0.01 0.61 4.27 1.77 3.36 -2.48 -2.43
MHco4(WRS) 1.70 1.21 3.50 3.56 4.36 2.17 2.47
A
INTROGRESSED LOCI NON-INTROGRESSED LOCIB
INTROGRESSED LOCI NON-INTROGRESSED LOCI

126
4.3.4.2 Genetic diversity and departures from neutrality for the candidate loci for the in
vitro phenotyped ivermectin resistant H. contortus isolates.
The genetic diversity and departures from neutrality were determined for each of the seven
candidate loci in ten different H. contortus strains for which the ivermectin resistance in vitro
phenotype had been determined by the LDA (Table 4.9). The in vitro phenotyped isolates Ph-10
and Ph-11 have a fully ivermectin susceptible phenotype in vitro, the remaining isolates are all
ivermectin resistant in ascending order of resistance – Ph-1, 2, 12, 9, 4, 6, 7, 8 – based on the
EC-50 of the LDA (Table 4.1, panel A). The within strain genetic diversity (Shannon alpha
diversity) is relatively high for all seven markers in all isolates with the exception of Hco-dyf-7,
which has very low genetic diversity in susceptible strain Ph-10 (Table 4.9, panel A). There was
no notable difference in the Shannon alpha diversity between the susceptible and resistant
isolates for any of the candidate loci (Table 4.9, panel A).
Tajima D values were positive, or zero, for all loci in the two ivermectin susceptible isolates
(Ph-10 and Ph-11) except for IR-end and Hco-dyf-7 in Ph-10 (Table 4.9, panel B), which, in the
latter case, reflects the low level of genetic diversity of this loci in that isolate (Table 4.9, panel
A). The only candidate locus which had a negative Tajima’s D value in any of the ivermectin
resistant isolates was Hcms8a20 (Table 4.9, panel B). Tajima D values for all other candidate
loci were positive in all ivermectin resistant isolates (Ph-1, 2, 12, 9, 4, 6, 7, 8) (Table 4.9, panel
B). Hcms8a20 had a negative Tajima’s D value in five out of the seven ivermectin resistant
strains – Ph-2, 9, 4, 7, 8 (Table 4.9, panel B). Notably, the isolate with the second highest EC-50
on the LDA (Ph-7) had the most negative Tajima’s D value at -1.48 which is statistically
significant below 95% confidence as estimated by coalescent simulation (i.e. < -1.46) (Table 4.9,
panel B).
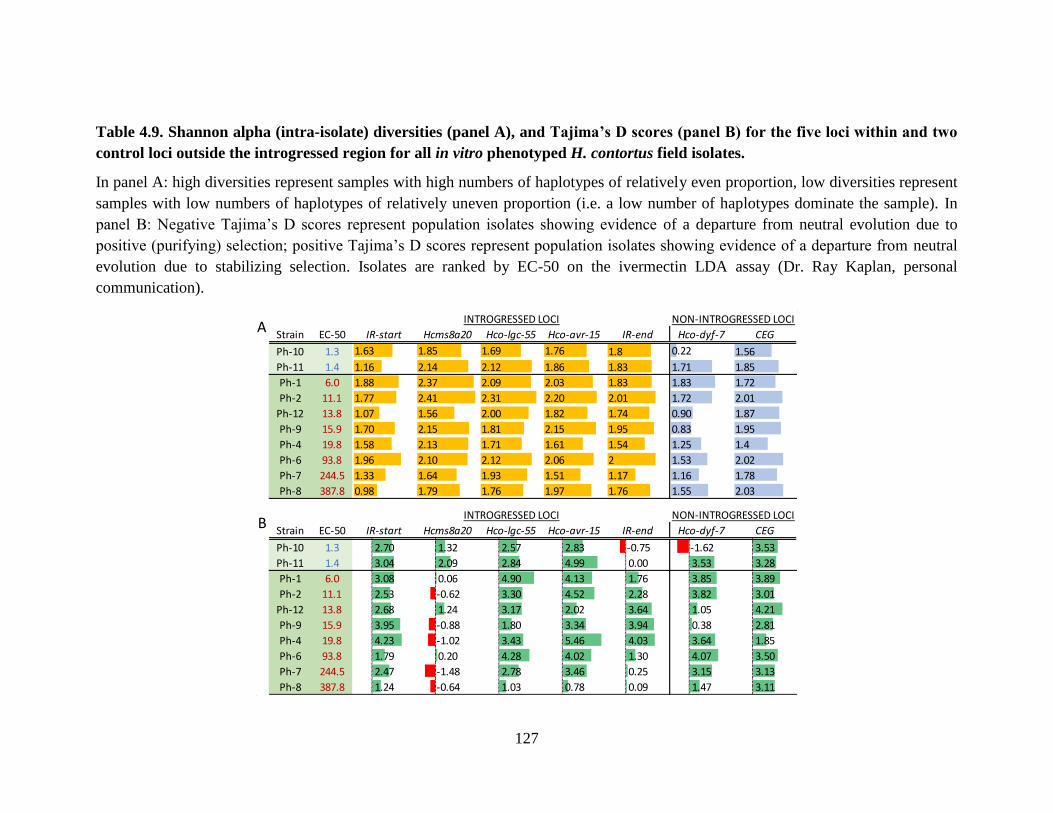
127
Table 4.9. Shannon alpha (intra-isolate) diversities (panel A), and Tajima’s D scores (panel B) for the five loci within and two
control loci outside the introgressed region for all in vitro phenotyped H. contortus field isolates.
In panel A: high diversities represent samples with high numbers of haplotypes of relatively even proportion, low diversities represent
samples with low numbers of haplotypes of relatively uneven proportion (i.e. a low number of haplotypes dominate the sample). In
panel B: Negative Tajima’s D scores represent population isolates showing evidence of a departure from neutral evolution due to
positive (purifying) selection; positive Tajima’s D scores represent population isolates showing evidence of a departure from neutral
evolution due to stabilizing selection. Isolates are ranked by EC-50 on the ivermectin LDA assay (Dr. Ray Kaplan, personal
communication).
Strain EC-50 IR-start Hcms8a20 Hco-lgc-55 Hco-avr-15 IR-end Hco-dyf-7 CEG
Ph-10 1.3 1.63 1.85 1.69 1.76 1.8 0.22 1.56
Ph-11 1.4 1.16 2.14 2.12 1.86 1.83 1.71 1.85
Ph-1 6.0 1.88 2.37 2.09 2.03 1.83 1.83 1.72
Ph-2 11.1 1.77 2.41 2.31 2.20 2.01 1.72 2.01
Ph-12 13.8 1.07 1.56 2.00 1.82 1.74 0.90 1.87
Ph-9 15.9 1.70 2.15 1.81 2.15 1.95 0.83 1.95
Ph-4 19.8 1.58 2.13 1.71 1.61 1.54 1.25 1.4
Ph-6 93.8 1.96 2.10 2.12 2.06 2 1.53 2.02
Ph-7 244.5 1.33 1.64 1.93 1.51 1.17 1.16 1.78
Ph-8 387.8 0.98 1.79 1.76 1.97 1.76 1.55 2.03
Strain EC-50 IR-start Hcms8a20 Hco-lgc-55 Hco-avr-15 IR-end Hco-dyf-7 CEG
Ph-10 1.3 2.70 1.32 2.57 2.83 -0.75 -1.62 3.53
Ph-11 1.4 3.04 2.09 2.84 4.99 0.00 3.53 3.28
Ph-1 6.0 3.08 0.06 4.90 4.13 1.76 3.85 3.89
Ph-2 11.1 2.53 -0.62 3.30 4.52 2.28 3.82 3.01
Ph-12 13.8 2.68 1.24 3.17 2.02 3.64 1.05 4.21
Ph-9 15.9 3.95 -0.88 1.80 3.34 3.94 0.38 2.81
Ph-4 19.8 4.23 -1.02 3.43 5.46 4.03 3.64 1.85
Ph-6 93.8 1.79 0.20 4.28 4.02 1.30 4.07 3.50
Ph-7 244.5 2.47 -1.48 2.78 3.46 0.25 3.15 3.13
Ph-8 387.8 1.24 -0.64 1.03 0.78 0.09 1.47 3.11
AINTROGRESSED LOCI NON-INTROGRESSED LOCI
BINTROGRESSED LOCI NON-INTROGRESSED LOCI
128
4.3.4.3 Genetic diversity and departures from neutrality for the candidate loci for the
Fecal Egg Count Reduction Test (FECRT) H. contortus populations from Alberta,
Canada.
Shannon alpha diversities were determined for the seven candidate loci in H. contortus
populations collected from seven different farms in Alberta, Canada on which FECRTs were
performed. Overall, the Shannon alpha diversities were relatively similar for all seven loci (Table
4.10, Panel A). Each FECRT farm provided four separate H. contortus samples: Three samples
not exposed to ivermectin (two from the untreated control group and one from the ivermectin
treated group pre-treatment) and one sample surviving exposure to ivermectin (sampled from the
ivermectin treated group two weeks post-treatment) (Figure 4.2). There were no consistent
differences in the Shannon alpha diversities for any locus between the ivermectin treated and
untreated populations across the farms (Table 4.10, panel A). Only Farm 15-F47 had a trend of
lower genetic diversities of candidate loci in the ivermectin treated compared with the untreated
groups. In that case, there were lower Shannon alpha diversity values in the post-ivermectin
treatment group than in any of the three groups not exposed to ivermectin for five of the seven
candidate loci (Hcms8a20, Hco-lgc-55, Hco-avr-15, IR-end, and Hco-dyf-7) (Table 4.10, panel
A). These had reductions in Shannon alpha diversities to 80.9%, 60.6%, 70.0%, 63.8% and
30.1% of the average diversities of the groups not exposed to ivermectin (Table 4.10, panel A).
Negative Tajima’s D values were observed in 23 of the 27 FECRT samples for the
Hcms8a20 locus (Table 4.10, panel B). These values averaged -0.65 across all FECRT samples
(95% confidence interval of -1.46 to 2.06). In contrast, none of the Tajima’s D values were
negative in any of the 27 FECRT populations for the candidate loci IR-start (average of 2.51),
Hco-lgc-55 (average of 3.71), Hco-avr-15 (average of 1.78), or CEG (average of 2.46), and for
10/27 and 6/27 samples for IR-end (average of 0.26) and Hco-dyf-7 (average of 0.64) loci
respectively with none reaching statistical significance (Table 10, panel B).
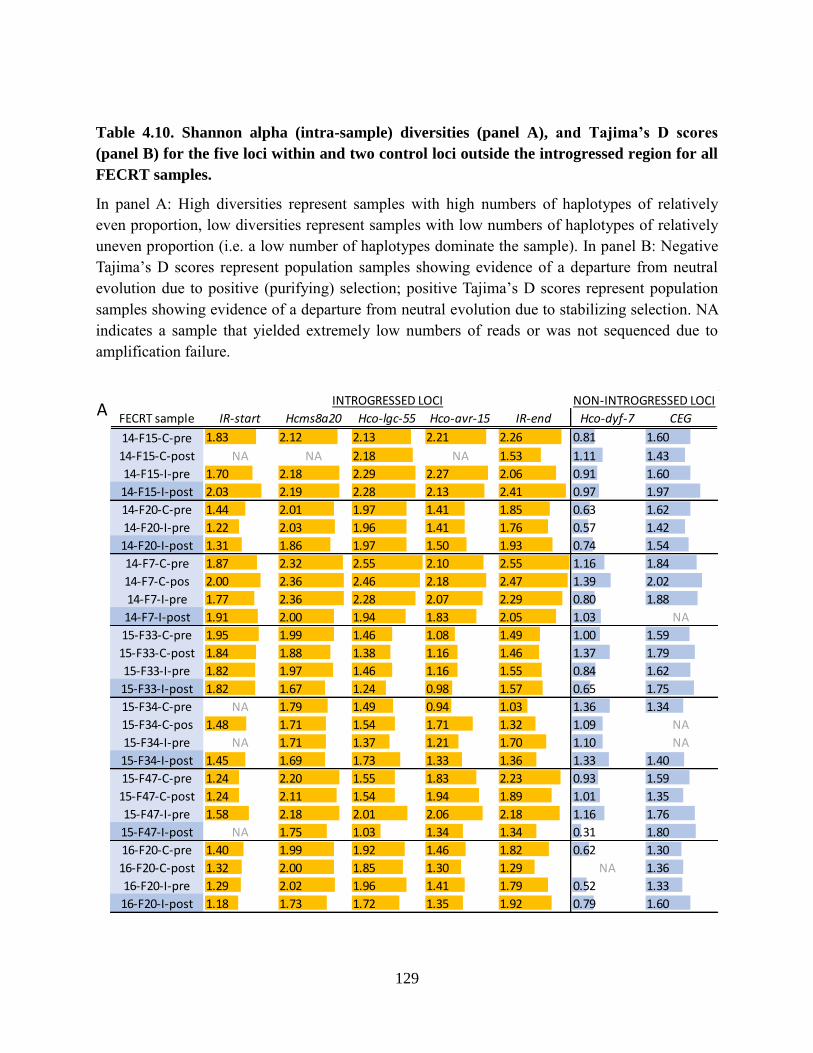
129
Table 4.10. Shannon alpha (intra-sample) diversities (panel A), and Tajima’s D scores
(panel B) for the five loci within and two control loci outside the introgressed region for all
FECRT samples.
In panel A: High diversities represent samples with high numbers of haplotypes of relatively
even proportion, low diversities represent samples with low numbers of haplotypes of relatively
uneven proportion (i.e. a low number of haplotypes dominate the sample). In panel B: Negative
Tajima’s D scores represent population samples showing evidence of a departure from neutral
evolution due to positive (purifying) selection; positive Tajima’s D scores represent population
samples showing evidence of a departure from neutral evolution due to stabilizing selection. NA
indicates a sample that yielded extremely low numbers of reads or was not sequenced due to
amplification failure.
FECRT sample IR-start Hcms8a20 Hco-lgc-55 Hco-avr-15 IR-end Hco-dyf-7 CEG
14-F15-C-pre 1.83 2.12 2.13 2.21 2.26 0.81 1.60
14-F15-C-post NA NA 2.18 NA 1.53 1.11 1.43
14-F15-I-pre 1.70 2.18 2.29 2.27 2.06 0.91 1.60
14-F15-I-post 2.03 2.19 2.28 2.13 2.41 0.97 1.97
14-F20-C-pre 1.44 2.01 1.97 1.41 1.85 0.63 1.62
14-F20-I-pre 1.22 2.03 1.96 1.41 1.76 0.57 1.42
14-F20-I-post 1.31 1.86 1.97 1.50 1.93 0.74 1.54
14-F7-C-pre 1.87 2.32 2.55 2.10 2.55 1.16 1.84
14-F7-C-pos 2.00 2.36 2.46 2.18 2.47 1.39 2.02
14-F7-I-pre 1.77 2.36 2.28 2.07 2.29 0.80 1.88
14-F7-I-post 1.91 2.00 1.94 1.83 2.05 1.03 NA
15-F33-C-pre 1.95 1.99 1.46 1.08 1.49 1.00 1.59
15-F33-C-post 1.84 1.88 1.38 1.16 1.46 1.37 1.79
15-F33-I-pre 1.82 1.97 1.46 1.16 1.55 0.84 1.62
15-F33-I-post 1.82 1.67 1.24 0.98 1.57 0.65 1.75
15-F34-C-pre NA 1.79 1.49 0.94 1.03 1.36 1.34
15-F34-C-pos 1.48 1.71 1.54 1.71 1.32 1.09 NA
15-F34-I-pre NA 1.71 1.37 1.21 1.70 1.10 NA
15-F34-I-post 1.45 1.69 1.73 1.33 1.36 1.33 1.40
15-F47-C-pre 1.24 2.20 1.55 1.83 2.23 0.93 1.59
15-F47-C-post 1.24 2.11 1.54 1.94 1.89 1.01 1.35
15-F47-I-pre 1.58 2.18 2.01 2.06 2.18 1.16 1.76
15-F47-I-post NA 1.75 1.03 1.34 1.34 0.31 1.80
16-F20-C-pre 1.40 1.99 1.92 1.46 1.82 0.62 1.30
16-F20-C-post 1.32 2.00 1.85 1.30 1.29 NA 1.36
16-F20-I-pre 1.29 2.02 1.96 1.41 1.79 0.52 1.33
16-F20-I-post 1.18 1.73 1.72 1.35 1.92 0.79 1.60
AINTROGRESSED LOCI NON-INTROGRESSED LOCI
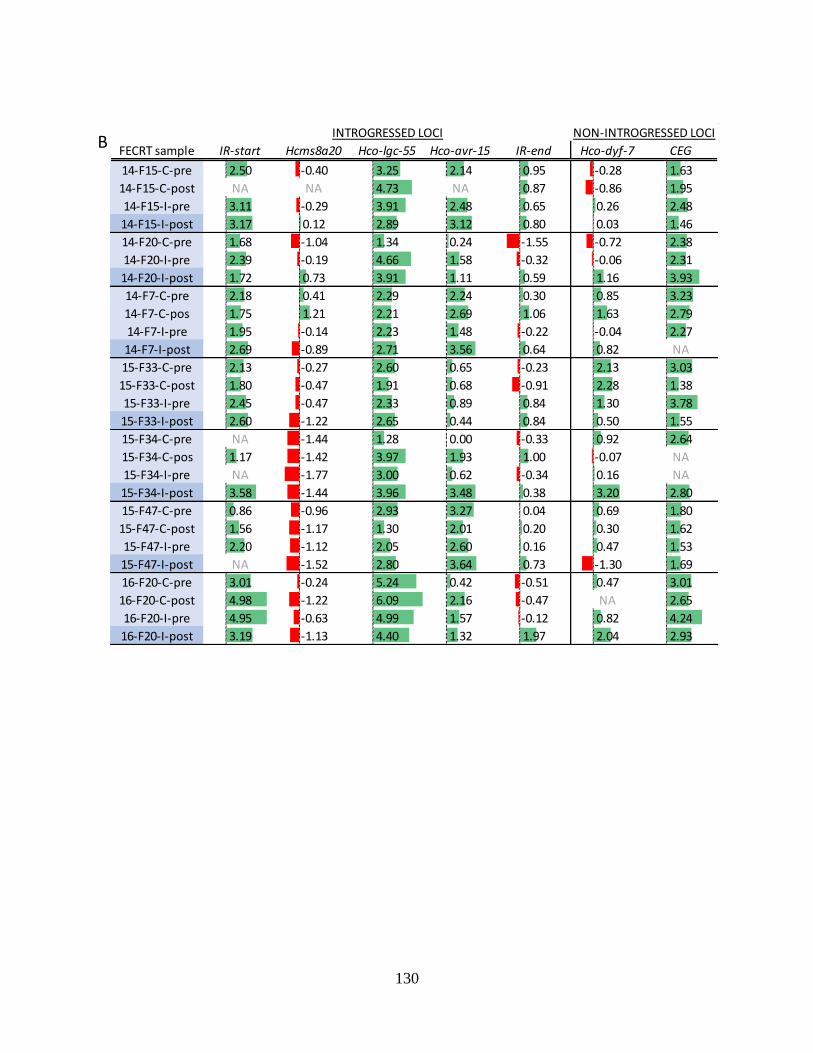
130
FECRT sample IR-start Hcms8a20 Hco-lgc-55 Hco-avr-15 IR-end Hco-dyf-7 CEG
14-F15-C-pre 2.50 -0.40 3.25 2.14 0.95 -0.28 1.63
14-F15-C-post NA NA 4.73 NA 0.87 -0.86 1.95
14-F15-I-pre 3.11 -0.29 3.91 2.48 0.65 0.26 2.48
14-F15-I-post 3.17 0.12 2.89 3.12 0.80 0.03 1.46
14-F20-C-pre 1.68 -1.04 1.34 0.24 -1.55 -0.72 2.38
14-F20-I-pre 2.39 -0.19 4.66 1.58 -0.32 -0.06 2.31
14-F20-I-post 1.72 0.73 3.91 1.11 0.59 1.16 3.93
14-F7-C-pre 2.18 0.41 2.29 2.24 0.30 0.85 3.23
14-F7-C-pos 1.75 1.21 2.21 2.69 1.06 1.63 2.79
14-F7-I-pre 1.95 -0.14 2.23 1.48 -0.22 -0.04 2.27
14-F7-I-post 2.69 -0.89 2.71 3.56 0.64 0.82 NA
15-F33-C-pre 2.13 -0.27 2.60 0.65 -0.23 2.13 3.03
15-F33-C-post 1.80 -0.47 1.91 0.68 -0.91 2.28 1.38
15-F33-I-pre 2.45 -0.47 2.33 0.89 0.84 1.30 3.78
15-F33-I-post 2.60 -1.22 2.65 0.44 0.84 0.50 1.55
15-F34-C-pre NA -1.44 1.28 0.00 -0.33 0.92 2.64
15-F34-C-pos 1.17 -1.42 3.97 1.93 1.00 -0.07 NA
15-F34-I-pre NA -1.77 3.00 0.62 -0.34 0.16 NA
15-F34-I-post 3.58 -1.44 3.96 3.48 0.38 3.20 2.80
15-F47-C-pre 0.86 -0.96 2.93 3.27 0.04 0.69 1.80
15-F47-C-post 1.56 -1.17 1.30 2.01 0.20 0.30 1.62
15-F47-I-pre 2.20 -1.12 2.05 2.60 0.16 0.47 1.53
15-F47-I-post NA -1.52 2.80 3.64 0.73 -1.30 1.69
16-F20-C-pre 3.01 -0.24 5.24 0.42 -0.51 0.47 3.01
16-F20-C-post 4.98 -1.22 6.09 2.16 -0.47 NA 2.65
16-F20-I-pre 4.95 -0.63 4.99 1.57 -0.12 0.82 4.24
16-F20-I-post 3.19 -1.13 4.40 1.32 1.97 2.04 2.93
INTROGRESSED LOCI NON-INTROGRESSED LOCIB
131
4.3.4.4 Genetic diversity and departures from neutrality for the candidate loci for the
On-Farm Deworming Assay (OFDA) H. contortus populations from Western Canada.
The intra-sample Shannon alpha diversity values for the eight OFDA farms were of a
similar overall magnitude as the FECRT farms, although the Hco-dyf-7 locus showed very low
diversity in several pre- and post-treatment samples (Table 4.11, panel A). There were no
consistent differences in the Shannon alpha diversities for any locus between the pre- and post-
ivermectin treatment samples across each farm (Table 4.11, panel A).
Negative Tajima’s D values were observed for locus Hcms8a20 in 13 of 14 OFDA samples
(Table 4.11, panel B). These values averaged -0.99 across all OFDA populations (95%
confidence interval of -1.46 to 2.06) (Table 4.11, panel B). Tajima’s D values were also negative
in 10/15 OFDA samples for the Hco-dyf-7 (average of -0.33) locus. In this case, unlike for
Hcms8a20, negative Tajima’s D values were also associated with very low Shannon diversity
index values in seven of the ten samples (Table 4.11, panels A and B). In contrast, Tajima’s D
values were negative in just 1/13, 0/14, 0/15, 4/13, and 1/14 OFDA samples for IR-start (average
of 1.85), Hco-lgc-55 (average of 2.91), Hco-avr-15 (average of 3.19), IR-end (average of 0.46),
and CEG (average of 1.97) respectively, with none reaching statistical significance.
4.3.5 Analysis of candidate gene haplotype profiles in the different sample sets.
4.3.5.1 Haplotype profile analysis of the candidate gene loci in the parental and
backcross strains is consistent with previous genetic analyses.
We previously provided evidence, using a cloning and Sanger sequencing based analysis,
that a sequence tag marker adjacent to microsatellite Hcms8a20 showed a signal of introgression
in two independent backcross experiments, suggesting it is linked to an important ivermectin
resistance mutation in both the MHco4(WRS) and MHco10(CAVR) strains (Rezansoff et al.,
(2016), and Chapter 3). The next generation sequencing data generated in this chapter was
examined to further corroborate that result for the Hcms8a20 locus and to undertake a similar
analysis of the other candidate markers in the introgressed region (IR-start, Hco-lgc-55, Hco-avr-15,
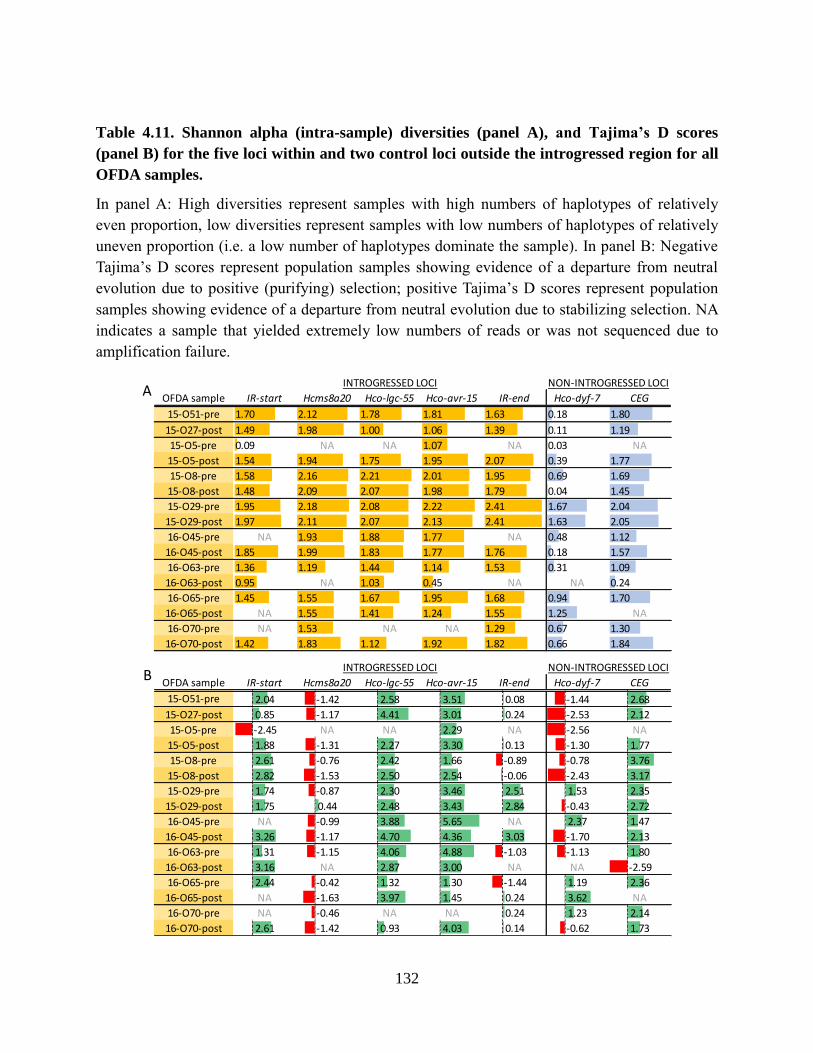
132
Table 4.11. Shannon alpha (intra-sample) diversities (panel A), and Tajima’s D scores
(panel B) for the five loci within and two control loci outside the introgressed region for all
OFDA samples.
In panel A: High diversities represent samples with high numbers of haplotypes of relatively
even proportion, low diversities represent samples with low numbers of haplotypes of relatively
uneven proportion (i.e. a low number of haplotypes dominate the sample). In panel B: Negative
Tajima’s D scores represent population samples showing evidence of a departure from neutral
evolution due to positive (purifying) selection; positive Tajima’s D scores represent population
samples showing evidence of a departure from neutral evolution due to stabilizing selection. NA
indicates a sample that yielded extremely low numbers of reads or was not sequenced due to
amplification failure.
OFDA sample IR-start Hcms8a20 Hco-lgc-55 Hco-avr-15 IR-end Hco-dyf-7 CEG
15-O51-pre 1.70 2.12 1.78 1.81 1.63 0.18 1.80
15-O27-post 1.49 1.98 1.00 1.06 1.39 0.11 1.19
15-O5-pre 0.09 NA NA 1.07 NA 0.03 NA
15-O5-post 1.54 1.94 1.75 1.95 2.07 0.39 1.77
15-O8-pre 1.58 2.16 2.21 2.01 1.95 0.69 1.69
15-O8-post 1.48 2.09 2.07 1.98 1.79 0.04 1.45
15-O29-pre 1.95 2.18 2.08 2.22 2.41 1.67 2.04
15-O29-post 1.97 2.11 2.07 2.13 2.41 1.63 2.05
16-O45-pre NA 1.93 1.88 1.77 NA 0.48 1.12
16-O45-post 1.85 1.99 1.83 1.77 1.76 0.18 1.57
16-O63-pre 1.36 1.19 1.44 1.14 1.53 0.31 1.09
16-O63-post 0.95 NA 1.03 0.45 NA NA 0.24
16-O65-pre 1.45 1.55 1.67 1.95 1.68 0.94 1.70
16-O65-post NA 1.55 1.41 1.24 1.55 1.25 NA
16-O70-pre NA 1.53 NA NA 1.29 0.67 1.30
16-O70-post 1.42 1.83 1.12 1.92 1.82 0.66 1.84
OFDA sample IR-start Hcms8a20 Hco-lgc-55 Hco-avr-15 IR-end Hco-dyf-7 CEG
15-O51-pre 2.04 -1.42 2.58 3.51 0.08 -1.44 2.68
15-O27-post 0.85 -1.17 4.41 3.01 0.24 -2.53 2.12
15-O5-pre -2.45 NA NA 2.29 NA -2.56 NA
15-O5-post 1.88 -1.31 2.27 3.30 0.13 -1.30 1.77
15-O8-pre 2.61 -0.76 2.42 1.66 -0.89 -0.78 3.76
15-O8-post 2.82 -1.53 2.50 2.54 -0.06 -2.43 3.17
15-O29-pre 1.74 -0.87 2.30 3.46 2.51 1.53 2.35
15-O29-post 1.75 0.44 2.48 3.43 2.84 -0.43 2.72
16-O45-pre NA -0.99 3.88 5.65 NA 2.37 1.47
16-O45-post 3.26 -1.17 4.70 4.36 3.03 -1.70 2.13
16-O63-pre 1.31 -1.15 4.06 4.88 -1.03 -1.13 1.80
16-O63-post 3.16 NA 2.87 3.00 NA NA -2.59
16-O65-pre 2.44 -0.42 1.32 1.30 -1.44 1.19 2.36
16-O65-post NA -1.63 3.97 1.45 0.24 3.62 NA
16-O70-pre NA -0.46 NA NA 0.24 1.23 2.14
16-O70-post 2.61 -1.42 0.93 4.03 0.14 -0.62 1.73
A
B
INTROGRESSED LOCI NON-INTROGRESSED LOCI
INTROGRESSED LOCI NON-INTROGRESSED LOCI
133
and IR-end). The rationale for this analysis was explained in detail in Chapter 3 (Figure 3.4).
Briefly, for loci not located in the introgressed region, the presence and frequency of haplotypes
in the backcross populations should be similar to those found in the MHco3(ISE) parental strain.
Further, haplotypes unique to the resistant parental strain should be absent (or rare) in the
backcross populations (Figure 3.4 in Chapter 3). This haplotype profile was the case for both the
Hco-dyf-7 and CEG loci, consistent with their chromosomal locations outside the introgressed
region (Figure 4.3, panel B). In contrast, for loci located within the introgressed region, the
presence and frequency of haplotypes should differ significantly from those in the MHco3(ISE)
parental strain due to the presence of one or more haplotypes that have been introgressed from
the resistant parental strain (Figure 3.4 in Chapter 3). This haplotype profile was the case for loci
IR-start, Hcms8a20, Hco-lgc-55, and Hco-avr-15, consistent with their location within the
introgressed region of chromosome 5 (Figure 4.3, panels A). The pattern was less clear for the
IR-end locus, given that the MHco3/10.BC backcross strain showed no introgressed haplotype
(Figure 4.3, panels A). Therefore, the haplotype analyses of the deep amplicon sequencing of the
candidate loci are consistent with their known genomic locations and previous results from the
backcross experimental strains.
4.3.5.2 Haplotype profile analysis of the candidate gene loci in in vitro phenotyped
ivermectin resistant H. contortus isolates.
The haplotype profiles of the seven candidate loci were examined in the in vitro phenotyped
H. contortus isolates to determine if any haplotypes were shared at high or moderate frequency
between the ivermectin resistant population isolates, but were absent from the two susceptible
isolates (Figure 4.4). This was not completely the case for any of the seven loci. For Hco-lgc-55
and Hco-avr-15, although one haplotype was present in all ivermectin resistant populations from
the USA, and absent in the two ivermectin susceptible populations, it was only present at very
low frequency in several of the ivermectin resistant populations (highlighted orange and yellow
haplotypes of the Hco-lgc-55 and Hco-avr-15 profiles respectively in Figure 4.4, panel A). The
other haplotype profile worth noting was for Hcms8a20, for which two haplotypes that were

134
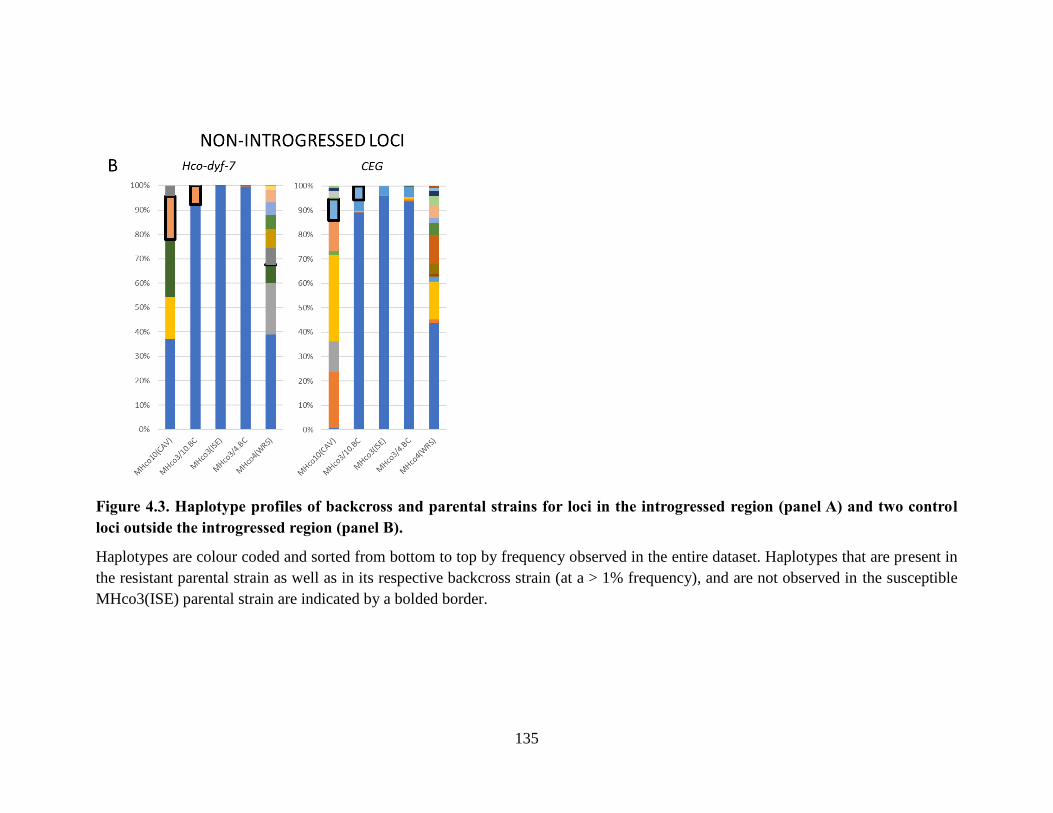
135
Figure 4.3. Haplotype profiles of backcross and parental strains for loci in the introgressed region (panel A) and two control
loci outside the introgressed region (panel B).
Haplotypes are colour coded and sorted from bottom to top by frequency observed in the entire dataset. Haplotypes that are present in
the resistant parental strain as well as in its respective backcross strain (at a > 1% frequency), and are not observed in the susceptible
MHco3(ISE) parental strain are indicated by a bolded border.
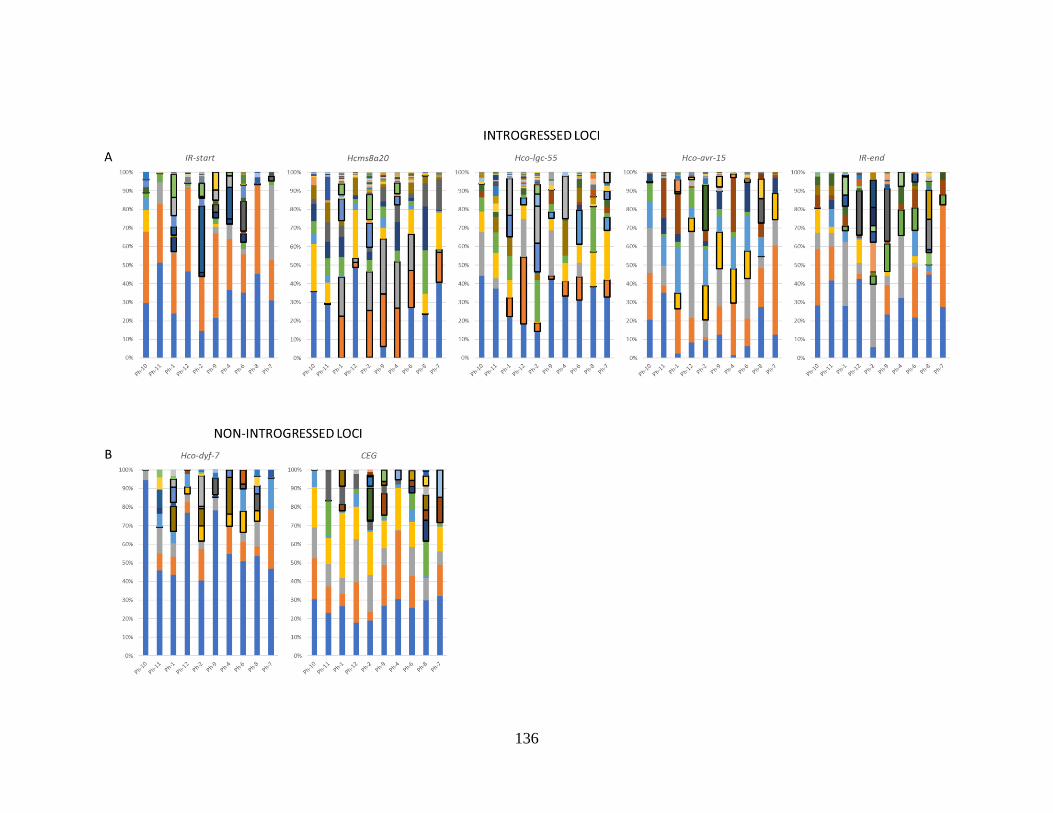
136
137
Figure 4.4. Haplotype profiles of the in vitro phenotyped H. contortus population isolates
for loci in the introgressed region (panel A) and two control loci outside the introgressed
region (panel B).
Haplotypes are colour coded and sorted from bottom to top by frequency observed in the entire
dataset. Susceptible isolates – Ph-10 and Ph-11 – are shown on the left for each locus, with
resistant isolates (Ph-1, 12, 2, 9, 4, 6, 8, 7) on the right. Haplotypes present in resistant any
resistant isolate at > 1% frequency and not observed in either susceptible isolate are highlighted.
completely absent from the two ivermectin susceptible isolates were present at variable
frequency in seven of eight ivermectin resistant isolates respectively (orange and grey haplotypes
of the Hcms8a20 profiles in Figure 4.4, panel A). These two haplotypes were absent from the
genetically divergent Colombian ivermectin resistant H. contortus population (Ph-8) (Figure 4.4,
panel A).
4.3.5.3 Haplotype profile analysis of the candidate gene loci in the Fecal Egg Count
Reduction Test (FECRT) populations.
Haplotype profiles of the candidate loci were examined in the seven FECRT populations.
Overall, at all seven loci, many of the most frequent haplotypes were shared between different
Alberta FECRT farms, but with some differences, as expected given the low but discernable
pairwise Fst values observed between populations (Figure 4.5). Particularly Farm-20, for which
FECRT samples were obtained in both 2014 and 2016, showed very similar haplotype profiles at
all loci relative to the moderate level of differences observed between the different farms (Figure
4.5). There was also a relatively high degree of haplotype sharing between the US in vitro
phenotyped populations and the Alberta FECRT populations (comparing Figure 4.4 and Figure
4.5; the same colour coding used for haplotypes within each locus on the two figures). The main
aim of the haplotype profile analysis of the FECRT data was to determine if any (high or
moderate frequency) haplotypes increased in frequency following ivermectin treatment (Figure
4.5). There was no clear pattern of this for any of the loci when comparing haplotype profiles
between the three samples not exposed to drug (C-pre, C-post and I-pre) with the post-ivermectin

138

139
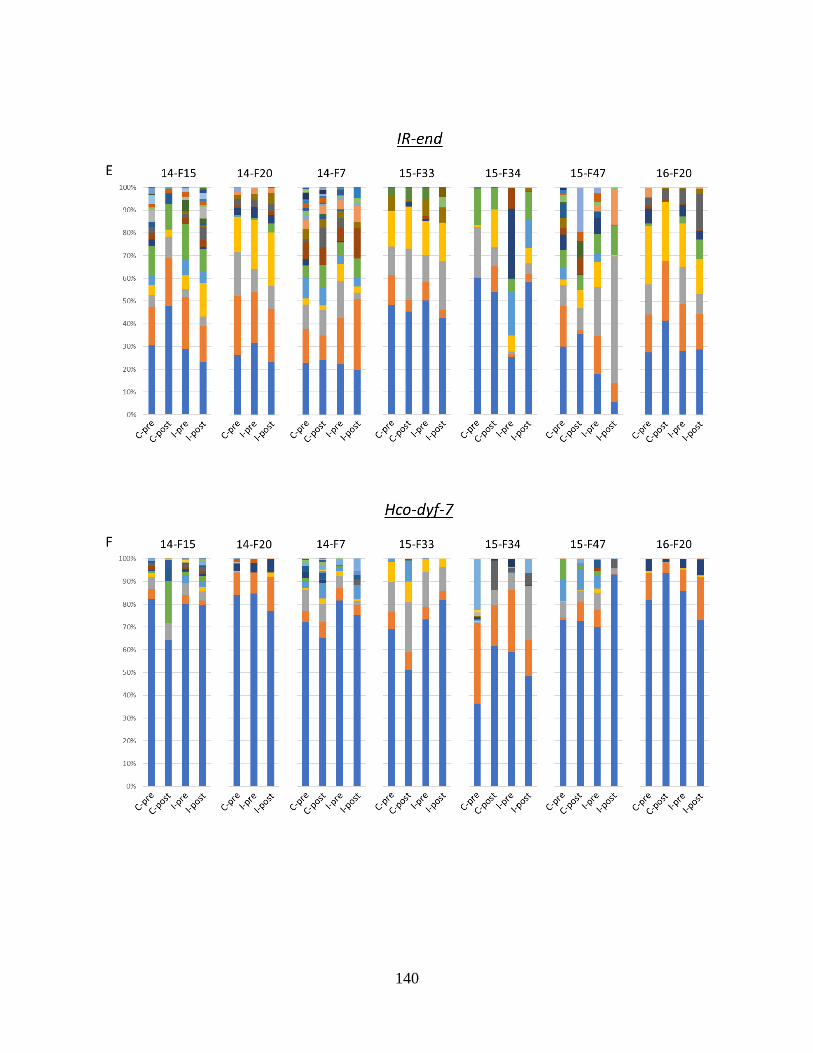
140
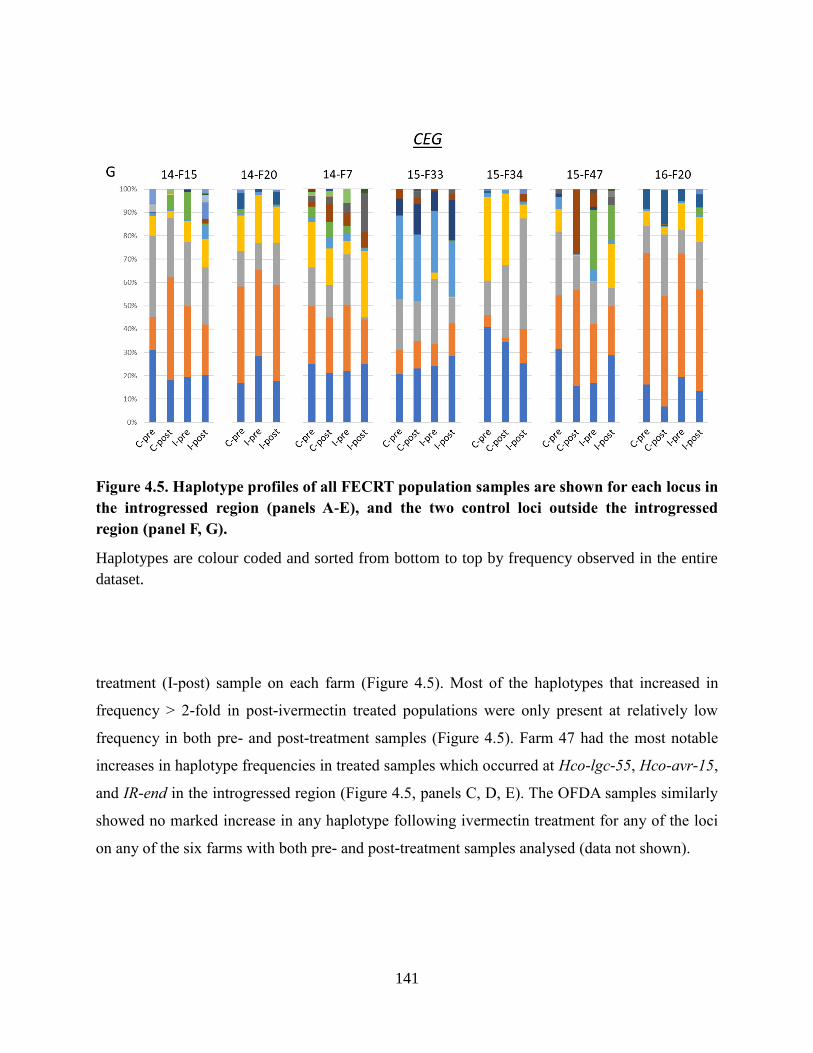
141
Figure 4.5. Haplotype profiles of all FECRT population samples are shown for each locus in
the introgressed region (panels A-E), and the two control loci outside the introgressed
region (panel F, G).
Haplotypes are colour coded and sorted from bottom to top by frequency observed in the entire
dataset.
treatment (I-post) sample on each farm (Figure 4.5). Most of the haplotypes that increased in
frequency > 2-fold in post-ivermectin treated populations were only present at relatively low
frequency in both pre- and post-treatment samples (Figure 4.5). Farm 47 had the most notable
increases in haplotype frequencies in treated samples which occurred at Hco-lgc-55, Hco-avr-15,
and IR-end in the introgressed region (Figure 4.5, panels C, D, E). The OFDA samples similarly
showed no marked increase in any haplotype following ivermectin treatment for any of the loci
on any of the six farms with both pre- and post-treatment samples analysed (data not shown).
142
4.4 Discussion
4.4.1 Deep amplicon sequencing confirms and extends the evidence supporting the
introgression of the Hcms8a20 locus under the influence of ivermectin selection in two
independent serial backcross experiments.
A deep amplicon sequencing approach was used to investigate the genetic diversity of seven
candidate loci in the parental and backcross populations of the MHco3/4 and MHco3/10 serial
backcrosses. The results demonstrate the validity of this approach by providing data consistent
with the previous cloning and Sanger sequencing based techniques presented in Chapter 3
(Rezansoff et al., 2016). Two of the loci examined using deep amplicon sequencing here –
Hcms8a20 and Hco-dyf-7 – were investigated in the previous study of candidate genes in the
backcross experiments (Rezansoff et al., 2016). In that work, Hcms8a20 showed clear evidence
of introgression into both serial backcross populations – MHco3/4.BC and MHco3/10.BC –
whereas the Hco-dyf-7 locus, a candidate ivermectin resistance locus, showed no evidence of
such introgression. The deep amplicon sequencing results provided here confirm those results.
As with the previous study, there was a high level of genetic differentiation of the Hcms8a20
locus between both backcross populations and the MHco3(ISE) parental strain (Table 4.4, panel
A). In contrast, there was little genetic differentiation for the Hco-dyf-7 locus between both
backcrosses and the MHco3(ISE) parental strain, as expected for a locus in a non-introgressed
region of the genome (Table 4.4, panel B; Figure 3.4 in Chapter 3).
In addition to using deep amplicon sequencing to confirm the introgression of Hcms8a20 in
the backcross experiments, we also confirmed the introgression of four additional loci (IR-start,
Hco-lgc-55, and Hco-avr-15, and IR-end) located in an 11.2 Mb region on chromosome 5 that
has recently been shown to be introgressed in both serial backcross experiments by whole
genome sequencing analysis (Doyle et al., manuscript in preparation). With the exception of the
IR-end locus in MHco3/10.BC, all these loci showed high Fst values between the susceptible
MHco3(ISE) parental strain and both backcross populations – MHco3/4.BC and MHco3/10.BC
– as predicted for introgressed loci. This was in contrast to an additional control locus, CEG on
chromosome 4, which showed low Fst values between the MHco3(ISE) susceptible parental
143
strain and the backcross populations as predicted for a locus in a non-introgressed region.
Furthermore, inheritance of haplotypes unique to the MHco4(WRS) and MHco10(CAVR)
ivermectin resistant parental strains were present in both backcross strains at a high frequency for
all loci located in the introgressed region with the exception of IR-end in MHco3/10.BC (Figure
4.3). In contrast, this was not the case for the Hco-dyf-7 and CEG loci located elsewhere in the
genome.
In summary, deep amplicon sequencing data confirms that Hcms8a20 and Hco-dyf-7 show
patterns of genetic diversity consistent with introgression and non-introgression in the backcross
experiments respectively. Further, four additional loci (IR-start, Hco-lgc-55, Hco-avr-15, and IR-
end), shown from whole genome sequencing experiments of the backcross populations to be
located in the large introgressed region, also show the expected pattern of genetic diversity in the
backcross populations (Table 4.4; Figure 4.3). These results demonstrate that the multiplexed
deep amplicon sequencing approach generates reliable data based on the constancy observed
with previous results that used different technical approaches. It is worth noting that this supports
the accuracy of the USEARCH based computational sequence processing pipeline to segregate
true haplotypes from variants caused by amplification and sequencing error. Hence, a
bioinformatic pipeline has been optimized that segregates unknown and highly polymorphic H.
contortus haplotypes that have not been previously specified in a reference library, at 100%
sequence identity with a level of accuracy such that inheritance patterns can be consistently
deciphered on a per haplotype basis.
4.4.2 The genetic differentiation of the seven sequenced loci in the Canadian and US
field populations reflects previous understanding of H. contortus population structure.
Previous studies, predominantly based on neutral microsatellite markers and mtDNA, have
shown that there is typically a high degree of genetic variation among H. contortus populations
from different continents but relatively little genetic differentiation within a region (reviewed by
Gilleard and Redman, (2016)). This is considered to be due to the high gene flow between
parasite populations within most regions/countries due to the high degree of animal movement
that occurs in modern livestock agriculture (Blouin et al., 1995; Gilleard and Beech, 2007; Troell
144
et al., 2006). This has implications for the spread of anthelmintic resistance mutations, and
haplotypes, across regions. The genetic differentiation analysis of the seven loci examined in this
study is broadly consistent with that view. The FECRT sample set included four sub-populations
collected from each farm. Overall, the population pairwise Fst values between different farms,
when averaged across all farms and all loci, were 2.42 – 3.75 times higher than they were among
samples from the same farm (Table 4.6, panel C). This is also true of the OFDA samples, but
with slightly higher levels of overall genetic differentiation both among and between farms than
observed for the FECRT farms (Table 4.7, panel C). This could reflect the fact that four of the
OFDA farms are located in Manitoba (Table 4.1, panel C). However, the H. contortus
populations of the US (in vitro phenotyped samples) had levels of population differentiation
between farms (an average of 0.084 across all loci) similar to Western Canadian OFDA and
FECRT samples (Table 4.5, panel B). This suggests that geographic distance at this scale has
little effect on genetic differentiation. The pairwise Fst values between the parental backcross
isolates were much higher (average of 0.220), which is expected since these are derived from
different continents (Table 4.4, panel C) (Le Jambre et al., 1995; Roos et al., 1990; Van Wyk and
Malan, 1988). In summary, the distribution of genetic differentiation based on the seven
candidate loci is consistent with the expectation of a low but discernable population structure
between farms within a region.
4.4.3 Hcms8a20 is the only marker in the introgressed region to show evidence of
selection in the in vitro phenotyped ivermectin resistant H. contortus isolates from the USA.
Two parameters were used to test each locus’ evidence for a signature of selection in the in
vitro phenotyped ivermectin resistant H. contortus isolates; genetic diversity using Shannon
alpha diversity, and departure from neutral evolution using Tajima’s D (Tajima, 1989). Shannon
alpha diversity scores the genetic diversity of a sample based on the number of unique
haplotypes, and the evenness with which they are present in the sample. Fewer haplotypes
present at a less even frequency reduces the Shannon alpha diversity for that sample at that locus
(Morgan and Huttenhower, 2012). Shannon alpha diversity was not notably reduced in any of the
eight isolates with an in vitro ivermectin resistance phenotype (Ph-1, 2, 12, 9, 4, 6, 7, 8 in order

145
of EC-50 score) compared to the susceptible isolates (Ph-10, Ph-11) at any locus tested (Table
4.9, Panel A). Neither was there a trend of a reduction in Shannon alpha diversity with increasing
LDA EC-50 for the ivermectin resistant isolates (Table 4.9, Panel A). The only marker with a
notably low Shannon alpha diversity in any isolate was Hco-dyf-7 in the ivermectin susceptible
Ph-10 isolate (Table 4.9, Panel A).
Tajima’s D identifies departures from neutral evolution, such as positive (or purifying)
selection (resulting in negative D scores) or balancing selection (resulting in positive D scores)
on a locus (Tajima, 1989). Negative Tajima’s D scores indicate a locus with fewer average
pairwise differences (nucleotide diversity) between haplotypes than would be expected given the
number of segregating sites under neutral evolution. This can infer a history of positive selection
on one or a number of haplotypes of that locus. Hcms8a20 had negative Tajima’s D scores in 5/8
in vitro phenotyped ivermectin resistant isolates (Ph-2, Ph-9, Ph-4, Ph-7, and Ph-8) and a very
low value (near zero), relative to values for other markers, in two of the remaining three isolates
(Ph-1 and Ph-6) (Table 4.9, panel B). Further, Hcms8a20 had a positive Tajima’s D value in both
susceptible isolates (Ph-10 and Ph-11). In contrast, none of the other loci from within the
introgressed region, or the two control loci, had negative Tajima’s D values in any of the
ivermectin resistant isolates. The only other negative Tajima’s D values were for IR-end and
Hco-dyf-7 in the susceptible Ph-10 isolate. In the latter case, this reflects the very low diversity
of the Hco-dyf-7 locus in the Ph-10 isolate (Table 4.9, Panel A).
Examining the haplotype profiles of these isolates for each of the markers revealed no
obvious relationship between the frequency of haplotype(s) and the drug resistant phenotype
based on EC-50 values (Figure 4.4). However, two Hcms8a20 haplotypes are worth noting
(colour coded orange and grey in Figure 4.4, panel A). These are present in seven of eight of the
ivermectin resistant isolates (Ph-1, 2, 12, 9, 4, 6, 7) but are absent in the two susceptible isolates
(they are also absent from the ivermectin resistant isolate from Colombia (Ph-8) (Figure 4.4,
panel A).
146
4.4.4 Hcms8a20 has evidence of positive selection in multiple H. contortus population
samples from the FECRT and OFDA farms from Western Canada.
In addition to examining H. contortus populations that are phenotypically resistant to
ivermectin based on an LDA assay, we examined populations that are ivermectin resistant based
on an FECRT assay. This assay examines the efficacy of a drug based on the reduction of fecal
egg counts in animals following administration of a therapeutic dose of the drug (0.2 mg/kg of
ivermectin in this case). This is considered to be the most reliable test of anthelmintic resistance
and is widely accepted as the formal diagnostic confirmation of a drug resistant parasite
population (Coles et al., 1992). We examined the evidence for selection at each candidate locus
in seven H. contortus populations that have relatively high levels of ivermectin resistance (<
90% reduction in post-treatment fecal egg count) (Table 4.1, panel B). The Shannon haplotype
diversities were relatively high for all markers in most FECRT populations. There was no overall
pattern of reduction in Shannon alpha diversity in the ivermectin post-treatment group for any
locus with the possible exception of farm 15-F47, in which several of the markers had lower
values in the “I-post” group (Table 4.10, panel A). Of all the loci tested, Hcms8a20 showed by
far the most consistent patterns of negative Tajima’s D values across the seven ivermectin
resistant H. contortus populations, with 23/27 of the FECRT samples tested having a negative
Tajima’s D value (Table 4.10, panel B). The only other two loci with any negative Tajima’s D
values were IR-end and Hco-dyf-7, but these were much less consistent (Table 4.10, panel B).
Given that the majority of untreated samples also showed negative Tajima’s D values at
Hcms8a20, this likely explains why we did not observe noticeable drops in Shannon diversities
post-treatment at this locus, as this suggests a history of selection on this locus before the
experimental ivermectin treatment.
The OFDA samples provided an additional set of H. contortus populations to examine.
However, these samples have to be treated with some caution, as their phenotypic information is
less reliable than the FECRT samples. These are H. contortus populations that have shown a poor
response to ivermectin administered by the producer. This could be because of ivermectin
resistance, but could also be due to other factors such as incorrect dosage or administration
technique. Nevertheless, we predict that many of these populations are ivermectin resistant based
147
on the poor response to treatment. The Hcms8a20 locus was the only locus in the introgressed
region to show negative Tajima’s D values across the nine OFDA farms (14/15 samples tested)
(Table 4.11, panel B). The Hco-dyf-7 locus also had negative Tajima’s D values in 10/15
samples, but this locus had very low Shannon diversities in many of these samples (Table 4.11,
panel A).
4.4.5 The signature of selection at the Hcms8a20 locus suggests a “soft selective
sweep”.
The marker at the Hcms8a20 locus has consistent evidence of selection in almost all the
ivermectin resistant populations based on its pattern of nucleotide diversity departing from
neutral evolution (Tajima’s D). In spite of this, there was no obvious reduction in overall
haplotype diversity (Shannon alpha) at this locus and there was no single haplotype that was
present at high frequency in all the ivermectin resistant populations. Further, there was no
increase in the negative values of Tajima’s D at Hcms8a20 in the post-ivermectin treatment
samples for the FECRT or OFDA farms. Neither was there a clear and consistent increase in the
frequency of any haplotype(s) in ivermectin post-treatment samples. This pattern of selection is
consistent with a “soft selective sweep” in which multiple haplotypes are present at loci linked to
the causal mutation (Messer and Petrov, 2013). This is in contrast with the classic “hard selective
sweep” in which a single haplotype rises in frequency in a population. In that case, there is a
dramatic reduction in sequence diversity resulting in a single dominant haplotype across a long-
range of the genome either side of the causal mutation. Soft selective sweeps are quite different
and have been reported for benzimidazole resistance in H. contortus (Chaudhry et al., 2016;
Redman et al., 2015). A number of factors help explain why soft selective sweeps may be
common in H. contortus and so explain the nature of the signature of selection at the Hcms8a20
locus: First, although Hcms8a20 is clearly genetically linked to an important ivermectin
resistance locus, it is likely to be some physical distance away in the genome. Consequently, if
the causal mutation of ivermectin resistance arose in North American H. contortus populations
many generations ago, or was part of the pre-existing standing genetic variation, it is likely that
recombination will have shuffled the causal mutation on to a variety of different haplotype
148
backgrounds at the Hcms8a20 locus. This is particularly likely for an organism such as H.
contortus, which has a very large effective population size. Hence, although the sequence
diversity at the Hcms8a20 locus departs from a model of neutral evolution due to the effects of
positive selection, the presence of multiple Hcms8a20 haplotypes means that a simple reduction
in overall sequence diversity, or changes in the frequency of specific haplotypes post-treatment,
may not be apparent. Alternatively, if the same causal ivermectin resistance mutation has arisen
several times independently in different parasite populations and then been moved between
locations by animal movement, multiple haplotypes would be present at linked loci such as
Hcms8a20.
4.4.6 Evidence of selection on Hcms8a20 in ivermectin resistant H. contortus field
populations further narrows the location of a major causal resistance mutation.
Two independent backcross experiments identified an 11.2 Mb region of introgression in
two independent experiments in which two ivermectin resistant H. contortus strains –
MHco4(WRS) and MHco10(CAVR) – were serially backcrossed with a susceptible strain whilst
applying ivermectin selection at each generation (Redman et al., 2012; Rezansoff et al., 2016;
Doyle et al., manuscript in preparation) (Figure 4.1). This region was the dominant introgressed
portion of the genome in both backcrosses, suggesting it contains the most important ivermectin
resistance locus in both resistant strains. The fact that the MHco4(WRS) and MHco10(CAVR)
strains are derived from different continents suggests this may be a generally important
ivermectin resistance locus. The work in this chapter has shown evidence of selection on the
Hcms8a20 locus in multiple ivermectin resistant field populations from Canada and USA. This
not only suggests linkage to an important ivermectin resistance locus in these populations but
further supports the hypothesis that this locus may be important in many H. contortus
populations across the world. In contrast, several other loci (IR-start, Hco-lgc-55, Hco-avr-15,
and IR-end) distributed across the 11.2 Mb introgressed region show no such evidence of
selection. Consequently, this work suggests the causal mutation is closer to Hcms8a20 than to the
adjacent loci Hco-lgc-55 and IR-start, further narrowing the region in which it resides. Future

149
work, using a similar amplicon sequencing approach with a series of markers closer to
Hcms8a20, should further narrow the region of interest.

150
Chapter Five: General Discussion
151
5.1 The significance of these research findings
The work presented here represents valuable additions to our knowledge of ivermectin
resistance in H. contortus, as well as knowledge that can be applied to anthelmintic resistance
research across many parasitic species. These contributions were facilitated by use of multiple
new approaches to interrogate the genetics of the ivermectin resistance phenotype in H. contortus
in multiple independent population sample sets, many of which have not been assessed before.
This work highlighted the challenges of obtaining genetic signals from populations of a hyper-
diverse species like H. contortus, particularly when interrogating a complex multigenic
phenotype that ivermectin resistance in H. contortus appears to be. Despite this, genome-wide
approaches enabled by high-throughput sequencing and an accurate genome assembly and
annotation, coupled with a novel genetic backcrossing experiment and optimized bioinformatic
analyses, allowed us to obtain results from three ambitious experiments that would not have been
possible under traditional constraints. Thus, we contributed 1) The first inter-strain
transcriptomic comparison in a parasitic nematode, coupled with a characterization of the effect
of high genetic diversity on differential expression reporting, and the specification of
bioinformatic practices that can be used to mitigate this effect, 2) A multi-gene assay using a
validated genetic backcrossing approach to assess for signatures of in vivo ivermectin selection
on six candidate genes previously implicated for involvement in ivermectin resistance, and 3) the
first assessment of the ivermectin selected introgressed region in populations outside of the
backcross experiment, populations which have either been in vitro phenotyped, or undergone
years of in vivo ivermectin selection on multiple independent farms.
5.2 RNAseq reveals high transcriptomic diversity in H. contortus, and the associated
challenges in quantifying expression as a result
Chapter 2 presented the first transcriptomic comparison of different strains of a parasitic
nematode and revealed the extent of CDS genetic variation and variation in background gene
expression that can exist among different populations of a parasitic nematode species. Whole
genome sequence (WGS) data created for three independent strains of H. contortus revealed
152
average SNP rates in CDS sequence of between 2.97% to 4.84%. Transcriptionally, the RNAseq
datasets revealed 824 to 1,498 low-polymorphic genes differentially expressed between adult
female isolates of these strains (Figure 2.11). This high level of genetic diversity has been noted
before and reflects H. contortus’ biology, particularly its fast generation time and large effective
population size (Gilleard and Redman, 2016). Interestingly, the traits that led to this exceptional
diversity are hypothesized to have facilitated H. contortus’ rapid rate of resistance development
to anthelmintic drugs (Kaplan and Vidyashankar, 2012; McKellar and Jackson, 2004). Though
the genetic diversity of H. contortus has been outlined previously (Gilleard and Redman, 2016;
Redman et al., 2012, 2008b), this study represents the first exploration of transcriptomic
diversity in H. contortus, revealing a high level of background transcriptional diversity between
the strains. This high transcriptional diversity is an important finding given that numerous
published studies have associated expression differences of a single or a handful of candidate
genes with phenotypic differences between strains (Dicker et al., 2011; El-Abdellati et al., 2011;
Urdaneta-Marquez et al., 2014; Williamson et al., 2011; Xu et al., 1998). Our work suggests that,
unlike observations in some model systems in which only a handful of genes are differentially
expressed between groups, background differences in expression are common through a large
minority of genes in H. contortus. This being said, high transcriptomic diversity has been
documented in other species – mostly invertebrates – and therefore, particularly when working
with invertebrates, there should be an expectation of this diversity when beginning an experiment
(Catalán et al., 2012; Kamkina et al., 2016). The central concern of high diversity is that a
phenotype of choice cannot be reliably associated with observed difference in expression at a
gene of interest. More cautious uses and interpretations of RNAseq data are required for making
reliable associations of RNAseq based expression data if high background levels of differential
expression are expected. Below, I briefly outline some of the most promising methods to expand
RNAseq based studies in the H. contortus model system for the interrogation of ivermectin
resistance and other phenotypes of interest.
153
5.3 Advancing RNAseq based approaches in H. contortus
5.3.1 Improvement of the functional annotation of the H. contortus genome assembly.
Much potential exists from the improvement of the H. contortus functional annotation.
Though the genome assembly has received steady improvement since its publication in 2013
(Doyle et al., 2018; Laing et al., 2016), the H. contortus genome annotation has not received an
official update since its original publication (Laing et al., 2013). An addition of roughly three
thousand gene models to the H. contortus annotation from an additional run of Augustus
annotation software on the unofficial “V2.5” version of the assembly (N50 = 5.2 Mb) highlighted
that at least a small minority of genes may not have been annotated in the original published
assembly. This being said, the 21,799 gene models specified in the published genome assembly
appear to be robust in their positional coordinates and should encompass a large majority of the
genes in the genome, as suggested by the assemblies relatively high CEGMA score (Laing et al.,
2013). The genome project conducted full life cycle RNAseq sequencing of the reference
MHco3(ISE) strain from eggs, L1 to L4, to male and female adult stage samples, which is
considered best practice to first identify gene models in a newly sequenced species (Todd et al.,
2016). Further, L3-L4-adult stage specific expression of a subset of genes was validated by
cDNA amplification (Stasiuk, S., Rezansoff, A., Gilleard, J.S., unpublished). A high degree of
compliance of mapped RNAseq reads to exonic coordinates was also observed for reads of the
three strains assessed in Chapter 2 when observed in a genome browsing application, with reads
rarely mapping outside exonic coordinates (data not shown). Thus, it appears the completeness
and coordinates of the H. contortus genome annotation are generally trustworthy to the extent of
their use for expression quantification in RNAseq-based experiments. This completeness,
however, is contrasted by a lack of identity and functional annotation for a large proportion of
gene models, which represents a far more significant bottleneck to making biological inferences.
The publications of the H. contortus genome assemblies and respective annotations in Laing
et al., (2013) and Schwarz et al., (2013) both noted the high but still distant homology observed
between the H. contortus gene models and respective C. elegans gene models. Laing et al.,
(2013) found over 5,937 of the 21,799 protein coding genes identified to have C. elegans
154
orthology, the large majority (5,012) being one-to-one orthologues. Schwarz et al., (2013) found
a similar number (4,576) of one-to-one orthologues in 23,610 total gene models. Notable gene
families were emphasized in both projects. In Laing et al., (2013), the ligand-gated ion channels
(LGICs) and ABC transporters in H. contortus (which were of focus in Chapter 2) were
manually characterized based on their C. elegans orthology. Other genes families of emphasis
included the cytochrome P450s, explored for their inter-life stage differential expression, and
gene expansion of the cathepsin B protease family (Laing et al., 2013). Emphasis on these
particular families was motivated by their potential involvement in arguably the most important
phenotype of this parasite, anthelmintic mode of action and resistance. However, this bias
highlights the lack of extensive functional annotation for the majority of H. contortus gene
models. Having functional knowledge only for a select few gene families presents a significant
barrier to understanding the biological relevance of genetic and transcriptional results obtained
for them. In Chapter 2 we found between 110 and 259 low-polymorphic genes to be
differentially expressed in the three pairwise strain comparisons at > log2 2X fold change (Figure
2.11). A large proportion of these genes has no functional information associated with them,
including observed ontological characteristics as determined by their protein sequence, simply
being classified as “Uncharacterized proteins” in UniProt, for example. For example, as
discussed in Chapter 2, it was difficult to make predictions on the importance of the majority of
the most strongly differentially expressed genes in the pairwise comparisons of the ivermectin
resistant strains with the MHco3(ISE) ivermectin susceptible strain (Table 5.1). The functions of
these genes may hold important information about the phenotypic differences between these
strains, including anthelmintic resistance, but without a more complete functional annotation, our
ability to explore this possibility is limited. Furthermore, from a conceptual standpoint, having
functional information available only for a subset of genes deemed most relevant to anthelmintic
resistance essentially contradicts the purpose and advantage of carrying out whole
genome/transcriptome scale experiments, given that biological inferences can only be made on
the genes for which functional knowledge has been obtained.
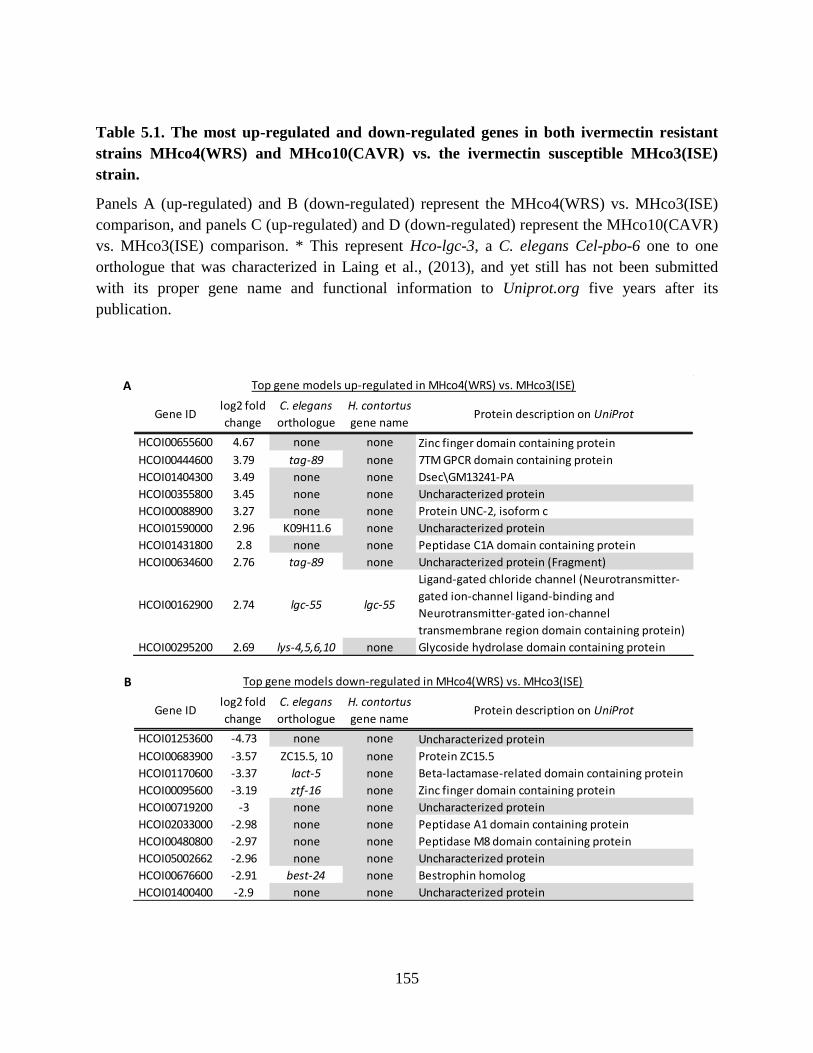
155
Table 5.1. The most up-regulated and down-regulated genes in both ivermectin resistant
strains MHco4(WRS) and MHco10(CAVR) vs. the ivermectin susceptible MHco3(ISE)
strain.
Panels A (up-regulated) and B (down-regulated) represent the MHco4(WRS) vs. MHco3(ISE)
comparison, and panels C (up-regulated) and D (down-regulated) represent the MHco10(CAVR)
vs. MHco3(ISE) comparison. * This represent Hco-lgc-3, a C. elegans Cel-pbo-6 one to one
orthologue that was characterized in Laing et al., (2013), and yet still has not been submitted
with its proper gene name and functional information to Uniprot.org five years after its
publication.
A
Gene ID log2 fold
change
C. elegans
orthologue
H. contortus
gene nameProtein description on UniProt
HCOI00655600 4.67 none none Zinc finger domain containing protein
HCOI00444600 3.79 tag-89 none 7TM GPCR domain containing protein
HCOI01404300 3.49 none none Dsec\GM13241-PA
HCOI00355800 3.45 none none Uncharacterized protein
HCOI00088900 3.27 none none Protein UNC-2, isoform c
HCOI01590000 2.96 K09H11.6 none Uncharacterized protein
HCOI01431800 2.8 none none Peptidase C1A domain containing protein
HCOI00634600 2.76 tag-89 none Uncharacterized protein (Fragment)
HCOI00162900 2.74 lgc-55 lgc-55
Ligand-gated chloride channel (Neurotransmitter-
gated ion-channel ligand-binding and
Neurotransmitter-gated ion-channel
transmembrane region domain containing protein)
HCOI00295200 2.69 lys-4,5,6,10 none Glycoside hydrolase domain containing protein
B
Gene ID log2 fold
change
C. elegans
orthologue
H. contortus
gene nameProtein description on UniProt
HCOI01253600 -4.73 none none Uncharacterized protein
HCOI00683900 -3.57 ZC15.5, 10 none Protein ZC15.5
HCOI01170600 -3.37 lact-5 none Beta-lactamase-related domain containing protein
HCOI00095600 -3.19 ztf-16 none Zinc finger domain containing protein
HCOI00719200 -3 none none Uncharacterized protein
HCOI02033000 -2.98 none none Peptidase A1 domain containing protein
HCOI00480800 -2.97 none none Peptidase M8 domain containing protein
HCOI05002662 -2.96 none none Uncharacterized protein
HCOI00676600 -2.91 best-24 none Bestrophin homolog
HCOI01400400 -2.9 none none Uncharacterized protein
Top gene models up-regulated in MHco4(WRS) vs. MHco3(ISE)
Top gene models down-regulated in MHco4(WRS) vs. MHco3(ISE)
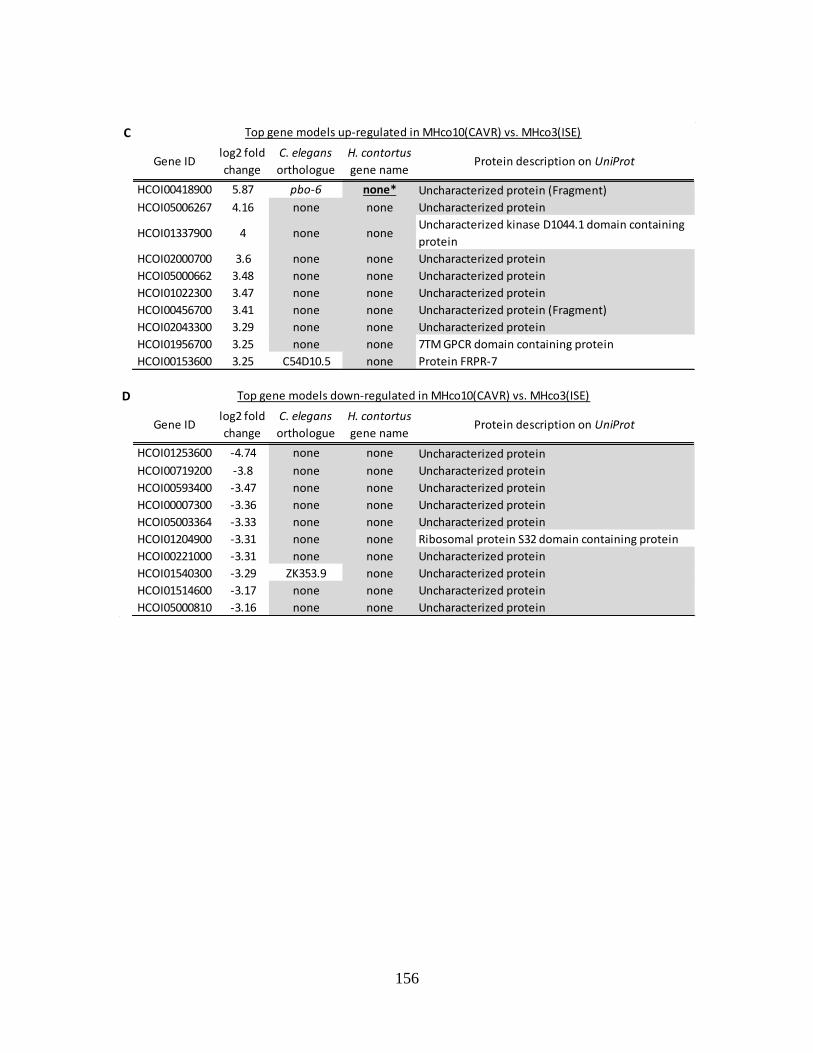
156
C
Gene ID log2 fold
change
C. elegans
orthologue
H. contortus
gene nameProtein description on UniProt
HCOI00418900 5.87 pbo-6 none* Uncharacterized protein (Fragment)
HCOI05006267 4.16 none none Uncharacterized protein
HCOI01337900 4 none noneUncharacterized kinase D1044.1 domain containing
protein
HCOI02000700 3.6 none none Uncharacterized protein
HCOI05000662 3.48 none none Uncharacterized protein
HCOI01022300 3.47 none none Uncharacterized protein
HCOI00456700 3.41 none none Uncharacterized protein (Fragment)
HCOI02043300 3.29 none none Uncharacterized protein
HCOI01956700 3.25 none none 7TM GPCR domain containing protein
HCOI00153600 3.25 C54D10.5 none Protein FRPR-7
D
Gene ID log2 fold
change
C. elegans
orthologue
H. contortus
gene nameProtein description on UniProt
HCOI01253600 -4.74 none none Uncharacterized protein
HCOI00719200 -3.8 none none Uncharacterized protein
HCOI00593400 -3.47 none none Uncharacterized protein
HCOI00007300 -3.36 none none Uncharacterized protein
HCOI05003364 -3.33 none none Uncharacterized protein
HCOI01204900 -3.31 none none Ribosomal protein S32 domain containing protein
HCOI00221000 -3.31 none none Uncharacterized protein
HCOI01540300 -3.29 ZK353.9 none Uncharacterized protein
HCOI01514600 -3.17 none none Uncharacterized protein
HCOI05000810 -3.16 none none Uncharacterized protein
Top gene models up-regulated in MHco10(CAVR) vs. MHco3(ISE)
Top gene models down-regulated in MHco10(CAVR) vs. MHco3(ISE)
157
The H. contortus functional annotation could most easily be improved by a unification of
the knowledge of genes that have been described already. Lack of consistency exists among the
current resources for H. contortus in that most described H. contortus genes are not officially
named nor have their functional descriptions readily accessible online. Neither Wormbase
Parasite, UniProt, or Nematodes.net have relevant gene name information associated with their
respective H. contortus gene model IDs. For example, HCOI_00418900, a Cel-pbo-6
homologue, has been officially named as Hco-lgc-3 in Laing et al., (2013), yet it is classified as
an uncharacterized protein in these databases. This gene was found to be the most up-regulated
in MHco10(CAVR) relative to MHco3(ISE), and its status as a named LGIC whose C. elegans
homologue affects worm motility would not have been known had it not been discovered
through personal communications (Table 5.1). This lack of name and description is true of nearly
all genes belonging to gene families that have been characterized over years of H. contortus
research. Lack of association of described genes with respective gene model IDs in all public
databases is in stark contrast to the exceptional clarity and uniformity of C. elegans genes and
their respective functional classifications. This problem serves as a serious barrier to information
flow, and can lead to a lack of communication of results and knowledge of genes being studied
by different labs. Further, given the technically trivial nature of the problem, with proper
communication and collaboration among lab groups, a uniform, publicly accessible annotation
for the genes of H. contortus that have any level of description and research history should be a
relatively straightforward (albeit potentially time consuming) goal.
Expanding functional annotations to H. contortus’ genes that have only either a basic
comparative ontological classification, or no ontological classification at all, is unfortunately a
much more difficult process. Comparative ontological classifications (generally derived from C.
elegans orthology) can serve as a starting point to explore the roles of genes in H. contortus
when coupled with other types of data for that gene. RNAseq based studies can help identify
when in the H. contortus life cycle, and where these genes are expressed (Wang et al., 2009).
Reverse genetic approaches such as gene knockdown/knockout (e.g. RNAi, CRISPR), and
forward genetic screens (e.g. through chemical or radiation mutagenesis) would generally be the
techniques of choice to interrogate gene function (Kutscher and Shaham, 2014). Unfortunately,
their application to H. contortus and parasitic nematodes in general has proven challenging,
158
(Britton et al., 2016; Selkirk et al., 2012). Progress has been made, however, so these techniques
may be powerful applications in the future to interrogate H. contortus gene function (Britton et
al., 2016). Confirmation of C. elegans orthology-based functional predictions of H. contortus
genes via functional heterologous expression of genes in C. elegans backgrounds has been
achieved for genes of high interest to anthelmintic resistance research (for example, Hco-tub-1 in
Kwa et al., (1995)). Thus, this technique should be acknowledged as a useful strategy to
determine gene function (discussed further in section 5.5). This being said, the investment to
elucidate the functional character of these candidate genes remains large in both time and
resources, and therefore will likely remain feasible only for a very select set of genes discovered
in other experiments. Therefore, a large proportion of H. contortus genes will remain poorly or
completely undescribed into the foreseeable future.
5.3.2. Future uses of RNAseq to interrogate the genetics of ivermectin resistance in H.
contortus.
Though Chapter 2 represents the first use of RNAseq to interrogate anthelmintic resistance
among different strains of this parasite, multiple informative expansions can be undertaken on
different H. contortus populations in future analyses. As has been previously discussed, one of
the disadvantages of comparing independent strains is the confounding effect that inter-strain
genetic diversity can have on differential expression analysis. Polymorphism between RNAseq
reads and the reference CDS sequence to which they are mapped reduces mapping efficiency. If
the different strains or groups being compared show different levels of polymorphism, this can
confound differential expression reporting. Accounting for this potential confounding effect
should be considered of utmost importance when dealing with genetically diverse species. The
most obvious way to avoid the issue of hyper-diversity is to focus on single strain interrogations
instead. This could be executed in a number of ways, the most straightforward being the use of a
single strain that has been subjected to ivermectin treatment. This could be done in a single
generation, though multiple generations of drug selection, preferably in vivo at normal doses,
would be preferred before isolation of mRNA from treatment and control groups. A single strain
with only marginal levels of resistance could hypothetically see changing signals of gene
159
expression with increased drug resistance levels evolving through generations of drug selection.
Standardized methods to passage H. contortus with drug treatment have been carried out on
numerous strains, including both of the fourth generation backcross strains passaged an
additional four generations with treatment (Urdaneta-Marquez et al., 2014; Doyle, S.,
Illingworth, C., Laing, R., Redman, L., Martinelli, A., Cotton, J., and Gilleard, J.S., manuscript
in preparation). Furthermore, given the evidence that ivermectin resistance is multigenic in H.
contortus (Redman et al., 2012; Doyle et al., manuscript in preparation), genes contributing to a
quantitative resistance phenotype through the evolution of induced expression of certain genes,
may be a reasonable hypothesis. Resistance conferring ABC transporters in particular may hold
the most promise for discovery with a drug induced expression assay, since ivermectin treatment
has already been observed to induce expression of P-glycoproteins in resistant C. elegans
(Ardelli and Prichard, 2013).
Another promising future RNAseq experiment would be the inclusion of the backcross
strains (along with the additional 4X passaged backcross strains) in an RNAseq experiment
along with their respective parental strains. This was the original goal of the initial RNAseq
experiment carried out for Chapter 2. However, the independent conditions under which the
backcross worms were harvested and cDNA prepared for sequencing to produce RNAseq data
rendered them incomparable to their parental strains, and as a result they were removed from the
analysis. Inclusion of respective backcross strains would offer a more robust screen of genes that
might be involved in ivermectin resistance through increased or decreased expression. A gene
showing differential expression in the backcross strain along with its respective resistant parent
relative vs. the MHco3(ISE) susceptible parental strain would suggest that the gene was
introgressed in the backcross strain and may confer resistance. Given our updated knowledge of
the chromosome 5 ivermectin selected region in H. contortus, assessment for differential
expression of any of the ~ 927 genes in the 11.2 Mb introgressed region (and now within the
reduced locus adjacent to the field selected Hcms8a20 marker) would narrow down the set of
differentially expressed genes in the region to only a small sample of a few backcross
differentially expressed genes. Given the large number of introgressed low-polymorphic genes
differentially expressed between the resistant and susceptible parental strains – 137 in the
MHco4(WRS) vs. MHco3(ISE) comparison, and 228 in the MHco10(CAVR) vs. MHco3(ISE)
160
comparison – narrowing down this number would significantly advance the future search for any
expression-based resistance genes in the ivermectin selected region.
To increase the reliability of future inter-strain RNAseq based experiments like the one
conducted in Chapter 2, a morphing (i.e. modification of SNP sites) of the H. contortus genome
may also be a useful strategy to mitigate the effect that polymorphism can have in biasing
differential expression reporting. This was attempted using SNP data from the whole genome
sequence alignments of the MHco4(WRS) and MHco10(CAVR) strains, but was abandoned due
to the need for a custom bioinformatic procedure to adjust the gene annotation coordinates of
both strains morphed genomes. If this could be successfully achieved, much of the high
frequency polymorphism that exists in gene models between the RNAseq reads of each strain
and the MHco3(ISE) based references genome could be morphed into strain specific genome
assemblies, reducing the overall SNP rate differences in gene models between the strains, in turn
reducing bias in differential expression calls between them.
A final factor that might improve RNAseq based analyses is the steady improvement of
both the sequencing hardware and the bioinformatic tools used to analyse the RNAseq data. The
RNAseq carried out in Chapter 2 used paired-end 100 bp reads (trimmed to 75 bp) which were
the customary size of Illumina reads at the time of sequencing in 2011. Since this time,
maximum lengths of HiSeq based sequencing has increased to up to paired-end 250 base pair
reads. Sequencing at this increased max length would undoubtedly increase the precision and
accuracy of read mapping, such that higher read mapping efficiencies at improved specificity
could be attained at all polymorphism allowances, potentially reducing the effect of this
polymorphism, and ultimately the differential expression biases between the strains.
Bioinformatically, numerous new aligners have been released that could be used as alternates to
tophat2 (Baruzzo et al., 2017). A strategy could be to attempt mapping with multiple RNAseq
read mappers followed by the averaging of normalized read counts.
5.4. Advancing the search for the ivermectin selected locus on H. contortus chromosome 5
Chapter 3 represents the first utilization of the backcross strains to interrogate the genetics
of ivermectin resistance. Though the work in Chapter 3 utilized conventional cloning and Sanger
161
sequencing techniques, the experimental power of the backcross strains afforded the potential to
determine linkage of any chosen loci to selected ivermectin resistance conferring mutations in
two independently resistant H. contortus strains. We found no linkage to a resistance mutation
for any of the leading candidate loci interrogated, with the exception of the Hcms8a20 locus,
which was first identified as introgressed in the original backcross experiment. This result
highlighted the hazards of making inferences based on associations of background genetic
variation with a chosen phenotype, as had been done with the five candidate genes assessed, and
supports the importance of genome-wide and genetic approaches. We have shown that
associative studies do not have the ability to reliably identify resistance conferring markers, and
this experiment stressed how the anthelmintic resistance research community should carry out
future interrogations of the genetics of other phenotypes of interest. Given the high levels of
genetic diversity that exist in H. contortus and related nematodes, anthelmintic resistance
research is particularly susceptible to the dangers of false positive signals in these types of
association studies.
With the identification of the introgressed region on chromosome 5, and the location of
Hcms8a20 within it, this ivermectin selected region became the primary focus for further genetic
interrogations. Chapter 4 was the first attempt to assess populations outside the experimental
backcross populations and assessed multiple loci along the introgressed region. The use of deep
amplicon sequencing was chosen for this interrogation due to its cost effectiveness in assessing a
target genome region of interest, and the ease with which it can be massively multiplexed to
assess upwards of hundreds of samples in one sequencing run. These included the most
promising differentially expressed gene in the introgressed region found in Chapter 2 – Hco-lgc-
55, the only glutamate-gated chloride channel (GLC) in the introgressed region, whose C.
elegans homologue confers ivermectin resistance – Hco-avr-15, an adjacent gene locus to
Hcms8a20, and two gene loci peripheral to the introgressed region. The results showed that the
in vivo and in vitro phenotyped field isolates near uniformly exhibited that Hcms8a20 is under
positive selection, in contrast to the other four introgressed loci assessed. This implies that, of the
loci tested, Hcms8a20 is the closest to an ivermectin selected mutation(s) across the majority of
22 independent ivermectin resistant field populations. Thus, as evidenced by this result on a large
set of independent populations, Chapter 4 has 1) shown that the ivermectin selected marker
162
identified in the backcross resistant strains appears to be important in many independent
ivermectin resistant populations across North America, and 2) substantially reduced the size of
the ivermectin selected region of interest, and therefore future work should be focused on a
smaller region adjacent to Hcms8a20.
5.4.1 Limitations of the deep amplicon sequencing experiment of Chapter 4.
Given that Chapter 4 represented the first attempt at deep amplicon sequencing of multiple
previously uncharacterized gene loci in the hyper-diverse H. contortus, a few unexpected
complications arose. In this experiment, I chose to target loci that focused on amplicons at a
target length of roughly 450-500 bp. Due to the hyper-diverse status of intronic sequence over
which each locus spanned, the whole genome sequence datasets used to specify primer binding
sights seemingly under-represented the true length of some introns by upwards of 150 bp
(particularly for Hco-dyf-7) (Table 4.2). Because of this, three of the seven loci assessed in this
study (IR-start, Hco-dyf-7, and CEG), once sequenced, were longer than optimal for forward and
reverse read merging (Table 4.2). Unfortunately, reverse reads of these three loci had to be
removed from the analysis, which reduced the length of their sequences from a target length of
~500 bp to trimmed forward read lengths of 225 bp. In a number of different populations
samples, particularly at the X-linked (the lowest diversity H. contortus chromosome) Hco-dyf-7
locus, this short length corresponded with a high rate of near haplotype fixation across the
samples. This in turn corresponded to extremely variable Shannon(e) alpha diversities (Tables
4.8-11, panels A), being near zero in some samples due to the near fixation of a single
haplotypes. Thus, Hco-dyf-7 in particular appears to lack a sufficient number of segregating SNP
sites to inform true patterns of haplotypic diversity and signatures of selection, increasing the
variability of diversity scores across samples. As a result, Shannon alpha diversities for Hco-dyf-
7, and to a lesser extent the other forward read only loci – IR-start and CEG, are less reliable
estimates of true diversity at these loci compared to diversities for the four full length loci.
Regarding the samples assessed, the high levels of resistance observed in the majority of the
FECRT and OFDA farm populations may have reduced the potential to properly assess for drops
in genetic diversity caused by ivermectin treatment (Table 4.1). Egg count reductions far less
163
than 90% for all seven FECRT farms and all seven OFDA farms with both pre- and post-
treatment samples likely explains the lack of drop in genetic diversity we see at introgressed loci
in post-treatment samples. This is because, given the high rates of pre-experimental ivermectin
resistance, an insufficient number of worms were killed by the treatment, and many different
haplotypes that exist at these loci may already be linked to a resistance mutation. Fortunately,
long term selection was more easily informed by Tajima’s D scores, and thus the signal at the
Hcms8a20 locus was observed. Caution should be taken when using diversity scores, or any
score in general, to inform selection on populations that already have high levels of resistance
from long term treatment.
In general, the experiment would have benefitted by inclusion of more ivermectin
susceptible H. contortus isolates. The lack of even marginally susceptible FECRT and OFDA
farms left only the backcross susceptible parental strain MHco3(ISE), and the two susceptible in
vitro phenotyped isolates Ph-10 and Ph-11, as the only reliable susceptible isolates. Inclusion of
more susceptible isolates of close relation to, and obtained under similar sampling conditions to
resistant isolates, would increase the robustness of each experiment.
5.4.2 Next steps in the search for ivermectin resistance conferring mutations in H.
contortus.
The expansion of the interrogation of the ivermectin selected introgressed region to fifteen
independent in vivo resistance phenotyped H. contortus field populations from Western Canada,
and ten in vitro phenotyped field isolates from the United States and Colombia, proved to be a
useful strategy for narrowing down the location of the ivermectin selected marker. We now have
evidence that the ivermectin resistance locus lies somewhere within ~ 1-3 Mb of Hcms8a20. The
applicability of the deep amplicon sequencing approach lies in the fact that it allows incremental
targeting of a locus or loci of interest in the genome at a significantly reduced cost relative to
non-targeted WGS approaches. The targeted nature of deep amplicon sequencing allows it to be
reapplied to specific loci of interest based on new genetic information. In contrast, more
expensive WGS approaches can suffer from lower than optimal ceilings on sequence depth at
specific loci. For instance, a similar deep amplicon sequencing approach to that carried out in
164
Chapter 4, specifically centered near the Hcms8a20 locus, offers a straightforward next step to
further narrow down the location of the resistance mutation in the region of interest. Selecting
loci across a region of a few megabases on each side of Hcms8a20 is a sufficient and already
validated strategy to narrow down the location of the ivermectin selected locus to within a scale
of kilobases, which should only contain a few dozen genes.
The method we developed utilizing a deep amplicon sequencing based approach is
applicable to other types of experiments and projects interrogating the genetics of anthelmintic
resistance. If a gene shows evidence of containing the actual resistance conferring mutation, use
of deep amplicon sequencing to assess it in an expanded set of populations could potentially
reveal 1) the specific location(s) of the resistance conferring mutation or mutations in different
populations, and 2) whether multiple or a single origin of the mutation(s) arose among the
populations. Further, given that evidence suggests ivermectin resistance is a quantitative,
multigenic phenotype (Redman et al., 2012; Doyle et al., manuscript in preparation), some
populations showing resistance may not show associated mutations that are observed in other
resistant populations. Even if a resistance conferring gene is identified, its role in resistance
across many different populations may not be consistent. Both conventional and deep sequencing
applications exploring the character of multiple resistance mutations in a single gene have
already been carried out on Hco-tub-1, assessing mutations at three codons known to confer
benzimidazole resistance in H. contortus, as well as other nematodes (Chaudhry et al., 2015;
Redman et al., 2015; Avramenko, R., Gilleard, J., unpublished). These studies offer an analogous
example of the complex genetic character of a resistance conferring locus under selection by
anthelmintic treatment, and the potential of a deep amplicon sequencing approach to elucidate
this character.
5.4.3. Future challenges in identifying an ivermectin resistance mutations.
When the 11.2 Mb introgressed region was identified, we evaluated the 927 gene models
within the region to associate non-synonymous mutations existing in CDS of these genes with
differential expression between the resistant and susceptible backcross parental strains. Upon
initial assessment, a high frequency of non-synonymous SNPs in gene models across the
165
introgressed region was revealed (Table 5.2). Non-synonymous SNPs were categorized by their
missense and nonsense mutational status: 17 (1.8%) and 137 (14.8%) of the 927 genes contained
at least one nonsense and missense mutation respectively in MHco4(WRS) and its respective
backcross strain (relative to the MHco3(ISE) reference assembly), and 23 (2.5%) and 172
(18.6%) of the 927 genes contained at least one nonsense and missense mutation respectively in
MHco10(CAVR) and its respective backcross strain (Table 5.2). This highlighted the extreme
level of diversity that exists within strains even within protein coding sites, and even when
utilizing the backcross strains to screen for mutations of highest importance (i.e. the total number
of mutations found in just the resistant parental strains were much higher (Table 5.2)). 5 and 81
of these genes had mutations in both backcrosses and their respective resistant parental strains,
and 2 and 7 of these genes were also differentially expressed in both resistant parental strains vs.
MHco3(ISE) (Table 5.2).
These results suggest that any candidate gene or genes identified by deep amplicon
sequencing, or any other approach, will likely contain multiple non-synonymous mutations that
may appear to be selected by experimental ivermectin treatment. Narrowing down the region of
interest to a locus containing substantially fewer than the 927 genes of the introgressed region
will aid in the search. This being said, a region < 1 Mb in length will still contain ~80 genes,
many of which will contain non-synonymous mutations. Therefore, it is likely that numerous
mutational candidates will emerge from continued studies, and it is also possible that numerous
independent mutations at different locations will confer a level of resistance on the same gene,
with many “false flag” mutations to confound analysis a likely reality. Thus, functional genetic
approaches, typically executed in a C. elegans background system, will serve as a natural next
step when up to a few candidate gene loci containing mutations of interest are identified.
5.5. Heterologous expression of future H. contortus ivermectin resistance candidate genes in
the C. elegans model system
Once the identification of one or a few promising candidate genes for contribution to the
ivermectin resistance phenotype is achieved, functional assays are the next step to confirm
resistance conferring mutations within them. In H. contortus, the most promising method to carry
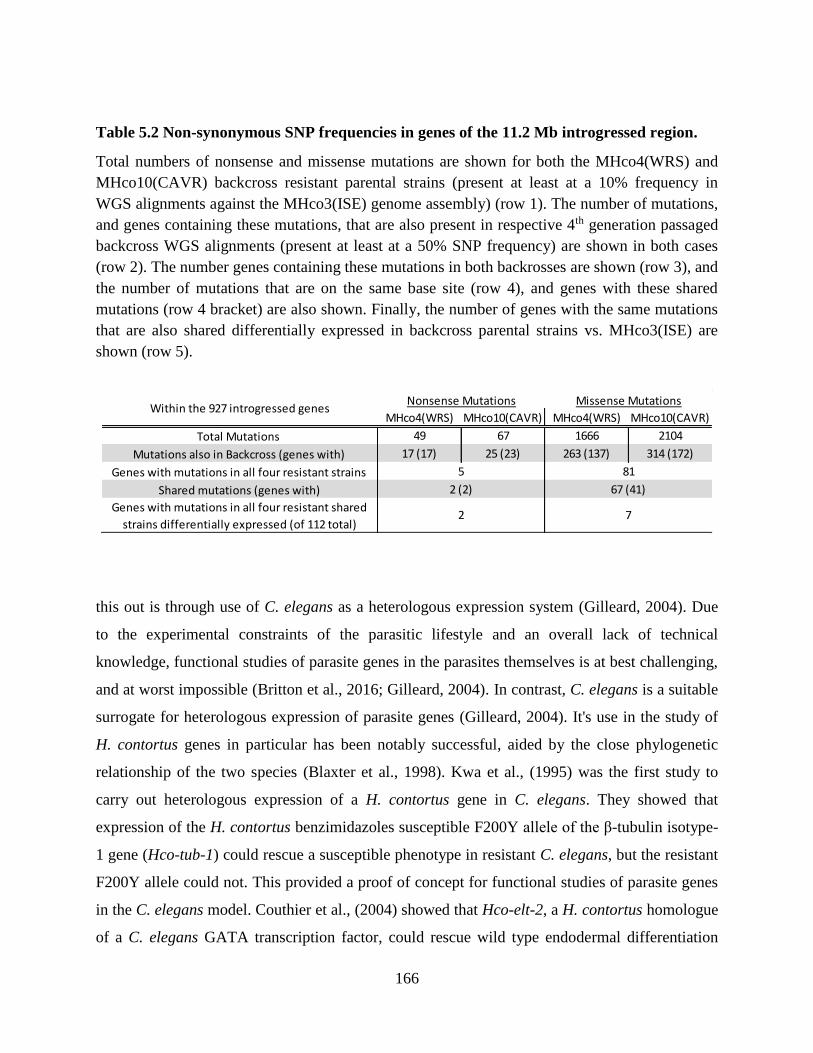
166
Table 5.2 Non-synonymous SNP frequencies in genes of the 11.2 Mb introgressed region.
Total numbers of nonsense and missense mutations are shown for both the MHco4(WRS) and
MHco10(CAVR) backcross resistant parental strains (present at least at a 10% frequency in
WGS alignments against the MHco3(ISE) genome assembly) (row 1). The number of mutations,
and genes containing these mutations, that are also present in respective 4th generation passaged
backcross WGS alignments (present at least at a 50% SNP frequency) are shown in both cases
(row 2). The number genes containing these mutations in both backrosses are shown (row 3), and
the number of mutations that are on the same base site (row 4), and genes with these shared
mutations (row 4 bracket) are also shown. Finally, the number of genes with the same mutations
that are also shared differentially expressed in backcross parental strains vs. MHco3(ISE) are
shown (row 5).
this out is through use of C. elegans as a heterologous expression system (Gilleard, 2004). Due
to the experimental constraints of the parasitic lifestyle and an overall lack of technical
knowledge, functional studies of parasite genes in the parasites themselves is at best challenging,
and at worst impossible (Britton et al., 2016; Gilleard, 2004). In contrast, C. elegans is a suitable
surrogate for heterologous expression of parasite genes (Gilleard, 2004). It's use in the study of
H. contortus genes in particular has been notably successful, aided by the close phylogenetic
relationship of the two species (Blaxter et al., 1998). Kwa et al., (1995) was the first study to
carry out heterologous expression of a H. contortus gene in C. elegans. They showed that
expression of the H. contortus benzimidazoles susceptible F200Y allele of the β-tubulin isotype-
1 gene (Hco-tub-1) could rescue a susceptible phenotype in resistant C. elegans, but the resistant
F200Y allele could not. This provided a proof of concept for functional studies of parasite genes
in the C. elegans model. Couthier et al., (2004) showed that Hco-elt-2, a H. contortus homologue
of a C. elegans GATA transcription factor, could rescue wild type endodermal differentiation
MHco4(WRS) MHco10(CAVR) MHco4(WRS) MHco10(CAVR)
Total Mutations 49 67 1666 2104
Mutations also in Backcross (genes with) 17 (17) 25 (23) 263 (137) 314 (172)
Genes with mutations in all four resistant strains
Shared mutations (genes with)
Genes with mutations in all four resistant shared
strains differentially expressed (of 112 total)2 7
Within the 927 introgressed genes
5
2 (2)
81
67 (41)
Nonsense Mutations Missense Mutations

167
when ectopically expressed in mutant C. elegans. This provided further proof that, even with
stark sequence heterogeneity between homologous regulatory proteins, expression of H.
contortus transgenes can rescue wild-type phenotypes in the C. elegans model. More recently,
Glendinning et al., (2011) succeeded in integrated transgenesis of numerous H. contortus GLC
genes in an ivermectin resistant strain of C. elegans. This study provided a key demonstration
that even transgenes with no C. elegans orthologue (in this case, Hco-glc-6) can be
transgenically expressed in C. elegans to rescue a wild-type phenotype (i.e. drug susceptibility).
Thus, heterologous expression of H. contortus genes has been extensively validated across a
diverse set of gene families, and therefore use of this system is a valuable tool to interrogate
future candidate ivermectin resistance genes.
The way to best structure transgenic experiments in C. elegans will depend on the type of
candidate gene implicated for functional involvement. If the gene is a potential drug target, such
as a LGIC (e.g. a GLC), it is hypothesized that knockouts or conformational changes in these
targets can confer resistance relative to wild-type alleles by removal of the drug target.
Conversely, genes encoding drug metabolism enzymes or efflux transporters, such as the P-
glycoproteins, are hypothesized to confer ivermectin resistance when up-regulated via increased
efflux of the drug away from target sites. Other genes may influence drug efficacy through a
variety of other mechanisms contributing to a quantitative phenotype (Dent et al., 2000). To
properly assess these different types of candidate genes, the use of different C. elegans
backgrounds will be required (Gilleard, 2004). The most important of these backgrounds for
ivermectin resistance assays would be the highly ivermectin resistant triple knockout strain,
DA1316, a strain with no apparent ivermectin target (Dent et al., 2000), which has already been
used to assess H. contortus GLCs in Glendinning et al., (2011). Use of other backgrounds, such
as the N2/Bristol susceptible wild-type strain, and candidate gene orthologue knockout strains
may also be necessary for the interrogation of heterologously expressed H. contortus genes.
Generally, a custom set of backgrounds will likely have to be specified for each new gene. Until
more advances in functional genetics can be made via RNAi, or successful CRISPR/CAS-9
genome editing application in H. contortus, the continued use of the C. elegans heterologous
gene expression system to explore the functional effect of mutations in H. contortus genes will
remain the best strategy (Britton et al., 2016; Gilleard, 2004).
168
5.6. Application of high-throughput sequencing techniques beyond the interrogation of
ivermectin resistance in H. contortus
Though H. contortus is utilized as a model parasitic nematode system to interrogate the
genetics of ivermectin resistance, as this thesis work has shown, ivermectin resistance is a
significant problem in other parasite species as well (Kaplan and Vidyashankar, 2012).
Conversely, other forms of anthelmintic resistance are a problem in H. contortus (Kaplan and
Vidyashankar, 2012; Kotze et al., 2014; McKellar and Jackson, 2004). The procedures carried
out in Chapters 2 and 4 represent high-throughput sequencing approaches that are applicable to
other resistance phenotypes in H. contortus and other parasites. Genome-wide exploration of
ivermectin resistance has already begun in other parasitic nematode species. A serial
backcrossing experiment similar to that conducted for H. contortus in Redman et al., (2012) was
recently conducted on a multi-drug resistant strain of Teladorsagia circumcincta with multiple
anthelmintics, including ivermectin (Choi et al., 2017). The goal of this study was to introgress
resistance conferring regions of the genome into a susceptible genetic background. Multiple loci
of the T. circumcincta genome were found to show a signal of selection by each of the
anthelmintics utilized. Another study recently conducted a genome wide association study on
populations of Onchocerca volvulus showing reduced response to ivermectin (Doyle et al.,
2017). This represents the first study to assess the genetics of ivermectin resistance in a human
parasitic nematode. Up to 31 quantitative trait loci were found to associate with O. volvulus
population samples showing a reduced ivermectin response phenotype. Loci identified in
genome wide studies such as these offer promising starting points for future targeted analyses
such as conducting deep amplicon sequencing to assay specific genes for drug selection in
multiple populations. As future whole genome studies continue to identify broad regions of a
diverse set of parasite genomes under selection by anthelmintics, the use of targeted approaches
to focus on loci within them will become ever more valuable.
The most readily studied resistance phenotype in H. contortus has been that of
benzimidazole resistance (Gilleard, 2006; Kotze et al., 2014). It was discovered in the 1990s that
a single genes held numerous resistance conferring mutations to the BZ class of drugs (Kotze et
al., 2014; Kwa et al., 1994). The discovery of Hco-tub-1’s involvement, and the subsequent gain
169
in functional understanding of its resistance conferring status, represents more of an exception to,
than the rule when it comes to our overall understanding of anthelmintic resistance across the
different drug classes (reviewed in Kotze et al., 2014). Two other drugs – levamisole, and
monepantel – have putative genes claimed to be associated with respective resistance phenotypes
in H. contortus. An isoform of Hco-acr-8 is suspected to associate with H. contortus’ levamisole
resistance phenotype (Fauvin et al., 2010). Stronger evidence has been shown for Hco-mtpl-1’s
involvement in monepantel resistance, with the observation of a loss of function mutation in
known monepantel target genes associating with increased drug tolerance (Rufener et al., 2009).
These genes represent just two potential candidates for screening using the approaches utilized in
this thesis: 1) assessment for transcriptional differences between respective resistant and
susceptible strains, and 2) deep amplicon sequencing to assess for drops in genetic diversity, and
departures from genetic neutrality.
Broadly speaking, irrespective of the anthelmintic drug in question, and irrespective of the
genes implicated for involvement in resistance, the genomic age has opened up a wealth of
potential tools at our disposal that can now be utilized to study the seemingly inevitable
development of anthelmintic resistance in parasitic nematodes.
170
References
Anders, S., Pyl, P.T., Huber, W., 2014. 10D-HTSeq – A Python framework to work with high-
throughput sequencing data HTSeq – A Python framework to work with high-throughput
sequencing data. Bioinformatics. 31, 0–5. https://doi.org/10.1093/bioinformatics/btu638
Andersen, E.C., Gerke, J.P., Shapiro, J.A., Crissman, J.R., Ghosh, R., Bloom, J.S., Felix, M.-A.,
Kruglyak, L., 2012. Chromosome-scale selective sweeps shape Caenorhabditis elegans
genomic diversity. Nat. Genet. 44, 285–295. https://doi.org/10.1038/ng.1050
Antony, H.A., Pathak, V., Parija, S.C., Ghosh, K., Bhattacherjee, A., 2016. Transcriptomic
Analysis of Chloroquine-Sensitive and Chloroquine-Resistant Strains of Plasmodium
falciparum : Toward Malaria Diagnostics and Therapeutics for Global Health. Omi. A J.
Integr. Biol. 20, 424–432. https://doi.org/10.1089/omi.2016.0058
Ardelli, B.F., Prichard, R.K., 2013. Inhibition of P-glycoprotein enhances sensitivity of
Caenorhabditis elegans to ivermectin. Vet. Parasitol. 191, 264–275.
https://doi.org/10.1016/j.vetpar.2012.09.021
Avramenko, R.W., Redman, E.M., Lewis, R., Yazwinski, T.A., Wasmuth, J.D., Gilleard, J.S.,
2015. Exploring the Gastrointestinal “Nemabiome”: Deep Amplicon Sequencing to
Quantify the Species Composition of Parasitic Nematode Communities. PLoS One 10,
e0143559. https://doi.org/10.1371/journal.pone.0143559
Bartley, D.J., McAllister, H., Bartley, Y., Dupuy, J., Ménez, C., Alvinerie, M., Jackson, F.,
Lespine, A., 2009. P-glycoprotein interfering agents potentiate ivermectin susceptibility in
ivermectin sensitive and resistant isolates of Teladorsagia circumcincta and Haemonchus
contortus. Parasitology 136, 1081–8. https://doi.org/10.1017/S0031182009990345
Baruzzo, G., Hayer, K.E., Kim, E.J., DI Camillo, B., Fitzgerald, G.A., Grant, G.R., 2017.
Simulation-based comprehensive benchmarking of RNA-seq aligners. Nat. Methods 14,
135–139. https://doi.org/10.1038/nmeth.4106
Bateman, A., Martin, M.J., O’Donovan, C., Magrane, M., Apweiler, R., Alpi, E., Antunes, R.,
Arganiska, J., Bely, B., Bingley, M., Bonilla, C., Britto, R., Bursteinas, B., Chavali, G.,
Cibrian-Uhalte, E., Da Silva, A., De Giorgi, M., Dogan, T., Fazzini, F., Gane, P., Castro,
L.G., Garmiri, P., Hatton-Ellis, E., Hieta, R., Huntley, R., Legge, D., Liu, W., Luo, J.,
Macdougall, A., Mutowo, P., Nightingale, A., Orchard, S., Pichler, K., Poggioli, D., Pundir,
S., Pureza, L., Qi, G., Rosanoff, S., Saidi, R., Sawford, T., Shypitsyna, A., Turner, E.,
Volynkin, V., Wardell, T., Watkins, X., Zellner, H., Cowley, A., Figueira, L., Li, W.,
McWilliam, H., Lopez, R., Xenarios, I., Bougueleret, L., Bridge, A., Poux, S., Redaschi, N.,
Aimo, L., Argoud-Puy, G., Auchincloss, A., Axelsen, K., Bansal, P., Baratin, D., Blatter,
M.C., Boeckmann, B., Bolleman, J., Boutet, E., Breuza, L., Casal-Casas, C., De Castro, E.,
Coudert, E., Cuche, B., Doche, M., Dornevil, D., Duvaud, S., Estreicher, A., Famiglietti, L.,
Feuermann, M., Gasteiger, E., Gehant, S., Gerritsen, V., Gos, A., Gruaz-Gumowski, N.,
Hinz, U., Hulo, C., Jungo, F., Keller, G., Lara, V., Lemercier, P., Lieberherr, D.,
Lombardot, T., Martin, X., Masson, P., Morgat, A., Neto, T., Nouspikel, N., Paesano, S.,
Pedruzzi, I., Pilbout, S., Pozzato, M., Pruess, M., Rivoire, C., Roechert, B., Schneider, M.,
Sigrist, C., Sonesson, K., Staehli, S., Stutz, A., Sundaram, S., Tognolli, M., Verbregue, L.,
Veuthey, A.L., Wu, C.H., Arighi, C.N., Arminski, L., Chen, C., Chen, Y., Garavelli, J.S.,
Huang, H., Laiho, K., McGarvey, P., Natale, D.A., Suzek, B.E., Vinayaka, C.R., Wang, Q.,
Wang, Y., Yeh, L.S., Yerramalla, M.S., Zhang, J., 2015. UniProt: A hub for protein
171
information. Nucleic Acids Res. 43, D204–D212. https://doi.org/10.1093/nar/gku989
Beech, R., Levitt, N., Cambos, M., Zhou, S., Forrester, S.G., 2010. Association of ion-channel
genotype and macrocyclic lactone sensitivity traits in Haemonchus contortus. Mol.
Biochem. Parasitol. 171, 74–80. https://doi.org/10.1016/j.molbiopara.2010.02.004
Beech, R.N., Skuce, P., Bartley, D.J., Martin, R.J., Prichard, R.K., Gilleard, J.S., 2011.
Anthelmintic resistance: markers for resistance, or susceptibility? Parasitology 138, 160–74.
https://doi.org/10.1017/S0031182010001198
Beech, R.N., Wolstenholme, A.J., Neveu, C., Dent, J.A., 2010. Nematode parasite genes: what’s
in a name? Trends Parasitol. 26, 334–340. https://doi.org/10.1016/j.pt.2010.04.003
Beg, A.A., Ernstrom, G.G., Nix, P., Davis, M.W., Jorgensen, E.M., 2008. Protons Act as a
Transmitter for Muscle Contraction in C. elegans. Cell 132, 149–160.
https://doi.org/10.1016/j.cell.2007.10.058
Bernard, G.C., Egnin, M., Bonsi, C., 2017. The Impact of Plant-Parasitic Nematodes on
Agriculture and Methods of Control, in: NEMATOLOGY CONCEPTS, DIAGNOSIS AND
CONTROL. InTech, pp. 121–153. https://doi.org/10.5772/intechopen.68958
Blackhall, W.J., Liu, H.Y., Xu, M., Prichard, R.K., Beech, R.N., 1998. Selection at a P-
glycoprotein gene in ivermectin- and moxidectin-selected strains of Haemonchus contortus.
Mol. Biochem. Parasitol. 95, 193–201. https://doi.org/10.1016/S0166-6851(98)00087-5
Blackhall, W.J., Pouliot, J.-F., Prichard, R.K., Beech, R.N., 1998. Haemonchus contortus :
Selection at a Glutamate-Gated Chloride Channel Gene in Ivermectin- and Moxidectin-
Selected Strains. Exp. Parasitol. 48, 42–48.
https://doi.org/https://doi.org/10.1006/expr.1998.4316
Blackhall, W.J., Prichard, R.K., Beech, R.N., 2003. Selection at a γ-aminobutyric acid receptor
gene in Haemonchus contortus resistant to avermectins/milbemycins. Mol. Biochem.
Parasitol. 131, 137–145. https://doi.org/10.1016/S0166-6851(03)00201-9
Blaxter, M.L., De Ley, P., Garey, J.R., Liu, L.X., Scheldeman, P., Vierstraete, A., Vanfleteren,
J.R., Mackey, L.Y., Dorris, M., Frisse, L.M., Vida, J.T., Thomas, W.K., 1998. A molecular
evolutionary framework for the phylum Nematoda. Nature 392, 71–5.
https://doi.org/10.1038/32160
Blouin, M.S., Yowell, C.A., Courtney, C.H., Dame, J.B., 1995. Host movement and the genetic
structure of populations of parasitic nematodes. Genetics 141, 1007–14.
Blumenthal, T., Davis, R.E., 2004. Exploring nematode diversity. Nat. Genet.
https://doi.org/10.1038/ng1204-1246
Bottomly, D., Walter, N.A.R., Hunter, J.E., Darakjian, P., Kawane, S., Buck, K.J., Searles, R.P.,
Mooney, M., McWeeney, S.K., Hitzemann, R., 2011. Evaluating gene expression in
C57BL/6J and DBA/2J mouse striatum using RNA-Seq and microarrays. PLoS One 6.
https://doi.org/10.1371/journal.pone.0017820
Britton, C., Roberts, B., Marks, N.D., 2016. Functional Genomics Tools for Haemonchus
contortus and Lessons From Other Helminths, in: Advances in Parasitology. pp. 599–623.
https://doi.org/10.1016/bs.apar.2016.02.017
Bull, K., Cook, A., Hopper, N.A., Harder, A., Holden-Dye, L., Walker, R.J., 2007. Effects of the
novel anthelmintic emodepside on the locomotion, egg-laying behaviour and development
of Caenorhabditis elegans. Int. J. Parasitol. 37, 627–36.
https://doi.org/10.1016/j.ijpara.2006.10.013
Cabaret, J., 2008. Pro and cons of targeted selective treatment against digestive-tract strongyles
172
of ruminants. Parasite 15, 506–9. https://doi.org/10.1051/parasite/2008153506
Campbell, W.C., Conder, G. a, Marchiondo, A. a, 2009. Future of the animal health industry at a
time of food crisis. Vet. Parasitol. 163, 188–95. https://doi.org/10.1016/j.vetpar.2009.05.025
Campbell, W.C., Fisher, M.H., Stapley, E.O., Albers-Schönberg, G., Jacob, T.A., 1983.
Ivermectin: a potent new antiparasitic agent. Science 221, 823–8.
https://doi.org/10.1126/science.6308762
Capra, E.J., Skrovanek, S.M., Kruglyak, L., 2008. Comparative developmental expression
profiling of two C. elegans isolates. PLoS One 3.
https://doi.org/10.1371/journal.pone.0004055
Catalán, A., Hutter, S., Parsch, J., 2012. Population and sex differences in Drosophila
melanogaster brain gene expression. BMC Genomics 13, 654. https://doi.org/10.1186/1471-
2164-13-654
Chaudhry, U., Redman, E.M., Ashraf, K., Shabbir, M.Z., Rashid, M.I., Ashraf, S., Gilleard, J.S.,
2016. Microsatellite marker analysis of Haemonchus contortus populations from Pakistan
suggests that frequent benzimidazole drug treatment does not result in a reduction of overall
genetic diversity. Parasit. Vectors 9, 349. https://doi.org/10.1186/s13071-016-1624-0
Chaudhry, U., Redman, E.M., Raman, M., Gilleard, J.S., 2015. Genetic evidence for the spread
of a benzimidazole resistance mutation across southern India from a single origin in the
parasitic nematode Haemonchus contortus. Int. J. Parasitol. 45, 721–728.
https://doi.org/10.1016/j.ijpara.2015.04.007
Choi, Y.J., Bisset, S.A., Doyle, S.R., Hallsworth-Pepin, K., Martin, J., Grant, W.N., Mitreva, M.,
2017. Genomic introgression mapping of field-derived multiple-anthelmintic resistance in
Teladorsagia circumcincta. PLoS Genet. 13, e1006857.
https://doi.org/10.1371/journal.pgen.1006857
Cingolani, P., Platts, A., Wang, L.L., Coon, M., Nguyen, T., Wang, L., Land, S.J., Lu, X.,
Ruden, D.M., 2012. A program for annotating and predicting the effects of single nucleotide
polymorphisms, SnpEff: SNPs in the genome of Drosophila melanogaster strain. Fly
(Austin). 6, 80–92. https://doi.org/10.4161/fly.19695
Coles, G.C., Bauer, C., Borgsteede, F.H., Geerts, S., Klei, T.R., Taylor, M.A., Waller, P.J., 1992.
World Association for the Advancement of Veterinary Parasitology (W.A.A.V.P.) methods
for the detection of anthelmintic resistance in nematodes of veterinary importance. Vet.
Parasitol. 44, 35–44. https://doi.org/10.1016/0304-4017(92)90141-U
Coles, G.C., Jackson, F., Pomroy, W.E., Prichard, R.K., von Samson-Himmelstjerna, G.,
Silvestre, A., Taylor, M.A., Vercruysse, J., 2006. The detection of anthelmintic resistance in
nematodes of veterinary importance. Vet. Parasitol. 136, 167–185.
https://doi.org/10.1016/j.vetpar.2005.11.019
Conesa, A., Madrigal, P., Tarazona, S., Gomez-Cabrero, D., Cervera, A., McPherson, A.,
Szcześniak, M.W., Gaffney, D.J., Elo, L.L., Zhang, X., Mortazavi, A., 2016. A survey of
best practices for RNA-seq data analysis. Genome Biol. https://doi.org/10.1186/s13059-
016-0881-8
Couthier, A., Smith, J., McGarr, P., Craig, B., Gilleard, J.S., 2004. Ectopic expression of a
Haemonchus contortus GATA transcription factor in Caenorhabditis elegans reveals
conserved function in spite of extensive sequence divergence. Mol. Biochem. Parasitol. 133,
241–53. https://doi.org/10.1016/j.molbiopara.2003.10.012
Coyne, M.J., Smith, G., 1992. The mortality and fecundity of Haemonchus contortus in parasite-
173
naive and parasite-exposed sheep following single experimental infections. Int. J. Parasitol.
22, 315–325. https://doi.org/10.1016/S0020-7519(05)80009-8
Croken, M.M.K., Ma, Y., Markillie, L.M., Taylor, R.C., Orr, G., Weiss, L.M., Kim, K., 2014.
Distinct strains of Toxoplasma gondii feature divergent transcriptomes regardless of
developmental stage. PLoS One 9, 1–10. https://doi.org/10.1371/journal.pone.0111297
Crump, A., Ōmura, S., 2011. Ivermectin, “wonder drug” from Japan: the human use perspective.
Proc. Jpn. Acad. Ser. B. Phys. Biol. Sci. 87, 13–28. https://doi.org/10.2183/pjab.87.13
Cully, D.F., Vassilatis, D.K., Liu, K.K., Paress, P.S., Van der Ploeg, L.H., Schaeffer, J.M.,
Arena, J.P., 1994. Cloning of an avermectin-sensitive glutamate-gated chloride channel
from Caenorhabditis elegans. Nature. https://doi.org/10.1038/371707a0
De Ley, P., 2006. A quick tour of nematode diversity and the backbone of nematode phylogeny.
WormBook. https://doi.org/10.1895/wormbook.1.41.1
Dent, J.A., Smith, M.M., Vassilatis, D.K., Avery, L., 2000. The genetics of ivermectin resistance
in Caenorhabditis elegans. Proc. Natl. Acad. Sci. 97, 2674–2679.
https://doi.org/10.1073/pnas.97.6.2674
Dey, A., Chan, C.K.W., Thomas, C.G., Cutter, A.D., 2013. Molecular hyperdiversity defines
populations of the nematode Caenorhabditis brenneri. Proc. Natl. Acad. Sci. 110, 11056–
11060. https://doi.org/10.1073/pnas.1303057110
Dicker, A.J., Nisbet, A.J., Skuce, P.J., 2011. Gene expression changes in a P-glycoprotein (Tci-
pgp-9) putatively associated with ivermectin resistance in Teladorsagia circumcincta. Int. J.
Parasitol. 41, 935–942. https://doi.org/10.1016/j.ijpara.2011.03.015
Dimander, S.-O., Höglund, J., Uggla, A., Spörndly, E., Waller, P.J., 2003. Evaluation of gastro-
intestinal nematode parasite control strategies for first-season grazing cattle in Sweden. Vet.
Parasitol. 111, 193–209. https://doi.org/10.1016/S0304-4017(02)00380-1
Dobin, A., Gingeras, T.R., 2013. Comment on “TopHat2: accurate alignment of transcriptomes
in the presence of insertions, deletions and gene fusions” by Kim et al. 2013. bioRxiv 0–9.
https://doi.org/10.1101/000851
Doyle, S.R., Bourguinat, C., Nana-Djeunga, H.C., Kengne-Ouafo, J.A., Pion, S.D.S., Bopda, J.,
Kamgno, J., Wanji, S., Che, H., Kuesel, A.C., Walker, M., Basáñez, M.-G., Boakye, D.A.,
Osei-Atweneboana, M.Y., Boussinesq, M., Prichard, R.K., Grant, W.N., 2017. Genome-
wide analysis of ivermectin response by Onchocerca volvulus reveals that genetic drift and
soft selective sweeps contribute to loss of drug sensitivity. PLoS Negl. Trop. Dis. 11,
e0005816. https://doi.org/10.1371/journal.pntd.0005816
Doyle, S.R., Laing, R., Bartley, D.J., Britton, C., Chaudhry, U., Gilleard, J.S., Holroyd, N.,
Mable, B.K., Maitland, K., Morrison, A.A., Tait, A., Tracey, A., Berriman, M., Devaney,
E., Cotton, J.A., Sargison, N.D., 2018. A Genome Resequencing-Based Genetic Map
Reveals the Recombination Landscape of an Outbred Parasitic Nematode in the Presence of
Polyploidy and Polyandry. Genome Biol. Evol. 10, 396–409.
https://doi.org/10.1093/gbe/evx269
Edgar, R.C., 2004. MUSCLE: multiple sequence alignment with high accuracy and high
throughput. Nucleic Acid Res. 32, 1792–1797. https://doi.org/10.1093/nar/gkh340
Edwards, J.A., Chen, C., Kemski, M.M., Hu, J., Mitchell, T.K., Rappleye, C.A., 2013.
Histoplasma yeast and mycelial transcriptomes reveal pathogenic-phase and lineage-
specific gene expression profiles. BMC Genomics 14. https://doi.org/10.1186/1471-2164-
14-695
174
El-Abdellati, A., De Graef, J., Van Zeveren, A., Donnan, A., Skuce, P., Walsh, T.,
Wolstenholme, A., Tait, A., Vercruysse, J., Claerebout, E., Geldhof, P., 2011. Altered avr-
14B gene transcription patterns in ivermectin-resistant isolates of the cattle parasites,
Cooperia oncophora and Ostertagia ostertagi. Int. J. Parasitol. 41, 951–957.
https://doi.org/10.1016/j.ijpara.2011.04.003
Excoffier, L., Laval, G., Schneider, S., 2005. Arlequin (version 3.0): an integrated software
package for population genetics data analysis. Evol Bioinform Online 1, 47–50.
https://doi.org/10.1111/j.1755-0998.2010.02847.x
Fauvin, A., Charvet, C., Issouf, M., Cortet, J., Cabaret, J., Neveu, C., 2010. cDNA-AFLP
analysis in levamisole-resistant Haemonchus contortus reveals alternative splicing in a
nicotinic acetylcholine receptor subunit. Mol. Biochem. Parasitol. 170, 105–107.
https://doi.org/10.1016/j.molbiopara.2009.11.007
Fiebig, M., Kelly, S., Gluenz, E., 2015. Comparative Life Cycle Transcriptomics Revises
Leishmania mexicana Genome Annotation and Links a Chromosome Duplication with
Parasitism of Vertebrates. PLoS Pathog. 11, 1–28.
https://doi.org/10.1371/journal.ppat.1005186
Forbes, A.B., Huckle, C.A., Gibb, M.J., Rook, A.J., Nuthall, R., 2000. Evaluation of the effects
of nematode parasitism on grazing behaviour, herbage intake and growth in young grazing
cattle. Vet. Parasitol. 90, 111–118. https://doi.org/10.1016/S0304-4017(00)00218-1
Francesconi, M., Lehner, B., 2014. The effects of genetic variation on gene expression dynamics
during development. Nature 505, 208–211. https://doi.org/10.1038/nature12772
Geary, T.G., Woo, K., McCarthy, J.S., Mackenzie, C.D., Horton, J., Prichard, R.K., de Silva,
N.R., Olliaro, P.L., Lazdins-Helds, J.K., Engels, D. a., Bundy, D. a., 2010. Unresolved
issues in anthelmintic pharmacology for helminthiases of humans. Int. J. Parasitol. 40, 1–13.
https://doi.org/10.1016/j.ijpara.2009.11.001
Ghosh, R., Andersen, E.C., Shapiro, J. a., Gerke, J.P., Kruglyak, L., 2012. Natural Variation in a
Chloride Channel Subunit Confers Avermectin Resistance in C. elegans. Science (80-. ).
335, 574–578. https://doi.org/10.1126/science.1214318
Gilleard, J.S., 2013. Haemonchus contortus as a paradigm and model to study anthelmintic drug
resistance. Parasitology 140, 1506–1522. https://doi.org/10.1017/S0031182013001145
Gilleard, J.S., 2006. Understanding anthelmintic resistance: The need for genomics and genetics.
Int. J. Parasitol. https://doi.org/10.1016/j.ijpara.2006.06.010
Gilleard, J.S., 2004. The use of Caenorhabditis elegans in parasitic nematode research.
Parasitology 128 Suppl, S49-70. https://doi.org/10.1017/S003118200400647X
Gilleard, J.S., Beech, R.N., 2007. Population genetics of anthelmintic resistance in parasitic
nematodes. Parasitology 134, 1133–1147. https://doi.org/10.1017/S0031182007000066
Gilleard, J.S., Redman, E., 2016. Genetic Diversity and Population Structure of Haemonchus
contortus, in: Advances in Parasitology. pp. 31–68.
https://doi.org/10.1016/bs.apar.2016.02.009
Gilleard, J.S., Woods, D.J., Dow, J. a T., 2005. Model-organism genomics in veterinary parasite
drug-discovery. Trends Parasitol. 21, 302–305. https://doi.org/10.1016/j.pt.2005.05.007
Glendinning, S.K., Buckingham, S.D., Sattelle, D.B., Wonnacott, S., Wolstenholme, A.J., 2011.
Glutamate-Gated Chloride Channels of Haemonchus contortus Restore Drug Sensitivity to
Ivermectin Resistant Caenorhabditis elegans. PLoS One 6, e22390.
https://doi.org/10.1371/journal.pone.0022390
175
Goodwin, S., McPherson, J.D., McCombie, W.R., 2016. Coming of age: ten years of next-
generation sequencing technologies. Nat. Rev. Genet. 17, 333–51.
https://doi.org/10.1038/nrg.2016.49
Grillo, V., Jackson, F., Gilleard, J.S., 2006. Characterisation of Teladorsagia circumcincta
microsatellites and their development as population genetic markers. Mol. Biochem.
Parasitol. 148, 181–189. https://doi.org/10.1016/j.molbiopara.2006.03.014
Guryev, V., Koudijs, M.J., Berezikov, E., Johnson, S.L., Plasterk, R.H.A., van Eeden, F.J.M.,
Cuppen, E., 2006. Genetic variation in the zebrafish. Genome Res. 16, 491–7.
https://doi.org/10.1101/gr.4791006
Hall, A., Hewitt, G., Tuffrey, V., De Silva, N., 2008. A review and meta-analysis of the impact
of intestinal worms on child growth and nutrition. Matern. Child Nutr. 4, 118–236.
https://doi.org/10.1111/j.1740-8709.2007.00127.x
Heiman, M.G., Shaham, S., 2009. DEX-1 and DYF-7 Establish Sensory Dendrite Length by
Anchoring Dendritic Tips during Cell Migration. Cell 137, 344–355.
https://doi.org/10.1016/j.cell.2009.01.057
Hibbs, R.E., Gouaux, E., 2011. Principles of activation and permeation in an anion-selective
Cys-loop receptor. Nature 474, 54–60. https://doi.org/10.1038/nature10139
Hotez, P.J., 2009. Forgotten People, Forgotten Diseases: The Neglected Tropical Diseases and
Their Impact on Global Health and Development. Emerg. Infect. Dis. 15, 510–511.
https://doi.org/10.3201/eid1503.081597
Hotez, P.J., Brindley, P.J., Bethony, J.M., King, C.H., Pearce, E.J., Jacobson, J., 2008. Helminth
infections: the great neglected tropical diseases. J. Clin. Invest. 118, 1311–21.
https://doi.org/10.1172/JCI34261
Howell, S.B., Burke, J.M., Miller, J.E., Terrill, T.H., Valencia, E., 2008. Prevalence of
anthelmintic resistance on sheep and goat farms in the southeastern United States. J. Am.
Vet. Med. Assoc. 233, 1913–1919.
https://doi.org/https://doi.org/10.2460/javma.233.12.1913
Hudson, R.R., Slatkin, M., Maddison, W.P., 1992. Estimation of levels of gene flow from DNA
sequence data. Genetics 132, 583–589. https://doi.org/PMC1205159
Hunt, P., 2006. The human right to the highest attainable standard of health: new opportunities
and challenges. Trans. R. Soc. Trop. Med. Hyg. 100, 603–7.
https://doi.org/10.1016/j.trstmh.2006.03.001
Jagannathan, S., Laughton, D.L., Critten, C.L., Skinner, T.M., Horoszok, L., Wolstenholme,
A.J., 1999. Ligand-gated chloride channel subunits encoded by the Haemonchus contortus
and Ascaris suum orthologues of the Caenorhabditis elegans gbr-2 (avr-14) gene. Mol.
Biochem. Parasitol. 103, 129–140. https://doi.org/10.1016/S0166-6851(99)00120-6
James, C.E., Hudson, A.L., Davey, M.W., 2009. Drug resistance mechanisms in helminths: is it
survival of the fittest? Trends Parasitol. 25, 328–35.
https://doi.org/10.1016/j.pt.2009.04.004
Jones, B.C., Middleton, D.S., Youdim, K., 2009. 6 Cytochrome P450 Metabolism and Inhibition:
Analysis for Drug Discovery, in: Progress in Medicinal Chemistry. pp. 239–263.
https://doi.org/10.1016/S0079-6468(08)00206-3
Kaminsky, R., Ducray, P., Jung, M., Clover, R., Rufener, L., Bouvier, J., Weber, S.S., Wenger,
A., Wieland-Berghausen, S., Goebel, T., Gauvry, N., Pautrat, F., Skripsky, T., Froelich, O.,
Komoin-Oka, C., Westlund, B., Sluder, A., Mäser, P., 2008. A new class of anthelmintics
176
effective against drug-resistant nematodes. Nature 452, 176–180.
https://doi.org/10.1038/nature06722
Kamkina, P., Snoek, L.B., Grossmann, J., Volkers, R.J.M., Sterken, M.G., Daube, M.,
Roschitzki, B., Fortes, C., Schlapbach, R., Roth, A., von Mering, C., Hengartner, M.O.,
Schrimpf, S.P., Kammenga, J.E., 2016. Natural Genetic Variation Differentially Affects the
Proteome and Transcriptome in Caenorhabditis elegans. Mol. Cell. Proteomics 15, 1670–
80. https://doi.org/10.1074/mcp.M115.052548
Kaplan, R.M., 2004. Drug resistance in nematodes of veterinary importance: a status report.
Trends Parasitol. 20, 477–81. https://doi.org/10.1016/j.pt.2004.08.001
Kaplan, R.M., Vidyashankar, A.N., 2012. An inconvenient truth: Global worming and
anthelmintic resistance. Vet. Parasitol. 186, 70–78.
https://doi.org/10.1016/j.vetpar.2011.11.048
Kearse, M., Moir, R., Wilson, A., Stones-Havas, S., Cheung, M., Sturrock, S., Buxton, S.,
Cooper, A., Markowitz, S., Duran, C., Thierer, T., Ashton, B., Meintjes, P., Drummond, A.,
2012. Geneious Basic: an integrated and extendable desktop software platform for the
organization and analysis of sequence data. Bioinformatics 28, 1647–9.
https://doi.org/10.1093/bioinformatics/bts199
Kenyon, F., Greer, A.W., Coles, G.C., Cringoli, G., Papadopoulos, E., Cabaret, J., Berrag, B.,
Varady, M., Van Wyk, J.A., Thomas, E., Vercruysse, J., Jackson, F., 2009. The role of
targeted selective treatments in the development of refugia-based approaches to the control
of gastrointestinal nematodes of small ruminants. Vet. Parasitol. 164, 3–11.
https://doi.org/10.1016/j.vetpar.2009.04.015
Kotze, A.C., Hunt, P.W., Skuce, P., von Samson-Himmelstjerna, G., Martin, R.J., Sager, H.,
Krücken, J., Hodgkinson, J., Lespine, A., Jex, A.R., Gilleard, J.S., Beech, R.N.,
Wolstenholme, A.J., Demeler, J., Robertson, A.P., Charvet, C.L., Neveu, C., Kaminsky, R.,
Rufener, L., Alberich, M., Menez, C., Prichard, R.K., 2014. Recent advances in candidate-
gene and whole-genome approaches to the discovery of anthelmintic resistance markers and
the description of drug/receptor interactions. Int. J. Parasitol. Drugs Drug Resist. 4, 164–
184. https://doi.org/10.1016/J.IJPDDR.2014.07.007
Kutscher, L.M., Shaham, S., 2014. Forward and reverse mutagenesis in C. elegans. WormBook
1–26. https://doi.org/10.1895/wormbook.1.167.1
Kwa, M.S., Veenstra, J.G., Van Dijk, M., Roos, M.H., 1995. Beta-tubulin genes from the
parasitic nematode Haemonchus contortus modulate drug resistance in Caenorhabditis
elegans. J. Mol. Biol. 246, 500–510. https://doi.org/10.1006/jmbi.1994.0102
Kwa, M.S.G., Veenstra, J.G., Roos, M.H., 1994. Benzimidazole resistance in Haemonchus
contortus is correlated with a conserved mutation at amino acid 200 in β-tubulin isotype 1.
Mol. Biochem. Parasitol. 63, 299–303. https://doi.org/10.1016/0166-6851(94)90066-3
Lacey, E., 1990. Mode of action of benzimidazoles. Parasitol. Today 6, 112–5.
https://doi.org/10.1016/0169-4758(90)90227-U
Lafferty, K.D., Allesina, S., Arim, M., Briggs, C.J., De Leo, G., Dobson, A.P., Dunne, J.A.,
Johnson, P.T.J., Kuris, A.M., Marcogliese, D.J., Martinez, N.D., Memmott, J., Marquet,
P.A., McLaughlin, J.P., Mordecai, E.A., Pascual, M., Poulin, R., Thieltges, D.W., 2008.
Parasites in food webs: The ultimate missing links. Ecol. Lett.
https://doi.org/10.1111/j.1461-0248.2008.01174.x
Laing, R., Hunt, M., Protasio, A. V, Saunders, G., Mungall, K., Laing, S., Jackson, F., Quail, M.,

177
Beech, R., Berriman, M., Gilleard, J.S., 2011. Annotation of two large contiguous regions
from the Haemonchus contortus genome using RNA-seq and comparative analysis with
Caenorhabditis elegans. PLoS One 6, e23216. https://doi.org/10.1371/journal.pone.0023216
Laing, R., Kikuchi, T., Martinelli, A., Tsai, I., Beech, R., Redman, E., Holroyd, N., Bartley, D.,
Beasley, H., Britton, C., Curran, D., Devaney, E., Gilabert, A., Hunt, M., Jackson, F.,
Johnston, S., Kryukov, I., Li, K., Morrison, A., Reid, A., Sargison, N., Saunders, G.,
Wasmuth, J., Wolstenholme, A., Berriman, M., Gilleard, J., Cotton, J., 2013. The genome
and transcriptome of Haemonchus contortus, a key model parasite for drug and vaccine
discovery. Genome Biol. 14, R88. https://doi.org/10.1186/gb-2013-14-8-r88
Laing, R., Martinelli, A., Tracey, A., Holroyd, N., Gilleard, J.S., Cotton, J.A., 2016.
Haemonchus contortus: Genome Structure, Organization and Comparative Genomics. Adv.
Parasitol. 93, 569–598. https://doi.org/10.1016/BS.APAR.2016.02.016
Le Jambre, L., Gill, J., Lenane, I., Lacey, E., 1995. Characterization of an avermectin resistant
strain of autralian Haemonchus contortus. Int. J. Parasitol. 25, 691–698.
Le Jambre, L.F., Gill, J.H., Lenane, I.J., Baker, P., 2000. Inheritance of avermectin resistance in
Haemonchus contortus. Int. J. Parasitol. 30, 105–111. https://doi.org/10.1016/S0020-
7519(99)00172-1
Le Jambre, L.F., Lenane, I.J., Wardrop, A.J., 1999. A hybridisation technique to identify
anthelmintic resistance genes in Haemonchus. Int. J. Parasitol. 29, 1979–1985.
https://doi.org/https://doi.org/10.1016/0020-7519(94)00200-8
Le Jambre, L.F., Royal, W.M., Martin, P.J., 1979. The inheritance of thiabendazole resistance in
Haemonchus contortus. Parasitology 78, 107–19.
Lespine, A., Alvinerie, M., Vercruysse, J., Prichard, R.K., Geldhof, P., 2008. ABC transporter
modulation: a strategy to enhance the activity of macrocyclic lactone anthelmintics. Trends
Parasitol. 24, 293–298. https://doi.org/10.1016/j.pt.2008.03.011
Lespine, A., Ménez, C., Bourguinat, C., Prichard, R.K., 2012. International Journal for
Parasitology : Drugs and Drug Resistance P-glycoproteins and other multidrug resistance
transporters in the pharmacology of anthelmintics : Prospects for reversing transport-
dependent anthelmintic resistance. Int. J. Parasitol. Drugs Drug Resist. 2, 58–75.
https://doi.org/10.1016/j.ijpddr.2011.10.001
Li, H., Handsaker, B., Wysoker, A., Fennell, T., Ruan, J., Homer, N., Marth, G., Abecasis, G.,
Durbin, R., Subgroup, 1000 Genome Project Data Processing, 2009. The Sequence
Alignment/Map format and SAMtools. Bioinformatics 25, 2078–2079.
https://doi.org/10.1093/bioinformatics/btp352
Li, J., Lai, K., Ching, A.K.K., Chan, T., 2014. Genomics Transcriptome sequencing of Chinese
and Caucasian population identi fi es ethnic-associated differential transcript abundance of
heterogeneous nuclear ribonucleoprotein K ( hnRNPK ). Genomics 103, 56–64.
https://doi.org/10.1016/j.ygeno.2013.12.005
Lichtenfels, J.R., Pilitt, P. a, Hoberg, E.P., 1994. New morphological characters for identifying
individual specimens of Haemonchus spp. (Nematoda: Trichostrongyloidea) and a key to
species in ruminants of North America. J. Parasitol. 80, 107–119.
Lindblad-Toh, K., Lander, E.S., Winchester, E., Daly, M.J., Wang, D.G., Hirschhorn, J.N.,
Laviolette, J.-P., Ardlie, K., Reich, D.E., Robinson, E., Sklar, P., Shah, N., Thomas, D.,
Fan, J.-B., Gingeras, T., Warrington, J., Patil, N., Hudson, T.J., 2000. Large-scale discovery
and genotyping of single-nucleotide polymorphismsin the mouse. Nat. Genet. 24, 381–386.
178
https://doi.org/10.1038/74215
Little, P.R., Hodges, A., Watson, T.G., Seed, J.A., Maeder, S.J., 2010. Field efficacy and safety
of an oral formulation of the novel combination anthelmintic, derquantel-abamectin, in
sheep in New Zealand. N. Z. Vet. J. 58, 121–9.
https://doi.org/10.1080/00480169.2010.67513
Love, M.I., Huber, W., Anders, S., 2014. Moderated estimation of fold change and dispersion for
RNA-seq data with DESeq2. Genome Biol. 15, 1–21. https://doi.org/10.1186/s13059-014-
0550-8
Lustigman, S., McCarter, J.P., 2007. Ivermectin resistance in Onchocerca volvulus: toward a
genetic basis. PLoS Negl. Trop. Dis. 1, e76. https://doi.org/10.1371/journal.pntd.0000076
Martin, P.J., McKenzie, J.A., 1990. Levamisole resistance in Trichostrongylus colubriformis: A
sex-linked recessive character. Int. J. Parasitol. 20, 867–872. https://doi.org/10.1016/0020-
7519(90)90024-H
Martin, R.J., 1997. Modes of action of anthelmintic drugs. Vet. J. 154, 11–34.
https://doi.org/10.1016/S1090-0233(05)80005-X
Mccavera, S., Rogers, A.T., Yates, D.M., Woods, D.J., Wolstenholme, A.J., 2009. An
ivermectin-sensitive glutamate-gated chloride channel from the parasitic nematode
Haemonchus contortus. Mol Pharm 75, 1347–1355.
https://doi.org/10.1124/mol.108.053363.living
McCavera, S., Walsh, T.K., Wolstenholme, A.J., 2007. Nematode ligand-gated chloride
channels: an appraisal of their involvement in macrocyclic lactone resistance and prospects
for developing molecular markers. Parasitology 134, 1111–21.
https://doi.org/10.1017/S0031182007000042
McKellar, Q.A., Jackson, F., 2004. Veterinary anthelmintics: old and new. Trends Parasitol. 20,
456–461. https://doi.org/10.1016/j.pt.2004.08.002
Mcleod, R.S., 1995. Costs of major parasites to the Australian livestock industries. Int. J.
Parasitol. 25, 1363–1367. https://doi.org/10.1016/0020-7519(95)00071-9
Messer, P.W., Petrov, D.A., 2013. Population genomics of rapid adaptation by soft selective
sweeps. Trends Ecol. Evol. 28, 659–669. https://doi.org/10.1016/j.tree.2013.08.003
Molento, M.B., 2009. Parasite control in the age of drug resistance and changing agricultural
practices. Vet. Parasitol. 163, 229–34. https://doi.org/10.1016/j.vetpar.2009.06.007
Molyneux, D.H., Hotez, P.J., Fenwick, A., 2005. “Rapid-Impact Interventions”: How a Policy of
Integrated Control for Africa’s Neglected Tropical Diseases Could Benefit the Poor. PLoS
Med. 2, e336. https://doi.org/10.1371/journal.pmed.0020336
Morgan, X.C., Huttenhower, C., 2012. Chapter 12: Human Microbiome Analysis. PLoS Comput.
Biol. 8. https://doi.org/10.1371/journal.pcbi.1002808
Neveu, C., Charvet, C.L., Fauvin, A., Cortet, J., Beech, R.N., Cabaret, J., 2010. Genetic diversity
of levamisole receptor subunits in parasitic nematode species and abbreviated transcripts
associated with resistance. Pharmacogenet. Genomics 20, 414–25.
https://doi.org/10.1097/FPC.0b013e328338ac8c
Nicol, J.M., Turner, S.J., Coyne, D.L., Nijs, L. den, Hockland, S., Maafi, Z.T., 2011. Current
Nematode Threats to World Agriculture, in: Genomics and Molecular Genetics of Plant-
Nematode Interactions. Springer Netherlands, Dordrecht, pp. 21–43.
https://doi.org/10.1007/978-94-007-0434-3_2
Osei-Atweneboana, M.Y., Awadzi, K., Attah, S.K., Boakye, D.A., Gyapong, J.O., Prichard,
179
R.K., 2011. Phenotypic evidence of emerging ivermectin resistance in Onchocerca
volvulus. PLoS Negl. Trop. Dis. 5, e998. https://doi.org/10.1371/journal.pntd.0000998
Otsen, M., Hoekstra, R., Plas, M.E., Buntjer, J.B., Lenstra, J.A., Roos, M.H., 2001. Amplied
fragment length polymorphism analysis of genetic diversity of Haemonchus contortus
during selection for drug resistance. Int. J. Parasitol. 31, 1138–1143.
https://doi.org/10.1016/S0020-7519(01)00225-9
Papenfort, K., Förstner, K.U., Cong, J., Sharma, C.M., Bassler, B.L., 2015. Differential RNA-seq
of Vibrio cholerae identifies the VqmR small RNA as a regulator of biofilm formation.
Proc. Natl. Acad. Sci. 112, E766–E775. https://doi.org/10.1073/pnas.1500203112
Pathan, M., Keerthikumar, S., Ang, C.S., Gangoda, L., Quek, C.Y.J., Williamson, N.A.,
Mouradov, D., Sieber, O.M., Simpson, R.J., Salim, A., Bacic, A., Hill, A.F., Stroud, D.A.,
Ryan, M.T., Agbinya, J.I., Mariadason, J.M., Burgess, A.W., Mathivanan, S., 2015.
FunRich: An open access standalone functional enrichment and interaction network analysis
tool. Proteomics 15, 2597–2601. https://doi.org/10.1002/pmic.201400515
Prado-Martinez, J., Sudmant, P.H., Kidd, J.M., Li, H., Kelley, J.L., Lorente-Galdos, B.,
Veeramah, K.R., Woerner, A.E., O’Connor, T.D., Santpere, G., Cagan, A., Theunert, C.,
Casals, F., Laayouni, H., Munch, K., Hobolth, A., Halager, A.E., Malig, M., Hernandez-
Rodriguez, J., Hernando-Herraez, I., Prüfer, K., Pybus, M., Johnstone, L., Lachmann, M.,
Alkan, C., Twigg, D., Petit, N., Baker, C., Hormozdiari, F., Fernandez-Callejo, M., Dabad,
M., Wilson, M.L., Stevison, L., Camprubí, C., Carvalho, T., Ruiz-Herrera, A., Vives, L.,
Mele, M., Abello, T., Kondova, I., Bontrop, R.E., Pusey, A., Lankester, F., Kiyang, J.A.,
Bergl, R.A., Lonsdorf, E., Myers, S., Ventura, M., Gagneux, P., Comas, D., Siegismund, H.,
Blanc, J., Agueda-Calpena, L., Gut, M., Fulton, L., Tishkoff, S.A., Mullikin, J.C., Wilson,
R.K., Gut, I.G., Gonder, M.K., Ryder, O.A., Hahn, B.H., Navarro, A., Akey, J.M.,
Bertranpetit, J., Reich, D., Mailund, T., Schierup, M.H., Hvilsom, C., Andrés, A.M., Wall,
J.D., Bustamante, C.D., Hammer, M.F., Eichler, E.E., Marques-Bonet, T., 2013. Great ape
genetic diversity and population history. Nature 499, 471–475.
https://doi.org/10.1038/nature12228
Prichard, R.K., 2001. Genetic variability following selection of Haemonchus contortus with
anthelmintics. Trends Parasitol. 17, 445–453. https://doi.org/10.1016/S1471-
4922(01)01983-3
Rao, V.T.S., Accardi, M. V., Siddiqui, S.Z., Beech, R.N., Prichard, R.K., Forrester, S.G., 2010.
Characterization of a novel tyramine-gated chloride channel from Haemonchus contortus.
Mol. Biochem. Parasitol. 173, 64–68. https://doi.org/10.1016/j.molbiopara.2010.05.005
Redman, E., Grillo, V., Saunders, G., Packard, E., Jackson, F., Berriman, M., Gilleard, J.S.,
2008a. Genetics of mating and sex determination in the parasitic nematode Haemonchus
contortus. Genetics 180, 1877–1887. https://doi.org/10.1534/genetics.108.094623
Redman, E., Packard, E., Grillo, V., Smith, J., Jackson, F., Gilleard, J.S., 2008b. Microsatellite
analysis reveals marked genetic differentiation between Haemonchus contortus laboratory
isolates and provides a rapid system of genetic fingerprinting. Int. J. Parasitol. 38, 111–22.
https://doi.org/10.1016/j.ijpara.2007.06.008
Redman, E., Sargison, N., Whitelaw, F., Jackson, F., Morrison, A., Bartley, D.J., Gilleard, J.S.,
2012. Introgression of Ivermectin Resistance Genes into a Susceptible Haemonchus
contortus Strain by Multiple Backcrossing. PLoS Pathog. 8, e1002534.
https://doi.org/10.1371/journal.ppat.1002534
180
Redman, E., Whitelaw, F., Tait, A., Burgess, C., Bartley, Y., Skuce, P.J., Jackson, F., Gilleard,
J.S., 2015. The emergence of resistance to the benzimidazole anthlemintics in parasitic
nematodes of livestock is characterised by multiple independent hard and soft selective
sweeps. PLoS Negl. Trop. Dis. 9, e0003494. https://doi.org/10.1371/journal.pntd.0003494
Rezansoff, A.M., Laing, R., Gilleard, J.S., 2016. Evidence from two independent backcross
experiments supports genetic linkage of microsatellite Hcms8a20, but not other candidate
loci, to a major ivermectin resistance locus in Haemonchus contortus. Int. J. Parasitol. 46,
653–661. https://doi.org/10.1016/j.ijpara.2016.04.007
Richmond, J.E., Jorgensen, E.M., 1999. One GABA and two acetylcholine receptors function at
the C. elegans neuromuscular junction. Nat. Neurosci. 2, 791–7.
https://doi.org/10.1038/12160
Ringstad, N., Abe, N., Horvitz, H.R., 2009. Ligand-gated chloride channels are receptors for
biogenic amines in C. elegans. Science 325, 96–100.
https://doi.org/10.1126/science.1169243
Romiguier, J., Gayral, P., Ballenghien, M., Bernard, A., Cahais, V., Chenuil, A., Chiari, Y.,
Dernat, R., Duret, L., Faivre, N., Loire, E., Lourenco, J.M., Nabholz, B., Roux, C.,
Tsagkogeorga, G., Weber, A.A.T., Weinert, L.A., Belkhir, K., Bierne, N., Glémin, S.,
Galtier, N., 2014. Comparative population genomics in animals uncovers the determinants
of genetic diversity. Nature 515, 261–263. https://doi.org/10.1038/nature13685
Roos, M.H., Boersema, J.H., Borgsteede, F.H.M., Cornelissen, J., Taylor, M., Joost Ruitenberg,
E., 1990. Molecular analysis of selection for benzimidazole resistance in the sheep parasite
Haemonchus contortus. Mol. Biochem. Parasitol. 43, 77–88. https://doi.org/10.1016/0166-
6851(90)90132-6
Roos, M.H., Otsen, M., Hoekstra, R., Veenstra, J.G., Lenstra, J.A., 2004. Genetic analysis of
inbreeding of two strains of the parasitic nematode Haemonchus contortus. Int. J. Parasitol.
34, 109–115. https://doi.org/10.1016/j.ijpara.2003.10.002
Rozas, J., Ferrer-Mata, A., Sánchez-DelBarrio, J.C., Guirao-Rico, S., Librado, P., Ramos-
Onsins, S.E., Sánchez-Gracia, A., 2017. DnaSP 6: DNA Sequence Polymorphism Analysis
of Large Data Sets. Mol. Biol. Evol. 34, 3299–3302.
https://doi.org/10.1093/molbev/msx248
Rufener, L., Mäser, P., Roditi, I., Kaminsky, R., 2009. Haemonchus contortus acetylcholine
receptors of the DEG-3 subfamily and their role in sensitivity to monepantel. PLoS Pathog.
5, e1000380. https://doi.org/10.1371/journal.ppat.1000380
Samson-Himmelstjerna, G. von, 2006. Molecular diagnosis of anthelmintic resistance. Vet.
Parasitol. 136, 99–107. https://doi.org/10.1016/j.vetpar.2005.12.005
Sangster, N.C., Bannan, S.C., Weiss, A.S., Nulf, S.C., Klein, R.D., Geary, T.G., 1999.
Haemonchus contortus: Sequence Heterogeneity of Internucleotide Binding Domains from
P-Glycoproteinsand an Association with Avermectin/Milbemycin Resistance. Exp.
Parasitol. 91, 250–257. https://doi.org/10.1006/expr.1998.4373
Sangster, N.C., Redwin, J.M., Bjorn, H., 1998. Inheritance of levamisole and benzimidazole
resistance in an isolate of Haemonchus contortus. Int. J. Parasitol. 28, 503–510.
https://doi.org/10.1016/S0020-7519(97)00194-X
Sargison, N.D., Redman, E., Morrison, A.A., Bartley, D.J., Jackson, F., Naghra-van Gijzel, H.,
Holroyd, N., Berriman, M., Cotton, J.A., Gilleard, J.S., 2018. A method for single pair
mating in an obligate parasitic nematode. Int. J. Parasitol. 48, 159–165.

181
https://doi.org/10.1016/J.IJPARA.2017.08.010
Schinkel, A.H., 1999. P-Glycoprotein, a gatekeeper in the blood-brain barrier. Adv. Drug Deliv.
Rev. 36, 179–194. https://doi.org/10.1016/S0169-409X(98)00085-4
Schwarz, E.M., Korhonen, P.K., Campbell, B.E., Young, N.D., Jex, A.R., Jabbar, A., Hall, R.S.,
Mondal, A., Howe, A.C., Pell, J., Hofmann, A., Boag, P.R., Zhu, X.-Q., Gregory, T.,
Loukas, A., Williams, B.A., Antoshechkin, I., Brown, C., Sternberg, P.W., Gasser, R.B.,
2013. The genome and developmental transcriptome of the strongylid nematode
Haemonchus contortus. Genome Biol. 14, R89. https://doi.org/10.1186/gb-2013-14-8-r89
Selkirk, M.E., Huang, S.C., Knox, D.P., Britton, C., 2012. The development of RNA interference
(RNAi) in gastrointestinal nematodes. Parasitology 139, 605–612.
https://doi.org/10.1017/S0031182011002332
Stanke, M., Morgenstern, B., 2005. AUGUSTUS: a web server for gene prediction in eukaryotes
that allows user-defined constraints. Nucleic Acids Res. 33, W465–W467.
https://doi.org/10.1093/nar/gki458
Stromberg, B.E., Gasbarre, L.C., 2006. Gastrointestinal Nematode Control Programs with an
Emphasis on Cattle. Vet. Clin. North Am. - Food Anim. Pract.
https://doi.org/10.1016/j.cvfa.2006.08.003
Tajima, F., 1989. Statistical method for testing the neutral mutation hypothesis by DNA
polymorphism. Genetics 123, 585–595. https://doi.org/PMC1203831
Todd, E. V., Black, M.A., Gemmell, N.J., 2016. The power and promise of RNA-seq in ecology
and evolution. Mol. Ecol. 25, 1224–1241. https://doi.org/10.1111/mec.13526
Troell, K., Engström, A., Morrison, D.A., Mattsson, J.G., Höglund, J., 2006. Global patterns
reveal strong population structure in Haemonchus contortus, a nematode parasite of
domesticated ruminants. Int. J. Parasitol. 36, 1305–1316.
https://doi.org/10.1016/j.ijpara.2006.06.015
Urdaneta-Marquez, L., Bae, S.H., Janukavicius, P., Beech, R., Dent, J., Prichard, R., 2014. A
dyf-7 haplotype causes sensory neuron defects and is associated with macrocyclic lactone
resistance worldwide in the nematode parasite Haemonchus contortus. Int. J. Parasitol. 44,
1063–1071. https://doi.org/10.1016/j.ijpara.2014.08.005
Urquhart, G. M., Armour, J., Duncan, J. L., Dunn, A. and Jennings, F., 1996. Veterinary
Parasitology, 2nd ed. Blackwell, Oxford.
van Dijk, E.L., Auger, H., Jaszczyszyn, Y., Thermes, C., 2014. Ten years of next-generation
sequencing technology. Trends Genet. 30, 418–426.
https://doi.org/10.1016/J.TIG.2014.07.001
Van Wyk, J.A., Malan, F.S., 1988. Resistance of field strains of Haemonchus contortus to
ivermectin, closantel, rafoxanide and the benzimidazoles in South Africa. Vet. Rec. 123,
226–228. https://doi.org/10.1136/vr.123.9.226
Vercruysse, J., Albonico, M., Behnke, J.M., Kotze, A.C., Prichard, R.K., McCarthy, J.S.,
Montresor, A., Levecke, B., 2011. Is anthelmintic resistance a concern for the control of
human soil-transmitted helminths? Int. J. Parasitol. Drugs Drug Resist.
https://doi.org/10.1016/j.ijpddr.2011.09.002
Waller, P.J., 1997. Anthelmintic resistance. Vet. Parasitol. 72, 391–412.
https://doi.org/10.1016/S0304-4017(97)00107-6
Wang, D.G., Fan, J.-B., Siao, C.-J., Berno, A., Young, P., Sapolsky, R., Ghandour, G., Perkins,
N., Winchester, E., Spencer, J., Kruglyak, L., Stein, L., Hsie, L., Topaloglou, T., Hubbell,

182
E., Robinson, E., Mittmann, M., Morris, M.S., Shen, N., Kilburn, D., Rioux, J., Nusbaum,
C., Rozen, S., Hudson, T.J., Lipshutz, R., Chee, M., Lander, E.S., 2007. Genotyping of
Single-Nucleotide Polymorphisms in the Human Genome Large-Scale Identification ,
Mapping , and Genotyping of Single-Nucleotide Polymorphisms in the Human Genome.
Technology 1077. https://doi.org/10.1126/science.280.5366.1077
Wang, Z., Gerstein, M., Snyder, M., 2009. RNA-Seq: a revolutionary tool for transcriptomics.
Nat. Rev. Genet. 10, 57–63. https://doi.org/10.1038/nrg2484
Williamson, S.M., Storey, B., Howell, S., Harper, K.M., Kaplan, R.M., Wolstenholme, A.J.,
2011. Candidate anthelmintic resistance-associated gene expression and sequence
polymorphisms in a triple-resistant field isolate of Haemonchus contortus. Mol. Biochem.
Parasitol. 180, 99–105. https://doi.org/10.1016/j.molbiopara.2011.09.003
Williamson, S.M., Wolstenholme, a J., 2012. P-glycoproteins of Haemonchus contortus:
development of real-time PCR assays for gene expression studies. J. Helminthol. 86, 202–8.
https://doi.org/10.1017/S0022149X11000216
Wolstenholme, A.J., 2011. Ion channels and receptor as targets for the control of parasitic
nematodes. Int. J. Parasitol. Drugs Drug Resist. 1, 2–13.
https://doi.org/10.1016/j.ijpddr.2011.09.003
Wolstenholme, A.J., Fairweather, I., Prichard, R., von Samson-Himmelstjerna, G., Sangster,
N.C., 2004. Drug resistance in veterinary helminths. Trends Parasitol. 20, 469–476.
https://doi.org/10.1016/j.pt.2004.07.010
Wolstenholme, A.J., Rogers, A.T., 2005. Glutamate-gated chloride channels and the mode of
action of the avermectin/milbemycin anthelmintics. Parasitology 131 Suppl, S85–S95.
https://doi.org/10.1017/S0031182005008218
Xu, M., Molento, M., Blackhall, W., Ribeiro, P., Beech, R., Prichard, R., 1998. Ivermectin
resistance in nematodes may be caused by alteration of P-glycoprotein homolog. Mol.
Biochem. Parasitol. 91, 327–335. https://doi.org/10.1016/S0166-6851(97)00215-6
Yates, D.M., Portillo, V., Wolstenholme, A.J., 2003. The avermectin receptors of Haemonchus
contortus and Caenorhabditis elegans. Int. J. Parasitol. 33, 1183–1193.
https://doi.org/10.1016/S0020-7519(03)00172-3
Zarowiecki, M., Berriman, M., 2015. What helminth genomes have taught us about parasite
evolution. Parasitology. https://doi.org/10.1017/S0031182014001449
Zhang, Z., Schwartz, S., Wagner, L., Miller, W., 2000. A Greedy Algorithm for Aligning DNA
Sequences. J. Comput. Biol. 7, 203–214. https://doi.org/10.1089/10665270050081478

183
Appendices
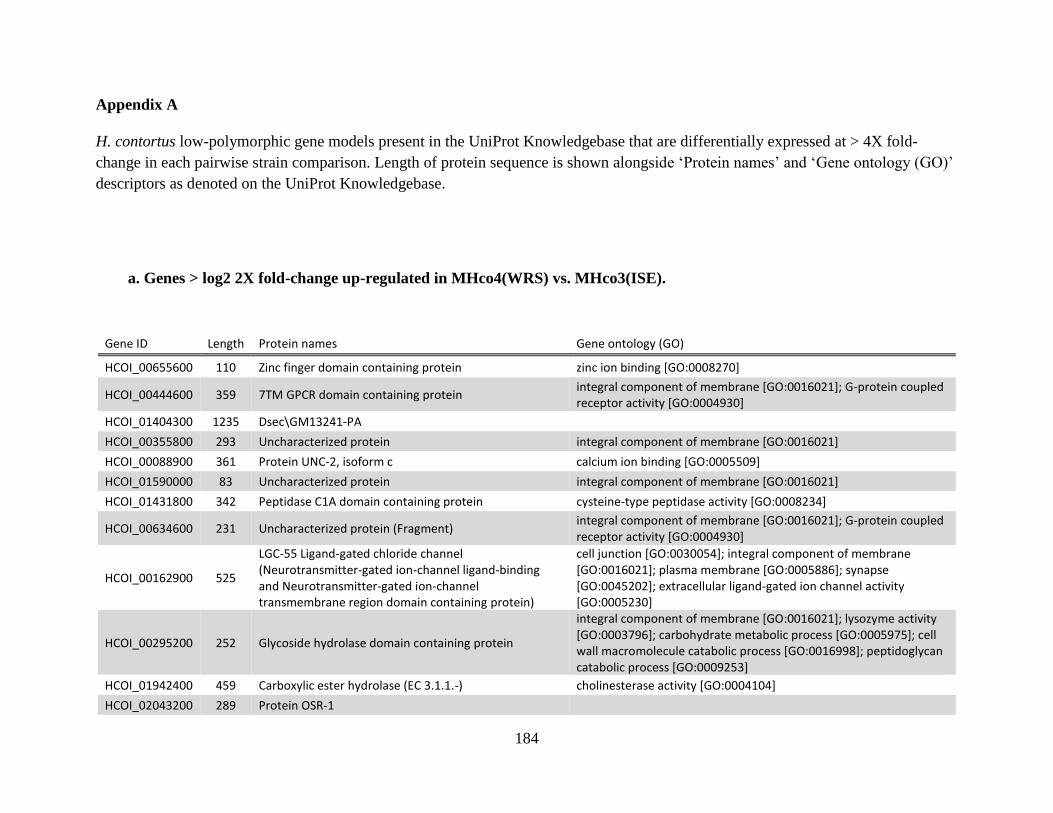
184
Appendix A
H. contortus low-polymorphic gene models present in the UniProt Knowledgebase that are differentially expressed at > 4X fold-
change in each pairwise strain comparison. Length of protein sequence is shown alongside ‘Protein names’ and ‘Gene ontology (GO)’
descriptors as denoted on the UniProt Knowledgebase.
a. Genes > log2 2X fold-change up-regulated in MHco4(WRS) vs. MHco3(ISE).
Gene ID Length Protein names Gene ontology (GO)
HCOI_00655600 110 Zinc finger domain containing protein zinc ion binding [GO:0008270]
HCOI_00444600 359 7TM GPCR domain containing protein integral component of membrane [GO:0016021]; G-protein coupled receptor activity [GO:0004930]
HCOI_01404300 1235 Dsec\GM13241-PA
HCOI_00355800 293 Uncharacterized protein integral component of membrane [GO:0016021]
HCOI_00088900 361 Protein UNC-2, isoform c calcium ion binding [GO:0005509]
HCOI_01590000 83 Uncharacterized protein integral component of membrane [GO:0016021]
HCOI_01431800 342 Peptidase C1A domain containing protein cysteine-type peptidase activity [GO:0008234]
HCOI_00634600 231 Uncharacterized protein (Fragment) integral component of membrane [GO:0016021]; G-protein coupled receptor activity [GO:0004930]
HCOI_00162900 525
LGC-55 Ligand-gated chloride channel (Neurotransmitter-gated ion-channel ligand-binding and Neurotransmitter-gated ion-channel transmembrane region domain containing protein)
cell junction [GO:0030054]; integral component of membrane [GO:0016021]; plasma membrane [GO:0005886]; synapse [GO:0045202]; extracellular ligand-gated ion channel activity [GO:0005230]
HCOI_00295200 252 Glycoside hydrolase domain containing protein
integral component of membrane [GO:0016021]; lysozyme activity [GO:0003796]; carbohydrate metabolic process [GO:0005975]; cell wall macromolecule catabolic process [GO:0016998]; peptidoglycan catabolic process [GO:0009253]
HCOI_01942400 459 Carboxylic ester hydrolase (EC 3.1.1.-) cholinesterase activity [GO:0004104]
HCOI_02043200 289 Protein OSR-1
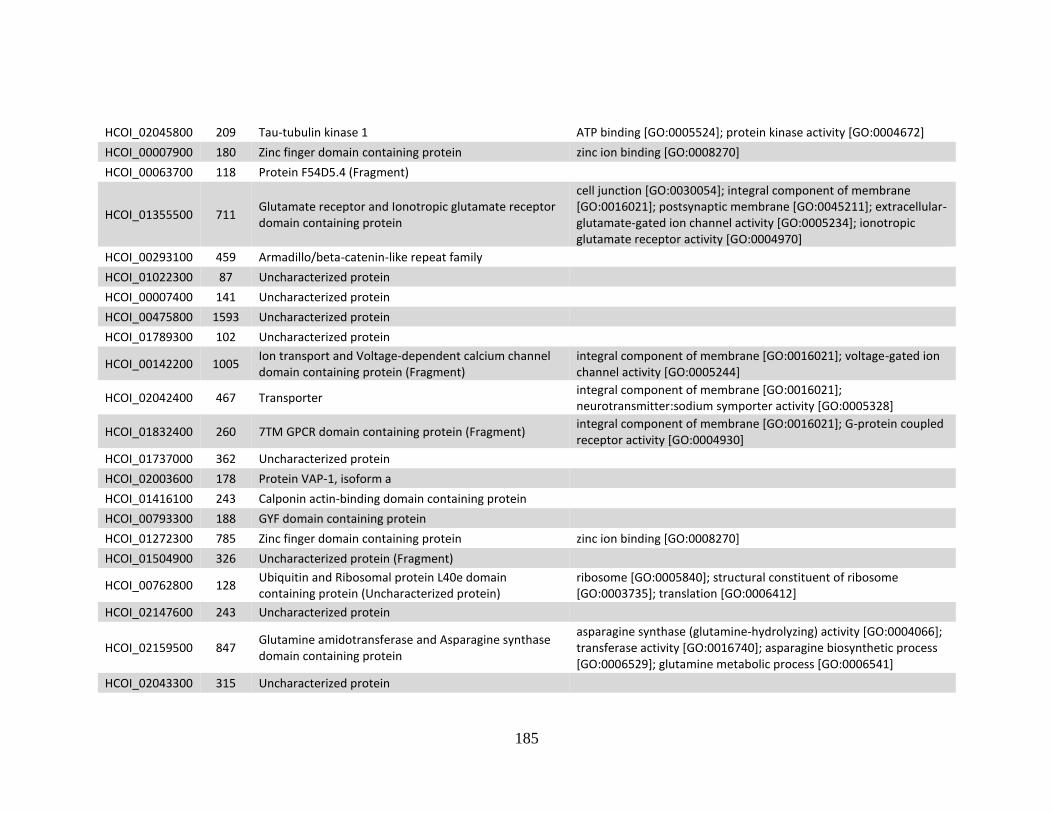
185
HCOI_02045800 209 Tau-tubulin kinase 1 ATP binding [GO:0005524]; protein kinase activity [GO:0004672]
HCOI_00007900 180 Zinc finger domain containing protein zinc ion binding [GO:0008270]
HCOI_00063700 118 Protein F54D5.4 (Fragment)
HCOI_01355500 711 Glutamate receptor and Ionotropic glutamate receptor domain containing protein
cell junction [GO:0030054]; integral component of membrane [GO:0016021]; postsynaptic membrane [GO:0045211]; extracellular-glutamate-gated ion channel activity [GO:0005234]; ionotropic glutamate receptor activity [GO:0004970]
HCOI_00293100 459 Armadillo/beta-catenin-like repeat family
HCOI_01022300 87 Uncharacterized protein
HCOI_00007400 141 Uncharacterized protein
HCOI_00475800 1593 Uncharacterized protein
HCOI_01789300 102 Uncharacterized protein
HCOI_00142200 1005 Ion transport and Voltage-dependent calcium channel domain containing protein (Fragment)
integral component of membrane [GO:0016021]; voltage-gated ion channel activity [GO:0005244]
HCOI_02042400 467 Transporter integral component of membrane [GO:0016021]; neurotransmitter:sodium symporter activity [GO:0005328]
HCOI_01832400 260 7TM GPCR domain containing protein (Fragment) integral component of membrane [GO:0016021]; G-protein coupled receptor activity [GO:0004930]
HCOI_01737000 362 Uncharacterized protein
HCOI_02003600 178 Protein VAP-1, isoform a
HCOI_01416100 243 Calponin actin-binding domain containing protein
HCOI_00793300 188 GYF domain containing protein
HCOI_01272300 785 Zinc finger domain containing protein zinc ion binding [GO:0008270]
HCOI_01504900 326 Uncharacterized protein (Fragment)
HCOI_00762800 128 Ubiquitin and Ribosomal protein L40e domain containing protein (Uncharacterized protein)
ribosome [GO:0005840]; structural constituent of ribosome [GO:0003735]; translation [GO:0006412]
HCOI_02147600 243 Uncharacterized protein
HCOI_02159500 847 Glutamine amidotransferase and Asparagine synthase domain containing protein
asparagine synthase (glutamine-hydrolyzing) activity [GO:0004066]; transferase activity [GO:0016740]; asparagine biosynthetic process [GO:0006529]; glutamine metabolic process [GO:0006541]
HCOI_02043300 315 Uncharacterized protein

186
HCOI_00850700 1121 Pleckstrin homology and Unconventional myosin plant kinesin protein non-motor protein conserved region MyTH4 and FERM central domain containing protein
cytoskeleton [GO:0005856]
HCOI_01875600 972 Diaphanous GTPase-binding and Diaphanous FH3 and Actin-binding FH2 domain containing protein
actin cytoskeleton organization [GO:0030036]
b. Genes > log2 2X fold-change down-regulated in MHco4(WRS) vs. MHco3(ISE).
Gene ID Length Protein names Gene ontology (GO)
HCOI_01253600 313 Uncharacterized protein nucleus [GO:0005634]
HCOI_00683900 319 Protein ZC15.5
HCOI_01170600 405 Beta-lactamase-related domain containing protein
HCOI_00095600 179 Zinc finger domain containing protein metal ion binding [GO:0046872]; nucleic acid binding [GO:0003676]
HCOI_00719200 289 Uncharacterized protein
HCOI_02033000 329 Peptidase A1 domain containing protein aspartic-type endopeptidase activity [GO:0004190]
HCOI_00480800 554 Peptidase M8 domain containing protein membrane [GO:0016020]; metalloendopeptidase activity [GO:0004222]; cell adhesion [GO:0007155]
HCOI_00676600 506 Bestrophin domain containing protein
HCOI_01400400 99 Uncharacterized protein DNA binding [GO:0003677]
HCOI_00719400 312 Uncharacterized protein
HCOI_00915600 332 Uncharacterized protein integral component of membrane [GO:0016021]
HCOI_00035800 142 Uncharacterized protein
HCOI_01910900 230 Uncharacterized protein
HCOI_01997300 137 Uncharacterized protein
HCOI_00694400 150 Uncharacterized protein
HCOI_01240800 136 Uncharacterized protein
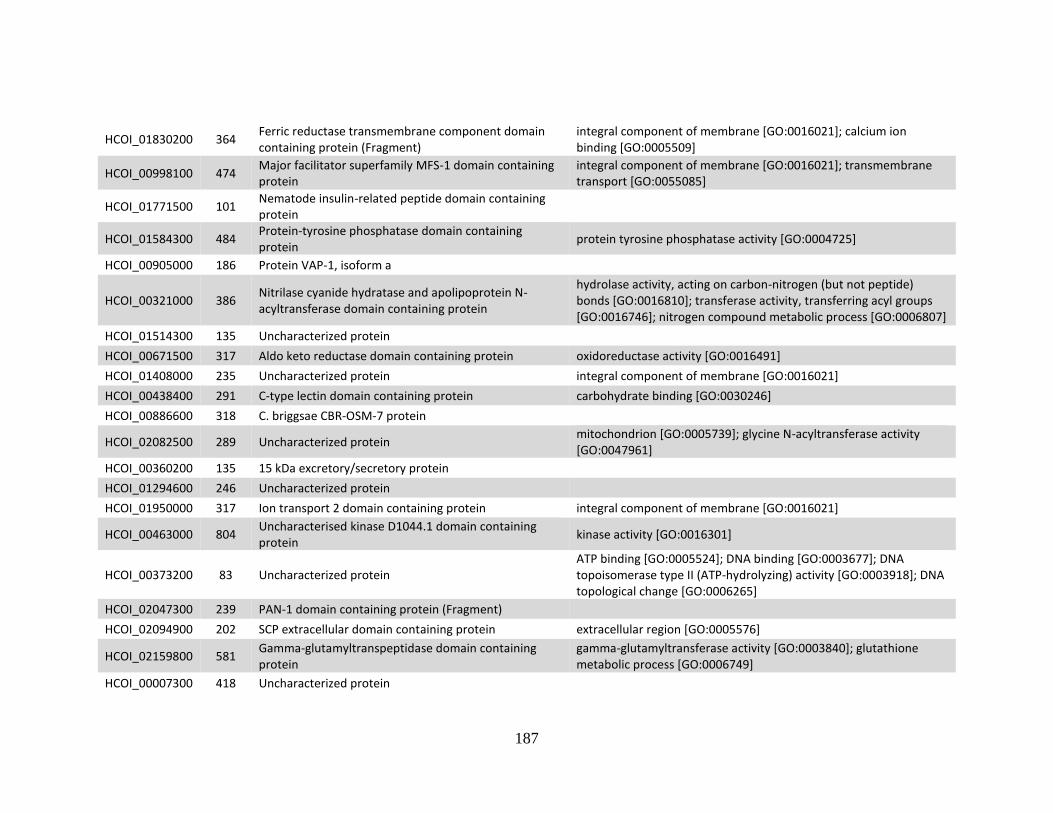
187
HCOI_01830200 364 Ferric reductase transmembrane component domain containing protein (Fragment)
integral component of membrane [GO:0016021]; calcium ion binding [GO:0005509]
HCOI_00998100 474 Major facilitator superfamily MFS-1 domain containing protein
integral component of membrane [GO:0016021]; transmembrane transport [GO:0055085]
HCOI_01771500 101 Nematode insulin-related peptide domain containing protein
HCOI_01584300 484 Protein-tyrosine phosphatase domain containing protein
protein tyrosine phosphatase activity [GO:0004725]
HCOI_00905000 186 Protein VAP-1, isoform a
HCOI_00321000 386 Nitrilase cyanide hydratase and apolipoprotein N-acyltransferase domain containing protein
hydrolase activity, acting on carbon-nitrogen (but not peptide) bonds [GO:0016810]; transferase activity, transferring acyl groups [GO:0016746]; nitrogen compound metabolic process [GO:0006807]
HCOI_01514300 135 Uncharacterized protein
HCOI_00671500 317 Aldo keto reductase domain containing protein oxidoreductase activity [GO:0016491]
HCOI_01408000 235 Uncharacterized protein integral component of membrane [GO:0016021]
HCOI_00438400 291 C-type lectin domain containing protein carbohydrate binding [GO:0030246]
HCOI_00886600 318 C. briggsae CBR-OSM-7 protein
HCOI_02082500 289 Uncharacterized protein mitochondrion [GO:0005739]; glycine N-acyltransferase activity [GO:0047961]
HCOI_00360200 135 15 kDa excretory/secretory protein
HCOI_01294600 246 Uncharacterized protein
HCOI_01950000 317 Ion transport 2 domain containing protein integral component of membrane [GO:0016021]
HCOI_00463000 804 Uncharacterised kinase D1044.1 domain containing protein
kinase activity [GO:0016301]
HCOI_00373200 83 Uncharacterized protein ATP binding [GO:0005524]; DNA binding [GO:0003677]; DNA topoisomerase type II (ATP-hydrolyzing) activity [GO:0003918]; DNA topological change [GO:0006265]
HCOI_02047300 239 PAN-1 domain containing protein (Fragment)
HCOI_02094900 202 SCP extracellular domain containing protein extracellular region [GO:0005576]
HCOI_02159800 581 Gamma-glutamyltranspeptidase domain containing protein
gamma-glutamyltransferase activity [GO:0003840]; glutathione metabolic process [GO:0006749]
HCOI_00007300 418 Uncharacterized protein
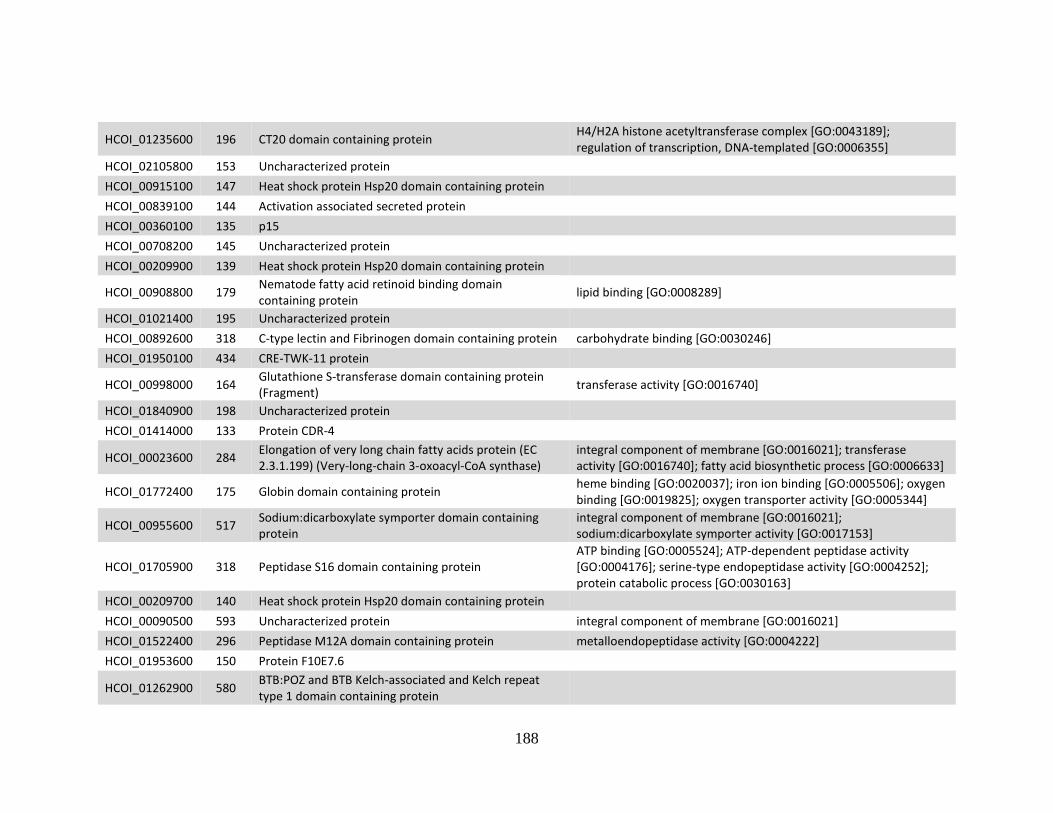
188
HCOI_01235600 196 CT20 domain containing protein H4/H2A histone acetyltransferase complex [GO:0043189]; regulation of transcription, DNA-templated [GO:0006355]
HCOI_02105800 153 Uncharacterized protein
HCOI_00915100 147 Heat shock protein Hsp20 domain containing protein
HCOI_00839100 144 Activation associated secreted protein
HCOI_00360100 135 p15
HCOI_00708200 145 Uncharacterized protein
HCOI_00209900 139 Heat shock protein Hsp20 domain containing protein
HCOI_00908800 179 Nematode fatty acid retinoid binding domain containing protein
lipid binding [GO:0008289]
HCOI_01021400 195 Uncharacterized protein
HCOI_00892600 318 C-type lectin and Fibrinogen domain containing protein carbohydrate binding [GO:0030246]
HCOI_01950100 434 CRE-TWK-11 protein
HCOI_00998000 164 Glutathione S-transferase domain containing protein (Fragment)
transferase activity [GO:0016740]
HCOI_01840900 198 Uncharacterized protein
HCOI_01414000 133 Protein CDR-4
HCOI_00023600 284 Elongation of very long chain fatty acids protein (EC 2.3.1.199) (Very-long-chain 3-oxoacyl-CoA synthase)
integral component of membrane [GO:0016021]; transferase activity [GO:0016740]; fatty acid biosynthetic process [GO:0006633]
HCOI_01772400 175 Globin domain containing protein heme binding [GO:0020037]; iron ion binding [GO:0005506]; oxygen binding [GO:0019825]; oxygen transporter activity [GO:0005344]
HCOI_00955600 517 Sodium:dicarboxylate symporter domain containing protein
integral component of membrane [GO:0016021]; sodium:dicarboxylate symporter activity [GO:0017153]
HCOI_01705900 318 Peptidase S16 domain containing protein ATP binding [GO:0005524]; ATP-dependent peptidase activity [GO:0004176]; serine-type endopeptidase activity [GO:0004252]; protein catabolic process [GO:0030163]
HCOI_00209700 140 Heat shock protein Hsp20 domain containing protein
HCOI_00090500 593 Uncharacterized protein integral component of membrane [GO:0016021]
HCOI_01522400 296 Peptidase M12A domain containing protein metalloendopeptidase activity [GO:0004222]
HCOI_01953600 150 Protein F10E7.6
HCOI_01262900 580 BTB:POZ and BTB Kelch-associated and Kelch repeat type 1 domain containing protein
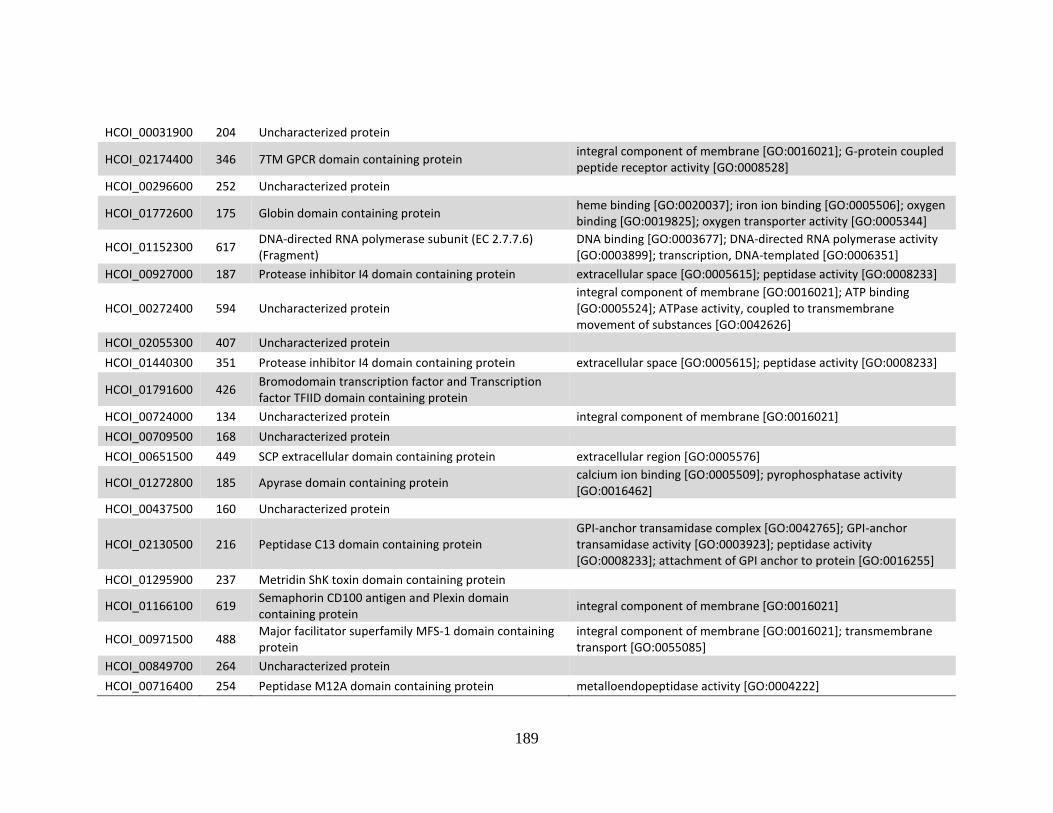
189
HCOI_00031900 204 Uncharacterized protein
HCOI_02174400 346 7TM GPCR domain containing protein integral component of membrane [GO:0016021]; G-protein coupled peptide receptor activity [GO:0008528]
HCOI_00296600 252 Uncharacterized protein
HCOI_01772600 175 Globin domain containing protein heme binding [GO:0020037]; iron ion binding [GO:0005506]; oxygen binding [GO:0019825]; oxygen transporter activity [GO:0005344]
HCOI_01152300 617 DNA-directed RNA polymerase subunit (EC 2.7.7.6) (Fragment)
DNA binding [GO:0003677]; DNA-directed RNA polymerase activity [GO:0003899]; transcription, DNA-templated [GO:0006351]
HCOI_00927000 187 Protease inhibitor I4 domain containing protein extracellular space [GO:0005615]; peptidase activity [GO:0008233]
HCOI_00272400 594 Uncharacterized protein integral component of membrane [GO:0016021]; ATP binding [GO:0005524]; ATPase activity, coupled to transmembrane movement of substances [GO:0042626]
HCOI_02055300 407 Uncharacterized protein
HCOI_01440300 351 Protease inhibitor I4 domain containing protein extracellular space [GO:0005615]; peptidase activity [GO:0008233]
HCOI_01791600 426 Bromodomain transcription factor and Transcription factor TFIID domain containing protein
HCOI_00724000 134 Uncharacterized protein integral component of membrane [GO:0016021]
HCOI_00709500 168 Uncharacterized protein
HCOI_00651500 449 SCP extracellular domain containing protein extracellular region [GO:0005576]
HCOI_01272800 185 Apyrase domain containing protein calcium ion binding [GO:0005509]; pyrophosphatase activity [GO:0016462]
HCOI_00437500 160 Uncharacterized protein
HCOI_02130500 216 Peptidase C13 domain containing protein GPI-anchor transamidase complex [GO:0042765]; GPI-anchor transamidase activity [GO:0003923]; peptidase activity [GO:0008233]; attachment of GPI anchor to protein [GO:0016255]
HCOI_01295900 237 Metridin ShK toxin domain containing protein
HCOI_01166100 619 Semaphorin CD100 antigen and Plexin domain containing protein
integral component of membrane [GO:0016021]
HCOI_00971500 488 Major facilitator superfamily MFS-1 domain containing protein
integral component of membrane [GO:0016021]; transmembrane transport [GO:0055085]
HCOI_00849700 264 Uncharacterized protein
HCOI_00716400 254 Peptidase M12A domain containing protein metalloendopeptidase activity [GO:0004222]
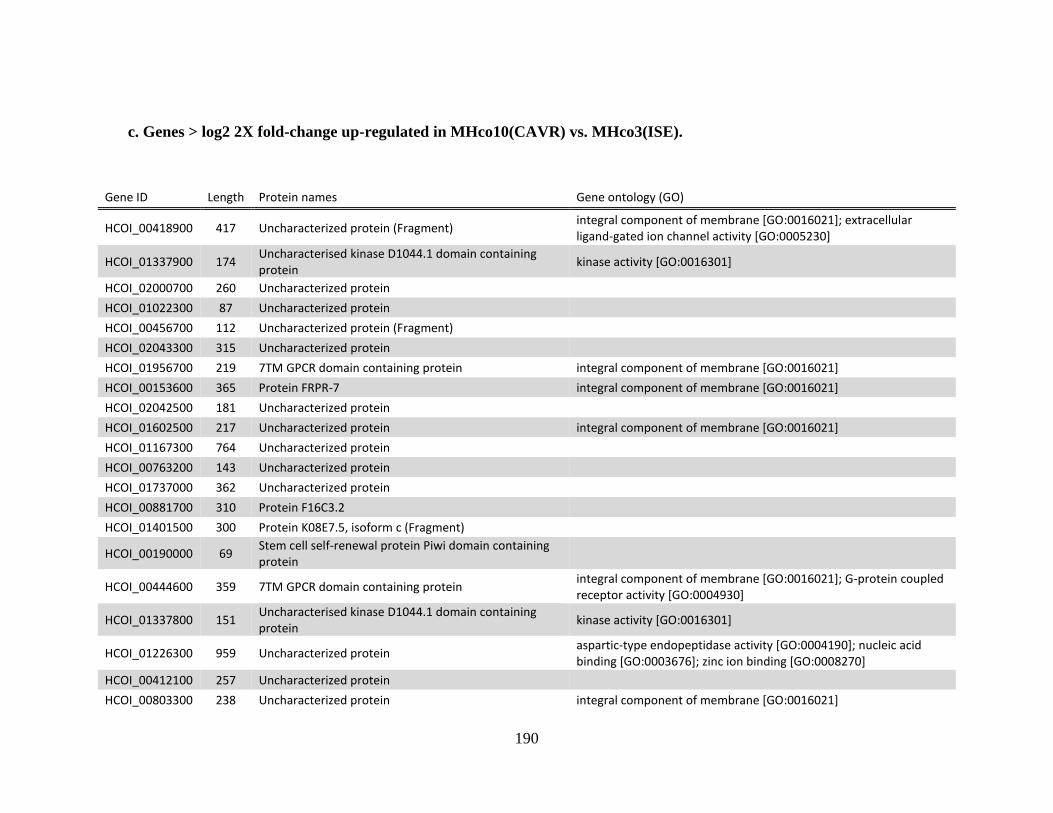
190
c. Genes > log2 2X fold-change up-regulated in MHco10(CAVR) vs. MHco3(ISE).
Gene ID Length Protein names Gene ontology (GO)
HCOI_00418900 417 Uncharacterized protein (Fragment) integral component of membrane [GO:0016021]; extracellular ligand-gated ion channel activity [GO:0005230]
HCOI_01337900 174 Uncharacterised kinase D1044.1 domain containing protein
kinase activity [GO:0016301]
HCOI_02000700 260 Uncharacterized protein
HCOI_01022300 87 Uncharacterized protein
HCOI_00456700 112 Uncharacterized protein (Fragment)
HCOI_02043300 315 Uncharacterized protein
HCOI_01956700 219 7TM GPCR domain containing protein integral component of membrane [GO:0016021]
HCOI_00153600 365 Protein FRPR-7 integral component of membrane [GO:0016021]
HCOI_02042500 181 Uncharacterized protein
HCOI_01602500 217 Uncharacterized protein integral component of membrane [GO:0016021]
HCOI_01167300 764 Uncharacterized protein
HCOI_00763200 143 Uncharacterized protein
HCOI_01737000 362 Uncharacterized protein
HCOI_00881700 310 Protein F16C3.2
HCOI_01401500 300 Protein K08E7.5, isoform c (Fragment)
HCOI_00190000 69 Stem cell self-renewal protein Piwi domain containing protein
HCOI_00444600 359 7TM GPCR domain containing protein integral component of membrane [GO:0016021]; G-protein coupled receptor activity [GO:0004930]
HCOI_01337800 151 Uncharacterised kinase D1044.1 domain containing protein
kinase activity [GO:0016301]
HCOI_01226300 959 Uncharacterized protein aspartic-type endopeptidase activity [GO:0004190]; nucleic acid binding [GO:0003676]; zinc ion binding [GO:0008270]
HCOI_00412100 257 Uncharacterized protein
HCOI_00803300 238 Uncharacterized protein integral component of membrane [GO:0016021]
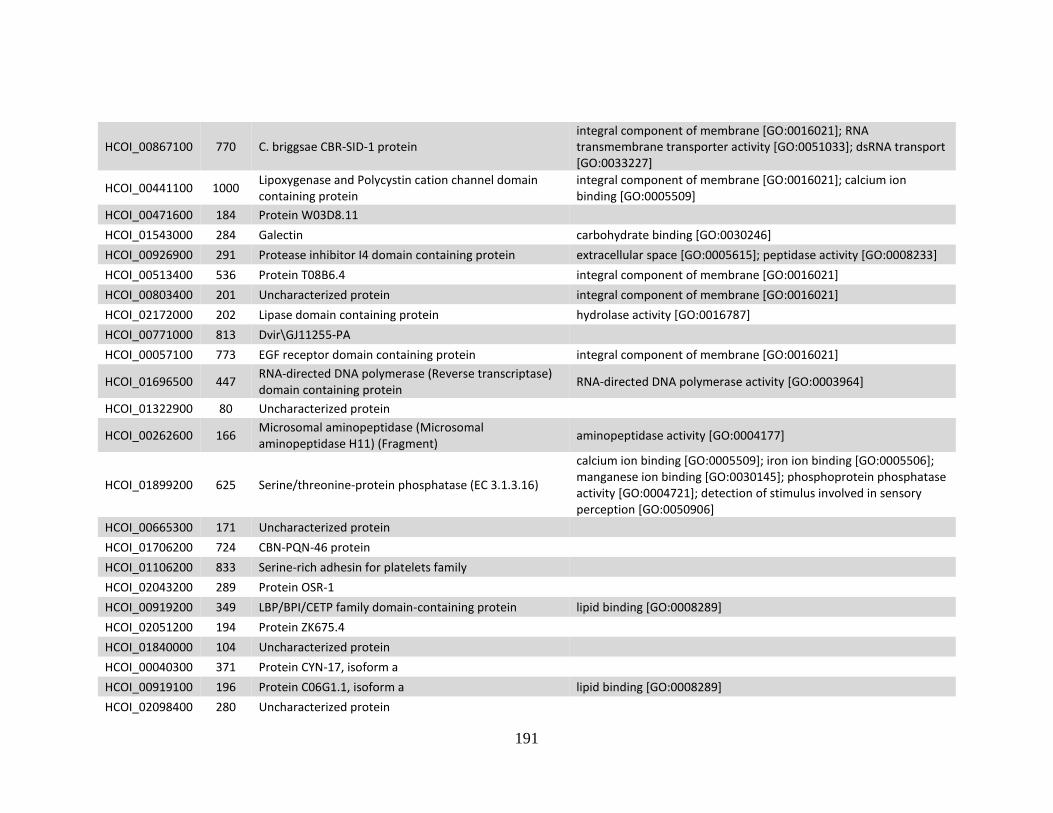
191
HCOI_00867100 770 C. briggsae CBR-SID-1 protein integral component of membrane [GO:0016021]; RNA transmembrane transporter activity [GO:0051033]; dsRNA transport [GO:0033227]
HCOI_00441100 1000 Lipoxygenase and Polycystin cation channel domain containing protein
integral component of membrane [GO:0016021]; calcium ion binding [GO:0005509]
HCOI_00471600 184 Protein W03D8.11
HCOI_01543000 284 Galectin carbohydrate binding [GO:0030246]
HCOI_00926900 291 Protease inhibitor I4 domain containing protein extracellular space [GO:0005615]; peptidase activity [GO:0008233]
HCOI_00513400 536 Protein T08B6.4 integral component of membrane [GO:0016021]
HCOI_00803400 201 Uncharacterized protein integral component of membrane [GO:0016021]
HCOI_02172000 202 Lipase domain containing protein hydrolase activity [GO:0016787]
HCOI_00771000 813 Dvir\GJ11255-PA
HCOI_00057100 773 EGF receptor domain containing protein integral component of membrane [GO:0016021]
HCOI_01696500 447 RNA-directed DNA polymerase (Reverse transcriptase) domain containing protein
RNA-directed DNA polymerase activity [GO:0003964]
HCOI_01322900 80 Uncharacterized protein
HCOI_00262600 166 Microsomal aminopeptidase (Microsomal aminopeptidase H11) (Fragment)
aminopeptidase activity [GO:0004177]
HCOI_01899200 625 Serine/threonine-protein phosphatase (EC 3.1.3.16)
calcium ion binding [GO:0005509]; iron ion binding [GO:0005506]; manganese ion binding [GO:0030145]; phosphoprotein phosphatase activity [GO:0004721]; detection of stimulus involved in sensory perception [GO:0050906]
HCOI_00665300 171 Uncharacterized protein
HCOI_01706200 724 CBN-PQN-46 protein
HCOI_01106200 833 Serine-rich adhesin for platelets family
HCOI_02043200 289 Protein OSR-1
HCOI_00919200 349 LBP/BPI/CETP family domain-containing protein lipid binding [GO:0008289]
HCOI_02051200 194 Protein ZK675.4
HCOI_01840000 104 Uncharacterized protein
HCOI_00040300 371 Protein CYN-17, isoform a
HCOI_00919100 196 Protein C06G1.1, isoform a lipid binding [GO:0008289]
HCOI_02098400 280 Uncharacterized protein

192
HCOI_00441800 112 Uncharacterized protein
HCOI_01776700 210 Uncharacterized protein integral component of membrane [GO:0016021]
HCOI_00162900 525
LGC-55, Ligand-gated chloride channel (Neurotransmitter-gated ion-channel ligand-binding and Neurotransmitter-gated ion-channel transmembrane region domain containing protein)
cell junction [GO:0030054]; integral component of membrane [GO:0016021]; plasma membrane [GO:0005886]; synapse [GO:0045202]; extracellular ligand-gated ion channel activity [GO:0005230]
HCOI_00180600 148 Uncharacterized protein integral component of membrane [GO:0016021]
HCOI_00137800 71 Uncharacterized protein
HCOI_01958000 386 Uncharacterized protein
HCOI_02039400 1527 Immunoglobulin I-set domain containing protein (Fragment)
HCOI_00260400 223 Protein T05A7.1
HCOI_00394900 841 Selectin-like protein (Fragment) carbohydrate binding [GO:0030246]
HCOI_01492900 427 BTB:POZ and BTB Kelch-associated and Kelch repeat type 1 domain containing protein
HCOI_02042400 467 Transporter integral component of membrane [GO:0016021]; neurotransmitter:sodium symporter activity [GO:0005328]
HCOI_00930900 261 ELL-associated factor domain containing protein ELL-EAF complex [GO:0032783]; regulation of transcription, DNA-templated [GO:0006355]
HCOI_02167300 124 Uncharacterized protein
HCOI_01901700 401 Transcription factor jumonji domain containing protein
HCOI_01226200 583 Integrase domain containing protein nucleic acid binding [GO:0003676]; DNA integration [GO:0015074]
HCOI_01140400 67 Uncharacterized protein
HCOI_00293100 459 Armadillo/beta-catenin-like repeat family
HCOI_00582100 476 Uncharacterized protein
HCOI_00980400 326 Uncharacterized protein
HCOI_01825500 193 Nucleolar protein 10 (Fragment)
HCOI_02042900 565 Transporter integral component of membrane [GO:0016021]; neurotransmitter:sodium symporter activity [GO:0005328]
HCOI_01438100 430 Uncharacterized protein integral component of membrane [GO:0016021]
HCOI_01428100 277 Uncharacterized protein
HCOI_01590000 83 Uncharacterized protein integral component of membrane [GO:0016021]
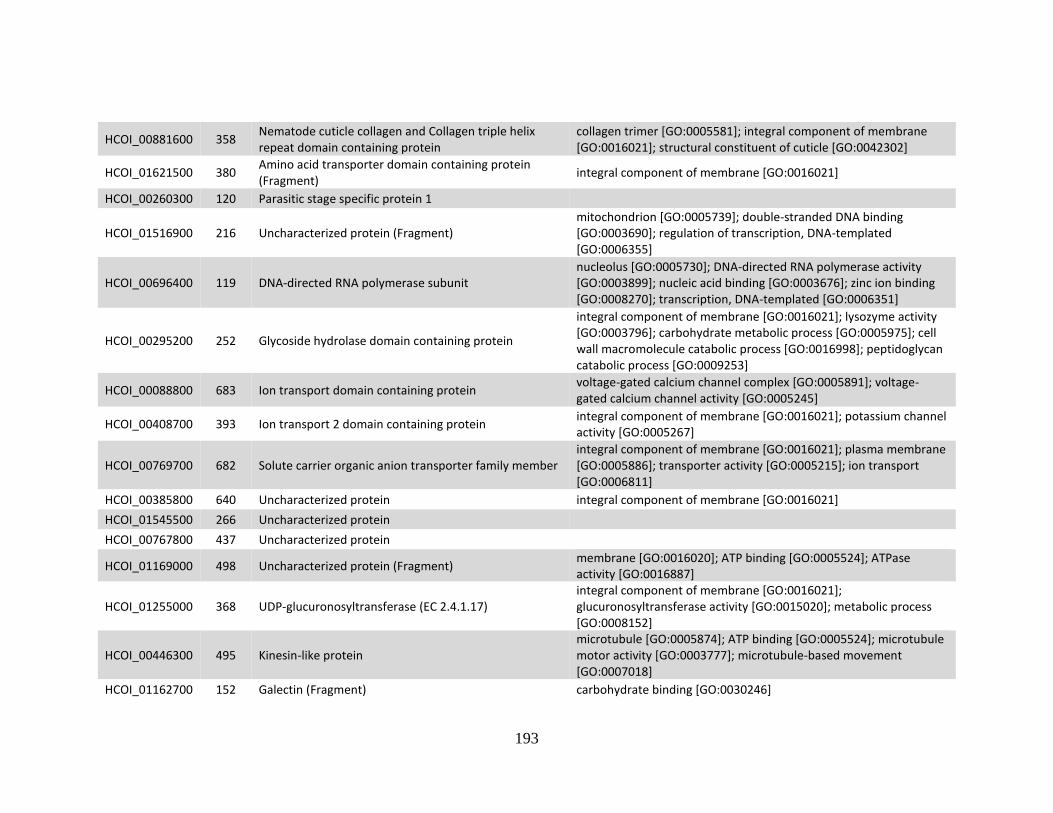
193
HCOI_00881600 358 Nematode cuticle collagen and Collagen triple helix repeat domain containing protein
collagen trimer [GO:0005581]; integral component of membrane [GO:0016021]; structural constituent of cuticle [GO:0042302]
HCOI_01621500 380 Amino acid transporter domain containing protein (Fragment)
integral component of membrane [GO:0016021]
HCOI_00260300 120 Parasitic stage specific protein 1
HCOI_01516900 216 Uncharacterized protein (Fragment) mitochondrion [GO:0005739]; double-stranded DNA binding [GO:0003690]; regulation of transcription, DNA-templated [GO:0006355]
HCOI_00696400 119 DNA-directed RNA polymerase subunit nucleolus [GO:0005730]; DNA-directed RNA polymerase activity [GO:0003899]; nucleic acid binding [GO:0003676]; zinc ion binding [GO:0008270]; transcription, DNA-templated [GO:0006351]
HCOI_00295200 252 Glycoside hydrolase domain containing protein
integral component of membrane [GO:0016021]; lysozyme activity [GO:0003796]; carbohydrate metabolic process [GO:0005975]; cell wall macromolecule catabolic process [GO:0016998]; peptidoglycan catabolic process [GO:0009253]
HCOI_00088800 683 Ion transport domain containing protein voltage-gated calcium channel complex [GO:0005891]; voltage-gated calcium channel activity [GO:0005245]
HCOI_00408700 393 Ion transport 2 domain containing protein integral component of membrane [GO:0016021]; potassium channel activity [GO:0005267]
HCOI_00769700 682 Solute carrier organic anion transporter family member integral component of membrane [GO:0016021]; plasma membrane [GO:0005886]; transporter activity [GO:0005215]; ion transport [GO:0006811]
HCOI_00385800 640 Uncharacterized protein integral component of membrane [GO:0016021]
HCOI_01545500 266 Uncharacterized protein
HCOI_00767800 437 Uncharacterized protein
HCOI_01169000 498 Uncharacterized protein (Fragment) membrane [GO:0016020]; ATP binding [GO:0005524]; ATPase activity [GO:0016887]
HCOI_01255000 368 UDP-glucuronosyltransferase (EC 2.4.1.17) integral component of membrane [GO:0016021]; glucuronosyltransferase activity [GO:0015020]; metabolic process [GO:0008152]
HCOI_00446300 495 Kinesin-like protein microtubule [GO:0005874]; ATP binding [GO:0005524]; microtubule motor activity [GO:0003777]; microtubule-based movement [GO:0007018]
HCOI_01162700 152 Galectin (Fragment) carbohydrate binding [GO:0030246]
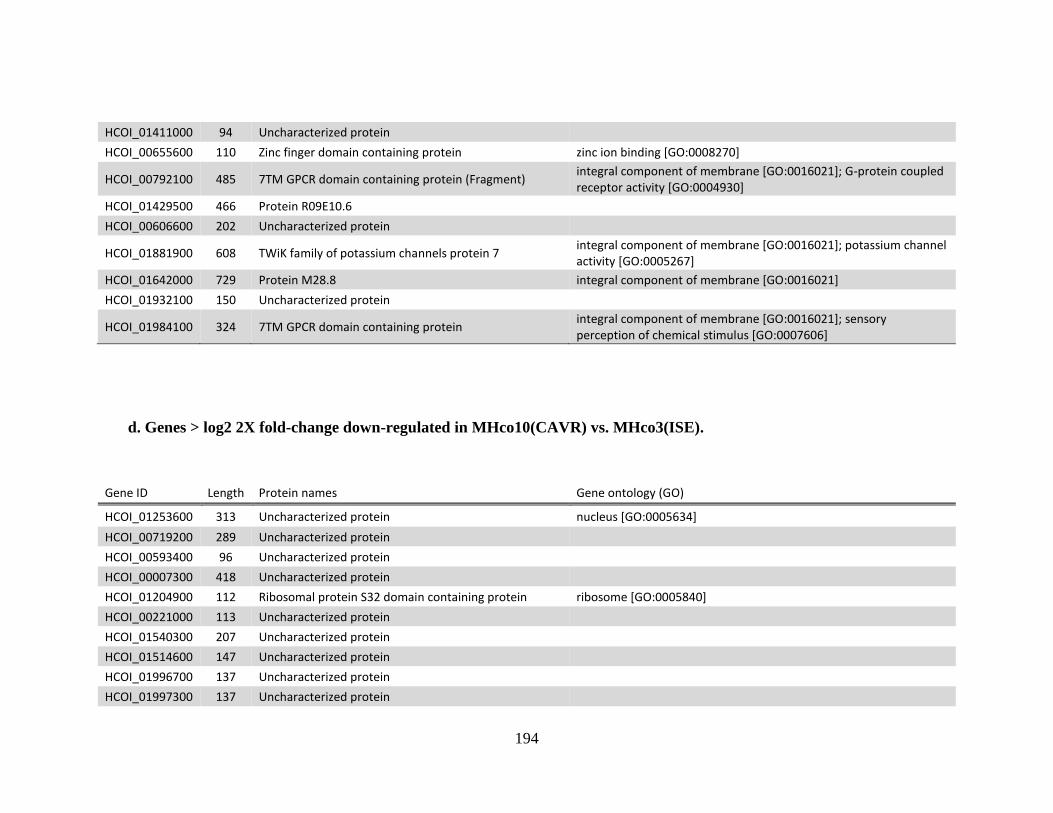
194
HCOI_01411000 94 Uncharacterized protein
HCOI_00655600 110 Zinc finger domain containing protein zinc ion binding [GO:0008270]
HCOI_00792100 485 7TM GPCR domain containing protein (Fragment) integral component of membrane [GO:0016021]; G-protein coupled receptor activity [GO:0004930]
HCOI_01429500 466 Protein R09E10.6
HCOI_00606600 202 Uncharacterized protein
HCOI_01881900 608 TWiK family of potassium channels protein 7 integral component of membrane [GO:0016021]; potassium channel activity [GO:0005267]
HCOI_01642000 729 Protein M28.8 integral component of membrane [GO:0016021]
HCOI_01932100 150 Uncharacterized protein
HCOI_01984100 324 7TM GPCR domain containing protein integral component of membrane [GO:0016021]; sensory perception of chemical stimulus [GO:0007606]
d. Genes > log2 2X fold-change down-regulated in MHco10(CAVR) vs. MHco3(ISE).
Gene ID Length Protein names Gene ontology (GO)
HCOI_01253600 313 Uncharacterized protein nucleus [GO:0005634]
HCOI_00719200 289 Uncharacterized protein
HCOI_00593400 96 Uncharacterized protein
HCOI_00007300 418 Uncharacterized protein
HCOI_01204900 112 Ribosomal protein S32 domain containing protein ribosome [GO:0005840]
HCOI_00221000 113 Uncharacterized protein
HCOI_01540300 207 Uncharacterized protein
HCOI_01514600 147 Uncharacterized protein
HCOI_01996700 137 Uncharacterized protein
HCOI_01997300 137 Uncharacterized protein
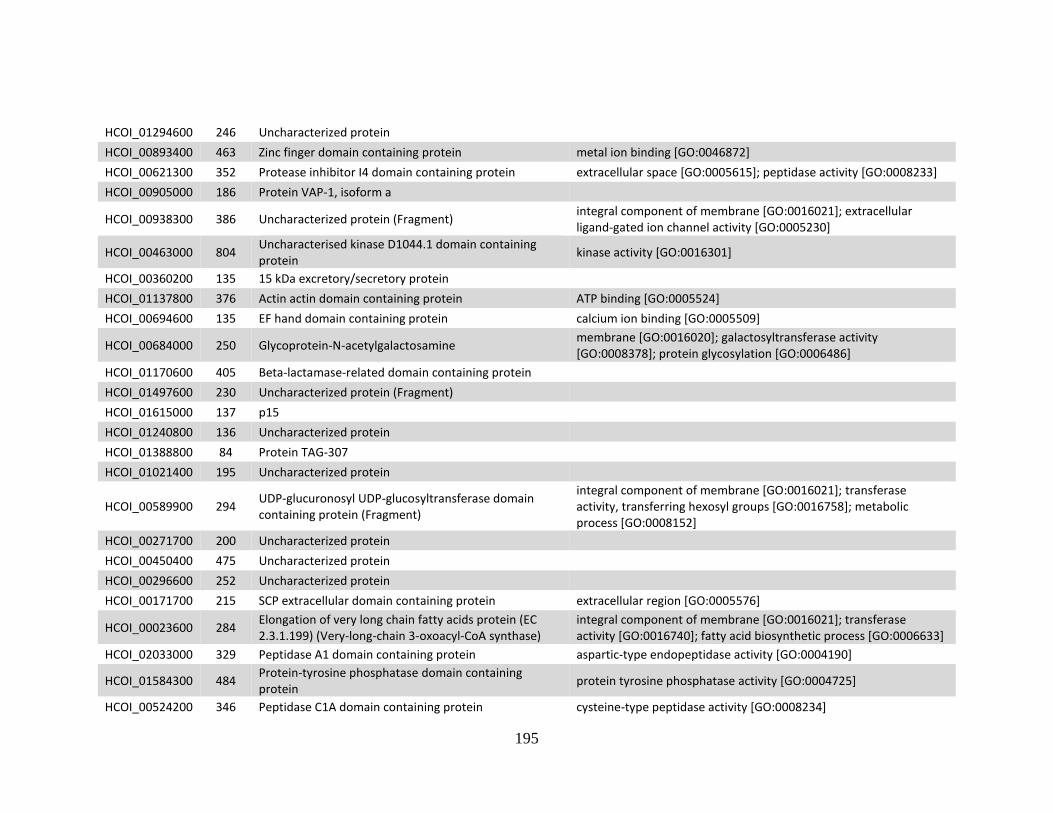
195
HCOI_01294600 246 Uncharacterized protein
HCOI_00893400 463 Zinc finger domain containing protein metal ion binding [GO:0046872]
HCOI_00621300 352 Protease inhibitor I4 domain containing protein extracellular space [GO:0005615]; peptidase activity [GO:0008233]
HCOI_00905000 186 Protein VAP-1, isoform a
HCOI_00938300 386 Uncharacterized protein (Fragment) integral component of membrane [GO:0016021]; extracellular ligand-gated ion channel activity [GO:0005230]
HCOI_00463000 804 Uncharacterised kinase D1044.1 domain containing protein
kinase activity [GO:0016301]
HCOI_00360200 135 15 kDa excretory/secretory protein
HCOI_01137800 376 Actin actin domain containing protein ATP binding [GO:0005524]
HCOI_00694600 135 EF hand domain containing protein calcium ion binding [GO:0005509]
HCOI_00684000 250 Glycoprotein-N-acetylgalactosamine membrane [GO:0016020]; galactosyltransferase activity [GO:0008378]; protein glycosylation [GO:0006486]
HCOI_01170600 405 Beta-lactamase-related domain containing protein
HCOI_01497600 230 Uncharacterized protein (Fragment)
HCOI_01615000 137 p15
HCOI_01240800 136 Uncharacterized protein
HCOI_01388800 84 Protein TAG-307
HCOI_01021400 195 Uncharacterized protein
HCOI_00589900 294 UDP-glucuronosyl UDP-glucosyltransferase domain containing protein (Fragment)
integral component of membrane [GO:0016021]; transferase activity, transferring hexosyl groups [GO:0016758]; metabolic process [GO:0008152]
HCOI_00271700 200 Uncharacterized protein
HCOI_00450400 475 Uncharacterized protein
HCOI_00296600 252 Uncharacterized protein
HCOI_00171700 215 SCP extracellular domain containing protein extracellular region [GO:0005576]
HCOI_00023600 284 Elongation of very long chain fatty acids protein (EC 2.3.1.199) (Very-long-chain 3-oxoacyl-CoA synthase)
integral component of membrane [GO:0016021]; transferase activity [GO:0016740]; fatty acid biosynthetic process [GO:0006633]
HCOI_02033000 329 Peptidase A1 domain containing protein aspartic-type endopeptidase activity [GO:0004190]
HCOI_01584300 484 Protein-tyrosine phosphatase domain containing protein
protein tyrosine phosphatase activity [GO:0004725]
HCOI_00524200 346 Peptidase C1A domain containing protein cysteine-type peptidase activity [GO:0008234]
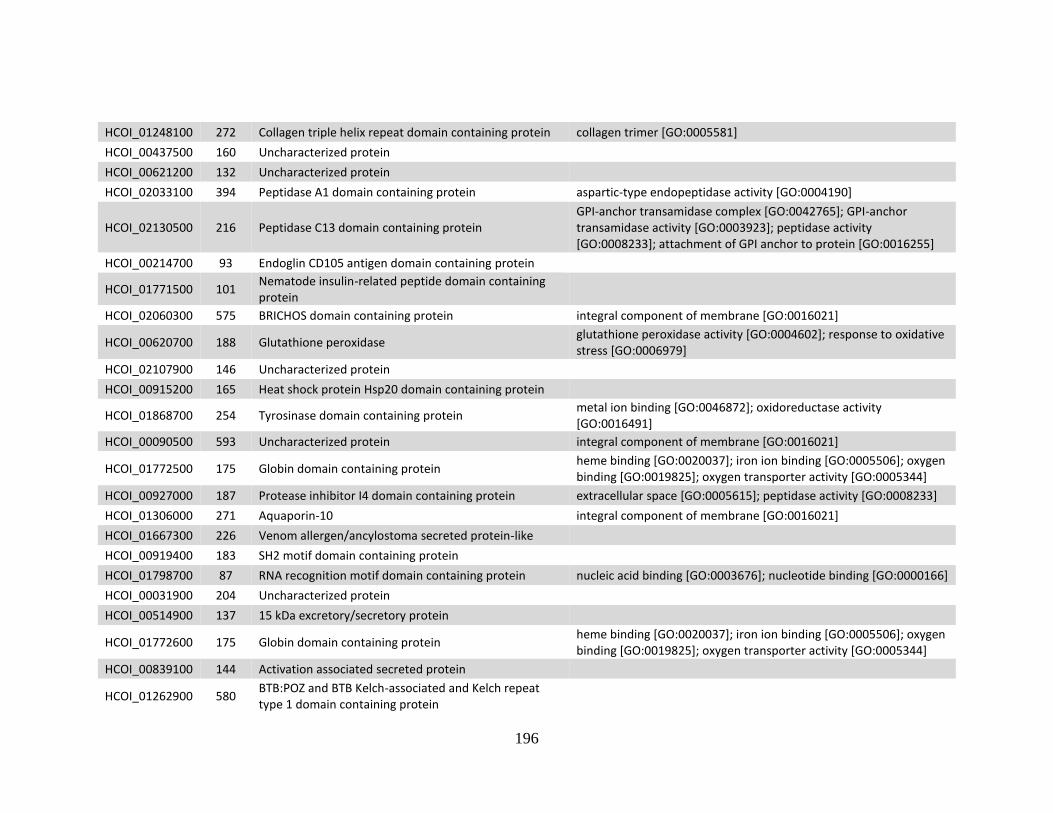
196
HCOI_01248100 272 Collagen triple helix repeat domain containing protein collagen trimer [GO:0005581]
HCOI_00437500 160 Uncharacterized protein
HCOI_00621200 132 Uncharacterized protein
HCOI_02033100 394 Peptidase A1 domain containing protein aspartic-type endopeptidase activity [GO:0004190]
HCOI_02130500 216 Peptidase C13 domain containing protein GPI-anchor transamidase complex [GO:0042765]; GPI-anchor transamidase activity [GO:0003923]; peptidase activity [GO:0008233]; attachment of GPI anchor to protein [GO:0016255]
HCOI_00214700 93 Endoglin CD105 antigen domain containing protein
HCOI_01771500 101 Nematode insulin-related peptide domain containing protein
HCOI_02060300 575 BRICHOS domain containing protein integral component of membrane [GO:0016021]
HCOI_00620700 188 Glutathione peroxidase glutathione peroxidase activity [GO:0004602]; response to oxidative stress [GO:0006979]
HCOI_02107900 146 Uncharacterized protein
HCOI_00915200 165 Heat shock protein Hsp20 domain containing protein
HCOI_01868700 254 Tyrosinase domain containing protein metal ion binding [GO:0046872]; oxidoreductase activity [GO:0016491]
HCOI_00090500 593 Uncharacterized protein integral component of membrane [GO:0016021]
HCOI_01772500 175 Globin domain containing protein heme binding [GO:0020037]; iron ion binding [GO:0005506]; oxygen binding [GO:0019825]; oxygen transporter activity [GO:0005344]
HCOI_00927000 187 Protease inhibitor I4 domain containing protein extracellular space [GO:0005615]; peptidase activity [GO:0008233]
HCOI_01306000 271 Aquaporin-10 integral component of membrane [GO:0016021]
HCOI_01667300 226 Venom allergen/ancylostoma secreted protein-like
HCOI_00919400 183 SH2 motif domain containing protein
HCOI_01798700 87 RNA recognition motif domain containing protein nucleic acid binding [GO:0003676]; nucleotide binding [GO:0000166]
HCOI_00031900 204 Uncharacterized protein
HCOI_00514900 137 15 kDa excretory/secretory protein
HCOI_01772600 175 Globin domain containing protein heme binding [GO:0020037]; iron ion binding [GO:0005506]; oxygen binding [GO:0019825]; oxygen transporter activity [GO:0005344]
HCOI_00839100 144 Activation associated secreted protein
HCOI_01262900 580 BTB:POZ and BTB Kelch-associated and Kelch repeat type 1 domain containing protein

197
HCOI_00359200 76 Uncharacterized protein
HCOI_00915300 136 Heat shock protein Hsp20 domain containing protein
HCOI_01387700 342 Uncharacterized protein integral component of membrane [GO:0016021]
HCOI_01202200 502 Protein Y54G11A.1
HCOI_00223400 1169 Uncharacterized protein (Fragment)
HCOI_00696100 128 RNA polymerase Rpb6 domain containing protein DNA-directed RNA polymerase II, core complex [GO:0005665]; DNA binding [GO:0003677]; DNA-directed RNA polymerase activity [GO:0003899]; transcription, DNA-templated [GO:0006351]
HCOI_01953600 150 Protein F10E7.6
HCOI_01996600 137 15 kDa excretory/secretory protein
HCOI_02003500 120 Uncharacterized protein
HCOI_00862400 112 Metalloprotease I metallopeptidase activity [GO:0008237]
HCOI_01449200 449 SCP extracellular domain containing protein extracellular region [GO:0005576]
HCOI_01615200 139 Transthyretin domain containing protein extracellular space [GO:0005615]
HCOI_01456200 134 Uncharacterized protein (Fragment)
HCOI_00388200 420 SCP extracellular domain containing protein extracellular region [GO:0005576]
HCOI_00330700 567 Myosin head and IQ calmodulin-binding region and Myosin tail domain containing protein (Fragment)
myosin complex [GO:0016459]; ATP binding [GO:0005524]; motor activity [GO:0003774]
HCOI_00651500 449 SCP extracellular domain containing protein extracellular region [GO:0005576]
HCOI_00480800 554 Peptidase M8 domain containing protein membrane [GO:0016020]; metalloendopeptidase activity [GO:0004222]; cell adhesion [GO:0007155]
HCOI_00338800 238 RNA-directed DNA polymerase (Reverse transcriptase) domain containing protein
RNA-directed DNA polymerase activity [GO:0003964]
HCOI_00927100 698 Protein C35D10.8 (Fragment)
integral component of membrane [GO:0016021]; protein phosphatase inhibitor activity [GO:0004864]; regulation of phosphoprotein phosphatase activity [GO:0043666]; regulation of signal transduction [GO:0009966]
HCOI_00700300 344 Proteasome component region PCI domain containing protein (Fragment)
proteasome complex [GO:0000502]
HCOI_00229700 288 Uncharacterized protein integral component of membrane [GO:0016021]
HCOI_00722000 270 Dere\GG20951-PA integral component of membrane [GO:0016021]; neurotransmitter:sodium symporter activity [GO:0005328]
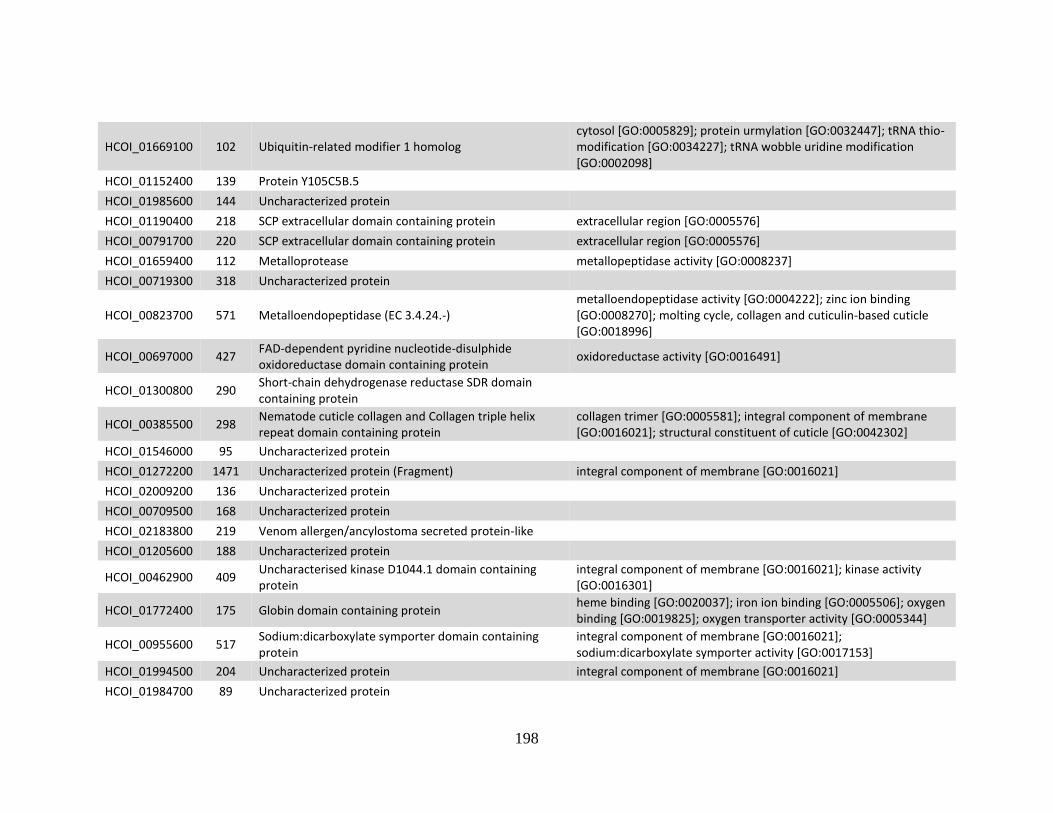
198
HCOI_01669100 102 Ubiquitin-related modifier 1 homolog cytosol [GO:0005829]; protein urmylation [GO:0032447]; tRNA thio-modification [GO:0034227]; tRNA wobble uridine modification [GO:0002098]
HCOI_01152400 139 Protein Y105C5B.5
HCOI_01985600 144 Uncharacterized protein
HCOI_01190400 218 SCP extracellular domain containing protein extracellular region [GO:0005576]
HCOI_00791700 220 SCP extracellular domain containing protein extracellular region [GO:0005576]
HCOI_01659400 112 Metalloprotease metallopeptidase activity [GO:0008237]
HCOI_00719300 318 Uncharacterized protein
HCOI_00823700 571 Metalloendopeptidase (EC 3.4.24.-) metalloendopeptidase activity [GO:0004222]; zinc ion binding [GO:0008270]; molting cycle, collagen and cuticulin-based cuticle [GO:0018996]
HCOI_00697000 427 FAD-dependent pyridine nucleotide-disulphide oxidoreductase domain containing protein
oxidoreductase activity [GO:0016491]
HCOI_01300800 290 Short-chain dehydrogenase reductase SDR domain containing protein
HCOI_00385500 298 Nematode cuticle collagen and Collagen triple helix repeat domain containing protein
collagen trimer [GO:0005581]; integral component of membrane [GO:0016021]; structural constituent of cuticle [GO:0042302]
HCOI_01546000 95 Uncharacterized protein
HCOI_01272200 1471 Uncharacterized protein (Fragment) integral component of membrane [GO:0016021]
HCOI_02009200 136 Uncharacterized protein
HCOI_00709500 168 Uncharacterized protein
HCOI_02183800 219 Venom allergen/ancylostoma secreted protein-like
HCOI_01205600 188 Uncharacterized protein
HCOI_00462900 409 Uncharacterised kinase D1044.1 domain containing protein
integral component of membrane [GO:0016021]; kinase activity [GO:0016301]
HCOI_01772400 175 Globin domain containing protein heme binding [GO:0020037]; iron ion binding [GO:0005506]; oxygen binding [GO:0019825]; oxygen transporter activity [GO:0005344]
HCOI_00955600 517 Sodium:dicarboxylate symporter domain containing protein
integral component of membrane [GO:0016021]; sodium:dicarboxylate symporter activity [GO:0017153]
HCOI_01994500 204 Uncharacterized protein integral component of membrane [GO:0016021]
HCOI_01984700 89 Uncharacterized protein
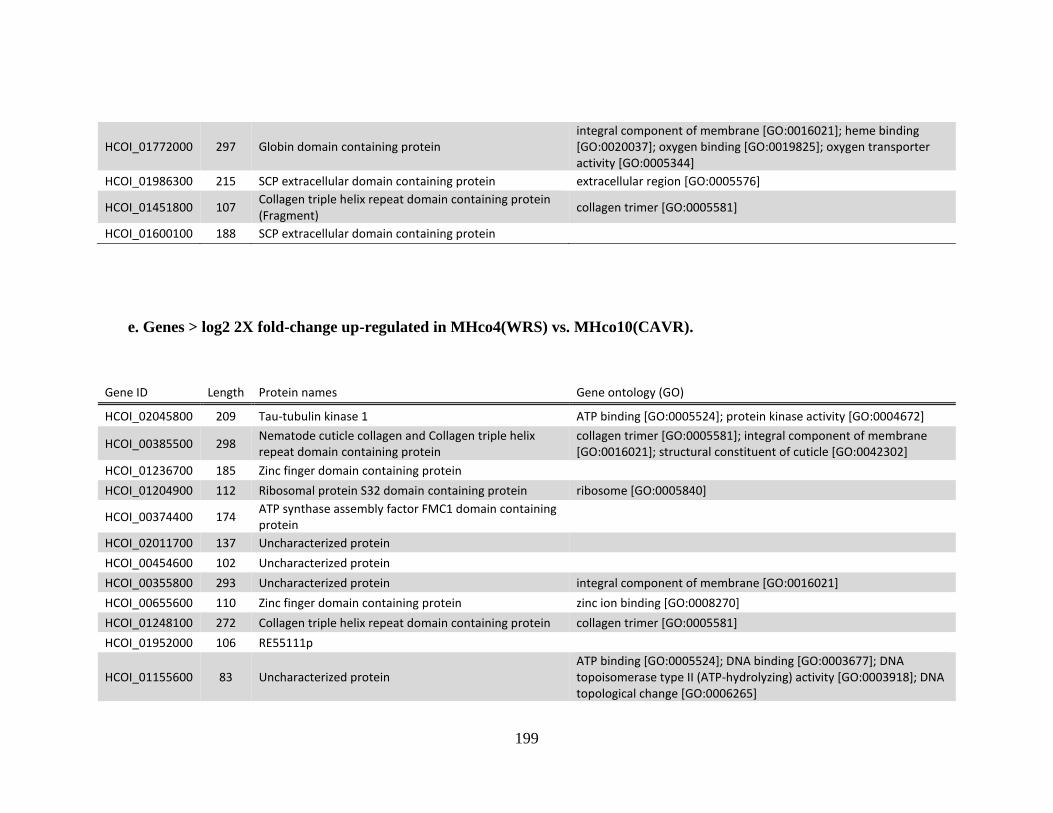
199
HCOI_01772000 297 Globin domain containing protein integral component of membrane [GO:0016021]; heme binding [GO:0020037]; oxygen binding [GO:0019825]; oxygen transporter activity [GO:0005344]
HCOI_01986300 215 SCP extracellular domain containing protein extracellular region [GO:0005576]
HCOI_01451800 107 Collagen triple helix repeat domain containing protein (Fragment)
collagen trimer [GO:0005581]
HCOI_01600100 188 SCP extracellular domain containing protein
e. Genes > log2 2X fold-change up-regulated in MHco4(WRS) vs. MHco10(CAVR).
Gene ID Length Protein names Gene ontology (GO)
HCOI_02045800 209 Tau-tubulin kinase 1 ATP binding [GO:0005524]; protein kinase activity [GO:0004672]
HCOI_00385500 298 Nematode cuticle collagen and Collagen triple helix repeat domain containing protein
collagen trimer [GO:0005581]; integral component of membrane [GO:0016021]; structural constituent of cuticle [GO:0042302]
HCOI_01236700 185 Zinc finger domain containing protein
HCOI_01204900 112 Ribosomal protein S32 domain containing protein ribosome [GO:0005840]
HCOI_00374400 174 ATP synthase assembly factor FMC1 domain containing protein
HCOI_02011700 137 Uncharacterized protein
HCOI_00454600 102 Uncharacterized protein
HCOI_00355800 293 Uncharacterized protein integral component of membrane [GO:0016021]
HCOI_00655600 110 Zinc finger domain containing protein zinc ion binding [GO:0008270]
HCOI_01248100 272 Collagen triple helix repeat domain containing protein collagen trimer [GO:0005581]
HCOI_01952000 106 RE55111p
HCOI_01155600 83 Uncharacterized protein ATP binding [GO:0005524]; DNA binding [GO:0003677]; DNA topoisomerase type II (ATP-hydrolyzing) activity [GO:0003918]; DNA topological change [GO:0006265]
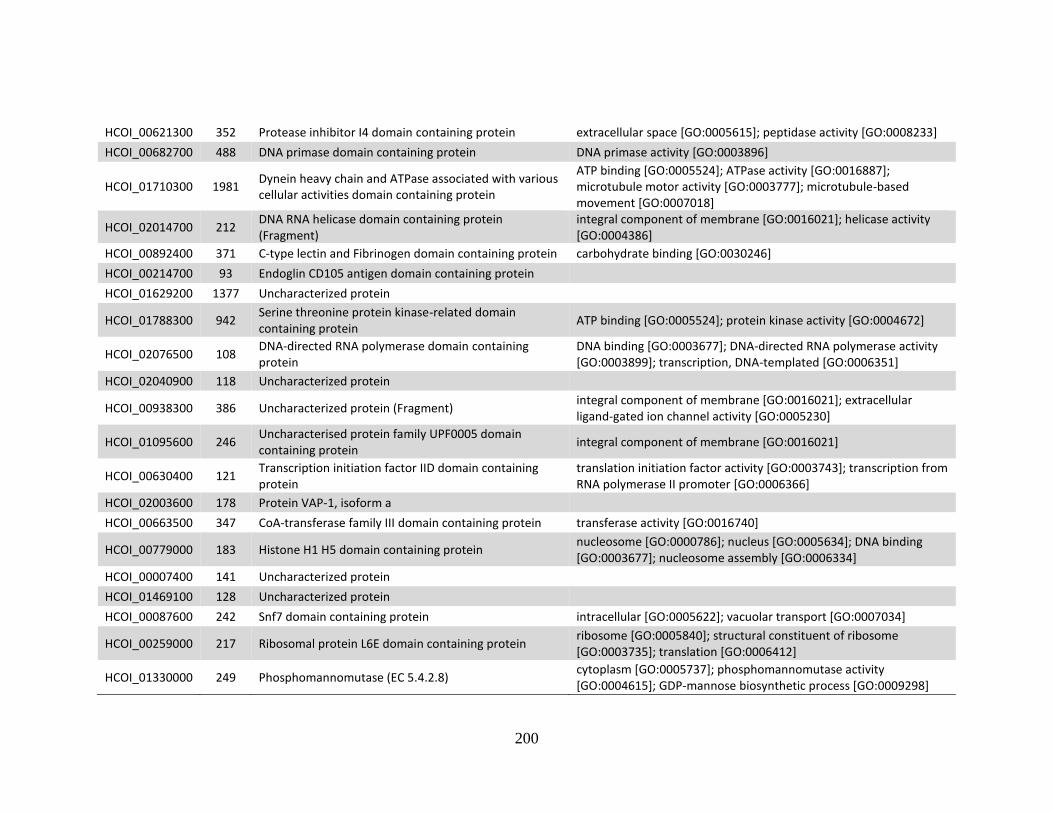
200
HCOI_00621300 352 Protease inhibitor I4 domain containing protein extracellular space [GO:0005615]; peptidase activity [GO:0008233]
HCOI_00682700 488 DNA primase domain containing protein DNA primase activity [GO:0003896]
HCOI_01710300 1981 Dynein heavy chain and ATPase associated with various cellular activities domain containing protein
ATP binding [GO:0005524]; ATPase activity [GO:0016887]; microtubule motor activity [GO:0003777]; microtubule-based movement [GO:0007018]
HCOI_02014700 212 DNA RNA helicase domain containing protein (Fragment)
integral component of membrane [GO:0016021]; helicase activity [GO:0004386]
HCOI_00892400 371 C-type lectin and Fibrinogen domain containing protein carbohydrate binding [GO:0030246]
HCOI_00214700 93 Endoglin CD105 antigen domain containing protein
HCOI_01629200 1377 Uncharacterized protein
HCOI_01788300 942 Serine threonine protein kinase-related domain containing protein
ATP binding [GO:0005524]; protein kinase activity [GO:0004672]
HCOI_02076500 108 DNA-directed RNA polymerase domain containing protein
DNA binding [GO:0003677]; DNA-directed RNA polymerase activity [GO:0003899]; transcription, DNA-templated [GO:0006351]
HCOI_02040900 118 Uncharacterized protein
HCOI_00938300 386 Uncharacterized protein (Fragment) integral component of membrane [GO:0016021]; extracellular ligand-gated ion channel activity [GO:0005230]
HCOI_01095600 246 Uncharacterised protein family UPF0005 domain containing protein
integral component of membrane [GO:0016021]
HCOI_00630400 121 Transcription initiation factor IID domain containing protein
translation initiation factor activity [GO:0003743]; transcription from RNA polymerase II promoter [GO:0006366]
HCOI_02003600 178 Protein VAP-1, isoform a
HCOI_00663500 347 CoA-transferase family III domain containing protein transferase activity [GO:0016740]
HCOI_00779000 183 Histone H1 H5 domain containing protein nucleosome [GO:0000786]; nucleus [GO:0005634]; DNA binding [GO:0003677]; nucleosome assembly [GO:0006334]
HCOI_00007400 141 Uncharacterized protein
HCOI_01469100 128 Uncharacterized protein
HCOI_00087600 242 Snf7 domain containing protein intracellular [GO:0005622]; vacuolar transport [GO:0007034]
HCOI_00259000 217 Ribosomal protein L6E domain containing protein ribosome [GO:0005840]; structural constituent of ribosome [GO:0003735]; translation [GO:0006412]
HCOI_01330000 249 Phosphomannomutase (EC 5.4.2.8) cytoplasm [GO:0005737]; phosphomannomutase activity [GO:0004615]; GDP-mannose biosynthetic process [GO:0009298]
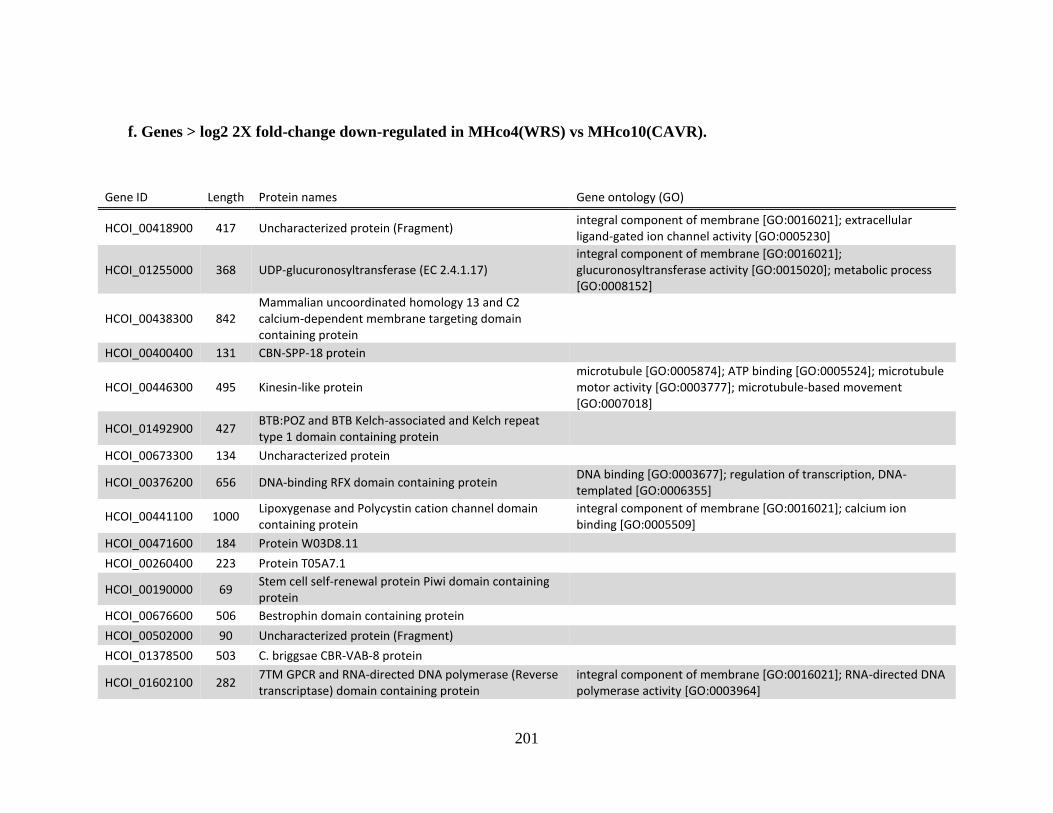
201
f. Genes > log2 2X fold-change down-regulated in MHco4(WRS) vs MHco10(CAVR).
Gene ID Length Protein names Gene ontology (GO)
HCOI_00418900 417 Uncharacterized protein (Fragment) integral component of membrane [GO:0016021]; extracellular ligand-gated ion channel activity [GO:0005230]
HCOI_01255000 368 UDP-glucuronosyltransferase (EC 2.4.1.17) integral component of membrane [GO:0016021]; glucuronosyltransferase activity [GO:0015020]; metabolic process [GO:0008152]
HCOI_00438300 842 Mammalian uncoordinated homology 13 and C2 calcium-dependent membrane targeting domain containing protein
HCOI_00400400 131 CBN-SPP-18 protein
HCOI_00446300 495 Kinesin-like protein microtubule [GO:0005874]; ATP binding [GO:0005524]; microtubule motor activity [GO:0003777]; microtubule-based movement [GO:0007018]
HCOI_01492900 427 BTB:POZ and BTB Kelch-associated and Kelch repeat type 1 domain containing protein
HCOI_00673300 134 Uncharacterized protein
HCOI_00376200 656 DNA-binding RFX domain containing protein DNA binding [GO:0003677]; regulation of transcription, DNA-templated [GO:0006355]
HCOI_00441100 1000 Lipoxygenase and Polycystin cation channel domain containing protein
integral component of membrane [GO:0016021]; calcium ion binding [GO:0005509]
HCOI_00471600 184 Protein W03D8.11
HCOI_00260400 223 Protein T05A7.1
HCOI_00190000 69 Stem cell self-renewal protein Piwi domain containing protein
HCOI_00676600 506 Bestrophin domain containing protein
HCOI_00502000 90 Uncharacterized protein (Fragment)
HCOI_01378500 503 C. briggsae CBR-VAB-8 protein
HCOI_01602100 282 7TM GPCR and RNA-directed DNA polymerase (Reverse transcriptase) domain containing protein
integral component of membrane [GO:0016021]; RNA-directed DNA polymerase activity [GO:0003964]
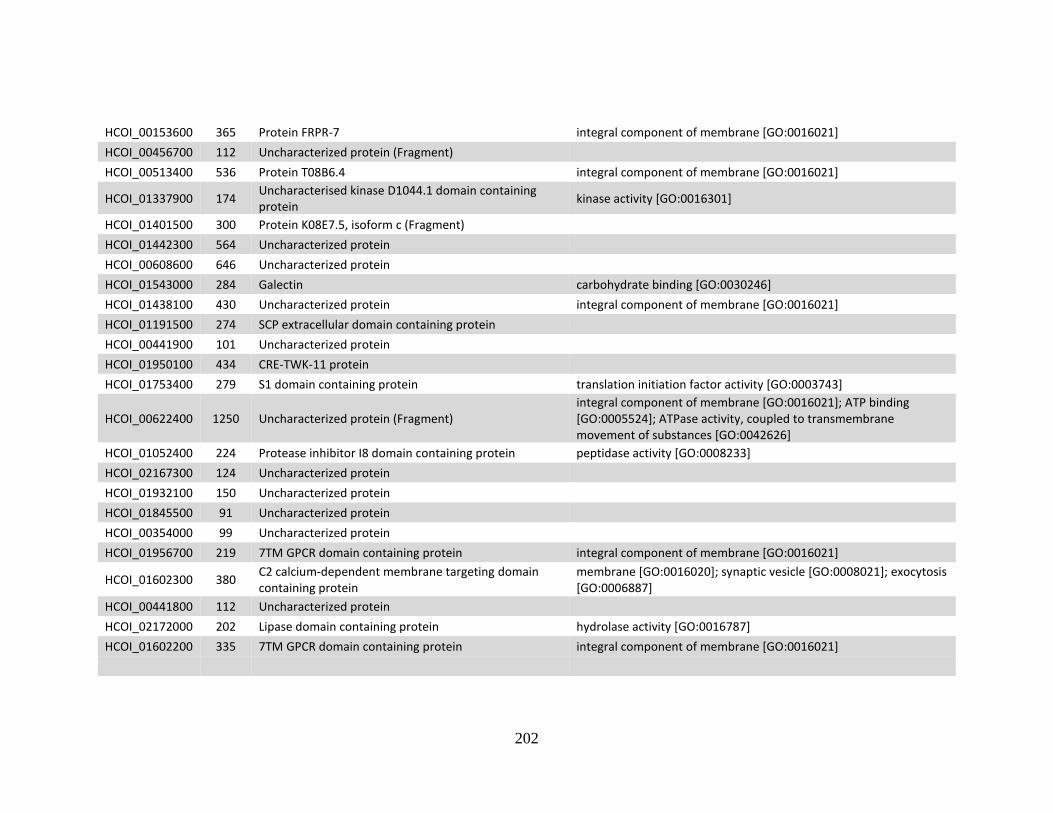
202
HCOI_00153600 365 Protein FRPR-7 integral component of membrane [GO:0016021]
HCOI_00456700 112 Uncharacterized protein (Fragment)
HCOI_00513400 536 Protein T08B6.4 integral component of membrane [GO:0016021]
HCOI_01337900 174 Uncharacterised kinase D1044.1 domain containing protein
kinase activity [GO:0016301]
HCOI_01401500 300 Protein K08E7.5, isoform c (Fragment)
HCOI_01442300 564 Uncharacterized protein
HCOI_00608600 646 Uncharacterized protein
HCOI_01543000 284 Galectin carbohydrate binding [GO:0030246]
HCOI_01438100 430 Uncharacterized protein integral component of membrane [GO:0016021]
HCOI_01191500 274 SCP extracellular domain containing protein
HCOI_00441900 101 Uncharacterized protein
HCOI_01950100 434 CRE-TWK-11 protein
HCOI_01753400 279 S1 domain containing protein translation initiation factor activity [GO:0003743]
HCOI_00622400 1250 Uncharacterized protein (Fragment) integral component of membrane [GO:0016021]; ATP binding [GO:0005524]; ATPase activity, coupled to transmembrane movement of substances [GO:0042626]
HCOI_01052400 224 Protease inhibitor I8 domain containing protein peptidase activity [GO:0008233]
HCOI_02167300 124 Uncharacterized protein
HCOI_01932100 150 Uncharacterized protein
HCOI_01845500 91 Uncharacterized protein
HCOI_00354000 99 Uncharacterized protein
HCOI_01956700 219 7TM GPCR domain containing protein integral component of membrane [GO:0016021]
HCOI_01602300 380 C2 calcium-dependent membrane targeting domain containing protein
membrane [GO:0016020]; synaptic vesicle [GO:0008021]; exocytosis [GO:0006887]
HCOI_00441800 112 Uncharacterized protein
HCOI_02172000 202 Lipase domain containing protein hydrolase activity [GO:0016787]
HCOI_01602200 335 7TM GPCR domain containing protein integral component of membrane [GO:0016021]
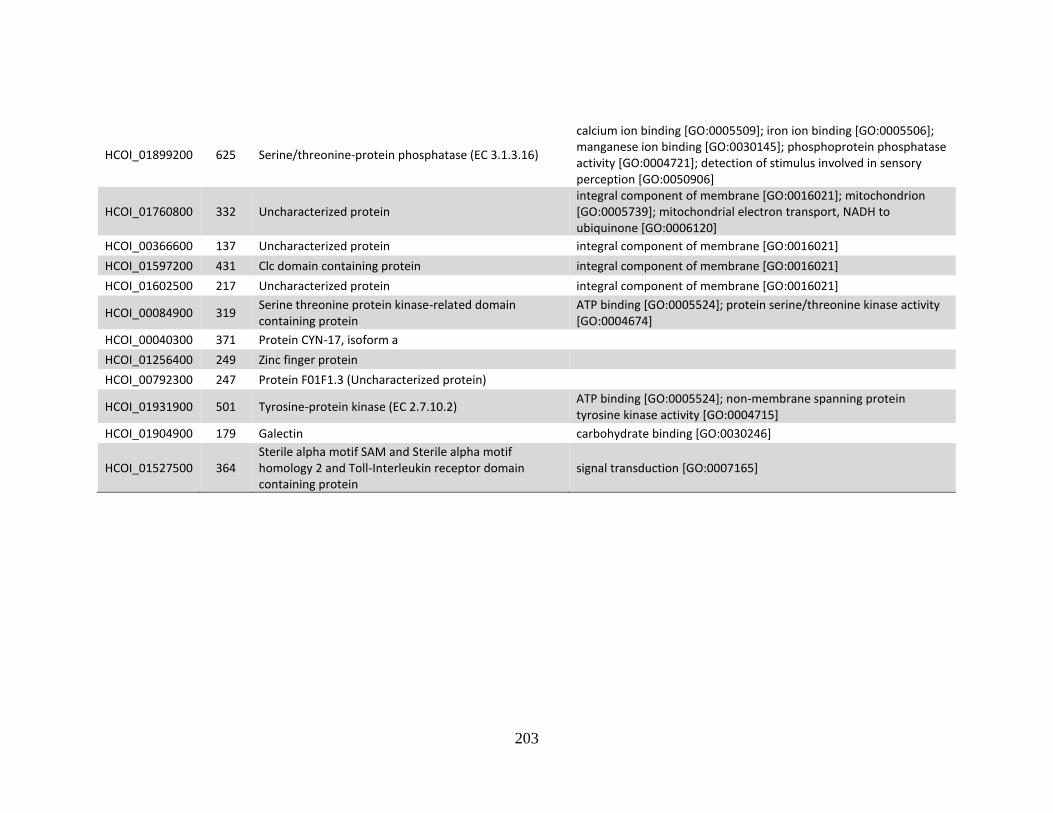
203
HCOI_01899200 625 Serine/threonine-protein phosphatase (EC 3.1.3.16)
calcium ion binding [GO:0005509]; iron ion binding [GO:0005506]; manganese ion binding [GO:0030145]; phosphoprotein phosphatase activity [GO:0004721]; detection of stimulus involved in sensory perception [GO:0050906]
HCOI_01760800 332 Uncharacterized protein integral component of membrane [GO:0016021]; mitochondrion [GO:0005739]; mitochondrial electron transport, NADH to ubiquinone [GO:0006120]
HCOI_00366600 137 Uncharacterized protein integral component of membrane [GO:0016021]
HCOI_01597200 431 Clc domain containing protein integral component of membrane [GO:0016021]
HCOI_01602500 217 Uncharacterized protein integral component of membrane [GO:0016021]
HCOI_00084900 319 Serine threonine protein kinase-related domain containing protein
ATP binding [GO:0005524]; protein serine/threonine kinase activity [GO:0004674]
HCOI_00040300 371 Protein CYN-17, isoform a
HCOI_01256400 249 Zinc finger protein
HCOI_00792300 247 Protein F01F1.3 (Uncharacterized protein)
HCOI_01931900 501 Tyrosine-protein kinase (EC 2.7.10.2) ATP binding [GO:0005524]; non-membrane spanning protein tyrosine kinase activity [GO:0004715]
HCOI_01904900 179 Galectin carbohydrate binding [GO:0030246]
HCOI_01527500 364 Sterile alpha motif SAM and Sterile alpha motif homology 2 and Toll-Interleukin receptor domain containing protein
signal transduction [GO:0007165]
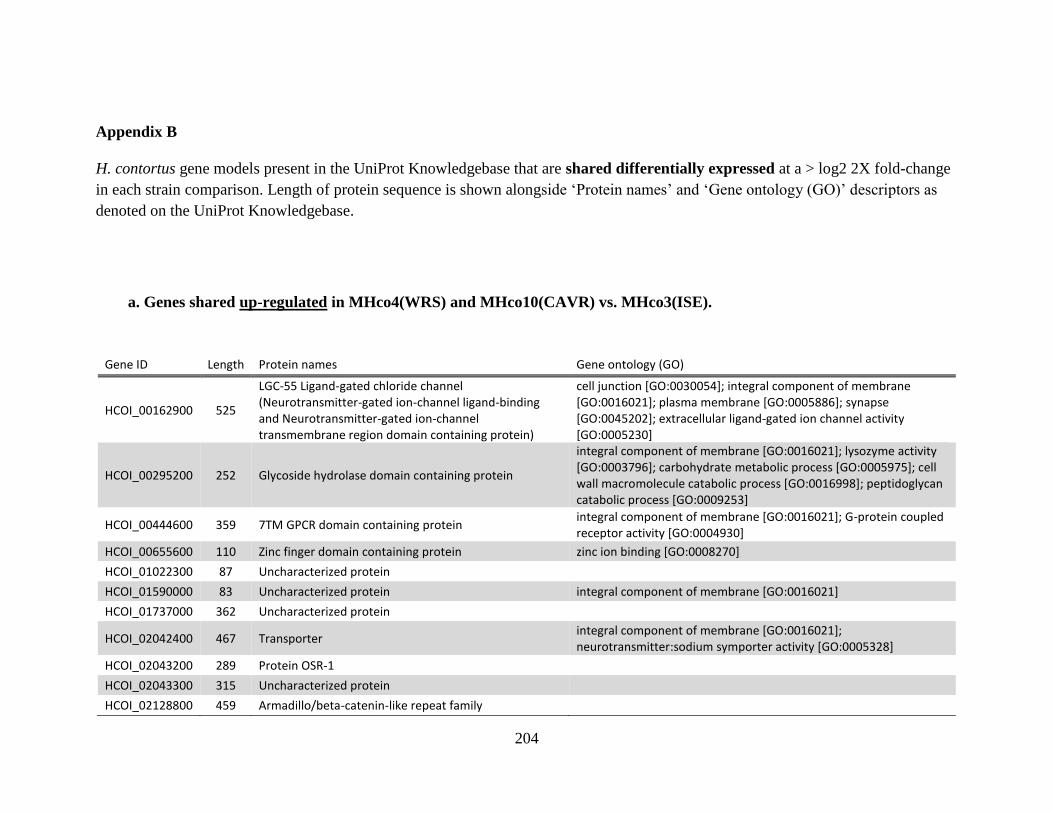
204
Appendix B
H. contortus gene models present in the UniProt Knowledgebase that are shared differentially expressed at a > log2 2X fold-change
in each strain comparison. Length of protein sequence is shown alongside ‘Protein names’ and ‘Gene ontology (GO)’ descriptors as
denoted on the UniProt Knowledgebase.
a. Genes shared up-regulated in MHco4(WRS) and MHco10(CAVR) vs. MHco3(ISE).
Gene ID Length Protein names Gene ontology (GO)
HCOI_00162900 525
LGC-55 Ligand-gated chloride channel (Neurotransmitter-gated ion-channel ligand-binding and Neurotransmitter-gated ion-channel transmembrane region domain containing protein)
cell junction [GO:0030054]; integral component of membrane [GO:0016021]; plasma membrane [GO:0005886]; synapse [GO:0045202]; extracellular ligand-gated ion channel activity [GO:0005230]
HCOI_00295200 252 Glycoside hydrolase domain containing protein
integral component of membrane [GO:0016021]; lysozyme activity [GO:0003796]; carbohydrate metabolic process [GO:0005975]; cell wall macromolecule catabolic process [GO:0016998]; peptidoglycan catabolic process [GO:0009253]
HCOI_00444600 359 7TM GPCR domain containing protein integral component of membrane [GO:0016021]; G-protein coupled receptor activity [GO:0004930]
HCOI_00655600 110 Zinc finger domain containing protein zinc ion binding [GO:0008270]
HCOI_01022300 87 Uncharacterized protein
HCOI_01590000 83 Uncharacterized protein integral component of membrane [GO:0016021]
HCOI_01737000 362 Uncharacterized protein
HCOI_02042400 467 Transporter integral component of membrane [GO:0016021]; neurotransmitter:sodium symporter activity [GO:0005328]
HCOI_02043200 289 Protein OSR-1
HCOI_02043300 315 Uncharacterized protein
HCOI_02128800 459 Armadillo/beta-catenin-like repeat family
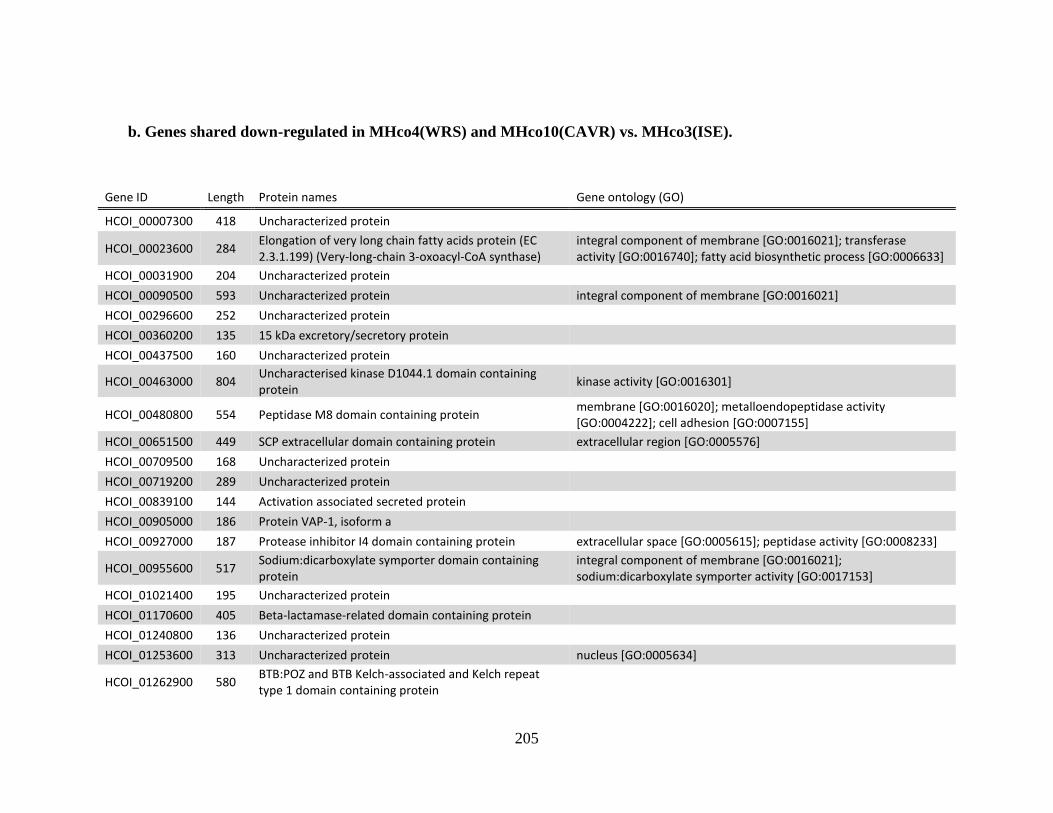
205
b. Genes shared down-regulated in MHco4(WRS) and MHco10(CAVR) vs. MHco3(ISE).
Gene ID Length Protein names Gene ontology (GO)
HCOI_00007300 418 Uncharacterized protein
HCOI_00023600 284 Elongation of very long chain fatty acids protein (EC 2.3.1.199) (Very-long-chain 3-oxoacyl-CoA synthase)
integral component of membrane [GO:0016021]; transferase activity [GO:0016740]; fatty acid biosynthetic process [GO:0006633]
HCOI_00031900 204 Uncharacterized protein
HCOI_00090500 593 Uncharacterized protein integral component of membrane [GO:0016021]
HCOI_00296600 252 Uncharacterized protein
HCOI_00360200 135 15 kDa excretory/secretory protein
HCOI_00437500 160 Uncharacterized protein
HCOI_00463000 804 Uncharacterised kinase D1044.1 domain containing protein
kinase activity [GO:0016301]
HCOI_00480800 554 Peptidase M8 domain containing protein membrane [GO:0016020]; metalloendopeptidase activity [GO:0004222]; cell adhesion [GO:0007155]
HCOI_00651500 449 SCP extracellular domain containing protein extracellular region [GO:0005576]
HCOI_00709500 168 Uncharacterized protein
HCOI_00719200 289 Uncharacterized protein
HCOI_00839100 144 Activation associated secreted protein
HCOI_00905000 186 Protein VAP-1, isoform a
HCOI_00927000 187 Protease inhibitor I4 domain containing protein extracellular space [GO:0005615]; peptidase activity [GO:0008233]
HCOI_00955600 517 Sodium:dicarboxylate symporter domain containing protein
integral component of membrane [GO:0016021]; sodium:dicarboxylate symporter activity [GO:0017153]
HCOI_01021400 195 Uncharacterized protein
HCOI_01170600 405 Beta-lactamase-related domain containing protein
HCOI_01240800 136 Uncharacterized protein
HCOI_01253600 313 Uncharacterized protein nucleus [GO:0005634]
HCOI_01262900 580 BTB:POZ and BTB Kelch-associated and Kelch repeat type 1 domain containing protein
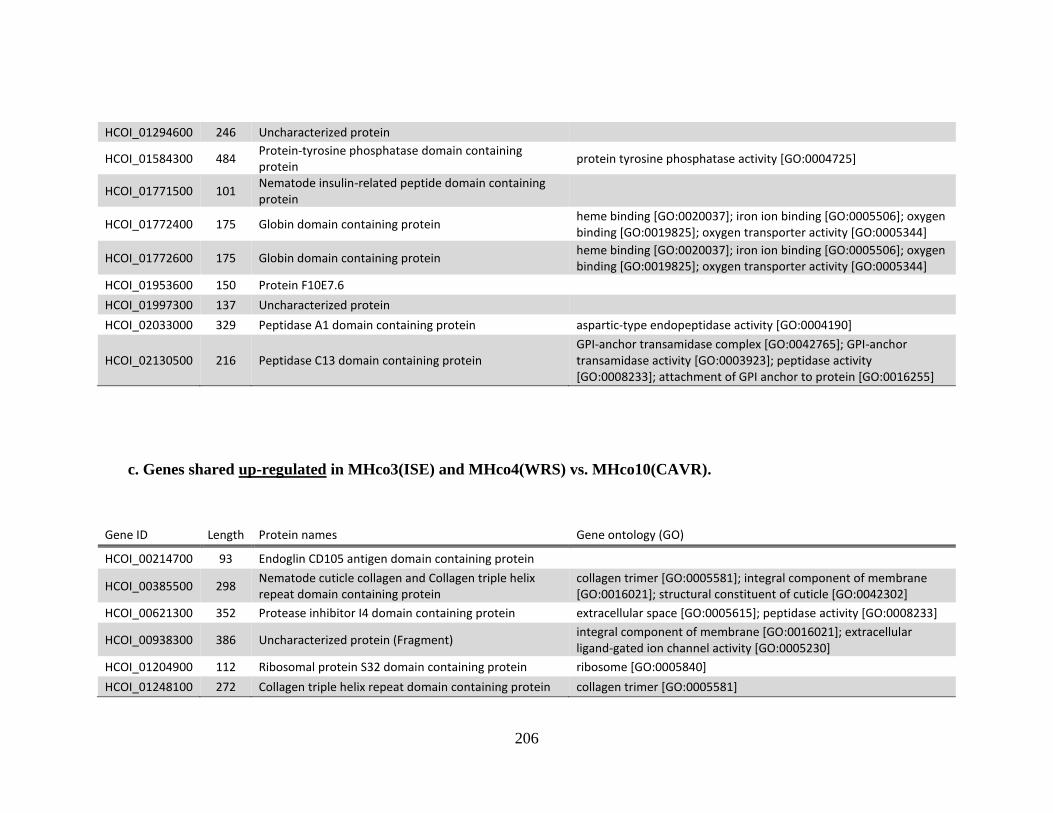
206
HCOI_01294600 246 Uncharacterized protein
HCOI_01584300 484 Protein-tyrosine phosphatase domain containing protein
protein tyrosine phosphatase activity [GO:0004725]
HCOI_01771500 101 Nematode insulin-related peptide domain containing protein
HCOI_01772400 175 Globin domain containing protein heme binding [GO:0020037]; iron ion binding [GO:0005506]; oxygen binding [GO:0019825]; oxygen transporter activity [GO:0005344]
HCOI_01772600 175 Globin domain containing protein heme binding [GO:0020037]; iron ion binding [GO:0005506]; oxygen binding [GO:0019825]; oxygen transporter activity [GO:0005344]
HCOI_01953600 150 Protein F10E7.6
HCOI_01997300 137 Uncharacterized protein
HCOI_02033000 329 Peptidase A1 domain containing protein aspartic-type endopeptidase activity [GO:0004190]
HCOI_02130500 216 Peptidase C13 domain containing protein GPI-anchor transamidase complex [GO:0042765]; GPI-anchor transamidase activity [GO:0003923]; peptidase activity [GO:0008233]; attachment of GPI anchor to protein [GO:0016255]
c. Genes shared up-regulated in MHco3(ISE) and MHco4(WRS) vs. MHco10(CAVR).
Gene ID Length Protein names Gene ontology (GO)
HCOI_00214700 93 Endoglin CD105 antigen domain containing protein
HCOI_00385500 298 Nematode cuticle collagen and Collagen triple helix repeat domain containing protein
collagen trimer [GO:0005581]; integral component of membrane [GO:0016021]; structural constituent of cuticle [GO:0042302]
HCOI_00621300 352 Protease inhibitor I4 domain containing protein extracellular space [GO:0005615]; peptidase activity [GO:0008233]
HCOI_00938300 386 Uncharacterized protein (Fragment) integral component of membrane [GO:0016021]; extracellular ligand-gated ion channel activity [GO:0005230]
HCOI_01204900 112 Ribosomal protein S32 domain containing protein ribosome [GO:0005840]
HCOI_01248100 272 Collagen triple helix repeat domain containing protein collagen trimer [GO:0005581]

207
d. Genes shared down-regulated in MHco3(ISE) and MHco4(WRS) vs. MHco10(CAVR).
Gene ID Length Protein names Gene ontology (GO)
HCOI_00040300 371 Protein CYN-17, isoform a
HCOI_00153600 365 Protein FRPR-7 integral component of membrane [GO:0016021]
HCOI_00190000 69 Stem cell self-renewal protein Piwi domain containing protein
HCOI_00260400 223 Protein T05A7.1
HCOI_00418900 417 Uncharacterized protein (Fragment) integral component of membrane [GO:0016021]; extracellular ligand-gated ion channel activity [GO:0005230]
HCOI_00441100 1000 Lipoxygenase and Polycystin cation channel domain containing protein
integral component of membrane [GO:0016021]; calcium ion binding [GO:0005509]
HCOI_00441800 112 Uncharacterized protein
HCOI_00446300 495 Kinesin-like protein microtubule [GO:0005874]; ATP binding [GO:0005524]; microtubule motor activity [GO:0003777]; microtubule-based movement [GO:0007018]
HCOI_00456700 112 Uncharacterized protein (Fragment)
HCOI_00471600 184 Protein W03D8.11
HCOI_00513400 536 Protein T08B6.4 integral component of membrane [GO:0016021]
HCOI_01255000 368 UDP-glucuronosyltransferase (EC 2.4.1.17) integral component of membrane [GO:0016021]; glucuronosyltransferase activity [GO:0015020]; metabolic process [GO:0008152]
HCOI_01337900 174 Uncharacterised kinase D1044.1 domain containing protein
kinase activity [GO:0016301]
HCOI_01401500 300 Protein K08E7.5, isoform c (Fragment)
HCOI_01438100 430 Uncharacterized protein integral component of membrane [GO:0016021]
HCOI_01492900 427 BTB:POZ and BTB Kelch-associated and Kelch repeat type 1 domain containing protein
HCOI_01543000 284 Galectin carbohydrate binding [GO:0030246]
HCOI_01602500 217 Uncharacterized protein integral component of membrane [GO:0016021]
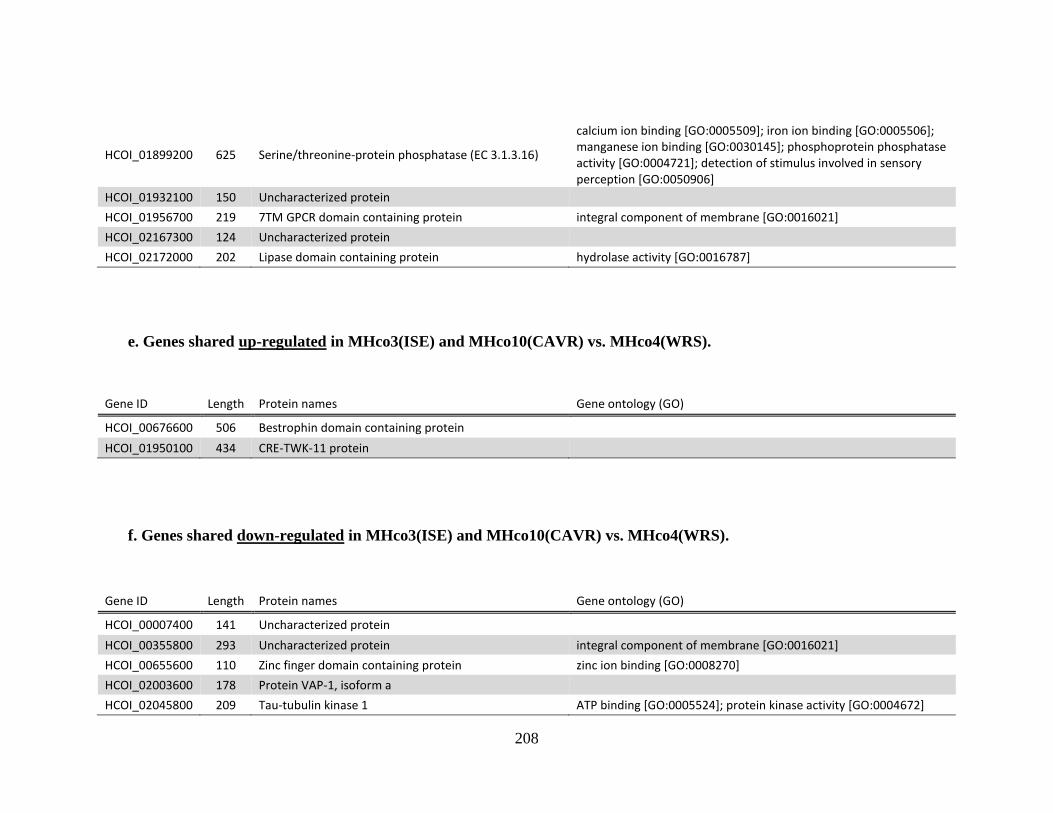
208
HCOI_01899200 625 Serine/threonine-protein phosphatase (EC 3.1.3.16)
calcium ion binding [GO:0005509]; iron ion binding [GO:0005506]; manganese ion binding [GO:0030145]; phosphoprotein phosphatase activity [GO:0004721]; detection of stimulus involved in sensory perception [GO:0050906]
HCOI_01932100 150 Uncharacterized protein
HCOI_01956700 219 7TM GPCR domain containing protein integral component of membrane [GO:0016021]
HCOI_02167300 124 Uncharacterized protein
HCOI_02172000 202 Lipase domain containing protein hydrolase activity [GO:0016787]
e. Genes shared up-regulated in MHco3(ISE) and MHco10(CAVR) vs. MHco4(WRS).
Gene ID Length Protein names Gene ontology (GO)
HCOI_00676600 506 Bestrophin domain containing protein
HCOI_01950100 434 CRE-TWK-11 protein
f. Genes shared down-regulated in MHco3(ISE) and MHco10(CAVR) vs. MHco4(WRS).
Gene ID Length Protein names Gene ontology (GO)
HCOI_00007400 141 Uncharacterized protein
HCOI_00355800 293 Uncharacterized protein integral component of membrane [GO:0016021]
HCOI_00655600 110 Zinc finger domain containing protein zinc ion binding [GO:0008270]
HCOI_02003600 178 Protein VAP-1, isoform a
HCOI_02045800 209 Tau-tubulin kinase 1 ATP binding [GO:0005524]; protein kinase activity [GO:0004672]
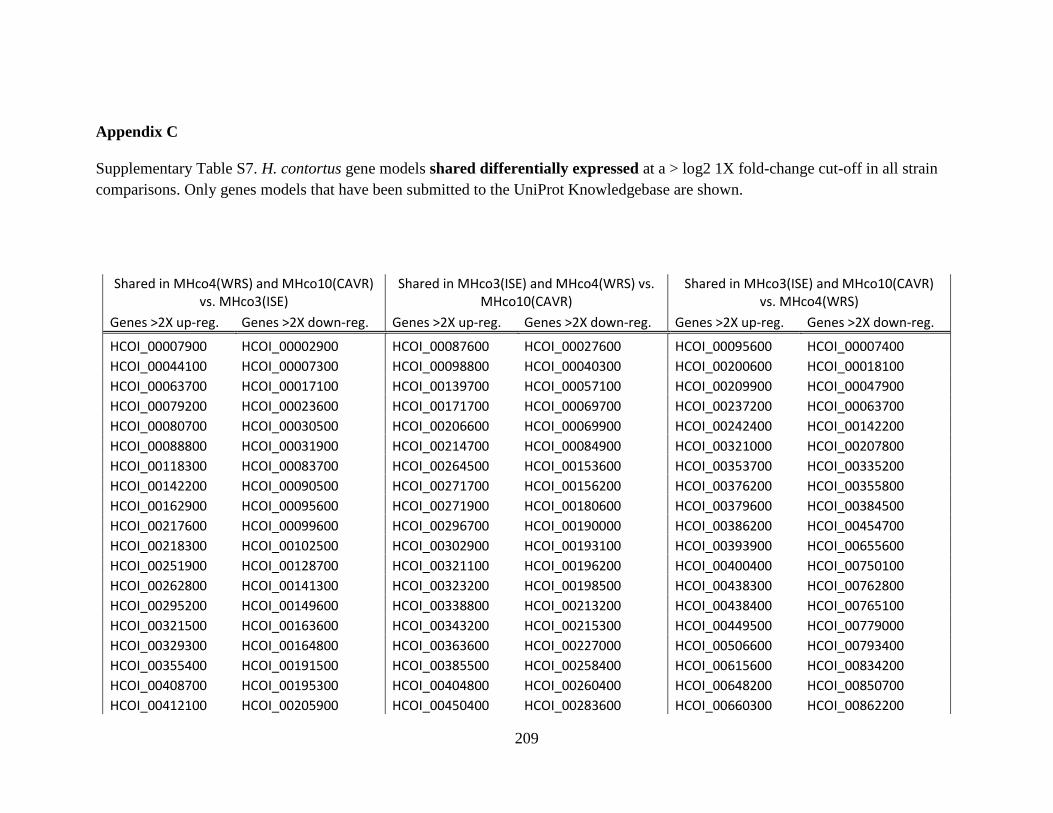
209
Appendix C
Supplementary Table S7. H. contortus gene models shared differentially expressed at a > log2 1X fold-change cut-off in all strain
comparisons. Only genes models that have been submitted to the UniProt Knowledgebase are shown.
Shared in MHco4(WRS) and MHco10(CAVR) vs. MHco3(ISE)
Shared in MHco3(ISE) and MHco4(WRS) vs. MHco10(CAVR)
Shared in MHco3(ISE) and MHco10(CAVR) vs. MHco4(WRS)
Genes >2X up-reg. Genes >2X down-reg. Genes >2X up-reg. Genes >2X down-reg. Genes >2X up-reg. Genes >2X down-reg.
HCOI_00007900 HCOI_00002900 HCOI_00087600 HCOI_00027600 HCOI_00095600 HCOI_00007400
HCOI_00044100 HCOI_00007300 HCOI_00098800 HCOI_00040300 HCOI_00200600 HCOI_00018100
HCOI_00063700 HCOI_00017100 HCOI_00139700 HCOI_00057100 HCOI_00209900 HCOI_00047900
HCOI_00079200 HCOI_00023600 HCOI_00171700 HCOI_00069700 HCOI_00237200 HCOI_00063700
HCOI_00080700 HCOI_00030500 HCOI_00206600 HCOI_00069900 HCOI_00242400 HCOI_00142200
HCOI_00088800 HCOI_00031900 HCOI_00214700 HCOI_00084900 HCOI_00321000 HCOI_00207800
HCOI_00118300 HCOI_00083700 HCOI_00264500 HCOI_00153600 HCOI_00353700 HCOI_00335200
HCOI_00142200 HCOI_00090500 HCOI_00271700 HCOI_00156200 HCOI_00376200 HCOI_00355800
HCOI_00162900 HCOI_00095600 HCOI_00271900 HCOI_00180600 HCOI_00379600 HCOI_00384500
HCOI_00217600 HCOI_00099600 HCOI_00296700 HCOI_00190000 HCOI_00386200 HCOI_00454700
HCOI_00218300 HCOI_00102500 HCOI_00302900 HCOI_00193100 HCOI_00393900 HCOI_00655600
HCOI_00251900 HCOI_00128700 HCOI_00321100 HCOI_00196200 HCOI_00400400 HCOI_00750100
HCOI_00262800 HCOI_00141300 HCOI_00323200 HCOI_00198500 HCOI_00438300 HCOI_00762800
HCOI_00295200 HCOI_00149600 HCOI_00338800 HCOI_00213200 HCOI_00438400 HCOI_00765100
HCOI_00321500 HCOI_00163600 HCOI_00343200 HCOI_00215300 HCOI_00449500 HCOI_00779000
HCOI_00329300 HCOI_00164800 HCOI_00363600 HCOI_00227000 HCOI_00506600 HCOI_00793400
HCOI_00355400 HCOI_00191500 HCOI_00385500 HCOI_00258400 HCOI_00615600 HCOI_00834200
HCOI_00408700 HCOI_00195300 HCOI_00404800 HCOI_00260400 HCOI_00648200 HCOI_00850700
HCOI_00412100 HCOI_00205900 HCOI_00450400 HCOI_00283600 HCOI_00660300 HCOI_00862200
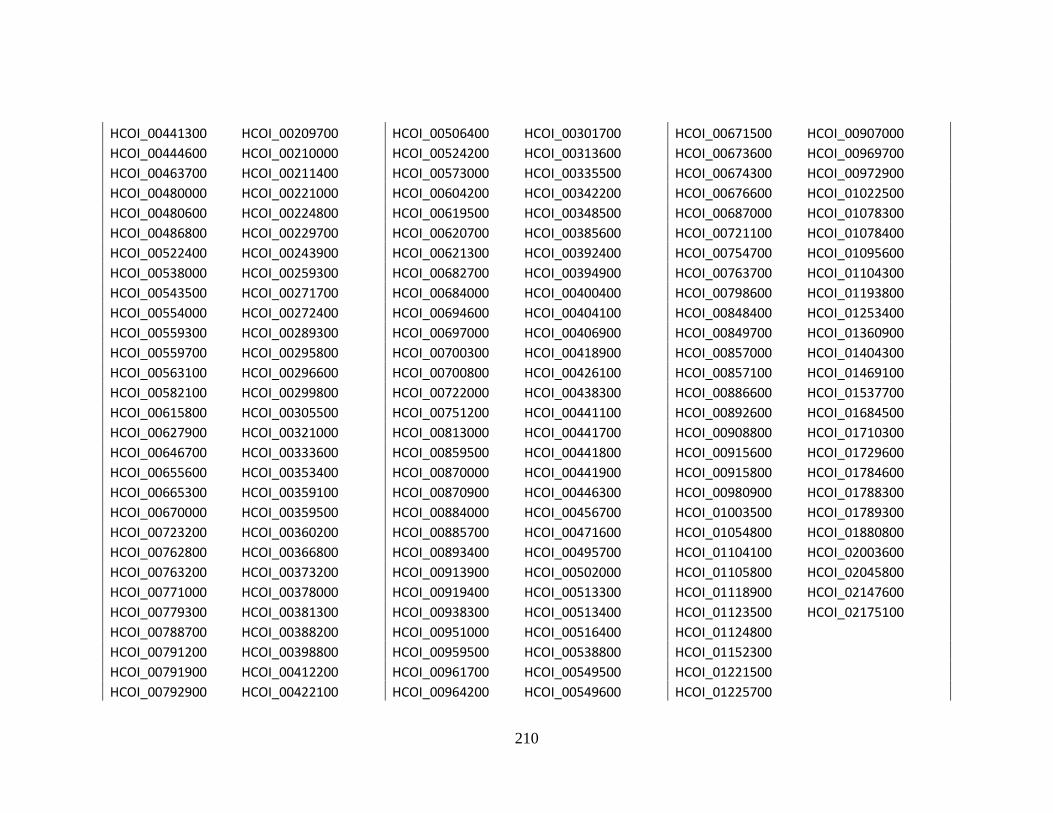
210
HCOI_00441300 HCOI_00209700 HCOI_00506400 HCOI_00301700 HCOI_00671500 HCOI_00907000
HCOI_00444600 HCOI_00210000 HCOI_00524200 HCOI_00313600 HCOI_00673600 HCOI_00969700
HCOI_00463700 HCOI_00211400 HCOI_00573000 HCOI_00335500 HCOI_00674300 HCOI_00972900
HCOI_00480000 HCOI_00221000 HCOI_00604200 HCOI_00342200 HCOI_00676600 HCOI_01022500
HCOI_00480600 HCOI_00224800 HCOI_00619500 HCOI_00348500 HCOI_00687000 HCOI_01078300
HCOI_00486800 HCOI_00229700 HCOI_00620700 HCOI_00385600 HCOI_00721100 HCOI_01078400
HCOI_00522400 HCOI_00243900 HCOI_00621300 HCOI_00392400 HCOI_00754700 HCOI_01095600
HCOI_00538000 HCOI_00259300 HCOI_00682700 HCOI_00394900 HCOI_00763700 HCOI_01104300
HCOI_00543500 HCOI_00271700 HCOI_00684000 HCOI_00400400 HCOI_00798600 HCOI_01193800
HCOI_00554000 HCOI_00272400 HCOI_00694600 HCOI_00404100 HCOI_00848400 HCOI_01253400
HCOI_00559300 HCOI_00289300 HCOI_00697000 HCOI_00406900 HCOI_00849700 HCOI_01360900
HCOI_00559700 HCOI_00295800 HCOI_00700300 HCOI_00418900 HCOI_00857000 HCOI_01404300
HCOI_00563100 HCOI_00296600 HCOI_00700800 HCOI_00426100 HCOI_00857100 HCOI_01469100
HCOI_00582100 HCOI_00299800 HCOI_00722000 HCOI_00438300 HCOI_00886600 HCOI_01537700
HCOI_00615800 HCOI_00305500 HCOI_00751200 HCOI_00441100 HCOI_00892600 HCOI_01684500
HCOI_00627900 HCOI_00321000 HCOI_00813000 HCOI_00441700 HCOI_00908800 HCOI_01710300
HCOI_00646700 HCOI_00333600 HCOI_00859500 HCOI_00441800 HCOI_00915600 HCOI_01729600
HCOI_00655600 HCOI_00353400 HCOI_00870000 HCOI_00441900 HCOI_00915800 HCOI_01784600
HCOI_00665300 HCOI_00359100 HCOI_00870900 HCOI_00446300 HCOI_00980900 HCOI_01788300
HCOI_00670000 HCOI_00359500 HCOI_00884000 HCOI_00456700 HCOI_01003500 HCOI_01789300
HCOI_00723200 HCOI_00360200 HCOI_00885700 HCOI_00471600 HCOI_01054800 HCOI_01880800
HCOI_00762800 HCOI_00366800 HCOI_00893400 HCOI_00495700 HCOI_01104100 HCOI_02003600
HCOI_00763200 HCOI_00373200 HCOI_00913900 HCOI_00502000 HCOI_01105800 HCOI_02045800
HCOI_00771000 HCOI_00378000 HCOI_00919400 HCOI_00513300 HCOI_01118900 HCOI_02147600
HCOI_00779300 HCOI_00381300 HCOI_00938300 HCOI_00513400 HCOI_01123500 HCOI_02175100
HCOI_00788700 HCOI_00388200 HCOI_00951000 HCOI_00516400 HCOI_01124800
HCOI_00791200 HCOI_00398800 HCOI_00959500 HCOI_00538800 HCOI_01152300
HCOI_00791900 HCOI_00412200 HCOI_00961700 HCOI_00549500 HCOI_01221500
HCOI_00792900 HCOI_00422100 HCOI_00964200 HCOI_00549600 HCOI_01225700

211
HCOI_00796900 HCOI_00429600 HCOI_01012500 HCOI_00570400 HCOI_01250800
HCOI_00803300 HCOI_00437500 HCOI_01137800 HCOI_00606600 HCOI_01250900
HCOI_00803400 HCOI_00450400 HCOI_01163800 HCOI_00608600 HCOI_01271400
HCOI_00867100 HCOI_00454200 HCOI_01167500 HCOI_00622400 HCOI_01271500
HCOI_00879800 HCOI_00463000 HCOI_01191900 HCOI_00622700 HCOI_01272800
HCOI_00881700 HCOI_00464500 HCOI_01204900 HCOI_00642400 HCOI_01279100
HCOI_00926900 HCOI_00480800 HCOI_01222300 HCOI_00644700 HCOI_01307800
HCOI_00929400 HCOI_00484200 HCOI_01236600 HCOI_00653500 HCOI_01342900
HCOI_00930900 HCOI_00499100 HCOI_01248100 HCOI_00665600 HCOI_01378500
HCOI_00934700 HCOI_00514900 HCOI_01259300 HCOI_00704400 HCOI_01400400
HCOI_00934800 HCOI_00523300 HCOI_01272200 HCOI_00707800 HCOI_01425900
HCOI_00934900 HCOI_00526500 HCOI_01274900 HCOI_00763200 HCOI_01466700
HCOI_00943400 HCOI_00529300 HCOI_01300800 HCOI_00767800 HCOI_01468500
HCOI_00966000 HCOI_00529400 HCOI_01306000 HCOI_00779700 HCOI_01489100
HCOI_01022300 HCOI_00536200 HCOI_01327100 HCOI_00792100 HCOI_01500300
HCOI_01058400 HCOI_00536300 HCOI_01330000 HCOI_00803300 HCOI_01532400
HCOI_01072800 HCOI_00551100 HCOI_01334900 HCOI_00803400 HCOI_01581500
HCOI_01136400 HCOI_00563600 HCOI_01346000 HCOI_00825100 HCOI_01582700
HCOI_01140400 HCOI_00574000 HCOI_01361000 HCOI_00867100 HCOI_01602100
HCOI_01156400 HCOI_00588000 HCOI_01468800 HCOI_00881600 HCOI_01602300
HCOI_01167300 HCOI_00588400 HCOI_01470500 HCOI_00881700 HCOI_01620300
HCOI_01186400 HCOI_00589900 HCOI_01497600 HCOI_00908300 HCOI_01634700
HCOI_01197100 HCOI_00593800 HCOI_01540300 HCOI_00919100 HCOI_01641900
HCOI_01198300 HCOI_00620700 HCOI_01547600 HCOI_00919200 HCOI_01699400
HCOI_01226300 HCOI_00622900 HCOI_01591400 HCOI_00926900 HCOI_01777700
HCOI_01267300 HCOI_00627700 HCOI_01613300 HCOI_00931300 HCOI_01783500
HCOI_01268300 HCOI_00639700 HCOI_01615000 HCOI_00936400 HCOI_01785800
HCOI_01272300 HCOI_00651500 HCOI_01615100 HCOI_00936700 HCOI_01845500
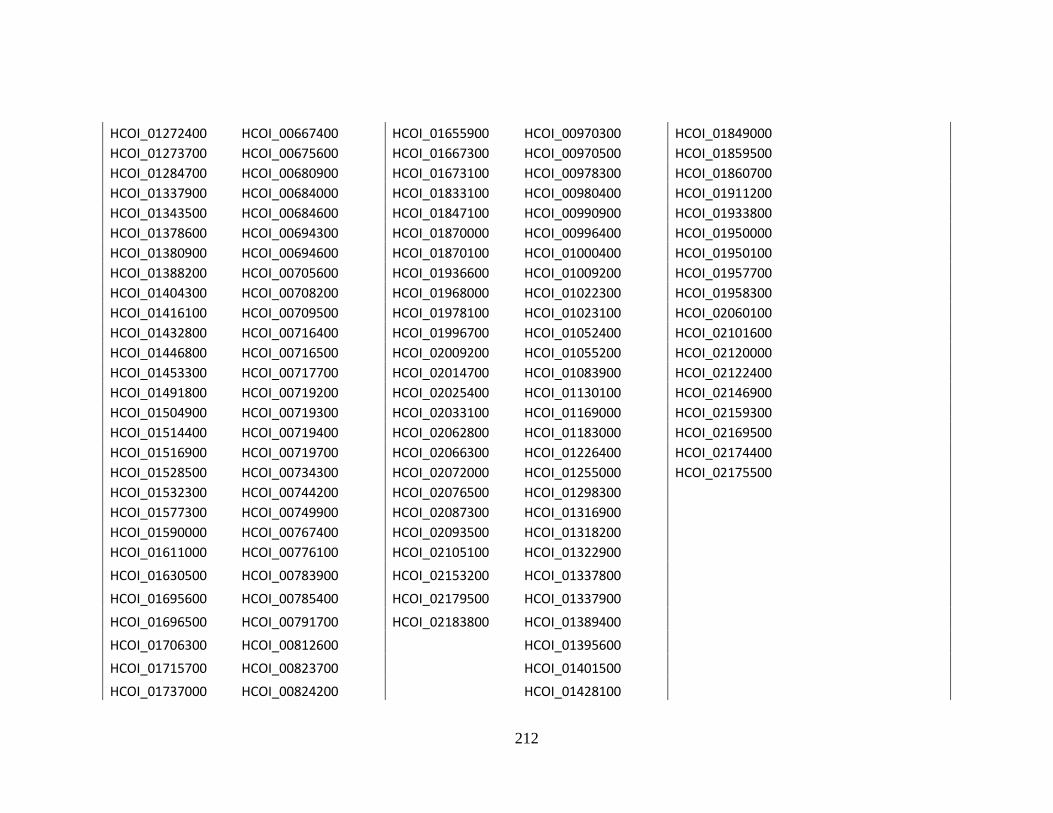
212
HCOI_01272400 HCOI_00667400 HCOI_01655900 HCOI_00970300 HCOI_01849000
HCOI_01273700 HCOI_00675600 HCOI_01667300 HCOI_00970500 HCOI_01859500
HCOI_01284700 HCOI_00680900 HCOI_01673100 HCOI_00978300 HCOI_01860700
HCOI_01337900 HCOI_00684000 HCOI_01833100 HCOI_00980400 HCOI_01911200
HCOI_01343500 HCOI_00684600 HCOI_01847100 HCOI_00990900 HCOI_01933800
HCOI_01378600 HCOI_00694300 HCOI_01870000 HCOI_00996400 HCOI_01950000
HCOI_01380900 HCOI_00694600 HCOI_01870100 HCOI_01000400 HCOI_01950100
HCOI_01388200 HCOI_00705600 HCOI_01936600 HCOI_01009200 HCOI_01957700
HCOI_01404300 HCOI_00708200 HCOI_01968000 HCOI_01022300 HCOI_01958300
HCOI_01416100 HCOI_00709500 HCOI_01978100 HCOI_01023100 HCOI_02060100
HCOI_01432800 HCOI_00716400 HCOI_01996700 HCOI_01052400 HCOI_02101600
HCOI_01446800 HCOI_00716500 HCOI_02009200 HCOI_01055200 HCOI_02120000
HCOI_01453300 HCOI_00717700 HCOI_02014700 HCOI_01083900 HCOI_02122400
HCOI_01491800 HCOI_00719200 HCOI_02025400 HCOI_01130100 HCOI_02146900
HCOI_01504900 HCOI_00719300 HCOI_02033100 HCOI_01169000 HCOI_02159300
HCOI_01514400 HCOI_00719400 HCOI_02062800 HCOI_01183000 HCOI_02169500
HCOI_01516900 HCOI_00719700 HCOI_02066300 HCOI_01226400 HCOI_02174400
HCOI_01528500 HCOI_00734300 HCOI_02072000 HCOI_01255000 HCOI_02175500
HCOI_01532300 HCOI_00744200 HCOI_02076500 HCOI_01298300
HCOI_01577300 HCOI_00749900 HCOI_02087300 HCOI_01316900
HCOI_01590000 HCOI_00767400 HCOI_02093500 HCOI_01318200
HCOI_01611000 HCOI_00776100 HCOI_02105100 HCOI_01322900
HCOI_01630500 HCOI_00783900 HCOI_02153200 HCOI_01337800
HCOI_01695600 HCOI_00785400 HCOI_02179500 HCOI_01337900
HCOI_01696500 HCOI_00791700 HCOI_02183800 HCOI_01389400
HCOI_01706300 HCOI_00812600 HCOI_01395600
HCOI_01715700 HCOI_00823700 HCOI_01401500
HCOI_01737000 HCOI_00824200 HCOI_01428100
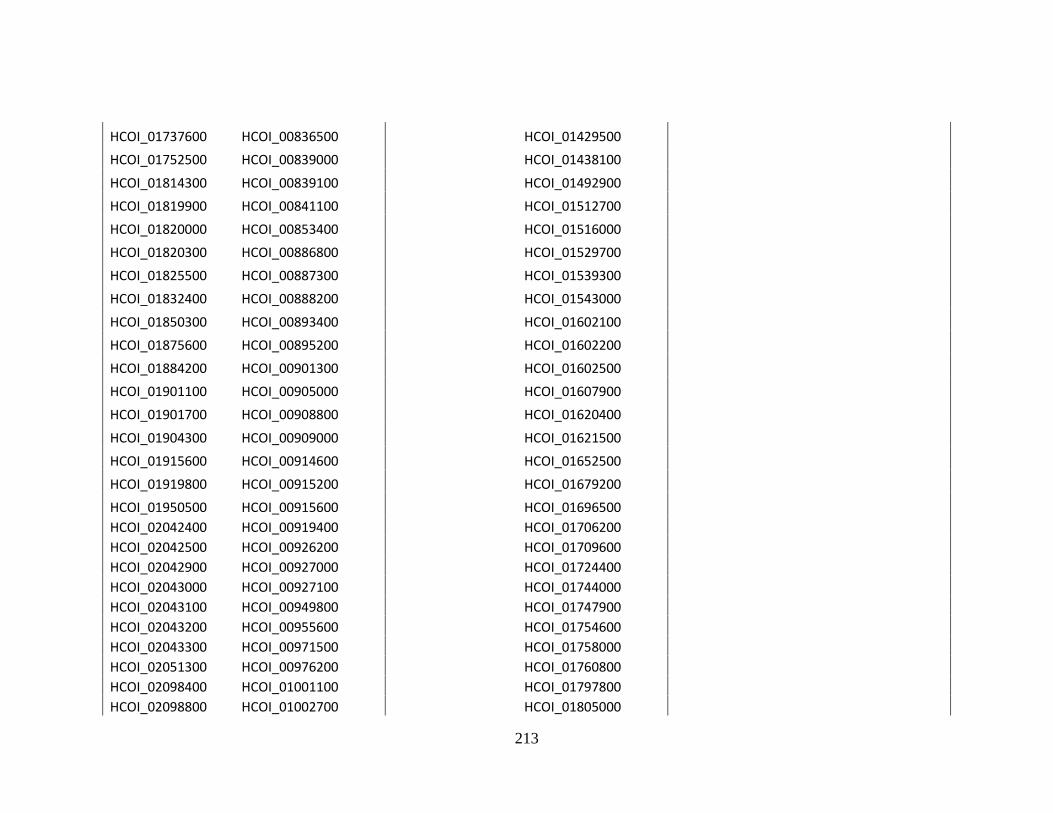
213
HCOI_01737600 HCOI_00836500 HCOI_01429500
HCOI_01752500 HCOI_00839000 HCOI_01438100
HCOI_01814300 HCOI_00839100 HCOI_01492900
HCOI_01819900 HCOI_00841100 HCOI_01512700
HCOI_01820000 HCOI_00853400 HCOI_01516000
HCOI_01820300 HCOI_00886800 HCOI_01529700
HCOI_01825500 HCOI_00887300 HCOI_01539300
HCOI_01832400 HCOI_00888200 HCOI_01543000
HCOI_01850300 HCOI_00893400 HCOI_01602100
HCOI_01875600 HCOI_00895200 HCOI_01602200
HCOI_01884200 HCOI_00901300 HCOI_01602500
HCOI_01901100 HCOI_00905000 HCOI_01607900
HCOI_01901700 HCOI_00908800 HCOI_01620400
HCOI_01904300 HCOI_00909000 HCOI_01621500
HCOI_01915600 HCOI_00914600 HCOI_01652500
HCOI_01919800 HCOI_00915200 HCOI_01679200
HCOI_01950500 HCOI_00915600 HCOI_01696500
HCOI_02042400 HCOI_00919400 HCOI_01706200
HCOI_02042500 HCOI_00926200 HCOI_01709600
HCOI_02042900 HCOI_00927000 HCOI_01724400
HCOI_02043000 HCOI_00927100 HCOI_01744000
HCOI_02043100 HCOI_00949800 HCOI_01747900
HCOI_02043200 HCOI_00955600 HCOI_01754600
HCOI_02043300 HCOI_00971500 HCOI_01758000
HCOI_02051300 HCOI_00976200 HCOI_01760800
HCOI_02098400 HCOI_01001100 HCOI_01797800
HCOI_02098800 HCOI_01002700 HCOI_01805000
214
HCOI_02128800 HCOI_01021400 HCOI_01816900
HCOI_02140200 HCOI_01022600 HCOI_01822000
HCOI_02170000 HCOI_01045700 HCOI_01822100
HCOI_01047900 HCOI_01838200
HCOI_01092500 HCOI_01840000
HCOI_01100900 HCOI_01850400
HCOI_01124700 HCOI_01884900
HCOI_01130400 HCOI_01887700
HCOI_01137800 HCOI_01899200
HCOI_01165200 HCOI_01904900
HCOI_01168900 HCOI_01931900
HCOI_01170600 HCOI_01932100
HCOI_01180600 HCOI_01956700
HCOI_01184400 HCOI_01958400
HCOI_01190400 HCOI_01964000
HCOI_01196200 HCOI_01984100
HCOI_01199000 HCOI_02036300
HCOI_01205600 HCOI_02039400
HCOI_01229700 HCOI_02042500
HCOI_01240800 HCOI_02043300
HCOI_01245200 HCOI_02090200
HCOI_01246500 HCOI_02112800
HCOI_01253100 HCOI_02167300
HCOI_01253300 HCOI_02172000
HCOI_01253600
HCOI_01259900

215
HCOI_01262900
HCOI_01279400
HCOI_01294600
HCOI_01303400
HCOI_01307900
HCOI_01310300
HCOI_01315000
HCOI_01349600
HCOI_01388800
HCOI_01400400
HCOI_01405100
HCOI_01408000
HCOI_01414000
HCOI_01415900
HCOI_01417500
HCOI_01418000
HCOI_01449200
HCOI_01451800
HCOI_01453700
HCOI_01456200
HCOI_01474700
HCOI_01489700
HCOI_01494100
HCOI_01495600
HCOI_01497600
216
HCOI_01509400
HCOI_01515500
HCOI_01515600
HCOI_01525600
HCOI_01537000
HCOI_01540200
HCOI_01540300
HCOI_01546000
HCOI_01547800
HCOI_01584300
HCOI_01586300
HCOI_01592500
HCOI_01600300
HCOI_01600600
HCOI_01605700
HCOI_01614500
HCOI_01615000
HCOI_01615200
HCOI_01617300
HCOI_01625500
HCOI_01636800
HCOI_01654100
HCOI_01659400
HCOI_01660500
HCOI_01660600
HCOI_01667300
HCOI_01687100
HCOI_01691200
HCOI_01705500
217
HCOI_01705700
HCOI_01705900
HCOI_01716100
HCOI_01727100
HCOI_01727800
HCOI_01749500
HCOI_01771500
HCOI_01771700
HCOI_01772000
HCOI_01772400
HCOI_01772500
HCOI_01772600
HCOI_01787100
HCOI_01787500
HCOI_01791600
HCOI_01798700
HCOI_01806800
HCOI_01809800
HCOI_01812100
HCOI_01827900
HCOI_01834200
HCOI_01855900
HCOI_01857200
HCOI_01866900
HCOI_01883100
HCOI_01883200
HCOI_01924200
HCOI_01953600
HCOI_01953700

218
HCOI_01978000
HCOI_01978100
HCOI_01978300
HCOI_01984700
HCOI_01985600
HCOI_01986300
HCOI_01993000
HCOI_01994500
HCOI_01996600
HCOI_01996700
HCOI_01997300
HCOI_01997400
HCOI_01997500
HCOI_02000400
HCOI_02006400
HCOI_02013800
HCOI_02028700
HCOI_02030600
HCOI_02033000
HCOI_02047300
HCOI_02049700
HCOI_02053700
HCOI_02058000
HCOI_02060300
HCOI_02073200
HCOI_02079400
HCOI_02082500
HCOI_02094900
HCOI_02105600
219
HCOI_02105900
HCOI_02107900
HCOI_02123000
HCOI_02130500
HCOI_02146100
HCOI_02154000
HCOI_02159800
HCOI_02171600
HCOI_02173300
HCOI_02177500

220
Appendix D
All gene models differentially expressed at > log2 1X fold-change expression in the three pairwise strain comparisons are shown.
Genes are sorted by highest log2 fold-change difference in expression in all comparisons. Up-regulated genes are shown on the left
and down-regulated genes on the right for each strain comparison.
MHco4(WRS) vs. MHco3(ISE) MHco10(CAVR) vs. MHco3(ISE) MHco4(WRS) vs. MHco10(CAVR)
IDs - UP reg log2 F.C. IDs - DOWN reg
log2 F.C. IDs - UP reg
log2 F.C. IDs - DOWN reg
log2 F.C. IDs - UP reg
log2 F.C. IDs - DOWN reg
log2 F.C.
HCOI_00655600 4.67 HCOI_01253600 -4.73 HCOI_00418900 5.87 HCOI_01253600 -4.74 HCOI_05003364 3.48 HCOI_00418900 -5.39
HCOI_00444600 3.79 HCOI_00683900 -3.57 HCOI_05006267 4.16 HCOI_00719200 -3.80 HCOI_02045800 3.48 HCOI_01255000 -4.38
HCOI_01404300 3.49 HCOI_01170600 -3.37 HCOI_01337900 4.00 HCOI_00593400 -3.47 HCOI_00385500 3.03 HCOI_05000662 -3.75
HCOI_00355800 3.45 HCOI_00095600 -3.19 HCOI_02000700 3.60 HCOI_00007300 -3.36 HCOI_01236700 2.87 HCOI_00438300 -3.49
HCOI_00088900 3.27 HCOI_00719200 -3.00 HCOI_05000662 3.48 HCOI_05003364 -3.33 HCOI_01204900 2.84 HCOI_00400400 -3.45
HCOI_01590000 2.96 HCOI_02033000 -2.98 HCOI_01022300 3.47 HCOI_01204900 -3.31 HCOI_00374400 2.79 HCOI_05002060 -3.32
HCOI_01431800 2.80 HCOI_00480800 -2.97 HCOI_00456700 3.41 HCOI_00221000 -3.31 HCOI_02011700 2.75 HCOI_00446300 -3.30
HCOI_00634600 2.76 HCOI_05002662 -2.96 HCOI_02043300 3.29 HCOI_01540300 -3.29 HCOI_00454600 2.74 HCOI_05006267 -3.29
HCOI_00162900 2.74 HCOI_00676600 -2.91 HCOI_01956700 3.25 HCOI_01514600 -3.17 HCOI_05001113 2.72 HCOI_01492900 -3.06
HCOI_00295200 2.69 HCOI_01400400 -2.90 HCOI_00153600 3.25 HCOI_05000810 -3.16 HCOI_00355800 2.71 HCOI_00673300 -3.03
HCOI_01942400 2.66 HCOI_00719400 -2.87 HCOI_05002060 3.24 HCOI_01997400 -3.13 HCOI_00655600 2.62 HCOI_00376200 -2.86
HCOI_02043200 2.63 HCOI_01997300 -2.86 HCOI_02042500 3.18 HCOI_01996700 -3.10 HCOI_01248100 2.58 HCOI_00441100 -2.75
HCOI_02045800 2.59 HCOI_00915600 -2.80 HCOI_01136400.2 3.15 HCOI_01997300 -3.08 HCOI_01952000 2.56 HCOI_00471600 -2.74
HCOI_00007900 2.58 HCOI_00035800 -2.80 HCOI_01602500 3.14 HCOI_01294600 -3.02 HCOI_01155600 2.53 HCOI_05004764 -2.69
HCOI_00063700 2.54 HCOI_01910900 -2.78 HCOI_01167300 3.13 HCOI_00893400 -2.97 HCOI_00621300 2.52 HCOI_00260400 -2.65
HCOI_01355500 2.54 HCOI_01997400 -2.75 HCOI_00763200 3.07 HCOI_00621300 -2.94 HCOI_05000234 2.51 HCOI_00190000 -2.64
HCOI_05005928 2.53 HCOI_00694400 -2.70 HCOI_01737000 3.05 HCOI_00905000 -2.92 HCOI_05004321 2.47 HCOI_00676600 -2.62
HCOI_02128800 2.52 HCOI_01240800 -2.70 HCOI_00881700 3.04 HCOI_00938300 -2.91 HCOI_00682700 2.45 HCOI_05001839 -2.60
221
HCOI_01022300 2.47 HCOI_01830200 -2.69 HCOI_05002136 2.99 HCOI_00463000 -2.89 HCOI_01710300 2.44 HCOI_05001835 -2.59
HCOI_00007400 2.43 HCOI_00998100 -2.69 HCOI_01401500 2.97 HCOI_00360200 -2.89 HCOI_02014700 2.40 HCOI_00502000 -2.55
HCOI_00475800 2.41 HCOI_01771500 -2.66 HCOI_00190000 2.96 HCOI_01137800 -2.89 HCOI_00892400 2.36 HCOI_01378500 -2.54
HCOI_05000057 2.38 HCOI_01584300 -2.65 HCOI_00444600 2.92 HCOI_00694600 -2.86 HCOI_00214700 2.25 HCOI_01602100 -2.54
HCOI_01789300 2.37 HCOI_00905000 -2.65 HCOI_01337800 2.91 HCOI_00684000 -2.85 HCOI_01629200 2.23 HCOI_00153600 -2.53
HCOI_00142200 2.36 HCOI_05003316 -2.62 HCOI_01226300 2.84 HCOI_01170600 -2.82 HCOI_01788300 2.22 HCOI_00456700 -2.52
HCOI_05006183 2.32 HCOI_00321000 -2.60 HCOI_00412100 2.83 HCOI_05004333 -2.77 HCOI_02076500 2.21 HCOI_00513400 -2.50
HCOI_02042400 2.31 HCOI_05003585 -2.59 HCOI_00803300 2.82 HCOI_01497600 -2.74 HCOI_00319600.2 2.20 HCOI_01337900 -2.50
HCOI_01832400 2.29 HCOI_01514300 -2.56 HCOI_00867100 2.80 HCOI_01615000 -2.71 HCOI_02040900 2.19 HCOI_01401500 -2.44
HCOI_01737000 2.27 HCOI_00671500 -2.56 HCOI_00441100 2.77 HCOI_01240800 -2.71 HCOI_05005928 2.17 HCOI_01442300 -2.42
HCOI_01136400.2 2.24 HCOI_01408000 -2.54 HCOI_05006271 2.75 HCOI_01388800 -2.70 HCOI_00938300 2.17 HCOI_00608600 -2.41
HCOI_02003600 2.22 HCOI_00438400 -2.54 HCOI_05000225 2.73 HCOI_05000558 -2.70 HCOI_01095600 2.14 HCOI_01543000 -2.28
HCOI_01416100 2.16 HCOI_00886600 -2.53 HCOI_00471600 2.72 HCOI_01021400 -2.69 HCOI_01784700 2.14 HCOI_01438100 -2.25
HCOI_00793300 2.12 HCOI_02082500 -2.53 HCOI_05000057 2.69 HCOI_00589900 -2.68 HCOI_02003600 2.13 HCOI_01191500 -2.23
HCOI_01272300 2.10 HCOI_00360200 -2.51 HCOI_01543000 2.67 HCOI_00271700 -2.66 HCOI_00663500 2.11 HCOI_00441900 -2.22
HCOI_01504900 2.10 HCOI_01294600 -2.51 HCOI_00301300.2 2.64 HCOI_00450400 -2.64 HCOI_00779000 2.08 HCOI_01950100 -2.20
HCOI_00762800 2.07 HCOI_01950000 -2.50 HCOI_00926900 2.62 HCOI_00296600 -2.64 HCOI_00007400 2.07 HCOI_01753400 -2.19
HCOI_02147600 2.05 HCOI_00463000 -2.48 HCOI_00513400 2.62 HCOI_00171700 -2.61 HCOI_01469100 2.03 HCOI_05002246 -2.19
HCOI_02159500 2.05 HCOI_00373200 -2.46 HCOI_00803400 2.62 HCOI_00023600 -2.61 HCOI_00087600 2.02 HCOI_00622400 -2.18
HCOI_00834000.2 2.05 HCOI_02047300 -2.45 HCOI_05001835 2.60 HCOI_02033000 -2.60 HCOI_05000558 2.01 HCOI_01052400 -2.16
HCOI_02043300 2.02 HCOI_02094900 -2.44 HCOI_02172000 2.56 HCOI_01584300 -2.59 HCOI_00259000 2.01 HCOI_02167300 -2.15
HCOI_00850700 2.02 HCOI_02159800 -2.42 HCOI_00771000 2.55 HCOI_00524200 -2.58 HCOI_01330000 2.01 HCOI_01932100 -2.14
HCOI_01875600 2.01 HCOI_00007300 -2.37 HCOI_00057100 2.54 HCOI_01248100 -2.58 HCOI_01361000 2.00 HCOI_01845500 -2.14
HCOI_00408700 2.00 HCOI_01235600 -2.37 HCOI_05003830 2.52 HCOI_00437500 -2.55 HCOI_00514700 1.97 HCOI_00354000 -2.12
HCOI_02098400 1.97 HCOI_02105800 -2.33 HCOI_01696500 2.49 HCOI_00621200 -2.55 HCOI_01684500 1.97 HCOI_01956700 -2.12
HCOI_01078300 1.96 HCOI_00915100 -2.32 HCOI_05000420 2.47 HCOI_02033100 -2.53 HCOI_01449700 1.96 HCOI_01602300 -2.11
HCOI_01072800 1.95 HCOI_00839100 -2.32 HCOI_05000667 2.47 HCOI_02130500 -2.52 HCOI_05003619 1.95 HCOI_00441800 -2.10
HCOI_05002932 1.95 HCOI_00360100 -2.31 HCOI_05003746 2.47 HCOI_00214700 -2.51 HCOI_01490800 1.94 HCOI_02172000 -2.09
HCOI_05003070 1.93 HCOI_00708200 -2.31 HCOI_01322900 2.46 HCOI_01771500 -2.50 HCOI_01490200 1.93 HCOI_01602200 -2.07
222
HCOI_00834200.2 1.92 HCOI_00209900 -2.31 HCOI_00262800 2.45 HCOI_02060300 -2.50 HCOI_01404300 1.93 HCOI_05004687 -2.07
HCOI_05003083 1.91 HCOI_00908800 -2.30 HCOI_01899200 2.43 HCOI_00620700 -2.49 HCOI_01789300 1.93 HCOI_01899200 -2.06
HCOI_00553900 1.91 HCOI_01021400 -2.28 HCOI_00665300 2.43 HCOI_05001758 -2.49 HCOI_00869100 1.93 HCOI_01760800 -2.06
HCOI_00329300 1.91 HCOI_00892600 -2.28 HCOI_01706200 2.42 HCOI_02107900 -2.48 HCOI_00524200 1.92 HCOI_00366600 -2.06
HCOI_01528500 1.90 HCOI_01950100 -2.28 HCOI_01106200 2.41 HCOI_05004291 -2.48 HCOI_02072000 1.92 HCOI_01597200 -2.06
HCOI_01819900 1.88 HCOI_00998000 -2.25 HCOI_05002738 2.40 HCOI_05001187 -2.47 HCOI_00964200 1.91 HCOI_01602500 -2.05
HCOI_01774400 1.87 HCOI_05001387 -2.24 HCOI_02043200 2.40 HCOI_00915200 -2.47 HCOI_01163800 1.91 HCOI_00084900 -2.05
HCOI_01022500 1.86 HCOI_01840900 -2.23 HCOI_00919200 2.39 HCOI_01868700 -2.45 HCOI_00700300 1.89 HCOI_00040300 -2.03
HCOI_01755800 1.83 HCOI_05004095 -2.20 HCOI_02051200 2.39 HCOI_00090500 -2.45 HCOI_00506400 1.88 HCOI_01256400 -2.03
HCOI_00080700 1.83 HCOI_01414000 -2.20 HCOI_01840000 2.39 HCOI_05004321 -2.44 HCOI_00207200 1.88 HCOI_01822100 -2.03
HCOI_01432800 1.82 HCOI_05000721 -2.19 HCOI_00040300 2.36 HCOI_01772500 -2.44 HCOI_00834000.2 1.88 HCOI_05003091 -2.02
HCOI_01132800 1.82 HCOI_00023600 -2.19 HCOI_05004161 2.35 HCOI_00927000 -2.43 HCOI_05002734 1.88 HCOI_01931900 -2.02
HCOI_01752500 1.81 HCOI_05006269 -2.18 HCOI_00919100 2.35 HCOI_01306000 -2.40 HCOI_01968000 1.86 HCOI_01904900 -2.01
HCOI_01167300 1.81 HCOI_01772400 -2.16 HCOI_02098400 2.34 HCOI_05005570 -2.40 HCOI_01833100 1.85 HCOI_05000122 -2.00
HCOI_01532300 1.81 HCOI_05000683 -2.16 HCOI_00441800 2.34 HCOI_05002839 -2.40 HCOI_01774700 1.85 HCOI_05000667 -2.00
HCOI_05006153 1.81 HCOI_00955600 -2.15 HCOI_01776700 2.34 HCOI_01667300 -2.39 HCOI_02073300 1.84 HCOI_05001795 -2.00
HCOI_00874500 1.80 HCOI_01705900 -2.15 HCOI_00162900 2.33 HCOI_05002984 -2.38 HCOI_01155200 1.82 HCOI_01527500 -2.00
HCOI_01140400 1.79 HCOI_00209700 -2.15 HCOI_00180600 2.33 HCOI_05001724 -2.37 HCOI_05004313 1.81 HCOI_00857000 -2.00
HCOI_01074800 1.79 HCOI_00090500 -2.14 HCOI_00137800 2.31 HCOI_00919400 -2.36 HCOI_01078400 1.80 HCOI_01226400 -1.99
HCOI_01814300 1.78 HCOI_01522400 -2.14 HCOI_05001183 2.31 HCOI_05000721 -2.36 HCOI_01300800 1.78 HCOI_01699400 -1.99
HCOI_01378600 1.78 HCOI_01953600 -2.14 HCOI_01958000 2.28 HCOI_01798700 -2.35 HCOI_05002808 1.78 HCOI_00043600 -1.98
HCOI_00930900 1.77 HCOI_05004013 -2.13 HCOI_02039400 2.26 HCOI_00031900 -2.35 HCOI_00098800 1.78 HCOI_01950000 -1.96
HCOI_05001108 1.77 HCOI_01262900 -2.12 HCOI_00260400 2.26 HCOI_00514900 -2.35 HCOI_00272700 1.77 HCOI_02146900 -1.96
HCOI_00480000 1.77 HCOI_00031900 -2.11 HCOI_00394900 2.25 HCOI_05001236 -2.34 HCOI_00139700 1.77 HCOI_00936400 -1.96
HCOI_05004261 1.75 HCOI_02174400 -2.11 HCOI_01492900 2.24 HCOI_01772600 -2.33 HCOI_00553600 1.76 HCOI_00227000 -1.96
HCOI_00079200 1.75 HCOI_00296600 -2.10 HCOI_02042400 2.24 HCOI_05003201 -2.33 HCOI_01547600 1.75 HCOI_00970300 -1.95
HCOI_01226300 1.74 HCOI_01772600 -2.10 HCOI_00930900 2.23 HCOI_00839100 -2.33 HCOI_01303200 1.75 HCOI_00798600 -1.95
HCOI_00088800 1.73 HCOI_01152300 -2.08 HCOI_05001993 2.23 HCOI_01262900 -2.33 HCOI_01373600 1.73 HCOI_00660300 -1.94
HCOI_02098800 1.73 HCOI_05000145 -2.08 HCOI_01749900.2 2.23 HCOI_05000750 -2.32 HCOI_00611600 1.73 HCOI_00095600 -1.94
223
HCOI_01784500 1.72 HCOI_00927000 -2.06 HCOI_02167300 2.23 HCOI_05001193 -2.31 HCOI_01273900 1.72 HCOI_00441700 -1.93
HCOI_01491800 1.72 HCOI_00272400 -2.06 HCOI_01901700 2.20 HCOI_00359200 -2.29 HCOI_02093500 1.71 HCOI_00213200 -1.91
HCOI_01253400 1.72 HCOI_02055300 -2.06 HCOI_01226200 2.19 HCOI_00915300 -2.29 HCOI_00722000 1.70 HCOI_01337800 -1.91
HCOI_01537700 1.72 HCOI_05001131 -2.06 HCOI_01140400 2.18 HCOI_01387700 -2.29 HCOI_01306000 1.70 HCOI_01532400 -1.91
HCOI_01443400.2 1.71 HCOI_01440300 -2.05 HCOI_02128800 2.18 HCOI_01202200 -2.27 HCOI_00736400 1.69 HCOI_01055200 -1.91
HCOI_01514400 1.71 HCOI_01791600 -2.05 HCOI_00582100 2.17 HCOI_05000234 -2.23 HCOI_05004307 1.69 HCOI_01322900 -1.90
HCOI_00126000 1.71 HCOI_00724000 -2.05 HCOI_00980400 2.17 HCOI_00223400 -2.23 HCOI_05001758 1.68 HCOI_01706200 -1.90
HCOI_01661800 1.70 HCOI_00709500 -2.04 HCOI_01825500 2.16 HCOI_01978100 -2.22 HCOI_00106900 1.68 HCOI_00353700 -1.89
HCOI_00463700 1.70 HCOI_00651500 -2.03 HCOI_02042900 2.16 HCOI_05003585 -2.22 HCOI_00385900 1.68 HCOI_01641900 -1.88
HCOI_01824900.2 1.69 HCOI_01272800 -2.03 HCOI_01438100 2.15 HCOI_01953600 -2.22 HCOI_05004775 1.67 HCOI_01516000 -1.87
HCOI_00412100 1.69 HCOI_00437500 -2.02 HCOI_05006346 2.15 HCOI_01996600 -2.21 HCOI_00338800 1.67 HCOI_00069900 -1.87
HCOI_01095600 1.69 HCOI_02130500 -2.02 HCOI_01428100 2.15 HCOI_05004095 -2.21 HCOI_00850700 1.67 HCOI_01530100 -1.86
HCOI_01381200 1.69 HCOI_01295900 -2.02 HCOI_01590000 2.14 HCOI_02003500 -2.21 HCOI_00171700 1.67 HCOI_02060100 -1.85
HCOI_02042500 1.69 HCOI_01166100 -2.01 HCOI_00881600 2.14 HCOI_00862400 -2.19 HCOI_01222300 1.66 HCOI_01428100 -1.85
HCOI_01820000 1.68 HCOI_00971500 -2.01 HCOI_01621500 2.13 HCOI_01449200 -2.19 HCOI_00870000 1.66 HCOI_02175500 -1.85
HCOI_01469100 1.67 HCOI_00849700 -2.01 HCOI_00260300 2.12 HCOI_01615200 -2.19 HCOI_00813000 1.65 HCOI_01989700 -1.85
HCOI_00966000 1.66 HCOI_00716400 -2.00 HCOI_01516900 2.12 HCOI_01456200 -2.19 HCOI_00972900 1.65 HCOI_00825100 -1.84
HCOI_02023500 1.66 HCOI_00386200 -1.99 HCOI_05003511 2.12 HCOI_05000527 -2.18 HCOI_00784100 1.65 HCOI_05004247 -1.84
HCOI_02175100 1.64 HCOI_01811400 -1.99 HCOI_00696400 2.12 HCOI_00388200 -2.18 HCOI_01044600 1.65 HCOI_00792100 -1.82
HCOI_00792900 1.63 HCOI_00719300 -1.99 HCOI_00295200 2.12 HCOI_00330700 -2.18 HCOI_01972200 1.65 HCOI_05004260 -1.82
HCOI_00207800 1.63 HCOI_00221000 -1.99 HCOI_00088800 2.11 HCOI_05000550 -2.18 HCOI_00251400 1.64 HCOI_05004226 -1.81
HCOI_00723200 1.63 HCOI_02107900 -1.98 HCOI_00408700 2.11 HCOI_00651500 -2.17 HCOI_05002256 1.64 HCOI_00404100 -1.80
HCOI_01380900 1.61 HCOI_05002734 -1.97 HCOI_00769700 2.10 HCOI_00480800 -2.17 HCOI_00757000 1.64 HCOI_01152300 -1.77
HCOI_05003905 1.61 HCOI_01307800 -1.97 HCOI_00385800 2.10 HCOI_05003593 -2.17 HCOI_05000749 1.63 HCOI_01013600 -1.77
HCOI_01871200 1.61 HCOI_05001443 -1.97 HCOI_01545500 2.09 HCOI_05001064 -2.15 HCOI_00604200 1.63 HCOI_00394900 -1.77
HCOI_00772900 1.60 HCOI_01777700 -1.97 HCOI_00767800 2.09 HCOI_00338800 -2.15 HCOI_01236800 1.63 HCOI_00361900 -1.77
HCOI_01503100 1.60 HCOI_00164800 -1.97 HCOI_05005587 2.07 HCOI_05004081 -2.15 HCOI_02009200 1.63 HCOI_00283600 -1.77
HCOI_00771000 1.60 HCOI_00673600 -1.96 HCOI_01169000 2.07 HCOI_00927100 -2.13 HCOI_00834200.2 1.63 HCOI_00210200 -1.74
HCOI_02043000 1.60 HCOI_05000309 -1.96 HCOI_01255000 2.06 HCOI_00700300 -2.13 HCOI_00343200 1.63 HCOI_00679600 -1.73
224
HCOI_00332200 1.60 HCOI_00694300 -1.96 HCOI_00446300 2.06 HCOI_00229700 -2.12 HCOI_05003322 1.63 HCOI_01783500 -1.73
HCOI_00554000 1.60 HCOI_02055400 -1.95 HCOI_01162700 2.05 HCOI_00722000 -2.12 HCOI_00430000 1.63 HCOI_01850400 -1.72
HCOI_05001652 1.59 HCOI_01045700 -1.95 HCOI_01411000 2.05 HCOI_01669100 -2.12 HCOI_00752100 1.63 HCOI_00615600 -1.72
HCOI_02042900 1.58 HCOI_00471400 -1.94 HCOI_00655600 2.05 HCOI_01152400 -2.12 HCOI_02033100 1.62 HCOI_02101600 -1.72
HCOI_01425700 1.58 HCOI_05002997 -1.94 HCOI_00792100 2.05 HCOI_01985600 -2.11 HCOI_00323200 1.61 HCOI_01250900 -1.72
HCOI_01516900 1.58 HCOI_00209800 -1.94 HCOI_00994200.2 2.04 HCOI_01190400 -2.11 HCOI_01615000 1.61 HCOI_00818000 -1.72
HCOI_00592100 1.58 HCOI_01986300 -1.93 HCOI_05005106 2.04 HCOI_00791700 -2.09 HCOI_00959500 1.61 HCOI_02121700 -1.72
HCOI_05000491 1.57 HCOI_01602300 -1.92 HCOI_01429500 2.04 HCOI_01659400 -2.09 HCOI_01823400 1.61 HCOI_00644700 -1.71
HCOI_01284700 1.57 HCOI_01822400 -1.92 HCOI_05006270 2.04 HCOI_00719300 -2.08 HCOI_00112700 1.61 HCOI_05005106 -1.71
HCOI_01715700 1.56 HCOI_00347400 -1.92 HCOI_00606600 2.03 HCOI_00823700 -2.08 HCOI_01860100 1.61 HCOI_00763200 -1.71
HCOI_05002907 1.56 HCOI_01279400 -1.92 HCOI_01881900 2.03 HCOI_05001224 -2.07 HCOI_00951000 1.58 HCOI_00653200 -1.71
HCOI_02170000 1.56 HCOI_01292100 -1.92 HCOI_01642000 2.03 HCOI_00697000 -2.07 HCOI_00018100 1.57 HCOI_01933800 -1.71
HCOI_01074700 1.56 HCOI_01985600 -1.92 HCOI_05002246 2.03 HCOI_01300800 -2.07 HCOI_00454700 1.57 HCOI_01014300 -1.70
HCOI_05003511 1.55 HCOI_00915200 -1.91 HCOI_01932100 2.02 HCOI_00385500 -2.06 HCOI_05004198 1.57 HCOI_01169000 -1.70
HCOI_00829900 1.55 HCOI_01022600 -1.91 HCOI_01984100 2.01 HCOI_01546000 -2.06 HCOI_01228300 1.57 HCOI_00881700 -1.70
HCOI_00582100 1.53 HCOI_01834200 -1.90 HCOI_05002100 2.00 HCOI_05002337 -2.05 HCOI_01115000 1.56 HCOI_01015000 -1.70
HCOI_00577500 1.53 HCOI_01307900 -1.90 HCOI_01052400 2.00 HCOI_01272200 -2.05 HCOI_01207800 1.55 HCOI_01840000 -1.70
HCOI_05002136 1.53 HCOI_01772500 -1.90 HCOI_00348500 2.00 HCOI_05001387 -2.05 HCOI_01290600 1.55 HCOI_00935100 -1.70
HCOI_00803300 1.53 HCOI_00359500 -1.89 HCOI_02080500 1.99 HCOI_02009200 -2.05 HCOI_01820800 1.55 HCOI_01652500 -1.69
HCOI_00943500 1.53 HCOI_01253100 -1.89 HCOI_01722200 1.98 HCOI_00709500 -2.05 HCOI_00321100 1.55 HCOI_02159400 -1.69
HCOI_01078200 1.52 HCOI_02154400 -1.89 HCOI_01380900 1.98 HCOI_05002660 -2.04 HCOI_01762100 1.55 HCOI_05004410 -1.69
HCOI_00791300 1.52 HCOI_00210000 -1.88 HCOI_02051300 1.97 HCOI_02183800 -2.04 HCOI_01012500 1.54 HCOI_02161500 -1.68
HCOI_01272400 1.52 HCOI_02060300 -1.88 HCOI_05006208 1.97 HCOI_01205600 -2.03 HCOI_01191900 1.53 HCOI_01329300 -1.68
HCOI_00200900 1.51 HCOI_01787100 -1.87 HCOI_05000122 1.96 HCOI_00462900 -2.03 HCOI_01348900 1.52 HCOI_01785800 -1.68
HCOI_00670000 1.51 HCOI_01783500 -1.87 HCOI_00936700 1.96 HCOI_05001296 -2.03 HCOI_05001653 1.51 HCOI_00606600 -1.68
HCOI_01710300 1.50 HCOI_00210300 -1.87 HCOI_01931900 1.96 HCOI_01772400 -2.03 HCOI_00447300 1.50 HCOI_01403300 -1.67
HCOI_05002100 1.50 HCOI_00149600 -1.87 HCOI_05003302 1.95 HCOI_00955600 -2.03 HCOI_00236900 1.50 HCOI_05004320 -1.66
HCOI_01337900 1.50 HCOI_00710400.2 -1.87 HCOI_01268300 1.95 HCOI_01994500 -2.02 HCOI_00697000 1.49 HCOI_01964000 -1.66
HCOI_00138700 1.50 HCOI_05001710 -1.85 HCOI_00966000 1.95 HCOI_01984700 -2.02 HCOI_01762000 1.49 HCOI_00687000 -1.66
225
HCOI_01269600 1.50 HCOI_05001389 -1.84 HCOI_02112800 1.95 HCOI_01772000 -2.02 HCOI_01497600 1.49 HCOI_01250800 -1.66
HCOI_02051300 1.49 HCOI_01158100 -1.84 HCOI_00818200 1.95 HCOI_01986300 -2.01 HCOI_05000713 1.49 HCOI_00963000 -1.65
HCOI_01695600 1.48 HCOI_00141300 -1.84 HCOI_01777000 1.94 HCOI_01451800 -2.01 HCOI_00302900 1.49 HCOI_00648200 -1.65
HCOI_00665300 1.48 HCOI_01798700 -1.84 HCOI_05006153 1.93 HCOI_01600100 -2.00 HCOI_01449800 1.48 HCOI_00621700 -1.65
HCOI_01343400 1.47 HCOI_01977800 -1.84 HCOI_01904300 1.93 HCOI_01590500 -1.99 HCOI_01517000 1.48 HCOI_01961800 -1.65
HCOI_01343500 1.47 HCOI_02060100 -1.84 HCOI_00227000 1.93 HCOI_00359100 -1.98 HCOI_01022500 1.48 HCOI_01620300 -1.65
HCOI_01828900 1.47 HCOI_00895800 -1.84 HCOI_00486800 1.93 HCOI_00997900 -1.97 HCOI_02085600 1.48 HCOI_01395600 -1.65
HCOI_00934800 1.47 HCOI_01190900 -1.83 HCOI_02144400 1.92 HCOI_01229700 -1.96 HCOI_01253400 1.48 HCOI_05002250 -1.64
HCOI_01082600 1.46 HCOI_05000550 -1.83 HCOI_05004247 1.92 HCOI_00951000 -1.96 HCOI_02147600 1.47 HCOI_01786700 -1.64
HCOI_01901700 1.46 HCOI_01271500 -1.83 HCOI_00187700 1.92 HCOI_00299800 -1.96 HCOI_05000810 1.47 HCOI_00313600 -1.64
HCOI_01788300 1.46 HCOI_01540300 -1.83 HCOI_01611600 1.91 HCOI_00483700 -1.96 HCOI_00207800 1.47 HCOI_01462600 -1.63
HCOI_01737600 1.46 HCOI_05001296 -1.83 HCOI_01388200 1.91 HCOI_02093500 -1.95 HCOI_00140700 1.47 HCOI_00382600 -1.63
HCOI_00384500 1.44 HCOI_00660300 -1.83 HCOI_01919800 1.90 HCOI_00087600 -1.94 HCOI_00961700 1.46 HCOI_00549600 -1.63
HCOI_01808500 1.44 HCOI_00824200 -1.82 HCOI_00522400 1.90 HCOI_02154000 -1.94 HCOI_01259300 1.46 HCOI_01468500 -1.63
HCOI_01388200 1.44 HCOI_01860700 -1.82 HCOI_01620400 1.90 HCOI_01223200.2 -1.94 HCOI_01540300 1.46 HCOI_00502500.2 -1.63
HCOI_01935200 1.44 HCOI_00025700 -1.82 HCOI_00796900 1.90 HCOI_01978000 -1.93 HCOI_01013800 1.46 HCOI_01777700 -1.62
HCOI_05001226 1.43 HCOI_00059600 -1.82 HCOI_02070100 1.89 HCOI_01956300 -1.93 HCOI_01262600 1.45 HCOI_05005587 -1.62
HCOI_00946300 1.43 HCOI_00841100 -1.82 HCOI_00502000 1.89 HCOI_01165200 -1.93 HCOI_00834200 1.45 HCOI_05000123 -1.61
HCOI_00601600 1.43 HCOI_01634700 -1.82 HCOI_00538000 1.89 HCOI_00694100 -1.92 HCOI_01996700 1.45 HCOI_00069700 -1.61
HCOI_01267300 1.43 HCOI_01473700 -1.81 HCOI_01023800 1.89 HCOI_01022600 -1.92 HCOI_00140800 1.44 HCOI_01884900 -1.61
HCOI_01575200 1.42 HCOI_00529400 -1.81 HCOI_05001462 1.89 HCOI_01870000 -1.92 HCOI_01543100 1.44 HCOI_01860700 -1.61
HCOI_01907200 1.41 HCOI_00466500 -1.81 HCOI_01267300 1.88 HCOI_00321100 -1.92 HCOI_00765100 1.44 HCOI_05004416 -1.61
HCOI_01156400 1.41 HCOI_01548200 -1.81 HCOI_02043000 1.88 HCOI_00744200 -1.91 HCOI_00703000 1.44 HCOI_01023100 -1.60
HCOI_05002596 1.40 HCOI_01116900 -1.80 HCOI_01539300 1.88 HCOI_02171600 -1.91 HCOI_00506500 1.44 HCOI_00919100 -1.60
HCOI_05004161 1.40 HCOI_00776100 -1.80 HCOI_00196200 1.87 HCOI_05001371 -1.91 HCOI_01468800 1.43 HCOI_00335500 -1.60
HCOI_00867100 1.40 HCOI_00674300 -1.80 HCOI_01598700 1.87 HCOI_05003940 -1.90 HCOI_01137800 1.43 HCOI_01342900 -1.60
HCOI_00720600 1.40 HCOI_00980900 -1.79 HCOI_01318200 1.86 HCOI_00445000 -1.90 HCOI_01542100 1.43 HCOI_00196200 -1.59
HCOI_00047900 1.39 HCOI_05001188 -1.79 HCOI_05005707 1.86 HCOI_01515500 -1.90 HCOI_02175100 1.42 HCOI_00665600 -1.59
HCOI_00321500 1.38 HCOI_00705600 -1.79 HCOI_00653500 1.86 HCOI_05000551 -1.90 HCOI_00389400 1.42 HCOI_00549500 -1.59
226
HCOI_00972900 1.38 HCOI_00438300 -1.79 HCOI_05004261 1.86 HCOI_01687100 -1.89 HCOI_01615100 1.41 HCOI_02181100 -1.59
HCOI_01904300 1.38 HCOI_01284100 -1.79 HCOI_01226400 1.86 HCOI_00511000 -1.89 HCOI_01128900 1.41 HCOI_00886600 -1.59
HCOI_00946800 1.37 HCOI_02177500 -1.78 HCOI_00715300 1.86 HCOI_00209700 -1.88 HCOI_01847100 1.41 HCOI_00588700 -1.58
HCOI_01193800 1.37 HCOI_00893400 -1.78 HCOI_00027600 1.85 HCOI_05000254 -1.88 HCOI_00136900 1.41 HCOI_00057100 -1.58
HCOI_01042000 1.37 HCOI_01466700 -1.78 HCOI_00961200 1.85 HCOI_01418000 -1.88 HCOI_01880800 1.41 HCOI_00671500 -1.58
HCOI_00262800 1.37 HCOI_01418000 -1.78 HCOI_01023100 1.85 HCOI_00638900 -1.87 HCOI_01078300 1.40 HCOI_00958300 -1.58
HCOI_00218300 1.37 HCOI_00912000 -1.78 HCOI_00390300 1.85 HCOI_00710400.2 -1.87 HCOI_00765000 1.40 HCOI_01429500 -1.58
HCOI_00615800 1.37 HCOI_01489700 -1.77 HCOI_01822300 1.84 HCOI_00604200 -1.87 HCOI_00885700 1.39 HCOI_01307800 -1.57
HCOI_05000420 1.36 HCOI_00669300 -1.77 HCOI_01709600 1.84 HCOI_00671900 -1.87 HCOI_02015500 1.39 HCOI_00173200 -1.56
HCOI_01178900 1.36 HCOI_00529300 -1.77 HCOI_00936400 1.83 HCOI_05000710 -1.86 HCOI_00271900 1.39 HCOI_00522800 -1.56
HCOI_01648700 1.36 HCOI_00684700 -1.76 HCOI_01601600 1.82 HCOI_02058000 -1.86 HCOI_01578300 1.39 HCOI_00980400 -1.56
HCOI_01337700 1.36 HCOI_01996600 -1.76 HCOI_01832400 1.82 HCOI_00378000 -1.86 HCOI_02028200 1.39 HCOI_00513300 -1.55
HCOI_01975600 1.36 HCOI_01515500 -1.75 HCOI_00215300 1.82 HCOI_02031300 -1.85 HCOI_00047900 1.38 HCOI_05003910 -1.55
HCOI_00791200 1.36 HCOI_05001699 -1.75 HCOI_01453600 1.81 HCOI_05001600 -1.85 HCOI_00240400 1.38 HCOI_00495800 -1.55
HCOI_00763200 1.36 HCOI_00976200 -1.75 HCOI_00792900 1.81 HCOI_01787500 -1.85 HCOI_05000527 1.38 HCOI_00803400 -1.55
HCOI_01611000 1.36 HCOI_01235500 -1.75 HCOI_00446300.2 1.81 HCOI_05000191 -1.85 HCOI_02062800 1.38 HCOI_05001495 -1.55
HCOI_00251900 1.36 HCOI_00398800 -1.75 HCOI_00528400 1.81 HCOI_00719400 -1.85 HCOI_01236400 1.37 HCOI_01771200 -1.54
HCOI_01180100 1.35 HCOI_00059900 -1.73 HCOI_01368200 1.80 HCOI_00464000 -1.85 HCOI_00605900 1.37 HCOI_05002811 -1.54
HCOI_01136400 1.35 HCOI_01310300 -1.73 HCOI_00007900 1.80 HCOI_02079400 -1.85 HCOI_00614600 1.36 HCOI_01272800 -1.53
HCOI_05006270 1.34 HCOI_01342500 -1.73 HCOI_00611800 1.79 HCOI_05001190 -1.85 HCOI_01655900 1.36 HCOI_00587900 -1.53
HCOI_00018100 1.34 HCOI_01253300 -1.73 HCOI_00480000 1.78 HCOI_01591400 -1.85 HCOI_00943200 1.36 HCOI_01869000 -1.52
HCOI_00881700 1.34 HCOI_01388800 -1.72 HCOI_01623700 1.78 HCOI_01507500 -1.84 HCOI_00700800 1.36 HCOI_00180600 -1.51
HCOI_01453300 1.33 HCOI_00333600 -1.72 HCOI_00714400.2 1.78 HCOI_00366800 -1.84 HCOI_05002406 1.36 HCOI_05005707 -1.51
HCOI_01381100 1.33 HCOI_02146100 -1.72 HCOI_05001535 1.78 HCOI_00895200 -1.84 HCOI_01673100 1.35 HCOI_01035800 -1.51
HCOI_00454700 1.33 HCOI_00163600 -1.72 HCOI_02036300 1.78 HCOI_01659500 -1.84 HCOI_01891000 1.35 HCOI_05004130 -1.51
HCOI_01567900.2 1.33 HCOI_00109700 -1.71 HCOI_00335500 1.78 HCOI_01614500 -1.84 HCOI_01894100 1.34 HCOI_00399600 -1.50
HCOI_00969700 1.33 HCOI_00400400 -1.71 HCOI_01800600 1.78 HCOI_01693500 -1.83 HCOI_00175000 1.33 HCOI_01958400 -1.50
HCOI_00522400 1.32 HCOI_05002362 -1.71 HCOI_00908300 1.77 HCOI_01259300 -1.83 HCOI_00860900 1.33 HCOI_00931300 -1.50
HCOI_01383000 1.32 HCOI_01716000 -1.71 HCOI_05004769 1.77 HCOI_00926200 -1.82 HCOI_05000198 1.33 HCOI_01710900 -1.50

227
HCOI_01446800 1.32 HCOI_01312300 -1.71 HCOI_01458500 1.76 HCOI_01673100 -1.82 HCOI_01334900 1.33 HCOI_00760100 -1.50
HCOI_00217600 1.32 HCOI_00078800 -1.70 HCOI_00582000 1.76 HCOI_05002099 -1.82 HCOI_05002984 1.32 HCOI_00779700 -1.49
HCOI_01729600 1.32 HCOI_05002337 -1.70 HCOI_00832100 1.76 HCOI_00296700 -1.82 HCOI_00073600 1.32 HCOI_00915800 -1.49
HCOI_00779300 1.32 HCOI_00376200 -1.70 HCOI_00254800 1.76 HCOI_00971500 -1.82 HCOI_05004333 1.32 HCOI_02042500 -1.49
HCOI_00141600 1.32 HCOI_00783900 -1.70 HCOI_01714000 1.75 HCOI_01956400 -1.82 HCOI_05002786 1.32 HCOI_01730500 -1.49
HCOI_01268300 1.31 HCOI_01129200 -1.70 HCOI_00913600 1.75 HCOI_00099400 -1.81 HCOI_01892100 1.32 HCOI_01529700 -1.49
HCOI_00486800 1.30 HCOI_01229700 -1.69 HCOI_05005714 1.75 HCOI_00703100 -1.81 HCOI_02025400 1.32 HCOI_05002285 -1.48
HCOI_01288000 1.30 HCOI_00983500 -1.69 HCOI_01789000 1.75 HCOI_01803600 -1.81 HCOI_00326400 1.31 HCOI_00506600 -1.48
HCOI_00781600 1.29 HCOI_05000810 -1.69 HCOI_00516400 1.75 HCOI_01997500 -1.81 HCOI_01274900 1.31 HCOI_01271500 -1.47
HCOI_00765100 1.29 HCOI_01593300 -1.69 HCOI_00087300 1.74 HCOI_00259300 -1.81 HCOI_01870000 1.31 HCOI_01314000 -1.47
HCOI_01836600 1.29 HCOI_00259300 -1.68 HCOI_01626900 1.74 HCOI_05000256 -1.81 HCOI_00271700 1.31 HCOI_01871900 -1.47
HCOI_02043100 1.28 HCOI_01958300 -1.68 HCOI_05004260 1.73 HCOI_01001100 -1.80 HCOI_01658200 1.31 HCOI_01724400 -1.47
HCOI_05002452 1.28 HCOI_05002507 -1.68 HCOI_05006446 1.73 HCOI_01820700 -1.80 HCOI_02058600 1.31 HCOI_01797800 -1.47
HCOI_00441300 1.28 HCOI_00895200 -1.68 HCOI_00400400 1.73 HCOI_00429600 -1.80 HCOI_01747500 1.31 HCOI_01806200 -1.47
HCOI_00627900 1.27 HCOI_05002066 -1.68 HCOI_02098800 1.73 HCOI_05001699 -1.80 HCOI_01575400 1.31 HCOI_01683500 -1.46
HCOI_01825500 1.27 HCOI_00716500 -1.68 HCOI_01101600 1.73 HCOI_02066300 -1.80 HCOI_00290500 1.30 HCOI_02057400 -1.46
HCOI_00834200 1.26 HCOI_00575800 -1.68 HCOI_00931300 1.73 HCOI_01002700 -1.80 HCOI_01193800 1.30 HCOI_01130100 -1.46
HCOI_05003135 1.26 HCOI_00791700 -1.68 HCOI_00915700 1.73 HCOI_00301200 -1.79 HCOI_00684000 1.30 HCOI_05002136 -1.46
HCOI_05003746 1.25 HCOI_00305500 -1.67 HCOI_00213100 1.73 HCOI_01190300 -1.79 HCOI_00772500 1.29 HCOI_05001389 -1.46
HCOI_01429300 1.25 HCOI_05002839 -1.67 HCOI_05006180 1.73 HCOI_01716100 -1.79 HCOI_00524300 1.29 HCOI_01774300 -1.46
HCOI_01293900.2 1.24 HCOI_05000164 -1.67 HCOI_01652500 1.73 HCOI_00195300 -1.79 HCOI_00710400 1.29 HCOI_00704400 -1.45
HCOI_00559300 1.24 HCOI_01719200 -1.67 HCOI_01491300 1.72 HCOI_00055800 -1.79 HCOI_05000005 1.29 HCOI_02039400 -1.45
HCOI_01950500 1.23 HCOI_01154500 -1.67 HCOI_00218300 1.72 HCOI_05006162 -1.78 HCOI_00748700 1.29 HCOI_00915600 -1.45
HCOI_02016600 1.23 HCOI_01250800 -1.66 HCOI_01717600 1.72 HCOI_02047300 -1.78 HCOI_01280000 1.29 HCOI_00621600 -1.45
HCOI_00049600 1.23 HCOI_01996700 -1.66 HCOI_00213200 1.72 HCOI_00099600 -1.78 HCOI_00788300 1.29 HCOI_00209900 -1.45
HCOI_01058400 1.23 HCOI_05000551 -1.66 HCOI_01950500 1.72 HCOI_00862600 -1.77 HCOI_01613300 1.28 HCOI_00385600 -1.45
HCOI_00538000 1.23 HCOI_01047900 -1.65 HCOI_01820000 1.72 HCOI_00272400 -1.77 HCOI_01236600 1.28 HCOI_00398700 -1.44
HCOI_00934900 1.23 HCOI_00615600 -1.65 HCOI_05003198 1.72 HCOI_01615100 -1.77 HCOI_00666000 1.28 HCOI_00673600 -1.44
HCOI_00793400 1.23 HCOI_00845500 -1.65 HCOI_00302400 1.72 HCOI_00523300 -1.77 HCOI_05001538 1.27 HCOI_01816900 -1.44
228
HCOI_00907000 1.23 HCOI_01845500 -1.65 HCOI_01838200 1.72 HCOI_00017100 -1.77 HCOI_01104300 1.27 HCOI_01183000 -1.44
HCOI_01104300 1.22 HCOI_00957500 -1.64 HCOI_01136400 1.71 HCOI_00791600 -1.77 HCOI_00624100 1.26 HCOI_00258400 -1.44
HCOI_00559600 1.22 HCOI_00070100 -1.64 HCOI_05003525 1.71 HCOI_05000207 -1.76 HCOI_01274200 1.26 HCOI_00674300 -1.44
HCOI_00044100 1.22 HCOI_01191700 -1.64 HCOI_01822100 1.71 HCOI_05000145 -1.76 HCOI_00928400 1.25 HCOI_05004296 -1.44
HCOI_01115700 1.22 HCOI_01615200 -1.64 HCOI_00513100 1.71 HCOI_02105900 -1.76 HCOI_00619500 1.25 HCOI_00990900 -1.44
HCOI_01630500 1.22 HCOI_05000203 -1.64 HCOI_00438300 1.71 HCOI_05004332 -1.76 HCOI_05003906 1.25 HCOI_00200600 -1.44
HCOI_01884200 1.21 HCOI_01997500 -1.64 HCOI_00664400 1.71 HCOI_00236600 -1.75 HCOI_00694600 1.25 HCOI_02090200 -1.44
HCOI_00714400.2 1.21 HCOI_01822500 -1.64 HCOI_01416100 1.70 HCOI_01475700 -1.75 HCOI_01787800 1.25 HCOI_01054800 -1.44
HCOI_01959100 1.21 HCOI_05001371 -1.64 HCOI_00538800 1.70 HCOI_00791800 -1.75 HCOI_05003308 1.24 HCOI_00919200 -1.43
HCOI_00926900 1.21 HCOI_00035200 -1.63 HCOI_00404100 1.70 HCOI_01905700 -1.75 HCOI_02015600 1.24 HCOI_00438400 -1.43
HCOI_00796900 1.21 HCOI_00839000 -1.63 HCOI_01059500.2 1.70 HCOI_00483000 -1.75 HCOI_00859900 1.24 HCOI_05006034 -1.43
HCOI_05002899 1.21 HCOI_01124800 -1.63 HCOI_01814300 1.69 HCOI_00295000 -1.75 HCOI_00404800 1.24 HCOI_00936200 -1.43
HCOI_01203300 1.20 HCOI_00817700 -1.63 HCOI_00422000 1.69 HCOI_00373200 -1.74 HCOI_00870900 1.24 HCOI_00892600 -1.43
HCOI_01078400 1.20 HCOI_01599400 -1.62 HCOI_01747900 1.69 HCOI_01608300 -1.74 HCOI_00264500 1.24 HCOI_00980500 -1.43
HCOI_01490500 1.20 HCOI_05003892 -1.62 HCOI_00304800 1.68 HCOI_00175300 -1.74 HCOI_05004291 1.23 HCOI_01512700 -1.42
HCOI_05001138 1.20 HCOI_05001193 -1.61 HCOI_01715700 1.68 HCOI_01605700 -1.73 HCOI_00564300 1.23 HCOI_01466700 -1.42
HCOI_01438900 1.20 HCOI_05002099 -1.61 HCOI_00788700 1.68 HCOI_01124700 -1.73 HCOI_00765200 1.23 HCOI_00763700 -1.42
HCOI_01273700 1.20 HCOI_00694600 -1.61 HCOI_01760800 1.68 HCOI_02025400 -1.72 HCOI_05000491 1.23 HCOI_00642400 -1.42
HCOI_05003167 1.20 HCOI_01993000 -1.61 HCOI_01875600 1.67 HCOI_00813000 -1.72 HCOI_00620700 1.23 HCOI_01400400 -1.42
HCOI_05003428 1.19 HCOI_01687100 -1.61 HCOI_00859000 1.67 HCOI_01408000 -1.72 HCOI_00142200 1.23 HCOI_00881600 -1.42
HCOI_00480600 1.19 HCOI_01705400 -1.61 HCOI_00671300 1.67 HCOI_05004593 -1.71 HCOI_00907000 1.23 HCOI_00383700 -1.42
HCOI_00406600 1.19 HCOI_00589900 -1.60 HCOI_05004885 1.67 HCOI_01474700 -1.71 HCOI_00063700 1.23 HCOI_00096200 -1.41
HCOI_05000564 1.19 HCOI_01600600 -1.60 HCOI_01157300 1.66 HCOI_01497900.2 -1.71 HCOI_05002145 1.22 HCOI_00926900 -1.41
HCOI_00052300 1.19 HCOI_05001224 -1.60 HCOI_01267600 1.66 HCOI_05001757 -1.71 HCOI_01487300 1.22 HCOI_01477900 -1.41
HCOI_00137900 1.18 HCOI_01837900 -1.60 HCOI_00441900 1.66 HCOI_00711100 -1.71 HCOI_01497900.2 1.22 HCOI_05001423 -1.41
HCOI_00521100 1.18 HCOI_01199000 -1.60 HCOI_00644700 1.66 HCOI_00343200 -1.71 HCOI_01665800 1.22 HCOI_01583900 -1.41
HCOI_01197100 1.18 HCOI_05004410 -1.60 HCOI_05003197 1.65 HCOI_00506400 -1.71 HCOI_02153200 1.22 HCOI_01738500 -1.40
HCOI_00246000 1.17 HCOI_01361800 -1.60 HCOI_00040000 1.65 HCOI_01047900 -1.70 HCOI_00384500 1.21 HCOI_00538800 -1.40
HCOI_05000608 1.17 HCOI_05001198 -1.59 HCOI_00948100 1.65 HCOI_01705900 -1.70 HCOI_01936600 1.21 HCOI_01123300 -1.40
229
HCOI_05002407 1.16 HCOI_01984700 -1.59 HCOI_05000040 1.65 HCOI_00191500 -1.70 HCOI_00859500 1.20 HCOI_01000400 -1.40
HCOI_00335200 1.16 HCOI_00450400 -1.59 HCOI_01611000 1.65 HCOI_00885700 -1.70 HCOI_00026600 1.20 HCOI_05002339 -1.40
HCOI_01784600 1.16 HCOI_00886800 -1.58 HCOI_01706300 1.64 HCOI_01222300 -1.70 HCOI_02066300 1.20 HCOI_01850800 -1.40
HCOI_02082700 1.16 HCOI_00195600 -1.58 HCOI_01746500 1.64 HCOI_00915400 -1.70 HCOI_00638800 1.20 HCOI_00027600 -1.40
HCOI_01706300 1.16 HCOI_00970400 -1.58 HCOI_01233900 1.64 HCOI_00098800 -1.69 HCOI_00919400 1.19 HCOI_01970000 -1.39
HCOI_00477700 1.16 HCOI_00563600 -1.57 HCOI_00787600 1.63 HCOI_02086400 -1.69 HCOI_00375500 1.19 HCOI_00867100 -1.39
HCOI_01915600 1.16 HCOI_01646500 -1.57 HCOI_00966900 1.63 HCOI_00989000 -1.69 HCOI_02056900 1.19 HCOI_00653500 -1.39
HCOI_05002447 1.15 HCOI_00706600 -1.57 HCOI_01528500 1.63 HCOI_05002507 -1.69 HCOI_01019400 1.19 HCOI_00987500 -1.39
HCOI_00670500 1.15 HCOI_01396200 -1.57 HCOI_05002177 1.63 HCOI_05005462 -1.69 HCOI_01778500 1.19 HCOI_00342200 -1.39
HCOI_05003808 1.15 HCOI_01349600 -1.57 HCOI_05004011 1.63 HCOI_00676900 -1.68 HCOI_01267700 1.19 HCOI_05003307 -1.39
HCOI_01901100 1.15 HCOI_01767400 -1.57 HCOI_01458200 1.63 HCOI_01402700 -1.68 HCOI_00893400 1.19 HCOI_00707800 -1.38
HCOI_00534600 1.15 HCOI_00477000 -1.57 HCOI_01447100 1.62 HCOI_01349600 -1.68 HCOI_00335200 1.19 HCOI_05004769 -1.38
HCOI_01696500 1.15 HCOI_00359100 -1.57 HCOI_00321500 1.62 HCOI_00414000 -1.68 HCOI_01367300 1.19 HCOI_05001244 -1.38
HCOI_02158400 1.15 HCOI_01100900 -1.57 HCOI_01331400 1.62 HCOI_01655900 -1.67 HCOI_01667300 1.19 HCOI_01599000 -1.38
HCOI_00779000 1.15 HCOI_01123500 -1.57 HCOI_00069700 1.62 HCOI_02051400 -1.67 HCOI_01595500 1.19 HCOI_00849700 -1.38
HCOI_01684500 1.14 HCOI_00914600 -1.57 HCOI_05000183 1.62 HCOI_00475400 -1.67 HCOI_00952900 1.18 HCOI_00215300 -1.38
HCOI_05000713 1.14 HCOI_00526500 -1.57 HCOI_00779700 1.62 HCOI_00682700 -1.67 HCOI_00479600 1.17 HCOI_00156200 -1.38
HCOI_02008200 1.14 HCOI_01603800 -1.56 HCOI_00013700 1.62 HCOI_00149600 -1.66 HCOI_00296700 1.17 HCOI_00392400 -1.38
HCOI_00192700 1.14 HCOI_01699000 -1.56 HCOI_01055500 1.62 HCOI_01468800 -1.66 HCOI_01876300 1.17 HCOI_00395800 -1.37
HCOI_00534500 1.14 HCOI_02123000 -1.56 HCOI_01389400 1.61 HCOI_01677400 -1.66 HCOI_01227800 1.17 HCOI_00281300 -1.37
HCOI_00280300.2 1.14 HCOI_01849700 -1.56 HCOI_01819800 1.61 HCOI_01965800 -1.66 HCOI_01056900 1.17 HCOI_01607900 -1.36
HCOI_01186400 1.14 HCOI_00321200 -1.56 HCOI_00441300 1.61 HCOI_01293800 -1.66 HCOI_01327100 1.16 HCOI_01849000 -1.36
HCOI_00929400 1.14 HCOI_05004764 -1.56 HCOI_01504900 1.61 HCOI_00853400 -1.65 HCOI_00025000 1.16 HCOI_00152900 -1.36
HCOI_00874200 1.13 HCOI_05001236 -1.55 HCOI_00123100 1.61 HCOI_01116100 -1.65 HCOI_00206600 1.15 HCOI_00848400 -1.35
HCOI_00214500 1.13 HCOI_00684000 -1.55 HCOI_00570400 1.61 HCOI_00327400 -1.65 HCOI_01470500 1.15 HCOI_01957700 -1.35
HCOI_01919800 1.13 HCOI_05005462 -1.55 HCOI_05002897 1.60 HCOI_01809300 -1.65 HCOI_00403300 1.15 HCOI_00379600 -1.35
HCOI_01681900 1.13 HCOI_05003522 -1.55 HCOI_00248900 1.60 HCOI_01494100 -1.65 HCOI_00969700 1.14 HCOI_00393900 -1.35
HCOI_00257700 1.13 HCOI_00722400 -1.55 HCOI_00198500 1.60 HCOI_05000950 -1.65 HCOI_01870100 1.13 HCOI_00495700 -1.35
HCOI_01820300 1.13 HCOI_01546000 -1.54 HCOI_00413100 1.60 HCOI_00083700 -1.65 HCOI_00363600 1.12 HCOI_00908300 -1.35
230
HCOI_01198300 1.13 HCOI_05000435 -1.54 HCOI_05003653 1.60 HCOI_02089800 -1.64 HCOI_02179500 1.12 HCOI_01634700 -1.34
HCOI_00559700 1.13 HCOI_01225700 -1.54 HCOI_00465200 1.60 HCOI_05001302 -1.64 HCOI_00682800 1.12 HCOI_05003853 -1.34
HCOI_00193000 1.13 HCOI_01651300 -1.54 HCOI_01342700 1.60 HCOI_00412200 -1.64 HCOI_00884000 1.12 HCOI_01696500 -1.34
HCOI_00633200.2 1.13 HCOI_05000376 -1.54 HCOI_00395100 1.60 HCOI_05003382 -1.64 HCOI_05000207 1.12 HCOI_00662100 -1.34
HCOI_00934700 1.12 HCOI_00173000 -1.54 HCOI_00215800 1.60 HCOI_01866900 -1.64 HCOI_00573000 1.12 HCOI_00707200 -1.34
HCOI_00750100 1.12 HCOI_01221500 -1.54 HCOI_05004232 1.60 HCOI_01787100 -1.64 HCOI_02105100 1.12 HCOI_00031300 -1.33
HCOI_01042500 1.12 HCOI_00340700 -1.54 HCOI_05003428 1.59 HCOI_02108200 -1.64 HCOI_01876400 1.11 HCOI_00161400 -1.33
HCOI_00991600 1.11 HCOI_01849000 -1.54 HCOI_00970500 1.59 HCOI_01636800 -1.63 HCOI_00751200 1.11 HCOI_01486500 -1.33
HCOI_01880800 1.11 HCOI_01547800 -1.54 HCOI_00492800 1.59 HCOI_01310300 -1.62 HCOI_01360900 1.11 HCOI_01003500 -1.32
HCOI_01133400 1.11 HCOI_01495200 -1.54 HCOI_05000348 1.59 HCOI_01617300 -1.62 HCOI_01537700 1.11 HCOI_01936400 -1.32
HCOI_00943400 1.11 HCOI_00772100 -1.54 HCOI_01084700 1.59 HCOI_00210000 -1.62 HCOI_01784600 1.11 HCOI_01300300 -1.32
HCOI_00646700 1.11 HCOI_01302000 -1.53 HCOI_00329300 1.59 HCOI_01016900 -1.62 HCOI_01946700 1.11 HCOI_00980900 -1.32
HCOI_01733700 1.10 HCOI_01487300 -1.53 HCOI_00257900 1.58 HCOI_05002119 -1.62 HCOI_05002311 1.10 HCOI_01805000 -1.32
HCOI_00462500 1.10 HCOI_01260100 -1.53 HCOI_01421000 1.58 HCOI_00884000 -1.62 HCOI_00947400 1.10 HCOI_01271400 -1.32
HCOI_05001746 1.10 HCOI_02173300 -1.53 HCOI_01378600 1.58 HCOI_00901300 -1.62 HCOI_00750100 1.10 HCOI_00237200 -1.32
HCOI_02019900 1.10 HCOI_00450500 -1.53 HCOI_00597100 1.58 HCOI_00693700 -1.62 HCOI_00762600 1.10 HCOI_00301700 -1.31
HCOI_01901800 1.10 HCOI_01054800 -1.53 HCOI_00969600 1.58 HCOI_00836500 -1.62 HCOI_01272200 1.10 HCOI_05000076 -1.31
HCOI_00631200 1.10 HCOI_00436800 -1.53 HCOI_05001978 1.58 HCOI_01659300 -1.61 HCOI_00201200 1.09 HCOI_01449500 -1.31
HCOI_05002275 1.09 HCOI_01366000 -1.53 HCOI_05002044 1.57 HCOI_01806800 -1.61 HCOI_00440400 1.09 HCOI_01221500 -1.31
HCOI_00879800 1.09 HCOI_00960900 -1.52 HCOI_00543500 1.57 HCOI_05002541 -1.61 HCOI_01147400 1.09 HCOI_00606800 -1.31
HCOI_01122400 1.08 HCOI_00627700 -1.52 HCOI_00260600 1.57 HCOI_01613300 -1.61 HCOI_01087200 1.09 HCOI_00609000 -1.31
HCOI_00278600 1.08 HCOI_00901300 -1.52 HCOI_00986600 1.57 HCOI_01199000 -1.61 HCOI_01773600 1.08 HCOI_01539300 -1.31
HCOI_05000059 1.08 HCOI_01745700 -1.52 HCOI_00815700 1.57 HCOI_02159800 -1.60 HCOI_00489700 1.08 HCOI_01500700 -1.31
HCOI_00868800 1.08 HCOI_01092500 -1.52 HCOI_01404300 1.56 HCOI_05000310 -1.60 HCOI_05001652 1.08 HCOI_01957200 -1.30
HCOI_01594000 1.08 HCOI_05005094 -1.52 HCOI_02065300 1.56 HCOI_00205900 -1.60 HCOI_00956700 1.08 HCOI_01601900 -1.30
HCOI_01914800.2 1.08 HCOI_00328300 -1.51 HCOI_00753800 1.56 HCOI_01705500 -1.60 HCOI_00323300 1.08 HCOI_00387700 -1.30
HCOI_00559500 1.07 HCOI_01417600 -1.51 HCOI_00651600 1.56 HCOI_02011500 -1.60 HCOI_00142800 1.07 HCOI_00242400 -1.30
HCOI_00788700 1.07 HCOI_01494100 -1.51 HCOI_01316900 1.56 HCOI_01190800 -1.60 HCOI_00564500 1.07 HCOI_00759500 -1.29
HCOI_00913700 1.07 HCOI_05002810 -1.51 HCOI_00080700 1.56 HCOI_02028100 -1.59 HCOI_05001187 1.07 HCOI_01960800 -1.29
231
HCOI_02140200 1.07 HCOI_02171600 -1.51 HCOI_01724400 1.55 HCOI_00153000 -1.59 HCOI_01167500 1.07 HCOI_01180700 -1.29
HCOI_00563100 1.07 HCOI_05003894 -1.51 HCOI_02100300 1.55 HCOI_00604800 -1.59 HCOI_01028500 1.07 HCOI_01679200 -1.29
HCOI_00059100 1.07 HCOI_05001031 -1.51 HCOI_01904200 1.55 HCOI_00719700 -1.59 HCOI_00985200 1.06 HCOI_01954200 -1.29
HCOI_01360900 1.07 HCOI_01489600 -1.50 HCOI_05001138 1.55 HCOI_01163800 -1.59 HCOI_00734900 1.06 HCOI_00999000 -1.29
HCOI_05003057 1.07 HCOI_01785800 -1.50 HCOI_01538300 1.55 HCOI_05001765 -1.59 HCOI_02087300 1.06 HCOI_00803300 -1.29
HCOI_01708700 1.07 HCOI_00987600 -1.50 HCOI_05004335 1.54 HCOI_00488000 -1.59 HCOI_02183800 1.06 HCOI_00471500 -1.29
HCOI_00803400 1.07 HCOI_01001100 -1.50 HCOI_00107900 1.54 HCOI_00819600 -1.58 HCOI_00801800.2 1.05 HCOI_00177500 -1.29
HCOI_01228500 1.07 HCOI_01806800 -1.50 HCOI_02170000 1.54 HCOI_00584500.2 -1.58 HCOI_00861000 1.05 HCOI_00721500 -1.28
HCOI_01059500.2 1.06 HCOI_01250900 -1.50 HCOI_05001996 1.54 HCOI_01771700 -1.58 HCOI_01232400 1.05 HCOI_01225700 -1.28
HCOI_01354500 1.06 HCOI_01933800 -1.50 HCOI_00187100 1.54 HCOI_01484100 -1.58 HCOI_00873500 1.05 HCOI_01754600 -1.28
HCOI_00371200.2 1.06 HCOI_00224800 -1.49 HCOI_02001200 1.54 HCOI_05002761 -1.58 HCOI_00450400 1.05 HCOI_01316900 -1.28
HCOI_05002653 1.05 HCOI_01659400 -1.49 HCOI_05003390 1.54 HCOI_01279000 -1.57 HCOI_01346000 1.05 HCOI_00449500 -1.28
HCOI_00355400 1.05 HCOI_05000750 -1.49 HCOI_05001983 1.54 HCOI_01100900 -1.57 HCOI_00236800 1.04 HCOI_02102000 -1.27
HCOI_00118300 1.05 HCOI_00734300 -1.49 HCOI_00990900 1.54 HCOI_01592500 -1.57 HCOI_01588800 1.04 HCOI_00357700 -1.27
HCOI_00479500 1.05 HCOI_00102500 -1.49 HCOI_01819900 1.54 HCOI_05002188 -1.57 HCOI_01978100 1.04 HCOI_01880100 -1.27
HCOI_00724500 1.05 HCOI_00295800 -1.49 HCOI_01797800 1.54 HCOI_02082500 -1.57 HCOI_00793400 1.04 HCOI_02043300 -1.27
HCOI_01972700 1.05 HCOI_01425500 -1.49 HCOI_05003169 1.53 HCOI_00882500 -1.56 HCOI_00913900 1.03 HCOI_00887600 -1.27
HCOI_00278700 1.05 HCOI_01636800 -1.49 HCOI_00353900 1.53 HCOI_01407900 -1.56 HCOI_01001000.2 1.03 HCOI_01368900 -1.26
HCOI_05001116 1.04 HCOI_00667200 -1.49 HCOI_00540600 1.53 HCOI_01046500 -1.56 HCOI_00597300 1.03 HCOI_00909600 -1.26
HCOI_00687100 1.04 HCOI_00812600 -1.49 HCOI_01072800 1.53 HCOI_02028700 -1.56 HCOI_01572000 1.03 HCOI_05000040 -1.26
HCOI_00543500 1.04 HCOI_00744200 -1.48 HCOI_02156600 1.53 HCOI_05002121 -1.56 HCOI_01367400 1.03 HCOI_00973100.2 -1.26
HCOI_01850300 1.04 HCOI_01165200 -1.48 HCOI_02094600 1.53 HCOI_00914900 -1.56 HCOI_00049000 1.02 HCOI_00506700 -1.26
HCOI_00169600 1.04 HCOI_01614500 -1.48 HCOI_00934700 1.53 HCOI_00437100 -1.56 HCOI_00762800 1.02 HCOI_01219200 -1.25
HCOI_00554600 1.04 HCOI_01105800 -1.48 HCOI_00615800 1.53 HCOI_01279400 -1.56 HCOI_01729600 1.02 HCOI_01451000 -1.25
HCOI_00668900 1.03 HCOI_01232200 -1.48 HCOI_02178800 1.52 HCOI_01614800 -1.55 HCOI_05003618 1.01 HCOI_01584200 -1.25
HCOI_01094100 1.03 HCOI_00569200 -1.48 HCOI_01506600 1.52 HCOI_05000203 -1.55 HCOI_00382700 1.01 HCOI_00035900.2 -1.25
HCOI_05002379 1.03 HCOI_01342900 -1.47 HCOI_00010500 1.52 HCOI_05001921 -1.55 HCOI_01272500 1.01 HCOI_02120000 -1.25
HCOI_01577300 1.02 HCOI_01509400 -1.47 HCOI_05002288 1.52 HCOI_00224800 -1.55 HCOI_01497200 1.01 HCOI_02091400 -1.25
HCOI_01425600.2 1.02 HCOI_01953700 -1.47 HCOI_01404100 1.51 HCOI_00961800 -1.55 HCOI_00073800.2 1.01 HCOI_00825000 -1.25
232
HCOI_00278100 1.02 HCOI_00853400 -1.47 HCOI_00908200 1.51 HCOI_00002900 -1.55 HCOI_01463300 1.01 HCOI_01810500 -1.25
HCOI_00580800 1.02 HCOI_01660600 -1.47 HCOI_05004277 1.51 HCOI_02062800 -1.55 HCOI_01591400 1.01 HCOI_01506300 -1.24
HCOI_05001464 1.02 HCOI_00132300 -1.46 HCOI_01424500 1.51 HCOI_01191600 -1.55 HCOI_05003057 1.00 HCOI_01911200 -1.23
HCOI_00193700 1.02 HCOI_00361200 -1.46 HCOI_02039700 1.51 HCOI_05000072 -1.54 HCOI_00114800 1.00 HCOI_00682200 -1.23
HCOI_00122700 1.02 HCOI_01088500 -1.46 HCOI_05003070 1.51 HCOI_05004072 -1.54 HCOI_00394600 1.00 HCOI_00339300 -1.23
HCOI_00022900 1.02 HCOI_01551100 -1.46 HCOI_02036400 1.51 HCOI_00288400 -1.54 HCOI_01478300 1.00 HCOI_00936700 -1.22
HCOI_00174700.2 1.01 HCOI_01137800 -1.46 HCOI_05000663 1.51 HCOI_05001131 -1.54 HCOI_00862200 1.00 HCOI_00978300 -1.22
HCOI_00236500 1.01 HCOI_00885800.2 -1.46 HCOI_02043800 1.51 HCOI_02014700 -1.54
HCOI_01927700 -1.22
HCOI_01695700 1.01 HCOI_00262400 -1.46 HCOI_00625600 1.51 HCOI_01883100 -1.54
HCOI_01109600 -1.22
HCOI_00862200 1.01 HCOI_05004333 -1.45 HCOI_01993100 1.50 HCOI_00398800 -1.53
HCOI_05003746 -1.22
HCOI_00991700 1.00 HCOI_00761000 -1.45 HCOI_01904800 1.50 HCOI_05002788 -1.53
HCOI_01758000 -1.21
HCOI_00791900 1.00 HCOI_01787500 -1.45 HCOI_05004257 1.50 HCOI_00684600 -1.53
HCOI_05000427 -1.21
HCOI_00077400 -1.45 HCOI_00387500 1.50 HCOI_00030500 -1.53
HCOI_05004013 -1.21
HCOI_05000832 -1.45 HCOI_01653300 1.49 HCOI_00708200 -1.53
HCOI_02112800 -1.21
HCOI_02000400 -1.45 HCOI_05003091 1.49 HCOI_00749900 -1.53
HCOI_01384700 -1.21
HCOI_00298300 -1.45 HCOI_05004288 1.49 HCOI_00363600 -1.53
HCOI_01984100 -1.21
HCOI_00353400 -1.45 HCOI_01409500 1.48 HCOI_01065900 -1.53
HCOI_00059300 -1.21
HCOI_05003301 -1.44 HCOI_02093300 1.48 HCOI_00960100 -1.53
HCOI_01958300 -1.21
HCOI_00484200 -1.44 HCOI_01640400 1.48 HCOI_00785400 -1.53
HCOI_00386000 -1.21
HCOI_01507900 -1.44 HCOI_01656500 1.48 HCOI_01066500 -1.53
HCOI_00922800 -1.21
HCOI_00684600 -1.44 HCOI_01902800 1.48 HCOI_01204700 -1.52
HCOI_02169500 -1.20
HCOI_00949800 -1.44 HCOI_01652600 1.48 HCOI_01546200 -1.52
HCOI_01940100 -1.20
HCOI_00060000 -1.44 HCOI_00114300 1.48 HCOI_01547600 -1.52
HCOI_00767800 -1.20
HCOI_00926200 -1.44 HCOI_05004369 1.48 HCOI_01084200 -1.52
HCOI_01552100 -1.20
HCOI_00366200 -1.44 HCOI_01737600 1.47 HCOI_00716400 -1.51
HCOI_00992100 -1.20
HCOI_00622900 -1.43 HCOI_00287600 1.47 HCOI_02006400 -1.51
HCOI_01541300 -1.19
HCOI_02013800 -1.43 HCOI_00920500 1.47 HCOI_01167500 -1.51
HCOI_02041200 -1.19
HCOI_00195300 -1.43 HCOI_01272300 1.47 HCOI_01600600 -1.50
HCOI_01123600 -1.19
HCOI_00915800 -1.43 HCOI_05004687 1.47 HCOI_00574700 -1.50
HCOI_01160600 -1.19
233
HCOI_00887300 -1.43 HCOI_00779400 1.47 HCOI_05002840 -1.50
HCOI_00543600 -1.19
HCOI_02058000 -1.43 HCOI_05001746 1.47 HCOI_01310700 -1.50
HCOI_05000663 -1.19
HCOI_00082600 -1.43 HCOI_00821100 1.46 HCOI_00321000 -1.50
HCOI_00398900 -1.18
HCOI_02140400 -1.43 HCOI_01286100 1.46 HCOI_01600000 -1.50
HCOI_00198500 -1.18
HCOI_00749900 -1.43 HCOI_05002386 1.46 HCOI_00959500 -1.50
HCOI_00886400 -1.18
HCOI_01654100 -1.43 HCOI_00084900 1.46 HCOI_01936600 -1.50
HCOI_00495300 -1.17
HCOI_00271000 -1.42 HCOI_00723200 1.46 HCOI_01405100 -1.50
HCOI_00305900 -1.17
HCOI_01449200 -1.42 HCOI_01744000 1.46 HCOI_01414000 -1.50
HCOI_02174400 -1.17
HCOI_01532100 -1.42 HCOI_00195100 1.46 HCOI_00529400 -1.50
HCOI_01142900 -1.17
HCOI_05000567 -1.42 HCOI_00707800 1.46 HCOI_05003011 -1.49
HCOI_00426100 -1.17
HCOI_01855900 -1.42 HCOI_01074200 1.46 HCOI_02076500 -1.49
HCOI_00248300 -1.17
HCOI_01063100 -1.42 HCOI_05001464 1.45 HCOI_05002460 -1.49
HCOI_01527200 -1.17
HCOI_01769100 -1.42 HCOI_00044100 1.45 HCOI_01834200 -1.49
HCOI_01905800 -1.16
HCOI_01124700 -1.42 HCOI_01904900 1.45 HCOI_00118000 -1.48
HCOI_01384100 -1.16
HCOI_00393900 -1.42 HCOI_00549500 1.45 HCOI_01870100 -1.48
HCOI_01621500 -1.16
HCOI_00718000 -1.42 HCOI_00680000 1.45 HCOI_00964200 -1.48
HCOI_00347700 -1.16
HCOI_01279100 -1.42 HCOI_00304700 1.45 HCOI_00302900 -1.48
HCOI_01420300 -1.16
HCOI_00743900 -1.42 HCOI_01216400 1.44 HCOI_01361000 -1.48
HCOI_02159300 -1.16
HCOI_00454200 -1.42 HCOI_01194100 1.44 HCOI_01400400 -1.48
HCOI_01118900 -1.16
HCOI_05004174 -1.42 HCOI_05002485 1.44 HCOI_05004625 -1.48
HCOI_01582700 -1.15
HCOI_01205600 -1.42 HCOI_00824900 1.44 HCOI_00851200 -1.48
HCOI_00162200 -1.15
HCOI_05002339 -1.41 HCOI_00283600 1.44 HCOI_00597000 -1.48
HCOI_02184900 -1.15
HCOI_05000673 -1.41 HCOI_01557100 1.44 HCOI_01660600 -1.48
HCOI_01124800 -1.15
HCOI_00567200 -1.41 HCOI_01306400 1.44 HCOI_01812100 -1.48
HCOI_00570400 -1.15
HCOI_01862700 -1.41 HCOI_05000704 1.43 HCOI_00671800 -1.48
HCOI_00721100 -1.15
HCOI_00420800 -1.41 HCOI_01943700 1.43 HCOI_00694300 -1.48
HCOI_01389400 -1.14
HCOI_00818800 -1.41 HCOI_05002626 1.43 HCOI_00487700 -1.47
HCOI_01887700 -1.14
HCOI_02073200 -1.41 HCOI_00069800 1.43 HCOI_01907600 -1.47
HCOI_00576100 -1.14
HCOI_02057500 -1.41 HCOI_01570200 1.43 HCOI_01870700 -1.47
HCOI_00406900 -1.14
234
HCOI_01705500 -1.41 HCOI_05000773 1.43 HCOI_01330000 -1.47
HCOI_00754700 -1.14
HCOI_01727600 -1.41 HCOI_05002137 1.42 HCOI_02151600 -1.46
HCOI_00964600 -1.13
HCOI_05001187 -1.41 HCOI_00475700 1.42 HCOI_00037600 -1.46
HCOI_00199500 -1.13
HCOI_01045600 -1.41 HCOI_01157100 1.42 HCOI_00013300 -1.46
HCOI_01298300 -1.13
HCOI_01699400 -1.41 HCOI_00704400 1.42 HCOI_00128700 -1.46
HCOI_00386200 -1.12
HCOI_01851700 -1.40 HCOI_01000400 1.42 HCOI_01346000 -1.46
HCOI_01318200 -1.12
HCOI_01586300 -1.40 HCOI_00254100 1.42 HCOI_00551800 -1.46
HCOI_01991600 -1.12
HCOI_02028700 -1.40 HCOI_01964000 1.42 HCOI_00354300 -1.46
HCOI_00709200 -1.12
HCOI_01118900 -1.40 HCOI_00187900 1.42 HCOI_00516600 -1.46
HCOI_00970500 -1.12
HCOI_00464600 -1.40 HCOI_01805000 1.42 HCOI_01974300 -1.46
HCOI_02054700 -1.12
HCOI_02055200 -1.39 HCOI_01602100 1.41 HCOI_02123000 -1.46
HCOI_01425900 -1.12
HCOI_01890900 -1.39 HCOI_01958400 1.41 HCOI_01415900 -1.46
HCOI_00348500 -1.12
HCOI_05002254 -1.39 HCOI_02105400 1.41 HCOI_01985700 -1.45
HCOI_00908800 -1.12
HCOI_02095000 -1.39 HCOI_05001823 1.41 HCOI_02066600 -1.45
HCOI_05000545 -1.12
HCOI_01677100 -1.39 HCOI_02090200 1.41 HCOI_00949800 -1.45
HCOI_00519700 -1.12
HCOI_00901100 -1.39 HCOI_02043100 1.41 HCOI_05000376 -1.45
HCOI_00495400 -1.11
HCOI_05003881 -1.39 HCOI_00934800 1.41 HCOI_00913900 -1.45
HCOI_01768000 -1.11
HCOI_00290200 -1.39 HCOI_01727900 1.41 HCOI_05003301 -1.45
HCOI_01009200 -1.11
HCOI_01525600 -1.39 HCOI_01559500 1.41 HCOI_00981900 -1.45
HCOI_00653100 -1.11
HCOI_00536300 -1.39 HCOI_02141500 1.41 HCOI_05000838 -1.45
HCOI_00321000 -1.10
HCOI_01770500 -1.38 HCOI_00646700 1.41 HCOI_00462200 -1.44
HCOI_01500300 -1.10
HCOI_00848400 -1.38 HCOI_05005743 1.40 HCOI_00917900 -1.44
HCOI_01822000 -1.10
HCOI_05000254 -1.38 HCOI_01733000 1.40 HCOI_00769000 -1.44
HCOI_00193100 -1.10
HCOI_00055100 -1.38 HCOI_00086000 1.40 HCOI_01123400 -1.44
HCOI_01838200 -1.10
HCOI_01663600 -1.37 HCOI_00217600 1.40 HCOI_00630100 -1.44
HCOI_00380700 -1.10
HCOI_00200600 -1.37 HCOI_05002245 1.40 HCOI_05005386 -1.44
HCOI_01464600 -1.09
HCOI_01225600 -1.37 HCOI_00792400 1.40 HCOI_01515600 -1.43
HCOI_00571300 -1.09
HCOI_01495600 -1.37 HCOI_02141600 1.39 HCOI_02000400 -1.43
HCOI_02186700 -1.09
HCOI_05003940 -1.37 HCOI_01347800 1.39 HCOI_00026800 -1.43
HCOI_05002897 -1.09

235
HCOI_00680900 -1.36 HCOI_00301700 1.39 HCOI_00529300 -1.43
HCOI_00516400 -1.08
HCOI_01921400 -1.36 HCOI_01532300 1.39 HCOI_00437400 -1.43
HCOI_01160500 -1.08
HCOI_05001940 -1.36 HCOI_01006400 1.39 HCOI_05001800 -1.42
HCOI_00037000 -1.08
HCOI_02030400 -1.36 HCOI_01186400 1.39 HCOI_00161100 -1.42
HCOI_01872600 -1.08
HCOI_00271700 -1.35 HCOI_05000685 1.39 HCOI_02085000 -1.42
HCOI_01714800 -1.08
HCOI_00722200 -1.35 HCOI_01476800 1.39 HCOI_01273000 -1.41
HCOI_01083900 -1.07
HCOI_05001275 -1.35 HCOI_01267900 1.39 HCOI_00150000 -1.41
HCOI_01489100 -1.07
HCOI_01883100 -1.35 HCOI_02144200 1.39 HCOI_01550400 -1.41
HCOI_00622700 -1.07
HCOI_01809800 -1.35 HCOI_01046100 1.39 HCOI_01180600 -1.41
HCOI_01123500 -1.07
HCOI_00475600 -1.34 HCOI_00158800 1.39 HCOI_01815400 -1.41
HCOI_01264800 -1.07
HCOI_00336200 -1.34 HCOI_01316100 1.39 HCOI_01660500 -1.41
HCOI_02122400 -1.07
HCOI_00083700 -1.34 HCOI_00033600 1.39 HCOI_01847100 -1.41
HCOI_00996400 -1.07
HCOI_02169500 -1.34 HCOI_00613000 1.39 HCOI_00404700 -1.41
HCOI_02173700 -1.07
HCOI_01456200 -1.34 HCOI_00482000 1.38 HCOI_01478900 -1.41
HCOI_01744000 -1.07
HCOI_00588300 -1.34 HCOI_00778400 1.38 HCOI_00333600 -1.41
HCOI_01497400 -1.07
HCOI_00429600 -1.34 HCOI_01043000 1.38 HCOI_01399300 -1.41
HCOI_00673800 -1.07
HCOI_00196800 -1.34 HCOI_01284700 1.38 HCOI_01787400 -1.41
HCOI_01496500 -1.06
HCOI_00536200 -1.34 HCOI_01214200 1.37 HCOI_05002066 -1.40
HCOI_01620400 -1.06
HCOI_00593800 -1.33 HCOI_00251900 1.37 HCOI_00933500 -1.40
HCOI_01925500 -1.06
HCOI_00821800 -1.33 HCOI_00344100 1.37 HCOI_01671400 -1.40
HCOI_01607000 -1.06
HCOI_00630200 -1.33 HCOI_01631700 1.37 HCOI_05003881 -1.40
HCOI_01805200 -1.06
HCOI_01617300 -1.33 HCOI_05001597 1.37 HCOI_00931900 -1.40
HCOI_05006163 -1.06
HCOI_05003987 -1.33 HCOI_00670000 1.37 HCOI_05005094 -1.40
HCOI_00857100 -1.06
HCOI_01308900 -1.33 HCOI_01804900 1.36 HCOI_01215800 -1.40
HCOI_00381100 -1.06
HCOI_01625500 -1.33 HCOI_02135100 1.36 HCOI_01253300 -1.40
HCOI_00410600 -1.06
HCOI_05000296 -1.33 HCOI_00313600 1.36 HCOI_01993000 -1.40
HCOI_00213400 -1.06
HCOI_02030600 -1.33 HCOI_00563100 1.35 HCOI_01705700 -1.40
HCOI_01018800 -1.06
HCOI_00611300 -1.32 HCOI_00549600 1.35 HCOI_01184400 -1.39
HCOI_01275000 -1.05
HCOI_00229700 -1.32 HCOI_01514400 1.35 HCOI_01291700 -1.39
HCOI_01859500 -1.05
236
HCOI_00590200 -1.32 HCOI_01298400 1.35 HCOI_00962000 -1.39
HCOI_00519800 -1.05
HCOI_01428000 -1.32 HCOI_05004416 1.34 HCOI_00082000 -1.39
HCOI_05001286 -1.05
HCOI_01259800 -1.32 HCOI_00642900 1.34 HCOI_00839000 -1.39
HCOI_00066500 -1.05
HCOI_00763700 -1.32 HCOI_00643200 1.34 HCOI_00156600 -1.39
HCOI_01747900 -1.04
HCOI_01605700 -1.32 HCOI_02140200 1.34 HCOI_01509400 -1.39
HCOI_01489900 -1.04
HCOI_00099600 -1.32 HCOI_05001893 1.34 HCOI_02079500 -1.39
HCOI_02027900 -1.04
HCOI_00914500 -1.31 HCOI_00249200 1.34 HCOI_00639700 -1.39
HCOI_01279100 -1.04
HCOI_01002700 -1.31 HCOI_01407700 1.34 HCOI_00264500 -1.39
HCOI_01009900 -1.04
HCOI_02175500 -1.31 HCOI_01757700 1.34 HCOI_00102500 -1.39
HCOI_01581500 -1.04
HCOI_00225400 -1.31 HCOI_00725600 1.33 HCOI_01561500 -1.38
HCOI_05004297 -1.04
HCOI_01957700 -1.31 HCOI_00463700 1.33 HCOI_05002352 -1.38
HCOI_01104100 -1.03
HCOI_00298000 -1.31 HCOI_02065100 1.33 HCOI_05001232 -1.38
HCOI_00950000 -1.03
HCOI_00574000 -1.30 HCOI_02050000 1.33 HCOI_01481000 -1.38
HCOI_01549900 -1.03
HCOI_05004184 -1.30 HCOI_01405300 1.33 HCOI_00551100 -1.38
HCOI_00242600 -1.03
HCOI_01180600 -1.30 HCOI_01023000 1.33 HCOI_01072700 -1.38
HCOI_05002071 -1.02
HCOI_01823400 -1.30 HCOI_01820300 1.32 HCOI_00627700 -1.38
HCOI_00846600 -1.02
HCOI_00798600 -1.30 HCOI_01140500 1.32 HCOI_05003520 -1.38
HCOI_01709600 -1.02
HCOI_01978000 -1.30 HCOI_01839500 1.32 HCOI_02094900 -1.38
HCOI_00899200 -1.02
HCOI_00754700 -1.30 HCOI_00402700 1.32 HCOI_00888200 -1.38
HCOI_00796800 -1.02
HCOI_01468500 -1.30 HCOI_00063700 1.32 HCOI_05001119 -1.38
HCOI_01849600 -1.02
HCOI_00233200 -1.30 HCOI_00920400 1.32 HCOI_00641100 -1.37
HCOI_02036300 -1.02
HCOI_01238700 -1.30 HCOI_05003455 1.32 HCOI_01678300 -1.37
HCOI_00713700 -1.01
HCOI_00327100 -1.30 HCOI_01754600 1.32 HCOI_01585300 -1.37
HCOI_05000104 -1.01
HCOI_00888200 -1.29 HCOI_01504200 1.32 HCOI_01494000 -1.37
HCOI_01105800 -1.01
HCOI_01911200 -1.29 HCOI_00434200 1.31 HCOI_00018800 -1.37
HCOI_02017600.2 -1.01
HCOI_01206300 -1.29 HCOI_01467300 1.31 HCOI_05002096 -1.37
HCOI_00844400 -1.00
HCOI_01728000 -1.29 HCOI_00020600 1.31 HCOI_01560200 -1.37
HCOI_01022300 -1.00
HCOI_02146900 -1.29 HCOI_01850300 1.31 HCOI_00776100 -1.37
HCOI_00388200 -1.29 HCOI_00594900 1.31 HCOI_01659200 -1.37

237
HCOI_00588400 -1.29 HCOI_00232700 1.31 HCOI_01489700 -1.37
HCOI_00381300 -1.29 HCOI_01439000 1.30 HCOI_01988700 -1.37
HCOI_01994500 -1.29 HCOI_05003295 1.30 HCOI_00583600 -1.36
HCOI_00621100 -1.29 HCOI_05000059 1.30 HCOI_00909000 -1.36
HCOI_00889900 -1.29 HCOI_00779300 1.30 HCOI_02173300 -1.36
HCOI_00608900 -1.28 HCOI_05001801 1.30 HCOI_00859500 -1.36
HCOI_00648200 -1.28 HCOI_00825100 1.30 HCOI_00619500 -1.36
HCOI_00784300 -1.28 HCOI_00934900 1.30 HCOI_00259700 -1.36
HCOI_01270500 -1.28 HCOI_01156400 1.30 HCOI_01727800 -1.36
HCOI_01772000 -1.28 HCOI_00665600 1.29 HCOI_02033200 -1.36
HCOI_01246500 -1.28 HCOI_01083900 1.29 HCOI_02099900 -1.36
HCOI_02105600 -1.28 HCOI_00342200 1.29 HCOI_02140000 -1.36
HCOI_00046300 -1.28 HCOI_01884900 1.29 HCOI_00271900 -1.36
HCOI_00719700 -1.28 HCOI_05003720 1.29 HCOI_02073200 -1.36
HCOI_01515600 -1.28 HCOI_01183000 1.29 HCOI_05003522 -1.35
HCOI_01032400 -1.27 HCOI_01867300 1.29 HCOI_00640500 -1.35
HCOI_01843500 -1.27 HCOI_01577300 1.29 HCOI_05000198 -1.35
HCOI_01532400 -1.27 HCOI_00608600 1.29 HCOI_01868000 -1.35
HCOI_05000104 -1.27 HCOI_00554000 1.28 HCOI_02146100 -1.35
HCOI_00807300 -1.27 HCOI_01156900 1.28 HCOI_00915600 -1.35
HCOI_00048200 -1.27 HCOI_01679200 1.28 HCOI_01798400 -1.35
HCOI_01851800 -1.27 HCOI_01058400 1.28 HCOI_01525600 -1.35
HCOI_01735500 -1.27 HCOI_00495700 1.28 HCOI_00305500 -1.35
HCOI_01158000 -1.27 HCOI_05005495 1.27 HCOI_01325200 -1.35
HCOI_01062800 -1.26 HCOI_00441700 1.27 HCOI_01548500 -1.35
HCOI_00620700 -1.26 HCOI_01395600 1.27 HCOI_00067600 -1.35
HCOI_00379600 -1.26 HCOI_00498200 1.27 HCOI_05001642 -1.35
HCOI_01754900 -1.26 HCOI_01607900 1.27 HCOI_05004295 -1.34
HCOI_05001361 -1.26 HCOI_01877000 1.27 HCOI_05000296 -1.34
238
HCOI_02109000 -1.26 HCOI_00961400 1.27 HCOI_00085400 -1.34
HCOI_00857100 -1.26 HCOI_00501800 1.27 HCOI_01063000 -1.34
HCOI_00973500 -1.26 HCOI_00622400 1.26 HCOI_01191900 -1.34
HCOI_00084800 -1.26 HCOI_00612100 1.26 HCOI_00320300 -1.34
HCOI_01397400 -1.25 HCOI_01485700 1.26 HCOI_00783900 -1.34
HCOI_02159600 -1.25 HCOI_01473300 1.26 HCOI_00072300 -1.34
HCOI_05003437 -1.25 HCOI_01432800 1.26 HCOI_00219900.2 -1.34
HCOI_00823700 -1.25 HCOI_01009200 1.26 HCOI_00886800 -1.34
HCOI_00915500 -1.25 HCOI_00052900 1.26 HCOI_00632300 -1.34
HCOI_00407300 -1.25 HCOI_01292600 1.26 HCOI_05000081 -1.33
HCOI_01727800 -1.25 HCOI_00791200 1.25 HCOI_00887300 -1.33
HCOI_00271100 -1.25 HCOI_00513300 1.25 HCOI_02087300 -1.33
HCOI_01497600 -1.25 HCOI_01443400.2 1.25 HCOI_00494000 -1.33
HCOI_01712100 -1.25 HCOI_00559700 1.25 HCOI_01585700 -1.33
HCOI_00551100 -1.25 HCOI_00156200 1.25 HCOI_02153200 -1.33
HCOI_00588000 -1.24 HCOI_01272400 1.24 HCOI_00323200 -1.33
HCOI_02088400 -1.24 HCOI_01670300 1.24 HCOI_02105600 -1.33
HCOI_01738200 -1.24 HCOI_00518600 1.24 HCOI_00914600 -1.33
HCOI_05002163 -1.24 HCOI_01678200 1.24 HCOI_05003316 -1.33
HCOI_01489100 -1.24 HCOI_02163700 1.24 HCOI_02177500 -1.33
HCOI_00614500 -1.24 HCOI_01273700 1.24 HCOI_00988900 -1.33
HCOI_00251100 -1.24 HCOI_01637700 1.24 HCOI_01953700 -1.33
HCOI_00506600 -1.24 HCOI_05003493 1.23 HCOI_01194700 -1.32
HCOI_01176600 -1.24 HCOI_01562100 1.23 HCOI_02102600 -1.32
HCOI_00601700 -1.24 HCOI_05002168 1.23 HCOI_00667400 -1.32
HCOI_00514900 -1.24 HCOI_00712700 1.23 HCOI_00329900 -1.32
HCOI_00857000 -1.24 HCOI_00532400 1.23 HCOI_02072000 -1.32
HCOI_00242400 -1.23 HCOI_01055200 1.23 HCOI_02111700 -1.32
HCOI_05004072 -1.23 HCOI_01752500 1.23 HCOI_02128500 -1.31
239
HCOI_05001222 -1.23 HCOI_01172200 1.23 HCOI_01236600 -1.31
HCOI_01827900 -1.23 HCOI_00338300 1.22 HCOI_05005618 -1.31
HCOI_00739900 -1.23 HCOI_02064800 1.22 HCOI_01048100 -1.31
HCOI_01620300 -1.23 HCOI_00604400 1.21 HCOI_00360000 -1.31
HCOI_01228900 -1.22 HCOI_02036500 1.20 HCOI_01025200 -1.31
HCOI_00574800 -1.22 HCOI_01850400 1.20 HCOI_00868000 -1.31
HCOI_05003257 -1.22 HCOI_00338900 1.20 HCOI_05005592 -1.30
HCOI_00237500 -1.22 HCOI_00900100 1.20 HCOI_00220900 -1.30
HCOI_02078600 -1.22 HCOI_00280300.2 1.20 HCOI_01833100 -1.30
HCOI_02105900 -1.22 HCOI_01169500 1.20 HCOI_00134200 -1.30
HCOI_05000355 -1.22 HCOI_01512700 1.19 HCOI_05006061 -1.30
HCOI_00482300 -1.22 HCOI_00989700 1.19 HCOI_00588000 -1.29
HCOI_01143600 -1.21 HCOI_00278500 1.19 HCOI_00870900 -1.29
HCOI_00679100 -1.21 HCOI_01182000 1.19 HCOI_00525300 -1.29
HCOI_05003520 -1.21 HCOI_01758000 1.19 HCOI_05000759 -1.29
HCOI_01453700 -1.21 HCOI_01577400 1.18 HCOI_02165000 -1.29
HCOI_01667300 -1.21 HCOI_01198300 1.18 HCOI_00425800 -1.29
HCOI_01184400 -1.21 HCOI_00338700 1.17 HCOI_02142100 -1.29
HCOI_01190400 -1.20 HCOI_00642400 1.17 HCOI_02041600 -1.28
HCOI_00238000 -1.20 HCOI_01246400 1.17 HCOI_02028400 -1.28
HCOI_01727100 -1.20 HCOI_02039900 1.17 HCOI_00976200 -1.28
HCOI_00909000 -1.20 HCOI_00455500 1.16 HCOI_00381300 -1.28
HCOI_01600300 -1.20 HCOI_01796900 1.16 HCOI_01470500 -1.28
HCOI_05004297 -1.20 HCOI_00706300 1.16 HCOI_01883200 -1.28
HCOI_00366800 -1.20 HCOI_01805100 1.15 HCOI_05001275 -1.28
HCOI_01068100 -1.20 HCOI_00307800 1.15 HCOI_01709200 -1.27
HCOI_05004096 -1.20 HCOI_00118300 1.15 HCOI_00880100 -1.27
HCOI_00854000 -1.19 HCOI_00808400 1.15 HCOI_00800400 -1.27
HCOI_02049700 -1.19 HCOI_00627900 1.15 HCOI_00575700 -1.27
240
HCOI_01866900 -1.19 HCOI_00079200 1.15 HCOI_05003227 -1.27
HCOI_01537000 -1.19 HCOI_01417800 1.14 HCOI_00866900 -1.27
HCOI_01959700 -1.19 HCOI_01225800 1.14 HCOI_00261000 -1.27
HCOI_01997700 -1.19 HCOI_00531800 1.14 HCOI_01791600 -1.27
HCOI_00664900 -1.19 HCOI_01440200 1.14 HCOI_00166200 -1.27
HCOI_00687000 -1.19 HCOI_00193100 1.14 HCOI_01333200 -1.27
HCOI_01978100 -1.18 HCOI_01575700 1.14 HCOI_02160400 -1.26
HCOI_00243900 -1.18 HCOI_01298300 1.14 HCOI_00362100 -1.26
HCOI_00289300 -1.18 HCOI_01967300 1.14 HCOI_01968000 -1.26
HCOI_01126200 -1.18 HCOI_01969100 1.14 HCOI_01130400 -1.26
HCOI_02120500 -1.18 HCOI_01198800 1.13 HCOI_05002808 -1.26
HCOI_00539200 -1.18 HCOI_00875100 1.13 HCOI_00514500 -1.26
HCOI_01660500 -1.18 HCOI_00142200 1.13 HCOI_05004280 -1.25
HCOI_05000133 -1.17 HCOI_00109500 1.13 HCOI_01899800 -1.25
HCOI_00353700 -1.17 HCOI_01130100 1.13 HCOI_00095600 -1.25
HCOI_05000072 -1.17 HCOI_00996400 1.13 HCOI_00141300 -1.25
HCOI_00927100 -1.17 HCOI_01027700 1.13 HCOI_00060200 -1.25
HCOI_05001286 -1.17 HCOI_05004134 1.12 HCOI_00812600 -1.25
HCOI_00919400 -1.17 HCOI_00559300 1.12 HCOI_00841100 -1.25
HCOI_01582700 -1.17 HCOI_01296100 1.12 HCOI_01452100 -1.25
HCOI_02159300 -1.17 HCOI_05004124 1.12 HCOI_05000832 -1.24
HCOI_00185900 -1.17 HCOI_00385600 1.12 HCOI_05003508 -1.24
HCOI_00464500 -1.17 HCOI_01792600 1.12 HCOI_00243900 -1.24
HCOI_00434400 -1.17 HCOI_00015600 1.12 HCOI_05000184 -1.24
HCOI_01592500 -1.17 HCOI_00622700 1.12 HCOI_00661700 -1.24
HCOI_00205900 -1.17 HCOI_01695600 1.12 HCOI_01510900 -1.24
HCOI_01656200 -1.17 HCOI_01970800 1.11 HCOI_00894000 -1.24
HCOI_00630400 -1.17 HCOI_00973100.2 1.11 HCOI_00020100 -1.24
HCOI_01978300 -1.17 HCOI_01915600 1.11 HCOI_02053700 -1.23
241
HCOI_00299800 -1.17 HCOI_00496200 1.11 HCOI_01033500 -1.23
HCOI_00039500 -1.17 HCOI_00696500 1.11 HCOI_01296900 -1.23
HCOI_01474700 -1.17 HCOI_00970300 1.11 HCOI_01688900 -1.23
HCOI_01050000 -1.17 HCOI_01577200 1.11 HCOI_00304600 -1.23
HCOI_02053700 -1.16 HCOI_01527300 1.11 HCOI_01356400.2 -1.23
HCOI_00228400 -1.16 HCOI_05002630 1.11 HCOI_00836300 -1.23
HCOI_01859500 -1.16 HCOI_00461500 1.11 HCOI_01286400 -1.23
HCOI_00219900.2 -1.16 HCOI_05002379 1.10 HCOI_00485200 -1.23
HCOI_05001683 -1.16 HCOI_01424400 1.10 HCOI_01621600 -1.23
HCOI_01249900 -1.16 HCOI_01822000 1.10 HCOI_00484200 -1.22
HCOI_01540200 -1.16 HCOI_00506800 1.10 HCOI_00206600 -1.22
HCOI_01322400 -1.16 HCOI_01446800 1.10 HCOI_00588400 -1.22
HCOI_00717700 -1.15 HCOI_01426500 1.10 HCOI_01809800 -1.22
HCOI_00412200 -1.15 HCOI_00978300 1.10 HCOI_01092500 -1.22
HCOI_02019100 -1.15 HCOI_00185400 1.10 HCOI_01827900 -1.22
HCOI_00667400 -1.15 HCOI_01303800 1.10 HCOI_01334900 -1.22
HCOI_00560600 -1.15 HCOI_00216200 1.09 HCOI_01444800 -1.22
HCOI_05002276 -1.15 HCOI_01310000 1.09 HCOI_02066700 -1.22
HCOI_00232400 -1.15 HCOI_01453300 1.09 HCOI_01527700 -1.22
HCOI_01335300 -1.15 HCOI_01554000 1.09 HCOI_01137900 -1.21
HCOI_00408900 -1.15 HCOI_02038700 1.09 HCOI_05002120 -1.21
HCOI_00147400 -1.15 HCOI_00663700 1.09 HCOI_05001185 -1.21
HCOI_00240000 -1.15 HCOI_05002250 1.08 HCOI_01274900 -1.21
HCOI_01705700 -1.15 HCOI_00317300 1.08 HCOI_01696100 -1.21
HCOI_00017100 -1.15 HCOI_00921000 1.08 HCOI_01047400 -1.21
HCOI_00422100 -1.14 HCOI_01884200 1.08 HCOI_00367400 -1.21
HCOI_05003910 -1.14 HCOI_01648300 1.08 HCOI_05001469 -1.21
HCOI_01130400 -1.14 HCOI_00392400 1.08 HCOI_02049700 -1.21
HCOI_00639700 -1.14 HCOI_00967200 1.08 HCOI_01473800 -1.21
242
HCOI_02101600 -1.14 HCOI_00480600 1.08 HCOI_01648900 -1.21
HCOI_01857200 -1.14 HCOI_00929400 1.08 HCOI_00672100 -1.21
HCOI_01104100 -1.14 HCOI_01529700 1.07 HCOI_00163600 -1.20
HCOI_05001190 -1.14 HCOI_02113200 1.07 HCOI_05001513 -1.20
HCOI_00191500 -1.14 HCOI_01757500 1.07 HCOI_00505400 -1.20
HCOI_00134100 -1.14 HCOI_01399700 1.07 HCOI_00563600 -1.20
HCOI_02154000 -1.14 HCOI_01471500 1.07 HCOI_01625000 -1.20
HCOI_05003201 -1.13 HCOI_01067300 1.06 HCOI_02030600 -1.20
HCOI_00168600 -1.13 HCOI_05001226 1.06 HCOI_01516800 -1.20
HCOI_01500300 -1.13 HCOI_01523500 1.06 HCOI_01307900 -1.19
HCOI_00102400 -1.13 HCOI_00069900 1.06 HCOI_01750500 -1.19
HCOI_01691200 -1.13 HCOI_01901100 1.05 HCOI_00908800 -1.19
HCOI_01771700 -1.13 HCOI_00762800 1.05 HCOI_05001361 -1.18
HCOI_05001232 -1.13 HCOI_01343500 1.05 HCOI_00164800 -1.18
HCOI_00061300 -1.13 HCOI_00355400 1.05 HCOI_01526900 -1.18
HCOI_00128700 -1.13 HCOI_01197100 1.05 HCOI_01537000 -1.18
HCOI_01812100 -1.13 HCOI_01516000 1.04 HCOI_05002671 -1.18
HCOI_05000081 -1.13 HCOI_00943400 1.04 HCOI_05001825 -1.18
HCOI_01743000 -1.12 HCOI_00074400 1.04 HCOI_02180200 -1.18
HCOI_05000191 -1.12 HCOI_00879800 1.04 HCOI_01526400 -1.18
HCOI_00856500 -1.12 HCOI_00461700 1.04 HCOI_01078900 -1.17
HCOI_01196200 -1.12 HCOI_00696200 1.04 HCOI_00190400 -1.17
HCOI_00499100 -1.12 HCOI_02026200 1.04 HCOI_00536300 -1.17
HCOI_01602100 -1.12 HCOI_00865500 1.04 HCOI_02065400 -1.17
HCOI_00971800 -1.12 HCOI_01700700 1.04 HCOI_01670500 -1.17
HCOI_02111200 -1.12 HCOI_00626600 1.04 HCOI_00219400 -1.17
HCOI_00689600 -1.12 HCOI_05001923 1.04 HCOI_00716500 -1.17
HCOI_00584500.2 -1.12 HCOI_00342600 1.04 HCOI_00717700 -1.17
HCOI_01271400 -1.12 HCOI_02006800 1.04 HCOI_02013700 -1.17

243
HCOI_01979200 -1.12 HCOI_00329600 1.04 HCOI_01793500 -1.16
HCOI_01855500 -1.12 HCOI_00406900 1.04 HCOI_00404800 -1.16
HCOI_02091300 -1.11 HCOI_01368000 1.04 HCOI_00507100 -1.16
HCOI_00022200 -1.11 HCOI_00861100 1.03 HCOI_01451400 -1.16
HCOI_05003977 -1.11 HCOI_00168300 1.03 HCOI_00499100 -1.16
HCOI_01405100 -1.11 HCOI_01887700 1.03 HCOI_00139700 -1.16
HCOI_00237200 -1.11 HCOI_00065900 1.03 HCOI_02147500 -1.16
HCOI_00675600 -1.11 HCOI_05000123 1.03 HCOI_00260000 -1.16
HCOI_02175400 -1.11 HCOI_00214000 1.03 HCOI_00705600 -1.16
HCOI_01303400 -1.11 HCOI_00838600 1.03 HCOI_01855900 -1.16
HCOI_00327200 -1.11 HCOI_00705500 1.03 HCOI_01219500 -1.16
HCOI_01509500 -1.11 HCOI_00008100 1.02 HCOI_05003897 -1.15
HCOI_00908700 -1.10 HCOI_00067200 1.02 HCOI_00536200 -1.15
HCOI_02122400 -1.10 HCOI_00426100 1.02 HCOI_00675600 -1.15
HCOI_01003500 -1.10 HCOI_00258400 1.02 HCOI_01769500 -1.15
HCOI_00576500 -1.10 HCOI_01301100 1.02 HCOI_02003100 -1.15
HCOI_00814800 -1.10 HCOI_01491800 1.02 HCOI_01116000 -1.15
HCOI_01978500 -1.10 HCOI_00751300 1.02 HCOI_00359500 -1.15
HCOI_00836500 -1.10 HCOI_00727000 1.02 HCOI_00507300 -1.15
HCOI_05006268 -1.10 HCOI_01714400 1.01 HCOI_01883000 -1.14
HCOI_01615000 -1.10 HCOI_01197300 1.01 HCOI_01858500 -1.14
HCOI_05000739 -1.10 HCOI_01602200 1.01 HCOI_05002745 -1.14
HCOI_00279200 -1.09 HCOI_01816900 1.01 HCOI_00484500 -1.14
HCOI_00832700 -1.09 HCOI_00584100 1.01 HCOI_01746100 -1.14
HCOI_00566800 -1.09 HCOI_01630500 1.01 HCOI_00824200 -1.14
HCOI_01259900 -1.09 HCOI_01574800 1.01 HCOI_00453900 -1.14
HCOI_01169100 -1.09 HCOI_00361600 1.00 HCOI_05003761 -1.14
HCOI_02048800 -1.08 HCOI_01415700 1.00 HCOI_00734300 -1.13
HCOI_00697600 -1.08 HCOI_05002071 1.00 HCOI_00700800 -1.13
244
HCOI_01357300 -1.08 HCOI_00791900 1.00 HCOI_00522100 -1.13
HCOI_01924200 -1.08
HCOI_05002810 -1.13
HCOI_01315000 -1.08
HCOI_00353400 -1.13
HCOI_05000061 -1.08
HCOI_00729200 -1.13
HCOI_01245200 -1.08
HCOI_05001737 -1.13
HCOI_01641900 -1.08
HCOI_05000166 -1.13
HCOI_00614600 -1.08
HCOI_00528300 -1.13
HCOI_05004702 -1.08
HCOI_00196900 -1.13
HCOI_01425900 -1.07
HCOI_00961700 -1.12
HCOI_01749500 -1.07
HCOI_00687200 -1.12
HCOI_01951500 -1.07
HCOI_00782300 -1.12
HCOI_01196000 -1.07
HCOI_00289300 -1.12
HCOI_00378000 -1.07
HCOI_02157200 -1.12
HCOI_01153300 -1.07
HCOI_00464500 -1.12
HCOI_01417500 -1.07
HCOI_01453700 -1.12
HCOI_05001167 -1.07
HCOI_00224900 -1.12
HCOI_02149900 -1.07
HCOI_00105500 -1.12
HCOI_01378500 -1.07
HCOI_02030500 -1.12
HCOI_00449500 -1.06
HCOI_00705700 -1.12
HCOI_01441000 -1.06
HCOI_01540200 -1.12
HCOI_01464500 -1.06
HCOI_00526500 -1.12
HCOI_00358000 -1.06
HCOI_00622900 -1.11
HCOI_00335300 -1.06
HCOI_00640700 -1.11
HCOI_01716100 -1.06
HCOI_00275200 -1.11
HCOI_00363700 -1.06
HCOI_01614100 -1.11
HCOI_00002900 -1.06
HCOI_01253100 -1.11
HCOI_00350100 -1.06
HCOI_00720900 -1.11
HCOI_00150300 -1.06
HCOI_01196200 -1.11
HCOI_02120000 -1.06
HCOI_01045700 -1.11

245
HCOI_05002984 -1.06
HCOI_00575600 -1.11
HCOI_00875300 -1.05
HCOI_01303700 -1.10
HCOI_01062300 -1.05
HCOI_01385100 -1.10
HCOI_00852100 -1.05
HCOI_00211400 -1.10
HCOI_00193200 -1.05
HCOI_02018600 -1.10
HCOI_02006400 -1.05
HCOI_00454200 -1.10
HCOI_05003071 -1.05
HCOI_01978300 -1.09
HCOI_02142600 -1.05
HCOI_05002370 -1.09
HCOI_00089400 -1.05
HCOI_01245200 -1.09
HCOI_00758300 -1.05
HCOI_05002547 -1.09
HCOI_00038500 -1.04
HCOI_01586300 -1.09
HCOI_01706000 -1.04
HCOI_01256300 -1.09
HCOI_01168900 -1.04
HCOI_00090400 -1.09
HCOI_00523300 -1.04
HCOI_00821500 -1.09
HCOI_01419100 -1.04
HCOI_01417500 -1.09
HCOI_00767400 -1.04
HCOI_00456800 -1.09
HCOI_05002188 -1.04
HCOI_01857200 -1.08
HCOI_00235400 -1.04
HCOI_01495600 -1.08
HCOI_02079400 -1.04
HCOI_01547800 -1.08
HCOI_01307500 -1.03
HCOI_00617000 -1.08
HCOI_01305500 -1.03
HCOI_00665000 -1.08
HCOI_01302900 -1.03
HCOI_00295800 -1.07
HCOI_01127100 -1.03
HCOI_00584400 -1.07
HCOI_01786100 -1.03
HCOI_05001710 -1.07
HCOI_00785400 -1.03
HCOI_01012500 -1.07
HCOI_01112900 -1.03
HCOI_00980800 -1.07
HCOI_00759400 -1.03
HCOI_00841400 -1.07
HCOI_01409700 -1.03
HCOI_01978600 -1.07
HCOI_01451800 -1.03
HCOI_01691200 -1.07
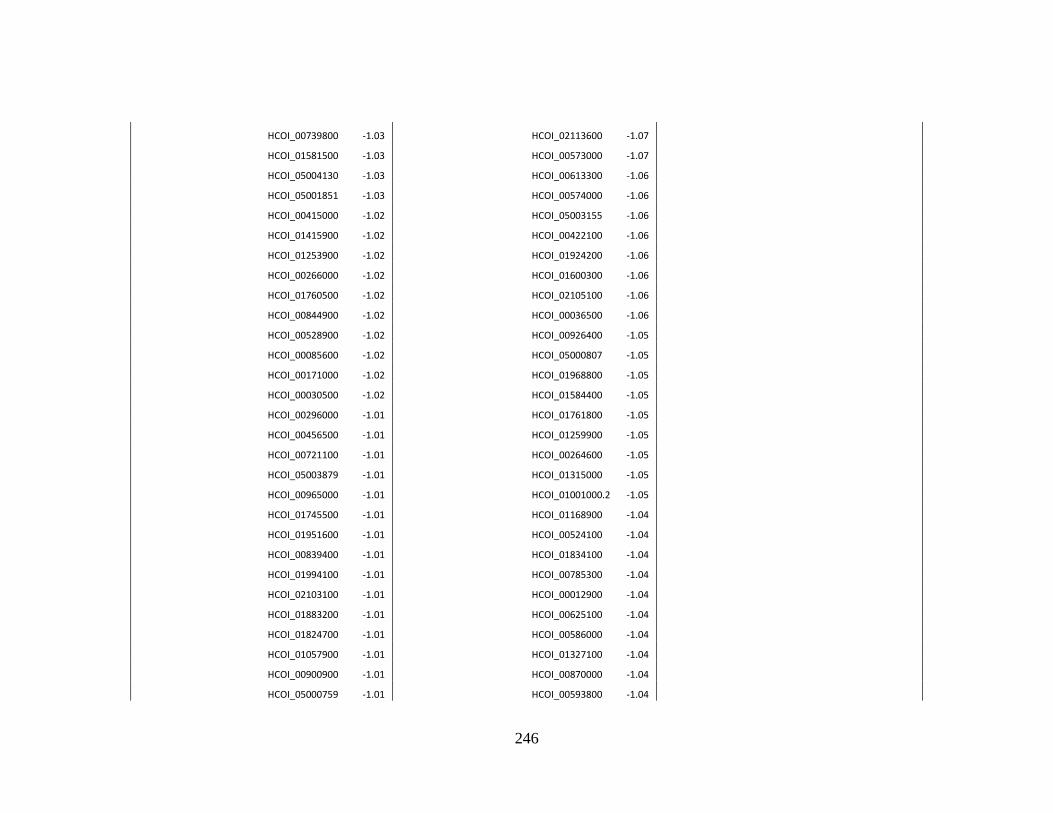
246
HCOI_00739800 -1.03
HCOI_02113600 -1.07
HCOI_01581500 -1.03
HCOI_00573000 -1.07
HCOI_05004130 -1.03
HCOI_00613300 -1.06
HCOI_05001851 -1.03
HCOI_00574000 -1.06
HCOI_00415000 -1.02
HCOI_05003155 -1.06
HCOI_01415900 -1.02
HCOI_00422100 -1.06
HCOI_01253900 -1.02
HCOI_01924200 -1.06
HCOI_00266000 -1.02
HCOI_01600300 -1.06
HCOI_01760500 -1.02
HCOI_02105100 -1.06
HCOI_00844900 -1.02
HCOI_00036500 -1.06
HCOI_00528900 -1.02
HCOI_00926400 -1.05
HCOI_00085600 -1.02
HCOI_05000807 -1.05
HCOI_00171000 -1.02
HCOI_01968800 -1.05
HCOI_00030500 -1.02
HCOI_01584400 -1.05
HCOI_00296000 -1.01
HCOI_01761800 -1.05
HCOI_00456500 -1.01
HCOI_01259900 -1.05
HCOI_00721100 -1.01
HCOI_00264600 -1.05
HCOI_05003879 -1.01
HCOI_01315000 -1.05
HCOI_00965000 -1.01
HCOI_01001000.2 -1.05
HCOI_01745500 -1.01
HCOI_01168900 -1.04
HCOI_01951600 -1.01
HCOI_00524100 -1.04
HCOI_00839400 -1.01
HCOI_01834100 -1.04
HCOI_01994100 -1.01
HCOI_00785300 -1.04
HCOI_02103100 -1.01
HCOI_00012900 -1.04
HCOI_01883200 -1.01
HCOI_00625100 -1.04
HCOI_01824700 -1.01
HCOI_00586000 -1.04
HCOI_01057900 -1.01
HCOI_01327100 -1.04
HCOI_00900900 -1.01
HCOI_00870000 -1.04
HCOI_05000759 -1.01
HCOI_00593800 -1.04
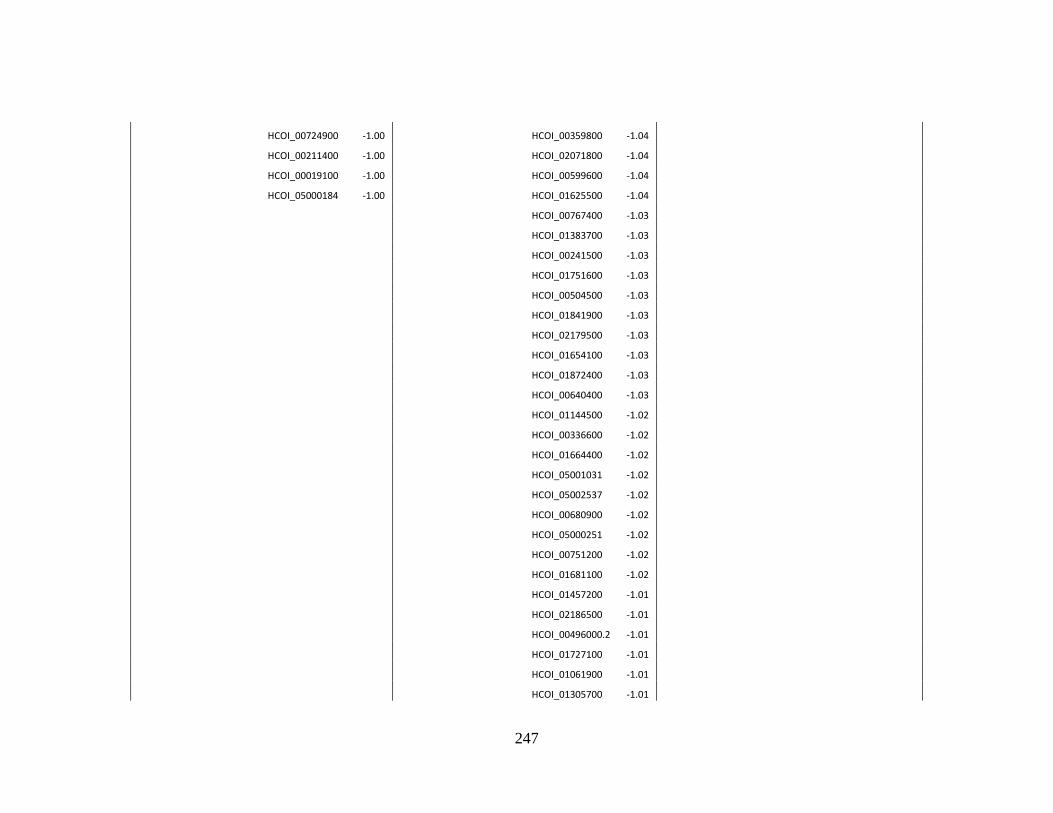
247
HCOI_00724900 -1.00
HCOI_00359800 -1.04
HCOI_00211400 -1.00
HCOI_02071800 -1.04
HCOI_00019100 -1.00
HCOI_00599600 -1.04
HCOI_05000184 -1.00
HCOI_01625500 -1.04
HCOI_00767400 -1.03
HCOI_01383700 -1.03
HCOI_00241500 -1.03
HCOI_01751600 -1.03
HCOI_00504500 -1.03
HCOI_01841900 -1.03
HCOI_02179500 -1.03
HCOI_01654100 -1.03
HCOI_01872400 -1.03
HCOI_00640400 -1.03
HCOI_01144500 -1.02
HCOI_00336600 -1.02
HCOI_01664400 -1.02
HCOI_05001031 -1.02
HCOI_05002537 -1.02
HCOI_00680900 -1.02
HCOI_05000251 -1.02
HCOI_00751200 -1.02
HCOI_01681100 -1.02
HCOI_01457200 -1.01
HCOI_02186500 -1.01
HCOI_00496000.2 -1.01
HCOI_01727100 -1.01
HCOI_01061900 -1.01
HCOI_01305700 -1.01
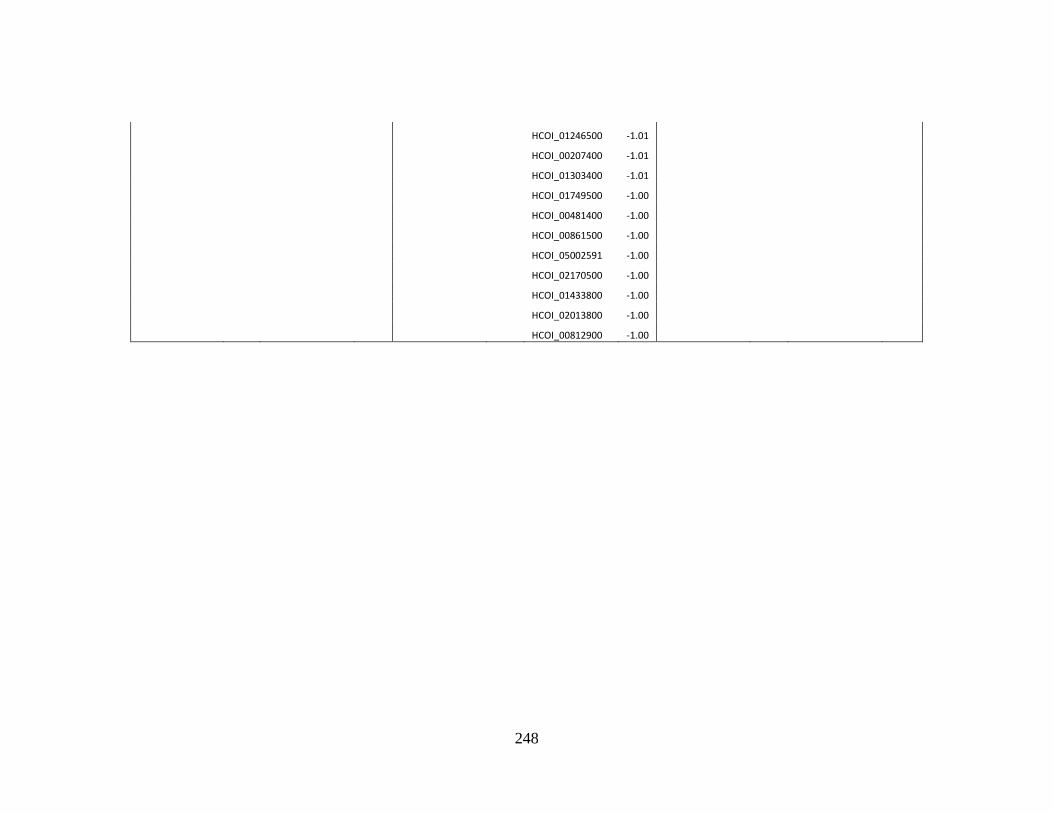
248
HCOI_01246500 -1.01
HCOI_00207400 -1.01
HCOI_01303400 -1.01
HCOI_01749500 -1.00
HCOI_00481400 -1.00
HCOI_00861500 -1.00
HCOI_05002591 -1.00
HCOI_02170500 -1.00
HCOI_01433800 -1.00
HCOI_02013800 -1.00
HCOI_00812900 -1.00
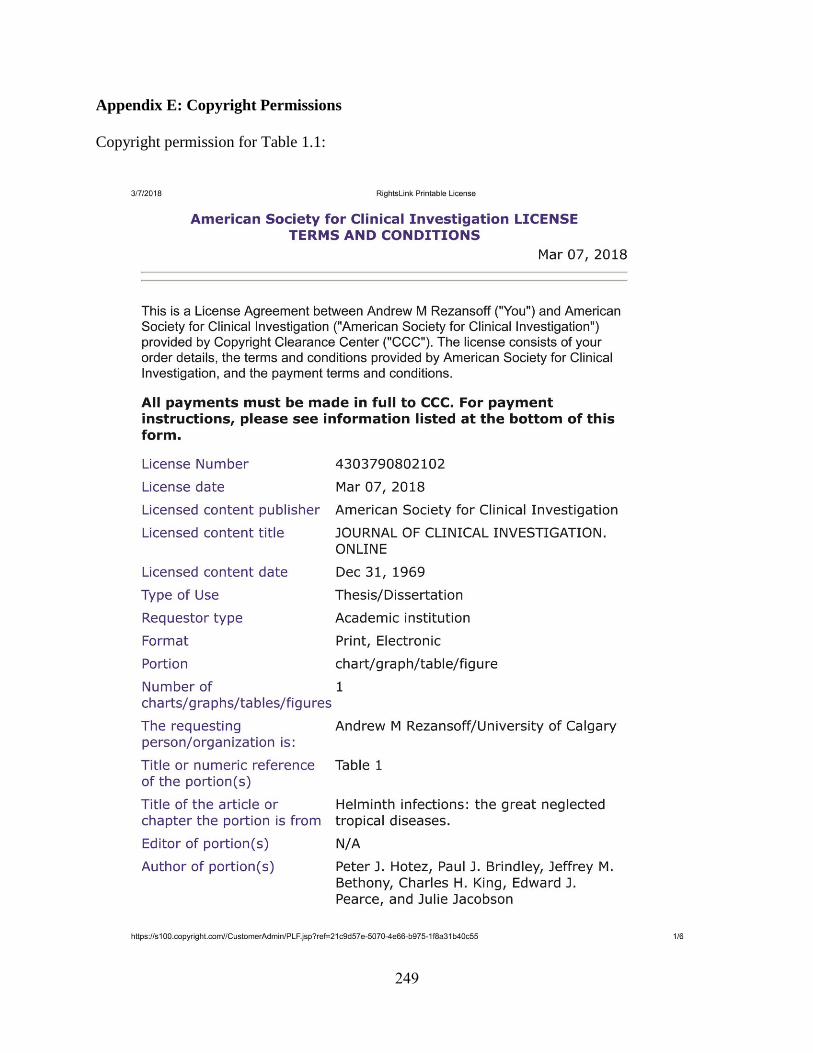
249
Appendix E: Copyright Permissions
Copyright permission for Table 1.1:
250
251
252

253
254

255
Copyright permission for Figure 1.1:
256

257

258
Copyright permission for Figure 1.2:
259
Copyright permission for Figure 1.3 Panel A:
260
261

262
Copyright permission for Chapter 3:
263
Copyright permission for Chapter 3 from co-author: