introduction to transaction processing
TRANSCRIPT
LEARNING OBJECTIVESAfter studying this chapter, you should:
• Understand the broad objectives of transaction cycles.
• Recognize the types of transactions processed by each of the three transaction cycles.
• Know the basic accounting records used in transaction processing systems.
• Understand the relationship between traditional accounting records and their magnetic equivalents in computer-based systems.
• Be familiar with the documentation techniques used for representing manual and computer-based systems.
• Understand the differences between batch and real-time processing and the impact of these technologies on transaction processing.
Chapter 1 introduced the transaction processing system (TPS) as an activity consisting of three major subsys-tems called cycles: the revenue cycle, the expenditure cycle, and the conversion cycle. While each cycle per-
forms different specific tasks and supports different objectives, they share common characteristics. For example, all three TPS cycles capture financial transactions, record the effects of trans-actions in accounting records, and provide information about transactions to users in support of their day-to-day activities. In addition, transaction cycles produce much of the raw data from which management reports and financial statements are derived. Because of their financial impact on the firm, transaction cycles command much of the accountant’s professional attention.
The purpose of this chapter is to present some preliminary topics that are common to all three transaction processing cycles. In subsequent chapters, we will draw heavily from this material as we examine the individual subsystems of each cycle in detail. The chapter is organized into four major sections. The first is an overview of transaction processing. This section defines the broad objective of the three transaction cycles and specifies the roles of their individual subsystems. The second section describes the relationship among accounting records in forming an audit trail in both manual and computer-based systems. The third sec-tion examines documentation techniques used to represent sys-tems. This section presents several documentation techniques for manual and computer-based systems. The fourth section of this chapter addresses computer-based systems. It reviews the fun-damental features of batch and real-time technologies and their implication for transaction processing.
Chapter 2
Introduction to Transaction Processing
An Overview of Transaction ProcessingTPS applications process financial transactions. A financial transaction was defined in Chapter 1 as
An economic event that affects the assets and equities of the firm, is reflected in its accounts, and is measured in monetary terms.
The most common financial transactions are economic exchanges with external par-ties. These include the sale of goods or services, the purchase of inventory, the discharge of financial obligations, and the receipt of cash on account from customers. Financial transactions also include certain internal events such as the depreciation of fixed assets; the application of labor, raw materials, and overhead to the production process; and the transfer of inventory from one department to another.
Financial transactions are common business events that occur regularly. For instance, thousands of transactions of a particular type (sales to customers) may occur daily. To deal efficiently with such volume, business firms group similar types of transactions into transaction cycles.
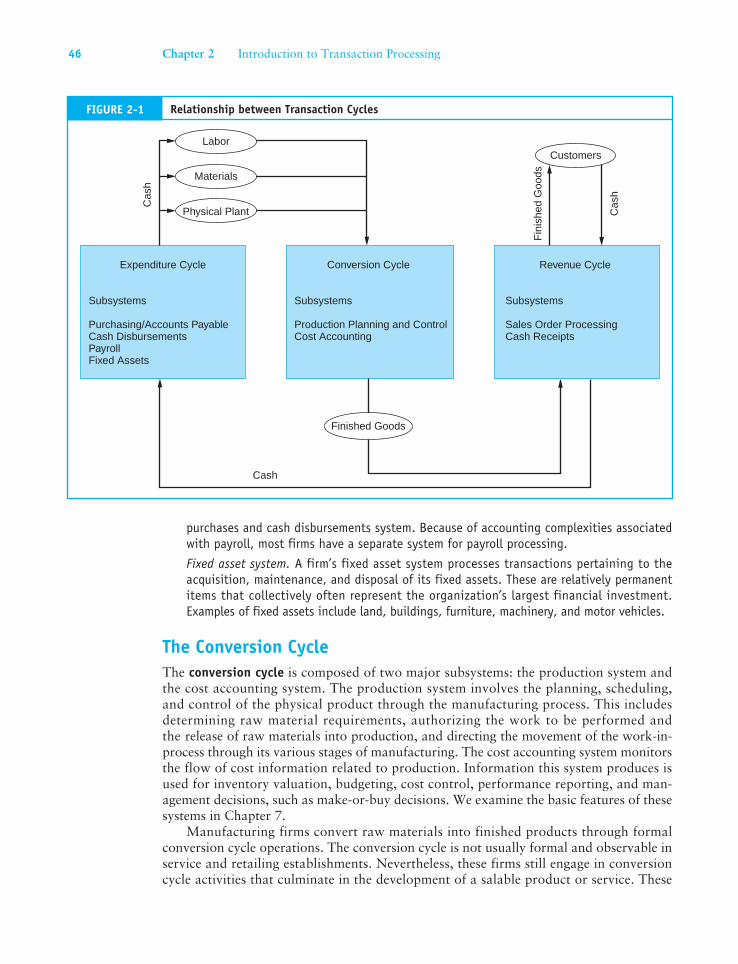
Transaction CyclesThree transaction cycles process most of the firm’s economic activity: the expenditure cycle, the conversion cycle, and the revenue cycle. These cycles exist in all types of businesses—both profit-seeking and not-for-profit. For instance, every business (1) incurs expenditures in exchange for resources (expenditure cycle), (2) provides value added through its products or services (conversion cycle), and (3) receives revenue from outside sources (revenue cycle). Figure 2-1 shows the relationship of these cycles and the resource flows between them.
The Expenditure CycleBusiness activities begin with the acquisition of materials, property, and labor in exchange for cash—the expenditure cycle. Figure 2-1 shows the flow of cash from the organization to the various providers of these resources. Most expenditure transactions are based on a credit relationship between the trading parties. The actual disbursement of cash takes place at some point after the receipt of the goods or services. Days or even weeks may pass between these two events. Thus, from a systems perspective, this transaction has two parts: a physical component (the acquisition of the goods) and a financial component (the cash disbursement to the supplier). A separate subsystem of the cycle processes each component. The major subsystems of the expenditure cycle are outlined below. Because of the extent of this body of material, two chapters are devoted to the expenditure cycle. Purchases/accounts payable and cash disbursements systems are the topics of Chapter 5. Payroll and fixed asset systems are examined in Chapter 6.
Purchases/accounts payable system. This system recognizes the need to acquire physical inventory (such as raw materials) and places an order with the vendor. When the goods are received, the purchases system records the event by increasing inventory and estab-lishing an account payable to be paid at a later date.
Cash disbursements system. When the obligation created in the purchases system is due, the cash disbursements system authorizes the payment, disburses the funds to the vendor, and records the transaction by reducing the cash and accounts payable accounts.
Payroll system. The payroll system collects labor usage data for each employee, computes the payroll, and disburses paychecks to the employees. Conceptually, payroll is a special-case
Part I Overview of Accounting Information Systems 45
purchases and cash disbursements system. Because of accounting complexities associated with payroll, most firms have a separate system for payroll processing.
Fixed asset system. A firm’s fixed asset system processes transactions pertaining to the acquisition, maintenance, and disposal of its fixed assets. These are relatively permanent items that collectively often represent the organization’s largest financial investment. Examples of fixed assets include land, buildings, furniture, machinery, and motor vehicles.
The Conversion CycleThe conversion cycle is composed of two major subsystems: the production system and the cost accounting system. The production system involves the planning, scheduling, and control of the physical product through the manufacturing process. This includes determining raw material requirements, authorizing the work to be performed and the release of raw materials into production, and directing the movement of the work-in-process through its various stages of manufacturing. The cost accounting system monitors the flow of cost information related to production. Information this system produces is used for inventory valuation, budgeting, cost control, performance reporting, and man-agement decisions, such as make-or-buy decisions. We examine the basic features of these systems in Chapter 7.
Manufacturing firms convert raw materials into finished products through formal conversion cycle operations. The conversion cycle is not usually formal and observable in service and retailing establishments. Nevertheless, these firms still engage in conversion cycle activities that culminate in the development of a salable product or service. These
Expenditure Cycle Conversion Cycle Revenue Cycle
Cash
Subsystems
Purchasing/Accounts PayableCash DisbursementsPayrollFixed Assets
Subsystems
Production Planning and ControlCost Accounting
Subsystems
Sales Order ProcessingCash Receipts
Labor
Physical Plant
Materials
Finished Goods
CustomersC
ash
Cas
h
Fin
ishe
d G
oods
FIGURE 2-1 Relationship between Transaction Cycles
46 Chapter 2 Introduction to Transaction Processing
activities include the readying of products and services for market and the allocation of resources such as depreciation, building amortization, and prepaid expenses to the proper accounting period. However, unlike manufacturing firms, merchandising companies do not process these activities through formal conversion cycle subsystems.
The Revenue CycleFirms sell their finished goods to customers through the revenue cycle, which involves processing cash sales, credit sales, and the receipt of cash following a credit sale. Revenue cycle transactions also have a physical and a financial component, which are processed separately. The primary subsystems of the revenue cycle, which are the topics of Chapter 4, are briefly outlined below.
Sales order processing. The majority of business sales are made on credit and involve tasks such as preparing sales orders, granting credit, shipping products (or rendering of a ser-vice) to the customer, billing customers, and recording the transaction in the accounts (accounts receivable, inventory, expenses, and sales).
Cash receipts. For credit sales, some period of time (days or weeks) passes between the point of sale and the receipt of cash. Cash receipts processing includes collecting cash, depositing cash in the bank, and recording these events in the accounts (accounts receiv-able and cash).
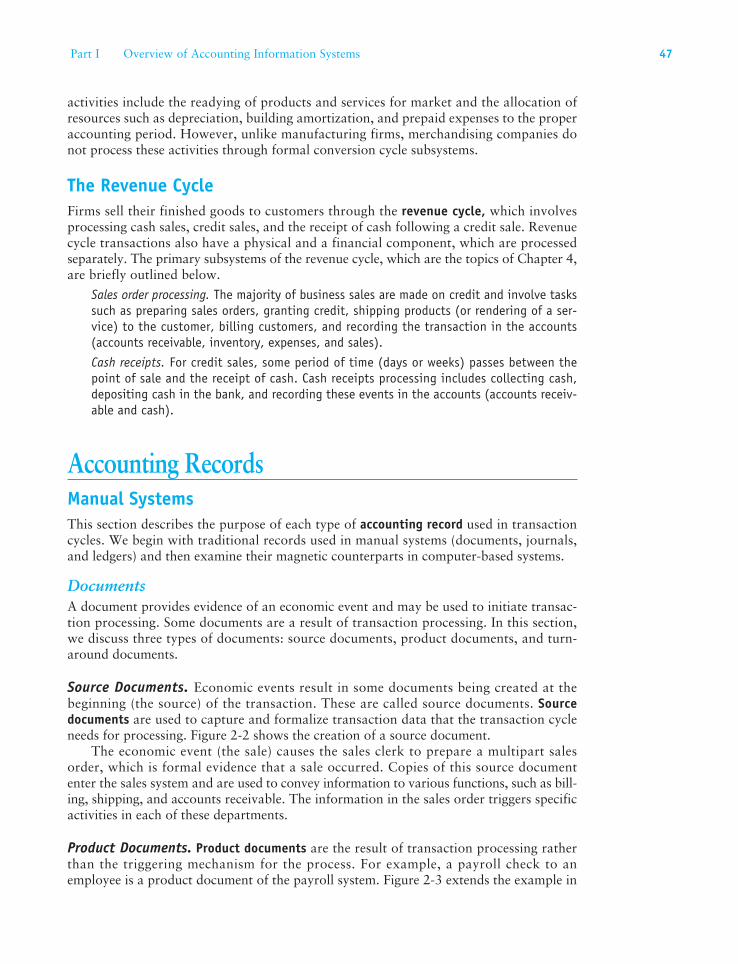
Accounting RecordsManual SystemsThis section describes the purpose of each type of accounting record used in transaction cycles. We begin with traditional records used in manual systems (documents, journals, and ledgers) and then examine their magnetic counterparts in computer-based systems.
DocumentsA document provides evidence of an economic event and may be used to initiate transac-tion processing. Some documents are a result of transaction processing. In this section, we discuss three types of documents: source documents, product documents, and turn-around documents.
Source Documents. Economic events result in some documents being created at the beginning (the source) of the transaction. These are called source documents. Source documents are used to capture and formalize transaction data that the transaction cycle needs for processing. Figure 2-2 shows the creation of a source document.
The economic event (the sale) causes the sales clerk to prepare a multipart sales order, which is formal evidence that a sale occurred. Copies of this source document enter the sales system and are used to convey information to various functions, such as bill-ing, shipping, and accounts receivable. The information in the sales order triggers specific activities in each of these departments.
Product Documents. Product documents are the result of transaction processing rather than the triggering mechanism for the process. For example, a payroll check to an employee is a product document of the payroll system. Figure 2-3 extends the example in
Part I Overview of Accounting Information Systems 47
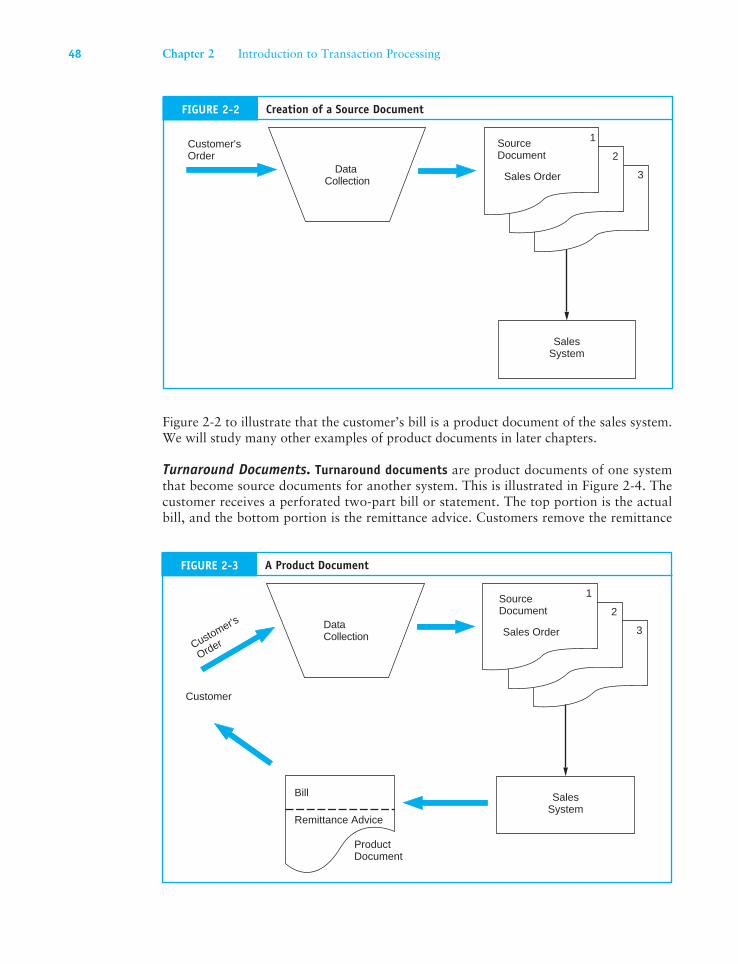
Figure 2-2 to illustrate that the customer’s bill is a product document of the sales system. We will study many other examples of product documents in later chapters.
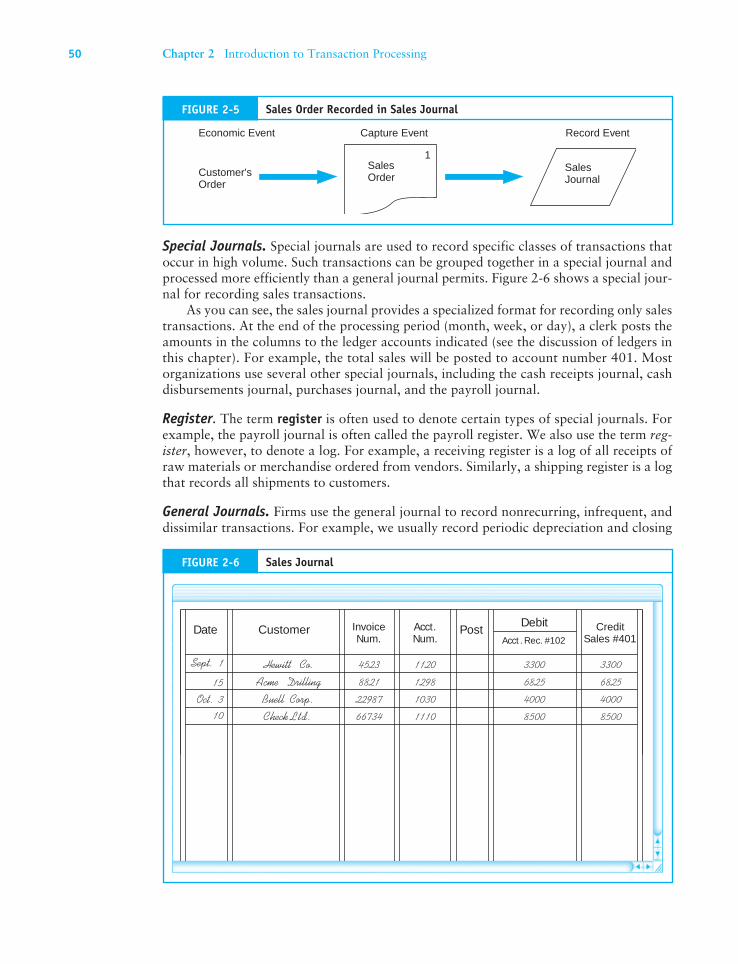
Turnaround Documents. Turnaround documents are product documents of one system that become source documents for another system. This is illustrated in Figure 2-4. The customer receives a perforated two-part bill or statement. The top portion is the actual bill, and the bottom portion is the remittance advice. Customers remove the remittance
DataCollection
Customer'sOrder
SalesSystem
SourceDocument
Sales Order
2
3
1
Creation of a Source Document
Customer's
Order
Customer
DataCollection
SalesSystem
SourceDocument
Sales Order
2
3
1
Bill
Remittance Advice
ProductDocument
FIGURE 2-3 A Product Document
48 Chapter 2 Introduction to Transaction Processing
FIGURE 2-2
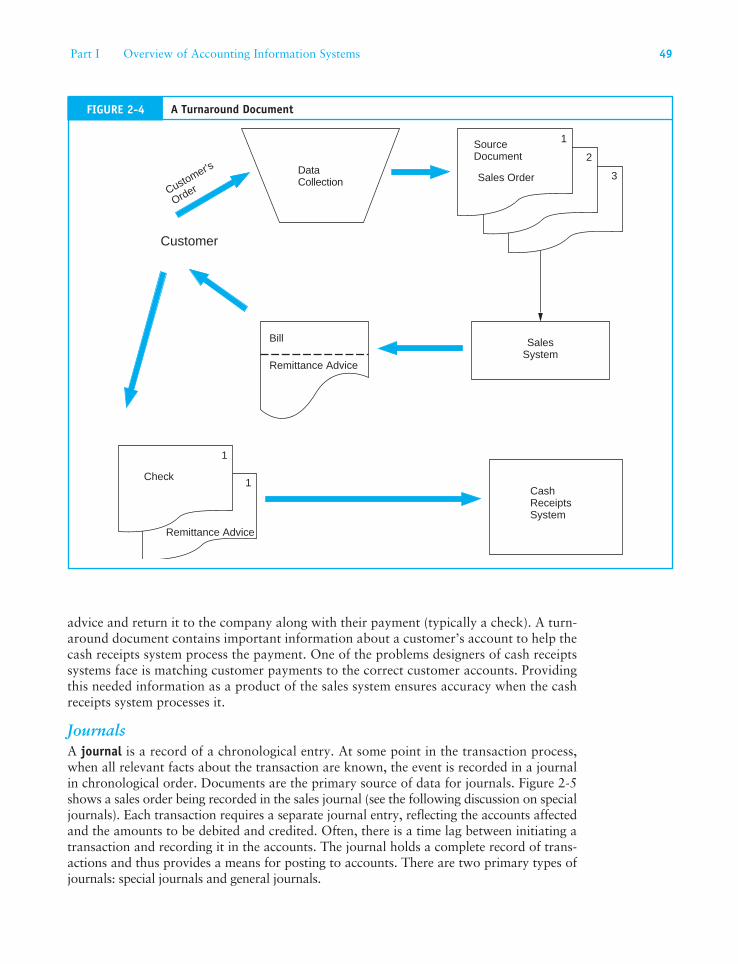
advice and return it to the company along with their payment (typically a check). A turn-around document contains important information about a customer’s account to help the cash receipts system process the payment. One of the problems designers of cash receipts systems face is matching customer payments to the correct customer accounts. Providing this needed information as a product of the sales system ensures accuracy when the cash receipts system processes it.
JournalsA journal is a record of a chronological entry. At some point in the transaction process, when all relevant facts about the transaction are known, the event is recorded in a journal in chronological order. Documents are the primary source of data for journals. Figure 2-5 shows a sales order being recorded in the sales journal (see the following discussion on special journals). Each transaction requires a separate journal entry, reflecting the accounts affected and the amounts to be debited and credited. Often, there is a time lag between initiating a transaction and recording it in the accounts. The journal holds a complete record of trans-actions and thus provides a means for posting to accounts. There are two primary types of journals: special journals and general journals.
FIGURE 2-4 A Turnaround Document
CashReceiptsSystem
Customer
DataCollection
SalesSystem
SourceDocument
Sales Order
2
3
1
Bill
Remittance Advice
1
1
Check
Remittance Advice
Customer's
Order
Part I Overview of Accounting Information Systems 49
50 Chapter 2 Introduction to Transaction Processing
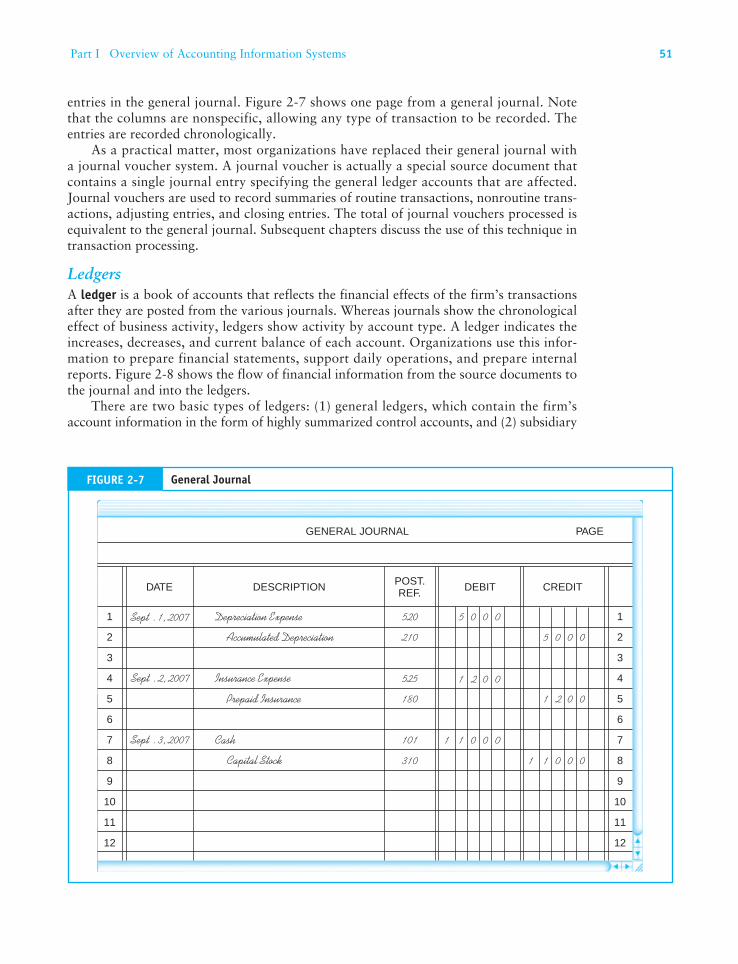
Special Journals. Special journals are used to record specific classes of transactions that occur in high volume. Such transactions can be grouped together in a special journal and processed more efficiently than a general journal permits. Figure 2-6 shows a special jour-nal for recording sales transactions.
As you can see, the sales journal provides a specialized format for recording only sales transactions. At the end of the processing period (month, week, or day), a clerk posts the amounts in the columns to the ledger accounts indicated (see the discussion of ledgers in this chapter). For example, the total sales will be posted to account number 401. Most organizations use several other special journals, including the cash receipts journal, cash disbursements journal, purchases journal, and the payroll journal.
Register. The term register is often used to denote certain types of special journals. For example, the payroll journal is often called the payroll register. We also use the term reg-ister, however, to denote a log. For example, a receiving register is a log of all receipts of raw materials or merchandise ordered from vendors. Similarly, a shipping register is a log that records all shipments to customers.
General Journals. Firms use the general journal to record nonrecurring, infrequent, and dissimilar transactions. For example, we usually record periodic depreciation and closing
CustomerDate InvoiceNum.
Acct.Num.
PostDebit
Acct . Rec. #102Credit
Sales #401
Sept. 1
15Oct. 3
10
Hewitt Co.Acme Drilling
Buell Corp.Check Ltd .
4523 11208821 1298
22987 103066734 1110
3300682540008500
3300682540008500
FIGURE 2-6 Sales Journal
Customer'sOrder
SalesJournal
Economic Event Capture Event Record Event
SalesOrder
1
FIGURE 2-5 Sales Order Recorded in Sales Journal
Part I Overview of Accounting Information Systems 51
entries in the general journal. Figure 2-7 shows one page from a general journal. Note that the columns are nonspecific, allowing any type of transaction to be recorded. The entries are recorded chronologically.
As a practical matter, most organizations have replaced their general journal with a journal voucher system. A journal voucher is actually a special source document that contains a single journal entry specifying the general ledger accounts that are affected. Journal vouchers are used to record summaries of routine transactions, nonroutine trans-actions, adjusting entries, and closing entries. The total of journal vouchers processed is equivalent to the general journal. Subsequent chapters discuss the use of this technique in transaction processing.
LedgersA ledger is a book of accounts that reflects the financial effects of the firm’s transactions after they are posted from the various journals. Whereas journals show the chronological effect of business activity, ledgers show activity by account type. A ledger indicates the increases, decreases, and current balance of each account. Organizations use this infor-mation to prepare financial statements, support daily operations, and prepare internal reports. Figure 2-8 shows the flow of financial information from the source documents to the journal and into the ledgers.
There are two basic types of ledgers: (1) general ledgers, which contain the firm’s account information in the form of highly summarized control accounts, and (2) subsidiary
0
0
GENERAL JOURNAL PAGE
DATE DESCRIPTION POST.REF. DEBIT CREDIT
Sept . 1, 2007 Depreciation Expense 520 5 0 00
210 5 0 0 0Accumulated Depreciation
Insurance ExpenseSept . 2, 2007
Sept . 3, 2007 Cash
Capital Stock
Prepaid Insurance
525
180
1 2 0 0
1 2 0 0
1 0 0
1 0 0
101 1
1
1
2
3
4
5
6
7
8
9
10
11
12
1
2
3
4
5
6
7
8
9
10
11
12
310
FIGURE 2-7 General Journal
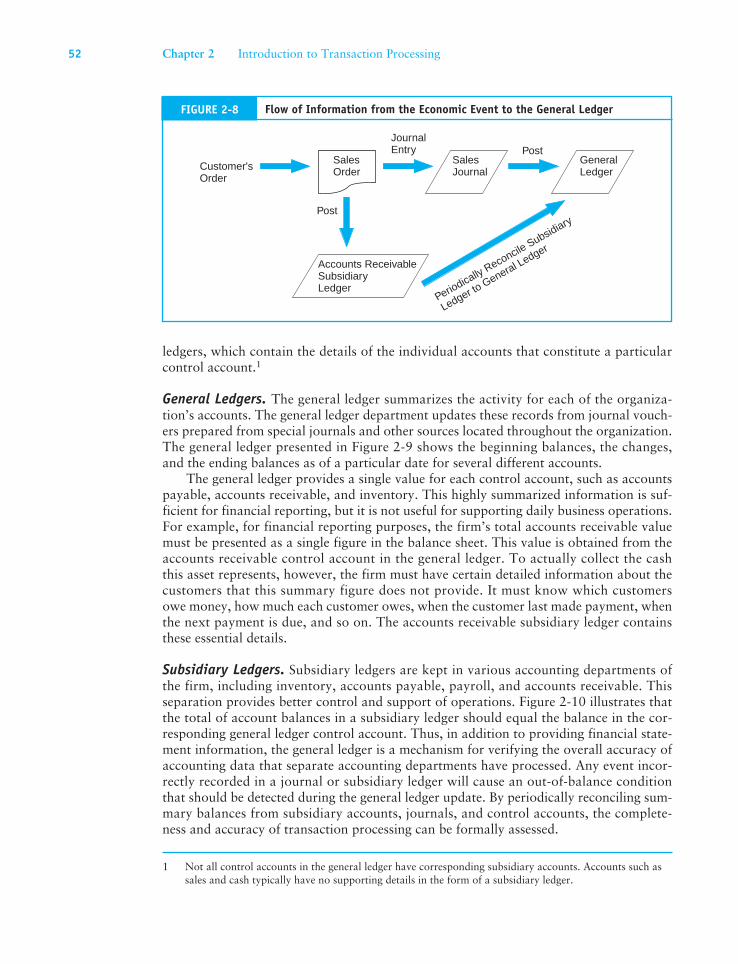
ledgers, which contain the details of the individual accounts that constitute a particular control account.1
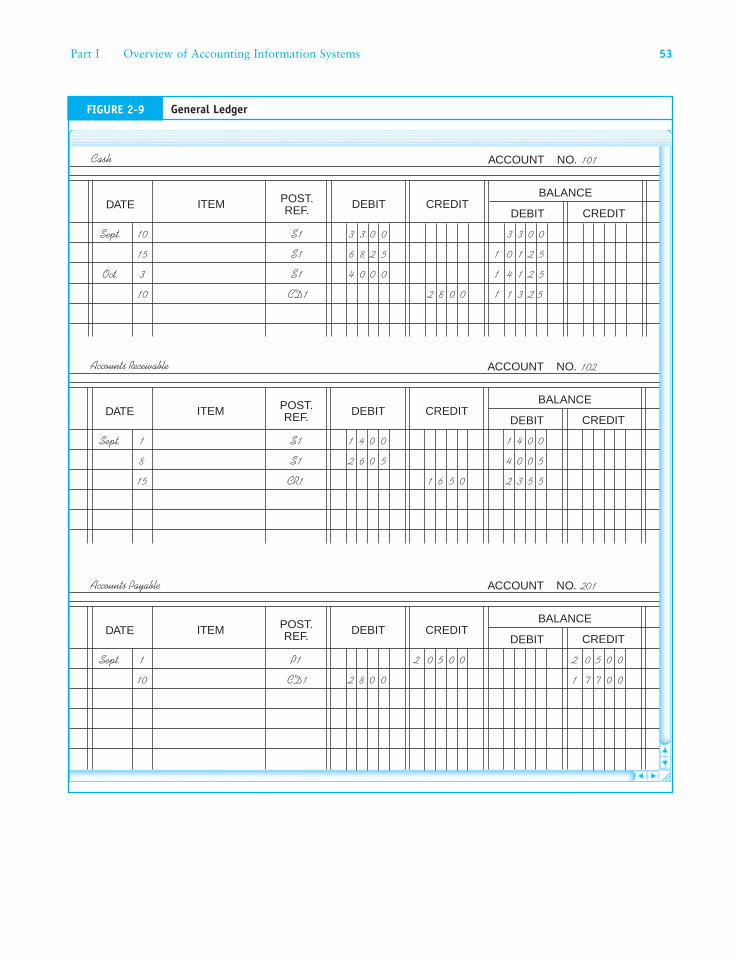
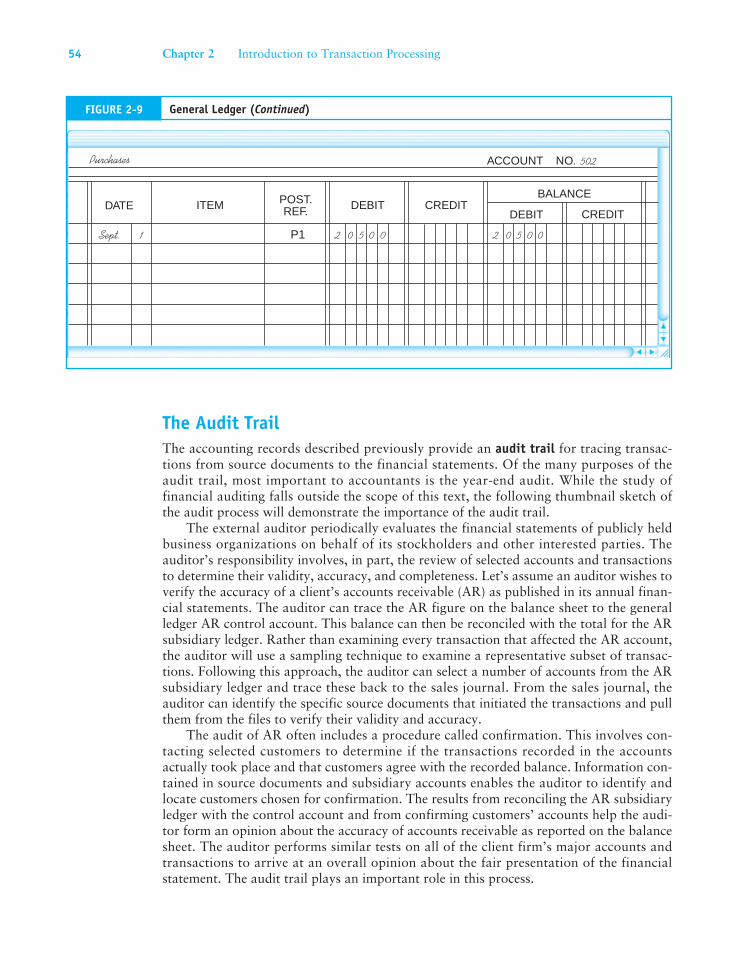
General Ledgers. The general ledger summarizes the activity for each of the organiza-tion’s accounts. The general ledger department updates these records from journal vouch-ers prepared from special journals and other sources located throughout the organization. The general ledger presented in Figure 2-9 shows the beginning balances, the changes, and the ending balances as of a particular date for several different accounts.
The general ledger provides a single value for each control account, such as accounts payable, accounts receivable, and inventory. This highly summarized information is suf-ficient for financial reporting, but it is not useful for supporting daily business operations. For example, for financial reporting purposes, the firm’s total accounts receivable value must be presented as a single figure in the balance sheet. This value is obtained from the accounts receivable control account in the general ledger. To actually collect the cash this asset represents, however, the firm must have certain detailed information about the customers that this summary figure does not provide. It must know which customers owe money, how much each customer owes, when the customer last made payment, when the next payment is due, and so on. The accounts receivable subsidiary ledger contains these essential details.
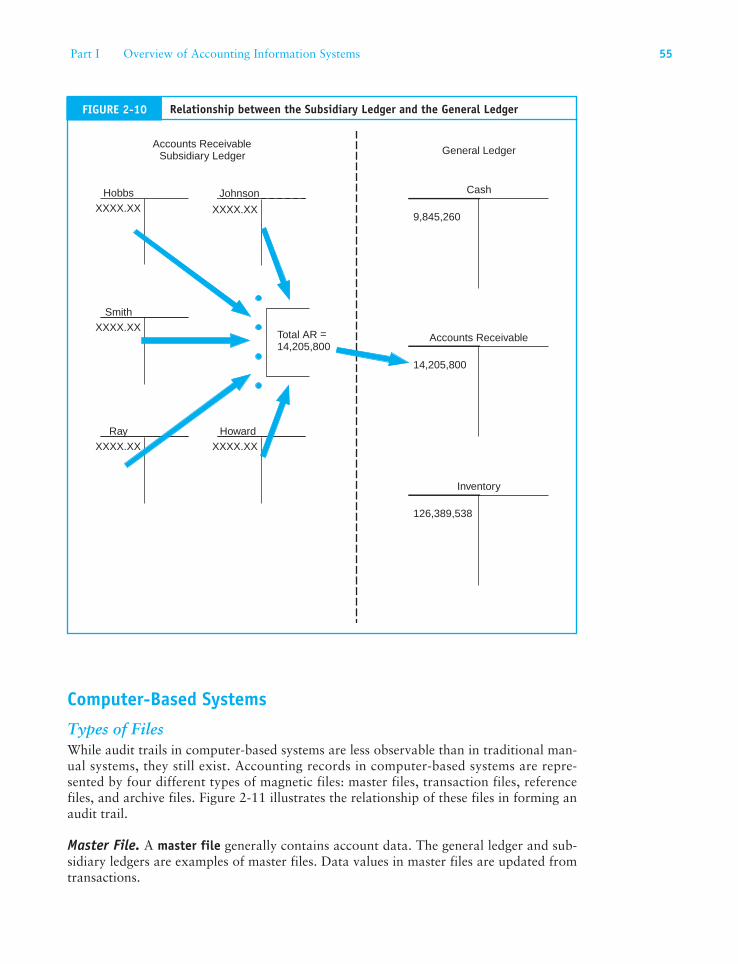
Subsidiary Ledgers. Subsidiary ledgers are kept in various accounting departments of the firm, including inventory, accounts payable, payroll, and accounts receivable. This separation provides better control and support of operations. Figure 2-10 illustrates that the total of account balances in a subsidiary ledger should equal the balance in the cor-responding general ledger control account. Thus, in addition to providing financial state-ment information, the general ledger is a mechanism for verifying the overall accuracy of accounting data that separate accounting departments have processed. Any event incor-rectly recorded in a journal or subsidiary ledger will cause an out-of-balance condition that should be detected during the general ledger update. By periodically reconciling sum-mary balances from subsidiary accounts, journals, and control accounts, the complete-ness and accuracy of transaction processing can be formally assessed.
1 Not all control accounts in the general ledger have corresponding subsidiary accounts. Accounts such as sales and cash typically have no supporting details in the form of a subsidiary ledger.
Customer'sOrder
SalesOrder
SalesJournal
GeneralLedger
Accounts ReceivableSubsidiaryLedger
Periodically Reconcile Subsidiary
Ledger to General Ledger
Post
JournalEntry Post
FIGURE 2-8 Flow of Information from the Economic Event to the General Ledger
52 Chapter 2 Introduction to Transaction Processing
DATE ITEM POST.REF. DEBIT
ACCOUNT NO. 101
DEBIT CREDITCREDIT
BALANCE
3 3 0 0S110Sept. 3 3 0 0
6 8 2 5S115 1 0 1 2 5
4 0 0 0S13Oct. 1 4 1 2 5
CD110 82 0 0 1 1 3 2 5
Cash
DATE ITEM POST.REF. DEBIT
ACCOUNT NO. 102
DEBIT CREDITCREDIT
BALANCE
1 4 0 0S11Sept. 1 4 0 0
2 6 0 5S18 4 0 0 5
CR115 61 5 0 2 3 5 5
Accounts Receivable
Accounts Payable
DATE ITEM POST.REF. DEBIT
ACCOUNT NO. 201
DEBIT CREDITCREDIT
BALANCE
P11Sept. 2 50 0 0 2 0 5 0 0
2 8 0 0CD110 1 7 7 0 0
FIGURE 2-9 General Ledger
Part I Overview of Accounting Information Systems 53
The Audit TrailThe accounting records described previously provide an audit trail for tracing transac-tions from source documents to the financial statements. Of the many purposes of the audit trail, most important to accountants is the year-end audit. While the study of financial auditing falls outside the scope of this text, the following thumbnail sketch of the audit process will demonstrate the importance of the audit trail.
The external auditor periodically evaluates the financial statements of publicly held business organizations on behalf of its stockholders and other interested parties. The auditor’s responsibility involves, in part, the review of selected accounts and transactions to determine their validity, accuracy, and completeness. Let’s assume an auditor wishes to verify the accuracy of a client’s accounts receivable (AR) as published in its annual finan-cial statements. The auditor can trace the AR figure on the balance sheet to the general ledger AR control account. This balance can then be reconciled with the total for the AR subsidiary ledger. Rather than examining every transaction that affected the AR account, the auditor will use a sampling technique to examine a representative subset of transac-tions. Following this approach, the auditor can select a number of accounts from the AR subsidiary ledger and trace these back to the sales journal. From the sales journal, the auditor can identify the specific source documents that initiated the transactions and pull them from the files to verify their validity and accuracy.
The audit of AR often includes a procedure called confirmation. This involves con-tacting selected customers to determine if the transactions recorded in the accounts actually took place and that customers agree with the recorded balance. Information con-tained in source documents and subsidiary accounts enables the auditor to identify and locate customers chosen for confirmation. The results from reconciling the AR subsidiary ledger with the control account and from confirming customers’ accounts help the audi-tor form an opinion about the accuracy of accounts receivable as reported on the balance sheet. The auditor performs similar tests on all of the client firm’s major accounts and transactions to arrive at an overall opinion about the fair presentation of the financial statement. The audit trail plays an important role in this process.
DATE ITEM POST.REF. DEBIT
ACCOUNT NO. 502
DEBIT CREDITCREDIT
BALANCE
0 5 0 02P11Sept. 2 0 5 0 0
Purchases
FIGURE 2-9 General Ledger (Continued)
54 Chapter 2 Introduction to Transaction Processing
Computer-Based Systems
Types of FilesWhile audit trails in computer-based systems are less observable than in traditional man-ual systems, they still exist. Accounting records in computer-based systems are repre-sented by four different types of magnetic files: master files, transaction files, reference files, and archive files. Figure 2-11 illustrates the relationship of these files in forming an audit trail.
Master File. A master file generally contains account data. The general ledger and sub-sidiary ledgers are examples of master files. Data values in master files are updated from transactions.
Accounts ReceivableSubsidiary Ledger General Ledger
Hobbs Johnson
Smith
Ray Howard
Total AR =14,205,800
XXXX.XX XXXX.XX
XXXX.XX
XXXX.XX XXXX.XX
Cash
9,845,260
Accounts Receivable
14,205,800
Inventory
126,389,538
FIGURE 2-10 Relationship between the Subsidiary Ledger and the General Ledger
Part I Overview of Accounting Information Systems 55
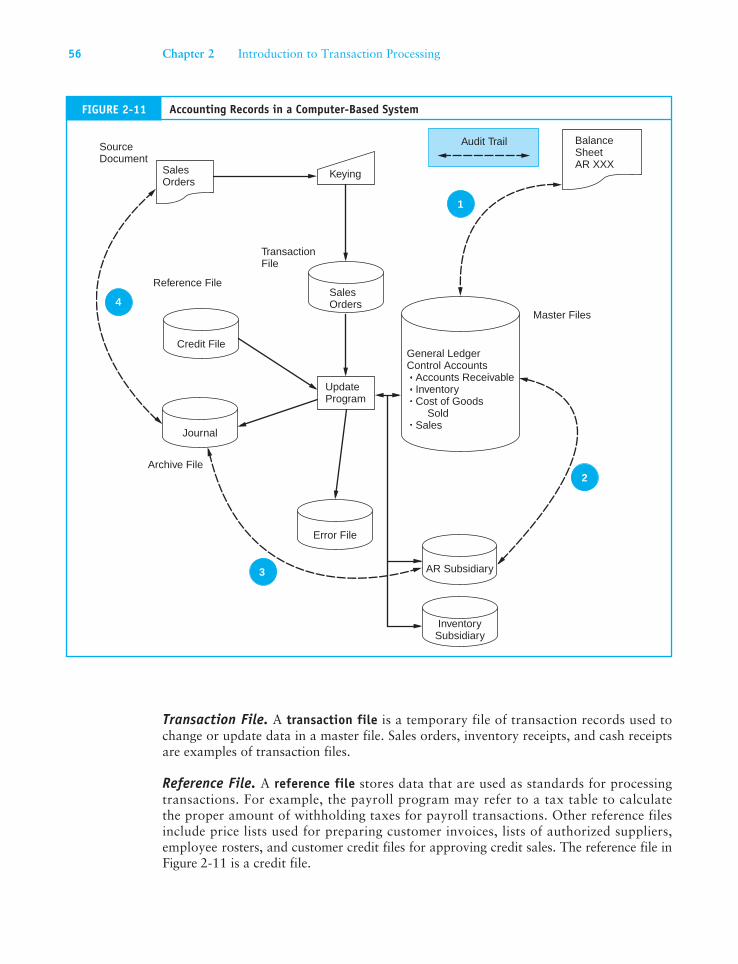
Transaction File. A transaction file is a temporary file of transaction records used to change or update data in a master file. Sales orders, inventory receipts, and cash receipts are examples of transaction files.
Reference File. A reference file stores data that are used as standards for processing transactions. For example, the payroll program may refer to a tax table to calculate the proper amount of withholding taxes for payroll transactions. Other reference files include price lists used for preparing customer invoices, lists of authorized suppliers, employee rosters, and customer credit files for approving credit sales. The reference file in Figure 2-11 is a credit file.
4
2
3
General LedgerControl Accounts Accounts Receivable Inventory Cost of Goods Sold Sales
BalanceSheetAR XXXSales
Orders
Reference File
Archive File
SourceDocument
TransactionFile
SalesOrders
Keying
Audit Trail
1
Journal
Error File
AR Subsidiary
InventorySubsidiary
Master Files
Credit File
UpdateProgram
FIGURE 2-11 Accounting Records in a Computer-Based System
56 Chapter 2 Introduction to Transaction Processing
Archive File. An archive file contains records of past transactions that are retained for future reference. These transactions form an important part of the audit trail. Archive files include journals, prior-period payroll information, lists of former employees, records of accounts written off, and prior-period ledgers.
The Digital Audit TrailLet’s walk through the system represented in Figure 2-11 to illustrate how computer files provide an audit trail. We begin with the capture of the economic event. In this example, sales are recorded manually on source documents, just as in the manual system. The next step in this process is to convert the source documents to digital form. This is done in the data input stage, where the transactions are edited and a transaction file of sales orders is produced. Some computer systems do not use physical source documents. Instead, trans-actions are captured directly on digital media.
The next step is to update the various master file subsidiary and control accounts that the transaction affects. During the update procedure, additional editing of transactions takes place. Some transactions may prove to be in error or invalid for such reasons as incorrect account numbers, insufficient quantities on hand, or customer credit problems. In this example, the system determines the available credit for each customer from the credit file before processing the sale. Any records that are rejected for credit problems are transferred to the error file. The remaining good records are used to update the master files. Only these transactions are added to the archive file that serves as the sales journal. By copying the valid transactions to the journal, the original transaction file is not needed for audit trail purposes. This file can now be erased (scratched) in preparation for the next batch of sales orders.
Like the paper trail, this digital audit trail allows transaction tracing. Again, an audi-tor attempting to evaluate the accuracy of the accounts receivable figure published in the balance sheet could do so via the following steps, which are identified in Figure 2-11.
1. Compare the accounts receivable balance in the balance sheet with the master file AR control account balance.
2. Reconcile the AR control figure with the AR subsidiary account total.
3. Select a sample of update entries made to accounts in the AR subsidiary ledger and trace these to transactions in the sales journal (archive file).
4. From these journal entries, identify specific source documents that can be pulled from their files and verified. If necessary, the auditor can confirm the accuracy and propri-ety of these source documents by contacting the customers in question.
Documentation TechniquesThe old saying that a picture is worth a thousand words is extremely applicable when it comes to documenting systems. A written description of a system can be wordy and difficult to follow. Experience has shown that a visual image can convey vital system information more effectively and efficiently than words. As both systems designers and auditors, accoun-tants use system documentation routinely. The ability to document systems in graphic form is thus an important skill for accountants to master. Six basic documentation techniques are introduced in this section: data flow diagrams, entity relationship diagrams, document flow-charts, system flowcharts, program flowcharts, and record layout diagrams.
Part I Overview of Accounting Information Systems 57
Data Flow Diagrams and Entity Relationship DiagramsTwo commonly used systems design and documentation techniques are the entity rela-tionship diagram and the data flow diagram. This section introduces the principal fea-tures of these techniques, illustrates their use, and shows how they are related.
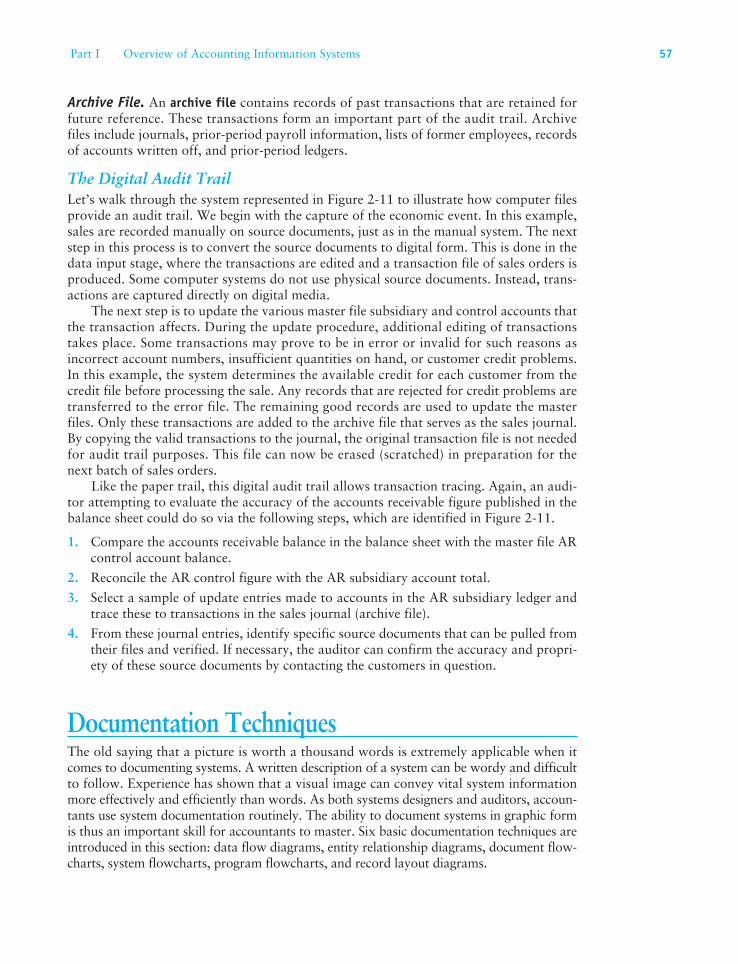
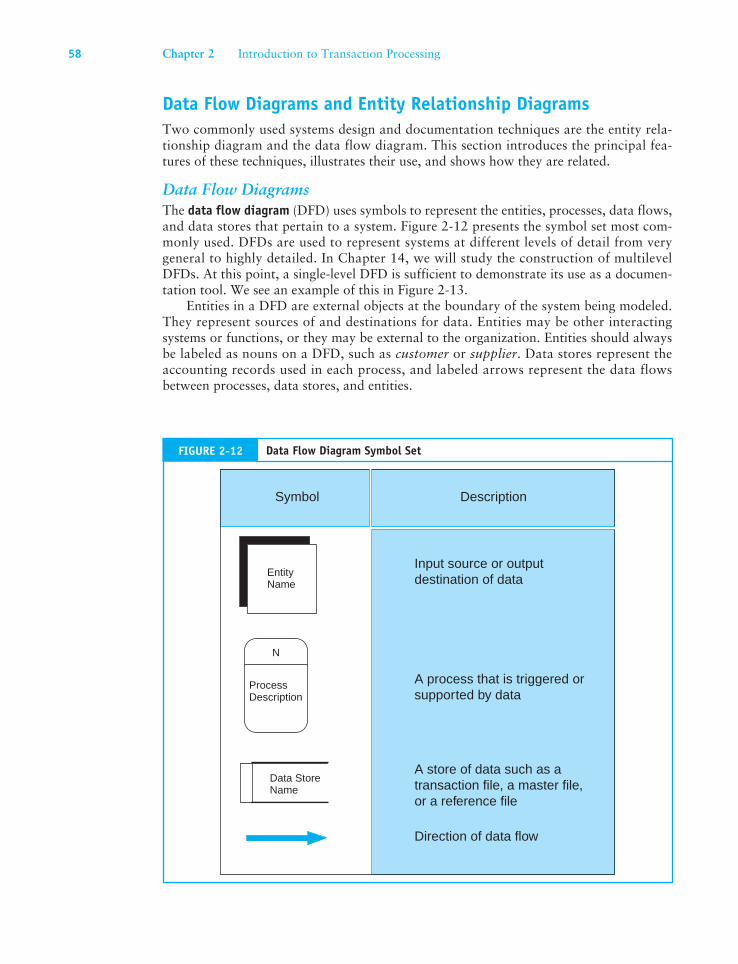
Data Flow DiagramsThe data flow diagram (DFD) uses symbols to represent the entities, processes, data flows, and data stores that pertain to a system. Figure 2-12 presents the symbol set most com-monly used. DFDs are used to represent systems at different levels of detail from very general to highly detailed. In Chapter 14, we will study the construction of multilevel DFDs. At this point, a single-level DFD is sufficient to demonstrate its use as a documen-tation tool. We see an example of this in Figure 2-13.
Entities in a DFD are external objects at the boundary of the system being modeled. They represent sources of and destinations for data. Entities may be other interacting systems or functions, or they may be external to the organization. Entities should always be labeled as nouns on a DFD, such as customer or supplier. Data stores represent the accounting records used in each process, and labeled arrows represent the data flows between processes, data stores, and entities.
ProcessDescription
Data StoreName
N
EntityName
Symbol Description
Input source or outputdestination of data
A process that is triggered orsupported by data
A store of data such as atransaction file, a master file,or a reference file
Direction of data flow
FIGURE 2-12 Data Flow Diagram Symbol Set
58 Chapter 2 Introduction to Transaction Processing
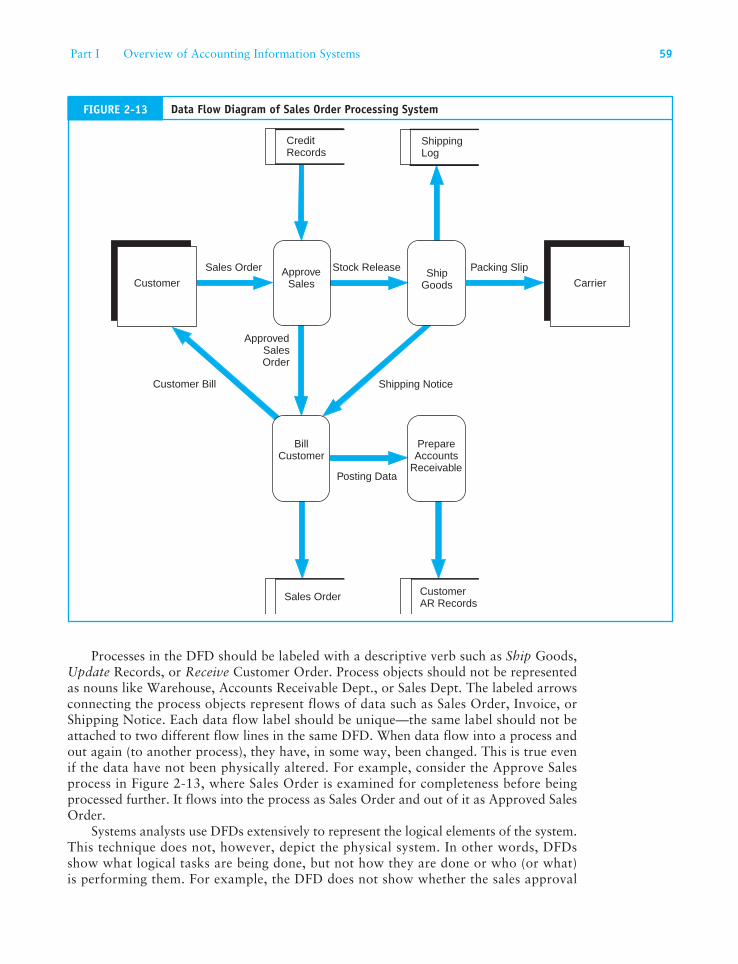
Processes in the DFD should be labeled with a descriptive verb such as Ship Goods, Update Records, or Receive Customer Order. Process objects should not be represented as nouns like Warehouse, Accounts Receivable Dept., or Sales Dept. The labeled arrows connecting the process objects represent flows of data such as Sales Order, Invoice, or Shipping Notice. Each data flow label should be unique—the same label should not be attached to two different flow lines in the same DFD. When data flow into a process and out again (to another process), they have, in some way, been changed. This is true even if the data have not been physically altered. For example, consider the Approve Sales process in Figure 2-13, where Sales Order is examined for completeness before being processed further. It flows into the process as Sales Order and out of it as Approved Sales Order.
Systems analysts use DFDs extensively to represent the logical elements of the system. This technique does not, however, depict the physical system. In other words, DFDs show what logical tasks are being done, but not how they are done or who (or what) is performing them. For example, the DFD does not show whether the sales approval
BillCustomer
PrepareAccounts
Receivable
Customer Carrier
Sales Order CustomerAR Records
CreditRecords
ApproveSales
ShipGoods
Sales Order
ApprovedSalesOrder
Stock Release
Customer Bill Shipping Notice
Posting Data
Packing Slip
ShippingLog
FIGURE 2-13 Data Flow Diagram of Sales Order Processing System
Part I Overview of Accounting Information Systems 59
process is separated physically from the billing process in compliance with internal con-trol objectives.
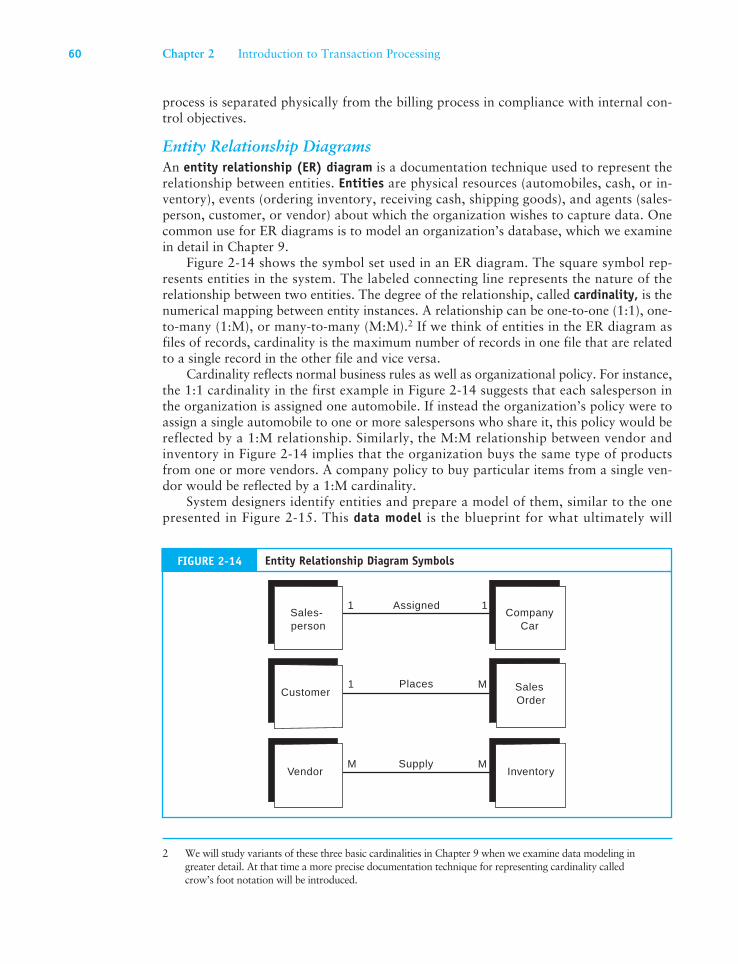
Entity Relationship DiagramsAn entity relationship (ER) diagram is a documentation technique used to represent the relationship between entities. Entities are physical resources (automobiles, cash, or in-ventory), events (ordering inventory, receiving cash, shipping goods), and agents (sales-person, customer, or vendor) about which the organization wishes to capture data. One common use for ER diagrams is to model an organization’s database, which we examine in detail in Chapter 9.
Figure 2-14 shows the symbol set used in an ER diagram. The square symbol rep-resents entities in the system. The labeled connecting line represents the nature of the relationship between two entities. The degree of the relationship, called cardinality, is the numerical mapping between entity instances. A relationship can be one-to-one (1:1), one-to-many (1:M), or many-to-many (M:M).2 If we think of entities in the ER diagram as files of records, cardinality is the maximum number of records in one file that are related to a single record in the other file and vice versa.
Cardinality reflects normal business rules as well as organizational policy. For instance, the 1:1 cardinality in the first example in Figure 2-14 suggests that each salesperson in the organization is assigned one automobile. If instead the organization’s policy were to assign a single automobile to one or more salespersons who share it, this policy would be reflected by a 1:M relationship. Similarly, the M:M relationship between vendor and inventory in Figure 2-14 implies that the organization buys the same type of products from one or more vendors. A company policy to buy particular items from a single ven-dor would be reflected by a 1:M cardinality.
System designers identify entities and prepare a model of them, similar to the one presented in Figure 2-15. This data model is the blueprint for what ultimately will
2 We will study variants of these three basic cardinalities in Chapter 9 when we examine data modeling in greater detail. At that time a more precise documentation technique for representing cardinality called crow’s foot notation will be introduced.
Assigned
Places
Supply
CompanyCar
Inventory
Sales-person
Customer
Vendor
1
1
M M
M
1
SalesOrder
FIGURE 2-14 Entity Relationship Diagram Symbols
60 Chapter 2 Introduction to Transaction Processing
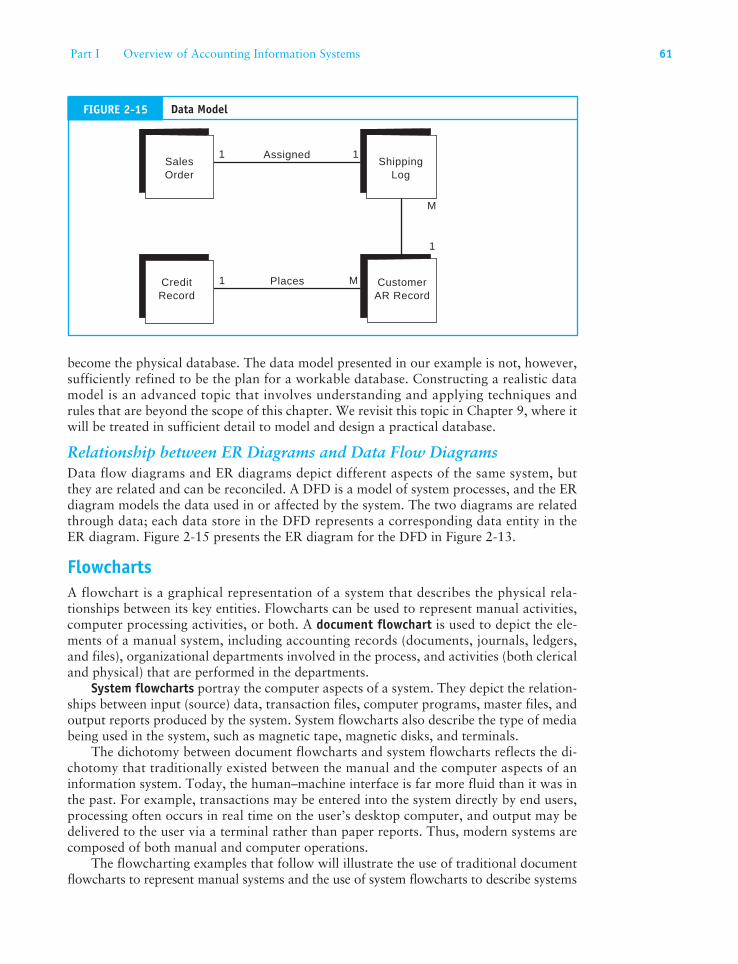
become the physical database. The data model presented in our example is not, however, sufficiently refined to be the plan for a workable database. Constructing a realistic data model is an advanced topic that involves understanding and applying techniques and rules that are beyond the scope of this chapter. We revisit this topic in Chapter 9, where it will be treated in sufficient detail to model and design a practical database.
Relationship between ER Diagrams and Data Flow DiagramsData flow diagrams and ER diagrams depict different aspects of the same system, but they are related and can be reconciled. A DFD is a model of system processes, and the ER diagram models the data used in or affected by the system. The two diagrams are related through data; each data store in the DFD represents a corresponding data entity in the ER diagram. Figure 2-15 presents the ER diagram for the DFD in Figure 2-13.
FlowchartsA flowchart is a graphical representation of a system that describes the physical rela-tionships between its key entities. Flowcharts can be used to represent manual activities, computer processing activities, or both. A document flowchart is used to depict the ele-ments of a manual system, including accounting records (documents, journals, ledgers, and files), organizational departments involved in the process, and activities (both clerical and physical) that are performed in the departments.
System flowcharts portray the computer aspects of a system. They depict the relation-ships between input (source) data, transaction files, computer programs, master files, and output reports produced by the system. System flowcharts also describe the type of media being used in the system, such as magnetic tape, magnetic disks, and terminals.
The dichotomy between document flowcharts and system flowcharts reflects the di-chotomy that traditionally existed between the manual and the computer aspects of an information system. Today, the human–machine interface is far more fluid than it was in the past. For example, transactions may be entered into the system directly by end users, processing often occurs in real time on the user’s desktop computer, and output may be delivered to the user via a terminal rather than paper reports. Thus, modern systems are composed of both manual and computer operations.
The flowcharting examples that follow will illustrate the use of traditional document flowcharts to represent manual systems and the use of system flowcharts to describe systems
Assigned
Places
ShippingLog
SalesOrder
CreditRecord
1
1 M
1
CustomerAR Record
M
1
FIGURE 2-15 Data Model
Part I Overview of Accounting Information Systems 61
62 Chapter 2 Introduction to Transaction Processing
that employ both manual and computer operations. Program flowcharts that describe the internal logic of computer programs are explained last.
Document FlowchartsTo demonstrate the preparation of a document flowchart, let’s assume that an auditor needs to flowchart a sales order system to evaluate its internal controls and procedures. The auditor will begin by interviewing individuals involved in the sales order process to determine what they do. This information will be captured in a set of facts similar to those below. Keep in mind that the purpose here is to demonstrate flowcharting. Thus, for clarity, the system facts are intentionally simplistic.
1. A clerk in the sales department receives customer orders by mail and prepares four copies of a sales order.
2. Copy 1 of the sales order is sent to the credit department for approval. The other three copies and the original customer order are filed temporarily, pending credit approval.
3. The credit department clerk validates the customer’s order against credit records kept in the credit department. The clerk signs Copy 1 to signify approval and returns it to the sales clerk.
4. When the sales clerk receives credit approval, he or she files Copy 1 and the customer order in the department. The clerk sends Copy 2 to the warehouse and Copies 3 and 4 to the shipping department.
5. The warehouse clerk picks the products from the shelves, records the transfer in the stock records, and sends the products and Copy 2 to the shipping department.
6. The shipping department receives Copy 2 and the goods from the warehouse, attaches Copy 2 as a packing slip, and ships the goods to the customer. Finally, the clerk files Copies 3 and 4 in the shipping department.
Based on these facts, the auditor can create a flowchart of this partial system. It is impor-tant to note that flowcharting is as much an art form as it is a technical skill, giving the flowchart author a great deal of license. Nevertheless, the primary objective should be to provide an unambiguous description of the system. With this in mind, certain rules and conventions need to be observed:
1. The flowchart should be labeled to clearly identify the system that it represents.
2. The correct symbols should be used to represent the entities in the system.
3. All symbols on the flowchart should be labeled.
4. Lines should have arrowheads to clearly show the process flow and sequence of events.
5. If complex processes need additional explanation for clarity, a text description should be included on the flowchart or in an attached document referenced by the flowchart.
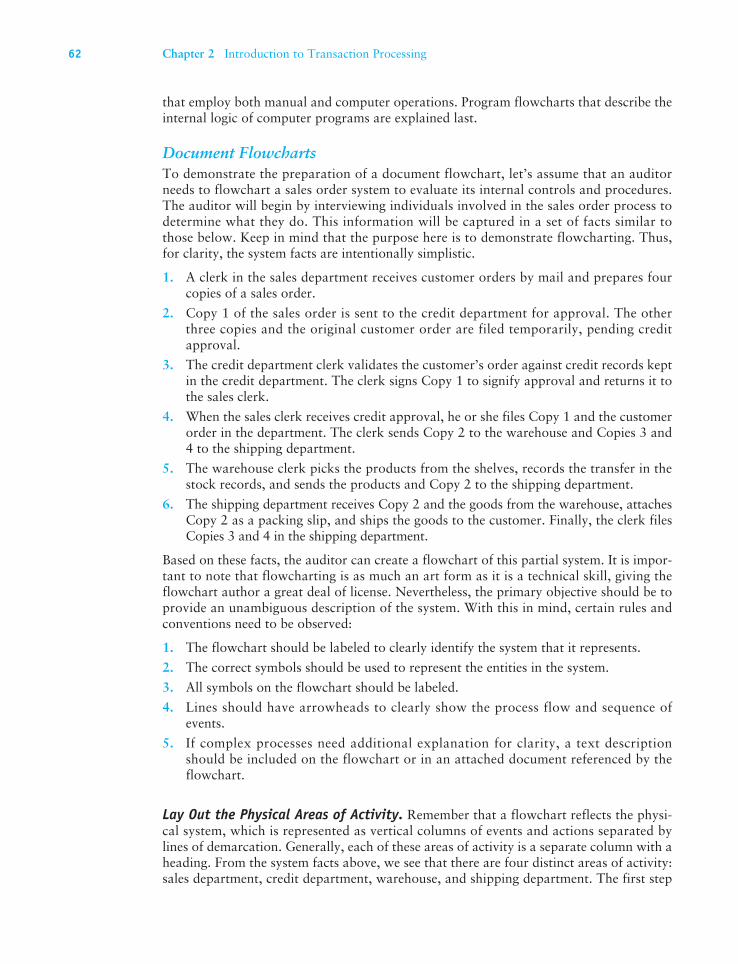
Lay Out the Physical Areas of Activity. Remember that a flowchart reflects the physi-cal system, which is represented as vertical columns of events and actions separated by lines of demarcation. Generally, each of these areas of activity is a separate column with a heading. From the system facts above, we see that there are four distinct areas of activity: sales department, credit department, warehouse, and shipping department. The first step
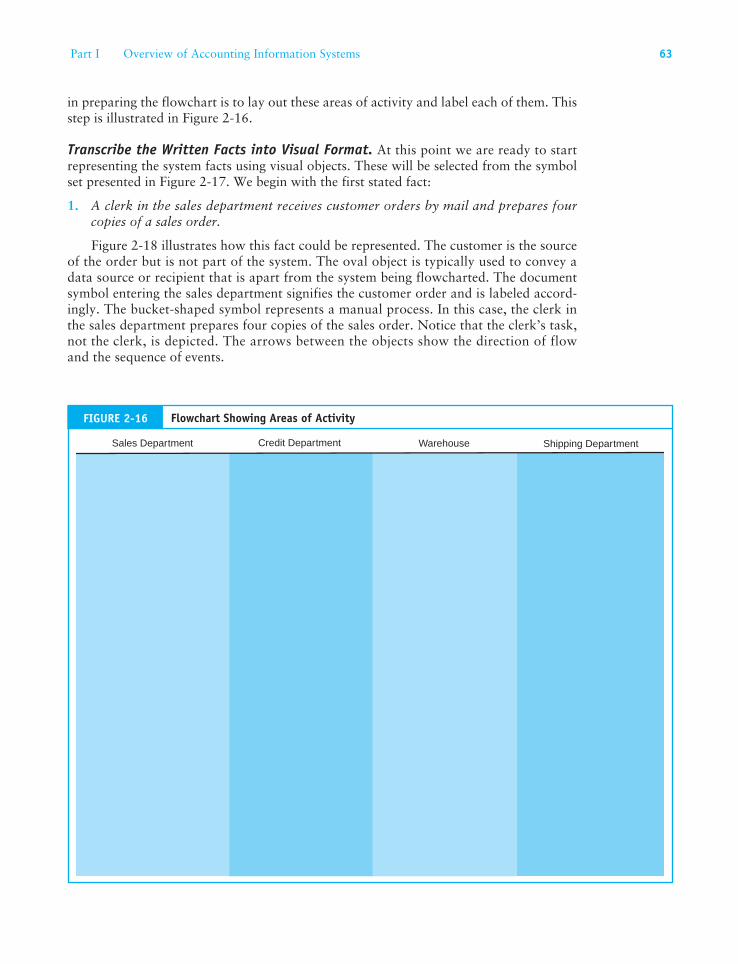
in preparing the flowchart is to lay out these areas of activity and label each of them. This step is illustrated in Figure 2-16.
Transcribe the Written Facts into Visual Format. At this point we are ready to start representing the system facts using visual objects. These will be selected from the symbol set presented in Figure 2-17. We begin with the first stated fact:
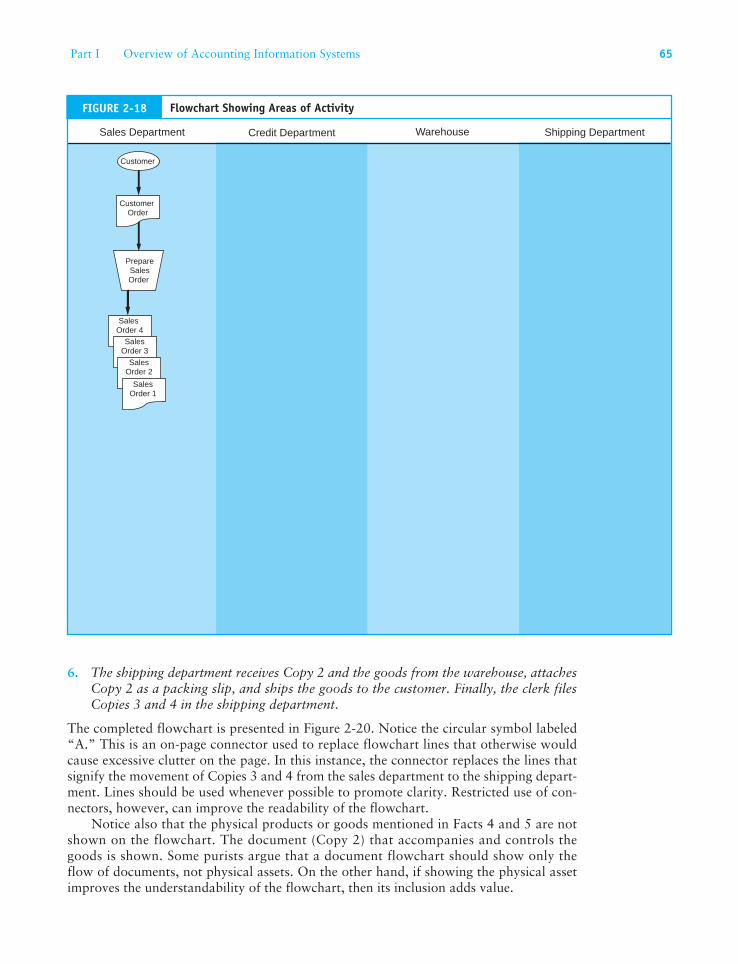
1. A clerk in the sales department receives customer orders by mail and prepares four copies of a sales order.
Figure 2-18 illustrates how this fact could be represented. The customer is the source of the order but is not part of the system. The oval object is typically used to convey a data source or recipient that is apart from the system being flowcharted. The document symbol entering the sales department signifies the customer order and is labeled accord-ingly. The bucket-shaped symbol represents a manual process. In this case, the clerk in the sales department prepares four copies of the sales order. Notice that the clerk’s task, not the clerk, is depicted. The arrows between the objects show the direction of flow and the sequence of events.
Sales Department Credit Department Warehouse Shipping Department
FIGURE 2-16 Flowchart Showing Areas of Activity
Part I Overview of Accounting Information Systems 63
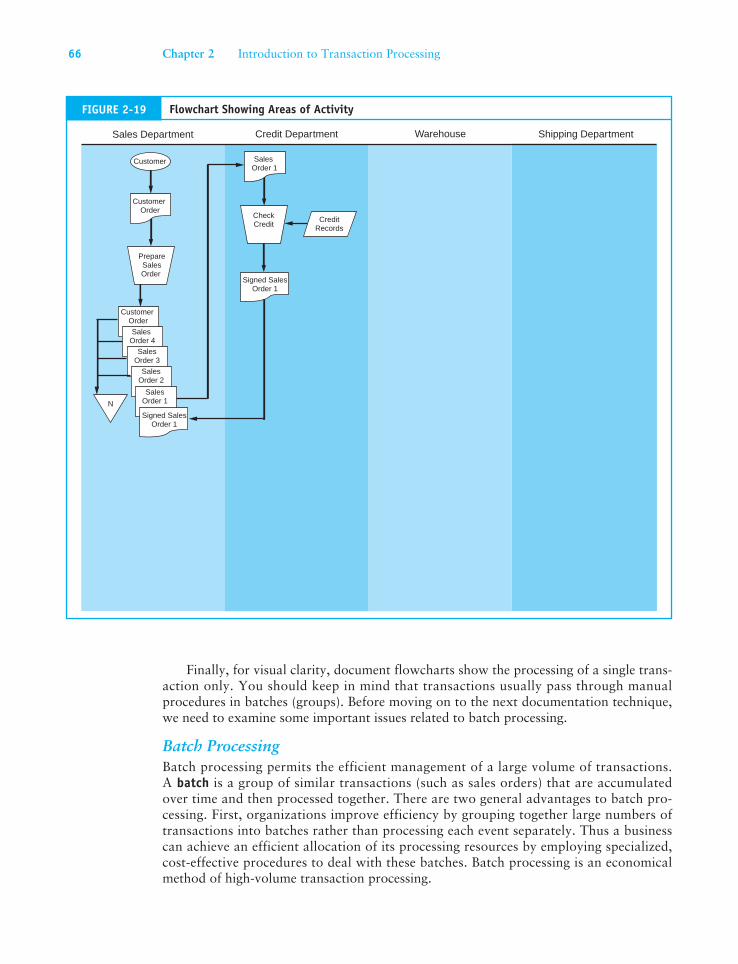
By transcribing each fact in this way, we systematically construct a flowchart. See how the second and third facts restated below add to the flowchart in Figure 2-19.
2. Copy 1 of the sales order is sent to the credit department for approval. The other three copies and the original customer order are filed temporarily, pending credit approval.
3. The credit department clerk validates the customer’s order against credit records kept in the credit department. The clerk signs Copy 1 to signify approval and returns it to the sales clerk.
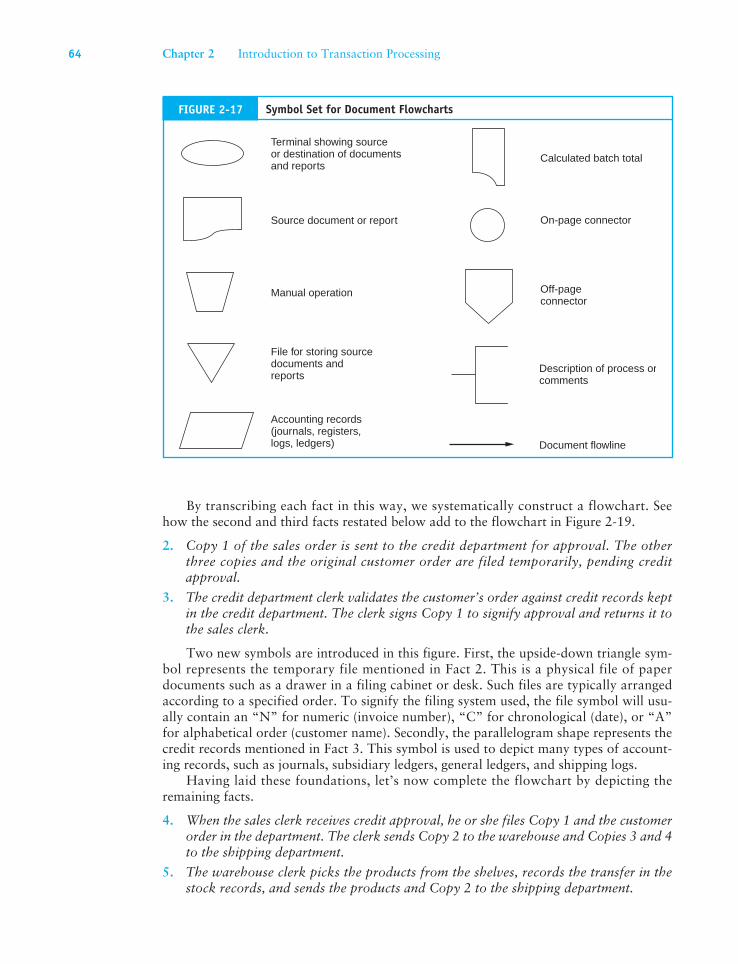
Two new symbols are introduced in this figure. First, the upside-down triangle sym-bol represents the temporary file mentioned in Fact 2. This is a physical file of paper documents such as a drawer in a filing cabinet or desk. Such files are typically arranged according to a specified order. To signify the filing system used, the file symbol will usu-ally contain an “N” for numeric (invoice number), “C” for chronological (date), or “A” for alphabetical order (customer name). Secondly, the parallelogram shape represents the credit records mentioned in Fact 3. This symbol is used to depict many types of account-ing records, such as journals, subsidiary ledgers, general ledgers, and shipping logs.
Having laid these foundations, let’s now complete the flowchart by depicting the remaining facts.
4. When the sales clerk receives credit approval, he or she files Copy 1 and the customer order in the department. The clerk sends Copy 2 to the warehouse and Copies 3 and 4 to the shipping department.
5. The warehouse clerk picks the products from the shelves, records the transfer in the stock records, and sends the products and Copy 2 to the shipping department.
Terminal showing sourceor destination of documentsand reports
Source document or report
Manual operation
File for storing sourcedocuments andreports
Accounting records(journals, registers,logs, ledgers)
Calculated batch total
On-page connector
Off-pageconnector
Document flowline
Description of process orcomments
FIGURE 2-17 Symbol Set for Document Flowcharts
64 Chapter 2 Introduction to Transaction Processing
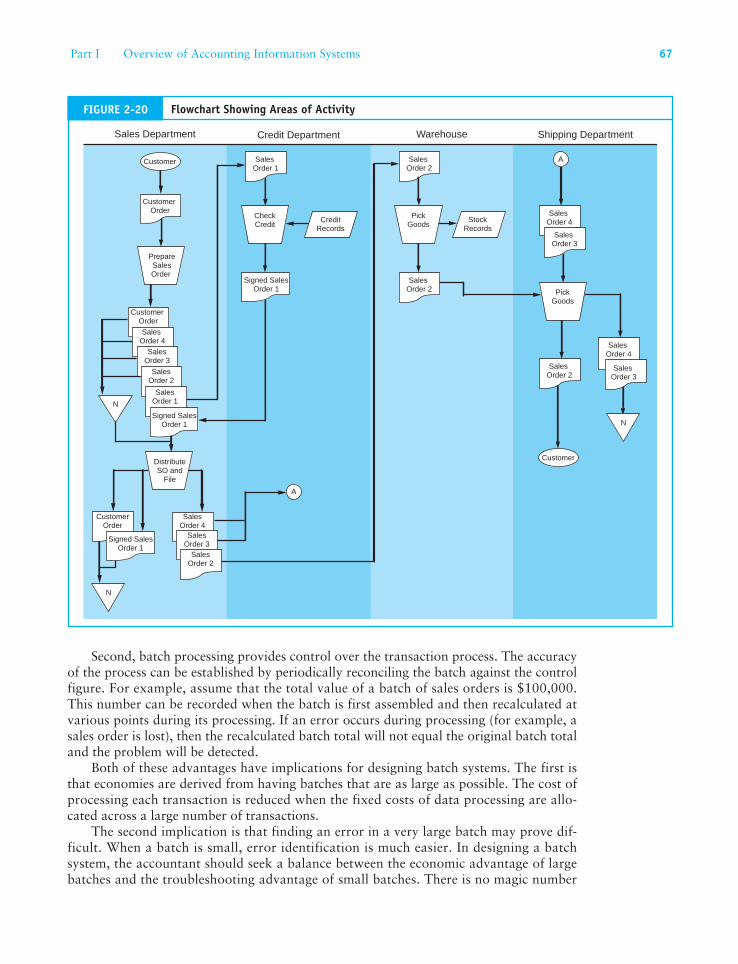
6. The shipping department receives Copy 2 and the goods from the warehouse, attaches Copy 2 as a packing slip, and ships the goods to the customer. Finally, the clerk files Copies 3 and 4 in the shipping department.
The completed flowchart is presented in Figure 2-20. Notice the circular symbol labeled “A.” This is an on-page connector used to replace flowchart lines that otherwise would cause excessive clutter on the page. In this instance, the connector replaces the lines that signify the movement of Copies 3 and 4 from the sales department to the shipping depart-ment. Lines should be used whenever possible to promote clarity. Restricted use of con-nectors, however, can improve the readability of the flowchart.
Notice also that the physical products or goods mentioned in Facts 4 and 5 are not shown on the flowchart. The document (Copy 2) that accompanies and controls the goods is shown. Some purists argue that a document flowchart should show only the flow of documents, not physical assets. On the other hand, if showing the physical asset improves the understandability of the flowchart, then its inclusion adds value.
Sales Department Credit Department Warehouse Shipping Department
Customer
PrepareSalesOrder
SalesOrder 4
SalesOrder 3
SalesOrder 2
SalesOrder 1
CustomerOrder
FIGURE 2-18 Flowchart Showing Areas of Activity
Part I Overview of Accounting Information Systems 65
Finally, for visual clarity, document flowcharts show the processing of a single trans-action only. You should keep in mind that transactions usually pass through manual procedures in batches (groups). Before moving on to the next documentation technique, we need to examine some important issues related to batch processing.
Batch ProcessingBatch processing permits the efficient management of a large volume of transactions. A batch is a group of similar transactions (such as sales orders) that are accumulated over time and then processed together. There are two general advantages to batch pro-cessing. First, organizations improve efficiency by grouping together large numbers of transactions into batches rather than processing each event separately. Thus a business can achieve an efficient allocation of its processing resources by employing specialized, cost-effective procedures to deal with these batches. Batch processing is an economical method of high-volume transaction processing.
Sales Department Credit Department Warehouse Shipping Department
Customer
PrepareSalesOrder
CustomerOrder
SalesOrder 4
SalesOrder 3
SalesOrder 2
SalesOrder 1
Signed SalesOrder 1
N
CheckCredit
Signed SalesOrder 1
CustomerOrder
SalesOrder 1
CreditRecords
FIGURE 2-19 Flowchart Showing Areas of Activity
66 Chapter 2 Introduction to Transaction Processing
Second, batch processing provides control over the transaction process. The accuracy of the process can be established by periodically reconciling the batch against the control figure. For example, assume that the total value of a batch of sales orders is $100,000. This number can be recorded when the batch is first assembled and then recalculated at various points during its processing. If an error occurs during processing (for example, a sales order is lost), then the recalculated batch total will not equal the original batch total and the problem will be detected.
Both of these advantages have implications for designing batch systems. The first is that economies are derived from having batches that are as large as possible. The cost of processing each transaction is reduced when the fixed costs of data processing are allo-cated across a large number of transactions.
The second implication is that finding an error in a very large batch may prove dif-ficult. When a batch is small, error identification is much easier. In designing a batch system, the accountant should seek a balance between the economic advantage of large batches and the troubleshooting advantage of small batches. There is no magic number
Sales Department Credit Department Warehouse Shipping Department
Customer
PrepareSalesOrder
CustomerOrder
SalesOrder 4
SalesOrder 3
SalesOrder 2
DistributeSO and
File
SalesOrder 3
SalesOrder 2
SalesOrder 4
CustomerOrder
N
SalesOrder 1
Signed SalesOrder 1
N
CheckCredit
A
SalesOrder 2
PickGoods
StockRecords
SalesOrder 2
SalesOrder 4
PickGoods
SalesOrder 4
SalesOrder 2
N
Customer
SalesOrder 3
A
Signed SalesOrder 1
CustomerOrder
Signed SalesOrder 1
SalesOrder 1
CreditRecords
SalesOrder 3
FIGURE 2-20 Flowchart Showing Areas of Activity
Part I Overview of Accounting Information Systems 67
for the size of a batch. This decision is based on a number of operational, business, and economic factors. Among these are the volume of transactions, the competitiveness of the industry, the normal frequency of errors, the financial implications of an undetected error, and the costs of processing. Depending on these factors, a system might process small batches (50 to 100 items) several times a day or an entire day’s activity as a single batch.
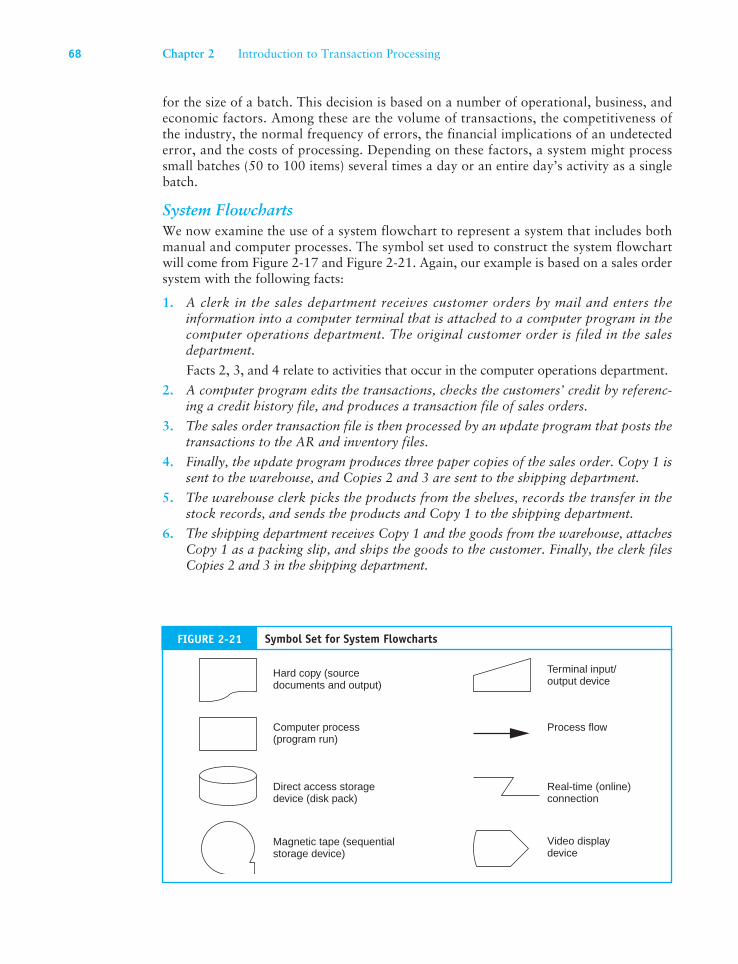
System FlowchartsWe now examine the use of a system flowchart to represent a system that includes both manual and computer processes. The symbol set used to construct the system flowchart will come from Figure 2-17 and Figure 2-21. Again, our example is based on a sales order system with the following facts:
1. A clerk in the sales department receives customer orders by mail and enters the information into a computer terminal that is attached to a computer program in the computer operations department. The original customer order is filed in the sales department.
Facts 2, 3, and 4 relate to activities that occur in the computer operations department.
2. A computer program edits the transactions, checks the customers’ credit by referenc-ing a credit history file, and produces a transaction file of sales orders.
3. The sales order transaction file is then processed by an update program that posts the transactions to the AR and inventory files.
4. Finally, the update program produces three paper copies of the sales order. Copy 1 is sent to the warehouse, and Copies 2 and 3 are sent to the shipping department.
5. The warehouse clerk picks the products from the shelves, records the transfer in the stock records, and sends the products and Copy 1 to the shipping department.
6. The shipping department receives Copy 1 and the goods from the warehouse, attaches Copy 1 as a packing slip, and ships the goods to the customer. Finally, the clerk files Copies 2 and 3 in the shipping department.
Hard copy (sourcedocuments and output)
Computer process(program run)
Direct access storagedevice (disk pack)
Magnetic tape (sequential storage device)
Terminal input/output device
Process flow
Real-time (online)connection
Video displaydevice
FIGURE 2-21 Symbol Set for System Flowcharts
68 Chapter 2 Introduction to Transaction Processing
Lay Out the Physical Areas of Activity. The flowcharting process begins by creating a template that depicts the areas of activity similar to the one in Figure 2-16. The only difference is that this system has a computer operations department and does not have a credit department.
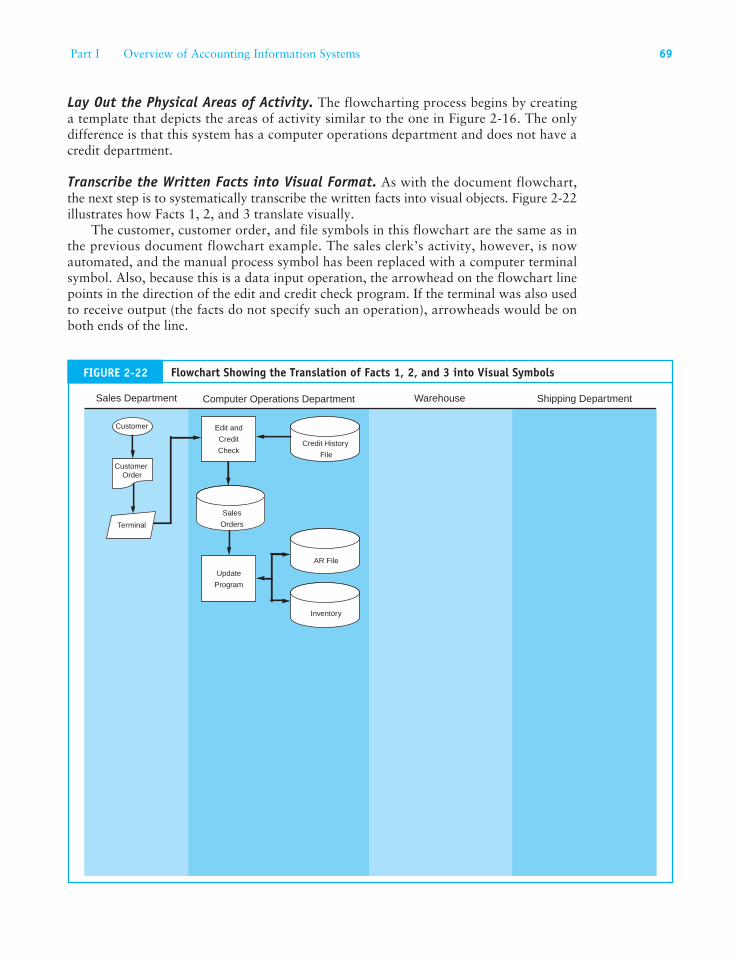
Transcribe the Written Facts into Visual Format. As with the document flowchart, the next step is to systematically transcribe the written facts into visual objects. Figure 2-22 illustrates how Facts 1, 2, and 3 translate visually.
The customer, customer order, and file symbols in this flowchart are the same as in the previous document flowchart example. The sales clerk’s activity, however, is now automated, and the manual process symbol has been replaced with a computer terminal symbol. Also, because this is a data input operation, the arrowhead on the flowchart line points in the direction of the edit and credit check program. If the terminal was also used to receive output (the facts do not specify such an operation), arrowheads would be on both ends of the line.
Sales Department Computer Operations Department Warehouse Shipping Department
Customer
Terminal
Credit History
File
Edit and
Credit
Check
Sales
Orders
Update
Program
AR File
Inventory
CustomerOrder
FIGURE 2-22 Flowchart Showing the Translation of Facts 1, 2, and 3 into Visual Symbols
Part I Overview of Accounting Information Systems 69
As with the document flowchart, the emphasis here is on the physical system. For example, the terminal used by the sales clerk to enter customer orders is physically located in the sales department, but the programs that process the transactions and the files that are used, created, and updated by these events are stored in a separate computer operations department.
Notice how the flowchart line points from the credit history file to the edit program. This indicates that the file is read (referenced) but not changed (updated) by the program. In contrast, the interactions between the update program and the AR and inventory files are two-way. Records are read by the program, updated to reflect the transactions, and then written back to the files. The logic of a file update is explained later in the chapter.
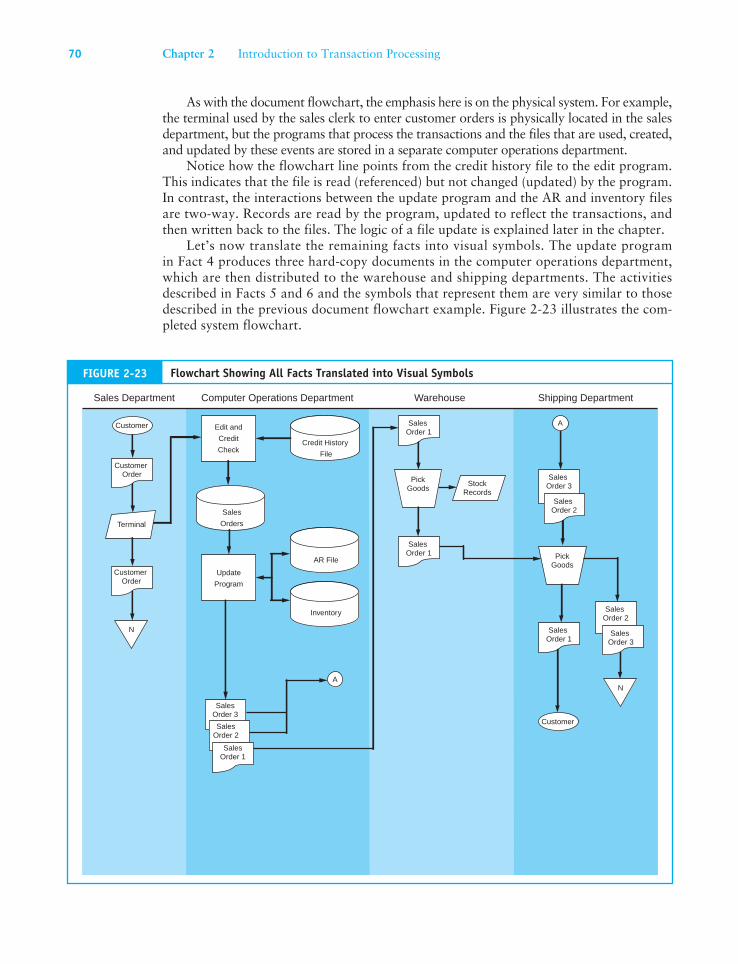
Let’s now translate the remaining facts into visual symbols. The update program in Fact 4 produces three hard-copy documents in the computer operations department, which are then distributed to the warehouse and shipping departments. The activities described in Facts 5 and 6 and the symbols that represent them are very similar to those described in the previous document flowchart example. Figure 2-23 illustrates the com-pleted system flowchart.
Sales Department Computer Operations Department Warehouse Shipping Department
Customer
N
PickGoods
StockRecords
SalesOrder 1
SalesOrder 3
PickGoods
SalesOrder 2
SalesOrder 1
N
Customer
A
Terminal
Credit History
File
Edit and
Credit
Check
Sales
Orders
Update
Program
AR File
Inventory
SalesOrder 1
A
SalesOrder 3
SalesOrder 2
CustomerOrder
CustomerOrder
SalesOrder 1
SalesOrder 3
SalesOrder 2
FIGURE 2-23 Flowchart Showing All Facts Translated into Visual Symbols
70 Chapter 2 Introduction to Transaction Processing
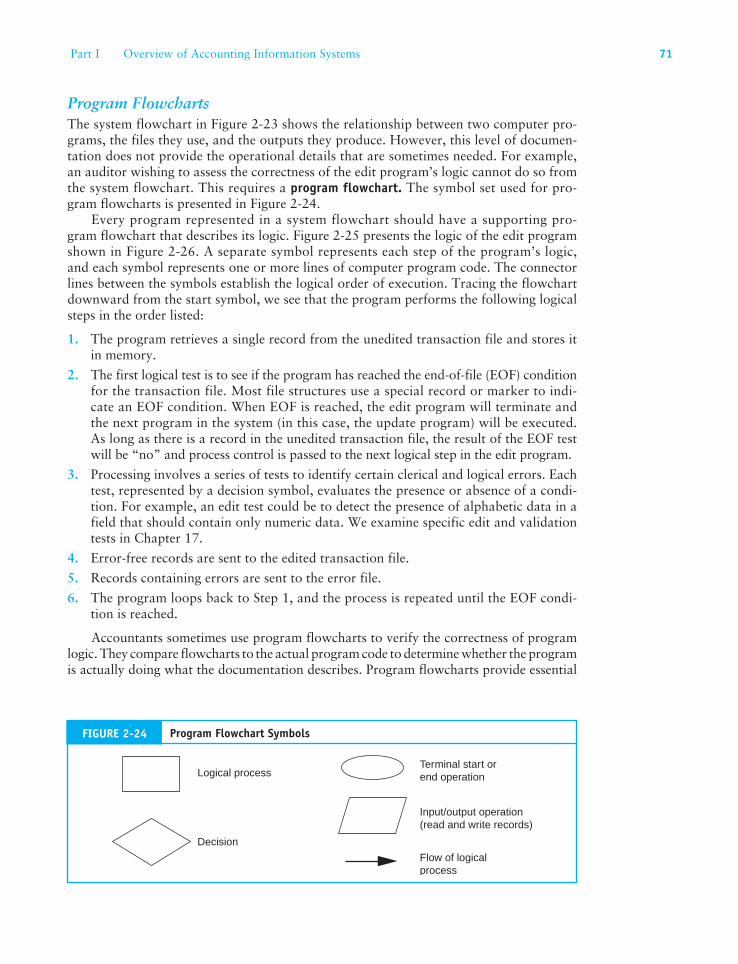
Program FlowchartsThe system flowchart in Figure 2-23 shows the relationship between two computer pro-grams, the files they use, and the outputs they produce. However, this level of documen-tation does not provide the operational details that are sometimes needed. For example, an auditor wishing to assess the correctness of the edit program’s logic cannot do so from the system flowchart. This requires a program flowchart. The symbol set used for pro-gram flowcharts is presented in Figure 2-24.
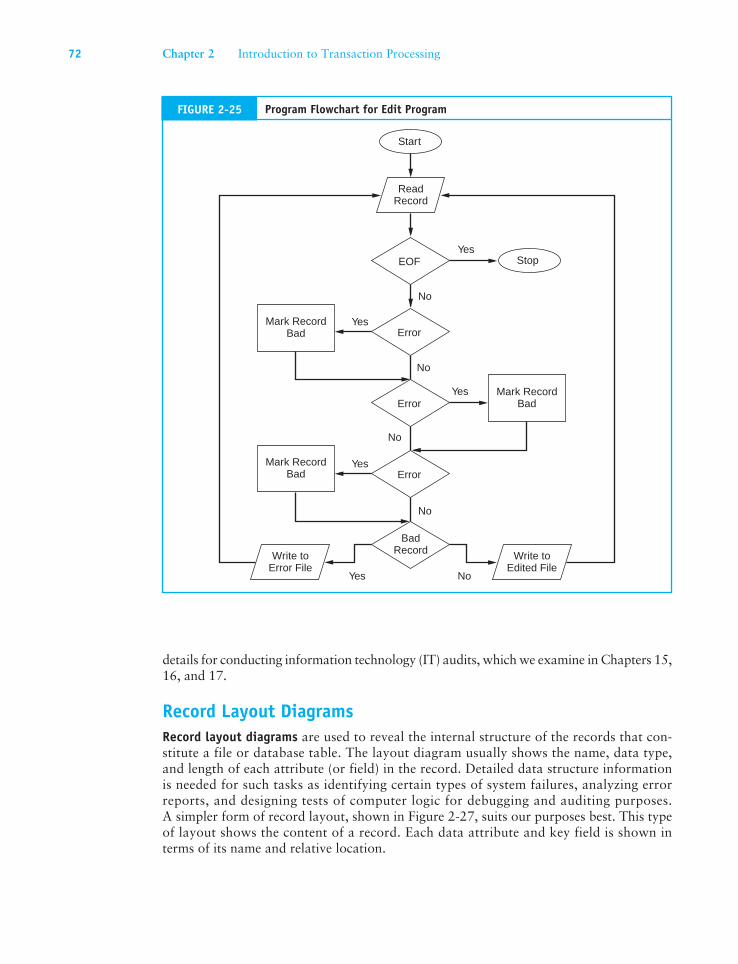
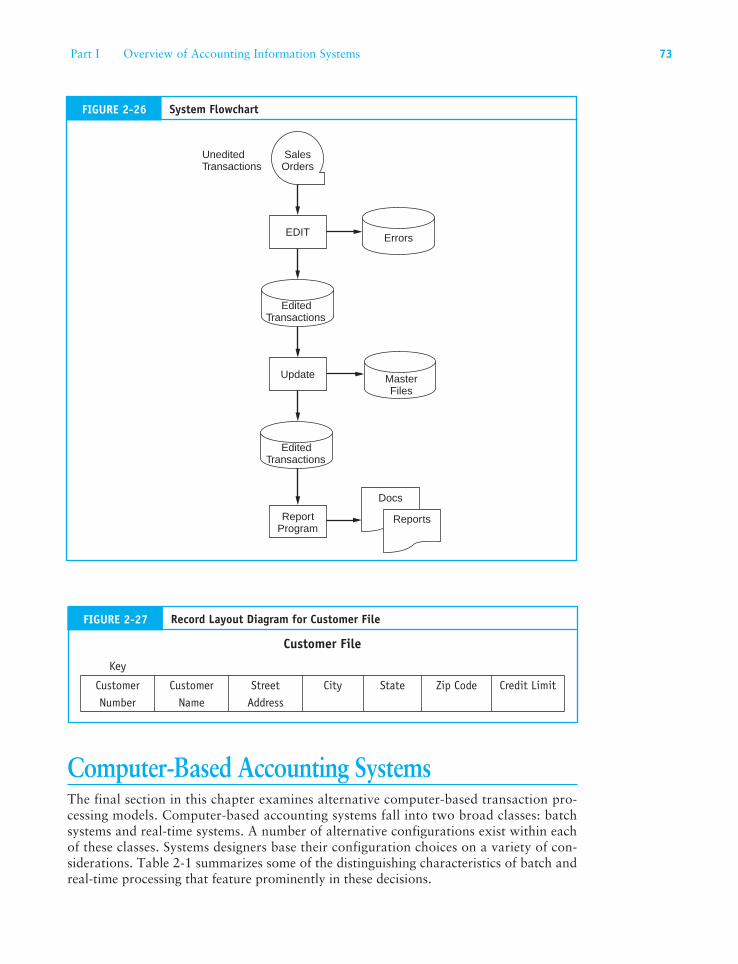
Every program represented in a system flowchart should have a supporting pro-gram flowchart that describes its logic. Figure 2-25 presents the logic of the edit program shown in Figure 2-26. A separate symbol represents each step of the program’s logic, and each symbol represents one or more lines of computer program code. The connector lines between the symbols establish the logical order of execution. Tracing the flowchart downward from the start symbol, we see that the program performs the following logical steps in the order listed:
1. The program retrieves a single record from the unedited transaction file and stores it in memory.
2. The first logical test is to see if the program has reached the end-of-file (EOF) condition for the transaction file. Most file structures use a special record or marker to indi-cate an EOF condition. When EOF is reached, the edit program will terminate and the next program in the system (in this case, the update program) will be executed. As long as there is a record in the unedited transaction file, the result of the EOF test will be “no” and process control is passed to the next logical step in the edit program.
3. Processing involves a series of tests to identify certain clerical and logical errors. Each test, represented by a decision symbol, evaluates the presence or absence of a condi-tion. For example, an edit test could be to detect the presence of alphabetic data in a field that should contain only numeric data. We examine specific edit and validation tests in Chapter 17.
4. Error-free records are sent to the edited transaction file.
5. Records containing errors are sent to the error file.
6. The program loops back to Step 1, and the process is repeated until the EOF condi-tion is reached.
Accountants sometimes use program flowcharts to verify the correctness of program logic. They compare flowcharts to the actual program code to determine whether the program is actually doing what the documentation describes. Program flowcharts provide essential
Terminal start orend operation
Input/output operation(read and write records)
Logical process
Decision
Flow of logicalprocess
FIGURE 2-24 Program Flowchart Symbols
Part I Overview of Accounting Information Systems 71
details for conducting information technology (IT) audits, which we examine in Chapters 15, 16, and 17.
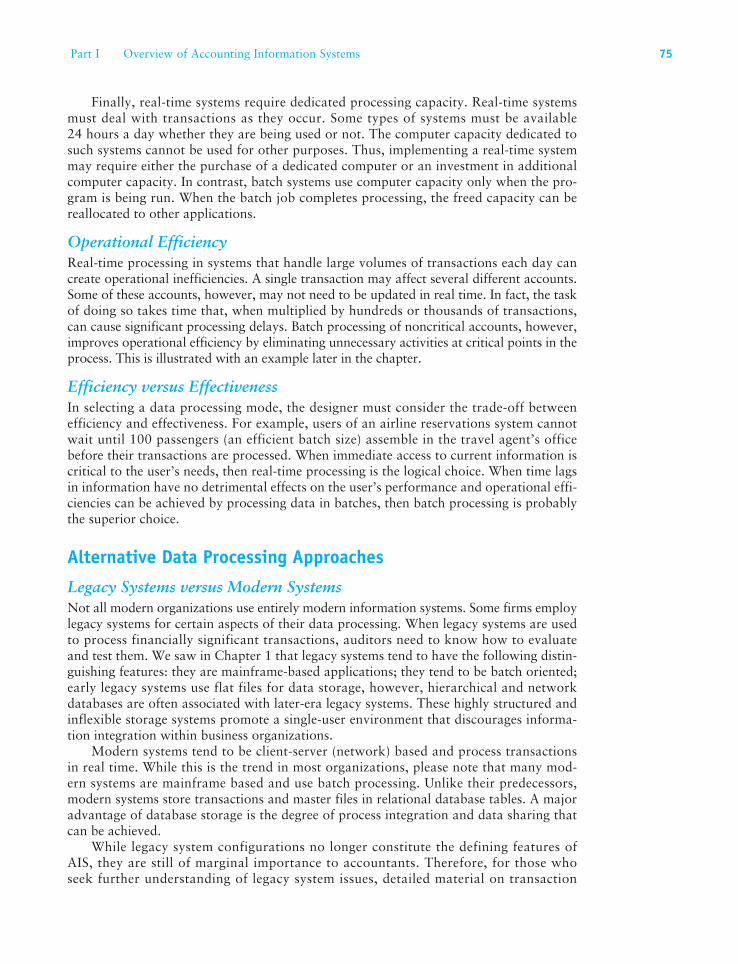
Record Layout DiagramsRecord layout diagrams are used to reveal the internal structure of the records that con-stitute a file or database table. The layout diagram usually shows the name, data type, and length of each attribute (or field) in the record. Detailed data structure information is needed for such tasks as identifying certain types of system failures, analyzing error reports, and designing tests of computer logic for debugging and auditing purposes. A simpler form of record layout, shown in Figure 2-27, suits our purposes best. This type of layout shows the content of a record. Each data attribute and key field is shown in terms of its name and relative location.
Start
ReadRecord
EOF
Error
Error
Error
Yes
Yes
Yes
Yes
Yes
No
No
No
No
No
BadRecordWrite to
Error FileWrite to
Edited File
Mark RecordBad
Stop
Mark RecordBad
Mark RecordBad
FIGURE 2-25 Program Flowchart for Edit Program
72 Chapter 2 Introduction to Transaction Processing
Computer-Based Accounting SystemsThe final section in this chapter examines alternative computer-based transaction pro-cessing models. Computer-based accounting systems fall into two broad classes: batch systems and real-time systems. A number of alternative configurations exist within each of these classes. Systems designers base their configuration choices on a variety of con-siderations. Table 2-1 summarizes some of the distinguishing characteristics of batch and real-time processing that feature prominently in these decisions.
FIGURE 2-27 Record Layout Diagram for Customer File
Customer File
Key
Customer Number
Customer Name
Street Address
City State Zip Code Credit Limit
SalesOrders
Update
Errors
MasterFiles
EDIT
ReportProgram
Docs
Reports
UneditedTransactions
EditedTransactions
EditedTransactions
FIGURE 2-26 System Flowchart
Part I Overview of Accounting Information Systems 73
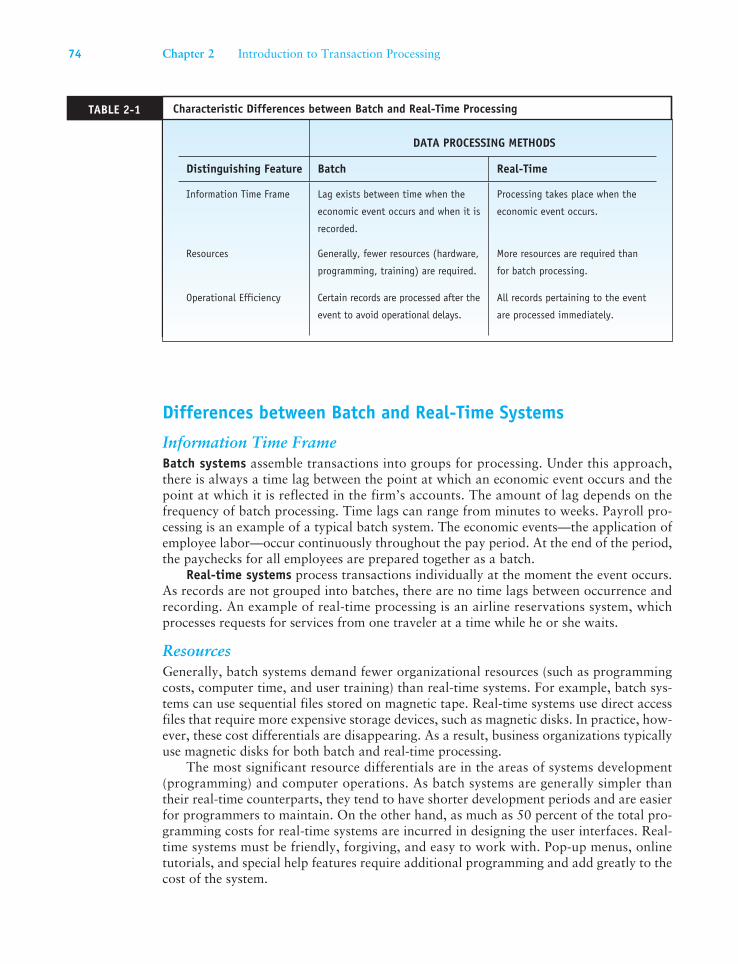
Differences between Batch and Real-Time Systems
Information Time FrameBatch systems assemble transactions into groups for processing. Under this approach, there is always a time lag between the point at which an economic event occurs and the point at which it is reflected in the firm’s accounts. The amount of lag depends on the frequency of batch processing. Time lags can range from minutes to weeks. Payroll pro-cessing is an example of a typical batch system. The economic events—the application of employee labor—occur continuously throughout the pay period. At the end of the period, the paychecks for all employees are prepared together as a batch.
Real-time systems process transactions individually at the moment the event occurs. As records are not grouped into batches, there are no time lags between occurrence and recording. An example of real-time processing is an airline reservations system, which processes requests for services from one traveler at a time while he or she waits.
ResourcesGenerally, batch systems demand fewer organizational resources (such as programming costs, computer time, and user training) than real-time systems. For example, batch sys-tems can use sequential files stored on magnetic tape. Real-time systems use direct access files that require more expensive storage devices, such as magnetic disks. In practice, how-ever, these cost differentials are disappearing. As a result, business organizations typically use magnetic disks for both batch and real-time processing.
The most significant resource differentials are in the areas of systems development (programming) and computer operations. As batch systems are generally simpler than their real-time counterparts, they tend to have shorter development periods and are easier for programmers to maintain. On the other hand, as much as 50 percent of the total pro-gramming costs for real-time systems are incurred in designing the user interfaces. Real-time systems must be friendly, forgiving, and easy to work with. Pop-up menus, online tutorials, and special help features require additional programming and add greatly to the cost of the system.
DATA PROCESSING METHODS
Distinguishing Feature Batch Real-Time
Information Time Frame Lag exists between time when the
economic event occurs and when it is
recorded.
Processing takes place when the
economic event occurs.
Resources Generally, fewer resources (hardware,
programming, training) are required.
More resources are required than
for batch processing.
Operational Efficiency Certain records are processed after the
event to avoid operational delays.
All records pertaining to the event
are processed immediately.
TABLE 2-1 Characteristic Differences between Batch and Real-Time Processing
74 Chapter 2 Introduction to Transaction Processing
Finally, real-time systems require dedicated processing capacity. Real-time systems must deal with transactions as they occur. Some types of systems must be available 24 hours a day whether they are being used or not. The computer capacity dedicated to such systems cannot be used for other purposes. Thus, implementing a real-time system may require either the purchase of a dedicated computer or an investment in additional computer capacity. In contrast, batch systems use computer capacity only when the pro-gram is being run. When the batch job completes processing, the freed capacity can be reallocated to other applications.
Operational Efficiency Real-time processing in systems that handle large volumes of transactions each day can create operational inefficiencies. A single transaction may affect several different accounts. Some of these accounts, however, may not need to be updated in real time. In fact, the task of doing so takes time that, when multiplied by hundreds or thousands of transactions, can cause significant processing delays. Batch processing of noncritical accounts, however, improves operational efficiency by eliminating unnecessary activities at critical points in the process. This is illustrated with an example later in the chapter.
Efficiency versus EffectivenessIn selecting a data processing mode, the designer must consider the trade-off between efficiency and effectiveness. For example, users of an airline reservations system cannot wait until 100 passengers (an efficient batch size) assemble in the travel agent’s office before their transactions are processed. When immediate access to current information is critical to the user’s needs, then real-time processing is the logical choice. When time lags in information have no detrimental effects on the user’s performance and operational effi-ciencies can be achieved by processing data in batches, then batch processing is probably the superior choice.
Alternative Data Processing Approaches
Legacy Systems versus Modern SystemsNot all modern organizations use entirely modern information systems. Some firms employ legacy systems for certain aspects of their data processing. When legacy systems are used to process financially significant transactions, auditors need to know how to evaluate and test them. We saw in Chapter 1 that legacy systems tend to have the following distin-guishing features: they are mainframe-based applications; they tend to be batch oriented; early legacy systems use flat files for data storage, however, hierarchical and network databases are often associated with later-era legacy systems. These highly structured and inflexible storage systems promote a single-user environment that discourages informa-tion integration within business organizations.
Modern systems tend to be client-server (network) based and process transactions in real time. While this is the trend in most organizations, please note that many mod-ern systems are mainframe based and use batch processing. Unlike their predecessors, modern systems store transactions and master files in relational database tables. A major advantage of database storage is the degree of process integration and data sharing that can be achieved.
While legacy system configurations no longer constitute the defining features of AIS, they are still of marginal importance to accountants. Therefore, for those who seek further understanding of legacy system issues, detailed material on transaction
Part I Overview of Accounting Information Systems 75
processing techniques using flat-file structures is provided in Section B of the Appendix to this chapter.
The remainder of the chapter focuses on modern system technologies used for pro-cessing accounting transactions. Some systems employ a combination of batch and real-time processing, while others are purely real-time systems. In several chapters that follow, we will examine how these approaches are configured to support specific functions such as sales order processing, purchasing, and payroll.
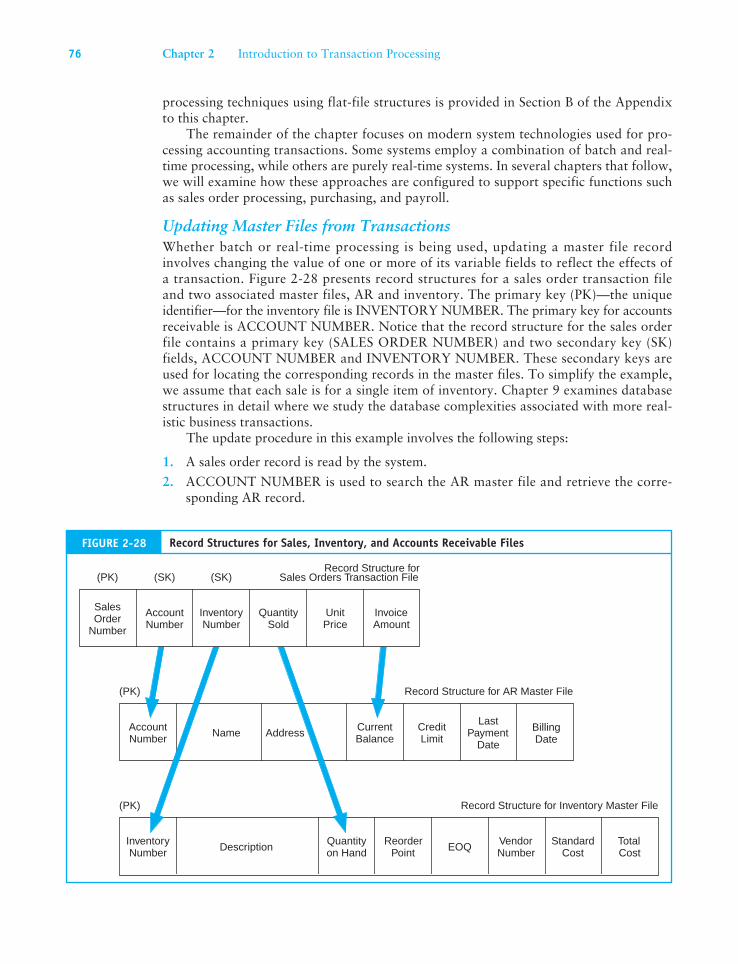
Updating Master Files from TransactionsWhether batch or real-time processing is being used, updating a master file record involves changing the value of one or more of its variable fields to reflect the effects of a transaction. Figure 2-28 presents record structures for a sales order transaction file and two associated master files, AR and inventory. The primary key (PK)—the unique identifier—for the inventory file is INVENTORY NUMBER. The primary key for accounts receivable is ACCOUNT NUMBER. Notice that the record structure for the sales order file contains a primary key (SALES ORDER NUMBER) and two secondary key (SK) fields, ACCOUNT NUMBER and INVENTORY NUMBER. These secondary keys are used for locating the corresponding records in the master files. To simplify the example, we assume that each sale is for a single item of inventory. Chapter 9 examines database structures in detail where we study the database complexities associated with more real-istic business transactions.
The update procedure in this example involves the following steps:
1. A sales order record is read by the system.
2. ACCOUNT NUMBER is used to search the AR master file and retrieve the corre-sponding AR record.
(PK) Record Structure for AR Master File
AccountNumber Address Current
BalanceCreditLimit
LastPayment
Date
BillingDate
Record Structure for Inventory Master File(PK)
InventoryNumber
Quantityon Hand
ReorderPoint EOQ Vendor
NumberStandard
CostTotalCost
Name
Description
(SK)Record Structure for
Sales Orders Transaction File
InventoryNumber
QuantitySold
UnitPrice
InvoiceAmount
(SK)(PK)
SalesOrder
Number
AccountNumber
FIGURE 2-28 Record Structures for Sales, Inventory, and Accounts Receivable Files
76 Chapter 2 Introduction to Transaction Processing
3. The AR update procedure calculates the new customer balance by adding the value stored in the INVOICE AMOUNT field of the sales order record to the CURRENT BALANCE field value in the AR master record.
4. Next, INVENTORY NUMBER is used to search for the corresponding record in the inventory master file.
5. The inventory update program reduces inventory levels by deducting the QUANTITY SOLD value in a transaction record from the QUANTITY ON HAND field value in the inventory record.
6. A new sales order record is read, and the process is repeated.
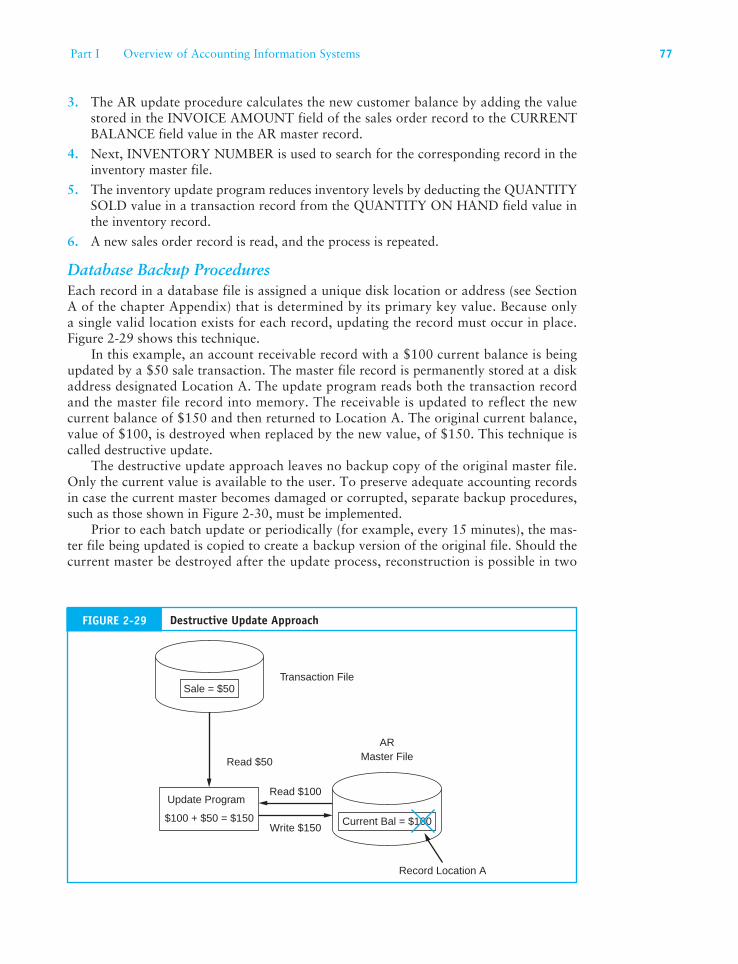
Database Backup ProceduresEach record in a database file is assigned a unique disk location or address (see Section A of the chapter Appendix) that is determined by its primary key value. Because only a single valid location exists for each record, updating the record must occur in place. Figure 2-29 shows this technique.
In this example, an account receivable record with a $100 current balance is being updated by a $50 sale transaction. The master file record is permanently stored at a disk address designated Location A. The update program reads both the transaction record and the master file record into memory. The receivable is updated to reflect the new current balance of $150 and then returned to Location A. The original current balance, value of $100, is destroyed when replaced by the new value, of $150. This technique is called destructive update.
The destructive update approach leaves no backup copy of the original master file. Only the current value is available to the user. To preserve adequate accounting records in case the current master becomes damaged or corrupted, separate backup procedures, such as those shown in Figure 2-30, must be implemented.
Prior to each batch update or periodically (for example, every 15 minutes), the mas-ter file being updated is copied to create a backup version of the original file. Should the current master be destroyed after the update process, reconstruction is possible in two
Transaction File
Read $50
Read $100
Write $150
Record Location A
ARMaster File
Sale = $50
Current Bal = $100
Update Program
$100 + $50 = $150
FIGURE 2-29 Destructive Update Approach
Part I Overview of Accounting Information Systems 77
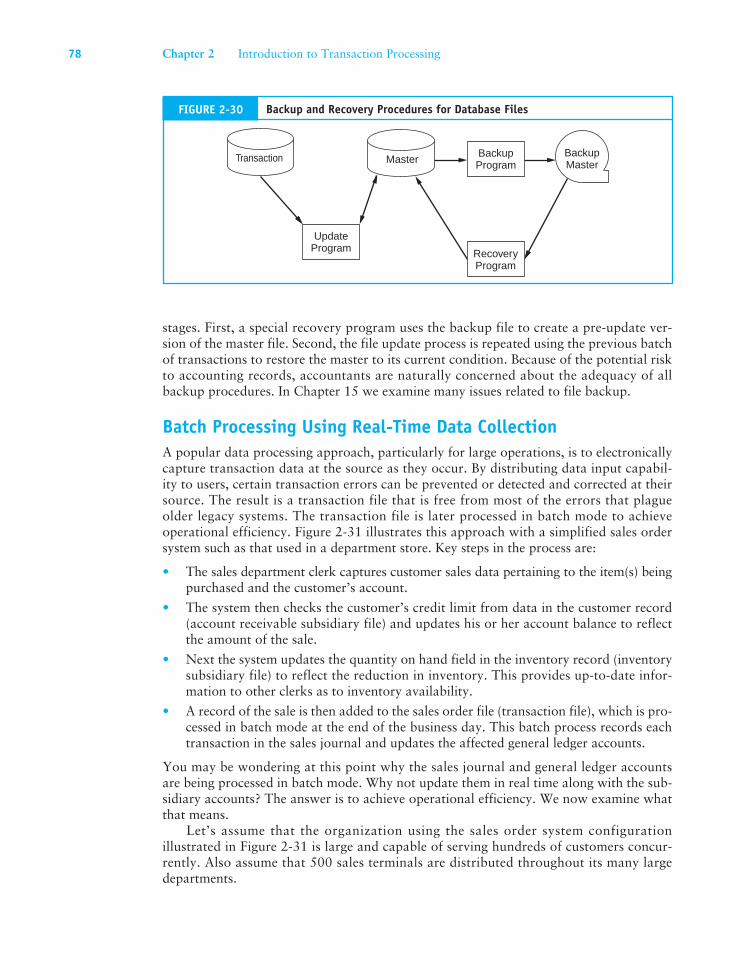
stages. First, a special recovery program uses the backup file to create a pre-update ver-sion of the master file. Second, the file update process is repeated using the previous batch of transactions to restore the master to its current condition. Because of the potential risk to accounting records, accountants are naturally concerned about the adequacy of all backup procedures. In Chapter 15 we examine many issues related to file backup.
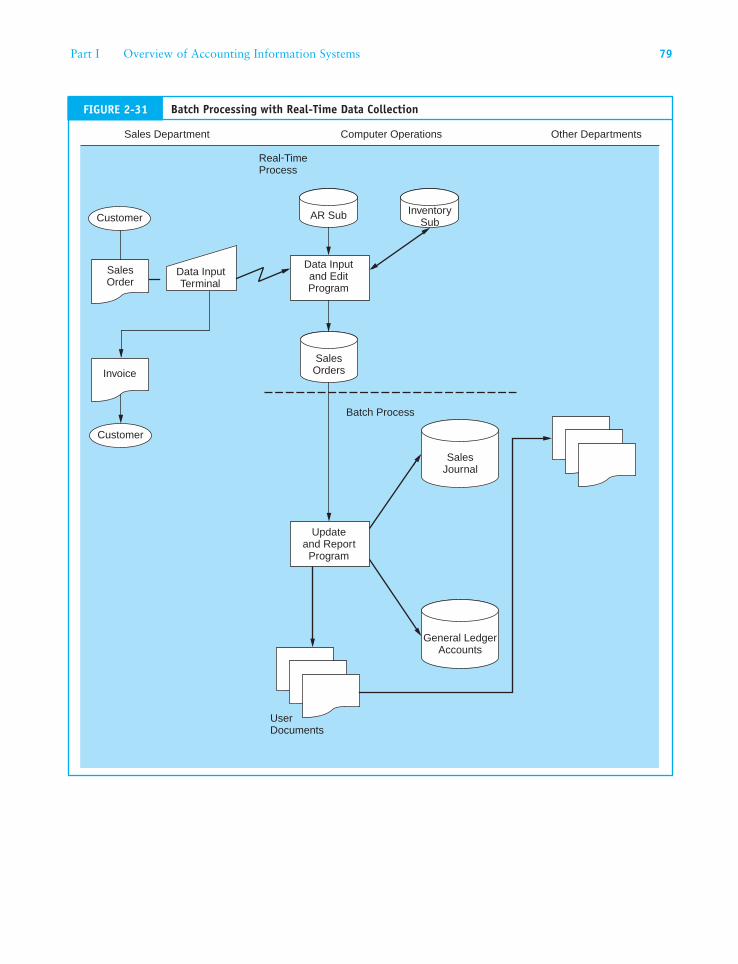
Batch Processing Using Real-Time Data CollectionA popular data processing approach, particularly for large operations, is to electronically capture transaction data at the source as they occur. By distributing data input capabil-ity to users, certain transaction errors can be prevented or detected and corrected at their source. The result is a transaction file that is free from most of the errors that plague older legacy systems. The transaction file is later processed in batch mode to achieve operational efficiency. Figure 2-31 illustrates this approach with a simplified sales order system such as that used in a department store. Key steps in the process are:
• The sales department clerk captures customer sales data pertaining to the item(s) being purchased and the customer’s account.
• The system then checks the customer’s credit limit from data in the customer record (account receivable subsidiary file) and updates his or her account balance to reflect the amount of the sale.
• Next the system updates the quantity on hand field in the inventory record (inventory subsidiary file) to reflect the reduction in inventory. This provides up-to-date infor-mation to other clerks as to inventory availability.
• A record of the sale is then added to the sales order file (transaction file), which is pro-cessed in batch mode at the end of the business day. This batch process records each transaction in the sales journal and updates the affected general ledger accounts.
You may be wondering at this point why the sales journal and general ledger accounts are being processed in batch mode. Why not update them in real time along with the sub-sidiary accounts? The answer is to achieve operational efficiency. We now examine what that means.
Let’s assume that the organization using the sales order system configuration illustrated in Figure 2-31 is large and capable of serving hundreds of customers concur-rently. Also assume that 500 sales terminals are distributed throughout its many large departments.
BackupMaster
BackupProgramMasterTransaction
UpdateProgram Recovery
Program
FIGURE 2-30 Backup and Recovery Procedures for Database Files
78 Chapter 2 Introduction to Transaction Processing
Customer AR Sub InventorySub
SalesOrders
Data Inputand EditProgram
General LedgerAccounts
SalesJournal
SalesOrder
Data InputTerminal
Invoice
UserDocuments
Batch Process
Real-TimeProcess
Customer
Updateand Report
Program
Sales Department Computer Operations Other Departments
FIGURE 2-31 Batch Processing with Real-Time Data Collection
Part I Overview of Accounting Information Systems 79
Each customer sale affects the following six accounting records:
• Customer account receivable (Subsidiary—unique)
• Inventory item (Subsidiary—almost unique)
• Inventory control (GL—common)
• Account receivable control (GL—common)
• Sales (GL—common)
• Cost of good sold (GL—common)
To maintain the integrity of accounting data, once a record has been accessed for pro-cessing, it is locked by the system and made unavailable to other users until its processing is complete. Using the affected records above as an example, consider the implications that this data-locking rule has on the users of the system.
When processing a customer account receivable subsidiary record, the rule has no im-plications for other users of the system. Each user accesses only his or her unique record. For example, accessing John Smith’s account does not prevent Mary Jones from accessing her account. Updating the inventory subsidiary record is almost unique. Since it is possible that both Mary Jones and John Smith are independently purchasing the same item at the same time, Mary Jones may be kept waiting a few seconds until John Smith’s transaction releases the lock on the inventory account. This will be a relatively rare event, and any such conflicts will be of little inconvenience to customers. As a general rule, therefore, master file records that are unique to a transaction such as customer accounts and indi-vidual inventory records can be updated in real time without causing operational delays.
Updating the records in the general ledger is a different matter. All general ledger accounts previously listed need to be updated by every sales transaction. If the process-ing of John Smith’s transaction begins before Mary Jones’s, then she must wait until all six records have been updated before her transaction can proceed. The 20- or 30-second delay brought about by this conflict will, however, probably not inconvenience Mary Jones. This problem becomes manifest as transaction volumes increase. A 20-second delay in each of 500 customer transactions would create operational inefficiency on a chaotic level. Each of the 500 customers must wait until the person ahead of him or her in the queue has completed processing their transaction. The last person in the queue will experience a delay of 500 � 20 seconds = 2¾ hours.
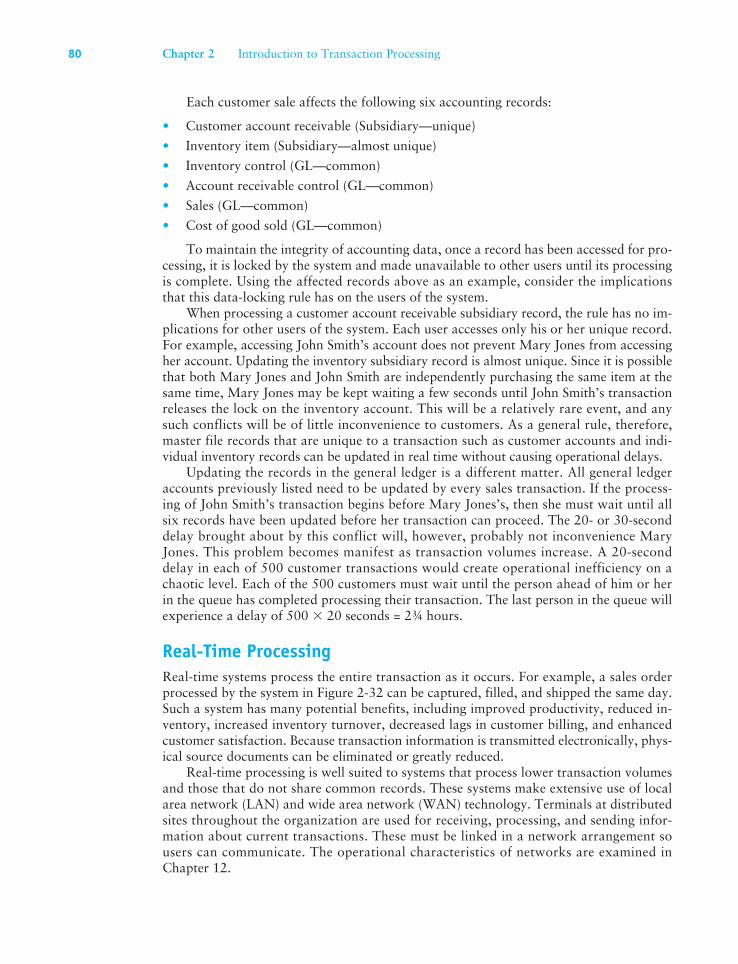
Real-Time ProcessingReal-time systems process the entire transaction as it occurs. For example, a sales order processed by the system in Figure 2-32 can be captured, filled, and shipped the same day. Such a system has many potential benefits, including improved productivity, reduced in-ventory, increased inventory turnover, decreased lags in customer billing, and enhanced customer satisfaction. Because transaction information is transmitted electronically, phys-ical source documents can be eliminated or greatly reduced.
Real-time processing is well suited to systems that process lower transaction volumes and those that do not share common records. These systems make extensive use of local area network (LAN) and wide area network (WAN) technology. Terminals at distributed sites throughout the organization are used for receiving, processing, and sending infor-mation about current transactions. These must be linked in a network arrangement so users can communicate. The operational characteristics of networks are examined in Chapter 12.
80 Chapter 2 Introduction to Transaction Processing
BOL BOL
Customer Sales Computer Operations
Real-Time Process
Bill Customer
Warehouse Shipping
Ship Goods to Customer
Reconcile Goodswith Packing Slip.Prepare Bill ofLading
TerminalPrinter
PackingSlip
CustomerOrder
Invoice
StockRelease
Credit andInventory
Check
Credit File Inventory
Closed SalesOrders
Open SalesOrders
PackingSlip
PackingSlip
TerminalPrinter
Data InputTerminal
TerminalPrinter
Subsidiaryand ControlAccounts
FIGURE 2-32 Real-Time Processing of Sales Orders
Part I O
verview of A
ccounting Information System
s 81
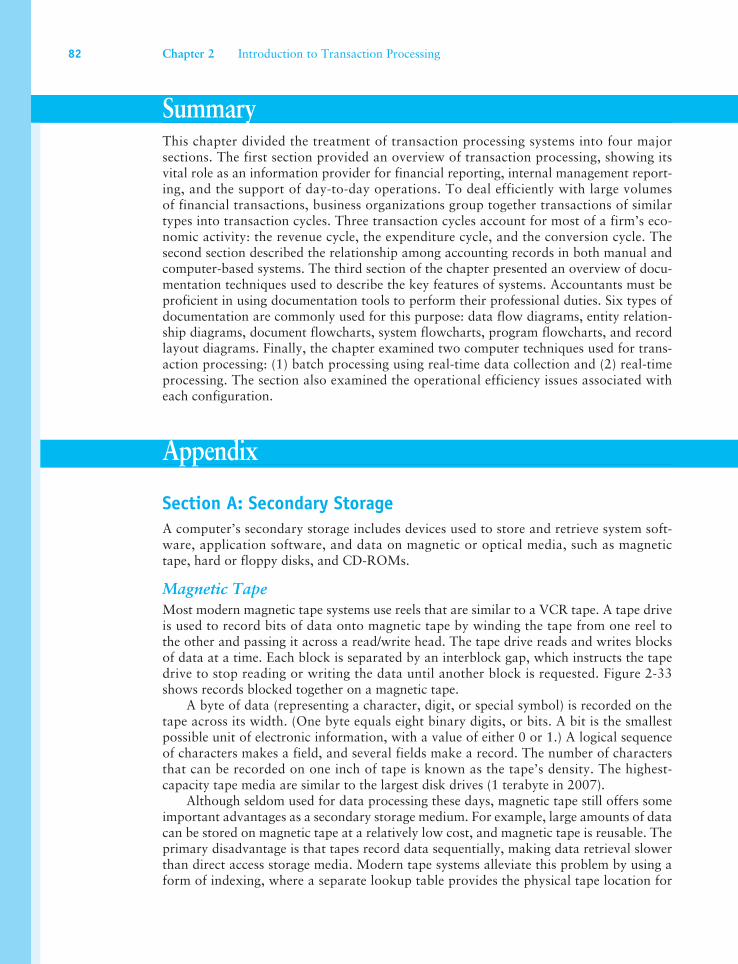
82 Chapter 2 Introduction to Transaction Processing
SummaryThis chapter divided the treatment of transaction processing systems into four major sections. The first section provided an overview of transaction processing, showing its vital role as an information provider for financial reporting, internal management report-ing, and the support of day-to-day operations. To deal efficiently with large volumes of financial transactions, business organizations group together transactions of similar types into transaction cycles. Three transaction cycles account for most of a firm’s eco-nomic activity: the revenue cycle, the expenditure cycle, and the conversion cycle. The second section described the relationship among accounting records in both manual and computer-based systems. The third section of the chapter presented an overview of docu-mentation techniques used to describe the key features of systems. Accountants must be proficient in using documentation tools to perform their professional duties. Six types of documentation are commonly used for this purpose: data flow diagrams, entity relation-ship diagrams, document flowcharts, system flowcharts, program flowcharts, and record layout diagrams. Finally, the chapter examined two computer techniques used for trans-action processing: (1) batch processing using real-time data collection and (2) real-time processing. The section also examined the operational efficiency issues associated with each configuration.
Appendix
Section A: Secondary StorageA computer’s secondary storage includes devices used to store and retrieve system soft-ware, application software, and data on magnetic or optical media, such as magnetic tape, hard or floppy disks, and CD-ROMs.
Magnetic TapeMost modern magnetic tape systems use reels that are similar to a VCR tape. A tape drive is used to record bits of data onto magnetic tape by winding the tape from one reel to the other and passing it across a read/write head. The tape drive reads and writes blocks of data at a time. Each block is separated by an interblock gap, which instructs the tape drive to stop reading or writing the data until another block is requested. Figure 2-33 shows records blocked together on a magnetic tape.
A byte of data (representing a character, digit, or special symbol) is recorded on the tape across its width. (One byte equals eight binary digits, or bits. A bit is the smallest possible unit of electronic information, with a value of either 0 or 1.) A logical sequence of characters makes a field, and several fields make a record. The number of characters that can be recorded on one inch of tape is known as the tape’s density. The highest-capacity tape media are similar to the largest disk drives (1 terabyte in 2007).
Although seldom used for data processing these days, magnetic tape still offers some important advantages as a secondary storage medium. For example, large amounts of data can be stored on magnetic tape at a relatively low cost, and magnetic tape is reusable. The primary disadvantage is that tapes record data sequentially, making data retrieval slower than direct access storage media. Modern tape systems alleviate this problem by using a form of indexing, where a separate lookup table provides the physical tape location for
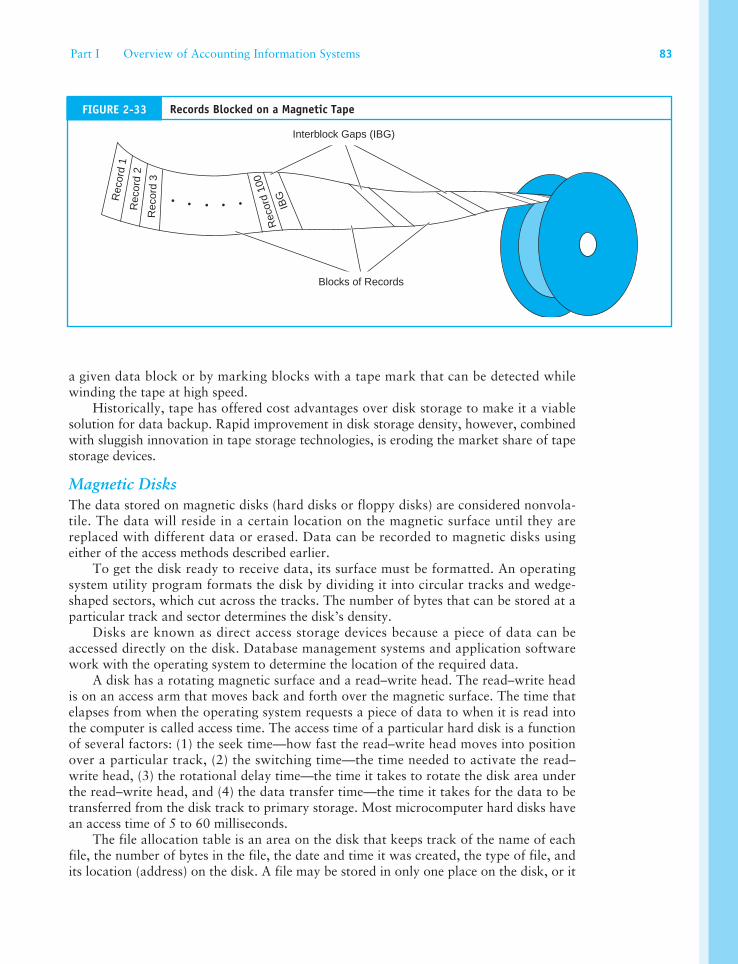
a given data block or by marking blocks with a tape mark that can be detected while winding the tape at high speed.
Historically, tape has offered cost advantages over disk storage to make it a viable solution for data backup. Rapid improvement in disk storage density, however, combined with sluggish innovation in tape storage technologies, is eroding the market share of tape storage devices.
Magnetic DisksThe data stored on magnetic disks (hard disks or floppy disks) are considered nonvola-tile. The data will reside in a certain location on the magnetic surface until they are replaced with different data or erased. Data can be recorded to magnetic disks using either of the access methods described earlier.
To get the disk ready to receive data, its surface must be formatted. An operating system utility program formats the disk by dividing it into circular tracks and wedge-shaped sectors, which cut across the tracks. The number of bytes that can be stored at a particular track and sector determines the disk’s density.
Disks are known as direct access storage devices because a piece of data can be accessed directly on the disk. Database management systems and application software work with the operating system to determine the location of the required data.
A disk has a rotating magnetic surface and a read–write head. The read–write head is on an access arm that moves back and forth over the magnetic surface. The time that elapses from when the operating system requests a piece of data to when it is read into the computer is called access time. The access time of a particular hard disk is a function of several factors: (1) the seek time—how fast the read–write head moves into position over a particular track, (2) the switching time—the time needed to activate the read–write head, (3) the rotational delay time—the time it takes to rotate the disk area under the read–write head, and (4) the data transfer time—the time it takes for the data to be transferred from the disk track to primary storage. Most microcomputer hard disks have an access time of 5 to 60 milliseconds.
The file allocation table is an area on the disk that keeps track of the name of each file, the number of bytes in the file, the date and time it was created, the type of file, and its location (address) on the disk. A file may be stored in only one place on the disk, or it
Rec
ord
2R
ecor
d3
Rec
ord
1
Rec
ord
100
IBG
Interblock Gaps (IBG)
Blocks of Records
FIGURE 2-33 Records Blocked on a Magnetic Tape
Part I Overview of Accounting Information Systems 83
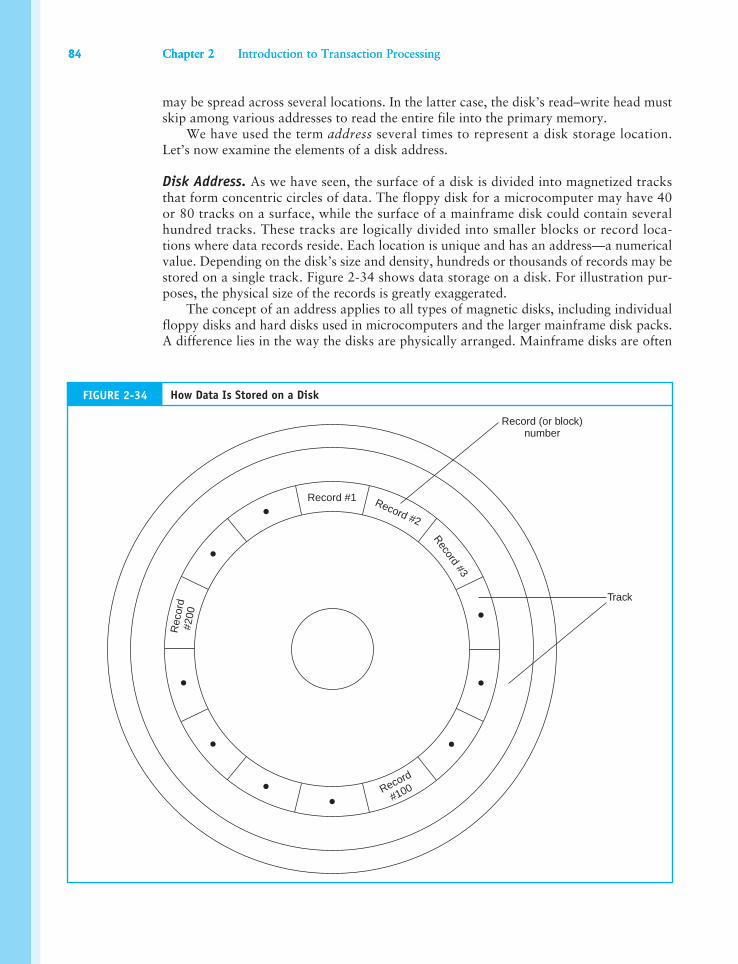
may be spread across several locations. In the latter case, the disk’s read–write head must skip among various addresses to read the entire file into the primary memory.
We have used the term address several times to represent a disk storage location. Let’s now examine the elements of a disk address.
Disk Address. As we have seen, the surface of a disk is divided into magnetized tracks that form concentric circles of data. The floppy disk for a microcomputer may have 40 or 80 tracks on a surface, while the surface of a mainframe disk could contain several hundred tracks. These tracks are logically divided into smaller blocks or record loca-tions where data records reside. Each location is unique and has an address—a numerical value. Depending on the disk’s size and density, hundreds or thousands of records may be stored on a single track. Figure 2-34 shows data storage on a disk. For illustration pur-poses, the physical size of the records is greatly exaggerated.
The concept of an address applies to all types of magnetic disks, including individual floppy disks and hard disks used in microcomputers and the larger mainframe disk packs. A difference lies in the way the disks are physically arranged. Mainframe disks are often
Record #2
Record #1
Record #3
Record
#100
Rec
ord
#200
Track
Record (or block)number
FIGURE 2-34 How Data Is Stored on a Disk
84 Chapter 2 Introduction to Transaction Processing84 Chapter 2 Introduction to Transaction Processing
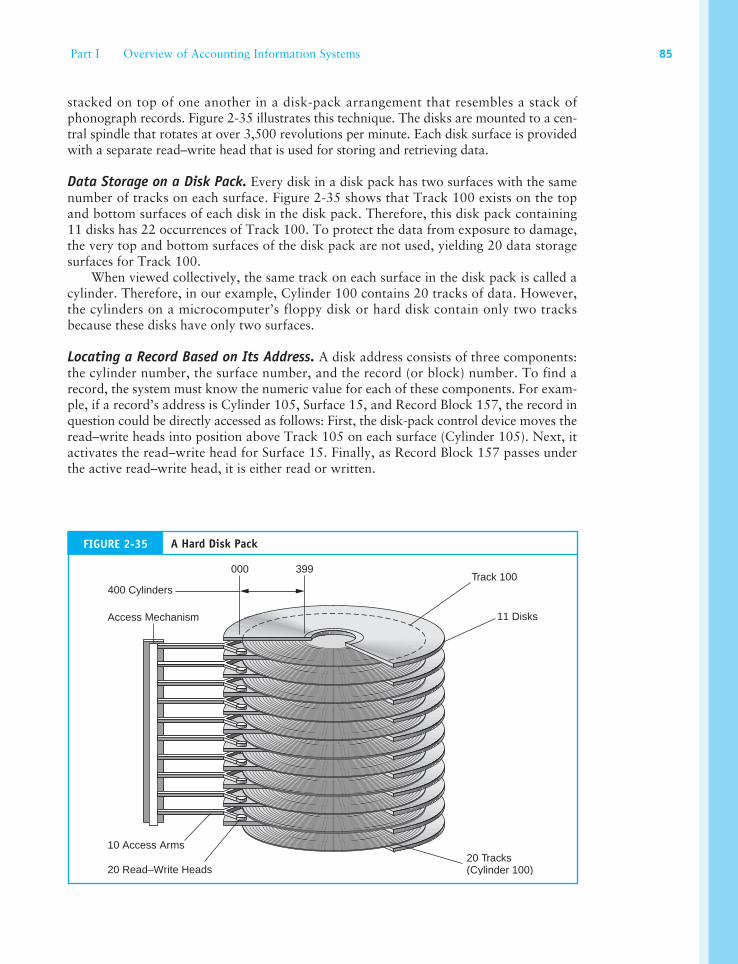
stacked on top of one another in a disk-pack arrangement that resembles a stack of phonograph records. Figure 2-35 illustrates this technique. The disks are mounted to a cen-tral spindle that rotates at over 3,500 revolutions per minute. Each disk surface is provided with a separate read–write head that is used for storing and retrieving data.
Data Storage on a Disk Pack. Every disk in a disk pack has two surfaces with the same number of tracks on each surface. Figure 2-35 shows that Track 100 exists on the top and bottom surfaces of each disk in the disk pack. Therefore, this disk pack containing 11 disks has 22 occurrences of Track 100. To protect the data from exposure to damage, the very top and bottom surfaces of the disk pack are not used, yielding 20 data storage surfaces for Track 100.
When viewed collectively, the same track on each surface in the disk pack is called a cylinder. Therefore, in our example, Cylinder 100 contains 20 tracks of data. However, the cylinders on a microcomputer’s floppy disk or hard disk contain only two tracks because these disks have only two surfaces.
Locating a Record Based on Its Address. A disk address consists of three components: the cylinder number, the surface number, and the record (or block) number. To find a record, the system must know the numeric value for each of these components. For exam-ple, if a record’s address is Cylinder 105, Surface 15, and Record Block 157, the record in question could be directly accessed as follows: First, the disk-pack control device moves the read–write heads into position above Track 105 on each surface (Cylinder 105). Next, it activates the read–write head for Surface 15. Finally, as Record Block 157 passes under the active read–write head, it is either read or written.
400 Cylinders
000 399Track 100
11 Disks
20 Tracks(Cylinder 100)
Access Mechanism
10 Access Arms
20 Read–Write Heads
FIGURE 2-35 A Hard Disk Pack
Part I Overview of Accounting Information Systems 85
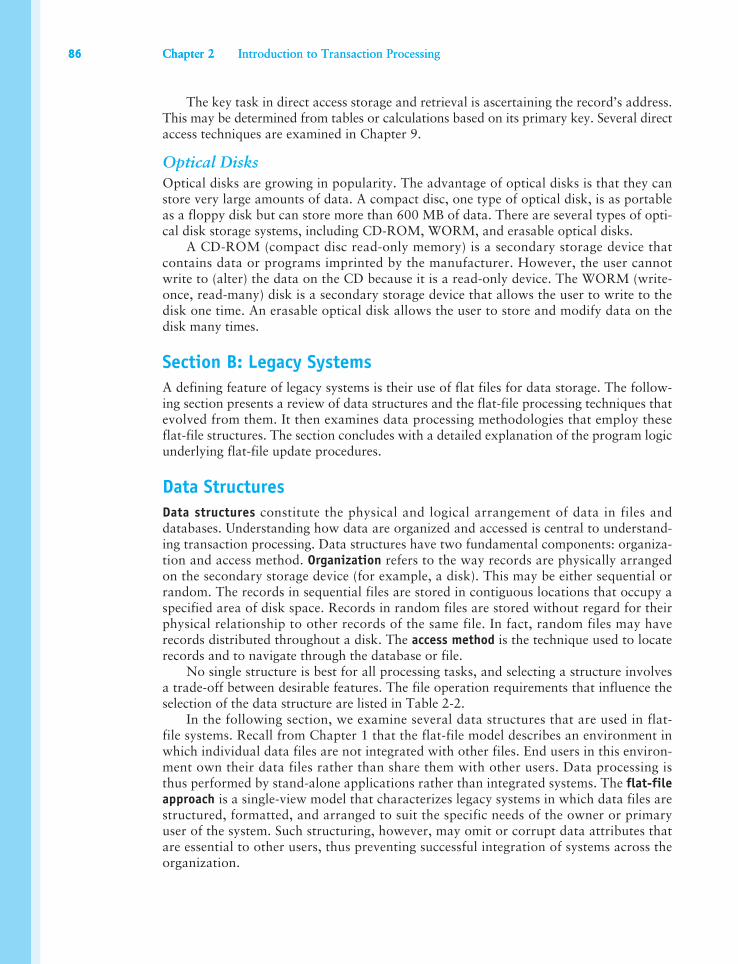
The key task in direct access storage and retrieval is ascertaining the record’s address. This may be determined from tables or calculations based on its primary key. Several direct access techniques are examined in Chapter 9.
Optical DisksOptical disks are growing in popularity. The advantage of optical disks is that they can store very large amounts of data. A compact disc, one type of optical disk, is as portable as a floppy disk but can store more than 600 MB of data. There are several types of opti-cal disk storage systems, including CD-ROM, WORM, and erasable optical disks.
A CD-ROM (compact disc read-only memory) is a secondary storage device that contains data or programs imprinted by the manufacturer. However, the user cannot write to (alter) the data on the CD because it is a read-only device. The WORM (write-once, read-many) disk is a secondary storage device that allows the user to write to the disk one time. An erasable optical disk allows the user to store and modify data on the disk many times.
Section B: Legacy SystemsA defining feature of legacy systems is their use of flat files for data storage. The follow-ing section presents a review of data structures and the flat-file processing techniques that evolved from them. It then examines data processing methodologies that employ these flat-file structures. The section concludes with a detailed explanation of the program logic underlying flat-file update procedures.
Data StructuresData structures constitute the physical and logical arrangement of data in files and databases. Understanding how data are organized and accessed is central to understand-ing transaction processing. Data structures have two fundamental components: organiza-tion and access method. Organization refers to the way records are physically arranged on the secondary storage device (for example, a disk). This may be either sequential or random. The records in sequential files are stored in contiguous locations that occupy a specified area of disk space. Records in random files are stored without regard for their physical relationship to other records of the same file. In fact, random files may have records distributed throughout a disk. The access method is the technique used to locate records and to navigate through the database or file.
No single structure is best for all processing tasks, and selecting a structure involves a trade-off between desirable features. The file operation requirements that influence the selection of the data structure are listed in Table 2-2.
In the following section, we examine several data structures that are used in flat-file systems. Recall from Chapter 1 that the flat-file model describes an environment in which individual data files are not integrated with other files. End users in this environ-ment own their data files rather than share them with other users. Data processing is thus performed by stand-alone applications rather than integrated systems. The flat-file approach is a single-view model that characterizes legacy systems in which data files are structured, formatted, and arranged to suit the specific needs of the owner or primary user of the system. Such structuring, however, may omit or corrupt data attributes that are essential to other users, thus preventing successful integration of systems across the organization.
86 Chapter 2 Introduction to Transaction Processing86 Chapter 2 Introduction to Transaction Processing
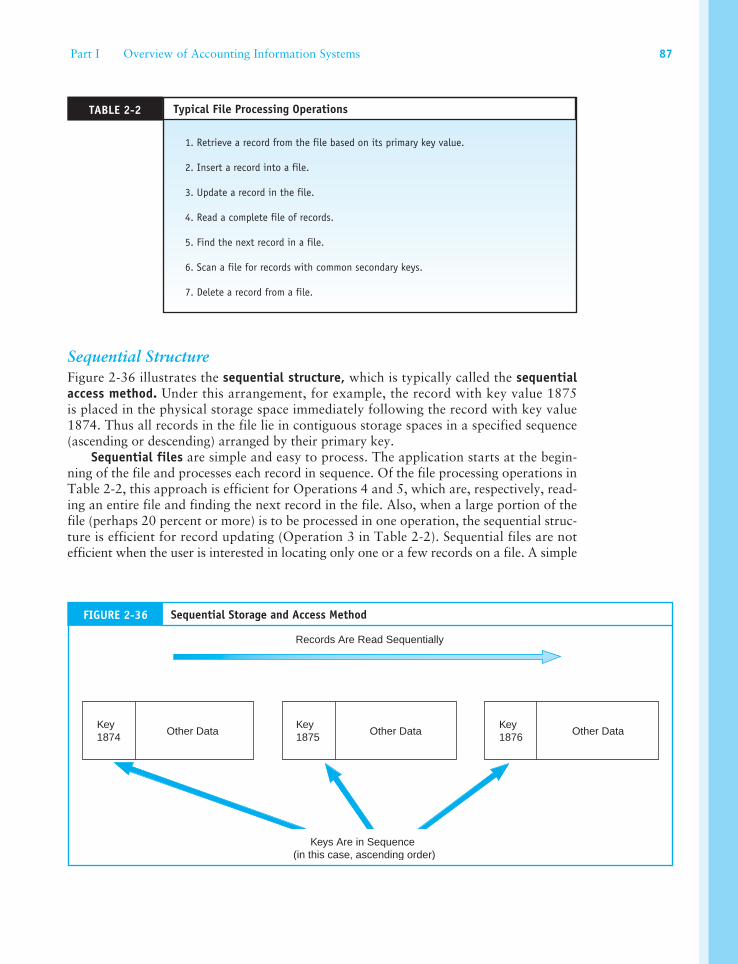
Sequential StructureFigure 2-36 illustrates the sequential structure, which is typically called the sequential access method. Under this arrangement, for example, the record with key value 1875 is placed in the physical storage space immediately following the record with key value 1874. Thus all records in the file lie in contiguous storage spaces in a specified sequence (ascending or descending) arranged by their primary key.
Sequential files are simple and easy to process. The application starts at the begin-ning of the file and processes each record in sequence. Of the file processing operations in Table 2-2, this approach is efficient for Operations 4 and 5, which are, respectively, read-ing an entire file and finding the next record in the file. Also, when a large portion of the file (perhaps 20 percent or more) is to be processed in one operation, the sequential struc-ture is efficient for record updating (Operation 3 in Table 2-2). Sequential files are not efficient when the user is interested in locating only one or a few records on a file. A simple
TABLE 2-2 Typical File Processing Operations
1. Retrieve a record from the file based on its primary key value.
2. Insert a record into a file.
3. Update a record in the file.
4. Read a complete file of records.
5. Find the next record in a file.
6. Scan a file for records with common secondary keys.
7. Delete a record from a file.
Records Are Read Sequentially
Key1874 Other Data
Key1875 Other Data
Key1876 Other Data
Keys Are in Sequence (in this case, ascending order)
FIGURE 2-36 Sequential Storage and Access Method
Part I Overview of Accounting Information Systems 87
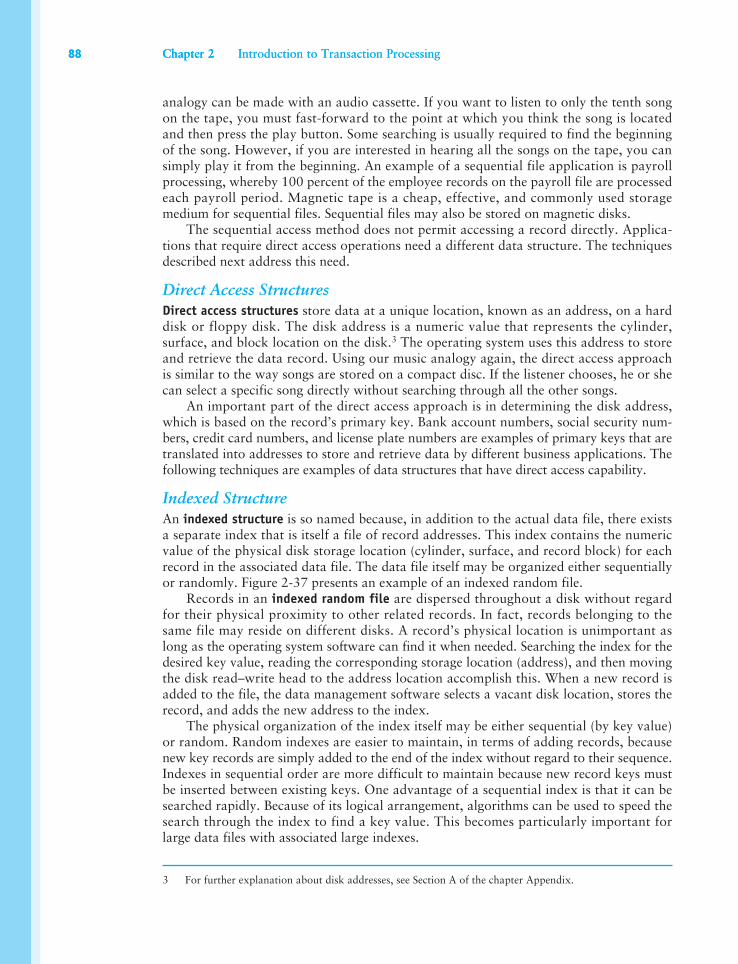
analogy can be made with an audio cassette. If you want to listen to only the tenth song on the tape, you must fast-forward to the point at which you think the song is located and then press the play button. Some searching is usually required to find the beginning of the song. However, if you are interested in hearing all the songs on the tape, you can simply play it from the beginning. An example of a sequential file application is payroll processing, whereby 100 percent of the employee records on the payroll file are processed each payroll period. Magnetic tape is a cheap, effective, and commonly used storage medium for sequential files. Sequential files may also be stored on magnetic disks.
The sequential access method does not permit accessing a record directly. Applica-tions that require direct access operations need a different data structure. The techniques described next address this need.
Direct Access StructuresDirect access structures store data at a unique location, known as an address, on a hard disk or floppy disk. The disk address is a numeric value that represents the cylinder, surface, and block location on the disk.3 The operating system uses this address to store and retrieve the data record. Using our music analogy again, the direct access approach is similar to the way songs are stored on a compact disc. If the listener chooses, he or she can select a specific song directly without searching through all the other songs.
An important part of the direct access approach is in determining the disk address, which is based on the record’s primary key. Bank account numbers, social security num-bers, credit card numbers, and license plate numbers are examples of primary keys that are translated into addresses to store and retrieve data by different business applications. The following techniques are examples of data structures that have direct access capability.
Indexed StructureAn indexed structure is so named because, in addition to the actual data file, there exists a separate index that is itself a file of record addresses. This index contains the numeric value of the physical disk storage location (cylinder, surface, and record block) for each record in the associated data file. The data file itself may be organized either sequentially or randomly. Figure 2-37 presents an example of an indexed random file.
Records in an indexed random file are dispersed throughout a disk without regard for their physical proximity to other related records. In fact, records belonging to the same file may reside on different disks. A record’s physical location is unimportant as long as the operating system software can find it when needed. Searching the index for the desired key value, reading the corresponding storage location (address), and then moving the disk read–write head to the address location accomplish this. When a new record is added to the file, the data management software selects a vacant disk location, stores the record, and adds the new address to the index.
The physical organization of the index itself may be either sequential (by key value) or random. Random indexes are easier to maintain, in terms of adding records, because new key records are simply added to the end of the index without regard to their sequence. Indexes in sequential order are more difficult to maintain because new record keys must be inserted between existing keys. One advantage of a sequential index is that it can be searched rapidly. Because of its logical arrangement, algorithms can be used to speed the search through the index to find a key value. This becomes particularly important for large data files with associated large indexes.
3 For further explanation about disk addresses, see Section A of the chapter Appendix.
88 Chapter 2 Introduction to Transaction Processing88 Chapter 2 Introduction to Transaction Processing
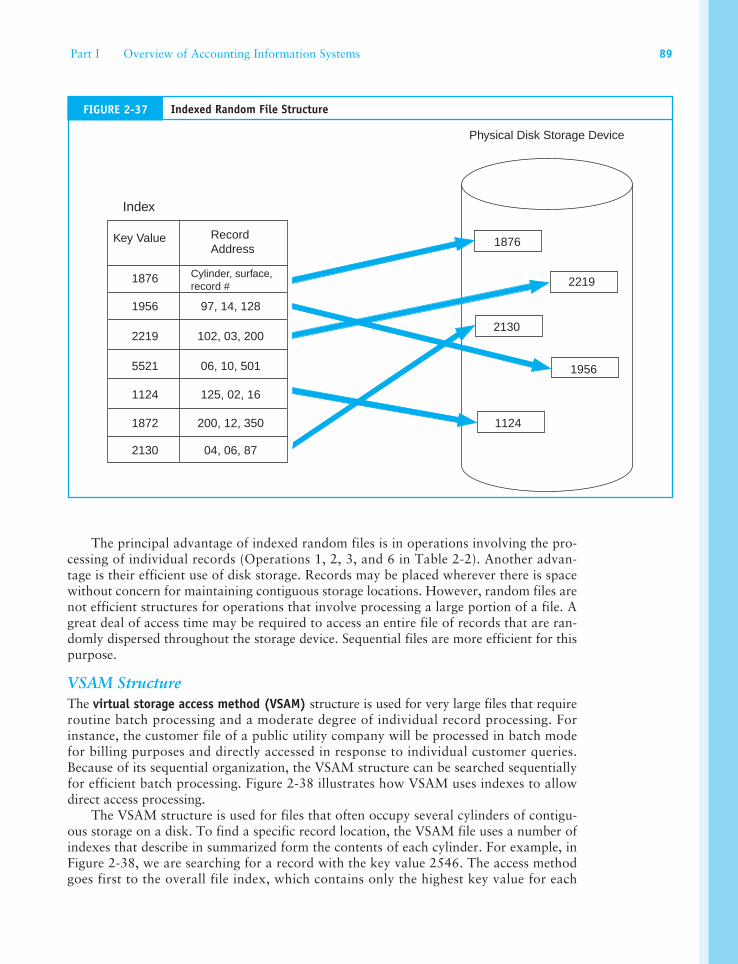
The principal advantage of indexed random files is in operations involving the pro-cessing of individual records (Operations 1, 2, 3, and 6 in Table 2-2). Another advan-tage is their efficient use of disk storage. Records may be placed wherever there is space without concern for maintaining contiguous storage locations. However, random files are not efficient structures for operations that involve processing a large portion of a file. A great deal of access time may be required to access an entire file of records that are ran-domly dispersed throughout the storage device. Sequential files are more efficient for this purpose.
VSAM StructureThe virtual storage access method (VSAM) structure is used for very large files that require routine batch processing and a moderate degree of individual record processing. For instance, the customer file of a public utility company will be processed in batch mode for billing purposes and directly accessed in response to individual customer queries. Because of its sequential organization, the VSAM structure can be searched sequentially for efficient batch processing. Figure 2-38 illustrates how VSAM uses indexes to allow direct access processing.
The VSAM structure is used for files that often occupy several cylinders of contigu-ous storage on a disk. To find a specific record location, the VSAM file uses a number of indexes that describe in summarized form the contents of each cylinder. For example, in Figure 2-38, we are searching for a record with the key value 2546. The access method goes first to the overall file index, which contains only the highest key value for each
Key Value RecordAddress
1876
1956
2219
5521
1124
1872
2130
Cylinder, surface,record #
Physical Disk Storage Device
1876
2219
2130
1956
1124
Index
97, 14, 128
102, 03, 200
06, 10, 501
125, 02, 16
200, 12, 350
04, 06, 87
FIGURE 2-37 Indexed Random File Structure
Part I Overview of Accounting Information Systems 89
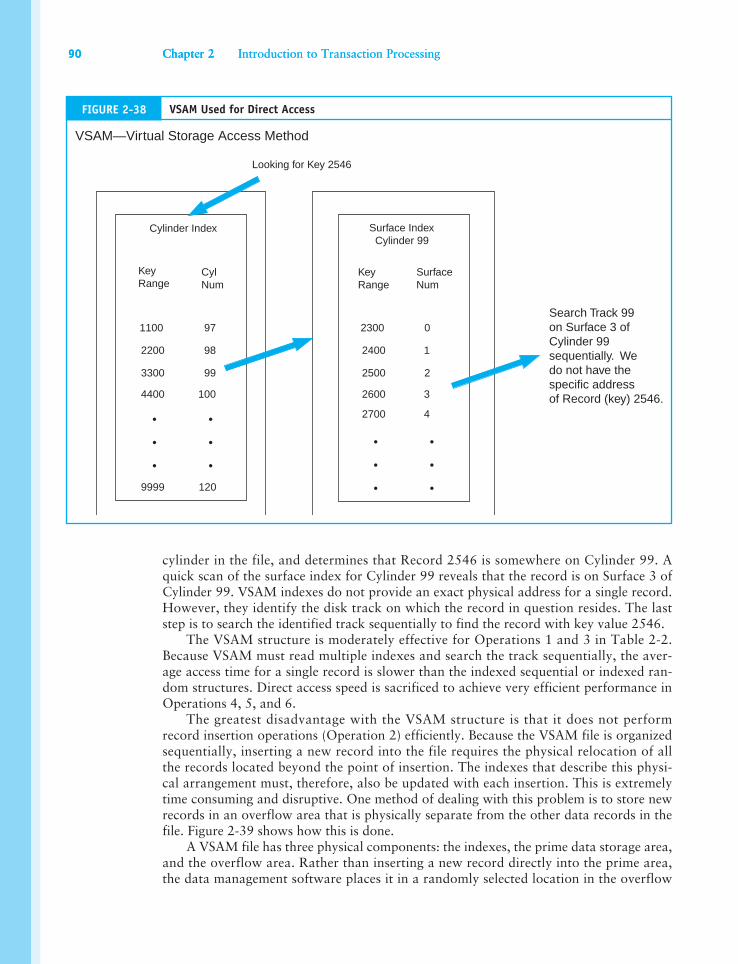
cylinder in the file, and determines that Record 2546 is somewhere on Cylinder 99. A quick scan of the surface index for Cylinder 99 reveals that the record is on Surface 3 of Cylinder 99. VSAM indexes do not provide an exact physical address for a single record. However, they identify the disk track on which the record in question resides. The last step is to search the identified track sequentially to find the record with key value 2546.
The VSAM structure is moderately effective for Operations 1 and 3 in Table 2-2. Because VSAM must read multiple indexes and search the track sequentially, the aver-age access time for a single record is slower than the indexed sequential or indexed ran-dom structures. Direct access speed is sacrificed to achieve very efficient performance in Operations 4, 5, and 6.
The greatest disadvantage with the VSAM structure is that it does not perform record insertion operations (Operation 2) efficiently. Because the VSAM file is organized sequentially, inserting a new record into the file requires the physical relocation of all the records located beyond the point of insertion. The indexes that describe this physi-cal arrangement must, therefore, also be updated with each insertion. This is extremely time consuming and disruptive. One method of dealing with this problem is to store new records in an overflow area that is physically separate from the other data records in the file. Figure 2-39 shows how this is done.
A VSAM file has three physical components: the indexes, the prime data storage area, and the overflow area. Rather than inserting a new record directly into the prime area, the data management software places it in a randomly selected location in the overflow
Search Track 99on Surface 3 ofCylinder 99sequentially. We do not have thespecific addressof Record (key) 2546.
VSAM—Virtual Storage Access Method
Looking for Key 2546
Cylinder Index Surface IndexCylinder 99
Key Range
CylNum
Key Range
SurfaceNum
1100
2200
3300
4400
9999
97
98
99
100
120
2300
2400
2500
2600
0
1
2
3
42700
FIGURE 2-38 VSAM Used for Direct Access
90 Chapter 2 Introduction to Transaction Processing90 Chapter 2 Introduction to Transaction Processing
area. It then records the address of the location in a special field (called a pointer) in the prime area. Later, when searching for the record, the indexes direct the access method to the track location on which the record should reside. The pointer at that location reveals the record’s actual location in the overflow area. Thus accessing a record may involve searching the indexes, searching the track in the prime data area, and finally searching the overflow area. This slows data access time for both direct access and batch processing.
Periodically, the VSAM file must be reorganized by integrating the overflow records into the prime area and then reconstructing the indexes. This involves time, cost, and disruption to operations. Therefore, when a file is highly volatile (records are added or deleted frequently), the maintenance burden associated with the VSAM approach tends to render it impractical. However, for large, stable files that need both direct access and batch processing, the VSAM structure is a popular option.
Hashing StructureA hashing structure employs an algorithm that converts the primary key of a record directly into a storage address. Hashing eliminates the need for a separate index. By cal-culating the address, rather than reading it from an index, records can be retrieved more quickly. Figure 2-40 illustrates the hashing approach.
This example assumes an inventory file with 100,000 inventory items. The algorithm divides the inventory number (the primary key) into a prime number. Recall that a prime number is one that can be divided only by itself and 1 without leaving a residual value.
Key 241
OverflowArea
Key 237
Key 223
Key 226
Key 231
Key 235
Key 240
Key 224
Key 228
Key 233
Key 238
Key 225
Key 229
Key 234
Key 239
Key 269 Key 270
Insert New Record with Key Value = 237
Index
PrimeArea
FIGURE 2-39 Inserting a Record into a VSAM File
Part I Overview of Accounting Information Systems 91
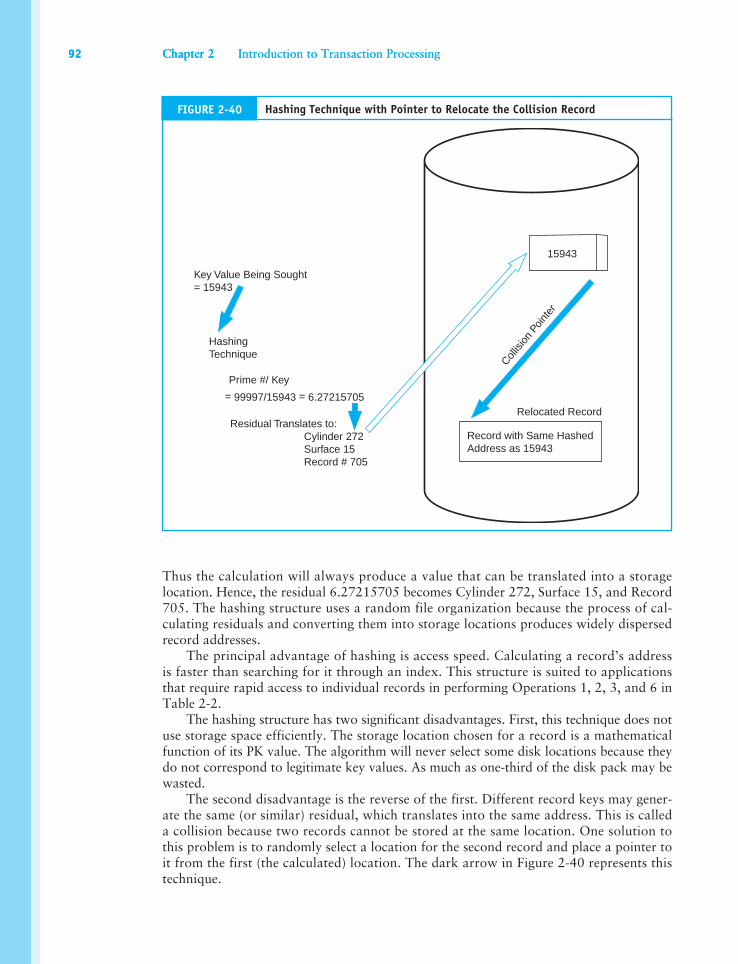
Thus the calculation will always produce a value that can be translated into a storage location. Hence, the residual 6.27215705 becomes Cylinder 272, Surface 15, and Record 705. The hashing structure uses a random file organization because the process of cal-culating residuals and converting them into storage locations produces widely dispersed record addresses.
The principal advantage of hashing is access speed. Calculating a record’s address is faster than searching for it through an index. This structure is suited to applications that require rapid access to individual records in performing Operations 1, 2, 3, and 6 in Table 2-2.
The hashing structure has two significant disadvantages. First, this technique does not use storage space efficiently. The storage location chosen for a record is a mathematical function of its PK value. The algorithm will never select some disk locations because they do not correspond to legitimate key values. As much as one-third of the disk pack may be wasted.
The second disadvantage is the reverse of the first. Different record keys may gener-ate the same (or similar) residual, which translates into the same address. This is called a collision because two records cannot be stored at the same location. One solution to this problem is to randomly select a location for the second record and place a pointer to it from the first (the calculated) location. The dark arrow in Figure 2-40 represents this technique.
15943
Record with Same HashedAddress as 15943
Relocated Record
Collis
ion
Poin
ter
Key Value Being Sought= 15943
HashingTechnique
Prime #/ Key
= 99997/15943 = 6.27215705
Residual Translates to: Cylinder 272 Surface 15 Record # 705
FIGURE 2-40 Hashing Technique with Pointer to Relocate the Collision Record
92 Chapter 2 Introduction to Transaction Processing92 Chapter 2 Introduction to Transaction Processing
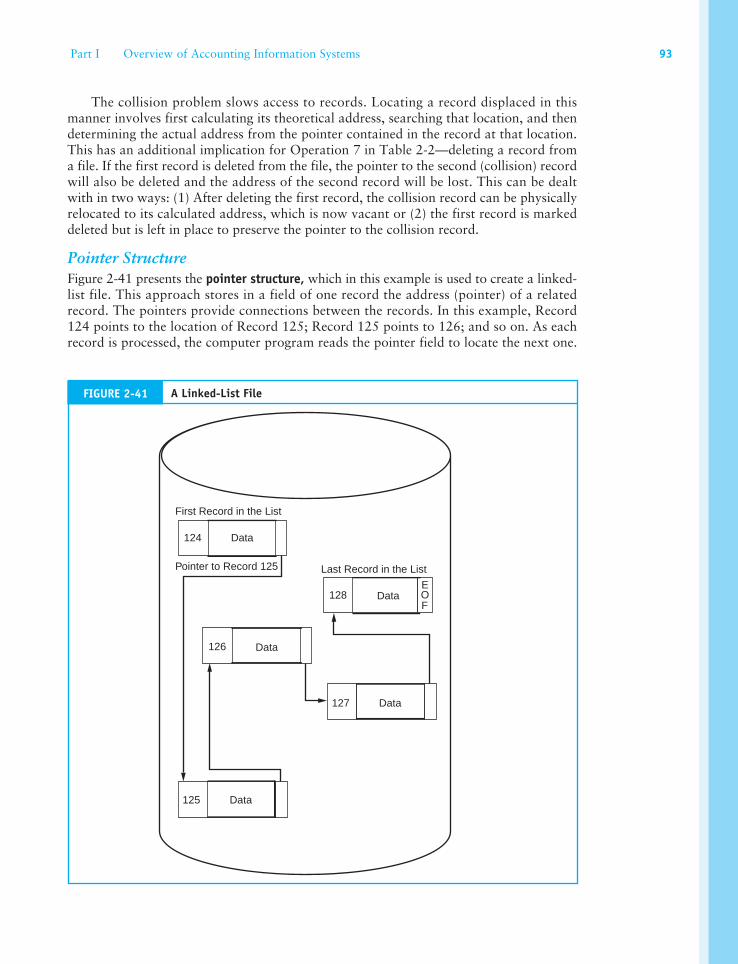
The collision problem slows access to records. Locating a record displaced in this manner involves first calculating its theoretical address, searching that location, and then determining the actual address from the pointer contained in the record at that location. This has an additional implication for Operation 7 in Table 2-2—deleting a record from a file. If the first record is deleted from the file, the pointer to the second (collision) record will also be deleted and the address of the second record will be lost. This can be dealt with in two ways: (1) After deleting the first record, the collision record can be physically relocated to its calculated address, which is now vacant or (2) the first record is marked deleted but is left in place to preserve the pointer to the collision record.
Pointer StructureFigure 2-41 presents the pointer structure, which in this example is used to create a linked-list file. This approach stores in a field of one record the address (pointer) of a related record. The pointers provide connections between the records. In this example, Record 124 points to the location of Record 125; Record 125 points to 126; and so on. As each record is processed, the computer program reads the pointer field to locate the next one.
Data
Data
Data
Data
Data
124
128
126
127
125
First Record in the List
Pointer to Record 125 Last Record in the List
EOF
FIGURE 2-41 A Linked-List File
Part I Overview of Accounting Information Systems 93
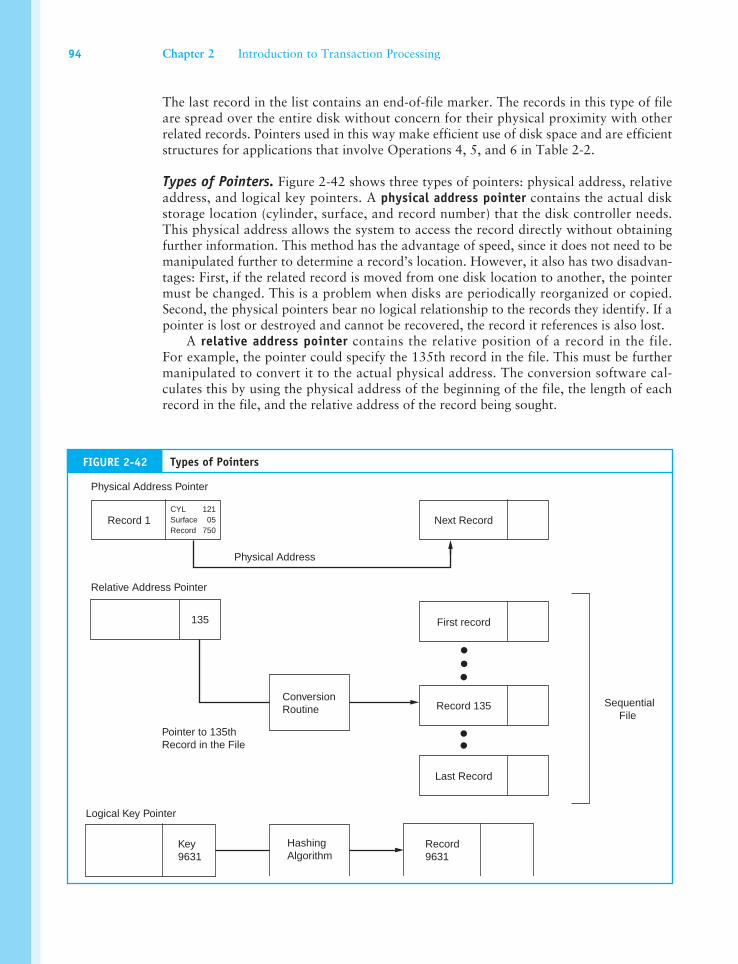
The last record in the list contains an end-of-file marker. The records in this type of file are spread over the entire disk without concern for their physical proximity with other related records. Pointers used in this way make efficient use of disk space and are efficient structures for applications that involve Operations 4, 5, and 6 in Table 2-2.
Types of Pointers. Figure 2-42 shows three types of pointers: physical address, relative address, and logical key pointers. A physical address pointer contains the actual disk storage location (cylinder, surface, and record number) that the disk controller needs. This physical address allows the system to access the record directly without obtaining further information. This method has the advantage of speed, since it does not need to be manipulated further to determine a record’s location. However, it also has two disadvan-tages: First, if the related record is moved from one disk location to another, the pointer must be changed. This is a problem when disks are periodically reorganized or copied. Second, the physical pointers bear no logical relationship to the records they identify. If a pointer is lost or destroyed and cannot be recovered, the record it references is also lost.
A relative address pointer contains the relative position of a record in the file. For example, the pointer could specify the 135th record in the file. This must be further manipulated to convert it to the actual physical address. The conversion software cal-culates this by using the physical address of the beginning of the file, the length of each record in the file, and the relative address of the record being sought.
Record 1
Physical Address Pointer
Relative Address Pointer
Conversion Routine
Logical Key Pointer
Key 9631
HashingAlgorithm
Physical Address
First record
•••Record 135
Last Record
Sequential File
••Pointer to 135thRecord in the File
135
Next Record
Record9631
CYLSurfaceRecord
12105
750
FIGURE 2-42 Types of Pointers
94 Chapter 2 Introduction to Transaction Processing
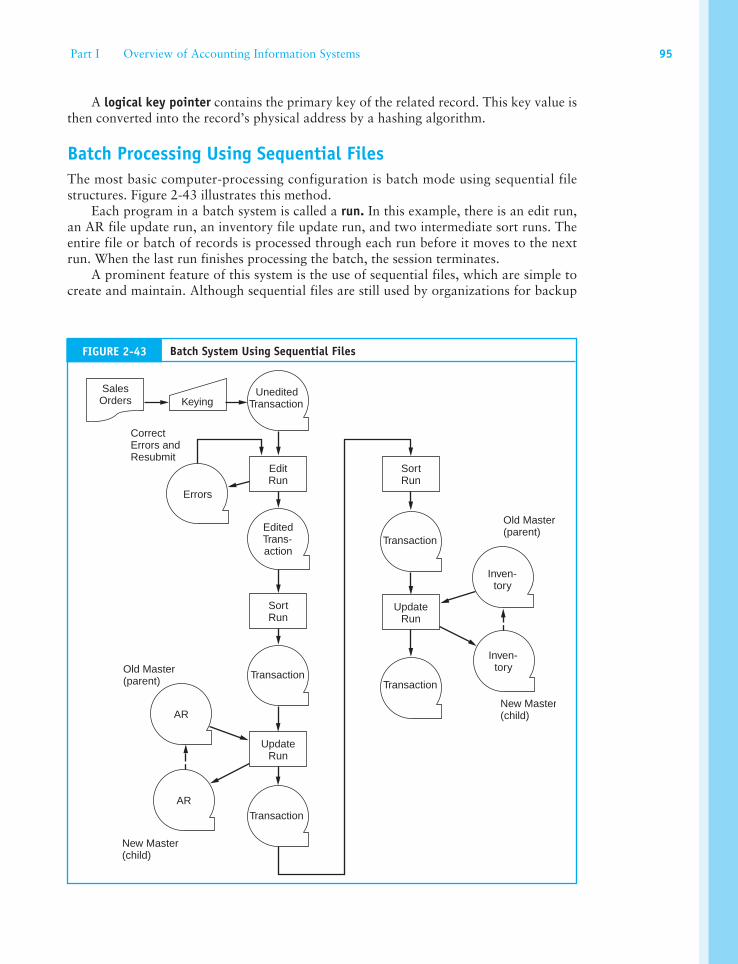
A logical key pointer contains the primary key of the related record. This key value is then converted into the record’s physical address by a hashing algorithm.
Batch Processing Using Sequential FilesThe most basic computer-processing configuration is batch mode using sequential file structures. Figure 2-43 illustrates this method.
Each program in a batch system is called a run. In this example, there is an edit run, an AR file update run, an inventory file update run, and two intermediate sort runs. The entire file or batch of records is processed through each run before it moves to the next run. When the last run finishes processing the batch, the session terminates.
A prominent feature of this system is the use of sequential files, which are simple to create and maintain. Although sequential files are still used by organizations for backup
SalesOrders Keying
AR
Inven-tory
CorrectErrors andResubmit
EditedTrans-action
UneditedTransaction
Errors
EditRun
Transaction
Transaction
AR
Inven-tory
Transaction
Transaction
Old Master(parent)
New Master(child)
Old Master(parent)
New Master(child)
SortRun
UpdateRun
UpdateRun
SortRun
FIGURE 2-43 Batch System Using Sequential Files
Part I Overview of Accounting Information Systems 95
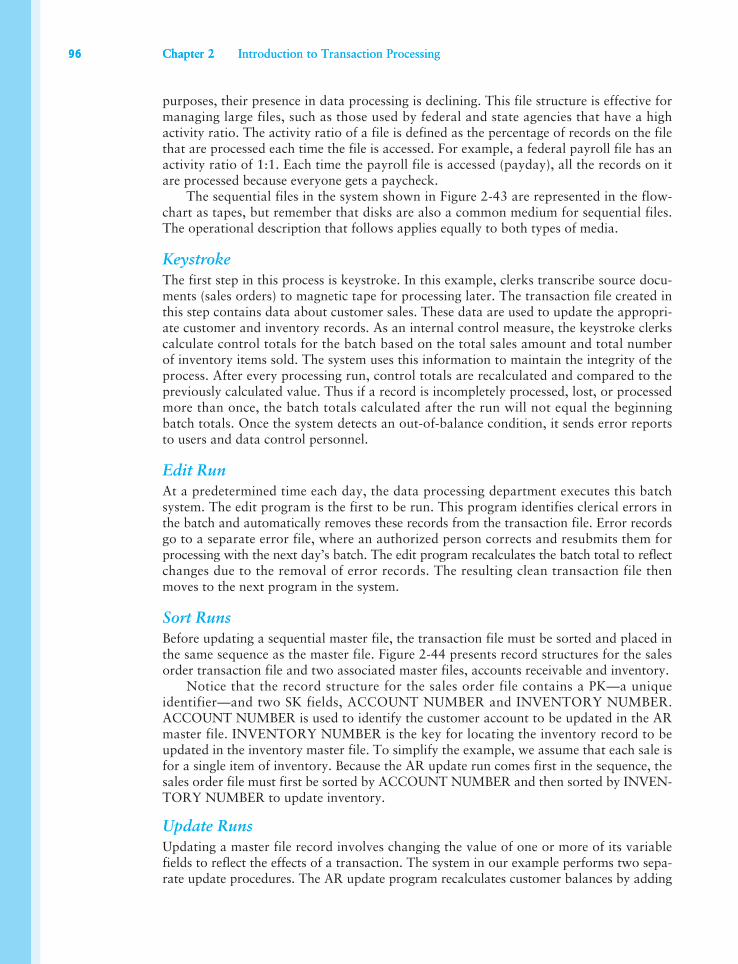
purposes, their presence in data processing is declining. This file structure is effective for managing large files, such as those used by federal and state agencies that have a high activity ratio. The activity ratio of a file is defined as the percentage of records on the file that are processed each time the file is accessed. For example, a federal payroll file has an activity ratio of 1:1. Each time the payroll file is accessed (payday), all the records on it are processed because everyone gets a paycheck.
The sequential files in the system shown in Figure 2-43 are represented in the flow-chart as tapes, but remember that disks are also a common medium for sequential files. The operational description that follows applies equally to both types of media.
KeystrokeThe first step in this process is keystroke. In this example, clerks transcribe source docu-ments (sales orders) to magnetic tape for processing later. The transaction file created in this step contains data about customer sales. These data are used to update the appropri-ate customer and inventory records. As an internal control measure, the keystroke clerks calculate control totals for the batch based on the total sales amount and total number of inventory items sold. The system uses this information to maintain the integrity of the process. After every processing run, control totals are recalculated and compared to the previously calculated value. Thus if a record is incompletely processed, lost, or processed more than once, the batch totals calculated after the run will not equal the beginning batch totals. Once the system detects an out-of-balance condition, it sends error reports to users and data control personnel.
Edit RunAt a predetermined time each day, the data processing department executes this batch system. The edit program is the first to be run. This program identifies clerical errors in the batch and automatically removes these records from the transaction file. Error records go to a separate error file, where an authorized person corrects and resubmits them for processing with the next day’s batch. The edit program recalculates the batch total to reflect changes due to the removal of error records. The resulting clean transaction file then moves to the next program in the system.
Sort RunsBefore updating a sequential master file, the transaction file must be sorted and placed in the same sequence as the master file. Figure 2-44 presents record structures for the sales order transaction file and two associated master files, accounts receivable and inventory.
Notice that the record structure for the sales order file contains a PK—a unique identifier—and two SK fields, ACCOUNT NUMBER and INVENTORY NUMBER. ACCOUNT NUMBER is used to identify the customer account to be updated in the AR master file. INVENTORY NUMBER is the key for locating the inventory record to be updated in the inventory master file. To simplify the example, we assume that each sale is for a single item of inventory. Because the AR update run comes first in the sequence, the sales order file must first be sorted by ACCOUNT NUMBER and then sorted by INVEN-TORY NUMBER to update inventory.
Update RunsUpdating a master file record involves changing the value of one or more of its variable fields to reflect the effects of a transaction. The system in our example performs two sepa-rate update procedures. The AR update program recalculates customer balances by adding
96 Chapter 2 Introduction to Transaction Processing96 Chapter 2 Introduction to Transaction Processing
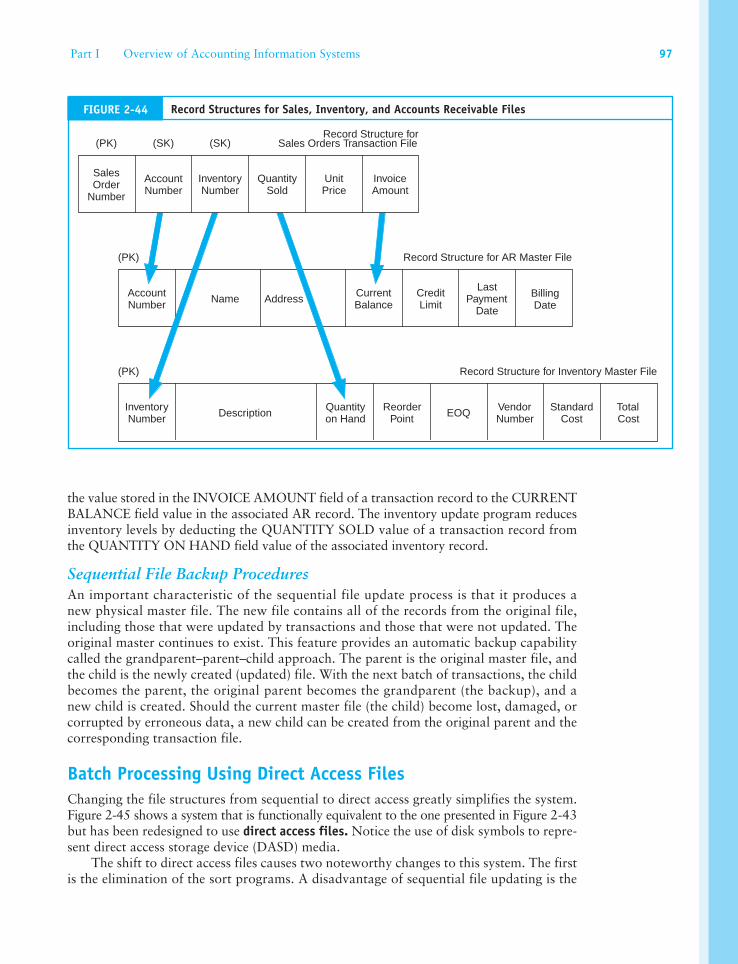
the value stored in the INVOICE AMOUNT field of a transaction record to the CURRENT BALANCE field value in the associated AR record. The inventory update program reduces inventory levels by deducting the QUANTITY SOLD value of a transaction record from the QUANTITY ON HAND field value of the associated inventory record.
Sequential File Backup ProceduresAn important characteristic of the sequential file update process is that it produces a new physical master file. The new file contains all of the records from the original file, including those that were updated by transactions and those that were not updated. The original master continues to exist. This feature provides an automatic backup capability called the grandparent–parent–child approach. The parent is the original master file, and the child is the newly created (updated) file. With the next batch of transactions, the child becomes the parent, the original parent becomes the grandparent (the backup), and a new child is created. Should the current master file (the child) become lost, damaged, or corrupted by erroneous data, a new child can be created from the original parent and the corresponding transaction file.
Batch Processing Using Direct Access FilesChanging the file structures from sequential to direct access greatly simplifies the system. Figure 2-45 shows a system that is functionally equivalent to the one presented in Figure 2-43 but has been redesigned to use direct access files. Notice the use of disk symbols to repre-sent direct access storage device (DASD) media.
The shift to direct access files causes two noteworthy changes to this system. The first is the elimination of the sort programs. A disadvantage of sequential file updating is the
(PK) Record Structure for AR Master File
AccountNumber Address Current
BalanceCreditLimit
LastPayment
Date
BillingDate
Record Structure for Inventory Master File(PK)
InventoryNumber
Quantityon Hand
ReorderPoint EOQ Vendor
NumberStandard
CostTotalCost
Name
Description
(SK)Record Structure for
Sales Orders Transaction File
InventoryNumber
QuantitySold
UnitPrice
InvoiceAmount
(SK)(PK)
SalesOrder
Number
AccountNumber
FIGURE 2-44 Record Structures for Sales, Inventory, and Accounts Receivable Files
Part I Overview of Accounting Information Systems 97
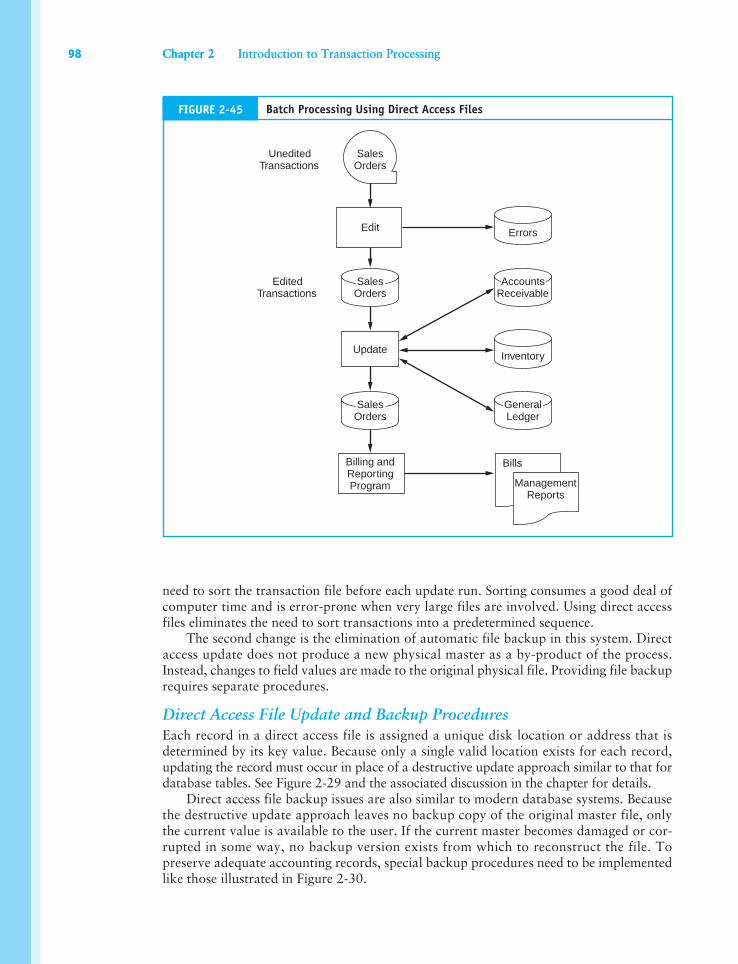
need to sort the transaction file before each update run. Sorting consumes a good deal of computer time and is error-prone when very large files are involved. Using direct access files eliminates the need to sort transactions into a predetermined sequence.
The second change is the elimination of automatic file backup in this system. Direct access update does not produce a new physical master as a by-product of the process. Instead, changes to field values are made to the original physical file. Providing file backup requires separate procedures.
Direct Access File Update and Backup ProceduresEach record in a direct access file is assigned a unique disk location or address that is determined by its key value. Because only a single valid location exists for each record, updating the record must occur in place of a destructive update approach similar to that for database tables. See Figure 2-29 and the associated discussion in the chapter for details.
Direct access file backup issues are also similar to modern database systems. Because the destructive update approach leaves no backup copy of the original master file, only the current value is available to the user. If the current master becomes damaged or cor-rupted in some way, no backup version exists from which to reconstruct the file. To preserve adequate accounting records, special backup procedures need to be implemented like those illustrated in Figure 2-30.
SalesOrders
SalesOrders
AccountsReceivable
Errors
Inventory
GeneralLedger
Edit
Update
Billing andReportingProgram
SalesOrders
UneditedTransactions
EditedTransactions
ManagementReports
Bills
FIGURE 2-45 Batch Processing Using Direct Access Files
98 Chapter 2 Introduction to Transaction Processing98 Chapter 2 Introduction to Transaction Processing
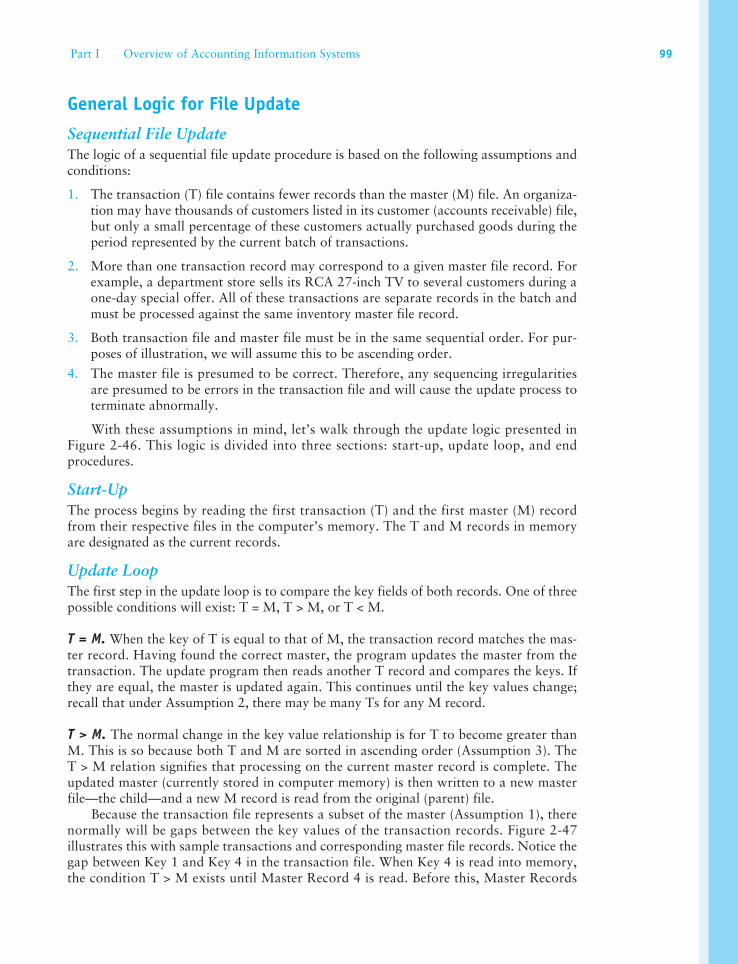
General Logic for File Update
Sequential File UpdateThe logic of a sequential file update procedure is based on the following assumptions and conditions:
1. The transaction (T) file contains fewer records than the master (M) file. An organiza-tion may have thousands of customers listed in its customer (accounts receivable) file, but only a small percentage of these customers actually purchased goods during the period represented by the current batch of transactions.
2. More than one transaction record may correspond to a given master file record. For example, a department store sells its RCA 27-inch TV to several customers during a one-day special offer. All of these transactions are separate records in the batch and must be processed against the same inventory master file record.
3. Both transaction file and master file must be in the same sequential order. For pur-poses of illustration, we will assume this to be ascending order.
4. The master file is presumed to be correct. Therefore, any sequencing irregularities are presumed to be errors in the transaction file and will cause the update process to terminate abnormally.
With these assumptions in mind, let’s walk through the update logic presented in Figure 2-46. This logic is divided into three sections: start-up, update loop, and end procedures.
Start-UpThe process begins by reading the first transaction (T) and the first master (M) record from their respective files in the computer’s memory. The T and M records in memory are designated as the current records.
Update LoopThe first step in the update loop is to compare the key fields of both records. One of three possible conditions will exist: T = M, T > M, or T < M.
T = M. When the key of T is equal to that of M, the transaction record matches the mas-ter record. Having found the correct master, the program updates the master from the transaction. The update program then reads another T record and compares the keys. If they are equal, the master is updated again. This continues until the key values change; recall that under Assumption 2, there may be many Ts for any M record.
T > M. The normal change in the key value relationship is for T to become greater than M. This is so because both T and M are sorted in ascending order (Assumption 3). The T > M relation signifies that processing on the current master record is complete. The updated master (currently stored in computer memory) is then written to a new master file—the child—and a new M record is read from the original (parent) file.
Because the transaction file represents a subset of the master (Assumption 1), there normally will be gaps between the key values of the transaction records. Figure 2-47 illustrates this with sample transactions and corresponding master file records. Notice the gap between Key 1 and Key 4 in the transaction file. When Key 4 is read into memory, the condition T > M exists until Master Record 4 is read. Before this, Master Records
Part I Overview of Accounting Information Systems 99
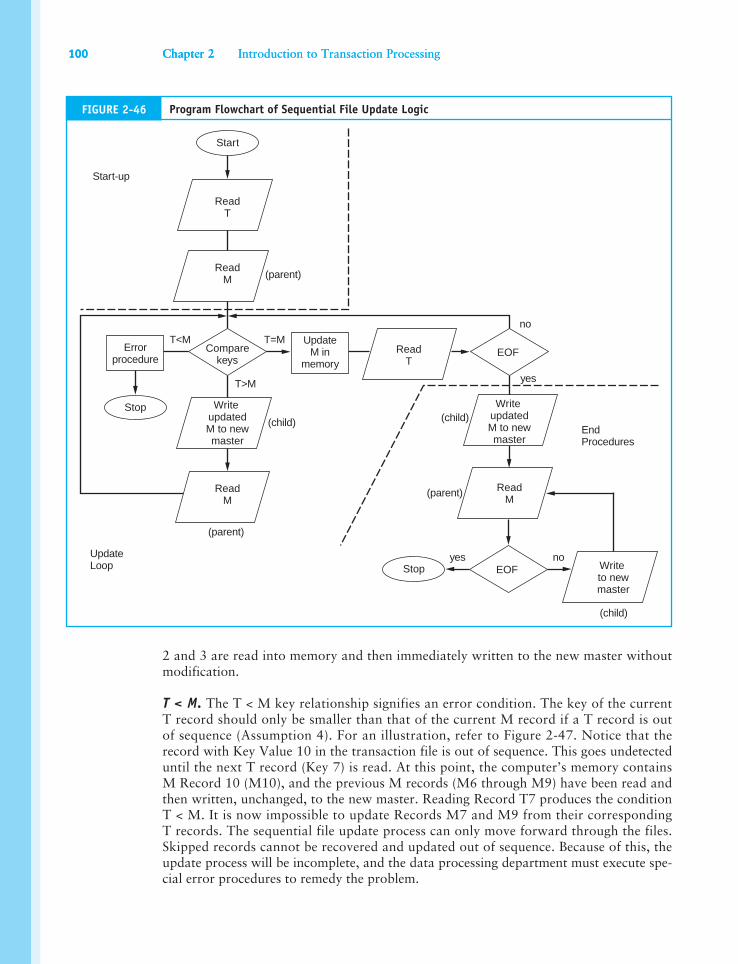
2 and 3 are read into memory and then immediately written to the new master without modification.
T < M. The T < M key relationship signifies an error condition. The key of the current T record should only be smaller than that of the current M record if a T record is out of sequence (Assumption 4). For an illustration, refer to Figure 2-47. Notice that the record with Key Value 10 in the transaction file is out of sequence. This goes undetected until the next T record (Key 7) is read. At this point, the computer’s memory contains M Record 10 (M10), and the previous M records (M6 through M9) have been read and then written, unchanged, to the new master. Reading Record T7 produces the condition T < M. It is now impossible to update Records M7 and M9 from their corresponding T records. The sequential file update process can only move forward through the files. Skipped records cannot be recovered and updated out of sequence. Because of this, the update process will be incomplete, and the data processing department must execute spe-cial error procedures to remedy the problem.
Start
Stop
ReadT
ReadT
ReadM
ReadM
EOFComparekeys
Write updatedM to newmaster
Errorprocedure
UpdateM in
memory
Start-up
(parent)
(child)
(parent)
(child)
(parent)
T<M T=M
T>M
no
yes
UpdateLoop
EndProcedures
(child)
yes no
ReadM
Write updatedM to newmaster
Stop Write to newmaster
EOF
FIGURE 2-46 Program Flowchart of Sequential File Update Logic
100 Chapter 2 Introduction to Transaction Processing100 Chapter 2 Introduction to Transaction Processing
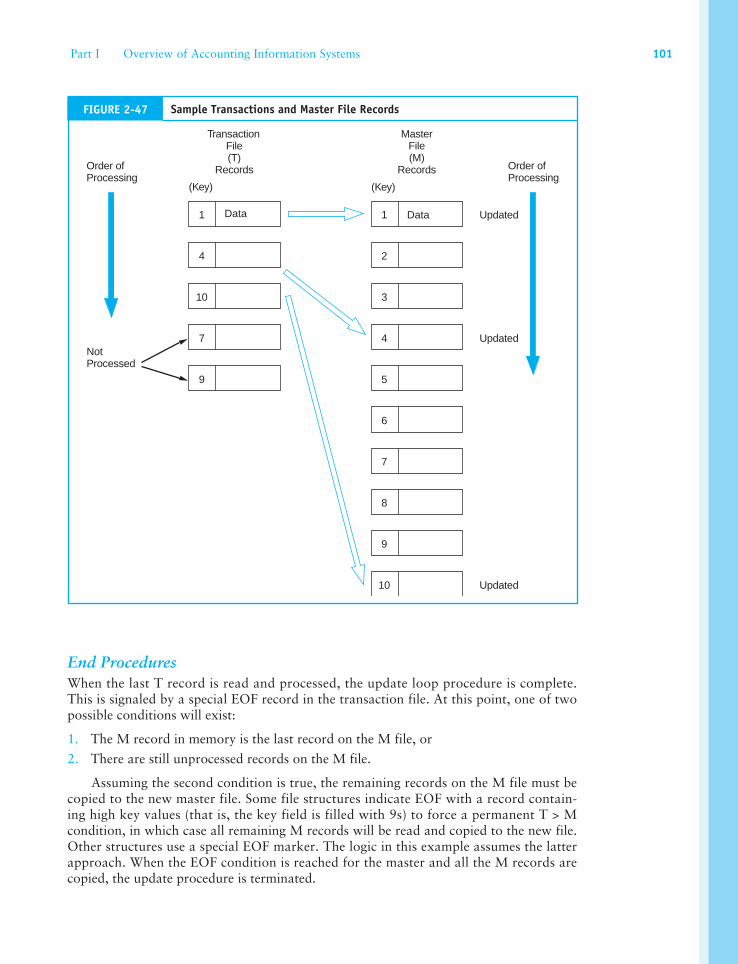
End ProceduresWhen the last T record is read and processed, the update loop procedure is complete. This is signaled by a special EOF record in the transaction file. At this point, one of two possible conditions will exist:
1. The M record in memory is the last record on the M file, or
2. There are still unprocessed records on the M file.
Assuming the second condition is true, the remaining records on the M file must be copied to the new master file. Some file structures indicate EOF with a record contain-ing high key values (that is, the key field is filled with 9s) to force a permanent T > M condition, in which case all remaining M records will be read and copied to the new file. Other structures use a special EOF marker. The logic in this example assumes the latter approach. When the EOF condition is reached for the master and all the M records are copied, the update procedure is terminated.
TransactionFile(T)
Records
MasterFile(M)
Records Order ofProcessing
7
2
3
4
5
6
8
9
10
Updated
Updated
Updated
(Key) (Key)
NotProcessed
1 Data1 Data
4
10
7
9
Order ofProcessing
FIGURE 2-47 Sample Transactions and Master File Records
Part I Overview of Accounting Information Systems 101
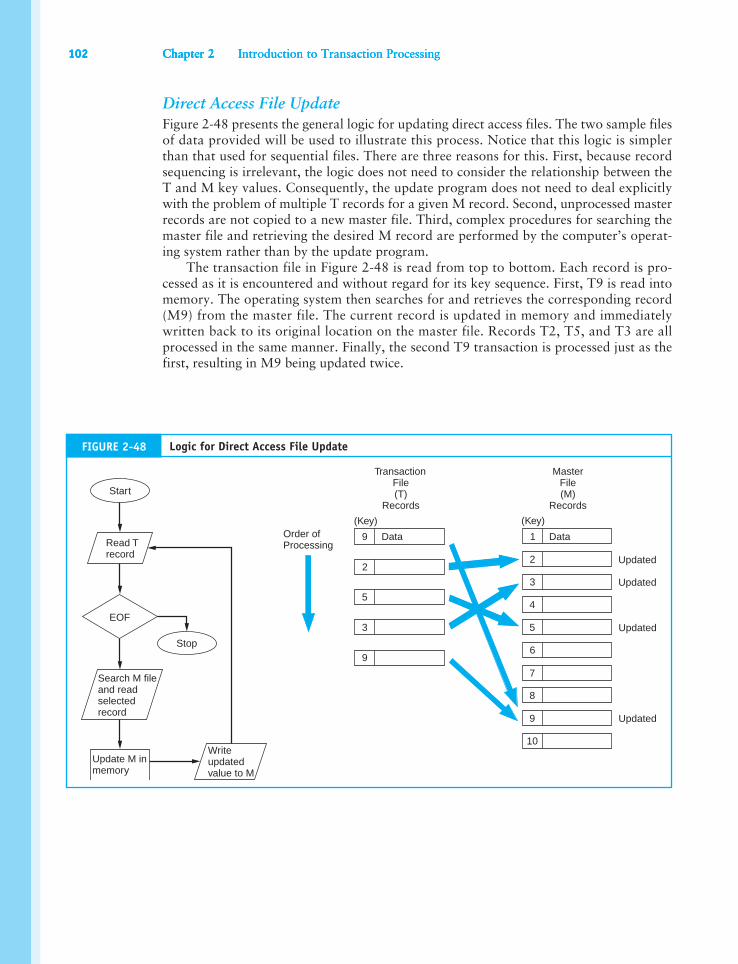
Direct Access File UpdateFigure 2-48 presents the general logic for updating direct access files. The two sample files of data provided will be used to illustrate this process. Notice that this logic is simpler than that used for sequential files. There are three reasons for this. First, because record sequencing is irrelevant, the logic does not need to consider the relationship between the T and M key values. Consequently, the update program does not need to deal explicitly with the problem of multiple T records for a given M record. Second, unprocessed master records are not copied to a new master file. Third, complex procedures for searching the master file and retrieving the desired M record are performed by the computer’s operat-ing system rather than by the update program.
The transaction file in Figure 2-48 is read from top to bottom. Each record is pro-cessed as it is encountered and without regard for its key sequence. First, T9 is read into memory. The operating system then searches for and retrieves the corresponding record (M9) from the master file. The current record is updated in memory and immediately written back to its original location on the master file. Records T2, T5, and T3 are all processed in the same manner. Finally, the second T9 transaction is processed just as the first, resulting in M9 being updated twice.
FIGURE 2-48 Logic for Direct Access File Update
Start
Read Trecord
EOF
Stop
Search M fileand read selectedrecord
Update M inmemory
Writeupdatedvalue to M
Updated
Order ofProcessing
TransactionFile(T)
Records
MasterFile(M)
Records
Updated
Updated
Updated
(Key)(Key)
9
2
5
3
9
1
2
3
4
5
6
7
8
9
10
Data Data
102 Chapter 2 Introduction to Transaction Processing102 Chapter 2 Introduction to Transaction Processing102 Chapter 2 Introduction to Transaction Processing
Part I Overview of Accounting Information Systems 103
logical key pointer (95)master file (55)organization (86)physical address pointer (94)pointer structure (93)product documents (47)program flowchart (71)real-time systems (74)record layout diagrams (72)reference file (56)register (50)relative address pointer (94)revenue cycle (47)run (95)sequential access method (87)sequential files (87)sequential structure (87)source documents (47)system flowcharts (61)transaction file (56)turnaround documents (48)virtual storage access method (VSAM) (89)
access method (86)accounting record (47) archive file (57)audit trail (54)batch (66)batch systems (74)cardinality (60)conversion cycle (46)data flow diagram (58)data model (60)data structures (86)direct access files (97)direct access structures (88)document flowchart (61)entities (60)entity relationship (ER) diagram (60)expenditure cycle (45)flat-file approach (86)hashing structure (91)indexed random file (88)indexed structure (88)journal (49)ledger (51)
1. What three transaction cycles exist in all businesses?
2. Name the major subsystems of the expenditure cycle.
3. Identify and distinguish between the physical and financial components of the expenditure cycle.
4. Name the major subsystems of the conversion cycle.
5. Name the major subsystems of the revenue cycle.
6. Name the three types of documents. 7. Name the two types of journals. 8. Distinguish between a general journal and
journal vouchers. 9. Name the two types of ledgers.10. What is an audit trail?11. What is the confirmation process?
12. Computer-based systems employ four types of files. Name them.
13. Give an example of a record that might comprise each of the four file types found in a computer-based system.
14. What is the purpose of a digital audit trail?15. Give an example of how cardinality relates to
business policy. 16. Distinguish between entity relationship diagrams,
data flow diagrams, document flowcharts, and system flowcharts.
17. What is meant by cardinality in entity relation-ship diagrams?
18. For what purpose are ER diagrams used?19. What is an entity?20. Distinguish between batch and real-time
processing.21. Distinguish between the sequential file and
database approaches to data backup.
R e v i e w Q u e s t i o n s
K e y T e r m s
104 Chapter 2 Introduction to Transaction Processing
22. Is a DFD an effective documentation technique for identifying who or what performs a partic-ular task? Explain.
23. Is a flowchart an effective documentation tech-nique for identifying who or what performs a particular task? Explain.
24. How may batch processing be used to improve operational efficiency?
25. Why might an auditor use a program flowchart?26. How are system flowcharts and program flow-
charts related?27. What are the distinguishing features of a leg-
acy system?28. What are the two data processing approaches
used in modern systems?29. How is backup of database files accomplished?
30. What information is provided by a record lay-out diagram?
31. In one sentence, what does updating a master file record involve?
32. Comment on the following statement: “Legacy systems always use flat-file structures.”
33. Explain the technique known as destructive update.
34. What factor influences the decision to employ real-time data collection with batch updat-ing rather that purely real-time processing? Explain.
35. What are the advantages of real-time data processing?
36. What are the advantages of real-time data collection?
D i s c u s s i o n Q u e s t i o n s
1. Discuss the flow of cash through the transac-tion cycles. Include in your discussion the rel-evant subsystems and any time lags that may occur.
2. Explain whether the cost accounting system pri-marily supports internal or external reporting.
3. Discuss the role of the conversion cycle for service and retailing entities.
4. Can a turnaround document contain informa-tion that is subsequently used as a source doc-ument? Why or why not?
5. Would the write-down of obsolete inventory be recorded in a special journal or the general journal? Why?
6. Are both registers and special journals necessary? 7. Discuss the relationship between the balance
in the accounts payable general ledger control account and what is found in the accounts payable subsidiary ledger.
8. What role does the audit trail play in the task of confirmation?
9. Explain how the magnetic audit trail functions.10. Are large batch sizes preferable to small batch
sizes? Explain.
11. Discuss why an understanding of legacy sys-tem technologies is of some importance to auditors.
12. If an organization processes large numbers of transactions that use common data records, what type of system would work best (all else being equal)?
13. If an organization processes transactions that have independent (unique) data needs, what type of system would work best (all else being equal)?
14. Explain how a hashing structure works and why it’s quicker than using an index. Give an example. If it’s so much faster, why isn’t it used exclusively?
15. Describe a specific accounting application that could make use of a VSAM file.
16. Explain the following three types of pointers: physical address pointer, relative address pointer, and logical key pointer.
17. Should an auditor wishing to assess the adequacy of separation of functions examine a data flow diagram, a document flowchart, or a system flowchart? Why?
104 Chapter 2 Introduction to Transaction Processing
Part I Overview of Accounting Information Systems 105
7. Which of the following is NOT an advan-tage of real-time processing files over batch processing?
a. shorter transaction processing time b. reduction of inventory stocks c. improved customer service d. all are advantages 8. Which statement is NOT correct? a. Legacy systems may process financially sig-
nificant transactions. b. Some legacy sys tems use database
technology. c. Mainframes are exclusive to legacy systems,
while modern systems use only the client-server model.
d. All the above are true. 9. Which statement is NOT correct? a. Indexed random fi les are dispersed
throughout the storage device without re-gard for physical proximity with related records.
b. Indexed random files use disk storage space efficiently.
c. Indexed random files are efficient when pro-cessing a large portion of a file at one time.
d. Indexed random files are easy to maintain in terms of adding records.
10. Which statement is NOT correct? The indexed sequential access method
a. is used for very large files that need both direct access and batch processing.
b. may use an overflow area for records. c. provides an exact physical address for each
record. d. is appropriate for files that require few
insertions or deletions.11. Which statement is true about a hashing
structure? a. The same address could be calculated for
two records. b. Storage space is used efficiently. c. Records cannot be accessed rapidly. d. A separate index is required.
1. Which statement is not true? a. Business activities begin with the acquisi-
tion of materials, property, and labor in ex-change for cash.
b. The conversion cycle includes the task of determining raw materials requirements.
c. Manufacturing firms have a conversion cycle but retail firms do not.
d. A payroll check is an example of a product document of the payroll system.
e. A journal voucher is actually a special source document.
2. A documentation tool that depicts the physi-cal flow of information relating to a particular transaction through an organization is a
a. document flowchart. b. program flowchart. c. decision table. d. work distribution analysis. e. systems survey. 3. Sequential file processing will not permit a. data to be edited on a separate computer run. b. the use of a database structure. c. data to be edited in an offline mode. d. batch processing to be initiated from a
terminal. e. data to be edited on a real-time basis. 4. The production subsystem of the conversion
cycle includes all of the following EXCEPT a. determining raw materials requirements. b. make or buy decisions on component parts. c. release of raw materials into production. d. scheduling the goods to be produced. 5. Which of the following files is a temporary file? a. transaction file b. master file c. reference file d. none of the above 6. A documentation tool used to represent the
logical elements of a system is a(n) a. programming flowchart. b. entity relationship diagram. c. document flowchart. d. data flow diagram.
M u l t i p l e - C h o i c e Q u e s t i o n s
106 Chapter 2 Introduction to Transaction Processing
12. In a hashing structure a. two records can be stored at the same
address. b. pointers are used to indicate the location of
all records. c. pointers are used to indicate location of a
record with the same address as another record.
d. all locations on the disk are used for record storage.
13. An advantage of a physical address pointer is that
a. it points directly to the actual disk storage location.
b. it is easily recovered if it is inadvertently lost.
c. it remains unchanged when disks are reorganized.
d. all of the above are advantages of the physi-cal address pointer.
14. Which of the following is NOT true of a turn-around document?
a. They may reduce the number of errors made by external parties.
b. They are commonly used by utility compa-nies (gas, power, water).
c. They are documents used by internal par-ties only.
d. They are both input and output documents.15. Which of the following is NOT a true statement? a. Transactions are recorded on source docu-
ments and are posted to journals.
b. Transactions are recorded in journals and are posted to ledgers.
c. Infrequent transactions are recorded in the general journal.
d. Frequent transactions are recorded in spe-cial journals.
16. Which of the following is true of the relation-ship between subsidiary ledgers and general ledger accounts?
a. The two contain different and unrelated data. b. All general ledger accounts have subsidiaries. c. The relationship between the two provides
an audit trail from the financial statements to the source documents.
d. The total of subsidiary ledger accounts usu-ally exceeds the total in the related general ledger account.
17. Real-time systems might be appropriate for all of the following EXCEPT
a. airline reservations. b. payroll. c. point-of-sale transactions. d. air traffic control systems. e. all of these applications typically utilize
real-time processing.18. is the document flowchart symbol for: a. on-page connector. b. off-page connector. c. home base. d. manual operation. e. document.
1. Transaction Cycle IdentificationCategorize each of the following activities into the expenditure, conversion, or revenue cycles and identify the applicable subsystem.
a. preparing the weekly payroll for manufac-turing personnel
b. releasing raw materials for use in the man-ufacturing cycle
c. recording the receipt of payment for goods sold
d. recording the order placed by a customer e. ordering raw materials f. determining the amount of raw materials
to order
106 Chapter 2 Introduction to Transaction Processing
P r o b l e m s
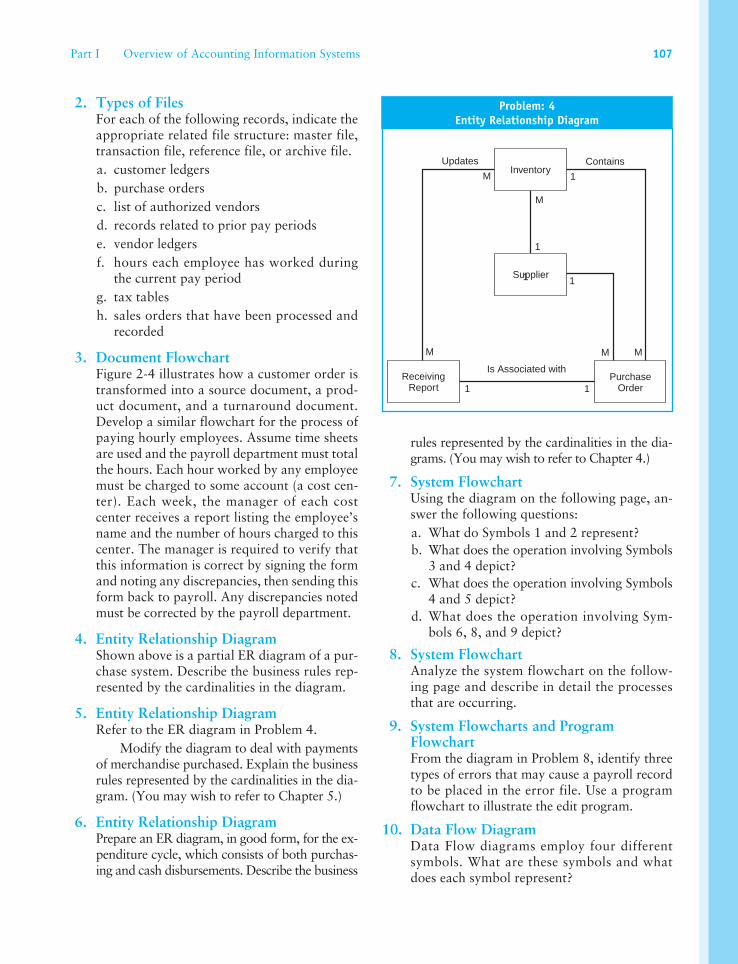
Part I Overview of Accounting Information Systems 107
Problem: 4Entity Relationship Diagram
Supplier
Inventory
ReceivingReport
PurchaseOrder
M
MM
M
M
1
1
1
1
1
1
Is Associated with
ContainsUpdates
rules represented by the cardinalities in the dia-grams. (You may wish to refer to Chapter 4.)
7. System FlowchartUsing the diagram on the following page, an-swer the following questions:
a. What do Symbols 1 and 2 represent? b. What does the operation involving Symbols
3 and 4 depict? c. What does the operation involving Symbols
4 and 5 depict? d. What does the operation involving Sym-
bols 6, 8, and 9 depict?
8. System FlowchartAnalyze the system flowchart on the follow-ing page and describe in detail the processes that are occurring.
9. System Flowcharts and Program FlowchartFrom the diagram in Problem 8, identify three types of errors that may cause a payroll record to be placed in the error file. Use a program flowchart to illustrate the edit program.
10. Data Flow DiagramData Flow diagrams employ four different symbols. What are these symbols and what does each symbol represent?
2. Types of FilesFor each of the following records, indicate the appropriate related file structure: master file, transaction file, reference file, or archive file.
a. customer ledgers b. purchase orders c. list of authorized vendors d. records related to prior pay periods e. vendor ledgers f. hours each employee has worked during
the current pay period g. tax tables h. sales orders that have been processed and
recorded
3. Document FlowchartFigure 2-4 illustrates how a customer order is transformed into a source document, a prod-uct document, and a turnaround document. Develop a similar flowchart for the process of paying hourly employees. Assume time sheets are used and the payroll department must total the hours. Each hour worked by any employee must be charged to some account (a cost cen-ter). Each week, the manager of each cost center receives a report listing the employee’s name and the number of hours charged to this center. The manager is required to verify that this information is correct by signing the form and noting any discrepancies, then sending this form back to payroll. Any discrepancies noted must be corrected by the payroll department.
4. Entity Relationship DiagramShown above is a partial ER diagram of a pur-chase system. Describe the business rules rep-resented by the cardinalities in the diagram.
5. Entity Relationship DiagramRefer to the ER diagram in Problem 4.
Modify the diagram to deal with payments of merchandise purchased. Explain the business rules represented by the cardinalities in the dia-gram. (You may wish to refer to Chapter 5.)
6. Entity Relationship DiagramPrepare an ER diagram, in good form, for the ex-penditure cycle, which consists of both purchas-ing and cash disbursements. Describe the business
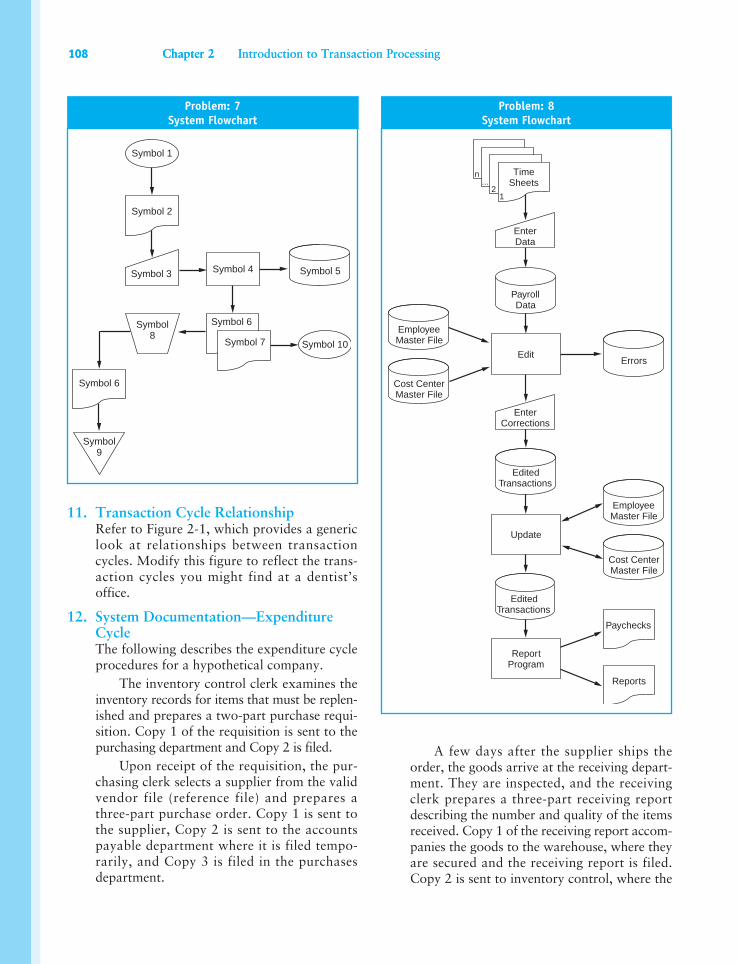
108 Chapter 2 Introduction to Transaction Processing108 Chapter 2 Introduction to Transaction Processing
A few days after the supplier ships the order, the goods arrive at the receiving depart-ment. They are inspected, and the receiving clerk prepares a three-part receiving report describing the number and quality of the items received. Copy 1 of the receiving report accom-panies the goods to the warehouse, where they are secured and the receiving report is filed. Copy 2 is sent to inventory control, where the
Problem: 7System Flowchart
Symbol 2
Symbol 6
Symbol9
Symbol 1
Symbol 3 Symbol 4 Symbol 5
Symbol 6
Symbol 7 Symbol 10
Symbol8
11. Transaction Cycle RelationshipRefer to Figure 2-1, which provides a generic look at relationships between transaction cycles. Modify this figure to reflect the trans-action cycles you might find at a dentist’s office.
12. System Documentation—Expenditure CycleThe following describes the expenditure cycle procedures for a hypothetical company.
The inventory control clerk examines the inventory records for items that must be replen-ished and prepares a two-part purchase requi-sition. Copy 1 of the requisition is sent to the purchasing department and Copy 2 is filed.
Upon receipt of the requisition, the pur-chasing clerk selects a supplier from the valid vendor file (reference file) and prepares a three-part purchase order. Copy 1 is sent to the supplier, Copy 2 is sent to the accounts payable department where it is filed tempo-rarily, and Copy 3 is filed in the purchases department.
Problem: 8System Flowchart
TimeSheets
PayrollData
12
...n
Errors
EmployeeMaster File
Cost CenterMaster File
EnterData
EnterCorrections
EditedTransactions
EmployeeMaster File
Cost CenterMaster File
Paychecks
Reports
EditedTransactions
Update
Edit
ReportProgram
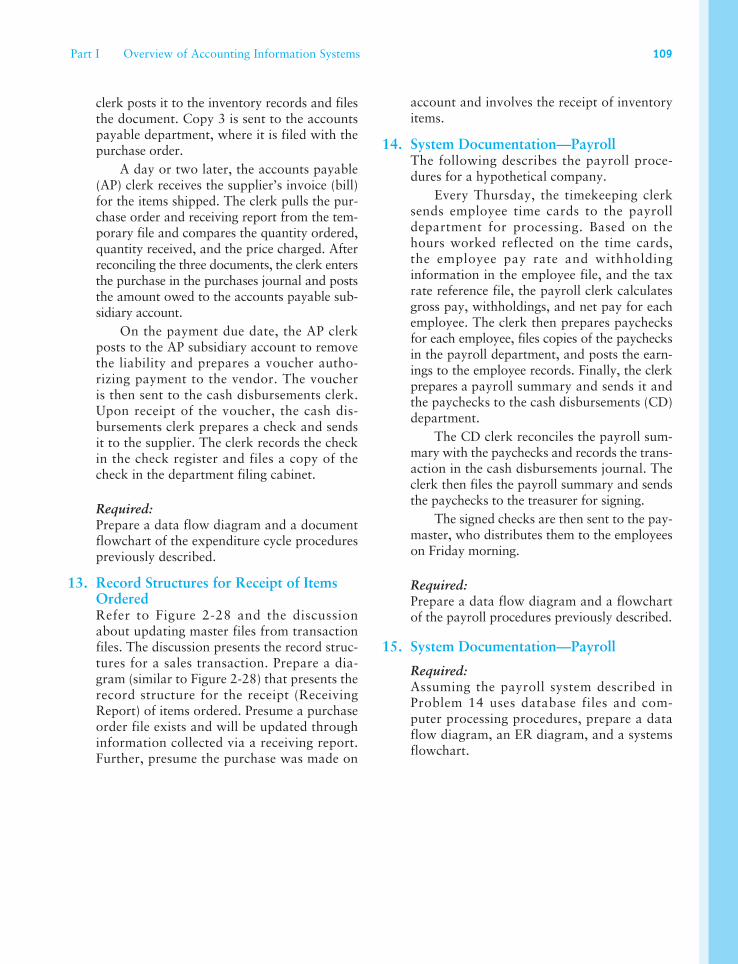
Part I Overview of Accounting Information Systems 109
account and involves the receipt of inventory items.
14. System Documentation—PayrollThe following describes the payroll proce-dures for a hypothetical company.
Every Thursday, the timekeeping clerk sends employee time cards to the payroll department for processing. Based on the hours worked reflected on the time cards, the employee pay rate and withholding information in the employee file, and the tax rate reference file, the payroll clerk calculates gross pay, withholdings, and net pay for each employee. The clerk then prepares paychecks for each employee, files copies of the paychecks in the payroll department, and posts the earn-ings to the employee records. Finally, the clerk prepares a payroll summary and sends it and the paychecks to the cash disbursements (CD) department.
The CD clerk reconciles the payroll sum-mary with the paychecks and records the trans-action in the cash disbursements journal. The clerk then files the payroll summary and sends the paychecks to the treasurer for signing.
The signed checks are then sent to the pay-master, who distributes them to the employees on Friday morning.
Required:Prepare a data flow diagram and a flowchart of the payroll procedures previously described.
15. System Documentation—Payroll
Required: Assuming the payroll system described in Problem 14 uses database files and com-puter processing procedures, prepare a data flow diagram, an ER diagram, and a systems flowchart.
clerk posts it to the inventory records and files the document. Copy 3 is sent to the accounts payable department, where it is filed with the purchase order.
A day or two later, the accounts payable (AP) clerk receives the supplier’s invoice (bill) for the items shipped. The clerk pulls the pur-chase order and receiving report from the tem-porary file and compares the quantity ordered, quantity received, and the price charged. After reconciling the three documents, the clerk enters the purchase in the purchases journal and posts the amount owed to the accounts payable sub-sidiary account.
On the payment due date, the AP clerk posts to the AP subsidiary account to remove the liability and prepares a voucher autho-rizing payment to the vendor. The voucher is then sent to the cash disbursements clerk. Upon receipt of the voucher, the cash dis-bursements clerk prepares a check and sends it to the supplier. The clerk records the check in the check register and files a copy of the check in the department filing cabinet.
Required:Prepare a data flow diagram and a document flowchart of the expenditure cycle procedures previously described.
13. Record Structures for Receipt of Items OrderedRefer to Figure 2-28 and the discussion about updating master files from transaction files. The discussion presents the record struc-tures for a sales transaction. Prepare a dia-gram (similar to Figure 2-28) that presents the record structure for the receipt (Receiving Report) of items ordered. Presume a purchase order file exists and will be updated through information collected via a receiving report. Further, presume the purchase was made on
110 Chapter 2 Introduction to Transaction Processing110 Chapter 2 Introduction to Transaction Processing
L e g a c y S y s t e m s P r o b l e m s
16. Access MethodsFor each of the following file processing operations, indicate whether a sequential file, indexed random file, virtual storage access method (VSAM), hashing, or pointer struc-ture would work best. You may choose as many as you wish for each step. Also indicate which would perform the least optimally.
a. Retrieve a record from the file based on its primary key value.
b. Update a record in the file. c. Read a complete file of records. d. Find the next record in a file. e. Insert a record into a file. f. Delete a record from a file. g. Scan a file for records with secondary keys.
17. File OrganizationFor the following situations, indicate the most appropriate type of file organization. Explain your choice.
a. A local utility company has 80,000 residen-tial customers and 10,000 commercial cus-tomers. The monthly billings are staggered throughout the month and, as a result, the cash receipts are fairly uniform throughout the month. For 99 percent of all accounts, one check per month is received. These receipts are recorded in a batch file, and the customer account records are updated biweekly. In a typical month, customer in-quiries are received at the rate of about 20 per day.
b. A national credit card agency has 12 million customer accounts. On average, 30 million purchases and 700,000 receipts of payments are processed per day. Additionally, the cus-tomer support hotline provides information to approximately 150,000 credit card hold-ers and 30,000 merchants per day.
c. An airline reservations system assumes that the traveler knows the departing city. From that point, fares and flight times are examined based on the destination. When a flight is identified as being acceptable to the traveler, the availability is checked and,
if necessary, a seat is reserved. The volume of transactions exceeds one-half million per day.
d. A library system stocks over 2 million books and has 30,000 patrons. Each patron is allowed to check out five books. On average, there are 1.3 copies of each title in the library. Over 3,000 books are checked out each day, with approximately the same amount being returned daily. The checked-out books are posted immediately, as well as any returns of overdue books by patrons who wish to pay their fines.
18. Manual System Accounting RecordsThe Manual System section of this text presents the documents, journals, and ledgers typically used for the revenue cycle of a manual system. Using this discussion as a guideline, present the documents, journals, and ledgers for an expen-diture cycle. Presume the expenditure in ques-tion is the receipt of and payment for inventory items. Further, presume there is a time lag between the purchase of inventory and the pay-ment for inventory.
a. What are the documents that will be used by this cycle?
b. For each document stated above, is this a source, product, or turnaround document?
c. What are the journals that will be used in this cycle?
d. For each journal stated, is this a general or special journal?
e. What are the ledgers that will be used in this cycle?
f. For each ledger stated, is this a subsidiary or general ledger?
19. Backup and Recovery Procedures for Database FilesFigure 2-30 provides a backup and recov-ery system for files that are updated using a destructive update approach. Now think about a specific situation that might use this approach. A company creates its sales order transaction file in batches. Once a day, a sales
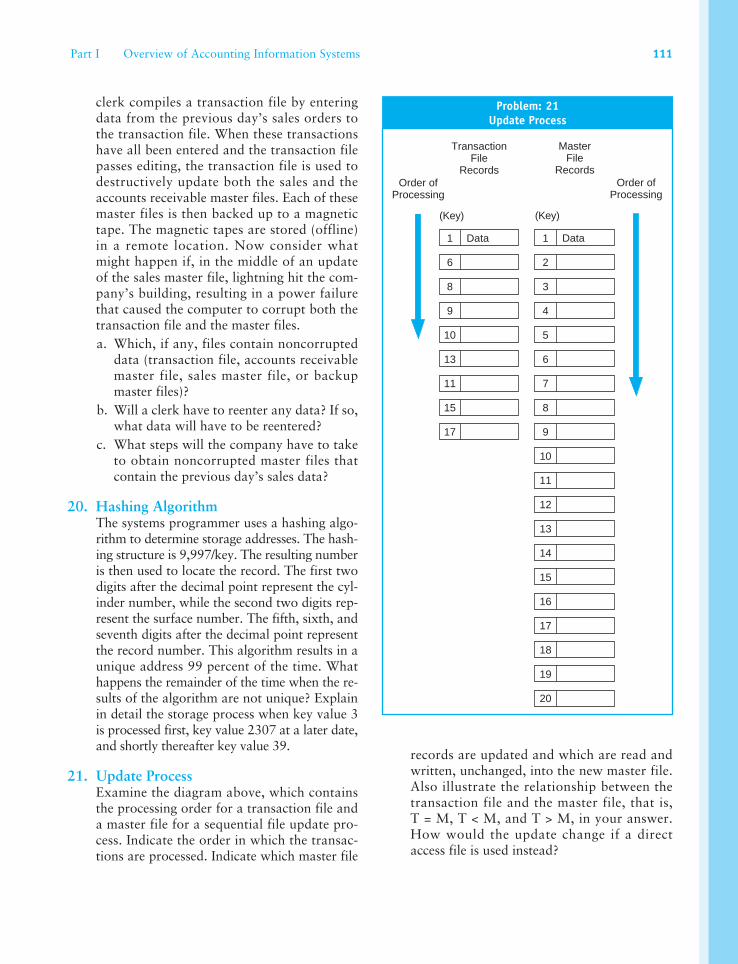
Part I Overview of Accounting Information Systems 111
clerk compiles a transaction file by entering data from the previous day’s sales orders to the transaction file. When these transactions have all been entered and the transaction file passes editing, the transaction file is used to destructively update both the sales and the accounts receivable master files. Each of these master files is then backed up to a magnetic tape. The magnetic tapes are stored (offline) in a remote location. Now consider what might happen if, in the middle of an update of the sales master file, lightning hit the com-pany’s building, resulting in a power failure that caused the computer to corrupt both the transaction file and the master files.
a. Which, if any, files contain noncorrupted data (transaction file, accounts receivable master file, sales master file, or backup master files)?
b. Will a clerk have to reenter any data? If so, what data will have to be reentered?
c. What steps will the company have to take to obtain noncorrupted master files that contain the previous day’s sales data?
20. Hashing AlgorithmThe systems programmer uses a hashing algo-rithm to determine storage addresses. The hash-ing structure is 9,997/key. The resulting number is then used to locate the record. The first two digits after the decimal point represent the cyl-inder number, while the second two digits rep-resent the surface number. The fifth, sixth, and seventh digits after the decimal point represent the record number. This algorithm results in a unique address 99 percent of the time. What happens the remainder of the time when the re-sults of the algorithm are not unique? Explain in detail the storage process when key value 3 is processed first, key value 2307 at a later date, and shortly thereafter key value 39.
21. Update ProcessExamine the diagram above, which contains the processing order for a transaction file and a master file for a sequential file update pro-cess. Indicate the order in which the transac-tions are processed. Indicate which master file
records are updated and which are read and written, unchanged, into the new master file. Also illustrate the relationship between the transaction file and the master file, that is, T = M, T < M, and T > M, in your answer. How would the update change if a direct access file is used instead?
Problem: 21Update Process
TransactionFile
Records
MasterFile
RecordsOrder of
Processing
7
2
3
4
5
6
8
9
10
(Key) (Key)
1 DataData
Order ofProcessing
11
12
13
14
15
16
17
18
19
20
1
6
8
10
13
11
15
17
9