intra-season variations in workload parameters in europe's
TRANSCRIPT
healthcare
Article
Intra-Season Variations in Workload Parameters in Europe’sElite Young Soccer Players: A Comparative Pilot Study betweenStarters and Non-Starters
Alexandre D. Martins 1,2,* , Rafael Oliveira 1,2,3 , João P. Brito 1,2,3 , Nuno Loureiro 1,2 , Sérgio M. Querido 4
and Hadi Nobari 5,6,7,8
�����������������
Citation: Martins, A.D.; Oliveira, R.;
Brito, J.P.; Loureiro, N.; Querido, S.M.;
Nobari, H. Intra-Season Variations in
Workload Parameters in Europe’s
Elite Young Soccer Players: A
Comparative Pilot Study between
Starters and Non-Starters. Healthcare
2021, 9, 977. https://doi.org/
10.3390/healthcare9080977
Academic Editor: José Carmelo
Adsuar Sala
Received: 24 June 2021
Accepted: 27 July 2021
Published: 31 July 2021
Publisher’s Note: MDPI stays neutral
with regard to jurisdictional claims in
published maps and institutional affil-
iations.
Copyright: © 2021 by the authors.
Licensee MDPI, Basel, Switzerland.
This article is an open access article
distributed under the terms and
conditions of the Creative Commons
Attribution (CC BY) license (https://
creativecommons.org/licenses/by/
4.0/).
1 Institute of Santarém, Sports Science School of Rio Maior–Polytechnic, 2140-413 Rio Maior, Portugal;[email protected] (R.O.); [email protected] (J.P.B.);[email protected] (N.L.)
2 Life Quality Research Centre, 2140-413 Rio Maior, Portugal3 Research Center in Sport Sciences, Health Sciences and Human Development, Quinta de Prados,
Edifício Ciências de Desporto, 5001-801 Vila Real, Portugal4 Faculty of Human Kinetics, University of Lisbon, 1649-004 Lisbon, Portugal; [email protected] Department of Physical Education and Sports, University of Granada, 18010 Granada, Spain;
[email protected] HEME Research Group, Faculty of Sport Sciences, University of Extremadura, 10003 Cáceres, Spain7 Sports Scientist, Sepahan Football Club, Isfahan 81887-78473, Iran8 Department of Exercise Physiology, Faculty of Sport Sciences, University of Isfahan, Isfahan 81746-7344, Iran* Correspondence: [email protected]; Tel.: +243-999-280
Abstract: Background: The main purpose of the current study was to compare the within-seasonvariations of workload, training duration, acute/chronic workload ratio (ACWR), training monotony ™,and training strain (TS) through session rating perceived exertion (s-RPE) between starters andnon-starters. Methods: Seventeen under-17 European male soccer players (age, 16.2 ± 0.3 y, height,1.8 ± 0.1 m; body mass, 66.5 ± 4.0 kg) divided in two groups: nine starters and eight non-starters,were evaluated over 50 weeks throughout the season. Results: In general, there were load variationsfor all players during the full-season. RPE tended to decrease during in-season and RPE, trainingduration and s-RPE did not present significant differences between starters and non-starters. TM andTS presented lower values for starters in mesocycle (M) 4 and M11 compared to non-starters. TS pre-sented lower values for starters in M4 and M11 compared to non-starters, while in M10 a higher valuewas found for starters when compared to non-starters. ACWR showed differences between startersand non-starters in two of the mesocycles. Conclusions: This study showed that some mesocyclesprovided higher load for non-starters. This information can alert coaches that non-starter players arelikely to try too hard in training to demonstrate their abilities, leading to non-functional overreaching,overtraining syndrome, and then poor performance.
Keywords: internal load; young soccer; ACWR; monotony; performance; monitoring
1. Introduction
The quantification of workload is necessary when determining load imposed to theathletes, their individual response, and adaptation to training programs. All data derivedfrom workload monitoring provides a better understanding when recovery is needed.It also allows to reduce injury risk, illness, overreaching, or overtraining [1,2].
Workload quantification can be characterized as external and internal. External isrelated to the physical work performed during a training session or match (e.g., distancescovered and/or accelerometry-based variables), while internal is related to psychologicaland physiological variables such as rating of perceived exertion (RPE) and/or heart rate [3,4].
In youth soccer, workload quantification becomes even more relevant because growth,maturation, and puberty also contribute to expose players to non-traumatic injuries [5].
Healthcare 2021, 9, 977. https://doi.org/10.3390/healthcare9080977 https://www.mdpi.com/journal/healthcare
Healthcare 2021, 9, 977 2 of 13
In addition, there are several studies that have demonstrated the association betweenworkload, and physical fitness, fatigue or the risk of injury [6,7].
In soccer athletes, the RPE and session-RPE (s-RPE) are the most used measures toquantify internal workload [2,8]. For instance, Wrigley et al. [9] quantified the weeklyworkload through RPE in under (U) 14, 16, and 18 soccer players and reported that trainingsessions after the match presented the highest RPE values.
According to Impellizzeri et al. [2], internal workload is recommended as a primarymeasure to monitor athletes because it reflects the experienced training from a specificexternal load that can be different either between or within athletes. Moreover, the limitedresources available in youth soccer may also justify the importance to adopt accessible,easy to use, low-cost, and reliable tools.
In addition, there are some metrics that have also been widely suggested in literature astraining monotony I [10–12], training strain (TS) [10–12], and acute: chronic workload ratio(ACWR) [13–15]. TM represents the load variability within the week, while TS representsthe load variability multiplied by the acute workload [16], which is the accumulated loadduring a week. Moreover, chronic workload represents the mean load in the past 4 weeks)and consequently makes ACWR, which represents the relationship between acute andchronic workloads [17].
The use of the aforementioned metrics gives information about weekly load variationsand provides individual thresholds to minimize the occurrence of injury, which allows re-searchers and coaches to better adjust training load and take evidence-based decisions [15,18,19].Despite there being several studies that demonstrate responses to training, whether it isphysical fitness, fatigue, or the risk of injury [1,6,7], the literature is still scarce regardingworkload quantification in youth training soccer athletes [11], especially when analysingspecific characteristic of the players, such as their status (e.g., starters and non-starters).
The focus during the week will shift towards optimally preparing the players for peakperformance in the match, rather than on solely improving their physical capacities [20].Therefore, there will only be one high-intensity training session during the week, as theother conditional training sessions are replaced by competitive matches. However, sincethe preparation period is also used to form a starting team, there may also be playerswho are not exposed to the physically challenging demands of these matches every week.Or conversely, non-starting players can train harder to demonstrate their abilities to thecoach. It is crucial to study whether non-starter players are likely to train too hard, leadingto non-functional overreaching, overtraining syndrome, and then poor performance. Thiscan be to the detriment of the team when it needs non-starter players. Through the full-season, starters and non-starters could reveal different physiological adaptations [21],and recently, new evidence about workload and the player status has been shown in thescientific literature [12,22,23].
In U17 players, the adaptations through the full-season could be determinant forplayers increasing their participation in competition, as match days usually are the dayswith higher soccer-specific practice and load [23]. Especially at the youth level, this couldbe crucial because soccer teams usually participate in three to five training sessions andonly one match per week during the in-season [24]. This is a very important aspect in soccer,highlighting the discrepancies in physical loads, which could impair the use of non-playersin official matches [22]. Therefore, it is essential to monitor the weekly workload, in order tounderstand the impact on physical and psychological well-being and the differences in theworkload between starters and non-starters [21,22], which could influence the performancein training and matches.
To the best of the author’s knowledge, there is no research on TM, TS, and ACWR,and comparisons between starters and non-starters, through the full-season in youth soccerplayers, simultaneously. Based on that, the purpose of this study was two-fold: (a) todescribe the in-season variations of workload, training duration, TM, TS, and ACWRthrough s-RPE; and (b) to compare the aforementioned workload parameters betweenstarters and non-starters. It was hypothesized that variations occurred across the season
Healthcare 2021, 9, 977 3 of 13
with a tendency of higher values from the pre-season to the end-season. Moreover, itwas also hypothesized that starters presented higher values for the workload measuresthan non-starters.
2. Materials and Methods2.1. Participants
The present study included 17 male U17 soccer players belonging to a Portugueseelite team. They were divided into two groups, starters (n = 9, age: 16.2 ± 0.4 years) andnon-starters (n = 8, age: 16.2 ± 0.2 years). The inclusion criteria were regular participationin 80% of weekly training sessions. Players had an average of 5.7 ± 2.1 years of soccertraining experience.
The exclusion criteria included: (i) players with prolonged injury or a lack of participa-tion in training for at least 2 consecutive weeks; (ii) those who presented the initial physicalfitness tests 2 standard deviations below the squad mean (four players were removedbased on this criterion); and (iii) goal keepers, due to differences in training activities andworkload in training and matches (two players were removed based on this criterion).
The criteria to define starters were assessed week by week to a player’s attendance timein three consecutive matches (≥60 min in each match) while non-starters were consideredthose who did not achieve this duration [22].
The participants and their parents were informed of the study design as well as thepotential risks and benefits of their participation. After being informed and agreeing withthe terms of participation, each player and their parent signed an informed and privateconsent. The study design was approved by the local institutional scientific committee andethical standards were ensured based on the standards for the experiments conducted inhumans as suggested by the Declaration of Helsinki [25].
2.2. Design
This study is a descriptive-longitudinal approach and followed a cohort design con-ducted during a 12-months period from June 2017 to July 2018 (4 weeks during the pre-season and 46 weeks during the in-season). An approach used in previous studies wasadapted in which each month corresponded to a mesocycle [26–28].
The number of training sessions and the number of competitive matches is presentedin Table 1. TL data were collected over a 50-week period of competition where 43 matchesand 168 training sessions occurred. Data from rehabilitation or additional training sessionsof recuperation were excluded. This study did not influence or alter the training sessionsin any way across the full-season, which means that the coach was completely responsiblefor the training process. A total of 5100 individual training observations were collectedduring the study. Players performed four training sessions and one match per week duringthe season [match day minus (MD-), MD-4; MD-3; MD-2, MD and MD plus (+) 2, (MD+2)].MD+2 is equivalent to MD-5, however, we opted to use MD+2 because this training sessionwas planned according to the previous match. This approach was adapted from previousstudies [20,23,26].
Table 1. Description of macrocycle of the present study.
Mesocycle (M) M1 M2 M3 M4 M5 M6 M7 M8 M9 M10 M11 M12
Phases Pre-season Early-season Mid-season End-seasonNumber of weeks 4 4 4 4 4 4 4 4 4 4 4 6
Training sessions (N) 17 16 15 14 14 14 15 15 9 15 12 12Training duration, total minutes, ST 1676 3170 1316 1118 1235 1227 1204 1190 802 1197 791 1365
Training duration, total minutes, NST 1706 1576 1353 1319 1177 1188 1325 1218 939 1166 1022 1491Match duration, total minutes, ST 198 194 242 193 223 205 241 183 122 221 0 312
Match duration, total minutes, NST 178 82 130 190 153 105 110 90 46 61 0 153Number of matches (N) 4 * 4 4 4 4 4 4 3 2 3 0 7
Abbreviations: *, friendly matches; ST, Starters; NST, Non-starters; N, number.
Healthcare 2021, 9, 977 4 of 13
2.3. Internal Workload Quantification
During training sessions, CR10-point scale [29], adapted by Foster et al. [30] wasapplied. Thirty minutes after the end of each training session, players rated their RPE valueusing an app on a tablet. The scores provided by the players were also multiplied by thetraining duration, to obtain the s-RPE [30,31]. The players were previously familiarizedwith the scale during the previous two seasons, and all the answers were provided individ-ually to avoid non-valid scores. Through s-RPE, the following variables were calculated:(i) TM (mean of training load during the 7 days of the week divided by the standarddeviation of the training load of the 7 days) [10–12]; (ii) TS (sum of the training load for alltraining sessions during a week multiplied by training monotony) [10–12]; and (iii) ACWR(dividing the acute workload, 1-week rolling workload data, by the chronic workload,the rolling 4-week average workload data) [13–15].
2.4. Statistical Analysis
Data were analysed using SPSS version 22.0 (SPSS Inc., Chicago, IL, USA) for Windowsstatistical software package. Initially, descriptive statistics were used to describe andcharacterize the sample. Shapiro-Wilk and the Levene tests were used to assumed normalityand homogeneity, respectively. Repeated measures ANOVA was used with Tukey’ b posthoc once variables obtained normal distribution (Shapiro-Wilk > 0.05), to compare differentM and groups (player status). Hedge’s g effect size with 95% confidence interval was alsocalculated. The Hopkins’ thresholds for effect size statistics were used, as follows: ≤0.2,trivial; >0.2, small; >0.6, moderate; >1.2, large; >2.0, very large; and >4.0, nearly perfect [32].Results were considered significant with p ≤ 0.05.
3. Results3.1. Mesocycle Analysis
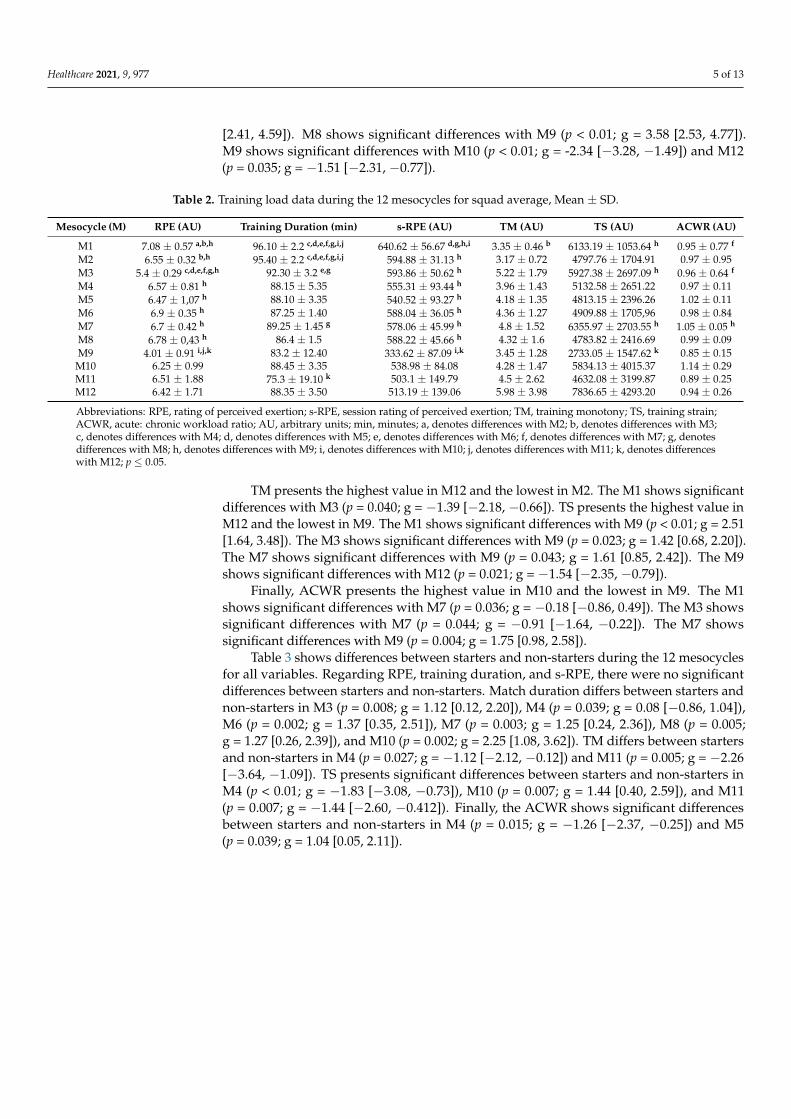
Table 2 presents descriptive data for training duration, RPE, s-RPE, TM, TS, and ACWR.The results indicate that the highest RPE occurred in M1 (pre-season) and the lowest RPE oc-curred in M9. The M1 shows significant differences with M2 (p = 0.044; g = 1.12 [0.41, 1.87]),M3 (p < 0.01; g = 3.63 [2.58, 4.83]), and M9 (p < 0.01; g = 3.95 [2.84, 5.23]). M2 showssignificant differences with M3 (p < 0.01; g = 3.68 [2.62, 4.89]) and M9 (p < 0.01; g = 3.64[2.58, 4.84]). M3 shows significant differences with M4 (p = 0.001; g = −1.88 [−2.73,−1.09]), M5 (p = 0.032; g = −1.33 [−2.11, −0.61]), M6 (p < 0.01; g = −4.56 [−5.98, −3.33]),M7 (p < 0.01; g = −3.52 [−4.69, −2.48]), M8 (p < 0.01; g = −3.67 [−4.89, −2.61]), and M9(p = 0.001; g = 2.01 [1.21, 2.87]).
The highest training duration occurred in M1 (pre-season) and the lowest in M11.The M2 shows significant differences with M4 (p = 0.025; g = 1.89 [1.11, 2.76]), M5 (p < 0.01;g = 2.76 [1.85, 3.77]), M6 (p < 0.01; g = 4.68 [3.44, 6.14]), M7 (p < 0.01; g = 3.59 [2.54, 4.79]),M8 (p < 0.01; g = 5.03 [3.72, 6.57]), M9 (p = 0.034; g = 1.41 [0.68, 2.19]), M10 (p < 0.01; g = 2.64[1.75, 3.63]), and M11 (p = 0.025; g = 1.49 [0.75, 2.29]). M2 shows significant differenceswith M4 (p = 0.002; g = 1.73 [0.96, 2.59]), M5 (p < 0.01; g = 2.52 [1.64, 3.49]), M6 (p < 0.01;g = 4.32 [3.14, 5.67]), M7 (p < 0.01; g = 3.22 [2.24, 4.34]), M8 (p < 0.01; g = 4.67 [3.42, 6.12]),M10 (p < 0.01; g = 2.39 [1.54, 3.34]), and M11 (p = 0.049; g = 1.44 [0.71, 2.23]). M3 showssignificant differences with M6 (p = 0.007; g = 1.99 [1.19, 2.87]) and M8 (p < 0.01; g = 2.31[1.46, 3.24]). M7 shows significant differences with M8 (p = 0.003; g = 1.88 [1.10, 2.74]) andM11 shows significant differences with M12 (p = 0.012; g = −0.93 [−1.65, −0.23]).
The s-RPE presents the highest value in M1 and the lowest in M9. The M1 showssignificant differences with M6 (p = 0.041; g = 1.08 [0.38, 1.82]), M8 (p = 0.005; g = 0.99[0.29, 1.73]), M9 (p < 0.01; g = 4.08 [2.95, 5.39]), and M10 (p = 0.028; g = 1.38 [0.65, 2.16]).M2 shows significant differences with M9 (p < 0.01; g = 3.90 [2.80, 5.17]). M3 showssignificant differences with M9 (p < 0.01; g = 3.57 [2.53, 4.76]). M4 shows significantdifferences with M9 (p < 0.01; g = 2.39 [1.54, 3.34]). M5 shows significant differenceswith M9 (p = 0.001; g = 2.24 [1.41, 3.16]). M6 shows significant differences with M9(p < 0.01; g = 3.73 [2.66, 4.95]). M7 shows significant differences with M9 (p < 0.01; g = 3.43
Healthcare 2021, 9, 977 5 of 13
[2.41, 4.59]). M8 shows significant differences with M9 (p < 0.01; g = 3.58 [2.53, 4.77]).M9 shows significant differences with M10 (p < 0.01; g = -2.34 [−3.28, −1.49]) and M12(p = 0.035; g = −1.51 [−2.31, −0.77]).
Table 2. Training load data during the 12 mesocycles for squad average, Mean ± SD.
Mesocycle (M) RPE (AU) Training Duration (min) s-RPE (AU) TM (AU) TS (AU) ACWR (AU)
M1 7.08 ± 0.57 a,b,h 96.10 ± 2.2 c,d,e,f,g,i,j 640.62 ± 56.67 d,g,h,i 3.35 ± 0.46 b 6133.19 ± 1053.64 h 0.95 ± 0.77 f
M2 6.55 ± 0.32 b,h 95.40 ± 2.2 c,d,e,f,g,i,j 594.88 ± 31.13 h 3.17 ± 0.72 4797.76 ± 1704.91 0.97 ± 0.95M3 5.4 ± 0.29 c,d,e,f,g,h 92.30 ± 3.2 e,g 593.86 ± 50.62 h 5.22 ± 1.79 5927.38 ± 2697.09 h 0.96 ± 0.64 f
M4 6.57 ± 0.81 h 88.15 ± 5.35 555.31 ± 93.44 h 3.96 ± 1.43 5132.58 ± 2651.22 0.97 ± 0.11M5 6.47 ± 1,07 h 88.10 ± 3.35 540.52 ± 93.27 h 4.18 ± 1.35 4813.15 ± 2396.26 1.02 ± 0.11M6 6.9 ± 0.35 h 87.25 ± 1.40 588.04 ± 36.05 h 4.36 ± 1.27 4909.88 ± 1705,96 0.98 ± 0.84M7 6.7 ± 0.42 h 89.25 ± 1.45 g 578.06 ± 45.99 h 4.8 ± 1.52 6355.97 ± 2703.55 h 1.05 ± 0.05 h
M8 6.78 ± 0,43 h 86.4 ± 1.5 588.22 ± 45.66 h 4.32 ± 1.6 4783.82 ± 2416.69 0.99 ± 0.09M9 4.01 ± 0.91 i,j,k 83.2 ± 12.40 333.62 ± 87.09 i,k 3.45 ± 1.28 2733.05 ± 1547.62 k 0.85 ± 0.15
M10 6.25 ± 0.99 88.45 ± 3.35 538.98 ± 84.08 4.28 ± 1.47 5834.13 ± 4015.37 1.14 ± 0.29M11 6.51 ± 1.88 75.3 ± 19.10 k 503.1 ± 149.79 4.5 ± 2.62 4632.08 ± 3199.87 0.89 ± 0.25M12 6.42 ± 1.71 88.35 ± 3.50 513.19 ± 139.06 5.98 ± 3.98 7836.65 ± 4293.20 0.94 ± 0.26
Abbreviations: RPE, rating of perceived exertion; s-RPE, session rating of perceived exertion; TM, training monotony; TS, training strain;ACWR, acute: chronic workload ratio; AU, arbitrary units; min, minutes; a, denotes differences with M2; b, denotes differences with M3;c, denotes differences with M4; d, denotes differences with M5; e, denotes differences with M6; f, denotes differences with M7; g, denotesdifferences with M8; h, denotes differences with M9; i, denotes differences with M10; j, denotes differences with M11; k, denotes differenceswith M12; p ≤ 0.05.
TM presents the highest value in M12 and the lowest in M2. The M1 shows significantdifferences with M3 (p = 0.040; g = −1.39 [−2.18, −0.66]). TS presents the highest value inM12 and the lowest in M9. The M1 shows significant differences with M9 (p < 0.01; g = 2.51[1.64, 3.48]). The M3 shows significant differences with M9 (p = 0.023; g = 1.42 [0.68, 2.20]).The M7 shows significant differences with M9 (p = 0.043; g = 1.61 [0.85, 2.42]). The M9shows significant differences with M12 (p = 0.021; g = −1.54 [−2.35, −0.79]).
Finally, ACWR presents the highest value in M10 and the lowest in M9. The M1shows significant differences with M7 (p = 0.036; g = −0.18 [−0.86, 0.49]). The M3 showssignificant differences with M7 (p = 0.044; g = −0.91 [−1.64, −0.22]). The M7 showssignificant differences with M9 (p = 0.004; g = 1.75 [0.98, 2.58]).
Table 3 shows differences between starters and non-starters during the 12 mesocyclesfor all variables. Regarding RPE, training duration, and s-RPE, there were no significantdifferences between starters and non-starters. Match duration differs between starters andnon-starters in M3 (p = 0.008; g = 1.12 [0.12, 2.20]), M4 (p = 0.039; g = 0.08 [−0.86, 1.04]),M6 (p = 0.002; g = 1.37 [0.35, 2.51]), M7 (p = 0.003; g = 1.25 [0.24, 2.36]), M8 (p = 0.005;g = 1.27 [0.26, 2.39]), and M10 (p = 0.002; g = 2.25 [1.08, 3.62]). TM differs between startersand non-starters in M4 (p = 0.027; g = −1.12 [−2.12, −0.12]) and M11 (p = 0.005; g = −2.26[−3.64, −1.09]). TS presents significant differences between starters and non-starters inM4 (p < 0.01; g = −1.83 [−3.08, −0.73]), M10 (p = 0.007; g = 1.44 [0.40, 2.59]), and M11(p = 0.007; g = −1.44 [−2.60, −0.412]). Finally, the ACWR shows significant differencesbetween starters and non-starters in M4 (p = 0.015; g = −1.26 [−2.37, −0.25]) and M5(p = 0.039; g = 1.04 [0.05, 2.11]).

Healthcare 2021, 9, 977 6 of 13
Table 3. Differences between starters and non-starters during the 12 mesocycles, Mean ± SD.
Variables M1 M2 M3 M4 M5 M6 M7 M8 M9 M10 M11 M12
RPE (AU), ST 6.99 ± 0.75 6.59 ± 0.32 5.39 ± 0.19 6.26 ± 0.97 6.58 ± 0.95 6.90 ± 0.35 6.86 ± 0.37 6.77 ± 0.47 3.87 ± 1.27 6.54 ± 0.52 5.86 ± 2.37 6.06 ± 2.33RPE (AU),
NST 7.18 ± 0.31 6.51 ± 0.34 5.41 ± 0.39 6.93 ± 0.39 6.35 ± 1.24 6.92 ± 0.39 6.69 ± 0.48 6.80 ± 0.41 4.17 ± 0.13 5.92 ± 1.31 7.25 ± 0.66 6.82 ± 0.34
TD (min), ST 96.32 ± 2.50 95.81 ± 2.00 92.20 ± 1.30 86.00 ± 6.15 86.50 ± 4.05 88.12 ± 1.45 88.45 ± 1.50 85.45 ± 1.55 82.30 ± 16.10 87.22 ± 2.45 69.55 ± 26.34 75.00 ± 28.14TD (min), NST 95.00 ± 3.10 95.55 ± 2.45 92.55 ± 4.50 90.10 ± 2.20 90.15 ± 2.55 87.40 ± 2.05 90.15 ± 1.57 87.30 ± 1.40 83.48 ± 7.35 89.51 ± 2.58 81.45 ± 2.55 85.37 ± 2.50
MD (min), ST 69.00 ± 6.05 67.55 ± 17.25 72.55 ± 6.58 66.51 ± 15.03 68.33 ± 9.58 74.22 ± 10.26 72.00 ± 6.37 68.55 ± 8.20 67.58 ± 28.00 74.00 ± 7.10 0.00 ± 0.00 61.44 ± 25.59MD (min),
NST 64.00 ± 9.44 33.38 ± 27.56 54.50 ± 20.00 64.50 ± 6.55 54.5 ± 15.00 37.37 ± 33.41 50.00 ± 22.05 38.00 ± 30.17 28.55 ± 33.00 24.00 ± 28.00 0.00 ± 0.00 47.00 ± 33.44
s-RPE (AU), ST 638.94 ± 68.21 591.94 ± 31.98 594.28 ± 34.46 515.36 ± 114.48 550.48 ± 86.80 589.01 ± 41.70 586.04 ± 38.38 551.91 ± 52.32 317.53 ± 120.09 559.15 ± 53.14 441.26 ± 181.34 483.42 ± 188.39s-RPE (AU),
NST 642.52 ± 44.88 598.18 ± 31.97 593.39 ± 67.08 600.26 ± 24.87 529.33 ± 104.90 586.95 ± 31.30 569.09 ± 54.57 565.33 ± 39.10 351.74 ± 12.16 516.30 ± 108.73 572.68 ± 57.05 546.69 ± 34.90
TM (AU), ST 3.44 ± 0.51 3.28 ± 0.99 4.59 ± 0.94 3.27 ± 1.16 4.39 ± 0.93 4.48 ± 1.21 5.13 ± 1.85 4.46 ± 1.82 3.55 ± 1.64 4.50 ± 1.49 2.94 ± 1.22 7.04 ± 5.22TM (AU), NST 3.25 ± 0.42 3.06 ± 0.19 5.93 ± 2.29 4.75 ± 1.35 3.95 ± 1.74 4.24 ± 1.40 4.42 ± 1.04 4.16 ± 1.42 3.35 ± 0.81 4.03 ± 1.51 6.26 ± 2.71 4.78 ± 1.45
TS (AU), ST 6443.53 ± 1026.87 5172.80 ± 2266.35 4860.10 ± 1496.07 3396.85 ± 1542.00 4369.03 ± 1142.45 5054.42 ± 1641.17 6612.66 ± 3311.01 4913.58 ± 1788.51 2936.06 ± 2049.18 8142.53 ± 4144.94 2787.64 ± 1481.85 9205.20 ± 5405.25TS (AU), NST 5784.05 ± 1034.05 4375.83 ± 624.07 7128.07 ± 3310.12 7085.29 ± 2262.19 5312.79 ± 3330.78 4747.26 ± 1875.31 6067.20 ± 1999.47 4637.84 ± 3106.09 2504.66 ± 750.29 3237.18 ± 1630.65 6707.08 ± 3405.82 6297.03 ± 1903.08
ACWR (AU), ST 0.95 ± 0.06 0.98 ± 0.07 0.97 ± 0.03 0.91 ± 0.08 1.07 ± 0.07 0.97 ± 0.08 1.04 ± 0.05 0.97 ± 0.11 0.81 ± 0.20 1.23 ± 0.39 0.81 ± 0.32 0.92 ± 0.36ACWR (AU), NST 0.95 ± 0.09 0.96 ± 0.12 0.95 ± 0.09 1.04 ± 0.10 0.96 ± 0.12 0.99 ± 0.09 1.06 ± 0.06 1.00 ± 0.06 0.89 ± 0.06 1.05 ± 0.08 0.98 ± 0.12 0.97 ± 0.06
Significant differences (p ≤ 0.05) between starters and non-starters are highlighted in bold. Abbreviations: M, mesocycle; RPE, rating of perceived exertion; TD, training duration; MD, match duration; s-RPE,session rating of perceived exertion; TM, training monotony; TS, training strain; ACWR, acute: chronic workload ratio; AU, arbitrary units; ST, Starters; NST, Non-Starters; min, minutes.
Healthcare 2021, 9, 977 7 of 13
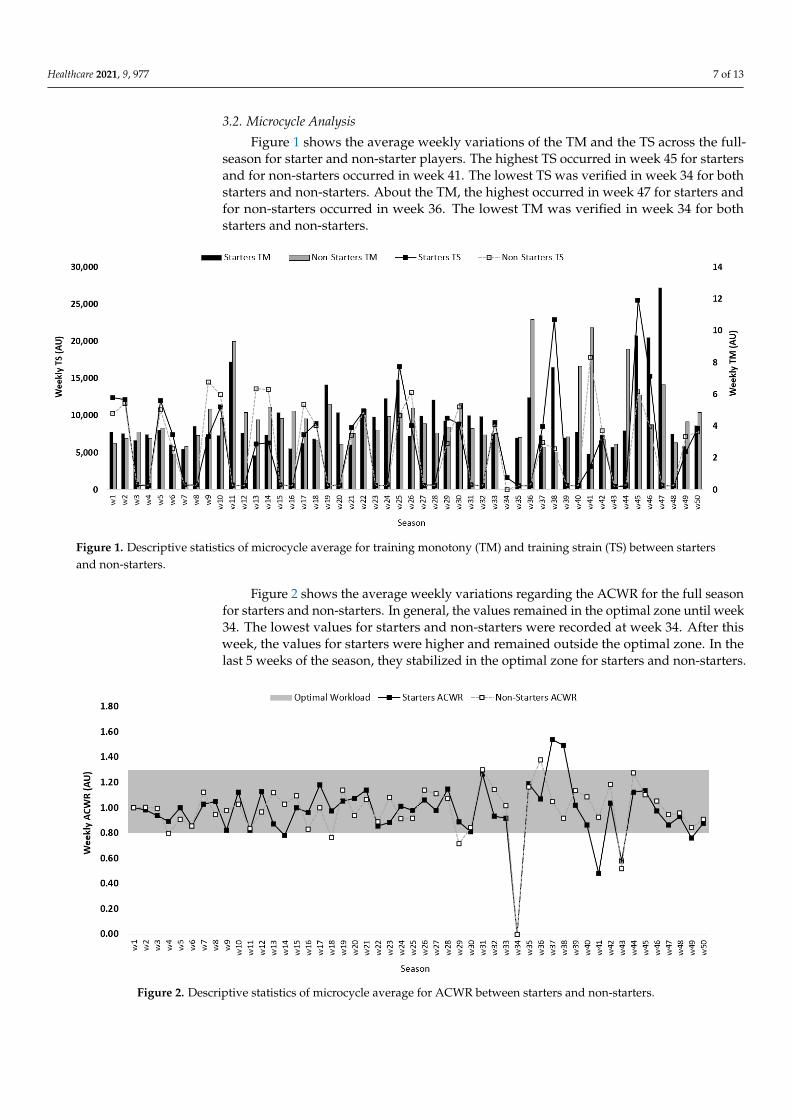
3.2. Microcycle Analysis
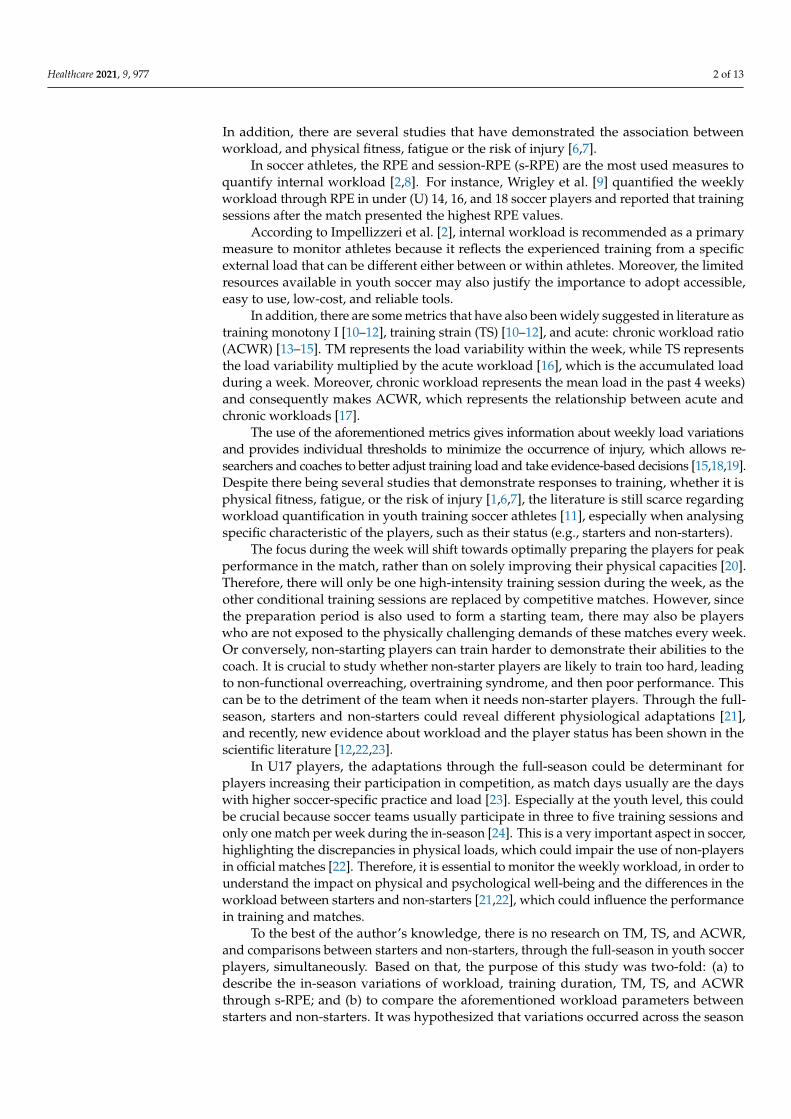
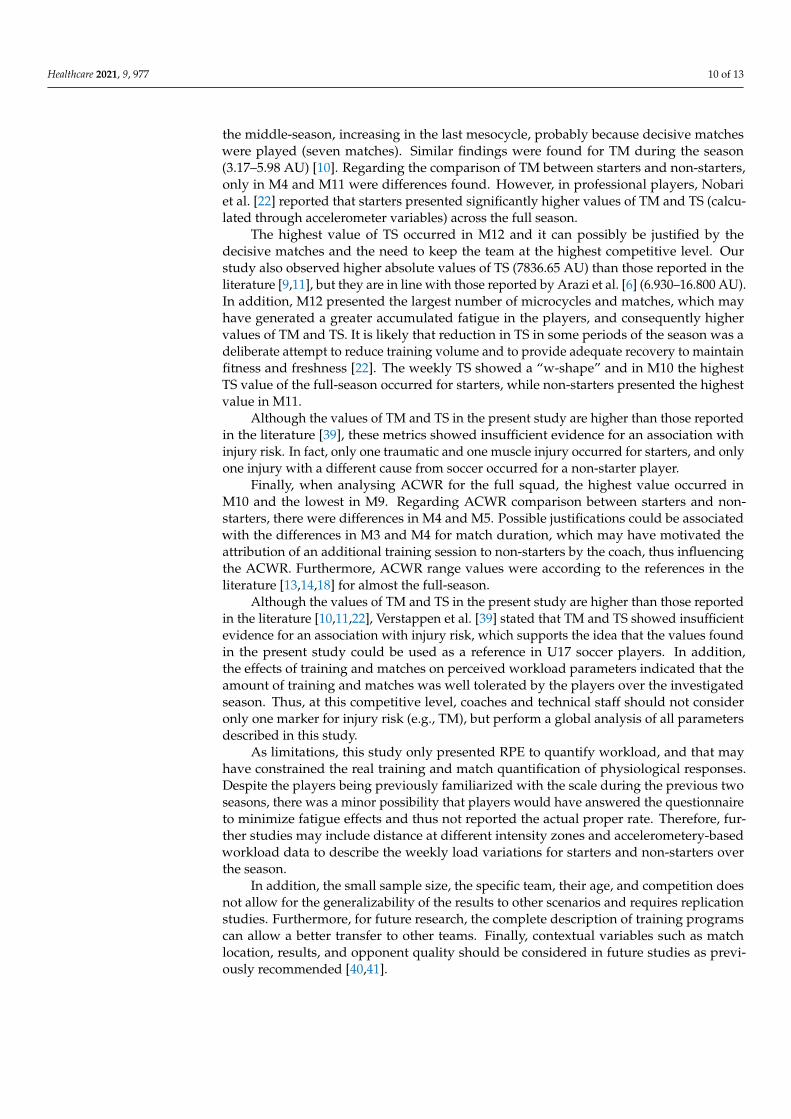
Figure 1 shows the average weekly variations of the TM and the TS across the full-season for starter and non-starter players. The highest TS occurred in week 45 for startersand for non-starters occurred in week 41. The lowest TS was verified in week 34 for bothstarters and non-starters. About the TM, the highest occurred in week 47 for starters andfor non-starters occurred in week 36. The lowest TM was verified in week 34 for bothstarters and non-starters.
Healthcare 2021, 9, 977 8 of 14
3.2. Microcycle Analysis Figure 1 shows the average weekly variations of the TM and the TS across the full-
season for starter and non-starter players. The highest TS occurred in week 45 for starters and for non-starters occurred in week 41. The lowest TS was verified in week 34 for both starters and non-starters. About the TM, the highest occurred in week 47 for starters and for non-starters occurred in week 36. The lowest TM was verified in week 34 for both starters and non-starters.
Figure 1. Descriptive statistics of microcycle average for training monotony (TM) and training strain (TS) between starters and non-starters.
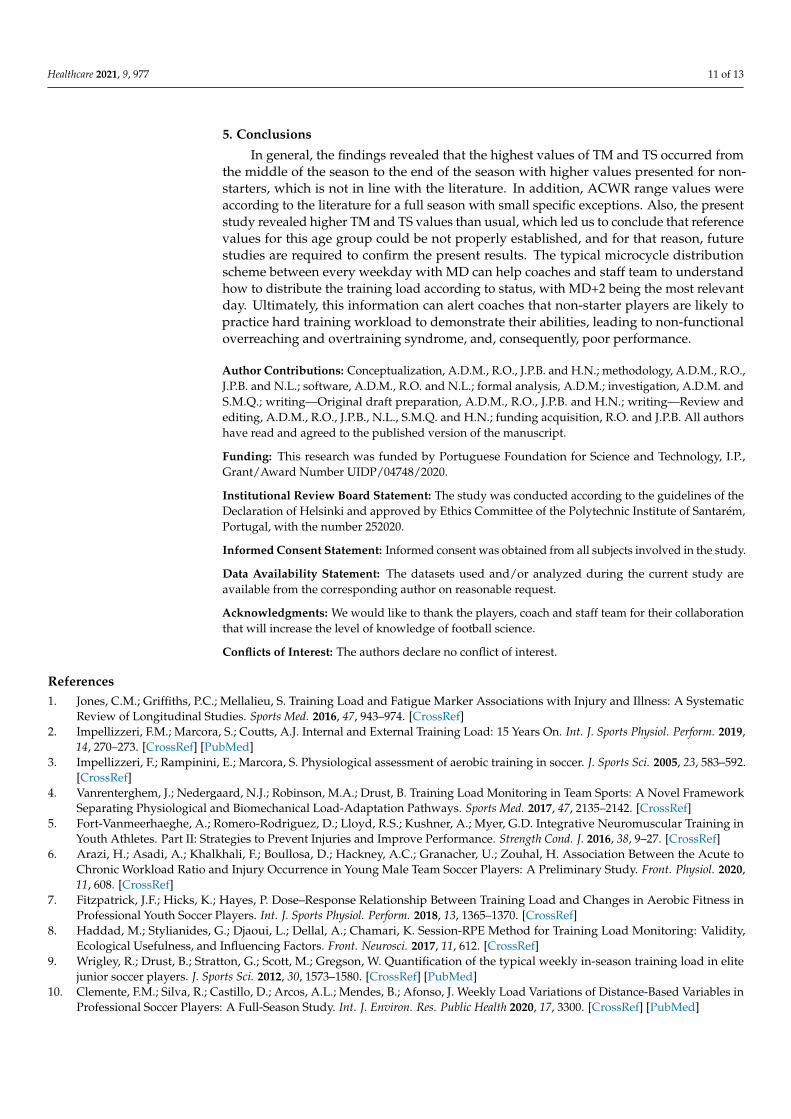
Figure 2 shows the average weekly variations regarding the ACWR for the full sea-son for starters and non-starters. In general, the values remained in the optimal zone until week 34. The lowest values for starters and non-starters were recorded at week 34. After this week, the values for starters were higher and remained outside the optimal zone. In the last 5 weeks of the season, they stabilized in the optimal zone for starters and non-starters.
Figure 1. Descriptive statistics of microcycle average for training monotony (TM) and training strain (TS) between startersand non-starters.
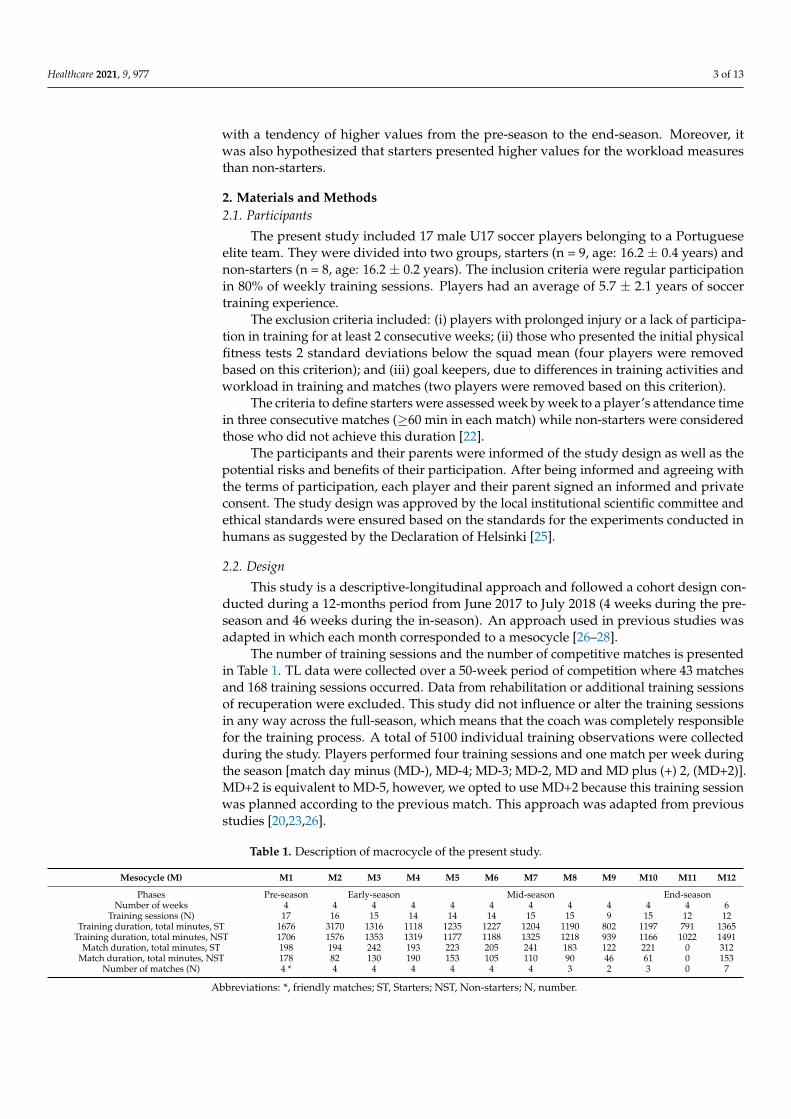
Figure 2 shows the average weekly variations regarding the ACWR for the full seasonfor starters and non-starters. In general, the values remained in the optimal zone until week34. The lowest values for starters and non-starters were recorded at week 34. After thisweek, the values for starters were higher and remained outside the optimal zone. In thelast 5 weeks of the season, they stabilized in the optimal zone for starters and non-starters.
Healthcare 2021, 9, 977 8 of 14
3.2. Microcycle Analysis Figure 1 shows the average weekly variations of the TM and the TS across the full-
season for starter and non-starter players. The highest TS occurred in week 45 for starters and for non-starters occurred in week 41. The lowest TS was verified in week 34 for both starters and non-starters. About the TM, the highest occurred in week 47 for starters and for non-starters occurred in week 36. The lowest TM was verified in week 34 for both starters and non-starters.
Figure 1. Descriptive statistics of microcycle average for training monotony (TM) and training strain (TS) between starters and non-starters.
Figure 2 shows the average weekly variations regarding the ACWR for the full sea-son for starters and non-starters. In general, the values remained in the optimal zone until week 34. The lowest values for starters and non-starters were recorded at week 34. After this week, the values for starters were higher and remained outside the optimal zone. In the last 5 weeks of the season, they stabilized in the optimal zone for starters and non-starters.
Figure 2. Descriptive statistics of microcycle average for ACWR between starters and non-starters.
Healthcare 2021, 9, 977 8 of 13
3.3. Match-Day-Minus Analyses
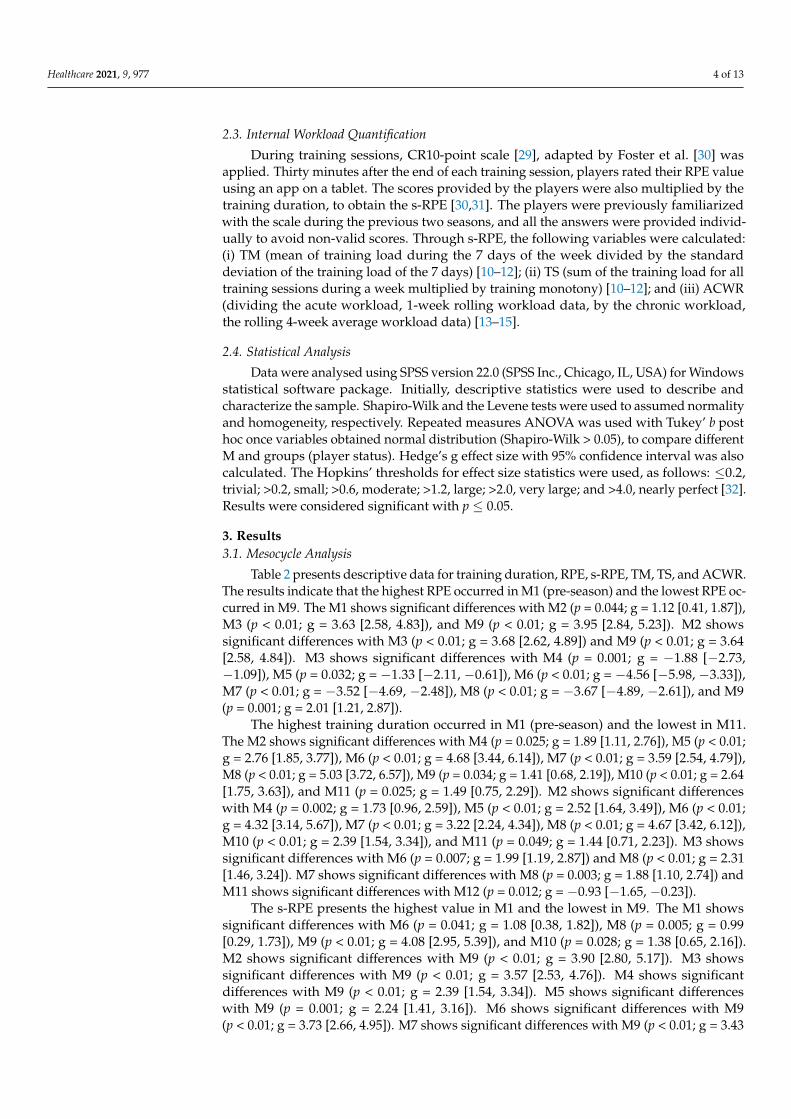
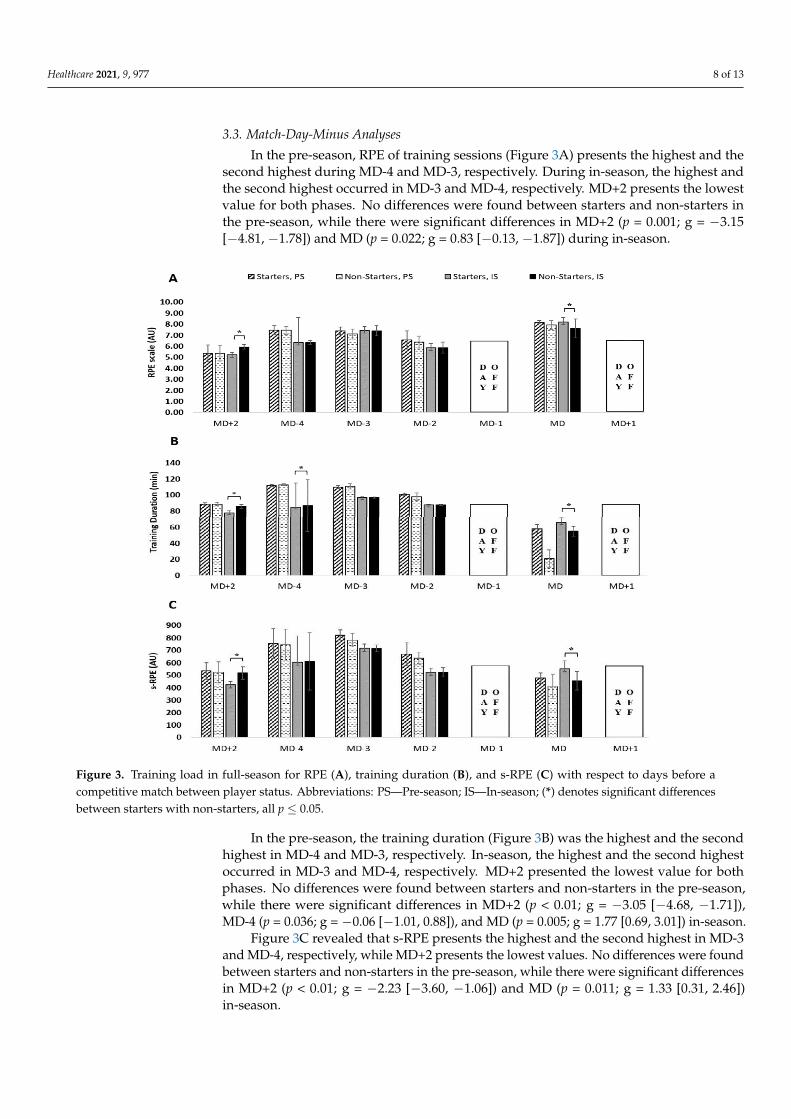
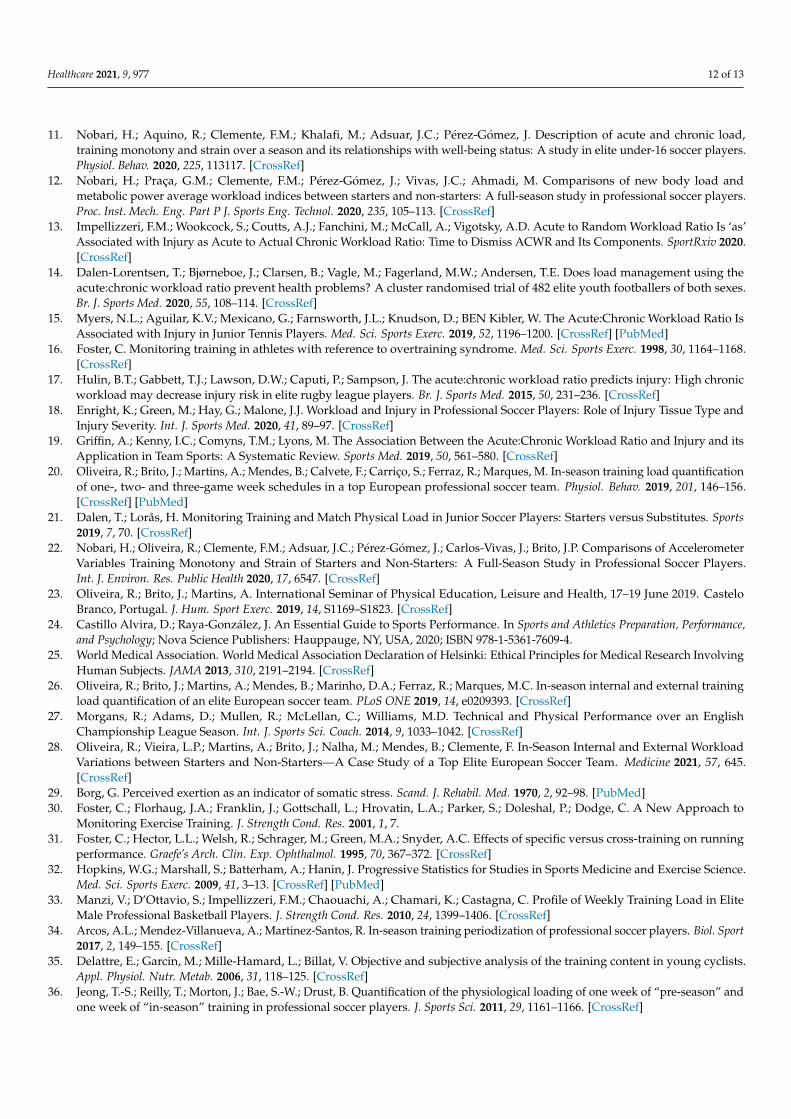
In the pre-season, RPE of training sessions (Figure 3A) presents the highest and thesecond highest during MD-4 and MD-3, respectively. During in-season, the highest andthe second highest occurred in MD-3 and MD-4, respectively. MD+2 presents the lowestvalue for both phases. No differences were found between starters and non-starters inthe pre-season, while there were significant differences in MD+2 (p = 0.001; g = −3.15[−4.81, −1.78]) and MD (p = 0.022; g = 0.83 [−0.13, −1.87]) during in-season.
Healthcare 2021, 9, 977 9 of 14
Figure 2. Descriptive statistics of microcycle average for ACWR between starters and non-starters.
3.3. Match-Day-Minus AnalysesIn the pre-season, RPE of training sessions (Figure 3A) presents the highest and the
second highest during MD-4 and MD-3, respectively. During in-season, the highest and the second highest occurred in MD-3 and MD-4, respectively. MD+2 presents the lowestvalue for both phases. No differences were found between starters and non-starters in the pre-season, while there were significant differences in MD+2 (p = 0.001; g = −3.15 [−4.81, −1.78]) and MD (p = 0.022; g = 0.83 [−0.13, −1.87]) during in-season.
In the pre-season, the training duration (Figure 3B) was the highest and the secondhighest in MD-4 and MD-3, respectively. In-season, the highest and the second highest occurred in MD-3 and MD-4, respectively. MD+2 presented the lowest value for bothphases. No differences were found between starters and non-starters in the pre-season,while there were significant differences in MD+2 (p < 0.01; g = −3.05 [−4.68, −1.71]), MD-4 (p = 0.036; g = −0.06 [−1.01, 0.88]), and MD (p = 0.005; g = 1.77 [0.69, 3.01]) in-season.
Figure 3C revealed that s-RPE presents the highest and the second highest in MD-3 and MD-4, respectively, while MD+2 presents the lowest values. No differences were found between starters and non-starters in the pre-season, while there were significant differences in MD+2 (p < 0.01; g = −2.23 [−3.60, −1.06]) and MD (p = 0.011; g = 1.33 [0.31, 2.46]) in-season.
Figure 3. Training load in full-season for RPE (A), training duration (B), and s-RPE (C) with respect to days before a competitive match between player status. Abbreviations: PS—Pre-season; IS—In-season; (*) denotes significant differences between starters with non-starters, all p ≤ 0.05.
Figure 3. Training load in full-season for RPE (A), training duration (B), and s-RPE (C) with respect to days before acompetitive match between player status. Abbreviations: PS—Pre-season; IS—In-season; (*) denotes significant differencesbetween starters with non-starters, all p ≤ 0.05.
In the pre-season, the training duration (Figure 3B) was the highest and the secondhighest in MD-4 and MD-3, respectively. In-season, the highest and the second highestoccurred in MD-3 and MD-4, respectively. MD+2 presented the lowest value for bothphases. No differences were found between starters and non-starters in the pre-season,while there were significant differences in MD+2 (p < 0.01; g = −3.05 [−4.68, −1.71]),MD-4 (p = 0.036; g = −0.06 [−1.01, 0.88]), and MD (p = 0.005; g = 1.77 [0.69, 3.01]) in-season.
Figure 3C revealed that s-RPE presents the highest and the second highest in MD-3and MD-4, respectively, while MD+2 presents the lowest values. No differences were foundbetween starters and non-starters in the pre-season, while there were significant differencesin MD+2 (p < 0.01; g = −2.23 [−3.60, −1.06]) and MD (p = 0.011; g = 1.33 [0.31, 2.46])in-season.
Healthcare 2021, 9, 977 9 of 13
4. Discussion
The purposes of the present study were: (a) to characterize the pre-season and in-season workload variation; and (b) to compare the full-season between starters and non-starters of European U17 soccer players. The major finding revealed a meaningful variationin the workload indices for the squad average. The results indicated that RPE tendedto decrease and flatten in-season, where in M3 and M9 the lowest values were found.While M9 is easily explained by the lowest volume in training, M3 is possibly explained bya greater focus of the coach in the tactical preparation of the squad. However, the athleticperformance improvement is an adaptive process that requires manipulation of the work-load imposed on the players; the lower intensity applied in that mesocycle may explain thelower RPE values [33].
Regarding RPE, higher values were found for the full-squad during the pre-season(M1) when compared to other mesocycles, which is in line with several authors [10,11,34].During this period, a higher workload was achieved to prepare players for the competitivephase. However, most mesocycles have similar RPE values, which cause a tendency toflatten out differences in RPE. Nevertheless, it seems that varying short term workloadaccording to the different developmental ages benefits players’ physical performances [35].In the present study, the variations that occurred in the microcycles did not have an ex-pression in the total workload of the mesocycle, justifying the reduced variations observed.For instance, Wrigley et al. [9] presented higher RPE values during training sessions thanin matches for U14, 16, and 18, and eventually, these variations may have occurred andcontributed to the results recorded in the microcycles and mesocycles of the present study.The comparison of RPE between starters and non-starters showed significant differences inMD+2 and MD (Figure 3A). This result is in line with a previous study [36]. In fact, MD+2is very important for the recovery of the team (namely, the players who were starters) andto prepare players for the next training sessions with higher-intensity (MD-4 and MD-3).
Regarding training duration for the entire-squad, it was higher than the values re-ported by some authors in elite professional teams [1,22] and in elite U17–19 soccer play-ers [9,21], however, it is similar to the values reported by Brink et al. [37] in elite U19soccer players. Moreover, as reported by Coutinho et al. [38], the lower training frequenciesin the youngest groups were balanced by a higher training stimulus. However, as thefocus moved towards the competition rather than the player development, there was aprogressive decrement of the individual responses to training as the competition congestionfixture approached [2].
Concerning s-RPE, there were no differences between the starters and non-startersin the pre-season phase (M1). The 6 friendly matches and the 17 training sessions thatoccurred in M1 may have imposed a greater physical demand on players, allowing asimilar workload for all squad players. Also, in M2 and M3 there were no differencesbetween the starters and non-starters for all variables, which can perhaps be explained bya higher turnover of players, since the main 11 starters were not yet well defined in thatperiod of the season. The highest value of s-RPE was presented in M1 and the lowest waspresented in M9, which is similar to another study [37]. Furthermore, the highest trainingduration and s-RPE occurred in M1 for both starters and non-starters, and they were inline with some studies [10,22,34], which means that the exercise training program focusedon improving physical conditions through a higher training load during the pre-season.In match-day-minus analyses, regarding s-RPE, it was possible to identify significantdifferences in MD+2 and MD (Figure 3C). The explanation for this difference was the factthat the coach and his technical team planned the MD+2 with two distinct concerns: theconcern for starters was to decrease muscle soreness and mental fatigue, and to restore thehormonal balance, while the concern for non-starters was to increase the physical, tactical,and technical levels.
Regarding TM, the highest value for the full squad was observed in M3 and M12.A previous study [11] reported that weekly TM showed reduced variation over the season(e.g., weekly changes: −8.8–7.5%). In the present study, TM seemed to stabilize during
Healthcare 2021, 9, 977 10 of 13
the middle-season, increasing in the last mesocycle, probably because decisive matcheswere played (seven matches). Similar findings were found for TM during the season(3.17–5.98 AU) [10]. Regarding the comparison of TM between starters and non-starters,only in M4 and M11 were differences found. However, in professional players, Nobariet al. [22] reported that starters presented significantly higher values of TM and TS (calcu-lated through accelerometer variables) across the full season.
The highest value of TS occurred in M12 and it can possibly be justified by thedecisive matches and the need to keep the team at the highest competitive level. Ourstudy also observed higher absolute values of TS (7836.65 AU) than those reported in theliterature [9,11], but they are in line with those reported by Arazi et al. [6] (6.930–16.800 AU).In addition, M12 presented the largest number of microcycles and matches, which mayhave generated a greater accumulated fatigue in the players, and consequently highervalues of TM and TS. It is likely that reduction in TS in some periods of the season was adeliberate attempt to reduce training volume and to provide adequate recovery to maintainfitness and freshness [22]. The weekly TS showed a “w-shape” and in M10 the highestTS value of the full-season occurred for starters, while non-starters presented the highestvalue in M11.
Although the values of TM and TS in the present study are higher than those reportedin the literature [39], these metrics showed insufficient evidence for an association withinjury risk. In fact, only one traumatic and one muscle injury occurred for starters, and onlyone injury with a different cause from soccer occurred for a non-starter player.
Finally, when analysing ACWR for the full squad, the highest value occurred inM10 and the lowest in M9. Regarding ACWR comparison between starters and non-starters, there were differences in M4 and M5. Possible justifications could be associatedwith the differences in M3 and M4 for match duration, which may have motivated theattribution of an additional training session to non-starters by the coach, thus influencingthe ACWR. Furthermore, ACWR range values were according to the references in theliterature [13,14,18] for almost the full-season.
Although the values of TM and TS in the present study are higher than those reportedin the literature [10,11,22], Verstappen et al. [39] stated that TM and TS showed insufficientevidence for an association with injury risk, which supports the idea that the values foundin the present study could be used as a reference in U17 soccer players. In addition,the effects of training and matches on perceived workload parameters indicated that theamount of training and matches was well tolerated by the players over the investigatedseason. Thus, at this competitive level, coaches and technical staff should not consideronly one marker for injury risk (e.g., TM), but perform a global analysis of all parametersdescribed in this study.
As limitations, this study only presented RPE to quantify workload, and that mayhave constrained the real training and match quantification of physiological responses.Despite the players being previously familiarized with the scale during the previous twoseasons, there was a minor possibility that players would have answered the questionnaireto minimize fatigue effects and thus not reported the actual proper rate. Therefore, fur-ther studies may include distance at different intensity zones and accelerometery-basedworkload data to describe the weekly load variations for starters and non-starters overthe season.
In addition, the small sample size, the specific team, their age, and competition doesnot allow for the generalizability of the results to other scenarios and requires replicationstudies. Furthermore, for future research, the complete description of training programscan allow a better transfer to other teams. Finally, contextual variables such as matchlocation, results, and opponent quality should be considered in future studies as previ-ously recommended [40,41].
Healthcare 2021, 9, 977 11 of 13
5. Conclusions
In general, the findings revealed that the highest values of TM and TS occurred fromthe middle of the season to the end of the season with higher values presented for non-starters, which is not in line with the literature. In addition, ACWR range values wereaccording to the literature for a full season with small specific exceptions. Also, the presentstudy revealed higher TM and TS values than usual, which led us to conclude that referencevalues for this age group could be not properly established, and for that reason, futurestudies are required to confirm the present results. The typical microcycle distributionscheme between every weekday with MD can help coaches and staff team to understandhow to distribute the training load according to status, with MD+2 being the most relevantday. Ultimately, this information can alert coaches that non-starter players are likely topractice hard training workload to demonstrate their abilities, leading to non-functionaloverreaching and overtraining syndrome, and, consequently, poor performance.
Author Contributions: Conceptualization, A.D.M., R.O., J.P.B. and H.N.; methodology, A.D.M., R.O.,J.P.B. and N.L.; software, A.D.M., R.O. and N.L.; formal analysis, A.D.M.; investigation, A.D.M. andS.M.Q.; writing—Original draft preparation, A.D.M., R.O., J.P.B. and H.N.; writing—Review andediting, A.D.M., R.O., J.P.B., N.L., S.M.Q. and H.N.; funding acquisition, R.O. and J.P.B. All authorshave read and agreed to the published version of the manuscript.
Funding: This research was funded by Portuguese Foundation for Science and Technology, I.P.,Grant/Award Number UIDP/04748/2020.
Institutional Review Board Statement: The study was conducted according to the guidelines of theDeclaration of Helsinki and approved by Ethics Committee of the Polytechnic Institute of Santarém,Portugal, with the number 252020.
Informed Consent Statement: Informed consent was obtained from all subjects involved in the study.
Data Availability Statement: The datasets used and/or analyzed during the current study areavailable from the corresponding author on reasonable request.
Acknowledgments: We would like to thank the players, coach and staff team for their collaborationthat will increase the level of knowledge of football science.
Conflicts of Interest: The authors declare no conflict of interest.
References1. Jones, C.M.; Griffiths, P.C.; Mellalieu, S. Training Load and Fatigue Marker Associations with Injury and Illness: A Systematic
Review of Longitudinal Studies. Sports Med. 2016, 47, 943–974. [CrossRef]2. Impellizzeri, F.M.; Marcora, S.; Coutts, A.J. Internal and External Training Load: 15 Years On. Int. J. Sports Physiol. Perform. 2019,
14, 270–273. [CrossRef] [PubMed]3. Impellizzeri, F.; Rampinini, E.; Marcora, S. Physiological assessment of aerobic training in soccer. J. Sports Sci. 2005, 23, 583–592.
[CrossRef]4. Vanrenterghem, J.; Nedergaard, N.J.; Robinson, M.A.; Drust, B. Training Load Monitoring in Team Sports: A Novel Framework
Separating Physiological and Biomechanical Load-Adaptation Pathways. Sports Med. 2017, 47, 2135–2142. [CrossRef]5. Fort-Vanmeerhaeghe, A.; Romero-Rodriguez, D.; Lloyd, R.S.; Kushner, A.; Myer, G.D. Integrative Neuromuscular Training in
Youth Athletes. Part II: Strategies to Prevent Injuries and Improve Performance. Strength Cond. J. 2016, 38, 9–27. [CrossRef]6. Arazi, H.; Asadi, A.; Khalkhali, F.; Boullosa, D.; Hackney, A.C.; Granacher, U.; Zouhal, H. Association Between the Acute to
Chronic Workload Ratio and Injury Occurrence in Young Male Team Soccer Players: A Preliminary Study. Front. Physiol. 2020,11, 608. [CrossRef]
7. Fitzpatrick, J.F.; Hicks, K.; Hayes, P. Dose–Response Relationship Between Training Load and Changes in Aerobic Fitness inProfessional Youth Soccer Players. Int. J. Sports Physiol. Perform. 2018, 13, 1365–1370. [CrossRef]
8. Haddad, M.; Stylianides, G.; Djaoui, L.; Dellal, A.; Chamari, K. Session-RPE Method for Training Load Monitoring: Validity,Ecological Usefulness, and Influencing Factors. Front. Neurosci. 2017, 11, 612. [CrossRef]
9. Wrigley, R.; Drust, B.; Stratton, G.; Scott, M.; Gregson, W. Quantification of the typical weekly in-season training load in elitejunior soccer players. J. Sports Sci. 2012, 30, 1573–1580. [CrossRef] [PubMed]
10. Clemente, F.M.; Silva, R.; Castillo, D.; Arcos, A.L.; Mendes, B.; Afonso, J. Weekly Load Variations of Distance-Based Variables inProfessional Soccer Players: A Full-Season Study. Int. J. Environ. Res. Public Health 2020, 17, 3300. [CrossRef] [PubMed]
Healthcare 2021, 9, 977 12 of 13
11. Nobari, H.; Aquino, R.; Clemente, F.M.; Khalafi, M.; Adsuar, J.C.; Pérez-Gómez, J. Description of acute and chronic load,training monotony and strain over a season and its relationships with well-being status: A study in elite under-16 soccer players.Physiol. Behav. 2020, 225, 113117. [CrossRef]
12. Nobari, H.; Praça, G.M.; Clemente, F.M.; Pérez-Gómez, J.; Vivas, J.C.; Ahmadi, M. Comparisons of new body load andmetabolic power average workload indices between starters and non-starters: A full-season study in professional soccer players.Proc. Inst. Mech. Eng. Part P J. Sports Eng. Technol. 2020, 235, 105–113. [CrossRef]
13. Impellizzeri, F.M.; Wookcock, S.; Coutts, A.J.; Fanchini, M.; McCall, A.; Vigotsky, A.D. Acute to Random Workload Ratio Is ‘as’Associated with Injury as Acute to Actual Chronic Workload Ratio: Time to Dismiss ACWR and Its Components. SportRxiv 2020.[CrossRef]
14. Dalen-Lorentsen, T.; Bjørneboe, J.; Clarsen, B.; Vagle, M.; Fagerland, M.W.; Andersen, T.E. Does load management using theacute:chronic workload ratio prevent health problems? A cluster randomised trial of 482 elite youth footballers of both sexes.Br. J. Sports Med. 2020, 55, 108–114. [CrossRef]
15. Myers, N.L.; Aguilar, K.V.; Mexicano, G.; Farnsworth, J.L.; Knudson, D.; BEN Kibler, W. The Acute:Chronic Workload Ratio IsAssociated with Injury in Junior Tennis Players. Med. Sci. Sports Exerc. 2019, 52, 1196–1200. [CrossRef] [PubMed]
16. Foster, C. Monitoring training in athletes with reference to overtraining syndrome. Med. Sci. Sports Exerc. 1998, 30, 1164–1168.[CrossRef]
17. Hulin, B.T.; Gabbett, T.J.; Lawson, D.W.; Caputi, P.; Sampson, J. The acute:chronic workload ratio predicts injury: High chronicworkload may decrease injury risk in elite rugby league players. Br. J. Sports Med. 2015, 50, 231–236. [CrossRef]
18. Enright, K.; Green, M.; Hay, G.; Malone, J.J. Workload and Injury in Professional Soccer Players: Role of Injury Tissue Type andInjury Severity. Int. J. Sports Med. 2020, 41, 89–97. [CrossRef]
19. Griffin, A.; Kenny, I.C.; Comyns, T.M.; Lyons, M. The Association Between the Acute:Chronic Workload Ratio and Injury and itsApplication in Team Sports: A Systematic Review. Sports Med. 2019, 50, 561–580. [CrossRef]
20. Oliveira, R.; Brito, J.; Martins, A.; Mendes, B.; Calvete, F.; Carriço, S.; Ferraz, R.; Marques, M. In-season training load quantificationof one-, two- and three-game week schedules in a top European professional soccer team. Physiol. Behav. 2019, 201, 146–156.[CrossRef] [PubMed]
21. Dalen, T.; Lorås, H. Monitoring Training and Match Physical Load in Junior Soccer Players: Starters versus Substitutes. Sports2019, 7, 70. [CrossRef]
22. Nobari, H.; Oliveira, R.; Clemente, F.M.; Adsuar, J.C.; Pérez-Gómez, J.; Carlos-Vivas, J.; Brito, J.P. Comparisons of AccelerometerVariables Training Monotony and Strain of Starters and Non-Starters: A Full-Season Study in Professional Soccer Players.Int. J. Environ. Res. Public Health 2020, 17, 6547. [CrossRef]
23. Oliveira, R.; Brito, J.; Martins, A. International Seminar of Physical Education, Leisure and Health, 17–19 June 2019. CasteloBranco, Portugal. J. Hum. Sport Exerc. 2019, 14, S1169–S1823. [CrossRef]
24. Castillo Alvira, D.; Raya-González, J. An Essential Guide to Sports Performance. In Sports and Athletics Preparation, Performance,and Psychology; Nova Science Publishers: Hauppauge, NY, USA, 2020; ISBN 978-1-5361-7609-4.
25. World Medical Association. World Medical Association Declaration of Helsinki: Ethical Principles for Medical Research InvolvingHuman Subjects. JAMA 2013, 310, 2191–2194. [CrossRef]
26. Oliveira, R.; Brito, J.; Martins, A.; Mendes, B.; Marinho, D.A.; Ferraz, R.; Marques, M.C. In-season internal and external trainingload quantification of an elite European soccer team. PLoS ONE 2019, 14, e0209393. [CrossRef]
27. Morgans, R.; Adams, D.; Mullen, R.; McLellan, C.; Williams, M.D. Technical and Physical Performance over an EnglishChampionship League Season. Int. J. Sports Sci. Coach. 2014, 9, 1033–1042. [CrossRef]
28. Oliveira, R.; Vieira, L.P.; Martins, A.; Brito, J.; Nalha, M.; Mendes, B.; Clemente, F. In-Season Internal and External WorkloadVariations between Starters and Non-Starters—A Case Study of a Top Elite European Soccer Team. Medicine 2021, 57, 645.[CrossRef]
29. Borg, G. Perceived exertion as an indicator of somatic stress. Scand. J. Rehabil. Med. 1970, 2, 92–98. [PubMed]30. Foster, C.; Florhaug, J.A.; Franklin, J.; Gottschall, L.; Hrovatin, L.A.; Parker, S.; Doleshal, P.; Dodge, C. A New Approach to
Monitoring Exercise Training. J. Strength Cond. Res. 2001, 1, 7.31. Foster, C.; Hector, L.L.; Welsh, R.; Schrager, M.; Green, M.A.; Snyder, A.C. Effects of specific versus cross-training on running
performance. Graefe’s Arch. Clin. Exp. Ophthalmol. 1995, 70, 367–372. [CrossRef]32. Hopkins, W.G.; Marshall, S.; Batterham, A.; Hanin, J. Progressive Statistics for Studies in Sports Medicine and Exercise Science.
Med. Sci. Sports Exerc. 2009, 41, 3–13. [CrossRef] [PubMed]33. Manzi, V.; D’Ottavio, S.; Impellizzeri, F.M.; Chaouachi, A.; Chamari, K.; Castagna, C. Profile of Weekly Training Load in Elite
Male Professional Basketball Players. J. Strength Cond. Res. 2010, 24, 1399–1406. [CrossRef]34. Arcos, A.L.; Mendez-Villanueva, A.; Martinez-Santos, R. In-season training periodization of professional soccer players. Biol. Sport
2017, 2, 149–155. [CrossRef]35. Delattre, E.; Garcin, M.; Mille-Hamard, L.; Billat, V. Objective and subjective analysis of the training content in young cyclists.
Appl. Physiol. Nutr. Metab. 2006, 31, 118–125. [CrossRef]36. Jeong, T.-S.; Reilly, T.; Morton, J.; Bae, S.-W.; Drust, B. Quantification of the physiological loading of one week of “pre-season” and
one week of “in-season” training in professional soccer players. J. Sports Sci. 2011, 29, 1161–1166. [CrossRef]
Healthcare 2021, 9, 977 13 of 13
37. Brink, M.S.; Nederhof, E.; Visscher, C.; Schmikli, S.L.; Lemmink, K.A.P.M. Monitoring Load, Recovery, and Performance in YoungElite Soccer Players. J. Strength Cond. Res. 2010, 24, 597–603. [CrossRef]
38. Coutinho, D.; Gonçalves, B.; Figueira, B.; Abade, E.A.D.A.; Marcelino, R.; Sampaio, J. Typical weekly workload of under 15,under 17, and under 19 elite Portuguese football players. J. Sports Sci. 2015, 33, 1229–1237. [CrossRef]
39. Verstappen, S.; van Rijn, R.M.; Cost, R.; Stubbe, J.H. The Association Between Training Load and Injury Risk in Elite Youth SoccerPlayers: A Systematic Review and Best Evidence Synthesis. Sports Med. Open 2021, 7, 1–14. [CrossRef]
40. Oliveira, R.; Brito, J.P.; Loureiro, N.; Padinha, V.; Ferreira, B.; Mendes, B. Does the distribution of the weekly training load accountfor the match results of elite professional soccer players? Physiol. Behav. 2020, 225, 113118. [CrossRef] [PubMed]
41. Oliveira, R.; Brito, J.; Loureiro, N.; Padinha, V.; Nobari, H.; Mendes, B. Will Next Match Location Influence External and InternalTraining Load of a Top-Class Elite Professional European Soccer Team? Int. J. Environ. Res. Public Health 2021, 18, 5229. [CrossRef]