interphase cell cycle dynamics of a late-replicating, heterochromatic homogeneously staining region:...
TRANSCRIPT
The Rockefeller University Press, 0021-9525/98/03/975/15 $2.00The Journal of Cell Biology, Volume 140, Number 5, March 9, 1998 975–989http://www.jcb.org 975
Interphase Cell Cycle Dynamics of a Late-Replicating,Heterochromatic Homogeneously Staining Region: Precise Choreography of Condensation/Decondensation and Nuclear Positioning
Gang Li, Gail Sudlow, and Andrew S. Belmont
Department of Cell and Structural Biology, University of Illinois, Urbana-Champaign, Urbana, Illinois 61801
Abstract.
Recently we described a new method for in situ localization of specific DNA sequences, based on lac operator/repressor recognition (Robinett, C.C., A. Straight, G. Li, C. Willhelm, G. Sudlow, A. Murray, and A.S. Belmont. 1996.
J. Cell Biol.
135:1685–1700). We have applied this methodology to visualize the cell
cycle dynamics of an
z
90 Mbp, late-replicating, hetero-chromatic homogeneously staining region (HSR) in CHO cells, combining immunostaining with direct in vivo observations. Between anaphase and early G1, the HSR extends approximately twofold to a linear,
z
0.3-
m
m-diam chromatid, and then recondenses to a com-pact mass adjacent to the nuclear envelope. No further
changes in HSR conformation or position are seen through mid-S phase. However, HSR DNA replication is preceded by a decondensation and movement of the HSR into the nuclear interior 4–6 h into S phase. Dur-ing DNA replication the HSR resolves into linear chro-matids and then recondenses into a compact mass; this is followed by a third extension of the HSR during G2/prophase. Surprisingly, compaction of the HSR is ex-tremely high at all stages of interphase. Preliminary ul-trastructural analysis of the HSR suggests at least three levels of large-scale chromatin organization above the 30-nm fiber.
I
n
mammalian cells, DNA is compacted linearly
.
15,000:1 within metaphase chromosomes (Beckeret al., 1996). For interphase chromosomes, fluores-
cence in situ hybridization studies suggests a linear pack-
ing ratio of
z
200–1,000:1 (Lawrence et al., 1990), whereasthe compaction of DNA within 30-nm chromatin fibersyields a linear packing ratio of
z
40:1 (Suau et al., 1979).The additional folding of these chromatin fibers into inter-phase and mitotic chromosomes, which we refer to as thelarge-scale chromatin structure, is poorly characterized atthis time. Still unclear are very basic questions, includingwhether defined higher order folding motifs beyond the30-nm fiber even exist, particularly within interphase nu-clei, and to what degree the large-scale chromatin struc-ture of specific chromosome regions fold reproducibly indifferent cells at specific cell cycle and developmentalstages.
Our general approach to understanding the hierarchy offolding motifs underlying higher-order chromosome struc-
ture has been to focus on intermediates of folding and un-folding during progression into and out of mitosis and dur-ing progression through interphase (Belmont, 1997). Thiswork has led to the description of
z
100-nm diam large-scale “chromonema” fibers, formed by the folding of 10-and 30-nm chromatin fibers, as basic units of mitotic andinterphase chromosome structure (Belmont et al., 1987,1989; Belmont and Bruce, 1994; Robinett et al., 1996; Bel-mont, 1997).
However, this experimental strategy of dissecting fold-ing motifs underlying chromosome architecture throughthe analysis of cell cycle folding intermediates has been se-verely handicapped by two serious experimental difficul-ties. First, is the problem that in most experimental sys-tems methods for cell cycle synchronization are imperfectand after synchronization there is a relatively rapid, inher-ent loss of synchronization obvious even between daugh-ter cells. This means that analysis of structural changes infixed cell populations will be statistical in nature. Morespecifically, this implies that only slow modulations instructure can be described adequately; structural changesoccurring over a time scale less than or comparable to thevariability in synchrony are not easily observed or inter-preted, particularly in terms of establishing a temporal se-quence of structural changes. Especially difficult is distin-guishing a statistical variability in structure within the cell
Address all correspondence to Dr. Andrew S. Belmont, Department ofCell and Structural Biology, B107 Chemical and Life Sciences Building,601 South Goodwin Avenue, University of Illinois, Urbana-Champaign,Urbana, IL 61801. Tel.: (217) 244-2311. Fax: (217) 244-1648. E-mail: [email protected]
This document was created with FrameMaker 4.0.4
The Journal of Cell Biology, Volume 140, 1998 976
population from a defined temporal sequence of structuralchanges experienced by every cell in the population.
The second difficulty is the tremendous heterogeneity inlarge-scale chromatin organization observed even withinthe same nucleus. For example, within late telophase nu-clei we have observed decondensation of chromosomes toan
z
100–130 “chromonema” fiber adjacent to a still con-densed, telophase chromosome
z
200–500-nm in diameter(Belmont and Bruce, 1994). This heterogeneity in large-scale chromatin packing persists through middle to lateprophase (Li, G., K. Bruce, and A.S. Belmont, unpub-lished observations). Again it is difficult to distinguish towhat degree this heterogeneity reflects a different large-scale chromatin organization for different genomic re-gions, versus a similar hierarchical chromatin organizationbut different cell cycle timing of decondensation and con-densation for different genomic regions, versus a statisticalvariation in chromatin organization for the same genomicregion observed within a cell population. Again, assumingthat a defined hierarchical folding pathway does exist, thisheterogeneity makes it very difficult to recognize distinctintermediates of this pathway, and to determine the exacttemporal sequence for transitions between these interme-diates during chromosome condensation/decondensation.
To overcome these experimental difficulties, we haverecently developed a novel methodology for in situ visual-ization of the cell cycle condensation/decondensation of aspecific chromosome region produced by gene amplifica-tion (Robinett, C., C. Willhelm, G. Li, and A.S. Belmont.1994.
Mol. Biol.
Cell.
5(Suppl.):3
a
; Robinett et al., 1996).With respect to the problems outlined above, this method-ology has two important components. First, by using alarge, tandem array of lac operators in conjunction withexpression of a green fluorescent protein (GFP)
1
–lac re-pressor–nuclear localization signal (NLS) fusion proteinwe are able to visualize the location of specific DNA se-quences within living cells. Moreover, we are able to visu-alize the locations of these operator sequences withinfixed specimens at both light and electron microscopy res-olution using lac repressor staining in conjunction with im-munostaining; this allows us to minimize perturbation oflarge-scale chromatin organization by substitution of DNAdenaturation protocols required by in situ hybridizationwith the less harsh staining conditions used for immuno-staining.
Second, by combining this lac operator/repressor–taggedsystem with gene amplification we are able to selectivelyvisualize the cell cycle dynamics of a specific chromosomearm region. Typically, gene amplification produces ampli-con repeats consisting of a several hundred to one thou-sand kb of genomic DNA flanking the selectable marker.Tens to hundreds of these amplicons typically produce alarge chromosome region, tens to hundreds of Mbp in size,with uniform staining using typical chromosome bandingprotocols; this homogeneously staining region is called anHSR. Because chromosome bands often delineate blocksof DNA that show similar timing of replication, or blocks
of heterochromatin or euchromatin, we may expect theseHSRs also to show a more uniform pattern of chromo-some condensation and decondensation than normal chro-mosome regions of comparable size.
In this paper we have now applied this methodology todescribe the cell cycle dynamics of a late-replicating, het-erochromatic HSR. In contrast to the tremendous hetero-geneity in large-scale chromatin organization observedwithin and between nuclei from cell cycle–synchronizedpopulations, we show that this HSR follows a precise cho-reography of condensation and decondensation eventsthroughout the interphase cell cycle that is the same for allcells in the population and very different from that ob-served for the bulk chromatin. Moreover this pattern ofcondensation and decondensation is accompanied by simi-larly reproducible changes in intranuclear positioning ofthe HSR. Both the conformational and intranuclear posi-tioning changes of the HSR are tightly correlated with thetiming of HSR DNA replication.
Materials and Methods
Cell Culture and Synchronization
CHO DG44 cells (Urlaub et al., 1986) were grown in F-12 media supple-mented with 10% FBS (Hyclone Labs, Logan, UT). pSV2-DHFR-8.32–transfected DG44 cells (Robinett et al., 1996) were grown in selective me-dia (F-12 media without thymidine and hypoxanthine) supplemented withdialyzed FBS (Hyclone Labs). Gene amplification of the transfectedDHFR gene was carried out by stepwise increments in methotrexate(MTX) (Sigma Chemical Co., St. Louis, MI) concentration. A03 cellswere initially cloned from cells grown at 0.3
m
m MTX; a further subclon-ing yielded the A03_1 cell line, which showed higher stability of the chro-mosome HSR than the original A03 clone. A03_1 cells were maintained inselective media supplemented with 0.3
m
m MTX. A03_1 cultures werefrozen in aliquots, and approximately every month new vials were thawedfor use to ensure that the HSR studied in this paper did not change duringcourse of these experiments. A03_1 cells were transfected with p3
9
SSdimer (Robinett et al., 1996), which contained a dimer form of lac repres-sor–nuclear localization signal fusion protein, and stable clones were se-lected in 0.2 mM hygromycin. Incubation was at 37
8
C with 5% CO
2
.An early S phase synchronization protocol (Tobey and Crissman, 1972;
Tobey et al., 1990) was applied that used a G1 block induced by isoleu-cine-deficient media, this was followed by release and a hydroxyurea(HU) S phase block. This early S phase block was completely reversible asdemonstrated by flow cytometry (data not shown). After a 6-h releasefrom HU block, 75% of the cells were enriched in late S and G2 phase.Mitotic cells were collected by mechanical shake-off (98–100% cells in Mphase) after a 2-h nocodazole (600 ng/ml) treatment, which was added 7 hafter the release from early S phase block. After washing off the nocoda-zole, the cells progressed into G1 phase in synchrony.
Immunofluorescence Staining
In Vitro Repressor Staining.
Cells grown on glass coverslips were rinsed,permeabilized in 0.1% Triton X-100 for 30 s, and then fixed with 1.6%formaldehyde for 15 min in PBS* (Ca-, Mg-free PBS with 5 mM MgCl
2
,and 0.1 mM EDTA). After three 5-min washes in PBS*, excess aldehydegroups were quenched by washing three times for 5 min with 20 mM gly-cine in PBS*, followed by washing three times for 5 min in PBS*. The cellswere then washed 5 min in repressor-binding solution (PBS*, 0.1% TritonX-100, 0.1 mM DTT, and 50
m
g/ml BSA) before incubation with 0.45
m
g/mlpurified lac repressor for 2 h at 4
8
C. After another 5-min wash with re-pressor-binding solution, the cells were fixed a second time with 1.6%formaldehyde for 15 min, and washed as described above after the firstfixation. The cells were then blocked in 5% normal goat serum (NGS) inPBS* for 1 h. After washing three times for 5 min with PBS*, the cells wereincubated with rabbit anti-repressor antibody (Stratagene, La Jolla, CA)(diluted at 1/1,000 in PBS* with 0.1 Triton X-100) for 4 h at 4
8
C. Afterwashing three times for 5 min in PBS* with 0.1% Triton X-100, the cells were
1.
Abbreviations used in this paper
: BrdU, bromodeoxyuridine; DAPI, 4,6-diamidino-2-phenylindole; GFP, green fluorescent protein; HSR, homo-geneously staining region; NE, nuclear envelope; NLS, nuclear localiza-tion signal.
Li et al.
Interphase Cell Cycle Dynamics—Precise Choreography
977
stained with Texas red–conjugated goat anti–rabbit antibody (JacksonLaboratories, Bar Harbor, ME) (diluted at 1/1,000) overnight at 4
8
C. Thecells were then washed with PBS* with 0.1% Triton X-100, followed byPBS*, each three times for 5 min. The cells were stained with 0.2
m
g/ml4,6-diamidino-2-phenylindole (DAPI) (Molecular Probes, Eugene, OR)for 5 min before mounting. Samples used for optical sectioning werestepped through a glycerol/buffer series ending with 90% glycerol contain-ing 3.5%
N
-propyl-gallate as an antifading agent (Giloh and Sedat, 1983).
Bromodeoxyuridine Labeling and lac Repressor Double Staining.
Cells grownon coverslips were labeled with 10
m
m bromodeoxyuridine (BrdU) in F-12selective media for 15 min at 37
8
C. After washing three times for 5 minwith PBS at 37
8
C, the cells were permeabilized, fixed with 1.6% formalde-hyde, stained with purified lac repressor, fixed a second time, and thenwashed as described above. The cells were then treated with 4N HCl for30 min at room temperature to denature the DNA. After washing four tofive times with PBS*, the cells were incubated with FITC-conjugatedmonoclonal mouse anti-BrdU antibody (Boehringer Mannheim Corp., In-dianapolis, IN) (diluted at 1/20 in PBS* with 1% BSA and 0.5% Tween-20) and rabbit anti-repressor antibody (diluted at 1/1,000) for 1 h at roomtemperature. After three 5-min washes in PBS*, the cells were furtherstained with Texas red–conjugated goat anti–rabbit antibody.
Immunogold Staining
In Vitro Repressor Staining.
A different staining protocol was developedto improve the preservation of large-scale chromatin ultrastructure duringimmunostaining. Cells grown on Aclar film (Pro-Plastic, Linden, NJ) wererinsed with buffer C (0.25 M sucrose, 10 mM Pipes, pH 7.0, 1.5 MgCl
2
,1.0 mM CaCl
2
, 10
m
g/ml turkey egg white protease inhibitor), perme-ablized in buffer C with 0.1% Triton X-100 for 5 min on ice, and then fixedwith 1.6% formaldehyde in buffer C for 15 min at room temperature. Af-ter washing three times for 5 min with buffer C, the buffer was changed tobuffer A (80 mM KCl, 20 mM NaCl, 2 mM EDTA, 0.5 mM EGTA, 0.5 mMspermidine, 0.2 mM spermine, 15 mM
b
-mercaptoethanol, 10
m
g/ml tur-key egg white protease inhibitor (Sigma Chemical Co.), adjusted to pH7.0) to carry out repressor staining, using the procedures as described forimmunofluorescence staining. Before the second fixation, the buffer waschanged back to buffer C, and the cells were fixed with 1.6% formalde-hyde in buffer C for 15 min at room temperature. After washing threetimes for 5 min with buffer C, the buffer was changed to buffer A without
b
-mercaptoethanol. Primary (rabbit anti-repressor) and secondary anti-body (1.4-nm Nanogold cluster–labeled, goat anti–rabbit antibody, used at1/50 dilution [Nanogold, Stony Brook, NY]) staining was carried out asdescribed for immunofluorescence staining. After silver enhancement(Dancher, 1981), dehydration, embedding in Epon, sectioning, and uranylacetate and lead staining were carried out as described previously (Bel-mont et al., 1993).
Staining of Cells Expressing Repressor.
After rinsing in calcium- andmagnesium-free (CMF)-PBS, cells were fixed in 1.6% formaldehyde for1 h at room temperature. The remaining steps were essentially the same asabove except that the repressor staining, the second fixation, and all thewashing steps after the second fixation were eliminated.
GFP–lac Repressor Construction and LiveCell Observation
The S65T “improved” GFP (Helm et al., 1995) and dimer form of lac re-pressor (Chen et al., 1992) were constructed as a fusion protein in thep3
9
SS eukaryotic expression vector (Robinett et al., 1996). A03_1 cellswere transfected with the fusion construct by LipofectAmine (GIBCOBRL, Gaithersburg, MD) and stable transformants were selected with0.2 mM hygromycin. For live cell observations, a FCS2 (Bioptics, Butler,PA) system was used on an inverted Olympus (Tokyo, Japan) fluorescentmicroscope equipped with a CCD camera (Hiraoka et al., 1991). The cellswere grown to log phase or synchronized at early S phase before transferto the chamber. Conditioned F12 selective media was used to replace me-dia in the cell chamber every 4 h. The pH was maintained by continuousflow of 5% CO
2
over the media in the reservoir. The FITC filters wereused to visualize the GFP and the exposure time was controlled carefully(total exposure time under 30 s) to minimize phototoxicity.
Mitotic Spreads
Mitotic cells were collected by mitotic shake-off after a 1-h colchicinetreatment. For BrdU pulse-chase experiments, mitotic cells were collected
by mitotic shake-off without use of colchicine. The harvested cells were in-cubated in 75 mM KCl at 37
8
C for 20 min, fixed for 10 min three times infresh 3:1 methanol/acetic acid, and then dropped onto cleaned glass cover-slips. The coverslips were air dried, stored at
2
20
8
C with desiccant, andused within 2–3 wk. Immunofluoresence staining was done as describedabove with the following modifications. The air-dried sample was rehy-drated in PBS* with 0.1% Triton X-100 for 30 min. Additional blockingwith 5% NGS in PBS* for 30 min was carried out to reduce the back-ground staining. The first formaldehyde fixation was eliminated.
DNA Stretching
Stretched DNA from A03_1 cells was prepared on coverslips as describedelsewhere (Parra and Windle, 1993). Immunofluorescence staining wasdone as described for staining of mitotic spreads.
Microscopy
Light microscopy images were collected on a inverted light microscope(IMT-2; Olympus) equipped with a cooled, slow-scan CCD camera (Pho-tometrics, Tucson, AZ). Optical sectioning and deconvolution were car-ried out as described previously (Hiraoka et al., 1991).
Thin and semi-thick Epon sections were examined at 120–200 V on atransmission electron microscope (CM200; Phillips Electron Optics, Mah-wah, NJ). A camera (1412; Eikonix), capable of 12 bit gray scale readoutof a 4096 pixel linear detector array, was used with a Plannar light source(model 5x5; Gordon Instruments, Orchard Park, New York) to digitizenegatives (Belmont et al., 1993). A “mass normalization” procedure, toconvert film optical density values to values proportional to the integratedscattering cross section, or electron optical density, was carried out as de-scribed previously (Belmont et al., 1987). Image “intensity” values thenreflect the density of heavy metal staining, with brighter regions corre-sponding to higher electron density as in a negative.
The display program, NEWVISION (Pixton and Belmont, 1996), wasused to display images and view results. Selected images or montageswere then assembled into figures using Photoshop (Adobe Systems, Inc.,Mountain View, CA). Figures were printed using a dye sublimationprinter.
Results
Isolation and Characterization of a Stable,Late-replicating HSR
A03_1 Is a Stable HSR.
The system for lac operator/re-pressor localization of DNA sequences described previ-ously (Robinett et al., 1996) uses a 256 copy lac operatordirect repeat located within pSV2-DHFR (Subramani et al.,1981), an expression vector for dihydrofolate reductase(DHFR). CHO DG44 cells (Urlaub et al., 1986) contain-ing a double DHFR deletion were transformed and a poolof stable transformants stepped collectively through in-creasing MTX concentrations. Cells growing at 0.3
m
mMTX were cloned. Out of approximately six clones, onlyone contained a single, stable HSR. A03_1, a subclone ofA03, showed increased stability with 98% of A03_1 cellscontaining a single HSR, with the remainder containingtwo HSRs.
All mitotic banding methods explored produced a ho-mogeneous staining pattern for the A03_1 amplified chro-mosome region (data not shown). By Giemsa banding, theamplified chromosome region stained as a light, R band;by Hoescht staining, however, the HSR appeared to be abrightly staining, AT rich band. After HCl treatment theHSR showed a DAPI fluorescence roughly twofold greaterthan the rest of the genome (Fig. 1
A
,
bottom inset
). An al-ternative, NaOH treatment used for DNA denaturationallowed good BrdU staining for the entire chromosomespread, with only the HSR chromosome arm unlabeled.
The Journal of Cell Biology, Volume 140, 1998 978
We interpret these last results as indicative of an atypicalchromatin structure for the A03_1 HSR such that it ismore resistant to denaturation than most chromosome re-gions.
After methanol/acetic acid or prolonged methanol fixa-
tion, lac repressor staining produced three very small,paired chromosomal spots in addition to the HSR staining,including one pair on the long chromosome arm oppositethe HSR (data not shown). This spot allowed unambigu-ous identification of the HSR containing chromosomefrom 4 to 5 chromosomes of comparable size in a typicalspread. An identical set of three spots was visualized in mi-totic spreads from the parental DG44 CHO cells. There-fore these spots are unrelated to the lac operator sites in-troduced by transformation and are seen only with alcoholfixation and not formaldehyde fixation or in vivo expres-sion of GFP repressor.
Mitotic spreads (Fig. 1
A
) show that the HSR occupiesmost of a short chromosome arm; this arm appears to havebeen added onto a small, telocentric chromosome presentin the original DG44 cells (Fig. 1
A
,
top inset
). 16–18spreads showed a single HSR located on the same distinc-tive chromosome (one showed an additional, smaller HSRon a different chromosome, and the second a similar sizeHSR but on a different chromosome). Measurements ofthe HSR length versus the total chromosome lengths inthe spread and the length of the arm opposite to the HSRfrom these 16 mitotic spreads are summarized in Table I.
Based on this analysis, the A03_1 HSR length was 1.55
6
0.17% of the total chromosome lengths. Assuming ametaphase compaction of the HSR comparable to the av-erage metaphase compaction, and a CHO genome size of6
3
10
9
bp per diploid genome, this corresponds to a HSRsize of 93 Mbp
6
10 Mbp.
Molecular Characterization of the A03_1 HSR.
To analyzethe spacing of vector DNA and flanking genomic DNA,we used a DNA stretching protocol (Parra and Windle,1993), which extends genomic DNA by fluid flow; thestretched DNA length is normally 50–200% of duplex re-laxed B form DNA. The maximum fragment length usingthis technique is
z
1 Mbp. Lac repressor staining to visual-ize the vector sequence was combined with DAPI counter-staining for staining of flanking DNA (see Fig. 1
B
). Theaverage length of repressor-stained regions, 86
6
3
m
m,implied a size of
z
250 kb assuming DNA was stretched to100% of B form DNA. Unlabeled DNA, at least equal tothe length of repressor stained regions, was observedflanking the repressor labeled regions. In one example, along segment of unstained DNA was flanked by two re-pressor stained regions, implying an intravening DNAlength of
z
700 kb, again assuming 100% stretching.We used pulse field gel electrophoresis and Southern
blot analysis to estimate the vector copy number withinthe units of amplification (Fig. 1
C
). A03_1 genomic DNAwas digested with Bsu36I and MluI, two 6-bp frequent cut-
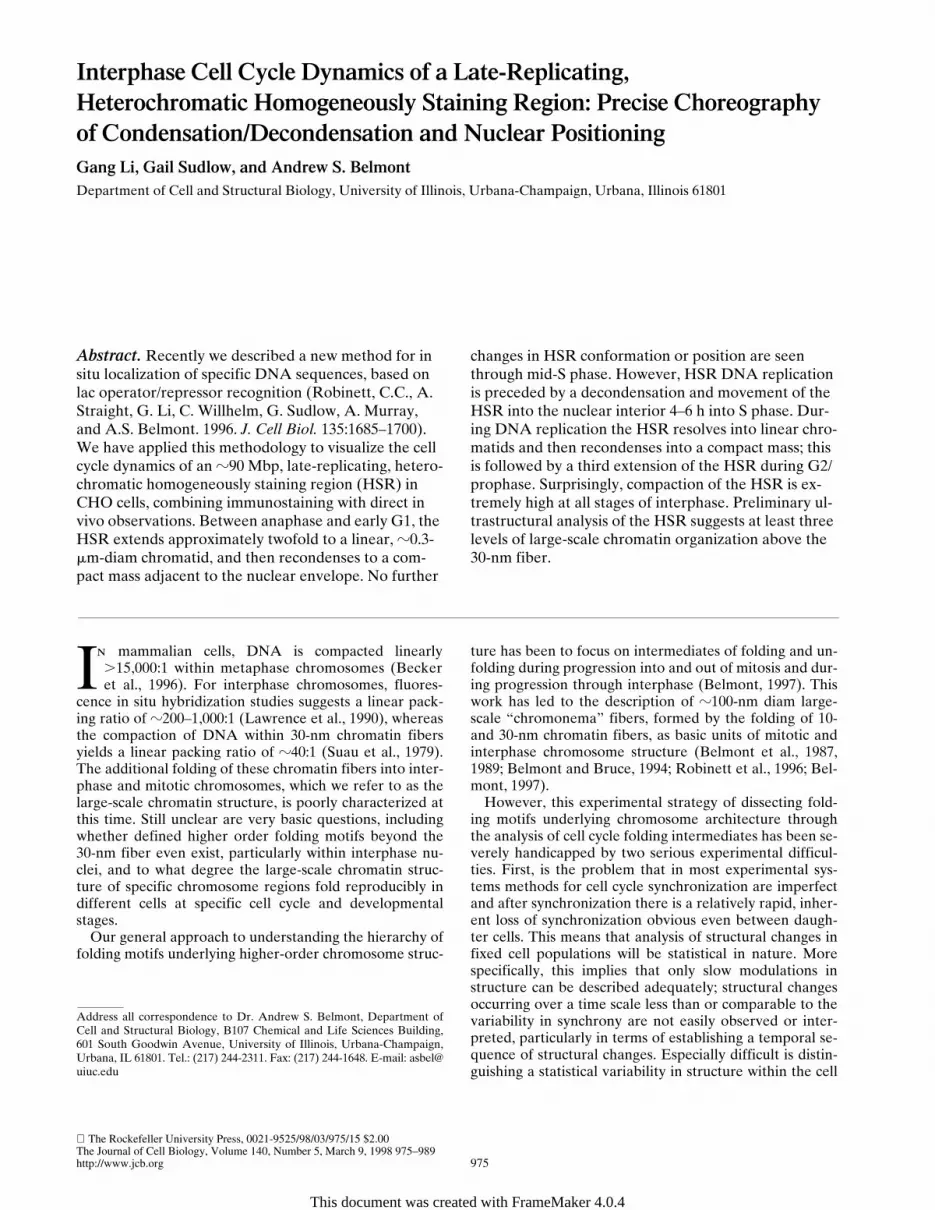
Figure 1. A03_1 HSR characterization: (A) HSR (arrow) is on adistinctive, late-replicating chromosome, present in the parentalDG44 cell line (top inset) and is itself late replicating. Log phasecells were labeled continuously for 2–3 h with BrdU and mitoticspreads prepared and triple stained with anti-BrdU (green), anti–lac repressor (red), and DAPI (blue). Lower inset shows selectedexamples from 2 h (first two panels) or 3 h (last three panels)BrdU labeling. HSR replication finishes before the adjacent armcompletes replication. (B) Organization of vector repeats visual-ized within stretched A03_1 DNA, stained with DAPI (blue) andlac repressor (red). (a) Example of flanking DNA between lac re-pressor staining regions. (b) Several examples of lac repressor–staining regions. (C) Southern blot shows size of vector repeat.A03_1 genomic DNA was digested with Bsu36I, which does notcut the pSV2–DHFR–8.32 vector. The major band (a doublet) isat z400 kb with minor bands at 500 and 700 kb. (D) HSR finishesreplication 0.5–1 h before the end of S phase. Percentage of mi-totic spreads or HSRs incorporating BrdU versus time of BrdUcontinuous labeling. (E) HSR replication peaks at z6 h after be-ginning of S phase (z11 h chase time). Percentage of mitoticspreads or HSR incorporating BrdU versus chase time after 15min BrdU pulse labeling. (D and E) Squares correspond to label-ing of mitotic spreads, and diamonds to labeling of HSR (at least100 cells per data point). Bars: (A) 2 mm; (B) 20 mm.
Table I. Calculation of A03_1 HSR Size
Mean SD
R
1
5
L
hsr
/
L
total
1.55% 0.33%
R
2
5
L
hsr
_
ch
/
L
total
4.70% 0.76%
R
norm
5
R
1
3
/R
2
1.55% 0.17%HSR size (
Mbp)
93.0 10.2
Statistics from 22 mitotic spreads from three separate experiments.
L
hsr
,
L
hsr
_
ch
, and
L
total
represent the HSR length, HSR containing chromosome length, and sum of allchromosome lengths in a mitotic spread, respectively.
R
1
is normalized to
R
norm
by themean of
R
2 ( ) to correct for variations in the aneuploid state of cells. The HSR sizeis calculated by Rnorm 3 estimated, diploid CHO genome size (6 3 109 bp).
R2
R2
Li et al. Interphase Cell Cycle Dynamics—Precise Choreography 979
ters, which do not cut the original vector sequence. Assum-ing normal sequence variation within the flanking DNA,the length of the restriction fragments visualized by South-ern blotting should closely approximate the actual lengthof the large vector repeat. There was a major, doubletband at z400 and 425 kb after Bsu36I digestion as well asseveral minor bands at z500, 700, and 1,000 kb. Similarbands were observed after MluI digestion.
Recalibration of the size of the lac repressor staining re-gion in the stretched DNA experiments would then sug-gest that the flanking genomic DNA is equal or larger onaverage to the z400-kb size of the vector array, and esti-mate a distance between the two vector arrays in the ex-ample shown in Fig. 1 B of z1,100 kb. To estimate the av-erage amount of flanking DNA per amplicon, we quantitatedthe total lac operator DNA contained within the A03_1cell line by monitoring the 292-bp EcoRI fragment corre-sponding to the 8-mer lac operator repeat within the larger256 copy operator array. The lac operator repeat was esti-mated as 0.43% of the total genomic DNA, z28% of theestimated HSR DNA. Assuming the average amplicon con-tains 400 kb of vector repeat, this leads to an estimate ofz1,000 kb of flanking coamplified genomic DNA per am-plicon.
A03_1 HSR Is Late Replicating. BrdU was added to alogarithmically growing population of A03_1 cells and mi-totic cells harvested afterwards at 1-h intervals for prepa-ration of mitotic spreads. The time required for the firstappearance of BrdU label within the mitotic spreads thencorresponds to the G2 duration. BrdU/lac repressor dou-ble staining of a mitotic spread from such a continuous la-beling experiment is shown in Fig. 1 A. The chromosomearm opposite to the HSR is very late replicating. Similarexperiments done using the parental DG44 cell line re-vealed a similar very late replication pattern for the origi-nal chromosome without the HSR (Fig. 1 A, top inset).This late-replicating chromosome arm, together with theincreased DAPI fluorescence of the HSR after HCl treat-ment, made it possible to distinguish the HSR by onlyBrdU staining. HSR replication is seen to occur between 2and 3 h before mitosis, while replication of the adjacent,late-replicating chromosome arm is still ongoing at thevery end of S phase, 2 h before mitosis (Fig. 1 A, bottominset). We estimate the HSR completes its replication z30min before the end of S phase (Fig. 1 D).
To estimate the length and starting time of the HSR rep-lication, a 15-min BrdU pulse was followed by a variablechase. The start of S phase, estimated as when 50% of mi-totic spreads were labeled, was 11–12 h before mitosis(Fig. 1 E). The beginning of HSR replication, when 50%of the HSRs were BrdU positive, was z5.5 h before mito-sis, or 6.5 h after the beginning of S phase. The average Sphase duration in these log phase populations was esti-mated as z8–9 h.
Early G1 Uncoiling of HSR Is Followedby a Recondensation and Movement to theNuclear Periphery
Mitotic Conformation. In mitotic spreads the mean HSRlength was 1.76 6 0.15 mm (n 5 16), yielding a 18,000:1compaction ratio for the metaphase chromosome, within
the 15,000–20,000 textbook range for human chromo-somes (Becker et al., 1996), which is also based on lengthmeasurements from mitotic spreads. Here, we are definingthe packing ratio as the ratio of the predicted length of thechromosomal DNA to the actual chromosome length. Avariability in chromosome lengths in mitotic spreads arisesfrom several causes including variations in mitotic stage,variations in metaphase chromosome condensation re-lated to drug arrest, and variations in stretching accompa-nying fixation and spreading.
The actual, in situ metaphase chromosome length wasmore difficult to measure because of inherent resolutionlimits of optical microscopy, particularly along the opticalaxis. However, based on measurements from individualoptical sections from several metaphase cells, selecting ex-amples in which the HSR chromosome arm was orientedroughly perpendicular to the optical axis, the mitotic chro-mosome length varied between 1.2 and 1.5 mm with amean of 1.3 mm. Chromosome diameter was estimated asz1 mm, implying an z0.5-mm diam for each daughterchromatid. These measurements were made from metaphasecells grown on coverslips, fixed in formaldehyde, andstained with lac repressor using immunofluorescence de-tection. An example is shown in Fig. 2 A. These measure-ments indicate a significantly higher compaction ratio ofz24,000:1 for these more native, metaphase chromosomes.
Telophase to Early G1 Transition. Mitotic cells harvestedby selective detachment were released from a mitoticblock and plated onto coverslips. At 40, 80, 120, 180, and240 min after release, cells were fixed and stained with lacrepressor. Deconvolved optical sections from nuclei at dif-ferent stages of chromosome decondensation were exam-ined (Fig. 2). In telophase and early G1 nuclei, where con-densed chromosomes could still be recognized, the HSRvaried in length between 1.1 and 1.4 mm with a mean of1.26 mm, based on measurements from five deconvolveddata sets in which the HSR arm was perpendicular to theoptical axis. The width of these telophase chromatids wasincreased from metaphase from z0.5 to 0.8 mm and a largefraction of these HSRs showed substructure suggestive ofirregular uncoiling of an z0.3–0.4-mm-diam fiber as seenby light microscopy (Fig. 2 B).
We attribute the increased telophase chromatid width,relative to metaphase chromatids, to the loosening and be-ginning of uncoiling of this 0.3–0.4 mm fiber. Uncoiling ofthe chromatid during the telophase to early G1 transitionis further suggested by optical sections of several examples(Fig. 3). A closer look is provided by individual, serial opti-cal sections (Fig. 3 D) and stereopairs generated by projec-tion of deconvolved, three-dimensional data sets (Fig. 3 E).
Chromatid uncoiling is further suggested by the appear-ance of many HSRs, between 80 and 120 min after mitoticrelease, as thinner, 2–3-mm extended fibers (2.2 mmmean), approximately twice the earlier telophase length(Fig. 2 C). By light microscopy the width of these fiberswas z0.3 mm. To better visualize this chromatid extension,EM immunogold staining was carried out on cells stablyexpressing the lac repressor using an anti-repressor pri-mary antibody and a Nanogold-labeled secondary. Inter-nal substructure (Fig. 3 F) is consistent with the coiling of az0.3–0.4-mm smaller fiber, as suggested further by ste-reopairs (data not shown). Supporting this interpretation,

The Journal of Cell Biology, Volume 140, 1998 980
Fig. 3 G shows an extended, linear chromatid with a widthof z0.3 mm.
At later times, the HSR begins to recondense, as indi-cated by an increasing fraction of cells between 2 and 3 hafter release with a loose, irregular folding of the HSRchromatid (Fig. 2 D). Further condensation of the HSR
occurred such that by 4 h nearly all nuclei showed a highlycondensed, oval mass with no visible substructure by lightmicroscopy (Fig. 2 E). Typical diameters for the axes ofthis oval mass ranged from 0.5 to 1.0 mm.
The overall level of chromatin decondensation, revealedby DAPI staining, provided a rough temporal ordering of
Figure 2. HSR changes during telophase/earlyG1. A03_1 cells were stained with lac repressordifferent times after release from mitotic block (t 50). Deconvolved lac repressor (Texas red) andDNA (DAPI) staining images are superimposedin A–E; bright regions (arrows) correspond to lacstaining. (A) Metaphase HSR, z1 mm in length.Staining is concentrated on periphery. (B) Initialuncoiling of HSR (40 min). (C) Extension ofHSR to z0.3-mm diam, z2-mm-long fiber (80min). (D) Intermediate, possibly irregularlycoiled (see text) structure leading towards con-densed chromatin mass (180 min). (E) Uniform,condensed mass with no substructure evident atlight microscopy resolution (4 h). (F) HSRs inA–E at higher magnification. Bars, 2 mm.
Figure 3. Chromosome uncoiling during telo-phase/early G1. A03_1 cells were stained with lacrepressor 40 min after release from nocodazole.(A–C) Deconvolved optical sectioning data fromselected examples. HSR staining is merged withDAPI staining as in Fig. 2. (D) Serial optical sec-tions, separated by 0.2 mm, showing uncoiling ofHSR (same HSR as A). (E) Stereo pairs fromprojection of three-dimensional data set (sameHSR as in Fig. 2 B): top, 2328, and 2188; middle,2108, and 48; and bottom, 88, and 228. (F–G) Im-munogold EM of synchronized cells, 0.2-mm-thicksections. (F) Condensed telophase HSR beforeuncoiling (image suggests coiling with arrowsbracketing z0.3-mm apparent fibers or stria-tions). (G) Extended z0.3-mm-wide fiber. Bars:(A–C) 2 mm; (D and E) 1 mm; (F and G) 0.5 mm.

Li et al. Interphase Cell Cycle Dynamics—Precise Choreography 981
nuclei during progression through telophase and early G1.This ordering suggested an uncoiling of the mitotic HSRchromatid to the linear, z2.2-mm telophase chromatid,followed by a refolding of this chromatid. The high degreeof condensation into a compact mass with an absence ofsubstructure at later times in G1 is consistent either with afurther, tight folding of the original, linear, z0.3-mm chro-matid, or a complete remodeling of the chromatin into adifferent, higher order conformation. Preliminary electronmicroscopy of immunogold-stained samples, however, ismore suggestive of the tight folding, chromatid hypothesis,as described below.
In Vivo Confirmation. The above temporal sequence ofstructural changes was confirmed by direct in vivo obser-vations using a GFP–lac repressor–NLS fusion protein stablyexpressed in A03_1 cells. We selected late anaphase/telo-phase cells from a log phase population and limited totalexposure time to ,10 s, a time which permitted passage ofcells through one cell cycle without abnormal cell division(see below). Time-lapse observations revealed a relatively
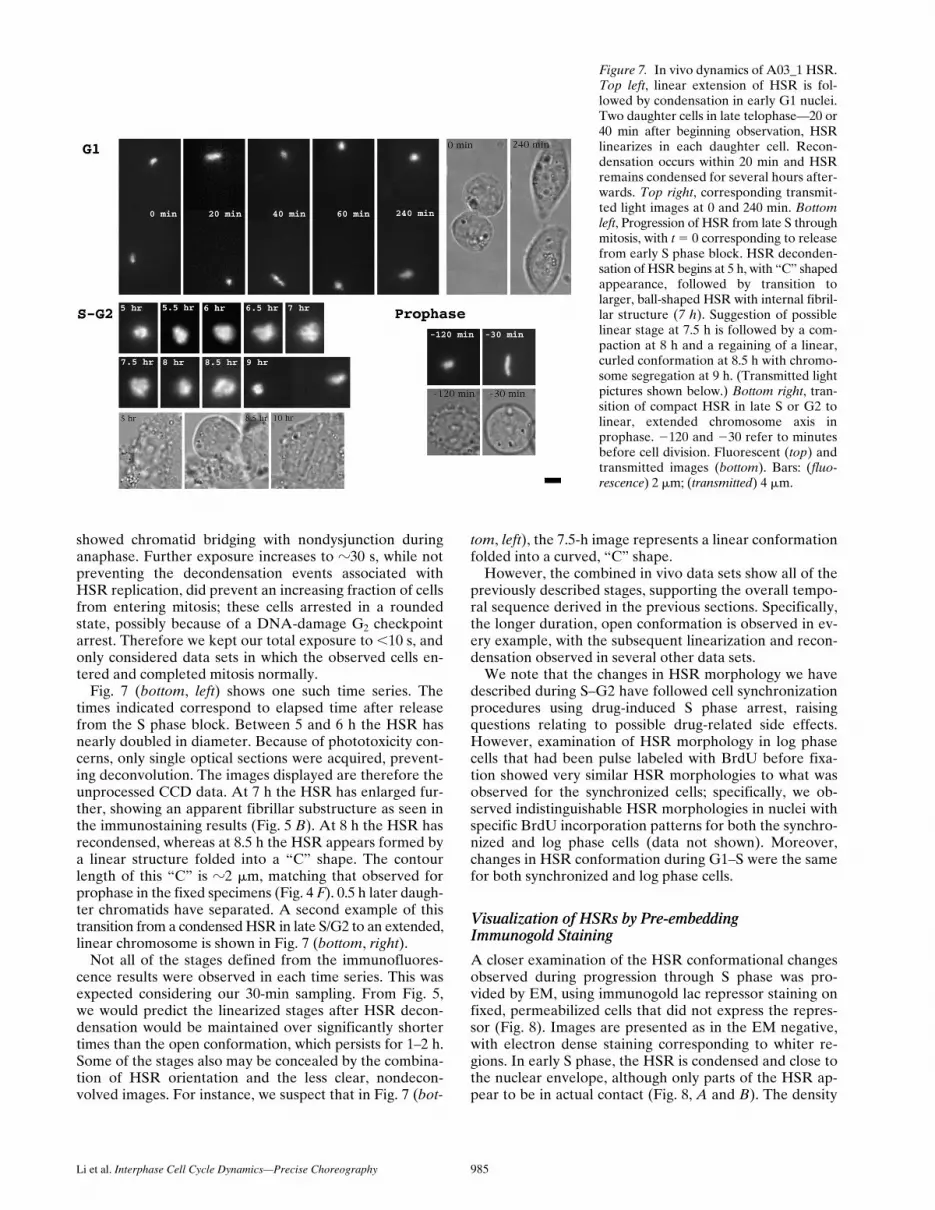
abrupt, linear extension of the HSR occurring nonsyn-chronously in daughter cells. In the example shown in Fig.7 (top), both the linearization and recondensation eventsoccur in ,20 min. An intermediate time point at 7 min(data not shown) showed a partial chromatid extension to1.5 mm in length increasing to 1.9 mm at 20 min. In otherexamples, chromatid extension occurred within 5–10 minwith recondensation occurring in as short as 8 min. BothHSRs remained condensed over the next 3 h of observa-tions. By the end of the GFP observation period, the cellshad moved apart and flattened as expected for normal cellcycle progression (see Fig. 7, top right). The cells weremaintained on the microscope for another 24 h and ob-served to have divided over this time period.
A similar sequence of events was observed in 12 inde-pendent observations of late telophase/early G1 cells.Seven examples clearly show the early extension of thechromatid, and nine examples show the recondensation af-ter linearization. The complete sequence of linearizationand recondensation was observed in four cases. In mostcases where the complete sequence was not observed, thiswas either because the first time point showed an ex-tended chromatid or because it was not possible to capturethe HSRs of both daughter cells in the same focal planefor the entire sequence. In two cases, the cells were fol-lowed for only 2 h and the HSR extended but did not re-condense over this period.
The HSR extension and recondensation in these cellsoccurred earlier than that observed in the synchronized, fixedpopulations. This was rationalized to be because of effectsrelated to recovery of cells from the mitotic block in the ex-periments with synchronized cells, as well as beginning ob-servations for the live cell experiments after cell division.
Intranuclear Repositioning of the HSR. Accompanyingthese structural changes was a change in nuclear position-ing. Table II summarizes data from three-dimensional op-tical sectioning of lac repressor–stained nuclei from syn-chronized populations. The HSR was defined as nuclearenvelope (NE) associated if the nearest region of the HSR
Table II. A03_1 HSR Conformation Versus Nuclear Location during G1 Phase
HSR conformation
Nuclear location
SubtotalNEExtend
from NENuclearinterior
Uncoiling 9 0 0 9Linear 0 4 4 8Loose 14 0 7 21
Deconvolved, three-dimensional optical sectioning data were collected from lac re-pressor–stained synchronized early G1 cells. The HSR conformations were catego-rized as “uncoiling,” “linear,” and “loose,” as shown in Fig. 2, B, C, and D, respec-tively. The location of the nuclear envelope was defined according to the DAPIstaining and/or lac repressor nuclear background staining. The distance between thenuclear envelope and the closest HSR region was measured and used to define threeHSR nuclear locations: “NE” when the HSR was within 0.5 mm from the nuclear en-velope for middle sections, or near the top or bottom nuclear optical sections; “Extendfrom NE” when one end of a linear HSR was located within 0.5 mm from the nuclearenvelope and the other end pointed towards the nuclear interior; and “Nuclear Inte-rior” when the HSR was .0.5 mm from the nuclear envelope.
Table III. Statistics Relating A03_1 HSR Conformation, Intranuclear Position, and HSR DNA Replication
Condense conformation Open conformation
Nuclear location
BrdU pattern
Subtotal Nuclear location
BrdU pattern
SubtotalI and II III IV V I and II III IV V
NE 8 (0) 1 (0) 0 0 9 (0) NE 3 (0) 6 (1) 1 (1) 0 10 (2)Extend from NE 0 0 0 0 0 Extend from NE 0 0 0 0 0Nuclear interior 1 (0) 0 0 0 1 (0) Nuclear interior 0 8 (8) 0 0 8 (8)Subtotal 9 (0) 1 (0) 0 0 10 (0) Subtotal 3 (0) 14 (9) 1 (1) 0 18 (10)
Linear conformation Open-2 conformation
BrdU pattern BrdU pattern
Nuclear location I and II III IV V Subtotal Nuclear location I and II III IV (late) V Subtotal
NE 0 0 0 0 0 NE 0 0 1 (0) 8 (1) 9 (1)Extend from NE 2 (0) 4 (4) 4 (4) 0 10 (8) Extend from NE 0 0 0 0 0Nuclear interior 5 (5) 2 (2) 0 7 (7) Nuclear interior 0 0 3 (0) 4 (0) 7 (0)Subtotal 2 (0) 9 (9) 6 (6) 0 17 (15) Subtotal 0 0 4 (0) 12 (1) 16 (1)
Deconvolved three-dimensional optical sectioning data sets were used for these statistics. Lac repressor and BrdU double staining was done on BrdU pulse-labeled cells from logphase or synchronized populations. The HSR conformations were categorized as “condensed,” “open,” “linear,” or “open-2,” as described in the text and illustrated in Fig. 6. Thenuclear locations (NE, Extend from NE, and Nuclear Interior) were defined as in Table II. BrdU patterns define the temporal sequence from early to late S phase, as described intext. “Late pattern 4” refers to a replication pattern similar to pattern 5 but with more, but smaller, BrdU labeling foci, suggestive of a transition stage between patterns 4 and 5. Foreach HSR conformation and nuclear location combination, the number of nuclei showing colocalization of BrdU and lac repressor staining is shown within parentheses.
The Journal of Cell Biology, Volume 140, 1998 982
was ,0.5 mm from the NE for middle optical sections, or ifthe HSR was near the top or bottom nuclear sections.HSRs were classified as within the nuclear interior if thedistance from the nuclear envelope was .0.5 mm, and asextended from the NE if one end of a linear HSR waswithin 0.5 mm of the NE.
During the initial uncoiling stage (Fig. 2 B), when chro-mosomes were still highly condensed and HSRs showed anonuniform substructure suggestive of uncoiling, the HSRswere predominately on the NE (9/9). After chromatid ex-tension (Fig. 2 C), HSRs were predominately located in-side nuclei (4/8 in nuclear interior, 4 extended from NE).During recondensation, with the HSR showing a compactbut “loose” conformation with significant substructure vis-ible (Fig. 2 D), roughly one-third of HSRs were locatedwithin the nuclear interior. In contrast, in the fully recon-densed stage in which HSRs showed no substructure, theHSRs are again predominately at the nuclear periphery(Table III; 7/7).
No Changes During Mid-G1 through Mid-S Phase
After condensing in G1, the HSR remains condensed andassociated near the NE through mid-S phase. We estimatethis period lasts z6–8 h. This conclusion is based on lac re-pressor staining of cells synchronized in G1 or in S phase(see below), as well as direct, in vivo observations. For in-stance the percentage of nuclei showing a condensed, pe-ripherally located HSR in early S phase is z90%, compa-rable to the level of cell synchronization as assayed by flowcytometry. During live observations beginning at late telo-phase/early G1, we observed a number of cells at this con-densed stage for several additional hours; none showedany change in morphology. With log phase cells we usually
have to wait many hours to see any structural changes. Fi-nally, in our in vivo observations of cells released from anearly S phase, no change in the condensed state is seen forthe first several h, as described below. These results areconsistent with the condensed conformation being presentin .80% of log phase cells.
Decondensation and Nuclear Repositioning during HSR Replication
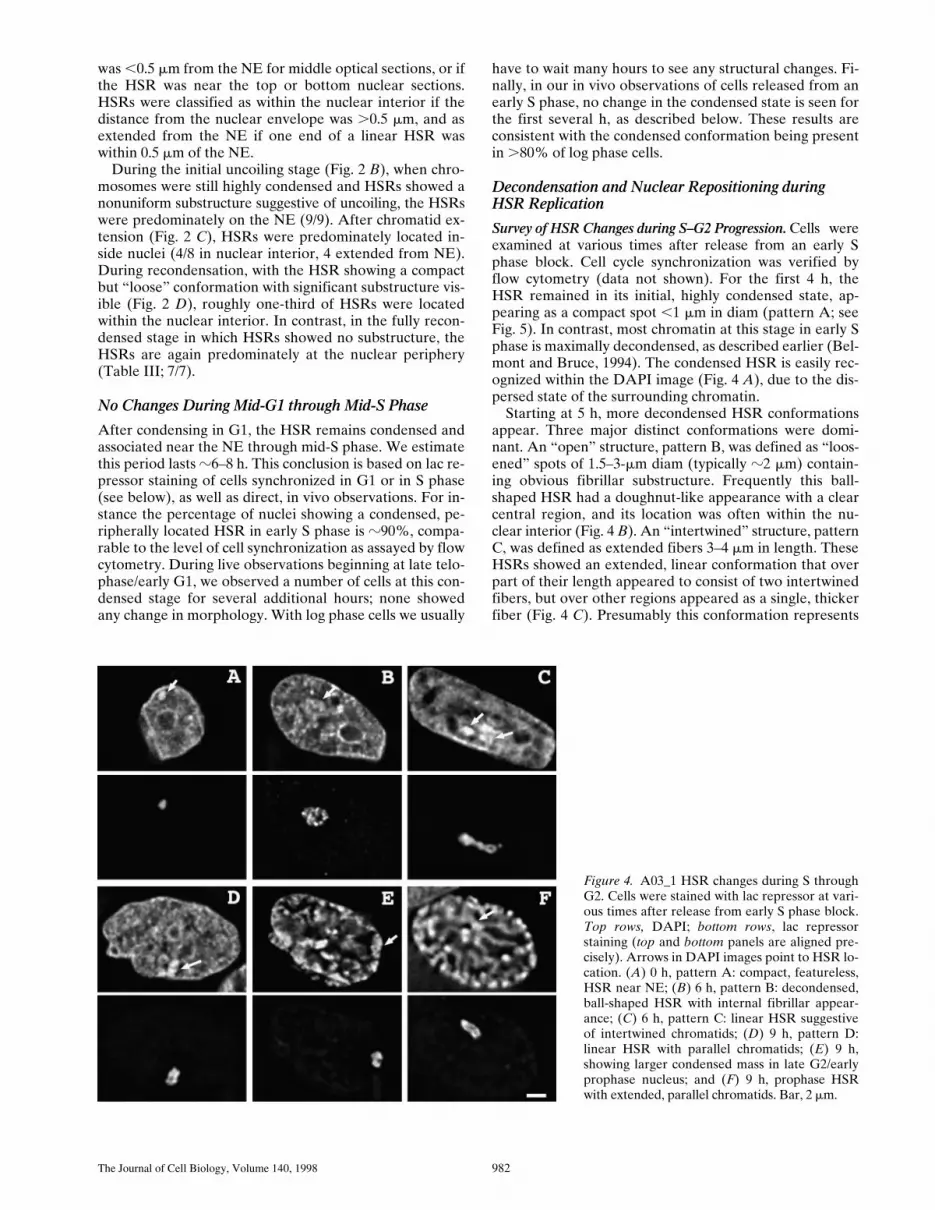
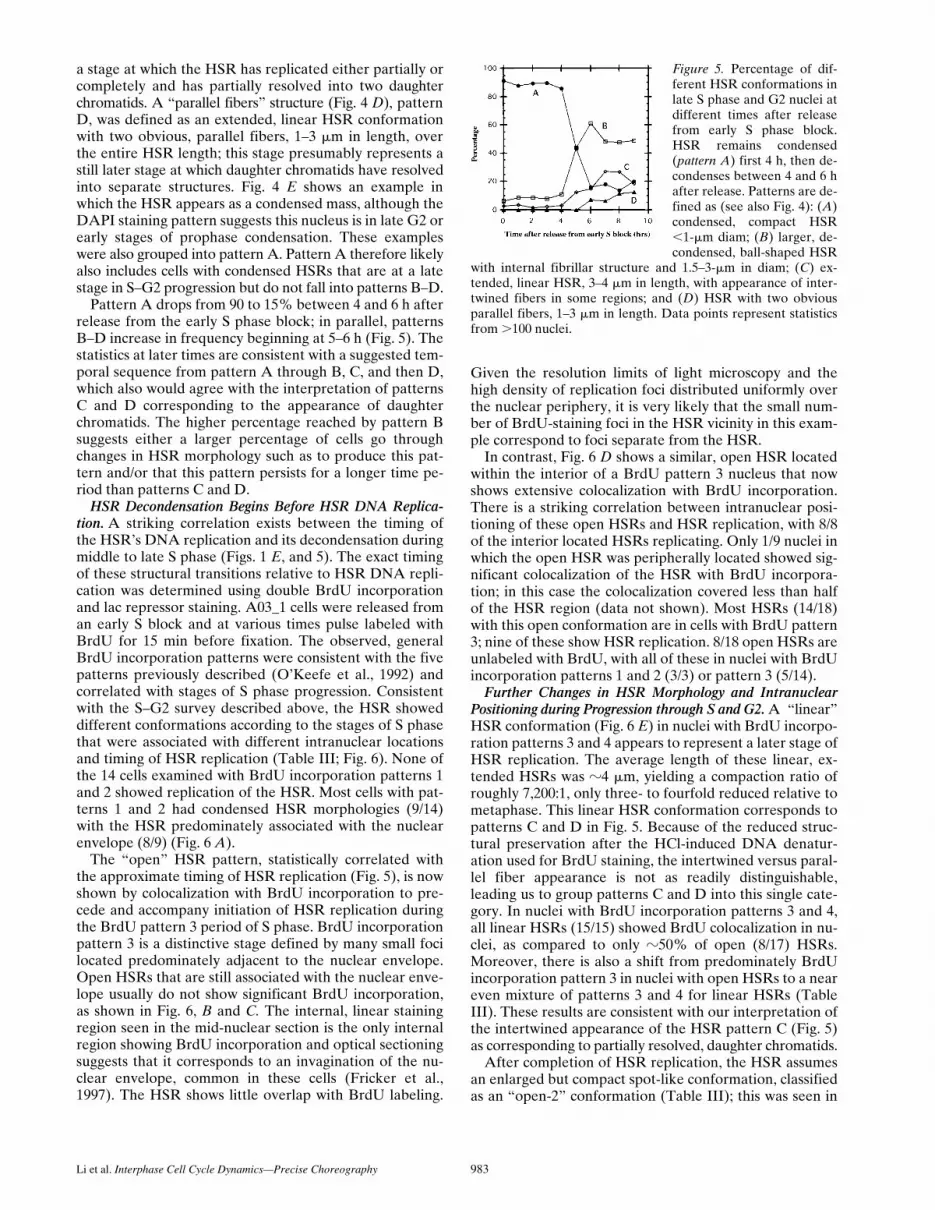
Survey of HSR Changes during S–G2 Progression. Cells wereexamined at various times after release from an early Sphase block. Cell cycle synchronization was verified byflow cytometry (data not shown). For the first 4 h, theHSR remained in its initial, highly condensed state, ap-pearing as a compact spot ,1 mm in diam (pattern A; seeFig. 5). In contrast, most chromatin at this stage in early Sphase is maximally decondensed, as described earlier (Bel-mont and Bruce, 1994). The condensed HSR is easily rec-ognized within the DAPI image (Fig. 4 A), due to the dis-persed state of the surrounding chromatin.
Starting at 5 h, more decondensed HSR conformationsappear. Three major distinct conformations were domi-nant. An “open” structure, pattern B, was defined as “loos-ened” spots of 1.5–3-mm diam (typically z2 mm) contain-ing obvious fibrillar substructure. Frequently this ball-shaped HSR had a doughnut-like appearance with a clearcentral region, and its location was often within the nu-clear interior (Fig. 4 B). An “intertwined” structure, patternC, was defined as extended fibers 3–4 mm in length. TheseHSRs showed an extended, linear conformation that overpart of their length appeared to consist of two intertwinedfibers, but over other regions appeared as a single, thickerfiber (Fig. 4 C). Presumably this conformation represents
Figure 4. A03_1 HSR changes during S throughG2. Cells were stained with lac repressor at vari-ous times after release from early S phase block.Top rows, DAPI; bottom rows, lac repressorstaining (top and bottom panels are aligned pre-cisely). Arrows in DAPI images point to HSR lo-cation. (A) 0 h, pattern A: compact, featureless,HSR near NE; (B) 6 h, pattern B: decondensed,ball-shaped HSR with internal fibrillar appear-ance; (C) 6 h, pattern C: linear HSR suggestiveof intertwined chromatids; (D) 9 h, pattern D:linear HSR with parallel chromatids; (E) 9 h,showing larger condensed mass in late G2/earlyprophase nucleus; and (F) 9 h, prophase HSRwith extended, parallel chromatids. Bar, 2 mm.
Li et al. Interphase Cell Cycle Dynamics—Precise Choreography 983
a stage at which the HSR has replicated either partially orcompletely and has partially resolved into two daughterchromatids. A “parallel fibers” structure (Fig. 4 D), patternD, was defined as an extended, linear HSR conformationwith two obvious, parallel fibers, 1–3 mm in length, overthe entire HSR length; this stage presumably represents astill later stage at which daughter chromatids have resolvedinto separate structures. Fig. 4 E shows an example inwhich the HSR appears as a condensed mass, although theDAPI staining pattern suggests this nucleus is in late G2 orearly stages of prophase condensation. These exampleswere also grouped into pattern A. Pattern A therefore likelyalso includes cells with condensed HSRs that are at a latestage in S–G2 progression but do not fall into patterns B–D.
Pattern A drops from 90 to 15% between 4 and 6 h afterrelease from the early S phase block; in parallel, patternsB–D increase in frequency beginning at 5–6 h (Fig. 5). Thestatistics at later times are consistent with a suggested tem-poral sequence from pattern A through B, C, and then D,which also would agree with the interpretation of patternsC and D corresponding to the appearance of daughterchromatids. The higher percentage reached by pattern Bsuggests either a larger percentage of cells go throughchanges in HSR morphology such as to produce this pat-tern and/or that this pattern persists for a longer time pe-riod than patterns C and D.
HSR Decondensation Begins Before HSR DNA Replica-tion. A striking correlation exists between the timing ofthe HSR’s DNA replication and its decondensation duringmiddle to late S phase (Figs. 1 E, and 5). The exact timingof these structural transitions relative to HSR DNA repli-cation was determined using double BrdU incorporationand lac repressor staining. A03_1 cells were released froman early S block and at various times pulse labeled withBrdU for 15 min before fixation. The observed, generalBrdU incorporation patterns were consistent with the fivepatterns previously described (O’Keefe et al., 1992) andcorrelated with stages of S phase progression. Consistentwith the S–G2 survey described above, the HSR showeddifferent conformations according to the stages of S phasethat were associated with different intranuclear locationsand timing of HSR replication (Table III; Fig. 6). None ofthe 14 cells examined with BrdU incorporation patterns 1and 2 showed replication of the HSR. Most cells with pat-terns 1 and 2 had condensed HSR morphologies (9/14)with the HSR predominately associated with the nuclearenvelope (8/9) (Fig. 6 A).
The “open” HSR pattern, statistically correlated withthe approximate timing of HSR replication (Fig. 5), is nowshown by colocalization with BrdU incorporation to pre-cede and accompany initiation of HSR replication duringthe BrdU pattern 3 period of S phase. BrdU incorporationpattern 3 is a distinctive stage defined by many small focilocated predominately adjacent to the nuclear envelope.Open HSRs that are still associated with the nuclear enve-lope usually do not show significant BrdU incorporation,as shown in Fig. 6, B and C. The internal, linear stainingregion seen in the mid-nuclear section is the only internalregion showing BrdU incorporation and optical sectioningsuggests that it corresponds to an invagination of the nu-clear envelope, common in these cells (Fricker et al.,1997). The HSR shows little overlap with BrdU labeling.
Given the resolution limits of light microscopy and thehigh density of replication foci distributed uniformly overthe nuclear periphery, it is very likely that the small num-ber of BrdU-staining foci in the HSR vicinity in this exam-ple correspond to foci separate from the HSR.
In contrast, Fig. 6 D shows a similar, open HSR locatedwithin the interior of a BrdU pattern 3 nucleus that nowshows extensive colocalization with BrdU incorporation.There is a striking correlation between intranuclear posi-tioning of these open HSRs and HSR replication, with 8/8of the interior located HSRs replicating. Only 1/9 nuclei inwhich the open HSR was peripherally located showed sig-nificant colocalization of the HSR with BrdU incorpora-tion; in this case the colocalization covered less than halfof the HSR region (data not shown). Most HSRs (14/18)with this open conformation are in cells with BrdU pattern3; nine of these show HSR replication. 8/18 open HSRs areunlabeled with BrdU, with all of these in nuclei with BrdUincorporation patterns 1 and 2 (3/3) or pattern 3 (5/14).
Further Changes in HSR Morphology and IntranuclearPositioning during Progression through S and G2. A “linear”HSR conformation (Fig. 6 E) in nuclei with BrdU incorpo-ration patterns 3 and 4 appears to represent a later stage ofHSR replication. The average length of these linear, ex-tended HSRs was z4 mm, yielding a compaction ratio ofroughly 7,200:1, only three- to fourfold reduced relative tometaphase. This linear HSR conformation corresponds topatterns C and D in Fig. 5. Because of the reduced struc-tural preservation after the HCl-induced DNA denatur-ation used for BrdU staining, the intertwined versus paral-lel fiber appearance is not as readily distinguishable,leading us to group patterns C and D into this single cate-gory. In nuclei with BrdU incorporation patterns 3 and 4,all linear HSRs (15/15) showed BrdU colocalization in nu-clei, as compared to only z50% of open (8/17) HSRs.Moreover, there is also a shift from predominately BrdUincorporation pattern 3 in nuclei with open HSRs to a neareven mixture of patterns 3 and 4 for linear HSRs (TableIII). These results are consistent with our interpretation ofthe intertwined appearance of the HSR pattern C (Fig. 5)as corresponding to partially resolved, daughter chromatids.
After completion of HSR replication, the HSR assumesan enlarged but compact spot-like conformation, classifiedas an “open-2” conformation (Table III); this was seen in
Figure 5. Percentage of dif-ferent HSR conformations inlate S phase and G2 nuclei atdifferent times after releasefrom early S phase block.HSR remains condensed(pattern A) first 4 h, then de-condenses between 4 and 6 hafter release. Patterns are de-fined as (see also Fig. 4): (A)condensed, compact HSR,1-mm diam; (B) larger, de-condensed, ball-shaped HSR
with internal fibrillar structure and 1.5–3-mm in diam; (C) ex-tended, linear HSR, 3–4 mm in length, with appearance of inter-twined fibers in some regions; and (D) HSR with two obviousparallel fibers, 1–3 mm in length. Data points represent statisticsfrom .100 nuclei.

The Journal of Cell Biology, Volume 140, 1998 984
nuclei containing a late BrdU incorporation distribution(Fig. 6 F). BrdU incorporation pattern 5 is very distinctiveand is characterized by a small number of very large, inte-riorly located replication foci, similar in number and rela-tive size to mitotic replication bands arising from labelingduring the last 0.5–1 h of S phase (see Fig. 1 A). We alsoobserved a small number of nuclei with an open HSR mor-phology in which the BrdU labeling pattern was similar topattern 5 but with an increased number of large spots,which was still significantly less than that described forpattern 4 (O’Keefe et al., 1992). These nuclei may repre-sent a transitional stage between patterns 4 and 5 and inTable III we have labeled these nuclei as pattern 4 (late).
15/16 nuclei with this open-2 HSR conformation clearlyshowed HSRs that did not overlap with these late replica-tion foci. This is consistent with our mitotic replicationbanding experiments in which the HSR was observed tohave already completed replication during the last 30–60min of S phase when the chromosome arm opposite to theHSR was replicating. Many examples showed the HSR ad-jacent to or surrounded by a large spot of BrdU labeling.Presumably this adjacent region incorporating BrdU cor-responds to the late replicating chromosome arm oppositeto the HSR. In Fig. 6 F the adjacent, BrdU-labeled regionis partially associated with the NE, but near the HSR it ex-tends into the nuclear interior. A number of the HSRs atthis time were located in the nuclear interior together withthe adjacent BrdU-labeling region.
In Fig. 5, this open conformation would have beengrouped within the single category B. The double BrdU,lac repressor staining now allows us to divide this groupinginto an initial decondensation stage, preceding and accom-panying DNA replication, with a second open-2 HSR con-formation with comparable size to the open HSR mor-phology. This second open-2 conformation representsHSRs after replication; its increased size represents HSRduplication rather than decondensation. The grouping of
these two categories may explain why the HSR morphol-ogy pattern B in Fig. 5 did not show a clearly defined peak.
Our results suggest the following temporal sequence.The HSR remains condensed and near the nuclear enve-lope through the first 4 h of S phase. 4–6 h into S phase theHSR begins to decondense and move toward the nuclearinterior. During this decondensation and intranuclearmovement, HSR DNA replication initiates. Continued rep-lication of the HSR leads to an extended, linear morphol-ogy, z4 mm in length, with partially resolved daughterchromatids. During HSR DNA replication the HSR re-mains within the nuclear interior or, in the linear, extendedconformation, either within or extending into the nuclearinterior. HSR replication is followed by recondensation ofthe daughter chromatids such that the linear, extendedHSR morphology is transformed into a ball-shaped con-formation, with a movement of the majority of HSRs backto the NE. This may reflect either a refolding of the under-lying linear chromatids or a remodeling of the large-scalechromatin organization.
Finally, during the transition into prophase, the HSRagain extends into linear, parallel daughter chromatids,z2-mm long (Fig. 4 F). Both the length and width of thechromatids at this stage are very close to that observedduring the linear extension stage observed in late telo-phase/early G1. This is consistent with the transition intoand out of mitosis being associated with the coiling anduncoiling of this z2-mm chromatid.
In Vivo Confirmation of S–G2 Events
The temporal ordering described above was further sub-stantiated by direct, in vivo observations. Cells expressinga GFP–lac repressor–NLS fusion protein were blocked inearly S phase and we typically began our observations sev-eral hours after release. As the total exposure was in-creased above z10 s, an increasing percentage of cells
Figure 6. HSR replication correlates with changesin HSR conformation and intranuclear position-ing. (A–F) Merged lac repressor (red) and BrdUpulse label (green) images. (A) Grazing opticalsection shows early S phase DNA replicationpattern 2 with peripheral, condensed, and unla-beled HSR; (B–E) middle S phase DNA replica-tion pattern 3 with small peripheral BrdU incor-poration sites. Grazing (B) and mid-nuclear (C)sections of same nucleus. Peripheral HSR hasdecondensed into ball-shaped, open conforma-tion, but has not yet begun DNA replication. (D)Different nucleus, HSR is similarly decondensedbut now shows extensive repressor and BrdUcolocalization and is located within nuclear inte-rior. (E) Linear HSR conformation with interiorlocation, at this conformational stage all HSRsshow BrdU colocalization. (F) Very late S DNAreplication pattern 5, with HSR now in “open-2”conformation (see text); HSR has completedreplication and is adjacent to large replication fo-cus with partial association (arrow) to nuclearperiphery; this is most likely the late-replicatingchromosome arm opposite the HSR. (G) EnlargedHSR images, A–F. Bars: (A–F) 1 mm; (G) 2 mm.
Li et al. Interphase Cell Cycle Dynamics—Precise Choreography 985
showed chromatid bridging with nondysjunction duringanaphase. Further exposure increases to z30 s, while notpreventing the decondensation events associated withHSR replication, did prevent an increasing fraction of cellsfrom entering mitosis; these cells arrested in a roundedstate, possibly because of a DNA-damage G2 checkpointarrest. Therefore we kept our total exposure to ,10 s, andonly considered data sets in which the observed cells en-tered and completed mitosis normally.
Fig. 7 (bottom, left) shows one such time series. Thetimes indicated correspond to elapsed time after releasefrom the S phase block. Between 5 and 6 h the HSR hasnearly doubled in diameter. Because of phototoxicity con-cerns, only single optical sections were acquired, prevent-ing deconvolution. The images displayed are therefore theunprocessed CCD data. At 7 h the HSR has enlarged fur-ther, showing an apparent fibrillar substructure as seen inthe immunostaining results (Fig. 5 B). At 8 h the HSR hasrecondensed, whereas at 8.5 h the HSR appears formed bya linear structure folded into a “C” shape. The contourlength of this “C” is z2 mm, matching that observed forprophase in the fixed specimens (Fig. 4 F). 0.5 h later daugh-ter chromatids have separated. A second example of thistransition from a condensed HSR in late S/G2 to an extended,linear chromosome is shown in Fig. 7 (bottom, right).
Not all of the stages defined from the immunofluores-cence results were observed in each time series. This wasexpected considering our 30-min sampling. From Fig. 5,we would predict the linearized stages after HSR decon-densation would be maintained over significantly shortertimes than the open conformation, which persists for 1–2 h.Some of the stages also may be concealed by the combina-tion of HSR orientation and the less clear, nondecon-volved images. For instance, we suspect that in Fig. 7 (bot-
tom, left), the 7.5-h image represents a linear conformationfolded into a curved, “C” shape.
However, the combined in vivo data sets show all of thepreviously described stages, supporting the overall tempo-ral sequence derived in the previous sections. Specifically,the longer duration, open conformation is observed in ev-ery example, with the subsequent linearization and recon-densation observed in several other data sets.
We note that the changes in HSR morphology we havedescribed during S–G2 have followed cell synchronizationprocedures using drug-induced S phase arrest, raisingquestions relating to possible drug-related side effects.However, examination of HSR morphology in log phasecells that had been pulse labeled with BrdU before fixa-tion showed very similar HSR morphologies to what wasobserved for the synchronized cells; specifically, we ob-served indistinguishable HSR morphologies in nuclei withspecific BrdU incorporation patterns for both the synchro-nized and log phase cells (data not shown). Moreover,changes in HSR conformation during G1–S were the samefor both synchronized and log phase cells.
Visualization of HSRs by Pre-embeddingImmunogold Staining
A closer examination of the HSR conformational changesobserved during progression through S phase was pro-vided by EM, using immunogold lac repressor staining onfixed, permeabilized cells that did not express the repres-sor (Fig. 8). Images are presented as in the EM negative,with electron dense staining corresponding to whiter re-gions. In early S phase, the HSR is condensed and close tothe nuclear envelope, although only parts of the HSR ap-pear to be in actual contact (Fig. 8, A and B). The density
Figure 7. In vivo dynamics of A03_1 HSR.Top left, linear extension of HSR is fol-lowed by condensation in early G1 nuclei.Two daughter cells in late telophase—20 or40 min after beginning observation, HSRlinearizes in each daughter cell. Recon-densation occurs within 20 min and HSRremains condensed for several hours after-wards. Top right, corresponding transmit-ted light images at 0 and 240 min. Bottomleft, Progression of HSR from late S throughmitosis, with t 5 0 corresponding to releasefrom early S phase block. HSR deconden-sation of HSR begins at 5 h, with “C” shapedappearance, followed by transition tolarger, ball-shaped HSR with internal fibril-lar structure (7 h). Suggestion of possiblelinear stage at 7.5 h is followed by a com-paction at 8 h and a regaining of a linear,curled conformation at 8.5 h with chromo-some segregation at 9 h. (Transmitted lightpictures shown below.) Bottom right, tran-sition of compact HSR in late S or G2 tolinear, extended chromosome axis inprophase. 2120 and 230 refer to minutesbefore cell division. Fluorescent (top) andtransmitted images (bottom). Bars: (fluo-rescence) 2 mm; (transmitted) 4 mm.

The Journal of Cell Biology, Volume 140, 1998 986
of chromatin packing within the HSR is quite high, al-though stereopairs of semi-thick sections (data not shown)suggest an underlying fibrillar substructure with diameterswell above the 30-nm diam of chromatin fibers. This issupported by serial thin sections (Fig. 8, C–E). Arrows andarrowheads point to features suggesting a hierarchy of fi-ber folding motifs. Specifically, features with z100- and200-nm widths are seen. The z100-nm-diam features areconsistent with the chromonema fibers we have describedpreviously (Belmont et al., 1994). Several serial sectiondata sets to date consistently show apparent 200-nm fibersat this stage, and initial impressions are suggestive of fold-ing an z200-nm fiber to form an z400-nm-diam fiberwhose folding then forms the compact HSR.
A range of HSR morphologies is observed 6 h after re-lease from the early S phase block (Fig. 8, F–J), as ex-pected (Fig. 5). An HSR matching the open, internally lo-cated pattern associated with HSR DNA replication (Fig.8, F and G) can be recognized by its size, z1.8 3 1 mm,and dispersed, loosened substructure (see Fig. 4 B). Part ofthe HSR is closely associated with the surface of a nucleolus,which has also been observed in a significant number of otherexamples of this HSR stage by both electron and light mi-croscopy, including in vivo observations. An z100-nm-diamsubstructure, consistent with folding of chromonema fibers,is more obvious at this less condensed stage. Based on theBrdU–lac repressor double staining results (Table III), 9/9of HSRs with this conformation were undergoing DNA
Figure 8. Changes in HSRultrastructure during S–G2progression. (A and B) Con-densed, peripherally locatedHSR (arrow), 0 h after re-lease from early S phaseblock. (Section thickness 0.5mm). HSR is condensed andadjacent to nuclear envelope.(C–E) 60-nm-thick serialsections of early S phaseHSR. Several levels of chro-matin condensation are sug-gested. Immunogold stainingis confined to exterior HSRsurfaces. Small arrow pointsto z100-nm fibers, com-pacted within HSR, similarto chromonema fibers seenthroughout nucleus. Arrow-heads bracket larger, z200-nm-diam features. Severalserial section data sets to dateconsistently show apparent200-nm fibers at this 0 hstage. (F and G) Decon-densed, ball-shaped HSR, 6 hafter release from early Sphase. HSR (arrow) is adja-cent to nucleolus with regionsclosely apposed to nucleolarsurface. (H–J) Different ex-amples of HSR conforma-tion, 6 h after release fromearly S phase. (H) 0.5-mmsection with HSR adjacent tonuclear envelope suggestiveof a 0.3–0.4-mm chromatidcurled into “C” shape. (I) de-condensed HSR with extendedchromonema fiber (arrow)(0.2-mm section). (J) LinearHSR (60-nm section). Arrow-heads bracket an z0.2–0.25-mm-diam segment, bottomright suggests parallel chro-matids, with arrowheadpointing to chromonema fiberoutlined by peripheral goldstaining. Bars: (A–J) 0.5 mm.

Li et al. Interphase Cell Cycle Dynamics—Precise Choreography 987
replication. There is no indication of a specialized replicationfactory or subnuclear organelle, rather the large-scale chro-matin packing appears similar to that seen at other stages.
Additional examples from this 6 h time point (Fig. 8, H–J)are suggestive of other HSR conformations assigned bylight microscopy, but unambiguous assignments are notpossible without serial sectioning. An early stage of HSRdecondensation is suggested in Fig. 8 H. The HSR is closelyassociated with the nuclear envelope and compact. Inter-estingly, it appears to be formed by the tight curvature ofan z0.4-mm-diam fiber, with hints in the stereo pair of in-ternal z0.2–0.3-mm fibers (data not shown), with an over-all contour length of z2.5 mm. A similar, curved fiber ap-pearance was seen in the in vivo light microscopy sequenceFig. 7 (bottom, left, 5 h) at the beginning of HSR decon-densation.
Extended, z100-nm chromonema fibers are seen in de-condensed HSRs (Fig. 8 I, arrow), demonstrating the simi-larity of large-scale substructure found within the HSRand the surrounding chromatin. A highly condensed HSR,most likely corresponding to a linear HSR conformation,is suggestive of paired daughter chromatids, z0.4-mmdiam (Fig. 8 J, right); a linear segment to the left and aboveis z0.25 mm in width. An arrow marks an z100-nm seg-ment, outlined by immunogold labeling, within the HSR.
Discussion
Summary
Previous work has described a large degree of heterogene-ity when comparing large-scale chromatin structure withina single nucleus or between nuclei in a population of logphase cells. Although changes in overall chromatin struc-ture as a function of the interphase cell cycle have beendescribed, it has never been clear how tightly correlatedthese structural transitions are to cell cycle progression.Using a new methodology for selectively staining specificchromosome regions, we now have demonstrated a precisechoreography of changes in large-scale chromatin organi-zation occurring with each cell cycle for a late replicating,heterochromatic amplified chromosome region, or HSR.Dramatic reorganization and changes in intranuclear posi-tioning of this HSR occur at specific times during the in-terphase cell cycle, as summarized in Fig. 9.
Biological Implications and Connections
Chromatid Coiling. Evidence for the coiling, possibly heli-cal, of a prophase-like chromatid to form the final metaphasechromosome has accumulated over several decades. Mostof this work has been derived either from in vitro manipu-lation of metaphase chromosomes or by partial inhibitionof chromosome condensation in vivo (Ohnuki, 1968; Ratt-ner and Lin, 1985; Boy de la Tour and Laemmli, 1988). Apossible objection to all of these studies is that by alteringnormal chromosome structure by various manipulations acoiled conformation could be induced that is unrelated tothe actual physiological folding process leading to metaphasechromosome condensation.
Through direct observation of the normal, physiologicalchromosome decondensation associated with late telophase/
early G1 chromosome, we now present data supportingthe concept of the uncoiling of metaphase chromosomesinto an underlying, z0.3–0.4-mm chromatid decondensation.Chromosomes after mitosis showed an extension, oftenabrupt, occurring nonsynchronously in daughter cells dur-ing late telophase/early G1 with a roughly twofold exten-sion in length. The telophase HSR width was increasedrelative to metaphase, suggestive of a partial unwinding,and both three-dimensional light microscopy optical sec-tioning and EM stereopairs were suggestive of a coiled fi-ber forming these loosened telophase chromatids. In fur-ther support of the coiled model for metaphase chromosomestructure, the length of the HSR in early prophase nucleiwas the same as that seen for the extended late telophase/early G1 HSR, suggesting a similar ultrastructure just beforecondensation into metaphase chromosomes.
Whereas our results support a model in which an z0.3–0.4-mm-diam fiber folds to form the final metaphase chro-matid, it remains unclear whether this folding process occursthrough a helical versus irregular coiling. Future three-dimensional reconstructions of the A03_1 HSR by EM serialsection and tomographic reconstructions should resolvethis question.
Chromosome Axis Formation and Hierarchical Models of Chromosome Folding
Surprisingly, we observed a distinct chromosome axis andcondensed chromatid for the A03_1 HSR in early G1,middle to late S phase, and G2 nuclei, with the compactionratio of the linear HSR during late S phase only several-fold lower than during metaphase. In vitro chromosomeassembly experiments have suggested a requirement forthe XCAP C and E condensin complex for both initiationand maintenance of chromosome condensation (Hiranoand Mitchison, 1994; Hirano et al., 1997). Based on initialin vitro and in vivo studies, the XCAP complex is targetedto chromosomes during mitosis (Hirano and Mitchison,1994; Saitoh et al., 1994; Hirano et al., 1997) and it hasbeen suggested that XCAP function may involve the coilingof a prophase chromatid and/or the formation of a distinctchromosome axis (Peterson, 1994; Gasser, 1995; Saitoh etal., 1995). Our observation of a distinct chromosome axis
Figure 9. Summary of changes in A03_1 HSR conformation andintranuclear position as a function of cell cycle progression. (A)shows a sequence of different conformations and intranuclear po-sitions seen for the HSR during interphase; gray color of HSR de-notes DNA replication; (B) the approximate cell cycle timing foreach of the stages in this sequence.
The Journal of Cell Biology, Volume 140, 1998 988
during interphase for the A03_1 HSR therefore raises in-teresting questions regarding the structural motifs and bio-chemical components underlying chromatid axis formation.
One current proposal for mitotic chromosome structureis the coiled/radial loop model in which radial loops of 30-nmchromatin fibers are organized by a chromosome scaffoldthat itself is helically coiled (Rattner and Lin, 1985; Boy dela Tour and Laemmli, 1988). In contrast, we have visual-ized large-scale chromatin fibers z100 nm in diameter andthis has led us to propose a hierarchical model of chro-mosome structure (Belmont and Bruce, 1994; Belmont,1997). Although the highly condensed conformation of theA03_1 HSR does not facilitate investigation into theselower levels of large-scale chromatin structure, our resultspresented in this paper further support a hierarchicalmodel of chromosome architecture.
The highest level of condensation would correspond tothe uncoiling of the z1.3-mm metaphase chromatid intothe z2.2-mm extended, early G1 chromatid. The visualiza-tion of z4-mm chromatids during late stages of HSR repli-cation suggests an additional unfolding step correspondingto a still lower level of organization. In fact, a small per-centage of light microscopy images of early G1 nuclei,including one in vivo data set, show portions of the ex-tended late telophase/early G1 HSR conformation furtheruncoiling into thinner, and longer linear fibers (data notshown). This additional uncoiling may be related to thez0.2-mm-wide features seen in the thin EM serial sectionsof condensed HSRs shown in Fig. 8. Finally, a third levelof uncoiling is implied by the fibrillar substructure of thedecondensed, open HSR conformation, with organizationof the HSR into the z100-nm chromonema fibers we havedescribed previously, as illustrated in Fig. 8. Recently, wehave targeted a lac repressor protein, fused with the VP16acidic activation domain, to the A03_1 HSR. Localizationof this transcriptional activator to the A03_1 HSR leads toa striking decondensation of the HSR into long, extendedfibers, z100 nm in diameter (Tumbar, T., G. Li, G. Sud-low, and A.S. Belmont. 1996. Mol. Biol. Cell. 7:100a; Tum-bar, T., G. Li, G. Sudlow, and A.S. Belmont, manuscript inpreparation).
Intranuclear Chromosome Movements andDNA Replication
Previous work has demonstrated cell cycle changes in cen-tromere intranuclear positioning (Ferguson and Ward,1992; Vourc’h et al., 1993). We now extend these previousobservations by describing a specific example of chromo-some motion in which the A03_1 HSR moves from the nu-clear periphery to the nuclear interior during a 1–2-h pe-riod during middle to late S phase; both the motion andaccompanying HSR decondensation precede initiation ofDNA replication.
This change in HSR position could be a result of its de-condensation into the nuclear interior from its NE attach-ment point. However, the interiorly located, decondensedHSRs show no apparent connections of lac repressorstaining to the nuclear periphery. Moreover, in several ex-amples the late replicating arm of the HSR-containingchromosome can be visualized as attached at the distal endto the nuclear envelope with its proximal end extending
inwards towards the interiorly located HSR. We must con-clude therefore that the HSR does in fact show a move-ment within the nucleus. A second possibility is that thesame chromatin modifications driving HSR decondensa-tion might also eliminate HSR NE binding. The HSR mightthen show random diffusion away from the nuclear enve-lope. A third possibility is that there is a directed motionof the HSR within the nucleus through unknown mecha-nisms.
The discrete nature and characteristic sizes and nuclearlocation of replication foci during S phase have led to theconcept of motion of chromosome regions to specific in-tranuclear locations for replication (Jackson and Cook,1995). The A03_1 HSR intranuclear repositioning is corre-lated with HSR replication. However, the HSR initiatesreplication at an S phase stage in which most of the repli-cating DNA is peripherally located, decreasing the attrac-tiveness of a model in which the HSR moves to a preexist-ing replication body. Alternatively, this HSR movementmay be associated with changes in transcriptional activityaccompanying the HSR decondensation. Preliminary re-sults, including limited in vivo observations, suggest alarge fraction of the decondensed, interiorly located HSRsappear attached to the nucleolus. More extensive in vivoobservations are now beginning that will focus on the dy-namics of this motion.
Possible Links to Heterochromatin Behavior
The highly condensed conformation of the A03_1 HSR, itsperipheral location adjacent to the NE, and its replicationin middle to late S phase suggests it has heterochromatin-like properties. The origin of these heterochromatin-likeproperties is currently unclear. They might result from thelarge number of lac operator repeats and vector copieswithin the A03_1 HSR (Csink and Henikoff, 1996). Alter-natively, they may result from coamplification of hetero-chromatin. Whatever their origin, certain correlations ofthe A03_1 cell cycle behavior with observations from othersystems involving heterochromatin behavior are intriguing.
For instance, insertion of an z1-Mbp repetitive, hetero-chromatic sequence into the brown locus leads to a reposi-tioning of this locus to the chromocenter (Csink and Heni-koff, 1996; Dernburg et al., 1996). This association with thechromocenter occurs in G1 nuclei and early S phase, whilein late S and G2 the locus is not associated with the chro-mocenter (Csink, A.K., and S. Henikoff, unpublished re-sults). This timing is strikingly similar to that observed forassociation of the A03_1 HSR with the nuclear envelope.We speculate that similar cell cycle modulations in hetero-chromatin structure are occurring in both systems, leadingto the modulated association of heterochromatin with ei-ther the chromocenter in Drosophila or the nuclear pe-riphery in CHO cells.
A second interesting observation involves heterochro-matin induced gene silencing. b Globin genes linked to anincomplete locus control region (LCR) are partially si-lenced when integrated into centromeric heterochromatinregions. In one pattern of silencing, a small but character-istic percentage of cells within a given cell clone escape si-lencing; this has been proposed to be due to an escapefrom silencing during a specific cell cycle stage (Milot et al.,
Li et al. Interphase Cell Cycle Dynamics—Precise Choreography 989
1996). We have shown a pronounced decondensation ofthe A03_1 HSR occurring during middle to late S phase.We speculate that a similar, cell cycle–dependent changein large-scale chromatin organization of centromere re-gions may allow restricted expression of the globin trans-genes during middle to late S phase, accounting for the es-cape from silencing of the globin gene in these cell clones.
The A03_1 HSR provides an excellent cytological sys-tem to investigate issues related to nuclear positioning ofchromosomal loci, formation of condensed large-scalechromatin structure, and the relationship between tran-scription and heterochromatin formation.
This work was supported by National Institutes of Health grant GM42516to A. Belmont. Electron microscopy was carried out at the Beckman Visu-alization laboratory at UIUC.
Received for publication 19 September 1997 and in revised form 6 Janu-ary 1998.
References
Becker, W.M., J.B. Reece, and M.F. Poenie. 1996. The World of the Cell. TheBenjamin/Cummings Publishing Co., Menlo Park. 434–435.
Belmont, A.S. 1997. Large–scale chromatin organization. In Genome Structureand Function. Kluwer Academic Publishers, Dordrecht, Germany. 261–276.
Belmont, A.S., and K. Bruce. 1994. Visualization of G1 chromosomes—afolded, twisted, supercoiled chromonema model of interphase chromatidstructure. J. Cell Biol. 127:287–302.
Belmont, A.S., J.W. Sedat, and D.A. Agard. 1987. A three-dimensional ap-proach to mitotic chromosome structure: evidence for a complex hierarchi-cal organization. J. Cell Biol. 105:77–92.
Belmont, A.S., M.B. Braunfeld, J.W. Sedat, and D.A. Agard. 1989. Large-scalechromatin structural domains within mitotic and interphase chromosomes invivo and in vitro. Chromosoma. 98:129–143.
Belmont, A.S., Y. Zhai, and A. Thilenius. 1993. Lamin B distribution and asso-ciation with peripheral chromatin revealed by optical sectioning and elec-tron microscopy tomography. J. Cell Biol. 123: 1671–1685.
Boy de la Tour, E., and U.K. Laemmli. 1988. The metaphase scaffold is heli-cally folded: sister chromatids have predominately opposite helical handed-ness. Cell. 55:937–944.
Chen, J., Y.Kanai, N.J. Cowan, and N. Hirokawa. 1992. Projection domains ofMAP2 and tau determine spacings between microtubules in dendrites andaxons. Nature. 360:674–677.
Csink, A.K., and S. Henikoff. 1996. Genetic modification of heterochromatinassociation and nuclear organization in Drosophila. Nature. 381:529–531.
Dancher, G. 1981. Localization of gold in biological tissue. A photochemicalmethod for light and electron microscopy. Histochemistry. 71:81–88.
Dernburg, A.F., K.W. Broman, J.C. Fung, W.F. Marshall, J. Philips, D.A.Agard, and J.W. Sedat. 1996. Perturbation of nuclear architecture by long-distance chromosome interactions. Cell. 85:745–759.
Ferguson, M., and D.C. Ward. 1992. Cell cycle dependent chromosomal move-ment in pre-mitotic human T-lymphocyte nuclei. Chromosoma. 101:557–565.
Fricker, M., M. Hollinshead, N. White, and D. Vaux. 1997. Interphase nuclei ofmany mammalian cell types contain deep, dynamic, tubular membrane-bound invaginations of the nuclear envelope. J. Cell Biol. 136:531–544.
Gasser, S.M. 1995. Chromosome structure-coiling up chromosomes. Curr. Biol.5:357–360.
Giloh, H., and J.W. Sedat. 1983. Fluorescence microscopy: reduced pho-tobleaching of rhodamine and fluorescein protein conjugates by n-propylgal-late. Science. 217:1252–1255.
Helm, R., A.B. Cubitt, and R.Y. Tsien. 1995. Improved Green Fluorescence.Nature. 373:663–664.
Hirano, T., and T.J. Mitchison. 1994. A heterodimeric coiled–coil protein re-quired for mitotic chromosome condensation in vitro. Cell. 79:449–458.
Hirano, T., R. Kobayashi, and M. Hirano. 1997. Condensins, Chromosome con-densation protein complexes containing XCAP-C, XCAP-E and a Xenopushomolog of the Drosophila Barren protein. Cell. 89:511–521.
Hiraoka, Y., J.R. Swedlow, M.R. Paddy, D.A. Agard, and J.W. Sedat. 1991.Three-dimensional multiple-wavelength fluorescence microscopy for thestructural analysis of biological phenomena. Semin. Cell Biol. 2:153–165.
Jackson, D.A., and P.R. Cook. 1995. The structural basis of nuclear function.Int. Rev. Cytol. 162:125–149.
Lawrence, J.B., R.H. Singer, and J.A. McNeil. 1990. Interphase and metaphaseresolution of different distances within the human dystrophin gene. Science.249:928–932.
Milot, E., J. Strouboulis, T. Trimborn, M. Wijgerde, E. de Boer, A. Langeveld,K. Tan-Un, W. Vergeer, N. Yannoutsos, F. Grosveld, and P. Fraser. 1996.Heterochromatin effects on the frequency and duration of LCR-mediatedgene transcription. Cell. 87:105–114.
O’Keefe, R.T., S.C. Henderson, and D.L. Spector. 1992. Dynamic organizationof DNA replication in mammalian cell nuclei: Spatially and temporally de-fined replication of chromosome-specific a-satellite DNA sequences. J. CellBiol. 116:1095–1110.
Ohnuki, Y. 1968. Structure of chromosomes: 1. Morphological studies of thespiral structure of human somatic chromosomes. Chromosoma. 25:402–428.
Parra, I., and B. Windle. 1993. High resolution visual mapping of stretchedDNA by fluorescent hybridization. Nat. Genet. 5:17–21.
Peterson, C.L. 1994. The SMC family: novel motor proteins for chromosomecondensation? Cell. 79:389–392.
Pixton, J., and A.S. Belmont. 1996. NewVision: a program for interactive navi-gation and analysis of muliple 3-D data sets using coordinated virtual cam-eras. J. Struct. Biol. 116:77–85.
Rattner, J.B., and C.C. Lin. 1985. Radial loops and helical coils coexist inmetaphase chromosomes. Cell. 42:291–296.
Robinett, C.C., A. Straight, G. Li, C. Willhelm, G. Sudlow, A. Murray, and A.S.Belmont. 1996. In vivo localization of DNA sequences and visualization oflarge-scale chromatin organization using lac operator/repressor recognition.J. Cell Biol. 135:1685–1700.
Saitoh, N., I.G. Goldberg, E.R. Wood, and W.C. Earnshaw. 1994. ScII: Anabundant chromosome scaffold protein is a member of a family of putativeATPases with an unusual predicted tertiary structure. J. Cell Biol. 127:303–318.
Saitoh, N., I. Goldberg, and W.C. Earnshaw. 1995. The SMC proteins and thecoming of age of the chromosome scaffold hypothesis. Bioessays. 17:759–766.
Suau, P., E.M. Bradbury, and J.P. Baldwin. 1979. Higher–order structures ofchromatin in solution. Eur. J. Biochem. 97:593–602.
Subramani, S., R. Mulligan, and P. Berg. 1981. Expression of the mouse dihy-drofolate reductase complementary deoxyribonucleic acid in simian virus 40vectors. Mol. Cell. Biol. 1:854–864.
Tobey, R.A., and H.A. Crissman. 1972. Preparation of large quantities of syn-chronized mammalian cells in late G1 in the pre-DNA replicative phase ofthe cell cycle. Exp. Cell Res. 75:460–464.
Tobey, R.A., N. Oishi, and H.A. Crissman. 1990. Cell cycle synchronization: re-versible induction of G2 synchrony in cultured rodent and human diploid fi-broblasts. Proc. Natl. Acad. Sci. USA. 87:5104–5108.
Urlaub, G., P.G. Mitchell, E. Kas, L.A. Chasin, V.L. Funanage, T.T. Myoda,and J. Hamlin. 1986. Effect of gamma rays at the dihydrofolate reductase lo-cus: deletions and inversions. Somatic Cell Molec. Genet. 12:555–566.
Vourc’h, C., D. Taruscio, A.L. Boyle, and D.C. Ward. 1993. Cell cycle-depen-dent distribution of telomeres, centromeres, and chromosome-specific sub-satellite domains in the interphase nucleus of mouse lymphocytes. Exp. CellRes. 205:142–151.

The Journal of Cell Biology, Volume 140, 1998 990