internet of things (iot) based advanced energy auditing on
TRANSCRIPT
International Journal of Innovative Technology and Exploring Engineering (IJITEE)
ISSN: 2278-3075, Volume-9 Issue-6, April 2020
2253
Published By: Blue Eyes Intelligence Engineering
& Sciences Publication
Retrieval Number: F3340049620/2020©BEIESP
DOI: 10.35940/ijitee.F3340.049620
Abstract: This Paper is an investigation on methods involved
for different energy auditing practices using the Internet of
Things (IOT) technology. A practical sugar industry environment
is emulated to get the overall power delivery at each stage of the
sugar industry process. The sensors utilized at different sugar
making process are discussed with the perspective of the power
usage at each of the sugar processing stages. The Raspberry Pi
based logging and analysis process is developed for the sugar
industry. The sensors are connected to the power usage capability
and the data collected are logged to be able to analyse the power
delivery and carry out the energy auditing in the complete process.
Python based UI for the complete energy auditing process is
developed and the results are discussed in detail. The emulation
carried out is found to replicate the complete process of sugar
industry and the auditing is scaled up to match the specifications
of the practical sugar industry. Suggestions regarding the power
conservation measures are provided to be followed by the industry.
The manual means of energy audit is removed to replace it with
the automated energy audit as given in the graphical form. It is
observed that the total cost for the energy audit is getting reduced
except for the capital cost.
Keywords: Internet of Things, Energy Auditing, Cloud
Computing, Sugar Industry, Process Control
I. INTRODUCTION
India being one of the leading sugar producers in the
world needs a better automated sugar production technology
with lesser energy consumption in every power delivery
stage of the sugar production. The energy audit
implementation in an industry is meant to develop the
conservation strategy of energy in the plant. The total capital
cost and the breakeven point of the industry’s income is a
crucial parameter considered in the economics of the
company [1]. The energy demand that is prevailing in the
industry and ever increasing demand, with increasing cost on
energy, the leakage in the energy and depleting source of
energy the purpose of auditing the energy is inevitable. The
energy conservation strategies are the results of the energy
audit procedure carried out in the industry. The automation of
energy audit is prime in order to avoid human hours on the
auditing process. Categorising the sections of the plant, by
means of power specifications or the industry process, is
Revised Manuscript Received on April 09, 2020.
* Correspondence Author
Yamanappa.N .Doddamani * Research Scholar , VisvesvarayaTechnical
University, Belagavi, , Karnataka, India Email: [email protected]
U. C. Kapale, department, ** Departement of Mechanical Engineering, . S.
G. Balekundri Institute of Technology, Belagavi, Karnataka, India
carried out while conducting the energy audit survey in the
plant. Among the total power that is used commercially in
India almost 45% of the energy is used in industries [2-4]. It
is observed that the energy saving capability of the sugar
plant is about 35% [5-7]. Thus the need of the energy audit
implementation and the conservation of energy in the sugar
industry has a bigger scope with government encouraging the
energy conservation initiatives. The government of India
initiated the energy conservation act way back in 2001
establishing the Bureau of Energy Efficiency (BEE) later in
2002. Every industrial sector is concentrated to develop the
conservation practice through this establishment. The
processes in the sugar industry include juice extraction plant
that comprise of unloading sugarcane, moving sugarcane in
the conveyor belt, preparing the cane and juicing. The other
processes are Juice purification followed by the evaporation
and crystallization at the end. The cogeneration process using
the bagasse which is the residue from the cane after the juice
extraction is considered in the modern sugar industries [8-9].
This paper takes up the challenge of identifying the sections
in the sugar industry which utilises higher power and audits
the energy. The conservation tactics utilized in the sugar
industry by using the data available from the energy audit is
discussed and further suggestion is followed in the industry.
II. ENERGY AUDIT PURPOSE, PREREQUISITES
AND PROCEDURE
The purpose of the energy audit in the sugar industry is the
problem of lesser profit due different reasons including the
transportation cost, sugar price, low output from the sugar
industry from high amount of sugarcane. The cost cutting at
every stage of the production is a primary need in order to
improve profit in the sugar industry while Indian scenario is
considered.
The power rating of the equipment used all over the sugar
plant is as given in the table 1. The Sugar industry capable of
handling 7500 tonnes of sugar cane with slings lifting 6
tonnes for every lift and frequenting 20 lifts per hour with
three bridges with three trolleys. Electrical equipment with
power delivery capacity for the specifications thus discussed
is detailed in the following Table1.
Internet of Things (IOT) based Advanced
Energy Auditing on Sugar Industry
Automation for Better Energy Conservation
Measures
Yamanappa.N.Doddamani, U. C. Kapale
Internet of Things (IOT) based Advanced Energy Auditing on Sugar Industry Automation for Better Energy
Conservation Measures
2254
Published By: Blue Eyes Intelligence Engineering
& Sciences Publication
Retrieval Number: F3340049620/2020©BEIESP
DOI: 10.35940/ijitee.F3340.049620
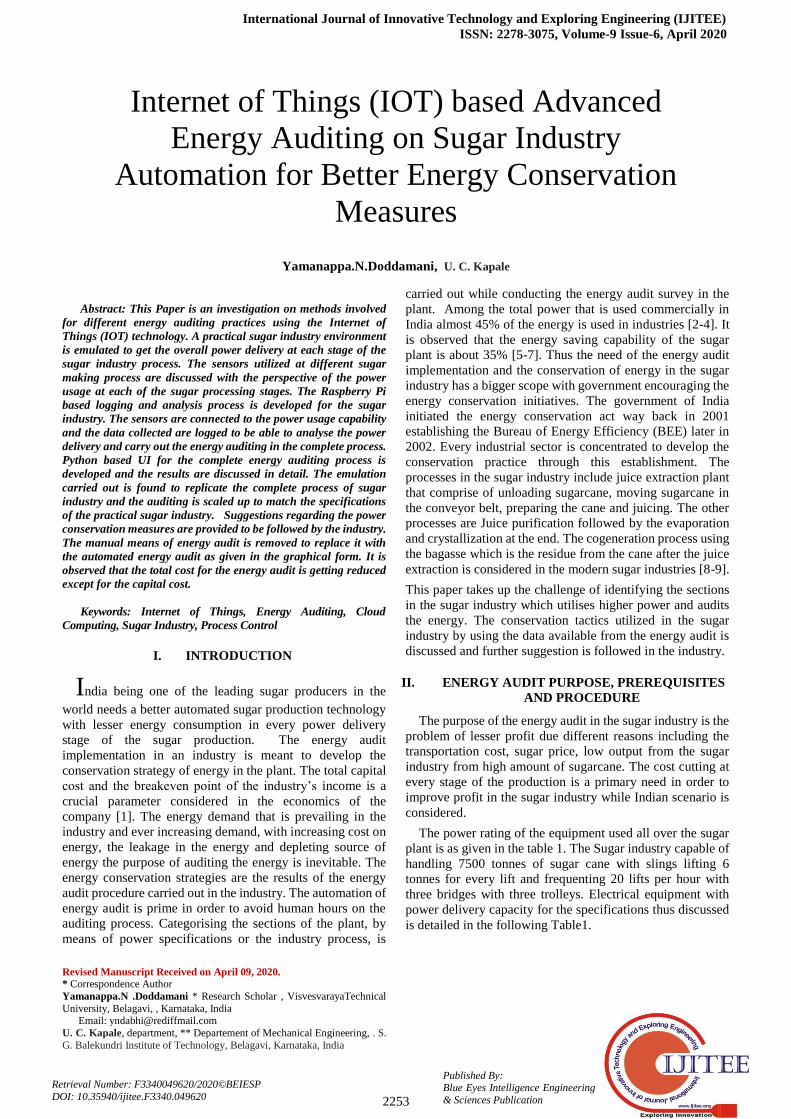
Table I : Equipment Used in Sugar Industry and
Corresponding Specifications
Equipment Rating Induction Motor
Hoisting Drum Drive 35HP
Holding Drum Drive 35HP
Cross Travel Drive 10HP
Feeder Table 15HP
Cane Carrier 125 BHP
Rake Carrier 100BHP
Cane Chopper 200BHP
Cane Leveller 500BHP
Fibrizer 3MW
Mill Drive 850HP
Bagasse Elevator 75HP
Bagasse Carrier 100BHP
Return Bagasse Carrier 75BHP
Main Hoist Motor 25HP
Long Travel Motor 10HP
Cross Travel Motor 7.5HP
Roller 400HP
Mill and Pressure Feeder
Drive
1000HP
Drum Drive for Vacuum
Filter
3.7KW
Agitator Drive 2.2KW
Seed and Vacuum
Crystallizer
15HP
The Table above is the power used in the sugar industry while
the table below is the production from the bagasse based
power generating plant. 8000KW alternator is available for
the supply to the sugar industry.
Table II : Alternator Rating in Bagasse Cogeneration
Plant
Equipment Alternator
Diesel Generating 500KW
Bagasse Power Generating Plant 8000KW
The choice of both the electric and hydraulic sugarcane
handling system by using in the hoisting and holding drum
drive is suggesting that the hydraulic based system would
reduce the power usage if more bridges with more trolleys are
used. After both the drive to move the sugar cane to the
processing system the cane feeder is utilized with the 15HP
motor to feed the cane to the processing stages. The
automation that carries on the logging and analysis of the data
regarding power usage takes help of the IOT technology
using the Raspberry Pi along with the voltage and current
sensors.
a. IOT based automated Energy Audit
The IOT implementation on the energy audit of the sugar
industry is carried out using the above data that is gathered
from the sensors connected at nodes that matters in the
sugar plant. The energy audit process involves the
following steps,
• The first step is the identification of the higher
energy consuming equipment in the sugar
industry.
• Grouping the energy consuming equipment
according to its usability
• IOT sensors decided on the basis of different
nodes to be chosen
• Data Collection from different nodes through
cloud environment
• Energy Usage variation due to seasonal variation,
cost saving suggestions and payback period.
• Identifying higher power consuming section in
the plant
• Calculating Energy for per unit production in the
plant
The rating of the different sections after grouping the
equipment by means of its process in the sugar industry is
given in Table 3.
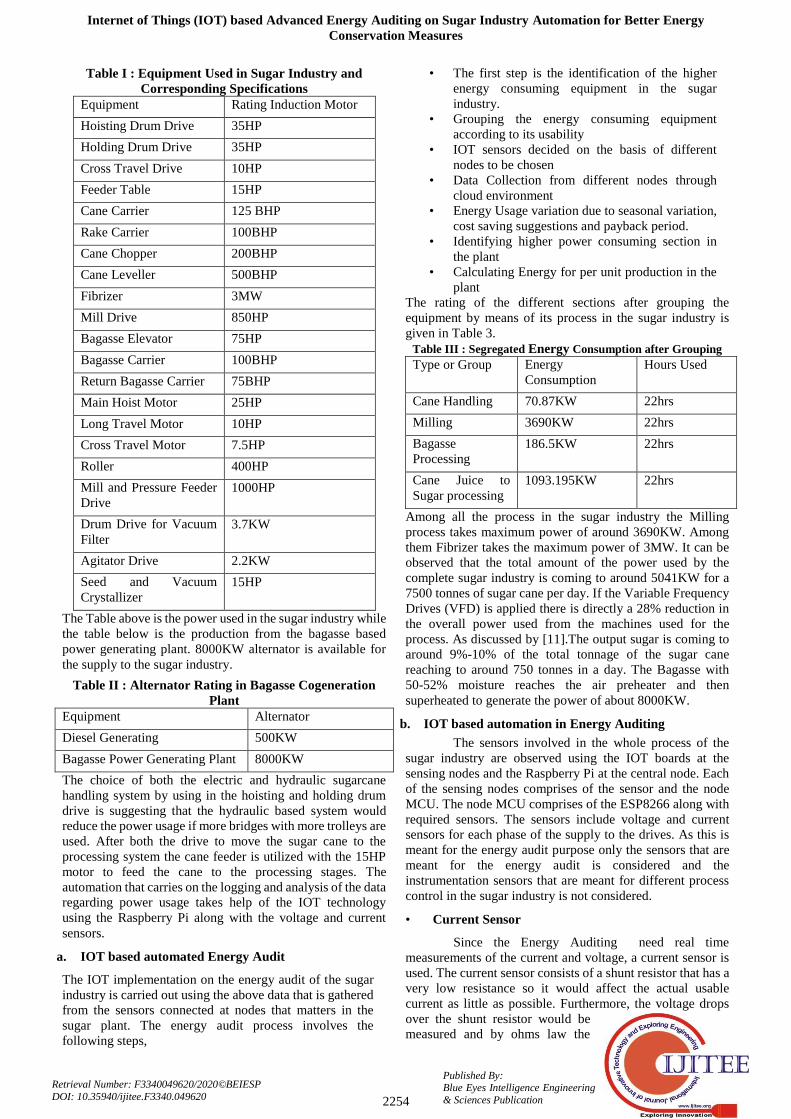
Table III : Segregated Energy Consumption after Grouping
Type or Group Energy
Consumption
Hours Used
Cane Handling 70.87KW 22hrs
Milling 3690KW 22hrs
Bagasse
Processing
186.5KW 22hrs
Cane Juice to
Sugar processing
1093.195KW 22hrs
Among all the process in the sugar industry the Milling
process takes maximum power of around 3690KW. Among
them Fibrizer takes the maximum power of 3MW. It can be
observed that the total amount of the power used by the
complete sugar industry is coming to around 5041KW for a
7500 tonnes of sugar cane per day. If the Variable Frequency
Drives (VFD) is applied there is directly a 28% reduction in
the overall power used from the machines used for the
process. As discussed by [11].The output sugar is coming to
around 9%-10% of the total tonnage of the sugar cane
reaching to around 750 tonnes in a day. The Bagasse with
50-52% moisture reaches the air preheater and then
superheated to generate the power of about 8000KW.
b. IOT based automation in Energy Auditing
The sensors involved in the whole process of the
sugar industry are observed using the IOT boards at the
sensing nodes and the Raspberry Pi at the central node. Each
of the sensing nodes comprises of the sensor and the node
MCU. The node MCU comprises of the ESP8266 along with
required sensors. The sensors include voltage and current
sensors for each phase of the supply to the drives. As this is
meant for the energy audit purpose only the sensors that are
meant for the energy audit is considered and the
instrumentation sensors that are meant for different process
control in the sugar industry is not considered.
• Current Sensor
Since the Energy Auditing need real time
measurements of the current and voltage, a current sensor is
used. The current sensor consists of a shunt resistor that has a
very low resistance so it would affect the actual usable
current as little as possible. Furthermore, the voltage drops
over the shunt resistor would be
measured and by ohms law the
International Journal of Innovative Technology and Exploring Engineering (IJITEE)
ISSN: 2278-3075, Volume-9 Issue-6, April 2020
2255
Published By: Blue Eyes Intelligence Engineering
& Sciences Publication
Retrieval Number: F3340049620/2020©BEIESP
DOI: 10.35940/ijitee.F3340.049620
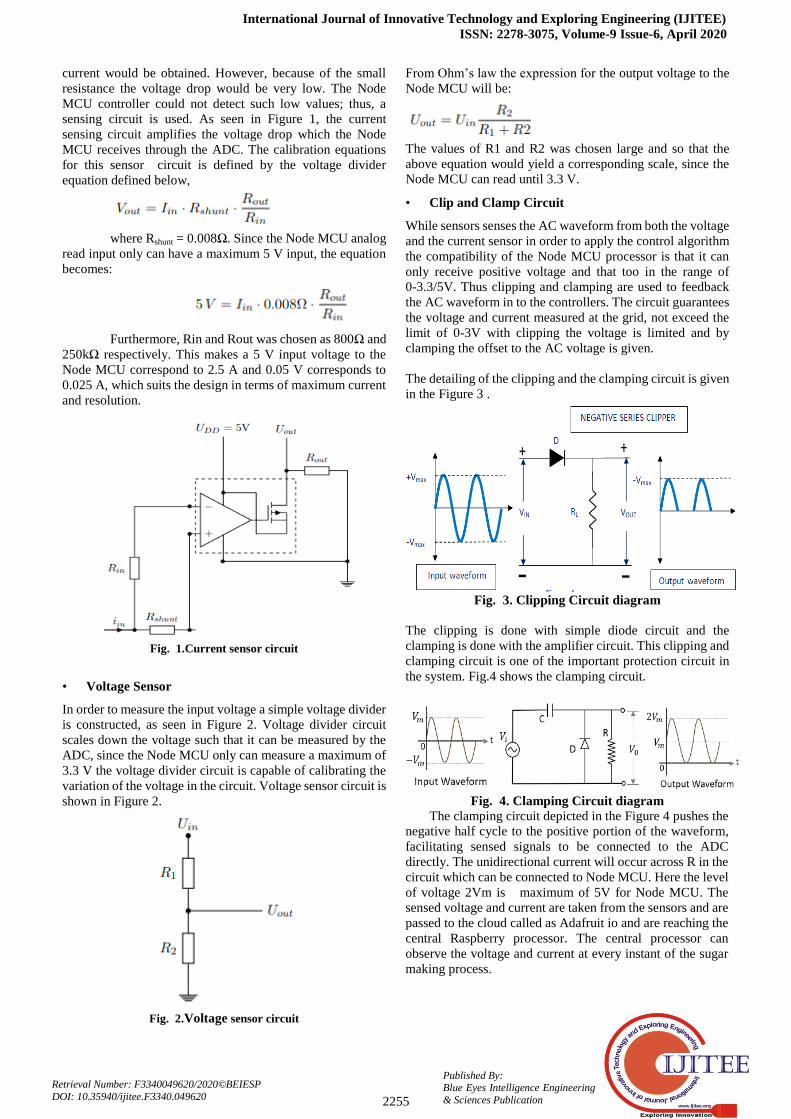
current would be obtained. However, because of the small
resistance the voltage drop would be very low. The Node
MCU controller could not detect such low values; thus, a
sensing circuit is used. As seen in Figure 1, the current
sensing circuit amplifies the voltage drop which the Node
MCU receives through the ADC. The calibration equations
for this sensor circuit is defined by the voltage divider
equation defined below,
where Rshunt = 0.008Ω. Since the Node MCU analog
read input only can have a maximum 5 V input, the equation
becomes:
Furthermore, Rin and Rout was chosen as 800Ω and
250kΩ respectively. This makes a 5 V input voltage to the
Node MCU correspond to 2.5 A and 0.05 V corresponds to
0.025 A, which suits the design in terms of maximum current
and resolution.
Fig. 1.Current sensor circuit
• Voltage Sensor
In order to measure the input voltage a simple voltage divider
is constructed, as seen in Figure 2. Voltage divider circuit
scales down the voltage such that it can be measured by the
ADC, since the Node MCU only can measure a maximum of
3.3 V the voltage divider circuit is capable of calibrating the
variation of the voltage in the circuit. Voltage sensor circuit is
shown in Figure 2.
Fig. 2.Voltage sensor circuit
From Ohm’s law the expression for the output voltage to the
Node MCU will be:
The values of R1 and R2 was chosen large and so that the
above equation would yield a corresponding scale, since the
Node MCU can read until 3.3 V.
• Clip and Clamp Circuit
While sensors senses the AC waveform from both the voltage
and the current sensor in order to apply the control algorithm
the compatibility of the Node MCU processor is that it can
only receive positive voltage and that too in the range of
0-3.3/5V. Thus clipping and clamping are used to feedback
the AC waveform in to the controllers. The circuit guarantees
the voltage and current measured at the grid, not exceed the
limit of 0-3V with clipping the voltage is limited and by
clamping the offset to the AC voltage is given.
The detailing of the clipping and the clamping circuit is given
in the Figure 3 .
Fig. 3. Clipping Circuit diagram
The clipping is done with simple diode circuit and the
clamping is done with the amplifier circuit. This clipping and
clamping circuit is one of the important protection circuit in
the system. Fig.4 shows the clamping circuit.
Fig. 4. Clamping Circuit diagram
The clamping circuit depicted in the Figure 4 pushes the
negative half cycle to the positive portion of the waveform,
facilitating sensed signals to be connected to the ADC
directly. The unidirectional current will occur across R in the
circuit which can be connected to Node MCU. Here the level
of voltage 2Vm is maximum of 5V for Node MCU. The
sensed voltage and current are taken from the sensors and are
passed to the cloud called as Adafruit io and are reaching the
central Raspberry processor. The central processor can
observe the voltage and current at every instant of the sugar
making process.
Internet of Things (IOT) based Advanced Energy Auditing on Sugar Industry Automation for Better Energy
Conservation Measures
2256
Published By: Blue Eyes Intelligence Engineering
& Sciences Publication
Retrieval Number: F3340049620/2020©BEIESP
DOI: 10.35940/ijitee.F3340.049620
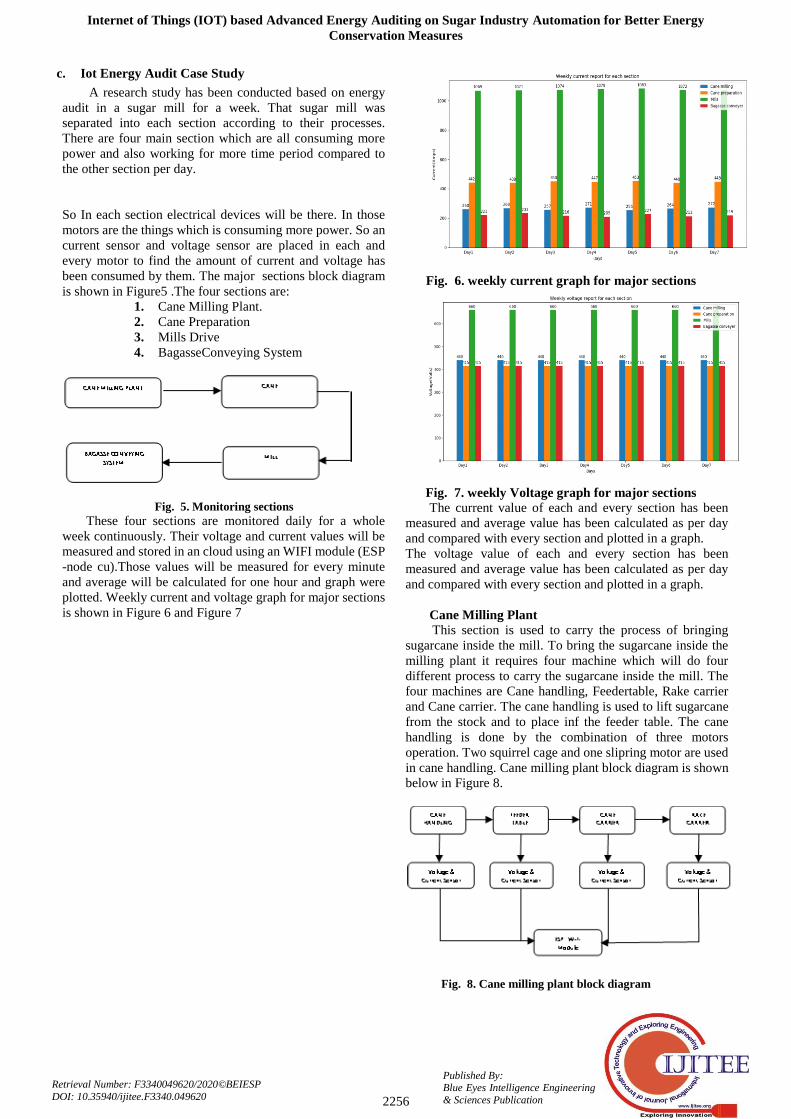
c. Iot Energy Audit Case Study
A research study has been conducted based on energy
audit in a sugar mill for a week. That sugar mill was
separated into each section according to their processes.
There are four main section which are all consuming more
power and also working for more time period compared to
the other section per day.
So In each section electrical devices will be there. In those
motors are the things which is consuming more power. So an
current sensor and voltage sensor are placed in each and
every motor to find the amount of current and voltage has
been consumed by them. The major sections block diagram
is shown in Figure5 .The four sections are:
1. Cane Milling Plant.
2. Cane Preparation
3. Mills Drive
4. BagasseConveying System
Fig. 5. Monitoring sections These four sections are monitored daily for a whole
week continuously. Their voltage and current values will be
measured and stored in an cloud using an WIFI module (ESP
-node cu).Those values will be measured for every minute
and average will be calculated for one hour and graph were
plotted. Weekly current and voltage graph for major sections
is shown in Figure 6 and Figure 7
Fig. 6. weekly current graph for major sections
Fig. 7. weekly Voltage graph for major sections
The current value of each and every section has been
measured and average value has been calculated as per day
and compared with every section and plotted in a graph.
The voltage value of each and every section has been
measured and average value has been calculated as per day
and compared with every section and plotted in a graph.
Cane Milling Plant
This section is used to carry the process of bringing
sugarcane inside the mill. To bring the sugarcane inside the
milling plant it requires four machine which will do four
different process to carry the sugarcane inside the mill. The
four machines are Cane handling, Feedertable, Rake carrier
and Cane carrier. The cane handling is used to lift sugarcane
from the stock and to place inf the feeder table. The cane
handling is done by the combination of three motors
operation. Two squirrel cage and one slipring motor are used
in cane handling. Cane milling plant block diagram is shown
below in Figure 8.
Fig. 8. Cane milling plant block diagram
International Journal of Innovative Technology and Exploring Engineering (IJITEE)
ISSN: 2278-3075, Volume-9 Issue-6, April 2020
2257
Published By: Blue Eyes Intelligence Engineering
& Sciences Publication
Retrieval Number: F3340049620/2020©BEIESP
DOI: 10.35940/ijitee.F3340.049620
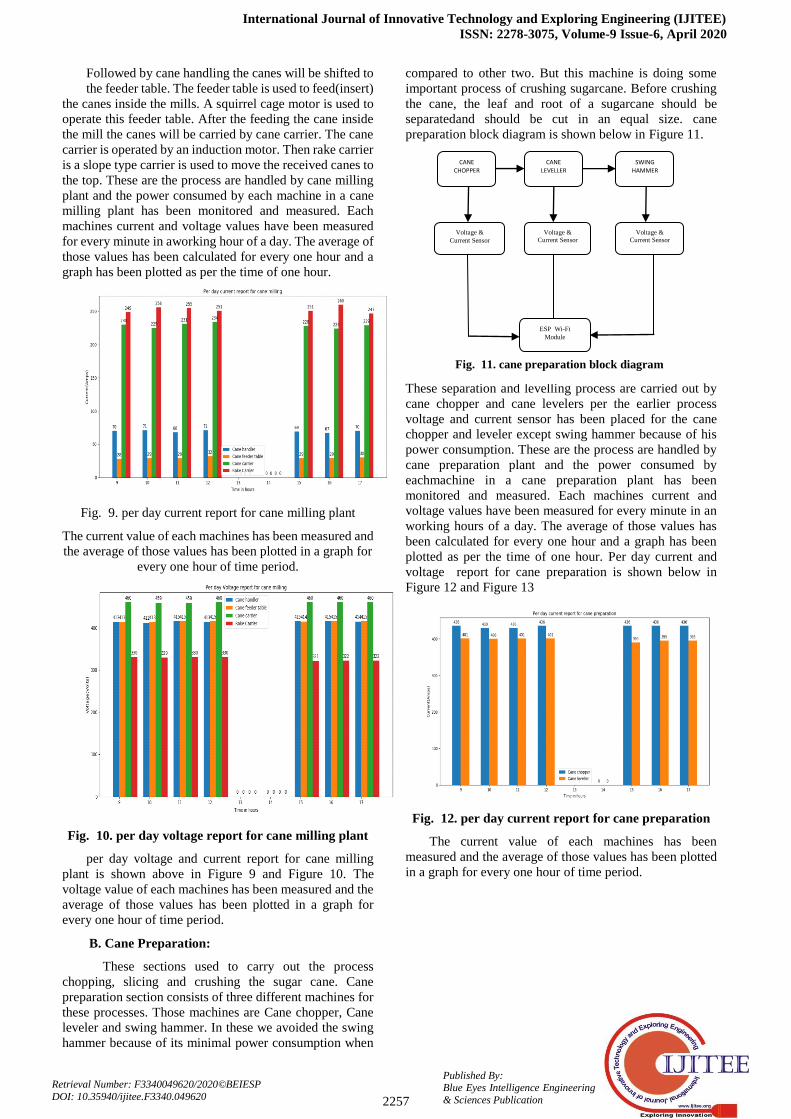
Followed by cane handling the canes will be shifted to
the feeder table. The feeder table is used to feed(insert)
the canes inside the mills. A squirrel cage motor is used to
operate this feeder table. After the feeding the cane inside
the mill the canes will be carried by cane carrier. The cane
carrier is operated by an induction motor. Then rake carrier
is a slope type carrier is used to move the received canes to
the top. These are the process are handled by cane milling
plant and the power consumed by each machine in a cane
milling plant has been monitored and measured. Each
machines current and voltage values have been measured
for every minute in aworking hour of a day. The average of
those values has been calculated for every one hour and a
graph has been plotted as per the time of one hour.
Fig. 9. per day current report for cane milling plant
The current value of each machines has been measured and
the average of those values has been plotted in a graph for
every one hour of time period.
Fig. 10. per day voltage report for cane milling plant
per day voltage and current report for cane milling
plant is shown above in Figure 9 and Figure 10. The
voltage value of each machines has been measured and the
average of those values has been plotted in a graph for
every one hour of time period.
B. Cane Preparation:
These sections used to carry out the process
chopping, slicing and crushing the sugar cane. Cane
preparation section consists of three different machines for
these processes. Those machines are Cane chopper, Cane
leveler and swing hammer. In these we avoided the swing
hammer because of its minimal power consumption when
compared to other two. But this machine is doing some
important process of crushing sugarcane. Before crushing
the cane, the leaf and root of a sugarcane should be
separatedand should be cut in an equal size. cane
preparation block diagram is shown below in Figure 11.
These separation and levelling process are carried out by
cane chopper and cane levelers per the earlier process
voltage and current sensor has been placed for the cane
chopper and leveler except swing hammer because of his
power consumption. These are the process are handled by
cane preparation plant and the power consumed by
eachmachine in a cane preparation plant has been
monitored and measured. Each machines current and
voltage values have been measured for every minute in an
working hours of a day. The average of those values has
been calculated for every one hour and a graph has been
plotted as per the time of one hour. Per day current and
voltage report for cane preparation is shown below in
Figure 12 and Figure 13
Fig. 12. per day current report for cane preparation
The current value of each machines has been
measured and the average of those values has been plotted
in a graph for every one hour of time period.
CANE CHOPPER
CANE LEVELLER
SWING HAMMER
Voltage &
Current Sensor
Voltage &
Current Sensor
Voltage &
Current Sensor
ESP Wi-Fi
Module
Fig. 11. cane preparation block diagram
Internet of Things (IOT) based Advanced Energy Auditing on Sugar Industry Automation for Better Energy
Conservation Measures
2258
Published By: Blue Eyes Intelligence Engineering
& Sciences Publication
Retrieval Number: F3340049620/2020©BEIESP
DOI: 10.35940/ijitee.F3340.049620
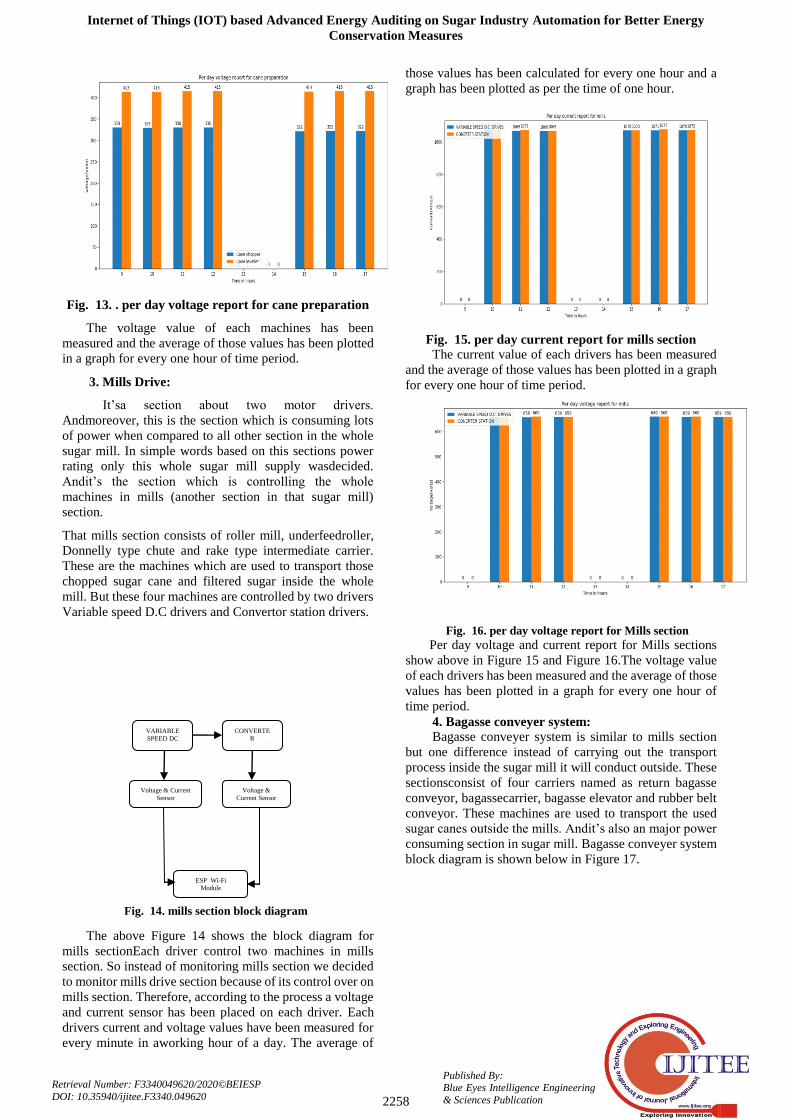
Fig. 13. . per day voltage report for cane preparation
The voltage value of each machines has been
measured and the average of those values has been plotted
in a graph for every one hour of time period.
3. Mills Drive:
It’sa section about two motor drivers.
Andmoreover, this is the section which is consuming lots
of power when compared to all other section in the whole
sugar mill. In simple words based on this sections power
rating only this whole sugar mill supply wasdecided.
Andit’s the section which is controlling the whole
machines in mills (another section in that sugar mill)
section.
That mills section consists of roller mill, underfeedroller,
Donnelly type chute and rake type intermediate carrier.
These are the machines which are used to transport those
chopped sugar cane and filtered sugar inside the whole
mill. But these four machines are controlled by two drivers
Variable speed D.C drivers and Convertor station drivers.
The above Figure 14 shows the block diagram for
mills sectionEach driver control two machines in mills
section. So instead of monitoring mills section we decided
to monitor mills drive section because of its control over on
mills section. Therefore, according to the process a voltage
and current sensor has been placed on each driver. Each
drivers current and voltage values have been measured for
every minute in aworking hour of a day. The average of
those values has been calculated for every one hour and a
graph has been plotted as per the time of one hour.
Fig. 15. per day current report for mills section
The current value of each drivers has been measured
and the average of those values has been plotted in a graph
for every one hour of time period.
Fig. 16. per day voltage report for Mills section
Per day voltage and current report for Mills sections
show above in Figure 15 and Figure 16.The voltage value
of each drivers has been measured and the average of those
values has been plotted in a graph for every one hour of
time period.
4. Bagasse conveyer system:
Bagasse conveyer system is similar to mills section
but one difference instead of carrying out the transport
process inside the sugar mill it will conduct outside. These
sectionsconsist of four carriers named as return bagasse
conveyor, bagassecarrier, bagasse elevator and rubber belt
conveyor. These machines are used to transport the used
sugar canes outside the mills. Andit’s also an major power
consuming section in sugar mill. Bagasse conveyer system
block diagram is shown below in Figure 17.
VARIABLE
SPEED DC
DRIVER(4)
CONVERTE
R
STATION(4)
Voltage & Current
Sensor
Voltage &
Current Sensor
ESP Wi-Fi Module
Fig. 14. mills section block diagram
International Journal of Innovative Technology and Exploring Engineering (IJITEE)
ISSN: 2278-3075, Volume-9 Issue-6, April 2020
2259
Published By: Blue Eyes Intelligence Engineering
& Sciences Publication
Retrieval Number: F3340049620/2020©BEIESP
DOI: 10.35940/ijitee.F3340.049620
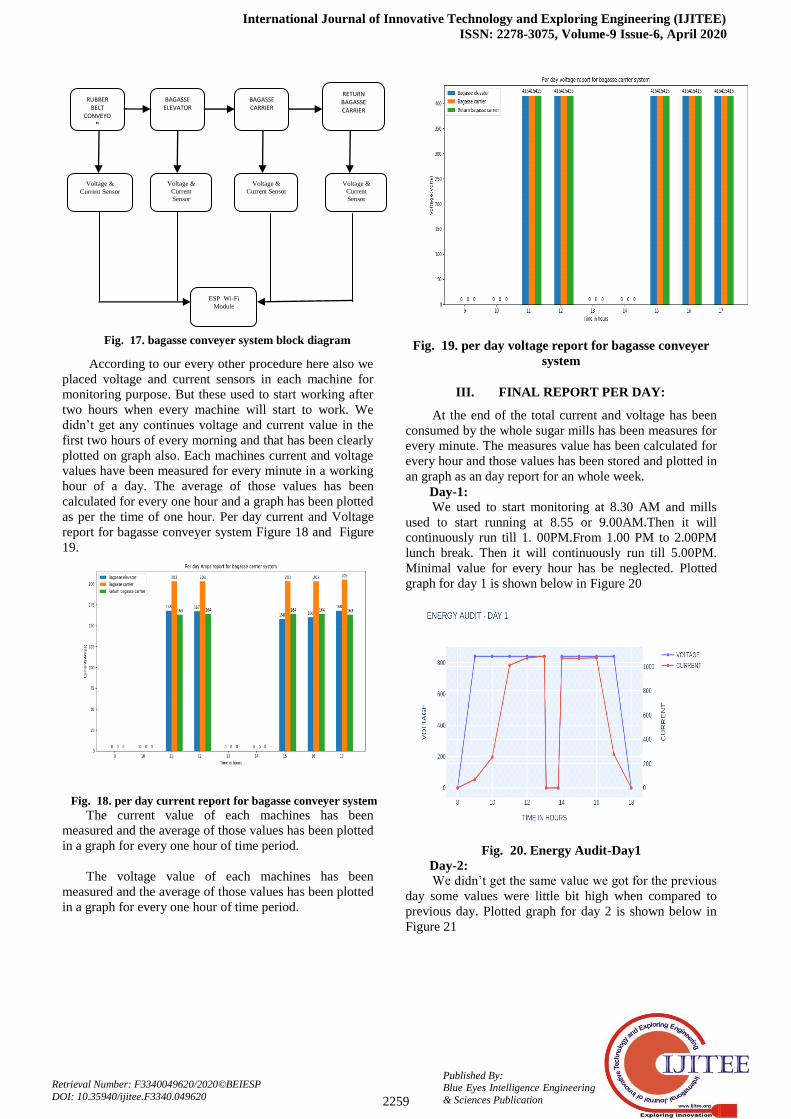
According to our every other procedure here also we
placed voltage and current sensors in each machine for
monitoring purpose. But these used to start working after
two hours when every machine will start to work. We
didn’t get any continues voltage and current value in the
first two hours of every morning and that has been clearly
plotted on graph also. Each machines current and voltage
values have been measured for every minute in a working
hour of a day. The average of those values has been
calculated for every one hour and a graph has been plotted
as per the time of one hour. Per day current and Voltage
report for bagasse conveyer system Figure 18 and Figure
19.
Fig. 18. per day current report for bagasse conveyer system
The current value of each machines has been
measured and the average of those values has been plotted
in a graph for every one hour of time period.
The voltage value of each machines has been
measured and the average of those values has been plotted
in a graph for every one hour of time period.
Fig. 19. per day voltage report for bagasse conveyer
system
III. FINAL REPORT PER DAY:
At the end of the total current and voltage has been
consumed by the whole sugar mills has been measures for
every minute. The measures value has been calculated for
every hour and those values has been stored and plotted in
an graph as an day report for an whole week.
Day-1: We used to start monitoring at 8.30 AM and mills
used to start running at 8.55 or 9.00AM.Then it will
continuously run till 1. 00PM.From 1.00 PM to 2.00PM
lunch break. Then it will continuously run till 5.00PM.
Minimal value for every hour has be neglected. Plotted
graph for day 1 is shown below in Figure 20
Fig. 20. Energy Audit-Day1
Day-2:
We didn’t get the same value we got for the previous
day some values were little bit high when compared to
previous day. Plotted graph for day 2 is shown below in
Figure 21
RUBBER BELT
CONVEYOR
BAGASSE ELEVATOR
BAGASSE CARRIER
RETURN BAGASSE CARRIER
Voltage &
Current Sensor
Voltage &
Current
Sensor
Voltage &
Current Sensor
Voltage &
Current
Sensor
ESP Wi-Fi
Module
Fig. 17. bagasse conveyer system block diagram
Internet of Things (IOT) based Advanced Energy Auditing on Sugar Industry Automation for Better Energy
Conservation Measures
2260
Published By: Blue Eyes Intelligence Engineering
& Sciences Publication
Retrieval Number: F3340049620/2020©BEIESP
DOI: 10.35940/ijitee.F3340.049620
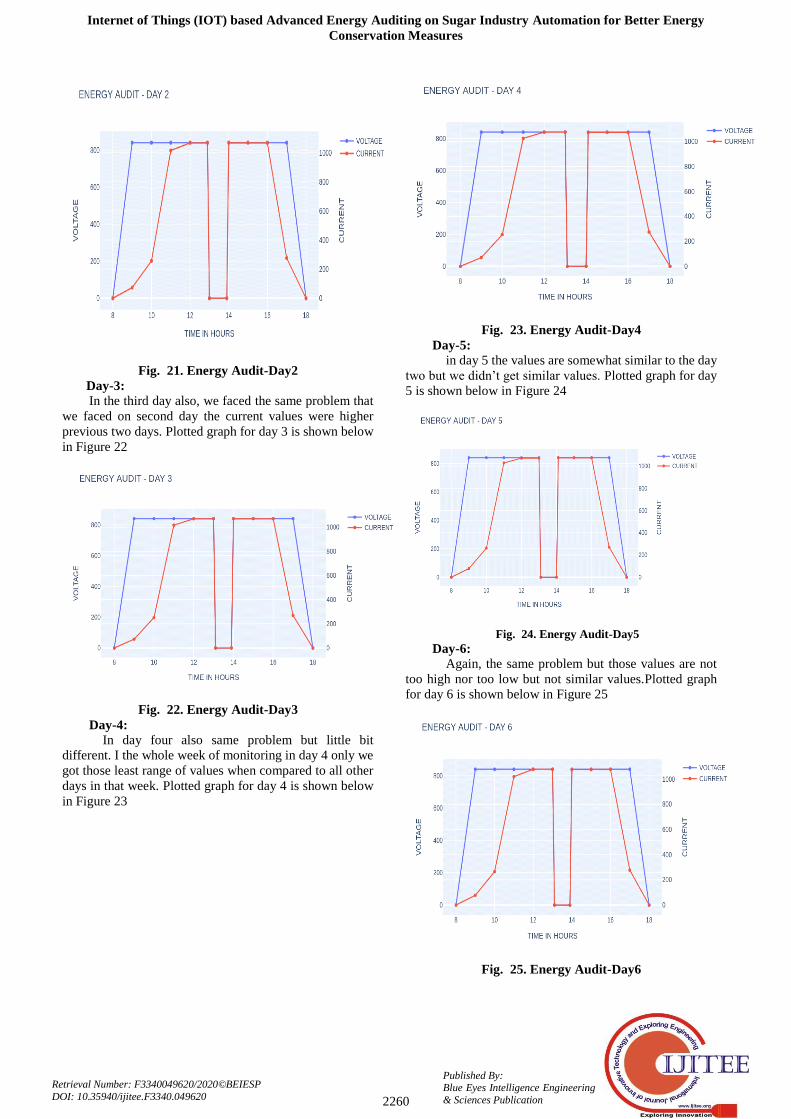
Fig. 21. Energy Audit-Day2
Day-3:
In the third day also, we faced the same problem that
we faced on second day the current values were higher
previous two days. Plotted graph for day 3 is shown below
in Figure 22
Fig. 22. Energy Audit-Day3
Day-4:
In day four also same problem but little bit
different. I the whole week of monitoring in day 4 only we
got those least range of values when compared to all other
days in that week. Plotted graph for day 4 is shown below
in Figure 23
Fig. 23. Energy Audit-Day4
Day-5:
in day 5 the values are somewhat similar to the day
two but we didn’t get similar values. Plotted graph for day
5 is shown below in Figure 24
Fig. 24. Energy Audit-Day5
Day-6:
Again, the same problem but those values are not
too high nor too low but not similar values.Plotted graph
for day 6 is shown below in Figure 25
Fig. 25. Energy Audit-Day6
International Journal of Innovative Technology and Exploring Engineering (IJITEE)
ISSN: 2278-3075, Volume-9 Issue-6, April 2020
2261
Published By: Blue Eyes Intelligence Engineering
& Sciences Publication
Retrieval Number: F3340049620/2020©BEIESP
DOI: 10.35940/ijitee.F3340.049620
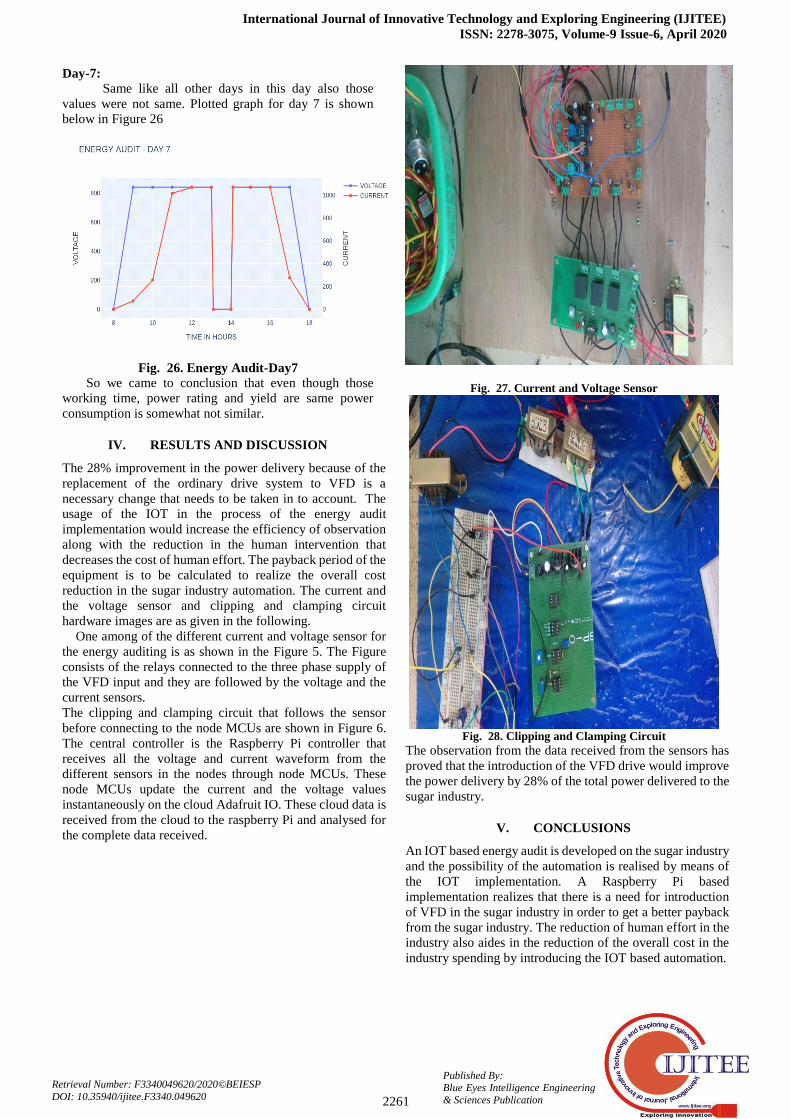
Day-7:
Same like all other days in this day also those
values were not same. Plotted graph for day 7 is shown
below in Figure 26
Fig. 26. Energy Audit-Day7
So we came to conclusion that even though those
working time, power rating and yield are same power
consumption is somewhat not similar.
IV. RESULTS AND DISCUSSION
The 28% improvement in the power delivery because of the
replacement of the ordinary drive system to VFD is a
necessary change that needs to be taken in to account. The
usage of the IOT in the process of the energy audit
implementation would increase the efficiency of observation
along with the reduction in the human intervention that
decreases the cost of human effort. The payback period of the
equipment is to be calculated to realize the overall cost
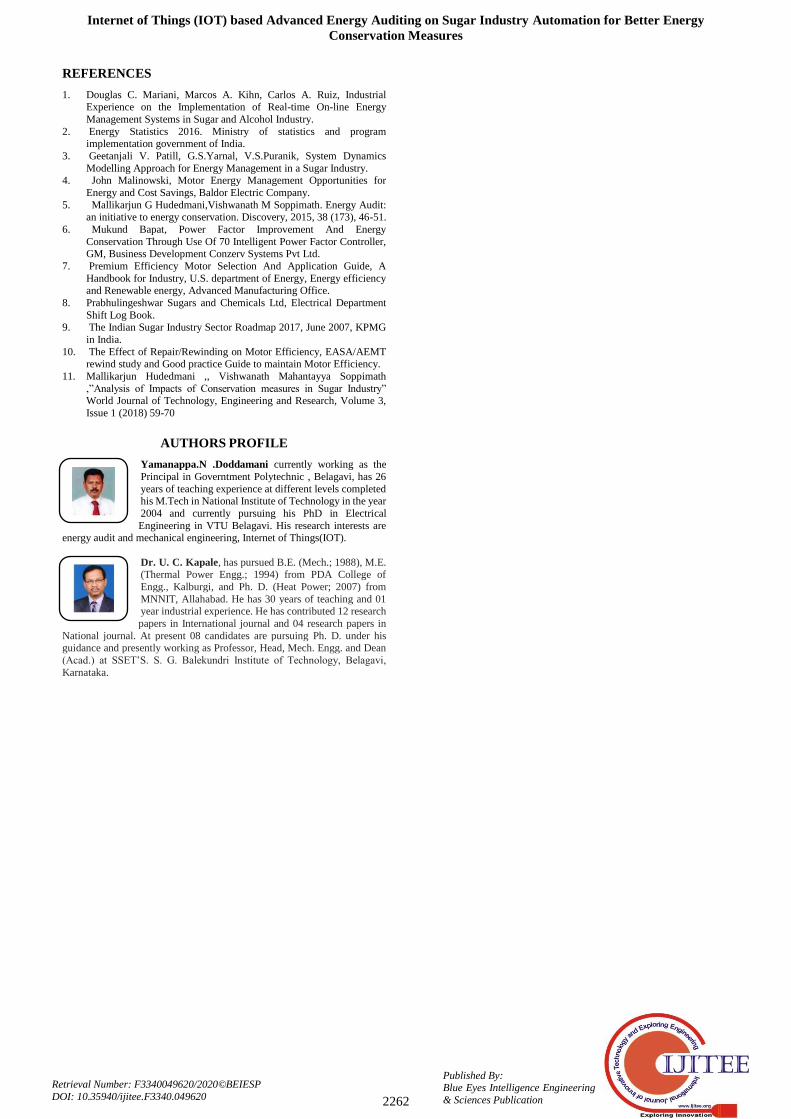
reduction in the sugar industry automation. The current and
the voltage sensor and clipping and clamping circuit
hardware images are as given in the following.
One among of the different current and voltage sensor for
the energy auditing is as shown in the Figure 5. The Figure
consists of the relays connected to the three phase supply of
the VFD input and they are followed by the voltage and the
current sensors.
The clipping and clamping circuit that follows the sensor
before connecting to the node MCUs are shown in Figure 6.
The central controller is the Raspberry Pi controller that
receives all the voltage and current waveform from the
different sensors in the nodes through node MCUs. These
node MCUs update the current and the voltage values
instantaneously on the cloud Adafruit IO. These cloud data is
received from the cloud to the raspberry Pi and analysed for
the complete data received.
Fig. 27. Current and Voltage Sensor
Fig. 28. Clipping and Clamping Circuit
The observation from the data received from the sensors has
proved that the introduction of the VFD drive would improve
the power delivery by 28% of the total power delivered to the
sugar industry.
V. CONCLUSIONS
An IOT based energy audit is developed on the sugar industry
and the possibility of the automation is realised by means of
the IOT implementation. A Raspberry Pi based
implementation realizes that there is a need for introduction
of VFD in the sugar industry in order to get a better payback
from the sugar industry. The reduction of human effort in the
industry also aides in the reduction of the overall cost in the
industry spending by introducing the IOT based automation.
Internet of Things (IOT) based Advanced Energy Auditing on Sugar Industry Automation for Better Energy
Conservation Measures
2262
Published By: Blue Eyes Intelligence Engineering
& Sciences Publication
Retrieval Number: F3340049620/2020©BEIESP
DOI: 10.35940/ijitee.F3340.049620
REFERENCES
1. Douglas C. Mariani, Marcos A. Kihn, Carlos A. Ruiz, Industrial
Experience on the Implementation of Real-time On-line Energy
Management Systems in Sugar and Alcohol Industry.
2. Energy Statistics 2016. Ministry of statistics and program implementation government of India.
3. Geetanjali V. Patill, G.S.Yarnal, V.S.Puranik, System Dynamics
Modelling Approach for Energy Management in a Sugar Industry. 4. John Malinowski, Motor Energy Management Opportunities for
Energy and Cost Savings, Baldor Electric Company.
5. Mallikarjun G Hudedmani,Vishwanath M Soppimath. Energy Audit: an initiative to energy conservation. Discovery, 2015, 38 (173), 46-51.
6. Mukund Bapat, Power Factor Improvement And Energy
Conservation Through Use Of 70 Intelligent Power Factor Controller, GM, Business Development Conzerv Systems Pvt Ltd.
7. Premium Efficiency Motor Selection And Application Guide, A
Handbook for Industry, U.S. department of Energy, Energy efficiency and Renewable energy, Advanced Manufacturing Office.
8. Prabhulingeshwar Sugars and Chemicals Ltd, Electrical Department
Shift Log Book. 9. The Indian Sugar Industry Sector Roadmap 2017, June 2007, KPMG
in India.
10. The Effect of Repair/Rewinding on Motor Efficiency, EASA/AEMT rewind study and Good practice Guide to maintain Motor Efficiency.
11. Mallikarjun Hudedmani ,, Vishwanath Mahantayya Soppimath
,”Analysis of Impacts of Conservation measures in Sugar Industry” World Journal of Technology, Engineering and Research, Volume 3,
Issue 1 (2018) 59-70
AUTHORS PROFILE
Yamanappa.N .Doddamani currently working as the
Principal in Governtment Polytechnic , Belagavi, has 26
years of teaching experience at different levels completed his M.Tech in National Institute of Technology in the year
2004 and currently pursuing his PhD in Electrical
Engineering in VTU Belagavi. His research interests are energy audit and mechanical engineering, Internet of Things(IOT).
Dr. U. C. Kapale, has pursued B.E. (Mech.; 1988), M.E. (Thermal Power Engg.; 1994) from PDA College of
Engg., Kalburgi, and Ph. D. (Heat Power; 2007) from
MNNIT, Allahabad. He has 30 years of teaching and 01 year industrial experience. He has contributed 12 research
papers in International journal and 04 research papers in
National journal. At present 08 candidates are pursuing Ph. D. under his guidance and presently working as Professor, Head, Mech. Engg. and Dean
(Acad.) at SSET’S. S. G. Balekundri Institute of Technology, Belagavi,
Karnataka.