international trade outlook for latin america and the caribbean
TRANSCRIPT
2017International Trade Outlook for Latin America and the Caribbean
Recovery in an uncertain context
Thank you for your interest in
this ECLAC publication
Please register if you would like to receive information on our editorial
products and activities. When you register, you may specify your particular
areas of interest and you will gain access to our products in other formats.
www.cepal.org/en/suscripciones
ECLACPublications
2017International Trade Outlook for Latin America and the Caribbean
Recovery in an uncertain context
Alicia BárcenaExecutive Secretary
Mario CimoliDeputy Executive Secretary a.i Officer in Charge, Division of International Trade and Integration
Ricardo PérezChief, Publications and Web Services Division
International Trade Outlook for Latin America and the Caribbean, formerly known as Latin America and the Caribbean in the World Economy, is the annual report prepared by the Division of International Trade and Integration of ECLAC.
The production of the report was overseen by Mario Cimoli, Officer in Charge of the Division of International Trade and Integration. Keiji Inoue, Senior Economic Affairs Officer with that Division, was responsible for its technical coordination. The following staff members of the Division assisted in the preparation and drafting of the chapters: José Elías Durán, Sebastián Herreros and Nanno Mulder.
The authors are grateful for inputs provided by Mariano Álvarez, Prachi Agarwal, Rolando Avendaño, Santacruz Banacloche, Filippo Bontadini, Sebastián Castresana, Tania García-Millán, John Hewitt, Valeria Jordán, Zebulun Kreiter, Javier Meneses, Ana María Palacios, Mauricio Pereira, Wilson Peres, Adrián Rodríguez, Nunzia Saporito, Gastón Rigollet and Dayna Zaclicever.
Explanatory notes:- Three dots (…) indicate that data are not available or are not separately reported.- A dash (-) indicates that the amount is nil or negligible.- A full stop (.) is used to indicate decimals.- The term “dollars” refers to United States dollars, unless otherwise specified.- A slash (/) between years (e.g. 2013/2014) indicates a 12-month period falling between the two years.- Figures and percentages in tables may not necessarily add up to the corresponding totals due to rounding.
This publication should be cited as: Economic Commission for Latin America and the Caribbean (ECLAC), International Trade Outlook for Latin America and the Caribbean, 2017 (LC/PUB.2017/22-P), Santiago, 2017.
Applications for authorization to reproduce this work in whole or in part should be sent to the Economic Commission for Latin America and the Caribbean (ECLAC), Publications and Web Services Division, [email protected]. Member States and their governmental institutions may reproduce this work without prior authorization, but are requested to mention the source and to inform ECLAC of such reproduction.
United Nations publication
ISBN: 978-92-1-121969-2 (print)
ISBN: 978-92-1-058606-1 (pdf)
ISBN: 978-92-1-358070-7 (ePub)
Sales No.: E.17.II.G.5
LC/PUB.2017/22-P
Distr.: General
Copyright © United Nations, 2017
All rights reserved
Printed at United Nations, Santiago
S.17-01117
3International Trade Outlook for Latin America and the Caribbean • 2017 ContentsCONTENTS
Foreword ..................................................................................................................................................................... 7Summary.................................................................................................................................................................... 11
Chapter I Regional trade picks up in an uncertain global context .................................................................................... 27
A. An incipient recovery in global trade, after half a decade of low dynamism ................................................ 29B. A particularly uncertain context: macroeconomics, technology and geopolitics ........................................... 32
1. Macroeconomic dynamics: the crisis of the dominant model .............................................................. 322. Heightened tensions in the governance of global trade .......................................................................................363. Additional uncertainty from the digital revolution .................................................................................. 38
C. Regional foreign trade recovers after four years of decline .......................................................................... 401. First half of 2017 marks a turning point ................................................................................................. 402. Prices of oil, minerals and metals recover, while the prices of some agricultural and agroindustrial products fall ............................................................................................................... 453. Trade projections for 2017 are positive ................................................................................................... 494. Intraregional trade is also improving ....................................................................................................... 565. The importance of deepening regional economic integration ................................................................ 59
D. Conclusions .................................................................................................................................................... 67Bibliography ........................................................................................................................................................... 68Annex I.A1 ............................................................................................................................................................. 71
Chapter II The region’s weak performance in modern services trade .............................................................................. 75
Introduction ........................................................................................................................................................... 77A. The region’s services exports perform poorly in a global context ................................................................. 78
1. Global services exports have increased faster than goods exports ........................................................ 782. The region’s export performance in modern services has stagnated ..................................................... 813. South America accounts of three quarters of the region’s modern services exports ............................. 844. Few countries in the region specialize in modern services exports ........................................................ 885. The regional market is important for modern services exports .............................................................. 916. Information technology has been a key driver of the rise of trade in modern services .......................... 94
B. Intermediate services in manufacturing exports are another key component of services trade ................... 961. Intermediate services are a key driver of manufacturing export performance ....................................... 962. Countries in the region incorporate mostly domestic services in manufacturing exports ...................... 993. Domestic intermediate services may contribute differently to competitiveness than imported ones ......104
C. Few countries have active public-private strategies to promote modern services exports ..............................1061. Dynamic modern services exports require active public-private policies ............................................. 1062. Subregional integration schemes could step up services liberalization ...........................................113
D. Moving forward............................................................................................................................................. 117Bibliography ......................................................................................................................................................... 119
Chapter III Latin America and the Caribbean: the challenges of global agricultural trade .......................................... 121
Introduction ......................................................................................................................................................... 123A. Except for Brazil, the main players in world agricultural trade are the industrialized countries and China ...................................................................................................................................... 123B. The place of Latin America and the Caribbean in world agricultural trade ................................................. 127
1. The region is a net agricultural exporter, but with great heterogeneity among subregions and countries ....................................................................................................................... 1272. Asia has become the most important market for the region’s agricultural exports, while the United States is its main supplier ......................................................................................... 1333. The region is an important international player in commodities trade, but its export performance in processed products is weak ......................................................................................... 136
C. Proactive public policies are needed to de-commoditize the agricultural export basket ............................ 1441. Industrial policies are essential to generate distinctive attributes in world markets .......................... 1442. Trade agreements are important when it comes to enhancing access to highly protected markets .................................................................................................................................. 146
D. Final reflections............................................................................................................................................. 149Bibliography ......................................................................................................................................................... 151Annex III.A1 ......................................................................................................................................................... 152
4 Economic Commission for Latin America and the Caribbean (ECLAC)Contents
Tables
Table I.1 Expected impacts of automation in employment ........................................................................... 40Table I.2 World, selected regions and countries: variation in trade in goods, January to June 2017
compared with January to June 2016 ............................................................................................ 42Table I.3 World (selected countries): variation in trade in services by value, January to June 2017
compared with January to June 2016 ............................................................................................ 42Table I.4 Latin America and the Caribbean: variations in exports of goods and services
by value, first half of 2016 and first half of 2017 ........................................................................... 43Table I.5 Latin America and the Caribbean: variation in trade in goods by value and trading partners,
January to June 2016 compared with January to June 2017 ........................................................ 44Table I.6 Latin America and the Caribbean: year-on-year variation in the prices of main export
commodities, January to April 2017, January to August 2017 and projection for 2017 ............... 48Table I.7 Latin America and the Caribbean (selected groupings and countries): projected variations
in foreign trade by price, volume and value, 2017 ......................................................................... 52Table I.8 Caribbean Community (CARICOM): projected variations in external trade, 2017 ......................... 54Table I.9 Latin America and the Caribbean: variation in value of intraregional and intrasubregional
exports, by sector and by integration scheme, January-June 2017 compared with the year-earlier period ........................................................................................... 58
Table I.10 Latin America and the Caribbean (selected groupings and Mexico): tariff protection and tariff equivalents of non-tariff and administrative barriers applicable to intraregional imports, 2002-2011 ............................................................................................... 63
Table I.11 Mexico and the United States: existing preferences under the North American Free Trade Agreement (NAFTA) and tariffs applied in a scenario of denunciation of the agreement .................................................................................................. 64
Table I.12 Mexico: variations in imports from the United States and the rest of Latin America and the Caribbean in three alternative scenarios .......................................................................... 66
Table I.A1.1 Latin America and the Caribbean (selected groupings and countries): variations in the value of services trade, first half of 2017 relative to the same period in 2016 ...................................... 71
Table I.A1.2 Mexico: variation in the market share of imports from the United States and Latin America and the Caribbean in three scenarios ............................................................................................. 72
Table I.A1.3 Latin America and the Caribbean: value of exports and imports, 2015-2017 ................................ 73Table I.A1.4 Latin America and the Caribbean: variations in exports to selected destinations
by value, 2016 and 2017 ................................................................................................................ 74Table I.A1.5 Latin America and the Caribbean: variations in imports from selected origins
by value, 2016 and 2017 ................................................................................................................ 74Table II.1 Latin American and Caribbean countries in top 55 ranking of A.T. Kearney
and Tholons, 2009, 2016 and 2017 ............................................................................................... 108Table II.2 Latin America (selected countries): double taxation treaties, 2017 ............................................ 111Table II.3 Selected subregional trade agreements: provisions on trade in services, 2017 ......................... 114Table II.4 MERCOSUR and the Pacific Alliance: GATS-plus and GATS-extra commitments, 2017 ............. 117Table III.1 Latin America and the Caribbean: composition of agricultural exports by category,
2000 and 2015 .............................................................................................................................. 137Table III.2 Latin America and the Caribbean: 10 main agricultural products exported to the world,
2000 and 2016............................................................................................................................... 137Table III.3 Latin America and the Caribbean: composition of agricultural imports by category,
2000 and 2015............................................................................................................................... 138Table III.4 Latin America and the Caribbean: main agricultural products exported to selected
destinations, 2016......................................................................................................................... 141Table III.5 Latin America and the Caribbean: trade agreements between countries and groupings
of the region with selected partners, as of August 2017 ............................................................. 148Table III.6 World population distribution by regions, 2015 and 2030 ........................................................... 149Table III.A1.1 Latin America and the Caribbean (30 countries): value of agricultural exports, 2007-2016 ........... 152Table III.A1.2 Latin America and the Caribbean (30 countries): value of agricultural imports, 2007-2016 ........... 153Table III.A1.3 Latin America and the Caribbean (27 countries): distribution of agricultural exports
by destination, 2016...................................................................................................................... 154Table III.A1.4 Latin America and the Caribbean (27 countries): distribution of agricultural imports
by origin, 2016............................................................................................................................... 155Table III.A1.5 Latin America and the Caribbean (26 countries): five main agricultural products exported,
by country, 2016 ............................................................................................................................ 156
5International Trade Outlook for Latin America and the Caribbean • 2017 Contents
FiguresFigure I.1 Annual variation in the volume of global trade in goods and in world GDP, and quotient
between both variations, 1981-2018 .............................................................................................. 29Figure I.2 China: share of parts and components in total imports (excluding oil) from the rest
of the world and selected partners, 2000-2016 ............................................................................. 31Figure I.3 United States, eurozone, Japan and selected countries: evolution of different
economic variables ......................................................................................................................... 33Figure I.4 Latin America and the Caribbean: variations in trade in goods and services
by value, 2006-2017 ........................................................................................................................ 41Figure I.5 World prices for selected commodities, 2000-2017 ...................................................................... 45Figure I.6 Annual changes in goods trade by volume, price and value, 2000-2017 ....................................... 50Figure I.7 Latin America and the Caribbean (subregions and Mexico): projected variations
in exports by volume, price and value, 2017 .................................................................................. 51Figure I.8 Caribbean Community (CARICOM): effect of hurricanes on external trade, 2017 ......................... 53Figure I.9 Latin America and the Caribbean (selected subregions and countries):
projected variations in imports by volume, price and value 2017 .................................................. 55Figure I.10 Latin America and the Caribbean: variations in the value of goods trade
by origin and destination, 2016 and 2017 ...................................................................................... 55Figure I.11 Latin America and the Caribbean: variation in value of intraregional exports
by integration scheme, January-June 2017 compared with the year-earlier period ..................... 57Figure I.12 Latin America and the Caribbean: annual variations in intraregional and extraregional
exports by value, 2007-2017 ........................................................................................................... 57Figure I.13 Latin America and the Caribbean (selected integration schemes): intraregional trade
coefficients, by exports, January-June 2016 and January-June 2017 .......................................... 58Figure I.14 Latin America and the Caribbean: intraregional goods exports, 1991-2017 ................................. 59Figure I.15 Latin America and the Caribbean (selected integration schemes): intrasubregional exports
and exports to other countries of the region as a percentage of total exports, 2016 ................... 60Figure I.16 Latin America and the Caribbean: products exported to selected destinations, 2016 ................. 60Figure I.17 Latin America and the Caribbean (20 countries): share of total manufacture exports, 2016 ........ 61Figure I.18 Latin America and the Caribbean (selected groupings and countries): proportion
of intraregional imports with and without preferential tariffs, 2002-2011 ................................... 61Figure I.19 Selected global regions: tariffs and ad valorem equivalents of non-tariff measures
applied to imports, 2002-2011 ........................................................................................................ 62Figure I.20 Mexico and Latin America and the Caribbean (excluding Mexico): variations
in gross domestic product in three different scenarios .................................................................. 65Figure II.1 World: services in relation to total exports and modern services in relation to
total services exports, 2005-2016 .................................................................................................. 79Figure II.2 World: top exporters and importers of total and modern services, 2005 and 2016 ...................... 80Figure II.3 World and Latin America and the Caribbean: region’s share in global services exports
and global modern services exports in relation to total global services exports, 2005-2016 ....... 82Figure II.4 Latin America and the Caribbean: trade balance in total and modern services, 2005-2016 ......... 83Figure II.5 World and Latin America and the Caribbean: main categories of services exports, 2005 and 2016 ..... 84Figure II.6 Latin America and the Caribbean: geographic composition of total and modern
services trade, 2005-2006 and 2015-2016 ..................................................................................... 85Figure II.7 Latin America and the Caribbean: trade in total and modern services by subregion, 2005-2016 ......... 86Figure II.8 Latin America and the Caribbean: trade balances by services categories, 2005 and 2016 ...............87Figure II.9 Latin America and the Caribbean: selected country shares in total and modern services
trade, 2005 and 2016 ...................................................................................................................... 88Figure II.10 Latin America and the Caribbean (28 countries): average share of different types
of services in total exports of goods and services, 2015-2016 ...................................................... 89Figure II.11 Latin America and the Caribbean (33 countries): trade balance in total and modern
services trade, 2005 and 2016 ........................................................................................................ 90Figure II.12 Brazil, Chile and Colombia: geographic breakdown of services exports and imports,
average, 2015-2016 ........................................................................................................................ 92Figure II.13 Selected countries and groupings: indirect services exports as a share of direct
services exports, 1995 and 2011 .................................................................................................... 97Figure II.14 Latin America (7 countries), ASEAN (8 countries), China and India: share in world
manufacturing exports, 1995, 2005 and 2011 .............................................................................. 100Figure II.15 Selected countries: share of services in gross value of manufacturing exports, 1995 and 2011 ........ 101
6 Economic Commission for Latin America and the Caribbean (ECLAC)Contents
Figure II.16 ASEAN (8 countries) and Latin America (7 countries): types of services incorporated into manufacturing exports, 1995 and 2011 ................................................................................. 102
Figure II.17 Selected countries: share of domestic and foreign services in gross value of manufacturing exports, 1995 and 2011 .................................................................................... 103
Figure II.18 Latin America (7 countries), ASEAN, China and India: position in global rankings of 138 countries, 2016 .................................................................................................................. 104
Figure II.19 Latin America: importance of determinants of competitiveness in business services exports, 2014................................................................................................................................. 107
Figure II.20 Latin America and the Caribbean (17 countries): digitalization of production, 2015 ................... 112Figure III.1 World agricultural exports, 2000-2015 ......................................................................................... 124Figure III.2 Composition of world agricultural exports, 2015 ......................................................................... 124Figure III.3 Ten leading agricultural exporting and importing countries worldwide, 2015 ........................... 125Figure III.4 Monthly real index of food prices, January 1990 to July 2017 .................................................... 127Figure III.5 Latin America and the Caribbean: agricultural trade with the rest of the world, 2000-2016 ..... 128Figure III.6 Latin America and the Caribbean: share of regional agricultural exports in world agricultural
exports and in the region’s total merchandise exports to the world, 2000-2016 ........................ 128Figure III.7 Latin America and the Caribbean: trade balance in the agriculture sector
with selected partners, 2000-2015 ............................................................................................... 129Figure III.8 Latin America and the Caribbean: composition of agricultural trade by subregion, 2000-2015 ..... 130Figure III.9 Latin America and the Caribbean: agricultural trade balances by subregion, 2000-2015 ........... 131Figure III.10 Latin America and the Caribbean (31 countries): agricultural trade balances by country,
average 2015-2016 ....................................................................................................................... 132Figure III.11 Latin America and the Caribbean (selected countries): share of the agricultural sector
in merchandise trade, 2000 and 2016 .......................................................................................... 133Figure III.12 Latin America and the Caribbean: composition of agricultural exports by destination,
2000-2015 ..................................................................................................................................... 134Figure III.13 Latin America and the Caribbean (23 countries): Herfindahl-Hirschman index
of agricultural exports by destination, 2000 and 2015 ................................................................. 135Figure III.14 Latin America and the Caribbean: composition of agricultural imports by origin, 2000-2015 .... 135Figure III.15 Latin America and the Caribbean (subregions and selected countries): composition
of agricultural imports by origin, 2015 ........................................................................................ 136Figure III.16 Latin America and the Caribbean: trade balance in the agricultural sector by category,
2000 and 2015............................................................................................................................... 139Figure III.17 Latin America and the Caribbean (20 countries): Herfindahl-Hirschman index
of agricultural exports by product, 2000 and 2015 ....................................................................... 140Figure III.18 Latin America and the Caribbean: number of agricultural products exported
to selected destinations, 2000-2016 ............................................................................................ 142Figure III.19 Selected agricultural products: leading world exporters, 2000 and 2016 ................................... 143Figure III.20 Selected countries: average value of exports of coffee and frozen meat of bovine
animals, by origin, 2015 ................................................................................................................ 145Figure III.21 Selected countries: average tariffs applied to agricultural and non-agricultural products, 2016........ 147
Boxes
Box I.1 The impact of trade on the region’s productive structure, 2000-2011 ........................................... 46Box II.1 Improvements and challenges in Latin American trade in services statistics ............................... 92Box II.2 Empirical studies show intermediate services playing a significant role
in manufacturing competitiveness ................................................................................................. 98Box II.3 Econometric regressions on the role of domestic and imported services
in manufacturing performance ..................................................................................................... 105
Diagrams
Diagram II.1 Classification of traditional and modern services .......................................................................... 78Diagram II.2 Offshore services and labour demand ............................................................................................ 95Diagram II.3 Role of services in manufacturing supply chains ........................................................................... 97Diagram II.4 Trade in services: GATS-plus and GATS-extra disciplines under megaregional
agreements, 2017 ......................................................................................................................... 116

7International Trade Outlook for Latin America and the Caribbean • 2017 Contents
Foreword

9International Trade Outlook for Latin America and the Caribbean • 2017 ContentsFOREWORD
This first edition of International Trade Outlook for Latin America and the Caribbean, which is the continuation of Latin America and the Caribbean in the World Economy with a new title, covers 2017 and contains three chapters. The first chapter describes the current international context and the recovery of trade in the region. Despite the recent upturn in global growth, the medium-term international context remains uncertain, with unanswered questions regarding the sustainability of the recovery of the world economy, challenges to traditional trade posed by the digital revolution and the emergence of political movements in developed countries. In turn, these factors could impact policies to promote investment and productive diversification. In that uncertain context, the foreign trade of Latin America and the Caribbean is showing signs of recovery after four years of negative performance between 2012 and 2016. The value of the region’s goods exports is projected to increase by 10% in 2017. That increase comprises a 6.5% rise in prices and 3.5% growth in volumes. After four years of falling value, the region’s imports are also recovering and are projected to grow by 7.0% in 2017. That improvement derives mainly from a 5.0% rise in import basket prices, together with a slight increase (2.0%) in import volumes.
Chapter II reviews the region’s performance in global trade in services in general and in modern services in particular, since 2005. Modern services are those traded mainly over the Internet, such as telecoms, computer and information services; financial services; insurance and pension services; royalties; and other business services. Latin America and the Caribbean is still a marginal player in global modern services trade, accounting for just 2% of exports in this category, although it is the fastest-growing segment of global trade. The chapter examines the experience of the region’s larger economies with respect to services exported indirectly through incorporation into manufacturing exports, in whose competitiveness they are crucial. Some South American countries have a relatively high domestic services content in their manufacturing exports, which raises their cost, whereas manufacturing export firms in Costa Rica and Mexico, for example, tend to import proportionally more services than similar firms in South America, partly because they are more integrated into North American value chains. The differences between countries with respect to their export patterns partly reflect the public-private strategies in place in such areas as human capital and certification, tax treatment of business and foreign direct investment attraction. In addition, only a few subregional integration schemes are actively engaged in promoting this type of trade.
Chapter III provides an overview of Latin America and the Caribbean’s share of the world agricultural trade since 2000 and offers some policy recommendations for increasing the sector’s contribution to regional development. It highlights the specificities of various subregions and countries through a range of indicators (such as net exporters and importers, the weight of the agricultural sector in total exports and imports, composition of the export basket, main destination markets and suppliers, and the evolution of product and market concentration). It notes that although the region is a significant global supplier of a range of agricultural products, most of them are primary goods, with a very low presence of agroindustrial products. The product concentration is particularly high in shipments to Asia, a part of the world that has become the main market for the region’s agricultural exports. In contrast, greater diversification can be seen in intraregional trade. The chapter then addresses the central role that industrial policy has to play in de-commoditizing the region’s agricultural exports through the creation of differentiating factors and the processing of products that are currently exported almost exclusively in their raw form. Finally, it highlights the importance of trade agreements in improving those exports’ access to important, highly protected markets.
The foreign trade of Latin America and the Caribbean is showing signs of recovery after four years of negative performance between 2012 and 2016. The value of the region’s goods exports is projected to increase by 10% in 2017.

11SummaryInternational Trade Outlook for Latin America and the Caribbean • 2017
A. Regional trade picks up in an uncertain global context
B. The region’s weak performance in modern services trade
C. Latin America and the Caribbean: the challenges of global agricultural trade
Summary

13SummaryInternational Trade Outlook for Latin America and the Caribbean • 2017 SUMMARY
A. Regional trade picks up in an uncertain global context
The global trade in goods has been less dynamic following the international economic and financial crisis. Before the crisis, its volume was growing by an average of 6.3% per year, while its post-crisis annual growth has been only 2.2%. The correlation between trade and global GDP also decreased, until in 2016 trade expanded more slowly than GDP. The factors that could explain the weakness of world trade in the wake of the crisis include low dynamism in global demand, a reduced rate of expansion of global value chains and reduced trade liberalization if not an actual increase in protectionism.
In 2017, world trade is expected to increase by 3.6%, driven by increased growth in output in the United States, the eurozone and China. Slightly slower growth is forecast for 2018, on account of a higher baseline than in 2017 and the tightening of monetary policy expected in the United States, the eurozone and China, exacerbated in the case of China by reduced fiscal expansion. In the medium term, the international context remains uncertain, with doubts still existing about the recovery of the global economy, the challenges posed to traditional trade by the digital revolution and, more recently, the emergence of populist political movements in some developed countries.
Despite the recent uptick in growth, the advanced economies face considerable uncertainty regarding the long-term sustainability of economic activity. The major economies are reporting significant decelerations in per capita GDP growth compared to historical trends. At the same time, investment as a percentage of GDP is still below its pre-crisis levels in all the major developed economies. Productive capital continues to expand slowly and productivity growth has not returned to its past levels. Inflation rates are still too low, and while unemployment stands at historically low levels, nominal wages remain stagnant, which curtails consumption.
The digital revolution is creating new patterns of consumption, production and business in all sectors of the economy, which has the potential for a significant impact on employment. While traditional trade and investment flows slowed notably in the wake of the financial crisis, digital flows increased 45-fold between 2005 and 2014 and are expected to increase by a factor of nine over the next five years. In that context, e-commerce is of growing importance. The Internet plays a dual role in the consumption and delivery of goods and services: first, it facilitates the exchange of traditional goods and services and, second, it serves as a platform for goods and services that are entirely digital, such as music, books and software, As regards production, the Internet and technology facilitate communications, shorten value chains through additive manufacturing and redefine the traditional boundaries between goods and services. Accordingly, global trade in the twenty-first century covers physical goods and services that are conveyed through traditional channels, physical goods and services that are produced, consumed and delivered by means of digital platforms and goods and services that are by nature entirely digital and intangible.
The digital revolution poses unprecedented challenges for the regulation of global trade. The trade agreements of the 1990s are not up to the task of governing today’s exponentially expanding cross-border digital flows. While the leeway for formulating traditional industrial policy has been sharply reduced as a result of World Trade Organization (WTO) agreements and North-South trade and investment arrangements, the digital economy remains largely unregulated. This means that governments have room to implement measures such as blocking specific Internet sites, imposing network location server requirements or compelling foreign providers to reveal the source code of their software. In this context, actors such as China, the United States and the European
In 2017, world trade is expected to increase by 3.6%, driven by increased growth in output in the United States, the eurozone and China. Slightly slower growth is forecast for 2018, on account of a higher baseline than in 2017 and the tightening of monetary policy expected in the United States, the eurozone and China, exacerbated in the case of China by reduced fiscal expansion.
14 Summary Economic Commission for Latin America and the Caribbean (ECLAC)
Union are competing to influence the regulation of global digital trade, with widely divergent visions and models.
After being the leading advocate of trade liberalization for seven decades, the United States has set out in a radically different direction. While undeniably disruptive, that shift does not yet appear to mark a turning point in the process of trade liberalization that the world has undergone over the past three decades. In this context, the European Union has assumed de facto international leadership in the governance of trade and investment: for instance, through its proposal to replace the heavily criticized system for investor-state dispute settlement that currently exists with a system of permanent tribunals. Its recent agreements with Canada and Singapore include such a mechanism, as well as the parties’ commitment to work for the creation of a multilateral investment court. Those agreements also include several provisions that seek to guarantee the right of host States to enact regulations in the public interest. More generally, the European Union has set itself the goal of ensuring that its trade and investment agreements make a greater contribution to sustainable development, including the implementation of the 2030 Agenda for Sustainable Development and efforts to combat climate change.
The high degree of uncertainty seen in the macroeconomic, technological and geopolitical spheres further complicate assessments of whether the current growth will be sustained in the medium term. In any case, their overall impact on policies to promote investment and productive diversification are negative. Uncertainty hampers economic calculations and reduces expected rates of return, with negative repercussions for investment. Difficulties in designing sector-wide policies increase as technological dynamism fuels greater doubts about patterns of specialization and employment generation, even in the medium term. Finally, the growing conflict between the dynamics of growth, usage and consumption in the digital and analogue universes raises questions about the productive structure that will be resolved only with the passage of time.
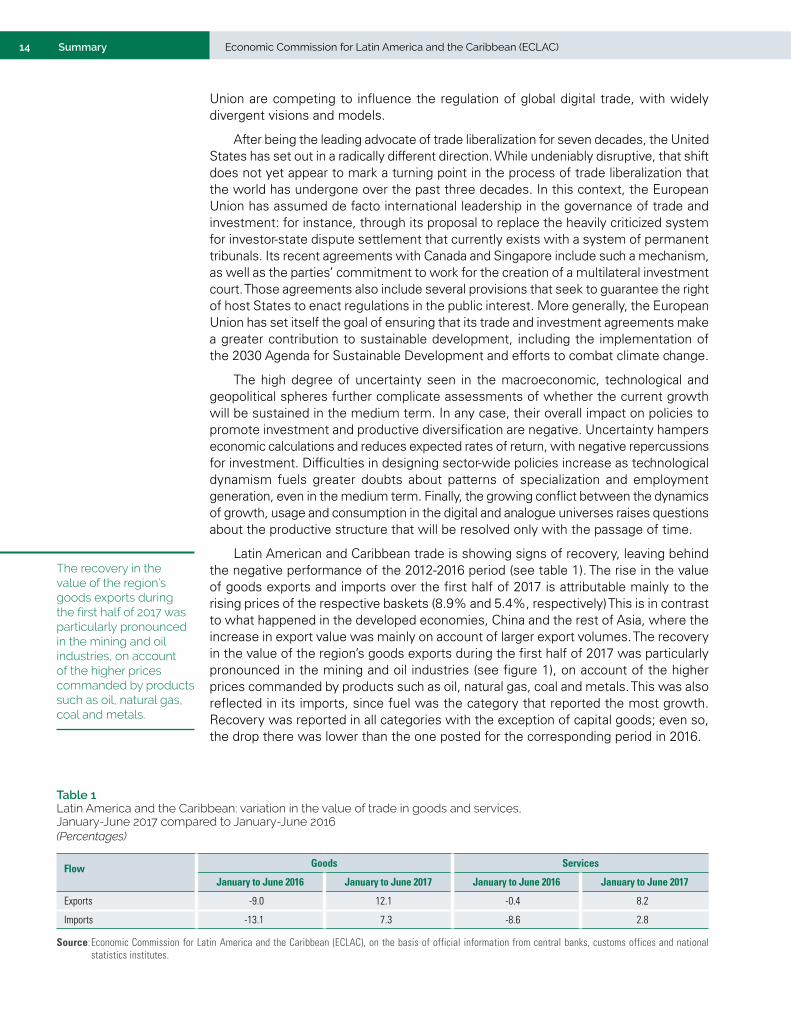
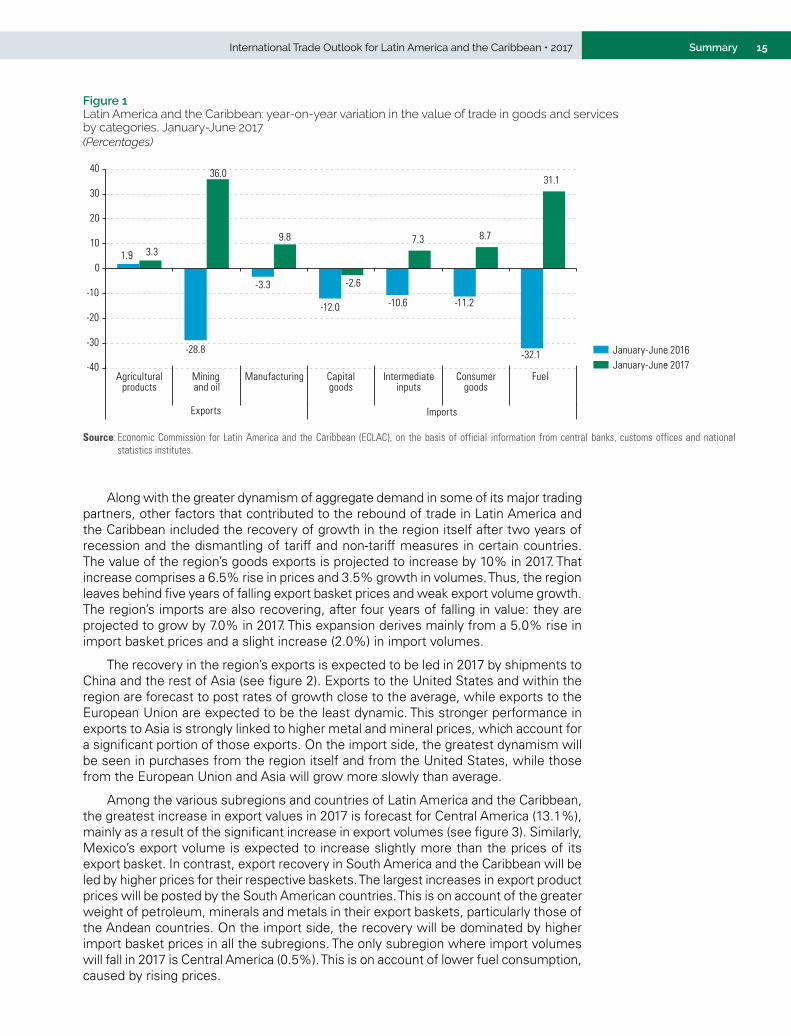
Latin American and Caribbean trade is showing signs of recovery, leaving behind the negative performance of the 2012-2016 period (see table 1). The rise in the value of goods exports and imports over the first half of 2017 is attributable mainly to the rising prices of the respective baskets (8.9% and 5.4%, respectively) This is in contrast to what happened in the developed economies, China and the rest of Asia, where the increase in export value was mainly on account of larger export volumes. The recovery in the value of the region’s goods exports during the first half of 2017 was particularly pronounced in the mining and oil industries (see figure 1), on account of the higher prices commanded by products such as oil, natural gas, coal and metals. This was also reflected in its imports, since fuel was the category that reported the most growth. Recovery was reported in all categories with the exception of capital goods; even so, the drop there was lower than the one posted for the corresponding period in 2016.
Table 1 Latin America and the Caribbean: variation in the value of trade in goods and services, January-June 2017 compared to January-June 2016 (Percentages)
Flow Goods Services
January to June 2016 January to June 2017 January to June 2016 January to June 2017
Exports -9.0 12.1 -0.4 8.2
Imports -13.1 7.3 -8.6 2.8
Source: Economic Commission for Latin America and the Caribbean (ECLAC), on the basis of official information from central banks, customs offices and national statistics institutes.
The recovery in the value of the region’s goods exports during the first half of 2017 was particularly pronounced in the mining and oil industries, on account of the higher prices commanded by products such as oil, natural gas, coal and metals.
15SummaryInternational Trade Outlook for Latin America and the Caribbean • 2017
Figure 1 Latin America and the Caribbean: year-on-year variation in the value of trade in goods and services by categories, January-June 2017 (Percentages)
1.9
-28.8
-3.3
-12.0 -10.6 -11.2
-32.1
3.3
36.0
9.8
-2.6
7.3 8.7
31.1
-40
-30
-20
-10
0
10
20
30
40
Agriculturalproducts
Mining and oil
Manufacturing Capitalgoods
Intermediateinputs
Consumergoods
Fuel
Exports Imports
January-June 2017January-June 2016
Source: Economic Commission for Latin America and the Caribbean (ECLAC), on the basis of official information from central banks, customs offices and national statistics institutes.
Along with the greater dynamism of aggregate demand in some of its major trading partners, other factors that contributed to the rebound of trade in Latin America and the Caribbean included the recovery of growth in the region itself after two years of recession and the dismantling of tariff and non-tariff measures in certain countries. The value of the region’s goods exports is projected to increase by 10% in 2017. That increase comprises a 6.5% rise in prices and 3.5% growth in volumes. Thus, the region leaves behind five years of falling export basket prices and weak export volume growth. The region’s imports are also recovering, after four years of falling in value: they are projected to grow by 7.0% in 2017. This expansion derives mainly from a 5.0% rise in import basket prices and a slight increase (2.0%) in import volumes.
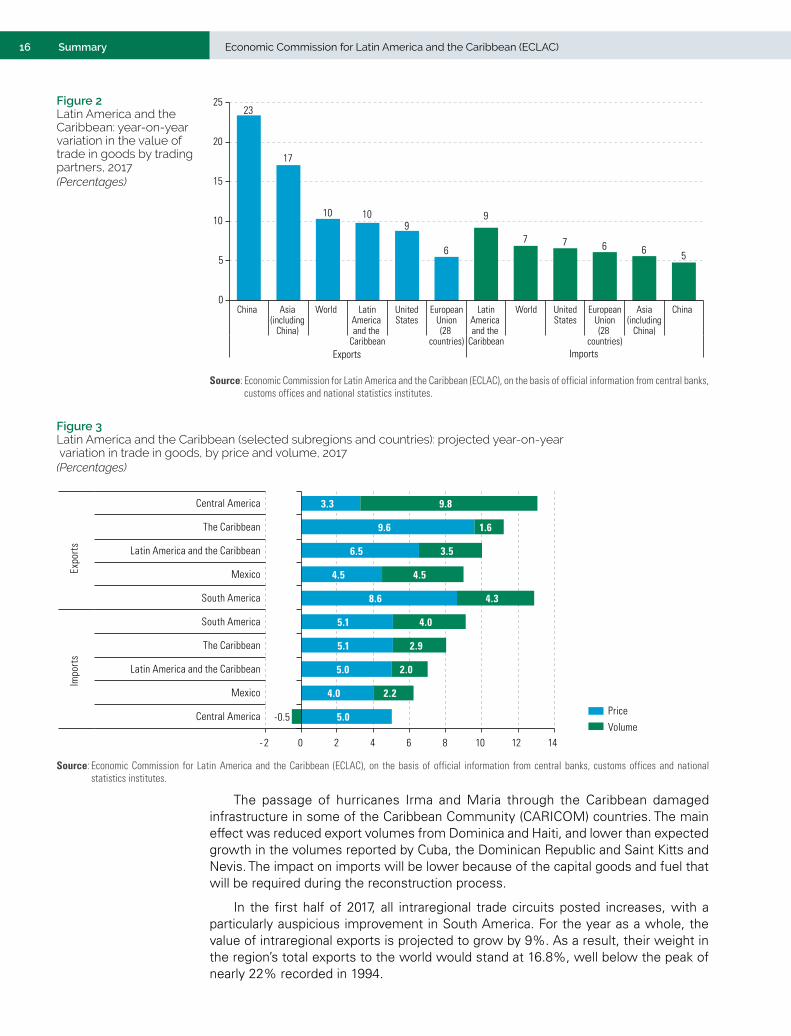
The recovery in the region’s exports is expected to be led in 2017 by shipments to China and the rest of Asia (see figure 2). Exports to the United States and within the region are forecast to post rates of growth close to the average, while exports to the European Union are expected to be the least dynamic. This stronger performance in exports to Asia is strongly linked to higher metal and mineral prices, which account for a significant portion of those exports. On the import side, the greatest dynamism will be seen in purchases from the region itself and from the United States, while those from the European Union and Asia will grow more slowly than average.
Among the various subregions and countries of Latin America and the Caribbean, the greatest increase in export values in 2017 is forecast for Central America (13.1%), mainly as a result of the significant increase in export volumes (see figure 3). Similarly, Mexico’s export volume is expected to increase slightly more than the prices of its export basket. In contrast, export recovery in South America and the Caribbean will be led by higher prices for their respective baskets. The largest increases in export product prices will be posted by the South American countries. This is on account of the greater weight of petroleum, minerals and metals in their export baskets, particularly those of the Andean countries. On the import side, the recovery will be dominated by higher import basket prices in all the subregions. The only subregion where import volumes will fall in 2017 is Central America (0.5%). This is on account of lower fuel consumption, caused by rising prices.
16 Summary Economic Commission for Latin America and the Caribbean (ECLAC)
23
17
10 109
6
9
7 7 6 6 5
0
5
10
15
20
25
China World WorldLatinAmerica and the
Caribbean
LatinAmerica and the
Caribbean
UnitedStates
UnitedStates
China
Exports Imports
Asia(including
China)
Asia(including
China)
EuropeanUnion(28
countries)
EuropeanUnion(28
countries)
Source: Economic Commission for Latin America and the Caribbean (ECLAC), on the basis of official information from central banks, customs offices and national statistics institutes.
Figure 2 Latin America and the Caribbean: year-on-year variation in the value of trade in goods by trading partners, 2017 (Percentages)
Figure 3 Latin America and the Caribbean (selected subregions and countries): projected year-on-year variation in trade in goods, by price and volume, 2017 (Percentages)
Volume
Price5.0
4.0
5.0
5.1
5.1
8.6
4.5
6.5
9.6
3.3
--0.5
2.2
2.0
2.9
4.0
4.3
4.5
3.5
1.6
9.8
- 2 0 2 4 6 8 10 12 14
Central America
Mexico
Latin America and the Caribbean
The Caribbean
South America
South America
Mexico
Latin America and the Caribbean
The Caribbean
Central America
Impo
rts
Expo
rts
Source: Economic Commission for Latin America and the Caribbean (ECLAC), on the basis of official information from central banks, customs offices and national statistics institutes.
The passage of hurricanes Irma and Maria through the Caribbean damaged infrastructure in some of the Caribbean Community (CARICOM) countries. The main effect was reduced export volumes from Dominica and Haiti, and lower than expected growth in the volumes reported by Cuba, the Dominican Republic and Saint Kitts and Nevis. The impact on imports will be lower because of the capital goods and fuel that will be required during the reconstruction process.
In the first half of 2017, all intraregional trade circuits posted increases, with a particularly auspicious improvement in South America. For the year as a whole, the value of intraregional exports is projected to grow by 9%. As a result, their weight in the region’s total exports to the world would stand at 16.8%, well below the peak of nearly 22% recorded in 1994.
17SummaryInternational Trade Outlook for Latin America and the Caribbean • 2017
Empirical evidence shows that intraregional trade is characterized by a model favourable to production diversification. Thus, the regional market is the destination for the largest number of products. Similarly, for many countries in Latin America and the Caribbean, this is the largest market for their manufactured exports (in many cases, accounting for more than 50% of the total). The region is also the natural market for the internationalization of small and medium-sized enterprises (SMEs). However, intraregional trade remains subject to severe, mainly non-tariff barriers (quotas, non-automatic import licences, informal barriers, antidumping duties and others). On average, non-tariff barriers in force in the region equate to a tariff of 25.3%, which is almost nine times the average value of the tariffs imposed on intraregional trade (2.9%). In addition to tariffs and non-tariff measures, there are costs associated with customs processes (reflected in export and import times) which, according to estimates by the Economic Commission for Latin America and the Caribbean (ECLAC), are equal to an additional average tariff of 20%.
To summarize, global output and trade are showing signs of a rebound in 2017, after several years of sluggish growth. However, there are still doubts about the sustainability of this upturn, given the considerable macroeconomic, technological and geopolitical uncertainty that exists. In that context, the value of the region’s exports has started to rise again in 2017, after falling for four years. Yet, this recovery is underpinned more by exogenous factors (the increase in the prices of several commodities) than by domestic growth.
Intraregional trade offers great potential for exports of manufactured goods and more processed products in general. This underscores the urgent need for deeper regional integration, especially with the recent shift in the United States’ trade policy and the uncertainty surrounding the renegotiation of the North American Free Trade Agreement (NAFTA). The simulations presented in this chapter indicate that signing a regional trade agreement would produce considerable gains, which would be greater if the agreement were not limited to reducing tariffs, but also included the removal of non-tariff barriers and the harmonization or mutual recognition of technical, sanitary and phytosanitary standards. Likewise, appropriate cumulation of origin mechanisms would also promote the integration of production. Trade facilitation is another major component of deeper regional integration, which could help raise the current low levels of intraregional trade, promote the internationalization of SMEs and strengthen production chains within the region.
B. The region’s weak performance in modern services trade
The spread of information and communications technologies (ICTs) has driven a growing business, analytical and policy interest in trade in services. The Internet enabled the long-distance delivery of services between producer and consumer, something that was not possible before and opened up great potential for international trade in these activities. In addition the different types of services built into industrial products through digital platforms generate the greatest value for clients, for example in mobile telephone. Other digital platforms (such as Alibaba, Amazon, Flipkart and Skype, for example) facilitate the exchange of traditional goods and services. Platforms also make certain goods and services entirely digital, as in the case of music, books and software. As a result, the traditional boundaries between goods and services are gradually blurring. A number of services are also crucial for the operation of global value chains in goods, such as research and development (R&D), logistics, financial services and marketing.
Global output and trade are showing signs of a rebound in 2017, after several years of sluggish growth. In that context, the value of the region’s exports has started to rise again in 2017, after falling for four years. Yet, this recovery is underpinned more by exogenous factors (the increase in the prices of several commodities) than by domestic growth.
18 Summary Economic Commission for Latin America and the Caribbean (ECLAC)
The great business interest in services is reflected in the rapid growth in their international trade, especially in Internet-enabled modern services, compared with goods trade. Modern services include telecoms, computer and information services; financial services; insurance and pension services; royalties; and other business services. From 2005 to 2016, the value of global modern services exports grew by an annual average of 6.7%, compared with 4.5% for traditional services (goods-related services, transport; travel; construction; personal, cultural and recreational services; and government services), and 3.9% for goods.
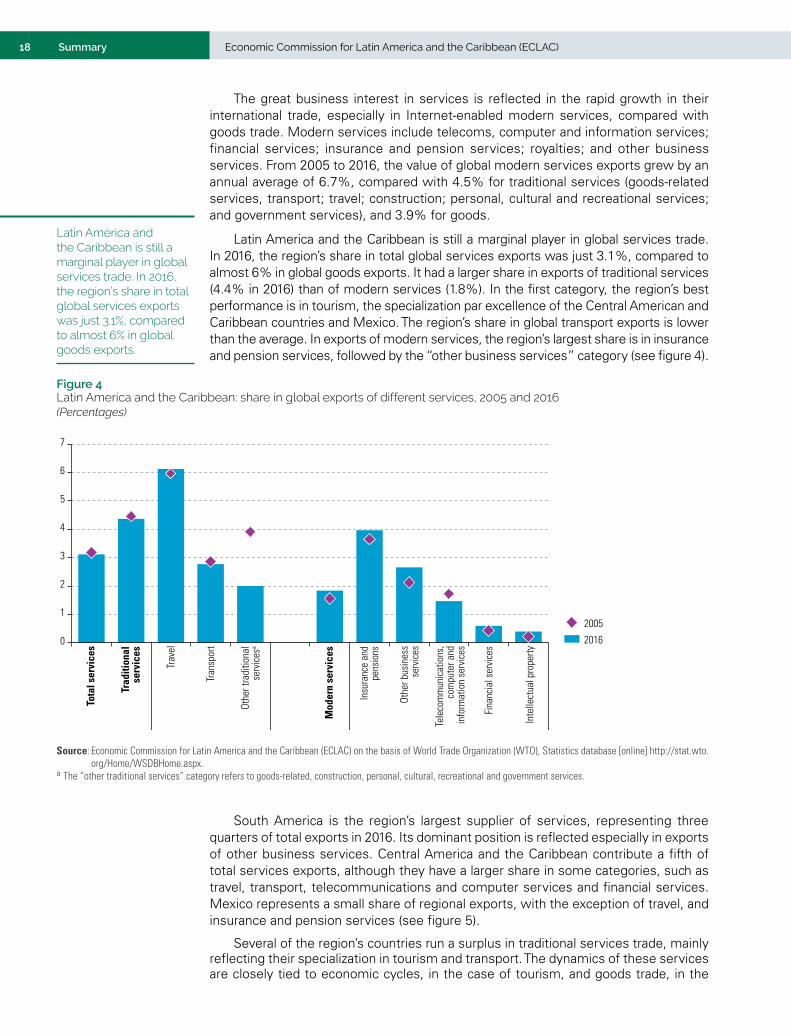
Latin America and the Caribbean is still a marginal player in global services trade. In 2016, the region’s share in total global services exports was just 3.1%, compared to almost 6% in global goods exports. It had a larger share in exports of traditional services (4.4% in 2016) than of modern services (1.8%). In the first category, the region’s best performance is in tourism, the specialization par excellence of the Central American and Caribbean countries and Mexico. The region’s share in global transport exports is lower than the average. In exports of modern services, the region’s largest share is in insurance and pension services, followed by the “other business services” category (see figure 4).
Figure 4 Latin America and the Caribbean: share in global exports of different services, 2005 and 2016(Percentages)
0
1
2
3
4
5
6
7
Tota
l ser
vice
s
Trad
ition
alse
rvic
es
Trav
el
Tran
spor
t
Othe
r tra
ditio
nal
serv
ices
a
Mod
ern
serv
ices
Insu
ranc
e an
d p
ensi
ons
Othe
r bus
ines
s s
ervi
ces
Tele
com
mun
icat
ions
,co
mpu
ter a
ndin
form
atio
n se
rvic
es
Fina
ncia
l ser
vice
s
Inte
llect
ual p
rope
rty
2016
2005
Traditional services Modern servicesSource: Economic Commission for Latin America and the Caribbean (ECLAC) on the basis of World Trade Organization (WTO), Statistics database [online] http://stat.wto.
org/Home/WSDBHome.aspx.a The “other traditional services” category refers to goods-related, construction, personal, cultural, recreational and government services.
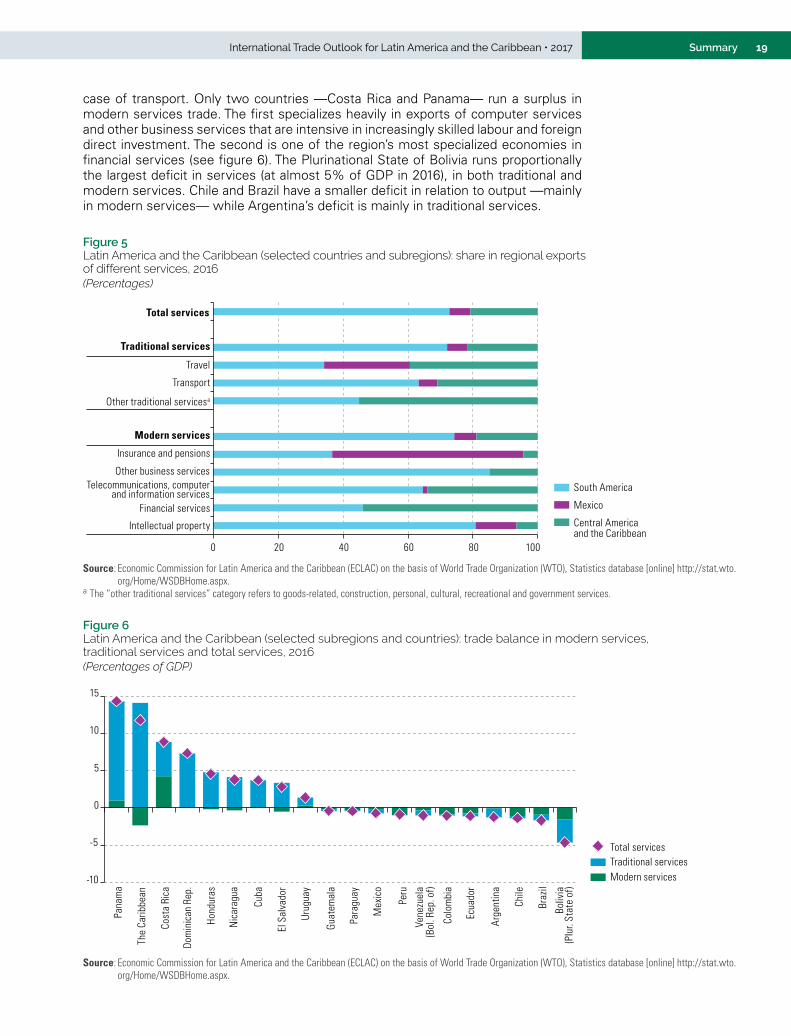
South America is the region’s largest supplier of services, representing three quarters of total exports in 2016. Its dominant position is reflected especially in exports of other business services. Central America and the Caribbean contribute a fifth of total services exports, although they have a larger share in some categories, such as travel, transport, telecommunications and computer services and financial services. Mexico represents a small share of regional exports, with the exception of travel, and insurance and pension services (see figure 5).
Several of the region’s countries run a surplus in traditional services trade, mainly reflecting their specialization in tourism and transport. The dynamics of these services are closely tied to economic cycles, in the case of tourism, and goods trade, in the
Latin America and the Caribbean is still a marginal player in global services trade. In 2016, the region’s share in total global services exports was just 3.1%, compared to almost 6% in global goods exports.
19SummaryInternational Trade Outlook for Latin America and the Caribbean • 2017
case of transport. Only two countries —Costa Rica and Panama— run a surplus in modern services trade. The first specializes heavily in exports of computer services and other business services that are intensive in increasingly skilled labour and foreign direct investment. The second is one of the region’s most specialized economies in financial services (see figure 6). The Plurinational State of Bolivia runs proportionally the largest deficit in services (at almost 5% of GDP in 2016), in both traditional and modern services. Chile and Brazil have a smaller deficit in relation to output —mainly in modern services— while Argentina’s deficit is mainly in traditional services.
Figure 5 Latin America and the Caribbean (selected countries and subregions): share in regional exports of different services, 2016(Percentages)
0 20 40 60 80 100
Intellectual property
Financial services
Telecommunications, computerand information services
Other business services
Insurance and pensions
Modern services
Other traditional servicesa
Transport
Travel
Traditional services
Total services
South America
Mexico
Central Americaand the Caribbean
Source: Economic Commission for Latin America and the Caribbean (ECLAC) on the basis of World Trade Organization (WTO), Statistics database [online] http://stat.wto.org/Home/WSDBHome.aspx.
a The “other traditional services” category refers to goods-related, construction, personal, cultural, recreational and government services.
Figure 6 Latin America and the Caribbean (selected subregions and countries): trade balance in modern services, traditional services and total services, 2016(Percentages of GDP)
Modern services
Total services
-10
-5
0
5
10
15
Pana
ma
The
Carib
bean
Cost
a Ri
ca
Dom
inic
an R
ep.
Hond
uras
Nic
arag
ua
Cuba
El S
alva
dor
Urug
uay
Guat
emal
a
Para
guay
Mex
ico
Peru
Vene
zuel
a(B
ol. R
ep. o
f)
Colo
mbi
a
Ecua
dor
Arge
ntin
a
Chile
Braz
il
Boliv
ia(P
lur.
Stat
e of
)
Traditional services
Source: Economic Commission for Latin America and the Caribbean (ECLAC) on the basis of World Trade Organization (WTO), Statistics database [online] http://stat.wto.org/Home/WSDBHome.aspx.
20 Summary Economic Commission for Latin America and the Caribbean (ECLAC)
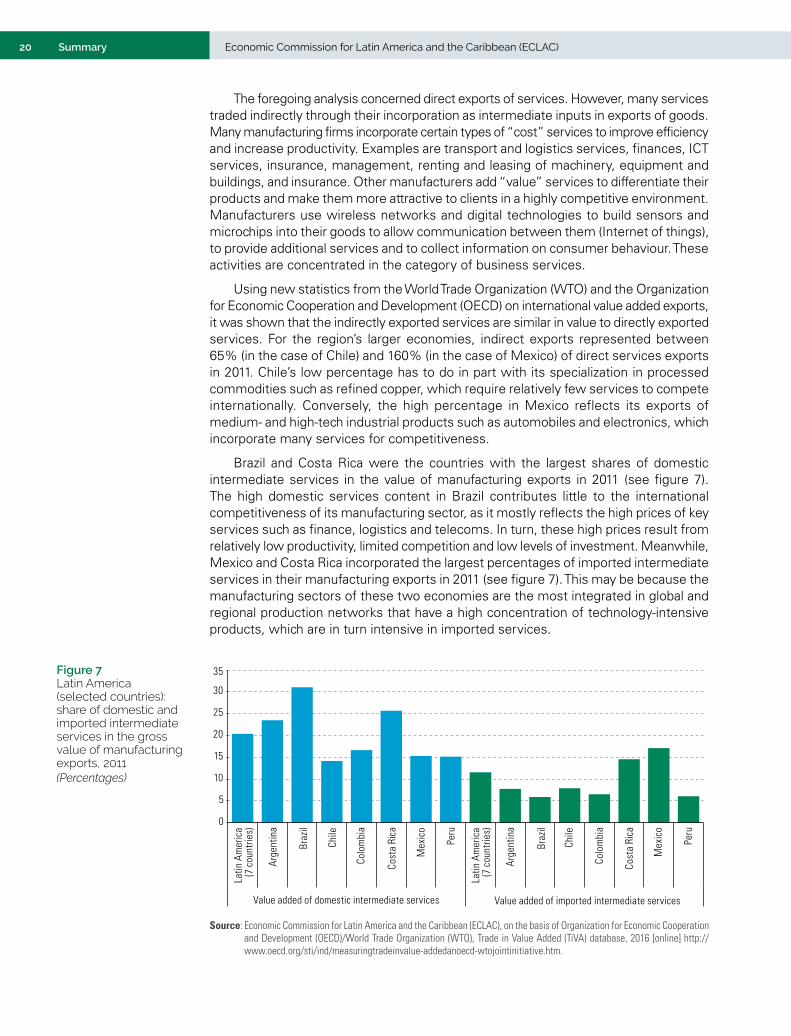
The foregoing analysis concerned direct exports of services. However, many services traded indirectly through their incorporation as intermediate inputs in exports of goods. Many manufacturing firms incorporate certain types of “cost” services to improve efficiency and increase productivity. Examples are transport and logistics services, finances, ICT services, insurance, management, renting and leasing of machinery, equipment and buildings, and insurance. Other manufacturers add “value” services to differentiate their products and make them more attractive to clients in a highly competitive environment. Manufacturers use wireless networks and digital technologies to build sensors and microchips into their goods to allow communication between them (Internet of things), to provide additional services and to collect information on consumer behaviour. These activities are concentrated in the category of business services.
Using new statistics from the World Trade Organization (WTO) and the Organization for Economic Cooperation and Development (OECD) on international value added exports, it was shown that the indirectly exported services are similar in value to directly exported services. For the region’s larger economies, indirect exports represented between 65% (in the case of Chile) and 160% (in the case of Mexico) of direct services exports in 2011. Chile’s low percentage has to do in part with its specialization in processed commodities such as refined copper, which require relatively few services to compete internationally. Conversely, the high percentage in Mexico reflects its exports of medium- and high-tech industrial products such as automobiles and electronics, which incorporate many services for competitiveness.
Brazil and Costa Rica were the countries with the largest shares of domestic intermediate services in the value of manufacturing exports in 2011 (see figure 7). The high domestic services content in Brazil contributes little to the international competitiveness of its manufacturing sector, as it mostly reflects the high prices of key services such as finance, logistics and telecoms. In turn, these high prices result from relatively low productivity, limited competition and low levels of investment. Meanwhile, Mexico and Costa Rica incorporated the largest percentages of imported intermediate services in their manufacturing exports in 2011 (see figure 7). This may be because the manufacturing sectors of these two economies are the most integrated in global and regional production networks that have a high concentration of technology-intensive products, which are in turn intensive in imported services.
0
5
10
15
20
25
30
35
Latin
Am
eric
a(7
cou
ntrie
s)
Arge
ntin
a
Braz
il
Chile
Colo
mbi
a
Cost
a Ri
ca
Mex
ico
Peru
Latin
Am
eric
a(7
cou
ntrie
s)
Arge
ntin
a
Braz
il
Chile
Colo
mbi
a
Cost
a Ri
ca
Mex
ico
Peru
Value added of domestic intermediate services Value added of imported intermediate services
Source: Economic Commission for Latin America and the Caribbean (ECLAC), on the basis of Organization for Economic Cooperation and Development (OECD)/World Trade Organization (WTO), Trade in Value Added (TiVA) database, 2016 [online] http://www.oecd.org/sti/ind/measuringtradeinvalue-addedanoecd-wtojointinitiative.htm.
Figure 7 Latin America (selected countries): share of domestic and imported intermediate services in the gross value of manufacturing exports, 2011(Percentages)
21SummaryInternational Trade Outlook for Latin America and the Caribbean • 2017
The success of traditional and modern services exporters in the region depends heavily on the public-private strategies in place to support this sector. These strategies need to comply with modern governance standards, with a medium-term focus, clear goals, sufficient budgets, clear allocation of responsibilities, constant monitoring and regular evaluation. Examples in the region are the Productive Transformation Programme established in Colombia in 2009, with targets for 2019 for software and information technology (IT) services exports, business process outsourcing (BPO) and knowledge process outsourcing (KPO), and the public-private plans known as PROSOFT 3.0 in Mexico, introduced in 2014, which seeks to quadruple sales and exports by 2024. The governments of other countries, including Chile and Peru, also have export targets.
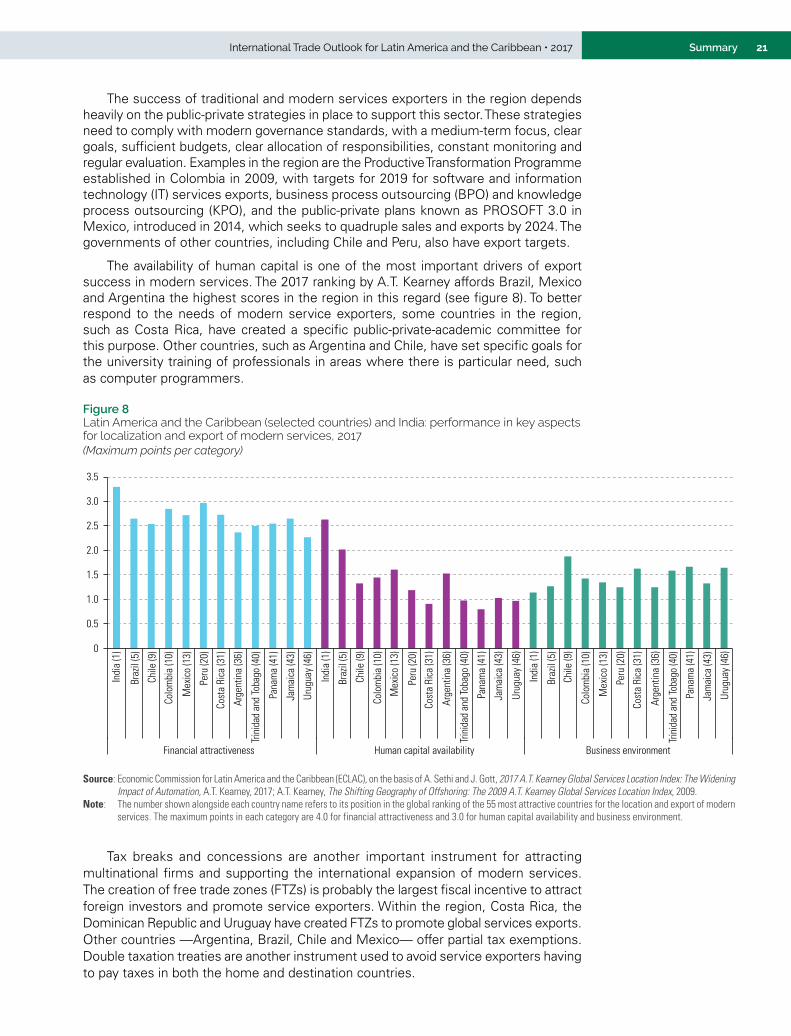
The availability of human capital is one of the most important drivers of export success in modern services. The 2017 ranking by A.T. Kearney affords Brazil, Mexico and Argentina the highest scores in the region in this regard (see figure 8). To better respond to the needs of modern service exporters, some countries in the region, such as Costa Rica, have created a specific public-private-academic committee for this purpose. Other countries, such as Argentina and Chile, have set specific goals for the university training of professionals in areas where there is particular need, such as computer programmers.
Figure 8 Latin America and the Caribbean (selected countries) and India: performance in key aspects for localization and export of modern services, 2017(Maximum points per category)
0
0.5
1.0
1.5
2.0
2.5
3.0
3.5
Indi
a (1
)
Braz
il (5
)
Chile
(9)
Colo
mbi
a (1
0)
Mex
ico
(13)
Peru
(20)
Cost
a Ri
ca (3
1)
Arge
ntin
a (3
6)
Trin
idad
and
Toba
go (4
0)
Pana
ma
(41)
Jam
aica
(43)
Urug
uay
(46)
Indi
a (1
)
Braz
il (5
)
Chile
(9)
Colo
mbi
a (1
0)
Mex
ico
(13)
Peru
(20)
Cos
ta R
ica
(31)
Arg
entin
a (3
6)
Trin
idad
and
Toba
go (4
0)
Pana
ma
(41)
Jam
aica
(43)
Urug
uay
(46)
Indi
a (1
)
Braz
il (5
)
Chile
(9)
Colo
mbi
a (1
0)
Mex
ico
(13)
Per
u (2
0)
Cost
a Ri
ca (3
1)
Arge
ntin
a (3
6)
Trin
idad
and
Toba
go (4
0)
Pana
ma
(41)
Jam
aica
(43)
Urug
uay
(46)
Financial attractiveness Human capital availability Business environment
Source: Economic Commission for Latin America and the Caribbean (ECLAC), on the basis of A. Sethi and J. Gott, 2017 A.T. Kearney Global Services Location Index: The Widening Impact of Automation, A.T. Kearney, 2017; A.T. Kearney, The Shifting Geography of Offshoring: The 2009 A.T. Kearney Global Services Location Index, 2009.
Note: The number shown alongside each country name refers to its position in the global ranking of the 55 most attractive countries for the location and export of modern services. The maximum points in each category are 4.0 for financial attractiveness and 3.0 for human capital availability and business environment.
Tax breaks and concessions are another important instrument for attracting multinational firms and supporting the international expansion of modern services. The creation of free trade zones (FTZs) is probably the largest fiscal incentive to attract foreign investors and promote service exporters. Within the region, Costa Rica, the Dominican Republic and Uruguay have created FTZs to promote global services exports. Other countries —Argentina, Brazil, Chile and Mexico— offer partial tax exemptions. Double taxation treaties are another instrument used to avoid service exporters having to pay taxes in both the home and destination countries.
22 Summary Economic Commission for Latin America and the Caribbean (ECLAC)
Digital ecosystems are also increasingly important for the development and export of modern services. These systems refer to how governments, firms, consumers and things interconnect through standardized digital platforms based on common interests. The spread, use and safety of these platforms require active policies. The development of digital industries, including modern services, depends critically on the overall digitalization of production. The region is substantially behind Europe and North America in this sphere. Most of the countries examined have also adopted policies to expedite the development of a digital ecosystem. Brazil, Chile, Colombia, Costa Rica, Peru and Uruguay have introduced laws for personal data protection and to enhance cybersecurity. Moreover, Costa Rica, Peru and Uruguay have developed e-platforms in the form of a digital market-place to connect buyers with sellers, consumers with suppliers and employees with employers.
In addition to national endeavours, a more determined effort is needed to promote regional integration in services trade. In two of the region’s five subregional integration schemes, the negotiation agenda on trade in services is stalled, while the others could do more to bring new regulatory areas into their agendas, following the example of numerous twenty-first century trade agreements. This is particularly important considering that the region is the most important destination for many services exporters. Finally, governments must also increase their cooperation at the regional level to produce public goods related, for example, to the digital ecosystem.
C. Latin America and the Caribbean: the challenges of global agricultural trade
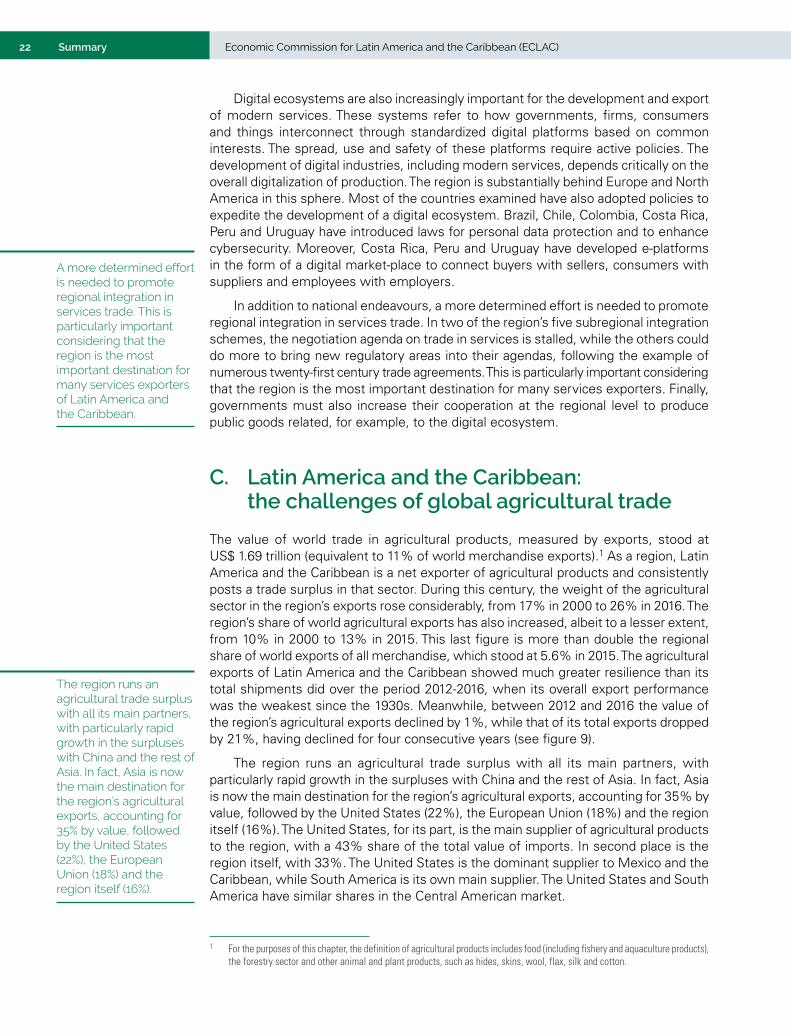
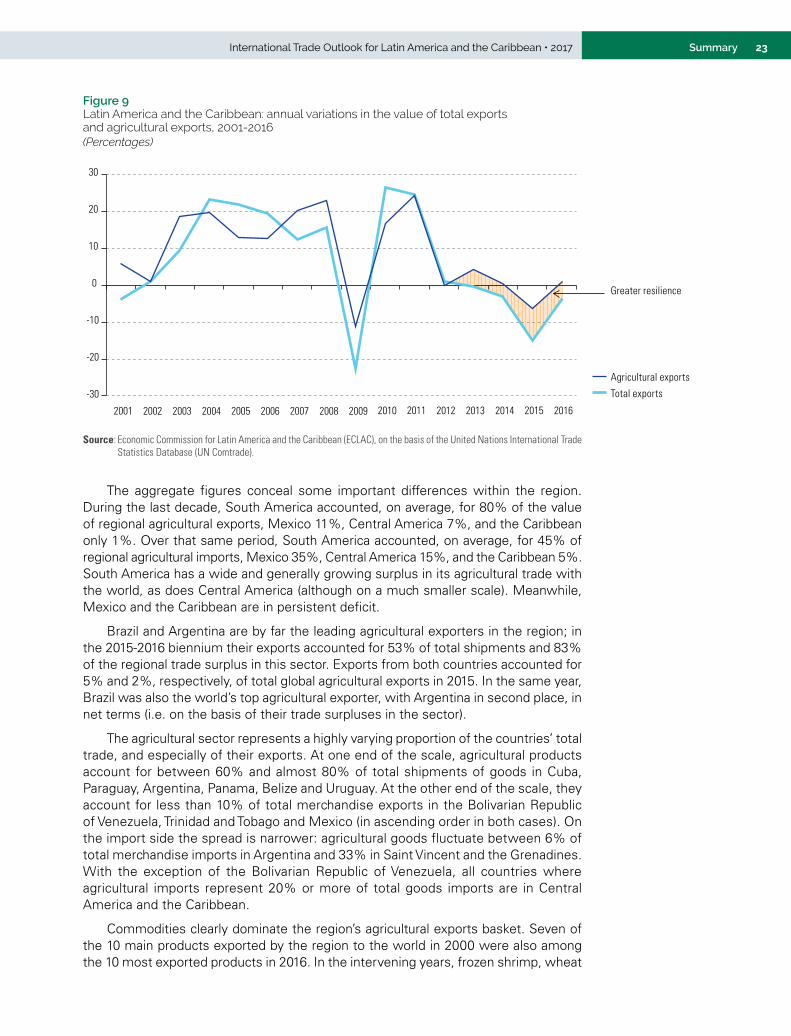
The value of world trade in agricultural products, measured by exports, stood at US$ 1.69 trillion (equivalent to 11% of world merchandise exports).1 As a region, Latin America and the Caribbean is a net exporter of agricultural products and consistently posts a trade surplus in that sector. During this century, the weight of the agricultural sector in the region’s exports rose considerably, from 17% in 2000 to 26% in 2016. The region’s share of world agricultural exports has also increased, albeit to a lesser extent, from 10% in 2000 to 13% in 2015. This last figure is more than double the regional share of world exports of all merchandise, which stood at 5.6% in 2015. The agricultural exports of Latin America and the Caribbean showed much greater resilience than its total shipments did over the period 2012-2016, when its overall export performance was the weakest since the 1930s. Meanwhile, between 2012 and 2016 the value of the region’s agricultural exports declined by 1%, while that of its total exports dropped by 21%, having declined for four consecutive years (see figure 9).
The region runs an agricultural trade surplus with all its main partners, with particularly rapid growth in the surpluses with China and the rest of Asia. In fact, Asia is now the main destination for the region’s agricultural exports, accounting for 35% by value, followed by the United States (22%), the European Union (18%) and the region itself (16%). The United States, for its part, is the main supplier of agricultural products to the region, with a 43% share of the total value of imports. In second place is the region itself, with 33%. The United States is the dominant supplier to Mexico and the Caribbean, while South America is its own main supplier. The United States and South America have similar shares in the Central American market.
1 For the purposes of this chapter, the definition of agricultural products includes food (including fishery and aquaculture products), the forestry sector and other animal and plant products, such as hides, skins, wool, flax, silk and cotton.
A more determined effort is needed to promote regional integration in services trade. This is particularly important considering that the region is the most important destination for many services exporters of Latin America and the Caribbean.
The region runs an agricultural trade surplus with all its main partners, with particularly rapid growth in the surpluses with China and the rest of Asia. In fact, Asia is now the main destination for the region’s agricultural exports, accounting for 35% by value, followed by the United States (22%), the European Union (18%) and the region itself (16%).
23SummaryInternational Trade Outlook for Latin America and the Caribbean • 2017
Figure 9 Latin America and the Caribbean: annual variations in the value of total exports and agricultural exports, 2001-2016(Percentages)
-30
-20
-10
0
10
20
30
2001 2002 2003 2004 2005 2006 2007 2008 2009 2010 2011 2012 2013 2014 2015 2016
Total exports
Agricultural exports
Greater resilience
Source: Economic Commission for Latin America and the Caribbean (ECLAC), on the basis of the United Nations International Trade Statistics Database (UN Comtrade).
The aggregate figures conceal some important differences within the region. During the last decade, South America accounted, on average, for 80% of the value of regional agricultural exports, Mexico 11%, Central America 7%, and the Caribbean only 1%. Over that same period, South America accounted, on average, for 45% of regional agricultural imports, Mexico 35%, Central America 15%, and the Caribbean 5%. South America has a wide and generally growing surplus in its agricultural trade with the world, as does Central America (although on a much smaller scale). Meanwhile, Mexico and the Caribbean are in persistent deficit.
Brazil and Argentina are by far the leading agricultural exporters in the region; in the 2015-2016 biennium their exports accounted for 53% of total shipments and 83% of the regional trade surplus in this sector. Exports from both countries accounted for 5% and 2%, respectively, of total global agricultural exports in 2015. In the same year, Brazil was also the world’s top agricultural exporter, with Argentina in second place, in net terms (i.e. on the basis of their trade surpluses in the sector).
The agricultural sector represents a highly varying proportion of the countries’ total trade, and especially of their exports. At one end of the scale, agricultural products account for between 60% and almost 80% of total shipments of goods in Cuba, Paraguay, Argentina, Panama, Belize and Uruguay. At the other end of the scale, they account for less than 10% of total merchandise exports in the Bolivarian Republic of Venezuela, Trinidad and Tobago and Mexico (in ascending order in both cases). On the import side the spread is narrower: agricultural goods fluctuate between 6% of total merchandise imports in Argentina and 33% in Saint Vincent and the Grenadines. With the exception of the Bolivarian Republic of Venezuela, all countries where agricultural imports represent 20% or more of total goods imports are in Central America and the Caribbean.
Commodities clearly dominate the region’s agricultural exports basket. Seven of the 10 main products exported by the region to the world in 2000 were also among the 10 most exported products in 2016. In the intervening years, frozen shrimp, wheat

24 Summary Economic Commission for Latin America and the Caribbean (ECLAC)
and frozen orange juice dropped out of the top 10, and maize, frozen meat of bovine animals and poultry cuts and offal entered the list. Likewise, soybeans displaced coffee (not roasted, not decaffeinated) as the leading export. In fact, the combined weight of soybean products —soybeans, soybean meal (and other solid residues from the extraction of soybean oil) and crude soybean oil— rose from 14% to 22% of the total value of exports, as a result of high demand from China and the rest of Asia.
Fruits and vegetables, oilseeds and meats are, in that order, the categories that contribute most to the region’s trade surplus in the agriculture sector, accounting for 51% in 2015. The region has small deficits in only a few categories (the largest, in the paper and paper pulp sector, was US$ 750 million). This situation contrasts with that observed in 2000. At that time, although fruits and vegetables were also the category that generated the largest surplus in the region’s agricultural trade, the weight of oilseeds and meats was much lower, while the share of coffee and fishery products was greater in relative terms. This highlights the profound reconfiguration of the region’s export basket during this century and, in particular, the growing weight of soybeans. Moreover, in 2000, the region ran larger deficits (in absolute terms) than it does today, especially in the paper and paper pulp, cereals and dairy products sectors.
The composition and the degree of concentration of the region’s export basket fluctuate considerably according to the market of destination. Among the most important markets, the most concentrated is China, where a single product (soybeans) accounts for 60% of total agricultural exports by value; the next most concentrated market is the European Union. Shipments to the United States and within the region itself are much more diversified (see figure 10). Accordingly, the number of agricultural products exported to China is much smaller than the number sent to the European Union, the United States and intraregional market, although it has increased significantly since 2000.
Figure 10 Latin America and the Caribbean: share of the top 10 products in the value of agricultural exports destined for selected markets and the world as a whole, 2016(Percentages)
87
59
44
3328
0
10
20
30
40
50
60
70
80
90
100
China European Union(28 countries)
World United States Latin America andthe Caribbean
Source: Economic Commission for Latin America and the Caribbean (ECLAC), on the basis of the United Nations International Trade Statistics Database (UN Comtrade).
Latin America and the Caribbean, as a region, is a major supplier of several agricultural commodities, such as raw cane sugar, soybeans and soybean meal, coffee (not roasted, not decaffeinated), frozen poultry meat, maize and frozen meat from bovine animals (see figure 11). The region’s share of exports of all these products increased substantially compared to 2000, mainly as a result of Brazil’s greater market share. Meanwhile, the region has very limited weight as a supplier of processed products. For example, despite
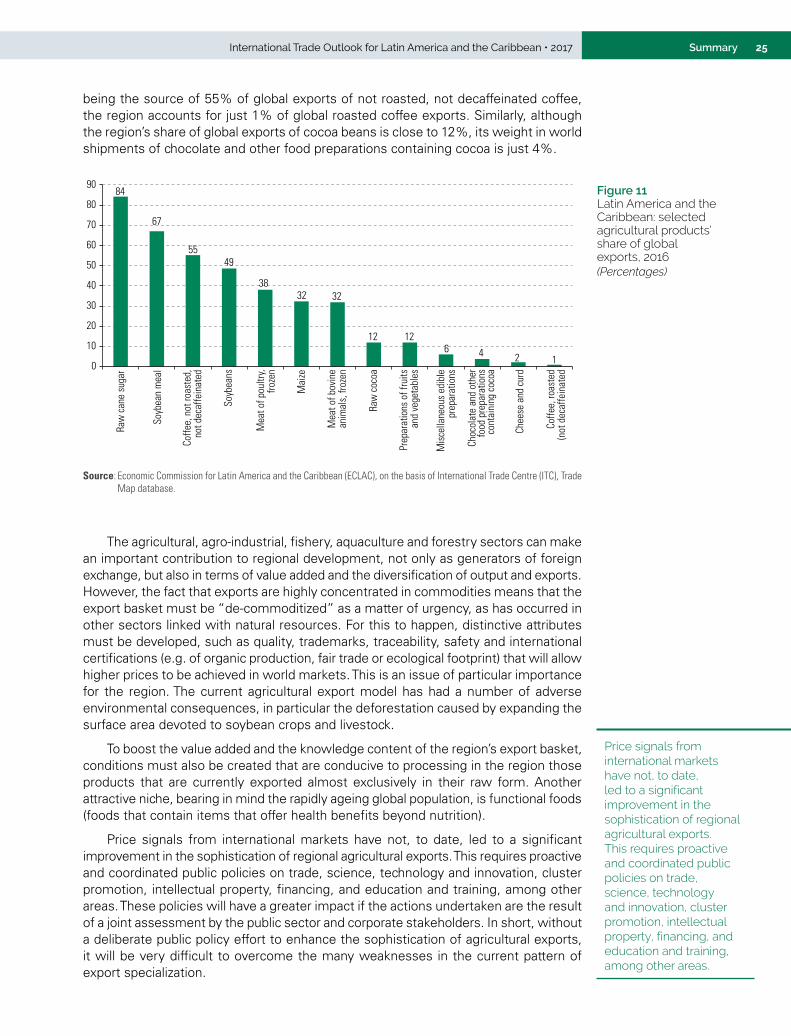
25SummaryInternational Trade Outlook for Latin America and the Caribbean • 2017
being the source of 55% of global exports of not roasted, not decaffeinated coffee, the region accounts for just 1% of global roasted coffee exports. Similarly, although the region’s share of global exports of cocoa beans is close to 12%, its weight in world shipments of chocolate and other food preparations containing cocoa is just 4%.
Figure 11 Latin America and the Caribbean: selected agricultural products’ share of global exports, 2016(Percentages)
0
10
20
30
40
50
60
70
80
90
Raw
can
e su
gar
Soyb
ean
mea
l
Coffe
e, n
ot ro
aste
d, n
ot d
ecaf
fein
ated
Soyb
eans
Mea
t of p
oultr
y,fro
zen
Mai
ze
Mea
t of b
ovin
ean
imal
s, fr
ozen
Raw
coc
oa
Prep
arat
ions
of f
ruits
and
vege
tabl
es
Mis
cella
neou
s ed
ible
prep
arat
ions
Choc
olat
e an
d ot
her
food
pre
para
tions
cont
aini
ng c
ocoa
Chee
se a
nd c
urd
Coffe
e, ro
aste
d(n
ot d
ecaf
fein
ated
67
84
5549
3832 32
12 12
462 1
Source: Economic Commission for Latin America and the Caribbean (ECLAC), on the basis of International Trade Centre (ITC), Trade Map database.
The agricultural, agro-industrial, fishery, aquaculture and forestry sectors can make an important contribution to regional development, not only as generators of foreign exchange, but also in terms of value added and the diversification of output and exports. However, the fact that exports are highly concentrated in commodities means that the export basket must be “de-commoditized” as a matter of urgency, as has occurred in other sectors linked with natural resources. For this to happen, distinctive attributes must be developed, such as quality, trademarks, traceability, safety and international certifications (e.g. of organic production, fair trade or ecological footprint) that will allow higher prices to be achieved in world markets. This is an issue of particular importance for the region. The current agricultural export model has had a number of adverse environmental consequences, in particular the deforestation caused by expanding the surface area devoted to soybean crops and livestock.
To boost the value added and the knowledge content of the region’s export basket, conditions must also be created that are conducive to processing in the region those products that are currently exported almost exclusively in their raw form. Another attractive niche, bearing in mind the rapidly ageing global population, is functional foods (foods that contain items that offer health benefits beyond nutrition).
Price signals from international markets have not, to date, led to a significant improvement in the sophistication of regional agricultural exports. This requires proactive and coordinated public policies on trade, science, technology and innovation, cluster promotion, intellectual property, financing, and education and training, among other areas. These policies will have a greater impact if the actions undertaken are the result of a joint assessment by the public sector and corporate stakeholders. In short, without a deliberate public policy effort to enhance the sophistication of agricultural exports, it will be very difficult to overcome the many weaknesses in the current pattern of export specialization.
Price signals from international markets have not, to date, led to a significant improvement in the sophistication of regional agricultural exports. This requires proactive and coordinated public policies on trade, science, technology and innovation, cluster promotion, intellectual property, financing, and education and training, among other areas.
26 Summary Economic Commission for Latin America and the Caribbean (ECLAC)
Looking ahead, another important task for the countries of the region will be to improve the access conditions of their agricultural exports to the markets that will account for the bulk of the expected increase in global demand for food. The world population, currently around 7.3 billion, is expected to reach 9.5 billion by 2050. Nearly all of this increase will take place in developing countries, especially in Africa (which today accounts for just 5% of the region’s agricultural exports) and Asia. In addition to their robust economic growth, these two continents are going through a rapid process of urbanization and expansion of the middle class. All of this creates significant room for food exports from the Latin America and the Caribbean.
As in other sectors, intraregional trade in food and other agricultural products is most conducive to export diversification, being characterized by the greatest number of products traded and by the largest share of processed products. Therefore, any action aimed at promoting such trade will also foster the necessary diversification of output and exports, and the development of agro-industrial value chains. In this context, a successful conclusion to Mexico’s current trade negotiations with Argentina and Brazil will encourage diversification of Mexico’s agricultural imports, reducing its heavy dependence on the United States. Seeing those negotiations through to a successful conclusion is even more important in the light of the great uncertainty created by the current renegotiation of the North American Free Trade Agreement (NAFTA).
27International Trade Outlook for Latin America and the Caribbean • 2017 Chapter I
Regional trade picks up in an uncertain global context
ICHAPTER
A. An incipient recovery in global trade, after half a decade of low dynamism
B. A particularly uncertain context: macroeconomics, technology and geopolitics
C. Regional foreign trade recovers after four years of decline
D. Conclusions
Bibliography
Annex I.A1

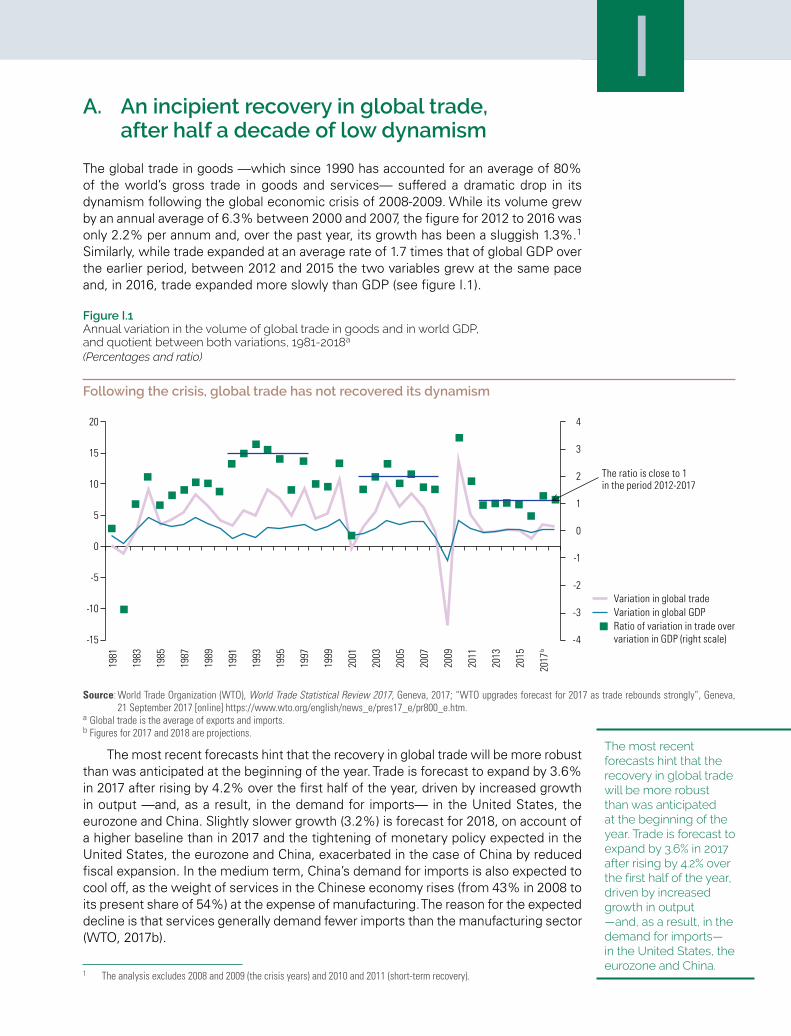
29International Trade Outlook for Latin America and the Caribbean • 2017 Chapter IIA. An incipient recovery in global trade,
after half a decade of low dynamism
The global trade in goods —which since 1990 has accounted for an average of 80% of the world’s gross trade in goods and services— suffered a dramatic drop in its dynamism following the global economic crisis of 2008-2009. While its volume grew by an annual average of 6.3% between 2000 and 2007, the figure for 2012 to 2016 was only 2.2% per annum and, over the past year, its growth has been a sluggish 1.3%.1 Similarly, while trade expanded at an average rate of 1.7 times that of global GDP over the earlier period, between 2012 and 2015 the two variables grew at the same pace and, in 2016, trade expanded more slowly than GDP (see figure I.1).
1 The analysis excludes 2008 and 2009 (the crisis years) and 2010 and 2011 (short-term recovery).
Figure I.1 Annual variation in the volume of global trade in goods and in world GDP, and quotient between both variations, 1981-2018a
(Percentages and ratio)
Following the crisis, global trade has not recovered its dynamism
-4
-3
-2
-1
0
1
2
3
4
-15
-10
-5
0
5
10
15
20
1981
1983
1985
1987
1989
1991
1993
1995
1997
1999
2001
2003
2005
2007
2009
2011
2013
2015
2017
b
Variation in global tradeVariation in global GDP Ratio of variation in trade overvariation in GDP (right scale)
The ratio is close to 1in the period 2012-2017
Source: World Trade Organization (WTO), World Trade Statistical Review 2017, Geneva, 2017; “WTO upgrades forecast for 2017 as trade rebounds strongly”, Geneva, 21 September 2017 [online] https://www.wto.org/english/news_e/pres17_e/pr800_e.htm.
a Global trade is the average of exports and imports.b Figures for 2017 and 2018 are projections.
The most recent forecasts hint that the recovery in global trade will be more robust than was anticipated at the beginning of the year. Trade is forecast to expand by 3.6% in 2017 after rising by 4.2% over the first half of the year, driven by increased growth in output —and, as a result, in the demand for imports— in the United States, the eurozone and China. Slightly slower growth (3.2%) is forecast for 2018, on account of a higher baseline than in 2017 and the tightening of monetary policy expected in the United States, the eurozone and China, exacerbated in the case of China by reduced fiscal expansion. In the medium term, China’s demand for imports is also expected to cool off, as the weight of services in the Chinese economy rises (from 43% in 2008 to its present share of 54%) at the expense of manufacturing. The reason for the expected decline is that services generally demand fewer imports than the manufacturing sector (WTO, 2017b).
The most recent forecasts hint that the recovery in global trade will be more robust than was anticipated at the beginning of the year. Trade is forecast to expand by 3.6% in 2017 after rising by 4.2% over the first half of the year, driven by increased growth in output —and, as a result, in the demand for imports— in the United States, the eurozone and China.
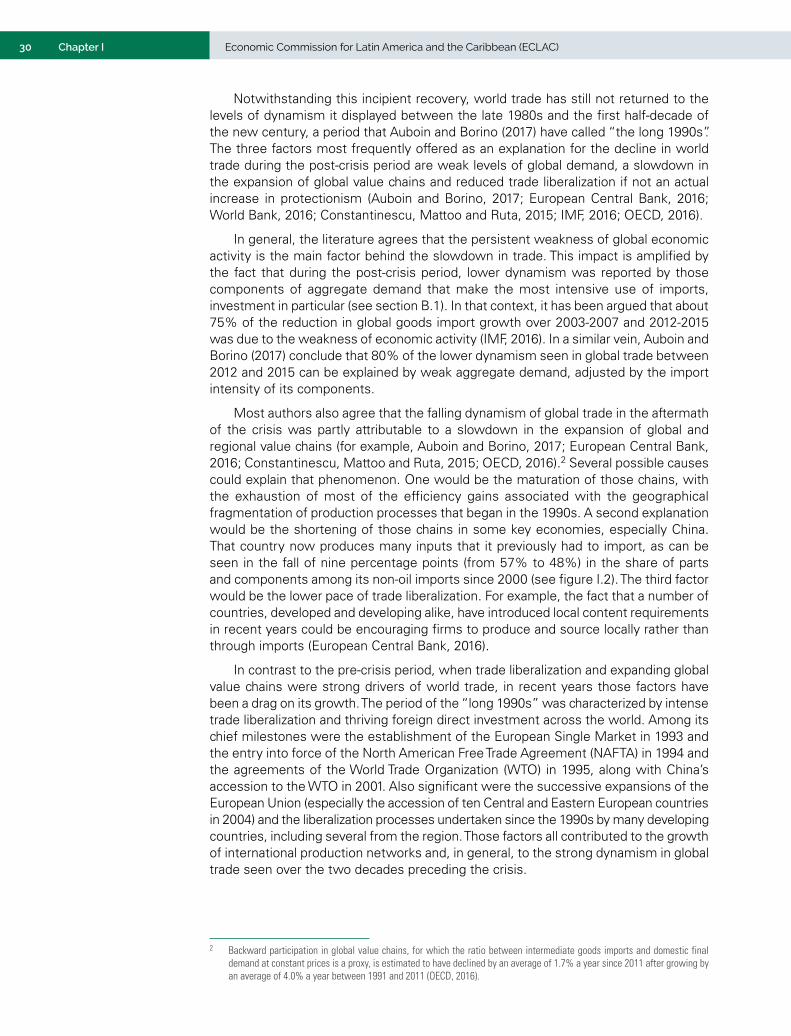
30 Economic Commission for Latin America and the Caribbean (ECLAC)Chapter I
Notwithstanding this incipient recovery, world trade has still not returned to the levels of dynamism it displayed between the late 1980s and the first half-decade of the new century, a period that Auboin and Borino (2017) have called “the long 1990s”. The three factors most frequently offered as an explanation for the decline in world trade during the post-crisis period are weak levels of global demand, a slowdown in the expansion of global value chains and reduced trade liberalization if not an actual increase in protectionism (Auboin and Borino, 2017; European Central Bank, 2016; World Bank, 2016; Constantinescu, Mattoo and Ruta, 2015; IMF, 2016; OECD, 2016).
In general, the literature agrees that the persistent weakness of global economic activity is the main factor behind the slowdown in trade. This impact is amplified by the fact that during the post-crisis period, lower dynamism was reported by those components of aggregate demand that make the most intensive use of imports, investment in particular (see section B.1). In that context, it has been argued that about 75% of the reduction in global goods import growth over 2003-2007 and 2012-2015 was due to the weakness of economic activity (IMF, 2016). In a similar vein, Auboin and Borino (2017) conclude that 80% of the lower dynamism seen in global trade between 2012 and 2015 can be explained by weak aggregate demand, adjusted by the import intensity of its components.
Most authors also agree that the falling dynamism of global trade in the aftermath of the crisis was partly attributable to a slowdown in the expansion of global and regional value chains (for example, Auboin and Borino, 2017; European Central Bank, 2016; Constantinescu, Mattoo and Ruta, 2015; OECD, 2016).2 Several possible causes could explain that phenomenon. One would be the maturation of those chains, with the exhaustion of most of the efficiency gains associated with the geographical fragmentation of production processes that began in the 1990s. A second explanation would be the shortening of those chains in some key economies, especially China. That country now produces many inputs that it previously had to import, as can be seen in the fall of nine percentage points (from 57% to 48%) in the share of parts and components among its non-oil imports since 2000 (see figure I.2). The third factor would be the lower pace of trade liberalization. For example, the fact that a number of countries, developed and developing alike, have introduced local content requirements in recent years could be encouraging firms to produce and source locally rather than through imports (European Central Bank, 2016).
In contrast to the pre-crisis period, when trade liberalization and expanding global value chains were strong drivers of world trade, in recent years those factors have been a drag on its growth. The period of the “long 1990s” was characterized by intense trade liberalization and thriving foreign direct investment across the world. Among its chief milestones were the establishment of the European Single Market in 1993 and the entry into force of the North American Free Trade Agreement (NAFTA) in 1994 and the agreements of the World Trade Organization (WTO) in 1995, along with China’s accession to the WTO in 2001. Also significant were the successive expansions of the European Union (especially the accession of ten Central and Eastern European countries in 2004) and the liberalization processes undertaken since the 1990s by many developing countries, including several from the region. Those factors all contributed to the growth of international production networks and, in general, to the strong dynamism in global trade seen over the two decades preceding the crisis.
2 Backward participation in global value chains, for which the ratio between intermediate goods imports and domestic final demand at constant prices is a proxy, is estimated to have declined by an average of 1.7% a year since 2011 after growing by an average of 4.0% a year between 1991 and 2011 (OECD, 2016).
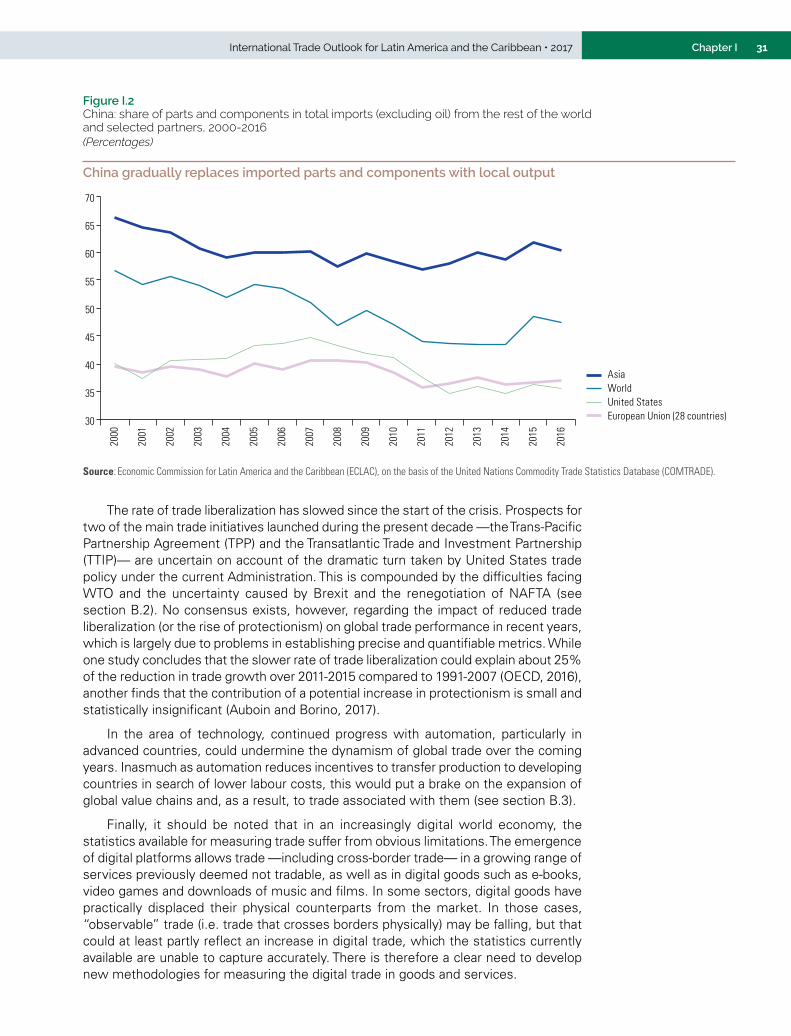
31International Trade Outlook for Latin America and the Caribbean • 2017 Chapter I
Figure I.2 China: share of parts and components in total imports (excluding oil) from the rest of the world and selected partners, 2000-2016(Percentages)
China gradually replaces imported parts and components with local output
30
35
40
45
50
55
60
65
70
2000
2001
2002
2003
2004
2005
2006
2007
2008
2009
2010
2011
2012
2013
2014
2015
2016
Asia
European Union (28 countries)United StatesWorld
Source: Economic Commission for Latin America and the Caribbean (ECLAC), on the basis of the United Nations Commodity Trade Statistics Database (COMTRADE).
The rate of trade liberalization has slowed since the start of the crisis. Prospects for two of the main trade initiatives launched during the present decade —the Trans-Pacific Partnership Agreement (TPP) and the Transatlantic Trade and Investment Partnership (TTIP)— are uncertain on account of the dramatic turn taken by United States trade policy under the current Administration. This is compounded by the difficulties facing WTO and the uncertainty caused by Brexit and the renegotiation of NAFTA (see section B.2). No consensus exists, however, regarding the impact of reduced trade liberalization (or the rise of protectionism) on global trade performance in recent years, which is largely due to problems in establishing precise and quantifiable metrics. While one study concludes that the slower rate of trade liberalization could explain about 25% of the reduction in trade growth over 2011-2015 compared to 1991-2007 (OECD, 2016), another finds that the contribution of a potential increase in protectionism is small and statistically insignificant (Auboin and Borino, 2017).
In the area of technology, continued progress with automation, particularly in advanced countries, could undermine the dynamism of global trade over the coming years. Inasmuch as automation reduces incentives to transfer production to developing countries in search of lower labour costs, this would put a brake on the expansion of global value chains and, as a result, to trade associated with them (see section B.3).
Finally, it should be noted that in an increasingly digital world economy, the statistics available for measuring trade suffer from obvious limitations. The emergence of digital platforms allows trade —including cross-border trade— in a growing range of services previously deemed not tradable, as well as in digital goods such as e-books, video games and downloads of music and films. In some sectors, digital goods have practically displaced their physical counterparts from the market. In those cases, “observable” trade (i.e. trade that crosses borders physically) may be falling, but that could at least partly reflect an increase in digital trade, which the statistics currently available are unable to capture accurately. There is therefore a clear need to develop new methodologies for measuring the digital trade in goods and services.
32 Economic Commission for Latin America and the Caribbean (ECLAC)Chapter I
B. A particularly uncertain context: macroeconomics, technology and geopolitics
1. Macroeconomic dynamics: the crisis of the dominant model
In 2017, the world economy is showing signs of recovery: GDP growth is projected to reach 2.7%, compared to 2.3% in 2016. Global GDP growth should rise to 2.9% in 2018, although that would still be below the pre-crisis average (United Nations, 2017). Industrial output, investment and private consumption are expanding, and international trade continues along the path of recovery on which it embarked in late 2016. Thus, there is a chance that the expansionary monetary policies that have characterized the post-crisis period can be abandoned. Macroeconomic authorities in the eurozone and the United States plan to gradually reduce their central banks’ balance sheets and have shown openness towards the idea of a slight increase in interest rates.
The countries of the eurozone are growing simultaneously and more than expected (2.4% in the second quarter compared to the corresponding period in 2016), largely on account of private investment and consumption.3 For the first time since the crisis, the labour market is showing a degree of dynamism, with increased employment and a drop in the unemployment rate to take it to 9.1%, its lowest level since 2009. Nevertheless, a large number of people willing to work still remain outside the labour force, and there are others who, while employed, would like to work more hours, which would partly explain the low dynamism of wages. At the same time, recovery in the eurozone continues to be affected by uncertainties surrounding the Brexit negotiations.4
In the United States, economic growth in the second quarter of 2017 (3.1% in annualized terms) has been driven by a larger than expected increase in investment.5 While employment continues to grow and the unemployment rate remains around 4%, wages are reporting a weak recovery. The high rate of labour inactivity and the structural changes affecting the labour market (digitization, corporate concentration, globalization) could explain the limited increase in wage pressures. In turn, the Japanese economy also regained dynamism in the first quarter of 2017 (1.0% in annualized terms), thanks to increased investment and higher demand for exports, especially in the Asian market.6 As in the United States, wage pressure remains low, despite the lowest unemployment rate (2.8% in August) in 23 years. For its part, the Chinese economy continues to evolve from its focus on investment and manufacturing to a model based more on consumption and services, and its growth rate will stabilize in the range of 6.4% to 6.7% during the 2016-2018 period (OECD, 2016).
To summarize, despite the recent uptick in growth, the advanced economies face considerable uncertainty regarding the long-term sustainability of economic activity. The major economies are reporting significant decelerations in per capita GDP growth compared to historical trends. At the same time, in all the major developed economies, investment as a percentage of GDP is still below its pre-crisis levels. Productive capital continues to expand slowly and productivity growth has not returned to its historic levels. Inflation rates are still too low, and while unemployment stands at historically low levels (above all in the United States and Japan), nominal wages remain stagnated (see figure I.3).
3 See European Commission (2017).4 United Kingdom GDP continues to perform weakly, and productivity and wages continue to grow sluggishly despite the recovery
of private consumption and investment.5 See: US Bureau of Economic Analysis, “National income and product accounts. Gross domestic product: second quarter 2017
(third estimate). Corporate profits: second quarter 2017 (revised estimate)”, 2017 [online] https://www.bea.gov/newsreleases/national/gdp/gdpnewsrelease.htm.
6 See Bank of Japan (2017a).
Despite the recent uptick in growth, the advanced economies face considerable uncertainty regarding the long-term sustainability of economic activity.
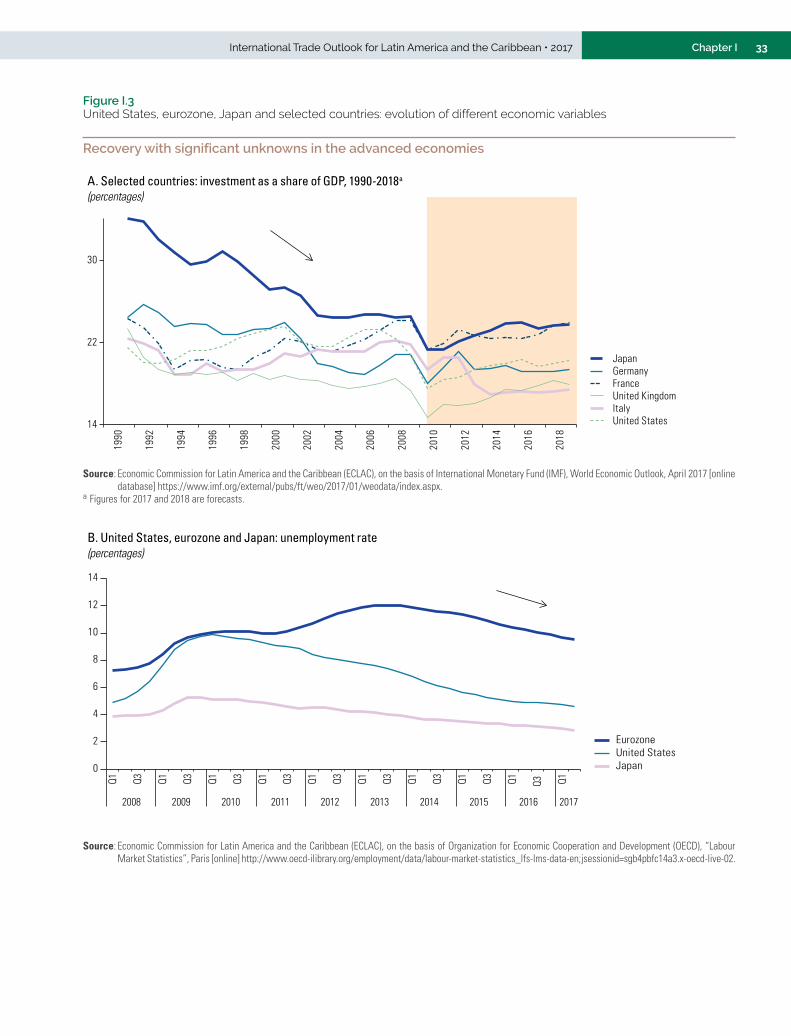
33International Trade Outlook for Latin America and the Caribbean • 2017 Chapter I
Figure I.3 United States, eurozone, Japan and selected countries: evolution of different economic variables
Recovery with significant unknowns in the advanced economies
14
22
30
1990
1992
1994
1996
1998
2000
2002
2004
2006
2008
2010
2012
2014
2016
2018
France Germany
Italy
Japan
United Kingdom
United States
A. Selected countries: investment as a share of GDP, 1990-2018a
(percentages)
Source: Economic Commission for Latin America and the Caribbean (ECLAC), on the basis of International Monetary Fund (IMF), World Economic Outlook, April 2017 [online database] https://www.imf.org/external/pubs/ft/weo/2017/01/weodata/index.aspx.
a Figures for 2017 and 2018 are forecasts.
B. United States, eurozone and Japan: unemployment rate (percentages)
0
2
4
6
8
10
12
14
Q1 Q3 Q1 Q3 Q1 Q3 Q1 Q3 Q1 Q3 Q1 Q3 Q1 Q3 Q1 Q3 Q1 Q3
Q1
Japan United StatesEurozone
2008 2009 2010 2011 2012 2013 2014 2015 2016 2017
Source: Economic Commission for Latin America and the Caribbean (ECLAC), on the basis of Organization for Economic Cooperation and Development (OECD), “Labour Market Statistics”, Paris [online] http://www.oecd-ilibrary.org/employment/data/labour-market-statistics_lfs-lms-data-en;jsessionid=sgb4pbfc14a3.x-oecd-live-02.
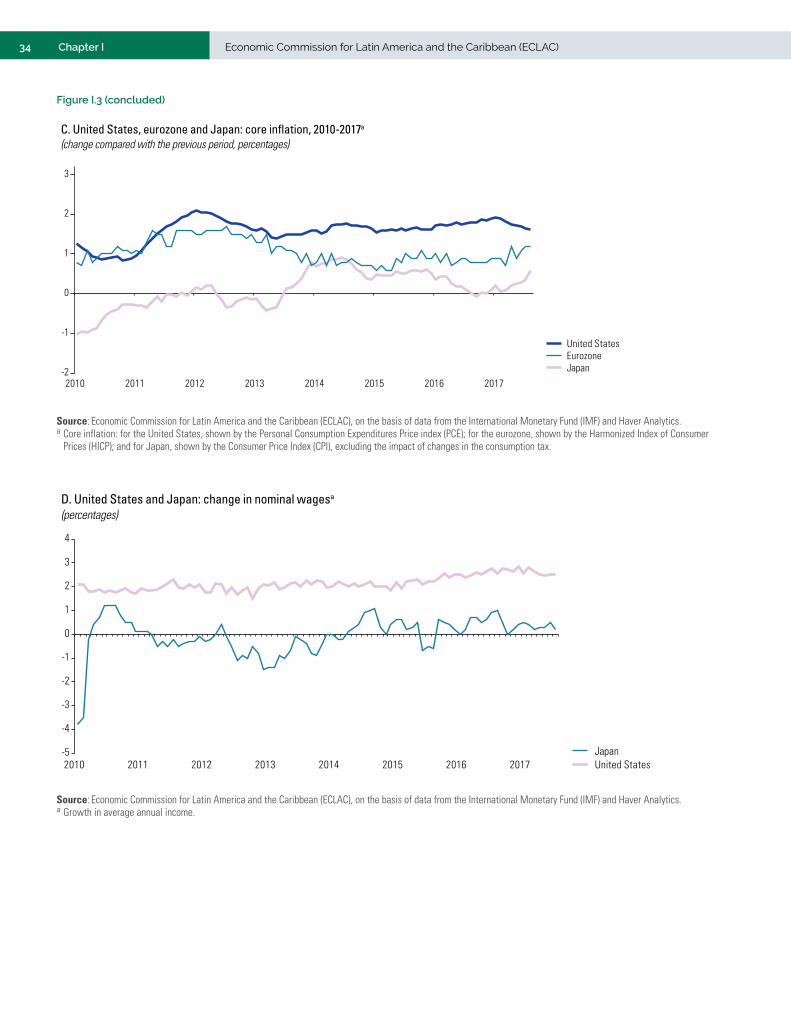
34 Economic Commission for Latin America and the Caribbean (ECLAC)Chapter I
C. United States, eurozone and Japan: core inflation, 2010-2017a
(change compared with the previous period, percentages)
-2
-1
0
1
2
3
2010 2011 2012 2013 2014 2015 2016 2017
United States
Japan Eurozone
Source: Economic Commission for Latin America and the Caribbean (ECLAC), on the basis of data from the International Monetary Fund (IMF) and Haver Analytics.a Core inflation: for the United States, shown by the Personal Consumption Expenditures Price index (PCE); for the eurozone, shown by the Harmonized Index of Consumer
Prices (HICP); and for Japan, shown by the Consumer Price Index (CPI), excluding the impact of changes in the consumption tax.
D. United States and Japan: change in nominal wagesa
(percentages)
-5
-4
-3
-2
-1
0
1
2
3
4
2010 2011 2012 2013 2014 2015 2016 2017JapanUnited States
Source: Economic Commission for Latin America and the Caribbean (ECLAC), on the basis of data from the International Monetary Fund (IMF) and Haver Analytics.a Growth in average annual income.
Figure I.3 (concluded)
35International Trade Outlook for Latin America and the Caribbean • 2017 Chapter I
The quantitative easing programmes adopted by the advanced economies in the aftermath of the crisis sought to stimulate growth by expanding the monetary base and accelerating inflation.7 That would cause a drop in long-term interest rates, which would drive aggregate demand. Despite those monetary stimulus policies, however, the recessionary bias of the global economy lasted longer than anticipated, which heightened social tensions and fuelled doubts about globalization and the traditional economic model (ECLAC, 2016).
The failure of inflation to react to low levels of unemployment and to economic expansion, particularly in the United States and Japan, suggests a weakening in the relationship between those variables and calls into question the validity of certain traditional economic models. The fact that certain key variables have not responded as those models suggest raises doubts about the assumption that the world economy was finally escaping the trap of low growth. It is also clear that the relationship between economic growth, employment and inflation is not as stable as traditionally believed.
In the United States, the Federal Reserve has indicated its intention to begin reducing its balance sheet and to gradually adjust interest rates, with the prospect of a possible intervention in the event of change in the path of growth.8 The Chair of the Federal Reserve System has expressed optimism about the future response of inflation to economic growth and low unemployment, but on a number of occasions she has admitted the poor understanding that central banks have regarding the determining factors behind inflation and unemployment rates.9 On the other hand, the European Central Bank is confident about the stability of growth and the resurgence of inflationary dynamics.10 The Bank of Japan has stated that the economic situation and low inflation rate do not warrant an interruption of its quantitative easing monetary policies.11 In that context, a lively debate exists regarding those economies’ macroeconomic prospects.
These developed countries’ macroeconomic authorities interpret the low responsiveness of inflation to labour market dynamics and economic growth as a temporary phenomenon and expect a return to the normal situation. They argue that temporary factors are at play, constraining inflationary pressures, and that at some point they will dissipate, reviving growth in productive investment. The return to pre-crisis levels could take between 15 and 20 years. That is the time frame required for the deleverage of the central banks’ balance sheets, especially since there is no certainty about their desirable structure and size.
In addition, the high level of public and private debt in many countries, the large credit expansion in the Chinese economy and strong risk taking in financial markets could also put a brake on the recovery of nominal demand, and monetary policy alone would not be effective to drive consumption and investment.12 Accordingly, the two largest central banks, the Federal Reserve and the European Central Bank, have maintained a considerable degree of flexibility in the policies they are to follow in the short and medium terms.
7 Quantitative easing is a non-conventional expansionary monetary policy adopted in light of the ineffectiveness of traditional monetary policy to stimulate economic growth. An increase in the monetary base —through purchases of public debt and other financial instruments— entails an increase in the amount of currency in circulation. This would reduce its value and encourage price hikes. Quantitative easing was adopted in Japan in the 1990s, in the United States in late 2008, in the United Kingdom in 2009, and in the eurozone in 2011 and on successive occasions since then.
8 See: Breuninger and Campo (2017) and Federal Reserve Bank of New York (2017).9 See: J. Yellen, “Inflation, uncertainty, and monetary policy”, Washington, D.C., Federal Reserve Board, 26 September 2017
[online] https://www.federalreserve.gov/newsevents/speech/yellen20170926a.htm.10 European Central Bank, “Monetary policy decisions”, Frankfurt, 7 September 2017 [online] https://www.ecb.europa.eu/press/
pr/date/2017/html/ecb.mp170907.es.html.11 See: Bank of Japan (2017a).12 Total debt in the global economy amounted to 220% of GDP in March 2017 (BIS, 2017).
36 Economic Commission for Latin America and the Caribbean (ECLAC)Chapter I
Another view maintains that the forces involved are more structural and long-term, and that economic and monetary policy instruments should take those forces and their effects on board in order to restore predictability.13 It argues that the age-old forces that operate in the economic system and that are felt through positive supply shocks could have permanent effects in determining macroeconomic variables. From that point of view, it is naive to expect globalization and the technological revolution not to affect the determination of wages and prices. Globalization constrains inflationary pressures, keeping the prices of goods and services imported from China and other emerging markets low. Furthermore, the entry of a growing number of workers into the world market and the weakening of trade unionization have reduced workers’ bargaining power. So, although structural unemployment is low, wage compression remains in place. The technological revolution and the possibility of job automation reinforce those processes. The Internet revolution and e-commerce help constrain inflationary pressures by lowering the prices of consumer goods and enabling consumers to compare prices more easily.
In a slowly recovering global economy, there is a vital need for certainty that growth will be sufficiently stable and will cease to depend on the monetary stimulus resulting from quantitative easing policies. Examining the causes for the weak response of inflation to economic growth, for the slow dynamics in productivity and for wage stagnation is essential in preventing a shift in central bank policies from slowing down growth or generating new recessionary forces.
2. Heightened tensions in the governance of global trade
Over the past decade, a combination of factors have brought pressure to bear on the actors and institutions behind globalization and the governance of the process. They include the slow recovery of the global economy following the financial crisis, the digital revolution, the rise of China and, more recently, the emergence of populist political movements in some developed countries. Those pressures coexist at a time when the United States, Europe and China are deploying strategies to assume leadership over the technologies of the future and thus ensure their dominance in the global arena.
The digital revolution is creating new patterns of consumption, production and business in all sectors of the economy (ECLAC, 2016), and those patterns have the potential for a significant impact on employment (see section B.3). While traditional trade and investment flows slowed notably in the wake of the financial crisis, digital flows —measured by the use of cross-border broadband— increased 45-fold between 2005 and 2014 and are expected to increase by a factor of nine over the next five years (Manyika and others, 2016). In that context, e-commerce (that is, trade in which the Internet and technology play a major role in the consumption, production and delivery of goods and services) is of growing importance. The Internet plays a dual role in the consumption and delivery of goods and services: first, it facilitates the exchange of traditional goods and services (using digital platforms such as Alibaba, Amazon, Flipkart and Skype) and, second, it serves as a platform for goods and services that are entirely digital, such as music, books and software (Fefer, Ilias and Morrison, 2017). As regards production, the Internet and technology facilitate communications, shorten value chains through additive manufacturing and redefine the traditional boundaries between goods and services. Accordingly, global trade in the twenty-first century covers physical goods and services that are conveyed through traditional channels, physical goods and services that are produced, consumed and delivered by means of digital platforms and goods and services that are by nature entirely digital and intangible.
13 See Auer, Borio and Filardo (2017).
A combination of factors have brought pressure to bear on the actors and institutions behind globalization and the governance of the process. They include the slow recovery of the global economy following the financial crisis, the digital revolution, the rise of China and, more recently, the emergence of populist political movements in some developed countries.

37International Trade Outlook for Latin America and the Caribbean • 2017 Chapter I
The digital revolution poses unprecedented challenges for the regulation of global trade. The trade agreements of the 1990s are not up to the task of governing today’s exponentially expanding cross-border digital flows. While the leeway for formulating traditional industrial policy has been sharply reduced as a result of WTO agreements and North-South trade and investment arrangements, the digital economy remains largely unregulated. This means that governments have room to implement measures such as blocking specific Internet sites, imposing network location server requirements or compelling foreign providers to reveal the source code of their software. In this context, actors such as China, the United States and the European Union are competing to influence the regulation of global digital trade, with widely divergent visions and models.
Megaregional agreements —in particular, the TPP, the TTIP and the Regional Comprehensive Economic Partnership (RCEP)— were one first response to the emergence of the digital economy and e-commerce. These multilateral agreements are characterized by their significant economic and demographic weight, their reduction of non-tariff barriers through regulatory harmonization and their adoption of new standards to govern digital commerce (ECLAC, 2016). These initiatives are in addition to the negotiations for the Trade in Services Agreement, which involve 23 WTO members —including the European Union acting together as one— that account for 70% of the global trade in services (European Commission, 2017). In addition to establishing binding rules for the countries involved, these agreements could create de facto global standards for the new issues of the twenty-first century, particularly e-commerce. Indeed, one of the hallmarks of the TPP was its emphasis on the regulation of the digital economy, in response to the interest of the United States in preserving its position of leadership over emerging competitors: particularly China, which in recent years has deployed an aggressive digital industrial policy (Azmeh and Foster, 2016).
The election of Donald Trump as President of the United States in November 2016 and his new “America First” trade policy has increased uncertainty regarding the governance of world trade, at a time when it was already undergoing comprehensive restructuring. The country’s new trade policy is characterized by openly protectionist rhetoric, a shift from multilateralism to bilateralism, a focus on reducing trade deficits and efforts to bring about the reshoring of industries and jobs. In that context, the new Administration withdrew the United States from the TPP and the Trade in Services Agreement, indefinitely suspended the TTIP negotiations, has been openly critical of WTO and has embarked on negotiations to modernize NAFTA. It has also intimated that the agreements with Chile, Colombia, Panama, Peru and the Central America countries and the Dominican Republic could be renegotiated once the NAFTA negotiations are concluded (Inside U.S. Trade, 2017).
Unlike the United States, other key players in world trade —including China, Japan and the European Union— have publicly reiterated their commitment to openness and multilateralism. In Asia, for example, negotiations for the Regional Comprehensive Economic Partnership remain ongoing between the member countries of the Association of Southeast Asian Nations (ASEAN), Australia, China, India, Japan, New Zealand and the Republic of Korea. This process is expected to conclude in 2018, creating a free trade area with a membership covering half of the world’s population, 38% of its GDP (measured in purchasing power parity), 31% of world goods exports and 26% of imports. Likewise, in 2013 China announced its “One Belt, One Road” initiative, an ambitious infrastructure project that seeks to establish global overland, maritime, air and digital connectivity to foster economic integration and balanced development.
In turn, the European Union has continued with its intense trade negotiations agenda, announcing in July 2017 an agreement in principle with Japan on the contents of an ambitious free trade agreement. In addition to reducing barriers to trade and establishing
38 Economic Commission for Latin America and the Caribbean (ECLAC)Chapter I
effective regulations, one central objective of the agreement is to unequivocally signal that two of the world’s largest economies reject protectionism (European Commission, 2017). This agreement would join the negotiations that the European Union has already completed with Canada (the Comprehensive Economic and Trade Agreement, or CETA), Singapore and Viet Nam and the ongoing negotiations with Indonesia, the Southern Common Market (MERCOSUR) and Mexico (in the last case, to update the existing agreement in force since 2000). At the same time, the European Union and China are negotiating an agreement on investment that would replace the 26 bilateral agreements that the members of the European Union have signed individually with China.
Following the withdrawal of the United States from the TPP, the agreement’s other 11 signatories have continued to meet to assess the prospects for an agreement among them, to be called the “TPP 11” (ICTSD, 2017). Were this to crystallize, the agreement’s economic weight would be much smaller than originally planned, but it would still be a powerful political signal of their commitment to open trade and to the standards agreed on in the negotiations that ended in 2016. Finally, despite the difficulties it has faced in recent years, the World Trade Organization has finalized two agreements —the expansion of the Information Technology Agreement (ITA) and the Trade Facilitation Agreement— that could give a major boost to both traditional and digital trade flows.
To summarize, after being the leading advocate of trade liberalization for seven decades, the United States has set out in a radically different direction. While undeniably disruptive, that shift does not yet appear to mark a turning point in the process of trade liberalization that the world has undergone over the past three decades. In this context, the European Union has assumed de facto international leadership in the governance of trade and investment: for instance, through its proposal to replace the heavily criticized system for investor-state arbitration that currently exists with a system of permanent tribunals. Its recent agreements with Canada and Singapore include such a mechanism, as well as the parties’ commitment to work for the creation of a multilateral investment court. Those agreements also include several provisions that seek to guarantee the right of host States to regulate in the public interest. More generally, the European Union has set itself the goal of ensuring that its trade and investment agreements make a greater contribution to sustainable development, including the implementation of the 2030 Agenda for Sustainable Development and efforts to combat climate change.
3. Additional uncertainty from the digital revolution
The world of technology also entails a strong degree of uncertainty regarding both its own dynamics and its impact on analogue activities. However, in contrast to the macroeconomic reality, where the uncertainty is the result of a decade of slow growth and doubts about the validity of the interpretative model on which policies are based, the uncertainty in the digital arena is the result of its success. The development of new technologies has accelerated and the impact of this has expanded across the economy and society.
The acceleration of technological change can be seen by considering the installed capacity for cross-border broadband flows. That capacity has been growing exponentially since 2007, at a time when international flows of goods and services, foreign direct investment and financing were fluctuating wildly, most notably in the wake of the global financial crisis. The digital expansion, expressed through increased data processing, transmission and storage capacities, was not affected by the problems that impacted capital formation, growth and aggregate employment.
The uncertainty in the digital arena is the result of its success. The development of new technologies has accelerated and the impact of this has expanded across the economy and society.
39International Trade Outlook for Latin America and the Caribbean • 2017 Chapter I
The speed of change can also be seen in numerous other indicators, including those related to Internet access and the use of mobile technologies. In 2017, nearly five billion people use mobile phones and almost half of humanity uses the Internet. The pace of expansion in software use has accelerated, and the time needed to reach 100 million users has been reduced from years to as little as one month in the most dynamic cases. As a result, it is increasingly difficult to predict what type of software will be used in the medium term (for example, five years hence) and, accordingly, to foresee what hardware and skills will be necessary to handle them effectively.
The most advanced technologies are also registering remarkable levels of dynamism. In less than a decade, technology packages for cloud computing and the analysis of big data have been launched and massively taken up by consumers and businesses, especially medium-sized and large-scale companies. Likewise, in less than two years, new fields of action have opened up in the areas of robotics and artificial intelligence which, although they have been in development for decades, have now become commonplace in policy discussions on account of their potential impact.
The uncertainty resulting from those technological developments is compounded by a radical reconfiguration of business structures. The world is seeing the consolidation of global digital platforms that, in addition to dominating the online universe, are also having an increasing impact on the analogue economy. These platforms, which developed over the past 15 years, have a strong presence throughout the world but belong mostly to companies from the United States (Apple, Google, Facebook, Amazon, Microsoft) and China (Baidu, Alibaba, Tencent). It is still too early to predict the dynamics of this new business structure and how governments will respond regarding regulatory issues (safety, privacy) and fiscal matters. This increases the overall uncertainty, as these platforms are the most dynamic actors in investments for digital goods and services and in supplying them.
The repercussions of this progress in the digital economy and society are manifold, but three are of particular interest for policymaking. First, the expansion of digital technologies has eroded the distinction between sectors that produce goods and those that provide services. The proliferation of “smart, connected products” makes it increasingly difficult to separate the costs and benefits of physical production and use and those of their digital equivalents. Traditional cost-based competitive advantages have become more difficult to identify and build on as the use of physical products increasingly depends on their connection to the “product cloud”. A similar phenomenon can be seen in the growing number of businesses using online-to-offline (O2O) strategies: for example, to manage idle capacity in the provision of services. The second repercussion is the renewed discussion of Solow’s productivity paradox (“You can see the computer age everywhere but in the productivity statistics”). Debates about the impact of the platform economy on productivity have intensified and are far from reaching a conclusion. In particular, attention has been drawn to problems arising from measurement errors and from delays in implementing and creating the necessary complementarities (McAfee and Brynjolfsson, 2017).
The third impact is by far the most relevant for policy decisions and is possibly the most uncertain. The impact of new technologies —particularly robotics and artificial intelligence— on the level and quality of employment can be seen in areas ranging from compensatory mechanisms for affected sectors to the design of new education plans. Estimates made from 2013 onwards reach very different conclusions (see table I.1). In all cases, however, the repercussions are substantial, especially in contexts characterized by slow employment growth or a rapidly expanding working age population.
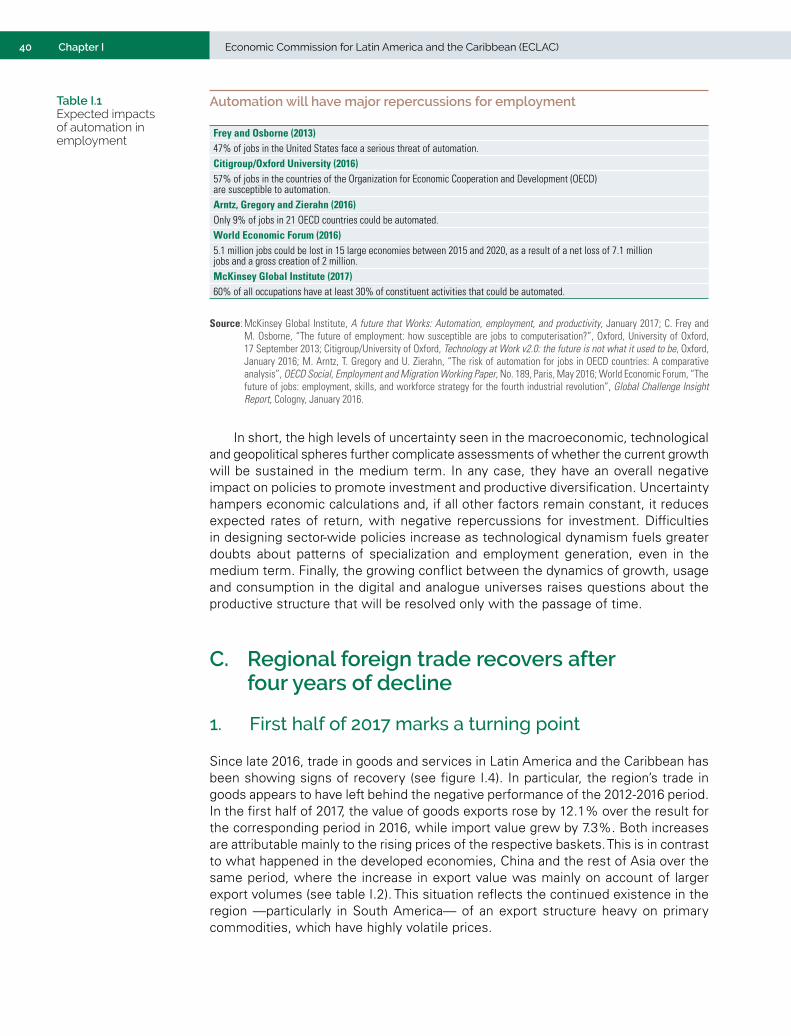
40 Economic Commission for Latin America and the Caribbean (ECLAC)Chapter I
Automation will have major repercussions for employment
Frey and Osborne (2013)47% of jobs in the United States face a serious threat of automation.Citigroup/Oxford University (2016)57% of jobs in the countries of the Organization for Economic Cooperation and Development (OECD) are susceptible to automation.Arntz, Gregory and Zierahn (2016)Only 9% of jobs in 21 OECD countries could be automated.World Economic Forum (2016)5.1 million jobs could be lost in 15 large economies between 2015 and 2020, as a result of a net loss of 7.1 million jobs and a gross creation of 2 million. McKinsey Global Institute (2017)60% of all occupations have at least 30% of constituent activities that could be automated.
Source: McKinsey Global Institute, A future that Works: Automation, employment, and productivity, January 2017; C. Frey and M. Osborne, “The future of employment: how susceptible are jobs to computerisation?”, Oxford, University of Oxford, 17 September 2013; Citigroup/University of Oxford, Technology at Work v2.0: the future is not what it used to be, Oxford, January 2016; M. Arntz, T. Gregory and U. Zierahn, “The risk of automation for jobs in OECD countries: A comparative analysis”, OECD Social, Employment and Migration Working Paper, No. 189, Paris, May 2016; World Economic Forum, “The future of jobs: employment, skills, and workforce strategy for the fourth industrial revolution”, Global Challenge Insight Report, Cologny, January 2016.
In short, the high levels of uncertainty seen in the macroeconomic, technological and geopolitical spheres further complicate assessments of whether the current growth will be sustained in the medium term. In any case, they have an overall negative impact on policies to promote investment and productive diversification. Uncertainty hampers economic calculations and, if all other factors remain constant, it reduces expected rates of return, with negative repercussions for investment. Difficulties in designing sector-wide policies increase as technological dynamism fuels greater doubts about patterns of specialization and employment generation, even in the medium term. Finally, the growing conflict between the dynamics of growth, usage and consumption in the digital and analogue universes raises questions about the productive structure that will be resolved only with the passage of time.
C. Regional foreign trade recovers after four years of decline
1. First half of 2017 marks a turning point
Since late 2016, trade in goods and services in Latin America and the Caribbean has been showing signs of recovery (see figure I.4). In particular, the region’s trade in goods appears to have left behind the negative performance of the 2012-2016 period. In the first half of 2017, the value of goods exports rose by 12.1% over the result for the corresponding period in 2016, while import value grew by 7.3%. Both increases are attributable mainly to the rising prices of the respective baskets. This is in contrast to what happened in the developed economies, China and the rest of Asia over the same period, where the increase in export value was mainly on account of larger export volumes (see table I.2). This situation reflects the continued existence in the region —particularly in South America— of an export structure heavy on primary commodities, which have highly volatile prices.
Table I.1 Expected impacts of automation in employment
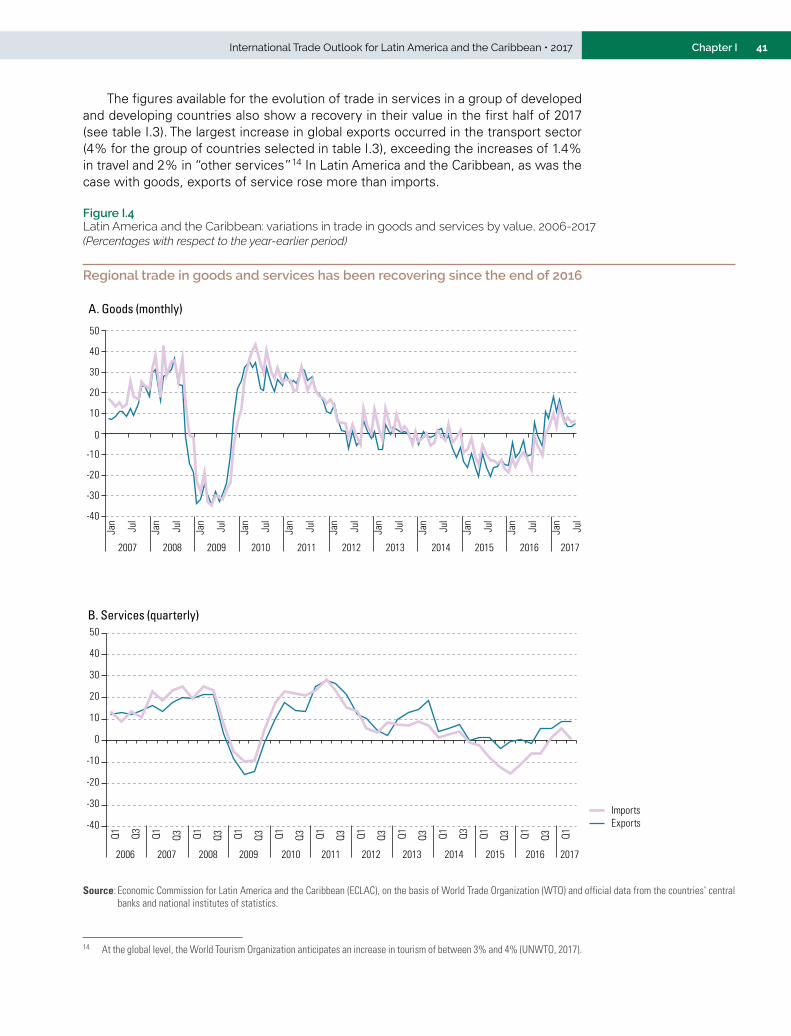
41International Trade Outlook for Latin America and the Caribbean • 2017 Chapter I
The figures available for the evolution of trade in services in a group of developed and developing countries also show a recovery in their value in the first half of 2017 (see table I.3). The largest increase in global exports occurred in the transport sector (4% for the group of countries selected in table I.3), exceeding the increases of 1.4% in travel and 2% in “other services”14 In Latin America and the Caribbean, as was the case with goods, exports of service rose more than imports.
14 At the global level, the World Tourism Organization anticipates an increase in tourism of between 3% and 4% (UNWTO, 2017).
Figure I.4 Latin America and the Caribbean: variations in trade in goods and services by value, 2006-2017(Percentages with respect to the year-earlier period)
Regional trade in goods and services has been recovering since the end of 2016
A. Goods (monthly)
-40
-30
-20
-10
0
10
20
30
40
50
Jan
Jul
Jan
Jul
Jan
Jul
Jan
Jul
Jan
Jul
Jan
Jul
Jan
Jul
Jan
Jul
Jan
Jul
Jan
Jul
Jan
Jul
2007 2008 2009 2010 2011 2012 2013 2014 2015 2016 2017
B. Services (quarterly)
-40
-30
-20
-10
0
10
20
30
40
50
Q1 Q3 Q1 Q3
Q1 Q3
Q1 Q3
Q1 Q3
Q1 Q3
Q1 Q3
Q1 Q3
Q1 Q3 Q1 Q3
Q1 Q3
Q1
ExportsImports
2006 2007 2008 2009 2010 2011 2012 2013 2014 2015 2016 2017
Source: Economic Commission for Latin America and the Caribbean (ECLAC), on the basis of World Trade Organization (WTO) and official data from the countries’ central banks and national institutes of statistics.
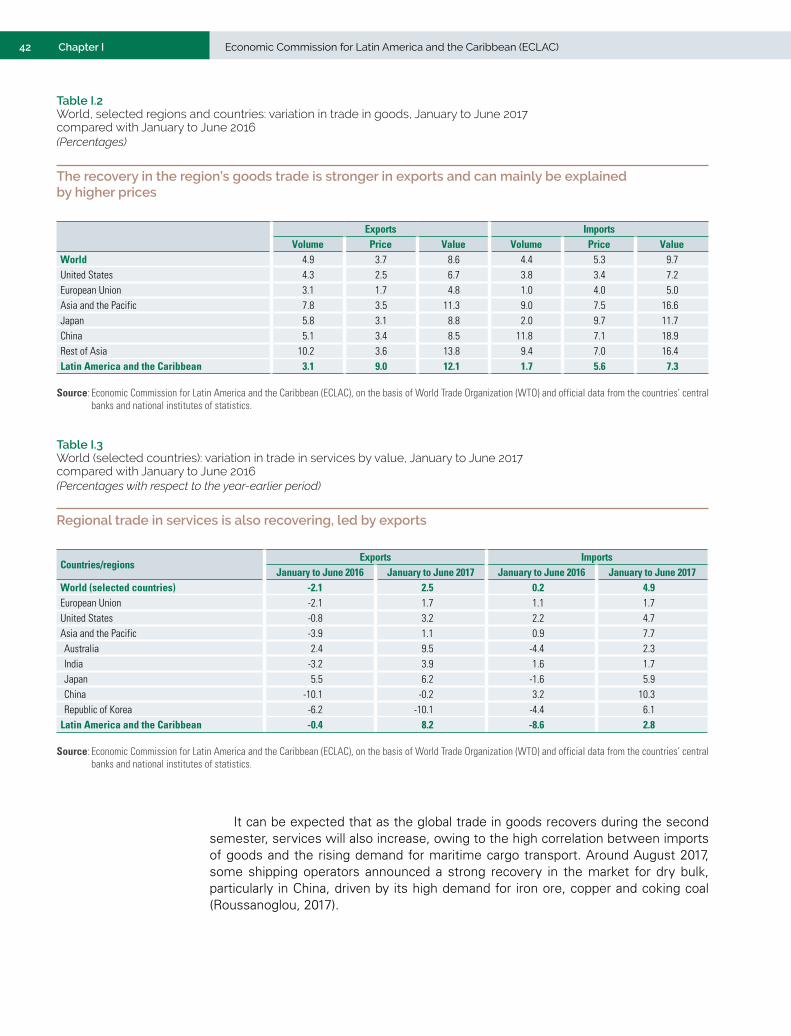
42 Economic Commission for Latin America and the Caribbean (ECLAC)Chapter I
Table I.2 World, selected regions and countries: variation in trade in goods, January to June 2017 compared with January to June 2016(Percentages)
The recovery in the region’s goods trade is stronger in exports and can mainly be explained by higher prices
Exports ImportsVolume Price Value Volume Price Value
World 4.9 3.7 8.6 4.4 5.3 9.7United States 4.3 2.5 6.7 3.8 3.4 7.2European Union 3.1 1.7 4.8 1.0 4.0 5.0Asia and the Pacific 7.8 3.5 11.3 9.0 7.5 16.6Japan 5.8 3.1 8.8 2.0 9.7 11.7China 5.1 3.4 8.5 11.8 7.1 18.9Rest of Asia 10.2 3.6 13.8 9.4 7.0 16.4Latin America and the Caribbean 3.1 9.0 12.1 1.7 5.6 7.3
Source: Economic Commission for Latin America and the Caribbean (ECLAC), on the basis of World Trade Organization (WTO) and official data from the countries’ central banks and national institutes of statistics.
Table I.3 World (selected countries): variation in trade in services by value, January to June 2017 compared with January to June 2016(Percentages with respect to the year-earlier period)
Regional trade in services is also recovering, led by exports
Countries/regionsExports Imports
January to June 2016 January to June 2017 January to June 2016 January to June 2017World (selected countries) -2.1 2.5 0.2 4.9European Union -2.1 1.7 1.1 1.7United States -0.8 3.2 2.2 4.7Asia and the Pacific -3.9 1.1 0.9 7.7Australia 2.4 9.5 -4.4 2.3India -3.2 3.9 1.6 1.7Japan 5.5 6.2 -1.6 5.9China -10.1 -0.2 3.2 10.3Republic of Korea -6.2 -10.1 -4.4 6.1
Latin America and the Caribbean -0.4 8.2 -8.6 2.8
Source: Economic Commission for Latin America and the Caribbean (ECLAC), on the basis of World Trade Organization (WTO) and official data from the countries’ central banks and national institutes of statistics.
It can be expected that as the global trade in goods recovers during the second semester, services will also increase, owing to the high correlation between imports of goods and the rising demand for maritime cargo transport. Around August 2017, some shipping operators announced a strong recovery in the market for dry bulk, particularly in China, driven by its high demand for iron ore, copper and coking coal (Roussanoglou, 2017).
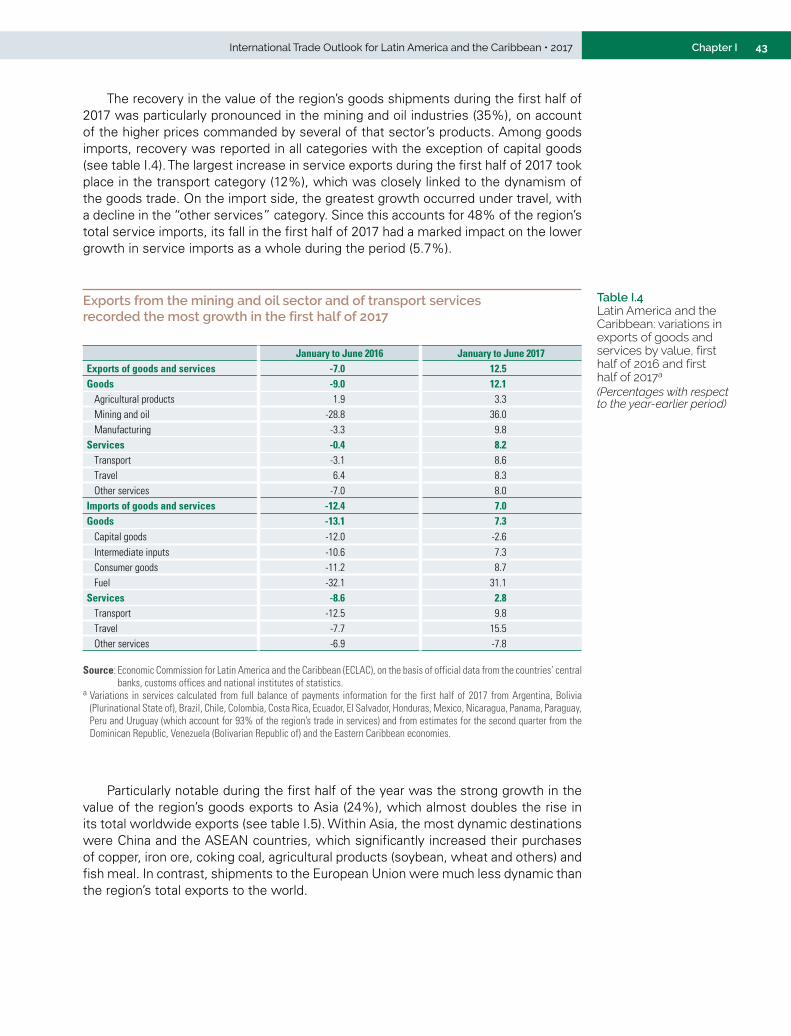
43International Trade Outlook for Latin America and the Caribbean • 2017 Chapter I
The recovery in the value of the region’s goods shipments during the first half of 2017 was particularly pronounced in the mining and oil industries (35%), on account of the higher prices commanded by several of that sector’s products. Among goods imports, recovery was reported in all categories with the exception of capital goods (see table I.4). The largest increase in service exports during the first half of 2017 took place in the transport category (12%), which was closely linked to the dynamism of the goods trade. On the import side, the greatest growth occurred under travel, with a decline in the “other services” category. Since this accounts for 48% of the region’s total service imports, its fall in the first half of 2017 had a marked impact on the lower growth in service imports as a whole during the period (5.7%).
Table I.4 Latin America and the Caribbean: variations in exports of goods and services by value, first half of 2016 and first half of 2017a
(Percentages with respect to the year-earlier period)
Exports from the mining and oil sector and of transport services recorded the most growth in the first half of 2017
January to June 2016 January to June 2017Exports of goods and services -7.0 12.5Goods -9.0 12.1
Agricultural products 1.9 3.3Mining and oil -28.8 36.0Manufacturing -3.3 9.8
Services -0.4 8.2Transport -3.1 8.6Travel 6.4 8.3Other services -7.0 8.0
Imports of goods and services -12.4 7.0Goods -13.1 7.3
Capital goods -12.0 -2.6Intermediate inputs -10.6 7.3Consumer goods -11.2 8.7Fuel -32.1 31.1
Services -8.6 2.8Transport -12.5 9.8Travel -7.7 15.5Other services -6.9 -7.8
Source: Economic Commission for Latin America and the Caribbean (ECLAC), on the basis of official data from the countries’ central banks, customs offices and national institutes of statistics.
a Variations in services calculated from full balance of payments information for the first half of 2017 from Argentina, Bolivia (Plurinational State of), Brazil, Chile, Colombia, Costa Rica, Ecuador, El Salvador, Honduras, Mexico, Nicaragua, Panama, Paraguay, Peru and Uruguay (which account for 93% of the region’s trade in services) and from estimates for the second quarter from the Dominican Republic, Venezuela (Bolivarian Republic of) and the Eastern Caribbean economies.
Particularly notable during the first half of the year was the strong growth in the value of the region’s goods exports to Asia (24%), which almost doubles the rise in its total worldwide exports (see table I.5). Within Asia, the most dynamic destinations were China and the ASEAN countries, which significantly increased their purchases of copper, iron ore, coking coal, agricultural products (soybean, wheat and others) and fish meal. In contrast, shipments to the European Union were much less dynamic than the region’s total exports to the world.
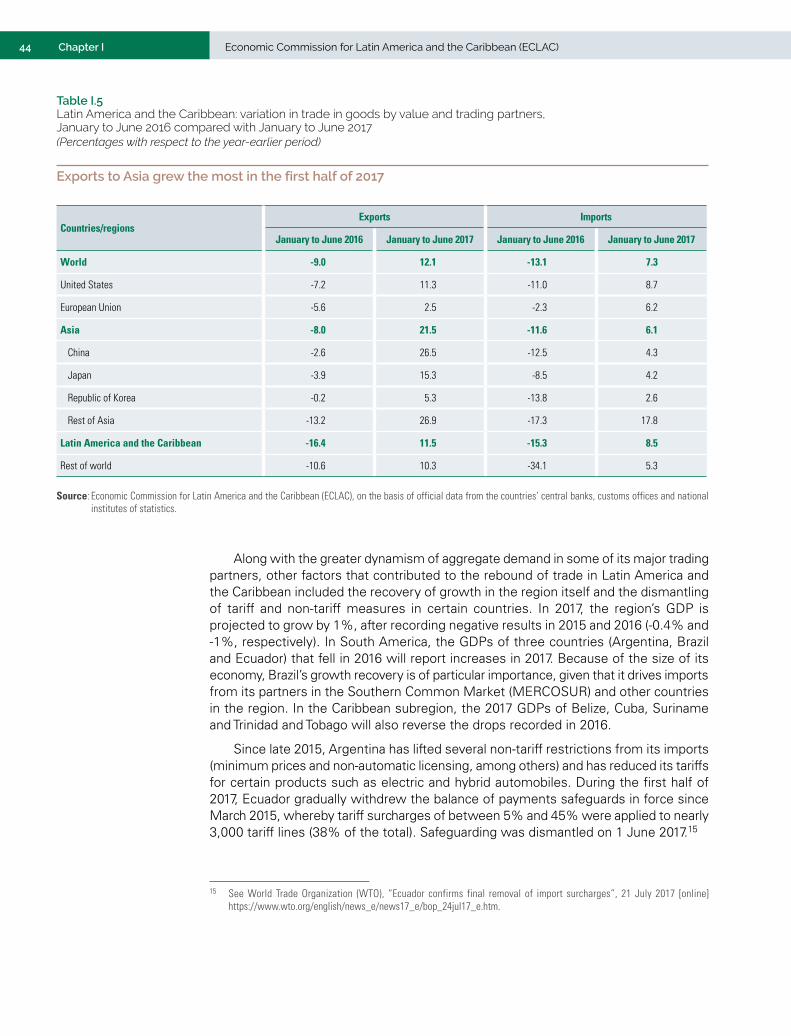
44 Economic Commission for Latin America and the Caribbean (ECLAC)Chapter I
Table I.5 Latin America and the Caribbean: variation in trade in goods by value and trading partners, January to June 2016 compared with January to June 2017(Percentages with respect to the year-earlier period)
Exports to Asia grew the most in the first half of 2017
Countries/regionsExports Imports
January to June 2016 January to June 2017 January to June 2016 January to June 2017
World -9.0 12.1 -13.1 7.3
United States -7.2 11.3 -11.0 8.7
European Union -5.6 2.5 -2.3 6.2
Asia -8.0 21.5 -11.6 6.1
China -2.6 26.5 -12.5 4.3
Japan -3.9 15.3 -8.5 4.2
Republic of Korea -0.2 5.3 -13.8 2.6
Rest of Asia -13.2 26.9 -17.3 17.8
Latin America and the Caribbean -16.4 11.5 -15.3 8.5
Rest of world -10.6 10.3 -34.1 5.3
Source: Economic Commission for Latin America and the Caribbean (ECLAC), on the basis of official data from the countries’ central banks, customs offices and national institutes of statistics.
Along with the greater dynamism of aggregate demand in some of its major trading partners, other factors that contributed to the rebound of trade in Latin America and the Caribbean included the recovery of growth in the region itself and the dismantling of tariff and non-tariff measures in certain countries. In 2017, the region’s GDP is projected to grow by 1%, after recording negative results in 2015 and 2016 (-0.4% and -1%, respectively). In South America, the GDPs of three countries (Argentina, Brazil and Ecuador) that fell in 2016 will report increases in 2017. Because of the size of its economy, Brazil’s growth recovery is of particular importance, given that it drives imports from its partners in the Southern Common Market (MERCOSUR) and other countries in the region. In the Caribbean subregion, the 2017 GDPs of Belize, Cuba, Suriname and Trinidad and Tobago will also reverse the drops recorded in 2016.
Since late 2015, Argentina has lifted several non-tariff restrictions from its imports (minimum prices and non-automatic licensing, among others) and has reduced its tariffs for certain products such as electric and hybrid automobiles. During the first half of 2017, Ecuador gradually withdrew the balance of payments safeguards in force since March 2015, whereby tariff surcharges of between 5% and 45% were applied to nearly 3,000 tariff lines (38% of the total). Safeguarding was dismantled on 1 June 2017.15
15 See World Trade Organization (WTO), “Ecuador confirms final removal of import surcharges”, 21 July 2017 [online] https://www.wto.org/english/news_e/news17_e/bop_24jul17_e.htm.
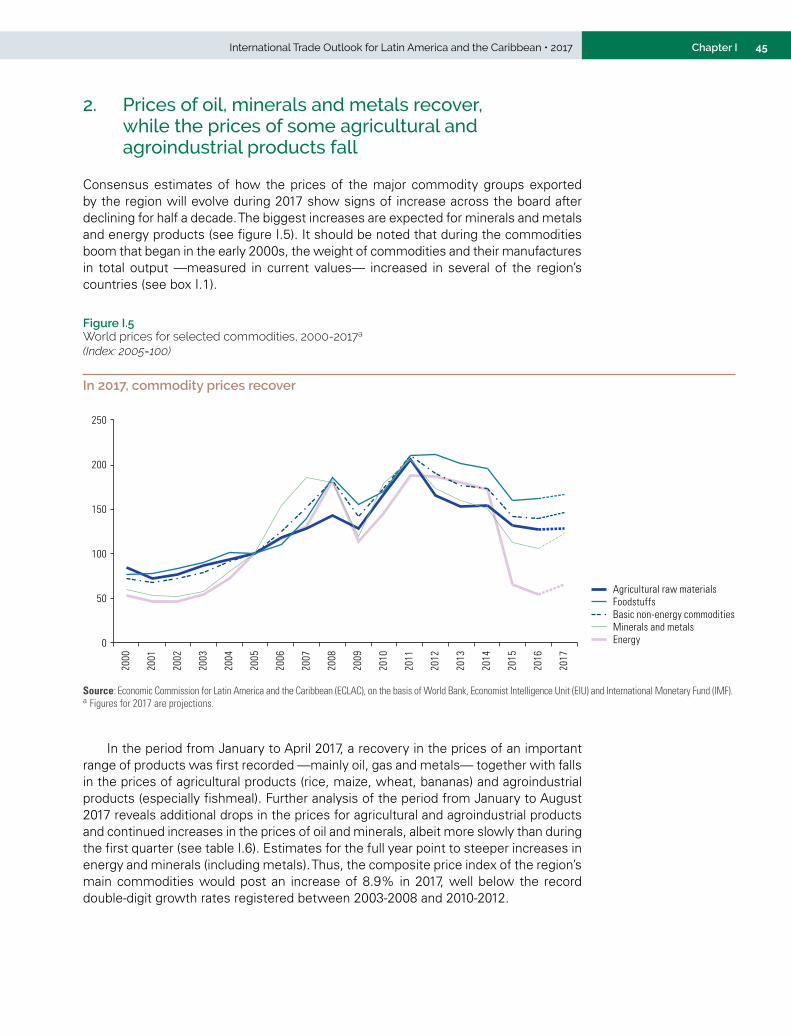
45International Trade Outlook for Latin America and the Caribbean • 2017 Chapter I
Figure I.5 World prices for selected commodities, 2000-2017a
(Index: 2005=100)
In 2017, commodity prices recover
0
50
100
150
200
250
2000
2001
2002
2003
2004
2005
2006
2007
2008
2009
2010
2011
2012
2013
2014
2015
2016
2017
Energy
Basic non-energy commodities
Agricultural raw materialsFoodstuffs
Minerals and metals
Source: Economic Commission for Latin America and the Caribbean (ECLAC), on the basis of World Bank, Economist Intelligence Unit (EIU) and International Monetary Fund (IMF).a Figures for 2017 are projections.
In the period from January to April 2017, a recovery in the prices of an important range of products was first recorded —mainly oil, gas and metals— together with falls in the prices of agricultural products (rice, maize, wheat, bananas) and agroindustrial products (especially fishmeal). Further analysis of the period from January to August 2017 reveals additional drops in the prices for agricultural and agroindustrial products and continued increases in the prices of oil and minerals, albeit more slowly than during the first quarter (see table I.6). Estimates for the full year point to steeper increases in energy and minerals (including metals). Thus, the composite price index of the region’s main commodities would post an increase of 8.9% in 2017, well below the record double-digit growth rates registered between 2003-2008 and 2010-2012.
2. Prices of oil, minerals and metals recover, while the prices of some agricultural and agroindustrial products fall
Consensus estimates of how the prices of the major commodity groups exported by the region will evolve during 2017 show signs of increase across the board after declining for half a decade. The biggest increases are expected for minerals and metals and energy products (see figure I.5). It should be noted that during the commodities boom that began in the early 2000s, the weight of commodities and their manufactures in total output —measured in current values— increased in several of the region’s countries (see box I.1).
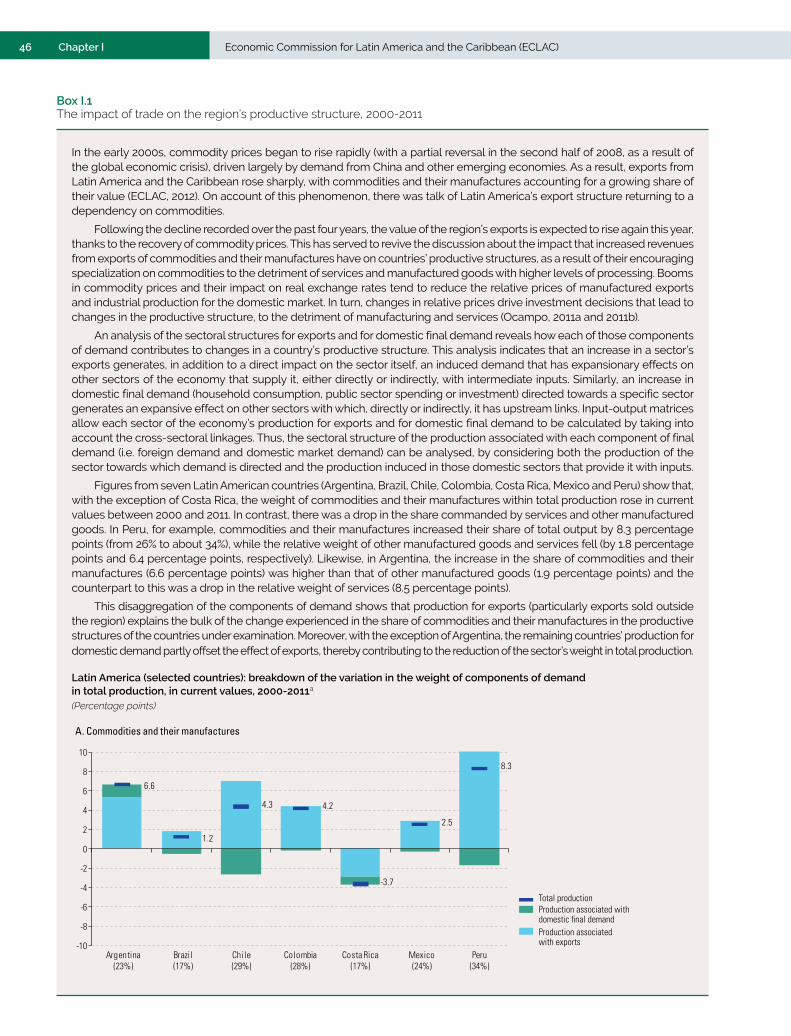
46 Economic Commission for Latin America and the Caribbean (ECLAC)Chapter I
In the early 2000s, commodity prices began to rise rapidly (with a partial reversal in the second half of 2008, as a result of the global economic crisis), driven largely by demand from China and other emerging economies. As a result, exports from Latin America and the Caribbean rose sharply, with commodities and their manufactures accounting for a growing share of their value (ECLAC, 2012). On account of this phenomenon, there was talk of Latin America’s export structure returning to a dependency on commodities.
Following the decline recorded over the past four years, the value of the region’s exports is expected to rise again this year, thanks to the recovery of commodity prices. This has served to revive the discussion about the impact that increased revenues from exports of commodities and their manufactures have on countries’ productive structures, as a result of their encouraging specialization on commodities to the detriment of services and manufactured goods with higher levels of processing. Booms in commodity prices and their impact on real exchange rates tend to reduce the relative prices of manufactured exports and industrial production for the domestic market. In turn, changes in relative prices drive investment decisions that lead to changes in the productive structure, to the detriment of manufacturing and services (Ocampo, 2011a and 2011b).
An analysis of the sectoral structures for exports and for domestic final demand reveals how each of those components of demand contributes to changes in a country’s productive structure. This analysis indicates that an increase in a sector’s exports generates, in addition to a direct impact on the sector itself, an induced demand that has expansionary effects on other sectors of the economy that supply it, either directly or indirectly, with intermediate inputs. Similarly, an increase in domestic final demand (household consumption, public sector spending or investment) directed towards a specific sector generates an expansive effect on other sectors with which, directly or indirectly, it has upstream links. Input-output matrices allow each sector of the economy’s production for exports and for domestic final demand to be calculated by taking into account the cross-sectoral linkages. Thus, the sectoral structure of the production associated with each component of final demand (i.e. foreign demand and domestic market demand) can be analysed, by considering both the production of the sector towards which demand is directed and the production induced in those domestic sectors that provide it with inputs.
Figures from seven Latin American countries (Argentina, Brazil, Chile, Colombia, Costa Rica, Mexico and Peru) show that, with the exception of Costa Rica, the weight of commodities and their manufactures within total production rose in current values between 2000 and 2011. In contrast, there was a drop in the share commanded by services and other manufactured goods. In Peru, for example, commodities and their manufactures increased their share of total output by 8.3 percentage points (from 26% to about 34%), while the relative weight of other manufactured goods and services fell (by 1.8 percentage points and 6.4 percentage points, respectively). Likewise, in Argentina, the increase in the share of commodities and their manufactures (6.6 percentage points) was higher than that of other manufactured goods (1.9 percentage points) and the counterpart to this was a drop in the relative weight of services (8.5 percentage points).
This disaggregation of the components of demand shows that production for exports (particularly exports sold outside the region) explains the bulk of the change experienced in the share of commodities and their manufactures in the productive structures of the countries under examination. Moreover, with the exception of Argentina, the remaining countries’ production for domestic demand partly offset the effect of exports, thereby contributing to the reduction of the sector’s weight in total production. Latin America (selected countries): breakdown of the variation in the weight of components of demand in total production, in current values, 2000-2011a
(Percentage points)
6.6
1.2
4.3 4.2
-3.7
2.5
8.3
-10
-8
-6
-4
-2
0
2
4
6
8
10
Argentina(23%)
Brazil(17%)
Chile(29%)
Colombia(28%)
Costa Rica(17%)
Mexico(24%)
Peru(34%)
A. Commodities and their manufactures
Production associatedwith exports
Production associated withdomestic final demand
Total production
Box I.1 The impact of trade on the region’s productive structure, 2000-2011
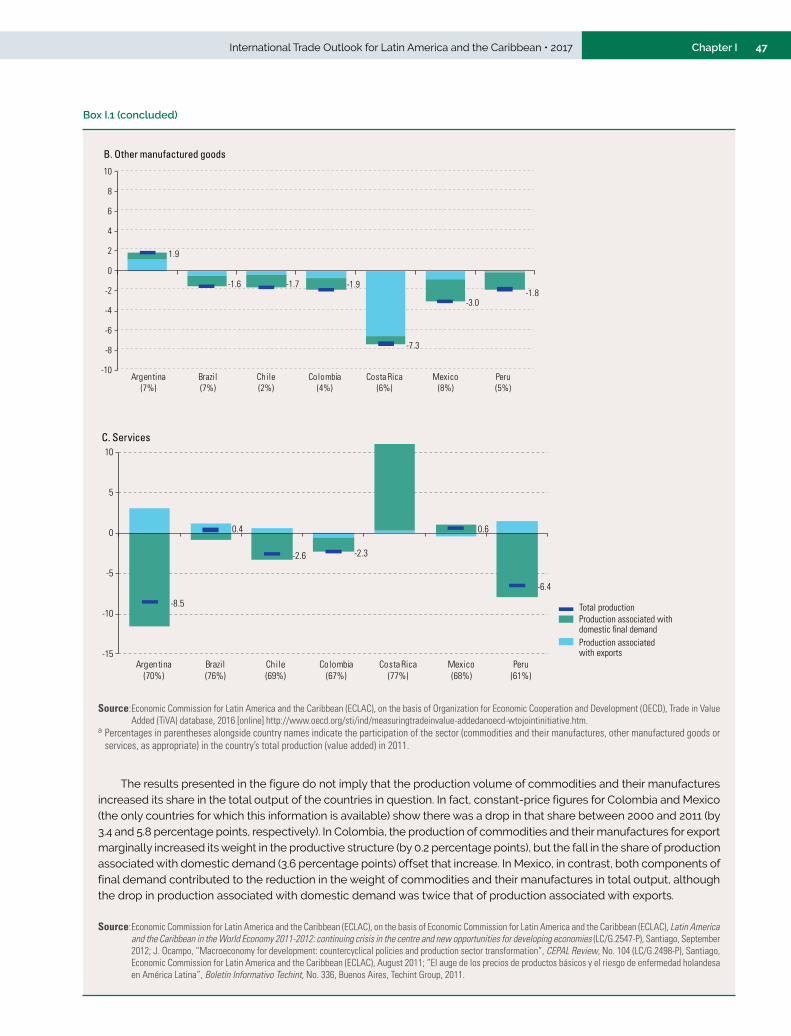
47International Trade Outlook for Latin America and the Caribbean • 2017 Chapter I
Argentina(7%)
Brazil(7%)
Chile(2%)
Colombia(4%)
Costa Rica(6%)
Mexico(8%)
Peru(5%)
B. Other manufactured goods
1.9
-1.6 -1.7 -1.9
-7.3
-3.0-1.8
-10
-8
-6
-4
-2
0
2
4
6
8
10
Argentina(70%)
Brazil(76%)
Chile(69%)
Colombia(67%)
Costa Rica(77%)
Mexico(68%)
Peru(61%)
C. Services
-8.5
0.4
-2.6 -2.3
0.6
-6.4
-15
-10
-5
0
5
10
Production associatedwith exports
Production associated withdomestic final demand
Total production
Source: Economic Commission for Latin America and the Caribbean (ECLAC), on the basis of Organization for Economic Cooperation and Development (OECD), Trade in Value Added (TiVA) database, 2016 [online] http://www.oecd.org/sti/ind/measuringtradeinvalue-addedanoecd-wtojointinitiative.htm.
a Percentages in parentheses alongside country names indicate the participation of the sector (commodities and their manufactures, other manufactured goods or services, as appropriate) in the country’s total production (value added) in 2011.
The results presented in the figure do not imply that the production volume of commodities and their manufactures increased its share in the total output of the countries in question. In fact, constant-price figures for Colombia and Mexico (the only countries for which this information is available) show there was a drop in that share between 2000 and 2011 (by 3.4 and 5.8 percentage points, respectively). In Colombia, the production of commodities and their manufactures for export marginally increased its weight in the productive structure (by 0.2 percentage points), but the fall in the share of production associated with domestic demand (3.6 percentage points) offset that increase. In Mexico, in contrast, both components of final demand contributed to the reduction in the weight of commodities and their manufactures in total output, although the drop in production associated with domestic demand was twice that of production associated with exports.
Source: Economic Commission for Latin America and the Caribbean (ECLAC), on the basis of Economic Commission for Latin America and the Caribbean (ECLAC), Latin America and the Caribbean in the World Economy 2011-2012: continuing crisis in the centre and new opportunities for developing economies (LC/G.2547-P), Santiago, September 2012; J. Ocampo, “Macroeconomy for development: countercyclical policies and production sector transformation”, CEPAL Review, No. 104 (LC/G.2498-P), Santiago, Economic Commission for Latin America and the Caribbean (ECLAC), August 2011; “El auge de los precios de productos básicos y el riesgo de enfermedad holandesa en América Latina”, Boletín Informativo Techint, No. 336, Buenos Aires, Techint Group, 2011.
Box I.1 (concluded)
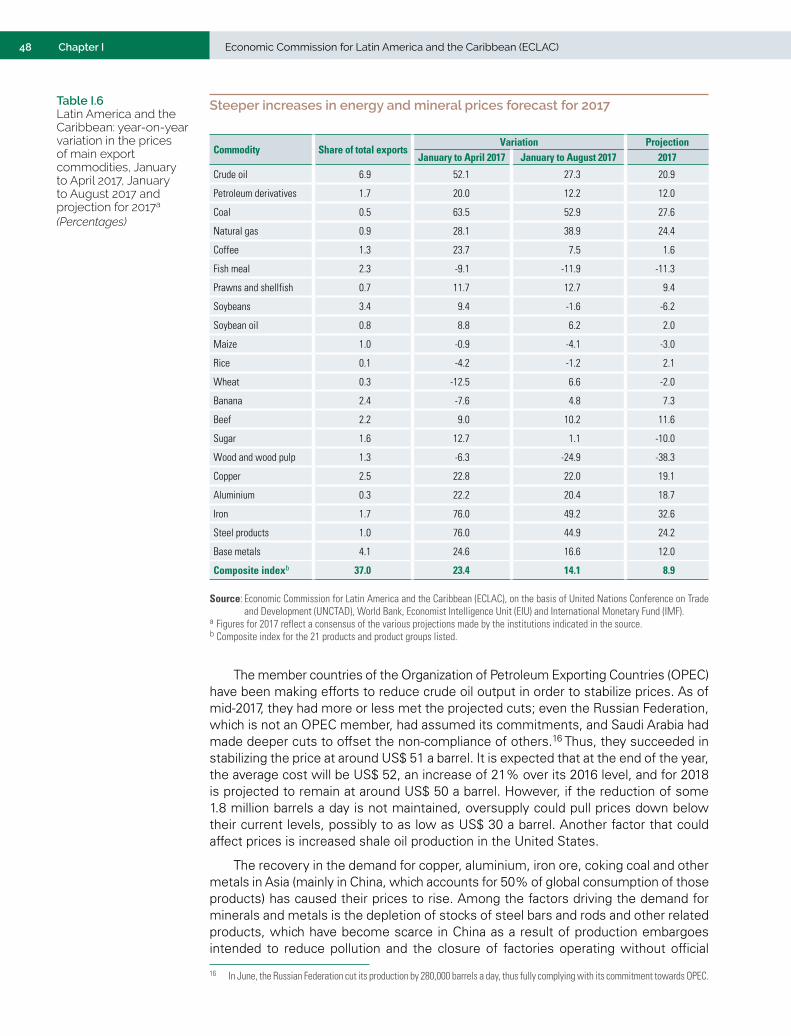
48 Economic Commission for Latin America and the Caribbean (ECLAC)Chapter I
Steeper increases in energy and mineral prices forecast for 2017
Commodity Share of total exportsVariation Projection
January to April 2017 January to August 2017 2017
Crude oil 6.9 52.1 27.3 20.9
Petroleum derivatives 1.7 20.0 12.2 12.0
Coal 0.5 63.5 52.9 27.6
Natural gas 0.9 28.1 38.9 24.4
Coffee 1.3 23.7 7.5 1.6
Fish meal 2.3 -9.1 -11.9 -11.3
Prawns and shellfish 0.7 11.7 12.7 9.4
Soybeans 3.4 9.4 -1.6 -6.2
Soybean oil 0.8 8.8 6.2 2.0
Maize 1.0 -0.9 -4.1 -3.0
Rice 0.1 -4.2 -1.2 2.1
Wheat 0.3 -12.5 6.6 -2.0
Banana 2.4 -7.6 4.8 7.3
Beef 2.2 9.0 10.2 11.6
Sugar 1.6 12.7 1.1 -10.0
Wood and wood pulp 1.3 -6.3 -24.9 -38.3
Copper 2.5 22.8 22.0 19.1
Aluminium 0.3 22.2 20.4 18.7
Iron 1.7 76.0 49.2 32.6
Steel products 1.0 76.0 44.9 24.2
Base metals 4.1 24.6 16.6 12.0
Composite indexb 37.0 23.4 14.1 8.9
Source: Economic Commission for Latin America and the Caribbean (ECLAC), on the basis of United Nations Conference on Trade and Development (UNCTAD), World Bank, Economist Intelligence Unit (EIU) and International Monetary Fund (IMF).
a Figures for 2017 reflect a consensus of the various projections made by the institutions indicated in the source.b Composite index for the 21 products and product groups listed.
The member countries of the Organization of Petroleum Exporting Countries (OPEC) have been making efforts to reduce crude oil output in order to stabilize prices. As of mid-2017, they had more or less met the projected cuts; even the Russian Federation, which is not an OPEC member, had assumed its commitments, and Saudi Arabia had made deeper cuts to offset the non-compliance of others.16 Thus, they succeeded in stabilizing the price at around US$ 51 a barrel. It is expected that at the end of the year, the average cost will be US$ 52, an increase of 21% over its 2016 level, and for 2018 is projected to remain at around US$ 50 a barrel. However, if the reduction of some 1.8 million barrels a day is not maintained, oversupply could pull prices down below their current levels, possibly to as low as US$ 30 a barrel. Another factor that could affect prices is increased shale oil production in the United States.
The recovery in the demand for copper, aluminium, iron ore, coking coal and other metals in Asia (mainly in China, which accounts for 50% of global consumption of those products) has caused their prices to rise. Among the factors driving the demand for minerals and metals is the depletion of stocks of steel bars and rods and other related products, which have become scarce in China as a result of production embargoes intended to reduce pollution and the closure of factories operating without official
16 In June, the Russian Federation cut its production by 280,000 barrels a day, thus fully complying with its commitment towards OPEC.
Table I.6 Latin America and the Caribbean: year-on-year variation in the prices of main export commodities, January to April 2017, January to August 2017 and projection for 2017a
(Percentages)
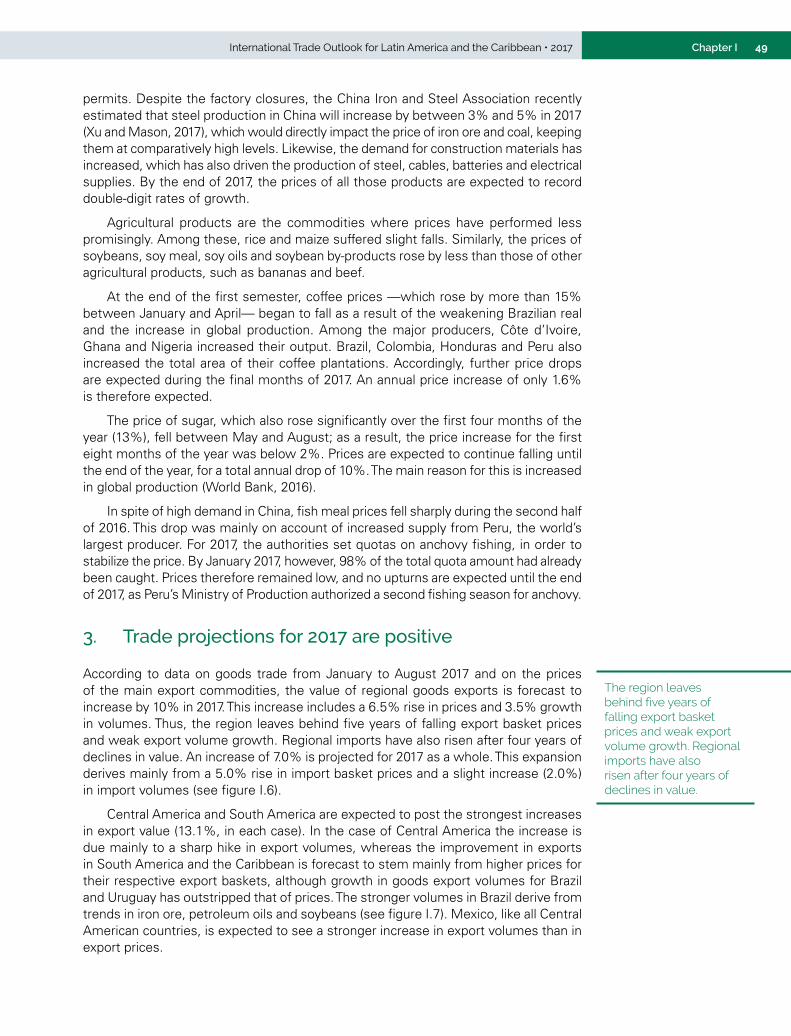
49International Trade Outlook for Latin America and the Caribbean • 2017 Chapter I
permits. Despite the factory closures, the China Iron and Steel Association recently estimated that steel production in China will increase by between 3% and 5% in 2017 (Xu and Mason, 2017), which would directly impact the price of iron ore and coal, keeping them at comparatively high levels. Likewise, the demand for construction materials has increased, which has also driven the production of steel, cables, batteries and electrical supplies. By the end of 2017, the prices of all those products are expected to record double-digit rates of growth.
Agricultural products are the commodities where prices have performed less promisingly. Among these, rice and maize suffered slight falls. Similarly, the prices of soybeans, soy meal, soy oils and soybean by-products rose by less than those of other agricultural products, such as bananas and beef.
At the end of the first semester, coffee prices —which rose by more than 15% between January and April— began to fall as a result of the weakening Brazilian real and the increase in global production. Among the major producers, Côte d’Ivoire, Ghana and Nigeria increased their output. Brazil, Colombia, Honduras and Peru also increased the total area of their coffee plantations. Accordingly, further price drops are expected during the final months of 2017. An annual price increase of only 1.6% is therefore expected.
The price of sugar, which also rose significantly over the first four months of the year (13%), fell between May and August; as a result, the price increase for the first eight months of the year was below 2%. Prices are expected to continue falling until the end of the year, for a total annual drop of 10%. The main reason for this is increased in global production (World Bank, 2016).
In spite of high demand in China, fish meal prices fell sharply during the second half of 2016. This drop was mainly on account of increased supply from Peru, the world’s largest producer. For 2017, the authorities set quotas on anchovy fishing, in order to stabilize the price. By January 2017, however, 98% of the total quota amount had already been caught. Prices therefore remained low, and no upturns are expected until the end of 2017, as Peru’s Ministry of Production authorized a second fishing season for anchovy.
3. Trade projections for 2017 are positive
According to data on goods trade from January to August 2017 and on the prices of the main export commodities, the value of regional goods exports is forecast to increase by 10% in 2017. This increase includes a 6.5% rise in prices and 3.5% growth in volumes. Thus, the region leaves behind five years of falling export basket prices and weak export volume growth. Regional imports have also risen after four years of declines in value. An increase of 7.0% is projected for 2017 as a whole. This expansion derives mainly from a 5.0% rise in import basket prices and a slight increase (2.0%) in import volumes (see figure I.6).
Central America and South America are expected to post the strongest increases in export value (13.1%, in each case). In the case of Central America the increase is due mainly to a sharp hike in export volumes, whereas the improvement in exports in South America and the Caribbean is forecast to stem mainly from higher prices for their respective export baskets, although growth in goods export volumes for Brazil and Uruguay has outstripped that of prices. The stronger volumes in Brazil derive from trends in iron ore, petroleum oils and soybeans (see figure I.7). Mexico, like all Central American countries, is expected to see a stronger increase in export volumes than in export prices.
The region leaves behind five years of falling export basket prices and weak export volume growth. Regional imports have also risen after four years of declines in value.
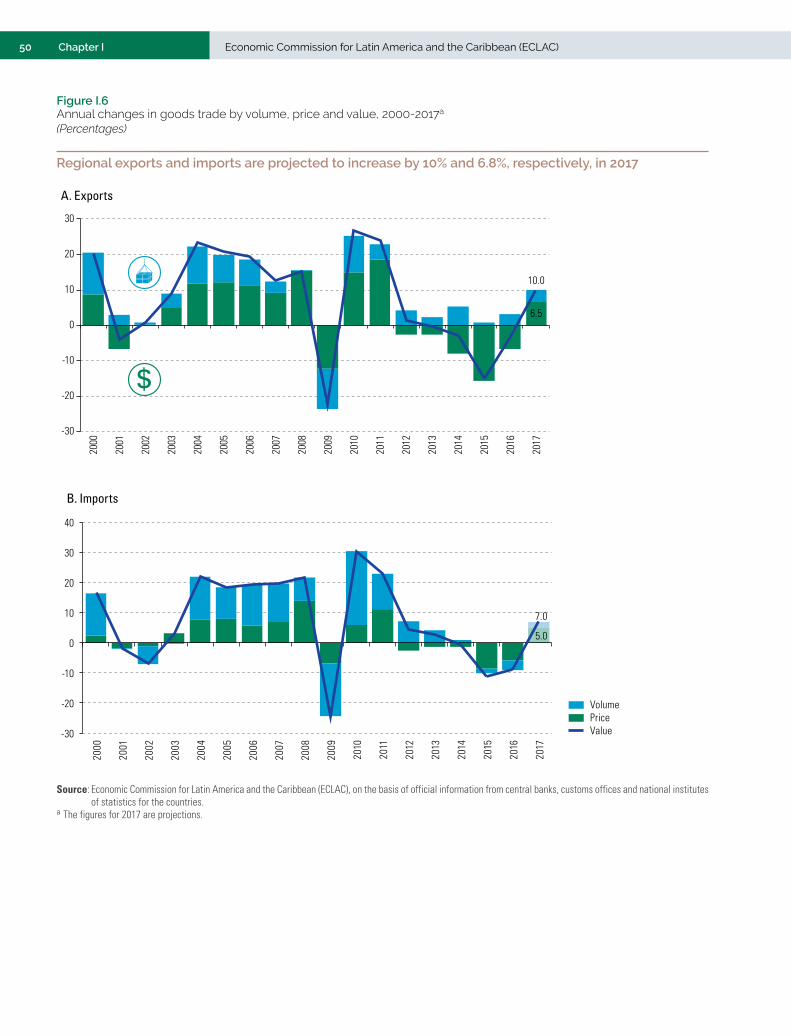
50 Economic Commission for Latin America and the Caribbean (ECLAC)Chapter I
Figure I.6 Annual changes in goods trade by volume, price and value, 2000-2017a
(Percentages)
Regional exports and imports are projected to increase by 10% and 6.8%, respectively, in 2017
6.5
10.0
-30
-20
-10
0
10
20
30
2000
2001
2002
2003
2004
2005
2006
2007
2008
2009
2010
2011
2012
2013
2014
2015
2016
2017
A. Exports
VolumePriceValue
B. Imports
5.0
7.0
-30
-20
-10
0
10
20
30
40
2000
2001
2002
2003
2004
2005
2006
2007
2008
2009
2010
2011
2012
2013
2014
2015
2016
2017
Source: Economic Commission for Latin America and the Caribbean (ECLAC), on the basis of official information from central banks, customs offices and national institutes of statistics for the countries.
a The figures for 2017 are projections.
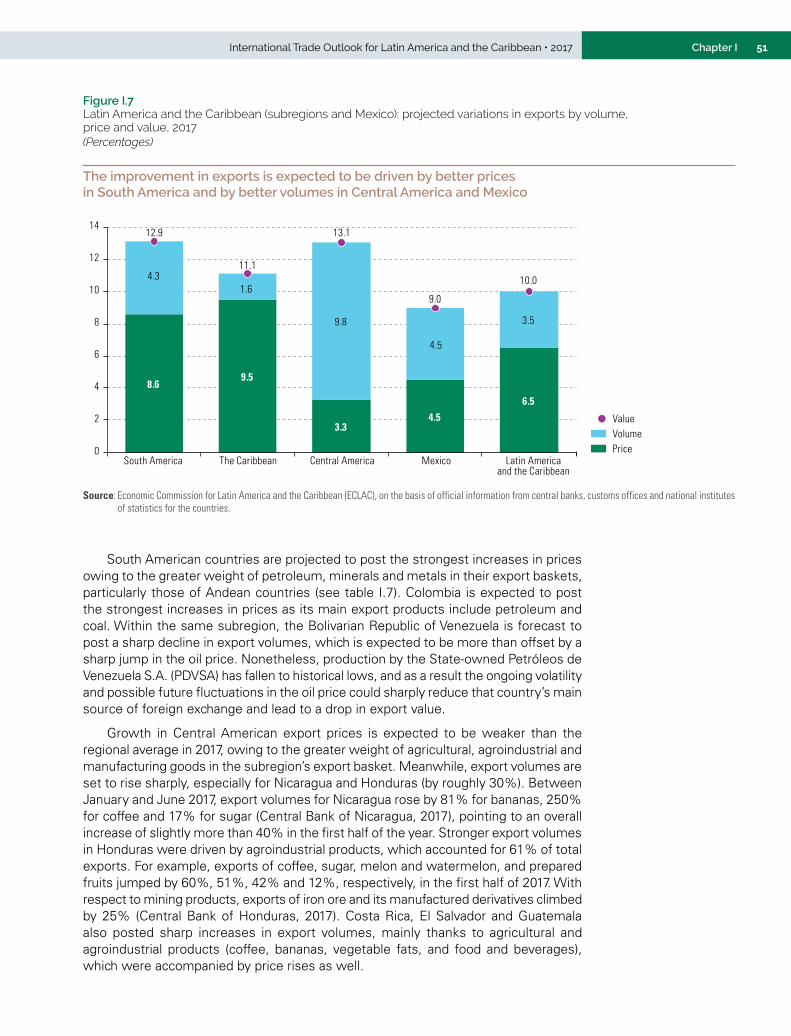
51International Trade Outlook for Latin America and the Caribbean • 2017 Chapter I
Figure I.7 Latin America and the Caribbean (subregions and Mexico): projected variations in exports by volume, price and value, 2017(Percentages)
The improvement in exports is expected to be driven by better prices in South America and by better volumes in Central America and Mexico
South America The Caribbean Central America Mexico Latin Americaand the Caribbean
VolumePrice
Value
8.69.5
3.34.5
6.5
1.6
9.8
4.5
3.5
12.9
11.1
13.1
9.0
10.0
0
2
4
6
8
10
12
14
4.3
Source: Economic Commission for Latin America and the Caribbean (ECLAC), on the basis of official information from central banks, customs offices and national institutes of statistics for the countries.
South American countries are projected to post the strongest increases in prices owing to the greater weight of petroleum, minerals and metals in their export baskets, particularly those of Andean countries (see table I.7). Colombia is expected to post the strongest increases in prices as its main export products include petroleum and coal. Within the same subregion, the Bolivarian Republic of Venezuela is forecast to post a sharp decline in export volumes, which is expected to be more than offset by a sharp jump in the oil price. Nonetheless, production by the State-owned Petróleos de Venezuela S.A. (PDVSA) has fallen to historical lows, and as a result the ongoing volatility and possible future fluctuations in the oil price could sharply reduce that country’s main source of foreign exchange and lead to a drop in export value.
Growth in Central American export prices is expected to be weaker than the regional average in 2017, owing to the greater weight of agricultural, agroindustrial and manufacturing goods in the subregion’s export basket. Meanwhile, export volumes are set to rise sharply, especially for Nicaragua and Honduras (by roughly 30%). Between January and June 2017, export volumes for Nicaragua rose by 81% for bananas, 250% for coffee and 17% for sugar (Central Bank of Nicaragua, 2017), pointing to an overall increase of slightly more than 40% in the first half of the year. Stronger export volumes in Honduras were driven by agroindustrial products, which accounted for 61% of total exports. For example, exports of coffee, sugar, melon and watermelon, and prepared fruits jumped by 60%, 51%, 42% and 12%, respectively, in the first half of 2017. With respect to mining products, exports of iron ore and its manufactured derivatives climbed by 25% (Central Bank of Honduras, 2017). Costa Rica, El Salvador and Guatemala also posted sharp increases in export volumes, mainly thanks to agricultural and agroindustrial products (coffee, bananas, vegetable fats, and food and beverages), which were accompanied by price rises as well.
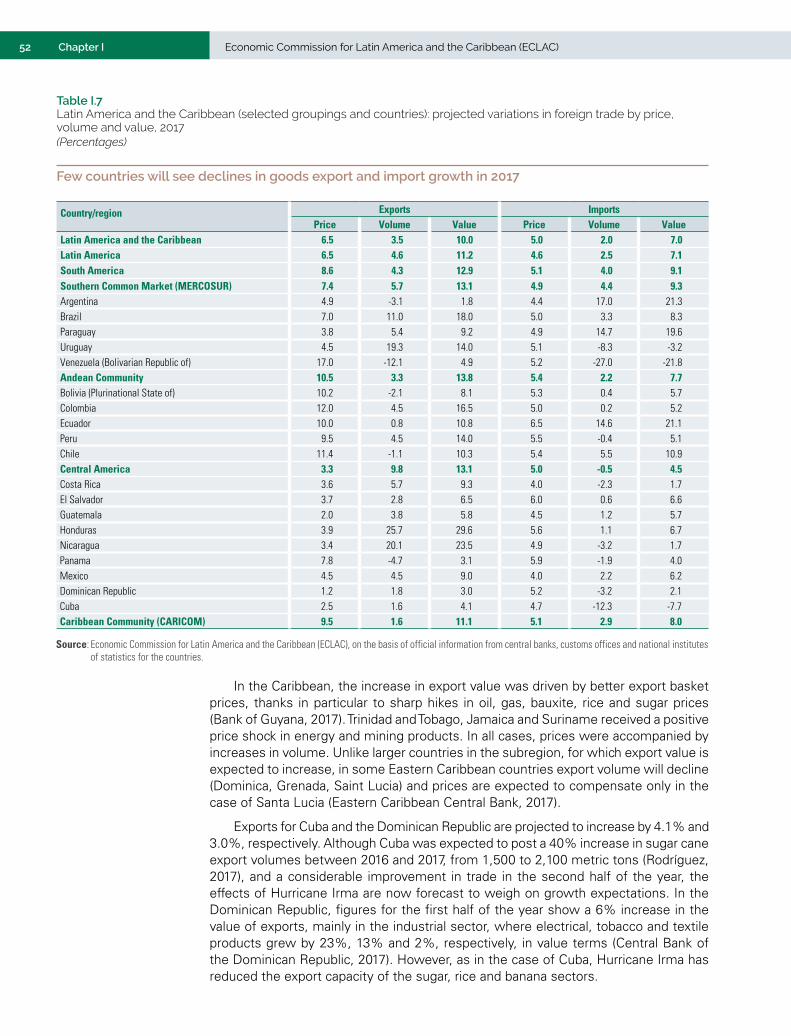
52 Economic Commission for Latin America and the Caribbean (ECLAC)Chapter I
Table I.7 Latin America and the Caribbean (selected groupings and countries): projected variations in foreign trade by price, volume and value, 2017(Percentages)
Few countries will see declines in goods export and import growth in 2017
Country/region Exports ImportsPrice Volume Value Price Volume Value
Latin America and the Caribbean 6.5 3.5 10.0 5.0 2.0 7.0Latin America 6.5 4.6 11.2 4.6 2.5 7.1South America 8.6 4.3 12.9 5.1 4.0 9.1Southern Common Market (MERCOSUR) 7.4 5.7 13.1 4.9 4.4 9.3Argentina 4.9 -3.1 1.8 4.4 17.0 21.3Brazil 7.0 11.0 18.0 5.0 3.3 8.3Paraguay 3.8 5.4 9.2 4.9 14.7 19.6Uruguay 4.5 19.3 14.0 5.1 -8.3 -3.2Venezuela (Bolivarian Republic of) 17.0 -12.1 4.9 5.2 -27.0 -21.8Andean Community 10.5 3.3 13.8 5.4 2.2 7.7Bolivia (Plurinational State of) 10.2 -2.1 8.1 5.3 0.4 5.7Colombia 12.0 4.5 16.5 5.0 0.2 5.2Ecuador 10.0 0.8 10.8 6.5 14.6 21.1Peru 9.5 4.5 14.0 5.5 -0.4 5.1Chile 11.4 -1.1 10.3 5.4 5.5 10.9Central America 3.3 9.8 13.1 5.0 -0.5 4.5Costa Rica 3.6 5.7 9.3 4.0 -2.3 1.7El Salvador 3.7 2.8 6.5 6.0 0.6 6.6Guatemala 2.0 3.8 5.8 4.5 1.2 5.7Honduras 3.9 25.7 29.6 5.6 1.1 6.7Nicaragua 3.4 20.1 23.5 4.9 -3.2 1.7Panama 7.8 -4.7 3.1 5.9 -1.9 4.0Mexico 4.5 4.5 9.0 4.0 2.2 6.2Dominican Republic 1.2 1.8 3.0 5.2 -3.2 2.1Cuba 2.5 1.6 4.1 4.7 -12.3 -7.7Caribbean Community (CARICOM) 9.5 1.6 11.1 5.1 2.9 8.0
Source: Economic Commission for Latin America and the Caribbean (ECLAC), on the basis of official information from central banks, customs offices and national institutes of statistics for the countries.
In the Caribbean, the increase in export value was driven by better export basket prices, thanks in particular to sharp hikes in oil, gas, bauxite, rice and sugar prices (Bank of Guyana, 2017). Trinidad and Tobago, Jamaica and Suriname received a positive price shock in energy and mining products. In all cases, prices were accompanied by increases in volume. Unlike larger countries in the subregion, for which export value is expected to increase, in some Eastern Caribbean countries export volume will decline (Dominica, Grenada, Saint Lucia) and prices are expected to compensate only in the case of Santa Lucia (Eastern Caribbean Central Bank, 2017).
Exports for Cuba and the Dominican Republic are projected to increase by 4.1% and 3.0%, respectively. Although Cuba was expected to post a 40% increase in sugar cane export volumes between 2016 and 2017, from 1,500 to 2,100 metric tons (Rodríguez, 2017), and a considerable improvement in trade in the second half of the year, the effects of Hurricane Irma are now forecast to weigh on growth expectations. In the Dominican Republic, figures for the first half of the year show a 6% increase in the value of exports, mainly in the industrial sector, where electrical, tobacco and textile products grew by 23%, 13% and 2%, respectively, in value terms (Central Bank of the Dominican Republic, 2017). However, as in the case of Cuba, Hurricane Irma has reduced the export capacity of the sugar, rice and banana sectors.
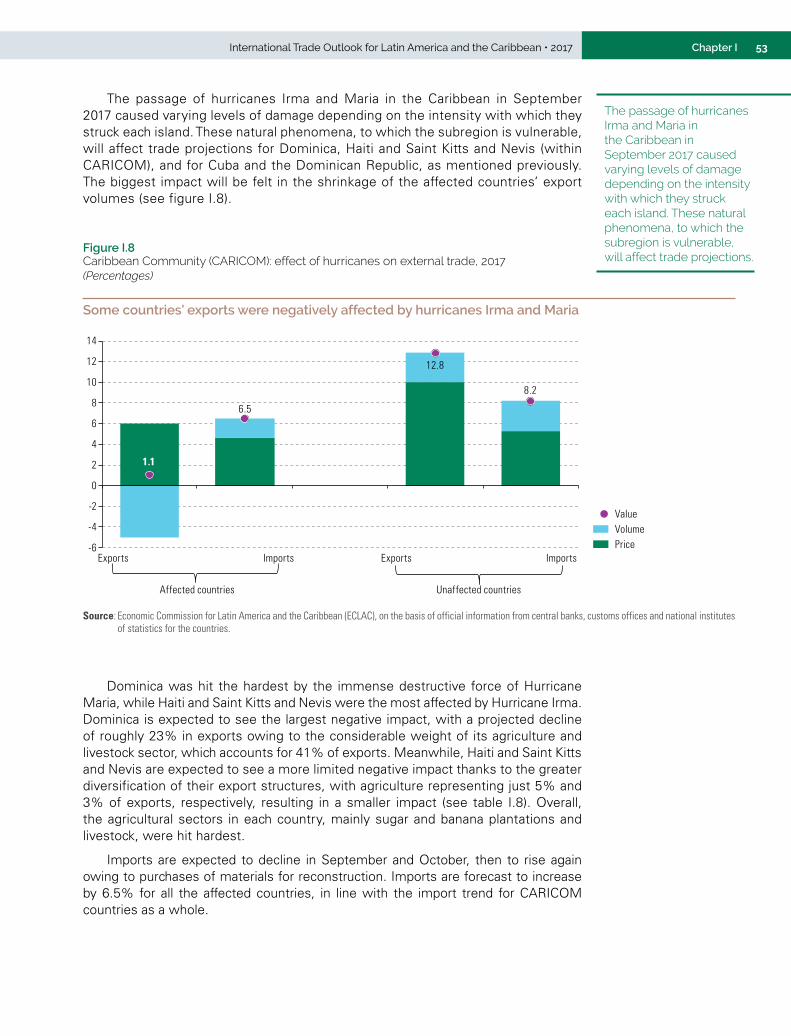
53International Trade Outlook for Latin America and the Caribbean • 2017 Chapter I
The passage of hurricanes Irma and Maria in the Caribbean in September 2017 caused varying levels of damage depending on the intensity with which they struck each island. These natural phenomena, to which the subregion is vulnerable, will affect trade projections for Dominica, Haiti and Saint Kitts and Nevis (within CARICOM), and for Cuba and the Dominican Republic, as mentioned previously. The biggest impact will be felt in the shrinkage of the affected countries’ export volumes (see figure I.8).
Figure I.8 Caribbean Community (CARICOM): effect of hurricanes on external trade, 2017(Percentages)
Some countries’ exports were negatively affected by hurricanes Irma and Maria
VolumePrice
Value
1.1
6.5
12.8
8.2
-6
-4
-2
0
2
4
6
8
10
12
14
Exports Imports Exports Imports
Affected countries Unaffected countries
Source: Economic Commission for Latin America and the Caribbean (ECLAC), on the basis of official information from central banks, customs offices and national institutes of statistics for the countries.
Dominica was hit the hardest by the immense destructive force of Hurricane Maria, while Haiti and Saint Kitts and Nevis were the most affected by Hurricane Irma. Dominica is expected to see the largest negative impact, with a projected decline of roughly 23% in exports owing to the considerable weight of its agriculture and livestock sector, which accounts for 41% of exports. Meanwhile, Haiti and Saint Kitts and Nevis are expected to see a more limited negative impact thanks to the greater diversification of their export structures, with agriculture representing just 5% and 3% of exports, respectively, resulting in a smaller impact (see table I.8). Overall, the agricultural sectors in each country, mainly sugar and banana plantations and livestock, were hit hardest.
Imports are expected to decline in September and October, then to rise again owing to purchases of materials for reconstruction. Imports are forecast to increase by 6.5% for all the affected countries, in line with the import trend for CARICOM countries as a whole.
The passage of hurricanes Irma and Maria in the Caribbean in September 2017 caused varying levels of damage depending on the intensity with which they struck each island. These natural phenomena, to which the subregion is vulnerable, will affect trade projections.
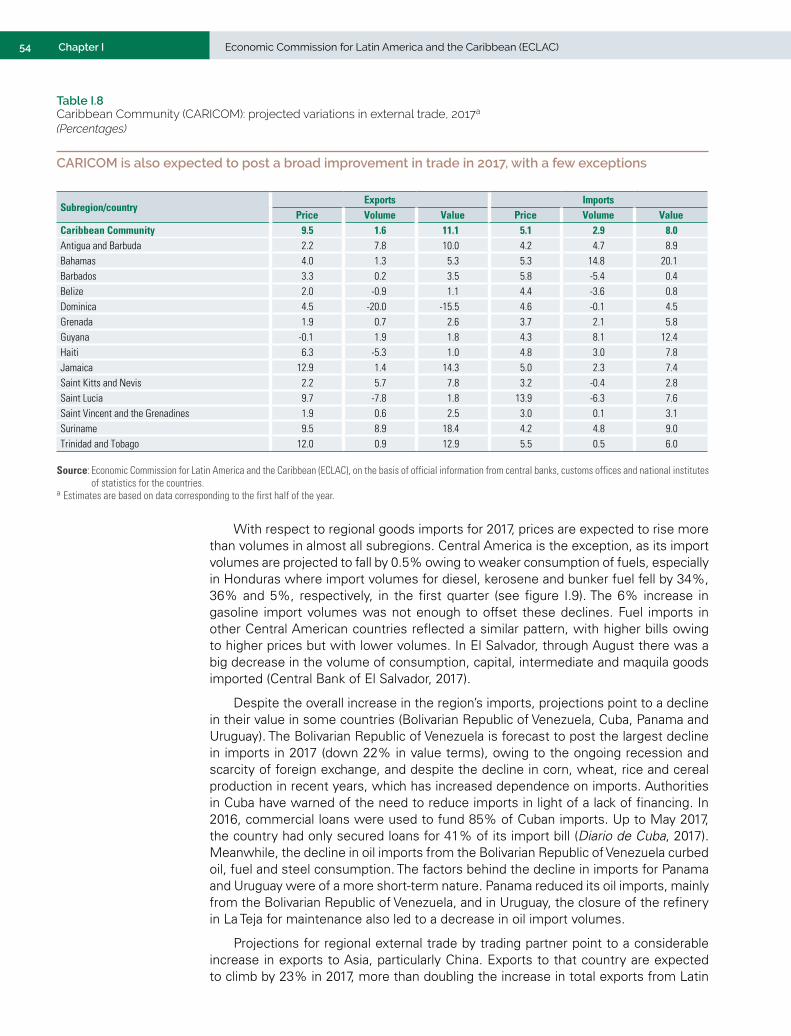
54 Economic Commission for Latin America and the Caribbean (ECLAC)Chapter I
Table I.8 Caribbean Community (CARICOM): projected variations in external trade, 2017a
(Percentages)
CARICOM is also expected to post a broad improvement in trade in 2017, with a few exceptions
Subregion/countryExports Imports
Price Volume Value Price Volume ValueCaribbean Community 9.5 1.6 11.1 5.1 2.9 8.0Antigua and Barbuda 2.2 7.8 10.0 4.2 4.7 8.9Bahamas 4.0 1.3 5.3 5.3 14.8 20.1Barbados 3.3 0.2 3.5 5.8 -5.4 0.4Belize 2.0 -0.9 1.1 4.4 -3.6 0.8Dominica 4.5 -20.0 -15.5 4.6 -0.1 4.5Grenada 1.9 0.7 2.6 3.7 2.1 5.8Guyana -0.1 1.9 1.8 4.3 8.1 12.4Haiti 6.3 -5.3 1.0 4.8 3.0 7.8Jamaica 12.9 1.4 14.3 5.0 2.3 7.4Saint Kitts and Nevis 2.2 5.7 7.8 3.2 -0.4 2.8Saint Lucia 9.7 -7.8 1.8 13.9 -6.3 7.6Saint Vincent and the Grenadines 1.9 0.6 2.5 3.0 0.1 3.1Suriname 9.5 8.9 18.4 4.2 4.8 9.0Trinidad and Tobago 12.0 0.9 12.9 5.5 0.5 6.0
Source: Economic Commission for Latin America and the Caribbean (ECLAC), on the basis of official information from central banks, customs offices and national institutes of statistics for the countries.
a Estimates are based on data corresponding to the first half of the year.
With respect to regional goods imports for 2017, prices are expected to rise more than volumes in almost all subregions. Central America is the exception, as its import volumes are projected to fall by 0.5% owing to weaker consumption of fuels, especially in Honduras where import volumes for diesel, kerosene and bunker fuel fell by 34%, 36% and 5%, respectively, in the first quarter (see figure I.9). The 6% increase in gasoline import volumes was not enough to offset these declines. Fuel imports in other Central American countries reflected a similar pattern, with higher bills owing to higher prices but with lower volumes. In El Salvador, through August there was a big decrease in the volume of consumption, capital, intermediate and maquila goods imported (Central Bank of El Salvador, 2017).
Despite the overall increase in the region’s imports, projections point to a decline in their value in some countries (Bolivarian Republic of Venezuela, Cuba, Panama and Uruguay). The Bolivarian Republic of Venezuela is forecast to post the largest decline in imports in 2017 (down 22% in value terms), owing to the ongoing recession and scarcity of foreign exchange, and despite the decline in corn, wheat, rice and cereal production in recent years, which has increased dependence on imports. Authorities in Cuba have warned of the need to reduce imports in light of a lack of financing. In 2016, commercial loans were used to fund 85% of Cuban imports. Up to May 2017, the country had only secured loans for 41% of its import bill (Diario de Cuba, 2017). Meanwhile, the decline in oil imports from the Bolivarian Republic of Venezuela curbed oil, fuel and steel consumption. The factors behind the decline in imports for Panama and Uruguay were of a more short-term nature. Panama reduced its oil imports, mainly from the Bolivarian Republic of Venezuela, and in Uruguay, the closure of the refinery in La Teja for maintenance also led to a decrease in oil import volumes.
Projections for regional external trade by trading partner point to a considerable increase in exports to Asia, particularly China. Exports to that country are expected to climb by 23% in 2017, more than doubling the increase in total exports from Latin
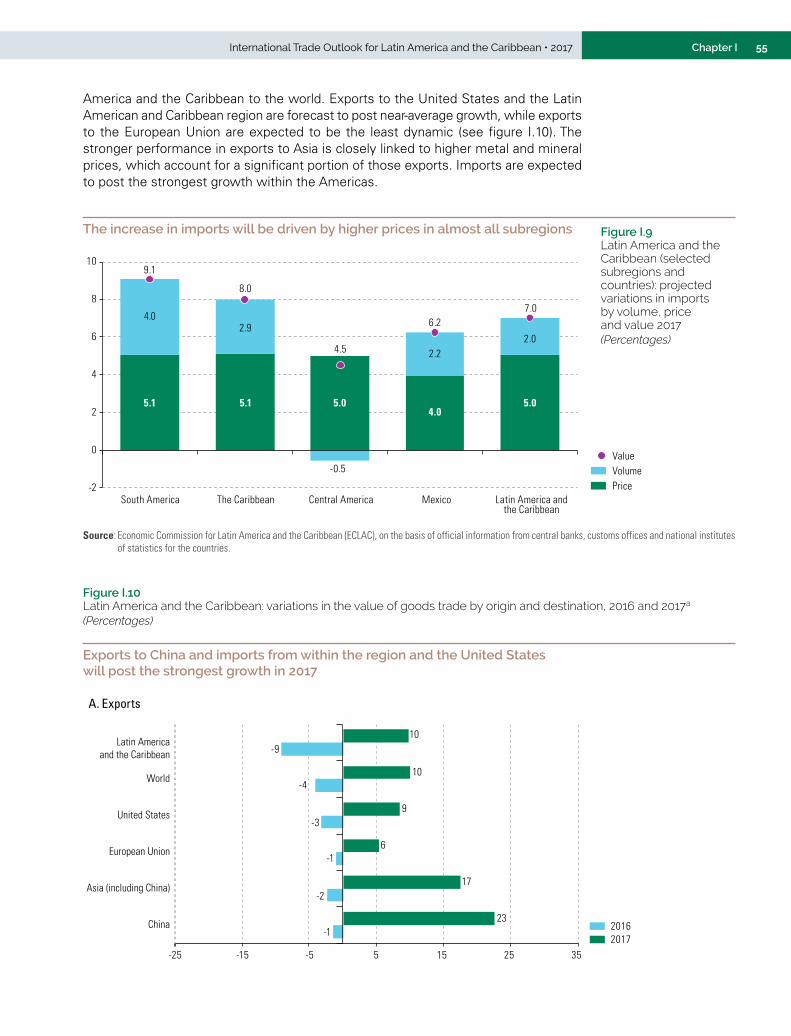
55International Trade Outlook for Latin America and the Caribbean • 2017 Chapter I
America and the Caribbean to the world. Exports to the United States and the Latin American and Caribbean region are forecast to post near-average growth, while exports to the European Union are expected to be the least dynamic (see figure I.10). The stronger performance in exports to Asia is closely linked to higher metal and mineral prices, which account for a significant portion of those exports. Imports are expected to post the strongest growth within the Americas.
Figure I.9 Latin America and the Caribbean (selected subregions and countries): projected variations in imports by volume, price and value 2017(Percentages)
The increase in imports will be driven by higher prices in almost all subregions
VolumeValue
PriceSouth America The Caribbean Central America Mexico Latin America and
the Caribbean
2.9
-0.5
2.22.0
9.1
4.0
5.1 5.1 5.05.04.0
8.0
4.5
6.27.0
-2
0
2
4
6
8
10
Source: Economic Commission for Latin America and the Caribbean (ECLAC), on the basis of official information from central banks, customs offices and national institutes of statistics for the countries.
Figure I.10 Latin America and the Caribbean: variations in the value of goods trade by origin and destination, 2016 and 2017a
(Percentages)
Exports to China and imports from within the region and the United States will post the strongest growth in 2017
-25 -15 -5 5 15 25 35
China
Asia (including China)
European Union
United States
World
Latin Americaand the Caribbean
20172016
A. Exports
-1
-2
-1
-3
-4
-9
23
17
6
9
10
10
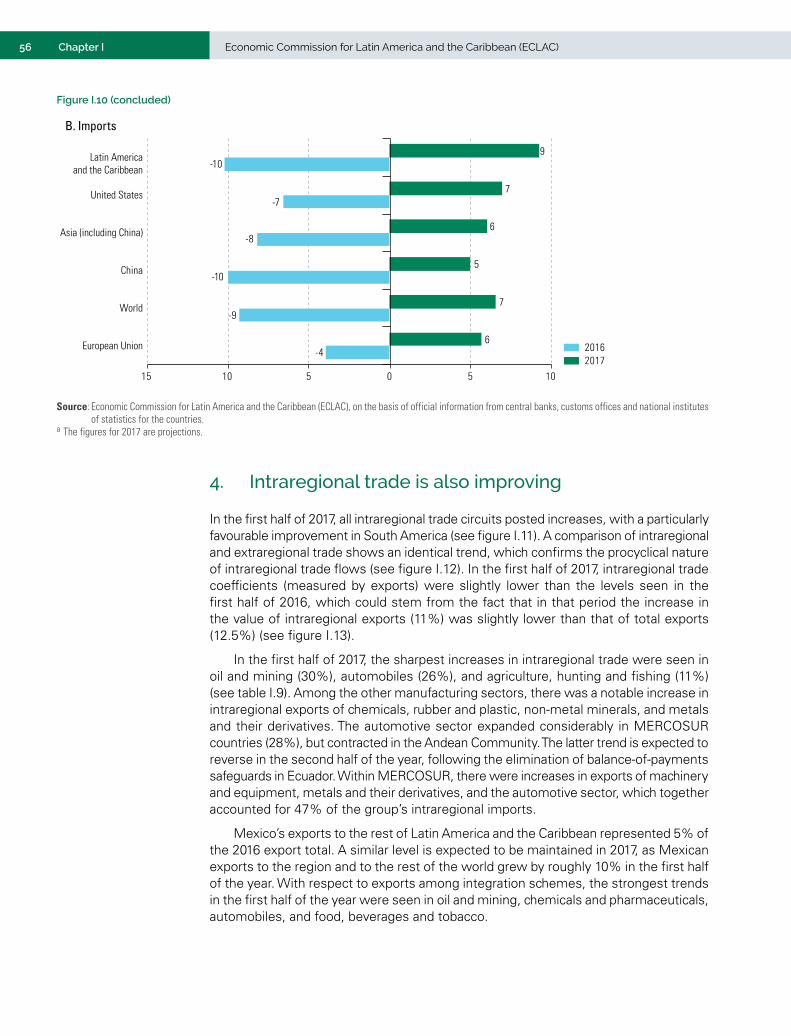
56 Economic Commission for Latin America and the Caribbean (ECLAC)Chapter I
20172016
B. Imports
-4
-9
-10
-8
-7
-10
6
7
5
6
7
9
15 10 5 0 5 10
European Union
World
China
Asia (including China)
United States
Latin Americaand the Caribbean
Source: Economic Commission for Latin America and the Caribbean (ECLAC), on the basis of official information from central banks, customs offices and national institutes of statistics for the countries.
a The figures for 2017 are projections.
4. Intraregional trade is also improving
In the first half of 2017, all intraregional trade circuits posted increases, with a particularly favourable improvement in South America (see figure I.11). A comparison of intraregional and extraregional trade shows an identical trend, which confirms the procyclical nature of intraregional trade flows (see figure I.12). In the first half of 2017, intraregional trade coefficients (measured by exports) were slightly lower than the levels seen in the first half of 2016, which could stem from the fact that in that period the increase in the value of intraregional exports (11%) was slightly lower than that of total exports (12.5%) (see figure I.13).
In the first half of 2017, the sharpest increases in intraregional trade were seen in oil and mining (30%), automobiles (26%), and agriculture, hunting and fishing (11%) (see table I.9). Among the other manufacturing sectors, there was a notable increase in intraregional exports of chemicals, rubber and plastic, non-metal minerals, and metals and their derivatives. The automotive sector expanded considerably in MERCOSUR countries (28%), but contracted in the Andean Community. The latter trend is expected to reverse in the second half of the year, following the elimination of balance-of-payments safeguards in Ecuador. Within MERCOSUR, there were increases in exports of machinery and equipment, metals and their derivatives, and the automotive sector, which together accounted for 47% of the group’s intraregional imports.
Mexico’s exports to the rest of Latin America and the Caribbean represented 5% of the 2016 export total. A similar level is expected to be maintained in 2017, as Mexican exports to the region and to the rest of the world grew by roughly 10% in the first half of the year. With respect to exports among integration schemes, the strongest trends in the first half of the year were seen in oil and mining, chemicals and pharmaceuticals, automobiles, and food, beverages and tobacco.
Figure I.10 (concluded)
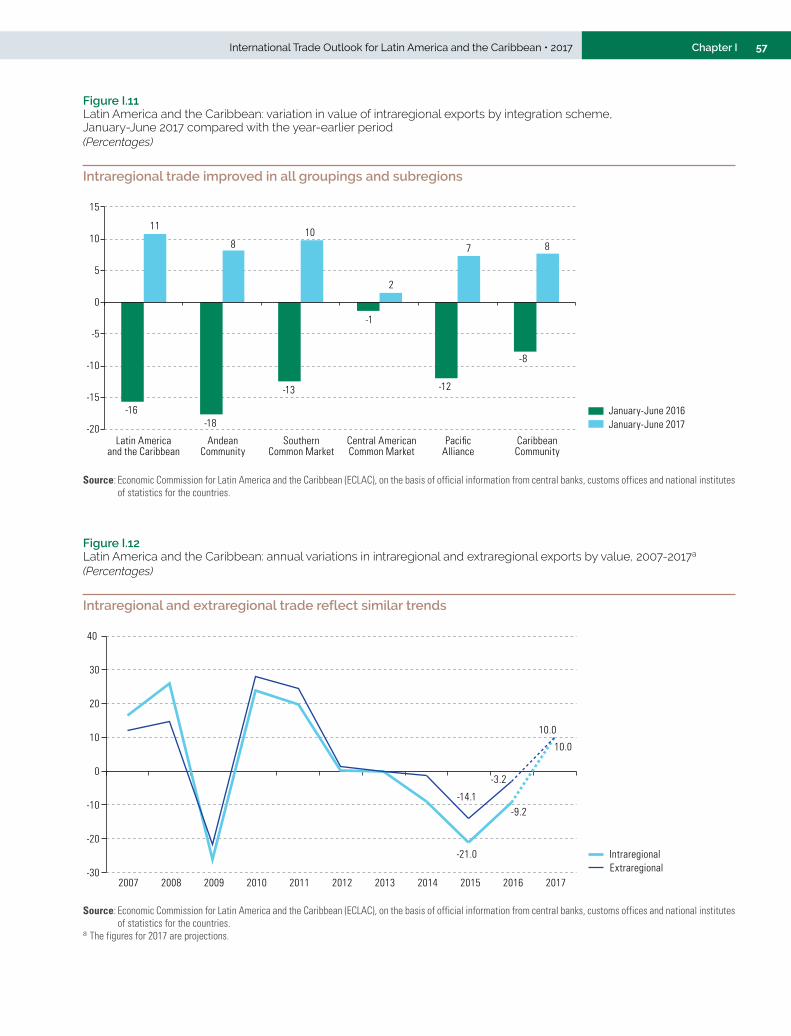
57International Trade Outlook for Latin America and the Caribbean • 2017 Chapter I
Figure I.11 Latin America and the Caribbean: variation in value of intraregional exports by integration scheme, January-June 2017 compared with the year-earlier period(Percentages)
Intraregional trade improved in all groupings and subregions
-16-18
-13
-1-1
-12
-8
11
810
2
7 8
-20
-15
-10
-5
0
5
10
15
Latin Americaand the Caribbean
AndeanCommunity
SouthernCommon Market
Central AmericanCommon Market
PacificAlliance
CaribbeanCommunity
January-June 2017January-June 2016
Source: Economic Commission for Latin America and the Caribbean (ECLAC), on the basis of official information from central banks, customs offices and national institutes of statistics for the countries.
Figure I.12 Latin America and the Caribbean: annual variations in intraregional and extraregional exports by value, 2007-2017a
(Percentages)
Intraregional and extraregional trade reflect similar trends
-21.0
-9.2
10.0
-14.1
-3.2
10.0
-30
-20
-10
0
10
20
30
40
2007 2008 2009 2010 2011 2012 2013 2014 2015 2016 2017
IntraregionalExtraregional
Source: Economic Commission for Latin America and the Caribbean (ECLAC), on the basis of official information from central banks, customs offices and national institutes of statistics for the countries.
a The figures for 2017 are projections.
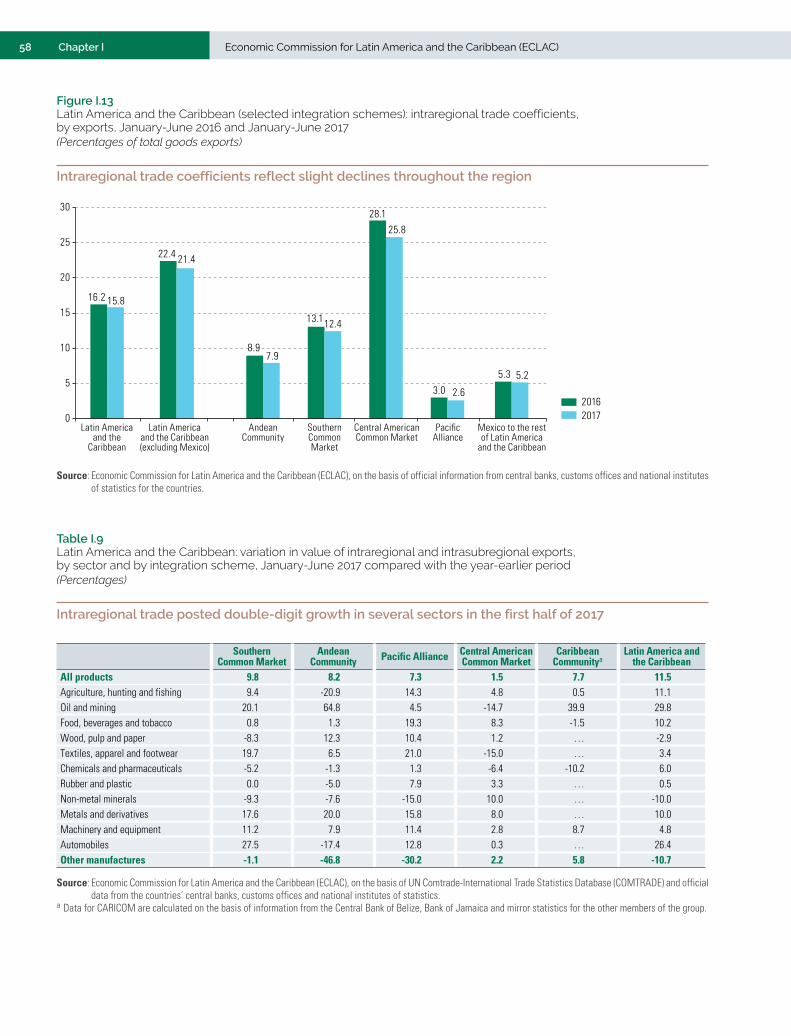
58 Economic Commission for Latin America and the Caribbean (ECLAC)Chapter I
Figure I.13 Latin America and the Caribbean (selected integration schemes): intraregional trade coefficients, by exports, January-June 2016 and January-June 2017(Percentages of total goods exports)
Intraregional trade coefficients reflect slight declines throughout the region
SouthernCommonMarket
AndeanCommunity
Central AmericanCommon Market
PacificAlliance
20172016
16.2
22.4
8.9
13.1
28.1
3.0
5.3
15.8
21.4
7.9
12.4
25.8
2.6
5.2
0
5
10
15
20
25
30
Latin Americaand the
Caribbean
Mexico to the restof Latin America
and the Caribbean
Latin Americaand the Caribbean(excluding Mexico)
Source: Economic Commission for Latin America and the Caribbean (ECLAC), on the basis of official information from central banks, customs offices and national institutes of statistics for the countries.
Table I.9 Latin America and the Caribbean: variation in value of intraregional and intrasubregional exports, by sector and by integration scheme, January-June 2017 compared with the year-earlier period(Percentages)
Intraregional trade posted double-digit growth in several sectors in the first half of 2017
Southern Common Market
Andean Community Pacific Alliance Central American
Common MarketCaribbean
CommunityaLatin America and
the CaribbeanAll products 9.8 8.2 7.3 1.5 7.7 11.5Agriculture, hunting and fishing 9.4 -20.9 14.3 4.8 0.5 11.1 Oil and mining 20.1 64.8 4.5 -14.7 39.9 29.8 Food, beverages and tobacco 0.8 1.3 19.3 8.3 -1.5 10.2Wood, pulp and paper -8.3 12.3 10.4 1.2 … -2.9Textiles, apparel and footwear 19.7 6.5 21.0 -15.0 … 3.4 Chemicals and pharmaceuticals -5.2 -1.3 1.3 -6.4 -10.2 6.0 Rubber and plastic 0.0 -5.0 7.9 3.3 … 0.5 Non-metal minerals -9.3 -7.6 -15.0 10.0 … -10.0Metals and derivatives 17.6 20.0 15.8 8.0 … 10.0Machinery and equipment 11.2 7.9 11.4 2.8 8.7 4.8Automobiles 27.5 -17.4 12.8 0.3 … 26.4 Other manufactures -1.1 -46.8 -30.2 2.2 5.8 -10.7
Source: Economic Commission for Latin America and the Caribbean (ECLAC), on the basis of UN Comtrade-International Trade Statistics Database (COMTRADE) and official data from the countries’ central banks, customs offices and national institutes of statistics.
a Data for CARICOM are calculated on the basis of information from the Central Bank of Belize, Bank of Jamaica and mirror statistics for the other members of the group.
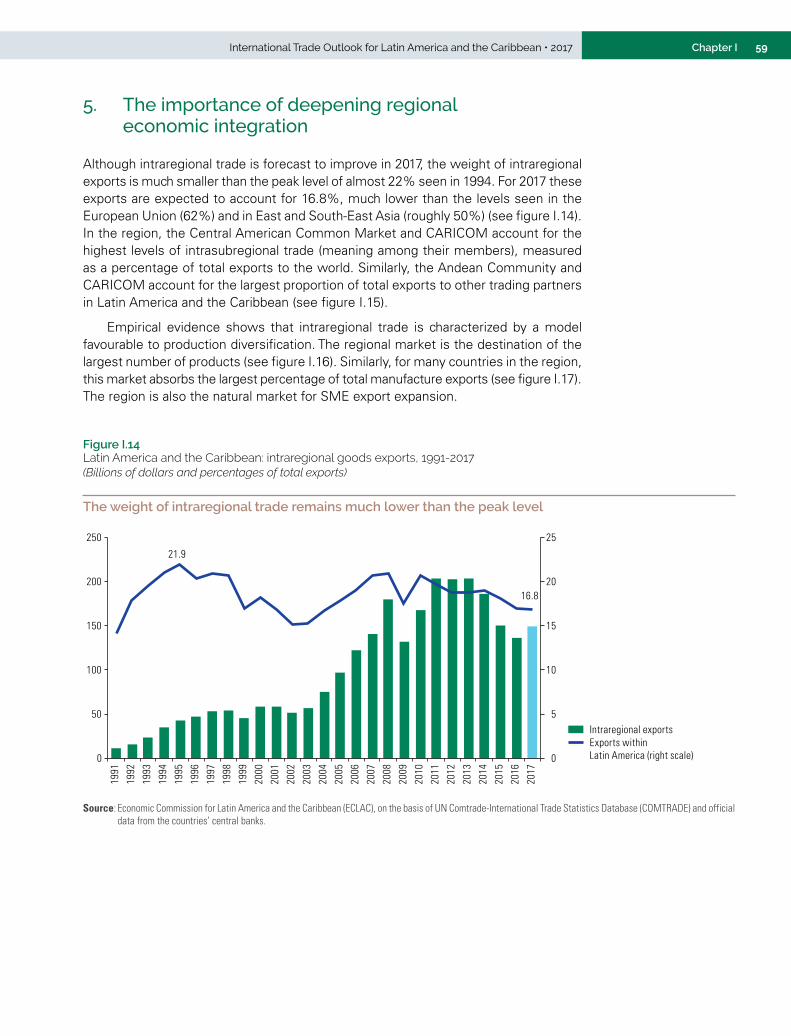
59International Trade Outlook for Latin America and the Caribbean • 2017 Chapter I
5. The importance of deepening regional economic integration
Although intraregional trade is forecast to improve in 2017, the weight of intraregional exports is much smaller than the peak level of almost 22% seen in 1994. For 2017 these exports are expected to account for 16.8%, much lower than the levels seen in the European Union (62%) and in East and South-East Asia (roughly 50%) (see figure I.14). In the region, the Central American Common Market and CARICOM account for the highest levels of intrasubregional trade (meaning among their members), measured as a percentage of total exports to the world. Similarly, the Andean Community and CARICOM account for the largest proportion of total exports to other trading partners in Latin America and the Caribbean (see figure I.15).
Empirical evidence shows that intraregional trade is characterized by a model favourable to production diversification. The regional market is the destination of the largest number of products (see figure I.16). Similarly, for many countries in the region, this market absorbs the largest percentage of total manufacture exports (see figure I.17). The region is also the natural market for SME export expansion.
Figure I.14 Latin America and the Caribbean: intraregional goods exports, 1991-2017(Billions of dollars and percentages of total exports)
The weight of intraregional trade remains much lower than the peak level
21.9
16.8
0
5
10
15
20
25
0
50
100
150
200
250
1991
1992
1993
1994
1995
1996
1997
1998
1999
2000
2001
2002
2003
2004
2005
2006
2007
2008
2009
2010
2011
2012
2013
2014
2015
2016
2017
Intraregional exportsExports withinLatin America (right scale)
Source: Economic Commission for Latin America and the Caribbean (ECLAC), on the basis of UN Comtrade-International Trade Statistics Database (COMTRADE) and official data from the countries’ central banks.
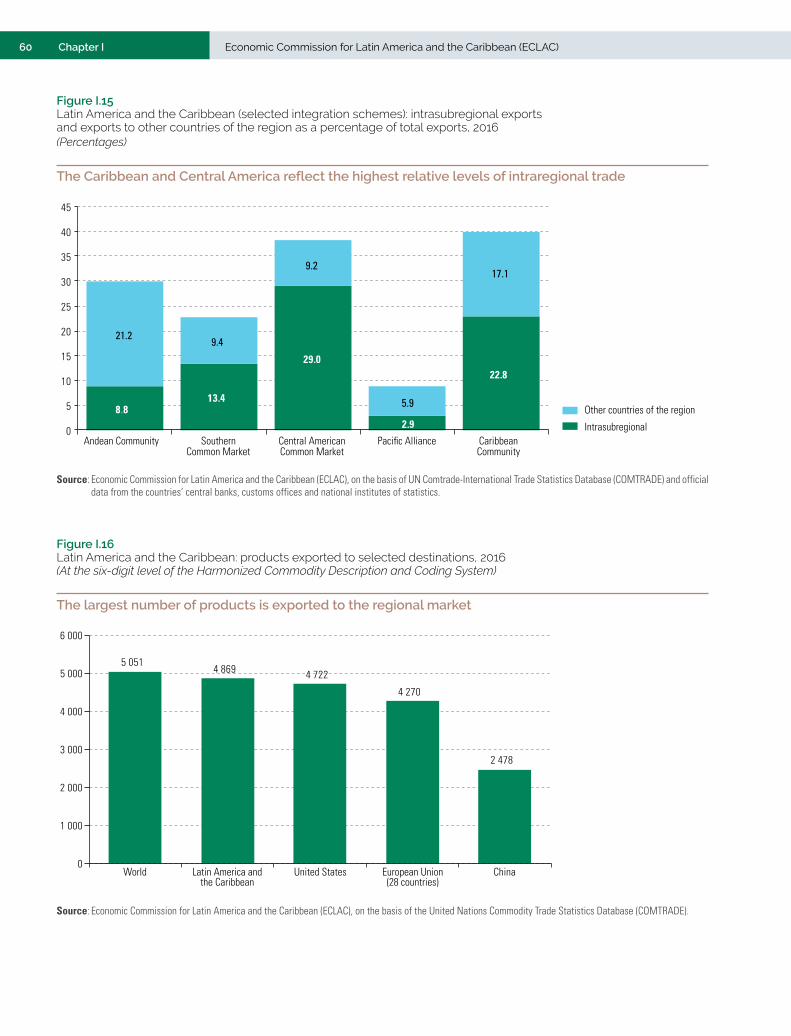
60 Economic Commission for Latin America and the Caribbean (ECLAC)Chapter I
Figure I.15 Latin America and the Caribbean (selected integration schemes): intrasubregional exports and exports to other countries of the region as a percentage of total exports, 2016(Percentages)
The Caribbean and Central America reflect the highest relative levels of intraregional trade
8.8
21.29.4
9.2
5.9
17.1
13.4
29.0
2.9
22.8
0
5
10
15
20
25
30
35
40
45
Andean Community SouthernCommon Market
Central AmericanCommon Market
Pacific Alliance CaribbeanCommunity
Other countries of the region
Intrasubregional
Source: Economic Commission for Latin America and the Caribbean (ECLAC), on the basis of UN Comtrade-International Trade Statistics Database (COMTRADE) and official data from the countries’ central banks, customs offices and national institutes of statistics.
Figure I.16 Latin America and the Caribbean: products exported to selected destinations, 2016 (At the six-digit level of the Harmonized Commodity Description and Coding System)
The largest number of products is exported to the regional market
5 0514 869 4 722
4 270
2 478
0
1 000
2 000
3 000
4 000
5 000
6 000
World Latin America andthe Caribbean
United States European Union(28 countries)
China
Source: Economic Commission for Latin America and the Caribbean (ECLAC), on the basis of the United Nations Commodity Trade Statistics Database (COMTRADE).
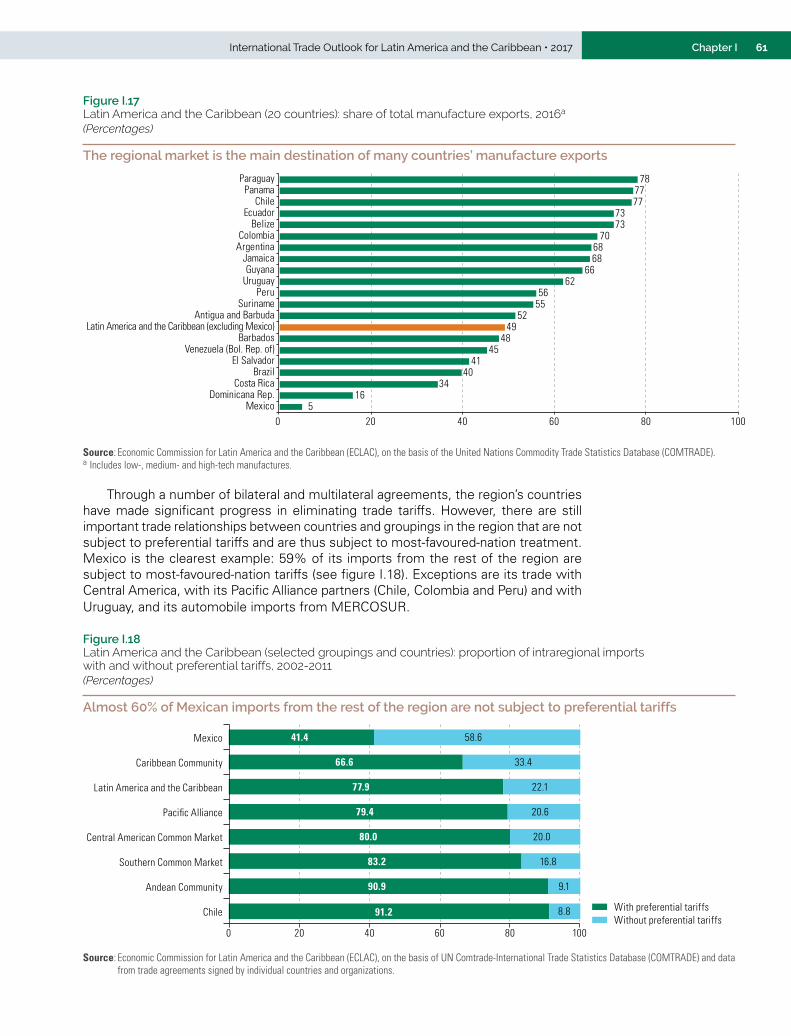
61International Trade Outlook for Latin America and the Caribbean • 2017 Chapter I
Figure I.17 Latin America and the Caribbean (20 countries): share of total manufacture exports, 2016a
(Percentages)
The regional market is the main destination of many countries’ manufacture exports
516
3440
4145
4849
525556
6266
6868
707373
7777
78
0 20 40 60 80 100Mexico
Dominicana Rep.Costa Rica
BrazilEl Salvador
Venezuela (Bol. Rep. of)Barbados
Latin America and the Caribbean (excluding Mexico)Antigua and Barbuda
SurinamePeru
UruguayGuyana
JamaicaArgentinaColombia
BelizeEcuador
ChilePanama
Paraguay
Source: Economic Commission for Latin America and the Caribbean (ECLAC), on the basis of the United Nations Commodity Trade Statistics Database (COMTRADE).a Includes low-, medium- and high-tech manufactures.
Through a number of bilateral and multilateral agreements, the region’s countries have made significant progress in eliminating trade tariffs. However, there are still important trade relationships between countries and groupings in the region that are not subject to preferential tariffs and are thus subject to most-favoured-nation treatment. Mexico is the clearest example: 59% of its imports from the rest of the region are subject to most-favoured-nation tariffs (see figure I.18). Exceptions are its trade with Central America, with its Pacific Alliance partners (Chile, Colombia and Peru) and with Uruguay, and its automobile imports from MERCOSUR.
Figure I.18 Latin America and the Caribbean (selected groupings and countries): proportion of intraregional imports with and without preferential tariffs, 2002-2011(Percentages)
Almost 60% of Mexican imports from the rest of the region are not subject to preferential tariffs
8.8
9.1
16.8
20.0
20.6
22.1
33.4
58.6
0 20 40 60 80 100
Chile
Andean Community
Southern Common Market
Central American Common Market
Pacific Alliance
Latin America and the Caribbean
Caribbean Community
Mexico
With preferential tariffsWithout preferential tariffs
41.4
66.6
77.9
79.4
80.0
83.2
90.9
91.2
Source: Economic Commission for Latin America and the Caribbean (ECLAC), on the basis of UN Comtrade-International Trade Statistics Database (COMTRADE) and data from trade agreements signed by individual countries and organizations.
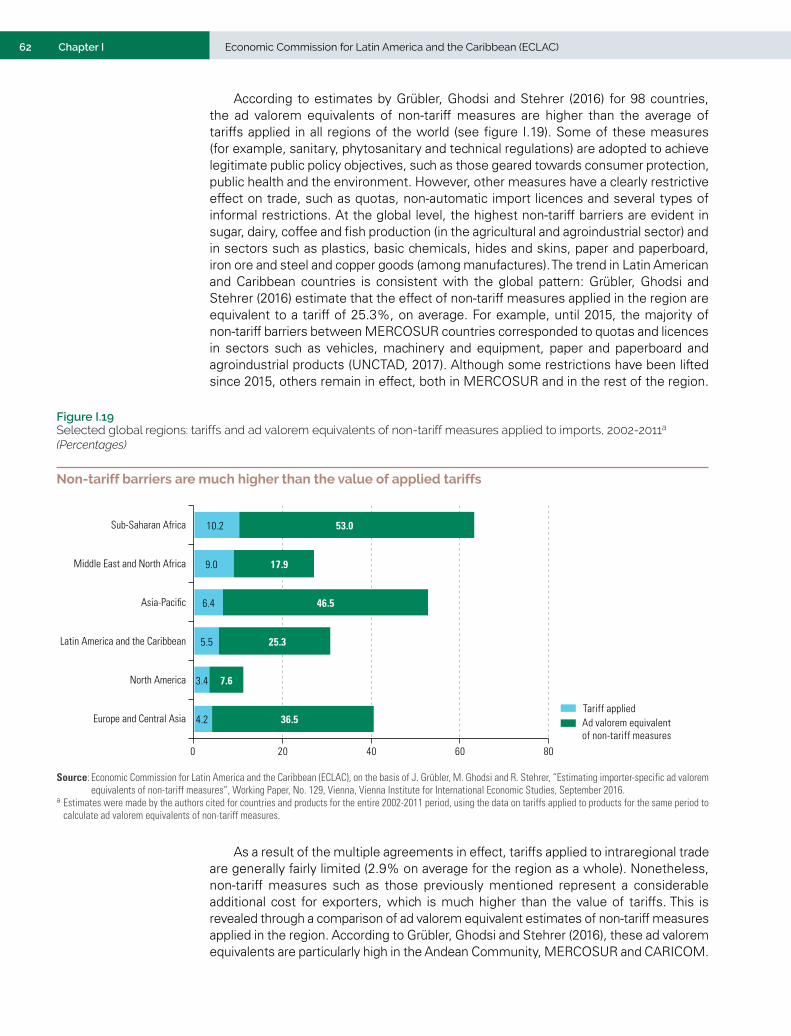
62 Economic Commission for Latin America and the Caribbean (ECLAC)Chapter I
According to estimates by Grübler, Ghodsi and Stehrer (2016) for 98 countries, the ad valorem equivalents of non-tariff measures are higher than the average of tariffs applied in all regions of the world (see figure I.19). Some of these measures (for example, sanitary, phytosanitary and technical regulations) are adopted to achieve legitimate public policy objectives, such as those geared towards consumer protection, public health and the environment. However, other measures have a clearly restrictive effect on trade, such as quotas, non-automatic import licences and several types of informal restrictions. At the global level, the highest non-tariff barriers are evident in sugar, dairy, coffee and fish production (in the agricultural and agroindustrial sector) and in sectors such as plastics, basic chemicals, hides and skins, paper and paperboard, iron ore and steel and copper goods (among manufactures). The trend in Latin American and Caribbean countries is consistent with the global pattern: Grübler, Ghodsi and Stehrer (2016) estimate that the effect of non-tariff measures applied in the region are equivalent to a tariff of 25.3%, on average. For example, until 2015, the majority of non-tariff barriers between MERCOSUR countries corresponded to quotas and licences in sectors such as vehicles, machinery and equipment, paper and paperboard and agroindustrial products (UNCTAD, 2017). Although some restrictions have been lifted since 2015, others remain in effect, both in MERCOSUR and in the rest of the region.
Figure I.19 Selected global regions: tariffs and ad valorem equivalents of non-tariff measures applied to imports, 2002-2011a
(Percentages)
Non-tariff barriers are much higher than the value of applied tariffs
4.2
3.4
5.5
6.4
9.0
10.2
36.5
7.6
25.3
46.5
17.9
53.0
0 20 40 60 80
Europe and Central Asia
North America
Latin America and the Caribbean
Asia-Pacific
Middle East and North Africa
Sub-Saharan Africa
Tariff appliedAd valorem equivalentof non-tariff measures
Source: Economic Commission for Latin America and the Caribbean (ECLAC), on the basis of J. Grübler, M. Ghodsi and R. Stehrer, “Estimating importer-specific ad valorem equivalents of non-tariff measures”, Working Paper, No. 129, Vienna, Vienna Institute for International Economic Studies, September 2016.
a Estimates were made by the authors cited for countries and products for the entire 2002-2011 period, using the data on tariffs applied to products for the same period to calculate ad valorem equivalents of non-tariff measures.
As a result of the multiple agreements in effect, tariffs applied to intraregional trade are generally fairly limited (2.9% on average for the region as a whole). Nonetheless, non-tariff measures such as those previously mentioned represent a considerable additional cost for exporters, which is much higher than the value of tariffs. This is revealed through a comparison of ad valorem equivalent estimates of non-tariff measures applied in the region. According to Grübler, Ghodsi and Stehrer (2016), these ad valorem equivalents are particularly high in the Andean Community, MERCOSUR and CARICOM.
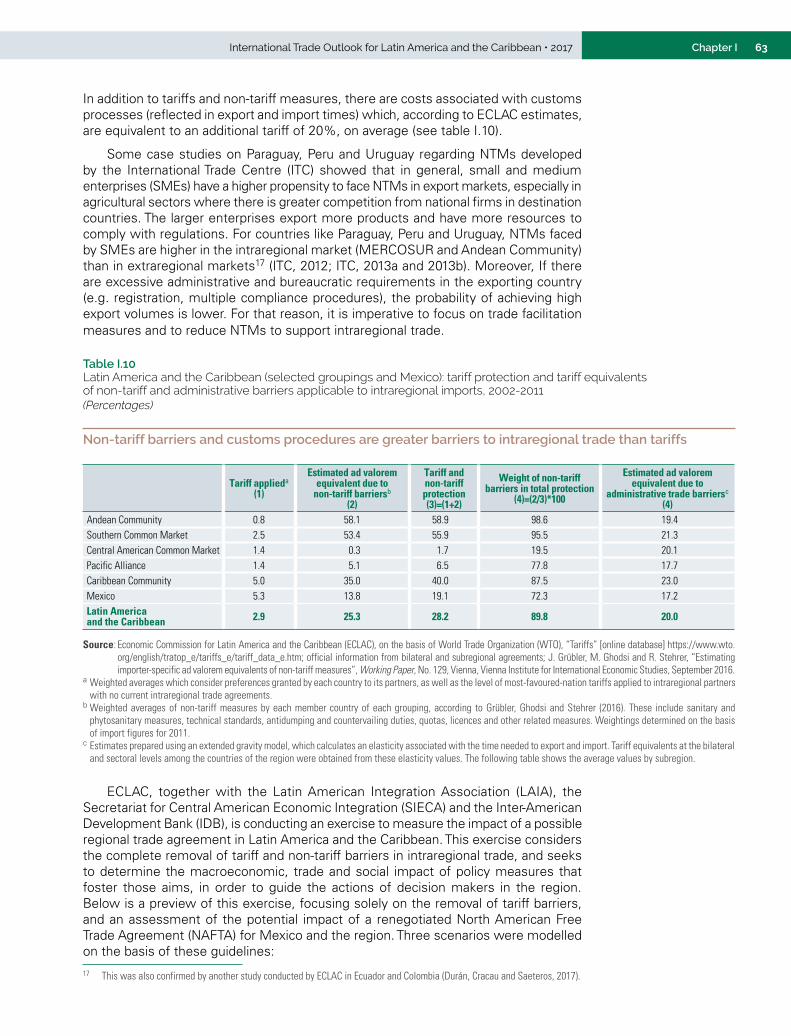
63International Trade Outlook for Latin America and the Caribbean • 2017 Chapter I
In addition to tariffs and non-tariff measures, there are costs associated with customs processes (reflected in export and import times) which, according to ECLAC estimates, are equivalent to an additional tariff of 20%, on average (see table I.10).
Some case studies on Paraguay, Peru and Uruguay regarding NTMs developed by the International Trade Centre (ITC) showed that in general, small and medium enterprises (SMEs) have a higher propensity to face NTMs in export markets, especially in agricultural sectors where there is greater competition from national firms in destination countries. The larger enterprises export more products and have more resources to comply with regulations. For countries like Paraguay, Peru and Uruguay, NTMs faced by SMEs are higher in the intraregional market (MERCOSUR and Andean Community) than in extraregional markets17 (ITC, 2012; ITC, 2013a and 2013b). Moreover, If there are excessive administrative and bureaucratic requirements in the exporting country (e.g. registration, multiple compliance procedures), the probability of achieving high export volumes is lower. For that reason, it is imperative to focus on trade facilitation measures and to reduce NTMs to support intraregional trade.
17 This was also confirmed by another study conducted by ECLAC in Ecuador and Colombia (Durán, Cracau and Saeteros, 2017).
Table I.10 Latin America and the Caribbean (selected groupings and Mexico): tariff protection and tariff equivalents of non-tariff and administrative barriers applicable to intraregional imports, 2002-2011 (Percentages)
Non-tariff barriers and customs procedures are greater barriers to intraregional trade than tariffs
Tariff applieda
(1)
Estimated ad valorem equivalent due to
non-tariff barriersb (2)
Tariff and non-tariff protection(3)=(1+2)
Weight of non-tariff barriers in total protection
(4)=(2/3)*100
Estimated ad valorem equivalent due to
administrative trade barriersc (4)
Andean Community 0.8 58.1 58.9 98.6 19.4Southern Common Market 2.5 53.4 55.9 95.5 21.3Central American Common Market 1.4 0.3 1.7 19.5 20.1Pacific Alliance 1.4 5.1 6.5 77.8 17.7Caribbean Community 5.0 35.0 40.0 87.5 23.0Mexico 5.3 13.8 19.1 72.3 17.2Latin America and the Caribbean 2.9 25.3 28.2 89.8 20.0
Source: Economic Commission for Latin America and the Caribbean (ECLAC), on the basis of World Trade Organization (WTO), “Tariffs” [online database] https://www.wto.org/english/tratop_e/tariffs_e/tariff_data_e.htm; official information from bilateral and subregional agreements; J. Grübler, M. Ghodsi and R. Stehrer, “Estimating importer-specific ad valorem equivalents of non-tariff measures”, Working Paper, No. 129, Vienna, Vienna Institute for International Economic Studies, September 2016.
a Weighted averages which consider preferences granted by each country to its partners, as well as the level of most-favoured-nation tariffs applied to intraregional partners with no current intraregional trade agreements.
b Weighted averages of non-tariff measures by each member country of each grouping, according to Grübler, Ghodsi and Stehrer (2016). These include sanitary and phytosanitary measures, technical standards, antidumping and countervailing duties, quotas, licences and other related measures. Weightings determined on the basis of import figures for 2011.
c Estimates prepared using an extended gravity model, which calculates an elasticity associated with the time needed to export and import. Tariff equivalents at the bilateral and sectoral levels among the countries of the region were obtained from these elasticity values. The following table shows the average values by subregion.
ECLAC, together with the Latin American Integration Association (LAIA), the Secretariat for Central American Economic Integration (SIECA) and the Inter-American Development Bank (IDB), is conducting an exercise to measure the impact of a possible regional trade agreement in Latin America and the Caribbean. This exercise considers the complete removal of tariff and non-tariff barriers in intraregional trade, and seeks to determine the macroeconomic, trade and social impact of policy measures that foster those aims, in order to guide the actions of decision makers in the region. Below is a preview of this exercise, focusing solely on the removal of tariff barriers, and an assessment of the potential impact of a renegotiated North American Free Trade Agreement (NAFTA) for Mexico and the region. Three scenarios were modelled on the basis of these guidelines:
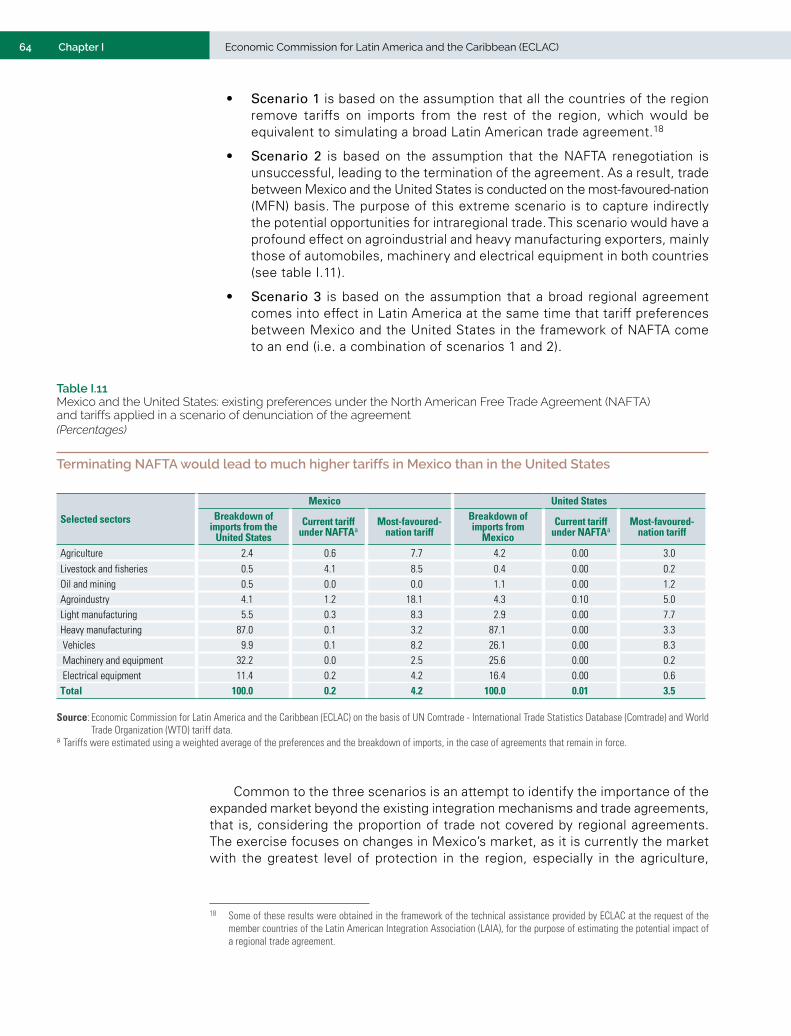
64 Economic Commission for Latin America and the Caribbean (ECLAC)Chapter I
• Scenario 1 is based on the assumption that all the countries of the region remove tariffs on imports from the rest of the region, which would be equivalent to simulating a broad Latin American trade agreement.18
• Scenario 2 is based on the assumption that the NAFTA renegotiation is unsuccessful, leading to the termination of the agreement. As a result, trade between Mexico and the United States is conducted on the most-favoured-nation (MFN) basis. The purpose of this extreme scenario is to capture indirectly the potential opportunities for intraregional trade. This scenario would have a profound effect on agroindustrial and heavy manufacturing exporters, mainly those of automobiles, machinery and electrical equipment in both countries (see table I.11).
• Scenario 3 is based on the assumption that a broad regional agreement comes into effect in Latin America at the same time that tariff preferences between Mexico and the United States in the framework of NAFTA come to an end (i.e. a combination of scenarios 1 and 2).
18 Some of these results were obtained in the framework of the technical assistance provided by ECLAC at the request of the member countries of the Latin American Integration Association (LAIA), for the purpose of estimating the potential impact of a regional trade agreement.
Table I.11 Mexico and the United States: existing preferences under the North American Free Trade Agreement (NAFTA) and tariffs applied in a scenario of denunciation of the agreement(Percentages)
Terminating NAFTA would lead to much higher tariffs in Mexico than in the United States
Selected sectors
Mexico United StatesBreakdown of
imports from the United States
Current tariff under NAFTAa
Most-favoured-nation tariff
Breakdown of imports from
MexicoCurrent tariff
under NAFTAaMost-favoured-
nation tariff
Agriculture 2.4 0.6 7.7 4.2 0.00 3.0Livestock and fisheries 0.5 4.1 8.5 0.4 0.00 0.2Oil and mining 0.5 0.0 0.0 1.1 0.00 1.2Agroindustry 4.1 1.2 18.1 4.3 0.10 5.0Light manufacturing 5.5 0.3 8.3 2.9 0.00 7.7Heavy manufacturing 87.0 0.1 3.2 87.1 0.00 3.3 Vehicles 9.9 0.1 8.2 26.1 0.00 8.3 Machinery and equipment 32.2 0.0 2.5 25.6 0.00 0.2 Electrical equipment 11.4 0.2 4.2 16.4 0.00 0.6Total 100.0 0.2 4.2 100.0 0.01 3.5
Source: Economic Commission for Latin America and the Caribbean (ECLAC) on the basis of UN Comtrade - International Trade Statistics Database (Comtrade) and World Trade Organization (WTO) tariff data.
a Tariffs were estimated using a weighted average of the preferences and the breakdown of imports, in the case of agreements that remain in force.
Common to the three scenarios is an attempt to identify the importance of the expanded market beyond the existing integration mechanisms and trade agreements, that is, considering the proportion of trade not covered by regional agreements. The exercise focuses on changes in Mexico’s market, as it is currently the market with the greatest level of protection in the region, especially in the agriculture,
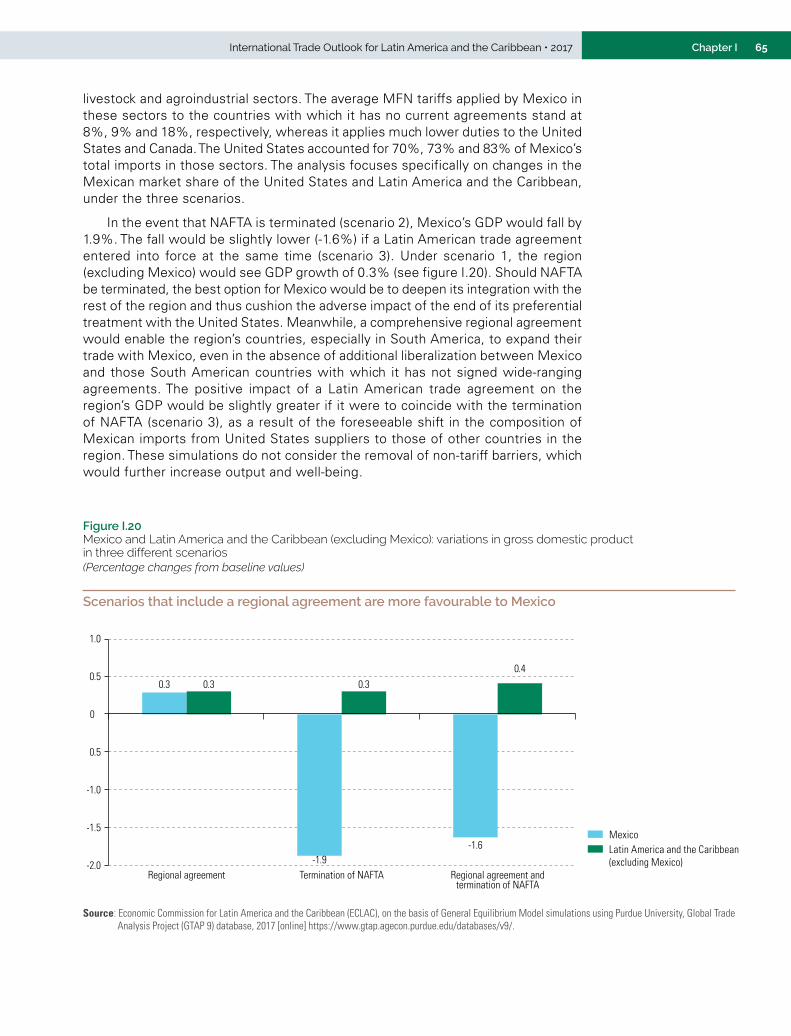
65International Trade Outlook for Latin America and the Caribbean • 2017 Chapter I
livestock and agroindustrial sectors. The average MFN tariffs applied by Mexico in these sectors to the countries with which it has no current agreements stand at 8%, 9% and 18%, respectively, whereas it applies much lower duties to the United States and Canada. The United States accounted for 70%, 73% and 83% of Mexico’s total imports in those sectors. The analysis focuses specifically on changes in the Mexican market share of the United States and Latin America and the Caribbean, under the three scenarios.
In the event that NAFTA is terminated (scenario 2), Mexico’s GDP would fall by 1.9%. The fall would be slightly lower (-1.6%) if a Latin American trade agreement entered into force at the same time (scenario 3). Under scenario 1, the region (excluding Mexico) would see GDP growth of 0.3% (see figure I.20). Should NAFTA be terminated, the best option for Mexico would be to deepen its integration with the rest of the region and thus cushion the adverse impact of the end of its preferential treatment with the United States. Meanwhile, a comprehensive regional agreement would enable the region’s countries, especially in South America, to expand their trade with Mexico, even in the absence of additional liberalization between Mexico and those South American countries with which it has not signed wide-ranging agreements. The positive impact of a Latin American trade agreement on the region’s GDP would be slightly greater if it were to coincide with the termination of NAFTA (scenario 3), as a result of the foreseeable shift in the composition of Mexican imports from United States suppliers to those of other countries in the region. These simulations do not consider the removal of non-tariff barriers, which would further increase output and well-being.
Figure I.20 Mexico and Latin America and the Caribbean (excluding Mexico): variations in gross domestic product in three different scenarios(Percentage changes from baseline values)
Scenarios that include a regional agreement are more favourable to Mexico
0.3
-1.9-1.6
0.3 0.30.4
-2.0
-1.5
-1.0
0.5
0
0.5
1.0
Regional agreement Termination of NAFTA Regional agreement andtermination of NAFTA
MexicoLatin America and the Caribbean (excluding Mexico)
Source: Economic Commission for Latin America and the Caribbean (ECLAC), on the basis of General Equilibrium Model simulations using Purdue University, Global Trade Analysis Project (GTAP 9) database, 2017 [online] https://www.gtap.agecon.purdue.edu/databases/v9/.
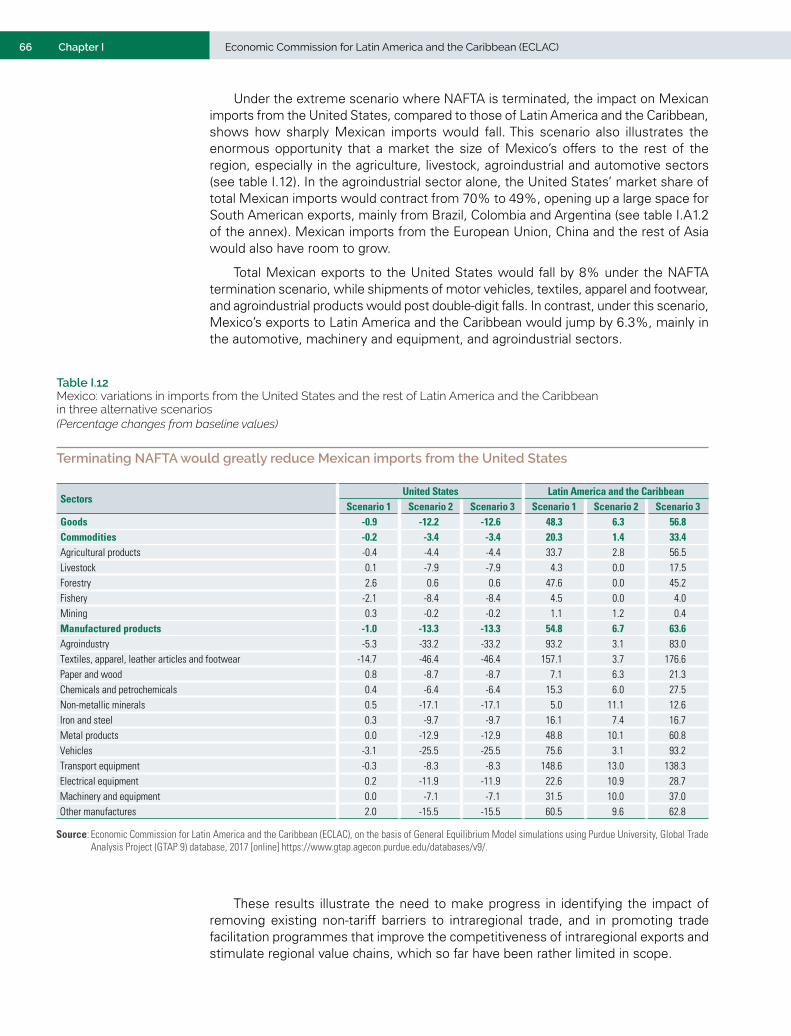
66 Economic Commission for Latin America and the Caribbean (ECLAC)Chapter I
Under the extreme scenario where NAFTA is terminated, the impact on Mexican imports from the United States, compared to those of Latin America and the Caribbean, shows how sharply Mexican imports would fall. This scenario also illustrates the enormous opportunity that a market the size of Mexico’s offers to the rest of the region, especially in the agriculture, livestock, agroindustrial and automotive sectors (see table I.12). In the agroindustrial sector alone, the United States’ market share of total Mexican imports would contract from 70% to 49%, opening up a large space for South American exports, mainly from Brazil, Colombia and Argentina (see table I.A1.2 of the annex). Mexican imports from the European Union, China and the rest of Asia would also have room to grow.
Total Mexican exports to the United States would fall by 8% under the NAFTA termination scenario, while shipments of motor vehicles, textiles, apparel and footwear, and agroindustrial products would post double-digit falls. In contrast, under this scenario, Mexico’s exports to Latin America and the Caribbean would jump by 6.3%, mainly in the automotive, machinery and equipment, and agroindustrial sectors.
Table I.12 Mexico: variations in imports from the United States and the rest of Latin America and the Caribbean in three alternative scenarios(Percentage changes from baseline values)
Terminating NAFTA would greatly reduce Mexican imports from the United States
SectorsUnited States Latin America and the Caribbean
Scenario 1 Scenario 2 Scenario 3 Scenario 1 Scenario 2 Scenario 3Goods -0.9 -12.2 -12.6 48.3 6.3 56.8Commodities -0.2 -3.4 -3.4 20.3 1.4 33.4Agricultural products -0.4 -4.4 -4.4 33.7 2.8 56.5Livestock 0.1 -7.9 -7.9 4.3 0.0 17.5Forestry 2.6 0.6 0.6 47.6 0.0 45.2Fishery -2.1 -8.4 -8.4 4.5 0.0 4.0Mining 0.3 -0.2 -0.2 1.1 1.2 0.4Manufactured products -1.0 -13.3 -13.3 54.8 6.7 63.6Agroindustry -5.3 -33.2 -33.2 93.2 3.1 83.0Textiles, apparel, leather articles and footwear -14.7 -46.4 -46.4 157.1 3.7 176.6Paper and wood 0.8 -8.7 -8.7 7.1 6.3 21.3Chemicals and petrochemicals 0.4 -6.4 -6.4 15.3 6.0 27.5Non-metallic minerals 0.5 -17.1 -17.1 5.0 11.1 12.6Iron and steel 0.3 -9.7 -9.7 16.1 7.4 16.7Metal products 0.0 -12.9 -12.9 48.8 10.1 60.8Vehicles -3.1 -25.5 -25.5 75.6 3.1 93.2Transport equipment -0.3 -8.3 -8.3 148.6 13.0 138.3Electrical equipment 0.2 -11.9 -11.9 22.6 10.9 28.7Machinery and equipment 0.0 -7.1 -7.1 31.5 10.0 37.0Other manufactures 2.0 -15.5 -15.5 60.5 9.6 62.8
Source: Economic Commission for Latin America and the Caribbean (ECLAC), on the basis of General Equilibrium Model simulations using Purdue University, Global Trade Analysis Project (GTAP 9) database, 2017 [online] https://www.gtap.agecon.purdue.edu/databases/v9/.
These results illustrate the need to make progress in identifying the impact of removing existing non-tariff barriers to intraregional trade, and in promoting trade facilitation programmes that improve the competitiveness of intraregional exports and stimulate regional value chains, which so far have been rather limited in scope.
67International Trade Outlook for Latin America and the Caribbean • 2017 Chapter I
D. Conclusions
Global output and trade are showing signs of a rebound in 2017, after several years of sluggish growth. However, there are still doubts about the sustainability of this upturn, given the considerable macroeconomic, technological and geopolitical uncertainty that exists. In this context, the value of regional exports has started to rise again in 2017, after falling for four years. Yet, this recovery is underpinned more by exogenous factors (the increase in prices of several commodities) than by domestic growth. In fact, commodities (oil, metals and some agricultural products) and natural resource-based manufactures (especially agribusiness products) continue to dominate the export patterns of much of the region.
Intraregional trade offers great potential for exports of manufactured goods and more processed products in general, underscoring the urgent need for deeper regional integration, especially with the recent shift in the United States’ trade policy. The simulations presented in this chapter indicate that signing a regional trade agreement would produce considerable gains, which would be greater if the agreement were not limited to reducing tariffs, but also included the removal of non-tariff barriers and the harmonization or mutual recognition of technical, sanitary and phytosanitary standards. In that connection, appropriate cumulation of origin mechanisms should be adopted at the subregional and regional level to promote production integration and the formation of regional value chains.
Trade facilitation is another major component of deeper regional integration, which could help to raise the current low levels of intraregional trade, to promote the internationalization of small and medium-sized enterprises (SMEs) and to strengthen intraregional production chains (ECLAC, 2015b). A survey on the implementation of trade facilitation measures in 21 countries of the region, carried out by ECLAC in the first half of 2017, reveals that most of the countries have made significant progress, but that they also face major obstacles in the area of coordination. For example, implementation rates for the cross-border digital exchange of certificates of origin and sanitary and phytosanitary certificates are only 38% and 19%, respectively (ECLAC, 2017).
The progress made by the various countries at the national level will have a greater impact if that progress is coordinated at the regional level or at least the subregional level. For example, if the aim is to ease the operations of regional value chains, it would be preferable for a number of countries to agree among themselves on the criteria a firm has to meet to be considered an authorized economic operator. In this context, the cases of the Central American Common Market and the Pacific Alliance are noteworthy. The Central American countries use a single customs form that also serves as a common certificate of preferential origin and is exchanged electronically. These countries are also moving towards a common electronic phytosanitary certificate. Members of the Pacific Alliance exchange electronic phytosanitary certificates and certificates of origin through their respective single windows for foreign trade, and they are making progress towards the mutual recognition of their respective authorized economic operator programmes. Another noteworthy initiative in this area is the digital certification of origin being developed by the 13 members of the Latin American Integration Association (LAIA).
In April 2017, the Pacific Alliance and MERCOSUR agreed on a road map to deepen their cooperation on various matters related to trade facilitation (digital certification of origin, customs cooperation and linking their members’ single windows for foreign trade). Given the economic size of both groups, this agenda offers great potential for boosting intraregional trade and production integration.
Intraregional trade offers great potential for exports of manufactured goods and more processed products in general, underscoring the urgent need for deeper regional integration. The simulations presented in this chapter indicate that signing a regional trade agreement would produce considerable gains.
68 Economic Commission for Latin America and the Caribbean (ECLAC)Chapter I
BibliographyAuboin, M. and F. Borino (2017), “The falling elasticity of global trade to economic activity:
testing the demand channel”, WTO Working Paper, No. ERSD-2017-09, Geneva, World Trade Organization (WTO), April [online] https://www.wto.org/english/res_e/reser_e/ersd201709_e.pdf.
Auer, R., C. Borio and A. Filardo (2017), “The globalisation of inflation: the growing importance of global value chains”, BIS Working Papers, No. 602, Basel, Bank for International Settlements (BIS), January.
Azmeh, S. and C. Foster (2016), “The TPP and the digital trade agenda: digital industrial policy and Silicon Valley’s influence on new trade agreements”, Working Paper series, No. 175, London, London School of Economics and Political Science, January.
Bank of Guyana (2017), Quarterly Report & Statistical Bulletin, vol. 11, No. 1, Georgetown, March [online] https://www.bankofguyana.org.gy/bog/images/research/Reports/Mar2017.pdf.
Bank of Japan (2017a), Outlook for Economic Activity and Prices, Tokyo, July [online] https://www.boj.or.jp/en/mopo/outlook/gor1707b.pdf.(2017b), “Statement on Monetary Policy”, Tokyo, 21 September [online] https://www.boj.or.jp/en/announcements/release_2017/k170921a.pdf.
BIS (Bank for International Settlements) (2017), “Total credit to the non-financial sector (core debt): as a percentage of GDP”, Basel [online] http://stats.bis.org/statx/srs/table/f1.1.
Breuninger, K. and C. Campo (2017), “Read Fed Chair Janet Yellen’s opening statement to the media”, CNBC, 20 September [online] https://www.cnbc.com/2017/09/20/heres-the-full-transcript-of-janet-yellens-media-brief.html.
Central Bank of Honduras (2017), “Comercio exterior de mercancías generales: a junio de 2017”, Tegucigalpa, June [online] http://www.bch.hn/download/comex/comex2017/informe_comex_06_2017.pdf.
Central Bank of Nicaragua (2017), “Informe de comercio exterior: enero-junio 2017”, Managua, August [online] http://www.bcn.gob.ni/publicaciones/periodicidad/mensual/comercio_exterior/ce_ene_junio2017.pdf.
Central Bank of the Dominican Republic (2017), “Resultados preliminares de la economía dominicana: enero-junio 2017”, Santo Domingo, August [online] https://www.bancentral.gov.do/publicaciones_economicas/infeco_preliminar/infeco_preliminar2017-06.pdf.
Central Reserve Bank of El Salvador (2017), Informe de Comercio Exterior de El Salvador, enero – agosto 2017 [online] http://www.bcr.gob.sv/bcrsite/uploaded/content/category/594712011.pdf.
“Estadisticas de Comercio Exterior, Enero-Agosto de 2017”, San Salvador, September Constantinescu, C., A. Mattoo and M. Ruta (2015), “The global trade slowdown: cyclical or
structural?”, IMF Working Paper, No. 15/6, Washington, D.C., International Monetary Fund (IMF), January.
Diario de Cuba (2017), “Cabrisas: la crisis financiera cubana empeoró en el primer semestre de 2017”, Havana, 19 July [online] http://www.diariodecuba.com/cuba/1500415914_32650.html.
Durán, J., D. Cracau and M. Saeteros (2017), “Integración productiva en la Comunidad Andina de Naciones: cadenas de valor entre Colombia y Ecuador”, Serie de Comercio Internacional, Santiago, Economic Commission for Latin America and the Caribbean (ECLAC), unpublished.
Eastern Caribbean Central Bank (2017), Economic and Financial Review, vol. 37, No. 1, Basseterre, March.
ECLAC (Economic Commission for Latin America and the Caribbean) (2017), Trade facilitation and paperless trade implementation in Latin America and the Caribbean. Regional Report 2017 (LC/TS.2017/74), Santiago.(2016), The new digital revolution: from the consumer Internet to the industrial Internet, (LC/L.4029(CMSI.5/4)/Rev.1), Santiago, August. (2015a), Latin America and the Caribbean in the World Economy 2015. The regional trade crisis: assessment and outlook (LC/G.2650-P), Santiago, October.(2015b), “Trade facilitation and paperless trade implementation survey 2015”, Project Documents (LC/W.667), Santiago, September.
European Central Bank (2016), Economic Bulletin, No. 6/2016, Frankfurt [online] https://www.ecb.europa.eu/pub/pdf/ecbu/eb201606.en.pdf?736d49e8295d82ec1762c76d09812ef8.
69International Trade Outlook for Latin America and the Caribbean • 2017 Chapter I
European Commission (2017), “GDP and main aggregates estímate for the second quarter of 2017: GDP up by 0.6% in the euro area and by 0.7% in the EU28 +2.3% and +2.4% respectively compared with the second quarter of 2016”, News Release Euro Indicators, No. 135/2017, 7 September [online] http://ec.europa.eu/eurostat/documents/2995521/8213935/2-07092017-AP-EN.pdf/6fe1f60c-51e2-4b98-9d14-ca6ea5c7e260.
Federal Reserve Bank of New York (2017), “Statement regarding reinvestment in treasury securities and agency mortgage-backed securities”, New York, 20 September [online] https://www.newyorkfed.org/markets/opolicy/operating_policy_170920.
Fefer, R., S. Ilias, and W. Morrison (2017), “Digital trade and U.S. trade policy”, CRS Report, Washington, D.C., Congressional Research Service, June [online] https://fas.org/sgp/crs/misc/R44565.pdf.
Grübler, J., M. Ghodsi and R. Stehrer (2016), “Estimating importer-specific ad valorem equivalents of non-tariff measures”, Working Paper, No. 129, Vienna, Vienna Institute for International Economic Studies, September.
ICTSD (International Centre for Trade and Sustainable Development) (2017), “TPP-11 negotiators examine options for advancing deal without U.S.”, Geneva, 20 July [online] https://www.ictsd.org/bridges-news/bridges/news/tpp-11-negotiators-examine-options-for-advancing-deal-without-us.
IMF (International Monetary Fund) (2016), World Economic Outlook. Subdued Demand: Symptoms and Remedies, Washington, D.C., October [online] http://www.imf.org/external/pubs/ft/weo/2016/02/pdf/text.pdf.
Inside U.S. Trade (2017), “Lighthizer says a slew of Latin American free trade deals must be ‘modernized’ after NAFTA”, Washington, D.C., 3 October [online] https://insidetrade.com/daily-news/lighthizer-says-slew-latin-american-free-trade-deals-must-be-modernized-after-nafta.
International Trade Centre (2013a), Paraguay: perspectivas empresariales. Serie del ITC sobre medidas no arancelarias, Geneva.(2013b), Uruguay: perspectivas empresariales. Serie del ITC sobre medidas no arancelarias, Geneva.(2012), “ITC NTM survey in Peru”, Geneva [online] http://www.tradeforum.org/ITC-NTM-survey-in-Peru/.
KPMG International Cooperative (2017), “Global IT-BPO outsourcing deals analysis: 1Q17 analysis”, May [online] https://assets.kpmg.com/content/dam/kpmg/in/pdf/2017/05/KPMG-Deal-Tracker-1Q17.pdf.
Manyika, J. and others (2016), Digital Globalization: The New Era of Global Flows, McKinsey Global Institute, March [online] https://www.mckinsey.com/business-functions/digital-mckinsey/our-insights/digital-globalization-the-new-era-of-global-flows.
McAfee, A. and E. Brynjolfsson (2017), Machine, Platform, Crowd: Harnessing our Digital Future, New York, W. W. Norton & Company.
OECD (Organization for Economic Cooperation and Development) (2016), “Cardiac arrest or dizzy spell: why is world trade so weak and what can policy do about it?”, OECD Economic Policy Paper, No. 18, Paris, September [online] http://www.oecd-ilibrary.org/economics/cardiac-arrest-or-dizzy-spell_5jlr2h45q532-en.
Rodríguez, J. (2017), “La economía cubana: actualizando el 2016 y una primera mirada al 2017 (III)”, Cuba Debate, Havana, 17 August [online] http://www.cubadebate.cu/opinion/2017/08/17/la-economia-cubana-actualizando-el-,2016-y-una-primera-mirada-al-2017-iii/#.WbiSlbKGOUk.
Roussanoglou, N. (2017), “Dry bulk market’s recovery on solid ground as China’s demand for commodities is driving freight rates forward”, Hellenic Shipping News Worldwide, Piraeus, 7 August [online] http://www.hellenicshippingnews.com/dry-bulk-markets-recovery-on-solid-ground-as-chinas-demand-for-commodities-is-driving-freight-rates-forward.
Secretariat of Commerce (2017), “Resolución 152-E/2017”, Boletín Oficial de la República Argentina, Buenos Aires, 2 March [online] https://www.boletinoficial.gob.ar/#!DetalleNorma/159517/20170303.
UNCTAD (United Nations Conference on Trade and Development) (2017), World Investment Report 2017: Investment and the Digital Economy (UNCTAD/WIR/2017), Geneva.
United Nations (2017), “World Economic Situation and Prospects 2017: update as of mid-2017”, New York [online] https://www.un.org/development/desa/dpad/wp-content/uploads/sites/45/publication/WESP2017_mid-year_update.pdf.
70 Economic Commission for Latin America and the Caribbean (ECLAC)Chapter I
UNWTO (World Tourism Organization) (2017), “Strong tourism results in the first part of 2017”, UNWTO World Tourism Barometer, vol. 15, Madrid, June [online] http://cf.cdn.unwto.org/sites/all/files/pdf/unwto_barom17_03_june_excerpt_1.pdf.
USITC (United States International Trade Commission) (2014), Digital Trade in the U.S. and Global Economies, Part 2, Washington, D.C., August [online] https://www.usitc.gov/publications/332/pub4485.pdf.
World Bank (2016), Global Economic Prospects. Divergences and Risks, Washington, D.C., June.WTO (World Trade Organization) (2017a), “Ecuador confirms final removal of import surcharges”,
Geneva, 21 July [online] https://www.wto.org/english/news_e/news17_e/bop_24jul17_e.htm. (2017b), World Trade Statistical Review 2017, Geneva.(2017c), “WTO upgrades forecast for 2017 as trade rebounds strongly”, Geneva, 21 September [online] https://www.wto.org/english/news_e/pres17_e/pr800_e.htm.
Xu, M. and J. Mason (2017), “China’s 2017 steel output to rise 3-5 percent despite mill closures: CISA”, Beijing, Reuters, 16 September [online] https://www.reuters.com/article/us-china-steel/chinas-2017-steel-output-to-rise-3-5-percent-despite-mill-closures-cisa-idUSKCN1BR08K.
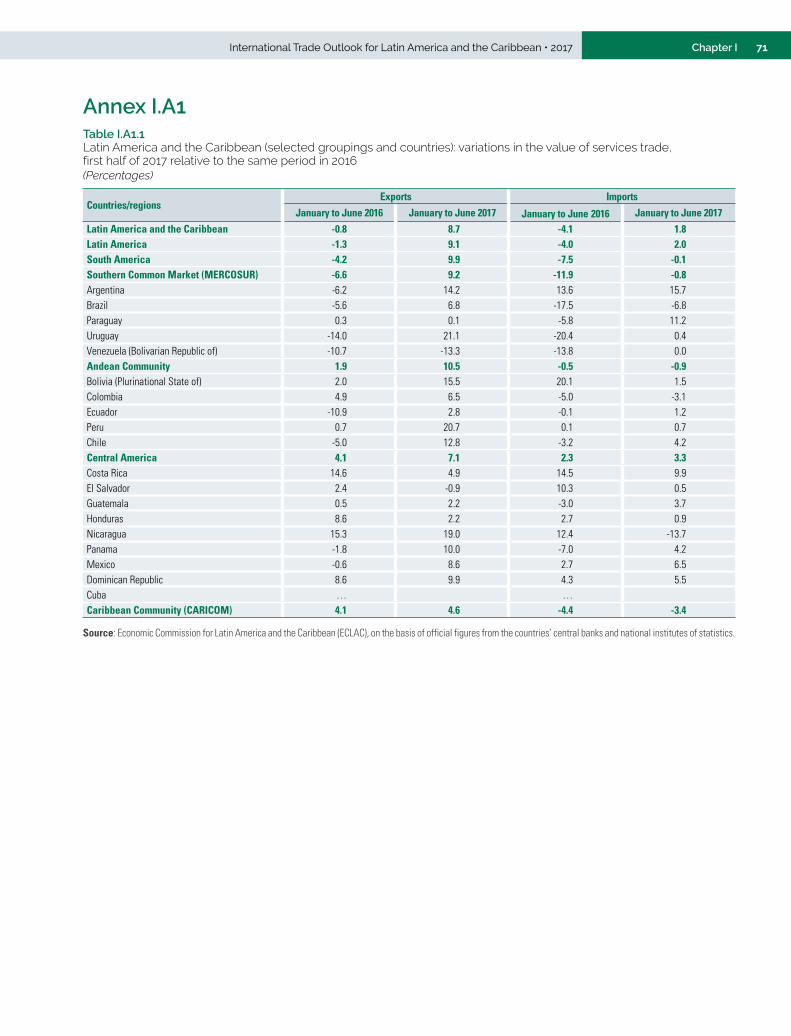
71International Trade Outlook for Latin America and the Caribbean • 2017 Chapter I
Annex I.A1Table I.A1.1 Latin America and the Caribbean (selected groupings and countries): variations in the value of services trade, first half of 2017 relative to the same period in 2016 (Percentages)
Countries/regionsExports Imports
January to June 2016 January to June 2017 January to June 2016 January to June 2017Latin America and the Caribbean -0.8 8.7 -4.1 1.8Latin America -1.3 9.1 -4.0 2.0South America -4.2 9.9 -7.5 -0.1Southern Common Market (MERCOSUR) -6.6 9.2 -11.9 -0.8Argentina -6.2 14.2 13.6 15.7Brazil -5.6 6.8 -17.5 -6.8Paraguay 0.3 0.1 -5.8 11.2Uruguay -14.0 21.1 -20.4 0.4Venezuela (Bolivarian Republic of) -10.7 -13.3 -13.8 0.0Andean Community 1.9 10.5 -0.5 -0.9Bolivia (Plurinational State of) 2.0 15.5 20.1 1.5Colombia 4.9 6.5 -5.0 -3.1Ecuador -10.9 2.8 -0.1 1.2Peru 0.7 20.7 0.1 0.7Chile -5.0 12.8 -3.2 4.2Central America 4.1 7.1 2.3 3.3Costa Rica 14.6 4.9 14.5 9.9El Salvador 2.4 -0.9 10.3 0.5Guatemala 0.5 2.2 -3.0 3.7Honduras 8.6 2.2 2.7 0.9Nicaragua 15.3 19.0 12.4 -13.7Panama -1.8 10.0 -7.0 4.2Mexico -0.6 8.6 2.7 6.5Dominican Republic 8.6 9.9 4.3 5.5Cuba … … Caribbean Community (CARICOM) 4.1 4.6 -4.4 -3.4
Source: Economic Commission for Latin America and the Caribbean (ECLAC), on the basis of official figures from the countries’ central banks and national institutes of statistics.
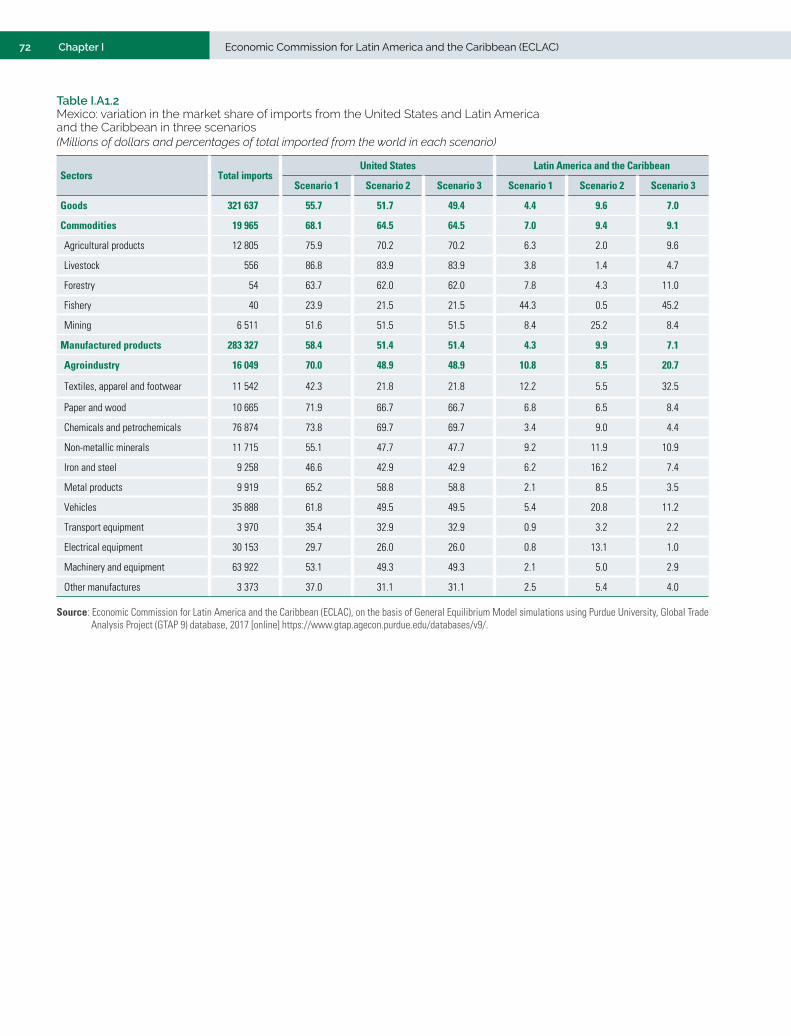
72 Economic Commission for Latin America and the Caribbean (ECLAC)Chapter I
Table I.A1.2 Mexico: variation in the market share of imports from the United States and Latin America and the Caribbean in three scenarios(Millions of dollars and percentages of total imported from the world in each scenario)
Sectors Total importsUnited States Latin America and the Caribbean
Scenario 1 Scenario 2 Scenario 3 Scenario 1 Scenario 2 Scenario 3
Goods 321 637 55.7 51.7 49.4 4.4 9.6 7.0
Commodities 19 965 68.1 64.5 64.5 7.0 9.4 9.1
Agricultural products 12 805 75.9 70.2 70.2 6.3 2.0 9.6
Livestock 556 86.8 83.9 83.9 3.8 1.4 4.7
Forestry 54 63.7 62.0 62.0 7.8 4.3 11.0
Fishery 40 23.9 21.5 21.5 44.3 0.5 45.2
Mining 6 511 51.6 51.5 51.5 8.4 25.2 8.4
Manufactured products 283 327 58.4 51.4 51.4 4.3 9.9 7.1
Agroindustry 16 049 70.0 48.9 48.9 10.8 8.5 20.7
Textiles, apparel and footwear 11 542 42.3 21.8 21.8 12.2 5.5 32.5
Paper and wood 10 665 71.9 66.7 66.7 6.8 6.5 8.4
Chemicals and petrochemicals 76 874 73.8 69.7 69.7 3.4 9.0 4.4
Non-metallic minerals 11 715 55.1 47.7 47.7 9.2 11.9 10.9
Iron and steel 9 258 46.6 42.9 42.9 6.2 16.2 7.4
Metal products 9 919 65.2 58.8 58.8 2.1 8.5 3.5
Vehicles 35 888 61.8 49.5 49.5 5.4 20.8 11.2
Transport equipment 3 970 35.4 32.9 32.9 0.9 3.2 2.2
Electrical equipment 30 153 29.7 26.0 26.0 0.8 13.1 1.0
Machinery and equipment 63 922 53.1 49.3 49.3 2.1 5.0 2.9
Other manufactures 3 373 37.0 31.1 31.1 2.5 5.4 4.0
Source: Economic Commission for Latin America and the Caribbean (ECLAC), on the basis of General Equilibrium Model simulations using Purdue University, Global Trade Analysis Project (GTAP 9) database, 2017 [online] https://www.gtap.agecon.purdue.edu/databases/v9/.
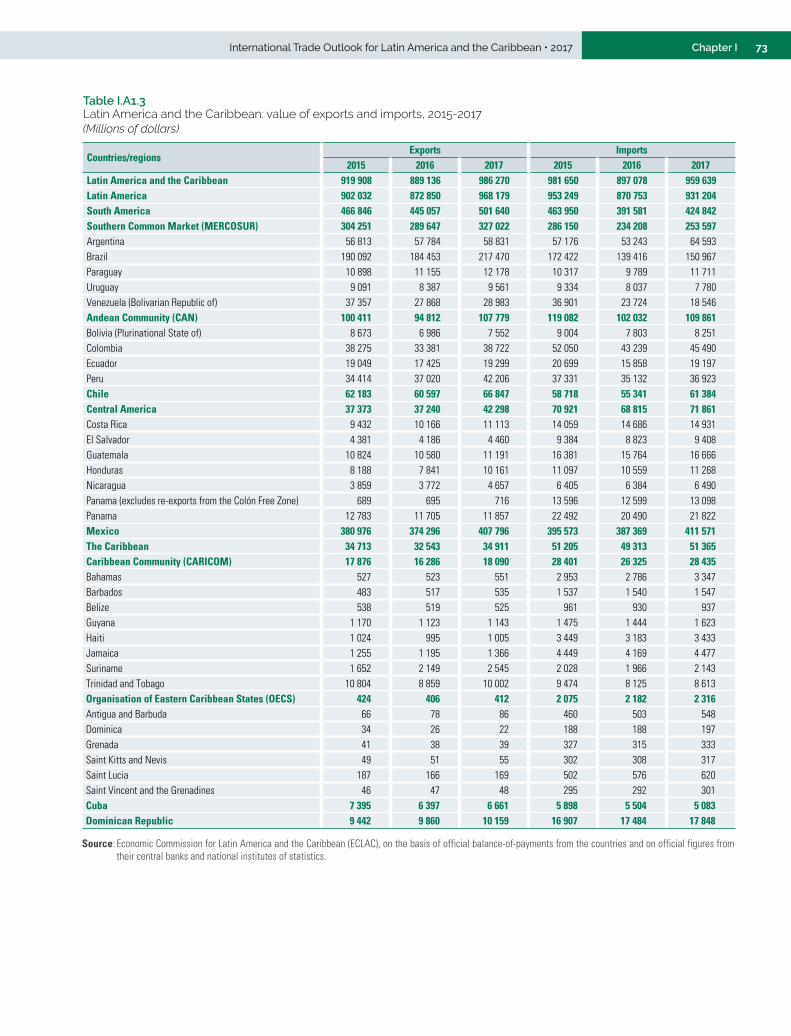
73International Trade Outlook for Latin America and the Caribbean • 2017 Chapter I
Table I.A1.3 Latin America and the Caribbean: value of exports and imports, 2015-2017(Millions of dollars)
Countries/regionsExports Imports
2015 2016 2017 2015 2016 2017Latin America and the Caribbean 919 908 889 136 986 270 981 650 897 078 959 639Latin America 902 032 872 850 968 179 953 249 870 753 931 204South America 466 846 445 057 501 640 463 950 391 581 424 842Southern Common Market (MERCOSUR) 304 251 289 647 327 022 286 150 234 208 253 597Argentina 56 813 57 784 58 831 57 176 53 243 64 593Brazil 190 092 184 453 217 470 172 422 139 416 150 967Paraguay 10 898 11 155 12 178 10 317 9 789 11 711Uruguay 9 091 8 387 9 561 9 334 8 037 7 780Venezuela (Bolivarian Republic of) 37 357 27 868 28 983 36 901 23 724 18 546Andean Community (CAN) 100 411 94 812 107 779 119 082 102 032 109 861Bolivia (Plurinational State of) 8 673 6 986 7 552 9 004 7 803 8 251Colombia 38 275 33 381 38 722 52 050 43 239 45 490Ecuador 19 049 17 425 19 299 20 699 15 858 19 197Peru 34 414 37 020 42 206 37 331 35 132 36 923Chile 62 183 60 597 66 847 58 718 55 341 61 384Central America 37 373 37 240 42 298 70 921 68 815 71 861Costa Rica 9 432 10 166 11 113 14 059 14 686 14 931El Salvador 4 381 4 186 4 460 9 384 8 823 9 408Guatemala 10 824 10 580 11 191 16 381 15 764 16 666Honduras 8 188 7 841 10 161 11 097 10 559 11 268Nicaragua 3 859 3 772 4 657 6 405 6 384 6 490Panama (excludes re-exports from the Colón Free Zone) 689 695 716 13 596 12 599 13 098Panama 12 783 11 705 11 857 22 492 20 490 21 822Mexico 380 976 374 296 407 796 395 573 387 369 411 571The Caribbean 34 713 32 543 34 911 51 205 49 313 51 365Caribbean Community (CARICOM) 17 876 16 286 18 090 28 401 26 325 28 435Bahamas 527 523 551 2 953 2 786 3 347Barbados 483 517 535 1 537 1 540 1 547Belize 538 519 525 961 930 937Guyana 1 170 1 123 1 143 1 475 1 444 1 623Haiti 1 024 995 1 005 3 449 3 183 3 433Jamaica 1 255 1 195 1 366 4 449 4 169 4 477Suriname 1 652 2 149 2 545 2 028 1 966 2 143Trinidad and Tobago 10 804 8 859 10 002 9 474 8 125 8 613Organisation of Eastern Caribbean States (OECS) 424 406 412 2 075 2 182 2 316Antigua and Barbuda 66 78 86 460 503 548Dominica 34 26 22 188 188 197Grenada 41 38 39 327 315 333Saint Kitts and Nevis 49 51 55 302 308 317Saint Lucia 187 166 169 502 576 620Saint Vincent and the Grenadines 46 47 48 295 292 301Cuba 7 395 6 397 6 661 5 898 5 504 5 083Dominican Republic 9 442 9 860 10 159 16 907 17 484 17 848
Source: Economic Commission for Latin America and the Caribbean (ECLAC), on the basis of official balance-of-payments from the countries and on official figures from their central banks and national institutes of statistics.
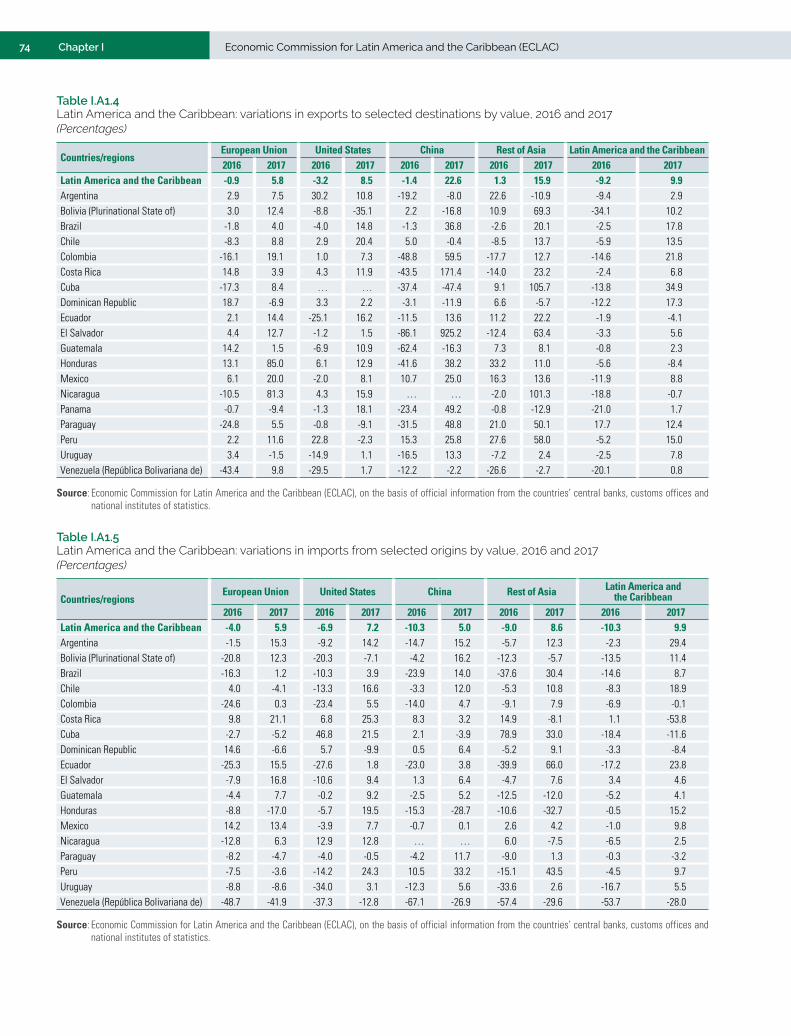
74 Economic Commission for Latin America and the Caribbean (ECLAC)Chapter I
Table I.A1.4 Latin America and the Caribbean: variations in exports to selected destinations by value, 2016 and 2017 (Percentages)
Countries/regionsEuropean Union United States China Rest of Asia Latin America and the Caribbean2016 2017 2016 2017 2016 2017 2016 2017 2016 2017
Latin America and the Caribbean -0.9 5.8 -3.2 8.5 -1.4 22.6 1.3 15.9 -9.2 9.9Argentina 2.9 7.5 30.2 10.8 -19.2 -8.0 22.6 -10.9 -9.4 2.9Bolivia (Plurinational State of) 3.0 12.4 -8.8 -35.1 2.2 -16.8 10.9 69.3 -34.1 10.2Brazil -1.8 4.0 -4.0 14.8 -1.3 36.8 -2.6 20.1 -2.5 17.8Chile -8.3 8.8 2.9 20.4 5.0 -0.4 -8.5 13.7 -5.9 13.5Colombia -16.1 19.1 1.0 7.3 -48.8 59.5 -17.7 12.7 -14.6 21.8Costa Rica 14.8 3.9 4.3 11.9 -43.5 171.4 -14.0 23.2 -2.4 6.8Cuba -17.3 8.4 … … -37.4 -47.4 9.1 105.7 -13.8 34.9Dominican Republic 18.7 -6.9 3.3 2.2 -3.1 -11.9 6.6 -5.7 -12.2 17.3Ecuador 2.1 14.4 -25.1 16.2 -11.5 13.6 11.2 22.2 -1.9 -4.1El Salvador 4.4 12.7 -1.2 1.5 -86.1 925.2 -12.4 63.4 -3.3 5.6Guatemala 14.2 1.5 -6.9 10.9 -62.4 -16.3 7.3 8.1 -0.8 2.3Honduras 13.1 85.0 6.1 12.9 -41.6 38.2 33.2 11.0 -5.6 -8.4Mexico 6.1 20.0 -2.0 8.1 10.7 25.0 16.3 13.6 -11.9 8.8Nicaragua -10.5 81.3 4.3 15.9 … … -2.0 101.3 -18.8 -0.7Panama -0.7 -9.4 -1.3 18.1 -23.4 49.2 -0.8 -12.9 -21.0 1.7Paraguay -24.8 5.5 -0.8 -9.1 -31.5 48.8 21.0 50.1 17.7 12.4Peru 2.2 11.6 22.8 -2.3 15.3 25.8 27.6 58.0 -5.2 15.0Uruguay 3.4 -1.5 -14.9 1.1 -16.5 13.3 -7.2 2.4 -2.5 7.8Venezuela (República Bolivariana de) -43.4 9.8 -29.5 1.7 -12.2 -2.2 -26.6 -2.7 -20.1 0.8
Source: Economic Commission for Latin America and the Caribbean (ECLAC), on the basis of official information from the countries’ central banks, customs offices and national institutes of statistics.
Table I.A1.5 Latin America and the Caribbean: variations in imports from selected origins by value, 2016 and 2017 (Percentages)
Countries/regionsEuropean Union United States China Rest of Asia Latin America and
the Caribbean2016 2017 2016 2017 2016 2017 2016 2017 2016 2017
Latin America and the Caribbean -4.0 5.9 -6.9 7.2 -10.3 5.0 -9.0 8.6 -10.3 9.9Argentina -1.5 15.3 -9.2 14.2 -14.7 15.2 -5.7 12.3 -2.3 29.4Bolivia (Plurinational State of) -20.8 12.3 -20.3 -7.1 -4.2 16.2 -12.3 -5.7 -13.5 11.4Brazil -16.3 1.2 -10.3 3.9 -23.9 14.0 -37.6 30.4 -14.6 8.7Chile 4.0 -4.1 -13.3 16.6 -3.3 12.0 -5.3 10.8 -8.3 18.9Colombia -24.6 0.3 -23.4 5.5 -14.0 4.7 -9.1 7.9 -6.9 -0.1Costa Rica 9.8 21.1 6.8 25.3 8.3 3.2 14.9 -8.1 1.1 -53.8Cuba -2.7 -5.2 46.8 21.5 2.1 -3.9 78.9 33.0 -18.4 -11.6Dominican Republic 14.6 -6.6 5.7 -9.9 0.5 6.4 -5.2 9.1 -3.3 -8.4Ecuador -25.3 15.5 -27.6 1.8 -23.0 3.8 -39.9 66.0 -17.2 23.8El Salvador -7.9 16.8 -10.6 9.4 1.3 6.4 -4.7 7.6 3.4 4.6Guatemala -4.4 7.7 -0.2 9.2 -2.5 5.2 -12.5 -12.0 -5.2 4.1Honduras -8.8 -17.0 -5.7 19.5 -15.3 -28.7 -10.6 -32.7 -0.5 15.2Mexico 14.2 13.4 -3.9 7.7 -0.7 0.1 2.6 4.2 -1.0 9.8Nicaragua -12.8 6.3 12.9 12.8 … … 6.0 -7.5 -6.5 2.5Paraguay -8.2 -4.7 -4.0 -0.5 -4.2 11.7 -9.0 1.3 -0.3 -3.2Peru -7.5 -3.6 -14.2 24.3 10.5 33.2 -15.1 43.5 -4.5 9.7Uruguay -8.8 -8.6 -34.0 3.1 -12.3 5.6 -33.6 2.6 -16.7 5.5Venezuela (República Bolivariana de) -48.7 -41.9 -37.3 -12.8 -67.1 -26.9 -57.4 -29.6 -53.7 -28.0
Source: Economic Commission for Latin America and the Caribbean (ECLAC), on the basis of official information from the countries’ central banks, customs offices and national institutes of statistics.
75International Trade Outlook for Latin America and the Caribbean • 2017 Chapter II
The region’s weak performance in modern services trade
IICHAPTER
Introduction
A. The region’s services exports perform poorly in a global context
B. Intermediate services in manufacturing exports are another key component of services trade
C. Few countries have active public-private strategies to promote modern services exports
D. Moving forward
Bibliography

77International Trade Outlook for Latin America and the Caribbean • 2017 Chapter IIIIIntroduction
In recent years, there has been a growing business, policy and academic interest in trade in services, which has been growing faster than trade in goods since the 1990s. This expansion is driven mostly by information and communications technologies (ICTs), which allow many services to be digitized and traded internationally. The producer and consumer therefore do not need to be in physical proximity for the service to be provided. These “modern services”, as they are termed, include a large range of business, financial, information technology, insurance and pension services, as well as professional services, research and development (R&D), and telecoms. In contrast, more traditional types of services, such as construction, government services, recreational services, and transport and travel (for business and leisure), have expanded at similar rates to goods trade.
The spread of global value chains, with their high dependence on services, has been another reason for this closer interest. Services are the glue of international production networks, playing a central role in particular in the upstream (R&D and innovation) and downstream (marketing and sales) activities. It is precisely at the beginning and end of production chains where most value is created through service activities. Moreover, various services (such as accounting, information technology, other business processes and logistics) play a role in all segments of the value chain. Most of these services are not traded directly, but incorporated into the value of traded goods. New statistics based on input-output tables can decompose gross values of internationally traded goods and services into intermediate value added components. These new statistics show that services represent about half of global trade, instead of almost a quarter by the measure of gross values.
Services play an increasingly important role as a determinant of the international competitiveness of manufacturing goods, in particular within the context of the ongoing technical revolution known as “manufacturing 4.0”. This revolution refers to the interaction of machinery, equipment and manufactured products able to gather, process and analyse data from the physical world and interact with each other independently. Digital technologies, the Internet of things (IoT) and large volumes of digital data (“big data”) generated by sensors and processed through cloud computing are all central parts of this evolving manufacturing ecosystem. Services such as software, big data analytics and cloud computing play a key role in adding value to manufactured goods. In less technologically sophisticated manufacturing and natural resource sectors, different types of intermediate services also contribute increasingly to differentiation and value creation. In sum, services are more and more intertwined with goods production and the two need to be analysed jointly to understand their dynamics.
Within this context, this chapter has three goals. First, to assess the region’s competitiveness in global services trade over the past decade. This is done using a new database of the World Trade Organization, which compiles trade in services data according to the sixth edition of the Balance of Payments Manual of the International Monetary Fund (IMF) for the period 2005 to 2016.1 Second, to analyse which services are being incorporated into the exports of manufactures in a subset of Latin American countries, compared with other countries and groupings, and how this is occurring. And, third, to review some of the public-private policies being implemented by a group of countries in the region to promote exports of modern services. The following categories of trade in services statistics are part of modern services: telecommunications, computer and information services; financial services; insurance and pension services; royalties; and other business services (Loungani and others, 2017) (see diagram II.1).
1 Data for earlier years compiled according to the fifth edition of the Balance of Payments Manual are not strictly comparable as these are compiled using a different methodology and classification.
Services are the glue of international production networks, playing a central role in particular in the upstream (R&D and innovation) and downstream (marketing and sales) activities.

78 Economic Commission for Latin America and the Caribbean (ECLAC)Chapter II
Modern services comprise a range of activities delivered mostly over the internet
Goods
Services
Modern services
Traditional services
• Telecommunications, computer and information services • Financial services• Insurance and pension services• Royalties• Other business services
• Goods related services• Transport• Travel• Construction• Personal, cultural and recreational services• Government services
Trad
e ba
lanc
e
Source: Economic Commission for Latin America and the Caribbean (ECLAC), on the basis of P. Loungani and others (2017), “World trade in services: evidence from a new dataset”, IMF Working Paper, No. 17/77, Washington, D.C., International Monetary Fund (IMF), 2017.
A. The region’s services exports perform poorly in a global context
1. Global services exports have increased faster than goods exports
From 2005 to 2016, the value of global services exports almost doubled, growing at an average annual rate of almost 6%. This expansion was not constant, however, as two growth spurts (from 2005 to 2008 and from 2010 to 2014) were each followed by stagnation, first during the global financial crisis in 2009-2010 and more recently in 2015-2016. The increase in the value of global goods exports was just under 4% on average per year for most of this period, except immediately after the global crisis. As a result, services increased their share in global goods and services exports from about a fifth to almost a quarter (see figure II.1A). Exports of modern services increased at an even faster rate (almost 7% on average per year) than those of total services, so that their share in global services exports rose from 44% to 50% (see figure II.1B).
World trade in services is highly concentrated, and trade in modern services especially so. The top 10 exporting countries of total and modern services accounted for 54% and 64% of these flows, respectively, in 2016 (see figure II.2). The United States alone represented 15.4% and 16.4% of total services and modern services exports worldwide in 2016, respectively, which was much higher than its share in global goods exports (9.4%). The United Kingdom, Germany and France are the following three largest exporters of both total and modern services, but their market shares were each less than half those of the United States.
Diagram II.1 Classification of traditional and modern services
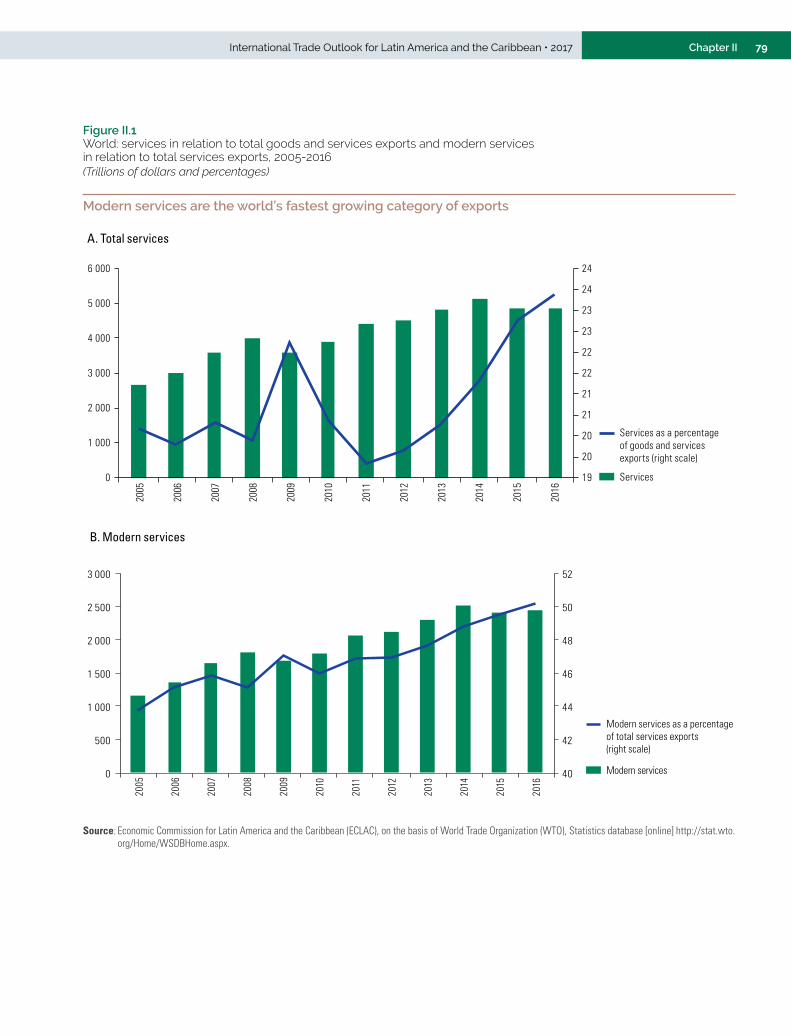
79International Trade Outlook for Latin America and the Caribbean • 2017 Chapter II
Figure II.1 World: services in relation to total goods and services exports and modern services in relation to total services exports, 2005-2016(Trillions of dollars and percentages)
Modern services are the world’s fastest growing category of exports
A. Total services
2005
2006
2007
2008
2009
2010
2011
2012
2013
2014
2015
2016
Services
Services as a percentageof goods and services exports (right scale)
19
20
20
21
21
22
22
23
23
24
24
0
1 000
2 000
3 000
4 000
5 000
6 000
B. Modern services
40
42
44
46
48
50
52
0
500
1 000
1 500
2 000
2 500
3 000
2005
2006
2007
2008
2009
2010
2011
2012
2013
2014
2015
2016
Modern services
Modern services as a percentageof total services exports(right scale)
Source: Economic Commission for Latin America and the Caribbean (ECLAC), on the basis of World Trade Organization (WTO), Statistics database [online] http://stat.wto.org/Home/WSDBHome.aspx.
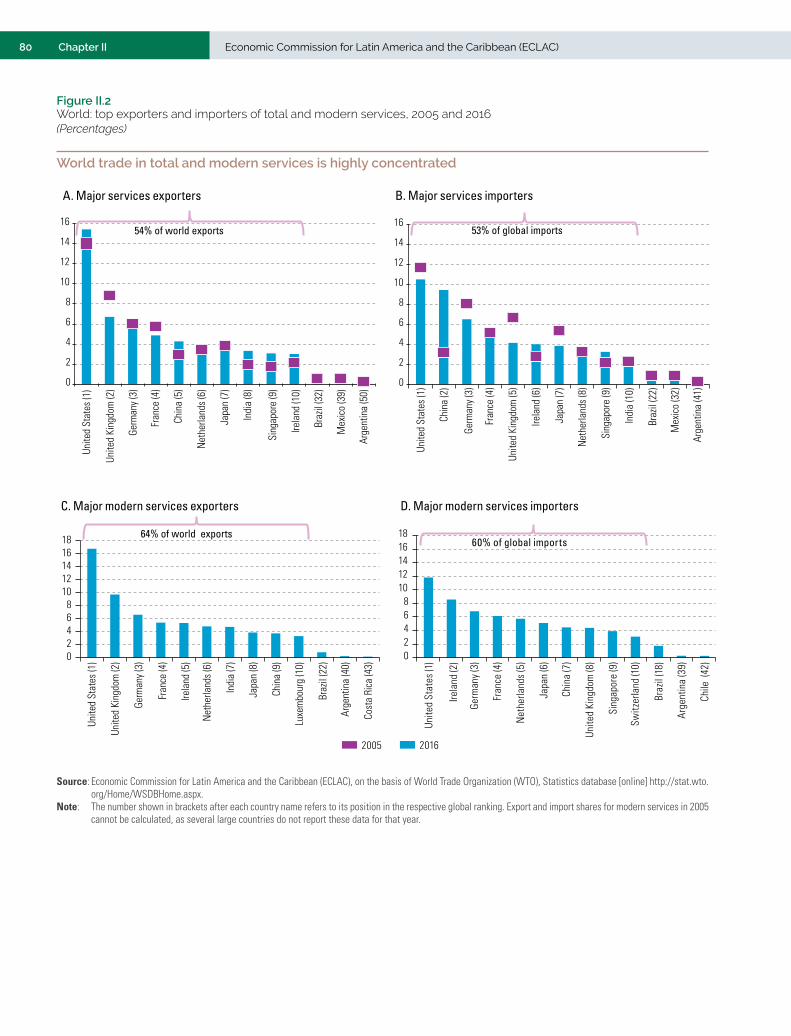
80 Economic Commission for Latin America and the Caribbean (ECLAC)Chapter II
Figure II.2 World: top exporters and importers of total and modern services, 2005 and 2016(Percentages)
World trade in total and modern services is highly concentrated
A. Major services exporters
0
2
4
6
8
10
12
14
16
Unite
d St
ates
(1)
Unite
d Ki
ngdo
m (2
)
Germ
any
(3)
Fran
ce (4
)
Chin
a (5
)
Net
herla
nds
(6)
Japa
n (7
)
Indi
a (8
)
Sing
apor
e (9
)
Irela
nd (1
0)
Braz
il (3
2)
Mex
ico
(39)
Arg
entin
a (5
0)
54% of world exports
0
2
4
6
8
10
12
14
16
Unite
d St
ates
(1)
Chin
a (2
)
Germ
any
(3)
Fra
nce
(4)
Unite
d Ki
ngdo
m (5
)
Irela
nd (6
)
Japa
n (7
)
Net
herla
nds
(8)
Sing
apor
e (9
)
Indi
a (1
0)
Braz
il (2
2)
Mex
ico
(32)
Arge
ntin
a (4
1)
53% of global imports
B. Major services importers
C. Major modern services exporters D. Major modern services importers
02468
1012141618
Unite
d St
ates
(1)
Irela
nd (2
)
Germ
any
(3)
Fran
ce (4
)
Net
herla
nds
(5)
Japa
n (6
)
Chin
a (7
)
Unite
d Ki
ngdo
m (8
)
Sing
apor
e (9
)
Switz
erla
nd (1
0)
Braz
il (1
8)
Arg
entin
a (3
9)
Chile
(42
)
60% of global imports
02468
1012141618 64% of world exports
Unite
d St
ates
(1)
Unite
d Ki
ngdo
m (2
)
Germ
any
(3)
Fran
ce (4
)
Irela
nd (5
)
Net
herla
nds
(6)
Indi
a (7
)
Japa
n (8
)
Chin
a (9
)
Luxe
mbo
urg
(10)
Braz
il (2
2)
Arg
entin
a (4
0)
Cost
a Ri
ca (4
3)
2005 2016
Source: Economic Commission for Latin America and the Caribbean (ECLAC), on the basis of World Trade Organization (WTO), Statistics database [online] http://stat.wto.org/Home/WSDBHome.aspx.
Note: The number shown in brackets after each country name refers to its position in the respective global ranking. Export and import shares for modern services in 2005 cannot be calculated, as several large countries do not report these data for that year.
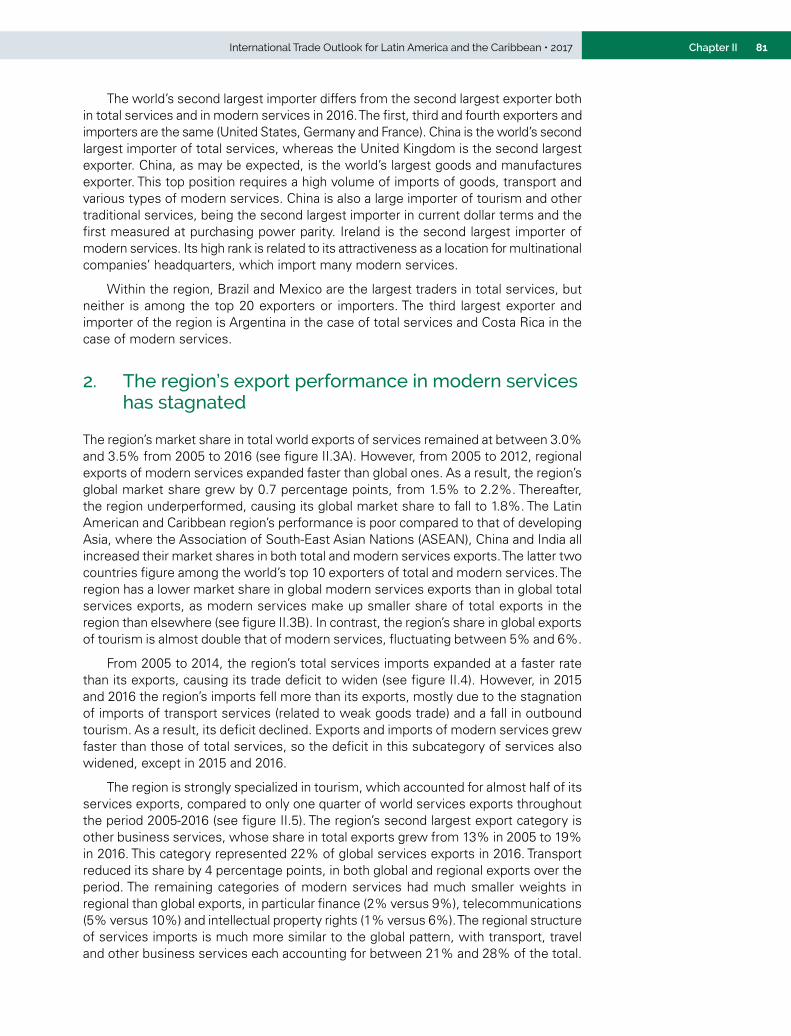
81International Trade Outlook for Latin America and the Caribbean • 2017 Chapter II
The world’s second largest importer differs from the second largest exporter both in total services and in modern services in 2016. The first, third and fourth exporters and importers are the same (United States, Germany and France). China is the world’s second largest importer of total services, whereas the United Kingdom is the second largest exporter. China, as may be expected, is the world’s largest goods and manufactures exporter. This top position requires a high volume of imports of goods, transport and various types of modern services. China is also a large importer of tourism and other traditional services, being the second largest importer in current dollar terms and the first measured at purchasing power parity. Ireland is the second largest importer of modern services. Its high rank is related to its attractiveness as a location for multinational companies’ headquarters, which import many modern services.
Within the region, Brazil and Mexico are the largest traders in total services, but neither is among the top 20 exporters or importers. The third largest exporter and importer of the region is Argentina in the case of total services and Costa Rica in the case of modern services.
2. The region’s export performance in modern services has stagnated
The region’s market share in total world exports of services remained at between 3.0% and 3.5% from 2005 to 2016 (see figure II.3A). However, from 2005 to 2012, regional exports of modern services expanded faster than global ones. As a result, the region’s global market share grew by 0.7 percentage points, from 1.5% to 2.2%. Thereafter, the region underperformed, causing its global market share to fall to 1.8%. The Latin American and Caribbean region’s performance is poor compared to that of developing Asia, where the Association of South-East Asian Nations (ASEAN), China and India all increased their market shares in both total and modern services exports. The latter two countries figure among the world’s top 10 exporters of total and modern services. The region has a lower market share in global modern services exports than in global total services exports, as modern services make up smaller share of total exports in the region than elsewhere (see figure II.3B). In contrast, the region’s share in global exports of tourism is almost double that of modern services, fluctuating between 5% and 6%.
From 2005 to 2014, the region’s total services imports expanded at a faster rate than its exports, causing its trade deficit to widen (see figure II.4). However, in 2015 and 2016 the region’s imports fell more than its exports, mostly due to the stagnation of imports of transport services (related to weak goods trade) and a fall in outbound tourism. As a result, its deficit declined. Exports and imports of modern services grew faster than those of total services, so the deficit in this subcategory of services also widened, except in 2015 and 2016.
The region is strongly specialized in tourism, which accounted for almost half of its services exports, compared to only one quarter of world services exports throughout the period 2005-2016 (see figure II.5). The region’s second largest export category is other business services, whose share in total exports grew from 13% in 2005 to 19% in 2016. This category represented 22% of global services exports in 2016. Transport reduced its share by 4 percentage points, in both global and regional exports over the period. The remaining categories of modern services had much smaller weights in regional than global exports, in particular finance (2% versus 9%), telecommunications (5% versus 10%) and intellectual property rights (1% versus 6%). The regional structure of services imports is much more similar to the global pattern, with transport, travel and other business services each accounting for between 21% and 28% of the total.
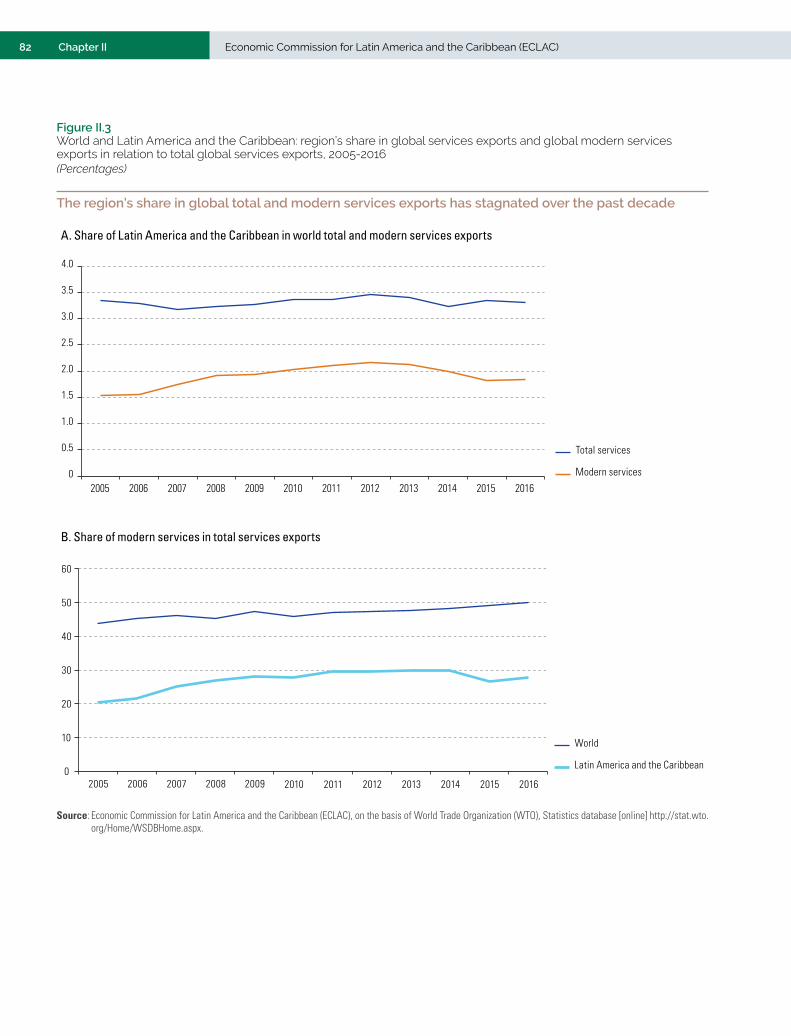
82 Economic Commission for Latin America and the Caribbean (ECLAC)Chapter II
Figure II.3 World and Latin America and the Caribbean: region’s share in global services exports and global modern services exports in relation to total global services exports, 2005-2016(Percentages)
The region’s share in global total and modern services exports has stagnated over the past decade
A. Share of Latin America and the Caribbean in world total and modern services exports
0
0.5
1.0
1.5
2.0
2.5
3.0
3.5
4.0
2005 2006 2007 2008 2009 2010 2011 2012 2013 2014 2015 2016
Total services
Modern services
B. Share of modern services in total services exports
0
10
20
30
40
50
60
2005 2006 2007 2008 2009 2010 2011 2012 2013 2014 2015 2016
World
Latin America and the Caribbean
Source: Economic Commission for Latin America and the Caribbean (ECLAC), on the basis of World Trade Organization (WTO), Statistics database [online] http://stat.wto.org/Home/WSDBHome.aspx.
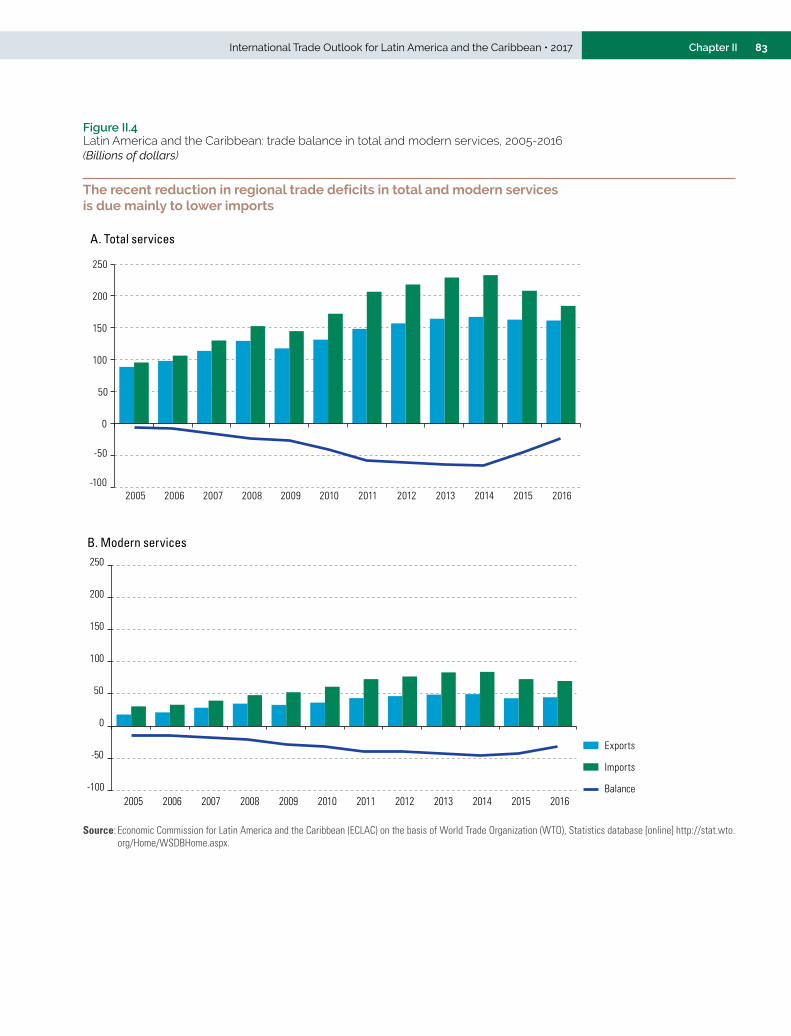
83International Trade Outlook for Latin America and the Caribbean • 2017 Chapter II
Figure II.4 Latin America and the Caribbean: trade balance in total and modern services, 2005-2016(Billions of dollars)
The recent reduction in regional trade deficits in total and modern services is due mainly to lower imports
A. Total services
-100
-50
0
50
100
150
200
250
2005 2006 2007 2008 2009 2010 2011 2012 2013 2014 2015 2016
B. Modern services
Imports
Balance
Exports
-100
-50
0
50
100
150
200
250
2005 2006 2007 2008 2009 2010 2011 2012 2013 2014 2015 2016
Source: Economic Commission for Latin America and the Caribbean (ECLAC) on the basis of World Trade Organization (WTO), Statistics database [online] http://stat.wto.org/Home/WSDBHome.aspx.
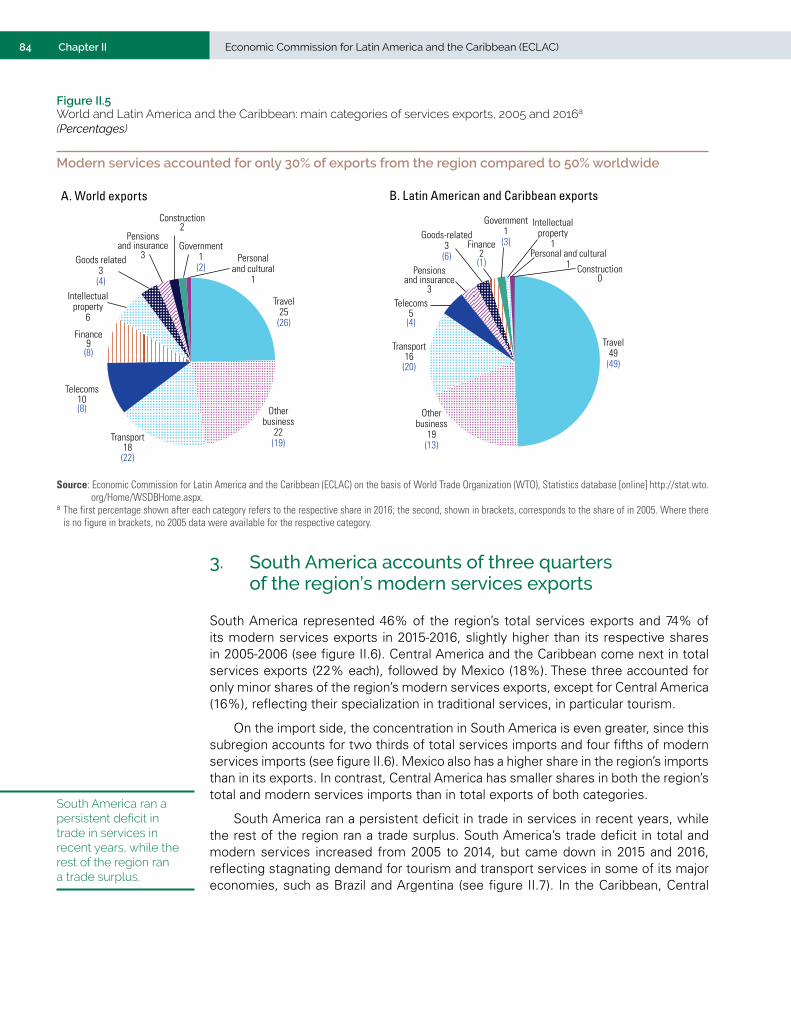
84 Economic Commission for Latin America and the Caribbean (ECLAC)Chapter II
Figure II.5 World and Latin America and the Caribbean: main categories of services exports, 2005 and 2016a
(Percentages)
Modern services accounted for only 30% of exports from the region compared to 50% worldwide
A. World exports
Intellectualproperty
6
Personaland cultural
1
Travel25
(26)
Otherbusiness
22(19) Transport
18(22)
Telecoms10(8)
Finance9(8)
Government1
(2)
Construction2
Pensionsand insurance
3Goods related3(4)
Travel49
(49)
Otherbusiness
19(13)
Transport16
(20)
Telecoms5
(4)
Pensionsand insurance
3
Personal and cultural1 Construction
0
Intellectualproperty
1
Government1
(3) Finance2
(1)
Goods-related3
(6)
B. Latin American and Caribbean exports
Source: Economic Commission for Latin America and the Caribbean (ECLAC) on the basis of World Trade Organization (WTO), Statistics database [online] http://stat.wto.org/Home/WSDBHome.aspx.
a The first percentage shown after each category refers to the respective share in 2016; the second, shown in brackets, corresponds to the share of in 2005. Where there is no figure in brackets, no 2005 data were available for the respective category.
3. South America accounts of three quarters of the region’s modern services exports
South America represented 46% of the region’s total services exports and 74% of its modern services exports in 2015-2016, slightly higher than its respective shares in 2005-2006 (see figure II.6). Central America and the Caribbean come next in total services exports (22% each), followed by Mexico (18%). These three accounted for only minor shares of the region’s modern services exports, except for Central America (16%), reflecting their specialization in traditional services, in particular tourism.
On the import side, the concentration in South America is even greater, since this subregion accounts for two thirds of total services imports and four fifths of modern services imports (see figure II.6). Mexico also has a higher share in the region’s imports than in its exports. In contrast, Central America has smaller shares in both the region’s total and modern services imports than in total exports of both categories.
South America ran a persistent deficit in trade in services in recent years, while the rest of the region ran a trade surplus. South America’s trade deficit in total and modern services increased from 2005 to 2014, but came down in 2015 and 2016, reflecting stagnating demand for tourism and transport services in some of its major economies, such as Brazil and Argentina (see figure II.7). In the Caribbean, Central
South America ran a persistent deficit in trade in services in recent years, while the rest of the region ran a trade surplus.
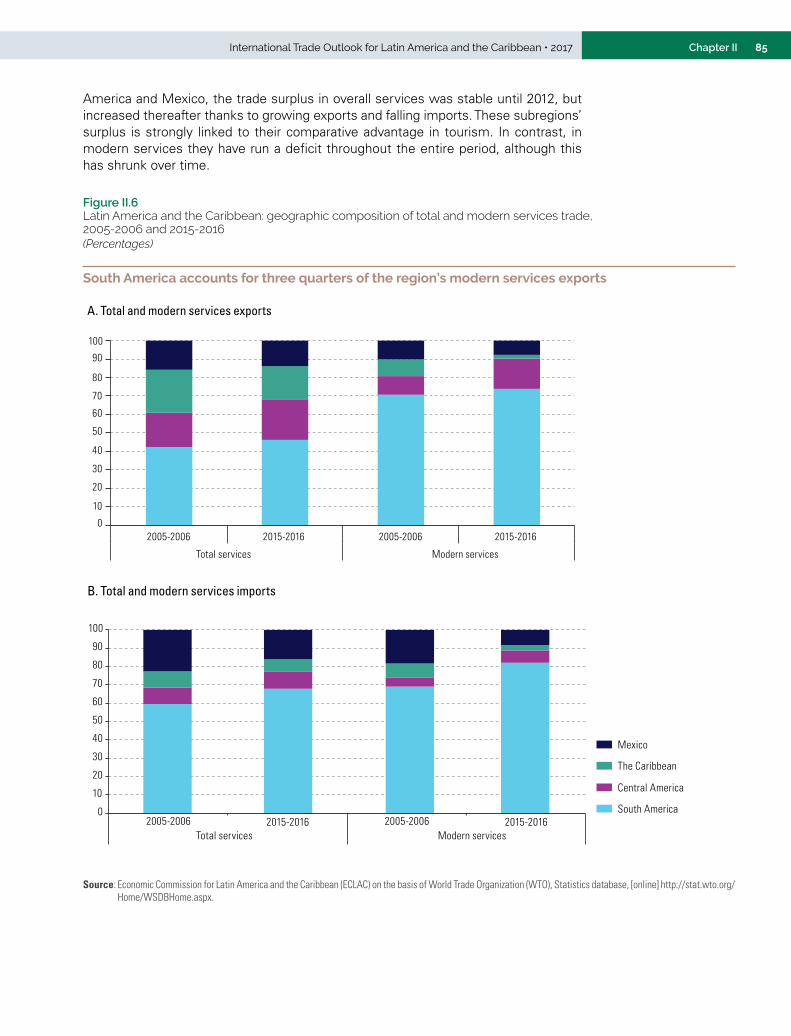
85International Trade Outlook for Latin America and the Caribbean • 2017 Chapter II
America and Mexico, the trade surplus in overall services was stable until 2012, but increased thereafter thanks to growing exports and falling imports. These subregions’ surplus is strongly linked to their comparative advantage in tourism. In contrast, in modern services they have run a deficit throughout the entire period, although this has shrunk over time.
Figure II.6 Latin America and the Caribbean: geographic composition of total and modern services trade, 2005-2006 and 2015-2016(Percentages)
South America accounts for three quarters of the region’s modern services exports
A. Total and modern services exports
0
10
20
30
40
50
60
70
80
90
100
2005-2006 2015-2016 2005-2006 2015-2016
Total services Modern services
B. Total and modern services imports
South America
Central America
The Caribbean
Mexico
0
10
20
30
40
50
60
70
80
90
100
2005-2006 2015-2016 2005-2006 2015-2016Total services Modern services
Source: Economic Commission for Latin America and the Caribbean (ECLAC) on the basis of World Trade Organization (WTO), Statistics database, [online] http://stat.wto.org/Home/WSDBHome.aspx.
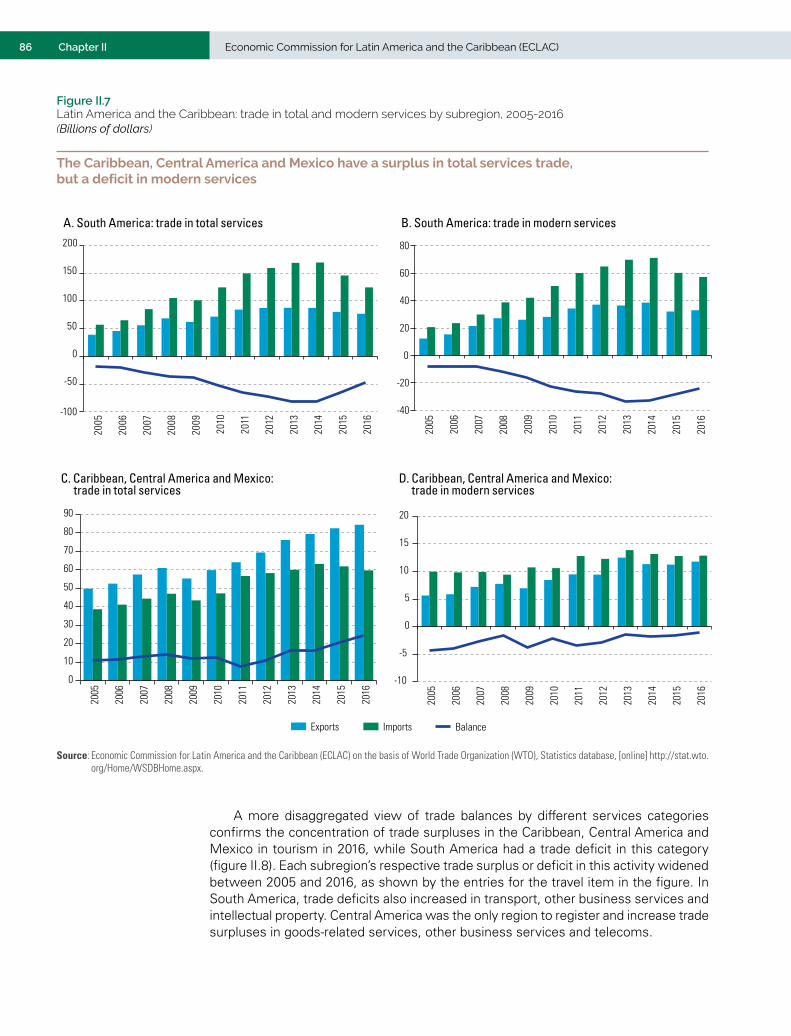
86 Economic Commission for Latin America and the Caribbean (ECLAC)Chapter II
Figure II.7 Latin America and the Caribbean: trade in total and modern services by subregion, 2005-2016(Billions of dollars)
The Caribbean, Central America and Mexico have a surplus in total services trade, but a deficit in modern services
A. South America: trade in total services B. South America: trade in modern services
-100
-50
0
50
100
150
200
2005
2006
2007
2008
2009
2010
2011
2012
2013
2014
2015
2016
-40
-20
0
20
40
60
80
2005
2006
2007
2008
2009
2010
2011
2012
2013
2014
2015
2016
C. Caribbean, Central America and Mexico: trade in total services
D. Caribbean, Central America and Mexico: trade in modern services
0
10
20
30
40
50
60
70
80
90
2005
2006
2007
2008
2009
2010
2011
2012
2013
2014
2015
2016
-10
-5
0
5
10
15
20
2005
2006
2007
2008
2009
2010
2011
2012
2013
2014
2015
2016
BalanceImportsExports
Source: Economic Commission for Latin America and the Caribbean (ECLAC) on the basis of World Trade Organization (WTO), Statistics database, [online] http://stat.wto.org/Home/WSDBHome.aspx.
A more disaggregated view of trade balances by different services categories confirms the concentration of trade surpluses in the Caribbean, Central America and Mexico in tourism in 2016, while South America had a trade deficit in this category (figure II.8). Each subregion’s respective trade surplus or deficit in this activity widened between 2005 and 2016, as shown by the entries for the travel item in the figure. In South America, trade deficits also increased in transport, other business services and intellectual property. Central America was the only region to register and increase trade surpluses in goods-related services, other business services and telecoms.
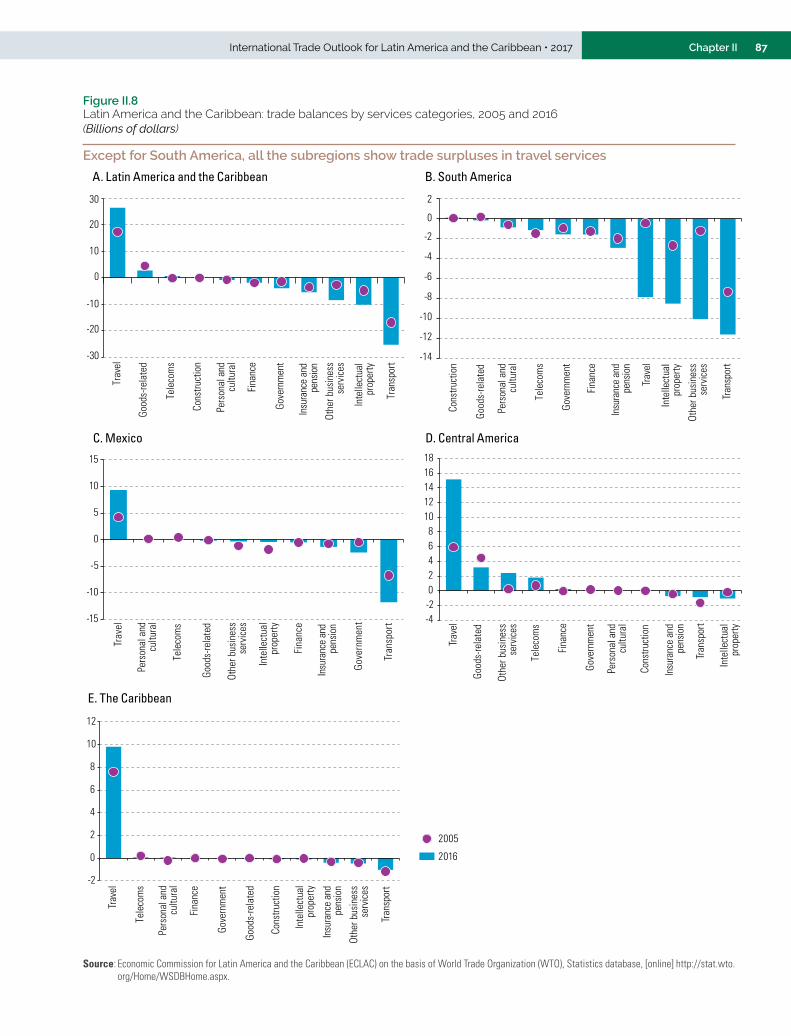
87International Trade Outlook for Latin America and the Caribbean • 2017 Chapter II
Figure II.8 Latin America and the Caribbean: trade balances by services categories, 2005 and 2016(Billions of dollars)
Except for South America, all the subregions show trade surpluses in travel services
A. Latin America and the Caribbean B. South America
-30
-20
-10
0
10
20
30
Trav
el
Good
s-re
late
d
Tele
com
s
Cons
truct
ion
Pers
onal
and
cultu
ral
Fina
nce
Gove
rnm
ent
Insu
ranc
e an
dpe
nsio
nOt
her b
usin
ess
serv
ices
Inte
llect
ual
prop
erty
Tran
spor
t -14
-12
-10
-8
-6
-4
-2
0
2
Cons
truct
ion
Good
s-re
late
d
Gove
rnm
ent
Fina
nce
Trav
el
Tran
spor
t
Pers
onal
and
cultu
ral
Tele
com
s
Insu
ranc
e an
dpe
nsio
n
Inte
llect
ual
prop
erty
Othe
r bus
ines
sse
rvic
es
C. Mexico D. Central America
Good
s-re
late
d
Pers
onal
and
cultu
ral
Tele
com
s
Insu
ranc
e an
dpe
nsio
n
Inte
llect
ual
prop
erty
Othe
r bus
ines
sse
rvic
es
-15
-10
-5
0
5
10
15
Trav
el
Fina
nce
Gove
rnm
ent
Tran
spor
t
Pers
onal
and
cultu
ral
Tele
com
s
Good
s-re
late
d
Othe
r bus
ines
sse
rvic
es
Inte
llect
ual
prop
erty
Insu
ranc
e an
dpe
nsio
n -4-202468
1012141618
Trav
el
Fina
nce
Gove
rnm
ent
Cons
truct
ion
Tran
spor
tE. The Caribbean
Good
s-re
late
d
Pers
onal
and
cultu
ral
Tele
com
s
Insu
ranc
e an
dpe
nsio
n
Inte
llect
ual
prop
erty
Othe
r bus
ines
sse
rvic
es
-2
0
2
4
6
8
10
12
Trav
el
Fina
nce
Gove
rnm
ent
Cons
truct
ion
Tran
spor
t
2005
2016
Source: Economic Commission for Latin America and the Caribbean (ECLAC) on the basis of World Trade Organization (WTO), Statistics database, [online] http://stat.wto.org/Home/WSDBHome.aspx.
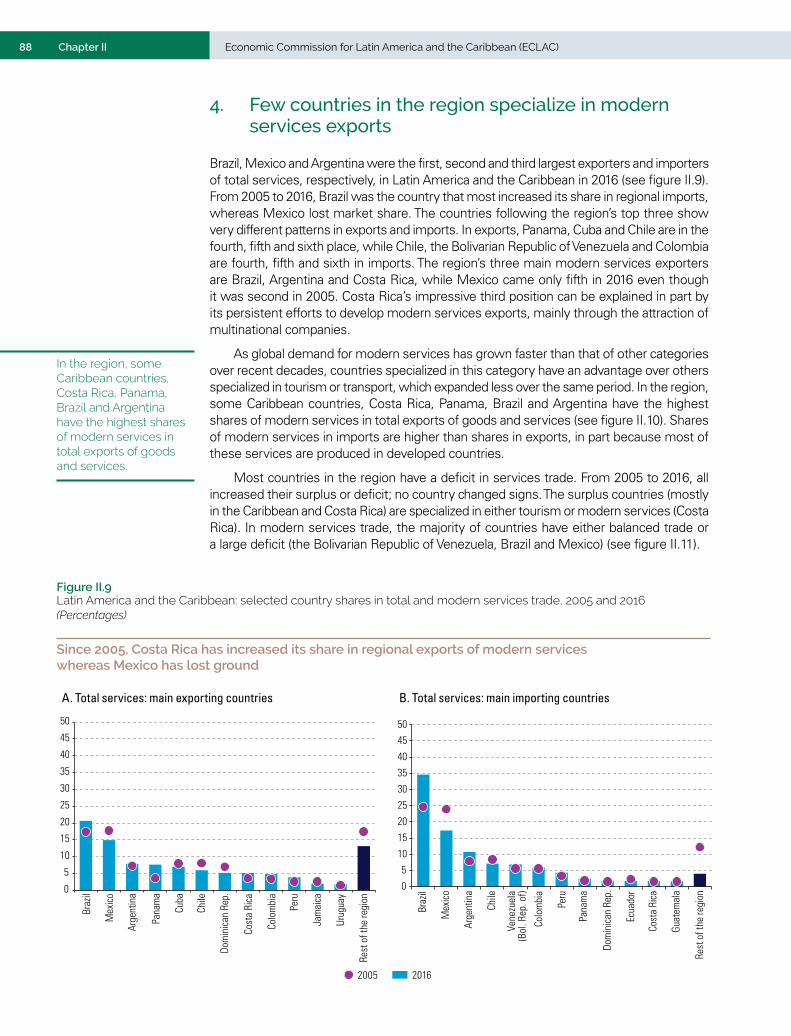
88 Economic Commission for Latin America and the Caribbean (ECLAC)Chapter II
4. Few countries in the region specialize in modern services exports
Brazil, Mexico and Argentina were the first, second and third largest exporters and importers of total services, respectively, in Latin America and the Caribbean in 2016 (see figure II.9). From 2005 to 2016, Brazil was the country that most increased its share in regional imports, whereas Mexico lost market share. The countries following the region’s top three show very different patterns in exports and imports. In exports, Panama, Cuba and Chile are in the fourth, fifth and sixth place, while Chile, the Bolivarian Republic of Venezuela and Colombia are fourth, fifth and sixth in imports. The region’s three main modern services exporters are Brazil, Argentina and Costa Rica, while Mexico came only fifth in 2016 even though it was second in 2005. Costa Rica’s impressive third position can be explained in part by its persistent efforts to develop modern services exports, mainly through the attraction of multinational companies.
As global demand for modern services has grown faster than that of other categories over recent decades, countries specialized in this category have an advantage over others specialized in tourism or transport, which expanded less over the same period. In the region, some Caribbean countries, Costa Rica, Panama, Brazil and Argentina have the highest shares of modern services in total exports of goods and services (see figure II.10). Shares of modern services in imports are higher than shares in exports, in part because most of these services are produced in developed countries.
Most countries in the region have a deficit in services trade. From 2005 to 2016, all increased their surplus or deficit; no country changed signs. The surplus countries (mostly in the Caribbean and Costa Rica) are specialized in either tourism or modern services (Costa Rica). In modern services trade, the majority of countries have either balanced trade or a large deficit (the Bolivarian Republic of Venezuela, Brazil and Mexico) (see figure II.11).
Figure II.9 Latin America and the Caribbean: selected country shares in total and modern services trade, 2005 and 2016(Percentages)
Since 2005, Costa Rica has increased its share in regional exports of modern services whereas Mexico has lost ground
A. Total services: main exporting countries B. Total services: main importing countries
0
5
10
15
20
25
30
35
40
45
50
Braz
il
Mex
ico
Arge
ntin
a
Pana
ma
Cuba
Chile
Dom
inic
an R
ep.
Cost
a Ri
ca
Colo
mbi
a
Peru
Jam
aica
Urug
uay
Rest
of t
he re
gion
0
5
10
15
20
25
30
35
40
45
50
Braz
il
Mex
ico
Arge
ntin
a
Chile
Vene
zuel
a(B
ol. R
ep. o
f)
Colo
mbi
a
Peru
Pana
ma
Dom
inic
an R
ep.
Ecua
dor
Cost
a Ri
ca
Guat
emal
a
Rest
of t
he re
gion
20162005
In the region, some Caribbean countries, Costa Rica, Panama, Brazil and Argentina have the highest shares of modern services in total exports of goods and services.

89International Trade Outlook for Latin America and the Caribbean • 2017 Chapter II
C. Modern services: main exporting countries D. Modern services: main importing countries
Vene
zuel
a(B
ol. R
ep. o
f)
0
5
10
15
20
25
30
35
40
45
50
Braz
il
Arge
ntin
a
Cost
a Ri
ca
Chile
Mex
ico
Pana
ma
Peru
Colo
mbi
a
Urug
uay
Guat
emal
a
El S
alva
dor
Jam
aica
20162005
Rest
of t
he re
gion
Rest
of t
he re
gion
0
10
20
30
40
50
60
Braz
il
Arg
entin
a
Chile
Mex
ico
Colo
mbi
a
Peru
Pana
ma
Cost
a Ri
ca
Jam
aica
Ecua
dor
Gua
tem
ala
Source: Economic Commission for Latin America and the Caribbean (ECLAC) on the basis of World Trade Organization (WTO), Statistics database, [online] http://stat.wto.org/Home/WSDBHome.aspx.
Figure II.9 (concluded)
Figure II.10 Latin America and the Caribbean (28 countries): average share of different types of services in total exports of goods and services, 2015-2016(Percentages)
Modern services represent more than 10% of total exports only in some Caribbean countries, Costa Rica and Brazil
0 20 40 60 80 100Paraguay
Venezuela (Bol. Rep. of)EcuadorMexico
NicaraguaHondurasColombia
PeruBolivia (Plur. State of)
HaitiSuriname
GuatemalaEl Salvador
ChileSaint Lucia
BahamasJamaicaUruguay
BelizePanama
ArgentinaAntigua and BarbudaSaint Kitts and Nevis
BrazilGrenada
DominicaSaint Vincent and the Grenadines
Costa Rica
Other services
Travel TransportModern services
A. Exports
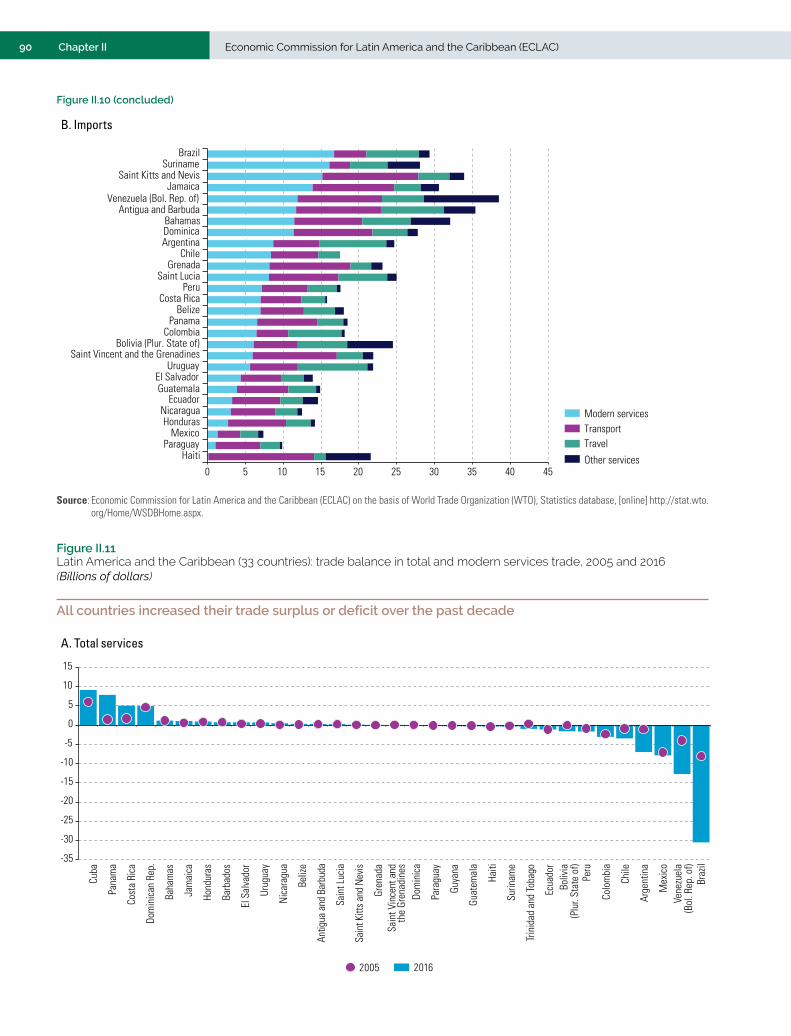
90 Economic Commission for Latin America and the Caribbean (ECLAC)Chapter II
0 5 10 15 20 25 30 35 40 45
HaitiParaguay
MexicoHonduras
NicaraguaEcuador
GuatemalaEl Salvador
UruguaySaint Vincent and the Grenadines
Bolivia (Plur. State of)Colombia
PanamaBelize
Costa RicaPeru
Saint LuciaGrenada
ChileArgentinaDominicaBahamas
Antigua and BarbudaVenezuela (Bol. Rep. of)
JamaicaSaint Kitts and Nevis
SurinameBrazil
Other services
Travel TransportModern services
B. Imports
Source: Economic Commission for Latin America and the Caribbean (ECLAC) on the basis of World Trade Organization (WTO), Statistics database, [online] http://stat.wto.org/Home/WSDBHome.aspx.
Figure II.11 Latin America and the Caribbean (33 countries): trade balance in total and modern services trade, 2005 and 2016(Billions of dollars)
All countries increased their trade surplus or deficit over the past decade
A. Total services
-35
-30
-25
-20
-15
-10
-5
0
5
10
15
Cuba
Pana
ma
Cost
a Ri
ca
Dom
inic
an R
ep.
Baha
mas
Jam
aica
Hond
uras
Barb
ados
El S
alva
dor
Urug
uay
Nic
arag
ua
Beliz
e
Antig
ua a
nd B
arbu
da
Sain
t Luc
ia
Sain
t Kitt
s and
Nev
is
Gren
ada
Sain
t Vin
cent
and
the
Gren
adin
esDo
min
ica
Para
guay
Guya
na
Guat
emal
a
Haiti
Surin
ame
Trin
idad
and
Toba
go
Ecua
dor
Boliv
ia(P
lur.
Stat
e of
)Pe
ru
Colo
mbi
a
Chile
Arge
ntin
a
Mex
ico
Vene
zuel
a(B
ol. R
ep. o
f)Br
azil
20162005
Figure II.10 (concluded)
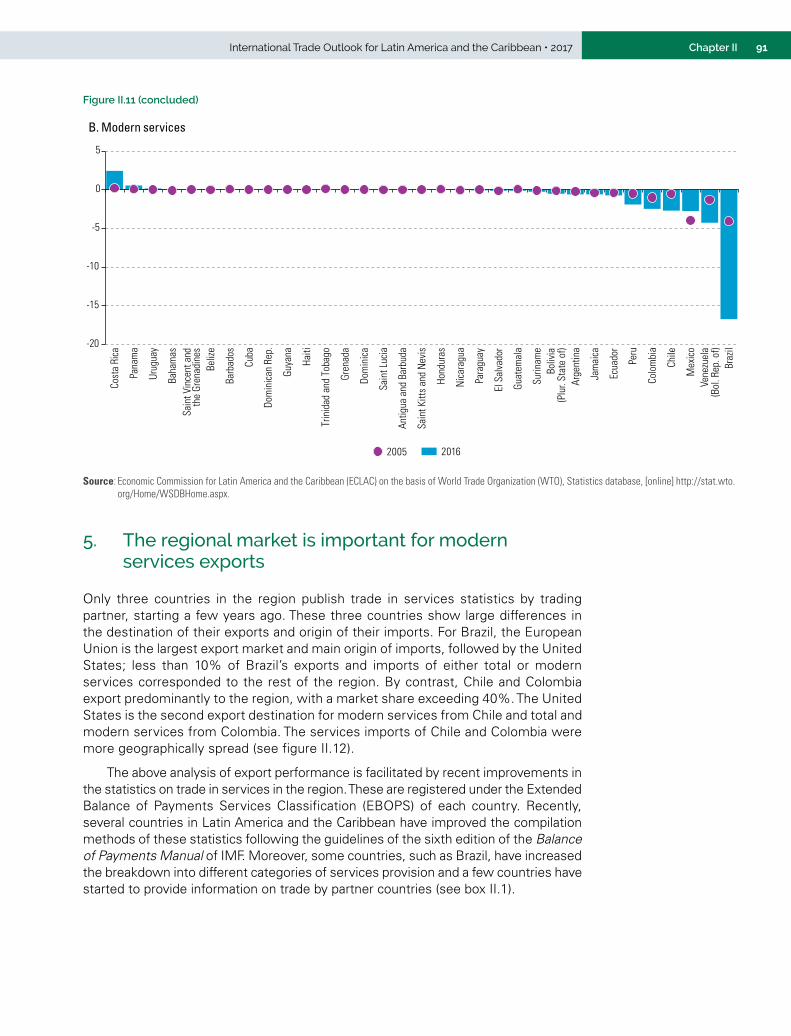
91International Trade Outlook for Latin America and the Caribbean • 2017 Chapter II
B. Modern services
-20
-15
-10
-5
0
5
Cost
a Ri
ca
Pana
ma
Urug
uay
Baha
mas
Beliz
e
Barb
ados
Cuba
Dom
inic
an R
ep.
Guya
na
Haiti
Trin
idad
and
Tob
ago
Gren
ada
Dom
inic
a
Sain
t Luc
ia
Antig
ua a
nd B
arbu
da
Sain
t Kitt
s an
d N
evis
Hond
uras
Nic
arag
ua
Para
guay
El S
alva
dor
Guat
emal
a
Surin
ame
Arge
ntin
a
Jam
aica
Ecua
dor
Peru
Colo
mbi
a
Chile
Mex
ico
Braz
il
Sain
t Vin
cent
and
the
Gren
adin
es
Boliv
ia(P
lur.
Stat
e of
)
Vene
zuel
a(B
ol. R
ep. o
f)
20162005
Source: Economic Commission for Latin America and the Caribbean (ECLAC) on the basis of World Trade Organization (WTO), Statistics database, [online] http://stat.wto.org/Home/WSDBHome.aspx.
Figure II.11 (concluded)
5. The regional market is important for modern services exports
Only three countries in the region publish trade in services statistics by trading partner, starting a few years ago. These three countries show large differences in the destination of their exports and origin of their imports. For Brazil, the European Union is the largest export market and main origin of imports, followed by the United States; less than 10% of Brazil’s exports and imports of either total or modern services corresponded to the rest of the region. By contrast, Chile and Colombia export predominantly to the region, with a market share exceeding 40%. The United States is the second export destination for modern services from Chile and total and modern services from Colombia. The services imports of Chile and Colombia were more geographically spread (see figure II.12).
The above analysis of export performance is facilitated by recent improvements in the statistics on trade in services in the region. These are registered under the Extended Balance of Payments Services Classification (EBOPS) of each country. Recently, several countries in Latin America and the Caribbean have improved the compilation methods of these statistics following the guidelines of the sixth edition of the Balance of Payments Manual of IMF. Moreover, some countries, such as Brazil, have increased the breakdown into different categories of services provision and a few countries have started to provide information on trade by partner countries (see box II.1).
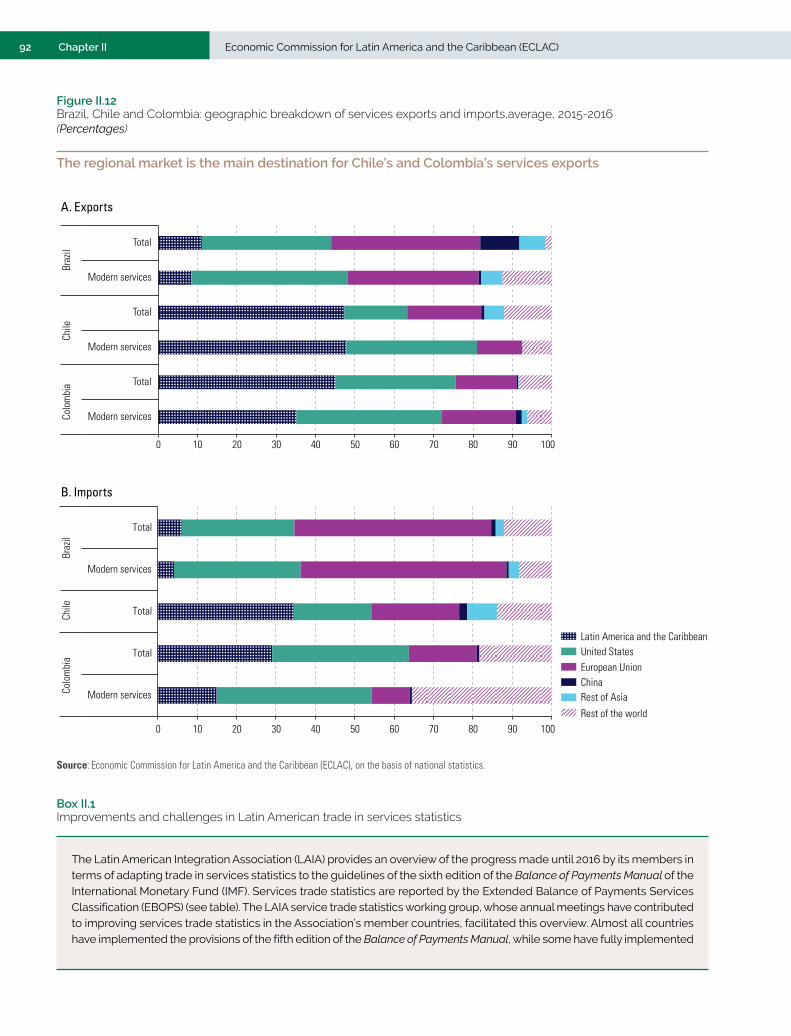
92 Economic Commission for Latin America and the Caribbean (ECLAC)Chapter II
Box II.1 Improvements and challenges in Latin American trade in services statistics
Figure II.12 Brazil, Chile and Colombia: geographic breakdown of services exports and imports,average, 2015-2016(Percentages)
The regional market is the main destination for Chile’s and Colombia’s services exports
A. Exports
0 10 20 30 40 50 60 70 80 90 100
Modern services
Total
Modern services
Total
Modern services
Total
Colo
mbi
aCh
ileBr
azil
B. Imports
0 10 20 30 40 50 60 70 80 90 100
Modern services
Total
Total
Modern services
Total
Colo
mbi
aCh
ileBr
azil
Rest of the world
Rest of AsiaChinaEuropean UnionUnited StatesLatin America and the Caribbean
Source: Economic Commission for Latin America and the Caribbean (ECLAC), on the basis of national statistics.
The Latin American Integration Association (LAIA) provides an overview of the progress made until 2016 by its members in terms of adapting trade in services statistics to the guidelines of the sixth edition of the Balance of Payments Manual of the International Monetary Fund (IMF). Services trade statistics are reported by the Extended Balance of Payments Services Classification (EBOPS) (see table). The LAIA service trade statistics working group, whose annual meetings have contributed to improving services trade statistics in the Association’s member countries, facilitated this overview. Almost all countries have implemented the provisions of the fifth edition of the Balance of Payments Manual, while some have fully implemented
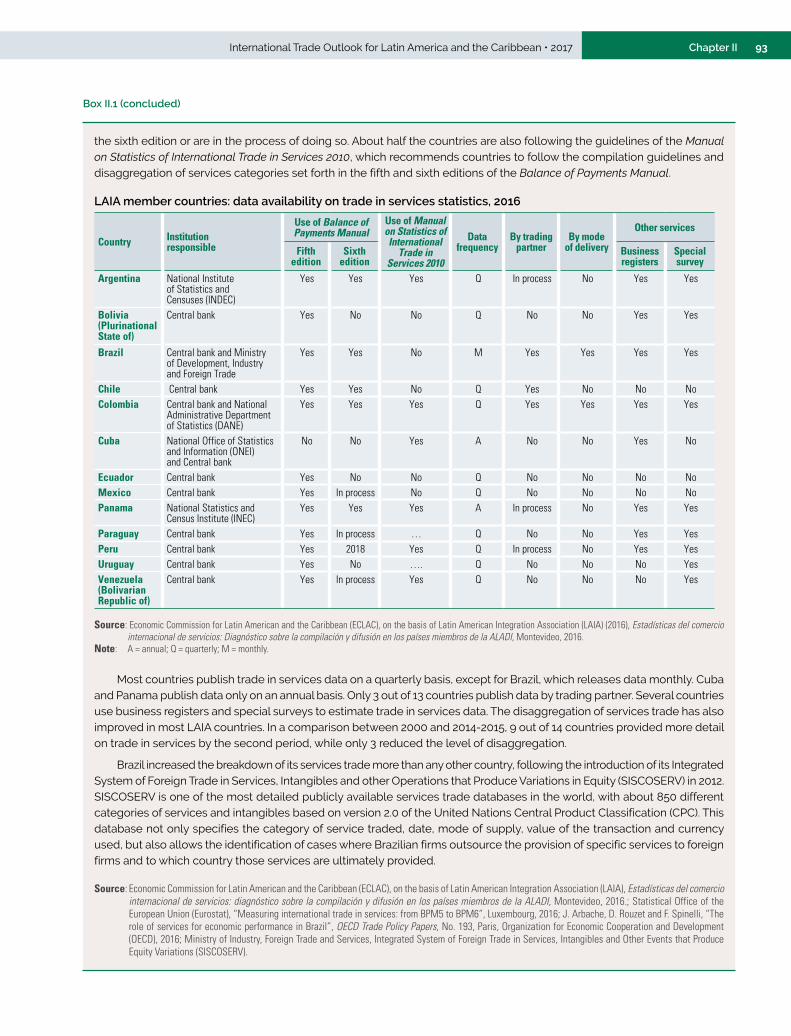
93International Trade Outlook for Latin America and the Caribbean • 2017 Chapter II
Box II.1 (concluded)
the sixth edition or are in the process of doing so. About half the countries are also following the guidelines of the Manual on Statistics of International Trade in Services 2010, which recommends countries to follow the compilation guidelines and disaggregation of services categories set forth in the fifth and sixth editions of the Balance of Payments Manual.
LAIA member countries: data availability on trade in services statistics, 2016
Country Institutionresponsible
Use of Balance of Payments Manual
Use of Manual on Statistics of International
Trade in Services 2010
Datafrequency
By trading partner
By mode of delivery
Other services
Fifth edition
Sixth edition
Business registers
Special survey
Argentina National Institute of Statistics and Censuses (INDEC)
Yes Yes Yes Q In process No Yes Yes
Bolivia (Plurinational State of)
Central bank Yes No No Q No No Yes Yes
Brazil Central bank and Ministry of Development, Industry and Foreign Trade
Yes Yes No M Yes Yes Yes Yes
Chile Central bank Yes Yes No Q Yes No No NoColombia Central bank and National
Administrative Department of Statistics (DANE)
Yes Yes Yes Q Yes Yes Yes Yes
Cuba National Office of Statistics and Information (ONEI) and Central bank
No No Yes A No No Yes No
Ecuador Central bank Yes No No Q No No No NoMexico Central bank Yes In process No Q No No No NoPanama National Statistics and
Census Institute (INEC)Yes Yes Yes A In process No Yes Yes
Paraguay Central bank Yes In process … Q No No Yes YesPeru Central bank Yes 2018 Yes Q In process No Yes YesUruguay Central bank Yes No …. Q No No No YesVenezuela (Bolivarian Republic of)
Central bank Yes In process Yes Q No No No Yes
Source: Economic Commission for Latin American and the Caribbean (ECLAC), on the basis of Latin American Integration Association (LAIA) (2016), Estadísticas del comercio internacional de servicios: Diagnóstico sobre la compilación y difusión en los países miembros de la ALADI, Montevideo, 2016.
Note: A = annual; Q = quarterly; M = monthly.
Most countries publish trade in services data on a quarterly basis, except for Brazil, which releases data monthly. Cuba and Panama publish data only on an annual basis. Only 3 out of 13 countries publish data by trading partner. Several countries use business registers and special surveys to estimate trade in services data. The disaggregation of services trade has also improved in most LAIA countries. In a comparison between 2000 and 2014-2015, 9 out of 14 countries provided more detail on trade in services by the second period, while only 3 reduced the level of disaggregation.
Brazil increased the breakdown of its services trade more than any other country, following the introduction of its Integrated System of Foreign Trade in Services, Intangibles and other Operations that Produce Variations in Equity (SISCOSERV) in 2012. SISCOSERV is one of the most detailed publicly available services trade databases in the world, with about 850 different categories of services and intangibles based on version 2.0 of the United Nations Central Product Classification (CPC). This database not only specifies the category of service traded, date, mode of supply, value of the transaction and currency used, but also allows the identification of cases where Brazilian firms outsource the provision of specific services to foreign firms and to which country those services are ultimately provided.
Source: Economic Commission for Latin American and the Caribbean (ECLAC), on the basis of Latin American Integration Association (LAIA), Estadísticas del comercio internacional de servicios: diagnóstico sobre la compilación y difusión en los países miembros de la ALADI, Montevideo, 2016.; Statistical Office of the European Union (Eurostat), “Measuring international trade in services: from BPM5 to BPM6”, Luxembourg, 2016; J. Arbache, D. Rouzet and F. Spinelli, “The role of services for economic performance in Brazil”, OECD Trade Policy Papers, No. 193, Paris, Organization for Economic Cooperation and Development (OECD), 2016; Ministry of Industry, Foreign Trade and Services, Integrated System of Foreign Trade in Services, Intangibles and Other Events that Produce Equity Variations (SISCOSERV).
94 Economic Commission for Latin America and the Caribbean (ECLAC)Chapter II
6. Information technology has been a key driver of the rise of trade in modern services
The growth of global modern services trade has been driven mainly by the spread of information and communication technologies (ICTs). From the 1960s onwards, these technologies contributed to the process of outsourcing of modern services in developed countries. Firms increasingly passed the responsibility for non-core business processes such as computer processing of payrolls and customer claims to third parties, which could manage these processes more efficiently and economically, thanks to staff specialization in those areas and economies of scale achieved by providing services to a number of clients from large data centres.
In the beginning, companies almost invariably outsourced their processes to providers in the same country, but later the outsourcing model expanded to include service providers whose facilities were located in developing countries (offshore outsourcing). This was facilitated by a wave of deployment of undersea fibre-optic cables, which reached its peak between 1998 and 2002 during the “dot-com” boom (Ruddy, 2013). In a parallel development, large corporations also increasingly established specialized offshore shared services centres (SSCs) in developing countries to provide services to their offices in other countries. Another contributor to this offshoring trend was the liberalization of services trade through the WTO General Agreement on Trade in Services (GATS) of 1995 and multiple regional and bilateral free trade agreements signed afterwards.
Although earlier developments in ICTs played a key role in the growth of offshore services provision and the resulting benefits for Latin American countries, some of the latest ICT developments have the potential to diminish those benefits. The most significant of these is automation —the use of machines that are capable of carrying out tasks without direct human intervention. A particularly simple type of modern automation that can be used by offshore service providers is robotic process automation (RPA), which involves the creation of a software “robot” that automates the repetitive tasks that a human worker performs when using multiple computer applications.
However, as the tasks to be automated become less standardized and repetitive, more advanced technologies are required. These often involve the use of machine learning and other artificial intelligence (AI) techniques to analyse large amounts of information about tasks and their desired outcomes, with the AI software creating rules based on the results of this analysis which can then be used to guide activities intended to achieve those outcomes. In contrast to basic RPA, the implementation of AI-based automation requires substantial technical sophistication on the part of the individuals who carry out the analysis upon which the details of automation will be based.
The results of recent surveys have shown that cost reduction is the most important reason for businesses to outsource services, and to move existing ones abroad (Deloitte, 2015). Offshore services providers are therefore under strong pressure to control their costs, as shown by the importance that they place on locating their facilities in countries with relatively low wages. Other options available to service providers for controlling costs via employment strategies have direct implications for the types of services that
In contrast to basic robotic process automation, the implementation of AI-based automation requires substantial technical sophistication on the part of the individuals who carry out the analysis upon which the details of automation will be based.
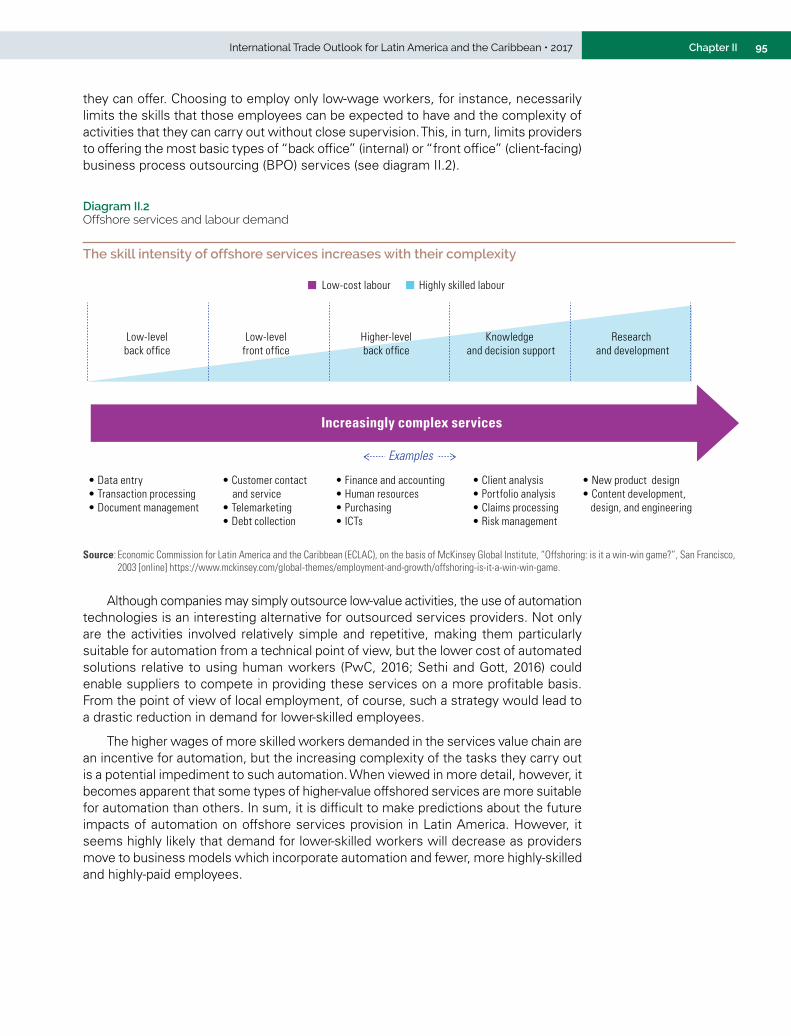
95International Trade Outlook for Latin America and the Caribbean • 2017 Chapter II
Diagram II.2 Offshore services and labour demand
The skill intensity of offshore services increases with their complexity
Low-levelback office
Low-levelfront office
Higher-levelback office
Examples
Knowledge and decision support
Research and development
• Data entry• Transaction processing• Document management
• Customer contact and service• Telemarketing• Debt collection
• Finance and accounting• Human resources• Purchasing• ICTs
• Client analysis• Portfolio analysis• Claims processing• Risk management
• New product design• Content development,
design, and engineering
Increasingly complex services
Low-cost labour Highly skilled labour
Source: Economic Commission for Latin America and the Caribbean (ECLAC), on the basis of McKinsey Global Institute, “Offshoring: is it a win-win game?”, San Francisco, 2003 [online] https://www.mckinsey.com/global-themes/employment-and-growth/offshoring-is-it-a-win-win-game.
Although companies may simply outsource low-value activities, the use of automation technologies is an interesting alternative for outsourced services providers. Not only are the activities involved relatively simple and repetitive, making them particularly suitable for automation from a technical point of view, but the lower cost of automated solutions relative to using human workers (PwC, 2016; Sethi and Gott, 2016) could enable suppliers to compete in providing these services on a more profitable basis. From the point of view of local employment, of course, such a strategy would lead to a drastic reduction in demand for lower-skilled employees.
The higher wages of more skilled workers demanded in the services value chain are an incentive for automation, but the increasing complexity of the tasks they carry out is a potential impediment to such automation. When viewed in more detail, however, it becomes apparent that some types of higher-value offshored services are more suitable for automation than others. In sum, it is difficult to make predictions about the future impacts of automation on offshore services provision in Latin America. However, it seems highly likely that demand for lower-skilled workers will decrease as providers move to business models which incorporate automation and fewer, more highly-skilled and highly-paid employees.
they can offer. Choosing to employ only low-wage workers, for instance, necessarily limits the skills that those employees can be expected to have and the complexity of activities that they can carry out without close supervision. This, in turn, limits providers to offering the most basic types of “back office” (internal) or “front office” (client-facing) business process outsourcing (BPO) services (see diagram II.2).
96 Economic Commission for Latin America and the Caribbean (ECLAC)Chapter II
B. Intermediate services in manufacturing exports are another key component of services trade
1. Intermediate services are a key driver of manufacturing export performance
The analysis in the previous section measuring services trade in gross value terms does not provide a complete picture of countries’ export performance in this sector. This is because many services are traded indirectly through their incorporation as intermediate inputs in exports of goods, a process termed the “servicification” of goods. To measure these indirect exports of services, the gross export values of those goods need to be decomposed into: (i) the value added generated in the particular goods sectors, and (ii) the value added incorporated from both domestic and imported other goods and services sectors as intermediate inputs.
Only recently has it become possible to decompose gross values into value added components, using inter-country input-output tables (IIOTs) such as the Trade in Value Added (TiVA) database of the Organization for Economic Cooperation and Development (OECD). This dataset covers 63 countries, including several developing economies from Asia and 7 countries in the region, with annual data between 1995 and 2011. Calculations using these data show that Latin American countries are very heterogeneous regarding the proportion of indirect to direct services exports, ranging from slightly more than 40% in Colombia to 160% in Mexico in 2011 (see figure II.13). In the case of Mexico, the large volume of indirectly exported services reflects their important role in the intertwining of the country’s manufacturing exports with United States manufacturing; this forms part of the set-up that gave rise to the term “Factory North America”. Asian developing economies showed similar differences in the proportion of indirect to direct services exports. Between 1995 and 2011, except in Chile, indirect exports became relatively more important for all the Latin American countries in the TiVA dataset, which may point to their increasing involvement in regional and global production networks —requiring higher services content— over this period.
A growing body of literature has shown that services are playing an increasing role in adding value to exports of natural resources and manufactures. There is mounting evidence of this “servicification” as a condition for successful export performance and diversification. In this chapter, the focus is on the role of services in the competitiveness of manufacturing exports.2
Manufacturing firms increasingly use different types of services at each stage of their value chains (see diagram II.3). This servicification has different origins (Lodefalk, 2017). First, several “cost” services are important to reduce expenditures, improve production efficiency and increase productivity (Arbache, Rouzet and Spinelli, 2016). Examples are transport and logistics, finance, ICT services, insurance, management, and renting and leasing of machinery, equipment and buildings. These services improve the coordination of the production process and save time and materials (Nordås, 2010; USITC, 2013). The importance of cost services increases with the length of supply chains. As many manufacturing firms do not consider these services part of their core competencies, they are often outsourced to specialized providers.
2 Services also play an increasingly large role in the exports of natural resources. However, large fluctuations of commodity prices over time produce strong variations in the services content, which are thus difficult to interpret.
The data show that Latin American countries are very heterogeneous regarding the proportion of indirect to direct services exports.
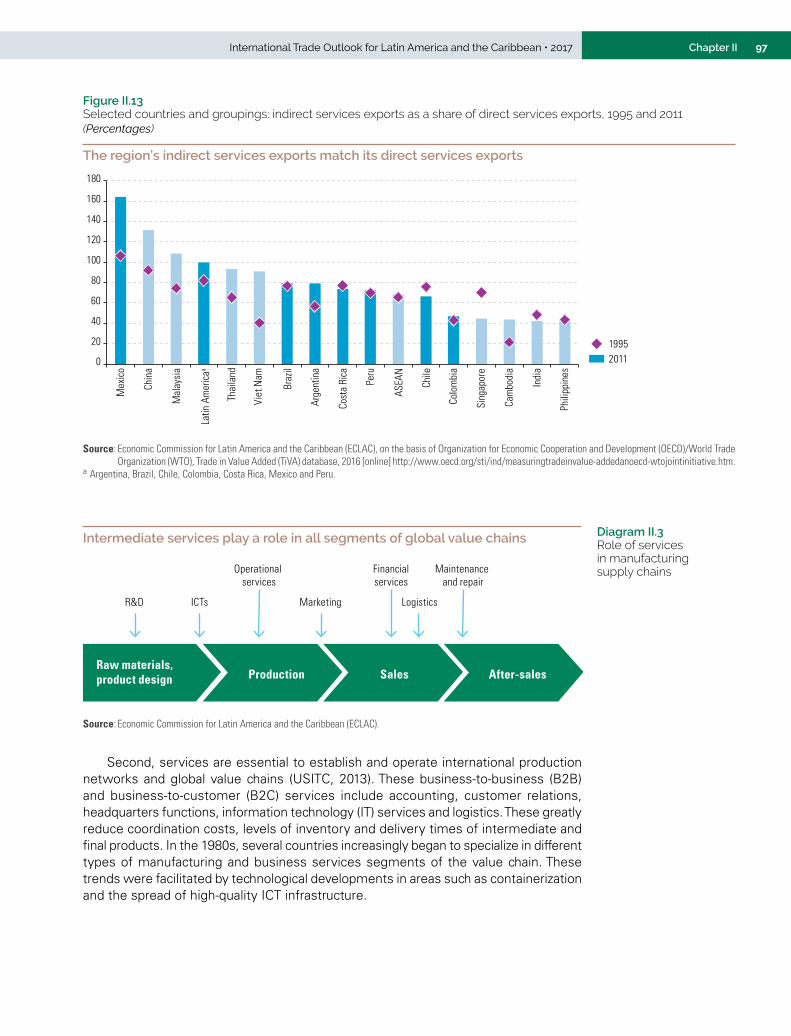
97International Trade Outlook for Latin America and the Caribbean • 2017 Chapter II
Figure II.13 Selected countries and groupings: indirect services exports as a share of direct services exports, 1995 and 2011(Percentages)
The region’s indirect services exports match its direct services exports
0
20
40
60
80
100
120
140
160
180
Mex
ico
Chin
a
Mal
aysi
a
Latin
Am
eric
aa
Thai
land
Viet
Nam
Braz
il
Arge
ntin
a
Cost
a Ri
ca
Peru
ASEA
N
Chile
Colo
mbi
a
Sing
apor
e
Cam
bodi
a
Indi
a
Phili
ppin
es
20111995
Source: Economic Commission for Latin America and the Caribbean (ECLAC), on the basis of Organization for Economic Cooperation and Development (OECD)/World Trade Organization (WTO), Trade in Value Added (TiVA) database, 2016 [online] http://www.oecd.org/sti/ind/measuringtradeinvalue-addedanoecd-wtojointinitiative.htm.
a Argentina, Brazil, Chile, Colombia, Costa Rica, Mexico and Peru.
Intermediate services play a role in all segments of global value chains
Raw materials, product design Production Sales After-sales
ICTs Marketing LogisticsR&D
Financialservices
Maintenance and repair
Operational services
Source: Economic Commission for Latin America and the Caribbean (ECLAC).
Second, services are essential to establish and operate international production networks and global value chains (USITC, 2013). These business-to-business (B2B) and business-to-customer (B2C) services include accounting, customer relations, headquarters functions, information technology (IT) services and logistics. These greatly reduce coordination costs, levels of inventory and delivery times of intermediate and final products. In the 1980s, several countries increasingly began to specialize in different types of manufacturing and business services segments of the value chain. These trends were facilitated by technological developments in areas such as containerization and the spread of high-quality ICT infrastructure.
Diagram II.3 Role of services in manufacturing supply chains
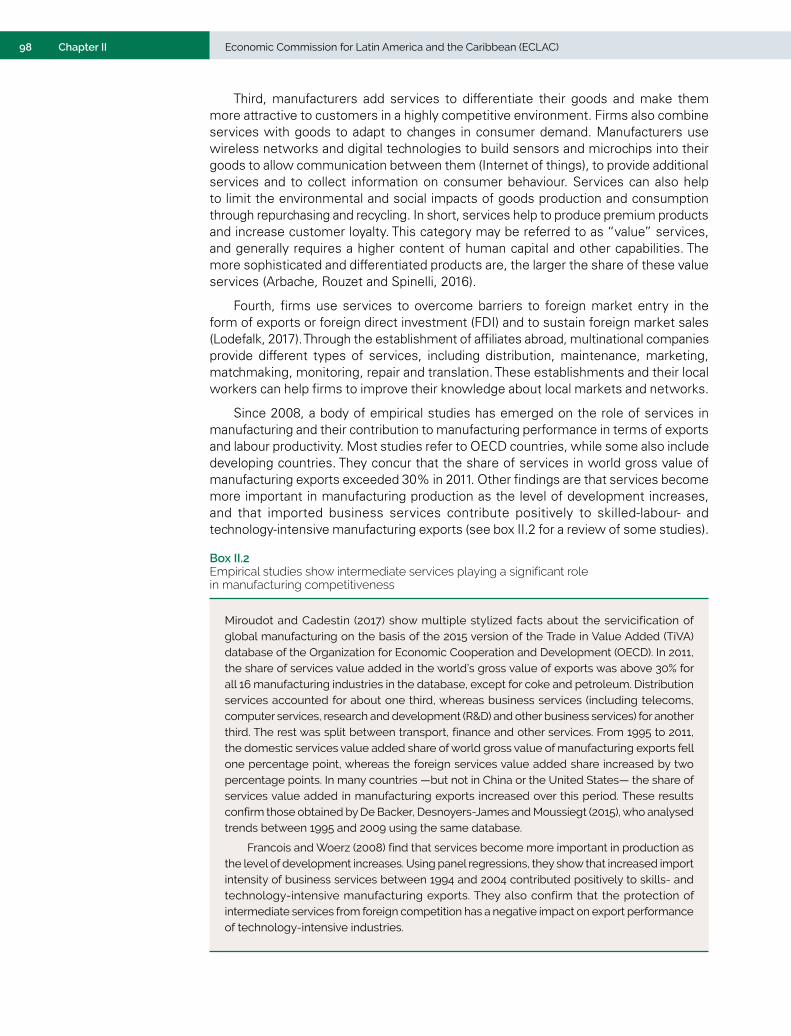
98 Economic Commission for Latin America and the Caribbean (ECLAC)Chapter II
Third, manufacturers add services to differentiate their goods and make them more attractive to customers in a highly competitive environment. Firms also combine services with goods to adapt to changes in consumer demand. Manufacturers use wireless networks and digital technologies to build sensors and microchips into their goods to allow communication between them (Internet of things), to provide additional services and to collect information on consumer behaviour. Services can also help to limit the environmental and social impacts of goods production and consumption through repurchasing and recycling. In short, services help to produce premium products and increase customer loyalty. This category may be referred to as “value” services, and generally requires a higher content of human capital and other capabilities. The more sophisticated and differentiated products are, the larger the share of these value services (Arbache, Rouzet and Spinelli, 2016).
Fourth, firms use services to overcome barriers to foreign market entry in the form of exports or foreign direct investment (FDI) and to sustain foreign market sales (Lodefalk, 2017). Through the establishment of affiliates abroad, multinational companies provide different types of services, including distribution, maintenance, marketing, matchmaking, monitoring, repair and translation. These establishments and their local workers can help firms to improve their knowledge about local markets and networks.
Since 2008, a body of empirical studies has emerged on the role of services in manufacturing and their contribution to manufacturing performance in terms of exports and labour productivity. Most studies refer to OECD countries, while some also include developing countries. They concur that the share of services in world gross value of manufacturing exports exceeded 30% in 2011. Other findings are that services become more important in manufacturing production as the level of development increases, and that imported business services contribute positively to skilled-labour- and technology-intensive manufacturing exports (see box II.2 for a review of some studies).
Box II.2 Empirical studies show intermediate services playing a significant role in manufacturing competitiveness
Miroudot and Cadestin (2017) show multiple stylized facts about the servicification of global manufacturing on the basis of the 2015 version of the Trade in Value Added (TiVA) database of the Organization for Economic Cooperation and Development (OECD). In 2011, the share of services value added in the world’s gross value of exports was above 30% for all 16 manufacturing industries in the database, except for coke and petroleum. Distribution services accounted for about one third, whereas business services (including telecoms, computer services, research and development (R&D) and other business services) for another third. The rest was split between transport, finance and other services. From 1995 to 2011, the domestic services value added share of world gross value of manufacturing exports fell one percentage point, whereas the foreign services value added share increased by two percentage points. In many countries —but not in China or the United States— the share of services value added in manufacturing exports increased over this period. These results confirm those obtained by De Backer, Desnoyers-James and Moussiegt (2015), who analysed trends between 1995 and 2009 using the same database.
Francois and Woerz (2008) find that services become more important in production as the level of development increases. Using panel regressions, they show that increased import intensity of business services between 1994 and 2004 contributed positively to skills- and technology-intensive manufacturing exports. They also confirm that the protection of intermediate services from foreign competition has a negative impact on export performance of technology-intensive industries.
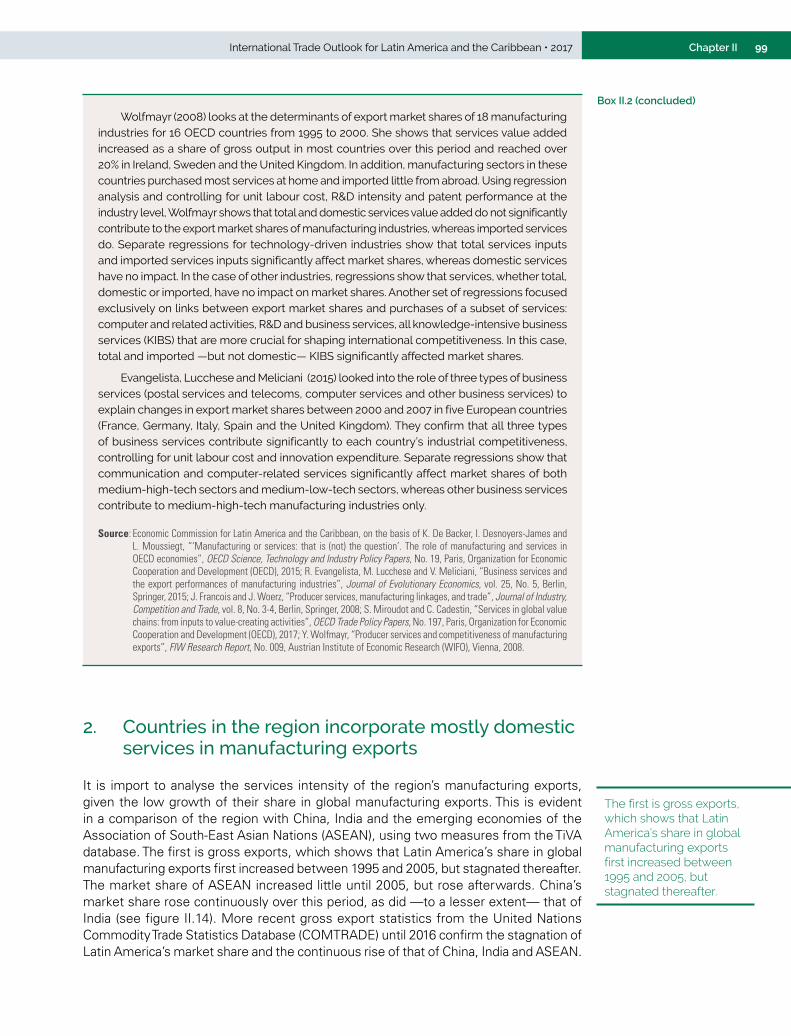
99International Trade Outlook for Latin America and the Caribbean • 2017 Chapter II
Wolfmayr (2008) looks at the determinants of export market shares of 18 manufacturing industries for 16 OECD countries from 1995 to 2000. She shows that services value added increased as a share of gross output in most countries over this period and reached over 20% in Ireland, Sweden and the United Kingdom. In addition, manufacturing sectors in these countries purchased most services at home and imported little from abroad. Using regression analysis and controlling for unit labour cost, R&D intensity and patent performance at the industry level, Wolfmayr shows that total and domestic services value added do not significantly contribute to the export market shares of manufacturing industries, whereas imported services do. Separate regressions for technology-driven industries show that total services inputs and imported services inputs significantly affect market shares, whereas domestic services have no impact. In the case of other industries, regressions show that services, whether total, domestic or imported, have no impact on market shares. Another set of regressions focused exclusively on links between export market shares and purchases of a subset of services: computer and related activities, R&D and business services, all knowledge-intensive business services (KIBS) that are more crucial for shaping international competitiveness. In this case, total and imported —but not domestic— KIBS significantly affected market shares.
Evangelista, Lucchese and Meliciani (2015) looked into the role of three types of business services (postal services and telecoms, computer services and other business services) to explain changes in export market shares between 2000 and 2007 in five European countries (France, Germany, Italy, Spain and the United Kingdom). They confirm that all three types of business services contribute significantly to each country’s industrial competitiveness, controlling for unit labour cost and innovation expenditure. Separate regressions show that communication and computer-related services significantly affect market shares of both medium-high-tech sectors and medium-low-tech sectors, whereas other business services contribute to medium-high-tech manufacturing industries only.
Source: Economic Commission for Latin America and the Caribbean, on the basis of K. De Backer, I. Desnoyers-James and L. Moussiegt, “‘Manufacturing or services: that is (not) the question’. The role of manufacturing and services in OECD economies”, OECD Science, Technology and Industry Policy Papers, No. 19, Paris, Organization for Economic Cooperation and Development (OECD), 2015; R. Evangelista, M. Lucchese and V. Meliciani, “Business services and the export performances of manufacturing industries”, Journal of Evolutionary Economics, vol. 25, No. 5, Berlin, Springer, 2015; J. Francois and J. Woerz, “Producer services, manufacturing linkages, and trade”, Journal of Industry, Competition and Trade, vol. 8, No. 3-4, Berlin, Springer, 2008; S. Miroudot and C. Cadestin, “Services in global value chains: from inputs to value-creating activities”, OECD Trade Policy Papers, No. 197, Paris, Organization for Economic Cooperation and Development (OECD), 2017; Y. Wolfmayr, “Producer services and competitiveness of manufacturing exports”, FIW Research Report, No. 009, Austrian Institute of Economic Research (WIFO), Vienna, 2008.
2. Countries in the region incorporate mostly domestic services in manufacturing exports
It is import to analyse the services intensity of the region’s manufacturing exports, given the low growth of their share in global manufacturing exports. This is evident in a comparison of the region with China, India and the emerging economies of the Association of South-East Asian Nations (ASEAN), using two measures from the TiVA database. The first is gross exports, which shows that Latin America’s share in global manufacturing exports first increased between 1995 and 2005, but stagnated thereafter. The market share of ASEAN increased little until 2005, but rose afterwards. China’s market share rose continuously over this period, as did —to a lesser extent— that of India (see figure II.14). More recent gross export statistics from the United Nations Commodity Trade Statistics Database (COMTRADE) until 2016 confirm the stagnation of Latin America’s market share and the continuous rise of that of China, India and ASEAN.
Box II.2 (concluded)
The first is gross exports, which shows that Latin America’s share in global manufacturing exports first increased between 1995 and 2005, but stagnated thereafter.
100 Economic Commission for Latin America and the Caribbean (ECLAC)Chapter II
Figure II.14 Latin America (7 countries), ASEAN (8 countries), China and India: share in world manufacturing exports, 1995, 2005 and 2011(Percentages)
Latin America’s market share in gross global manufacturing exports stagnated between 2005 and 2011
2011
1995
0
2
4
6
8
10
12
14
Grossexports
Value addedexports
Latin Americaa ASEANb China India
Grossexports
Value addedexports
Grossexports
Value addedexports
Grossexports
Value addedexports
2005
16
Source: Economic Commission for Latin America and the Caribbean (ECLAC), on the basis of Organization for Economic Cooperation and Development (OECD)/World Trade Organization (WTO), Trade in Value Added (TiVA) database, 2016 [online] http://www.oecd.org/sti/ind/measuringtradeinvalue-addedanoecd-wtojointinitiative.htm.
a Argentina, Brazil, Chile, Colombia, Costa Rica, Mexico and Peru. b Brunei Darussalam, Cambodia, Indonesia, Malaysia, Philippines, Singapore, Thailand and Viet Nam.
A second and more accurate measure of the “true” share of a country in global exports is its share in global value added exports, which equals gross exports minus imported intermediate inputs. This measure yields slightly lower shares in world manufacturing exports for all the countries and regions shown in figure II.14, because their manufacturing sectors have a higher imported content of intermediate inputs than the rest of the world. By this measure, Latin America’s share in the global exports market increased (by 0.7 percentage points) between 2005 and 2011, but less than that of ASEAN (1.0 percentage points) and China (4.6 percentage points).
Latin America’s underperformance compared to Asia is often attributed to South America’s growing export specialization in natural resources. This process was exacerbated by the fast-rising demand for these products by China and the rest of Asia as of the early 2000s. The region’s growing dependence on natural resources led to a stronger concentration of exports in terms of products and export firms. It also contributed to currency appreciation in several countries, which in turn increased the international prices of their manufactured goods and thus dampened their exports: a classic case of phenomenon known as Dutch Disease (Rodrik, 2015).
This section explores another possible explanation for the region’s stagnant performance in global manufacturing exports: the insufficient incorporation of domestic and foreign intermediate services. A comparison with Asian countries shows that some Latin American countries (Costa Rica and Brazil) had relatively high shares of incorporated services in 2011 (see figure II.15). By contrast, others (Colombia, Chile and Peru) had relatively low service shares, in part because they have a comparative advantage in
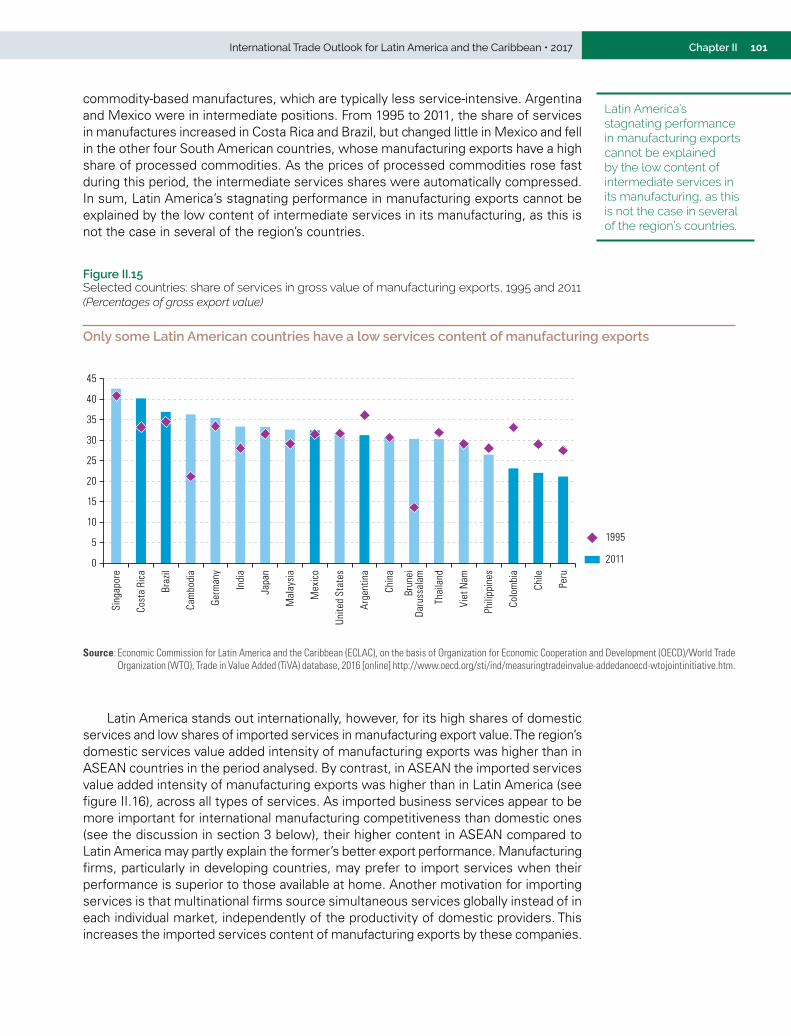
101International Trade Outlook for Latin America and the Caribbean • 2017 Chapter II
commodity-based manufactures, which are typically less service-intensive. Argentina and Mexico were in intermediate positions. From 1995 to 2011, the share of services in manufactures increased in Costa Rica and Brazil, but changed little in Mexico and fell in the other four South American countries, whose manufacturing exports have a high share of processed commodities. As the prices of processed commodities rose fast during this period, the intermediate services shares were automatically compressed. In sum, Latin America’s stagnating performance in manufacturing exports cannot be explained by the low content of intermediate services in its manufacturing, as this is not the case in several of the region’s countries.
Figure II.15 Selected countries: share of services in gross value of manufacturing exports, 1995 and 2011(Percentages of gross export value)
Only some Latin American countries have a low services content of manufacturing exports
0
5
10
15
20
25
30
35
40
45
Sing
apor
e
Cost
a Ri
ca
Braz
il
Cam
bodi
a
Germ
any
Indi
a
Japa
n
Mal
aysi
a
Mex
ico
Unite
d St
ates
Arge
ntin
a
Chin
a
Brun
eiDa
russ
alam
Thai
land
Viet
Nam
Phili
ppin
es
Colo
mbi
a
Chile
Peru
2011
1995
Source: Economic Commission for Latin America and the Caribbean (ECLAC), on the basis of Organization for Economic Cooperation and Development (OECD)/World Trade Organization (WTO), Trade in Value Added (TiVA) database, 2016 [online] http://www.oecd.org/sti/ind/measuringtradeinvalue-addedanoecd-wtojointinitiative.htm.
Latin America stands out internationally, however, for its high shares of domestic services and low shares of imported services in manufacturing export value. The region’s domestic services value added intensity of manufacturing exports was higher than in ASEAN countries in the period analysed. By contrast, in ASEAN the imported services value added intensity of manufacturing exports was higher than in Latin America (see figure II.16), across all types of services. As imported business services appear to be more important for international manufacturing competitiveness than domestic ones (see the discussion in section 3 below), their higher content in ASEAN compared to Latin America may partly explain the former’s better export performance. Manufacturing firms, particularly in developing countries, may prefer to import services when their performance is superior to those available at home. Another motivation for importing services is that multinational firms source simultaneous services globally instead of in each individual market, independently of the productivity of domestic providers. This increases the imported services content of manufacturing exports by these companies.
Latin America’s stagnating performance in manufacturing exports cannot be explained by the low content of intermediate services in its manufacturing, as this is not the case in several of the region’s countries.
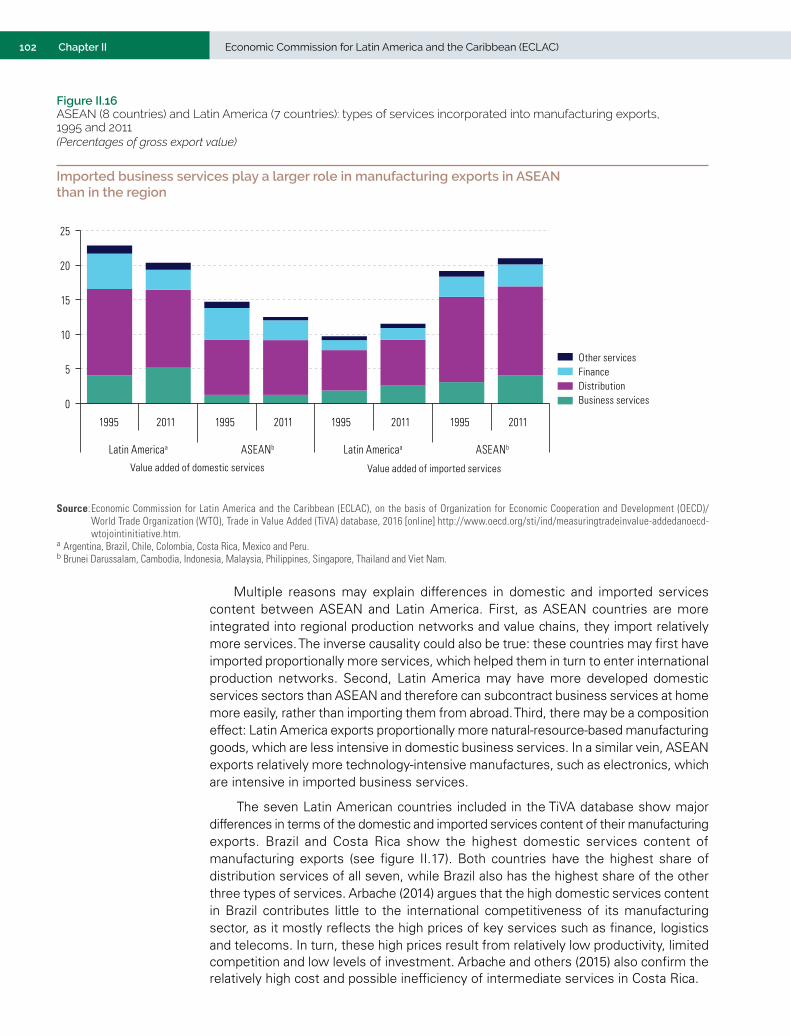
102 Economic Commission for Latin America and the Caribbean (ECLAC)Chapter II
Figure II.16 ASEAN (8 countries) and Latin America (7 countries): types of services incorporated into manufacturing exports, 1995 and 2011(Percentages of gross export value)
Imported business services play a larger role in manufacturing exports in ASEAN than in the region
0
5
10
15
20
25
1995 2011 1995 2011 1995 2011 1995 2011
Latin Americaa ASEANb Latin Americaa ASEANb
Value added of domestic services Value added of imported services
Business servicesDistributionFinanceOther services
Source: Economic Commission for Latin America and the Caribbean (ECLAC), on the basis of Organization for Economic Cooperation and Development (OECD)/World Trade Organization (WTO), Trade in Value Added (TiVA) database, 2016 [online] http://www.oecd.org/sti/ind/measuringtradeinvalue-addedanoecd-wtojointinitiative.htm.
a Argentina, Brazil, Chile, Colombia, Costa Rica, Mexico and Peru. b Brunei Darussalam, Cambodia, Indonesia, Malaysia, Philippines, Singapore, Thailand and Viet Nam.
Multiple reasons may explain differences in domestic and imported services content between ASEAN and Latin America. First, as ASEAN countries are more integrated into regional production networks and value chains, they import relatively more services. The inverse causality could also be true: these countries may first have imported proportionally more services, which helped them in turn to enter international production networks. Second, Latin America may have more developed domestic services sectors than ASEAN and therefore can subcontract business services at home more easily, rather than importing them from abroad. Third, there may be a composition effect: Latin America exports proportionally more natural-resource-based manufacturing goods, which are less intensive in domestic business services. In a similar vein, ASEAN exports relatively more technology-intensive manufactures, such as electronics, which are intensive in imported business services.
The seven Latin American countries included in the TiVA database show major differences in terms of the domestic and imported services content of their manufacturing exports. Brazil and Costa Rica show the highest domestic services content of manufacturing exports (see figure II.17). Both countries have the highest share of distribution services of all seven, while Brazil also has the highest share of the other three types of services. Arbache (2014) argues that the high domestic services content in Brazil contributes little to the international competitiveness of its manufacturing sector, as it mostly reflects the high prices of key services such as finance, logistics and telecoms. In turn, these high prices result from relatively low productivity, limited competition and low levels of investment. Arbache and others (2015) also confirm the relatively high cost and possible inefficiency of intermediate services in Costa Rica.
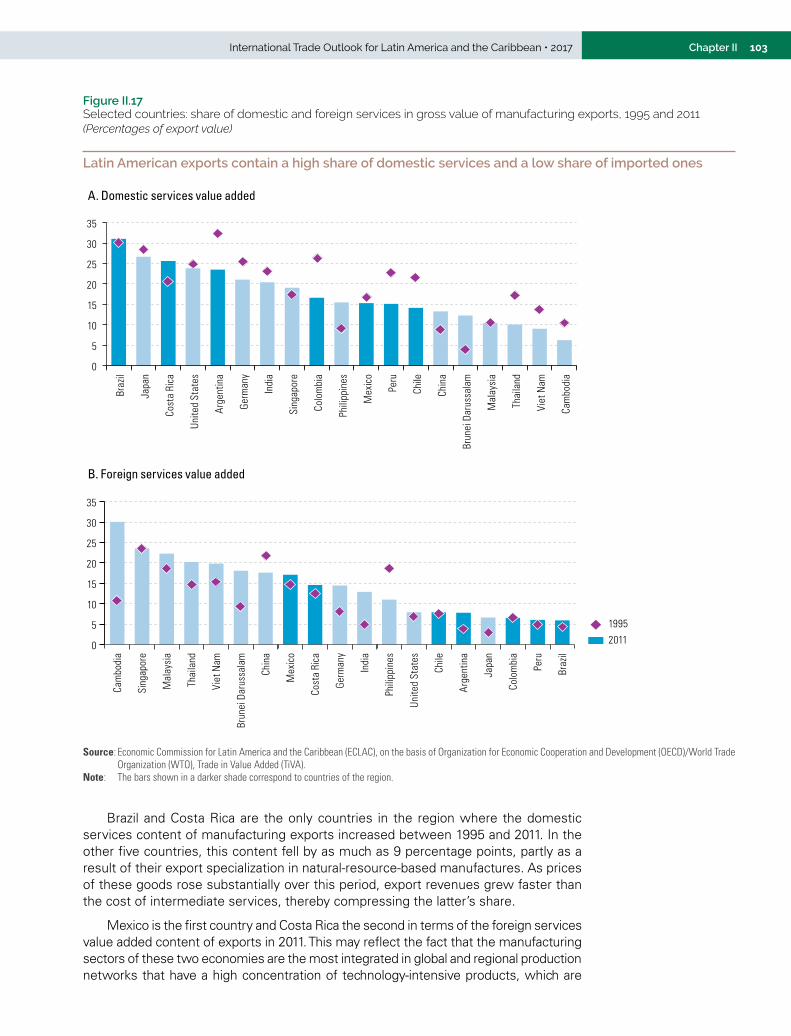
103International Trade Outlook for Latin America and the Caribbean • 2017 Chapter II
Figure II.17 Selected countries: share of domestic and foreign services in gross value of manufacturing exports, 1995 and 2011(Percentages of export value)
Latin American exports contain a high share of domestic services and a low share of imported ones
B. Foreign services value added
0
5
10
15
20
25
30
35
Braz
il
Japa
n
Cost
a Ri
ca
Unite
d St
ates
Arge
ntin
a
Germ
any
Indi
a
Sing
apor
e
Colo
mbi
a
Phili
ppin
es
Mex
ico
Peru
Chile
Chin
a
Brun
ei D
arus
sala
m
Mal
aysi
a
Thai
land
Viet
Nam
Cam
bodi
a
A. Domestic services value added
0
5
10
15
20
25
30
35
Cam
bodi
a
Sing
apor
e
Mal
aysi
a
Thai
land
Viet
Nam
Brun
ei D
arus
sala
m
Chin
a
Mex
ico
Cost
a Ri
ca
Germ
any
Indi
a
Phili
ppin
es
Unite
d St
ates
Chile
Arge
ntin
a
Japa
n
Colo
mbi
a
Peru
Braz
il
2011
1995
Source: Economic Commission for Latin America and the Caribbean (ECLAC), on the basis of Organization for Economic Cooperation and Development (OECD)/World Trade Organization (WTO), Trade in Value Added (TiVA).
Note: The bars shown in a darker shade correspond to countries of the region.
Brazil and Costa Rica are the only countries in the region where the domestic services content of manufacturing exports increased between 1995 and 2011. In the other five countries, this content fell by as much as 9 percentage points, partly as a result of their export specialization in natural-resource-based manufactures. As prices of these goods rose substantially over this period, export revenues grew faster than the cost of intermediate services, thereby compressing the latter’s share.
Mexico is the first country and Costa Rica the second in terms of the foreign services value added content of exports in 2011. This may reflect the fact that the manufacturing sectors of these two economies are the most integrated in global and regional production networks that have a high concentration of technology-intensive products, which are
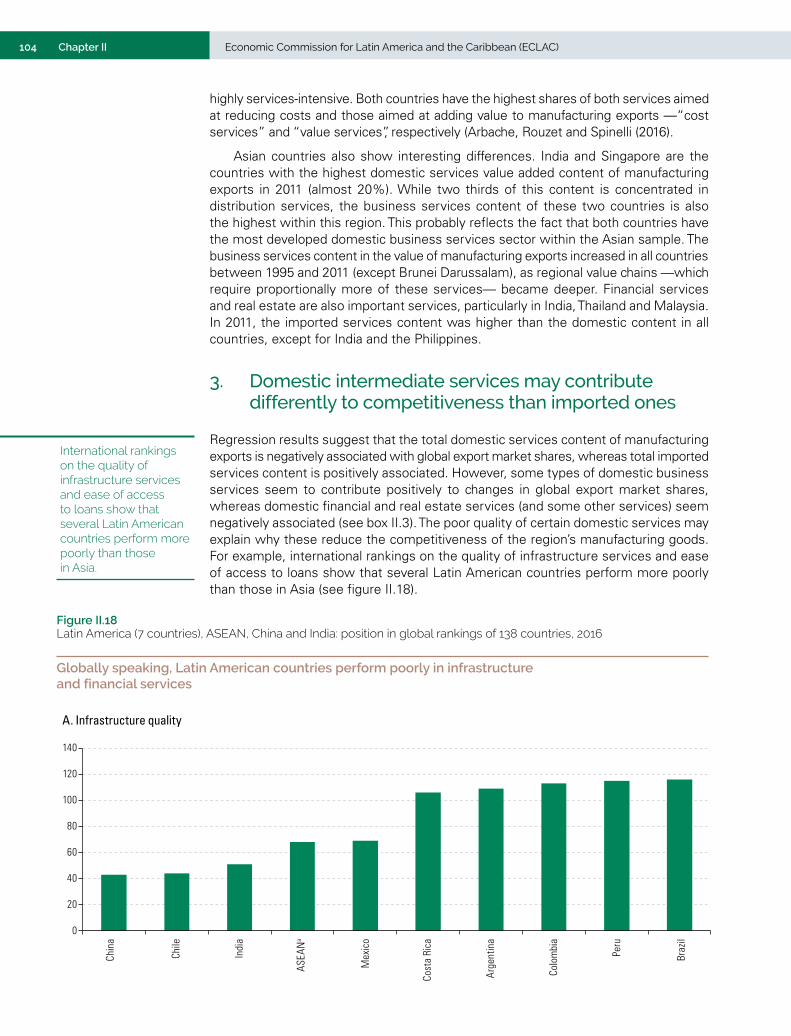
104 Economic Commission for Latin America and the Caribbean (ECLAC)Chapter II
highly services-intensive. Both countries have the highest shares of both services aimed at reducing costs and those aimed at adding value to manufacturing exports —“cost services” and “value services”, respectively (Arbache, Rouzet and Spinelli (2016).
Asian countries also show interesting differences. India and Singapore are the countries with the highest domestic services value added content of manufacturing exports in 2011 (almost 20%). While two thirds of this content is concentrated in distribution services, the business services content of these two countries is also the highest within this region. This probably reflects the fact that both countries have the most developed domestic business services sector within the Asian sample. The business services content in the value of manufacturing exports increased in all countries between 1995 and 2011 (except Brunei Darussalam), as regional value chains —which require proportionally more of these services— became deeper. Financial services and real estate are also important services, particularly in India, Thailand and Malaysia. In 2011, the imported services content was higher than the domestic content in all countries, except for India and the Philippines.
3. Domestic intermediate services may contribute differently to competitiveness than imported ones
Regression results suggest that the total domestic services content of manufacturing exports is negatively associated with global export market shares, whereas total imported services content is positively associated. However, some types of domestic business services seem to contribute positively to changes in global export market shares, whereas domestic financial and real estate services (and some other services) seem negatively associated (see box II.3). The poor quality of certain domestic services may explain why these reduce the competitiveness of the region’s manufacturing goods. For example, international rankings on the quality of infrastructure services and ease of access to loans show that several Latin American countries perform more poorly than those in Asia (see figure II.18).
Figure II.18 Latin America (7 countries), ASEAN, China and India: position in global rankings of 138 countries, 2016
Globally speaking, Latin American countries perform poorly in infrastructure and financial services
20
40
60
80
100
120
140
Chin
a
Chile
Indi
a
ASEA
Na
Mex
ico
Cost
a Ri
ca
Arge
ntin
a
Colo
mbi
a
Peru
Braz
il
0
A. Infrastructure quality
International rankings on the quality of infrastructure services and ease of access to loans show that several Latin American countries perform more poorly than those in Asia.
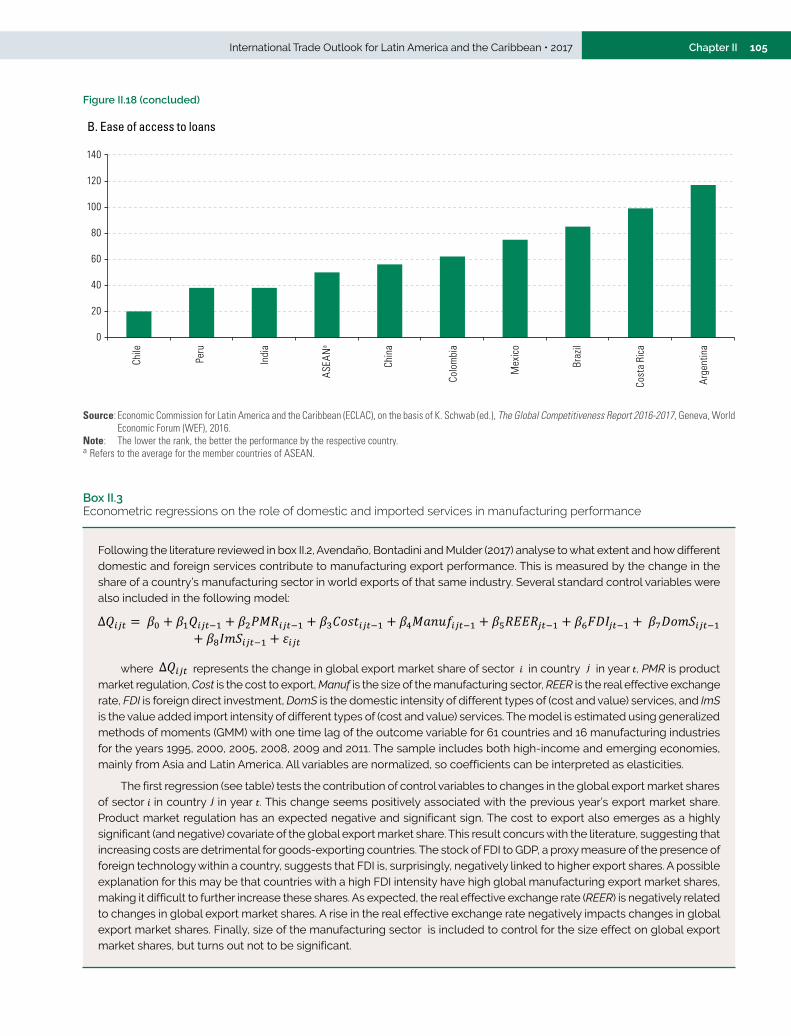
105International Trade Outlook for Latin America and the Caribbean • 2017 Chapter II
0
20
40
60
80
100
120
140
Chile
Peru
Indi
a
ASEA
Na
Chin
a
Colo
mbi
a
Mex
ico
Braz
il
Cost
a Ri
ca
Arge
ntin
a
B. Ease of access to loans
Source: Economic Commission for Latin America and the Caribbean (ECLAC), on the basis of K. Schwab (ed.), The Global Competitiveness Report 2016-2017, Geneva, World Economic Forum (WEF), 2016.
Note: The lower the rank, the better the performance by the respective country. a Refers to the average for the member countries of ASEAN.
Following the literature reviewed in box II.2, Avendaño, Bontadini and Mulder (2017) analyse to what extent and how different domestic and foreign services contribute to manufacturing export performance. This is measured by the change in the share of a country’s manufacturing sector in world exports of that same industry. Several standard control variables were also included in the following model:
where represents the change in global export market share of sector in country in year , PMR is product market regulation, Cost is the cost to export, Manuf is the size of the manufacturing sector, REER is the real effective exchange rate, FDI is foreign direct investment, DomS is the domestic intensity of different types of (cost and value) services, and ImS is the value added import intensity of different types of (cost and value) services. The model is estimated using generalized methods of moments (GMM) with one time lag of the outcome variable for 61 countries and 16 manufacturing industries for the years 1995, 2000, 2005, 2008, 2009 and 2011. The sample includes both high-income and emerging economies, mainly from Asia and Latin America. All variables are normalized, so coefficients can be interpreted as elasticities.
The first regression (see table) tests the contribution of control variables to changes in the global export market shares of sector in country in year . This change seems positively associated with the previous year’s export market share. Product market regulation has an expected negative and significant sign. The cost to export also emerges as a highly significant (and negative) covariate of the global export market share. This result concurs with the literature, suggesting that increasing costs are detrimental for goods-exporting countries. The stock of FDI to GDP, a proxy measure of the presence of foreign technology within a country, suggests that FDI is, surprisingly, negatively linked to higher export shares. A possible explanation for this may be that countries with a high FDI intensity have high global manufacturing export market shares, making it difficult to further increase these shares. As expected, the real effective exchange rate (REER) is negatively related to changes in global export market shares. A rise in the real effective exchange rate negatively impacts changes in global export market shares. Finally, size of the manufacturing sector is included to control for the size effect on global export market shares, but turns out not to be significant.
Box II.3 Econometric regressions on the role of domestic and imported services in manufacturing performance
Figure II.18 (concluded)
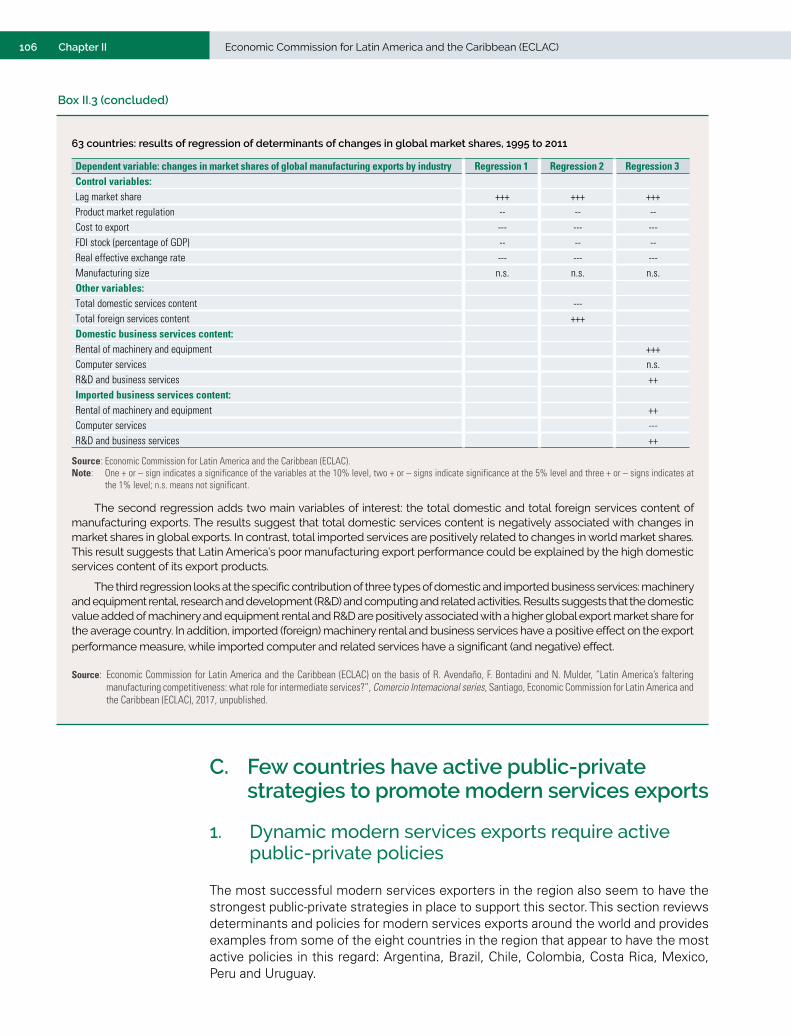
106 Economic Commission for Latin America and the Caribbean (ECLAC)Chapter II
Box II.3 (concluded)
C. Few countries have active public-private strategies to promote modern services exports
1. Dynamic modern services exports require active public-private policies
The most successful modern services exporters in the region also seem to have the strongest public-private strategies in place to support this sector. This section reviews determinants and policies for modern services exports around the world and provides examples from some of the eight countries in the region that appear to have the most active policies in this regard: Argentina, Brazil, Chile, Colombia, Costa Rica, Mexico, Peru and Uruguay.
63 countries: results of regression of determinants of changes in global market shares, 1995 to 2011
Dependent variable: changes in market shares of global manufacturing exports by industry Regression 1 Regression 2 Regression 3Control variables:Lag market share +++ +++ +++Product market regulation -- -- --Cost to export --- --- ---FDI stock (percentage of GDP) -- -- --Real effective exchange rate --- --- ---Manufacturing size n.s. n.s. n.s.Other variables:Total domestic services content ---Total foreign services content +++Domestic business services content: Rental of machinery and equipment +++Computer services n.s.R&D and business services ++Imported business services content: Rental of machinery and equipment ++Computer services ---R&D and business services ++
Source: Economic Commission for Latin America and the Caribbean (ECLAC). Note: One + or – sign indicates a significance of the variables at the 10% level, two + or – signs indicate significance at the 5% level and three + or – signs indicates at
the 1% level; n.s. means not significant.
The second regression adds two main variables of interest: the total domestic and total foreign services content of manufacturing exports. The results suggest that total domestic services content is negatively associated with changes in market shares in global exports. In contrast, total imported services are positively related to changes in world market shares. This result suggests that Latin America’s poor manufacturing export performance could be explained by the high domestic services content of its export products.
The third regression looks at the specific contribution of three types of domestic and imported business services: machinery and equipment rental, research and development (R&D) and computing and related activities. Results suggests that the domestic value added of machinery and equipment rental and R&D are positively associated with a higher global export market share for the average country. In addition, imported (foreign) machinery rental and business services have a positive effect on the export performance measure, while imported computer and related services have a significant (and negative) effect.
Source: Economic Commission for Latin America and the Caribbean (ECLAC) on the basis of R. Avendaño, F. Bontadini and N. Mulder, “Latin America’s faltering manufacturing competitiveness: what role for intermediate services?”, Comercio Internacional series, Santiago, Economic Commission for Latin America and the Caribbean (ECLAC), 2017, unpublished.
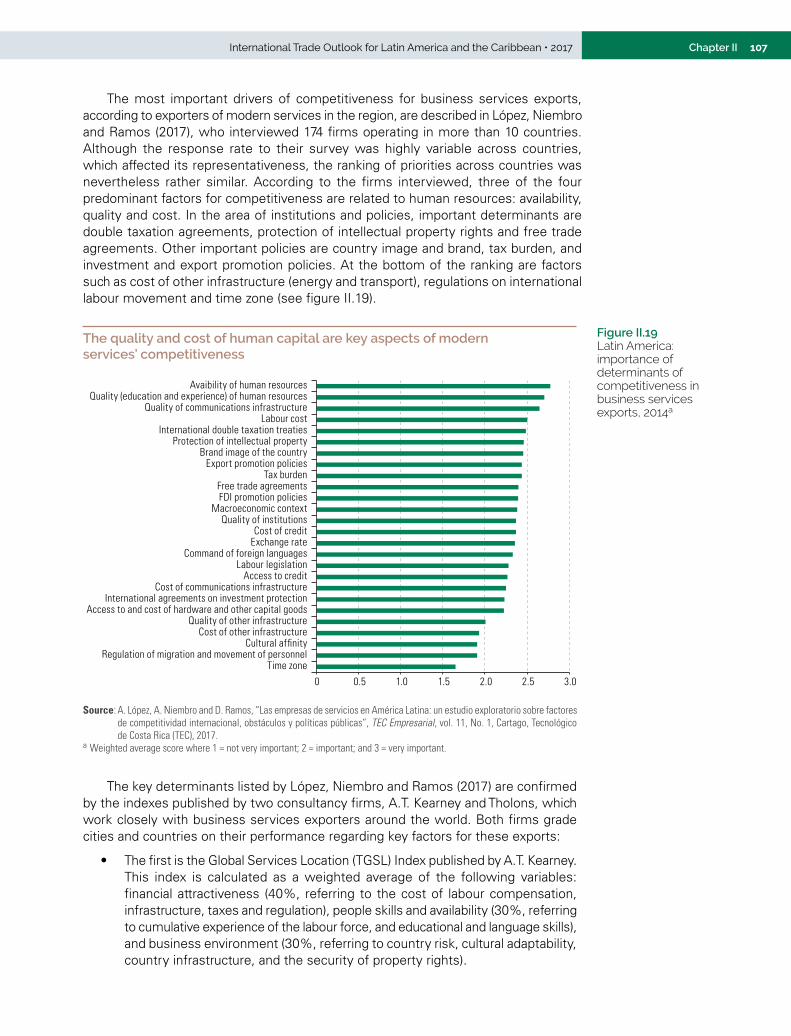
107International Trade Outlook for Latin America and the Caribbean • 2017 Chapter II
The most important drivers of competitiveness for business services exports, according to exporters of modern services in the region, are described in López, Niembro and Ramos (2017), who interviewed 174 firms operating in more than 10 countries. Although the response rate to their survey was highly variable across countries, which affected its representativeness, the ranking of priorities across countries was nevertheless rather similar. According to the firms interviewed, three of the four predominant factors for competitiveness are related to human resources: availability, quality and cost. In the area of institutions and policies, important determinants are double taxation agreements, protection of intellectual property rights and free trade agreements. Other important policies are country image and brand, tax burden, and investment and export promotion policies. At the bottom of the ranking are factors such as cost of other infrastructure (energy and transport), regulations on international labour movement and time zone (see figure II.19).
Figure II.19 Latin America: importance of determinants of competitiveness in business services exports, 2014a
The quality and cost of human capital are key aspects of modern services’ competitiveness
0.5 0 1.0 1.5 2.0 2.5 3.0
Time zoneRegulation of migration and movement of personnel
Cultural affinityCost of other infrastructure
Quality of other infrastructureAccess to and cost of hardware and other capital goods
International agreements on investment protectionCost of communications infrastructure
Access to creditLabour legislation
Command of foreign languagesExchange rateCost of credit
Quality of institutionsMacroeconomic context
FDI promotion policiesFree trade agreements
Tax burdenExport promotion policies
Brand image of the countryProtection of intellectual property
International double taxation treatiesLabour cost
Quality of communications infrastructureQuality (education and experience) of human resources
Avaibility of human resources
Source: A. López, A. Niembro and D. Ramos, “Las empresas de servicios en América Latina: un estudio exploratorio sobre factores de competitividad internacional, obstáculos y políticas públicas”, TEC Empresarial, vol. 11, No. 1, Cartago, Tecnológico de Costa Rica (TEC), 2017.
a Weighted average score where 1 = not very important; 2 = important; and 3 = very important.
The key determinants listed by López, Niembro and Ramos (2017) are confirmed by the indexes published by two consultancy firms, A.T. Kearney and Tholons, which work closely with business services exporters around the world. Both firms grade cities and countries on their performance regarding key factors for these exports:
• The first is the Global Services Location (TGSL) Index published by A.T. Kearney. This index is calculated as a weighted average of the following variables: financial attractiveness (40%, referring to the cost of labour compensation, infrastructure, taxes and regulation), people skills and availability (30%, referring to cumulative experience of the labour force, and educational and language skills), and business environment (30%, referring to country risk, cultural adaptability, country infrastructure, and the security of property rights).
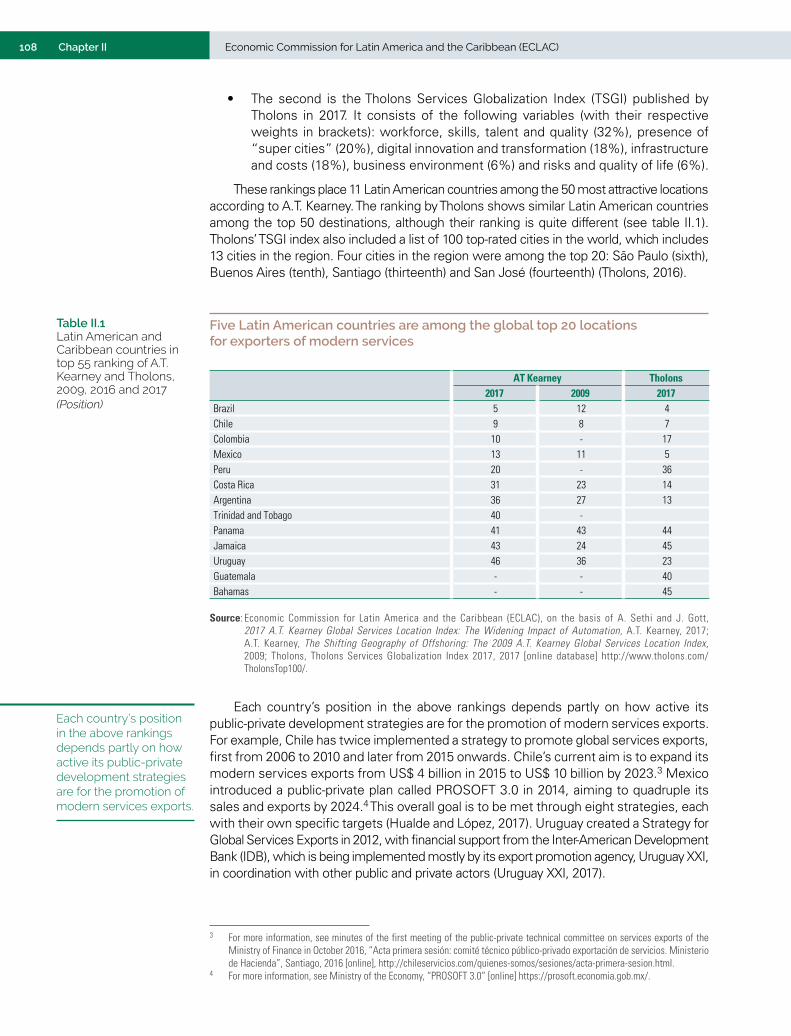
108 Economic Commission for Latin America and the Caribbean (ECLAC)Chapter II
• The second is the Tholons Services Globalization Index (TSGI) published by Tholons in 2017. It consists of the following variables (with their respective weights in brackets): workforce, skills, talent and quality (32%), presence of “super cities” (20%), digital innovation and transformation (18%), infrastructure and costs (18%), business environment (6%) and risks and quality of life (6%).
These rankings place 11 Latin American countries among the 50 most attractive locations according to A.T. Kearney. The ranking by Tholons shows similar Latin American countries among the top 50 destinations, although their ranking is quite different (see table II.1). Tholons’ TSGI index also included a list of 100 top-rated cities in the world, which includes 13 cities in the region. Four cities in the region were among the top 20: São Paulo (sixth), Buenos Aires (tenth), Santiago (thirteenth) and San José (fourteenth) (Tholons, 2016).
Table II.1 Latin American and Caribbean countries in top 55 ranking of A.T. Kearney and Tholons, 2009, 2016 and 2017(Position)
Five Latin American countries are among the global top 20 locations for exporters of modern services
AT Kearney Tholons2017 2009 2017
Brazil 5 12 4 Chile 9 8 7 Colombia 10 - 17 Mexico 13 11 5 Peru 20 - 36 Costa Rica 31 23 14 Argentina 36 27 13 Trinidad and Tobago 40 - Panama 41 43 44 Jamaica 43 24 45 Uruguay 46 36 23 Guatemala - - 40 Bahamas - - 45
Source: Economic Commission for Latin America and the Caribbean (ECLAC), on the basis of A. Sethi and J. Gott, 2017 A.T. Kearney Global Services Location Index: The Widening Impact of Automation, A.T. Kearney, 2017; A.T. Kearney, The Shifting Geography of Offshoring: The 2009 A.T. Kearney Global Services Location Index, 2009; Tholons, Tholons Services Globalization Index 2017, 2017 [online database] http://www.tholons.com/ TholonsTop100/.
Each country’s position in the above rankings depends partly on how active its public-private development strategies are for the promotion of modern services exports. For example, Chile has twice implemented a strategy to promote global services exports, first from 2006 to 2010 and later from 2015 onwards. Chile’s current aim is to expand its modern services exports from US$ 4 billion in 2015 to US$ 10 billion by 2023.3 Mexico introduced a public-private plan called PROSOFT 3.0 in 2014, aiming to quadruple its sales and exports by 2024.4 This overall goal is to be met through eight strategies, each with their own specific targets (Hualde and López, 2017). Uruguay created a Strategy for Global Services Exports in 2012, with financial support from the Inter-American Development Bank (IDB), which is being implemented mostly by its export promotion agency, Uruguay XXI, in coordination with other public and private actors (Uruguay XXI, 2017).
3 For more information, see minutes of the first meeting of the public-private technical committee on services exports of the Ministry of Finance in October 2016, “Acta primera sesión: comité técnico público-privado exportación de servicios. Ministerio de Hacienda”, Santiago, 2016 [online], http://chileservicios.com/quienes-somos/sesiones/acta-primera-sesion.html.
4 For more information, see Ministry of the Economy, “PROSOFT 3.0” [online] https://prosoft.economia.gob.mx/.
Each country’s position in the above rankings depends partly on how active its public-private development strategies are for the promotion of modern services exports.
109International Trade Outlook for Latin America and the Caribbean • 2017 Chapter II
Other countries have also set medium-term services export goals. For example, in Colombia, the Productive Transformation Programme implemented in 2009 established goals for 2019 for two modern services sectors: exports of US$ 3.3 billion in software and IT services, and of US$ 6.4 billion in offshore services in the areas of business process outsourcing (BPO), information technology outsourcing (ITO) and knowledge process outsourcing (KPO).5 In 2015, Peru set a goal to increase exports of business services from US$ 540 million that year to US$ 3.6 billion by 2025, in an effort supported mainly through its export agency PROMPERÚ (Quindimil, 2017).
The availability and cost of human capital is probably one of the most important drivers of export success in modern services, as highlighted by López (2016), A.T. Kearney and Tholons. This includes the availability of skilled workers at reasonable cost. To better respond to the needs of modern service exporters, some countries in the region, such as Costa Rica, have created a specific public-private-academic committee to oversee the needs of the global services industry and the development of new university careers and shorter courses and the adaptation of existing ones.
Other countries, such as Argentina and Chile, have set specific goals for the university training of professionals in areas where there is particular need, such as computer programmers (111,000 in Argentina and 2,000 in Chile in 2016 and 2017) (López, 2016), with students enrolling in these courses receiving tuition waivers or special scholarships. Under the PROSOFT 3.0 programme, Mexico intends to meet 90% of all talent demand from IT companies by 2024, by increasing enrolment in IT-related courses, linking internships with universities, increasing enrolment in mass open online courses (MOOC) and training the existing work force to enter the IT sector (Hualde and López, 2017).
Another example is specialized tripartite (public-private-academic) courses to bridge specific knowledge and skills gaps between university courses and industry needs. These programmes, known as “finishing schools” have been implemented in several countries in the region. In Uruguay, finishing schools are co-financed with a subsidy covering up to 70% of customized training programmes for global service companies interested in establishing themselves in the country or expanding their operations (Uruguay XXI, 2017). Costa Rica and Colombia have also set up finishing schools. García and Bafundo (2014) identified several best practices for finishing schools: they should be flexible and adapted to specific needs, focus on both technical and soft skills, and be implemented using an integrated approach in which all parties participate. In several countries, courses are also offered to improve language skills, in particular in English.
Workforce and enterprise certification is an important complement to education and training policies. Certification focuses on two areas. The first is certification of workers’ skills in IT, software development, programming and languages. The second is certification of firms regarding compliance with international production standards and measures that facilitate their integration in international value chains.
The governments of all the countries reviewed have instruments to promote the certification of workers and firms. Argentina has a fund called PRESOFT, which provides a subsidy to finance certifications for small and medium-sized enterprises (SMEs) producing software (López, 2016). Brazil devised a system, called Brasil IT+, which certifies software programs and developers and allows them, in turn, to benefit from preference margins of 18% in government tenders. In Costa Rica, multinational firms work closely with universities and national training institutes to promote worker certification. Almost three quarters of BPO firms’ employees are studying to obtain
5 For more information, see Ministry of Trade, Industry and Tourism, “Productive Transformation Programme” [online] www.ptp.com.co.
110 Economic Commission for Latin America and the Caribbean (ECLAC)Chapter II
a university degree and many firms pay for their employees’ technical and language skills training. In Uruguay, the public sector supports the testing, certification and maintenance of software, as well as training and advisory services.
Tax breaks and concessions are another important instrument for attracting multinational firms and supporting the international expansion of modern services. Some countries have eased the taxation burden on services exporters by reducing or eliminating certain taxes, providing tax breaks on social security charges, easing filing and reclaiming procedures, redistributing value added tax (VAT) proceeds, and promoting special tax regimes. The creation of free trade zones (FTZs) is probably the largest fiscal incentive to attract foreign investors and promote service exporters. Within the region, Costa Rica, the Dominican Republic and Uruguay have created FTZs to promote global services exports. In Costa Rica, service exporters are exempted from most taxes for eight years and pay only half during the following four. Further renewal periods of eight years are granted if significant new investments are made.6 In Uruguay, offshore service companies in FTZs are exempted from all national taxes, except from social security payments and taxes on dividend payments (Uruguay XXI, 2017).
Several countries offer partial tax exemptions. Argentina offers a 60% reduction in income tax to exporters of software. In Brazil, modern services exporters pay a range of federal, state and municipal taxes, but can also deduct up to half of social security contributions. Moreover, tax exemptions apply to the import of software development inputs and technology transfers, licences and royalties; expenses for staff training and development and R&D can be deducted from income tax; and some municipalities offer additional tax incentives. In Chile, companies can deduct taxes paid abroad from taxes paid within the country where no double taxation treaty exists. In Mexico, exports of business services are VAT-exempt and part of R&D expenditures is tax deductible, while cash grants are offered for new investments (Tucker, 2015).
Double taxation treaties are another instrument used to avoid service exporters having to pay taxes in both the home and destination countries. Countries in the region vary considerably in terms of the number of such treaties. Costa Rica has the fewest, perhaps because most of its modern services exports originate in FTZs, where companies pay little or no taxes anyway. Argentina, Brazil and Chile have the highest number of agreements with other countries in the region, as well as with Europe and Asia (see table II.2).
Some countries have designed specific support instruments to promote modern services exports. In 2015, Brazil launched its National Export Plan 2015-2018, which focuses on 18 strategic markets and has specific instruments to promote modern services exports. Chile promotes its own country brand and has specific instruments and a team dedicated to increasing its services exports within its export promotion agency, ProChile. In Colombia, ProColombia has designed special programmes for the promotion of BPO, ITO and KPO service companies, including through the provision of buildings with operators that provide specialized services (communications, energy, security and mass transport for example) to exporting firms.
6 For more information, see Costa Rica’s FDI attraction agency Coalición Costarricense de Iniciativas de Desarrollo (CINDE) [online] http://www.cinde.org/en/sectors/services.
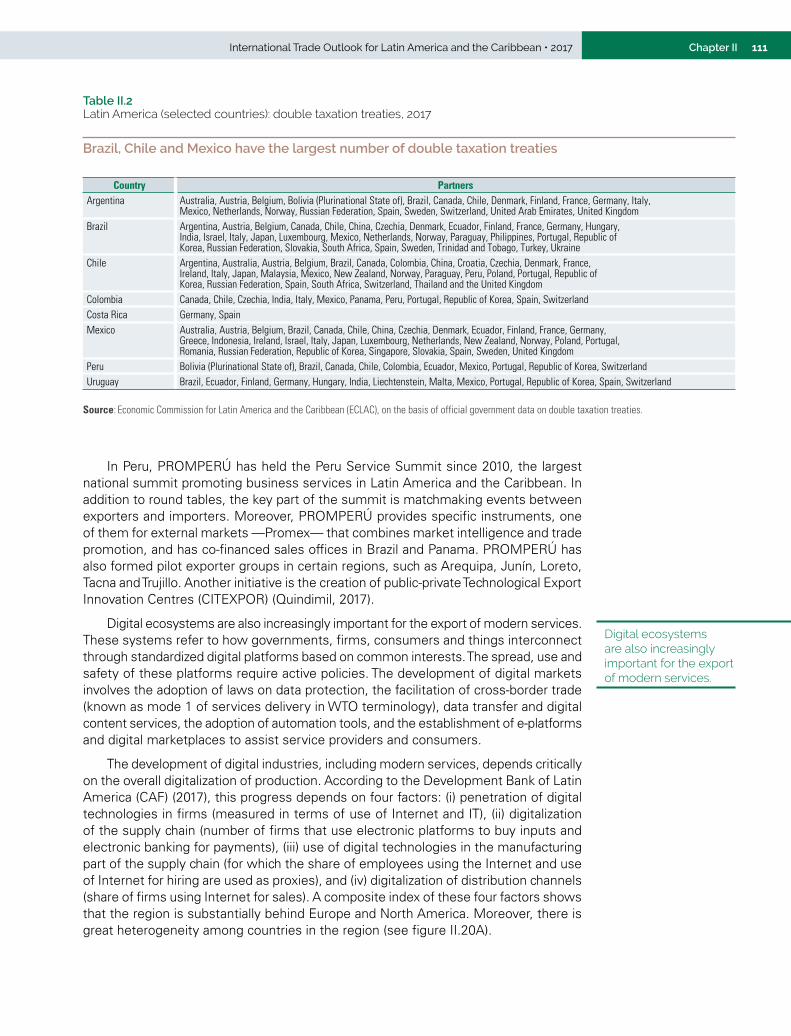
111International Trade Outlook for Latin America and the Caribbean • 2017 Chapter II
Table II.2 Latin America (selected countries): double taxation treaties, 2017
Brazil, Chile and Mexico have the largest number of double taxation treaties
Country PartnersArgentina Australia, Austria, Belgium, Bolivia (Plurinational State of), Brazil, Canada, Chile, Denmark, Finland, France, Germany, Italy,
Mexico, Netherlands, Norway, Russian Federation, Spain, Sweden, Switzerland, United Arab Emirates, United KingdomBrazil Argentina, Austria, Belgium, Canada, Chile, China, Czechia, Denmark, Ecuador, Finland, France, Germany, Hungary,
India, Israel, Italy, Japan, Luxembourg, Mexico, Netherlands, Norway, Paraguay, Philippines, Portugal, Republic of Korea, Russian Federation, Slovakia, South Africa, Spain, Sweden, Trinidad and Tobago, Turkey, Ukraine
Chile Argentina, Australia, Austria, Belgium, Brazil, Canada, Colombia, China, Croatia, Czechia, Denmark, France, Ireland, Italy, Japan, Malaysia, Mexico, New Zealand, Norway, Paraguay, Peru, Poland, Portugal, Republic of Korea, Russian Federation, Spain, South Africa, Switzerland, Thailand and the United Kingdom
Colombia Canada, Chile, Czechia, India, Italy, Mexico, Panama, Peru, Portugal, Republic of Korea, Spain, SwitzerlandCosta Rica Germany, SpainMexico Australia, Austria, Belgium, Brazil, Canada, Chile, China, Czechia, Denmark, Ecuador, Finland, France, Germany,
Greece, Indonesia, Ireland, Israel, Italy, Japan, Luxembourg, Netherlands, New Zealand, Norway, Poland, Portugal, Romania, Russian Federation, Republic of Korea, Singapore, Slovakia, Spain, Sweden, United Kingdom
Peru Bolivia (Plurinational State of), Brazil, Canada, Chile, Colombia, Ecuador, Mexico, Portugal, Republic of Korea, SwitzerlandUruguay Brazil, Ecuador, Finland, Germany, Hungary, India, Liechtenstein, Malta, Mexico, Portugal, Republic of Korea, Spain, Switzerland
Source: Economic Commission for Latin America and the Caribbean (ECLAC), on the basis of official government data on double taxation treaties.
In Peru, PROMPERÚ has held the Peru Service Summit since 2010, the largest national summit promoting business services in Latin America and the Caribbean. In addition to round tables, the key part of the summit is matchmaking events between exporters and importers. Moreover, PROMPERÚ provides specific instruments, one of them for external markets —Promex— that combines market intelligence and trade promotion, and has co-financed sales offices in Brazil and Panama. PROMPERÚ has also formed pilot exporter groups in certain regions, such as Arequipa, Junín, Loreto, Tacna and Trujillo. Another initiative is the creation of public-private Technological Export Innovation Centres (CITEXPOR) (Quindimil, 2017).
Digital ecosystems are also increasingly important for the export of modern services. These systems refer to how governments, firms, consumers and things interconnect through standardized digital platforms based on common interests. The spread, use and safety of these platforms require active policies. The development of digital markets involves the adoption of laws on data protection, the facilitation of cross-border trade (known as mode 1 of services delivery in WTO terminology), data transfer and digital content services, the adoption of automation tools, and the establishment of e-platforms and digital marketplaces to assist service providers and consumers.
The development of digital industries, including modern services, depends critically on the overall digitalization of production. According to the Development Bank of Latin America (CAF) (2017), this progress depends on four factors: (i) penetration of digital technologies in firms (measured in terms of use of Internet and IT), (ii) digitalization of the supply chain (number of firms that use electronic platforms to buy inputs and electronic banking for payments), (iii) use of digital technologies in the manufacturing part of the supply chain (for which the share of employees using the Internet and use of Internet for hiring are used as proxies), and (iv) digitalization of distribution channels (share of firms using Internet for sales). A composite index of these four factors shows that the region is substantially behind Europe and North America. Moreover, there is great heterogeneity among countries in the region (see figure II.20A).
Digital ecosystems are also increasingly important for the export of modern services.
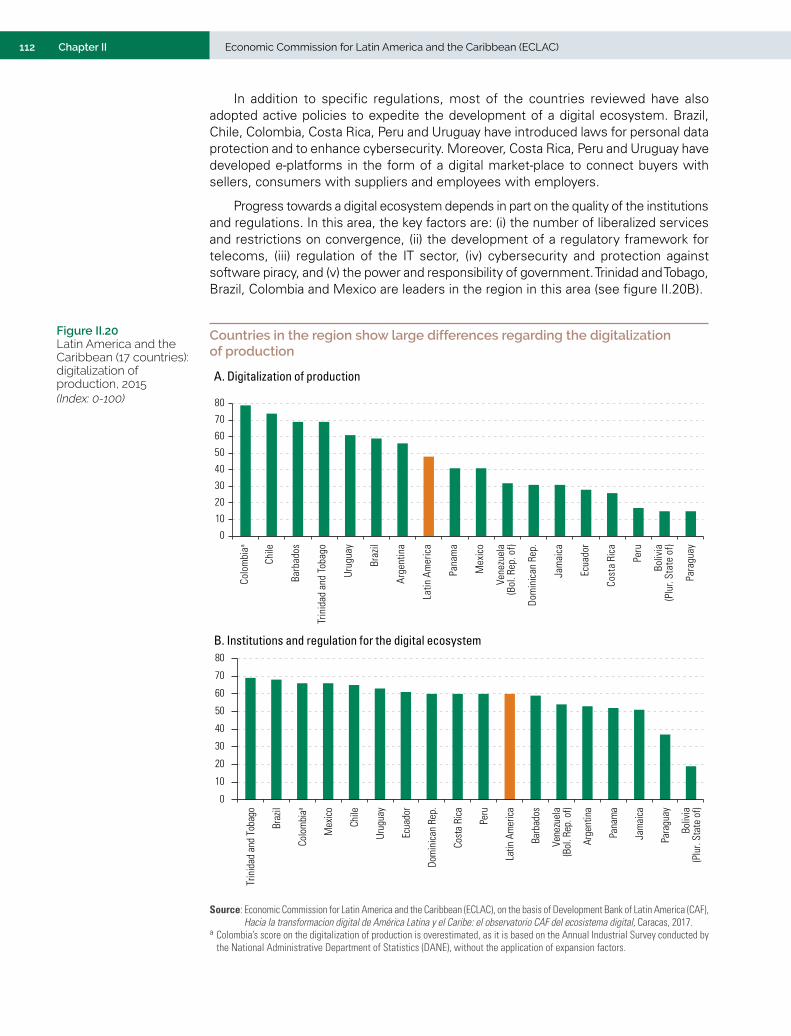
112 Economic Commission for Latin America and the Caribbean (ECLAC)Chapter II
In addition to specific regulations, most of the countries reviewed have also adopted active policies to expedite the development of a digital ecosystem. Brazil, Chile, Colombia, Costa Rica, Peru and Uruguay have introduced laws for personal data protection and to enhance cybersecurity. Moreover, Costa Rica, Peru and Uruguay have developed e-platforms in the form of a digital market-place to connect buyers with sellers, consumers with suppliers and employees with employers.
Progress towards a digital ecosystem depends in part on the quality of the institutions and regulations. In this area, the key factors are: (i) the number of liberalized services and restrictions on convergence, (ii) the development of a regulatory framework for telecoms, (iii) regulation of the IT sector, (iv) cybersecurity and protection against software piracy, and (v) the power and responsibility of government. Trinidad and Tobago, Brazil, Colombia and Mexico are leaders in the region in this area (see figure II.20B).
Figure II.20 Latin America and the Caribbean (17 countries): digitalization of production, 2015(Index: 0-100)
Countries in the region show large differences regarding the digitalization of production
A. Digitalization of production
0
10
20
30
40
50
60
70
80
Colo
mbi
aa
Chile
Barb
ados
Trin
idad
and
Tob
ago
Urug
uay
Braz
il
Arge
ntin
a
Latin
Am
eric
a
Pana
ma
Mex
ico
Vene
zuel
a(B
ol. R
ep. o
f)
Dom
inic
an R
ep.
Jam
aica
Ecua
dor
Cost
a Ri
ca
Peru
Boliv
ia(P
lur.
Stat
e of
)
Para
guay
B. Institutions and regulation for the digital ecosystem
0
10
20
30
40
50
60
70
80
Trin
idad
and
Tob
ago
Braz
il
Colo
mbi
aa
Mex
ico
Chile
Urug
uay
Ecua
dor
Dom
inic
an R
ep.
Cost
a Ri
ca
Peru
Latin
Am
eric
a
Barb
ados
Vene
zuel
a(B
ol. R
ep. o
f)
Arge
ntin
a
Pana
ma
Jam
aica
Para
guay
Boliv
ia(P
lur.
Stat
e of
)
Source: Economic Commission for Latin America and the Caribbean (ECLAC), on the basis of Development Bank of Latin America (CAF), Hacia la transformacion digital de América Latina y el Caribe: el observatorio CAF del ecosistema digital, Caracas, 2017.
a Colombia’s score on the digitalization of production is overestimated, as it is based on the Annual Industrial Survey conducted by the National Administrative Department of Statistics (DANE), without the application of expansion factors.
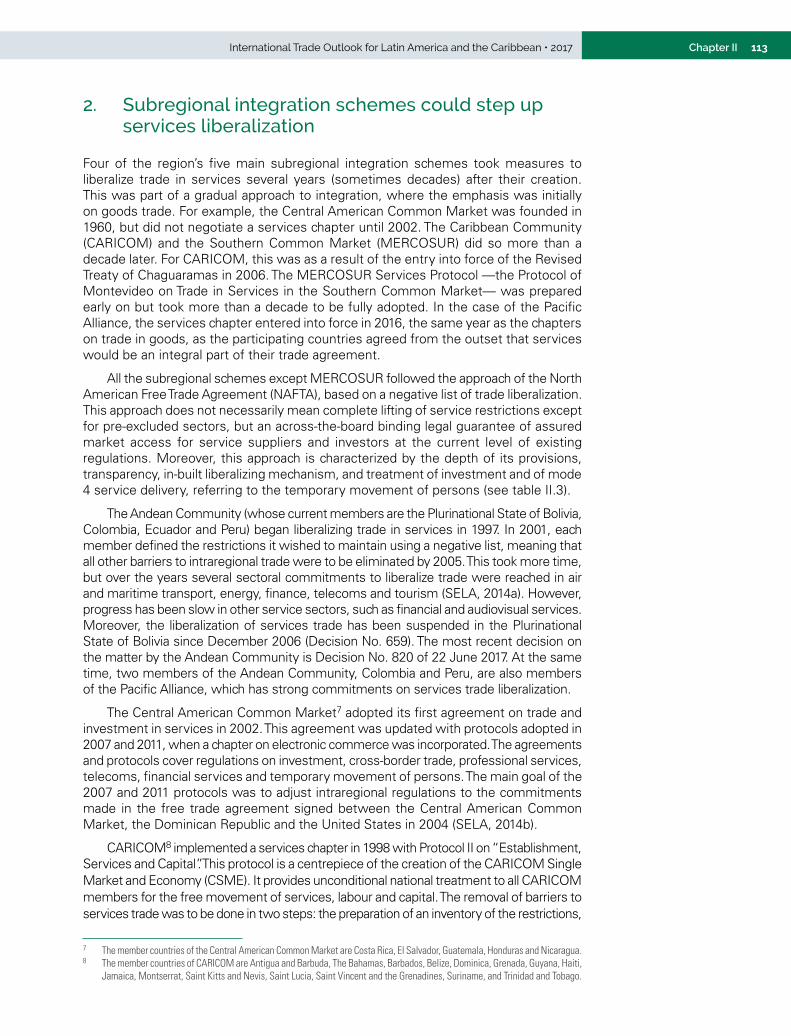
113International Trade Outlook for Latin America and the Caribbean • 2017 Chapter II
2. Subregional integration schemes could step up services liberalization
Four of the region’s five main subregional integration schemes took measures to liberalize trade in services several years (sometimes decades) after their creation. This was part of a gradual approach to integration, where the emphasis was initially on goods trade. For example, the Central American Common Market was founded in 1960, but did not negotiate a services chapter until 2002. The Caribbean Community (CARICOM) and the Southern Common Market (MERCOSUR) did so more than a decade later. For CARICOM, this was as a result of the entry into force of the Revised Treaty of Chaguaramas in 2006. The MERCOSUR Services Protocol —the Protocol of Montevideo on Trade in Services in the Southern Common Market— was prepared early on but took more than a decade to be fully adopted. In the case of the Pacific Alliance, the services chapter entered into force in 2016, the same year as the chapters on trade in goods, as the participating countries agreed from the outset that services would be an integral part of their trade agreement.
All the subregional schemes except MERCOSUR followed the approach of the North American Free Trade Agreement (NAFTA), based on a negative list of trade liberalization. This approach does not necessarily mean complete lifting of service restrictions except for pre-excluded sectors, but an across-the-board binding legal guarantee of assured market access for service suppliers and investors at the current level of existing regulations. Moreover, this approach is characterized by the depth of its provisions, transparency, in-built liberalizing mechanism, and treatment of investment and of mode 4 service delivery, referring to the temporary movement of persons (see table II.3).
The Andean Community (whose current members are the Plurinational State of Bolivia, Colombia, Ecuador and Peru) began liberalizing trade in services in 1997. In 2001, each member defined the restrictions it wished to maintain using a negative list, meaning that all other barriers to intraregional trade were to be eliminated by 2005. This took more time, but over the years several sectoral commitments to liberalize trade were reached in air and maritime transport, energy, finance, telecoms and tourism (SELA, 2014a). However, progress has been slow in other service sectors, such as financial and audiovisual services. Moreover, the liberalization of services trade has been suspended in the Plurinational State of Bolivia since December 2006 (Decision No. 659). The most recent decision on the matter by the Andean Community is Decision No. 820 of 22 June 2017. At the same time, two members of the Andean Community, Colombia and Peru, are also members of the Pacific Alliance, which has strong commitments on services trade liberalization.
The Central American Common Market7 adopted its first agreement on trade and investment in services in 2002. This agreement was updated with protocols adopted in 2007 and 2011, when a chapter on electronic commerce was incorporated. The agreements and protocols cover regulations on investment, cross-border trade, professional services, telecoms, financial services and temporary movement of persons. The main goal of the 2007 and 2011 protocols was to adjust intraregional regulations to the commitments made in the free trade agreement signed between the Central American Common Market, the Dominican Republic and the United States in 2004 (SELA, 2014b).
CARICOM8 implemented a services chapter in 1998 with Protocol II on “Establishment, Services and Capital”. This protocol is a centrepiece of the creation of the CARICOM Single Market and Economy (CSME). It provides unconditional national treatment to all CARICOM members for the free movement of services, labour and capital. The removal of barriers to services trade was to be done in two steps: the preparation of an inventory of the restrictions,
7 The member countries of the Central American Common Market are Costa Rica, El Salvador, Guatemala, Honduras and Nicaragua.8 The member countries of CARICOM are Antigua and Barbuda, The Bahamas, Barbados, Belize, Dominica, Grenada, Guyana, Haiti,
Jamaica, Montserrat, Saint Kitts and Nevis, Saint Lucia, Saint Vincent and the Grenadines, Suriname, and Trinidad and Tobago.
114 Economic Commission for Latin America and the Caribbean (ECLAC)Chapter II
followed by their removal. The CARICOM approach to services trade liberalization was relatively unique, using “transparency lists” or national inventories of policies and regulations on trade in services, which were deposited with the CARICOM Secretariat. These national inventories provided a baseline or standstill obligation of market openness, against which member States had to accomplish liberalization unilaterally by removing all the measures in the transparency lists between 2001 and 2006. The free movement of persons was also promoted through the CARICOM Model Legislation on Free Movement of Skilled Nationals of 1995 (Stephenson, 2008). In 2012, a study commissioned by the CARICOM Secretariat showed that the compliance level with the provisions on free movement of services was 37%, with the free movement of skilled people 66%, with the movement of capital 72%, and with the right of establishment 64% (CARICOM, 2012). In 2016, member governments requested the CARICOM Secretariat to review the implementation of CSME again. In 2017, the Secretariat reported substantial progress on services trade liberalization, in particular regarding the movement of skilled labour (Jamaica Observer, 2017).
Table II.3 Selected subregional trade agreements: provisions on trade in services, 2017
In two subregional integration schemes, services trade liberalization is at least partially halted
Central American Common Market Andean Community Caribbean Community
(CARICOM)Southern Common Market (MERCOSUR) Pacific Alliance
Creation of the scheme
1960 1969 1990 1991 2012
Introduction of the services chapter
2002 1997 (except Plurinational State of Bolivia)
1998 2005 (except Paraguay and Bolivarian Republic of Venezuela)
2016
Model NAFTA Sectoral negotiations NAFTA with variations GATS NAFTA Approach to lists or scheduling
Negative list Negative list Negative list with standstill provision
Positive list until 2010, mixed with negative list afterwards
Negative list, regionalizes bilateral FTAs
Flexibility Two-yearly negotiation rounds to liberalize restricted sectors
Annual rounds of negotiations
Special treatment for less developed members
Implementation period until 2015 with exceptions
_
Market access No requirement on local presence; curtailment of unfair advantages of monopolies
Full access except for public services, air transport and national exceptions
Full market access except for excluded sectors; restrictions on right to establishment, access under modes 1, 2 and 4; mode 3 restrictions on movement of capital
Full access; special provisions for mode 4, telecoms, air transport, financial services, labour, health, education and tourism
Subject to nonconforming measures in annex I and annex II
Non-discrimination National treatment and MFN for investments; special provisions for marginalized social and ethnic groups
MFN, except for public services and air transport. National treatment granted for liberalized sectors
National treatment granted; recognition of degrees, certificates and qualifications
MFN granted except in government procurement; national treatment: GATS-neutral; special requirements for corporate entities
National treatment and MFN subject to nonconforming measures
Transparency Country-specific annexes to list exclusions
GATS transparency provisions
Description of safeguard measures (art. 47), existing and necessary subsidies and mode 4 regulations; details on time-based restrictions
GATS-plus transparency: countries must list all existing restrictions with a view to their progressive removal
Extensive GATS-plus provisions; specific transparency provisions for financial services, telecoms and e-commerce
Others Specific chapter on financial services
Coordination of external trade policy; separate agreements on financial services, air and maritime transport
In-built dispute settlement mechanism
Includes e-commerce, maritime transport
Status at present Liberalization of other sectors (underway)
Deadlines of successive liberalization rounds according to the Protocol of Montevideo have not been met
Source: Economic Commission for Latin America and the Caribbean (ECLAC), on the basis of official data.Note: mode 1: export of a service from country A to country B (cross-border trade); mode 2: services supplied in country A to a consumer from country B (consumption
abroad); mode 3: service supplied by country A through commercial presence in country B (commercial presence); and mode 4: service supplied through the temporary presence of a natural persons from country A in country B (temporary movement of workers). MFN: most favoured nation. NAFTA: North American Free Trade Agreement. GATS: General Agreement on Trade in Services.
115International Trade Outlook for Latin America and the Caribbean • 2017 Chapter II
MERCOSUR9 adopted the Protocol of Montevideo on Trade in Services in MERCOSUR in 1997, and it has been in force since 2005, following a positive list approach. This approach is similar to that of GATS, under which members liberalize trade only in the agreed sectors listed in their schedules. The Protocol of Montevideo aimed to fully liberalize intraregional trade in all services by 2015 through biannual negotiation rounds. For this purpose, its members established the Plan of Action to Further the Programme for the Liberalization of Trade in Services (Dec. No. 49/08), which committed the countries to list all restrictions in place with the aim of gradually removing them (Stephenson and Roberts, 2014). Progress has been made, but several deadlines for the removal of barriers and harmonization of regulations have been missed (IDB, 2016). In April 2017, the four original members of MERCOSUR signed a protocol on intra-MERCOSUR FDI, which is relevant for the commercial presence modality of service delivery; however, this is not yet in force.
The commitments to liberalize trade in services among the four members of the Pacific Alliance (Chile, Colombia, Mexico and Peru) entered into force in 2016 with the Additional Protocol or Commercial Protocol to the Framework Agreement of the Pacific Alliance. The Protocol contains separate chapters on cross-border services trade, electronic commerce and investment. It follows the NAFTA negative list approach and contains a set of annexes in which countries spell out their restrictions. Many of the commitments are similar to those the countries have in their bilateral free trade agreements with the United States. In addition to the initial commitments, a working group on services and capital continues to work towards further liberalization and facilitation of services trade, focusing on areas such as investment barriers, cross-border trade in services, financial services, telecoms, air and maritime transport, and professional services (OEAP, 2017). A subgroup on the digital agenda was also established to work on the implementation of an action plan involving four pillars: digital economy, digital connectivity, digital ecosystem, and digital government.
A comparison between the two largest economic integration schemes in the region (MERCOSUR and the Pacific Alliance) regarding their efforts to promote trade in services suggests that commitments and disciplines within the Pacific Alliance are broader in scope, perhaps not surprisingly, given that the latter is more recent. The Trade Protocol of the Pacific Alliance addresses particular issues that are essential for trade and FDI in modern services and incorporates some of the new disciplines covered in twenty-first century trade agreements such as the Comprehensive Economic and Trade Agreement between Canada and the European Union (CETA), the Trade in Services Agreement (TiSA, under negotiation by 23 members of WTO) and the Trans-Pacific Partnership (TPP). These twenty-first century agreements contain significant regulatory innovations in relation to positive obligations (where parties undertake to behave in certain ways) and negative obligations (where the parties are prohibited from performing certain activities or are obliged to refrain from engaging in certain behaviours). They achieve horizontal depth,10 dealing with a variety of issues regarding e-commerce, financial services, telecommunications, investment and regulatory cooperation. They also have a wide range of provisions establishing soft (that is, not legally enforceable) commitments in terms of best endeavours and broad cooperative frameworks. These soft rules are also important, despite the challenges they pose in terms of implementation, monitoring and accountability, for their contribution to the international governance of services trade (Palacio, 2017).
9 The full members of MERCOSUR are Argentina, Bolivarian Republic of Venezuela, Brazil, Paraguay and Uruguay. However, the Bolivarian Republic of Venezuela is currently suspended from MERCOSUR.
10 The term “horizontal depth” refers to the number of policy areas (or breadth) included in plurinational trade agreements (Hofmann, Ornago, Ruta, 2017).
Progress has been made, but several deadlines for the removal of barriers and harmonization of regulations have been missed.
The Trade Protocol of the Pacific Alliance addresses particular issues that are essential for trade and FDI in modern services and incorporates some of the new disciplines covered in twenty-first century trade agreements.
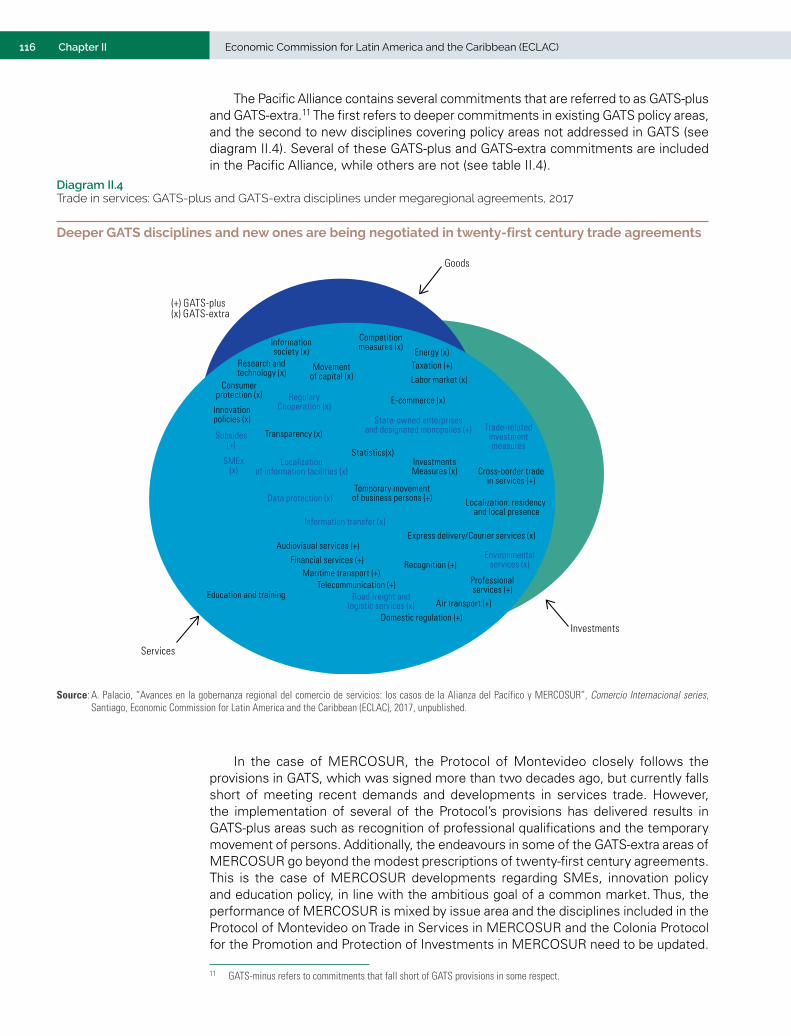
116 Economic Commission for Latin America and the Caribbean (ECLAC)Chapter II
The Pacific Alliance contains several commitments that are referred to as GATS-plus and GATS-extra.11 The first refers to deeper commitments in existing GATS policy areas, and the second to new disciplines covering policy areas not addressed in GATS (see diagram II.4). Several of these GATS-plus and GATS-extra commitments are included in the Pacific Alliance, while others are not (see table II.4).
11 GATS-minus refers to commitments that fall short of GATS provisions in some respect.
Diagram II.4 Trade in services: GATS-plus and GATS-extra disciplines under megaregional agreements, 2017
Deeper GATS disciplines and new ones are being negotiated in twenty-first century trade agreements
(+) GATS-plus(x) GATS-extra
Goods
Investments
Services
Research andtechnology (x)
Consumerprotection (x)
Innovationpolicies (x)
Subsides(+)
SMEx(x)
Informationsociety (x)
Education and training
Competitionmeasures (x)
Movementof capital (x)
RegularyCooperation (x)
Transparency (x)
Localizationof information facilities (x)
Data protection (x)
Information transfer (x)
Trade-relatedinvestmentmeasures
Cross-border tradein services (+)
Localization: residency and local presence
Audiovisual services (+)
Financial services (+) Recognition (+)Environmental
services (x)
Professionalservices (+)
Maritime transport (+)
Air transport (+)
Domestic regulation (+)
Telecommunication (+)Road freight and
logistic services (x)
Express delivery/Courier services (x)
Temporary movementof business persons (+)
InvestmentsMeasures (x)
State-owned enterprisesand designated monopolies (+)
E-commerce (x)
Labor market (x)
Taxation (+)Energy (x)
Statistics(x)
Source: A. Palacio, “Avances en la gobernanza regional del comercio de servicios: los casos de la Alianza del Pacífico y MERCOSUR”, Comercio Internacional series, Santiago, Economic Commission for Latin America and the Caribbean (ECLAC), 2017, unpublished.
In the case of MERCOSUR, the Protocol of Montevideo closely follows the provisions in GATS, which was signed more than two decades ago, but currently falls short of meeting recent demands and developments in services trade. However, the implementation of several of the Protocol’s provisions has delivered results in GATS-plus areas such as recognition of professional qualifications and the temporary movement of persons. Additionally, the endeavours in some of the GATS-extra areas of MERCOSUR go beyond the modest prescriptions of twenty-first century agreements. This is the case of MERCOSUR developments regarding SMEs, innovation policy and education policy, in line with the ambitious goal of a common market. Thus, the performance of MERCOSUR is mixed by issue area and the disciplines included in the Protocol of Montevideo on Trade in Services in MERCOSUR and the Colonia Protocol for the Promotion and Protection of Investments in MERCOSUR need to be updated.
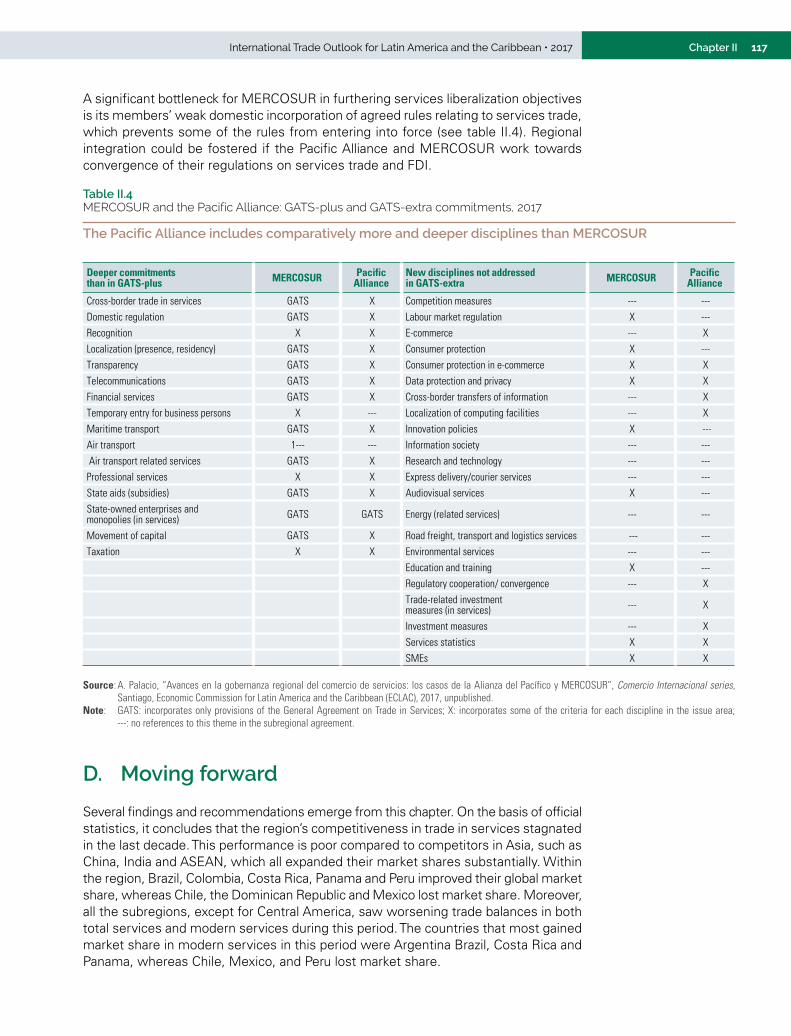
117International Trade Outlook for Latin America and the Caribbean • 2017 Chapter II
A significant bottleneck for MERCOSUR in furthering services liberalization objectives is its members’ weak domestic incorporation of agreed rules relating to services trade, which prevents some of the rules from entering into force (see table II.4). Regional integration could be fostered if the Pacific Alliance and MERCOSUR work towards convergence of their regulations on services trade and FDI.
Table II.4 MERCOSUR and the Pacific Alliance: GATS-plus and GATS-extra commitments, 2017
The Pacific Alliance includes comparatively more and deeper disciplines than MERCOSUR
Deeper commitments than in GATS-plus MERCOSUR Pacific
AllianceNew disciplines not addressed in GATS-extra MERCOSUR Pacific
Alliance
Cross-border trade in services GATS X Competition measures --- ---
Domestic regulation GATS X Labour market regulation X ---
Recognition X X E-commerce --- X
Localization (presence, residency) GATS X Consumer protection X ---
Transparency GATS X Consumer protection in e-commerce X X
Telecommunications GATS X Data protection and privacy X X
Financial services GATS X Cross-border transfers of information --- X
Temporary entry for business persons X --- Localization of computing facilities --- X
Maritime transport GATS X Innovation policies X ---
Air transport 1--- --- Information society --- ---
Air transport related services GATS X Research and technology --- ---
Professional services X X Express delivery/courier services --- ---
State aids (subsidies) GATS X Audiovisual services X ---
State-owned enterprises and monopolies (in services) GATS GATS Energy (related services) --- ---
Movement of capital GATS X Road freight, transport and logistics services --- ---
Taxation X X Environmental services --- ---
Education and training X ---
Regulatory cooperation/ convergence --- X
Trade-related investment measures (in services) --- X
Investment measures --- X
Services statistics X X
SMEs X X
Source: A. Palacio, “Avances en la gobernanza regional del comercio de servicios: los casos de la Alianza del Pacífico y MERCOSUR”, Comercio Internacional series, Santiago, Economic Commission for Latin America and the Caribbean (ECLAC), 2017, unpublished.
Note: GATS: incorporates only provisions of the General Agreement on Trade in Services; X: incorporates some of the criteria for each discipline in the issue area; ---: no references to this theme in the subregional agreement.
D. Moving forward
Several findings and recommendations emerge from this chapter. On the basis of official statistics, it concludes that the region’s competitiveness in trade in services stagnated in the last decade. This performance is poor compared to competitors in Asia, such as China, India and ASEAN, which all expanded their market shares substantially. Within the region, Brazil, Colombia, Costa Rica, Panama and Peru improved their global market share, whereas Chile, the Dominican Republic and Mexico lost market share. Moreover, all the subregions, except for Central America, saw worsening trade balances in both total services and modern services during this period. The countries that most gained market share in modern services in this period were Argentina Brazil, Costa Rica and Panama, whereas Chile, Mexico, and Peru lost market share.
118 Economic Commission for Latin America and the Caribbean (ECLAC)Chapter II
On the basis of these results, more detailed analyses of the competitiveness of the region, its subregions and countries are needed using different types of indicators. The primary focus should be on the most dynamic segments of modern services, which are heavy users of digital platforms. Despite some advances in the measurement of trade in these services, the great majority of the countries in the region do not publish data by trading partner, while almost none registers services trade by mode of delivery. In this context, countries should step up efforts to improve their statistics on trade in services on the basis of the recommendations of the Manual on Statistics of International Trade in Services, 2010.
More work could also be done to improve understanding of differences in country performance. These may stem in part from the vigour of public and private initiatives to promote the production and exports of specific types of modern services. In-depth studies on national strategies to develop specific human capital skills and attract and retain FDI in targeted sectors would be useful. In addition, the export services sector would benefit from research on the role of tax treatment for service exporters and the right regulatory environment for supporting domestic service providers and boosting competition, expanding digital platforms and promoting services exports. Apart from looking at exports, more analysis is also needed to analyse import barriers for intermediate services, as these play a key role in exports from all sectors in the economy. Such studies and experiences could usefully be shared through South-South cooperation modalities.
The region does not seem to underperform developing Asian countries in terms of incorporating intermediate services into its exports of manufactured goods. This finding appears to reject the hypothesis that the region’s almost stagnant export performance in goods trade over the past 15 years could be due to the insufficient incorporation of intermediate services in exports. Comparing Latin America with ASEAN, it turns out that the domestic services value added intensity of manufacturing exports is higher in the former, whereas the imported services value added intensity is greater in the latter. Econometric regressions suggest that the total domestic services content of manufacturing exports may be negatively associated with market shares in global exports, whereas total imported services are positively associated. However, some types of domestic business services seem to be positively associated with changes in global export market shares, while domestic finance and real estate services may be negatively associated. This work opens up avenues for future research on the contribution of different domestic and imported service intensities to manufacturing export performance. These service intensities can in turn be linked to performance measures of domestic service sectors. This work could also be extended to primary-goods-producing industries, which are of particular interest for South American countries.
The final part of this chapter argues that the competitiveness of modern services exporters depends crucially on domestic and regional strategies to promote these activities. More structural public-private-academic dialogue and strategies are required to create enabling conditions for modern services exporters to prosper. To be effective, these strategies need to comply with modern governance standards, with a medium-term focus, clear goals, sufficient budgets, clear allocation of responsibilities, constant monitoring and regular evaluation (Devlin and Moguillansky, 2011). They need to focus on key areas for modern services exporters, such as human capital development and certification, tax treatment, export promotion and digital markets. The efforts being made by various countries in these areas are still mostly modest.
Finally, a more determined effort is needed to promote regional integration in services trade. In two of the region’s five subregional integration schemes, the negotiation agenda on trade in services is stalled, while the others could do more to bring new regulatory areas into their agendas, following the example of multiple twenty-first century trade agreements. This is particularly important considering that the region is the most important destination for many services exporters. Finally, governments must also increase their cooperation at the regional level to produce public goods related, for example, to the digital ecosystem.
119International Trade Outlook for Latin America and the Caribbean • 2017 Chapter II
BibliographyArbache, J. (2014), Serviços e Competitividade Industrial no Brasil, National Confederation of
Industry, Brasilia. Arbache, J., D. Rouzet and F. Spinelli (2016), “The role of services for economic performance
in Brazil”, OECD Trade Policy Papers, No. 193, Paris, Organization for Economic Cooperation and Development (OECD), October.
Arbache, J. and others (2015), “El aporte de los servicios al desempeño del sector industrial en Costa Rica”, Aportes para el Análisis del Desarrollo Humano Sostenible series, No. 14, San José, Programa Estado de la Nación (PEN).
Avendaño, R., F. Bontadini and N. Mulder (2017), “Latin America’s faltering manufacturing competitiveness: what role for intermediate services?”, Comercio Internacional series, Santiago, Economic Commission for Latin America and the Caribbean (ECLAC), unpublished.
CAF (Development Bank of Latin America) (2017), Hacia la transformacion digital de América Latina y el Caribe: el observatorio CAF del ecosistema digital, Caracas.
CARICOM (Caribbean Community) (2012), “CARICOM studies show the CSME operating at about 64% level of compliance”, Georgetown, 23 January [online] http://caricom.org/media-center/communications/press-releases/caricom-studies-show-the-csme-operating-at-about-64-level-of-compliance.
De Backer, K., I. Desnoyers-James and L. Moussiegt (2015), “‘Manufacturing or services: that is (not) the question’. The role of manufacturing and services in OECD economies”, OECD Science, Technology and Industry Policy Papers, No. 19, Paris, Organization for Economic Cooperation and Development (OECD), February.
Deloitte (2015), “2015 global shared services survey: survey results”, March [online] https://www2.deloitte.com/content/dam/Deloitte/dk/Documents/finance/Deloitte-SSSurvey-Interactive.pdf.
Devlin, R. and G. Moguillansky (2011), Breeding Latin American Tigers: Operational Principles for Rehabilitating Industrial Policies, Santiago, Economic Commission for Latin America and the Caribbean (ECLAC)/World Bank.
Eurostat (Statistical Office of the European Union) (2016), “Measuring international trade in services: from BPM5 to BPM6”, Luxembourg [online] http://ec.europa.eu/eurostat/statistics-explained/index.php/Measuring_international_trade_in_services_-_from_BPM5_to_BPM6.
Evangelista, R., M. Lucchese and V. Meliciani (2015), “Business services and the export performances of manufacturing industries”, Journal of Evolutionary Economics, vol. 25, No. 5, Berlin, Springer.
Francois, J. and J. Woerz (2008), “Producer services, manufacturing linkages, and trade”, Journal of Industry, Competition and Trade, vol. 8, No. 3-4, Berlin, Springer.
García, P. and F. Bafundo (2014), “Best practices in finishing school programs for the global services industry”, Technical Note, No. 565, Washington, D.C., Inter-American Development Bank (IDB), April.
Hernández, R. and others (eds.) (2014), Latin America’s emergence in global services: a new driver of structural change in the region?, ECLAC Books, No. 121 (LC/G.2599-P), Santiago, Economic Commission for Latin America and the Caribbean (ECLAC).
Hofmann, C., A. Osnago and M. Ruta (2017), “Horizontal depth: a new database on the content of preferential trade agreements”, Policy Research Working Paper, No. 7981, World Bank Group.
Hualde, A. and C. López (2017), “Mexico’s PROSOFT strategy to develop its IT sector”, Santiago, Economic Commission for Latin America and the Caribbean (ECLAC), unpublished.
IDB (Inter-American Development Bank) (2016), “Informe MERCOSUR Nº 21: segundo semestre 2015, primer semestre 2016”, Technical Note, No. 1145, Buenos Aires, November.
Jamaica Observer (2017), “Regional leaders want review of CSME”, Georgetown, March 2 [online] http://www.jamaicaobserver.com/news/Regional-leaders-want-review-of-CSME_90764.
LAIA (Latin American Integration Association) (2016), Estadísticas del comercio internacional de servicios: diagnóstico sobre la compilación y difusión en los países miembros de la ALADI, Montevideo.
Lewis, L. and R. Monarch (2016), “Causes of the global trade slowdown”, International Finance Discussion Paper Note, Washington, D.C., Board of Governors of the Federal Reserve System, November.
Lodefalk, M. (2017), “Servicification of firms and trade policy implications”, World Trade Review, vol. 16, No. 1, Cambridge, Cambridge University Press.
120 Economic Commission for Latin America and the Caribbean (ECLAC)Chapter II
López, A. (2016), “Los servicios basados en conocimiento: ¿una oportunidad para la transformación productiva en Argentina?”, Buenos Aires, Ministry of Production [online] https://www.produccion.gob.ar/wp-content/uploads/2017/06/lopez_sbc-201705.pptx.
López, A., A. Niembro and D. Ramos (2017), “Las empresas de servicios en América Latina: un estudio exploratorio sobre factores de competitividad internacional, obstáculos y políticas públicas”, TEC Empresarial, vol. 11, No. 1, Cartago, Tecnológico de Costa Rica (TEC).
Loungani, P. and others (2017), “World trade in services: evidence from a new dataset”, IMF Working Paper, No. 17/77, Washington, D.C., International Monetary Fund (IMF), March.
McKinsey Global Institute (2003), “Offshoring: is it a win-win game?”, San Francisco, August [online] https://www.mckinsey.com/global-themes/employment-and-growth/offshoring-is-it-a-win-win-game.
Miroudot, S. and C. Cadestin (2017), “Services in global value chains: from inputs to value-creating activities”, OECD Trade Policy Papers, No. 197, Paris, Organization for Economic Cooperation and Development (OECD).
Monge, R. and others (2016), “El potencial dinamizador del sector exportador costarricense: encadenamientos productivos, valor agregado y empleo”, Project Documents (LC/MEX/W.19), Mexico City, Economic Commission for Latin America and the Caribbean (ECLAC).
Nordås, H. (2010), “Trade in goods and services: two sides of the same coin?”, Economic Modelling, vol. 27, No. 2, Amsterdam, Elsevier, March.
OEAP (Strategic Observatory of the Pacific Alliance) (2017), Estudio sobre comercio de servicios en la Alianza del Pacífico: normas vigentes para prestar servicios de ingeniería y de tecnología de información en los países miembros, Santiago, February.
Palacio, A. (2017), “Avances en la gobernanza regional del comercio de servicios: los casos de la Alianza del Pacífico y MERCOSUR”, Comercio Internacional series, Santiago, Economic Commission for Latin America and the Caribbean (ECLAC), unpublished.
PwC (2016), “Robotic process automation in shared services: how RPA applies to finance, HR and procurement” [online] http://www.pwc.com.au/pdf/robotic-process-automation-in-shared-services.pdf.
Quindimil, M. (2017), “Promover las exportaciones de servicios globales y las buenas prácticas de gobernanza en Perú”, document presented at the VI REDLAS Conference “Tendencias y perspectivas para la producción y el comercio de servicios en América Latina y el Caribe”, San José, Latin American Network for Research on Services (REDLAS), September 21 and 22.
Rodrik, D. (2015), “Premature deindustrialization”, NBER Working Paper, No. 20935, Cambridge, National Bureau of Economic Research (NBER), February.
Ruddy, M. (2013), “The submarine communications industry as a global enabler of growth & development, and the path forward”, SubOptic [online] http://www.suboptic.org/wp-content/uploads/2014/10/TU1A-1_Oral_169.pdf.
SELA (Latin American and Caribbean Economic System) (2014a), Evolución de la Comunidad Andina (CAN), Caracas, November.(2014b), Evolución del Sistema de Integración Centroamericano (SICA), Caracas, November.
Sethi, A. and J. Gott (2017), 2017 A.T. Kearney Global Services Location Index: The Widening Impact of Automation, A.T. Kearney.
Stephenson, S. (2008), “Mobility of service providers in the Caribbean region”, A Handbook on International Trade in Services, A. Mattoo, R. Stern and G. Zanini (eds.), Oxford, Oxford University Press.
Stephenson, S. and M. Roberts (2014), “Innovating regionalism: the Americas”, The Preferential Liberalization of Trade in Services: Comparative Regionalism, P. Sauvé and A. Shingal (eds.), Cheltenham, Edward Elgar Publishing.
Tholons (2016), “Tholons 2016 top 100 outsourcing destinations: rankings and executive summary”, January 29 [online] http://www.tholons.com/TholonsTop100/pdf/Tholons_Top_100_2016_Executive_Summary_and_Rankings.pdf.
Tucker, D. (2015), “Getting to grips with how LATAM’s tax laws impact outsourcing operations”, Nearshore Americas, July 27 [online] http://www.nearshoreamericas.com/grips-latin-americas-tax-laws-impact-outsourcing-operations/.
Uruguay XXI (2017), Servicios globales de exportación en Uruguay, Montevideo, February.USITC (United States International Trade Commission) (2013), World Investment Report 2013: Global
Value Chains. Investment and Trade for Development, Geneva, United Nations Conference on Trade and Development (UNCTAD).
121Chapter IIIInternational Trade Outlook for Latin America and the Caribbean • 2017
IIICHAPTER
Latin America and the Caribbean: the challenges of global agricultural trade
Introduction
A. Except for Brazil, the main players in world agricultural trade are the industrialized countries and China
B. The place of Latin America and the Caribbean in world agricultural trade
C. Proactive public policies are needed to de-commoditize the agricultural export basket
D. Final reflections
Bibliography
Annex III.A1

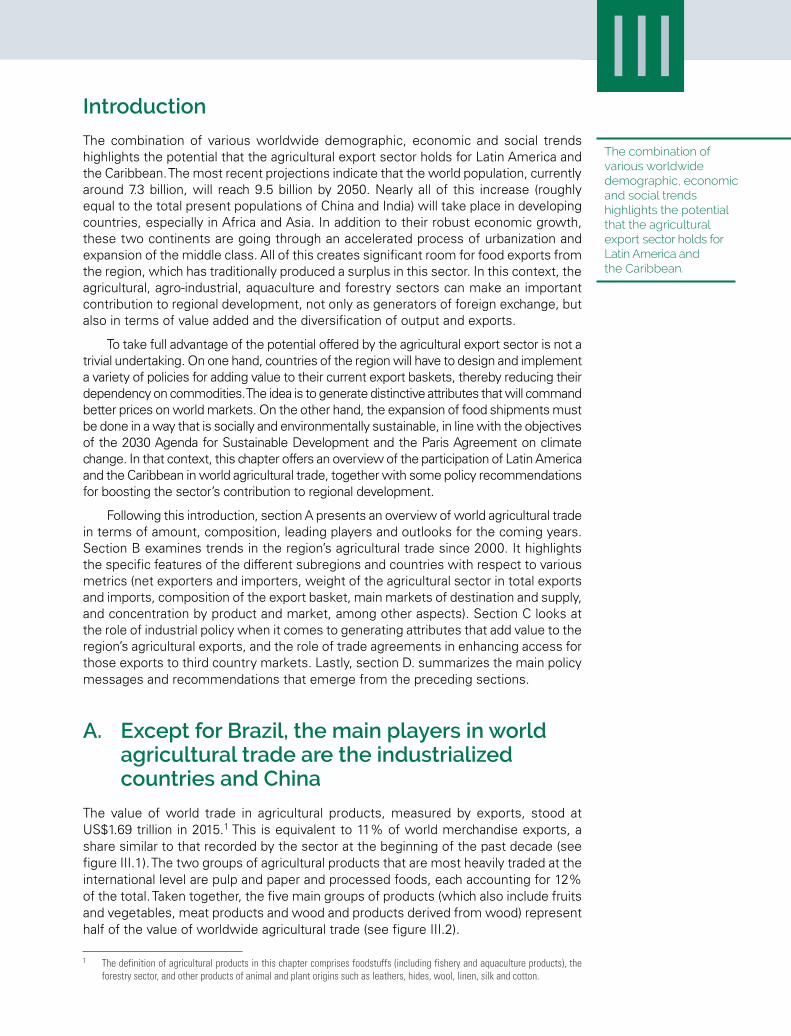
123Chapter IIIInternational Trade Outlook for Latin America and the Caribbean • 2017 IIIIntroduction
The combination of various worldwide demographic, economic and social trends highlights the potential that the agricultural export sector holds for Latin America and the Caribbean. The most recent projections indicate that the world population, currently around 7.3 billion, will reach 9.5 billion by 2050. Nearly all of this increase (roughly equal to the total present populations of China and India) will take place in developing countries, especially in Africa and Asia. In addition to their robust economic growth, these two continents are going through an accelerated process of urbanization and expansion of the middle class. All of this creates significant room for food exports from the region, which has traditionally produced a surplus in this sector. In this context, the agricultural, agro-industrial, aquaculture and forestry sectors can make an important contribution to regional development, not only as generators of foreign exchange, but also in terms of value added and the diversification of output and exports.
To take full advantage of the potential offered by the agricultural export sector is not a trivial undertaking. On one hand, countries of the region will have to design and implement a variety of policies for adding value to their current export baskets, thereby reducing their dependency on commodities. The idea is to generate distinctive attributes that will command better prices on world markets. On the other hand, the expansion of food shipments must be done in a way that is socially and environmentally sustainable, in line with the objectives of the 2030 Agenda for Sustainable Development and the Paris Agreement on climate change. In that context, this chapter offers an overview of the participation of Latin America and the Caribbean in world agricultural trade, together with some policy recommendations for boosting the sector’s contribution to regional development.
Following this introduction, section A presents an overview of world agricultural trade in terms of amount, composition, leading players and outlooks for the coming years. Section B examines trends in the region’s agricultural trade since 2000. It highlights the specific features of the different subregions and countries with respect to various metrics (net exporters and importers, weight of the agricultural sector in total exports and imports, composition of the export basket, main markets of destination and supply, and concentration by product and market, among other aspects). Section C looks at the role of industrial policy when it comes to generating attributes that add value to the region’s agricultural exports, and the role of trade agreements in enhancing access for those exports to third country markets. Lastly, section D. summarizes the main policy messages and recommendations that emerge from the preceding sections.
A. Except for Brazil, the main players in world agricultural trade are the industrialized countries and China
The value of world trade in agricultural products, measured by exports, stood at US$1.69 trillion in 2015.1 This is equivalent to 11% of world merchandise exports, a share similar to that recorded by the sector at the beginning of the past decade (see figure III.1). The two groups of agricultural products that are most heavily traded at the international level are pulp and paper and processed foods, each accounting for 12% of the total. Taken together, the five main groups of products (which also include fruits and vegetables, meat products and wood and products derived from wood) represent half of the value of worldwide agricultural trade (see figure III.2).
1 The definition of agricultural products in this chapter comprises foodstuffs (including fishery and aquaculture products), the forestry sector, and other products of animal and plant origins such as leathers, hides, wool, linen, silk and cotton.
The combination of various worldwide demographic, economic and social trends highlights the potential that the agricultural export sector holds for Latin America and the Caribbean.
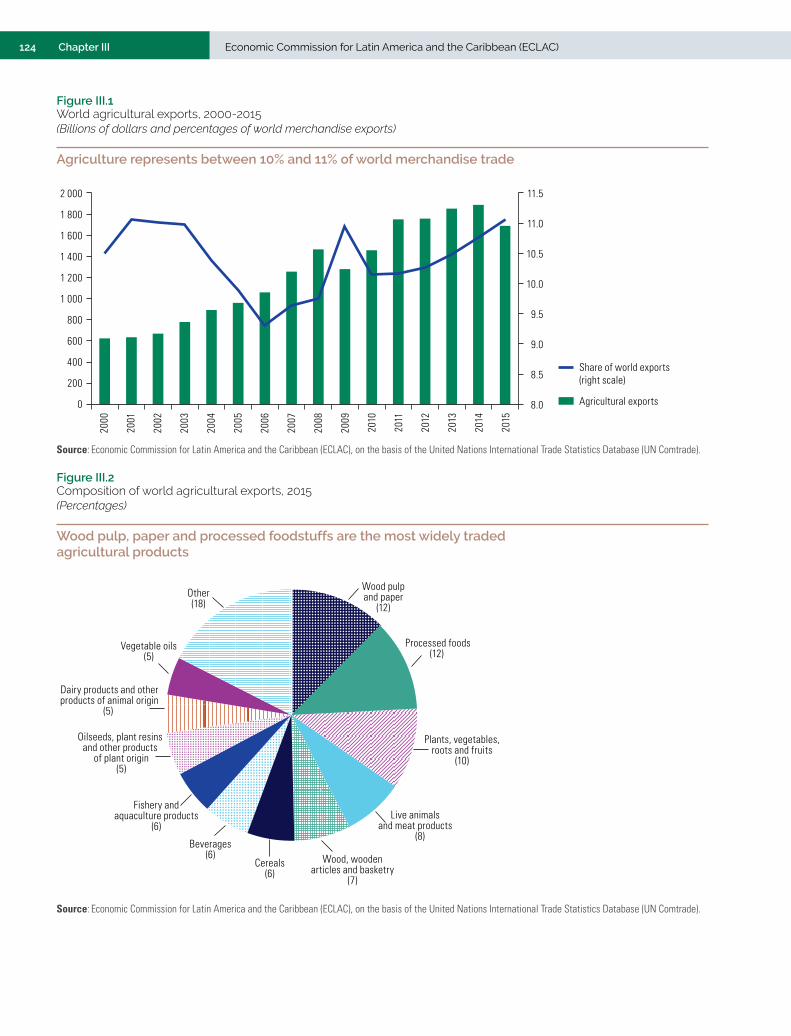
124 Chapter III Economic Commission for Latin America and the Caribbean (ECLAC)
Figure III.1 World agricultural exports, 2000-2015(Billions of dollars and percentages of world merchandise exports)
Agriculture represents between 10% and 11% of world merchandise trade
8.0
8.5
9.0
9.5
10.0
10.5
11.0
11.5
0
200
400
600
800
1 000
1 200
1 400
1 600
1 800
2 000
2000
2001
2002
2003
2004
2005
2006
2007
2008
2009
2010
2011
2012
2013
2014
2015
Agricultural exports
Share of world exports (right scale)
Source: Economic Commission for Latin America and the Caribbean (ECLAC), on the basis of the United Nations International Trade Statistics Database (UN Comtrade).
Figure III.2 Composition of world agricultural exports, 2015(Percentages)
Wood pulp, paper and processed foodstuffs are the most widely traded agricultural products
Wood pulpand paper
(12)
Processed foods(12)
Plants, vegetables,roots and fruits
(10)
Live animalsand meat products
(8)
Wood, woodenarticles and basketry
(7)
Cereals(6)
Beverages(6)
Fishery andaquaculture products
(6)
Oilseeds, plant resins and other products
of plant origin(5)
Dairy products and otherproducts of animal origin
(5)
Vegetable oils(5)
Other(18)
Source: Economic Commission for Latin America and the Caribbean (ECLAC), on the basis of the United Nations International Trade Statistics Database (UN Comtrade).
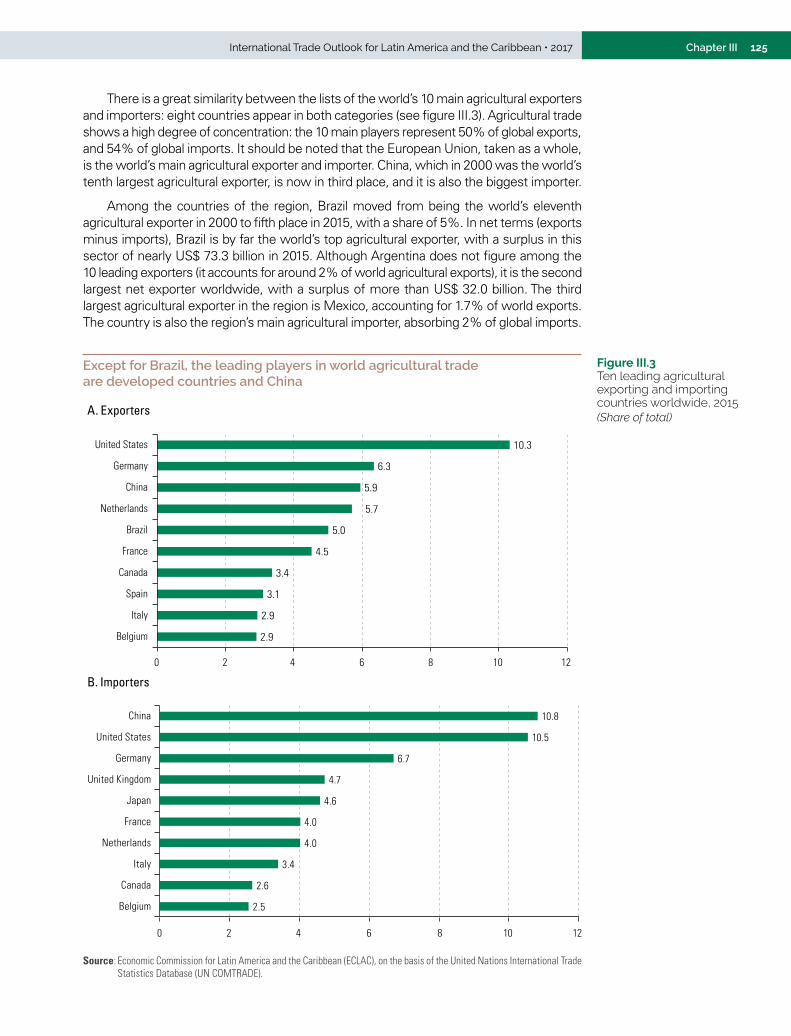
125Chapter IIIInternational Trade Outlook for Latin America and the Caribbean • 2017
There is a great similarity between the lists of the world’s 10 main agricultural exporters and importers: eight countries appear in both categories (see figure III.3). Agricultural trade shows a high degree of concentration: the 10 main players represent 50% of global exports, and 54% of global imports. It should be noted that the European Union, taken as a whole, is the world’s main agricultural exporter and importer. China, which in 2000 was the world’s tenth largest agricultural exporter, is now in third place, and it is also the biggest importer.
Among the countries of the region, Brazil moved from being the world’s eleventh agricultural exporter in 2000 to fifth place in 2015, with a share of 5%. In net terms (exports minus imports), Brazil is by far the world’s top agricultural exporter, with a surplus in this sector of nearly US$ 73.3 billion in 2015. Although Argentina does not figure among the 10 leading exporters (it accounts for around 2% of world agricultural exports), it is the second largest net exporter worldwide, with a surplus of more than US$ 32.0 billion. The third largest agricultural exporter in the region is Mexico, accounting for 1.7% of world exports. The country is also the region’s main agricultural importer, absorbing 2% of global imports.
Figure III.3 Ten leading agricultural exporting and importing countries worldwide, 2015 (Share of total)
Except for Brazil, the leading players in world agricultural trade are developed countries and China
2.9
2.9
3.1
3.4
4.5
5.0
5.7
5.9
6.3
10.3
0 2 4 6 8 10 12
Belgium
Italy
Spain
Canada
France
Brazil
Netherlands
China
Germany
United States
A. Exporters
B. Importers
2.5
2.6
3.4
4.0
4.0
4.6
4.7
6.7
10.5
10.8
0 2 4 6 8 10 12
Belgium
Canada
Italy
Netherlands
France
Japan
United Kingdom
Germany
United States
China
Source: Economic Commission for Latin America and the Caribbean (ECLAC), on the basis of the United Nations International Trade Statistics Database (UN COMTRADE).
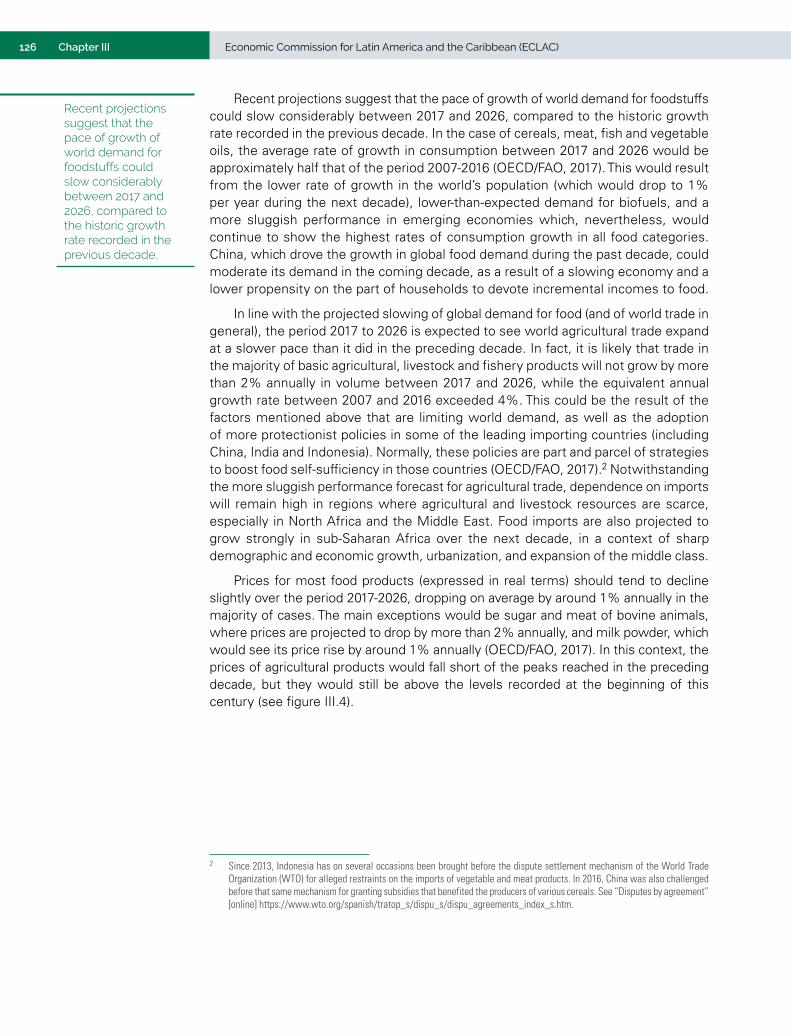
126 Chapter III Economic Commission for Latin America and the Caribbean (ECLAC)
Recent projections suggest that the pace of growth of world demand for foodstuffs could slow considerably between 2017 and 2026, compared to the historic growth rate recorded in the previous decade. In the case of cereals, meat, fish and vegetable oils, the average rate of growth in consumption between 2017 and 2026 would be approximately half that of the period 2007-2016 (OECD/FAO, 2017). This would result from the lower rate of growth in the world’s population (which would drop to 1% per year during the next decade), lower-than-expected demand for biofuels, and a more sluggish performance in emerging economies which, nevertheless, would continue to show the highest rates of consumption growth in all food categories. China, which drove the growth in global food demand during the past decade, could moderate its demand in the coming decade, as a result of a slowing economy and a lower propensity on the part of households to devote incremental incomes to food.
In line with the projected slowing of global demand for food (and of world trade in general), the period 2017 to 2026 is expected to see world agricultural trade expand at a slower pace than it did in the preceding decade. In fact, it is likely that trade in the majority of basic agricultural, livestock and fishery products will not grow by more than 2% annually in volume between 2017 and 2026, while the equivalent annual growth rate between 2007 and 2016 exceeded 4%. This could be the result of the factors mentioned above that are limiting world demand, as well as the adoption of more protectionist policies in some of the leading importing countries (including China, India and Indonesia). Normally, these policies are part and parcel of strategies to boost food self-sufficiency in those countries (OECD/FAO, 2017).2 Notwithstanding the more sluggish performance forecast for agricultural trade, dependence on imports will remain high in regions where agricultural and livestock resources are scarce, especially in North Africa and the Middle East. Food imports are also projected to grow strongly in sub-Saharan Africa over the next decade, in a context of sharp demographic and economic growth, urbanization, and expansion of the middle class.
Prices for most food products (expressed in real terms) should tend to decline slightly over the period 2017-2026, dropping on average by around 1% annually in the majority of cases. The main exceptions would be sugar and meat of bovine animals, where prices are projected to drop by more than 2% annually, and milk powder, which would see its price rise by around 1% annually (OECD/FAO, 2017). In this context, the prices of agricultural products would fall short of the peaks reached in the preceding decade, but they would still be above the levels recorded at the beginning of this century (see figure III.4).
2 Since 2013, Indonesia has on several occasions been brought before the dispute settlement mechanism of the World Trade Organization (WTO) for alleged restraints on the imports of vegetable and meat products. In 2016, China was also challenged before that same mechanism for granting subsidies that benefited the producers of various cereals. See “Disputes by agreement” [online] https://www.wto.org/spanish/tratop_s/dispu_s/dispu_agreements_index_s.htm.
Recent projections suggest that the pace of growth of world demand for foodstuffs could slow considerably between 2017 and 2026, compared to the historic growth rate recorded in the previous decade.
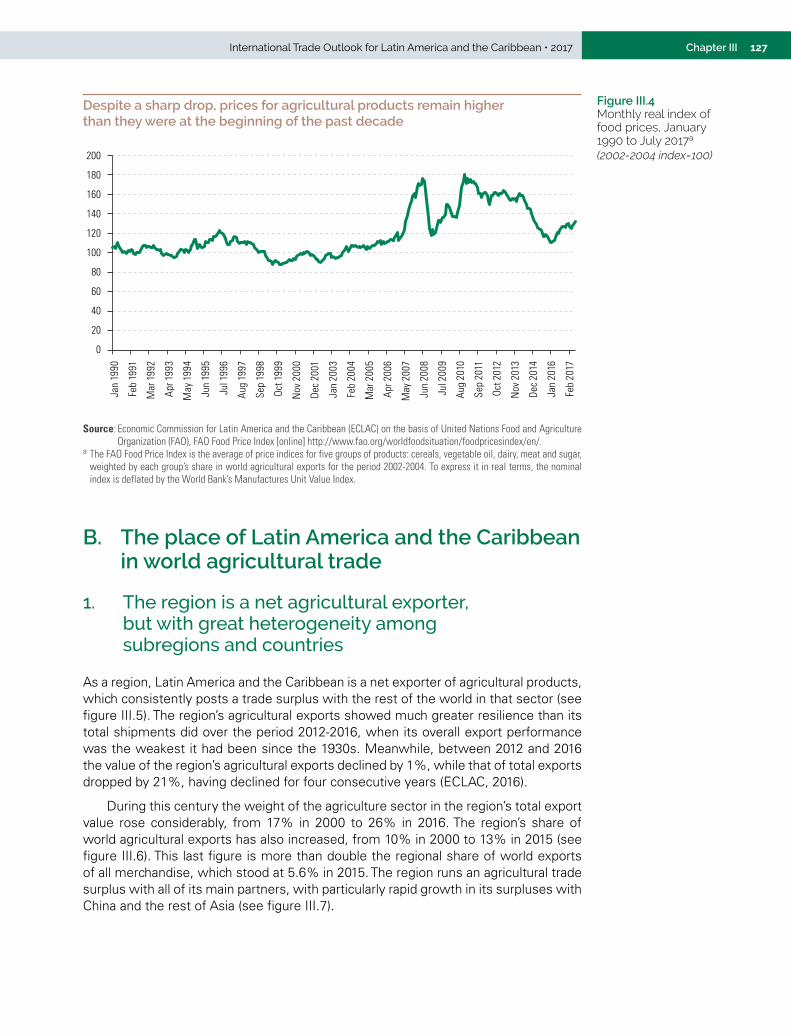
127Chapter IIIInternational Trade Outlook for Latin America and the Caribbean • 2017
Despite a sharp drop, prices for agricultural products remain higher than they were at the beginning of the past decade
0
20
40
60
80
100
120
140
160
180
200
Jan
1990
Feb
1991
Mar
199
2
Apr 1
993
May
199
4
Jun
1995
Jul 1
996
Aug
1997
Sep
1998
Oct 1
999
Nov
200
0
Dec
2001
Jan
2003
Feb
2004
Mar
200
5
Apr 2
006
May
200
7
Jun
2008
Jul 2
009
Aug
2010
Sep
2011
Oct 2
012
Nov
201
3
Dec
2014
Jan
2016
Feb
2017
Source: Economic Commission for Latin America and the Caribbean (ECLAC) on the basis of United Nations Food and Agriculture Organization (FAO), FAO Food Price Index [online] http://www.fao.org/worldfoodsituation/foodpricesindex/en/.
a The FAO Food Price Index is the average of price indices for five groups of products: cereals, vegetable oil, dairy, meat and sugar, weighted by each group’s share in world agricultural exports for the period 2002-2004. To express it in real terms, the nominal index is deflated by the World Bank’s Manufactures Unit Value Index.
B. The place of Latin America and the Caribbean in world agricultural trade
1. The region is a net agricultural exporter, but with great heterogeneity among subregions and countries
As a region, Latin America and the Caribbean is a net exporter of agricultural products, which consistently posts a trade surplus with the rest of the world in that sector (see figure III.5). The region’s agricultural exports showed much greater resilience than its total shipments did over the period 2012-2016, when its overall export performance was the weakest it had been since the 1930s. Meanwhile, between 2012 and 2016 the value of the region’s agricultural exports declined by 1%, while that of total exports dropped by 21%, having declined for four consecutive years (ECLAC, 2016).
During this century the weight of the agriculture sector in the region’s total export value rose considerably, from 17% in 2000 to 26% in 2016. The region’s share of world agricultural exports has also increased, from 10% in 2000 to 13% in 2015 (see figure III.6). This last figure is more than double the regional share of world exports of all merchandise, which stood at 5.6% in 2015. The region runs an agricultural trade surplus with all of its main partners, with particularly rapid growth in its surpluses with China and the rest of Asia (see figure III.7).
Figure III.4 Monthly real index of food prices, January 1990 to July 2017a
(2002-2004 index=100)
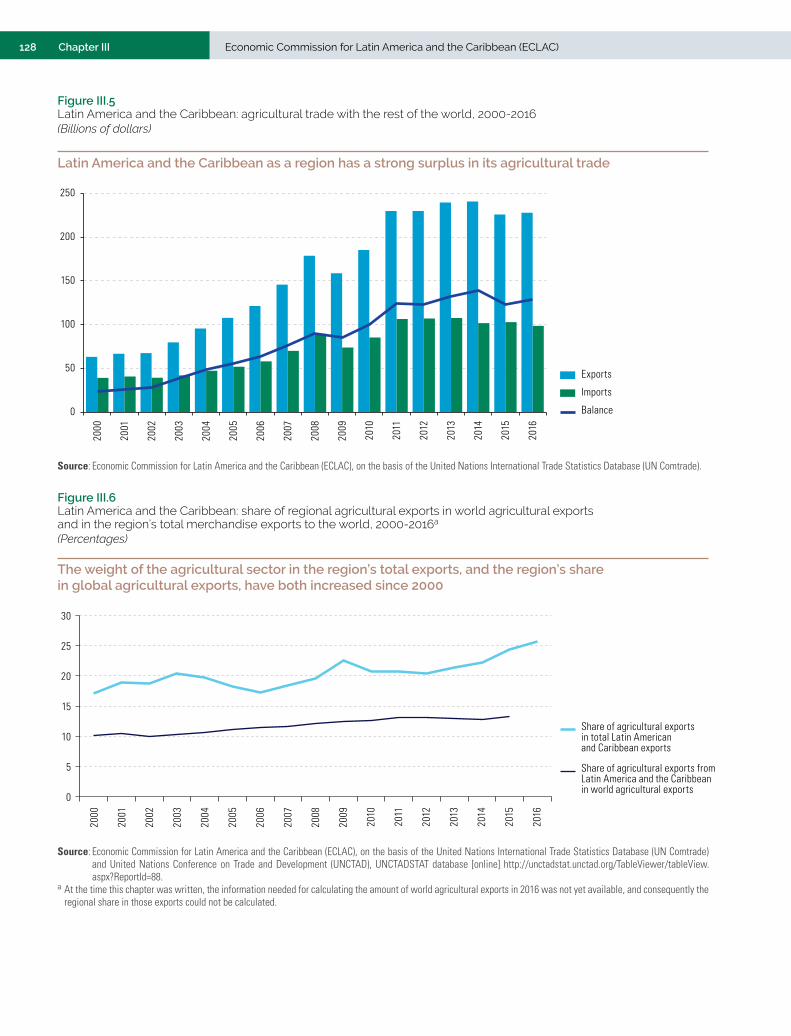
128 Chapter III Economic Commission for Latin America and the Caribbean (ECLAC)
Figure III.5 Latin America and the Caribbean: agricultural trade with the rest of the world, 2000-2016 (Billions of dollars)
Latin America and the Caribbean as a region has a strong surplus in its agricultural trade
0
50
100
150
200
250
2000
2001
2002
2003
2004
2005
2006
2007
2008
2009
2010
2011
2012
2013
2014
2015
2016
Exports
Imports
Balance
Source: Economic Commission for Latin America and the Caribbean (ECLAC), on the basis of the United Nations International Trade Statistics Database (UN Comtrade).
Figure III.6 Latin America and the Caribbean: share of regional agricultural exports in world agricultural exports and in the region’s total merchandise exports to the world, 2000-2016a
(Percentages)
The weight of the agricultural sector in the region’s total exports, and the region’s share in global agricultural exports, have both increased since 2000
0
5
10
15
20
25
30
2000
2001
2002
2003
2004
2005
2006
2007
2008
2009
2010
2011
2012
2013
2014
2015
2016
Share of agricultural exportsin total Latin Americanand Caribbean exports
Share of agricultural exports fromLatin America and the Caribbeanin world agricultural exports
Source: Economic Commission for Latin America and the Caribbean (ECLAC), on the basis of the United Nations International Trade Statistics Database (UN Comtrade) and United Nations Conference on Trade and Development (UNCTAD), UNCTADSTAT database [online] http://unctadstat.unctad.org/TableViewer/tableView.aspx?ReportId=88.
a At the time this chapter was written, the information needed for calculating the amount of world agricultural exports in 2016 was not yet available, and consequently the regional share in those exports could not be calculated.
129Chapter IIIInternational Trade Outlook for Latin America and the Caribbean • 2017
Figure III.7 Latin America and the Caribbean: trade balance in the agriculture sector with selected partners, 2000-2015(Billions of dollars)
The region has growing surpluses in its agricultural trade with Asia
0
5
10
15
20
25
30
35
40
45
50
China Rest of Asia European Union(28 countries)
United States Rest of the world
2000200520102015
Source: Economic Commission for Latin America and the Caribbean (ECLAC), on the basis of the United Nations International Trade Statistics Database (UN Comtrade).
The region’s agricultural exporting potential has been reinforced by the fact that there is still significant room to expand the crop and livestock area. Between 2016 and 2025, Latin America is projected to be the region of the world where that area will expand the most (some 24%) over the baseline period of 2013 to 2015. This expansion would be led by soybean crops (29%), primarily in Brazil and Argentina (OECD/FAO, 2016).
The aggregate figures conceal some important differences within the region. During the last decade, South America accounted, on average, for 80% of the value of regional agricultural exports, Mexico 11%, Central America 7%, and the Caribbean only 1%.3 Over that same time, South America accounted, on average, for 45% of regional agricultural imports, Mexico 35%, Central America 15%, and the Caribbean 5% (see figure III.8). Thus, South America has a wide and generally growing surplus in its agricultural trade with the world, as does Central America (although on a much smaller scale). Meanwhile, Mexico and the Caribbean are in systematic deficit (see figure III.9). At the country level, Brazil and Argentina are by far the leading agricultural exporters in the region; in the 2015-2016 biennium their exports accounted, on average, for 53% of total shipments, and 83% of the regional trade surplus in this sector (see figure III.10).
There are also sharp variations among countries of the region in terms of the weight of the agricultural sector in total merchandise trade, especially in the case of exports. At one extreme is a group of South American and Central American countries where the weight of agricultural shipments in total merchandise exports exceeds 40%, and in some cases can reach almost 80%. At the other extreme, in Mexico, Trinidad and Tobago and the Bolivarian Republic of Venezuela, the sector’s share is less than 10%. Between 2000 and 2016, the greatest increases in the agricultural sector’s share of total merchandise exports were recorded by countries of the Southern Cone (where they were already high). This phenomenon is strongly correlated with the expansion of oilseed exports. Double-digit increases were also recorded in Costa Rica, Cuba, Ecuador and the Dominican Republic (see figure III.11A).
3 Table III.A1.1 of annex III.A1 presents total agricultural exports for each country of the region between 2006 and 2016.
The aggregate figures conceal some important differences within the region. During the last decade, South America accounted, on average, for 80% of the value of regional agricultural exports, Mexico 11%, Central America 7%, and the Caribbean only 1%.
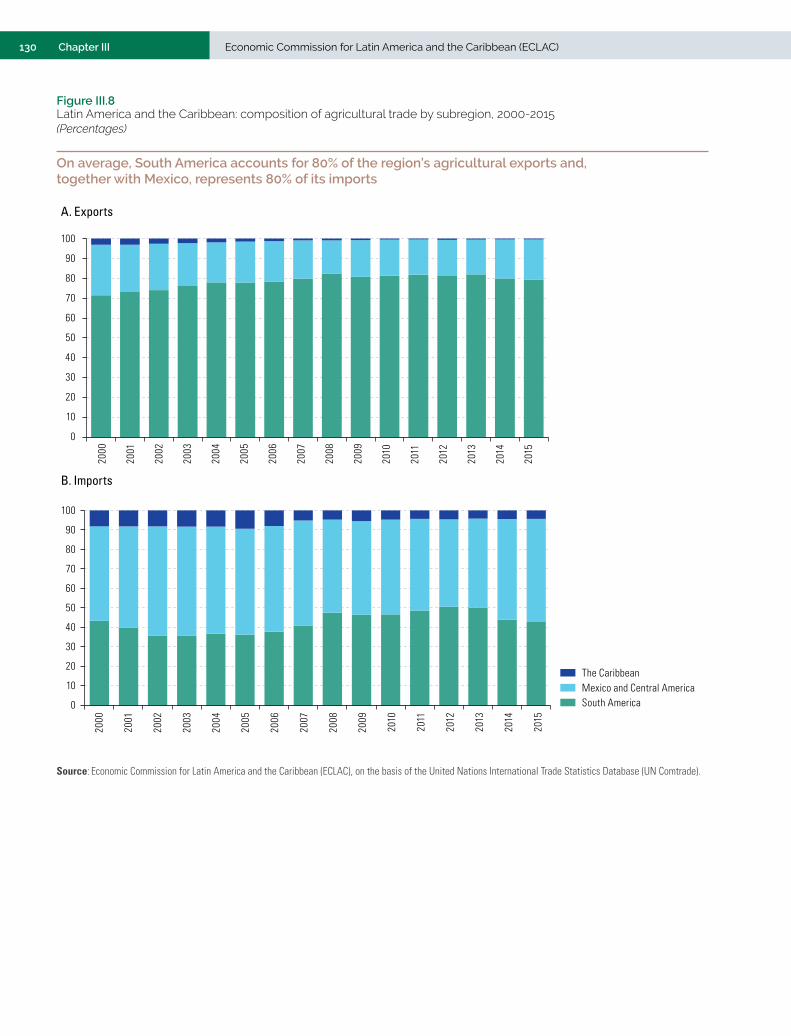
130 Chapter III Economic Commission for Latin America and the Caribbean (ECLAC)
Figure III.8 Latin America and the Caribbean: composition of agricultural trade by subregion, 2000-2015(Percentages)
On average, South America accounts for 80% of the region’s agricultural exports and, together with Mexico, represents 80% of its imports
0
10
20
30
40
50
60
70
80
90
100
2000
2001
2002
2003
2004
2005
2006
2007
2008
2009
2010
2011
2012
2013
2014
2015
South AmericaMexico and Central AmericaThe Caribbean
A. Exports
B. Imports
0
10
20
30
40
50
60
70
80
90
100
2000
2001
2002
2003
2004
2005
2006
2007
2008
2009
2010
2011
2012
2013
2014
2015
South AmericaMexico and Central AmericaThe Caribbean
Source: Economic Commission for Latin America and the Caribbean (ECLAC), on the basis of the United Nations International Trade Statistics Database (UN Comtrade).
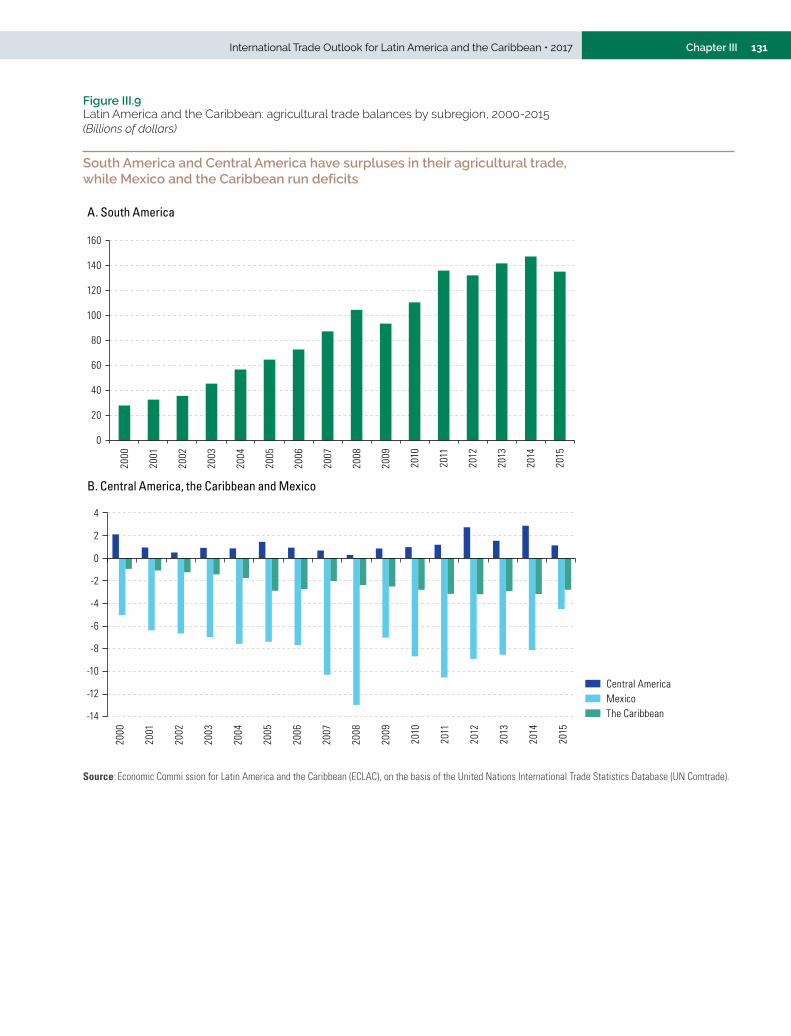
131Chapter IIIInternational Trade Outlook for Latin America and the Caribbean • 2017
Figure III.9 Latin America and the Caribbean: agricultural trade balances by subregion, 2000-2015(Billions of dollars)
South America and Central America have surpluses in their agricultural trade, while Mexico and the Caribbean run deficits
A. South America
0
20
40
60
80
100
120
140
160
2000
2001
2002
2003
2004
2005
2006
2007
2008
2009
2010
2011
2012
2013
2014
2015
B. Central America, the Caribbean and Mexico
-14
-12
-10
-8
-6
-4
-2
0
2
4
2000
2001
2002
2003
2004
2005
2006
2007
2008
2009
2010
2011
2012
2013
2014
2015
Central AmericaMexicoThe Caribbean
Source: Economic Commi ssion for Latin America and the Caribbean (ECLAC), on the basis of the United Nations International Trade Statistics Database (UN Comtrade).
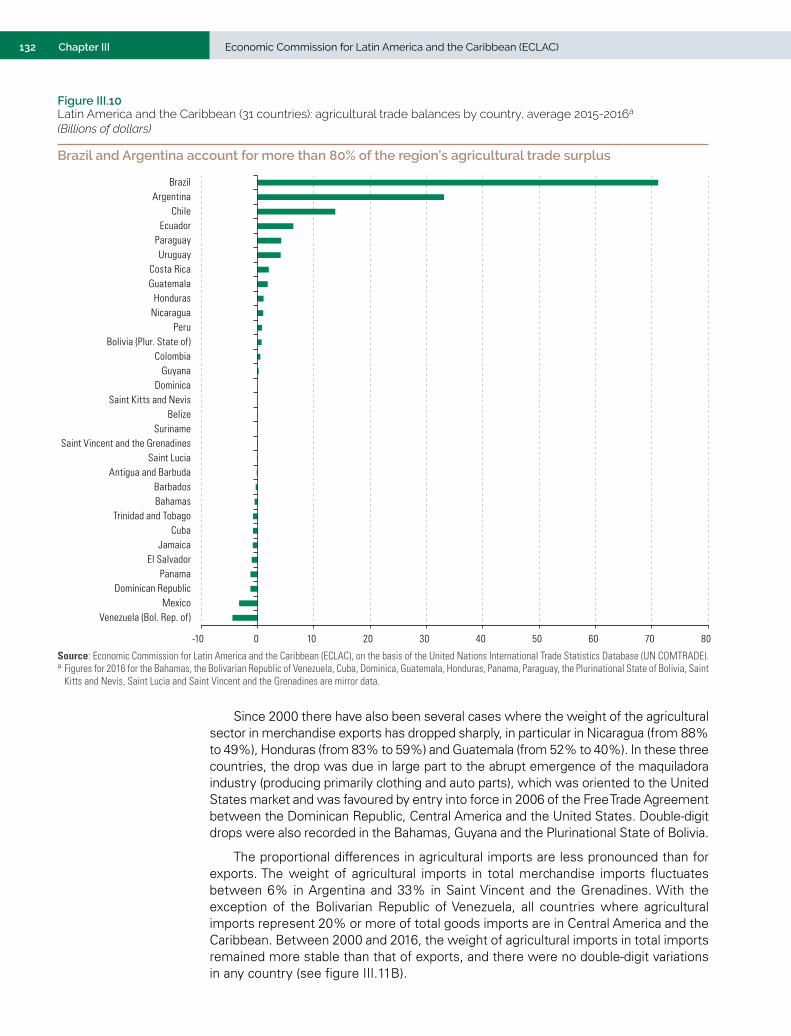
132 Chapter III Economic Commission for Latin America and the Caribbean (ECLAC)
Figure III.10 Latin America and the Caribbean (31 countries): agricultural trade balances by country, average 2015-2016a
(Billions of dollars)
Brazil and Argentina account for more than 80% of the region’s agricultural trade surplus
-10 0 10 20 30 40 50 60 70 80
Venezuela (Bol. Rep. of)Mexico
Dominican RepublicPanama
El SalvadorJamaica
CubaTrinidad and Tobago
BahamasBarbados
Antigua and BarbudaSaint Lucia
Saint Vincent and the GrenadinesSuriname
BelizeSaint Kitts and Nevis
DominicaGuyana
ColombiaBolivia (Plur. State of)
PeruNicaraguaHonduras
GuatemalaCosta Rica
UruguayParaguay
EcuadorChile
ArgentinaBrazil
Source: Economic Commission for Latin America and the Caribbean (ECLAC), on the basis of the United Nations International Trade Statistics Database (UN COMTRADE). a Figures for 2016 for the Bahamas, the Bolivarian Republic of Venezuela, Cuba, Dominica, Guatemala, Honduras, Panama, Paraguay, the Plurinational State of Bolivia, Saint
Kitts and Nevis, Saint Lucia and Saint Vincent and the Grenadines are mirror data.
Since 2000 there have also been several cases where the weight of the agricultural sector in merchandise exports has dropped sharply, in particular in Nicaragua (from 88% to 49%), Honduras (from 83% to 59%) and Guatemala (from 52% to 40%). In these three countries, the drop was due in large part to the abrupt emergence of the maquiladora industry (producing primarily clothing and auto parts), which was oriented to the United States market and was favoured by entry into force in 2006 of the Free Trade Agreement between the Dominican Republic, Central America and the United States. Double-digit drops were also recorded in the Bahamas, Guyana and the Plurinational State of Bolivia.
The proportional differences in agricultural imports are less pronounced than for exports. The weight of agricultural imports in total merchandise imports fluctuates between 6% in Argentina and 33% in Saint Vincent and the Grenadines. With the exception of the Bolivarian Republic of Venezuela, all countries where agricultural imports represent 20% or more of total goods imports are in Central America and the Caribbean. Between 2000 and 2016, the weight of agricultural imports in total imports remained more stable than that of exports, and there were no double-digit variations in any country (see figure III.11B).
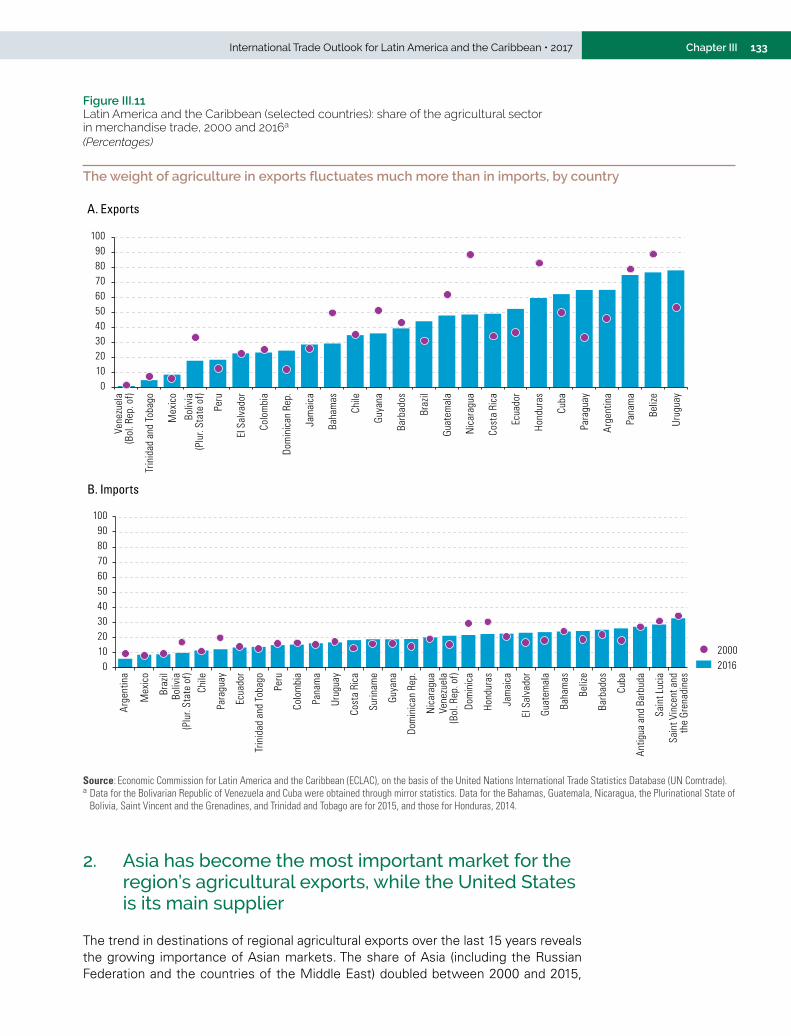
133Chapter IIIInternational Trade Outlook for Latin America and the Caribbean • 2017
Figure III.11 Latin America and the Caribbean (selected countries): share of the agricultural sector in merchandise trade, 2000 and 2016a
(Percentages)
The weight of agriculture in exports fluctuates much more than in imports, by country
0102030405060708090
100
Vene
zuel
a(B
ol. R
ep. o
f)
Trin
idad
and
Tob
ago
Mex
ico
Boliv
ia(P
lur.
Stat
e of
)
Peru
El S
alva
dor
Colo
mbi
a
Dom
inic
an R
ep.
Jam
aica
Baha
mas
Chile
Guya
na
Barb
ados
Braz
il
Guat
emal
a
Nic
arag
ua
Cost
a Ri
ca
Ecua
dor
Hond
uras
Cuba
Para
guay
Arge
ntin
a
Pana
ma
Beliz
e
Urug
uay
A. Exports
20162000
B. Imports
0102030405060708090
100
Arge
ntin
a
Mex
ico
Braz
ilBo
livia
(Plu
r. St
ate
of)
Chile
Para
guay
Ecua
dor
Trin
idad
and
Tob
ago
Peru
Colo
mbi
a
Pana
ma
Urug
uay
Cost
a Ri
ca
Surin
ame
Guya
na
Dom
inic
an R
ep.
Nic
arag
uaVe
nezu
ela
(Bol
. Rep
. of)
Dom
inic
a
Hond
uras
Jam
aica
El S
alva
dor
Guat
emal
a
Baha
mas
Beliz
e
Barb
ados
Cuba
Antig
ua a
nd B
arbu
da
Sain
t Luc
iaSa
int V
ince
nt a
ndth
e Gr
enad
ines
Source: Economic Commission for Latin America and the Caribbean (ECLAC), on the basis of the United Nations International Trade Statistics Database (UN Comtrade). a Data for the Bolivarian Republic of Venezuela and Cuba were obtained through mirror statistics. Data for the Bahamas, Guatemala, Nicaragua, the Plurinational State of
Bolivia, Saint Vincent and the Grenadines, and Trinidad and Tobago are for 2015, and those for Honduras, 2014.
2. Asia has become the most important market for the region’s agricultural exports, while the United States is its main supplier
The trend in destinations of regional agricultural exports over the last 15 years reveals the growing importance of Asian markets. The share of Asia (including the Russian Federation and the countries of the Middle East) doubled between 2000 and 2015,
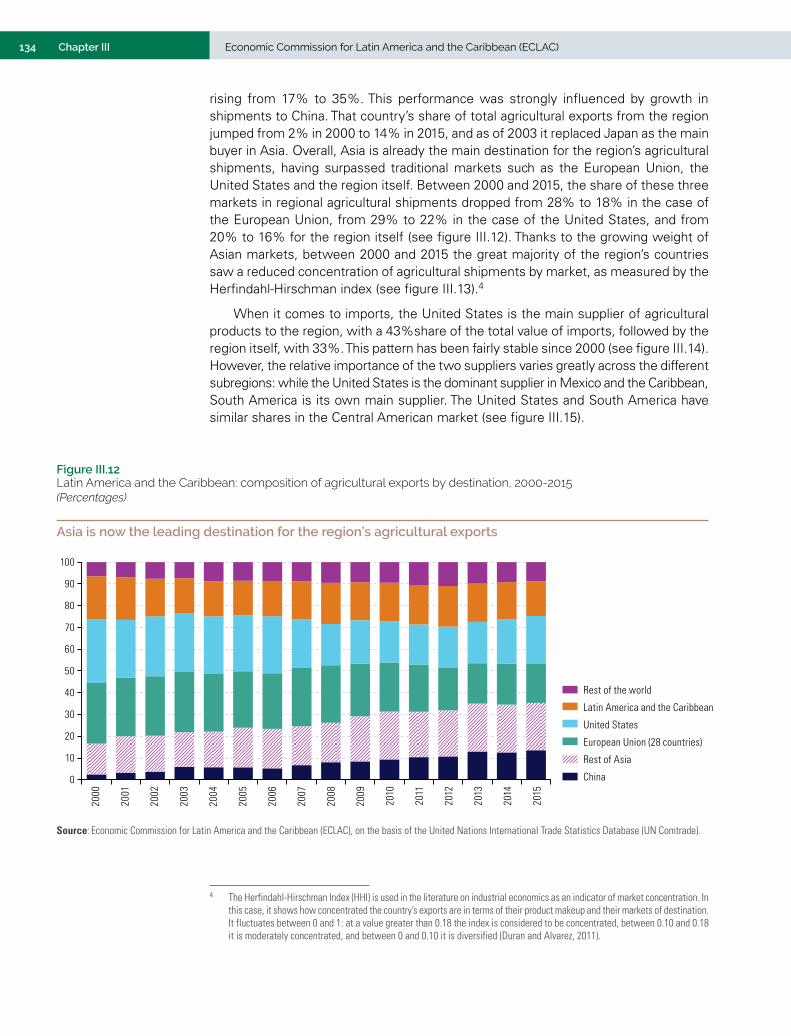
134 Chapter III Economic Commission for Latin America and the Caribbean (ECLAC)
rising from 17% to 35%. This performance was strongly influenced by growth in shipments to China. That country’s share of total agricultural exports from the region jumped from 2% in 2000 to 14% in 2015, and as of 2003 it replaced Japan as the main buyer in Asia. Overall, Asia is already the main destination for the region’s agricultural shipments, having surpassed traditional markets such as the European Union, the United States and the region itself. Between 2000 and 2015, the share of these three markets in regional agricultural shipments dropped from 28% to 18% in the case of the European Union, from 29% to 22% in the case of the United States, and from 20% to 16% for the region itself (see figure III.12). Thanks to the growing weight of Asian markets, between 2000 and 2015 the great majority of the region’s countries saw a reduced concentration of agricultural shipments by market, as measured by the Herfindahl-Hirschman index (see figure III.13).4
When it comes to imports, the United States is the main supplier of agricultural products to the region, with a 43%share of the total value of imports, followed by the region itself, with 33%. This pattern has been fairly stable since 2000 (see figure III.14). However, the relative importance of the two suppliers varies greatly across the different subregions: while the United States is the dominant supplier in Mexico and the Caribbean, South America is its own main supplier. The United States and South America have similar shares in the Central American market (see figure III.15).
4 The Herfindahl-Hirschman Index (HHI) is used in the literature on industrial economics as an indicator of market concentration. In this case, it shows how concentrated the country’s exports are in terms of their product makeup and their markets of destination. It fluctuates between 0 and 1: at a value greater than 0.18 the index is considered to be concentrated, between 0.10 and 0.18 it is moderately concentrated, and between 0 and 0.10 it is diversified (Duran and Alvarez, 2011).
Figure III.12 Latin America and the Caribbean: composition of agricultural exports by destination, 2000-2015(Percentages)
Asia is now the leading destination for the region’s agricultural exports
0
10
20
30
40
50
60
70
80
90
100
2000
2001
2002
2003
2004
2005
2006
2007
2008
2009
2010
2011
2012
2013
2014
2015
China
Rest of Asia
European Union (28 countries)
United States
Latin America and the Caribbean
Rest of the world
Source: Economic Commission for Latin America and the Caribbean (ECLAC), on the basis of the United Nations International Trade Statistics Database (UN Comtrade).
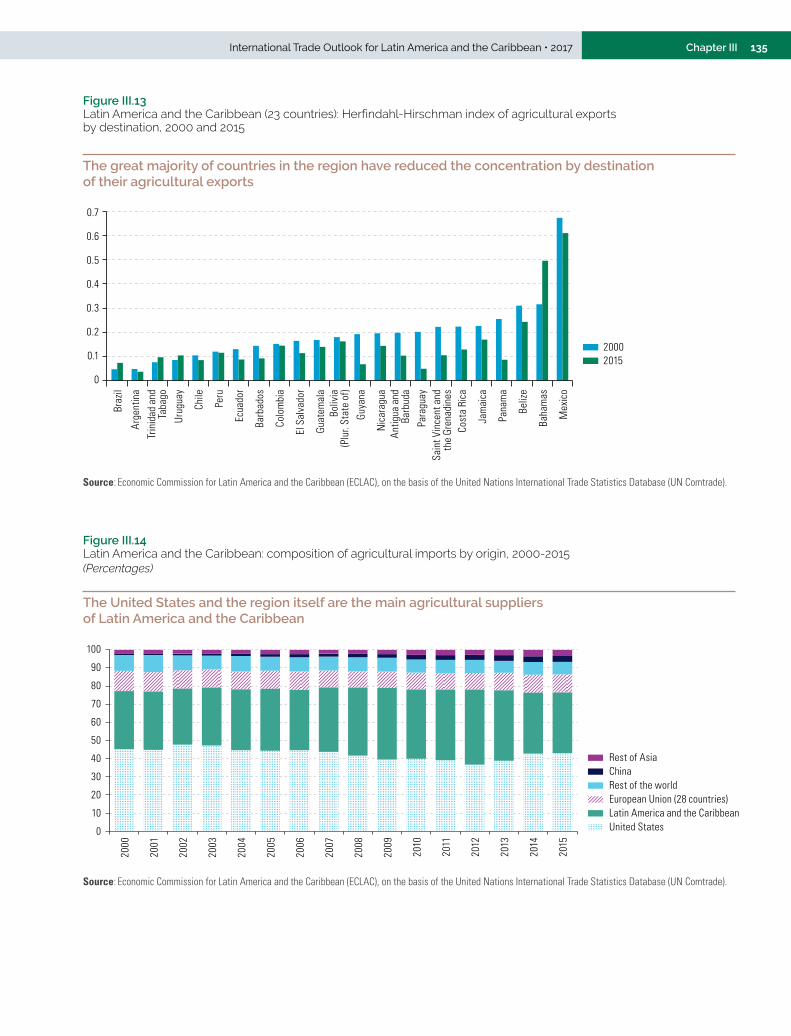
135Chapter IIIInternational Trade Outlook for Latin America and the Caribbean • 2017
Figure III.13 Latin America and the Caribbean (23 countries): Herfindahl-Hirschman index of agricultural exports by destination, 2000 and 2015
The great majority of countries in the region have reduced the concentration by destination of their agricultural exports
0
0.1
0.2
0.3
0.4
0.5
0.6
0.7
Braz
il
Arge
ntin
a
Trin
idad
and
Taba
go
Urug
uay
Chile
Peru
Ecua
dor
Barb
ados
Colo
mbi
a
El S
alva
dor
Guat
emal
aBo
livia
(Plu
r. St
ate
of)
Guya
na
Nic
arag
uaAn
tigua
and
Barb
uda
Para
guay
Sain
t Vin
cent
and
the
Gren
adin
esCo
sta
Rica
Jam
aica
Pana
ma
Beliz
e
Baha
mas
Mex
ico
20002015
Source: Economic Commission for Latin America and the Caribbean (ECLAC), on the basis of the United Nations International Trade Statistics Database (UN Comtrade).
Figure III.14 Latin America and the Caribbean: composition of agricultural imports by origin, 2000-2015(Percentages)
The United States and the region itself are the main agricultural suppliers of Latin America and the Caribbean
0
10
20
30
40
50
60
70
80
90
100
2000
2001
2002
2003
2004
2005
2006
2007
2008
2009
2010
2011
2012
2013
2014
2015
United StatesLatin America and the CaribbeanEuropean Union (28 countries)Rest of the worldChinaRest of Asia
Source: Economic Commission for Latin America and the Caribbean (ECLAC), on the basis of the United Nations International Trade Statistics Database (UN Comtrade).
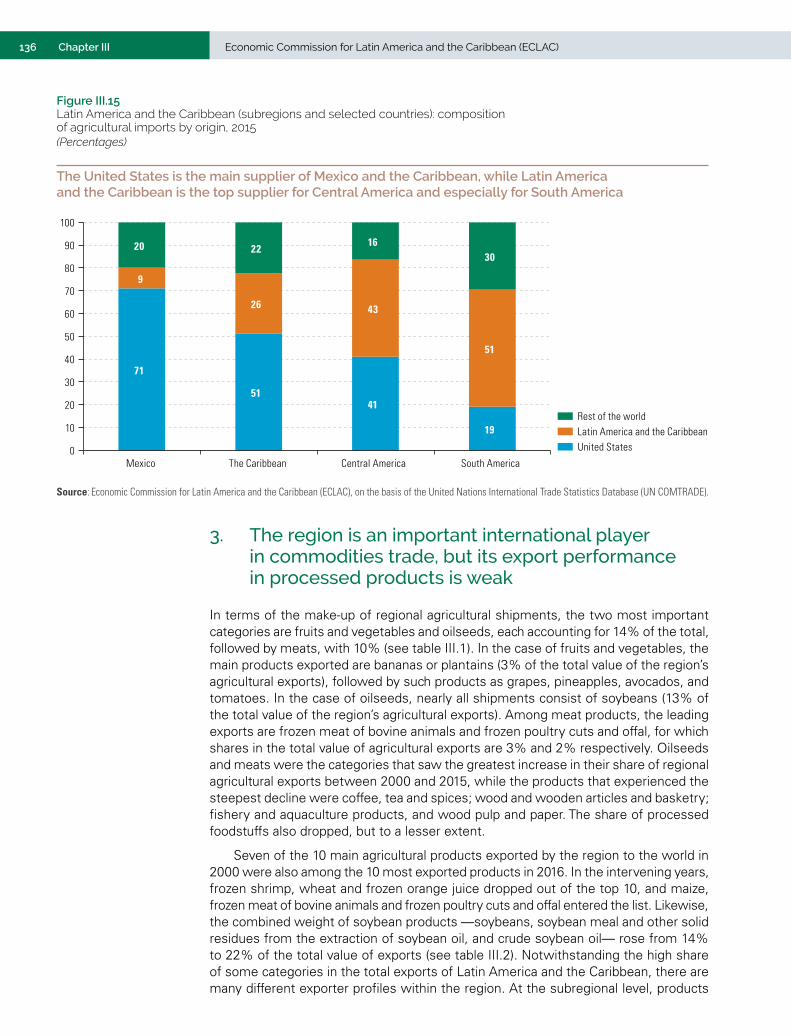
136 Chapter III Economic Commission for Latin America and the Caribbean (ECLAC)
Figure III.15 Latin America and the Caribbean (subregions and selected countries): composition of agricultural imports by origin, 2015 (Percentages)
The United States is the main supplier of Mexico and the Caribbean, while Latin America and the Caribbean is the top supplier for Central America and especially for South America
71
5141
19
9
26 43
51
20 2216
30
0
10
20
30
40
50
60
70
80
90
100
Mexico The Caribbean Central America South America
United StatesLatin America and the CaribbeanRest of the world
Source: Economic Commission for Latin America and the Caribbean (ECLAC), on the basis of the United Nations International Trade Statistics Database (UN COMTRADE).
3. The region is an important international player in commodities trade, but its export performance in processed products is weak
In terms of the make-up of regional agricultural shipments, the two most important categories are fruits and vegetables and oilseeds, each accounting for 14% of the total, followed by meats, with 10% (see table III.1). In the case of fruits and vegetables, the main products exported are bananas or plantains (3% of the total value of the region’s agricultural exports), followed by such products as grapes, pineapples, avocados, and tomatoes. In the case of oilseeds, nearly all shipments consist of soybeans (13% of the total value of the region’s agricultural exports). Among meat products, the leading exports are frozen meat of bovine animals and frozen poultry cuts and offal, for which shares in the total value of agricultural exports are 3% and 2% respectively. Oilseeds and meats were the categories that saw the greatest increase in their share of regional agricultural exports between 2000 and 2015, while the products that experienced the steepest decline were coffee, tea and spices; wood and wooden articles and basketry; fishery and aquaculture products, and wood pulp and paper. The share of processed foodstuffs also dropped, but to a lesser extent.
Seven of the 10 main agricultural products exported by the region to the world in 2000 were also among the 10 most exported products in 2016. In the intervening years, frozen shrimp, wheat and frozen orange juice dropped out of the top 10, and maize, frozen meat of bovine animals and frozen poultry cuts and offal entered the list. Likewise, the combined weight of soybean products —soybeans, soybean meal and other solid residues from the extraction of soybean oil, and crude soybean oil— rose from 14% to 22% of the total value of exports (see table III.2). Notwithstanding the high share of some categories in the total exports of Latin America and the Caribbean, there are many different exporter profiles within the region. At the subregional level, products
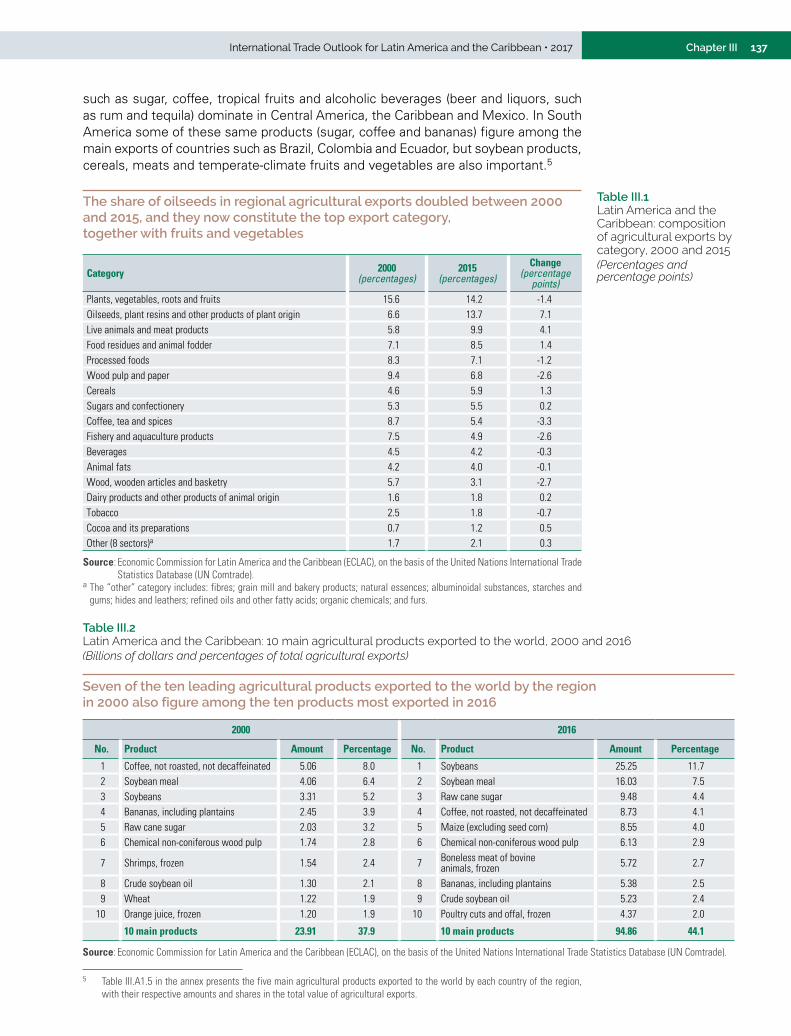
137Chapter IIIInternational Trade Outlook for Latin America and the Caribbean • 2017
such as sugar, coffee, tropical fruits and alcoholic beverages (beer and liquors, such as rum and tequila) dominate in Central America, the Caribbean and Mexico. In South America some of these same products (sugar, coffee and bananas) figure among the main exports of countries such as Brazil, Colombia and Ecuador, but soybean products, cereals, meats and temperate-climate fruits and vegetables are also important.5
5 Table III.A1.5 in the annex presents the five main agricultural products exported to the world by each country of the region, with their respective amounts and shares in the total value of agricultural exports.
Table III.1 Latin America and the Caribbean: composition of agricultural exports by category, 2000 and 2015 (Percentages and percentage points)
The share of oilseeds in regional agricultural exports doubled between 2000 and 2015, and they now constitute the top export category, together with fruits and vegetables
Category 2000(percentages)
2015(percentages)
Change(percentage
points)Plants, vegetables, roots and fruits 15.6 14.2 -1.4Oilseeds, plant resins and other products of plant origin 6.6 13.7 7.1Live animals and meat products 5.8 9.9 4.1Food residues and animal fodder 7.1 8.5 1.4Processed foods 8.3 7.1 -1.2Wood pulp and paper 9.4 6.8 -2.6Cereals 4.6 5.9 1.3Sugars and confectionery 5.3 5.5 0.2Coffee, tea and spices 8.7 5.4 -3.3Fishery and aquaculture products 7.5 4.9 -2.6Beverages 4.5 4.2 -0.3Animal fats 4.2 4.0 -0.1Wood, wooden articles and basketry 5.7 3.1 -2.7Dairy products and other products of animal origin 1.6 1.8 0.2Tobacco 2.5 1.8 -0.7Cocoa and its preparations 0.7 1.2 0.5Other (8 sectors)a 1.7 2.1 0.3
Source: Economic Commission for Latin America and the Caribbean (ECLAC), on the basis of the United Nations International Trade Statistics Database (UN Comtrade).
a The “other” category includes: fibres; grain mill and bakery products; natural essences; albuminoidal substances, starches and gums; hides and leathers; refined oils and other fatty acids; organic chemicals; and furs.
Table III.2 Latin America and the Caribbean: 10 main agricultural products exported to the world, 2000 and 2016(Billions of dollars and percentages of total agricultural exports)
Seven of the ten leading agricultural products exported to the world by the region in 2000 also figure among the ten products most exported in 2016
2000 2016
No. Product Amount Percentage No. Product Amount Percentage
1 Coffee, not roasted, not decaffeinated 5.06 8.0 1 Soybeans 25.25 11.72 Soybean meal 4.06 6.4 2 Soybean meal 16.03 7.53 Soybeans 3.31 5.2 3 Raw cane sugar 9.48 4.44 Bananas, including plantains 2.45 3.9 4 Coffee, not roasted, not decaffeinated 8.73 4.15 Raw cane sugar 2.03 3.2 5 Maize (excluding seed corn) 8.55 4.06 Chemical non-coniferous wood pulp 1.74 2.8 6 Chemical non-coniferous wood pulp 6.13 2.9
7 Shrimps, frozen 1.54 2.4 7 Boneless meat of bovine animals, frozen 5.72 2.7
8 Crude soybean oil 1.30 2.1 8 Bananas, including plantains 5.38 2.59 Wheat 1.22 1.9 9 Crude soybean oil 5.23 2.4
10 Orange juice, frozen 1.20 1.9 10 Poultry cuts and offal, frozen 4.37 2.0
10 main products 23.91 37.9 10 main products 94.86 44.1
Source: Economic Commission for Latin America and the Caribbean (ECLAC), on the basis of the United Nations International Trade Statistics Database (UN Comtrade).
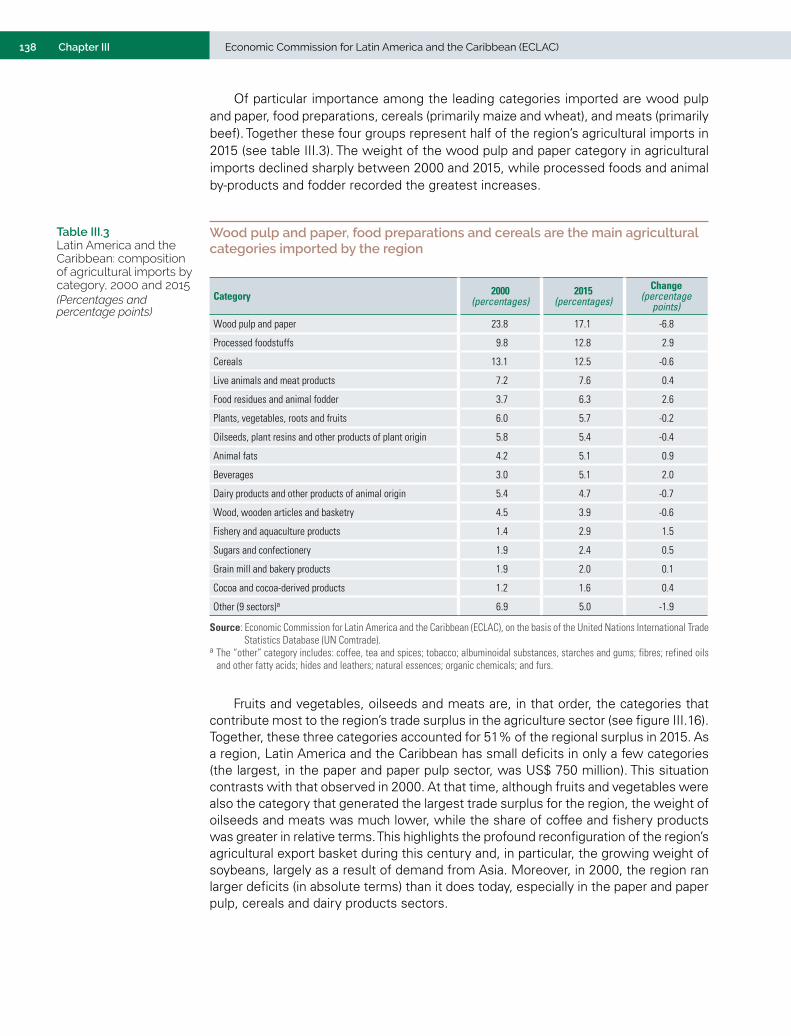
138 Chapter III Economic Commission for Latin America and the Caribbean (ECLAC)
Of particular importance among the leading categories imported are wood pulp and paper, food preparations, cereals (primarily maize and wheat), and meats (primarily beef). Together these four groups represent half of the region’s agricultural imports in 2015 (see table III.3). The weight of the wood pulp and paper category in agricultural imports declined sharply between 2000 and 2015, while processed foods and animal by-products and fodder recorded the greatest increases.
Table III.3 Latin America and the Caribbean: composition of agricultural imports by category, 2000 and 2015(Percentages and percentage points)
Wood pulp and paper, food preparations and cereals are the main agricultural categories imported by the region
Category 2000(percentages)
2015(percentages)
Change (percentage
points)
Wood pulp and paper 23.8 17.1 -6.8
Processed foodstuffs 9.8 12.8 2.9
Cereals 13.1 12.5 -0.6
Live animals and meat products 7.2 7.6 0.4
Food residues and animal fodder 3.7 6.3 2.6
Plants, vegetables, roots and fruits 6.0 5.7 -0.2
Oilseeds, plant resins and other products of plant origin 5.8 5.4 -0.4
Animal fats 4.2 5.1 0.9
Beverages 3.0 5.1 2.0
Dairy products and other products of animal origin 5.4 4.7 -0.7
Wood, wooden articles and basketry 4.5 3.9 -0.6
Fishery and aquaculture products 1.4 2.9 1.5
Sugars and confectionery 1.9 2.4 0.5
Grain mill and bakery products 1.9 2.0 0.1
Cocoa and cocoa-derived products 1.2 1.6 0.4
Other (9 sectors)a 6.9 5.0 -1.9
Source: Economic Commission for Latin America and the Caribbean (ECLAC), on the basis of the United Nations International Trade Statistics Database (UN Comtrade).
a The “other” category includes: coffee, tea and spices; tobacco; albuminoidal substances, starches and gums; fibres; refined oils and other fatty acids; hides and leathers; natural essences; organic chemicals; and furs.
Fruits and vegetables, oilseeds and meats are, in that order, the categories that contribute most to the region’s trade surplus in the agriculture sector (see figure III.16). Together, these three categories accounted for 51% of the regional surplus in 2015. As a region, Latin America and the Caribbean has small deficits in only a few categories (the largest, in the paper and paper pulp sector, was US$ 750 million). This situation contrasts with that observed in 2000. At that time, although fruits and vegetables were also the category that generated the largest trade surplus for the region, the weight of oilseeds and meats was much lower, while the share of coffee and fishery products was greater in relative terms. This highlights the profound reconfiguration of the region’s agricultural export basket during this century and, in particular, the growing weight of soybeans, largely as a result of demand from Asia. Moreover, in 2000, the region ran larger deficits (in absolute terms) than it does today, especially in the paper and paper pulp, cereals and dairy products sectors.
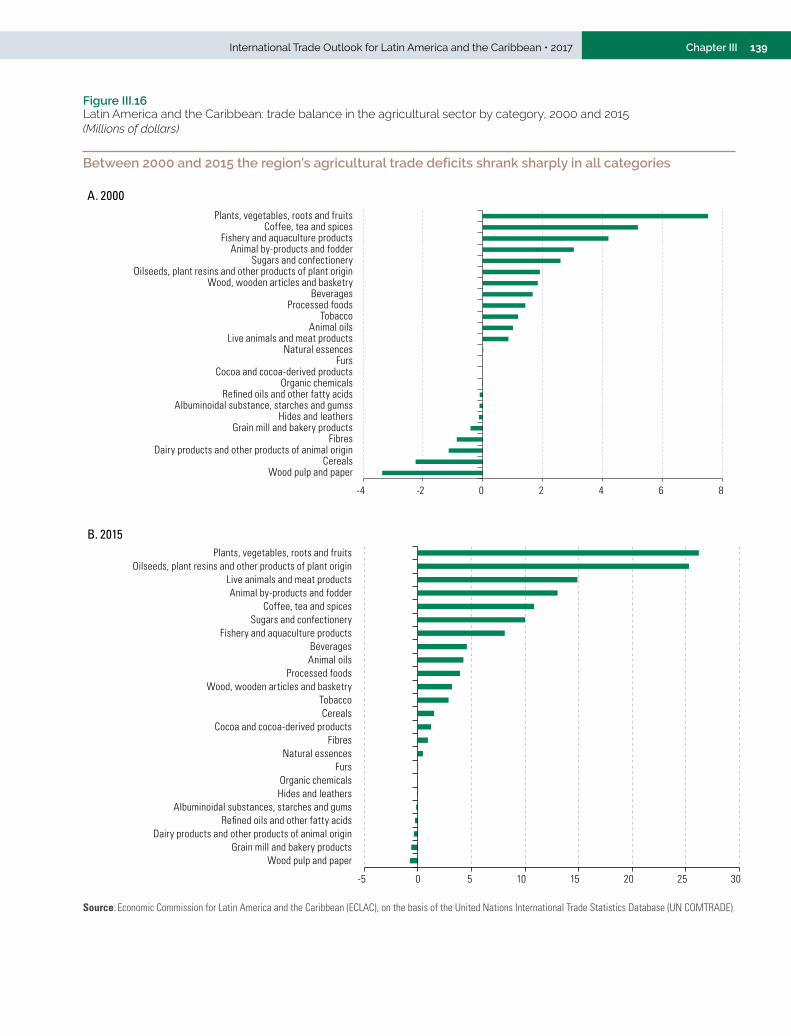
139Chapter IIIInternational Trade Outlook for Latin America and the Caribbean • 2017
Figure III.16 Latin America and the Caribbean: trade balance in the agricultural sector by category, 2000 and 2015(Millions of dollars)
Between 2000 and 2015 the region’s agricultural trade deficits shrank sharply in all categories
A. 2000
-4 -2 0 2 4 6 8
Wood pulp and paperCereals
Dairy products and other products of animal originFibres
Grain mill and bakery productsHides and leathers
Albuminoidal substance, starches and gumssRefined oils and other fatty acids
Organic chemicalsCocoa and cocoa-derived products
FursNatural essences
Live animals and meat productsAnimal oils
TobaccoProcessed foods
BeveragesWood, wooden articles and basketry
Oilseeds, plant resins and other products of plant originSugars and confectionery
Animal by-products and fodderFishery and aquaculture products
Coffee, tea and spicesPlants, vegetables, roots and fruits
B. 2015
-5 0 5 10 15 20 25 30
Wood pulp and paperGrain mill and bakery products
Dairy products and other products of animal originRefined oils and other fatty acids
Albuminoidal substances, starches and gumsHides and leathersOrganic chemicals
FursNatural essences
FibresCocoa and cocoa-derived products
CerealsTobacco
Wood, wooden articles and basketryProcessed foods
Animal oilsBeverages
Fishery and aquaculture productsSugars and confectionery
Coffee, tea and spicesAnimal by-products and fodder
Live animals and meat productsOilseeds, plant resins and other products of plant origin
Plants, vegetables, roots and fruits
Source: Economic Commission for Latin America and the Caribbean (ECLAC), on the basis of the United Nations International Trade Statistics Database (UN COMTRADE).
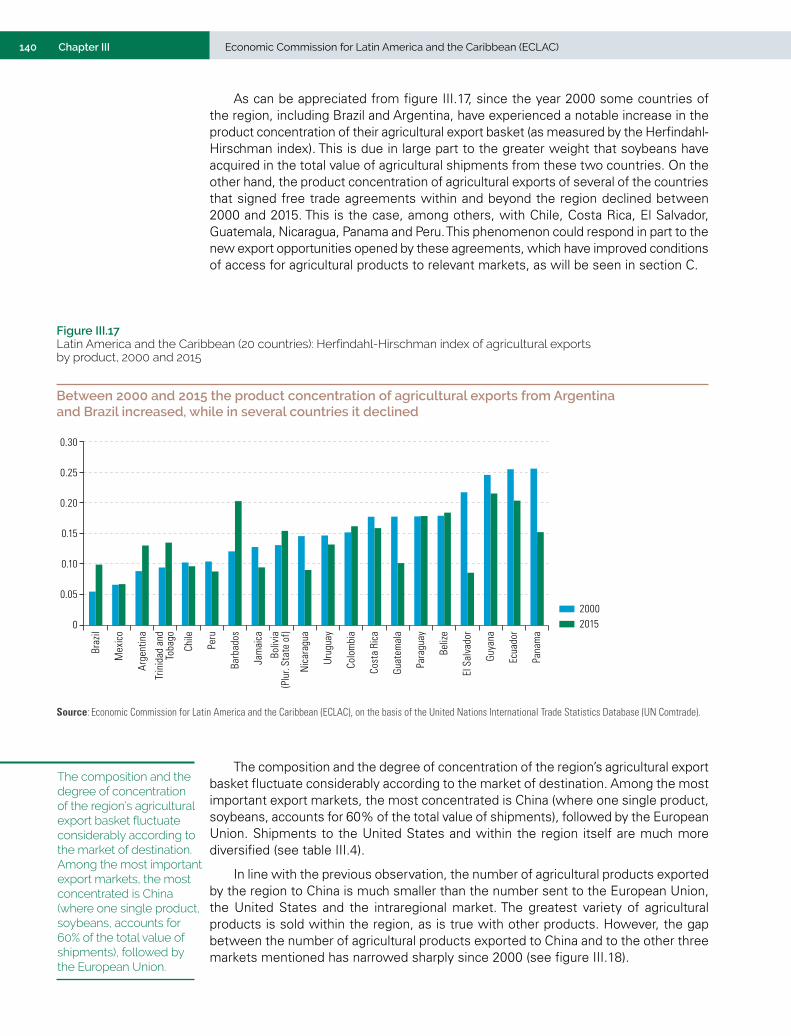
140 Chapter III Economic Commission for Latin America and the Caribbean (ECLAC)
As can be appreciated from figure III.17, since the year 2000 some countries of the region, including Brazil and Argentina, have experienced a notable increase in the product concentration of their agricultural export basket (as measured by the Herfindahl-Hirschman index). This is due in large part to the greater weight that soybeans have acquired in the total value of agricultural shipments from these two countries. On the other hand, the product concentration of agricultural exports of several of the countries that signed free trade agreements within and beyond the region declined between 2000 and 2015. This is the case, among others, with Chile, Costa Rica, El Salvador, Guatemala, Nicaragua, Panama and Peru. This phenomenon could respond in part to the new export opportunities opened by these agreements, which have improved conditions of access for agricultural products to relevant markets, as will be seen in section C.
Figure III.17 Latin America and the Caribbean (20 countries): Herfindahl-Hirschman index of agricultural exports by product, 2000 and 2015
Between 2000 and 2015 the product concentration of agricultural exports from Argentina and Brazil increased, while in several countries it declined
0
0.05
0.10
0.15
0.20
0.25
0.30
Braz
il
Mex
ico
Arge
ntin
a
Trin
idad
and
Toba
go
Chile
Peru
Barb
ados
Jam
aica
Boliv
ia(P
lur.
Stat
e of
)
Nic
arag
ua
Urug
uay
Colo
mbi
a
Cost
a Ri
ca
Guat
emal
a
Para
guay
Beliz
e
El S
alva
dor
Guya
na
Ecua
dor
Pana
ma
20002015
Source: Economic Commission for Latin America and the Caribbean (ECLAC), on the basis of the United Nations International Trade Statistics Database (UN Comtrade).
The composition and the degree of concentration of the region’s agricultural export basket fluctuate considerably according to the market of destination. Among the most important export markets, the most concentrated is China (where one single product, soybeans, accounts for 60% of the total value of shipments), followed by the European Union. Shipments to the United States and within the region itself are much more diversified (see table III.4).
In line with the previous observation, the number of agricultural products exported by the region to China is much smaller than the number sent to the European Union, the United States and the intraregional market. The greatest variety of agricultural products is sold within the region, as is true with other products. However, the gap between the number of agricultural products exported to China and to the other three markets mentioned has narrowed sharply since 2000 (see figure III.18).
The composition and the degree of concentration of the region’s agricultural export basket fluctuate considerably according to the market of destination. Among the most important export markets, the most concentrated is China (where one single product, soybeans, accounts for 60% of the total value of shipments), followed by the European Union.
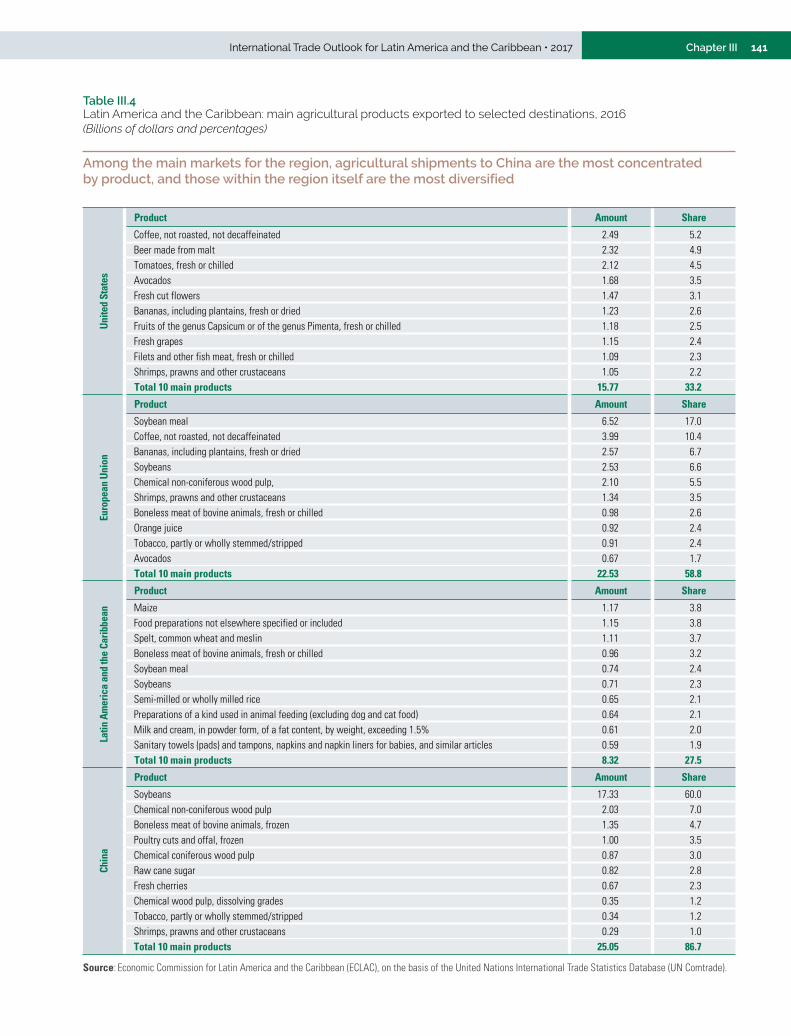
141Chapter IIIInternational Trade Outlook for Latin America and the Caribbean • 2017
Table III.4 Latin America and the Caribbean: main agricultural products exported to selected destinations, 2016(Billions of dollars and percentages)
Among the main markets for the region, agricultural shipments to China are the most concentrated by product, and those within the region itself are the most diversified
Unite
d St
ates
Product Amount Share
Coffee, not roasted, not decaffeinated 2.49 5.2Beer made from malt 2.32 4.9Tomatoes, fresh or chilled 2.12 4.5Avocados 1.68 3.5Fresh cut flowers 1.47 3.1Bananas, including plantains, fresh or dried 1.23 2.6Fruits of the genus Capsicum or of the genus Pimenta, fresh or chilled 1.18 2.5Fresh grapes 1.15 2.4Filets and other fish meat, fresh or chilled 1.09 2.3Shrimps, prawns and other crustaceans 1.05 2.2 Total 10 main products 15.77 33.2
Euro
pean
Uni
on
Product Amount Share
Soybean meal 6.52 17.0Coffee, not roasted, not decaffeinated 3.99 10.4Bananas, including plantains, fresh or dried 2.57 6.7Soybeans 2.53 6.6Chemical non-coniferous wood pulp, 2.10 5.5Shrimps, prawns and other crustaceans 1.34 3.5Boneless meat of bovine animals, fresh or chilled 0.98 2.6Orange juice 0.92 2.4Tobacco, partly or wholly stemmed/stripped 0.91 2.4Avocados 0.67 1.7 Total 10 main products 22.53 58.8
Latin
Am
eric
a an
d th
e Ca
ribbe
an
Product Amount Share
Maize 1.17 3.8Food preparations not elsewhere specified or included 1.15 3.8Spelt, common wheat and meslin 1.11 3.7Boneless meat of bovine animals, fresh or chilled 0.96 3.2Soybean meal 0.74 2.4Soybeans 0.71 2.3Semi-milled or wholly milled rice 0.65 2.1Preparations of a kind used in animal feeding (excluding dog and cat food) 0.64 2.1Milk and cream, in powder form, of a fat content, by weight, exceeding 1.5% 0.61 2.0Sanitary towels (pads) and tampons, napkins and napkin liners for babies, and similar articles 0.59 1.9 Total 10 main products 8.32 27.5
Chin
a
Product Amount Share
Soybeans 17.33 60.0Chemical non-coniferous wood pulp 2.03 7.0Boneless meat of bovine animals, frozen 1.35 4.7Poultry cuts and offal, frozen 1.00 3.5Chemical coniferous wood pulp 0.87 3.0Raw cane sugar 0.82 2.8Fresh cherries 0.67 2.3Chemical wood pulp, dissolving grades 0.35 1.2Tobacco, partly or wholly stemmed/stripped 0.34 1.2Shrimps, prawns and other crustaceans 0.29 1.0Total 10 main products 25.05 86.7
Source: Economic Commission for Latin America and the Caribbean (ECLAC), on the basis of the United Nations International Trade Statistics Database (UN Comtrade).
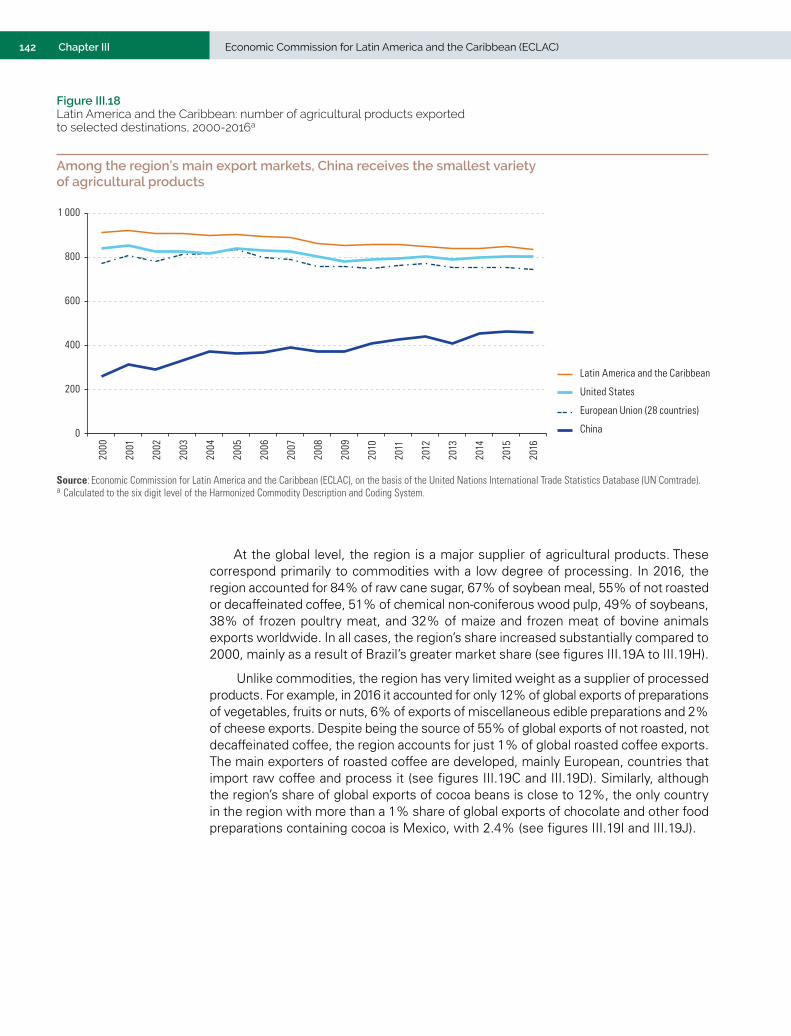
142 Chapter III Economic Commission for Latin America and the Caribbean (ECLAC)
Figure III.18 Latin America and the Caribbean: number of agricultural products exported to selected destinations, 2000-2016a
Among the region’s main export markets, China receives the smallest variety of agricultural products
0
200
400
600
800
1 000
2000
2001
2002
2003
2004
2005
2006
2007
2008
2009
2010
2011
2012
2013
2014
2015
2016
China
Latin America and the Caribbean
European Union (28 countries)
United States
Source: Economic Commission for Latin America and the Caribbean (ECLAC), on the basis of the United Nations International Trade Statistics Database (UN Comtrade).a Calculated to the six digit level of the Harmonized Commodity Description and Coding System.
At the global level, the region is a major supplier of agricultural products. These correspond primarily to commodities with a low degree of processing. In 2016, the region accounted for 84% of raw cane sugar, 67% of soybean meal, 55% of not roasted or decaffeinated coffee, 51% of chemical non-coniferous wood pulp, 49% of soybeans, 38% of frozen poultry meat, and 32% of maize and frozen meat of bovine animals exports worldwide. In all cases, the region’s share increased substantially compared to 2000, mainly as a result of Brazil’s greater market share (see figures III.19A to III.19H).
Unlike commodities, the region has very limited weight as a supplier of processed products. For example, in 2016 it accounted for only 12% of global exports of preparations of vegetables, fruits or nuts, 6% of exports of miscellaneous edible preparations and 2% of cheese exports. Despite being the source of 55% of global exports of not roasted, not decaffeinated coffee, the region accounts for just 1% of global roasted coffee exports. The main exporters of roasted coffee are developed, mainly European, countries that import raw coffee and process it (see figures III.19C and III.19D). Similarly, although the region’s share of global exports of cocoa beans is close to 12%, the only country in the region with more than a 1% share of global exports of chocolate and other food preparations containing cocoa is Mexico, with 2.4% (see figures III.19I and III.19J).
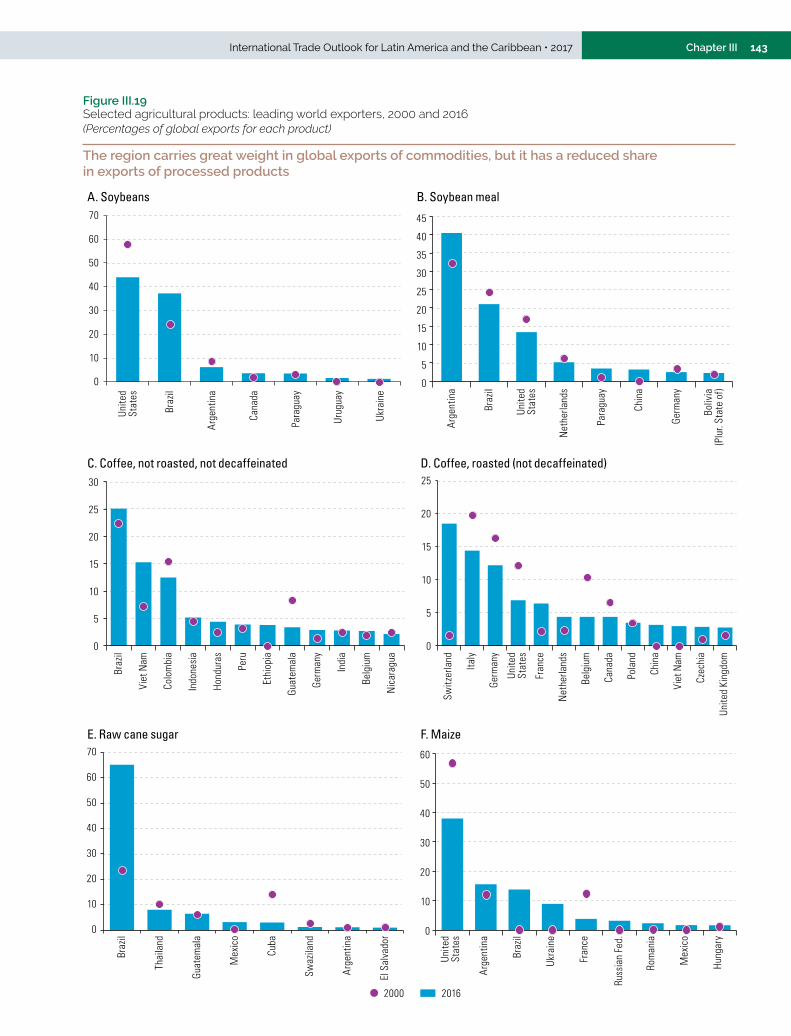
143Chapter IIIInternational Trade Outlook for Latin America and the Caribbean • 2017
Figure III.19 Selected agricultural products: leading world exporters, 2000 and 2016 (Percentages of global exports for each product)
The region carries great weight in global exports of commodities, but it has a reduced share in exports of processed products
0
10
20
30
40
50
60
70
Unite
dSt
ates
Braz
il
Arge
ntin
a
Cana
da
Para
guay
Urug
uay
Ukra
ine
A. Soybeans B. Soybean meal
0
5
10
15
20
25
30
35
40
45
Arge
ntin
a
Braz
il
Unite
dSt
ates
Net
herla
nds
Para
guay
Chin
a
Germ
any
Boliv
ia(P
lur.
Stat
e of
)
C. Coffee, not roasted, not decaffeinated D. Coffee, roasted (not decaffeinated)
0
5
10
15
20
25
30
Braz
il
Viet
Nam
Colo
mbi
a
Indo
nesi
a
Hond
uras
Peru
Ethi
opia
Guat
emal
a
Germ
any
Indi
a
Belg
ium
Nic
arag
ua
0
5
10
15
20
25
Switz
erla
nd
Italy
Germ
any
Unite
dSt
ates
Fran
ce
Net
herla
nds
Belg
ium
Cana
da
Pola
nd
Chin
a
Viet
Nam
Czec
hia
Unite
d Ki
ngdo
mE. Raw cane sugar F. Maize
0
10
20
30
40
50
60
Unite
dSt
ates
Arge
ntin
a
Braz
il
Ukra
ine
Fran
ce
Russ
ian
Fed.
Rom
ania
Mex
ico
Hung
ary
0
10
20
30
40
50
60
70
Braz
il
Thai
land
Guat
emal
a
Mex
ico
Cuba
Swaz
iland
Arge
ntin
a
El S
alva
dor
20162000
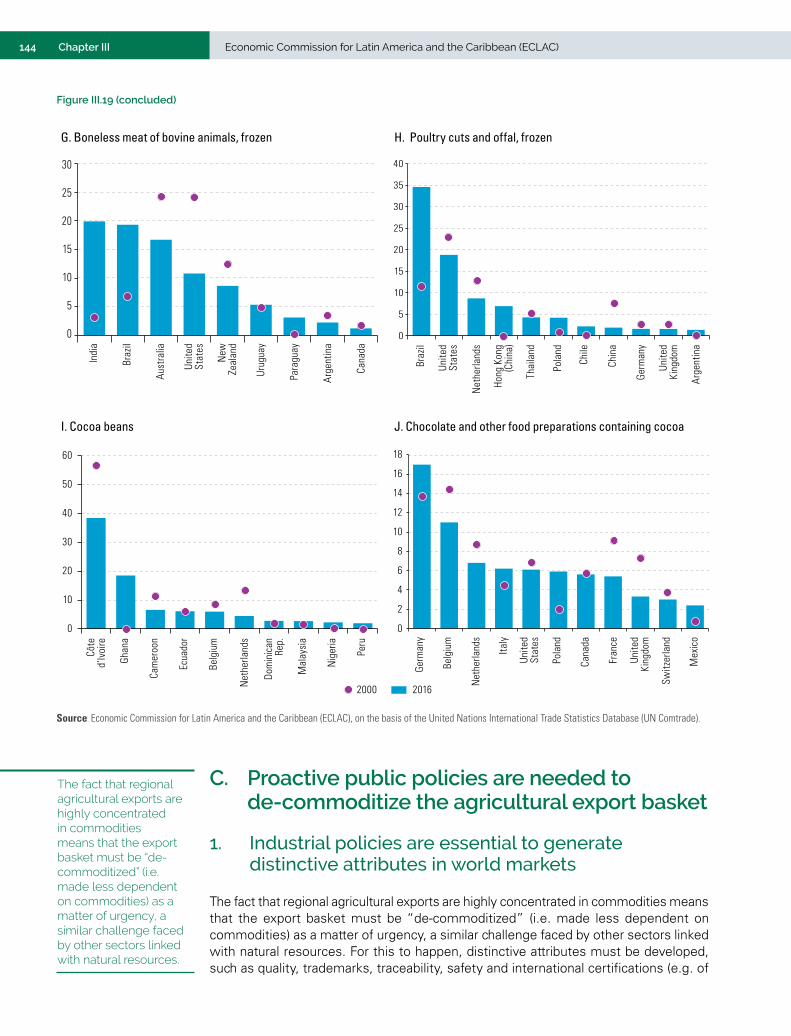
144 Chapter III Economic Commission for Latin America and the Caribbean (ECLAC)
G. Boneless meat of bovine animals, frozen H. Poultry cuts and offal, frozen
0
5
10
15
20
25
30
Indi
a
Braz
il
Aust
ralia
Unite
dSt
ates
New
Zeal
and
Urug
uay
Para
guay
Arge
ntin
a
Cana
da
2016 2000
0
5
10
15
20
25
30
35
40
Braz
il
Unite
dSt
ates
Net
herla
nds
Hong
Kon
g(C
hina
)
Thai
land
Pola
nd
Chile
Chin
a
Germ
any
Unite
dKi
ngdo
m
Arge
ntin
a
I. Cocoa beans J. Chocolate and other food preparations containing cocoa
0
10
20
30
40
50
60
Côte
d’Ivoire
Ghana
Cameroon
Ecuador
Belgium
Netherlands
Dominican
Rep.
Malaysia
Nigeria
Peru
0
2
4
6
8
10
12
14
16
18
Germany
Belgium
Netherlands
Italy
Unite
dStates
Poland
Canada
France
Unite
dKingdom
Switzerland
Mexico
20162000
Source: Economic Commission for Latin America and the Caribbean (ECLAC), on the basis of the United Nations International Trade Statistics Database (UN Comtrade).
Figure III.19 (concluded)
C. Proactive public policies are needed to de-commoditize the agricultural export basket
1. Industrial policies are essential to generate distinctive attributes in world markets
The fact that regional agricultural exports are highly concentrated in commodities means that the export basket must be “de-commoditized” (i.e. made less dependent on commodities) as a matter of urgency, a similar challenge faced by other sectors linked with natural resources. For this to happen, distinctive attributes must be developed, such as quality, trademarks, traceability, safety and international certifications (e.g. of
The fact that regional agricultural exports are highly concentrated in commodities means that the export basket must be “de-commoditized” (i.e. made less dependent on commodities) as a matter of urgency, a similar challenge faced by other sectors linked with natural resources.
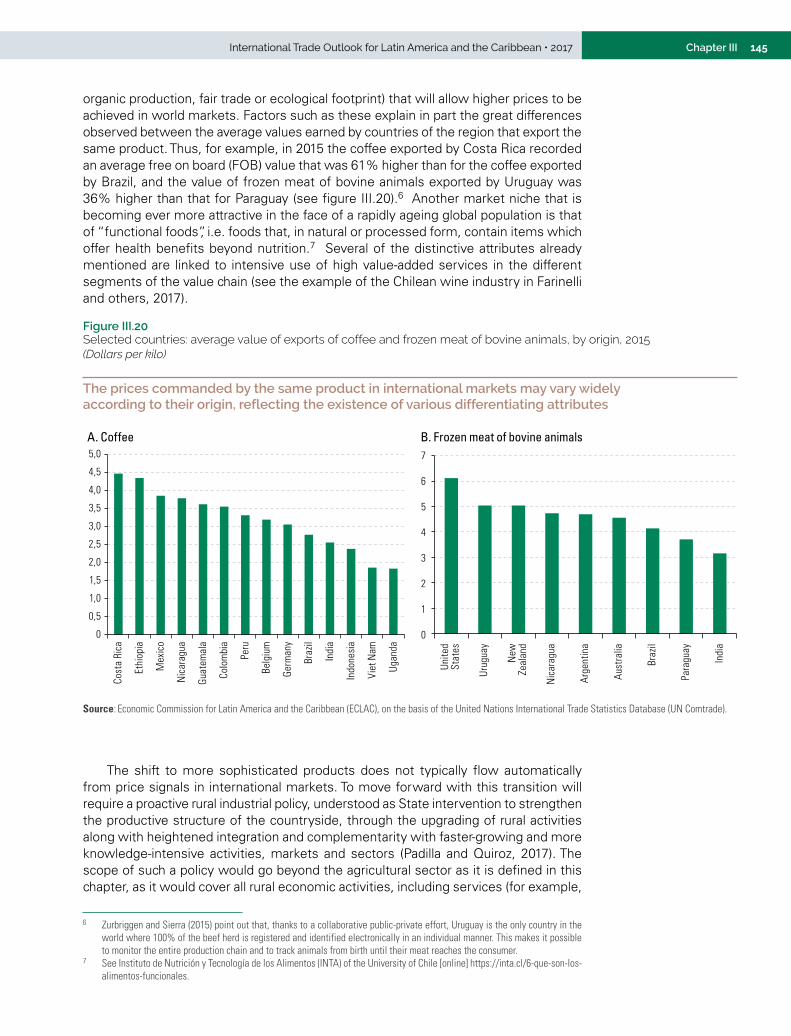
145Chapter IIIInternational Trade Outlook for Latin America and the Caribbean • 2017
organic production, fair trade or ecological footprint) that will allow higher prices to be achieved in world markets. Factors such as these explain in part the great differences observed between the average values earned by countries of the region that export the same product. Thus, for example, in 2015 the coffee exported by Costa Rica recorded an average free on board (FOB) value that was 61% higher than for the coffee exported by Brazil, and the value of frozen meat of bovine animals exported by Uruguay was 36% higher than that for Paraguay (see figure III.20).6 Another market niche that is becoming ever more attractive in the face of a rapidly ageing global population is that of “functional foods”, i.e. foods that, in natural or processed form, contain items which offer health benefits beyond nutrition.7 Several of the distinctive attributes already mentioned are linked to intensive use of high value-added services in the different segments of the value chain (see the example of the Chilean wine industry in Farinelli and others, 2017).
6 Zurbriggen and Sierra (2015) point out that, thanks to a collaborative public-private effort, Uruguay is the only country in the world where 100% of the beef herd is registered and identified electronically in an individual manner. This makes it possible to monitor the entire production chain and to track animals from birth until their meat reaches the consumer.
7 See Instituto de Nutrición y Tecnología de los Alimentos (INTA) of the University of Chile [online] https://inta.cl/6-que-son-los-alimentos-funcionales.
Figure III.20 Selected countries: average value of exports of coffee and frozen meat of bovine animals, by origin, 2015 (Dollars per kilo)
The prices commanded by the same product in international markets may vary widely according to their origin, reflecting the existence of various differentiating attributes
A. Coffee B. Frozen meat of bovine animals
0
0,5
1,0
1,5
2,0
2,5
3,0
3,5
4,0
4,5
5,0
Cost
a Ri
ca
Ethi
opia
Mex
ico
Nic
arag
ua
Guat
emal
a
Colo
mbi
a
Peru
Belg
ium
Germ
any
Braz
il
Indi
a
Indo
nesi
a
Viet
Nam
Ugan
da
0
1
2
3
4
5
6
7Un
ited
Stat
es
Urug
uay
New
Zeal
and
Nic
arag
ua
Arge
ntin
a
Aust
ralia
Braz
il
Para
guay
Indi
aSource: Economic Commission for Latin America and the Caribbean (ECLAC), on the basis of the United Nations International Trade Statistics Database (UN Comtrade).
The shift to more sophisticated products does not typically flow automatically from price signals in international markets. To move forward with this transition will require a proactive rural industrial policy, understood as State intervention to strengthen the productive structure of the countryside, through the upgrading of rural activities along with heightened integration and complementarity with faster-growing and more knowledge-intensive activities, markets and sectors (Padilla and Quiroz, 2017). The scope of such a policy would go beyond the agricultural sector as it is defined in this chapter, as it would cover all rural economic activities, including services (for example,
146 Chapter III Economic Commission for Latin America and the Caribbean (ECLAC)
rural tourism). Nevertheless, such a policy is undeniably important for achieving the objective of increasing value added and enhancing the knowledge intensity of the region’s agricultural exports.
A rural industrial policy calls for three categories of instruments: (i) trade, competitiveness and competition policies; (ii) tools for the promotion of productive development; and (iii) environmental policies (Padilla and Quiroz, 2017). The first category includes instruments such as export promotion and the negotiation of agreements to enhance access for agricultural products to new markets (see section 4 below), promotion of a stable macroeconomic framework, maintenance of a competitive exchange rate, the provision of infrastructure and the surveillance of competition in agrifood markets. All of these are basic conditions for the sound performance of exports in general, and of agricultural exports in particular.
Environmental policy, for its part, is an essential element for generating sustainable structural change in rural areas. Included here are instruments such as support for waste management and research for adaptation to climate change and mitigation of its effects, as well as programmes designed to measure, certify and reduce the environmental footprint, including the carbon footprint, of exports (Frohmann, 2017). Actions of this kind, besides generating an important environmental dividend, also have a clear link with the competitiveness of agricultural exports, as international markets (especially in developed countries) are increasingly insistent on knowing the environmental impact of imported foods (Frohmann and others, 2012). This is an issue of particular importance for the region. The current agricultural export model has had a number of adverse environmental consequences, in particular the deforestation caused by expanding the surface area devoted to soybean crops and livestock.
Policies for productive development are the broadest category within rural industrial policy, and include six areas of action: (i) productivity; (ii) marketing; (iii) education and training; (iv) access to financing; (v) science, technology and innovation (STI); and (vi) productive linkages. Included here are instruments such as support for obtaining international certifications, training programmes in information and communication technologies (ICT) and business management, the promotion of seed capital and venture capital funds, strengthening of agrifood innovation systems, the strategic use of intellectual property tools (for example denominations of origin) and incentives for forming clusters.8
The available data suggest that countries of the region still have a long way to go in order to make their agricultural and agro-industrial exports more sophisticated, and this will require industrial and technological policies that are more proactive than has been the case to date (see for example Solleiro and others, 2017). Obviously, as is the case with industrial policy in the broad sense, there is no “one size fits all” solution in terms of industrial policy for the agricultural export sector. The combination of instruments used will depend on the circumstances of each country, including the structure of the sector and the existing institutional, financial and technological capacities.
2. Trade agreements are important when it comes to enhancing access to highly protected markets
Given its great sensitivity in most countries, the agricultural sector has historically constituted an exceptional case within the multilateral trading system and for nearly half a century, between entry into force of the General Agreement on Tariffs and Trade (GATT) in 1948 and the creation of the World Trade Organization (WTO) in 1995, this sector
8 See the list of instruments for each area in Table II.8 of Padilla and Quiroz, 2017.
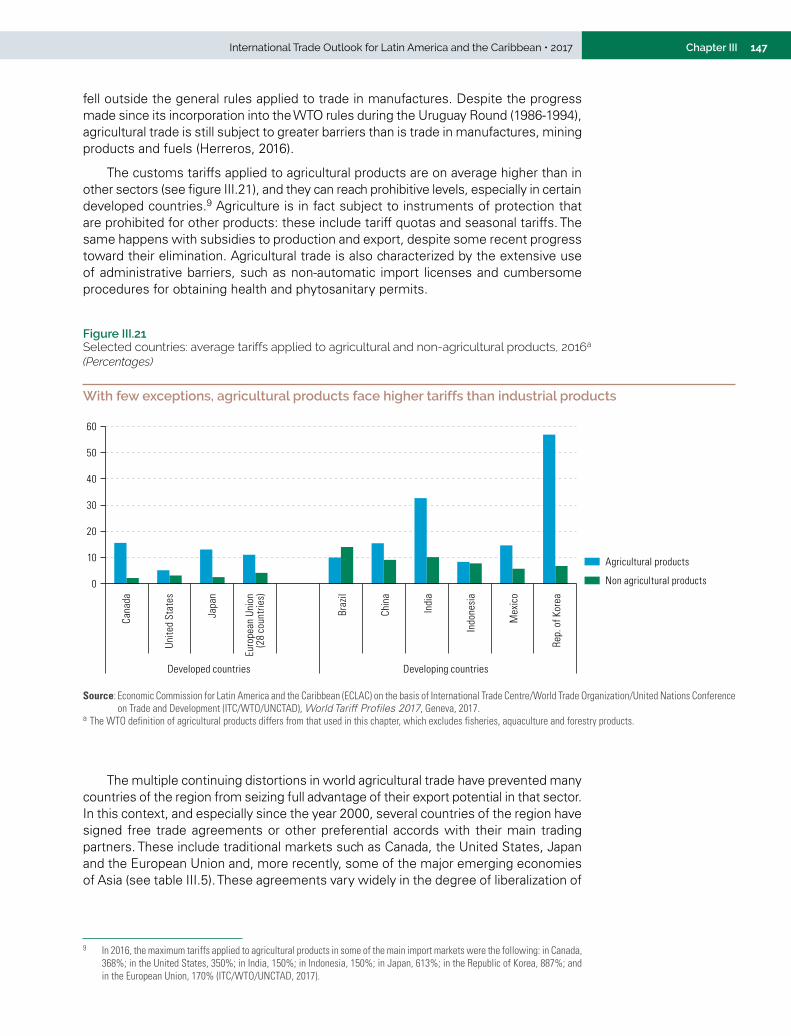
147Chapter IIIInternational Trade Outlook for Latin America and the Caribbean • 2017
fell outside the general rules applied to trade in manufactures. Despite the progress made since its incorporation into the WTO rules during the Uruguay Round (1986-1994), agricultural trade is still subject to greater barriers than is trade in manufactures, mining products and fuels (Herreros, 2016).
The customs tariffs applied to agricultural products are on average higher than in other sectors (see figure III.21), and they can reach prohibitive levels, especially in certain developed countries.9 Agriculture is in fact subject to instruments of protection that are prohibited for other products: these include tariff quotas and seasonal tariffs. The same happens with subsidies to production and export, despite some recent progress toward their elimination. Agricultural trade is also characterized by the extensive use of administrative barriers, such as non-automatic import licenses and cumbersome procedures for obtaining health and phytosanitary permits.
9 In 2016, the maximum tariffs applied to agricultural products in some of the main import markets were the following: in Canada, 368%; in the United States, 350%; in India, 150%; in Indonesia, 150%; in Japan, 613%; in the Republic of Korea, 887%; and in the European Union, 170% (ITC/WTO/UNCTAD, 2017).
Figure III.21 Selected countries: average tariffs applied to agricultural and non-agricultural products, 2016a
(Percentages)
With few exceptions, agricultural products face higher tariffs than industrial products
0
10
20
30
40
50
60
Cana
da
Unite
d St
ates
Japa
n
Euro
pean
Uni
on(2
8 co
untri
es)
Braz
il
Chin
a
Indi
a
Indo
nesi
a
Mex
ico
Rep.
of K
orea
Developed countries Developing countries
Agricultural products
Non agricultural products
Source: Economic Commission for Latin America and the Caribbean (ECLAC) on the basis of International Trade Centre/World Trade Organization/United Nations Conference on Trade and Development (ITC/WTO/UNCTAD), World Tariff Profiles 2017, Geneva, 2017.
a The WTO definition of agricultural products differs from that used in this chapter, which excludes fisheries, aquaculture and forestry products.
The multiple continuing distortions in world agricultural trade have prevented many countries of the region from seizing full advantage of their export potential in that sector. In this context, and especially since the year 2000, several countries of the region have signed free trade agreements or other preferential accords with their main trading partners. These include traditional markets such as Canada, the United States, Japan and the European Union and, more recently, some of the major emerging economies of Asia (see table III.5). These agreements vary widely in the degree of liberalization of
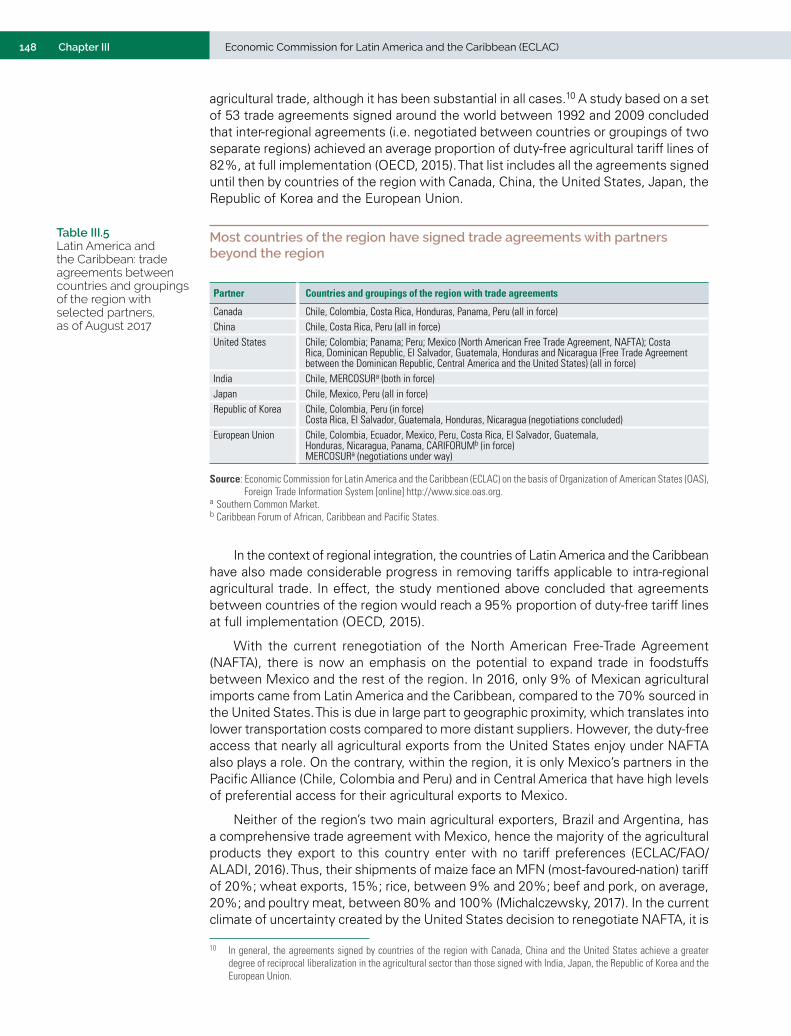
148 Chapter III Economic Commission for Latin America and the Caribbean (ECLAC)
agricultural trade, although it has been substantial in all cases.10 A study based on a set of 53 trade agreements signed around the world between 1992 and 2009 concluded that inter-regional agreements (i.e. negotiated between countries or groupings of two separate regions) achieved an average proportion of duty-free agricultural tariff lines of 82%, at full implementation (OECD, 2015). That list includes all the agreements signed until then by countries of the region with Canada, China, the United States, Japan, the Republic of Korea and the European Union.
10 In general, the agreements signed by countries of the region with Canada, China and the United States achieve a greater degree of reciprocal liberalization in the agricultural sector than those signed with India, Japan, the Republic of Korea and the European Union.
Table III.5 Latin America and the Caribbean: trade agreements between countries and groupings of the region with selected partners, as of August 2017
Most countries of the region have signed trade agreements with partners beyond the region
Partner Countries and groupings of the region with trade agreements
Canada Chile, Colombia, Costa Rica, Honduras, Panama, Peru (all in force) China Chile, Costa Rica, Peru (all in force)United States Chile; Colombia; Panama; Peru; Mexico (North American Free Trade Agreement, NAFTA); Costa
Rica, Dominican Republic, El Salvador, Guatemala, Honduras and Nicaragua (Free Trade Agreement between the Dominican Republic, Central America and the United States) (all in force)
India Chile, MERCOSURa (both in force)Japan Chile, Mexico, Peru (all in force)Republic of Korea Chile, Colombia, Peru (in force)
Costa Rica, El Salvador, Guatemala, Honduras, Nicaragua (negotiations concluded)European Union Chile, Colombia, Ecuador, Mexico, Peru, Costa Rica, El Salvador, Guatemala,
Honduras, Nicaragua, Panama, CARIFORUMb (in force)MERCOSURa (negotiations under way)
Source: Economic Commission for Latin America and the Caribbean (ECLAC) on the basis of Organization of American States (OAS), Foreign Trade Information System [online] http://www.sice.oas.org.
a Southern Common Market.b Caribbean Forum of African, Caribbean and Pacific States.
In the context of regional integration, the countries of Latin America and the Caribbean have also made considerable progress in removing tariffs applicable to intra-regional agricultural trade. In effect, the study mentioned above concluded that agreements between countries of the region would reach a 95% proportion of duty-free tariff lines at full implementation (OECD, 2015).
With the current renegotiation of the North American Free-Trade Agreement (NAFTA), there is now an emphasis on the potential to expand trade in foodstuffs between Mexico and the rest of the region. In 2016, only 9% of Mexican agricultural imports came from Latin America and the Caribbean, compared to the 70% sourced in the United States. This is due in large part to geographic proximity, which translates into lower transportation costs compared to more distant suppliers. However, the duty-free access that nearly all agricultural exports from the United States enjoy under NAFTA also plays a role. On the contrary, within the region, it is only Mexico’s partners in the Pacific Alliance (Chile, Colombia and Peru) and in Central America that have high levels of preferential access for their agricultural exports to Mexico.
Neither of the region’s two main agricultural exporters, Brazil and Argentina, has a comprehensive trade agreement with Mexico, hence the majority of the agricultural products they export to this country enter with no tariff preferences (ECLAC/FAO/ALADI, 2016). Thus, their shipments of maize face an MFN (most-favoured-nation) tariff of 20%; wheat exports, 15%; rice, between 9% and 20%; beef and pork, on average, 20%; and poultry meat, between 80% and 100% (Michalczewsky, 2017). In the current climate of uncertainty created by the United States decision to renegotiate NAFTA, it is
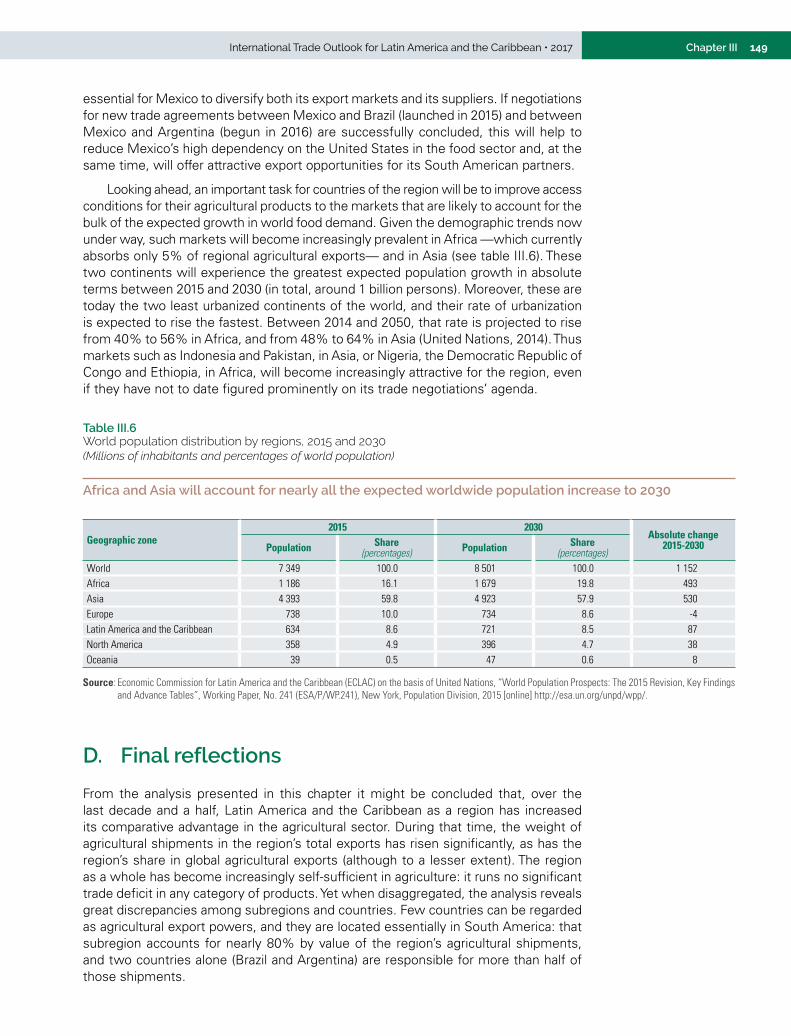
149Chapter IIIInternational Trade Outlook for Latin America and the Caribbean • 2017
essential for Mexico to diversify both its export markets and its suppliers. If negotiations for new trade agreements between Mexico and Brazil (launched in 2015) and between Mexico and Argentina (begun in 2016) are successfully concluded, this will help to reduce Mexico’s high dependency on the United States in the food sector and, at the same time, will offer attractive export opportunities for its South American partners.
Looking ahead, an important task for countries of the region will be to improve access conditions for their agricultural products to the markets that are likely to account for the bulk of the expected growth in world food demand. Given the demographic trends now under way, such markets will become increasingly prevalent in Africa —which currently absorbs only 5% of regional agricultural exports— and in Asia (see table III.6). These two continents will experience the greatest expected population growth in absolute terms between 2015 and 2030 (in total, around 1 billion persons). Moreover, these are today the two least urbanized continents of the world, and their rate of urbanization is expected to rise the fastest. Between 2014 and 2050, that rate is projected to rise from 40% to 56% in Africa, and from 48% to 64% in Asia (United Nations, 2014). Thus markets such as Indonesia and Pakistan, in Asia, or Nigeria, the Democratic Republic of Congo and Ethiopia, in Africa, will become increasingly attractive for the region, even if they have not to date figured prominently on its trade negotiations’ agenda.
Table III.6 World population distribution by regions, 2015 and 2030(Millions of inhabitants and percentages of world population)
Africa and Asia will account for nearly all the expected worldwide population increase to 2030
Geographic zone2015 2030
Absolute change 2015-2030Population Share
(percentages) Population Share (percentages)
World 7 349 100.0 8 501 100.0 1 152Africa 1 186 16.1 1 679 19.8 493Asia 4 393 59.8 4 923 57.9 530Europe 738 10.0 734 8.6 -4Latin America and the Caribbean 634 8.6 721 8.5 87North America 358 4.9 396 4.7 38Oceania 39 0.5 47 0.6 8
Source: Economic Commission for Latin America and the Caribbean (ECLAC) on the basis of United Nations, “World Population Prospects: The 2015 Revision, Key Findings and Advance Tables”, Working Paper, No. 241 (ESA/P/WP.241), New York, Population Division, 2015 [online] http://esa.un.org/unpd/wpp/.
D. Final reflections
From the analysis presented in this chapter it might be concluded that, over the last decade and a half, Latin America and the Caribbean as a region has increased its comparative advantage in the agricultural sector. During that time, the weight of agricultural shipments in the region’s total exports has risen significantly, as has the region’s share in global agricultural exports (although to a lesser extent). The region as a whole has become increasingly self-sufficient in agriculture: it runs no significant trade deficit in any category of products. Yet when disaggregated, the analysis reveals great discrepancies among subregions and countries. Few countries can be regarded as agricultural export powers, and they are located essentially in South America: that subregion accounts for nearly 80% by value of the region’s agricultural shipments, and two countries alone (Brazil and Argentina) are responsible for more than half of those shipments.
150 Chapter III Economic Commission for Latin America and the Caribbean (ECLAC)
Latin America and the Caribbean is a significant global supplier under various agricultural headings. However, these relate mainly to primary goods, with a very low presence of agro-industry products. The region’s agricultural exports have not escaped the phenomenon of reprimarization that has been affecting its total exports since 2003. Because of this the weight of oilseeds in the value of the region’s agricultural exports doubled between 2000 and 2015, moving to the top slot —together with fruits and vegetables— among its export categories. This in turn reflects the notable reorientation by destination of its agricultural shipments, of which China and the rest of Asia now absorb more than a third. Given current economic and demographic trends, the relative importance of Asian markets can be expected to rise further in coming years. For similar reasons, Africa may become an increasingly important market for the region’s agricultural exports even if —in the case of sub-Saharan Africa— it also has the potential to become a significant competitor.
Like its general export performance, the region faces the urgent challenge of boosting the value added and the knowledge content of its agricultural export basket. In this regard, conditions must be created that are conducive to processing in the region those products that are currently exported almost exclusively in their raw form. Moreover, it is indispensable to develop distinctive attributes in areas such as quality, safety, conservation, healthful properties, and social and environmental sustainability. All these goals demand proactive and coordinated public policies on trade, science, technology and innovation, cluster promotion, intellectual property, financing, and education and training, among other areas. These policies will have a greater impact if the actions undertaken are the result of a joint assessment by the public sector and corporate stakeholders. In short, without a deliberate public policy effort to enhance the sophistication of agricultural exports, it will be very difficult to overcome the many weaknesses in the current pattern of export specialization.
As in other sectors, intraregional trade in food and agricultural products is most conducive to export diversification, since it is characterized by the greatest number of products traded and by the largest share of processed products. Therefore, any action aimed at promoting such trade will also foster the necessary diversification of output and exports, and the development of agro-industrial value chains. In this context, a successful conclusion to Mexico’s current trade negotiations with Argentina and Brazil will encourage diversification of Mexico’s agricultural imports, reducing its heavy dependence on the United States. Seeing those negotiations through to a successful conclusion is even more important in the light of the great uncertainty created by the current renegotiation of NAFTA.
Without a deliberate public policy effort to enhance the sophistication of agricultural exports, it will be very difficult to overcome the many weaknesses in the current pattern of export specialization.
151Chapter IIIInternational Trade Outlook for Latin America and the Caribbean • 2017
BibliographyDurán Lima, J. and M. Álvarez (2011), “Manual de comercio exterior y política comercial. Nociones
básicas, clasificaciones e indicadores de posición y dinamismo”, Project Documents (LC/W.430), Santiago, Economic Commission for Latin America and the Caribbean (ECLAC).
ECLAC (Economic Commission for Latin America and the Caribbean) (2016), Latin America and the Caribbean in the World Economy. The region amid the tensions of globalization (LC/G.2697-P), Santiago, December.
ECLAC/FAO/ALADI (Economic Commission for Latin America and the Caribbean/Food and Agriculture Organization of the United Nations/Latin American Integration Association) (2016), Food and Nutrition Security and the Eradication of Hunger CELAC 2025. Furthering Discussion and Regional Cooperation (LC/L.4204), Santiago, July.
Farinelli, F. and others (2017), “Use of knowledge-intensive services in the Chilean wine industry”, AAWE Working Paper, No. 218, American Association of Wine Economists, July.
Frohmann, A. (2017), “Defining product environmental standards in international trade. The participation of Latin American stakeholders in the European Union Environmental Footprint Programme”, Project Documents (LC/TS.2017/51), Santiago, Economic Commission for Latin America and the Caribbean (ECLAC), July.
Frohmann, A. and others (2012), “Huella de carbono y exportaciones de alimentos”, Project Documents (LC/W.503), Santiago, Economic Commission for Latin America and the Caribbean (ECLAC), November [online] http://repositorio.cepal.org/bitstream/handle/11362/4013/1/S2012089_es.pdf.
Herreros, S. (2016), “La regulación multilateral de la agricultura”, Derecho de la Organización Mundial del Comercio (OMC), M. Matus and M. Unger (eds.), Colección en Derecho Económico Internacional, Bogota, Universidad Externado de Colombia.
ITC/WTO/UNCTAD (International Trade Centre/World Trade Organization/United Nations Conference on Trade and Development) (2017), World Tariff Profiles 2017, Geneva.
Michalczewsky, K. (2017), “México: ¿Oportunidades para el sector agropecuario latinoamericano?” [online] http://conexionintal.iadb.org/2017/04/27/mexico-oportunidades-para-el-sector-agropecuario-latinoamericano/.
OECD (Organization for Economic Cooperation and Development) (2015), “Regional trade agreements and agriculture”, OECD Food, Agriculture and Fisheries Papers, No. 79, Paris [online] http://www.oecd-ilibrary.org/agriculture-and-food/regional-trade-agreements-and-agriculture_5js4kg5xjvvf-en.
OECD/FAO (Organization for Economic Cooperation and Development/Food and Agriculture Organization of the United Nations) (2017), OECD-FAO Agricultural Outlook 2017-2026, Paris. (2016), OECD-FAO Agricultural Outlook 2016-2025, Paris.
Padilla, R. and V. Quiroz (2017), “Rural industrial policy”, Rural industrial policy and strengthening value chains, R. Padilla (ed.), ECLAC Books, No. 145 (LC/PUB.2017/11-P), Santiago, Economic Commission for Latin America and the Caribbean (CEPAL), August.
Solleiro, J. L. and others (2017), “Innovation in the agri-food sector in Latin America and the Caribbean”, Global Innovation Index 2017. Innovation Feeding the World, Cornell University/European Institute of Business Administration (INSEAD)/World Intellectual Property Organization (WIPO) [online] http://www.wipo.int/edocs/pubdocs/en/wipo_pub_gii_2017-chapter10.pdf.
United Nations (2015), “World Population Prospects: The 2015 Revision, Key Findings and Advance Tables”, Working Paper, No. 241 (ESA/P/WP.241), New York, Population Division [online] http://esa.un.org/unpd/wpp/.(2014), World Urbanization Prospects. The 2014 Revision Highlights (ST/ESA/SER.A/352), New York, Population Division.
Zurbriggen, C. and M. Sierra (2015), Redes, innovación y trazabilidad en el sector cárnico uruguayo, Santiago, Economic Research Corporation for Latin America (CIEPLAN) [online] http://www.cieplan.org/media/publicaciones/archivos/367/Redes_innovacion_y_trazabilidad_en_el_sector_carnico_uruguayo_Agregar_Capitulo.pdf.
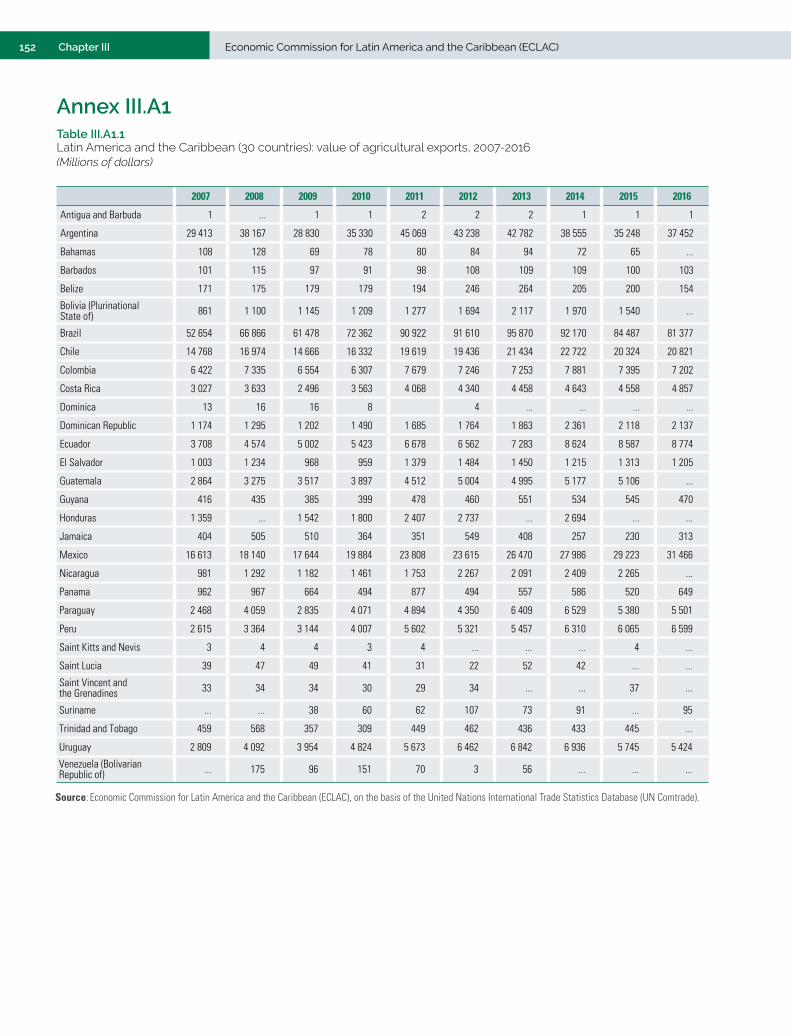
152 Chapter III Economic Commission for Latin America and the Caribbean (ECLAC)
Annex III.A1Table III.A1.1 Latin America and the Caribbean (30 countries): value of agricultural exports, 2007-2016(Millions of dollars)
2007 2008 2009 2010 2011 2012 2013 2014 2015 2016
Antigua and Barbuda 1 ... 1 1 2 2 2 1 1 1
Argentina 29 413 38 167 28 830 35 330 45 069 43 238 42 782 38 555 35 248 37 452
Bahamas 108 128 69 78 80 84 94 72 65 ...
Barbados 101 115 97 91 98 108 109 109 100 103
Belize 171 175 179 179 194 246 264 205 200 154
Bolivia (Plurinational State of) 861 1 100 1 145 1 209 1 277 1 694 2 117 1 970 1 540 ...
Brazil 52 654 66 866 61 478 72 362 90 922 91 610 95 870 92 170 84 487 81 377
Chile 14 768 16 974 14 666 16 332 19 619 19 436 21 434 22 722 20 324 20 821
Colombia 6 422 7 335 6 554 6 307 7 679 7 246 7 253 7 881 7 395 7 202
Costa Rica 3 027 3 633 2 496 3 563 4 068 4 340 4 458 4 643 4 558 4 857
Dominica 13 16 16 8 4 ... ... ... ...
Dominican Republic 1 174 1 295 1 202 1 490 1 685 1 764 1 863 2 361 2 118 2 137
Ecuador 3 708 4 574 5 002 5 423 6 678 6 562 7 283 8 624 8 587 8 774
El Salvador 1 003 1 234 968 959 1 379 1 484 1 450 1 215 1 313 1 205
Guatemala 2 864 3 275 3 517 3 897 4 512 5 004 4 995 5 177 5 106 ...
Guyana 416 435 385 399 478 460 551 534 545 470
Honduras 1 359 ... 1 542 1 800 2 407 2 737 ... 2 694 ... ...
Jamaica 404 505 510 364 351 549 408 257 230 313
Mexico 16 613 18 140 17 644 19 884 23 808 23 615 26 470 27 986 29 223 31 466
Nicaragua 981 1 292 1 182 1 461 1 753 2 267 2 091 2 409 2 265 ...
Panama 962 967 664 494 877 494 557 586 520 649
Paraguay 2 468 4 059 2 835 4 071 4 894 4 350 6 409 6 529 5 380 5 501
Peru 2 615 3 364 3 144 4 007 5 602 5 321 5 457 6 310 6 065 6 599
Saint Kitts and Nevis 3 4 4 3 4 ... ... ... 4 ...
Saint Lucia 39 47 49 41 31 22 52 42 ... ...
Saint Vincent and the Grenadines 33 34 34 30 29 34 ... ... 37 ...
Suriname ... ... 38 60 62 107 73 91 ... 95
Trinidad and Tobago 459 568 357 309 449 462 436 433 445 ...
Uruguay 2 809 4 092 3 954 4 824 5 673 6 462 6 842 6 936 5 745 5 424
Venezuela (Bolivarian Republic of) ... 175 96 151 70 3 56 ... ... ...
Source: Economic Commission for Latin America and the Caribbean (ECLAC), on the basis of the United Nations International Trade Statistics Database (UN Comtrade).
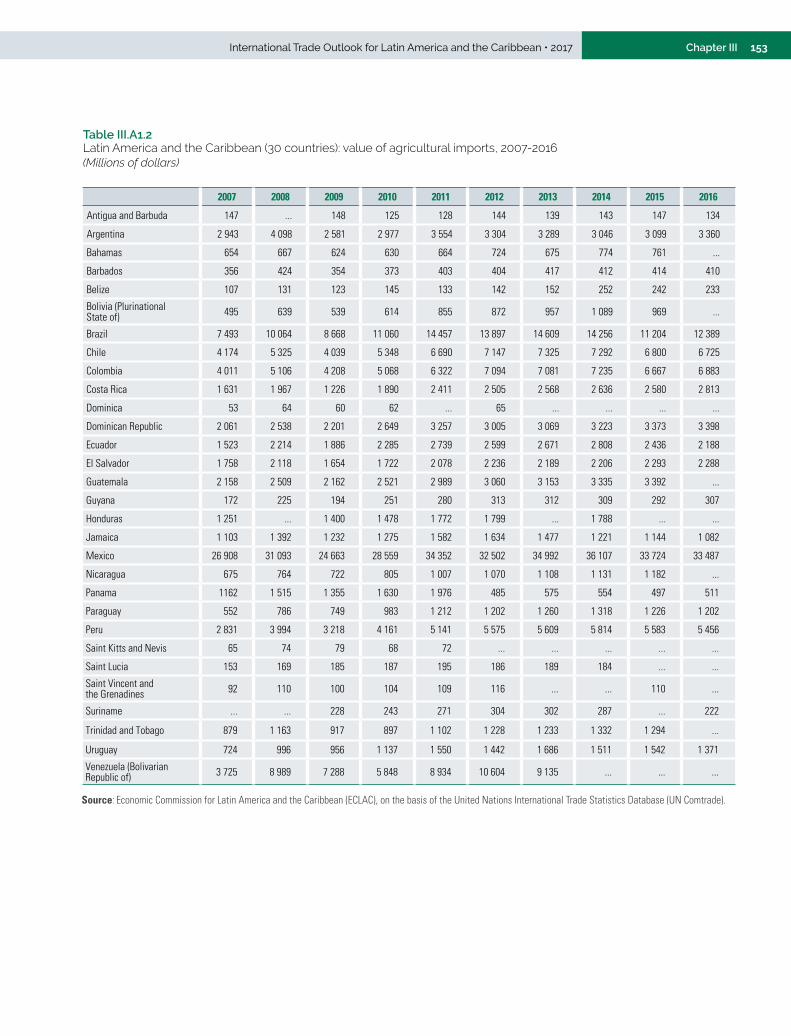
153Chapter IIIInternational Trade Outlook for Latin America and the Caribbean • 2017
Table III.A1.2 Latin America and the Caribbean (30 countries): value of agricultural imports, 2007-2016(Millions of dollars)
2007 2008 2009 2010 2011 2012 2013 2014 2015 2016
Antigua and Barbuda 147 ... 148 125 128 144 139 143 147 134
Argentina 2 943 4 098 2 581 2 977 3 554 3 304 3 289 3 046 3 099 3 360
Bahamas 654 667 624 630 664 724 675 774 761 ...
Barbados 356 424 354 373 403 404 417 412 414 410
Belize 107 131 123 145 133 142 152 252 242 233
Bolivia (Plurinational State of) 495 639 539 614 855 872 957 1 089 969 ...
Brazil 7 493 10 064 8 668 11 060 14 457 13 897 14 609 14 256 11 204 12 389
Chile 4 174 5 325 4 039 5 348 6 690 7 147 7 325 7 292 6 800 6 725
Colombia 4 011 5 106 4 208 5 068 6 322 7 094 7 081 7 235 6 667 6 883
Costa Rica 1 631 1 967 1 226 1 890 2 411 2 505 2 568 2 636 2 580 2 813
Dominica 53 64 60 62 ... 65 ... ... ... ...
Dominican Republic 2 061 2 538 2 201 2 649 3 257 3 005 3 069 3 223 3 373 3 398
Ecuador 1 523 2 214 1 886 2 285 2 739 2 599 2 671 2 808 2 436 2 188
El Salvador 1 758 2 118 1 654 1 722 2 078 2 236 2 189 2 206 2 293 2 288
Guatemala 2 158 2 509 2 162 2 521 2 989 3 060 3 153 3 335 3 392 ...
Guyana 172 225 194 251 280 313 312 309 292 307
Honduras 1 251 ... 1 400 1 478 1 772 1 799 ... 1 788 ... ...
Jamaica 1 103 1 392 1 232 1 275 1 582 1 634 1 477 1 221 1 144 1 082
Mexico 26 908 31 093 24 663 28 559 34 352 32 502 34 992 36 107 33 724 33 487
Nicaragua 675 764 722 805 1 007 1 070 1 108 1 131 1 182 ...
Panama 1162 1 515 1 355 1 630 1 976 485 575 554 497 511
Paraguay 552 786 749 983 1 212 1 202 1 260 1 318 1 226 1 202
Peru 2 831 3 994 3 218 4 161 5 141 5 575 5 609 5 814 5 583 5 456
Saint Kitts and Nevis 65 74 79 68 72 ... ... ... ... ...
Saint Lucia 153 169 185 187 195 186 189 184 ... ...
Saint Vincent and the Grenadines 92 110 100 104 109 116 ... ... 110 ...
Suriname ... ... 228 243 271 304 302 287 ... 222
Trinidad and Tobago 879 1 163 917 897 1 102 1 228 1 233 1 332 1 294 ...
Uruguay 724 996 956 1 137 1 550 1 442 1 686 1 511 1 542 1 371
Venezuela (Bolivarian Republic of) 3 725 8 989 7 288 5 848 8 934 10 604 9 135 ... ... ...
Source: Economic Commission for Latin America and the Caribbean (ECLAC), on the basis of the United Nations International Trade Statistics Database (UN Comtrade).
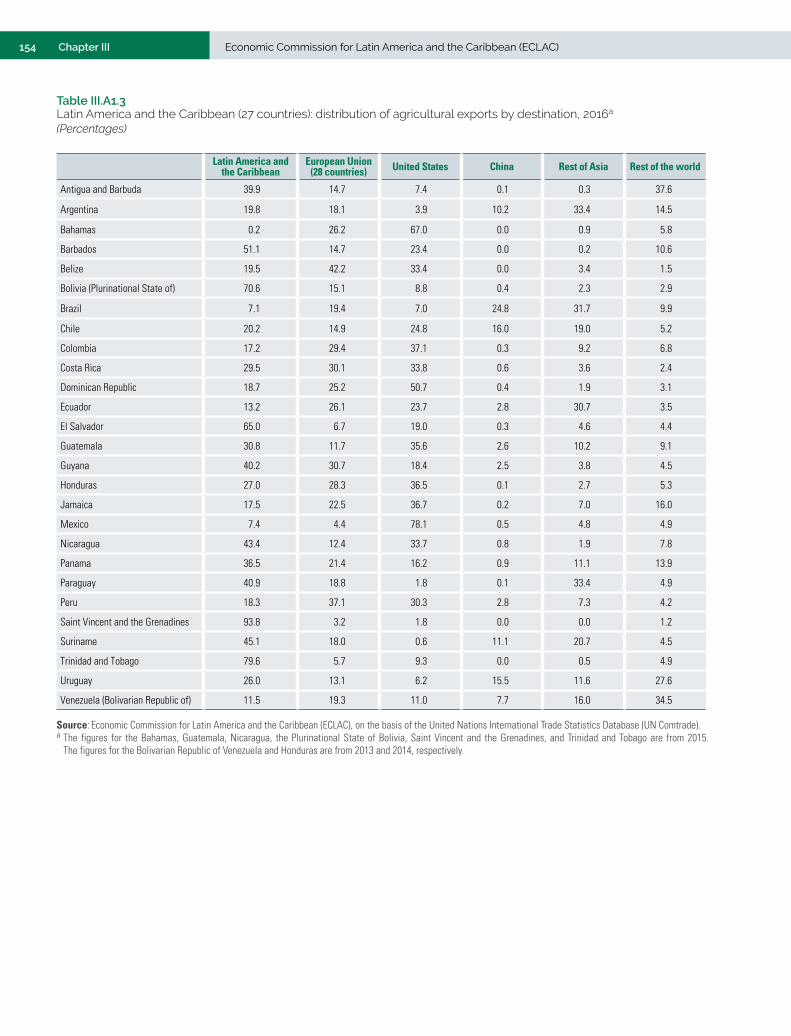
154 Chapter III Economic Commission for Latin America and the Caribbean (ECLAC)
Table III.A1.3 Latin America and the Caribbean (27 countries): distribution of agricultural exports by destination, 2016a
(Percentages)
Latin America and the Caribbean
European Union (28 countries) United States China Rest of Asia Rest of the world
Antigua and Barbuda 39.9 14.7 7.4 0.1 0.3 37.6
Argentina 19.8 18.1 3.9 10.2 33.4 14.5
Bahamas 0.2 26.2 67.0 0.0 0.9 5.8
Barbados 51.1 14.7 23.4 0.0 0.2 10.6
Belize 19.5 42.2 33.4 0.0 3.4 1.5
Bolivia (Plurinational State of) 70.6 15.1 8.8 0.4 2.3 2.9
Brazil 7.1 19.4 7.0 24.8 31.7 9.9
Chile 20.2 14.9 24.8 16.0 19.0 5.2
Colombia 17.2 29.4 37.1 0.3 9.2 6.8
Costa Rica 29.5 30.1 33.8 0.6 3.6 2.4
Dominican Republic 18.7 25.2 50.7 0.4 1.9 3.1
Ecuador 13.2 26.1 23.7 2.8 30.7 3.5
El Salvador 65.0 6.7 19.0 0.3 4.6 4.4
Guatemala 30.8 11.7 35.6 2.6 10.2 9.1
Guyana 40.2 30.7 18.4 2.5 3.8 4.5
Honduras 27.0 28.3 36.5 0.1 2.7 5.3
Jamaica 17.5 22.5 36.7 0.2 7.0 16.0
Mexico 7.4 4.4 78.1 0.5 4.8 4.9
Nicaragua 43.4 12.4 33.7 0.8 1.9 7.8
Panama 36.5 21.4 16.2 0.9 11.1 13.9
Paraguay 40.9 18.8 1.8 0.1 33.4 4.9
Peru 18.3 37.1 30.3 2.8 7.3 4.2
Saint Vincent and the Grenadines 93.8 3.2 1.8 0.0 0.0 1.2
Suriname 45.1 18.0 0.6 11.1 20.7 4.5
Trinidad and Tobago 79.6 5.7 9.3 0.0 0.5 4.9
Uruguay 26.0 13.1 6.2 15.5 11.6 27.6
Venezuela (Bolivarian Republic of) 11.5 19.3 11.0 7.7 16.0 34.5
Source: Economic Commission for Latin America and the Caribbean (ECLAC), on the basis of the United Nations International Trade Statistics Database (UN Comtrade).a The figures for the Bahamas, Guatemala, Nicaragua, the Plurinational State of Bolivia, Saint Vincent and the Grenadines, and Trinidad and Tobago are from 2015.
The figures for the Bolivarian Republic of Venezuela and Honduras are from 2013 and 2014, respectively.
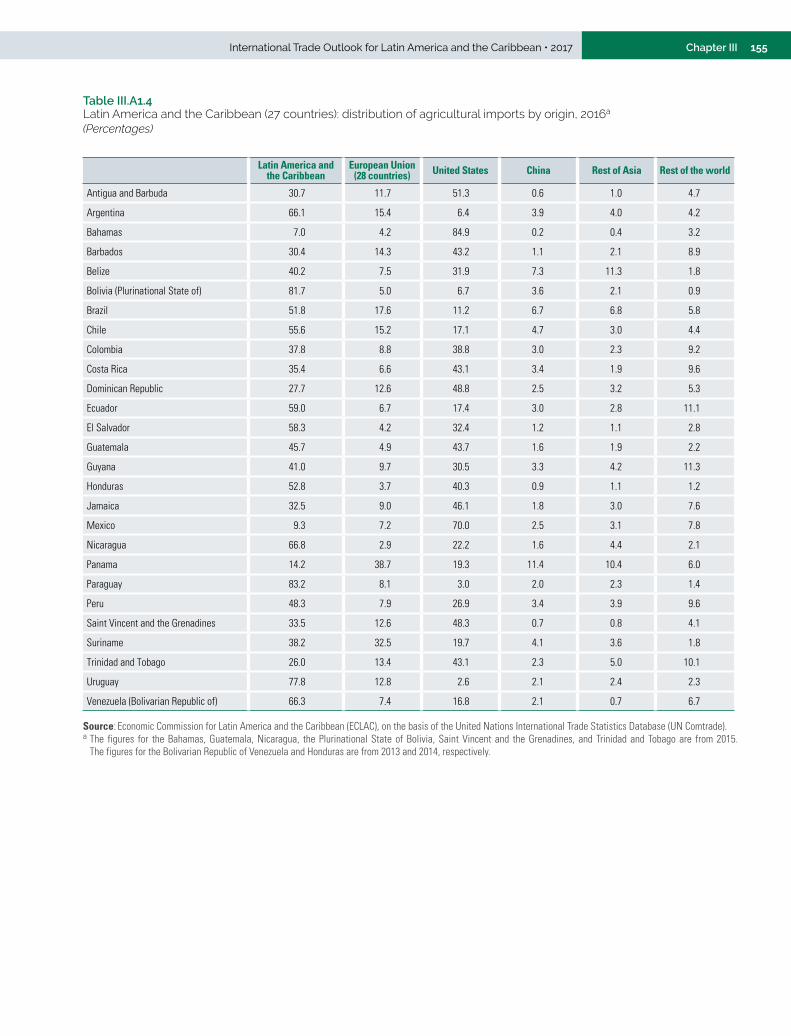
155Chapter IIIInternational Trade Outlook for Latin America and the Caribbean • 2017
Table III.A1.4 Latin America and the Caribbean (27 countries): distribution of agricultural imports by origin, 2016a
(Percentages)
Latin America and the Caribbean
European Union (28 countries) United States China Rest of Asia Rest of the world
Antigua and Barbuda 30.7 11.7 51.3 0.6 1.0 4.7
Argentina 66.1 15.4 6.4 3.9 4.0 4.2
Bahamas 7.0 4.2 84.9 0.2 0.4 3.2
Barbados 30.4 14.3 43.2 1.1 2.1 8.9
Belize 40.2 7.5 31.9 7.3 11.3 1.8
Bolivia (Plurinational State of) 81.7 5.0 6.7 3.6 2.1 0.9
Brazil 51.8 17.6 11.2 6.7 6.8 5.8
Chile 55.6 15.2 17.1 4.7 3.0 4.4
Colombia 37.8 8.8 38.8 3.0 2.3 9.2
Costa Rica 35.4 6.6 43.1 3.4 1.9 9.6
Dominican Republic 27.7 12.6 48.8 2.5 3.2 5.3
Ecuador 59.0 6.7 17.4 3.0 2.8 11.1
El Salvador 58.3 4.2 32.4 1.2 1.1 2.8
Guatemala 45.7 4.9 43.7 1.6 1.9 2.2
Guyana 41.0 9.7 30.5 3.3 4.2 11.3
Honduras 52.8 3.7 40.3 0.9 1.1 1.2
Jamaica 32.5 9.0 46.1 1.8 3.0 7.6
Mexico 9.3 7.2 70.0 2.5 3.1 7.8
Nicaragua 66.8 2.9 22.2 1.6 4.4 2.1
Panama 14.2 38.7 19.3 11.4 10.4 6.0
Paraguay 83.2 8.1 3.0 2.0 2.3 1.4
Peru 48.3 7.9 26.9 3.4 3.9 9.6
Saint Vincent and the Grenadines 33.5 12.6 48.3 0.7 0.8 4.1
Suriname 38.2 32.5 19.7 4.1 3.6 1.8
Trinidad and Tobago 26.0 13.4 43.1 2.3 5.0 10.1
Uruguay 77.8 12.8 2.6 2.1 2.4 2.3
Venezuela (Bolivarian Republic of) 66.3 7.4 16.8 2.1 0.7 6.7
Source: Economic Commission for Latin America and the Caribbean (ECLAC), on the basis of the United Nations International Trade Statistics Database (UN Comtrade).a The figures for the Bahamas, Guatemala, Nicaragua, the Plurinational State of Bolivia, Saint Vincent and the Grenadines, and Trinidad and Tobago are from 2015.
The figures for the Bolivarian Republic of Venezuela and Honduras are from 2013 and 2014, respectively.
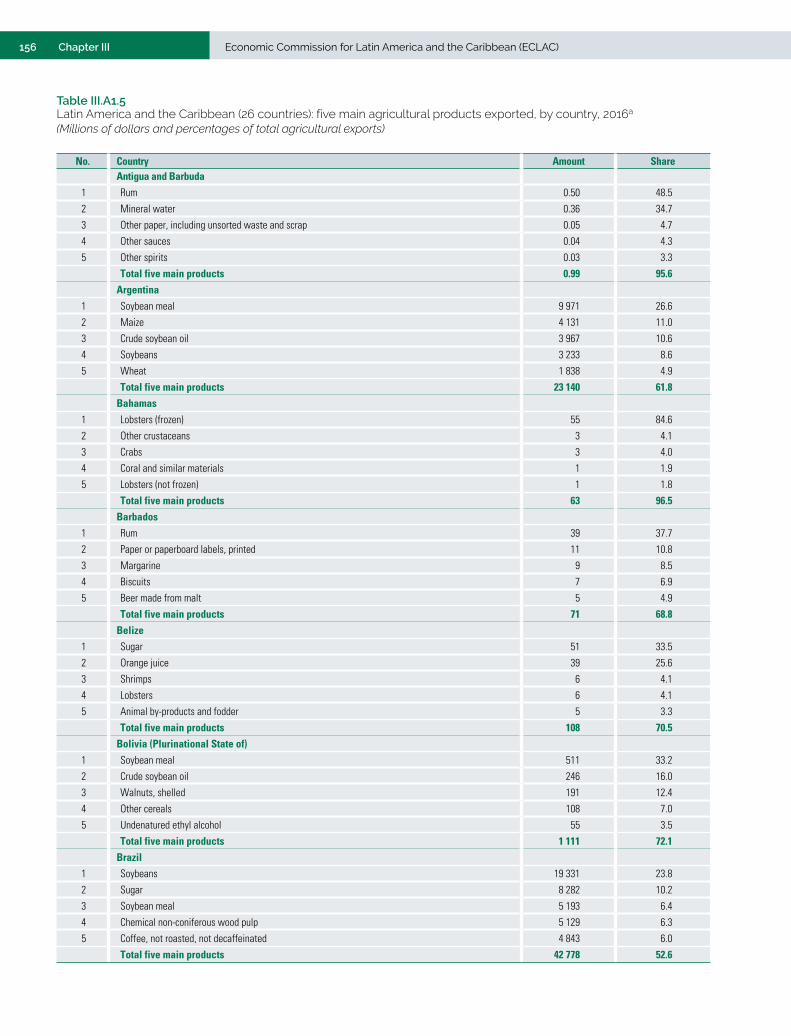
156 Chapter III Economic Commission for Latin America and the Caribbean (ECLAC)
Table III.A1.5 Latin America and the Caribbean (26 countries): five main agricultural products exported, by country, 2016a
(Millions of dollars and percentages of total agricultural exports)
No. Country Amount ShareAntigua and Barbuda
1 Rum 0.50 48.5
2 Mineral water 0.36 34.7
3 Other paper, including unsorted waste and scrap 0.05 4.7
4 Other sauces 0.04 4.3
5 Other spirits 0.03 3.3
Total five main products 0.99 95.6
Argentina
1 Soybean meal 9 971 26.6
2 Maize 4 131 11.0
3 Crude soybean oil 3 967 10.6
4 Soybeans 3 233 8.6
5 Wheat 1 838 4.9
Total five main products 23 140 61.8
Bahamas
1 Lobsters (frozen) 55 84.6
2 Other crustaceans 3 4.1
3 Crabs 3 4.0
4 Coral and similar materials 1 1.9
5 Lobsters (not frozen) 1 1.8
Total five main products 63 96.5
Barbados
1 Rum 39 37.7
2 Paper or paperboard labels, printed 11 10.8
3 Margarine 9 8.5
4 Biscuits 7 6.9
5 Beer made from malt 5 4.9
Total five main products 71 68.8
Belize
1 Sugar 51 33.5
2 Orange juice 39 25.6
3 Shrimps 6 4.1
4 Lobsters 6 4.1
5 Animal by-products and fodder 5 3.3
Total five main products 108 70.5
Bolivia (Plurinational State of)
1 Soybean meal 511 33.2
2 Crude soybean oil 246 16.0
3 Walnuts, shelled 191 12.4
4 Other cereals 108 7.0
5 Undenatured ethyl alcohol 55 3.5
Total five main products 1 111 72.1
Brazil
1 Soybeans 19 331 23.8
2 Sugar 8 282 10.2
3 Soybean meal 5 193 6.4
4 Chemical non-coniferous wood pulp 5 129 6.3
5 Coffee, not roasted, not decaffeinated 4 843 6.0
Total five main products 42 778 52.6
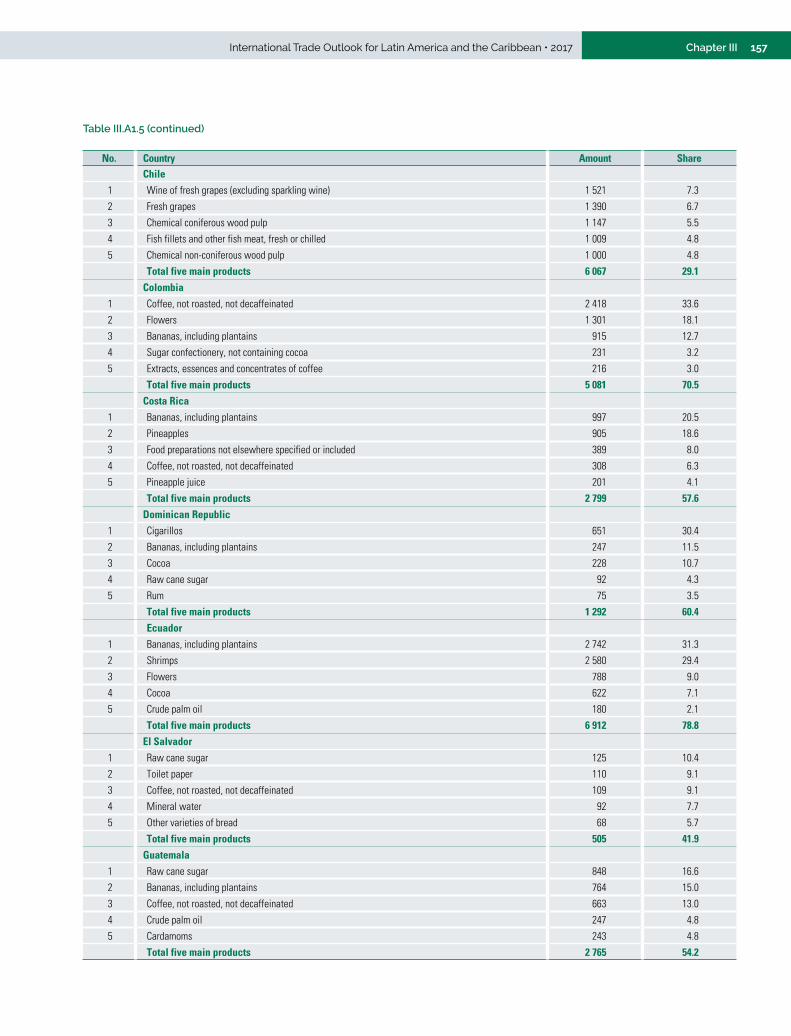
157Chapter IIIInternational Trade Outlook for Latin America and the Caribbean • 2017
No. Country Amount ShareChile
1 Wine of fresh grapes (excluding sparkling wine) 1 521 7.3
2 Fresh grapes 1 390 6.7
3 Chemical coniferous wood pulp 1 147 5.5
4 Fish fillets and other fish meat, fresh or chilled 1 009 4.8
5 Chemical non-coniferous wood pulp 1 000 4.8
Total five main products 6 067 29.1
Colombia
1 Coffee, not roasted, not decaffeinated 2 418 33.6
2 Flowers 1 301 18.1
3 Bananas, including plantains 915 12.7
4 Sugar confectionery, not containing cocoa 231 3.2
5 Extracts, essences and concentrates of coffee 216 3.0
Total five main products 5 081 70.5
Costa Rica
1 Bananas, including plantains 997 20.5
2 Pineapples 905 18.6
3 Food preparations not elsewhere specified or included 389 8.0
4 Coffee, not roasted, not decaffeinated 308 6.3
5 Pineapple juice 201 4.1
Total five main products 2 799 57.6
Dominican Republic
1 Cigarillos 651 30.4
2 Bananas, including plantains 247 11.5
3 Cocoa 228 10.7
4 Raw cane sugar 92 4.3
5 Rum 75 3.5
Total five main products 1 292 60.4
Ecuador
1 Bananas, including plantains 2 742 31.3
2 Shrimps 2 580 29.4
3 Flowers 788 9.0
4 Cocoa 622 7.1
5 Crude palm oil 180 2.1
Total five main products 6 912 78.8
El Salvador
1 Raw cane sugar 125 10.4
2 Toilet paper 110 9.1
3 Coffee, not roasted, not decaffeinated 109 9.1
4 Mineral water 92 7.7
5 Other varieties of bread 68 5.7
Total five main products 505 41.9
Guatemala
1 Raw cane sugar 848 16.6
2 Bananas, including plantains 764 15.0
3 Coffee, not roasted, not decaffeinated 663 13.0
4 Crude palm oil 247 4.8
5 Cardamoms 243 4.8
Total five main products 2 765 54.2
Table III.A1.5 (continued)
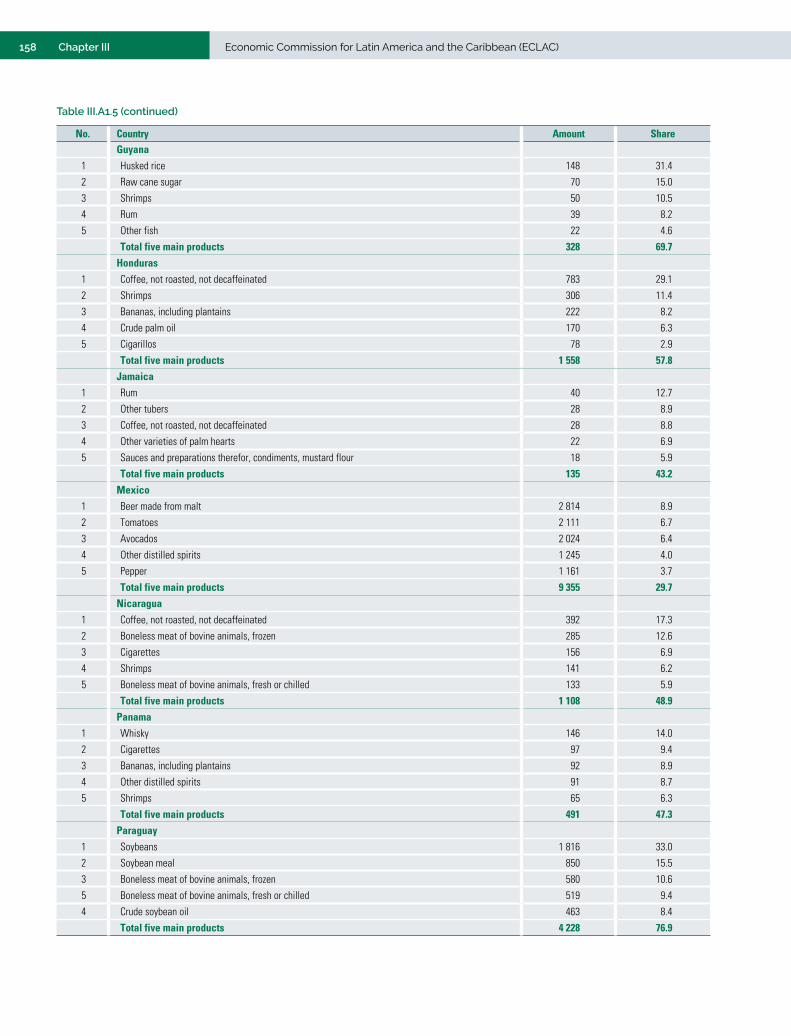
158 Chapter III Economic Commission for Latin America and the Caribbean (ECLAC)
No. Country Amount ShareGuyana
1 Husked rice 148 31.4
2 Raw cane sugar 70 15.0
3 Shrimps 50 10.5
4 Rum 39 8.2
5 Other fish 22 4.6
Total five main products 328 69.7
Honduras
1 Coffee, not roasted, not decaffeinated 783 29.1
2 Shrimps 306 11.4
3 Bananas, including plantains 222 8.2
4 Crude palm oil 170 6.3
5 Cigarillos 78 2.9
Total five main products 1 558 57.8
Jamaica
1 Rum 40 12.7
2 Other tubers 28 8.9
3 Coffee, not roasted, not decaffeinated 28 8.8
4 Other varieties of palm hearts 22 6.9
5 Sauces and preparations therefor, condiments, mustard flour 18 5.9
Total five main products 135 43.2
Mexico
1 Beer made from malt 2 814 8.9
2 Tomatoes 2 111 6.7
3 Avocados 2 024 6.4
4 Other distilled spirits 1 245 4.0
5 Pepper 1 161 3.7
Total five main products 9 355 29.7
Nicaragua
1 Coffee, not roasted, not decaffeinated 392 17.3
2 Boneless meat of bovine animals, frozen 285 12.6
3 Cigarettes 156 6.9
4 Shrimps 141 6.2
5 Boneless meat of bovine animals, fresh or chilled 133 5.9
Total five main products 1 108 48.9
Panama
1 Whisky 146 14.0
2 Cigarettes 97 9.4
3 Bananas, including plantains 92 8.9
4 Other distilled spirits 91 8.7
5 Shrimps 65 6.3
Total five main products 491 47.3
Paraguay
1 Soybeans 1 816 33.0
2 Soybean meal 850 15.5
3 Boneless meat of bovine animals, frozen 580 10.6
5 Boneless meat of bovine animals, fresh or chilled 519 9.4
4 Crude soybean oil 463 8.4
Total five main products 4 228 76.9
Table III.A1.5 (continued)
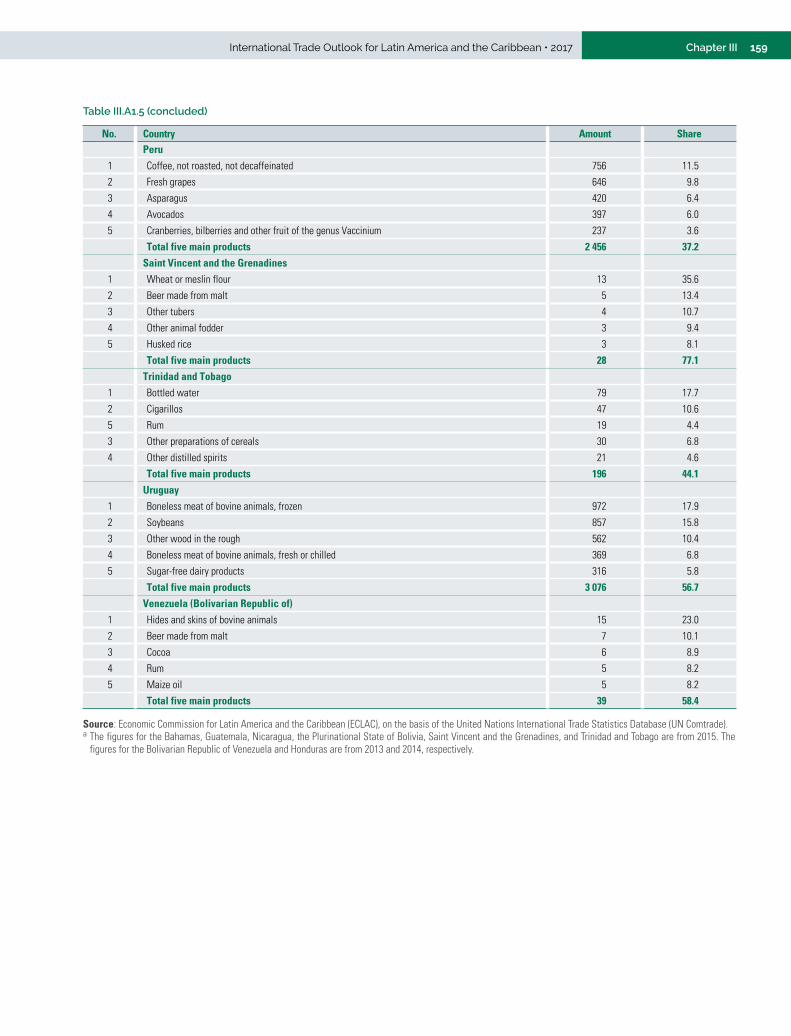
159Chapter IIIInternational Trade Outlook for Latin America and the Caribbean • 2017
No. Country Amount SharePeru
1 Coffee, not roasted, not decaffeinated 756 11.5
2 Fresh grapes 646 9.8
3 Asparagus 420 6.4
4 Avocados 397 6.0
5 Cranberries, bilberries and other fruit of the genus Vaccinium 237 3.6
Total five main products 2 456 37.2
Saint Vincent and the Grenadines
1 Wheat or meslin flour 13 35.6
2 Beer made from malt 5 13.4
3 Other tubers 4 10.7
4 Other animal fodder 3 9.4
5 Husked rice 3 8.1
Total five main products 28 77.1
Trinidad and Tobago
1 Bottled water 79 17.7
2 Cigarillos 47 10.6
5 Rum 19 4.4
3 Other preparations of cereals 30 6.8
4 Other distilled spirits 21 4.6
Total five main products 196 44.1
Uruguay
1 Boneless meat of bovine animals, frozen 972 17.9
2 Soybeans 857 15.8
3 Other wood in the rough 562 10.4
4 Boneless meat of bovine animals, fresh or chilled 369 6.8
5 Sugar-free dairy products 316 5.8
Total five main products 3 076 56.7
Venezuela (Bolivarian Republic of)
1 Hides and skins of bovine animals 15 23.0
2 Beer made from malt 7 10.1
3 Cocoa 6 8.9
4 Rum 5 8.2
5 Maize oil 5 8.2
Total five main products 39 58.4
Source: Economic Commission for Latin America and the Caribbean (ECLAC), on the basis of the United Nations International Trade Statistics Database (UN Comtrade).a The figures for the Bahamas, Guatemala, Nicaragua, the Plurinational State of Bolivia, Saint Vincent and the Grenadines, and Trinidad and Tobago are from 2015. The
figures for the Bolivarian Republic of Venezuela and Honduras are from 2013 and 2014, respectively.
Table III.A1.5 (concluded)

Publicaciones recientes de la CEPAL ECLAC recent publications
www.cepal.org/publicaciones
Informes periódicos / Annual reportsTambién disponibles para años anteriores / Issues for previous years also available• Estudio Económico de América Latina y el Caribe 2017, 218 p.
Economic Survey of Latin America and the Caribbean 2017, 214 p.
• La Inversión Extranjera Directa en América Latina y el Caribe 2017, 206 p.Foreign Direct Investment in Latin America and the Caribbean 2016, 196 p.
• Anuario Estadístico de América Latina y el Caribe 2016 / Statistical Yearbook for Latin America and the Caribbean 2016, 132 p.
• Balance Preliminar de las Economías de América Latina y el Caribe 2016, 132 p.Preliminary Overview of the Economies of Latin America and the Caribbean 2016, 124 p.
• Panorama Social de América Latina 2016, 290 p.Social Panorama of Latin America 2016, 272 p.
• Perspectivas del Comercio Internacional de América Latina y el Caribe 2017. Documento informativo, 176 p.International Trade Outlook for Latin America and the Caribbean 2017. Briefing paper, 170 p.
Libros y documentos institucionales / Institutional books and documents• • Plan de acción regional para la implementación de la nueva agenda urbana en América Latina y el Caribe, 2016-2036, 2017, 64 p.
Regional Action Plan for the implementation of the New Urban Agenda in Latin America and the Caribbean 2016-2036, 2017, 62 p.
• Brechas, ejes y desafíos en el vínculo entre lo social y lo productivo, 2017, 182 p.Linkages between the social and production spheres: Gaps, pillars and challenges, 2017, 170 p.
• Derechos de las personas mayores: retos para la interdependencia y autonomía, 2017, 176 p.Challenges to the autonomy and interdependent rights of older persons, 2017, 162 p.
• Panorama fiscal de América Latina y el Caribe 2017: la movilización de recursos para el financiamiento del desarrollo sostenible, 2017, 115 p.Fiscal Panorama of Latin America and the Caribbean 2017: Mobilizing resources to finance sustainable development, 2017, 108 p.
• La matriz de la desigualdad en América Latina, 2016, 96 p.The social inequality matrix in Latin America, 2016, 94 p.
• Autonomía de las mujeres e igualdad en la agenda de desarrollo sostenible, 2016, 184 p.Equality and women’s autonomy in the sustainable development agenda, 2016, 168 p.
• Autonomia das mulheres e igualdade na agenda de desenvolvimento sustentável. Síntese, 2016, 106 p.La Unión Europea y América Latina y el Caribe ante la Agenda 2030 para el Desarrollo Sostenible: el gran impulso ambiental, 2016, 112 p.
• The European Union and Latin America and the Caribbean vis-à-vis the 2030 Agenda for Sustainable Development: The environmental big push, 2016, 112 p.Horizontes 2030: la igualdad en el centro del desarrollo sostenible, 2016, 176 p.
• Horizons 2030: Equality at the centre of sustainable development, 2016, 174 p.Horizontes 2030: a igualdade no centro do desenvolvimento sustentável, 2016, 176 p.
• 40 años de agenda regional de género, 2016, 130 p.40 years of the regional gender agenda, 2016,128 p.
Libros de la CEPAL / ECLAC books• 150 ¿Quién cuida en la ciudad?: aportes para políticas urbanas de igualdad, María Nieves Rico, Olga Segovia (eds.), 2017, 476 p.
• 149 Manufactura y cambio estructural: aportes para pensar la política industrial en la Argentina, Martín Abeles, Mario Cimoli, Pablo José Lavarello (eds.), 2017, 336 p.
• 148 Planificación para el desarrollo en América Latina y el Caribe: enfoques, experiencias y perspectivas, Jorge Máttar, Luis Mauricio Cuervo (eds.), 2017, 336 p.
• 147 Inclusión financiera de pequeños productores rurales, Francisco G. Villarreal (ed.), 2017, 218 p.
• 147 Financial inclusion of small rural producers, Francisco G. Villarreal (ed.), 201, 196 p.
• 146 Institucionalidad social en América Latina y el Caribe, Jorge Martínez (ed.), 2017, 334 p.
• 145 Política industrial rural y fortalecimiento de cadenas de valor, Ramón Padilla (ed.), 2017, 242 p. 145 Rural industrial policy and strengthening value chains, Ramón Padilla (ed.), 2017, 236 p.
Páginas Selectas de la CEPAL / ECLAC Select Pages• Empleo en América Latina y el Caribe. Textos seleccionados 2006-2017, Jürgen Weller (comp.), 2017, 446 p.
• Planificación y prospectiva para la construcción de futuro en América Latina y el Caribe. Textos seleccionados 2013-2016, Jorge Máttar y Mauricio Cuervo (comps.), 2016, 222 p.
• Desarrollo inclusivo en América Latina. Textos seleccionados 2009-2016, Ricardo Infante (comp.), 2016, 294 p.
• Globalización, integración y comercio inclusivo en América Latina. Textos seleccionados 2010-2014, Osvaldo Rosales (comp.), 2015, 326 p.
Copublicaciones / Co-publications• El imperativo de la igualdad, Alicia Bárcena, Antonio Prado, CEPAL/Siglo Veintiuno, Argentina, 2016, 244 p.
• Gobernanza global y desarrollo: nuevos desafíos y prioridades de la cooperación internacional, José Antonio Ocampo (ed.), CEPAL/Siglo Veintiuno, Argentina, 2015, 286 p.
• Decentralization and Reform in Latin America: Improving Intergovernmental Relations, Giorgio Brosio and Juan Pablo Jiménez (eds.), ECLAC/Edward Elgar Publishing, United Kingdom, 2012, 450 p.
• Sentido de pertenencia en sociedades fragmentadas: América Latina desde una perspectiva global, Martín Hopenhayn y Ana Sojo (comps.), CEPAL/Siglo Veintiuno, Argentina, 2011, 350 p.
Coediciones / Co-editions• Perspectivas económicas de América Latina 2017: Juventud, Competencias y Emprendimiento, 2016, 338 p.
Latin American Economic Outlook 2017: Youth, Skills and Entrepreneurship, 2016, 314 p.
• Desarrollo e integración en América Latina, 2016, 314 p.
• Hacia un desarrollo inclusivo: el caso del Uruguay, 2016, 174 p.
• Perspectivas de la agricultura y del desarrollo rural en las Américas: una mirada hacia América Latina y el Caribe 2015-2016, CEPAL/FAO/IICA, 2015, 212 p.
Documentos de proyecto / Project documents• El gran impulso ambiental en el sector de la energía, Andrés Arroyo Peláez, 2017, 62 p.
• La transversalización del enfoque de género en las políticas públicas frente al cambio climático en América Latina, Marina Casas Varez, 2017, 101 p.
• Financiamiento para el cambio climático en América Latina y el Caribe en 2015, Joseluis Samaniego y Heloísa Schneider, 2017, 76 p.
• El cambio tecnológico y el nuevo contexto del empleo: tendencias generales y en América Latina, Sebastian Krull, 2016, 48 p.
• Cambio climático, políticas públicas y demanda de energía y gasolinas en América Latina: un meta-análisis, Luis Miguel Galindo, Joseluis Samaniego, Jimy Ferrer, José Eduardo Alatorre, Orlando Reyes, 2016, 68 p.
Cuadernos estadísticos de la CEPAL• 44 Las cuentas de los hogares y el bienestar en América Latina. Más allá del PIB, 2016.
• 43 Estadísticas económicas de América Latina y el Caribe: Aspectos metodológicos y resultados del cambio de año base de 2005 a 2010
Series de la CEPAL / ECLAC SeriesAsuntos de Género / Comercio Internacional / Desarrollo Productivo / Desarrollo Territorial / Estudios Estadísticos / Estudios y Perspectivas (Bogotá, Brasilia, Buenos Aires, México, Montevideo) / Studies and Perspectives (The Caribbean, Washington) / Financiamiento del Desarrollo / Gestión Pública / Informes y Estudios Especiales / Macroeconomía del Desarrollo / Medio Ambiente y Desarrollo / Población y Desarrollo / Política Fiscal / Políticas Sociales / Recursos Naturales e Infraestructura / Seminarios y Conferencias.
Manuales de la CEPAL• 5 Estimación de las erogaciones sociales a partir del sistema de cuentas nacionales: una propuesta para las funciones de educación, salud y
protección social, María Paz Colinao, Federico Dorin, Rodrigo Martínez y Varinia Tromben, 2016, 63 p.
• 4 Territorio e igualdad: planificación del desarrollo con perspectiva de género, 2016, 84 p.
• 3 Manual de formación regional para la implementación de la resolución 1325 (2000) del Consejo de Seguridad de las Naciones Unidas relativa a las mujeres, la paz y la seguridad, María Cristina Benavente R., Marcela Donadio, Pamela Villalobos, 2016, 126 p.
Revista CEPAL / CEPAL ReviewLa Revista se inició en 1976, con el propósito de contribuir al examen de los problemas del desarrollo socioeconómico de la región. La Revista CEPAL se publica en español e inglés tres veces por año.
CEPAL Review first appeared in 1976, its aim being to make a contribution to the study of the economic and social development problems of the region. CEPAL Review is published in Spanish and English versions three times a year.
Observatorio demográfico / Demographic Observatory Edición bilingüe (español e inglés) que proporciona información estadística actualizada, referente a estimaciones y proyecciones de población de los países de América Latina y el Caribe. Desde 2013 el Observatorio aparece una vez al año.
Bilingual publication (Spanish and English) proving up-to-date estimates and projections of the populations of the Latin American and Caribbean countries. Since 2013, the Observatory appears once a year.
Notas de poblaciónRevista especializada que publica artículos e informes acerca de las investigaciones más recientes sobre la dinámica demográfica en la región. También incluye información sobre actividades científicas y profesionales en el campo de población. La revista se publica desde 1973 y aparece dos veces al año, en junio y diciembre.
Specialized journal which publishes articles and reports on recent studies of demographic dynamics in the region. Also includes information on scientific and professional activities in the field of population. Published since 1973, the journal appears twice a year in June and December.
Las publicaciones de la CEPAL están disponibles en:ECLAC publications are available at:
www.cepal.org/publicaciones
También se pueden adquirir a través de:They can also be ordered through:
www.un.org/publications
United Nations PublicationsPO Box 960
Herndon, VA 20172USA
Tel. (1-888)254-4286 Fax (1-800)338-4550
Contacto / Contact: [email protected] / Orders: [email protected]

www.eclac.org
Inte
rna
tio
na
l Tra
de
Ou
tlo
ok
fo
r L
atin
Am
eri
ca a
nd
th
e C
arib
be
an
20
17