international course for hotel management textbook hotel marketing
TRANSCRIPT

Vienna, September 2014
International Course for Hotel
Management
Textbook Hotel Marketing
© 2014 harald hafner – hotmama Page 1
Table of Contents
1. Configuring the Service Experience .............................................................................. 2
1.1. Service Design ........................................................................................................ 2 1.2. Flowcharting / Blueprinting ..................................................................................... 7 1.3. The Physical setting .............................................................................................. 13
1.3.1. Physical setting and service delivery .............................................................. 13 1.3.2. Individuals responses to physical setting ....................................................... 14 1.3.3. Crowding, capacity and control ...................................................................... 22
1.4. The service employees ......................................................................................... 24 1.4.1. Human resources policies and the customer ................................................. 25 1.4.2. Empowerment and enfranchisement .............................................................. 27 1.4.3. Implications for marketing .............................................................................. 31
2. Service pricing policy ................................................................................................... 33 2.1. Time-dependent capacity and its impact on pricing .............................................. 33 2.2. The nature of service costs ................................................................................... 34 2.3. Price sensitivity measurement (PSM) ................................................................... 35
2.3.1. Price: Indicator of Quality ............................................................................... 35 2.3.2. Price-Value ..................................................................................................... 36 2.3.3. Price-Sensitivity Measurement ....................................................................... 38 2.3.4. Case study: PSM for a product introduction for single travellers .................... 39
2.4. The nature of service demand .............................................................................. 44 2.5. Conditioning the price ........................................................................................... 45 2.6. Multiple services and price bundling ..................................................................... 46
3. Promotion Mix ............................................................................................................. 49 3.1. Advertising ............................................................................................................ 49
3.1.1. Mission ........................................................................................................... 50 3.1.2. Money ............................................................................................................ 51 3.1.3. Message......................................................................................................... 52 3.1.4. Media ............................................................................................................. 58 3.1.5. Measurement ................................................................................................. 63
3.2. Public Relations .................................................................................................... 65 3.2.1. Marketing PR (MPR) ...................................................................................... 65 3.2.2. Major decisions in Marketing PR .................................................................... 66
3.3. Sales promotion .................................................................................................... 69 3.3.1. Purpose of sales promotions .......................................................................... 69 3.3.2. Major decisions in sales promotion ................................................................ 70
© 2014 harald hafner – hotmama Page 2
1. Configuring the Service Experience
1.1. Service Design Strategically, the hotel can choose to use its operations as the key component of its competitive strategy. Associating with the firm in the mind of the customer with service operational excellence can create a competitive advantage, but doing this also places considerable demands on the organization. This chapter discusses the strategic choices and the design criteria in terms of the organization and the operation itself. Once the strategic choices have been made, they can be operationalized by using a flowchart to describe the detailed operations of the service. There need to be both consumer and operational versions of the flowchart. The chapter uses the flowcharting approach to understand the design of new services and to show how operations strategy can be tied back to a detailed flowchart. Chase and Hayes1 argue that there are four operation stages in the competitiveness of service firms: “available for service”, “journeyman”, “distinctive competence” and world-class service delivery”. Along this dimensions of competitiveness clearly the key determinants are the customers and their perspectives. The different stages relate to varying degrees of preference for the hotel. The primary focus of Chace and Hayes, however, is the operational capabilities of firms that are different stages of competitiveness. Stage 1: Available for Service: Operations for a firm with this level of competitiveness are a “necessary evil”. Operations are at best reactive to the needs of the rest of the organization and deliver the service as specified. As its mission, the operations department attempts primarily to avoid mistakes. Back office support is minimized to keep costs down. Technological investment is also minimized, as is investment in training for front-line personnel. Management designs skill out of the work done by these personnel and pays them the minimum wage wherever possible.
Stage 2: Journeyman: This form of competitiveness is often provided by the arrival of competition. It is no longer enough just to have an operation that works. The firm must now seek feedback from its customers on the relative costs and perceived qualities of the service. At this point, the operations department becomes much more outward-looking and often becomes interested in benchmarking. Technology for firms at this stage tends to be justified based on the cost savings possible. The back office is now seen as a contributor to the service but tends to be treated as an internal service function. In the management of front-line employees, the emphasis shifts from controlling workers to managing processes. Employees are often given procedures to follow, and management consist of ensuring that these procedures are followed.
1 Source: Richard B. Chase and Douglas M. Stewart, “Making your service fail-safe” Sloan Management Review, Spring 1994
© 2014 harald hafner – hotmama Page 3
Stage 3: Distinctive competence achieved: By this stage, operations have reached a point where they continually excel, reinforced by the personnel management function and systems to support the customer focus. By this time, the firm has mastered the core service and understands the complexity of changing such operations. The back office is now seen to be as valuable as the front-of-house personnel. Technology is no longer seen as a source of cost advantage alone, but also as a way of enhancing the service to customers. Perhaps the biggest changes come about in the workforce and in the nature of front-line management. Front-line workers are allowed to select from alternative procedures and are not tied down in the same way. The role of front-line management is to listen to customers and become coaches to the front-line-workers. Stage 4: World-class service delivery: To sustain this level of performance, operations not only have to continually excel but also become a fast learner and innovator. The back office, once seen as second-class citizen, now must be proactive , develop its own capabilities, and generate opportunities. Technology is seen as a way to break the paradigm – to do things competitors cannot do. The workforce itself must be a source of innovators, not just operators. To achieve this, the front-line supervisors must go beyond coaching to mentoring. As mentors, they need to be accountable for the personal development of the workforce so that employees can develop the skills necessary for them to innovate the firm. The starting point for this discussion is the work of J.D. Thompson2. Thompson, who started from an organizational perspective, introduced the idea of a “technical core” that is, the technical heart of the organization. He specified that, to operate efficiently, the firm must be able to operate “as if the market will absorb the single kind of product at a continuous rate and as if the inputs flowed continuously at a steady rate and with specified quality”. At the centre of his argument was the idea that uncertainty creates inefficiency. In the ideal situation envisaged by Thompson, the technical core is able to operate without uncertainty on both the input and output side, thereby creating many advantages for management. The absence of uncertainty means that decisions within the core can become programmed and individual discretion can be replaced by rules; the removal of individual discretion means that jobs are deskilled and lower-quality labour is used. Alternatively, the rules can be programmed into machines and labour can be replaced with capital. Because output and input are fixed, it is very easy to plan capacity and to run at the high levels of utilization needed to generate the most efficient operations performance. A system without uncertainty is very easy to control and manage. Clearly, such an ideal world is virtually impossible to create, and even in goods companies, the demands of procurement and marketing management have to be traded off against the ideal operations demand. At this point, the need for a marketing involvement in this approach becomes clear, as a decision about the extent of customer contact favoured by the customer is clearly a marketing issue. In some cases, a high degree of customer contact can be used to differentiate the hotel from its competitors. In these cases, the operational costs have to be traded against the competitive benefits.
2 Source: J.D. Thompson, Organizations in action, New York, McGraw-Hill 1967
© 2014 harald hafner – hotmama Page 4
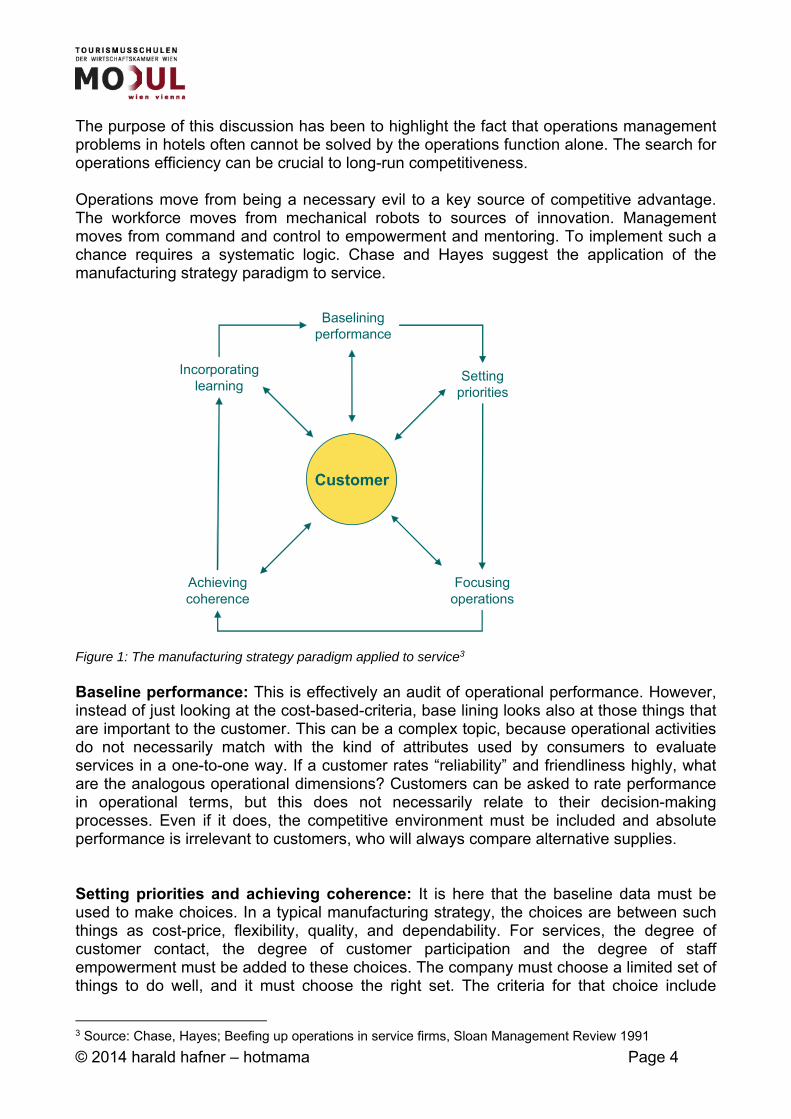
The purpose of this discussion has been to highlight the fact that operations management problems in hotels often cannot be solved by the operations function alone. The search for operations efficiency can be crucial to long-run competitiveness. Operations move from being a necessary evil to a key source of competitive advantage. The workforce moves from mechanical robots to sources of innovation. Management moves from command and control to empowerment and mentoring. To implement such a chance requires a systematic logic. Chase and Hayes suggest the application of the manufacturing strategy paradigm to service. Figure 1: The manufacturing strategy paradigm applied to service3 Baseline performance: This is effectively an audit of operational performance. However, instead of just looking at the cost-based-criteria, base lining looks also at those things that are important to the customer. This can be a complex topic, because operational activities do not necessarily match with the kind of attributes used by consumers to evaluate services in a one-to-one way. If a customer rates “reliability” and friendliness highly, what are the analogous operational dimensions? Customers can be asked to rate performance in operational terms, but this does not necessarily relate to their decision-making processes. Even if it does, the competitive environment must be included and absolute performance is irrelevant to customers, who will always compare alternative supplies. Setting priorities and achieving coherence: It is here that the baseline data must be used to make choices. In a typical manufacturing strategy, the choices are between such things as cost-price, flexibility, quality, and dependability. For services, the degree of customer contact, the degree of customer participation and the degree of staff empowerment must be added to these choices. The company must choose a limited set of things to do well, and it must choose the right set. The criteria for that choice include
3 Source: Chase, Hayes; Beefing up operations in service firms, Sloan Management Review 1991
Customer
Baseliningperformance
Settingpriorities
Focusingoperations
Achievingcoherence
Incorporatinglearning
© 2014 harald hafner – hotmama Page 5
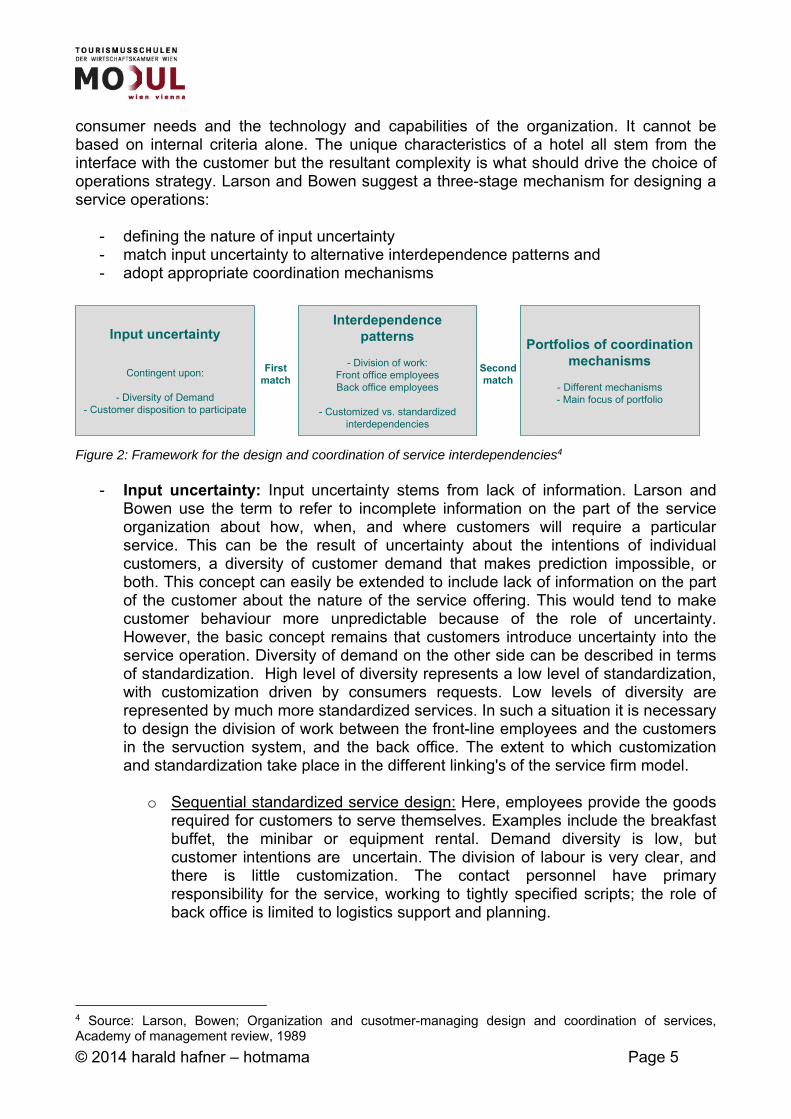
consumer needs and the technology and capabilities of the organization. It cannot be based on internal criteria alone. The unique characteristics of a hotel all stem from the interface with the customer but the resultant complexity is what should drive the choice of operations strategy. Larson and Bowen suggest a three-stage mechanism for designing a service operations:
- defining the nature of input uncertainty - match input uncertainty to alternative interdependence patterns and - adopt appropriate coordination mechanisms
Figure 2: Framework for the design and coordination of service interdependencies4
- Input uncertainty: Input uncertainty stems from lack of information. Larson and Bowen use the term to refer to incomplete information on the part of the service organization about how, when, and where customers will require a particular service. This can be the result of uncertainty about the intentions of individual customers, a diversity of customer demand that makes prediction impossible, or both. This concept can easily be extended to include lack of information on the part of the customer about the nature of the service offering. This would tend to make customer behaviour more unpredictable because of the role of uncertainty. However, the basic concept remains that customers introduce uncertainty into the service operation. Diversity of demand on the other side can be described in terms of standardization. High level of diversity represents a low level of standardization, with customization driven by consumers requests. Low levels of diversity are represented by much more standardized services. In such a situation it is necessary to design the division of work between the front-line employees and the customers in the servuction system, and the back office. The extent to which customization and standardization take place in the different linking's of the service firm model.
o Sequential standardized service design: Here, employees provide the goods
required for customers to serve themselves. Examples include the breakfast buffet, the minibar or equipment rental. Demand diversity is low, but customer intentions are uncertain. The division of labour is very clear, and there is little customization. The contact personnel have primary responsibility for the service, working to tightly specified scripts; the role of back office is limited to logistics support and planning.
4 Source: Larson, Bowen; Organization and cusotmer-managing design and coordination of services, Academy of management review, 1989
Input uncertainty
Contingent upon:
- Diversity of Demand- Customer disposition to participate
Interdependencepatterns
- Division of work:Front office employeesBack office employees
- Customized vs. standardizedinterdependencies
Portfolios of coordinationmechanisms
- Different mechanisms- Main focus of portfolio
Firstmatch
Secondmatch
© 2014 harald hafner – hotmama Page 6
o Reciprocal service design: These are very high-contact services with necessarily high levels of customization and contact; the division of labour sees contact staff playing a major role. Customer diversity is high, and customer intentions are uncertain. Examples are concierge services or a la carte meals in a restaurant. For the highly interactive and customized reciprocal service design, it is the mutual adjustment of the customer and the front-line- employee that delivers the service with long, complex and loosely-specified scripts. The role of the back office is limited to programming and scheduling, and the linkage between front and back office allows for limited decoupling because “client” records and requests can be prepared “off-line”.
o Sequential customized service design: Here, diversity of demand is high, but
customer intentions can be predicted; therefore, there is the opportunity to safely customize the service. The division of labour is biased heavily toward the staff. Examples are seminars and conferences or banqueting. The service operations take place as a coordinating mechanism between contact personal and back office. Front-office staff, working with limited but loosely configured scripts (due to the customizable nature of the service), are responsible primarily for ascertaining customer needs and then delivering the completed service to the customer.
o Pooled service design: Here, diversity of demand is low, and customer
intentions are more likely to be known. There is low customization and a fairly even division of labour, with much of the service work being carried out by back office staff and then delivered through contact personnel. Examples are fast-food restaurants, airlines or the rooms in hotels.
- Incorporating learning: Incorporating learning requires both gathering and
disseminating new roles obtained from analyzing the operations. A true learning organization does not just learn on an ad hoc basis. Rather, it learns systematically, often experimenting formally with the operation to learn more. In manufacturing, such experiments are commonplace and focus on “yield”. With services, they need to focus on both cost and customer satisfaction.
© 2014 harald hafner – hotmama Page 7
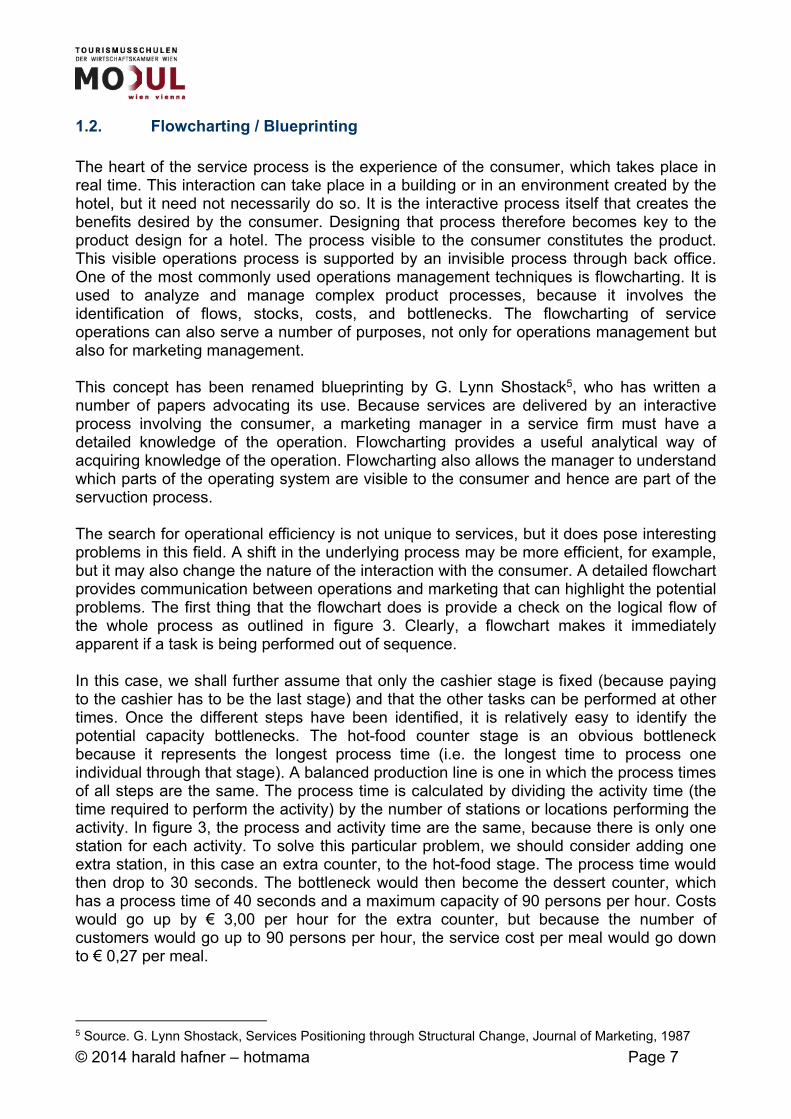
1.2. Flowcharting / Blueprinting The heart of the service process is the experience of the consumer, which takes place in real time. This interaction can take place in a building or in an environment created by the hotel, but it need not necessarily do so. It is the interactive process itself that creates the benefits desired by the consumer. Designing that process therefore becomes key to the product design for a hotel. The process visible to the consumer constitutes the product. This visible operations process is supported by an invisible process through back office. One of the most commonly used operations management techniques is flowcharting. It is used to analyze and manage complex product processes, because it involves the identification of flows, stocks, costs, and bottlenecks. The flowcharting of service operations can also serve a number of purposes, not only for operations management but also for marketing management. This concept has been renamed blueprinting by G. Lynn Shostack5, who has written a number of papers advocating its use. Because services are delivered by an interactive process involving the consumer, a marketing manager in a service firm must have a detailed knowledge of the operation. Flowcharting provides a useful analytical way of acquiring knowledge of the operation. Flowcharting also allows the manager to understand which parts of the operating system are visible to the consumer and hence are part of the servuction process. The search for operational efficiency is not unique to services, but it does pose interesting problems in this field. A shift in the underlying process may be more efficient, for example, but it may also change the nature of the interaction with the consumer. A detailed flowchart provides communication between operations and marketing that can highlight the potential problems. The first thing that the flowchart does is provide a check on the logical flow of the whole process as outlined in figure 3. Clearly, a flowchart makes it immediately apparent if a task is being performed out of sequence. In this case, we shall further assume that only the cashier stage is fixed (because paying to the cashier has to be the last stage) and that the other tasks can be performed at other times. Once the different steps have been identified, it is relatively easy to identify the potential capacity bottlenecks. The hot-food counter stage is an obvious bottleneck because it represents the longest process time (i.e. the longest time to process one individual through that stage). A balanced production line is one in which the process times of all steps are the same. The process time is calculated by dividing the activity time (the time required to perform the activity) by the number of stations or locations performing the activity. In figure 3, the process and activity time are the same, because there is only one station for each activity. To solve this particular problem, we should consider adding one extra station, in this case an extra counter, to the hot-food stage. The process time would then drop to 30 seconds. The bottleneck would then become the dessert counter, which has a process time of 40 seconds and a maximum capacity of 90 persons per hour. Costs would go up by € 3,00 per hour for the extra counter, but because the number of customers would go up to 90 persons per hour, the service cost per meal would go down to € 0,27 per meal.
5 Source. G. Lynn Shostack, Services Positioning through Structural Change, Journal of Marketing, 1987
© 2014 harald hafner – hotmama Page 8
Figure 3: Simple process flowchart of a cafeteria style restaurant A marketing manager dealing with the same process has some of the same problems as the operations colleague. The process as defined is designed to operate at certain production levels, and these are the service standards that customer should perceive. But, if the process is capable of processing only 60 customers per hour, there may be a problem. Also, it is clear that the bottleneck at the hot-food counter will produce queues within the line. The marketing manager should recognize the capacity benefits immediately. However, what the chart also shows is the chance in consumer behaviour required for the system to operate. The use of flowcharting approach allows the marketing and operations manager to analyze in detail the process that they are jointly trying to create and manage. Flowcharting can easily highlight the kind of conflicts occurring and can provide a common language for their discussion and for the resolution of their problems. Although the idea of a flowchart is attractive to both, marketing and operations, it may well be that a marketing flowchart should be prepared in a different way. The chart used in figure 3 have an internal focus: although they identify clearly the tangible points of contact with the client, they start from the organization and look outward. An alternative way to develop a flowchart would be to start from a consumer protocol. Respondents, individually or in groups, and be asked to describe the process or the script they follow in using the service. Clearly, such an approach cannot cover the invisible parts of the service firm, but it can provide a much better understanding of the points in contact. The process described by the consumer, may well differ greatly from that perceived by the firm. Respondents asked to describe a stay at a hotel, for example, might start with their experience with the travel agent. They then might proceed to describe the process of getting to the hotel, parking and entering the lobby. If the direction signs for the hotel are nonexistent or confusing, they might reflect on the customers. Although the hotel might not be in control over these points of contact, it could be a wise investment to use its own staff to improve the signage. McDonalds long ago learned the value of removing litter not only from its own property but also from the adjoining roadways.
Maximum
output/hr.
Process timeActivity timeStationsFlowchart
12030 secs.30 secs.1
18020 secs.20 secs.1
9040 secs.40 secs.1
6060 secs.60 secs.1
12030 secs.30 secs.1
24015 secs.15 secs.1
Maximum
output/hr.
Process timeActivity timeStationsFlowchart
12030 secs.30 secs.1
18020 secs.20 secs.1
9040 secs.40 secs.1
6060 secs.60 secs.1
12030 secs.30 secs.1
24015 secs.15 secs.1Appetizer Counter
Salad Counter
Hot-food Counter
Dessert Counter
Drinks Counter
Cashier
Bottleneck
€ 3,00/hour
€ 3,00/hour
€ 3,00/hour
€ 3,00/hour
€ 3,00/hour
€ 6,00/hour
Service cost per meal = € 21,00/60 = € 0,35
© 2014 harald hafner – hotmama Page 9
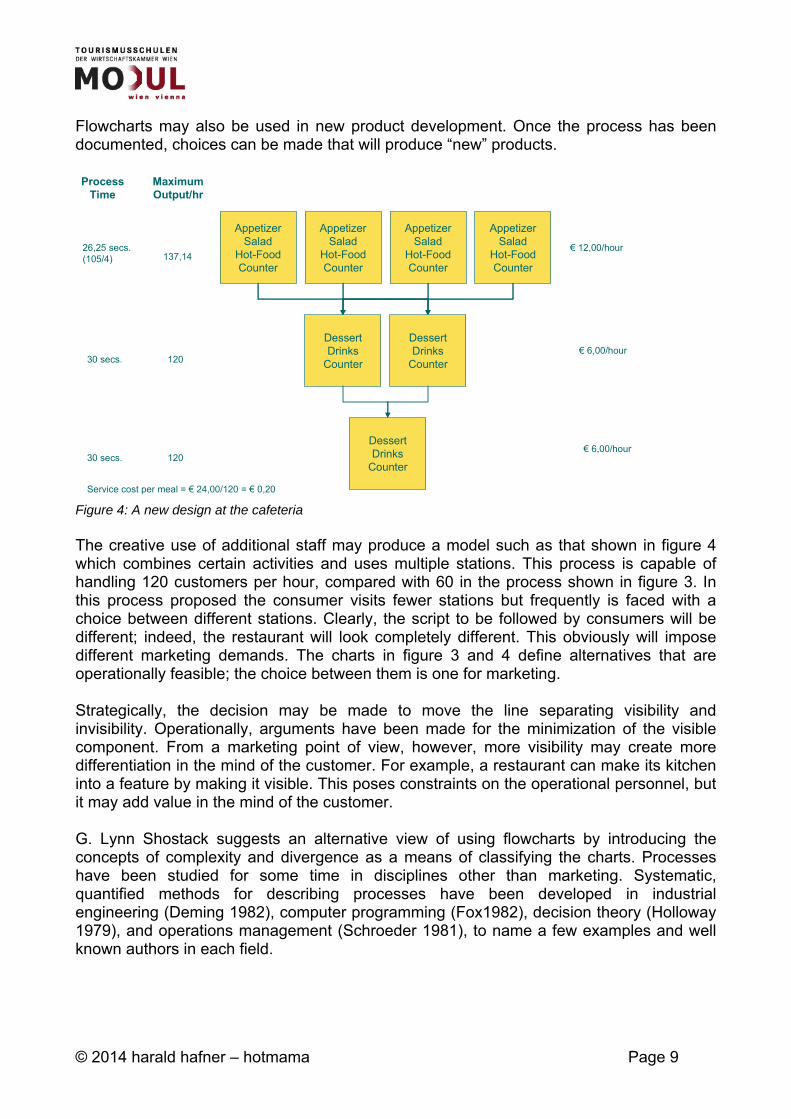
Flowcharts may also be used in new product development. Once the process has been documented, choices can be made that will produce “new” products. Figure 4: A new design at the cafeteria The creative use of additional staff may produce a model such as that shown in figure 4 which combines certain activities and uses multiple stations. This process is capable of handling 120 customers per hour, compared with 60 in the process shown in figure 3. In this process proposed the consumer visits fewer stations but frequently is faced with a choice between different stations. Clearly, the script to be followed by consumers will be different; indeed, the restaurant will look completely different. This obviously will impose different marketing demands. The charts in figure 3 and 4 define alternatives that are operationally feasible; the choice between them is one for marketing. Strategically, the decision may be made to move the line separating visibility and invisibility. Operationally, arguments have been made for the minimization of the visible component. From a marketing point of view, however, more visibility may create more differentiation in the mind of the customer. For example, a restaurant can make its kitchen into a feature by making it visible. This poses constraints on the operational personnel, but it may add value in the mind of the customer. G. Lynn Shostack suggests an alternative view of using flowcharts by introducing the concepts of complexity and divergence as a means of classifying the charts. Processes have been studied for some time in disciplines other than marketing. Systematic, quantified methods for describing processes have been developed in industrial engineering (Deming 1982), computer programming (Fox1982), decision theory (Holloway 1979), and operations management (Schroeder 1981), to name a few examples and well known authors in each field.
AppetizerSalad
Hot-FoodCounter
AppetizerSalad
Hot-FoodCounter
AppetizerSalad
Hot-FoodCounter
AppetizerSalad
Hot-FoodCounter
DessertDrinks
Counter
DessertDrinks
Counter
DessertDrinks
Counter
ProcessTime
MaximumOutput/hr
26,25 secs.(105/4) 137,14
30 secs. 120
30 secs. 120
€ 12,00/hour
€ 6,00/hour
€ 6,00/hour
Service cost per meal = € 24,00/120 = € 0,20
© 2014 harald hafner – hotmama Page 10
Though their techniques and nomenclatures may differ, process-oriented disciplines share certain basic concepts.
- First, each of them provides a way of breaking any process down into logical steps and sequences to facilitate its control and analysis.
- Second, each includes ways to accommodate more variable processes in which
outcomes may differ because of the effects of judgement, chance, or choice on a sequence.
- Finally, each system includes the concept of deviation of tolerance standards in
recognition that processes are “real time” phenomena that do not conform perfectly to any model or description, but rather function within a band or “norm” of some sort.
Extracting from various approaches, we can suggest two ways to describe processes. One way is according to the steps and sequences that constitute the process; the other is according to the executional latitude or variability of those steps and sequences. Let us call the first factor the complexity of the process and the second its divergence.
- Complexity of a process: We can define a service´s complexity by analyzing the number of the steps required to perform it. A check in at the reception is more complex than accepting a reservation at the restaurant. Serving a meal is more complex than washing dishes. Accounting is more complex than bookkeeping.
- Diversity of a process: Apart from complexity, however, some processes include a
high level of executional latitude and others do not. The degree of freedom allowed or inherent in a process step or sequence can be thought of as its divergence. A highly divergent service thus would be one in which virtually every performance of the process is unique. A service of low divergence would be one that is largely standardized.
Every service can be analyzed according to its overall complexity and divergence. A physician`s services, for example, are highly complex. They are also highly divergent. As the service is being performed, a doctor constantly alters and shapes it by assimilating new data, weighing probabilities, reaching conclusions, and then taking action. Every case may be handled differently, yet all performances may be satisfactory from the consumer point of view. Architecture, law, consulting, and most other professional services have similarly high divergences (as well as high complexity), because they involve a considerable amount of judgment, discretion, and situational adaption. However, a process can be high in complexity and low in divergence. Hotel services are a complex aggregation of processes, but the majority of hotels standardize these processes through documentations and establishment of executional rules for every sequence from check in to check out. De luxe hotels on the other hand or hotels offering their services to a number of market segments can also get pretty high in divergence.
© 2014 harald hafner – hotmama Page 11
Services also can be low in complexity but high in divergence. In process terms, a singer renders the service of entertainment in one step: sing. This service is infinitely divergent, however, because each execution is unique and unlike that of any other provider. Services that involve interpretative skills, artistic crafting, or highly individualized execution often appear simple in process terms, yet are highly divergent in operation. In fact, for such services defining “what” is done in process terms is often easier than describing “how” it is done. Shostack argues that in developing products in the service sector, manipulation of complexity and divergence are two of the key choices.
- Low Divergence: Reducing divergence leads to uniformity which tends to reduce costs, improve productivity, and make distribution easier. It usually indicates a shift to a volume-oriented positioning strategy based on economies of scale. The positive market effects of such a move can include perceived increases in reliability - more uniform service quality and greater service availability. However, reducing divergence also can have negative market effects. It dictates conformity as well as inflexibility in operating procedures. Customers may perceive the shift as one that lowers customization and limits their options, and may reject a highly standardized service even if it costs less.
- High Divergence: Raising divergence is the service equivalent of creating a “job
shop”. Greater customization and flexibility tend to command higher prices. Increased divergence usually indicates a niche positioning strategy, dependent less on volume and more on margins. The market can respond positively to such a shift if the service taps have a desire for prestige, customization, or personalization. Here, too, however, care is needed in making such a shift. A divergent service is more difficult to manage, control, and distribute. Moreover, customers may not be willing to pay the price that customization demands.
- Low Complexity: Reduced complexity usually indicates a specialization strategy.
As steps or functions are dropped from the system, resources can be focused on a narrower service offering. Narrowing the service offering usually makes distribution and control easier. Such a service can be perceived positively by the market if the provider stands out as an expert. However, reduced complexity also can cause a service to be perceived as “stripped down” or so limited that its specialized quality is not enough to overcome the inconvenience or price of obtaining it. Reducing complexity can be competitively risky, if other providers continue to offer a broader, more extensive full-service alternative.
- High Complexity: Higher complexity usually indicates a strategy to gain greater
penetration in a market by adding more services or enhancing current ones. Hotels and restaurants have expanded their service lines with this strategic goal in mind. Increasing complexity can increase efficiency by maximizing the revenue generated from each customer. In contrast, too much complexity can be confusing to customers and can cause overall service quality to fail. Thus, a highly complex service system may be vulnerable to inroads by competitors who specialize.
© 2014 harald hafner – hotmama Page 12
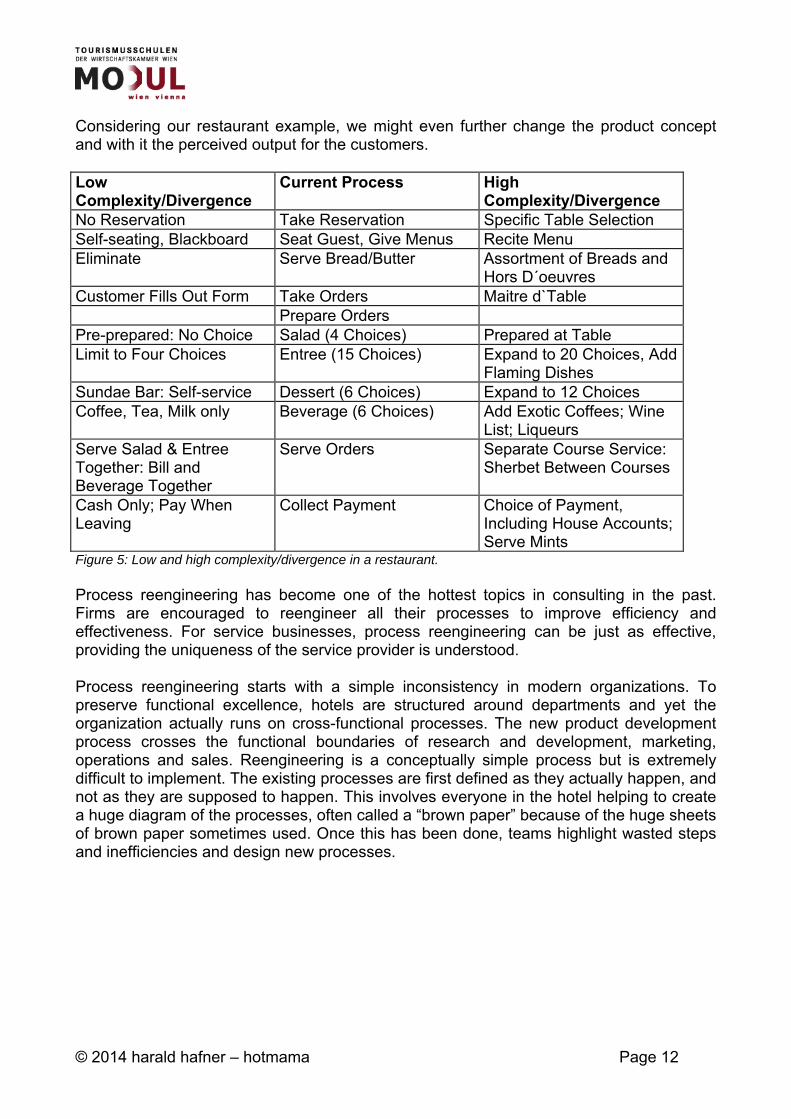
Considering our restaurant example, we might even further change the product concept and with it the perceived output for the customers. Low Complexity/Divergence
Current Process High Complexity/Divergence
No Reservation Take Reservation Specific Table Selection Self-seating, Blackboard Seat Guest, Give Menus Recite Menu Eliminate Serve Bread/Butter Assortment of Breads and
Hors D´oeuvres Customer Fills Out Form Take Orders Maitre d`Table Prepare Orders Pre-prepared: No Choice Salad (4 Choices) Prepared at Table Limit to Four Choices Entree (15 Choices) Expand to 20 Choices, Add
Flaming Dishes Sundae Bar: Self-service Dessert (6 Choices) Expand to 12 Choices Coffee, Tea, Milk only Beverage (6 Choices) Add Exotic Coffees; Wine
List; Liqueurs Serve Salad & Entree Together: Bill and Beverage Together
Serve Orders Separate Course Service: Sherbet Between Courses
Cash Only; Pay When Leaving
Collect Payment Choice of Payment, Including House Accounts; Serve Mints
Figure 5: Low and high complexity/divergence in a restaurant. Process reengineering has become one of the hottest topics in consulting in the past. Firms are encouraged to reengineer all their processes to improve efficiency and effectiveness. For service businesses, process reengineering can be just as effective, providing the uniqueness of the service provider is understood. Process reengineering starts with a simple inconsistency in modern organizations. To preserve functional excellence, hotels are structured around departments and yet the organization actually runs on cross-functional processes. The new product development process crosses the functional boundaries of research and development, marketing, operations and sales. Reengineering is a conceptually simple process but is extremely difficult to implement. The existing processes are first defined as they actually happen, and not as they are supposed to happen. This involves everyone in the hotel helping to create a huge diagram of the processes, often called a “brown paper” because of the huge sheets of brown paper sometimes used. Once this has been done, teams highlight wasted steps and inefficiencies and design new processes.
© 2014 harald hafner – hotmama Page 13
1.3. The Physical setting The physical setting of a hotel has many different roles to play. It is a big part of the service delivered to the consumer. It has a role to play in the operational efficiency of the hotel, coordination and providing a framework for the service delivery process. At a more subtle level, the physical setting can be a source of competitive advantage by differentiating the hotel from its competitors. This chapter discusses these different roles and shows that the consumer and, to a lesser extent, the contact personnel must be the key determinants of the structure and form of the physical setting.
1.3.1. Physical setting and service delivery The servuction model provides a highly simplified view of a service business. However even at this level it is clear that for many services the physical setting, or ev0000idence, is a key part of the process. Moreover, it is clear that for the contact personnel, the physical evidence is just as important. Whatever the physical infrastructure and artefacts the hotel entails, they are experienced by the consumer and the contact personnel. Indeed, the contact personnel are exposed for far longer time than the average customer. And, because we know that the attitude and behaviour of the contact personnel can have a major impact on the consumer, the physical setting can therefore have a large secondary effect on the consumer through the contact personnel. For the contact personnel, the physical environment is their personal working environment, an this will always condition behaviour. The relative emphasis given to the consumer in designing the evidence and environment will therefore depend on the opportunity to use that evidence as part of the service delivery and to create a competitive advantage in this way. The translation of an operations flowchart into a physical design is relatively straight-forward. For example flowcharts like those given in Figures 3 and 4 can be used to forecast the lines expected at various stations. The lengths of the lines and the physical equipment needed by each station than can be used to work out the square footage required. To a large extent, the logical sequencing of the stages defines the physical layout. All of this, of course, is constrained by the size and shape of the building available. Chase and Stewart6 suggest that many common failures caused by contact personnel and staff can be avoided through restructuring of the physical environment. Failures on the part of the staff to deliver the basic service can be solved by creating physical aids. The ways in which staff interact with customers also can be built into the systems and facilities. A mirror facing a telephone operator will produce a smiling voice; a request to receptionists to record the colour of their customer’s eyes will result in eye contact. Finally, the facilities themselves can be made fail-safe. Uncomfortable chairs stop staff from sleeping, and mirrors in strategic points remind staff to check their appearance. Intriguingly, the same logic can be applied to making customers behaviour fail-safe. Checklists sent to customers ensure that they are prepared before calling in for a service request. In fast-food restaurants, strategically located tray-returns stands and trash receptacles remind customers to return their trays.
6 Source: Richard B. Chase and Douglas M. Stewart; Making your Service Fail-Safe, Sloan Management Review, Spring 1994
© 2014 harald hafner – hotmama Page 14
Organizational socialization is the process by which an individual adapts to and comes to appreciate the values, norms and required behaviour patterns of an organization7. The hotel’s physical evidence plays an important part in the socialization process by conveying expected roles, behaviours, and relationships among employees and between employees and customers. The purpose of socialization is to project a positive and consistent image to the public. However, the service hotel’s image is only as good as the image each employee conveys when interacting with the public8. Physical evidence, such as the use of uniforms, facilitates the socialization of employees towards accepting organizational goals and affect consumer perceptions of the quality of the service provided. Studies have shown that the use of uniforms aids in
- identifying the hotel’s personnel, - presents a physical symbol that embodies the group’s ideals and attributes, - implies a coherent group structure, - facilitates the perceived consistency of performance, - provides a tangible symbol of an employee*s change in status and - assists in controlling the behaviour of employees.
As competition increases in the hospitality industry, opportunities for differentiating the firm become increasingly difficult to find. The physical evidence of the firm can be used as a means of service differentiation. The physical appearance of personnel and facilities often have a direct impact on how consumers perceive that the hotel will handle the service aspects of its business. Numerous studies have shown that well-dressed individuals are perceived as more intelligent, better workers and more pleasant to engage in interactions. Similarly, nicely designed facilities are going to be perceived as having the advantage over poorly designed and decorated alternatives. At the heart of such a set of differentiation strategies, there must be an understanding of how individuals, both consumers and service providers, interpret and react to their physical environment.
1.3.2. Individuals responses to physical setting The study of how environments influence people provides the rationale for the field of environmental psychology. The physical characteristics of the environment generally are hypothesized to create or influence some internal state of the consumer, which in turn influences behaviour within the setting or the behavioural intention toward it. Environmental psychologists (Mehrabian and Russel 1974; Mehrabian 1980; Russell and Pratt 1980) have presented what we consider a potentially valuable theoretical model for studying the effects of store atmosphere on shopping behaviour. This is of interest for the hospitality industry as the effects on the consumers are similar and the model can also be applied. Using a Stimulus-Organism-Response (S-O-R) paradigm, they offer a description of environment, intervening variables, and behaviours relevant to the retail setting. 7 Source: Edgar Schein, Organizational Socialization and the Profession of Management, Industrial Management Review, Winter 1968 8 Source: Michael R. Solomon, Packaging the Service Provider, in Christopher H. Lovelock ed., Managing Services Marketing, Operations and Human Resources (Englewood Cliffs, NJ), 1988
© 2014 harald hafner – hotmama Page 15
An adequate S-O-R model has the following requisites:
- a stimulus taxonomy - a set of intervening or mediating variables - a taxonomy of responses
Stimulus, intervening, and response variables should be conceptually clear, comprehensive yet parsimonious, and operationally measurable. There should be a well-specified expression of the relationship between stimuli and responses via the intervening variables.
- Stimulus taxonomy: As previously noted, the development of an adequate stimulus taxonomy for research in environmental psychology has proven extremely difficult because of the many stimuli involved in any environmental setting. Clearly, a great deal on in-store experimentation will be needed to determine which specific types of in-store stimulus configurations (such as colour arrangements, store layouts, noise levels, lighting, in-store promotions) evoke which types of emotional responses so as to result in approach or avoidance behaviours.
- Intervening or mediating variables: Mehrabian and Russel propose that three
basic emotional states mediate approach-avoidance behaviours in environmental situations. These emotional responses, known by the acronym PAD are:
o Pleasure – Displeasure o Arousal – No arousal o Dominance – Submissiveness
Their model suggests that any environment, including that of a hotel, will produce an emotional state in an individual that can be characterized in terms of the three PAD dimensions, which are factorial orthogonal.
o Pleasure-displeasure refers to the degree to which the person feels good, joyful, happy, or satisfied in the situation;
o arousal-no arousal refers to the degree to which a person feels excited, stimulated, alert, or active in the situation;
o and dominance-submissiveness refers to the extent to which the individual feels in control of, or free to act in, the situation.
- Response taxonomy: Mehrabian and Russel postulate that all responses to an
environment can be considered as approach or avoidance behaviours. Approach-avoidance behaviours are considered to have four aspects:
o A desire physically to stay in (approach) or to get out of (avoid) the environment.
o A desire or willingness to look around and to explore the environment (approach) versus a tendency to avoid moving through or interacting with the environment or a tendency to remain inanimate in the environment (avoidance).
o A desire or willingness to communicate with others in the environment (approach) as opposed to a tendency to avoid interacting with others or to ignore communication attempts from others (avoidance).
o The degree of enhancement (approach) or hindrance (avoidance) of performance and satisfaction with task performances.
© 2014 harald hafner – hotmama Page 16
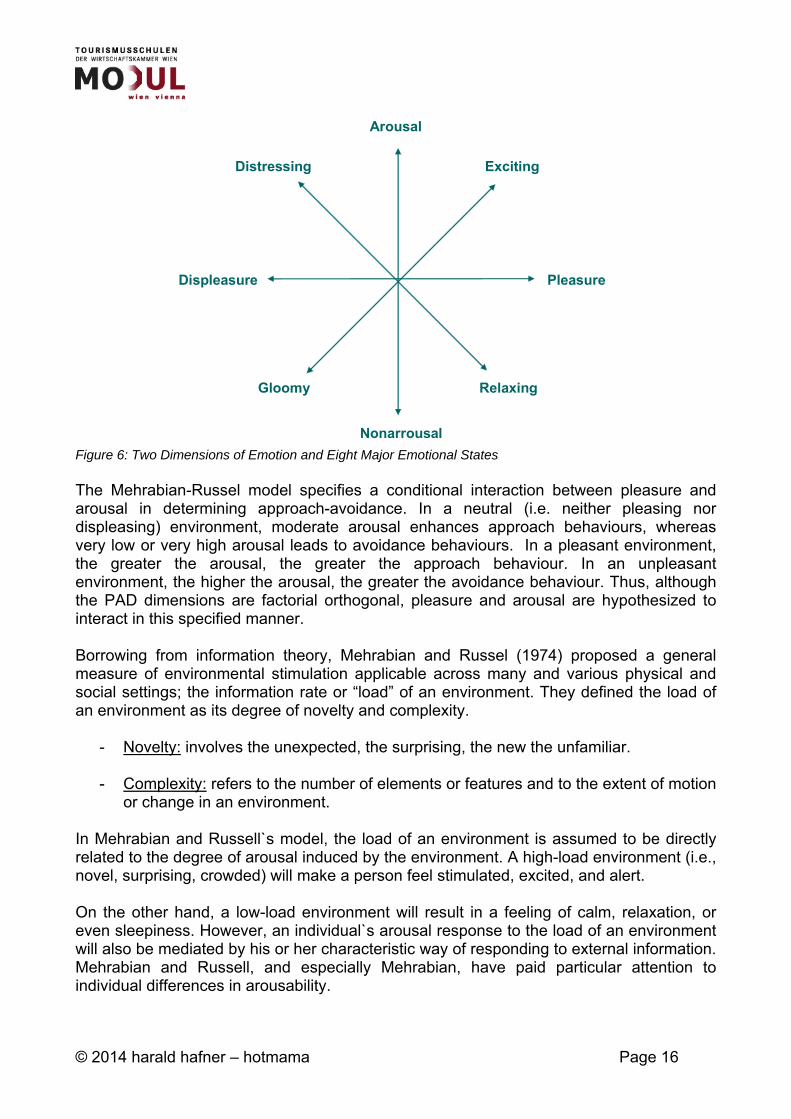
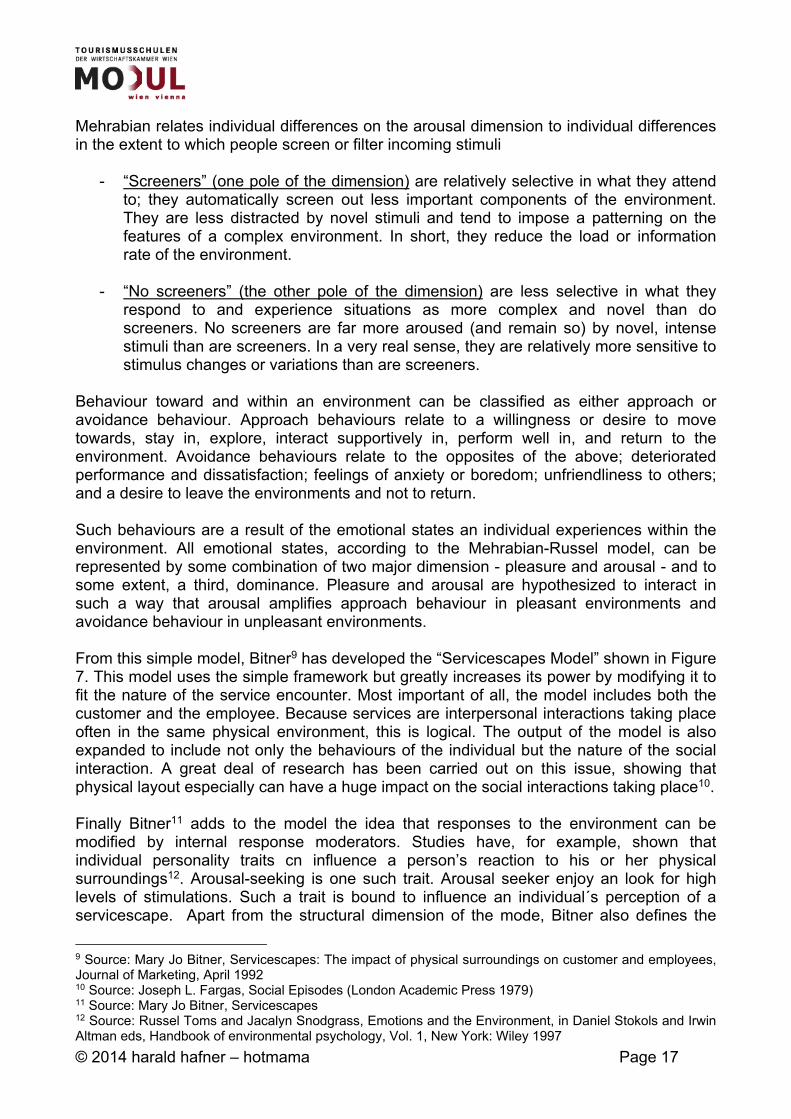
Figure 6: Two Dimensions of Emotion and Eight Major Emotional States The Mehrabian-Russel model specifies a conditional interaction between pleasure and arousal in determining approach-avoidance. In a neutral (i.e. neither pleasing nor displeasing) environment, moderate arousal enhances approach behaviours, whereas very low or very high arousal leads to avoidance behaviours. In a pleasant environment, the greater the arousal, the greater the approach behaviour. In an unpleasant environment, the higher the arousal, the greater the avoidance behaviour. Thus, although the PAD dimensions are factorial orthogonal, pleasure and arousal are hypothesized to interact in this specified manner. Borrowing from information theory, Mehrabian and Russel (1974) proposed a general measure of environmental stimulation applicable across many and various physical and social settings; the information rate or “load” of an environment. They defined the load of an environment as its degree of novelty and complexity.
- Novelty: involves the unexpected, the surprising, the new the unfamiliar. - Complexity: refers to the number of elements or features and to the extent of motion
or change in an environment.
In Mehrabian and Russell`s model, the load of an environment is assumed to be directly related to the degree of arousal induced by the environment. A high-load environment (i.e., novel, surprising, crowded) will make a person feel stimulated, excited, and alert. On the other hand, a low-load environment will result in a feeling of calm, relaxation, or even sleepiness. However, an individual`s arousal response to the load of an environment will also be mediated by his or her characteristic way of responding to external information. Mehrabian and Russell, and especially Mehrabian, have paid particular attention to individual differences in arousability.
Arousal
Exciting
Pleasure
Relaxing
Nonarrousal
Gloomy
Displeasure
Distressing
© 2014 harald hafner – hotmama Page 17
Mehrabian relates individual differences on the arousal dimension to individual differences in the extent to which people screen or filter incoming stimuli
- “Screeners” (one pole of the dimension) are relatively selective in what they attend to; they automatically screen out less important components of the environment. They are less distracted by novel stimuli and tend to impose a patterning on the features of a complex environment. In short, they reduce the load or information rate of the environment.
- “No screeners” (the other pole of the dimension) are less selective in what they
respond to and experience situations as more complex and novel than do screeners. No screeners are far more aroused (and remain so) by novel, intense stimuli than are screeners. In a very real sense, they are relatively more sensitive to stimulus changes or variations than are screeners.
Behaviour toward and within an environment can be classified as either approach or avoidance behaviour. Approach behaviours relate to a willingness or desire to move towards, stay in, explore, interact supportively in, perform well in, and return to the environment. Avoidance behaviours relate to the opposites of the above; deteriorated performance and dissatisfaction; feelings of anxiety or boredom; unfriendliness to others; and a desire to leave the environments and not to return. Such behaviours are a result of the emotional states an individual experiences within the environment. All emotional states, according to the Mehrabian-Russel model, can be represented by some combination of two major dimension - pleasure and arousal - and to some extent, a third, dominance. Pleasure and arousal are hypothesized to interact in such a way that arousal amplifies approach behaviour in pleasant environments and avoidance behaviour in unpleasant environments. From this simple model, Bitner9 has developed the “Servicescapes Model” shown in Figure 7. This model uses the simple framework but greatly increases its power by modifying it to fit the nature of the service encounter. Most important of all, the model includes both the customer and the employee. Because services are interpersonal interactions taking place often in the same physical environment, this is logical. The output of the model is also expanded to include not only the behaviours of the individual but the nature of the social interaction. A great deal of research has been carried out on this issue, showing that physical layout especially can have a huge impact on the social interactions taking place10. Finally Bitner11 adds to the model the idea that responses to the environment can be modified by internal response moderators. Studies have, for example, shown that individual personality traits cn influence a person’s reaction to his or her physical surroundings12. Arousal-seeking is one such trait. Arousal seeker enjoy an look for high levels of stimulations. Such a trait is bound to influence an individual´s perception of a servicescape. Apart from the structural dimension of the mode, Bitner also defines the
9 Source: Mary Jo Bitner, Servicescapes: The impact of physical surroundings on customer and employees, Journal of Marketing, April 1992 10 Source: Joseph L. Fargas, Social Episodes (London Academic Press 1979) 11 Source: Mary Jo Bitner, Servicescapes 12 Source: Russel Toms and Jacalyn Snodgrass, Emotions and the Environment, in Daniel Stokols and Irwin Altman eds, Handbook of environmental psychology, Vol. 1, New York: Wiley 1997
© 2014 harald hafner – hotmama Page 18
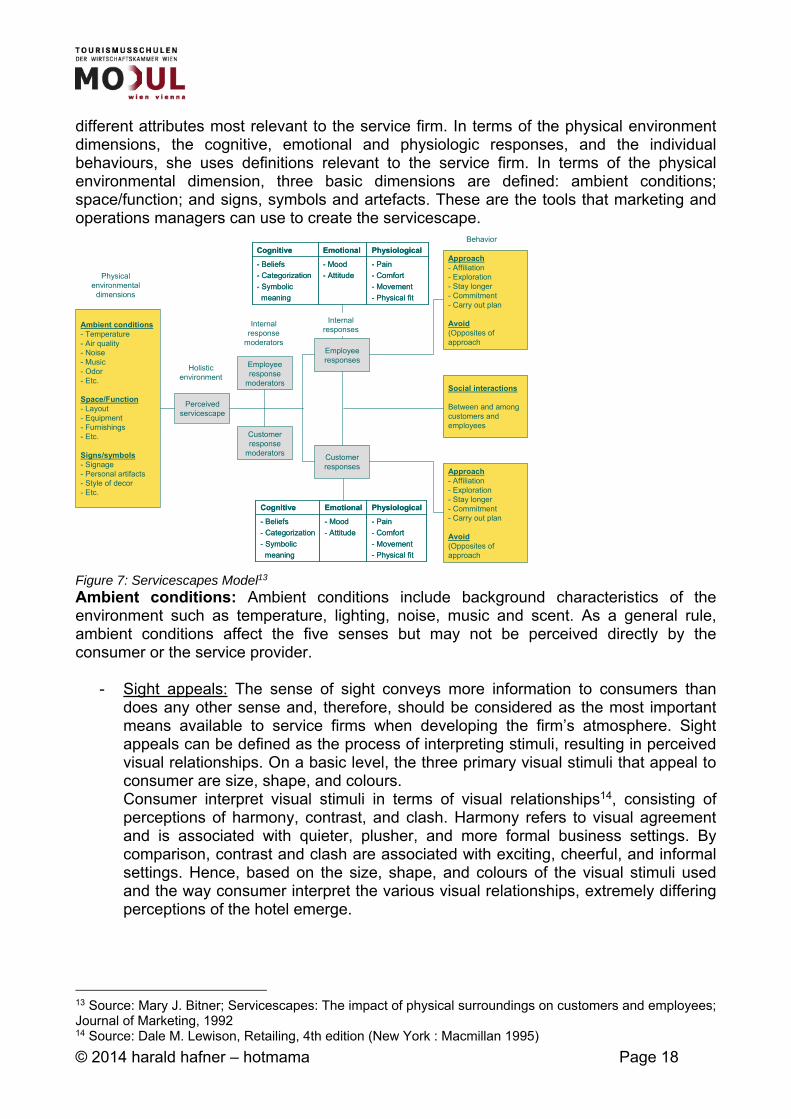
different attributes most relevant to the service firm. In terms of the physical environment dimensions, the cognitive, emotional and physiologic responses, and the individual behaviours, she uses definitions relevant to the service firm. In terms of the physical environmental dimension, three basic dimensions are defined: ambient conditions; space/function; and signs, symbols and artefacts. These are the tools that marketing and operations managers can use to create the servicescape. Figure 7: Servicescapes Model13 Ambient conditions: Ambient conditions include background characteristics of the environment such as temperature, lighting, noise, music and scent. As a general rule, ambient conditions affect the five senses but may not be perceived directly by the consumer or the service provider.
- Sight appeals: The sense of sight conveys more information to consumers than does any other sense and, therefore, should be considered as the most important means available to service firms when developing the firm’s atmosphere. Sight appeals can be defined as the process of interpreting stimuli, resulting in perceived visual relationships. On a basic level, the three primary visual stimuli that appeal to consumer are size, shape, and colours. Consumer interpret visual stimuli in terms of visual relationships14, consisting of perceptions of harmony, contrast, and clash. Harmony refers to visual agreement and is associated with quieter, plusher, and more formal business settings. By comparison, contrast and clash are associated with exciting, cheerful, and informal settings. Hence, based on the size, shape, and colours of the visual stimuli used and the way consumer interpret the various visual relationships, extremely differing perceptions of the hotel emerge.
13 Source: Mary J. Bitner; Servicescapes: The impact of physical surroundings on customers and employees; Journal of Marketing, 1992 14 Source: Dale M. Lewison, Retailing, 4th edition (New York : Macmillan 1995)
- Pain
- Comfort
- Movement
- Physical fit
- Mood
- Attitude
- Beliefs
- Categorization
- Symbolic
meaning
PhysiologicalEmotionalCognitive
- Pain
- Comfort
- Movement
- Physical fit
- Mood
- Attitude
- Beliefs
- Categorization
- Symbolic
meaning
PhysiologicalEmotionalCognitive
Ambient conditions- Temperature- Air quality- Noise- Music- Odor- Etc.
Space/Function- Layout- Equipment- Furnishings- Etc.
Signs/symbols- Signage- Personal artifacts- Style of decor- Etc.
Perceivedservicescape
Employeeresponse
moderators
Customerresponse
moderators
Employeeresponses
Customerresponses
- Pain
- Comfort
- Movement
- Physical fit
- Mood
- Attitude
- Beliefs
- Categorization
- Symbolic
meaning
PhysiologicalEmotionalCognitive
- Pain
- Comfort
- Movement
- Physical fit
- Mood
- Attitude
- Beliefs
- Categorization
- Symbolic
meaning
PhysiologicalEmotionalCognitive
Approach- Affiliation- Exploration- Stay longer- Commitment- Carry out plan
Avoid(Opposites of approach
Approach- Affiliation- Exploration- Stay longer- Commitment- Carry out plan
Avoid(Opposites of approach
Social interactions
Between and amongcustomers andemployees
Physicalenvironmental
dimensions
Holisticenvironment
Internalresponse
moderators
Behavior
Internalresponses
© 2014 harald hafner – hotmama Page 19
- Size perceptions: The actual size of the hotel’s facility, signs, and departments conveys different meanings to different markets. In general, the larger the size of the hotel and its corresponding physical evidence, the more consumers associate the hotel with importance, power, success, security, and stability. For many consumers, the larger the firm, the lower the perceived risk associated with the service purchase. Such consumers believe that larger firms are more competent and more likely to engage in service recovery efforts when problem do arise. Still other customers enjoy the prestige often associated with conducting business with a larger, well-known firm. On the flip side, other customers may view large hotels as impersonal and uncaring and seek out smaller, niche hotels that they view as more personal, intimate, and friendly. Hence, depending on the needs of the firm’s target market, size appeals differently to different categories.
- Shape: Shape perceptions of service firm are created from a variety of sources,
such as the use and placement of shelves, mirrors, and windows, and even the design of wallpaper if applicable. Studies show that different shapes arouse different emotions in consumers. Vertical shapes or vertical lines are perceived as rigid, severe and lending a masculine quality to an area. It expresses strength and stability…gives the viewer an up-and-down eye movement…tends to heighten an area, and gives the illusion of perceived space in this directions15. In contrast, horizontal shapes or lines evoke perceptions of relaxation and restfulness. Diagonal shapes and lines evoke perceptions of progressiveness, pro activeness, and movement. Curved shapes and lines are perceived as feminine and flowing. Using similar and/or dissimilar shapes in facility design will create the desired visual relationship of harmony, contrast or clash. For example, the use of several different shapes in one area might be used to distinguish an area of emphasis16.
- Colour perceptions: The colour of the firm’s physical evidence often makes the first
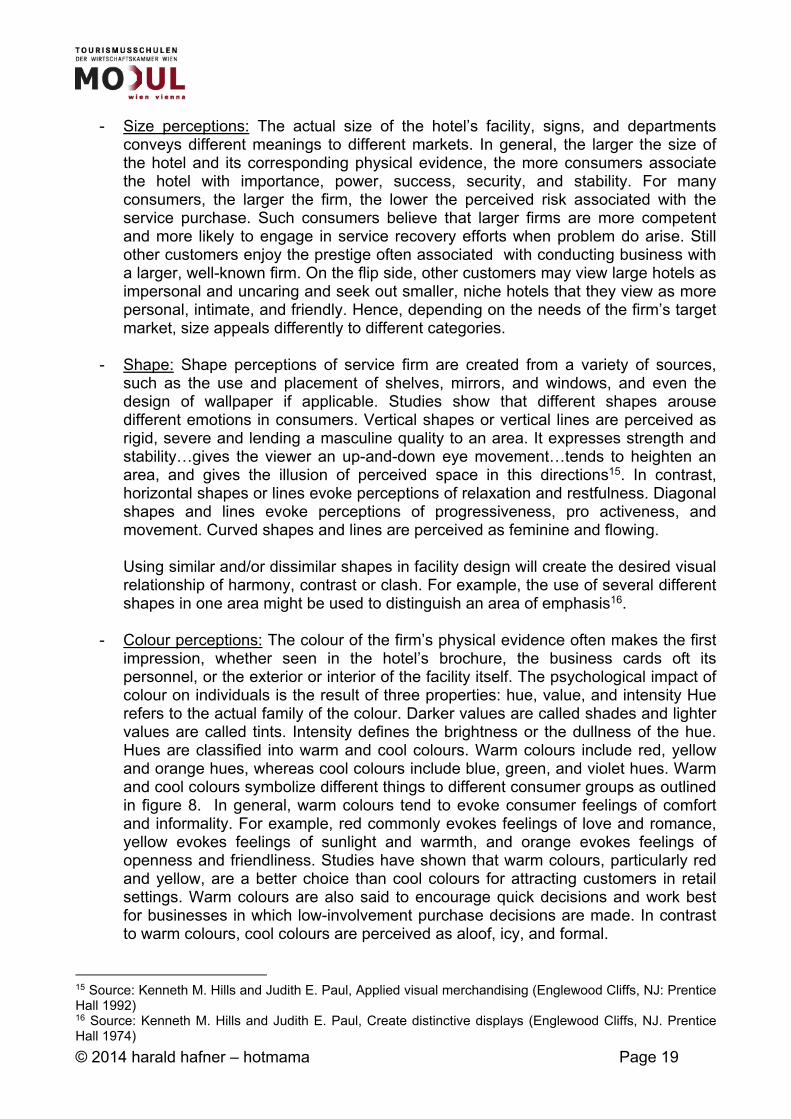
impression, whether seen in the hotel’s brochure, the business cards oft its personnel, or the exterior or interior of the facility itself. The psychological impact of colour on individuals is the result of three properties: hue, value, and intensity Hue refers to the actual family of the colour. Darker values are called shades and lighter values are called tints. Intensity defines the brightness or the dullness of the hue. Hues are classified into warm and cool colours. Warm colours include red, yellow and orange hues, whereas cool colours include blue, green, and violet hues. Warm and cool colours symbolize different things to different consumer groups as outlined in figure 8. In general, warm colours tend to evoke consumer feelings of comfort and informality. For example, red commonly evokes feelings of love and romance, yellow evokes feelings of sunlight and warmth, and orange evokes feelings of openness and friendliness. Studies have shown that warm colours, particularly red and yellow, are a better choice than cool colours for attracting customers in retail settings. Warm colours are also said to encourage quick decisions and work best for businesses in which low-involvement purchase decisions are made. In contrast to warm colours, cool colours are perceived as aloof, icy, and formal.
15 Source: Kenneth M. Hills and Judith E. Paul, Applied visual merchandising (Englewood Cliffs, NJ: Prentice Hall 1992) 16 Source: Kenneth M. Hills and Judith E. Paul, Create distinctive displays (Englewood Cliffs, NJ. Prentice Hall 1974)
© 2014 harald hafner – hotmama Page 20
For example, the use of too much violet may dampen consumer spirits and depress employees who have to continuously work in the violet environment. Although cool colours do not initially attract customers as well as warm colours, cool colours are favoured when the customer needs time to make decisions, such as the time needed for high-involvement purchases. Despite their differing psychological effects, when used together properly, combinations of warm and cool colours can create relaxing, yet stimulating atmospheres. The value of hues also psychologically affect the hotel’s customers. The intensity of the colour also affects perceptions of the hotel’s atmosphere. For example, bright colours make objects appear larger than do duller colours. However, brighter colours are perceived as harsher and “harder”, whereas duller colours are perceived as “softer”.
Figure 8: Perceptions of Colors17
- Sound appeals: Sound appeals have three major roles: mood setter, attention
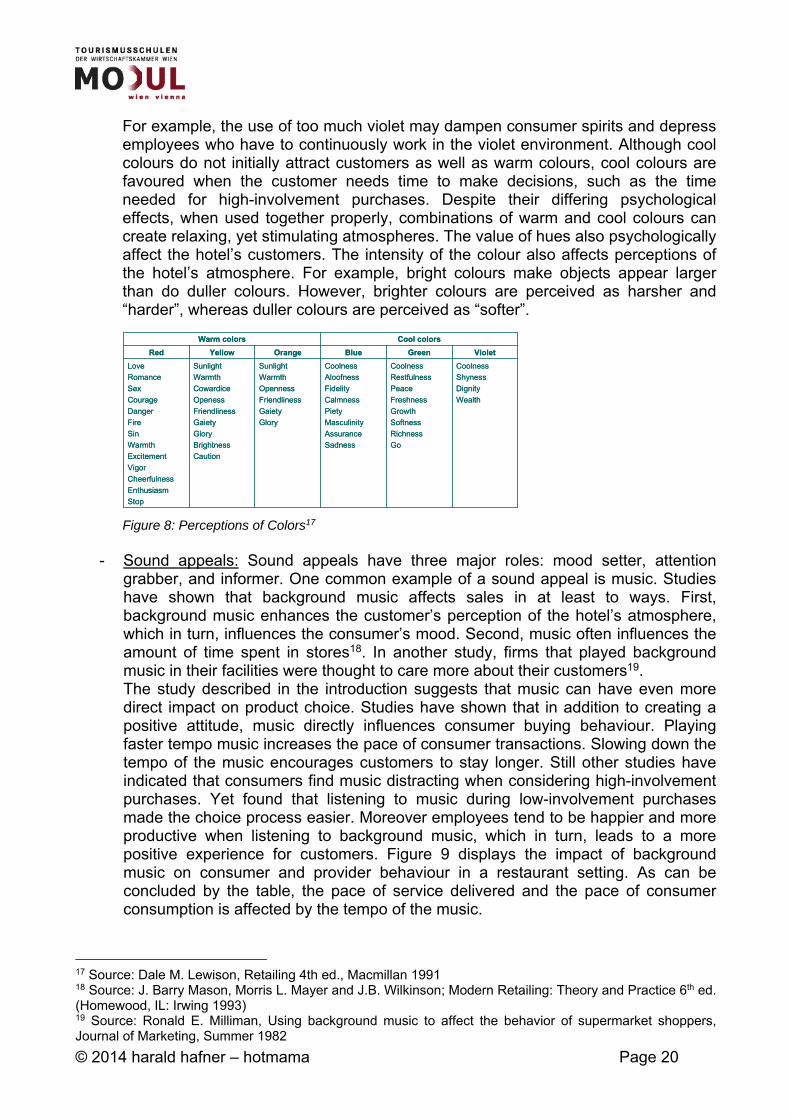
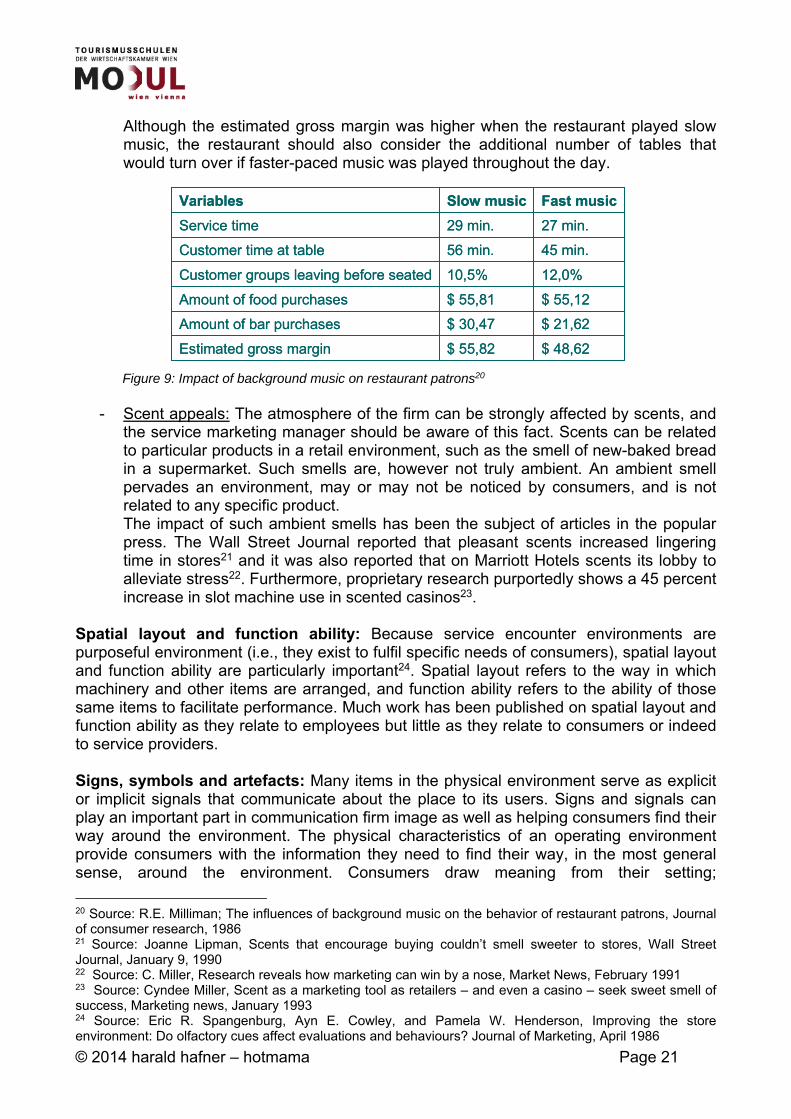
grabber, and informer. One common example of a sound appeal is music. Studies have shown that background music affects sales in at least to ways. First, background music enhances the customer’s perception of the hotel’s atmosphere, which in turn, influences the consumer’s mood. Second, music often influences the amount of time spent in stores18. In another study, firms that played background music in their facilities were thought to care more about their customers19. The study described in the introduction suggests that music can have even more direct impact on product choice. Studies have shown that in addition to creating a positive attitude, music directly influences consumer buying behaviour. Playing faster tempo music increases the pace of consumer transactions. Slowing down the tempo of the music encourages customers to stay longer. Still other studies have indicated that consumers find music distracting when considering high-involvement purchases. Yet found that listening to music during low-involvement purchases made the choice process easier. Moreover employees tend to be happier and more productive when listening to background music, which in turn, leads to a more positive experience for customers. Figure 9 displays the impact of background music on consumer and provider behaviour in a restaurant setting. As can be concluded by the table, the pace of service delivered and the pace of consumer consumption is affected by the tempo of the music.
17 Source: Dale M. Lewison, Retailing 4th ed., Macmillan 1991 18 Source: J. Barry Mason, Morris L. Mayer and J.B. Wilkinson; Modern Retailing: Theory and Practice 6th ed. (Homewood, IL: Irwing 1993) 19 Source: Ronald E. Milliman, Using background music to affect the behavior of supermarket shoppers, Journal of Marketing, Summer 1982
VioletGreenBlueOrangeYellowRed
Coolness
Shyness
Dignity
Wealth
Coolness
Restfulness
Peace
Freshness
Growth
Softness
Richness
Go
Coolness
Aloofness
Fidelity
Calmness
Piety
Masculinity
Assurance
Sadness
Sunlight
Warmth
Openness
Friendliness
Gaiety
Glory
Sunlight
Warmth
Cowardice
Openess
Friendliness
Gaiety
Glory
Brightness
Caution
Love
Romance
Sex
Courage
Danger
Fire
Sin
Warmth
Excitement
Vigor
Cheerfulness
Enthusiasm
Stop
Cool colorsWarm colors
© 2014 harald hafner – hotmama Page 21
Although the estimated gross margin was higher when the restaurant played slow music, the restaurant should also consider the additional number of tables that would turn over if faster-paced music was played throughout the day.
Figure 9: Impact of background music on restaurant patrons20
- Scent appeals: The atmosphere of the firm can be strongly affected by scents, and
the service marketing manager should be aware of this fact. Scents can be related to particular products in a retail environment, such as the smell of new-baked bread in a supermarket. Such smells are, however not truly ambient. An ambient smell pervades an environment, may or may not be noticed by consumers, and is not related to any specific product. The impact of such ambient smells has been the subject of articles in the popular press. The Wall Street Journal reported that pleasant scents increased lingering time in stores21 and it was also reported that on Marriott Hotels scents its lobby to alleviate stress22. Furthermore, proprietary research purportedly shows a 45 percent increase in slot machine use in scented casinos23.
Spatial layout and function ability: Because service encounter environments are purposeful environment (i.e., they exist to fulfil specific needs of consumers), spatial layout and function ability are particularly important24. Spatial layout refers to the way in which machinery and other items are arranged, and function ability refers to the ability of those same items to facilitate performance. Much work has been published on spatial layout and function ability as they relate to employees but little as they relate to consumers or indeed to service providers. Signs, symbols and artefacts: Many items in the physical environment serve as explicit or implicit signals that communicate about the place to its users. Signs and signals can play an important part in communication firm image as well as helping consumers find their way around the environment. The physical characteristics of an operating environment provide consumers with the information they need to find their way, in the most general sense, around the environment. Consumers draw meaning from their setting;
20 Source: R.E. Milliman; The influences of background music on the behavior of restaurant patrons, Journal of consumer research, 1986 21 Source: Joanne Lipman, Scents that encourage buying couldn’t smell sweeter to stores, Wall Street Journal, January 9, 1990 22 Source: C. Miller, Research reveals how marketing can win by a nose, Market News, February 1991 23 Source: Cyndee Miller, Scent as a marketing tool as retailers – and even a casino – seek sweet smell of success, Marketing news, January 1993 24 Source: Eric R. Spangenburg, Ayn E. Cowley, and Pamela W. Henderson, Improving the store environment: Do olfactory cues affect evaluations and behaviours? Journal of Marketing, April 1986
$ 48,62$ 55,82Estimated gross margin
$ 21,62$ 30,47Amount of bar purchases
$ 55,12$ 55,81Amount of food purchases
12,0%10,5%Customer groups leaving before seated
45 min.56 min.Customer time at table
27 min.29 min.Service time
Fast musicSlow musicVariables
$ 48,62$ 55,82Estimated gross margin
$ 21,62$ 30,47Amount of bar purchases
$ 55,12$ 55,81Amount of food purchases
12,0%10,5%Customer groups leaving before seated
45 min.56 min.Customer time at table
27 min.29 min.Service time
Fast musicSlow musicVariables
© 2014 harald hafner – hotmama Page 22
environmental design sends clear signals and can affect behaviour radically, as recent studies of jails have shown. Jails with high levels of violence are able to reduce violence by manipulating the physical environment. Bright wall colours, such as orange, were replaced by pastels Mirrors on sharp corners reduced congestions and barging. Disorientation occurs when consumer no longer are able to derive clear signals from their environment. Complex operations can increase consumer fears about getting lost, and poor legibility can lead to incomprehension or uncertainty about how a system actually works. These problems can be partially offset by consumer experience, but for new consumers, they are likely to lead to delays, anger, and frustration25. Much way-finding literature focuses on the concept of control as the intervening variable. This concept suggests that individuals wish to feel in control of the situations in which they find themselves. Clearly, the sense of knowing where you are or what you are being served is closely related to the idea of control and to the physical characteristics or the environment. Just as a firm cannot be all things to all people, so the atmosphere developed will likely not appeal to all customers. Therefore, hotels should develop facilities with a particular target market in mind. Experts suggest answering the following questions before implementing an atmosphere development plan26:
- Who is the firm’s target market? - What does the target market seek from the service experience? - What atmospheric elements can reinforce the beliefs and emotional reactions that
buyers seek? - How do these same atmospheric elements affect employee satisfaction and the
firm’s operation? - Does the suggested atmosphere development plan compete effectively with
competitors atmospheres?
1.3.3. Crowding, capacity and control From an operational point of view, one of the key questions is. What is the capacity of the service operation? Capacity management is a key operational task, and discussed in some of the operational and marketing approaches to capacity management. From the perspective of a retail service, the capacity of, for example, a restaurant can be set legally or can depend on the capacity of the kitchen. However, capacity can also be determined by the perceived level of crowding. The relationship between the density of individuals in a setting and perceive crowding is a classic of the complexity implied by the servicescapes model. Crowding is an emotional and psychological response. Individuals experiencing crowding demonstrate sings of stress including palm sweating and find the experience unpleasant. The onset of perceived crowding, however, does not depend only on physical density. Individuals can experience high levels of density at a football game and yet not trigger crowding response. However, those same individuals will immediately exhibit crowding symptoms if someone yells “fire”. The intervening variable is again perceived control. As long as they feel in control, density does not equate to crowding. When control is threatened by the density of the crowd, then the crowding response results. The capacity of a restaurant can be driven by the density of
25 Source: Bitner, Servicescapes 26 Source: Philip Kotler, Atmosphere as a marketing tool, Journal of retailing Winter 1973/74
© 2014 harald hafner – hotmama Page 23
the customers. However, if they are distracted and/or the situation is clearly signalled and predictable, the crowding response may not occur. Thus, even an apparently objective capacity can be manipulated by the servicescape. The alternative solution to a crowded retail service environment is a queue. Having the consumers “wait in line” provides an operational buffer for the “manufacturing” operation. The unpleasantness of crowding may, however, be merely replaced by the unsatisfactory waiting experience. Here again, the psychology of queuing shows that an apparently objective waiting time is actually subjective and influence by the servicescape. In one study, the researchers were able to compare actual waiting time with perceived waiting time. Moreover, they manipulated whether the respondents were distracted during the wait and whether the length of wait was known in advance. Distraction was provided by an electronic news board placed so that respondents could see it while waiting in line. Predictability was manipulated by changing the news board so that it showed the expected time of wait. Thus the servicescape of the queue was changed and the researcher were able to compare results for three groups; those with no manipulation, those with distraction, and those with predictability27. News board installation did not significantly affect perceived waiting times, nor the amount by which respondents overestimated their waits. Nor did it affect how customers rated the length of the wait on a ten-point scale. What it did do was make the wait more palatable. Interest level increased and perceived boredom while waiting dropped. After the news board had been removed, many customers noticed and asked that the bank bring it back. The electronic clock appeared to influence perceived waiting time and overestimation of waiting time. Perceived waiting times were lower, and the respondents with the queuing time estimate overestimated their waiting time to a lesser extent. At a more general level, Maister28 proposes eight principles that organization can use to influence customers satisfaction with waiting times:
- Unoccupied time feels longer than occupied time. - Pre-process waits feel longer than in-process waits. - Anxiety makes waits seem longer - Uncertain waits are longer than known finite waits - Unexplained waits are longer than explained waits - Unfair waits are longer than equitable waits - The more valuable the service, the longer individuals will wait. - Solo waiting feels longer than group waiting
In each case, his principles imply that time is subjective rather than objective an can be manipulated through the servicescape. Other authors have taken these principles and converted them into suggestions for managers29.
- Do not overlook the effects of perceptions management: consumer concern about waiting is growing.
- Determine the acceptable waiting time for your customers - Install distractions and entertain and physically involve the customer. Keep the
content light-hearted. 27 Source: Karen Katz, Blair Larson, and Richard Larson, Prescripton for the waiting line blues, Sloan management review, Winter 1991 28 Source: D.W. Maister, The psychology of waiting in line, Harvard business school note, May 1984 29 Source: Katz, Larson and Larson, Prescription for the „Waiting in line Blues“.
© 2014 harald hafner – hotmama Page 24
- Get customers out of line - Only make individuals conscious of time if they grossly overestimate waiting times. - Modify customers arrival behaviour - Keep resources not serving customers out of sight - Segment customers by personality type - Adopt a long-term perspective - Never underestimate the power of a friendly server.
1.4. The service employees Strategically, contact personnel can be the source of product differentiation. One way to consider the problem of product differentiation is to break the service firm into three parts:
- the benefit concept, - the servuction system, - and the service level.
The benefit concept is the bundle of benefits received by the customer, and it can be measured only in the mind of the customer. The basis of the service-level idea is that the operating system itself should be separated from the way it operates. This rather arbitrary separation allows for the separation of systems design from the operating performance of that design. It is often impossible for a service organization to differentiate itself from other similar organizations in regard to the benefit bundle its offers or its delivery servuction system. For example, one extreme view is that many airlines offer similar bundles of benefits and fly the same planes from the same airports. Their only hope of a competitive advantage is therefore from the service level – the way things are done. Some of this differentiation can come from staffing levels or the physical systems designed to support the staff. Often, however, the deciding factor that distinguishes one airline from another is the attitude of the service providers30. Benjamin Schneider31 argues that measurements of staff effectiveness cannot focus solely on short-term statistical factors such as number of transactions processed or number of errors made. More general factors also need to be included. He argues that at the very least, courtesy and style of performance should be assessed and indicators of effectiveness. In Schneider’s view, management has a strong role to play in creating a climate in which good service is the norm. Managers who establish policies and procedures that emphasize style of service performance are service enthusiasts; those who stress routine and maintenance of the system are service bureaucrats. The consequences of the latter can be lack of fit between the employees own service organization and that of management, role ambiguity, and role conflict, followed by feelings of dissatisfaction and frustration on the part of employees. However, if procedures are used to create a “climate for service”, an environment can result in which employees are encouraged and supported in their wish to give good service.
30 Source: Earl W. Sasser, P. Olsen, and D. Daryl Wyckoff, Management of service operations, text, cases and readings, 1978 31 Source: Benjamin Schneider, The service organization: Climate is crucial, organizational dynamics, 1980
© 2014 harald hafner – hotmama Page 25
Schneider starts from the perspective that most employees desire to give good service and have a service orientation; if they did not, they would not be in their jobs in the first place. His surveys of service employees show that the most important creator of job dissatisfaction is lack of managerial support. Likewise, an important determinant of satisfaction by employees is the availability of support in areas such as personnel central processing, marketing, and equipment. Parallel research conducted with customers, aimed at eliciting their views on good service, found many areas of customer satisfaction were contingent on the presence or absence of these same systems. Courtesy and competence on the part of staff, adequate numbers of staff, promptness and convenience, and a general air of being well managed and run were all given as determinants of satisfaction. Schneider’s research showed strong correlation between employee and customer dissatisfaction and satisfaction. His conclusion is that when employees think there is a strong service orientation and that they are being supported in their desire to give good service, then customers are offered a higher standard of service, notice this, reflect back a corresponding increase in satisfaction.
1.4.1. Human resources policies and the customer Schneider32 argued that service organizations are open systems and that the policies and practices of the organizations, as well as the climate or culture those policies created, would be visible to the consumer. Schneider and Bowen33 provide even more conclusive proof of this proposition. They relate empirically a range of internal variable to the experience of the consumer. They relate employee’s perception of the organization in terms of both its climate and its procedures to outcomes perceived by customers of that organization. Schneider and Bowen thereby stress the importance of the climate created within the organization and its importance in supporting or inhibiting good service. Climate is conceptualized as employee perceptions of one or more strategic imperatives. A passion for service within the organization would therefore lead to a climate that sets service as the key strategic imperative34. In previous studies, such a climate has been shown to be strongly associated with positive outcome variables for customers. But what are the signals within the organization that can trigger such a perception for service contact personnel? When service commitment is high, the service unit reveals a passion for doing things directly related to the provision of service. Employees speak often and favourably about the service delivery process and the product offered to consumers, as well as about the service delivery process and the product offered to consumers, as well as about the concern for and/or responsiveness of the unit to customer opinions.
32 Source: Benjamin Schneider, The service organization: Climate is crucial, organizational dynamics, 1980 33 Source: Benjamin Schneider, David E. Bowen; The service organizaton: Human resource managment is crucial, Oranizational Dynamics 21, Spring 1993 34 Source: Benjamin Schneider, Jill K. Wheeler, and Jonathan F. Fox, A passion for service: Using content analysis to explicate service climate themes, Journal of applied psychology, 1992
© 2014 harald hafner – hotmama Page 26
HRM issues also feature strongly in creating a passion for the service within the organization. When this passion is strong, employees speak favourably about performance feedback, internal equity of compensation, training and staff quality. Even the physical design of the setting can have an influence, with service passion being associated with excellent office conditions and facilities and automation systems. HRM practices are the key levers available to senior management for creating a type of organization that can be a source of sustainable competitive advantage. At the same time, front-line customer contact jobs are designed to be as simple and narrow as possible so that they can be filled by anyone – in other words, idiot-proof jobs. Employers place few demands on employees, selection criteria are minimal, and wages are low. The result is the classic cycle of failure35. Fewer and less knowledgeable contact persons are available, and hence the customer gets less and lower-quality help. The customers vent their feeling of impatience and dissatisfaction on the staff which in turn do not motivate the employees, especially the most conscientious ones because they are already aware of the poor service they are being forced to give. The best staff leave and are replaced with poorly trained recruits, and the cycle continues. What prevents service firms from breaking out of this cycle? The argument seems to be that they are locked into the old manufacturing logic, which argues that, all things being equal, it is better to rely on machines, systems, and technology than on people. However, it is possible to break out of the old thinking and hence escape from the classic cycle of failure. To do this, the organization must build a new model that
- Values investments in people as much as investments in machines and sometimes more.
- Uses technology to support the efforts of men and women on the front line, not just to monitor or replace them.
- Makes recruitment and training as crucial for the sales clerks and housekeepers as for managers and senior managers.
- Links compensation to performance for employees at every level, not just for those at the top.
Thus the organization must use the full battery of HRM policies to break out of this cycle. Successful companies that use these policies strategically see training, for example, as a means to greater competitive performance. In addition to educating and motivating employees, training sessions typically provide the context in which employees commit themselves to the company and its service expectation. Once committed, employees remain loyal but also provide a source of new employees by referring their friends. Such referrals reduce recruiting costs but also dramatically increase the quality of the applicant.
35 Source. Schlesinger and Heskett: The service-driven service company
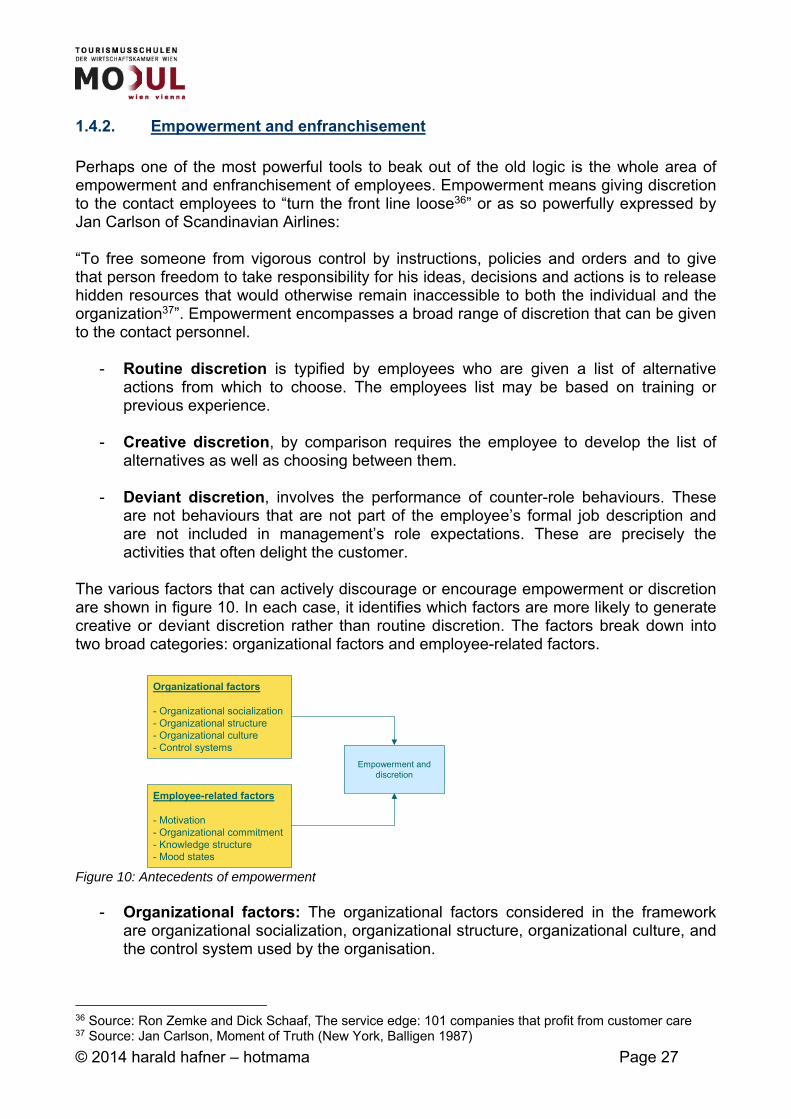
© 2014 harald hafner – hotmama Page 27
1.4.2. Empowerment and enfranchisement Perhaps one of the most powerful tools to beak out of the old logic is the whole area of empowerment and enfranchisement of employees. Empowerment means giving discretion to the contact employees to “turn the front line loose36” or as so powerfully expressed by Jan Carlson of Scandinavian Airlines: “To free someone from vigorous control by instructions, policies and orders and to give that person freedom to take responsibility for his ideas, decisions and actions is to release hidden resources that would otherwise remain inaccessible to both the individual and the organization37”. Empowerment encompasses a broad range of discretion that can be given to the contact personnel.
- Routine discretion is typified by employees who are given a list of alternative actions from which to choose. The employees list may be based on training or previous experience.
- Creative discretion, by comparison requires the employee to develop the list of
alternatives as well as choosing between them. - Deviant discretion, involves the performance of counter-role behaviours. These
are not behaviours that are not part of the employee’s formal job description and are not included in management’s role expectations. These are precisely the activities that often delight the customer.
The various factors that can actively discourage or encourage empowerment or discretion are shown in figure 10. In each case, it identifies which factors are more likely to generate creative or deviant discretion rather than routine discretion. The factors break down into two broad categories: organizational factors and employee-related factors.
Figure 10: Antecedents of empowerment
- Organizational factors: The organizational factors considered in the framework are organizational socialization, organizational structure, organizational culture, and the control system used by the organisation.
36 Source: Ron Zemke and Dick Schaaf, The service edge: 101 companies that profit from customer care 37 Source: Jan Carlson, Moment of Truth (New York, Balligen 1987)
Organizational factors
- Organizational socialization- Organizational structure- Organizational culture- Control systems
Employee-related factors
- Motivation- Organizational commitment- Knowledge structure- Mood states
Empowerment anddiscretion
© 2014 harald hafner – hotmama Page 28
o Organizational socialization: is a process that leads individuals understanding the values, abilities, expected behaviour and social knowledge necessary for performing organizational roles38. In the service organization that has effectively socialized its employees, a clear understanding of the context and process characteristics associated with employee’s role will facilitate the exercise of routine discretion. When employees become comfortable with the role and processes, they are more able to cope with novel and different tasks and to exercise creative discretion. The self-confidence of socialization creates the capacity to act outside of the role, to do what is best for the consumer.
o Organizational structure: is considered in three aspects: formalization,
centralization, and complexity. The more formal the organization, the more likely it is that service-worker discretion will be confined to the routine, because in highly formalized organizations, even creative discretion would be seen as deviant. As organizations decentralize, they have the opportunity to become less formal, and therefore the probability to become less formal, and therefore the probability of creative and deviant discretion increases. In general, greater organizational complexity is characterized by greater specialization of labour, narrower spans of control, and longer chains of command39. Each of these is more likely to drive employees toward the routine end of the discretion operation.
o Organizational culture: is the shared set pf assumptions about the
functioning of the organization40. The culture provides the service manager with an ad hoc means of conveying expected service deliver standards to employees. Culture is closely related to the ideas of Schneider, and in fact, the culture and climate concepts overlap. Using Schneider’s distinction between a “climate for services” and a “bureaucratic climate” it is clear that the climate or culture sends some of the strongest signals to the employees about their desired behaviour with regard to discretion.
o Control systems: are one of the key sources of a climate or culture. They are
used to monitor, direct, and evaluate performance and can be categorized as either behaviour-based or outcome-based. Behaviour-based systems involve high levels of activity monitoring, a great deal of managerial discretion, and subjective evaluation of activities. Outcome-based systems, by comparison, are characterized by low levels of monitoring, little managerial discretion, and objective measures of outcomes achieved by individuals. In service organizations, behaviour-based control systems focus on task performance during the process of service delivery. The high levels of activity monitoring are more likely to produce routine rather than creative or deviant discretion from employees. Conversely, outcome-based systems will result in greater discretion.
38 Source: Meryl Reis Louis, Surprise and sense-making: What newcomers experience in entering unfamiliar organizational settings, Administrative science quarterly, 1980 39 Source: James L. Gibson, John M. Ivancevich, and James M. Donnelly, Organizations : Behaviour, structure, process, 7th ed. 1991 40 Source: Rohit Deshpande and Frederick Webster, Organizational culture and marketing: Defining the research agenda, Journal of Marketing, January 1989
© 2014 harald hafner – hotmama Page 29
- Employee-related factors: Several employee-related factors contribute to the level of discretion exercised. These are motivation, organizational commitment, knowledge, and mood states.
o Motivation: has a direct impact on discretion, because creative and deviant
discretion require higher levels of effort. High levels of motivation should therefore be associated with high levels of activity.
o Organizational commitment: can be defined as the strength of an individual’s
involvement and identification with an organization41. It is generally believed to result in the acceptance of organizational goals and values. As service employees become more committed to an organization, it is therefore possible for managers to allow them more discretion, because they are more committed to the goals of the organization.
o Knowledge: clearly has an impact on both the ability of the service provider
to use routine discretion and the self-confidence to use higher-level discretion. High levels of discretion are logically associated with experienced employees, who have a large repertoire of scripts on which to draw.
o Moods: are feelings, generally ranging from positive to negative, that can
mediate an individual’s propensity to use discretion. Individuals in positive mood states tend to be risk-prone.
This model has direct implications for management action. Clearly, socialization of new employees is a key variable in increasing discretion. The “new starter” program run by the organization must convey the expected behaviours and roles. This provides not only socialization but higher levels of knowledge and motivation. Role ambiguity and conflict can lead to low levels of motivation. The roles and expected behaviours signalled in the socialization process will also have an impact on the culture of the organization. As roles and behaviours become more consistent across the organization, the organization culture will become stronger. Training can reinforce this process, while at the same time increasing the knowledge of the service providers. Training can be tailored to the level of discretion required. Organizations aiming at routine discretion would focus training activities on tasks and procedures. Those aiming at higher levels of discretion would focus instead on the goals of the organization. Management systems must reinforce the desired level of discretion. A “command and control” activity measurement model is unlikely to produce discretion of any kind. This is especially the case when the complicit assumption is also that the employees are in some way dishonest and need to be “policed”. Enfranchisement gives discretion over earnings to the employee as ell as discretion over work. It has been shown to be very powerful in retail settings for salespersons. If empowerment changes the organizational relationships, then enfranchisement polarizes them even further. All the job role changes described in the previous section are even more polarized. To this must be added two other key factors: equity and inadequate conditioning.
41 Source: Schneider, The service organization
© 2014 harald hafner – hotmama Page 30
Clearly, under enfranchisement, issues such as assignment take on major equity dimensions. A particular assignment within a store or hotel can dramatically influence the income of the individuals concerned. To the extent that participants feel that the enfranchisement program is being managed unfairly, the program is wide open for criticism. Enfranchisement may seem instantly obvious to management, but it involves large amount of perceived risk for the participants. It violates many of the normal roles within the organization and changes the risk/reward relationship. Introducing such a program therefore requires a great deal of communication and precondition to ensure that everyone in the organization knows what the now roles are to be. Enfranchisement may seem instantly obvious to management, but it involves large amounts of perceived risk for the participants. It violates many of the normal roles within the organization and changes the risk/reward relationship. Introducing such a program therefore requires a great deal of communication and precondition to ensure that everyone in the organization knows what the new roles are to be. Is there a single solution to managing the contact personnel? Do empowerment and enfranchisement always win out against the manufacturing-base models? Empowerment clearly brings benefits. Empowered employees are more customer focused and will be much quicker in responding in real time to customer needs. They will customize the product or remix it in real time42. Empowered employees are more likely to respond positively to service failures and to engage in service recovery. Fixing something after doing it wrong the first time can turn a dissatisfied customer into a satisfied, even loyal, customer. Employees who are empowered tend to feel better about their jobs and themselves. This is reflected automatically in the way they interact with the customers. They will genuinely warmer and friendlier. Empowerment can therefore not only reduce costs but also improve the quality of the product. Being close to the front line, an empowered employee is continuously seeing the good and the bad things about the service operation. They can be the key to new service ideas and can often be a cheaper source of market research than going to the customers directly43. Unfortunately, empowerment and enfranchisement do carry costs. The balance between benefits and costs determines the appropriateness of the approach. Empowerment increases the costs of the organization. A greater investment is needed in remuneration and recruitment to ensure that the right persons are empowered. A low-cost model using cheap labour and part-time labour cannot cope with empowerment, so the basic labour costs of the organization will be higher. If costs are higher, then there are also marketing implications. By definition, an empowered employee will “customize” the product. This means that the service received will be inconsistent, varying with the employee. It is also likely to be slower service because it is customized.
42 Source. Martin L. Bell, Tactical services marketing and the process of remixing, in W.R. George and J.M Donnelly eds. Marketing of Services (Chicago American Marketing Association, 1991 43 Source: Benjamin Schneider and David E. Bowen; New service design, development, and implementation and the employee, in William R. George and Claudia Marshall, eds, Developing new services, American Marketing Association, 1982
© 2014 harald hafner – hotmama Page 31
The balance of empowerment and enfranchisement therefore comes down to the benefit concept of the organization. A branded organization that guarantees consistency of product and service dare not empower for fear of inconsistency it would produce. What would be the implications of empowerment on McDonalds? An organization that competes on the basis of value driven by a low cost base cannot afford to empower because of the costs involved. Equally, a high-cost service organization using a non routine and complex technology almost certainly has to empower because the ability to use a “manufacturing” approach is severely limited.
1.4.3. Implications for marketing Although the focus of this chapter has been on human resource policy, the servuction system implies that decisions made within one function will have implications within others. The decisions about the way the contact personnel are to be managed affects marketing at three levels, strategy, mix, and tactics. Strategically, the role of marketing is to be actively involved in the decision on the benefit concept to be offered to consumers. That decisions will determine the feasibility of empowerment or enfranchisement. Therefore, the debate is two-way because the benefit concept may have to adopt to management style preference. An empowered organization has major implications for the marketing mix, especially for the “product”. Empowerment implies high levels of customization, so where is the product designed? Clearly, the marketing group itself must take on the role of coach to the front-line staff, where the product is continually being “remixed”. New product development cannot be done without the active and complete involvement of the front line. These contact personnel know the customer and the system and provide a unique resource. More important, they have to be involved to maintain a sense of equity. Traditionally, marketing can cause or reduce the role stress, merely by the way it implements its tactics. Marketing can, without making major strategic changes, help to reduce service employee stress levels. It is in the best interests of the marketing department to do so. Clearly, unhappy, frustrated, and disagreeing contact personnel are visible to the customer, and Schneider has shown that such employees will deleteriously affect customer’s perceptions of a service’s quality. The contact personnel’s use of any of the stress-reducing strategies will also influence customer perceptions of the quality of the service. Customers obviously do not like being ignored by waiters or treated as if they were inanimate objects. If the contact personnel maintain their sense of control over their encounters, there is every likelihood that it will be at the expense of the sense of control felt by customers. Finally, although we may sympathize with service providers who tell us how the organization stops them from giving good service, such a narration will reflect negatively on our perception of the organization.
© 2014 harald hafner – hotmama Page 32
- Person/role conflicts: Conflicts between the individual and the assigned role can often be reduced simply by being sensitive to the issue. A promotional gimmick dreamed up at head office may look great on paper. A medieval theme day in the hotel will almost certainly have great public relations value. But how will the staff feel when called on to wear strange costumes? How will it affect their relationship with the hotel guests? To improve the quality of the service, a change in operating procedure may be needed. However, it is important to ensure that the service providers are well trained in the new script. Should they not be, they may well be extremely embarrassed in the presence of customers? This situation can be aggravated if the new service is advertised so that the customers are more aware of the new script than the staff.
- Organization/client conflicts: Marketing can similarly help to reduce conflicts
between the organization and its clients. It is crucial, for example, that customer expectations should be consistent with the capabilities of the service system. Customers should not ask for services that the system cannot perform. Advertising is one of the main sources of inflated expectations, as the temptation is to exaggerate claims in advertising to maximize the impact. Consider, for example, the airline that portrayed in its advertising a stewardess reading a story to a child passenger. The ad was designed to demonstrate the friendliness of the airline. Unfortunately, in subsequent weeks a number of passengers to the advertisement literally, either because they believed it or could not resist the temptation, and called on the stewardess to read stories.
- Interclient conflicts: Conflicts between clients can be avoided if the clients are
relatively homogeneous in their expectations. Segmentation therefore is vital to service organizations – a concept based on other customers forming part of the service. In this case, however, it is the impact of two disparate groups of customers on the service providers that is crucial. As long as all clients share the same script and expect the same standard of service, the chances of inter client conflicts are much reduced.
© 2014 harald hafner – hotmama Page 33
2. Service pricing policy A group of passengers travelling from London to New York are delayed and, to entertain themselves, decided to compare the price they have paid for their tickets. To their surprise, they discover many different prices. Apart from an expected differential between first, business, and economy class, they find many variations within each calls. Some booked early and paid less other did not boo and went stand-by and also paid less. Some are staying for the weekend and paid less, other bought the airfare and hotel as a package and have a different price. Some remember paying a different price when making an identical trip but at a different time of the year.
2.1. Time-dependent capacity and its impact on pricing The idea that service cannot be inventoried was introduced in the first semester. And the operations-management problems of services were explained in some detail in earlier sections of this textbook. The interaction that creates the service experience, which is what the consumer buys, takes place in real time. It is possible to create an inventory of the physical components of the service experience, but not of the experience itself. Because consumers, in most cases, must come to the service setting to be part of the experience, this means that capacity utilization depends on when they arrive for most services consumers tend to arrive unevenly and unpredictably. The result is often periods of low utilization of capacity, because it is impossible to match capacity to demand. Capacity,, in turn, represents the bulk of the costs for a service. The restaurant has to e open, staffed, and stocked, even at times when it has no customers. As Dearden points out, the result is a very low level of variable costs for services and a high value attributable to incremental customers even at discount prices44. As a result, pricing is called on to try to smooth demand in two ways:
- Creating new demand in off-peak, low-capacity utilization periods. - Flattening peaks by moving existing customers from peaks to less busy times.
Price discrimination is essential, however, if a cheap “off peak” airfare use to shift demand is not to be available to full-fare-paying-passengers. If such an exchange is possible, the result will be an overall reduction in revenue, and non of the desired movement to off-peak periods will take place. The used of time-based price discrimination, therefore, conveys a double benefit. As well as minimizing consumer surplus and maximizing the number of customers, it also maximizes capacity utilization. This is the basic argument that will e developed in this chapter and that can explain much of the proliferation of service prices. To complete the argument, the idea of consumer surplus needs to be extended to include the costs of both participation in service production and the cost of ticket acquisition. Each one of the building blocks in the argument now will be elaborated. The low level of variable costs in service, the high level of shared costs, price discrimination, and the ability to price by time of usage or reservation. 44 John Dearden, „Cost accounting comes to service industries, Harvard Business Review 56, 1978
© 2014 harald hafner – hotmama Page 34
2.2. The nature of service costs When deciding on a pricing policy, the seller must be aware that the range of pricing options open to him or her is limited. Demand considerations provide a ceiling to the price that may be charged, whereas cost considerations create a price floor. The difference between what buyers are willing to pay and what sellers can afford to charge creates a vital price discretion. This price discretion is narrowed at both ends. Sellers must consider corporate objectives, as well as costs, when setting the price floor. Merely covering costs is insufficient, because the firm needs to meet its financial objectives and generate a profit. At the other end, competitive factors usually reduce the price ceiling and often can prevent the firm from charging the full value as it is perceived by the customer. Calculating the cost of a product raises two problems, according to Dearden:
- Identifying which of the company’s costs are relevant when calculating the profitability o a particular product.
- Creating methods to assign relevant costs to that product Dearden argues, that for services, the best answer to the relevance question is to consider “uniquely attributable costs”. These are costs that can be uniquely attributed to the production and sale of a particular service. One way of approaching this concept is to realize that these are costs that disappear if the service is not produced. The concept of uniquely attributable costs differ from the traditional cost-accounting distinction between variable and fixed costs. Variable costs are those costs that change with volume, assuming that the company continues to produce and market the service. The unique-cost concept assumes that no amount of the product would be produced. At zero volume, many costs can be eliminated that would have to be incurred at higher levels. Revenues minus uniquely attributable costs constitute the total profit contribution of a service for a specific period. The uniquely attributable cost concept is necessary because of the characteristics of services. Variable costs for goods consist of such things as direct labour, material, and energy costs and some indirect labour and maintenance costs. All these vary directly and proportionately with volume. As a consequence, variable costs tend to range between 60 percent and 90 percent of total manufacturing costs. By contrast, many service organizations have little or no direct material or labour costs and limited variable overhead costs. As a result, variable costs for these businesses represent a very small proportion of total costs. Because variable cost are so low, the financial impact of most factors affecting the volume of sales in the short run can be estimated by simply calculating the revenue impact. Variable costs, therefore have little use in setting a pricing floor. Following he uniquely attributable cost idea, however, it is possible for a product’s price to exceed its variable cost and the sale of a service to result in a loss of net worth. Although a uniquely attributable cot is likely to be higher than a simple variable cost, it is still clear that the price floor for many services can be very low. An extra customer usually will generate a large incremental profit. This is logical at an intuitive level if one considers the time-dependent nature of service capacity. However, it should not be surprising that many service firms offering an undifferentiated product can end up in deadly price wars.
© 2014 harald hafner – hotmama Page 35
Incremental customers are only valuable if the service operation has the capacity to service them. That capacity often is dictated by the quality of the experience that can be provided. There is a steep deterioration in the quality of the experience as the system reaches capacity and queries and crowds become a problem. The problem for the hotel is that, at times of peak demand, it wants both to charge as much as possible and to be as close to the consumer reservation prices (the maximum amounts buyers are willing to pay) as possible. Consumers exchange their money, time, and effort for the bundle of benefits offered by the service provider. Economic theory suggests that consumers will have a reservation price that captures the value they place on these benefits. As long as the total cost to the consumer is less than the reservation price, consumers will be prepared to buy.. If they can purchase the service for less than their reservation price, there will be a consumer’s surplus. However, in non peak times, there is a large opportunity to reduce price and return surplus to the consumer, but still make a profit because of the low uniquely attributable costs and the high fixed costs. Such as strategy is only possible if it is possible to price discriminate.
2.3. Price sensitivity measurement (PSM) The reference price of any good or service is the price that a consumer thinks of as an appropriate price for that item. Zeithaml and Bitner point out that the reference price can consist of "the price last paid, the price most frequently paid, or the average of all prices customers have paid for similar offerings.“ Reference prices for services are usually fuzzier in the consumer's mind than reference prices for goods. A consumer has a fairly good idea of how much to pay for a pound of sugar or a television set, for instance, but the price of a hotel room is another question entirely. One reason for the discrepancy is the variability across services. Sugar is sugar, for instance, and television sets are generally priced by size and number of features, but hotel rooms vary widely in size, features, location, and attendant services. Similarly, the price of restaurant items also varies according to the type of restaurant that produces the item. Reference prices for services are also complicated by the different needs of customers. Guests desperate for a hotel room in high season will generally agree to pay more for a room than those who visit during low season. The purpose of the guest's purchase also influences the reference price. Hotels attempt to offset demand variability by practicing yield or revenue management, further confusing the customer about what things "should" cost. The lack of a firm reference point makes it difficult for consumers to assess current service pricing relative to the price they paid the last time they used a similar service. Consumers often consider a price range instead of an exact price as they judge an appropriate price.
2.3.1. Price: Indicator of Quality Price can play a considerable role in consumers’ formation perceptions. In a consumer's consideration of two different segments of the industry (e.g., tablecloth restaurants versus quick-service restaurants), price becomes a dominant indicator of quality. The consumer must decide how large a per-person cost is justified by the eating occasion. As a relative indicator of quality, on the other hand, price can separate restaurants operating in the same segment (e.g., Taco Bell and McDonald's).
© 2014 harald hafner – hotmama Page 36
The emphasis an operator places on price as a marketing strategy must take into account the two roles of price in the formation of quality perception. When price acts as a dominant indicator of quality, the pricing aspect of the marketing mix can be used to position the product and service offering. On the other hand, when price acts as a relative indicator of quality, it can be used to alter the consumer's perception of value. This is what Taco Bell did with its "value menus," as explained in the accompanying box. Taco Bell's Approach to PSM Taco Bell used price sensitivity measurement when it introduced "value pricing" to the quick- service industry in 1988 with its 59-cent value menu. After sales at the chain rose 50 percent in two years to $2.4 billion, McDonald's and Burger King among others "tried to imitate" the value-pricing practice, as Zeithaml and Bitner put it. Taco Bell has succeeded with its value pricing while others did not because Taco Bell based its strategy on customer perceptions of value. Taco Bell did not use the cost-based-pricing methods common in the industry. Instead, it took the approach of examining customer perception, and made no plans to drop its food quality. Rather than taking the traditional approach to pricing of first developing a new food item (e.g., a chicken soft taco) and then determining what the price should be, Taco Bell first determined what customers were willing to pay for a specific type of item and then determined what they needed to do to develop a product in that price range. lf the price customers were willing to pay could not guarantee a profit, then the product was not further developed. To generate the range of prices, respondents first read a description of a proposed concept. They are then asked the following three questions:
1. Assuming you could buy this product at Taco Bell, at what price would this item be so cheap that you would worry about the quality?
2. Assuming you could buy this product at Taco Bell, at what price would this item be so expensive that you would not purchase the product?
3. What price do you expect to pay for this item?
Following the technique detailed, it is easy to see that Taco Bell was establishing an acceptable range for pricing the product. Provided with this information, Taco Bell was then able to determine what products it could afford to make and achieve its profit goals. Like many quick-service chains, Taco Bell has recently had difficult times due to saturation in the market. Nevertheless, value pricing gave the company a tremendous boost in the late '80s and early '90s.
2.3.2. Price-Value Price-value has become a common expression for a relationship that goes beyond the manifest monetary price of an item or service. The interpretation of price-value must be based on the buyer's view of the relationship between price and value. A technique known as price sensitivity-measurement (PSM) can be used to determine how consumers' perceptions of value are affected by the interaction of price and quality. PSM also provides
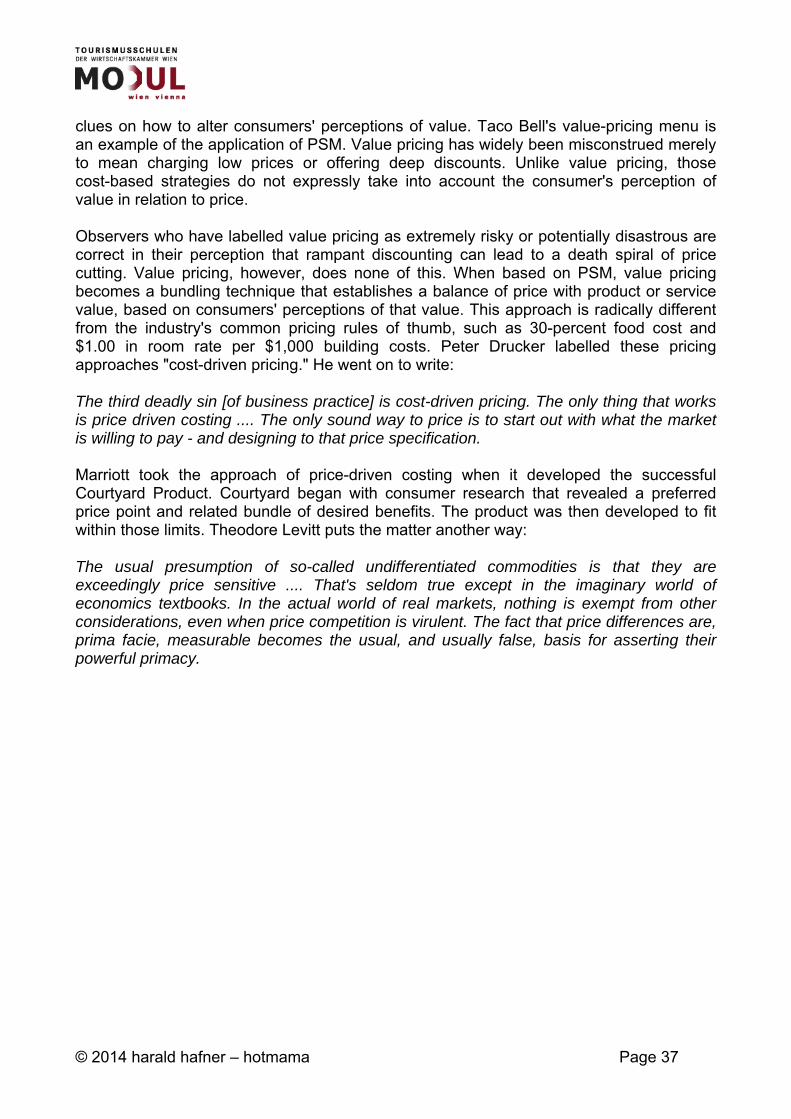
© 2014 harald hafner – hotmama Page 37
clues on how to alter consumers' perceptions of value. Taco Bell's value-pricing menu is an example of the application of PSM. Value pricing has widely been misconstrued merely to mean charging low prices or offering deep discounts. Unlike value pricing, those cost-based strategies do not expressly take into account the consumer's perception of value in relation to price. Observers who have labelled value pricing as extremely risky or potentially disastrous are correct in their perception that rampant discounting can lead to a death spiral of price cutting. Value pricing, however, does none of this. When based on PSM, value pricing becomes a bundling technique that establishes a balance of price with product or service value, based on consumers' perceptions of that value. This approach is radically different from the industry's common pricing rules of thumb, such as 30-percent food cost and $1.00 in room rate per $1,000 building costs. Peter Drucker labelled these pricing approaches "cost-driven pricing." He went on to write: The third deadly sin [of business practice] is cost-driven pricing. The only thing that works is price driven costing .... The only sound way to price is to start out with what the market is willing to pay - and designing to that price specification. Marriott took the approach of price-driven costing when it developed the successful Courtyard Product. Courtyard began with consumer research that revealed a preferred price point and related bundle of desired benefits. The product was then developed to fit within those limits. Theodore Levitt puts the matter another way: The usual presumption of so-called undifferentiated commodities is that they are exceedingly price sensitive .... That's seldom true except in the imaginary world of economics textbooks. In the actual world of real markets, nothing is exempt from other considerations, even when price competition is virulent. The fact that price differences are, prima facie, measurable becomes the usual, and usually false, basis for asserting their powerful primacy.
© 2014 harald hafner – hotmama Page 38
2.3.3. Price-Sensitivity Measurement Price sensitivity was explored by Andre Gabor and Clive Granger in a seminal work that appeared in the journal Economica. Gabor and Granger conducted a study in which they asked consumers to state the highest and lowest prices at which they would purchase selected inexpensive items (e.g., stockings). The resulting distribution enabled the researchers to determine upper and lower price limits for these products. Gabor and Granger suggested that within these limits price may continue to act as a quality indicator but does not act as an absolute barrier to purchase. Outside these limits, however, price may act as the dominant indicator of quality and, further, may become a barrier. A price falling above the upper limit can cause the item to be judged as being too expensive, suggesting quality levels and attributes exceeding those desired by the consumer. A price falling below the lower limit, on the other hand, can cause the item to be judged as being of questionable quality. The concept of a price range, whereby the consumer enters the market with two price limits in mind, is a far more realistic approach than reference pricing in understanding consumers’ market behaviour, particularly with regard to services, because a price range does not assume that the consumer has perfect knowledge of current market prices. The concept of price limits was developed into the model of price-sensitivity measurement by the Dutch economist Peter H. Van Westendorp. In the early 1980s Kenneth Travers expanded on the technique. Travers investigated a method for using PSM to reveal price perceptions by determining the level of consumer price resistance over a range of prices as they relate to quality perceptions. The approach was largely ignored in the hospitality industry until Taco Bell employed it to create its value-price menu. PSMs assessment of price-value for a product or service is determined by the perception of the target market, which is the ultimate authority on prices. Through value pricing based on hard research data, Taco Bell learned to bundle its products (for example, adding sour cream, including a soft drink) in a way and at a price at which the consumer perceived "value." The PSM model is easy to use, is parsimonious, and requires no special knowledge or skills on the part of either the researcher or the respondents. The survey contains four questions. When consumers' aggregate responses to those questions are graphed, the model indicates the price-sensitivity level of the market being tested. The questions are: (1) At what price on the scale do you consider the product or service to be cheap? (2) At what price on the scale do you consider the product or service to be expensive? (3) At what price on the scale do you consider the product or service to be too expensive,
so expensive that you would not consider buying it? (4) At what price on the scale do you consider the product or service too cheap, so cheap
that you would question the quality? The responses to those questions are analyzed statistically and plotted on a graph. Even though the model is simple to use, it must be carefully applied to ensure accurate results. Attention must be paid to market segmentation, for instance, so that the results are meaningful and not just an average of a catchall group of respondents. Casual users of a brand, for instance, may indicate that they want to pay an unreasonably low price, while loyal, heavy users may have more realistic price expectations.
© 2014 harald hafner – hotmama Page 39
lf those two groups' responses are aggregated, the results may be biased. Along the same lines, the researcher must also make sure the sample is representative of the target population and that the respondent is qualified to answer (i.e., she is familiar with your offering). The model’s chief disadvantage is that it is extremely sensitive to outlying data. The researcher must, as a result, first plot the data and run basic descriptive statistics to locate extreme or nonsensical answers. Finally, like all survey research, the number of respondents to be interviewed must be determined by first calculating the desired confidence level for the estimate. If one desires the true range to be within 10 percent of the derived estimates, for instance, the sample size will need to be larger than if one can accept a range within 25 percent. Calculations like this are available in statistical-methods books. Once this range is determined, it is then a straight-forward matter to determine the required number of respondents. PSM can also be used to determine the threshold range in price, as discussed by Gabor and Granger and also by Margaret Shaw. The "range of acceptable prices" gives the lowest price, the one below which the consumer will question the quality of the product or service, and the highest price, above which the consumer feels the product or service is too expensive. Marketers have found that when the cost of a room or meal exceeds the upper threshold price, the consumer will substitute products or services rather than reduce consumption.
2.3.4. Case study: PSM for a product introduction for single travellers We conducted a study to test the application of the price-sensitivity measurement model to travellers travelling alone. The five components of our hypothesis were as follows: (1) There is a point at which the package rates are considered to be cheap. (2) There is a point at which the package rates are considered to be expensive. (3) There is a point at which the price is considered too cheap and quality is questioned. (4) There is a point at which, no matter what the quality, the price is too expensive and
purchase is beyond consideration. (5) There is a way to measure the above points. We applied the PSM technique to the single traveller market because package price is a key factor in a travellers purchase decision. We gave the respondents the hypothetical situation so that they would have a realistic situation on which to base their answers to the four questions in the PSM model. The hypothetical situation was referring to a weekend/short-holiday package which included: - 2 Overnights in a first class (4-star) hotel - Halfboard (Breakfast & Dinner) - 1 on-site activity (sports, excursions, events etc.) during the stay Our design was made with two objectives in mind. First, we wanted to minimize the intervening variables that might enter into the travellers price considerations, thereby affecting their responses. Second, we expected the respondents to project their needs and wants into the situation. The determination of price would, therefore, be based on the package-rate values they would expect to receive given their requirements.
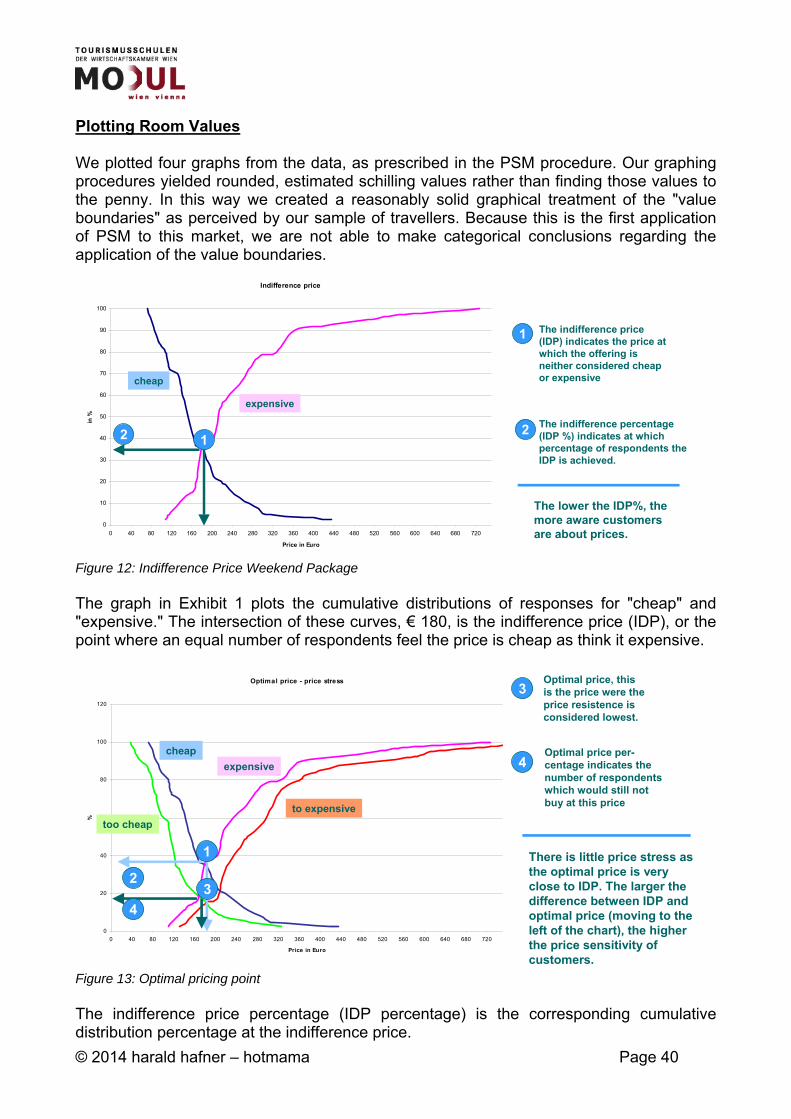
© 2014 harald hafner – hotmama Page 40
Plotting Room Values We plotted four graphs from the data, as prescribed in the PSM procedure. Our graphing procedures yielded rounded, estimated schilling values rather than finding those values to the penny. In this way we created a reasonably solid graphical treatment of the "value boundaries" as perceived by our sample of travellers. Because this is the first application of PSM to this market, we are not able to make categorical conclusions regarding the application of the value boundaries.
Figure 12: Indifference Price Weekend Package The graph in Exhibit 1 plots the cumulative distributions of responses for "cheap" and "expensive." The intersection of these curves, € 180, is the indifference price (IDP), or the point where an equal number of respondents feel the price is cheap as think it expensive.
Figure 13: Optimal pricing point The indifference price percentage (IDP percentage) is the corresponding cumulative distribution percentage at the indifference price.
Indifference price
0
10
20
30
40
50
60
70
80
90
100
0 40 80 120 160 200 240 280 320 360 400 440 480 520 560 600 640 680 720
Price in Euro
in %
2
1
2
cheap
expensive
1
The indifference price(IDP) indicates the price atwhich the offering is neither considered cheap or expensive
The indifference percentage(IDP %) indicates at whichpercentage of respondents theIDP is achieved.
The lower the IDP%, themore aware customersare about prices.
3
4
Optimal price - price stress
0
20
40
60
80
100
120
0 40 80 120 160 200 240 280 320 360 400 440 480 520 560 600 640 680 720
Price in Euro
%
expensive
to expensive
cheap
too cheap
1
23
4
Optimal price, thisis the price were theprice resistence isconsidered lowest.
Optimal price per-centage indicates thenumber of respondentswhich would still notbuy at this price
There is little price stress asthe optimal price is veryclose to IDP. The larger thedifference between IDP andoptimal price (moving to theleft of the chart), the higherthe price sensitivity ofcustomers.
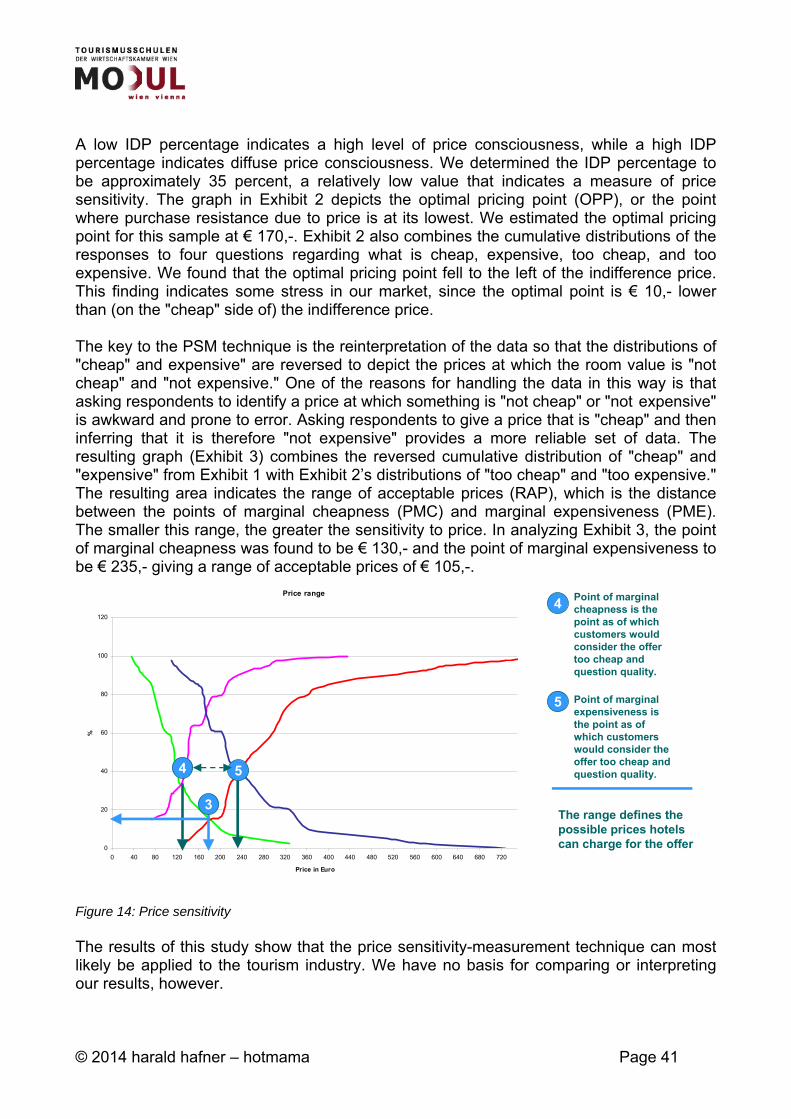
© 2014 harald hafner – hotmama Page 41
A low IDP percentage indicates a high level of price consciousness, while a high IDP percentage indicates diffuse price consciousness. We determined the IDP percentage to be approximately 35 percent, a relatively low value that indicates a measure of price sensitivity. The graph in Exhibit 2 depicts the optimal pricing point (OPP), or the point where purchase resistance due to price is at its lowest. We estimated the optimal pricing point for this sample at € 170,-. Exhibit 2 also combines the cumulative distributions of the responses to four questions regarding what is cheap, expensive, too cheap, and too expensive. We found that the optimal pricing point fell to the left of the indifference price. This finding indicates some stress in our market, since the optimal point is € 10,- lower than (on the "cheap" side of) the indifference price. The key to the PSM technique is the reinterpretation of the data so that the distributions of "cheap" and expensive" are reversed to depict the prices at which the room value is "not cheap" and "not expensive." One of the reasons for handling the data in this way is that asking respondents to identify a price at which something is "not cheap" or "not expensive" is awkward and prone to error. Asking respondents to give a price that is "cheap" and then inferring that it is therefore "not expensive" provides a more reliable set of data. The resulting graph (Exhibit 3) combines the reversed cumulative distribution of "cheap" and "expensive" from Exhibit 1 with Exhibit 2’s distributions of "too cheap" and "too expensive." The resulting area indicates the range of acceptable prices (RAP), which is the distance between the points of marginal cheapness (PMC) and marginal expensiveness (PME). The smaller this range, the greater the sensitivity to price. In analyzing Exhibit 3, the point of marginal cheapness was found to be € 130,- and the point of marginal expensiveness to be € 235,- giving a range of acceptable prices of € 105,-.
Figure 14: Price sensitivity The results of this study show that the price sensitivity-measurement technique can most likely be applied to the tourism industry. We have no basis for comparing or interpreting our results, however.
Price range
0
20
40
60
80
100
120
0 40 80 120 160 200 240 280 320 360 400 440 480 520 560 600 640 680 720
Price in Euro
%
4 5
3
4
5
Point of marginalcheapness is thepoint as of whichcustomers wouldconsider the offertoo cheap andquestion quality.
Point of marginalexpensiveness isthe point as of which customerswould consider theoffer too cheap andquestion quality.
The range defines thepossible prices hotelscan charge for the offer
© 2014 harald hafner – hotmama Page 42
Although we have been able to ascertain an indifference point, an indifference percentage, an optimum pricing point, a stress level, and a range of acceptable prices, we have no tourism industry benchmarks with which to compare those values. We can conclude that some travellers have in mind threshold prices outside of which price will inhibit their decision to purchase. At this point, however, we are unable to determine the degree to which our respondents are price sensitive (compared to other buyers). We learned that the range of acceptable prices was € 105,-, but without more study we cannot conclude whether this is a large or a small range. These limitations could be overcome by further applications of the model to the tourism industry. Additional research would provide more data with which we could compare these results. Not Definitive, But Useful Although we cannot draw definitive conclusions about the travellers market's price sensitivity based on the results of this pilot study, we can discuss marketing implications. Several indicators have been identified that can indicate the level of price sensitivity in a market. The degree of price sensitivity depends on the interplay of the indifference percentage, stress level, and range of acceptable price. A combination of low indifference-percentage levels, high stress levels, and a small acceptable price range suggests a fairly sensitive market in which special attention should be given to the pricing component of the marketing mix. This is especially true in a highly sensitive market when the range of acceptable prices is narrow. To minimize resistance to purchase due to price, the price would have to fall within that narrow range - giving marketers little flexibility in pricing strategy. The marketer would then have to emphasize informational cues other than price that influence consumer perceptions of value (e.g., bundled benefits or services, superior location, prestige of a property). Determining what informational cues consumers use in forming perceptions is an area to be explored for any given product. This information, combined with what consumers' expectations are at different price levels, particularly the threshold limits, can give marketers a framework within which they might form, for example, their advertising efforts. Furthermore, if marketers are to change price perceptions so that purchase resistance is minimized, an understanding of what forms those perceptions is essential. In addition to determining the market's level of price sensitivity, this model enables a marketer to see where the price of a particular product or service falls in relation to the range of acceptable prices. Inside this range the information cues discussed above are particularly important, because price is a relative indicator of quality and not the sole determinant in the decision to purchase. As more information becomes available to the buyer, reliance on price in determining quality perceptions will decrease. lf a service's price falls outside the range of acceptable prices, where price is the dominant indicator of quality, a hotel would have to change its positioning if consumers' perceptions are to change. Travers found, through his application of this model, that pricing outside the acceptable range will generate little new business unless a major shift in brand positioning effectively alters the consumer's price consciousness. lf a service were priced just below the point of marginal cheapness, however, and an emphasis were placed on value, some consumers might be persuaded to try the service because they would perceive the purchase as a bargain for the value offered.
© 2014 harald hafner – hotmama Page 43
On the other hand, if a service were priced above the point of marginal expensiveness, it would be difficult to sway those potential buyers since consumers generally will substitute another product rather than reduce consumption. That is, the consumer planning a four-night hotel stay is going to stay four nights at an acceptably priced hotel, rather than cut the stay to two nights at a high price hotel. Marketing efforts should concentrate on those who feel the price is within the range of acceptable prices. Attempts to draw consumers who fall outside the range of acceptable prices should be minimal, given the low likelihood of success relative to the cost of the effort. A market with a low sensitivity to price would have a high indifference-price percentage, a low level of stress, and a broad range of acceptable prices. The marketer has a measure of flexibility with this market, particularly with regard to price, since factors other than price influence perceptions and ultimately the decision to purchase. An excessive emphasis on price as a component of the marketing mix would be a wasted effort in this instance, and possibly damaging to future marketing efforts. Instead marketers should concentrate on offering cues that influence quality perceptions, given consumer expectations within the range of acceptable prices. The identification of these cues will aid in differentiating the service offering from that of the competition. In a market with a low sensitivity to price, attempting to entice those who feel the product or service is too cheap or too expensive might have some payback. During shoulder seasons, for example, a four-star hotel could appeal to consumers who might be willing to spend "too much" for a special occasion such as a wedding anniversary. A budget hotel could fill anticipated empty rooms by appealing to those who might not book due to quality concerns by emphasizing the basic quality of the rooms (as Motel 6 does: "a clean, comfortable room") and stressing that the room is a good value. In summary, regardless of whether a market is characterized by a high or low degree of price sensitivity emphasis must be placed on those who perceive the price of the product or service as being, within the range of acceptable prices. The PSM model can be used to determine the sensitivity of different target markets and their respective ranges of acceptable prices. Marketers would then know which markets would be least inhibited to purchase due to price and, thus, upon which markets to concentrate their efforts of demonstrating the value offered for the price. Through additional research, marketers can determine what variables interact to form the perceived value at a given price, particularly within the range of acceptable prices. By influencing the cues that consumers use to form perceptions and knowing what consumer expectations are at the threshold prices, marketers can effectively reduce resistance to purchase. This study has indicated the existence of a range of acceptable prices for as-sociation-meeting planners. Marketers can use this model for this and other markets to identify a range of acceptable prices and to determine to what degree markets are price sensitive. Additionally, this model can be used to compare perceptions of specific brands, the competition, and variations within a product line. This model is of particular value to marketers who appreciate that it is consumers, and not the spreadsheets from the accounting office, that determine a hotel's or restaurant's acceptable prices.
© 2014 harald hafner – hotmama Page 44
2.4. The nature of service demand The reservation price idea suggests that consumes determine a price that captures the benefits they perceive in a service. The consumer’s surplus is then the difference between this price and the reservation price. Such an idea is at the heart of price discrimination and time-based pricing. Up to this point, we have assumed implicitly that a reservation price is fixed and homogeneous across the market. Segmentation theory would argue that it is more likely that the market will be heterogeneous and that different groups of consumers will put different valuations or reservation prices on a service. Where different groups of customers are willing to pay different prices, price discrimination can be used to set differing prices that do not reflect a proportional difference in marginal cost. To successfully price discriminate and hence minimize aggregate consumer surplus, the following criteria must be met: - Different groups of consumers must have different responses to price (i.e. they must
value the service differently). - The different segments must be identifiable, and a mechanism must exist to price them
differently. - There should be no opportunity for individuals in one segment who have paid a low
price to sell their tickets to other segments. - The segment should be large enough to make the exercise worthwhile. - The cost of running the price-discrimination strategy should not exceed the incremental
revenues obtained. This is partly a function of item 4 above. - The customers should not become confused by the use of different prices. It is an interesting characteristic of service that these criteria frequently can be met through time-based nature of demand. Discrimination can be practiced by time of usage of the service or by time of reservation or ticket purchase. Discrimination by time of usage There are a number of obvious examples of price discrimination by time of usage. To return to airline tickets, it is clearly impossible to identify the business and leisure travellers separately as they approach the ticket counter. Even if they were identifiable, it would be impossible to the offer them differential prices at the same time. There is, however, a good surrogate for travel occasion in the time of travel. Business travellers are unlikely to want to travel at awkward hours (the time costs of the transaction are too high), but leisure travellers may be willing to do so. Hence, airlines can offer inexpensive late-night flights to attract leisure demand without risking price dilution. Discrimination by time of reservation or ticket purchase Price discrimination by time of reservation or ticket purchase has long been used by the hotel industry. Conference or group bookings offer the hotel the advantage of guaranteed demand but usually require cheaper prices. The lone traveller arriving at 6 P.M. without a reservation has, by comparison, little bargaining power and will happily pay the full rate. Profitable hotel management therefore depends on a balancing act between capacity utilization and yield. Filling the hotel with low-rate guests who have booked six months in advance precludes higher-priced, same-day sales.
© 2014 harald hafner – hotmama Page 45
However, reserving capacity runs the risk that capacity will be unused. The airline industry uses time of reservation to tap into the leisure and business segments. Few business travellers can risk booking flights weeks in advance and often need to book tickets on the day of departure. Leisure travellers, by comparison, plan their trips in advance and are willing to buy tickets in advance. Discrimination is therefore possible, and low prices can be offered for early booking with little dilution of the business-traveller yield. Both airlines and hotels have an advantage in that tickets are not interchangeable, so that cross-selling of tickets by different segments is impossible. Confusion in the consumer’s mind is avoided because the strategies follow an economic logic, which is consistent with the nature of service costs.
2.5. Conditioning the price Companies usually do not set a single price but rather a pricing structure that reflects variations in geographical demand and costs, market-segment requirements, purchase timing, order levels, user frequency and other factors. As a result, discounts, allowances, and promotional support, a company rarely realizes the same profit from each unit of a product that it sells. Here we will examine several price-adaptation strategies: geographical pricing, price discounts and allowances as well as promotional pricing. - Geographical pricing: Geographical pricing involves the company in deciding how to
price its products to different customers in different locations and countries. One issue is whether the company should charge higher prices to distant customers to cover for the higher distribution cost and risk losing their business. Or should it charge a lower price hoping that a lower price will generate higher sales volume?
- Price discounts and allowances: Most companies will modify their basic price to
reward customers for such acts as early payment, volume purchases, and off-season buying. Descriptions of these price adjustments – called discounts and allowances follow. Before we begin however, a word of warning is in order. Many companies are so ready to grant discounts, allowances, and special terms to their dealers and customers that they may fail to realize how little profit may be left. Companies should measure the cost of granting each discount or allowance against ist impact on making the sale. They should establish better policies as to what should be granted to customers in bidding for their business.
- A cash discount is a price reduction to buyers who promptly pay their bills. A typical
example is „1/10, net 30“, which means that payment is due within 30 days and the buyer can deduct 2% by paying the bill within 10 days. The discount must be offered to all buyers who meet these terms.
- A quantity discount is a price reduction to buyers who buy large volumes. The can
be offered on a noncumulative basis (on each order placed) or a cumulative basis (on the number of units ordered over a given period). Discounts provide an incentive to the customer to order more from a given seller rather than buy from multiple sources.
© 2014 harald hafner – hotmama Page 46
- Functional discounts (also called trade discounts or commissions) are offered by the hotel to trade-channel members if they will perform certain functions, such as selling, billing, record keeping etc. Hotels may offer different functional discounts to different trade channels. In the hotel industry retailer typically receive a 10% commission whereas wholesalers are offered anywhere between 25% and 30%.
- A seasonal discount is a price reduction to buyers who buy the product in off
season. Seasonal discounts allow the seller to maintain steadier production during the year. (also see price discrimination)
- Promotional pricing: Companies use several pricing techniques to stimulate early
purchase. International companies must research these promotional pricing tools and make sure that they are lawful in the particular countries in which they do business.
- Loss-leader-pricing: Here travel agencies drop the price on well know brands or
destinations to stimulate additional store traffic. Manufacturers typically disapprove of their brands being used as loss leaders because this practice can dilute the brand image as well as cause complaints from other retailers who charge the list price.
- Special-event pricing: Sellers will establish special prices in certain seasons to draw
in more customers.
- Cash rebates: Consumers are offered cash rebates to encourage their purchase of the product within a specified time period.
- Psychological discounting: This strategy involves putting an artificially high price on
a product and then offering it at substantial savings. Promotional-pricing strategies are often a zero-sum game. If they work, competitors will copy them rapidly, and they will lose their effectiveness for the individual company. If they do not work, they waste company money that would have been put into longer-impact marketing tools, such as building up product quality and service and/or improving the product image through advertising.
2.6. Multiple services and price bundling Most service organizations provide more than one service. In recent years, the practice o f bundling services has become more prevalent. Bundling, broadly defined, is the practice of marketing two or more products and/or service in a single package. Common examples include hotels putting together weekend packages that include meals, and sometimes entertainment, as well as lodging at an inclusive rate. Airlines routinely price vacation packages that include air travel, car rental, and hotel accommodations. Such price bundling follows logically from both the nature of service costs and the nature of service demand. Individual service have low uniquely attributable costs and high joint costs, making the incremental cost of adding a service to bundle very low. On the demand side, there is interdependence as well. This stems partly from the search theory perspective on demand. Search theory provides a paradigm for examining the elasticity of demand.
© 2014 harald hafner – hotmama Page 47
It argues that price sensitivity depends on the number of alternatives considered for the purchase. The fewer the number of alternatives considered, the more inelastic the demand curve will be. The number of alternatives, however, can be said to depend on the number of alternatives about which the consumer is knowledgeable. It has been argued that the consumer’s ability to obtain knowledge of alternatives depends on the nature of the attributes of the service. Three types of attributes have been defined. Search attributes, experience attributes, and credence attributes. - Search attributes: are characteristics that can be evaluated before purchase of a
service by asking questions or looking up information, such as the category of a hotel, the location of a restaurant or the flight duration.
- Experience attributes: are characteristics that can be evaluated only after purchase; they include things as the quality of a meal or the friendliness of staff.
- Credence attributes: often cannot be evaluated until sometime after receiving the service and are thus experienced over time. They are particularly common in professional services such as health care or in technical consultancies.
Demand is likely to be most elastic for services that can be evaluated on the basis of search attributes. Consumer will be aware of more alternatives because such information is easier to collect. However, if service personnel themselves dictate the quality or nature of the service and if the service can be customized, consumers will be less able to evaluate the service and thus less sensitive to price differences between alternative. Generally, services are concerned with mixed bundling, which allows consumers either to buy service A and service B together or purchase one service separately. The simplest argument for bundling is based on the idea of consumer surplus. Bundling makes it possible to shift the consumer surplus from one service to another service that otherwise would have a negative surplus (i.e. would not be purchased). Thus, the combined value of the two services is less than the combined price, even though, separately, only one service would be purchased. This argument is made more complex if a competitive marketplace is assumed, and if the reservation price, or value, of the combined bundle is not assumed to be merely the sum of its parts. Assuming a competitive market means that the objectives of price bundling can be broadened. The combination of services A and B can be targeted at purchasers of A or B but not both, at A and B separately and concurrently, or at no purchasers of either A or B. Each target demands a different perspective. Relaxing the reservation price additively assumption is worth further exploration. Three reasons have been suggested for why the sum of the parts would have less value than the whole: - First, information theory would argue that there is value to the consumer in easy
access to information. Consumers of one service from an institution have a lower information cost when buying another service from the same institution than when buying the service from a different institution.
© 2014 harald hafner – hotmama Page 48
- A second case argues that the bundling of service B with service A can enhance a consumer’s satisfaction with service. Let us take the example of s ski resort that offers a ski-rental and lessons package. The reservation price for the lessons is likely to be the same whether or not the skis are rented because the value of the lessons depends on the skills and needs of the skier. However, the reservation price of the ski rental will be enhanced, at least for novices, by lessons.
- The final argument is that the addition of service B to service A can enhance the total image of the firm. A hotel offering both hotel and destination services enhances its credibility on both sides.
The extent to which there is more incremental value in a bundle than in the parts determines the price that can be charged. Ideally, the reservation prices of the separate services and of the bundle should be measured separately (see PSM). A number of researchers have argued that it is possible to measure reservation prices directly by asking what is the most that consumers are willing to pay. Clearly, reservation prices will vary because of institutional factors. Segmentation by occasion will be important because the reservation price of a service will depend on the use to which it is put. Thus far in this chapter, monetary and information costs have been included in the analysis. Economic theory itself has included the information costs through search theory. One of the key characteristics of service is that they may demand an effort cost from the consumer in the form of effort made during the process and during the purchase as well. - The self-service consumer – effort during the process: Essentially, it is possible to
reduce costs by having the consumer do part of the work. The issue then arises as to whether it is necessary to change the price to reflect the added cost of that effort to othe consumer. Is it necessary for buffet breakfast to be less expensive than served breakfast? Research suggests that consumer’s response to such do-it-yourself offerings is variable. One segment of consumers would prefer to do it themselves even if no price incentive is offered. Conversely, there is another segment that would not use these kinds of service even for large price discounts.
- The effort cost of purchasing: Services, like goods, require effort from the consumer
to acquire the right to use them. Discussions about goods focus on convenience and ensuring that goods will be “conveniently available”. In a similar way, there is a transaction cost for the purchase of services.
This cost is compounded in the case of frequently uses services, such as transportation, in which the cumulative effort can become very large. In these situations, consumers may be prepared to buy bulk access to save such costs, particularly if a bulk purchase-price is offered. The key components of pricing then become how, when, where, and to whom the price should be paid. In general, the pass program must be designed to minimize the nonmonetary cost to the consumer. However, pass programs also can be used to meet other objectives. Programs can be set up to increase usage or to maintain it. They can be targeted at current regular users, current irregular users, or nonusers.
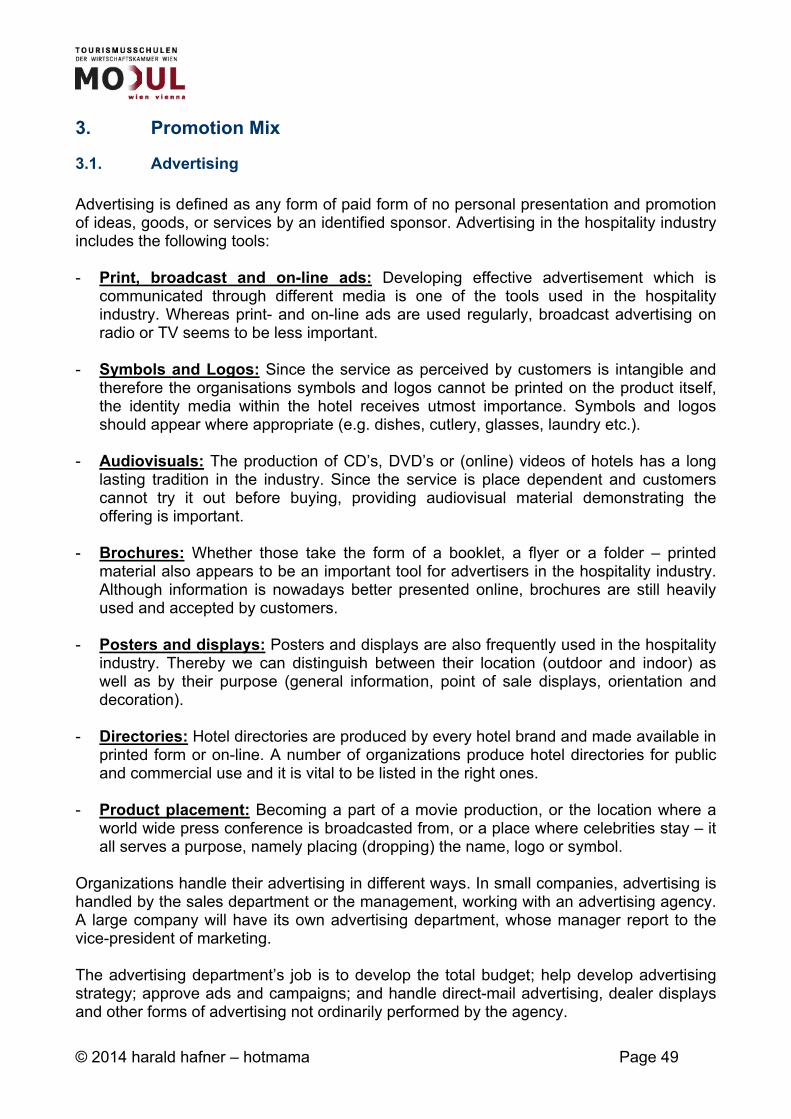
© 2014 harald hafner – hotmama Page 49
3. Promotion Mix
3.1. Advertising Advertising is defined as any form of paid form of no personal presentation and promotion of ideas, goods, or services by an identified sponsor. Advertising in the hospitality industry includes the following tools: - Print, broadcast and on-line ads: Developing effective advertisement which is
communicated through different media is one of the tools used in the hospitality industry. Whereas print- and on-line ads are used regularly, broadcast advertising on radio or TV seems to be less important.
- Symbols and Logos: Since the service as perceived by customers is intangible and
therefore the organisations symbols and logos cannot be printed on the product itself, the identity media within the hotel receives utmost importance. Symbols and logos should appear where appropriate (e.g. dishes, cutlery, glasses, laundry etc.).
- Audiovisuals: The production of CD’s, DVD’s or (online) videos of hotels has a long
lasting tradition in the industry. Since the service is place dependent and customers cannot try it out before buying, providing audiovisual material demonstrating the offering is important.
- Brochures: Whether those take the form of a booklet, a flyer or a folder – printed
material also appears to be an important tool for advertisers in the hospitality industry. Although information is nowadays better presented online, brochures are still heavily used and accepted by customers.
- Posters and displays: Posters and displays are also frequently used in the hospitality
industry. Thereby we can distinguish between their location (outdoor and indoor) as well as by their purpose (general information, point of sale displays, orientation and decoration).
- Directories: Hotel directories are produced by every hotel brand and made available in
printed form or on-line. A number of organizations produce hotel directories for public and commercial use and it is vital to be listed in the right ones.
- Product placement: Becoming a part of a movie production, or the location where a
world wide press conference is broadcasted from, or a place where celebrities stay – it all serves a purpose, namely placing (dropping) the name, logo or symbol.
Organizations handle their advertising in different ways. In small companies, advertising is handled by the sales department or the management, working with an advertising agency. A large company will have its own advertising department, whose manager report to the vice-president of marketing. The advertising department’s job is to develop the total budget; help develop advertising strategy; approve ads and campaigns; and handle direct-mail advertising, dealer displays and other forms of advertising not ordinarily performed by the agency.
© 2014 harald hafner – hotmama Page 50
Most companies use an outside advertising agency to help them create advertising campaigns and to select and purchase media45. In developing an advertising program, marketing managers must always start by identifying the target market and buyer motives. Then they can proceed to make the five major decisions in developing and advertising program, known as the five M’s46. Figure 1: The five M’s in advertising
3.1.1. Mission The first step in developing an advertising program is to set the advertising objectives. Those objectives must flow from prior decisions on the target market, market positioning, and marketing mix. The marketing-positioning and marketing mix strategies define the job that advertising must do in the total marketing program. An advertising goal (or objective) is a specific communication task and achievement level to be accomplished with specific audience in a specific period of time. Advertising objectives can be classified according to whether their aim is to inform, persuade, or remind. - Informative advertising is widely used in the hospitality industry, as the product
provides a variety of search criteria, that require communications. As such informative advertising is used when introducing products into the market and/or provide more in depth information on the product. Specific objectives in informative advertising are:
o Telling the market about a new product o Suggesting new uses for a product o Informing the market about a price change o Explaining how the product works o Describing available services o Correcting false impressions o Reducing buyers fears o Building a company image
45 Source: Philip Kotler, Marketing Management, analysis, planning, implementation and control, 9th edition, Prentice Hall New Jersy, 1997 46 Source: Philip Kotler, Marketing Management, analysis, planning, implementation and control, 9th edition, Prentice Hall New Jersy, 1997
Mission
- Sales goals- Advertising objective
Money
Factors to consider:Stage in PLC
- Market share- Customer base- Competition- Clutter/Noise- Advert. frequency- Product substitutab.
Message
- Generation- Evaluation/Selection- Execution- Social responsibility
Media
- Reach, frequency, impact- Types- Vehicles- Timing and allocation
Measurement
- Sales impact- Communic. impact
© 2014 harald hafner – hotmama Page 51
- Persuasive advertising becomes important in the competitive stage, where a hotel objective is to build selective demand for a particular offering. Most advertising falls into this category and includes specific objectives like:
o Building brand preference o Encouraging switching to the brand/offering o Changing buyers perceptions about product attributes o Persuading buyers to purchase now o Persuading buyers to receive sales calls
- Reminder advertising is highly important with mature products. A related form of advertising is reinforcement advertising, which seeks to assure current purchasers that they have made the right choice. Specific objectives when reminding are:
o Reminding buyers that the product is needed in the near future o Reminding buyers, where to buy it o Keeping in buyers minds during off-seasons o Maintaining its top-of-mind awareness
3.1.2. Money After determining advertising objectives, the company can proceed to establish its advertising budget for each product. The role of advertising is to increase demand for the product. The hotel wants to spend the amount required to achieve the sales goal. But how does a hotel know if it is spending the right amount? If it spends too little, the effect will be insignificant. If the company spends too much on advertising, then some of the money could have been put to better use. Although advertising is treated as a current expense, part of it is really an investment that builds up an intangible value called goodwill (or brand equity). There are five specific factors to consider when setting the advertising budget47. - Stage in the product life cycle: New product typically receive large advertising
budgets to build awareness and to gain consumer trial. Established brands usually are supported with lower advertising budgets as a ratio to sales.
- Market share and consumer base: High-market-share brands usually require less
advertising expenditure as apercentage of sales to maintain their share. To build share by increasing market size requires larger advertising expenditures. Additionally, on a cost-per-impression basis, it is less expensive to reach consumers of a widely used brand than to reach consumers of low-share brands.
- Competition and clutter: In a market with a large number of competitors and high
advertising spending, a brand must advertise more heavily to be heard above the noise in the market. Even simple clutter from advertisements not directly competitive to the brand creates a need for heavier advertising.
- Advertising frequency: The number of repetitions needed to put across the brand`s
message to consumers has an important impact on the advertising budget.
47 Source: Philip Kotler, Marketing Management, analysis, planning, implementation and control, 9th edition, Prentice Hall New Jersy, 1997
© 2014 harald hafner – hotmama Page 52
- Product substitutability: Brand in a commodity class (e.g. cigarettes, beer, soft drinks etc.) require heavy advertising to establish a differential image. Advertising is also important when a brand can offer unique physical benefits or features.
Marketing scientists have built a number of advertising-expenditure models that take into account these and other factors.
3.1.3. Message Clearly, the effect of the creativity factor in a campaign can be more important than the number of Euros spent. Only after gaining attention can a commercial help to increase the brand`s sales. Advertisers go through four steps to develop a creative strategy; message generation, message evaluation and selection, message execution, and message social-responsibility review. Message generation In principle, the product’s message – the major benefit that the brand offers – should be decided as part of developing the product concept. Yet even within this concept, there may be latitude for a number of possible messages. And over time, the marketer might wand to change the message without changing the product, especially if consumers are seeking new or different benefits from the product. - Creative people use several methods to generate possible advertising appeals. Many
creative people proceed inductively by talking to consumers, travel agents, experts and competitors. Consumer are the major source of good ideas. Their feelings about the strengths and shortcomings for existing brands provide important clues to creative strategy. Leo Burnett advocates in-depth interviewing where one comes realistically face to face with the people we are trying to sell. In-depth-interview techniques are used for message generation, whereby cognitive schemes are being developed from these interviews referred to as means-ends-chains.
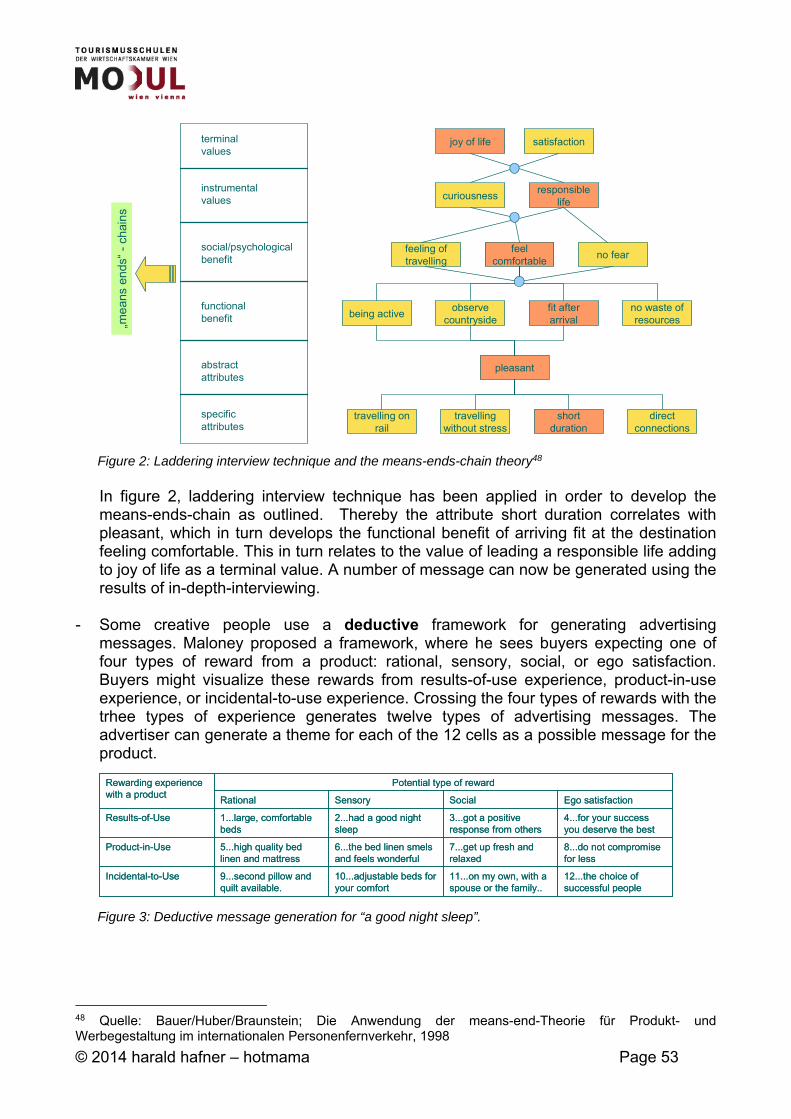
© 2014 harald hafner – hotmama Page 53
Figure 2: Laddering interview technique and the means-ends-chain theory48
In figure 2, laddering interview technique has been applied in order to develop the means-ends-chain as outlined. Thereby the attribute short duration correlates with pleasant, which in turn develops the functional benefit of arriving fit at the destination feeling comfortable. This in turn relates to the value of leading a responsible life adding to joy of life as a terminal value. A number of message can now be generated using the results of in-depth-interviewing.
- Some creative people use a deductive framework for generating advertising
messages. Maloney proposed a framework, where he sees buyers expecting one of four types of reward from a product: rational, sensory, social, or ego satisfaction. Buyers might visualize these rewards from results-of-use experience, product-in-use experience, or incidental-to-use experience. Crossing the four types of rewards with the trhee types of experience generates twelve types of advertising messages. The advertiser can generate a theme for each of the 12 cells as a possible message for the product.
Figure 3: Deductive message generation for “a good night sleep”.
48 Quelle: Bauer/Huber/Braunstein; Die Anwendung der means-end-Theorie für Produkt- und Werbegestaltung im internationalen Personenfernverkehr, 1998
12...the choice of successful people
11...on my own, with a spouse or the family..
10...adjustable beds foryour comfort
9...second pillow and quilt available.
Incidental-to-Use
8...do not compromisefor less
7...get up fresh and relaxed
6...the bed linen smelsand feels wonderful
5...high quality bedlinen and mattress
Product-in-Use
4...for your successyou deserve the best
3...got a positive response from others
2...had a good nightsleep
1...large, comfortablebeds
Results-of-Use
Ego satisfactionSocialSensoryRational
Potential type of rewardRewarding experiencewith a product
travelling onrail
travellingwithout stress
shortduration
directconnections
pleasant
being activeobserve
countrysidefit afterarrival
no waste ofresources
feeling oftravelling
feelcomfortable
no fear
curiousnessresponsible
life
joy of life satisfaction
specificattributes
abstractattributes
functionalbenefit
social/psychologicalbenefit
instrumentalvalues
terminalvalues
„mea
nsen
ds“
-ch
ains
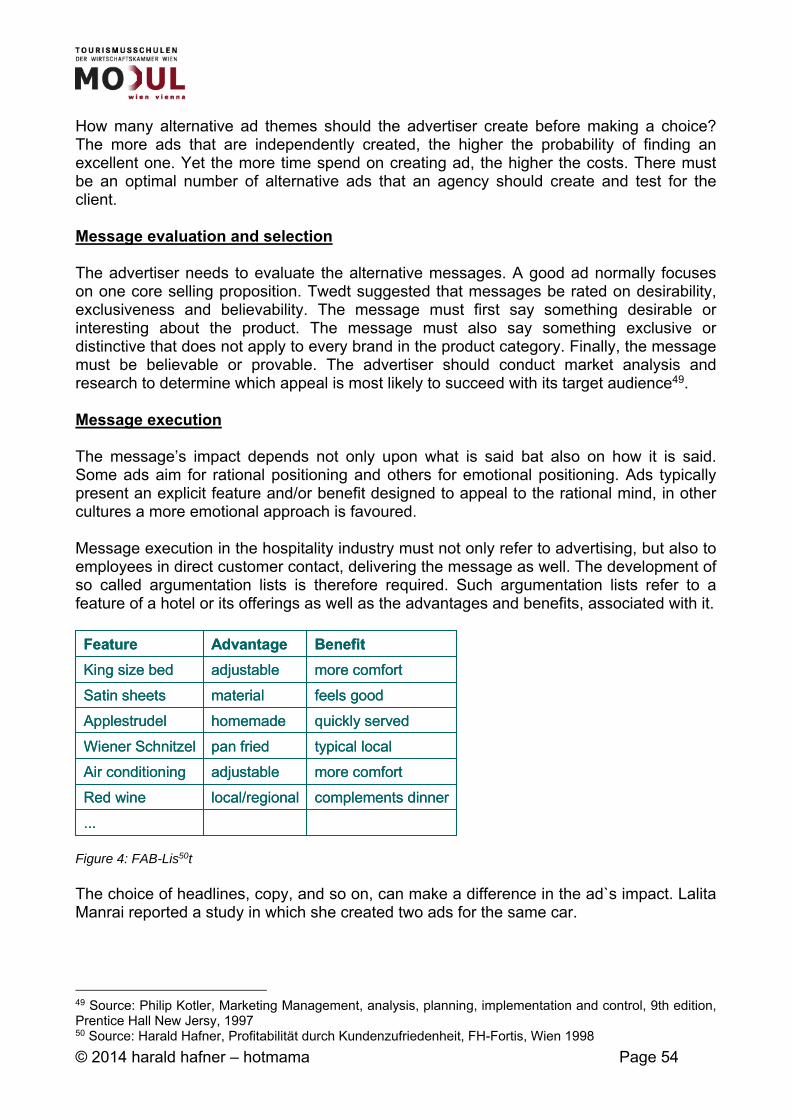
© 2014 harald hafner – hotmama Page 54
How many alternative ad themes should the advertiser create before making a choice? The more ads that are independently created, the higher the probability of finding an excellent one. Yet the more time spend on creating ad, the higher the costs. There must be an optimal number of alternative ads that an agency should create and test for the client. Message evaluation and selection The advertiser needs to evaluate the alternative messages. A good ad normally focuses on one core selling proposition. Twedt suggested that messages be rated on desirability, exclusiveness and believability. The message must first say something desirable or interesting about the product. The message must also say something exclusive or distinctive that does not apply to every brand in the product category. Finally, the message must be believable or provable. The advertiser should conduct market analysis and research to determine which appeal is most likely to succeed with its target audience49. Message execution The message’s impact depends not only upon what is said bat also on how it is said. Some ads aim for rational positioning and others for emotional positioning. Ads typically present an explicit feature and/or benefit designed to appeal to the rational mind, in other cultures a more emotional approach is favoured. Message execution in the hospitality industry must not only refer to advertising, but also to employees in direct customer contact, delivering the message as well. The development of so called argumentation lists is therefore required. Such argumentation lists refer to a feature of a hotel or its offerings as well as the advantages and benefits, associated with it. Figure 4: FAB-Lis50t The choice of headlines, copy, and so on, can make a difference in the ad`s impact. Lalita Manrai reported a study in which she created two ads for the same car.
49 Source: Philip Kotler, Marketing Management, analysis, planning, implementation and control, 9th edition, Prentice Hall New Jersy, 1997 50 Source: Harald Hafner, Profitabilität durch Kundenzufriedenheit, FH-Fortis, Wien 1998
...
complements dinnerlocal/regionalRed wine
more comfortadjustableAir conditioning
typical localpan friedWiener Schnitzel
quickly servedhomemadeApplestrudel
feels goodmaterialSatin sheets
more comfortadjustableKing size bed
BenefitAdvantageFeature
...
complements dinnerlocal/regionalRed wine
more comfortadjustableAir conditioning
typical localpan friedWiener Schnitzel
quickly servedhomemadeApplestrudel
feels goodmaterialSatin sheets
more comfortadjustableKing size bed
BenefitAdvantageFeature
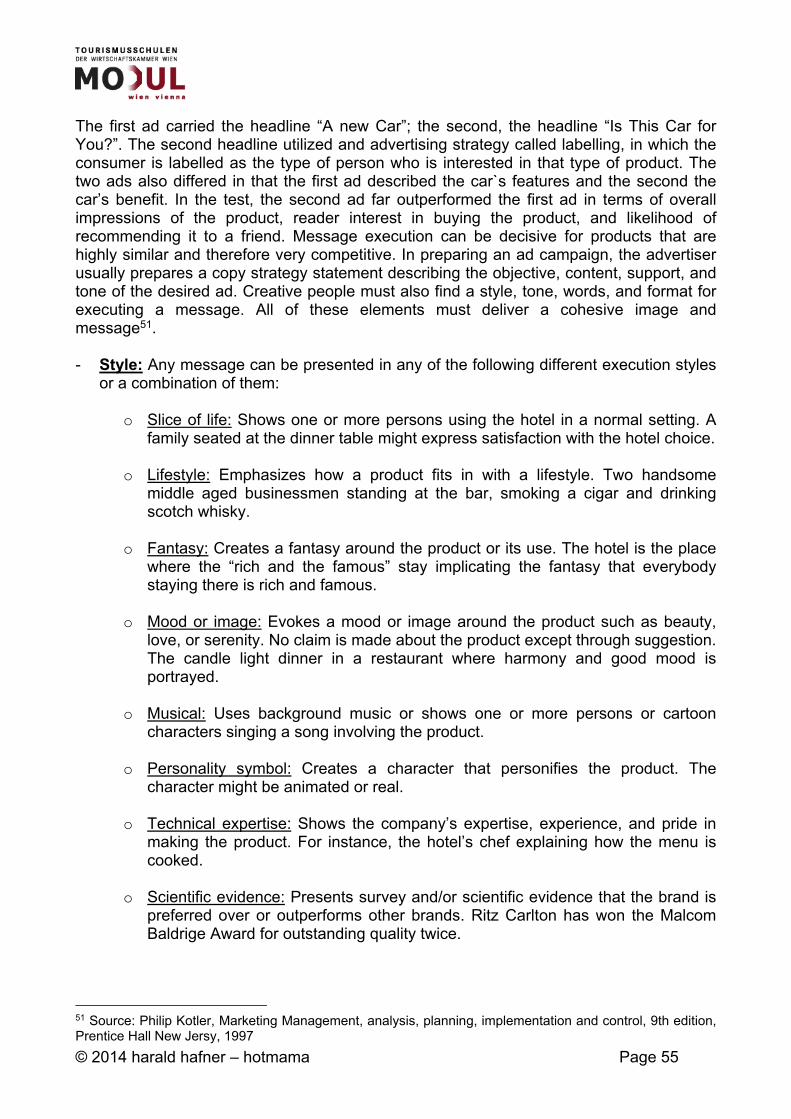
© 2014 harald hafner – hotmama Page 55
The first ad carried the headline “A new Car”; the second, the headline “Is This Car for You?”. The second headline utilized and advertising strategy called labelling, in which the consumer is labelled as the type of person who is interested in that type of product. The two ads also differed in that the first ad described the car`s features and the second the car’s benefit. In the test, the second ad far outperformed the first ad in terms of overall impressions of the product, reader interest in buying the product, and likelihood of recommending it to a friend. Message execution can be decisive for products that are highly similar and therefore very competitive. In preparing an ad campaign, the advertiser usually prepares a copy strategy statement describing the objective, content, support, and tone of the desired ad. Creative people must also find a style, tone, words, and format for executing a message. All of these elements must deliver a cohesive image and message51. - Style: Any message can be presented in any of the following different execution styles
or a combination of them:
o Slice of life: Shows one or more persons using the hotel in a normal setting. A family seated at the dinner table might express satisfaction with the hotel choice.
o Lifestyle: Emphasizes how a product fits in with a lifestyle. Two handsome
middle aged businessmen standing at the bar, smoking a cigar and drinking scotch whisky.
o Fantasy: Creates a fantasy around the product or its use. The hotel is the place
where the “rich and the famous” stay implicating the fantasy that everybody staying there is rich and famous.
o Mood or image: Evokes a mood or image around the product such as beauty,
love, or serenity. No claim is made about the product except through suggestion. The candle light dinner in a restaurant where harmony and good mood is portrayed.
o Musical: Uses background music or shows one or more persons or cartoon
characters singing a song involving the product.
o Personality symbol: Creates a character that personifies the product. The character might be animated or real.
o Technical expertise: Shows the company’s expertise, experience, and pride in
making the product. For instance, the hotel’s chef explaining how the menu is cooked.
o Scientific evidence: Presents survey and/or scientific evidence that the brand is
preferred over or outperforms other brands. Ritz Carlton has won the Malcom Baldrige Award for outstanding quality twice.
51 Source: Philip Kotler, Marketing Management, analysis, planning, implementation and control, 9th edition, Prentice Hall New Jersy, 1997
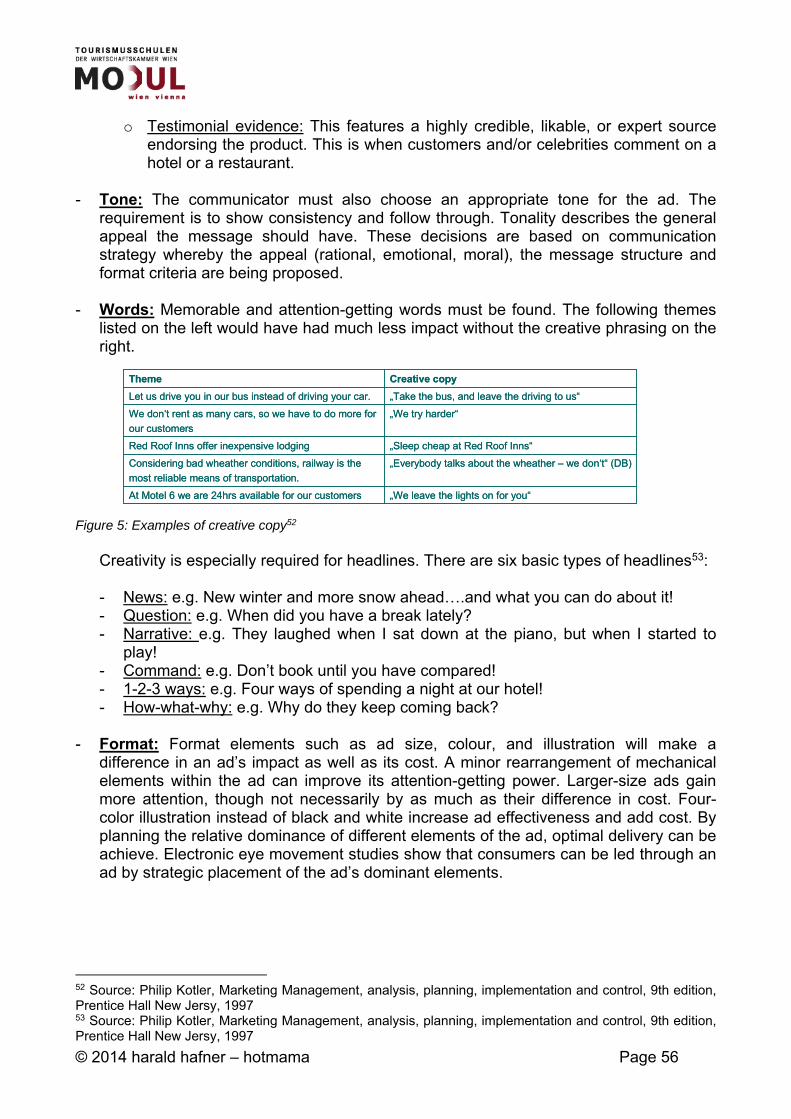
© 2014 harald hafner – hotmama Page 56
o Testimonial evidence: This features a highly credible, likable, or expert source endorsing the product. This is when customers and/or celebrities comment on a hotel or a restaurant.
- Tone: The communicator must also choose an appropriate tone for the ad. The
requirement is to show consistency and follow through. Tonality describes the general appeal the message should have. These decisions are based on communication strategy whereby the appeal (rational, emotional, moral), the message structure and format criteria are being proposed.
- Words: Memorable and attention-getting words must be found. The following themes
listed on the left would have had much less impact without the creative phrasing on the right.
Figure 5: Examples of creative copy52
Creativity is especially required for headlines. There are six basic types of headlines53: - News: e.g. New winter and more snow ahead….and what you can do about it! - Question: e.g. When did you have a break lately? - Narrative: e.g. They laughed when I sat down at the piano, but when I started to
play! - Command: e.g. Don’t book until you have compared! - 1-2-3 ways: e.g. Four ways of spending a night at our hotel! - How-what-why: e.g. Why do they keep coming back?
- Format: Format elements such as ad size, colour, and illustration will make a
difference in an ad’s impact as well as its cost. A minor rearrangement of mechanical elements within the ad can improve its attention-getting power. Larger-size ads gain more attention, though not necessarily by as much as their difference in cost. Four-color illustration instead of black and white increase ad effectiveness and add cost. By planning the relative dominance of different elements of the ad, optimal delivery can be achieve. Electronic eye movement studies show that consumers can be led through an ad by strategic placement of the ad’s dominant elements.
52 Source: Philip Kotler, Marketing Management, analysis, planning, implementation and control, 9th edition, Prentice Hall New Jersy, 1997 53 Source: Philip Kotler, Marketing Management, analysis, planning, implementation and control, 9th edition, Prentice Hall New Jersy, 1997
„We leave the lights on for you“At Motel 6 we are 24hrs available for our customers
„Everybody talks about the wheather – we don‘t“ (DB)Considering bad wheather conditions, railway is the
most reliable means of transportation.
„Sleep cheap at Red Roof Inns“Red Roof Inns offer inexpensive lodging
„We try harder“We don‘t rent as many cars, so we have to do more for
our customers
„Take the bus, and leave the driving to us“Let us drive you in our bus instead of driving your car.
Creative copyTheme
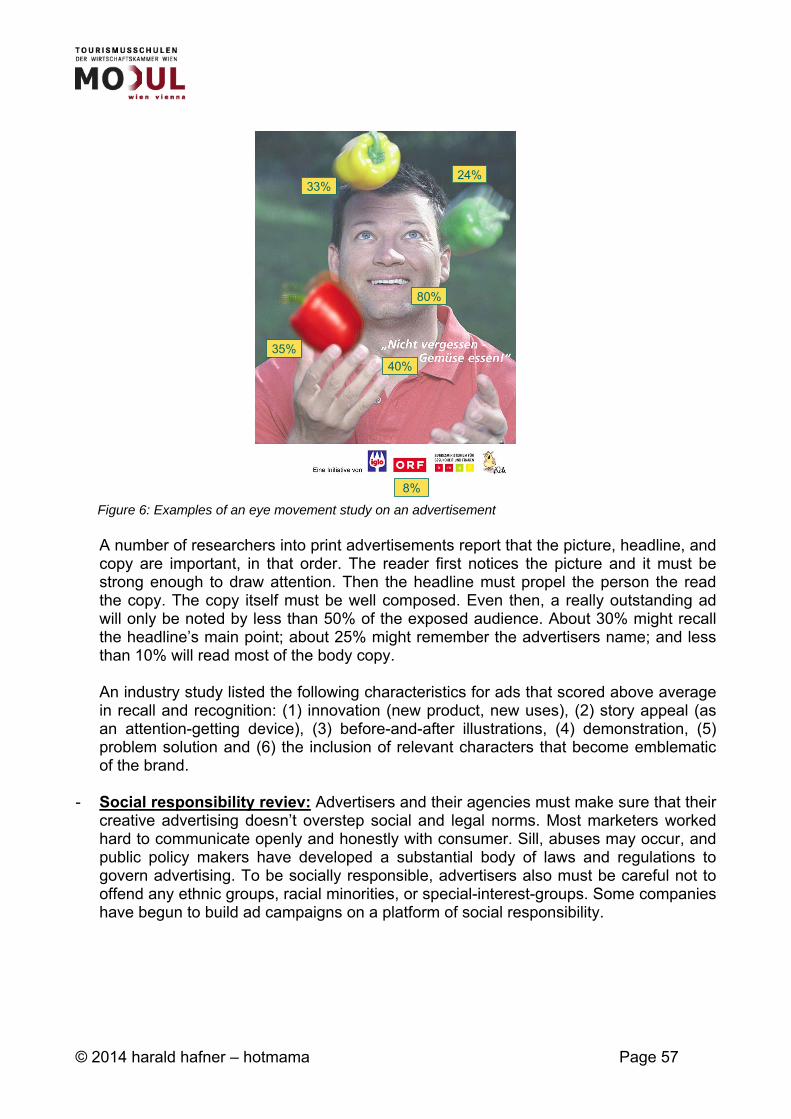
© 2014 harald hafner – hotmama Page 57
Figure 6: Examples of an eye movement study on an advertisement
A number of researchers into print advertisements report that the picture, headline, and copy are important, in that order. The reader first notices the picture and it must be strong enough to draw attention. Then the headline must propel the person the read the copy. The copy itself must be well composed. Even then, a really outstanding ad will only be noted by less than 50% of the exposed audience. About 30% might recall the headline’s main point; about 25% might remember the advertisers name; and less than 10% will read most of the body copy. An industry study listed the following characteristics for ads that scored above average in recall and recognition: (1) innovation (new product, new uses), (2) story appeal (as an attention-getting device), (3) before-and-after illustrations, (4) demonstration, (5) problem solution and (6) the inclusion of relevant characters that become emblematic of the brand.
- Social responsibility reviev: Advertisers and their agencies must make sure that their creative advertising doesn’t overstep social and legal norms. Most marketers worked hard to communicate openly and honestly with consumer. Sill, abuses may occur, and public policy makers have developed a substantial body of laws and regulations to govern advertising. To be socially responsible, advertisers also must be careful not to offend any ethnic groups, racial minorities, or special-interest-groups. Some companies have begun to build ad campaigns on a platform of social responsibility.
80%
40%
33%
35%
24%
8%
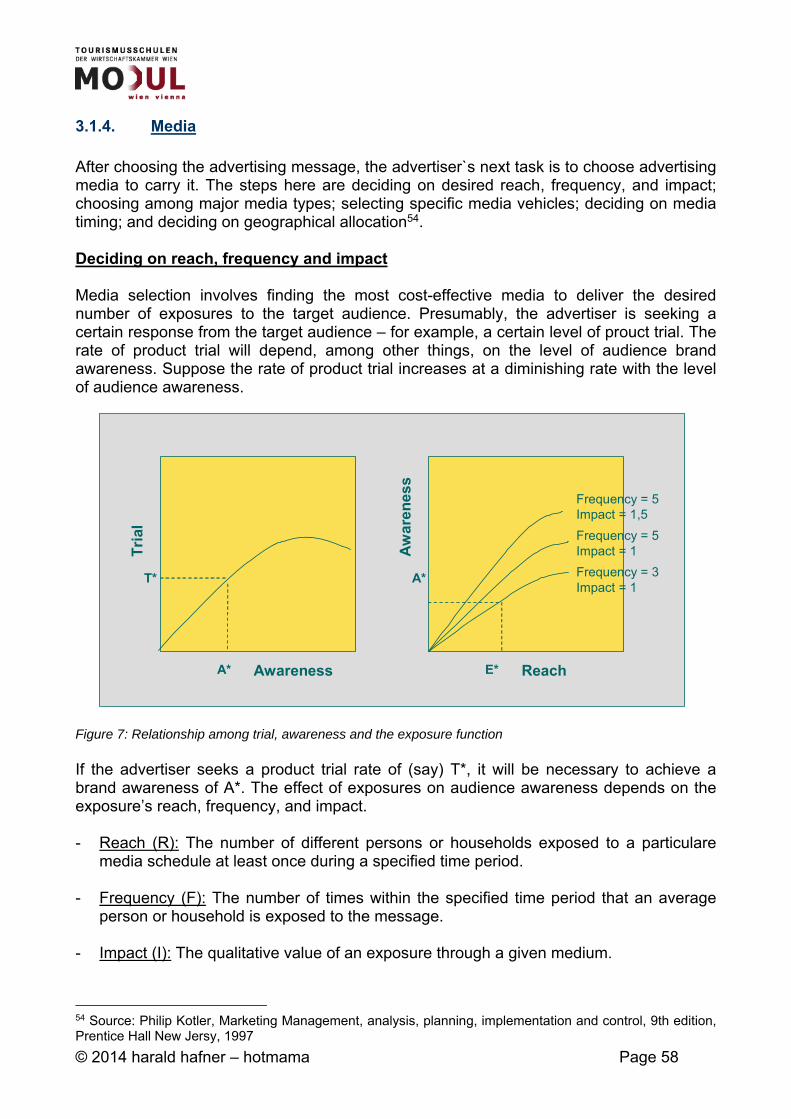
© 2014 harald hafner – hotmama Page 58
3.1.4. Media After choosing the advertising message, the advertiser`s next task is to choose advertising media to carry it. The steps here are deciding on desired reach, frequency, and impact; choosing among major media types; selecting specific media vehicles; deciding on media timing; and deciding on geographical allocation54. Deciding on reach, frequency and impact Media selection involves finding the most cost-effective media to deliver the desired number of exposures to the target audience. Presumably, the advertiser is seeking a certain response from the target audience – for example, a certain level of prouct trial. The rate of product trial will depend, among other things, on the level of audience brand awareness. Suppose the rate of product trial increases at a diminishing rate with the level of audience awareness.
Figure 7: Relationship among trial, awareness and the exposure function If the advertiser seeks a product trial rate of (say) T*, it will be necessary to achieve a brand awareness of A*. The effect of exposures on audience awareness depends on the exposure’s reach, frequency, and impact. - Reach (R): The number of different persons or households exposed to a particulare
media schedule at least once during a specified time period.
- Frequency (F): The number of times within the specified time period that an average person or household is exposed to the message.
- Impact (I): The qualitative value of an exposure through a given medium.
54 Source: Philip Kotler, Marketing Management, analysis, planning, implementation and control, 9th edition, Prentice Hall New Jersy, 1997
Awareness
Tri
al
T*
A* Reach
Aw
aren
ess
A*
E*
Frequency = 3Impact = 1
Frequency = 5Impact = 1
Frequency = 5Impact = 1,5
© 2014 harald hafner – hotmama Page 59
Figure 7 shows the relationship between audience awareness and reach. Audience awareness will be greater, the higher the exposures reach, frequency and impact. The media planner recognizes important trade-offs among reach, frequency, and impact. Suppose the media planner has an advertising budget for the opening of a new hotel resort of € 1 Mio. and the cost per thousand exposures of average quality is € 5,-. This means that the advertiser can buy 200 Mio. exposures. If the advertiser seeks an average exposure frequency of 10, then the advertiser can reach 20 Mio. people with the given budget. But if the advertiser wants higher-quality media costing € 10,- per thousand exposures, the advertiser will be able to reach only 10 Mio. peoples unless it is willing to lower the desired exposure frequency. The relationship among reach, frequency, an d impact is capture in the following concepts55. - Total number of exposures (E): This is the reach times the average frequency. This
measure is referred to as the gross rating points (GRP). If a given media schedule reaches 80% of the targeted group with an average exposure of 3, the media schedule is said to have a GRP of 240. If another media schedule has a GRP of 300, it is said to have more weight, but we cannot tell how this weight breaks down into reach and frequency.
- Weighted number of exposures (WE): This is the reach times average frequency
times average impact. The media planning trade off is as follows. With a given budget, what is the most cost-effective combination of reach, frequency, and impact? Reach is most important when launching new products, flanker brands, extension of well-known brands, or infrequently purchased brands, or when going after an undefined target market. Frequency is most important where there are strong competitor, a complex story to tell, high customer resistance, or a frequent purchase cycle. Choosing among media types The media planner has to know the capacity of the major media types to deliver reach, frequency, and impact. Media planners make their choice among the media categories by considering several variables, the most important of which are the following56: - Target audience media habits: For example, radio and television as well as the
internet are most effective media for reaching teenagers. - Product: Culinary delights are best shown in color magazines, and leisure activities
are best demonstrated on television. Media types have different potentials for demonstration, visualization, explanation, believablility and color.
- Message: A message announcing a major sale tomorrow will require radio or
newspaper. A message containing a great deal of techical data might require specialized magazines or mailings.
55 Source: Philip Kotler, Marketing Management, analysis, planning, implementation and control, 9th edition, Prentice Hall New Jersy, 1997 56 Source: Philip Kotler, Marketing Management, analysis, planning, implementation and control, 9th edition, Prentice Hall New Jersy, 1997
© 2014 harald hafner – hotmama Page 60
- Cost: Television is very expensive, while newspaper advertising is relatively inexpensive. What counts is the cost-per-thousand exposures rather than the total cost.
Ideas about media impact and cost must be re-examined regularly. For a long time, television enjoyed the dominant position in the media mix, and other media were neglected. Then media researchers began to notice television’s reduced effectiveness, which was due to increased commercial clutter. Another reason for review is the continuous emergence of new media. For example, advertisers have increased their spending on outdoor media substantially over the last decade. - Outdoor advertising provides an excellent way to reach important local consumer
segments. - Cable television now reaches a majority of households and allow narrow
programming formats such as all sports, all news, nutrition, arts etc., all of which ar appealing to marketers who target select groups.
- Another promising new media site is the hotel or restaurant itself. Older promotional in-store vehicles are being supplemented by a flurry of new media vehicles.
- Ads have also begun appearing in best-selling paperback books, in movie theatres and in/on DVD’s and/or movie videotapes.
- Written material such as annual reports, data sheets, catalogues and newsletters are increasingly carrying ads.
- Alternative media such as napkins, dishes, glasses, cutlery, laundry etc in a hotel provide an excellent media opportunity and is often only left to chance.
- Many companies sending out monthly bills (credit card companies, airlines etc.) are including inserts in the envelope that advertise products.
- Last but not least it is the internet, providing a whole new media world with still untapped opportunities.
Selecting specific media vehicles The media planner must next search for the most cost-effective media vehicles within a chosen media type. How does the media planner make choices among the rich array of media? The media planner relies on media-measurement services that provide estimates of audience size, composition, and media cost. Audience size has several possible measures57: - Circulation: The number of physical units carrying the advertising - Audience: The number of people who are exposed to the vehicle. If the vehicle has
pass-on readership, then the audience is larger than circulation) - Effective audience: The number of people with the target audience’s characteristics
who are exposed to the vehicle - Effective ad-exposed audience: The number of people with the target audience’s
characteristics who actually saw the ad. Medial planners calculate the cost per thousand persons reached by a vehicle. Several adjustments have to be applied to the initial cost-per-thousand measure. First, the measure should be adjusted for audience quality. Second, the exposure value should be
57 Source: Philip Kotler, Marketing Management, analysis, planning, implementation and control, 9th edition, Prentice Hall New Jersy, 1997
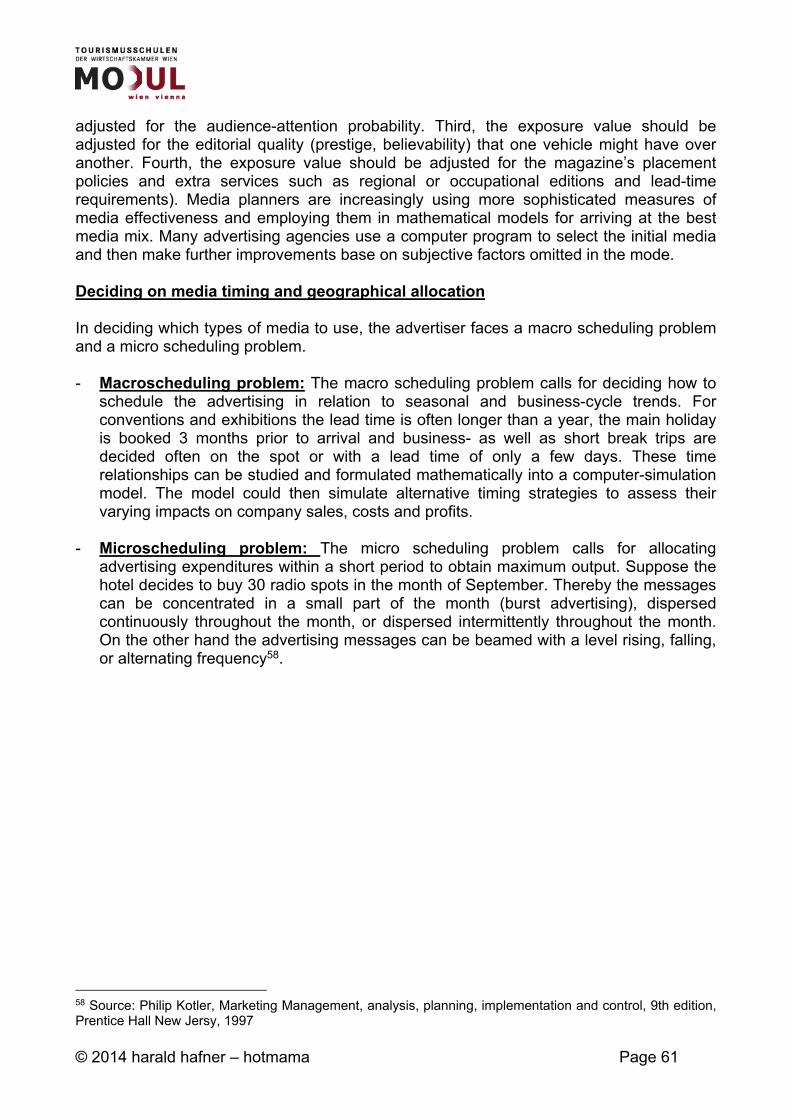
© 2014 harald hafner – hotmama Page 61
adjusted for the audience-attention probability. Third, the exposure value should be adjusted for the editorial quality (prestige, believability) that one vehicle might have over another. Fourth, the exposure value should be adjusted for the magazine’s placement policies and extra services such as regional or occupational editions and lead-time requirements). Media planners are increasingly using more sophisticated measures of media effectiveness and employing them in mathematical models for arriving at the best media mix. Many advertising agencies use a computer program to select the initial media and then make further improvements base on subjective factors omitted in the mode. Deciding on media timing and geographical allocation In deciding which types of media to use, the advertiser faces a macro scheduling problem and a micro scheduling problem. - Macroscheduling problem: The macro scheduling problem calls for deciding how to
schedule the advertising in relation to seasonal and business-cycle trends. For conventions and exhibitions the lead time is often longer than a year, the main holiday is booked 3 months prior to arrival and business- as well as short break trips are decided often on the spot or with a lead time of only a few days. These time relationships can be studied and formulated mathematically into a computer-simulation model. The model could then simulate alternative timing strategies to assess their varying impacts on company sales, costs and profits.
- Microscheduling problem: The micro scheduling problem calls for allocating
advertising expenditures within a short period to obtain maximum output. Suppose the hotel decides to buy 30 radio spots in the month of September. Thereby the messages can be concentrated in a small part of the month (burst advertising), dispersed continuously throughout the month, or dispersed intermittently throughout the month. On the other hand the advertising messages can be beamed with a level rising, falling, or alternating frequency58.
58 Source: Philip Kotler, Marketing Management, analysis, planning, implementation and control, 9th edition, Prentice Hall New Jersy, 1997
© 2014 harald hafner – hotmama Page 62
Figure 8: Classification of advertising timing patterns The most effective pattern depends upon the communications objectives in relation to the nature of the product, target customers, distribution channels, and other marketing factors. The timing pattern should consider:
o Buyer turnover: expresses the rate at which new buyers enter the market; the higher this rate, the more continuous the advertising should be.
o Purchase frequency: is the number of times during a given period that the
average buyer buys the product. The higher the purchase frequency, the more continuous the advertising should be.
o Forgetting rate: is the rate at which the buyer forgets the brand. The higher the
forgetting rate, the more continuous the advertising should be. A hotel has to decide how to allocate its advertising budget over space as well as over time. The company makes national buys, when it places ads on national TV networks or in nationally circulated magazines. It makes spot buys when it buys TV in just a few TV markets or regional editions of magazines. The company makes local buys when it advertises in local newspapers, radio or outdoor.
Concentrated
Continuous
Intermittent
Rising Falling AlternatingLevel
1 2 3 4
5 6 7 8
9 10 11 12
© 2014 harald hafner – hotmama Page 63
3.1.5. Measurement Good planning and control of advertising depend critically on measures of advertising effectiveness. Yet the amount of fundamental research on advertising effectiveness is appallingly small. Most measurement of advertising effectiveness is of an applied nature, dealing with specific ads and campaigns. Most of the money is spent by agencies on pretesting ads, and much less is spent on post evaluating their effects. Most advertisers try to measure the communication effect of an ad – that is, its potential effect on awareness, knowledge, or preference. They would also like to measure the ad’s sales effect but often feel it is too difficult to measure. Yet both can and should be researched59. - Communication-effect research: seeks to determine whether an ad is
communicating effectively. Also called copy testing, it can be done before an ad is put into media. Advertisers are also interested in post testing the overall communication impact of a completed advertising campaign. To what extend did the campaign increase brand awareness, brand comprehension, stated brand preference, and so on. Assuming that the advertiser measured these levels before the campaign, the advertiser can draw a random sample of consumer after the campaign to asses the communications effects. There are three major types of advertising pretesting:
o Direct rating: asks consumers to rate alternative ads. These ratings are used to
evaluate an ad’s attention, read-through, cognitive, affective, and behaviour strengths. Although an imperfect measure for an ad’s actual impact, a high rating indicates a potentially more effective ad.
o Portfolio tests: asks consumers to view and/or listen to a portfolio of
advertisements, taking as much time as they need. Consumers are then asked to recall all the ads and their content, aided or unaided by the interviewer. Their recall level indicates an ad’s ability to stand out and have its message understood and remembered.
o Laboratory tests: use equipment to measure consumer’s physiological reactions
– heartbeat, blood pressure, pupil dilation, perspiration – to an ad. These tests measure an ad’s attention-getting power but reveal nothing about its impact on beliefs, attitudes, or intentions.
- Sales-effect research: Communication-effect advertising research helps advertisers
assess advertising’s communication effects but reveals little about its sales impact. What sales are generated by an ad that increases brand awareness by 20% and brand preference by 10%? Advertising’s sales effect is generally harder to measure than its communication effect. Sales are influenced by many factors besides advertising, such as the product’s features, price, availability and competitor’s actions. The fewer or more controllable these other factors are, the easier it is to measure advertising’s effect on sales. The sales impact is easiest to measure in direct-marketing situations and hardest to measure in brand or corporate image building advertising. Researchers try to measure the sales impact through analyzing either historical or experimental data.
59 Source: Philip Kotler, Marketing Management, analysis, planning, implementation and control, 9th edition, Prentice Hall New Jersy, 1997

© 2014 harald hafner – hotmama Page 64
o Historical approach: involves correlating past sales to past advertising expenditures using advanced statistical techniques.
o Experimental design: Instead of spending the normal percentage of advertising
to sales in all territories, the company spends more in some and less in others. If the high-spending produces substantial sales increases, it appears that the company has been under spending. If they fail to produce more sales and if low-spending tests do not lead to sales decreases, then the company has been overspending. These tests, of course, must be accompanied by good experimental controls and last sufficiently long to capture delayed effects of changed advertising-expenditure levels.
© 2014 harald hafner – hotmama Page 65
3.2. Public Relations
3.2.1. Marketing PR (MPR) Like advertising, public relations is an important marketing tool. Not only must the company relate constructively to its customers, suppliers and middlemen, but it must also relate to a large set of interested publics. We define a public as follows60: A public is any group that has an actual or potential interest in or impact on a company’s ability to achieve its objectives. Public relations (PR) involves a variety of programs designed to promote and/or protect a company’s image or its individual products. Based on the various publics relating to a company we can distinguish between: - Financial PR: relating to all publics having a financial interest and/or impact on the
hotels ability to achieve its objectives. The target groups are investors, owner, banks and other financial institutions and publics.
- Community PR: relating to specific or general communities and to special interest
groups. These publics can have great impact on a hotels performance and well-being. Community PR mainly involves into making a company’s actions and intentions better understood and appreciated.
- Internal PR: relating to internal audiences such as employees, management and
suppliers in order to maintain a good level of communication and information amongst all involved in the servuction process.
- Marketing PR: The old name for MPR was publicity, which was seen as the task of
securing editorial space – as opposed to paid space – in print and broadcast media to promote or “hype” a product, place, or person. But MPR goes beyond simple publicity and plays and important role in the following tasks.
o Assisting in the launch of new products o Assisting in repositioning a mature product o Building interest in a product category o Influencing specific target groups o Defending products that have encountered public problems o Building the corporate image in a way that projects favourably on its products
As the power of mass advertising weakens, marketing managers are turning to MPR. Experts found it particularly effective in building awareness and brand knowledge for both new and established products. MPR is particularly effective in blanketing local communities and reaching specific ethnic and other special interest groups. In several cases MPR proved more cost effective than advertising. Nevertheless, it must be planned jointly with advertising.
60 Source: Philip Kotler, Marketing Management, analysis, planning, implementation and control, 9th edition, Prentice Hall New Jersy, 1997
© 2014 harald hafner – hotmama Page 66
A public can facilitate or impede a hotel’s ability to achieve its objectives. PR has often been treated as a marketing stepchild, an afterthought to more serious promotion planning. But the wise company takes concrete steps to manage successful relations with its key publics. Large companies operate a public relations department to plan these solutions. The PR function lies with management with smaller hotels. In both cases it can be supported by PR-Agencies. Most advertising agencies also operate PR departments allowing an optimum of coordination between the two tools. The PR department monitors the attitudes of the organization’s publics and distributes information and communication to build goodwill. PR Departments perform the following five activities, not all of which support marketing objectives61:
- Press relations: Presenting news and information about organization in the most
positive light. - Product publicity: Sponsoring various efforts to publicize specific products - Corporate communications: Promoting understanding of the organization with
internal and external communications. - Lobbying: Dealing with legislators and government officials to promote or defeat
legislation and regulation. - Counselling: Advising management about public issues and company positions and
image. This includes advising in the event of a product mishap when public confidence in a product is shaken.
3.2.2. Major decisions in Marketing PR In considering when and how to use MPR, management must establish the marketing objecties, choose the PR messages and vehicles, implement and plan carefully and evaluate the resutls. - Establishing the marketing objectives: MPR can contribute to the following
objectives:
o Build awareness: MPR can place stories in the media to bring attention to a product, service, person, organization, or idea.
o Build credibility: MPR can add credibility by communicating the message in an editorial context.
o Stimulate the sales force and dealers: MPR can help boost sales force and dealer enthusiasm. Stories about a new product before it is launched will help the sales force sell it to retailers.
o Hold down promotion costs: MPR costs less than direct mail and media advertising. The smaller the company’s promotion budget, the stronger the case for using PR to gain share of mind.
61 Source: Philip Kotler, Marketing Management, analysis, planning, implementation and control, 9th edition, Prentice Hall New Jersy, 1997
© 2014 harald hafner – hotmama Page 67
- Choosing the PR messages and vehicles: After establishing the MPR objectives, the manager must identify or develop interesting stories to tell about the product. If the number of interesting stories is insufficient, the MPR practitioner should propose newsworthy e.g. events that the company could sponsor. Here the challenge is to create rather find news. PR ideas include hosting conventions, inviting expert or celebrity speakers, and developing news conferences Each event is an opportunity to develop. The major tools in MPR can be summarized as follows62:
o Publications: Companies rely extensively on published materials to reach and
influence their target markets. These include annual reports, brochures, articles, company newsletters and magazines, and audio-visual materials. Brochures can play an important role informing target customers about what a product is, how it works, and how it is to be assembled. Thoughtful articles written by company executives can draw attention to the company and its products. Company newsletters and magazines can help build up the company’s image and convey important news to target markets. Audio-visual and multimedia material, such as films, slides-and sound, and audio- and video cassettes, CD and DVD’s are coming into increasing use as promotion tools.
o Events: Companies can draw attention to new products or other company
activities by arranging special events. These include news conferences, seminars, outings, exhibits, contests and competitions, anniversaries, and sport and cultural sponsorships that will reach the target publics. Sponsoring sports events gives the companies high visibility among their suppliers, distributors and customers.
o News: One of the major tasks of PR professionals is to find or create favourable
news about the company, its products, and its people. News generation requires skill in developing a story concept, researching it, and writing a press release. But the PR person’s skill must go beyond preparing news stories. Getting the media to accept press releases and attend press conferences calls for marketing and interpersonal skills. A good PR director understands the press’s needs for stories that are interesting and timely and for press releases that are well written and attention getting. The media director needs to build favourable relations with editors and reporters. The more the press is cultivated, the more likely it is to give more and better coverage to the company.
o Speeches: Speeches are another tool for creating product and company
publicity. Increasingly company executives must field questions from the media or give talks at trade association or sales meetings, and these appearances can buld the company’s image. Companies are choosing their spokespersons carefully and using speechwriters and coaches to help improve their spokesperson’s public speaking abilities.
62 Source: Philip Kotler, Marketing Management, analysis, planning, implementation and control, 9th edition, Prentice Hall New Jersy, 1997
© 2014 harald hafner – hotmama Page 68
o Public-service activities: Companies can improve public goodwill by contributing money and time to good causes. Large companies typically will ask executives to support community affairs where their offices and plants are located. In other instances, companies will donate an amount of money to a specified cause. Such cause-related marketing is used by a growing number of companies to build public goodwill.
o Identity media: In a society market by sensory overload, companies have to
compete for attention. They should strive to create a visual identity that the public immediately recognizes. The visual identity is carried by the company’s logos, stationery, brochures, signs, business forms, business cards, buildings and dress codes.
- Implementing the MPR plan: Implementing public relations requires care. Consider
the matter of placing stories in the media. A great story is easy to place. But most stories are less than great and might not get past busy editors. One of the chief assets of publicists is their personal relationship with media editors. Public-relation practitioners are often ex-journalists who know many media editors and know what they want. PR people look a t media editors as a market to satisfy so that these editors will continue to use their stories. Publicity requires extra care when it involves staging special events, such as testimonial dinners, news conferences, and national contests. PR practitioners need a good head for detail and for coming up with quick solutions when thins go wrong.
- Evaluating the MPR results: MPR’s contribution to the bottom line is difficult to
measure, because it is used along with other promotional tools. If it is used before the other tools come into action, its contribution is easier to evaluate. The three most commonly used measures of MPR effectiveness are number of exposures, awareness/comprehension/attitude change and contribution to sales and profits63.
o Exposures: The easiest measure of MPR effectiveness is the number of
exposures carried by the media. Publicists supply the client with a clippings book showing all the media that carried news about the product and a summary statement. The exposure measure is not very satisfying because it contains no indication of how many people actually read, heard or recalled the message and what they thought afterward. Nor does it contain information on the net audience reached, since publications overlap in readership. Because publicity’s goal is reach, not frequency, it would be more useful to know the number of unduplicated exposures.
o Awareness/comprehension/attitude change: A better measure is the change
in product awareness, comprehension and attitude resulting from MPR. For example, how many people recall hearing the new item? How many told others about it? How many changed their minds after hearing it?
o Sales-and-profit contribution: Sales-and-profit impact is the most satisfactory
measure, if obtainable.
63 Source: Philip Kotler, Marketing Management, analysis, planning, implementation and control, 9th edition, Prentice Hall New Jersy, 1997
© 2014 harald hafner – hotmama Page 69
3.3. Sales promotion
3.3.1. Purpose of sales promotions Sales promotion is a key ingredient in marketing campaigns. Sales promotion consists of a diverse collection of incentive tools, mostly short term, designed to stimulate quicker and/or greater purchase of particular products/services by consumer or the trade. Where advertising and MPR offer a reason to buy, sales promotion offers an incentive to buy. Sales promotion includes tools for consumer promotion, trade promotion and business promotion. Sales-promotion tools are used by most organizations. A decade ago, the advertising-to-sales-promotion ratio was about 60:40. Today in many tourism organizations, sales promotions have been increasing as a percentage of budget expenditure over the past two decades64. Several factors contributed to the rapid growth of sales promotion, particularly in consumer markets. Promotion is more accepted by top management as an effective sales tool, more product managers are qualified to use sales-promotion tools; and product managers are under greater pressure to increase their current sales. The number of brand has increase, competitors use promotions frequently, many brands are seen similar, consumers are more price-oriented, the trade demanded more deals from manufacturers and advertising efficiency has declined because of rising costs, media clutter, and legal restraints. Sales-promotion tools vary in their specific objectives. A free sample stimulates consumer trial, while a customer loyalty program fosters a long term relationship. Sellers use incentive-type promotions to attract new tries, to reward loyal customers, and to increase the repurchase rates of occasional users. Switchers are of three types – users of another brand in the same category, users in other categories, and frequent brand switchers. Sales promotion is unlikely to turn them into loyal brand users. Sales promotions used in market is of high brand similarity produce a high sales response in the short run but little permanent gain in market share. In markets of high brand dissimilarity, sales promotions can alter market shares permanently. Today many marketing managers first estimate what they need to spend in trade promotion, than what they need to spend in consumer promotion. Whatever is left they will budget for advertising. Advertising and PR typically act to build brand loyalty, while sales promotion aims to weaken brand loyalty. When a brand is price promoted too much of the time, the consumer begins to think less of it an buy it mainly when it goes on sales. Brown’s study of 2.500 instant coffee buyers concluded that: - Sales promotion yield faster and more measurable responses in sales than advertising
does. - Sales promotion do not tend to yield new, long-term buyers in mature markets because
thy attract mainly deal-prone consumers who switch among brands as deals become available.
- Loyal brand buyers tend not to change their buying patterns as a result of competitive promotions.
64 Source: Philip Kotler, Marketing Management, analysis, planning, implementation and control, 9th edition, Prentice Hall New Jersy, 1997
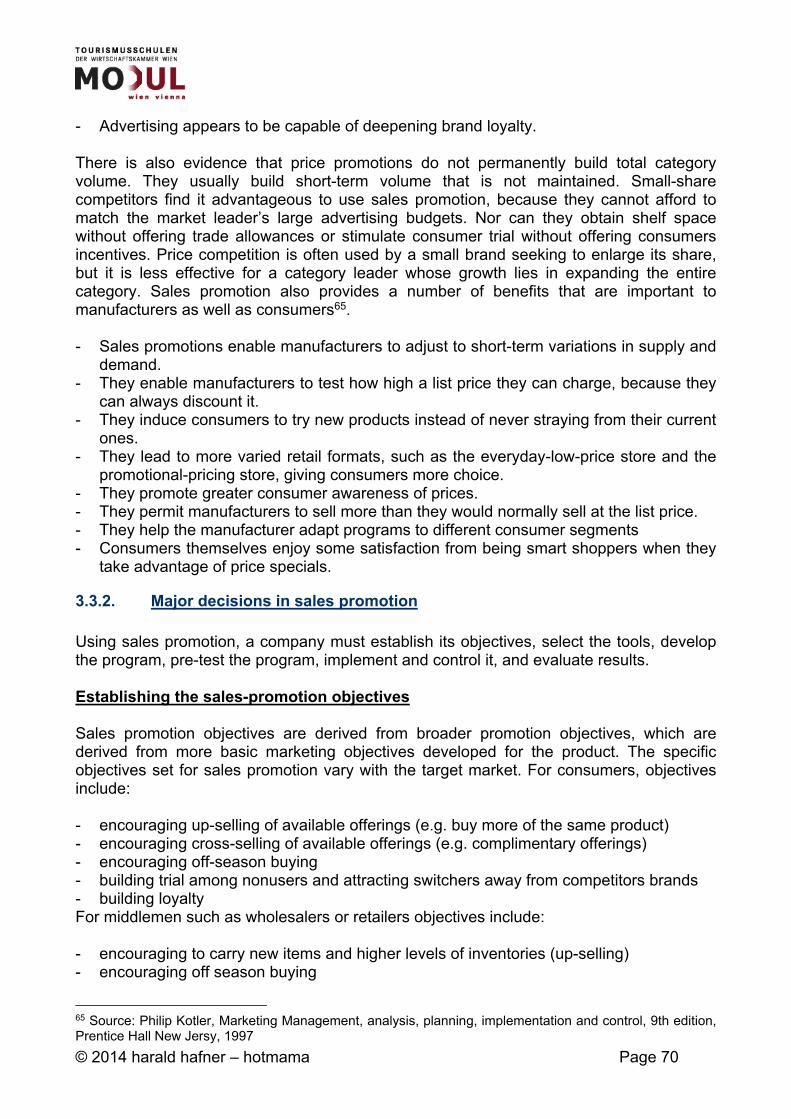
© 2014 harald hafner – hotmama Page 70
- Advertising appears to be capable of deepening brand loyalty. There is also evidence that price promotions do not permanently build total category volume. They usually build short-term volume that is not maintained. Small-share competitors find it advantageous to use sales promotion, because they cannot afford to match the market leader’s large advertising budgets. Nor can they obtain shelf space without offering trade allowances or stimulate consumer trial without offering consumers incentives. Price competition is often used by a small brand seeking to enlarge its share, but it is less effective for a category leader whose growth lies in expanding the entire category. Sales promotion also provides a number of benefits that are important to manufacturers as well as consumers65. - Sales promotions enable manufacturers to adjust to short-term variations in supply and
demand. - They enable manufacturers to test how high a list price they can charge, because they
can always discount it. - They induce consumers to try new products instead of never straying from their current
ones. - They lead to more varied retail formats, such as the everyday-low-price store and the
promotional-pricing store, giving consumers more choice. - They promote greater consumer awareness of prices. - They permit manufacturers to sell more than they would normally sell at the list price. - They help the manufacturer adapt programs to different consumer segments - Consumers themselves enjoy some satisfaction from being smart shoppers when they
take advantage of price specials.
3.3.2. Major decisions in sales promotion Using sales promotion, a company must establish its objectives, select the tools, develop the program, pre-test the program, implement and control it, and evaluate results. Establishing the sales-promotion objectives Sales promotion objectives are derived from broader promotion objectives, which are derived from more basic marketing objectives developed for the product. The specific objectives set for sales promotion vary with the target market. For consumers, objectives include: - encouraging up-selling of available offerings (e.g. buy more of the same product) - encouraging cross-selling of available offerings (e.g. complimentary offerings) - encouraging off-season buying - building trial among nonusers and attracting switchers away from competitors brands - building loyalty For middlemen such as wholesalers or retailers objectives include: - encouraging to carry new items and higher levels of inventories (up-selling) - encouraging off season buying
65 Source: Philip Kotler, Marketing Management, analysis, planning, implementation and control, 9th edition, Prentice Hall New Jersy, 1997
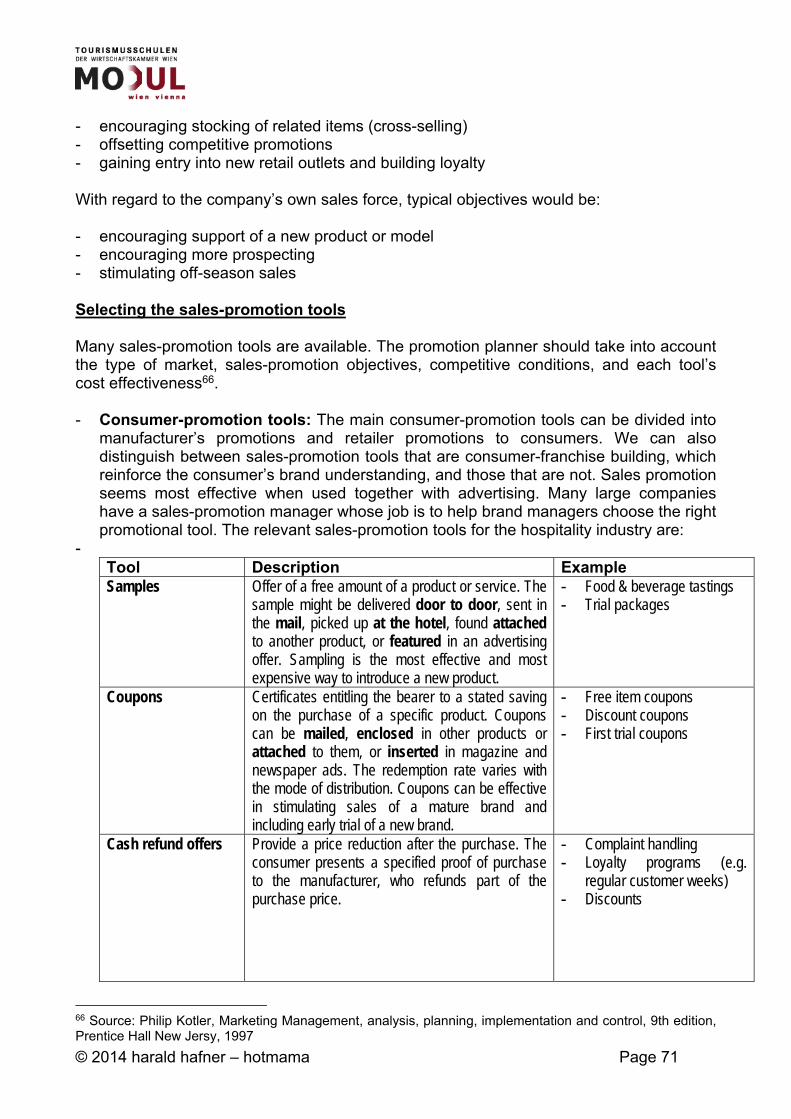
© 2014 harald hafner – hotmama Page 71
- encouraging stocking of related items (cross-selling) - offsetting competitive promotions - gaining entry into new retail outlets and building loyalty
With regard to the company’s own sales force, typical objectives would be: - encouraging support of a new product or model - encouraging more prospecting - stimulating off-season sales Selecting the sales-promotion tools Many sales-promotion tools are available. The promotion planner should take into account the type of market, sales-promotion objectives, competitive conditions, and each tool’s cost effectiveness66. - Consumer-promotion tools: The main consumer-promotion tools can be divided into
manufacturer’s promotions and retailer promotions to consumers. We can also distinguish between sales-promotion tools that are consumer-franchise building, which reinforce the consumer’s brand understanding, and those that are not. Sales promotion seems most effective when used together with advertising. Many large companies have a sales-promotion manager whose job is to help brand managers choose the right promotional tool. The relevant sales-promotion tools for the hospitality industry are:
- Tool Description Example Samples Offer of a free amount of a product or service. The
sample might be delivered door to door, sent in the mail, picked up at the hotel, found attached to another product, or featured in an advertising offer. Sampling is the most effective and most expensive way to introduce a new product.
- Food & beverage tastings - Trial packages
Coupons Certificates entitling the bearer to a stated saving on the purchase of a specific product. Coupons can be mailed, enclosed in other products or attached to them, or inserted in magazine and newspaper ads. The redemption rate varies with the mode of distribution. Coupons can be effective in stimulating sales of a mature brand and including early trial of a new brand.
- Free item coupons - Discount coupons - First trial coupons
Cash refund offers Provide a price reduction after the purchase. The consumer presents a specified proof of purchase to the manufacturer, who refunds part of the purchase price.
- Complaint handling - Loyalty programs (e.g.
regular customer weeks) - Discounts
66 Source: Philip Kotler, Marketing Management, analysis, planning, implementation and control, 9th edition, Prentice Hall New Jersy, 1997
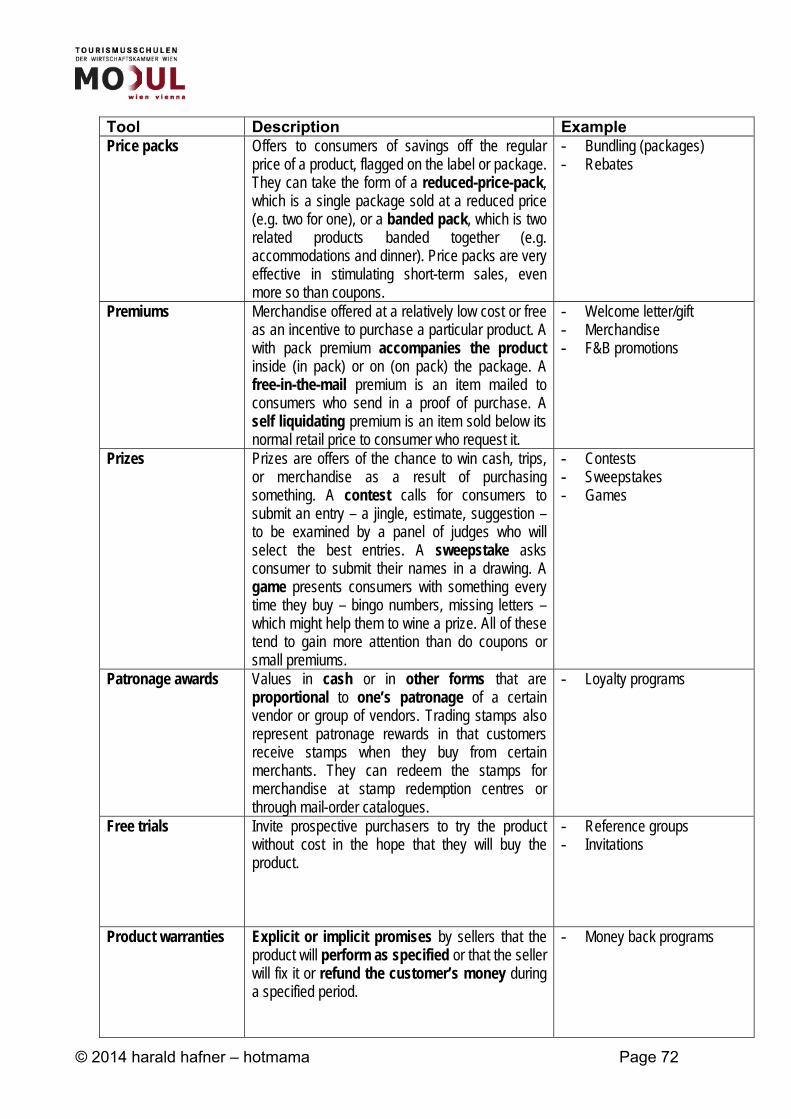
© 2014 harald hafner – hotmama Page 72
Tool Description Example Price packs Offers to consumers of savings off the regular
price of a product, flagged on the label or package. They can take the form of a reduced-price-pack, which is a single package sold at a reduced price (e.g. two for one), or a banded pack, which is two related products banded together (e.g. accommodations and dinner). Price packs are very effective in stimulating short-term sales, even more so than coupons.
- Bundling (packages) - Rebates
Premiums Merchandise offered at a relatively low cost or free as an incentive to purchase a particular product. A with pack premium accompanies the product inside (in pack) or on (on pack) the package. A free-in-the-mail premium is an item mailed to consumers who send in a proof of purchase. A self liquidating premium is an item sold below its normal retail price to consumer who request it.
- Welcome letter/gift - Merchandise - F&B promotions
Prizes Prizes are offers of the chance to win cash, trips, or merchandise as a result of purchasing something. A contest calls for consumers to submit an entry – a jingle, estimate, suggestion – to be examined by a panel of judges who will select the best entries. A sweepstake asks consumer to submit their names in a drawing. A game presents consumers with something every time they buy – bingo numbers, missing letters – which might help them to wine a prize. All of these tend to gain more attention than do coupons or small premiums.
- Contests - Sweepstakes - Games
Patronage awards Values in cash or in other forms that are proportional to one’s patronage of a certain vendor or group of vendors. Trading stamps also represent patronage rewards in that customers receive stamps when they buy from certain merchants. They can redeem the stamps for merchandise at stamp redemption centres or through mail-order catalogues.
- Loyalty programs
Free trials Invite prospective purchasers to try the product without cost in the hope that they will buy the product.
- Reference groups - Invitations
Product warranties Explicit or implicit promises by sellers that the product will perform as specified or that the seller will fix it or refund the customer’s money during a specified period.
- Money back programs
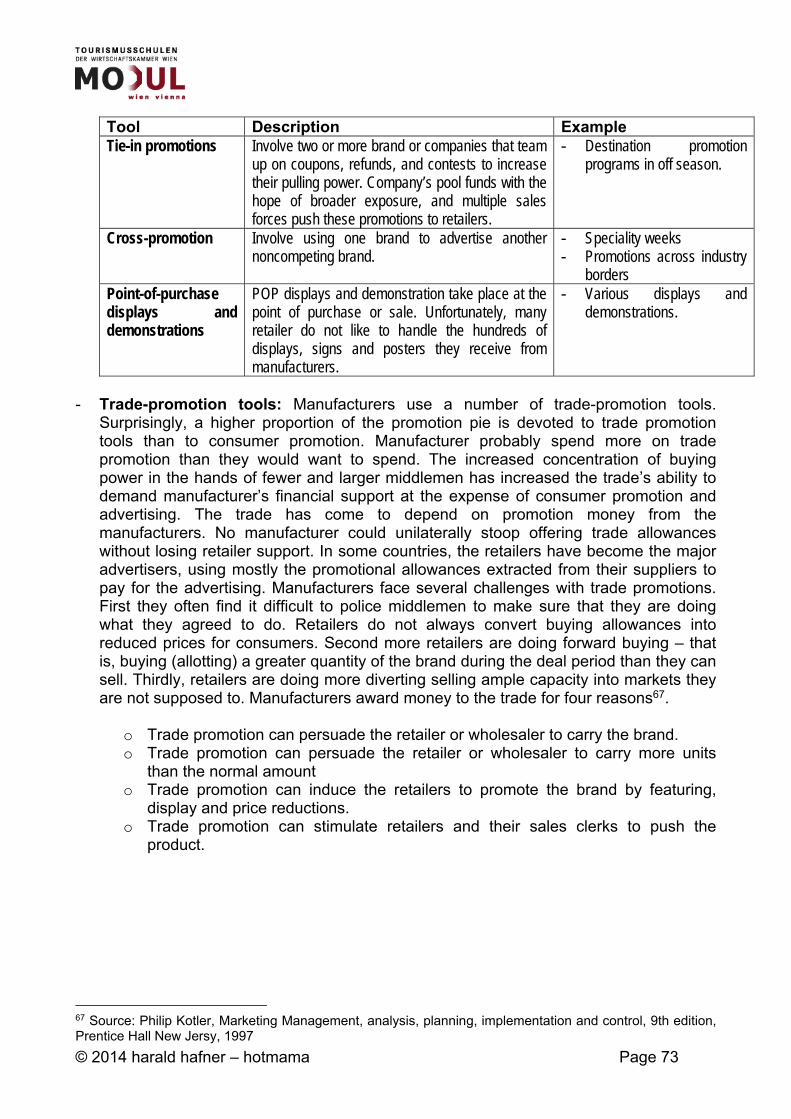
© 2014 harald hafner – hotmama Page 73
Tool Description Example Tie-in promotions Involve two or more brand or companies that team
up on coupons, refunds, and contests to increase their pulling power. Company’s pool funds with the hope of broader exposure, and multiple sales forces push these promotions to retailers.
- Destination promotion programs in off season.
Cross-promotion Involve using one brand to advertise another noncompeting brand.
- Speciality weeks - Promotions across industry
borders Point-of-purchase displays and demonstrations
POP displays and demonstration take place at the point of purchase or sale. Unfortunately, many retailer do not like to handle the hundreds of displays, signs and posters they receive from manufacturers.
- Various displays and demonstrations.
- Trade-promotion tools: Manufacturers use a number of trade-promotion tools.
Surprisingly, a higher proportion of the promotion pie is devoted to trade promotion tools than to consumer promotion. Manufacturer probably spend more on trade promotion than they would want to spend. The increased concentration of buying power in the hands of fewer and larger middlemen has increased the trade’s ability to demand manufacturer’s financial support at the expense of consumer promotion and advertising. The trade has come to depend on promotion money from the manufacturers. No manufacturer could unilaterally stoop offering trade allowances without losing retailer support. In some countries, the retailers have become the major advertisers, using mostly the promotional allowances extracted from their suppliers to pay for the advertising. Manufacturers face several challenges with trade promotions. First they often find it difficult to police middlemen to make sure that they are doing what they agreed to do. Retailers do not always convert buying allowances into reduced prices for consumers. Second more retailers are doing forward buying – that is, buying (allotting) a greater quantity of the brand during the deal period than they can sell. Thirdly, retailers are doing more diverting selling ample capacity into markets they are not supposed to. Manufacturers award money to the trade for four reasons67.
o Trade promotion can persuade the retailer or wholesaler to carry the brand. o Trade promotion can persuade the retailer or wholesaler to carry more units
than the normal amount o Trade promotion can induce the retailers to promote the brand by featuring,
display and price reductions. o Trade promotion can stimulate retailers and their sales clerks to push the
product.
67 Source: Philip Kotler, Marketing Management, analysis, planning, implementation and control, 9th edition, Prentice Hall New Jersy, 1997
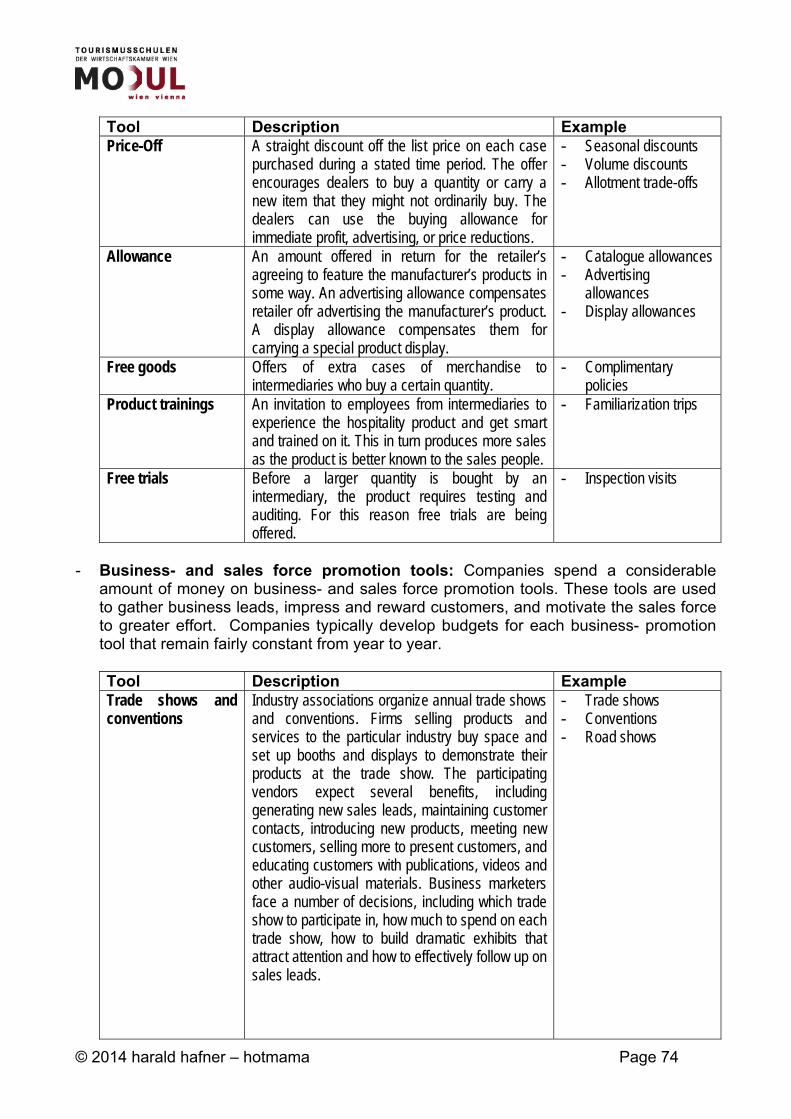
© 2014 harald hafner – hotmama Page 74
Tool Description Example Price-Off A straight discount off the list price on each case
purchased during a stated time period. The offer encourages dealers to buy a quantity or carry a new item that they might not ordinarily buy. The dealers can use the buying allowance for immediate profit, advertising, or price reductions.
- Seasonal discounts - Volume discounts - Allotment trade-offs
Allowance An amount offered in return for the retailer’s agreeing to feature the manufacturer’s products in some way. An advertising allowance compensates retailer ofr advertising the manufacturer’s product. A display allowance compensates them for carrying a special product display.
- Catalogue allowances - Advertising
allowances - Display allowances
Free goods Offers of extra cases of merchandise to intermediaries who buy a certain quantity.
- Complimentary policies
Product trainings An invitation to employees from intermediaries to experience the hospitality product and get smart and trained on it. This in turn produces more sales as the product is better known to the sales people.
- Familiarization trips
Free trials Before a larger quantity is bought by an intermediary, the product requires testing and auditing. For this reason free trials are being offered.
- Inspection visits
- Business- and sales force promotion tools: Companies spend a considerable
amount of money on business- and sales force promotion tools. These tools are used to gather business leads, impress and reward customers, and motivate the sales force to greater effort. Companies typically develop budgets for each business- promotion tool that remain fairly constant from year to year.
Tool Description Example Trade shows and conventions
Industry associations organize annual trade shows and conventions. Firms selling products and services to the particular industry buy space and set up booths and displays to demonstrate their products at the trade show. The participating vendors expect several benefits, including generating new sales leads, maintaining customer contacts, introducing new products, meeting new customers, selling more to present customers, and educating customers with publications, videos and other audio-visual materials. Business marketers face a number of decisions, including which trade show to participate in, how much to spend on each trade show, how to build dramatic exhibits that attract attention and how to effectively follow up on sales leads.
- Trade shows - Conventions - Road shows
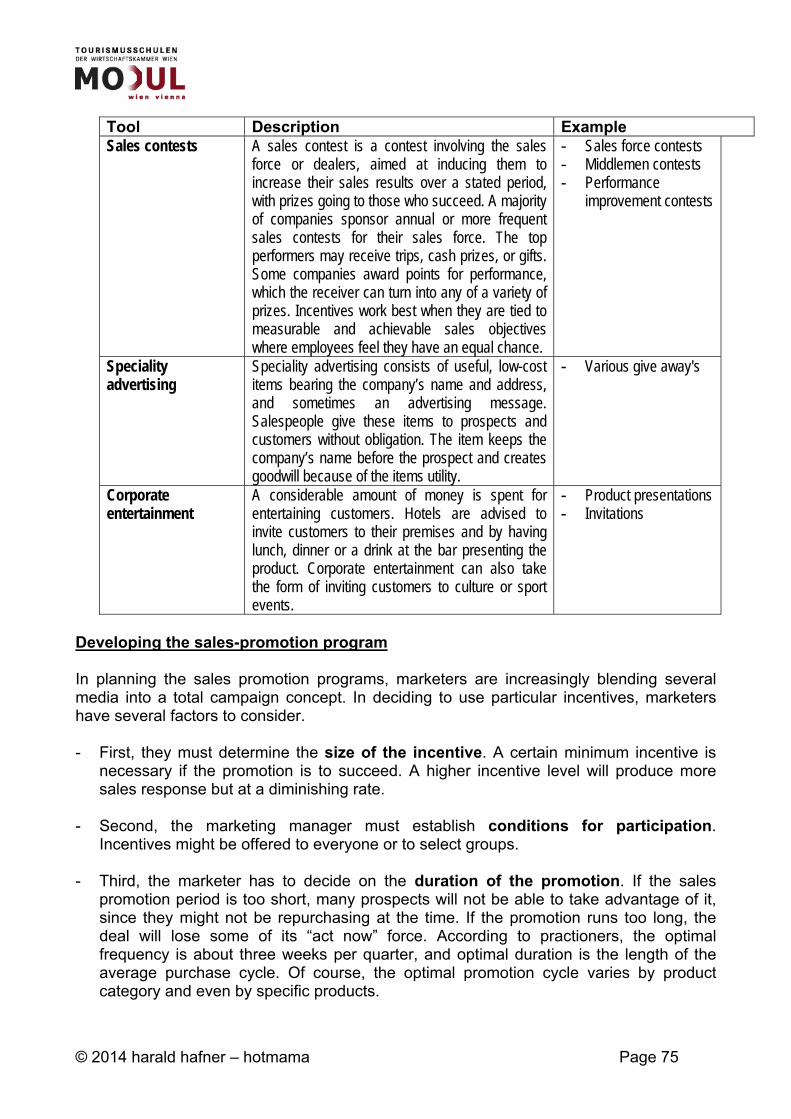
© 2014 harald hafner – hotmama Page 75
Tool Description Example Sales contests A sales contest is a contest involving the sales
force or dealers, aimed at inducing them to increase their sales results over a stated period, with prizes going to those who succeed. A majority of companies sponsor annual or more frequent sales contests for their sales force. The top performers may receive trips, cash prizes, or gifts. Some companies award points for performance, which the receiver can turn into any of a variety of prizes. Incentives work best when they are tied to measurable and achievable sales objectives where employees feel they have an equal chance.
- Sales force contests - Middlemen contests - Performance
improvement contests
Speciality advertising
Speciality advertising consists of useful, low-cost items bearing the company’s name and address, and sometimes an advertising message. Salespeople give these items to prospects and customers without obligation. The item keeps the company’s name before the prospect and creates goodwill because of the items utility.
- Various give away's
Corporate entertainment
A considerable amount of money is spent for entertaining customers. Hotels are advised to invite customers to their premises and by having lunch, dinner or a drink at the bar presenting the product. Corporate entertainment can also take the form of inviting customers to culture or sport events.
- Product presentations - Invitations
Developing the sales-promotion program In planning the sales promotion programs, marketers are increasingly blending several media into a total campaign concept. In deciding to use particular incentives, marketers have several factors to consider. - First, they must determine the size of the incentive. A certain minimum incentive is
necessary if the promotion is to succeed. A higher incentive level will produce more sales response but at a diminishing rate.
- Second, the marketing manager must establish conditions for participation.
Incentives might be offered to everyone or to select groups. - Third, the marketer has to decide on the duration of the promotion. If the sales
promotion period is too short, many prospects will not be able to take advantage of it, since they might not be repurchasing at the time. If the promotion runs too long, the deal will lose some of its “act now” force. According to practioners, the optimal frequency is about three weeks per quarter, and optimal duration is the length of the average purchase cycle. Of course, the optimal promotion cycle varies by product category and even by specific products.
© 2014 harald hafner – hotmama Page 76
- Fourth, the marketer must choose a distribution vehicle. Each distribution channel involves a different level of reach, cost, and impact.
- Fifth, the marketer must establish the timing of promotion. Brand managers develop
calendar dates for their annual promotions. These dates are used by the production, sales, and distribution departments.
- Finally, the marketer must determine the total sales-promotion budget. The sales-
promotion budget can be developed in two ways:
o It can be built from the ground up, with the marketer choosing the individual promotions and estimating their total cost. The cost of a particular promotion consists of the administrative cost (printing, mailing, and promoting the deal) and the incentive cost (cost of the promotion tool) multiplied by the expected number of units that will be sold on the deal.
o The more common way to develop the sales-promotion budget is to use a
conventional percentage of the total promotion budget. These percentages vary for different brands in different markets and are influence by the stages of the product life cycle and competitive expenditures on promotion.
Pretesting the sales-promotion program Although most sales-promotion programs are designed on the basis of experience, pre-tests should be conducted to determine if the tools are appropriate., the incentive size optimal, and the presentation method efficient. Unfortunately, a large percentage of premium offers are not pretested. Promotions can usually be tested quickly and inexpensively and that large companies should test alternative strategies in selected market areas with each national promotion. Consumers can be asked to rate or rank different possible deals, or trial tests can be run in limited geographical areas. Implementing and controlling the sales-promotion program Marketing managers must prepare implementation and control plans for each individual promotion. Implementation planning must cover lead time and sell-in time68. - Lead time: is the time necessary to prepare the program prior to launching it. Lead
time covers initial planning, design, and approval of package modifications or material to be mailed or distributed. Furthermore preparation of advertising and point-of-sale materials, notification of field sales personnel, establishment of allocations for individual distributors, purchasing and printing of special premium or packaging materials, production of advance inventories in preparation for release at a specific date, and finally the distribution to the retailer.
- Sell-in time: begins with the promotional launch and ends when approximately 95% of
the deal merchandise is in the hands of consumers. The time frame can last one to several months, depending on the deal duration.
68 Source: Philip Kotler, Marketing Management, analysis, planning, implementation and control, 9th edition, Prentice Hall New Jersy, 1997
© 2014 harald hafner – hotmama Page 77
Evaluating the sales-promotion results Evaluation of the promotion’s results is crucial. Manufacturers can use three methods to measure sales-promotion effectiveness; sales data, consumer surveys and experiments. - Sales data: The first method involves using scanner sales data, which are available
from companies such as Nielsen or Dataquest. Marketers can analyze the types of people who took advantage of the promotion, what their behaviour was before the promotion, and how consumers who purchased the promoted brand behaved later toward the brand and other brands. In general sales promotions works best when they attract competitor’s customers to try a superior product and these customers permanently switch as a result. If the company's product is not superior, the brand’s share is likely to return to its promotion level. The sales promotion altered only the time pattern of demand rather than the total demand. The promotion may have covered its cost, but more likely did not.
- Consumer surveys: If more information is needed, consumer surveys can be
conducted to learn how many recall the promotion, what they thought of it, how many took advantage of it, and how the promotion affected subsequent brand-choice behaviour.
- Experiments: Sales promotion can also be evaluated through experiments that vary
such attributes as incentive value, duration, and distribution media. Literature List The following literature was used in compiling this textbook.
1. Richard Teare, Josef A. Mazanec, Simon Crawford-Welch, Stephen Calver; Marketing in Hospitality and Tourism – A Consumer Focus; Cassell London 1994
2. L. Moutinho, Strategic Management in Tourism, CAB International, London 2000
3. Philip Kotler; Marketing Management – Analysis, Planning, Implementation, and
Control, 9th Edition; Prentice Hall Publishing; New Jersey 1997
4. John E.G. Bateson, K. Douglas Hoffman; Managing Services Marketing – Text and Readings, 4th edition; The Dryden Press, Fort Worth Texas, 1999