interim report 2015/2016 - hkexnews
TRANSCRIPT
Incorporated in Bermuda with limited liability
http://www.stelux.com
Stock Code: 84
INTERIM REPORT 2015/2016

website: www.stelux.com

When you reap the harvest of your land, do not reap to the very edges of your field
or gather the gleanings of your harvest. Do not go over your vineyard a second time
or pick up the grapes that have fallen. Leave them for the poor and the foreigner. I
am the Lord your God.
Leviticus 19:9-10
– 1 –
INTERIM REPORTFOR THE SIX MONTHS ENDED 30 SEPTEMBER 2015
The directors of Stelux Holdings International Limited (the “Company”) report the interim results and financial information of the Company and its subsidiaries (collectively the “Group”) for the six months ended 30 September 2015. The condensed consolidated results of the Group for the six months ended 30 September 2015, the condensed consolidated balance sheet as at 30 September 2015, the condensed consolidated cash flow statement and the condensed consolidated statement of changes in equity of the Group for the six months ended 30 September 2015, all of which are unaudited, along with the relevant explanatory notes, are set out below.
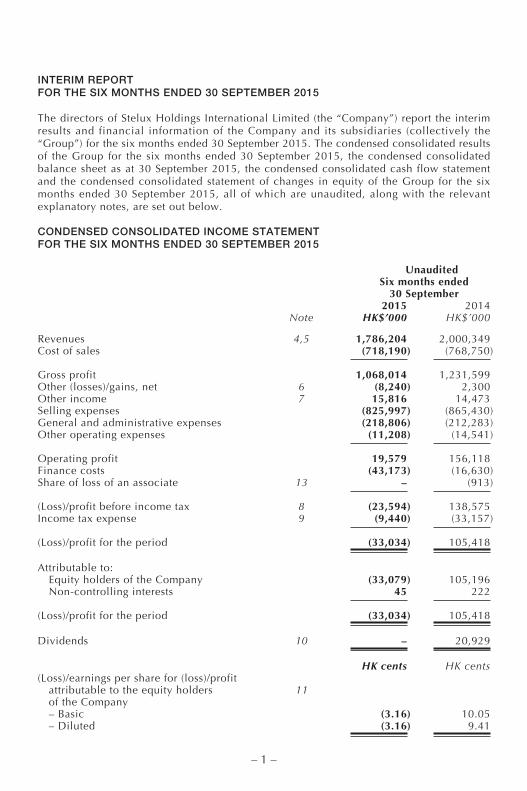
CONDENSED CONSOLIDATED INCOME STATEMENTFOR THE SIX MONTHS ENDED 30 SEPTEMBER 2015
Unaudited Six months ended 30 September
2015 2014 Note HK$’000 HK$’000
Revenues 4,5 1,786,204 2,000,349Cost of sales (718,190) (768,750)
Gross profit 1,068,014 1,231,599Other (losses)/gains, net 6 (8,240) 2,300Other income 7 15,816 14,473Selling expenses (825,997) (865,430)General and administrative expenses (218,806) (212,283)Other operating expenses (11,208) (14,541)
Operating profit 19,579 156,118Finance costs (43,173) (16,630)Share of loss of an associate 13 – (913)
(Loss)/profit before income tax 8 (23,594) 138,575Income tax expense 9 (9,440) (33,157)
(Loss)/profit for the period (33,034) 105,418
Attributable to: Equity holders of the Company (33,079) 105,196 Non-controlling interests 45 222
(Loss)/profit for the period (33,034) 105,418
Dividends 10 – 20,929
HK cents HK cents(Loss)/earnings per share for (loss)/profit attributable to the equity holders 11 of the Company – Basic (3.16) 10.05 – Diluted (3.16) 9.41

– 2 –
CONDENSED CONSOLIDATED STATEMENT OF COMPREHENSIVE INCOMEFOR THE SIX MONTHS ENDED 30 SEPTEMBER 2015
UnauditedSix months ended
30 September 2015 2014 HK$’000 HK$’000
(Loss)/profit for the period (33,034) 105,418
Other comprehensive (loss)/income: Items that may be reclassified subsequently to profit or loss: Exchange differences (57,398) 19,182 Revaluation of available-for-sale financial assets (63) –
Other comprehensive (loss)/income for the period, net of tax (57,461) 19,182
Total comprehensive (loss)/income for the period (90,495) 124,600
Attributable to: Equity holders of the Company (89,602) 124,454 Non-controlling interests (893) 146
Total comprehensive (loss)/income for the period (90,495) 124,600
– 3 –
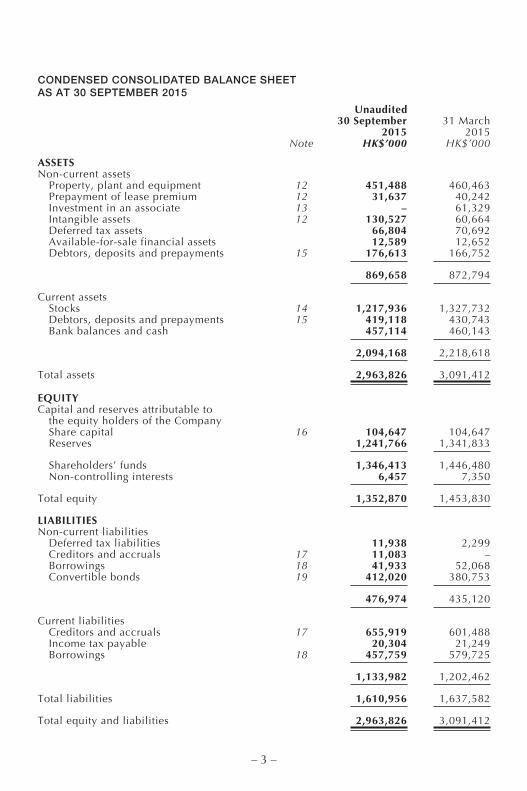
CONDENSED CONSOLIDATED BALANCE SHEETAS AT 30 SEPTEMBER 2015
Unaudited 30 September 31 March 2015 2015 Note HK$’000 HK$’000
ASSETSNon-current assets Property, plant and equipment 12 451,488 460,463 Prepayment of lease premium 12 31,637 40,242 Investment in an associate 13 – 61,329 Intangible assets 12 130,527 60,664 Deferred tax assets 66,804 70,692 Available-for-sale financial assets 12,589 12,652 Debtors, deposits and prepayments 15 176,613 166,752
869,658 872,794
Current assets Stocks 14 1,217,936 1,327,732 Debtors, deposits and prepayments 15 419,118 430,743 Bank balances and cash 457,114 460,143
2,094,168 2,218,618
Total assets 2,963,826 3,091,412
EQUITYCapital and reserves attributable to the equity holders of the Company Share capital 16 104,647 104,647 Reserves 1,241,766 1,341,833
Shareholders’ funds 1,346,413 1,446,480 Non-controlling interests 6,457 7,350
Total equity 1,352,870 1,453,830
LIABILITIESNon-current liabilities Deferred tax liabilities 11,938 2,299 Creditors and accruals 17 11,083 – Borrowings 18 41,933 52,068 Convertible bonds 19 412,020 380,753
476,974 435,120
Current liabilities Creditors and accruals 17 655,919 601,488 Income tax payable 20,304 21,249 Borrowings 18 457,759 579,725
1,133,982 1,202,462
Total liabilities 1,610,956 1,637,582
Total equity and liabilities 2,963,826 3,091,412
– 4 –
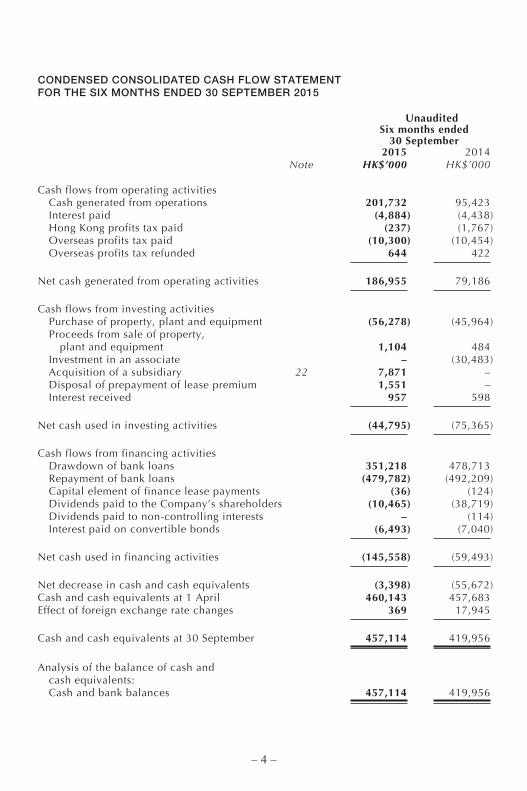
CONDENSED CONSOLIDATED CASH FLOW STATEMENTFOR THE SIX MONTHS ENDED 30 SEPTEMBER 2015
Unaudited Six months ended 30 September
2015 2014 Note HK$’000 HK$’000
Cash flows from operating activities Cash generated from operations 201,732 95,423 Interest paid (4,884) (4,438) Hong Kong profits tax paid (237) (1,767) Overseas profits tax paid (10,300) (10,454) Overseas profits tax refunded 644 422
Net cash generated from operating activities 186,955 79,186
Cash flows from investing activities Purchase of property, plant and equipment (56,278) (45,964) Proceeds from sale of property, plant and equipment 1,104 484 Investment in an associate – (30,483) Acquisition of a subsidiary 22 7,871 – Disposal of prepayment of lease premium 1,551 – Interest received 957 598
Net cash used in investing activities (44,795) (75,365)
Cash flows from financing activities Drawdown of bank loans 351,218 478,713 Repayment of bank loans (479,782) (492,209) Capital element of finance lease payments (36) (124) Dividends paid to the Company’s shareholders (10,465) (38,719) Dividends paid to non-controlling interests – (114) Interest paid on convertible bonds (6,493) (7,040)
Net cash used in financing activities (145,558) (59,493)
Net decrease in cash and cash equivalents (3,398) (55,672)Cash and cash equivalents at 1 April 460,143 457,683Effect of foreign exchange rate changes 369 17,945
Cash and cash equivalents at 30 September 457,114 419,956
Analysis of the balance of cash and cash equivalents: Cash and bank balances 457,114 419,956

– 5 –
CONDENSED CONSOLIDATED STATEMENT OF CHANGES IN EQUITYFOR THE SIX MONTHS ENDED 30 SEPTEMBER 2015
Unaudited
Attributable to equity holders of the Company
Convertible Non- Share Share Revaluation Exchange bonds Retained controlling capital premium reserve reserve reserve earnings Total interest Total equity HK$’000 HK$’000 HK$’000 HK$’000 HK$’000 HK$’000 HK$’000 HK$’000 HK$’000
At 1 April 2014 104,647 1,977 13,080 15,240 77,090 1,246,304 1,458,338 7,483 1,465,821
Profit for the period – – – – – 105,196 105,196 222 105,418Other comprehensive income: Exchange differences – – – 19,258 – – 19,258 (76) 19,182
Total comprehensive income for the period ended 30 September 2014 – – – 19,258 – 105,196 124,454 146 124,600
Dividends paid – – – – – (38,719) (38,719) (114) (38,833)
At 30 September 2014 104,647 1,977 13,080 34,498 77,090 1,312,781 1,544,073 7,515 1,551,588
At 1 April 2015 104,647 1,977 10,401 (26,046) 77,090 1,278,411 1,446,480 7,350 1,453,830
(Loss)/profit for the period – – – – – (33,079) (33,079) 45 (33,034)Other comprehensive loss: Exchange differences – – – (56,460) – – (56,460) (938) (57,398) Revaluation of available-for-sale financial assets – – (63) – – – (63) – (63)
Total comprehensive loss for the period ended 30 September 2015 – – (63) (56,460) – (33,079) (89,602) (893) (90,495)
Dividends paid – – – – – (10,465) (10,465) – (10,465)
At 30 September 2015 104,647 1,977 10,338 (82,506) 77,090 1,234,867 1,346,413 6,457 1,352,870
– 6 –
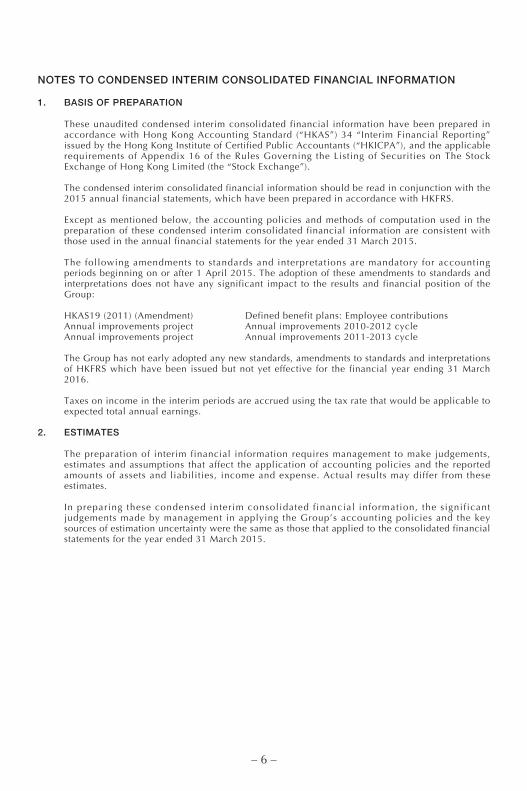
NOTES TO CONDENSED INTERIM CONSOLIDATED FINANCIAL INFORMATION
1. BASIS OF PREPARATION
These unaudited condensed interim consolidated financial information have been prepared in accordance with Hong Kong Accounting Standard (“HKAS”) 34 “Interim Financial Reporting” issued by the Hong Kong Institute of Certified Public Accountants (“HKICPA”), and the applicable requirements of Appendix 16 of the Rules Governing the Listing of Securities on The Stock Exchange of Hong Kong Limited (the “Stock Exchange”).
The condensed interim consolidated financial information should be read in conjunction with the 2015 annual financial statements, which have been prepared in accordance with HKFRS.
Except as mentioned below, the accounting policies and methods of computation used in the preparation of these condensed interim consolidated financial information are consistent with those used in the annual financial statements for the year ended 31 March 2015.
The following amendments to standards and interpretations are mandatory for accounting periods beginning on or after 1 April 2015. The adoption of these amendments to standards and interpretations does not have any significant impact to the results and financial position of the Group:
HKAS19 (2011) (Amendment) Defined benefit plans: Employee contributionsAnnual improvements project Annual improvements 2010-2012 cycleAnnual improvements project Annual improvements 2011-2013 cycle
The Group has not early adopted any new standards, amendments to standards and interpretations of HKFRS which have been issued but not yet effective for the financial year ending 31 March 2016.
Taxes on income in the interim periods are accrued using the tax rate that would be applicable to expected total annual earnings.
2. ESTIMATES
The preparation of interim financial information requires management to make judgements, estimates and assumptions that affect the application of accounting policies and the reported amounts of assets and liabilities, income and expense. Actual results may differ from these estimates.
In preparing these condensed interim consolidated f inancial information, the signif icant judgements made by management in applying the Group’s accounting policies and the key sources of estimation uncertainty were the same as those that applied to the consolidated financial statements for the year ended 31 March 2015.

– 7 –
3. FINANCIAL RISK MANAGEMENT
3.1 Financial risk factors
The Group’s activities expose it to a variety of financial risks: foreign exchange risk, interest rate risk, credit risk and liquidity risk.
The condensed interim consolidated financial information do not include all financial risk management information and disclosures required in the annual financial statements, and should be read in conjunction with the Group’s annual financial statements as at 31 March 2015.
There have been no changes in the risk management policies since year end.
3.2 Fair value estimation
The Group’s financial instruments carried at fair value is analysed by valuation method. The different levels have been defined as follows:
– Quoted prices (unadjusted) in active markets for identical assets or liabilities (level 1).
– Inputs other than quoted prices included within level 1 that are observable for the asset or liability, either directly (that is, as prices) or indirectly (that is, derived from prices) (level 2).
– Inputs for the asset or liability that are not based on observable market data (that is, unobservable inputs) (level 3).
The Group’s available-for-sale financial assets and liability components of convertible bonds are measured at fair value and are classified as level 3.
There were no movements in the available-for-sale financial assets during the period.
There were no transfer of financial instruments into or out of level 3 during the period.
The Group’s level 3 instruments are determined by using valuation techniques including discount cash flow analysis, with reference to inputs such as dividend stream, discount rates and other specific input relevant to those particular financial instruments.
There were no changes in valuation techniques during the period.
3.3 Group’s valuation process
The Group’s finance department reviews the valuations of the Group’s financial instruments that are stated at fair value for financial reporting purposes, including level 3 fair values. These valuation results are then reported to the chief financial officer and group senior management for discussions in relation to the valuation processes and the reasonableness of the valuation results.
3.4 Fair value of financial assets and liabilities measured at amortised cost
The carrying amounts of the Group’s financial assets including cash and cash equivalents, deposits in approved financial institutions and debtors and financial liabilities including creditors and short-term borrowings, approximate their fair values due to their short maturities.

– 8 –
4. SEGMENT INFORMATION
The chief operating decision-makers have been identified as the executive directors. The executive directors review the Group’s financial information mainly from product and geographical perspective. From a geographical perspective, the executive directors assesses the performance of the Group’s watch and optical operations in Hong Kong, Macau and Mainland China and rest of Asia.
Sales between operating segments are carried out on terms equivalent to those prevailing in arm’s length transactions. The executive directors assess the performance of the operating segments based on a measure of adjusted earnings before interest and tax (EBIT). This measurement basis excludes net corporate expenses.
Six months ended 30 September 2015
Watch retail Optical retail
Hong Kong, Hong Kong, Macau and Macau and Mainland Rest of Mainland Rest of Wholesale Group China Asia China Asia trading Total HK$’000 HK$’000 HK$’000 HK$’000 HK$’000 HK$’000
Revenues Gross segment 759,817 198,103 544,678 114,927 328,810 1,946,335 Inter-segment – – – – (160,131) (160,131)
759,817 198,103 544,678 114,927 168,679 1,786,204
Segment results 39,308 (23,622) 26,120 (11,534) 36,662 66,934
Net corporate expenses (47,355)
Operating profit 19,579Finance costs (43,173)
Loss before income tax (23,594)Income tax expense (9,440)
Loss after income tax (33,034)

– 9 –
4. SEGMENT INFORMATION (Continued)
Six months ended 30 September 2014
Watch retail Optical retail
Hong Kong, Hong Kong, Macau and Macau and Mainland Rest of Mainland Rest of Wholesale Group China Asia China Asia trading Total HK$’000 HK$’000 HK$’000 HK$’000 HK$’000 HK$’000
Revenues Gross segment 855,187 234,897 562,004 139,729 539,867 2,331,684 Inter-segment – – – – (331,335) (331,335)
855,187 234,897 562,004 139,729 208,532 2,000,349
Segment results 127,498 (12,467) 36,236 (4,034) 59,134 206,367
Net corporate expenses (50,249)
Operating profit 156,118Finance costs (16,630)Share of loss of an associate (913)
Profit before income tax 138,575Income tax expense (33,157)
Profit after income tax 105,418
There have been no material changes in total assets and total liabilities from the amount disclosed in the last annual financial statements.
5. REVENUES
Six months ended 30 September 2015 2014 HK$’000 HK$’000
Turnover Sales of goods 1,786,204 2,000,349
– 10 –
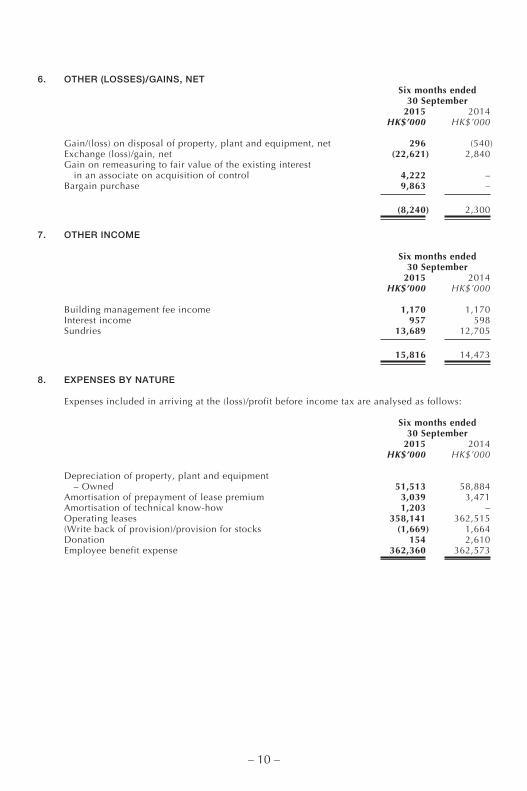
6. OTHER (LOSSES)/GAINS, NET Six months ended 30 September 2015 2014 HK$’000 HK$’000
Gain/(loss) on disposal of property, plant and equipment, net 296 (540)Exchange (loss)/gain, net (22,621) 2,840Gain on remeasuring to fair value of the existing interest in an associate on acquisition of control 4,222 –Bargain purchase 9,863 –
(8,240) 2,300
7. OTHER INCOME
Six months ended 30 September 2015 2014 HK$’000 HK$’000
Building management fee income 1,170 1,170Interest income 957 598Sundries 13,689 12,705
15,816 14,473
8. EXPENSES BY NATURE
Expenses included in arriving at the (loss)/profit before income tax are analysed as follows:
Six months ended 30 September 2015 2014 HK$’000 HK$’000
Depreciation of property, plant and equipment – Owned 51,513 58,884Amortisation of prepayment of lease premium 3,039 3,471Amortisation of technical know-how 1,203 –Operating leases 358,141 362,515(Write back of provision)/provision for stocks (1,669) 1,664Donation 154 2,610Employee benefit expense 362,360 362,573
– 11 –
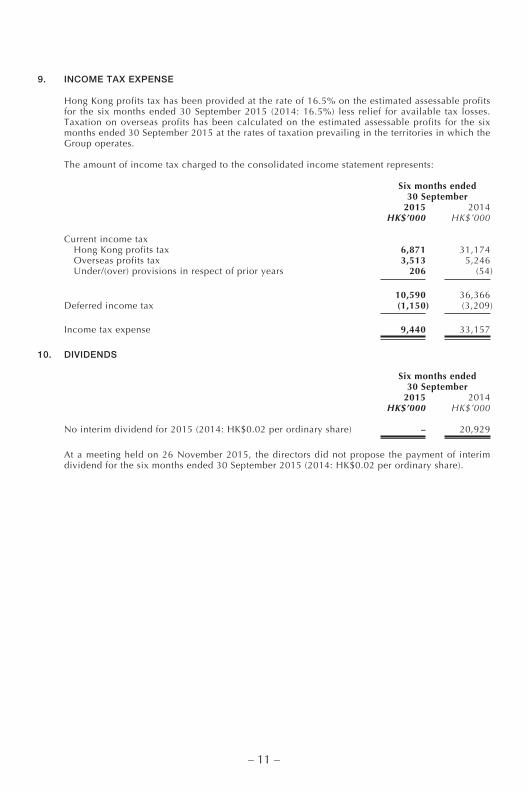
9. INCOME TAX EXPENSE
Hong Kong profits tax has been provided at the rate of 16.5% on the estimated assessable profits for the six months ended 30 September 2015 (2014: 16.5%) less relief for available tax losses. Taxation on overseas profits has been calculated on the estimated assessable profits for the six months ended 30 September 2015 at the rates of taxation prevailing in the territories in which the Group operates.
The amount of income tax charged to the consolidated income statement represents:
Six months ended 30 September 2015 2014 HK$’000 HK$’000
Current income tax Hong Kong profits tax 6,871 31,174 Overseas profits tax 3,513 5,246 Under/(over) provisions in respect of prior years 206 (54)
10,590 36,366Deferred income tax (1,150) (3,209)
Income tax expense 9,440 33,157
10. DIVIDENDS
Six months ended 30 September 2015 2014 HK$’000 HK$’000
No interim dividend for 2015 (2014: HK$0.02 per ordinary share) – 20,929
At a meeting held on 26 November 2015, the directors did not propose the payment of interim dividend for the six months ended 30 September 2015 (2014: HK$0.02 per ordinary share).
– 12 –
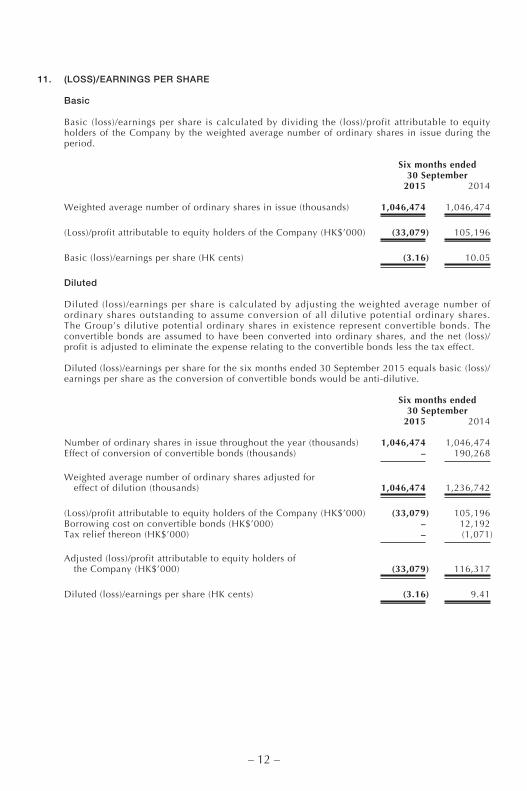
11. (LOSS)/EARNINGS PER SHARE
Basic
Basic (loss)/earnings per share is calculated by dividing the (loss)/profit attributable to equity holders of the Company by the weighted average number of ordinary shares in issue during the period.
Six months ended 30 September 2015 2014
Weighted average number of ordinary shares in issue (thousands) 1,046,474 1,046,474
(Loss)/profit attributable to equity holders of the Company (HK$’000) (33,079) 105,196
Basic (loss)/earnings per share (HK cents) (3.16) 10.05
Diluted
Diluted (loss)/earnings per share is calculated by adjusting the weighted average number of ordinary shares outstanding to assume conversion of all dilutive potential ordinary shares. The Group’s dilutive potential ordinary shares in existence represent convertible bonds. The convertible bonds are assumed to have been converted into ordinary shares, and the net (loss)/profit is adjusted to eliminate the expense relating to the convertible bonds less the tax effect.
Diluted (loss)/earnings per share for the six months ended 30 September 2015 equals basic (loss)/earnings per share as the conversion of convertible bonds would be anti-dilutive.
Six months ended 30 September 2015 2014
Number of ordinary shares in issue throughout the year (thousands) 1,046,474 1,046,474Effect of conversion of convertible bonds (thousands) – 190,268
Weighted average number of ordinary shares adjusted for effect of dilution (thousands) 1,046,474 1,236,742
(Loss)/profit attributable to equity holders of the Company (HK$’000) (33,079) 105,196Borrowing cost on convertible bonds (HK$’000) – 12,192Tax relief thereon (HK$’000) – (1,071)
Adjusted (loss)/profit attributable to equity holders of the Company (HK$’000) (33,079) 116,317
Diluted (loss)/earnings per share (HK cents) (3.16) 9.41
– 13 –
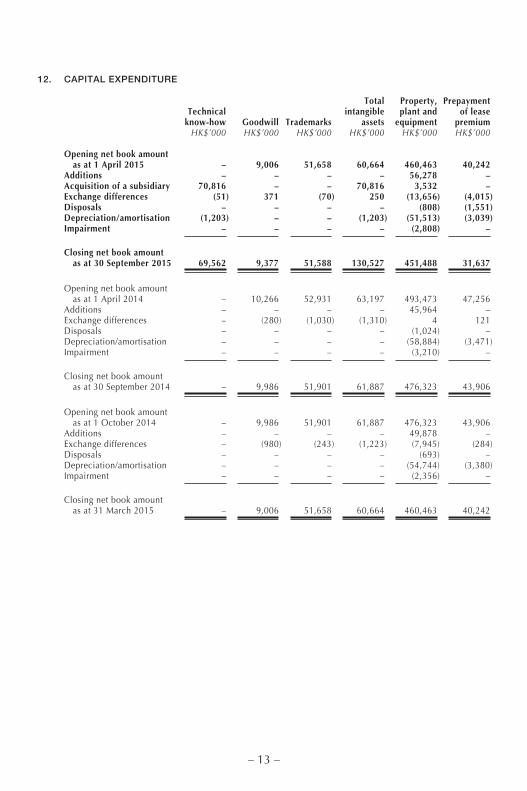
12. CAPITAL EXPENDITURE
Total Property, Prepayment Technical intangible plant and of lease know-how Goodwill Trademarks assets equipment premium HK$’000 HK$’000 HK$’000 HK$’000 HK$’000 HK$’000
Opening net book amount as at 1 April 2015 – 9,006 51,658 60,664 460,463 40,242Additions – – – – 56,278 –Acquisition of a subsidiary 70,816 – – 70,816 3,532 –Exchange differences (51) 371 (70) 250 (13,656) (4,015)Disposals – – – – (808) (1,551)Depreciation/amortisation (1,203) – – (1,203) (51,513) (3,039)Impairment – – – – (2,808) –
Closing net book amount as at 30 September 2015 69,562 9,377 51,588 130,527 451,488 31,637
Opening net book amount as at 1 April 2014 – 10,266 52,931 63,197 493,473 47,256Additions – – – – 45,964 –Exchange differences – (280) (1,030) (1,310) 4 121Disposals – – – – (1,024) –Depreciation/amortisation – – – – (58,884) (3,471)Impairment – – – – (3,210) –
Closing net book amount as at 30 September 2014 – 9,986 51,901 61,887 476,323 43,906
Opening net book amount as at 1 October 2014 – 9,986 51,901 61,887 476,323 43,906Additions – – – – 49,878 –Exchange differences – (980) (243) (1,223) (7,945) (284)Disposals – – – – (693) –Depreciation/amortisation – – – – (54,744) (3,380)Impairment – – – – (2,356) –
Closing net book amount as at 31 March 2015 – 9,006 51,658 60,664 460,463 40,242
– 14 –
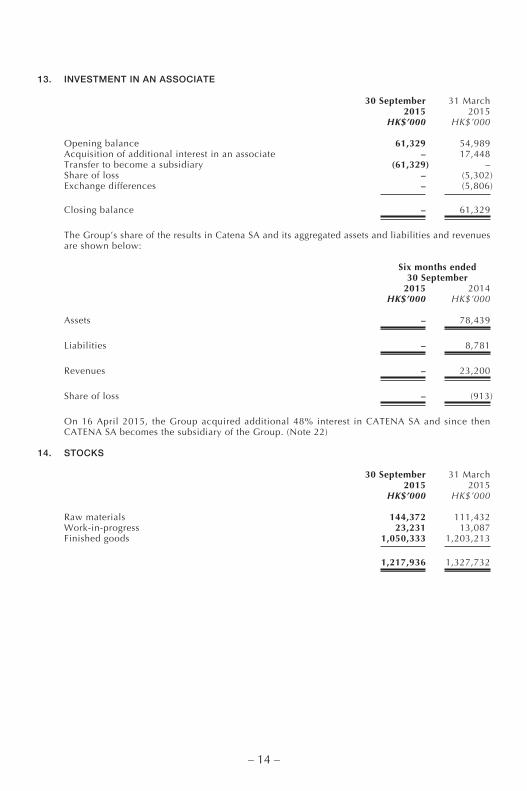
13. INVESTMENT IN AN ASSOCIATE
30 September 31 March 2015 2015 HK$’000 HK$’000
Opening balance 61,329 54,989Acquisition of additional interest in an associate – 17,448Transfer to become a subsidiary (61,329) –Share of loss – (5,302)Exchange differences – (5,806)
Closing balance – 61,329
The Group’s share of the results in Catena SA and its aggregated assets and liabilities and revenues are shown below:
Six months ended 30 September 2015 2014 HK$’000 HK$’000
Assets – 78,439
Liabilities – 8,781
Revenues – 23,200
Share of loss – (913)
On 16 April 2015, the Group acquired additional 48% interest in CATENA SA and since then CATENA SA becomes the subsidiary of the Group. (Note 22)
14. STOCKS
30 September 31 March 2015 2015 HK$’000 HK$’000
Raw materials 144,372 111,432Work-in-progress 23,231 13,087Finished goods 1,050,333 1,203,213
1,217,936 1,327,732
– 15 –
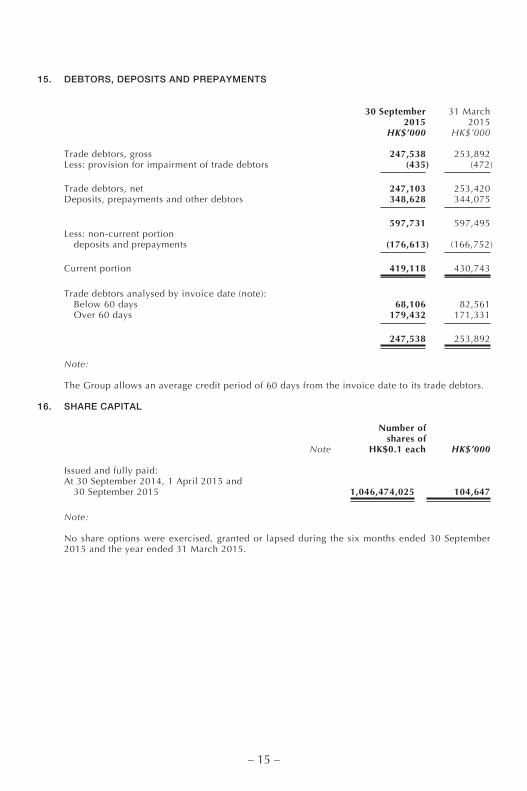
15. DEBTORS, DEPOSITS AND PREPAYMENTS
30 September 31 March 2015 2015 HK$’000 HK$’000
Trade debtors, gross 247,538 253,892Less: provision for impairment of trade debtors (435) (472)
Trade debtors, net 247,103 253,420Deposits, prepayments and other debtors 348,628 344,075
597,731 597,495Less: non-current portion deposits and prepayments (176,613) (166,752)
Current portion 419,118 430,743
Trade debtors analysed by invoice date (note): Below 60 days 68,106 82,561 Over 60 days 179,432 171,331
247,538 253,892
Note:
The Group allows an average credit period of 60 days from the invoice date to its trade debtors.
16. SHARE CAPITAL
Number of shares of Note HK$0.1 each HK$’000
Issued and fully paid:At 30 September 2014, 1 April 2015 and 30 September 2015 1,046,474,025 104,647
Note:
No share options were exercised, granted or lapsed during the six months ended 30 September 2015 and the year ended 31 March 2015.
– 16 –
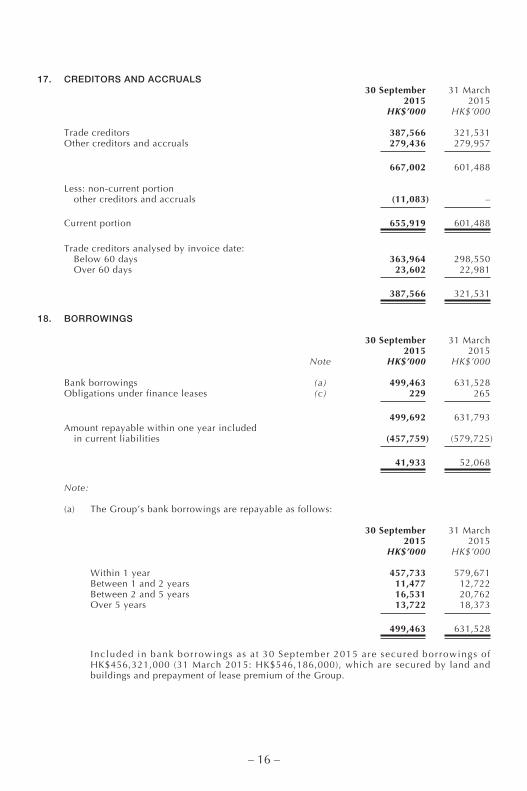
17. CREDITORS AND ACCRUALS 30 September 31 March 2015 2015 HK$’000 HK$’000
Trade creditors 387,566 321,531Other creditors and accruals 279,436 279,957
667,002 601,488
Less: non-current portion other creditors and accruals (11,083) –
Current portion 655,919 601,488
Trade creditors analysed by invoice date: Below 60 days 363,964 298,550 Over 60 days 23,602 22,981
387,566 321,531
18. BORROWINGS
30 September 31 March 2015 2015 Note HK$’000 HK$’000
Bank borrowings (a) 499,463 631,528Obligations under finance leases (c) 229 265
499,692 631,793Amount repayable within one year included in current liabilities (457,759) (579,725)
41,933 52,068
Note:
(a) The Group’s bank borrowings are repayable as follows:
30 September 31 March 2015 2015 HK$’000 HK$’000
Within 1 year 457,733 579,671Between 1 and 2 years 11,477 12,722Between 2 and 5 years 16,531 20,762Over 5 years 13,722 18,373
499,463 631,528
Inc luded in bank bor rowings as a t 30 September 2015 are secured bor rowings o f HK$456,321,000 (31 March 2015: HK$546,186,000), which are secured by land and buildings and prepayment of lease premium of the Group.

– 17 –
18. BORROWINGS (Continued)
Note: (Continued)
(b) Movement in bank loans during the period is analysed as follows:
Six months ended 30 September
2015 2014 HK$’000 HK$’000
Opening balance 631,528 534,463Drawdown of bank loans 351,218 478,713Repayment of bank loans (479,782) (492,209)Exchange differences (3,501) (95)
Closing balance 499,463 520,872
(c) The obligations under finance leases are payable as follows:
30 September 31 March 2015 2015 HK$’000 HK$’000
Within 1 year 29 60Between 1 and 2 years 59 60Between 2 and 5 years 171 179
259 299Future finance charges on finance leases (30) (34)
Present value of finance lease liabilities 229 265
The present value of finance lease liabilities is analysed as follows:
30 September 31 March 2015 2015 HK$’000 HK$’000
Within 1 year 26 53Between 1 and 2 years 52 53Between 2 and 5 years 151 159
229 265
19. CONVERTIBLE BONDS
The movement of the liability component of the convertible bonds for the period is set out below:
Six months ended 30 September 2015 2014 HK$’000 HK$’000
Liability component at 1 April 380,753 331,456Changes in fair value included in finance costs 37,760 12,212Interest incurred/accrued (6,493) (6,511)
Liability component at 30 September 412,020 337,157
During the period ended 30 September 2015, none of the bonds were redeemed, converted, purchased or cancelled.

– 18 –
20. COMMITMENTS
30 September 31 March 2015 2015 HK$’000 HK$’000
Capital commitments for property, plant and equipment: Contracted but not provided for 6,509 8,950
21. RELATED PARTY TRANSACTIONS
Parties are considered to be related if one party has the ability, directly or indirectly, to control the other party or exercise significant influence over the other party in making financial and operating decisions. Parties are also considered to be related if they are subject to common control or common significant influence.
Yee Hing Company Limited (“Yee Hing”), directly and indirectly through its subsidiary including Active Lights Company Limited, held 1,195,100 shares of the Company as at 30 September 2015. 55% of the total issued ordinary shares of Yee Hing is held by Klayze Holdings Limited, which is the trustee of a discretionary trust (the “Trust”). Mr. Joseph C.C. Wong and Mr. Sakorn Kanjanapas are the beneficiaries of the Trust and were therefore deemed to be interested in 1,195,100 shares of the Company through the Trust’s interest in Yee Hing.
The following is a summary of the significant related party transactions carried out in the normal course of the Group’s business:
(i) Sales of goods and services to related companies
Six months ended 30 September
2015 2014 HK$’000 HK$’000
Service income from a related company (note) 1,170 1,170
Note: A wholly-owned subsidiary of the Group entered into a renewal agreement with Mengiwa Property Investment Limited (“MPIL”), a wholly-owned subsidiary company of Yee Hing, for the provision of the following services for the period from 1 April 2013 to 31 March 2016:
(a) contract administration with respect to contracts entered into between MPIL and third parties from time to time;
(b) property agency liaison and tenancy management;
(c) management of the property manager of Stelux House; and
(d) other miscellaneous administrative services.
The fee for the provision of the above services was agreed at HK$195,000 per calendar month during the duration of the agreement.

– 19 –
21. RELATED PARTY TRANSACTIONS (Continued)
(ii) Purchases of goods and services from related companies
Six months ended 30 September
2015 2014 HK$’000 HK$’000
Purchases of goods from a related company (note a) 648 558Rental expense to related companies (note b) 8,569 6,989
Note:
(a) During the period, certain subsidiaries of the Group purchased optical products from International Optical Manufacturing Company Limited and its subsidiary (“IOM Group”), indirectly owned subsidiaries of Yee Hing, in accordance with the terms of written agreements for the Group’s retail and trading operations.
(b) During the period, certain subsidiaries of the Group have entered into tenancy agreements with the following related parties for office premises, warehouses, showroom and car-parking spaces:
Rental paid for the six months ended 30 September
2015 2014 HK$’000 HK$’000
MPIL 7,582 6,005Other related parties 987 984
8,569 6,989
(iii) Period/year-end balances arising from service income, purchases of goods and rental expenses
30 September 31 March 2015 2015 HK$’000 HK$’000
Trading balances receivable from related companies 5,314 5,150Trading balances payable to related companies (32) (1,413)
(iv) Key management compensation
Six months ended 30 September
2015 2014 HK$’000 HK$’000
Salaries and other short-term employee benefits 8,367 10,935Other long-term benefits 84 108
8,451 11,043
– 20 –
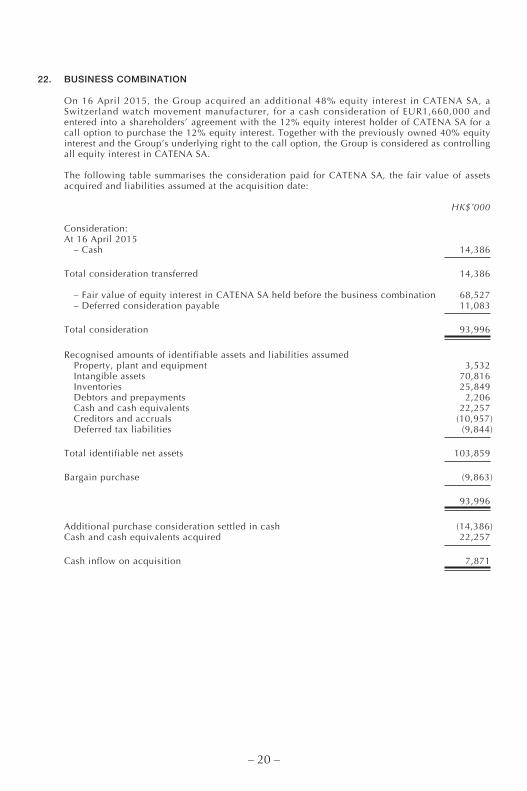
22. BUSINESS COMBINATION
On 16 April 2015, the Group acquired an additional 48% equity interest in CATENA SA, a Switzerland watch movement manufacturer, for a cash consideration of EUR1,660,000 and entered into a shareholders’ agreement with the 12% equity interest holder of CATENA SA for a call option to purchase the 12% equity interest. Together with the previously owned 40% equity interest and the Group’s underlying right to the call option, the Group is considered as controlling all equity interest in CATENA SA.
The following table summarises the consideration paid for CATENA SA, the fair value of assets acquired and liabilities assumed at the acquisition date:
HK$’000
Consideration:At 16 April 2015 – Cash 14,386
Total consideration transferred 14,386
– Fair value of equity interest in CATENA SA held before the business combination 68,527 – Deferred consideration payable 11,083
Total consideration 93,996
Recognised amounts of identifiable assets and liabilities assumed Property, plant and equipment 3,532 Intangible assets 70,816 Inventories 25,849 Debtors and prepayments 2,206 Cash and cash equivalents 22,257 Creditors and accruals (10,957) Deferred tax liabilities (9,844)
Total identifiable net assets 103,859
Bargain purchase (9,863)
93,996
Additional purchase consideration settled in cash (14,386)Cash and cash equivalents acquired 22,257
Cash inflow on acquisition 7,871

– 21 –
22. BUSINESS COMBINATION (Continued)
Acquisition-related costs of HK$770,000 have been charged to administrative expenses in the condensed consolidated income statement for the six months ended 30 September 2015.
The Group recognised a gain of HK$4,222,000 as a result of remeasuring at fair value its 40% equity interest in CATENA SA held before the business combination. The gain is included in other (losses)/gains, net in the condensed consolidated income statement for the six months ended 30 September 2015.
A gain on bargain purchase of HK$9,863,000 has been recognised to other (losses)/gains, net in the condensed consolidated income statement for the six months ended 30 September 2015.
CATENA SA contributed a revenue of approximately HK$625,000 and a loss of approximately HK$8,913,000 to the Group for the six months ended 30 September 2015.
Had CATENA SA been consolidated from 1 April 2015, the condensed consolidated income statement would show revenue of approximately HK$1,786,204,000 and a loss of approximately HK$33,034,000.

– 22 –
MANAGEMENT DISCUSSION AND ANALYSIS
BUSINESS REVIEW
• Group Turnover decrease by 10.7% (FX neutral: 7.9%)
• Group Gross Profit Margin down 1.8% to 59.8%
• Group Net Loss at HK$33.1 million
• Group operating cost down 3.3% including rental reduction of 1.2%
• Inventory reduced by HK$109.8 million, (8.3%) vs March 2015
• Gearing ratio improved to 33.8% from 38.2%
The Group’s businesses comprise principally of watch retailing (“CITY CHAIN”), optical retailing (“OPTICAL 88” and “eGG Optical Boutique”); and the wholesale trading of watches (“SEIKO” and “Suunto”). Operating 645 stores, our businesses offer affordable lifestyle products and quality services targeting the middle income consumer in Asia.
For the six months ended 30 September 2015 (“1H 2015”), the Group reported a decrease in turnover of 10.7% to HK$1,786.2 million (FX neutral: 7.9 %) and a net loss attributable to its equity holders of HK$33.1 million (1H 2014: net profit of HK$105.2 million) as the interim period posed challenging due to persistent weak consumer spending across the regions where we operate and the appreciation of the Hong Kong dollar against various Asian currencies. Excluding the non-cash impact of borrowing costs of convertible bonds of HK$34.1 million, fair value gain on acquisition of a subsidiary of HK$14.1 million and an exchange loss of HK$22.6 million, the Group would have reported a Profit Attributable to Shareholders of HK$9.5 million (1H 2014: HK$110.7 million).
Shop and office operation costs fell by 3.3%, including reduction of rental expenses by 1.2% (1H 2014: increase of 6.3% year on year) compared to 1H 2014 given prevailing inflationary pressures in the regions where we operate.
The Group continued to adopt a conservative approach to financial management and focused on strengthening working capital and liquidity; and tightening procurement, inventory management and rationalization. As such, Group inventory was reduced to HK$1,217.9 million, down 8.3% (HK$109.8 million) and 14.8% (HK$211.4 million) respectively against that as at the end of March 2015 and September 2014. Due to inventory optimization, Group gross profit margin decreased to 59.8% (2014: 61.6%) but gross profit margins at both Optical 88 and eGG improved slightly notwithstanding the competitive market and poor sentiment.
Owing to tightened inventory management and reduced purchases, net debts decreased by HK$97.8 million to HK$454.6 million (March 2015: HK$552.4 million), with a notable decrease in short term bank borrowings of HK$121.9 million. Group gearing ratio improved to 33.8% as at 30 September 2015 compared to 38.2% as at 31 March 2015 and Group operating cash inflow increased substantially to around HK$ 187.0 million(2014: HK$79.2 million).
– 23 –
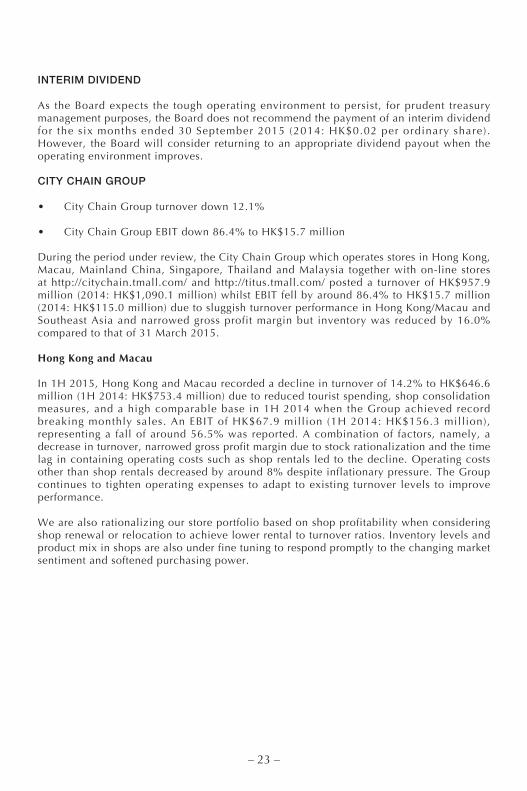
INTERIM DIVIDEND
As the Board expects the tough operating environment to persist, for prudent treasury management purposes, the Board does not recommend the payment of an interim dividend for the six months ended 30 September 2015 (2014: HK$0.02 per ordinary share) . However, the Board will consider returning to an appropriate dividend payout when the operating environment improves.
CITY CHAIN GROUP
• City Chain Group turnover down 12.1%
• City Chain Group EBIT down 86.4% to HK$15.7 million
During the period under review, the City Chain Group which operates stores in Hong Kong, Macau, Mainland China, Singapore, Thailand and Malaysia together with on-line stores at http://citychain.tmall.com/ and http://titus.tmall.com/ posted a turnover of HK$957.9 million (2014: HK$1,090.1 million) whilst EBIT fell by around 86.4% to HK$15.7 million (2014: HK$115.0 million) due to sluggish turnover performance in Hong Kong/Macau and Southeast Asia and narrowed gross profit margin but inventory was reduced by 16.0% compared to that of 31 March 2015.
Hong Kong and Macau
In 1H 2015, Hong Kong and Macau recorded a decline in turnover of 14.2% to HK$646.6 million (1H 2014: HK$753.4 million) due to reduced tourist spending, shop consolidation measures, and a high comparable base in 1H 2014 when the Group achieved record breaking monthly sales. An EBIT of HK$67.9 million (1H 2014: HK$156.3 million), representing a fall of around 56.5% was reported. A combination of factors, namely, a decrease in turnover, narrowed gross profit margin due to stock rationalization and the time lag in containing operating costs such as shop rentals led to the decline. Operating costs other than shop rentals decreased by around 8% despite inflationary pressure. The Group continues to tighten operating expenses to adapt to existing turnover levels to improve performance.
We are also rationalizing our store portfolio based on shop profitability when considering shop renewal or relocation to achieve lower rental to turnover ratios. Inventory levels and product mix in shops are also under fine tuning to respond promptly to the changing market sentiment and softened purchasing power.

– 24 –
Mainland China
Mainland China continues to be a key market where the Group will focus its long term growth plans.
In 1H 2015, our Mainland operations achieved moderate sales growth of 11.2% to HK$113.2 million (1H 2014: HK$ 101.8 million) despite the slowing economy, driven mostly by positive same store sales growth especially in the Eastern (around 27%) and Southwest regions (around 40%). Due to aggressive price cuts by competitors and a change in stock management strategy, gross profit margins came under pressure. Stock clearance initiatives have proven successful and we are on track towards maintaining a healthier and more competitive inventory balance. Loss, standing at HK$28.6 million remained similar to that of last year (1H 2014: HK$ 28.8 million) since most of the uplift in sales was offset by the drop in gross profit margin. Notably, the loss posted by existing operations in Northern China fell by around 57% compared to the same period last year due to restructuring efforts taken in Q2.
A few initiatives spurred sales growth-management structure was fine-tuned to fully unleash synergies, share best practices and maximize efficiencies, whilst investment on advertising especially in social media to enhance brand awareness of our house brand “TITUS” was also strengthened. Moreover, we revisited our network expansion strategy and shop portfolio to ensure scalable contributions from new shops.
We expect to accelerate network expansion, increasing penetration in regions where we have a presence, and also setting up in multiple second and third tier cities where we do not yet have a presence to achieve economies of scale.
South East Asia
In 1H 2015, our watch retai l business in Southeast Asia was adversely af fected by weakening economic fundamentals, with poor consumer sentiment and weak local currencies. Turnover dropped by 15.7% to HK$198.1 mill ion (1H 2014: HK$234.9 million). In local currency terms, turnover dropped by 4% while shop months fell by about 11.3% due to the store consolidation efforts in Thailand and Singapore. Due to inventory clearance and market competition, gross profit margin was reduced. A loss of HK$23.6 million was recorded (1H 2014: a loss of HK$12.5 million), but a large part of the loss was attributed to the sharp depreciation of the Malaysian ringgit. On an exchange neutral basis the loss would have been maintained at HK$13.2 million (1H 2014: HK$12.5 million).
The retail sector in Malaysia was severely affected by the introduction of GST in April 2015 and the depreciation of Malaysian ringgit. Despite this, turnover in local currency terms remained stable due to successful restructuring and re-merchandising measures adopted.

– 25 –
In Singapore, store consolidation and productivity enhancement measures have been very successful and we have seen sales per shop month improving significantly by 22.5% and at the same time operating costs have fallen by 19.6%. This has helped to narrow the loss by 33.6% to HK$8.3 million (1H 2014: a loss of HK$12.5 million).
The unstable political situation in Thailand and high household debt ratio has resulted in very low consumer confidence which has continued to fall since January 2015. Due to this, our Thai operations, posted a 24.2% (FX neutral: 18.8%) decline in turnover. We have implemented aggressive store consolidation measures with over 10 non-performing stores closed, and these store consolidation efforts will continue in the 2nd half of FY15/16 (“2H”). Cost control measures were also implemented reducing our operating costs by 22.0%.
OPTICAL 88 GROUP
• Optical 88 Group turnover down 10.5%
• Optical 88 Group EBIT down 53.2% to HK$18.0 million
Although, Optical 88 Hong Kong and Macau posted prof i table resul ts , the overal l performance of the Optical 88 Group was affected by weak performance in Hong Kong/Macau and Southeast Asia combined with weak local currencies in Southeast Asia.
For the period under review, the Optical 88 Group posted a turnover of HK$579.1 million down 10.5% (1H 2014: HK$ 646.8 million) and an EBIT of HK$18.0 million down 53.2% (2014: HK$ 38.4 million).
Hong Kong and Macau
For the period under review, turnover decreased by around 8.9% to HK$407.1 million (1H 2014: HK$446.8 million). Further, EBIT declined by around 32.6% to HK$36.9 million (1H 2014: HK$54.7 million) despite efforts in cutting operating costs (other than shop rentals) by around 7.4%. The turnover performance was impacted by the softened demand from local customers and tourists but gross profit margin remained healthy and stable.
Mainland China
Building on Optical 88’s professional and healthcare positioning, we will continue to expand our shop network in Mainland China and as such in the 2H of FY15/16, we aim to accelerate network expansion in the Southern and Southwest regions to further strengthen our market share, paving for further expansion into other parts of China.
Mainland China reported a slight decline in sales of 5.3% to HK$ 57.0 million (1H 2014: HK$60.3 million). A stable turnover performance at RMB41.8 million was posted (equivalent to HK$51.9 million) (1H 2014: RMB 41.6 million, equivalent to HK$ 52.0 million) and we sustained our position as one of the leading players in the more mature Southern region despite the very keen price competition and achieved robust sales growth of 22.3% in the Southwest region. Gross profit margin improved by 2%. Further, operating costs decreased by 11.9% with closure of loss making shops and lower fixed overheads in Eastern China. With improving gross margin and reduced operating costs, losses were reduced substantially by 39.3% to HK$7.4 million (1H 2014: HK$12.2 million). In the Southern region, our operations achieved results close to shop-level breakeven.

– 26 –
South East Asia
Like our watch retail business, our Optical 88 SEA operations faced similar adverse factors. Turnover dropped by 17.8% (FX neutral: 7.1%) to HK$114.9 million (1H 2014: HK$139.7 million) and a loss of HK$11.5 million was recorded (1H 2014: a loss of HK$4.0 million). On an exchange neutral basis, a smaller loss of HK$6.2 million would have been recorded.
With the introduction of GST in Malaysia in April 2015, turnover in the first quarter was impacted. However, we managed to alleviate it to a certain extent in the second quarter, resulting in the stable turnover in local currency compared to that of the corresponding period last year. The market will continue to be challenging for the remaining fiscal year. In the 2H of FY15/16, we will continue to improve our profit margin that has improved by 2.1% in 1H 2015 compared to 1H 2014.
Store consolidation and productivity enhancement measures in Singapore have paid off this year, with loss narrowing by 10.7% to HK$7.5 million (2014: HK$ 8.4 million) through reduction of operating costs by 15.4%. For the 2H of FY15/16, we will focus on improvements in operating efficiency to further reduce the loss in Singapore.
Our Thai operations is still profit generating but recorded a drop in turnover by 19.1% (FX neutral: 13.4%) caused by the significant decline in consumer confidence and purchasing power in Thailand. Severe competition driven by widespread sales promotions in the market has also led to narrowed margin. The tough market is expected to continue in Thailand, and we will consolidate shop operation via closure of non performing shops and continue with our cost control measures, which have reduced our operating costs by 15.7% in the 1H 2015.
eGG OPTICAL BOUTIQUE
• Turnover increased by 46.4% to HK$80.5 million
• Breakeven in Hong Kong
• Loss reduction to HK$3.3 million in PRC
• Continual positive same store sales growth
Currently, there are 21 stores in Hong Kong, 34 stores in Mainland China and 3 new stores in Southeast Asia. In 1H 2015, our eGG business performed well within expectations as turnover increased to HK$80.5 million (1H 2014: HK$55.0 million) with improving margin.
For the period under review, eGG Hong Kong posted almost breakeven results (1H 2014: loss of HK$0.5 million) given continual margin improvement and turnover increased by 45.0% to HK$ 49.5 million (1H 2014: HK$ 34.1 million) with shop expansion.
eGG PRC recorded a turnover of HK$31.0 million (1H 2014: HK$20.8 million), a growth of 48.8%. As the loss was reduced to HK$3.3 million (1H 2014: HK$5.7 million) owing to significant operating improvements in Northern China and close to breakeven achieved in Southwestern China through turnover growth. Combined with eGG’s attractive and eye-catching shop visual merchandising and ability to attract consumer traffic appreciating lifestyle and fashion design, the Group will capture the opportunities in the current soft leasing market to further expand into Mainland China.

– 27 –
SUPPLY CHAIN MANAGEMENT AND WHOLESALE TRADING
This business division is made up of the Group’s supply chain and watch and optical wholesale units.
For the reporting period, turnover fell 19.1% to HK$168.7 million (1H 2014: HK$208.5 million) whilst EBIT was down by 37.9% to HK$36.7 million (1H 2014: HK$59.1 million). The operating performance at our watch wholesale unit was negatively impacted by the widespread sluggish sentiment, contracting order placements from retailers and depreciation of currencies in Malaysia and Singapore.
FUTURE
As evident from the above set of results, the measures and policies we have put in place have been successful and these will continue as we do not foresee a turnaround in market conditions any time soon. We remain confident that the Group is well-positioned to meet challenges ahead and as such store expansion plans will continue in Mainland China in 2H of FY15/16, as we continue to transform the Group to become a major retail player in Greater China.
FINANCE
The Group’s gearing ratio at balance sheet date was 34% (at 31 March 2015: 38%), which was calculated based on the Group’s net debt of HK$455 million (at 31 March 2015: HK$553 million) and shareholders’ funds of HK$1,346 million (at 31 March 2015: HK$1,446 million). The Group’s net debt was calculated based on the Group’s borrowings of HK$500 million (at 31 March 2015: HK$632 million) and convertible bonds of HK$412 million (at 31 March 2015: HK$381 million) less the Group’s bank balances and cash of HK$457 million (at 31 March 2015: HK$460 million). Of the Group’s borrowings at balance sheet date, HK$458 million (at 31 March 2015: HK$580 million) were repayable within 12 months.
Of the Group’s borrowings, 3% (at 31 March 2015: 3%) were denominated in foreign currencies. The Group’s bank borrowings denominated in Hong Kong Dollars were on a floating rate basis at either bank prime lending rates or short term inter-bank offer rates.
The Group does not use any financial instruments for hedging purposes.
The Group does not engage in speculative derivative trading.
As at 30 September 2015, the Group does not have any significant contingent liabilities.
The Group does not have plans for material investments or change of capital assets.

– 28 –
CAPITAL STRUCTURE OF THE GROUP
There was no change in the capital structure of the Group during the period.
CHANGES IN THE COMPOSITION OF THE GROUP
There was no change in the composition of the Group during the period.
NUMBER AND REMUNERATION OF EMPLOYEES, REMUNERATION POLICIES, BONUS AND TRAINING SCHEMES
The Group’s remuneration policies are reviewed on a regular basis and remuneration packages are in line with market practices in the relevant countries where the Group operates. As of 30 September 2015, the Group had 3,864 (at 30 September 2014: 3,631) employees.
DETAILS OF THE CHARGES ON GROUP ASSETS
At 30 September 2015, certain of the Group’s freehold land and buildings amounting to HK$284 million (at 31 March 2015: HK$294 million) were pledged to secure banking facilities granted to the Group.
INTERESTS OF DIRECTORS AND CHIEF EXECUTIVE
Mr Joseph C. C. Wong and Mr Wallace Kwan Chi Kin are eligible to an annual bonus de te rminable under the te rms o f an execut ive bonus scheme wi th respec t to the management of the Group. Provision for the executive bonus in respect of the directors eligible under the Executive Bonus Scheme for the six months ended 30 September 2015 amounted to HK$4,700,000 (2014: HK$7,000,000).
As at 30 September 2015, the interests and short positions of the directors, and the Company’s chief executive in the shares, underlying shares and debentures of the Company or any associated corporation (within the meaning of Part XV of the Securities and Futures Ordinance (“SFO”)) as recorded in the register required to be kept under Section 352 of the SFO or as otherwise notified to the Company and the Stock Exchange pursuant to the Model Code for Securities Transactions by Directors of Listed Companies were as follows:

– 29 –
(a) The Company-Ordinary shares
Long position in shares and underlying shares of the Company
Approximate Number of shares percentage of Personal Family Corporate/ Other issued shareName of Director interest interest trust interest interest Total capital
Mr Joseph C. C. Wong 542,088,814 11,000 1,195,100 – 543,294,914 51.92 (Note 1)
Mr Sakorn Kanjanapas 67,221,078 – 1,195,100 – 68,416,178 6.54 (Note 1)
Mr Wallace Kwan Chi Kin – – – – – –
Notes:
(1) Yee Hing Company Limited, directly and indirectly through its subsidiary including Active Lights Company Limited, held 1,195,100 shares of the Company as at 30 September 2015. 55% of the total issued ordinary shares of Yee Hing Company Limited is held by Klayze Holdings Limited, which is the trustee of a discretionary trust (the “Trust”). Mr. Joseph C.C. Wong and Mr. Sakorn Kanjanapas are the beneficiaries of the Trust and were therefore deemed to be interested in 1,195,100 shares of the Company through the Trust’s interest in Yee Hing Company Limited.
– 30 –
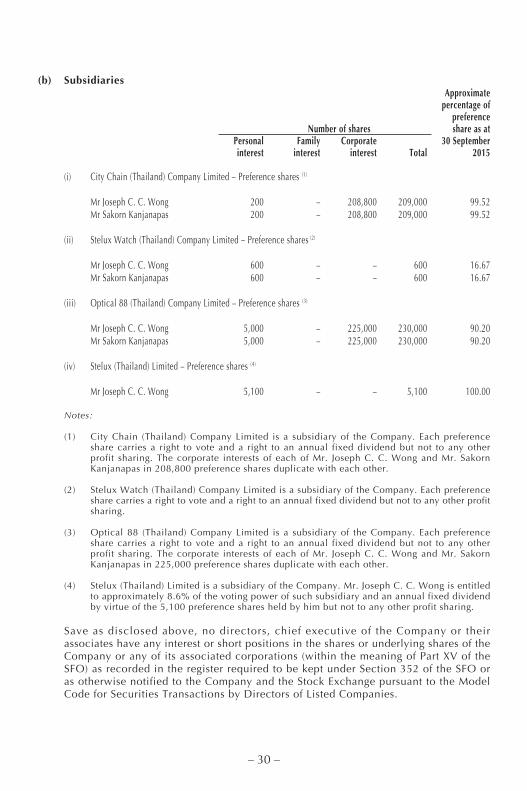
(b) Subsidiaries Approximate percentage of preference Number of shares share as at Personal Family Corporate 30 September interest interest interest Total 2015
(i) City Chain (Thailand) Company Limited – Preference shares (1)
Mr Joseph C. C. Wong 200 – 208,800 209,000 99.52Mr Sakorn Kanjanapas 200 – 208,800 209,000 99.52
(ii) Stelux Watch (Thailand) Company Limited – Preference shares (2)
Mr Joseph C. C. Wong 600 – – 600 16.67Mr Sakorn Kanjanapas 600 – – 600 16.67
(iii) Optical 88 (Thailand) Company Limited – Preference shares (3)
Mr Joseph C. C. Wong 5,000 – 225,000 230,000 90.20Mr Sakorn Kanjanapas 5,000 – 225,000 230,000 90.20
(iv) Stelux (Thailand) Limited – Preference shares (4)
Mr Joseph C. C. Wong 5,100 – – 5,100 100.00
Notes:
(1) City Chain (Thailand) Company Limited is a subsidiary of the Company. Each preference share carries a right to vote and a right to an annual fixed dividend but not to any other profit sharing. The corporate interests of each of Mr. Joseph C. C. Wong and Mr. Sakorn Kanjanapas in 208,800 preference shares duplicate with each other.
(2) Stelux Watch (Thailand) Company Limited is a subsidiary of the Company. Each preference share carries a right to vote and a right to an annual fixed dividend but not to any other profit sharing.
(3) Optical 88 (Thailand) Company Limited is a subsidiary of the Company. Each preference share carries a right to vote and a right to an annual fixed dividend but not to any other profit sharing. The corporate interests of each of Mr. Joseph C. C. Wong and Mr. Sakorn Kanjanapas in 225,000 preference shares duplicate with each other.
(4) Stelux (Thailand) Limited is a subsidiary of the Company. Mr. Joseph C. C. Wong is entitled to approximately 8.6% of the voting power of such subsidiary and an annual fixed dividend by virtue of the 5,100 preference shares held by him but not to any other profit sharing.
Save as disclosed above, no directors, chief executive of the Company or their associates have any interest or short positions in the shares or underlying shares of the Company or any of its associated corporations (within the meaning of Part XV of the SFO) as recorded in the register required to be kept under Section 352 of the SFO or as otherwise notified to the Company and the Stock Exchange pursuant to the Model Code for Securities Transactions by Directors of Listed Companies.

– 31 –
INTERESTS OF SHAREHOLDERS DISCLOSEABLE PURSUANT TO THE SFO
As at 30 September 2015, the following persons had interests in the shares and underlying shares of the Company as recorded in the register required to be kept by the Company under Section 336 of the SFO:
Long position in shares and underlying shares of the Company
Approximate Number of shares percentage of Personal Family Corporate/ Other issued shareName of Director interest interest trust interest interest Total capital
Mr Joseph C. C. Wong 542,088,814 11,000 1,195,100 – 543,294,914 51.92 (Note 1)
Mr Sakorn Kanjanapas 67,221,078 – 1,195,100 – 68,416,178 6.54 (Note 1)
Boyu Capital Holdings Ltd. – – 190,268,000 – 190,268,000 18.18 (Note 2)
NTAsian Discovery Master Fund 54,250,000 – – – 54,250,000 5.18
Notes:
(1) Yee Hing Company Limited, directly and indirectly through its subsidiary including Active Lights Company Limited, held 1,195,100 shares of the Company as at 30 September 2015. 55% of the total issued ordinary shares of Yee Hing Company Limited is held by Klayze Holdings Limited, which is the trustee of a discretionary trust (the “Trust”). Mr. Joseph C.C. Wong and Mr. Sakorn Kanjanapas are the beneficiaries of the Trust and were therefore deemed to be interested in 1,195,100 shares of the Company through the Trust’s interest in Yee Hing Company Limited.
(2) The Company has issued convertible bonds in an aggregate principal amount of HK$371,022,600 to Sapphire Illuminatus Holdings Limited (the “Convertible Bonds”), all of which were outstanding as at 30 September 2015. The Convertible Bonds are convertible into shares of the Company at the initial conversion price of HK$1.95 per new share. Assuming the exercise in full of the conversion right attaching to the Convertible Bonds at the initial conversion price, a total of 190,268,000 new shares of the Company will be issued. Sapphire Illuminatus Holdings Limited is wholly-owned by Boyu Capital Fund I, L.P., which is wholly-owned by Boyu Capital General Partner I, L.P., which is wholly-owned by Boyu Capital General Partner I, Ltd., which is in turn wholly-owned by Boyu Capital Holdings Ltd.
Save as disclosed above, the directors are not aware of any person (other than a director or chief executive of the Company or his/her respective associate(s)), who had an interest or short position in the shares or underlying shares of the Company as recorded in the register required to be kept under Section 336 of the SFO as at 30 September 2015.
SUBSTANTIAL SHAREHOLDING IN OTHER MEMBERS OF THE GROUP
The directors are not aware of any person (other than a director or chief executive of the Company or his/her respective associate (s)) who was directly or indirectly interested in 10% or more of the nominal value of any class of share capital carrying rights to vote in all circumstances at general meetings of any other member of the Group.

– 32 –
OTHER DIRECTORS’ INTERESTS
None of the directors or their respective associates had any interest in a business apart from the Company’s business which competes or is likely to compete, either directly or indirectly with, the Company’s business, or which would be required to be disclosed under Rule 8.10 of the Listing Rules if each of them were a controlling shareholder.
PURCHASE, SALE OR REDEMPTION OF LISTED SECURITIES
The Company has not redeemed any of its shares during the period. Neither the Company nor any of its subsidiaries has purchased or sold any of the Company’s shares during the year.
CORPORATE GOVERNANCE
During the six months ended 30 September 2015, the Company has complied with the Corporate Governance Code as set out in Appendix 14 of the Rules Governing the Listing of Securities on The Stock Exchange of Hong Kong Limited (the “Code”), except for the following deviations:
Code Provision A.2.1
Under Code Provision A.2.1 of the Code, the roles of chairman and chief executive officer (“CEO”) should be separate and should not be performed by the same individual. Under the current organisation structure of the Group, Mr. Joseph C.C. Wong is both Chairman and CEO of the Group. The Board is of the opinion that vesting the roles of both Chairman and CEO in Mr. Joseph C.C. Wong has the benefit of ensuring consistent leadership within the Group thus enabling more effective and efficient strategic planning and execution for the Group. Under this arrangement, the Board also believes that the balance of power and authority will not be compromised and is adequately ensured by the existing Board which comprises experienced and competent individuals with one-third of the Board being independent non-executive directors.
Code Provision A.4.2
Under Code Provision A.4.2, every director, including those appointed for a specific term, should be subject to retirement by rotation at least once every three years. Not all directors of the Company retire strictly under Code Provision A.4.2 but in accordance with the Company’s Bye-Laws. Bye-Law 110(A) stipulates that one-third of the directors of the Company who have been longest serving in office since their last election, except the Chairman or CEO, shall retire from office by rotation at each annual general meeting.
Code Provision B.1.2
This Code deals with the terms of reference of a remuneration committee. The Company has adopted the terms of reference under Code Provision B.1.2(c)(i) except that the terms of reference do not include reviewing and determining the remuneration packages of senior management.
The Company believes that the remuneration packages of senior management should be the responsibility of the executive directors as they are in a better position to appraise their performance.

– 33 –
Audit Committee
On 23 June 2015 and 23 November 2015, the Audi t Commit tee together wi th the management of the Company reviewed the effectiveness of the systems of internal control throughout the Group for the six months ended 30 September 2015 and discussed auditing and financial reporting matters including review of the Group’s results for the year ended 31 March 2015 and for the six months ended 30 September 2015 respectively before they were presented to the Board of directors for approval. The external auditors met with the Audit Committee on 23 June 2015 to discuss the Group’s audit service plan and to review the Group’s results for FY14/15 during the meeting.
Remuneration Committee
The Remuneration Committee met on 21 August 2015 to conduct a review on the salaries of the executive directors and determined the annual bonus scheme for FY15/16 for its executive directors.
Model Code for Securities Transactions by Directors of Listed Issuers
The Company has adopted the Model Code for Securities Transactions by Directors of Listed Companies contained in Appendix 10 of the Listing Rules (the “Model Code”) as the code of conduct regarding director’s securities transactions.
The Company has also made specific enquiry of all its directors to ascertain whether they have complied with or whether there has been any non-compliance with the required standard set out in the Model Code.
All directors complied with the provisions of the Model Code during the six months ended 30 September 2015.
On behalf of the BoardJoseph C. C. Wong
Chairman and Chief Executive Officer
Hong Kong, 26 November 2015
Directors of the Company as at the date hereof:
Executive directors:Chumphol Kanjanapas (also known as Joseph C. C. Wong) (Chairman and Chief Executive Officer) and Wallace Kwan Chi Kin (Chief Financial Officer)
Non-Executive directors:Sakorn Kanjanapas, Ma Xuezheng (also known as Mary Ma), Wong Yu Tsang Alex (also known as Alex Wong), Wu Chun Sang (independent), Lawrence Wu Chi Man (independent) and Agnes Kwong Yi Hang (independent)
