2012 - hkexnews
TRANSCRIPT
SWIR
E PAC
IFIC LIM
ITED2012 A
nnual Report
Annual Report 2012
Stock Codes: ‘A’ Shares 00019 ‘B’ Shares 00087www.swirepacific.com
Swire Pacific Group Overview 1 Corporate Statement 4 2012 Performance Highlights 8 Summary of Past Performance 12 Chairman’s Statement
Management Discussion and Analysis
16 2012 Performance Review and Outlook Property Division Aviation Division Beverages Division Marine Services Division Trading & Industrial Division 84 2012 Sustainable Development Review and 2013 Aims Overview Environment Health and Safety Community Involvement Staff Working with Others102 Financial Review111 Financing
Corporate Governance
120 Corporate Governance Report131 Risk Management135 Directors and Officers137 Directors’ Report
Auditor’s Report and Accounts
146 Independent Auditor’s Report147 Consolidated Income Statement148 Consolidated Statement of Comprehensive Income149 Consolidated Statement of Financial Position150 Company Statement of Financial Position151 Consolidated Statement of Cash Flows152 Consolidated Statement of Changes in Equity153 Notes to the Accounts201 Principal Accounting Policies211 Principal Subsidiary, Jointly Controlled and Associated Companies and Investments
Sustainable Development Statistics
222 Introduction224 Sustainable Development Assurance Statement225 Sustainable Development Statistics
Supplementary Information
234 Cathay Pacific Airways Limited – Abridged Financial Statements239 Schedule of Principal Group Properties252 Group Structure Chart254 Glossary256 Financial Calendar and Information for Investors
Contents
Note: Definitions of the terms and ratios used in this report can be found in the Glossary on pages 254 and 255.
SWIRE PACIFIC GROUP OVERVIEW
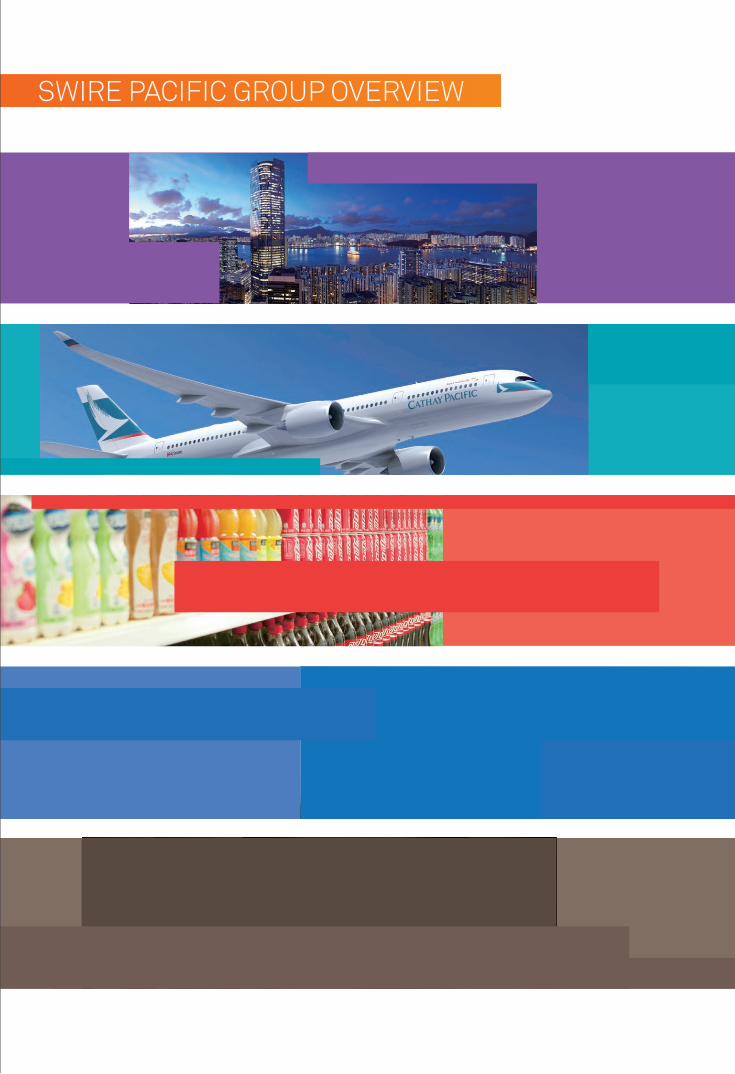
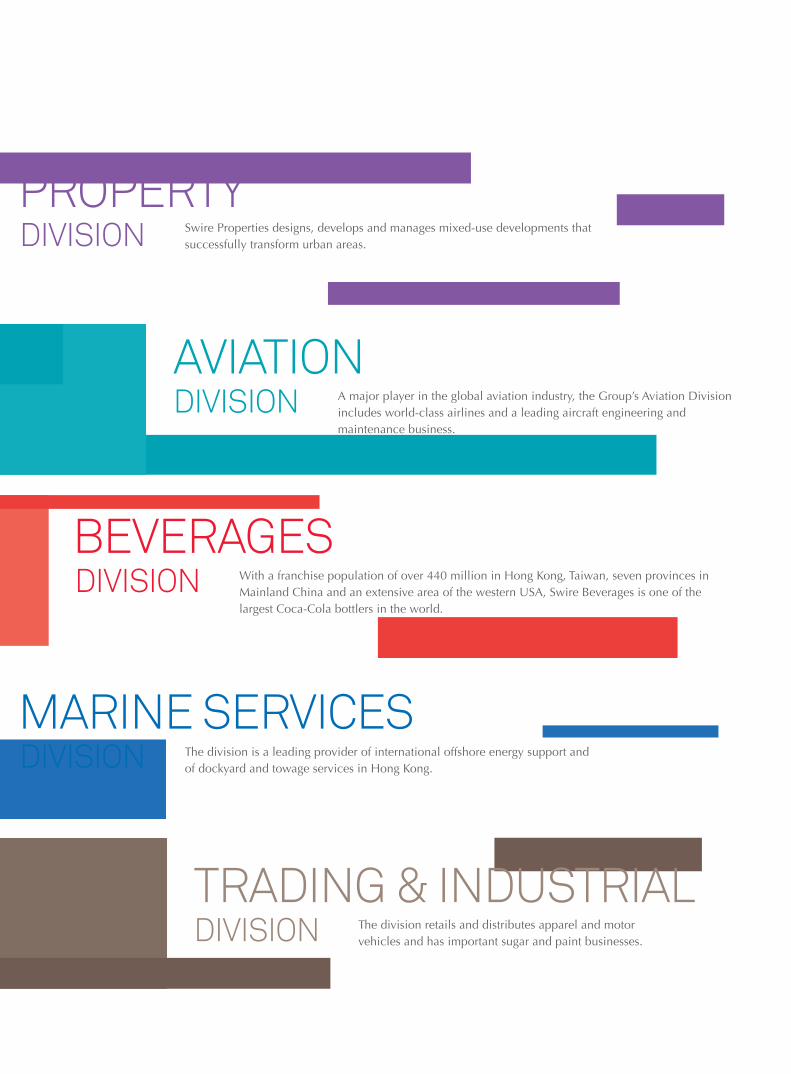
Swire Properties designs, develops and manages mixed-use developments that successfully transform urban areas.
PROPERTYDIVISION
A major player in the global aviation industry, the Group’s Aviation Division includes world-class airlines and a leading aircraft engineering and maintenance business.
AVIATION DIVISION
The division is a leading provider of international offshore energy support and of dockyard and towage services in Hong Kong.
MARINE SERVICES DIVISION
The division retails and distributes apparel and motor vehicles and has important sugar and paint businesses.
TRADING & INDUSTRIAL DIVISION
With a franchise population of over 440 million in Hong Kong, Taiwan, seven provinces in Mainland China and an extensive area of the western USA, Swire Beverages is one of the largest Coca-Cola bottlers in the world.
BEVERAGES DIVISION
SWIRE PACIFIC GROUP OVERVIEW
Swire Properties designs, develops and manages mixed-use developments that successfully transform urban areas.
PROPERTYDIVISION
A major player in the global aviation industry, the Group’s Aviation Division includes world-class airlines and a leading aircraft engineering and maintenance business.
AVIATION DIVISION
The division is a leading provider of international offshore energy support and of dockyard and towage services in Hong Kong.
MARINE SERVICES DIVISION
The division retails and distributes apparel and motor vehicles and has important sugar and paint businesses.
TRADING & INDUSTRIAL DIVISION
With a franchise population of over 440 million in Hong Kong, Taiwan, seven provinces in Mainland China and an extensive area of the western USA, Swire Beverages is one of the largest Coca-Cola bottlers in the world.
BEVERAGES DIVISION
CORPORATE
STATEMENT
Value in
DIVERSITY
Swire Pacifi c is one of the leading companies in Hong Kong, with fi ve operating divisions: Property, Aviation, Beverages, Marine Services and Trading & Industrial. The Group’s operations are predominantly in Greater China, where the name Swire or 太古 has been established for over 140 years.
The Group has a long history in the region. We take a long-term perspective in formulating strategy and this is reflected in the nature of our investments. We pride ourselves on being forward-looking and innovative. These qualities have helped us to grow and have enabled us to set benchmarks in the industries in which we operate.
Sustainability is key to our long-term approach. We recognise that sustainable development does not mean less profit. Rather it is an opportunity to increase efficiency. Our ultimate goal is for our operating companies to achieve zero net impact on the environment.
Swire Pacific is a highly diversified group. We have a wide range of commercial activities and conduct them internationally. We have interests in three other listed companies, Cathay Pacific Airways Limited (“Cathay Pacific”), Hong Kong Aircraft Engineering Company Limited (“HAECO”) and Swire Properties Limited (“Swire Properties”). Swire Properties is one of Hong Kong’s largest commercial landlords and operators of retail space. In 2012, our airlines (which are based in Hong Kong) carried 29 million passengers and flew to 179 destinations. We are leading suppliers of soft drinks and sugar in Hong Kong. We operate 175 retail outlets in Hong Kong. In Mainland China, Swire Properties’ mixed-use property developments in Guangzhou, Shanghai, Beijing and Chengdu will, when they are all completed, have more than 8.8 million square feet of lettable and saleable space. Sales from our Mainland China Coca-Cola franchises represented 79% of the 990 million unit cases of Coca-Cola products that we sold in total in 2012 to a franchise population of over 440 million people. Through Cathay Pacific, we have an interest of more than 19% in Air China. Dragon Airlines (“Dragonair”) (a wholly-owned subsidiary of Cathay Pacific) flies to 44 destinations in Mainland China. We have joint ventures in Hong Kong and Mainland China with Akzo Nobel in paint manufacturing and in Mainland China with The Campbell Soup Company in soup manufacturing. The Swire Pacific Offshore group (“SPO”) operates a fleet of specialist vessels supporting the offshore energy industry in every major offshore production and exploration region outside the Americas. Swire Pacific is one of Hong Kong’s largest and oldest employers, where we have over 36,000 employees. In Mainland China, in ventures under our own management, we have approximately 25,000 employees. Globally, we employ over 74,000 staff.
Swire Pacific 2012 Annual Report 1
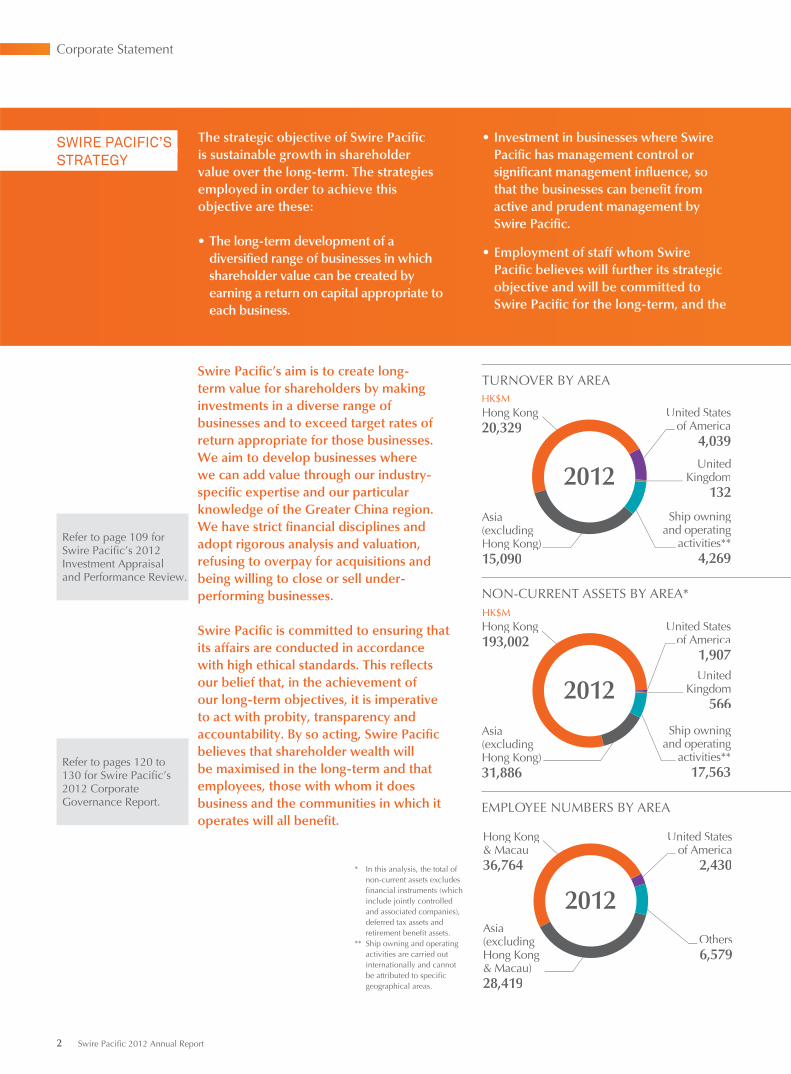
TURNOVER BY AREA
United Statesof America
4,039
Ship owningand operating
activities**4,269
Hong Kong20,329
Asia(excluding Hong Kong)15,090
UnitedKingdom
1322012
HK$M
NON-CURRENT ASSETS BY AREA*
United Statesof America
1,907
Ship owningand operating
activities**17,563
Hong Kong193,002
Asia(excluding Hong Kong)31,886
United Kingdom
5662012
HK$M
EMPLOYEE NUMBERS BY AREA
United Statesof America
2,430
Hong Kong& Macau 36,764
Asia(excludingHong Kong& Macau)28,419
Others6,579
2012
Swire Pacific’s aim is to create long-term value for shareholders by making investments in a diverse range of businesses and to exceed target rates of return appropriate for those businesses. We aim to develop businesses where we can add value through our industry-specific expertise and our particular knowledge of the Greater China region. We have strict financial disciplines and adopt rigorous analysis and valuation, refusing to overpay for acquisitions and being willing to close or sell under-performing businesses.
Swire Pacific is committed to ensuring that its affairs are conducted in accordance with high ethical standards. This reflects our belief that, in the achievement of our long-term objectives, it is imperative to act with probity, transparency and accountability. By so acting, Swire Pacific believes that shareholder wealth will be maximised in the long-term and that employees, those with whom it does business and the communities in which it operates will all benefit.
The strategic objective of Swire Pacific is sustainable growth in shareholder value over the long-term. The strategies employed in order to achieve this objective are these:
• The long-term development of a diversified range of businesses in which shareholder value can be created by earning a return on capital appropriate to each business.
SWIRE PACIFIC’S
STRATEGY
• Investment in businesses where Swire Pacific has management control or significant management influence, so that the businesses can benefit from active and prudent management by Swire Pacific.
• Employment of staff whom Swire Pacific believes will further its strategic objective and will be committed to Swire Pacific for the long-term, and the
Refer to page 109 for Swire Pacific’s 2012 Investment Appraisal and Performance Review.
Refer to pages 120 to 130 for Swire Pacific’s 2012 Corporate Governance Report.
* In this analysis, the total of non-current assets excludes financial instruments (which include jointly controlled and associated companies), deferred tax assets and retirement benefit assets.
** Ship owning and operating activities are carried out internationally and cannot be attributed to specific geographical areas.
2 Swire Pacific 2012 Annual Report
Corporate Statement
Given our commitment to sustainability, the 2012 Swire Pacific Annual Report combines our financial and sustainability reporting.
•Sustainabilitydata,whichfollowstheGlobalReporting Initiative’s (“GRI”) ‘Sustainability Reporting Guidelines’, can be found on pages 222 to 233.
•AreviewoftheGroup’sfivesustainabledevelopment pillars can be found on pages 84 to 101.
•Informationaboutsustainabledevelopmentcan also be found in the reviews of the operating divisions, where appropriate.
This report can be found online at www.swirepacific.com/eng/ir/reports.php, where a condensed version of the report can also be found.
External audit of financial information has been provided by PricewaterhouseCoopers (“PwC”). The Hong Kong Productivity Council was commissioned by the Group to verify the sustainability information in the report. Our sustainability reporting has been based on the GRI framework since 2003. For the 2012 Swire Pacific Annual Report, the GRI has confirmed that our sustainability reporting fulfills the expanded GRI guideline 3.1 with the qualification level C+.
•TheAuditor’sReportcanbefoundon page 146.
•TheSustainableDevelopmentAssuranceStatement can be found on page 224.
provision to them of a career path and training consistent with Swire Pacific’s strategic objective.
•OperationalexcellenceinthewaySwirePacific conducts its businesses.
•Doingbusinessinasustainablemanner.
•Commitmenttohighstandardsofcorporate governance, with a view to ensuring that Swire Pacific’s businesses
are conducted in accordance with properethicalstandardsandappropriatetransparency,thatthebusinessriskstowhichSwirePacificisexposedareproperlyunderstoodandmanagedandthattheinterestsofallSwirePacific’sstakeholdersareproperlyconsidered.
•ActivestewardshipoftheSwirebrand.
About this RepoRt
We support the efforts of the International Integrated Reporting Council (“IIRC”) to bring about greater consistency of reporting by companies, to improve the transparency of financial reports and to help investors and users of accounts better understand how businesses operate and how shareholder value is created. In taking further steps this year to improve our reporting, we hope to have produced a report that gives investors and other users a clear and concise explanation of Swire Pacific’s strategy, governance, performance and prospects. In so doing, we hope to be able to demonstrate better how we create and intend to create shareholder value.
•2012PerformanceHighlightsandtheChairman’s summary of the Group’s 2012 performance and its prospects can be found on pages 4 to 15.
•AreviewoftheGroup’sfinancialperformance can be found on pages 102 to 110.
•TheManagementDiscussionandAnalysissection on pages 16 to 83 provides a review of all five of the Group’s operating divisions. An overview of the business, the business model and the strategies of each division is provided. An explanation of the operating context and a summary of business performance and future prospects are also given.
•SwirePacific’s2012CorporateGovernanceReport can be found on pages 120 to 130.
Swire Pacific 2012 Annual Report 3
2012 PERFORMANCE
HIGHLIGHTS
2012 2011
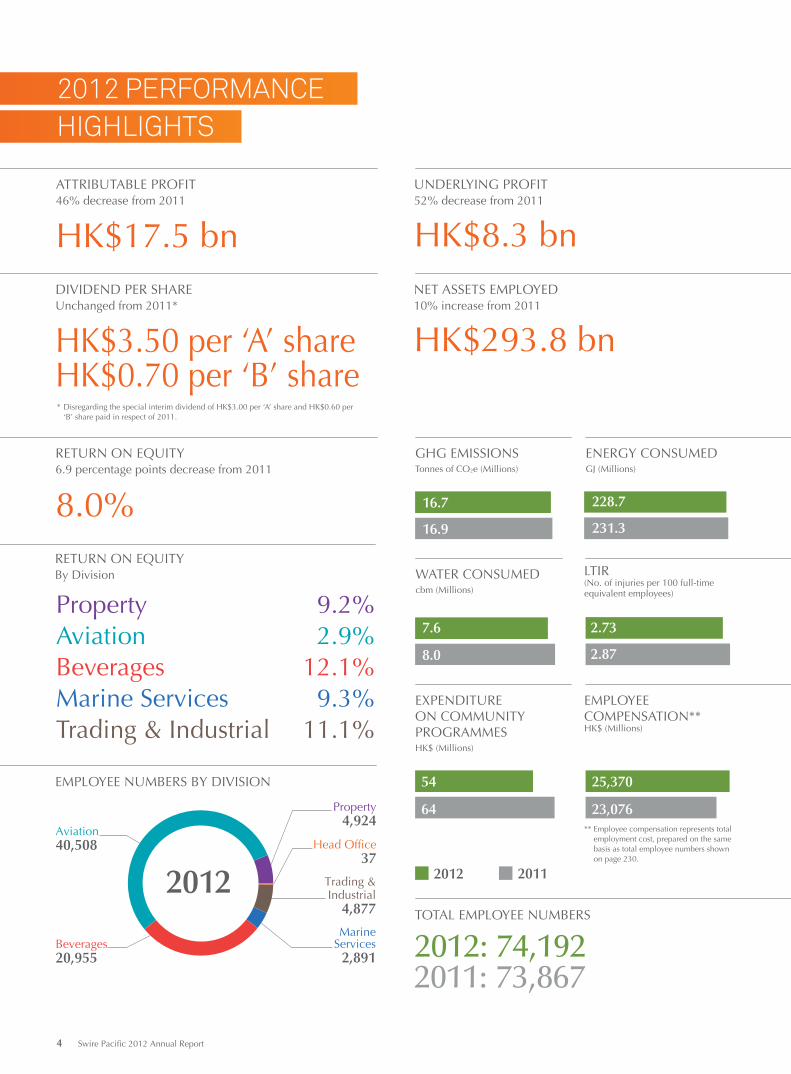
ENERGY CONSUMED GJ (Millions)
WATER CONSUMEDcbm (Millions)
2.87
2.73
GHG EMISSIONSTonnes of CO2e (Millions)
16.9
16.7
EXPENDITUREON COMMUNITY PROGRAMMESHK$ (Millions)
64
54
23,076
25,370
UNDERLYING PROFIT52% decrease from 2011
Beverages20,955
Aviation 40,508
ATTRIBUTABLE PROFIT46% decrease from 2011
HK$17.5 bn HK$8.3 bnNET ASSETS EMPLOYED10% increase from 2011
DIVIDEND PER SHAREUnchanged from 2011*
HK$3.50 per ‘A’ shareHK$0.70 per ‘B’ share
HK$293.8 bn
RETURN ON EQUITYBy Division
Property 9.2%Aviation 2.9%Beverages 12.1%Marine Services 9.3%Trading & Industrial 11.1%
EMPLOYEECOMPENSATION**HK$ (Millions)
231.3
228.7
LTIR(No. of injuries per 100 full-time equivalent employees)
** Employee compensation represents total employment cost, prepared on the same basis as total employee numbers shown on page 230.
8.0
7.6
TOTAL EMPLOYEE NUMBERS
2012: 74,192
EMPLOYEE NUMBERS BY DIVISION
2011: 73,867
RETURN ON EQUITY6.9 percentage points decrease from 2011
8.0%
Property4,924
Head Office37
MarineServices
2,891
Trading & Industrial
4,877
* Disregarding the special interim dividend of HK$3.00 per ‘A’ share and HK$0.60 per ‘B’ share paid in respect of 2011.
2012
4 Swire Pacific 2012 Annual Report
2012 FINANCIAL PERFORMANCE
2012 2011 Change
Note HK$M HK$M %
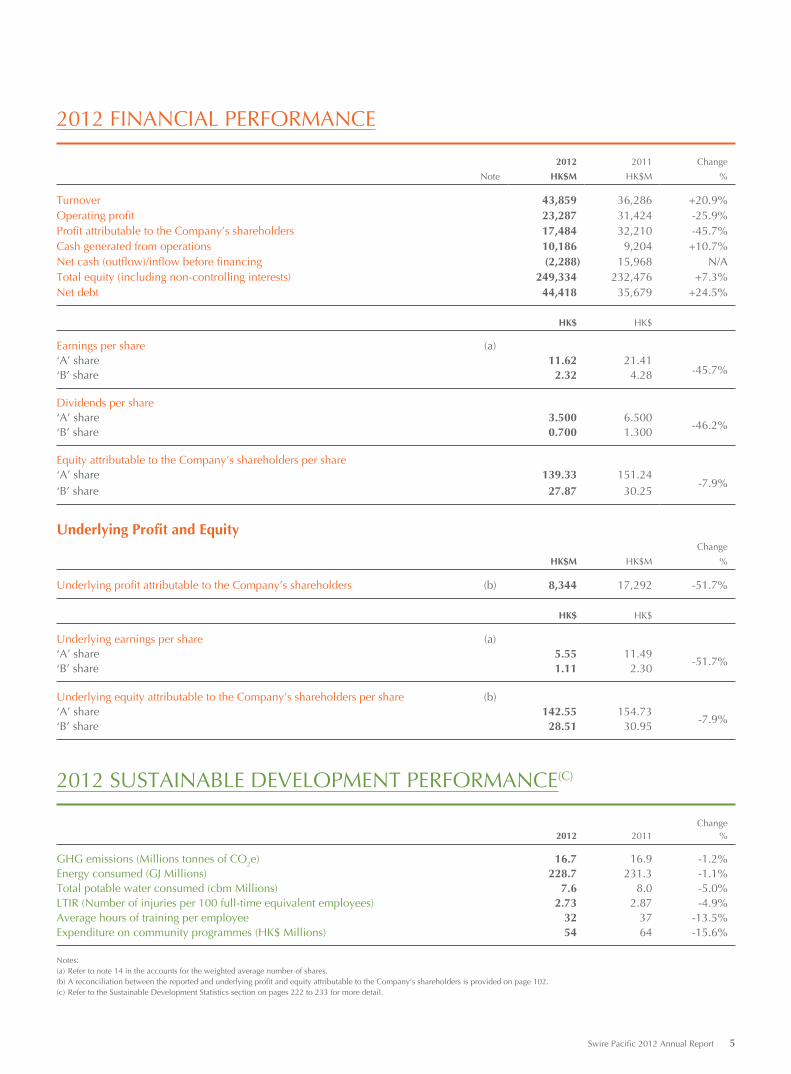
Turnover 43,859 36,286 +20.9%Operating profit 23,287 31,424 -25.9%Profit attributable to the Company’s shareholders 17,484 32,210 -45.7%Cash generated from operations 10,186 9,204 +10.7%Net cash (outflow)/inflow before financing (2,288) 15,968 N/ATotal equity (including non-controlling interests) 249,334 232,476 +7.3%Net debt 44,418 35,679 +24.5%
HK$ HK$
Earnings per share (a)‘A’ share 11.62 21.41
-45.7%‘B’ share 2.32 4.28
Dividends per share ‘A’ share 3.500 6.500
-46.2%‘B’ share 0.700 1.300
Equity attributable to the Company’s shareholders per share‘A’ share 139.33 151.24
-7.9%‘B’ share 27.87 30.25
Underlying Profit and EquityChange
HK$M HK$M %
Underlying profit attributable to the Company’s shareholders (b) 8,344 17,292 -51.7%
HK$ HK$
Underlying earnings per share (a)‘A’ share 5.55 11.49
-51.7%‘B’ share 1.11 2.30
Underlying equity attributable to the Company’s shareholders per share (b)‘A’ share 142.55 154.73
-7.9%‘B’ share 28.51 30.95
2012 SUSTAINABLE DEVELOPMENT PERFORMANCE(C)
Change2012 2011 %
GHG emissions (Millions tonnes of CO2e) 16.7 16.9 -1.2%Energy consumed (GJ Millions) 228.7 231.3 -1.1%Total potable water consumed (cbm Millions) 7.6 8.0 -5.0%LTIR (Number of injuries per 100 full-time equivalent employees) 2.73 2.87 -4.9%Average hours of training per employee 32 37 -13.5%Expenditure on community programmes (HK$ Millions) 54 64 -15.6%
Notes:(a) Refer to note 14 in the accounts for the weighted average number of shares.(b) A reconciliation between the reported and underlying profit and equity attributable to the Company’s shareholders is provided on page 102.(c) Refer to the Sustainable Development Statistics section on pages 222 to 233 for more detail.
Swire Pacific 2012 Annual Report 5
500
1,250
2,000
2,750
3,500
2,000
6,000
10,000
14,000
6,000
9,000
12,000
15,000
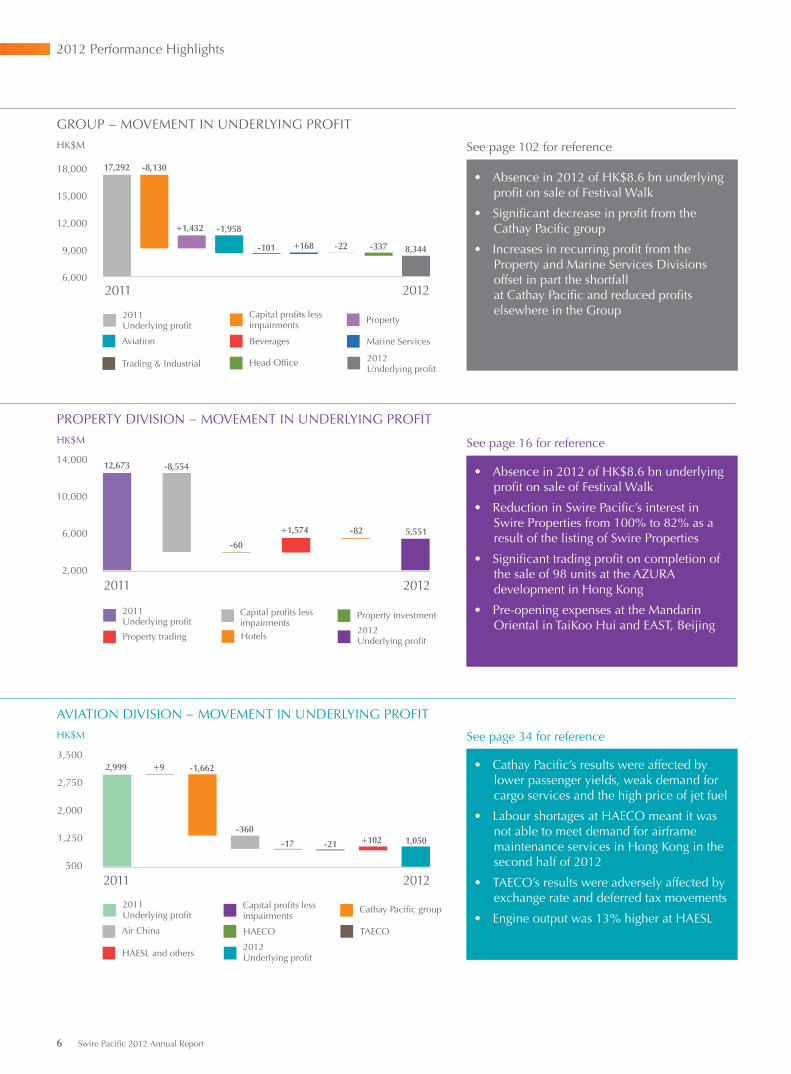
18,000• Absence in 2012 of HK$8.6 bn underlying
profit on sale of Festival Walk
• Significant decrease in profit from the Cathay Pacific group
• Increases in recurring profit from the Property and Marine Services Divisions offset in part the shortfall at Cathay Pacific and reduced profits elsewhere in the Group
GROUP − MOVEMENT IN UNDERLYING PROFIT
BeveragesAviation
2012Underlying profit
Property
Head Office
2011Underlying profit
Marine Services
Trading & Industrial
Capital profits lessimpairments
17,292 -8,130
+1,432 -1,958
-101 +168 -22 -337 8,344
20122011
See page 102 for reference
-8,55412,673
-60
+1,574 -82
Hotels
Capital profits lessimpairments
2011Underlying profit
2012Underlying profit
Property investment
Property trading
5,551
20122011
• Absence in 2012 of HK$8.6 bn underlying profit on sale of Festival Walk
• Reduction in Swire Pacific’s interest in Swire Properties from 100% to 82% as a result of the listing of Swire Properties
• Significant trading profit on completion of the sale of 98 units at the AZURA development in Hong Kong
• Pre-opening expenses at the Mandarin Oriental in TaiKoo Hui and EAST, Beijing
PROPERTY DIVISION − MOVEMENT IN UNDERLYING PROFIT
See page 16 for reference
2,999 +9 -1,662
-17
-360
-21 +102 1,050
Air China
2012Underlying profit
2011Underlying profit
HAECO TAECO
Capital profits lessimpairments
HAESL and others
Cathay Pacific group
20122011
• Cathay Pacific’s results were affected by lower passenger yields, weak demand for cargo services and the high price of jet fuel
• Labour shortages at HAECO meant it was not able to meet demand for airframe maintenance services in Hong Kong in the second half of 2012
• TAECO’s results were adversely affected by exchange rate and deferred tax movements
• Engine output was 13% higher at HAESL
AVIATION DIVISION − MOVEMENT IN UNDERLYING PROFIT
See page 34 for reference
HK$M
HK$M
HK$M
6 Swire Pacific 2012 Annual Report
2012 Performance Highlights
200
300
400
500
500
1,000
1,500
2,000
2,500
500
550
600
650
700
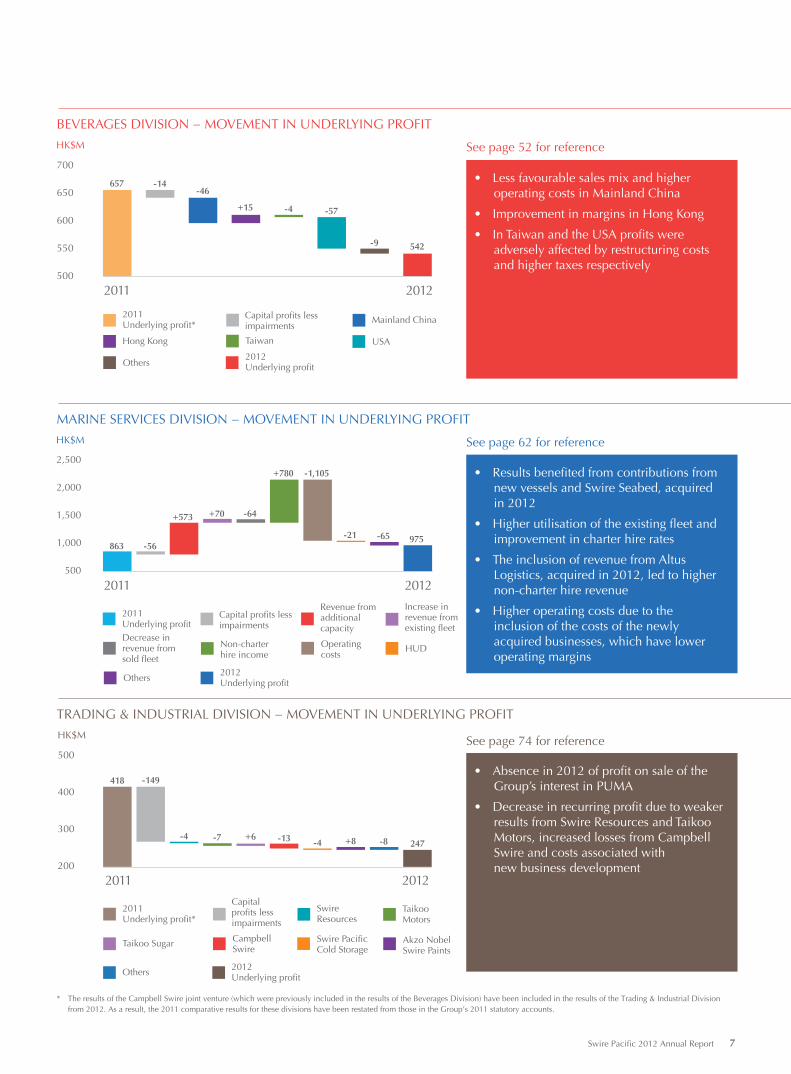
-14657-46
-4 -57
-9
+15
542
-56863
+573 +70
-1,105+780
-64
-21 -65 975
-149418
-4 -7 -13+6-4 +8 -8 247
Taiwan
2011Underlying profit*
USA
Capital profits lessimpairments
Others2012Underlying profit
Mainland China
Hong Kong
2011Underlying profit
Non-charter hire income
Operatingcosts
Capital profits lessimpairments
HUD
Revenue from additionalcapacity
Others
Increase inrevenue fromexisting fleet
2012Underlying profit
Decrease inrevenue fromsold fleet
20122011
• Less favourable sales mix and higher operating costs in Mainland China
• Improvement in margins in Hong Kong
• In Taiwan and the USA profits were adversely affected by restructuring costs and higher taxes respectively
BEVERAGES DIVISION − MOVEMENT IN UNDERLYING PROFIT
Taikoo Sugar
2012Underlying profit
2011Underlying profit*
CampbellSwire
Capitalprofits lessimpairments
Swire PacificCold Storage
Akzo NobelSwire Paints
SwireResources
Others
TaikooMotors
20122011
HK$M
• Results benefited from contributions from new vessels and Swire Seabed, acquired in 2012
• Higher utilisation of the existing fleet and improvement in charter hire rates
• The inclusion of revenue from Altus Logistics, acquired in 2012, led to higher non-charter hire revenue
• Higher operating costs due to the inclusion of the costs of the newly acquired businesses, which have lower operating margins
MARINE SERVICES DIVISION − MOVEMENT IN UNDERLYING PROFIT
20122011
HK$M
• Absence in 2012 of profit on sale of the Group’s interest in PUMA
• Decrease in recurring profit due to weaker results from Swire Resources and Taikoo Motors, increased losses from Campbell Swire and costs associated with new business development
TRADING & INDUSTRIAL DIVISION − MOVEMENT IN UNDERLYING PROFIT
See page 52 for reference
See page 62 for reference
See page 74 for reference
HK$M
* The results of the Campbell Swire joint venture (which were previously included in the results of the Beverages Division) have been included in the results of the Trading & Industrial Division from 2012. As a result, the 2011 comparative results for these divisions have been restated from those in the Group’s 2011 statutory accounts.
Swire Pacific 2012 Annual Report 7
SUMMARY OF PAST PERFORMANCE
FINANCIAL
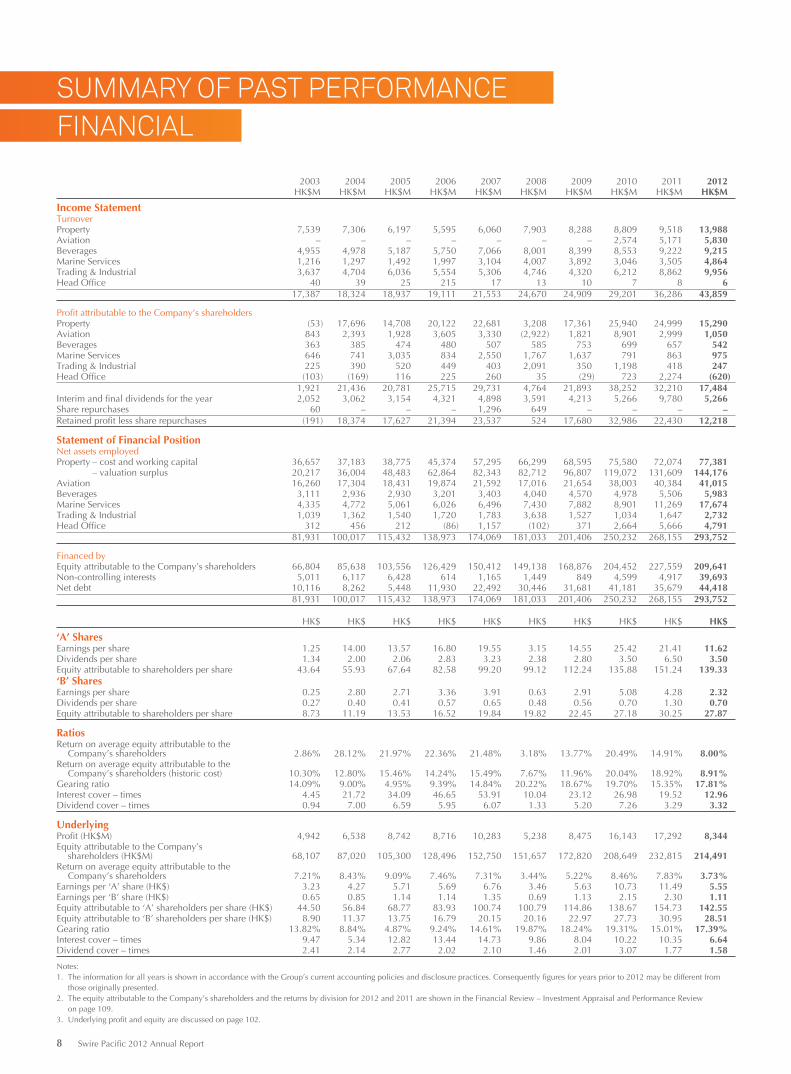
2003 2004 2005 2006 2007 2008 2009 2010 2011 2012HK$M HK$M HK$M HK$M HK$M HK$M HK$M HK$M HK$M HK$M
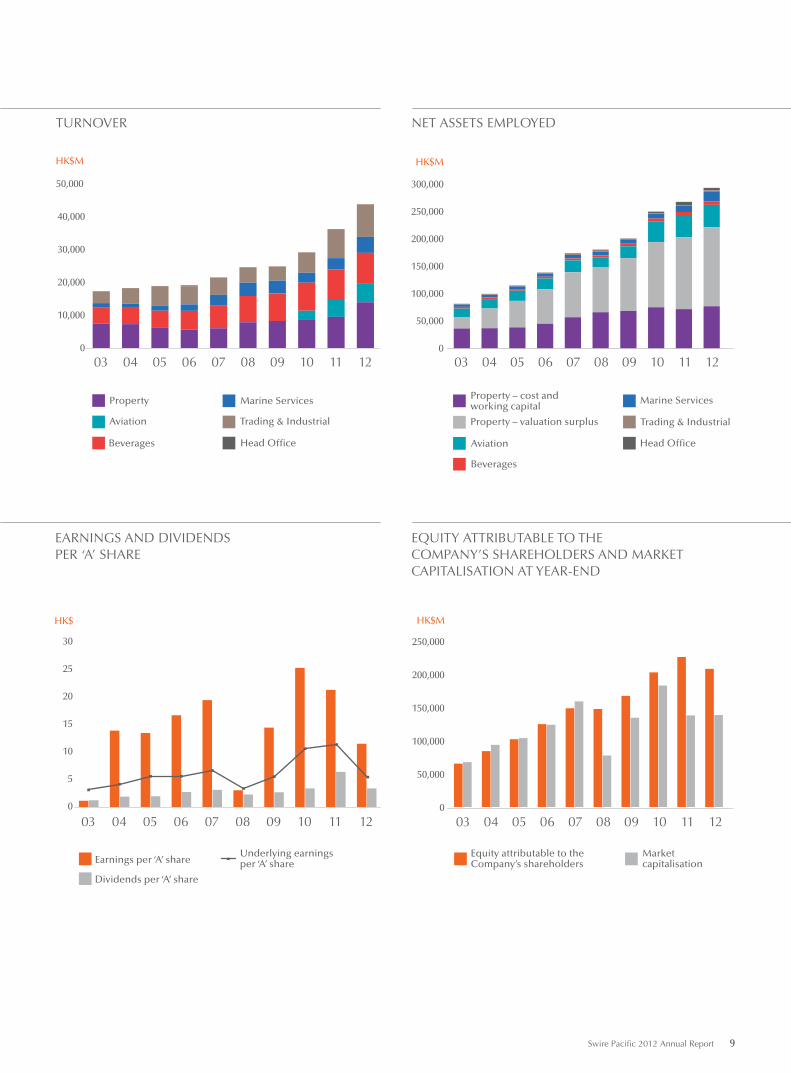
Income StatementTurnoverProperty 7,539 7,306 6,197 5,595 6,060 7,903 8,288 8,809 9,518 13,988Aviation – – – – – – – 2,574 5,171 5,830Beverages 4,955 4,978 5,187 5,750 7,066 8,001 8,399 8,553 9,222 9,215Marine Services 1,216 1,297 1,492 1,997 3,104 4,007 3,892 3,046 3,505 4,864Trading & Industrial 3,637 4,704 6,036 5,554 5,306 4,746 4,320 6,212 8,862 9,956Head Office 40 39 25 215 17 13 10 7 8 6
17,387 18,324 18,937 19,111 21,553 24,670 24,909 29,201 36,286 43,859
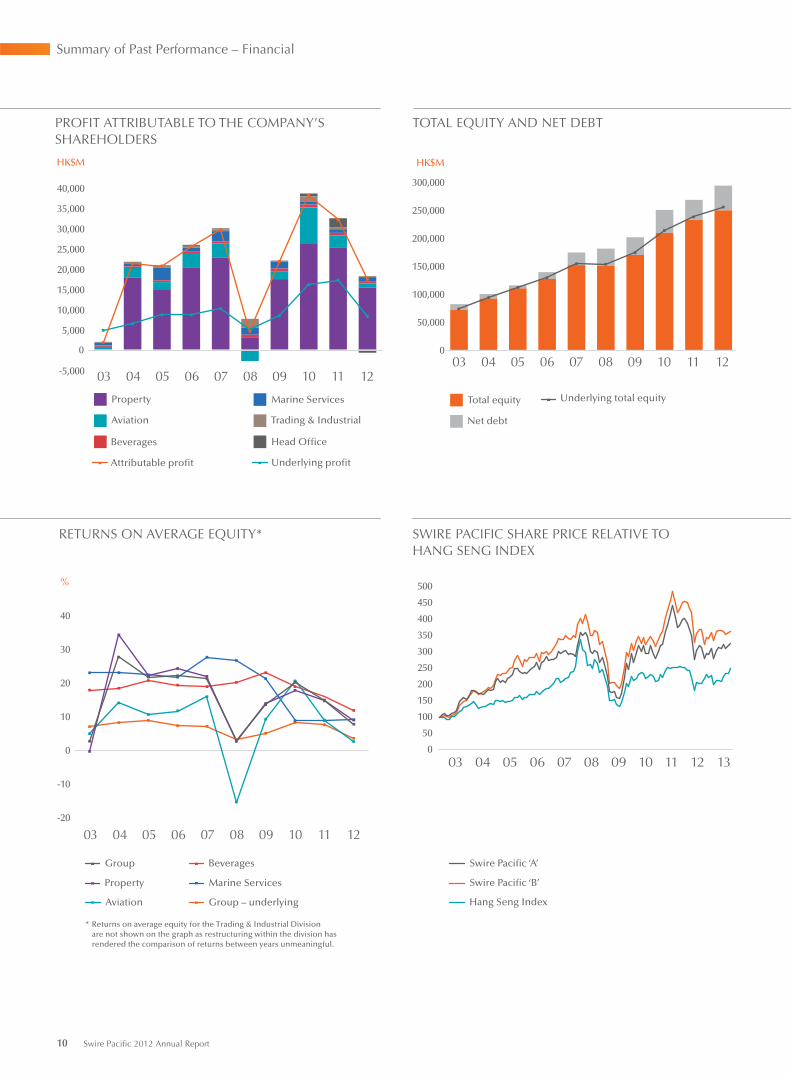
Profit attributable to the Company’s shareholdersProperty (53) 17,696 14,708 20,122 22,681 3,208 17,361 25,940 24,999 15,290Aviation 843 2,393 1,928 3,605 3,330 (2,922) 1,821 8,901 2,999 1,050Beverages 363 385 474 480 507 585 753 699 657 542Marine Services 646 741 3,035 834 2,550 1,767 1,637 791 863 975Trading & Industrial 225 390 520 449 403 2,091 350 1,198 418 247Head Office (103) (169) 116 225 260 35 (29) 723 2,274 (620)
1,921 21,436 20,781 25,715 29,731 4,764 21,893 38,252 32,210 17,484Interim and final dividends for the year 2,052 3,062 3,154 4,321 4,898 3,591 4,213 5,266 9,780 5,266Share repurchases 60 – – – 1,296 649 – – – –Retained profit less share repurchases (191) 18,374 17,627 21,394 23,537 524 17,680 32,986 22,430 12,218
Statement of Financial PositionNet assets employedProperty – cost and working capital 36,657 37,183 38,775 45,374 57,295 66,299 68,595 75,580 72,074 77,381 – valuation surplus 20,217 36,004 48,483 62,864 82,343 82,712 96,807 119,072 131,609 144,176Aviation 16,260 17,304 18,431 19,874 21,592 17,016 21,654 38,003 40,384 41,015Beverages 3,111 2,936 2,930 3,201 3,403 4,040 4,570 4,978 5,506 5,983Marine Services 4,335 4,772 5,061 6,026 6,496 7,430 7,882 8,901 11,269 17,674Trading & Industrial 1,039 1,362 1,540 1,720 1,783 3,638 1,527 1,034 1,647 2,732Head Office 312 456 212 (86) 1,157 (102) 371 2,664 5,666 4,791
81,931 100,017 115,432 138,973 174,069 181,033 201,406 250,232 268,155 293,752
Financed byEquity attributable to the Company’s shareholders 66,804 85,638 103,556 126,429 150,412 149,138 168,876 204,452 227,559 209,641Non-controlling interests 5,011 6,117 6,428 614 1,165 1,449 849 4,599 4,917 39,693Net debt 10,116 8,262 5,448 11,930 22,492 30,446 31,681 41,181 35,679 44,418
81,931 100,017 115,432 138,973 174,069 181,033 201,406 250,232 268,155 293,752
HK$ HK$ HK$ HK$ HK$ HK$ HK$ HK$ HK$ HK$
‘A’ SharesEarnings per share 1.25 14.00 13.57 16.80 19.55 3.15 14.55 25.42 21.41 11.62Dividends per share 1.34 2.00 2.06 2.83 3.23 2.38 2.80 3.50 6.50 3.50Equity attributable to shareholders per share 43.64 55.93 67.64 82.58 99.20 99.12 112.24 135.88 151.24 139.33‘B’ SharesEarnings per share 0.25 2.80 2.71 3.36 3.91 0.63 2.91 5.08 4.28 2.32Dividends per share 0.27 0.40 0.41 0.57 0.65 0.48 0.56 0.70 1.30 0.70Equity attributable to shareholders per share 8.73 11.19 13.53 16.52 19.84 19.82 22.45 27.18 30.25 27.87
RatiosReturn on average equity attributable to the
Company’s shareholders 2.86% 28.12% 21.97% 22.36% 21.48% 3.18% 13.77% 20.49% 14.91% 8.00%Return on average equity attributable to the
Company’s shareholders (historic cost) 10.30% 12.80% 15.46% 14.24% 15.49% 7.67% 11.96% 20.04% 18.92% 8.91%Gearing ratio 14.09% 9.00% 4.95% 9.39% 14.84% 20.22% 18.67% 19.70% 15.35% 17.81%Interest cover – times 4.45 21.72 34.09 46.65 53.91 10.04 23.12 26.98 19.52 12.96Dividend cover – times 0.94 7.00 6.59 5.95 6.07 1.33 5.20 7.26 3.29 3.32
UnderlyingProfit (HK$M) 4,942 6,538 8,742 8,716 10,283 5,238 8,475 16,143 17,292 8,344Equity attributable to the Company’s
shareholders (HK$M) 68,107 87,020 105,300 128,496 152,750 151,657 172,820 208,649 232,815 214,491Return on average equity attributable to the
Company’s shareholders 7.21% 8.43% 9.09% 7.46% 7.31% 3.44% 5.22% 8.46% 7.83% 3.73%Earnings per ‘A’ share (HK$) 3.23 4.27 5.71 5.69 6.76 3.46 5.63 10.73 11.49 5.55Earnings per ‘B’ share (HK$) 0.65 0.85 1.14 1.14 1.35 0.69 1.13 2.15 2.30 1.11Equity attributable to ‘A’ shareholders per share (HK$) 44.50 56.84 68.77 83.93 100.74 100.79 114.86 138.67 154.73 142.55Equity attributable to ‘B’ shareholders per share (HK$) 8.90 11.37 13.75 16.79 20.15 20.16 22.97 27.73 30.95 28.51Gearing ratio 13.82% 8.84% 4.87% 9.24% 14.61% 19.87% 18.24% 19.31% 15.01% 17.39%Interest cover – times 9.47 5.34 12.82 13.44 14.73 9.86 8.04 10.22 10.35 6.64Dividend cover – times 2.41 2.14 2.77 2.02 2.10 1.46 2.01 3.07 1.77 1.58
Notes:1. The information for all years is shown in accordance with the Group’s current accounting policies and disclosure practices. Consequently figures for years prior to 2012 may be different from
those originally presented.2. The equity attributable to the Company’s shareholders and the returns by division for 2012 and 2011 are shown in the Financial Review – Investment Appraisal and Performance Review
on page 109.3. Underlying profit and equity are discussed on page 102.
8 Swire Pacific 2012 Annual Report
Beverages
Property – cost and working capital
Property – valuation surplus
Aviation
HK$M
Property
Aviation
Beverages
Marine Services
Head Office
Trading & Industrial
TURNOVER
EARNINGS AND DIVIDENDSPER ‘A’ SHARE
NET ASSETS EMPLOYED
EQUITY ATTRIBUTABLE TO THE COMPANY’S SHAREHOLDERS AND MARKET CAPITALISATION AT YEAR-END
Underlying earningsper ‘A’ share
Equity attributable to theCompany’s shareholders
MarketcapitalisationEarnings per ‘A’ share
Dividends per ‘A’ share
0
10,000
20,000
30,000
40,000
50,000
HK$M
0
50,000
100,000
150,000
200,000
250,000
300,000
Trading & Industrial
Marine Services
Head Office
HK$M
0
5
10
15
20
25
30
HK$
0
50,000
100,000
150,000
200,000
250,000
121009080706050403 11 121009080706050403 11
121009080706050403 11 121009080706050403 11
Swire Pacific 2012 Annual Report 9
Total equity
Net debt
Property
Aviation
Beverages
Marine Services
Head Office
Underlying profit
Trading & Industrial
PROFIT ATTRIBUTABLE TO THE COMPANY’S SHAREHOLDERS
RETURNS ON AVERAGE EQUITY*
TOTAL EQUITY AND NET DEBT
SWIRE PACIFIC SHARE PRICE RELATIVE TOHANG SENG INDEX
Underlying total equity
Attributable profit
Swire Pacific ‘A’
Swire Pacific ‘B’
Hang Seng Index
HK$M
* Returns on average equity for the Trading & Industrial Division are not shown on the graph as restructuring within the division has rendered the comparison of returns between years unmeaningful.
HK$M
Group
Property
Aviation
Beverages
Marine Services
Group – underlying
-20
-10
0
10
20
30
40
0
50
100
150
200
250
300
350
400
450
500%
121009080706050403 11121009080706050403 11
121009080706050403 11
0
50,000
100,000
150,000
200,000
250,000
300,000
-5,000
0
5,000
10,000
15,000
20,000
25,000
30,000
35,000
40,000
1009 12 1311080706050403
10 Swire Pacific 2012 Annual Report
Summary of Past Performance – Financial
SUSTAINABLE DEVELOPMENT
SUMMARY OF PAST PERFORMANCE
2007 2008 2009 2010 2011 2012
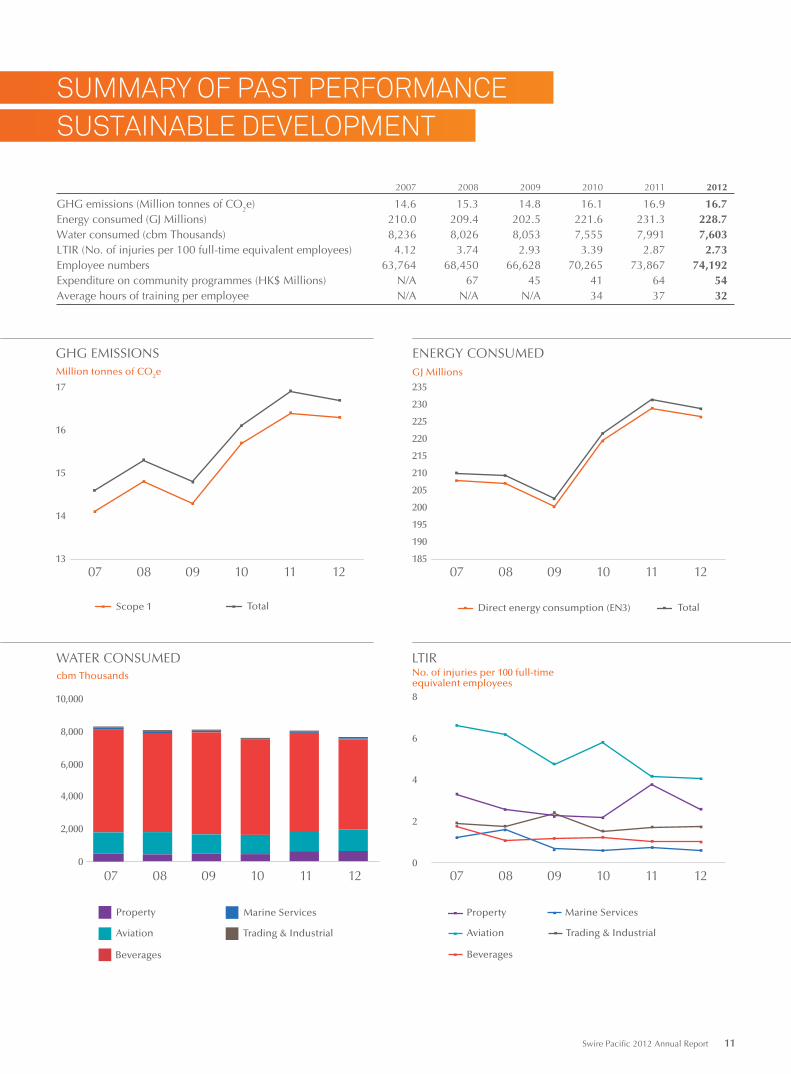
GHG emissions (Million tonnes of CO2e) 14.6 15.3 14.8 16.1 16.9 16.7Energy consumed (GJ Millions) 210.0 209.4 202.5 221.6 231.3 228.7Water consumed (cbm Thousands) 8,236 8,026 8,053 7,555 7,991 7,603LTIR (No. of injuries per 100 full-time equivalent employees) 4.12 3.74 2.93 3.39 2.87 2.73Employee numbers 63,764 68,450 66,628 70,265 73,867 74,192Expenditure on community programmes (HK$ Millions) N/A 67 45 41 64 54Average hours of training per employee N/A N/A N/A 34 37 32
GHG EMISSIONS ENERGY CONSUMED
LTIR
GJ MillionsMillion tonnes of CO2e
1110 120907 08 1110 120907 08
1110 120907 081110 120907 08
13
14
15
16
17
TotalScope 1
185
190
195
200
205
210
215
220
225
230
235
TotalDirect energy consumption (EN3)
0
2
4
6
8
WATER CONSUMED
0
2,000
4,000
6,000
8,000
10,000
cbm Thousands No. of injuries per 100 full-timeequivalent employees
Property Marine Services
Trading & Industrial
Beverages
Property
Aviation
Beverages
Marine Services
Trading & Industrial Aviation
Swire Pacific 2012 Annual Report 11
CHAIRMAN’S
STATEMENT
Our consolidated profi t attributable to shareholders for 2012 was HK$17,484 million, HK$14,726 million lower than in 2011. Underlying profi t attributable to shareholders, which principally adjusts for changes in the valuation of investment properties, decreased by HK$8,948 million to HK$8,344 million. Adjusted to exclude the effect of non-recurring items (the most signifi cant being the HK$8,615 million profi t on disposal of Festival Walk in 2011), underlying profi t decreased by HK$818 million or 9% to HK$7,910 million.
The register of members will be closed on Friday, 12th April 2013, during which day no transfer of shares will be effected. In order to qualify for entitlement to the second interim dividends, all transfer forms, accompanied by the relevant share certificates, must be lodged with the Company’s share registrars, Computershare Hong Kong Investor Services Limited, 17th Floor, Hopewell Centre, 183 Queen’s Road East, Hong Kong, for registration not later than 4:30 p.m. on Thursday, 11th April 2013.
Listing of Swire PropertiesIn January 2012, the shares in Swire Properties were listed on The Stock Exchange of Hong Kong Limited. The listing was achieved through a distribution in specie by Swire Pacific of 18% of the shares in Swire Properties. Following the listing, Swire Pacific’s shareholding in Swire Properties was reduced to 82%.
This decrease in adjusted underlying profit reflects significantly lower profit from the Cathay Pacific group and lower profits from the Beverages and Trading & Industrial Divisions. There were higher profits from the Property and Marine Services Divisions and from the Hong Kong Aircraft Engineering Company Limited (“HAECO”) group.
DividendsThe Directors have declared second interim dividends of HK$2.50 (2011: HK$2.35) per ‘A’ share and HK$0.50 (2011: HK$0.47) per ‘B’ share which, together with the first interim dividends of HK$1.00 per ‘A’ share and HK$0.20 per ‘B’ share paid in October 2012, amount to full year dividends of HK$3.50 per ‘A’ share and HK$0.70 per ‘B’ share, the same as those paid in respect of 2011 (disregarding the special interim dividends of HK$3.00 per ‘A’ share and HK$0.60 per ‘B’ share paid in 2011). The second interim dividends, which total HK$3,761 million (2011: HK$3,536 million), will be paid on 3rd May 2013 to shareholders registered at the close of business on the record date, being Friday, 12th April 2013. Shares of the Company will be traded ex-dividend from Wednesday, 10th April 2013.
12 Swire Pacific 2012 Annual Report
The Economic Background in 2012World economic conditions were subject to considerable uncertainties in 2012. The airline industry was significantly affected by this. Global economic uncertainties had less of an impact within Hong Kong. However, in the Hong Kong property market, measures introduced by the government towards the end of the year reduced demand for luxury residential properties. There was a slowdown in the growth of the Mainland China economy, particularly in coastal provinces. This adversely affected consumer confidence and expenditure. The high price of oil adversely affected our airlines but also resulted in increased exploration and production by oil companies, which benefited our Marine Services Division.
Operating PerformanceThe attributable adjusted underlying profit from the Property Division increased by HK$1,432 million to HK$5,545 million. This was achieved despite the reduction in Swire Pacific’s interest in Swire Properties from 100% to 82% as a result of the listing of Swire Properties. The increase principally reflects a significant trading profit of HK$1,534 million on the sale of 98 units in the AZURA residential development in Hong Kong. Profit from property investment decreased, reflecting the reduction in Swire Pacific’s interest in Swire Properties and the loss of rental income from Festival Walk following its sale in August 2011, partially offset by positive rental reversions from the Hong Kong portfolio, the first full year contribution from TaiKoo Hui in Guangzhou and a better performance at Sanlitun Village.
The Property Division’s net investment property valuation gain in 2012, before deferred tax in Mainland China, was HK$12,751 million, compared to a net gain in 2011 of HK$20,899 million.
The Aviation Division recorded an attributable profit of HK$1,050 million in 2012, compared to a profit of HK$2,999 million in 2011. Cathay Pacific was affected by the difficult conditions in the airline industry. The Cathay Pacific group contributed a profit of HK$412 million,
compared with a profit of HK$2,405 million in 2011. There was pressure on passenger yields and demand for cargo services was weak. The high price of jet fuel had a major impact on operating results. In May 2012, Cathay Pacific announced measures designed to protect its business in an environment of high fuel prices and weak revenues. By the end of the year costs had been reduced significantly as a result of reduced capacity and early retirement of less fuel-efficient aircraft. However, the reductions were not enough to offset in full the effects of high fuel prices and weak revenues.
The HAECO group’s profit attributable to shareholders in 2012 was HK$659 million, an increase of 7% compared to the corresponding figure in 2011 of HK$615 million. Demand for HAECO’s airframe maintenance services in Hong Kong was strong, but HAECO was not able to meet this demand in the second half because of a shortage of skilled and semi-skilled labour. HAECO’s line maintenance business in Hong Kong benefited from an increase in aircraft movements at Hong Kong International Airport. Results from TAECO were adversely affected by exchange rate and deferred tax movements. HAESL performed well. The operating results of HAECO’s joint ventures in Mainland China improved, but losses continued to be incurred because of under-utilisation of facilities.
The Beverages Division recorded an attributable profit of HK$542 million in 2012, a decrease of 18% compared to 2011. The decrease principally reflected a weak performance in Mainland China, higher taxes in the USA and higher operating costs in all territories. Overall sales volume fell by 0.5% to 990 million unit cases, compared with growth of 8% in 2011. Volume grew in the USA and Hong Kong but declined in Mainland China and Taiwan.
The Marine Services Division reported an attributable profit of HK$975 million, an increase of 13% compared to 2011. At Swire Pacific Offshore (“SPO”), there was an increase in fleet utilisation and charter hire rates. However, this was partially offset by an increase in operating costs. The results of SPO benefited from the additional contribution from new vessels that commenced operations in 2012.
Swire Pacific 2012 Annual Report 13
Attributable profit from the Trading & Industrial Division in 2012 decreased by 41% to HK$247 million. Excluding the gain of HK$148 million on disposal of the Group’s interest in PUMA in January 2011, attributable profit decreased by HK$23 million. The decrease reflected weaker results from Swire Resources and Taikoo Motors, increased losses from Campbell Swire and costs associated with new business development.
Economic OutlookWe are cautiously optimistic about economic prospects. Growth in the USA may be restricted by fiscal tightening and in Europe by the continuing problems of the Eurozone. The outlook for the Asian region is better. It appears that the Mainland China economy is returning to more robust growth. Hong Kong is likely to benefit from this.
ProspectsDemand from financial services companies for office space in the Central district of Hong Kong is likely to remain soft. However, occupancy at Pacific Place is high and there are no major leases expiring until the latter part of 2013. Rents are therefore expected to be fairly resilient in 2013. Our new development at 28 Hennessy Road is attracting interest from smaller businesses. At Island East, rents are expected to remain robust owing to high occupancy levels. In Mainland China, demand for office space and rental rates are expected to remain stable.
Demand for retail space in Hong Kong continues to be strong. Rents are expected to continue to increase. In Mainland China, retailers of internationally branded goods in high quality shopping malls remain popular. Retail rents are expected to be steady in 2013.
Profits from property trading are expected to be lower in 2013 than in 2012, but nevertheless significant, with the completion of the ARGENTA development and the expected sale of the remaining units at the AZURA development. The
effect of substantial increases and other changes in Hong Kong stamp duty on demand for luxury residential properties is uncertain.
The Cathay Pacific group operates in a volatile and challenging industry, one that will always be highly susceptible to external factors that remain largely beyond its control. The cost of fuel remains the biggest challenge, particularly for an airline where long-haul operations form a significant part of the business. The group’s focus will remain on protecting the business and managing short-term difficulties while remaining committed to its long-term strategy. Its financial position remains strong and it will continue to invest in the future.
The HAECO group expects to do less airframe maintenance work in Hong Kong in 2013 than in 2012, with labour shortages restricting manhours expected to be sold in the first half to 1.2 million compared with 1.6 million in the first half of 2012. Although these labour shortages may ease in the second half of 2013, the first half shortfall is likely to have a material adverse effect on HAECO’s overall turnover and profit for the full year.
Swire Beverages is cautiously optimistic about 2013. In Mainland China there are indications that the pace of economic growth will resume. Following completion of its reorganisation, the business in Taiwan is in a good position. The Hong Kong and USA businesses are doing well and should continue to benefit from their strong market positions.
The price of oil is expected to remain high in 2013, leading to a further increase in offshore exploration and production commitments by energy companies. In turn, demand for offshore support vessels is expected to improve, but the over-supply of tonnage in the industry will continue to restrict charter hire rates until it has been absorbed by the market.
14 Swire Pacific 2012 Annual Report
Chairman’s Statement
The performance of the Trading & Industrial Division will depend on economic conditions in the markets in which it operates. But the results of the division in 2013 are likely in any event to continue to be affected by the cost of new business development.
FinanceIn 2012, we raised HK$21,577 million of new finance. This principally comprised issues of HK dollar and US dollar denominated medium-term notes under the Group’s medium-term note programmes. The remaining finance raised mainly consists of HK dollar and US dollar loans.
Net debt at 31st December 2012 was HK$44,418 million, an increase of HK$8,739 million since 31st December 2011. The increase principally reflects investments in property projects in Mainland China and Hong Kong and in new vessels at SPO. Gearing increased by 2.4 percentage points to 17.8%. Cash and undrawn committed facilities totalled HK$22,459 million at 31st December 2012, compared with HK$20,339 million at 31st December 2011.
Sustainable DevelopmentSustainability is integral to Swire Pacific’s long-term approach to business. We wish to protect the environment we work in. Our ultimate goal is for our operating companies to achieve zero net impact on the environment. We try to conduct our operations in a manner which safeguards the health and safety of our employees, those with whom we do business, our visitors and the communities in which we operate. We work hard to recruit and retain employees and to develop their potential. We support the communities in which we operate with charitable donations from the Swire Group Charitable Trust (which we fund) and by supporting the community initiatives of our staff. We share values and knowledge with those with whom we deal and encourage them to adopt similar ethical standards and sustainability practices.
In 2012, we held our first energy conference and established a carbon desk. We introduced quarterly reporting on health and safety performance and developed a staff transportation safety policy. We held our second sustainable development forum. The Swire Group Charitable Trust’s donations in 2012 included one to Xiamen University to assist it to develop a marine research centre. We made progress in extending our purchases of sustainable seafood and other certified products.
The commitment and hard work of employees of the Group and its jointly controlled and associated companies are central to our continuing success. I take this opportunity to thank them.
Christopher PrattChairmanHong Kong, 14th March 2013
Swire Pacific 2012 Annual Report 15
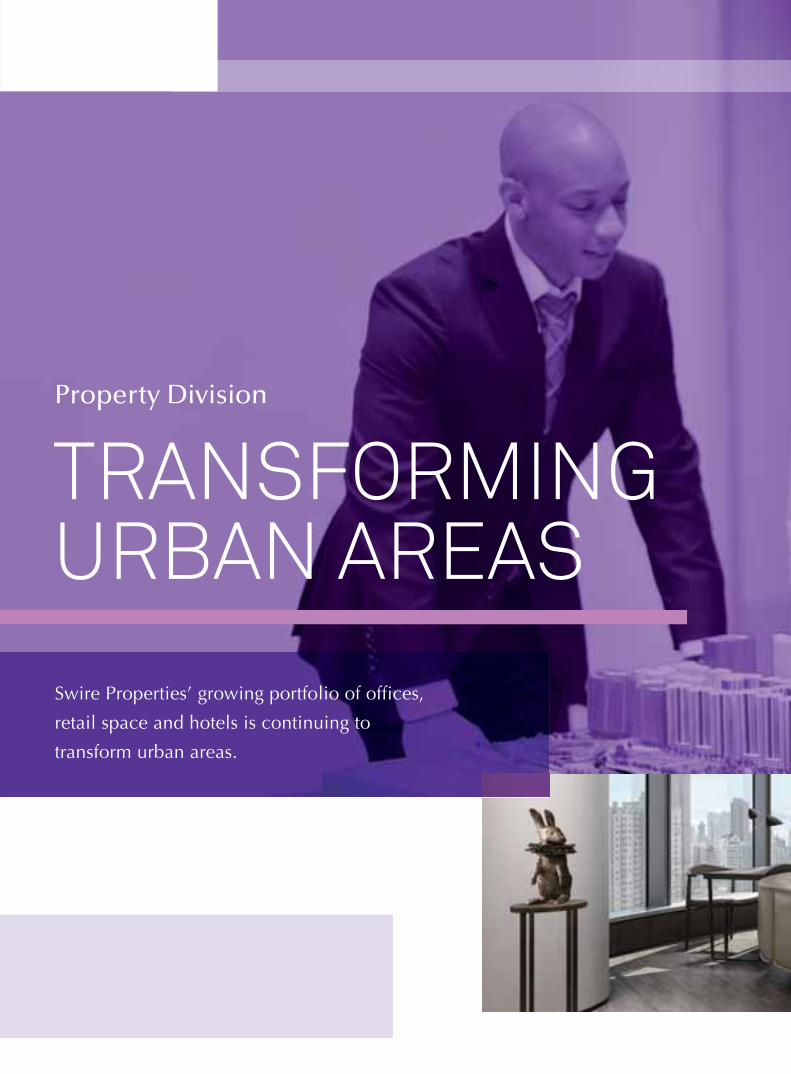
TRANSFORMING URBAN AREAS
Property Division
Swire Properties’ growing portfolio of offices,
retail space and hotels is continuing to
transform urban areas.

Swire Pacific 2012 Annual Report 17
OVERVIEW OF THE BUSINESS
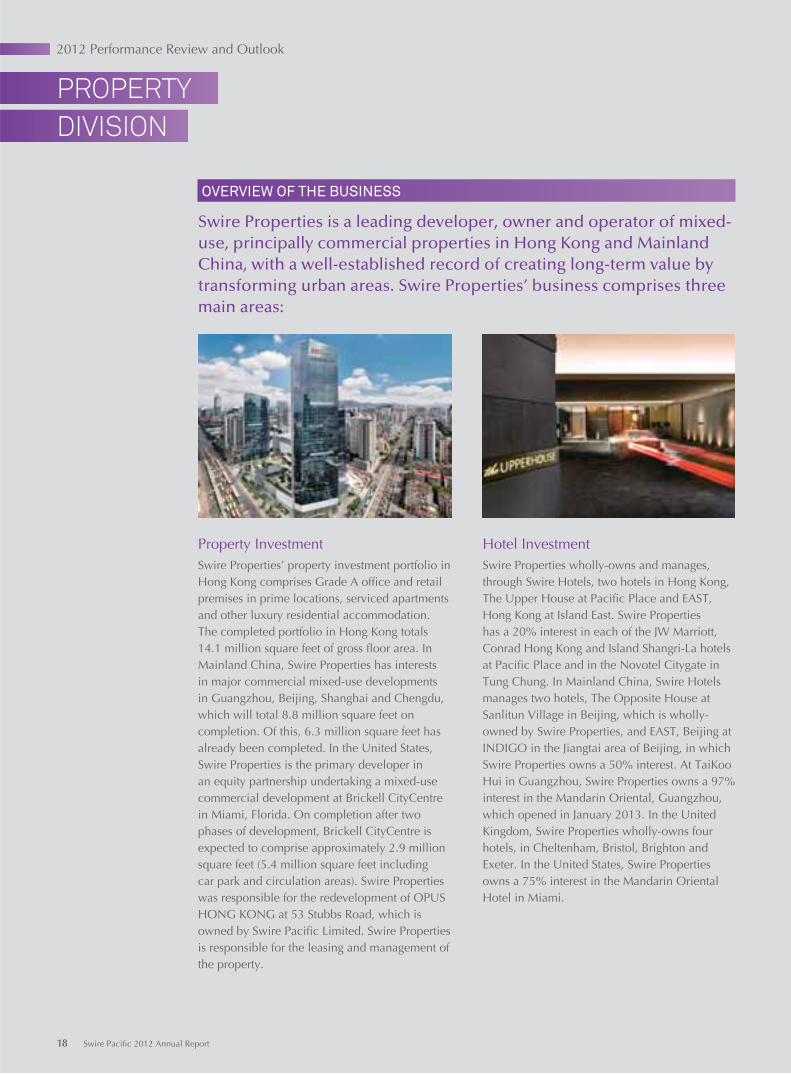
Swire Properties is a leading developer, owner and operator of mixed-use, principally commercial properties in Hong Kong and Mainland China, with a well-established record of creating long-term value by transforming urban areas. Swire Properties’ business comprises three main areas:
Property InvestmentSwire Properties’ property investment portfolio in Hong Kong comprises Grade A office and retail premises in prime locations, serviced apartments and other luxury residential accommodation. The completed portfolio in Hong Kong totals 14.1 million square feet of gross floor area. In Mainland China, Swire Properties has interests in major commercial mixed-use developments in Guangzhou, Beijing, Shanghai and Chengdu, which will total 8.8 million square feet on completion. Of this, 6.3 million square feet has already been completed. In the United States, Swire Properties is the primary developer in an equity partnership undertaking a mixed-use commercial development at Brickell CityCentre in Miami, Florida. On completion after two phases of development, Brickell CityCentre is expected to comprise approximately 2.9 million square feet (5.4 million square feet including car park and circulation areas). Swire Properties was responsible for the redevelopment of OPUS HONG KONG at 53 Stubbs Road, which is owned by Swire Pacific Limited. Swire Properties is responsible for the leasing and management of the property.
Hotel InvestmentSwire Properties wholly-owns and manages, through Swire Hotels, two hotels in Hong Kong, The Upper House at Pacific Place and EAST, Hong Kong at Island East. Swire Properties has a 20% interest in each of the JW Marriott, Conrad Hong Kong and Island Shangri-La hotels at Pacific Place and in the Novotel Citygate in Tung Chung. In Mainland China, Swire Hotels manages two hotels, The Opposite House at Sanlitun Village in Beijing, which is wholly-owned by Swire Properties, and EAST, Beijing at INDIGO in the Jiangtai area of Beijing, in which Swire Properties owns a 50% interest. At TaiKoo Hui in Guangzhou, Swire Properties owns a 97% interest in the Mandarin Oriental, Guangzhou, which opened in January 2013. In the United Kingdom, Swire Properties wholly-owns four hotels, in Cheltenham, Bristol, Brighton and Exeter. In the United States, Swire Properties owns a 75% interest in the Mandarin Oriental Hotel in Miami.
PROPERTY
DIVISION
18 Swire Pacific 2012 Annual Report
2012 Performance Review and Outlook
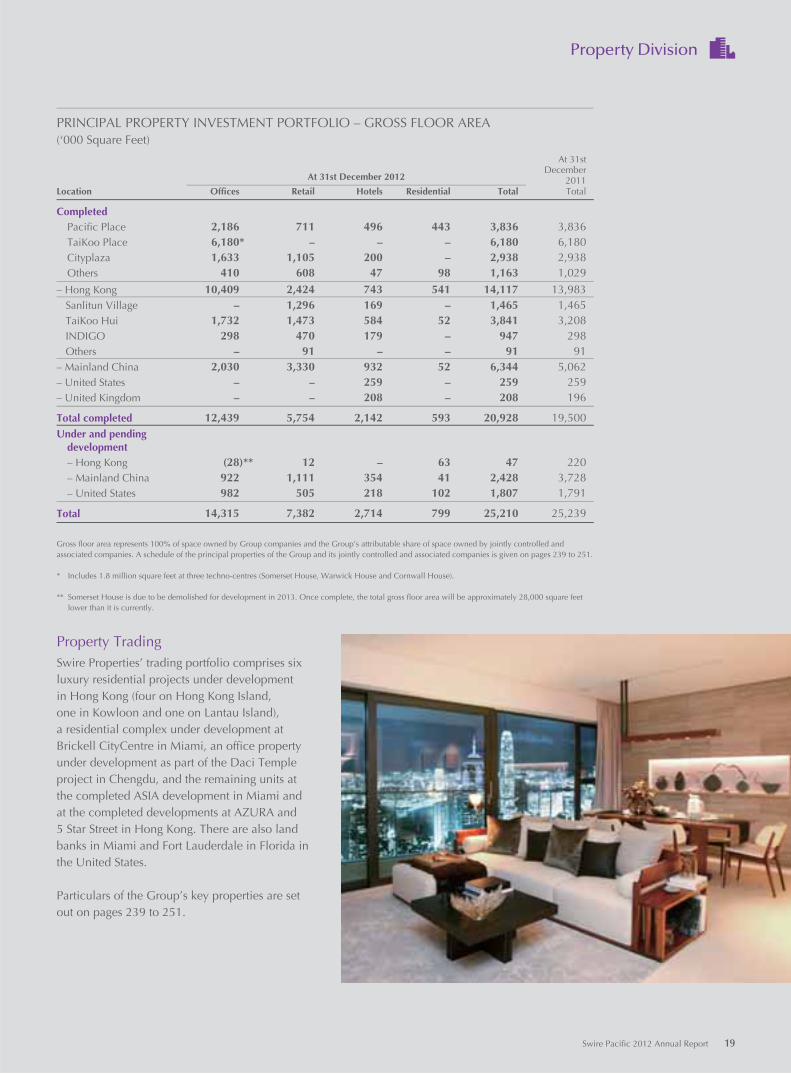
Property TradingSwire Properties’ trading portfolio comprises six luxury residential projects under development in Hong Kong (four on Hong Kong Island, one in Kowloon and one on Lantau Island), a residential complex under development at Brickell CityCentre in Miami, an office property under development as part of the Daci Temple project in Chengdu, and the remaining units at the completed ASIA development in Miami and at the completed developments at AZURA and 5 Star Street in Hong Kong. There are also land banks in Miami and Fort Lauderdale in Florida in the United States.
Particulars of the Group’s key properties are set out on pages 239 to 251.
PRINCIPAL PROPERTY INVESTMENT PORTFOLIO – GROSS FLOOR AREA(‘000 Square Feet)
Location
At 31st December 2012
At 31stDecember
2011Offices Retail Hotels Residential Total Total
Completed Pacific Place 2,186 711 496 443 3,836 3,836 TaiKoo Place 6,180* – – – 6,180 6,180 Cityplaza 1,633 1,105 200 – 2,938 2,938 Others 410 608 47 98 1,163 1,029
– Hong Kong 10,409 2,424 743 541 14,117 13,983Sanlitun Village – 1,296 169 – 1,465 1,465TaiKoo Hui 1,732 1,473 584 52 3,841 3,208INDIGO 298 470 179 – 947 298Others – 91 – – 91 91
– Mainland China 2,030 3,330 932 52 6,344 5,062– United States – – 259 – 259 259– United Kingdom – – 208 – 208 196
Total completed 12,439 5,754 2,142 593 20,928 19,500Under and pending development – Hong Kong (28)** 12 – 63 47 220 – Mainland China 922 1,111 354 41 2,428 3,728 – United States 982 505 218 102 1,807 1,791
Total 14,315 7,382 2,714 799 25,210 25,239
Gross floor area represents 100% of space owned by Group companies and the Group’s attributable share of space owned by jointly controlled and associated companies. A schedule of the principal properties of the Group and its jointly controlled and associated companies is given on pages 239 to 251.
* Includes 1.8 million square feet at three techno-centres (Somerset House, Warwick House and Cornwall House).
** Somerset House is due to be demolished for development in 2013. Once complete, the total gross floor area will be approximately 28,000 square feet lower than it is currently.
Swire Pacific 2012 Annual Report 19
Property Division
IMPLEMENTING STRATEGIES
New Projects
Swire Properties designs projects which it believes will have the necessary scale, mix of uses and transport links to become key commercial destinations and to transform the areas in which they are situated. Swire Properties’ experience and record of success as a developer of major commercial projects gives it a strong competitive advantage in securing new projects. In Hong Kong suitable development sites of significant size are not easy to obtain due to strong competition and the limited amount of suitable undeveloped land. The progress and cost of developments can be adversely affected by a number of different factors. In Mainland China, Swire Properties aims to replicate the success which it has experienced in Hong Kong. It intends to take a measured approach to land purchases. Swire Properties will focus on developments where it can secure sites through early engagement with local governments who recognise its strengths in developing large-scale mixed-use projects.
Rental Income
Swire Properties actively manages its completed property developments (including by optimising the mix of retail tenants and negotiations with office tenants about early renewal). Its long-term aim is to maintain consistently high levels of service and to enhance and reinforce its assets. By doing so, Swire Properties expects to maximise the occupancy and earnings potential of its properties. Notwithstanding Swire Properties’ active management of its developments, the growth of rental income principally depends on the performance of the real estate markets in Hong Kong and Mainland China (in the latter in particular in Beijing and Guangzhou). Any real estate market downturn in these areas could affect Swire Properties’ rental income.
The strategic objective of Swire Properties (as a listed company in its own right) is sustainable growth in shareholder value over the long-term as a leading developer, owner and operator of mixed-use commercial properties in Hong Kong and Mainland China. The strategies employed in order to achieve this objective are these:
• The creation of long-term value through conceiving, designing, developing, owning and managing transformational mixed-use and other projects in urban areas.
2012PERFORMANCE
Capital Expenditure Gross Rental Income (HK)
HK$3.8 bn -2% *
Capital Commitments at Year-end Gross Rental Income (Mainland China)
HK$15.9 bn +75%
STRATEGY
20 Swire Pacific 2012 Annual Report
2012 Performance Review and Outlook
Trading Profit
A key objective of Swire Properties is to expand its luxury residential property activities through acquiring appropriate sites for the development of luxury residential projects.
• Maximisation of the earnings and value of its completed properties through active asset management, including reinforcing its assets through enhancement, redevelopment and new additions.
• Continuing to expand its luxury residential property activities.
• Remaining focused principally on Hong Kong and Mainland China.
• Conservative management of its capital base.
Capital Base
Swire Properties aims to maintain a strong capital base by investing in and financing projects in a disciplined and targeted manner. Its aim in managing its capital base is to safeguard its ability to operate as a going concern and to have access to finance at a reasonable cost. In monitoring its capital structure, Swire Properties considers (among other things) its gearing ratio, its cash interest cover and the return cycle of its various investments.
Property Trading – Operating Profit Gearing Energy Consumption
+HK$2.4 bn -0.7% pts -11% **
Units Closed Return on Equity Water Consumption
115 9% +1% **
Sustainability
Tenants increasingly scrutinise the sustainability credentials of landlords and buildings. Swire Properties aims to be at the forefront of sustainable development by designing energy efficient buildings through the innovative use of design, materials and new technology.
* Disregarding the gross rental income from Festival Walk in 2011, the gross rental income in Hong Kong in 2012 grew by 7%. ** The size of the completed property portfolio grew by 7% in the same period.
Swire Pacific 2012 Annual Report 21
Property Division
2012 PERFORMANCE
FINANCIAL HIGHLIGHTS
2012 2011HK$M HK$M
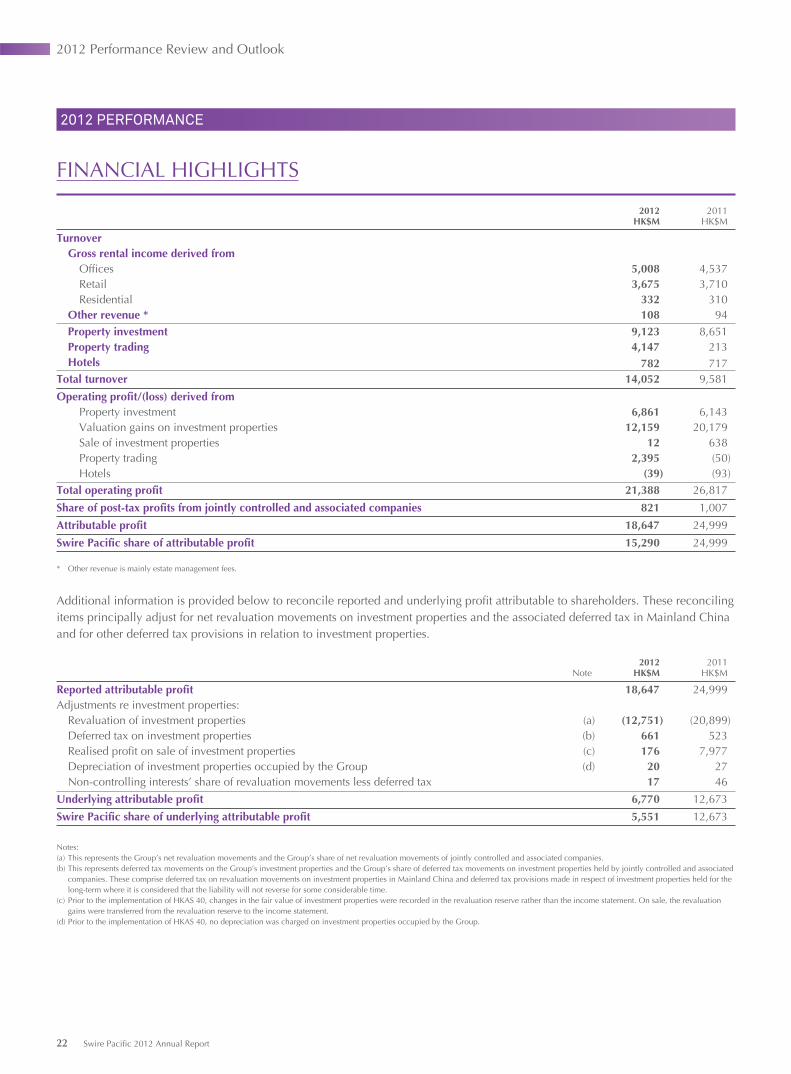
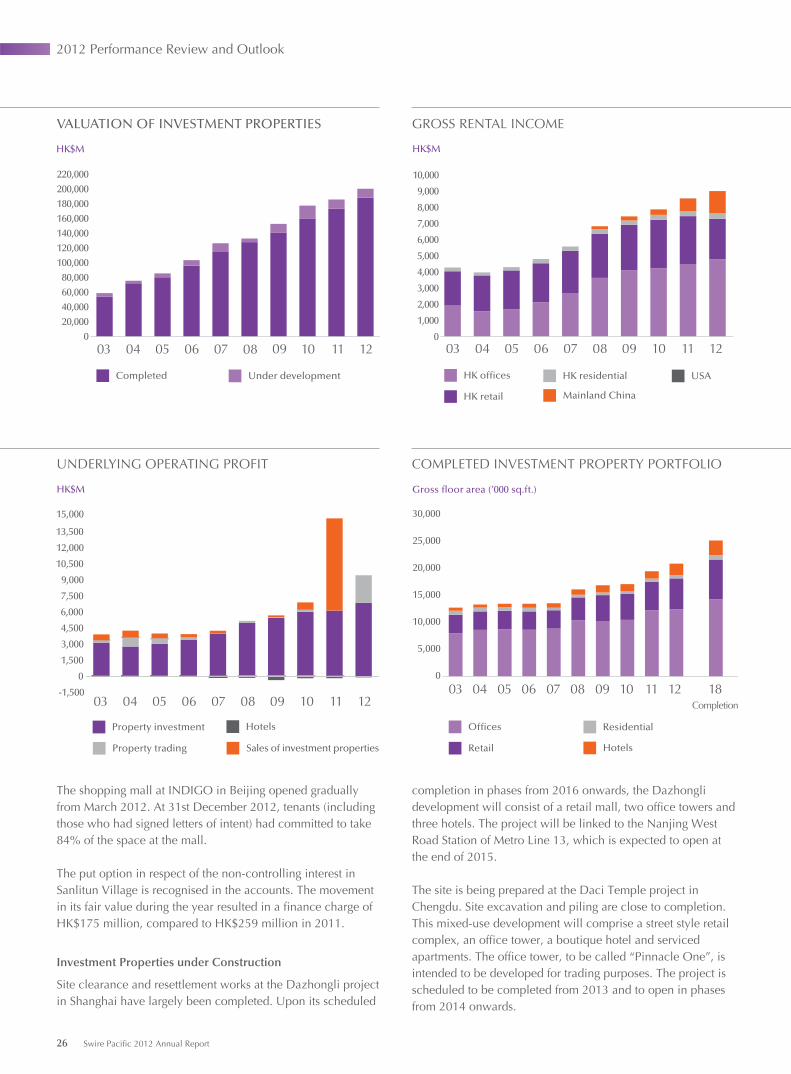
Turnover Gross rental income derived from Offices 5,008 4,537 Retail 3,675 3,710 Residential 332 310 Other revenue * 108 94 Property investment 9,123 8,651 Property trading 4,147 213 Hotels 782 717Total turnover 14,052 9,581
Operating profit/(loss) derived from Property investment 6,861 6,143 Valuation gains on investment properties 12,159 20,179 Sale of investment properties 12 638 Property trading 2,395 (50) Hotels (39) (93)Total operating profit 21,388 26,817
Share of post-tax profits from jointly controlled and associated companies 821 1,007
Attributable profit 18,647 24,999
Swire Pacific share of attributable profit 15,290 24,999
* Other revenue is mainly estate management fees.
Additional information is provided below to reconcile reported and underlying profit attributable to shareholders. These reconciling items principally adjust for net revaluation movements on investment properties and the associated deferred tax in Mainland China and for other deferred tax provisions in relation to investment properties.
2012 2011Note HK$M HK$M
Reported attributable profit 18,647 24,999Adjustments re investment properties: Revaluation of investment properties (a) (12,751) (20,899) Deferred tax on investment properties (b) 661 523 Realised profit on sale of investment properties (c) 176 7,977 Depreciation of investment properties occupied by the Group (d) 20 27 Non-controlling interests’ share of revaluation movements less deferred tax 17 46
Underlying attributable profit 6,770 12,673
Swire Pacific share of underlying attributable profit 5,551 12,673
Notes:(a) This represents the Group’s net revaluation movements and the Group’s share of net revaluation movements of jointly controlled and associated companies. (b) This represents deferred tax movements on the Group’s investment properties and the Group’s share of deferred tax movements on investment properties held by jointly controlled and associated
companies. These comprise deferred tax on revaluation movements on investment properties in Mainland China and deferred tax provisions made in respect of investment properties held for the long-term where it is considered that the liability will not reverse for some considerable time.
(c) Prior to the implementation of HKAS 40, changes in the fair value of investment properties were recorded in the revaluation reserve rather than the income statement. On sale, the revaluation gains were transferred from the revaluation reserve to the income statement.
(d) Prior to the implementation of HKAS 40, no depreciation was charged on investment properties occupied by the Group.
22 Swire Pacific 2012 Annual Report
2012 Performance Review and Outlook
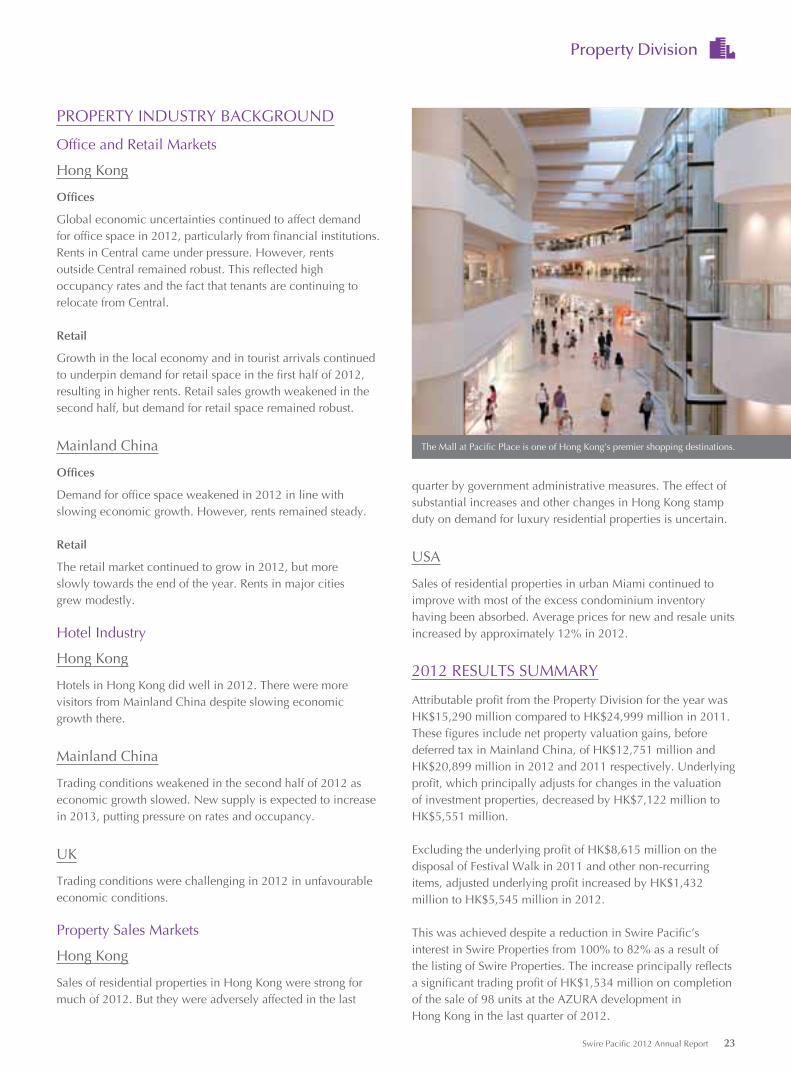
The Mall at Pacific Place is one of Hong Kong’s premier shopping destinations.
PROPERTY INDUSTRY BACKGROUND
Office and Retail Markets
Hong Kong
Offices
Global economic uncertainties continued to affect demand for office space in 2012, particularly from financial institutions. Rents in Central came under pressure. However, rents outside Central remained robust. This reflected high occupancy rates and the fact that tenants are continuing to relocate from Central.
Retail
Growth in the local economy and in tourist arrivals continued to underpin demand for retail space in the first half of 2012, resulting in higher rents. Retail sales growth weakened in the second half, but demand for retail space remained robust.
Mainland China
Offices
Demand for office space weakened in 2012 in line with slowing economic growth. However, rents remained steady.
Retail
The retail market continued to grow in 2012, but more slowly towards the end of the year. Rents in major cities grew modestly.
Hotel Industry
Hong Kong
Hotels in Hong Kong did well in 2012. There were more visitors from Mainland China despite slowing economic growth there.
Mainland China
Trading conditions weakened in the second half of 2012 as economic growth slowed. New supply is expected to increase in 2013, putting pressure on rates and occupancy.
UK
Trading conditions were challenging in 2012 in unfavourable economic conditions.
Property Sales Markets
Hong Kong
Sales of residential properties in Hong Kong were strong for much of 2012. But they were adversely affected in the last
quarter by government administrative measures. The effect of substantial increases and other changes in Hong Kong stamp duty on demand for luxury residential properties is uncertain.
USA
Sales of residential properties in urban Miami continued to improve with most of the excess condominium inventory having been absorbed. Average prices for new and resale units increased by approximately 12% in 2012.
2012 RESULTS SUMMARY
Attributable profit from the Property Division for the year was HK$15,290 million compared to HK$24,999 million in 2011. These figures include net property valuation gains, before deferred tax in Mainland China, of HK$12,751 million and HK$20,899 million in 2012 and 2011 respectively. Underlying profit, which principally adjusts for changes in the valuation of investment properties, decreased by HK$7,122 million to HK$5,551 million.
Excluding the underlying profit of HK$8,615 million on the disposal of Festival Walk in 2011 and other non-recurring items, adjusted underlying profit increased by HK$1,432 million to HK$5,545 million in 2012.
This was achieved despite a reduction in Swire Pacific’s interest in Swire Properties from 100% to 82% as a result of the listing of Swire Properties. The increase principally reflects a significant trading profit of HK$1,534 million on completion of the sale of 98 units at the AZURA development in Hong Kong in the last quarter of 2012.
Swire Pacific 2012 Annual Report 23
Property Division
Adjusted underlying profit from property investment decreased. This reflected the reduction in Swire Pacific’s interest in Swire Properties and the loss of rental income from Festival Walk following its sale in August 2011, partially offset by positive rental reversions from the Hong Kong portfolio, the first full year contribution from TaiKoo Hui in Guangzhou and a better performance at Sanlitun Village.
There were better performances in 2012 from the three managed hotels, The Upper House and EAST in Hong Kong and The Opposite House in Beijing. However, this was more than offset by pre-opening expenses at the Mandarin Oriental hotel in TaiKoo Hui and EAST in Beijing.
INVESTMENT PROPERTIES
Hong Kong
Offices
Swire Properties’ completed office portfolio comprises 10.4 million square feet of space in Hong Kong, including 2.2 million square feet at Pacific Place in Admiralty, 1.6 million square feet at Cityplaza in Island East and 6.2 million square feet at TaiKoo Place in Island East.
Swire Properties has office tenants in Hong Kong operating in different sectors. The top ten office tenants occupied approximately 21% of the office space in Hong Kong at 31st December 2012. Approximately one-third of the office space in Hong Kong is occupied by companies operating in the financial services sector.
The Hong Kong office portfolio did well in 2012. Demand for space was strong in the first half, both from new tenants and from existing tenants wanting more space. Demand slowed in the second half but growth in rental income continued as a result of reversionary rent increases on tenancy renewals and rent reviews. Occupancy rates at Pacific Place and Island East remained high throughout the year.
28 Hennessy Road, a 145,390 square foot office building, was completed in the second half of 2012. Two of the 24 floors have been leased. The property continues to attract interest from smaller businesses currently based in Central.
At 31st December 2012, the office occupancy rate (excluding Somerset House which is scheduled to be demolished for development in 2013 and the newly opened 28 Hennessy Road) was 98%.
Retail
Swire Properties manages three retail malls in Hong Kong: The Mall at Pacific Place, comprising 0.7 million square feet; Cityplaza in Island East, comprising 1.1 million square feet; and Citygate Outlets at Tung Chung, comprising 0.5 million square feet. The malls are wholly-owned by Swire Properties, except for Citygate Outlets, in which it has a 20% interest. There are other minor retail interests in Hong Kong.
Rental income from the retail portfolio in Hong Kong improved in 2012. Rental reversions were positive. This reflected strong demand for space and a lack of supply.
The Group’s wholly-owned malls were effectively fully let throughout the year.
Retail sales growth in The Mall at Pacific Place was 0.3% and same store retail sales growth was 3% (after excluding major shops which were closed or fitted out in 2011 and 2012). Retail sales at the Cityplaza and Citygate malls were 6% and 21% higher respectively in 2012 than in 2011.
Residential
The completed residential portfolio comprises Pacific Place Apartments, the recently completed luxury OPUS HONG KONG development (owned by Swire Pacific) and a small number of luxury houses and apartments.
Rental income from the residential portfolio continued to improve in 2012. But demand for space at Pacific Place Apartments softened in the fourth quarter of 2012.
Two units at OPUS HONG KONG were sold.
Occupancy at the residential portfolio was approximately 86% at 31st December 2012 (excluding OPUS HONG KONG).
Investment Properties under Construction
In 2012, improvement works continued at the Mall at Pacific Place. The space previously occupied by a department store has been reconfigured. New stores have opened. A beauty gallery has been created for retailers of high quality cosmetic and skin care brands. An additional arcade has linked the two
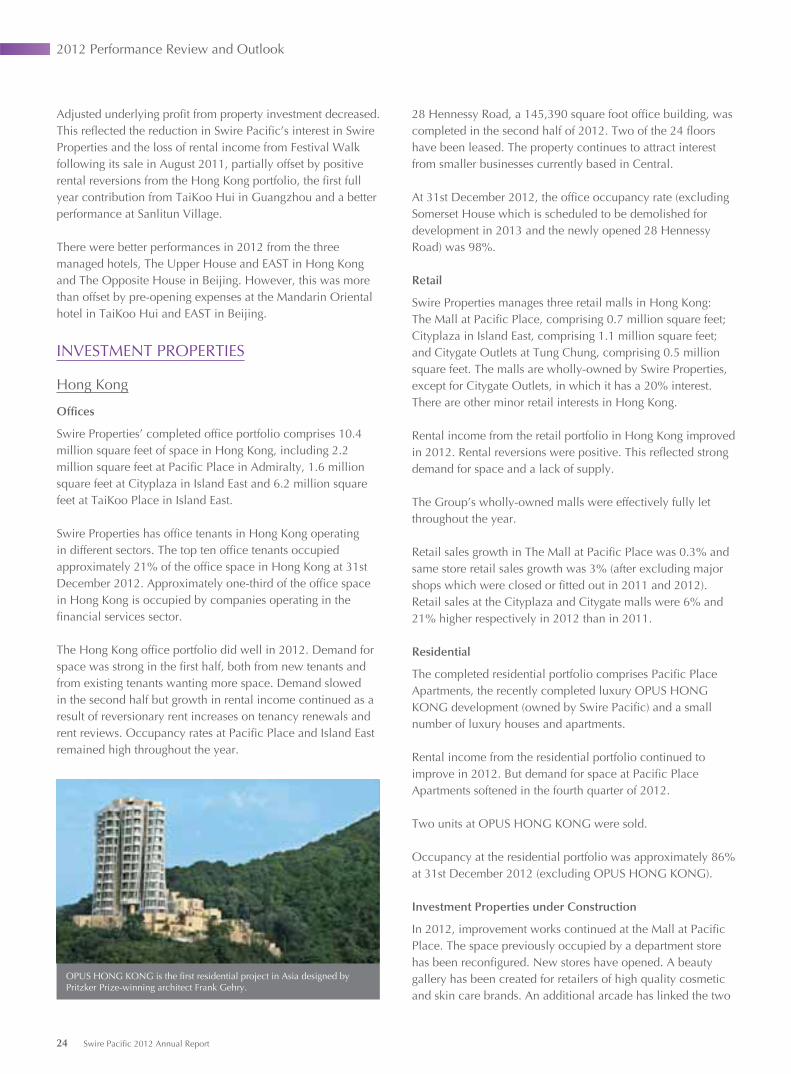
OPUS HONG KONG is the first residential project in Asia designed by Pritzker Prize-winning architect Frank Gehry.
24 Swire Pacific 2012 Annual Report
2012 Performance Review and Outlook
sides of the Mall in order to improve the flow of pedestrian traffic. Refurbishment of the external façade is scheduled to be completed in the first half of 2013.
Swire Properties has leased the whole of 8 Queen’s Road East, a 19-storey commercial building with 81,346 square feet of space, for a ten year term. Refurbishment of the building is scheduled to be completed later in the first half of 2013.
The property at 23 Tong Chong Street, which is being redeveloped into serviced apartments with a total area of approximately 75,000 square feet, is scheduled to be completed in 2014.
In March 2013, the company which owns the existing Citygate Outlets development at Tung Chung in Hong Kong (in which Swire Properties Limited has a 20% equity interest) won a tender to develop an adjacent commercial site.
Mainland China
Swire Properties owns and manages one retail centre and two mixed-use developments in Mainland China.
Sanlitun Village comprises two neighbouring sites in the Chaoyang district of Beijing, Village South (0.8 million square feet of retail space) and Village North (0.5 million square feet of retail space). Retail tenants in Sanlitun Village sell internationally branded goods. Village South focuses on global mid-market brands, with tenants including the largest Adidas store in the world and the largest Apple store in Mainland China. Tenants at Village North are principally retailers of international and local designer fashion brands. The Opposite House hotel (see page 29 “Hotels – Mainland China”) is also at Sanlitun Village.
Gateway China Fund I, a fund managed by Gaw Capital Partners, owns 20% of the Sanlitun Village development (except The Opposite House, which is wholly-owned by Swire Properties). The fund has an option to sell its 20% interest to Swire Properties before the end of 2013.
TaiKoo Hui is a mixed-use development in the Tianhe central business district of Guangzhou with a total area of 3.8 milllion square feet. The development comprises a premium shopping mall, two Grade A office towers, a cultural centre and a Mandarin Oriental hotel with serviced apartments, together with approximately 700 car parking spaces, all of which are interconnected. The shopping mall opened in September 2011, with tenants including retailers of major international brands. The hotel and serviced apartments opened in January 2013.
INDIGO is a 1.9 million square foot mixed-use development at Jiangtai in the Chaoyang district of Beijing, comprising a retail mall, a Grade A office tower – ONE INDIGO, and a 369-room hotel operated by EAST, which opened in September 2012.
Offices
Gross rental income from the office portfolio in Mainland China grew strongly in 2012, reflecting a full-year contribution from the office towers at TaiKoo Hui.
At TaiKoo Hui, some of the remaining office space was taken up during the year. At 31st December 2012, tenants (including those who had signed letters of intent) had committed to take 79% of the office space at TaiKoo Hui. The corresponding figure at 31st December 2011 was 68%. Further vacant office space at TaiKoo Hui is expected to be leased in 2013.
The occupancy rate at the offices at ONE INDIGO was 95% at 31st December 2012. The corresponding figure at 31st December 2011 was 46%.
Retail
Gross rental income from the retail portfolio in Mainland China improved significantly in 2012. This reflected a full year of operation in 2012 of the shopping mall at TaiKoo Hui and better rental performance at Sanlitun Village.
Retail sales at the shopping mall at TaiKoo Hui have been encouraging since it opened in September 2011. The mall was 99% leased at 31st December 2012.
At Sanlitun Village, retail sales increased strongly in 2012 compared with 2011. At 31st December 2012, occupancy rates were 97% at Village South and 90% at Village North.
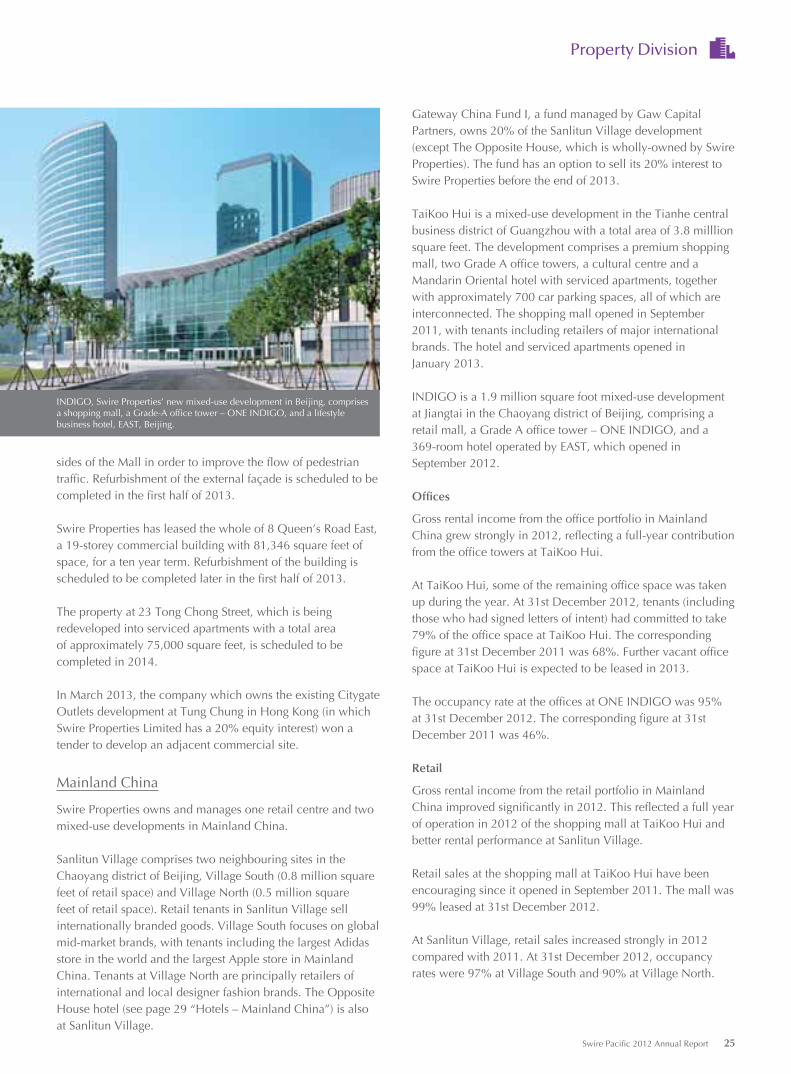
INDIGO, Swire Properties’ new mixed-use development in Beijing, comprises a shopping mall, a Grade-A office tower – ONE INDIGO, and a lifestyle business hotel, EAST, Beijing.
Swire Pacific 2012 Annual Report 25
Property Division
HK offices HK residential USA
HK retail Mainland China
GROSS RENTAL INCOME
11 121009080706050403
HK$M
0
1,000
2,000
3,000
4,000
5,000
6,000
7,000
8,000
9,000
10,000
Offices Residential
Retail Hotels
COMPLETED INVESTMENT PROPERTY PORTFOLIO
18Completion
11 121009080706050403
Gross floor area (’000 sq.ft.)
0
5,000
10,000
15,000
20,000
25,000
30,000
-1,500
0
1,500
3,000
4,500
6,000
7,500
9,000
10,500
12,000
13,500
15,000
Property investment Hotels
Property trading Sales of investment properties
UNDERLYING OPERATING PROFIT
11 121009080706050403
HK$M
Completed Under development
VALUATION OF INVESTMENT PROPERTIES
11 121009080706050403
HK$M
0
20,000
40,000
60,000
80,000
100,000
120,000
140,000
160,000
180,000
200,000
220,000
The shopping mall at INDIGO in Beijing opened gradually from March 2012. At 31st December 2012, tenants (including those who had signed letters of intent) had committed to take 84% of the space at the mall.
The put option in respect of the non-controlling interest in Sanlitun Village is recognised in the accounts. The movement in its fair value during the year resulted in a finance charge of HK$175 million, compared to HK$259 million in 2011.
Investment Properties under Construction
Site clearance and resettlement works at the Dazhongli project in Shanghai have largely been completed. Upon its scheduled
completion in phases from 2016 onwards, the Dazhongli development will consist of a retail mall, two office towers and three hotels. The project will be linked to the Nanjing West Road Station of Metro Line 13, which is expected to open at the end of 2015.
The site is being prepared at the Daci Temple project in Chengdu. Site excavation and piling are close to completion. This mixed-use development will comprise a street style retail complex, an office tower, a boutique hotel and serviced apartments. The office tower, to be called “Pinnacle One”, is intended to be developed for trading purposes. The project is scheduled to be completed from 2013 and to open in phases from 2014 onwards.
26 Swire Pacific 2012 Annual Report
2012 Performance Review and Outlook
Audited Financial Information
Investment PropertiesGroup Company
CompletedUnder
Construction Total TotalHK$M HK$M HK$M HK$M
At 1st January 2012 174,130 17,385 191,515 5,266Translation differences 190 – 190 –Additions 465 1,812 2,277 73Disposals (931) (2) (933) (931)Transfer upon completion 7,391 (7,391) – –Other net transfers from property, plant and equipment 72 5 77 –Fair value gains 11,674 473 12,147 (12)
192,991 12,282 205,273 4,396Add: Initial leasing costs 315 – 315 –At 31st December 2012 193,306 12,282 205,588 4,396
At 1st January 2011 160,763 19,485 180,248 2,295Translation differences 374 421 795 –Change in composition of Group (18,090) – (18,090) –Additions 141 5,084 5,225 303Transfer upon completion 11,142 (11,142) – –Other net transfers from property, plant and equipment 175 38 213 –Other net transfers from property held for development 104 249 353 –Fair value gains 19,521 3,250 22,771 2,668
174,130 17,385 191,515 5,266Add: Initial leasing costs 290 – 290 –At 31st December 2011 174,420 17,385 191,805 5,266
Geographical Analysis of Investment PropertiesGroup Company
2012 2011 2012 2011HK$M HK$M HK$M HK$M
Held in Hong KongOn medium-term leases (10 to 50 years) 25,342 25,143 – –On long-term leases (over 50 years) 156,272 144,751 4,396 5,266
181,614 169,894 4,396 5,266Held in Mainland ChinaOn medium-term leases (10 to 50 years) 23,105 21,230Held in USAFreehold 554 391
205,273 191,515
Note: The Group figures in the table above comprise investment properties owned by Swire Properties and a small number of properties owned by Swire Pacific Limited which are managed by Swire Properties. The Company figures represent those investment properties owned directly by Swire Pacific Limited.
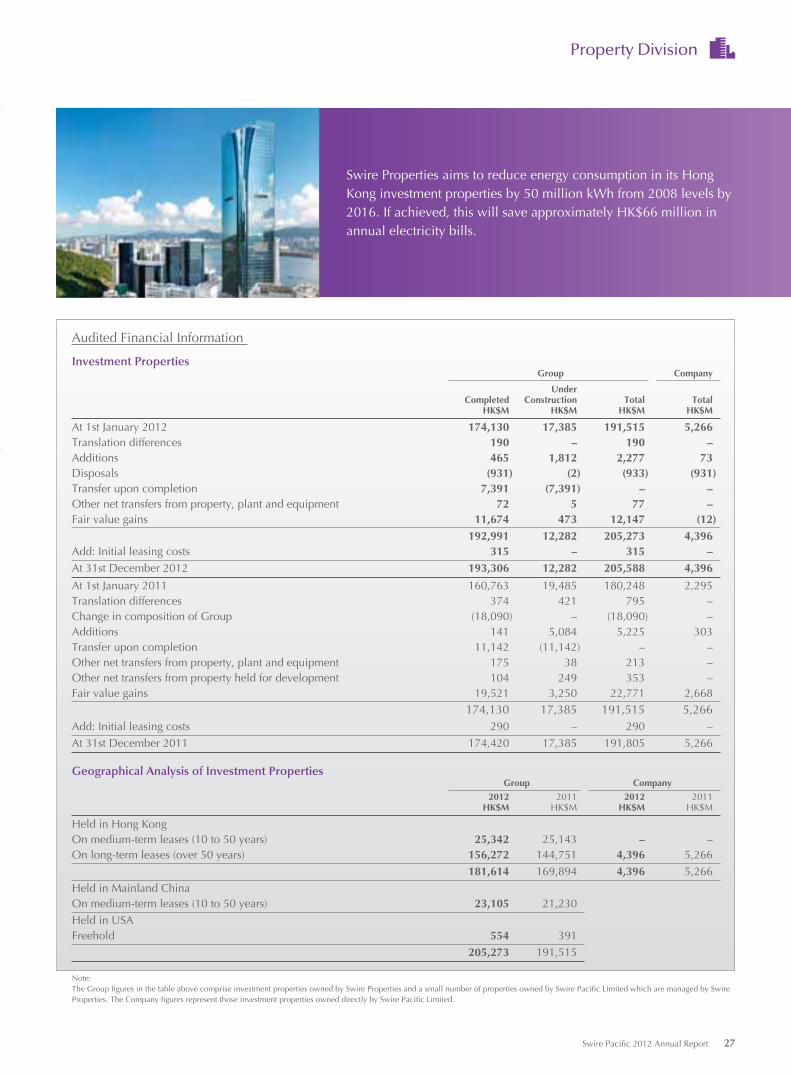
Swire Properties aims to reduce energy consumption in its Hong Kong investment properties by 50 million kWh from 2008 levels by 2016. If achieved, this will save approximately HK$66 million in annual electricity bills.
Swire Pacific 2012 Annual Report 27
Property Division
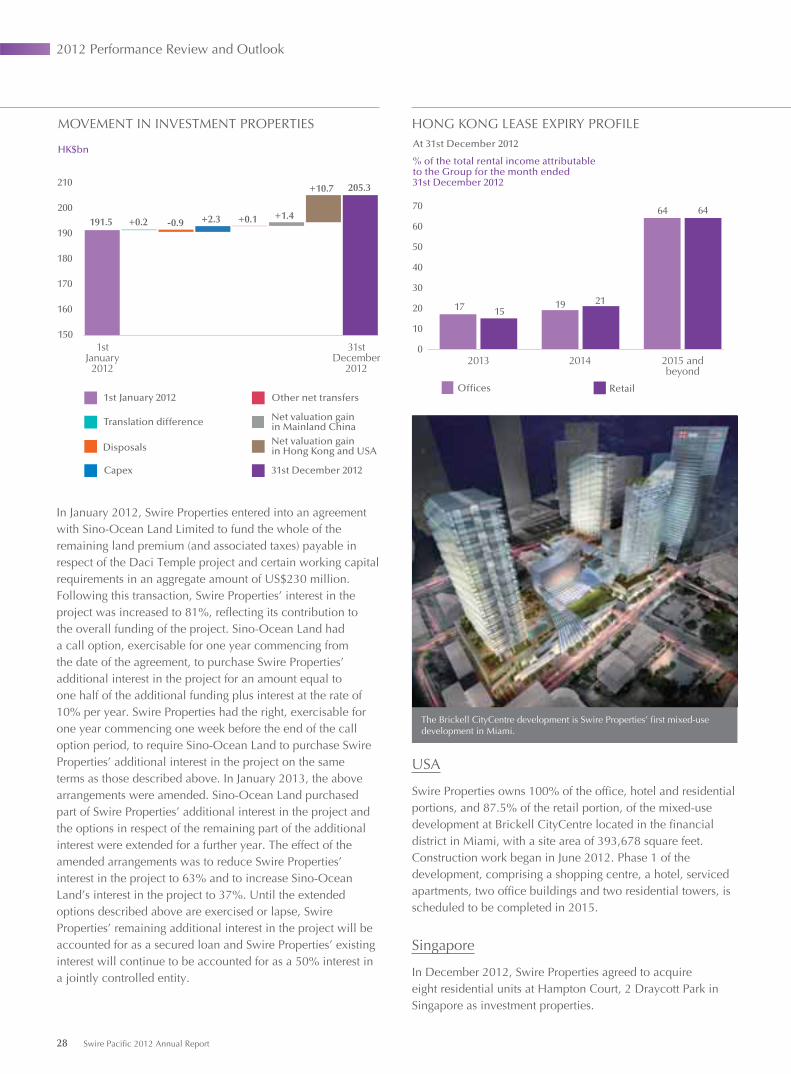
MOVEMENT IN INVESTMENT PROPERTIES
HK$bn
Other net transfers
31st December 2012Capex
Net valuation gain in Mainland ChinaNet valuation gain in Hong Kong and USA
1st January 2012
Translation difference
Disposals
+0.2191.5 -0.9 +2.3
205.3
+1.4
+10.7
+0.1
31stDecember
2012
1stJanuary2012
150
160
170
180
190
200
210
In January 2012, Swire Properties entered into an agreement with Sino-Ocean Land Limited to fund the whole of the remaining land premium (and associated taxes) payable in respect of the Daci Temple project and certain working capital requirements in an aggregate amount of US$230 million. Following this transaction, Swire Properties’ interest in the project was increased to 81%, reflecting its contribution to the overall funding of the project. Sino-Ocean Land had a call option, exercisable for one year commencing from the date of the agreement, to purchase Swire Properties’ additional interest in the project for an amount equal to one half of the additional funding plus interest at the rate of 10% per year. Swire Properties had the right, exercisable for one year commencing one week before the end of the call option period, to require Sino-Ocean Land to purchase Swire Properties’ additional interest in the project on the same terms as those described above. In January 2013, the above arrangements were amended. Sino-Ocean Land purchased part of Swire Properties’ additional interest in the project and the options in respect of the remaining part of the additional interest were extended for a further year. The effect of the amended arrangements was to reduce Swire Properties’ interest in the project to 63% and to increase Sino-Ocean Land’s interest in the project to 37%. Until the extended options described above are exercised or lapse, Swire Properties’ remaining additional interest in the project will be accounted for as a secured loan and Swire Properties’ existing interest will continue to be accounted for as a 50% interest in a jointly controlled entity.
The Brickell CityCentre development is Swire Properties’ first mixed-use development in Miami.
HONG KONG LEASE EXPIRY PROFILEAt 31st December 2012
% of the total rental income attributable to the Group for the month ended 31st December 2012
2013 2014 2015 andbeyond
Offices Retail
0
10
20
30
40
50
60
70
17 1519 21
64 64
USA
Swire Properties owns 100% of the office, hotel and residential portions, and 87.5% of the retail portion, of the mixed-use development at Brickell CityCentre located in the financial district in Miami, with a site area of 393,678 square feet. Construction work began in June 2012. Phase 1 of the development, comprising a shopping centre, a hotel, serviced apartments, two office buildings and two residential towers, is scheduled to be completed in 2015.
Singapore
In December 2012, Swire Properties agreed to acquire eight residential units at Hampton Court, 2 Draycott Park in Singapore as investment properties.
28 Swire Pacific 2012 Annual Report
2012 Performance Review and Outlook
2011 levels. Higher room rates were partially offset by lower occupancy rates in the second half.
United Kingdom
Swire Properties wholly-owns four hotels in the United Kingdom, one each in Cheltenham, Bristol, Brighton and Exeter. The hotel in Exeter, The Magdalen Chapter, re-opened in June 2012 after a major refurbishment. Although occupancy and room rates improved in 2012, trading conditions remained challenging.
CAPITAL EXPENDITURE AND COMMITMENTS FOR INVESTMENT PROPERTIES AND HOTELS
Capital expenditure in 2012 on Hong Kong investment properties and hotels, including completed projects, was HK$1,828 million (2011: HK$3,104 million). Outstanding capital commitments at 31st December 2012 were HK$5,405 million (31st December 2011: HK$6,740 million).
Capital expenditure in 2012 on Mainland China investment properties and hotels, including the Group’s share of the capital expenditure of jointly controlled companies, was HK$1,776 million (2011: HK$3,180 million). Outstanding capital commitments at 31st December 2012 were HK$7,546 million (2011: HK$8,430 million), including the Group’s share of the capital commitments of jointly controlled companies of HK$6,620 million (2011: HK$7,101 million). The Group is committed to funding HK$818 million (31st December 2011: HK$1,828 million) of the capital commitments of jointly controlled companies in Mainland China.
Capital expenditure in 2012 on USA, UK and Singapore investment properties and hotels was HK$239 million (2011: HK$102 million). Outstanding capital commitments at 31st December 2012 were HK$2,963 million (2011: HK$2,510 million).
VALUATION OF INVESTMENT PROPERTIES
The portfolio of investment properties was valued at 31st December 2012 (96% by value having been valued by DTZ Debenham Tie Leung) on the basis of open market value. The amount of this valuation, before associated deferred tax in Mainland China, was HK$205,273 million compared to HK$191,515 million at 31st December 2011 and HK$199,300 million at 30th June 2012.
The change in the valuation of the investment property portfolio since 31st December 2011 principally reflects increased rental income.
Under HKAS 40, hotel properties are not accounted for as investment properties but are included within property, plant and equipment at cost less accumulated depreciation and any provision for impairment losses.
HOTELS
Hong Kong
Swire Properties wholly-owns Swire Hotels, which manages two hotels in Hong Kong, The Upper House, a 117-room luxury hotel at Pacific Place and EAST, Hong Kong, a 345-room hotel at Cityplaza. Swire Properties has a 20% interest in each of the JW Marriott, Conrad Hong Kong and Island Shangri-La hotels at Pacific Place and in the Novotel Citygate in Tung Chung.
The performance of the wholly-owned and managed hotels improved in 2012. At The Upper House, revenue per available room increased by 9% from 2011. At EAST, Hong Kong, revenue per available room increased by 5%. The performance of the non-managed hotels also improved in 2012.
Mainland China
Swire Hotels manages two hotels in Mainland China, The Opposite House, a 99-room luxury hotel at Sanlitun Village, Beijing, and EAST, a 369-room hotel located at INDIGO, Beijing. Swire Properties owns the whole of The Opposite House and 50% of EAST. Swire Properties owns 97% of, but does not manage, the Mandarin Oriental at TaiKoo Hui, which has 263 rooms and 24 serviced apartments.
The accommodation, restaurant and bar businesses at The Opposite House continued to improve in 2012. Revenue per available room increased by 3% from 2011. EAST, Beijing, opened in September 2012. The Mandarin Oriental at TaiKoo Hui opened in January 2013.
USA
Swire Properties has a 75% interest in the 326-room Mandarin Oriental Hotel in Miami. Results in 2012 improved from
EAST, Beijing, located at INDIGO, is Swire Hotels’ second hotel in Beijing and its fourth in Asia.
Swire Pacific 2012 Annual Report 29
Property Division
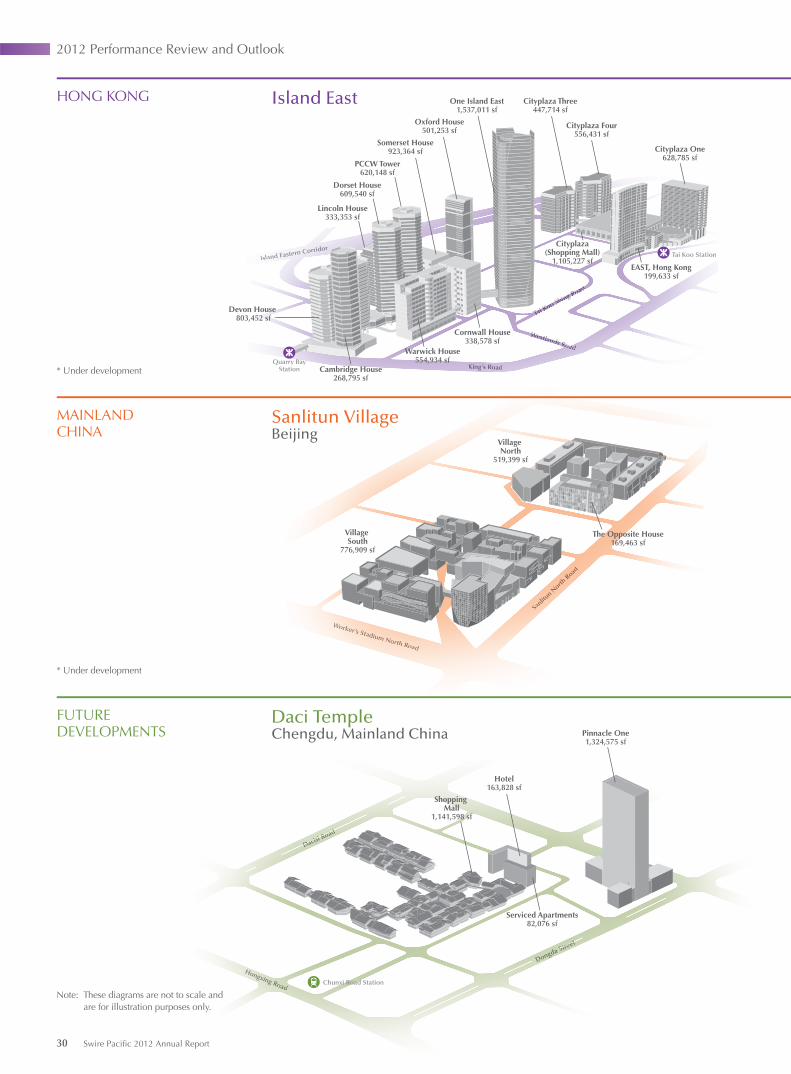
Quarry BayBayStation
Westlands Road
WWestestlandandds Rs RoRoadadad
Tai Koo Station
KiKingg’s Rs Rs Roadoaoad
Tai Koo Shing Road
Tai Koo ShinShing Rog Roadad
Island Ed Easteasteern Crn Corriorrirriddodor
Devon House 803,452 sf
Cambridge House268,795 sf
Warwick House554,934 sf
Cornwall House338,578 sf
Cityplaza One628,785 sf
Cityplaza Four556,431 sf
Cityplaza Three447,714 sf
One Island East1,537,011 sf
Oxford House501,253 sf
Somerset House923,364 sf
PCCW Tower620,148 sf
Dorset House609,540 sf
Lincoln House333,353 sf
Cityplaza(Shopping Mall)
1,105,227 sfEAST, Hong Kong
199,633 sf
The Opposite House169,463 sf
Village North
519,399 sf
Village South
776,909 sf
anl
Sanl
Sanlitu
nitu
nit
orNor N
orth R
th R
thoado
WoWorkrkkWorWer’ser’s’ser StaSta Stadiumdiumdium Nor Nor North Rth Rth RRoadoadoad
Island East
Sanlitun VillageBeijing
Daci TempleChengdu, Mainland China
Hotel163,828 sf
Serviced Apartments82,076 sf
Shopping Mall
1,141,598 sf
Pinnacle One1,324,575 sf
Dacisi Road
DaciDaciDaci i Ri Rsi R
adoadoad
HHonHononH gxingxingxinxinngg
g Rog RoRoog Rog gadadadad
a Street
DonDon Dongda
gda gda StreStSt
tet
Note: These diagrams are not to scale and are for illustration purposes only.
* Under development
* Under development
Chunxi Road Station
HONG KONG
MAINLANDCHINA
FUTUREDEVELOPMENTS
30 Swire Pacific 2012 Annual Report
2012 Performance Review and Outlook
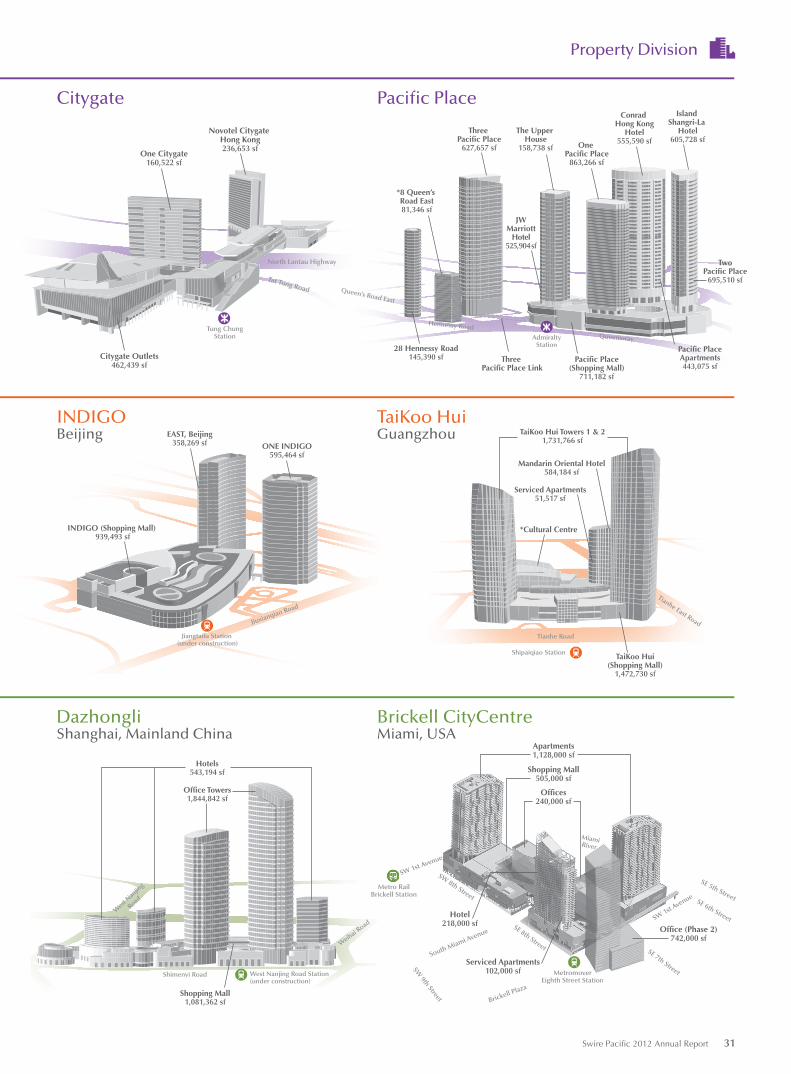
Quarry BayStation
Westlands Road
Tai Koo Station
King’s Road
Tai Koo Shing Road
Island Eastern Corridor
Devon House 803,452 sf
Cambridge House268,795 sf
Warwick House554,934 sf
Cornwall House338,578 sf
Cityplaza One628,785 sf
Cityplaza Four556,431 sf
Cityplaza Three447,714 sf
One Island East1,537,011 sf
Oxford House501,253 sf
Somerset House923,364 sf
PCCW Tower620,148 sf
Dorset House609,540 sf
Lincoln House333,353 sf
Cityplaza(Shopping Mall)
1,105,227 sfEAST, Hong Kong
199,633 sf
Shipaiqiao Station
Tianhe Road
Tianhe East Road
Serviced Apartments51,517 sf
*Cultural Centre
TaiKoo Hui(Shopping Mall)
1,472,730 sf
TaiKoo Hui Towers 1 & 21,731,766 sf
Mandarin Oriental Hotel584,184 sf
The Opposite House169,463 sf
Village North
519,399 sf
Village South
776,909 sf
Sanlitu
n North
Road
Worker’s Stadium North Road
One Citygate160,522 sf
Citygate Outlets462,439 sf
Novotel Citygate Hong Kong236,653 sf
North Lantau Highway
Tat Tung Road
Tung Chung Station
Jiangtailu Station (under construction)
Jiuxianqiao Road
ONE INDIGO595,464 sf
EAST, Beijing358,269 sf
INDIGO (Shopping Mall) 939,493 sf
West Nanjing Road Station(under construction)
Shimenyi Road
Weihai Road
West
Nanjin
g
Road
Hotels543,194 sf
Office Towers1,844,842 sf
Shopping Mall1,081,362 sf
Island East
Sanlitun VillageBeijing
Daci TempleChengdu, Mainland China
Citygate
INDIGOBeijing
TaiKoo HuiGuangzhou
DazhongliShanghai, Mainland China
Brickell CityCentreMiami, USA
Pacific Place
Pacific PlaceApartments443,075 sf
TwoPacific Place
695,510 sf
Pacific Place(Shopping Mall)
711,182 sf
JWMarriott
Hotel525,904 sf
*8 Queen’s Road East81,346 sf
Three Pacific Place
627,657 sf
The Upper House
158,738 sf One Pacific Place
863,266 sf
Conrad Hong Kong
Hotel555,590 sf
Island Shangri-La
Hotel605,728 sf
28 Hennessy Road145,390 sf Three
Pacific Place Link
Queen’s Road East
Hennessy RoadQueenswayAdmiralty
Station
Hotel163,828 sf
Serviced Apartments82,076 sf
Shopping Mall
1,141,598 sf
Pinnacle One1,324,575 sf
Dacisi Road
Hongxing Road
Dongda Street
Note: These diagrams are not to scale and are for illustration purposes only.
Hotel218,000 sf
Serviced Apartments102,000 sf
SE 8th Street SE 7th Street
SW 1st Avenue
SW 1st Avenue
SW 8th Street
South Miami Avenue
Brickell Plaza
SW 9th Street
MiamiRiver
SE 6th Street
SE 5th Street
MetromoverEighth Street Station
Office (Phase 2)742,000 sf
Shopping Mall505,000 sf
Offices240,000 sf
Apartments1,128,000 sf
* Under development
* Under development
Chunxi Road Station
HONG KONG
MAINLANDCHINA
FUTUREDEVELOPMENTS
Metro RailBrickell Station
Swire Pacific 2012 Annual Report 31
Property Division
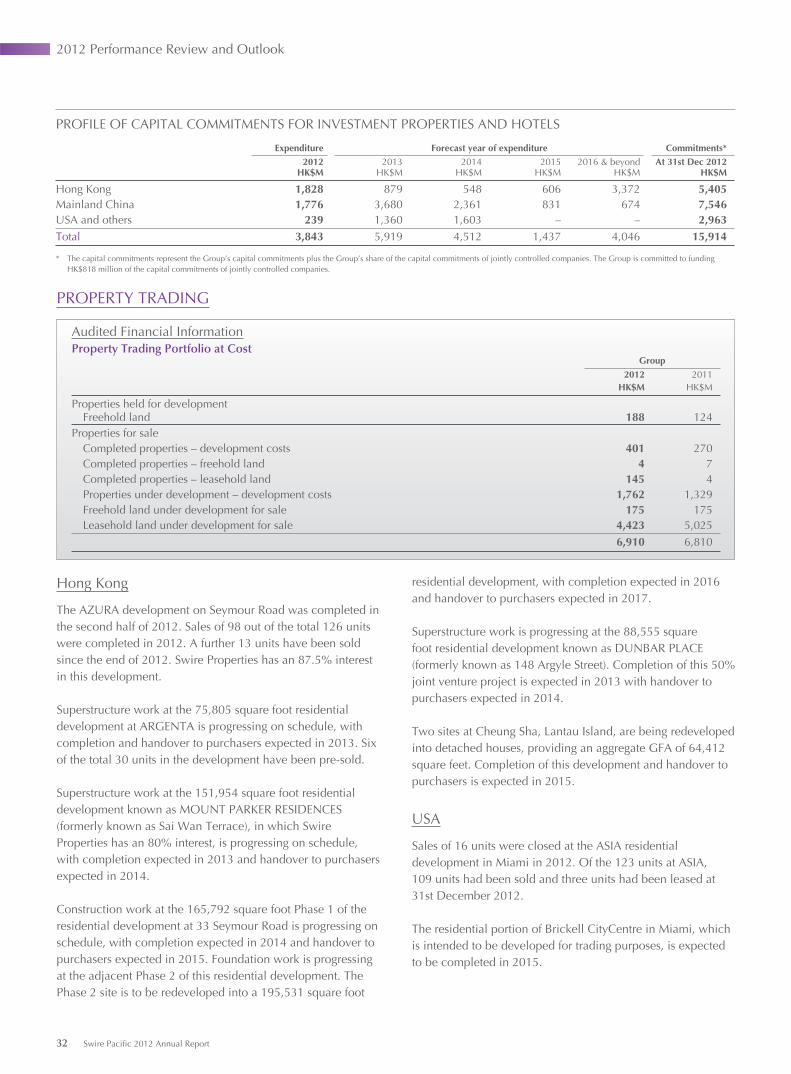
PROFILE OF CAPITAL COMMITMENTS FOR INVESTMENT PROPERTIES AND HOTELS
Expenditure Forecast year of expenditure Commitments*2012
HK$M2013
HK$M2014
HK$M2015
HK$M2016 & beyond
HK$MAt 31st Dec 2012
HK$M
Hong Kong 1,828 879 548 606 3,372 5,405Mainland China 1,776 3,680 2,361 831 674 7,546USA and others 239 1,360 1,603 – – 2,963Total 3,843 5,919 4,512 1,437 4,046 15,914
* The capital commitments represent the Group’s capital commitments plus the Group’s share of the capital commitments of jointly controlled companies. The Group is committed to funding HK$818 million of the capital commitments of jointly controlled companies.
Audited Financial InformationProperty Trading Portfolio at Cost
Group
2012 2011HK$M HK$M
Properties held for development Freehold land 188 124Properties for sale Completed properties – development costs 401 270 Completed properties – freehold land 4 7 Completed properties – leasehold land 145 4 Properties under development – development costs 1,762 1,329 Freehold land under development for sale 175 175 Leasehold land under development for sale 4,423 5,025
6,910 6,810
Hong Kong
The AZURA development on Seymour Road was completed in the second half of 2012. Sales of 98 out of the total 126 units were completed in 2012. A further 13 units have been sold since the end of 2012. Swire Properties has an 87.5% interest in this development.
Superstructure work at the 75,805 square foot residential development at ARGENTA is progressing on schedule, with completion and handover to purchasers expected in 2013. Six of the total 30 units in the development have been pre-sold.
Superstructure work at the 151,954 square foot residential development known as MOUNT PARKER RESIDENCES (formerly known as Sai Wan Terrace), in which Swire Properties has an 80% interest, is progressing on schedule, with completion expected in 2013 and handover to purchasers expected in 2014.
Construction work at the 165,792 square foot Phase 1 of the residential development at 33 Seymour Road is progressing on schedule, with completion expected in 2014 and handover to purchasers expected in 2015. Foundation work is progressing at the adjacent Phase 2 of this residential development. The Phase 2 site is to be redeveloped into a 195,531 square foot
residential development, with completion expected in 2016 and handover to purchasers expected in 2017.
Superstructure work is progressing at the 88,555 square foot residential development known as DUNBAR PLACE (formerly known as 148 Argyle Street). Completion of this 50% joint venture project is expected in 2013 with handover to purchasers expected in 2014.
Two sites at Cheung Sha, Lantau Island, are being redeveloped into detached houses, providing an aggregate GFA of 64,412 square feet. Completion of this development and handover to purchasers is expected in 2015.
USA
Sales of 16 units were closed at the ASIA residential development in Miami in 2012. Of the 123 units at ASIA, 109 units had been sold and three units had been leased at 31st December 2012.
The residential portion of Brickell CityCentre in Miami, which is intended to be developed for trading purposes, is expected to be completed in 2015.
PROPERTY TRADING
32 Swire Pacific 2012 Annual Report
2012 Performance Review and Outlook
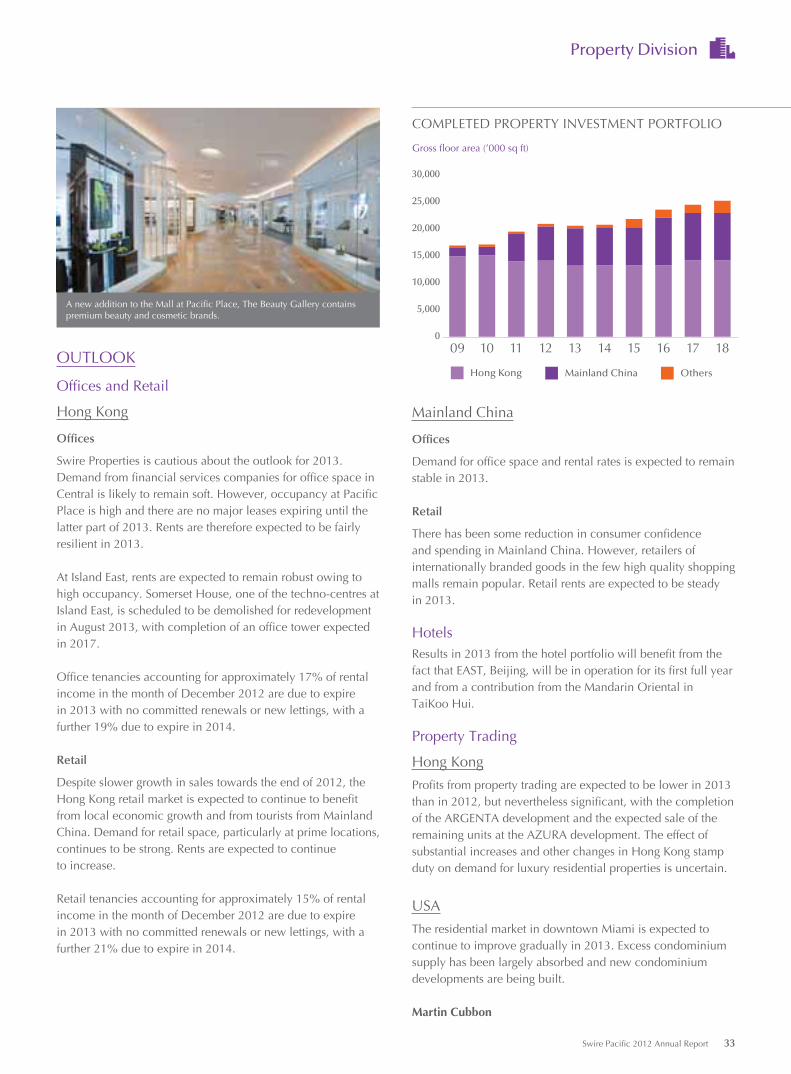
OUTLOOK
Offices and Retail
Hong Kong
Offices
Swire Properties is cautious about the outlook for 2013. Demand from financial services companies for office space in Central is likely to remain soft. However, occupancy at Pacific Place is high and there are no major leases expiring until the latter part of 2013. Rents are therefore expected to be fairly resilient in 2013.
At Island East, rents are expected to remain robust owing to high occupancy. Somerset House, one of the techno-centres at Island East, is scheduled to be demolished for redevelopment in August 2013, with completion of an office tower expected in 2017.
Office tenancies accounting for approximately 17% of rental income in the month of December 2012 are due to expire in 2013 with no committed renewals or new lettings, with a further 19% due to expire in 2014.
Retail
Despite slower growth in sales towards the end of 2012, the Hong Kong retail market is expected to continue to benefit from local economic growth and from tourists from Mainland China. Demand for retail space, particularly at prime locations, continues to be strong. Rents are expected to continue to increase.
Retail tenancies accounting for approximately 15% of rental income in the month of December 2012 are due to expire in 2013 with no committed renewals or new lettings, with a further 21% due to expire in 2014.
Mainland China
Offices
Demand for office space and rental rates is expected to remain stable in 2013.
Retail
There has been some reduction in consumer confidence and spending in Mainland China. However, retailers of internationally branded goods in the few high quality shopping malls remain popular. Retail rents are expected to be steady in 2013.
HotelsResults in 2013 from the hotel portfolio will benefit from the fact that EAST, Beijing, will be in operation for its first full year and from a contribution from the Mandarin Oriental in TaiKoo Hui.
Property Trading
Hong Kong
Profits from property trading are expected to be lower in 2013 than in 2012, but nevertheless significant, with the completion of the ARGENTA development and the expected sale of the remaining units at the AZURA development. The effect of substantial increases and other changes in Hong Kong stamp duty on demand for luxury residential properties is uncertain.
USA
The residential market in downtown Miami is expected to continue to improve gradually in 2013. Excess condominium supply has been largely absorbed and new condominium developments are being built.
Martin Cubbon
Hong Kong OthersMainland China
COMPLETED PROPERTY INVESTMENT PORTFOLIO
Gross floor area (’000 sq ft)
181716151413121110090
5,000
10,000
15,000
20,000
25,000
30,000
A new addition to the Mall at Pacific Place, The Beauty Gallery contains premium beauty and cosmetic brands.
Swire Pacific 2012 Annual Report 33
Property Division
14 Swire Pacific 2012 Annual Report
We aim to continue to improve our products
and services on the ground and in the air, to
strengthen our aircraft engineering business
and to expand our fleet by acquiring fuel
efficient aircraft.

101010101000101000100000000000 ADVANCING WORLD-CLASS SERVICE
Aviation Division
Swire Pacific 2012 Annual Report 35
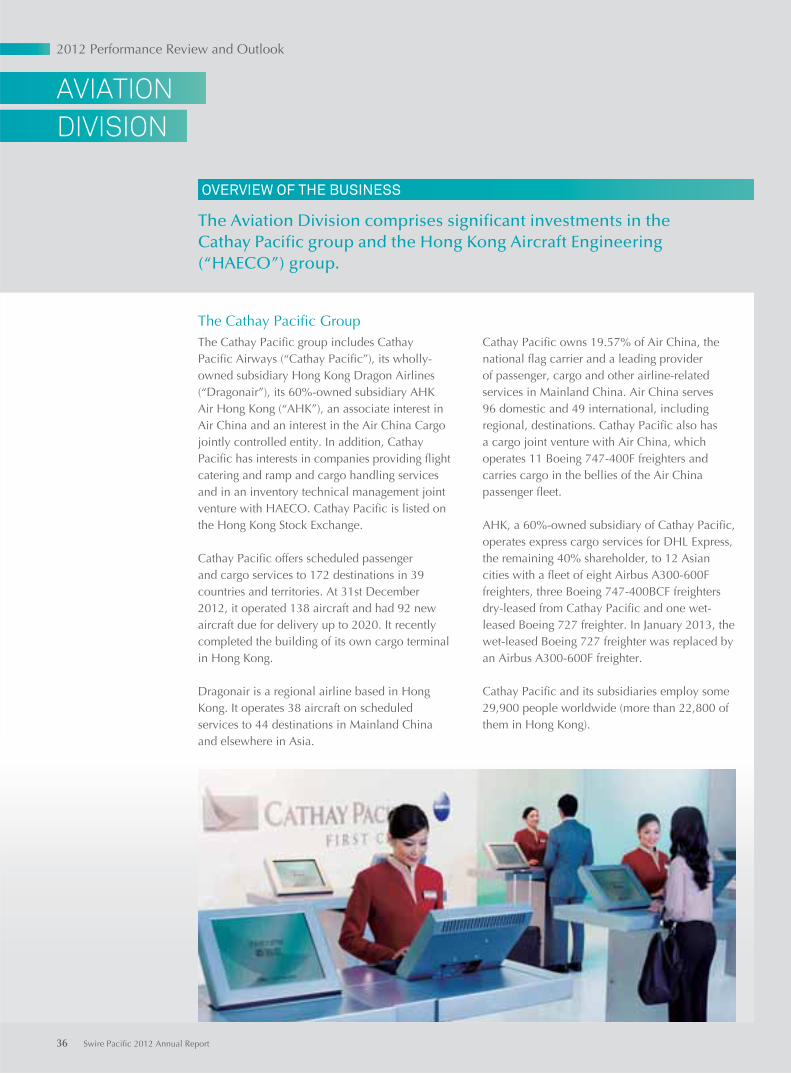
OVERVIEW OF THE BUSINESS
The Aviation Division comprises signifi cant investments in theCathay Pacifi c group and the Hong Kong Aircraft Engineering (“HAECO”) group.
Cathay Pacific owns 19.57% of Air China, the national flag carrier and a leading provider of passenger, cargo and other airline-related services in Mainland China. Air China serves 96 domestic and 49 international, including regional, destinations. Cathay Pacific also has a cargo joint venture with Air China, which operates 11 Boeing 747-400F freighters and carries cargo in the bellies of the Air China passenger fleet.
AHK, a 60%-owned subsidiary of Cathay Pacific, operates express cargo services for DHL Express, the remaining 40% shareholder, to 12 Asian cities with a fleet of eight Airbus A300-600F freighters, three Boeing 747-400BCF freighters dry-leased from Cathay Pacific and one wet-leased Boeing 727 freighter. In January 2013, the wet-leased Boeing 727 freighter was replaced by an Airbus A300-600F freighter.
Cathay Pacific and its subsidiaries employ some 29,900 people worldwide (more than 22,800 of them in Hong Kong).
The Cathay Pacific GroupThe Cathay Pacific group includes Cathay Pacific Airways (“Cathay Pacific”), its wholly-owned subsidiary Hong Kong Dragon Airlines (“Dragonair”), its 60%-owned subsidiary AHK Air Hong Kong (“AHK”), an associate interest in Air China and an interest in the Air China Cargo jointly controlled entity. In addition, Cathay Pacific has interests in companies providing flight catering and ramp and cargo handling services and in an inventory technical management joint venture with HAECO. Cathay Pacific is listed on the Hong Kong Stock Exchange.
Cathay Pacific offers scheduled passenger and cargo services to 172 destinations in 39 countries and territories. At 31st December 2012, it operated 138 aircraft and had 92 new aircraft due for delivery up to 2020. It recently completed the building of its own cargo terminal in Hong Kong.
Dragonair is a regional airline based in Hong Kong. It operates 38 aircraft on scheduled services to 44 destinations in Mainland China and elsewhere in Asia.
DIVISION
AVIATION
36 Swire Pacific 2012 Annual Report
2012 Performance Review and Outlook
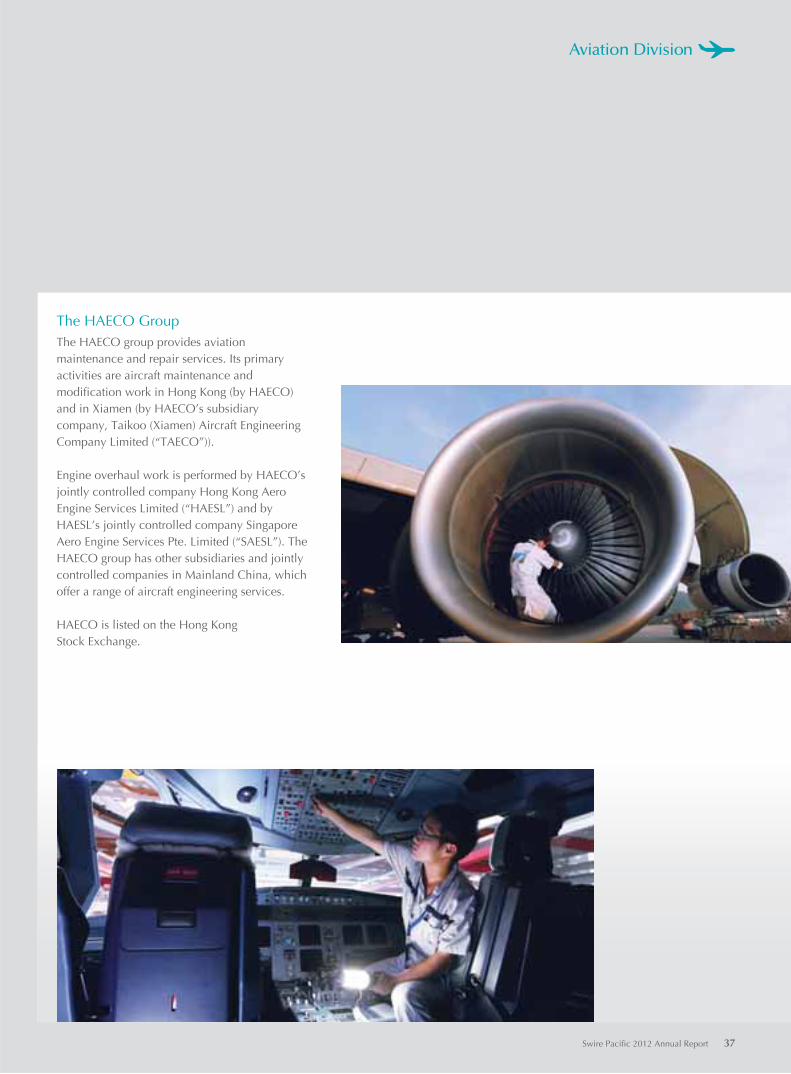
The HAECO GroupThe HAECO group provides aviation maintenance and repair services. Its primary activities are aircraft maintenance and modification work in Hong Kong (by HAECO) and in Xiamen (by HAECO’s subsidiary company, Taikoo (Xiamen) Aircraft Engineering Company Limited (“TAECO”)).
Engine overhaul work is performed by HAECO’s jointly controlled company Hong Kong Aero Engine Services Limited (“HAESL”) and by HAESL’s jointly controlled company Singapore Aero Engine Services Pte. Limited (“SAESL”). The HAECO group has other subsidiaries and jointly controlled companies in Mainland China, which offer a range of aircraft engineering services.
HAECO is listed on the Hong Kong Stock Exchange.
Swire Pacific 2012 Annual Report 37
Aviation Division
The strategic objective of Cathay Pacific and HAECO (as listed companies in their own right) is sustainable growth in shareholder value over the long-term. The strategies employed in order to achieve this objective are these:
• The development and strengthening of Hong Kong as a centre for aviation services, including passenger, cargo and aircraft engineering services.
• The development and strengthening of the airline (Cathay Pacific and Dragonair) and aircraft engineering (HAECO) brands.
IMPLEMENTING STRATEGIES
Turnover
Changes in turnover are determined by changes in capacity, load factors and yields. Capacity is determined by the size and composition of the fleets and by the intensity of their usage. Load factors are determined by economic conditions, competition, the routes on which the airlines fly, flight schedules, pricing and standards of service. Yields depend on pricing and, in the case of passenger services, the split between premium and economy class passengers. To the extent that these factors are within the control of the airlines, they do their best to ensure that they result in increased turnover. However, factors which are not within the control of the airlines, in particular economic conditions, cause fluctuations in turnover.
HAECO tries to increase turnover by expanding and improving the range of aircraft engineering services the HAECO group can offer to customers. Where possible, HAECO will increase prices to generate increased revenue. HAECO’s ability to expand services in Hong Kong, which is its most important area of operations, can be constrained by labour shortages.
Operating Costs
Managing operating costs is important for the Cathay Pacific group and the HAECO group. Fuel is the Cathay Pacific group’s biggest single cost and high fuel prices have a significant adverse effect on operating results. Managing the risk associated with changing fuel prices is a high priority. To this end, Cathay Pacific hedges some of its fuel costs. Investing in a younger, more fuel efficient fleet helps to control fuel costs (and to reduce the Cathay Pacific group’s environmental impact). The Cathay Pacific group is vigilant in managing other operating costs but aims to ensure that this does not compromise the quality of its products and services or the long-term strategic investment in its business.
Employee costs make up over 45% of HAECO’s operating expenses. Managing these costs whilst retaining a highly skilled workforce is a key challenge for HAECO.
STRATEGY
38 Swire Pacific 2012 Annual Report38 Swire Pacific 2012 Annual Report
2012 Performance Review and Outlook
• Developing the airlines’ fleets (by investing in modern fuel efficient aircraft) with a view to their becoming one of the youngest, most fuel efficient fleets in the world.
• Maintaining and enhancing high standards of service to passenger, cargo and aircraft engineering customers.
• Strengthening the airlines’ passenger and cargo networks and improving what they do on the ground and in the air.
• Continuing to build the strategic relationship with Air China.
• Increasing the range and depth of aircraft engineering services offered by HAECO.
• Endeavouring to minimise the impact of the airlines on the environment.
Investments
The Cathay Pacific group invests in new aircraft, new facilities and new services. Investing in new aircraft and facilities can expand capacity and control operating costs. Investing in new facilities is intended to attract and retain customers.
The HAECO group invests in order to expand its facilities and technical capabilities and to improve and widen the range of services it can offer to customers. By doing so, HAECO aims to set itself apart from competitors and to attract and retain new customers.
Sustainability
The Cathay Pacific group and the HAECO group endeavour to minimise their impact on the environment. The Cathay Pacific group invests in fuel efficient aircraft and tries to fly the shortest practicable distances between airports and to reduce the weight of its aircraft. The HAECO group tries to minimise the effect of effluents on the environment.
The HAECO group conducts business in a manner intended to protect the health and safety of its employees, its customers, those with whom it does business and the public. There is safety training and there are safety audits. Safety is of course a core commitment of the airlines.
Both groups recognise that the development of their staff is key to the sustainable development of their businesses and accordingly place great emphasis on supporting, rewarding, motivating and training staff.
Swire Pacific 2012 Annual Report 39
Aviation Division
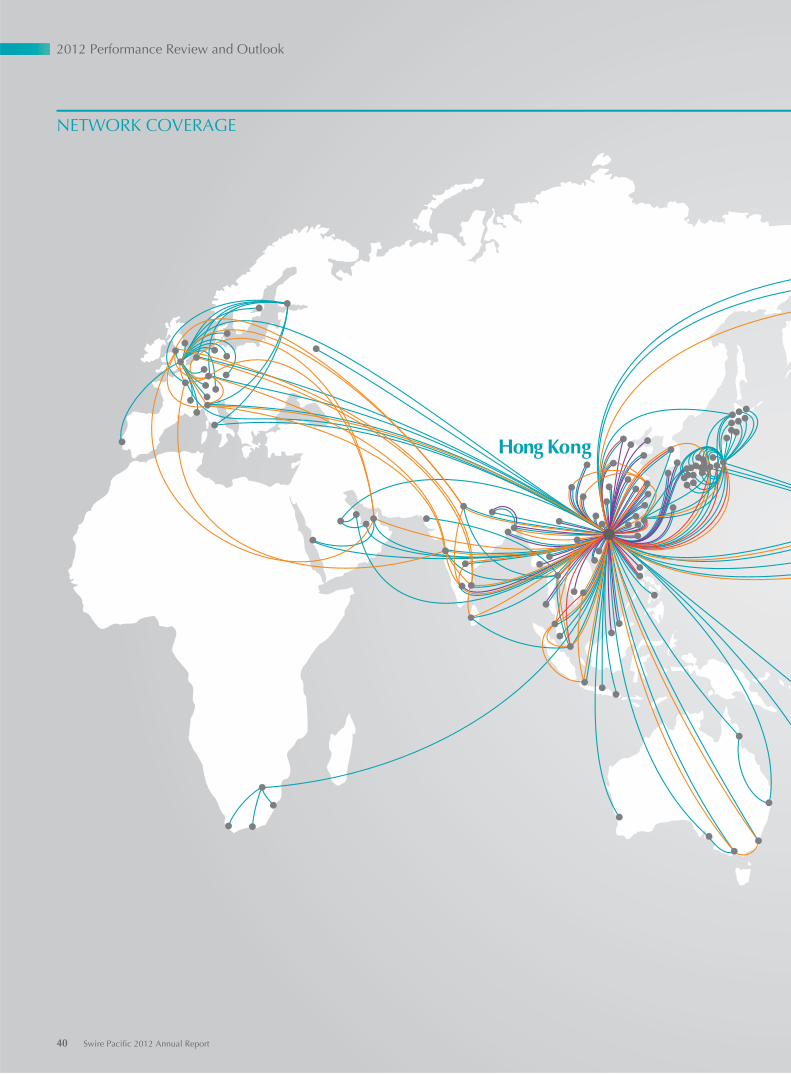
Hong Kong
NETWORK COVERAGE
40 Swire Pacific 2012 Annual Report
2012 Performance Review and Outlook
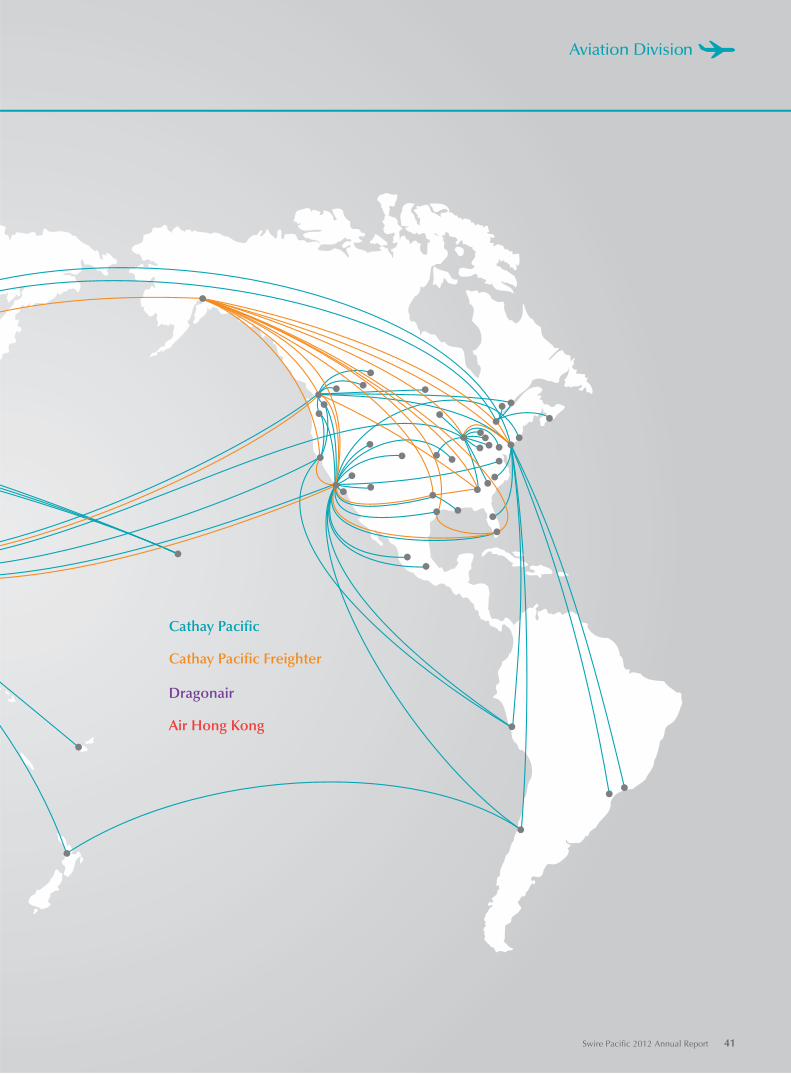
Cathay Pacific
Cathay Pacific Freighter
Dragonair
Air Hong Kong
Swire Pacific 2012 Annual Report 41
Aviation Division
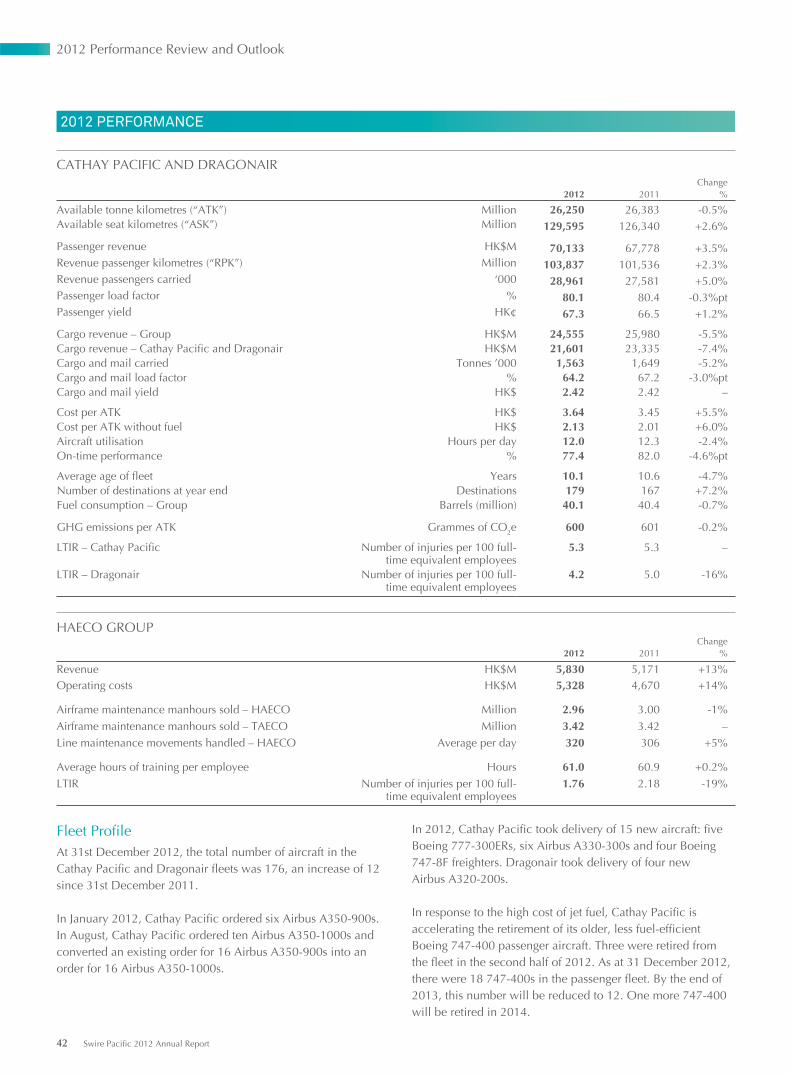
2012 PERFORMANCE
CATHAY PACIFIC AND DRAGONAIR
2012 2011Change
%
Available tonne kilometres (“ATK”) Million 26,250 26,383 -0.5%Available seat kilometres (“ASK”) Million 129,595 126,340 +2.6%
Passenger revenue HK$M 70,133 67,778 +3.5%Revenue passenger kilometres (“RPK”) Million 103,837 101,536 +2.3%Revenue passengers carried ‘000 28,961 27,581 +5.0%Passenger load factor % 80.1 80.4 -0.3%ptPassenger yield HK¢ 67.3 66.5 +1.2%
Cargo revenue – Group HK$M 24,555 25,980 -5.5%Cargo revenue – Cathay Pacific and Dragonair HK$M 21,601 23,335 -7.4%Cargo and mail carried Tonnes ’000 1,563 1,649 -5.2%Cargo and mail load factor % 64.2 67.2 -3.0%ptCargo and mail yield HK$ 2.42 2.42 –
Cost per ATK HK$ 3.64 3.45 +5.5%Cost per ATK without fuel HK$ 2.13 2.01 +6.0%Aircraft utilisation Hours per day 12.0 12.3 -2.4%On-time performance % 77.4 82.0 -4.6%pt
Average age of fleet Years 10.1 10.6 -4.7%Number of destinations at year end Destinations 179 167 +7.2%Fuel consumption – Group Barrels (million) 40.1 40.4 -0.7%
GHG emissions per ATK Grammes of CO2e 600 601 -0.2%
LTIR – Cathay Pacific Number of injuries per 100 full-time equivalent employees
5.3 5.3 –
LTIR – Dragonair Number of injuries per 100 full-time equivalent employees
4.2 5.0 -16%
HAECO GROUP
2012 2011Change
%
Revenue HK$M 5,830 5,171 +13%Operating costs HK$M 5,328 4,670 +14%
Airframe maintenance manhours sold – HAECO Million 2.96 3.00 -1%Airframe maintenance manhours sold – TAECO Million 3.42 3.42 –Line maintenance movements handled – HAECO Average per day 320 306 +5%
Average hours of training per employee Hours 61.0 60.9 +0.2%LTIR Number of injuries per 100 full-
time equivalent employees1.76 2.18 -19%
Fleet ProfileAt 31st December 2012, the total number of aircraft in the Cathay Pacific and Dragonair fleets was 176, an increase of 12 since 31st December 2011.
In January 2012, Cathay Pacific ordered six Airbus A350-900s. In August, Cathay Pacific ordered ten Airbus A350-1000s and converted an existing order for 16 Airbus A350-900s into an order for 16 Airbus A350-1000s.
In 2012, Cathay Pacific took delivery of 15 new aircraft: five Boeing 777-300ERs, six Airbus A330-300s and four Boeing 747-8F freighters. Dragonair took delivery of four new Airbus A320-200s.
In response to the high cost of jet fuel, Cathay Pacific is accelerating the retirement of its older, less fuel-efficient Boeing 747-400 passenger aircraft. Three were retired from the fleet in the second half of 2012. As at 31 December 2012, there were 18 747-400s in the passenger fleet. By the end of 2013, this number will be reduced to 12. One more 747-400 will be retired in 2014.
42 Swire Pacific 2012 Annual Report
2012 Performance Review and Outlook
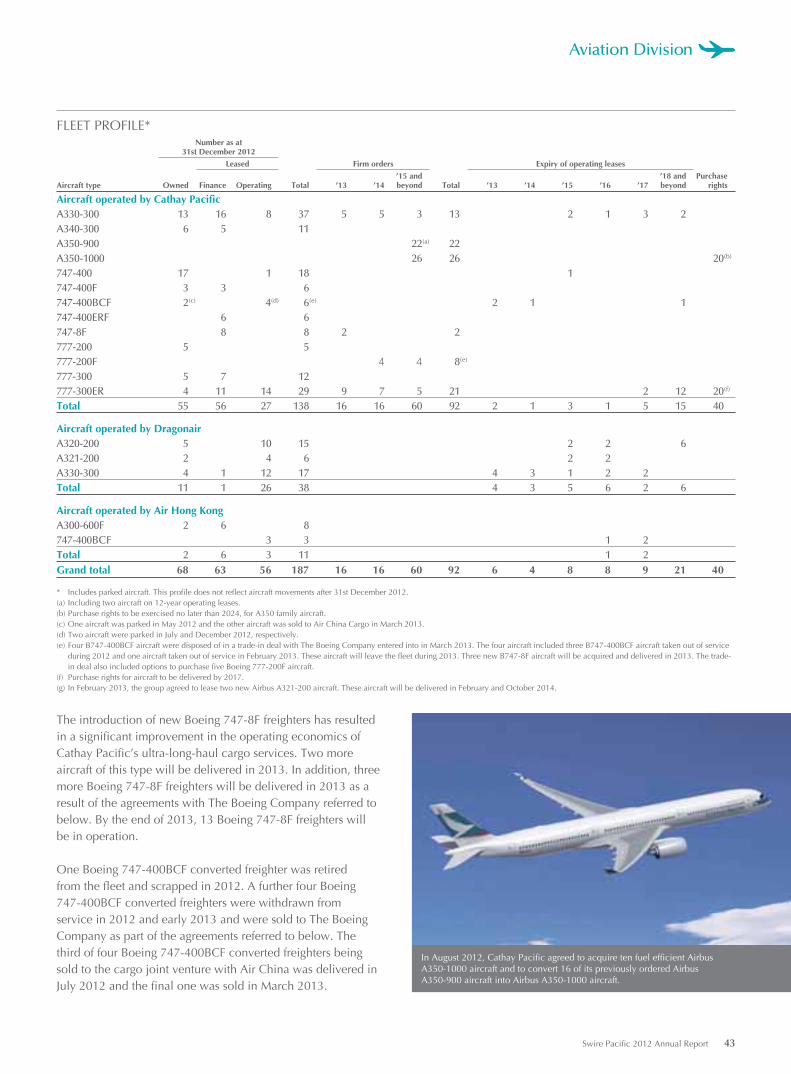
FLEET PROFILE*Number as at
31st December 2012
Leased Firm orders Expiry of operating leases
Aircraft type Owned Finance Operating Total ’13 ’14’15 andbeyond Total ’13 ’14 ’15 ’16 ’17
’18 andbeyond
Purchaserights
Aircraft operated by Cathay PacificA330-300 13 16 8 37 5 5 3 13 2 1 3 2A340-300 6 5 11A350-900 22(a) 22A350-1000 26 26 20(b)
747-400 17 1 18 1747-400F 3 3 6747-400BCF 2(c) 4(d) 6(e) 2 1 1747-400ERF 6 6747-8F 8 8 2 2777-200 5 5777-200F 4 4 8(e)
777-300 5 7 12777-300ER 4 11 14 29 9 7 5 21 2 12 20(f)
Total 55 56 27 138 16 16 60 92 2 1 3 1 5 15 40
Aircraft operated by DragonairA320-200 5 10 15 2 2 6A321-200 2 4 6 2 2A330-300 4 1 12 17 4 3 1 2 2Total 11 1 26 38 4 3 5 6 2 6
Aircraft operated by Air Hong KongA300-600F 2 6 8747-400BCF 3 3 1 2 Total 2 6 3 11 1 2 Grand total 68 63 56 187 16 16 60 92 6 4 8 8 9 21 40
* Includes parked aircraft. This profile does not reflect aircraft movements after 31st December 2012.(a) Including two aircraft on 12-year operating leases. (b) Purchase rights to be exercised no later than 2024, for A350 family aircraft.(c) One aircraft was parked in May 2012 and the other aircraft was sold to Air China Cargo in March 2013. (d) Two aircraft were parked in July and December 2012, respectively.(e) Four B747-400BCF aircraft were disposed of in a trade-in deal with The Boeing Company entered into in March 2013. The four aircraft included three B747-400BCF aircraft taken out of service
during 2012 and one aircraft taken out of service in February 2013. These aircraft will leave the fleet during 2013. Three new B747-8F aircraft will be acquired and delivered in 2013. The trade-in deal also included options to purchase five Boeing 777-200F aircraft.
(f) Purchase rights for aircraft to be delivered by 2017.(g) In February 2013, the group agreed to lease two new Airbus A321-200 aircraft. These aircraft will be delivered in February and October 2014.
In August 2012, Cathay Pacific agreed to acquire ten fuel efficient Airbus A350-1000 aircraft and to convert 16 of its previously ordered Airbus A350-900 aircraft into Airbus A350-1000 aircraft.
The introduction of new Boeing 747-8F freighters has resulted in a significant improvement in the operating economics of Cathay Pacific’s ultra-long-haul cargo services. Two more aircraft of this type will be delivered in 2013. In addition, three more Boeing 747-8F freighters will be delivered in 2013 as a result of the agreements with The Boeing Company referred to below. By the end of 2013, 13 Boeing 747-8F freighters will be in operation.
One Boeing 747-400BCF converted freighter was retired from the fleet and scrapped in 2012. A further four Boeing 747-400BCF converted freighters were withdrawn from service in 2012 and early 2013 and were sold to The Boeing Company as part of the agreements referred to below. The third of four Boeing 747-400BCF converted freighters being sold to the cargo joint venture with Air China was delivered in July 2012 and the final one was sold in March 2013.
Swire Pacific 2012 Annual Report 43
Aviation Division
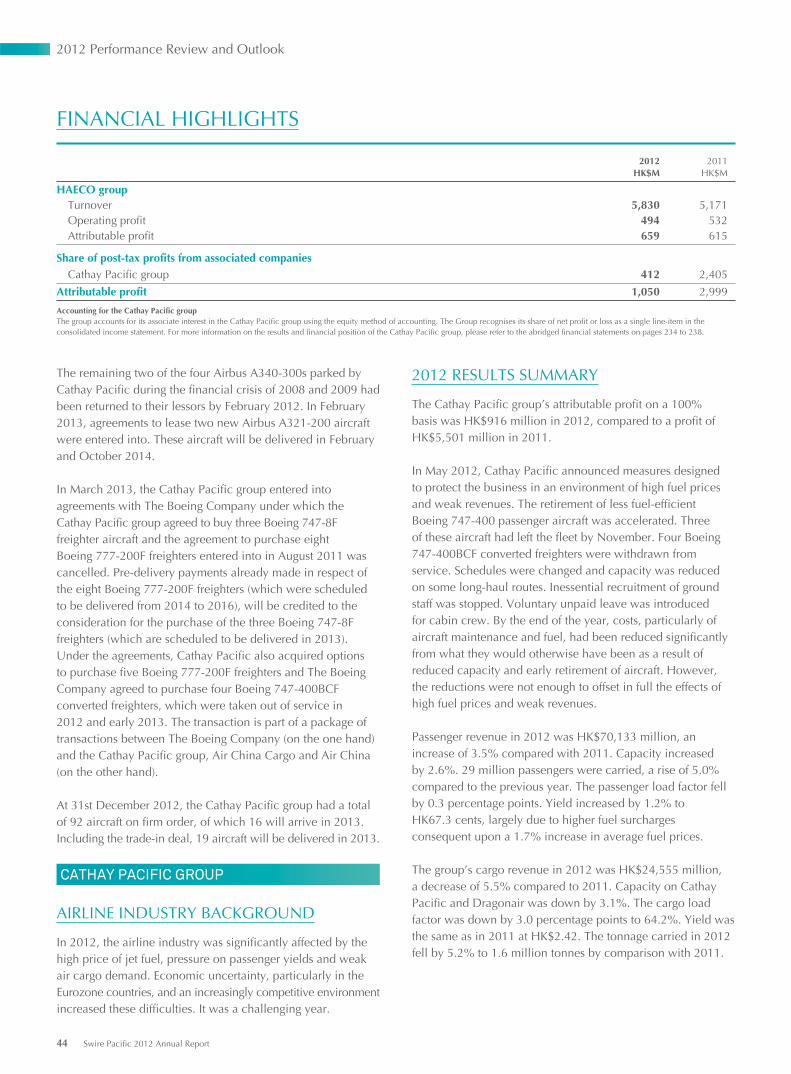
FINANCIAL HIGHLIGHTS
2012
HK$M2011
HK$M
HAECO group Turnover 5,830 5,171 Operating profit 494 532 Attributable profit 659 615
Share of post-tax profits from associated companies Cathay Pacific group 412 2,405
Attributable profit 1,050 2,999
Accounting for the Cathay Pacific groupThe group accounts for its associate interest in the Cathay Pacific group using the equity method of accounting. The Group recognises its share of net profit or loss as a single line-item in the consolidated income statement. For more information on the results and financial position of the Cathay Pacific group, please refer to the abridged financial statements on pages 234 to 238.
2012 RESULTS SUMMARY
The Cathay Pacific group’s attributable profit on a 100% basis was HK$916 million in 2012, compared to a profit of HK$5,501 million in 2011.
In May 2012, Cathay Pacific announced measures designed to protect the business in an environment of high fuel prices and weak revenues. The retirement of less fuel-efficient Boeing 747-400 passenger aircraft was accelerated. Three of these aircraft had left the fleet by November. Four Boeing 747-400BCF converted freighters were withdrawn from service. Schedules were changed and capacity was reduced on some long-haul routes. Inessential recruitment of ground staff was stopped. Voluntary unpaid leave was introduced for cabin crew. By the end of the year, costs, particularly of aircraft maintenance and fuel, had been reduced significantly from what they would otherwise have been as a result of reduced capacity and early retirement of aircraft. However, the reductions were not enough to offset in full the effects of high fuel prices and weak revenues.
Passenger revenue in 2012 was HK$70,133 million, an increase of 3.5% compared with 2011. Capacity increased by 2.6%. 29 million passengers were carried, a rise of 5.0% compared to the previous year. The passenger load factor fell by 0.3 percentage points. Yield increased by 1.2% to HK67.3 cents, largely due to higher fuel surcharges consequent upon a 1.7% increase in average fuel prices.
The group’s cargo revenue in 2012 was HK$24,555 million, a decrease of 5.5% compared to 2011. Capacity on Cathay Pacific and Dragonair was down by 3.1%. The cargo load factor was down by 3.0 percentage points to 64.2%. Yield was the same as in 2011 at HK$2.42. The tonnage carried in 2012 fell by 5.2% to 1.6 million tonnes by comparison with 2011.
The remaining two of the four Airbus A340-300s parked by Cathay Pacific during the financial crisis of 2008 and 2009 had been returned to their lessors by February 2012. In February 2013, agreements to lease two new Airbus A321-200 aircraft were entered into. These aircraft will be delivered in February and October 2014.
In March 2013, the Cathay Pacific group entered into agreements with The Boeing Company under which the Cathay Pacific group agreed to buy three Boeing 747-8F freighter aircraft and the agreement to purchase eight Boeing 777-200F freighters entered into in August 2011 was cancelled. Pre-delivery payments already made in respect of the eight Boeing 777-200F freighters (which were scheduled to be delivered from 2014 to 2016), will be credited to the consideration for the purchase of the three Boeing 747-8F freighters (which are scheduled to be delivered in 2013). Under the agreements, Cathay Pacific also acquired options to purchase five Boeing 777-200F freighters and The Boeing Company agreed to purchase four Boeing 747-400BCF converted freighters, which were taken out of service in 2012 and early 2013. The transaction is part of a package of transactions between The Boeing Company (on the one hand) and the Cathay Pacific group, Air China Cargo and Air China (on the other hand).
At 31st December 2012, the Cathay Pacific group had a total of 92 aircraft on firm order, of which 16 will arrive in 2013. Including the trade-in deal, 19 aircraft will be delivered in 2013.
CATHAY PACIFIC GROUP
AIRLINE INDUSTRY BACKGROUND
In 2012, the airline industry was significantly affected by thehigh price of jet fuel, pressure on passenger yields and weak air cargo demand. Economic uncertainty, particularly in theEurozone countries, and an increasingly competitive environmentincreased these difficulties. It was a challenging year.
44 Swire Pacific 2012 Annual Report
2012 Performance Review and Outlook
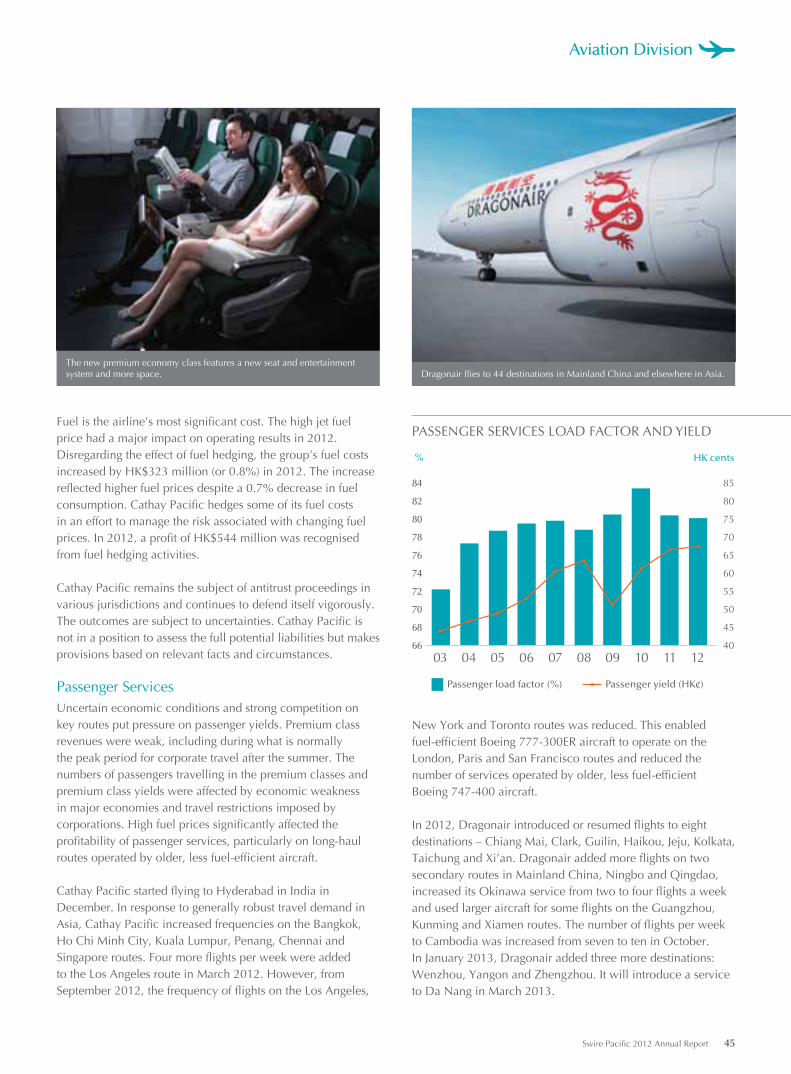
66
68
70
72
74
76
78
80
82
84
Passenger load factor (%)
11 121009080706050403
% HK cents
PASSENGER SERVICES LOAD FACTOR AND YIELD
Passenger yield (HK¢)
40
45
50
55
60
65
70
75
80
85
Fuel is the airline’s most significant cost. The high jet fuel price had a major impact on operating results in 2012. Disregarding the effect of fuel hedging, the group’s fuel costs increased by HK$323 million (or 0.8%) in 2012. The increase reflected higher fuel prices despite a 0.7% decrease in fuel consumption. Cathay Pacific hedges some of its fuel costs in an effort to manage the risk associated with changing fuel prices. In 2012, a profit of HK$544 million was recognised from fuel hedging activities.
Cathay Pacific remains the subject of antitrust proceedings in various jurisdictions and continues to defend itself vigorously. The outcomes are subject to uncertainties. Cathay Pacific is not in a position to assess the full potential liabilities but makes provisions based on relevant facts and circumstances.
Passenger ServicesUncertain economic conditions and strong competition on key routes put pressure on passenger yields. Premium class revenues were weak, including during what is normally the peak period for corporate travel after the summer. The numbers of passengers travelling in the premium classes and premium class yields were affected by economic weakness in major economies and travel restrictions imposed by corporations. High fuel prices significantly affected the profitability of passenger services, particularly on long-haul routes operated by older, less fuel-efficient aircraft.
Cathay Pacific started flying to Hyderabad in India in December. In response to generally robust travel demand in Asia, Cathay Pacific increased frequencies on the Bangkok, Ho Chi Minh City, Kuala Lumpur, Penang, Chennai and Singapore routes. Four more flights per week were added to the Los Angeles route in March 2012. However, from September 2012, the frequency of flights on the Los Angeles,
New York and Toronto routes was reduced. This enabled fuel-efficient Boeing 777-300ER aircraft to operate on the London, Paris and San Francisco routes and reduced the number of services operated by older, less fuel-efficient Boeing 747-400 aircraft.
In 2012, Dragonair introduced or resumed flights to eight destinations – Chiang Mai, Clark, Guilin, Haikou, Jeju, Kolkata, Taichung and Xi’an. Dragonair added more flights on two secondary routes in Mainland China, Ningbo and Qingdao, increased its Okinawa service from two to four flights a week and used larger aircraft for some flights on the Guangzhou, Kunming and Xiamen routes. The number of flights per week to Cambodia was increased from seven to ten in October. In January 2013, Dragonair added three more destinations: Wenzhou, Yangon and Zhengzhou. It will introduce a service to Da Nang in March 2013.
The new premium economy class features a new seat and entertainment system and more space. Dragonair flies to 44 destinations in Mainland China and elsewhere in Asia.
Swire Pacific 2012 Annual Report 45
Aviation Division
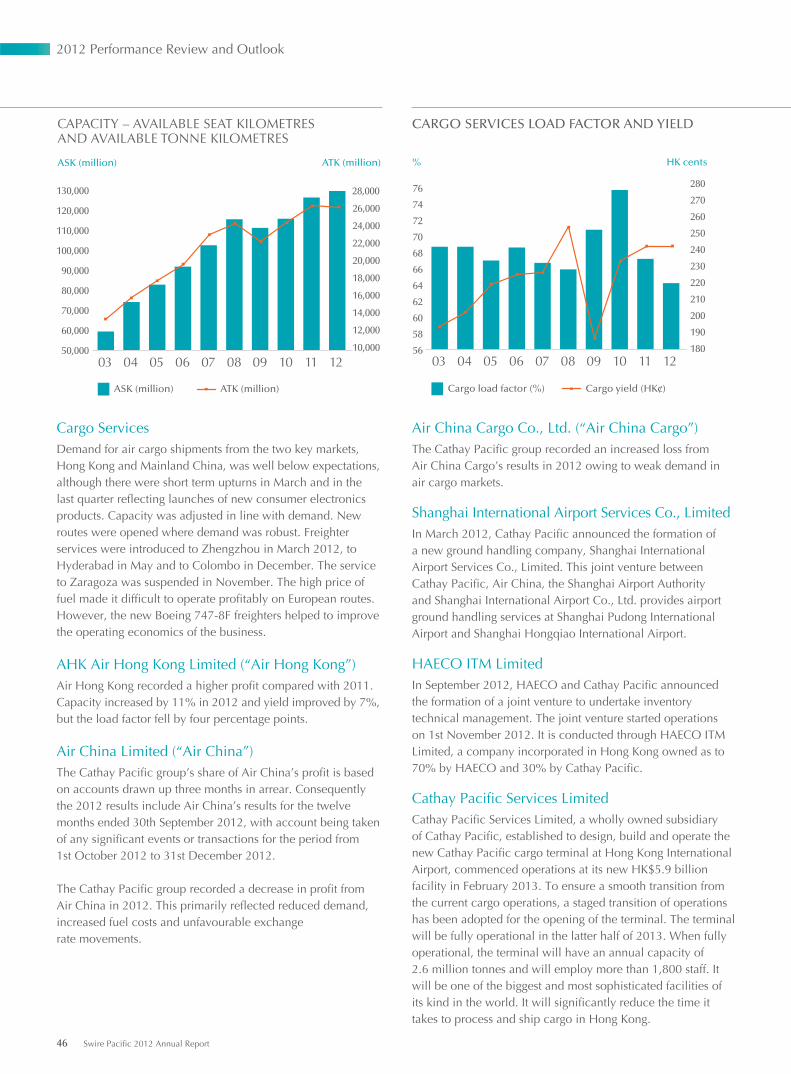
50,000
60,000
70,000
80,000
90,000
100,000
110,000
120,000
130,000
10,000
12,000
14,000
16,000
18,000
20,000
22,000
24,000
26,000
28,000
ASK (million)
11 121009080706050403
ASK (million) ATK (million)
CAPACITY – AVAILABLE SEAT KILOMETRESAND AVAILABLE TONNE KILOMETRES
ATK (million)
Air China Cargo Co., Ltd. (“Air China Cargo”)The Cathay Pacific group recorded an increased loss from Air China Cargo’s results in 2012 owing to weak demand in air cargo markets.
Shanghai International Airport Services Co., LimitedIn March 2012, Cathay Pacific announced the formation of a new ground handling company, Shanghai International Airport Services Co., Limited. This joint venture between Cathay Pacific, Air China, the Shanghai Airport Authority and Shanghai International Airport Co., Ltd. provides airport ground handling services at Shanghai Pudong International Airport and Shanghai Hongqiao International Airport.
HAECO ITM LimitedIn September 2012, HAECO and Cathay Pacific announced the formation of a joint venture to undertake inventory technical management. The joint venture started operations on 1st November 2012. It is conducted through HAECO ITM Limited, a company incorporated in Hong Kong owned as to 70% by HAECO and 30% by Cathay Pacific.
Cathay Pacific Services LimitedCathay Pacific Services Limited, a wholly owned subsidiary of Cathay Pacific, established to design, build and operate the new Cathay Pacific cargo terminal at Hong Kong International Airport, commenced operations at its new HK$5.9 billion facility in February 2013. To ensure a smooth transition from the current cargo operations, a staged transition of operations has been adopted for the opening of the terminal. The terminal will be fully operational in the latter half of 2013. When fully operational, the terminal will have an annual capacity of 2.6 million tonnes and will employ more than 1,800 staff. It will be one of the biggest and most sophisticated facilities of its kind in the world. It will significantly reduce the time it takes to process and ship cargo in Hong Kong.
Cargo load factor (%) Cargo yield (HK¢)
56
58
60
62
64
66
68
70
72
74
76
180
190
200
210
220
230
240
250
260
270
280
11 121009080706050403
% HK cents
CARGO SERVICES LOAD FACTOR AND YIELD
Cargo ServicesDemand for air cargo shipments from the two key markets, Hong Kong and Mainland China, was well below expectations, although there were short term upturns in March and in the last quarter reflecting launches of new consumer electronics products. Capacity was adjusted in line with demand. New routes were opened where demand was robust. Freighter services were introduced to Zhengzhou in March 2012, to Hyderabad in May and to Colombo in December. The service to Zaragoza was suspended in November. The high price of fuel made it difficult to operate profitably on European routes. However, the new Boeing 747-8F freighters helped to improve the operating economics of the business.
AHK Air Hong Kong Limited (“Air Hong Kong”)Air Hong Kong recorded a higher profit compared with 2011. Capacity increased by 11% in 2012 and yield improved by 7%, but the load factor fell by four percentage points.
Air China Limited (“Air China”)The Cathay Pacific group’s share of Air China’s profit is based on accounts drawn up three months in arrear. Consequently the 2012 results include Air China’s results for the twelve months ended 30th September 2012, with account being taken of any significant events or transactions for the period from 1st October 2012 to 31st December 2012.
The Cathay Pacific group recorded a decrease in profit from Air China in 2012. This primarily reflected reduced demand, increased fuel costs and unfavourable exchangerate movements.
46 Swire Pacific 2012 Annual Report
2012 Performance Review and Outlook
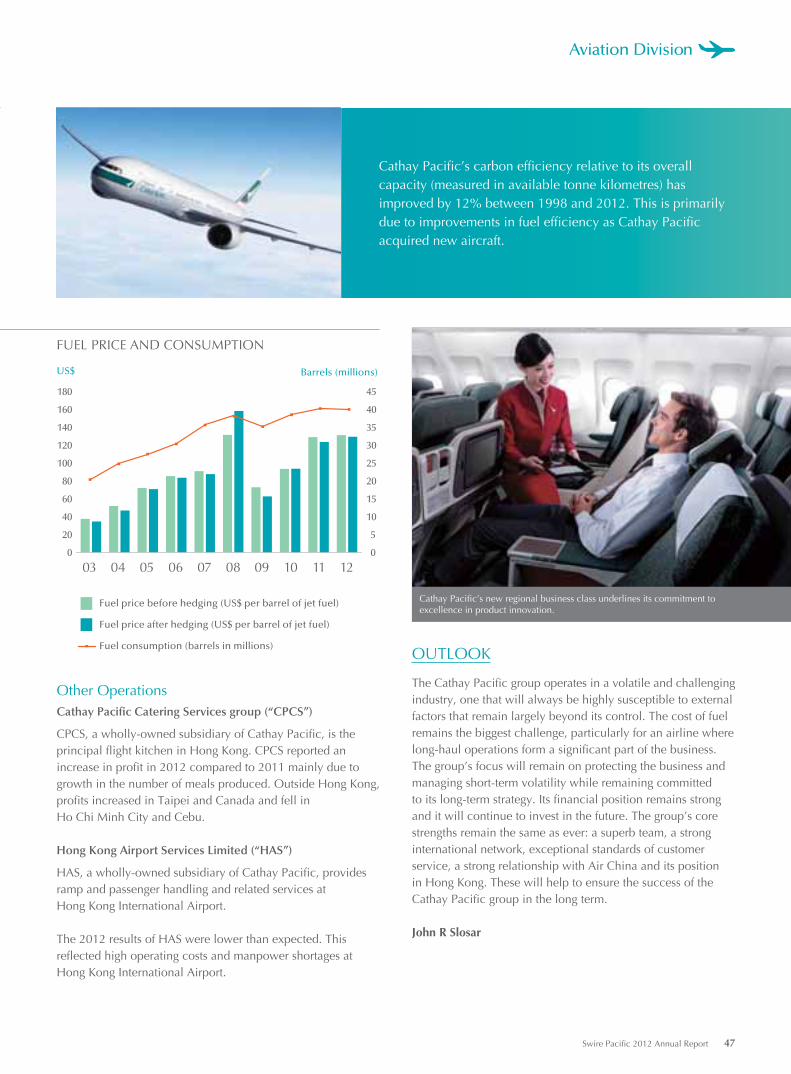
Other OperationsCathay Pacific Catering Services group (“CPCS”)
CPCS, a wholly-owned subsidiary of Cathay Pacific, is the principal flight kitchen in Hong Kong. CPCS reported an increase in profit in 2012 compared to 2011 mainly due to growth in the number of meals produced. Outside Hong Kong, profits increased in Taipei and Canada and fell in Ho Chi Minh City and Cebu.
Hong Kong Airport Services Limited (“HAS”)
HAS, a wholly-owned subsidiary of Cathay Pacific, provides ramp and passenger handling and related services at Hong Kong International Airport.
The 2012 results of HAS were lower than expected. This reflected high operating costs and manpower shortages at Hong Kong International Airport.
OUTLOOK
The Cathay Pacific group operates in a volatile and challenging industry, one that will always be highly susceptible to external factors that remain largely beyond its control. The cost of fuel remains the biggest challenge, particularly for an airline where long-haul operations form a significant part of the business. The group’s focus will remain on protecting the business and managing short-term volatility while remaining committed to its long-term strategy. Its financial position remains strong and it will continue to invest in the future. The group’s core strengths remain the same as ever: a superb team, a strong international network, exceptional standards of customer service, a strong relationship with Air China and its position in Hong Kong. These will help to ensure the success of the Cathay Pacific group in the long term.
John R Slosar
Cathay Pacific’s carbon efficiency relative to its overall capacity (measured in available tonne kilometres) has improved by 12% between 1998 and 2012. This is primarily due to improvements in fuel efficiency as Cathay Pacific acquired new aircraft.
0
20
40
60
80
100
120
140
160
180
Fuel price before hedging (US$ per barrel of jet fuel)
Fuel price after hedging (US$ per barrel of jet fuel)
Fuel consumption (barrels in millions)
11 121009080706050403
US$ Barrels (millions)
FUEL PRICE AND CONSUMPTION
0
5
10
15
20
25
30
35
40
45
Cathay Pacific’s new regional business class underlines its commitment to excellence in product innovation.
Swire Pacific 2012 Annual Report 47
Aviation Division
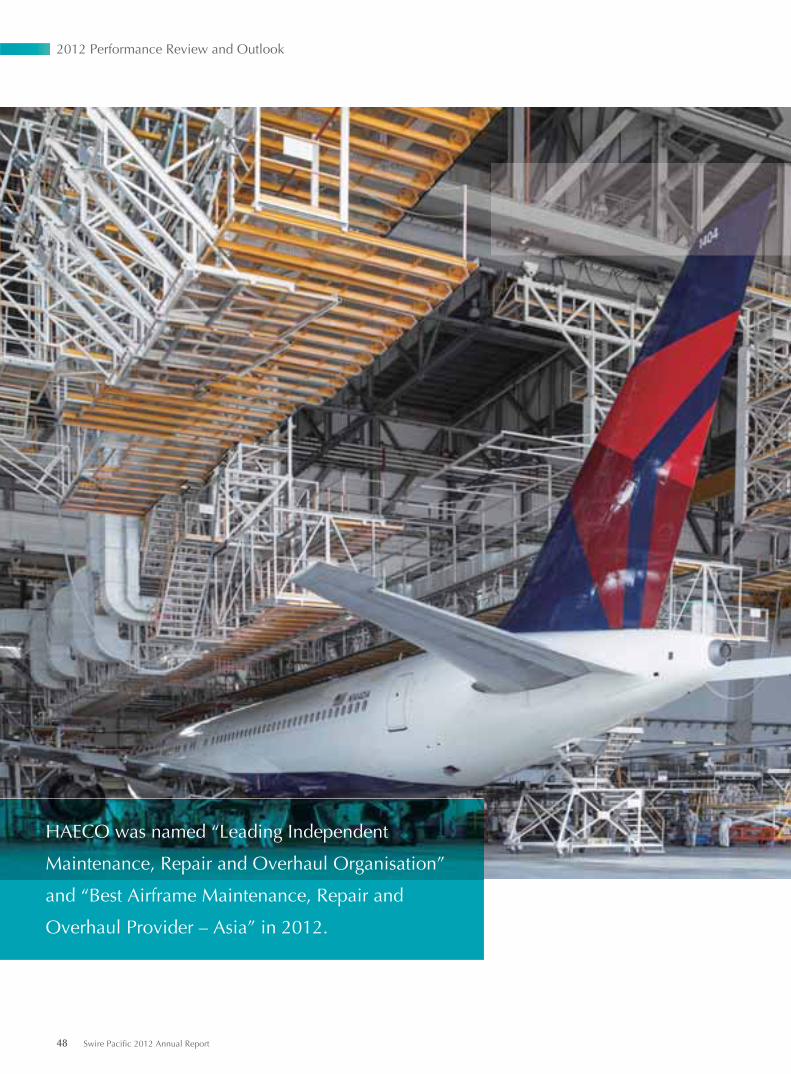
48 Swire Pacific 2012 Annual Report
2012 Performance Review and Outlook
HAECO was named “Leading Independent
Maintenance, Repair and Overhaul Organisation”
and “Best Airframe Maintenance, Repair and
Overhaul Provider – Asia” in 2012.
HONG KONG AIRCRAFT ENGINEERING COMPANY (“HAECO”) GROUP
FINANCIAL HIGHLIGHTS
HAECO Group 2012
HK$M 2011
HK$M Change
%
Turnover HAECO 3,421 3,307 +3% TAECO 1,668 1,581 +6% Others 741 283 +162%Net operating profit 477 525 -9%Profit attributable to the Company’s shareholders HAECO 329 381 -14% TAECO 70 98 -29%Share of profit/(loss) of: HAESL and SAESL 531 415 +28% Other subsidiary and jointly controlled companies (54) (73) +26%Total 876 821 +7%
Swire Pacific share 659 615 +7%
AVIATION MAINTENANCE AND REPAIR INDUSTRY BACKGROUND
The aviation industry was affected by instability and uncertainty in the world’s major economies in 2012. Despite this, airlines increased the size of their fleets. There were more passenger flights than in 2011 but fewer cargo flights. Demand for HAECO’s aviation maintenance services in Hong Kong was firm. Demand for TAECO’s aviation maintenance services in Mainland China was similar to that in 2011.
2012 RESULTS SUMMARY
The HAECO group’s profit attributable to shareholders in 2012 on a 100% basis was HK$876 million, an increase of 7% compared to the corresponding figure in 2011 of HK$821 million. Demand for HAECO’s airframe maintenance services in Hong Kong was strong throughout 2012, but HAECO was not able to meet this demand in the second half because of a shortage of skilled and semi-skilled labour. This was reflected in the results of the group for the second half, when profit attributable to shareholders was HK$394 million, compared with HK$482 million in the first half of 2012 and HK$396 million in the second half of 2011. HAECO’s line maintenance business in Hong Kong benefited from an increase in aircraft movements at Hong Kong International Airport.
Results from TAECO were adversely affected by exchange rate and deferred tax movements.
HAESL performed well, with an increase in engine output and the amount of work done per engine. The operating results of the group’s joint ventures in Mainland China improved. Output was higher, but losses continued because of under-utilisation of facilities.
HAECOManhours sold by HAECO for airframe maintenance decreased from 3.00 million in 2011 to 2.96 million in 2012. Demand for airframe maintenance remained firm. Approximately 76% of the work was for airlines based outside Hong Kong. Line maintenance aircraft movements increased by 5% compared with 2011, with an average of 320 aircraft handled per day. This reflected growth in air traffic. HAECO’s operating expenses increased by 5% to HK$3,062 million reflecting higher wage costs.
Swire Pacific 2012 Annual Report 49
Aviation Division
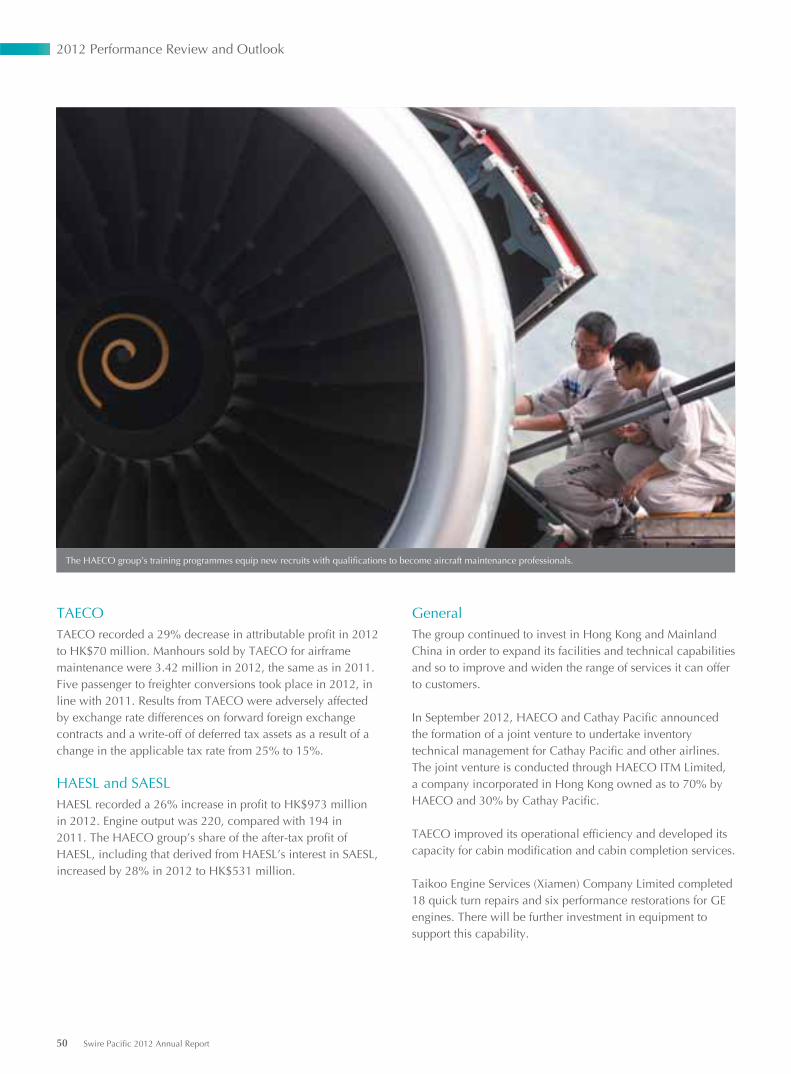
TAECOTAECO recorded a 29% decrease in attributable profit in 2012 to HK$70 million. Manhours sold by TAECO for airframe maintenance were 3.42 million in 2012, the same as in 2011. Five passenger to freighter conversions took place in 2012, in line with 2011. Results from TAECO were adversely affected by exchange rate differences on forward foreign exchange contracts and a write-off of deferred tax assets as a result of a change in the applicable tax rate from 25% to 15%.
HAESL and SAESLHAESL recorded a 26% increase in profit to HK$973 million in 2012. Engine output was 220, compared with 194 in 2011. The HAECO group’s share of the after-tax profit of HAESL, including that derived from HAESL’s interest in SAESL, increased by 28% in 2012 to HK$531 million.
The HAECO group’s training programmes equip new recruits with qualifications to become aircraft maintenance professionals.
GeneralThe group continued to invest in Hong Kong and Mainland China in order to expand its facilities and technical capabilities and so to improve and widen the range of services it can offer to customers.
In September 2012, HAECO and Cathay Pacific announced the formation of a joint venture to undertake inventory technical management for Cathay Pacific and other airlines. The joint venture is conducted through HAECO ITM Limited, a company incorporated in Hong Kong owned as to 70% by HAECO and 30% by Cathay Pacific.
TAECO improved its operational efficiency and developed its capacity for cabin modification and cabin completion services.
Taikoo Engine Services (Xiamen) Company Limited completed 18 quick turn repairs and six performance restorations for GE engines. There will be further investment in equipment to support this capability.
50 Swire Pacific 2012 Annual Report
2012 Performance Review and Outlook
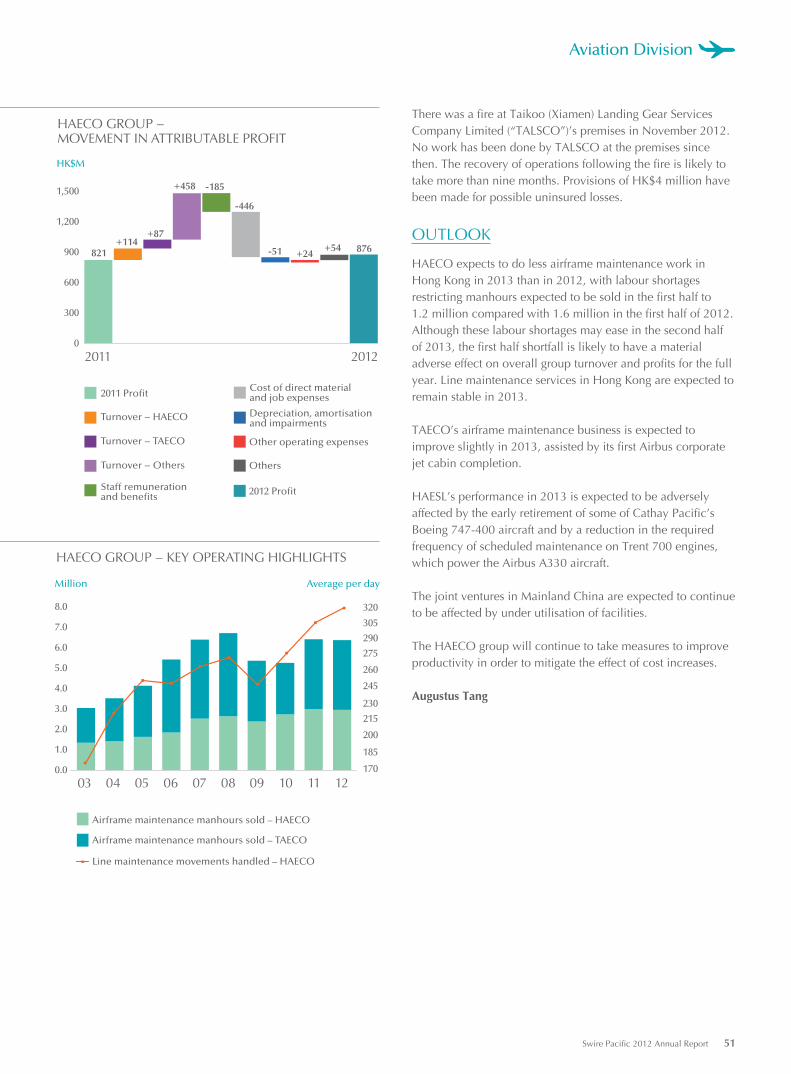
There was a fire at Taikoo (Xiamen) Landing Gear Services Company Limited (“TALSCO”)’s premises in November 2012. No work has been done by TALSCO at the premises since then. The recovery of operations following the fire is likely to take more than nine months. Provisions of HK$4 million have been made for possible uninsured losses.
OUTLOOK
HAECO expects to do less airframe maintenance work in Hong Kong in 2013 than in 2012, with labour shortages restricting manhours expected to be sold in the first half to 1.2 million compared with 1.6 million in the first half of 2012. Although these labour shortages may ease in the second half of 2013, the first half shortfall is likely to have a material adverse effect on overall group turnover and profits for the full year. Line maintenance services in Hong Kong are expected to remain stable in 2013.
TAECO’s airframe maintenance business is expected to improve slightly in 2013, assisted by its first Airbus corporate jet cabin completion.
HAESL’s performance in 2013 is expected to be adversely affected by the early retirement of some of Cathay Pacific’s Boeing 747-400 aircraft and by a reduction in the required frequency of scheduled maintenance on Trent 700 engines, which power the Airbus A330 aircraft.
The joint ventures in Mainland China are expected to continue to be affected by under utilisation of facilities.
The HAECO group will continue to take measures to improve productivity in order to mitigate the effect of cost increases.
Augustus Tang
0
300
600
900
1,200
1,500
HAECO GROUP − MOVEMENT IN ATTRIBUTABLE PROFIT
HK$M
+114821
+87
-185+458
876-51 +54+24
-446
20122011
Turnover − Others
2011 Profit
Turnover − HAECO
Turnover − TAECO
2012 Profit
Others
Staff remunerationand benefits
Other operating expenses
Depreciation, amortisation and impairments
Cost of direct material and job expenses
0.0
1.0
2.0
3.0
4.0
5.0
6.0
7.0
8.0
Airframe maintenance manhours sold – HAECO
Airframe maintenance manhours sold – TAECO
Line maintenance movements handled – HAECO
170
185
200
215
230
245
260
275
290
305
320
11 121009080706050403
Million Average per day
HAECO GROUP − KEY OPERATING HIGHLIGHTS
Swire Pacific 2012 Annual Report 51
Aviation Division
DELIVERING REFRESHING SOFT DRINKS
Beverages Division

Swire Beverages manufactures, markets and
distributes refreshing soft drinks to consumers in
Hong Kong, Taiwan, Mainland China, and the USA.
Swire Pacific 2012 Annual Report 53
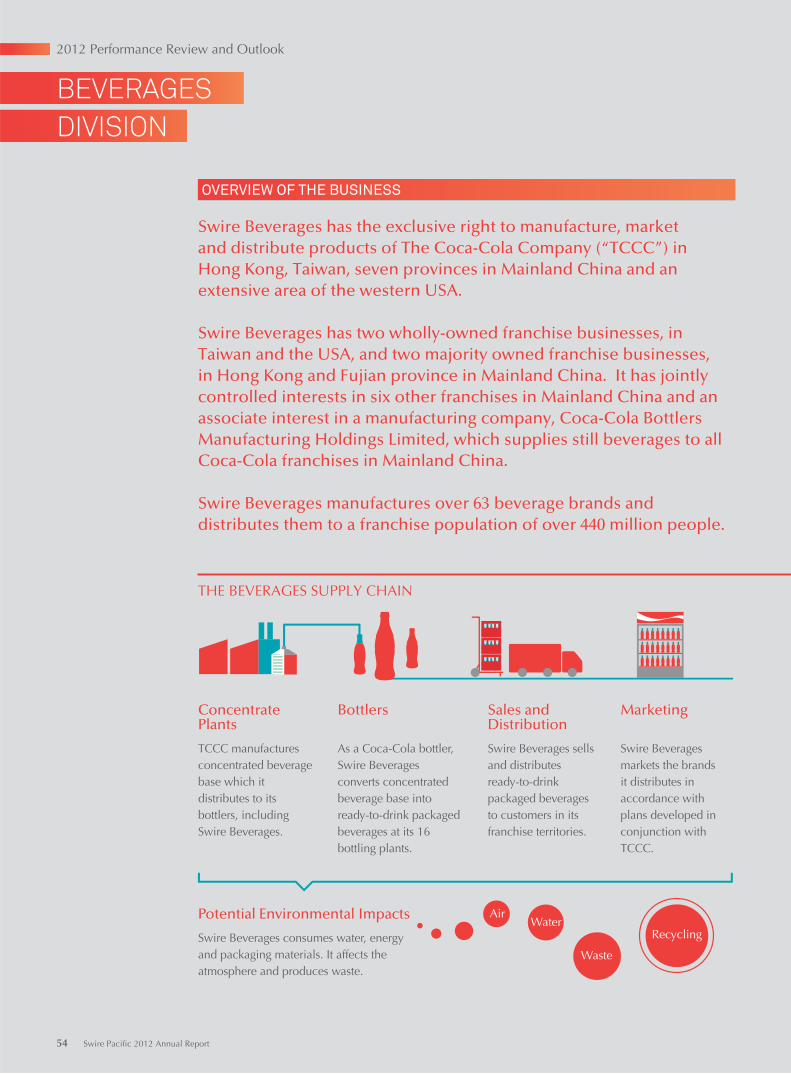
OVERVIEW OF THE BUSINESS
Swire Beverages has the exclusive right to manufacture, market and distribute products of The Coca-Cola Company (“TCCC”) in Hong Kong, Taiwan, seven provinces in Mainland China and an extensive area of the western USA.
Swire Beverages has two wholly-owned franchise businesses, in Taiwan and the USA, and two majority owned franchise businesses, in Hong Kong and Fujian province in Mainland China. It has jointly controlled interests in six other franchises in Mainland China and an associate interest in a manufacturing company, Coca-Cola Bottlers Manufacturing Holdings Limited, which supplies still beverages to all Coca-Cola franchises in Mainland China.
Swire Beverages manufactures over 63 beverage brands and distributes them to a franchise population of over 440 million people.
Concentrate Plants
TCCC manufactures concentrated beverage base which it distributes to its bottlers, including Swire Beverages.
Bottlers
As a Coca-Cola bottler, Swire Beverages converts concentrated beverage base into ready-to-drink packaged beverages at its 16 bottling plants.
Potential Environmental Impacts
Swire Beverages consumes water, energy and packaging materials. It affects the atmosphere and produces waste.
Sales and Distribution
Swire Beverages sells and distributes ready-to-drink packaged beveragesto customers in its franchise territories.
Marketing
Swire Beverages markets the brandsit distributes in accordance with plans developed in conjunction with TCCC.
AirWater
Waste
Recycling
THE BEVERAGES SUPPLY CHAIN
DIVISION
BEVERAGES
54 Swire Pacific 2012 Annual Report
2012 Performance Review and Outlook
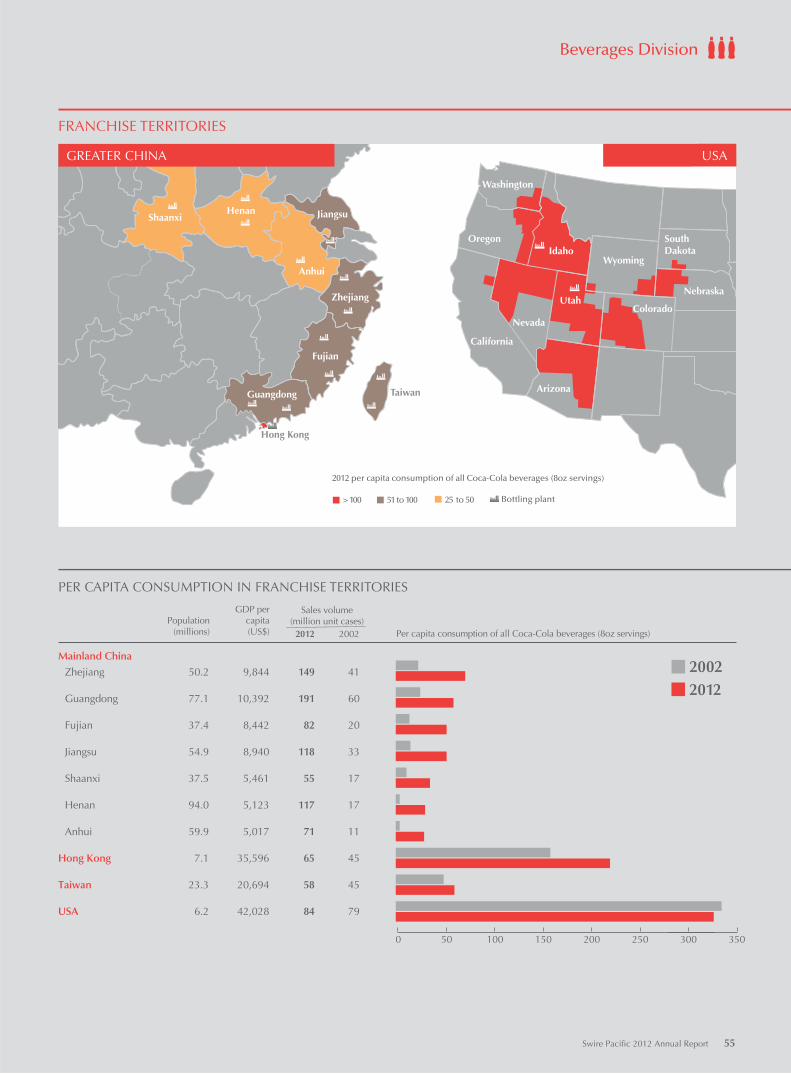
TO BE U
PDATED
Shaanxi
Idaho
Arizona
Henan Jiangsu
Anhui
Zhejiang
Fujian
Guangdong
Washington
Oregon
California
Nevada
Utah
Wyoming
SouthDakota
Colorado
Nebraska
Taiwan
Hong Kong
2012 per capita consumption of all Coca-Cola beverages (8oz servings)
> 100 51 to 100 25 to 50
Population(millions) Per capita consumption of all Coca-Cola beverages (8oz servings)
GDP percapita(US$)
PER CAPITA CONSUMPTION IN FRANCHISE TERRITORIES
FRANCHISE TERRITORIES
GREATER CHINA USA
Mainland China
Zhejiang 50.2 9,844 149 41
Guangdong 77.1 10,392 191 60
Fujian 37.4 8,442 82 20
Jiangsu 54.9 8,940 118 33
Shaanxi 37.5 5,461 55 17
Henan 94.0 5,123 117 17
Anhui 59.9 5,017 71 11
Hong Kong 7.1 35,596 65 45
Taiwan 23.3 20,694 58 45
USA 6.2 42,028 84 79
2012 2002
Sales volume(million unit cases)
20122002
0 50 100 150 200 250 300 350
Bottling plant
Swire Pacific 2012 Annual Report 55
Beverages Division
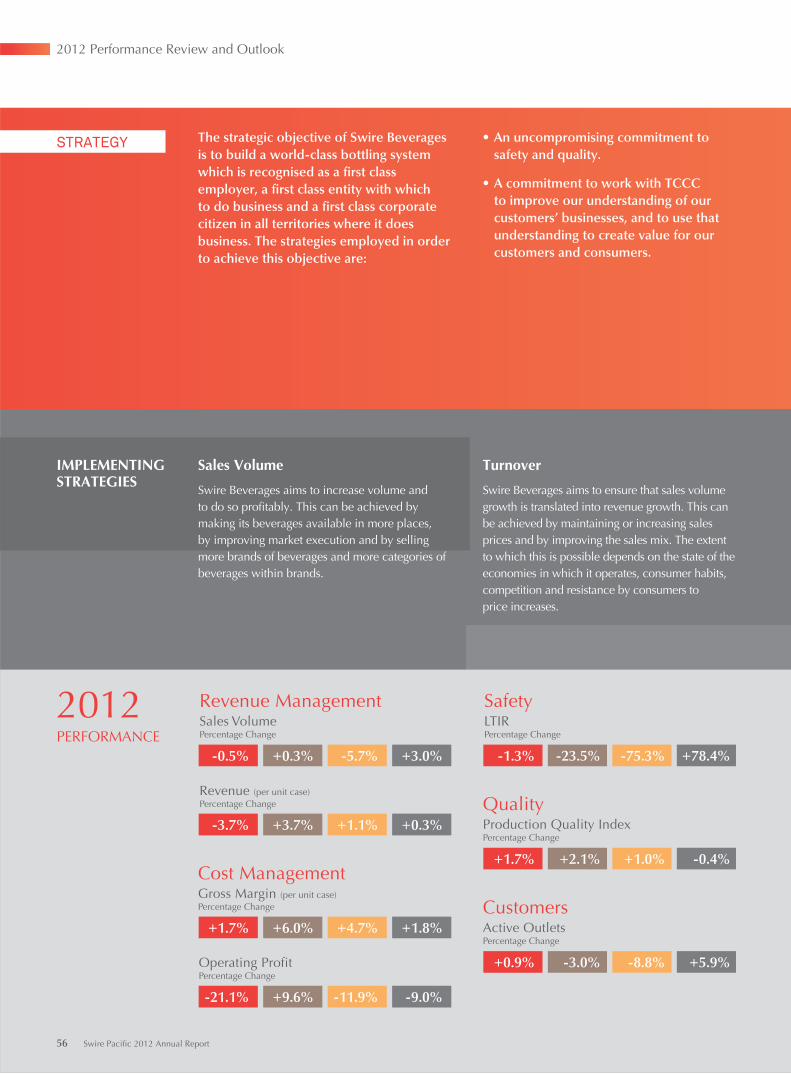
Turnover
Swire Beverages aims to ensure that sales volume growth is translated into revenue growth. This can be achieved by maintaining or increasing sales prices and by improving the sales mix. The extent to which this is possible depends on the state of the economies in which it operates, consumer habits, competition and resistance by consumers to price increases.
IMPLEMENTING STRATEGIES
Sales Volume
Swire Beverages aims to increase volume and to do so profitably. This can be achieved by making its beverages available in more places, by improving market execution and by selling more brands of beverages and more categories of beverages within brands.
The strategic objective of Swire Beverages is to build a world-class bottling system which is recognised as a first class employer, a first class entity with which to do business and a first class corporate citizen in all territories where it does business. The strategies employed in order to achieve this objective are:
• An uncompromising commitment to safety and quality.
• A commitment to work with TCCC to improve our understanding of our customers’ businesses, and to use that understanding to create value for our customers and consumers.
STRATEGY
2012PERFORMANCE
SafetyLTIRPercentage Change
-1.3% -23.5% -75.3% +78.4%
+0.9% -3.0% -8.8% +5.9%
CustomersActive OutletsPercentage Change
-0.5% +0.3% -5.7% +3.0%
Revenue ManagementSales VolumePercentage Change
-3.7% +3.7% +1.1% +0.3%
Revenue (per unit case)Percentage Change
+1.7% +6.0% +4.7% +1.8%
Cost ManagementGross Margin (per unit case)Percentage Change
-21.1% +9.6% -11.9% -9.0%
Operating ProfitPercentage Change
QualityProduction Quality IndexPercentage Change
+1.7% +2.1% +1.0% -0.4%
56 Swire Pacific 2012 Annual Report
2012 Performance Review and Outlook
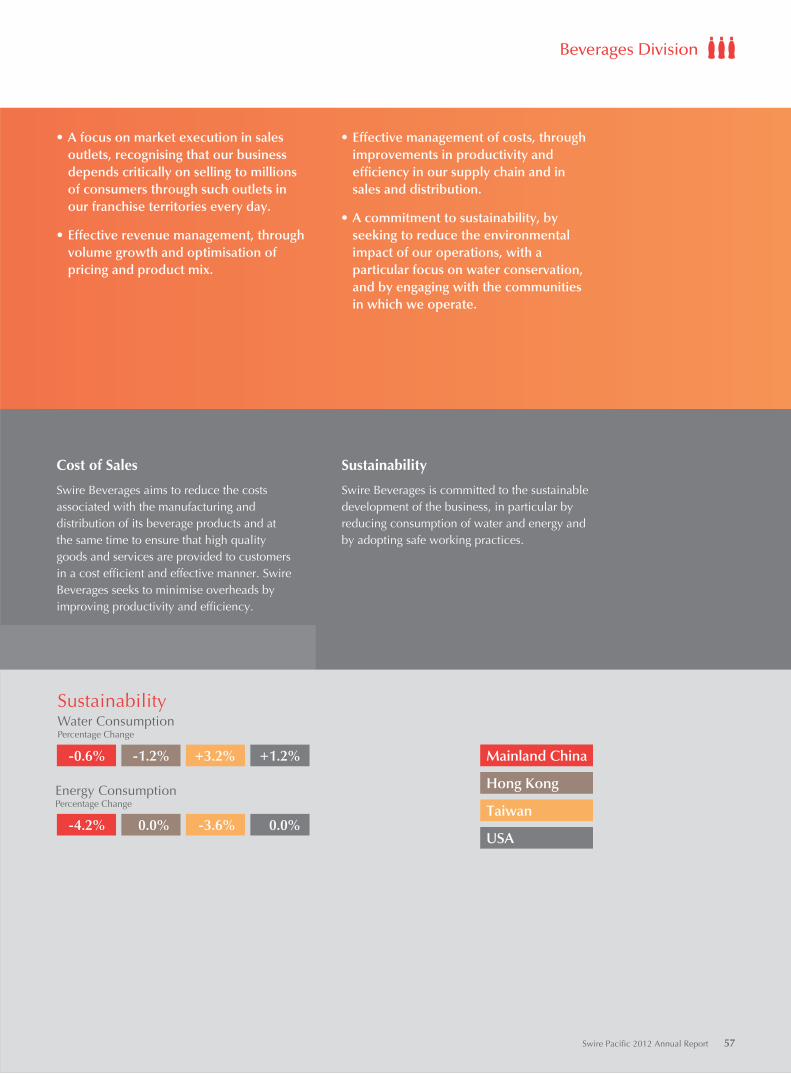
Cost of Sales
Swire Beverages aims to reduce the costs associated with the manufacturing and distribution of its beverage products and at the same time to ensure that high quality goods and services are provided to customers in a cost efficient and effective manner. Swire Beverages seeks to minimise overheads by improving productivity and efficiency.
Sustainability
Swire Beverages is committed to the sustainable development of the business, in particular by reducing consumption of water and energy and by adopting safe working practices.
• A focus on market execution in sales outlets, recognising that our business depends critically on selling to millions of consumers through such outlets in our franchise territories every day.
• Effective revenue management, through volume growth and optimisation of pricing and product mix.
• Effective management of costs, through improvements in productivity and efficiency in our supply chain and in sales and distribution.
• A commitment to sustainability, by seeking to reduce the environmental impact of our operations, with a particular focus on water conservation, and by engaging with the communities in which we operate.
Mainland China
Hong Kong
Taiwan
USA
-0.6% -1.2% +3.2% +1.2%
-4.2% 0.0% -3.6% 0.0%
SustainabilityWater ConsumptionPercentage Change
Energy ConsumptionPercentage Change
Swire Pacific 2012 Annual Report 57
Beverages Division
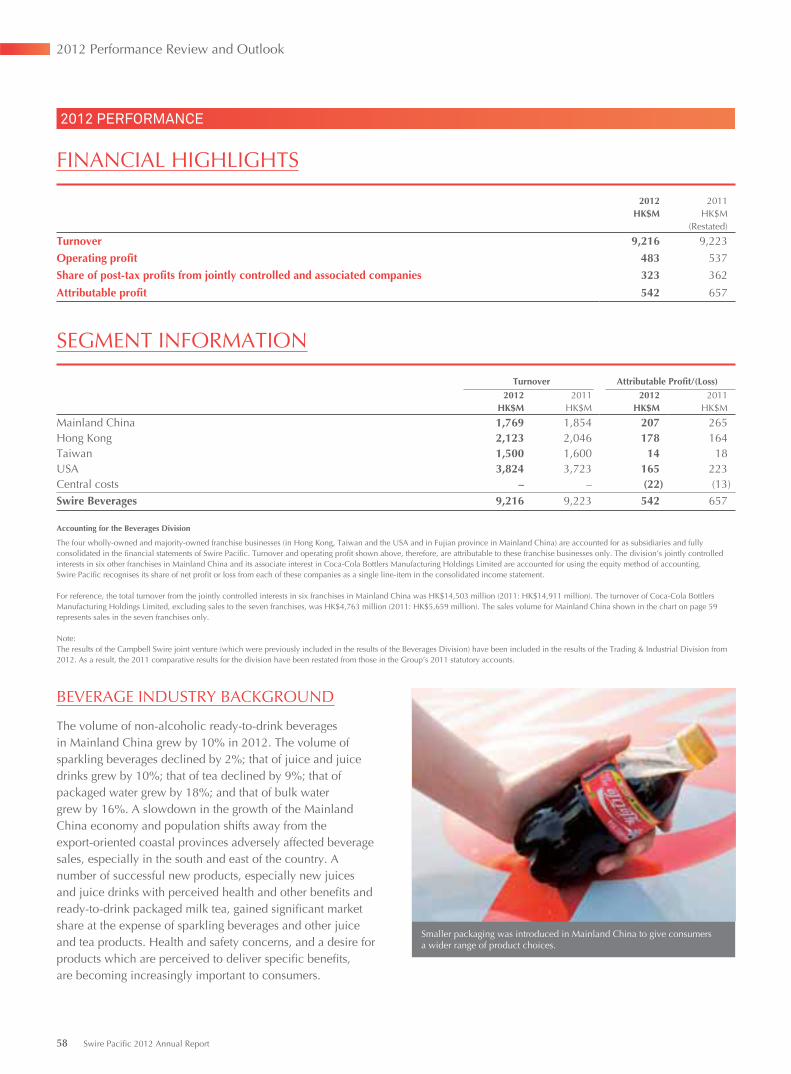
FINANCIAL HIGHLIGHTS
2012 2011HK$M HK$M
(Restated)
Turnover 9,216 9,223
Operating profit 483 537
Share of post-tax profits from jointly controlled and associated companies 323 362
Attributable profit 542 657
SEGMENT INFORMATION
Turnover Attributable Profit/(Loss)2012 2011 2012 2011
HK$M HK$M HK$M HK$M
Mainland China 1,769 1,854 207 265Hong Kong 2,123 2,046 178 164Taiwan 1,500 1,600 14 18USA 3,824 3,723 165 223Central costs – – (22) (13)Swire Beverages 9,216 9,223 542 657
Accounting for the Beverages Division
The four wholly-owned and majority-owned franchise businesses (in Hong Kong, Taiwan and the USA and in Fujian province in Mainland China) are accounted for as subsidiaries and fully consolidated in the financial statements of Swire Pacific. Turnover and operating profit shown above, therefore, are attributable to these franchise businesses only. The division’s jointly controlled interests in six other franchises in Mainland China and its associate interest in Coca-Cola Bottlers Manufacturing Holdings Limited are accounted for using the equity method of accounting. Swire Pacific recognises its share of net profit or loss from each of these companies as a single line-item in the consolidated income statement.
For reference, the total turnover from the jointly controlled interests in six franchises in Mainland China was HK$14,503 million (2011: HK$14,911 million). The turnover of Coca-Cola Bottlers Manufacturing Holdings Limited, excluding sales to the seven franchises, was HK$4,763 million (2011: HK$5,659 million). The sales volume for Mainland China shown in the chart on page 59 represents sales in the seven franchises only.
Note: The results of the Campbell Swire joint venture (which were previously included in the results of the Beverages Division) have been included in the results of the Trading & Industrial Division from 2012. As a result, the 2011 comparative results for the division have been restated from those in the Group’s 2011 statutory accounts.
Smaller packaging was introduced in Mainland China to give consumers a wider range of product choices.
BEVERAGE INDUSTRY BACKGROUND
The volume of non-alcoholic ready-to-drink beverages in Mainland China grew by 10% in 2012. The volume of sparkling beverages declined by 2%; that of juice and juice drinks grew by 10%; that of tea declined by 9%; that of packaged water grew by 18%; and that of bulk water grew by 16%. A slowdown in the growth of the Mainland China economy and population shifts away from the export-oriented coastal provinces adversely affected beverage sales, especially in the south and east of the country. A number of successful new products, especially new juices and juice drinks with perceived health and other benefits and ready-to-drink packaged milk tea, gained significant market share at the expense of sparkling beverages and other juice and tea products. Health and safety concerns, and a desire for products which are perceived to deliver specific benefits,are becoming increasingly important to consumers.
2012 PERFORMANCE
58 Swire Pacific 2012 Annual Report
2012 Performance Review and Outlook
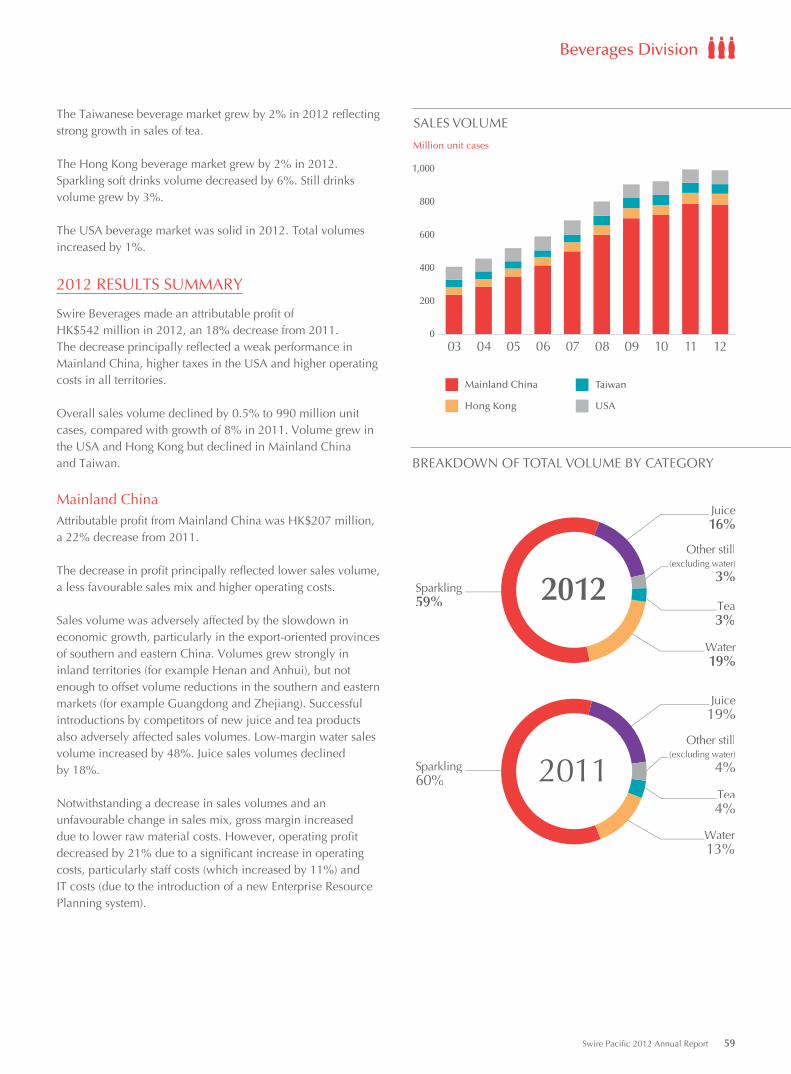
Mainland China
USA
Taiwan
Hong Kong
SALES VOLUME
11 121009080706050403
Million unit cases
0
200
400
600
800
1,000
Water19%
Sparkling59%
Juice16%
Other still(excluding water)
3%
Tea3%
2012
Water13%
Sparkling60%
W
Juice19%
Other still(excluding water)
4%
Tea4%
2011
BREAKDOWN OF TOTAL VOLUME BY CATEGORY
The Taiwanese beverage market grew by 2% in 2012 reflecting strong growth in sales of tea.
The Hong Kong beverage market grew by 2% in 2012. Sparkling soft drinks volume decreased by 6%. Still drinks volume grew by 3%.
The USA beverage market was solid in 2012. Total volumes increased by 1%.
2012 RESULTS SUMMARY
Swire Beverages made an attributable profit of HK$542 million in 2012, an 18% decrease from 2011. The decrease principally reflected a weak performance in Mainland China, higher taxes in the USA and higher operating costs in all territories.
Overall sales volume declined by 0.5% to 990 million unit cases, compared with growth of 8% in 2011. Volume grew in the USA and Hong Kong but declined in Mainland China and Taiwan.
Mainland ChinaAttributable profit from Mainland China was HK$207 million, a 22% decrease from 2011.
The decrease in profit principally reflected lower sales volume, a less favourable sales mix and higher operating costs.
Sales volume was adversely affected by the slowdown in economic growth, particularly in the export-oriented provinces of southern and eastern China. Volumes grew strongly in inland territories (for example Henan and Anhui), but not enough to offset volume reductions in the southern and eastern markets (for example Guangdong and Zhejiang). Successful introductions by competitors of new juice and tea products also adversely affected sales volumes. Low-margin water sales volume increased by 48%. Juice sales volumes declined by 18%.
Notwithstanding a decrease in sales volumes and an unfavourable change in sales mix, gross margin increased due to lower raw material costs. However, operating profit decreased by 21% due to a significant increase in operating costs, particularly staff costs (which increased by 11%) and IT costs (due to the introduction of a new Enterprise Resource Planning system).
Swire Pacific 2012 Annual Report 59
Beverages Division
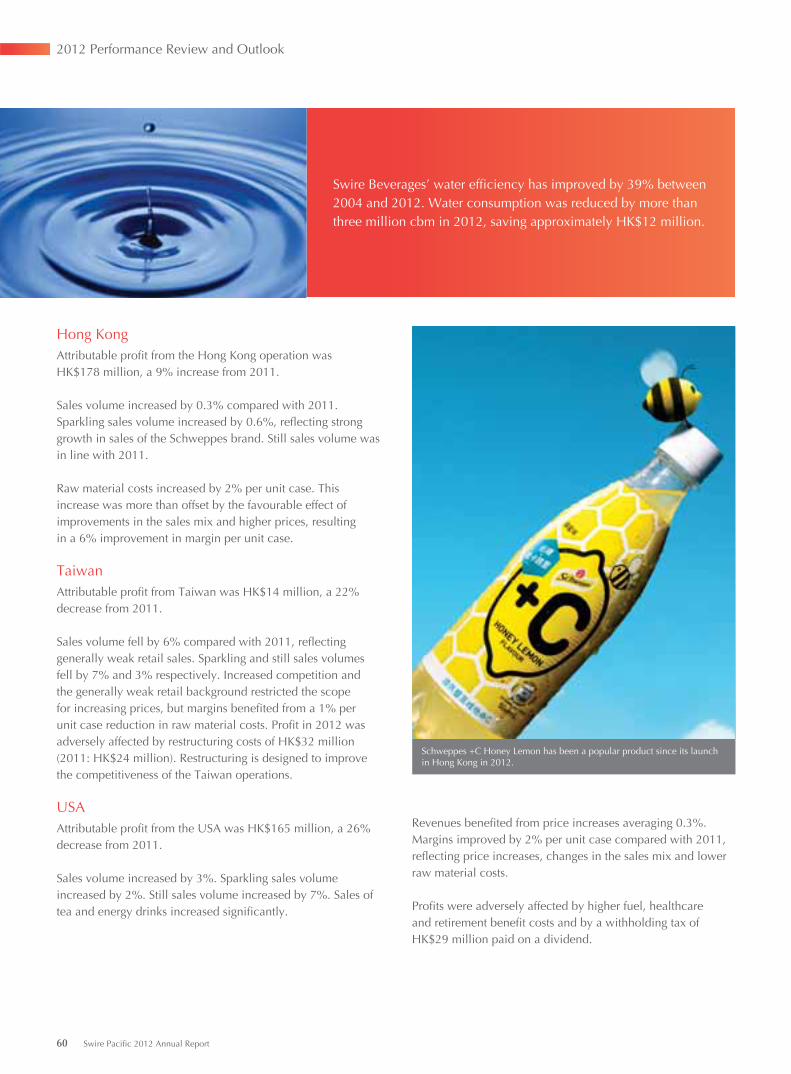
Revenues benefited from price increases averaging 0.3%. Margins improved by 2% per unit case compared with 2011, reflecting price increases, changes in the sales mix and lower raw material costs.
Profits were adversely affected by higher fuel, healthcare and retirement benefit costs and by a withholding tax of HK$29 million paid on a dividend.
Swire Beverages’ water efficiency has improved by 39% between 2004 and 2012. Water consumption was reduced by more than three million cbm in 2012, saving approximately HK$12 million.
Hong KongAttributable profit from the Hong Kong operation wasHK$178 million, a 9% increase from 2011.
Sales volume increased by 0.3% compared with 2011. Sparkling sales volume increased by 0.6%, reflecting strong growth in sales of the Schweppes brand. Still sales volume was in line with 2011.
Raw material costs increased by 2% per unit case. This increase was more than offset by the favourable effect of improvements in the sales mix and higher prices, resultingin a 6% improvement in margin per unit case.
TaiwanAttributable profit from Taiwan was HK$14 million, a 22% decrease from 2011.
Sales volume fell by 6% compared with 2011, reflecting generally weak retail sales. Sparkling and still sales volumes fell by 7% and 3% respectively. Increased competition and the generally weak retail background restricted the scope for increasing prices, but margins benefited from a 1% per unit case reduction in raw material costs. Profit in 2012 was adversely affected by restructuring costs of HK$32 million (2011: HK$24 million). Restructuring is designed to improve the competitiveness of the Taiwan operations.
USAAttributable profit from the USA was HK$165 million, a 26% decrease from 2011.
Sales volume increased by 3%. Sparkling sales volume increased by 2%. Still sales volume increased by 7%. Sales of tea and energy drinks increased significantly.
Schweppes +C Honey Lemon has been a popular product since its launch in Hong Kong in 2012.
60 Swire Pacific 2012 Annual Report
2012 Performance Review and Outlook
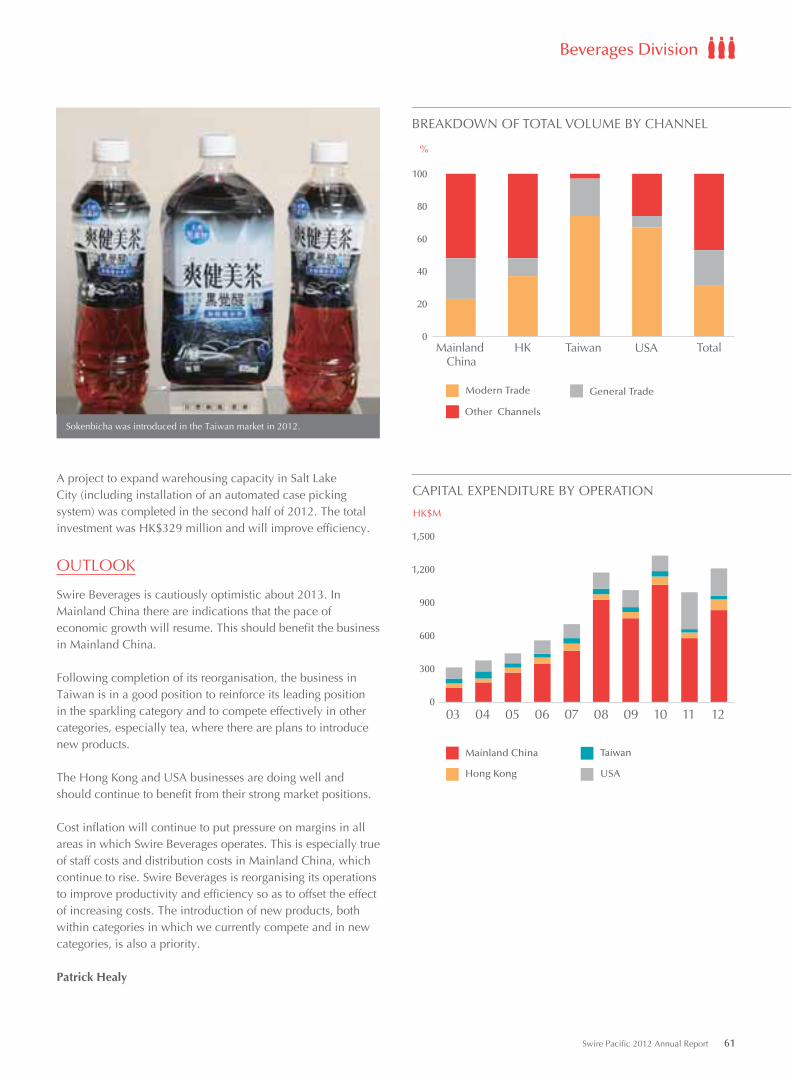
A project to expand warehousing capacity in Salt Lake City (including installation of an automated case picking system) was completed in the second half of 2012. The total investment was HK$329 million and will improve efficiency.
OUTLOOK
Swire Beverages is cautiously optimistic about 2013. In Mainland China there are indications that the pace of economic growth will resume. This should benefit the business in Mainland China.
Following completion of its reorganisation, the business in Taiwan is in a good position to reinforce its leading position in the sparkling category and to compete effectively in other categories, especially tea, where there are plans to introduce new products.
The Hong Kong and USA businesses are doing well and should continue to benefit from their strong market positions.
Cost inflation will continue to put pressure on margins in all areas in which Swire Beverages operates. This is especially true of staff costs and distribution costs in Mainland China, which continue to rise. Swire Beverages is reorganising its operations to improve productivity and efficiency so as to offset the effect of increasing costs. The introduction of new products, both within categories in which we currently compete and in new categories, is also a priority.
Patrick Healy
Modern Trade General Trade
Other Channels
TotalUSATaiwanHKMainland China
%
0
20
40
60
80
100
BREAKDOWN OF TOTAL VOLUME BY CHANNEL
Mainland China
USA
Taiwan
Hong Kong
CAPITAL EXPENDITURE BY OPERATION
11 121009080706050403
HK$M
0
300
600
900
1,200
1,500
Sokenbicha was introduced in the Taiwan market in 2012.
Swire Pacific 2012 Annual Report 61
Beverages Division
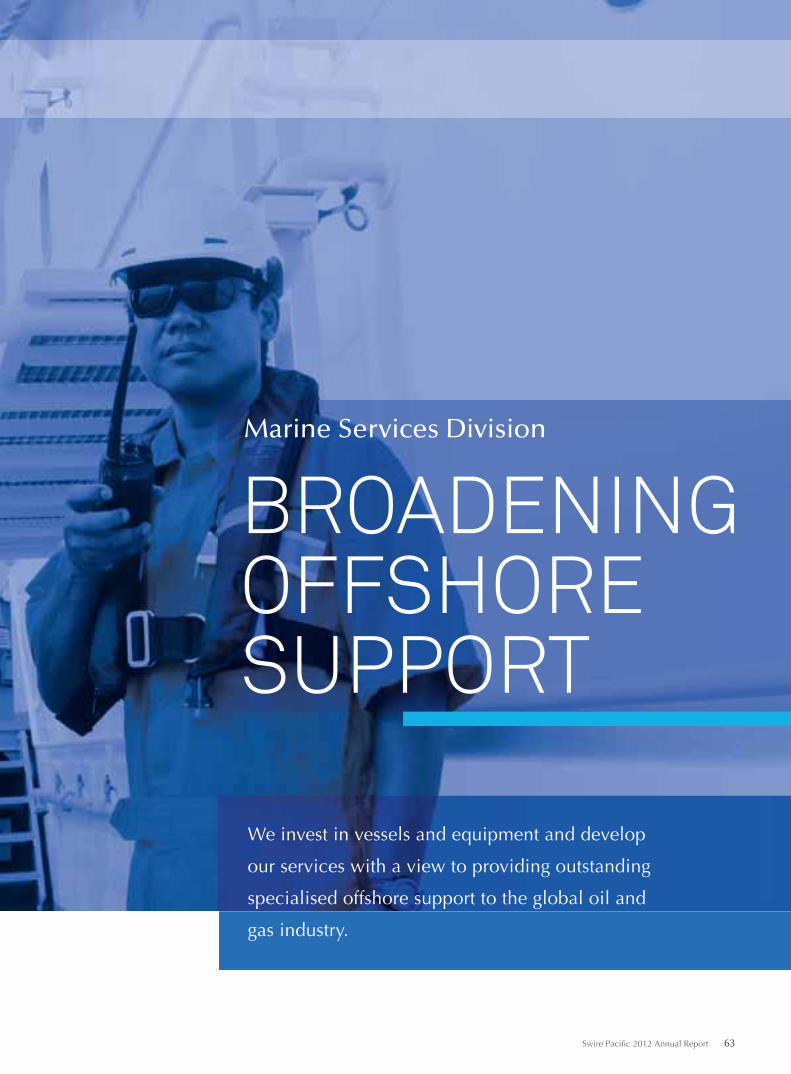
BROADENING OFFSHORE SUPPORT
Marine Services Division
We invest in vessels and equipment and develop
our services with a view to providing outstanding
specialised offshore support to the global oil and
gas industry.
Swire Pacific 2012 Annual Report 63
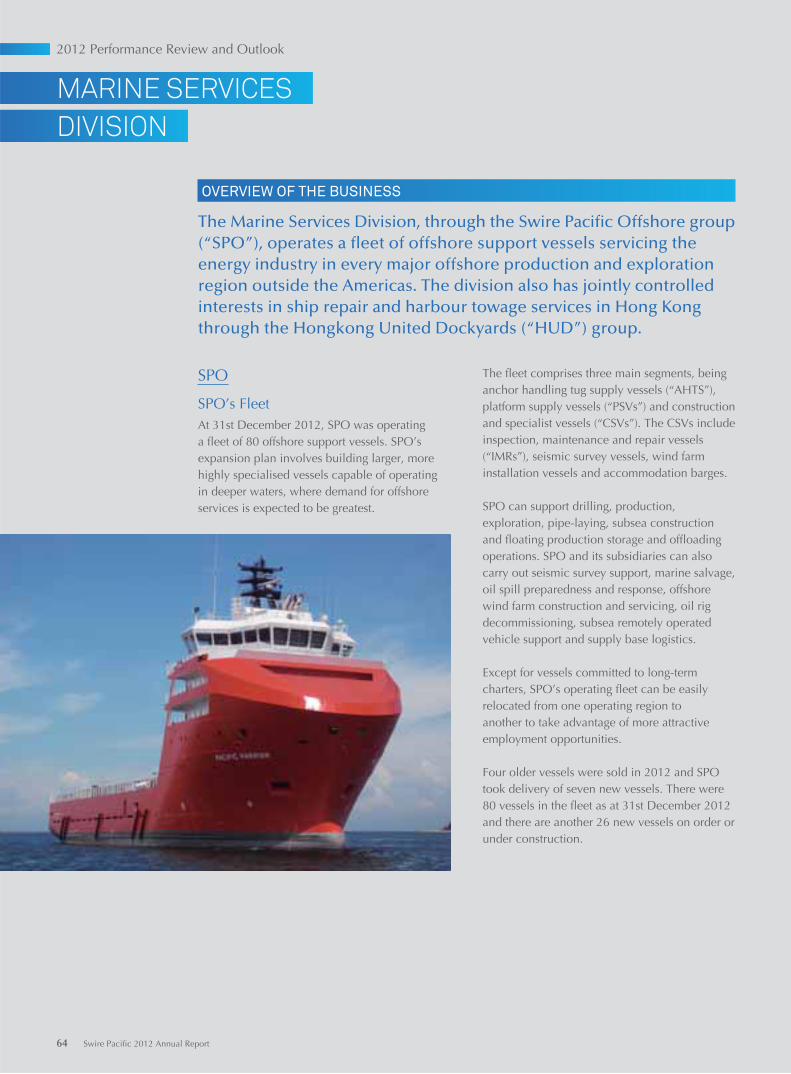
MARINE SERVICES
DIVISION
OVERVIEW OF THE BUSINESS
The Marine Services Division, through the Swire Pacific Offshore group (“SPO”), operates a fleet of offshore support vessels servicing the energy industry in every major offshore production and exploration region outside the Americas. The division also has jointly controlled interests in ship repair and harbour towage services in Hong Kong through the Hongkong United Dockyards (“HUD”) group.
The fleet comprises three main segments, being anchor handling tug supply vessels (“AHTS”), platform supply vessels (“PSVs”) and construction and specialist vessels (“CSVs”). The CSVs include inspection, maintenance and repair vessels (“IMRs”), seismic survey vessels, wind farm installation vessels and accommodation barges. SPO can support drilling, production, exploration, pipe-laying, subsea construction and floating production storage and offloading operations. SPO and its subsidiaries can also carry out seismic survey support, marine salvage, oil spill preparedness and response, offshore wind farm construction and servicing, oil rig decommissioning, subsea remotely operated vehicle support and supply base logistics.
Except for vessels committed to long-term charters, SPO’s operating fleet can be easily relocated from one operating region to another to take advantage of more attractive employment opportunities.
Four older vessels were sold in 2012 and SPO took delivery of seven new vessels. There were 80 vessels in the fleet as at 31st December 2012 and there are another 26 new vessels on order or under construction.
SPO
SPO’s FleetAt 31st December 2012, SPO was operating a fleet of 80 offshore support vessels. SPO’s expansion plan involves building larger, more highly specialised vessels capable of operating in deeper waters, where demand for offshore services is expected to be greatest.
64 Swire Pacific 2012 Annual Report
2012 Performance Review and Outlook
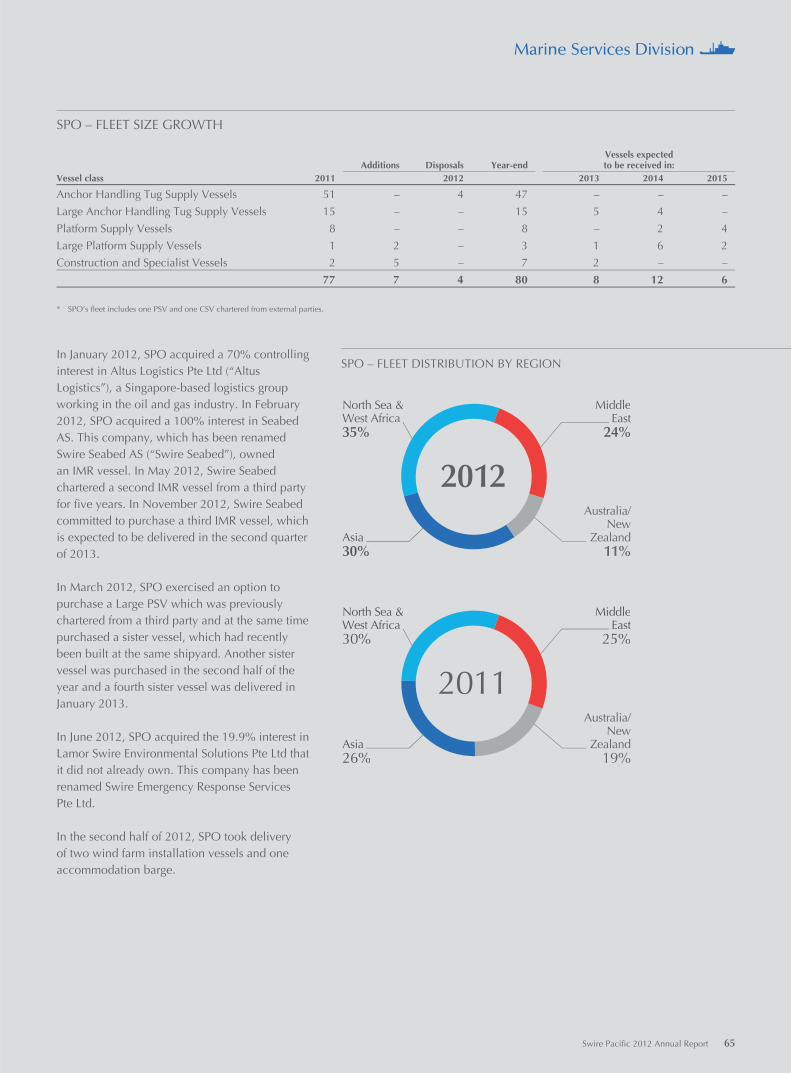
In January 2012, SPO acquired a 70% controlling interest in Altus Logistics Pte Ltd (“Altus Logistics”), a Singapore-based logistics group working in the oil and gas industry. In February 2012, SPO acquired a 100% interest in Seabed AS. This company, which has been renamed Swire Seabed AS (“Swire Seabed”), owned an IMR vessel. In May 2012, Swire Seabed chartered a second IMR vessel from a third party for five years. In November 2012, Swire Seabed committed to purchase a third IMR vessel, which is expected to be delivered in the second quarter of 2013.
In March 2012, SPO exercised an option to purchase a Large PSV which was previously chartered from a third party and at the same time purchased a sister vessel, which had recently been built at the same shipyard. Another sister vessel was purchased in the second half of the year and a fourth sister vessel was delivered in January 2013.
In June 2012, SPO acquired the 19.9% interest in Lamor Swire Environmental Solutions Pte Ltd that it did not already own. This company has been renamed Swire Emergency Response Services Pte Ltd.
In the second half of 2012, SPO took delivery of two wind farm installation vessels and one accommodation barge.
SPO – FLEET DISTRIBUTION BY REGION
Asia30%
North Sea &West Africa35%
MiddleEast
24%
2012Australia/
NewZealand
11%
Asia26%
North Sea &West Africa30%
MiddleEast
25%
2011Australia/
NewZealand
19%
SPO – FLEET SIZE GROWTH
Additions Disposals Year-endVessels expectedto be received in:
Vessel class 2011 2012 2013 2014 2015
Anchor Handling Tug Supply Vessels 51 – 4 47 – – –
Large Anchor Handling Tug Supply Vessels 15 – – 15 5 4 –
Platform Supply Vessels 8 – – 8 – 2 4
Large Platform Supply Vessels 1 2 – 3 1 6 2
Construction and Specialist Vessels 2 5 – 7 2 – –
77 7 4 80 8 12 6
* SPO’s fleet includes one PSV and one CSV chartered from external parties.
Swire Pacific 2012 Annual Report 65
Marine Services Division
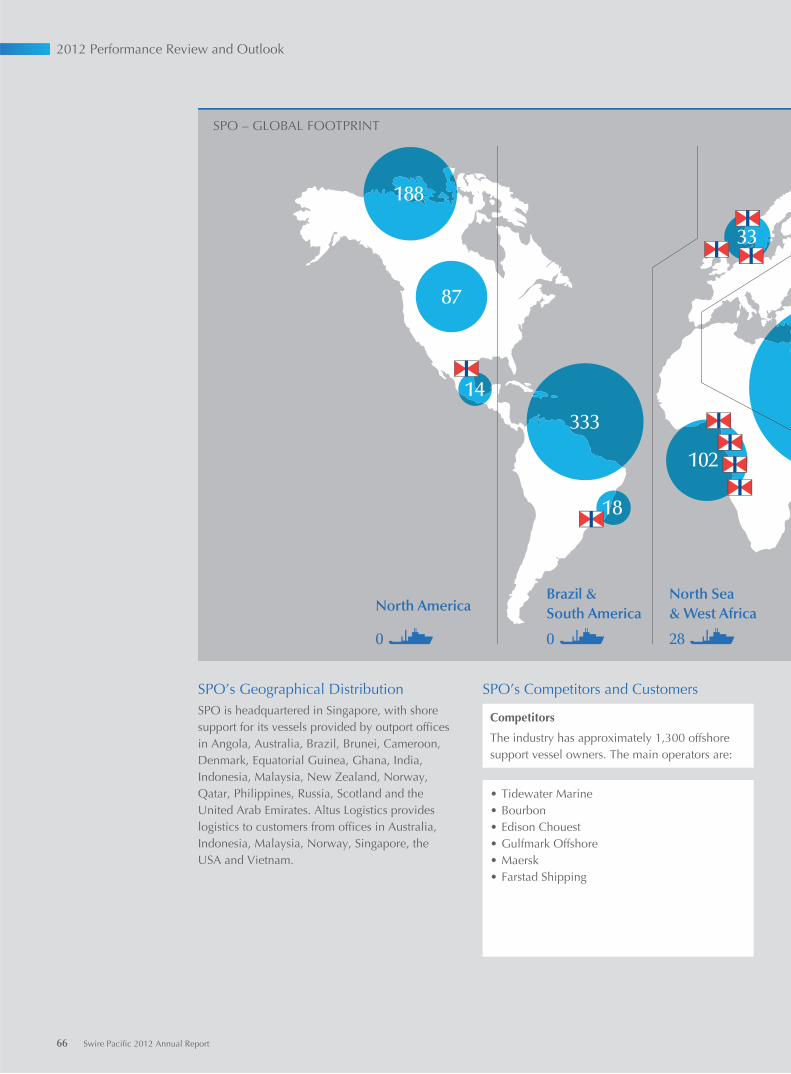
SPO – GLOBAL FOOTPRINT
North AmericaBrazil &South America
0 0
102
33
188
87
18
333
North Sea& West Africa
28
14
SPO’s Competitors and Customers
Competitors
The industry has approximately 1,300 offshore support vessel owners. The main operators are:
• Tidewater Marine• Bourbon• Edison Chouest• Gulfmark Offshore• Maersk• Farstad Shipping
SPO’s Geographical DistributionSPO is headquartered in Singapore, with shore support for its vessels provided by outport offices in Angola, Australia, Brazil, Brunei, Cameroon, Denmark, Equatorial Guinea, Ghana, India, Indonesia, Malaysia, New Zealand, Norway, Qatar, Philippines, Russia, Scotland and the United Arab Emirates. Altus Logistics provides logistics to customers from offices in Australia, Indonesia, Malaysia, Norway, Singapore, the USA and Vietnam.
66 Swire Pacific 2012 Annual Report
2012 Performance Review and Outlook
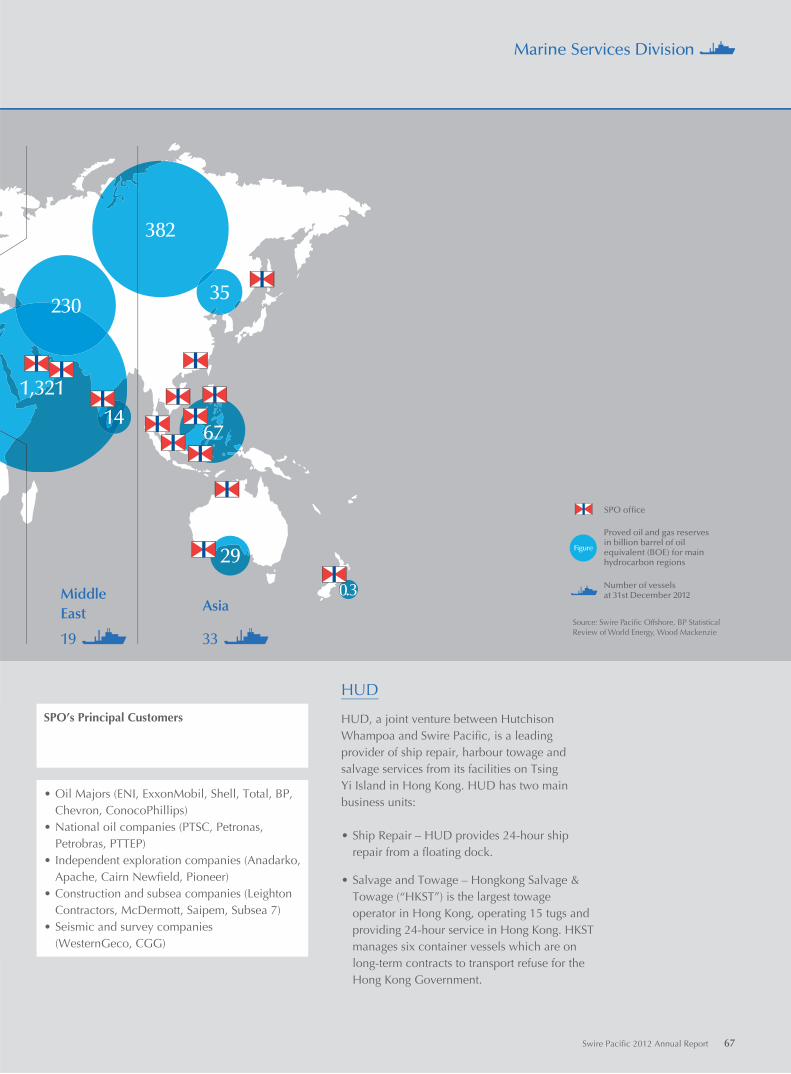
Asia
33
1,321
35
1467
29
0.3
382
230
SPO office
Proved oil and gas reservesin billion barrel of oil equivalent (BOE) for mainhydrocarbon regions
Number of vessels at 31st December 2012
Source: Swire Pacific Offshore, BP Statistical Review of World Energy, Wood Mackenzie
Figure
Middle East
19
HUD
HUD, a joint venture between Hutchison Whampoa and Swire Pacific, is a leading provider of ship repair, harbour towage and salvage services from its facilities on Tsing Yi Island in Hong Kong. HUD has two main business units:
• Ship Repair – HUD provides 24-hour ship repair from a floating dock.
• Salvage and Towage – Hongkong Salvage & Towage (“HKST”) is the largest towage operator in Hong Kong, operating 15 tugs and providing 24-hour service in Hong Kong. HKST manages six container vessels which are on long-term contracts to transport refuse for the Hong Kong Government.
SPO’s Principal Customers
• Oil Majors (ENI, ExxonMobil, Shell, Total, BP, Chevron, ConocoPhillips)
• National oil companies (PTSC, Petronas, Petrobras, PTTEP)
• Independent exploration companies (Anadarko, Apache, Cairn Newfield, Pioneer)
• Construction and subsea companies (Leighton Contractors, McDermott, Saipem, Subsea 7)
• Seismic and survey companies (WesternGeco, CGG)
Swire Pacific 2012 Annual Report 67
Marine Services Division

The principal strategic objective of the Marine Services Division is to maintain and strengthen SPO’s position as a leader in the offshore energy supply industry. The strategies employed in order to achieve this objective are these:
• Substantial and continuous investment by SPO in new vessels, especially those designed to operate in deeper waters, where the fastest growth in oil and gas exploration is expected.
• Selective investment in the provision of complementary marine services with a view to increasing both the range of services offered to customers and the scope of opportunities to utilise assets and resources.
IMPLEMENTING STRATEGIES
Fleet
The key objective is to strengthen SPO’s fleet by making it more diverse and reducing the average age of the vessels. A more diverse and younger fleet helps SPO to meet the needs of its customers by offering modern vessels capable of providing a wide range of offshore support services. Increased investment in vessels designed to operate in deeper waters means that SPO is well placed in the market where the fastest growth in oil and gas exploration is expected. Customers expect a modern, reliable fleet. SPO’s investments in new vessels and the retiring of older vessels has reduced the average age of its tonnage by over a third in the past ten years.
Charter Hire Revenue
SPO aims to maximise its charter hire revenue, which is its primary source of revenue. Charter hire revenue depends on demand for and supply of tonnage and on utilisation and current charter hire rates (which are themselves a product of demand and supply but also vary significantly between vessel classes and operating regions). SPO aims to deploy its vessels where demand and charter hire rates are expected to be strongest and to offer specialised offshore services in order to maximise its revenue.
2012PERFORMANCE
Capital Expenditure
HK$5.6 bnFleet Size Growth
+4%Average Age of Vessels at Year-end
8.5 years
Average Charter Hire Rates
+USD1,773 per day
Charter Hire Revenue
+18%
STRATEGY
(+10% excluding new acquisitions)
68 Swire Pacific 2012 Annual Report
2012 Performance Review and Outlook
• A commitment to operational excellence and to maintaining and enhancing high standards of service to customers, including by placing major emphasis on safety and training.
• Strengthening the global and local network of SPO, both by entry into new areas and by developing the network in existing areas.
• Doing business through operating commercial joint ventures where necessary or appropriate.
• Diversifying into the servicing of offshore wind farm developments (as an end in itself and as a contribution to the development of sustainable energy).
Fleet Utilisation
SPO aims to maintain a high fleet utilisation rate by reducing the number of days that vessels are unavailable. Low utilisation rates can occur as a result of a lack of demand or because vessels are unavailable due to repairs and maintenance (a modern fleet helps in this regard).
Operating Costs
While SPO seeks to maximise its revenues, it is also important that operating costs are kept low to maintain margins. SPO’s principal operating costs are manning costs, repair and maintenance costs and depreciation of vessels.
Average Utilisation Rate
+4% ptsOperating Costs
+40%
LTIR
+10%
Average Training Hours*
+8%
Health and Safety
Customers are increasingly risk averse and demand high standards of health and safety and operational excellence. SPO already has a strong reputation in the market for being a safe and reliable operator, but it constantly seeks to do more and places great emphasis on safety and training.
(+9% increase excluding new acquisitions)
* Average training hours represents seafarer health and safety training hours per year.
Swire Pacific 2012 Annual Report 69
Marine Services Division
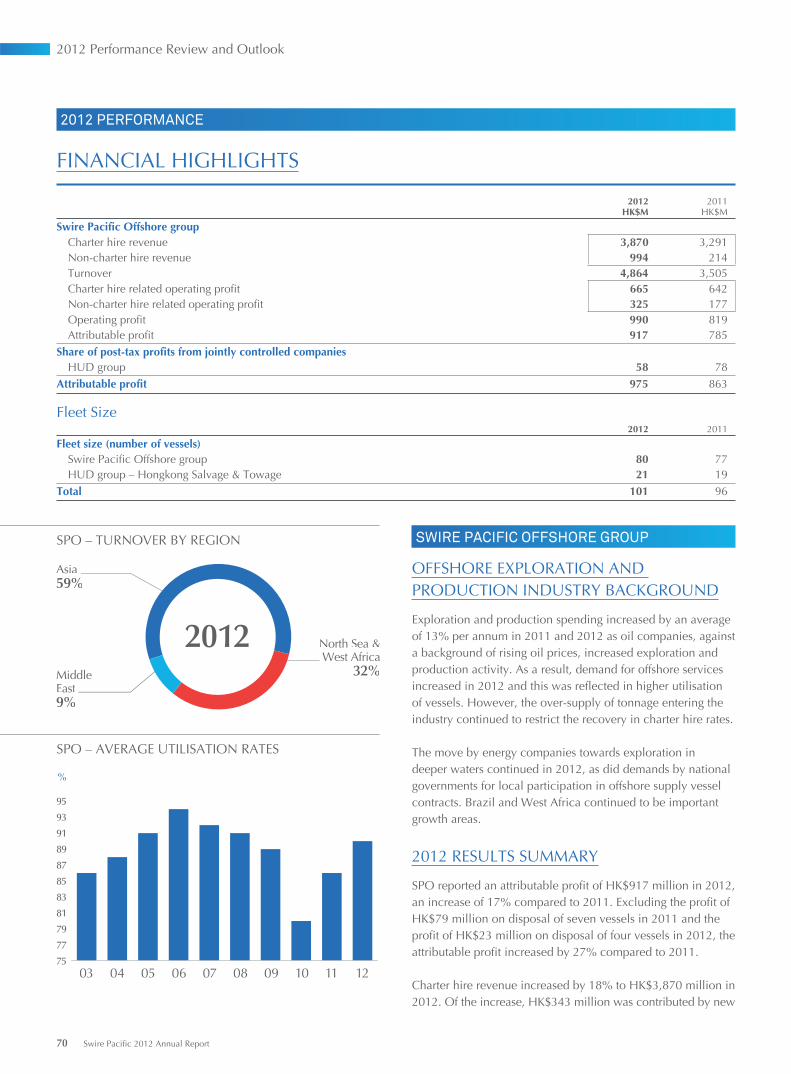
2012 PERFORMANCE
FINANCIAL HIGHLIGHTS
2012 2011HK$M HK$M
Swire Pacific Offshore group Charter hire revenue 3,870 3,291 Non-charter hire revenue 994 214 Turnover 4,864 3,505 Charter hire related operating profit 665 642 Non-charter hire related operating profit 325 177 Operating profit 990 819 Attributable profit 917 785Share of post-tax profits from jointly controlled companies HUD group 58 78Attributable profit 975 863
Fleet Size2012 2011
Fleet size (number of vessels) Swire Pacific Offshore group 80 77 HUD group – Hongkong Salvage & Towage 21 19Total 101 96
SWIRE PACIFIC OFFSHORE GROUP
OFFSHORE EXPLORATION AND PRODUCTION INDUSTRY BACKGROUND
Exploration and production spending increased by an average of 13% per annum in 2011 and 2012 as oil companies, against a background of rising oil prices, increased exploration and production activity. As a result, demand for offshore services increased in 2012 and this was reflected in higher utilisation of vessels. However, the over-supply of tonnage entering the industry continued to restrict the recovery in charter hire rates.
The move by energy companies towards exploration in deeper waters continued in 2012, as did demands by national governments for local participation in offshore supply vessel contracts. Brazil and West Africa continued to be important growth areas.
2012 RESULTS SUMMARY
SPO reported an attributable profit of HK$917 million in 2012, an increase of 17% compared to 2011. Excluding the profit of HK$79 million on disposal of seven vessels in 2011 and the profit of HK$23 million on disposal of four vessels in 2012, the attributable profit increased by 27% compared to 2011.
Charter hire revenue increased by 18% to HK$3,870 million in 2012. Of the increase, HK$343 million was contributed by new
SPO – AVERAGE UTILISATION RATES
75
77
79
81
83
85
87
89
91
93
95
10 11 1209080706050403
%
SPO – TURNOVER BY REGION
Middle East9%
Asia59%
North Sea &West Africa
32%
2012
70 Swire Pacific 2012 Annual Report
2012 Performance Review and Outlook
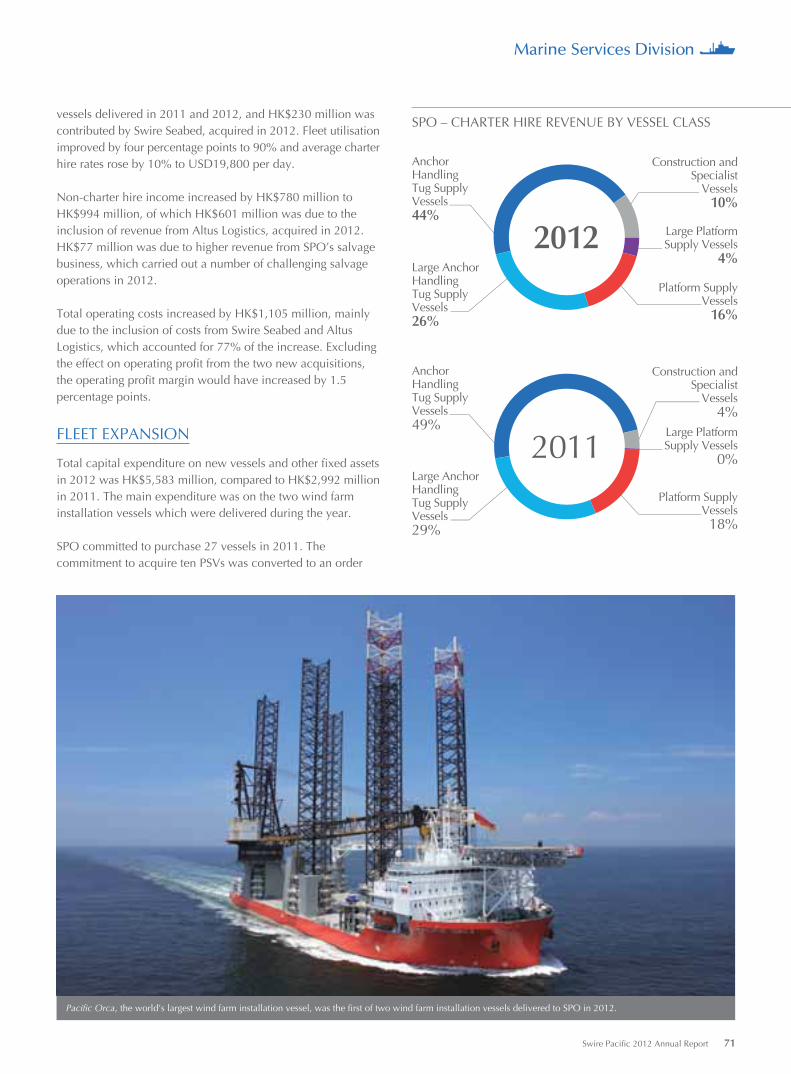
vessels delivered in 2011 and 2012, and HK$230 million was contributed by Swire Seabed, acquired in 2012. Fleet utilisation improved by four percentage points to 90% and average charter hire rates rose by 10% to USD19,800 per day.
Non-charter hire income increased by HK$780 million to HK$994 million, of which HK$601 million was due to the inclusion of revenue from Altus Logistics, acquired in 2012. HK$77 million was due to higher revenue from SPO’s salvage business, which carried out a number of challenging salvage operations in 2012.
Total operating costs increased by HK$1,105 million, mainly due to the inclusion of costs from Swire Seabed and Altus Logistics, which accounted for 77% of the increase. Excluding the effect on operating profit from the two new acquisitions, the operating profit margin would have increased by 1.5 percentage points.
FLEET EXPANSION
Total capital expenditure on new vessels and other fixed assets in 2012 was HK$5,583 million, compared to HK$2,992 million in 2011. The main expenditure was on the two wind farm installation vessels which were delivered during the year.
SPO committed to purchase 27 vessels in 2011. The commitment to acquire ten PSVs was converted to an order
Pacific Orca, the world’s largest wind farm installation vessel, was the first of two wind farm installation vessels delivered to SPO in 2012.
SPO – CHARTER HIRE REVENUE BY VESSEL CLASS
2012Large AnchorHandlingTug SupplyVessels26%
Construction andSpecialist
Vessels10%
Large PlatformSupply Vessels
4%
Platform SupplyVessels
16%
AnchorHandlingTug SupplyVessels44%
2011Large AnchorHandlingTug SupplyVessels29%
Construction andSpecialist
Vessels4%
Large PlatformSupply Vessels
0%
Platform SupplyVessels18%
AnchorHandlingTug SupplyVessels49%
Swire Pacific 2012 Annual Report 71
Marine Services Division
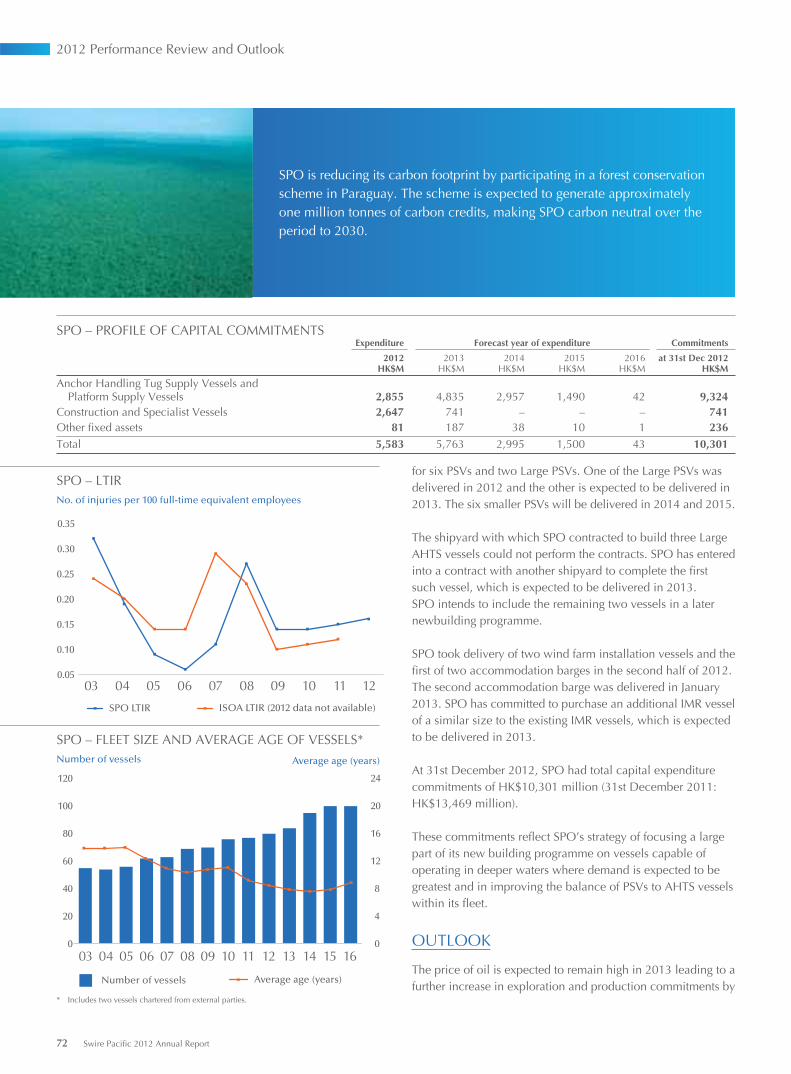
SPO – LTIR
0.05
0.10
0.15
0.20
0.25
0.30
0.35
10 11 1209080706050403
No. of injuries per 100 full-time equivalent employees
SPO LTIR ISOA LTIR (2012 data not available)
SPO – PROFILE OF CAPITAL COMMITMENTSExpenditure Forecast year of expenditure Commitments
2012 HK$M
2013HK$M
2014HK$M
2015HK$M
2016HK$M
at 31st Dec 2012HK$M
Anchor Handling Tug Supply Vessels and Platform Supply Vessels 2,855 4,835 2,957 1,490 42 9,324Construction and Specialist Vessels 2,647 741 – – – 741Other fixed assets 81 187 38 10 1 236Total 5,583 5,763 2,995 1,500 43 10,301
for six PSVs and two Large PSVs. One of the Large PSVs was delivered in 2012 and the other is expected to be delivered in 2013. The six smaller PSVs will be delivered in 2014 and 2015.
The shipyard with which SPO contracted to build three Large AHTS vessels could not perform the contracts. SPO has entered into a contract with another shipyard to complete the first such vessel, which is expected to be delivered in 2013. SPO intends to include the remaining two vessels in a later newbuilding programme.
SPO took delivery of two wind farm installation vessels and the first of two accommodation barges in the second half of 2012. The second accommodation barge was delivered in January 2013. SPO has committed to purchase an additional IMR vessel of a similar size to the existing IMR vessels, which is expected to be delivered in 2013.
At 31st December 2012, SPO had total capital expenditure commitments of HK$10,301 million (31st December 2011: HK$13,469 million).
These commitments reflect SPO’s strategy of focusing a large part of its new building programme on vessels capable of operating in deeper waters where demand is expected to be greatest and in improving the balance of PSVs to AHTS vessels within its fleet.
OUTLOOK
The price of oil is expected to remain high in 2013 leading to a further increase in exploration and production commitments by
SPO is reducing its carbon footprint by participating in a forest conservation scheme in Paraguay. The scheme is expected to generate approximately one million tonnes of carbon credits, making SPO carbon neutral over the period to 2030.
SPO – FLEET SIZE AND AVERAGE AGE OF VESSELS*
0
20
40
60
80
100
120
Number of vessels
Number of vessels Average age (years)
Average age (years)
10 15 1614131211090807060504030
4
8
12
16
20
24
* Includes two vessels chartered from external parties.
72 Swire Pacific 2012 Annual Report
2012 Performance Review and Outlook
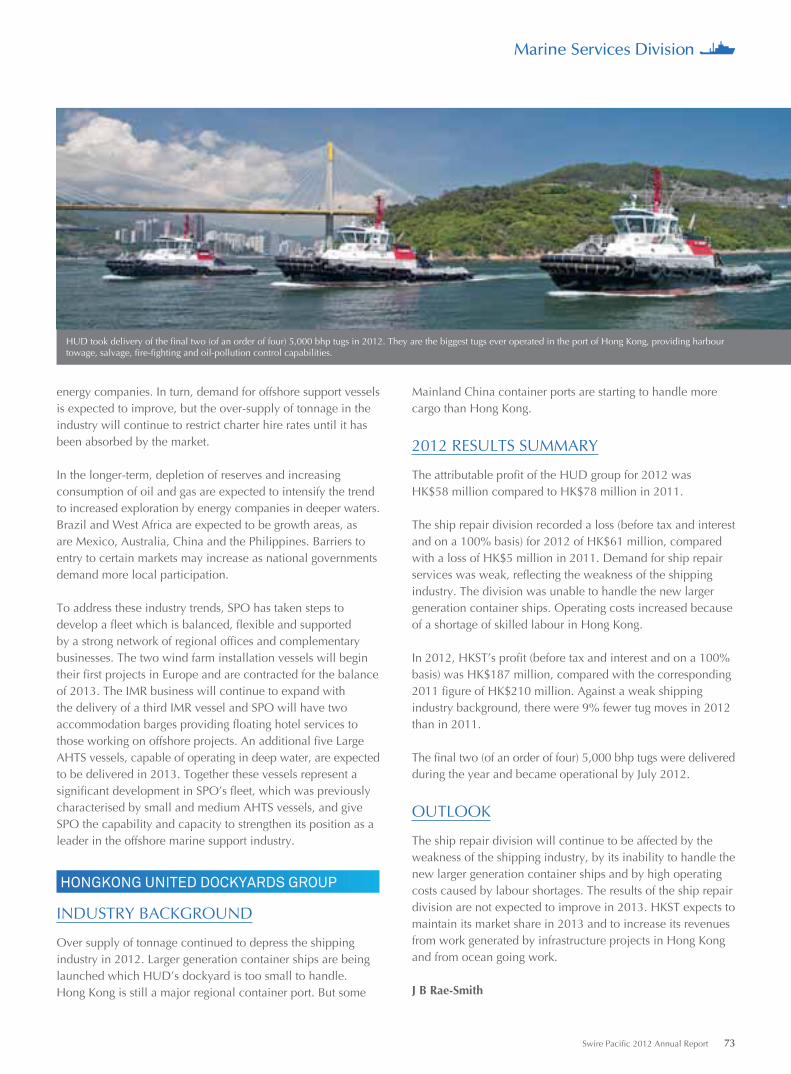
Mainland China container ports are starting to handle more cargo than Hong Kong.
2012 RESULTS SUMMARY
The attributable profit of the HUD group for 2012 wasHK$58 million compared to HK$78 million in 2011.
The ship repair division recorded a loss (before tax and interest and on a 100% basis) for 2012 of HK$61 million, compared with a loss of HK$5 million in 2011. Demand for ship repair services was weak, reflecting the weakness of the shipping industry. The division was unable to handle the new larger generation container ships. Operating costs increased because of a shortage of skilled labour in Hong Kong.
In 2012, HKST’s profit (before tax and interest and on a 100% basis) was HK$187 million, compared with the corresponding 2011 figure of HK$210 million. Against a weak shipping industry background, there were 9% fewer tug moves in 2012 than in 2011.
The final two (of an order of four) 5,000 bhp tugs were delivered during the year and became operational by July 2012.
OUTLOOK
The ship repair division will continue to be affected by the weakness of the shipping industry, by its inability to handle the new larger generation container ships and by high operating costs caused by labour shortages. The results of the ship repair division are not expected to improve in 2013. HKST expects to maintain its market share in 2013 and to increase its revenues from work generated by infrastructure projects in Hong Kong and from ocean going work.
J B Rae-Smith
HUD took delivery of the final two (of an order of four) 5,000 bhp tugs in 2012. They are the biggest tugs ever operated in the port of Hong Kong, providing harbour towage, salvage, fire-fighting and oil-pollution control capabilities.
energy companies. In turn, demand for offshore support vessels is expected to improve, but the over-supply of tonnage in the industry will continue to restrict charter hire rates until it has been absorbed by the market.
In the longer-term, depletion of reserves and increasing consumption of oil and gas are expected to intensify the trend to increased exploration by energy companies in deeper waters. Brazil and West Africa are expected to be growth areas, as are Mexico, Australia, China and the Philippines. Barriers to entry to certain markets may increase as national governments demand more local participation.
To address these industry trends, SPO has taken steps to develop a fleet which is balanced, flexible and supported by a strong network of regional offices and complementary businesses. The two wind farm installation vessels will begin their first projects in Europe and are contracted for the balance of 2013. The IMR business will continue to expand with the delivery of a third IMR vessel and SPO will have two accommodation barges providing floating hotel services to those working on offshore projects. An additional five Large AHTS vessels, capable of operating in deep water, are expected to be delivered in 2013. Together these vessels represent a significant development in SPO’s fleet, which was previously characterised by small and medium AHTS vessels, and give SPO the capability and capacity to strengthen its position as a leader in the offshore marine support industry.
HONGKONG UNITED DOCKYARDS GROUP
INDUSTRY BACKGROUND
Over supply of tonnage continued to depress the shipping industry in 2012. Larger generation container ships are being launched which HUD’s dockyard is too small to handle. Hong Kong is still a major regional container port. But some
Swire Pacific 2012 Annual Report 73
Marine Services Division

We market and sell internationally branded goods
to today’s discerning consumers.
Trading & Industrial Division
MAXIMISING BRAND POTENTIAL
Swire Pacific 2012 Annual Report 75
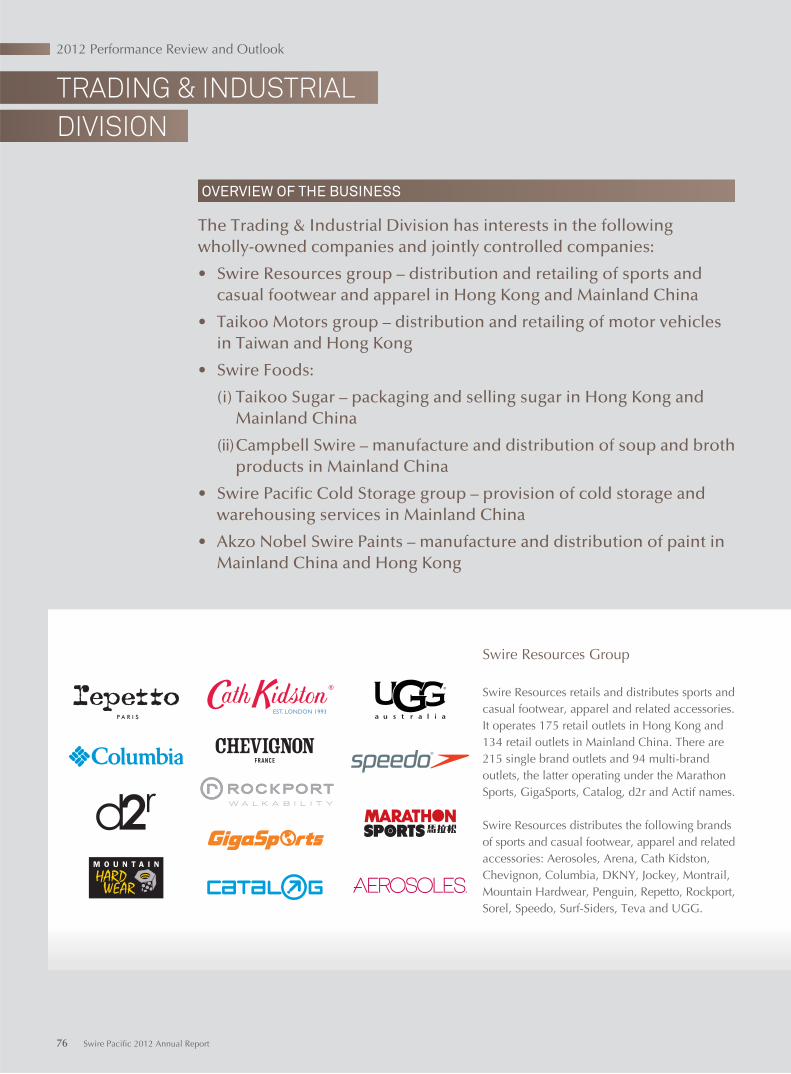
TRADING & INDUSTRIAL
DIVISION
OVERVIEW OF THE BUSINESS
The Trading & Industrial Division has interests in the followingwholly-owned companies and jointly controlled companies:
• Swire Resources group – distribution and retailing of sports and casual footwear and apparel in Hong Kong and Mainland China
• Taikoo Motors group – distribution and retailing of motor vehicles in Taiwan and Hong Kong
• Swire Foods:
(i) Taikoo Sugar – packaging and selling sugar in Hong Kong and Mainland China
(ii) Campbell Swire – manufacture and distribution of soup and broth products in Mainland China
• Swire Pacific Cold Storage group – provision of cold storage and warehousing services in Mainland China
• Akzo Nobel Swire Paints – manufacture and distribution of paint in Mainland China and Hong Kong
Swire Resources Group
Swire Resources retails and distributes sports and casual footwear, apparel and related accessories. It operates 175 retail outlets in Hong Kong and 134 retail outlets in Mainland China. There are 215 single brand outlets and 94 multi-brand outlets, the latter operating under the Marathon Sports, GigaSports, Catalog, d2r and Actif names.
Swire Resources distributes the following brands of sports and casual footwear, apparel and related accessories: Aerosoles, Arena, Cath Kidston, Chevignon, Columbia, DKNY, Jockey, Montrail, Mountain Hardwear, Penguin, Repetto, Rockport, Sorel, Speedo, Surf-Siders, Teva and UGG.
76 Swire Pacific 2012 Annual Report
2012 Performance Review and Outlook
Taikoo Motors Group
Taikoo Motors sells passenger cars, commercial vehicles, motorcycles and scooters. It is the principal distributor in Taiwan for Volkswagenand Škoda cars, Volkswagen light commercialvehicles, Volvo trucks and buses, Harley-Davidson motorcycles and Vespa scooters. In Hong Kong and Macau, it is the principal importer and distributor of FIAT and Alfa Romeo passenger cars, and Volvo, UD and Renault trucks.
Swire Foods
(i) Taikoo SugarTaikoo Sugar packages and sells sugar in Hong Kong and Mainland China under the Taikoo Sugar brand. It is the market leader in packaged sugar in the retail, catering and industrial sectors in Hong Kong. In Mainland China, it operates two packaging plants. It also exports sugar to Southeast Asia, the Middle East and North America, and sells tea, coffee, salt and pepper in Hong Kong and Mainland China.
(ii) Campbell Swire
Campbell Swire is a joint venture with The Campbell Soup Company which manufactures and distributes soup and broth products in Mainland China. The joint venture has a manufacturing plant in Xiamen. Swire Foods has a 40% interest in the venture.
Swire Pacific Cold Storage Group
Swire Pacific Cold Storage was established in 2010. A 60% equity interest in a company which operates a cold storage facility in Guangzhou was acquired in September 2012 from John Swire & Sons Pty Ltd, a wholly-owned subsidiary of John Swire & Sons Limited, the ultimate holding company of the Company. In the second half of 2012, land was acquired in Shanghai and Hebei on which cold storage facilities will be built. In the first quarter of 2013, two more sites were acquired (in Nanjing and Ningbo) on which cold storage facilities will be built. These four cold storage facilities are expected to open in 2014.
Akzo Nobel Swire Paints
Akzo Nobel Swire Paints is a joint venture with Akzo Nobel which manufactures and distributes decorative paints, primarily under the Dulux brand, in Mainland China and Hong Kong. The joint venture has manufacturing plants in Guangzhou, Shanghai and Hebei.
he venture.
Swire Pacific 2012 Annual Report 77
Trading & Industrial Division
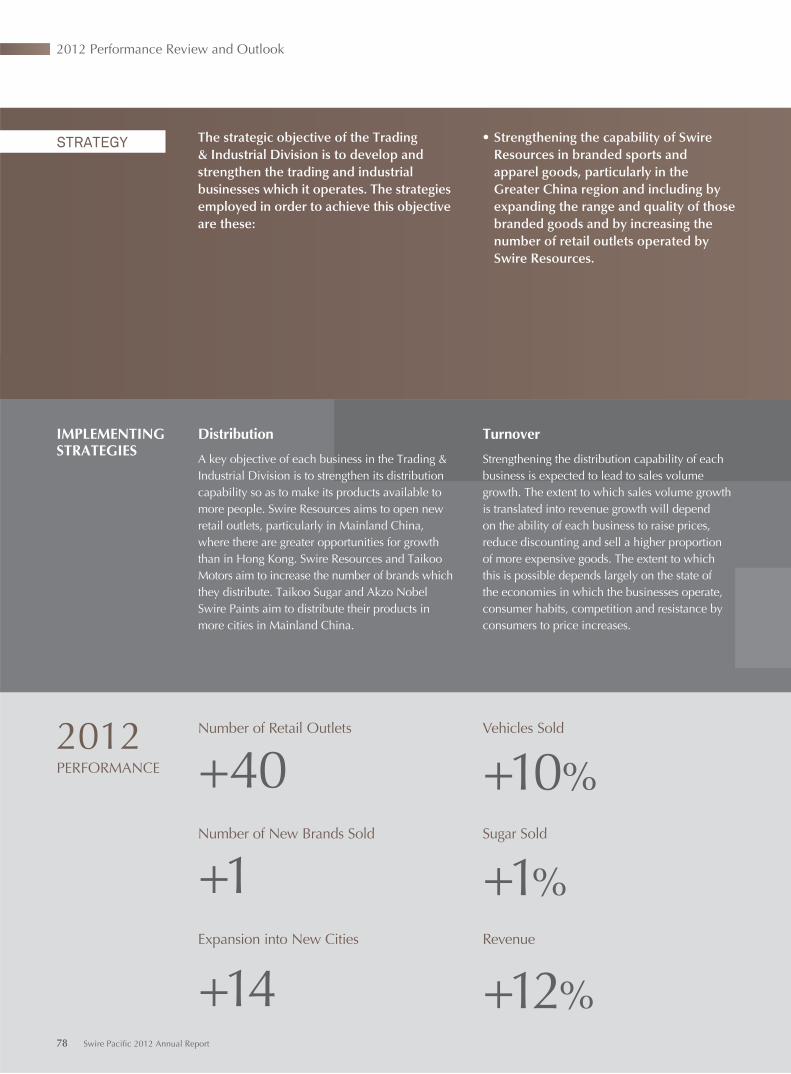
The strategic objective of the Trading & Industrial Division is to develop and strengthen the trading and industrial businesses which it operates. The strategies employed in order to achieve this objective are these:
• Strengthening the capability of Swire Resources in branded sports and apparel goods, particularly in the Greater China region and including by expanding the range and quality of those branded goods and by increasing the number of retail outlets operated by Swire Resources.
IMPLEMENTING STRATEGIES
Distribution
A key objective of each business in the Trading & Industrial Division is to strengthen its distribution capability so as to make its products available to more people. Swire Resources aims to open new retail outlets, particularly in Mainland China, where there are greater opportunities for growth than in Hong Kong. Swire Resources and Taikoo Motors aim to increase the number of brands which they distribute. Taikoo Sugar and Akzo Nobel Swire Paints aim to distribute their products in more cities in Mainland China.
Turnover
Strengthening the distribution capability of each business is expected to lead to sales volume growth. The extent to which sales volume growth is translated into revenue growth will depend on the ability of each business to raise prices, reduce discounting and sell a higher proportion of more expensive goods. The extent to which this is possible depends largely on the state of the economies in which the businesses operate, consumer habits, competition and resistance by consumers to price increases.
2012PERFORMANCE
Number of Retail Outlets Vehicles Sold
+40 +10%Number of New Brands Sold Sugar Sold
+1 +1%Expansion into New Cities Revenue
+14 +12%
STRATEGY
78 Swire Pacific 2012 Annual Report
2012 Performance Review and Outlook
* Average training hours represents training hours per employee per year.
• Strengthening the capability of Taikoo Motors in the import and distribution of motor vehicles, including by selective additions to the portfolio of brands represented.
• Expanding Taikoo Motors’ capability into other motor-related businesses and into other parts of Asia.
• Increasing the volume and broadening the range of products sold by Swire Foods.
• Establishing a network of cold storage and logistics businesses in Mainland China.
• Expanding the distribution network of Akzo Nobel Swire Paints in smaller cities and towns in Mainland China.
Cost of Sales
The businesses of the Trading & Industrial Division aim to reduce the costs of selling their products. Taikoo Sugar aims to ensure that suppliers of sugar provide a high quality product in a cost efficient manner. Swire Resources aims to minimise costs associated with renting premises.
People
Employees are key to the businesses of the Trading & Industrial Division. The Trading & Industrial Division believes that proper treatment of employees is an essential part of conducting a sustainable business. The businesses of the Trading & Industrial Division aim to build highly-trained teams, keep staff motivated, reduce staff turnover and adopt safe working practices.
Gross Margin Average Training Hours*
+1% pt -25%
Operating Costs Staff Turnover
+20% +1% pt
Swire Pacific 2012 Annual Report 79
Trading & Industrial Division
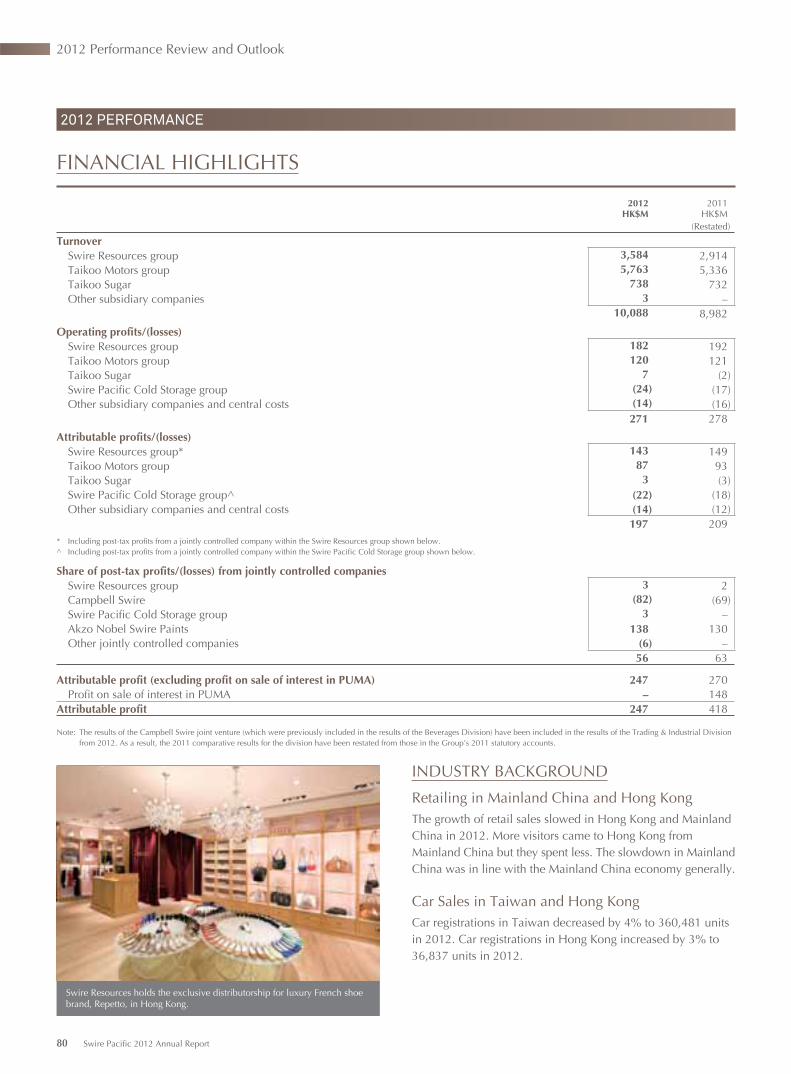
Swire Resources holds the exclusive distributorship for luxury French shoe brand, Repetto, in Hong Kong.
2012 PERFORMANCE
FINANCIAL HIGHLIGHTS
2012 2011HK$M HK$M
(Restated)
Turnover Swire Resources group 3,584 2,914 Taikoo Motors group 5,763 5,336 Taikoo Sugar 738 732 Other subsidiary companies 3 –
10,088 8,982
Operating profits/(losses) Swire Resources group 182 192 Taikoo Motors group 120 121 Taikoo Sugar 7 (2) Swire Pacific Cold Storage group (24) (17) Other subsidiary companies and central costs (14) (16)
271 278
Attributable profits/(losses) Swire Resources group* 143 149 Taikoo Motors group 87 93 Taikoo Sugar 3 (3) Swire Pacific Cold Storage group^ (22) (18) Other subsidiary companies and central costs (14) (12)
197 209* Including post-tax profits from a jointly controlled company within the Swire Resources group shown below.^ Including post-tax profits from a jointly controlled company within the Swire Pacific Cold Storage group shown below.
Share of post-tax profits/(losses) from jointly controlled companies Swire Resources group 3 2 Campbell Swire (82) (69) Swire Pacific Cold Storage group 3 – Akzo Nobel Swire Paints 138 130 Other jointly controlled companies (6) –
56 63
Attributable profit (excluding profit on sale of interest in PUMA) 247 270 Profit on sale of interest in PUMA – 148Attributable profit 247 418
Note: The results of the Campbell Swire joint venture (which were previously included in the results of the Beverages Division) have been included in the results of the Trading & Industrial Division from 2012. As a result, the 2011 comparative results for the division have been restated from those in the Group’s 2011 statutory accounts.
INDUSTRY BACKGROUND
Retailing in Mainland China and Hong KongThe growth of retail sales slowed in Hong Kong and Mainland China in 2012. More visitors came to Hong Kong from Mainland China but they spent less. The slowdown in Mainland China was in line with the Mainland China economy generally.
Car Sales in Taiwan and Hong KongCar registrations in Taiwan decreased by 4% to 360,481 units in 2012. Car registrations in Hong Kong increased by 3% to 36,837 units in 2012.
80 Swire Pacific 2012 Annual Report
2012 Performance Review and Outlook
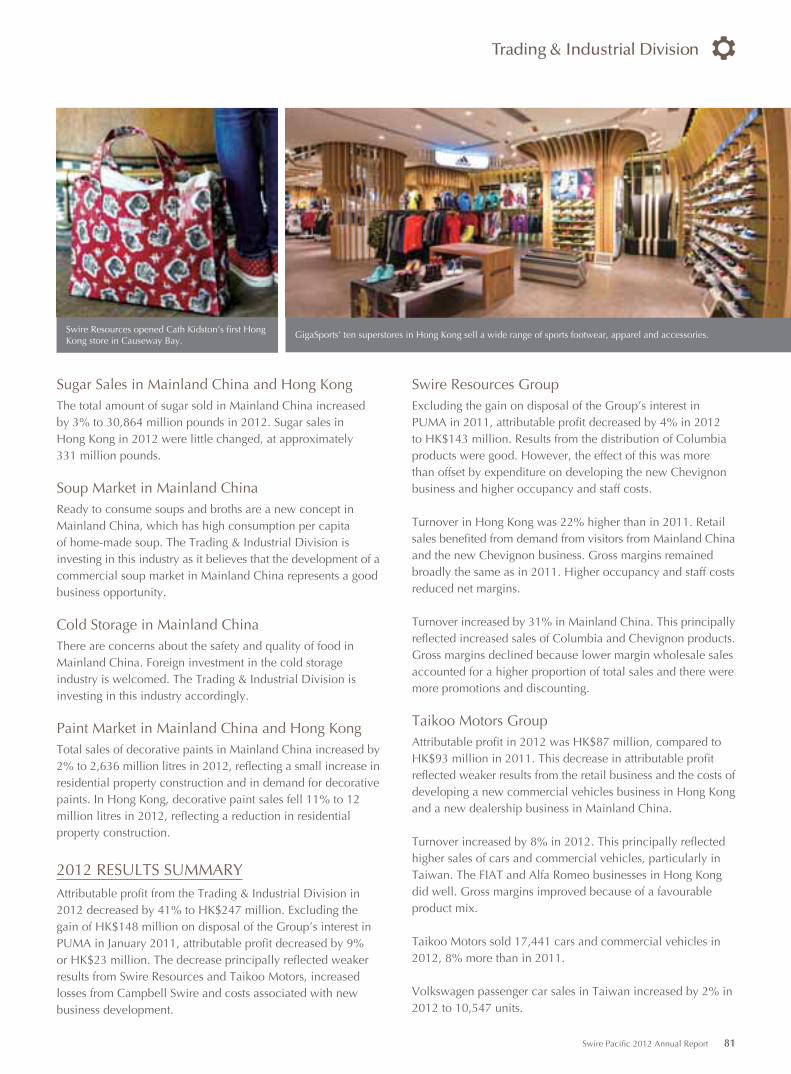
Swire Resources opened Cath Kidston’s first Hong Kong store in Causeway Bay.
GigaSports’ ten superstores in Hong Kong sell a wide range of sports footwear, apparel and accessories.
Sugar Sales in Mainland China and Hong KongThe total amount of sugar sold in Mainland China increased by 3% to 30,864 million pounds in 2012. Sugar sales in Hong Kong in 2012 were little changed, at approximately 331 million pounds.
Soup Market in Mainland ChinaReady to consume soups and broths are a new concept in Mainland China, which has high consumption per capita of home-made soup. The Trading & Industrial Division is investing in this industry as it believes that the development of a commercial soup market in Mainland China represents a good business opportunity.
Cold Storage in Mainland ChinaThere are concerns about the safety and quality of food in Mainland China. Foreign investment in the cold storage industry is welcomed. The Trading & Industrial Division is investing in this industry accordingly.
Paint Market in Mainland China and Hong KongTotal sales of decorative paints in Mainland China increased by 2% to 2,636 million litres in 2012, reflecting a small increase in residential property construction and in demand for decorative paints. In Hong Kong, decorative paint sales fell 11% to 12 million litres in 2012, reflecting a reduction in residential property construction.
2012 RESULTS SUMMARYAttributable profit from the Trading & Industrial Division in 2012 decreased by 41% to HK$247 million. Excluding the gain of HK$148 million on disposal of the Group’s interest in PUMA in January 2011, attributable profit decreased by 9% or HK$23 million. The decrease principally reflected weaker results from Swire Resources and Taikoo Motors, increased losses from Campbell Swire and costs associated with new business development.
Swire Resources GroupExcluding the gain on disposal of the Group’s interest in PUMA in 2011, attributable profit decreased by 4% in 2012 to HK$143 million. Results from the distribution of Columbia products were good. However, the effect of this was more than offset by expenditure on developing the new Chevignon business and higher occupancy and staff costs.
Turnover in Hong Kong was 22% higher than in 2011. Retail sales benefited from demand from visitors from Mainland China and the new Chevignon business. Gross margins remained broadly the same as in 2011. Higher occupancy and staff costs reduced net margins.
Turnover increased by 31% in Mainland China. This principally reflected increased sales of Columbia and Chevignon products. Gross margins declined because lower margin wholesale sales accounted for a higher proportion of total sales and there were more promotions and discounting.
Taikoo Motors GroupAttributable profit in 2012 was HK$87 million, compared to HK$93 million in 2011. This decrease in attributable profit reflected weaker results from the retail business and the costs of developing a new commercial vehicles business in Hong Kong and a new dealership business in Mainland China.
Turnover increased by 8% in 2012. This principally reflected higher sales of cars and commercial vehicles, particularly in Taiwan. The FIAT and Alfa Romeo businesses in Hong Kongdid well. Gross margins improved because of a favourable product mix.
Taikoo Motors sold 17,441 cars and commercial vehicles in 2012, 8% more than in 2011.
Volkswagen passenger car sales in Taiwan increased by 2% in 2012 to 10,547 units.
Swire Pacific 2012 Annual Report 81
Trading & Industrial Division
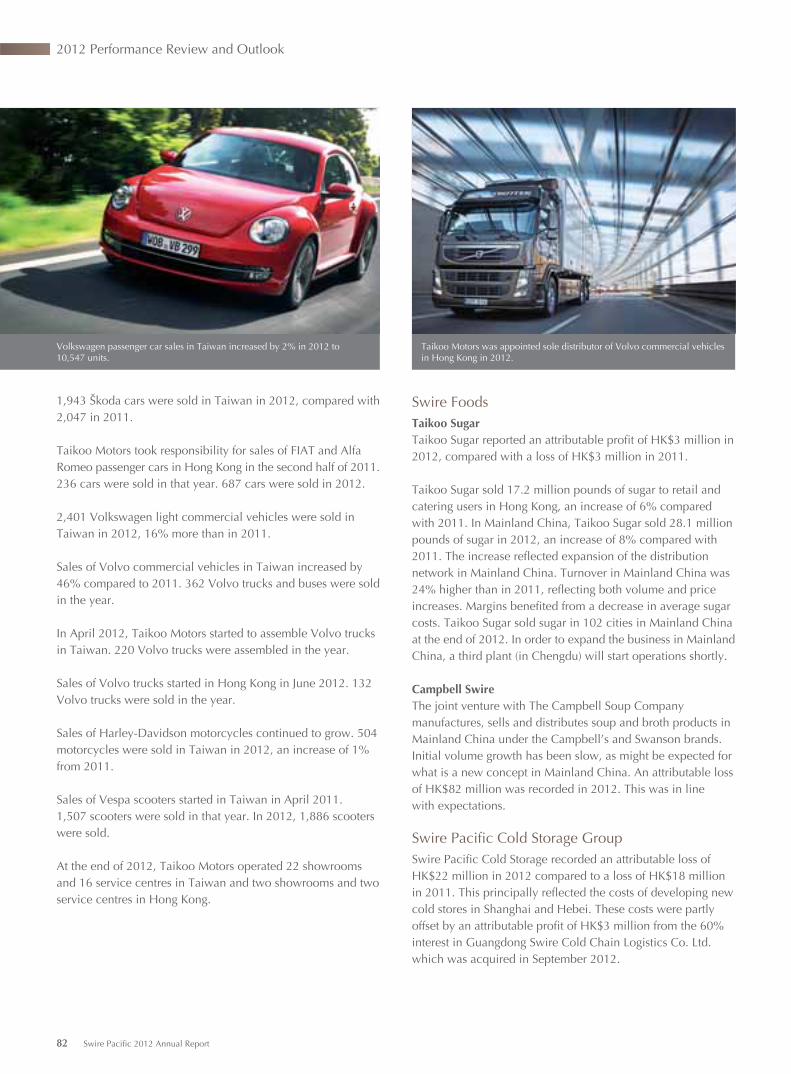
Taikoo Motors was appointed sole distributor of Volvo commercial vehicles in Hong Kong in 2012.
1,943 Škoda cars were sold in Taiwan in 2012, compared with 2,047 in 2011.
Taikoo Motors took responsibility for sales of FIAT and Alfa Romeo passenger cars in Hong Kong in the second half of 2011. 236 cars were sold in that year. 687 cars were sold in 2012. 2,401 Volkswagen light commercial vehicles were sold in Taiwan in 2012, 16% more than in 2011.
Sales of Volvo commercial vehicles in Taiwan increased by 46% compared to 2011. 362 Volvo trucks and buses were sold in the year.
In April 2012, Taikoo Motors started to assemble Volvo trucks in Taiwan. 220 Volvo trucks were assembled in the year.
Sales of Volvo trucks started in Hong Kong in June 2012. 132 Volvo trucks were sold in the year.
Sales of Harley-Davidson motorcycles continued to grow. 504 motorcycles were sold in Taiwan in 2012, an increase of 1% from 2011.
Sales of Vespa scooters started in Taiwan in April 2011. 1,507 scooters were sold in that year. In 2012, 1,886 scooters were sold.
At the end of 2012, Taikoo Motors operated 22 showrooms and 16 service centres in Taiwan and two showrooms and two service centres in Hong Kong.
Swire FoodsTaikoo SugarTaikoo Sugar reported an attributable profit of HK$3 million in 2012, compared with a loss of HK$3 million in 2011.
Taikoo Sugar sold 17.2 million pounds of sugar to retail and catering users in Hong Kong, an increase of 6% compared with 2011. In Mainland China, Taikoo Sugar sold 28.1 million pounds of sugar in 2012, an increase of 8% compared with 2011. The increase reflected expansion of the distribution network in Mainland China. Turnover in Mainland China was 24% higher than in 2011, reflecting both volume and price increases. Margins benefited from a decrease in average sugar costs. Taikoo Sugar sold sugar in 102 cities in Mainland China at the end of 2012. In order to expand the business in Mainland China, a third plant (in Chengdu) will start operations shortly.
Campbell SwireThe joint venture with The Campbell Soup Company manufactures, sells and distributes soup and broth products in Mainland China under the Campbell’s and Swanson brands. Initial volume growth has been slow, as might be expected for what is a new concept in Mainland China. An attributable loss of HK$82 million was recorded in 2012. This was in line with expectations.
Swire Pacific Cold Storage GroupSwire Pacific Cold Storage recorded an attributable loss of HK$22 million in 2012 compared to a loss of HK$18 million in 2011. This principally reflected the costs of developing new cold stores in Shanghai and Hebei. These costs were partly offset by an attributable profit of HK$3 million from the 60% interest in Guangdong Swire Cold Chain Logistics Co. Ltd. which was acquired in September 2012.
Volkswagen passenger car sales in Taiwan increased by 2% in 2012 to 10,547 units.
82 Swire Pacific 2012 Annual Report
2012 Performance Review and Outlook
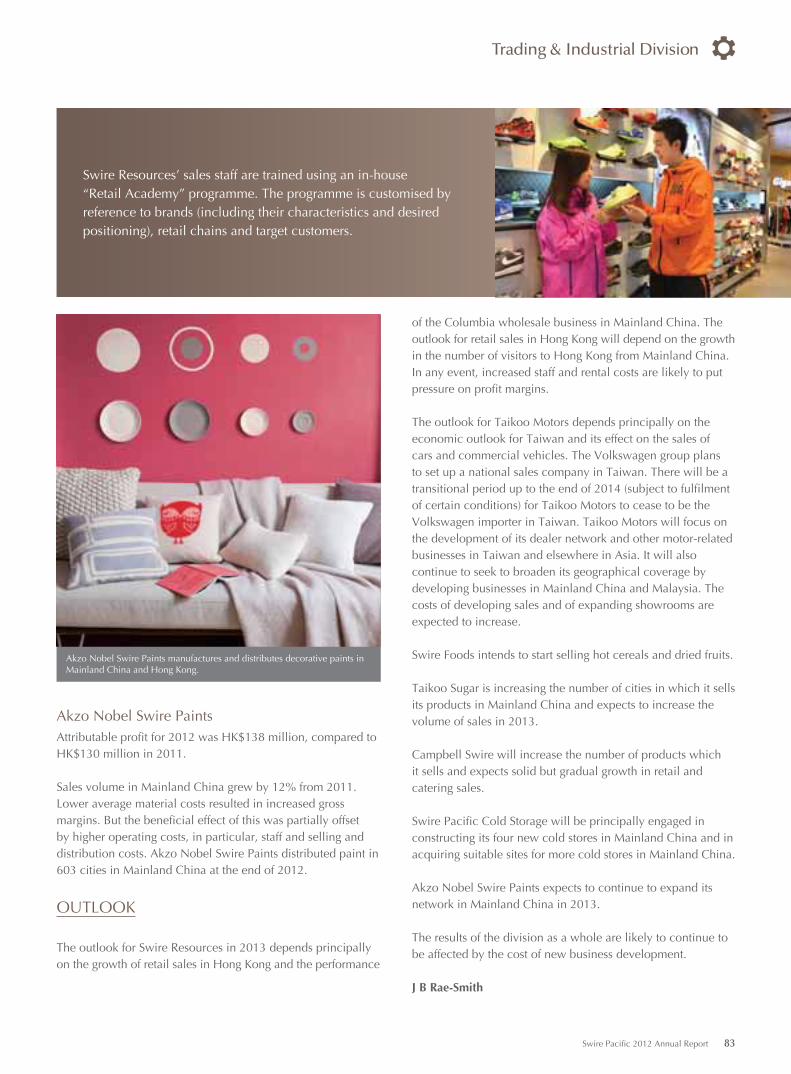
Akzo Nobel Swire Paints manufactures and distributes decorative paints in Mainland China and Hong Kong.
Swire Resources’ sales staff are trained using an in-house“Retail Academy” programme. The programme is customised by reference to brands (including their characteristics and desired positioning), retail chains and target customers.
of the Columbia wholesale business in Mainland China. The outlook for retail sales in Hong Kong will depend on the growth in the number of visitors to Hong Kong from Mainland China. In any event, increased staff and rental costs are likely to put pressure on profit margins.
The outlook for Taikoo Motors depends principally on the economic outlook for Taiwan and its effect on the sales of cars and commercial vehicles. The Volkswagen group plans to set up a national sales company in Taiwan. There will be a transitional period up to the end of 2014 (subject to fulfilment of certain conditions) for Taikoo Motors to cease to be the Volkswagen importer in Taiwan. Taikoo Motors will focus on the development of its dealer network and other motor-related businesses in Taiwan and elsewhere in Asia. It will also continue to seek to broaden its geographical coverage by developing businesses in Mainland China and Malaysia. The costs of developing sales and of expanding showrooms are expected to increase.
Swire Foods intends to start selling hot cereals and dried fruits.
Taikoo Sugar is increasing the number of cities in which it sells its products in Mainland China and expects to increase the volume of sales in 2013.
Campbell Swire will increase the number of products which it sells and expects solid but gradual growth in retail and catering sales.
Swire Pacific Cold Storage will be principally engaged in constructing its four new cold stores in Mainland China and in acquiring suitable sites for more cold stores in Mainland China.
Akzo Nobel Swire Paints expects to continue to expand its network in Mainland China in 2013.
The results of the division as a whole are likely to continue to be affected by the cost of new business development.
J B Rae-Smith
Akzo Nobel Swire PaintsAttributable profit for 2012 was HK$138 million, compared to HK$130 million in 2011.
Sales volume in Mainland China grew by 12% from 2011. Lower average material costs resulted in increased gross margins. But the beneficial effect of this was partially offset by higher operating costs, in particular, staff and selling and distribution costs. Akzo Nobel Swire Paints distributed paint in 603 cities in Mainland China at the end of 2012.
OUTLOOK
The outlook for Swire Resources in 2013 depends principally on the growth of retail sales in Hong Kong and the performance
Swire Pacific 2012 Annual Report 83
Trading & Industrial Division
2012 SustainableDevelopment Reviewand 2013 Aims
MANAGING FOR THE LONG TERM
84 Swire Pacific 2012 Annual Report

We develop our businesses along sustainable
lines with a view to maximising long-term
shareholder value.
Swire Pacific 2012 Annual Report 85
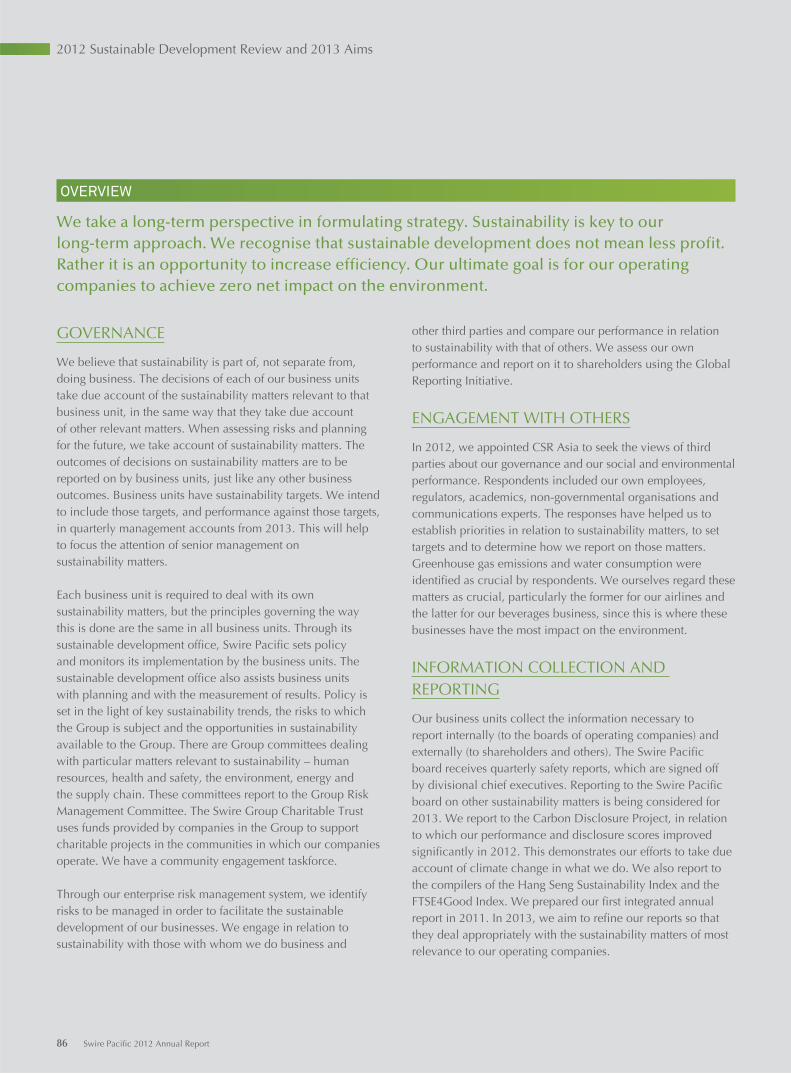
GOVERNANCE
We believe that sustainability is part of, not separate from, doing business. The decisions of each of our business units take due account of the sustainability matters relevant to that business unit, in the same way that they take due account of other relevant matters. When assessing risks and planning for the future, we take account of sustainability matters. The outcomes of decisions on sustainability matters are to be reported on by business units, just like any other business outcomes. Business units have sustainability targets. We intend to include those targets, and performance against those targets, in quarterly management accounts from 2013. This will help to focus the attention of senior management on sustainability matters.
Each business unit is required to deal with its own sustainability matters, but the principles governing the way this is done are the same in all business units. Through its sustainable development office, Swire Pacific sets policy and monitors its implementation by the business units. The sustainable development office also assists business units with planning and with the measurement of results. Policy is set in the light of key sustainability trends, the risks to which the Group is subject and the opportunities in sustainability available to the Group. There are Group committees dealing with particular matters relevant to sustainability – human resources, health and safety, the environment, energy and the supply chain. These committees report to the Group Risk Management Committee. The Swire Group Charitable Trust uses funds provided by companies in the Group to support charitable projects in the communities in which our companies operate. We have a community engagement taskforce.
Through our enterprise risk management system, we identify risks to be managed in order to facilitate the sustainable development of our businesses. We engage in relation to sustainability with those with whom we do business and
other third parties and compare our performance in relation to sustainability with that of others. We assess our own performance and report on it to shareholders using the Global Reporting Initiative.
ENGAGEMENT WITH OTHERS
In 2012, we appointed CSR Asia to seek the views of third parties about our governance and our social and environmental performance. Respondents included our own employees, regulators, academics, non-governmental organisations and communications experts. The responses have helped us to establish priorities in relation to sustainability matters, to set targets and to determine how we report on those matters. Greenhouse gas emissions and water consumption were identified as crucial by respondents. We ourselves regard these matters as crucial, particularly the former for our airlines and the latter for our beverages business, since this is where these businesses have the most impact on the environment.
INFORMATION COLLECTION AND REPORTING
Our business units collect the information necessary to report internally (to the boards of operating companies) and externally (to shareholders and others). The Swire Pacific board receives quarterly safety reports, which are signed off by divisional chief executives. Reporting to the Swire Pacific board on other sustainability matters is being considered for 2013. We report to the Carbon Disclosure Project, in relation to which our performance and disclosure scores improved significantly in 2012. This demonstrates our efforts to take due account of climate change in what we do. We also report to the compilers of the Hang Seng Sustainability Index and the FTSE4Good Index. We prepared our first integrated annual report in 2011. In 2013, we aim to refine our reports so that they deal appropriately with the sustainability matters of most relevance to our operating companies.
OVERVIEW
We take a long-term perspective in formulating strategy. Sustainability is key to our long-term approach. We recognise that sustainable development does not mean less profi t. Rather it is an opportunity to increase effi ciency. Our ultimate goal is for our operating companies to achieve zero net impact on the environment.
2012 Sustainable Development Review and 2013 Aims
86 Swire Pacific 2012 Annual Report
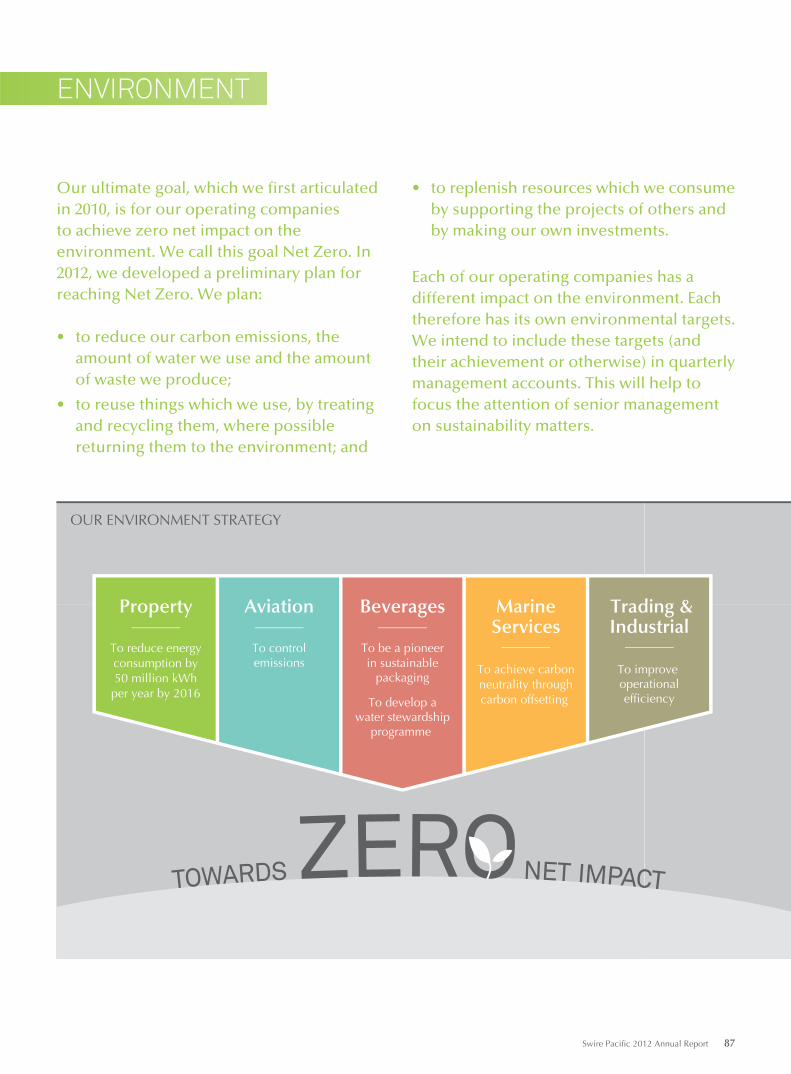
ENVIRONMENT
Our ultimate goal, which we fi rst articulated in 2010, is for our operating companies to achieve zero net impact on the environment. We call this goal Net Zero. In 2012, we developed a preliminary plan for reaching Net Zero. We plan:
• to reduce our carbon emissions, the amount of water we use and the amount of waste we produce;
• to reuse things which we use, by treating and recycling them, where possible returning them to the environment; and
• to replenish resources which we consume by supporting the projects of others and by making our own investments.
Each of our operating companies has a different impact on the environment. Each therefore has its own environmental targets. We intend to include these targets (and their achievement or otherwise) in quarterly management accounts. This will help to focus the attention of senior management on sustainability matters.
OUR ENVIRONMENT STRATEGY
TOWARDS ZERO NET IMPACT
Beverages
To be a pioneerin sustainable
packaging
To develop awater stewardship
programme
To achieve carbonneutrality throughcarbon offsetting
MarineServices
Trading &Industrial
To improve operationalefficiency
Property
To reduce energyconsumption by50 million kWhper year by 2016
Aviation
To controlemissions
Swire Pacific 2012 Annual Report 87
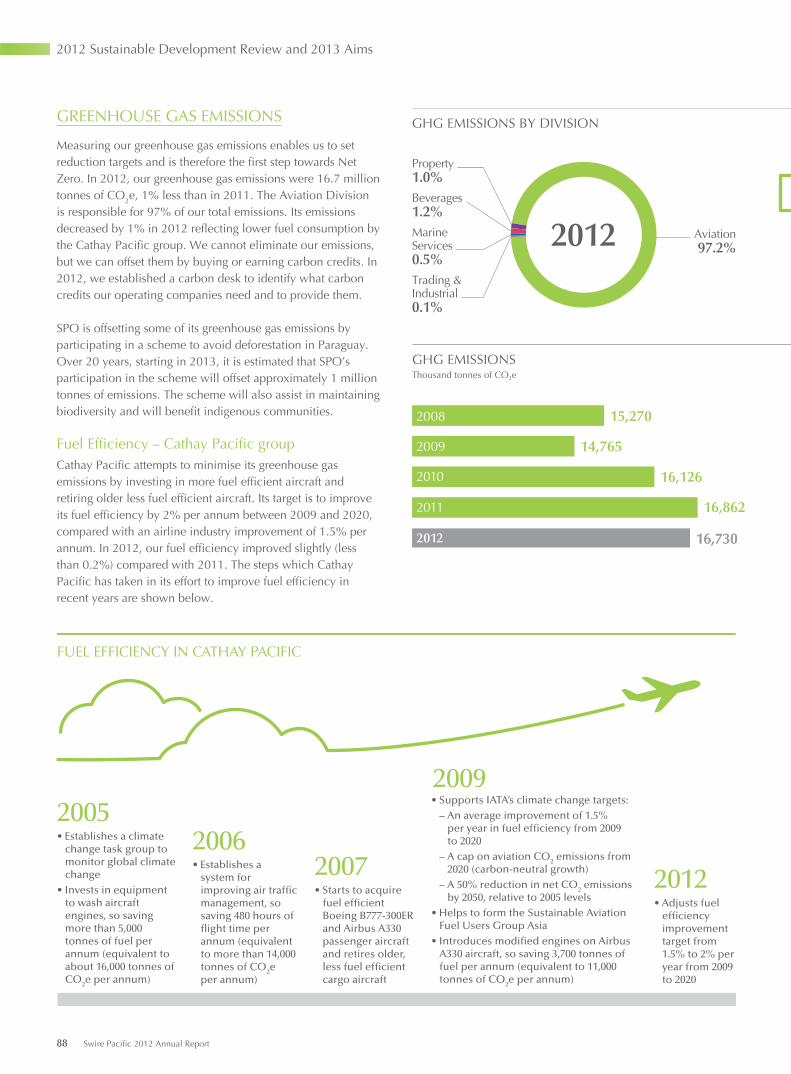
GREENHOUSE GAS EMISSIONS
Measuring our greenhouse gas emissions enables us to set reduction targets and is therefore the first step towards Net Zero. In 2012, our greenhouse gas emissions were 16.7 million tonnes of CO2e, 1% less than in 2011. The Aviation Division is responsible for 97% of our total emissions. Its emissions decreased by 1% in 2012 reflecting lower fuel consumption by the Cathay Pacific group. We cannot eliminate our emissions, but we can offset them by buying or earning carbon credits. In 2012, we established a carbon desk to identify what carbon credits our operating companies need and to provide them.
SPO is offsetting some of its greenhouse gas emissions by participating in a scheme to avoid deforestation in Paraguay. Over 20 years, starting in 2013, it is estimated that SPO’s participation in the scheme will offset approximately 1 million tonnes of emissions. The scheme will also assist in maintaining biodiversity and will benefit indigenous communities.
Fuel Efficiency – Cathay Pacific groupCathay Pacific attempts to minimise its greenhouse gas emissions by investing in more fuel efficient aircraft and retiring older less fuel efficient aircraft. Its target is to improve its fuel efficiency by 2% per annum between 2009 and 2020, compared with an airline industry improvement of 1.5% per annum. In 2012, our fuel efficiency improved slightly (less than 0.2%) compared with 2011. The steps which Cathay Pacific has taken in its effort to improve fuel efficiency in recent years are shown below.
Property1.0%
Aviation97.2%
Beverages1.2%MarineServices0.5%Trading &Industrial0.1%
GHG EMISSIONS BY DIVISION
2012
FUEL EFFICIENCY IN CATHAY PACIFIC
• Establishes a climate change task group to monitor global climate change
• Invests in equipment to wash aircraft engines, so saving more than 5,000 tonnes of fuel per annum (equivalent to about 16,000 tonnes of CO2e per annum)
2005
• Establishes a system for improving air traffic management, so saving 480 hours of flight time per annum (equivalent to more than 14,000 tonnes of CO2e per annum)
2006
• Starts to acquire fuel efficient Boeing B777-300ER and Airbus A330 passenger aircraft and retires older, less fuel efficient cargo aircraft
2007
• Supports IATA’s climate change targets:– An average improvement of 1.5%
per year in fuel efficiency from 2009 to 2020
– A cap on aviation CO2 emissions from 2020 (carbon-neutral growth)
– A 50% reduction in net CO2 emissions by 2050, relative to 2005 levels
• Helps to form the Sustainable Aviation Fuel Users Group Asia
• Introduces modified engines on Airbus A330 aircraft, so saving 3,700 tonnes of fuel per annum (equivalent to 11,000 tonnes of CO2e per annum)
2009
• Adjusts fuel efficiency improvement target from 1.5% to 2% per year from 2009 to 2020
2012
GHG EMISSIONSThousand tonnes of CO2e
2009
2008
2012
2011
2010
15,270
14,765
16,126
16,862
16,73016,730
2012 Sustainable Development Review and 2013 Aims
88 Swire Pacific 2012 Annual Report
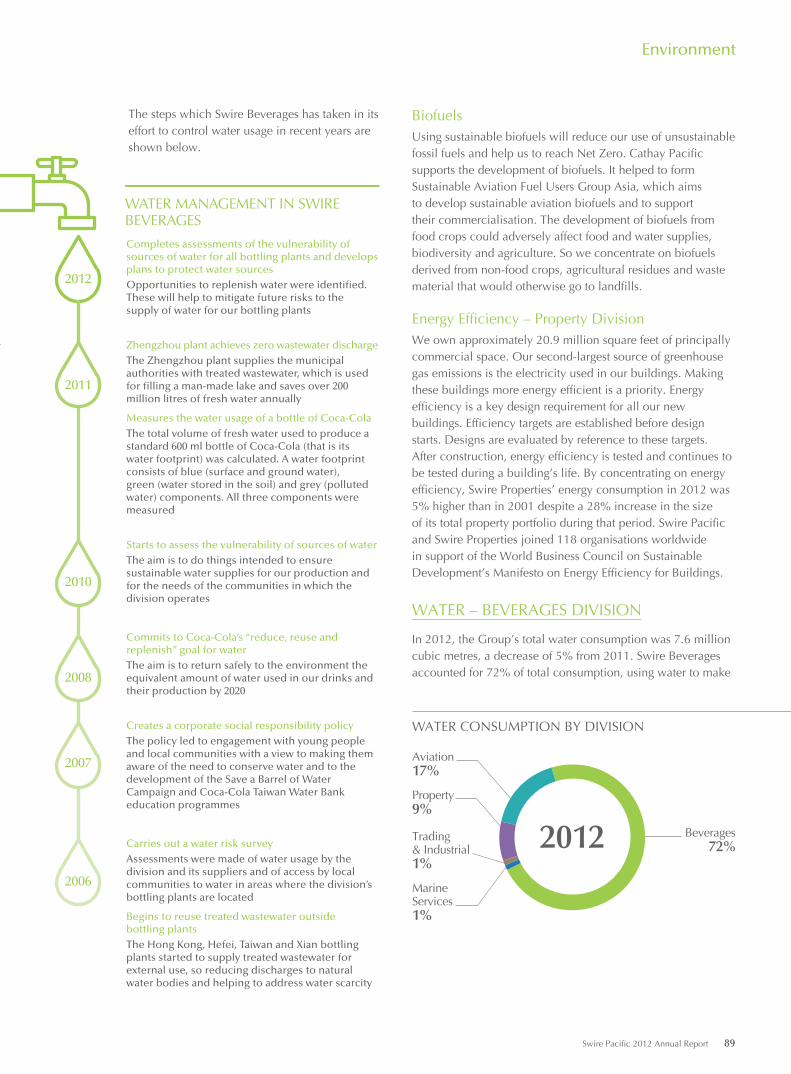
BiofuelsUsing sustainable biofuels will reduce our use of unsustainable fossil fuels and help us to reach Net Zero. Cathay Pacific supports the development of biofuels. It helped to form Sustainable Aviation Fuel Users Group Asia, which aims to develop sustainable aviation biofuels and to support their commercialisation. The development of biofuels from food crops could adversely affect food and water supplies, biodiversity and agriculture. So we concentrate on biofuels derived from non-food crops, agricultural residues and waste material that would otherwise go to landfills.
Energy Efficiency – Property DivisionWe own approximately 20.9 million square feet of principally commercial space. Our second-largest source of greenhouse gas emissions is the electricity used in our buildings. Making these buildings more energy efficient is a priority. Energy efficiency is a key design requirement for all our new buildings. Efficiency targets are established before design starts. Designs are evaluated by reference to these targets. After construction, energy efficiency is tested and continues to be tested during a building’s life. By concentrating on energy efficiency, Swire Properties’ energy consumption in 2012 was 5% higher than in 2001 despite a 28% increase in the size of its total property portfolio during that period. Swire Pacific and Swire Properties joined 118 organisations worldwide in support of the World Business Council on Sustainable Development’s Manifesto on Energy Efficiency for Buildings.
WATER – BEVERAGES DIVISION
In 2012, the Group’s total water consumption was 7.6 million cubic metres, a decrease of 5% from 2011. Swire Beverages accounted for 72% of total consumption, using water to make
Completes assessments of the vulnerability of sources of water for all bottling plants and develops plans to protect water sourcesOpportunities to replenish water were identified. These will help to mitigate future risks to the supply of water for our bottling plants
Zhengzhou plant achieves zero wastewater dischargeThe Zhengzhou plant supplies the municipal authorities with treated wastewater, which is used for filling a man-made lake and saves over 200 million litres of fresh water annually
Measures the water usage of a bottle of Coca-ColaThe total volume of fresh water used to produce a standard 600 ml bottle of Coca-Cola (that is its water footprint) was calculated. A water footprint consists of blue (surface and ground water), green (water stored in the soil) and grey (polluted water) components. All three components were measured
Starts to assess the vulnerability of sources of waterThe aim is to do things intended to ensure sustainable water supplies for our production and for the needs of the communities in which the division operates
Commits to Coca-Cola’s “reduce, reuse and replenish” goal for waterThe aim is to return safely to the environment the equivalent amount of water used in our drinks and their production by 2020
Creates a corporate social responsibility policyThe policy led to engagement with young people and local communities with a view to making them aware of the need to conserve water and to the development of the Save a Barrel of Water Campaign and Coca-Cola Taiwan Water Bank education programmes
Carries out a water risk surveyAssessments were made of water usage by the division and its suppliers and of access by local communities to water in areas where the division’s bottling plants are located
Begins to reuse treated wastewater outsidebottling plantsThe Hong Kong, Hefei, Taiwan and Xian bottling plants started to supply treated wastewater for external use, so reducing discharges to natural water bodies and helping to address water scarcity
2006
2007
2008
2010
2011
2012
WATER MANAGEMENT IN SWIREBEVERAGES
The steps which Swire Beverages has taken in its effort to control water usage in recent years are shown below.
Beverages72%
Property9%
Trading& Industrial1%
Aviation17%
MarineServices1%
WATER CONSUMPTION BY DIVISION
2012
Environment
Swire Pacific 2012 Annual Report 89
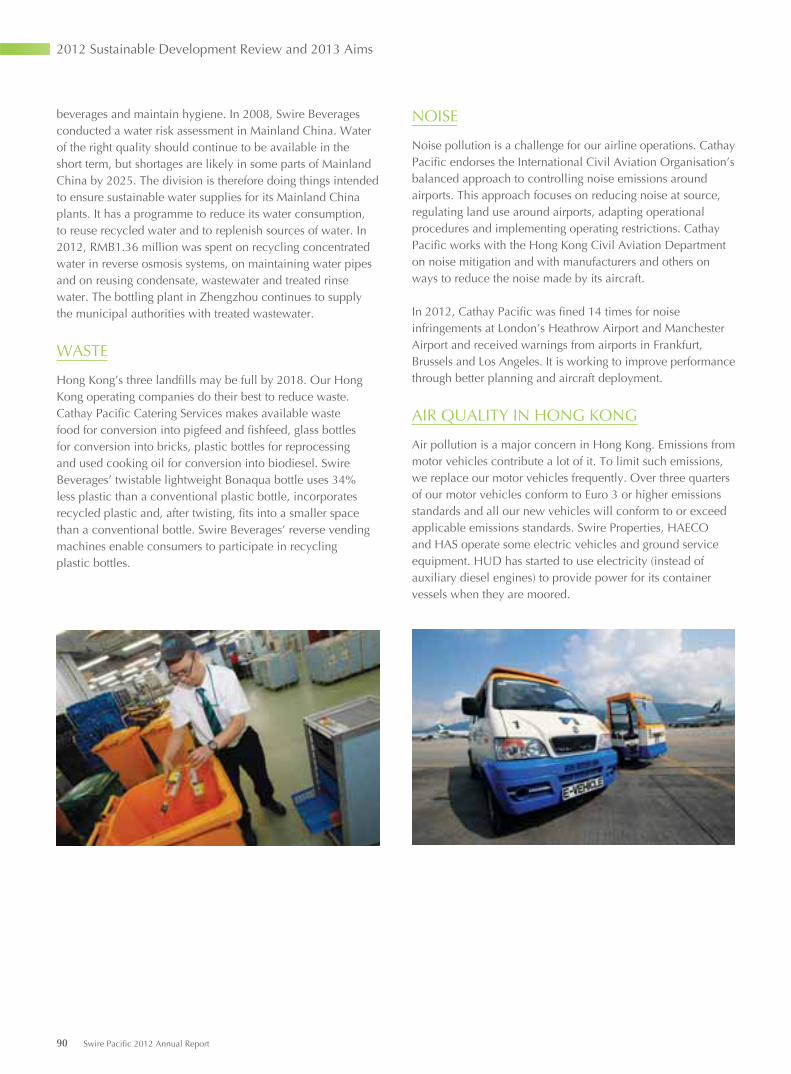
beverages and maintain hygiene. In 2008, Swire Beverages conducted a water risk assessment in Mainland China. Water of the right quality should continue to be available in the short term, but shortages are likely in some parts of Mainland China by 2025. The division is therefore doing things intended to ensure sustainable water supplies for its Mainland China plants. It has a programme to reduce its water consumption, to reuse recycled water and to replenish sources of water. In 2012, RMB1.36 million was spent on recycling concentrated water in reverse osmosis systems, on maintaining water pipes and on reusing condensate, wastewater and treated rinse water. The bottling plant in Zhengzhou continues to supply the municipal authorities with treated wastewater.
WASTE
Hong Kong’s three landfills may be full by 2018. Our Hong Kong operating companies do their best to reduce waste. Cathay Pacific Catering Services makes available waste food for conversion into pigfeed and fishfeed, glass bottles for conversion into bricks, plastic bottles for reprocessing and used cooking oil for conversion into biodiesel. Swire Beverages’ twistable lightweight Bonaqua bottle uses 34% less plastic than a conventional plastic bottle, incorporates recycled plastic and, after twisting, fits into a smaller space than a conventional bottle. Swire Beverages’ reverse vending machines enable consumers to participate in recycling plastic bottles.
NOISE
Noise pollution is a challenge for our airline operations. Cathay Pacific endorses the International Civil Aviation Organisation’s balanced approach to controlling noise emissions around airports. This approach focuses on reducing noise at source, regulating land use around airports, adapting operational procedures and implementing operating restrictions. Cathay Pacific works with the Hong Kong Civil Aviation Department on noise mitigation and with manufacturers and others on ways to reduce the noise made by its aircraft.
In 2012, Cathay Pacific was fined 14 times for noise infringements at London’s Heathrow Airport and Manchester Airport and received warnings from airports in Frankfurt, Brussels and Los Angeles. It is working to improve performance through better planning and aircraft deployment.
AIR QUALITY IN HONG KONG
Air pollution is a major concern in Hong Kong. Emissions from motor vehicles contribute a lot of it. To limit such emissions, we replace our motor vehicles frequently. Over three quarters of our motor vehicles conform to Euro 3 or higher emissions standards and all our new vehicles will conform to or exceed applicable emissions standards. Swire Properties, HAECO and HAS operate some electric vehicles and ground service equipment. HUD has started to use electricity (instead of auxiliary diesel engines) to provide power for its container vessels when they are moored.
2012 Sustainable Development Review and 2013 Aims
90 Swire Pacific 2012 Annual Report
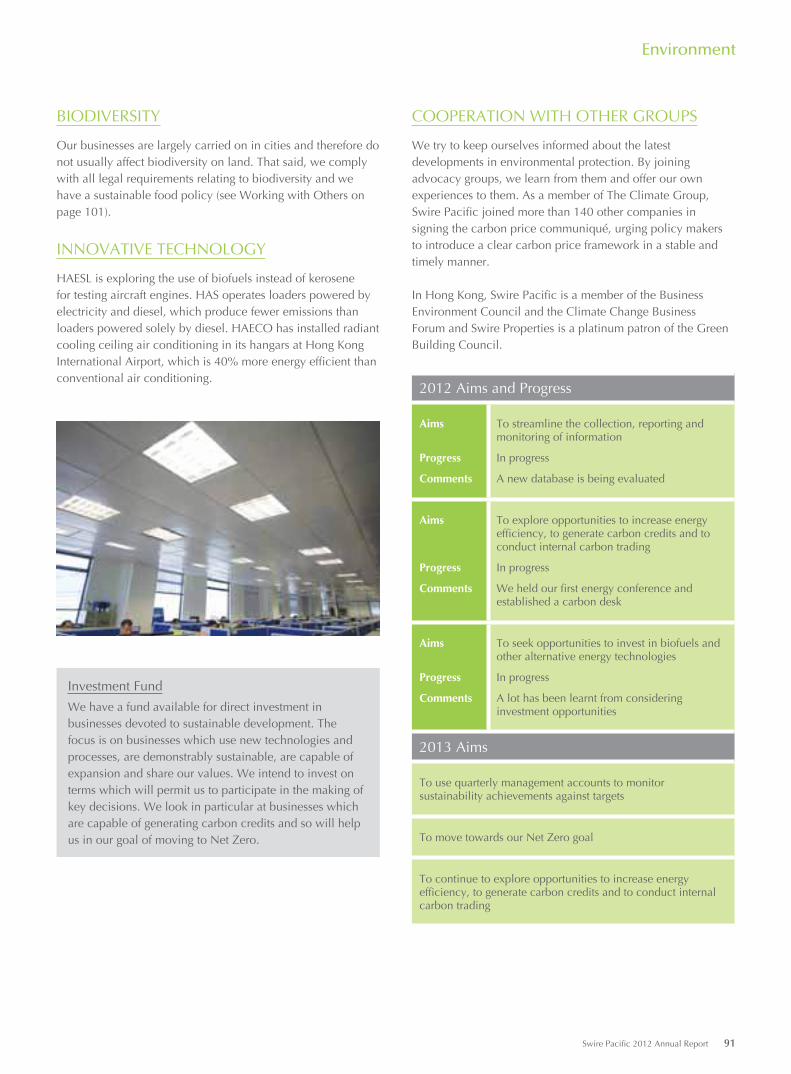
BIODIVERSITY
Our businesses are largely carried on in cities and therefore do not usually affect biodiversity on land. That said, we comply with all legal requirements relating to biodiversity and we have a sustainable food policy (see Working with Others on page 101).
INNOVATIVE TECHNOLOGY
HAESL is exploring the use of biofuels instead of kerosene for testing aircraft engines. HAS operates loaders powered by electricity and diesel, which produce fewer emissions than loaders powered solely by diesel. HAECO has installed radiant cooling ceiling air conditioning in its hangars at Hong Kong International Airport, which is 40% more energy efficient than conventional air conditioning.
Investment Fund
We have a fund available for direct investment in businesses devoted to sustainable development. The focus is on businesses which use new technologies and processes, are demonstrably sustainable, are capable of expansion and share our values. We intend to invest on terms which will permit us to participate in the making of key decisions. We look in particular at businesses which are capable of generating carbon credits and so will help us in our goal of moving to Net Zero.
COOPERATION WITH OTHER GROUPS
We try to keep ourselves informed about the latest developments in environmental protection. By joining advocacy groups, we learn from them and offer our own experiences to them. As a member of The Climate Group, Swire Pacific joined more than 140 other companies in signing the carbon price communiqué, urging policy makers to introduce a clear carbon price framework in a stable and timely manner.
In Hong Kong, Swire Pacific is a member of the Business Environment Council and the Climate Change Business Forum and Swire Properties is a platinum patron of the Green Building Council.
2012 Aims and Progress
Aims
Progress
Comments
To streamline the collection, reporting and monitoring of information
In progress
A new database is being evaluated
Aims
Progress
Comments
To explore opportunities to increase energy efficiency, to generate carbon credits and to conduct internal carbon trading
In progress
We held our first energy conference and established a carbon desk
Aims
Progress
Comments
To seek opportunities to invest in biofuels and other alternative energy technologies
In progress
A lot has been learnt from considering investment opportunities
2013 Aims
To use quarterly management accounts to monitor sustainability achievements against targets
To move towards our Net Zero goal
To continue to explore opportunities to increase energy efficiency, to generate carbon credits and to conduct internal carbon trading
Environment
Swire Pacific 2012 Annual Report 91
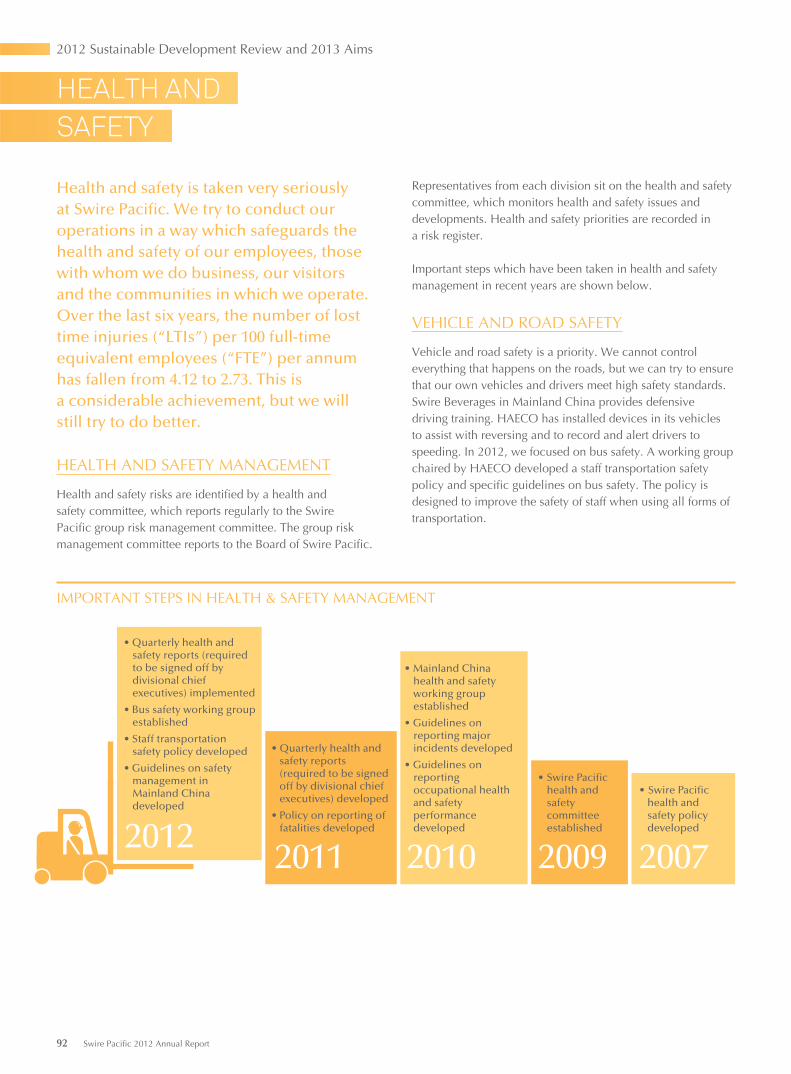
SAFETY
HEALTH AND
Health and safety is taken very seriously at Swire Pacifi c. We try to conduct our operations in a way which safeguards the health and safety of our employees, those with whom we do business, our visitors and the communities in which we operate. Over the last six years, the number of lost time injuries (“LTIs”) per 100 full-time equivalent employees (“FTE”) per annum has fallen from 4.12 to 2.73. This is a considerable achievement, but we will still try to do better.
HEALTH AND SAFETY MANAGEMENT
Health and safety risks are identified by a health and safety committee, which reports regularly to the Swire Pacific group risk management committee. The group risk management committee reports to the Board of Swire Pacific.
2009
• Swire Pacific health and safety committee established
2007
• Swire Pacific health and safety policy developed
2011
• Quarterly health and safety reports (required to be signed off by divisional chief executives) developed
• Policy on reporting of fatalities developed
2010
• Mainland China health and safety working group established
• Guidelines on reporting major incidents developed
• Guidelines on reporting occupational health and safety performance developed2012
• Quarterly health and safety reports (required to be signed off by divisional chief executives) implemented
• Bus safety working group established
• Staff transportation safety policy developed
• Guidelines on safety management in Mainland China developed
IMPORTANT STEPS IN HEALTH & SAFETY MANAGEMENT
Representatives from each division sit on the health and safety committee, which monitors health and safety issues and developments. Health and safety priorities are recorded in a risk register.
Important steps which have been taken in health and safety management in recent years are shown below.
VEHICLE AND ROAD SAFETY
Vehicle and road safety is a priority. We cannot control everything that happens on the roads, but we can try to ensure that our own vehicles and drivers meet high safety standards. Swire Beverages in Mainland China provides defensive driving training. HAECO has installed devices in its vehicles to assist with reversing and to record and alert drivers to speeding. In 2012, we focused on bus safety. A working group chaired by HAECO developed a staff transportation safety policy and specific guidelines on bus safety. The policy is designed to improve the safety of staff when using all forms of transportation.
92 Swire Pacific 2012 Annual Report
2012 Sustainable Development Review and 2013 Aims
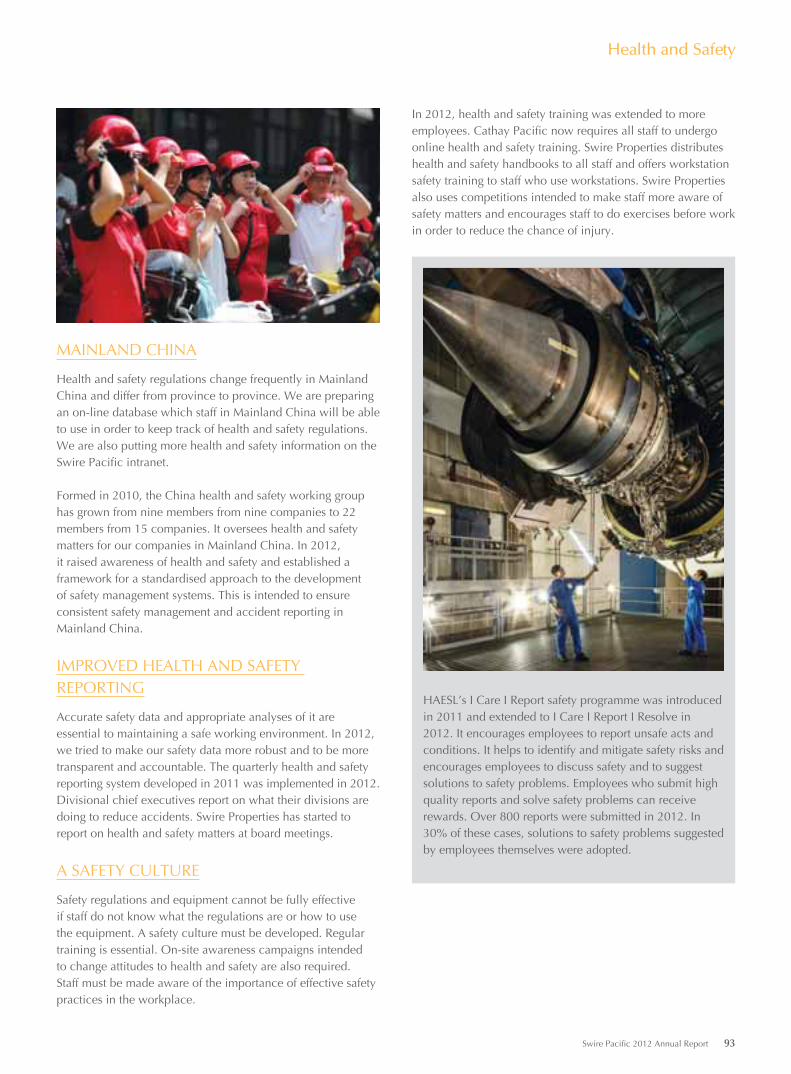
Health and Safety
MAINLAND CHINA
Health and safety regulations change frequently in Mainland China and differ from province to province. We are preparing an on-line database which staff in Mainland China will be able to use in order to keep track of health and safety regulations. We are also putting more health and safety information on the Swire Pacific intranet.
Formed in 2010, the China health and safety working group has grown from nine members from nine companies to 22 members from 15 companies. It oversees health and safety matters for our companies in Mainland China. In 2012, it raised awareness of health and safety and established a framework for a standardised approach to the development of safety management systems. This is intended to ensure consistent safety management and accident reporting in Mainland China.
IMPROVED HEALTH AND SAFETY REPORTING
Accurate safety data and appropriate analyses of it are essential to maintaining a safe working environment. In 2012, we tried to make our safety data more robust and to be more transparent and accountable. The quarterly health and safety reporting system developed in 2011 was implemented in 2012. Divisional chief executives report on what their divisions are doing to reduce accidents. Swire Properties has started to report on health and safety matters at board meetings.
A SAFETY CULTURE
Safety regulations and equipment cannot be fully effective if staff do not know what the regulations are or how to use the equipment. A safety culture must be developed. Regular training is essential. On-site awareness campaigns intended to change attitudes to health and safety are also required. Staff must be made aware of the importance of effective safety practices in the workplace.
In 2012, health and safety training was extended to more employees. Cathay Pacific now requires all staff to undergo online health and safety training. Swire Properties distributes health and safety handbooks to all staff and offers workstation safety training to staff who use workstations. Swire Properties also uses competitions intended to make staff more aware of safety matters and encourages staff to do exercises before work in order to reduce the chance of injury.
HAESL’s I Care I Report safety programme was introduced in 2011 and extended to I Care I Report I Resolve in 2012. It encourages employees to report unsafe acts and conditions. It helps to identify and mitigate safety risks and encourages employees to discuss safety and to suggest solutions to safety problems. Employees who submit high quality reports and solve safety problems can receive rewards. Over 800 reports were submitted in 2012. In 30% of these cases, solutions to safety problems suggested by employees themselves were adopted.
Swire Pacific 2012 Annual Report 93
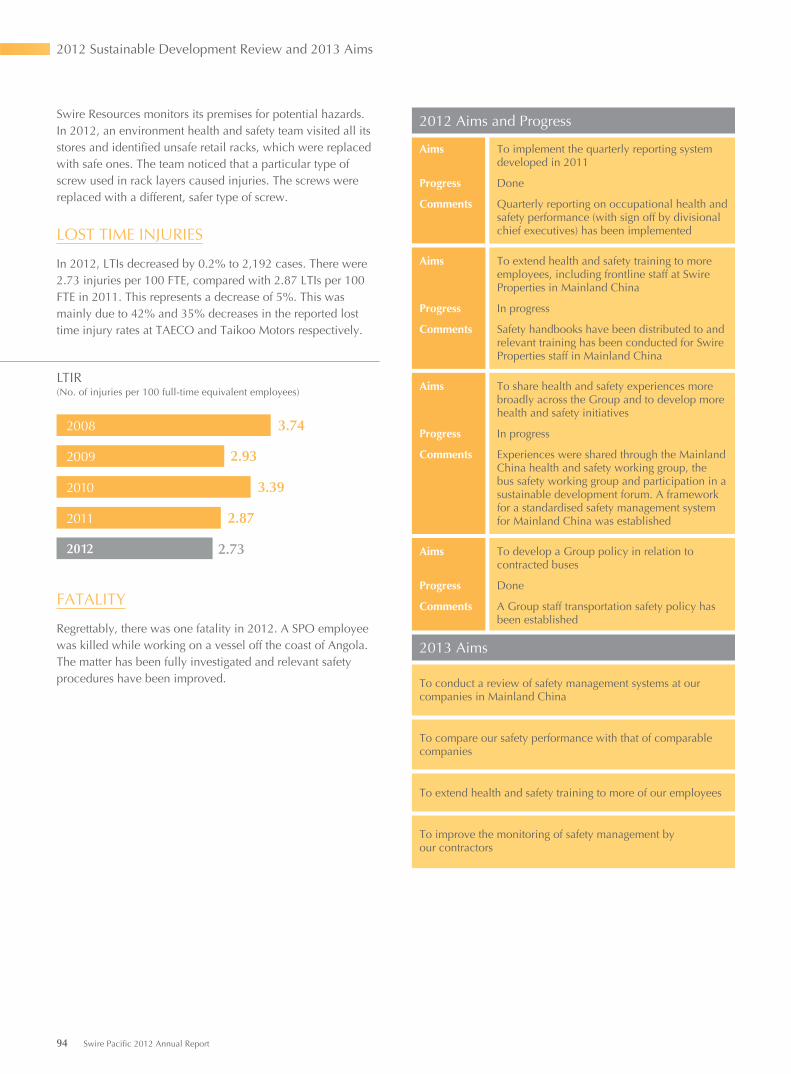
Swire Resources monitors its premises for potential hazards. In 2012, an environment health and safety team visited all its stores and identified unsafe retail racks, which were replaced with safe ones. The team noticed that a particular type of screw used in rack layers caused injuries. The screws were replaced with a different, safer type of screw.
LOST TIME INJURIES
In 2012, LTIs decreased by 0.2% to 2,192 cases. There were 2.73 injuries per 100 FTE, compared with 2.87 LTIs per 100 FTE in 2011. This represents a decrease of 5%. This was mainly due to 42% and 35% decreases in the reported lost time injury rates at TAECO and Taikoo Motors respectively.
LTIR(No. of injuries per 100 full-time equivalent employees)
2008 3.74
2011 2.87
2009 2.93
2010 3.39
2012 2.73
2012 Aims and Progress
Aims
Progress
Comments
To implement the quarterly reporting system developed in 2011
Done
Quarterly reporting on occupational health and safety performance (with sign off by divisional chief executives) has been implemented
Aims
Progress
Comments
To extend health and safety training to more employees, including frontline staff at Swire Properties in Mainland China
In progress
Safety handbooks have been distributed to and relevant training has been conducted for Swire Properties staff in Mainland China
Aims
Progress
Comments
To share health and safety experiences more broadly across the Group and to develop more health and safety initiatives
In progress
Experiences were shared through the Mainland China health and safety working group, the bus safety working group and participation in a sustainable development forum. A framework for a standardised safety management system for Mainland China was established
Aims
Progress
Comments
To develop a Group policy in relation to contracted buses
Done
A Group staff transportation safety policy has been established
2013 Aims
To conduct a review of safety management systems at our companies in Mainland China
To compare our safety performance with that of comparable companies
To extend health and safety training to more of our employees
To improve the monitoring of safety management by our contractors
FATALITY
Regrettably, there was one fatality in 2012. A SPO employee was killed while working on a vessel off the coast of Angola. The matter has been fully investigated and relevant safety procedures have been improved.
94 Swire Pacific 2012 Annual Report
2012 Sustainable Development Review and 2013 Aims
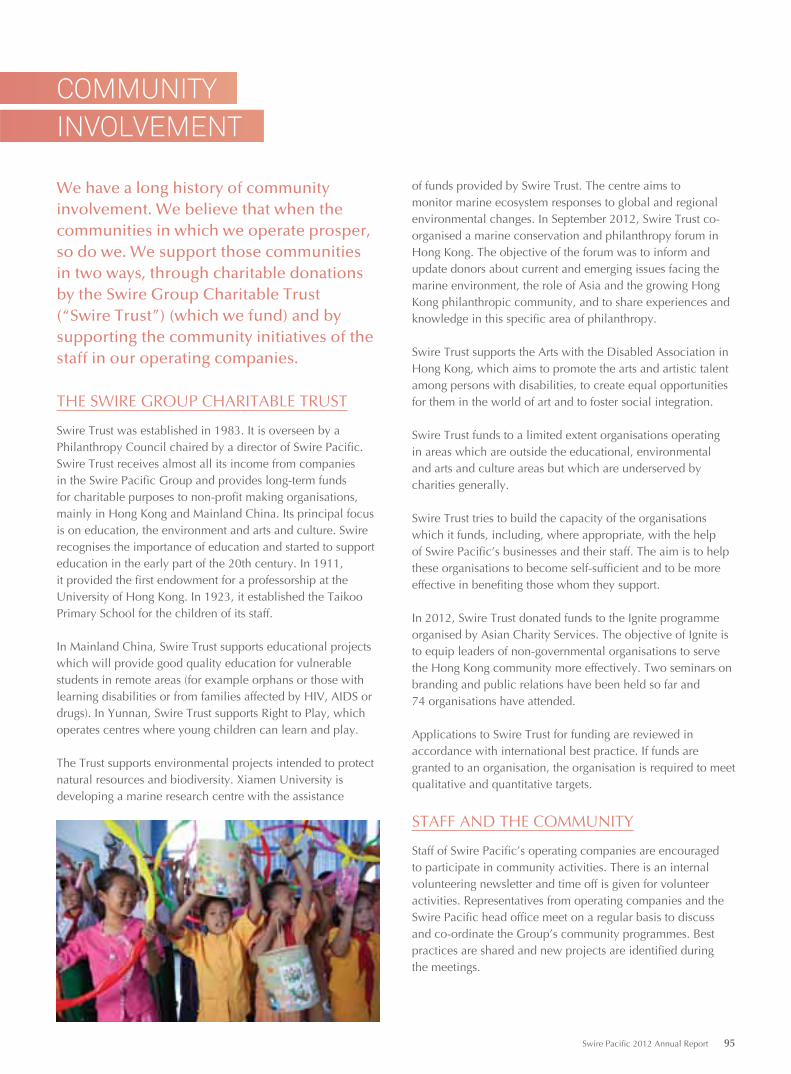
INVOLVEMENT
COMMUNITY
We have a long history of community involvement. We believe that when the communities in which we operate prosper, so do we. We support those communitiesin two ways, through charitable donations by the Swire Group Charitable Trust(“Swire Trust”) (which we fund) and by supporting the community initiatives of the staff in our operating companies.
THE SWIRE GROUP CHARITABLE TRUST
Swire Trust was established in 1983. It is overseen by a Philanthropy Council chaired by a director of Swire Pacific. Swire Trust receives almost all its income from companies in the Swire Pacific Group and provides long-term funds for charitable purposes to non-profit making organisations, mainly in Hong Kong and Mainland China. Its principal focus is on education, the environment and arts and culture. Swire recognises the importance of education and started to support education in the early part of the 20th century. In 1911, it provided the first endowment for a professorship at the University of Hong Kong. In 1923, it established the Taikoo Primary School for the children of its staff.
In Mainland China, Swire Trust supports educational projects which will provide good quality education for vulnerable students in remote areas (for example orphans or those with learning disabilities or from families affected by HIV, AIDS or drugs). In Yunnan, Swire Trust supports Right to Play, which operates centres where young children can learn and play.
The Trust supports environmental projects intended to protect natural resources and biodiversity. Xiamen University is developing a marine research centre with the assistance
of funds provided by Swire Trust. The centre aims to monitor marine ecosystem responses to global and regional environmental changes. In September 2012, Swire Trust co-organised a marine conservation and philanthropy forum in Hong Kong. The objective of the forum was to inform and update donors about current and emerging issues facing the marine environment, the role of Asia and the growing Hong Kong philanthropic community, and to share experiences and knowledge in this specific area of philanthropy.
Swire Trust supports the Arts with the Disabled Association in Hong Kong, which aims to promote the arts and artistic talent among persons with disabilities, to create equal opportunities for them in the world of art and to foster social integration.
Swire Trust funds to a limited extent organisations operating in areas which are outside the educational, environmental and arts and culture areas but which are underserved by charities generally.
Swire Trust tries to build the capacity of the organisations which it funds, including, where appropriate, with the help of Swire Pacific’s businesses and their staff. The aim is to help these organisations to become self-sufficient and to be more effective in benefiting those whom they support.
In 2012, Swire Trust donated funds to the Ignite programme organised by Asian Charity Services. The objective of Ignite is to equip leaders of non-governmental organisations to serve the Hong Kong community more effectively. Two seminars on branding and public relations have been held so far and74 organisations have attended.
Applications to Swire Trust for funding are reviewed in accordance with international best practice. If funds are granted to an organisation, the organisation is required to meet qualitative and quantitative targets.
STAFF AND THE COMMUNITY
Staff of Swire Pacific’s operating companies are encouraged to participate in community activities. There is an internal volunteering newsletter and time off is given for volunteer activities. Representatives from operating companies and the Swire Pacific head office meet on a regular basis to discuss and co-ordinate the Group’s community programmes. Best practices are shared and new projects are identified duringthe meetings.
Swire Pacific 2012 Annual Report 95
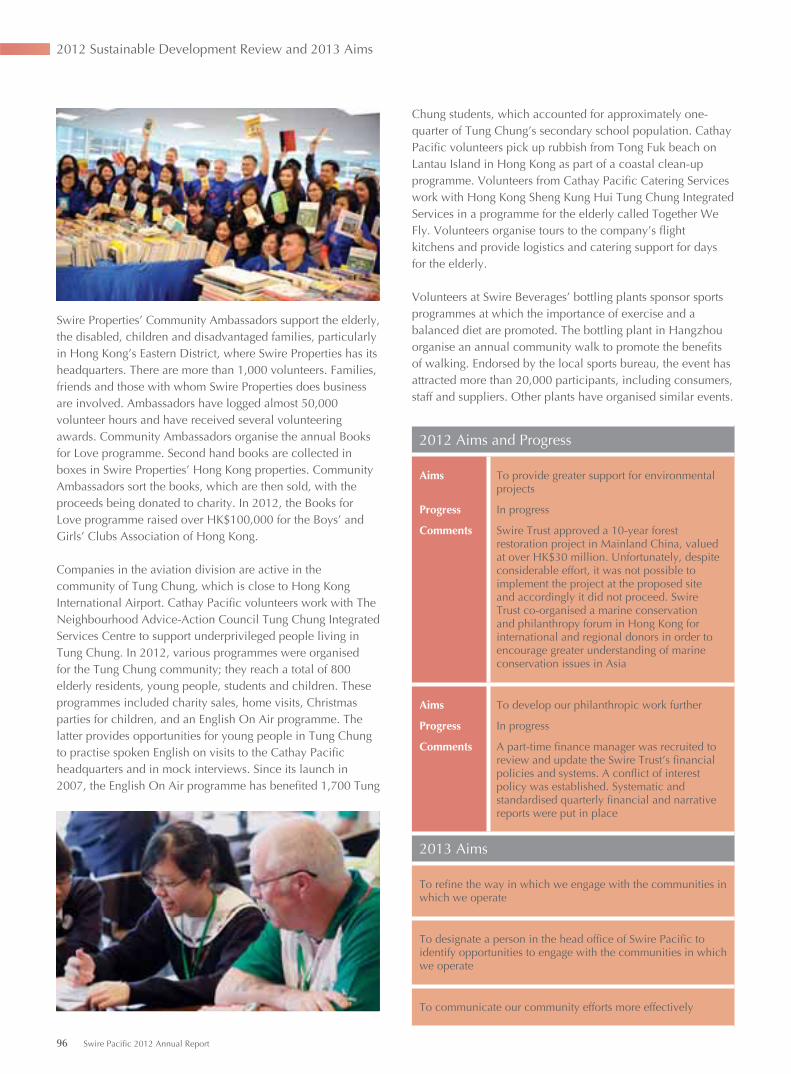
Swire Properties’ Community Ambassadors support the elderly, the disabled, children and disadvantaged families, particularly in Hong Kong’s Eastern District, where Swire Properties has its headquarters. There are more than 1,000 volunteers. Families, friends and those with whom Swire Properties does business are involved. Ambassadors have logged almost 50,000 volunteer hours and have received several volunteering awards. Community Ambassadors organise the annual Books for Love programme. Second hand books are collected in boxes in Swire Properties’ Hong Kong properties. Community Ambassadors sort the books, which are then sold, with the proceeds being donated to charity. In 2012, the Books for Love programme raised over HK$100,000 for the Boys’ and Girls’ Clubs Association of Hong Kong.
Companies in the aviation division are active in the community of Tung Chung, which is close to Hong Kong International Airport. Cathay Pacific volunteers work with The Neighbourhood Advice-Action Council Tung Chung Integrated Services Centre to support underprivileged people living in Tung Chung. In 2012, various programmes were organised for the Tung Chung community; they reach a total of 800 elderly residents, young people, students and children. These programmes included charity sales, home visits, Christmas parties for children, and an English On Air programme. The latter provides opportunities for young people in Tung Chung to practise spoken English on visits to the Cathay Pacific headquarters and in mock interviews. Since its launch in 2007, the English On Air programme has benefited 1,700 Tung
Chung students, which accounted for approximately one-quarter of Tung Chung’s secondary school population. Cathay Pacific volunteers pick up rubbish from Tong Fuk beach on Lantau Island in Hong Kong as part of a coastal clean-up programme. Volunteers from Cathay Pacific Catering Services work with Hong Kong Sheng Kung Hui Tung Chung Integrated Services in a programme for the elderly called Together We Fly. Volunteers organise tours to the company’s flight kitchens and provide logistics and catering support for days for the elderly.
Volunteers at Swire Beverages’ bottling plants sponsor sports programmes at which the importance of exercise and a balanced diet are promoted. The bottling plant in Hangzhou organise an annual community walk to promote the benefits of walking. Endorsed by the local sports bureau, the event has attracted more than 20,000 participants, including consumers, staff and suppliers. Other plants have organised similar events.
2012 Aims and Progress
Aims
Progress
Comments
To provide greater support for environmental projects
In progress
Swire Trust approved a 10-year forest restoration project in Mainland China, valued at over HK$30 million. Unfortunately, despite considerable effort, it was not possible to implement the project at the proposed site and accordingly it did not proceed. Swire Trust co-organised a marine conservation and philanthropy forum in Hong Kong for international and regional donors in order to encourage greater understanding of marine conservation issues in Asia
Aims
Progress
Comments
To develop our philanthropic work further
In progress
A part-time finance manager was recruited to review and update the Swire Trust’s financial policies and systems. A conflict of interest policy was established. Systematic and standardised quarterly financial and narrative reports were put in place
2013 Aims
To refine the way in which we engage with the communities in which we operate
To designate a person in the head office of Swire Pacific to identify opportunities to engage with the communities in which we operate
To communicate our community efforts more effectively
2012 Sustainable Development Review and 2013 Aims
96 Swire Pacific 2012 Annual Report
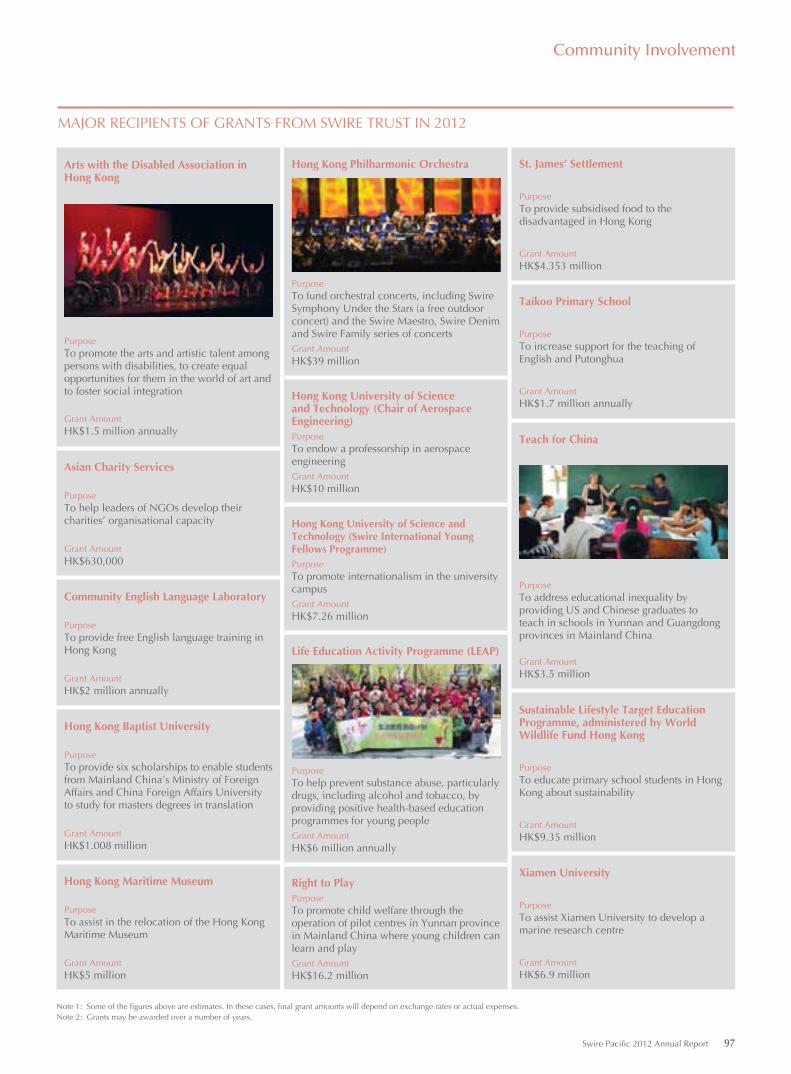
MAJOR RECIPIENTS OF GRANTS FROM SWIRE TRUST IN 2012
Arts with the Disabled Association in Hong Kong
PurposeTo promote the arts and artistic talent among persons with disabilities, to create equal opportunities for them in the world of art and to foster social integration
Grant AmountHK$1.5 million annually
Asian Charity Services
PurposeTo help leaders of NGOs develop their charities’ organisational capacity
Grant AmountHK$630,000
Community English Language Laboratory
PurposeTo provide free English language training in Hong Kong
Grant AmountHK$2 million annually
Hong Kong Baptist University
PurposeTo provide six scholarships to enable students from Mainland China’s Ministry of Foreign Affairs and China Foreign Affairs University to study for masters degrees in translation
Grant AmountHK$1.008 million
Hong Kong Maritime Museum
PurposeTo assist in the relocation of the Hong Kong Maritime Museum
Grant AmountHK$5 million
St. James’ Settlement
PurposeTo provide subsidised food to the disadvantaged in Hong Kong
Grant AmountHK$4.353 million
Taikoo Primary School
PurposeTo increase support for the teaching of English and Putonghua
Grant AmountHK$1.7 million annually
Teach for China
PurposeTo address educational inequality by providing US and Chinese graduates to teach in schools in Yunnan and Guangdong provinces in Mainland China
Grant AmountHK$3.5 million
Sustainable Lifestyle Target Education Programme, administered by World Wildlife Fund Hong Kong
PurposeTo educate primary school students in Hong Kong about sustainability
Grant AmountHK$9.35 million
Xiamen University
PurposeTo assist Xiamen University to develop a marine research centre
Grant AmountHK$6.9 million
Hong Kong Philharmonic Orchestra
PurposeTo fund orchestral concerts, including Swire Symphony Under the Stars (a free outdoor concert) and the Swire Maestro, Swire Denim and Swire Family series of concertsGrant AmountHK$39 million
Hong Kong University of Science and Technology (Chair of Aerospace Engineering)PurposeTo endow a professorship in aerospace engineeringGrant AmountHK$10 million
Hong Kong University of Science and Technology (Swire International Young Fellows Programme)PurposeTo promote internationalism in the university campusGrant AmountHK$7.26 million
Life Education Activity Programme (LEAP)
PurposeTo help prevent substance abuse, particularly drugs, including alcohol and tobacco, by providing positive health-based education programmes for young peopleGrant AmountHK$6 million annually
Right to PlayPurposeTo promote child welfare through the operation of pilot centres in Yunnan province in Mainland China where young children can learn and playGrant AmountHK$16.2 million
Note 1: Some of the figures above are estimates. In these cases, final grant amounts will depend on exchange rates or actual expenses.Note 2: Grants may be awarded over a number of years.
Community Involvement
Swire Pacific 2012 Annual Report 97
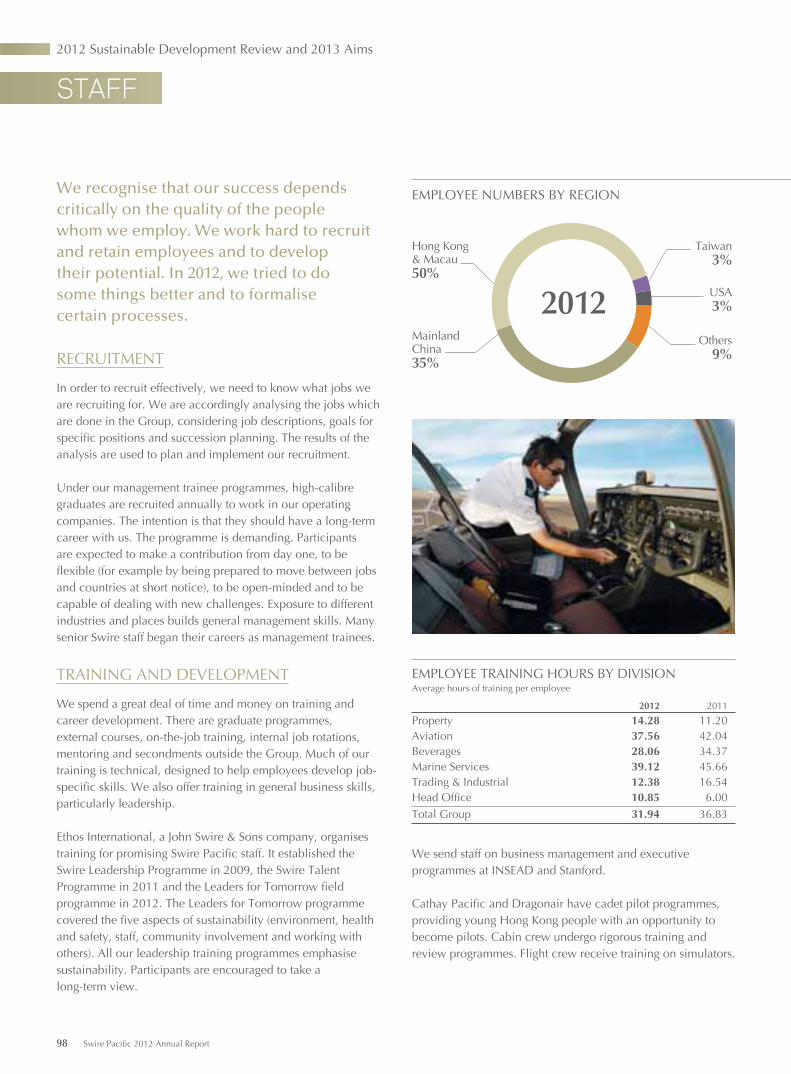
STAFF
We recognise that our success depends critically on the quality of the people whom we employ. We work hard to recruit and retain employees and to develop their potential. In 2012, we tried to do some things better and to formalise certain processes.
RECRUITMENT
In order to recruit effectively, we need to know what jobs we are recruiting for. We are accordingly analysing the jobs which are done in the Group, considering job descriptions, goals for specific positions and succession planning. The results of the analysis are used to plan and implement our recruitment.
Under our management trainee programmes, high-calibre graduates are recruited annually to work in our operating companies. The intention is that they should have a long-term career with us. The programme is demanding. Participants are expected to make a contribution from day one, to be flexible (for example by being prepared to move between jobs and countries at short notice), to be open-minded and to be capable of dealing with new challenges. Exposure to different industries and places builds general management skills. Many senior Swire staff began their careers as management trainees.
TRAINING AND DEVELOPMENT
We spend a great deal of time and money on training and career development. There are graduate programmes, external courses, on-the-job training, internal job rotations, mentoring and secondments outside the Group. Much of our training is technical, designed to help employees develop job-specific skills. We also offer training in general business skills, particularly leadership.
Ethos International, a John Swire & Sons company, organises training for promising Swire Pacific staff. It established the Swire Leadership Programme in 2009, the Swire Talent Programme in 2011 and the Leaders for Tomorrow field programme in 2012. The Leaders for Tomorrow programme covered the five aspects of sustainability (environment, health and safety, staff, community involvement and working with others). All our leadership training programmes emphasise sustainability. Participants are encouraged to take a long-term view.
USA3%
Taiwan3%
Others9%
Hong Kong& Macau50%
EMPLOYEE NUMBERS BY REGION
MainlandChina35%
2012
EMPLOYEE TRAINING HOURS BY DIVISIONAverage hours of training per employee
2012 2011
Property 14.28 11.20Aviation 37.56 42.04Beverages 28.06 34.37Marine Services 39.12 45.66Trading & Industrial 12.38 16.54Head Office 10.85 6.00Total Group 31.94 36.83
We send staff on business management and executive programmes at INSEAD and Stanford.
Cathay Pacific and Dragonair have cadet pilot programmes, providing young Hong Kong people with an opportunity to become pilots. Cabin crew undergo rigorous training and review programmes. Flight crew receive training on simulators.
2012 Sustainable Development Review and 2013 Aims
98 Swire Pacific 2012 Annual Report
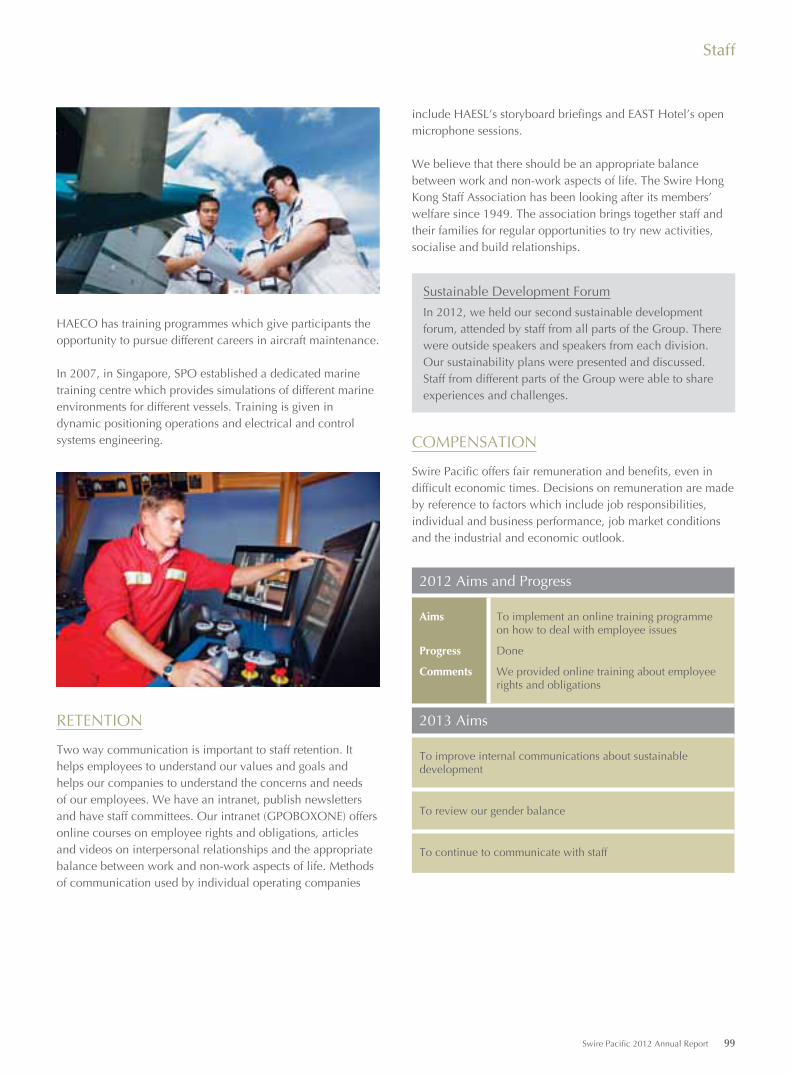
Staff
HAECO has training programmes which give participants the opportunity to pursue different careers in aircraft maintenance.
In 2007, in Singapore, SPO established a dedicated marine training centre which provides simulations of different marine environments for different vessels. Training is given in dynamic positioning operations and electrical and control systems engineering.
RETENTION
Two way communication is important to staff retention. It helps employees to understand our values and goals and helps our companies to understand the concerns and needs of our employees. We have an intranet, publish newsletters and have staff committees. Our intranet (GPOBOXONE) offers online courses on employee rights and obligations, articles and videos on interpersonal relationships and the appropriate balance between work and non-work aspects of life. Methods of communication used by individual operating companies
include HAESL’s storyboard briefings and EAST Hotel’s open microphone sessions.
We believe that there should be an appropriate balance between work and non-work aspects of life. The Swire Hong Kong Staff Association has been looking after its members’ welfare since 1949. The association brings together staff and their families for regular opportunities to try new activities, socialise and build relationships.
Sustainable Development Forum
In 2012, we held our second sustainable development forum, attended by staff from all parts of the Group. There were outside speakers and speakers from each division. Our sustainability plans were presented and discussed. Staff from different parts of the Group were able to share experiences and challenges.
COMPENSATION
Swire Pacific offers fair remuneration and benefits, even in difficult economic times. Decisions on remuneration are made by reference to factors which include job responsibilities, individual and business performance, job market conditions and the industrial and economic outlook.
2012 Aims and Progress
Aims
Progress
Comments
To implement an online training programme on how to deal with employee issues
Done
We provided online training about employee rights and obligations
2013 Aims
To improve internal communications about sustainable development
To review our gender balance
To continue to communicate with staff
Swire Pacific 2012 Annual Report 99
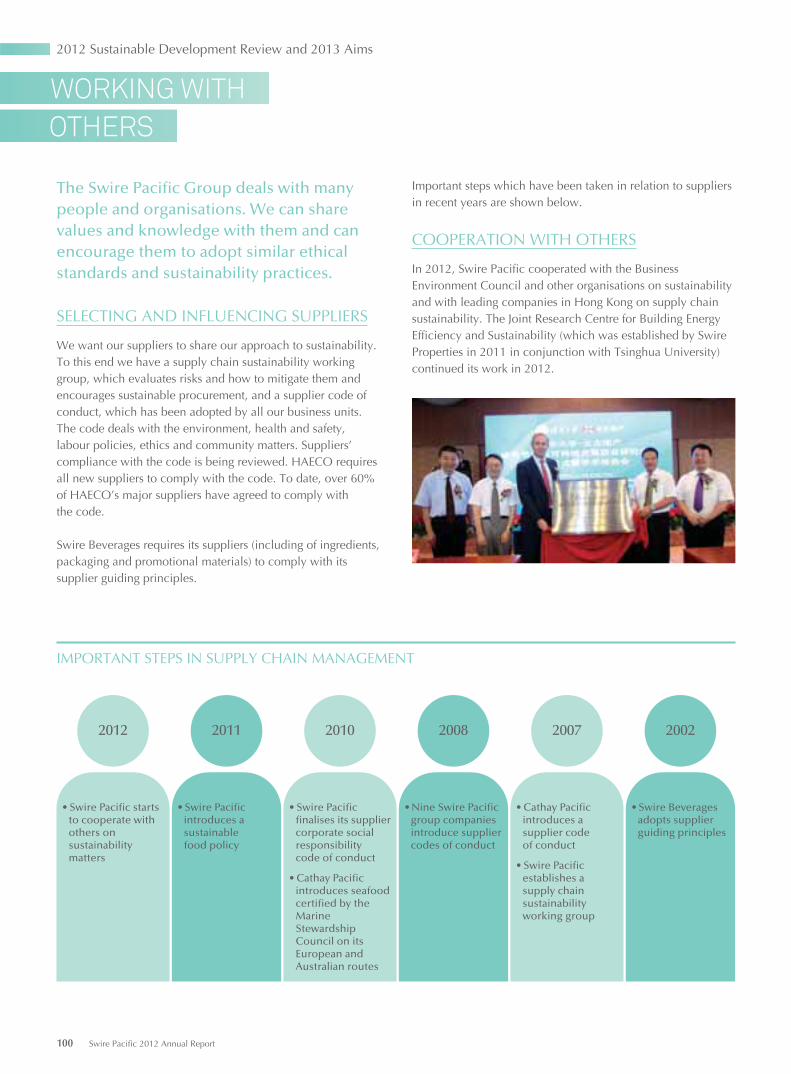
The Swire Pacifi c Group deals with many people and organisations. We can share values and knowledge with them and can encourage them to adopt similar ethical standards and sustainability practices.
SELECTING AND INFLUENCING SUPPLIERS
We want our suppliers to share our approach to sustainability. To this end we have a supply chain sustainability working group, which evaluates risks and how to mitigate them and encourages sustainable procurement, and a supplier code of conduct, which has been adopted by all our business units. The code deals with the environment, health and safety, labour policies, ethics and community matters. Suppliers’ compliance with the code is being reviewed. HAECO requires all new suppliers to comply with the code. To date, over 60% of HAECO’s major suppliers have agreed to comply with the code.
Swire Beverages requires its suppliers (including of ingredients, packaging and promotional materials) to comply with its supplier guiding principles.
OTHERS
WORKING WITH
Important steps which have been taken in relation to suppliers in recent years are shown below.
COOPERATION WITH OTHERS
In 2012, Swire Pacific cooperated with the Business Environment Council and other organisations on sustainability and with leading companies in Hong Kong on supply chain sustainability. The Joint Research Centre for Building Energy Efficiency and Sustainability (which was established by Swire Properties in 2011 in conjunction with Tsinghua University) continued its work in 2012.
• Swire Pacific starts to cooperate with others on sustainability matters
2012
• Swire Pacific introduces a sustainable food policy
2011
• Swire Pacific finalises its supplier corporate social responsibility code of conduct
• Cathay Pacific introduces seafood certified by the Marine Stewardship Council on its European and Australian routes
2010
• Nine Swire Pacific group companies introduce supplier codes of conduct
2008
• Cathay Pacific introduces a supplier code of conduct
• Swire Pacific establishes a supply chain sustainability working group
2007
• Swire Beverages adopts supplier guiding principles
2002
IMPORTANT STEPS IN SUPPLY CHAIN MANAGEMENT
2012 Sustainable Development Review and 2013 Aims
100 Swire Pacific 2012 Annual Report
Working with Others
ADVOCACY
Swire Pacific aims to raise awareness of sustainability and to encourage sustainable practices, including through the responsible use of the Group’s products and services. Cathay Pacific’s FLY greener offset programme allows passengers on Cathay Pacific and Dragonair flights to buy offsets for the carbon emissions of their flights. This enables passengers to contribute to projects which reduce CO2 emissions (or take CO2 out of the atmosphere) and supports the management of greenhouse gas emissions. 11,000 fewer tonnes of CO2 were released into the atmosphere in 2012 as a result of FLY greener. Taikoo Motors Group supports Volvo Trucks’ Fuelwatch programme, which promotes fuel-efficient driving. In 2012, Cathay Pacific and Dragonair announced that they would stop carrying unsustainably harvested shark fins and other shark products. It is hoped that this will encourage other carriers to do the same. An advisory panel, which includes representatives of NGOs, advises Cathay Pacific on carrying animal products.
PURCHASING SUSTAINABLE PRODUCTS
The Swire Pacific Group tries to purchase sustainable products. Finding appropriate products is difficult, but, for example, all printing paper used in our offices is certified by the Forest Stewardship Council.
Important steps which have been taken in relation to purchasing sustainable products in recent years are shown below.
2012 Aims and Progress
Aims
Progress
Comments
To develop a database containing information about compliance by suppliers with our supplier code of conduct
In progress
The information collected is being checked by business units and will be shared with other business units in 2013
Aims
Progress
Comments
To extend the purchasing of sustainable seafood and other certified products to all our businesses
In progress
The types and quantities of sustainable seafood products purchased by Cathay Pacific Catering Services in 2012 have increased compared with 2011. We are evaluating the use of toilet paper and paper hand towels certified by the Forest Stewardship Council
Aims
Progress
Comments
To continue to identify areas where progress is needed in sustainable seafood sourcing
In progress
We try to ensure that suppliers of our catering facilities supply only sustainably sourced seafood
Aims
Progress
Comments
To develop relationships with other organisations which have sustainability goals which are similar to ours
Done
We share relevant information with other leading Hong Kong companies
2013 Aims
To develop a group policy on sustainable procurement
To continue developing a database containing information about compliance by suppliers with our supplier code of conduct
IMPORTANT STEPS IN RELATION TO PURCHASING SUSTAINABLE FOOD PRODUCTS
2010• Cathay Pacific
introduces seafood certified by the Marine Stewardship Council on its European and Australian routes
2011• Cathay Pacific introduces
seafood certified by the Marine Stewardship Council on its North American routes
• Swire Hotels stops serving shark fins and starts serving a menu according to the WWF Hong Kong’s Seafood Guide
2009• Cathay Pacific
and Dragonair stop serving shark fins
2012• Cathay Pacific and
Dragonair announce that they will stop carrying unsustainably harvested shark fins and other shark products
Swire Pacific 2012 Annual Report 101
102 Swire Pacific 2012 Annual Report
Additional information is provided below to reconcile reported and underlying profit and equity attributable to the Company’s
shareholders. The reconciling items principally adjust for net revaluation movements on investment properties and the associated
deferred tax in Mainland China and for other deferred tax provisions in relation to investment properties. There is also an analysis of
the effect of other significant non-recurring items.
Underlying profit 2012 2011Note HK$M HK$M
Profit attributable to the Company’s shareholders per accounts 17,484 32,210Adjustments re investment properties: Revaluation of investment properties (a) (12,739) (23,491) Deferred tax on investment properties (b) 661 523 Realised profit on sale of investment properties (c) 763 7,977 Depreciation of investment properties occupied by the Group (d) 20 27 Non-controlling interests’ share of adjustments 2,155 46
Underlying profit attributable to the Company’s shareholders 8,344 17,292
Other significant items: Profit on sale of interest in Festival Walk – (8,615) Profit on sale of investment properties (651) – Profit on sale of interest in PUMA – (148) Loss/(profit) on sale of property, plant and equipment and other investments 135 (91) Net impairment of property, plant and equipment, leasehold land and intangible assets 82 290
Adjusted underlying profit 7,910 8,728
Underlying equityEquity attributable to the Company’s shareholders per accounts 208,738 227,559Deferred tax on investment properties 3,236 3,284Unrecognised valuation gains on hotels held as part of mixed-use developments (e) 1,423 912Revaluation of investment properties occupied by the Group 1,036 997Cumulative depreciation of investment properties occupied by the Group 58 63
Underlying equity attributable to the Company’s shareholders 214,491 232,815Underlying non-controlling interests 40,961 4,961
Underlying equity 255,452 237,776
Notes:(a) This represents the net revaluation movements as shown in the consolidated income statement plus the Group’s share of net revaluation movements of jointly
controlled and associated companies.(b) This represents deferred tax movements on the Group’s investment properties and the Group’s share of deferred tax movements on investment properties held by
jointly controlled and associated companies. These comprise deferred tax on revaluation movements on investment properties in Mainland China and deferred tax provisions made in respect of investment properties held for the long-term where it is considered that the liability will not reverse for some considerable time.
(c) Prior to the implementation of HKAS 40, changes in the fair value of investment properties were recorded in the revaluation reserve rather than the consolidated income statement. On sale, the revaluation gains were transferred from the revaluation reserve to the consolidated income statement.
(d) Prior to the implementation of HKAS 40, no depreciation was charged on investment properties occupied by the Group.(e) Under HKAS 40, hotel properties are stated in the accounts at cost less accumulated depreciation and any provision for impairment losses, rather than at fair value.
If HKAS 40 did not apply, those hotel properties owned by subsidiary and jointly controlled companies and held for the long-term as part of mixed-use property developments would be accounted for as investment properties. Accordingly, any increase or write-down in their value would be recorded in the revaluation reserve rather than the consolidated income statement.
FINANCIAL
REVIEW
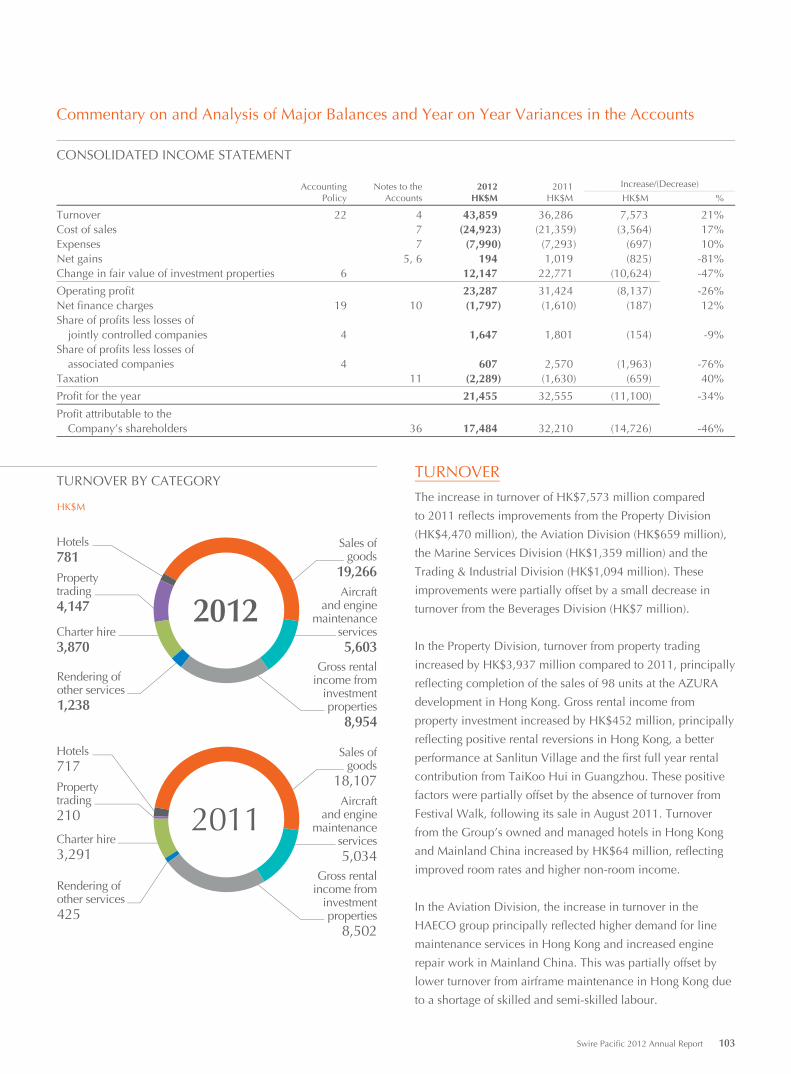
Swire Pacific 2012 Annual Report 103
Commentary on and Analysis of Major Balances and Year on Year Variances in the Accounts
CONSOLIDATED INCOME STATEMENT
Accounting Notes to the 2012 2011 Increase/(Decrease)
Policy Accounts HK$M HK$M HK$M %
Turnover 22 4 43,859 36,286 7,573 21%Cost of sales 7 (24,923) (21,359) (3,564) 17%Expenses 7 (7,990) (7,293) (697) 10%Net gains 5, 6 194 1,019 (825) -81%Change in fair value of investment properties 6 12,147 22,771 (10,624) -47%
Operating profit 23,287 31,424 (8,137) -26%Net finance charges 19 10 (1,797) (1,610) (187) 12%Share of profits less losses of jointly controlled companies 4 1,647 1,801 (154) -9%Share of profits less losses of associated companies 4 607 2,570 (1,963) -76%Taxation 11 (2,289) (1,630) (659) 40%
Profit for the year 21,455 32,555 (11,100) -34%
Profit attributable to the Company’s shareholders 36 17,484 32,210 (14,726) -46%
TURNOVER BY CATEGORY
HK$M
Rendering ofother services425
Aircraftand engine
maintenanceservices5,034
Gross rentalincome from
investmentproperties
8,502
Hotels717Propertytrading210
Sales ofgoods
18,107
Charter hire3,291
2011
Rendering ofother services1,238
Aircraftand engine
maintenanceservices5,603
Gross rentalincome from
investmentproperties
8,954
Hotels781Propertytrading4,147
Sales ofgoods
19,266
Charter hire3,870
2012
TURNOVER
The increase in turnover of HK$7,573 million compared
to 2011 reflects improvements from the Property Division
(HK$4,470 million), the Aviation Division (HK$659 million),
the Marine Services Division (HK$1,359 million) and the
Trading & Industrial Division (HK$1,094 million). These
improvements were partially offset by a small decrease in
turnover from the Beverages Division (HK$7 million).
In the Property Division, turnover from property trading
increased by HK$3,937 million compared to 2011, principally
reflecting completion of the sales of 98 units at the AZURA
development in Hong Kong. Gross rental income from
property investment increased by HK$452 million, principally
reflecting positive rental reversions in Hong Kong, a better
performance at Sanlitun Village and the first full year rental
contribution from TaiKoo Hui in Guangzhou. These positive
factors were partially offset by the absence of turnover from
Festival Walk, following its sale in August 2011. Turnover
from the Group’s owned and managed hotels in Hong Kong
and Mainland China increased by HK$64 million, reflecting
improved room rates and higher non-room income.
In the Aviation Division, the increase in turnover in the
HAECO group principally reflected higher demand for line
maintenance services in Hong Kong and increased engine
repair work in Mainland China. This was partially offset by
lower turnover from airframe maintenance in Hong Kong due
to a shortage of skilled and semi-skilled labour.
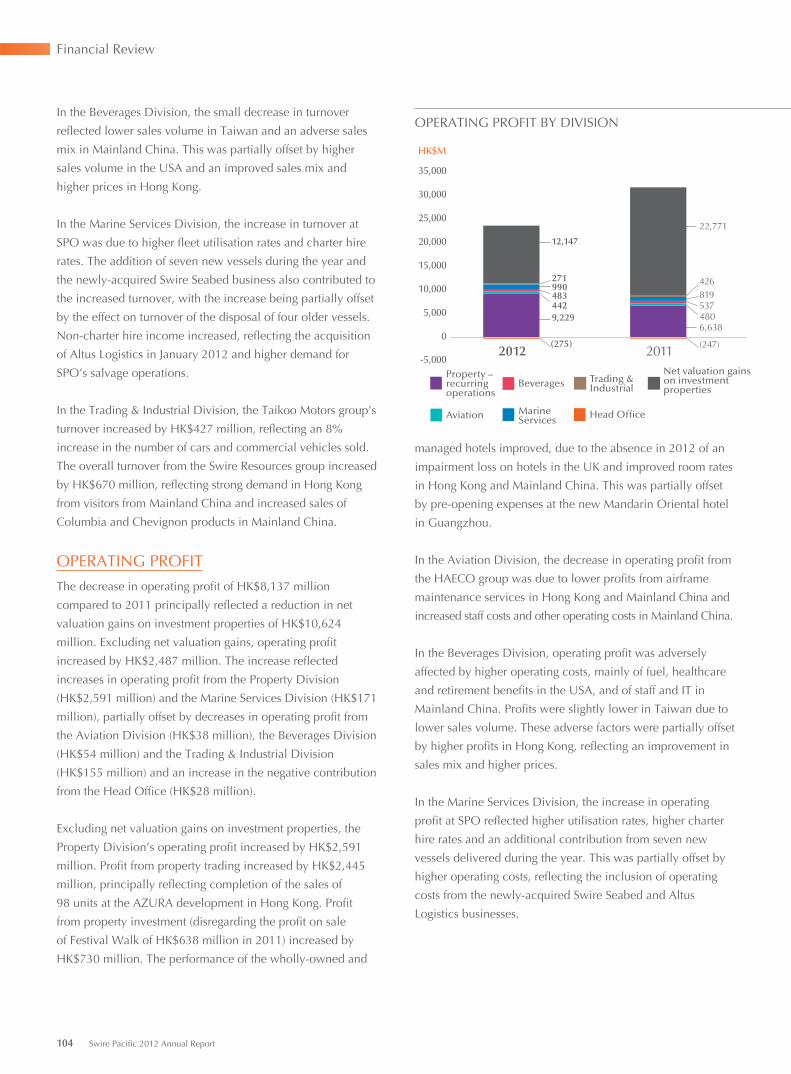
Financial Review
104 Swire Pacific 2012 Annual Report
In the Beverages Division, the small decrease in turnover
reflected lower sales volume in Taiwan and an adverse sales
mix in Mainland China. This was partially offset by higher
sales volume in the USA and an improved sales mix and
higher prices in Hong Kong.
In the Marine Services Division, the increase in turnover at
SPO was due to higher fleet utilisation rates and charter hire
rates. The addition of seven new vessels during the year and
the newly-acquired Swire Seabed business also contributed to
the increased turnover, with the increase being partially offset
by the effect on turnover of the disposal of four older vessels.
Non-charter hire income increased, reflecting the acquisition
of Altus Logistics in January 2012 and higher demand for
SPO’s salvage operations.
In the Trading & Industrial Division, the Taikoo Motors group’s
turnover increased by HK$427 million, reflecting an 8%
increase in the number of cars and commercial vehicles sold.
The overall turnover from the Swire Resources group increased
by HK$670 million, reflecting strong demand in Hong Kong
from visitors from Mainland China and increased sales of
Columbia and Chevignon products in Mainland China.
OPERATING PROFIT
The decrease in operating profit of HK$8,137 million
compared to 2011 principally reflected a reduction in net
valuation gains on investment properties of HK$10,624
million. Excluding net valuation gains, operating profit
increased by HK$2,487 million. The increase reflected
increases in operating profit from the Property Division
(HK$2,591 million) and the Marine Services Division (HK$171
million), partially offset by decreases in operating profit from
the Aviation Division (HK$38 million), the Beverages Division
(HK$54 million) and the Trading & Industrial Division
(HK$155 million) and an increase in the negative contribution
from the Head Office (HK$28 million).
Excluding net valuation gains on investment properties, the
Property Division’s operating profit increased by HK$2,591
million. Profit from property trading increased by HK$2,445
million, principally reflecting completion of the sales of
98 units at the AZURA development in Hong Kong. Profit
from property investment (disregarding the profit on sale
of Festival Walk of HK$638 million in 2011) increased by
HK$730 million. The performance of the wholly-owned and
managed hotels improved, due to the absence in 2012 of an
impairment loss on hotels in the UK and improved room rates
in Hong Kong and Mainland China. This was partially offset
by pre-opening expenses at the new Mandarin Oriental hotel
in Guangzhou.
In the Aviation Division, the decrease in operating profit from
the HAECO group was due to lower profits from airframe
maintenance services in Hong Kong and Mainland China and
increased staff costs and other operating costs in Mainland China.
In the Beverages Division, operating profit was adversely
affected by higher operating costs, mainly of fuel, healthcare
and retirement benefits in the USA, and of staff and IT in
Mainland China. Profits were slightly lower in Taiwan due to
lower sales volume. These adverse factors were partially offset
by higher profits in Hong Kong, reflecting an improvement in
sales mix and higher prices.
In the Marine Services Division, the increase in operating
profit at SPO reflected higher utilisation rates, higher charter
hire rates and an additional contribution from seven new
vessels delivered during the year. This was partially offset by
higher operating costs, reflecting the inclusion of operating
costs from the newly-acquired Swire Seabed and Altus
Logistics businesses.
OPERATING PROFIT BY DIVISION
Property –recurringoperations
Aviation
Beverages Trading &Industrial
MarineServices Head Office
2012 20110
5,000
-5,000
10,000
15,000
20,000
25,000
30,000
35,000
Net valuation gains on investment properties
4834429,229
990271
(275)
12,147
6,638480537819426
(247)
22,771
HK$M
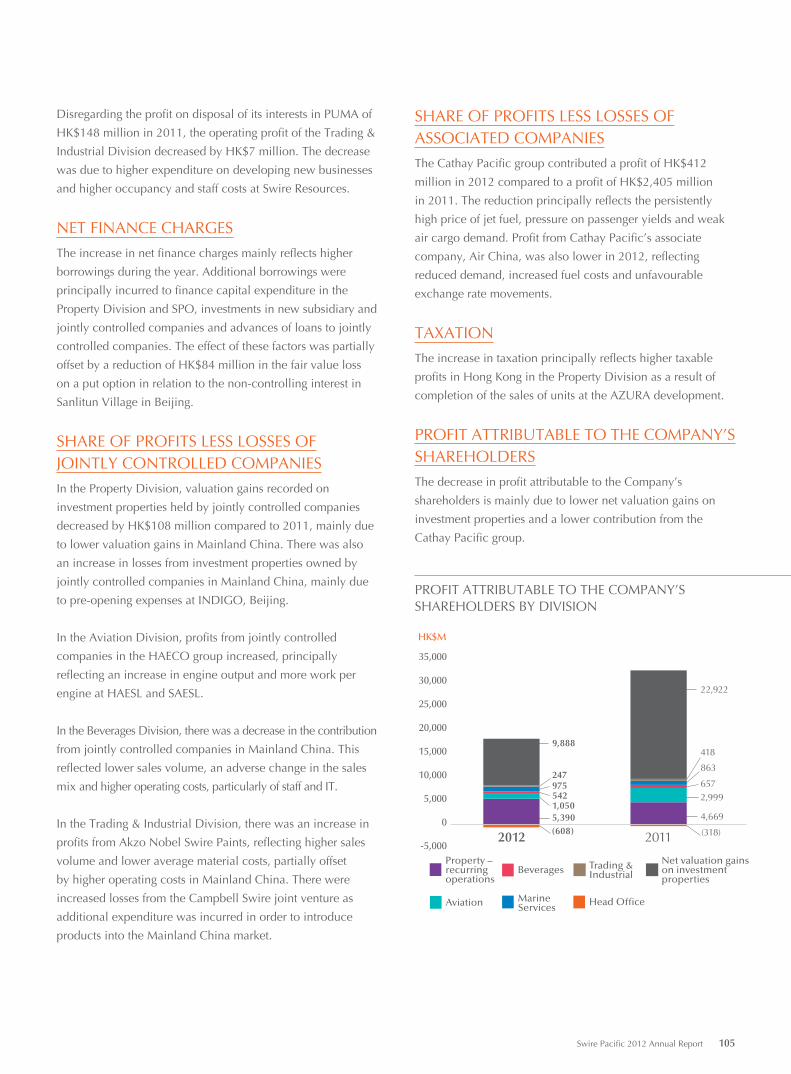
Swire Pacific 2012 Annual Report 105
Disregarding the profit on disposal of its interests in PUMA of
HK$148 million in 2011, the operating profit of the Trading &
Industrial Division decreased by HK$7 million. The decrease
was due to higher expenditure on developing new businesses
and higher occupancy and staff costs at Swire Resources.
NET FINANCE CHARGES
The increase in net finance charges mainly reflects higher
borrowings during the year. Additional borrowings were
principally incurred to finance capital expenditure in the
Property Division and SPO, investments in new subsidiary and
jointly controlled companies and advances of loans to jointly
controlled companies. The effect of these factors was partially
offset by a reduction of HK$84 million in the fair value loss
on a put option in relation to the non-controlling interest in
Sanlitun Village in Beijing.
SHARE OF PROFITS LESS LOSSES OFJOINTLY CONTROLLED COMPANIES
In the Property Division, valuation gains recorded on
investment properties held by jointly controlled companies
decreased by HK$108 million compared to 2011, mainly due
to lower valuation gains in Mainland China. There was also
an increase in losses from investment properties owned by
jointly controlled companies in Mainland China, mainly due
to pre-opening expenses at INDIGO, Beijing.
In the Aviation Division, profits from jointly controlled
companies in the HAECO group increased, principally
reflecting an increase in engine output and more work per
engine at HAESL and SAESL.
In the Beverages Division, there was a decrease in the contribution
from jointly controlled companies in Mainland China. This
reflected lower sales volume, an adverse change in the sales
mix and higher operating costs, particularly of staff and IT.
In the Trading & Industrial Division, there was an increase in
profits from Akzo Nobel Swire Paints, reflecting higher sales
volume and lower average material costs, partially offset
by higher operating costs in Mainland China. There were
increased losses from the Campbell Swire joint venture as
additional expenditure was incurred in order to introduce
products into the Mainland China market.
SHARE OF PROFITS LESS LOSSES OFASSOCIATED COMPANIES
The Cathay Pacific group contributed a profit of HK$412
million in 2012 compared to a profit of HK$2,405 million
in 2011. The reduction principally reflects the persistently
high price of jet fuel, pressure on passenger yields and weak
air cargo demand. Profit from Cathay Pacific’s associate
company, Air China, was also lower in 2012, reflecting
reduced demand, increased fuel costs and unfavourable
exchange rate movements.
TAXATION
The increase in taxation principally reflects higher taxable
profits in Hong Kong in the Property Division as a result of
completion of the sales of units at the AZURA development.
PROFIT ATTRIBUTABLE TO THE COMPANY’S SHAREHOLDERS
The decrease in profit attributable to the Company’s
shareholders is mainly due to lower net valuation gains on
investment properties and a lower contribution from the
Cathay Pacific group.
PROFIT ATTRIBUTABLE TO THE COMPANY’S SHAREHOLDERS BY DIVISION
0
5,000
-5,000
10,000
15,000
20,000
25,000
30,000
35,000
20112012
HK$M
Property –recurringoperations
Aviation
Beverages Trading &Industrial
MarineServices Head Office
Net valuation gains on investment properties
5,3901,050542975247
(608)
9,888
4,669
2,999657
863
418
(318)
22,922
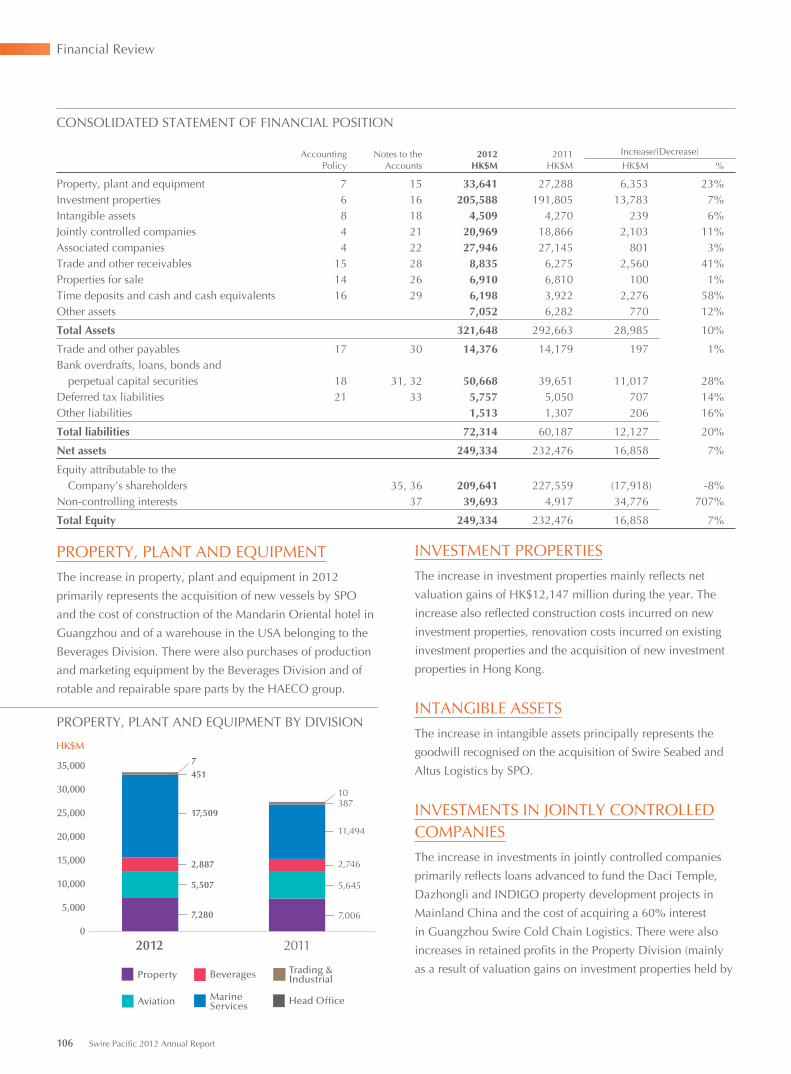
Financial Review
106 Swire Pacific 2012 Annual Report
CONSOLIDATED STATEMENT OF FINANCIAL POSITION
Accounting Notes to the 2012 2011 Increase/(Decrease)
Policy Accounts HK$M HK$M HK$M %
Property, plant and equipment 7 15 33,641 27,288 6,353 23%Investment properties 6 16 205,588 191,805 13,783 7%Intangible assets 8 18 4,509 4,270 239 6%Jointly controlled companies 4 21 20,969 18,866 2,103 11%Associated companies 4 22 27,946 27,145 801 3%Trade and other receivables 15 28 8,835 6,275 2,560 41%Properties for sale 14 26 6,910 6,810 100 1%Time deposits and cash and cash equivalents 16 29 6,198 3,922 2,276 58%Other assets 7,052 6,282 770 12%
Total Assets 321,648 292,663 28,985 10%
Trade and other payables 17 30 14,376 14,179 197 1%Bank overdrafts, loans, bonds and perpetual capital securities 18 31, 32 50,668 39,651 11,017 28%Deferred tax liabilities 21 33 5,757 5,050 707 14%Other liabilities 1,513 1,307 206 16%
Total liabilities 72,314 60,187 12,127 20%
Net assets 249,334 232,476 16,858 7%
Equity attributable to the Company’s shareholders 35, 36 209,641 227,559 (17,918) -8%Non-controlling interests 37 39,693 4,917 34,776 707%
Total Equity 249,334 232,476 16,858 7%
PROPERTY, PLANT AND EQUIPMENT
The increase in property, plant and equipment in 2012
primarily represents the acquisition of new vessels by SPO
and the cost of construction of the Mandarin Oriental hotel in
Guangzhou and of a warehouse in the USA belonging to the
Beverages Division. There were also purchases of production
and marketing equipment by the Beverages Division and of
rotable and repairable spare parts by the HAECO group.
INVESTMENT PROPERTIES
The increase in investment properties mainly reflects net
valuation gains of HK$12,147 million during the year. The
increase also reflected construction costs incurred on new
investment properties, renovation costs incurred on existing
investment properties and the acquisition of new investment
properties in Hong Kong.
INTANGIBLE ASSETS
The increase in intangible assets principally represents the
goodwill recognised on the acquisition of Swire Seabed and
Altus Logistics by SPO.
INVESTMENTS IN JOINTLY CONTROLLEDCOMPANIES
The increase in investments in jointly controlled companies
primarily reflects loans advanced to fund the Daci Temple,
Dazhongli and INDIGO property development projects in
Mainland China and the cost of acquiring a 60% interest
in Guangzhou Swire Cold Chain Logistics. There were also
increases in retained profits in the Property Division (mainly
as a result of valuation gains on investment properties held by
PROPERTY, PLANT AND EQUIPMENT BY DIVISION
0
5,000
10,000
15,000
20,000
25,000
30,000
35,000
20112012
HK$M
Property
Aviation
Beverages Trading &Industrial
MarineServices Head Office
7,280
5,507
2,887
17,509
4517
7,006
5,645
2,746
11,494
38710
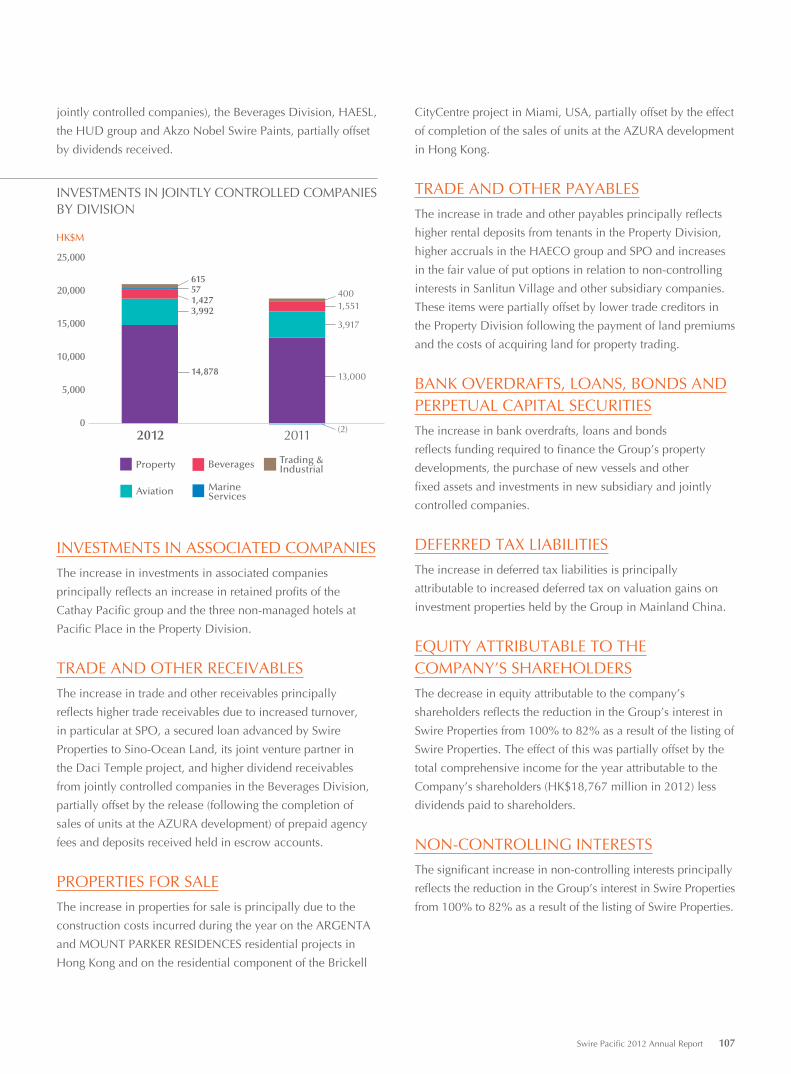
Swire Pacific 2012 Annual Report 107
jointly controlled companies), the Beverages Division, HAESL,
the HUD group and Akzo Nobel Swire Paints, partially offset
by dividends received.
CityCentre project in Miami, USA, partially offset by the effect
of completion of the sales of units at the AZURA development
in Hong Kong.
TRADE AND OTHER PAYABLES
The increase in trade and other payables principally reflects
higher rental deposits from tenants in the Property Division,
higher accruals in the HAECO group and SPO and increases
in the fair value of put options in relation to non-controlling
interests in Sanlitun Village and other subsidiary companies.
These items were partially offset by lower trade creditors in
the Property Division following the payment of land premiums
and the costs of acquiring land for property trading.
BANK OVERDRAFTS, LOANS, BONDS ANDPERPETUAL CAPITAL SECURITIES
The increase in bank overdrafts, loans and bonds
reflects funding required to finance the Group’s property
developments, the purchase of new vessels and other
fixed assets and investments in new subsidiary and jointly
controlled companies.
DEFERRED TAX LIABILITIES
The increase in deferred tax liabilities is principally
attributable to increased deferred tax on valuation gains on
investment properties held by the Group in Mainland China.
EQUITY ATTRIBUTABLE TO THECOMPANY’S SHAREHOLDERS
The decrease in equity attributable to the company’s
shareholders reflects the reduction in the Group’s interest in
Swire Properties from 100% to 82% as a result of the listing of
Swire Properties. The effect of this was partially offset by the
total comprehensive income for the year attributable to the
Company’s shareholders (HK$18,767 million in 2012) less
dividends paid to shareholders.
NON-CONTROLLING INTERESTS
The significant increase in non-controlling interests principally
reflects the reduction in the Group’s interest in Swire Properties
from 100% to 82% as a result of the listing of Swire Properties.
INVESTMENTS IN JOINTLY CONTROLLED COMPANIES BY DIVISION
0
5,000
10,000
15,000
20,000
25,000
20112012
HK$M
Property
Aviation
Beverages Trading &Industrial
MarineServices
14,878
3,9921,42757615
13,000
3,917
1,551400
(2)
INVESTMENTS IN ASSOCIATED COMPANIES
The increase in investments in associated companies
principally reflects an increase in retained profits of the
Cathay Pacific group and the three non-managed hotels at
Pacific Place in the Property Division.
TRADE AND OTHER RECEIVABLES
The increase in trade and other receivables principally
reflects higher trade receivables due to increased turnover,
in particular at SPO, a secured loan advanced by Swire
Properties to Sino-Ocean Land, its joint venture partner in
the Daci Temple project, and higher dividend receivables
from jointly controlled companies in the Beverages Division,
partially offset by the release (following the completion of
sales of units at the AZURA development) of prepaid agency
fees and deposits received held in escrow accounts.
PROPERTIES FOR SALE
The increase in properties for sale is principally due to the
construction costs incurred during the year on the ARGENTA
and MOUNT PARKER RESIDENCES residential projects in
Hong Kong and on the residential component of the Brickell
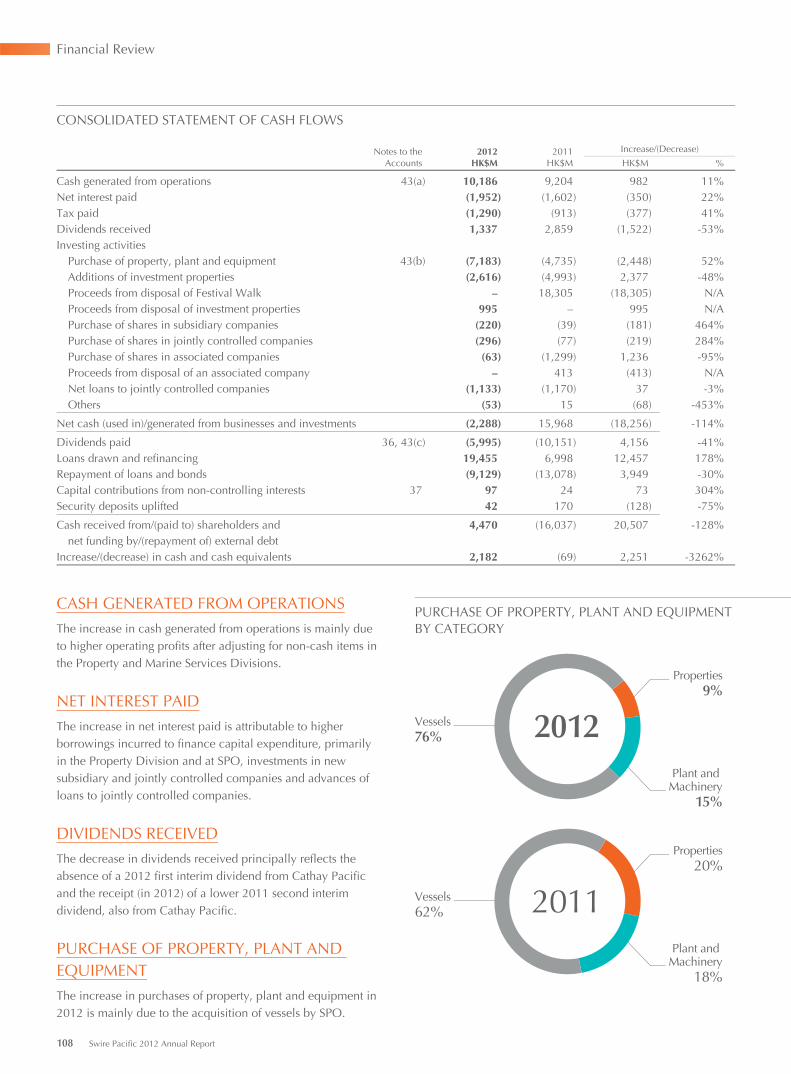
Financial Review
108 Swire Pacific 2012 Annual Report
CASH GENERATED FROM OPERATIONS
The increase in cash generated from operations is mainly due to higher operating profits after adjusting for non-cash items in the Property and Marine Services Divisions.
NET INTEREST PAID
The increase in net interest paid is attributable to higher borrowings incurred to finance capital expenditure, primarily in the Property Division and at SPO, investments in new subsidiary and jointly controlled companies and advances of loans to jointly controlled companies.
DIVIDENDS RECEIVED
The decrease in dividends received principally reflects the absence of a 2012 first interim dividend from Cathay Pacific and the receipt (in 2012) of a lower 2011 second interim dividend, also from Cathay Pacific.
PURCHASE OF PROPERTY, PLANT AND EQUIPMENT
The increase in purchases of property, plant and equipment in 2012 is mainly due to the acquisition of vessels by SPO.
PURCHASE OF PROPERTY, PLANT AND EQUIPMENT BY CATEGORY
Plant and Machinery
15%
Vessels76%
Properties9%
2012
Plant and Machinery
18%
Vessels62%
Properties20%
2011
CONSOLIDATED STATEMENT OF CASH FLOWS
Notes to the 2012 2011 Increase/(Decrease)
Accounts HK$M HK$M HK$M %
Cash generated from operations 43(a) 10,186 9,204 982 11%Net interest paid (1,952) (1,602) (350) 22%Tax paid (1,290) (913) (377) 41%Dividends received 1,337 2,859 (1,522) -53%Investing activities Purchase of property, plant and equipment 43(b) (7,183) (4,735) (2,448) 52% Additions of investment properties (2,616) (4,993) 2,377 -48% Proceeds from disposal of Festival Walk – 18,305 (18,305) N/A Proceeds from disposal of investment properties 995 – 995 N/A Purchase of shares in subsidiary companies (220) (39) (181) 464% Purchase of shares in jointly controlled companies (296) (77) (219) 284% Purchase of shares in associated companies (63) (1,299) 1,236 -95% Proceeds from disposal of an associated company – 413 (413) N/A Net loans to jointly controlled companies (1,133) (1,170) 37 -3% Others (53) 15 (68) -453%
Net cash (used in)/generated from businesses and investments (2,288) 15,968 (18,256) -114%
Dividends paid 36, 43(c) (5,995) (10,151) 4,156 -41%Loans drawn and refinancing 19,455 6,998 12,457 178%Repayment of loans and bonds (9,129) (13,078) 3,949 -30%Capital contributions from non-controlling interests 37 97 24 73 304%Security deposits uplifted 42 170 (128) -75%
Cash received from/(paid to) shareholders and 4,470 (16,037) 20,507 -128% net funding by/(repayment of) external debtIncrease/(decrease) in cash and cash equivalents 2,182 (69) 2,251 -3262%
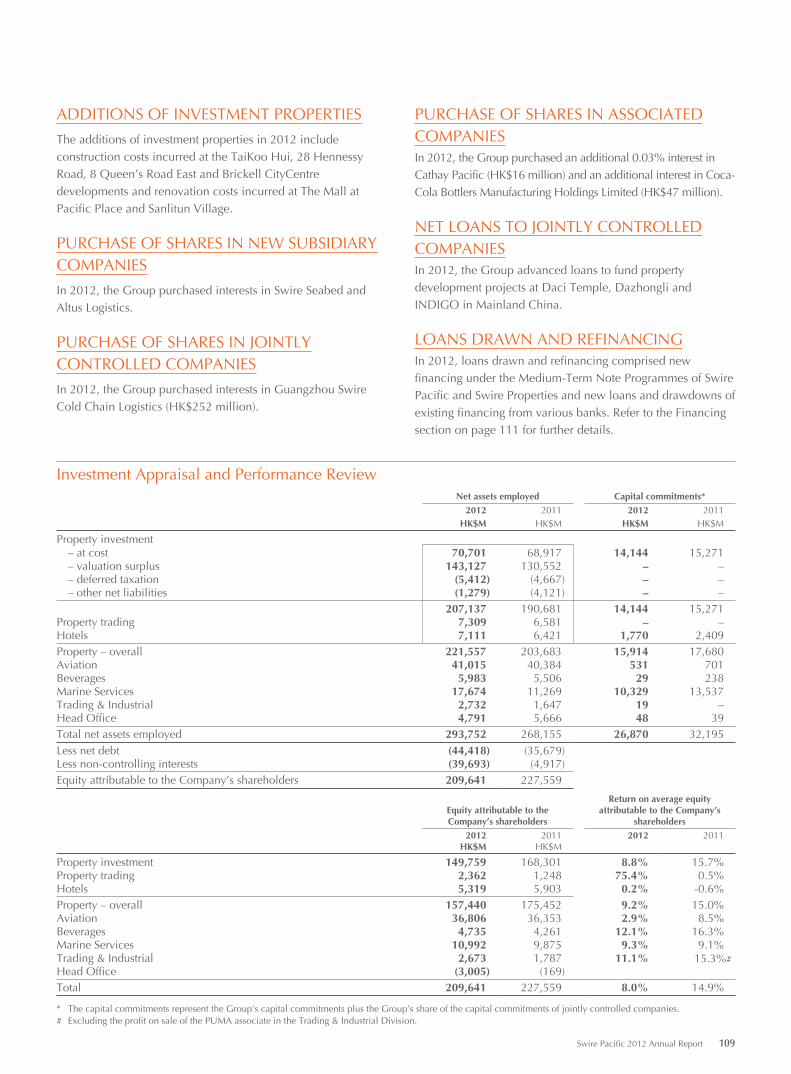
Swire Pacific 2012 Annual Report 109
ADDITIONS OF INVESTMENT PROPERTIES
The additions of investment properties in 2012 include construction costs incurred at the TaiKoo Hui, 28 Hennessy Road, 8 Queen’s Road East and Brickell CityCentre developments and renovation costs incurred at The Mall at Pacific Place and Sanlitun Village.
PURCHASE OF SHARES IN NEW SUBSIDIARY COMPANIES
In 2012, the Group purchased interests in Swire Seabed and Altus Logistics.
PURCHASE OF SHARES IN JOINTLYCONTROLLED COMPANIES
In 2012, the Group purchased interests in Guangzhou Swire Cold Chain Logistics (HK$252 million).
PURCHASE OF SHARES IN ASSOCIATEDCOMPANIESIn 2012, the Group purchased an additional 0.03% interest in Cathay Pacific (HK$16 million) and an additional interest in Coca-Cola Bottlers Manufacturing Holdings Limited (HK$47 million).
NET LOANS TO JOINTLY CONTROLLEDCOMPANIESIn 2012, the Group advanced loans to fund property development projects at Daci Temple, Dazhongli and INDIGO in Mainland China.
LOANS DRAWN AND REFINANCINGIn 2012, loans drawn and refinancing comprised new financing under the Medium-Term Note Programmes of Swire Pacific and Swire Properties and new loans and drawdowns of existing financing from various banks. Refer to the Financing section on page 111 for further details.
Investment Appraisal and Performance ReviewNet assets employed Capital commitments*
2012 2011 2012 2011HK$M HK$M HK$M HK$M
Property investment – at cost 70,701 68,917 14,144 15,271 – valuation surplus 143,127 130,552 – – – deferred taxation (5,412) (4,667) – – – other net liabilities (1,279) (4,121) – –
207,137 190,681 14,144 15,271Property trading 7,309 6,581 – –Hotels 7,111 6,421 1,770 2,409Property – overall 221,557 203,683 15,914 17,680Aviation 41,015 40,384 531 701Beverages 5,983 5,506 29 238Marine Services 17,674 11,269 10,329 13,537Trading & Industrial 2,732 1,647 19 –Head Office 4,791 5,666 48 39Total net assets employed 293,752 268,155 26,870 32,195Less net debt (44,418) (35,679)Less non-controlling interests (39,693) (4,917)Equity attributable to the Company’s shareholders 209,641 227,559
Equity attributable to theCompany’s shareholders
Return on average equityattributable to the Company’s
shareholders
2012 2011 2012 2011HK$M HK$M
Property investment 149,759 168,301 8.8% 15.7%Property trading 2,362 1,248 75.4% 0.5%Hotels 5,319 5,903 0.2% -0.6%Property – overall 157,440 175,452 9.2% 15.0%Aviation 36,806 36,353 2.9% 8.5%Beverages 4,735 4,261 12.1% 16.3%Marine Services 10,992 9,875 9.3% 9.1%Trading & Industrial 2,673 1,787 11.1% 15.3%#Head Office (3,005) (169) Total 209,641 227,559 8.0% 14.9%
* The capital commitments represent the Group’s capital commitments plus the Group’s share of the capital commitments of jointly controlled companies.# Excluding the profit on sale of the PUMA associate in the Trading & Industrial Division.
Financial Review
110 Swire Pacific 2012 Annual Report
The return on average equity decreased from 8.5% in 2011 to
2.9% in 2012. The decrease reflected lower profits from the
Cathay Pacific group.
Beverages Division
Net assets employed increased by HK$477 million (8.7%),
principally as a result of investments in Coca-Cola Bottlers
Manufacturing Holdings Limited and movements in retained profits.
The return on average equity decreased from 16.3% to 12.1%,
reflecting a decrease in attributable profit.
Marine Services Division
Net assets employed increased by HK$6,405 million (56.8%)
principally due to the purchase of seven new vessels by SPO
and investments in Swire Seabed and Altus Logistics.
The return on average equity was marginally higher at 9.3% in
2012. This principally reflected an increase in attributable profit.
Trading & Industrial Division
Net assets employed increased by HK$1,085 million,
primarily as a result of the investment in Guangzhou Swire
Cold Chain Logistics and an increase in working capital at
Taikoo Motors.
The return on average equity, excluding the profit on the sale
of PUMA in 2011, decreased from 15.3% in 2011 to 11.1%
in 2012. This principally reflected a decrease in attributable
profit and an increase in equity following the investment in
Guangzhou Swire Cold Chain Logistics.
Swire Pacific focuses on the long-term development of
businesses where it can add value through its industry-specific
expertise and particular knowledge of the Greater China
region. The Group endeavours to create value for shareholders
by making investments which exceed the target rate of return
appropriate for each of its businesses.
The tables on page 109 show where the Group’s net assets
are employed, capital commitments by division and returns
on equity attributable to the Company’s shareholders.
Property Division
Net assets employed in property investment increased by
HK$16,456 million (8.6%) during the year, principally due
to revaluation gains on investment properties and continued
investment in property projects in Mainland China.
Capital commitments at the year-end include the Group’s
share of the capital commitments of the companies
undertaking the property projects in Mainland China.
The return on average equity from property investment
decreased from 15.7% in 2011 to 8.8% in 2012, reflecting a
decrease in profit, which in turn principally reflected lower
property valuation gains.
The increase in net assets employed in property trading was
principally due to the costs of constructing residential projects
in Hong Kong, partly offset by the effect of completion of the
sales of units at the AZURA development in Hong Kong.
The increase in net assets employed in hotels was principally
due to the costs of constructing the Mandarin Oriental hotel
in Guangzhou.
Aviation Division
Net assets employed in the Aviation Division increased by
HK$631 million (1.6%). The increase principally reflects
movements in the retained profit of the Cathay Pacific group
and the HAECO group.
FINANCING
• Capital Structure• Changes in Financing• Sources of Finance
– Loans and Bonds– Perpetual Capital Securities– Bank Balances and Short-term Deposits
• Maturity Profile and Refinancing• Currency Profile• Finance Charges• Interest Cover and Gearing Ratios• Covenants and Credit Triggers• Capital Management• Key Credit Ratios
• Attributable Net Debt• Debt in Jointly Controlled and Associated Companies• Attributable Profit Correlation
Capital StructureThe Group aims to maintain a capital structure that is appropriate for long-term credit ratings of A3 to A1 on Moody’s scale, A- to A+ on Standard & Poor’s scale, and A- to A+ on Fitch’s scale. Actual credit ratings may depart from these levels from time to time due to economic or other circumstances. At 31st December 2012 the Company’s long-term credit ratings were A3 from Moody’s, A- from Standard & Poor’s, and A from Fitch and Swire Properties’ long-term credit ratings were A2 from Moody’s, A- from Standard & Poor’s and A from Fitch.
Changes in FinancingAnalysis of changes in financing during the year
Audited Financial Information2012 2011
HK$M HK$M
Loans, bonds and perpetual capital securities At 1st January 39,650 45,435 Loans drawn and refinancing 19,455 6,998 Repayment of loans and bonds (9,129) (13,078) Changes in composition of Group 585 – Other non-cash movements 103 295
50,664 39,650 Overdrafts 4 1
At 31st December 50,668 39,651
During the year, the Group raised financing amounting to HK$21,577 million. This principally comprised:
• the issue of a ten-year US dollar denominated medium-term note of US$500 million, two ten-year medium-term notes totalling HK$1,380 million and a fifteen-year medium term note of HK$200 million under Swire Pacific’s US$3.5 billion medium-term note programme
• the issue of a five-year medium-term note of HK$500 million, a seven-year medium-term note of HK$300 million and a ten-year US dollar denominated medium-term note of US$500 million under Swire Properties’ newly established US$3 billion medium-term note programme
• a five-year dual currency term and revolving credit facility of US$100 million• six three-year term and revolving credit facilities aggregating HK$6,050 million• a four-year term and revolving credit facility of HK$2,000 million• a five-year revolving credit facility of HK$1,000 million• a five-year term and revolving credit facility of HK$500 million• a five-year dual currency revolving credit facility of HK$500 million• an increase in the size of an existing two-year revolving credit facility from US$60 million to US$140 million
Significant debt repayments during the year were:
• HK$6,950 million out of a HK$10,000 million syndicated loan facility
Swire Pacific 2012 Annual Report 111
Financing
Sources of FinanceAt 31st December 2012, committed loan facilities and debt securities amounted to HK$64,591 million, of which HK$16,261 million (25%) remained undrawn. In addition, the Group had undrawn uncommitted facilities totalling HK$6,965 million. Sources of funds at 31st December 2012 comprised:
Audited Financial Information
Available Drawn
Undrawnexpiring within
one year
Undrawnexpiring
beyond oneyear
HK$M HK$M HK$M HK$M
Committed facilitiesLoans and bonds Fixed/floating rate bonds 26,629 26,629 – – Bank loans, overdrafts and other loans 35,637 19,376 2,093 14,168Perpetual capital securities 2,325 2,325 – –
Total committed facilities 64,591 48,330 2,093 14,168Uncommitted facilities
Bank loans, overdrafts and other loans 9,590 2,625 6,823 142
Total 74,181 50,955 8,916 14,310
i) Loans and BondsFor accounting purposes, the loans and bonds are classified as follows:
Audited Financial Information2012 2011
Drawn, beforeunamortised
loan feesUnamortised
loan fees Carrying value
Drawn, beforeunamortised
loan feesUnamortised
loan fees Carrying valueHK$M HK$M HK$M HK$M HK$M HK$M
Bank overdrafts and short-term loans – unsecured 1,918 – 1,918 1,333 – 1,333
Long-term loans and bonds at amortised cost 46,712 (287) 46,425 36,144 (157) 35,987
Less: amount due within one year included under current liabilities (5,510) 2 (5,508) (8,759) 9 (8,750)
41,202 (285) 40,917 27,385 (148) 27,237
112 Swire Pacific 2012 Annual Report
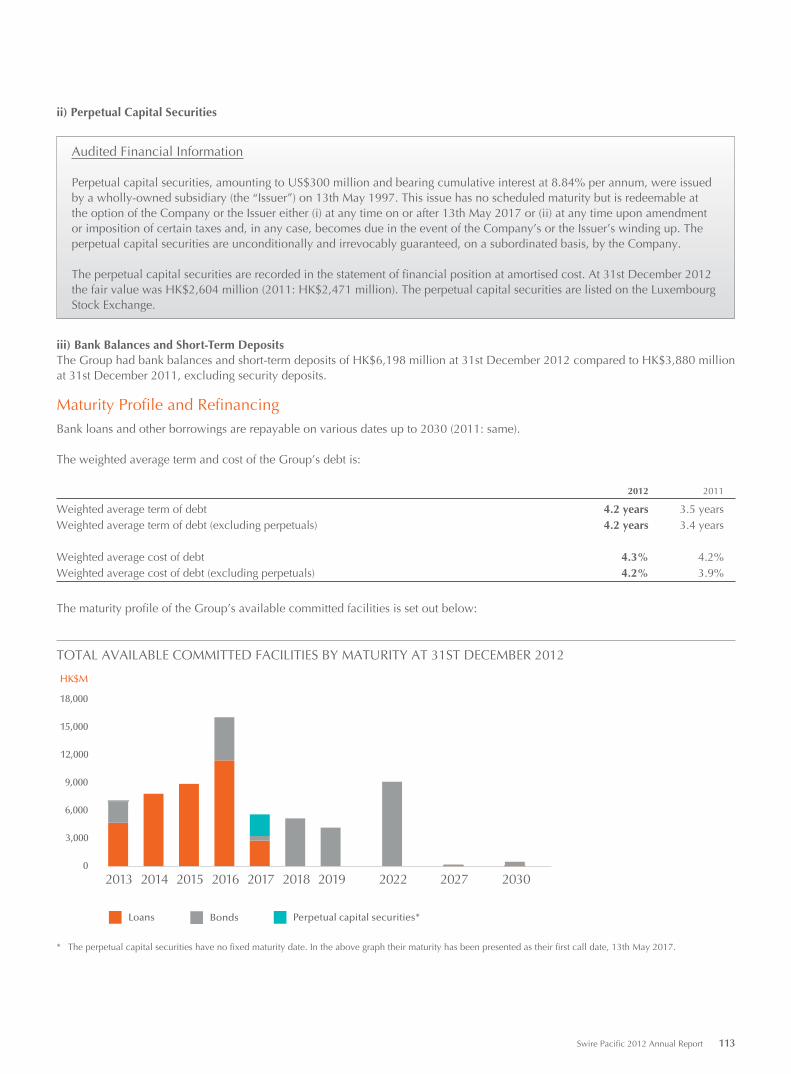
ii) Perpetual Capital Securities
Audited Financial Information
Perpetual capital securities, amounting to US$300 million and bearing cumulative interest at 8.84% per annum, were issued by a wholly-owned subsidiary (the “Issuer”) on 13th May 1997. This issue has no scheduled maturity but is redeemable at the option of the Company or the Issuer either (i) at any time on or after 13th May 2017 or (ii) at any time upon amendment or imposition of certain taxes and, in any case, becomes due in the event of the Company’s or the Issuer’s winding up. The perpetual capital securities are unconditionally and irrevocably guaranteed, on a subordinated basis, by the Company.
The perpetual capital securities are recorded in the statement of financial position at amortised cost. At 31st December 2012 the fair value was HK$2,604 million (2011: HK$2,471 million). The perpetual capital securities are listed on the Luxembourg Stock Exchange.
iii) Bank Balances and Short-Term DepositsThe Group had bank balances and short-term deposits of HK$6,198 million at 31st December 2012 compared to HK$3,880 million at 31st December 2011, excluding security deposits.
Maturity Profile and RefinancingBank loans and other borrowings are repayable on various dates up to 2030 (2011: same).
The weighted average term and cost of the Group’s debt is:
2012 2011
Weighted average term of debt 4.2 years 3.5 yearsWeighted average term of debt (excluding perpetuals) 4.2 years 3.4 years
Weighted average cost of debt 4.3% 4.2%Weighted average cost of debt (excluding perpetuals) 4.2% 3.9%
The maturity profile of the Group’s available committed facilities is set out below:
TOTAL AVAILABLE COMMITTED FACILITIES BY MATURITY AT 31ST DECEMBER 2012
0
3,000
6,000
9,000
12,000
15,000
18,000
Loans Perpetual capital securities*Bonds
2013 2014 2015 2016 2017 2018 2019 2022 2027 2030
HK$M
* The perpetual capital securities have no fixed maturity date. In the above graph their maturity has been presented as their first call date, 13th May 2017.
Swire Pacific 2012 Annual Report 113
Financing
The maturity of long-term loans and bonds is as follows:
Audited Financial Information2012 2011
HK$M HK$M
Bank loans (secured):Repayable within one year – 42
Bank loans (unsecured):Repayable within one year 3,209 8,708Repayable between one and two years 6,962 296Repayable between two and five years 9,738 10,456
Other borrowings (unsecured):Repayable within one year 2,299 –Repayable between one and two years – 2,299Repayable between two and five years 5,142 4,653Repayable after five years 19,075 9,533
46,425 35,987Amount due within one year included under current liabilities (5,508) (8,750)
40,917 27,237
Currency ProfileAn analysis of the carrying amounts of gross borrowings by currency (after cross-currency swaps) is shown below:
Audited Financial Information2012 2011
HK$M HK$M
CurrencyHong Kong dollar 35,337 70% 30,143 76%Renminbi 8,219 16% 7,039 18%United States dollar 6,441 13% 2,253 6%New Taiwan dollar 579 1% 156 –Others 92 – 60 –
Total 50,668 100% 39,651 100%
Finance ChargesAt 31st December 2012, 57% of the Group’s gross borrowings were on a fixed rate basis and 43% were on a floating rate basis (2011: 59% and 41% respectively).
The exposure of the Group’s loans and bonds to interest rate changes (after interest rate swaps) can be illustrated as follows:
Audited Financial InformationFixed interest rate maturing in:
Floatinginterest rate
1 yearor less
1 to 5years
Over 5years Total
HK$M HK$M HK$M HK$M HK$M
At 31st December 2012 21,791 2,186 5,291 19,075 48,343
At 31st December 2011 16,097 5,039 6,652 9,532 37,320
114 Swire Pacific 2012 Annual Report
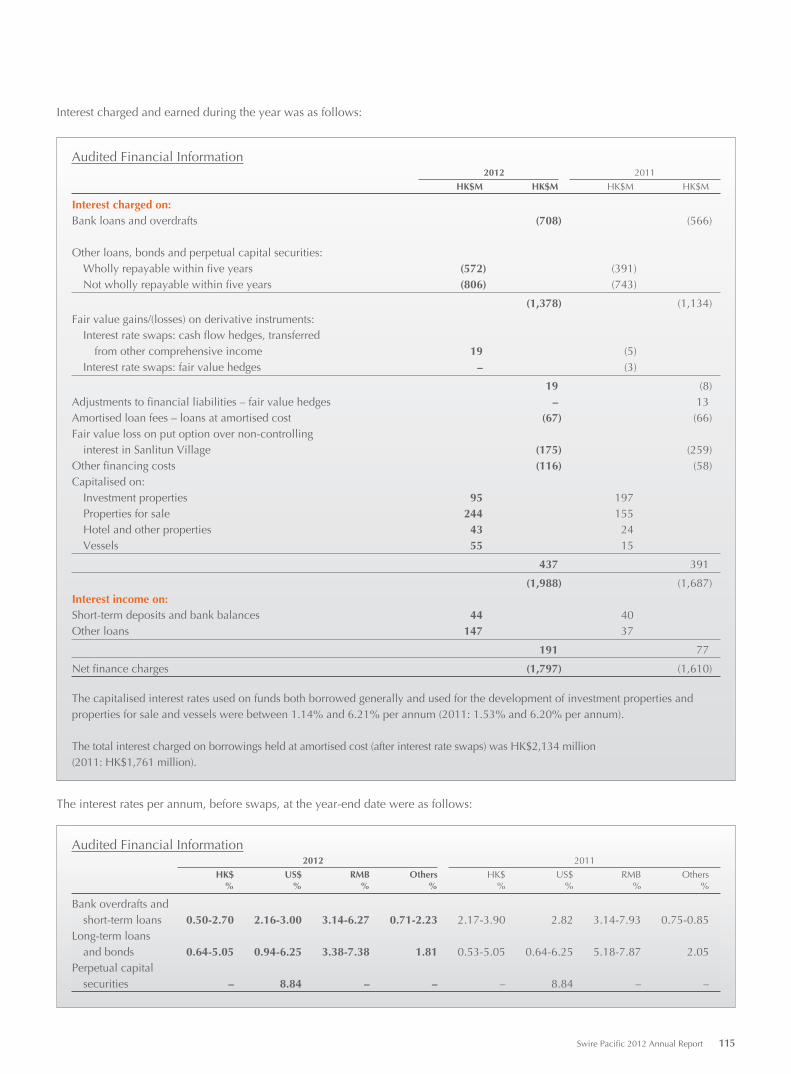
Interest charged and earned during the year was as follows:
Audited Financial Information2012 2011
HK$M HK$M HK$M HK$M
Interest charged on:Bank loans and overdrafts (708) (566)
Other loans, bonds and perpetual capital securities:Wholly repayable within five years (572) (391)Not wholly repayable within five years (806) (743)
(1,378) (1,134)Fair value gains/(losses) on derivative instruments:
Interest rate swaps: cash flow hedges, transferred from other comprehensive income 19 (5)Interest rate swaps: fair value hedges – (3)
19 (8)Adjustments to financial liabilities – fair value hedges – 13Amortised loan fees – loans at amortised cost (67) (66)Fair value loss on put option over non-controlling interest in Sanlitun Village (175) (259)Other financing costs (116) (58)Capitalised on:
Investment properties 95 197Properties for sale 244 155Hotel and other properties 43 24Vessels 55 15
437 391
(1,988) (1,687)Interest income on:Short-term deposits and bank balances 44 40Other loans 147 37
191 77
Net finance charges (1,797) (1,610)
The capitalised interest rates used on funds both borrowed generally and used for the development of investment properties and properties for sale and vessels were between 1.14% and 6.21% per annum (2011: 1.53% and 6.20% per annum).
The total interest charged on borrowings held at amortised cost (after interest rate swaps) was HK$2,134 million (2011: HK$1,761 million).
The interest rates per annum, before swaps, at the year-end date were as follows:
Audited Financial Information2012 2011
HK$ US$ RMB Others HK$ US$ RMB Others% % % % % % % %
Bank overdrafts and short-term loans 0.50-2.70 2.16-3.00 3.14-6.27 0.71-2.23 2.17-3.90 2.82 3.14-7.93 0.75-0.85Long-term loans and bonds 0.64-5.05 0.94-6.25 3.38-7.38 1.81 0.53-5.05 0.64-6.25 5.18-7.87 2.05Perpetual capital securities – 8.84 – – – 8.84 – –
Swire Pacific 2012 Annual Report 115
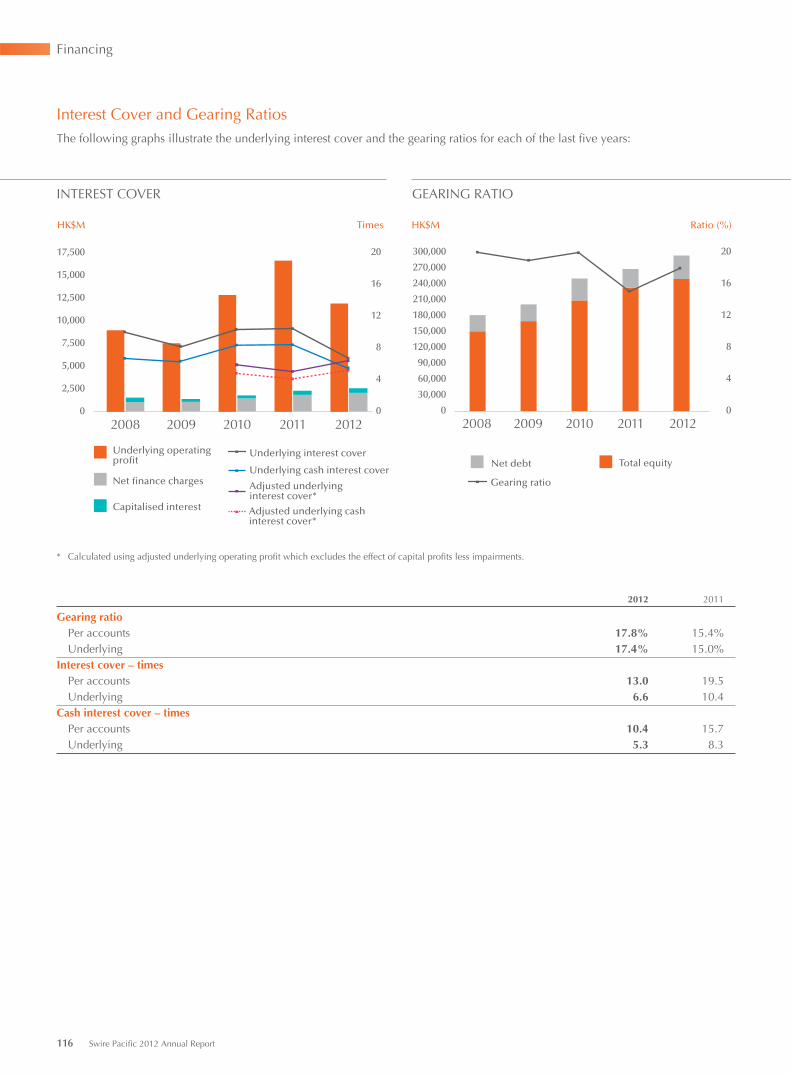
Financing
Interest Cover and Gearing RatiosThe following graphs illustrate the underlying interest cover and the gearing ratios for each of the last five years:
* Calculated using adjusted underlying operating profit which excludes the effect of capital profits less impairments.
2012 2011
Gearing ratioPer accounts 17.8% 15.4%Underlying 17.4% 15.0%
Interest cover – timesPer accounts 13.0 19.5Underlying 6.6 10.4
Cash interest cover – timesPer accounts 10.4 15.7Underlying 5.3 8.3
INTEREST COVER
0
2,500
5,000
7,500
10,000
12,500
15,000
17,500
HK$M Times
Capitalised interest
Net finance charges
Underlying operatingprofit
2009 2010 2011 20122008
Adjusted underlying cashinterest cover*
Underlying interest cover
Underlying cash interest cover
Adjusted underlying interest cover*
GEARING RATIO
2009 2010 2011 201220080
30,000
60,000
90,000
120,000
150,000
180,000
210,000
240,000
270,000
300,000
0
4
8
12
16
20
HK$M Ratio (%)
Total equityNet debt
Gearing ratio
116 Swire Pacific 2012 Annual Report
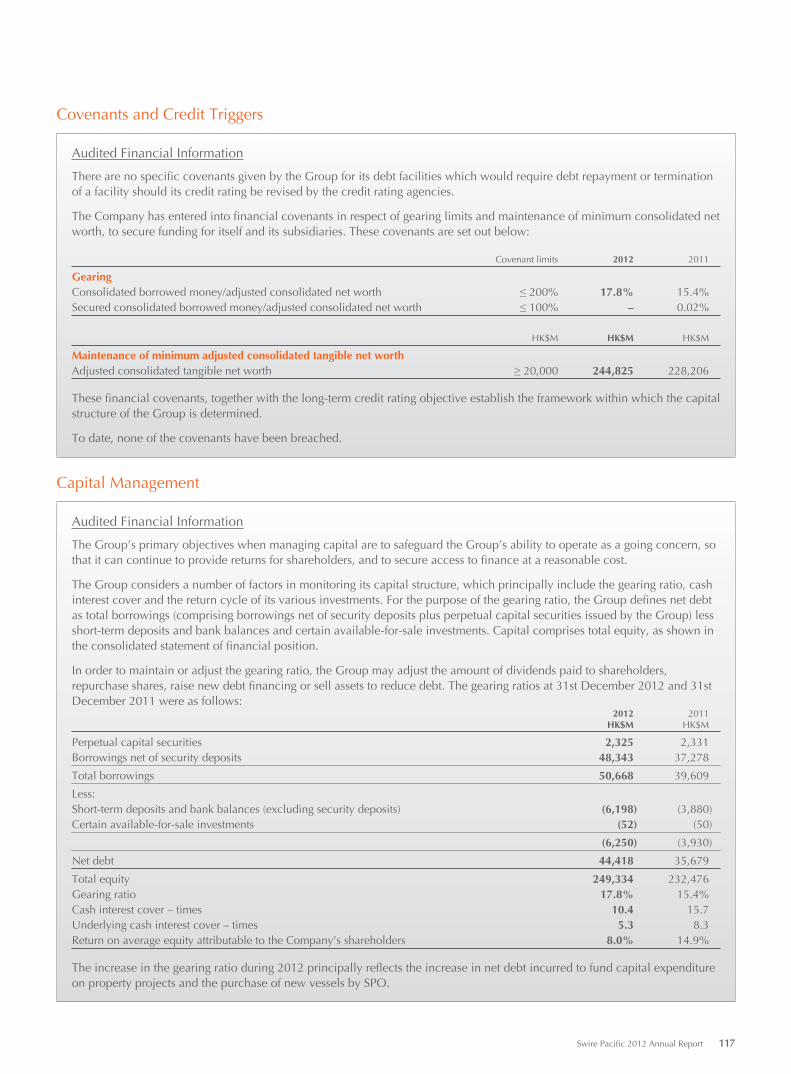
Covenants and Credit Triggers
Audited Financial Information
There are no specific covenants given by the Group for its debt facilities which would require debt repayment or termination of a facility should its credit rating be revised by the credit rating agencies.
The Company has entered into financial covenants in respect of gearing limits and maintenance of minimum consolidated net worth, to secure funding for itself and its subsidiaries. These covenants are set out below:
Covenant limits 2012 2011
GearingConsolidated borrowed money/adjusted consolidated net worth ≤ 200% 17.8% 15.4%Secured consolidated borrowed money/adjusted consolidated net worth ≤ 100% – 0.02%
HK$M HK$M HK$M
Maintenance of minimum adjusted consolidated tangible net worthAdjusted consolidated tangible net worth ≥ 20,000 244,825 228,206
These financial covenants, together with the long-term credit rating objective establish the framework within which the capital structure of the Group is determined.
To date, none of the covenants have been breached.
Capital Management
Audited Financial Information
The Group’s primary objectives when managing capital are to safeguard the Group’s ability to operate as a going concern, so that it can continue to provide returns for shareholders, and to secure access to finance at a reasonable cost.
The Group considers a number of factors in monitoring its capital structure, which principally include the gearing ratio, cash interest cover and the return cycle of its various investments. For the purpose of the gearing ratio, the Group defines net debt as total borrowings (comprising borrowings net of security deposits plus perpetual capital securities issued by the Group) less short-term deposits and bank balances and certain available-for-sale investments. Capital comprises total equity, as shown in the consolidated statement of financial position.
In order to maintain or adjust the gearing ratio, the Group may adjust the amount of dividends paid to shareholders, repurchase shares, raise new debt financing or sell assets to reduce debt. The gearing ratios at 31st December 2012 and 31st December 2011 were as follows:
2012 2011HK$M HK$M
Perpetual capital securities 2,325 2,331Borrowings net of security deposits 48,343 37,278
Total borrowings 50,668 39,609
Less:Short-term deposits and bank balances (excluding security deposits) (6,198) (3,880)Certain available-for-sale investments (52) (50)
(6,250) (3,930)
Net debt 44,418 35,679
Total equity 249,334 232,476Gearing ratio 17.8% 15.4%Cash interest cover – times 10.4 15.7Underlying cash interest cover – times 5.3 8.3Return on average equity attributable to the Company’s shareholders 8.0% 14.9%
The increase in the gearing ratio during 2012 principally reflects the increase in net debt incurred to fund capital expenditure on property projects and the purchase of new vessels by SPO.
Swire Pacific 2012 Annual Report 117
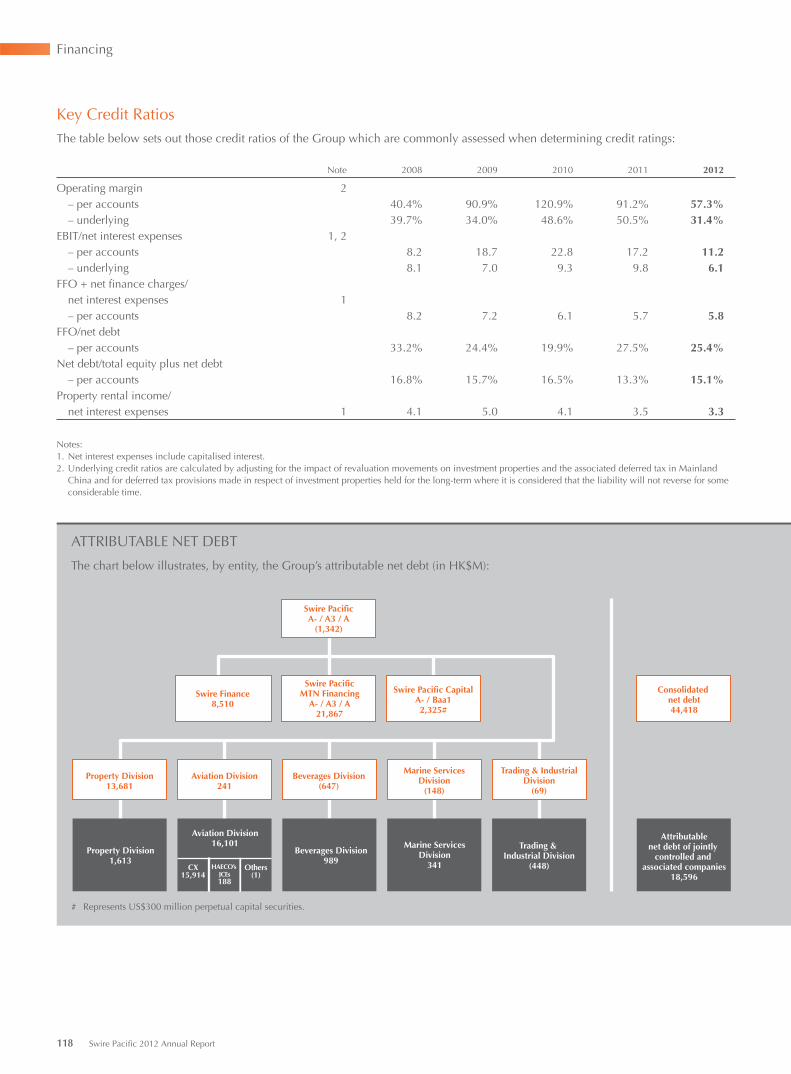
Financing
Key Credit RatiosThe table below sets out those credit ratios of the Group which are commonly assessed when determining credit ratings:
Note 2008 2009 2010 2011 2012
Operating margin 2– per accounts 40.4% 90.9% 120.9% 91.2% 57.3%– underlying 39.7% 34.0% 48.6% 50.5% 31.4%
EBIT/net interest expenses 1, 2– per accounts 8.2 18.7 22.8 17.2 11.2– underlying 8.1 7.0 9.3 9.8 6.1
FFO + net finance charges/ net interest expenses 1
– per accounts 8.2 7.2 6.1 5.7 5.8FFO/net debt
– per accounts 33.2% 24.4% 19.9% 27.5% 25.4%Net debt/total equity plus net debt
– per accounts 16.8% 15.7% 16.5% 13.3% 15.1%Property rental income/ net interest expenses 1 4.1 5.0 4.1 3.5 3.3
Notes:1. Net interest expenses include capitalised interest.2. Underlying credit ratios are calculated by adjusting for the impact of revaluation movements on investment properties and the associated deferred tax in Mainland
China and for deferred tax provisions made in respect of investment properties held for the long-term where it is considered that the liability will not reverse for some considerable time.
Aviation Division16,101
CX15,914
Property Division1,613
Beverages Division989
HAECO’s JCEs188
Others(1)
Swire Finance8,510
Swire PacificMTN Financing
A- / A3 / A21,867
Property Division13,681
Aviation Division241
Trading & IndustrialDivision
(69)
Beverages Division(647)
Marine ServicesDivision
(148)
Swire PacificA- / A3 / A
(1,342)
Swire Pacific CapitalA- / Baa12,325#
Consolidated net debt44,418
Marine ServicesDivision
341
Trading & Industrial Division
(448)
Attributablenet debt of jointly
controlled and associated companies
18,596
ATTRIBUTABLE NET DEBT
The chart below illustrates, by entity, the Group’s attributable net debt (in HK$M):
# Represents US$300 million perpetual capital securities.
118 Swire Pacific 2012 Annual Report
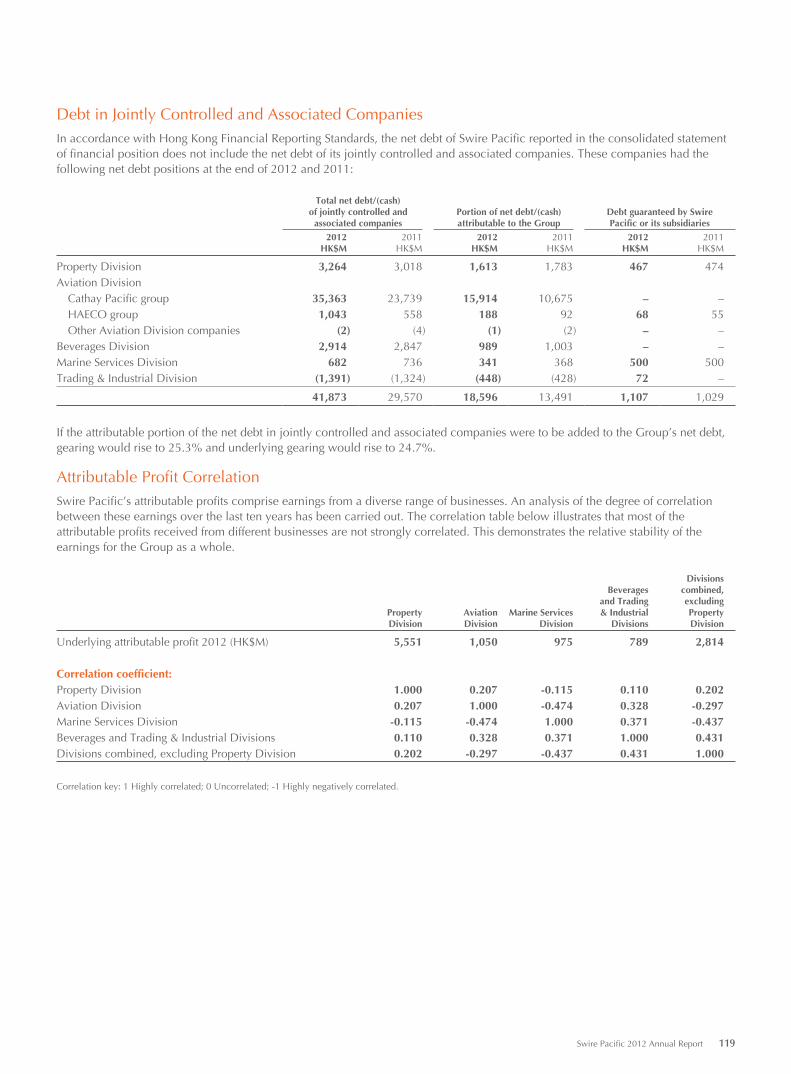
Debt in Jointly Controlled and Associated CompaniesIn accordance with Hong Kong Financial Reporting Standards, the net debt of Swire Pacific reported in the consolidated statement of financial position does not include the net debt of its jointly controlled and associated companies. These companies had the following net debt positions at the end of 2012 and 2011:
Total net debt/(cash) of jointly controlled and
associated companiesPortion of net debt/(cash) attributable to the Group
Debt guaranteed by Swire Pacific or its subsidiaries
2012 2011 2012 2011 2012 2011HK$M HK$M HK$M HK$M HK$M HK$M
Property Division 3,264 3,018 1,613 1,783 467 474Aviation Division
Cathay Pacific group 35,363 23,739 15,914 10,675 – –HAECO group 1,043 558 188 92 68 55Other Aviation Division companies (2) (4) (1) (2) – –
Beverages Division 2,914 2,847 989 1,003 – –Marine Services Division 682 736 341 368 500 500Trading & Industrial Division (1,391) (1,324) (448) (428) 72 –
41,873 29,570 18,596 13,491 1,107 1,029
If the attributable portion of the net debt in jointly controlled and associated companies were to be added to the Group’s net debt, gearing would rise to 25.3% and underlying gearing would rise to 24.7%.
Attributable Profit CorrelationSwire Pacific’s attributable profits comprise earnings from a diverse range of businesses. An analysis of the degree of correlation between these earnings over the last ten years has been carried out. The correlation table below illustrates that most of the attributable profits received from different businesses are not strongly correlated. This demonstrates the relative stability of the earnings for the Group as a whole.
PropertyDivision
AviationDivision
Marine ServicesDivision
Beverages and Trading & Industrial
Divisions
Divisions combined, excluding Property Division
Underlying attributable profit 2012 (HK$M) 5,551 1,050 975 789 2,814
Correlation coefficient:Property Division 1.000 0.207 -0.115 0.110 0.202Aviation Division 0.207 1.000 -0.474 0.328 -0.297Marine Services Division -0.115 -0.474 1.000 0.371 -0.437Beverages and Trading & Industrial Divisions 0.110 0.328 0.371 1.000 0.431Divisions combined, excluding Property Division 0.202 -0.297 -0.437 0.431 1.000
Correlation key: 1 Highly correlated; 0 Uncorrelated; -1 Highly negatively correlated.
Swire Pacific 2012 Annual Report 119
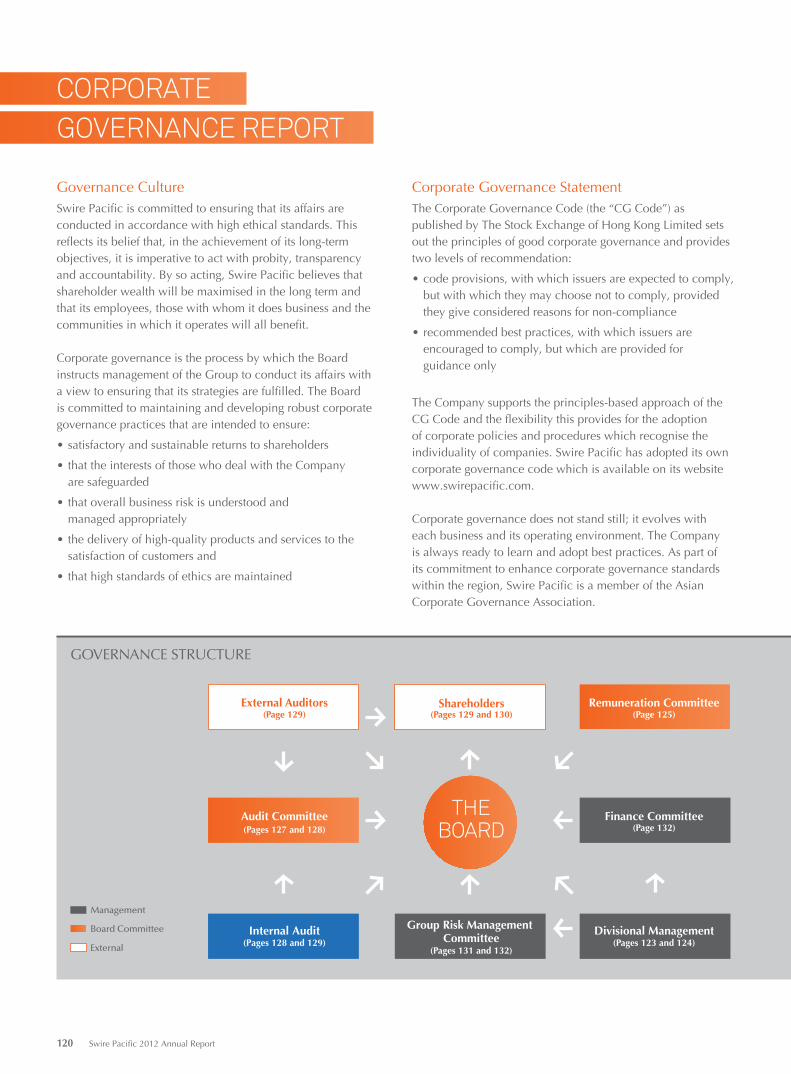
CORPORATEGOVERNANCE REPORT
Corporate Governance StatementThe Corporate Governance Code (the “CG Code”) as published by The Stock Exchange of Hong Kong Limited sets out the principles of good corporate governance and provides two levels of recommendation:
•codeprovisions,withwhichissuersareexpectedtocomply,butwithwhichtheymaychoosenottocomply,providedthey give considered reasons for non-compliance
•recommendedbestpractices,withwhichissuersareencouragedtocomply,butwhichareprovidedfor guidance only
The Company supports the principles-based approach of the CG Code and the flexibility this provides for the adoption of corporate policies and procedures which recognise the individuality of companies. Swire Pacific has adopted its own corporate governance code which is available on its website www.swirepacific.com.
Corporate governance does not stand still; it evolves with each business and its operating environment. The Company is always ready to learn and adopt best practices. As part of its commitment to enhance corporate governance standards withintheregion,SwirePacificisamemberoftheAsianCorporate Governance Association.
Governance CultureSwire Pacific is committed to ensuring that its affairs are conducted in accordance with high ethical standards. This reflectsitsbeliefthat,intheachievementofitslong-termobjectives,itisimperativetoactwithprobity,transparencyandaccountability.Bysoacting,SwirePacificbelievesthatshareholder wealth will be maximised in the long term and thatitsemployees,thosewithwhomitdoesbusinessandthecommunities in which it operates will all benefit.
Corporate governance is the process by which the Board instructs management of the Group to conduct its affairs with a view to ensuring that its strategies are fulfilled. The Board is committed to maintaining and developing robust corporate governance practices that are intended to ensure:
•satisfactoryandsustainablereturnstoshareholders
•thattheinterestsofthosewhodealwiththeCompany are safeguarded
•thatoverallbusinessriskisunderstoodand managed appropriately
•thedeliveryofhigh-qualityproductsandservicestothesatisfaction of customers and
•thathighstandardsofethicsaremaintained
Management
Board Committee
External
Shareholders Remuneration Committee
Finance Committee
Divisional ManagementGroup Risk Management Committee
Internal Audit
Audit Committee
External Auditors
THEBOARD
GOVERNANCE STRUCTURE
(Pages 129 and 130) (Page 125)
(Page 132)
(Pages 123 and 124)(Pages 131 and 132)
(Pages 128 and 129)
(Pages 127 and 128)
(Page 129)
120 Swire Pacific 2012 Annual Report
The Company complied with all the code provisions set out in the CG Code contained in Appendix 14 to the Rules Governing the Listing of Securities on The Stock Exchange of Hong Kong Limited (the “Listing Rules”) throughout the year covered by the annual report with the following exceptions which it believes do not benefit shareholders:
• Sections A.5.1 to A.5.4 of the CG Code in respect of the establishment, terms of reference and resources of a nomination committee. The Board has considered the merits of establishing a nomination committee but has concluded that it is in the best interests of the Company and potential new appointees that the Board collectively reviews and approves the appointment of any new Director as this allows a more informed and balanced decision to be made by both the potential Director and the Board as to suitability for the role.
The Board of DirectorsRole of the Board
The Company is governed by a Board of Directors, which has responsibility for strategic leadership and control of the Group designed to maximise shareholder value, while taking due account of the broad range of stakeholder interests.
Responsibility for achieving the Company’s objectives and running the business on a day-to-day basis is delegated to divisional management. The Board exercises a number of reserved powers which include:
• maintaining and promoting the culture of the Company
• formulation of long-term strategy
• approving public announcements, including accounts
• committing to major acquisitions, divestments and capital projects
• authorising significant changes to the capital structure and material borrowings
• any issue, or buy-back, of equity securities under the relevant general mandates
• approving treasury policy
• setting dividend policy
• approving appointments to the Board
• ensuring that appropriate management development and succession plans are in place
• setting the Group remuneration policy
• approving annual budgets and forecasts
• reviewing operational and financial performance
• reviewing the effectiveness of internal control and risk management, including the adequacy of the resources,
staff qualifications and experience, training programmes and budget of the Company’s accounting and financial reporting function
To assist it in fulfilling its duties, the Board has established two primary committees, the Audit Committee (see pages 127 and 128) and the Remuneration Committee (see page 125).
Chairman and Chief Executive
The CG Code requires that the roles of Chairman and Chief Executive be separate and not performed by the same individual to ensure there is a clear division of responsibilities between the running of the Board and the executives who run the business.
C D Pratt, the Chairman, is responsible for:
• leadership of the Board
• setting its agenda and taking into account any matters proposed by other Directors for inclusion in the agenda
• facilitating effective contributions from and dialogue with all Directors and constructive relations between them
• ensuring that all Directors are properly briefed on issues arising at Board meetings and that they receive accurate, timely and clear information
• obtaining consensus amongst the Directors
• ensuring, through the Board, that good corporate governance practices and procedures are followed
Each division of the Group has one or more Executive Directors or Officers who are responsible for implementing the policies and strategies set by the Board in order to ensure the successful day-to-day management of the Group’s individual businesses (see pages 123 and 124). During the year, these executives were: M Cubbon (Property), J R Slosar and Augustus Tang (Aviation), G L Cundle (Beverages) and J B Rae-Smith (Marine Services and Trading & Industrial).
Throughout the year, there was a clear division of responsibilities between the Chairman and the management executives named above.
Board Composition
The Board is structured with a view to ensuring it is of a high calibre and has a balance of key skills and knowledge so that it works effectively as a team and individuals or groups do not dominate decision-making.
The Board comprises the Chairman, six other Executive Directors and ten Non-Executive Directors. Their biographical details are set out on pages 135 to 136 of this report and are posted on the Company’s website.
Swire Pacific 2012 Annual Report 121
Corporate Governance Report
M Cubbon, J W J Hughes-Hallett, P A Kilgour, C D Pratt, I S C Shiu, J R Slosar and A K W Tang are directors and employees of the John Swire & Sons Limited (“Swire”) group. G L Cundle was a director and employee of the Swire group. Baroness Dunn and M B Swire are shareholders, directors and employees of Swire. J.B. Rae-Smith is a director and employee of the Swire group and a shareholder of Swire.
The Non-Executive Directors bring independent advice, judgement and, through constructive challenge, scrutiny of executives and review of performance and risks. The Audit and Remuneration Committees of the Board comprise only Non-Executive Directors.
The Board considers that six of the ten Non-Executive Directors are independent in character and judgement and fulfil the independence guidelines set out in Rule 3.13 of the Listing Rules. T G Freshwater was a Director of Goldman Sachs (Asia) L.L.C. (“GS”) until his resignation with effect from 1st April 2012. R W M Lee and M M T Yang are Directors of The Hongkong and Shanghai Banking Corporation Limited (“HSBC”). GS and HSBC (together with BOCI Asia Limited and Morgan Stanley Asia Limited) were engaged by the Company and Swire Properties Limited as joint sponsors in respect of the spin-off and listing of shares in Swire Properties Limited which took place on 18th January 2012. T G Freshwater, R W M Lee and M M T Yang had no personal involvement in the engagement. In these circumstances, the Board does not consider the fact that T G Freshwater, R W M Lee and M M T Yang are Directors of companies which were so engaged to be sufficiently material to affect their independence. C K M Kwok, C Lee and M M T Yang have served as Non-Executive Directors for more than nine years. The Directors are of the opinion that they remain independent, notwithstanding their length of tenure. C K M Kwok, C Lee and M M T Yang continue to demonstrate the attributes of an Independent Non-Executive Director noted above and there is no evidence that their tenure has had any impact on their independence. The Board believes that their detailed knowledge and experience of the Group’s business and their external experience continue to be of significant benefit to the Company, and that they maintain an independent view of its affairs.
Confirmation has been received from all Independent Non-Executive Directors that they are independent as set out in Rule 3.13 of the Listing Rules. In their confirmations T G Freshwater, R W M Lee and M M T Yang have noted the directorships referred to above.
The Independent Non-Executive Directors:
• provide open and objective challenge of management and the Board members
• raise intelligent questions and challenge constructively and with vigour
• bring outside knowledge of the businesses and markets in which the Group operates, providing informed insight and responses to management
The number of Independent Non-Executive Directors represented at least one-third of the Board of Directors.
Appointment and Re-election
Potential new Directors are identified and considered for appointment by the Board. A Director appointed by the Board is subject to election by shareholders at the first annual general meeting after his or her appointment, and all Executive and Non-Executive Directors are subject to re-election by shareholders every three years.
Potential new Board members are identified on the basis of skills and experience which, in the opinion of the Directors, will enable them to make a positive contribution to the performance of the Board.
Full details of changes in the Board during the year and to the date of this report are provided in the Directors’ Report on page 139.
Responsibilities of Directors
On appointment, the Directors receive information about the Group including:
• the role of the Board and the matters reserved for its attention
• the role and terms of Board Committees
• the Group’s corporate governance practices and procedures
• the powers delegated to management and
• the latest financial information
Directors update their skills, knowledge and familiarity with the Group through their ongoing participation at meetings of the Board and its committees and through regular meetings with management at the head office and in the divisions. Directors are regularly updated by the Company Secretary on their legal and other duties as Directors of a listed company.
Through the Company Secretary, Directors are able to obtain appropriate professional training and advice.
Each Director ensures that he can give sufficient time and attention to the affairs of the Group. All Directors disclose to the Board on their first appointment their interests as a Director or otherwise in other companies or organisations and such declarations of interests are updated regularly.
Details of Directors’ other appointments are shown in their biographies on pages 135 to 136.
122 Swire Pacific 2012 Annual Report
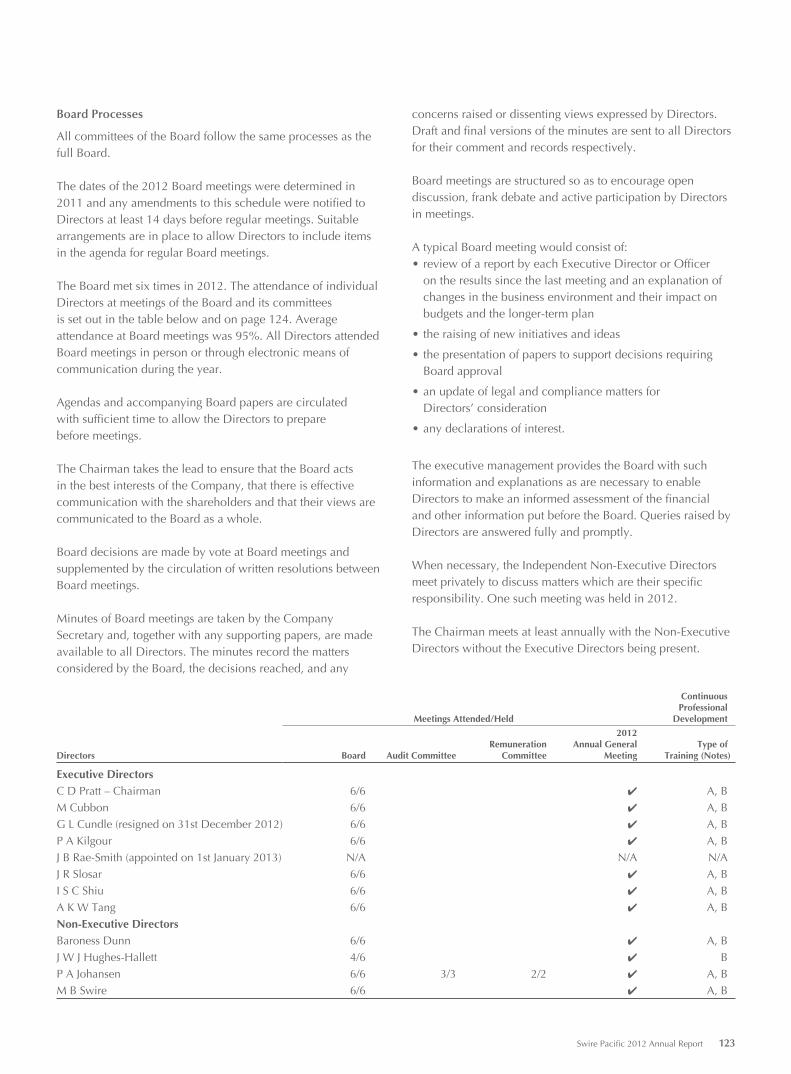
Board Processes
All committees of the Board follow the same processes as the full Board.
The dates of the 2012 Board meetings were determined in 2011 and any amendments to this schedule were notified to Directors at least 14 days before regular meetings. Suitable arrangements are in place to allow Directors to include items in the agenda for regular Board meetings.
The Board met six times in 2012. The attendance of individual Directors at meetings of the Board and its committees is set out in the table below and on page 124. Average attendance at Board meetings was 95%. All Directors attended Board meetings in person or through electronic means of communication during the year.
Agendas and accompanying Board papers are circulated with sufficient time to allow the Directors to prepare before meetings.
The Chairman takes the lead to ensure that the Board acts in the best interests of the Company, that there is effective communication with the shareholders and that their views are communicated to the Board as a whole.
Board decisions are made by vote at Board meetings and supplemented by the circulation of written resolutions between Board meetings.
Minutes of Board meetings are taken by the Company Secretary and, together with any supporting papers, are made available to all Directors. The minutes record the matters considered by the Board, the decisions reached, and any
concerns raised or dissenting views expressed by Directors. Draft and final versions of the minutes are sent to all Directors for their comment and records respectively.
Board meetings are structured so as to encourage open discussion, frank debate and active participation by Directors in meetings.
A typical Board meeting would consist of:• review of a report by each Executive Director or Officer
on the results since the last meeting and an explanation of changes in the business environment and their impact on budgets and the longer-term plan
• the raising of new initiatives and ideas
• the presentation of papers to support decisions requiring Board approval
• an update of legal and compliance matters for Directors’ consideration
• any declarations of interest.
The executive management provides the Board with such information and explanations as are necessary to enable Directors to make an informed assessment of the financial and other information put before the Board. Queries raised by Directors are answered fully and promptly.
When necessary, the Independent Non-Executive Directors meet privately to discuss matters which are their specific responsibility. One such meeting was held in 2012.
The Chairman meets at least annually with the Non-Executive Directors without the Executive Directors being present.
Directors
Meetings Attended/Held
ContinuousProfessional
Development
Board Audit CommitteeRemuneration
Committee
2012Annual General
MeetingType of
Training (Notes)
Executive DirectorsC D Pratt – Chairman 6/6 ✔ A, BM Cubbon 6/6 ✔ A, BG L Cundle (resigned on 31st December 2012) 6/6 ✔ A, BP A Kilgour 6/6 ✔ A, BJ B Rae-Smith (appointed on 1st January 2013) N/A N/A N/AJ R Slosar 6/6 ✔ A, BI S C Shiu 6/6 ✔ A, BA K W Tang 6/6 ✔ A, BNon-Executive DirectorsBaroness Dunn 6/6 ✔ A, BJ W J Hughes-Hallett 4/6 ✔ BP A Johansen 6/6 3/3 2/2 ✔ A, BM B Swire 6/6 ✔ A, B
Swire Pacific 2012 Annual Report 123
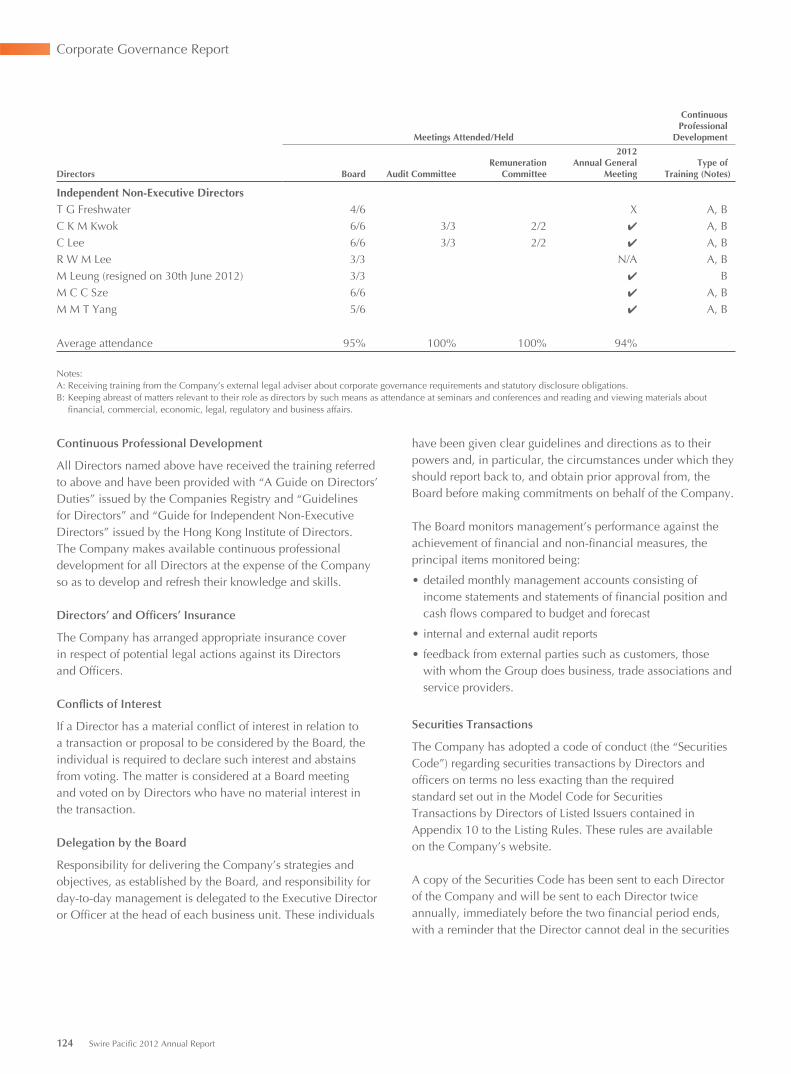
Corporate Governance Report
Directors
Meetings Attended/Held
ContinuousProfessional
Development
Board Audit CommitteeRemuneration
Committee
2012Annual General
MeetingType of
Training (Notes)
Independent Non-Executive DirectorsT G Freshwater 4/6 X A, BC K M Kwok 6/6 3/3 2/2 ✔ A, BC Lee 6/6 3/3 2/2 ✔ A, BR W M Lee 3/3 N/A A, BM Leung (resigned on 30th June 2012) 3/3 ✔ BM C C Sze 6/6 ✔ A, BM M T Yang 5/6 ✔ A, B
Average attendance 95% 100% 100% 94%
Notes:A: Receiving training from the Company’s external legal adviser about corporate governance requirements and statutory disclosure obligations.B: Keeping abreast of matters relevant to their role as directors by such means as attendance at seminars and conferences and reading and viewing materials about
financial, commercial, economic, legal, regulatory and business affairs.
Continuous Professional Development
All Directors named above have received the training referred to above and have been provided with “A Guide on Directors’ Duties” issued by the Companies Registry and “Guidelines for Directors” and “Guide for Independent Non-Executive Directors” issued by the Hong Kong Institute of Directors. The Company makes available continuous professional development for all Directors at the expense of the Company so as to develop and refresh their knowledge and skills.
Directors’ and Officers’ Insurance
The Company has arranged appropriate insurance cover in respect of potential legal actions against its Directors and Officers.
Conflicts of Interest
If a Director has a material conflict of interest in relation to a transaction or proposal to be considered by the Board, the individual is required to declare such interest and abstains from voting. The matter is considered at a Board meetingand voted on by Directors who have no material interest inthe transaction.
Delegation by the Board
Responsibility for delivering the Company’s strategies and objectives, as established by the Board, and responsibility for day-to-day management is delegated to the Executive Director or Officer at the head of each business unit. These individuals
have been given clear guidelines and directions as to their powers and, in particular, the circumstances under which they should report back to, and obtain prior approval from, the Board before making commitments on behalf of the Company.
The Board monitors management’s performance against the achievement of financial and non-financial measures, the principal items monitored being:
• detailed monthly management accounts consisting of income statements and statements of financial position and cash flows compared to budget and forecast
• internal and external audit reports
• feedback from external parties such as customers, those with whom the Group does business, trade associations and service providers.
Securities Transactions
The Company has adopted a code of conduct (the “Securities Code”) regarding securities transactions by Directors and officers on terms no less exacting than the required standard set out in the Model Code for Securities Transactions by Directors of Listed Issuers contained in Appendix 10 to the Listing Rules. These rules are available on the Company’s website.
A copy of the Securities Code has been sent to each Director of the Company and will be sent to each Director twice annually, immediately before the two financial period ends, with a reminder that the Director cannot deal in the securities
124 Swire Pacific 2012 Annual Report
and derivatives of the Company during the blackout period before the Group’s interim and annual results have been published, and that all their dealings must be conducted in accordance with the Securities Code.
Under the Securities Code, Directors and senior executives of the Company are required to notify the Chairman and receive a dated written acknowledgement before dealing in the securities and derivatives of the Company and, in the case of the Chairman himself, he must notify the Chairman of the Audit Committee and receive a dated written acknowledgement before any dealing.
On specific enquiries made, all the Directors of the Company have confirmed that they have complied with the required standard set out in the Securities Code.
Directors’ interests as at 31st December 2012 in the shares of the Company and its associated corporations (within the meaning of Part XV of the Securities and Futures Ordinance) are set out on pages 140 to 142.
Remuneration CommitteeFull details of the remuneration of the Directors and an Executive Officer are provided in note 9 to the accounts.
The Remuneration Committee comprises three Non-Executive Directors, C K M Kwok, C Lee and P A Johansen. Two of the Committee members are Independent Non-Executive Directors, one of whom, C Lee is Chairman. All the members served for the whole of 2012.
The Remuneration Committee reviews and approves the management’s remuneration proposals with reference to the Board’s corporate goals and objectives.
The Remuneration Committee exercises the powers of the Board to determine the remuneration packages of individual executive directors and individual members of senior management, (including salaries, bonuses, benefits in kind and the terms on which they participate in any provident fund or other retirement benefit scheme) taking into consideration salaries paid by comparable companies, time commitments and responsibilities and employment conditions elsewhere in the group.
The terms of reference of the Remuneration Committee have been reviewed with reference to the CG Code and are posted on the Company’s website.
A Services Agreement exists between the Company and John Swire & Sons (H.K.) Limited, a wholly-owned subsidiary of John Swire & Sons Limited, which is the parent company of the Swire group. This agreement has been considered in detail and approved by the Independent Non-Executive Directors of the Company. Under the terms of the agreement, staff at various levels, including Executive Directors and an Executive Officer, are seconded to the Company. These staff report to and take instructions from the Board of the Company but remain employees of the Swire group. As a substantial shareholder of the Company, it is in the best interests of the Swire group to ensure that executives of high quality are seconded to and retained within the Swire Pacific Group.
In order to be able to attract and retain staff of suitable calibre, the Swire group provides a competitive remuneration package designed to be commensurate, overall, with those of its peer group. This typically comprises salary, housing, retirement benefits, leave-passage and education allowances and, after three years’ service, a bonus related to the overall profit of the Swire group, of which the predominant element is derived from the Swire Pacific Group.
Although the remuneration of these executives is not entirely linked to the profits of the businesses in which they are working, it is considered that, given the different profitability of businesses within the Group, these arrangements have contributed considerably to the maintenance of a flexible, motivated and high-calibre senior management team within the Group.
The Remuneration Committee reviewed the structure and levels of remuneration paid to Executive Directors and an Executive Officer at its meeting in November 2012. At this meeting the Committee considered a report prepared for it by Mercer Limited, an independent firm of consultants, which confirmed that the remuneration of the Company’s Executive Directors and an Executive Officer, as disclosed in note 9 to the accounts was comparable with that paid to equivalent executives in peer group companies.
No Director takes part in any discussion about his or herown remuneration.
Swire Pacific 2012 Annual Report 125
Corporate Governance Report
The following fee levels have been approved by the Board:
2012 2013Fee HK$ HK$
Director’s Fee 690,000 690,000Fee for Audit Committee Chairman 240,000 240,000Fee for Audit Committee Member 180,000 180,000Fee for Remuneration Committee Chairman 75,000 75,000Fee for Remuneration Committee Member 58,000 58,000
Accountability and AuditFinancial Reporting
The Board acknowledges its responsibility for:• the proper stewardship of the Company’s affairs, to ensure
the integrity of financial information
• preparing annual and interim accounts and other related information that give a true and fair view of the Group’s affairs and of its results and cash flows for the relevant periods, in accordance with Hong Kong Financial Reporting Standards and the Hong Kong Companies Ordinance
• selecting appropriate accounting policies and ensuring that these are consistently applied
• making judgements and estimates that are prudent and reasonable; and
• ensuring that the application of the going concern assumption is appropriate
Internal Controls
The Board acknowledges its responsibility to establish, maintain and review the effectiveness of the Group’s system of internal controls with a view to ensuring that shareholders’ investments and the Company’s assets are safeguarded. This responsibility is primarily fulfilled on its behalf by the Audit Committee as discussed on pages 127 and 128.
The foundation of a strong system of internal control is dependent on the ethics and culture of the organisation, the quality and competence of its personnel, the direction provided by the Board, and the effectiveness of management.
Since profits are, in part, the reward for successful risk taking in business, the purpose of internal controls is to help manage and control, rather than eliminate, risk. Consequently internal controls can only provide reasonable, and not absolute, assurance against misstatement or loss.
The key components of the Group’s control structure are as follows:
Culture: The Board believes that good governance reflects the culture of an organisation. This is more significant than any written procedures.
The Company aims at all times to act ethically and with integrity, and to instil this behaviour in all its employees by example from the Board down. The Company has a Code of Conduct, which is posted on its internal intranet site.
The Company is committed to developing and maintaining high professional and ethical standards. These are reflected in the rigorous selection process and career development plans for all employees. The organisation prides itself on being a long-term employer which instils in individuals, as they progress through the Group, a thorough understanding of the Company’s ways of thinking and acting.
Channels of communication are clearly established, allowing employees a means of communicating their views upwards with a willingness on the part of more senior personnel to listen. Employees are aware that, whenever the unexpected occurs, attention should be given not only to the event itself, but also to determining the cause.
Through the Company’s Code of Conduct, employees are encouraged (and instructed as to how) to report control deficiencies or suspicions of impropriety to those who are in a position to take necessary action.
Risk assessment: The Board of Directors and the management each have a responsibility to identify and analyse the risks underlying the achievement of business objectives, and to determine how such risks should be managed and mitigated.
There are two key management committees which monitor risk processes throughout the Group; the Group Risk Management Committee (“GRMC”) and the Finance Committee. These primarily comprise senior management and both are chaired by the Group Finance Director, who reports to the Board on matters of significance that arise.
126 Swire Pacific 2012 Annual Report
The GRMC, discussed further on pages 131 and 132, focuses on business, operational, safety, security, legal and reputational risks. The Finance Committee, discussed further on page 132, focuses on broad financial and treasury risks.
Management structure: The Group has a clear organisational structure that, to the extent required, delegates the day-to-dayresponsibility for the design, documentation and implementation of procedures and monitoring of risk. Individuals appreciate where they will be held accountable in this process.
A control self-assessment process requires the management in each material business unit to assess, through the use of detailed questionnaires, the adequacy and effectiveness of controls over the reliability of financial reporting, the effectiveness and efficiency of operations and compliance with applicable laws and regulations. This process and its results are reviewed by internal auditors and form part of the Audit Committee’s annual assessment of control effectiveness.
Controls and review: The control environment comprises policies and procedures intended to ensure that relevant management directives are carried out and actions that may be needed to address risks are taken. These may include approvals and verifications, reviews, safeguarding of assets and segregation of duties. Control activities can be divided into operations, financial reporting and compliance, although there may, on occasion, be some overlap between them. The typical control activities adopted by Group companies include:
• analytical reviews: for example, conducting reviews of actual performance versus budgets, forecasts, prior periods and competitors
• direct functional or activity management: reviews of performance reports, conducted by managers in charge of functions or activities
• information-processing: performing controls intended to check the authorisation of transactions and the accuracy and completeness of their reporting, for example, exception reports
• physical controls: ensuring equipment, inventories, securities and other assets are safeguarded and subjected to periodic checks
• performance indicators: carrying out analyses of different sets of data, operational and financial, examining the relationships between them, and taking corrective action where necessary
• segregation of duties: dividing and segregating duties among different people, with a view to strengthening checks and minimising the risk of errors and abuse.
The Company has in place effective processes and systems for the identification, capture and reporting of operational, financial and compliance-related information in a form and time-frame intended to ensure that staff carry out their designated responsibilities.
Internal audit: Independent of management, the Internal Audit department reports directly to the Chairman and performs regular reviews of key risk areas and monitors compliance with Group accounting, financial and operational procedures. The role of Internal Audit is discussed further on pages 128 and 129.
Audit CommitteeThe Audit Committee, consisting of three Non-Executive Directors, C K M Kwok, C Lee and P A Johansen, assists the Board in discharging its responsibilities for corporate governance and financial reporting. Two of the Committee members are Independent Non-Executive Directors, one of whom, C K M Kwok, is Chairman. All the members served for the whole of 2012.
The terms of reference of the Audit Committee follow the guidelines set out by the Hong Kong Institute of Certified Public Accountants and comply with the CG Code. They are available on the Company’s website.
The Audit Committee met three times in 2012. Regular attendees at the Audit Committee meetings are the Group Finance Director, the Head of Internal Audit and the external auditors. The Audit Committee meets at least twice a year with the external auditors without the presence of management. Each meeting receives written reports from the Group Risk Management Committee, the external auditors and Internal Audit. Other attendees during the year included the Group Finance Manager and the Group Risk Manager.
The work of the Committee during 2012 included reviews of the following matters:
• the completeness, accuracy and integrity of formal announcements relating to the Group’s performance including the 2011 annual and 2012 interim reports and announcements, with recommendations to the Board for approval
• the Group’s compliance with regulatory and statutory requirements
• the Group’s internal controls and risk management systems and its compliance with the CG Code
Swire Pacific 2012 Annual Report 127
Corporate Governance Report
• the Group’s risk management processes
• the approval of the 2013 annual Internal Audit programme and review of progress on the 2012 programme
• periodic reports from Internal Audit and progress in resolving any matters identified in them
• significant accounting and audit issues
• the Company’s policy regarding connected transactions and the nature of such transactions
• the relationship with the external auditors as discussed on page 129
• the Company’s compliance with the CG Code, in particular with the amendments which came into effect on 1st April 2012.
In 2013, the Committee has reviewed, and recommended to the Board for approval, the 2012 accounts.
Assessing the Effectiveness of Internal Controls
On behalf of the Board, the Audit Committee reviews annually the continued effectiveness of the Group’s systems of internal controls dealing with risk and financial accounting and reporting, the effectiveness and efficiency of operations, compliance with laws and regulations, and risk management functions.
This assessment considers:• the scope and quality of management’s monitoring of
risks and of the systems of internal control, the work of Internal Audit and the assurances provided by the Group Finance Director
• the changes in the nature and extent of significant risks since the previous review and the Group’s ability to respond to changes in its business and the external environment
• the extent and frequency with which the results of monitoring are communicated, enabling the Committee to build up a cumulative assessment of the state of control in the Group and the effectiveness with which risk is being managed
• the incidence of any significant control failings or weaknesses that have been identified at any time during the period and the extent to which they have resulted in unforeseen outcomes or contingencies that have had, could have had, or may in the future have, a material impact on the Company’s financial performance or position
• the effectiveness of the Company’s processes in relation to financial reporting and statutory and regulatory compliance
• areas of risk identified by management
• significant risks reported by Internal Audit and the Group Risk Management Committee
• work programmes proposed by both Internal Audit and the external auditors
• significant issues arising from internal and external audit reports
• the results of management’s control self assessment exercise.
As a result of the above review, the Board confirms that the Group’s internal control systems are adequate and effective and have complied with the CG Code provisions on internal control throughout the year and up to the date of this annual report.
Company SecretaryThe Company Secretary is an employee of the Company and is appointed by the Board. The Company Secretary is responsible for facilitating the Board’s processes and communications among Board members, with shareholders and with management. The Company Secretary undertakes at least 15 hours of relevant professional training annually to update his skills and knowledge.
Internal Audit DepartmentThe Swire group has had an Internal Audit Department (“IA”) in place for 17 years. IA plays a critical role in monitoring the governance of the Group. The department is staffed by 21 audit professionals and conducts audits of the Group and of other companies in the Swire group. The 21 professionals include a team based in Mainland China which reports to IA in Hong Kong.
IA reports directly to the Chairman of the Board and, without the need to consult with management, to the Chairman of the Audit Committee and via him to the Board. IA has unrestricted access to all areas of the Group’s business units, assets, records and personnel in the course of conducting its work.
The annual IA work plan and resources are reviewed and agreed with the Audit Committee.
Scope of Work
Business unit audits are designed to provide assurance that the internal control systems of the Company are implemented properly and operating effectively, and that the risks associated with the achievement of business objectives are being properly identified, monitored and managed.
128 Swire Pacific 2012 Annual Report
The frequency of each audit is determined by IA using its own risk assessment methodology, which is based on the COSO (Committee of Sponsoring Organizations of the Treadway Commission) internal control framework, considering such factors as recognised risks, organisational change, overall materiality of each unit, previous IA results, external auditors’ comments, output from the work of the Group Risk Management Committee and management’s views. Each business unit is typically audited at least once every three years. Acquired businesses would normally be audited within 12 months. 40 assignments were conducted for Swire Pacific in 2012.
IA specifically assists the Audit Committee in assessing the effectiveness of the Group’s internal controls through its review of the process by which management has completed the annual Control Self Assessment, and the results of this assessment.
IA conducts ad-hoc projects and investigative work as may be required by management or the Audit Committee.
Audit Conclusion and Response
Copies of IA reports are sent to the Chairman of the Board, the Group Finance Director and the external auditors. The results of each review are also presented to the Audit Committee.
Management is called upon to present action plans in response to IA’s recommendations. These are agreed by IA, included in its reports and followed up with a view to ensuring that they are satisfactorily undertaken.
External AuditorsThe Audit Committee acts as a point of contact, independent from management, with the external auditors (the “auditors”). The auditors have direct access to the Chairman of the Audit Committee, who meets with them periodically without management present.
The Audit Committee’s duties in relation to the auditors include:
• recommending to the Board, for approval by shareholders, the auditors’ appointment
• approval of the auditors’ terms of engagement
• consideration of the letters of representation to be provided to the auditors in respect of the interim and annual accounts
• review of reports and other ad-hoc papers from the auditors
• annual appraisal of the quality and effectiveness of the auditors
• assessment of the auditors’ independence and objectivity, including the monitoring of non-audit services provided, with a view to ensuring that their independence and objectivity is not, and is not seen to be, compromised
• approval of audit and non-audit fees.
Auditors’ Independence
Independence of the auditors is of critical importance to the Audit Committee, the Board and shareholders. The auditors write annually to the members of the Audit Committee confirming that they are independent accountants within the meaning of Section 290 of the Code of Ethics for Professional Accountants of the Hong Kong Institute of Certified Public Accountants and that they are not aware of any matters which may reasonably be thought to bear on their independence. The Audit Committee assesses the independence of the auditors by considering and discussing each such letter (and having regard to the fees payable to the auditors for audit and non-audit work and the nature of the non-audit work) at a meeting of the Audit Committee.
Provision of Non-audit Services
In deciding whether the auditors should provide non-audit services the following key principles are considered:
• the auditors should not audit their own firm’s work
• the auditors should not make management decisions
• the auditors’ independence should not be impaired
• quality of service.
In addition, any services which may be considered to be in conflict with the role of the auditors must be submitted to the Audit Committee for approval prior to engagement, regardless of the amounts involved.
Fees paid to the auditors are disclosed in note 7 to the accounts.
ShareholdersCommunication with Shareholders and Investors
The Board and senior management recognise their responsibility to represent the interests of all shareholders and to maximise shareholder value. Communication with shareholders and accountability to shareholders is a high priority of the Company.
The principal methods used to communicate with shareholders include the following:
• The Group Finance Director makes himself available for meetings with major shareholders, investors and
Swire Pacific 2012 Annual Report 129
Corporate Governance Report
analysts over two-month periods immediately after the announcement of the interim and annual results and at certain other times during the year. In 2012 the Group Finance Director held 22 meetings with analysts and investors in Hong Kong and London, conducted two analyst briefings, three overseas roadshows and spoke at two investor conferences.
• Through the Company’s website. This includes electronic copies of financial reports, audio webcasts of analyst presentations given at the time of the interim and annual results announcements, slides of presentations given at investor conferences, latest news, public announcements and general information about the Group’s businesses
• Through publication of interim and annual reports
• Through the Annual General Meeting as discussed below.
Shareholders may send their enquiries and concerns to the Board by post or email at [email protected]. The relevant contact details are set out in the Financial Calendar and Information for Investors section of this Annual Report.
The Annual General Meeting
The Annual General Meeting is an important forum in which to engage with shareholders. The most recent Annual General Meeting was held on 11th May 2012. The meeting was open to all shareholders and to the press. The Directors who attended the meeting are shown in the table on pages 123 and 124.
At the Annual General Meeting, separate resolutions were proposed for each issue and were voted on by poll. The procedures for conducting a poll were explained at the meeting prior to the polls being taken. The agenda items were:
• receiving the report of the Directors and the audited accounts for the year ended 31st December 2011
• re-electing Directors
• re-appointing the auditors and authorising the Directors to set their remuneration
• a general mandate authorising the Directors to make on-market share repurchases
• a general mandate authorising the Directors to allot and issue shares up to 20% of the then issued share capital, provided that the aggregate nominal amount of the shares of any class so allotted wholly for cash would not exceed 5% of the aggregate nominal amount of the shares then in issue.
Minutes of the meeting together with voting results are available on the Company’s website.
Shareholder engagement
Pursuant to Article 95 of the Company’s Articles of Association, if a shareholder wishes to propose a person other than a retiring Director for election as a Director at a general meeting, he or she should deposit a written notice of nomination at the registered office of the Company within the 7-day period commencing on and including the day after the despatch of the notice of the meeting. The procedures for nominating candidates to stand for election as Directors at general meetings are set out in the Corporate Governance Section of the Company’s website.
If they wish to propose a resolution relating to other matters to be considered at a general meeting, shareholders are requested to follow the requirements and procedures set out in the Corporate Governance Section of the Company’s website.
Shareholder(s) holding not less than one-fortieth of the total voting rights of all members may request the Board to convene an extraordinary general meeting. The objects of the meeting must be stated in the related requisition deposited at the Company’s registered office. Detailed requirements and procedures are set out in the Corporate Governance Section of the Company’s website.
Other information for shareholders
Key shareholder dates for 2013 are set out on the inside back cover of this report and in the Financial Calendar on the Company’s website.
No amendment has been made to the Company’s Articles of Association during the year.
From information publicly available to the Company and within the knowledge of its Directors, at least 25% of the Company’s total issued share capital is held by the public. Details of the shareholder profile of the Company are included in the Directors’ Report on page 142.
130 Swire Pacific 2012 Annual Report
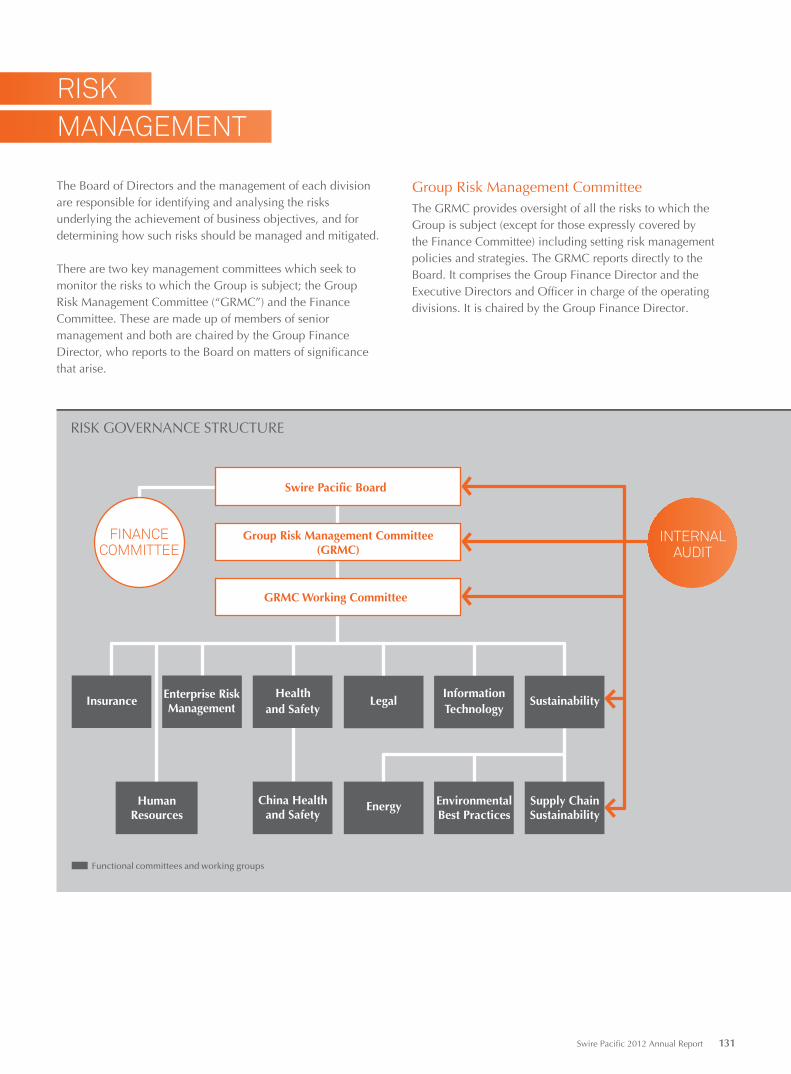
Group Risk Management CommitteeThe GRMC provides oversight of all the risks to which the Group is subject (except for those expressly covered by the Finance Committee) including setting risk management policies and strategies. The GRMC reports directly to the Board. It comprises the Group Finance Director and the Executive Directors and Officer in charge of the operating divisions. It is chaired by the Group Finance Director.
The Board of Directors and the management of each division are responsible for identifying and analysing the risks underlying the achievement of business objectives, and for determining how such risks should be managed and mitigated.
There are two key management committees which seek to monitor the risks to which the Group is subject; the Group Risk Management Committee (“GRMC”) and the Finance Committee. These are made up of members of senior management and both are chaired by the Group Finance Director, who reports to the Board on matters of significance that arise.
Functional committees and working groups
RISK GOVERNANCE STRUCTURE
InsuranceHealth
and SafetyLegal
China Healthand Safety
Enterprise RiskManagement
HumanResources
InformationTechnology
Energy EnvironmentalBest Practices
Sustainability
Supply ChainSustainability
FINANCECOMMITTEE
Swire Pacific Board
Group Risk Management Committee(GRMC)
GRMC Working Committee
INTERNALAUDIT
RISK
MANAGEMENT
Swire Pacific 2012 Annual Report 131
Risk Management
The GRMC oversees a number of committees and working groups. These cover the following areas: Insurance, Human Resources, Health & Safety, Legal, Information Technology, Sustainability, Environmental Best Practices, Supply Chain Sustainability, Energy and Enterprise Risk Management. The GRMC’s oversight role includes those areas which can be collectively categorised as Sustainable Development.
In 2012, the GRMC met three times and its functional Group committees and working groups met a total of 45 times.
The members of the functional Group committees and working groups are specialists in their respective areas. Each committee is chaired by a member of the GRMC Working Committee, with the exception of the Energy Committee which reports through the Sustainability Committee. The GRMC Working Committee has been established to monitor the activities of each of the functional Group committees and working groups and to submit consolidated proposals on key risk issues to the GRMC.
The role of the functional Group committees and working groups is to identify risks and opportunities which fall within their respective functional areas and to draw up policy recommendations for GRMC review and approval. The
policies approved by the GRMC apply to all companies in which Swire Pacific has a controlling interest. The boards of these operating companies are required to adopt these policies and to establish procedures to ensure compliance with them. Jointly controlled and associated companies are encouraged to adopt Group policies.
The management of risks is subject to audit by the Group’s Internal Audit department, with support from specialist external consultants where necessary.
Finance CommitteeThe role of the Finance Committee is to provide oversight of the Group’s financial risks, including setting the Group’s financial risk management policies and procedures. These are implemented within both the Group’s central financial reporting function and the divisional finance functions.
The Finance Committee consists of the Group Finance Director, five Divisional Finance Directors, the General Manager Corporate Finance, the Group Treasurer, the Group Finance Manager and the Group Taxation Manager. In 2012, the Finance Committee met four times.
The Group’s approach to financial risk management is discussed below.
Financial Risk Management
Audited Financial Information
Structure and Policies
In the normal course of business the Group is exposed to financial risks attributable to interest rates, currency, creditand liquidity.
The Finance Committee maintains and develops the Group’s financial risk management policies and procedures. These policies and procedures are implemented by the Head Office Treasury Department, within an agreed framework authorised by the Board.
The Treasury department manages the majority of the Group’s funding needs, as well as resulting interest rate, currency, credit and liquidity risks. Operating subsidiaries manage currency and credit exposures that are specific to their trading transactions.
It is the Group’s policy not to enter into derivative transactions for speculative purposes. Derivatives are used solely for management of an underlying risk and the Group minimises its exposure to market risk by applying hedge accounting for derivative instruments. By applying hedge accounting, gains and losses on derivatives offset the losses and gains on the assets, liabilities or transactions being hedged. Accounting for derivative financial instruments and hedging activities is discussed on pages 206 to 207.
The Group’s listed associated companies and its non-listed jointly controlled and associated companies arrange their financial and treasury affairs on a stand-alone basis. The Company may provide financial support by way of guarantees to its non-listed jointly controlled and associated companies in cases where significant cost savings are available and risks are acceptable.
132 Swire Pacific 2012 Annual Report
Financial Risk Management (continued)
Audited Financial Information (continued)
Interest Rate Exposure
The Group’s interest rate risk arises primarily from borrowings. Borrowings at variable rates expose the Group to cash flow interest rate risk. Borrowings at fixed rates expose the Group to fair value interest rate risk. The Group earns interest income on cash deposits.
The Group maintains a significant proportion of debt on a fixed rate basis with a view to increasing certainty of funding costs. The level of fixed rate debt for the Group is decided after taking into consideration the potential impact of higher interest rates on profit, interest cover and the expected cash flows of the Group’s businesses and investments. The Group uses interest rate swaps to manage its long-term interest rate exposure. The Group Finance Director approves all interest rate hedges prior to implementation.
On a quarterly basis, the Treasury department calculates the effect of the Group’s exposure to interest rate fluctuations on forecast earnings and cash flows by performing sensitivity testing with varying forecast interest rates. The Treasury department reports the results of this testing to the Finance Committee. Refer to page 155 for details of the sensitivity testing performed at 31st December 2012.
Currency Exposure
The Group operates internationally and is exposed to foreign exchange risk arising from various currency exposures, primarily with respect to US dollars and Chinese Renminbi. Foreign exchange risk arises from the foreign currency denomination of commercial transactions, assets and liabilities, and net investments in foreign operations.
The Group’s policy is to hedge in full all highly probable transactions in each major currency where their value or time to execution gives rise to a significant currency exposure, provided that the cost of the foreign exchange forward or other derivative contract is not prohibitively expensive having regard to the underlying exposure.
Exposure to movements in exchange rates on transactions other than borrowings is minimised by using forward foreign exchange contracts where active markets for the relevant currencies exist. At 31st December 2012, the Group had hedged its significant foreign currency funding exposures, by fixing the foreign exchange rates with forward contracts.
Exposure arising from the Group’s investments in operating subsidiaries with net assets denominated in foreign currencies is reduced, where practical, by providing funding in the same currency.
Foreign currency funding and deposit exposure is monitored by the Treasury department on a continuous basis and hedging proposals are presented to the Finance Committee. On a quarterly basis, the Treasury department performs sensitivity testing by varying forecast foreign exchange rates. The results of this testing are used to assess whether positions should remain unhedged. Refer to page 155 for details of the sensitivity testing performed at 31st December 2012.
Swire Pacific 2012 Annual Report 133
Risk Management
Financial Risk Management (continued)
Audited Financial Information (continued)
Credit Exposure
The Group’s credit risk is primarily attributable to trade and other receivables with wholesale customers, derivative financial instruments and cash and deposits with banks and financial institutions. Individual operating entities are responsible for setting credit terms appropriate to their industry and assessing the credit profile of individual customers.
Standard settlement terms within the Beverages Division and SPO are 30 days from the date of invoice. In accordance with the provisions of Swire Properties’ standard tenancy agreements, rentals and other charges are due on the first day of each calendar month. Typically sales to retail customers within Swire Resources are made by cash or major credit cards. The Group has no significant credit risk with any one customer.
When depositing surplus funds or entering into derivative contracts, the Group controls its exposure to non-performance by counterparties by dealing with investment grade counterparties, setting approved counterparty limits and applying monitoring procedures. Counterparty credit exposure limits for financial institutions are proposed by the Treasury department and approved by the Group Finance Director. The Treasury department monitors the counterparties’ credit ratings and issues an approved list of counterparties with their limits on a quarterly basis to all subsidiaries. Group companies require prior approval from the Group Treasurer to deal with banks not on the approved list.
The Group is not required by its counterparties to provide collateral or any other form of security against any change in the market value of derivatives. There are no specific conditions that would require the termination of derivative contracts should the credit rating of Swire Pacific be downgraded.
The maximum credit risk in respect of contingencies is disclosed in note 40 to the accounts.
Liquidity Risk
The Group takes liquidity risk into consideration when deciding its sources of funds and their tenors, so as to avoid over reliance on funds from any one source and to prevent substantial refinancing in any one period. The Group maintains significant undrawn committed revolving credit facilities and cash deposits in order to reduce liquidity risk further and to allow for flexibility in meeting funding requirements.
The Group aims to maintain immediate access to committed funds to meet its refinancing and capital commitments for the following 12 months on a rolling basis, excluding its onshore Renminbi debt funding, where forward commitments are not readily available. The Group does not have significant offshore Renminbi debt funding.
The Treasury department produces a forecast funding plan for the Group on a quarterly basis and a summary forecast on a monthly basis, in order to assess committed and probable funding requirements. The plan includes an analysis of debt refinancing by year and by source of funds. The Group Treasurer presents the forecast funding plan together with funding proposals to the Group Finance Director on a regular basis, and to the Finance Committee. Refer to page 156 for details of the Group’s contractual obligations at 31st December 2012.
Price Risk
The Group is exposed to price risk in relation to listed equity securities held as available-for-sale investments. Management regularly reviews the expected returns from holding such investments, on an individual basis.
134 Swire Pacific 2012 Annual Report
DIRECTORS AND
OFFICERS
* Tang, Kin Wing Augustus, aged 54, has been a Director of the Company since August 2011. He is also a Director and Chief Executive Officer of Hong Kong Aircraft Engineering Company Limited. He joined the Swire group in 1982 and has worked with Cathay Pacific Airways Limited in Hong Kong, Malaysia and Japan.
Non-Executive Directors Baroness Dunn, Lydia Selina, DBE, aged 73, has been a
Director of the Company since February 1981 and, until January 1996, had responsibility for the Trading Division. She is also a Director of John Swire & Sons Limited. She joined the Swire group in 1963 and has worked with the group in Hong Kong and London.
Hughes-Hallett, James Wyndham John, SBS, CMG, aged 63, has been a Director of the Company since January 1994 and was appointed Deputy Chairman in March 1998 and Chairman in June 1999. He stepped down as Chairman in December 2004 to become Chairman of John Swire & Sons Limited. He is also a Director of Cathay Pacific Airways Limited, Swire Properties Limited, Steamships Trading Company Limited and HSBC Holdings plc. He joined the Swire group in 1976 and has worked with the group in Hong Kong, Taiwan, Japan, Australia and London.
+# Johansen, Peter André, aged 70, has been a Director of the Company since January 1983 and was Finance Director until April 1997. He joined the Swire group in 1973 and worked in Hong Kong, Japan and the United Kingdom before retiring from John Swire & Sons Limited on 31st December 2008. He is also a Director of Hong Kong Aircraft Engineering Company Limited.
Swire, Merlin Bingham, aged 39, has been a Director of the Company since January 2009. He joined the Swire group in 1997 and has worked with the group in Hong Kong, Australia, Mainland China and London. He is a Director and shareholder of John Swire & Sons Limited, a Director of Cathay Pacific Airways Limited, Hong Kong Aircraft Engineering Company Limited and Swire Properties Limited and an Alternate Director of Steamships Trading Company Limited.
Executive Directors* Pratt, Christopher Dale, CBE, aged 56, has been a Director
and the Chairman of the Company since February 2006. He is also Chairman of Cathay Pacific Airways Limited, Hong Kong Aircraft Engineering Company Limited, John Swire & Sons (H.K.) Limited and Swire Properties Limited and a Director of Swire Beverages Limited, Air China Limited and The Hongkong and Shanghai Banking Corporation Limited. He joined the Swire group in 1978 and has worked with the group in Hong Kong, Australia and Papua New Guinea.
* Cubbon, Martin, aged 55, has been a Director of the Company since September 1998. He is also a Director and Chief Executive of Swire Properties Limited. He joined the Swire group in 1986.
* Kilgour, Peter Alan, aged 57, has been Finance Director of the Company since April 2009. He is also a Director of Cathay Pacific Airways Limited, Swire Properties Limited and Swire Beverages Limited. He joined the Swire group in 1983.
* Rae-Smith, John Bruce, aged 49, has been a Director of the Company since January 2013. He is Executive Director of the Marine Services Division and the Trading & Industrial Division. He joined the Swire group in 1985 and has worked with the group in Australia, Papua New Guinea, Japan, Taiwan, Hong Kong, the United States and Singapore.
* Shiu, Ian Sai Cheung, aged 58, has been a Director of the Company since August 2010. He is also a Director of Cathay Pacific Airways Limited, Hong Kong Dragon Airlines Limited and Air China Limited. He joined Cathay Pacific Airways Limited in 1978 and has worked with the group in Hong Kong, the Netherlands, Singapore and the United Kingdom.
* Slosar, John Robert, aged 56, has been a Director of the Company since May 2006. He is also a Director and Chief Executive of Cathay Pacific Airways Limited, Chairman of Hong Kong Dragon Airlines Limited, and Chairman of Swire Beverages Limited. He joined the Swire group in 1980 and has worked with the group in Hong Kong, the United States and Thailand.
Swire Pacific 2012 Annual Report 135
Directors and Officers
Independent Non-Executive Directors Freshwater, Timothy George, aged 68, has been a
Director of the Company since January 2008. He is a Non-Executive Director of Aquarius Platinum Limited and Savills Plc, Chairman and Non-Executive Director of Grosvenor Asia Pacific Limited, and an Independent Non-Executive Director of Chong Hing Bank Limited, Cosco Pacific Limited and Hong Kong Exchanges and Clearing Limited. He is also a Director of the Community Chest of Hong Kong.
+# Kwok, King Man Clement, aged 53, has been a Director of the Company since September 2002. He is Managing Director and Chief Executive Officer of The Hongkong and Shanghai Hotels, Limited. He is also a Board member of the Faculty of Business and Economics of the University of Hong Kong, a member of the Harbourfront Commission and a global member of the World Travel and Tourism Council.
+# Lee, Chien, aged 59, has been a Director of the Company since January 1993. He is a Non-Executive Director of Hysan Development Company Limited and an Independent Non-Executive Director of Television Broadcasts Limited. He is a Council member of the Chinese University of Hong Kong and St. Paul’s Co-educational College and also a Trustee Emeritus of Stanford University and Director of Stanford Hospital and Clinics.
Lee, Wai Mun Rose, aged 60, has been a Director of the Company since July 2012. She is Vice-Chairman and Chief Executive of Hang Seng Bank Limited, a Director of The Hongkong and Shanghai Banking Corporation Limited and an Independent Non-Executive Director of Hutchison Whampoa Limited. She is also Vice-Chairman of the China Committee of the Hong Kong General Chamber of Commerce, Vice President of The Hong Kong Institute of Bankers and a member of the court of The Hong Kong University of Science and Technology.
Sze, Cho Cheung Michael, GBS, CBE, ISO, JP, aged 67, has been a Director of the Company since November 2004. He was a former Executive Director of the Hong Kong Trade Development Council, a position he held for eight years prior to his retirement on 1st May 2004. Before that, he worked for 25 years in various capacities in the Hong Kong Government. He is also a Consultant to the Board of Lee Kum Kee Co., Ltd., and an Independent Non-Executive Director of Yangtzekiang Garment Limited and YGM Trading Limited.
Yang, Mun Tak Marjorie, aged 60, has been a Director of the Company since October 2002. She is Chairman of Esquel Group, and a Director of The Hongkong and Shanghai Banking Corporation Limited. She also serves as Chairman of the Asia Business Council, the Hong Kong – U.S. Business Council, and as Deputy Chairman of the Seoul International Business Advisory Council. She is Chairman of the Hong Kong Polytechnic University Council, a member of the Massachusetts Institute of Technology Corporation, and sits on advisory boards at Harvard Business School and Tsinghua School of Economics and Management.
Executive Officer Healy, Patrick, aged 47, has been Executive Director of
the Beverages Division since January 2013. He joined the Swire group in 1988 and has worked with the group in Hong Kong, Germany and Mainland China.
Secretary Fu, Yat Hung David, aged 49, has been Company
Secretary since January 2006. He joined the Swire group in 1988.
Notes:* These Directors are also Directors of John Swire & Sons (H.K.) Limited.+ These Directors are members of the Audit Committee.# These Directors are members of the Remuneration Committee.
All the Executive Directors, the Executive Officer, Baroness Dunn, J W J Hughes-Hallett and M B Swire are employees of the John Swire & Sons Limited group.
136 Swire Pacific 2012 Annual Report
DIRECTORS’
REPORT
The Directors submit their report together with the audited accounts for the year ended 31st December 2012, which are set out on pages 147 to 221.
Principal ActivitiesThe principal activity of Swire Pacific Limited (the “Company”) is that of a holding company, and the principal activities of its major subsidiary, jointly controlled and associated companies are shown on pages 211 to 221. An analysis of the Group’s performance for the year by reportable business segment and geographical area is set out in note 8 to the accounts.
Listing of Swire Properties LimitedOn 18th January 2012 the shares in Swire Properties Limited (“Swire Properties”) were listed on the Main Board of The Stock Exchange of Hong Kong Limited (the “Stock Exchange”). The listing was by way of introduction, achieved by a dividend in specie to the Company’s shareholders of 18% of the total issued shares in Swire Properties. As a result of this dividend in specie, the Company’s shareholding in Swire Properties decreased from 100% to approximately 82%.
DividendsThe Directors have declared second interim dividends of HK$2.50 per ‘A’ share and HK$0.50 per ‘B’ share which, together with the first interim dividends of HK$1.00 per ‘A’ share and HK$0.20 per ‘B’ share paid in October 2012, amount to full year dividends of HK$3.50 per ‘A’ share and HK$0.70 per ‘B’ share, compared to full year dividends of HK$6.50 per ‘A’ share and HK$1.30 per ‘B’ share in respect of 2011. The second interim dividends will be paid on 3rd May 2013 to shareholders registered at the close of business on the record date, being Friday, 12th April 2013. Shares of the Company will be traded ex-dividend from Wednesday, 10th April 2013.
Closure of Register of MembersThe register of members will be closed on Friday, 12th April 2013, during which day no transfer of shares will be effected. In order to qualify for entitlement to the second interim dividends, all transfer forms, accompanied by the relevant share certificates, must be lodged with the Company’s share registrars, Computershare Hong Kong Investor Services Limited, 17th Floor, Hopewell Centre, 183 Queen’s Road East, Hong Kong, for registration not later than 4:30 p.m. on Thursday, 11th April 2013.
To facilitate the processing of proxy voting for the annual general meeting to be held on 9th May 2013, the register of members will be closed from 6th May 2013 to 9th May 2013, both days inclusive, during which period no transfer of shares will be effected. In order to be entitled to attend and vote at the annual general meeting, all transfer forms accompanied by the relevant share certificates must be lodged with the Company’s share registrars, Computershare Hong Kong Investor Services Limited, 17th Floor, Hopewell Centre, 183 Queen’s Road East, Hong Kong, for registration not later than 4:30 p.m. on Friday, 3rd May 2013.
Swire Pacific 2012 Annual Report 137
Directors’ Report
ReservesMovements in the reserves of the Group and the Company during the year are set out in note 36 to the accounts.
Share CapitalDuring the year under review and up to the date of this report, the Company did not purchase, sell or redeem any of its shares and the Group has not adopted any share option scheme.
Accounting PoliciesThe principal accounting policies of the Group are set out on pages 201 to 210.
AuditorsPricewaterhouseCoopers retire and, being eligible, offer themselves for re-appointment. A resolution for the re-appointment of PricewaterhouseCoopers as auditors of the Company is to be proposed at the forthcoming Annual General Meeting.
Financial ReviewA review of the consolidated results, financial position and cash flows is shown on pages 102 to 110. A ten-year financial summary of the results and of the assets and liabilities of the Group is shown on pages 8 to 10.
Corporate GovernanceThe Company complied with all the code provisions set out in the Corporate Governance Code (“CG Code”) contained in Appendix 14 to the Listing Rules throughout the year covered by the annual report with the following exceptions which it believes do not benefit shareholders:
• Sections A.5.1 to A.5.4 of the CG Code in respect of the establishment, terms of reference and resources of a nomination committee. The Board has considered the merits of establishing a nomination committee but has concluded that it is in the best interests of the Company and potential new appointees that the Board collectively reviews and approves the appointment of any new Director as this allows a more informed and balanced decision to be made by both the potential Director and the Board as to suitability for the role.
Details of the Company’s corporate governance practices are set out on pages 120 to 130.
DonationsDuring the year, the Group made donations for charitable purposes of HK$40 million and donations towards various scholarships of HK$3 million.
Fixed AssetsFor details of movements in fixed assets refer to notes 15 and 16 to the accounts.
The annual valuation of the Group’s investment property portfolio, whether complete or in the course of development, was carried out by professionally qualified valuers (96% by value having been valued by DTZ Debenham Tie Leung) on the basis of open market value at 31st December 2012. This valuation resulted in an increase of HK$12,147 million in the carrying value of the investment property portfolio.
A schedule of the principal properties of the Group and its jointly controlled and associated companies is given on pages 239 to 251.
138 Swire Pacific 2012 Annual Report
BorrowingsFor details of the Group’s borrowings refer to pages 111 to 119.
InterestRefer to page 115 for details of the amount of interest capitalised by the Group.
Major Customers and SuppliersDuring the year, less than 30% of the Group’s sales and less than 30% of the Group’s purchases were attributable to the Group’s five largest customers and suppliers respectively.
DirectorsThe Directors of the Company as at the date of this report are listed on pages 135 and 136. With the exception of R W M Lee who was appointed as an Independent Non-Executive Director on 1st July 2012 and J B Rae-Smith who was appointed as an Executive Director on 1st January 2013, all the Directors at the date of this report served throughout the calendar year 2012. During the year, M Leung served as an Independent Non-Executive Director until her resignation with effect from 1st July 2012 and G L Cundle served as an Executive Director until his resignation with effect from 1st January 2013.
Independence confirmation
The Company has received from all of its Independent Non-Executive Directors listed on page 136 confirmation of their independence pursuant to Listing Rule 3.13 and considers all of them to be independent. The confirmation from T G Freshwater refers to his directorship of Goldman Sachs (Asia) L.L.C. until his resignation with effect from 1st April 2012 and the confirmations from R W M Lee and M M T Yang refer to their directorships of The Hongkong and Shanghai Banking Corporation Limited. These directorships are mentioned under “Directors and Officers – Independent Non-Executive Directors” on page 136.
Term of appointment
Article 93 of the Company’s Articles of Association provides for all Directors to retire at the third Annual General Meeting following their election by ordinary resolution. In accordance therewith, P A Johansen and J R Slosar retire this year and, being eligible, offer themselves for re-election.
R W M Lee and J B Rae-Smith, having been appointed to the Board under Article 91 since the last Annual General Meeting, also retire and offer themselves for election.
Each of the Directors has entered into a letter of appointment, which constitutes a service contract, with the Company for a term of up to three years until retirement under Article 91 or Article 93 of the Articles of Association of the Company, which will be renewed for a term of three years upon each election or re-election. No Director has a service contract with the Company which is not determinable by the employer within one year without payment of compensation (other than statutory compensation).
Fees and emoluments
Full details of Directors’ fees and emoluments are set out in note 9 to the accounts.
Directors’ fees paid to the Independent Non-Executive Directors during the year totalled HK$4.7 million. They received no other emoluments from the Group.
Swire Pacific 2012 Annual Report 139
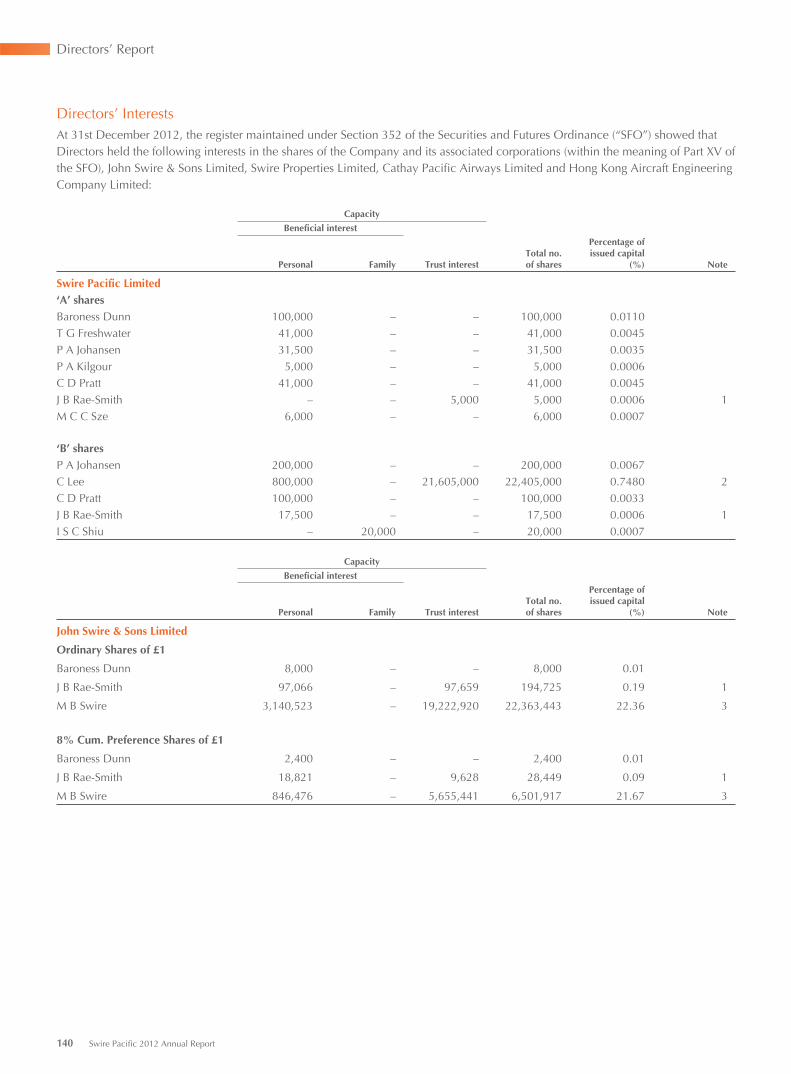
Directors’ Report
Directors’ InterestsAt 31st December 2012, the register maintained under Section 352 of the Securities and Futures Ordinance (“SFO”) showed that Directors held the following interests in the shares of the Company and its associated corporations (within the meaning of Part XV of the SFO), John Swire & Sons Limited, Swire Properties Limited, Cathay Pacific Airways Limited and Hong Kong Aircraft Engineering Company Limited:
Capacity
Beneficial interest
Personal Family Trust interestTotal no.of shares
Percentage of issued capital
(%) Note
Swire Pacific Limited‘A’ sharesBaroness Dunn 100,000 – – 100,000 0.0110T G Freshwater 41,000 – – 41,000 0.0045P A Johansen 31,500 – – 31,500 0.0035P A Kilgour 5,000 – – 5,000 0.0006C D Pratt 41,000 – – 41,000 0.0045J B Rae-Smith – – 5,000 5,000 0.0006 1M C C Sze 6,000 – – 6,000 0.0007
‘B’ sharesP A Johansen 200,000 – – 200,000 0.0067C Lee 800,000 – 21,605,000 22,405,000 0.7480 2C D Pratt 100,000 – – 100,000 0.0033J B Rae-Smith 17,500 – – 17,500 0.0006 1I S C Shiu – 20,000 – 20,000 0.0007
Capacity
Beneficial interest
Personal Family Trust interestTotal no.of shares
Percentage of issued capital
(%) Note
John Swire & Sons Limited
Ordinary Shares of £1
Baroness Dunn 8,000 – – 8,000 0.01
J B Rae-Smith 97,066 – 97,659 194,725 0.19 1
M B Swire 3,140,523 – 19,222,920 22,363,443 22.36 3
8% Cum. Preference Shares of £1
Baroness Dunn 2,400 – – 2,400 0.01
J B Rae-Smith 18,821 – 9,628 28,449 0.09 1
M B Swire 846,476 – 5,655,441 6,501,917 21.67 3
140 Swire Pacific 2012 Annual Report
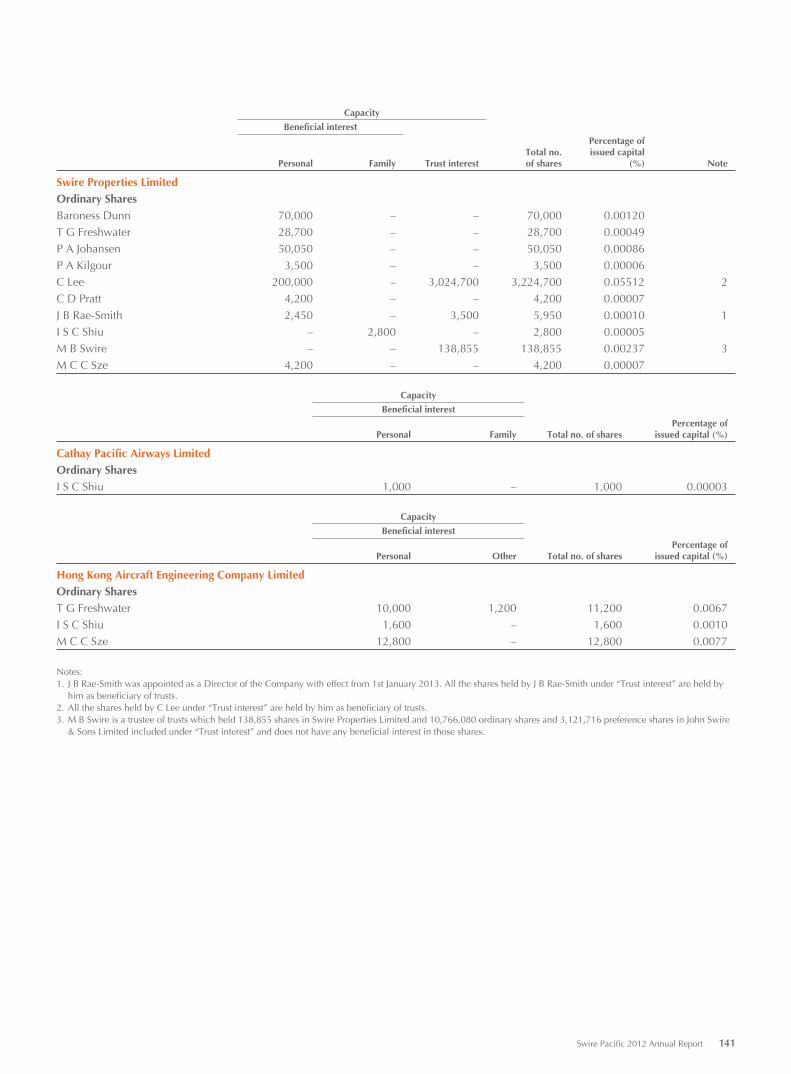
Capacity
Beneficial interest
Personal Family Trust interestTotal no.of shares
Percentage of issued capital
(%) Note
Swire Properties LimitedOrdinary SharesBaroness Dunn 70,000 – – 70,000 0.00120T G Freshwater 28,700 – – 28,700 0.00049P A Johansen 50,050 – – 50,050 0.00086P A Kilgour 3,500 – – 3,500 0.00006C Lee 200,000 – 3,024,700 3,224,700 0.05512 2C D Pratt 4,200 – – 4,200 0.00007J B Rae-Smith 2,450 – 3,500 5,950 0.00010 1I S C Shiu – 2,800 – 2,800 0.00005M B Swire – – 138,855 138,855 0.00237 3M C C Sze 4,200 – – 4,200 0.00007
Capacity
Beneficial interest
Personal Family Total no. of sharesPercentage of
issued capital (%)
Cathay Pacific Airways LimitedOrdinary SharesI S C Shiu 1,000 – 1,000 0.00003
Capacity
Beneficial interest
Personal Other Total no. of sharesPercentage of
issued capital (%)
Hong Kong Aircraft Engineering Company LimitedOrdinary SharesT G Freshwater 10,000 1,200 11,200 0.0067I S C Shiu 1,600 – 1,600 0.0010M C C Sze 12,800 – 12,800 0.0077
Notes:1. J B Rae-Smith was appointed as a Director of the Company with effect from 1st January 2013. All the shares held by J B Rae-Smith under “Trust interest” are held by
him as beneficiary of trusts.2. All the shares held by C Lee under “Trust interest” are held by him as beneficiary of trusts.3. M B Swire is a trustee of trusts which held 138,855 shares in Swire Properties Limited and 10,766,080 ordinary shares and 3,121,716 preference shares in John Swire
& Sons Limited included under “Trust interest” and does not have any beneficial interest in those shares.
Swire Pacific 2012 Annual Report 141
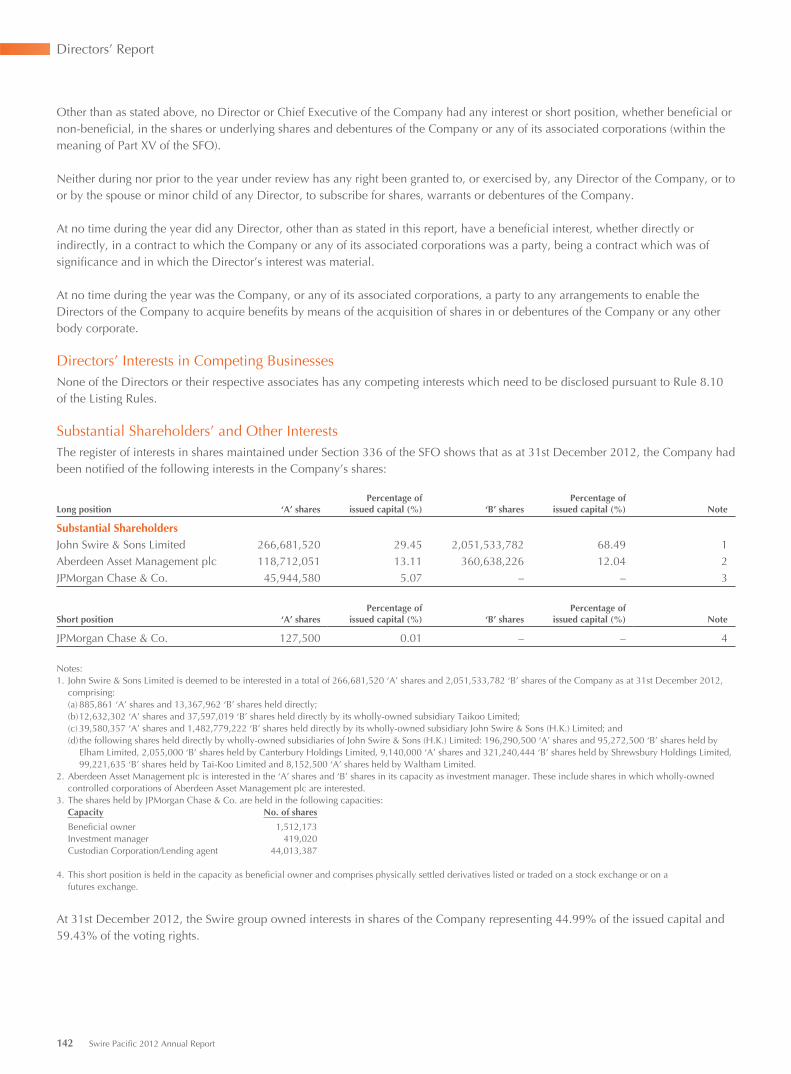
Directors’ Report
Other than as stated above, no Director or Chief Executive of the Company had any interest or short position, whether beneficial or non-beneficial, in the shares or underlying shares and debentures of the Company or any of its associated corporations (within the meaning of Part XV of the SFO).
Neither during nor prior to the year under review has any right been granted to, or exercised by, any Director of the Company, or to or by the spouse or minor child of any Director, to subscribe for shares, warrants or debentures of the Company.
At no time during the year did any Director, other than as stated in this report, have a beneficial interest, whether directly or indirectly, in a contract to which the Company or any of its associated corporations was a party, being a contract which was of significance and in which the Director’s interest was material.
At no time during the year was the Company, or any of its associated corporations, a party to any arrangements to enable the Directors of the Company to acquire benefits by means of the acquisition of shares in or debentures of the Company or any other body corporate.
Directors’ Interests in Competing BusinessesNone of the Directors or their respective associates has any competing interests which need to be disclosed pursuant to Rule 8.10 of the Listing Rules.
Substantial Shareholders’ and Other InterestsThe register of interests in shares maintained under Section 336 of the SFO shows that as at 31st December 2012, the Company had been notified of the following interests in the Company’s shares:
Long position ‘A’ sharesPercentage of
issued capital (%) ‘B’ sharesPercentage of
issued capital (%) Note
Substantial ShareholdersJohn Swire & Sons Limited 266,681,520 29.45 2,051,533,782 68.49 1Aberdeen Asset Management plc 118,712,051 13.11 360,638,226 12.04 2JPMorgan Chase & Co. 45,944,580 5.07 – – 3
Short position ‘A’ sharesPercentage of
issued capital (%) ‘B’ sharesPercentage of
issued capital (%) Note
JPMorgan Chase & Co. 127,500 0.01 – – 4
Notes:1. John Swire & Sons Limited is deemed to be interested in a total of 266,681,520 ‘A’ shares and 2,051,533,782 ‘B’ shares of the Company as at 31st December 2012,
comprising:(a) 885,861 ‘A’ shares and 13,367,962 ‘B’ shares held directly;(b) 12,632,302 ‘A’ shares and 37,597,019 ‘B’ shares held directly by its wholly-owned subsidiary Taikoo Limited;(c) 39,580,357 ‘A’ shares and 1,482,779,222 ‘B’ shares held directly by its wholly-owned subsidiary John Swire & Sons (H.K.) Limited; and(d) the following shares held directly by wholly-owned subsidiaries of John Swire & Sons (H.K.) Limited: 196,290,500 ‘A’ shares and 95,272,500 ‘B’ shares held by
Elham Limited, 2,055,000 ‘B’ shares held by Canterbury Holdings Limited, 9,140,000 ‘A’ shares and 321,240,444 ‘B’ shares held by Shrewsbury Holdings Limited, 99,221,635 ‘B’ shares held by Tai-Koo Limited and 8,152,500 ‘A’ shares held by Waltham Limited.
2. Aberdeen Asset Management plc is interested in the ‘A’ shares and ‘B’ shares in its capacity as investment manager. These include shares in which wholly-owned controlled corporations of Aberdeen Asset Management plc are interested.
3. The shares held by JPMorgan Chase & Co. are held in the following capacities:Capacity No. of shares
Beneficial owner 1,512,173Investment manager 419,020Custodian Corporation/Lending agent 44,013,387
4. This short position is held in the capacity as beneficial owner and comprises physically settled derivatives listed or traded on a stock exchange or on a futures exchange.
At 31st December 2012, the Swire group owned interests in shares of the Company representing 44.99% of the issued capital and 59.43% of the voting rights.
142 Swire Pacific 2012 Annual Report
Public FloatFrom information that is publicly available to the Company and within the knowledge of its Directors as at the date of this report, at least 25% of the Company’s total issued share capital is held by the public.
Connected TransactionOn 6th August 2012, Swire Pacific Cold Storage Limited, a wholly owned subsidiary of the Company entered into a sale and purchase agreement with John Swire & Sons Pty Ltd. (“JSS Pty”) for the purchase of JSS Pty’s entire 60% interest in Guangdong Swire Cold Chain Logistics Co., Ltd. (“Guangdong Swire”) for a total cash consideration of RMB202 million. The purchase was completed and the cash consideration was paid on 1st September 2012. As a result the Company holds an indirect 60% interest in Guangdong Swire.
As JSS Pty is a wholly-owned subsidiary of John Swire & Sons Limited, a substantial shareholder of the Company, JSS Pty is a connected person of the Company. The transaction under the sale and purchase agreement constituted a connected transaction for the Company, in respect of which an announcement dated 6th August 2012 was published.
Continuing Connected TransactionsThere are agreements for services (“Services Agreements”), in respect of which John Swire & Sons (H.K.) Limited (“JSSHK”), a wholly-owned subsidiary of John Swire & Sons Limited (“Swire”), provided to the Company and some of its subsidiary and associated companies advice and expertise of the directors and senior officers of the Swire group, full or part time services of members of the staff of the Swire group, other administrative and similar services and such other services as may have been agreed from time to time, and procured for the Company and its subsidiary, jointly controlled and associated companies the use of relevant trademarks owned by Swire.
In return for these services, JSSHK received annual fees calculated (A) in the case of the Company, as 2.5% of the dividends receivable from associated and jointly controlled companies of the Company, where there were no agreements for services with such companies, and (B) in the case of its subsidiary and associated companies with such agreements, as 2.5% of their relevant consolidated profits before taxation and non-controlling interests after certain adjustments. The fees for each year were payable in cash in arrear in two instalments; an interim payment by the end of October and a final payment by the end of April of the following year, adjusted to take account of the interim payment. The Company also reimbursed the Swire group at cost for all expenses incurred in the provision of the services.
The Services Agreements, which took effect from 1st January 2005 and were renewed on 1st October 2007, were renewed again on 1st October 2010 for a term of three years from 1st January 2011 to 31st December 2013. They are renewable for successive periods of three years thereafter unless either party to them gives to the other notice of termination of not less than three months expiring on any 31st December.
Under the Services Agreement between JSSHK and the Company, JSSHK is obliged to procure for the Company and its subsidiary, jointly controlled and associated companies the use of relevant trademarks owned by Swire. No fee is payable in consideration of such procuration obligation or such use. This procuration obligation would fall away if the Services Agreement between JSSHK and the Company were terminated or not renewed.
Particulars of the fees paid and the expenses reimbursed for the year ended 31st December 2012 are given in note 42 to the accounts.
The Company and JSSHK entered into a Tenancy Framework Agreement (“the JSSHK Tenancy Framework Agreement”) on 5th August 2010 to govern existing and future tenancy agreements between members of the Group and members of the JSSHK group for a term of six years from 1st January 2010 to 31st December 2015. Pursuant to the JSSHK Tenancy Framework Agreement, members of the Group will enter into tenancy agreements with members of the JSSHK group from time to time on normal commercial terms based on prevailing market rentals. The JSSHK Tenancy Framework Agreement is renewable for successive periods of six years thereafter unless either party to it gives to the other notice of termination of not less than three months expiring on any 31st December.
Swire Pacific 2012 Annual Report 143
Directors’ Report
Particulars of the aggregate rentals payable to the Group under the tenancies pursuant to the JSSHK Tenancy Framework Agreement for the year ended 31st December 2012 are given in note 42 to the accounts.
The Swire group owned approximately 44.99% of the issued capital of the Company and approximately 59.43% of voting rights attached to such issued share capital as at 31st December 2012. JSSHK, as a wholly-owned subsidiary of Swire, is therefore a connected person of the Company under the Listing Rules. The transactions under the Services Agreements and the JSSHK Tenancy Framework Agreement are continuing connected transactions in respect of which announcements were published dated 1st October 2010 and 5th August 2010 respectively.
As directors and employees of the Swire group, M Cubbon, J W J Hughes-Hallett, P A Kilgour, C D Pratt, I S C Shiu, J R Slosar and A K W Tang are interested in the Services Agreements and the JSSHK Tenancy Framework Agreement. G L Cundle was interested as director and employee of the Swire group. Baroness Dunn and M B Swire are interested as shareholders, directors and employees of Swire. J B Rae-Smith is interested as a director and employee of the Swire group and as a shareholder of Swire.
The Independent Non-Executive Directors of the Company, who are not interested in any connected transactions with the Group, have reviewed the continuing connected transactions set out above and have confirmed that they have been entered into by the Group in the ordinary and usual course of business, on normal commercial terms, and in accordance with the relevant agreements governing them on terms that are fair and reasonable and in the interests of the shareholders of the Company as a whole.
The auditors of the Company have also reviewed these transactions and confirmed to the Board that they have been approved by the Board of the Company and have been entered into in accordance with the relevant agreements governing the transactions; that they are in accordance with the pricing policies of the Group (if the transactions involve provision of goods or services by the Group); and that they have not exceeded the relevant annual caps disclosed in previous announcements.
On behalf of the Board
Christopher PrattChairmanHong Kong, 14th March 2013
144 Swire Pacific 2012 Annual Report
Auditor’s Report and Accounts
146 Independent Auditor’s Report147 Consolidated Income Statement148 Consolidated Statement of Comprehensive Income149 Consolidated Statement of Financial Position150 Company Statement of Financial Position151 Consolidated Statement of Cash Flows152 Consolidated Statement of Changes in Equity153 Notes to the Accounts201 Principal Accounting Policies211 Principal Subsidiary, Jointly Controlled and Associated Companies and Investments
Sustainable Development Statistics
222 Introduction224 Sustainable Development Assurance Statement225 Sustainable Development Statistics
Supplementary Information
234 Cathay Pacific Airways Limited – Abridged Financial Statements239 Schedule of Principal Group Properties252 Group Structure Chart254 Glossary256 Financial Calendar and Information for Investors
FINANCIALCONTENTS
Independent Auditor’s Report
To the shareholders of Swire Pacific Limited
(incorporated in Hong Kong with limited liability)
We have audited the accounts of Swire Pacific Limited (the “Company”) and its subsidiaries (together, the “Group”) set out on
pages 147 to 221, which comprise the consolidated and company statements of financial position as at 31 December 2012, and the
consolidated income statement, the consolidated statement of comprehensive income, the consolidated statement of changes in
equity and the consolidated statement of cash flows for the year then ended, and a summary of significant accounting policies and
other explanatory information.
Directors’ Responsibility for the Accounts
The directors of the Company are responsible for the preparation of accounts that give a true and fair view in accordance with
Hong Kong Financial Reporting Standards issued by the Hong Kong Institute of Certified Public Accountants, and the Hong Kong
Companies Ordinance, and for such internal control as the directors determine is necessary to enable the preparation of accounts
that are free from material misstatement, whether due to fraud or error.
Auditor’s Responsibility
Our responsibility is to express an opinion on these accounts based on our audit and to report our opinion solely to you, as a body,
in accordance with section 141 of the Hong Kong Companies Ordinance and for no other purpose. We do not assume responsibility
towards or accept liability to any other person for the contents of this report.
We conducted our audit in accordance with Hong Kong Standards on Auditing issued by the Hong Kong Institute of Certified
Public Accountants. Those standards require that we comply with ethical requirements and plan and perform the audit to obtain
reasonable assurance as about whether the accounts are free from material misstatement.
An audit involves performing procedures to obtain audit evidence about the amounts and disclosures in the accounts. The
procedures selected depend on the auditor’s judgment, including the assessment of the risks of material misstatement of the
accounts, whether due to fraud or error. In making those risk assessments, the auditor considers internal control relevant to the
entity’s preparation of accounts that give a true and fair view in order to design audit procedures that are appropriate in the
circumstances, but not for the purpose of expressing an opinion on the effectiveness of the entity’s internal control. An audit also
includes evaluating the appropriateness of accounting policies used and the reasonableness of accounting estimates made by the
directors, as well as evaluating the overall presentation of the accounts.
We believe that the audit evidence we have obtained is sufficient and appropriate to provide a basis for our audit opinion.
Opinion
In our opinion, the accounts give a true and fair view of the state of affairs of the Company and of the Group as at 31 December
2012, and of the Group’s profit and cash flows for the year then ended in accordance with Hong Kong Financial Reporting Standards
and have been properly prepared in accordance with the Hong Kong Companies Ordinance.
PricewaterhouseCoopers
Certified Public Accountants
Hong Kong, 14th March 2013
146 Swire Pacific 2012 Annual Report
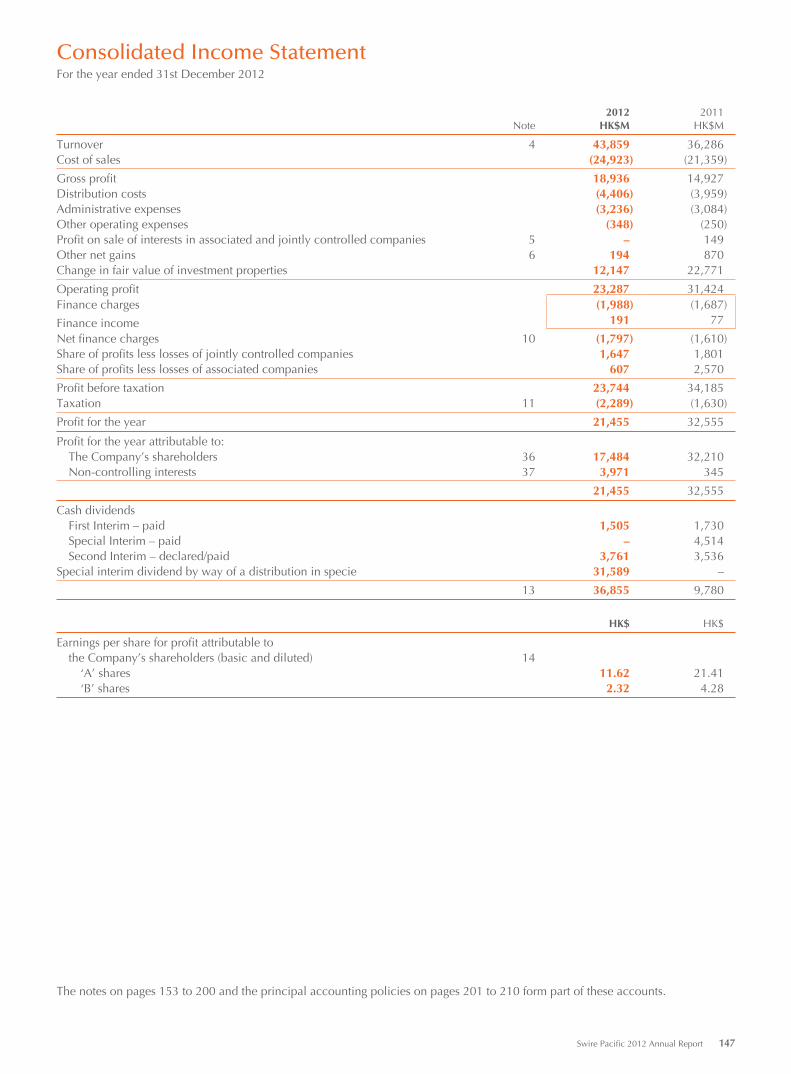
Consolidated Income StatementFor the year ended 31st December 2012
2012 2011Note HK$M HK$M
Turnover 4 43,859 36,286Cost of sales (24,923) (21,359)
Gross profit 18,936 14,927Distribution costs (4,406) (3,959)Administrative expenses (3,236) (3,084)Other operating expenses (348) (250)Profit on sale of interests in associated and jointly controlled companies 5 – 149Other net gains 6 194 870Change in fair value of investment properties 12,147 22,771
Operating profit 23,287 31,424Finance charges (1,988) (1,687)
Finance income 191 77
Net finance charges 10 (1,797) (1,610)Share of profits less losses of jointly controlled companies 1,647 1,801Share of profits less losses of associated companies 607 2,570
Profit before taxation 23,744 34,185Taxation 11 (2,289) (1,630)
Profit for the year 21,455 32,555
Profit for the year attributable to: The Company’s shareholders 36 17,484 32,210 Non-controlling interests 37 3,971 345
21,455 32,555
Cash dividends First Interim – paid 1,505 1,730 Special Interim – paid – 4,514 Second Interim – declared/paid 3,761 3,536Special interim dividend by way of a distribution in specie 31,589 –
13 36,855 9,780
HK$ HK$
Earnings per share for profit attributable to the Company’s shareholders (basic and diluted) 14 ‘A’ shares 11.62 21.41 ‘B’ shares 2.32 4.28
The notes on pages 153 to 200 and the principal accounting policies on pages 201 to 210 form part of these accounts.
Swire Pacific 2012 Annual Report 147
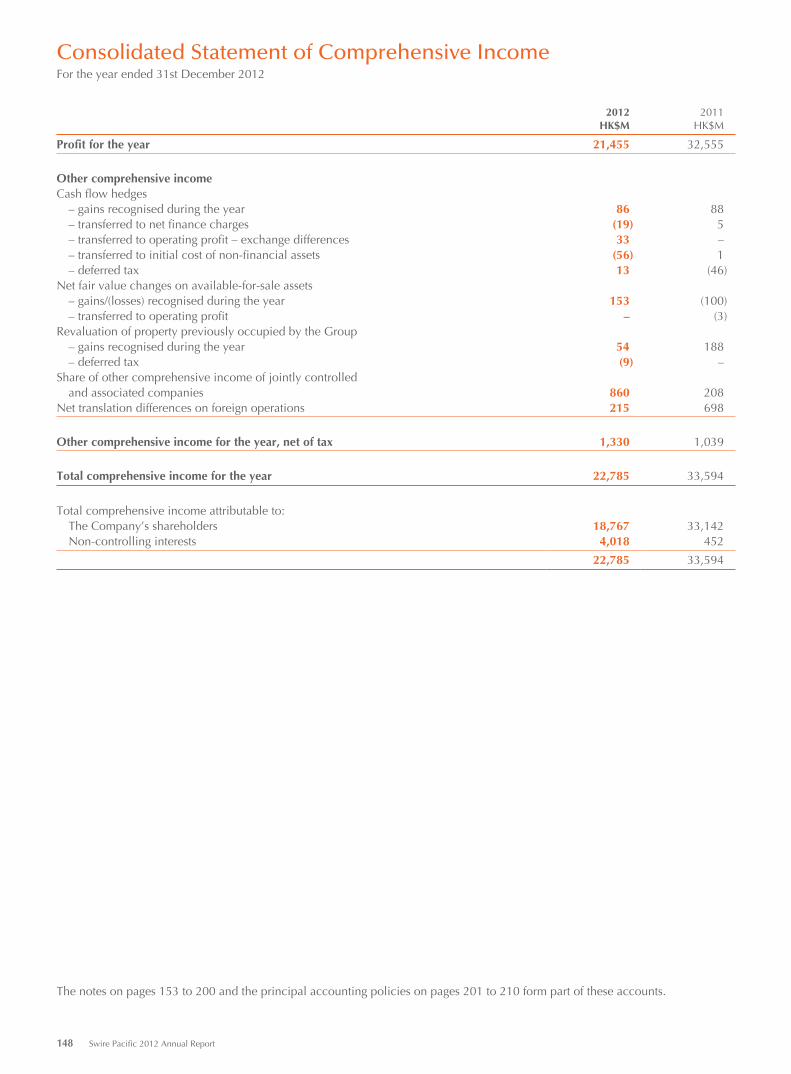
Consolidated Statement of Comprehensive IncomeFor the year ended 31st December 2012
2012 2011HK$M HK$M
Profit for the year 21,455 32,555
Other comprehensive incomeCash flow hedges – gains recognised during the year 86 88 – transferred to net finance charges (19) 5 – transferred to operating profit – exchange differences 33 – – transferred to initial cost of non-financial assets (56) 1 – deferred tax 13 (46)Net fair value changes on available-for-sale assets – gains/(losses) recognised during the year 153 (100) – transferred to operating profit – (3)Revaluation of property previously occupied by the Group – gains recognised during the year 54 188 – deferred tax (9) –Share of other comprehensive income of jointly controlled and associated companies 860 208Net translation differences on foreign operations 215 698
Other comprehensive income for the year, net of tax 1,330 1,039
Total comprehensive income for the year 22,785 33,594
Total comprehensive income attributable to: The Company’s shareholders 18,767 33,142 Non-controlling interests 4,018 452
22,785 33,594
The notes on pages 153 to 200 and the principal accounting policies on pages 201 to 210 form part of these accounts.
148 Swire Pacific 2012 Annual Report
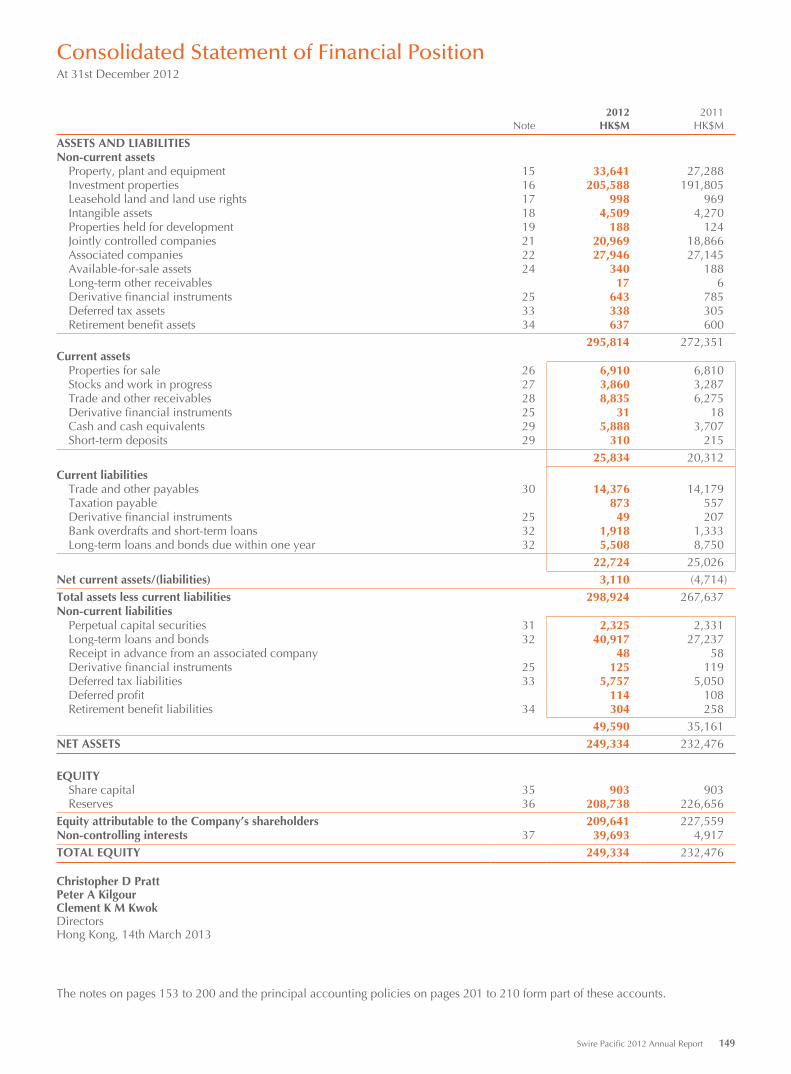
Consolidated Statement of Financial PositionAt 31st December 2012
2012 2011Note HK$M HK$M
ASSETS AND LIABILITIESNon-current assets Property, plant and equipment 15 33,641 27,288 Investment properties 16 205,588 191,805 Leasehold land and land use rights 17 998 969 Intangible assets 18 4,509 4,270 Properties held for development 19 188 124 Jointly controlled companies 21 20,969 18,866 Associated companies 22 27,946 27,145 Available-for-sale assets 24 340 188 Long-term other receivables 17 6 Derivative financial instruments 25 643 785 Deferred tax assets 33 338 305 Retirement benefit assets 34 637 600
295,814 272,351Current assets Properties for sale 26 6,910 6,810 Stocks and work in progress 27 3,860 3,287 Trade and other receivables 28 8,835 6,275 Derivative financial instruments 25 31 18 Cash and cash equivalents 29 5,888 3,707 Short-term deposits 29 310 215
25,834 20,312Current liabilities Trade and other payables 30 14,376 14,179 Taxation payable 873 557 Derivative financial instruments 25 49 207 Bank overdrafts and short-term loans 32 1,918 1,333 Long-term loans and bonds due within one year 32 5,508 8,750
22,724 25,026Net current assets/(liabilities) 3,110 (4,714)Total assets less current liabilities 298,924 267,637Non-current liabilities Perpetual capital securities 31 2,325 2,331 Long-term loans and bonds 32 40,917 27,237 Receipt in advance from an associated company 48 58 Derivative financial instruments 25 125 119 Deferred tax liabilities 33 5,757 5,050 Deferred profit 114 108 Retirement benefit liabilities 34 304 258
49,590 35,161NET ASSETS 249,334 232,476
EQUITY Share capital 35 903 903 Reserves 36 208,738 226,656Equity attributable to the Company’s shareholders 209,641 227,559Non-controlling interests 37 39,693 4,917TOTAL EQUITY 249,334 232,476
Christopher D PrattPeter A KilgourClement K M KwokDirectorsHong Kong, 14th March 2013
The notes on pages 153 to 200 and the principal accounting policies on pages 201 to 210 form part of these accounts.
Swire Pacific 2012 Annual Report 149
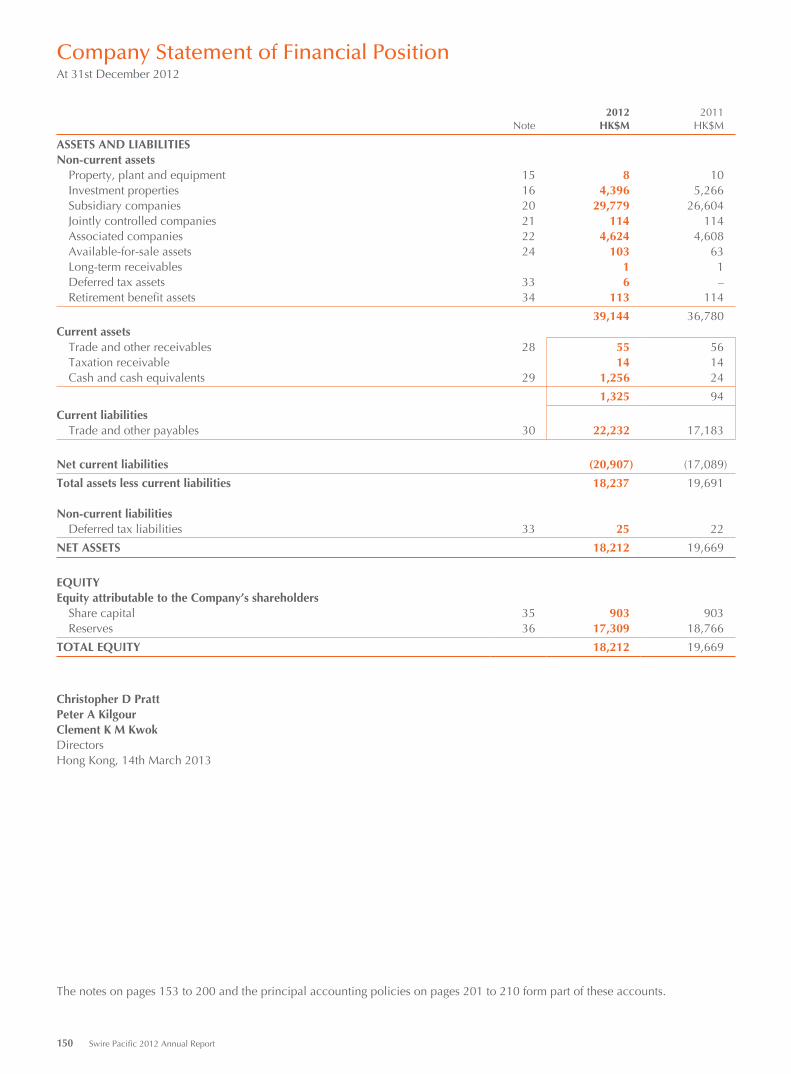
Company Statement of Financial PositionAt 31st December 2012
2012 2011Note HK$M HK$M
ASSETS AND LIABILITIESNon-current assets Property, plant and equipment 15 8 10 Investment properties 16 4,396 5,266 Subsidiary companies 20 29,779 26,604 Jointly controlled companies 21 114 114 Associated companies 22 4,624 4,608 Available-for-sale assets 24 103 63 Long-term receivables 1 1 Deferred tax assets 33 6 – Retirement benefit assets 34 113 114
39,144 36,780Current assets Trade and other receivables 28 55 56 Taxation receivable 14 14 Cash and cash equivalents 29 1,256 24
1,325 94
Current liabilities Trade and other payables 30 22,232 17,183
Net current liabilities (20,907) (17,089)
Total assets less current liabilities 18,237 19,691
Non-current liabilities Deferred tax liabilities 33 25 22
NET ASSETS 18,212 19,669
EQUITYEquity attributable to the Company’s shareholders Share capital 35 903 903 Reserves 36 17,309 18,766
TOTAL EQUITY 18,212 19,669
Christopher D PrattPeter A KilgourClement K M KwokDirectorsHong Kong, 14th March 2013
The notes on pages 153 to 200 and the principal accounting policies on pages 201 to 210 form part of these accounts.
150 Swire Pacific 2012 Annual Report
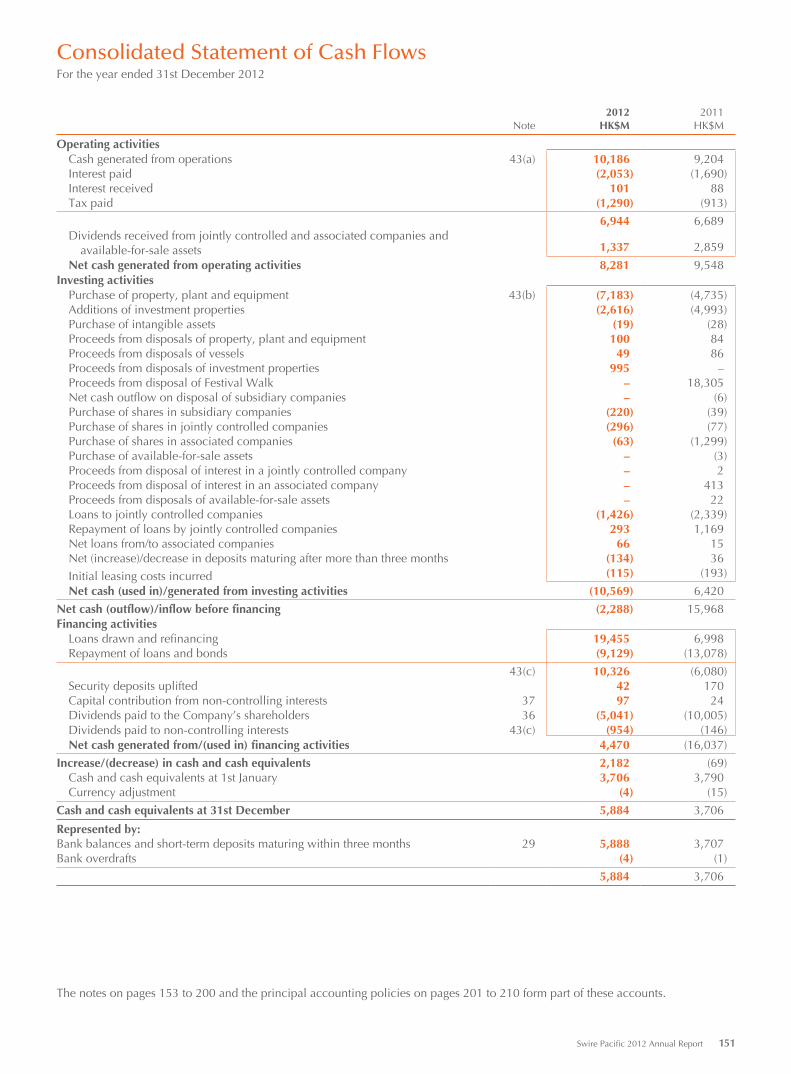
Consolidated Statement of Cash FlowsFor the year ended 31st December 2012
2012 2011Note HK$M HK$M
Operating activities Cash generated from operations 43(a) 10,186 9,204 Interest paid (2,053) (1,690) Interest received 101 88 Tax paid (1,290) (913)
6,944 6,689 Dividends received from jointly controlled and associated companies and available-for-sale assets 1,337 2,859
Net cash generated from operating activities 8,281 9,548Investing activities Purchase of property, plant and equipment 43(b) (7,183) (4,735) Additions of investment properties (2,616) (4,993) Purchase of intangible assets (19) (28) Proceeds from disposals of property, plant and equipment 100 84 Proceeds from disposals of vessels 49 86 Proceeds from disposals of investment properties 995 – Proceeds from disposal of Festival Walk – 18,305 Net cash outflow on disposal of subsidiary companies – (6) Purchase of shares in subsidiary companies (220) (39) Purchase of shares in jointly controlled companies (296) (77) Purchase of shares in associated companies (63) (1,299) Purchase of available-for-sale assets – (3) Proceeds from disposal of interest in a jointly controlled company – 2 Proceeds from disposal of interest in an associated company – 413 Proceeds from disposals of available-for-sale assets – 22 Loans to jointly controlled companies (1,426) (2,339) Repayment of loans by jointly controlled companies 293 1,169 Net loans from/to associated companies 66 15 Net (increase)/decrease in deposits maturing after more than three months (134) 36
Initial leasing costs incurred (115) (193)
Net cash (used in)/generated from investing activities (10,569) 6,420
Net cash (outflow)/inflow before financing (2,288) 15,968Financing activities Loans drawn and refinancing 19,455 6,998 Repayment of loans and bonds (9,129) (13,078)
43(c) 10,326 (6,080) Security deposits uplifted 42 170 Capital contribution from non-controlling interests 37 97 24 Dividends paid to the Company’s shareholders 36 (5,041) (10,005) Dividends paid to non-controlling interests 43(c) (954) (146) Net cash generated from/(used in) financing activities 4,470 (16,037)
Increase/(decrease) in cash and cash equivalents 2,182 (69) Cash and cash equivalents at 1st January 3,706 3,790 Currency adjustment (4) (15)
Cash and cash equivalents at 31st December 5,884 3,706
Represented by:Bank balances and short-term deposits maturing within three months 29 5,888 3,707Bank overdrafts (4) (1)
5,884 3,706
The notes on pages 153 to 200 and the principal accounting policies on pages 201 to 210 form part of these accounts.
Swire Pacific 2012 Annual Report 151
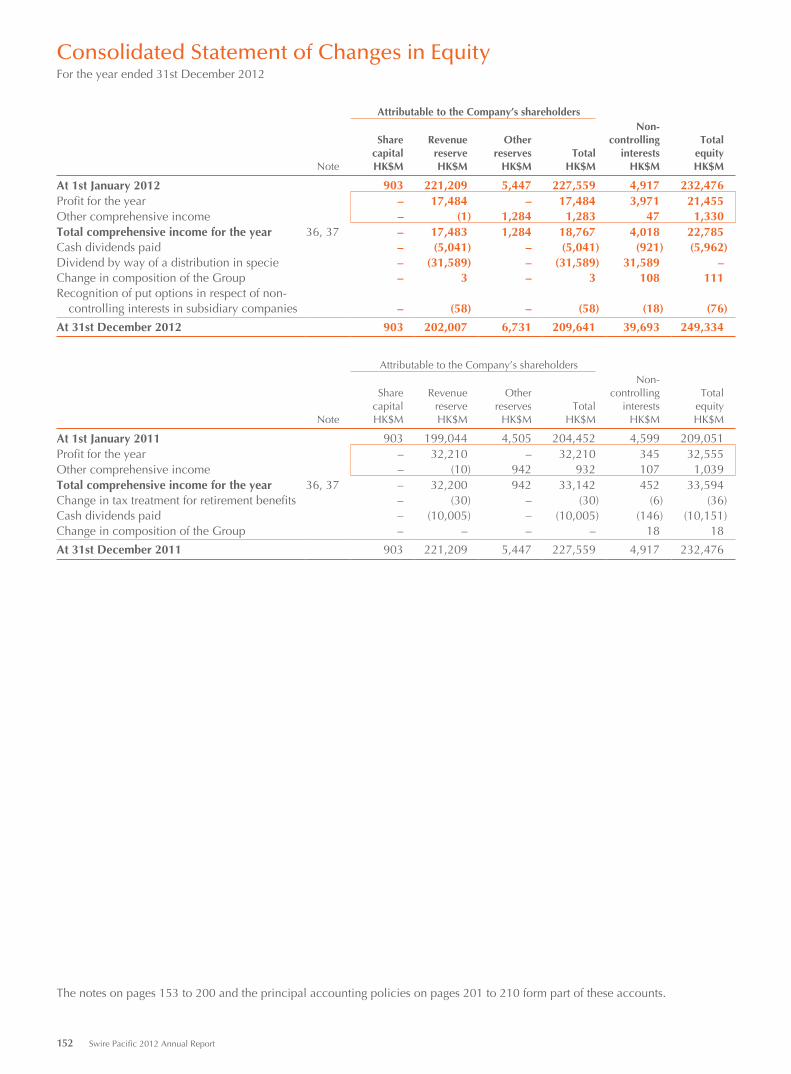
Consolidated Statement of Changes in EquityFor the year ended 31st December 2012
Attributable to the Company’s shareholders
Share Revenue OtherNon-
controlling Totalcapital reserve reserves Total interests equity
Note HK$M HK$M HK$M HK$M HK$M HK$M
At 1st January 2012 903 221,209 5,447 227,559 4,917 232,476Profit for the year – 17,484 – 17,484 3,971 21,455Other comprehensive income – (1) 1,284 1,283 47 1,330Total comprehensive income for the year 36, 37 – 17,483 1,284 18,767 4,018 22,785Cash dividends paid – (5,041) – (5,041) (921) (5,962)Dividend by way of a distribution in specie – (31,589) – (31,589) 31,589 –Change in composition of the Group – 3 – 3 108 111Recognition of put options in respect of non- controlling interests in subsidiary companies – (58) – (58) (18) (76)
At 31st December 2012 903 202,007 6,731 209,641 39,693 249,334
Attributable to the Company’s shareholders
Share Revenue OtherNon-
controlling Totalcapital reserve reserves Total interests equity
Note HK$M HK$M HK$M HK$M HK$M HK$M
At 1st January 2011 903 199,044 4,505 204,452 4,599 209,051Profit for the year – 32,210 – 32,210 345 32,555Other comprehensive income – (10) 942 932 107 1,039Total comprehensive income for the year 36, 37 – 32,200 942 33,142 452 33,594Change in tax treatment for retirement benefits – (30) – (30) (6) (36)Cash dividends paid – (10,005) – (10,005) (146) (10,151)Change in composition of the Group – – – – 18 18
At 31st December 2011 903 221,209 5,447 227,559 4,917 232,476
The notes on pages 153 to 200 and the principal accounting policies on pages 201 to 210 form part of these accounts.
152 Swire Pacific 2012 Annual Report
Notes to the Accounts
1. Changes in Accounting Standards(a) The following relevant amendments were required to be adopted by the Group effective from 1st January 2012:
HKAS 12 (Amendment) Income taxesHKFRS 7 (Amendment) Disclosures – Transfers of Financial Assets
The Group early adopted the amendment to HKAS 12 in 2010.
HKFRS 7 (Amendment) introduces new disclosure requirements on transfers of financial assets. Disclosure is required (by class of asset) of the nature and carrying amount of, and a description of the risks and rewards of, financial assets that have been transferred to another party yet remain on the entity’s balance sheet. The gain or loss on the transferred assets and any retained interest in those assets must be disclosed. In addition, other disclosures must enable users to understand the amount of any associated liabilities, and the relationship between the financial assets and associated liabilities. The disclosures must be presented by type of involvement. For example, the retained exposure could be presented by type of financial instrument (such as guarantees, call or put options), or by type of transfer (such as factoring of receivables, securitisations or securities lending). It also introduces new disclosures in respect of risk exposures arising from transferred financial assets that are either fully derecognised or derecognised but not in their entirety, yet the entity still has continuing involvement in them. The amendment has had no significant impact on the results and financial position of the Group.
(b) The following amended HKFRS is effective but not relevant to the Group’s operations:
HKFRS 1 (Amendment), Severe Hyperinflation and Removal of Fixed Dates for First–Time Adopters, is effective but not relevant to the Group’s operations because the Group is not a first–time adopter.
(c) The Group has not early adopted the following relevant new and revised standards and amendments that have been issued but are not yet effective:
HKFRSs (Amendment) Annual Improvements to HKFRSs 2009–2011 Cycle1
HKAS 1 (Amendment) Presentation of Financial Statements1
HKAS 19 (revised 2011) Employee Benefits1
HKAS 28 (revised 2011) Investments in Associates and Joint Ventures1
HKAS 32 (Amendment) Presentation – Offsetting Financial Assets and Financial Liabilities2
HKFRS 7 (Amendment) Disclosures – Offsetting Financial Assets and Financial Liabilities1
HKFRS 9 Financial Instruments3
HKFRS 10 Consolidated Financial Statements1
HKFRS 11 Joint Arrangements1
HKFRS 12 Disclosure of Interests in Other Entities1
HKFRS 13 Fair Value Measurements1
Amendments to HKFRS10, HKFRS 11 and HKFRS 12
Consolidated Financial Statements, Joint Arrangements and Disclosure of Interests in Other Entities: Transition Guidance 1
1 To be applied by the Group from 1st January 2013.2 To be applied by the Group from 1st January 2014.3 To be applied by the Group from 1st January 2015.
The improvements to HKFRSs 2009 to 2011 cycles consist of six amendments to five existing standards. It is not expected that these amendments will have a significant impact on the results and financial position of the Group.
The amendment to HKAS 1 focuses on improving the presentation of components of other comprehensive income items. It requires items presented in other comprehensive income to be grouped on the basis of whether they are potentially reclassifiable to the profit or loss account subsequently or not. It is not expected that this amendment will have a significant impact on the results and financial position of the Group.
Swire Pacific 2012 Annual Report 153
Notes to the Accounts
1. Changes in Accounting Standards (continued)HKAS 19 was amended in 2011. The impact on the Group’s defined benefit plans and post employment benefits will be as follows: to immediately recognise all past service costs; and to replace interest cost and expected return on plan assets with a net interest amount that is calculated by applying the discount rate to the net defined benefit liability. In addition, it will remove the accounting policy choice that currently permits only the recognition of actuarial gains and losses outside the 10% ‘corridor’ to be recognised in the Income Statement. Instead all such remeasurements will be required to be recognised in other comprehensive income, when they occur. The above change is required to be applied retrospectively. Had the standard been applied in 2012, profits for the year would have been lower by approximately HK$120 million, other comprehensive income would have been higher by approximately HK$111 million, and net retirement benefit assets and associated companies at 31 December 2012 would have been lower by approximately HK$939 million and HK$506 million respectively.
HKAS 28 (revised 2011) includes the requirements for joint ventures, as well as associates, to be equity accounted following the issue of HKFRS 11. It is not expected that this amendment will have a significant impact on the results and financial position of the Group.
The amendment to HKAS 32 clarifies some of the requirements for offsetting financial assets and financial liabilities on the balance sheet. Specifically, the amendments clarify the meaning of “currently has a legally enforceable right of set–off” and “simultaneous realisation and settlement”. It is not expected that this amendment will have a significant impact on the results and financial position of the Group.
The amendment to HKFRS 7 requires entities to disclose quantitative information about financial assets and financial liabilities that are offset in the statement of financial position or subject to enforceable master netting agreement or similar arrangement. It is not expected that this amendment will have a significant impact on the results and financial position of the Group.
HKFRS 9 addresses the classification, measurement and recognition of financial assets and financial liabilities. It replaces the parts of HKAS 39 that relate to the classification and measurement of financial instruments. HKFRS 9 requires financial assets to be classified into two measurement categories: those measured at fair value and those measured at amortised cost. The determination is made at initial recognition. The classification depends on the entity’s business model for managing its financial instruments and the contractual cash flow characteristics of the instrument. For financial liabilities, the standard retains most of the HKAS 39 requirements. The main change is that, in cases where the fair value option is taken for financial liabilities, the part of a fair value change due to an entity’s own credit risk is recorded in other comprehensive income rather than the income statement, unless this creates an accounting mismatch. The Group has yet to assess the full impact of the new standard.
HKFRS 10 builds on existing principles by identifying the concept of control as the determining factor in whether an entity should be included within the consolidated financial statements of the parent company. The standard provides additional guidance to assist in the determination of control where this is difficult to assess. The Group has considered whether to consolidate Cathay Pacific Airways Limited (“Cathay Pacific”) as a subsidiary in its accounts from 2013 in light of the provisions of HKFRS 10 and has concluded that because it does not have unilateral control of Cathay Pacific it should not consolidate it from 2013 but should continue to account for its interest in Cathay Pacific as an associate interest.
HKFRS 11 provides guidance on what constitutes a joint arrangement by focusing on the rights and obligations of the arrangement, rather than its legal form. There are two types of joint arrangements: joint operations and joint ventures. Joint operations arise where a joint operator has rights to the assets and obligations relating to the arrangement and hence accounts for its interest in assets, liabilities, revenue and expenses. Joint ventures arise where the joint operator has rights to the net assets of the arrangement and hence equity accounts for its interest. Proportional consolidation of joint ventures is no longer allowed. It is not expected that this new standard will have a significant impact on the results and financial position of the Group.
HKFRS 12 includes the disclosure requirements for all forms of interests in other entities, including joint arrangements, associates, special purpose vehicles and other off balance sheet vehicles. It is not expected that this new standard will have a significant impact on the results and financial position of the Group.
HKFRS 13 aims to improve consistency and reduce complexity by providing a precise definition of fair value and a single source of fair value measurement and disclosure requirements for use in all relevant HKFRSs. The requirements do not extend the use of fair value accounting but provide guidance on how fair value should be measured where its use is already required or permitted by other standards in HKFRSs. It also provides new disclosure requirements. It is not expected that this new standard will have a significant impact on the results and financial position of the Group.
154 Swire Pacific 2012 Annual Report
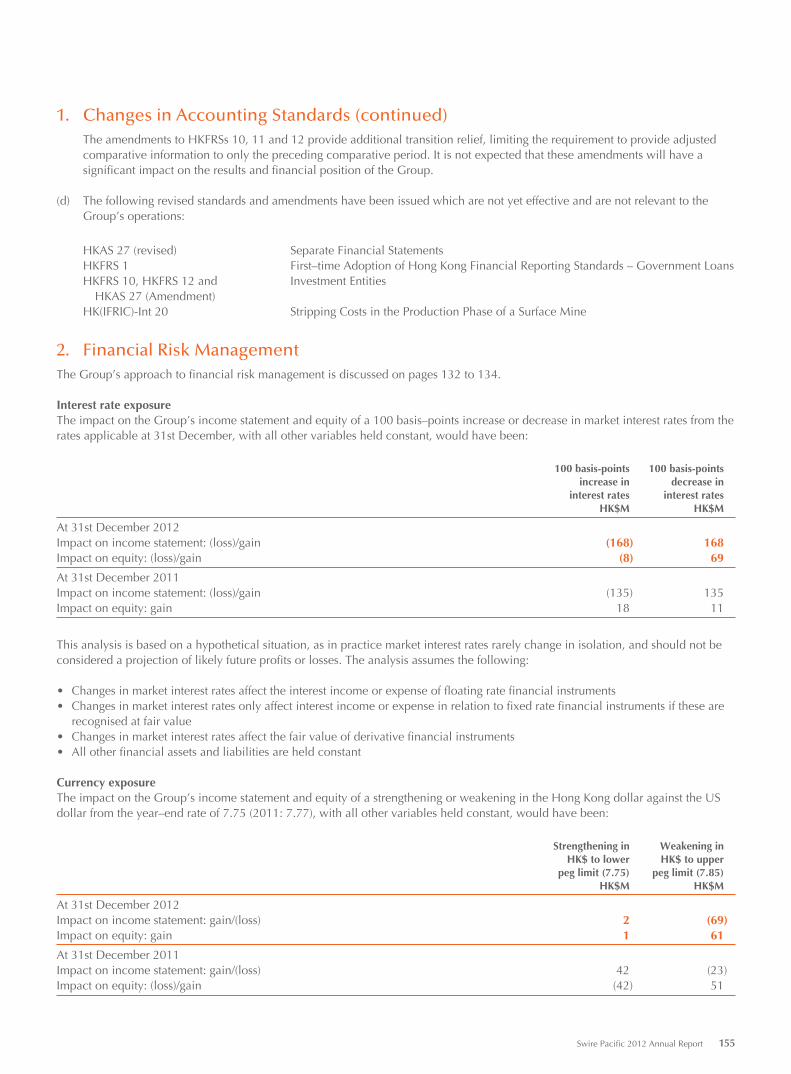
1. Changes in Accounting Standards (continued)The amendments to HKFRSs 10, 11 and 12 provide additional transition relief, limiting the requirement to provide adjusted comparative information to only the preceding comparative period. It is not expected that these amendments will have a significant impact on the results and financial position of the Group.
(d) The following revised standards and amendments have been issued which are not yet effective and are not relevant to the Group’s operations:
HKAS 27 (revised) Separate Financial StatementsHKFRS 1 First–time Adoption of Hong Kong Financial Reporting Standards – Government LoansHKFRS 10, HKFRS 12 and HKAS 27 (Amendment)
Investment Entities
HK(IFRIC)-Int 20 Stripping Costs in the Production Phase of a Surface Mine
2. Financial Risk ManagementThe Group’s approach to financial risk management is discussed on pages 132 to 134.
Interest rate exposureThe impact on the Group’s income statement and equity of a 100 basis–points increase or decrease in market interest rates from the rates applicable at 31st December, with all other variables held constant, would have been:
100 basis-pointsincrease in
interest rates
100 basis-pointsdecrease in
interest ratesHK$M HK$M
At 31st December 2012Impact on income statement: (loss)/gain (168) 168Impact on equity: (loss)/gain (8) 69
At 31st December 2011Impact on income statement: (loss)/gain (135) 135Impact on equity: gain 18 11
This analysis is based on a hypothetical situation, as in practice market interest rates rarely change in isolation, and should not be considered a projection of likely future profits or losses. The analysis assumes the following:
• Changes in market interest rates affect the interest income or expense of floating rate financial instruments• Changes in market interest rates only affect interest income or expense in relation to fixed rate financial instruments if these are
recognised at fair value• Changes in market interest rates affect the fair value of derivative financial instruments• All other financial assets and liabilities are held constant
Currency exposureThe impact on the Group’s income statement and equity of a strengthening or weakening in the Hong Kong dollar against the US dollar from the year–end rate of 7.75 (2011: 7.77), with all other variables held constant, would have been:
Strengthening inHK$ to lower
peg limit (7.75)
Weakening inHK$ to upper
peg limit (7.85)HK$M HK$M
At 31st December 2012Impact on income statement: gain/(loss) 2 (69)Impact on equity: gain 1 61
At 31st December 2011Impact on income statement: gain/(loss) 42 (23)Impact on equity: (loss)/gain (42) 51
Swire Pacific 2012 Annual Report 155
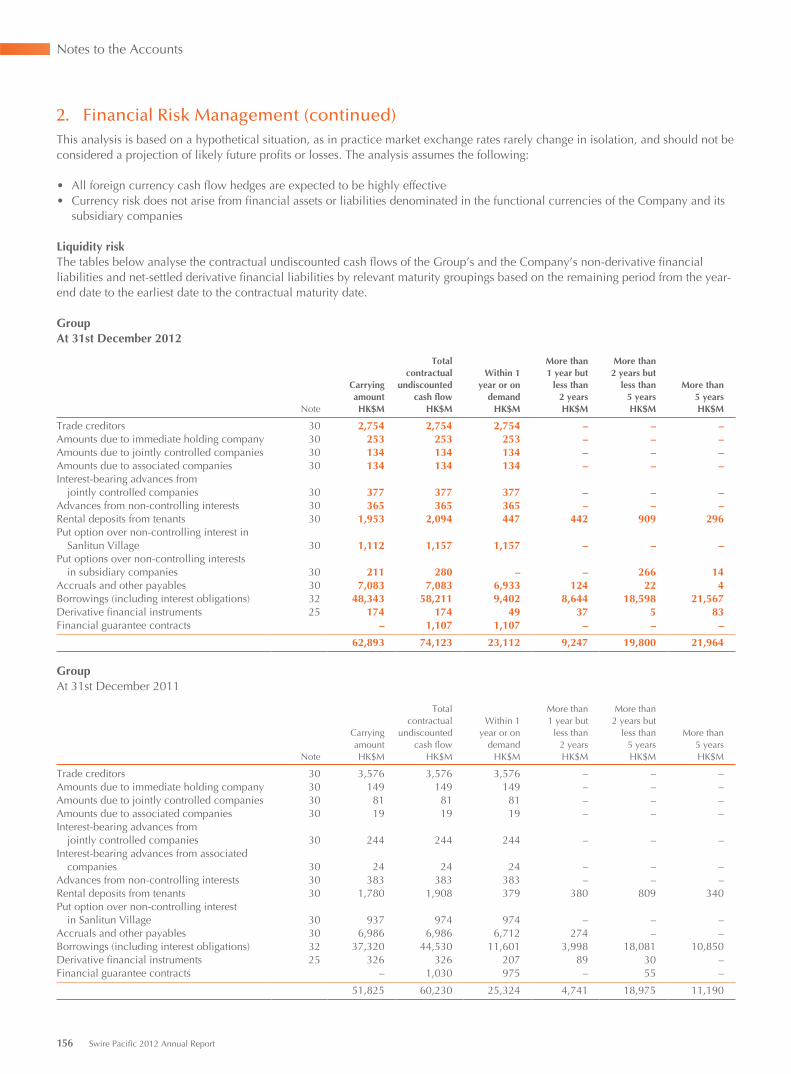
Notes to the Accounts
2. Financial Risk Management (continued)This analysis is based on a hypothetical situation, as in practice market exchange rates rarely change in isolation, and should not be considered a projection of likely future profits or losses. The analysis assumes the following:
• All foreign currency cash flow hedges are expected to be highly effective• Currency risk does not arise from financial assets or liabilities denominated in the functional currencies of the Company and its
subsidiary companies
Liquidity riskThe tables below analyse the contractual undiscounted cash flows of the Group’s and the Company’s non-derivative financial liabilities and net-settled derivative financial liabilities by relevant maturity groupings based on the remaining period from the year-end date to the earliest date to the contractual maturity date.
GroupAt 31st December 2012
Total More than More thancontractual Within 1 1 year but 2 years but
Carrying undiscounted year or on less than less than More thanamount cash flow demand 2 years 5 years 5 years
Note HK$M HK$M HK$M HK$M HK$M HK$M
Trade creditors 30 2,754 2,754 2,754 – – –Amounts due to immediate holding company 30 253 253 253 – – –Amounts due to jointly controlled companies 30 134 134 134 – – –Amounts due to associated companies 30 134 134 134 – – –Interest-bearing advances from jointly controlled companies 30 377 377 377 – – –Advances from non-controlling interests 30 365 365 365 – – –Rental deposits from tenants 30 1,953 2,094 447 442 909 296Put option over non-controlling interest in Sanlitun Village 30 1,112 1,157 1,157 – – –Put options over non-controlling interests in subsidiary companies 30 211 280 – – 266 14Accruals and other payables 30 7,083 7,083 6,933 124 22 4Borrowings (including interest obligations) 32 48,343 58,211 9,402 8,644 18,598 21,567Derivative financial instruments 25 174 174 49 37 5 83Financial guarantee contracts – 1,107 1,107 – – –
62,893 74,123 23,112 9,247 19,800 21,964
GroupAt 31st December 2011
Total More than More thancontractual Within 1 1 year but 2 years but
Carrying undiscounted year or on less than less than More thanamount cash flow demand 2 years 5 years 5 years
Note HK$M HK$M HK$M HK$M HK$M HK$M
Trade creditors 30 3,576 3,576 3,576 – – –Amounts due to immediate holding company 30 149 149 149 – – –Amounts due to jointly controlled companies 30 81 81 81 – – –Amounts due to associated companies 30 19 19 19 – – –Interest-bearing advances from jointly controlled companies 30 244 244 244 – – –Interest-bearing advances from associated companies 30 24 24 24 – – –Advances from non-controlling interests 30 383 383 383 – – –Rental deposits from tenants 30 1,780 1,908 379 380 809 340Put option over non-controlling interest in Sanlitun Village 30 937 974 974 – – –Accruals and other payables 30 6,986 6,986 6,712 274 – –Borrowings (including interest obligations) 32 37,320 44,530 11,601 3,998 18,081 10,850Derivative financial instruments 25 326 326 207 89 30 –Financial guarantee contracts – 1,030 975 – 55 –
51,825 60,230 25,324 4,741 18,975 11,190
156 Swire Pacific 2012 Annual Report
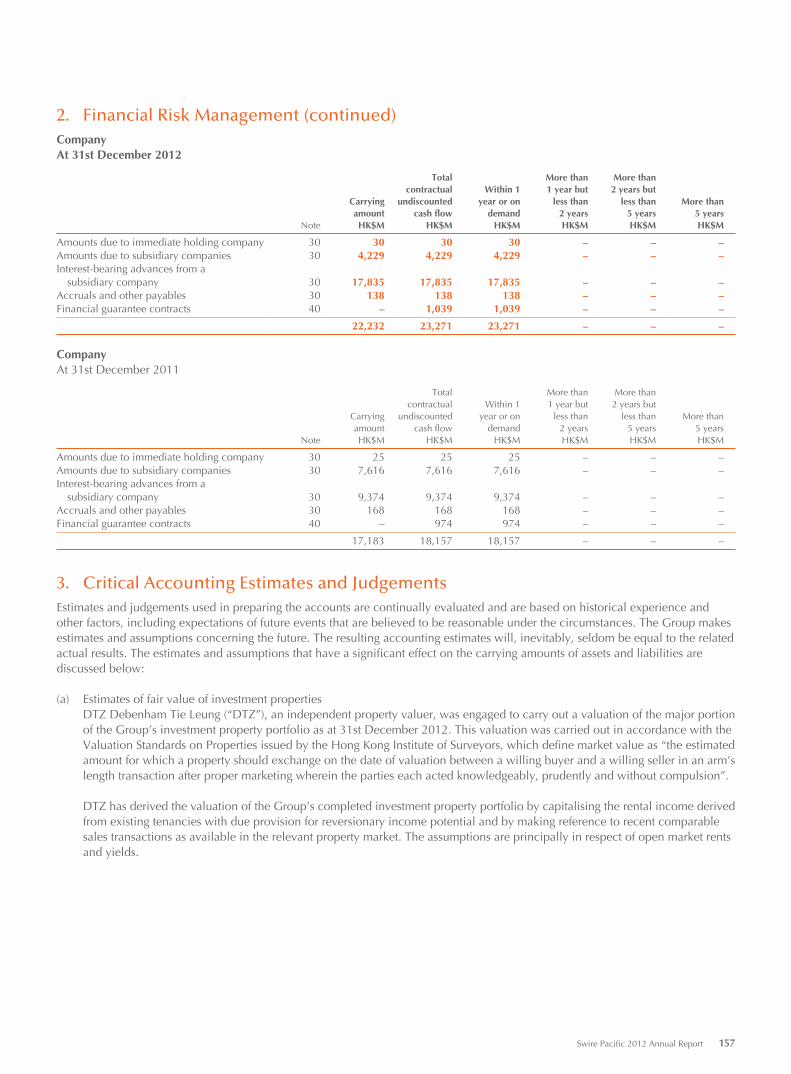
2. Financial Risk Management (continued)CompanyAt 31st December 2012
Total More than More thancontractual Within 1 1 year but 2 years but
Carrying undiscounted year or on less than less than More thanamount cash flow demand 2 years 5 years 5 years
Note HK$M HK$M HK$M HK$M HK$M HK$M
Amounts due to immediate holding company 30 30 30 30 – – –Amounts due to subsidiary companies 30 4,229 4,229 4,229 – – –Interest-bearing advances from a subsidiary company 30 17,835 17,835 17,835 – – –Accruals and other payables 30 138 138 138 – – –Financial guarantee contracts 40 – 1,039 1,039 – – –
22,232 23,271 23,271 – – –
CompanyAt 31st December 2011
Total More than More thancontractual Within 1 1 year but 2 years but
Carrying undiscounted year or on less than less than More thanamount cash flow demand 2 years 5 years 5 years
Note HK$M HK$M HK$M HK$M HK$M HK$M
Amounts due to immediate holding company 30 25 25 25 – – –Amounts due to subsidiary companies 30 7,616 7,616 7,616 – – –Interest-bearing advances from a subsidiary company 30 9,374 9,374 9,374 – – –Accruals and other payables 30 168 168 168 – – –Financial guarantee contracts 40 – 974 974 – – –
17,183 18,157 18,157 – – –
3. Critical Accounting Estimates and JudgementsEstimates and judgements used in preparing the accounts are continually evaluated and are based on historical experience and other factors, including expectations of future events that are believed to be reasonable under the circumstances. The Group makes estimates and assumptions concerning the future. The resulting accounting estimates will, inevitably, seldom be equal to the related actual results. The estimates and assumptions that have a significant effect on the carrying amounts of assets and liabilities are discussed below:
(a) Estimates of fair value of investment propertiesDTZ Debenham Tie Leung (“DTZ”), an independent property valuer, was engaged to carry out a valuation of the major portion of the Group’s investment property portfolio as at 31st December 2012. This valuation was carried out in accordance with the Valuation Standards on Properties issued by the Hong Kong Institute of Surveyors, which define market value as “the estimated amount for which a property should exchange on the date of valuation between a willing buyer and a willing seller in an arm’s length transaction after proper marketing wherein the parties each acted knowledgeably, prudently and without compulsion”.
DTZ has derived the valuation of the Group’s completed investment property portfolio by capitalising the rental income derived from existing tenancies with due provision for reversionary income potential and by making reference to recent comparable sales transactions as available in the relevant property market. The assumptions are principally in respect of open market rents and yields.
Swire Pacific 2012 Annual Report 157
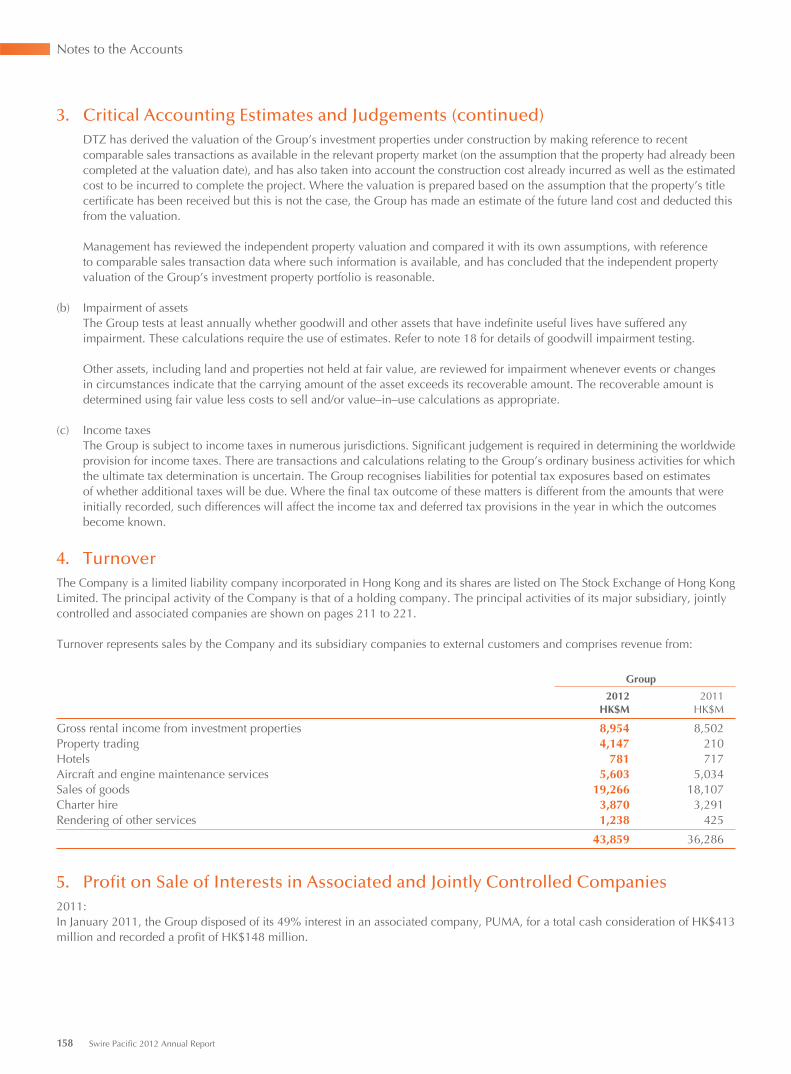
Notes to the Accounts
3. Critical Accounting Estimates and Judgements (continued)DTZ has derived the valuation of the Group’s investment properties under construction by making reference to recent comparable sales transactions as available in the relevant property market (on the assumption that the property had already been completed at the valuation date), and has also taken into account the construction cost already incurred as well as the estimated cost to be incurred to complete the project. Where the valuation is prepared based on the assumption that the property’s title certificate has been received but this is not the case, the Group has made an estimate of the future land cost and deducted this from the valuation.
Management has reviewed the independent property valuation and compared it with its own assumptions, with reference to comparable sales transaction data where such information is available, and has concluded that the independent property valuation of the Group’s investment property portfolio is reasonable.
(b) Impairment of assetsThe Group tests at least annually whether goodwill and other assets that have indefinite useful lives have suffered any impairment. These calculations require the use of estimates. Refer to note 18 for details of goodwill impairment testing.
Other assets, including land and properties not held at fair value, are reviewed for impairment whenever events or changes in circumstances indicate that the carrying amount of the asset exceeds its recoverable amount. The recoverable amount is determined using fair value less costs to sell and/or value–in–use calculations as appropriate.
(c) Income taxesThe Group is subject to income taxes in numerous jurisdictions. Significant judgement is required in determining the worldwide provision for income taxes. There are transactions and calculations relating to the Group’s ordinary business activities for which the ultimate tax determination is uncertain. The Group recognises liabilities for potential tax exposures based on estimates of whether additional taxes will be due. Where the final tax outcome of these matters is different from the amounts that were initially recorded, such differences will affect the income tax and deferred tax provisions in the year in which the outcomes become known.
4. TurnoverThe Company is a limited liability company incorporated in Hong Kong and its shares are listed on The Stock Exchange of Hong Kong Limited. The principal activity of the Company is that of a holding company. The principal activities of its major subsidiary, jointly controlled and associated companies are shown on pages 211 to 221.
Turnover represents sales by the Company and its subsidiary companies to external customers and comprises revenue from:
Group
2012 2011HK$M HK$M
Gross rental income from investment properties 8,954 8,502Property trading 4,147 210Hotels 781 717Aircraft and engine maintenance services 5,603 5,034Sales of goods 19,266 18,107Charter hire 3,870 3,291Rendering of other services 1,238 425
43,859 36,286
5. Profit on Sale of Interests in Associated and Jointly Controlled Companies2011:In January 2011, the Group disposed of its 49% interest in an associated company, PUMA, for a total cash consideration of HK$413 million and recorded a profit of HK$148 million.
158 Swire Pacific 2012 Annual Report
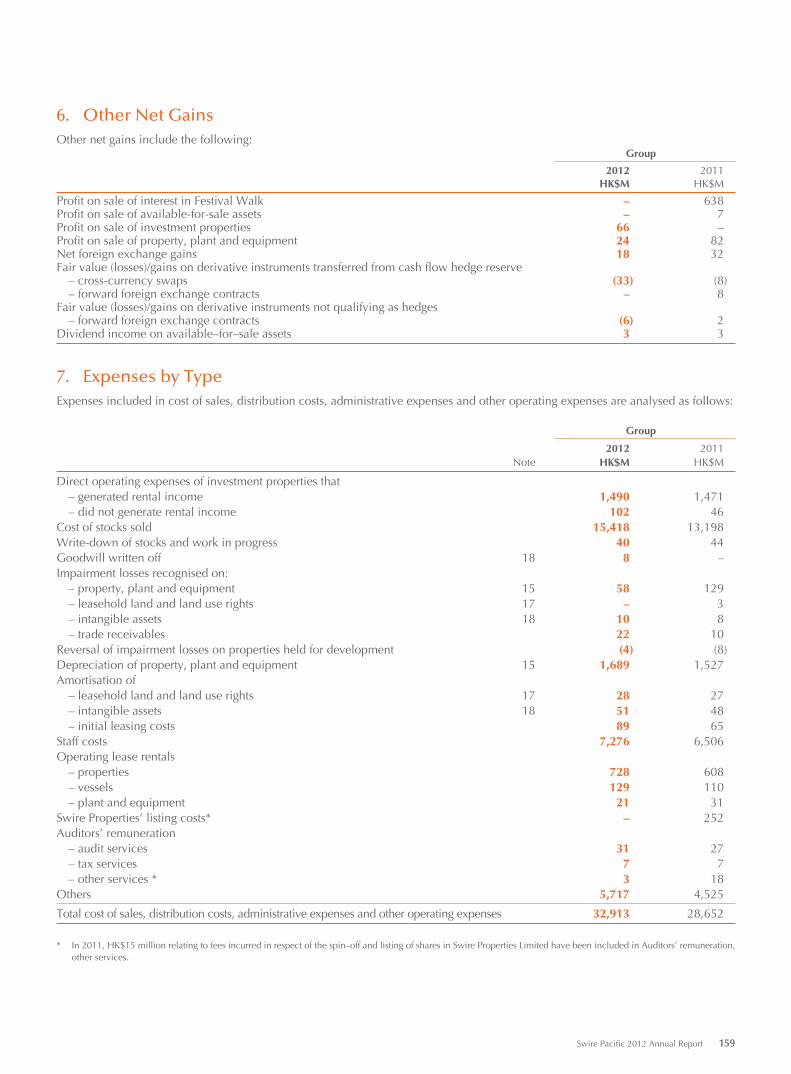
6. Other Net GainsOther net gains include the following:
Group
2012 2011HK$M HK$M
Profit on sale of interest in Festival Walk – 638Profit on sale of available-for-sale assets – 7Profit on sale of investment properties 66 –Profit on sale of property, plant and equipment 24 82Net foreign exchange gains 18 32Fair value (losses)/gains on derivative instruments transferred from cash flow hedge reserve – cross-currency swaps (33) (8) – forward foreign exchange contracts – 8Fair value (losses)/gains on derivative instruments not qualifying as hedges – forward foreign exchange contracts (6) 2Dividend income on available–for–sale assets 3 3
7. Expenses by TypeExpenses included in cost of sales, distribution costs, administrative expenses and other operating expenses are analysed as follows:
Group
2012 2011Note HK$M HK$M
Direct operating expenses of investment properties that – generated rental income 1,490 1,471 – did not generate rental income 102 46Cost of stocks sold 15,418 13,198Write-down of stocks and work in progress 40 44Goodwill written off 18 8 –Impairment losses recognised on: – property, plant and equipment 15 58 129 – leasehold land and land use rights 17 – 3 – intangible assets 18 10 8 – trade receivables 22 10Reversal of impairment losses on properties held for development (4) (8)Depreciation of property, plant and equipment 15 1,689 1,527Amortisation of – leasehold land and land use rights 17 28 27 – intangible assets 18 51 48 – initial leasing costs 89 65Staff costs 7,276 6,506Operating lease rentals – properties 728 608 – vessels 129 110 – plant and equipment 21 31Swire Properties’ listing costs* – 252Auditors’ remuneration – audit services 31 27 – tax services 7 7 – other services * 3 18Others 5,717 4,525
Total cost of sales, distribution costs, administrative expenses and other operating expenses 32,913 28,652
* In 2011, HK$15 million relating to fees incurred in respect of the spin–off and listing of shares in Swire Properties Limited have been included in Auditors’ remuneration, other services.
Swire Pacific 2012 Annual Report 159
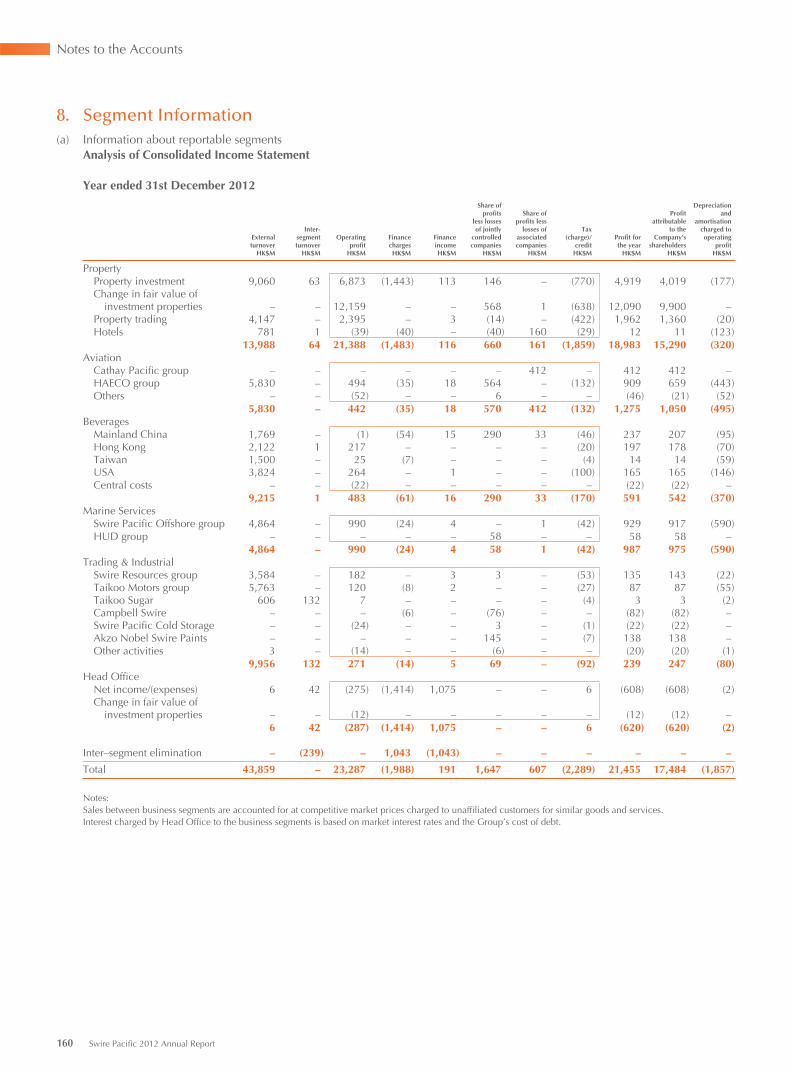
Notes to the Accounts
8. Segment Information(a) Information about reportable segments
Analysis of Consolidated Income Statement
Year ended 31st December 2012
Externalturnover
Inter-segmentturnover
Operatingprofit
Financecharges
Financeincome
Share ofprofits
less lossesof jointly
controlledcompanies
Share ofprofits less
losses ofassociatedcompanies
Tax(charge)/
creditProfit forthe year
Profitattributable
to theCompany’s
shareholders
Depreciationand
amortisationcharged tooperating
profitHK$M HK$M HK$M HK$M HK$M HK$M HK$M HK$M HK$M HK$M HK$M
Property Property investment 9,060 63 6,873 (1,443) 113 146 – (770) 4,919 4,019 (177) Change in fair value of investment properties – – 12,159 – – 568 1 (638) 12,090 9,900 – Property trading 4,147 – 2,395 – 3 (14) – (422) 1,962 1,360 (20) Hotels 781 1 (39) (40) – (40) 160 (29) 12 11 (123)
13,988 64 21,388 (1,483) 116 660 161 (1,859) 18,983 15,290 (320)Aviation Cathay Pacific group – – – – – – 412 – 412 412 – HAECO group 5,830 – 494 (35) 18 564 – (132) 909 659 (443) Others – – (52) – – 6 – – (46) (21) (52)
5,830 – 442 (35) 18 570 412 (132) 1,275 1,050 (495)Beverages Mainland China 1,769 – (1) (54) 15 290 33 (46) 237 207 (95) Hong Kong 2,122 1 217 – – – – (20) 197 178 (70) Taiwan 1,500 – 25 (7) – – – (4) 14 14 (59) USA 3,824 – 264 – 1 – – (100) 165 165 (146) Central costs – – (22) – – – – – (22) (22) –
9,215 1 483 (61) 16 290 33 (170) 591 542 (370)Marine Services Swire Pacific Offshore group 4,864 – 990 (24) 4 – 1 (42) 929 917 (590) HUD group – – – – – 58 – – 58 58 –
4,864 – 990 (24) 4 58 1 (42) 987 975 (590)Trading & Industrial Swire Resources group 3,584 – 182 – 3 3 – (53) 135 143 (22) Taikoo Motors group 5,763 – 120 (8) 2 – – (27) 87 87 (55) Taikoo Sugar 606 132 7 – – – – (4) 3 3 (2) Campbell Swire – – – (6) – (76) – – (82) (82) – Swire Pacific Cold Storage – – (24) – – 3 – (1) (22) (22) – Akzo Nobel Swire Paints – – – – – 145 – (7) 138 138 – Other activities 3 – (14) – – (6) – – (20) (20) (1)
9,956 132 271 (14) 5 69 – (92) 239 247 (80)Head Office Net income/(expenses) 6 42 (275) (1,414) 1,075 – – 6 (608) (608) (2) Change in fair value of investment properties – – (12) – – – – – (12) (12) –
6 42 (287) (1,414) 1,075 – – 6 (620) (620) (2)
Inter–segment elimination – (239) – 1,043 (1,043) – – – – – –
Total 43,859 – 23,287 (1,988) 191 1,647 607 (2,289) 21,455 17,484 (1,857)
Notes: Sales between business segments are accounted for at competitive market prices charged to unaffiliated customers for similar goods and services.Interest charged by Head Office to the business segments is based on market interest rates and the Group’s cost of debt.
160 Swire Pacific 2012 Annual Report
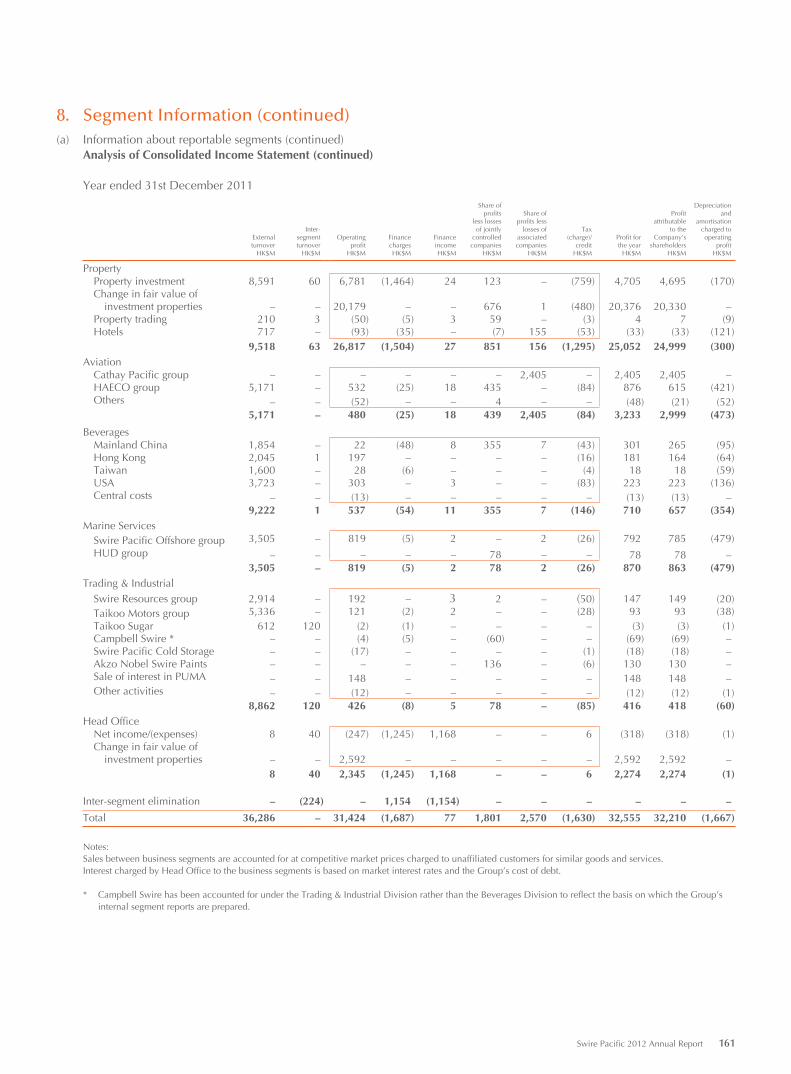
8. Segment Information (continued)(a) Information about reportable segments (continued)
Analysis of Consolidated Income Statement (continued)
Year ended 31st December 2011
External turnover
Inter-segment turnover
Operating profit
Finance charges
Finance income
Share of profits
less losses of jointly
controlled companies
Share of profits less
losses of associated companies
Tax(charge)/
creditProfit for the year
Profitattributable
to the Company’s
shareholders
Depreciation and
amortisation charged to operating
profitHK$M HK$M HK$M HK$M HK$M HK$M HK$M HK$M HK$M HK$M HK$M
Property Property investment 8,591 60 6,781 (1,464) 24 123 – (759) 4,705 4,695 (170) Change in fair value of investment properties – – 20,179 – – 676 1 (480) 20,376 20,330 – Property trading 210 3 (50) (5) 3 59 – (3) 4 7 (9) Hotels 717 – (93) (35) – (7) 155 (53) (33) (33) (121)
9,518 63 26,817 (1,504) 27 851 156 (1,295) 25,052 24,999 (300)Aviation Cathay Pacific group – – – – – – 2,405 – 2,405 2,405 – HAECO group 5,171 – 532 (25) 18 435 – (84) 876 615 (421) Others – – (52) – – 4 – – (48) (21) (52)
5,171 – 480 (25) 18 439 2,405 (84) 3,233 2,999 (473)
Beverages Mainland China 1,854 – 22 (48) 8 355 7 (43) 301 265 (95) Hong Kong 2,045 1 197 – – – – (16) 181 164 (64) Taiwan 1,600 – 28 (6) – – – (4) 18 18 (59) USA 3,723 – 303 – 3 – – (83) 223 223 (136) Central costs – – (13) – – – – – (13) (13) –
9,222 1 537 (54) 11 355 7 (146) 710 657 (354)Marine Services Swire Pacific Offshore group 3,505 – 819 (5) 2 – 2 (26) 792 785 (479) HUD group – – – – – 78 – – 78 78 –
3,505 – 819 (5) 2 78 2 (26) 870 863 (479)Trading & Industrial Swire Resources group 2,914 – 192 – 3 2 – (50) 147 149 (20) Taikoo Motors group 5,336 – 121 (2) 2 – – (28) 93 93 (38) Taikoo Sugar 612 120 (2) (1) – – – – (3) (3) (1) Campbell Swire * – – (4) (5) – (60) – – (69) (69) – Swire Pacific Cold Storage – – (17) – – – – (1) (18) (18) – Akzo Nobel Swire Paints – – – – – 136 – (6) 130 130 – Sale of interest in PUMA – – 148 – – – – – 148 148 – Other activities – – (12) – – – – – (12) (12) (1)
8,862 120 426 (8) 5 78 – (85) 416 418 (60)Head Office Net income/(expenses) 8 40 (247) (1,245) 1,168 – – 6 (318) (318) (1) Change in fair value of investment properties – – 2,592 – – – – – 2,592 2,592 –
8 40 2,345 (1,245) 1,168 – – 6 2,274 2,274 (1)
Inter-segment elimination – (224) – 1,154 (1,154) – – – – – –
Total 36,286 – 31,424 (1,687) 77 1,801 2,570 (1,630) 32,555 32,210 (1,667)
Notes: Sales between business segments are accounted for at competitive market prices charged to unaffiliated customers for similar goods and services.Interest charged by Head Office to the business segments is based on market interest rates and the Group’s cost of debt.
* Campbell Swire has been accounted for under the Trading & Industrial Division rather than the Beverages Division to reflect the basis on which the Group’s internal segment reports are prepared.
Swire Pacific 2012 Annual Report 161
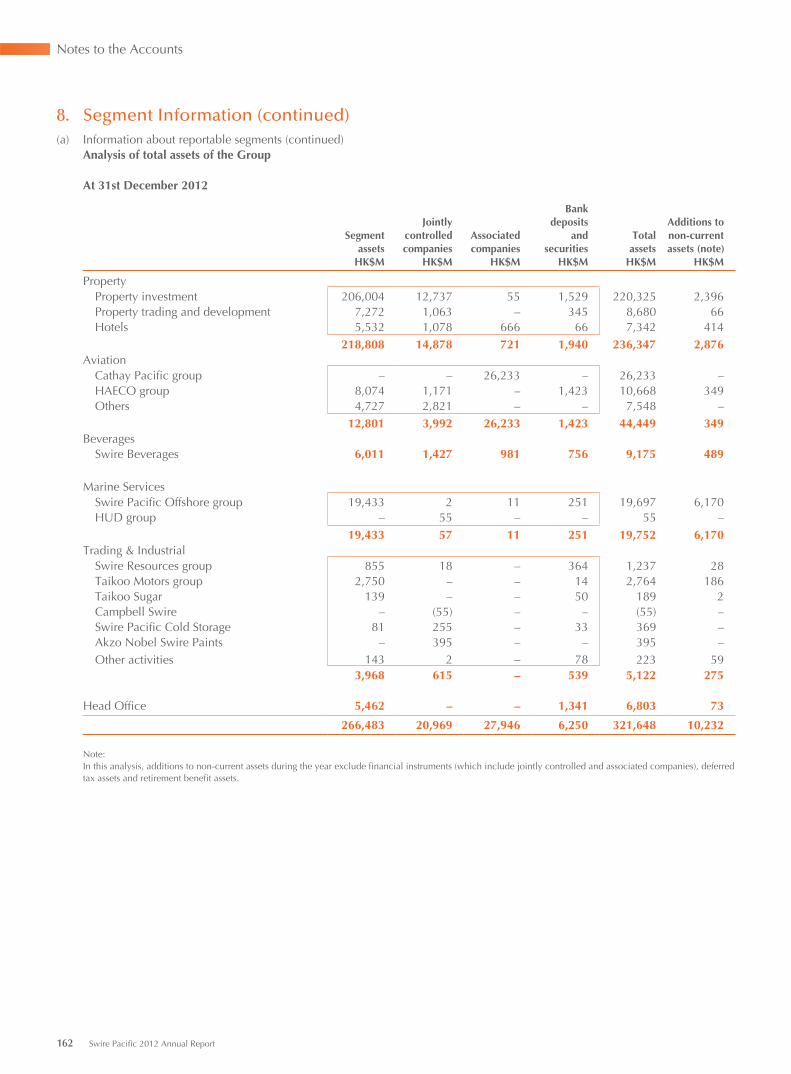
Notes to the Accounts
8. Segment Information (continued)(a) Information about reportable segments (continued)
Analysis of total assets of the Group
At 31st December 2012
JointlyBank
deposits Additions toSegment controlled Associated and Total non-current
assets companies companies securities assets assets (note)HK$M HK$M HK$M HK$M HK$M HK$M
Property Property investment 206,004 12,737 55 1,529 220,325 2,396 Property trading and development 7,272 1,063 – 345 8,680 66 Hotels 5,532 1,078 666 66 7,342 414
218,808 14,878 721 1,940 236,347 2,876Aviation Cathay Pacific group – – 26,233 – 26,233 – HAECO group 8,074 1,171 – 1,423 10,668 349 Others 4,727 2,821 – – 7,548 –
12,801 3,992 26,233 1,423 44,449 349Beverages Swire Beverages 6,011 1,427 981 756 9,175 489
Marine Services Swire Pacific Offshore group 19,433 2 11 251 19,697 6,170 HUD group – 55 – – 55 –
19,433 57 11 251 19,752 6,170Trading & Industrial Swire Resources group 855 18 – 364 1,237 28 Taikoo Motors group 2,750 – – 14 2,764 186 Taikoo Sugar 139 – – 50 189 2 Campbell Swire – (55) – – (55) – Swire Pacific Cold Storage 81 255 – 33 369 – Akzo Nobel Swire Paints – 395 – – 395 – Other activities 143 2 – 78 223 59
3,968 615 – 539 5,122 275
Head Office 5,462 – – 1,341 6,803 73
266,483 20,969 27,946 6,250 321,648 10,232
Note: In this analysis, additions to non-current assets during the year exclude financial instruments (which include jointly controlled and associated companies), deferred tax assets and retirement benefit assets.
162 Swire Pacific 2012 Annual Report
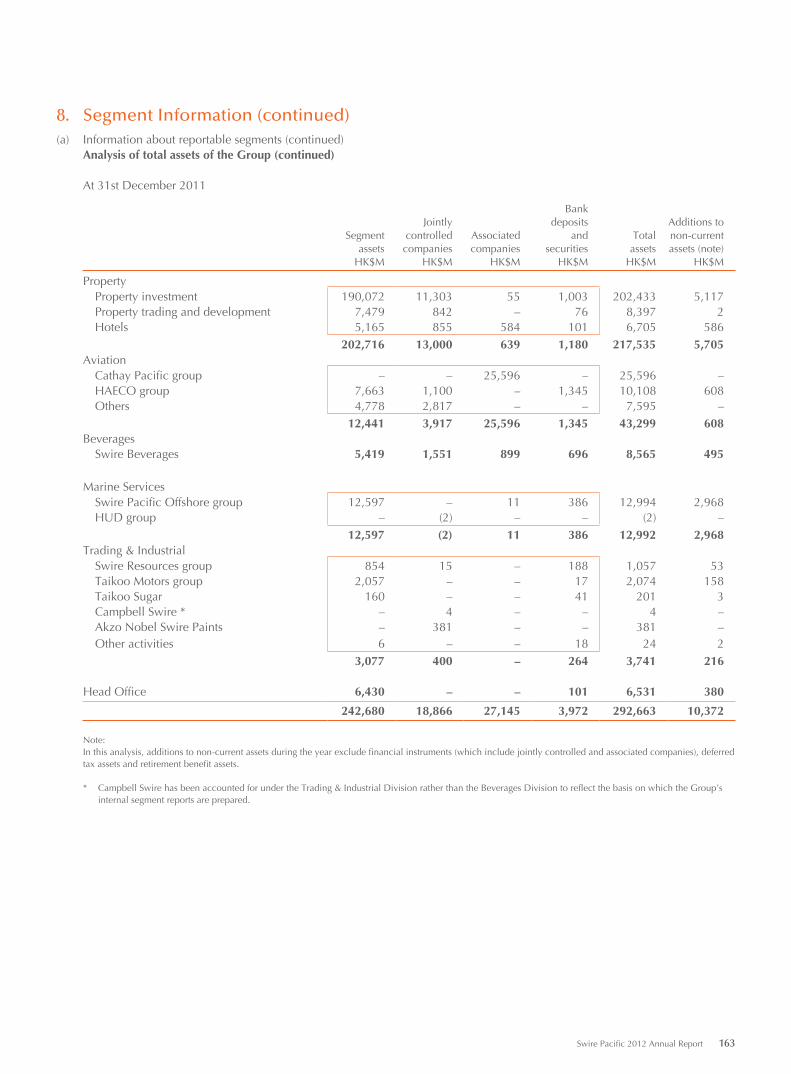
8. Segment Information (continued)(a) Information about reportable segments (continued)
Analysis of total assets of the Group (continued)
At 31st December 2011
JointlyBank
deposits Additions toSegment controlled Associated and Total non-current
assets companies companies securities assets assets (note)HK$M HK$M HK$M HK$M HK$M HK$M
Property Property investment 190,072 11,303 55 1,003 202,433 5,117 Property trading and development 7,479 842 – 76 8,397 2 Hotels 5,165 855 584 101 6,705 586
202,716 13,000 639 1,180 217,535 5,705Aviation Cathay Pacific group – – 25,596 – 25,596 – HAECO group 7,663 1,100 – 1,345 10,108 608 Others 4,778 2,817 – – 7,595 –
12,441 3,917 25,596 1,345 43,299 608Beverages Swire Beverages 5,419 1,551 899 696 8,565 495
Marine Services Swire Pacific Offshore group 12,597 – 11 386 12,994 2,968 HUD group – (2) – – (2) –
12,597 (2) 11 386 12,992 2,968Trading & Industrial Swire Resources group 854 15 – 188 1,057 53 Taikoo Motors group 2,057 – – 17 2,074 158 Taikoo Sugar 160 – – 41 201 3 Campbell Swire * – 4 – – 4 – Akzo Nobel Swire Paints – 381 – – 381 – Other activities 6 – – 18 24 2
3,077 400 – 264 3,741 216
Head Office 6,430 – – 101 6,531 380
242,680 18,866 27,145 3,972 292,663 10,372
Note: In this analysis, additions to non-current assets during the year exclude financial instruments (which include jointly controlled and associated companies), deferred tax assets and retirement benefit assets.
* Campbell Swire has been accounted for under the Trading & Industrial Division rather than the Beverages Division to reflect the basis on which the Group’s internal segment reports are prepared.
Swire Pacific 2012 Annual Report 163
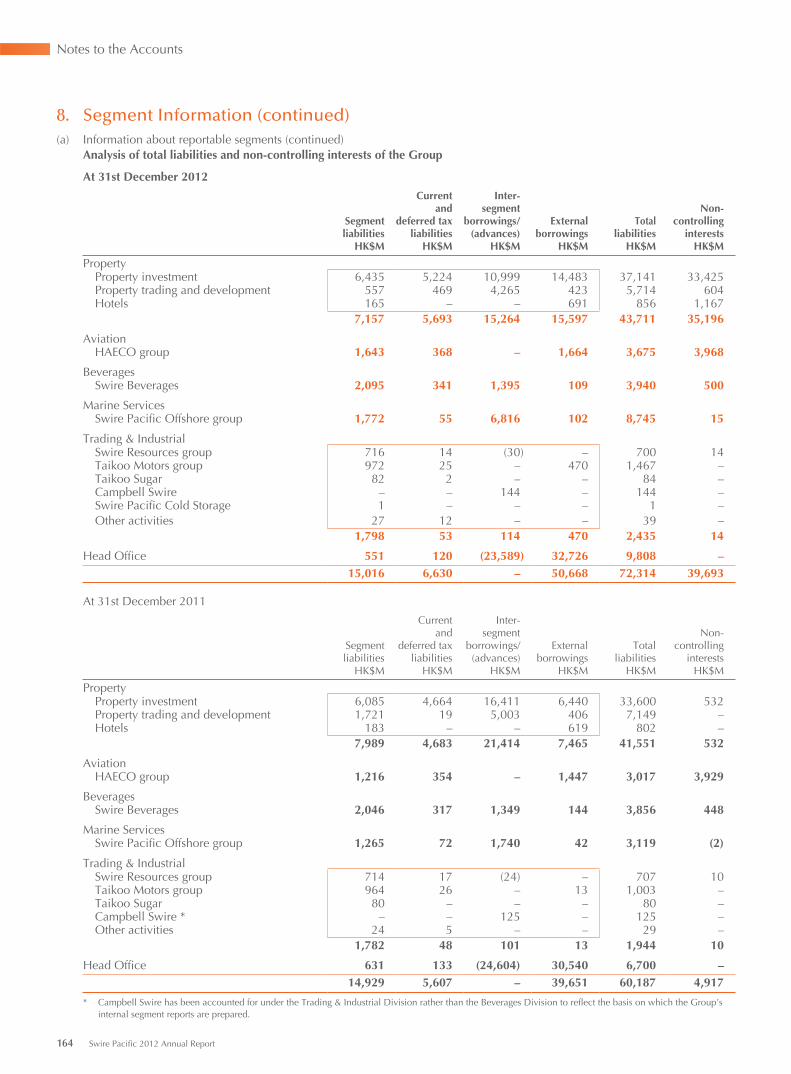
Notes to the Accounts
8. Segment Information (continued)(a) Information about reportable segments (continued)
Analysis of total liabilities and non-controlling interests of the Group
At 31st December 2012
Current Inter-and segment Non-
Segment deferred tax borrowings/ External Total controllingliabilities liabilities (advances) borrowings liabilities interests
HK$M HK$M HK$M HK$M HK$M HK$M
Property Property investment 6,435 5,224 10,999 14,483 37,141 33,425 Property trading and development 557 469 4,265 423 5,714 604 Hotels 165 – – 691 856 1,167
7,157 5,693 15,264 15,597 43,711 35,196
Aviation HAECO group 1,643 368 – 1,664 3,675 3,968
Beverages Swire Beverages 2,095 341 1,395 109 3,940 500
Marine Services Swire Pacific Offshore group 1,772 55 6,816 102 8,745 15
Trading & Industrial Swire Resources group 716 14 (30) – 700 14 Taikoo Motors group 972 25 – 470 1,467 – Taikoo Sugar 82 2 – – 84 – Campbell Swire – – 144 – 144 – Swire Pacific Cold Storage 1 – – – 1 – Other activities 27 12 – – 39 –
1,798 53 114 470 2,435 14
Head Office 551 120 (23,589) 32,726 9,808 –15,016 6,630 – 50,668 72,314 39,693
At 31st December 2011
Current Inter-and segment Non-
Segment deferred tax borrowings/ External Total controllingliabilities liabilities (advances) borrowings liabilities interests
HK$M HK$M HK$M HK$M HK$M HK$M
Property Property investment 6,085 4,664 16,411 6,440 33,600 532 Property trading and development 1,721 19 5,003 406 7,149 – Hotels 183 – – 619 802 –
7,989 4,683 21,414 7,465 41,551 532
Aviation HAECO group 1,216 354 – 1,447 3,017 3,929
Beverages Swire Beverages 2,046 317 1,349 144 3,856 448
Marine Services Swire Pacific Offshore group 1,265 72 1,740 42 3,119 (2)
Trading & Industrial Swire Resources group 714 17 (24) – 707 10 Taikoo Motors group 964 26 – 13 1,003 – Taikoo Sugar 80 – – – 80 – Campbell Swire * – – 125 – 125 – Other activities 24 5 – – 29 –
1,782 48 101 13 1,944 10
Head Office 631 133 (24,604) 30,540 6,700 –14,929 5,607 – 39,651 60,187 4,917
* Campbell Swire has been accounted for under the Trading & Industrial Division rather than the Beverages Division to reflect the basis on which the Group’s internal segment reports are prepared.
164 Swire Pacific 2012 Annual Report
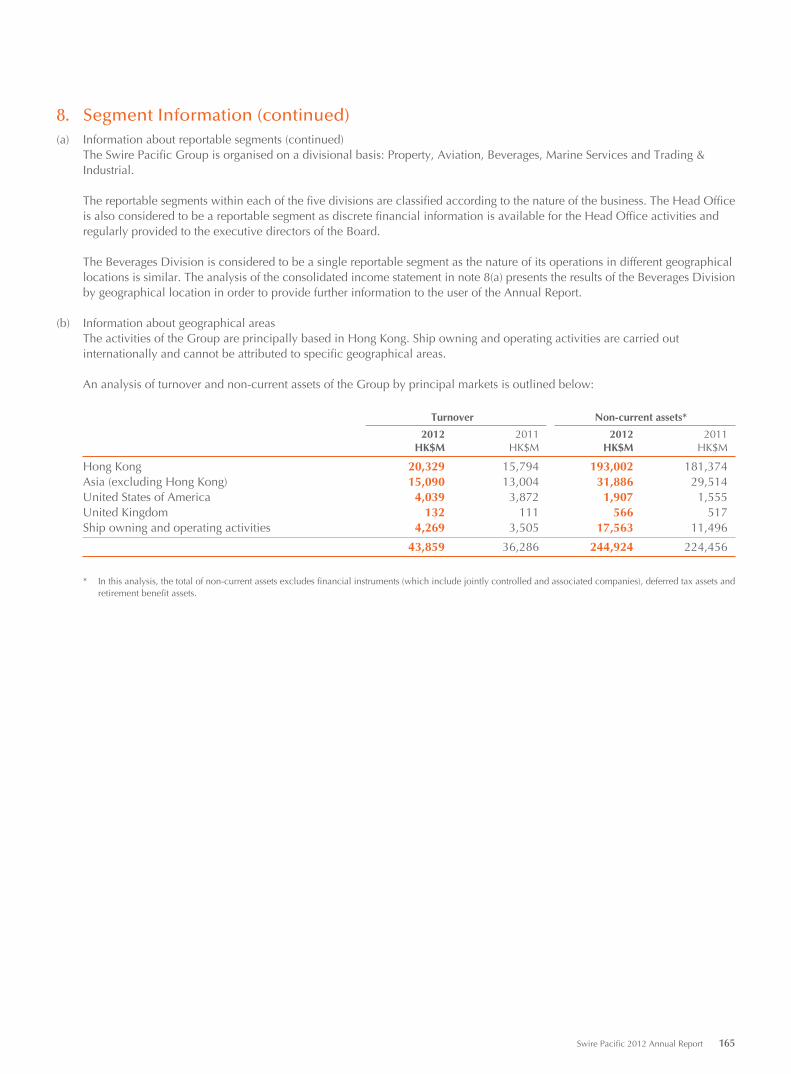
8. Segment Information (continued)(a) Information about reportable segments (continued)
The Swire Pacific Group is organised on a divisional basis: Property, Aviation, Beverages, Marine Services and Trading & Industrial.
The reportable segments within each of the five divisions are classified according to the nature of the business. The Head Office is also considered to be a reportable segment as discrete financial information is available for the Head Office activities and regularly provided to the executive directors of the Board.
The Beverages Division is considered to be a single reportable segment as the nature of its operations in different geographical locations is similar. The analysis of the consolidated income statement in note 8(a) presents the results of the Beverages Division by geographical location in order to provide further information to the user of the Annual Report.
(b) Information about geographical areasThe activities of the Group are principally based in Hong Kong. Ship owning and operating activities are carried out internationally and cannot be attributed to specific geographical areas.
An analysis of turnover and non-current assets of the Group by principal markets is outlined below:
Turnover Non-current assets*
2012 2011 2012 2011HK$M HK$M HK$M HK$M
Hong Kong 20,329 15,794 193,002 181,374Asia (excluding Hong Kong) 15,090 13,004 31,886 29,514United States of America 4,039 3,872 1,907 1,555United Kingdom 132 111 566 517Ship owning and operating activities 4,269 3,505 17,563 11,496
43,859 36,286 244,924 224,456
* In this analysis, the total of non-current assets excludes financial instruments (which include jointly controlled and associated companies), deferred tax assets and retirement benefit assets.
Swire Pacific 2012 Annual Report 165
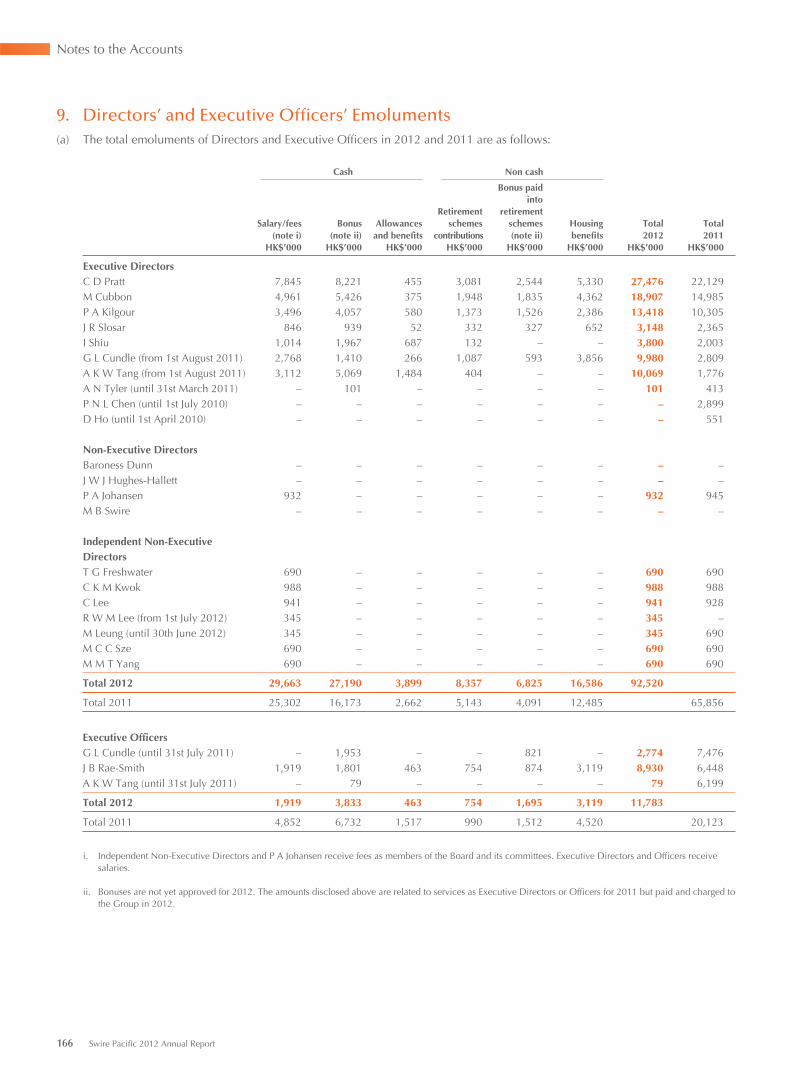
Notes to the Accounts
9. Directors’ and Executive Officers’ Emoluments(a) The total emoluments of Directors and Executive Officers in 2012 and 2011 are as follows:
Cash Non cash
Bonus paid
Retirementinto
retirementSalary/fees Bonus Allowances schemes schemes Housing Total Total
(note i) (note ii) and benefits contributions (note ii) benefits 2012 2011HK$’000 HK$’000 HK$’000 HK$’000 HK$’000 HK$’000 HK$’000 HK$’000
Executive DirectorsC D Pratt 7,845 8,221 455 3,081 2,544 5,330 27,476 22,129M Cubbon 4,961 5,426 375 1,948 1,835 4,362 18,907 14,985P A Kilgour 3,496 4,057 580 1,373 1,526 2,386 13,418 10,305J R Slosar 846 939 52 332 327 652 3,148 2,365I Shiu 1,014 1,967 687 132 – – 3,800 2,003G L Cundle (from 1st August 2011) 2,768 1,410 266 1,087 593 3,856 9,980 2,809A K W Tang (from 1st August 2011) 3,112 5,069 1,484 404 – – 10,069 1,776A N Tyler (until 31st March 2011) – 101 – – – – 101 413P N L Chen (until 1st July 2010) – – – – – – – 2,899D Ho (until 1st April 2010) – – – – – – – 551
Non-Executive DirectorsBaroness Dunn – – – – – – – –J W J Hughes-Hallett – – – – – – – –P A Johansen 932 – – – – – 932 945M B Swire – – – – – – – –
Independent Non-Executive DirectorsT G Freshwater 690 – – – – – 690 690C K M Kwok 988 – – – – – 988 988C Lee 941 – – – – – 941 928R W M Lee (from 1st July 2012) 345 – – – – – 345 –M Leung (until 30th June 2012) 345 – – – – – 345 690M C C Sze 690 – – – – – 690 690M M T Yang 690 – – – – – 690 690
Total 2012 29,663 27,190 3,899 8,357 6,825 16,586 92,520
Total 2011 25,302 16,173 2,662 5,143 4,091 12,485 65,856
Executive OfficersG L Cundle (until 31st July 2011) – 1,953 – – 821 – 2,774 7,476J B Rae-Smith 1,919 1,801 463 754 874 3,119 8,930 6,448A K W Tang (until 31st July 2011) – 79 – – – – 79 6,199
Total 2012 1,919 3,833 463 754 1,695 3,119 11,783
Total 2011 4,852 6,732 1,517 990 1,512 4,520 20,123
i. Independent Non-Executive Directors and P A Johansen receive fees as members of the Board and its committees. Executive Directors and Officers receive salaries.
ii. Bonuses are not yet approved for 2012. The amounts disclosed above are related to services as Executive Directors or Officers for 2011 but paid and charged to the Group in 2012.
166 Swire Pacific 2012 Annual Report
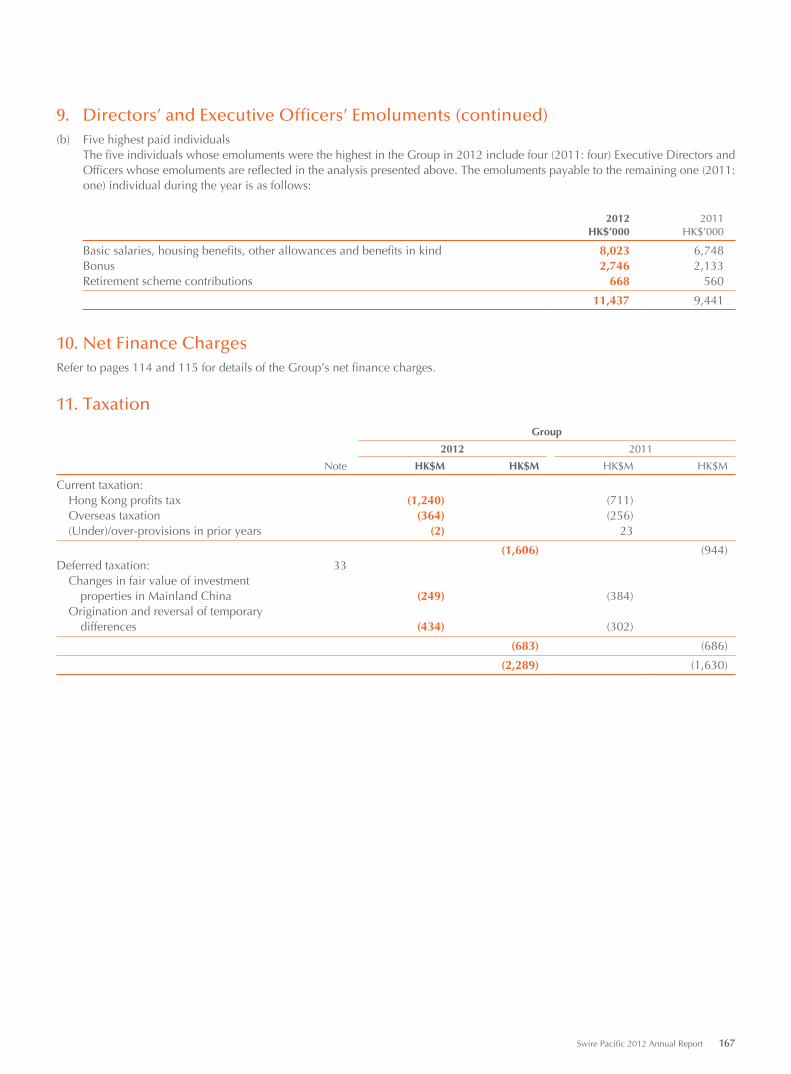
9. Directors’ and Executive Officers’ Emoluments (continued)(b) Five highest paid individuals
The five individuals whose emoluments were the highest in the Group in 2012 include four (2011: four) Executive Directors and Officers whose emoluments are reflected in the analysis presented above. The emoluments payable to the remaining one (2011: one) individual during the year is as follows:
2012 2011HK$’000 HK$’000
Basic salaries, housing benefits, other allowances and benefits in kind 8,023 6,748Bonus 2,746 2,133Retirement scheme contributions 668 560
11,437 9,441
10. Net Finance ChargesRefer to pages 114 and 115 for details of the Group’s net finance charges.
11. Taxation
Group
2012 2011
Note HK$M HK$M HK$M HK$M
Current taxation: Hong Kong profits tax (1,240) (711) Overseas taxation (364) (256) (Under)/over-provisions in prior years (2) 23
(1,606) (944)Deferred taxation: 33 Changes in fair value of investment properties in Mainland China (249) (384) Origination and reversal of temporary differences (434) (302)
(683) (686)
(2,289) (1,630)
Swire Pacific 2012 Annual Report 167
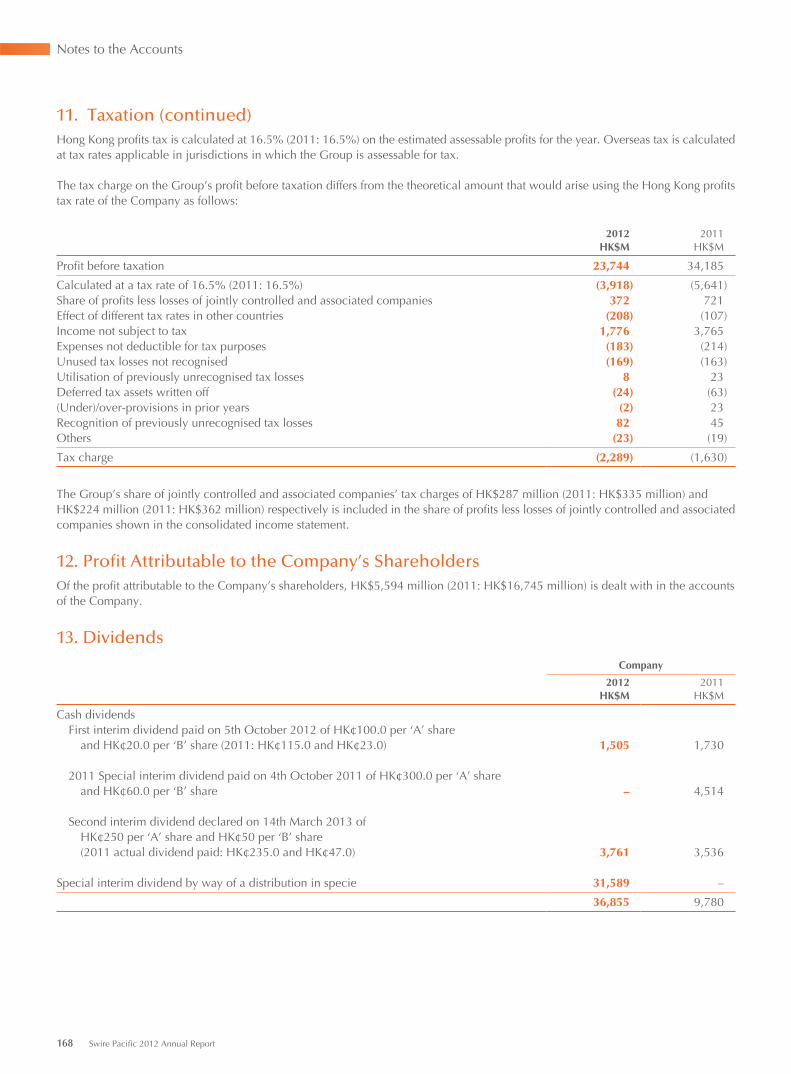
Notes to the Accounts
11. Taxation (continued)Hong Kong profits tax is calculated at 16.5% (2011: 16.5%) on the estimated assessable profits for the year. Overseas tax is calculated at tax rates applicable in jurisdictions in which the Group is assessable for tax.
The tax charge on the Group’s profit before taxation differs from the theoretical amount that would arise using the Hong Kong profits tax rate of the Company as follows:
2012 2011HK$M HK$M
Profit before taxation 23,744 34,185
Calculated at a tax rate of 16.5% (2011: 16.5%) (3,918) (5,641)Share of profits less losses of jointly controlled and associated companies 372 721Effect of different tax rates in other countries (208) (107)Income not subject to tax 1,776 3,765Expenses not deductible for tax purposes (183) (214)Unused tax losses not recognised (169) (163)Utilisation of previously unrecognised tax losses 8 23Deferred tax assets written off (24) (63)(Under)/over-provisions in prior years (2) 23Recognition of previously unrecognised tax losses 82 45Others (23) (19)
Tax charge (2,289) (1,630)
The Group’s share of jointly controlled and associated companies’ tax charges of HK$287 million (2011: HK$335 million) and HK$224 million (2011: HK$362 million) respectively is included in the share of profits less losses of jointly controlled and associated companies shown in the consolidated income statement.
12. Profit Attributable to the Company’s ShareholdersOf the profit attributable to the Company’s shareholders, HK$5,594 million (2011: HK$16,745 million) is dealt with in the accounts of the Company.
13. Dividends
Company
2012 2011HK$M HK$M
Cash dividends First interim dividend paid on 5th October 2012 of HK¢100.0 per ‘A’ share and HK¢20.0 per ‘B’ share (2011: HK¢115.0 and HK¢23.0) 1,505 1,730
2011 Special interim dividend paid on 4th October 2011 of HK¢300.0 per ‘A’ share and HK¢60.0 per ‘B’ share – 4,514
Second interim dividend declared on 14th March 2013 of HK¢250 per ‘A’ share and HK¢50 per ‘B’ share (2011 actual dividend paid: HK¢235.0 and HK¢47.0) 3,761 3,536
Special interim dividend by way of a distribution in specie 31,589 –
36,855 9,780
168 Swire Pacific 2012 Annual Report
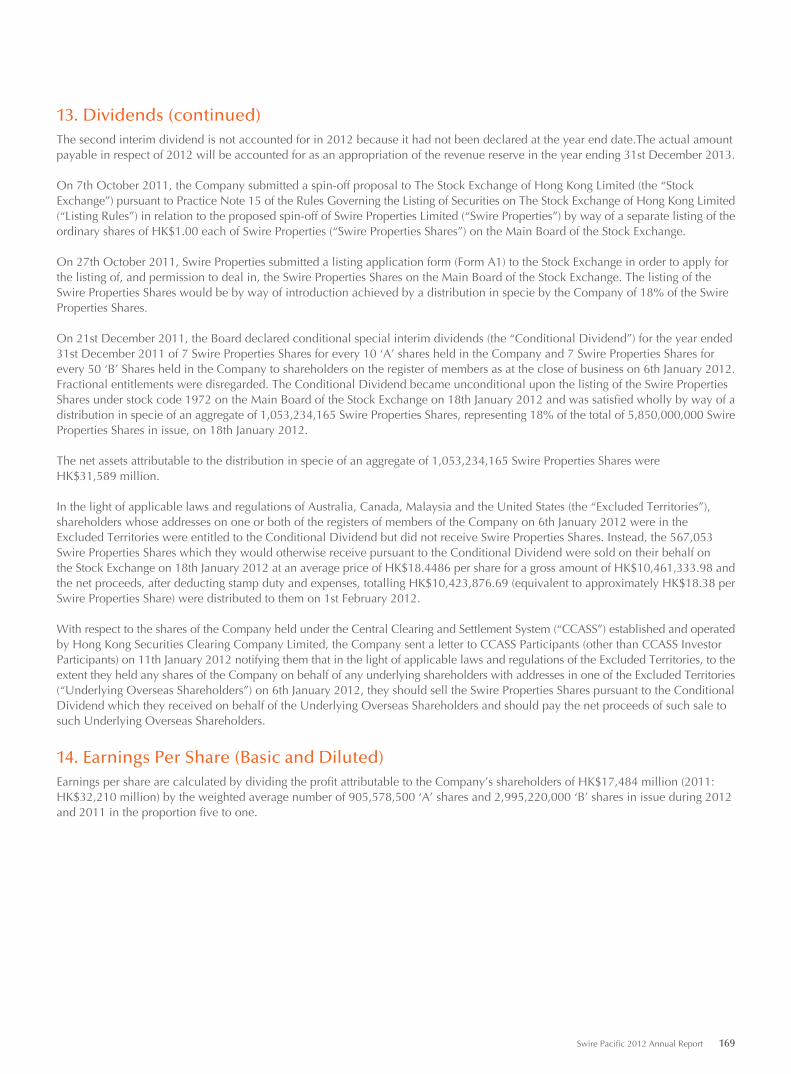
13. Dividends (continued)The second interim dividend is not accounted for in 2012 because it had not been declared at the year end date.The actual amount payable in respect of 2012 will be accounted for as an appropriation of the revenue reserve in the year ending 31st December 2013.
On 7th October 2011, the Company submitted a spin-off proposal to The Stock Exchange of Hong Kong Limited (the “Stock Exchange”) pursuant to Practice Note 15 of the Rules Governing the Listing of Securities on The Stock Exchange of Hong Kong Limited (“Listing Rules”) in relation to the proposed spin-off of Swire Properties Limited (“Swire Properties”) by way of a separate listing of the ordinary shares of HK$1.00 each of Swire Properties (“Swire Properties Shares”) on the Main Board of the Stock Exchange.
On 27th October 2011, Swire Properties submitted a listing application form (Form A1) to the Stock Exchange in order to apply for the listing of, and permission to deal in, the Swire Properties Shares on the Main Board of the Stock Exchange. The listing of the Swire Properties Shares would be by way of introduction achieved by a distribution in specie by the Company of 18% of the Swire Properties Shares.
On 21st December 2011, the Board declared conditional special interim dividends (the “Conditional Dividend”) for the year ended 31st December 2011 of 7 Swire Properties Shares for every 10 ‘A’ shares held in the Company and 7 Swire Properties Shares for every 50 ‘B’ Shares held in the Company to shareholders on the register of members as at the close of business on 6th January 2012. Fractional entitlements were disregarded. The Conditional Dividend became unconditional upon the listing of the Swire Properties Shares under stock code 1972 on the Main Board of the Stock Exchange on 18th January 2012 and was satisfied wholly by way of a distribution in specie of an aggregate of 1,053,234,165 Swire Properties Shares, representing 18% of the total of 5,850,000,000 SwireProperties Shares in issue, on 18th January 2012.
The net assets attributable to the distribution in specie of an aggregate of 1,053,234,165 Swire Properties Shares wereHK$31,589 million.
In the light of applicable laws and regulations of Australia, Canada, Malaysia and the United States (the “Excluded Territories”), shareholders whose addresses on one or both of the registers of members of the Company on 6th January 2012 were in theExcluded Territories were entitled to the Conditional Dividend but did not receive Swire Properties Shares. Instead, the 567,053Swire Properties Shares which they would otherwise receive pursuant to the Conditional Dividend were sold on their behalf onthe Stock Exchange on 18th January 2012 at an average price of HK$18.4486 per share for a gross amount of HK$10,461,333.98 and the net proceeds, after deducting stamp duty and expenses, totalling HK$10,423,876.69 (equivalent to approximately HK$18.38 per Swire Properties Share) were distributed to them on 1st February 2012.
With respect to the shares of the Company held under the Central Clearing and Settlement System (“CCASS”) established and operated by Hong Kong Securities Clearing Company Limited, the Company sent a letter to CCASS Participants (other than CCASS Investor Participants) on 11th January 2012 notifying them that in the light of applicable laws and regulations of the Excluded Territories, to the extent they held any shares of the Company on behalf of any underlying shareholders with addresses in one of the Excluded Territories (“Underlying Overseas Shareholders”) on 6th January 2012, they should sell the Swire Properties Shares pursuant to the Conditional Dividend which they received on behalf of the Underlying Overseas Shareholders and should pay the net proceeds of such sale to such Underlying Overseas Shareholders.
14. Earnings Per Share (Basic and Diluted)Earnings per share are calculated by dividing the profit attributable to the Company’s shareholders of HK$17,484 million (2011: HK$32,210 million) by the weighted average number of 905,578,500 ‘A’ shares and 2,995,220,000 ‘B’ shares in issue during 2012 and 2011 in the proportion five to one.
Swire Pacific 2012 Annual Report 169
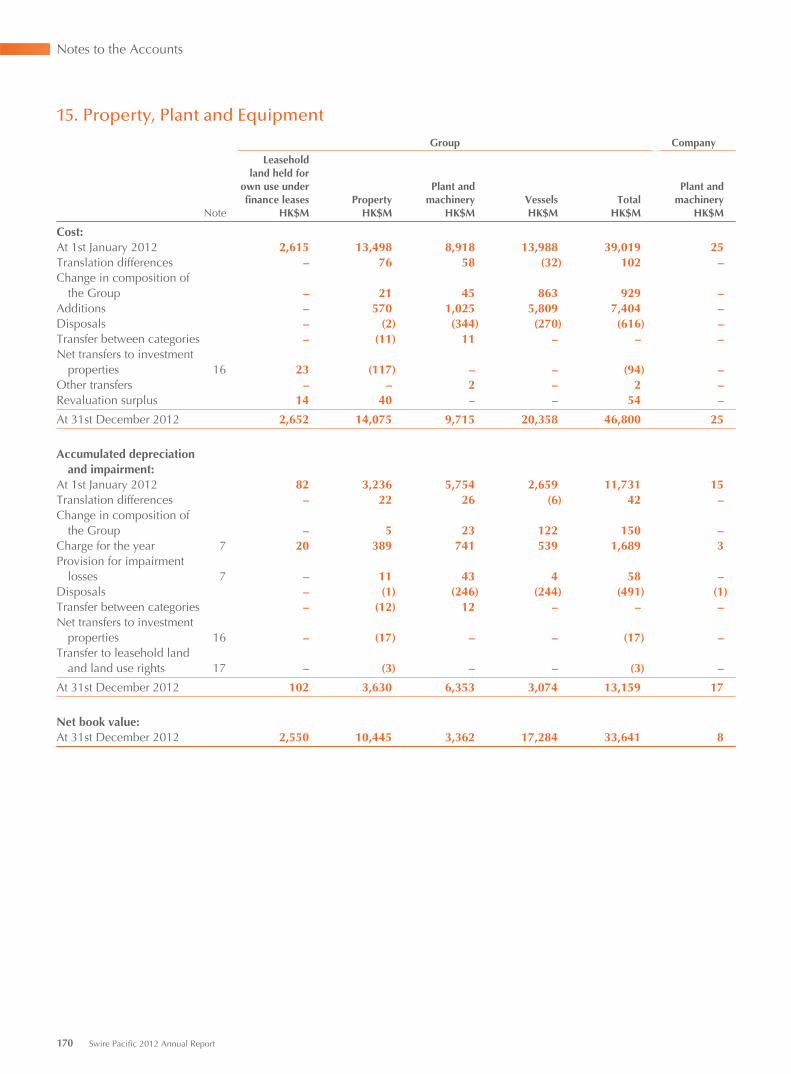
Notes to the Accounts
15. Property, Plant and Equipment
Group Company
Leaseholdland held for
own use under Plant and Plant andfinance leases Property machinery Vessels Total machinery
Note HK$M HK$M HK$M HK$M HK$M HK$M
Cost:At 1st January 2012 2,615 13,498 8,918 13,988 39,019 25Translation differences – 76 58 (32) 102 –Change in composition of
the Group – 21 45 863 929 –Additions – 570 1,025 5,809 7,404 –Disposals – (2) (344) (270) (616) –Transfer between categories – (11) 11 – – –Net transfers to investment
properties 16 23 (117) – – (94) –Other transfers – – 2 – 2 –Revaluation surplus 14 40 – – 54 –
At 31st December 2012 2,652 14,075 9,715 20,358 46,800 25
Accumulated depreciation and impairment:
At 1st January 2012 82 3,236 5,754 2,659 11,731 15Translation differences – 22 26 (6) 42 –Change in composition of
the Group – 5 23 122 150 –Charge for the year 7 20 389 741 539 1,689 3Provision for impairment
losses 7 – 11 43 4 58 –Disposals – (1) (246) (244) (491) (1)Transfer between categories – (12) 12 – – –Net transfers to investment
properties 16 – (17) – – (17) –Transfer to leasehold land
and land use rights 17 – (3) – – (3) –
At 31st December 2012 102 3,630 6,353 3,074 13,159 17
Net book value:At 31st December 2012 2,550 10,445 3,362 17,284 33,641 8
170 Swire Pacific 2012 Annual Report
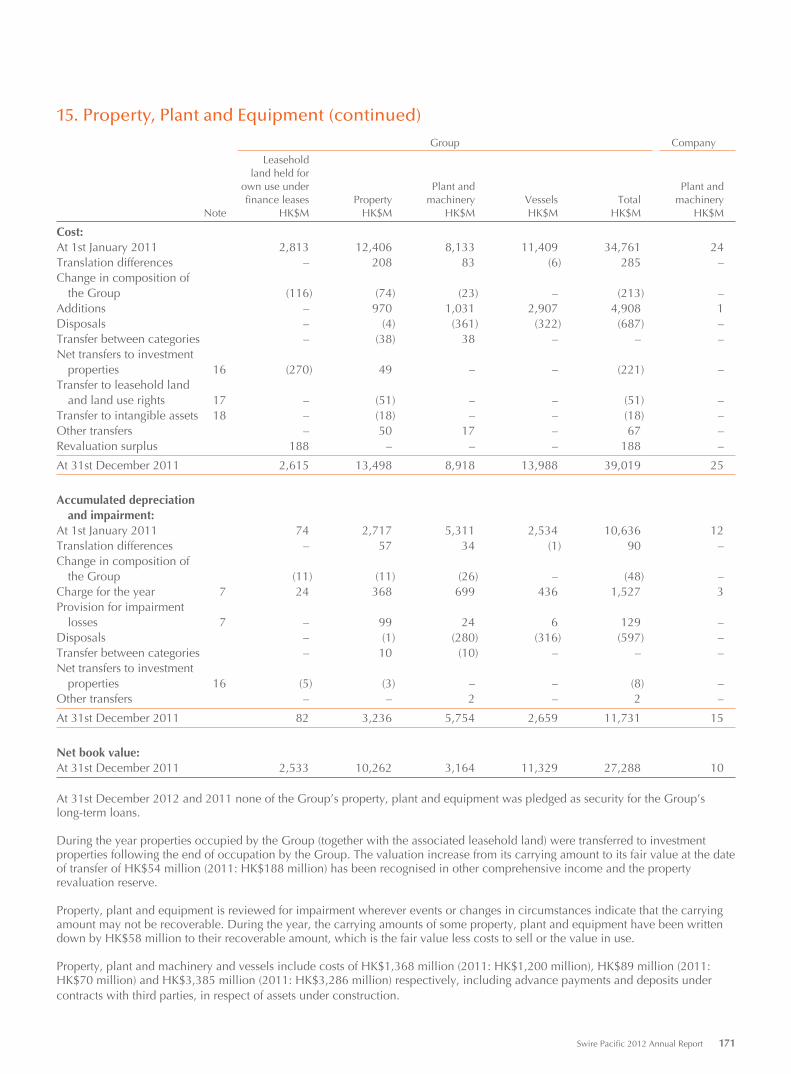
15. Property, Plant and Equipment (continued)
Group Company
Leaseholdland held for
own use under Plant and Plant andfinance leases Property machinery Vessels Total machinery
Note HK$M HK$M HK$M HK$M HK$M HK$M
Cost:At 1st January 2011 2,813 12,406 8,133 11,409 34,761 24Translation differences – 208 83 (6) 285 –Change in composition of
the Group (116) (74) (23) – (213) –Additions – 970 1,031 2,907 4,908 1Disposals – (4) (361) (322) (687) –Transfer between categories – (38) 38 – – –Net transfers to investment
properties 16 (270) 49 – – (221) –Transfer to leasehold land
and land use rights 17 – (51) – – (51) –Transfer to intangible assets 18 – (18) – – (18) –Other transfers – 50 17 – 67 –Revaluation surplus 188 – – – 188 –
At 31st December 2011 2,615 13,498 8,918 13,988 39,019 25
Accumulated depreciation and impairment:
At 1st January 2011 74 2,717 5,311 2,534 10,636 12Translation differences – 57 34 (1) 90 –Change in composition of
the Group (11) (11) (26) – (48) –Charge for the year 7 24 368 699 436 1,527 3Provision for impairment
losses 7 – 99 24 6 129 –Disposals – (1) (280) (316) (597) –Transfer between categories – 10 (10) – – –Net transfers to investment
properties 16 (5) (3) – – (8) –Other transfers – – 2 – 2 –
At 31st December 2011 82 3,236 5,754 2,659 11,731 15
Net book value:At 31st December 2011 2,533 10,262 3,164 11,329 27,288 10
At 31st December 2012 and 2011 none of the Group’s property, plant and equipment was pledged as security for the Group’s long-term loans.
During the year properties occupied by the Group (together with the associated leasehold land) were transferred to investment properties following the end of occupation by the Group. The valuation increase from its carrying amount to its fair value at the date of transfer of HK$54 million (2011: HK$188 million) has been recognised in other comprehensive income and the propertyrevaluation reserve.
Property, plant and equipment is reviewed for impairment wherever events or changes in circumstances indicate that the carrying amount may not be recoverable. During the year, the carrying amounts of some property, plant and equipment have been written down by HK$58 million to their recoverable amount, which is the fair value less costs to sell or the value in use.
Property, plant and machinery and vessels include costs of HK$1,368 million (2011: HK$1,200 million), HK$89 million (2011: HK$70 million) and HK$3,385 million (2011: HK$3,286 million) respectively, including advance payments and deposits under contracts with third parties, in respect of assets under construction.
Swire Pacific 2012 Annual Report 171
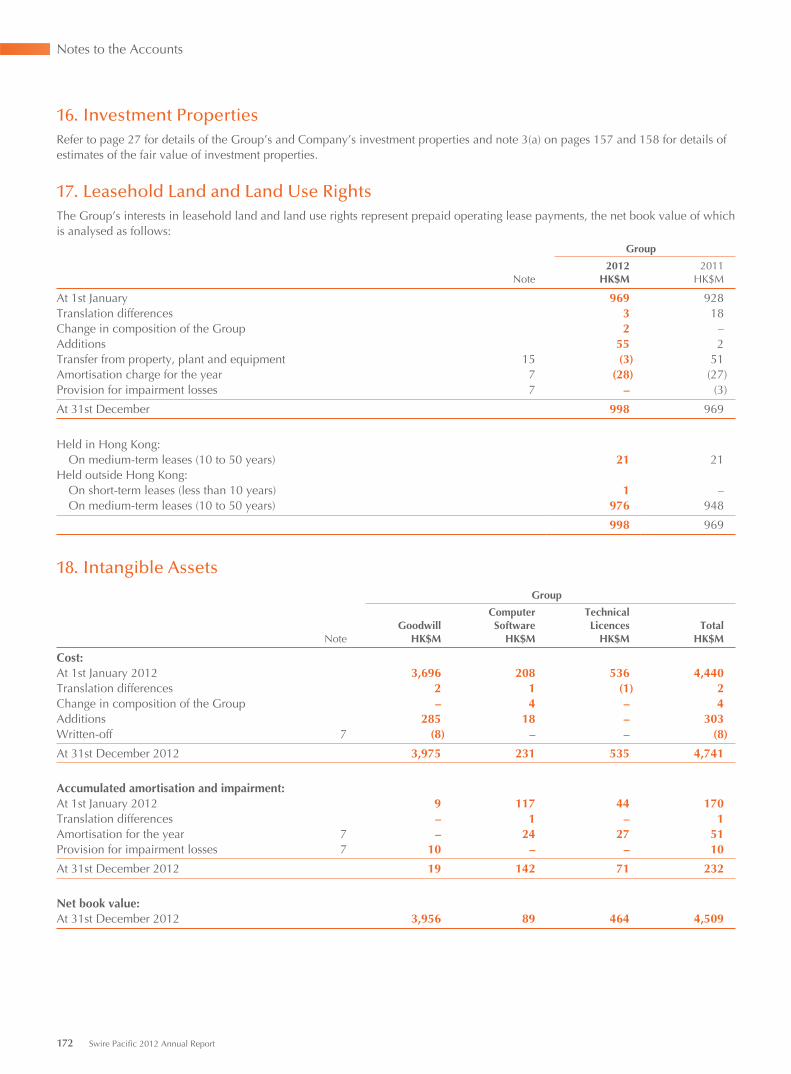
Notes to the Accounts
16. Investment PropertiesRefer to page 27 for details of the Group’s and Company’s investment properties and note 3(a) on pages 157 and 158 for details of estimates of the fair value of investment properties.
17. Leasehold Land and Land Use RightsThe Group’s interests in leasehold land and land use rights represent prepaid operating lease payments, the net book value of which is analysed as follows:
Group
2012 2011Note HK$M HK$M
At 1st January 969 928Translation differences 3 18Change in composition of the Group 2 –Additions 55 2Transfer from property, plant and equipment 15 (3) 51Amortisation charge for the year 7 (28) (27)Provision for impairment losses 7 – (3)
At 31st December 998 969
Held in Hong Kong: On medium-term leases (10 to 50 years) 21 21Held outside Hong Kong: On short-term leases (less than 10 years) 1 – On medium-term leases (10 to 50 years) 976 948
998 969
18. Intangible Assets
Group
GoodwillComputerSoftware
TechnicalLicences Total
Note HK$M HK$M HK$M HK$M
Cost:At 1st January 2012 3,696 208 536 4,440Translation differences 2 1 (1) 2Change in composition of the Group – 4 – 4Additions 285 18 – 303Written-off 7 (8) – – (8)
At 31st December 2012 3,975 231 535 4,741
Accumulated amortisation and impairment:At 1st January 2012 9 117 44 170Translation differences – 1 – 1Amortisation for the year 7 – 24 27 51Provision for impairment losses 7 10 – – 10
At 31st December 2012 19 142 71 232
Net book value:At 31st December 2012 3,956 89 464 4,509
172 Swire Pacific 2012 Annual Report
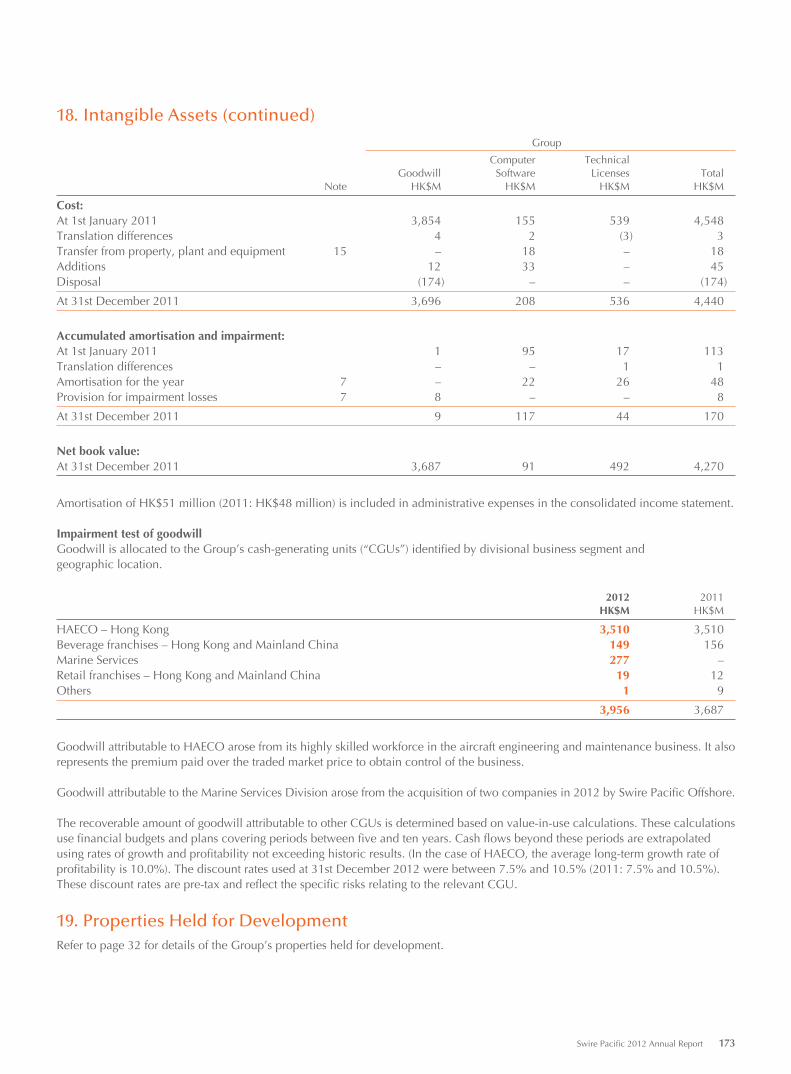
18. Intangible Assets (continued)
Group
Computer TechnicalGoodwill Software Licenses Total
Note HK$M HK$M HK$M HK$M
Cost:At 1st January 2011 3,854 155 539 4,548Translation differences 4 2 (3) 3Transfer from property, plant and equipment 15 – 18 – 18Additions 12 33 – 45Disposal (174) – – (174)
At 31st December 2011 3,696 208 536 4,440
Accumulated amortisation and impairment:At 1st January 2011 1 95 17 113Translation differences – – 1 1Amortisation for the year 7 – 22 26 48Provision for impairment losses 7 8 – – 8
At 31st December 2011 9 117 44 170
Net book value:At 31st December 2011 3,687 91 492 4,270
Amortisation of HK$51 million (2011: HK$48 million) is included in administrative expenses in the consolidated income statement.
Impairment test of goodwillGoodwill is allocated to the Group’s cash-generating units (“CGUs”) identified by divisional business segment andgeographic location.
2012 2011HK$M HK$M
HAECO – Hong Kong 3,510 3,510Beverage franchises – Hong Kong and Mainland China 149 156Marine Services 277 –Retail franchises – Hong Kong and Mainland China 19 12Others 1 9
3,956 3,687
Goodwill attributable to HAECO arose from its highly skilled workforce in the aircraft engineering and maintenance business. It also represents the premium paid over the traded market price to obtain control of the business.
Goodwill attributable to the Marine Services Division arose from the acquisition of two companies in 2012 by Swire Pacific Offshore.
The recoverable amount of goodwill attributable to other CGUs is determined based on value-in-use calculations. These calculations use financial budgets and plans covering periods between five and ten years. Cash flows beyond these periods are extrapolated using rates of growth and profitability not exceeding historic results. (In the case of HAECO, the average long-term growth rate of profitability is 10.0%). The discount rates used at 31st December 2012 were between 7.5% and 10.5% (2011: 7.5% and 10.5%). These discount rates are pre-tax and reflect the specific risks relating to the relevant CGU.
19. Properties Held for DevelopmentRefer to page 32 for details of the Group’s properties held for development.
Swire Pacific 2012 Annual Report 173
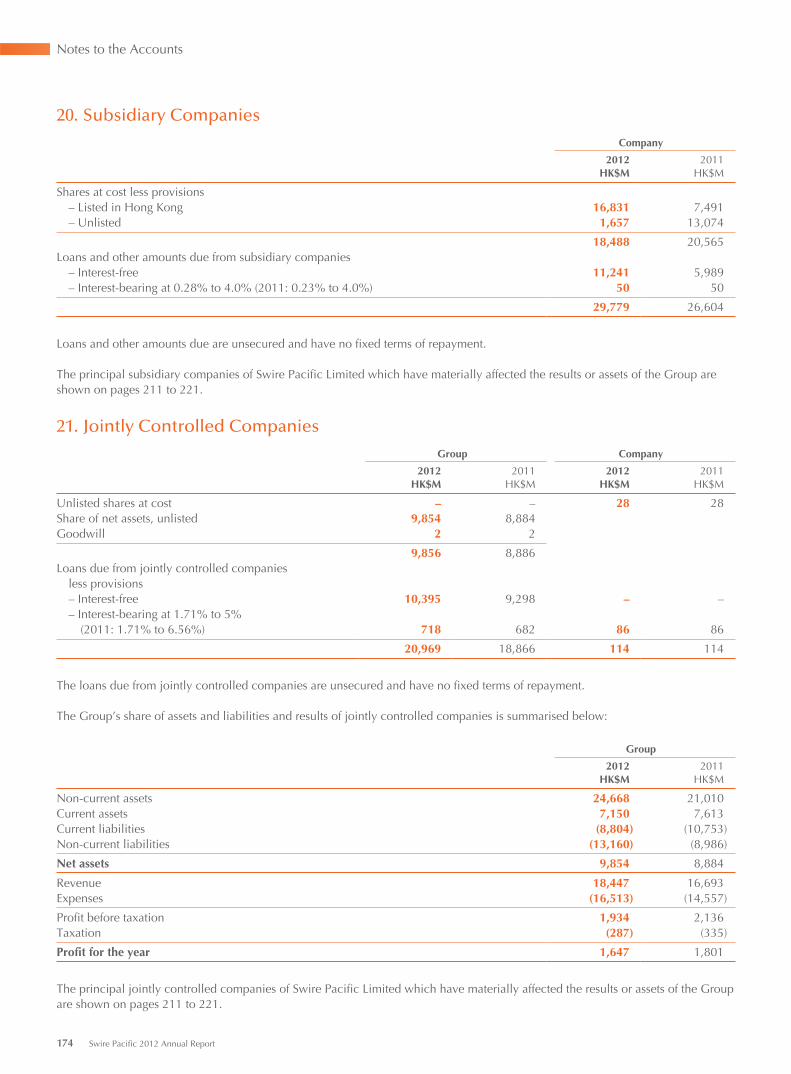
Notes to the Accounts
20. Subsidiary Companies
Company
2012 2011HK$M HK$M
Shares at cost less provisions – Listed in Hong Kong 16,831 7,491 – Unlisted 1,657 13,074
18,488 20,565Loans and other amounts due from subsidiary companies – Interest-free 11,241 5,989 – Interest-bearing at 0.28% to 4.0% (2011: 0.23% to 4.0%) 50 50
29,779 26,604
Loans and other amounts due are unsecured and have no fixed terms of repayment.
The principal subsidiary companies of Swire Pacific Limited which have materially affected the results or assets of the Group are shown on pages 211 to 221.
21. Jointly Controlled Companies
Group Company
2012 2011 2012 2011HK$M HK$M HK$M HK$M
Unlisted shares at cost – – 28 28Share of net assets, unlisted 9,854 8,884Goodwill 2 2
9,856 8,886Loans due from jointly controlled companies less provisions – Interest-free 10,395 9,298 – – – Interest-bearing at 1.71% to 5% (2011: 1.71% to 6.56%) 718 682 86 86
20,969 18,866 114 114
The loans due from jointly controlled companies are unsecured and have no fixed terms of repayment.
The Group’s share of assets and liabilities and results of jointly controlled companies is summarised below:
Group
2012 2011HK$M HK$M
Non-current assets 24,668 21,010Current assets 7,150 7,613Current liabilities (8,804) (10,753)Non-current liabilities (13,160) (8,986)
Net assets 9,854 8,884
Revenue 18,447 16,693Expenses (16,513) (14,557)
Profit before taxation 1,934 2,136Taxation (287) (335)
Profit for the year 1,647 1,801
The principal jointly controlled companies of Swire Pacific Limited which have materially affected the results or assets of the Group are shown on pages 211 to 221.
174 Swire Pacific 2012 Annual Report
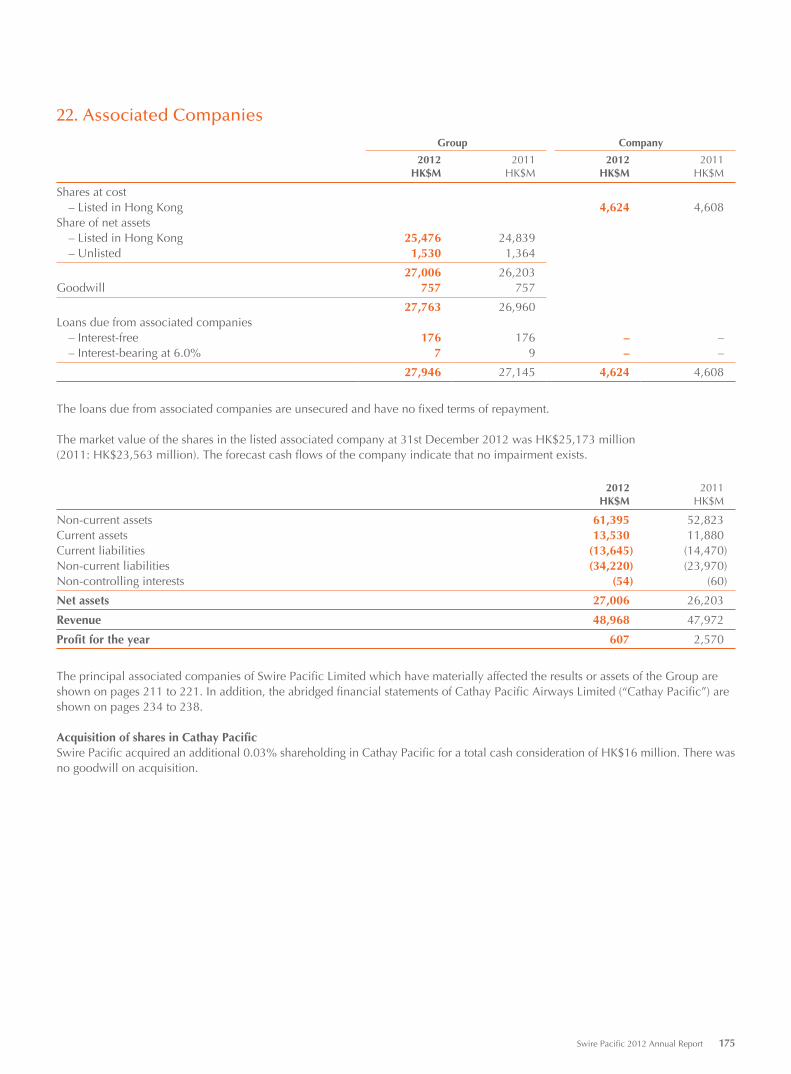
22. Associated Companies
Group Company
2012 2011 2012 2011HK$M HK$M HK$M HK$M
Shares at cost – Listed in Hong Kong 4,624 4,608Share of net assets – Listed in Hong Kong 25,476 24,839 – Unlisted 1,530 1,364
27,006 26,203Goodwill 757 757
27,763 26,960Loans due from associated companies – Interest-free 176 176 – – – Interest-bearing at 6.0% 7 9 – –
27,946 27,145 4,624 4,608
The loans due from associated companies are unsecured and have no fixed terms of repayment.
The market value of the shares in the listed associated company at 31st December 2012 was HK$25,173 million(2011: HK$23,563 million). The forecast cash flows of the company indicate that no impairment exists.
2012 2011HK$M HK$M
Non-current assets 61,395 52,823Current assets 13,530 11,880Current liabilities (13,645) (14,470)Non-current liabilities (34,220) (23,970)Non-controlling interests (54) (60)
Net assets 27,006 26,203
Revenue 48,968 47,972
Profit for the year 607 2,570
The principal associated companies of Swire Pacific Limited which have materially affected the results or assets of the Group are shown on pages 211 to 221. In addition, the abridged financial statements of Cathay Pacific Airways Limited (“Cathay Pacific”) are shown on pages 234 to 238.
Acquisition of shares in Cathay PacificSwire Pacific acquired an additional 0.03% shareholding in Cathay Pacific for a total cash consideration of HK$16 million. There was no goodwill on acquisition.
Swire Pacific 2012 Annual Report 175
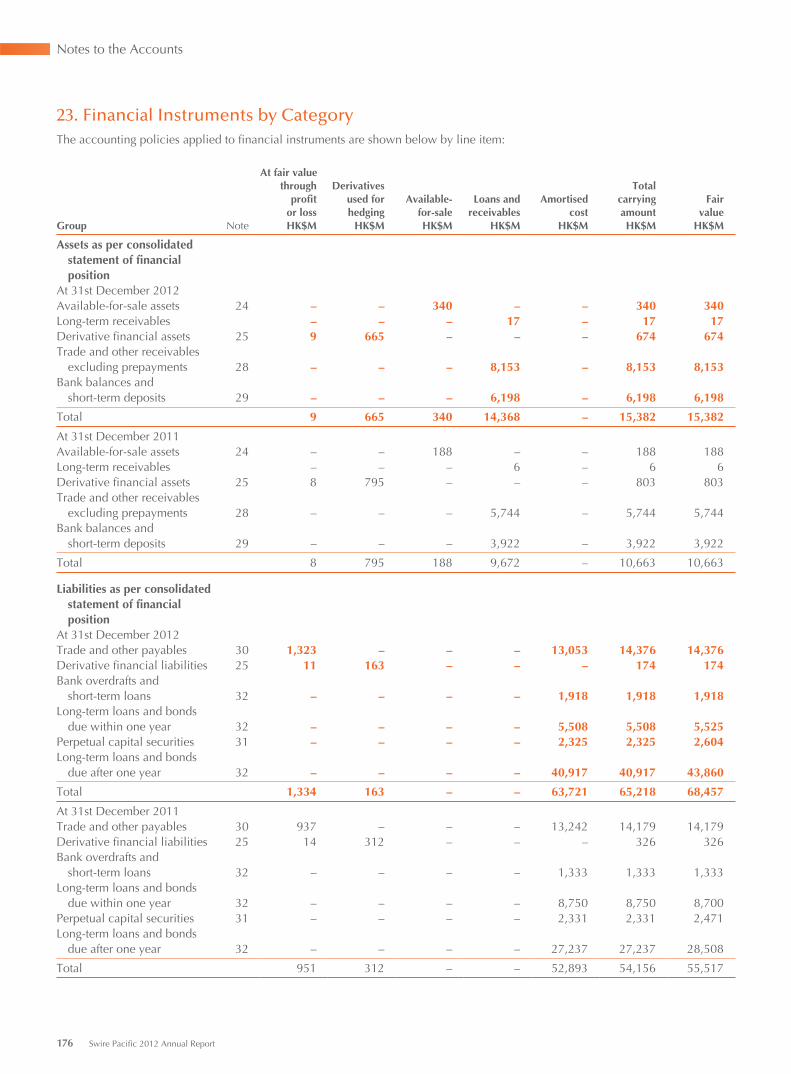
Notes to the Accounts
23. Financial Instruments by CategoryThe accounting policies applied to financial instruments are shown below by line item:
At fair valuethrough
profitor loss
Derivativesused forhedging
Available-for-sale
Loans andreceivables
Amortisedcost
Totalcarryingamount
Fairvalue
Group Note HK$M HK$M HK$M HK$M HK$M HK$M HK$M
Assets as per consolidated statement of financial position
At 31st December 2012Available-for-sale assets 24 – – 340 – – 340 340Long-term receivables – – – 17 – 17 17Derivative financial assets 25 9 665 – – – 674 674Trade and other receivables
excluding prepayments 28 – – – 8,153 – 8,153 8,153Bank balances and
short-term deposits 29 – – – 6,198 – 6,198 6,198
Total 9 665 340 14,368 – 15,382 15,382
At 31st December 2011Available-for-sale assets 24 – – 188 – – 188 188Long-term receivables – – – 6 – 6 6Derivative financial assets 25 8 795 – – – 803 803Trade and other receivables
excluding prepayments 28 – – – 5,744 – 5,744 5,744Bank balances and
short-term deposits 29 – – – 3,922 – 3,922 3,922
Total 8 795 188 9,672 – 10,663 10,663
Liabilities as per consolidated statement of financial position
At 31st December 2012Trade and other payables 30 1,323 – – – 13,053 14,376 14,376Derivative financial liabilities 25 11 163 – – – 174 174Bank overdrafts and
short-term loans 32 – – – – 1,918 1,918 1,918Long-term loans and bonds
due within one year 32 – – – – 5,508 5,508 5,525Perpetual capital securities 31 – – – – 2,325 2,325 2,604Long-term loans and bonds
due after one year 32 – – – – 40,917 40,917 43,860
Total 1,334 163 – – 63,721 65,218 68,457
At 31st December 2011Trade and other payables 30 937 – – – 13,242 14,179 14,179Derivative financial liabilities 25 14 312 – – – 326 326Bank overdrafts and
short-term loans 32 – – – – 1,333 1,333 1,333Long-term loans and bonds
due within one year 32 – – – – 8,750 8,750 8,700Perpetual capital securities 31 – – – – 2,331 2,331 2,471Long-term loans and bonds
due after one year 32 – – – – 27,237 27,237 28,508
Total 951 312 – – 52,893 54,156 55,517
176 Swire Pacific 2012 Annual Report
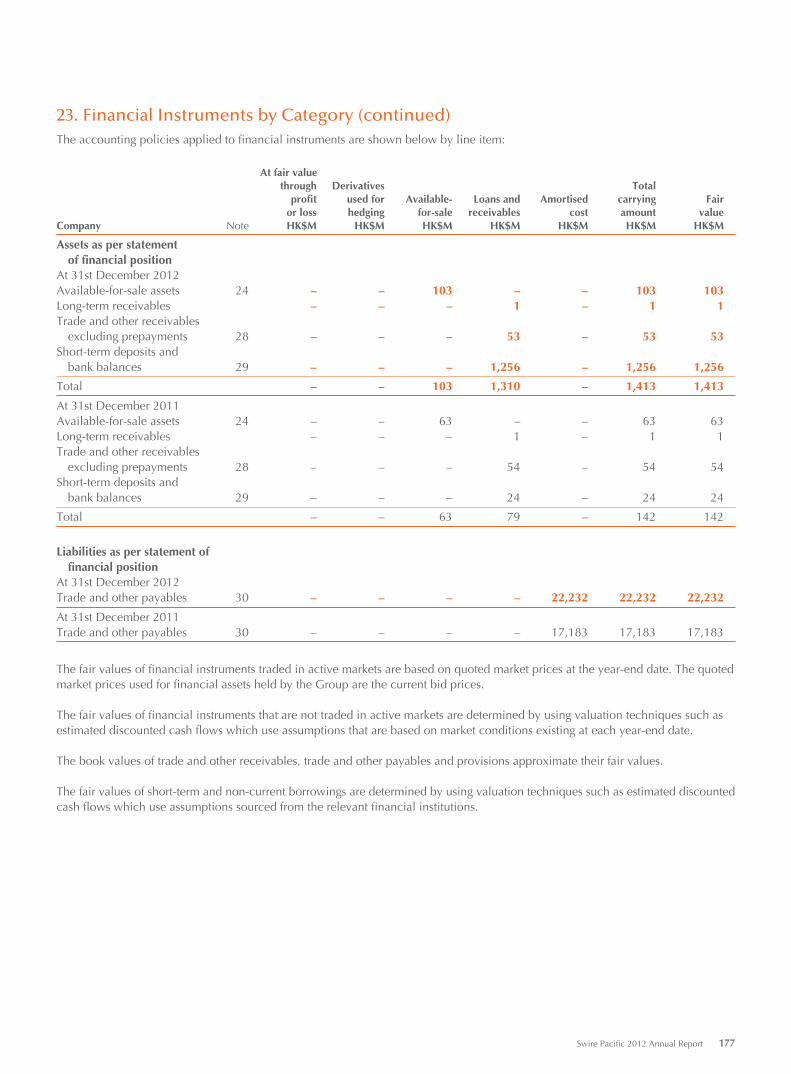
23. Financial Instruments by Category (continued)The accounting policies applied to financial instruments are shown below by line item:
At fair valuethrough Derivatives Total
profit used for Available- Loans and Amortised carrying Fairor loss hedging for-sale receivables cost amount value
Company Note HK$M HK$M HK$M HK$M HK$M HK$M HK$M
Assets as per statementof financial position
At 31st December 2012Available-for-sale assets 24 – – 103 – – 103 103Long-term receivables – – – 1 – 1 1Trade and other receivables
excluding prepayments 28 – – – 53 – 53 53Short-term deposits and
bank balances 29 – – – 1,256 – 1,256 1,256
Total – – 103 1,310 – 1,413 1,413
At 31st December 2011Available-for-sale assets 24 – – 63 – – 63 63Long-term receivables – – – 1 – 1 1Trade and other receivables
excluding prepayments 28 – – – 54 – 54 54Short-term deposits and
bank balances 29 – – – 24 – 24 24
Total – – 63 79 – 142 142
Liabilities as per statement of financial position
At 31st December 2012Trade and other payables 30 – – – – 22,232 22,232 22,232
At 31st December 2011Trade and other payables 30 – – – – 17,183 17,183 17,183
The fair values of financial instruments traded in active markets are based on quoted market prices at the year-end date. The quoted market prices used for financial assets held by the Group are the current bid prices.
The fair values of financial instruments that are not traded in active markets are determined by using valuation techniques such as estimated discounted cash flows which use assumptions that are based on market conditions existing at each year-end date.
The book values of trade and other receivables, trade and other payables and provisions approximate their fair values.
The fair values of short-term and non-current borrowings are determined by using valuation techniques such as estimated discounted cash flows which use assumptions sourced from the relevant financial institutions.
Swire Pacific 2012 Annual Report 177
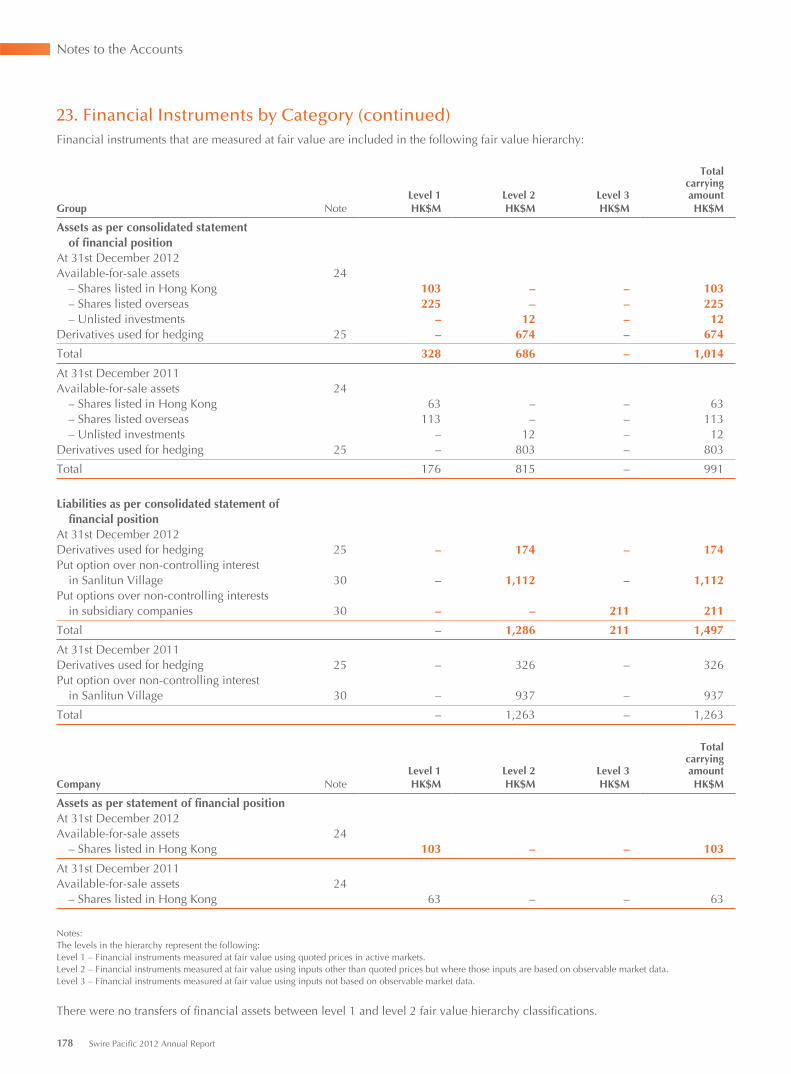
Notes to the Accounts
23. Financial Instruments by Category (continued)Financial instruments that are measured at fair value are included in the following fair value hierarchy:
Level 1 Level 2 Level 3
Totalcarryingamount
Group Note HK$M HK$M HK$M HK$M
Assets as per consolidated statement of financial positionAt 31st December 2012Available-for-sale assets 24 – Shares listed in Hong Kong 103 – – 103 – Shares listed overseas 225 – – 225 – Unlisted investments – 12 – 12Derivatives used for hedging 25 – 674 – 674
Total 328 686 – 1,014
At 31st December 2011Available-for-sale assets 24 – Shares listed in Hong Kong 63 – – 63 – Shares listed overseas 113 – – 113 – Unlisted investments – 12 – 12Derivatives used for hedging 25 – 803 – 803
Total 176 815 – 991
Liabilities as per consolidated statement of financial positionAt 31st December 2012Derivatives used for hedging 25 – 174 – 174Put option over non-controlling interest in Sanlitun Village 30 – 1,112 – 1,112Put options over non-controlling interests in subsidiary companies 30 – – 211 211
Total – 1,286 211 1,497
At 31st December 2011Derivatives used for hedging 25 – 326 – 326Put option over non-controlling interest in Sanlitun Village 30 – 937 – 937
Total – 1,263 – 1,263
Level 1 Level 2 Level 3
Totalcarryingamount
Company Note HK$M HK$M HK$M HK$M
Assets as per statement of financial positionAt 31st December 2012Available-for-sale assets 24 – Shares listed in Hong Kong 103 – – 103
At 31st December 2011Available-for-sale assets 24 – Shares listed in Hong Kong 63 – – 63
Notes:The levels in the hierarchy represent the following:Level 1 – Financial instruments measured at fair value using quoted prices in active markets.Level 2 – Financial instruments measured at fair value using inputs other than quoted prices but where those inputs are based on observable market data.Level 3 – Financial instruments measured at fair value using inputs not based on observable market data.
There were no transfers of financial assets between level 1 and level 2 fair value hierarchy classifications.
178 Swire Pacific 2012 Annual Report
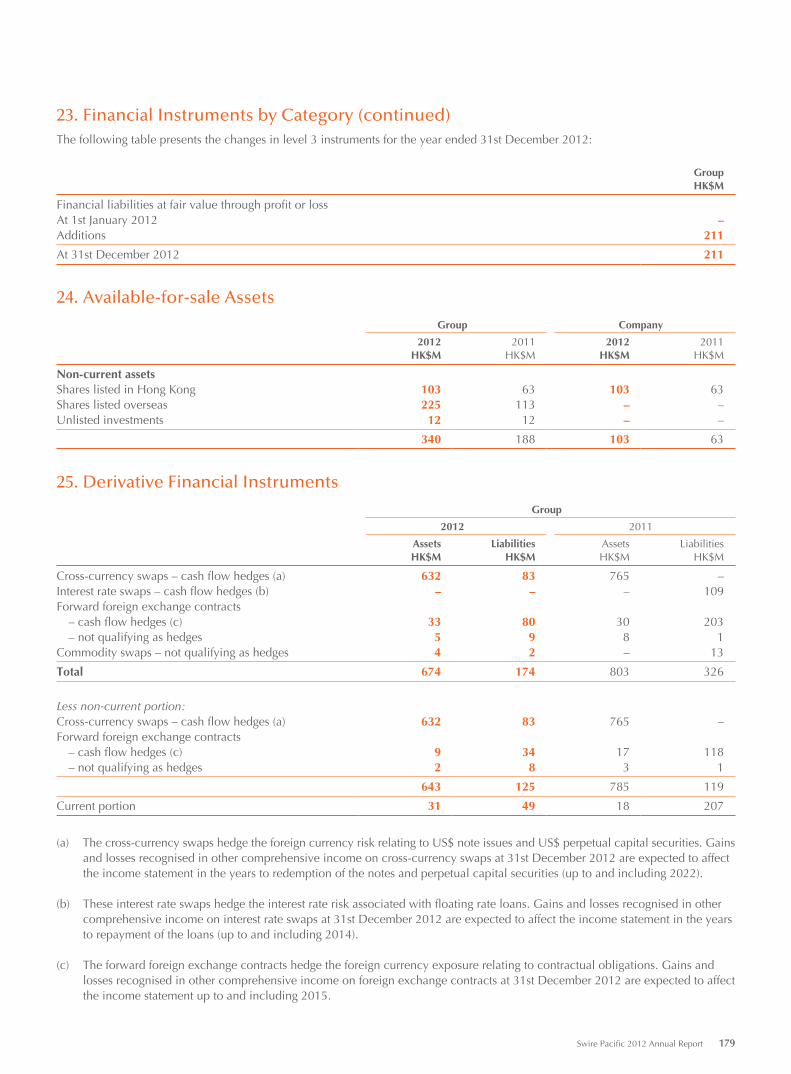
23. Financial Instruments by Category (continued)The following table presents the changes in level 3 instruments for the year ended 31st December 2012:
GroupHK$M
Financial liabilities at fair value through profit or lossAt 1st January 2012 –Additions 211
At 31st December 2012 211
24. Available-for-sale Assets
Group Company
2012 2011 2012 2011HK$M HK$M HK$M HK$M
Non-current assetsShares listed in Hong Kong 103 63 103 63Shares listed overseas 225 113 – –Unlisted investments 12 12 – –
340 188 103 63
25. Derivative Financial Instruments
Group
2012 2011
Assets Liabilities Assets LiabilitiesHK$M HK$M HK$M HK$M
Cross-currency swaps – cash flow hedges (a) 632 83 765 –Interest rate swaps – cash flow hedges (b) – – – 109Forward foreign exchange contracts – cash flow hedges (c) 33 80 30 203 – not qualifying as hedges 5 9 8 1Commodity swaps – not qualifying as hedges 4 2 – 13
Total 674 174 803 326
Less non-current portion:Cross-currency swaps – cash flow hedges (a) 632 83 765 –Forward foreign exchange contracts – cash flow hedges (c) 9 34 17 118 – not qualifying as hedges 2 8 3 1
643 125 785 119
Current portion 31 49 18 207
(a) The cross-currency swaps hedge the foreign currency risk relating to US$ note issues and US$ perpetual capital securities. Gains and losses recognised in other comprehensive income on cross-currency swaps at 31st December 2012 are expected to affect the income statement in the years to redemption of the notes and perpetual capital securities (up to and including 2022).
(b) These interest rate swaps hedge the interest rate risk associated with floating rate loans. Gains and losses recognised in other comprehensive income on interest rate swaps at 31st December 2012 are expected to affect the income statement in the years to repayment of the loans (up to and including 2014).
(c) The forward foreign exchange contracts hedge the foreign currency exposure relating to contractual obligations. Gains and losses recognised in other comprehensive income on foreign exchange contracts at 31st December 2012 are expected to affect the income statement up to and including 2015.
Swire Pacific 2012 Annual Report 179
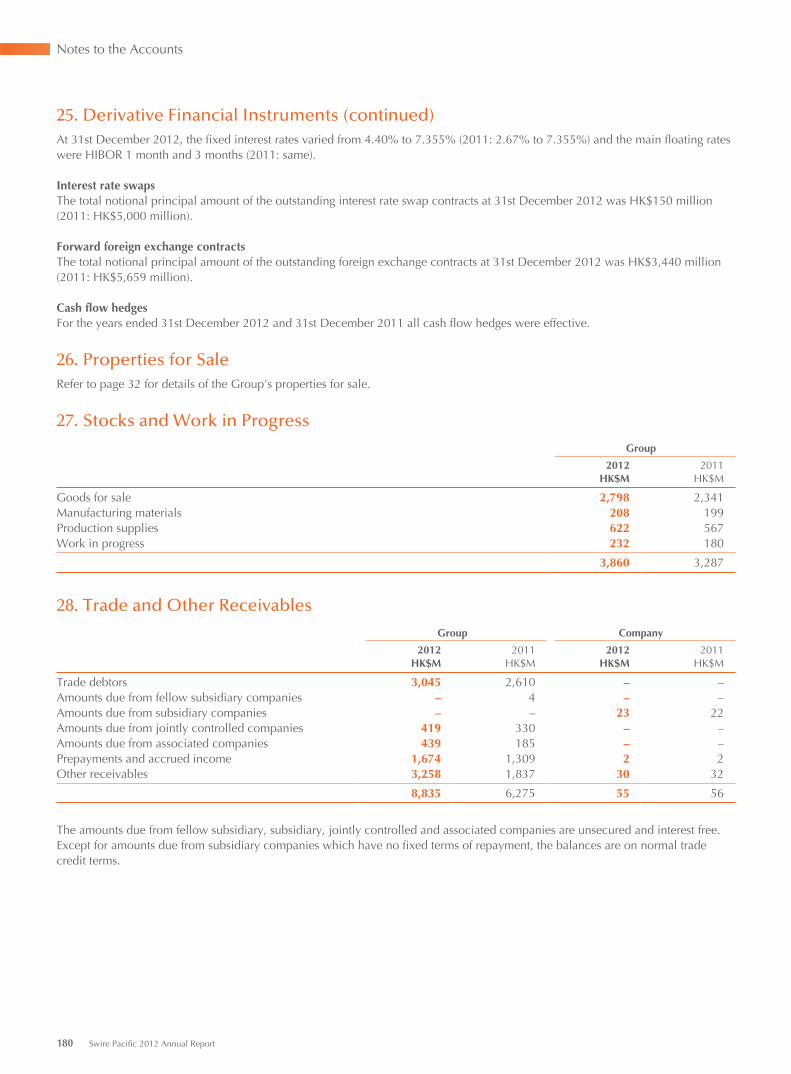
Notes to the Accounts
25. Derivative Financial Instruments (continued)At 31st December 2012, the fixed interest rates varied from 4.40% to 7.355% (2011: 2.67% to 7.355%) and the main floating rates were HIBOR 1 month and 3 months (2011: same).
Interest rate swapsThe total notional principal amount of the outstanding interest rate swap contracts at 31st December 2012 was HK$150 million (2011: HK$5,000 million).
Forward foreign exchange contractsThe total notional principal amount of the outstanding foreign exchange contracts at 31st December 2012 was HK$3,440 million (2011: HK$5,659 million).
Cash flow hedgesFor the years ended 31st December 2012 and 31st December 2011 all cash flow hedges were effective.
26. Properties for SaleRefer to page 32 for details of the Group’s properties for sale.
27. Stocks and Work in Progress
Group
2012 2011HK$M HK$M
Goods for sale 2,798 2,341Manufacturing materials 208 199Production supplies 622 567Work in progress 232 180
3,860 3,287
28. Trade and Other Receivables
Group Company
2012 2011 2012 2011HK$M HK$M HK$M HK$M
Trade debtors 3,045 2,610 – –Amounts due from fellow subsidiary companies – 4 – –Amounts due from subsidiary companies – – 23 22Amounts due from jointly controlled companies 419 330 – –Amounts due from associated companies 439 185 – –Prepayments and accrued income 1,674 1,309 2 2Other receivables 3,258 1,837 30 32
8,835 6,275 55 56
The amounts due from fellow subsidiary, subsidiary, jointly controlled and associated companies are unsecured and interest free. Except for amounts due from subsidiary companies which have no fixed terms of repayment, the balances are on normal tradecredit terms.
180 Swire Pacific 2012 Annual Report
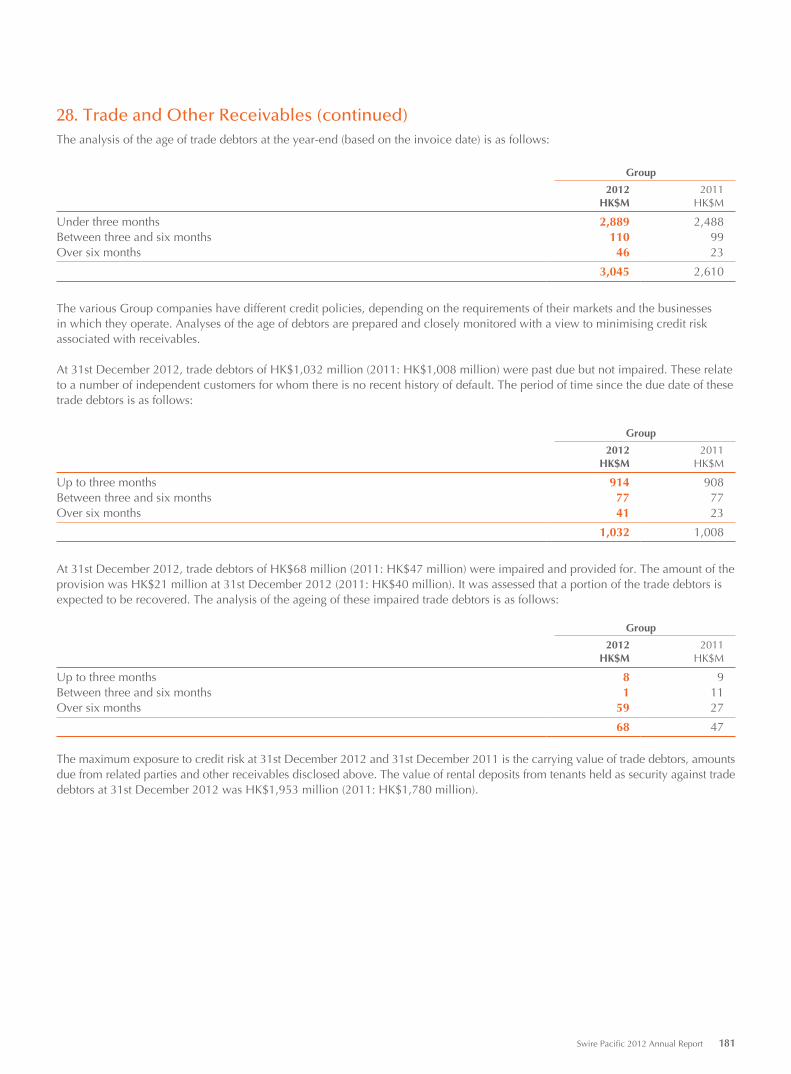
28. Trade and Other Receivables (continued)The analysis of the age of trade debtors at the year-end (based on the invoice date) is as follows:
Group
2012 2011HK$M HK$M
Under three months 2,889 2,488Between three and six months 110 99Over six months 46 23
3,045 2,610
The various Group companies have different credit policies, depending on the requirements of their markets and the businesses in which they operate. Analyses of the age of debtors are prepared and closely monitored with a view to minimising credit risk associated with receivables.
At 31st December 2012, trade debtors of HK$1,032 million (2011: HK$1,008 million) were past due but not impaired. These relate to a number of independent customers for whom there is no recent history of default. The period of time since the due date of these trade debtors is as follows:
Group
2012 2011HK$M HK$M
Up to three months 914 908Between three and six months 77 77Over six months 41 23
1,032 1,008
At 31st December 2012, trade debtors of HK$68 million (2011: HK$47 million) were impaired and provided for. The amount of the provision was HK$21 million at 31st December 2012 (2011: HK$40 million). It was assessed that a portion of the trade debtors is expected to be recovered. The analysis of the ageing of these impaired trade debtors is as follows:
Group
2012 2011HK$M HK$M
Up to three months 8 9Between three and six months 1 11Over six months 59 27
68 47
The maximum exposure to credit risk at 31st December 2012 and 31st December 2011 is the carrying value of trade debtors, amounts due from related parties and other receivables disclosed above. The value of rental deposits from tenants held as security against trade debtors at 31st December 2012 was HK$1,953 million (2011: HK$1,780 million).
Swire Pacific 2012 Annual Report 181
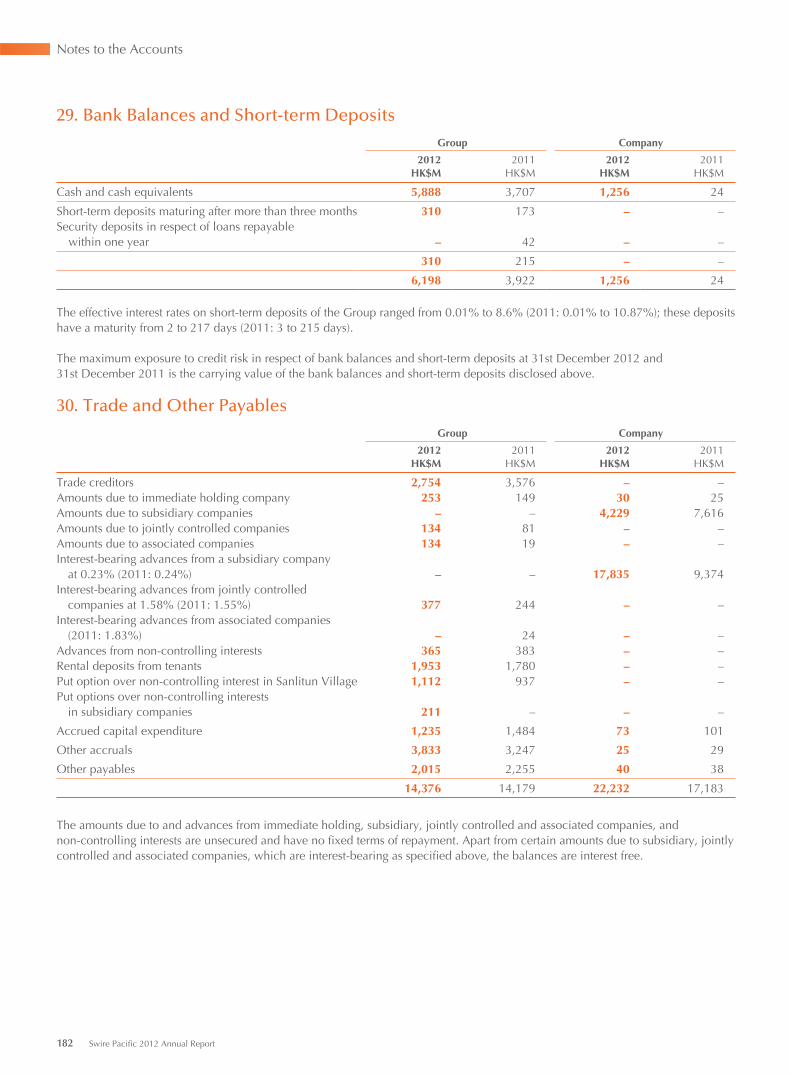
Notes to the Accounts
29. Bank Balances and Short-term Deposits
Group Company
2012 2011 2012 2011HK$M HK$M HK$M HK$M
Cash and cash equivalents 5,888 3,707 1,256 24
Short-term deposits maturing after more than three months 310 173 – –Security deposits in respect of loans repayable within one year – 42 – –
310 215 – –
6,198 3,922 1,256 24
The effective interest rates on short-term deposits of the Group ranged from 0.01% to 8.6% (2011: 0.01% to 10.87%); these deposits have a maturity from 2 to 217 days (2011: 3 to 215 days).
The maximum exposure to credit risk in respect of bank balances and short-term deposits at 31st December 2012 and31st December 2011 is the carrying value of the bank balances and short-term deposits disclosed above.
30. Trade and Other Payables
Group Company
2012 2011 2012 2011HK$M HK$M HK$M HK$M
Trade creditors 2,754 3,576 – –Amounts due to immediate holding company 253 149 30 25Amounts due to subsidiary companies – – 4,229 7,616Amounts due to jointly controlled companies 134 81 – –Amounts due to associated companies 134 19 – –Interest-bearing advances from a subsidiary company
at 0.23% (2011: 0.24%) – – 17,835 9,374Interest-bearing advances from jointly controlled
companies at 1.58% (2011: 1.55%) 377 244 – –Interest-bearing advances from associated companies
(2011: 1.83%) – 24 – –Advances from non-controlling interests 365 383 – –Rental deposits from tenants 1,953 1,780 – –Put option over non-controlling interest in Sanlitun Village 1,112 937 – –Put options over non-controlling interests
in subsidiary companies 211 – – –
Accrued capital expenditure 1,235 1,484 73 101
Other accruals 3,833 3,247 25 29
Other payables 2,015 2,255 40 38
14,376 14,179 22,232 17,183
The amounts due to and advances from immediate holding, subsidiary, jointly controlled and associated companies, andnon-controlling interests are unsecured and have no fixed terms of repayment. Apart from certain amounts due to subsidiary, jointly controlled and associated companies, which are interest-bearing as specified above, the balances are interest free.
182 Swire Pacific 2012 Annual Report
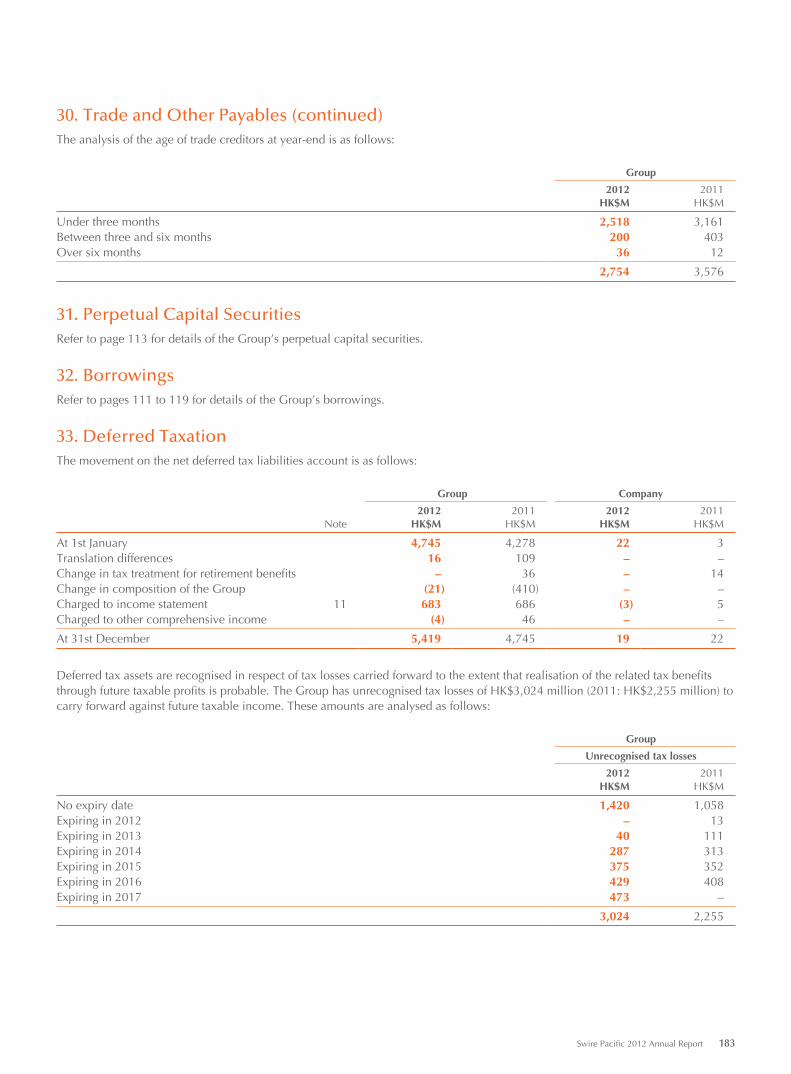
30. Trade and Other Payables (continued)The analysis of the age of trade creditors at year-end is as follows:
Group
2012 2011HK$M HK$M
Under three months 2,518 3,161Between three and six months 200 403Over six months 36 12
2,754 3,576
31. Perpetual Capital SecuritiesRefer to page 113 for details of the Group’s perpetual capital securities.
32. BorrowingsRefer to pages 111 to 119 for details of the Group’s borrowings.
33. Deferred TaxationThe movement on the net deferred tax liabilities account is as follows:
Group Company
2012 2011 2012 2011Note HK$M HK$M HK$M HK$M
At 1st January 4,745 4,278 22 3Translation differences 16 109 – –Change in tax treatment for retirement benefits – 36 – 14Change in composition of the Group (21) (410) – –Charged to income statement 11 683 686 (3) 5Charged to other comprehensive income (4) 46 – –
At 31st December 5,419 4,745 19 22
Deferred tax assets are recognised in respect of tax losses carried forward to the extent that realisation of the related tax benefits through future taxable profits is probable. The Group has unrecognised tax losses of HK$3,024 million (2011: HK$2,255 million) to carry forward against future taxable income. These amounts are analysed as follows:
Group
Unrecognised tax losses
2012 2011HK$M HK$M
No expiry date 1,420 1,058Expiring in 2012 – 13Expiring in 2013 40 111Expiring in 2014 287 313Expiring in 2015 375 352Expiring in 2016 429 408Expiring in 2017 473 –
3,024 2,255
Swire Pacific 2012 Annual Report 183
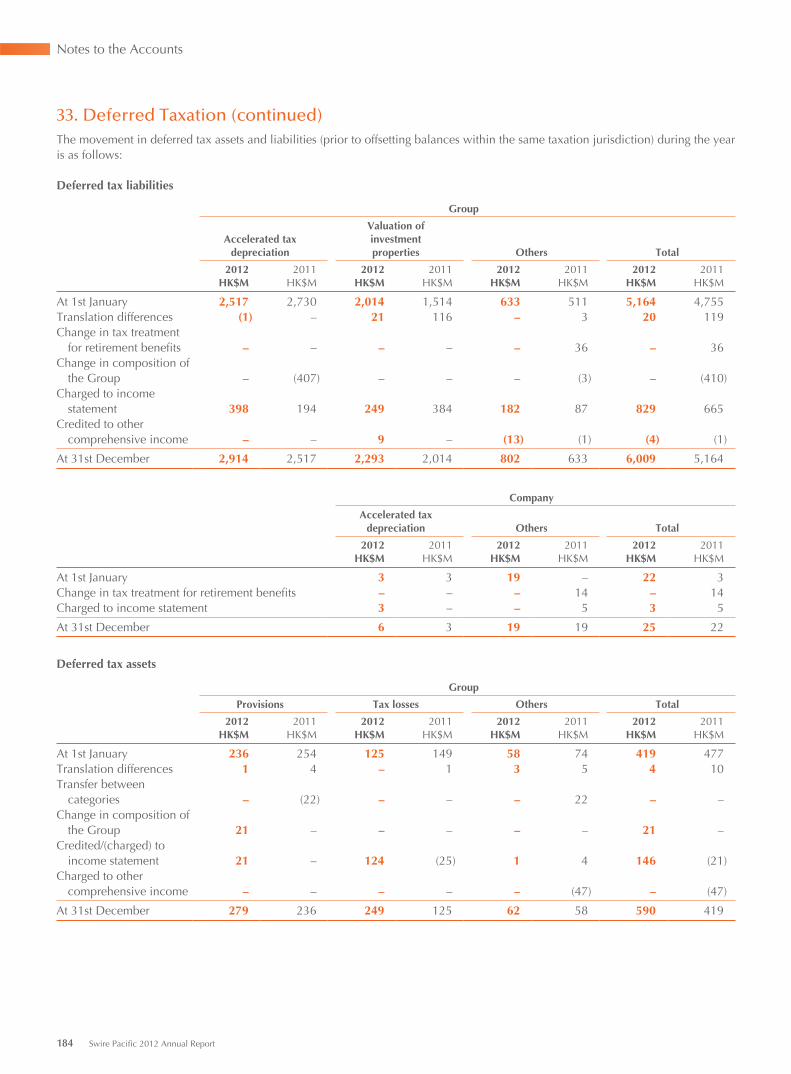
Notes to the Accounts
33. Deferred Taxation (continued)The movement in deferred tax assets and liabilities (prior to offsetting balances within the same taxation jurisdiction) during the year is as follows:
Deferred tax liabilities
Group
Accelerated tax depreciation
Valuation of investment properties Others Total
2012 2011 2012 2011 2012 2011 2012 2011HK$M HK$M HK$M HK$M HK$M HK$M HK$M HK$M
At 1st January 2,517 2,730 2,014 1,514 633 511 5,164 4,755Translation differences (1) – 21 116 – 3 20 119Change in tax treatment
for retirement benefits – – – – – 36 – 36Change in composition of
the Group – (407) – – – (3) – (410)Charged to income
statement 398 194 249 384 182 87 829 665Credited to other
comprehensive income – – 9 – (13) (1) (4) (1)
At 31st December 2,914 2,517 2,293 2,014 802 633 6,009 5,164
Company
Accelerated tax depreciation Others Total
2012 2011 2012 2011 2012 2011HK$M HK$M HK$M HK$M HK$M HK$M
At 1st January 3 3 19 – 22 3Change in tax treatment for retirement benefits – – – 14 – 14Charged to income statement 3 – – 5 3 5
At 31st December 6 3 19 19 25 22
Deferred tax assets
Group
Provisions Tax losses Others Total
2012 2011 2012 2011 2012 2011 2012 2011HK$M HK$M HK$M HK$M HK$M HK$M HK$M HK$M
At 1st January 236 254 125 149 58 74 419 477Translation differences 1 4 – 1 3 5 4 10Transfer between
categories – (22) – – – 22 – –Change in composition of
the Group 21 – – – – – 21 –Credited/(charged) to
income statement 21 – 124 (25) 1 4 146 (21)Charged to other
comprehensive income – – – – – (47) – (47)
At 31st December 279 236 249 125 62 58 590 419
184 Swire Pacific 2012 Annual Report
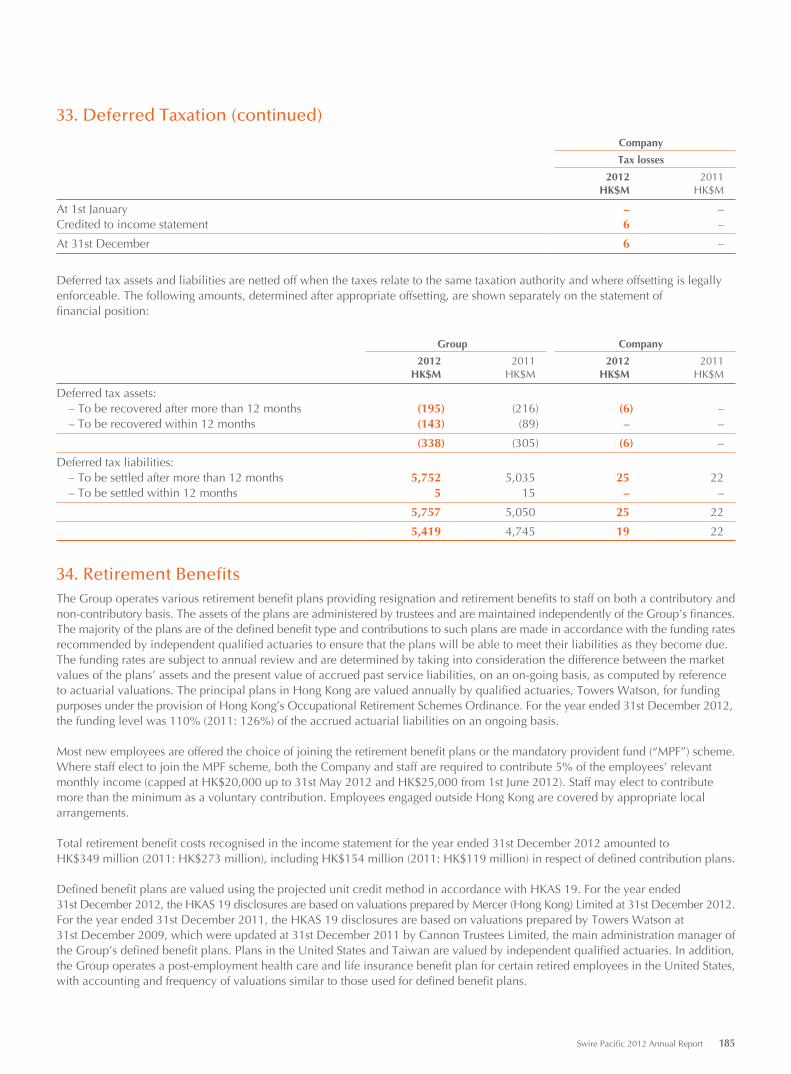
33. Deferred Taxation (continued)
Company
Tax losses
2012 2011HK$M HK$M
At 1st January – –Credited to income statement 6 –
At 31st December 6 –
Deferred tax assets and liabilities are netted off when the taxes relate to the same taxation authority and where offsetting is legally enforceable. The following amounts, determined after appropriate offsetting, are shown separately on the statement offinancial position:
Group Company
2012 2011 2012 2011HK$M HK$M HK$M HK$M
Deferred tax assets: – To be recovered after more than 12 months (195) (216) (6) – – To be recovered within 12 months (143) (89) – –
(338) (305) (6) –
Deferred tax liabilities: – To be settled after more than 12 months 5,752 5,035 25 22 – To be settled within 12 months 5 15 – –
5,757 5,050 25 22
5,419 4,745 19 22
34. Retirement BenefitsThe Group operates various retirement benefit plans providing resignation and retirement benefits to staff on both a contributory and non-contributory basis. The assets of the plans are administered by trustees and are maintained independently of the Group’s finances. The majority of the plans are of the defined benefit type and contributions to such plans are made in accordance with the funding rates recommended by independent qualified actuaries to ensure that the plans will be able to meet their liabilities as they become due. The funding rates are subject to annual review and are determined by taking into consideration the difference between the market values of the plans’ assets and the present value of accrued past service liabilities, on an on-going basis, as computed by referenceto actuarial valuations. The principal plans in Hong Kong are valued annually by qualified actuaries, Towers Watson, for funding purposes under the provision of Hong Kong’s Occupational Retirement Schemes Ordinance. For the year ended 31st December 2012,the funding level was 110% (2011: 126%) of the accrued actuarial liabilities on an ongoing basis.
Most new employees are offered the choice of joining the retirement benefit plans or the mandatory provident fund (“MPF”) scheme. Where staff elect to join the MPF scheme, both the Company and staff are required to contribute 5% of the employees’ relevant monthly income (capped at HK$20,000 up to 31st May 2012 and HK$25,000 from 1st June 2012). Staff may elect to contribute more than the minimum as a voluntary contribution. Employees engaged outside Hong Kong are covered by appropriate local arrangements.
Total retirement benefit costs recognised in the income statement for the year ended 31st December 2012 amounted toHK$349 million (2011: HK$273 million), including HK$154 million (2011: HK$119 million) in respect of defined contribution plans.
Defined benefit plans are valued using the projected unit credit method in accordance with HKAS 19. For the year ended31st December 2012, the HKAS 19 disclosures are based on valuations prepared by Mercer (Hong Kong) Limited at 31st December 2012.For the year ended 31st December 2011, the HKAS 19 disclosures are based on valuations prepared by Towers Watson at 31st December 2009, which were updated at 31st December 2011 by Cannon Trustees Limited, the main administration manager of the Group’s defined benefit plans. Plans in the United States and Taiwan are valued by independent qualified actuaries. In addition, the Group operates a post-employment health care and life insurance benefit plan for certain retired employees in the United States, with accounting and frequency of valuations similar to those used for defined benefit plans.
Swire Pacific 2012 Annual Report 185
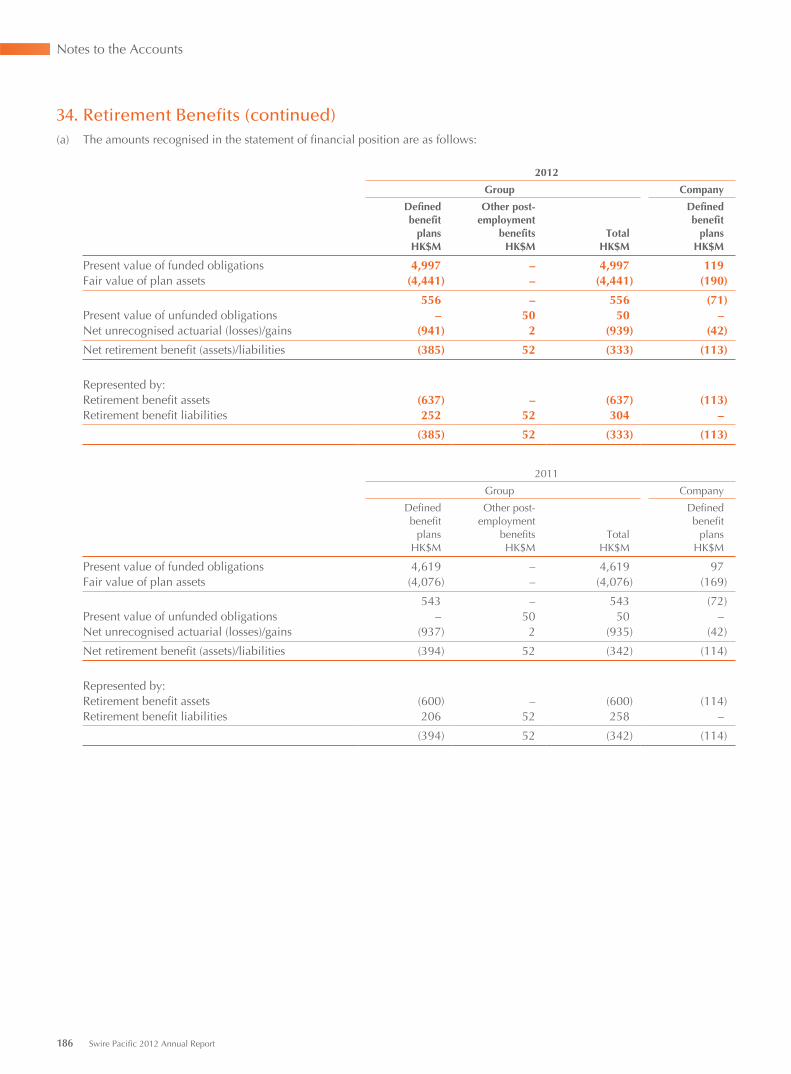
Notes to the Accounts
34. Retirement Benefits (continued)(a) The amounts recognised in the statement of financial position are as follows:
2012
Group Company
Defined Other post- Definedbenefit employment benefit
plans benefits Total plansHK$M HK$M HK$M HK$M
Present value of funded obligations 4,997 – 4,997 119Fair value of plan assets (4,441) – (4,441) (190)
556 – 556 (71)Present value of unfunded obligations – 50 50 –Net unrecognised actuarial (losses)/gains (941) 2 (939) (42)
Net retirement benefit (assets)/liabilities (385) 52 (333) (113)
Represented by:Retirement benefit assets (637) – (637) (113)Retirement benefit liabilities 252 52 304 –
(385) 52 (333) (113)
2011
Group Company
Defined Other post- Definedbenefit employment benefit
plans benefits Total plansHK$M HK$M HK$M HK$M
Present value of funded obligations 4,619 – 4,619 97Fair value of plan assets (4,076) – (4,076) (169)
543 – 543 (72)Present value of unfunded obligations – 50 50 –Net unrecognised actuarial (losses)/gains (937) 2 (935) (42)
Net retirement benefit (assets)/liabilities (394) 52 (342) (114)
Represented by:Retirement benefit assets (600) – (600) (114)Retirement benefit liabilities 206 52 258 –
(394) 52 (342) (114)
186 Swire Pacific 2012 Annual Report
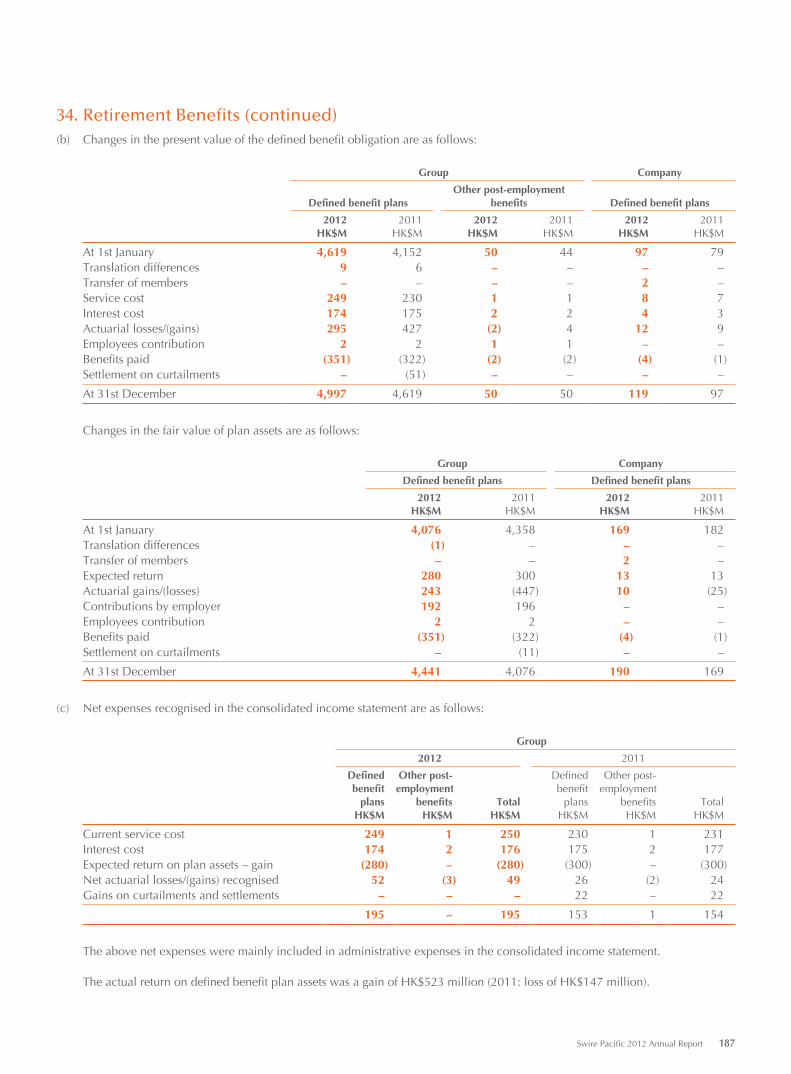
34. Retirement Benefits (continued)(b) Changes in the present value of the defined benefit obligation are as follows:
Group Company
Defined benefit plansOther post-employment
benefits Defined benefit plans
2012 2011 2012 2011 2012 2011HK$M HK$M HK$M HK$M HK$M HK$M
At 1st January 4,619 4,152 50 44 97 79Translation differences 9 6 – – – –Transfer of members – – – – 2 –Service cost 249 230 1 1 8 7Interest cost 174 175 2 2 4 3Actuarial losses/(gains) 295 427 (2) 4 12 9Employees contribution 2 2 1 1 – –Benefits paid (351) (322) (2) (2) (4) (1)Settlement on curtailments – (51) – – – –
At 31st December 4,997 4,619 50 50 119 97
Changes in the fair value of plan assets are as follows:
Group Company
Defined benefit plans Defined benefit plans
2012 2011 2012 2011HK$M HK$M HK$M HK$M
At 1st January 4,076 4,358 169 182Translation differences (1) – – –Transfer of members – – 2 –Expected return 280 300 13 13Actuarial gains/(losses) 243 (447) 10 (25)Contributions by employer 192 196 – –Employees contribution 2 2 – –Benefits paid (351) (322) (4) (1)Settlement on curtailments – (11) – –
At 31st December 4,441 4,076 190 169
(c) Net expenses recognised in the consolidated income statement are as follows:
Group
2012 2011
Defined Other post- Defined Other post-benefit employment benefit employment
plans benefits Total plans benefits TotalHK$M HK$M HK$M HK$M HK$M HK$M
Current service cost 249 1 250 230 1 231Interest cost 174 2 176 175 2 177Expected return on plan assets – gain (280) – (280) (300) – (300)Net actuarial losses/(gains) recognised 52 (3) 49 26 (2) 24Gains on curtailments and settlements – – – 22 – 22
195 – 195 153 1 154
The above net expenses were mainly included in administrative expenses in the consolidated income statement.
The actual return on defined benefit plan assets was a gain of HK$523 million (2011: loss of HK$147 million).
Swire Pacific 2012 Annual Report 187
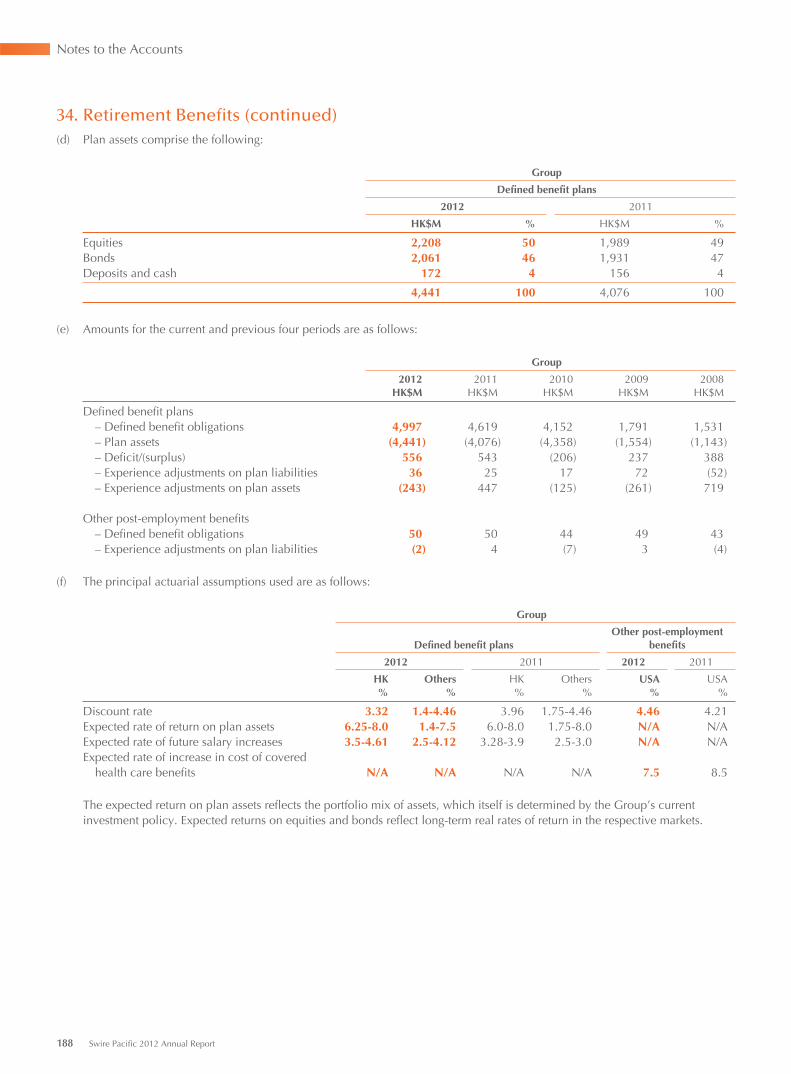
Notes to the Accounts
34. Retirement Benefits (continued)(d) Plan assets comprise the following:
Group
Defined benefit plans
2012 2011
HK$M % HK$M %
Equities 2,208 50 1,989 49Bonds 2,061 46 1,931 47Deposits and cash 172 4 156 4
4,441 100 4,076 100
(e) Amounts for the current and previous four periods are as follows:
Group
2012 2011 2010 2009 2008HK$M HK$M HK$M HK$M HK$M
Defined benefit plans – Defined benefit obligations 4,997 4,619 4,152 1,791 1,531 – Plan assets (4,441) (4,076) (4,358) (1,554) (1,143) – Deficit/(surplus) 556 543 (206) 237 388 – Experience adjustments on plan liabilities 36 25 17 72 (52) – Experience adjustments on plan assets (243) 447 (125) (261) 719
Other post-employment benefits – Defined benefit obligations 50 50 44 49 43 – Experience adjustments on plan liabilities (2) 4 (7) 3 (4)
(f) The principal actuarial assumptions used are as follows:
Group
Defined benefit plansOther post-employment
benefits
2012 2011 2012 2011
HK Others HK Others USA USA% % % % % %
Discount rate 3.32 1.4-4.46 3.96 1.75-4.46 4.46 4.21Expected rate of return on plan assets 6.25-8.0 1.4-7.5 6.0-8.0 1.75-8.0 N/A N/AExpected rate of future salary increases 3.5-4.61 2.5-4.12 3.28-3.9 2.5-3.0 N/A N/AExpected rate of increase in cost of covered health care benefits N/A N/A N/A N/A 7.5 8.5
The expected return on plan assets reflects the portfolio mix of assets, which itself is determined by the Group’s current investment policy. Expected returns on equities and bonds reflect long-term real rates of return in the respective markets.
188 Swire Pacific 2012 Annual Report
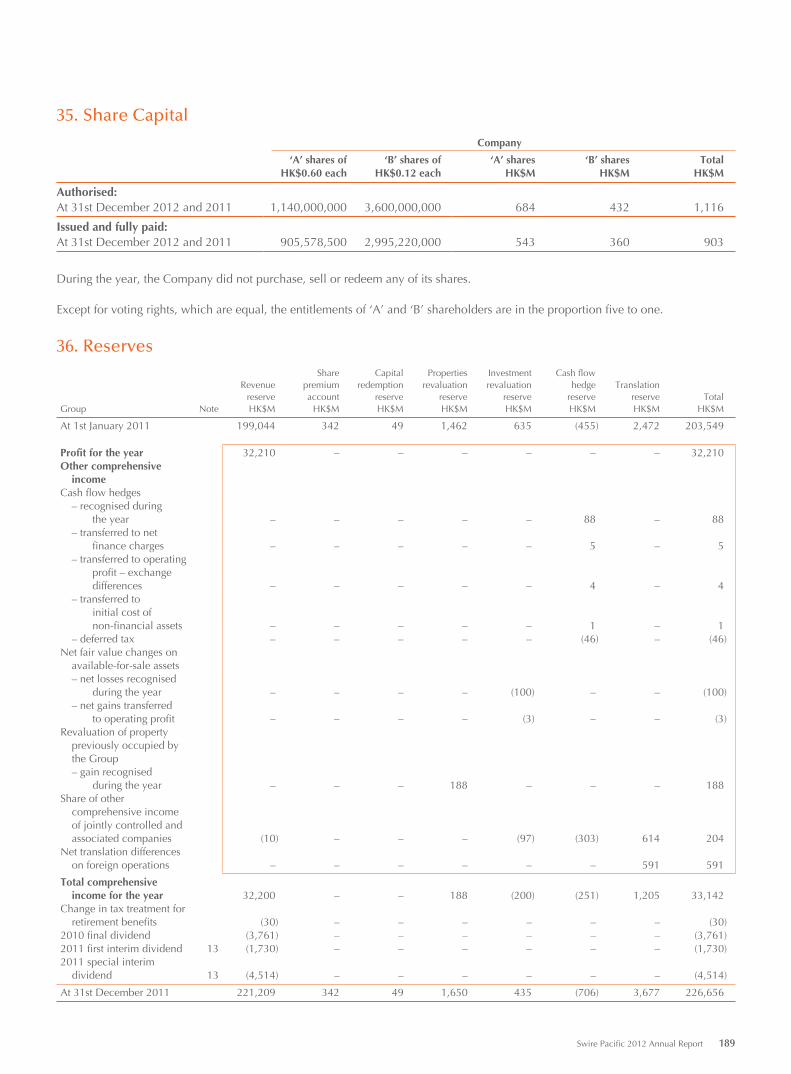
35. Share Capital
Company
‘A’ shares of ‘B’ shares of ‘A’ shares ‘B’ shares TotalHK$0.60 each HK$0.12 each HK$M HK$M HK$M
Authorised:At 31st December 2012 and 2011 1,140,000,000 3,600,000,000 684 432 1,116
Issued and fully paid:At 31st December 2012 and 2011 905,578,500 2,995,220,000 543 360 903
During the year, the Company did not purchase, sell or redeem any of its shares.
Except for voting rights, which are equal, the entitlements of ‘A’ and ‘B’ shareholders are in the proportion five to one.
36. ReservesShare Capital Properties Investment Cash flow
Revenue premium redemption revaluation revaluation hedge Translationreserve account reserve reserve reserve reserve reserve Total
Group Note HK$M HK$M HK$M HK$M HK$M HK$M HK$M HK$M
At 1st January 2011 199,044 342 49 1,462 635 (455) 2,472 203,549
Profit for the year 32,210 – – – – – – 32,210Other comprehensive
incomeCash flow hedges
– recognised duringthe year – – – – – 88 – 88
– transferred to netfinance charges – – – – – 5 – 5
– transferred to operating profit – exchange differences – – – – – 4 – 4
– transferred toinitial cost ofnon-financial assets – – – – – 1 – 1
– deferred tax – – – – – (46) – (46)Net fair value changes on
available-for-sale assets– net losses recognised
during the year – – – – (100) – – (100)– net gains transferred
to operating profit – – – – (3) – – (3)Revaluation of property
previously occupied by the Group– gain recognised
during the year – – – 188 – – – 188Share of other
comprehensive income of jointly controlled and associated companies (10) – – – (97) (303) 614 204
Net translation differences on foreign operations – – – – – – 591 591
Total comprehensive income for the year 32,200 – – 188 (200) (251) 1,205 33,142
Change in tax treatment for retirement benefits (30) – – – – – – (30)
2010 final dividend (3,761) – – – – – – (3,761)2011 first interim dividend 13 (1,730) – – – – – – (1,730)2011 special interim
dividend 13 (4,514) – – – – – – (4,514)
At 31st December 2011 221,209 342 49 1,650 435 (706) 3,677 226,656
Swire Pacific 2012 Annual Report 189
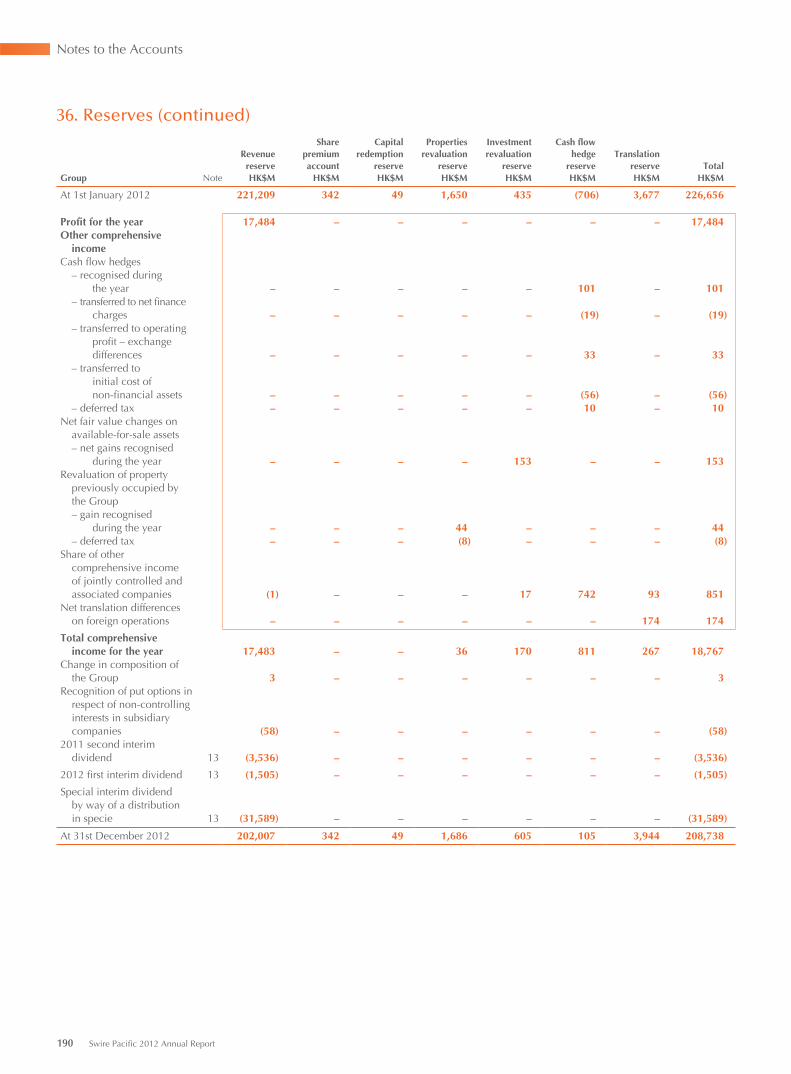
Notes to the Accounts
36. Reserves (continued)Share Capital Properties Investment Cash flow
Revenue premium redemption revaluation revaluation hedge Translationreserve account reserve reserve reserve reserve reserve Total
Group Note HK$M HK$M HK$M HK$M HK$M HK$M HK$M HK$M
At 1st January 2012 221,209 342 49 1,650 435 (706) 3,677 226,656
Profit for the year 17,484 – – – – – – 17,484Other comprehensive
incomeCash flow hedges
– recognised duringthe year – – – – – 101 – 101
– transferred to net finance charges – – – – – (19) – (19)
– transferred to operating profit – exchange differences – – – – – 33 – 33
– transferred toinitial cost ofnon-financial assets – – – – – (56) – (56)
– deferred tax – – – – – 10 – 10Net fair value changes on
available-for-sale assets– net gains recognised
during the year – – – – 153 – – 153Revaluation of property
previously occupied by the Group– gain recognised
during the year – – – 44 – – – 44– deferred tax – – – (8) – – – (8)
Share of other comprehensive income of jointly controlled and associated companies (1) – – – 17 742 93 851
Net translation differences on foreign operations – – – – – – 174 174
Total comprehensive income for the year 17,483 – – 36 170 811 267 18,767
Change in composition of the Group 3 – – – – – – 3
Recognition of put options in respect of non-controlling interests in subsidiary companies (58) – – – – – – (58)
2011 second interim dividend 13 (3,536) – – – – – – (3,536)
2012 first interim dividend 13 (1,505) – – – – – – (1,505)
Special interim dividendby way of a distribution in specie 13 (31,589) – – – – – – (31,589)
At 31st December 2012 202,007 342 49 1,686 605 105 3,944 208,738
190 Swire Pacific 2012 Annual Report
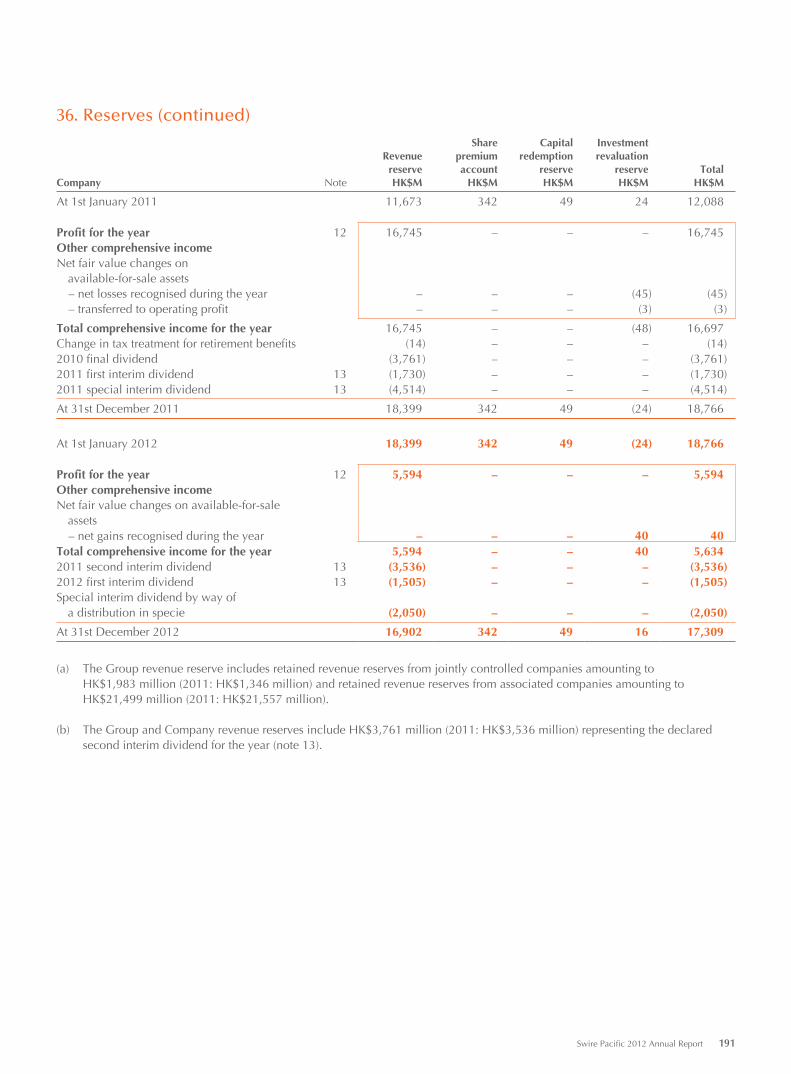
36. Reserves (continued)
Share Capital InvestmentRevenue premium redemption revaluationreserve account reserve reserve Total
Company Note HK$M HK$M HK$M HK$M HK$M
At 1st January 2011 11,673 342 49 24 12,088
Profit for the year 12 16,745 – – – 16,745Other comprehensive incomeNet fair value changes on
available-for-sale assets – net losses recognised during the year – – – (45) (45) – transferred to operating profit – – – (3) (3)
Total comprehensive income for the year 16,745 – – (48) 16,697Change in tax treatment for retirement benefits (14) – – – (14)2010 final dividend (3,761) – – – (3,761)2011 first interim dividend 13 (1,730) – – – (1,730)2011 special interim dividend 13 (4,514) – – – (4,514)
At 31st December 2011 18,399 342 49 (24) 18,766
At 1st January 2012 18,399 342 49 (24) 18,766
Profit for the year 12 5,594 – – – 5,594Other comprehensive incomeNet fair value changes on available-for-sale
assets – net gains recognised during the year – – – 40 40Total comprehensive income for the year 5,594 – – 40 5,6342011 second interim dividend 13 (3,536) – – – (3,536)2012 first interim dividend 13 (1,505) – – – (1,505)Special interim dividend by way of
a distribution in specie (2,050) – – – (2,050)
At 31st December 2012 16,902 342 49 16 17,309
(a) The Group revenue reserve includes retained revenue reserves from jointly controlled companies amounting toHK$1,983 million (2011: HK$1,346 million) and retained revenue reserves from associated companies amounting to HK$21,499 million (2011: HK$21,557 million).
(b) The Group and Company revenue reserves include HK$3,761 million (2011: HK$3,536 million) representing the declared second interim dividend for the year (note 13).
Swire Pacific 2012 Annual Report 191
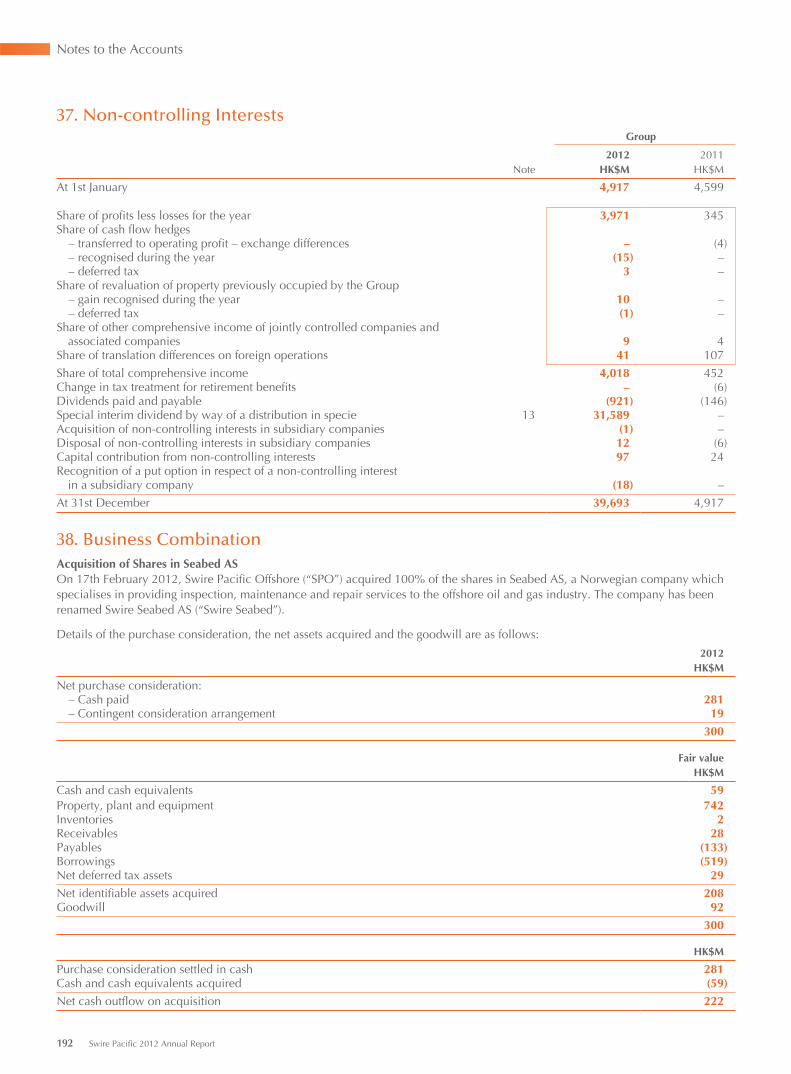
Notes to the Accounts
37. Non-controlling InterestsGroup
2012 2011Note HK$M HK$M
At 1st January 4,917 4,599
Share of profits less losses for the year 3,971 345Share of cash flow hedges – transferred to operating profit – exchange differences – (4) – recognised during the year (15) – – deferred tax 3 –Share of revaluation of property previously occupied by the Group – gain recognised during the year 10 – – deferred tax (1) –Share of other comprehensive income of jointly controlled companies and
associated companies 9 4Share of translation differences on foreign operations 41 107
Share of total comprehensive income 4,018 452Change in tax treatment for retirement benefits – (6)Dividends paid and payable (921) (146)Special interim dividend by way of a distribution in specie 13 31,589 –Acquisition of non-controlling interests in subsidiary companies (1) –Disposal of non-controlling interests in subsidiary companies 12 (6)Capital contribution from non-controlling interests 97 24Recognition of a put option in respect of a non-controlling interest
in a subsidiary company (18) –
At 31st December 39,693 4,917
38. Business CombinationAcquisition of Shares in Seabed ASOn 17th February 2012, Swire Pacific Offshore (“SPO”) acquired 100% of the shares in Seabed AS, a Norwegian company which specialises in providing inspection, maintenance and repair services to the offshore oil and gas industry. The company has been renamed Swire Seabed AS (“Swire Seabed”).
Details of the purchase consideration, the net assets acquired and the goodwill are as follows:
2012HK$M
Net purchase consideration: – Cash paid 281 – Contingent consideration arrangement 19
300
Fair valueHK$M
Cash and cash equivalents 59Property, plant and equipment 742Inventories 2Receivables 28Payables (133)Borrowings (519)Net deferred tax assets 29
Net identifiable assets acquired 208Goodwill 92
300
HK$M
Purchase consideration settled in cash 281Cash and cash equivalents acquired (59)
Net cash outflow on acquisition 222
192 Swire Pacific 2012 Annual Report
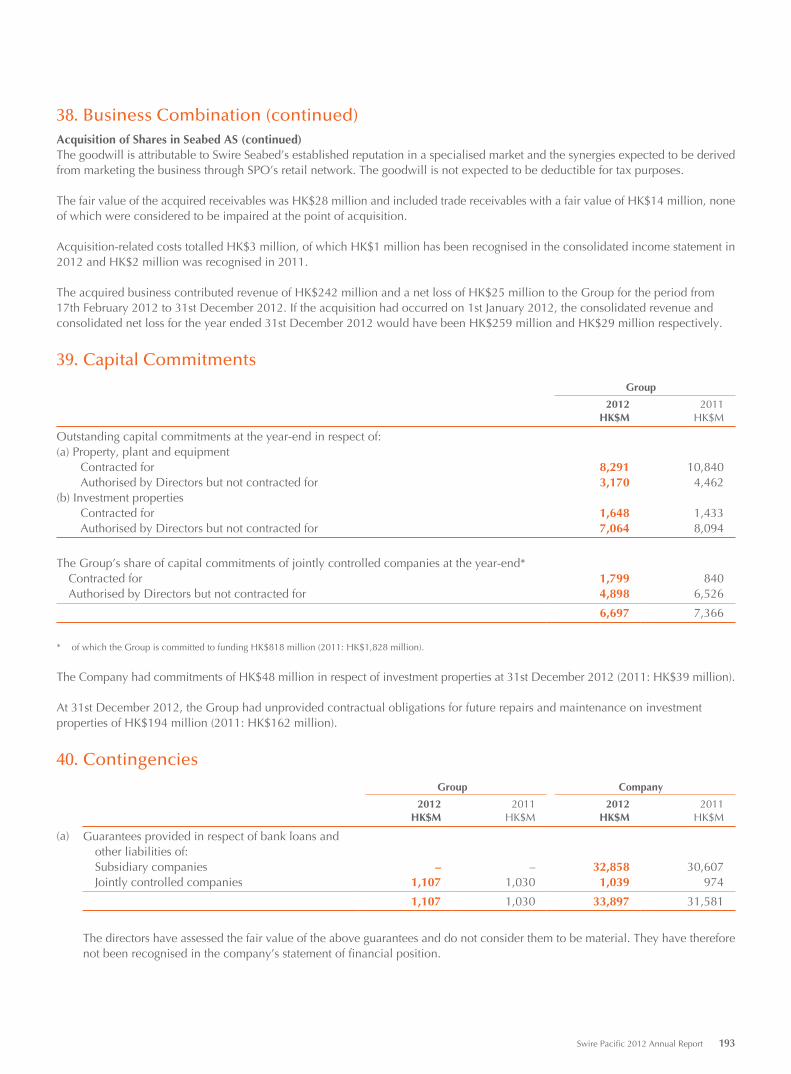
38. Business Combination (continued)Acquisition of Shares in Seabed AS (continued)The goodwill is attributable to Swire Seabed’s established reputation in a specialised market and the synergies expected to be derived from marketing the business through SPO’s retail network. The goodwill is not expected to be deductible for tax purposes.
The fair value of the acquired receivables was HK$28 million and included trade receivables with a fair value of HK$14 million, none of which were considered to be impaired at the point of acquisition.
Acquisition-related costs totalled HK$3 million, of which HK$1 million has been recognised in the consolidated income statement in 2012 and HK$2 million was recognised in 2011.
The acquired business contributed revenue of HK$242 million and a net loss of HK$25 million to the Group for the period from 17th February 2012 to 31st December 2012. If the acquisition had occurred on 1st January 2012, the consolidated revenue and consolidated net loss for the year ended 31st December 2012 would have been HK$259 million and HK$29 million respectively.
39. Capital Commitments
Group
2012 2011HK$M HK$M
Outstanding capital commitments at the year-end in respect of:(a) Property, plant and equipment Contracted for 8,291 10,840 Authorised by Directors but not contracted for 3,170 4,462(b) Investment properties Contracted for 1,648 1,433 Authorised by Directors but not contracted for 7,064 8,094
The Group’s share of capital commitments of jointly controlled companies at the year-end* Contracted for 1,799 840 Authorised by Directors but not contracted for 4,898 6,526
6,697 7,366
* of which the Group is committed to funding HK$818 million (2011: HK$1,828 million).
The Company had commitments of HK$48 million in respect of investment properties at 31st December 2012 (2011: HK$39 million).
At 31st December 2012, the Group had unprovided contractual obligations for future repairs and maintenance on investment properties of HK$194 million (2011: HK$162 million).
40. Contingencies
Group Company
2012 2011 2012 2011HK$M HK$M HK$M HK$M
(a) Guarantees provided in respect of bank loans and other liabilities of: Subsidiary companies – – 32,858 30,607 Jointly controlled companies 1,107 1,030 1,039 974
1,107 1,030 33,897 31,581
The directors have assessed the fair value of the above guarantees and do not consider them to be material. They have therefore not been recognised in the company’s statement of financial position.
Swire Pacific 2012 Annual Report 193
Notes to the Accounts
40. Contingencies (continued)(b) Contingent tax liability
Certain Group companies have been unable to finalise their liability to profits tax in respect of the years 1997/98 to 2005/06 inclusive as a consequence of queries raised by the Hong Kong Inland Revenue Department (“IRD”). These queries relate to the deductibility, in the assessment of profits tax, of interest on borrowings of those companies during the periods under review.
A number of discussions have taken place between the companies and the IRD to understand the precise nature of the IRD queries. However, at this stage there is insufficient information available to determine reliably the ultimate outcome of the IRD’s review with an acceptable degree of certainty. Consequently no provision has been recognised in these accounts for any amounts that may fall due in regard to these queries.
There is a contingent tax liability totalling HK$535 million in respect of the IRD queries for the years under review. The companies involved have objected to these assessments. The IRD has agreed to hold over conditionally part of the tax in dispute in the sum of HK$29 million and one of the companies involved has purchased Tax Reserve Certificates of the same amount. The IRD has agreed to hold over unconditionally the balance of the tax in dispute in the sum of HK$506 million. In addition, the estimated interest which would be payable in respect of the Notices of Assessment totalled HK$283 million as at 31st December 2012. It is not possible, given the lack of information available, to determine the ultimate outcome of the IRD’s review of this matter and consequently to make a judgement as to its materiality.
(c) Cathay Pacific AirwaysCathay Pacific Airways (“Cathay Pacific”) remains the subject of antitrust proceedings in various jurisdictions and continues to defend itself vigorously. The proceedings are focused on issues relating to pricing and competition. Cathay Pacific is represented by legal counsel in connection with these matters.
In December 2008, Cathay Pacific received a Statement of Claim from the New Zealand Commerce Commission (“NZCC”) with regard to Cathay Pacific’s air cargo operations. In December 2012, Cathay Pacific and the NZCC reached an agreement to resolve this matter and in February 2013, the High Court of New Zealand, pursuant to such agreement, held a hearing. The Court has yet to enter its judgment.
In July 2009, Cathay Pacific received an Amended Statement of Claim (“ASOC”) from the Australian Competition & Consumer Commission with regard to Cathay Pacific’s air cargo operations. In November 2012, Cathay Pacific and the ACCC reached an agreement to resolve this matter and in December 2012, the Federal Court of Australia, pursuant to such agreement, entered its judgment against Cathay Pacific for A$11.25 million and costs of A$0.5 million (total equivalent to HK$94.6 million at the exchange rate current as of the date of payment). Cathay Pacific has satisfied the judgment.
In November 2010, the European Commission issued a decision in its airfreight investigation finding that, amongst other things, Cathay Pacific and a number of other international cargo carriers agreed to cargo surcharge levels and that such agreements infringed European competition law. The European Commission imposed a fine of Euros 57,120,000 (equivalent toHK$618 million at the exchange rate current as of the date of the announcement) on Cathay Pacific. In January 2011,Cathay Pacific filed an appeal with the General Court of the European Union. The appeal is currently pending.
Cathay Pacific has been named as a defendant in a number of civil complaints, including class litigation and third party contribution claims, in a number of countries including the United States, Canada, the United Kingdom, the Netherlands and Australia alleging violations of applicable competition laws arising from Cathay Pacific’s conduct relating to its air cargo operations. In addition, civil class action claims have been filed in the United States and Canada alleging violations of applicable competition laws arising from Cathay Pacific’s conduct relating to certain of its passenger operations. Cathay Pacific is represented by legal counsel and is defending those actions.
The proceedings and civil actions, except as otherwise stated above, are ongoing and the outcomes are subject to uncertainties. Cathay Pacific is not in a position to assess the full potential liabilities but makes provisions based on facts and circumstances in line with the relevant accounting policy.
194 Swire Pacific 2012 Annual Report
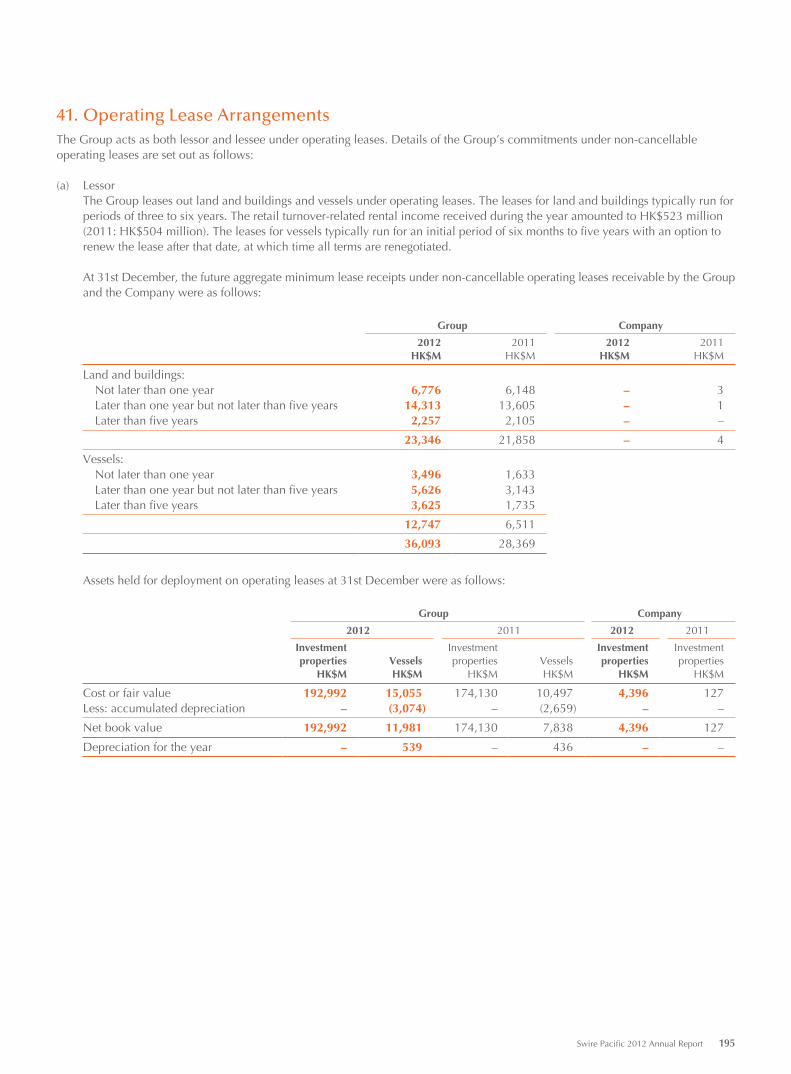
41. Operating Lease ArrangementsThe Group acts as both lessor and lessee under operating leases. Details of the Group’s commitments under non-cancellable operating leases are set out as follows:
(a) LessorThe Group leases out land and buildings and vessels under operating leases. The leases for land and buildings typically run for periods of three to six years. The retail turnover-related rental income received during the year amounted to HK$523 million (2011: HK$504 million). The leases for vessels typically run for an initial period of six months to five years with an option to renew the lease after that date, at which time all terms are renegotiated.
At 31st December, the future aggregate minimum lease receipts under non-cancellable operating leases receivable by the Group and the Company were as follows:
Group Company
2012 2011 2012 2011HK$M HK$M HK$M HK$M
Land and buildings: Not later than one year 6,776 6,148 – 3 Later than one year but not later than five years 14,313 13,605 – 1 Later than five years 2,257 2,105 – –
23,346 21,858 – 4
Vessels: Not later than one year 3,496 1,633 Later than one year but not later than five years 5,626 3,143 Later than five years 3,625 1,735
12,747 6,511
36,093 28,369
Assets held for deployment on operating leases at 31st December were as follows:
Group Company
2012 2011 2012 2011
Investment Investment Investment Investmentproperties Vessels properties Vessels properties properties
HK$M HK$M HK$M HK$M HK$M HK$M
Cost or fair value 192,992 15,055 174,130 10,497 4,396 127Less: accumulated depreciation – (3,074) – (2,659) – –
Net book value 192,992 11,981 174,130 7,838 4,396 127
Depreciation for the year – 539 – 436 – –
Swire Pacific 2012 Annual Report 195
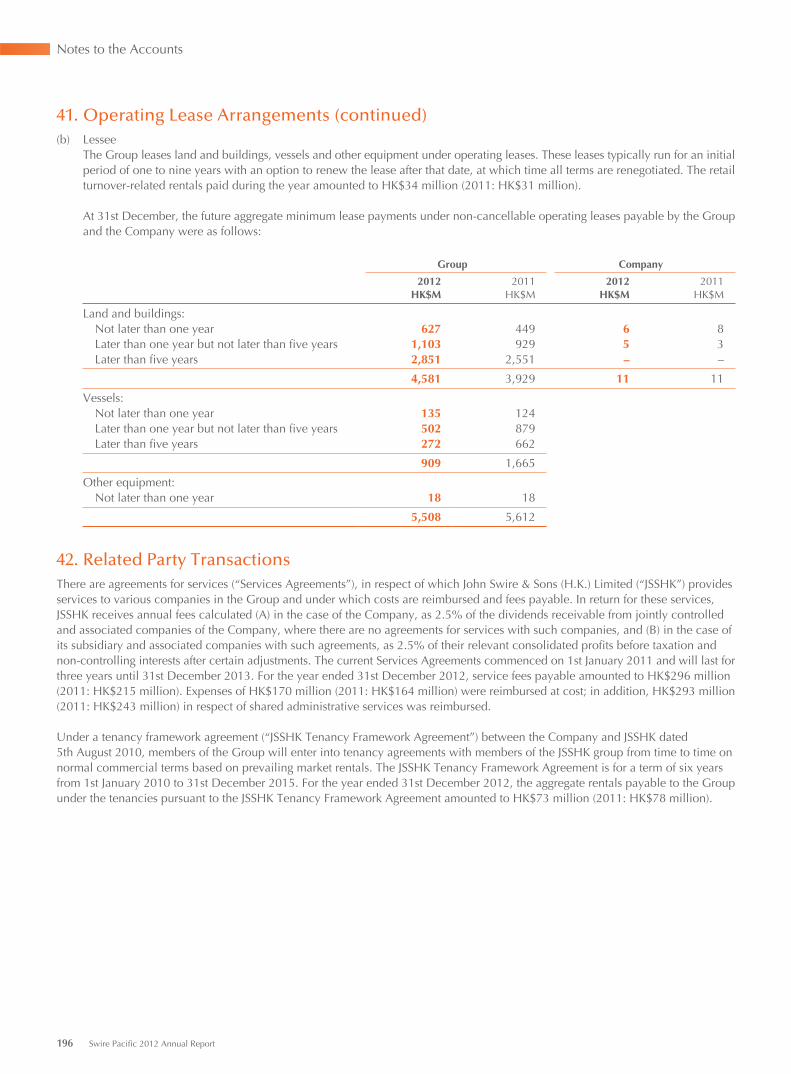
Notes to the Accounts
41. Operating Lease Arrangements (continued)(b) Lessee
The Group leases land and buildings, vessels and other equipment under operating leases. These leases typically run for an initial period of one to nine years with an option to renew the lease after that date, at which time all terms are renegotiated. The retail turnover-related rentals paid during the year amounted to HK$34 million (2011: HK$31 million).
At 31st December, the future aggregate minimum lease payments under non-cancellable operating leases payable by the Group and the Company were as follows:
Group Company
2012 2011 2012 2011HK$M HK$M HK$M HK$M
Land and buildings: Not later than one year 627 449 6 8 Later than one year but not later than five years 1,103 929 5 3 Later than five years 2,851 2,551 – –
4,581 3,929 11 11
Vessels: Not later than one year 135 124 Later than one year but not later than five years 502 879 Later than five years 272 662
909 1,665
Other equipment: Not later than one year 18 18
5,508 5,612
42. Related Party Transactions There are agreements for services (“Services Agreements”), in respect of which John Swire & Sons (H.K.) Limited (“JSSHK”) provides services to various companies in the Group and under which costs are reimbursed and fees payable. In return for these services, JSSHK receives annual fees calculated (A) in the case of the Company, as 2.5% of the dividends receivable from jointly controlled and associated companies of the Company, where there are no agreements for services with such companies, and (B) in the case of its subsidiary and associated companies with such agreements, as 2.5% of their relevant consolidated profits before taxation andnon-controlling interests after certain adjustments. The current Services Agreements commenced on 1st January 2011 and will last for three years until 31st December 2013. For the year ended 31st December 2012, service fees payable amounted to HK$296 million (2011: HK$215 million). Expenses of HK$170 million (2011: HK$164 million) were reimbursed at cost; in addition, HK$293 million (2011: HK$243 million) in respect of shared administrative services was reimbursed.
Under a tenancy framework agreement (“JSSHK Tenancy Framework Agreement”) between the Company and JSSHK dated5th August 2010, members of the Group will enter into tenancy agreements with members of the JSSHK group from time to time on normal commercial terms based on prevailing market rentals. The JSSHK Tenancy Framework Agreement is for a term of six years from 1st January 2010 to 31st December 2015. For the year ended 31st December 2012, the aggregate rentals payable to the Group under the tenancies pursuant to the JSSHK Tenancy Framework Agreement amounted to HK$73 million (2011: HK$78 million).
196 Swire Pacific 2012 Annual Report
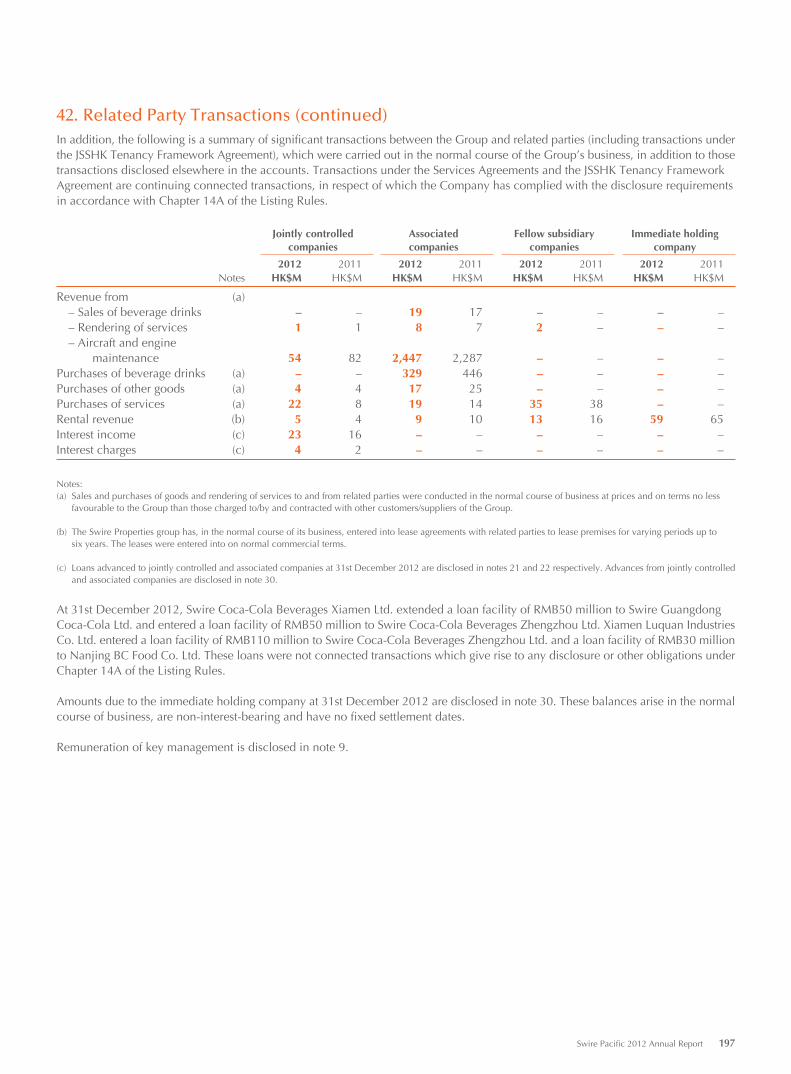
42. Related Party Transactions (continued)In addition, the following is a summary of significant transactions between the Group and related parties (including transactions under the JSSHK Tenancy Framework Agreement), which were carried out in the normal course of the Group’s business, in addition to those transactions disclosed elsewhere in the accounts. Transactions under the Services Agreements and the JSSHK Tenancy Framework Agreement are continuing connected transactions, in respect of which the Company has complied with the disclosure requirements in accordance with Chapter 14A of the Listing Rules.
Jointly controlled Associated Fellow subsidiary Immediate holding companies companies companies company
2012 2011 2012 2011 2012 2011 2012 2011Notes HK$M HK$M HK$M HK$M HK$M HK$M HK$M HK$M
Revenue from (a) – Sales of beverage drinks – – 19 17 – – – – – Rendering of services 1 1 8 7 2 – – – – Aircraft and engine maintenance 54 82 2,447 2,287 – – – –Purchases of beverage drinks (a) – – 329 446 – – – –Purchases of other goods (a) 4 4 17 25 – – – –Purchases of services (a) 22 8 19 14 35 38 – –Rental revenue (b) 5 4 9 10 13 16 59 65Interest income (c) 23 16 – – – – – –Interest charges (c) 4 2 – – – – – –
Notes:(a) Sales and purchases of goods and rendering of services to and from related parties were conducted in the normal course of business at prices and on terms no less
favourable to the Group than those charged to/by and contracted with other customers/suppliers of the Group.
(b) The Swire Properties group has, in the normal course of its business, entered into lease agreements with related parties to lease premises for varying periods up tosix years. The leases were entered into on normal commercial terms.
(c) Loans advanced to jointly controlled and associated companies at 31st December 2012 are disclosed in notes 21 and 22 respectively. Advances from jointly controlled and associated companies are disclosed in note 30.
At 31st December 2012, Swire Coca-Cola Beverages Xiamen Ltd. extended a loan facility of RMB50 million to Swire Guangdong Coca-Cola Ltd. and entered a loan facility of RMB50 million to Swire Coca-Cola Beverages Zhengzhou Ltd. Xiamen Luquan Industries Co. Ltd. entered a loan facility of RMB110 million to Swire Coca-Cola Beverages Zhengzhou Ltd. and a loan facility of RMB30 million to Nanjing BC Food Co. Ltd. These loans were not connected transactions which give rise to any disclosure or other obligations under Chapter 14A of the Listing Rules.
Amounts due to the immediate holding company at 31st December 2012 are disclosed in note 30. These balances arise in the normal course of business, are non-interest-bearing and have no fixed settlement dates.
Remuneration of key management is disclosed in note 9.
Swire Pacific 2012 Annual Report 197
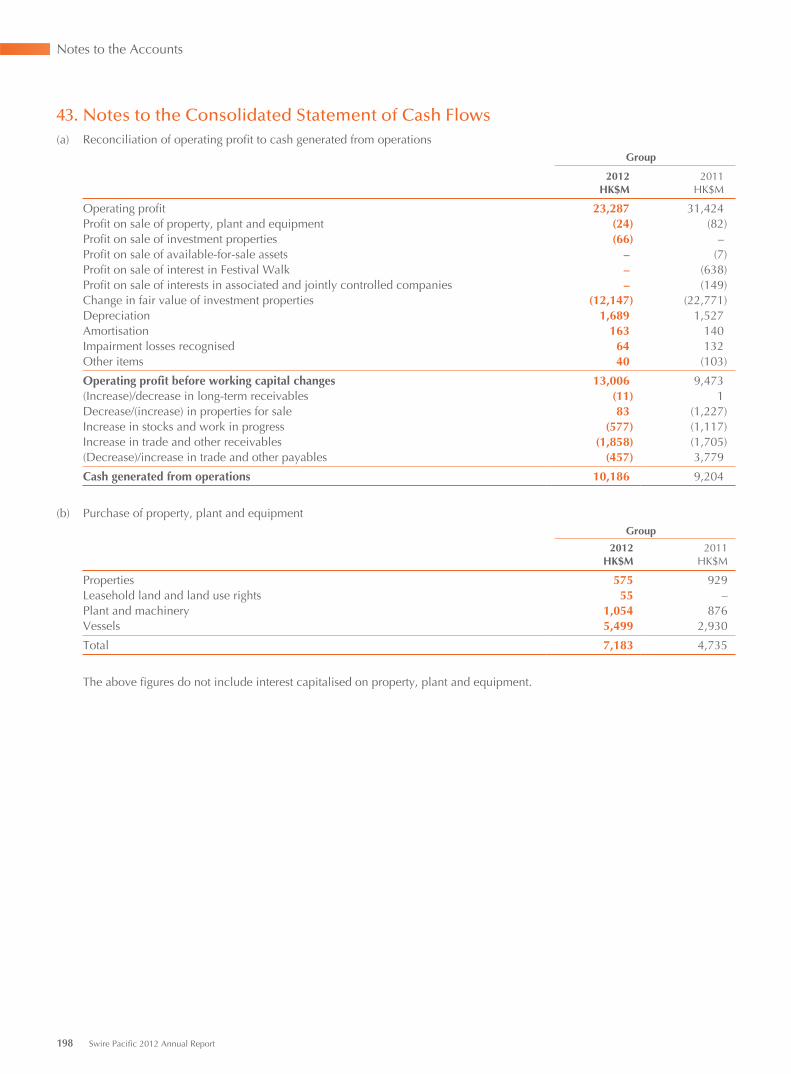
Notes to the Accounts
43. Notes to the Consolidated Statement of Cash Flows(a) Reconciliation of operating profit to cash generated from operations
Group
2012 2011HK$M HK$M
Operating profit 23,287 31,424Profit on sale of property, plant and equipment (24) (82)Profit on sale of investment properties (66) –Profit on sale of available-for-sale assets – (7)Profit on sale of interest in Festival Walk – (638)Profit on sale of interests in associated and jointly controlled companies – (149)Change in fair value of investment properties (12,147) (22,771)Depreciation 1,689 1,527Amortisation 163 140Impairment losses recognised 64 132Other items 40 (103)
Operating profit before working capital changes 13,006 9,473(Increase)/decrease in long-term receivables (11) 1Decrease/(increase) in properties for sale 83 (1,227)Increase in stocks and work in progress (577) (1,117)Increase in trade and other receivables (1,858) (1,705)(Decrease)/increase in trade and other payables (457) 3,779
Cash generated from operations 10,186 9,204
(b) Purchase of property, plant and equipmentGroup
2012 2011HK$M HK$M
Properties 575 929Leasehold land and land use rights 55 –Plant and machinery 1,054 876Vessels 5,499 2,930
Total 7,183 4,735
The above figures do not include interest capitalised on property, plant and equipment.
198 Swire Pacific 2012 Annual Report
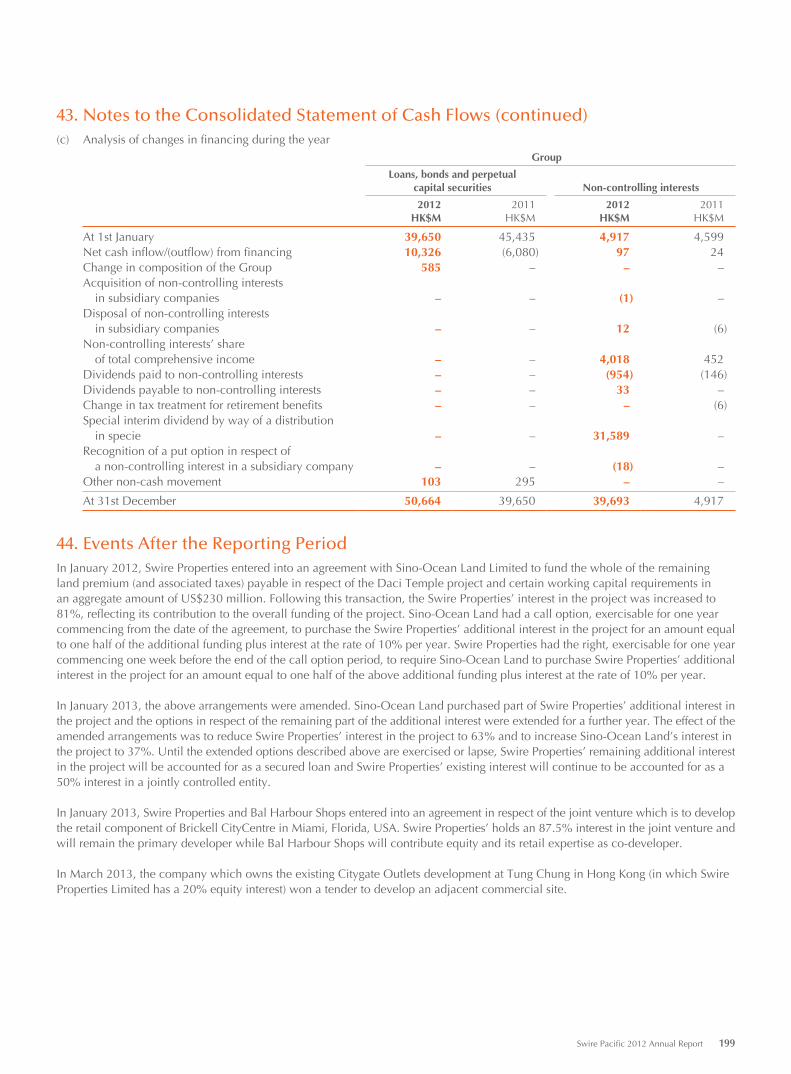
43. Notes to the Consolidated Statement of Cash Flows (continued)(c) Analysis of changes in financing during the year
Group
Loans, bonds and perpetualcapital securities Non-controlling interests
2012 2011 2012 2011HK$M HK$M HK$M HK$M
At 1st January 39,650 45,435 4,917 4,599Net cash inflow/(outflow) from financing 10,326 (6,080) 97 24Change in composition of the Group 585 – – –Acquisition of non-controlling interests in subsidiary companies – – (1) –Disposal of non-controlling interests in subsidiary companies – – 12 (6)Non-controlling interests’ share of total comprehensive income – – 4,018 452Dividends paid to non-controlling interests – – (954) (146)Dividends payable to non-controlling interests – – 33 –Change in tax treatment for retirement benefits – – – (6)Special interim dividend by way of a distribution in specie – – 31,589 –Recognition of a put option in respect of a non-controlling interest in a subsidiary company – – (18) –Other non-cash movement 103 295 – –
At 31st December 50,664 39,650 39,693 4,917
44. Events After the Reporting PeriodIn January 2012, Swire Properties entered into an agreement with Sino-Ocean Land Limited to fund the whole of the remaining land premium (and associated taxes) payable in respect of the Daci Temple project and certain working capital requirements in an aggregate amount of US$230 million. Following this transaction, the Swire Properties’ interest in the project was increased to 81%, reflecting its contribution to the overall funding of the project. Sino-Ocean Land had a call option, exercisable for one year commencing from the date of the agreement, to purchase the Swire Properties’ additional interest in the project for an amount equal to one half of the additional funding plus interest at the rate of 10% per year. Swire Properties had the right, exercisable for one year commencing one week before the end of the call option period, to require Sino-Ocean Land to purchase Swire Properties’ additional interest in the project for an amount equal to one half of the above additional funding plus interest at the rate of 10% per year.
In January 2013, the above arrangements were amended. Sino-Ocean Land purchased part of Swire Properties’ additional interest in the project and the options in respect of the remaining part of the additional interest were extended for a further year. The effect of the amended arrangements was to reduce Swire Properties’ interest in the project to 63% and to increase Sino-Ocean Land’s interest in the project to 37%. Until the extended options described above are exercised or lapse, Swire Properties’ remaining additional interest in the project will be accounted for as a secured loan and Swire Properties’ existing interest will continue to be accounted for as a 50% interest in a jointly controlled entity.
In January 2013, Swire Properties and Bal Harbour Shops entered into an agreement in respect of the joint venture which is to develop the retail component of Brickell CityCentre in Miami, Florida, USA. Swire Properties’ holds an 87.5% interest in the joint venture and will remain the primary developer while Bal Harbour Shops will contribute equity and its retail expertise as co-developer.
In March 2013, the company which owns the existing Citygate Outlets development at Tung Chung in Hong Kong (in which Swire Properties Limited has a 20% equity interest) won a tender to develop an adjacent commercial site.
Swire Pacific 2012 Annual Report 199
Notes to the Accounts
44. Events After the Reporting Period (continued)In March 2013, the Cathay Pacific group entered into agreements with The Boeing Company under which the Cathay Pacific group agreed to buy three Boeing 747-8F freighter aircraft and the agreement to purchase eight Boeing 777-200F freighters entered into in August 2011 was cancelled. Pre-delivery payments already made in respect of the eight Boeing 777-200F freighters (which were scheduled to be delivered from 2014 to 2016), will be credited to the consideration for the purchase of the three Boeing 747-8F freighters (which are scheduled to be delivered in 2013). Under the agreements, Cathay Pacific also acquired options to purchase five Boeing 777-200F freighters and The Boeing Company agreed to purchase four Boeing 747-400BCF converted freighters, which were taken out of service in 2012 and early 2013. The transaction is part of a package of transactions between The Boeing Company (on the one hand) and the Cathay Pacific group, Air China Cargo and Air China (on the other hand).
45. Immediate and Ultimate Holding CompanyThe immediate holding company is John Swire & Sons (H.K.) Limited, a company incorporated in Hong Kong.
The ultimate holding company is John Swire & Sons Limited, a company incorporated in England.
200 Swire Pacific 2012 Annual Report
Principal Accounting Policies
1. Basis of PreparationThe accounts have been prepared in accordance with Hong Kong Financial Reporting Standards (“HKFRS”). The accounts have been prepared under the historical cost convention as modified by the revaluation of certain investment properties, available-for-sale investments and financial assets and financial liabilities (including derivative instruments) at fair value through profit or loss.
2. Basis of ConsolidationThe consolidated accounts incorporate the accounts of Swire Pacific Limited, its subsidiary companies (together referred to as the “Group”) and the Group’s interests in jointly controlled and associated companies.
3. Subsidiary CompaniesSubsidiary companies are all entities (including special purpose entities) over which the Group has the power to govern the financial and operating policies generally accompanying a shareholding of more than one half of the voting rights. The existence and effect of potential voting rights that are currently exercisable or convertible are considered when assessing whether the Group controls another entity. Subsidiary companies are fully consolidated from the date on which control is transferred to the group. They are deconsolidated from the date that control ceases.
The Group uses the acquisition method of accounting to account for business combinations. The consideration transferred for the acquisition of a subsidiary company is the fair values of the assets transferred, the liabilities incurred and the equity interests issued by the Group. The consideration transferred includes the fair value of any asset or liability resulting from a contingent consideration arrangement. Acquisition-related costs are expensed as incurred. Identifiable assets acquired and liabilities and contingent liabilities assumed in a business combination are measured initially at their fair values at the acquisition date. On an acquisition-by-acquisition basis, the group recognises any non-controlling interest in the acquiree either at fair value or at the non-controlling interest’s proportionate share of the acquiree’s net assets.
Investments in subsidiary companies are accounted for at cost less impairment. Cost is adjusted to reflect changes in consideration arising from contingent consideration amendments. Cost also includes direct attributable costs of investment.
The excess of the consideration transferred, the amount of any non-controlling interest in the acquiree and the acquisition-date fair value of any previous equity interest in the acquiree over the fair value of the group’s share of the identifiable net assets acquired is recorded as goodwill. If this is less than the fair value of the net assets of the subsidiary company acquired in the case of a bargain purchase, the difference is recognised directly in the statement of comprehensive income.
Intercompany transactions, balances and unrealised gains on transactions between Group companies are eliminated on consolidation. Unrealised losses are also eliminated unless the transaction provides evidence of an impairment of the asset transferred. Accounting policies of subsidiary companies have been changed where necessary to ensure consistency with the policies adopted by the Group.
The Group treats transactions with non-controlling interests as transactions with equity owners of the Group. For purchases from non-controlling interests, the difference between any consideration paid and the relevant share acquired of the carrying value of net assets of the subsidiary company is recorded in equity. Gains or losses on disposals to non-controlling interests where control is not lost are also recorded in equity.
When the Group ceases to have control or significant influence, any retained interest in the entity is remeasured to its fair value, with the change in carrying amount recognised in profit or loss. The fair value is the initial carrying amount for the purposes of subsequently accounting for the retained interest as an associated company, jointly controlled company or financial asset. In addition, any amounts previously recognised in other comprehensive income in respect of that entity are accounted for as if the group had directly disposed of the related assets or liabilities. This may mean that amounts previously recognised in other comprehensive income are reclassified to profit or loss.
Where the Group enters into a contract that contains an obligation (for example a written put option exercisable by the contract counterparty) to acquire shares in a partly-owned subsidiary company from the non-controlling interest, which is not part of a business combination, the Group records a financial liability for the present value of the redemption amount and reclassified from equity. Changes to the value of the financial liability are recognised in the income statement within finance income or finance costs.
Swire Pacific 2012 Annual Report 201
In the Company’s statement of financial position, its investments in subsidiary companies are stated at cost less provision for any impairment losses. Income from subsidiary companies is accounted for by the Company on the basis of dividends received and receivable.
Long-term loans to subsidiary companies are considered to be quasi-equity in nature where there is no defined repayment terms and no historical repayment of the balances.
4. Jointly Controlled and Associated CompaniesJointly controlled companies are those companies held for the long-term, over which the Group is in a position to exercise joint control with other venturers in accordance with contractual arrangements, and where none of the participating parties has unilateral control over the economic activity of the joint venture.
Associated companies are those companies over which the Group has significant influence but not control or joint control, over their management including participation in the financial and operating policy decisions, generally accompanying a shareholding of between 20% and 50% of the voting rights.
Investments in jointly controlled and associated companies are accounted for using the equity method of accounting and are initially recognised at cost. The excess of the cost of investment in jointly controlled and associated companies over the fair value of the Group’s share of the identifiable net assets acquired represents goodwill. The Group’s investments in jointly controlled and associated companies include goodwill identified on acquisitions, net of any accumulated impairment loss.
The Group’s share of its jointly controlled and associated companies’ post-acquisition profits or losses is recognised in the consolidated income statement, and its share of post-acquisition movements in other comprehensive income is recognised in the consolidated statement of comprehensive income. The cumulative post-acquisition movements are adjusted against the carrying amount of the investment. When the Group’s share of losses equals or exceeds its interest in the jointly controlled or associated company, including any other unsecured receivables, the Group does not recognise further losses, unless it has incurred obligations or made payments on behalf of the jointly controlled or associated company.
The Group recognises the disposal of an interest in a jointly controlled company when it ceases to have joint control and the risks and rewards of ownership have passed to the acquirer.
If the ownership interest in an associated company is reduced but significant influence is retained, only a proportionate share of the amounts previously recognised in other comprehensive income are reclassified to profit or loss where appropriate.
Unrealised gains on transactions between the Group and its jointly controlled and associated companies are eliminated to the extent of the Group’s interest in these companies. Unrealised losses on assets transferred between the Group and its jointly controlled and associated companies are also eliminated unless the transactions provide evidence of impairment of the assets transferred. Accounting policies of jointly controlled and associated companies have been changed where necessary to ensure consistency with the policies adopted by the Group.
Dilution gains and losses arising in investments in associated companies are recognised in the consolidated income statement.
In the Company’s statement of financial position, its investments in jointly controlled and associated companies are stated at cost less provision for any impairment losses. Income from jointly controlled and associated companies is recognised by the Company on the basis of dividends received and receivable.
Long-term loans to jointly controlled and associated companies are considered to be quasi-equity in nature where there is no defined repayment terms and no historical repayment of the balances.
5. Foreign Currency Translation(a) Functional and presentation currency
Items included in the accounts of each of the Group’s entities are measured using the currency of the primary economic environment in which the entity operates (the “functional currency”). The consolidated accounts are presented in Hong Kong dollars, which is the Company’s functional and presentation currency.
Principal Accounting Policies
202 Swire Pacific 2012 Annual Report
(b) Transactions and balancesForeign currency transactions are translated into the functional currency using the exchange rates prevailing at the dates of the transactions. Foreign exchange gains and losses resulting from the settlement of such transactions and from the translation at year-end exchange rates of monetary assets and liabilities denominated in foreign currencies are recognised in the income statement, except when deferred in other comprehensive income as qualifying cash flow hedges or qualifying net investment hedges.
When a gain or loss on a non-monetary item is recognised directly in other comprehensive income, any associated translation difference is also recognised directly in other comprehensive income. When a gain or loss on a non-monetary item is recognised in the income statement, any associated translation difference is also recognised in the income statement.
(c) Group companiesThe results and financial position of all the Group entities (none of which has the currency of a hyperinflationary economy) that have a functional currency different from the presentation currency are translated into the presentation currency as follows:
(i) Assets and liabilities for each statement of financial position presented are translated at the closing rate at the date of that statement of financial position;
(ii) Income and expenses for each income statement are translated at average exchange rates (unless this average is not a reasonable approximation of the cumulative effect of the rates prevailing on the transaction dates, in which case income and expenses are translated at the dates of the transactions); and
(iii) All resulting exchange differences are recognised in other comprehensive income and accumulated in a separate component in equity.
On consolidation, exchange differences arising from the translation of the net investment in foreign operations, and of borrowings and other currency instruments designated as hedges of such investments, are taken to other comprehensive income. When a foreign operation is partially disposed of or sold, exchange differences that were recorded in equity are recognised in the consolidated income statement as part of the gain or loss on sale.
Goodwill and fair value adjustments arising on the acquisition of a foreign entity are treated as assets and liabilities of the foreign entity and translated at the closing rate.
6. Investment PropertiesProperty that is held for long-term rental yields or for capital appreciation or both, and that is not occupied by the Group, is classified as investment property. Investment property comprises leasehold land and buildings held under finance leases. Land held under operating or finance leases is classified and accounted for as investment property when the rest of the definition of investment property is met.
Investment properties (including those under construction) are carried at fair value and are valued at least annually. The majority of investment properties are valued by independent valuers. The valuations are performed in accordance with the Valuation Standards on Properties issued by the Hong Kong Institute of Surveyors and are on an open market basis, related to individual properties, and separate values are not attributed to land and buildings. Land and buildings that are being developed for future use as investment properties and investment properties that are being redeveloped for continuing use as investment properties are measured at fair value and included as under construction. Changes in fair values are recognised in the income statement.
Subsequent expenditure is charged to the asset’s carrying amount only when it is probable that future economic benefits associated with the item will flow to the Group and the cost of the item can be measured reliably. All other repairs and maintenance costs are expensed in the income statement during the financial period in which they are incurred.
If an investment property becomes owner-occupied, it is reclassified as property, plant and equipment, and its fair value at the date of reclassification becomes its cost for accounting purposes.
Swire Pacific 2012 Annual Report 203
7. Property, Plant and EquipmentProperty, plant and equipment are carried at cost less accumulated depreciation and accumulated impairment losses. Cost includes expenditure that is directly attributable to the acquisition of the items. Cost may also include transfers from equity of any gains/losses on qualifying cash flow hedges of foreign currency purchases of property, plant and equipment. Subsequent costs are included in the asset’s carrying amount or recognised as a separate asset, as appropriate, only when it is probable that future economic benefits associated with the item will flow to the Group and the cost of the item can be measured reliably. Major renovation costs and modifications that extend the life or usefulness of vessels are capitalised and depreciated over the period until the next drydocking. All other repairs and maintenance are expensed in the income statement during the financial period in which they are incurred.
Leasehold land can be classified as held under finance lease and recorded as property, plant and equipment if the lessee is exposed to substantially all the risks and rewards of ownership of that price of land. Leasehold land is depreciated over the lease term.
On the transfer of owner occupied property to investment property, increases in the carrying amount arising on revaluation of land and buildings are credited to other comprehensive income and shown as property revaluation reserve in shareholders’ equity. Decreases that offset previous increases of the same asset are charged in other comprehensive income and debited against property revaluation reserve directly in equity; all other decreases are charged to the income statement. Each year the difference between depreciation based on the revalued carrying amount of the asset charged to the income statement, and depreciation based on the asset’s original cost is transferred from ‘property revaluation reserve’ to ‘revenue reserve’.
With the exception of freehold land, all other property, plant and equipment are depreciated at rates sufficient to write off their original costs to estimated residual values using the straight-line method over their anticipated useful lives in the following manner:
Leasehold land Over the lease termProperties 2% to 5% per annumPlant and machinery 7% to 34% per annumVessels 4% to 7% per annumDrydocking costs 20% to 50% per annum
The assets’ expected useful lives and residual values are regularly reviewed and adjusted, if appropriate, at each period-end date to take into account operational experience and changing circumstances.
Vessels under construction are not depreciated until they are completed.
At each period-end date, both internal and external sources of information are considered to assess whether there is any indication that the assets are impaired. If any such indication exists, the recoverable amount of the asset is estimated and where relevant, an impairment loss is recognised to reduce the asset to its recoverable amount. Such impairment losses are recognised in the income statement.
Gains and losses on disposals are determined by comparing the proceeds with the carrying amount and are recognised within ‘Other net gains/(losses)’ in the income statement. When revalued assets are sold, the amounts included in the property revaluation reserve are transferred to revenue reserve.
8. Intangible Assets(a) Goodwill
Goodwill represents the excess of the cost of acquisition over the fair value of the Group’s share of the net identifiable assets of the acquired subsidiary, jointly controlled and associated companies at the date of acquisition. Goodwill is treated as an asset of the entity acquired and where attributable to a foreign entity will be translated at the closing rate.
Goodwill on acquisition of a subsidiary company is included in intangible assets. Goodwill on acquisitions of associated and jointly controlled companies is included in investments in associated and jointly controlled companies respectively.
Goodwill is stated at cost less accumulated impairment losses. Goodwill is allocated to cash-generating units for the purpose of impairment testing, which is performed annually. Impairment losses recognised on goodwill are not reversed.
Gains and losses on the disposal of an entity include the carrying amount of goodwill relating to the entity sold.
Principal Accounting Policies
204 Swire Pacific 2012 Annual Report
(b) Computer softwareAcquired computer software licences are capitalised on the basis of the costs incurred to acquire and bring to use the specific software. These costs are amortised over their estimated useful lives (three to five years).
Costs associated with maintaining computer software programmes are recognised as an expense as incurred. Costs that are directly associated with the development of identifiable and unique software products controlled by the Group, and that will probably generate economic benefits exceeding costs beyond one year, are recognised as intangible assets. Direct costs include the software development employee costs and an appropriate portion of relevant overheads.
Computer software costs recognised as assets are amortised over their estimated useful lives.
(c) Technical licencesSeparately acquired technical licences are shown at historical cost. Technical licences acquired in a business combination are recognised at fair value at the acquisition date. Technical licences have a finite useful life and are carried at cost less accumulated amortisation. Amortisation is calculated using the straight-line method to allocate the cost of technical licences over their estimated useful life of twenty two years.
9. Impairment of AssetsAssets that have an indefinite useful life are not subject to amortisation. These assets are tested at least annually for impairment and are reviewed for impairment whenever events or changes in circumstances indicate that the carrying amount may not be recoverable. Assets that are subject to amortisation are reviewed for impairment whenever events or changes in circumstances indicate that the carrying amount may not be recoverable. An impairment loss is recognised for the amount by which the asset’s carrying amount exceeds its recoverable amount. The recoverable amount is the higher of an asset’s fair value less costs to sell and value in use. For the purposes of assessing impairment, assets are grouped at the lowest levels for which there are separately identifiable cash flows (cash-generating units).
The Group assesses at the end of each reporting period whether there is any objective evidence that its interests in jointly controlled and associated companies are impaired. Such objective evidence includes whether there has been any significant adverse changes in the technological, market, economic or legal environment in which the jointly controlled and associated companies operate or whether there has been a significant or prolonged decline in value below their cost. If there is an indication that an interest in an associate or jointly controlled entity is impaired, the Group assesses whether the entire carrying amount of the investment (including goodwill) is recoverable. An impairment loss is recognised in profit or loss for the amount by which the carrying amount is lower than the higher of the investment’s fair value less costs to sell or value in use. Any reversal of such impairment loss in subsequent periods is reversed through profit or loss.
Impairment testing of the investment in a subsidiary is required upon receiving a dividend from that subsidiary if the dividend exceeds the total comprehensive income of the subsidiary concerned in the period the dividend is declared or if the carrying amount of the subsidiary in the Company’s statement of financial position exceeds the carrying amount of the subsidiary’s net assets including goodwill in the consolidated statement of financial position.
10. Financial AssetsThe Group classifies its financial assets in the following categories: financial assets at fair value through profit or loss, loans and receivables, held-to-maturity investments, and available-for-sale assets. The classification depends on the purpose for which the financial assets were acquired. Management determines the classification of its financial assets at initial recognition and re-evaluates this designation at every reporting date.
(a) Financial assets at fair value through profit or lossThis category has two sub-categories: financial assets held for trading, and financial assets designated at fair value through profit or loss at inception. A financial asset is classified in this category if acquired principally for the purpose of selling in the short-term or if so designated by management. Derivatives are also categorised as held for trading unless they are designated as hedges. Assets in this category are classified as current if they are either held for trading or are expected to be realised within 12 months of the period-end date.
(b) Loans and receivablesLoans and receivables are non-derivative financial assets with fixed or determinable payments that are not quoted in an active market. They arise when the Group provides money, goods or services directly to a debtor with no intention of trading the receivable. They are included in current assets, except for maturities greater than 12 months after the period-end date where these are classified as non-current assets. See also policy for trade and other receivables (accounting policy note 15).
Swire Pacific 2012 Annual Report 205
(c) Held-to-maturity investmentsHeld-to-maturity investments are non-derivative financial assets with fixed or determinable payments and fixed maturities that the Group’s management has the positive intention and ability to hold to maturity. During the year, the Group did not hold any investments in this category.
(d) Available-for-sale assetsAvailable-for-sale assets are non-derivative investments and other assets that are either designated in this category or not classified in any of the other categories. Available-for-sale investments are included in non-current assets unless management intends to dispose of the investment within 12 months of the period-end date.
Purchases and sales of financial assets are recognised on their trade-date – the date on which the Group commits to purchase or sell the asset. Financial assets are initially recognised at fair value. Transaction costs are included for all financial assets not carried at fair value through profit or loss. Financial assets are derecognised when the rights to receive cash flows from the investments have expired or have been transferred and the Group has transferred substantially all risks and rewards of ownership. Available-for-sale assets and financial assets at fair value through profit or loss are subsequently carried at fair value. Loans and receivables and held-to-maturity investments are carried at amortised cost using the effective interest method. Realised and unrealised gains and losses arising from changes in the fair value of the “financial assets at fair value through profit or loss” category are included in the income statement in the period in which they arise. Unrealised gains and losses arising from changes in the fair value of available-for-sale assets are recognised in other comprehensive income. When available-for-sale assets are sold or impaired, the accumulated fair value adjustments are included in the income statement as gains and losses from investments.
The fair value of financial instruments traded in active markets (such as publicly traded derivatives, and trading and available-for-sale investments) is based on quoted market prices at the period-end date. The quoted market price used for financial assets held by the Group is the current bid price.
The fair value of financial instruments that are not traded in an active market (for example, over-the-counter derivatives) is determined by using valuation techniques. Other techniques, such as estimated discounted cash flows, are used to determine fair value for the remaining financial instruments. The nominal value less estimated credit adjustments of trade receivables is assumed to approximate their fair value.
The Group assesses at each period-end date whether there is objective evidence that a financial asset or a group of financial assets is impaired. In the case of equity investments classified as available-for-sale, a significant or prolonged decline in the fair value of the investment below its cost is considered in determining whether the investments are impaired. If any such evidence exists for available-for-sale investments, the cumulative loss – measured as the difference between the acquisition cost and the current fair value, less any impairment loss on that investment previously recognised in profit or loss – is removed from equity and recognised in the income statement. Impairment losses recognised in the income statement on equity instruments are not reversed through the income statement.
11. Derivative Financial Instruments and Hedging ActivitiesDerivatives are initially recognised at fair value on the date a derivative contract is entered into and are subsequently remeasured at their fair value. The method of recognising the resulting gain or loss depends on whether the derivative is designated as a hedging instrument, and if so, the nature of the item being hedged. The Group designates certain derivatives as either: (1) hedges of the fair value of recognised assets or liabilities or a firm commitment (fair value hedges); (2) hedges of highly probable forecast transactions (cash flow hedges); or (3) hedges of net investments in foreign operations.
The Group documents at the inception of the transaction the relationship between hedging instruments and hedged items, as well as its risk management objective and strategy for undertaking various hedge transactions. The Group also documents its assessment, both at hedge inception and on an ongoing basis, of whether the derivatives that are used in hedging transactions are highly effective in offsetting changes in fair values or cash flows of hedged items.
(a) Fair value hedgesChanges in the fair value of derivatives that are designated and qualify as fair value hedges are recorded in the income statement, together with any changes in the fair value of the hedged asset or liability that are attributable to the hedged risk. The Group applies fair value hedge accounting for hedging fixed interest risk on borrowings and foreign exchange risk. The gain or loss relating to the effective portion of interest rate swaps hedging fixed rate borrowings is recognised in the income statement within finance income or finance costs. The gain or loss relating to forward foreign exchange contracts, whether effective or ineffective, is recognised in the income statement within other net gains.
Principal Accounting Policies
206 Swire Pacific 2012 Annual Report
If the hedge no longer meets the criteria for hedge accounting, the adjustment to the carrying amount of a hedged item for which the effective interest method is used is amortised through the income statement over the period to maturity.
(b) Cash flow hedgesThe effective portion of changes in the fair value of derivatives that are designated and qualify as cash flow hedges is recognised in other comprehensive income. The gain or loss relating to the ineffective portion is recognised immediately in the income statement.
Amounts accumulated in equity are recycled in the income statement in the periods when the hedged item will affect profit or loss (for instance when the forecast sale that is hedged takes place). The gain or loss relating to the effective portion of interest rate swaps hedging variable rate borrowings is recognised in the income statement within finance costs. The gain or loss relating to the effective portion of forward foreign exchange contracts hedging import purchases is recognised in the income statement within cost of sales. The gain or loss relating to the ineffective portion of interest rate swaps or forward foreign exchange contracts is recognised in the income statement within other net gains. However, when the forecast transaction that is hedged results in the recognition of a non-financial asset (for example, inventory or property, plant and equipment) or a non-financial liability, the gains and losses previously deferred in equity are transferred from equity and included in the initial measurement of the cost of the asset or liability.
When a hedging instrument expires or is sold, or when a hedge no longer meets the criteria for hedge accounting, any cumulative gain or loss existing in equity at that time remains in equity and is recognised when the forecast transaction is ultimately recognised in the income statement. When a forecast transaction is no longer expected to occur, the cumulative gain or loss that was reported in equity is immediately transferred to the income statement.
(c) Net investment hedgesHedges of net investments in foreign operations are accounted for similarly to cash flow hedges. Any gain or loss on the hedging instrument relating to the effective portion of the hedge is recognised in equity; the gain or loss relating to the ineffective portion is recognised immediately in the consolidated income statement.
Gains and losses accumulated in equity are included in the income statement when the foreign operation is disposed of.
(d) Derivatives that do not qualify for hedge accountingCertain derivative instruments do not qualify for hedge accounting. Changes in the fair value of any derivative instruments that do not qualify for hedge accounting are recognised immediately in the consolidated income statement.
The fair value of interest rate swaps is calculated as the present value of the estimated future cash flows. The fair value of forward foreign exchange contracts is determined using forward exchange market rates at the period-end date.
12. Initial Leasing CostsExpenditure incurred in leasing the Group’s property during construction is deferred and amortised on a straight-line basis to the income statement upon occupation of the property over a period not exceeding the terms of the lease.
13. Stocks and Work in ProgressStocks and work in progress are stated at the lower of cost and net realisable value. Cost represents average unit cost and net realisable value is determined on the basis of anticipated sales proceeds less estimated selling expenses. The costs of finished goods and work in progress comprise direct material and labour costs and an appropriate proportion of production overhead expenses less provisions for foreseeable losses. Cost includes the transfer from equity of any gains/losses on qualifying cash flow hedges relating to purchases of raw materials or stocks.
14. Properties Held for Development and Properties for SaleProperties held for development and properties for sale comprise freehold and leasehold land, construction costs and interest costs capitalised, less provisions for possible losses. Properties held for development are not expected to be sold within the Group’s normal operating cycle and are classified as non-current assets. Properties for sale are available for immediate sale and are classified as current assets.
Swire Pacific 2012 Annual Report 207
15. Trade and Other ReceivablesTrade and other receivables are recognised initially at fair value and subsequently measured at amortised cost using the effective interest method, less provision for impairment. A provision for impairment of trade and other receivables is established when there is objective evidence that the Group will not be able to collect all amounts due according to the original terms of receivables. Trade and other receivables in the statement of financial position are stated net of such provisions.
Objective evidence of impairment may include indications that the debtors or a group of debtors is experiencing significant financial difficulty, default or delinquency in interest or principal payments, the probability that they will enter bankruptcy or other financial reorganisation, and where observable data indicate that there is a measurable decrease in the estimated future cash flows, such as changes in arrears or economic conditions that correlate with defaults.
16. Cash and Cash EquivalentsIn the consolidated statement of cash flows, cash and cash equivalents comprise cash in hand, amounts repayable on demand from banks and financial institutions and short-term highly liquid investments which were within three months of maturity when acquired, less bank overdrafts. In the consolidated statement of financial position, bank overdrafts are shown within borrowings in current liabilities.
17. Trade PayablesTrade payables are recognised initially at fair value and subsequently measured at amortised cost using the effective interest method.
18. Borrowings (including Perpetual Capital Securities)Borrowings are recognised initially at fair value. Transaction costs incurred are included for those not held at fair value through profit or loss. Transaction costs are incremental costs that are directly attributable to the initiation of the borrowings, including fees and commission paid to agents, advisers, brokers and dealers, levies by regulatory agencies and securities exchanges, and transfer taxes and duties. Borrowings are subsequently stated either at amortised cost, with any difference between the proceeds (net of transaction costs) and the redemption value recognised in the income statement over the period of the borrowings using the effective interest method, or at fair value through profit or loss.
Borrowings are classified as current liabilities unless the Group has an unconditional right to defer settlement of the liability for at least 12 months after the period-end date.
For disclosure purposes, the fair value of borrowings stated at amortised cost is estimated by discounting the future contractual cash flows at the current market interest rate that is available to the Group for similar financial instruments.
19. Borrowing CostsInterest costs incurred are charged to the income statement except for those interest charges attributable to the acquisition, construction or production of qualifying assets (i.e. assets that necessarily take a substantial period of time to get ready for their intended use or sale) which are capitalised as part of the cost of those assets. Capitalisation of such borrowing costs ceases when the assets are substantially ready for their intended use or sale.
20. LeasesLeases in which a significant portion of the risks and rewards of ownership are retained by the lessor are classified as operating leases. Receipts or payments made under operating leases (net of any incentives paid to lessees or received from the lessors) are recognised as income or expense in the income statement on a straight-line basis over the period of the lease.
The Group leases certain property, plant and equipment. Leases of property, plant and equipment where the Group has substantially all the risks and rewards of ownership are classified as finance leases. Finance leases are capitalised at the lease’s commencement at the lower of the fair value of the leased property and the present value of the minimum lease payments.
Each lease payment is allocated between the liability and finance charges so as to achieve a constant rate on the finance balance outstanding. The corresponding rental obligations, net of finance charges, are included in other long-term payables. The interest element of the finance cost is charged to the income statement over the lease period so as to produce a constant periodic rate of interest on the remaining balance of the liability for each period. The property, plant and equipment acquired under finance leases is depreciated over the shorter of the useful life of the asset and the lease term.
Principal Accounting Policies
208 Swire Pacific 2012 Annual Report
21. Deferred TaxationDeferred taxation is provided in full, using the liability method, on temporary differences arising between the tax bases of assets and liabilities and their carrying amounts in the accounts. However, if the deferred tax arises from initial recognition of an asset or liability in a transaction other than a business combination that, at the time of the recognition, has no impact on taxable nor accounting profit or loss, it is not recognised. Tax rates enacted or substantially enacted by the period-end date are used to determine deferred taxation.
Deferred tax assets are recognised to the extent that it is probable that future taxable profit will be available against which the temporary differences can be utilised.
Deferred taxation is provided on temporary differences arising on investments in subsidiary, jointly controlled and associated companies, except where the timing of the reversal of the temporary difference is controlled by the Group and it is probable that the temporary difference will not reverse in the foreseeable future.
22. Revenue RecognitionProvided the collectibility of the related receivable is reasonably assured, revenue is recognised as follows:
(a) Rental income is recognised on a straight-line basis over the shorter of (i) the remaining lease term, (ii) the period to the next rent review date and (iii) the period from the commencement date of the lease to the first break option date (if any), exclusive of any turnover rent (if applicable) and other charges and reimbursements (if any). Where the lease includes a rent-free period, the rental income foregone is allocated evenly over the lease term. Turnover rent is recognised when earned.
(b) Sales of properties are recognised when effective control of ownership of the properties is transferred to the buyers.
(c) Sales of services, including aircraft maintenance services and services provided by hotel operations, are recognised when the services are rendered.
(d) Revenue from vessel charter hire services is recognised over the period of charter hire in accordance with the vessel charter hire agreements.
(e) Sales of goods are recognised when the goods are delivered to the customer and the customer has accepted the related risks and rewards of ownership, for example insurance and service costs.
(f) Interest income is recognised on a time-proportion basis using the effective interest method.
23. Related PartiesRelated parties are individuals and companies, including subsidiary, fellow subsidiary, jointly controlled and associated companies and key management (including close members of their families), where the individual, company or Group has the ability, directly or indirectly, to control the other party or exercise significant influence over the other party in making financial and operating decisions.
24. Government GrantsGrants from the government are recognised where there is reasonable assurance that the grant will be received and the Group will comply with all attached conditions.
25. Retirement BenefitsThe Group operates a number of defined benefit and defined contribution retirement benefit schemes for its employees, the assets of which are generally held in separate trustee-administered funds. The schemes are generally funded by payments from the relevant Group companies and, in some cases, employees themselves, taking account of the recommendations of independentqualified actuaries.
A defined benefit plan is a retirement plan that defines an amount of benefit that an employee will receive on retirement, usually dependent on one or more factors such as age, years of service and compensation. A defined contribution plan is a retirement plan under which the Group pays fixed contributions into a separate entity. The Group has no legal or constructive obligations to pay further contributions if the fund does not hold sufficient assets to pay all employees the benefits relating to employee service in the current and prior periods.
Swire Pacific 2012 Annual Report 209
The Group’s contributions to the defined contribution schemes are charged to the income statement in the period to which the contributions relate.
For defined benefit schemes, retirement benefit costs are assessed using the projected unit credit method. Under this method, the cost of providing retirement benefits is charged to the income statement so as to spread the regular cost over the service lives of employees. The retirement benefit obligation is measured as the present value of the estimated future cash outflows. Plan assets are measured at fair value. Cumulative unrecognised net actuarial gains and losses at the previous financial year-end, to the extent that the amount is in excess of 10% of the greater of the present value of the defined benefit obligations and the fair value of the plan assets, are recognised over the expected average remaining working lives of the employees participating in the plan. A subsidiary company may adopt any systematic method that results in faster recognition of actuarial gains and losses, provided the same basis is applied consistently from period to period. Past service costs are recognised as an expense on a straight-line basis over the average period until the benefits become vested.
26. ProvisionsProvisions are recognised when the Group has a present legal or constructive obligation as a result of past events; it is more likely than not that an outflow of resources will be required to settle the obligation; and the amount has been reliably estimated. Provisions are not recognised for future operating losses.
Where there are a number of similar obligations, the likelihood that an outflow will be required in settlement is determined by considering the class of obligations as a whole. A provision is recognised even if the likelihood of an outflow with respect to any one item included in the same class of obligations may be small.
27. Financial GuaranteesFinancial guarantees are initially recognised in the accounts at fair value on the date the guarantee was given. Subsequent to initial recognition, the liabilities under such guarantees are measured at the higher of the initial measurement, less amortisation calculated to recognise in the income statement the fee income earned on a straight-line basis over the life of the guarantee, and the best estimate of the expenditure required to settle any financial obligation arising at the period-end date. Any increase in the liability relating to guarantees is taken to the income statement.
28. Dividend DistributionDividend distribution to the Company’s shareholders is recognised as a liability in the Group’s accounts in the period in which the dividends are approved by the Company’s shareholders or directors, where appropriate.
29. Segment ReportingOperating segments are reported in a manner consistent with the Group’s internal financial reporting provided to the executive directors for making strategic decisions. For disclosure purposes, a reportable segment comprises either one or more operating segments which can be aggregated together because they share similar economic characteristics or single operating segments which are disclosable separately because they cannot be aggregated or because they exceed certain quantitative thresholds.
Principal Accounting Policies
210 Swire Pacific 2012 Annual Report
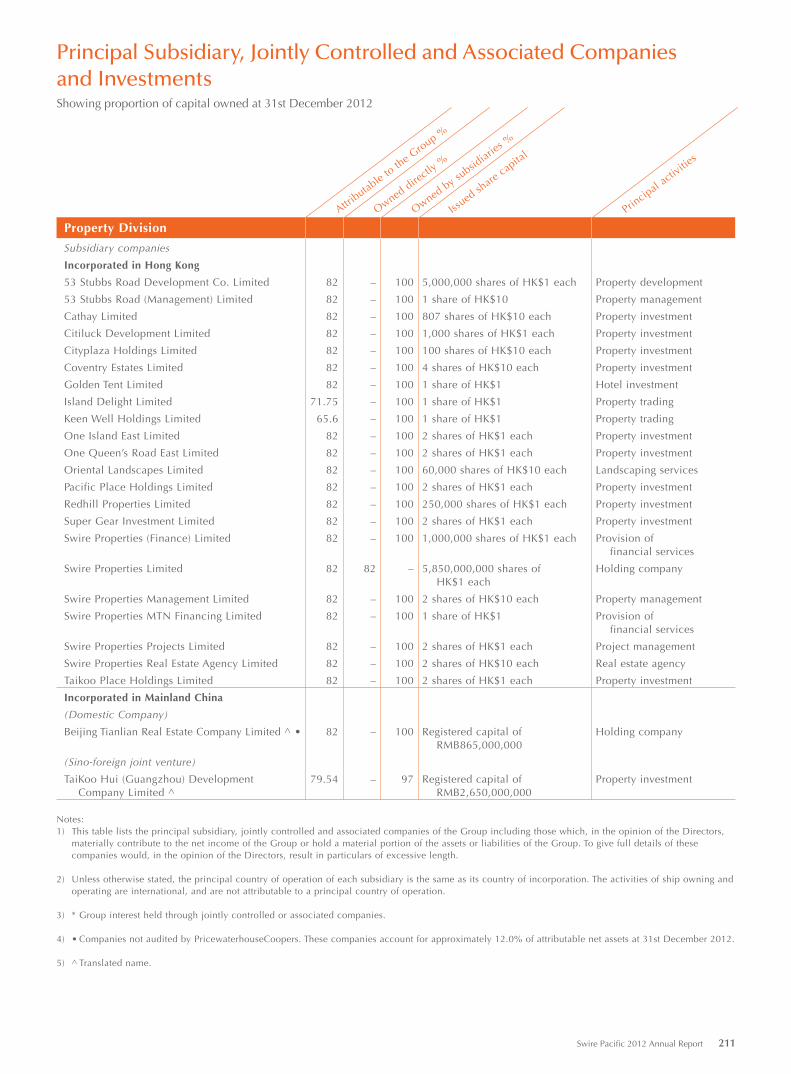
Principal Subsidiary, Jointly Controlled and Associated Companies and InvestmentsShowing proportion of capital owned at 31st December 2012
Attributable to
the G
roup %
Owned directly
%
Owned by subsid
iaries %
Issued sh
are capital
Principal a
ctivitie
s
Property Division
Subsidiary companies
Incorporated in Hong Kong
53 Stubbs Road Development Co. Limited 82 – 100 5,000,000 shares of HK$1 each Property development
53 Stubbs Road (Management) Limited 82 – 100 1 share of HK$10 Property management
Cathay Limited 82 – 100 807 shares of HK$10 each Property investment
Citiluck Development Limited 82 – 100 1,000 shares of HK$1 each Property investment
Cityplaza Holdings Limited 82 – 100 100 shares of HK$10 each Property investment
Coventry Estates Limited 82 – 100 4 shares of HK$10 each Property investment
Golden Tent Limited 82 – 100 1 share of HK$1 Hotel investment
Island Delight Limited 71.75 – 100 1 share of HK$1 Property trading
Keen Well Holdings Limited 65.6 – 100 1 share of HK$1 Property trading
One Island East Limited 82 – 100 2 shares of HK$1 each Property investment
One Queen’s Road East Limited 82 – 100 2 shares of HK$1 each Property investment
Oriental Landscapes Limited 82 – 100 60,000 shares of HK$10 each Landscaping services
Pacific Place Holdings Limited 82 – 100 2 shares of HK$1 each Property investment
Redhill Properties Limited 82 – 100 250,000 shares of HK$1 each Property investment
Super Gear Investment Limited 82 – 100 2 shares of HK$1 each Property investment
Swire Properties (Finance) Limited 82 – 100 1,000,000 shares of HK$1 each Provision of financial services
Swire Properties Limited 82 82 – 5,850,000,000 shares of HK$1 each
Holding company
Swire Properties Management Limited 82 – 100 2 shares of HK$10 each Property management
Swire Properties MTN Financing Limited 82 – 100 1 share of HK$1 Provision of financial services
Swire Properties Projects Limited 82 – 100 2 shares of HK$1 each Project management
Swire Properties Real Estate Agency Limited 82 – 100 2 shares of HK$10 each Real estate agency
Taikoo Place Holdings Limited 82 – 100 2 shares of HK$1 each Property investment
Incorporated in Mainland China
(Domestic Company)
Beijing Tianlian Real Estate Company Limited ^ • 82 – 100 Registered capital of RMB865,000,000
Holding company
(Sino-foreign joint venture)
TaiKoo Hui (Guangzhou) Development Company Limited ^
79.54 – 97 Registered capital of RMB2,650,000,000
Property investment
Notes:1) This table lists the principal subsidiary, jointly controlled and associated companies of the Group including those which, in the opinion of the Directors,
materially contribute to the net income of the Group or hold a material portion of the assets or liabilities of the Group. To give full details of these companies would, in the opinion of the Directors, result in particulars of excessive length.
2) Unless otherwise stated, the principal country of operation of each subsidiary is the same as its country of incorporation. The activities of ship owning and operating are international, and are not attributable to a principal country of operation.
3) * Group interest held through jointly controlled or associated companies.
4) • Companies not audited by PricewaterhouseCoopers. These companies account for approximately 12.0% of attributable net assets at 31st December 2012.
5) ^ Translated name.
Swire Pacific 2012 Annual Report 211
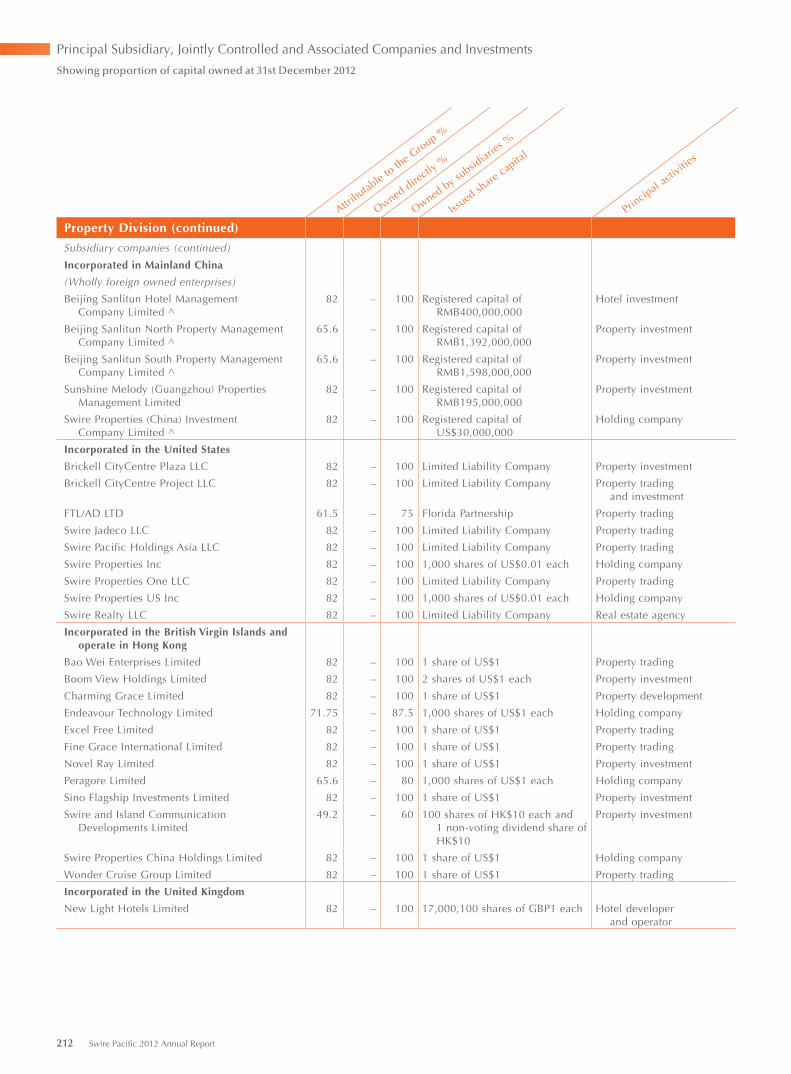
Attributable to
the G
roup %
Owned directly
%
Owned by subsid
iaries %
Issued sh
are capital
Principal a
ctivitie
s
Property Division (continued)
Subsidiary companies (continued)
Incorporated in Mainland China
(Wholly foreign owned enterprises)
Beijing Sanlitun Hotel Management Company Limited ^
82 – 100 Registered capital of RMB400,000,000
Hotel investment
Beijing Sanlitun North Property Management Company Limited ^
65.6 – 100 Registered capital of RMB1,392,000,000
Property investment
Beijing Sanlitun South Property Management Company Limited ^
65.6 – 100 Registered capital of RMB1,598,000,000
Property investment
Sunshine Melody (Guangzhou) Properties Management Limited
82 – 100 Registered capital of RMB195,000,000
Property investment
Swire Properties (China) Investment Company Limited ^
82 – 100 Registered capital of US$30,000,000
Holding company
Incorporated in the United States
Brickell CityCentre Plaza LLC 82 – 100 Limited Liability Company Property investment
Brickell CityCentre Project LLC 82 – 100 Limited Liability Company Property trading and investment
FTL/AD LTD 61.5 – 75 Florida Partnership Property trading
Swire Jadeco LLC 82 – 100 Limited Liability Company Property trading
Swire Pacific Holdings Asia LLC 82 – 100 Limited Liability Company Property trading
Swire Properties Inc 82 – 100 1,000 shares of US$0.01 each Holding company
Swire Properties One LLC 82 – 100 Limited Liability Company Property trading
Swire Properties US Inc 82 – 100 1,000 shares of US$0.01 each Holding company
Swire Realty LLC 82 – 100 Limited Liability Company Real estate agency
Incorporated in the British Virgin Islands and operate in Hong Kong
Bao Wei Enterprises Limited 82 – 100 1 share of US$1 Property trading
Boom View Holdings Limited 82 – 100 2 shares of US$1 each Property investment
Charming Grace Limited 82 – 100 1 share of US$1 Property development
Endeavour Technology Limited 71.75 – 87.5 1,000 shares of US$1 each Holding company
Excel Free Limited 82 – 100 1 share of US$1 Property trading
Fine Grace International Limited 82 – 100 1 share of US$1 Property trading
Novel Ray Limited 82 – 100 1 share of US$1 Property investment
Peragore Limited 65.6 – 80 1,000 shares of US$1 each Holding company
Sino Flagship Investments Limited 82 – 100 1 share of US$1 Property investment
Swire and Island Communication Developments Limited
49.2 – 60 100 shares of HK$10 each and 1 non-voting dividend share of HK$10
Property investment
Swire Properties China Holdings Limited 82 – 100 1 share of US$1 Holding company
Wonder Cruise Group Limited 82 – 100 1 share of US$1 Property trading
Incorporated in the United Kingdom
New Light Hotels Limited 82 – 100 17,000,100 shares of GBP1 each Hotel developer and operator
Principal Subsidiary, Jointly Controlled and Associated Companies and Investments
Showing proportion of capital owned at 31st December 2012
212 Swire Pacific 2012 Annual Report
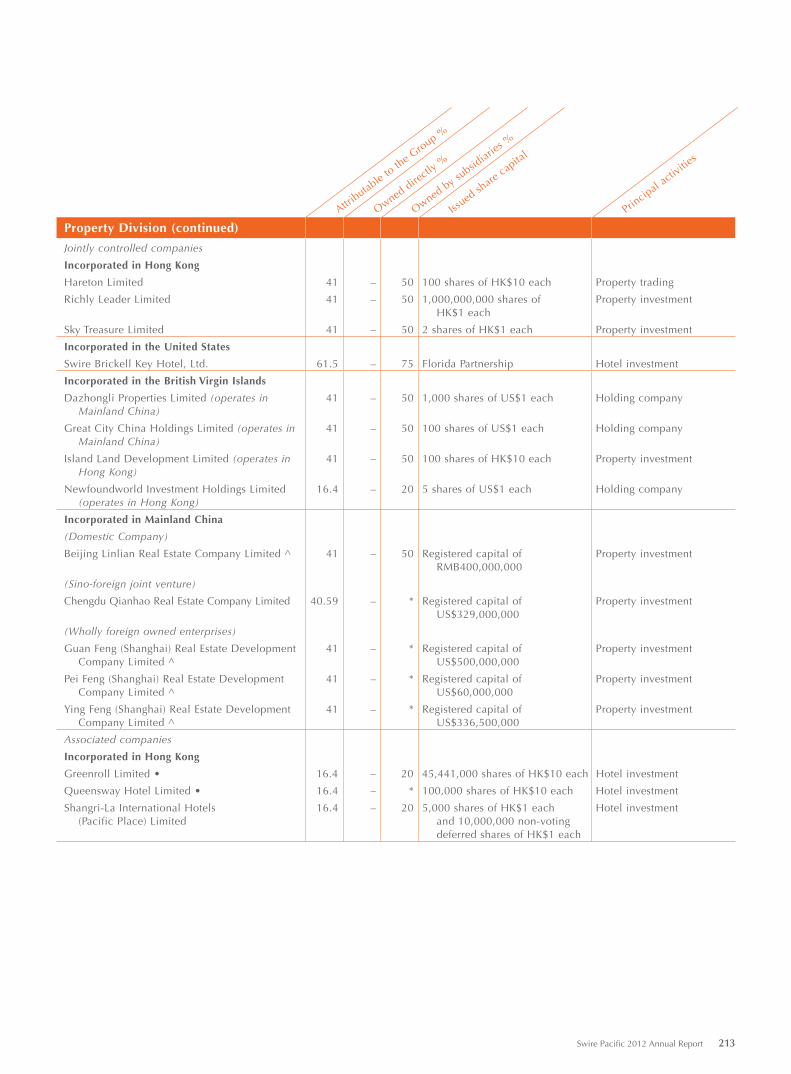
Attributable to
the G
roup %
Owned directly
%
Owned by subsid
iaries %
Issued sh
are capital
Principal a
ctivitie
s
Property Division (continued)
Jointly controlled companies
Incorporated in Hong Kong
Hareton Limited 41 – 50 100 shares of HK$10 each Property trading
Richly Leader Limited 41 – 50 1,000,000,000 shares of HK$1 each
Property investment
Sky Treasure Limited 41 – 50 2 shares of HK$1 each Property investment
Incorporated in the United States
Swire Brickell Key Hotel, Ltd. 61.5 – 75 Florida Partnership Hotel investment
Incorporated in the British Virgin Islands
Dazhongli Properties Limited (operates in Mainland China)
41 – 50 1,000 shares of US$1 each Holding company
Great City China Holdings Limited (operates in Mainland China)
41 – 50 100 shares of US$1 each Holding company
Island Land Development Limited (operates in Hong Kong)
41 – 50 100 shares of HK$10 each Property investment
Newfoundworld Investment Holdings Limited (operates in Hong Kong)
16.4 – 20 5 shares of US$1 each Holding company
Incorporated in Mainland China
(Domestic Company)
Beijing Linlian Real Estate Company Limited ^ 41 – 50 Registered capital of RMB400,000,000
Property investment
(Sino-foreign joint venture)
Chengdu Qianhao Real Estate Company Limited 40.59 – * Registered capital of US$329,000,000
Property investment
(Wholly foreign owned enterprises)
Guan Feng (Shanghai) Real Estate Development Company Limited ^
41 – * Registered capital of US$500,000,000
Property investment
Pei Feng (Shanghai) Real Estate Development Company Limited ^
41 – * Registered capital of US$60,000,000
Property investment
Ying Feng (Shanghai) Real Estate Development Company Limited ^
41 – * Registered capital of US$336,500,000
Property investment
Associated companies
Incorporated in Hong Kong
Greenroll Limited • 16.4 – 20 45,441,000 shares of HK$10 each Hotel investment
Queensway Hotel Limited • 16.4 – * 100,000 shares of HK$10 each Hotel investment
Shangri-La International Hotels (Pacific Place) Limited
16.4 – 20 5,000 shares of HK$1 each and 10,000,000 non-voting deferred shares of HK$1 each
Hotel investment
Swire Pacific 2012 Annual Report 213
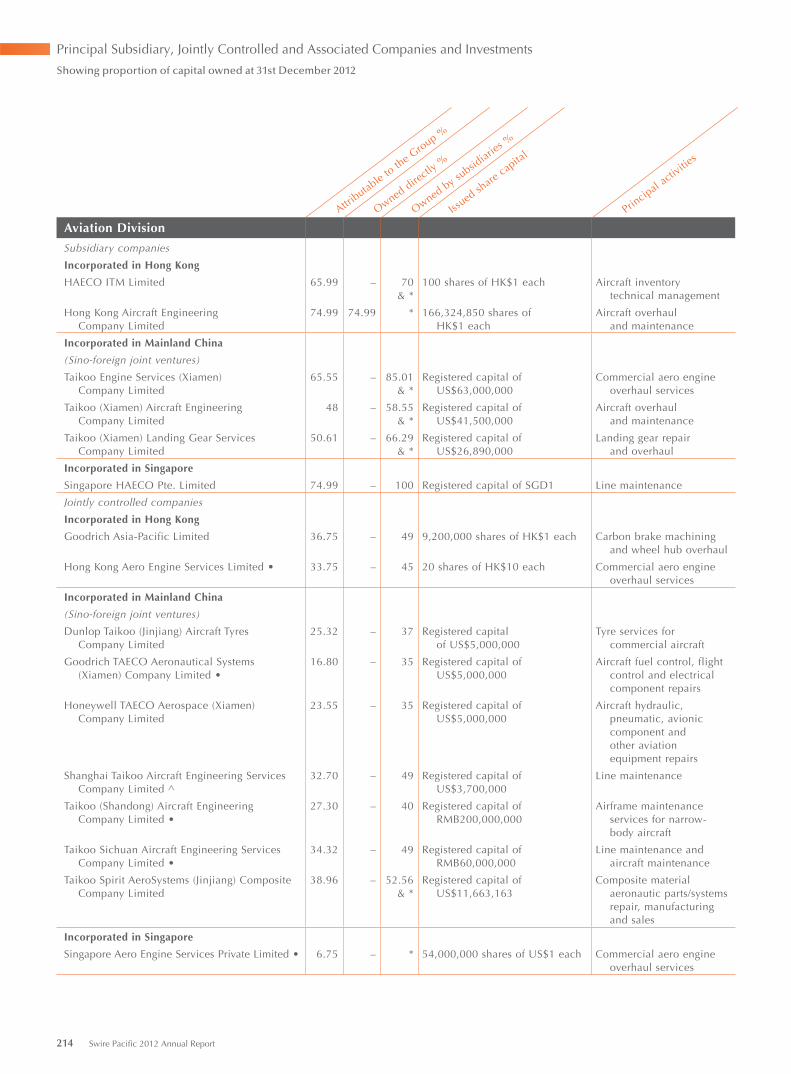
Attributable to
the G
roup %
Owned directly
%
Owned by subsid
iaries %
Issued sh
are capital
Principal a
ctivitie
s
Aviation Division
Subsidiary companies
Incorporated in Hong Kong
HAECO ITM Limited 65.99 – 70& *
100 shares of HK$1 each Aircraft inventory technical management
Hong Kong Aircraft Engineering Company Limited
74.99 74.99 * 166,324,850 shares of HK$1 each
Aircraft overhaul and maintenance
Incorporated in Mainland China
(Sino-foreign joint ventures)
Taikoo Engine Services (Xiamen) Company Limited
65.55 – 85.01 & *
Registered capital of US$63,000,000
Commercial aero engine overhaul services
Taikoo (Xiamen) Aircraft Engineering Company Limited
48 – 58.55 & *
Registered capital of US$41,500,000
Aircraft overhaul and maintenance
Taikoo (Xiamen) Landing Gear Services Company Limited
50.61 – 66.29 & *
Registered capital of US$26,890,000
Landing gear repair and overhaul
Incorporated in Singapore
Singapore HAECO Pte. Limited 74.99 – 100 Registered capital of SGD1 Line maintenance
Jointly controlled companies
Incorporated in Hong Kong
Goodrich Asia-Pacific Limited 36.75 – 49 9,200,000 shares of HK$1 each Carbon brake machining and wheel hub overhaul
Hong Kong Aero Engine Services Limited • 33.75 – 45 20 shares of HK$10 each Commercial aero engine overhaul services
Incorporated in Mainland China
(Sino-foreign joint ventures)
Dunlop Taikoo (Jinjiang) Aircraft TyresCompany Limited
25.32 – 37 Registered capital of US$5,000,000
Tyre services for commercial aircraft
Goodrich TAECO Aeronautical Systems (Xiamen) Company Limited •
16.80 – 35 Registered capital of US$5,000,000
Aircraft fuel control, flight control and electrical component repairs
Honeywell TAECO Aerospace (Xiamen) Company Limited
23.55 – 35 Registered capital of US$5,000,000
Aircraft hydraulic, pneumatic, avionic component and other aviation equipment repairs
Shanghai Taikoo Aircraft Engineering Services Company Limited ^
32.70 – 49 Registered capital of US$3,700,000
Line maintenance
Taikoo (Shandong) Aircraft Engineering Company Limited •
27.30 – 40 Registered capital of RMB200,000,000
Airframe maintenance services for narrow-body aircraft
Taikoo Sichuan Aircraft Engineering Services Company Limited •
34.32 – 49 Registered capital of RMB60,000,000
Line maintenance and aircraft maintenance
Taikoo Spirit AeroSystems (Jinjiang) Composite Company Limited
38.96 – 52.56 & *
Registered capital of US$11,663,163
Composite material aeronautic parts/systems repair, manufacturing and sales
Incorporated in Singapore
Singapore Aero Engine Services Private Limited • 6.75 – * 54,000,000 shares of US$1 each Commercial aero engine overhaul services
Principal Subsidiary, Jointly Controlled and Associated Companies and Investments
Showing proportion of capital owned at 31st December 2012
214 Swire Pacific 2012 Annual Report
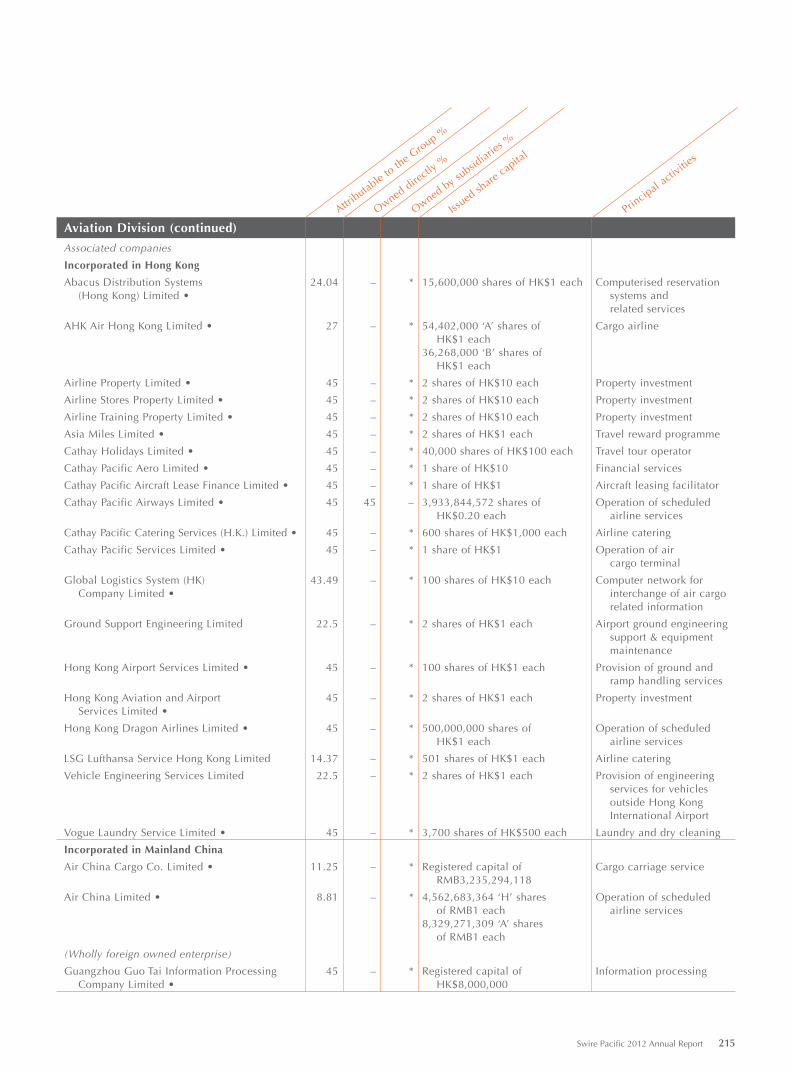
Attributable to
the G
roup %
Owned directly
%
Owned by subsid
iaries %
Issued sh
are capital
Principal a
ctivitie
s
Aviation Division (continued)
Associated companies
Incorporated in Hong Kong
Abacus Distribution Systems (Hong Kong) Limited •
24.04 – * 15,600,000 shares of HK$1 each Computerised reservation systems and related services
AHK Air Hong Kong Limited • 27 – * 54,402,000 ‘A’ shares of HK$1 each
36,268,000 ‘B’ shares of HK$1 each
Cargo airline
Airline Property Limited • 45 – * 2 shares of HK$10 each Property investment
Airline Stores Property Limited • 45 – * 2 shares of HK$10 each Property investment
Airline Training Property Limited • 45 – * 2 shares of HK$10 each Property investment
Asia Miles Limited • 45 – * 2 shares of HK$1 each Travel reward programme
Cathay Holidays Limited • 45 – * 40,000 shares of HK$100 each Travel tour operator
Cathay Pacific Aero Limited • 45 – * 1 share of HK$10 Financial services
Cathay Pacific Aircraft Lease Finance Limited • 45 – * 1 share of HK$1 Aircraft leasing facilitator
Cathay Pacific Airways Limited • 45 45 – 3,933,844,572 shares of HK$0.20 each
Operation of scheduled airline services
Cathay Pacific Catering Services (H.K.) Limited • 45 – * 600 shares of HK$1,000 each Airline catering
Cathay Pacific Services Limited • 45 – * 1 share of HK$1 Operation of air cargo terminal
Global Logistics System (HK)Company Limited •
43.49 – * 100 shares of HK$10 each Computer network for interchange of air cargo related information
Ground Support Engineering Limited 22.5 – * 2 shares of HK$1 each Airport ground engineering support & equipment maintenance
Hong Kong Airport Services Limited • 45 – * 100 shares of HK$1 each Provision of ground and ramp handling services
Hong Kong Aviation and AirportServices Limited •
45 – * 2 shares of HK$1 each Property investment
Hong Kong Dragon Airlines Limited • 45 – * 500,000,000 shares of HK$1 each
Operation of scheduled airline services
LSG Lufthansa Service Hong Kong Limited 14.37 – * 501 shares of HK$1 each Airline catering
Vehicle Engineering Services Limited 22.5 – * 2 shares of HK$1 each Provision of engineering services for vehicles outside Hong Kong International Airport
Vogue Laundry Service Limited • 45 – * 3,700 shares of HK$500 each Laundry and dry cleaning
Incorporated in Mainland China
Air China Cargo Co. Limited • 11.25 – * Registered capital of RMB3,235,294,118
Cargo carriage service
Air China Limited • 8.81 – * 4,562,683,364 ‘H’ shares of RMB1 each
8,329,271,309 ‘A’ shares of RMB1 each
Operation of scheduled airline services
(Wholly foreign owned enterprise)
Guangzhou Guo Tai Information Processing Company Limited •
45 – * Registered capital of HK$8,000,000
Information processing
Swire Pacific 2012 Annual Report 215
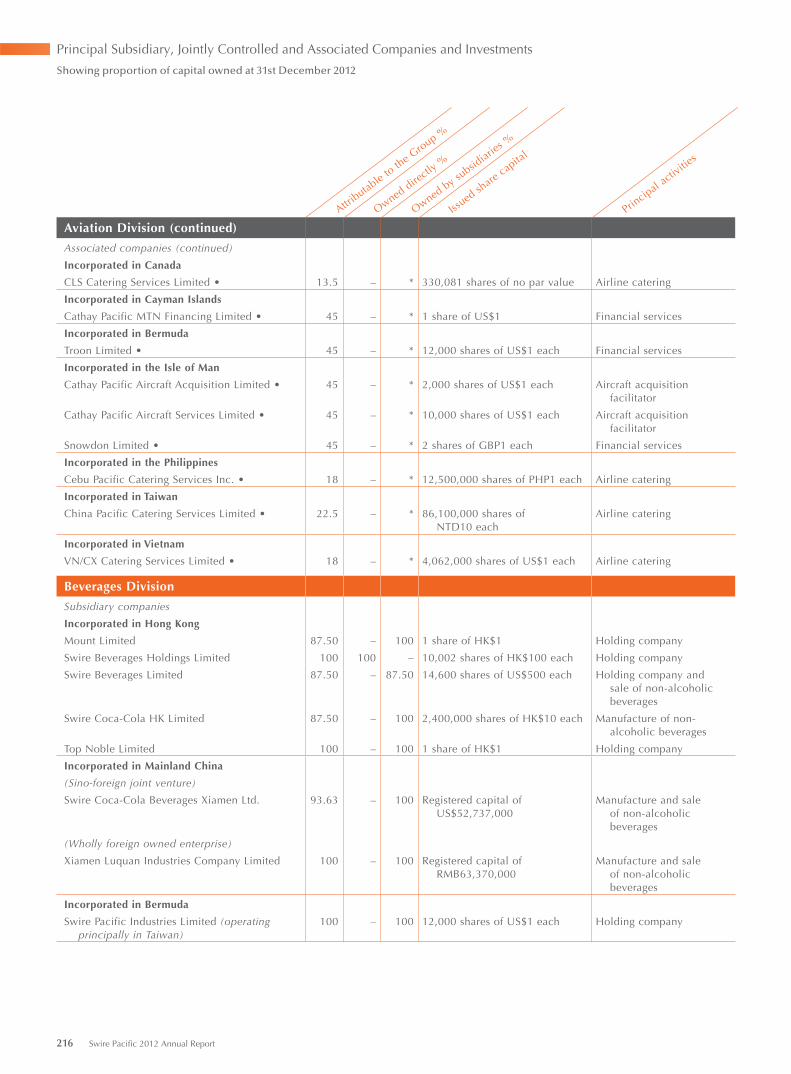
Attributable to
the G
roup %
Owned directly
%
Owned by subsid
iaries %
Issued sh
are capital
Principal a
ctivitie
s
Aviation Division (continued)
Associated companies (continued)
Incorporated in Canada
CLS Catering Services Limited • 13.5 – * 330,081 shares of no par value Airline catering
Incorporated in Cayman Islands
Cathay Pacific MTN Financing Limited • 45 – * 1 share of US$1 Financial services
Incorporated in Bermuda
Troon Limited • 45 – * 12,000 shares of US$1 each Financial services
Incorporated in the Isle of Man
Cathay Pacific Aircraft Acquisition Limited • 45 – * 2,000 shares of US$1 each Aircraft acquisition facilitator
Cathay Pacific Aircraft Services Limited • 45 – * 10,000 shares of US$1 each Aircraft acquisition facilitator
Snowdon Limited • 45 – * 2 shares of GBP1 each Financial services
Incorporated in the Philippines
Cebu Pacific Catering Services Inc. • 18 – * 12,500,000 shares of PHP1 each Airline catering
Incorporated in Taiwan
China Pacific Catering Services Limited • 22.5 – * 86,100,000 shares of NTD10 each
Airline catering
Incorporated in Vietnam
VN/CX Catering Services Limited • 18 – * 4,062,000 shares of US$1 each Airline catering
Beverages Division
Subsidiary companies
Incorporated in Hong Kong
Mount Limited 87.50 – 100 1 share of HK$1 Holding company
Swire Beverages Holdings Limited 100 100 – 10,002 shares of HK$100 each Holding company
Swire Beverages Limited 87.50 – 87.50 14,600 shares of US$500 each Holding company and sale of non-alcoholic beverages
Swire Coca-Cola HK Limited 87.50 – 100 2,400,000 shares of HK$10 each Manufacture of non-alcoholic beverages
Top Noble Limited 100 – 100 1 share of HK$1 Holding company
Incorporated in Mainland China
(Sino-foreign joint venture)
Swire Coca-Cola Beverages Xiamen Ltd. 93.63 – 100 Registered capital of US$52,737,000
Manufacture and sale of non-alcoholic beverages
(Wholly foreign owned enterprise)
Xiamen Luquan Industries Company Limited 100 – 100 Registered capital of RMB63,370,000
Manufacture and sale of non-alcoholic beverages
Incorporated in Bermuda
Swire Pacific Industries Limited (operating principally in Taiwan)
100 – 100 12,000 shares of US$1 each Holding company
Principal Subsidiary, Jointly Controlled and Associated Companies and Investments
Showing proportion of capital owned at 31st December 2012
216 Swire Pacific 2012 Annual Report
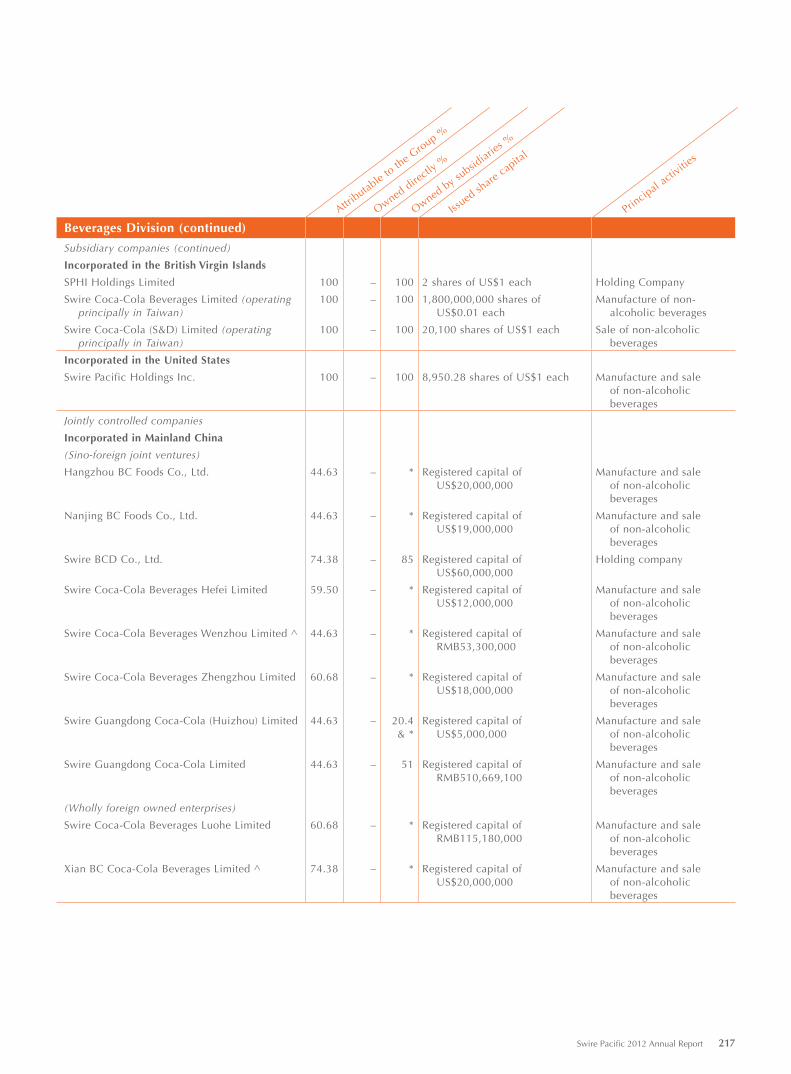
Attributable to
the G
roup %
Owned directly
%
Owned by subsid
iaries %
Issued sh
are capital
Principal a
ctivitie
s
Beverages Division (continued)
Subsidiary companies (continued)
Incorporated in the British Virgin Islands
SPHI Holdings Limited 100 – 100 2 shares of US$1 each Holding Company
Swire Coca-Cola Beverages Limited (operating principally in Taiwan)
100 – 100 1,800,000,000 shares of US$0.01 each
Manufacture of non-alcoholic beverages
Swire Coca-Cola (S&D) Limited (operating principally in Taiwan)
100 – 100 20,100 shares of US$1 each Sale of non-alcoholic beverages
Incorporated in the United States
Swire Pacific Holdings Inc. 100 – 100 8,950.28 shares of US$1 each Manufacture and sale of non-alcoholic beverages
Jointly controlled companies
Incorporated in Mainland China
(Sino-foreign joint ventures)
Hangzhou BC Foods Co., Ltd. 44.63 – * Registered capital of US$20,000,000
Manufacture and sale of non-alcoholic beverages
Nanjing BC Foods Co., Ltd. 44.63 – * Registered capital of US$19,000,000
Manufacture and sale of non-alcoholic beverages
Swire BCD Co., Ltd. 74.38 – 85 Registered capital of US$60,000,000
Holding company
Swire Coca-Cola Beverages Hefei Limited 59.50 – * Registered capital of US$12,000,000
Manufacture and sale of non-alcoholic beverages
Swire Coca-Cola Beverages Wenzhou Limited ^ 44.63 – * Registered capital of RMB53,300,000
Manufacture and sale of non-alcoholic beverages
Swire Coca-Cola Beverages Zhengzhou Limited 60.68 – * Registered capital of US$18,000,000
Manufacture and sale of non-alcoholic beverages
Swire Guangdong Coca-Cola (Huizhou) Limited 44.63 – 20.4 & *
Registered capital of US$5,000,000
Manufacture and sale of non-alcoholic beverages
Swire Guangdong Coca-Cola Limited 44.63 – 51 Registered capital of RMB510,669,100
Manufacture and sale of non-alcoholic beverages
(Wholly foreign owned enterprises)
Swire Coca-Cola Beverages Luohe Limited 60.68 – * Registered capital of RMB115,180,000
Manufacture and sale of non-alcoholic beverages
Xian BC Coca-Cola Beverages Limited ^ 74.38 – * Registered capital of US$20,000,000
Manufacture and sale of non-alcoholic beverages
Swire Pacific 2012 Annual Report 217
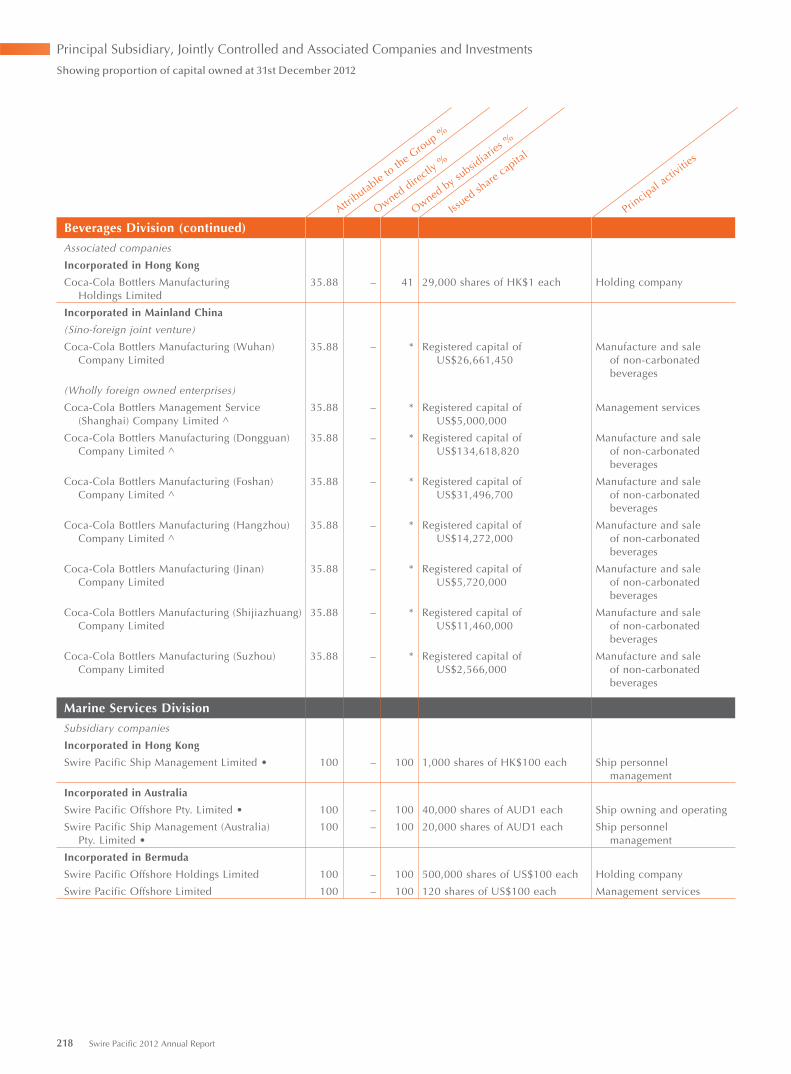
Attributable to
the G
roup %
Owned directly
%
Owned by subsid
iaries %
Issued sh
are capital
Principal a
ctivitie
s
Beverages Division (continued)
Associated companies
Incorporated in Hong Kong
Coca-Cola Bottlers Manufacturing Holdings Limited
35.88 – 41 29,000 shares of HK$1 each Holding company
Incorporated in Mainland China
(Sino-foreign joint venture)
Coca-Cola Bottlers Manufacturing (Wuhan) Company Limited
35.88 – * Registered capital of US$26,661,450
Manufacture and sale of non-carbonated beverages
(Wholly foreign owned enterprises)
Coca-Cola Bottlers Management Service (Shanghai) Company Limited ^
35.88 – * Registered capital of US$5,000,000
Management services
Coca-Cola Bottlers Manufacturing (Dongguan) Company Limited ^
35.88 – * Registered capital of US$134,618,820
Manufacture and sale of non-carbonated beverages
Coca-Cola Bottlers Manufacturing (Foshan) Company Limited ^
35.88 – * Registered capital of US$31,496,700
Manufacture and sale of non-carbonated beverages
Coca-Cola Bottlers Manufacturing (Hangzhou) Company Limited ^
35.88 – * Registered capital of US$14,272,000
Manufacture and sale of non-carbonated beverages
Coca-Cola Bottlers Manufacturing (Jinan) Company Limited
35.88 – * Registered capital of US$5,720,000
Manufacture and sale of non-carbonated beverages
Coca-Cola Bottlers Manufacturing (Shijiazhuang) Company Limited
35.88 – * Registered capital of US$11,460,000
Manufacture and sale of non-carbonated beverages
Coca-Cola Bottlers Manufacturing (Suzhou) Company Limited
35.88 – * Registered capital of US$2,566,000
Manufacture and sale of non-carbonated beverages
Marine Services Division
Subsidiary companies
Incorporated in Hong Kong
Swire Pacific Ship Management Limited • 100 – 100 1,000 shares of HK$100 each Ship personnel management
Incorporated in Australia
Swire Pacific Offshore Pty. Limited • 100 – 100 40,000 shares of AUD1 each Ship owning and operating
Swire Pacific Ship Management (Australia) Pty. Limited •
100 – 100 20,000 shares of AUD1 each Ship personnel management
Incorporated in Bermuda
Swire Pacific Offshore Holdings Limited 100 – 100 500,000 shares of US$100 each Holding company
Swire Pacific Offshore Limited 100 – 100 120 shares of US$100 each Management services
Principal Subsidiary, Jointly Controlled and Associated Companies and Investments
Showing proportion of capital owned at 31st December 2012
218 Swire Pacific 2012 Annual Report
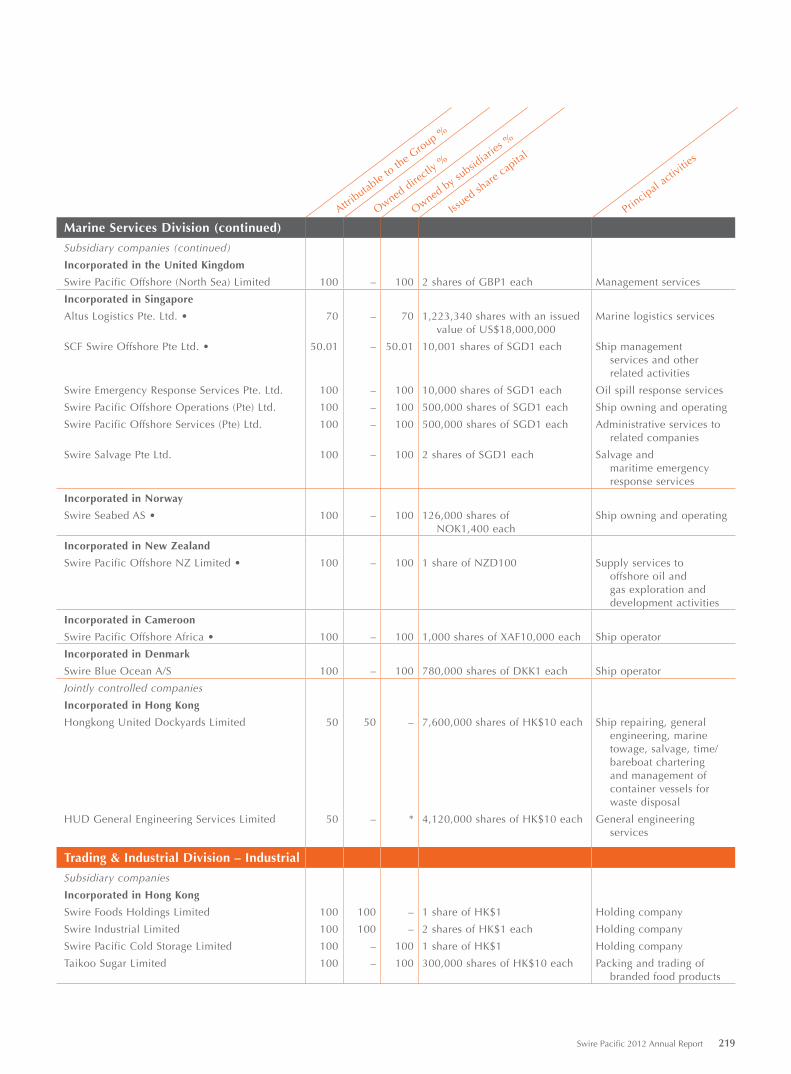
Attributable to
the G
roup %
Owned directly
%
Owned by subsid
iaries %
Issued sh
are capital
Principal a
ctivitie
s
Marine Services Division (continued)
Subsidiary companies (continued)
Incorporated in the United Kingdom
Swire Pacific Offshore (North Sea) Limited 100 – 100 2 shares of GBP1 each Management services
Incorporated in Singapore
Altus Logistics Pte. Ltd. • 70 – 70 1,223,340 shares with an issued value of US$18,000,000
Marine logistics services
SCF Swire Offshore Pte Ltd. • 50.01 – 50.01 10,001 shares of SGD1 each Ship management services and other related activities
Swire Emergency Response Services Pte. Ltd. 100 – 100 10,000 shares of SGD1 each Oil spill response services
Swire Pacific Offshore Operations (Pte) Ltd. 100 – 100 500,000 shares of SGD1 each Ship owning and operating
Swire Pacific Offshore Services (Pte) Ltd. 100 – 100 500,000 shares of SGD1 each Administrative services to related companies
Swire Salvage Pte Ltd. 100 – 100 2 shares of SGD1 each Salvage and maritime emergency response services
Incorporated in Norway
Swire Seabed AS • 100 – 100 126,000 shares of NOK1,400 each
Ship owning and operating
Incorporated in New Zealand
Swire Pacific Offshore NZ Limited • 100 – 100 1 share of NZD100 Supply services to offshore oil and gas exploration and development activities
Incorporated in Cameroon
Swire Pacific Offshore Africa • 100 – 100 1,000 shares of XAF10,000 each Ship operator
Incorporated in Denmark
Swire Blue Ocean A/S 100 – 100 780,000 shares of DKK1 each Ship operator
Jointly controlled companies
Incorporated in Hong Kong
Hongkong United Dockyards Limited 50 50 – 7,600,000 shares of HK$10 each Ship repairing, general engineering, marine towage, salvage, time/bareboat chartering and management of container vessels for waste disposal
HUD General Engineering Services Limited 50 – * 4,120,000 shares of HK$10 each General engineering services
Trading & Industrial Division – Industrial
Subsidiary companies
Incorporated in Hong Kong
Swire Foods Holdings Limited 100 100 – 1 share of HK$1 Holding company
Swire Industrial Limited 100 100 – 2 shares of HK$1 each Holding company
Swire Pacific Cold Storage Limited 100 – 100 1 share of HK$1 Holding company
Taikoo Sugar Limited 100 – 100 300,000 shares of HK$10 each Packing and trading of branded food products
Swire Pacific 2012 Annual Report 219
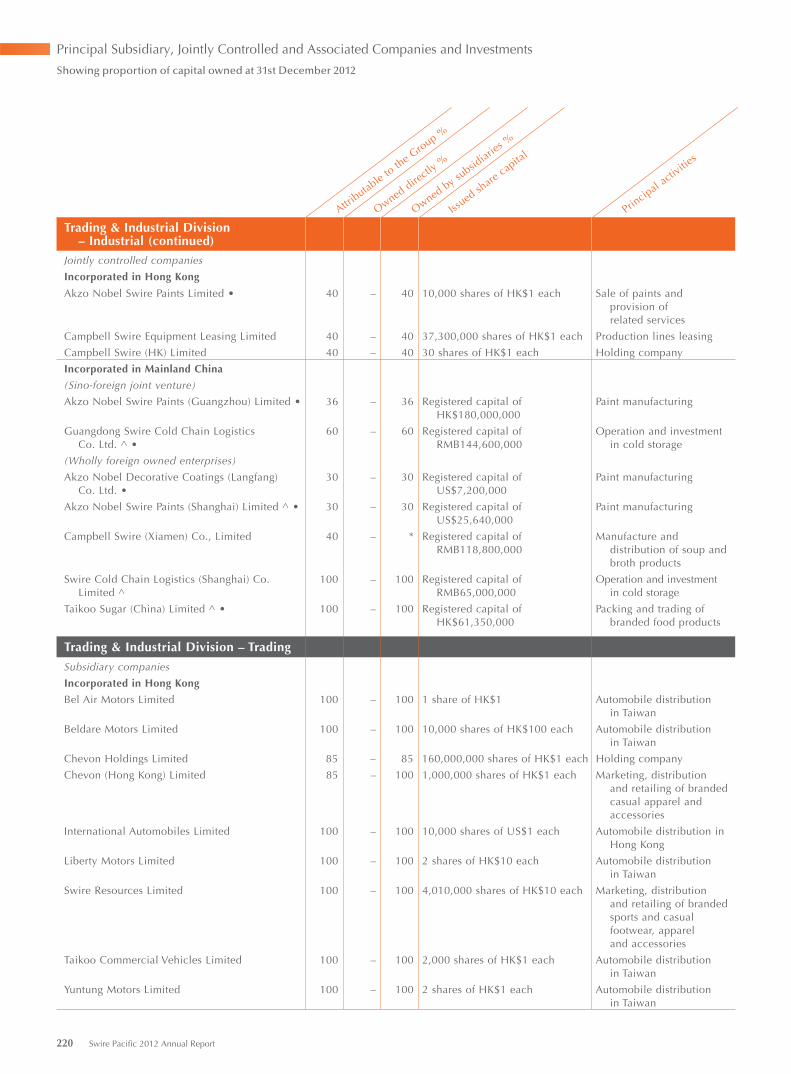
Attributable to
the G
roup %
Owned directly
%
Owned by subsid
iaries %
Issued sh
are capital
Principal a
ctivitie
s
Trading & Industrial Division – Industrial (continued)
Jointly controlled companies
Incorporated in Hong Kong
Akzo Nobel Swire Paints Limited • 40 – 40 10,000 shares of HK$1 each Sale of paints and provision of related services
Campbell Swire Equipment Leasing Limited 40 – 40 37,300,000 shares of HK$1 each Production lines leasing
Campbell Swire (HK) Limited 40 – 40 30 shares of HK$1 each Holding company
Incorporated in Mainland China
(Sino-foreign joint venture)
Akzo Nobel Swire Paints (Guangzhou) Limited • 36 – 36 Registered capital of HK$180,000,000
Paint manufacturing
Guangdong Swire Cold Chain LogisticsCo. Ltd. ^ •
60 – 60 Registered capital of RMB144,600,000
Operation and investment in cold storage
(Wholly foreign owned enterprises)
Akzo Nobel Decorative Coatings (Langfang)Co. Ltd. •
30 – 30 Registered capital of US$7,200,000
Paint manufacturing
Akzo Nobel Swire Paints (Shanghai) Limited ^ • 30 – 30 Registered capital of US$25,640,000
Paint manufacturing
Campbell Swire (Xiamen) Co., Limited 40 – * Registered capital of RMB118,800,000
Manufacture and distribution of soup and broth products
Swire Cold Chain Logistics (Shanghai) Co. Limited ^
100 – 100 Registered capital of RMB65,000,000
Operation and investment in cold storage
Taikoo Sugar (China) Limited ^ • 100 – 100 Registered capital of HK$61,350,000
Packing and trading of branded food products
Trading & Industrial Division – Trading
Subsidiary companies
Incorporated in Hong Kong
Bel Air Motors Limited 100 – 100 1 share of HK$1 Automobile distribution in Taiwan
Beldare Motors Limited 100 – 100 10,000 shares of HK$100 each Automobile distribution in Taiwan
Chevon Holdings Limited 85 – 85 160,000,000 shares of HK$1 each Holding company
Chevon (Hong Kong) Limited 85 – 100 1,000,000 shares of HK$1 each Marketing, distribution and retailing of branded casual apparel and accessories
International Automobiles Limited 100 – 100 10,000 shares of US$1 each Automobile distribution in Hong Kong
Liberty Motors Limited 100 – 100 2 shares of HK$10 each Automobile distribution in Taiwan
Swire Resources Limited 100 – 100 4,010,000 shares of HK$10 each Marketing, distribution and retailing of branded sports and casual footwear, apparel and accessories
Taikoo Commercial Vehicles Limited 100 – 100 2,000 shares of HK$1 each Automobile distribution in Taiwan
Yuntung Motors Limited 100 – 100 2 shares of HK$1 each Automobile distribution in Taiwan
Principal Subsidiary, Jointly Controlled and Associated Companies and Investments
Showing proportion of capital owned at 31st December 2012
220 Swire Pacific 2012 Annual Report
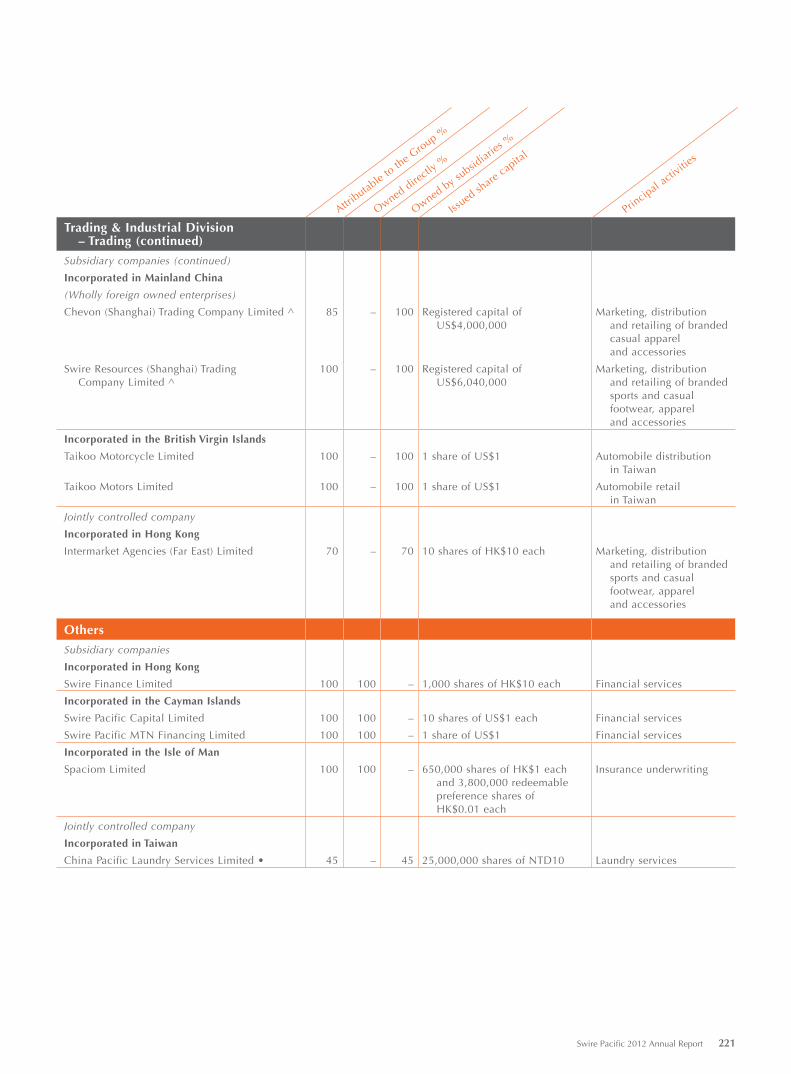
Attributable to
the G
roup %
Owned directly
%
Owned by subsid
iaries %
Issued sh
are capital
Principal a
ctivitie
s
Trading & Industrial Division – Trading (continued)
Subsidiary companies (continued)
Incorporated in Mainland China
(Wholly foreign owned enterprises)
Chevon (Shanghai) Trading Company Limited ^ 85 – 100 Registered capital of US$4,000,000
Marketing, distribution and retailing of branded casual apparel and accessories
Swire Resources (Shanghai) TradingCompany Limited ^
100 – 100 Registered capital of US$6,040,000
Marketing, distribution and retailing of branded sports and casual footwear, apparel and accessories
Incorporated in the British Virgin Islands
Taikoo Motorcycle Limited 100 – 100 1 share of US$1 Automobile distribution in Taiwan
Taikoo Motors Limited 100 – 100 1 share of US$1 Automobile retail in Taiwan
Jointly controlled company
Incorporated in Hong Kong
Intermarket Agencies (Far East) Limited 70 – 70 10 shares of HK$10 each Marketing, distribution and retailing of branded sports and casual footwear, apparel and accessories
Others
Subsidiary companies
Incorporated in Hong Kong
Swire Finance Limited 100 100 – 1,000 shares of HK$10 each Financial services
Incorporated in the Cayman Islands
Swire Pacific Capital Limited 100 100 – 10 shares of US$1 each Financial services
Swire Pacific MTN Financing Limited 100 100 – 1 share of US$1 Financial services
Incorporated in the Isle of Man
Spaciom Limited 100 100 – 650,000 shares of HK$1 each and 3,800,000 redeemable preference shares of HK$0.01 each
Insurance underwriting
Jointly controlled company
Incorporated in Taiwan
China Pacific Laundry Services Limited • 45 – 45 25,000,000 shares of NTD10 Laundry services
Swire Pacific 2012 Annual Report 221
Sustainable Development Statistics
IntroductionReader’s GuideThis report covers the calendar year 2012. Our 2011 Annual Report (dated April 2012) covered the calendar year 2011. Some data reported in 2011 has been restated to reflect revised methods of calculation used by operating companies.
The operating companies not covered by this report include:
Property Division USA and UKAviation Division Catering and laundry service companies outside Hong Kong and Cathay Pacific Services
Limited (a wholly-owned subsidiary of Cathay Pacific, established to design, build and operate the new Cathay Pacific Cargo Terminal, which commenced operations in February 2013).
Beverages Division Coca-Cola Bottlers Manufacturing Holdings Limited and Xiamen Luquan Industries Company Limited
Trading & Industrial Division Campbell Swire, Akzo Nobel Swire Paints Limited, Swire Pacific Cold Storage and Taikoo Motors Hong Kong and Mainland China
This report uses a framework which follows the Global Reporting Initiative’s (GRI) Sustainability Reporting Guidelines. Using this framework makes it easy for readers to compare this report with those prepared by others using the same framework. We report on the ten GRI performance indicators which are most relevant to the Swire Pacific Group. Our major operating companies report on additional indicators in their own reports, which can be found at www.swirepacific.com/sd.
The information in this report has been prepared having regard to the GRI G3.1 guidelines. The Report Application Level is C+, as verified by Hong Kong Productivity Council. The table on page 223 shows the GRI G3.1 references in abbreviated form. For full disclosure of the references from the Guidelines, please refer to the complete G3.1 Guidelines which can be found at www.globalreporting.org.
222 Swire Pacific 2012 Annual Report
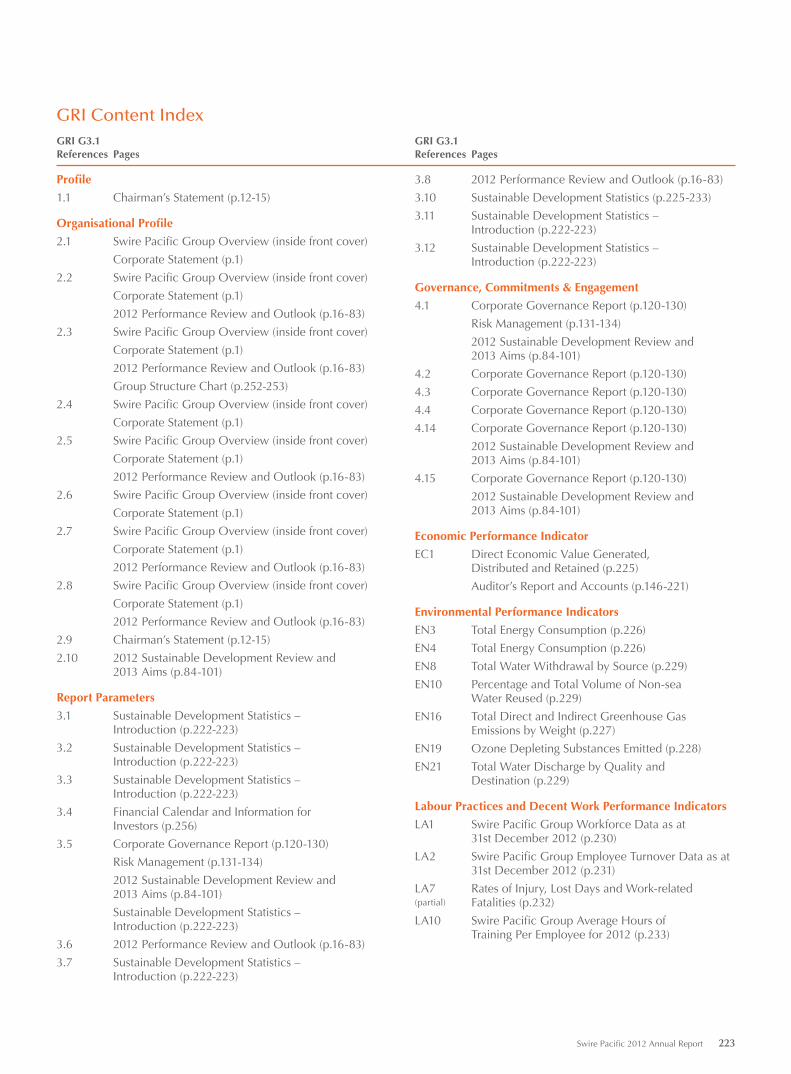
GRI G3.1 References Pages
Profile
1.1 Chairman’s Statement (p.12-15)
Organisational Profile
2.1 Swire Pacific Group Overview (inside front cover)
Corporate Statement (p.1)
2.2 Swire Pacific Group Overview (inside front cover)
Corporate Statement (p.1)
2012 Performance Review and Outlook (p.16-83)
2.3 Swire Pacific Group Overview (inside front cover)
Corporate Statement (p.1)
2012 Performance Review and Outlook (p.16-83)
Group Structure Chart (p.252-253)
2.4 Swire Pacific Group Overview (inside front cover)
Corporate Statement (p.1)
2.5 Swire Pacific Group Overview (inside front cover)
Corporate Statement (p.1)
2012 Performance Review and Outlook (p.16-83)
2.6 Swire Pacific Group Overview (inside front cover)
Corporate Statement (p.1)
2.7 Swire Pacific Group Overview (inside front cover)
Corporate Statement (p.1)
2012 Performance Review and Outlook (p.16-83)
2.8 Swire Pacific Group Overview (inside front cover)
Corporate Statement (p.1)
2012 Performance Review and Outlook (p.16-83)
2.9 Chairman’s Statement (p.12-15)
2.10 2012 Sustainable Development Review and 2013 Aims (p.84-101)
Report Parameters
3.1 Sustainable Development Statistics – Introduction (p.222-223)
3.2 Sustainable Development Statistics – Introduction (p.222-223)
3.3 Sustainable Development Statistics – Introduction (p.222-223)
3.4 Financial Calendar and Information for Investors (p.256)
3.5 Corporate Governance Report (p.120-130)
Risk Management (p.131-134)
2012 Sustainable Development Review and 2013 Aims (p.84-101)
Sustainable Development Statistics – Introduction (p.222-223)
3.6 2012 Performance Review and Outlook (p.16-83)
3.7 Sustainable Development Statistics – Introduction (p.222-223)
GRI G3.1 References Pages
3.8 2012 Performance Review and Outlook (p.16-83)
3.10 Sustainable Development Statistics (p.225-233)
3.11 Sustainable Development Statistics – Introduction (p.222-223)
3.12 Sustainable Development Statistics – Introduction (p.222-223)
Governance, Commitments & Engagement
4.1 Corporate Governance Report (p.120-130)
Risk Management (p.131-134)
2012 Sustainable Development Review and 2013 Aims (p.84-101)
4.2 Corporate Governance Report (p.120-130)
4.3 Corporate Governance Report (p.120-130)
4.4 Corporate Governance Report (p.120-130)
4.14 Corporate Governance Report (p.120-130)
2012 Sustainable Development Review and 2013 Aims (p.84-101)
4.15 Corporate Governance Report (p.120-130)
2012 Sustainable Development Review and 2013 Aims (p.84-101)
Economic Performance Indicator
EC1 Direct Economic Value Generated, Distributed and Retained (p.225)
Auditor’s Report and Accounts (p.146-221)
Environmental Performance Indicators
EN3 Total Energy Consumption (p.226)
EN4 Total Energy Consumption (p.226)
EN8 Total Water Withdrawal by Source (p.229)
EN10 Percentage and Total Volume of Non-sea Water Reused (p.229)
EN16 Total Direct and Indirect Greenhouse Gas Emissions by Weight (p.227)
EN19 Ozone Depleting Substances Emitted (p.228)
EN21 Total Water Discharge by Quality and Destination (p.229)
Labour Practices and Decent Work Performance Indicators
LA1 Swire Pacific Group Workforce Data as at 31st December 2012 (p.230)
LA2 Swire Pacific Group Employee Turnover Data as at 31st December 2012 (p.231)
LA7 Rates of Injury, Lost Days and Work-related (partial) Fatalities (p.232)
LA10 Swire Pacific Group Average Hours of Training Per Employee for 2012 (p.233)
GRI Content Index
Swire Pacific 2012 Annual Report 223
Sustainable Development Assurance Statement
Hong Kong Productivity Council1 (HKPC) was commissioned by the Swire Pacific Group (Swire Pacific) to verify the Sustainable Development Section and relevant sections covering sustainability aspects (The SD Section) in its Annual Report 2012. The SD Section covers the sustainability performance with respect to environmental, social and economic aspects of Swire Pacific during the calendar year 2012.
ObjectivesThe objective of HKPC’s verification work is to provide an independent assurance on the completeness, accuracy and reliability of the information presented in the SD Section of Swire Pacific’s Annual Report 2012 and, more specifically, to:• assess whether the scope of the SD Section covers all significant aspects in relation to Swire Pacific’s sustainability performance;• check whether the SD Section conforms to the Level C+ requirements of the Global Reporting Initiative (GRI) G3.1 Guidelines;• evaluate whether the selected statements and data presented in the SD Section are accurate;• review whether the data collection and information management mechanisms used to prepare the SD Section are reliable; and• provide recommendations for future reports.
ApproachOur verification procedures2 comprised a comprehensive review of the SD Section followed by the selection of a representative sample of statements and data in relation to Swire Pacific’s significant sustainability aspects for verification. Through the interviews with Swire Pacific’s representatives on 27 February 2013, we reviewed and examined the data collation systems and supporting materials relating to the selected statements and data as well as Swire Pacific’s relevant management practices and initiatives.
ResultsReport CompletenessThe SD Section conforms to Level C+ requirements of GRI G3.1 Guidelines. It presents a structured overview of the environmental, social and economic performance with respect to the key services, activities and initiatives of Swire Pacific and its major subsidiaries. In response to the recommendations mentioned in the Assurance Statement of the 2011 report, Swire Pacific has presented more information on the progress and achievements against the sustainability objectives established in 2011 in this Annual Report 2012.
Report Accuracy and ReliabilityThe selected sample of statements and data examined during the verification process are consistent with the source materials reviewed and reflect a fair account of Swire Pacific’s environmental, social and economic performance. The data collation and information management systems adopted are generally considered to be reliable.
Recommendations for Future ReportsWe encourage Swire Pacific to consider the following areas in the preparation of its future reports:• To present information with reference to readers’ interest such as the investment returns and achievement of
environmental initiatives;• To provide concrete information on the medium and long-term sustainability aims and measurable targets;• To include views from different stakeholder groups on Swire Pacific’s sustainability performance and Swire Pacific’s response;• To consider extending the coverage of appropriate performance indicators and disclosures with reference to the latest GRI
Reporting Guidelines and to prepare for the adoption of the upcoming GRI G4 Guidelines.
Clement LiPrincipal ConsultantHong Kong Productivity Council8 March 2013
1 HKPC is a multi-disciplinary organization established by statute in 1967. HKPC’s mission is to promote productivity excellence for industry to enhance competitiveness and sustainability through the provision of integrated support across the value chain of Hong Kong enterprises.
2 Our verification work did not cover data and information which have already been published in the press releases of the Swire Pacific Group and its subsidiaries, the EHS/Sustainable Development Report produced by relevant subsidiaries of the Group as well as the financial data presented in the Group’s Annual Report.
224 Swire Pacific 2012 Annual Report
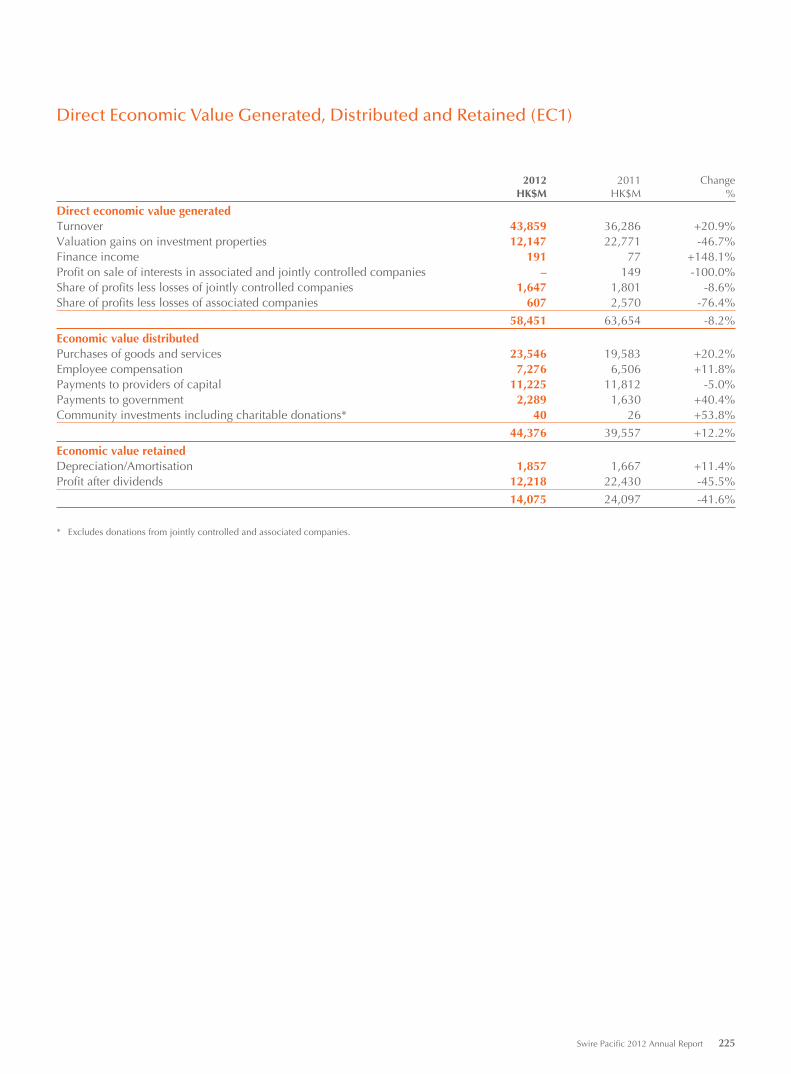
Direct Economic Value Generated, Distributed and Retained (EC1)
2012 2011 ChangeHK$M HK$M %
Direct economic value generatedTurnover 43,859 36,286 +20.9%Valuation gains on investment properties 12,147 22,771 -46.7%Finance income 191 77 +148.1%Profit on sale of interests in associated and jointly controlled companies – 149 -100.0%Share of profits less losses of jointly controlled companies 1,647 1,801 -8.6%Share of profits less losses of associated companies 607 2,570 -76.4%
58,451 63,654 -8.2%
Economic value distributedPurchases of goods and services 23,546 19,583 +20.2%Employee compensation 7,276 6,506 +11.8%Payments to providers of capital 11,225 11,812 -5.0%Payments to government 2,289 1,630 +40.4%Community investments including charitable donations* 40 26 +53.8%
44,376 39,557 +12.2%
Economic value retainedDepreciation/Amortisation 1,857 1,667 +11.4%Profit after dividends 12,218 22,430 -45.5%
14,075 24,097 -41.6%
* Excludes donations from jointly controlled and associated companies.
Swire Pacific 2012 Annual Report 225
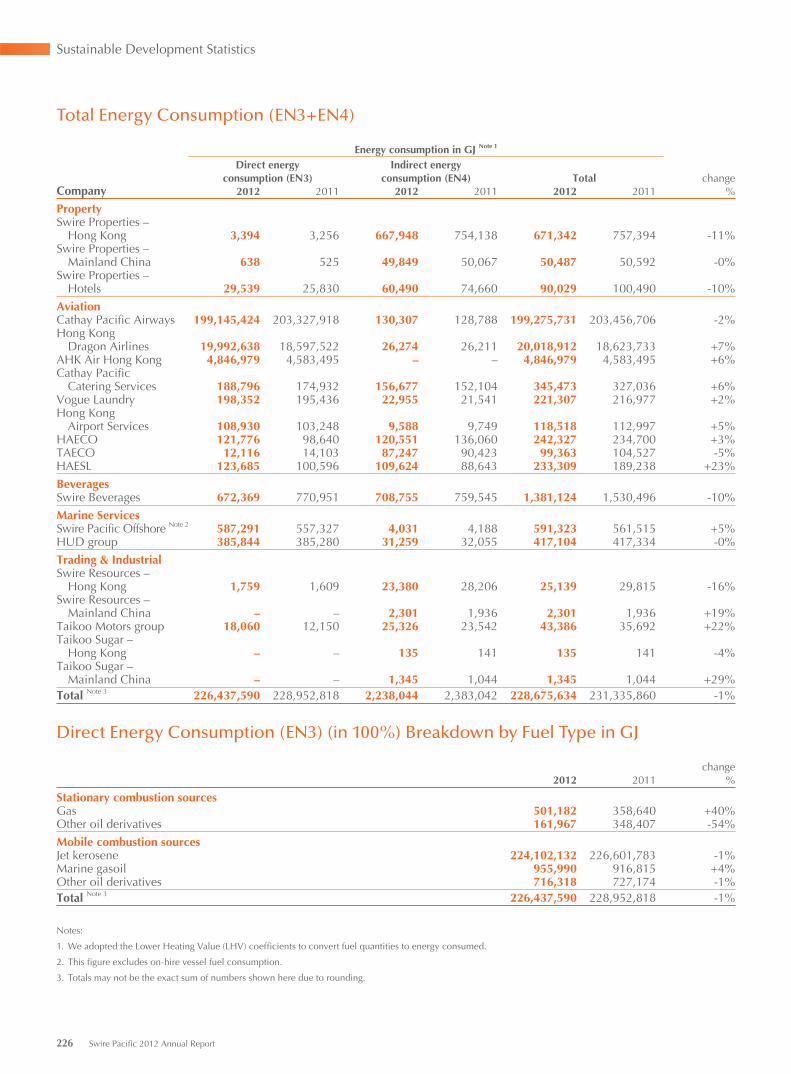
Total Energy Consumption (EN3+EN4)
Energy consumption in GJ Note 1
Direct energy consumption (EN3)
Indirect energy consumption (EN4) Total change
Company 2012 2011 2012 2011 2012 2011 %
PropertySwire Properties –
Hong Kong 3,394 3,256 667,948 754,138 671,342 757,394 -11%Swire Properties –
Mainland China 638 525 49,849 50,067 50,487 50,592 -0%Swire Properties –
Hotels 29,539 25,830 60,490 74,660 90,029 100,490 -10%
AviationCathay Pacific Airways 199,145,424 203,327,918 130,307 128,788 199,275,731 203,456,706 -2%Hong Kong
Dragon Airlines 19,992,638 18,597,522 26,274 26,211 20,018,912 18,623,733 +7%AHK Air Hong Kong 4,846,979 4,583,495 – – 4,846,979 4,583,495 +6%Cathay Pacific
Catering Services 188,796 174,932 156,677 152,104 345,473 327,036 +6%Vogue Laundry 198,352 195,436 22,955 21,541 221,307 216,977 +2%Hong Kong
Airport Services 108,930 103,248 9,588 9,749 118,518 112,997 +5%HAECO 121,776 98,640 120,551 136,060 242,327 234,700 +3%TAECO 12,116 14,103 87,247 90,423 99,363 104,527 -5%HAESL 123,685 100,596 109,624 88,643 233,309 189,238 +23%
BeveragesSwire Beverages 672,369 770,951 708,755 759,545 1,381,124 1,530,496 -10%
Marine ServicesSwire Pacific Offshore Note 2 587,291 557,327 4,031 4,188 591,323 561,515 +5%HUD group 385,844 385,280 31,259 32,055 417,104 417,334 -0%
Trading & IndustrialSwire Resources –
Hong Kong 1,759 1,609 23,380 28,206 25,139 29,815 -16%Swire Resources –
Mainland China – – 2,301 1,936 2,301 1,936 +19%Taikoo Motors group 18,060 12,150 25,326 23,542 43,386 35,692 +22%Taikoo Sugar –
Hong Kong – – 135 141 135 141 -4%Taikoo Sugar –
Mainland China – – 1,345 1,044 1,345 1,044 +29%Total Note 3 226,437,590 228,952,818 2,238,044 2,383,042 228,675,634 231,335,860 -1%
Direct Energy Consumption (EN3) (in 100%) Breakdown by Fuel Type in GJ
2012 2011change
%
Stationary combustion sourcesGas 501,182 358,640 +40%Other oil derivatives 161,967 348,407 -54%
Mobile combustion sourcesJet kerosene 224,102,132 226,601,783 -1%Marine gasoil 955,990 916,815 +4%Other oil derivatives 716,318 727,174 -1%Total Note 3 226,437,590 228,952,818 -1%
Notes:
1. We adopted the Lower Heating Value (LHV) coefficients to convert fuel quantities to energy consumed.
2. This figure excludes on-hire vessel fuel consumption.
3. Totals may not be the exact sum of numbers shown here due to rounding.
Sustainable Development Statistics
226 Swire Pacific 2012 Annual Report
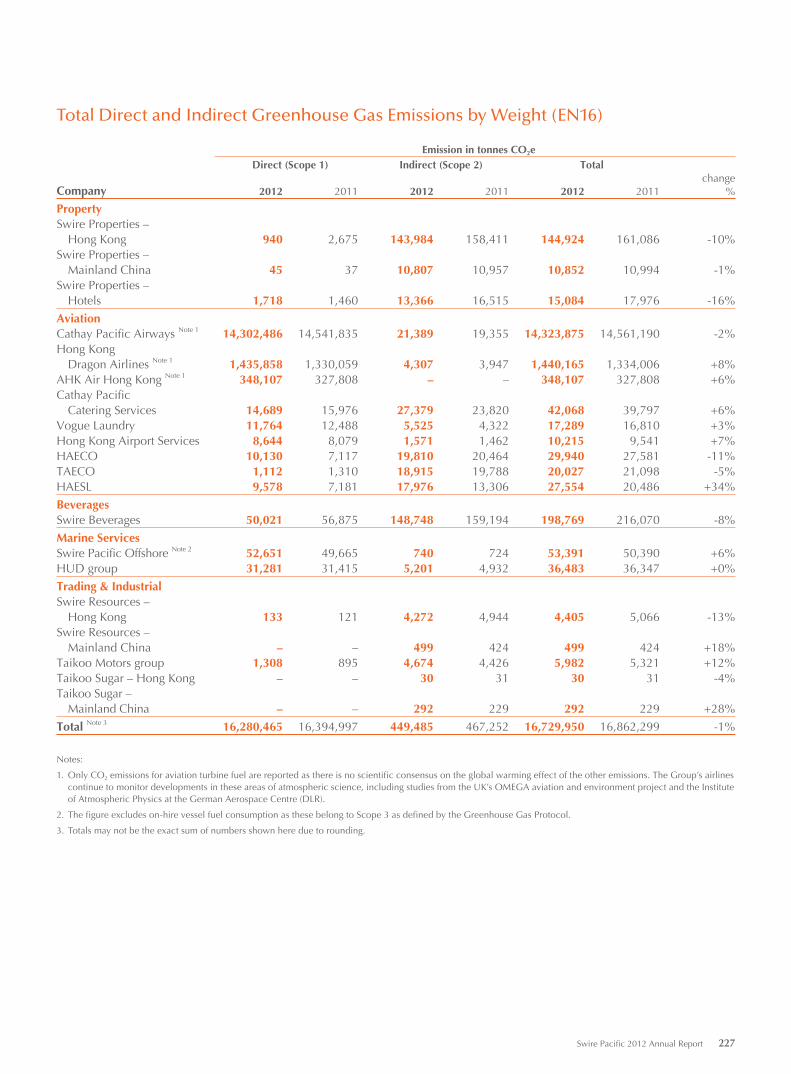
Total Direct and Indirect Greenhouse Gas Emissions by Weight (EN16)
Emission in tonnes CO2eDirect (Scope 1) Indirect (Scope 2) Total
Company 2012 2011 2012 2011 2012 2011change
%
PropertySwire Properties –
Hong Kong 940 2,675 143,984 158,411 144,924 161,086 -10%Swire Properties –
Mainland China 45 37 10,807 10,957 10,852 10,994 -1%Swire Properties –
Hotels 1,718 1,460 13,366 16,515 15,084 17,976 -16%
AviationCathay Pacific Airways Note 1 14,302,486 14,541,835 21,389 19,355 14,323,875 14,561,190 -2%Hong Kong
Dragon Airlines Note 1 1,435,858 1,330,059 4,307 3,947 1,440,165 1,334,006 +8%AHK Air Hong Kong Note 1 348,107 327,808 – – 348,107 327,808 +6%Cathay Pacific
Catering Services 14,689 15,976 27,379 23,820 42,068 39,797 +6%Vogue Laundry 11,764 12,488 5,525 4,322 17,289 16,810 +3%Hong Kong Airport Services 8,644 8,079 1,571 1,462 10,215 9,541 +7%HAECO 10,130 7,117 19,810 20,464 29,940 27,581 -11%TAECO 1,112 1,310 18,915 19,788 20,027 21,098 -5%HAESL 9,578 7,181 17,976 13,306 27,554 20,486 +34%
BeveragesSwire Beverages 50,021 56,875 148,748 159,194 198,769 216,070 -8%
Marine ServicesSwire Pacific Offshore Note 2 52,651 49,665 740 724 53,391 50,390 +6%HUD group 31,281 31,415 5,201 4,932 36,483 36,347 +0%
Trading & IndustrialSwire Resources –
Hong Kong 133 121 4,272 4,944 4,405 5,066 -13%Swire Resources –
Mainland China – – 499 424 499 424 +18%Taikoo Motors group 1,308 895 4,674 4,426 5,982 5,321 +12%Taikoo Sugar – Hong Kong – – 30 31 30 31 -4%Taikoo Sugar –
Mainland China – – 292 229 292 229 +28%
Total Note 3 16,280,465 16,394,997 449,485 467,252 16,729,950 16,862,299 -1%
Notes:
1. Only CO2 emissions for aviation turbine fuel are reported as there is no scientific consensus on the global warming effect of the other emissions. The Group’s airlines continue to monitor developments in these areas of atmospheric science, including studies from the UK’s OMEGA aviation and environment project and the Institute of Atmospheric Physics at the German Aerospace Centre (DLR).
2. The figure excludes on-hire vessel fuel consumption as these belong to Scope 3 as defined by the Greenhouse Gas Protocol.
3. Totals may not be the exact sum of numbers shown here due to rounding.
Swire Pacific 2012 Annual Report 227
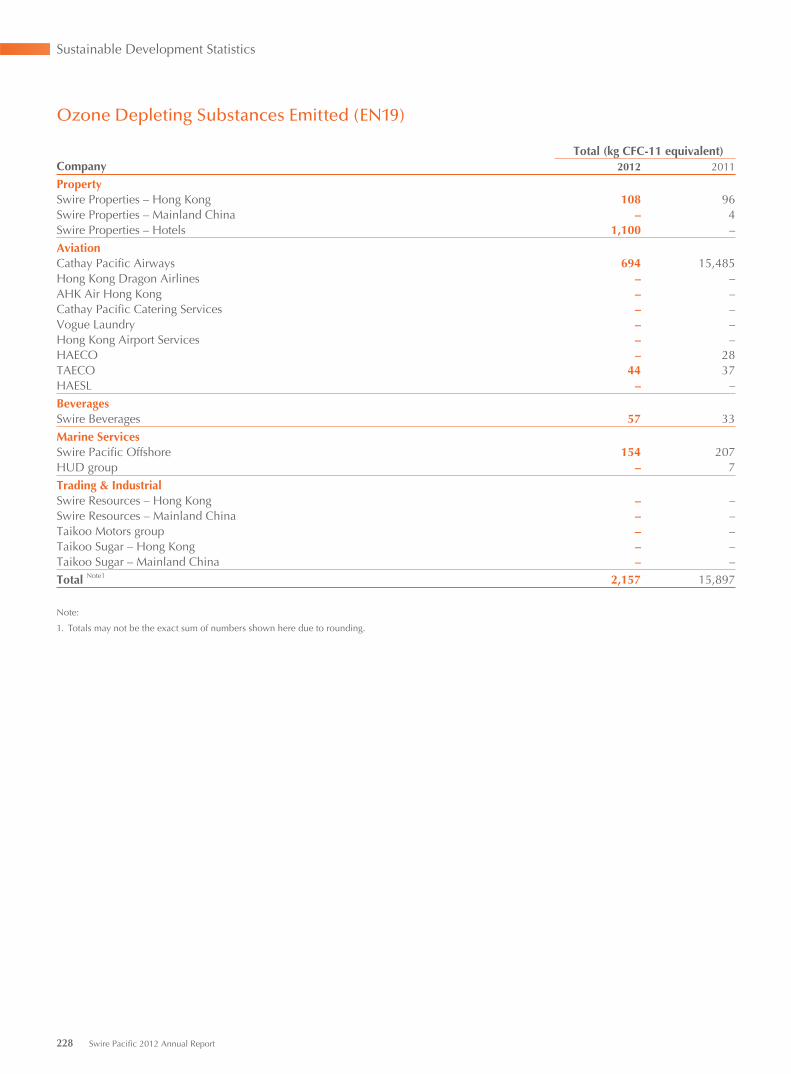
Ozone Depleting Substances Emitted (EN19)
Total (kg CFC-11 equivalent)Company 2012 2011
PropertySwire Properties – Hong Kong 108 96Swire Properties – Mainland China – 4Swire Properties – Hotels 1,100 –
AviationCathay Pacific Airways 694 15,485Hong Kong Dragon Airlines – –AHK Air Hong Kong – –Cathay Pacific Catering Services – –Vogue Laundry – –Hong Kong Airport Services – –HAECO – 28TAECO 44 37HAESL – –
BeveragesSwire Beverages 57 33
Marine ServicesSwire Pacific Offshore 154 207HUD group – 7
Trading & IndustrialSwire Resources – Hong Kong – –Swire Resources – Mainland China – –Taikoo Motors group – –Taikoo Sugar – Hong Kong – –Taikoo Sugar – Mainland China – –
Total Note1 2,157 15,897
Note:
1. Totals may not be the exact sum of numbers shown here due to rounding.
Sustainable Development Statistics
228 Swire Pacific 2012 Annual Report
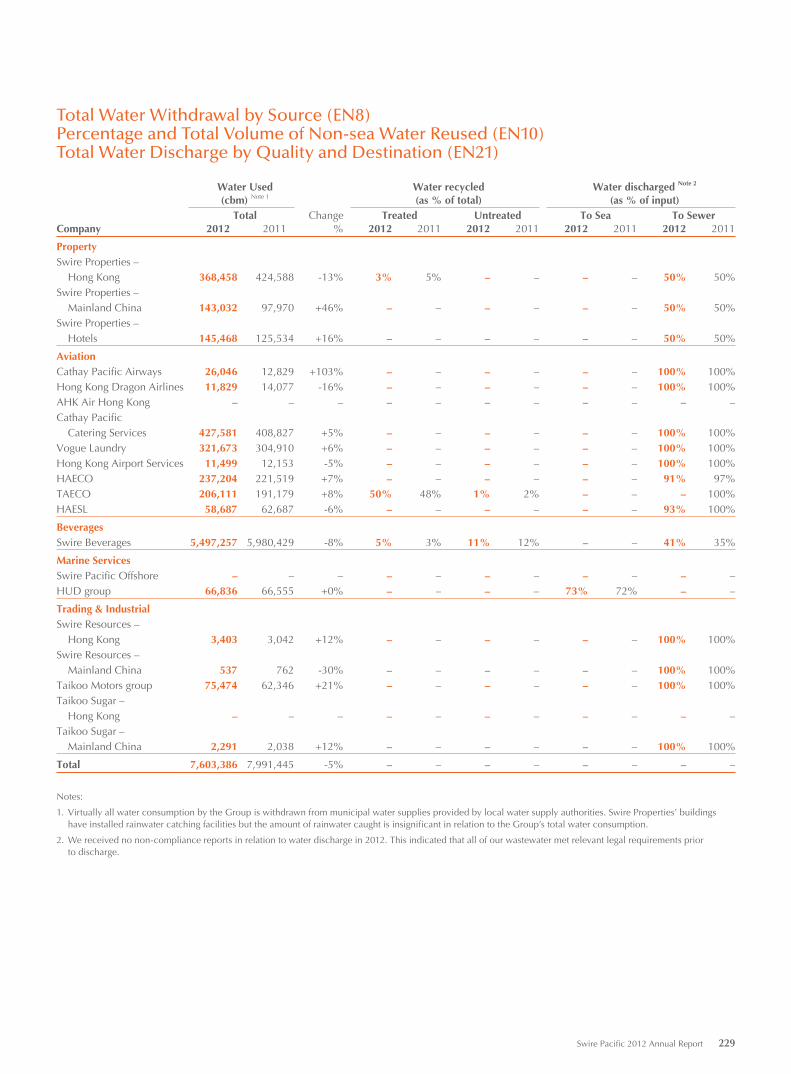
Total Water Withdrawal by Source (EN8)Percentage and Total Volume of Non-sea Water Reused (EN10)Total Water Discharge by Quality and Destination (EN21)
Water Used (cbm) Note 1
Water recycled (as % of total)
Water discharged Note 2 (as % of input)
Total Change Treated Untreated To Sea To SewerCompany 2012 2011 % 2012 2011 2012 2011 2012 2011 2012 2011
PropertySwire Properties –
Hong Kong 368,458 424,588 -13% 3% 5% – – – – 50% 50%Swire Properties –
Mainland China 143,032 97,970 +46% – – – – – – 50% 50%Swire Properties –
Hotels 145,468 125,534 +16% – – – – – – 50% 50%
AviationCathay Pacific Airways 26,046 12,829 +103% – – – – – – 100% 100%Hong Kong Dragon Airlines 11,829 14,077 -16% – – – – – – 100% 100%AHK Air Hong Kong – – – – – – – – – – –Cathay Pacific
Catering Services 427,581 408,827 +5% – – – – – – 100% 100%Vogue Laundry 321,673 304,910 +6% – – – – – – 100% 100%Hong Kong Airport Services 11,499 12,153 -5% – – – – – – 100% 100%HAECO 237,204 221,519 +7% – – – – – – 91% 97%TAECO 206,111 191,179 +8% 50% 48% 1% 2% – – – 100%HAESL 58,687 62,687 -6% – – – – – – 93% 100%
BeveragesSwire Beverages 5,497,257 5,980,429 -8% 5% 3% 11% 12% – – 41% 35%
Marine ServicesSwire Pacific Offshore – – – – – – – – – – –HUD group 66,836 66,555 +0% – – – – 73% 72% – –
Trading & IndustrialSwire Resources –
Hong Kong 3,403 3,042 +12% – – – – – – 100% 100%Swire Resources –
Mainland China 537 762 -30% – – – – – – 100% 100%Taikoo Motors group 75,474 62,346 +21% – – – – – – 100% 100%Taikoo Sugar –
Hong Kong – – – – – – – – – – –Taikoo Sugar –
Mainland China 2,291 2,038 +12% – – – – – – 100% 100%
Total 7,603,386 7,991,445 -5% – – – – – – – –
Notes:
1. Virtually all water consumption by the Group is withdrawn from municipal water supplies provided by local water supply authorities. Swire Properties’ buildings have installed rainwater catching facilities but the amount of rainwater caught is insignificant in relation to the Group’s total water consumption.
2. We received no non-compliance reports in relation to water discharge in 2012. This indicated that all of our wastewater met relevant legal requirements priorto discharge.
Swire Pacific 2012 Annual Report 229
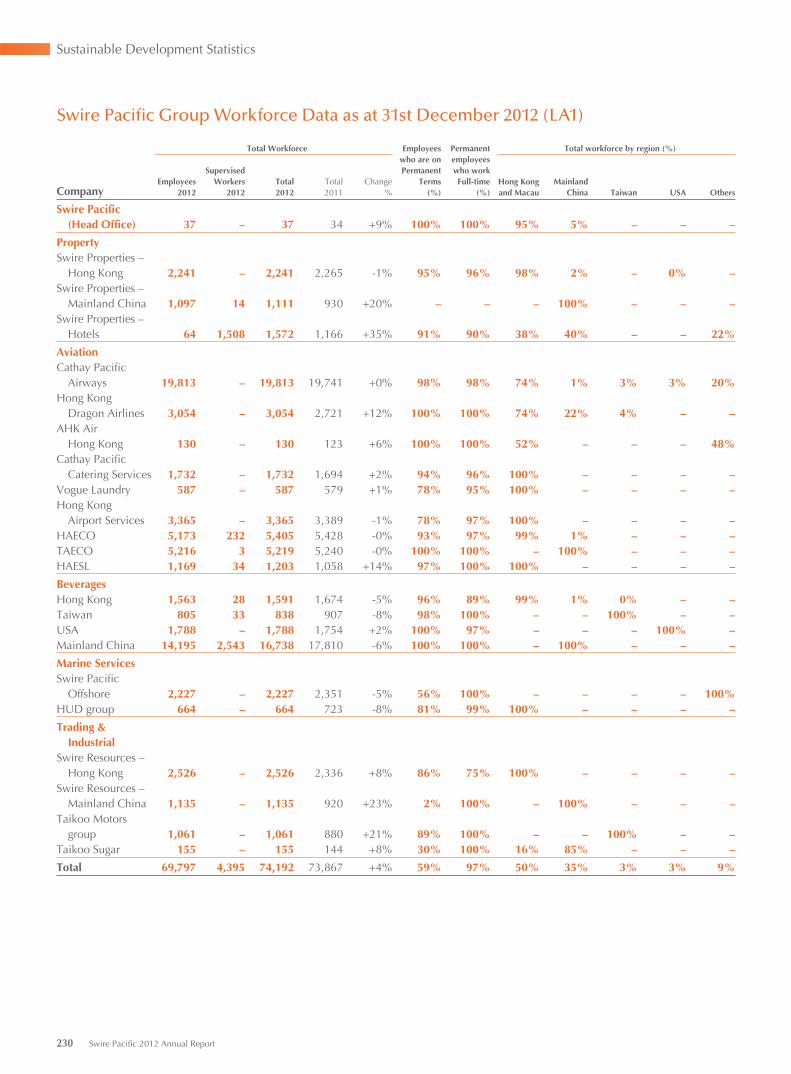
Swire Pacific Group Workforce Data as at 31st December 2012 (LA1)
Total Workforce Employees who are on Permanent
Terms(%)
Permanent employees who work Full-time
(%)
Total workforce by region (%)
CompanyEmployees
2012
Supervised Workers
2012Total 2012
Total2011
Change%
Hong Kong and Macau
Mainland China Taiwan USA Others
Swire Pacific (Head Office) 37 – 37 34 +9% 100% 100% 95% 5% – – –
PropertySwire Properties –
Hong Kong 2,241 – 2,241 2,265 -1% 95% 96% 98% 2% – 0% –Swire Properties –
Mainland China 1,097 14 1,111 930 +20% – – – 100% – – –Swire Properties –
Hotels 64 1,508 1,572 1,166 +35% 91% 90% 38% 40% – – 22%
AviationCathay Pacific
Airways 19,813 – 19,813 19,741 +0% 98% 98% 74% 1% 3% 3% 20%Hong Kong
Dragon Airlines 3,054 – 3,054 2,721 +12% 100% 100% 74% 22% 4% – –AHK Air
Hong Kong 130 – 130 123 +6% 100% 100% 52% – – – 48%Cathay Pacific
Catering Services 1,732 – 1,732 1,694 +2% 94% 96% 100% – – – –Vogue Laundry 587 – 587 579 +1% 78% 95% 100% – – – –Hong Kong
Airport Services 3,365 – 3,365 3,389 -1% 78% 97% 100% – – – –HAECO 5,173 232 5,405 5,428 -0% 93% 97% 99% 1% – – –TAECO 5,216 3 5,219 5,240 -0% 100% 100% – 100% – – –HAESL 1,169 34 1,203 1,058 +14% 97% 100% 100% – – – –
BeveragesHong Kong 1,563 28 1,591 1,674 -5% 96% 89% 99% 1% 0% – –Taiwan 805 33 838 907 -8% 98% 100% – – 100% – –USA 1,788 – 1,788 1,754 +2% 100% 97% – – – 100% –Mainland China 14,195 2,543 16,738 17,810 -6% 100% 100% – 100% – – –
Marine ServicesSwire Pacific
Offshore 2,227 – 2,227 2,351 -5% 56% 100% – – – – 100%HUD group 664 – 664 723 -8% 81% 99% 100% – – – –
Trading & Industrial
Swire Resources – Hong Kong 2,526 – 2,526 2,336 +8% 86% 75% 100% – – – –
Swire Resources – Mainland China 1,135 – 1,135 920 +23% 2% 100% – 100% – – –
Taikoo Motors group 1,061 – 1,061 880 +21% 89% 100% – – 100% – –
Taikoo Sugar 155 – 155 144 +8% 30% 100% 16% 85% – – –
Total 69,797 4,395 74,192 73,867 +4% 59% 97% 50% 35% 3% 3% 9%
Sustainable Development Statistics
230 Swire Pacific 2012 Annual Report
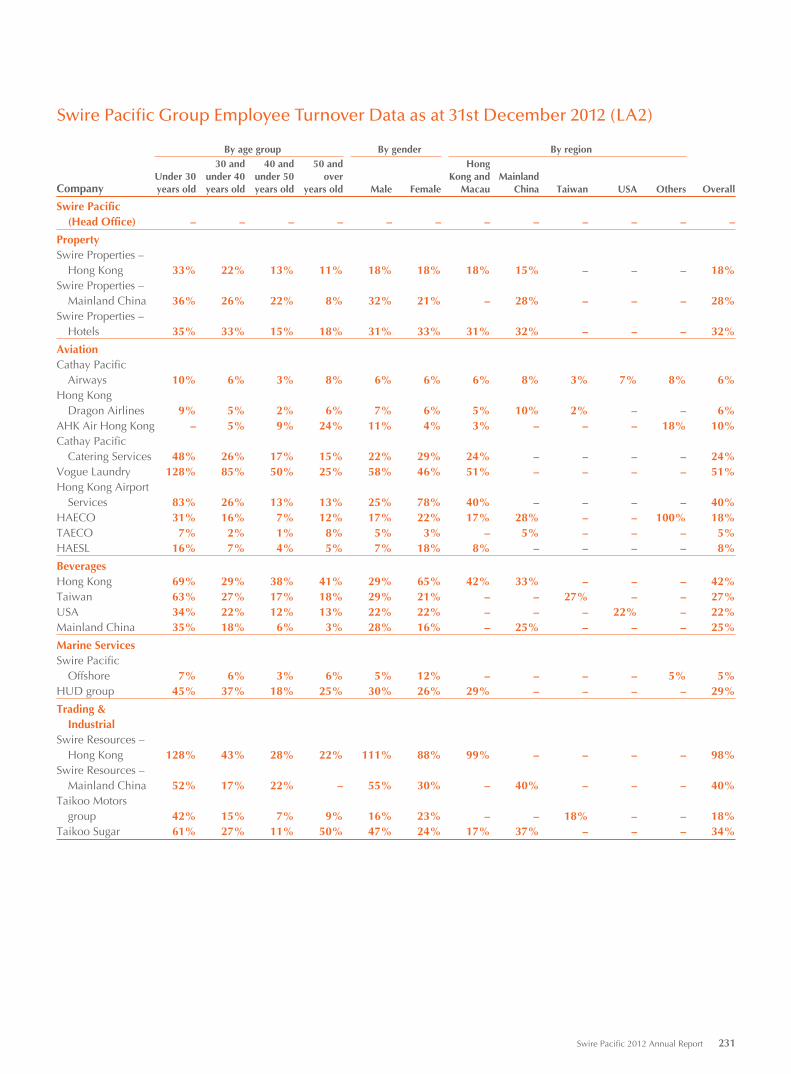
Swire Pacific Group Employee Turnover Data as at 31st December 2012 (LA2)
By age group By gender By region
CompanyUnder 30 years old
30 and under 40 years old
40 and under 50 years old
50 and over
years old Male Female
Hong Kong and
MacauMainland
China Taiwan USA Others Overall
Swire Pacific (Head Office) – – – – – – – – – – – –
PropertySwire Properties –
Hong Kong 33% 22% 13% 11% 18% 18% 18% 15% – – – 18%Swire Properties –
Mainland China 36% 26% 22% 8% 32% 21% – 28% – – – 28%Swire Properties –
Hotels 35% 33% 15% 18% 31% 33% 31% 32% – – – 32%
AviationCathay Pacific
Airways 10% 6% 3% 8% 6% 6% 6% 8% 3% 7% 8% 6%Hong Kong
Dragon Airlines 9% 5% 2% 6% 7% 6% 5% 10% 2% – – 6%AHK Air Hong Kong – 5% 9% 24% 11% 4% 3% – – – 18% 10%Cathay Pacific
Catering Services 48% 26% 17% 15% 22% 29% 24% – – – – 24%Vogue Laundry 128% 85% 50% 25% 58% 46% 51% – – – – 51%Hong Kong Airport
Services 83% 26% 13% 13% 25% 78% 40% – – – – 40%HAECO 31% 16% 7% 12% 17% 22% 17% 28% – – 100% 18%TAECO 7% 2% 1% 8% 5% 3% – 5% – – – 5%HAESL 16% 7% 4% 5% 7% 18% 8% – – – – 8%
BeveragesHong Kong 69% 29% 38% 41% 29% 65% 42% 33% – – – 42%Taiwan 63% 27% 17% 18% 29% 21% – – 27% – – 27%USA 34% 22% 12% 13% 22% 22% – – – 22% – 22%Mainland China 35% 18% 6% 3% 28% 16% – 25% – – – 25%
Marine ServicesSwire Pacific
Offshore 7% 6% 3% 6% 5% 12% – – – – 5% 5%HUD group 45% 37% 18% 25% 30% 26% 29% – – – – 29%
Trading & Industrial
Swire Resources – Hong Kong 128% 43% 28% 22% 111% 88% 99% – – – – 98%
Swire Resources – Mainland China 52% 17% 22% – 55% 30% – 40% – – – 40%
Taikoo Motors group 42% 15% 7% 9% 16% 23% – – 18% – – 18%
Taikoo Sugar 61% 27% 11% 50% 47% 24% 17% 37% – – – 34%
Swire Pacific 2012 Annual Report 231
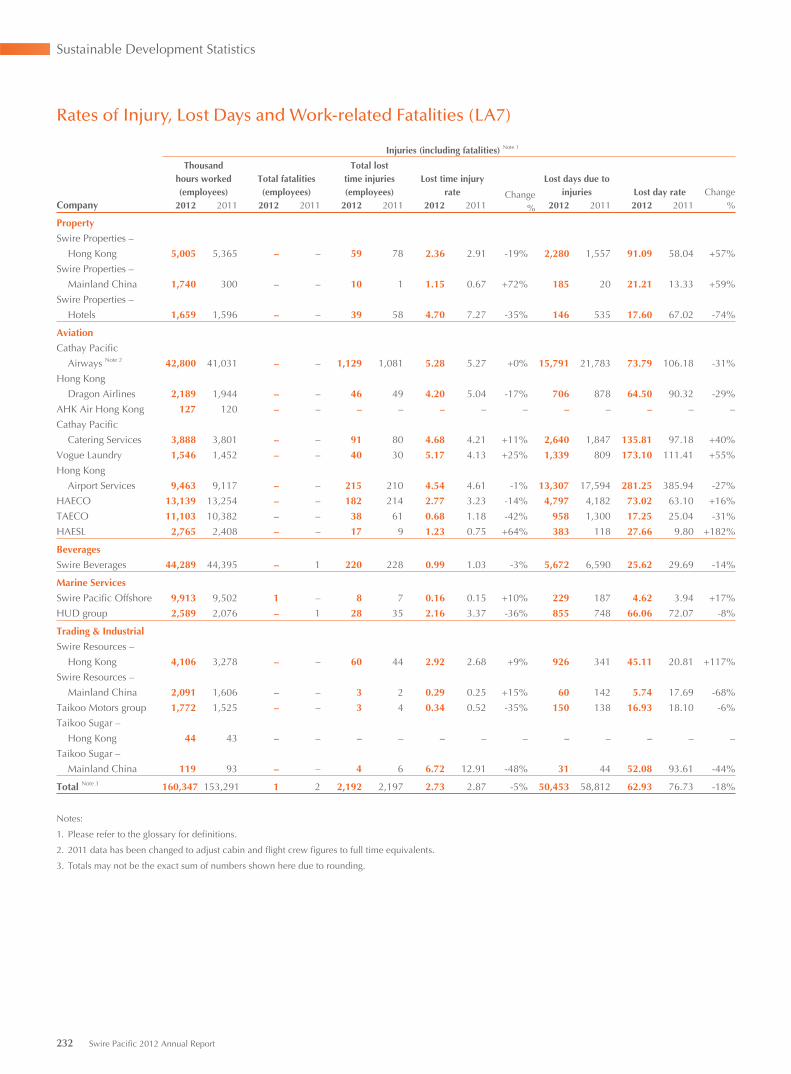
Rates of Injury, Lost Days and Work-related Fatalities (LA7)
Injuries (including fatalities) Note 1
Thousand hours worked (employees)
Total fatalities (employees)
Total lost time injuries (employees)
Lost time injury rate Change
%
Lost days due to injuries Lost day rate Change
%Company 2012 2011 2012 2011 2012 2011 2012 2011 2012 2011 2012 2011
Property
Swire Properties –
Hong Kong 5,005 5,365 – – 59 78 2.36 2.91 -19% 2,280 1,557 91.09 58.04 +57%
Swire Properties –
Mainland China 1,740 300 – – 10 1 1.15 0.67 +72% 185 20 21.21 13.33 +59%
Swire Properties –
Hotels 1,659 1,596 – – 39 58 4.70 7.27 -35% 146 535 17.60 67.02 -74%
Aviation
Cathay Pacific
Airways Note 2 42,800 41,031 – – 1,129 1,081 5.28 5.27 +0% 15,791 21,783 73.79 106.18 -31%
Hong Kong
Dragon Airlines 2,189 1,944 – – 46 49 4.20 5.04 -17% 706 878 64.50 90.32 -29%
AHK Air Hong Kong 127 120 – – – – – – – – – – – –
Cathay Pacific
Catering Services 3,888 3,801 – – 91 80 4.68 4.21 +11% 2,640 1,847 135.81 97.18 +40%
Vogue Laundry 1,546 1,452 – – 40 30 5.17 4.13 +25% 1,339 809 173.10 111.41 +55%
Hong Kong
Airport Services 9,463 9,117 – – 215 210 4.54 4.61 -1% 13,307 17,594 281.25 385.94 -27%
HAECO 13,139 13,254 – – 182 214 2.77 3.23 -14% 4,797 4,182 73.02 63.10 +16%
TAECO 11,103 10,382 – – 38 61 0.68 1.18 -42% 958 1,300 17.25 25.04 -31%
HAESL 2,765 2,408 – – 17 9 1.23 0.75 +64% 383 118 27.66 9.80 +182%
Beverages
Swire Beverages 44,289 44,395 – 1 220 228 0.99 1.03 -3% 5,672 6,590 25.62 29.69 -14%
Marine Services
Swire Pacific Offshore 9,913 9,502 1 – 8 7 0.16 0.15 +10% 229 187 4.62 3.94 +17%
HUD group 2,589 2,076 – 1 28 35 2.16 3.37 -36% 855 748 66.06 72.07 -8%
Trading & Industrial
Swire Resources –
Hong Kong 4,106 3,278 – – 60 44 2.92 2.68 +9% 926 341 45.11 20.81 +117%
Swire Resources –
Mainland China 2,091 1,606 – – 3 2 0.29 0.25 +15% 60 142 5.74 17.69 -68%
Taikoo Motors group 1,772 1,525 – – 3 4 0.34 0.52 -35% 150 138 16.93 18.10 -6%
Taikoo Sugar –
Hong Kong 44 43 – – – – – – – – – – – –
Taikoo Sugar –
Mainland China 119 93 – – 4 6 6.72 12.91 -48% 31 44 52.08 93.61 -44%
Total Note 3 160,347 153,291 1 2 2,192 2,197 2.73 2.87 -5% 50,453 58,812 62.93 76.73 -18%
Notes:
1. Please refer to the glossary for definitions.
2. 2011 data has been changed to adjust cabin and flight crew figures to full time equivalents.
3. Totals may not be the exact sum of numbers shown here due to rounding.
Sustainable Development Statistics
232 Swire Pacific 2012 Annual Report
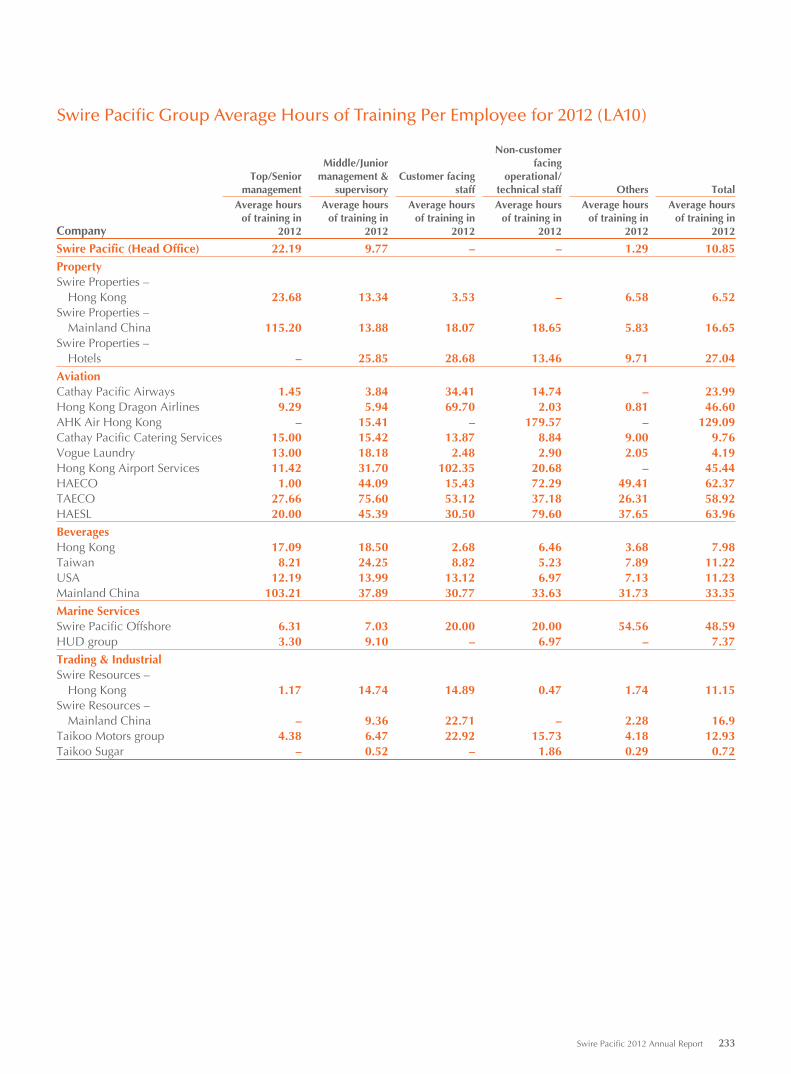
Swire Pacific Group Average Hours of Training Per Employee for 2012 (LA10)
Top/Senior management
Middle/Junior management &
supervisoryCustomer facing
staff
Non-customer facing
operational/technical staff Others Total
Company
Average hours of training in
2012
Average hours of training in
2012
Average hours of training in
2012
Average hours of training in
2012
Average hours of training in
2012
Average hours of training in
2012
Swire Pacific (Head Office) 22.19 9.77 – – 1.29 10.85
PropertySwire Properties –
Hong Kong 23.68 13.34 3.53 – 6.58 6.52Swire Properties –
Mainland China 115.20 13.88 18.07 18.65 5.83 16.65Swire Properties –
Hotels – 25.85 28.68 13.46 9.71 27.04
AviationCathay Pacific Airways 1.45 3.84 34.41 14.74 – 23.99Hong Kong Dragon Airlines 9.29 5.94 69.70 2.03 0.81 46.60AHK Air Hong Kong – 15.41 – 179.57 – 129.09Cathay Pacific Catering Services 15.00 15.42 13.87 8.84 9.00 9.76Vogue Laundry 13.00 18.18 2.48 2.90 2.05 4.19Hong Kong Airport Services 11.42 31.70 102.35 20.68 – 45.44HAECO 1.00 44.09 15.43 72.29 49.41 62.37TAECO 27.66 75.60 53.12 37.18 26.31 58.92HAESL 20.00 45.39 30.50 79.60 37.65 63.96
BeveragesHong Kong 17.09 18.50 2.68 6.46 3.68 7.98Taiwan 8.21 24.25 8.82 5.23 7.89 11.22USA 12.19 13.99 13.12 6.97 7.13 11.23Mainland China 103.21 37.89 30.77 33.63 31.73 33.35
Marine ServicesSwire Pacific Offshore 6.31 7.03 20.00 20.00 54.56 48.59HUD group 3.30 9.10 – 6.97 – 7.37
Trading & IndustrialSwire Resources –
Hong Kong 1.17 14.74 14.89 0.47 1.74 11.15Swire Resources –
Mainland China – 9.36 22.71 – 2.28 16.9Taikoo Motors group 4.38 6.47 22.92 15.73 4.18 12.93Taikoo Sugar – 0.52 – 1.86 0.29 0.72
Swire Pacific 2012 Annual Report 233
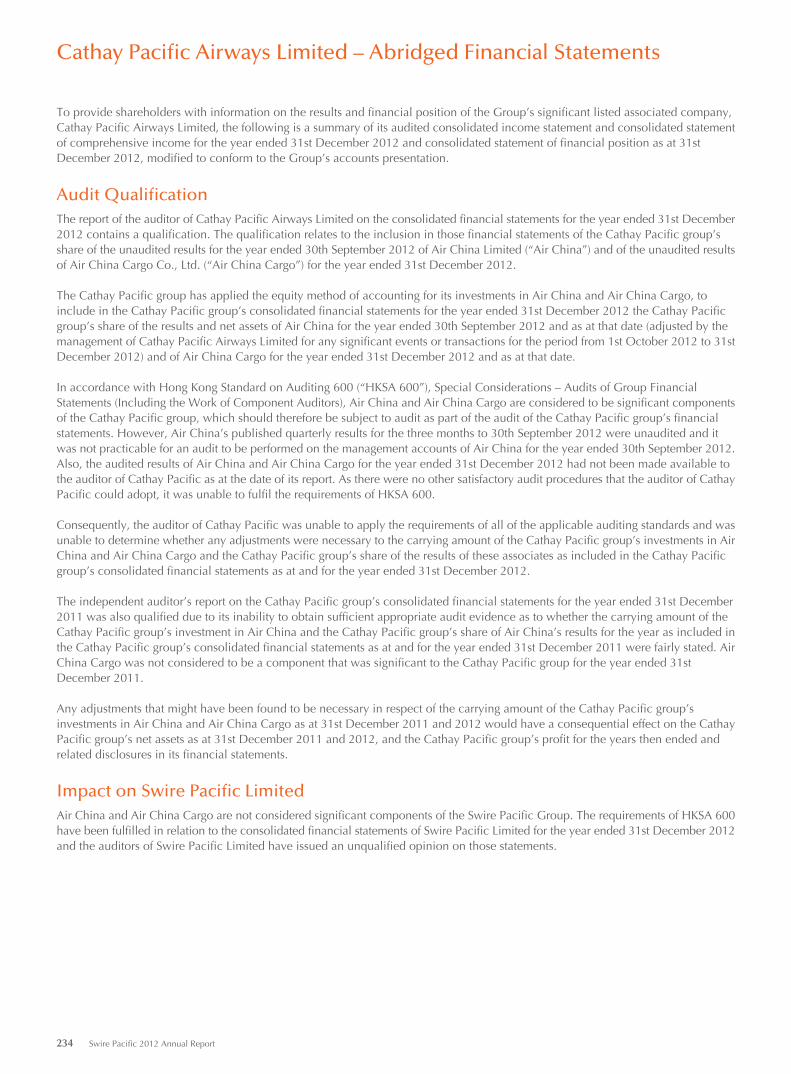
Cathay Pacifi c Airways Limited – Abridged Financial Statements
To provide shareholders with information on the results and financial position of the Group’s significant listed associated company, Cathay Pacific Airways Limited, the following is a summary of its audited consolidated income statement and consolidated statement of comprehensive income for the year ended 31st December 2012 and consolidated statement of financial position as at 31st December 2012, modified to conform to the Group’s accounts presentation.
Audit QualificationThe report of the auditor of Cathay Pacific Airways Limited on the consolidated financial statements for the year ended 31st December 2012 contains a qualification. The qualification relates to the inclusion in those financial statements of the Cathay Pacific group’s share of the unaudited results for the year ended 30th September 2012 of Air China Limited (“Air China”) and of the unaudited results of Air China Cargo Co., Ltd. (“Air China Cargo”) for the year ended 31st December 2012.
The Cathay Pacific group has applied the equity method of accounting for its investments in Air China and Air China Cargo, to include in the Cathay Pacific group’s consolidated financial statements for the year ended 31st December 2012 the Cathay Pacific group’s share of the results and net assets of Air China for the year ended 30th September 2012 and as at that date (adjusted by the management of Cathay Pacific Airways Limited for any significant events or transactions for the period from 1st October 2012 to 31st December 2012) and of Air China Cargo for the year ended 31st December 2012 and as at that date.
In accordance with Hong Kong Standard on Auditing 600 (“HKSA 600”), Special Considerations – Audits of Group Financial Statements (Including the Work of Component Auditors), Air China and Air China Cargo are considered to be significant components of the Cathay Pacific group, which should therefore be subject to audit as part of the audit of the Cathay Pacific group’s financial statements. However, Air China’s published quarterly results for the three months to 30th September 2012 were unaudited and it was not practicable for an audit to be performed on the management accounts of Air China for the year ended 30th September 2012. Also, the audited results of Air China and Air China Cargo for the year ended 31st December 2012 had not been made available to the auditor of Cathay Pacific as at the date of its report. As there were no other satisfactory audit procedures that the auditor of Cathay Pacific could adopt, it was unable to fulfil the requirements of HKSA 600.
Consequently, the auditor of Cathay Pacific was unable to apply the requirements of all of the applicable auditing standards and was unable to determine whether any adjustments were necessary to the carrying amount of the Cathay Pacific group’s investments in Air China and Air China Cargo and the Cathay Pacific group’s share of the results of these associates as included in the Cathay Pacific group’s consolidated financial statements as at and for the year ended 31st December 2012.
The independent auditor’s report on the Cathay Pacific group’s consolidated financial statements for the year ended 31st December 2011 was also qualified due to its inability to obtain sufficient appropriate audit evidence as to whether the carrying amount of the Cathay Pacific group’s investment in Air China and the Cathay Pacific group’s share of Air China’s results for the year as included in the Cathay Pacific group’s consolidated financial statements as at and for the year ended 31st December 2011 were fairly stated. Air China Cargo was not considered to be a component that was significant to the Cathay Pacific group for the year ended 31st December 2011.
Any adjustments that might have been found to be necessary in respect of the carrying amount of the Cathay Pacific group’s investments in Air China and Air China Cargo as at 31st December 2011 and 2012 would have a consequential effect on the Cathay Pacific group’s net assets as at 31st December 2011 and 2012, and the Cathay Pacific group’s profit for the years then ended and related disclosures in its financial statements.
Impact on Swire Pacific LimitedAir China and Air China Cargo are not considered significant components of the Swire Pacific Group. The requirements of HKSA 600 have been fulfilled in relation to the consolidated financial statements of Swire Pacific Limited for the year ended 31st December 2012 and the auditors of Swire Pacific Limited have issued an unqualified opinion on those statements.
234 Swire Pacific 2012 Annual Report
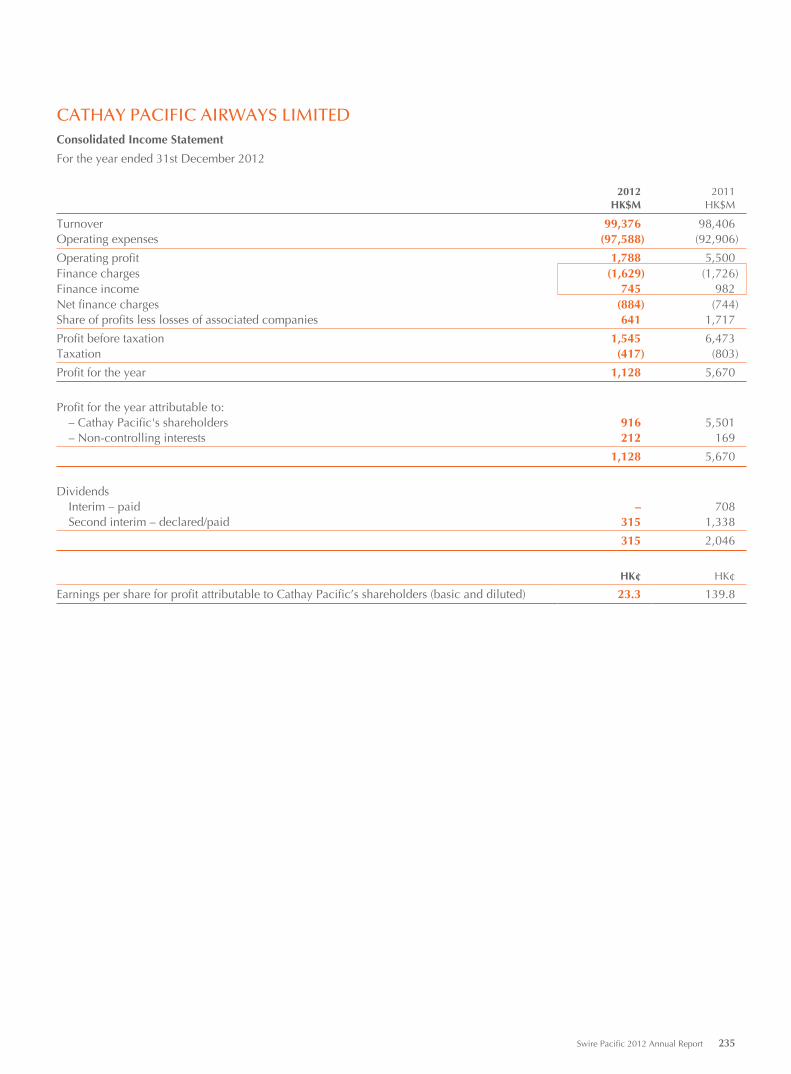
CATHAY PACIFIC AIRWAYS LIMITEDConsolidated Income Statement
For the year ended 31st December 2012
2012 2011HK$M HK$M
Turnover 99,376 98,406Operating expenses (97,588) (92,906)
Operating profit 1,788 5,500Finance charges (1,629) (1,726)Finance income 745 982Net finance charges (884) (744)Share of profits less losses of associated companies 641 1,717
Profit before taxation 1,545 6,473Taxation (417) (803)
Profit for the year 1,128 5,670
Profit for the year attributable to: – Cathay Pacific's shareholders 916 5,501 – Non-controlling interests 212 169
1,128 5,670
Dividends Interim – paid – 708 Second interim – declared/paid 315 1,338
315 2,046
HK¢ HK¢
Earnings per share for profit attributable to Cathay Pacific’s shareholders (basic and diluted) 23.3 139.8
Swire Pacific 2012 Annual Report 235
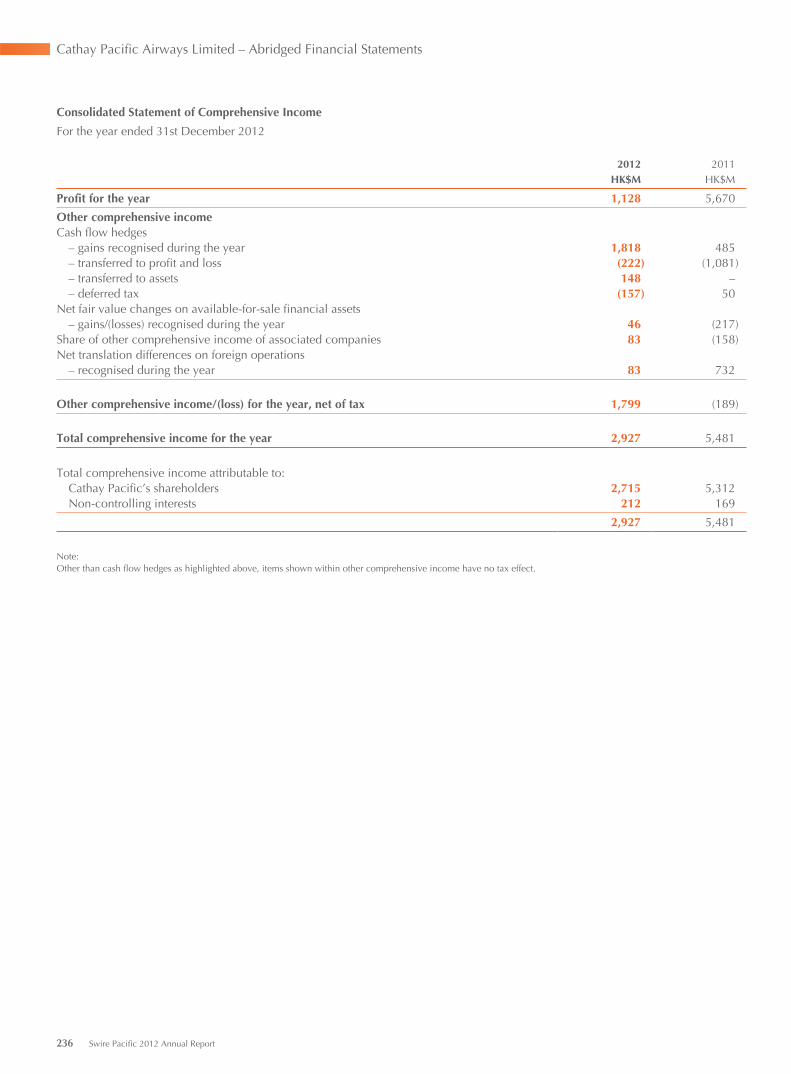
Cathay Pacific Airways Limited – Abridged Financial Statements
Consolidated Statement of Comprehensive Income
For the year ended 31st December 2012
2012 2011HK$M HK$M
Profit for the year 1,128 5,670
Other comprehensive incomeCash flow hedges – gains recognised during the year 1,818 485 – transferred to profit and loss (222) (1,081) – transferred to assets 148 – – deferred tax (157) 50Net fair value changes on available-for-sale financial assets – gains/(losses) recognised during the year 46 (217)Share of other comprehensive income of associated companies 83 (158)Net translation differences on foreign operations – recognised during the year 83 732
Other comprehensive income/(loss) for the year, net of tax 1,799 (189)
Total comprehensive income for the year 2,927 5,481
Total comprehensive income attributable to: Cathay Pacific’s shareholders 2,715 5,312 Non-controlling interests 212 169
2,927 5,481
Note:Other than cash flow hedges as highlighted above, items shown within other comprehensive income have no tax effect.
236 Swire Pacific 2012 Annual Report
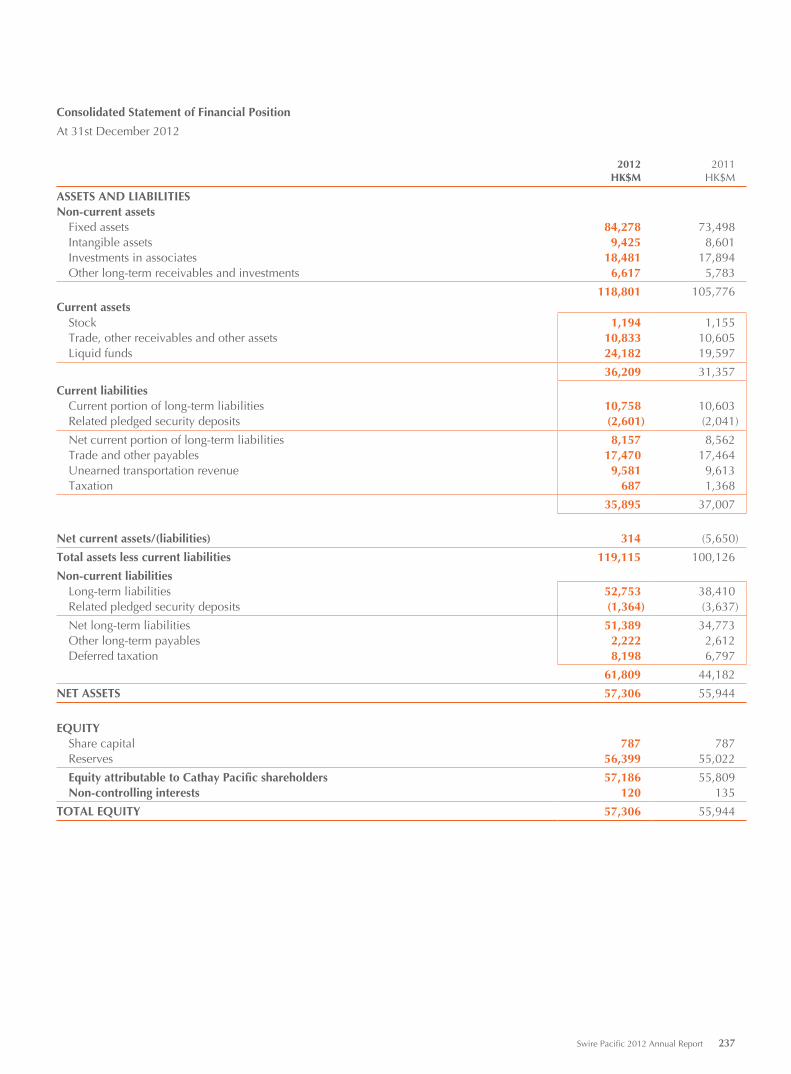
Consolidated Statement of Financial Position
At 31st December 2012
2012 2011HK$M HK$M
ASSETS AND LIABILITIESNon-current assets Fixed assets 84,278 73,498 Intangible assets 9,425 8,601 Investments in associates 18,481 17,894 Other long-term receivables and investments 6,617 5,783
118,801 105,776Current assets Stock 1,194 1,155 Trade, other receivables and other assets 10,833 10,605 Liquid funds 24,182 19,597
36,209 31,357
Current liabilities Current portion of long-term liabilities 10,758 10,603 Related pledged security deposits (2,601) (2,041)
Net current portion of long-term liabilities 8,157 8,562 Trade and other payables 17,470 17,464 Unearned transportation revenue 9,581 9,613 Taxation 687 1,368
35,895 37,007
Net current assets/(liabilities) 314 (5,650)
Total assets less current liabilities 119,115 100,126
Non-current liabilities Long-term liabilities 52,753 38,410 Related pledged security deposits (1,364) (3,637)
Net long-term liabilities 51,389 34,773 Other long-term payables 2,222 2,612 Deferred taxation 8,198 6,797
61,809 44,182
NET ASSETS 57,306 55,944
EQUITY Share capital 787 787 Reserves 56,399 55,022
Equity attributable to Cathay Pacific shareholders 57,186 55,809 Non-controlling interests 120 135
TOTAL EQUITY 57,306 55,944
Swire Pacific 2012 Annual Report 237
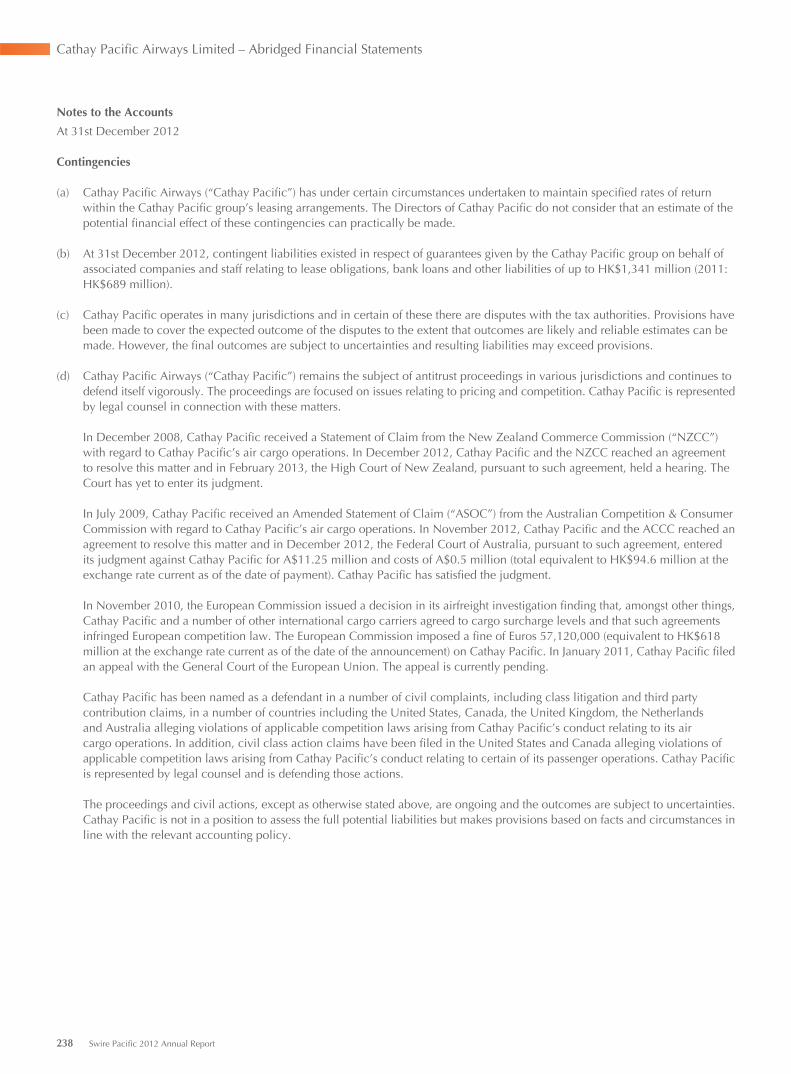
Cathay Pacific Airways Limited – Abridged Financial Statements
Notes to the Accounts
At 31st December 2012
Contingencies
(a) Cathay Pacific Airways (“Cathay Pacific”) has under certain circumstances undertaken to maintain specified rates of return within the Cathay Pacific group’s leasing arrangements. The Directors of Cathay Pacific do not consider that an estimate of the potential financial effect of these contingencies can practically be made.
(b) At 31st December 2012, contingent liabilities existed in respect of guarantees given by the Cathay Pacific group on behalf of associated companies and staff relating to lease obligations, bank loans and other liabilities of up to HK$1,341 million (2011: HK$689 million).
(c) Cathay Pacific operates in many jurisdictions and in certain of these there are disputes with the tax authorities. Provisions have been made to cover the expected outcome of the disputes to the extent that outcomes are likely and reliable estimates can be made. However, the final outcomes are subject to uncertainties and resulting liabilities may exceed provisions.
(d) Cathay Pacific Airways (“Cathay Pacific”) remains the subject of antitrust proceedings in various jurisdictions and continues to defend itself vigorously. The proceedings are focused on issues relating to pricing and competition. Cathay Pacific is represented by legal counsel in connection with these matters.
In December 2008, Cathay Pacific received a Statement of Claim from the New Zealand Commerce Commission (“NZCC”) with regard to Cathay Pacific’s air cargo operations. In December 2012, Cathay Pacific and the NZCC reached an agreement to resolve this matter and in February 2013, the High Court of New Zealand, pursuant to such agreement, held a hearing. The Court has yet to enter its judgment.
In July 2009, Cathay Pacific received an Amended Statement of Claim (“ASOC”) from the Australian Competition & Consumer Commission with regard to Cathay Pacific’s air cargo operations. In November 2012, Cathay Pacific and the ACCC reached an agreement to resolve this matter and in December 2012, the Federal Court of Australia, pursuant to such agreement, entered its judgment against Cathay Pacific for A$11.25 million and costs of A$0.5 million (total equivalent to HK$94.6 million at the exchange rate current as of the date of payment). Cathay Pacific has satisfied the judgment.
In November 2010, the European Commission issued a decision in its airfreight investigation finding that, amongst other things, Cathay Pacific and a number of other international cargo carriers agreed to cargo surcharge levels and that such agreements infringed European competition law. The European Commission imposed a fine of Euros 57,120,000 (equivalent to HK$618 million at the exchange rate current as of the date of the announcement) on Cathay Pacific. In January 2011, Cathay Pacific filed an appeal with the General Court of the European Union. The appeal is currently pending.
Cathay Pacific has been named as a defendant in a number of civil complaints, including class litigation and third party contribution claims, in a number of countries including the United States, Canada, the United Kingdom, the Netherlands and Australia alleging violations of applicable competition laws arising from Cathay Pacific’s conduct relating to its air cargo operations. In addition, civil class action claims have been filed in the United States and Canada alleging violations of applicable competition laws arising from Cathay Pacific’s conduct relating to certain of its passenger operations. Cathay Pacific is represented by legal counsel and is defending those actions.
The proceedings and civil actions, except as otherwise stated above, are ongoing and the outcomes are subject to uncertainties. Cathay Pacific is not in a position to assess the full potential liabilities but makes provisions based on facts and circumstances in line with the relevant accounting policy.
238 Swire Pacific 2012 Annual Report
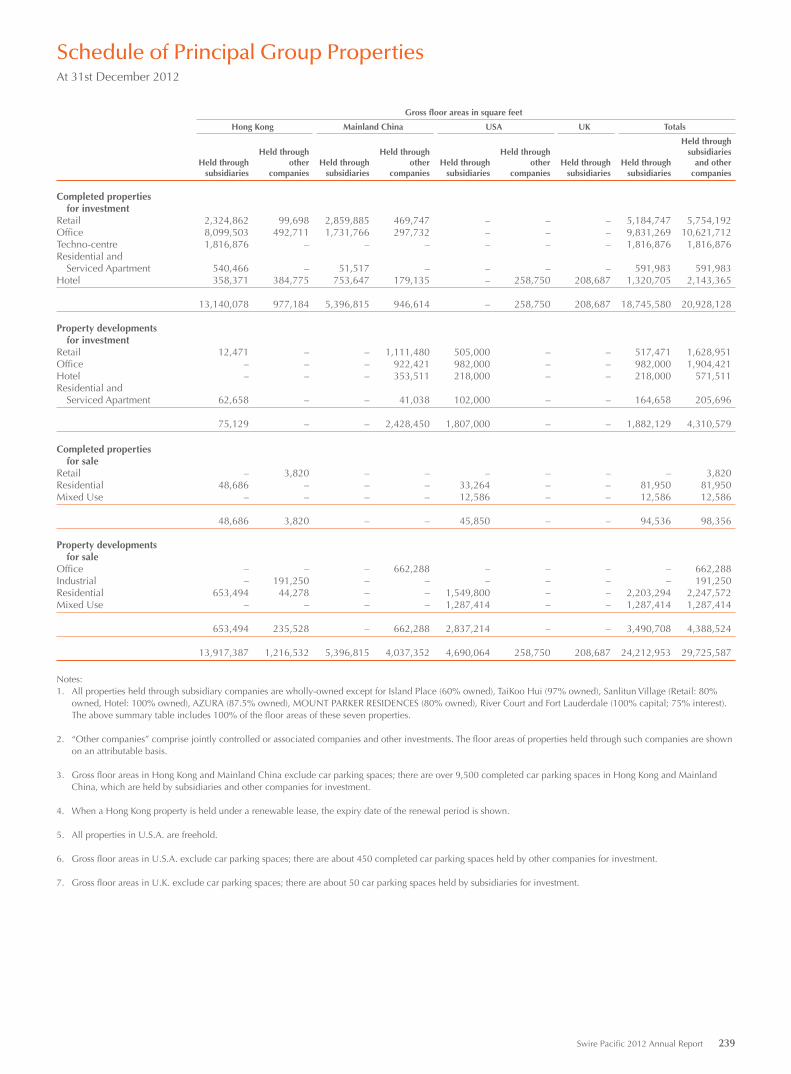
Schedule of Principal Group PropertiesAt 31st December 2012
Gross floor areas in square feet
Hong Kong Mainland China USA UK Totals
Held throughsubsidiaries
Held throughother
companiesHeld through
subsidiaries
Held throughother
companiesHeld through
subsidiaries
Held throughother
companiesHeld through
subsidiariesHeld through
subsidiaries
Held through subsidiaries
and other companies
Completed properties for investmentRetail 2,324,862 99,698 2,859,885 469,747 – – – 5,184,747 5,754,192Office 8,099,503 492,711 1,731,766 297,732 – – – 9,831,269 10,621,712Techno-centre 1,816,876 – – – – – – 1,816,876 1,816,876Residential and Serviced Apartment 540,466 – 51,517 – – – – 591,983 591,983Hotel 358,371 384,775 753,647 179,135 – 258,750 208,687 1,320,705 2,143,365
13,140,078 977,184 5,396,815 946,614 – 258,750 208,687 18,745,580 20,928,128
Property developments for investmentRetail 12,471 – – 1,111,480 505,000 – – 517,471 1,628,951Office – – – 922,421 982,000 – – 982,000 1,904,421Hotel – – – 353,511 218,000 – – 218,000 571,511Residential and Serviced Apartment 62,658 – – 41,038 102,000 – – 164,658 205,696
75,129 – – 2,428,450 1,807,000 – – 1,882,129 4,310,579
Completed properties for saleRetail – 3,820 – – – – – – 3,820Residential 48,686 – – – 33,264 – – 81,950 81,950Mixed Use – – – – 12,586 – – 12,586 12,586
48,686 3,820 – – 45,850 – – 94,536 98,356
Property developments for saleOffice – – – 662,288 – – – – 662,288Industrial – 191,250 – – – – – – 191,250Residential 653,494 44,278 – – 1,549,800 – – 2,203,294 2,247,572Mixed Use – – – – 1,287,414 – – 1,287,414 1,287,414
653,494 235,528 – 662,288 2,837,214 – – 3,490,708 4,388,524
13,917,387 1,216,532 5,396,815 4,037,352 4,690,064 258,750 208,687 24,212,953 29,725,587
Notes:1. All properties held through subsidiary companies are wholly-owned except for Island Place (60% owned), TaiKoo Hui (97% owned), Sanlitun Village (Retail: 80%
owned, Hotel: 100% owned), AZURA (87.5% owned), MOUNT PARKER RESIDENCES (80% owned), River Court and Fort Lauderdale (100% capital; 75% interest). The above summary table includes 100% of the floor areas of these seven properties.
2. “Other companies” comprise jointly controlled or associated companies and other investments. The floor areas of properties held through such companies are shown on an attributable basis.
3. Gross floor areas in Hong Kong and Mainland China exclude car parking spaces; there are over 9,500 completed car parking spaces in Hong Kong and Mainland China, which are held by subsidiaries and other companies for investment.
4. When a Hong Kong property is held under a renewable lease, the expiry date of the renewal period is shown.
5. All properties in U.S.A. are freehold.
6. Gross floor areas in U.S.A. exclude car parking spaces; there are about 450 completed car parking spaces held by other companies for investment.
7. Gross floor areas in U.K. exclude car parking spaces; there are about 50 car parking spaces held by subsidiaries for investment.
Swire Pacific 2012 Annual Report 239
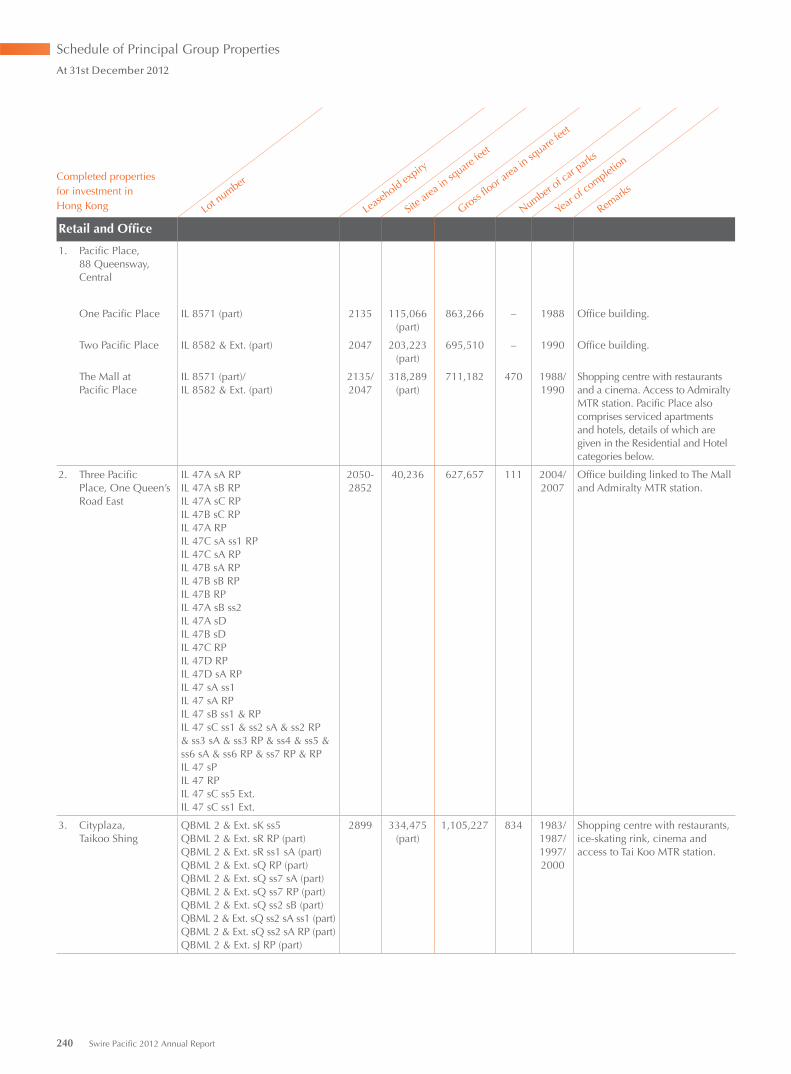
Completed properties for investment in Hong Kong Lo
t number
Lease
hold expiry
Site a
rea in
square
feet
Gross flo
or area
in sq
uare fe
et
Number of c
ar park
s
Year
of complet
ion
Remark
s
Retail and Office
1. Pacific Place,88 Queensway,Central
One Pacific Place IL 8571 (part) 2135 115,066 (part)
863,266 – 1988 Office building.
Two Pacific Place IL 8582 & Ext. (part) 2047 203,223 (part)
695,510 – 1990 Office building.
The Mall atPacific Place
IL 8571 (part)/IL 8582 & Ext. (part)
2135/ 2047
318,289 (part)
711,182 470 1988/1990
Shopping centre with restaurants and a cinema. Access to Admiralty MTR station. Pacific Place also comprises serviced apartments and hotels, details of which are given in the Residential and Hotel categories below.
2. Three PacificPlace, One Queen’s Road East
IL 47A sA RPIL 47A sB RPIL 47A sC RPIL 47B sC RPIL 47A RPIL 47C sA ss1 RPIL 47C sA RPIL 47B sA RPIL 47B sB RPIL 47B RPIL 47A sB ss2IL 47A sDIL 47B sDIL 47C RPIL 47D RPIL 47D sA RPIL 47 sA ss1IL 47 sA RPIL 47 sB ss1 & RPIL 47 sC ss1 & ss2 sA & ss2 RP & ss3 sA & ss3 RP & ss4 & ss5 & ss6 sA & ss6 RP & ss7 RP & RPIL 47 sPIL 47 RPIL 47 sC ss5 Ext.IL 47 sC ss1 Ext.
2050- 2852
40,236 627,657 111 2004/2007
Office building linked to The Mall and Admiralty MTR station.
3. Cityplaza, Taikoo Shing
QBML 2 & Ext. sK ss5QBML 2 & Ext. sR RP (part)QBML 2 & Ext. sR ss1 sA (part)QBML 2 & Ext. sQ RP (part)QBML 2 & Ext. sQ ss7 sA (part)QBML 2 & Ext. sQ ss7 RP (part)QBML 2 & Ext. sQ ss2 sB (part)QBML 2 & Ext. sQ ss2 sA ss1 (part)QBML 2 & Ext. sQ ss2 sA RP (part)QBML 2 & Ext. sJ RP (part)
2899 334,475 (part)
1,105,227 834 1983/ 1987/ 1997/ 2000
Shopping centre with restaurants, ice-skating rink, cinema and access to Tai Koo MTR station.
Schedule of Principal Group Properties
At 31st December 2012
240 Swire Pacific 2012 Annual Report
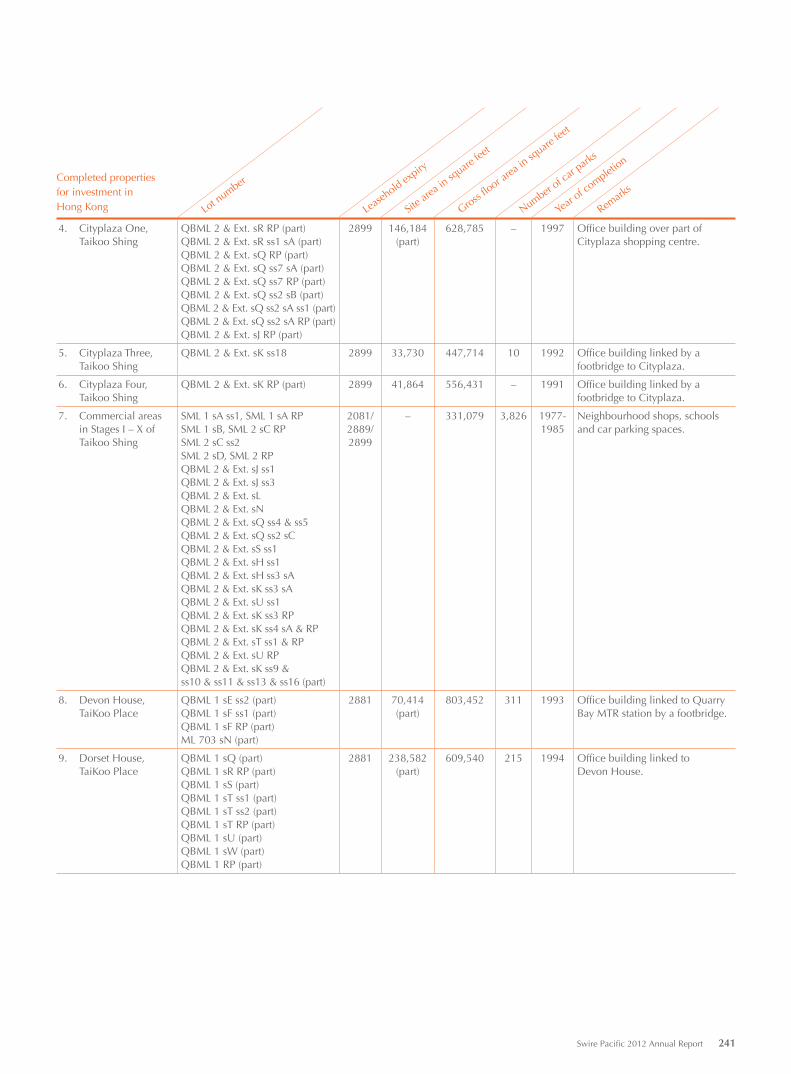
Completed properties for investment in Hong Kong Lo
t number
Lease
hold expiry
Site a
rea in
square
feet
Gross flo
or area
in sq
uare fe
et
Number of c
ar park
s
Year
of complet
ion
Remark
s
4. Cityplaza One, Taikoo Shing
QBML 2 & Ext. sR RP (part)QBML 2 & Ext. sR ss1 sA (part)QBML 2 & Ext. sQ RP (part)QBML 2 & Ext. sQ ss7 sA (part)QBML 2 & Ext. sQ ss7 RP (part)QBML 2 & Ext. sQ ss2 sB (part)QBML 2 & Ext. sQ ss2 sA ss1 (part)QBML 2 & Ext. sQ ss2 sA RP (part)QBML 2 & Ext. sJ RP (part)
2899 146,184 (part)
628,785 – 1997 Office building over part of Cityplaza shopping centre.
5. Cityplaza Three, Taikoo Shing
QBML 2 & Ext. sK ss18 2899 33,730 447,714 10 1992 Office building linked by a footbridge to Cityplaza.
6. Cityplaza Four, Taikoo Shing
QBML 2 & Ext. sK RP (part) 2899 41,864 556,431 – 1991 Office building linked by a footbridge to Cityplaza.
7. Commercial areas in Stages I – X of Taikoo Shing
SML 1 sA ss1, SML 1 sA RPSML 1 sB, SML 2 sC RPSML 2 sC ss2SML 2 sD, SML 2 RPQBML 2 & Ext. sJ ss1QBML 2 & Ext. sJ ss3QBML 2 & Ext. sLQBML 2 & Ext. sNQBML 2 & Ext. sQ ss4 & ss5QBML 2 & Ext. sQ ss2 sCQBML 2 & Ext. sS ss1QBML 2 & Ext. sH ss1QBML 2 & Ext. sH ss3 sAQBML 2 & Ext. sK ss3 sAQBML 2 & Ext. sU ss1QBML 2 & Ext. sK ss3 RPQBML 2 & Ext. sK ss4 sA & RPQBML 2 & Ext. sT ss1 & RPQBML 2 & Ext. sU RPQBML 2 & Ext. sK ss9 &ss10 & ss11 & ss13 & ss16 (part)
2081/ 2889/ 2899
– 331,079 3,826 1977- 1985
Neighbourhood shops, schools and car parking spaces.
8. Devon House, TaiKoo Place
QBML 1 sE ss2 (part)QBML 1 sF ss1 (part)QBML 1 sF RP (part)ML 703 sN (part)
2881 70,414 (part)
803,452 311 1993 Office building linked to Quarry Bay MTR station by a footbridge.
9. Dorset House, TaiKoo Place
QBML 1 sQ (part)QBML 1 sR RP (part)QBML 1 sS (part)QBML 1 sT ss1 (part)QBML 1 sT ss2 (part)QBML 1 sT RP (part)QBML 1 sU (part)QBML 1 sW (part)QBML 1 RP (part)
2881 238,582 (part)
609,540 215 1994 Office building linked toDevon House.
Swire Pacific 2012 Annual Report 241
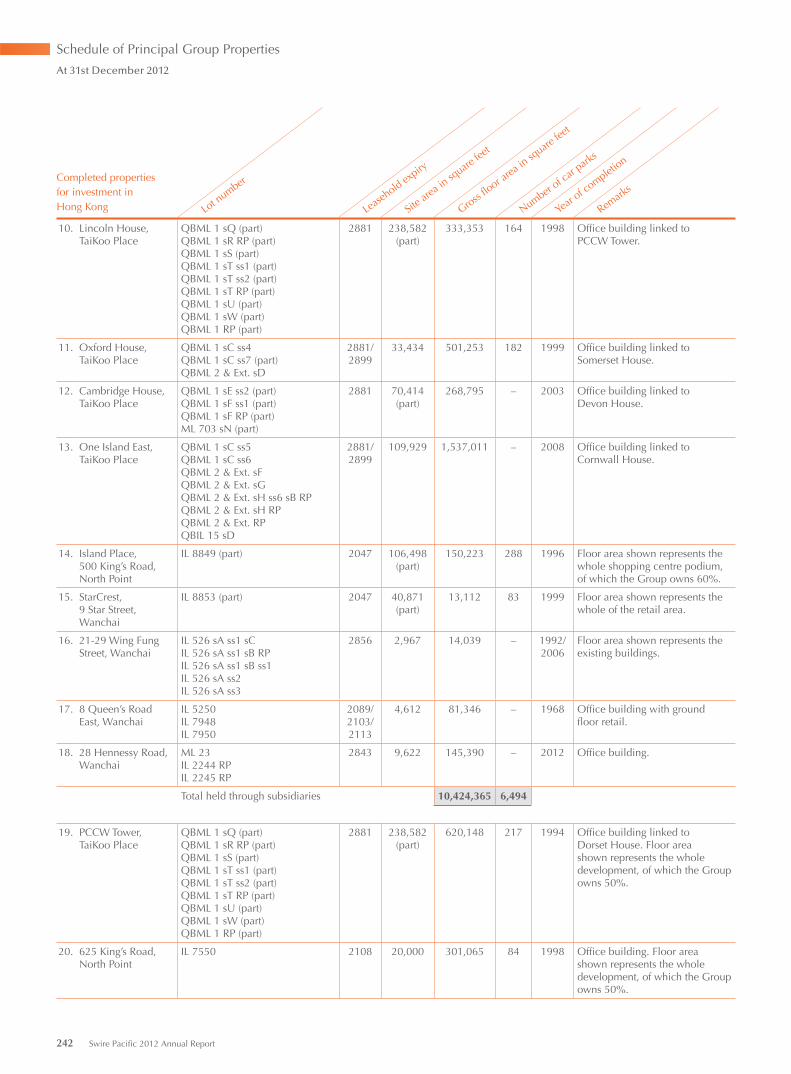
Completed properties for investment in Hong Kong Lo
t number
Lease
hold expiry
Site a
rea in
square
feet
Gross flo
or area
in sq
uare fe
et
Number of c
ar park
s
Year
of complet
ion
Remark
s
10. Lincoln House, TaiKoo Place
QBML 1 sQ (part)QBML 1 sR RP (part)QBML 1 sS (part)QBML 1 sT ss1 (part)QBML 1 sT ss2 (part)QBML 1 sT RP (part)QBML 1 sU (part)QBML 1 sW (part)QBML 1 RP (part)
2881 238,582 (part)
333,353 164 1998 Office building linked to PCCW Tower.
11. Oxford House, TaiKoo Place
QBML 1 sC ss4QBML 1 sC ss7 (part)QBML 2 & Ext. sD
2881/ 2899
33,434 501,253 182 1999 Office building linked to Somerset House.
12. Cambridge House, TaiKoo Place
QBML 1 sE ss2 (part)QBML 1 sF ss1 (part)QBML 1 sF RP (part)ML 703 sN (part)
2881 70,414 (part)
268,795 – 2003 Office building linked to Devon House.
13. One Island East, TaiKoo Place
QBML 1 sC ss5QBML 1 sC ss6QBML 2 & Ext. sFQBML 2 & Ext. sGQBML 2 & Ext. sH ss6 sB RPQBML 2 & Ext. sH RPQBML 2 & Ext. RPQBIL 15 sD
2881/ 2899
109,929 1,537,011 – 2008 Office building linked to Cornwall House.
14. Island Place, 500 King’s Road, North Point
IL 8849 (part) 2047 106,498 (part)
150,223 288 1996 Floor area shown represents the whole shopping centre podium, of which the Group owns 60%.
15. StarCrest, 9 Star Street, Wanchai
IL 8853 (part) 2047 40,871 (part)
13,112 83 1999 Floor area shown represents the whole of the retail area.
16. 21-29 Wing Fung Street, Wanchai
IL 526 sA ss1 sCIL 526 sA ss1 sB RPIL 526 sA ss1 sB ss1IL 526 sA ss2IL 526 sA ss3
2856 2,967 14,039 – 1992/ 2006
Floor area shown represents the existing buildings.
17. 8 Queen’s Road East, Wanchai
IL 5250IL 7948IL 7950
2089/ 2103/ 2113
4,612 81,346 – 1968 Office building with ground floor retail.
18. 28 Hennessy Road, Wanchai
ML 23IL 2244 RPIL 2245 RP
2843 9,622 145,390 – 2012 Office building.
Total held through subsidiaries 10,424,365 6,494
19. PCCW Tower, TaiKoo Place
QBML 1 sQ (part)QBML 1 sR RP (part)QBML 1 sS (part)QBML 1 sT ss1 (part)QBML 1 sT ss2 (part)QBML 1 sT RP (part)QBML 1 sU (part)QBML 1 sW (part)QBML 1 RP (part)
2881 238,582 (part)
620,148 217 1994 Office building linked to Dorset House. Floor area shown represents the whole development, of which the Group owns 50%.
20. 625 King’s Road, North Point
IL 7550 2108 20,000 301,065 84 1998 Office building. Floor area shown represents the whole development, of which the Group owns 50%.
Schedule of Principal Group Properties
At 31st December 2012
242 Swire Pacific 2012 Annual Report
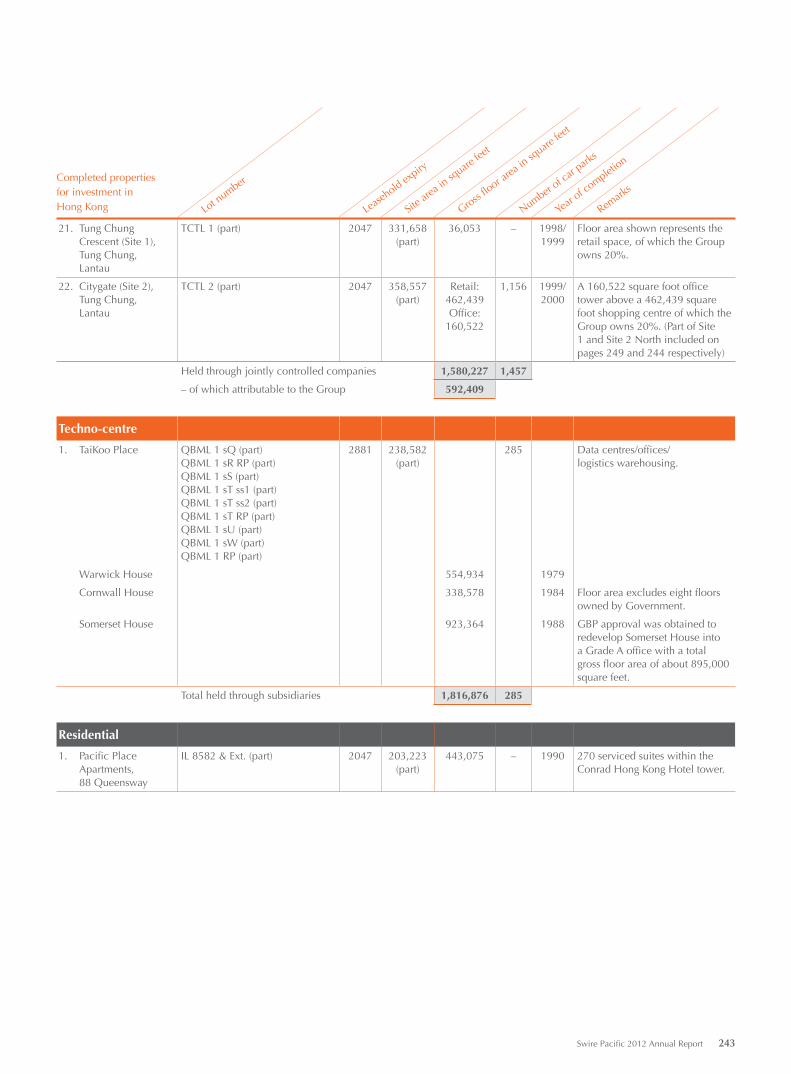
Completed properties for investment in Hong Kong Lo
t number
Lease
hold expiry
Site a
rea in
square
feet
Gross flo
or area
in sq
uare fe
et
Number of c
ar park
s
Year
of complet
ion
Remark
s
21. Tung Chung Crescent (Site 1), Tung Chung, Lantau
TCTL 1 (part) 2047 331,658 (part)
36,053 – 1998/ 1999
Floor area shown represents the retail space, of which the Group owns 20%.
22. Citygate (Site 2), Tung Chung, Lantau
TCTL 2 (part) 2047 358,557 (part)
Retail: 462,439Office:
160,522
1,156 1999/ 2000
A 160,522 square foot office tower above a 462,439 square foot shopping centre of which the Group owns 20%. (Part of Site 1 and Site 2 North included on pages 249 and 244 respectively)
Held through jointly controlled companies 1,580,227 1,457
– of which attributable to the Group 592,409
Techno-centre
1. TaiKoo Place QBML 1 sQ (part)QBML 1 sR RP (part)QBML 1 sS (part)QBML 1 sT ss1 (part)QBML 1 sT ss2 (part)QBML 1 sT RP (part)QBML 1 sU (part)QBML 1 sW (part)QBML 1 RP (part)
2881 238,582 (part)
285 Data centres/offices/logistics warehousing.
Warwick House 554,934 1979
Cornwall House 338,578 1984 Floor area excludes eight floors owned by Government.
Somerset House 923,364 1988 GBP approval was obtained to redevelop Somerset House into a Grade A office with a total gross floor area of about 895,000 square feet.
Total held through subsidiaries 1,816,876 285
Residential
1. Pacific Place Apartments, 88 Queensway
IL 8582 & Ext. (part) 2047 203,223 (part)
443,075 – 1990 270 serviced suites within the Conrad Hong Kong Hotel tower.
Swire Pacific 2012 Annual Report 243
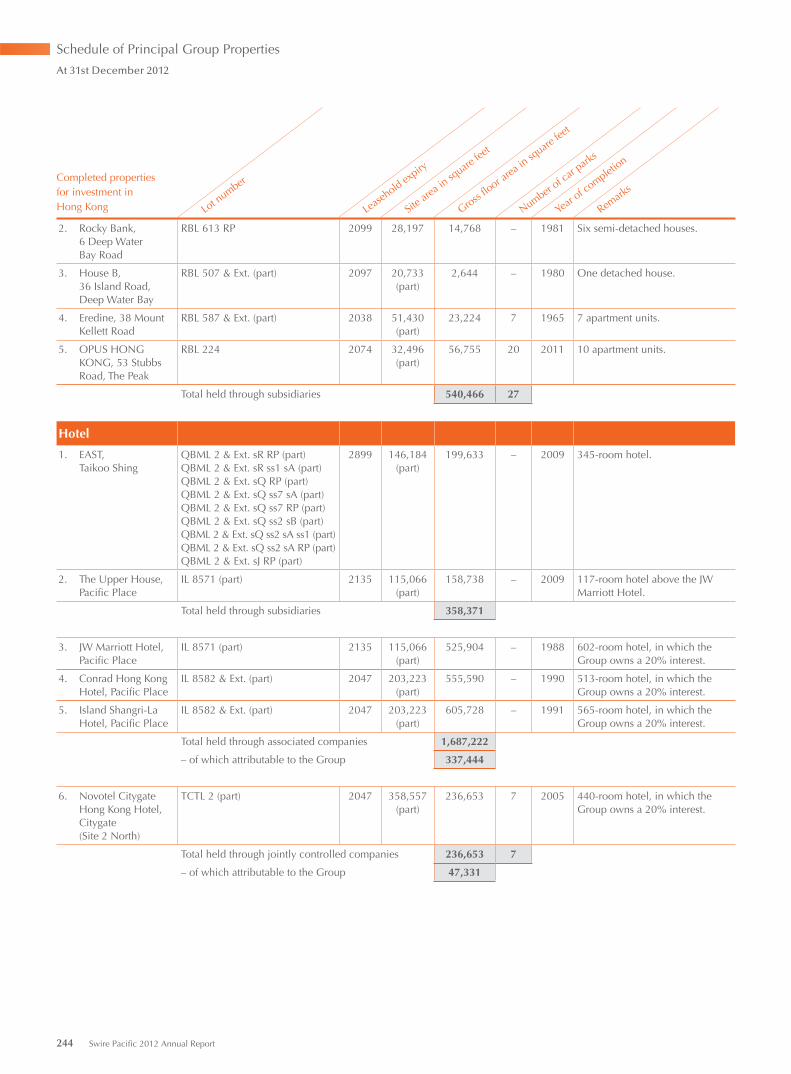
Completed properties for investment in Hong Kong Lo
t number
Lease
hold expiry
Site a
rea in
square
feet
Gross flo
or area
in sq
uare fe
et
Number of c
ar park
s
Year
of complet
ion
Remark
s
2. Rocky Bank, 6 Deep Water Bay Road
RBL 613 RP 2099 28,197 14,768 – 1981 Six semi-detached houses.
3. House B, 36 Island Road, Deep Water Bay
RBL 507 & Ext. (part) 2097 20,733 (part)
2,644 – 1980 One detached house.
4. Eredine, 38 Mount Kellett Road
RBL 587 & Ext. (part) 2038 51,430 (part)
23,224 7 1965 7 apartment units.
5. OPUS HONG KONG, 53 Stubbs Road, The Peak
RBL 224 2074 32,496 (part)
56,755 20 2011 10 apartment units.
Total held through subsidiaries 540,466 27
Hotel
1. EAST, Taikoo Shing
QBML 2 & Ext. sR RP (part)QBML 2 & Ext. sR ss1 sA (part)QBML 2 & Ext. sQ RP (part)QBML 2 & Ext. sQ ss7 sA (part)QBML 2 & Ext. sQ ss7 RP (part)QBML 2 & Ext. sQ ss2 sB (part)QBML 2 & Ext. sQ ss2 sA ss1 (part)QBML 2 & Ext. sQ ss2 sA RP (part)QBML 2 & Ext. sJ RP (part)
2899 146,184 (part)
199,633 – 2009 345-room hotel.
2. The Upper House, Pacific Place
IL 8571 (part) 2135 115,066 (part)
158,738 – 2009 117-room hotel above the JW Marriott Hotel.
Total held through subsidiaries 358,371
3. JW Marriott Hotel, Pacific Place
IL 8571 (part) 2135 115,066 (part)
525,904 – 1988 602-room hotel, in which the Group owns a 20% interest.
4. Conrad Hong Kong Hotel, Pacific Place
IL 8582 & Ext. (part) 2047 203,223 (part)
555,590 – 1990 513-room hotel, in which the Group owns a 20% interest.
5. Island Shangri-La Hotel, Pacific Place
IL 8582 & Ext. (part) 2047 203,223 (part)
605,728 – 1991 565-room hotel, in which the Group owns a 20% interest.
Total held through associated companies 1,687,222
– of which attributable to the Group 337,444
6. Novotel Citygate Hong Kong Hotel, Citygate(Site 2 North)
TCTL 2 (part) 2047 358,557 (part)
236,653 7 2005 440-room hotel, in which the Group owns a 20% interest.
Total held through jointly controlled companies 236,653 7
– of which attributable to the Group 47,331
Schedule of Principal Group Properties
At 31st December 2012
244 Swire Pacific 2012 Annual Report
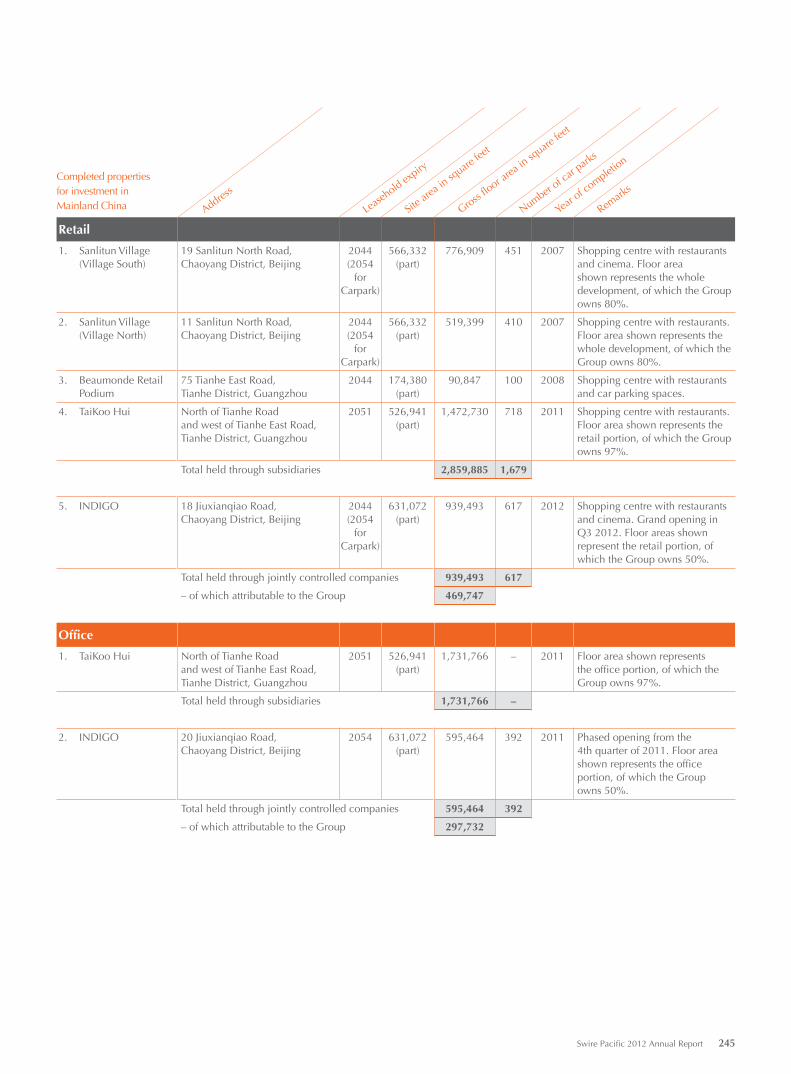
Completed propertiesfor investment inMainland China Addres
s
Lease
hold expiry
Site a
rea in
square
feet
Gross flo
or area
in sq
uare fe
et
Number of c
ar park
s
Year
of complet
ion
Remark
s
Retail
1. Sanlitun Village (Village South)
19 Sanlitun North Road, Chaoyang District, Beijing
2044 (2054
for Carpark)
566,332 (part)
776,909 451 2007 Shopping centre with restaurants and cinema. Floor area shown represents the whole development, of which the Group owns 80%.
2. Sanlitun Village (Village North)
11 Sanlitun North Road, Chaoyang District, Beijing
2044 (2054
for Carpark)
566,332 (part)
519,399 410 2007 Shopping centre with restaurants. Floor area shown represents the whole development, of which the Group owns 80%.
3. Beaumonde Retail Podium
75 Tianhe East Road, Tianhe District, Guangzhou
2044 174,380 (part)
90,847 100 2008 Shopping centre with restaurants and car parking spaces.
4. TaiKoo Hui North of Tianhe Road and west of Tianhe East Road, Tianhe District, Guangzhou
2051 526,941 (part)
1,472,730 718 2011 Shopping centre with restaurants. Floor area shown represents the retail portion, of which the Group owns 97%.
Total held through subsidiaries 2,859,885 1,679
5. INDIGO 18 Jiuxianqiao Road, Chaoyang District, Beijing
2044 (2054
for Carpark)
631,072 (part)
939,493 617 2012 Shopping centre with restaurants and cinema. Grand opening in Q3 2012. Floor areas shown represent the retail portion, of which the Group owns 50%.
Total held through jointly controlled companies 939,493 617
– of which attributable to the Group 469,747
Office
1. TaiKoo Hui North of Tianhe Road and west of Tianhe East Road, Tianhe District, Guangzhou
2051 526,941 (part)
1,731,766 – 2011 Floor area shown represents the office portion, of which the Group owns 97%.
Total held through subsidiaries 1,731,766 –
2. INDIGO 20 Jiuxianqiao Road, Chaoyang District, Beijing
2054 631,072 (part)
595,464 392 2011 Phased opening from the 4th quarter of 2011. Floor area shown represents the office portion, of which the Group owns 50%.
Total held through jointly controlled companies 595,464 392
– of which attributable to the Group 297,732
Swire Pacific 2012 Annual Report 245
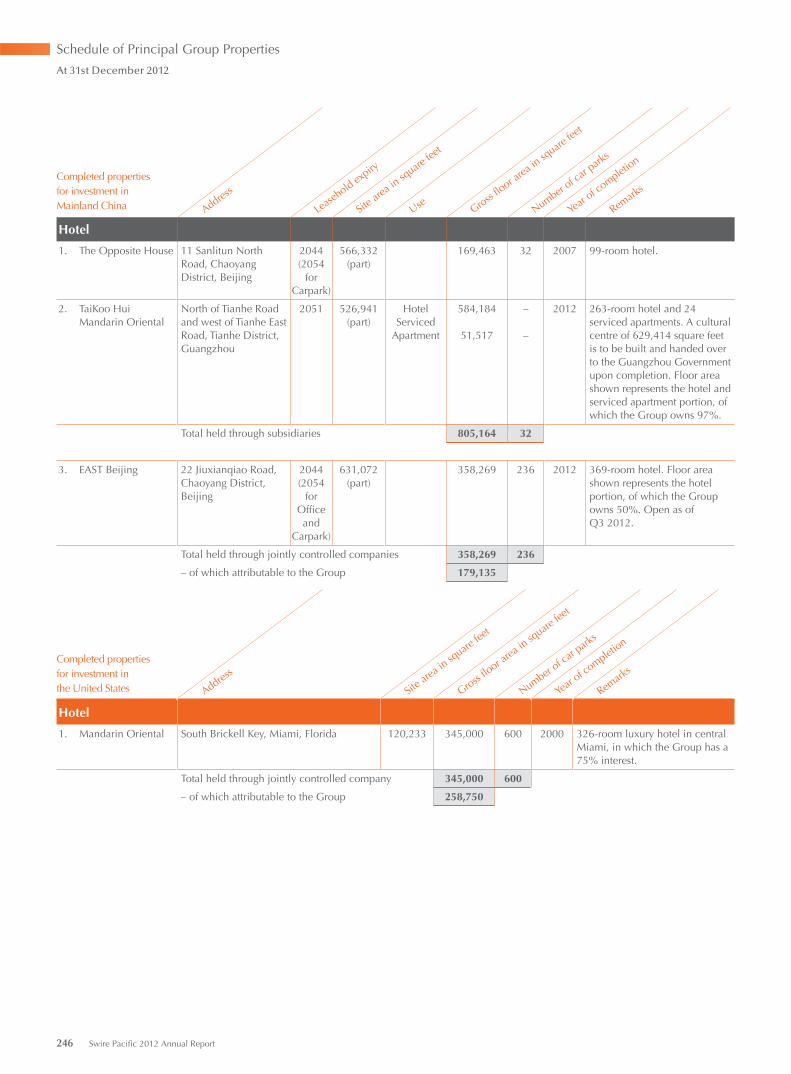
Completed propertiesfor investment inMainland China Addres
s
Lease
hold expiry
Site a
rea in
square
feet
Use Gross flo
or area
in sq
uare fe
et
Number of c
ar park
s
Year
of complet
ion
Remark
s
Hotel
1. The Opposite House 11 Sanlitun North Road, Chaoyang District, Beijing
2044 (2054
for Carpark)
566,332 (part)
169,463 32 2007 99-room hotel.
2. TaiKoo Hui Mandarin Oriental
North of Tianhe Road and west of Tianhe East Road, Tianhe District, Guangzhou
2051 526,941 (part)
Hotel Serviced
Apartment
584,184
51,517
–
–
2012 263-room hotel and 24 serviced apartments. A cultural centre of 629,414 square feet is to be built and handed over to the Guangzhou Government upon completion. Floor area shown represents the hotel and serviced apartment portion, of which the Group owns 97%.
Total held through subsidiaries 805,164 32
3. EAST Beijing 22 Jiuxianqiao Road, Chaoyang District, Beijing
2044 (2054
for Office and
Carpark)
631,072 (part)
358,269 236 2012 369-room hotel. Floor area shown represents the hotel portion, of which the Group owns 50%. Open as ofQ3 2012.
Total held through jointly controlled companies 358,269 236
– of which attributable to the Group 179,135
Completed properties for investment in the United States Addres
s
Site a
rea in
square
feet
Gross flo
or area
in sq
uare fe
et
Number of c
ar park
s
Year
of complet
ion
Remark
s
Hotel
1. Mandarin Oriental South Brickell Key, Miami, Florida 120,233 345,000 600 2000 326-room luxury hotel in central Miami, in which the Group has a 75% interest.
Total held through jointly controlled company 345,000 600
– of which attributable to the Group 258,750
Schedule of Principal Group Properties
At 31st December 2012
246 Swire Pacific 2012 Annual Report
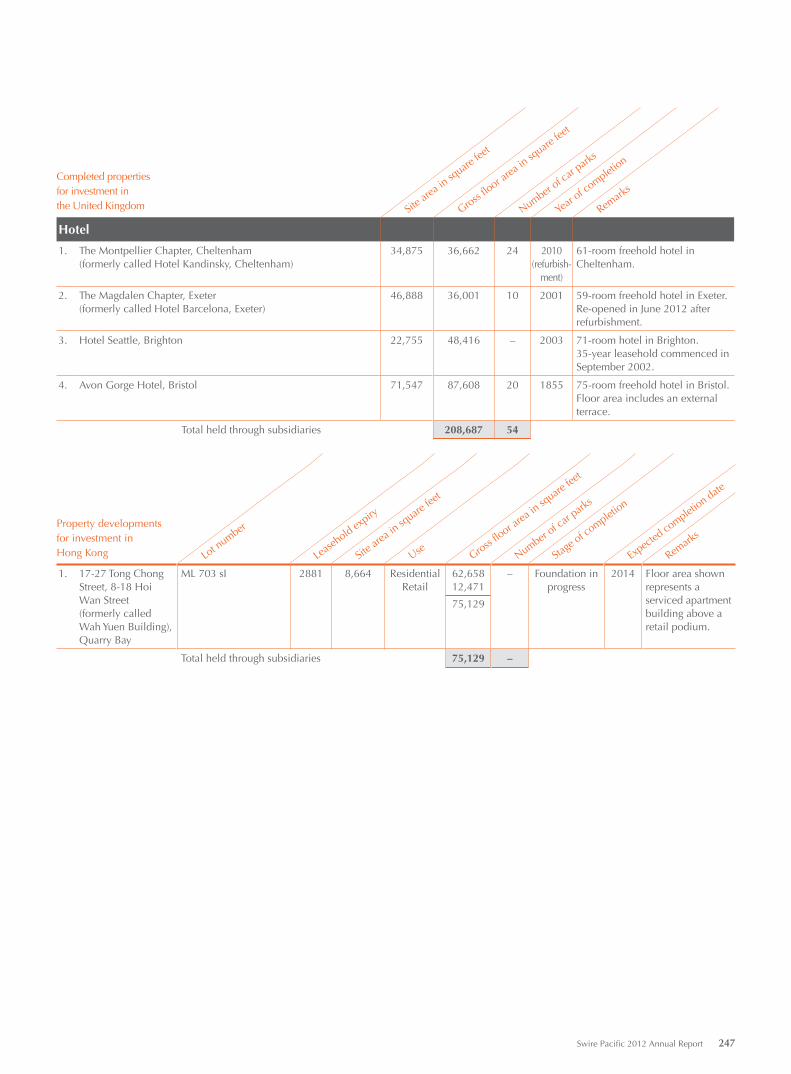
Completed properties for investment in the United Kingdom Sit
e area
in sq
uare fe
et
Gross flo
or area
in sq
uare fe
et
Number of c
ar park
s
Year
of complet
ion
Remark
s
Hotel
1. The Montpellier Chapter, Cheltenham (formerly called Hotel Kandinsky, Cheltenham)
34,875 36,662 24 2010(refurbish-
ment)
61-room freehold hotel in Cheltenham.
2. The Magdalen Chapter, Exeter (formerly called Hotel Barcelona, Exeter)
46,888 36,001 10 2001 59-room freehold hotel in Exeter. Re-opened in June 2012 after refurbishment.
3. Hotel Seattle, Brighton 22,755 48,416 – 2003 71-room hotel in Brighton. 35-year leasehold commenced in September 2002.
4. Avon Gorge Hotel, Bristol 71,547 87,608 20 1855 75-room freehold hotel in Bristol. Floor area includes an external terrace.
Total held through subsidiaries 208,687 54
Property developments for investment inHong Kong Lo
t number
Lease
hold expiry
Site a
rea in
square
feet
Use Gross flo
or area
in sq
uare fe
et
Number of c
ar park
s
Stage
of complet
ion
Expec
ted co
mpletion date
Remark
s
1. 17-27 Tong Chong Street, 8-18 Hoi Wan Street(formerly called Wah Yuen Building), Quarry Bay
ML 703 sI 2881 8,664 ResidentialRetail
62,65812,471
75,129
– Foundation in progress
2014 Floor area shown represents a serviced apartment building above a retail podium.
Total held through subsidiaries 75,129 –
Swire Pacific 2012 Annual Report 247
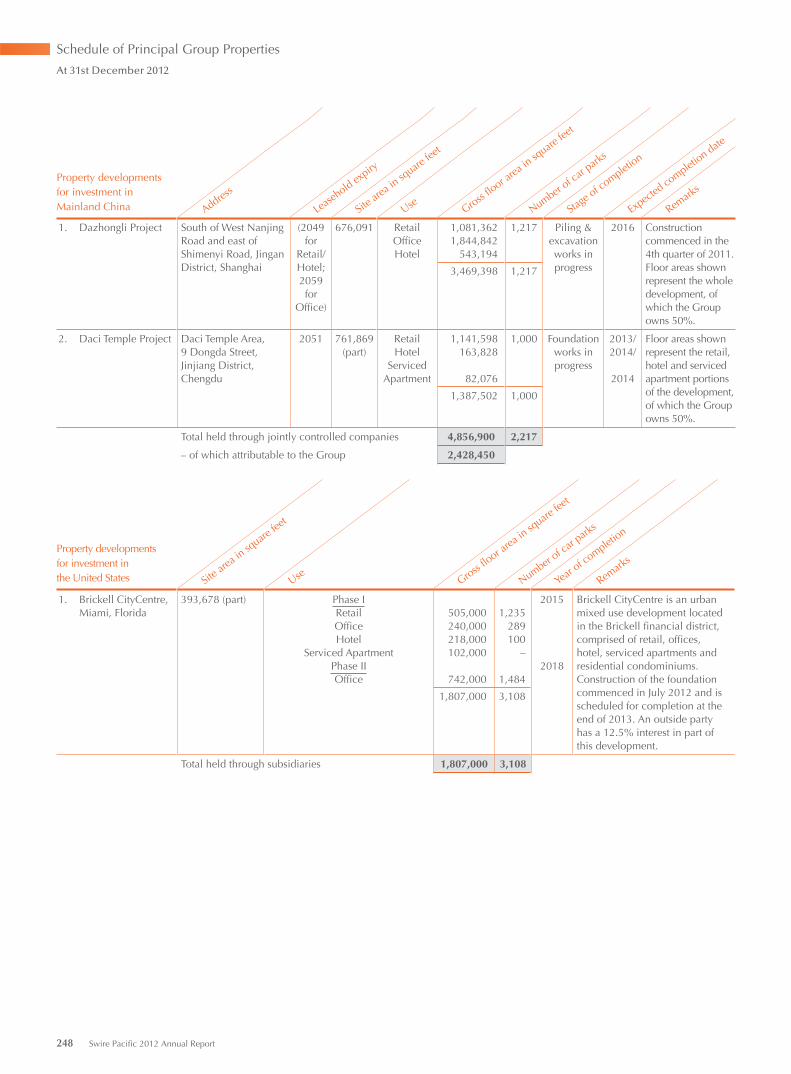
Property developments for investment in Mainland China Addres
s
Lease
hold expiry
Site a
rea in
square
feet
Use Gross flo
or area
in sq
uare fe
et
Number of c
ar park
s
Stage
of complet
ion
Expec
ted co
mpletion date
Remark
s
1. Dazhongli Project South of West Nanjing Road and east of Shimenyi Road, Jingan District, Shanghai
(2049 for
Retail/Hotel; 2059 for
Office)
676,091 Retail OfficeHotel
1,081,3621,844,842
543,194
3,469,398
1,217
1,217
Piling & excavation works in progress
2016 Construction commenced in the 4th quarter of 2011. Floor areas shown represent the whole development, of which the Group owns 50%.
2. Daci Temple Project Daci Temple Area, 9 Dongda Street, Jinjiang District, Chengdu
2051 761,869 (part)
RetailHotel
Serviced Apartment
1,141,598163,828
82,076
1,387,502
1,000
1,000
Foundation works in progress
2013/ 2014/
2014
Floor areas shown represent the retail, hotel and serviced apartment portions of the development, of which the Group owns 50%.
Total held through jointly controlled companies 4,856,900 2,217
– of which attributable to the Group 2,428,450
Property developments for investment inthe United States Sit
e area
in sq
uare fe
et
Use Gross flo
or area
in sq
uare fe
et
Number of c
ar park
s
Year
of complet
ion
Remark
s
1. Brickell CityCentre, Miami, Florida
393,678 (part) Phase IRetailOfficeHotel
Serviced ApartmentPhase IIOffice
505,000240,000218,000102,000
742,000
1,807,000
1,235289100
–
1,484
3,108
2015
2018
Brickell CityCentre is an urban mixed use development located in the Brickell financial district, comprised of retail, offices, hotel, serviced apartments and residential condominiums. Construction of the foundation commenced in July 2012 and is scheduled for completion at the end of 2013. An outside partyhas a 12.5% interest in part of this development.
Total held through subsidiaries 1,807,000 3,108
Schedule of Principal Group Properties
At 31st December 2012
248 Swire Pacific 2012 Annual Report
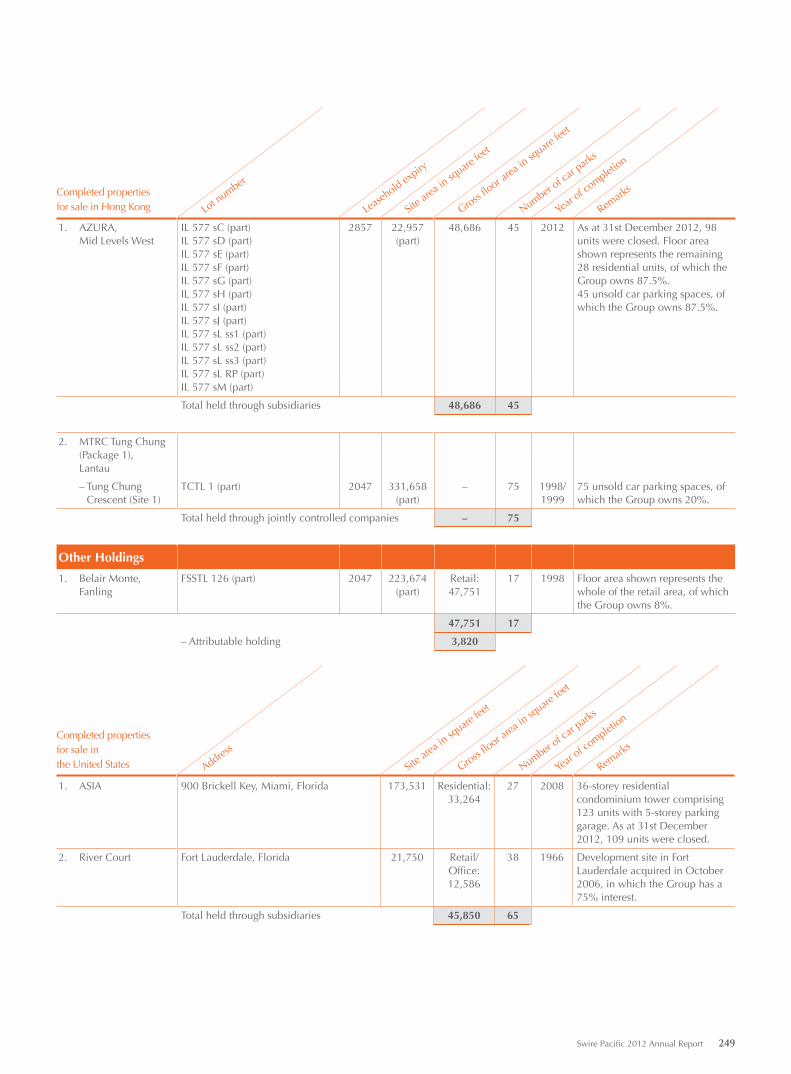
Completed properties for sale in Hong Kong Lo
t number
Lease
hold expiry
Site a
rea in
square
feet
Gross flo
or area
in sq
uare fe
et
Number of c
ar park
s
Year
of complet
ion
Remark
s
1. AZURA, Mid Levels West
IL 577 sC (part)IL 577 sD (part) IL 577 sE (part)IL 577 sF (part) IL 577 sG (part)IL 577 sH (part)IL 577 sI (part)IL 577 sJ (part)IL 577 sL ss1 (part)IL 577 sL ss2 (part)IL 577 sL ss3 (part)IL 577 sL RP (part)IL 577 sM (part)
2857 22,957 (part)
48,686 45 2012 As at 31st December 2012, 98 units were closed. Floor area shown represents the remaining 28 residential units, of which the Group owns 87.5%.45 unsold car parking spaces, of which the Group owns 87.5%.
Total held through subsidiaries 48,686 45
2. MTRC Tung Chung (Package 1), Lantau
– Tung Chung Crescent (Site 1)
TCTL 1 (part) 2047 331,658 (part)
– 75 1998/ 1999
75 unsold car parking spaces, of which the Group owns 20%.
Total held through jointly controlled companies – 75
Other Holdings
1. Belair Monte, Fanling
FSSTL 126 (part) 2047 223,674 (part)
Retail: 47,751
17 1998 Floor area shown represents the whole of the retail area, of which the Group owns 8%.
47,751 17
– Attributable holding 3,820
Completed properties for sale inthe United States Addres
s
Site a
rea in
square
feet
Gross flo
or area
in sq
uare fe
et
Number of c
ar park
s
Year
of complet
ion
Remark
s
1. ASIA 900 Brickell Key, Miami, Florida 173,531 Residential: 33,264
27 2008 36-storey residential condominium tower comprising 123 units with 5-storey parking garage. As at 31st December 2012, 109 units were closed.
2. River Court Fort Lauderdale, Florida 21,750 Retail/ Office: 12,586
38 1966 Development site in Fort Lauderdale acquired in October 2006, in which the Group has a 75% interest.
Total held through subsidiaries 45,850 65
Swire Pacific 2012 Annual Report 249
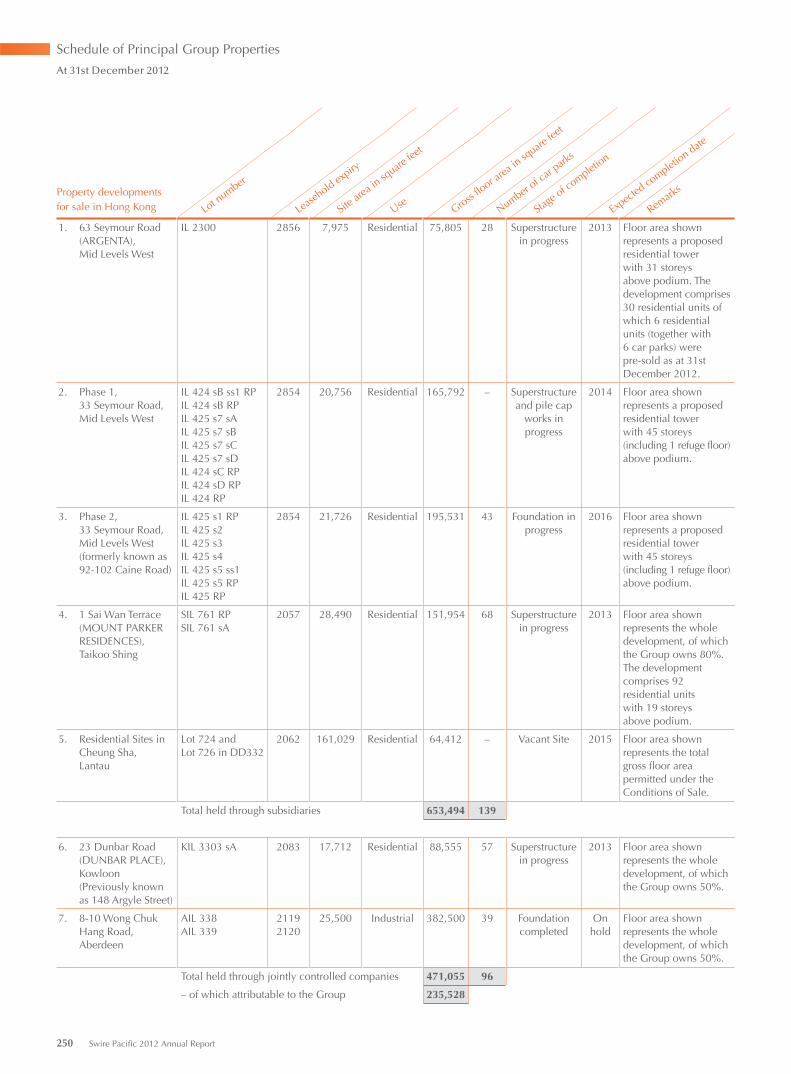
Property developments for sale in Hong Kong Lo
t number
Lease
hold expiry
Site a
rea in
square
feet
Use Gross flo
or area
in sq
uare fe
et
Number of c
ar park
s
Stage
of complet
ion
Expec
ted co
mpletion date
Remark
s
1. 63 Seymour Road (ARGENTA), Mid Levels West
IL 2300 2856 7,975 Residential 75,805 28 Superstructure in progress
2013 Floor area shown represents a proposed residential tower with 31 storeys above podium. The development comprises 30 residential units of which 6 residential units (together with 6 car parks) were pre-sold as at 31st December 2012.
2. Phase 1, 33 Seymour Road, Mid Levels West
IL 424 sB ss1 RPIL 424 sB RPIL 425 s7 sAIL 425 s7 sBIL 425 s7 sCIL 425 s7 sDIL 424 sC RPIL 424 sD RPIL 424 RP
2854 20,756 Residential 165,792 – Superstructure and pile cap
works in progress
2014 Floor area shown represents a proposed residential towerwith 45 storeys (including 1 refuge floor)above podium.
3. Phase 2, 33 Seymour Road, Mid Levels West (formerly known as 92-102 Caine Road)
IL 425 s1 RPIL 425 s2IL 425 s3IL 425 s4IL 425 s5 ss1IL 425 s5 RPIL 425 RP
2854 21,726 Residential 195,531 43 Foundation in progress
2016 Floor area shown represents a proposed residential towerwith 45 storeys (including 1 refuge floor) above podium.
4. 1 Sai Wan Terrace (MOUNT PARKER RESIDENCES), Taikoo Shing
SIL 761 RPSIL 761 sA
2057 28,490 Residential 151,954 68 Superstructure in progress
2013 Floor area shown represents the whole development, of which the Group owns 80%. The development comprises 92 residential unitswith 19 storeysabove podium.
5. Residential Sites in Cheung Sha, Lantau
Lot 724 and Lot 726 in DD332
2062 161,029 Residential 64,412 – Vacant Site 2015 Floor area shown represents the total gross floor area permitted under the Conditions of Sale.
Total held through subsidiaries 653,494 139
6. 23 Dunbar Road (DUNBAR PLACE), Kowloon (Previously known as 148 Argyle Street)
KIL 3303 sA 2083 17,712 Residential 88,555 57 Superstructure in progress
2013 Floor area shown represents the whole development, of which the Group owns 50%.
7. 8-10 Wong Chuk Hang Road, Aberdeen
AIL 338AIL 339
21192120
25,500 Industrial 382,500 39 Foundation completed
On hold
Floor area shown represents the whole development, of which the Group owns 50%.
Total held through jointly controlled companies 471,055 96
– of which attributable to the Group 235,528
Schedule of Principal Group Properties
At 31st December 2012
250 Swire Pacific 2012 Annual Report
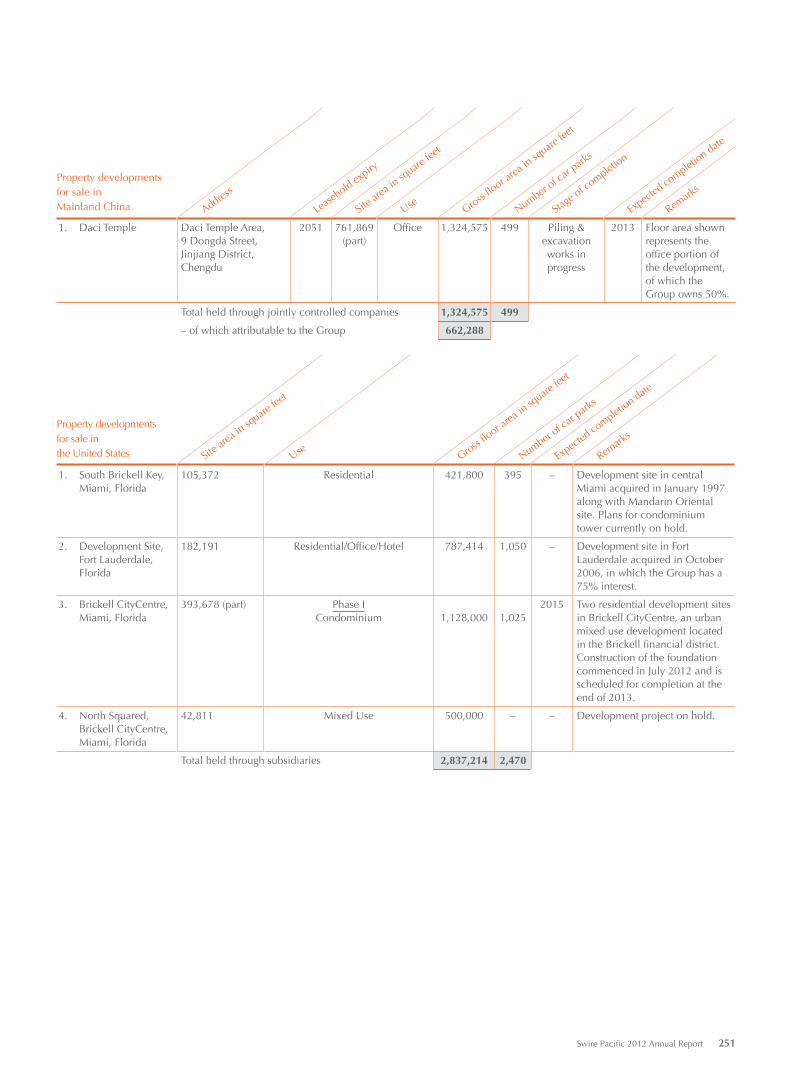
Property developments for sale in Mainland China Addres
s
Lease
hold expiry
Site a
rea in
square
feet
Use Gross flo
or area
in sq
uare fe
et
Number of c
ar park
s
Stage
of complet
ion
Expec
ted co
mpletion date
Remark
s
1. Daci Temple Daci Temple Area, 9 Dongda Street, Jinjiang District, Chengdu
2051 761,869 (part)
Office 1,324,575 499 Piling & excavation works in progress
2013 Floor area shown represents the office portion of the development, of which the Group owns 50%.
Total held through jointly controlled companies 1,324,575 499
– of which attributable to the Group 662,288
Property developments for sale inthe United States Sit
e area
in sq
uare fe
et
Use Gross flo
or area
in sq
uare fe
et
Number of c
ar park
s
Expec
ted co
mpletion date
Remark
s
1. South Brickell Key, Miami, Florida
105,372 Residential 421,800 395 – Development site in central Miami acquired in January 1997 along with Mandarin Oriental site. Plans for condominium tower currently on hold.
2. Development Site, Fort Lauderdale, Florida
182,191 Residential/Office/Hotel 787,414 1,050 – Development site in Fort Lauderdale acquired in October 2006, in which the Group has a 75% interest.
3. Brickell CityCentre, Miami, Florida
393,678 (part) Phase ICondominium 1,128,000 1,025
2015 Two residential development sites in Brickell CityCentre, an urban mixed use development located in the Brickell financial district. Construction of the foundation commenced in July 2012 and is scheduled for completion at the end of 2013.
4. North Squared, Brickell CityCentre, Miami, Florida
42,811 Mixed Use 500,000 – – Development project on hold.
Total held through subsidiaries 2,837,214 2,470
Swire Pacific 2012 Annual Report 251
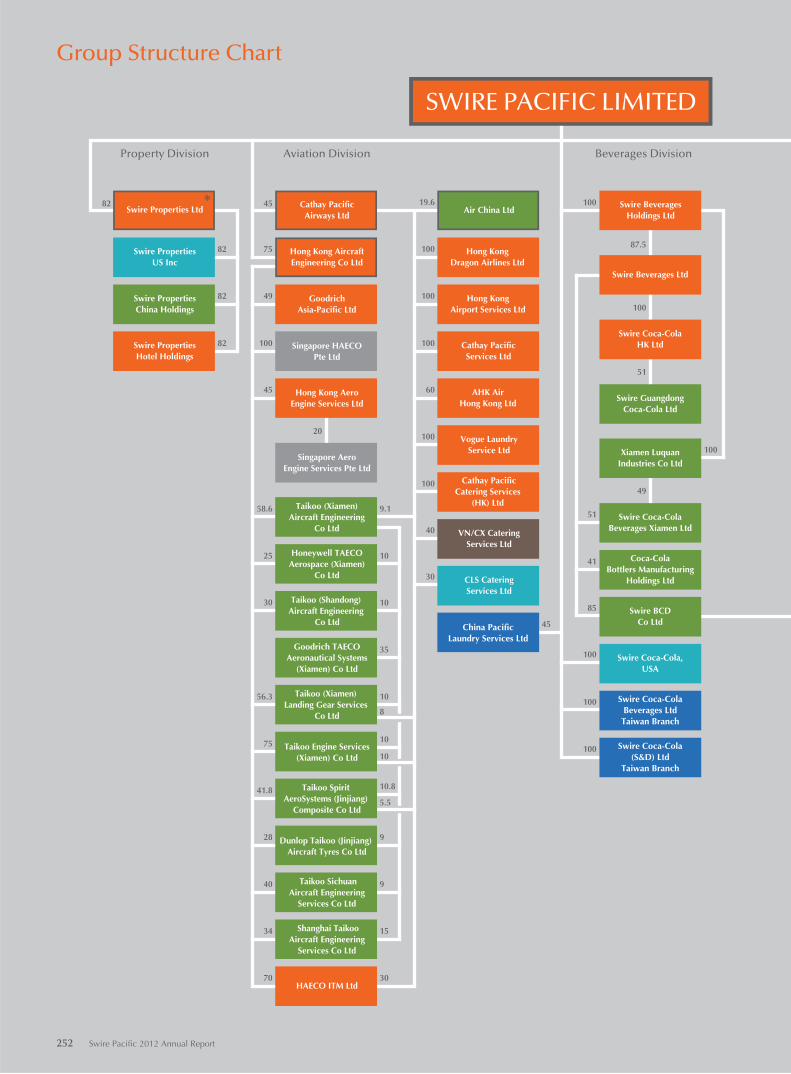
TO BE U
PDATED10
8
82
82
82
82
45
100
19.6
100
100
60
100
9.1
10
30
25
58.6
45
100
49
10
10
35
75
20
100
85
51
100
100
100
87.5
51
49
100
100
41
56.3
1075
41.8
28
40
10.8
5.5
9
9
34 15
70 30
40
100
30
45
Hong KongDragon Airlines Ltd
Air China Ltd
Hong KongAirport Services Ltd
Swire BeveragesHoldings Ltd
Swire Beverages Ltd
Swire Coca-ColaHK Ltd
Xiamen LuquanIndustries Co Ltd
Swire GuangdongCoca-Cola Ltd
Swire Coca-ColaBeverages Xiamen Ltd
Coca-ColaBottlers Manufacturing
Holdings Ltd
Swire BCDCo Ltd
Beverages Division
AHK AirHong Kong Ltd
Cathay PacificServices Ltd
Vogue LaundryService Ltd
Cathay PacificCatering Services
(HK) Ltd
VN/CX CateringServices Ltd
CLS CateringServices Ltd
Swire PropertiesChina Holdings
China PacificLaundry Services Ltd
Swire PropertiesHotel Holdings
Hong Kong AircraftEngineering Co Ltd
Hong Kong AeroEngine Services Ltd
Singapore AeroEngine Services Pte Ltd
Taikoo (Xiamen)Aircraft Engineering
Co Ltd
Honeywell TAECOAerospace (Xiamen)
Co Ltd
Taikoo (Shandong) Aircraft Engineering
Co Ltd
Goodrich TAECOAeronautical Systems
(Xiamen) Co Ltd
Taikoo (Xiamen) Landing Gear Services
Co Ltd
Cathay PacificAirways Ltd
Dunlop Taikoo (Jinjiang) Aircraft Tyres Co Ltd
Taikoo Engine Services(Xiamen) Co Ltd
Taikoo Spirit AeroSystems (Jinjiang)
Composite Co Ltd
Taikoo SichuanAircraft Engineering
Services Co Ltd
Shanghai TaikooAircraft Engineering
Services Co Ltd
HAECO ITM Ltd
GoodrichAsia-Pacific Ltd
Singapore HAECOPte Ltd
Swire PropertiesUS Inc
Swire Coca-Cola(S&D) Ltd
Taiwan Branch
Swire Coca-Cola,USA
Swire Coca-ColaBeverages LtdTaiwan Branch
SWIRE PACIFIC LIMITED
Swire Properties Ltd
Aviation DivisionProperty Division
Group Structure Chart
252 Swire Pacific 2012 Annual Report
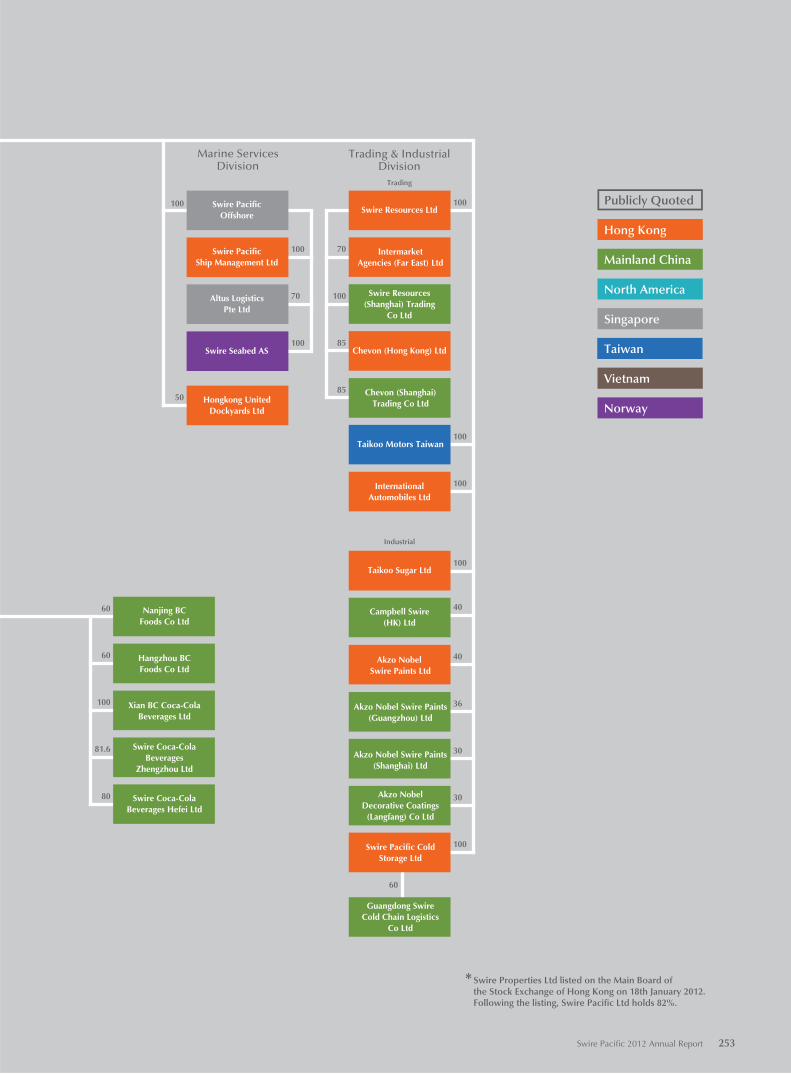
TO BE U
PDATED
100
85
85
70100
70
100
100 100
100
50
81.6
100
60
60
80
60
100
100
40
40
36
30
30
100
Marine ServicesDivision
Trading & IndustrialDivision
Trading
Publicly Quoted
Hong Kong
Mainland China
North America
Singapore
Taiwan
Vietnam
Norway
Swire Resources(Shanghai) Trading
Co Ltd
IntermarketAgencies (Far East) Ltd
Chevon (Hong Kong) Ltd
Chevon (Shanghai)Trading Co Ltd
Swire PacificOffshore
InternationalAutomobiles Ltd
Swire PacificShip Management Ltd
Altus LogisticsPte Ltd
Swire Seabed AS
Hongkong UnitedDockyards Ltd
Industrial
Taikoo Motors Taiwan
Swire Resources Ltd
Hangzhou BCFoods Co Ltd
Xian BC Coca-ColaBeverages Ltd
Swire Coca-ColaBeverages Hefei Ltd
Swire Coca-ColaBeverages
Zhengzhou Ltd
Nanjing BCFoods Co Ltd
Taikoo Sugar Ltd
Campbell Swire(HK) Ltd
Akzo Nobel Swire Paints Ltd
Akzo Nobel Swire Paints(Guangzhou) Ltd
Akzo Nobel Swire Paints(Shanghai) Ltd
Akzo NobelDecorative Coatings
(Langfang) Co Ltd
Swire Pacific ColdStorage Ltd
Guangdong SwireCold Chain Logistics
Co Ltd
*Swire Properties Ltd listed on the Main Board ofthe Stock Exchange of Hong Kong on 18th January 2012.Following the listing, Swire Pacific Ltd holds 82%.
Swire Pacific 2012 Annual Report 253
Glossary
TermsFinancialAdjusted consolidated net worth Total of share capital, reserves and non-controlling interests.
Adjusted consolidated tangible net worth Adjusted consolidated net worth less goodwill and other intangible assets.
EBIT Operating profit before dividends received from jointly controlled and associated companies.
Equity attributable to the Company’s shareholders Equity before non-controlling interests.
FFO Funds from operations – Operating profit (excluding profit or loss on sale of investment properties and property, plant and equipment) less net finance charges less change in fair value of investment properties less tax paid less non-recurring items plus depreciation and amortisation plus dividends from jointly controlled and associated companies plus non cash items.
Gross borrowings Total of loans, bonds, overdrafts and perpetual capital securities.
Net assets employed Total equity plus net debt.
Net debt or consolidated borrowed money Total of loans, bonds, overdrafts and perpetual capital securities net of bank deposits, bank balances and certain available-for-sale investments.
Underlying equity attributable to the Company’s shareholders Reported equity before non-controlling interests, adjusted for the impact of deferred tax on changes in the fair value of investment properties in Mainland China.
Underlying profit Reported profit adjusted principally for net revaluation movements on investment properties and the associated deferred tax in Mainland China and for deferred tax provisions made in respect of investment properties held for the long-term where it is considered that the liability will not reverse for some considerable time.
AviationAvailable seat kilometres (“ASK”) Passenger seat capacity, measured in seats available for the carriage of passengers on each sector multiplied by the sector distance.
Available tonne kilometres (“ATK”) is the overall capacity, measured in tonnes, available for the carriage of airline passengers, excess baggage, cargo and mail on each sector multiplied by the sector distance.
On-time performance Departure within 15 minutes of scheduled departure time.
Revenue passenger kilometres (“RPK”) Number of passengers carried on each sector multiplied by the sector distance.
BeveragesGeneral Trade Small, usually independent, grocery outlets.
Modern Trade Supermarkets and convenience stores, which are usually members of large retail chains.
Other Channels Includes wholesalers, restaurants and outlets at entertainment and educational establishments.
Production Quality Index An index used throughout TCCC system for evaluating the quality during the production process over a 12-month period.
Marine ServicesISOA International Support Vessel Owners’ Association.
Sustainable DevelopmentCarbon Dioxide Equivalent (“CO2e”) A measure of the global warming potential of releases of the six greenhouse gases (“GHG”) specified by the Kyoto protocol. These are carbon dioxide (CO2), methane (CH4), nitrous oxide (N2O), hydrofluorocarbons (HFCs), perfluorocarbons (PFCs), and sulphur hexafluoride (SF6).
Greenhouse Gas (“GHG”) A gas in the atmosphere that absorbs and emits radiation within the thermal infrared range. This process is the fundamental cause of the greenhouse effect because part of the re-radiation is back towards the surface of the earth and the lower atmosphere, resulting in an elevation of the average surface temperature above what it would be in the absence of greenhouse gases.
Cubic metres (“cbm”) A metric unit of volume or capacity equal to 1,000 litres or 1.0 metric tonnes of water.
Global Reporting Initiative (“GRI”) (www.globalreporting.org) An institution which provides a generally accepted framework for sustainability reporting. This framework sets out the principles and indicators that entities can use to measure and report their economic, environmental and social performance.
254 Swire Pacific 2012 Annual Report
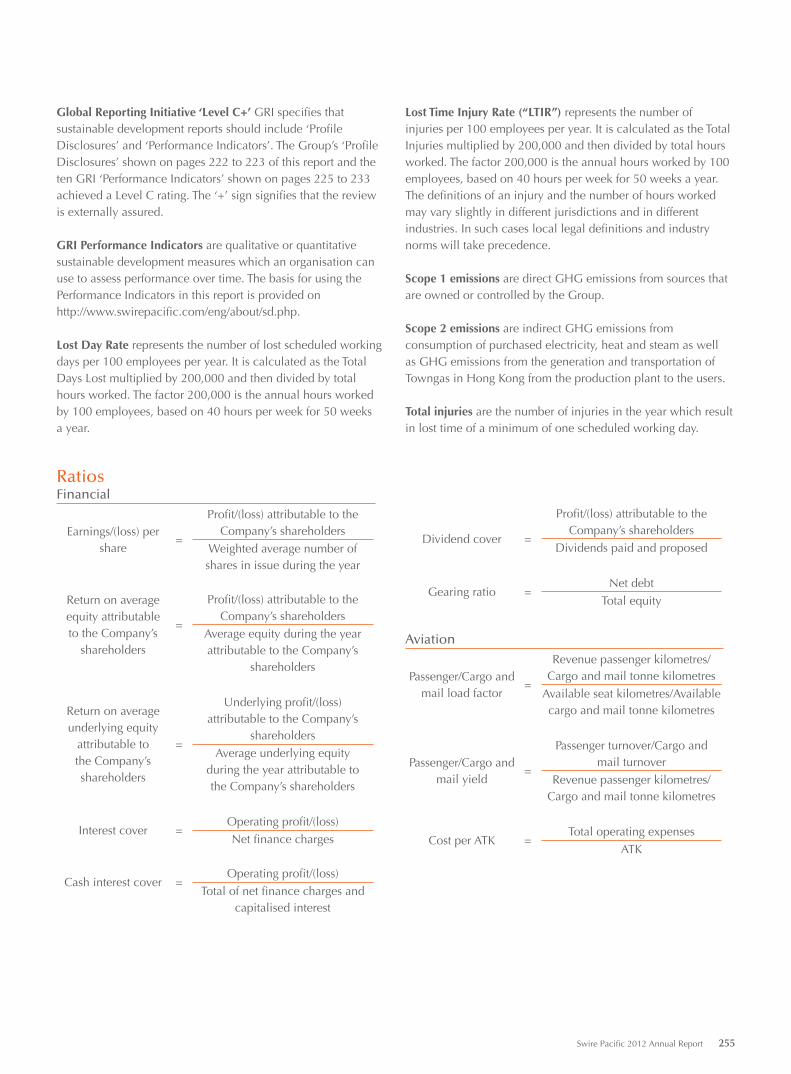
RatiosFinancial
Earnings/(loss) per share
=
Profit/(loss) attributable to the Company’s shareholders
Weighted average number of shares in issue during the year
Return on average equity attributable to the Company’s
shareholders
=
Profit/(loss) attributable to the
Company’s shareholdersAverage equity during the year attributable to the Company’s
shareholders
Return on average underlying equity
attributable to the Company’s shareholders
=
Underlying profit/(loss) attributable to the Company’s
shareholdersAverage underlying equity
during the year attributable to the Company’s shareholders
Interest cover =Operating profit/(loss)Net finance charges
Cash interest cover =
Operating profit/(loss)
Total of net finance charges and capitalised interest
Dividend cover =
Profit/(loss) attributable to the Company’s shareholders
Dividends paid and proposed
Gearing ratio =Net debt
Total equity
Aviation
Passenger/Cargo and mail load factor
=
Revenue passenger kilometres/Cargo and mail tonne kilometres
Available seat kilometres/Available cargo and mail tonne kilometres
Passenger/Cargo and mail yield
=
Passenger turnover/Cargo and mail turnover
Revenue passenger kilometres/Cargo and mail tonne kilometres
Cost per ATK =Total operating expenses
ATK
Global Reporting Initiative ‘Level C+’ GRI specifies that sustainable development reports should include ‘Profile Disclosures’ and ‘Performance Indicators’. The Group’s ‘Profile Disclosures’ shown on pages 222 to 223 of this report and the ten GRI ‘Performance Indicators’ shown on pages 225 to 233 achieved a Level C rating. The ‘+’ sign signifies that the review is externally assured.
GRI Performance Indicators are qualitative or quantitative sustainable development measures which an organisation can use to assess performance over time. The basis for using the Performance Indicators in this report is provided on http://www.swirepacific.com/eng/about/sd.php.
Lost Day Rate represents the number of lost scheduled working days per 100 employees per year. It is calculated as the Total Days Lost multiplied by 200,000 and then divided by total hours worked. The factor 200,000 is the annual hours worked by 100 employees, based on 40 hours per week for 50 weeks a year.
Lost Time Injury Rate (“LTIR”) represents the number of injuries per 100 employees per year. It is calculated as the Total Injuries multiplied by 200,000 and then divided by total hours worked. The factor 200,000 is the annual hours worked by 100 employees, based on 40 hours per week for 50 weeks a year. The definitions of an injury and the number of hours worked may vary slightly in different jurisdictions and in different industries. In such cases local legal definitions and industry norms will take precedence.
Scope 1 emissions are direct GHG emissions from sources that are owned or controlled by the Group.
Scope 2 emissions are indirect GHG emissions from consumption of purchased electricity, heat and steam as well as GHG emissions from the generation and transportation of Towngas in Hong Kong from the production plant to the users.
Total injuries are the number of injuries in the year which result in lost time of a minimum of one scheduled working day.
Swire Pacific 2012 Annual Report 255
Financial Calendar and Information for Investors
Financial Calendar 2013Annual Report available to shareholders 9th April‘A’ and ‘B’ shares trade ex-dividend 10th AprilShare registers closed for second interim dividends entitlement 12th AprilPayment of 2012 second interim dividends 3rd MayShare registers closed for attending and voting at Annual General Meeting 6th-9th MayAnnual General Meeting 9th MayInterim results announcement AugustFirst interim dividends payable October
Registered OfficeSwire Pacific Limited33rd Floor, One Pacific Place88 QueenswayHong Kong
RegistrarsComputershare Hong Kong Investor Services Limited17M Floor, Hopewell Centre183 Queen’s Road EastHong KongWebsite: www.computershare.com
DepositaryThe Bank of New York MellonP.O. Box 358516Pittsburgh, PA 15252-8516USA
Website: www.bnymellon.com/shareownerE-mail: [email protected]: Calls within USA-toll free: 1-888-BNY-ADRS International callers: 1-201-680-6825
Stock Codes ‘A’ ‘B’Hong Kong Stock Exchange 19 87ADR SWRAY SWRBY
Except for voting rights, which are equal, the entitlements of ‘A’ and ‘B’ shareholders are in the proportion 5 to 1.
AuditorsPricewaterhouseCoopers
Investor RelationsE-mail: [email protected]
Public AffairsE-mail: [email protected]: (852) 2840-8098Fax: (852) 2526-9365Website: www.swirepacific.com
Request for FeedbackIn order that we may improve our reporting, we would be grateful to receive your comments on our public announcements and disclosures via e-mail to [email protected]
256 Swire Pacific 2012 Annual Report

Design: FutureBrand www.futurebrand.com Printed in Hong Kong This Annual Report is printed on FSCTM certified paper with 25% recycled and vegetable oil-based inks.

SWIR
E PAC
IFIC LIM
ITED2012 A
nnual Report
Annual Report 2012
Stock Codes: ‘A’ Shares 00019 ‘B’ Shares 00087www.swirepacific.com
Swire Pacific Group Overview 1 Corporate Statement 4 2012 Performance Highlights 8 Summary of Past Performance 12 Chairman’s Statement
Management Discussion and Analysis
16 2012 Performance Review and Outlook Property Division Aviation Division Beverages Division Marine Services Division Trading & Industrial Division 84 2012 Sustainable Development Review and 2013 Aims Overview Environment Health and Safety Community Involvement Staff Working with Others102 Financial Review111 Financing
Corporate Governance
120 Corporate Governance Report131 Risk Management135 Directors and Officers137 Directors’ Report
Auditor’s Report and Accounts
146 Independent Auditor’s Report147 Consolidated Income Statement148 Consolidated Statement of Comprehensive Income149 Consolidated Statement of Financial Position150 Company Statement of Financial Position151 Consolidated Statement of Cash Flows152 Consolidated Statement of Changes in Equity153 Notes to the Accounts201 Principal Accounting Policies211 Principal Subsidiary, Jointly Controlled and Associated Companies and Investments
Sustainable Development Statistics
222 Introduction224 Sustainable Development Assurance Statement225 Sustainable Development Statistics
Supplementary Information
234 Cathay Pacific Airways Limited – Abridged Financial Statements239 Schedule of Principal Group Properties252 Group Structure Chart254 Glossary256 Financial Calendar and Information for Investors
Contents
Note: Definitions of the terms and ratios used in this report can be found in the Glossary on pages 254 and 255.