interest rates 4: interest rate discovery
TRANSCRIPT
INTEREST RATES 4: INTEREST RATE DISCOVERY
AP Faure1 ABSTRACT This is the fourth in a series of seven papers on interest rates and it covers the principle of interest rate discovery and security valuation, the micro structure of financial markets, the role of secondary markets, interest rate discovery in the debt and deposit markets, and the micro factors which impact on price discovery. The seven papers cover: (1) what are interest rates?; (2) relationship of interest rates; (3) composition of interest rates; (4) interest rate discovery; (5) bank liquidity & interest rate discovery; (6) role of interest rates; (7) an optimal rate of interest: the natural rate. JEL Classification: E 40, E43, E44, E50, E51, E52, E58 Keywords: interest rates, money market, monetary policy, money, financial markets 1. INTRODUCTION All economics scholars are familiar with the term price discovery. It is the process of “finding” or “determining” the price of a financial market security or commodity through the actions of buyers and sellers in the secondary market. In the primary market it is the actions of an issuer and buyers, both of whom rely on information emanating from the secondary market for the relevant security (if it exists, such as in the case of an equity rights issue, or a similar security if it does not). These terms also apply to interest rates which, as we have seen, are inversely related to their prices. We discuss the important issue of interest rate discovery under the following headings:
Interest rate discovery and security valuation. Organisational structure of financial markets. Role of the secondary markets. Interest rate discovery in the debt and deposit markets. Factors which impact on price discovery.
2. INTEREST RATE DISCOVERY AND SECURITY VALUATION
1 Rhodes University.
2
It is important to state at the outset that in the case of price discovery in the share / equity / stock market, there usually is a difference between the price discovered of a share and its valuation. The price discovered of a share is the outcome of all buyers’ and sellers’ market sentiments at a point in time. This is different to its valuation, which is the result of analysis of three approaches: balance sheet valuation, discounted cash flow valuation, and relative valuation. Thus, the outcome of valuation analysis may be a price which is higher than, equal to, or lower than, the market price discovered. This is not the case with debt and deposit securities (ignoring a minuscule proportion of securities – floating rate securities2). In the overwhelming majority of cases the maturity values (MVs) and future cash flows (FVs) are fixed. In these cases, when an interest rate is discovered, its exact price can be derived. 3. ORGANISATIONAL STRUCTURE OF FINANCIAL MARKETS 3.1 Introduction As we know, interest rate discovery takes place in the financial markets. As such, we need to cover the microeconomics of financial markets: the types, forms, nature, trading driver, secondary market, etc, of financial markets, and how they operate or work in the real world. The terms “types”, “forms, “nature”, “trading driver”, “secondary market”, etc, are part of the financial market jargon that can be confusing. A sub-aim of this section is to create some logical order in this regard. It is organised as follows:
Spot and derivative markets. Primary and secondary markets. Market form: exchange-traded and OTC markets. Issuing methods. Trading driver: order or quote. Trading system. Trading form: single and dual capacity.
Note that this is a general discussion and as such does not focus only on the debt and deposit markets. The focus on the debt and deposit markets comes in a later section. 3.2 Spot and derivative markets The first distinction we need to make is between spot and derivative markets. A spot deal (aka a cash deal) refers to a transaction / deal, which is a contract, that is settled at the earliest opportunity possible. For example (see Figure 4.1), in the
2 Floating rate securities which have frequent rate changes, such as call securities, are priced at 1.0.
3
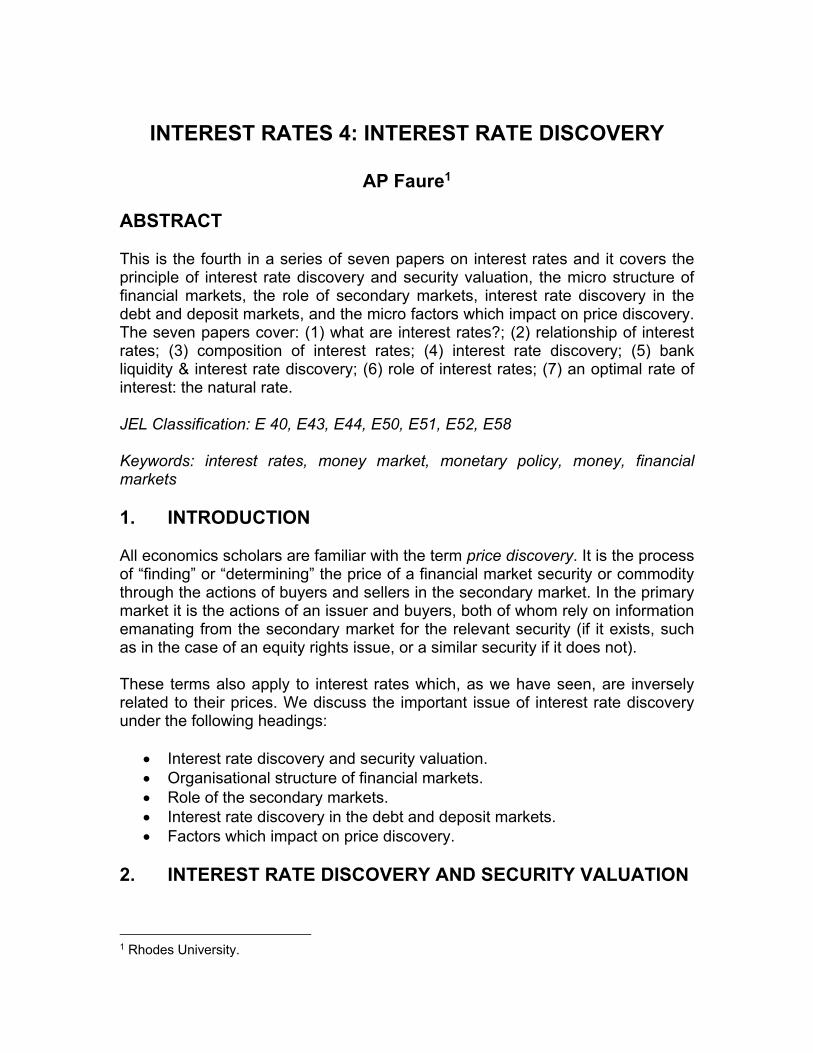
money market a spot deal is where securities are exchanged for payment (also called delivery versus payment) on the day the deal is transacted (T+0) or the following day (T+1). In most bond markets a spot deal transacted on T+0 is settled after 3 working days (T+3). In most share / equity markets spot means T+5.
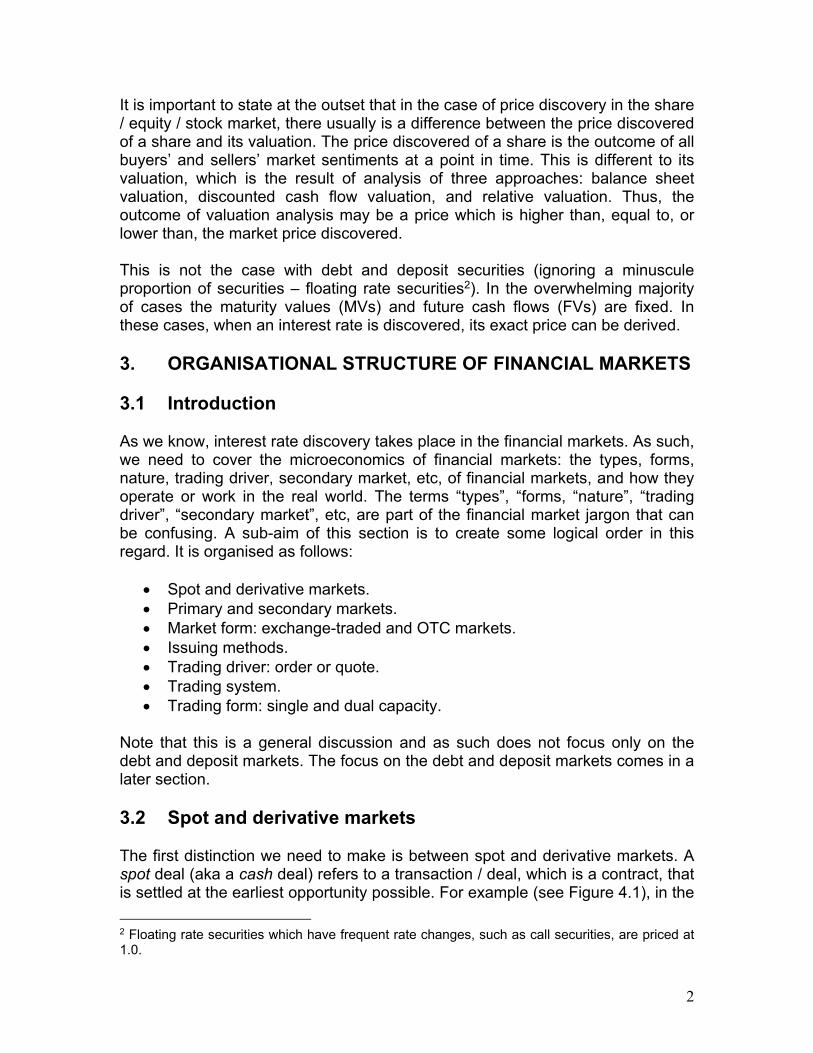
Figure 4.1: Settlement in the spot / cash and derivative markets The issue that determines the number after the “+” sign is essentially convenience. In the money market it is convenient to settle now or tomorrow, whereas in the share market many individuals are involved who are spread across the county; therefore, it takes time for the securities to be posted to the exchange. This of course changes with security dematerialisation / immobilisation3. The difference between a spot deal and a derivative deal [forwards, futures, swaps, options and “other” (weather, credit, etc)] is only the settlement date. Spot and derivatives deals are transacted on T+0 at a price agreed then, but settlement tales place on days other than spot deal days, that is, on days in the future, such as T+90. 3.3 Primary and secondary markets The next level of distinction in the spot markets is primary and secondary markets, which we call market type. We have discussed this briefly, and take it a little further here. With the market types we are able to make a start with our illustration which is designed to demystify the jargon (see Figure 4.2).
3 Dematerialisation means that scrip (physical certificates) no longer exist, while immobilisation means that scrip exists but is placed in a scrip depository which holds them on behalf of the investors (usually this means one certificate).
4
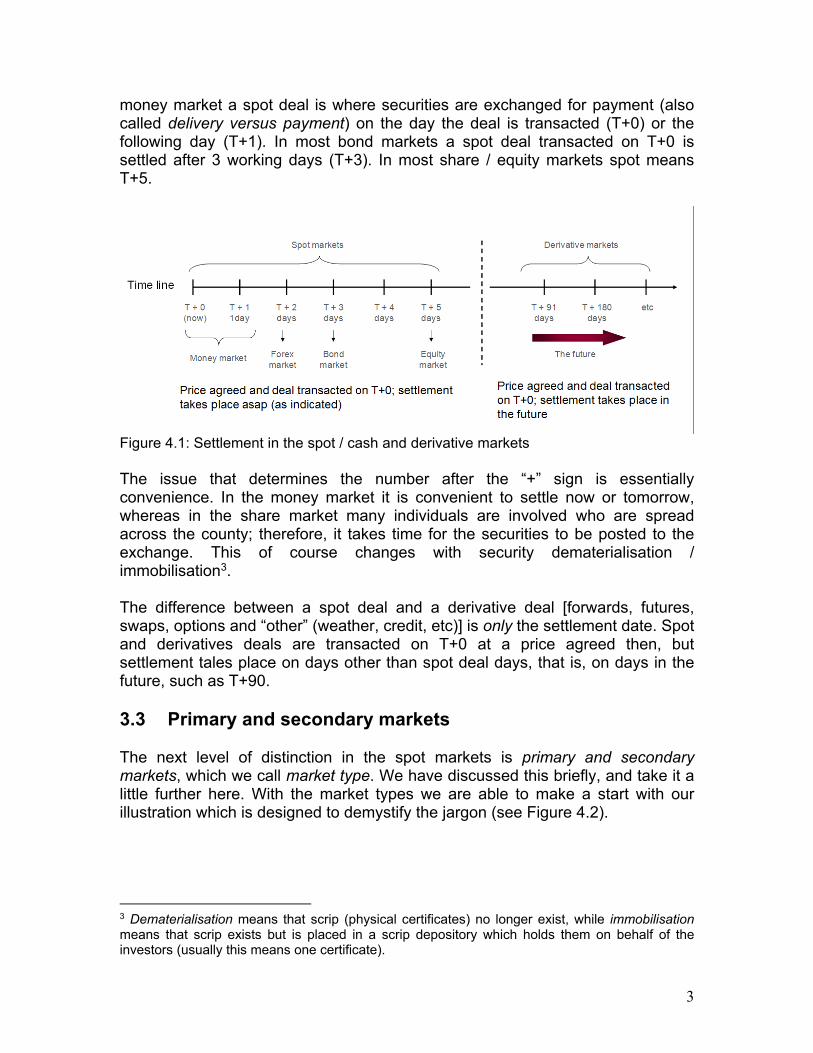
Figure 4.2: Organisational structure of spot financial markets (1) The primary market is the market for the issue of new securities (debt, deposits and shares). It will be evident that the markets in non-marketable securities, such as mortgage loans, savings deposits and life policies, are entirely primary markets, while NCDs and bonds (for example) are issued in the primary market, but are traded in the secondary market. Secondary market is the term used for the markets in which previously issued financial securities are traded. Broker-dealers usually facilitate these secondary market transactions. In the primary market the issuer receives funds, whereas in the secondary market the original issuer does not receive funds; only the seller does. The primary and secondary markets can be portrayed as in Figure 4.3. Secondary markets play a significant role in the financial system, and specifically in interest rate discovery. This is covered in the following main section.
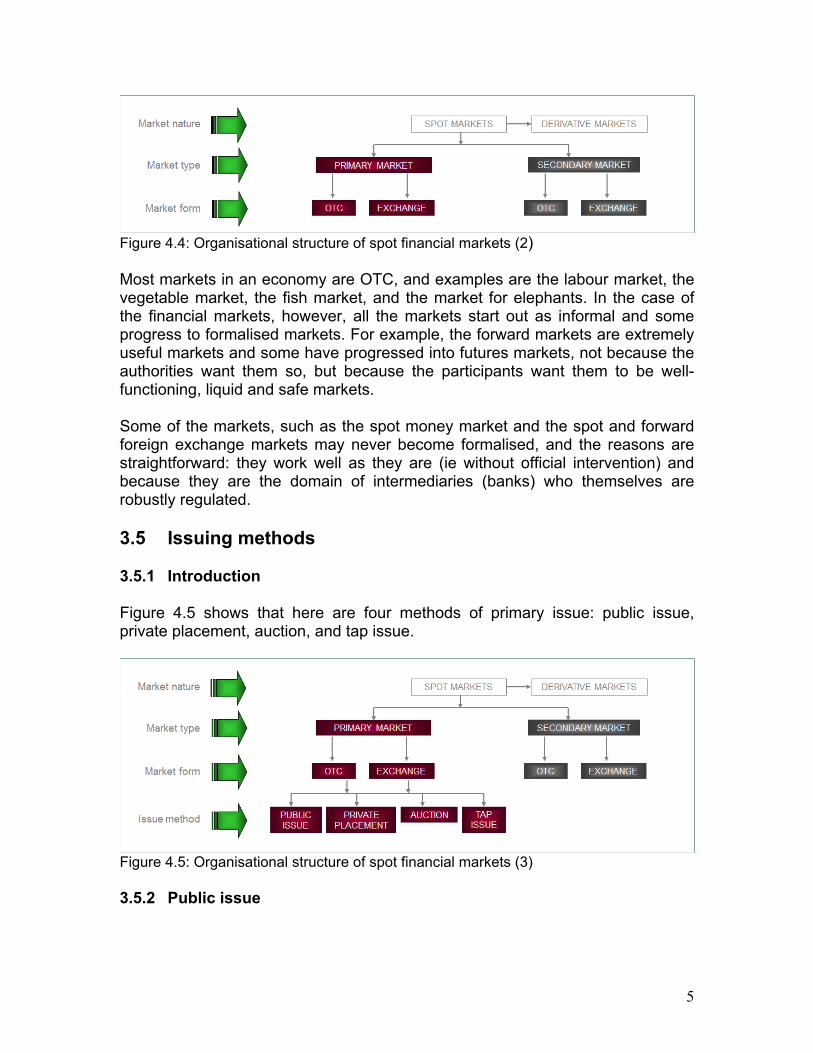
Figure 4.3: Primary and secondary markets: The difference 3.4 Market form: exchange-traded and OTC markets Markets may be of the form over-the-counter (OTC), which are not usually legislated, or of the form exchange-traded (aka formalised). These fit into our growing financial markets illustration as portrayed in Figure 4.4.
5
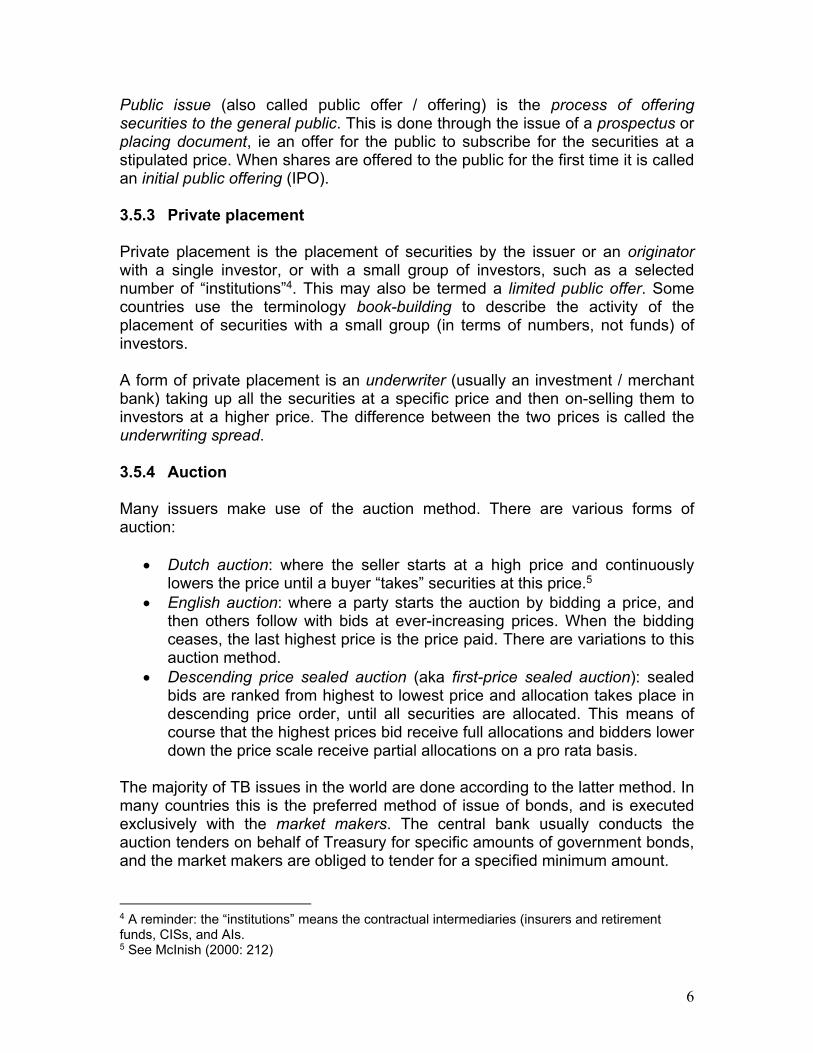
Figure 4.4: Organisational structure of spot financial markets (2) Most markets in an economy are OTC, and examples are the labour market, the vegetable market, the fish market, and the market for elephants. In the case of the financial markets, however, all the markets start out as informal and some progress to formalised markets. For example, the forward markets are extremely useful markets and some have progressed into futures markets, not because the authorities want them so, but because the participants want them to be well-functioning, liquid and safe markets. Some of the markets, such as the spot money market and the spot and forward foreign exchange markets may never become formalised, and the reasons are straightforward: they work well as they are (ie without official intervention) and because they are the domain of intermediaries (banks) who themselves are robustly regulated. 3.5 Issuing methods 3.5.1 Introduction Figure 4.5 shows that here are four methods of primary issue: public issue, private placement, auction, and tap issue.
Figure 4.5: Organisational structure of spot financial markets (3) 3.5.2 Public issue
6
Public issue (also called public offer / offering) is the process of offering securities to the general public. This is done through the issue of a prospectus or placing document, ie an offer for the public to subscribe for the securities at a stipulated price. When shares are offered to the public for the first time it is called an initial public offering (IPO). 3.5.3 Private placement Private placement is the placement of securities by the issuer or an originator with a single investor, or with a small group of investors, such as a selected number of “institutions”4. This may also be termed a limited public offer. Some countries use the terminology book-building to describe the activity of the placement of securities with a small group (in terms of numbers, not funds) of investors. A form of private placement is an underwriter (usually an investment / merchant bank) taking up all the securities at a specific price and then on-selling them to investors at a higher price. The difference between the two prices is called the underwriting spread. 3.5.4 Auction Many issuers make use of the auction method. There are various forms of auction:
Dutch auction: where the seller starts at a high price and continuously lowers the price until a buyer “takes” securities at this price.5
English auction: where a party starts the auction by bidding a price, and then others follow with bids at ever-increasing prices. When the bidding ceases, the last highest price is the price paid. There are variations to this auction method.
Descending price sealed auction (aka first-price sealed auction): sealed bids are ranked from highest to lowest price and allocation takes place in descending price order, until all securities are allocated. This means of course that the highest prices bid receive full allocations and bidders lower down the price scale receive partial allocations on a pro rata basis.
The majority of TB issues in the world are done according to the latter method. In many countries this is the preferred method of issue of bonds, and is executed exclusively with the market makers. The central bank usually conducts the auction tenders on behalf of Treasury for specific amounts of government bonds, and the market makers are obliged to tender for a specified minimum amount.
4 A reminder: the “institutions” means the contractual intermediaries (insurers and retirement funds, CISs, and AIs. 5 See McInish (2000: 212)
7
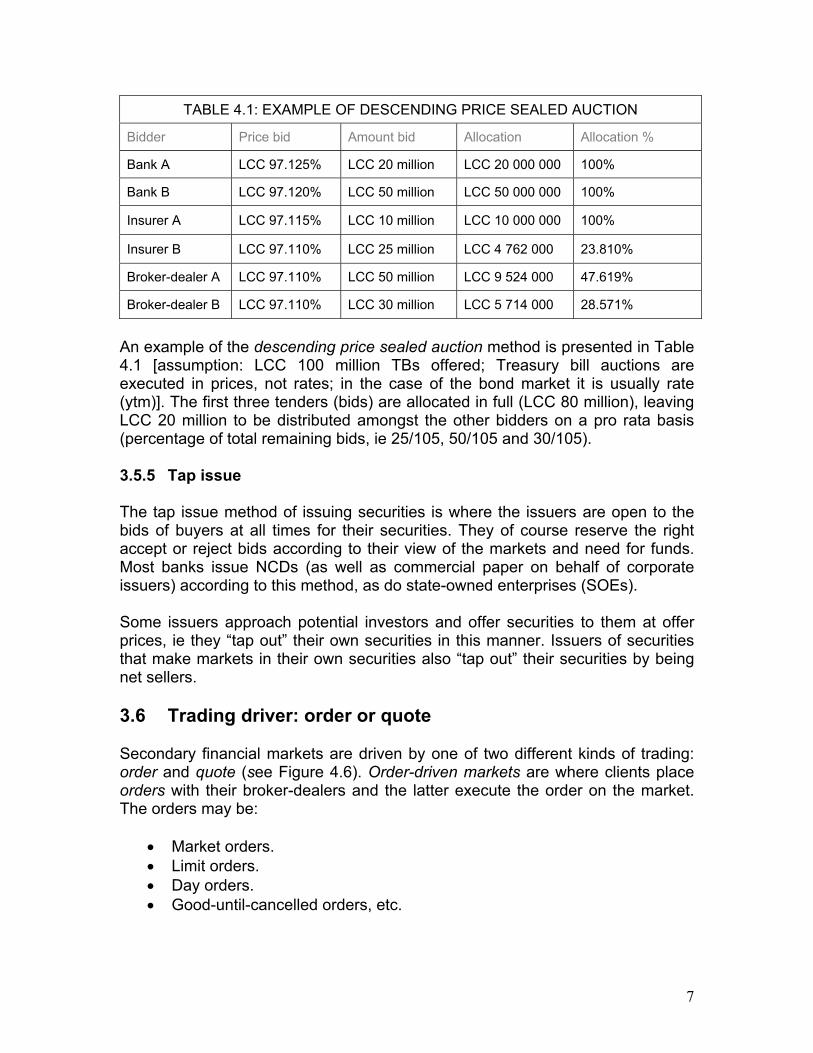
TABLE 4.1: EXAMPLE OF DESCENDING PRICE SEALED AUCTION
Bidder Price bid Amount bid Allocation Allocation %
Bank A LCC 97.125% LCC 20 million LCC 20 000 000 100%
Bank B LCC 97.120% LCC 50 million LCC 50 000 000 100%
Insurer A LCC 97.115% LCC 10 million LCC 10 000 000 100%
Insurer B LCC 97.110% LCC 25 million LCC 4 762 000 23.810%
Broker-dealer A LCC 97.110% LCC 50 million LCC 9 524 000 47.619%
Broker-dealer B LCC 97.110% LCC 30 million LCC 5 714 000 28.571%
An example of the descending price sealed auction method is presented in Table 4.1 [assumption: LCC 100 million TBs offered; Treasury bill auctions are executed in prices, not rates; in the case of the bond market it is usually rate (ytm)]. The first three tenders (bids) are allocated in full (LCC 80 million), leaving LCC 20 million to be distributed amongst the other bidders on a pro rata basis (percentage of total remaining bids, ie 25/105, 50/105 and 30/105). 3.5.5 Tap issue The tap issue method of issuing securities is where the issuers are open to the bids of buyers at all times for their securities. They of course reserve the right accept or reject bids according to their view of the markets and need for funds. Most banks issue NCDs (as well as commercial paper on behalf of corporate issuers) according to this method, as do state-owned enterprises (SOEs). Some issuers approach potential investors and offer securities to them at offer prices, ie they “tap out” their own securities in this manner. Issuers of securities that make markets in their own securities also “tap out” their securities by being net sellers. 3.6 Trading driver: order or quote Secondary financial markets are driven by one of two different kinds of trading: order and quote (see Figure 4.6). Order-driven markets are where clients place orders with their broker-dealers and the latter execute the order on the market. The orders may be:
Market orders. Limit orders. Day orders. Good-until-cancelled orders, etc.
8
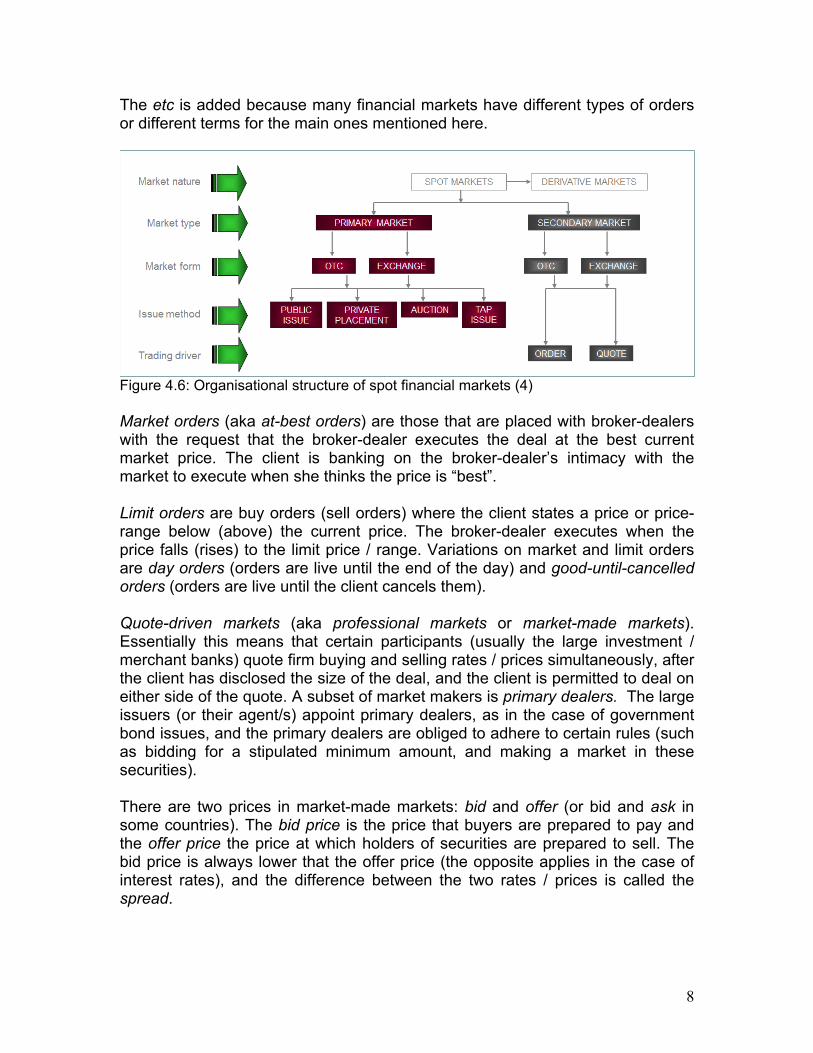
The etc is added because many financial markets have different types of orders or different terms for the main ones mentioned here.
Figure 4.6: Organisational structure of spot financial markets (4) Market orders (aka at-best orders) are those that are placed with broker-dealers with the request that the broker-dealer executes the deal at the best current market price. The client is banking on the broker-dealer’s intimacy with the market to execute when she thinks the price is “best”. Limit orders are buy orders (sell orders) where the client states a price or price-range below (above) the current price. The broker-dealer executes when the price falls (rises) to the limit price / range. Variations on market and limit orders are day orders (orders are live until the end of the day) and good-until-cancelled orders (orders are live until the client cancels them). Quote-driven markets (aka professional markets or market-made markets). Essentially this means that certain participants (usually the large investment / merchant banks) quote firm buying and selling rates / prices simultaneously, after the client has disclosed the size of the deal, and the client is permitted to deal on either side of the quote. A subset of market makers is primary dealers. The large issuers (or their agent/s) appoint primary dealers, as in the case of government bond issues, and the primary dealers are obliged to adhere to certain rules (such as bidding for a stipulated minimum amount, and making a market in these securities). There are two prices in market-made markets: bid and offer (or bid and ask in some countries). The bid price is the price that buyers are prepared to pay and the offer price the price at which holders of securities are prepared to sell. The bid price is always lower that the offer price (the opposite applies in the case of interest rates), and the difference between the two rates / prices is called the spread.
9
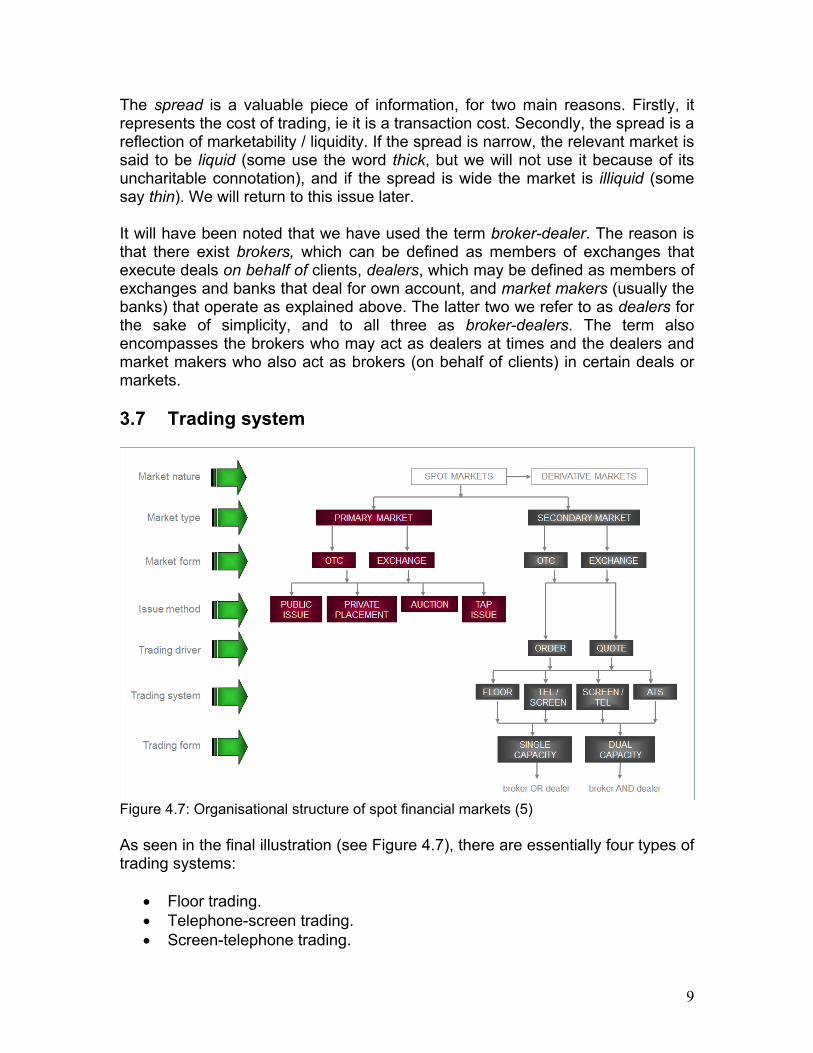
The spread is a valuable piece of information, for two main reasons. Firstly, it represents the cost of trading, ie it is a transaction cost. Secondly, the spread is a reflection of marketability / liquidity. If the spread is narrow, the relevant market is said to be liquid (some use the word thick, but we will not use it because of its uncharitable connotation), and if the spread is wide the market is illiquid (some say thin). We will return to this issue later. It will have been noted that we have used the term broker-dealer. The reason is that there exist brokers, which can be defined as members of exchanges that execute deals on behalf of clients, dealers, which may be defined as members of exchanges and banks that deal for own account, and market makers (usually the banks) that operate as explained above. The latter two we refer to as dealers for the sake of simplicity, and to all three as broker-dealers. The term also encompasses the brokers who may act as dealers at times and the dealers and market makers who also act as brokers (on behalf of clients) in certain deals or markets. 3.7 Trading system
Figure 4.7: Organisational structure of spot financial markets (5) As seen in the final illustration (see Figure 4.7), there are essentially four types of trading systems:
Floor trading. Telephone-screen trading. Screen-telephone trading.
10
Automated trading [on an automated trading system (ATS)].6 Floor trading involves the physical presence of broker-dealers (ie members of the exchanges) in a large room (a room has a floor) and they cry out (aka open-outcry trading) or hand signal (in case of some derivative markets) the orders they have from their clients (or their own orders in the case of dealers) to other members in the hope that their orders match those (opposite orders) of the other members. Orders are amended in the case of market orders until orders are matched. Floor trading usually implies an order-driven market (in which dual capacity trading is allowed), and a formalised market - because rules of trading and behaviour by members are required to make the market credible. Telephone-screen trading is where negotiation by broker-dealers of deals takes place over the telephone, and where a screen (communications system such as Bloomberg’s, Reuters) is used to advertise prices / rates. Deals are consummated on the telephone. The screen prices / rates are usually indication rates, ie not binding. This trading system implies that the relevant market is an OTC market, but this market may also be formal. Screen-telephone trading involves the advertising by broker-dealers of firm prices / rates for specified maximum amounts of securities on a trading system or a communications system, and the deals are also consummated on the telephone. Quite often the trading system is used to communicate deals struck to a clearinghouse (within an agreed period of time), meaning that this type of trading system is used in exchange-driven markets and that the trading is quote-driven. The automated trading system (ATS) is an electronic system (only available to the members, but not always so) where all orders of clients (indicating an order-driven market) are placed in the central order book of the ATS by the member broker-dealers and the system matches the orders when they coincide in price. Orders are price-time prioritised, and may be partly fulfilled. ATS systems are usually found in exchange-driven markets. 3.8 Trading form: single and dual capacity Trading in dual capacity or single capacity (see Figure 4.7) was covered earlier under different terminology. Single capacity means that a broker-dealer deals only as a broker on behalf of clients or as a principal for own account (but not both). Dual capacity means that the exchange member or broker-dealer at a bank in the case of the informal markets trades as both a broker and a dealer for own account (which may lead to a conflict of interests: called an agency-principal
6 Note that there may also be hybrids of these main trading systems.
11
problem7). In exchange-driven markets there are usually strict rules in this respect, the most important of which is that a client’s order must always be executed first. Strict surveillance by the exchange ensures this. 4. ROLE OF SECONDARY MARKETS 4.1 Introduction The economic functions of secondary markets may be summarised as follows:
Price discovery. Liquidity and borrowing cost reduction. Support of primary market. Implementation of monetary policy.
4.2 Price discovery Price discovery (we use “price” here as this is a general financial markets discussion) is the central function of secondary markets. It is the route through which securities markets arrive at prices for the securities traded. (As we know, prices in the fixed-interest markets are inversely related to interest rates.) The “route” refers to the method of trading, and there are various trading methods, as seen. Price discovery is important because it provides information that influences economic decisions, for example whether a company will expand production and finance this with long-term borrowing, or the issue of new shares (rights offer) or bonds. Price discovery provides important clues as to the prices that need to be offered on new primary issues of securities. 4.3 Liquidity and borrowing cost reduction Liquidity (or marketability) refers to the ability to trade a security with ease, ie without impacting significantly on its price. It will be apparent that in liquid markets, prices are not adversely affected by large orders, whereas in thin markets prices may be shifted markedly by small orders. It may be said that a liquid market is more likely to create a state of equilibrium in the market. By this is meant that if the buyers and sellers are equally matched in terms of orders, the price will not be affected adversely (up or down), ie the price is a market-clearing price. As indicated, in a thin market, the market may clear at a vastly different price, depending on whether buyer orders outweigh sell orders (higher price), or vice versa (lower price). Equilibrium is disturbed in thin markets.
7 This phrase is usually used by economists in respect of a moral hazard problem that arises with share ownership and the management of that company. It fits well here though.
12
Liquidity is significant for two main reasons. Firstly, it enables investors to rapidly adjust their portfolios in terms of size, risk, return, liquidity and maturity. This in turn has a major influence of the liquidity discount (in terms of rate) or liquidity premium (in terms of price) investors place on liquid (ie highly marketable) securities. This of course means that the issuer is able to borrow at a lower cost than in the absence of liquidity. It is for this reason that many issuers of bonds attempt to create their own markets by acting as market makers (quoting buying and selling prices simultaneously) in their own securities, or by outsourcing this function to an investment / merchant bank/s. It is notable that central governments usually jumpstart the bond market by market making in their own securities (they usually outsource this function to the central bank). An important question is how to enhance liquidity? The answer is, firstly, the active participation of the role-players in the financial markets, secondly, the existence of market makers and, thirdly, the existence of arbitrageurs and speculators (which seek out market rate and mispriced opportunities and act thereon). 4.4 Support of primary market The secondary market plays an important role in terms of supporting the primary market. We noted above that price discovery in the secondary market assists the primary markets in terms of providing clues as to the pricing of new issues. In addition to this important function, the secondary market provides clues as to the receptiveness of market for new issues (which is reflected in the spread). Clearly, a liquid market improves the ability of issuers to place securities, and increases the price / lowers the rate. 4.5 Implementation of monetary policy An active secondary market enables the central bank to buy and sell securities in order to influence the liquidity of the banking system, with a view the ultimately influencing interest rates. This is termed OMO, as we have seen, which means that the central bank buys and sells securities in the open market. In essence OMO is an adjunct to the primary central bank monetary policy weapon: interest rate manipulation. We discuss bank liquidity and its role in interest rate discovery later in this text. 5. INTEREST RATE DISCOVERY IN THE DEBT AND DEPOSIT
MARKETS 5.1 Introduction With the foregoing as useful background, we move on to interest rate discovery in the debt and deposit markets. A reminder:
13
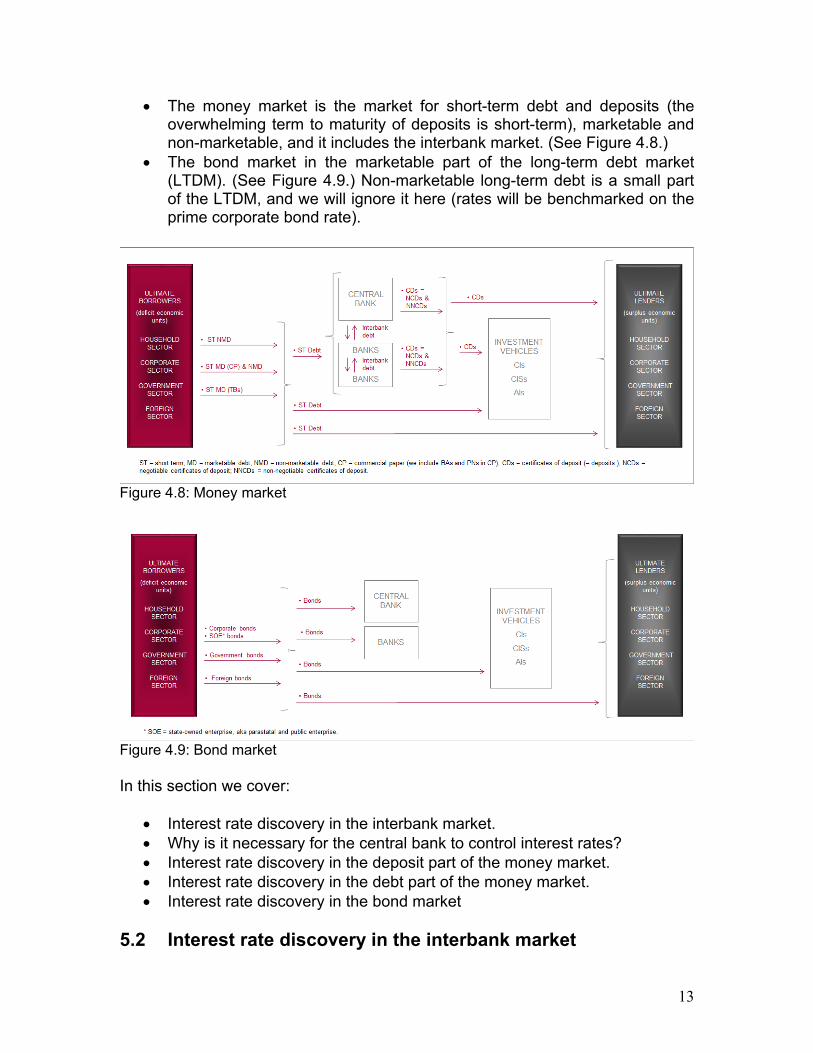
The money market is the market for short-term debt and deposits (the overwhelming term to maturity of deposits is short-term), marketable and non-marketable, and it includes the interbank market. (See Figure 4.8.)
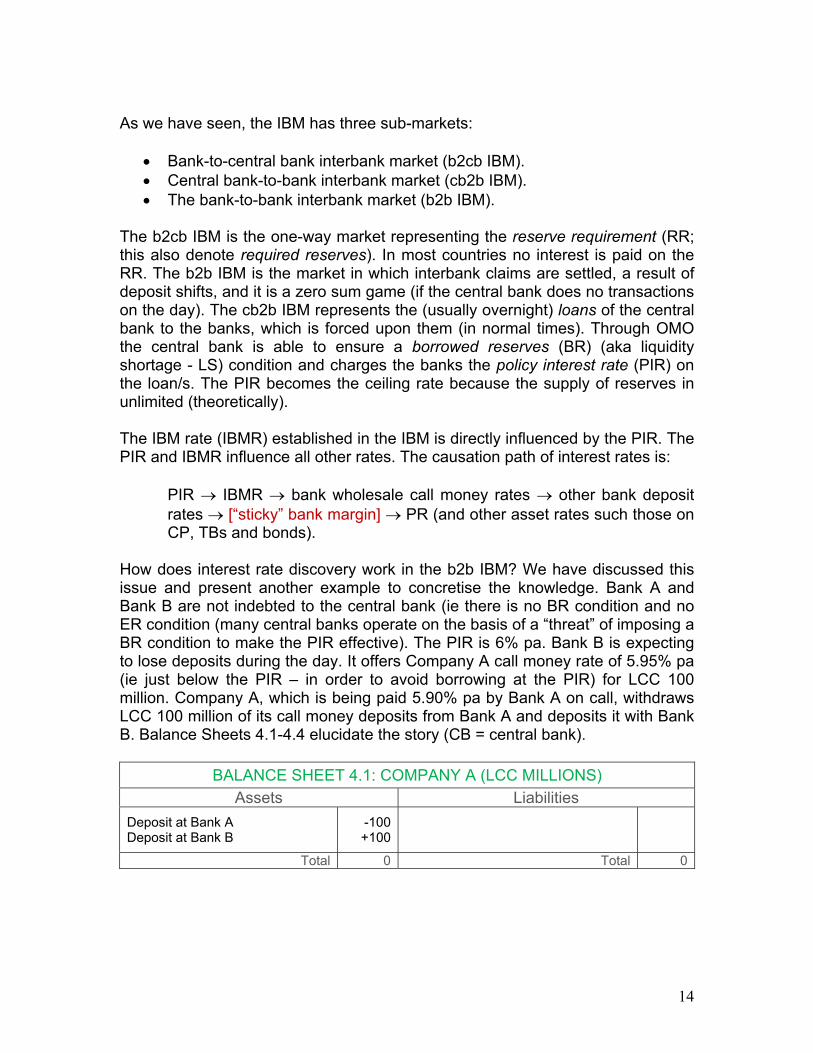
The bond market in the marketable part of the long-term debt market (LTDM). (See Figure 4.9.) Non-marketable long-term debt is a small part of the LTDM, and we will ignore it here (rates will be benchmarked on the prime corporate bond rate).
Figure 4.8: Money market
Figure 4.9: Bond market In this section we cover:
Interest rate discovery in the interbank market. Why is it necessary for the central bank to control interest rates? Interest rate discovery in the deposit part of the money market. Interest rate discovery in the debt part of the money market. Interest rate discovery in the bond market
5.2 Interest rate discovery in the interbank market
14
As we have seen, the IBM has three sub-markets:
Bank-to-central bank interbank market (b2cb IBM). Central bank-to-bank interbank market (cb2b IBM). The bank-to-bank interbank market (b2b IBM).
The b2cb IBM is the one-way market representing the reserve requirement (RR; this also denote required reserves). In most countries no interest is paid on the RR. The b2b IBM is the market in which interbank claims are settled, a result of deposit shifts, and it is a zero sum game (if the central bank does no transactions on the day). The cb2b IBM represents the (usually overnight) loans of the central bank to the banks, which is forced upon them (in normal times). Through OMO the central bank is able to ensure a borrowed reserves (BR) (aka liquidity shortage - LS) condition and charges the banks the policy interest rate (PIR) on the loan/s. The PIR becomes the ceiling rate because the supply of reserves in unlimited (theoretically). The IBM rate (IBMR) established in the IBM is directly influenced by the PIR. The PIR and IBMR influence all other rates. The causation path of interest rates is:
PIR IBMR bank wholesale call money rates other bank deposit rates [“sticky” bank margin] PR (and other asset rates such those on CP, TBs and bonds).
How does interest rate discovery work in the b2b IBM? We have discussed this issue and present another example to concretise the knowledge. Bank A and Bank B are not indebted to the central bank (ie there is no BR condition and no ER condition (many central banks operate on the basis of a “threat” of imposing a BR condition to make the PIR effective). The PIR is 6% pa. Bank B is expecting to lose deposits during the day. It offers Company A call money rate of 5.95% pa (ie just below the PIR – in order to avoid borrowing at the PIR) for LCC 100 million. Company A, which is being paid 5.90% pa by Bank A on call, withdraws LCC 100 million of its call money deposits from Bank A and deposits it with Bank B. Balance Sheets 4.1-4.4 elucidate the story (CB = central bank).
BALANCE SHEET 4.1: COMPANY A (LCC MILLIONS)
Assets Liabilities
Deposit at Bank A Deposit at Bank B
-100+100
Total 0 Total 0
15
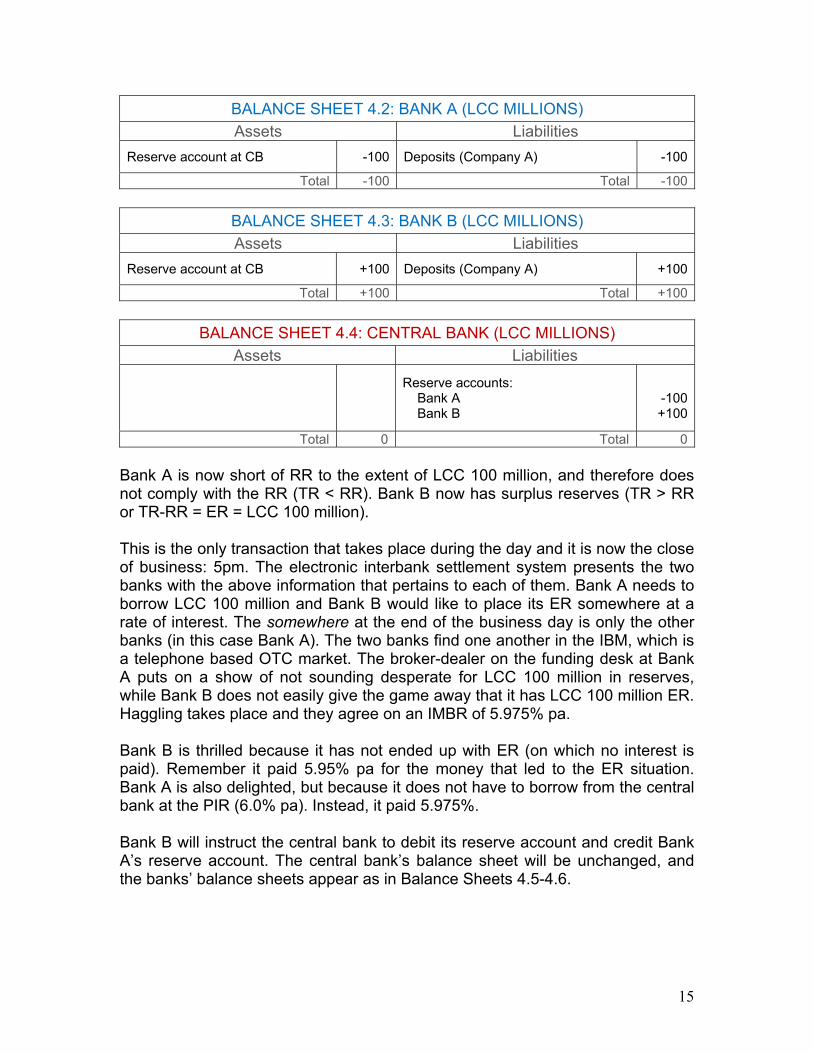
BALANCE SHEET 4.2: BANK A (LCC MILLIONS)
Assets Liabilities
Reserve account at CB -100 Deposits (Company A) -100
Total -100 Total -100
BALANCE SHEET 4.3: BANK B (LCC MILLIONS)
Assets Liabilities
Reserve account at CB +100 Deposits (Company A) +100
Total +100 Total +100
BALANCE SHEET 4.4: CENTRAL BANK (LCC MILLIONS)
Assets Liabilities
Reserve accounts: Bank A Bank B
-100+100
Total 0 Total 0 Bank A is now short of RR to the extent of LCC 100 million, and therefore does not comply with the RR (TR < RR). Bank B now has surplus reserves (TR > RR or TR-RR = ER = LCC 100 million). This is the only transaction that takes place during the day and it is now the close of business: 5pm. The electronic interbank settlement system presents the two banks with the above information that pertains to each of them. Bank A needs to borrow LCC 100 million and Bank B would like to place its ER somewhere at a rate of interest. The somewhere at the end of the business day is only the other banks (in this case Bank A). The two banks find one another in the IBM, which is a telephone based OTC market. The broker-dealer on the funding desk at Bank A puts on a show of not sounding desperate for LCC 100 million in reserves, while Bank B does not easily give the game away that it has LCC 100 million ER. Haggling takes place and they agree on an IMBR of 5.975% pa. Bank B is thrilled because it has not ended up with ER (on which no interest is paid). Remember it paid 5.95% pa for the money that led to the ER situation. Bank A is also delighted, but because it does not have to borrow from the central bank at the PIR (6.0% pa). Instead, it paid 5.975%. Bank B will instruct the central bank to debit its reserve account and credit Bank A’s reserve account. The central bank’s balance sheet will be unchanged, and the banks’ balance sheets appear as in Balance Sheets 4.5-4.6.
16
BALANCE SHEET 4.5: BANK A (LCC MILLIONS)
Assets Liabilities
Deposits (Company A) Loan (Bank B)
-100+100
Total 0 Total 0
BALANCE SHEET 4.6: BANK B (LCC MILLIONS)
Assets Liabilities
Loan to Bank A +100 Deposits (Company A) +100
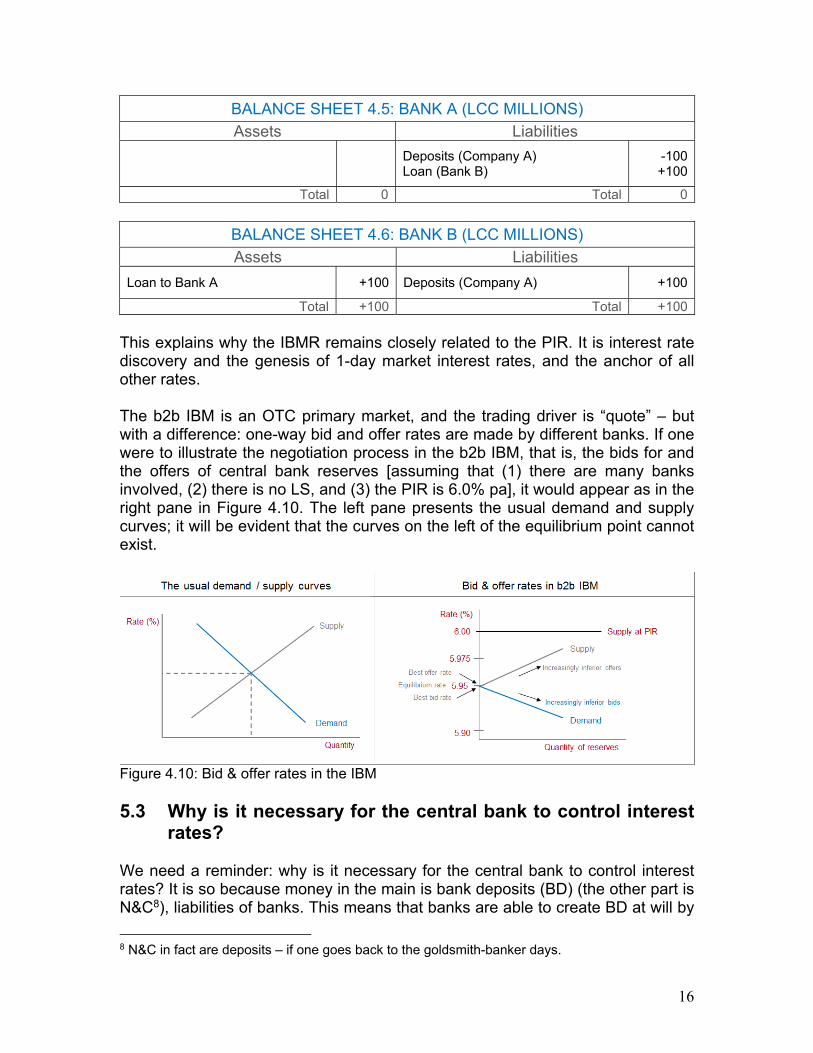
Total +100 Total +100 This explains why the IBMR remains closely related to the PIR. It is interest rate discovery and the genesis of 1-day market interest rates, and the anchor of all other rates. The b2b IBM is an OTC primary market, and the trading driver is “quote” – but with a difference: one-way bid and offer rates are made by different banks. If one were to illustrate the negotiation process in the b2b IBM, that is, the bids for and the offers of central bank reserves [assuming that (1) there are many banks involved, (2) there is no LS, and (3) the PIR is 6.0% pa], it would appear as in the right pane in Figure 4.10. The left pane presents the usual demand and supply curves; it will be evident that the curves on the left of the equilibrium point cannot exist.
Figure 4.10: Bid & offer rates in the IBM 5.3 Why is it necessary for the central bank to control interest
rates? We need a reminder: why is it necessary for the central bank to control interest rates? It is so because money in the main is bank deposits (BD) (the other part is N&C8), liabilities of banks. This means that banks are able to create BD at will by
8 N&C in fact are deposits – if one goes back to the goldsmith-banker days.
17
providing bank credit (if there is demand for credit). In practice credit is extended based on the ability of the borrower to repay. But banks are in competition with one another to “grow their books” (grow their liabilities and assets), and this makes them inherently unstable. In addition, a high rate of BD growth [which represents new demand for goods and services (GDPN)] is inflationary because the economy cannot supply additional goods, requiring new capacity, quickly. High and unstable inflation is not conducive to economic growth and employment creation. Thus, there has to be a referee in the system, which is the central bank. A central bank has one tool: interest rates. By creating a liquidity shortage condition (BR / LS) and charging PIR for the BR, the central bank controls the PR of the banks, and therefore the demand for credit. It exercises discretion in setting the rates, because it desires economic growth (as reflected in bank credit growth) on behalf of the country, but is needs the growth rate to be sustainable, that is, to ensure a low and stable rate of inflation. The rate of inflation recognised worldwide as ideal / desired is 2.0% pa. Why is it not 0.0% pa? Because at 0% pa, there is a danger of deflation, and deflation has its own set of economic problems. Thus, the 1-day rate is determined by the central bank, and all other longer rates are related to this rate. 5.4 Interest rate discovery in the deposit part of the money
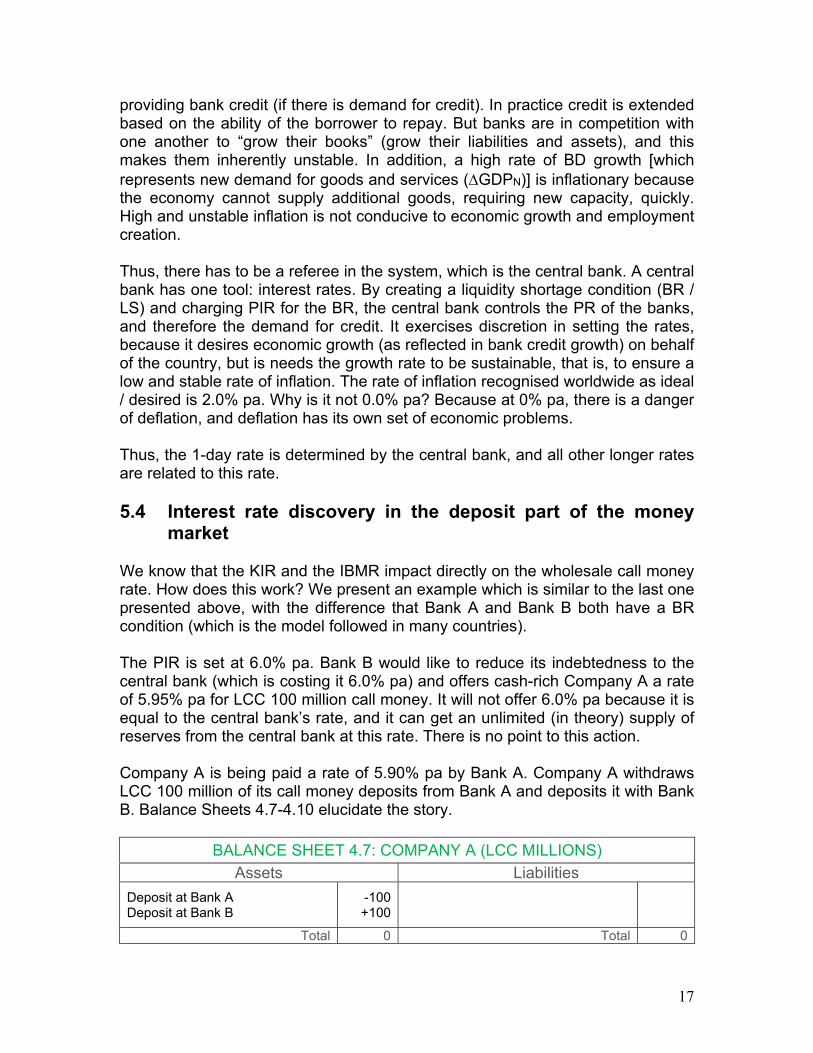
market We know that the KIR and the IBMR impact directly on the wholesale call money rate. How does this work? We present an example which is similar to the last one presented above, with the difference that Bank A and Bank B both have a BR condition (which is the model followed in many countries). The PIR is set at 6.0% pa. Bank B would like to reduce its indebtedness to the central bank (which is costing it 6.0% pa) and offers cash-rich Company A a rate of 5.95% pa for LCC 100 million call money. It will not offer 6.0% pa because it is equal to the central bank’s rate, and it can get an unlimited (in theory) supply of reserves from the central bank at this rate. There is no point to this action. Company A is being paid a rate of 5.90% pa by Bank A. Company A withdraws LCC 100 million of its call money deposits from Bank A and deposits it with Bank B. Balance Sheets 4.7-4.10 elucidate the story.
BALANCE SHEET 4.7: COMPANY A (LCC MILLIONS)
Assets Liabilities
Deposit at Bank A Deposit at Bank B
-100+100
Total 0 Total 0
18
BALANCE SHEET 4.8: BANK A (LCC MILLIONS)
Assets Liabilities
Reserve account at CB -100 Deposits (Company A) -100
Total -100 Total -100
BALANCE SHEET 4.9: BANK B (LCC MILLIONS)
Assets Liabilities
Reserve account at CB +100 Deposits (Company A) +100
Total +100 Total +100
BALANCE SHEET 4.10: CENTRAL BANK (LCC MILLIONS)
Assets Liabilities
Reserve accounts: Bank A Bank B
-100+100
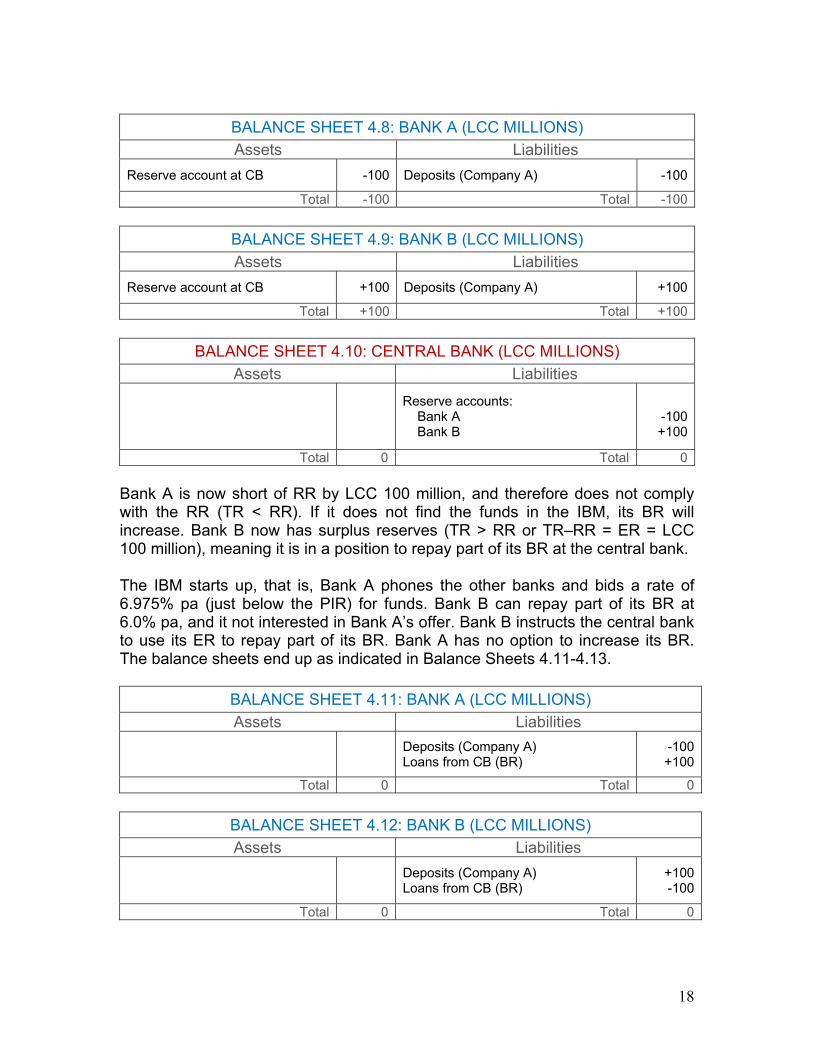
Total 0 Total 0 Bank A is now short of RR by LCC 100 million, and therefore does not comply with the RR (TR < RR). If it does not find the funds in the IBM, its BR will increase. Bank B now has surplus reserves (TR > RR or TR–RR = ER = LCC 100 million), meaning it is in a position to repay part of its BR at the central bank. The IBM starts up, that is, Bank A phones the other banks and bids a rate of 6.975% pa (just below the PIR) for funds. Bank B can repay part of its BR at 6.0% pa, and it not interested in Bank A’s offer. Bank B instructs the central bank to use its ER to repay part of its BR. Bank A has no option to increase its BR. The balance sheets end up as indicated in Balance Sheets 4.11-4.13.
BALANCE SHEET 4.11: BANK A (LCC MILLIONS)
Assets Liabilities
Deposits (Company A) Loans from CB (BR)
-100+100
Total 0 Total 0
BALANCE SHEET 4.12: BANK B (LCC MILLIONS)
Assets Liabilities
Deposits (Company A) Loans from CB (BR)
+100-100
Total 0 Total 0
19
BALANCE SHEET 4.13: CENTRAL BANK (LCC MILLIONS)
Assets Liabilities
Loans to Bank A Loans to Bank B
+100-100
Reserve accounts: Bank A Bank B
-100+100
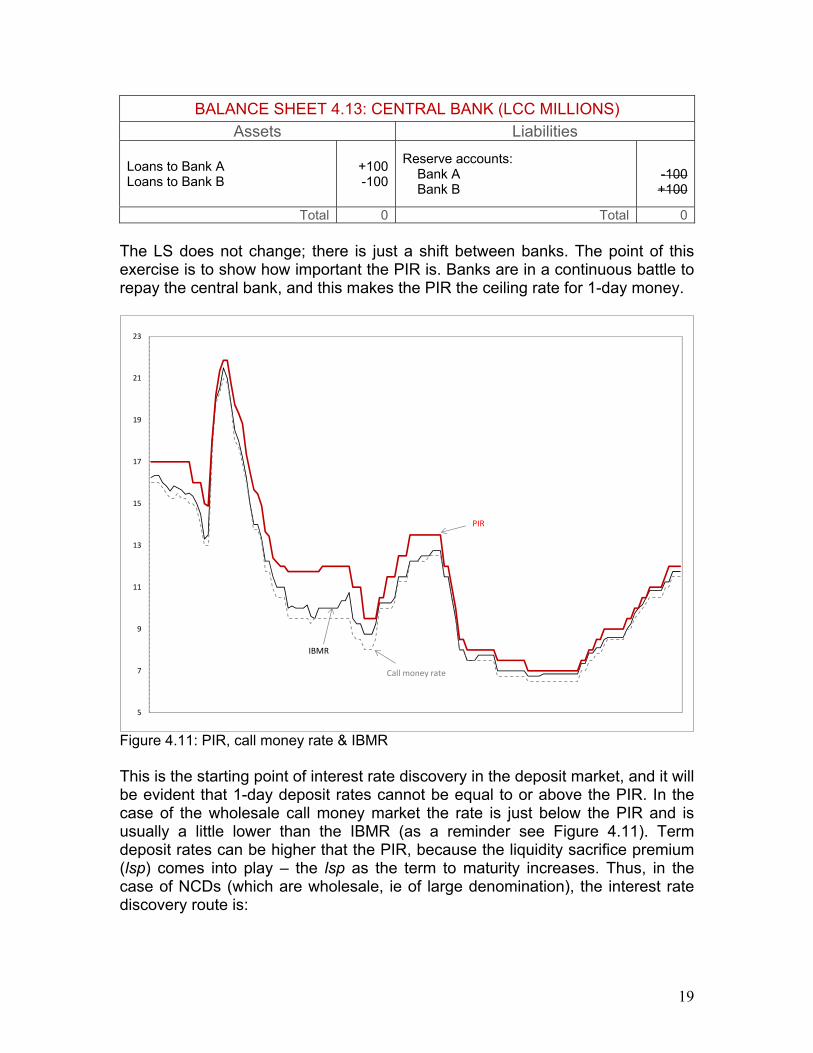
Total 0 Total 0 The LS does not change; there is just a shift between banks. The point of this exercise is to show how important the PIR is. Banks are in a continuous battle to repay the central bank, and this makes the PIR the ceiling rate for 1-day money.
5
7
9
11
13
15
17
19
21
23
PIR
Call money rate
IBMR
Figure 4.11: PIR, call money rate & IBMR This is the starting point of interest rate discovery in the deposit market, and it will be evident that 1-day deposit rates cannot be equal to or above the PIR. In the case of the wholesale call money market the rate is just below the PIR and is usually a little lower than the IBMR (as a reminder see Figure 4.11). Term deposit rates can be higher that the PIR, because the liquidity sacrifice premium (lsp) comes into play – the lsp as the term to maturity increases. Thus, in the case of NCDs (which are wholesale, ie of large denomination), the interest rate discovery route is:
20
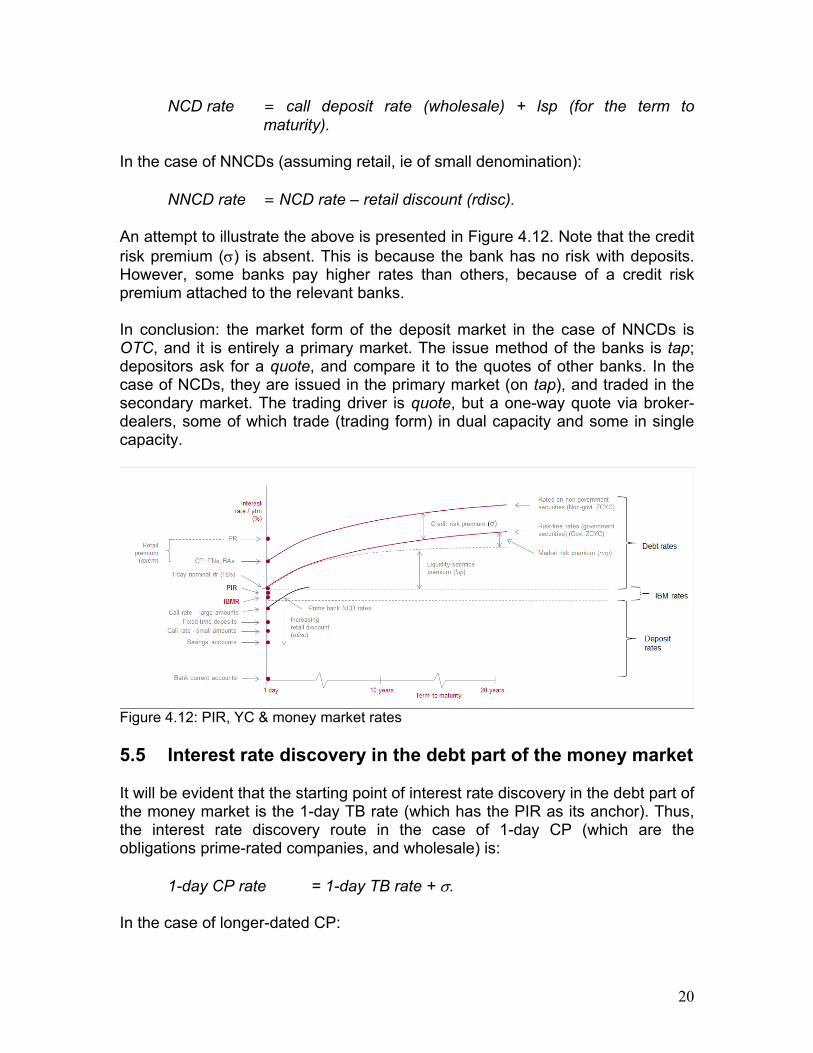
NCD rate = call deposit rate (wholesale) + lsp (for the term to maturity).
In the case of NNCDs (assuming retail, ie of small denomination):
NNCD rate = NCD rate – retail discount (rdisc). An attempt to illustrate the above is presented in Figure 4.12. Note that the credit risk premium () is absent. This is because the bank has no risk with deposits. However, some banks pay higher rates than others, because of a credit risk premium attached to the relevant banks. In conclusion: the market form of the deposit market in the case of NNCDs is OTC, and it is entirely a primary market. The issue method of the banks is tap; depositors ask for a quote, and compare it to the quotes of other banks. In the case of NCDs, they are issued in the primary market (on tap), and traded in the secondary market. The trading driver is quote, but a one-way quote via broker-dealers, some of which trade (trading form) in dual capacity and some in single capacity.
Figure 4.12: PIR, YC & money market rates 5.5 Interest rate discovery in the debt part of the money market It will be evident that the starting point of interest rate discovery in the debt part of the money market is the 1-day TB rate (which has the PIR as its anchor). Thus, the interest rate discovery route in the case of 1-day CP (which are the obligations prime-rated companies, and wholesale) is:
1-day CP rate = 1-day TB rate + . In the case of longer-dated CP:
21
CP rate = 1-day TB rate + + lsp = 1-day CP rate + lsp.
We know that TBs and CP are marketable. In the case of retail non-marketable debt (NMD), the interest rate discovery route is:
1-day NMD rate = 1-day TB rate + + retail premium (rprem) In the case of longer-dated retail NMD: NMD rate = 1-day TB rate + + rprem + lsp = 1-day NMD rate + lsp. In the case of wholesale NMD for prime companies, the rate will be a little lower. In conclusion: the market form of the short-term debt market (STDM) is OTC, and in the case of ST-NMD it is a primary market. The issue method is tap via the banks. Investors ask for a quote and compare it to the quotes of other banks. In the case of marketable debt (CP) they are issued in the primary market, via the banks, and traded in the secondary market. The trading driver is quote, but a one-way quote via broker-dealers, some of which trade (trading form) in dual capacity and some in single capacity. 5.6 Interest rate discovery in the bond market We know that the bond market is the marketable arm of the LTDM. We also know that government bond rates (recall that they are all nominal risk-free rates - nrfr) are discovered by the route:
nrfr = 1-day rrfr + e + lsp + mrp and in the case of prime corporate bond rates (nominal rates for corporates - nrc):
nrc = 1-day rrfr + e + lsp + mrp + σ = nrfr + σ.
In the case of the non-marketable long-term debt, a premium is added for non-marketability (nmp)
nrc (non-marketable) = 1-day rrfr + e + lsp + mrp + σ + nmp = nrfr + σ + nmp. Bonds are issued in the primary market and traded in the secondary market. The market form is exchange, ie they are traded on a regulated and supervised exchange. The trading driver is quote (in the pure sense), meaning that there are
22
market makers (or a subset, primary dealers – the large banks) which quote two-way rates simultaneously once the client (buyer or seller) has disclosed the size of the deal (but not whether he is a buyer or seller). The trading system in most countries is telephone-screen, ie the system where a screen (communications system such as Bloomberg / Reuters) is used to indicate rates, but negotiation by clients of deals takes place over the telephone. Consummated deals are reported to the exchange.
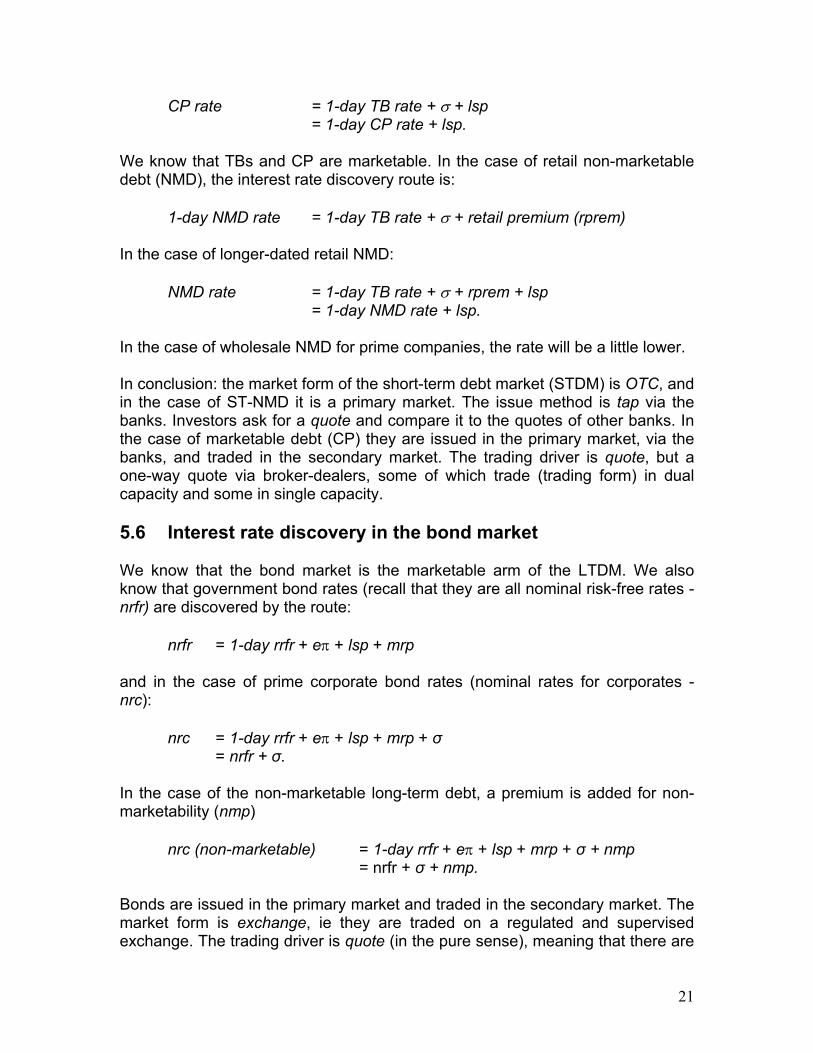
Figure 4.13: Demand & supply curves (price & rate) In a number of financial market texts9 the bid-offer spread is illustrated as indicated in the left pane in Figure 4.13. If one places “rate” on the Y-axis, the curves are swapped, as are the best bid and offer rate legends.
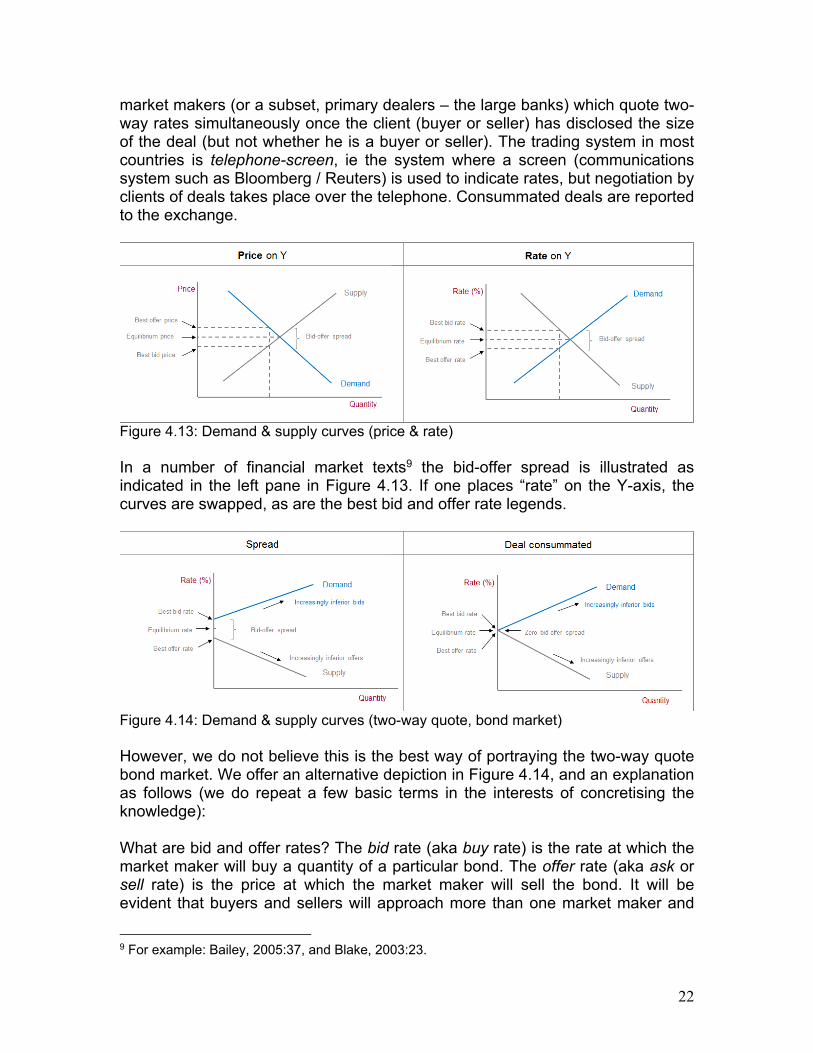
Figure 4.14: Demand & supply curves (two-way quote, bond market) However, we do not believe this is the best way of portraying the two-way quote bond market. We offer an alternative depiction in Figure 4.14, and an explanation as follows (we do repeat a few basic terms in the interests of concretising the knowledge): What are bid and offer rates? The bid rate (aka buy rate) is the rate at which the market maker will buy a quantity of a particular bond. The offer rate (aka ask or sell rate) is the price at which the market maker will sell the bond. It will be evident that buyers and sellers will approach more than one market maker and
9 For example: Bailey, 2005:37, and Blake, 2003:23.
23
that buying clients will seek to deal at the highest quoted offer rate (= lowest price) of the market makers. On the other hand, selling clients will seek to deal at the lowest quoted bid rate (= highest price) of the market makers. What is the spread? It is the differential between the best bid and offer rates, and can be seen as the dealing profit of the market maker (assuming it is “hit” on “both sides” of the quote, which is highly unlikely, because there is a better rate available). It is the remuneration for the capital employed and risk inherent in holding an inventory of bonds and being prepared to sell from it or add to it. The size of the spread provides information on the breadth and depth of the market (but we will not discuss this interesting issue here as it is not relevant to the discussion). What is the equilibrium price? It is presented as the mid-point between the bid and offer rates, and it is a theoretical price in the absence of a consummated deal. When bid and offer rates coincide, a deal is consummated and we have a true equilibrium rate. The equilibrium rate fluctuates constantly because the bond market is a dynamic (aka continuing or continuous) market. In the Figure 4.14 depiction the demand and supply curves to the left of the best bid and offer rates (the equilibrium rate), do not exist. Why?
No market maker will offer a higher rate that the best bid rate. No market maker will bid a lower rate that the best offer rate.
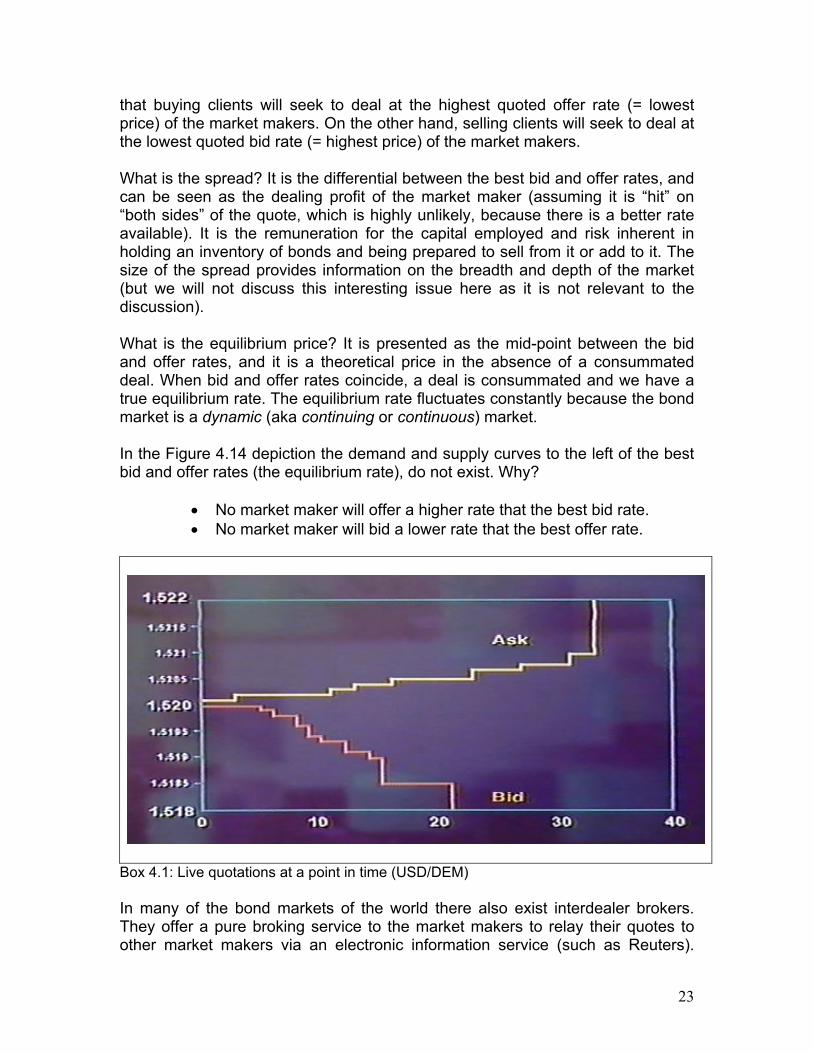
Box 4.1: Live quotations at a point in time (USD/DEM) In many of the bond markets of the world there also exist interdealer brokers. They offer a pure broking service to the market makers to relay their quotes to other market makers via an electronic information service (such as Reuters).
24
Market makers use interdealer brokers in cases where they prefer to remain anonymous in a particular deal. Interdealer brokers are paid a commission on deals. Does the above exposition exist in reality? It does. Some years back Prof CAE Goodhart and colleagues of The Financial Markets Group, London School of Economics produced a video10 on the foreign exchange market in which they presented foreign exchange quotes (note: in prices) and consummated deals in real time. A frame-grab of a particular time is shown in Box 4.1. The bid-offer (bid-ask in the frame grab) curves and spread are clearly visible. 6. FACTORS WHICH IMPACT ON PRICE DISCOVERY We know that interest rates have their genesis in the IBM, and that monetary policy in the form of the administratively-set PIR is the starting point (assuming a LS / BR condition which makes the PIR effective – under normal circumstances). As we move along the yield curve, the rates reflect various premia / discount factors and the bank margin, but, macroeconomically-speaking, longer rates are a function of short rates and expectations in respect of the level of short rates in the future. What are the micro-economic factors that play a role in small movements in interest rates, in the spread, and so on? They may be summarised as follows:
Number of buyers and sellers. Size of deals. Market capitalisation of issues (ie size of issue of, for example, a particular
bond). Market mechanism. Information dissemination. Existence of debt and deposit derivative markets.
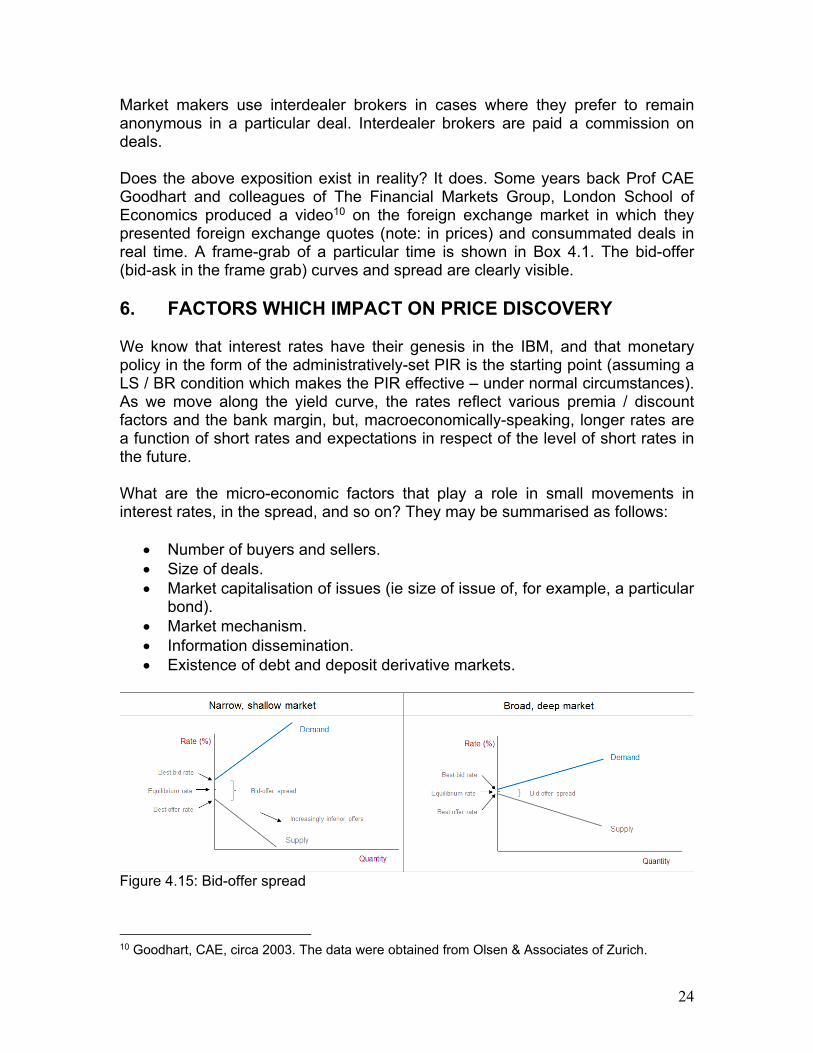
Figure 4.15: Bid-offer spread
10 Goodhart, CAE, circa 2003. The data were obtained from Olsen & Associates of Zurich.
25
All of these factors impact ultimately on the liquidity of and the “spread” in markets, which is a reflection of the depth and breadth of the market. Figure 4.15 illustrates this. 7. REFERENCES Bailey, RE, 2005. The economics of financial markets. Cambridge: Cambridge University Press. Blake, D, 2003. Financial market analysis. New York: John Wiley & Sons Limited. Goodhart, CAE, circa 2003. Video: The foreign exchange market: a visual representation. London: The Financial Markets Group, London School of Economics. Faure, AP (2012 – 2013). Various which can be accessed at http://ssrn.com/author=1786379. Faure, AP (2013). Various which can be accessed at http://bookboon.com/en/banking-financial-markets-ebooks.