housing affordability in three dimensions: price, income and interest rates
TRANSCRIPT
HOUSING AFFORDABILITYIN THREE DIMENSIONS:PRICE, INCOME ANDINTEREST RATES
by SUSANNE TRIMBATH AND JUAN MONTOYA
September 2002
P O L I C Y B R I E F
Number 31
HOUSING AFFORDABILITY INTHREE DIMENSIONS:
PRICE, INCOME AND INTEREST RATES
September 2002
By Susanne Trimbathand Juan Montoya
Susanne Trimbath is a Research Economist with the Capital Studies group, Milken Institute; andJuan Montoya is a Research Analyst with the Capital Studies group, Milken Institute.
The authors thank Joel Kotkin for his support and guidance in this research. This paper benefitedfrom comments on an earlier draft by Richard Blount, Carlos Royal and Bill Sheehan.
All rights reserved © Copyright 2002 Milken Instittue
1 Housing Affordability in Three Dimensions September 2002
Housing Affordability in Three Dimensions:
Price, Income and Interest Rates Executive Summary
While the “American Dream” of homeownership can be traced back to the homesteading
spirit of the pioneers, today, the possibility for many American households of achieving
that dream is precariously balanced on a tripod of price, income and interest rates. The
current demand for housing has put upward pressure on prices, creating a situation were
home price growth is currently outpacing income growth. Yet the potential for a
reduction of affordability is being offset by historically low mortgage interest rates,
which are currently favorable to affordability. Issues affecting affordability – critical to
broad-based home ownership – particularly affect minority groups. The most stable of the
three dimensions currently seems to be mortgage interest rates, which are low and
moving in a direction favorable to affordability.
“Affordability” is a public policy target that moves in three-dimensional space measured
by home prices, household income and mortgage interest rates. Analyzing it from the
dimensions of home prices and income, affordability is near record lows as the ratio of
home prices to income is currently at 4.14, close to the maximum of 4.19 reached in
1988. The ratio had declined to 3.90 by 1992 and ever since, it has risen steadily to
today’s level. For many, this high ratio brings another comparison to mind – that of a
“housing bubble.” If prices rise too fast, fewer Americans will be able to afford a home.
The concern then becomes that the resulting reduction in demand will allow home prices
to “bust.” Dramatic changes in demand, however, are not likely to occur in the broad
national market, but rather in regional markets where the availability of employment
tends to fluctuate more dramatically.
The important difference between today’s housing market and that of the 1980s is that
mortgage interest rates are at 6.50 percent and falling, compared to 10.25 percent in 1988.
2 Housing Affordability in Three Dimensions September 2002
Therefore, when this third dimension is incorporated, we find that the ratio of mortgage
payment to income at the median is currently 32.4 percent, compared to 40.5 percent in
1988. This lower payment ratio is largely the result of lower interest rates, but it is also
being affected by the recent increase in the income growth rate. In June 2002, personal
income grew by 0.6 percent, the highest rate in two years.
Since interest rates are not expected to rise in the near future, and income is experiencing
strong growth, the demand that supports the current prices can be expected to remain
stable for the near term. That’s good news for the housing market in generally, but
particularly for those interested in housing affordability.
3 Housing Affordability in Three Dimensions September 2002
Introduction
Recent low mortgage interest rates have dramatically increased housing affordability for
many Americans creating a concomitant increase in demand. This demand, however, has
not been met with a proportionate increase in supply, creating a very tight residential real
estate market that has driven prices upwards. Because the increase in prices was driven
by demand stimulated by the reduced cost of mortgages, this rise should not be
considered to be a signal of overvaluation in the housing market. Paul Kasriel, Director of
Economic Research at Northern Trust suggests that when housing is overvalued,
developers overbuild. In contrast, although new home inventory is currently rising, it
remains low relative to current sales. The current supply of new homes on the market is
3.9 months, among the lowest ever.1 The confluence of circumstances that created this
rapid appreciation of home prices has attracted the attention of nonowner households,
bringing more of them into the market.
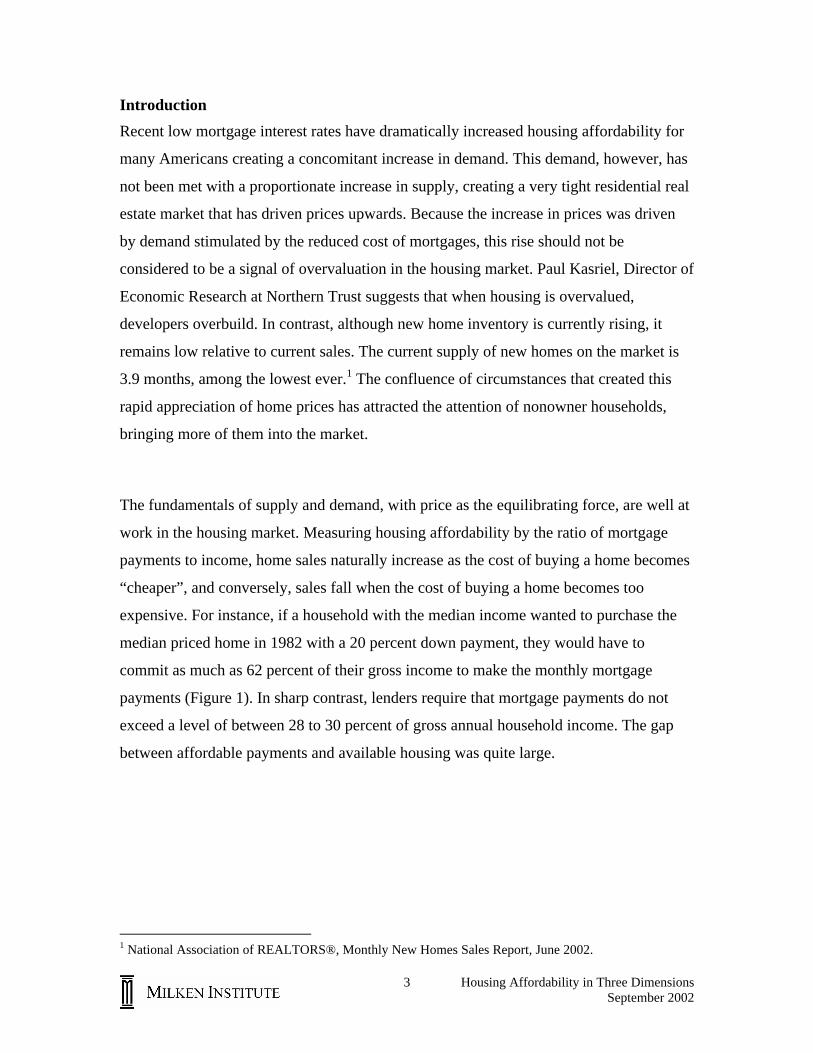
The fundamentals of supply and demand, with price as the equilibrating force, are well at
work in the housing market. Measuring housing affordability by the ratio of mortgage
payments to income, home sales naturally increase as the cost of buying a home becomes
“cheaper”, and conversely, sales fall when the cost of buying a home becomes too
expensive. For instance, if a household with the median income wanted to purchase the
median priced home in 1982 with a 20 percent down payment, they would have to
commit as much as 62 percent of their gross income to make the monthly mortgage
payments (Figure 1). In sharp contrast, lenders require that mortgage payments do not
exceed a level of between 28 to 30 percent of gross annual household income. The gap
between affordable payments and available housing was quite large.
1 National Association of REALTORS®, Monthly New Homes Sales Report, June 2002.

4 Housing Affordability in Three Dimensions September 2002
Figure 1 : Housing Affordability and New House Sales
0%
10%
20%
30%
40%
50%
60%
70%
1975
1978
1981
1984
1987
1990
1993
1996
1999
2002
Mor
tgag
e Pa
ymen
t as
Perc
ent o
f Inc
ome
0
150
300
450
600
750
900
1050
Num
ber o
f New
Hou
ses
Sold
Mortgage Payment to Income Ratio New House Sales
The mortgage payment is calculated monthly using the median price for a new single-family house (U.S. Census Bureau) and the national average 30-year fixed-rate conventional mortgage rate (Bloomberg), assuming a 20 percent down payment. Income refers to the median annual household income (U.S. Census Bureau). The number of houses sold is an annualized, seasonally-adjusted, based on monthly sales (U.S. Census Bureau). Source: U.S. Census Bureau, Bloomberg, Milken Institute Determinants of Affordability Deputy Secretary of Housing and Urban Development Alphonso Jackson, addressing a
Mayoral Summit2, repeated what Secretary Martinez told him when he took the job:
“Affordable housing is not a Republican or a Democratic issue. It is an American issue.”
With policymakers paying increasing attention to this issue, understanding the
determining factors of housing affordability toward which policy could be directed,
becomes critical. The three dimensions of affordability are:
• home prices • household income • mortgage interest rates
2 On July 18, 2002, The Ziman Center for Real Estate and the Los Angeles Business Council co-hosted “The 2002 Mayoral Summit: Leveraging the Housing Trust Fund” at UCLA.
5 Housing Affordability in Three Dimensions September 2002
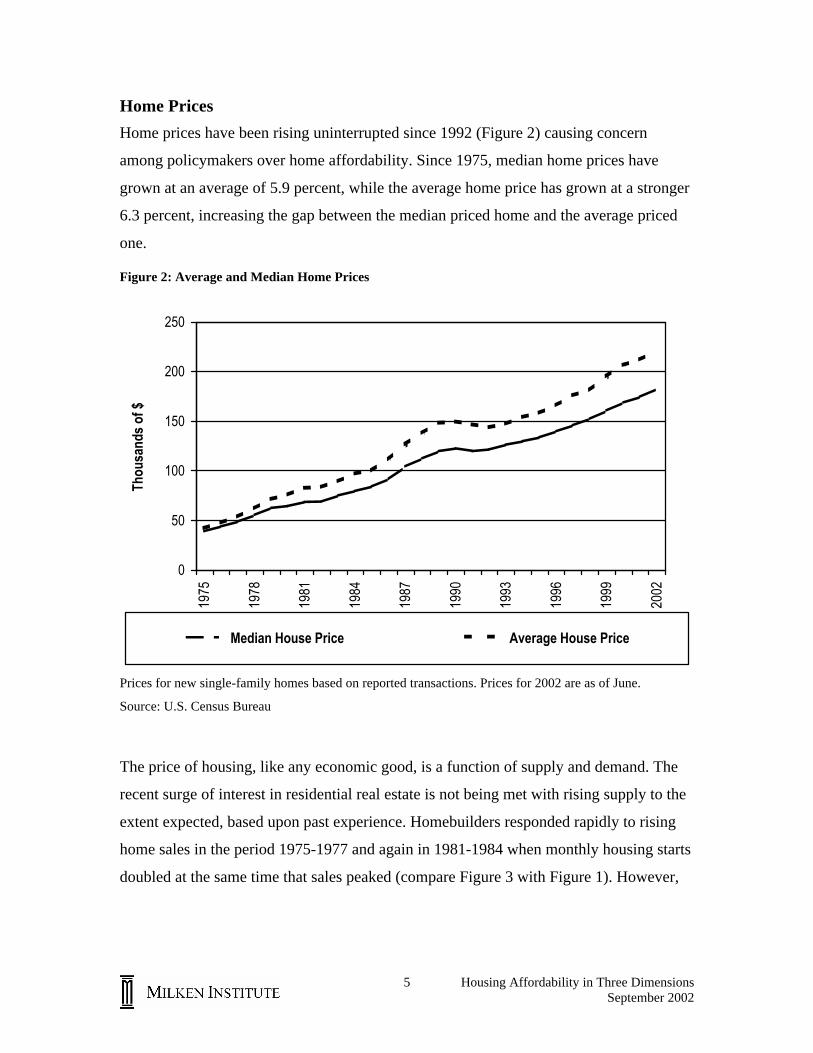
Home Prices
Home prices have been rising uninterrupted since 1992 (Figure 2) causing concern
among policymakers over home affordability. Since 1975, median home prices have
grown at an average of 5.9 percent, while the average home price has grown at a stronger
6.3 percent, increasing the gap between the median priced home and the average priced
one.
Figure 2: Average and Median Home Prices
0
50
100
150
200
250
1975
1978
1981
1984
1987
1990
1993
1996
1999
2002
Thou
sand
s of
$
Median House Price Average House Price
Prices for new single-family homes based on reported transactions. Prices for 2002 are as of June.
Source: U.S. Census Bureau
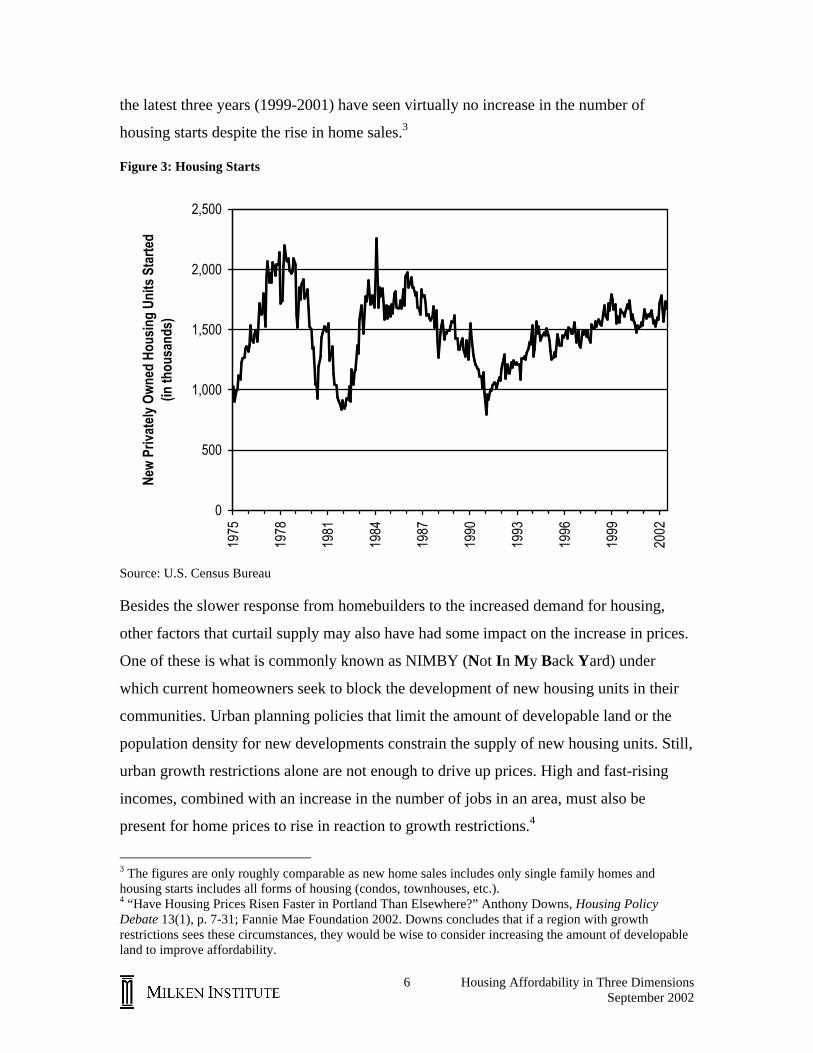
The price of housing, like any economic good, is a function of supply and demand. The
recent surge of interest in residential real estate is not being met with rising supply to the
extent expected, based upon past experience. Homebuilders responded rapidly to rising
home sales in the period 1975-1977 and again in 1981-1984 when monthly housing starts
doubled at the same time that sales peaked (compare Figure 3 with Figure 1). However,
6 Housing Affordability in Three Dimensions September 2002
the latest three years (1999-2001) have seen virtually no increase in the number of
housing starts despite the rise in home sales.3
Figure 3: Housing Starts
0
500
1,000
1,500
2,000
2,500
1975
1978
1981
1984
1987
1990
1993
1996
1999
2002
New
Priv
atel
y O
wne
d Ho
usin
g Un
its S
tarte
d(in
thou
sand
s)
Source: U.S. Census Bureau
Besides the slower response from homebuilders to the increased demand for housing,
other factors that curtail supply may also have had some impact on the increase in prices.
One of these is what is commonly known as NIMBY (Not In My Back Yard) under
which current homeowners seek to block the development of new housing units in their
communities. Urban planning policies that limit the amount of developable land or the
population density for new developments constrain the supply of new housing units. Still,
urban growth restrictions alone are not enough to drive up prices. High and fast-rising
incomes, combined with an increase in the number of jobs in an area, must also be
present for home prices to rise in reaction to growth restrictions.4
3 The figures are only roughly comparable as new home sales includes only single family homes and housing starts includes all forms of housing (condos, townhouses, etc.). 4 “Have Housing Prices Risen Faster in Portland Than Elsewhere?” Anthony Downs, Housing Policy Debate 13(1), p. 7-31; Fannie Mae Foundation 2002. Downs concludes that if a region with growth restrictions sees these circumstances, they would be wise to consider increasing the amount of developable land to improve affordability.
7 Housing Affordability in Three Dimensions September 2002
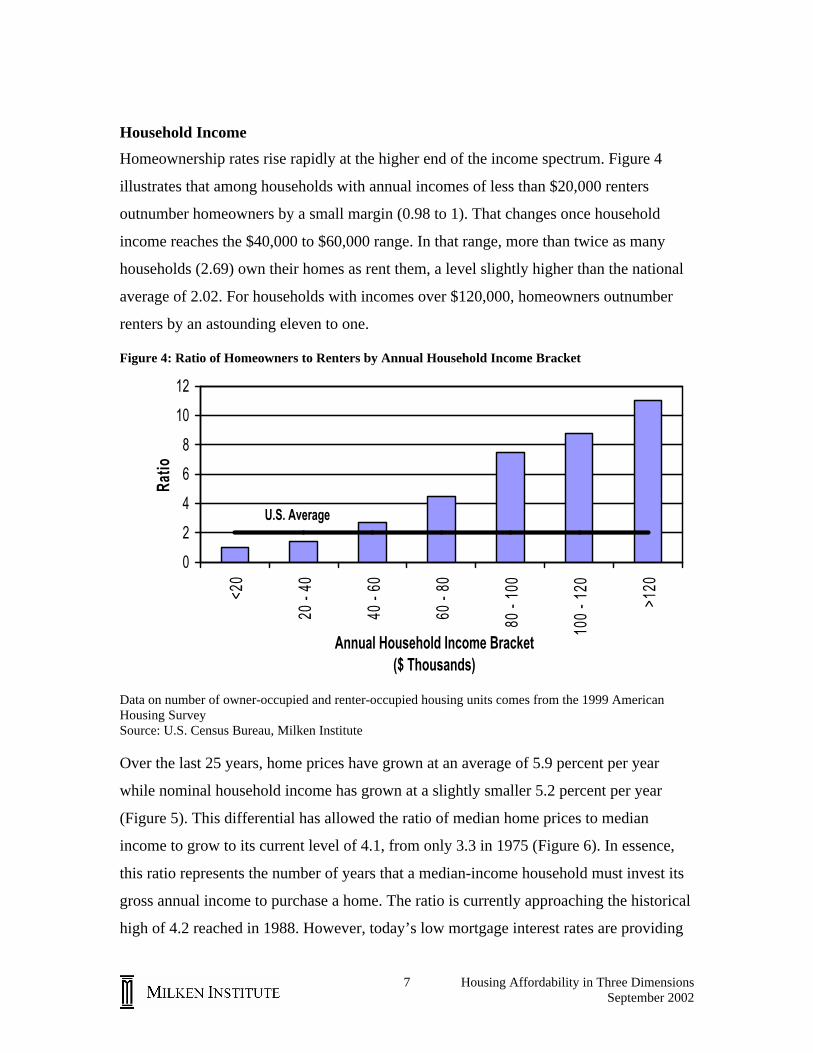
Household Income
Homeownership rates rise rapidly at the higher end of the income spectrum. Figure 4
illustrates that among households with annual incomes of less than $20,000 renters
outnumber homeowners by a small margin (0.98 to 1). That changes once household
income reaches the $40,000 to $60,000 range. In that range, more than twice as many
households (2.69) own their homes as rent them, a level slightly higher than the national
average of 2.02. For households with incomes over $120,000, homeowners outnumber
renters by an astounding eleven to one.
Figure 4: Ratio of Homeowners to Renters by Annual Household Income Bracket
U.S. Average
0
2
4
6
8
10
12
<20
20 -
40
40 -
60
60 -
80
80 -
100
100
- 120
>120
Annual Household Income Bracket($ Thousands)
Ratio
Data on number of owner-occupied and renter-occupied housing units comes from the 1999 American Housing Survey Source: U.S. Census Bureau, Milken Institute
Over the last 25 years, home prices have grown at an average of 5.9 percent per year
while nominal household income has grown at a slightly smaller 5.2 percent per year
(Figure 5). This differential has allowed the ratio of median home prices to median
income to grow to its current level of 4.1, from only 3.3 in 1975 (Figure 6). In essence,
this ratio represents the number of years that a median-income household must invest its
gross annual income to purchase a home. The ratio is currently approaching the historical
high of 4.2 reached in 1988. However, today’s low mortgage interest rates are providing

8 Housing Affordability in Three Dimensions September 2002
some low-end support for prices that was not available in 1988. In fact, as of June 2002,
mortgage payments as a percent of income were 31 percent, compared to 45 percent in
December 1988 (Figure 1, earlier).
Figure 5: House Prices and Household Income
0
50
100
150
200
250
1975
1978
1981
1984
1987
1990
1993
1996
1999
2002
Thou
sand
s of
$
Median House Price Mean House Price
Median Household Income Mean Household Income
2001 and 2002 household income figures are Milken Institute estimates. Source: U.S. Census Bureau, Milken Institute

9 Housing Affordability in Three Dimensions September 2002
Figure 6: Ratio of Median House Price to Median Income
2.5
3
3.5
4
4.5
1975
1978
1981
1984
1987
1990
1993
1996
1999
2002
Ratio
Median prices for new single-family homes based on reported transactions; 2001 and 2002 are Milken Institute estimates. Source: U.S. Census Bureau, Milken Institute
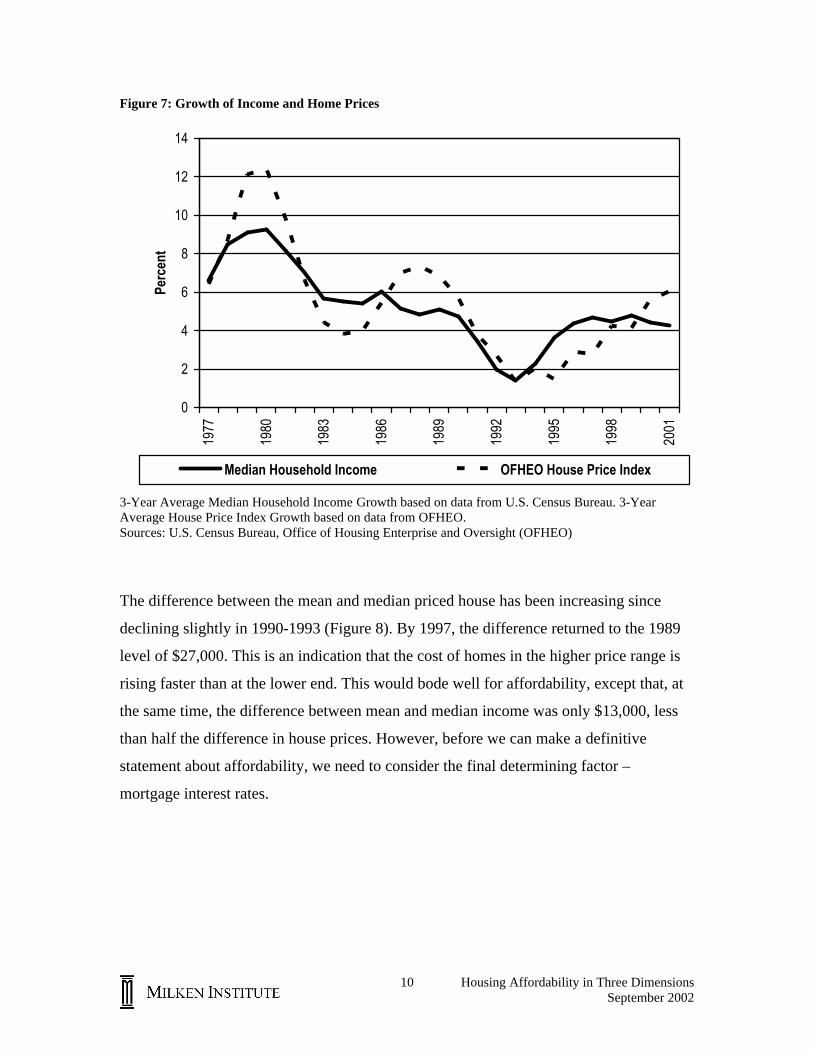
When home prices grow faster than income, affordability suffers. As seen in Figure 7,
home prices grew faster than income in 1978-1981, 1987-1992, and 2000. The difference
in the growth rates in 2000 was 1.18, which was previously exceeded only in 1979-1981
and 1987-1989. For the 13 years across 1977-2000 generally, however, income actually
grew faster than home prices, during which time more households were able to afford to
purchase homes.
10 Housing Affordability in Three Dimensions September 2002
Figure 7: Growth of Income and Home Prices
0
2
4
6
8
10
12
14
1977
1980
1983
1986
1989
1992
1995
1998
2001
Perc
ent
Median Household Income OFHEO House Price Index
3-Year Average Median Household Income Growth based on data from U.S. Census Bureau. 3-Year Average House Price Index Growth based on data from OFHEO. Sources: U.S. Census Bureau, Office of Housing Enterprise and Oversight (OFHEO)
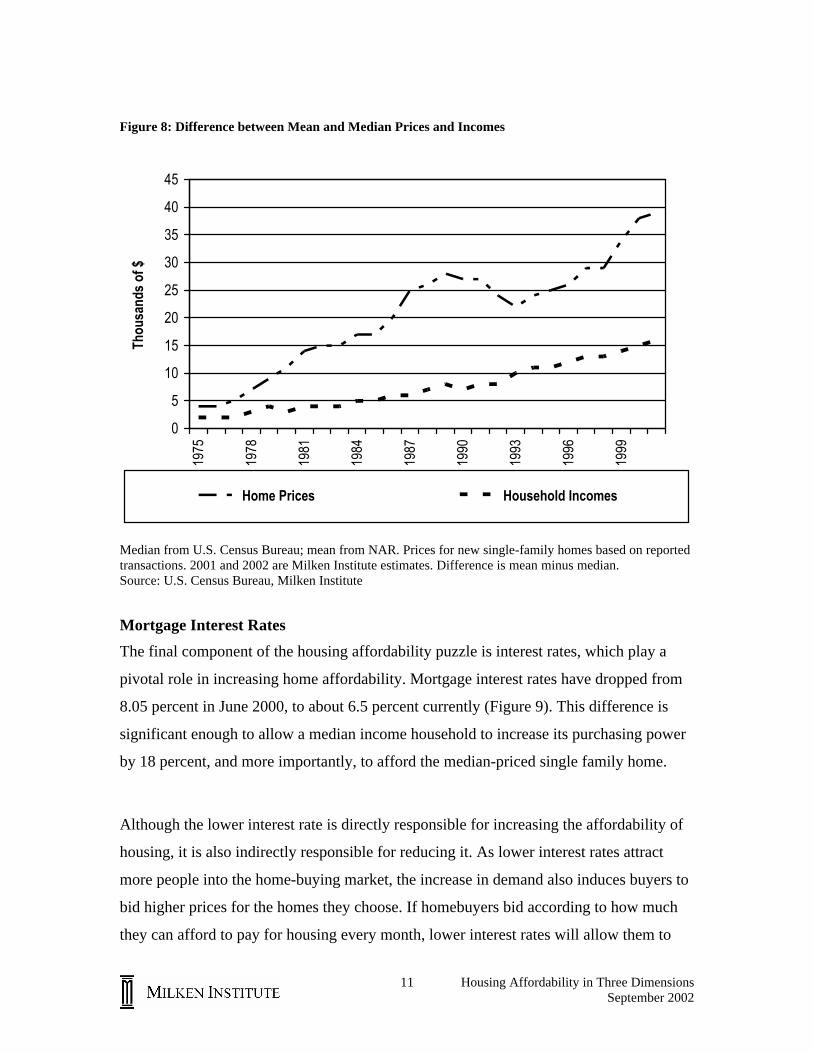
The difference between the mean and median priced house has been increasing since
declining slightly in 1990-1993 (Figure 8). By 1997, the difference returned to the 1989
level of $27,000. This is an indication that the cost of homes in the higher price range is
rising faster than at the lower end. This would bode well for affordability, except that, at
the same time, the difference between mean and median income was only $13,000, less
than half the difference in house prices. However, before we can make a definitive
statement about affordability, we need to consider the final determining factor –
mortgage interest rates.
11 Housing Affordability in Three Dimensions September 2002
Figure 8: Difference between Mean and Median Prices and Incomes
0
5
10
15
20
25
30
35
40
4519
75
1978
1981
1984
1987
1990
1993
1996
1999
Thou
sand
s of
$
Home Prices Household Incomes
Median from U.S. Census Bureau; mean from NAR. Prices for new single-family homes based on reported transactions. 2001 and 2002 are Milken Institute estimates. Difference is mean minus median. Source: U.S. Census Bureau, Milken Institute
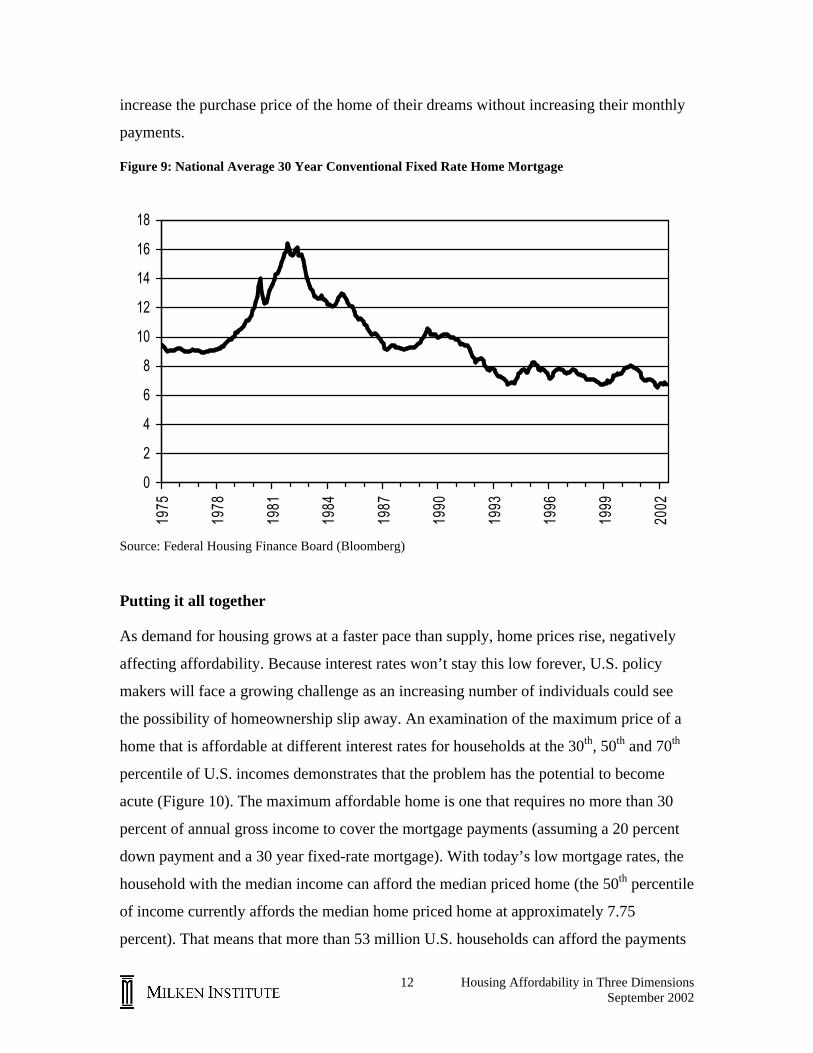
Mortgage Interest Rates
The final component of the housing affordability puzzle is interest rates, which play a
pivotal role in increasing home affordability. Mortgage interest rates have dropped from
8.05 percent in June 2000, to about 6.5 percent currently (Figure 9). This difference is
significant enough to allow a median income household to increase its purchasing power
by 18 percent, and more importantly, to afford the median-priced single family home.
Although the lower interest rate is directly responsible for increasing the affordability of
housing, it is also indirectly responsible for reducing it. As lower interest rates attract
more people into the home-buying market, the increase in demand also induces buyers to
bid higher prices for the homes they choose. If homebuyers bid according to how much
they can afford to pay for housing every month, lower interest rates will allow them to
12 Housing Affordability in Three Dimensions September 2002
increase the purchase price of the home of their dreams without increasing their monthly
payments.
Figure 9: National Average 30 Year Conventional Fixed Rate Home Mortgage
0
2
4
6
8
10
12
14
16
18
1975
1978
1981
1984
1987
1990
1993
1996
1999
2002
Source: Federal Housing Finance Board (Bloomberg)
Putting it all together
As demand for housing grows at a faster pace than supply, home prices rise, negatively
affecting affordability. Because interest rates won’t stay this low forever, U.S. policy
makers will face a growing challenge as an increasing number of individuals could see
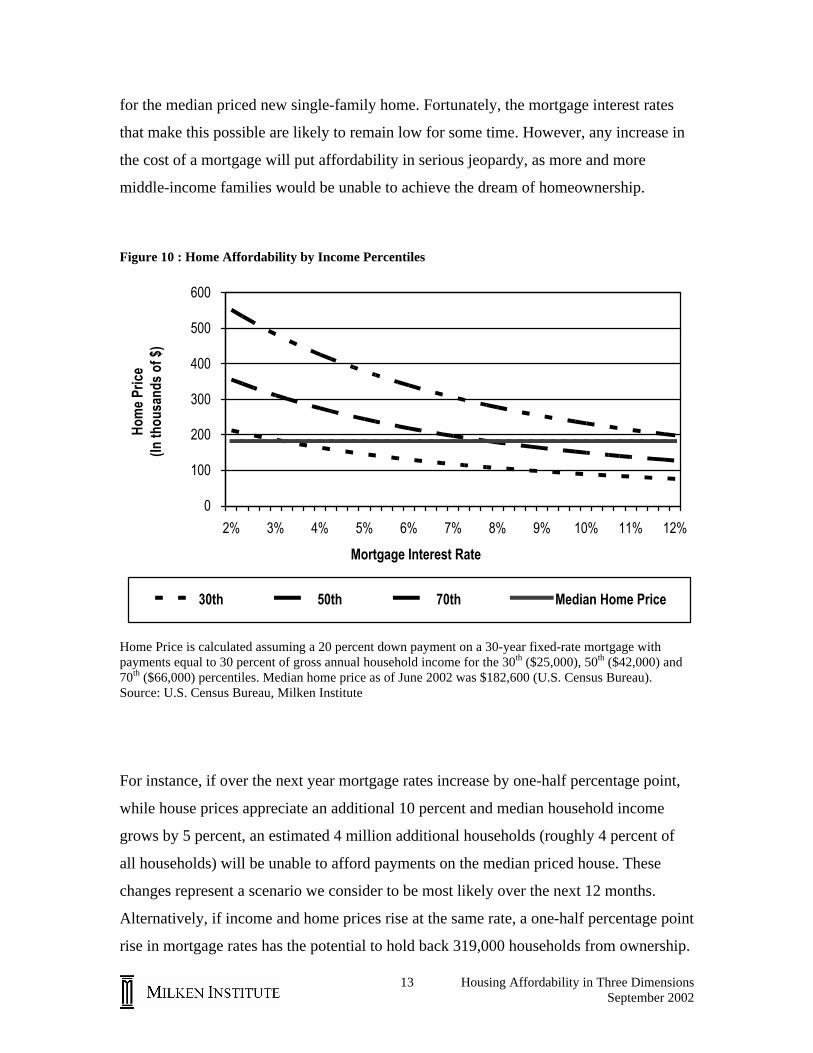
the possibility of homeownership slip away. An examination of the maximum price of a
home that is affordable at different interest rates for households at the 30th, 50th and 70th
percentile of U.S. incomes demonstrates that the problem has the potential to become
acute (Figure 10). The maximum affordable home is one that requires no more than 30
percent of annual gross income to cover the mortgage payments (assuming a 20 percent
down payment and a 30 year fixed-rate mortgage). With today’s low mortgage rates, the
household with the median income can afford the median priced home (the 50th percentile
of income currently affords the median home priced home at approximately 7.75
percent). That means that more than 53 million U.S. households can afford the payments
13 Housing Affordability in Three Dimensions September 2002
for the median priced new single-family home. Fortunately, the mortgage interest rates
that make this possible are likely to remain low for some time. However, any increase in
the cost of a mortgage will put affordability in serious jeopardy, as more and more
middle-income families would be unable to achieve the dream of homeownership.
Figure 10 : Home Affordability by Income Percentiles
0
100
200
300
400
500
600
2% 3% 4% 5% 6% 7% 8% 9% 10% 11% 12%
Mortgage Interest Rate
Hom
e Pr
ice
(In th
ousa
nds
of $
)
30th 50th 70th Median Home Price
Home Price is calculated assuming a 20 percent down payment on a 30-year fixed-rate mortgage with payments equal to 30 percent of gross annual household income for the 30th ($25,000), 50th ($42,000) and 70th ($66,000) percentiles. Median home price as of June 2002 was $182,600 (U.S. Census Bureau). Source: U.S. Census Bureau, Milken Institute
For instance, if over the next year mortgage rates increase by one-half percentage point,
while house prices appreciate an additional 10 percent and median household income
grows by 5 percent, an estimated 4 million additional households (roughly 4 percent of
all households) will be unable to afford payments on the median priced house. These
changes represent a scenario we consider to be most likely over the next 12 months.
Alternatively, if income and home prices rise at the same rate, a one-half percentage point
rise in mortgage rates has the potential to hold back 319,000 households from ownership.

14 Housing Affordability in Three Dimensions September 2002
Housing affordability among minorities Providing homeownership opportunities for some minorities presents an even greater
challenge for policymakers. Some minorities earn as much as 40 percent less across all
income brackets than what their white counterparts do (Figure 11). The year 2000 annual
median income for all U.S. households was $42,000, while the median income for
African American households was $30,000. The comparable figure for Hispanics was
$33,000.
Figure 11: Household Income Distribution by Race
0
20
40
60
80
100
120
140
160
Med
ian
Annu
al In
com
e(in
thou
sand
s of
$)
10th 30th 50th 70th 90th
Percentile
US Average African Americans Hispanics
Source: U.S. Census Bureau (2000)
This income disparity translates into lower levels of home affordability for minorities, as
only Hispanics and African Americans in the upper two-fifths of income can afford a
median-priced single-family home in the U.S. today. Table 1 shows the maximum home
price affordable across income levels for U.S. minorities. These results stand in sharp
contrast to those shown in Figure 1, where the median income affords the median home.
15 Housing Affordability in Three Dimensions September 2002
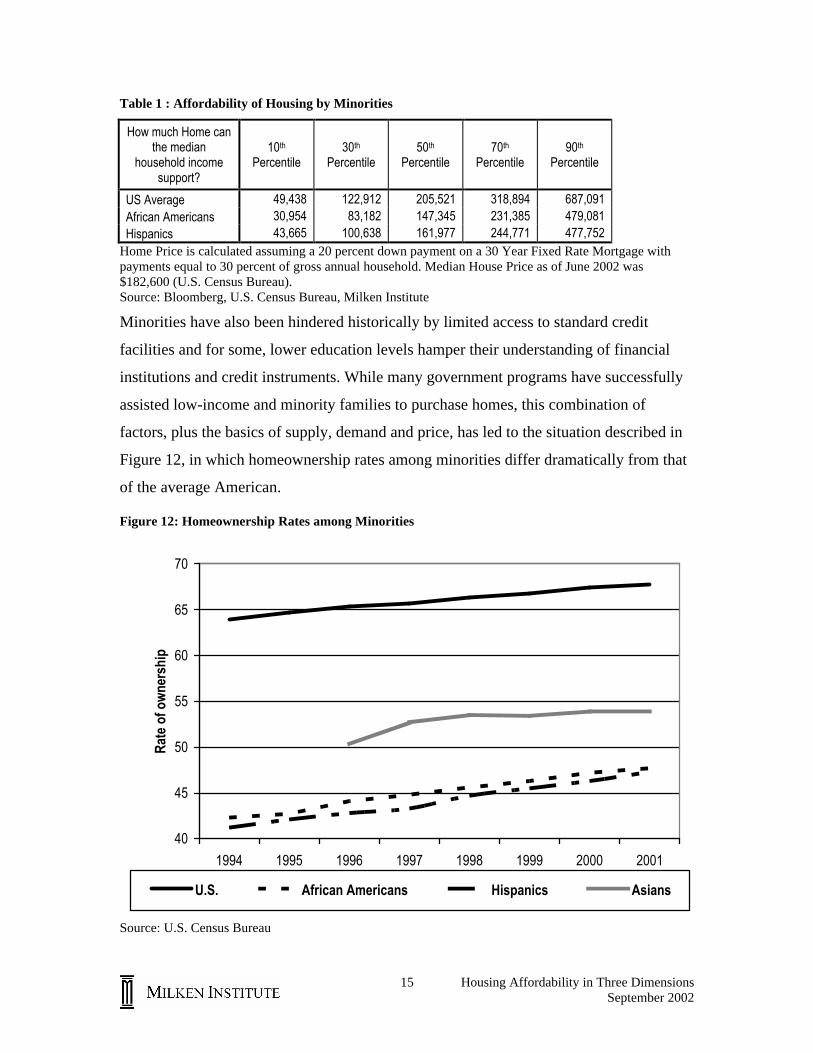
Table 1 : Affordability of Housing by Minorities
How much Home can the median
household income support?
10th Percentile
30th Percentile
50th Percentile
70th Percentile
90th Percentile
US Average 49,438 122,912 205,521 318,894 687,091 African Americans 30,954 83,182 147,345 231,385 479,081 Hispanics 43,665 100,638 161,977 244,771 477,752
Home Price is calculated assuming a 20 percent down payment on a 30 Year Fixed Rate Mortgage with payments equal to 30 percent of gross annual household. Median House Price as of June 2002 was $182,600 (U.S. Census Bureau). Source: Bloomberg, U.S. Census Bureau, Milken Institute
Minorities have also been hindered historically by limited access to standard credit
facilities and for some, lower education levels hamper their understanding of financial
institutions and credit instruments. While many government programs have successfully
assisted low-income and minority families to purchase homes, this combination of
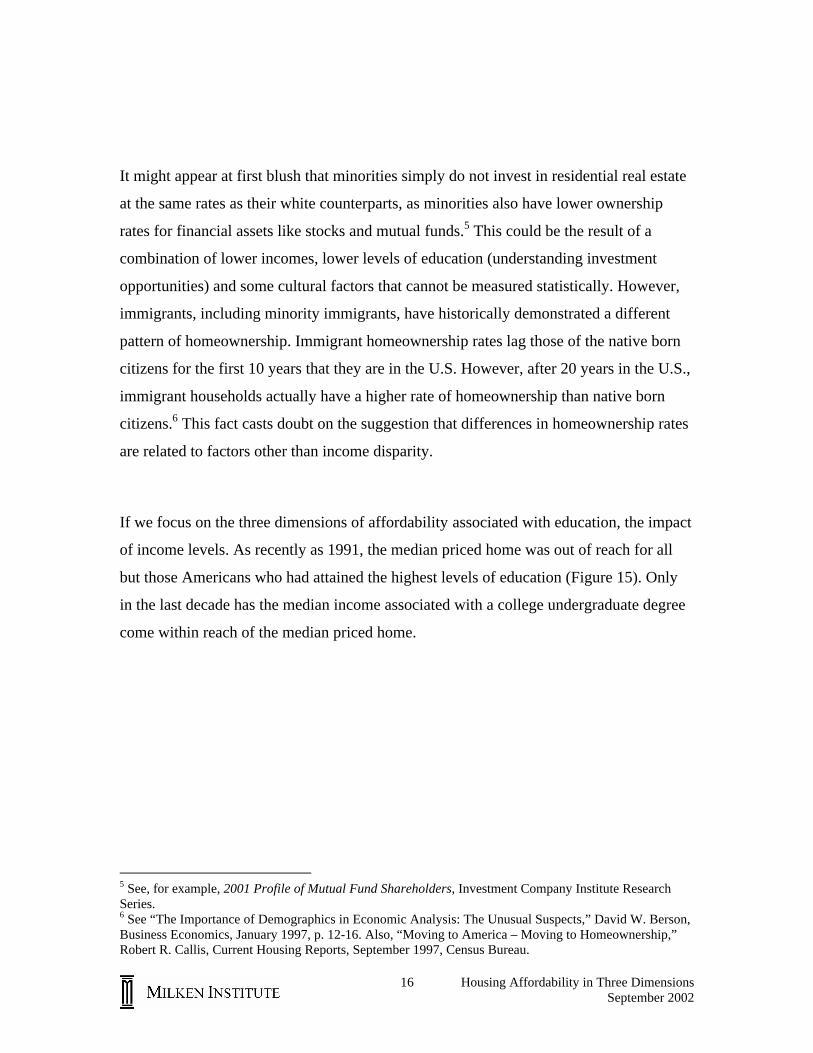
factors, plus the basics of supply, demand and price, has led to the situation described in
Figure 12, in which homeownership rates among minorities differ dramatically from that
of the average American.
Figure 12: Homeownership Rates among Minorities
40
45
50
55
60
65
70
1994 1995 1996 1997 1998 1999 2000 2001
Rate
of o
wne
rshi
p
U.S. African Americans Hispanics Asians
Source: U.S. Census Bureau
16 Housing Affordability in Three Dimensions September 2002
It might appear at first blush that minorities simply do not invest in residential real estate
at the same rates as their white counterparts, as minorities also have lower ownership
rates for financial assets like stocks and mutual funds.5 This could be the result of a
combination of lower incomes, lower levels of education (understanding investment
opportunities) and some cultural factors that cannot be measured statistically. However,
immigrants, including minority immigrants, have historically demonstrated a different
pattern of homeownership. Immigrant homeownership rates lag those of the native born
citizens for the first 10 years that they are in the U.S. However, after 20 years in the U.S.,
immigrant households actually have a higher rate of homeownership than native born
citizens.6 This fact casts doubt on the suggestion that differences in homeownership rates
are related to factors other than income disparity.
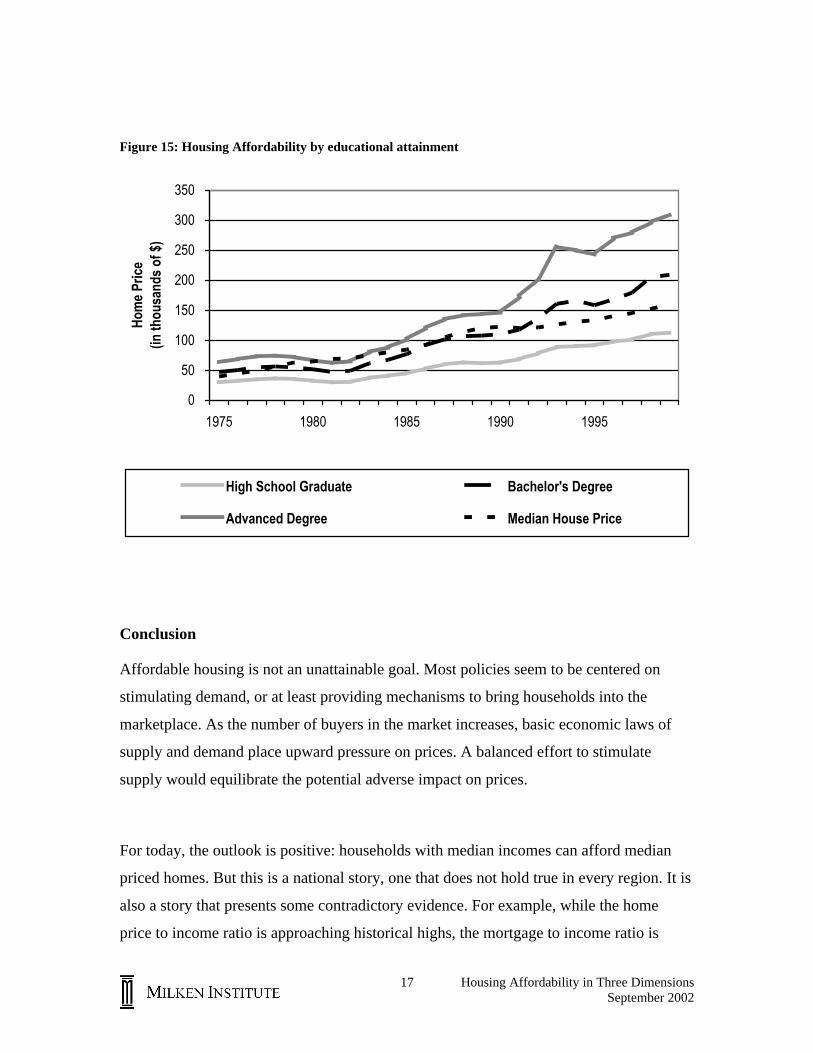
If we focus on the three dimensions of affordability associated with education, the impact
of income levels. As recently as 1991, the median priced home was out of reach for all
but those Americans who had attained the highest levels of education (Figure 15). Only
in the last decade has the median income associated with a college undergraduate degree
come within reach of the median priced home.
5 See, for example, 2001 Profile of Mutual Fund Shareholders, Investment Company Institute Research Series. 6 See “The Importance of Demographics in Economic Analysis: The Unusual Suspects,” David W. Berson, Business Economics, January 1997, p. 12-16. Also, “Moving to America – Moving to Homeownership,” Robert R. Callis, Current Housing Reports, September 1997, Census Bureau.
17 Housing Affordability in Three Dimensions September 2002
Figure 15: Housing Affordability by educational attainment
Conclusion
Affordable housing is not an unattainable goal. Most policies seem to be centered on
stimulating demand, or at least providing mechanisms to bring households into the
marketplace. As the number of buyers in the market increases, basic economic laws of
supply and demand place upward pressure on prices. A balanced effort to stimulate
supply would equilibrate the potential adverse impact on prices.
For today, the outlook is positive: households with median incomes can afford median
priced homes. But this is a national story, one that does not hold true in every region. It is
also a story that presents some contradictory evidence. For example, while the home
price to income ratio is approaching historical highs, the mortgage to income ratio is
0
50
100
150
200
250
300
350
1975 1980 1985 1990 1995
Hom
e Pr
ice
(in th
ousa
nds
of $
)
High School Graduate Bachelor's Degree
Advanced Degree Median House Price
18 Housing Affordability in Three Dimensions September 2002
approaching historical lows. Based on the latter, Americans can continue to support
higher and higher mortgage payments. If mortgage interest rates do not rise in the near
future, and income growth rates remain strong, the demand that supports the current
prices can be expected to remain stable for the near term. Like a tripod, however, if one
of the three dimensions moves faster or directionally opposite to the other two, it has the
potential to upset the current balance of affordable housing in the U.S.

1250 Fourth Street • Santa Monica, California 90401Phone (310) 998-2600 • Fax (310) 998-2627 • E-mail [email protected]
www.milkeninstitute.org