interactive infographics on the internet
TRANSCRIPT
INTERACTIVE INFOGRAPHICS ON THE INTERNET
Banu İnanç Uyan Dur Assist. Prof., TOBB University of Economics and Technology, Faculty of Fine Arts, Design and
Architecture, Dept. of Visual Communication Design, Söğütözü St. No:43, Ankara/Turkey, [email protected]
ABSTRACT Today humanity is subject to unprecedented amount of information. This makes the information design a much more important subject for regulating the complex data and information traffic. Human mind can perceive visual information transfer very quickly and in a more efficient and permanent manner compared to written or verbal information transfer. Scientific researches on this matter indicate how effective the eyesight is in the process of presenting information and perceiving the message. Therefore, an increase has been noticed in recent years in the use of infographics to provide more comprehensible information on various media. The purpose of infographics is to present intense and complex data content in a regular and perceivable manner. Infographics present data, information and/or processes related to a certain subject in a story like visual arrangement. This visual story making may include various elements like image, illustration, typography, map and data visualization. Infographics which we see in static versions only in printed media are now available in different media formats. In recent years, interactive infographics applications with larger information capacity and more effective structure are becoming more popular. This study examines the content presentation types, functionality, differences from static versions and visual designs of interactive infographics applications within the scope of visual communication design which is increasingly more multidisciplinary field in line with the requirements of the information era. Keywords: Infographic, interactive infographic, data visualization. INTRODUCTION Today humanity is subject to unprecedented amount of information. This makes the information design a much more important subject for regulating the complex data and information traffic. Human mind can perceive visual information transfer very quickly and in a more efficient and permanent manner compared to written or verbal information transfer. Scientific researches on this matter indicate how effective the eyesight is in the process of presenting information and perceiving the message. We use our sight the most for perceiving the world that we live in. For this reason, visual communication is more effective than the other communication types. The history of visual communication dates back to thousands of years ago from pictograms on cave walls to ideograms in hieroglyphs. Today, humanity lives in a much more visuality centered world. The development of technologically visual media and facilities in the 21st century, have directed the thinking and perception processes of societies to the visual one. According to Parsa (2007) “in the contemporary Western society in this new century, which is under the supremacy of visual culture, it is concluded that images are at the center and in this sense ocularcentrist societies are formed”. The faster progress of urbanization and technology since the 20th century resulted in visual communication to gain more importance within modern life. The gradual increase in sign and direction systems, outdoor advertising and the visual elements in printed publications can be given as examples of this process. Today, facilities that are integral part of modern life, such as smart phones, touch screens, television, the Internet and social media brought visuality and visual communication to a more central place. For National Education Association (2001), “Western civilization has become more dependent than ever on visual culture, visual artifacts, and visual communication as a mode of discourse and a means of developing a social and cultural identity”. IMPORTANT TURNING POINTS IN THE HISTORY UNTIL THE INFORGRAPHICS OF OUR TIME Besides the dominant power of visuality and visual communication, another outcome of this age is increasing flow of data and information. In the information age, the importance of visual design for arranging and presenting intense, complicated, unsystematic information and data in a certain systematic way gradually increases. Therefore, an increase has been noticed in recent years in the use of infographics to provide more comprehensible information on various media. The purpose of infographics is to present intense and complex data content in a regular and perceivable manner. Infographics present data,
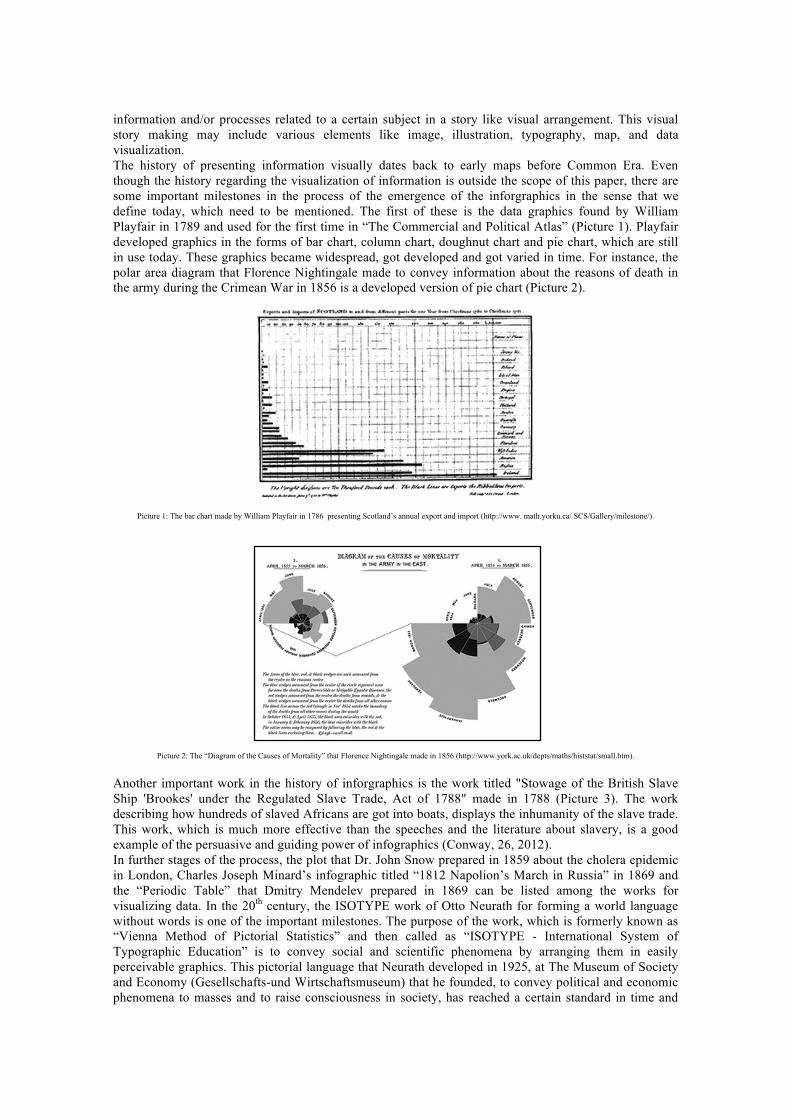
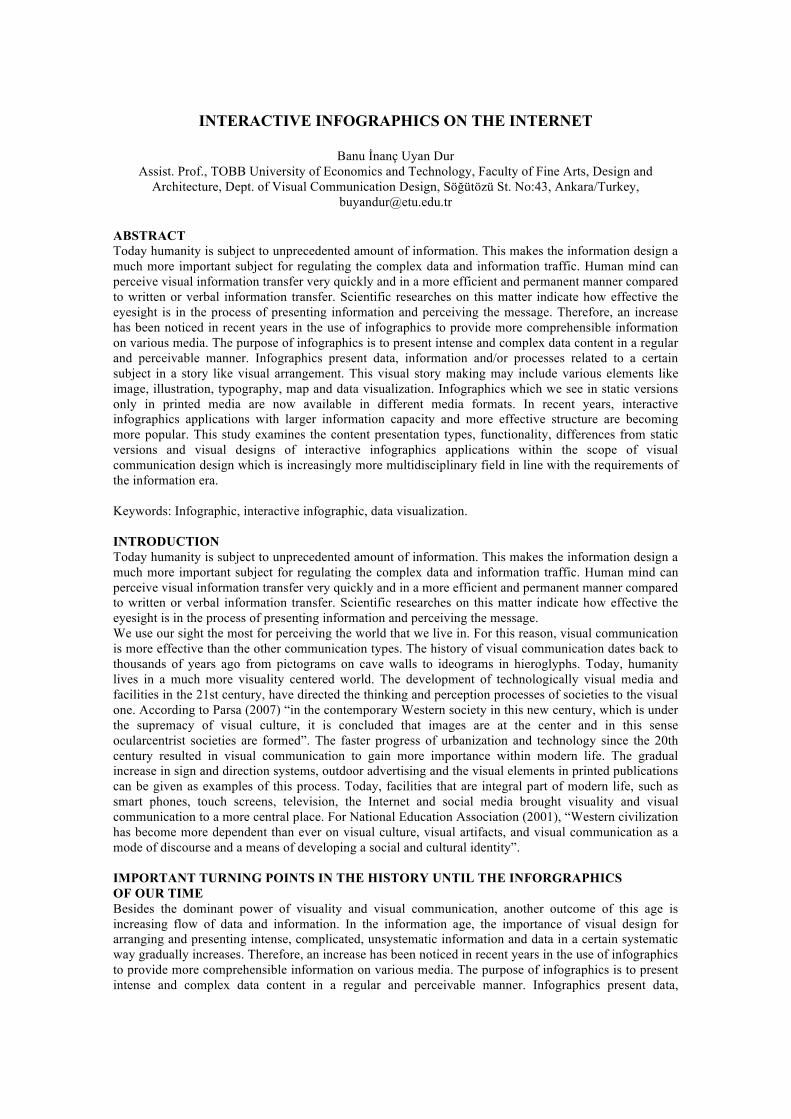
information and/or processes related to a certain subject in a story like visual arrangement. This visual story making may include various elements like image, illustration, typography, map, and data visualization. The history of presenting information visually dates back to early maps before Common Era. Even though the history regarding the visualization of information is outside the scope of this paper, there are some important milestones in the process of the emergence of the inforgraphics in the sense that we define today, which need to be mentioned. The first of these is the data graphics found by William Playfair in 1789 and used for the first time in “The Commercial and Political Atlas” (Picture 1). Playfair developed graphics in the forms of bar chart, column chart, doughnut chart and pie chart, which are still in use today. These graphics became widespread, got developed and got varied in time. For instance, the polar area diagram that Florence Nightingale made to convey information about the reasons of death in the army during the Crimean War in 1856 is a developed version of pie chart (Picture 2).
Picture 1: The bar chart made by William Playfair in 1786 presenting Scotland’s annual export and import (http://www. math.yorku.ca/ SCS/Gallery/milestone/).
Picture 2: The “Diagram of the Causes of Mortality” that Florence Nightingale made in 1856 (http://www.york.ac.uk/depts/maths/histstat/small.htm).
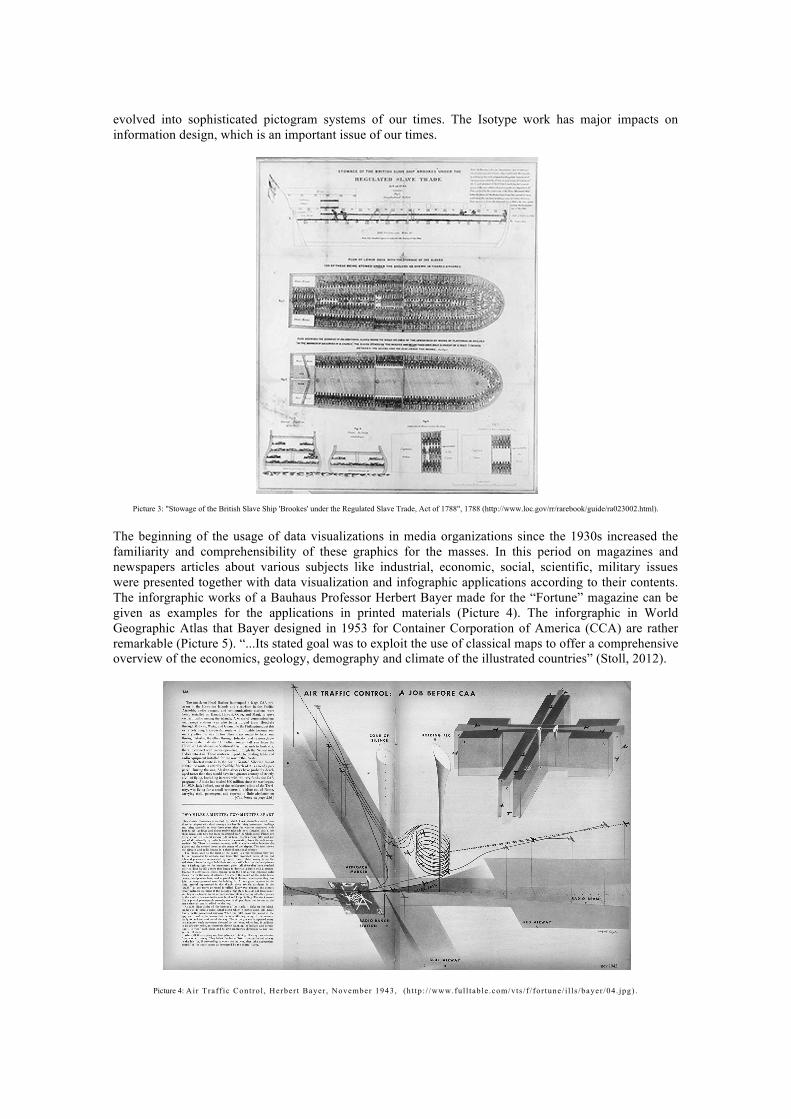
Another important work in the history of inforgraphics is the work titled "Stowage of the British Slave Ship 'Brookes' under the Regulated Slave Trade, Act of 1788" made in 1788 (Picture 3). The work describing how hundreds of slaved Africans are got into boats, displays the inhumanity of the slave trade. This work, which is much more effective than the speeches and the literature about slavery, is a good example of the persuasive and guiding power of infographics (Conway, 26, 2012). In further stages of the process, the plot that Dr. John Snow prepared in 1859 about the cholera epidemic in London, Charles Joseph Minard’s infographic titled “1812 Napolion’s March in Russia” in 1869 and the “Periodic Table” that Dmitry Mendelev prepared in 1869 can be listed among the works for visualizing data. In the 20th century, the ISOTYPE work of Otto Neurath for forming a world language without words is one of the important milestones. The purpose of the work, which is formerly known as “Vienna Method of Pictorial Statistics” and then called as “ISOTYPE - International System of Typographic Education” is to convey social and scientific phenomena by arranging them in easily perceivable graphics. This pictorial language that Neurath developed in 1925, at The Museum of Society and Economy (Gesellschafts-und Wirtschaftsmuseum) that he founded, to convey political and economic phenomena to masses and to raise consciousness in society, has reached a certain standard in time and
evolved into sophisticated pictogram systems of our times. The Isotype work has major impacts on information design, which is an important issue of our times.
Picture 3: "Stowage of the British Slave Ship 'Brookes' under the Regulated Slave Trade, Act of 1788", 1788 (http://www.loc.gov/rr/rarebook/guide/ra023002.html).
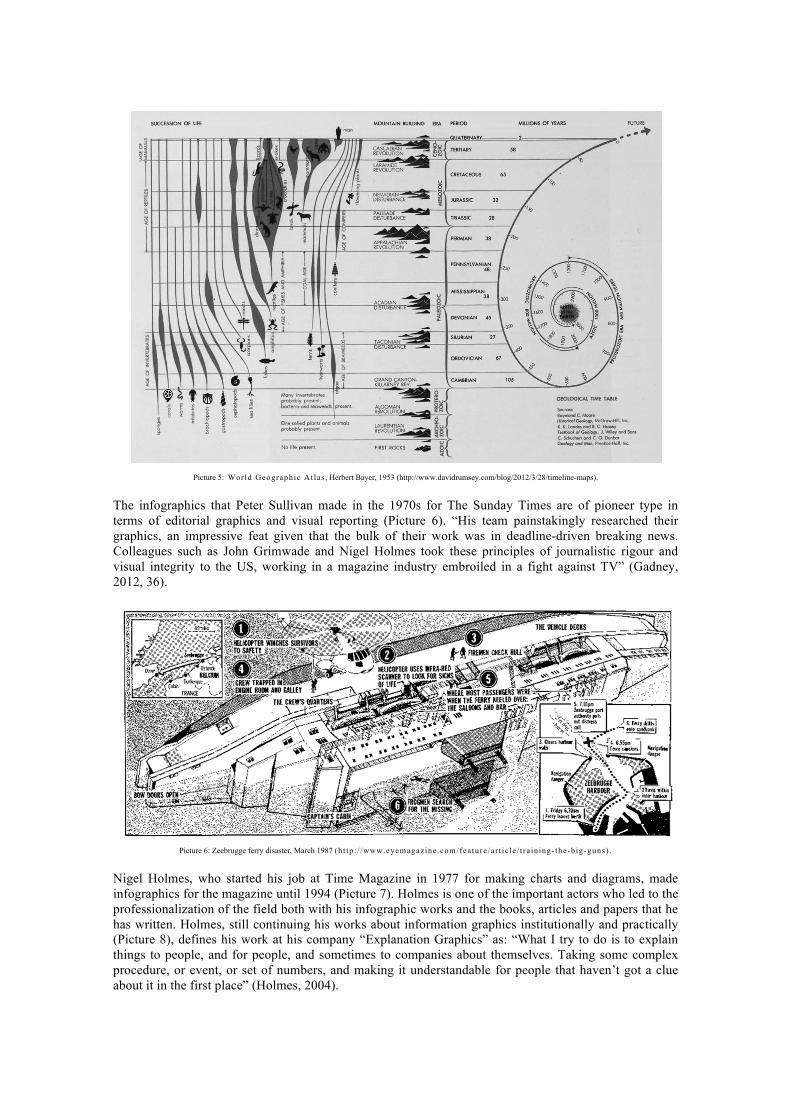
The beginning of the usage of data visualizations in media organizations since the 1930s increased the familiarity and comprehensibility of these graphics for the masses. In this period on magazines and newspapers articles about various subjects like industrial, economic, social, scientific, military issues were presented together with data visualization and infographic applications according to their contents. The inforgraphic works of a Bauhaus Professor Herbert Bayer made for the “Fortune” magazine can be given as examples for the applications in printed materials (Picture 4). The inforgraphic in World Geographic Atlas that Bayer designed in 1953 for Container Corporation of America (CCA) are rather remarkable (Picture 5). “...Its stated goal was to exploit the use of classical maps to offer a comprehensive overview of the economics, geology, demography and climate of the illustrated countries” (Stoll, 2012).
Picture 4: Air Traf f ic Cont ro l , Herber t Bayer , November 1943, (h t tp : / /www.ful l tab le .com/vts / f / for tune/ i l l s /bayer /04 . jpg) .
Picture 5: World Geographic At las , Herbert Bayer, 1953 (http://www.davidrumsey.com/blog/2012/3/28/timeline-maps).
The infographics that Peter Sullivan made in the 1970s for The Sunday Times are of pioneer type in terms of editorial graphics and visual reporting (Picture 6). “His team painstakingly researched their graphics, an impressive feat given that the bulk of their work was in deadline-driven breaking news. Colleagues such as John Grimwade and Nigel Holmes took these principles of journalistic rigour and visual integrity to the US, working in a magazine industry embroiled in a fight against TV” (Gadney, 2012, 36).
Picture 6: Zeebrugge ferry disaster, March 1987 (h t tp : / /www.eyemagazine .com/fea ture /ar t ic le / t ra in ing- the-b ig-guns) .
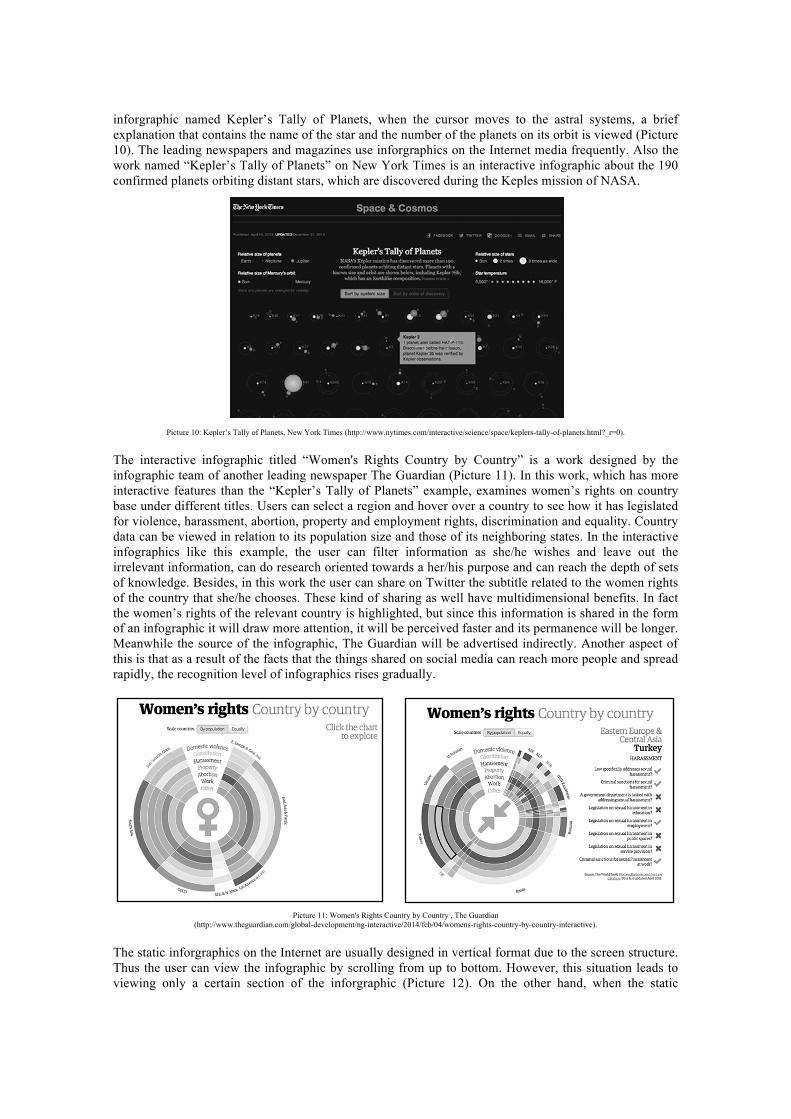
Nigel Holmes, who started his job at Time Magazine in 1977 for making charts and diagrams, made infographics for the magazine until 1994 (Picture 7). Holmes is one of the important actors who led to the professionalization of the field both with his infographic works and the books, articles and papers that he has written. Holmes, still continuing his works about information graphics institutionally and practically (Picture 8), defines his work at his company “Explanation Graphics” as: “What I try to do is to explain things to people, and for people, and sometimes to companies about themselves. Taking some complex procedure, or event, or set of numbers, and making it understandable for people that haven’t got a clue about it in the first place” (Holmes, 2004).
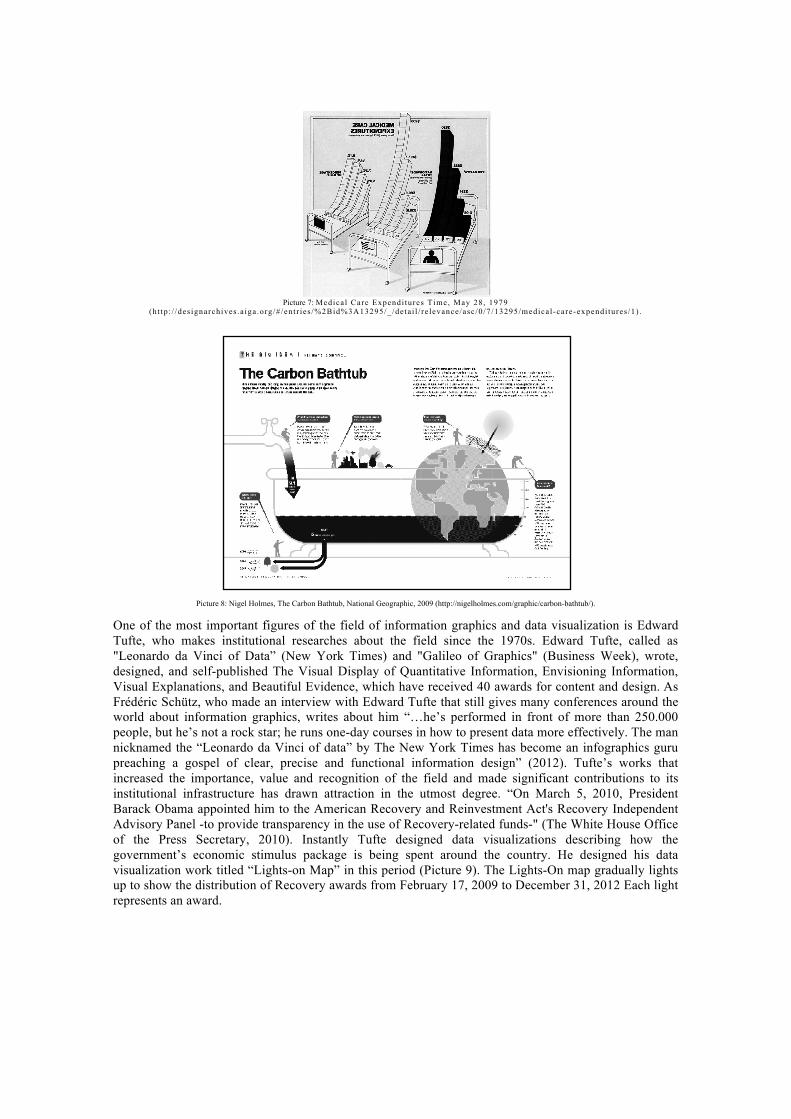
Picture 7: Medica l Care Expendi tures Time, May 28 , 1979
(h t tp : / /des ignarchives .a iga .org /# /ent r ies /%2Bid%3A13295/_/de ta i l / re levance/asc /0 /7 /13295/medica l-care-expendi tures /1) .
Picture 8: Nigel Holmes, The Carbon Bathtub, National Geographic, 2009 (http://nigelholmes.com/graphic/carbon-bathtub/).
One of the most important figures of the field of information graphics and data visualization is Edward Tufte, who makes institutional researches about the field since the 1970s. Edward Tufte, called as "Leonardo da Vinci of Data” (New York Times) and "Galileo of Graphics" (Business Week), wrote, designed, and self-published The Visual Display of Quantitative Information, Envisioning Information, Visual Explanations, and Beautiful Evidence, which have received 40 awards for content and design. As Frédéric Schütz, who made an interview with Edward Tufte that still gives many conferences around the world about information graphics, writes about him “…he’s performed in front of more than 250.000 people, but he’s not a rock star; he runs one-day courses in how to present data more effectively. The man nicknamed the “Leonardo da Vinci of data” by The New York Times has become an infographics guru preaching a gospel of clear, precise and functional information design” (2012). Tufte’s works that increased the importance, value and recognition of the field and made significant contributions to its institutional infrastructure has drawn attraction in the utmost degree. “On March 5, 2010, President Barack Obama appointed him to the American Recovery and Reinvestment Act's Recovery Independent Advisory Panel -to provide transparency in the use of Recovery-related funds-" (The White House Office of the Press Secretary, 2010). Instantly Tufte designed data visualizations describing how the government’s economic stimulus package is being spent around the country. He designed his data visualization work titled “Lights-on Map” in this period (Picture 9). The Lights-On map gradually lights up to show the distribution of Recovery awards from February 17, 2009 to December 31, 2012 Each light represents an award.

Picture 9: The Lights-On map, Edward Tufte (http://semanticommunity.info/FederalTransparency.gov#Slide_9_Tufte.E2.80.99s_Lights-On-Map).
THE USAGE FIELDS OF CONTEMPORARY INFOGRAPHICS The infographics, which are used in leading newspapers and magazines of the world since the 1940s for the purpose of enhancing comprehensibility and ensuring the reader to grasp the issue in a short period of time, became the essential elements of media organs. Today, news contents like economic data, new technological advancements, weather broadcasts cannot be thought without infographics. Infographics are on the newspapers only, they are everywhere. Many examples can be given to the places where we encounter infographics in our daily lives. Among them, usage manuals, touristic city maps, annual activity reports, medical prospectuses, bills, kiosks, newspapers, magazines and the TV can be listed. Certainly the infographics are getting widespread in the Internet media, which is always with us with smart phones and touch tablets. Every day tens of thousands of infographics are shared on the web sites of newspapers and magazines, blogs and among the users of social media which increases its power and popularity daily. As the user numbers of social networks increase every day the time spent by these users in social networks gradually increase as well. A new period has started in the global connection between the social networks and the people. The ways of communication, interaction and sharing of information are being reshaped. In this media, the users talk about their daily activities, share information, follow and review the social, cultural and political agenda. In social networks as a type of 24-hour brain storming, the increasing prevalence of infographics is due to its ability to respond to the communication pace of the century with its features of presenting complex information in a fast and effective way. Both in social media and on the web sites infographics gain prevalence both with their static versions and with the interactive versions of the Internet medium. Here, an important point that needs to be underlined is that the interactive infographics are not solely found on the Internet media. Interactive infographics can be used offline on the interface of a software product, on an application guidance table or on the dashboard of a kiosk. The interactive infographics on the Internet are examined within the scope of this research. INTERACTIVE INFOGRAPHICS AND THEIR SUPREMACIES OVER THE STATIC VERSIONS Whether they are printed or online, the information is fixed in the static versions of the infographics, the audience interaction is limited only to seeing and reading. Yet, in the interactive infographics there are various applications open to user interaction. The interactive infographics, which can bear much more information compared to their static versions, accommodate various applications open to user interaction and this way they invite the user inside the information and provide her/him to set more bonds with the information. User interaction involves which and how much information to be viewed and in which detailed level with its features like choosing the information, searching and actively shaping the content to be viewed. For reaching the specific information that she/he searches, the user determined her/his own ways, goes through the depths of the inforgraphic and discovers the information herself/himself. The user, who can get the content in a direction that she/he determines, is in a more ruling position in the process of getting informed. There are numerous variations of interactive infographics, according to content, target, audience and purpose, from simple applications that give information with pop-ups when one moves over the image, to complex ones that are automatically updated in every second. For example in the interactive
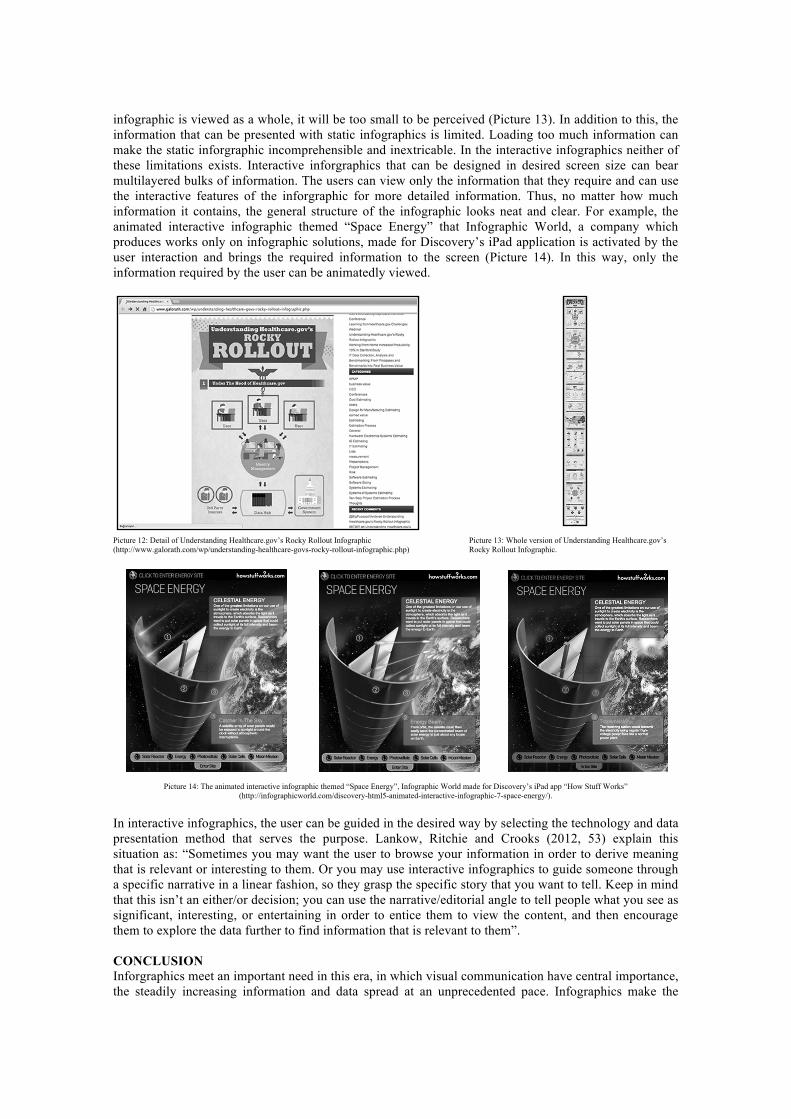
inforgraphic named Kepler’s Tally of Planets, when the cursor moves to the astral systems, a brief explanation that contains the name of the star and the number of the planets on its orbit is viewed (Picture 10). The leading newspapers and magazines use inforgraphics on the Internet media frequently. Also the work named “Kepler’s Tally of Planets” on New York Times is an interactive infographic about the 190 confirmed planets orbiting distant stars, which are discovered during the Keples mission of NASA.
Picture 10: Kepler’s Tally of Planets, New York Times (http://www.nytimes.com/interactive/science/space/keplers-tally-of-planets.html?_r=0).
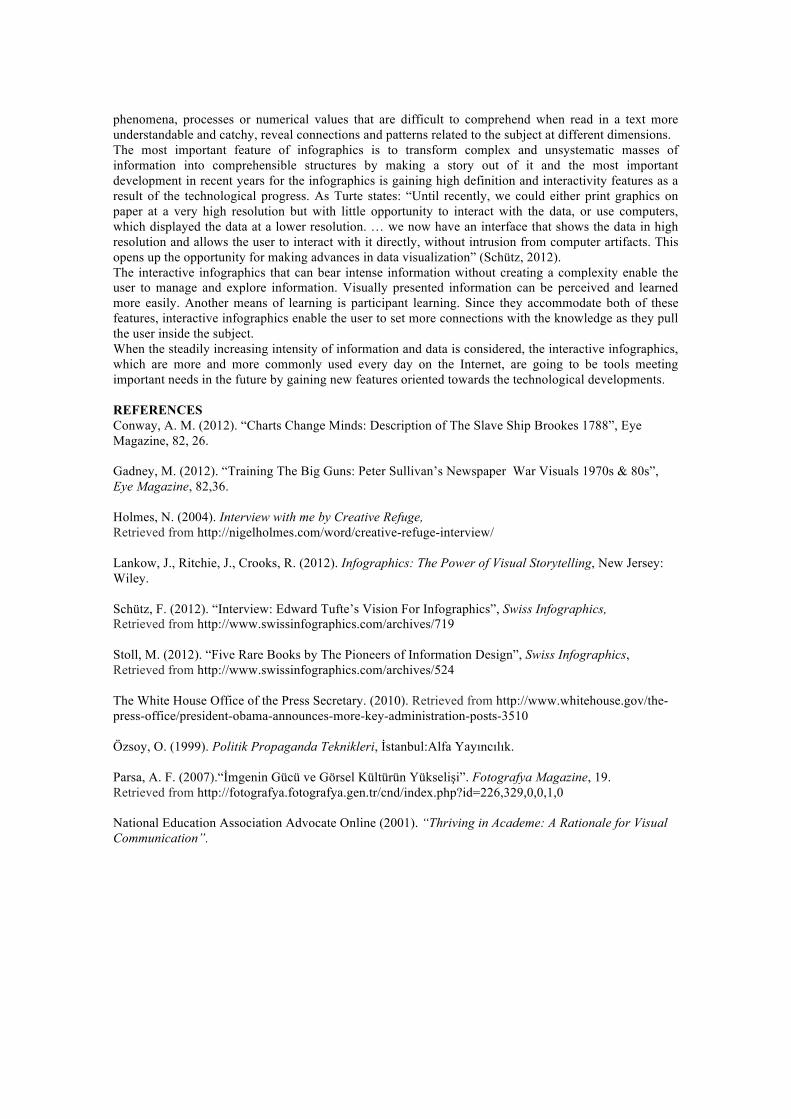
The interactive infographic titled “Women's Rights Country by Country” is a work designed by the infographic team of another leading newspaper The Guardian (Picture 11). In this work, which has more interactive features than the “Kepler’s Tally of Planets” example, examines women’s rights on country base under different titles. Users can select a region and hover over a country to see how it has legislated for violence, harassment, abortion, property and employment rights, discrimination and equality. Country data can be viewed in relation to its population size and those of its neighboring states. In the interactive infographics like this example, the user can filter information as she/he wishes and leave out the irrelevant information, can do research oriented towards a her/his purpose and can reach the depth of sets of knowledge. Besides, in this work the user can share on Twitter the subtitle related to the women rights of the country that she/he chooses. These kind of sharing as well have multidimensional benefits. In fact the women’s rights of the relevant country is highlighted, but since this information is shared in the form of an infographic it will draw more attention, it will be perceived faster and its permanence will be longer. Meanwhile the source of the infographic, The Guardian will be advertised indirectly. Another aspect of this is that as a result of the facts that the things shared on social media can reach more people and spread rapidly, the recognition level of infographics rises gradually.
Picture 11: Women's Rights Country by Country , The Guardian (http://www.theguardian.com/global-development/ng-interactive/2014/feb/04/womens-rights-country-by-country-interactive).
The static inforgraphics on the Internet are usually designed in vertical format due to the screen structure. Thus the user can view the infographic by scrolling from up to bottom. However, this situation leads to viewing only a certain section of the inforgraphic (Picture 12). On the other hand, when the static
infographic is viewed as a whole, it will be too small to be perceived (Picture 13). In addition to this, the information that can be presented with static infographics is limited. Loading too much information can make the static inforgraphic incomprehensible and inextricable. In the interactive infographics neither of these limitations exists. Interactive inforgraphics that can be designed in desired screen size can bear multilayered bulks of information. The users can view only the information that they require and can use the interactive features of the inforgraphic for more detailed information. Thus, no matter how much information it contains, the general structure of the infographic looks neat and clear. For example, the animated interactive infographic themed “Space Energy” that Infographic World, a company which produces works only on infographic solutions, made for Discovery’s iPad application is activated by the user interaction and brings the required information to the screen (Picture 14). In this way, only the information required by the user can be animatedly viewed.
Picture 12: Detail of Understanding Healthcare.gov’s Rocky Rollout Infographic (http://www.galorath.com/wp/understanding-healthcare-govs-rocky-rollout-infographic.php)
Picture 13: Whole version of Understanding Healthcare.gov’s Rocky Rollout Infographic.
Picture 14: The animated interactive infographic themed “Space Energy”, Infographic World made for Discovery’s iPad app “How Stuff Works” (http://infographicworld.com/discovery-html5-animated-interactive-infographic-7-space-energy/).
In interactive infographics, the user can be guided in the desired way by selecting the technology and data presentation method that serves the purpose. Lankow, Ritchie and Crooks (2012, 53) explain this situation as: “Sometimes you may want the user to browse your information in order to derive meaning that is relevant or interesting to them. Or you may use interactive infographics to guide someone through a specific narrative in a linear fashion, so they grasp the specific story that you want to tell. Keep in mind that this isn’t an either/or decision; you can use the narrative/editorial angle to tell people what you see as significant, interesting, or entertaining in order to entice them to view the content, and then encourage them to explore the data further to find information that is relevant to them”. CONCLUSION Inforgraphics meet an important need in this era, in which visual communication have central importance, the steadily increasing information and data spread at an unprecedented pace. Infographics make the
phenomena, processes or numerical values that are difficult to comprehend when read in a text more understandable and catchy, reveal connections and patterns related to the subject at different dimensions. The most important feature of infographics is to transform complex and unsystematic masses of information into comprehensible structures by making a story out of it and the most important development in recent years for the infographics is gaining high definition and interactivity features as a result of the technological progress. As Turte states: “Until recently, we could either print graphics on paper at a very high resolution but with little opportunity to interact with the data, or use computers, which displayed the data at a lower resolution. … we now have an interface that shows the data in high resolution and allows the user to interact with it directly, without intrusion from computer artifacts. This opens up the opportunity for making advances in data visualization” (Schütz, 2012). The interactive infographics that can bear intense information without creating a complexity enable the user to manage and explore information. Visually presented information can be perceived and learned more easily. Another means of learning is participant learning. Since they accommodate both of these features, interactive infographics enable the user to set more connections with the knowledge as they pull the user inside the subject. When the steadily increasing intensity of information and data is considered, the interactive infographics, which are more and more commonly used every day on the Internet, are going to be tools meeting important needs in the future by gaining new features oriented towards the technological developments. REFERENCES Conway, A. M. (2012). “Charts Change Minds: Description of The Slave Ship Brookes 1788”, Eye Magazine, 82, 26. Gadney, M. (2012). “Training The Big Guns: Peter Sullivan’s Newspaper War Visuals 1970s & 80s”, Eye Magazine, 82,36. Holmes, N. (2004). Interview with me by Creative Refuge, Retrieved from http://nigelholmes.com/word/creative-refuge-interview/ Lankow, J., Ritchie, J., Crooks, R. (2012). Infographics: The Power of Visual Storytelling, New Jersey: Wiley. Schütz, F. (2012). “Interview: Edward Tufte’s Vision For Infographics”, Swiss Infographics, Retrieved from http://www.swissinfographics.com/archives/719 Stoll, M. (2012). “Five Rare Books by The Pioneers of Information Design”, Swiss Infographics, Retrieved from http://www.swissinfographics.com/archives/524 The White House Office of the Press Secretary. (2010). Retrieved from http://www.whitehouse.gov/the-press-office/president-obama-announces-more-key-administration-posts-3510 Özsoy, O. (1999). Politik Propaganda Teknikleri, İstanbul:Alfa Yayıncılık. Parsa, A. F. (2007).“İmgenin Gücü ve Görsel Kültürün Yükselişi”. Fotografya Magazine, 19. Retrieved from http://fotografya.fotografya.gen.tr/cnd/index.php?id=226,329,0,0,1,0 National Education Association Advocate Online (2001). “Thriving in Academe: A Rationale for Visual Communication”.