integration of iconic gestures and speech in left superior temporal areas boosts speech...
TRANSCRIPT

Integration of iconic gestures and speech in left superior
temporal areas boosts speech comprehension under adverse
listening conditions
Henning Holle1, Jonas Obleser2, Shirley-Ann Rueschemeyer3, & Thomas C. Gunter2
This is a preprint of a published article. Please cite as:
Holle H, Obleser J, Rueschemeyer SA, Gunter TC (2010). Integration of iconic
gestures and speech in left superior temporal areas boost speech comprehension
under adverse listening conditions. Neuroimage, 49, 875-884.
1 University of Sussex, Dept. of Psychology, Falmer, Brighton, BN1 9QH, U.K.
2 Max Planck Institute for Human Cognitive and Brain Sciences, Stephanstr. 1a, 04103
Leipzig, Germany
3 Donders Centre for Cognition, Radboud University, P.O. Box 9104, 6500 HE
Nijmegen, Netherlands
Correspondence should be addressed to Henning Holle, [email protected], Phone
+44-(0)1273 – 877240, Fax +44-(0)1273 - 678058
Running title: Gesture–speech integration
Supporting Information (SI): example video, example of multispeaker babble

2
Keywords: Language, fMRI, multisensory, audiovisual, inverse effectiveness

3
Abstract
Iconic gestures are spontaneous hand movements that illustrate certain contents of
speech and, as such, are an important part of face-to-face communication. This
experiment targets the brain bases of how iconic gestures and speech are integrated
during comprehension. Areas of integration were identified on the basis of two
classic properties of multimodal integration, bimodal enhancement and inverse
effectiveness (i.e., greater enhancement for unimodally least effective stimuli).
Participants underwent fMRI while being presented with videos of gesture-
supported sentences as well as their unimodal components, which allowed us to
identify areas showing bimodal enhancement. Additionally, we manipulated the
signal-to-noise ratio of speech (either moderate or good) to probe for integration
areas exhibiting the inverse effectiveness property. Bimodal enhancement was found
at the posterior end of the superior temporal sulcus and adjacent superior temporal
gyrus (pSTS/STG) in both hemispheres, indicating that the integration of iconic
gestures and speech takes place in these areas. Furthermore, we found that the left
pSTS/STG specifically showed a pattern of inverse effectiveness, i.e., the neural
enhancement for bimodal stimulation was greater under adverse listening
conditions. This indicates that activity in this area is boosted when an iconic gesture
accompanies an utterance that is otherwise difficult to comprehend. The neural
response paralleled the behavioral data observed. The present data extends results
from previous gesture–speech integration studies in showing that pSTS/STG plays a
key role in the facilitation of speech comprehension through simultaneous gestural
input.

4
Introduction
Gestures are an important component of human face-to-face communication. For
instance, when engaged in a conversation, speakers spontaneously produce hand
movements that illustrate certain aspects. Some of these gestures provide
illustrations of the forms, shapes, events or actions that are topic of the
simultaneously occurring speech and have therefore been termed iconic gestures
(McNeill, 1992). For instance, a speaker might produce hammering movements while
saying “I was fixing the chair”. In this case, gesture provides the listeners with
additional information about how the chair was repaired. Addressees not only
process the speech of a speaker, but also continuously integrate gestures with speech
during comprehension (Goldin-Meadow, 2006; McNeill, 2005). In the case of iconic
gestures, this integration is thought to occur by means of a linking process between
gesture and speech semantics (Green et al., in press; Holle, 2007). Here, we are
interested in the brain bases of this interaction between gesture and speech.
The neuronal basis of multisensory integration has been studied in most detail in the
superior colliculus. When presenting stimuli either isolated (e.g., in the auditory (A)
or the visual (V) domain) or in combination (AV), Stein and Meredith (1993)
observed that some of these neurons not only responded to each stimulus in
isolation, but also that the response to bimodal stimulation surpassed the linear sum
of the unimodal responses (AV > A+V). Because the output in this case no longer
resembles a linear combination of the input, the assumption is that the information
obtained from the two sources has essentially been fused to form a single new
integrated percept (c.f. Calvert & Thesen, 2004). On the basis of these findings, a
response pattern of bimodal enhancement has been taken as a hallmark of multisensory
integration. Another observation of Stein and Meredith was that bimodal
enhancement is strongest for unimodally least effective stimuli, a property which is
known as inverse effectiveness. An example of this can be taken from Kayser and
coworkers (2005), who investigated the integration of auditory and tactile events in
non-human primates. After lowering the loudness of their auditory stimuli, they
observed reduced activations in auditory cortex. However, when paired with a

5
tactile event, these softer auditory events produced the greatest bimodal
enhancement.
Taking these findings obtained from single-unit recordings in non-human mammals,
researchers have applied bimodal enhancement as a criterion to identify regions of
multisensory integration in the human brain as well, using large-scale measures of
neuronal activation such as fMRI (for reviews, see Amedi et al., 2005; Beauchamp,
2005a; Calvert & Thesen, 2004). Quite a few of these studies focused on the
integration of lip movements and speech (Callan et al., 2003; Calvert et al., 2000;
Sekiyama et al., 2003), which shares some superficial similarities with the integration
of iconic gestures and speech (but see below). One area that has been consistently
found in these studies is the posterior portion of the left superior temporal sulcus
and adjacent superior temporal gyrus (pSTS/STG), indicating an important role of
this region in the integration of speech-related audiovisual information.
One important question is whether iconic gestures and speech are also integrated in
pSTS/STG. The answer is far from obvious, because the integration of iconic gestures
and speech requires additional, more complex integration mechanisms than the
integration of audiovisual speech. Firstly, temporal synchrony (although present to
some extent) is much looser for iconic gestures and speech than for audiovisual
speech (McNeill, 1992; Morrel-Samuels & Krauss, 1992). Thus, a broader time
window of integration is needed for iconic gestures. Secondly, the integration of
audiovisual speech does not require a semantic level of processing, as integration can
already occur at the phoneme level (Brancazio, 2004). In contrast, the form of an
iconic gesture first has to be interpreted to some extent before it can be related to an
accompanying word or phrase. Thus, the integration of iconic gestures and speech
must be occurring on a higher semantic–conceptual level.
Does the notion of a semantic level of integration automatically entail that other
“higher level areas” (such as the IFG) are needed for the integration of iconic gestures
and speech? Or could the posterior superior temporal cortex possibly serve as a
general audiovisual integration module (Beauchamp, Lee et al., 2004), which is

6
capable both of lower form-level as well as higher semantic-conceptual integration
processes?
Unfortunately, the five published studies (Dick et al., in press; Green et al., in press;
Holle et al., 2008; Willems et al., 2007, 2009) come to different conclusions: some
studies argue that integration of iconic gestures and speech takes place in the IFG
(Dick et al., in press; Willems et al., 2007, 2009), while others emphasize the
involvement of posterior temporal areas (Green et al., in press; Holle et al., 2008). In
some of these studies, alternative explanations unrelated to integration cannot be
excluded. One concern is that some studies could not demonstrate bimodal
enhancement because they either lacked the necessary unimodal conditions (Dick et
al., in press; Holle et al., 2008; Willems et al., 2007) or demonstrated bimodal
enhancement only for a selected region of interest (Green et al., in press).
A recent study by Willems and colleagues (2009) did not suffer from this drawback,
because the respective unimodal conditions were included. In this study, the authors
investigated whether speech and iconic gestures are integrated in different brain
areas than speech and pantomime. They argued that there is a qualitative difference
in the semantic relationship of the two types of hand movements and the
accompanying speech. Whereas iconic gestures are not unambiguously understood
without speech, pantomimes can easily be understood in the absence of
accompanying speech. They hypothesized that integrating a speech-supported
pantomime can be achieved by matching the bimodal input onto a pre-existing
common representation, whereas the integration of speech-supported iconic gestures
requires unifying the streams of information into a newly constructed representation.
On a neural level, Willems et al. hypothesized that pSTS should be more involved in
the integration of stimuli for which there is a stable representation (i.e., pantomimes
and speech), whereas the IFG was expected to be more tuned towards the integration
of audiovisual stimuli which require the creation of a new representation (i.e., iconic
gestures and speech). They found that left and right pSTS/STG as well as left IFG
showed bimodal enhancement, indicating that all of these areas are involved in some
aspect of integration. By additionally probing for areas that show an effect of

7
semantic congruency, the authors were able to further specify the specific
contribution of pSTS/MTG and IFG to the integration process. In this analysis, the
left IFG was found to exhibit an effect of semantic congruency for both movement
types, whereas congruency effects in the STS were observed only for pantomimes.
Finally, effective connectivity analyses indicated that when speech is accompanied by
pantomime, the left IFG modulates activity in the left pSTS, whereas no such
modulation was found for speech accompanied by iconic gestures. The authors
interpreted their findings as indicating that iconic gestures and speech are integrated
in the left IFG. In contrast, STS/MTG was suggested to be only involved in the
integration of pantomime and speech, with a subsequent modulatory influence of the
left IFG.
Notably, Willems et al. (2009) insights into differential roles of left IFG and
pSTS/MTG were largely based on the use of semantically incongruent combinations
of speech and hand movements. One could argue that such clear-cut gesture-speech
mismatches, which are rarely encountered in spontaneous discourse, may trigger
additional integration processes which are not normally part of multimodal language
comprehension. Therefore, we decided to employ a different way to manipulate the
integration of gesture and speech based on the property of inverse effectiveness.
One way to utilise inverse effectiveness in speech and gesture research is to lower the
signal to noise ratio (SNR) of speech. Multimodal integration not only boosts the
neural response, but can also improve the perception of otherwise weakly salient
stimuli. For instance, speech is more difficult to comprehend in noisy environments,
that is, when the SNR of speech is only moderate (e.g., Miller, 1951; Obleser et al.,
2007). In these cases, additionally observing the speech-related visual movements of
a speaker (e.g., lip movements, co-speech gestures) can greatly facilitate speech
comprehension (Rogers, 1978; Sumby & Pollack, 1954). In other words, the benefit in
speech comprehension afforded by additional visual stimulation is greater when
speech has a moderate SNR as compared to when it has a good SNR. On a neural
level, the increased integration efforts between visual and auditory speech-related
information under moderate SNR conditions have been shown to elicit increased
levels of activation in the left posterior STS, which has been interpreted – according

8
to the principle of inverse effectiveness – as evidence that this brain area is the
integration site of lip movements and speech (Callan et al., 2003; Sekiyama et al.,
2003). Thus, by additionally including a SNR manipulation in our design, we are able
to probe the integration areas (as identified by bimodal enhancement) for sites where
gesture actually facilitates speech comprehension by boosting the neural response, as
indicated by the inverse effectiveness property.
On the basis of the existing literature, the following hypotheses can be formulated:
(1) An area that integrates gesture and speech should show a greater neural response
to gesture speech combinations than to either a gesture only or a speech only
condition (bimodal enhancement) and (2) such an integration area should show a
greater increase to bimodal as compared to unimodal stimulation under a moderate
as compared to a good SNR (inverse effectiveness). Accordingly, we included in our
study bimodal gesture speech stimuli (GS) as well as its unimodal components (G,S).
Additionally, we manipulated the SNR of speech (either moderate or good), resulting
in five experimental conditions (GSgood, Sgood, G, GSmod, Smod). We especially
hypothesized that specifically the left pSTS/STG should show both bimodal
enhancement as well as inverse effectiveness during the processing of co-speech
iconic gestures (Green et al., in press; Holle et al., 2008).
Methods and Materials
Participants
Sixteen native speakers of German (7 females), age 22–31 (mean age 26, SD=3.03)
participated in this experiment after giving informed written consent following the
guidelines of the Ethics committee of the University of Leipzig. All participants were
right-handed (mean laterality coefficient 97.4, Oldfield, 1971) and had normal or
corrected-to-normal vision. None reported any known hearing deficits. Participants
received financial compensation of 15 EUR.

9
Stimulus Material
A total of 160 German sentences describing manual object actions were constructed
specifically for this study. All sentences used present tense and had a highly similar
structure. (And now I [verb] the [object]; see Fig. 1). In contrast to a stimulus set used in
previous studies (Holle & Gunter, 2007; Holle et al., 2008), all sentences in the present
stimulus set were unambiguous, i.e. they did not contain homonyms. A professional
actress was invited to record the stimuli. For the recording, we used the same setup
used successfully in the previous studies (Holle & Gunter, 2007; Holle et al., 2008).
Briefly, this involved the actress uttering the sentences while simultaneously
producing an iconic gesture that illustrated the meaning of the sentence. The gestures
were not choreographed in advance by the experimenters but created by the actress
on the fly. All of the gestures of the present study were iconic (McNeill, 1992), in that
they were re-enactments of the action described in the sentence (e.g. cutting onions,
strumming a guitar, writing a letter, etc.).
PLEASE INSERT FIGURE 1 HERE
Multispeaker babble tracks (MSB) were created by overlaying speech streams from
different commercial audiobooks. A total of 10 different speakers were used (5
female). Each track was duplicated with a slight temporal offset. Thus, a total of 20
different wav files were combined, in order to yield a “dense” babble track, which
made it impossible to identify individual speakers or words in the final babble tracks.
In order to manipulate the signal-to-noise ratio (i.e., log difference of speech to MSB
loudness, in dB), the ten created babble tracks were scaled to different intensity levels
using the PRAAT software package (www.praat.org). Five different intensity levels
were realized for each MSB.
A rater who was blind with respect to purpose of this experiment determined the
onset of preparation and stroke (McNeill, 1992) for all of the video-recorded gestures.
Interrater agreement of preparation onset and stroke onset was assessed by having
an additional rater independently rate 20 % of the recorded material. Interrater

10
agreement of the ratings for preparation onset and stroke onset was good (r = 0.90 for
preparation onset, r = 0.82 for stroke onset).
The actress re-recorded only the voice track of the experimental sentences in a
separate session, to ensure a good sound quality. The onset of the verb was marked
in each re-recorded sentence, and all sentences were scaled to the same intensity
level. Video editing software (Final Cut Pro 5, Apple Inc.) was used to combine and
edit the gesture and speech recordings. In order to achieve similar gesture-speech
synchrony during the combination of re-recorded sentences with the gesture stimuli,
the onset of the verb was temporally aligned with the onset of gesture preparation.
Thus, in all of the resulting experimental gesture stimuli, the onset of gesture always
coincided with the onset of the verb. The final experimental set consisted of 160
different sentences. As each sentence was combined both with a gesture video as
well as with a video of a still standing speaker, there were a total of 320 video clips.
The simultaneous playback of a babble track and a sentence yielded a total of five
different Signal-to-Noise ratios for speech to multispeaker babble (+2 dB, –2 dB, –6
dB, –10 dB, –14 dB).
Pre-Test
A pre-test was conducted to test the degree to which the different intensities of multi-
speaker babble affected speech comprehension. In a functional neuroimaging
experiment with continuous scanning1, the gradient noise of the scanner presents a
massive auditory disturbance. As we wanted to make the level of gradient noise in
our pre-test comparable to the actual scanner environment, we used audio-
recordings of the gradient noise elicited by the functional imaging sequence to be
used in the experiment proper (see Data Acquisition). Subsequently, the principal
investigator (HH) was presented with alternating real and recorded gradient noise
1 Though preferable from a speech science perspective, sparse temporal scanning / clustered
acquisition (Hall et al., 1999) with stimuli being presented in silence was not chosen here, because
continuous scanning offered the valuable advantage of a by far greater number of sampling points in
the fMRI time series.

11
while lying in the scanner. The intensity of the recorded noise was adjusted until its
loudness subjectively matched the real gradient noise. Sound level meter
measurements indicated that gradient noise had an intensity of approx. 100 dB SPL.
Twenty native speakers of German, which were not part of the experiment proper,
participated in the pre-test. The pre-test had a 2 × 5 design, with Gesture (Present vs.
Not present) and Signal-to-Noise-Ratio (from +2 dB to -14 dB) as within-subject
factors. To control for item-specific effects in the pre-test, a total of ten counter-
balanced experimental lists with 160 items each were created, ensuring that each
participant saw and heard only one version of an item. Thus, there were 16 items per
condition per subject. Stimuli were presented on a Laptop running Presentation
software (Neurobehavioral Systems, Inc.). Participants wore MR-compatible ear-
plugs and ear-phones while watching the videos and listening to the sentences. In
addition to the Signal-to-Noise manipulation, participants were presented with a
constant stream of the pre-recorded gradient noise at 100 dB SPL.
After each video, the two words Und jetzt (And now) appeared on the screen,
prompting participants to type in as much as they were able to understand from the
previous sentence. Because gestures always coincided with the verbs of the
sentences, we assumed that the benefit of gesture on sentence comprehension should
be most pronounced at the position of the verb. Accordingly, we subjected the
percentage of correctly recognized verbs to a repeated-measure ANOVA with the
within-subject factors Gesture (2) and SNR (5). A significant main effect of Gesture
(F(1,19) = 167.66, p < 0.0001) indicated that gestures generally facilitated speech
comprehension. Additionally, higher SNRs were also associated with an increased
percentage of correctly identified verbs than lower SNRs (F(4,76) = 512.34, p < 0.0001,
Greenhouse-Geisser e = 0.74). Most importantly, there was a significant interaction
between Gesture and SNR (F(4,76) = 10.14, p < 0.0001, e = 0.77). As can be seen in Fig.
2, this interaction was driven by a stronger gesture benefit at the moderate SNR.
Participants were able to recognize only 25 % of all verbs correctly at the moderate
SNR, when they had been presented with a still standing speaker only. In contrast,
an additional gesture almost doubled verb identification accuracy, with a total of 57

12
% correct. Thus, the gesture benefit at the moderate SNR was 22 %. At the highest
SNR, participants identified 80 % of verbs correctly even without facilitation through
a gesture, leaving only approx. 10 % headroom for a gesture benefit. A post-hoc
paired t test confirmed that the gesture benefit for moderate SNR was indeed
significantly greater than the benefit for good SNR (t(19) = 6.51, p < 0.0001).
PLEASE INSERT FIGURE 2 HERE
On the basis of the inverse effectiveness property, brain areas involved in gesture-
speech integration should show a stronger activation increase to a gesture supported
sentence as compared to a speech-only stimulation under a moderate SNR (here: –6
dB; see Fig. 2) than under a good SNR (here: +2 dB). Therefore, the following
conditions from the pre-test were selected for the fMRI experiment:
1. Gesture accompanied by speech with a moderate SNR (henceforth
abbreviated as GSmod)
2. No gesture, speech only with a moderate amount of noise (abbr. as Smod)
3. Gesture accompanied by speech with a good SNR (abbr. as GSgood)
4. No gesture, speech with a good SNR (abbr. as Sgood)
In addition, a gesture-only condition (crucial in order to calculate multimodal
enhancement; see introduction) and a baseline condition (here: video of still standing
actress without speech or multi speaker babble) were devised:
5. Gesture, no speech (abbr. as G)
6. No Gesture, no speech (abbr. as Null)
Procedure
The pool of stimuli for the fMRI experiment consisted of a total of 800 video-speech
combinations (160 items with five possible variations, corresponding to the
experimental conditions GSmod, Smod, GSgood, Sgood, G). To control for item-specific
effects, five experimental lists were created out of the stimulus pool, ensuring that

13
each list contained only one version of an item. Each list was then amended with 32
null events that were identical for each participant. Subsequently, each list was
pseudo-randomized with the constraint that (1) identical conditions did not directly
follow each other and that (2) the regularity with which one condition followed
another was matched. Each participant received a different randomization of items.
A trial consisted of the playback of a video, accompanied by speech and multi
speaker babble where applicable. The length of the trials in the critical conditions
depended upon the length of the video and varied from 2.36 to 4.12 s (mean 3.16 s,
SD 0.35). Trials were separated by an inter trial interval (ITI), during which a fixation
cross was displayed on the screen. The distribution of the ITI was logarithmic (range
2 – 12 sec, mean 4.03 sec). An experimental session lasted approx. 24 min.
Subjects passively listened to and/or viewed the stimuli to avoid interaction between
activity related to stimulus processing and task-related activity due to cognitive
factors (see also Calvert et al., 2000; N. M. van Atteveldt et al., 2007; Willems et al.,
2007).
Functional MRI data acquisition
Participants were placed in the scanner in a supine position. Visual stimuli were
presented on a computer screen outside of the scanner, which participants could see
via mirror-glasses. Time-locked to the videos, the corresponding auditory stimuli
were presented via a set of specialized headphones allowing for comfortable
listening despite ongoing scanner noise (Resonance Technology Inc.).
Twenty-nine axial slices (4 mm thickness, no gap, FOV 19.2 cm, data matrix of 64×64
voxels, in-plane resolution of 3×3 mm) were acquired every 2 s during functional
measurements (BOLD-sensitive gradient EPI sequence, TR=2 s, TE=30 ms, flip
angle=90, acquisition bandwidth=100 Hz) with a 3 T Siemens TRIO system. Prior to
functional imaging T1-weighted MDEFT images (data matrix 256×256, TR 1.3s, TE 10
ms) were obtained with a non-slice-selective inversion pulse followed by a single

14
excitation of each slice (Norris, 2000). For each participant, a previously acquired
high-resolution T1-weighted MR scan was available for off-line (e.g., normalization)
procedures.
Data analysis
MRI data were analyzed using SPM5 (http://www.fil.ion.ucl.ac.uk/spm) and
Matlab R2007b (The MathWorks Inc, Natick, MA, USA). Standard spatial pre-
processing (realignment, coregistration, segmentation, normalization to MNI space,
and smoothing with a 6 mm full-width at half-maximum (FWHM) Gaussian kernel)
(Friston et al., 1995) was performed. Voxel size was interpolated during pre-
processing to isotropic 3 × 3 × 3 mm3.
For the statistical analysis, the onset of gesture preparation (which always coincided
with the onset of the verb) was modeled as the event of interest for each condition. In
total, there were 32 events per condition. In the context of the general linear model,
these events were convolved with a synthetic hemodynamic response function,
yielding statistical parametric maps (Friston et al., 1994).
For each participant six contrast images were generated to identify activations
related to the experimental conditions (G > Null, Sgood > Null, Smod > Null, GSgood >
Null, GSmod > Null). For the group analysis based on the contrast images, single-
participant contrast images were entered into a second-level mixed effects analysis
for each of the contrasts. The group analysis consisted of a one-sample t-test across
the contrast images of all participants that indicated whether observed differences
between conditions were significantly distinct from zero. To protect against false
positive activations a double threshold was applied, by which only regions with a z-
score exceeding 2.58 (p < 0.005, uncorrected) and a volume exceeding 297 mm3 were
considered (corresponding to p < 0.05, corrected). This was determined in a Monte
Carlo simulation using a Matlab script provided by Scott Slotnick (see
http://www2.bc.edu/~slotnics/scripts.htm).

15
There is consensus among researchers that a multisensory integration area has to
exhibit bimodal enhancement, however, it has been a matter of debate how much
enhancement is needed to convincingly isolate areas of integration. While on the one
hand the most conservative of suggested criteria to identify a multisensory region
(i.e., superadditivity: AV > A + V) has recently come under scrutiny as being overly
restrictive (Beauchamp, Argall et al., 2004; Laurienti et al., 2005), the use of
alternatives such as the mean-criterion (Beauchamp, 2005b, AV > mean(A,V)) may be
too lenient and pose a risk of identifying false positives. The max-criterion (AV >
max(A, V)), can be see as a compromise between the aforementioned criteria. It has
been described as sufficiently strict to isolate areas of integration (Hein et al., 2007)
and has the advantage of having more detection power than the superadditivity
criterion (Beauchamp, 2005b; Beauchamp, Argall et al., 2004).
The max-criterion was applied by means of a conjunction analysis (Nichols et al.,
2005) in the form of [GS > S ∩ GS > G]. Because unisensory deactivations can possibly
have a distorting influence on the detection of integration sites (Beauchamp, 2005b),
we also included activity in the unimodal conditions as additional terms in the
conjunction (see also Hein et al., 2007). Thus, the identification of regions of gesture-
speech integration under good SNR conditions was based upon significant activation
in a [GSgood > Sgood ∩ GSgood > G ∩ Sgood > Null ∩ G > Null] conjunction analysis,
henceforth called the good-SNR conjunction. Similarly, areas of gesture-speech
integration under moderate SNR conditions were identified by means of significant
activation in a [GSmod > Smod ∩ GSmod > G ∩ Smod > Null ∩ G > Null] conjunction
analysis, henceforth called the moderate-SNR conjunction.
Bimodal regions (which are part of the integration conjunction, see above) were
identified by combining the respective unimodal contrasts, i.e. by means of
significant activation for the conjunction of [Sgood > Null ∩ G > Null] for the good
SNR condition, and [Smod > Null ∩ G > Null] for the moderate SNR condition. We
further characterized the relative contribution of the gesture-only and the speech-
only condition to activity in these bimodal regions by calculating a relative
contribution map using the beta values from the unimodal contrasts. Relative

16
contribution was calculated as (bG - bS)/(bG + bS) and therefore ranged from -1
(indicating that a bimodal area responded primarily to speech) to 1 (indicating a
bimodal area primarily driven by gesture, see also N.M. van Atteveldt et al., 2004).
We confined our search for inverse effectiveness to those areas of the brain that were
active in both of the integration conjunctions (i.e., to areas that integrate gesture and
speech both under moderate and good SNR conditions: see Kayser et al., 2005, for a
similar approach to test inverse effectiveness in non-human primates). We extracted
the percent signal change from the regions defined by the overlap of the two
integration conjunctions using the MarsBaR toolbox. The property of inverse
effectiveness predicts that multimodal enhancement should be strongest for near
threshold stimuli. Accordingly, the enhancement of a gesture supported sentence as
compared to a sentence without a gesture should be stronger under moderate as
compared to good SNR conditions. The unimodal speech conditions were therefore
subtracted from the respective bimodal conditions, to test for each ROI whether the
planned contrast of (GSmod – Smod) – (GSgood – Sgood) was significantly greater than
zero.2
Results
Unimodal contrasts
Listening to speech with a moderate SNR (accompanied only by the sight of a
speaker not moving her hands) was associated with strong activations in extended
portions of the STG and STS bilaterally. Additionally, activations in the posterior part
of the left IFG and in left SMA were observed (see Table 1).
2 Holmes (2009) argued recently that some analysis strategies of multisensory integration are biased
towards finding inverse effectiveness. Note that the present study does not suffer from such a bias,
because the SNRs were defined a-priori (thereby eliminating the problem of regression towards the
mean) and we did not target the extreme ends of the SNR spectrum (i.e., neither a very poor SNR, nor
an excellent SNR was used) thus excluding the possibility of floor or ceiling effects.

17
Processing speech with a good SNR activated the same system of brain regions, as
well as additionally the left postcentral gyrus (see Table 1).
Observing gestures without speech was associated with mostly bilateral activations
in various cortical and subcortical structures including the temporo-occipital
junction, intraparietal sulcus, premotor cortex and the left IFG (see Table 1).
Main effect of SNR
When contrasting videos containing speech with a good SNR with videos containing
speech with a moderate SNR, we observed extended activations in the STG and STS
bilaterally (see Table 1, supplementary Figure 1).
Bimodal areas
As a first step towards the identification of integration areas, we tested for brain
areas that are active in each of the unimodal conditions. For the conjunction of [Smod
> Null ∩ G > Null], we found activations in bilateral STS/STG, left SMA, two
activations in the left IFG (one in the pars opercularis, extending into the pars
triangularis, the other located more inferior in the pars orbitalis), as well as an
activation in the cerebellum (see Fig. 3a, Table 1). A highly similar pattern was found
for the conjunction of [Sgood > Null ∩ G > Null] (see Fig. 3b, Table 1)
Integration areas
For moderate SNR conditions, we found an area in the posterior STS bilaterally that
showed a significant enhancement for bimodal gesture speech combinations as
compared to the respective unimodal conditions, as indicated by a significant
activation in the moderate-SNR conjunction (see Fig. 3c, Table 1).
For good SNR conditions, we also found that the STS bilaterally shows significant
enhancement for bimodal gesture speech combinations, as indicated by significant
activation in the good-SNR conjunction (see Fig. 3d, Table 1). However, as the SNR
improved, integration activated a larger portion of the STS in both hemispheres

18
(compare extent of activations in Fig. 3c and 3d). Additionally, we observed an
integration related activation in the left STG present only when the SNR was good
but not when the SNR was only moderate.
Notably, the left IFG did not yield suprathreshold activation in these strict
conjunction analyses. However, as the left IFG has been suggested before as being
crucial for the integration of gesture and speech (Willems et al., 2007), we lowered
the significance criterion for a post-hoc inspection of this area. Indeed we found
integration-related activity in this area near the coordinates reported by Willems et
al. (2007, MNI coordinates –51, 12, 21), but only after lowering to a voxel-wise
threshold of p < 0.05 (uncorrected).
Overlap of integration areas
We searched for areas that integrate gesture and speech under both SNR conditions
by performing a conjunction of conjunctions (i.e., moderate SNR conjunction ∩ good
SNR conjunction). This 2nd order conjunction revealed activity in the posterior STS
bilaterally (see Table 1, Fig. 3e).
Inverse effectiveness
Using the previously identified areas that integrate gesture and speech under both
SNR conditions (i.e., the areas defined by the overlap of the two integration
conjunctions), we tested whether these two regions of interest (ROI) also obeyed the
principle of inverse effectiveness. We found that the planned contrast (GSmod – Smod)
> (GSgood – Sgood) was only significant in the left (t(15) = 1.86, p < 0.05) but not in the
right STS ROI (t(15) = 0.47, n.s.), indicating that only the left STS shows inverse
effectiveness (see Fig. 3f).
PLEASE INSERT FIGURE 3 HERE
Discussion
The present study investigated the brain bases of the interaction and integration of
iconic gestures and speech in language comprehension. One main finding of the

19
present study is that integration of iconic gestures and speech takes place at the
posterior end of the superior temporal sulcus and the adjacent superior temporal
gyrus (pSTS/STG) in both hemispheres. A second main finding is that specifically
the left pSTS/STG shows a pattern of inverse effectiveness, i.e., the neural
enhancement for bimodal stimulation was greater under adverse listening
conditions. This indicates that activity in this area is boosted when an iconic gesture
accompanies an utterance that is otherwise difficult to comprehend. As the neural
response paralleled the behavioral data observed in the pretest, we suggest that left
pSTS/STG plays a key role in the facilitation of speech comprehension by concurrent
gestural input.
Before discussing the functional data in more detail, the behavioral data from the
pre-test merit attention. Willems et al. (2009) found a different neural signature for
the integration of speech and pantomimes (i.e., gestures that can be understood
easily in the absence of speech) and the integration of speech and iconic gestures (i.e.,
gestures that are hard to interpret when presented without speech). Therefore, it is
important to determine whether the gestures of the present study can be understood
in the absence of speech. The data from the pre-test clearly show that this is not the
case. At the lowest signal-to-noise ratio, the gestures only elicited the correct verbal
description in 12% of all cases, suggesting that these gestures did not reliably elicit a
verbal description in the absence of intelligible speech. Thus, using the definition
given by Willems et al. (2009), the stimuli of the present study should be considered
as iconic gestures, not as pantomimes.
The results of the pre-test also show that attending to the gestures of a speaker can
significantly enhance speech comprehension, especially under less then optimal SNR
levels (see Fig. 2). This finding is in line with the data from Rogers (1978) who found
that gesture only enhances speech comprehension if a considerable degree of noise is
added to the speech track. A second important result of the pre-test is that this
gesture benefit is most pronounced at a moderate SNR. We found that when the
background noise is 4 dB louder than the speech signal, the beneficial effect of
gesture on speech comprehension is maximal. Ross et al. (2007) investigated the

20
degree to which the observation of lip movements facilitates speech comprehension
while varying the SNR of the speech channel. They also found the greatest benefit at
moderate SNRs (which were −12 dB in that study). Another similarity between the
findings from Ross et al. and our pre-test is that there was in both studies a benefit of
the additional visual cue throughout all levels of the SNR, even at the lowest level
where speech is hardly intelligible at all. At these extreme levels, participants may
disregard the speech stream altogether and base their response on lipreading or a
verbalized description of the observed gesture.
While our previous study had already indicated that the left STS/STG is generally
involved in the processing of co-speech iconic gestures (Holle et al., 2008), the
present study was able to dissociate main effects of gesture and speech from the
interaction between both domains, and provides strong evidence that pSTS/STG
does indeed participate in the integration of iconic gestures and speech. As all
sentences in the present study were unambiguous, we are also able to rule out an
alternative explanation put forward by Dick et al. (in press), who argued that
activation to co-speech gestures in pSTS/STG may be dependent on the use of
ambiguous sentences. Together with the findings of Green et al. (in press), the results
of the present study strongly suggest that although the integration of iconic gestures
and speech is considerably more complex than the integration of lip movements and
speech (see introduction), both types of integration (i.e., lip movements and speech
as well as iconic gestures and speech) appear to take place within the same brain
region. This could reflect either that simple form-based and more complex
associative integration modules coexist in the posterior sections of the temporal lobe,
or, alternatively, that pSTS/STG may be regarded as a general-purpose audiovisual
association device (c.f. Beauchamp, Lee et al., 2004). Future studies that manipulate
the type of visual information that accompanies speech (e.g., faces vs. hands) may
shed further light on this issue.
Bimodal enhancements were observed in both hemispheres, however, only the left
STS/STG additionally exhibited an interaction conforming to the property of inverse
effectiveness. Moderate SNR stimuli were generally less effective in eliciting

21
activation than stimuli with a good SNR, as indicated by a strong main effect of SNR
along the superior temporal gyrus in both hemispheres. Such a less effective stimulus
also drove a smaller cortical volume to integration (see the size reduction of
integration-related activity in pSTS/STG as SNR decreases from good to moderate in
Fig. 3) replicating a pattern found previously in non-human primates (Kayser et al.,
2005). However, on top of this general effect of reduction of activation strength and
activation extent in posterior temporal areas as the SNR decreases, we identified a
circumscribed portion in left pSTS that shows a relative increase in activation for
bimodal gesture speech stimulation under adverse listening conditions. The neural
activation pattern of this area parallels the behavioral pattern observed in the pretest
(strongest gesture benefit at a moderate SNRs). Thus, only in this area we see an
integration of iconic gestures and speech as well as a boost of bimodal enhancement
according to the principle of inverse effectiveness. This indicates that the posterior
STS/STG region in both hemispheres is generally involved in integrating iconic
gestures and speech by continuously linking information from gesture and speech
during comprehension. However, only in the left, but not in the right hemisphere,
this linking process is more heavily taxed as speech comprehension becomes more
difficult. We attribute this to the left-lateralization of language-related integration
processes in the brain (Friederici et al., in press; Hein & Knight, 2008; Obleser et al.,
2007). Our finding is in line with a recent study by Stevenson and James (2009) who
parametrically varied the signal strength of audiovisual speech stimuli and found an
inversely effective pattern in the STS/STG. At the same time, our result extends their
findings in demonstrating that the STS/STG region displays inverse effectiveness not
only during the integration of lip movements of speech, but also for the more
complex integration of iconic gestures and speech (see introduction).
Given that the pSTS/STG is not a small volume, it is important to note where within
this larger volume the integration of iconic gestures and speech occurred. Within the
bimodal areas, we observed a gradient of sensitivity, with more anterior portions
near mid STS/STG being more sensitive to speech processing, and more posterior
portions near the temporo-occipital junction showing a preference for gesture
processing. As can be seen in Figure 3, the integration occurred actually in the

22
speech-preferring parts of the bimodal cluster. Note that the integration site we
observed in left STS is clearly less posterior (15–30 mm) than the activations reported
in previous studies, where integration-related activation was found near the gesture-
preferring temporo-occipital junction (Green et al., in press; Holle et al., 2008). A
general finding in the literature is that the heteromodal zone of the pSTS/STG has a
considerable anterior to posterior extension. Taken together, the results from
previous studies and the present study suggest that within this larger heteromodal
zone, the exact location of multimodal interaction seems to depend upon the nature
of the stimuli that are being integrated. Both our previous study (Holle et al., 2008) as
well as the study by Green et al. (in press) manipulated the semantic status of the
hand movements that accompanied the sentence (meaningful vs. meaningless).
Accordingly, the gesture-preferring aspects of the pSTS/STG near the temporo-
occipital junction were taxed more heavily in these experiments. In contrast, the
focus of the present study was clearly on speech intelligibility, with gesture as a
moderating influence. Under such circumstances, gesture and speech are likely to
interact in more anterior, primarily speech-sensitive portions of the left STS. Such an
interpretation is also supported by findings from Kable and colleagues (2005), who
found evidence for an anterior to posterior gradient of conceptual action
representations in the lateral temporal cortex, with picture-based action
representations in more posterior and word-based action representations in more
anterior portions.
While iconic gestures and speech arguably interact at a higher semantic-conceptual
level, a recent study by Hubbard et al. (2008) investigated the integration of speech
and another gesture type, namely beat gestures. These gestures are rather simple in
their form and have been suggested to mark speech prosody (Krahmer & Swerts,
2007). In the absence of speech, beat gestures have little meaning per se. Thus, unlike
iconic gestures and speech, the interactions of beat gestures and speech should take
place at lower, more sensory processing levels. Hubbard and colleagues (2008)
identified an area in the right planum temporale as putative integration site for beat
gestures and speech. Note that the planum temporale is more anterior and superior
than the integration site identified in the present experiment. Hubbard and

23
colleagues discussed the fact that the interaction occured in the right hemisphere as
possibly reflecting that beat gestures primarily interact with speech at the prosodic
level.
Together with the study by Willems et al. (2009), the present study allows to further
characterize the interplay of left IFG and the STS region during integration of iconic
gestures and speech. Both areas tend to show similar patterns of bimodal
enhancement for gesture-supported speech3. Therefore, bimodal enhancement needs
to be combined with additional criteria to further specify the specific contribution of
these two areas to the integration process. Willems and colleagues used semantic
congruency as such an additional criterion and found that the left IFG, but not
pSTS/MTG is sensitive to the semantic relationship between iconic gestures and
speech. By manipulating the SNR of the accompanying speech, the present study
used the inverse effectiveness property as an additional criterion and found that
specifically the left STS shows a pattern of inverse effectiveness.
Thus, pSTS and left IFG may both play a role in integrating gesture and speech, but
they are sensitive to different aspects of the integration process. Activity in pSTS may
reflect an initial conceptual matching between the two input streams. When the
saliency of one domain is decreased (as in the present study), this matching process
is more heavily taxed as indicated by a neural pattern of inverse effectiveness. In this
sense, integration in pSTS is suggested to be more data-driven and more sensitive to
the concrete physical form of the stimulus. Although negative findings can occur for
a variety of reasons, the fact that Willems et al. did not find an effect of semantic
congruency for iconic gestures in the pSTS may indicate that this area operates on
more primitive semantic units whose meanings are not yet fully specified
(Jackendoff, 1990). In contrast, activity in the left IFG may reflect a subsequent
3 Please note that in the present study, the effect of bimodal enhancement for the IFG was only
observed after lowering the significance threshold (see Results). In the study by Willems et al. (2009),
data from congruent and incongruent conditions were pooled together for the analysis of bimodal
enhancement. This may be problematic because there is evidence suggesting the left IFG to be mainly
involved in the integration of incongruent, but not congruent audiovisual information (Hein et al.,
2007, Doehrmann & Naumer, 2008).

24
process of modulation and revision of audiovisual information. This area is very
sensitive to the semantic relationship of gesture-speech pairings and it shows a
stronger neural response whenever gesture-speech combinations require a
modulation or revision of audiovisual information, such as incongruent pairings of
gesture and speech (Willems et al., 2007, 2009) or when speech is paired with hand
movements devised as a control condition (i.e., grooming movements Dick et al., in
press; or unrelated gestures Green et al., in press). Thus, integration effects in the IFG
are more interpretation-driven and may reflect the fully specified (and potentially
unified) meaning of a gesture-supported speech segment. Taken together, the
existing studies are in line with the suggestion by Willems et al. (2009) that STS and
left IFG may work together in integrating multimodal information, with a more
integrative role of the STS and a more modulatory function of the left IFG. However,
the present study also extends their findings in showing that integrating iconic
gestures and speech activates not only the left IFG (arguably reflecting processes of
modulation and revision), but does also crucially involve the pSTS/MTG (suggested
to reflect an initial process of conceptual matching).
In summary, the existing studies are difficult to reconcile with the notion that the
brain contains a single area for integration of information from multiple domains, as
has been suggested previously (Hagoort, 2005, 2007; but see Ghazanfar & Schroeder,
2006). Instead the evidence suggests that a network of brain regions including the left
IFG, the bilateral STS region and the right planum temporale is involved in the
integration of information from both domains (present study, Hubbard et al., 2008;
Willems et al., 2009). Inferior frontal areas play an important role in the higher-level
semantic aspects of gesture-speech integration such as modulation and revision of
audiovisual information. Regarding the role of posterior temporal areas, the studies
by Green et al. (in press) as well as the present study provide strong evidence that
the heteromodal portions of this area are generally important for the integration of
gesture and speech. One important variable that determines the exact portion within
bimodal STG /STS at which information from both domains does actually interact
seems to be the semantic status of the hand movements that accompany speech. If an
addressee is presented with a mixture of meaningless and meaningful co-speech

25
hand movements, information from both domains interacts in primarily gesture-
sensitive regions near the temporo-occipital junction (Green et al., in press; Holle et
al., 2008). If all observed hand movements in an experiment are meaningful and the
focus is on speech intelligibility, gesture and speech interact in less posterior portions
of the STS in primarily speech-sensitive regions near mid STS/STG (present study).
Finally, co-speech hand movements that have no semantic meaning in themselves
seem to be integrated in lower-hierarchy areas like the planum temporale (Hubbard
et al., 2008).
While the existing studies have looked at isolated components of speech-related
audiovisual integration (lip movements and speech, gesture and speech), future
studies should try to combine these approaches by investigating three-way
interactions between lip movements, gesture and speech during comprehension, in
order to arrive at a fuller understanding of natural face-to-face communication.
Conclusion
By employing the established criteria of multimodal integration, bimodal
enhancement and inverse effectiveness, the present study offers compelling evidence
for the left posterior temporal cortex’ crucial involvement in the integration of iconic
gestures and speech. Our data suggest that this area continuously integrates gesture
and speech during comprehension, thereby facilitating language comprehension
especially under adverse conditions.
Acknowledgments
This study was supported by the Max Planck Society and we are grateful to Angela
Friederici, who kindly supported the research described here. The manuscript was
written while the first author was supported by grants from the Volkswagenstiftung
(Az. II/82 175) and the ESRC (Grant No RES-062-23-1150). We also would like to
thank Karsten Müller for SPM advice, Sven Gutekunst for technical support, Thomas
Dolk and Nick Meyers for their assistance during stimulus preparation and Christian

26
Obermeier for providing the Multispeaker Babble Track. We thank two anonymous
reviewers for their fruitful comments.

27
References
Amedi, A., von Kriegstein, K., van Atteveldt, N. M., Beauchamp, M. S., & Naumer, M. J. (2005). Functional imaging of human crossmodal identification and object recognition. Experimental Brain Research, 166(3-4), 559-571.
Beauchamp, M. S. (2005a). See me, hear me, touch me: multisensory integration in lateral occipital-temporal cortex. Current Opinion in Neurobiology, 15(2), 145-153.
Beauchamp, M. S. (2005b). Statistical criteria in FMRI studies of multisensory integration. Neuroinformatics, 3(2), 93-113.
Beauchamp, M. S., Argall, B. D., Bodurka, J., Duyn, J. H., & Martin, A. (2004). Unraveling multisensory integration: patchy organization within human STS multisensory cortex. Supplementary Online Material. Nature Neuroscience, 7(11), 1190-1192.
Beauchamp, M. S., Lee, K. E., Argall, B. D., & Martin, A. (2004). Integration of auditory and visual information about objects in superior temporal sulcus. Neuron, 41(5), 809-823.
Brancazio, L. (2004). Lexical influences in audiovisual speech perception. Journal of Experimental Psychology: Human Perception & Performance, 30(3), 445-463.
Callan, D. E., Jones, J. A., Munhall, K., Callan, A. M., Kroos, C., & Vatikiotis-Bateson, E. (2003). Neural processes underlying perceptual enhancement by visual speech gestures. Neuroreport, 14(17), 2213-2218.
Calvert, G. A., Campbell, R., & Brammer, M. J. (2000). Evidence from functional magnetic resonance imaging of crossmodal binding in the human heteromodal cortex. Current Biology, 10(11), 649-657.
Calvert, G. A., & Thesen, T. (2004). Multisensory integration: methodological approaches and emerging principles in the human brain. Journal of Physiology, Paris, 98(1-3), 191-205.
Dick, A. S., Goldin-Meadow, S., Hasson, U., Skipper, J. I., & Small, S. L. (in press). Co-speech gestures influence neural activity in brain regions associated with processing semantic information. Human Brain Mapping.
Friederici, A. D., Kotz, S. A., Scott, S. K., & Obleser, J. (in press). Disentangling Syntax and Intelligibility in Auditory Language Comprehension. Human Brain Mapping.
Friston, K. J., Ashburner, J., Frith, C. D., Poline, J. B., Heather, J. D., & Frackowiak, R. S. J. (1995). Spatial registration and normalization of images. Human Brain Mapping, 3(3), 165-189.
Friston, K. J., Holmes, A. P., Worsley, K. J., Poline, J. P., Frith, C. D., & Frackowiak, R. S. J. (1994). Statistical parametric maps in functional imaging: A general linear approach. Human Brain Mapping, 2(4), 189-210.
Ghazanfar, A. A., & Schroeder, C. E. (2006). Is neocortex essentially multisensory? Trends in Cognitive Science, 10(6), 278-285.
Goldin-Meadow, S. (2006). Talking and thinking with our hands. Current Directions in Psychological Science, 15(1), 34-39.

28
Green, A., Straube, B., Weis, S., Jansen, A., Willmes, K., Konrad, K., et al. (in press). Neural integration of iconic and unrelated coverbal gestures: A functional MRI study. Human Brain Mapping.
Hagoort, P. (2005). On Broca, brain, and binding: a new framework. Trends in Cognitive Sciences, 9(9), 416-423.
Hagoort, P. (2007). The memory, unification, and control (MUC) model of language. In T. Sakamoto (Ed.), Communicating skills of intention (pp. 259-291). Tokyo: Hituzi Syobo Publishing.
Hall, D. A., Haggard, M. P., Akeroyd, M. A., Palmer, A. R., Summerfield, A. Q., Elliott, M. R., et al. (1999). "Sparse" temporal sampling in auditory fMRI. Human Brain Mapping, 7(3), 213-223.
Hein, G., Doehrmann, O., Muller, N. G., Kaiser, J., Muckli, L., & Naumer, M. J. (2007). Object familiarity and semantic congruency modulate responses in cortical audiovisual integration areas. J Neurosci, 27(30), 7881-7887.
Hein, G., & Knight, R. T. (2008). Superior temporal sulcus--It's my area: or is it? Journal of Cognitive Neuroscience, 20(12), 2125-2136.
Holle, H. (2007). The Comprehension of Co-Speech Iconic Gestures: Behavioral, Electrophysiological and Neuroimaging Studies (Ph.D. thesis). Leipzig: Max Planck Institute for Human Cognitive and Brain Sciences, available online at http://www.cbs.mpg.de/institute/mpi_series.
Holle, H., & Gunter, T. C. (2007). The role of iconic gestures in speech disambiguation: ERP evidence. Journal of Cognitive Neuroscience, 19(7), 1175-1192.
Holle, H., Gunter, T. C., Ruschemeyer, S. A., Hennenlotter, A., & Iacoboni, M. (2008). Neural correlates of the processing of co-speech gestures. Neuroimage, 39(4), 2010-2024.
Holmes, N. P. (2009). The principle of inverse effectiveness in multisensory integration: some statistical considerations. Brain Topography, 21(3-4), 168-176.
Hubbard, A. L., Wilson, S. M., Callan, D. E., & Dapretto, M. (2008). Giving speech a hand: Gesture modulates activity in auditory cortex during speech perception. Human Brain Mapping.
Jackendoff, R. (1990). Semantic Structures. Massachussets: The MIT Press. Kable, J. W., Kan, I. P., Wilson, A., Thompson-Schill, S. L., & Chatterjee, A. (2005).
Conceptual representations of action in the lateral temporal cortex. Journal of Cognitive Neuroscience, 17(12), 1855-1870.
Kayser, C., Petkov, C. I., Augath, M., & Logothetis, N. K. (2005). Integration of touch and sound in auditory cortex. Neuron, 48(2), 373-384.
Krahmer, E., & Swerts, M. (2007). The effects of visual beats on prosodic prominence: Acoustic analyses, auditory perception and visual perception. Journal of Memory and Language, 57(3), 396-414.
Laurienti, P. J., Perrault, T. J., Stanford, T. R., Wallace, M. T., & Stein, B. E. (2005). On the use of superadditivity as a metric for characterizing multisensory integration in functional neuroimaging studies. Experimental Brain Research, 166(3-4), 289-297.
McNeill, D. (1992). Hand and Mind - What Gestures Reveal about Thought. Chicago, Illinois, and London, England: The University of Chicago Press.

29
McNeill, D. (2005). Gesture and Thought. Chicago and London: University of Chicago Press.
Miller, G. (1951). Language and communication. New York: McGraw- Hill. Morrel-Samuels, P., & Krauss, R. M. (1992). Word familiarity predicts temporal
asynchrony of hand gestures and speech. Journal of Experimental Psychology:
Learning, Memory, & Cognition, 18(3), 615-622. Nichols, T., Brett, M., Andersson, J., Wager, T., & Poline, J. B. (2005). Valid
conjunction inference with the minimum statistic. Neuroimage, 25(3), 653-660. Norris, D. G. (2000). Reduced power multislice MDEFT imaging. JMRI-Journal of
Magnetic Resonance Imaging, 11(4), 445-451. Obleser, J., Wise, R. J., Dresner, M. A., & Scott, S. K. (2007). Functional integration
across brain regions improves speech perception under adverse listening conditions. Journal of Neuroscience, 27(9), 2283-2289.
Oldfield, R. C. (1971). The assessment and analysis of handedness: The Edinburgh inventory. Neuropsychologia, 9(1), 97-113.
Rogers, W. T. (1978). The contribution of kinesic illustrators toward the comprehension of verbal behavior within utterances. Human Communication Research, 5(1), 54-62.
Ross, L. A., Saint-Amour, D., Leavitt, V. M., Javitt, D. C., & Foxe, J. J. (2007). Do you see what I am saying? Exploring visual enhancement of speech comprehension in noisy environments. Cerebral Cortex, 17(5), 1147-1153.
Sekiyama, K., Kanno, I., Miura, S., & Sugita, Y. (2003). Auditory-visual speech perception examined by fMRI and PET. Neuroscience Research, 47(3), 277-287.
Stein, B. E., & Meredith, M. A. (1993). The merging of the senses. Cambridge, Massachusetts: MIT press.
Stevenson, R. A., & James, T. W. (2009). Audiovisual integration in human superior temporal sulcus: Inverse effectiveness and the neural processing of speech and object recognition. Neuroimage, 44(3), 1210-1223.
Sumby, W. H., & Pollack, I. (1954). Visual contribution to speech intelligibility in noise. Journal of the Acoustical Society of America, 26, 212-215.
van Atteveldt, N. M., Formisano, E., Blomert, L., & Goebel, R. (2007). The effect of temporal asynchrony on the multisensory integration of letters and speech sounds. Cerebral Cortex, 17(4), 962-974.
van Atteveldt, N. M., Formisano, E., Goebel, R., & Blomert, L. (2004). Integration of letters and speech sounds in the human brain. Neuron, 43(2), 271-282.
Willems, R. M., Ozyurek, A., & Hagoort, P. (2007). When language meets action: the neural integration of gesture and speech. Cerebral Cortex, 17(10), 2322-2333.
Willems, R. M., Ozyurek, A., & Hagoort, P. (2009). Differential roles for left inferior frontal and superior temporal cortex in multimodal integration of action and language. Neuroimage.

30
Figure captions
Figure 1. Experimental Design & Stimulus Examples
The material consisted of videos which either contained a gesture or a still standing
speaker. Additionally, videos in conditions Sgood, GSgood, Smod, and GSmod additionally
contained a speech track (Indicated by the speech bubbles). The amount of
multispeaker babble that was added to the speech to manipulate the signal-to-noise
ratio (SNR) is indicated by the diagonal lines in the speech bubbles (with lines:
moderate amount of babble added, without lines: only small amount of babble
added).
Figure 2. Results of Pre-Test
Error bars indicate standard error of the mean. For further details, see text.

31
Verb identification
0
10
20
30
40
50
60
70
80
90
100
-14
poor
-10 -6
moderate
-2 2
good
SNR (dB)
% c
orr
ectl
y i
den
tifi
ed
verb
s
gesture
no gesture
Figure 3. fMRI results
Illustration of significantly activated brain regions. (a) show regions active in the Smod
> Null ∩ G > Null conjunction. Color coding of the significantly activated voxels
indicates relative contribution of auditory (red) and visual (green) unimodal
stimulation to the signal change in each voxel. Similar contribution of both unimodal
predictors is indicated in yellow. (b) Regions active in the Sgood > Null ∩ G > Null
conjunction. (c) Areas active in the moderate-SNR conjunction. (d) Regions showing
significant activation in the good-SNR conjunction. (e) Regions activated in both the
moderate and the good-SNR conjunction. (f) Test for inverse effectiveness in the
regions defined by the overlap of integration areas (shown in e). For further details,
see text.
(figure 3.pdf in separate file)
32
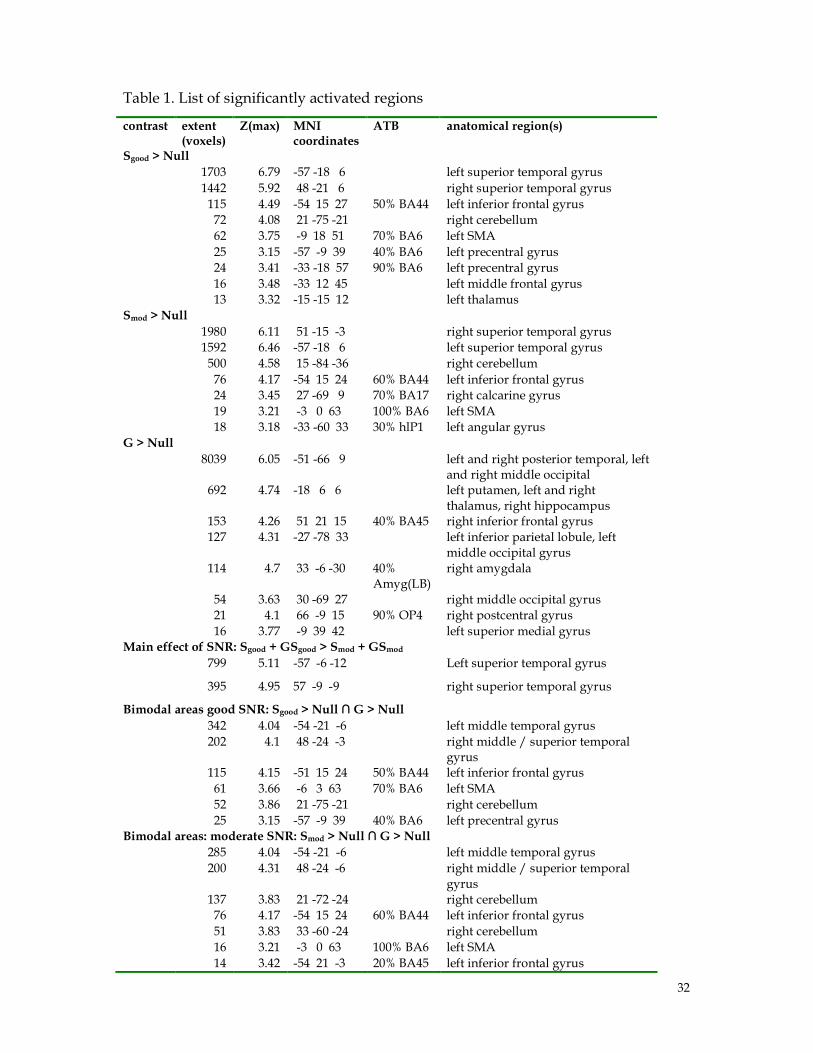
Table 1. List of significantly activated regions
contrast extent (voxels)
Z(max) MNI coordinates
ATB anatomical region(s)
Sgood > Null
1703 6.79 -57 -18 6 left superior temporal gyrus
1442 5.92 48 -21 6 right superior temporal gyrus
115 4.49 -54 15 27 50% BA44 left inferior frontal gyrus
72 4.08 21 -75 -21 right cerebellum
62 3.75 -9 18 51 70% BA6 left SMA
25 3.15 -57 -9 39 40% BA6 left precentral gyrus
24 3.41 -33 -18 57 90% BA6 left precentral gyrus
16 3.48 -33 12 45 left middle frontal gyrus
13 3.32 -15 -15 12 left thalamus
Smod > Null
1980 6.11 51 -15 -3 right superior temporal gyrus
1592 6.46 -57 -18 6 left superior temporal gyrus
500 4.58 15 -84 -36 right cerebellum
76 4.17 -54 15 24 60% BA44 left inferior frontal gyrus
24 3.45 27 -69 9 70% BA17 right calcarine gyrus
19 3.21 -3 0 63 100% BA6 left SMA
18 3.18 -33 -60 33 30% hlP1 left angular gyrus
G > Null
8039 6.05 -51 -66 9 left and right posterior temporal, left and right middle occipital
692 4.74 -18 6 6 left putamen, left and right thalamus, right hippocampus
153 4.26 51 21 15 40% BA45 right inferior frontal gyrus
127 4.31 -27 -78 33 left inferior parietal lobule, left middle occipital gyrus
114 4.7 33 -6 -30 40% Amyg(LB)
right amygdala
54 3.63 30 -69 27 right middle occipital gyrus
21 4.1 66 -9 15 90% OP4 right postcentral gyrus
16 3.77 -9 39 42 left superior medial gyrus Main effect of SNR: Sgood + GSgood > Smod + GSmod
799 5.11 -57 -6 -12 Left superior temporal gyrus
395 4.95 57 -9 -9 right superior temporal gyrus
Bimodal areas good SNR: Sgood > Null ∩ G > Null
342 4.04 -54 -21 -6 left middle temporal gyrus
202 4.1 48 -24 -3 right middle / superior temporal gyrus
115 4.15 -51 15 24 50% BA44 left inferior frontal gyrus
61 3.66 -6 3 63 70% BA6 left SMA
52 3.86 21 -75 -21 right cerebellum
25 3.15 -57 -9 39 40% BA6 left precentral gyrus Bimodal areas: moderate SNR: Smod > Null ∩ G > Null
285 4.04 -54 -21 -6 left middle temporal gyrus
200 4.31 48 -24 -6 right middle / superior temporal gyrus
137 3.83 21 -72 -24 right cerebellum
76 4.17 -54 15 24 60% BA44 left inferior frontal gyrus
51 3.83 33 -60 -24 right cerebellum
16 3.21 -3 0 63 100% BA6 left SMA
14 3.42 -54 21 -3 20% BA45 left inferior frontal gyrus

33
Integration areas: Good SNR: GSgood > Sgood ∩ GSgood > G ∩ Sgood > Null ∩ G > Null
85 3.55 51 -33 3 right middle / superior temporal gyrus
42 3.14 -57 -48 9 left middle temporal gyrus
15 3.14 -54 -39 18 50% IPC(PFcm)
left superior temporal gyrus
Integration areas: Moderate SNR: GSmod > Smod ∩ GSmod > G ∩ Smod > Null ∩ G > Null
38 3.36 51 -33 3 right middle / superior temporal gyrus
15 3.4 -51 -36 0 left middle temporal gyrus Overlap of Integration areas
31 3.36 51 -33 3 right middle / superior temporal gyrus
4† 2.95 -48 -39 3 left middle temporal gyrus
Results of fMRI experiment. Abbreviations: SMA, Supplementary motor area, IPC =
Inferior parietal cortex. ATB, Most probable anatomical region in the Anatomy
Toolbox 1.6, (Eickhoff et al., 2007).
† p < 0.05, corrected (small volume correction, 6mm sphere centered around -49 -39
3)