integrated assessment for catchment and coastal zone management: the case of the humber
TRANSCRIPT
Integrated assessment for catchment and coastal zone management: the case of the Humber
Julian Andrews, Nicola Beaumont, Roy Brouwer, Rachel Cave, Tim Jickells, Laure Ledoux and R. Kerry Turner1
Abstract
In the context of the Water Framework Directive (2000/60/EC), EU Member States are required to introduce water quality objectives for all water bodies, in-cluding coastal waters. Given the impact of catchment fluxes on coastal water quality, decision-making at the catchment scale is essential. This chapter investi-gates the use of integrated assessment as an overall decision-support process and toolbox in the Humber estuary.
Introduction
In the context of the Water Framework Directive (2000/60/EC), EU Member States are required to introduce water quality objectives for all water bodies, in-cluding coastal waters. Given the impact of catchment fluxes on coastal water quality, decision-making at the catchment scale is essential. This chapter investi-gates the use of integrated assessment as an overall decision-support process and toolbox in the Humber estuary. The context of this research is an ongoing Euro-pean research project, EUROCAT, which is focused on the requirements of inte-grated catchment and coastal zone management and analyses the response of the coastal sea to changes in fluxes of nutrients and contaminants from the catch-ments. The first section of the chapter describes briefly a suitable decision-support framework and its main analytical steps. The chapter then describes the case
1 Correspondence to Kerry Turner: [email protected]
In: Vermaat et al. (2004) Managing European coasts: past, present and future, pp x-x © Springer Verlag
18.

2 Integrated assessment for catchment and coastal zone management: the case of the Humber
study, the Humber catchment and estuary, exploring the management issues through the Driver-Pressure State Response (DPSIR) scoping framework. The general methodology for scenarios is reviewed, before regional scenarios are de-rived, which describe three possible futures for the Humber. The chapter finally presents a policy analysis, including an abatement cost study, highlighting the issue of copper discharges to the estuary, and reports on how the scenarios can be used to investigate future fluxes and provide a consistent framework to evaluate potential policies to improve water quality in the estuary, in the context of the Wa-ter Framework Directive.
Integrated environmental assessment (IEA) for coastal zone management
When water resources, including coastal waters, are seen as components of a wider set of interrelated systems encompassed within catchment and watershed boundaries, more efficient management of water and related measures to protect the wider supporting ecosystems are all vital components of a sustainable devel-opment strategy. Managing water resources at the catchment scale requires an appreciation of the full functioning of hydrological, ecological and biogeochemi-cal systems and the total range of valuable functions and functional outputs of goods and services that are provided. A sustainable approach to water manage-ment and pricing must therefore be based on a wide spatial and temporal apprecia-tion of the landscape ecological processes present, together with the relevant envi-ronmental and socio-economic driving forces. Such a management strategy will need to be underpinned by a scientifically credible but also pragmatic environ-mental decision support system, i.e., a toolbox of evaluation methods and tech-niques, complemented by a set of environmental change indicators and an ena-bling analytical framework.
The support system should allow managers to identify a number of steps or ‘decision rules’ in order to use the framework in a given catchment. The main steps are listed below: • Scoping and auditing stage - to scope the nature of the problem and the causes
and consequences that are relevant. The so-called DP-S-I-R framework has proved useful at this stage (Turner et al. 2001).
• Identification and selection of complementary analytical methods and tech-niques - such as GIS, coupled natural science models, cost benefit analysis, etc;
• Data collection and monitoring via indicators of change and forecasting of fu-ture possibilities via environmental change scenarios;
• Evaluation of project, policy or programme options - using methods such as stakeholder analysis, cost effectiveness, cost benefit analysis and multi-criteria analysis.
The following steps and related information gathering and analysis procedures are recommended in the appraisal process:
Scoping and problem auditing
The DP-S-I-R (driving pressures-state-impacts-response) framework, originally developed by the OECD, is a useful device for the scoping of complicated man-agement issues and problems. It can make tractable the complexity of causes of degradation or loss of water resources, habitat and species and the links to socio-economic activities, across the relevant spatial and temporal scales. It also pro-vides the important conceptual connection between ecosystem change and the impacts of that change on people’s economic and social well-being. Relevant indi-cators of environmental change can be derived (see below), and the loss of ecosys-tem function provision in terms of goods and services (direct and indirectly re-ceived) can be translated into human welfare loss and quantified in monetary and/or other more qualitative ways.
In this initial stage of the analysis an empirical description and explanation is also required covering the relevant policy context and regulatory regime that is to form the focal point of the research within any given catchment. The regulatory regime work where necessary, will need to encompass both regional/national and international regulations and designations and their implications for the catchment.
At the core of this analytical stage is the process of stakeholder mapping and the related identification (via the DP-S-I-R approach) of those impacts and conse-quences of environmental change which impinge on stakeholders.
Stakeholder mapping
For a given catchment it is necessary to identify the following: • The different ‘interest’ groups within the catchment and outside (national and
international) that are relevant to the policy issues and contexts being focused on.
• Existing stakeholder networks (or the lack of networks). • Existing institutional arrangements and ‘power’ structures. • The aggregate ‘policy networks’ (or the lack of networks) that serve to influ-
ence policy choice outcomes.
This stakeholder-related information should then be set against the relevant drivers and pressures of environmental change in the catchment (from the DP-S-I-R data) e.g. population growth and density changes, pollutants and contaminants trends and climate change. The findings should help, among other things, to highlight any distributional equity concerns (i.e. who gains who loses) and power relation-ships relevant to existing policies and future potential policy measures. The policy set should include any national, EC or other international regulations, designations and agreements. All this information will be relevant to the outputs from the fu-tures scenarios and policy goals and measures research.
4 Integrated assessment for catchment and coastal zone management: the case of the Humber
Scenario analysis
The future will always be shrouded by uncertainty and therefore accurate predic-tion is not a feasible goal. However, it is possible to formulate scenarios that can shed light on and offer insights about possible future developments. It is these scenarios, which can inform the policy targets, standards and measures packages relating to the policy issues chosen as the foci for the catchment-level research.
Indicators and critical thresholds
Given the degree of scientific and socio economic (economic, social, political and cultural factors) uncertainty that exists about current and future environmental change issues and consequences, the scenario-related perspectives are heavily in-fluenced by the degree of risk aversion that may be adopted by different stake-holders and the government on behalf of the whole of society. The so-called pre-cautionary principle is a reflection of this concern about uncertainty and the sort of decision-making approach that should be adopted. We turn to this concept next.
Different societal positions (perspectives) will encapsulate different approaches to the precautionary principle and the treatment of risk and uncertainty. The posi-tion taken over how to mitigate the uncertainty problem will also affect the indica-tors of change that are chosen and their interpretation. In many cases it will not be possible to determine single number outcomes for ‘critical loads’ of given sub-stances, or ‘critical thresholds’. Instead there will be standards/targets, which in-corporate different interpretations of ‘safety margins’, necessary to avoid breach-ing uncertain thresholds. Relevant environmental change indicators may of neces-sity be fairly crude measures of trends (positive and negative) relating to substance fluxes, ambient quality states and wider ecosystem changes, augmented by a qualitative assessment.
Identification and selection of appropriate decision-making methods
Managed ecosystems will be in an almost constant state of flux as the natural processes and systems react to human management interventions, which in turn, subject to various lags, produce more policy responses i.e. a co-evolutionary proc-ess characterised by continuous feedback effects. It is therefore important to be able to assess the impact of alternative sets of management actions or strategies in order to judge their social acceptability against a range of criteria such as envi-ronmental effectiveness, economic efficiency and fairness across different stake-holder interests (including different generations). Evaluation methods and tech-niques have to be matched up to the chosen evaluation criteria.
Data collection, monitoring and indicators
Official interest in quantifiable environmental indicators intensified during the 1990’s as sustainability thinking came to prominence. They serve to reduce the complexity of environmental pressures, state changes and impacts and to increase the transparency of the possible trade-offs involved in policy options choice. Indi-cators do not, however, provide a panacea for scientific uncertainty and they also require suitable institutional structures to be in place to regularly collect and up-date the relevant background data.
Evaluation of project, policy or programme options
A combination of quantitative and qualitative research methods is advocated in order to generate a blend of different types of policy relevant information. This applies to both the biophysical assessment of management options and the evalua-tion of the welfare gains and losses people perceive to be associated with the envi-ronmental changes and management responses. The main generic approaches that can form the methodological basis for strategic options appraisal are: • Stakeholder analysis. • Cost-effectiveness analysis. • Extended cost-benefit analysis and risk-benefit analysis. • Social discourse analysis. • Multi-criteria analysis.
This chapter reviews how these different steps were applied to the Humber within the context of estuarine water quality management.
The Humber case study and the DPSIR framework
The Humber catchment and the coastal zone
The Humber catchment covers an area of ca. 24,240km2, more than 20% of the land area of England (Jarvie et al. 1997). It is home to 20% of the UK population, and a very significant proportion of the energy, industrial and agricultural produc-tion. Industrial, urban and agricultural development over the last few hundred years have adversely impacted the quality of the water entering the estuary from the rivers.
The macro-tidal Humber estuary is one of the largest in the UK. The area sur-rounding the Humber Estuary (generally referred to as Humberside) is mainly high quality agricultural land, with many thousands of hectares reclaimed from the estuary over the last few centuries (Murby 2001). As a result, it is estimated that over a third of a million people now live on areas of land below high spring tide
6 Integrated assessment for catchment and coastal zone management: the case of the Humber
level (EA 1999). Humberside ports handle 13% of the UK’s sea-borne trade, with Grimsby-Immingham representing the largest port complex in the UK (DETR 2000a). In spite of extensive reclamation and coastal squeeze over several centu-ries, large areas of intertidal and coastal wetland habitat still exist in the estuary, supporting year-round bird populations, as well as species that use it during migra-tory passage and as a winter residence. The outer estuary is also of particular im-portance as a fish nursery area for North Sea plaice. Much of the Humber is desig-nated under the Habitats Directive, and the entire Estuary has been proposed as a marine Special Area of Conservation, in recognition of its importance to nature conservation.
The Humber case study represents a good example of what can be called a “mature” environmental problem. Over the last few decades, as heavy industry in the catchment has declined, and regulations on emissions and inputs to controlled waters have become more stringent, the water quality of both catchment and estu-ary have improved. The “peak” loading impact to the Humber estuary in terms of nutrients and many metal inputs from the near-estuary and wider catchment zones was in the past. However, a legacy of contamination still exists in the sediments (Millward and Glegg 1997), and the loss of intertidal area has led to a severe re-duction of the ability of the estuary to trap nutrients, which instead get exported direct to the North Sea (Jickells et al. 2000).
The DPSIR framework for the Humber
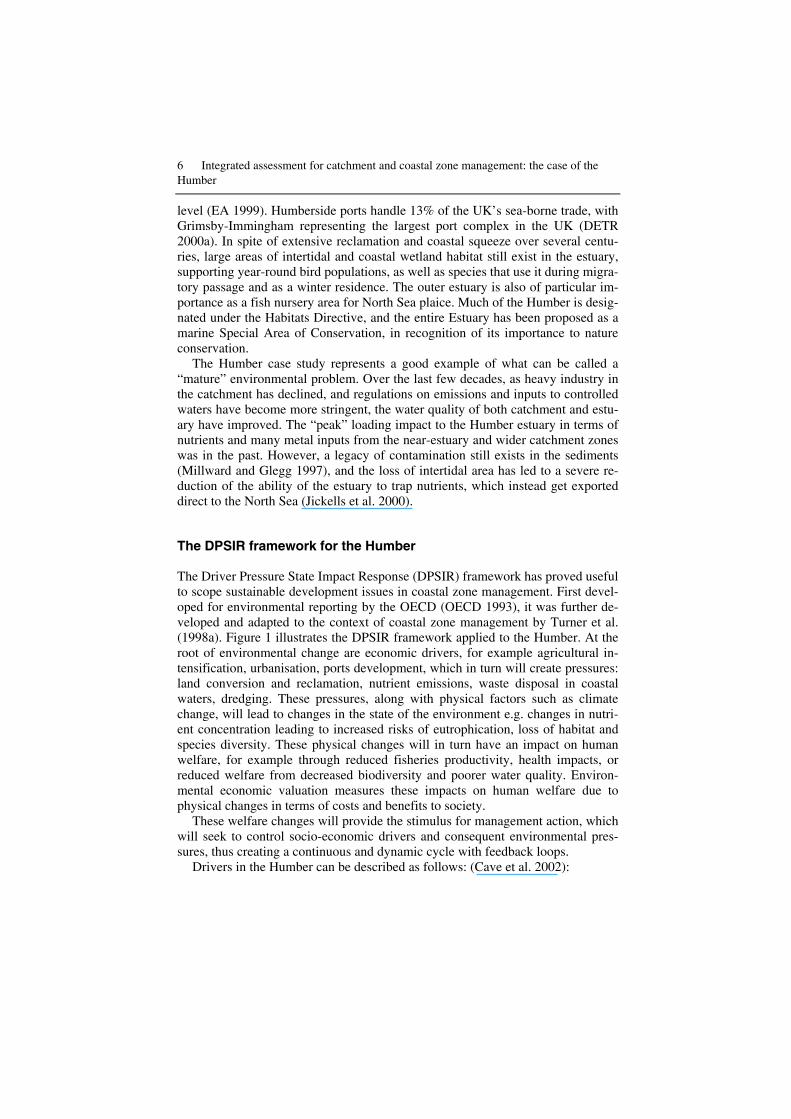
The Driver Pressure State Impact Response (DPSIR) framework has proved useful to scope sustainable development issues in coastal zone management. First devel-oped for environmental reporting by the OECD (OECD 1993), it was further de-veloped and adapted to the context of coastal zone management by Turner et al. (1998a). Figure 1 illustrates the DPSIR framework applied to the Humber. At the root of environmental change are economic drivers, for example agricultural in-tensification, urbanisation, ports development, which in turn will create pressures: land conversion and reclamation, nutrient emissions, waste disposal in coastal waters, dredging. These pressures, along with physical factors such as climate change, will lead to changes in the state of the environment e.g. changes in nutri-ent concentration leading to increased risks of eutrophication, loss of habitat and species diversity. These physical changes will in turn have an impact on human welfare, for example through reduced fisheries productivity, health impacts, or reduced welfare from decreased biodiversity and poorer water quality. Environ-mental economic valuation measures these impacts on human welfare due to physical changes in terms of costs and benefits to society.
These welfare changes will provide the stimulus for management action, which will seek to control socio-economic drivers and consequent environmental pres-sures, thus creating a continuous and dynamic cycle with feedback loops.
Drivers in the Humber can be described as follows: (Cave et al. 2002):
Population growth and urbanisation
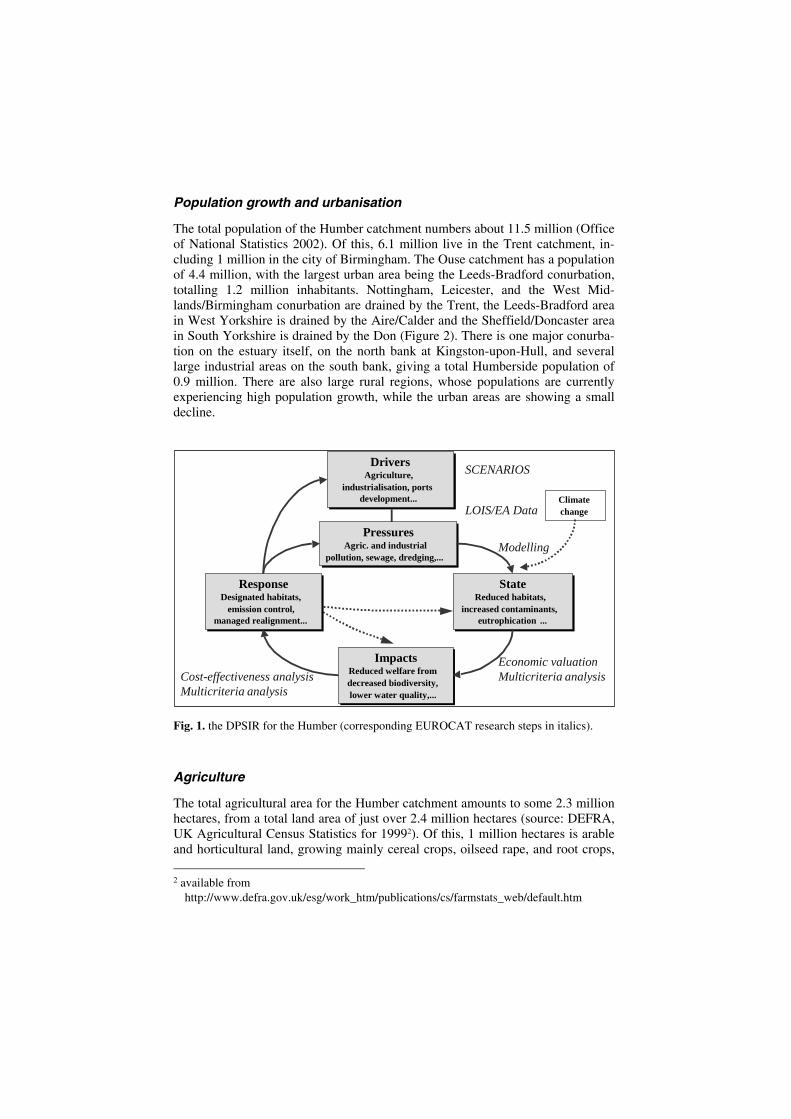
The total population of the Humber catchment numbers about 11.5 million (Office of National Statistics 2002). Of this, 6.1 million live in the Trent catchment, in-cluding 1 million in the city of Birmingham. The Ouse catchment has a population of 4.4 million, with the largest urban area being the Leeds-Bradford conurbation, totalling 1.2 million inhabitants. Nottingham, Leicester, and the West Mid-lands/Birmingham conurbation are drained by the Trent, the Leeds-Bradford area in West Yorkshire is drained by the Aire/Calder and the Sheffield/Doncaster area in South Yorkshire is drained by the Don (Figure 2). There is one major conurba-tion on the estuary itself, on the north bank at Kingston-upon-Hull, and several large industrial areas on the south bank, giving a total Humberside population of 0.9 million. There are also large rural regions, whose populations are currently experiencing high population growth, while the urban areas are showing a small decline.
Fig. 1. the DPSIR for the Humber (corresponding EUROCAT research steps in italics).
Agriculture
The total agricultural area for the Humber catchment amounts to some 2.3 million hectares, from a total land area of just over 2.4 million hectares (source: DEFRA, UK Agricultural Census Statistics for 19992). Of this, 1 million hectares is arable and horticultural land, growing mainly cereal crops, oilseed rape, and root crops,
2 available from
http://www.defra.gov.uk/esg/work_htm/publications/cs/farmstats_web/default.htm
DriversAgriculture,
industrialisation, portsdevelopment...
DriversAgriculture,
industrialisation, portsdevelopment...
StateReduced habitats,
increased contaminants,eutrophication ...
StateReduced habitats,
increased contaminants,eutrophication ...
ImpactsReduced welfare fromdecreased biodiversity,lower water quality,...
ImpactsReduced welfare fromdecreased biodiversity,lower water quality,...
ResponseDesignated habitats,
emission control,managed realignment...
ResponseDesignated habitats,
emission control,managed realignment...
PressuresAgric. and industrial
pollution, sewage, dredging,...
PressuresAgric. and industrial
pollution, sewage, dredging,...
Climatechange
SCENARIOS
LOIS/EA Data
Modelling
Economic valuationMulticriteria analysisCost-effectiveness analysis
Multicriteria analysis
8 Integrated assessment for catchment and coastal zone management: the case of the Humber
and the remainder is predominantly grazing land. Land use in the Ouse and Trent catchments is broadly similar, but with the Trent having almost double the urban area of the Ouse, while the Ouse has more extensive woodland, heath and bog.
Fig. 2. Map of the Humber Catchment. (after Edwards et al. 1997). Inset map of part of the UK, showing the extent of the catchment in grey.

Industry
In the catchment, traditional industries such as textiles and iron and steel have declined, while the chemical and petrochemical industries are thriving, as is the power industry. The estuary is now in a post-industrial phase, with some of the large polluting manufacturing plants on the estuary now closed down (e.g. tin smelter at North Ferriby), and others subject to more stringent effluent restrictions (e.g. titanium dioxide plants on the south bank).
Port Development
The Humber ports (Goole, Grimsby, Hull and Immingham) handle 13% of the UK's seaborne trade (DETR 2000a). This has risen from 58 million tonnes in 1989 to 74 million tonnes in 1998. Up to 50,000 ship movements per year are handled by the Vessel Traffic Service Centre at Spurn Head, and the volume of ship traffic is expected to increase as the European Union expands over the coming years. Grimsby and Immingham overtook London to become the UK's leading port in 2000 with 52.2 Mt of freight traffic (DETR 2000b).
Climate change
In addition to the socio-economic drivers, an emerging additional driver in the Humber catchment for the foreseeable future is the necessity to cope with climate change. This includes more extreme weather events, which can lead to flooding in parts of the catchment (Longfield and Macklin 1999), and expected sea-level rise around the estuary. Major floods occurred in the catchment in 1986 1995 and 2000, with the Ouse catchment most affected. This type of event, both in the catchment and in the intertidal area could remobilise contaminated sediments.
An area of more than 800km2 around the Humber estuary currently lies below the level of high spring tide, protected by extensive coastal defences. This includes urban/industrial areas, high-grade farmland, infrastructure such as roads and rail-ways, and natural reserves e.g. wetlands. More than 280km of defences are cur-rently maintained by the EA in the Humber area, and it is now realised that the long-term maintenance of all these defences is not desirable either on economic or environmental grounds.
Institutions and stakeholders in the Humber
International agreements
There are a number of international agreements and conventions that are relevant to the North Sea in general, and the Humber in particular. The most relevant as-pects are highlighted here, and summarised in Figure 3. The Humber is one of the major contributors of fresh water from the UK to the North Sea, together with
10 Integrated assessment for catchment and coastal zone management: the case of the Humber
significant loads of nutrients and contaminants. As such, its outflow has been scru-tinised under the terms of the Oslo and Paris Conventions and subsequent North Sea Conferences. The Convention for the Protection of the Marine Environment of the North-East Atlantic (OSPAR Convention) was opened for signature in 1992, and came into force in 1998 (see http://www.ospar.org/). The parts of the conven-tion most relevant to the Humber are those that deal with the prevention and elimination of pollution from land-based sources to the North Sea, and with the prevention and elimination of pollution by dumping or incineration.
European legislation
A number of EU directives are also directly relevant to the HUMCAT study. Of particular importance is the Water Framework Directive (2000/60/EC), which is a major example of policy response addressing water quality issues at the catchment scale. Adopted in June 2000, it integrates previously existing water legislation, updates existing directives according to new scientific knowledge, and strengthens existing legal obligations to ensure better compliance (Kaika and Page 2002). Kal-lis and Butler (2001) point out that the directive introduces both new goals, and new means of achieving them (new organisational framework, and new measures). The overall goal is a “good” and non-deteriorating “status for all waters (surface, underground and coastal). Measures to achieve the new goals will be co-ordinated at the level of river basin districts, i.e. hydrological units and not political bounda-ries. Authorities should set up River Basin Management Plans, to be reviewed every 6 years, based on identifying river basin characteristics, assessing pressures and impacts on water bodies following future trend scenarios, and drawing on an economic analysis of water uses within the catchment (including a cost-effectiveness analysis of potential measures). Monitoring is also an essential com-ponent, determining the necessity for additional measures. Finally, an important innovation of the Directive is to widen participation in water policy-making: river basin management plans should involve extensive consultation and public access to information.
Although it does not target coastal zones specifically, the Directive does cover coastal water quality in its objective for good quality status, and provides a good example of integrated catchment management, addressing in particular the issue of diffuse pollution of coastal waters. A major part of the research within HUMCAT is relevant to the implementation of the directive: e.g. the scenarios analysing po-tential future fluxes of contaminants; the cost-effectiveness and multi-criteria analysis of potential policy measures to improve water quality, and the involve-ment of stakeholders throughout the project.
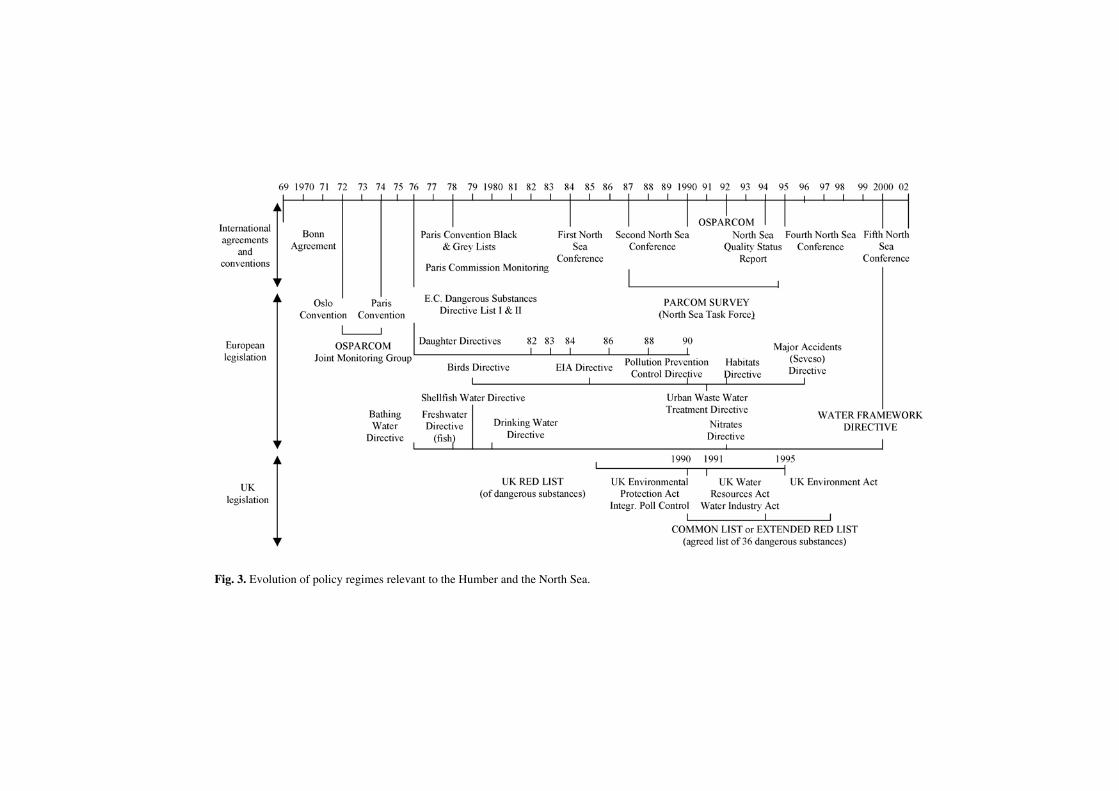
Fig. 3. Evolution of policy regimes relevant to the Humber and the North Sea.
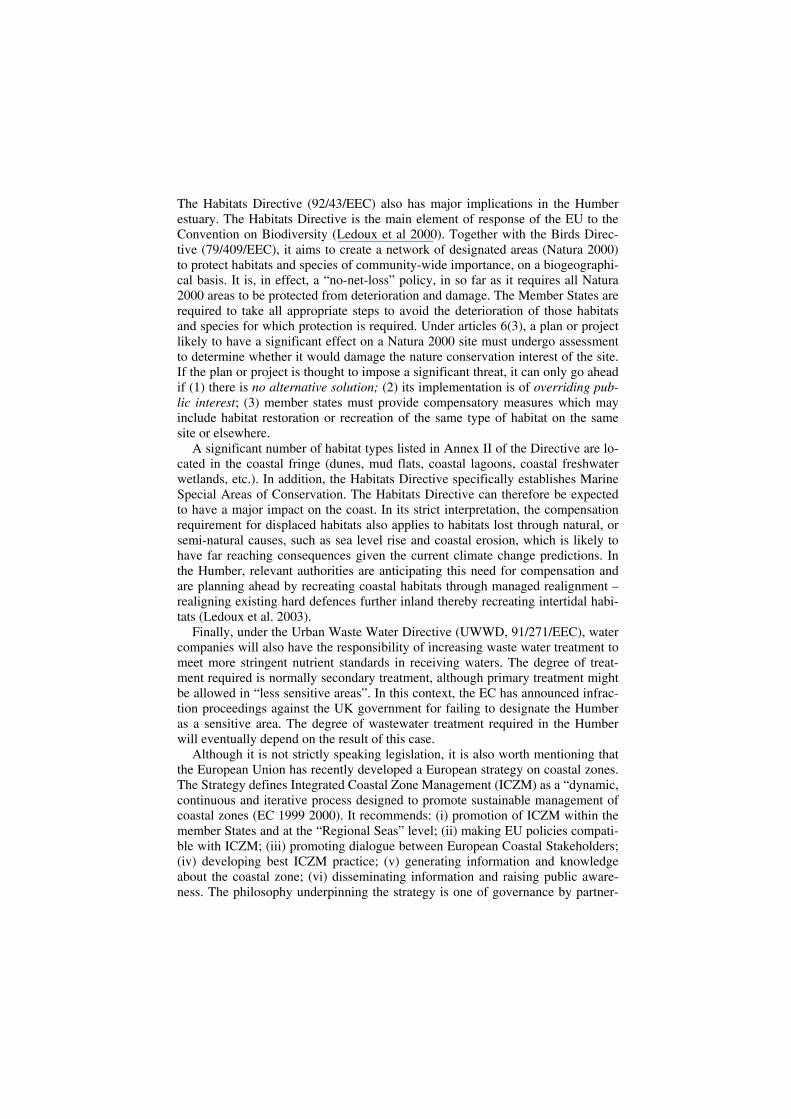
The Habitats Directive (92/43/EEC) also has major implications in the Humber estuary. The Habitats Directive is the main element of response of the EU to the Convention on Biodiversity (Ledoux et al 2000). Together with the Birds Direc-tive (79/409/EEC), it aims to create a network of designated areas (Natura 2000) to protect habitats and species of community-wide importance, on a biogeographi-cal basis. It is, in effect, a “no-net-loss” policy, in so far as it requires all Natura 2000 areas to be protected from deterioration and damage. The Member States are required to take all appropriate steps to avoid the deterioration of those habitats and species for which protection is required. Under articles 6(3), a plan or project likely to have a significant effect on a Natura 2000 site must undergo assessment to determine whether it would damage the nature conservation interest of the site. If the plan or project is thought to impose a significant threat, it can only go ahead if (1) there is no alternative solution; (2) its implementation is of overriding pub-lic interest; (3) member states must provide compensatory measures which may include habitat restoration or recreation of the same type of habitat on the same site or elsewhere.
A significant number of habitat types listed in Annex II of the Directive are lo-cated in the coastal fringe (dunes, mud flats, coastal lagoons, coastal freshwater wetlands, etc.). In addition, the Habitats Directive specifically establishes Marine Special Areas of Conservation. The Habitats Directive can therefore be expected to have a major impact on the coast. In its strict interpretation, the compensation requirement for displaced habitats also applies to habitats lost through natural, or semi-natural causes, such as sea level rise and coastal erosion, which is likely to have far reaching consequences given the current climate change predictions. In the Humber, relevant authorities are anticipating this need for compensation and are planning ahead by recreating coastal habitats through managed realignment – realigning existing hard defences further inland thereby recreating intertidal habi-tats (Ledoux et al. 2003).
Finally, under the Urban Waste Water Directive (UWWD, 91/271/EEC), water companies will also have the responsibility of increasing waste water treatment to meet more stringent nutrient standards in receiving waters. The degree of treat-ment required is normally secondary treatment, although primary treatment might be allowed in “less sensitive areas”. In this context, the EC has announced infrac-tion proceedings against the UK government for failing to designate the Humber as a sensitive area. The degree of wastewater treatment required in the Humber will eventually depend on the result of this case.
Although it is not strictly speaking legislation, it is also worth mentioning that the European Union has recently developed a European strategy on coastal zones. The Strategy defines Integrated Coastal Zone Management (ICZM) as a “dynamic, continuous and iterative process designed to promote sustainable management of coastal zones (EC 1999 2000). It recommends: (i) promotion of ICZM within the member States and at the “Regional Seas” level; (ii) making EU policies compati-ble with ICZM; (iii) promoting dialogue between European Coastal Stakeholders; (iv) developing best ICZM practice; (v) generating information and knowledge about the coastal zone; (vi) disseminating information and raising public aware-ness. The philosophy underpinning the strategy is one of governance by partner-
ship with civil society, with the EU providing leadership and guidance to support implementation at other levels.
A recommendation of the European Parliament and of the Council recommends that Member States should develop a national strategy, or where appropriate sev-eral strategies, following the principles of ICZM as described in the European Strategy. These strategies might be specific to the coastal zone, or be part of a geographically broader programme for promoting integrated management of a wider area.
National legislation
At the national level, the Humber Estuary Management Strategy (HEMS) identi-fies a long list of legislation affecting the HEMS area. The most recent and influ-ential elements of this are (see also Figure 3): • The Environmental Protection Act 1990 - established statutory provisions for
environment protection purposes including integrated pollution control for dan-gerous processes.
• The Water Resources Act 1991 - consolidated previous water legislation in respect of both the quality and quantity of water resources.
• The Water Industry Act 1991 - consolidated legislation relating to the supply of water and the provision of sewerage services.
• The Environment Act 1995 - established the Environment Agency, and intro-duced measures to enhance protection of the environment, including further powers for the prevention and remediation of water pollution.
Stakeholder interests
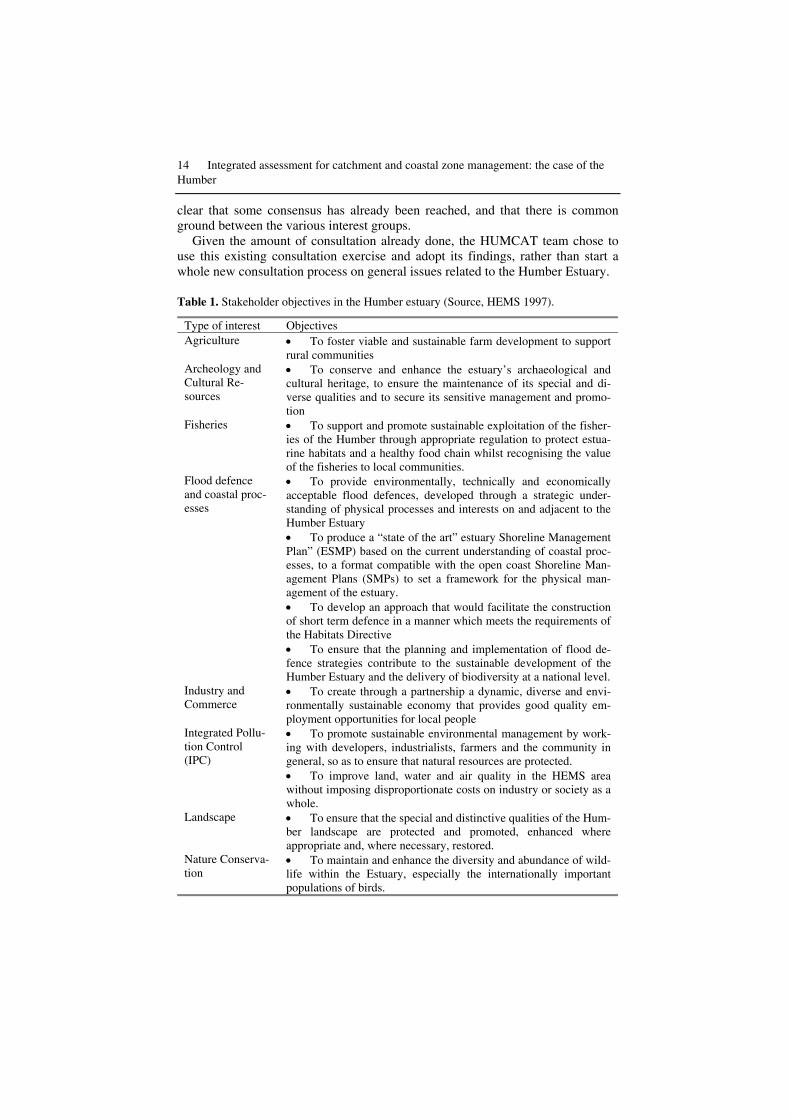
The Environment Agency has the main responsibility for long-term water re-sources planning in England and Wales, and as such is responsible for water qual-ity in the Humber. In 1992, the Department of Environment published guidance on coastal planning (Planning Policy Guidance Note 20), advocating the creation of Estuary Management Plans, with the objective of bringing together decision-makers and stakeholders to adopt a strategic approach to estuary management. A management structure was set up during 1993 and 1994, comprising of a project officer, an executive steering group to guide the project, and a working group with which the Project Officer maintained regular contact, the latter two groups repre-senting a range of interests. Extensive consultation and a close cooperation with the Environment Agency lead to the publication of a Humber Management Strat-egy, summarising the objectives for the long term management of the Humber, with the aim of guiding future activities through a voluntary framework of plan-ning and management options, as a complement to statutory processes and legisla-tive framework. Table 1 summarises the objectives from different stakeholders, as reported in the Humber Management Strategy (HEMS 1997).
Objectives listed in Table 1 suggest that there might be potential conflicts be-tween types of interests. However, the way the objectives are formulated, it is also
14 Integrated assessment for catchment and coastal zone management: the case of the Humber
clear that some consensus has already been reached, and that there is common ground between the various interest groups.
Given the amount of consultation already done, the HUMCAT team chose to use this existing consultation exercise and adopt its findings, rather than start a whole new consultation process on general issues related to the Humber Estuary.
Table 1. Stakeholder objectives in the Humber estuary (Source, HEMS 1997).
Type of interest Objectives Agriculture • To foster viable and sustainable farm development to support
rural communities Archeology and Cultural Re-sources
• To conserve and enhance the estuary’s archaeological and cultural heritage, to ensure the maintenance of its special and di-verse qualities and to secure its sensitive management and promo-tion
Fisheries • To support and promote sustainable exploitation of the fisher-ies of the Humber through appropriate regulation to protect estua-rine habitats and a healthy food chain whilst recognising the value of the fisheries to local communities.
Flood defence and coastal proc-esses
• To provide environmentally, technically and economically acceptable flood defences, developed through a strategic under-standing of physical processes and interests on and adjacent to the Humber Estuary • To produce a “state of the art” estuary Shoreline Management Plan” (ESMP) based on the current understanding of coastal proc-esses, to a format compatible with the open coast Shoreline Man-agement Plans (SMPs) to set a framework for the physical man-agement of the estuary. • To develop an approach that would facilitate the construction of short term defence in a manner which meets the requirements of the Habitats Directive • To ensure that the planning and implementation of flood de-fence strategies contribute to the sustainable development of the Humber Estuary and the delivery of biodiversity at a national level.
Industry and Commerce
• To create through a partnership a dynamic, diverse and envi-ronmentally sustainable economy that provides good quality em-ployment opportunities for local people
Integrated Pollu-tion Control (IPC)
• To promote sustainable environmental management by work-ing with developers, industrialists, farmers and the community in general, so as to ensure that natural resources are protected. • To improve land, water and air quality in the HEMS area without imposing disproportionate costs on industry or society as a whole.
Landscape • To ensure that the special and distinctive qualities of the Hum-ber landscape are protected and promoted, enhanced where appropriate and, where necessary, restored.
Nature Conserva-tion
• To maintain and enhance the diversity and abundance of wild-life within the Estuary, especially the internationally important populations of birds.
Navigation and Port Development
• To ensure the continued growth and vitality of the Humber’s Ports and Wharves and their related developments.
Sport, Recreation and Access
• To maintain, and improve the provision and availability of as wide a range of sport and recreational facilities as are compatible with the local environment of the Humber Estuary.
Tourism • To maintain, develop and promote tourism on the Estuary in a way which ensures that all development achieves a suitable log term balance between needs of visitors, local communities, and the environment.
Stakeholder consultation was however carried out on a regular basis through set-ting up a Policy Advisory Board, comprising key stakeholders: the Environment Agency, British Associated British Ports, and the Royal Society for the Protection of Birds. Two years into the project, the group has now met six times, providing regular feedback on different stages of project development. Fuller consultation has also already taken place through the pre-existing Humber Shoreline Manage-ment Plan steering group, originally set up to maximise input from stakeholders into the Humber Strategy, and representing the main interests around the estuary. A workshop was organised to discuss potential policies likely to be adopted to improve water quality in the Humber estuary, and what main areas of interests should be taken into account for decision making.
Scenarios Methodology
What are scenarios?
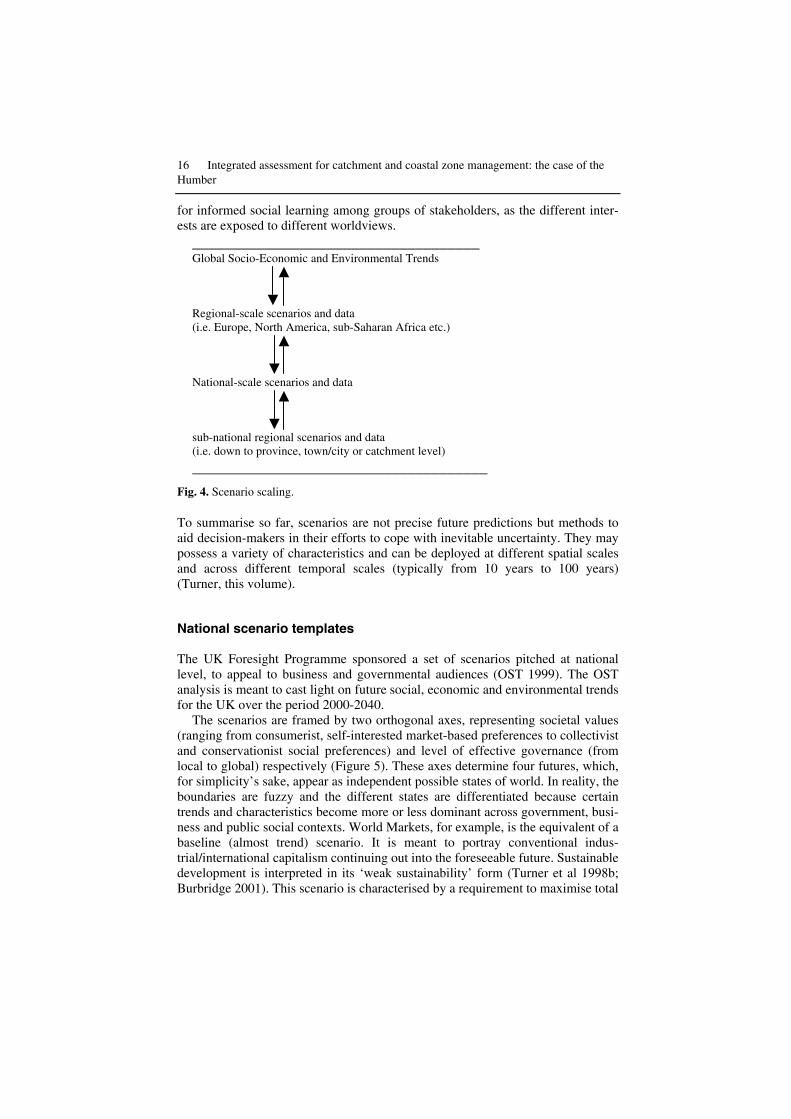
A scenario should provide a plausible context, but not a probabilistic forecast, for a possible future state of the world (Parry and Carter 1998). Scenario analysis has been under development since the 1960s across a number of different applications (Miles 1981; Kassler 1995; Hammond 1998). Scenario analysis usually proceeds through a series of spatial scales, involving a process of aggrega-tion/disaggregation until an appropriate policy/management option level is at-tained (Figure 4).
A growing body of research work has been exploring the application of sce-nario-based ‘futures studies’ as a means of obtaining a better understanding of the potential for societal adaptation to future environmental change (Gallopin and Raskin 1998). Scenarios can be used to inform present choices in the light of fu-ture alternatives, such as in the context of climate change mitigation and adapta-tion options (Lorenzoni et al. 2000a, b; Parry 2000). Thus a longer-term context can provide a framework within which to comprehensively evaluate short-term decisions, as well as providing the capacity to explore the consequences of sur-prise events (‘side-swipes’). Plausible scenarios are potentially useful constructs
16 Integrated assessment for catchment and coastal zone management: the case of the Humber
for informed social learning among groups of stakeholders, as the different inter-ests are exposed to different worldviews.
____________________________________ Global Socio-Economic and Environmental Trends Regional-scale scenarios and data (i.e. Europe, North America, sub-Saharan Africa etc.) National-scale scenarios and data
sub-national regional scenarios and data (i.e. down to province, town/city or catchment level)
_____________________________________
Fig. 4. Scenario scaling.
To summarise so far, scenarios are not precise future predictions but methods to aid decision-makers in their efforts to cope with inevitable uncertainty. They may possess a variety of characteristics and can be deployed at different spatial scales and across different temporal scales (typically from 10 years to 100 years) (Turner, this volume).
National scenario templates
The UK Foresight Programme sponsored a set of scenarios pitched at national level, to appeal to business and governmental audiences (OST 1999). The OST analysis is meant to cast light on future social, economic and environmental trends for the UK over the period 2000-2040.
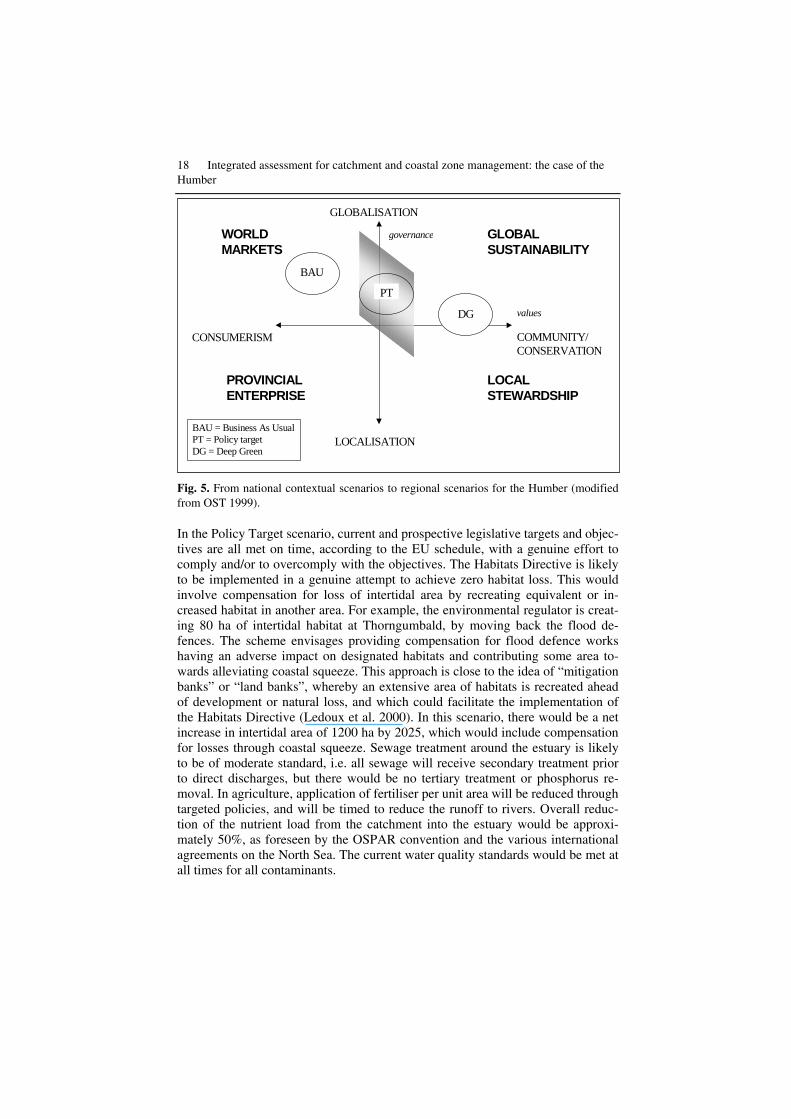
The scenarios are framed by two orthogonal axes, representing societal values (ranging from consumerist, self-interested market-based preferences to collectivist and conservationist social preferences) and level of effective governance (from local to global) respectively (Figure 5). These axes determine four futures, which, for simplicity’s sake, appear as independent possible states of world. In reality, the boundaries are fuzzy and the different states are differentiated because certain trends and characteristics become more or less dominant across government, busi-ness and public social contexts. World Markets, for example, is the equivalent of a baseline (almost trend) scenario. It is meant to portray conventional indus-trial/international capitalism continuing out into the foreseeable future. Sustainable development is interpreted in its ‘weak sustainability’ form (Turner et al 1998b; Burbridge 2001). This scenario is characterised by a requirement to maximise total
output (GDP), with widening income inequality. Environmental concerns are im-portant but constrained to ‘local’ health and/or amenity concerns; international environmental agreements have relatively modest targets/standards.
Global Sustainability, on the other hand, is a scenario which contains the belief that environmental systems are often of infinite value and are the foundations of a sustainable economic and social system, not vice versa. Resource use effi-ciency/productivity can be radically improved via a mixture of regulation, eco-nomic incentive mechanisms and technological innovation. Sustainable develop-ment requires the redressing of global inequities of income and wealth, as well as efficiency gains. A move towards more globalisation of governance systems is supported.
The Provincial Enterprise scenario has a mixed technocentric and ecocentric makeup depending on the national resource base available and its configuration. Global and national governance are significantly downgraded in importance. Envi-ronmental concerns are local/regional but mitigation measures are constrained by budget limits.
Finally, in the Local Stewardship Scenario, social values coalesce around long-term requirements and the satisfaction of collective needs. Governance is concen-trated on federal political systems, with the emphasis on deliberative and participatory/inclusive processes at the local scale. Key technologies become renewable energy and small-scale manufacturing processes. Environmental concerns are high but strong action is limited to local scales.
Regional scenarios
Three regional variants (Ledoux et al 2002) were derived from the OST national scenarios and adapted to the Humber (Figure 5). The Business As Usual scenario (BAU) is the baseline scenario, corresponding roughly to the World Markets sce-nario at national level. It is a forward projection of the past 20 year trends in data, ignoring the recent sustainable development strictures. In this scenario, current legislation is only complied with in a formal way. For example, expected port ex-pansion within the Humber estuary over the next 20-25 years would lead to a loss of 0.2% of the intertidal area in the Humber estuary, approx. 20 ha. In terms of flood defence around the estuary, hard defences would be maintained as far as possible, exacerbating the problem of coastal squeeze. Given the commitment of the UK to implement the Habitats Directive, compensation in the form of recre-ated habitats would have to be provided, but one could assume that this would be on the basis of minimum compliance. One would therefore expect a net loss of habitats in this scenario. Water quality objectives are likely to include exceptions for a variety of polluting industries. The standard of sewage treatment is likely to be relatively low (up to recently, there was no treatment for the large, direct sew-age discharges in the tideway). At the catchment level, agriculture is likely to re-main relatively intensive and based on technology (e.g. GM crops) to sustain high yields, leading to no net reduction in nitrate input to rivers. Contaminant concen-trations would also remain at their current level.
18 Integrated assessment for catchment and coastal zone management: the case of the Humber
Fig. 5. From national contextual scenarios to regional scenarios for the Humber (modified from OST 1999).
In the Policy Target scenario, current and prospective legislative targets and objec-tives are all met on time, according to the EU schedule, with a genuine effort to comply and/or to overcomply with the objectives. The Habitats Directive is likely to be implemented in a genuine attempt to achieve zero habitat loss. This would involve compensation for loss of intertidal area by recreating equivalent or in-creased habitat in another area. For example, the environmental regulator is creat-ing 80 ha of intertidal habitat at Thorngumbald, by moving back the flood de-fences. The scheme envisages providing compensation for flood defence works having an adverse impact on designated habitats and contributing some area to-wards alleviating coastal squeeze. This approach is close to the idea of “mitigation banks” or “land banks”, whereby an extensive area of habitats is recreated ahead of development or natural loss, and which could facilitate the implementation of the Habitats Directive (Ledoux et al. 2000). In this scenario, there would be a net increase in intertidal area of 1200 ha by 2025, which would include compensation for losses through coastal squeeze. Sewage treatment around the estuary is likely to be of moderate standard, i.e. all sewage will receive secondary treatment prior to direct discharges, but there would be no tertiary treatment or phosphorus re-moval. In agriculture, application of fertiliser per unit area will be reduced through targeted policies, and will be timed to reduce the runoff to rivers. Overall reduc-tion of the nutrient load from the catchment into the estuary would be approxi-mately 50%, as foreseen by the OSPAR convention and the various international agreements on the North Sea. The current water quality standards would be met at all times for all contaminants.
values
GLOBALISATION
LOCALISATION
CONSUMERISM COMMUNITY/CONSERVATION
PROVINCIALENTERPRISE
WORLDMARKETS
GLOBALSUSTAINABILITY
LOCALSTEWARDSHIP
governance
BAU
PT
DG
BAU = Business As UsualPT = Policy targetDG = Deep Green
In the Deep Green scenario, environmental protection is given maximum prior-ity. It corresponds loosely to a state between the Global Sustainability and Local Stewardship national scenarios. This represents some environmental state beyond that which could be achieved if current policies were implemented. The economy is also likely to be more regionalised. A Deep Green scenario would involve sub-stantial increases in intertidal areas, compensating for any new works or extension of existing installations, over and above coastal squeeze. The creation of mitiga-tion banks in a formal and regulated setting might contribute to a strategic ap-proach to an increase in biodiversity (Crooks and Ledoux 1999). A recent RSPB study (Pilcher et al 2002) identified 2 858 ha with potential for intertidal habitat creation within the Humber Estuary. In this scenario, intertidal habitat would in-crease to 2500 ha, i.e. more than double the area in the Policy Target scenario. Agriculture is likely to become less intensive. Riparian zones will be created along most riverbanks bordering farmland to reduce inputs of nutrients to rivers. Envi-ronmental schemes such as reed bed treatment will be widely applied for secon-dary sewage treatment, rather than hard technology, and tertiary treatment will be widespread, removing nitrogen and phosphorus. In this scenario, the long run ob-jective would be to approach “natural” background levels of nutrient and contami-nant fluxes through the system, with due allowance for the historical contaminant legacy “locked” into sediments.
Data collection and sources of contaminants
The extensive research and data gathering (Table 2) that occurred in the past few years in the Humber enabled us to produce a good picture of what the main sources of pollution are.
Nitrate is the dominant source of N to the rivers, and the Trent and Ouse sys-tems provide roughly equal shares of the nitrate load to the estuary. The ammonia-cal N load from the Ouse was much higher than for the Trent in the 1980s, due to poorer sewage treatment in the Ouse catchment at that time. Virtually all catch-ment sewage now receives secondary treatment, e.g. the total population for re-porting year 1999-2000 served by sewers for Yorkshire Water is 4.8 million (Ouse catchment, Yorkshire Water returns to OFWAT), of which 4.5 million are con-nected to plants with secondary sewage treatment. To date no specific efforts have been made to remove P in sewage effluent, although some reduction in load is assumed due to the decline in the use of P in detergents. Orthophosphate loads from the Trent are much higher than from the Ouse, reflecting the larger popula-tion in the Trent (Neal and Davies, in press). Most of the nitrogen input to the es-tuary (Table 3) is in dissolved form, and is exported to the North Sea as dissolved inorganic nitrogen. Most of the phosphorus input is also in dissolved form (Table 3), but is transformed by in-estuarine processes and is exported to the North Sea as particulate (Jickells et al. 2000). Only a fraction of the inputs are stored in sedi-ments within the estuary.
20 Integrated assessment for catchment and coastal zone management: the case of the Humber
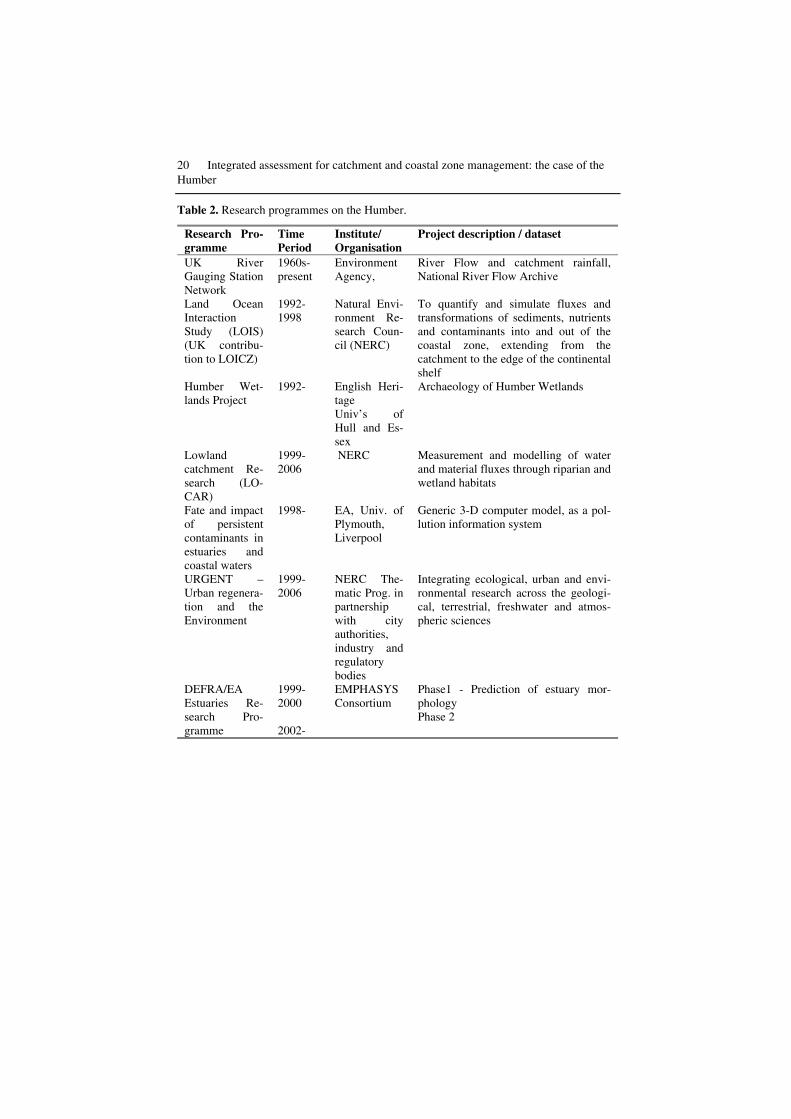
Table 2. Research programmes on the Humber.
Research Pro-gramme
Time Period
Institute/ Organisation
Project description / dataset
UK River Gauging Station Network
1960s- present
Environment Agency,
River Flow and catchment rainfall, National River Flow Archive
Land Ocean Interaction Study (LOIS) (UK contribu-tion to LOICZ)
1992-1998
Natural Envi-ronment Re-search Coun-cil (NERC)
To quantify and simulate fluxes and transformations of sediments, nutrients and contaminants into and out of the coastal zone, extending from the catchment to the edge of the continental shelf
Humber Wet-lands Project
1992- English Heri-tage Univ’s of Hull and Es-sex
Archaeology of Humber Wetlands
Lowland catchment Re-search (LO-CAR)
1999-2006
NERC Measurement and modelling of water and material fluxes through riparian and wetland habitats
Fate and impact of persistent contaminants in estuaries and coastal waters
1998- EA, Univ. of Plymouth, Liverpool
Generic 3-D computer model, as a pol-lution information system
URGENT –Urban regenera-tion and the Environment
1999-2006
NERC The-matic Prog. in partnership with city authorities, industry and regulatory bodies
Integrating ecological, urban and envi-ronmental research across the geologi-cal, terrestrial, freshwater and atmos-pheric sciences
DEFRA/EA Estuaries Re-search Pro-gramme
1999-2000 2002-
EMPHASYS Consortium
Phase1 - Prediction of estuary mor-phology Phase 2
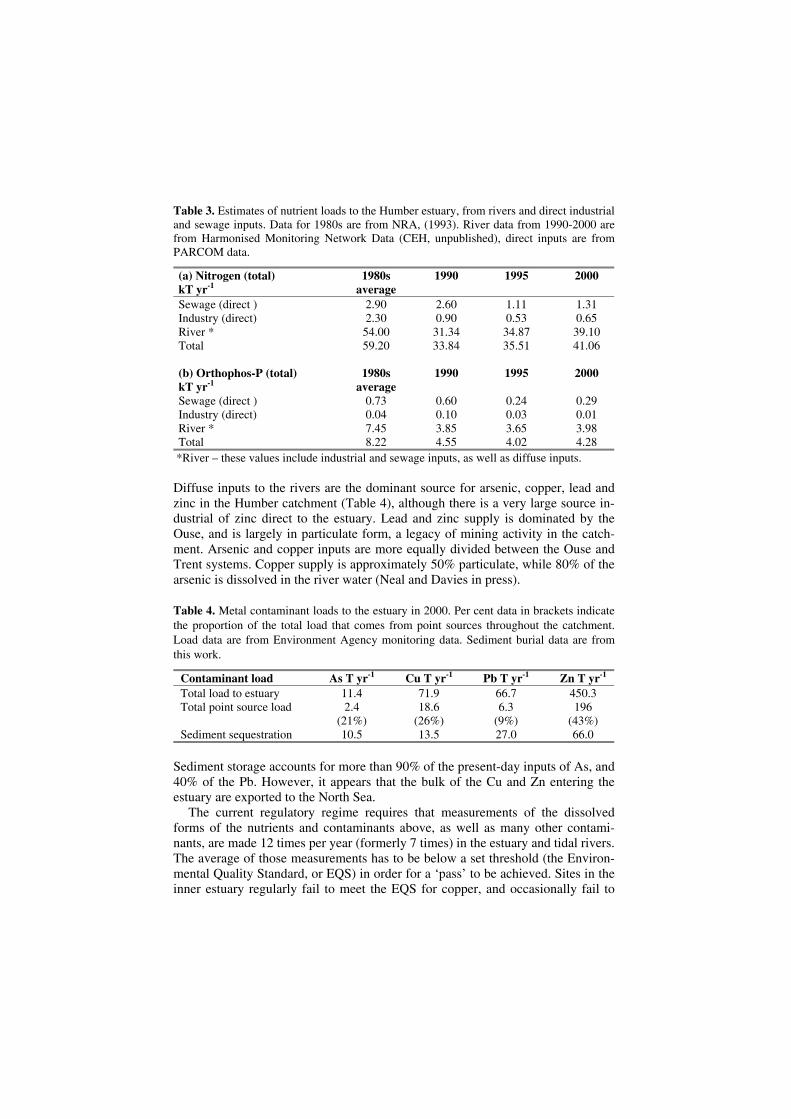
Table 3. Estimates of nutrient loads to the Humber estuary, from rivers and direct industrial and sewage inputs. Data for 1980s are from NRA, (1993). River data from 1990-2000 are from Harmonised Monitoring Network Data (CEH, unpublished), direct inputs are from PARCOM data.
(a) Nitrogen (total) kT yr-1
1980s average
1990 1995 2000
Sewage (direct ) 2.90 2.60 1.11 1.31 Industry (direct) 2.30 0.90 0.53 0.65 River * 54.00 31.34 34.87 39.10 Total 59.20 33.84 35.51 41.06 (b) Orthophos-P (total) kT yr-1
1980s average
1990 1995 2000
Sewage (direct ) 0.73 0.60 0.24 0.29 Industry (direct) 0.04 0.10 0.03 0.01 River * 7.45 3.85 3.65 3.98 Total 8.22 4.55 4.02 4.28
*River – these values include industrial and sewage inputs, as well as diffuse inputs.
Diffuse inputs to the rivers are the dominant source for arsenic, copper, lead and zinc in the Humber catchment (Table 4), although there is a very large source in-dustrial of zinc direct to the estuary. Lead and zinc supply is dominated by the Ouse, and is largely in particulate form, a legacy of mining activity in the catch-ment. Arsenic and copper inputs are more equally divided between the Ouse and Trent systems. Copper supply is approximately 50% particulate, while 80% of the arsenic is dissolved in the river water (Neal and Davies in press).
Table 4. Metal contaminant loads to the estuary in 2000. Per cent data in brackets indicate the proportion of the total load that comes from point sources throughout the catchment. Load data are from Environment Agency monitoring data. Sediment burial data are from this work.
Contaminant load As T yr-1 Cu T yr-1 Pb T yr-1 Zn T yr-1 Total load to estuary 11.4 71.9 66.7 450.3 Total point source load 2.4
(21%) 18.6
(26%) 6.3
(9%) 196
(43%) Sediment sequestration 10.5 13.5 27.0 66.0
Sediment storage accounts for more than 90% of the present-day inputs of As, and 40% of the Pb. However, it appears that the bulk of the Cu and Zn entering the estuary are exported to the North Sea.
The current regulatory regime requires that measurements of the dissolved forms of the nutrients and contaminants above, as well as many other contami-nants, are made 12 times per year (formerly 7 times) in the estuary and tidal rivers. The average of those measurements has to be below a set threshold (the Environ-mental Quality Standard, or EQS) in order for a ‘pass’ to be achieved. Sites in the inner estuary regularly fail to meet the EQS for copper, and occasionally fail to
22 Integrated assessment for catchment and coastal zone management: the case of the Humber
achieve the required EQS for dissolved oxygen. There are no EQS values set for contaminants in suspended particulate matter, nor in bed sediments within the es-tuary, despite the fact that the sediments are the habitat for benthic species which form part of the food chain and underpin much of the ecology of the estuary. Lev-els of contaminants in sediments and biota are monitored, however, and have shown significant reductions over the last decade.
Policy analysis
The general approach
In the context of EUROCAT, scenarios are useful to think about what type of management strategies would be best adapted to a variety of possible futures. In each scenario, there is a different objective for water quality improvement, and a different combination of policy options is likely to be implemented according to environmental objectives, but also depending on the general socio-economic and political context. Options might be related to: control measures on agriculture or industry, sewage treatment, cleaning up or removal of contaminated sediments, or managed realignment (the case of interest here involves realigning coastal de-fences further inland, thereby recreating intertidal habitats which can play a role in nutrient and contaminant removal). Practical measures are likely to be a combina-tion of options. These options can be targeted at the level of the estuary or in the wider catchment.
Theoretically, all policy options would be analysed in each scenario, taking into account future conditions and preferences. In practice however, this is impossible to carry out, as it would imply too many assumptions about future price-elasticities, consumer preferences, general socio-economic conditions etc. The pragmatic approach taken here is to analyse in present time the policy options likely to be implemented in each scenario – i.e., what impact would these policy options have if they were implemented now. In a final step, the scenarios will pro-vide a consistent framework to undertake a sensitivity analysis of how the out-come of the present time analysis would change under the three different possible future scenarios.
Policy analysis of water quality improvement options within EUROCAT focus on two complementary approaches: a “cost-effectiveness”, and a “multi-criteria” analyses. The format of these approaches is described in detail in the following sections. Although the ultimate aim is to use the scenarios to explore impact of policies in different futures, as a first step, the scenarios are used to generate pol-icy packages that would be likely to be used in each of the possible future worlds.
A cost-effectiveness analysis of reducing copper inputs to the Humber
One policy question is: how effective are available policy measures at reaching the environmental targets, and at what cost? This is a cost-effectiveness issue: what measures or combination of measures are able to reach a certain water quality tar-get at least cost? In the Humber, this sort of analysis can help to answer the fol-lowing questions: which economic activities generating pollution should be prior-ity targets? Should policy measures target activities with direct input in the estuary or activities further up in the catchment? Are there any sub-catchments that are more obvious candidates for specific policies? This involves an economic analysis of abatement costs for different types of activities. This section first provides an example of cost-effectiveness analysis focusing on direct industrial inputs of cop-per in the Humber.
Copper pollution is one of the few current significant water quality issues in the Humber Estuary. Copper is a List 2 substance under the European Dangerous Substance Directive (76/464/EEC) and it is this designation that defines how cop-per is regulated in the Humber estuary. The Environmental Quality Standard for dissolved copper in estuarine waters is 5ug/l relating to soluble copper as an an-nual average concentration (Mance et al. 1984), and the Environment Agency’s statutory duty is to ensure this standard is met. Copper concentrations in the Hum-ber Estuary exceeded the Environmental Quality Standard (EQS) on several occa-sions in the period 1989 to 1995 (Beaumont and Tinch 2003), and as a result con-siderable investment has been made to reduce copper discharges to the estuary. Despite this reduction the dissolved copper concentrations in the estuary still ex-ceed the 5�gl-1 limit, albeit occasionally.
A cost-effectiveness analysis was undertaken to assess the potential methods of reducing copper inputs in the Humber. It is recognised that there are many sources of copper to the Humber Estuary (mainly contaminated sediments, sewage, and industry with point and diffuse inputs throughout the catchment, and direct inputs to the estuary). In the first instance, however, only the industrial point sources to the Humber Estuary were included in the analysis, with scope to include all the sources at a later date if the methodology proved successful.
Cost-effectiveness analysis in this context requires the derivation of abatement cost curves (Boer and Bosch 1995, Wickborn 1996, Maya and Fenhann 1994, Kram et al. 1995, Greer et al. 1997). Abatement cost curves provide an estimate of the cost to reach a required level of abatement, and also reveal the most efficient route to this discharge target. The description of costs in this format allows the ready evaluation of the impact upon the economy, and aids negotiations between the government, regulators and industries (Jung et al. 1996).
A drawback of the method applied is that it does not take into account the ef-fects on the national economy, and the secondary impacts of the abatement tech-nologies were also not included in the calculation of the abatement costs. Guide-lines to standardise abatement cost studies have recently been produced (Wenborn et al. 1997, A.E.A. 1999) and these procedures were adopted in this study. There are 5 major steps in the derivation of the abatement cost curves:
24 Integrated assessment for catchment and coastal zone management: the case of the Humber
1. Identification of all sources 2. Collation of abatement techniques 3. Total Costs and Abatement Potential 4. Manipulation and standardisation of abatement cost data 5. Production of the curves
A database was developed which included the details of each abatement method, the current copper output of the industry (kg/year), the abatement level achieved (kg/year) following implementation, the investment cost, and operating costs. In-vestment costs are defined as the capital costs of the technology. The costs of im-plementing the technique over time are known here as operating costs.
There were a number of assumptions associated with the cost data. In many cases the investment has not been made specifically to reduce the copper concen-tration in the waste, however as the situation was rarely clear cut, to ensure consis-tency, the total cost of abatement was assumed to be targeted at copper. Another significant assumption was that secondary impacts of applying the abatement technologies were considered outside the scope of the primary analysis, but were taken into account when drawing conclusions. Abatement technologies can have beneficial side effects: for example, enhancing production, reducing running costs (including energy savings) and increased recovery of material. Health and safety benefits may also be enjoyed. There are also adverse effects related to the imple-mentation of new processes, resulting in indirect costs. Older equipment is some-times replaced prematurely, causing a financial loss.
All data was standardised to the baseline year of 1998. An annuity was calcu-lated for each technology, permitting the comparison of measures on a cost/year basis. A variety of discount rates and time periods were used, as detailed in Beau-mont (2000).
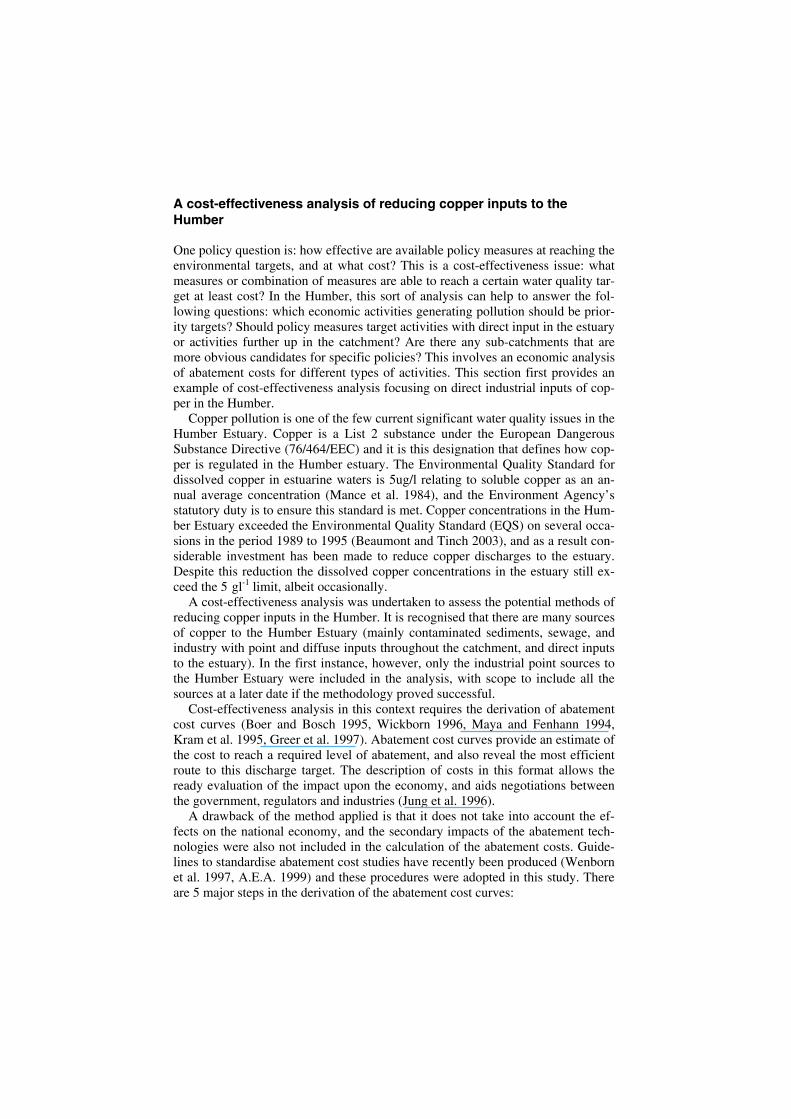
The abatement techniques in this case study were fully compatible and hence all combinations were used to produce the cost curve. Figure 6 depicts an aggre-gate cost curve for the most cost-effective application of available abatement measures, it is based upon a 4% discount rate and a 10 year time period. As ex-pected the curve is stepped in nature and has a similar distribution to those docu-mented in Riege-Wcislo and Heinze (1996).
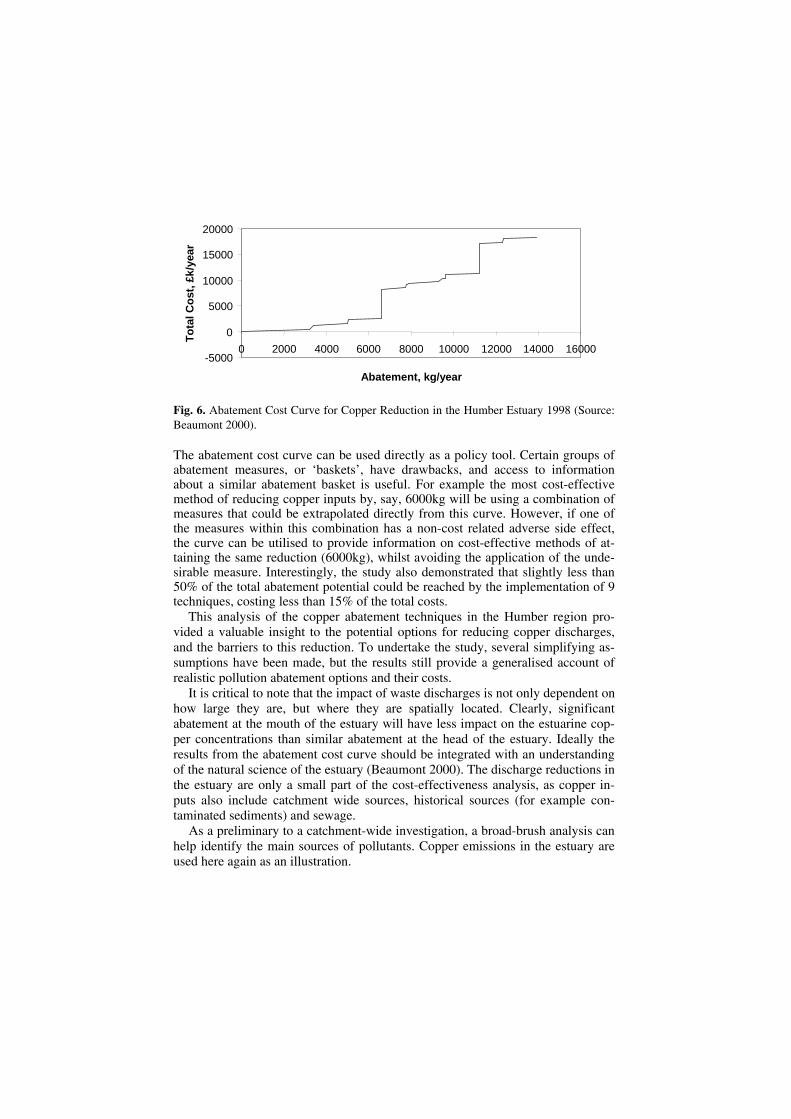
Fig. 6. Abatement Cost Curve for Copper Reduction in the Humber Estuary 1998 (Source: Beaumont 2000).
The abatement cost curve can be used directly as a policy tool. Certain groups of abatement measures, or ‘baskets’, have drawbacks, and access to information about a similar abatement basket is useful. For example the most cost-effective method of reducing copper inputs by, say, 6000kg will be using a combination of measures that could be extrapolated directly from this curve. However, if one of the measures within this combination has a non-cost related adverse side effect, the curve can be utilised to provide information on cost-effective methods of at-taining the same reduction (6000kg), whilst avoiding the application of the unde-sirable measure. Interestingly, the study also demonstrated that slightly less than 50% of the total abatement potential could be reached by the implementation of 9 techniques, costing less than 15% of the total costs.
This analysis of the copper abatement techniques in the Humber region pro-vided a valuable insight to the potential options for reducing copper discharges, and the barriers to this reduction. To undertake the study, several simplifying as-sumptions have been made, but the results still provide a generalised account of realistic pollution abatement options and their costs.
It is critical to note that the impact of waste discharges is not only dependent on how large they are, but where they are spatially located. Clearly, significant abatement at the mouth of the estuary will have less impact on the estuarine cop-per concentrations than similar abatement at the head of the estuary. Ideally the results from the abatement cost curve should be integrated with an understanding of the natural science of the estuary (Beaumont 2000). The discharge reductions in the estuary are only a small part of the cost-effectiveness analysis, as copper in-puts also include catchment wide sources, historical sources (for example con-taminated sediments) and sewage.
As a preliminary to a catchment-wide investigation, a broad-brush analysis can help identify the main sources of pollutants. Copper emissions in the estuary are used here again as an illustration.
-5000
0
5000
10000
15000
20000
0 2000 4000 6000 8000 10000 12000 14000 16000
Abatement, kg/year
Tota
l Cos
t, £k
/yea
r
26 Integrated assessment for catchment and coastal zone management: the case of the Humber
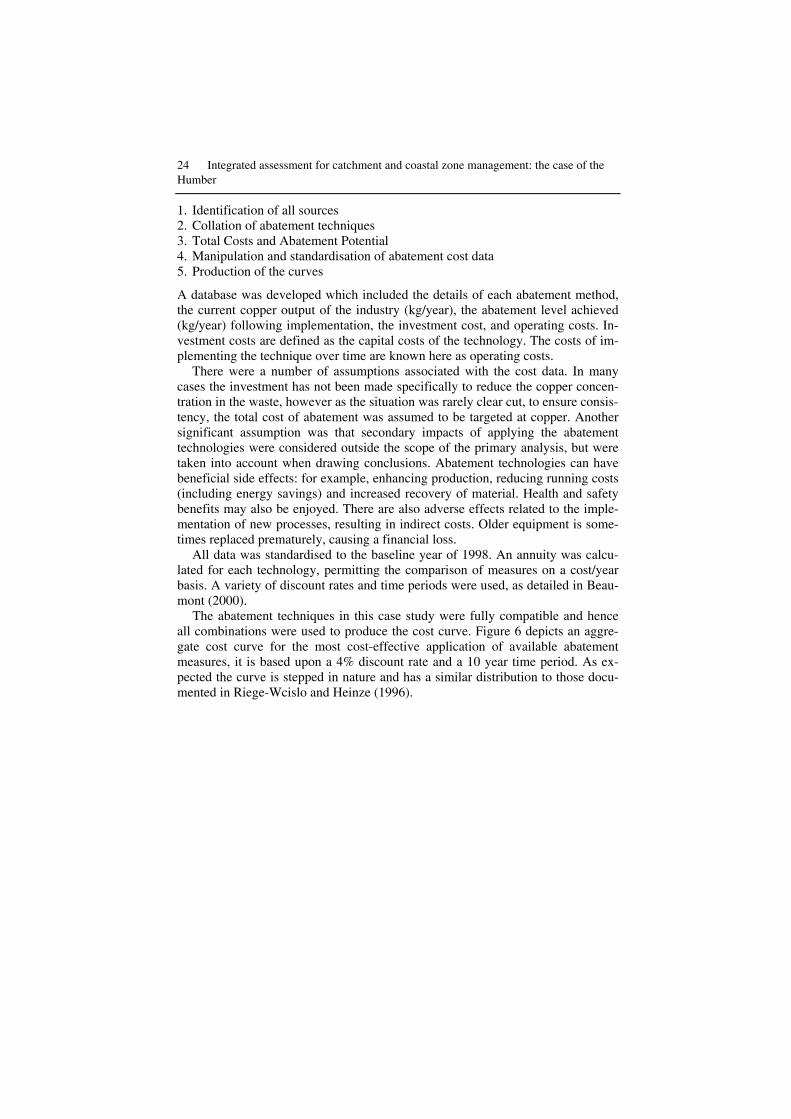
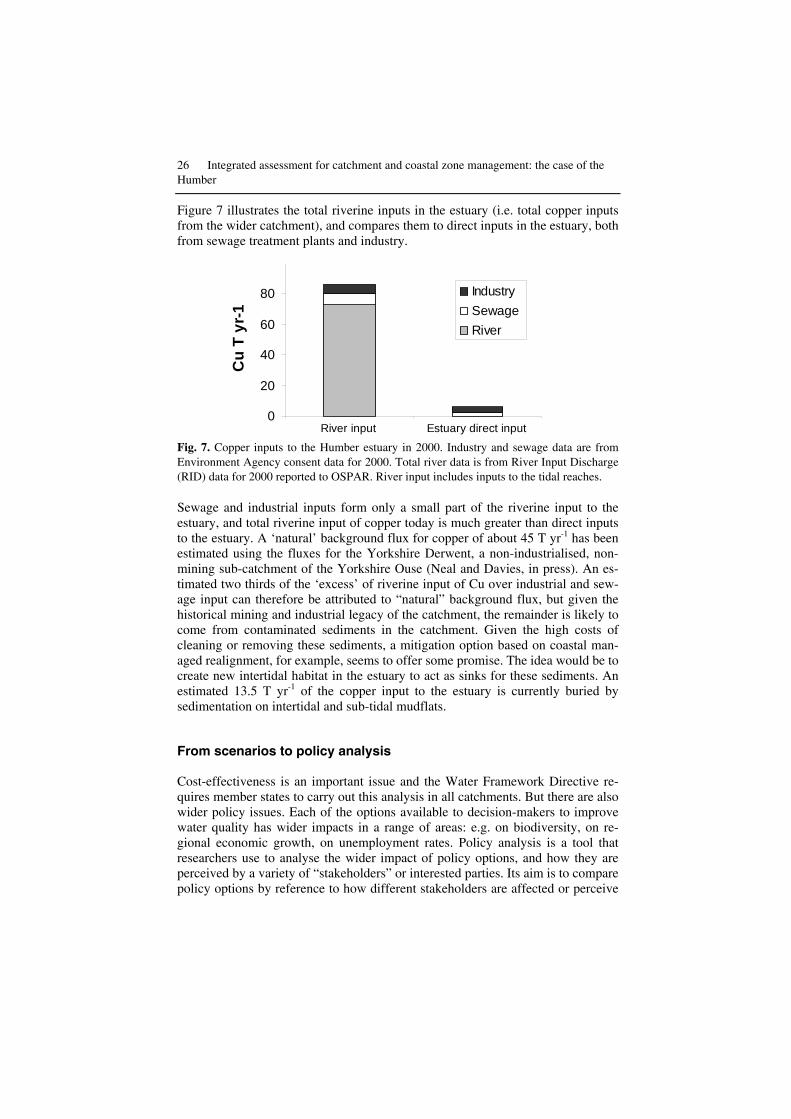
Figure 7 illustrates the total riverine inputs in the estuary (i.e. total copper inputs from the wider catchment), and compares them to direct inputs in the estuary, both from sewage treatment plants and industry.
Fig. 7. Copper inputs to the Humber estuary in 2000. Industry and sewage data are from Environment Agency consent data for 2000. Total river data is from River Input Discharge (RID) data for 2000 reported to OSPAR. River input includes inputs to the tidal reaches.
Sewage and industrial inputs form only a small part of the riverine input to the estuary, and total riverine input of copper today is much greater than direct inputs to the estuary. A ‘natural’ background flux for copper of about 45 T yr-1 has been estimated using the fluxes for the Yorkshire Derwent, a non-industrialised, non-mining sub-catchment of the Yorkshire Ouse (Neal and Davies, in press). An es-timated two thirds of the ‘excess’ of riverine input of Cu over industrial and sew-age input can therefore be attributed to “natural” background flux, but given the historical mining and industrial legacy of the catchment, the remainder is likely to come from contaminated sediments in the catchment. Given the high costs of cleaning or removing these sediments, a mitigation option based on coastal man-aged realignment, for example, seems to offer some promise. The idea would be to create new intertidal habitat in the estuary to act as sinks for these sediments. An estimated 13.5 T yr-1 of the copper input to the estuary is currently buried by sedimentation on intertidal and sub-tidal mudflats.
From scenarios to policy analysis
Cost-effectiveness is an important issue and the Water Framework Directive re-quires member states to carry out this analysis in all catchments. But there are also wider policy issues. Each of the options available to decision-makers to improve water quality has wider impacts in a range of areas: e.g. on biodiversity, on re-gional economic growth, on unemployment rates. Policy analysis is a tool that researchers use to analyse the wider impact of policy options, and how they are perceived by a variety of “stakeholders” or interested parties. Its aim is to compare policy options by reference to how different stakeholders are affected or perceive
0
20
40
60
80
Cu
T yr
-1
IndustrySewage River
River input Estuary direct input
to be affected. In the context of EUROCAT, stakeholders provide input by identi-fying possible policy packages, as well as specific criteria within three broad cate-gories (economic, environmental, and social). They can also, in principle, be asked to give weights to the evaluation criteria to determine their relative importance. The impact of each of the policy packages on the set of criteria can be assessed through scores, determined by modelling and expert opinion. Policy options can be ranked according to their impacts on the criteria, taking into account the stake-holder weights attributed to each criterion. But the dominant criterion, especially in the context of the Water Framework Directive, will be economic cost and cost-effectiveness.
This section reports on the stakeholder consultation, which took place in the context of the EUROCAT Humber case study. The main objectives were to iden-tify the policy packages likely to be implemented and the main criteria use to evaluate them.
A workshop was organised to bring together key stakeholders from the Humber estuary and catchment, and get their views on options to improve water quality in the Humber estuary. The day was structured in plenary brainstorming sessions and break-out in-depth discussion groups, with two main themes: policy options to improve water quality in the Humber, and criteria to evaluate these policy options.
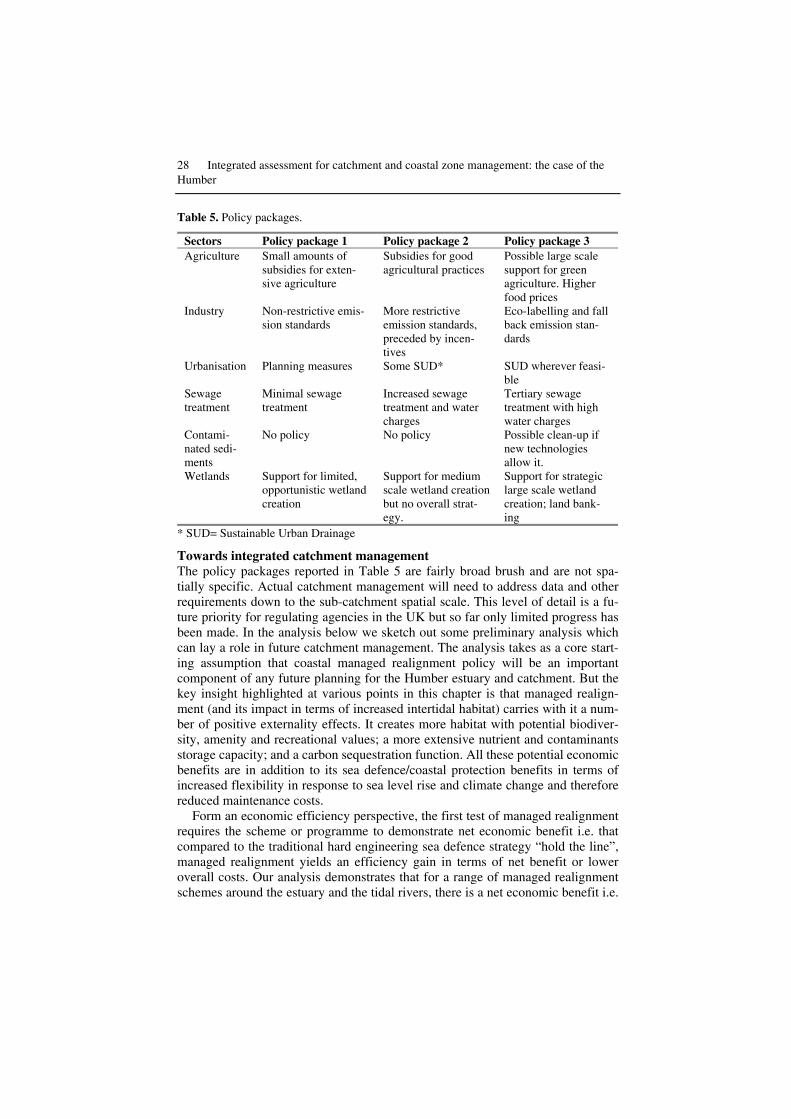
In the first part of the workshop, participants were asked to provide three ex-amples of policy options that they considered would contribute to improving water quality in the estuary, and to organise the list of options into three coherent policy packages. To avoid being constrained by present conditions, and to make sure policy packages were as different as possible to make the analysis worthwhile, they were asked to think about three world views, or mind sets, which would re-sult in different approaches to dealing with water quality. Participants were there-fore presented with the context of scenarios, although the scenario methodology was not introduced. The story lines of scenarios were presented only to frame the identification of policy packages: participants were asked to discuss the combina-tion of instruments they would use in each different context using the list of op-tions resulting from the brainstorming session as a starting point, and including others if necessary. Rationalising these preliminary discussions, and making pack-ages consistent amongst each other could lead to three policy packages as de-scribed in Table 5, using the same instruments to varying degrees.
28 Integrated assessment for catchment and coastal zone management: the case of the Humber
Table 5. Policy packages.
Sectors Policy package 1 Policy package 2 Policy package 3 Agriculture Small amounts of
subsidies for exten-sive agriculture
Subsidies for good agricultural practices
Possible large scale support for green agriculture. Higher food prices
Industry Non-restrictive emis-sion standards
More restrictive emission standards, preceded by incen-tives
Eco-labelling and fall back emission stan-dards
Urbanisation Planning measures Some SUD* SUD wherever feasi-ble
Sewage treatment
Minimal sewage treatment
Increased sewage treatment and water charges
Tertiary sewage treatment with high water charges
Contami-nated sedi-ments
No policy No policy Possible clean-up if new technologies allow it.
Wetlands Support for limited, opportunistic wetland creation
Support for medium scale wetland creation but no overall strat-egy.
Support for strategic large scale wetland creation; land bank-ing
* SUD= Sustainable Urban Drainage
Towards integrated catchment management The policy packages reported in Table 5 are fairly broad brush and are not spa-tially specific. Actual catchment management will need to address data and other requirements down to the sub-catchment spatial scale. This level of detail is a fu-ture priority for regulating agencies in the UK but so far only limited progress has been made. In the analysis below we sketch out some preliminary analysis which can lay a role in future catchment management. The analysis takes as a core start-ing assumption that coastal managed realignment policy will be an important component of any future planning for the Humber estuary and catchment. But the key insight highlighted at various points in this chapter is that managed realign-ment (and its impact in terms of increased intertidal habitat) carries with it a num-ber of positive externality effects. It creates more habitat with potential biodiver-sity, amenity and recreational values; a more extensive nutrient and contaminants storage capacity; and a carbon sequestration function. All these potential economic benefits are in addition to its sea defence/coastal protection benefits in terms of increased flexibility in response to sea level rise and climate change and therefore reduced maintenance costs.
Form an economic efficiency perspective, the first test of managed realignment requires the scheme or programme to demonstrate net economic benefit i.e. that compared to the traditional hard engineering sea defence strategy “hold the line”, managed realignment yields an efficiency gain in terms of net benefit or lower overall costs. Our analysis demonstrates that for a range of managed realignment schemes around the estuary and the tidal rivers, there is a net economic benefit i.e.
that the costs of realignment over a 25 year time period or more are outweighed by the benefits created in terms of savings in maintenance costs and the positive envi-ronmental externality effects (Coombes and Turner, 2004).
Coastal realignment can therefore form a key component of, for example, any wider catchment or estuary water quality policy. Cost-effectiveness analysis can show which combination of policy measures combined with realignment are most economic. Thus achieving higher water quality standards in the Humber estuary in terms of nutrient reduction will require managed realignment plus a set of meas-ures directed at point sources e.g. sewage treatment plants and diffuse pollution e.g. agricultural run-off. Since managed realignment policy will be implemented anyway, and our analysis shows that it is an economically efficient strategy, the pragmatic response to water quality issues should be to factor in this policy con-text. Therefore the policy response to the problem of meeting future higher water quality standards should be to find the most cost-effective set of measures around the estuary and in the catchment that can provide additional nutrient reduction effects, once the baseline effect of increased intertidal habitat (via realignment) has been quantified. Our analysis has investigated improved sewage treatment and nitrate zoning and related measures in agricultural areas as elements of the overall pollution reduction programme, given a range of water quality targets in the estu-ary (Brouwer et al. 2004).
Conclusions
This chapter has presented a practical example of applying integrated assessment at the catchment scale, in the context of coastal water quality improvement. The existence of extensive data series from previous research programmes has been essential in scoping management issues in the Humber, and tracing the main driv-ers and pressures of environmental change in estuarine water quality, and their evolution over time. The evidence gathered so far indicates that although point source inputs have shown significant reductions over the last decade, atmospheric inputs to, and contaminated sediments from, the river catchment are likely to con-tinue to have an impact on the water quality of the Humber estuary over the next few decades. The planned implementation of extended nitrate vulnerable zones (NVZs) throughout the catchment, combined with continuing improvements in sewage treatment, is likely to reduce nutrient and contaminant inputs to the estu-ary. Some of this reduction, however, may be buffered by the atmospheric and groundwater inputs. The continued availability of a supply of contaminated river-ine sediments, together with expected increases in flooding due to climate change, is likely to limit improvements in water quality with respect to trace metals. Most of the sediments on the bed of the Humber are contaminated by trace metals re-sulting from long-term anthropogenic inputs. As the water quality in the estuary improves due to expected reductions in anthropogenic inputs, leading to a lower-ing in the concentrations of some elements in solution, there is potential for trace elements presently bound to sediments to go into solution, and for interstitial wa-
30 Integrated assessment for catchment and coastal zone management: the case of the Humber
ters to try to equilibrate with overlying waters, leading to a flux of trace elements out of the sediments. Like the atmospheric and groundwater inputs, the bed-sediments may therefore act to buffer any improvement in water quality for many decades to come. However, setback of sea defences around the estuary may pro-vide an additional sink for sediment-bound nutrients and contaminants.
Scenarios are an essential part of this research. The main aim is to aid decision-making in setting up river basin management plans in the context of uncertainty. Uncertainty stems from both socio-economic and political future conditions, and climate change. The Water Framework Directive requires the use of baseline sce-narios to assess future impacts. Two of the scenarios used within EUROCAT can be related to this approach: the Business as Usual scenario can be interpreted as a pessimistic baseline, while the Policy targets scenario could be an optimistic one. The Deep Green scenario goes further and investigates the issue of how close we can get to “pristine” conditions, and what the socio-economic implications would be. This is an important issue in the current debate around the notion of what “good ecological status” means.
The first steps of the integrated assessment feed into the final stage of policy analysis. Now the physical relationships have been identified, the preferred man-agement strategy can be further investigated. Cost-effectiveness analysis is an essential component of any river basin management plan and an explicit require-ment of the Water Framework directive. As shown by the copper abatement cost curve methodology, it is a valuable tool for ensuring the efficient reduction of pol-lution, however, applying this analysis at a catchment scale is a real challenge.
Acknowledgements
This work is funded by the European Commission under the Fifth Framework Programme (project No EVK1-CT-2000-00044). The authors are grateful to the UK Environment Agency for facilitating communication with the Humber Shore-line Management Plan steering group, and for making available biogeochemical datasets for the Humber.
References
AEA Technology (1999) Guidelines for defining and documenting data on costs of possible environmental protection measures. European Environment Agency, Copenhagen
Beaumont NJ (2000) The Assimilative Capacity of the Humber Estuary for Copper: An Interdisciplinary Study. Ph.D. thesis, University of East Anglia, Norwich
Beaumont NJ, Tinch R (2003) Cost-effective reduction of copper pollution in the Humber estuary. CSERGE working paper ECM 03-04
De Boer B, Bosch P (1995) The greenhouse effect: an example of the prevention cost ap-proach. Second meting of the London group on national accounts and the environment, Washington, March 15-17, 1995
Brouwer R, Cave R, Coombes E, Turner RK, Hadley D, Lorenzoni I (2004) Cost effective-ness analysis of alternative policy options to improve water quality in the Humber catchment in the UK. Forthcoming
Burbridge P (2001) Sustainability and Human Use of Coastal Systems. LOICZ newsletter 21:3-5
Cave R, Ledoux L, Turner RK, Jickells T, Andrews J (2002) The Humber Catchment and its Coastal Area: from UK to European Perspectives. Sci Tot Env 314-316:31-52
Coombes E, Turner RK (2004) A cost-benefit analysis of managed realignment policy in England. CSERGE working paper, forthcoming
Crooks S, Ledoux L (1999) Mitigation banking as a toll for strategic coastal zone manage-ment: a UK perspective. CSERGE working paper GEC 99-02
DETR (2000a) Modern Ports: A UK Policy. Department of the Environment, Transport and the Regions
DETR (2000b) Transport Statistics, Maritime Statistics: United Kingdom 2000. Department for Environment, Transport and the Regions
Edwards AMC, Freestone RJ, Crockett CP (1997) River management in the Humber catchment. Sci Tot Env 194:235-246
Environment Agency (1999) The Humber Estuary, State of the Environment 1998 European Commission (1999) Towards a European Integrated Coastal Zone Management
(IZM) Strategy, General principles and Policy Options: A reflection Paper European Commission (2000) Communication from the Commission to the Council and the
European Parliament on "Integrated Coastal Zone Management: a Strategy for Europe" COM/00/547
European Environment Agency (2000) Cloudy crystal balls: an assessment of recent Euro-pean and global scenario studies and models. Environmental issue report no. 17, Euro-pean Environment Agency, Copenhagen
Gallopin GC, Raskin P (1998) Windows on the future: global scenarios and sustainability. Env 40:7-11, 26-31
Greer L, Van Loben Sels C (1997) When pollution prevention meets the bottom line. En Sci Tech 31:418-422
Hammond A (998) Which World? Scenarios for the 21st century. Global Destinies, Re-gional Choices. Earthscan Publications Ltd., London
HEMS (1997) Humber Estuary Management Strategy. March 1997 Jarvie HP, Neal C, Robson AJ (1997) The geography of the Humber catchment. Sci Tot
Env 194:87-99 Jickells T, Andrews J, Samways G, Sanders R, Malcolm S, Sivyer D, Parker R, Nedwell D,
Trimmer M, Ridgway J (2000) Nutrient fluxes through the Humber estuary - Past, pre-sent and future. Ambio 29:130-135
Jung C, Krutilla K, Boyd R (1996) Incentives for advanced pollution abatement technology at the industry level: an evaluation of policy alternatives. J Env Econ Man 30:95-111
Kaika M, Page B (2002) The making of the EU Water Framework Directive: shifting cho-reographies of governance and the effectiveness of environmental lobying. Economic Geography Research Group, School of Geography and the Environment, University of Oxford, working paper WPG 02-12
32 Integrated assessment for catchment and coastal zone management: the case of the Humber
Kallis G, Butler D (2001) The EU Water Framework Directive: measures and implications. Wat Policy 3:125-142
Kassler P (1995) Scenarios for world energy: barricades or new frontiers? Long Range Plann 28(b):38-47
Kram T, Schol E, Stoffer A, Rothengatter W, Guhnemann A, Sorensen MM, Stouge A, Suter S, Walter F (1995) External costs of transport and internalisation, Synthesis re-port on topic A: External costs of transport. Energy Research Centre of the Nether-lands (ECN), report to the European Commission, ECN-C-95-080
Ledoux L, Cave R, Turner RK (2002) The use of scenarios in integrated environmental assessment of catchment-coastal zones: the Humber estuary, UK. LOICZ newsletter 23:1-4.
Ledoux L, Cornell S, O’Riordan T, Harvey R, Banyard L (2003) Managed realignment: towards sustainable flood and coastal management. CSERGE working paper, forth-coming
Ledoux L, Crooks S, Jordan A, Turner RK (2000) Implementing EU Biodiversity Policy: UK experiences. Land Use Policy 17: 257-268
Longfield SA, Macklin MG (1999) The influence of recent environmental change on flood-ing and sediment fluxes in the Yorkshire Ouse basin. Hydr Proc 13:1051-1066
Lorenzoni I, Jordan A, Hulme M, Turner RK, O'Riordan T (2000a) A co-evolutionary ap-proach to climate change impact assessment – Part I: Integrating socio-economic and climate change scenarios. Glob Env Ch 10:57-68
Lorenzoni I, Jordan A, O'Riordan T, Turner RK, Hulme M (2000b) A co-evolutionary ap-proach to climate change impact assessment – Part II: A scenario-based case study in East Anglia (UK). Glob Env Ch 10:145-155
Mance G, Brown VM, Yates J (1984) Proposed environmental quality standards for list II substances in water: copper. Water Research Council, technical Report 210
Maya RS, Fenhann J (1994) Methodological lessons and results from UNEP GHG abate-ment costing studies. En Policy 22:955-963
Miles I (1981) Scenario analysis: identifying ideologies and issues. In: Methods for Devel-opment Planning: Scenarios, Models and Micro-studies. UNESCO Press, Paris
Millward GE, Glegg GA (1997) Fluxes and retention of trace metals in the Humber Estu-ary. Est Coast Shelf Sci 44:97-105
Murby P (2001) The Causes, Extent and Implications of Intertidal Change - A regional view from eastern England. Ph.D. thesis, University of Hull
Neal C, Davies H, (in press) Water quality fluxes for eastern UK rivers entering the North Sea: a summary of information from the Land-Ocean Interaction Study (LOIS). Sci Tot Env
NRA (1993) The Quality of the Humber Estuary 1980-1990. National Rivers Authority OECD (1993) OECD Core Set of Indicators for Environmental Performance Reviews. A
Synthesis Report by the Group on the State of the Environment. OECD, Paris Office for National Statistics (2002) Census 2001: First results on population for England
and Wales. HMSO Office of Science and Technology (1999) Environmental futures. Report for the UK’s Na-
tional Technology Foresight Programme, Department of Trade and Industry, DTI/Pub 4015/lk 3 99 NP, URN 99 647
Parry ML (ed) (2000) Assessment of Potential Effects and Adaptations for Climate Change in Europe: The Europe Acacia Project. Jackson Environment Institute, University of East Anglia, Norwich
Parry M, Carter T (1998) Climate Impact and Adaptation Assessment. Earthscan Publica-tions Ltd., London
Pilcher R, Burston P, Davis R (2002) Seas of Change. The potential area for inter-tidal habitat creation around the coast of mainland Britain. Royal Society for the Protection of Birds, Sandy, Bedfordshire
Riege-Wcislo W, Heinze A (1996) The construction of abatement cost curves. Methodo-logical steps and empirical experiences. German Environmental Economic Accounting (GEEA), Federal Statistical Office
Turner, RK (2004) Integrated environmental assessment and coastal futures. In: Vermaat JE, Bouwer LM, Salomons W, Turner RK (eds) Managing European coasts: past, pre-sent and future. Springer, Berlin, pp x-x
Turner RK, Adger WN, Lorenzoni I (1998a) Towards integrated modelling and analysis in coastal zones: principles and practices. LOICZ Reports and Studies No 11, NIOZ, Texel
Turner RK, Bateman IJ, Adger WN (eds) (2001) Economics of Coastal and Water Re-sources: Valuing Environmental Functions. Kluwer, Dodrecht
Turner RK, Lorenzoni I, Beaumont N, Bateman IJ, Langford IH, McDonald AL (1998b) Coastal management for sustainable development: analysing environmental and socio-economic changes in the UK coast. Geogr J 164:269-281
Wenborn M, King K, Boyd R, Johnson C, Marlowe I (1997) Towards guidelines for data collection on costs of possible environmental protection measures – technical report. European Environment Agency, National Environmental Technology Centre, Report number AEAT-1836/RHOD/20325001/ISSUE1
Wickborn G (1996) Avoidance Cost Curves for NOx. London group meeting on environ-mental accounting, Stockholm, May 28-31