insulin and glucagon regulate pancreatic alpha-cell proliferation
TRANSCRIPT
Insulin and Glucagon Regulate Pancreatic a-CellProliferationZhuo Liu, Wook Kim, Zhike Chen, Yu-Kyong Shin, Olga D. Carlson, Jennifer L. Fiori, Li Xin, Joshua K.
Napora, Ryan Short, Juliana O. Odetunde, Qizong Lao, Josephine M. Egan*
National Institute on Aging, National Institutes of Health, Baltimore, Maryland, United States of America
Abstract
Type 2 diabetes mellitus (T2DM) results from insulin resistance and b-cell dysfunction, in the setting of hyperglucagonemia.Glucagon is a 29 amino acid peptide hormone, which is secreted from pancreatic a cells: excessively high circulating levelsof glucagon lead to excessive hepatic glucose output. We investigated if a-cell numbers increase in T2DM and what factor(s) regulate a-cell turnover. Leprdb/Leprdb (db/db) mice were used as a T2DM model and aTC1 cells were used to studypotential a-cell trophic factors. Here, we demonstrate that in db/db mice a-cell number and plasma glucagon levelsincreased as diabetes progressed. Insulin treatment (EC50 = 2 nM) of a cells significantly increased a-cell proliferation in aconcentration-dependent manner compared to non-insulin-treated a cells. Insulin up-regulated a-cell proliferation throughthe IR/IRS2/AKT/mTOR signaling pathway, and increased insulin-mediated proliferation was prevented by pretreatment withrapamycin, a specific mTOR inhibitor. GcgR antagonism resulted in reduced rates of cell proliferation in aTC1 cells. Inaddition, blockade of GcgRs in db/db mice improved glucose homeostasis, lessened a-cell proliferation, and increased intra-islet insulin content in b cells in db/db mice. These studies illustrate that pancreatic a-cell proliferation increases as diabetesdevelops, resulting in elevated plasma glucagon levels, and both insulin and glucagon are trophic factors to a-cells. Ourcurrent findings suggest that new therapeutic strategies for the treatment of T2DM may include targeting a cells andglucagon.
Citation: Liu Z, Kim W, Chen Z, Shin Y-K, Carlson OD, et al. (2011) Insulin and Glucagon Regulate Pancreatic a-Cell Proliferation. PLoS ONE 6(1): e16096.doi:10.1371/journal.pone.0016096
Editor: Adrian Vella, Mayo Clinic College of Medicine, United States
Received July 30, 2010; Accepted December 8, 2010; Published January 25, 2011
This is an open-access article distributed under the terms of the Creative Commons Public Domain declaration which stipulates that, once placed in the publicdomain, this work may be freely reproduced, distributed, transmitted, modified, built upon, or otherwise used by anyone for any lawful purpose.
Funding: Research was supported by the Intramural Research Program of the NIH, National Institute on Aging. The funders had no role in study design, datacollection and analysis, decision to publish, or preparation of the manuscript.
Competing Interests: The authors have declared that no competing interests exist.
* E-mail: [email protected]
Introduction
Type 2 diabetes mellitus (T2DM) is considered to be a direct
consequence of insulin resistance and b-cell dysfunction. Pancreatic
a cells and their secretary product, glucagon, are often overlooked
even though a ‘‘bihormonal abnormality’’ theory of T2DM
pathology was proposed as long ago as 35 years [1]. Clinical studies
show that increased fasting glucagon levels and lack of suppression
of postprandial glucagon secretion are responsible for the increased
glucose levels observed in T2DM [1–6]. Long-term hypergluca-
gonemia, as seen with glucagonomas, also causes a T2DM
phenotype, and glucagonomas in mice cause a metabolic phenotype
characteristic of T2DM [7]. It is poorly understood why plasma
glucagon levels are elevated in T2DM patients. The major targets of
glucagon are hepatocytes on which glucagon receptors (GcgRs) are
prevalent, but GcgRs are also expressed on b cells [8] and GcgR
null mice are resistant to b-cell loss and hyperglycemia [9]. There is
also some evidence that glucagon directly regulates a-cell activity.
GcgRs are expressed on a cells and glucagon was shown to
stimulate exocytosis from mouse and rat a cells [10]. Additionally,
glutamate co-secreted from a-cell secretory granules with glucagon
directly causes additional a-cell exocytosis through glutamate
receptor activation [11].
To date, the dysfunction of glucagon secretion in diabetes is
vaguely considered to result from defective glucose sensing and
insulin resistance in liver and muscle [12]. Recently, several papers
have focused on the signaling pathways in a cells that regulate
glucagon secretion under physiological conditions [10,11,13,14].
Regulation of a-cell function and turnover in the diabetic state
deserves more investigation so as to better design therapeutic
strategies and while much work has been done on understanding
how pancreatic b-cell function and proliferation are regulated,
factors that regulate a-cell proliferation are largely ignored. We
hypothesize that not only increased glucagon secretion but also
increased a-cell proliferation is responsible for the elevated
glucagon levels that occur in T2DM. There are data pointing to
increased a-cell numbers in T2DM [15] and therefore we sought
to determine if, in fact, a-cell numbers increase during the
development of T2DM, and what factors, especially if any intra-
islet factors, control pancreatic a-cell proliferation. There are
several candidate islet factors that may be involved in a-cell
proliferation: (1) glucagon itself, because it regulates its own
secretion, (2) insulin, because it directly regulates glucagon
secretion through insulin receptors (IR) on a cells [13], it regulates
b-cell proliferation [16–18], and therefore may also regulate a-cell
proliferation.
In recent years, it has been reported that blocking glucagon
receptors improves glucose homeostasis [19–21]. Yet, targeting
glucagon as a therapy for T2DM is not well developed, at least
compared with the overwhelming information and attempts at
PLoS ONE | www.plosone.org 1 January 2011 | Volume 6 | Issue 1 | e16096
modulating insulin receptor function. In this study, we used cell
lines and animal models of diabetes. We found that a-cell numbers
increased as blood glucose levels increase, insulin regulates a-cell
proliferation by signaling through mTOR and glucagon receptor
antagonism is beneficial to both a and b cells.
Materials and Methods
Animal studyLeprdb/Leprdb (db/db) and Leprdb/+ (non-diabetic) mice (male)
were from Jackson laboratories and were housed in the NIH/NIA
mouse barrier facility with access to standard chow and water ad
libitum. Over time, db/db mice displayed typical phenotypes of
obesity, polyuria and hyperglycemia. Streptozotoxin (50 mg/kg)
was administrated by daily intraperitoneal (i.p.) injection into 3-
month-old CD1 mice for 5 days (n = 5). One month later, one
mouse having died, their pancreata were collected for morpho-
logical analyses. Some db/db and control mice were given 20 ml
(50 mM) of GcgR antagonist II (Calbiochem) (control n = 4,
treated n = 5) orally once daily for 17 days. All animal testing
procedures were approved by the Animal Care and Use
Committee of the National Institute on Aging. The ID number
of the animal study is 156 JME.
Cell culture and reagentsThe glucagon-producing aTC1 and insulin-producing mouse
cell lines were grown in DMEM medium (Invitrogen) containing
4.5 g/L D-glucose, supplemented with fetal bovine serum (10%
for aTC1 and 15% for MIN6), 1% L-Glutamine, 1% streptomy-
cin/penicillin. CHO cells were grown in F-12 medium (Invitrogen)
containing L-glutamine, supplemented with 10% fetal bovine
serum and 1% streptomycin/penicillin.
Transwell cell co-culture and cell proliferationaTC1 cells were co-cultured with MIN6, aTC1, CHO cells
or medium for 7 days using HTS Transwell-96 Tissue Culture
Systems (Corning). Cells were also stimulated as follows for
72 hours: 14 mM GcgR Antagonist II, 20 ng/ml rapamycin (a
kind gift from Dr. Paritosh Ghosh), recombinant insulin
(Upstate Biotechnology), concentration and time points are
indicated in figures or legends. The cells were grown from 3–5
days before treatment. Cell proliferation was assayed using The
CellTiter 96 AQueous One Solution Cell Proliferation Assay
(Promega). This assay is a colorimetric method for determining
the number of viable cells in proliferation [22]. After 1 hour at
37uC in a humidified, 5% CO2 atmosphere, the absorbance at
490 nm was recorded using an ELISA plate reader (Molecular
Devices).
Propidium iodide staining for DNA cell cycle analysisaTC1 cells were serum starved for 5 h, followed by treatment
with insulin (2 nM) in the absence or presence of rapamycin
(20 ng/ml) for 24 h. The medium was collected and transferred
into a 15 ml conical tube on ice. Cells were washed with PBS,
trypsinized, and collected into conical tubes containing medium.
After centrifugation, the cell pellets were gently resuspended in
300 ml of PBS to break up clumps and, while vortexing, 10 ml of
ice cold 70% ethanol was added before storage at 220uCovernight. The following day, cells were centrifuged, washed with
PBS, and 1 ml of 50 mg/ml propidium iodide solution (Calbio-
chem) containing 1 mg/ml RNAse (Ambion) was added. The cells
were placed in the dark for 1 h prior to analysis using a BD FACS
Calibur flow cytometer.
Plasma glucose and hormone assayWe quantified plasma glucose levels using a glucose analyzer
(Beckman Instruments). We measured plasma glucagon by RIA
(Linco Research) and insulin by ELISA (Alpco Diagnostics).
ImmunofluorescenceCell lines were cultured on glass slides for 48 hours before
staining. Mouse pancreata were fixed in 4% paraformaldehyde
for 2 hours, followed by immersion in 20% sucrose overnight at
4uC and then frozen. Sections (7 mm) were cut on a cryostat.
Sections of human pancreas tissue were acquired from
Histological Control Systems Inc (catalog # cs039-SAMPLE).
Antigen retrieval (Citra solution, Biogenes) was performed on
tissue sections before staining. Thereafter, sections were
incubated overnight with the following primary antibodies:
mouse anti-insulin (1:200; Sigma), guinea pig anti-glucagon
(1:2000; Sigma) and rabbit anti-p-insulin Rb (1:100; Santa
Cruz). Cell nuclei were stained with topro-3 (1:2000; Invitrogen).
The antigens were visualized using appropriate secondary
antibody conjugated with Fluorescein FITC and cyanine Cy5
(1:1000; Jackson ImmunoResearch Laboratories). All images
were digitally acquired and were not further processed. Sections
were viewed at 406and 636magnification. Digital images were
compiled using Zeiss LSM image browser. Only brightness and
contrast were adjusted.
Immunoblot analysesFor western blot analyses, 20 mg of protein was separated by 4–
12% Tris-Glycine gels (Invitrogen) electrophoresis and electro-
blotted onto PVDF filters (Invitrogen).
For protein detection, the following primary antibodies were
used: mouse anti-IRb (1:1000, Santa Cruz), rabbit anti-IGF-1R
(1:1000, Cell Signaling), rabbit anti-p-insulin Rb (1:1000; Santa
Cruz), rabbit anti-p-IRS1/2(Tyr612) (1:1000, Santa Cruz), rabbit
anti-p-PDK1 (Ser241) (1:2000, Cell Signaling), rabbit anti-p-AKT
(Ser473) (1:1000, Cell Signaling), rabbit anti-AKT (1:1000, Cell
Signaling), rabbit anti-p-FOXO1 (Ser256) (1:2000, Abcam),
mouse p27 (1:2500, BD), rabbit anti-p-mTOR (Ser2448)
(1:1000, Cell Signaling), rabbit anti-mTOR (1:1000, Cell Signal-
ing), b-Actin (1:2000, Cell signaling) and GAPDH (1:2000,
Abcam) were used as internal control. HRP-linked (Abcam)
secondary antibodies were visualized using ECL (GE Healthcare).
For immunoprecipitation assays, aTC1 cells were lysed with ice-
cold RIPA buffer. Cell lysate was then subjected to immunopre-
cipitation with anti-IRS1 (1:1000, Santa Cruz) or anti-IRS2
(1:1000, Santa Cruz) and immunoblotted with anti-p-IRS1/2
(Tyr612) (1:1000, Santa Cruz).
DAB staining and pancreatic a cell number countingMice pancreas frozen sections was stained with guinea pig anti-
glucagon (1:1000; Sigma). DAB (3,3-diaminobenzidine) staining
was performed using ultravision mouse tissue detection system kit
(labvision) following IHC slide staining DAB LABVISION
PROTOCOL.
Quantification of DAB stained pancreatic images were
performed in Matlab (Mathworks) (http://www.mathworks.com),
a computer program used for technical computing, using novel
software in conjunction with the image processing toolbox.
Statistical analysisData are expressed as means 6 SEM, and statistical significance
was tested by Student’s t test. Asterisks indicate statistical
significance as follows: *, P,0.05; **; P,0.005, ***; P,0.0005.
Regulation of a-Cell Proliferation
PLoS ONE | www.plosone.org 2 January 2011 | Volume 6 | Issue 1 | e16096
Results
1. Elevated plasma glucose levels in diabetic mice isaccompanied by increased pancreatic a-cell number
We evaluated the islets of db/db mice, a well-characterized
mouse model of T2DM, and non-diabetic heterozygous Leprdb/+
mice, as blood glucose homeostasis worsens over time in the
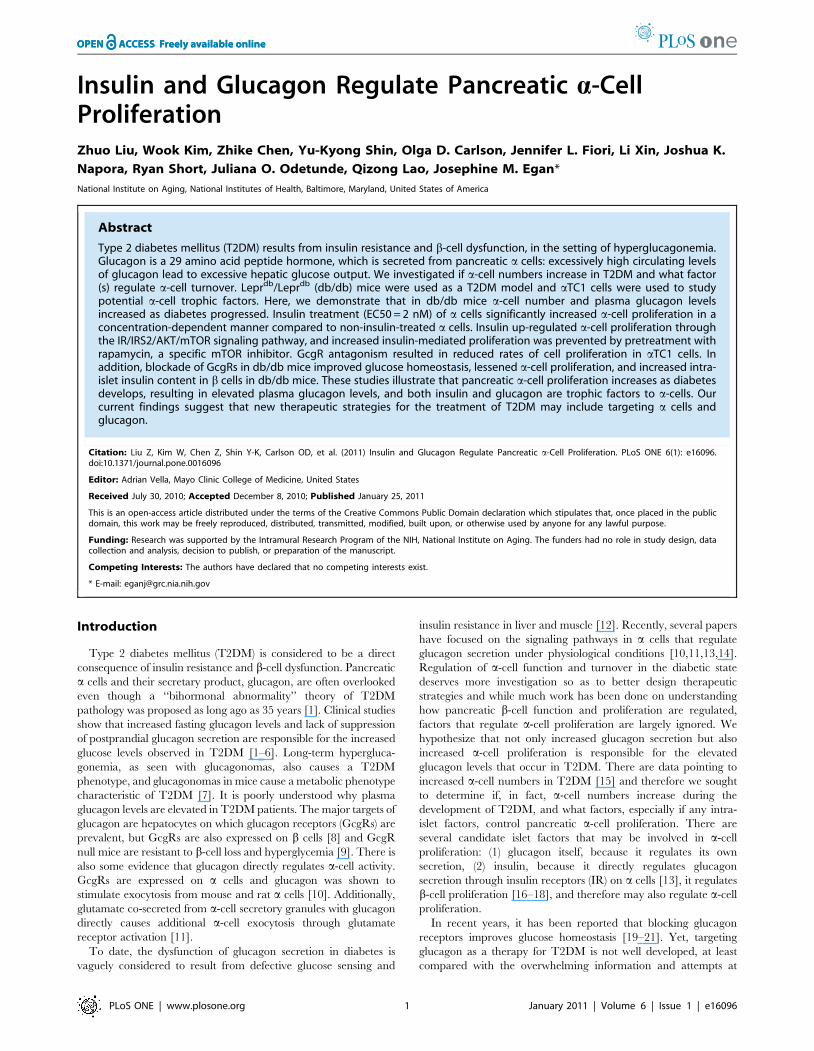
animals. Using immunohistochemical techniques, it can be seen
the number of a cells obviously increased while insulin staining
decreased over time (Figure 1A) as blood glucose rose (from
normal at 4 weeks to .400 mg/dl at 7 weeks) in db/db mice. In
conjunction, db/db mice had an increased a-cell area compared
with non-diabetic mice and a-cell area increased over time
(Figure 1B). Consistently, plasma glucagon levels were higher in
db/db mice compared with non-diabetic mice (Figure 1C). The
decreased insulin staining did not result in decreased plasma
insulin levels when compared to non-diabetic animals, and must
be at least in part due to degranulation of b cells because fasting
plasma levels of insulin were extremely elevated, compared to non-
diabetic mice (Figure 1D). In non-diabetic littermates there was no
change in the islet morphology out to 6 months of age (Figure 1A).
To confirm increasing a-cell numbers in another model of
diabetes, we induced diabetes by giving streptozotocin (STZ) daily
for 5 days to CD1 mice. Blood glucose was .500 mg/dl, 4 weeks
after STZ. This particular mouse strain under normal conditions
has few a cells compared to b-cell numbers in islets (96:4 ratio) and
therefore increasing a-cell numbers, a-cell area and dispersal of acells thoughout the islets became obvious as a result of the STZ
treatment (Figure 1E). The increased a-cell number is as a result of
increased proliferation because numerous PCNA-positive a cells
are evident in every islet from db/db mice at 7 weeks of age (four
islets from four different mice are shown (Figure 1F), and no
PCNA-positive a-cell could be found in non-diabetic mice. We
had previously observed an increase in a-cell numbers in a
Huntington’s Disease mouse model that also develops diabetes
[23]. We next investigated if a-cell proliferation is regulated by
islet hormones.
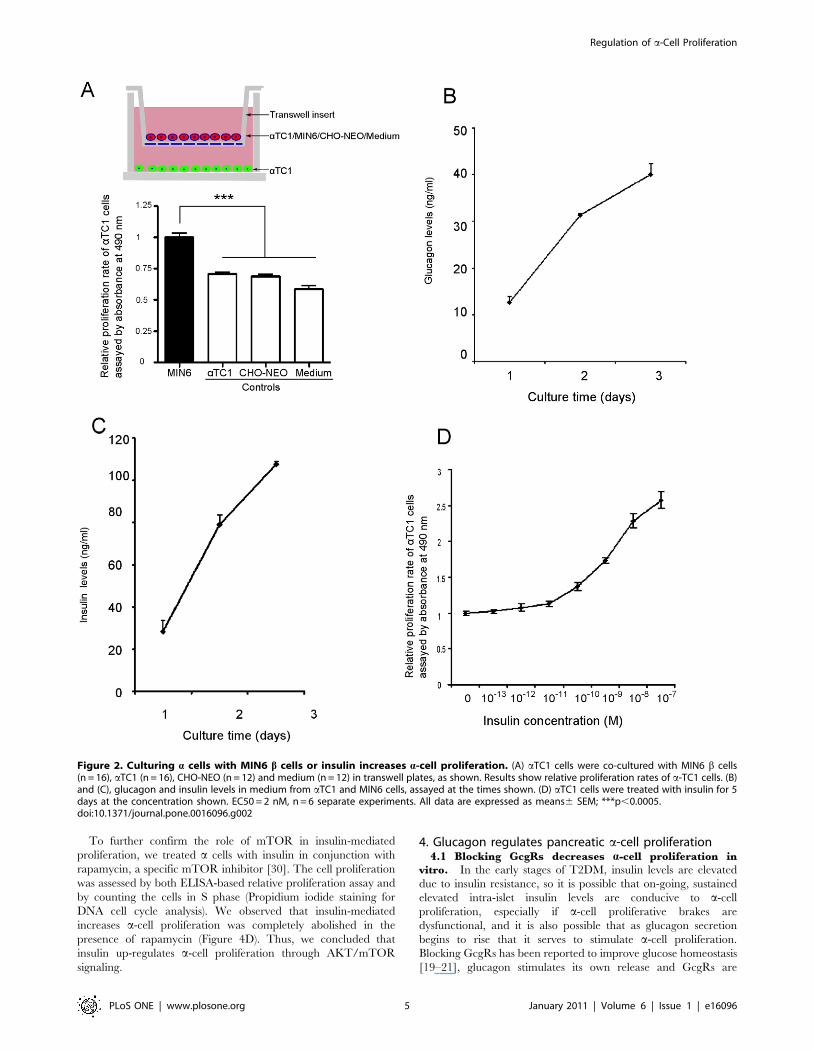
2. Up-regulation of pancreatic a cell proliferation2.1 Co-culture of b cells with a cells increases a-cell
proliferation. In non-diabetic rodents, the a cells are located
on the rim (or mantle) of islets (Figure 1A arrow), while in human
pancreatic islets, a cells are additionally interspersed among b cells
(Figure 1G for examples) [24]. To mimic free association of
endocrine products we used a trans-well co-culture system to
culture pancreatic a cells (lower chamber) with b cells and any
other cells of interest (upper chamber) (Figure 2A). We found that
a-cell proliferation (aTC1) was significantly increased by co-
culture with MIN6 cells (a mouse b-cell line) compared with co-
culture of a cells with a non-b-cell line (CHO-NEO), aTC1 cells
themselves, or medium only (Figure 2A), suggesting that a factor
secreted from b cells caused increased a-cell proliferation. a Cells
as well as b cells continued to secrete their respective hormones,
which accumulated over time in the medium (Figure 2 B,C).
2.2 Insulin increases a-cell proliferation. As insulin is a
known trophic factor, especially to b cells [16–18,25], we next
studied if it influenced a-cell proliferation. After 5 days of insulin
treatment at various concentrations, we found that the a-cell
proliferative rate was increased in a dose-dependent manner
(EC50 = 2 nM) (Figure 2D), and therefore was most likely a factor
in the a-cell proliferation seen when a cells were co-cultured with
b-cell lines.
2.3 Insulin up-regulates a-cell proliferation through
insulin receptor. It’s reported that IRs are expressed on
mouse a cells [13]. We confirmed this by immunofluorescence and
while mouse islets express IRs on both a and b cells (Figure 3A),
IGF-1 receptors (IGF-1Rs) are expressed only on b cells
(Figure 3B). We further studied this using western blotting of
whole cell extracts from cell lines and confirmed that IRs are
expressed in both mouse pancreatic a-cell (aTC1) and b-cell
(bTC6 and Min6) lines, but IGF-1Rs are only expressed on b-cell
lines (Figure 3C). In agreement with the immunofluorescence data
from mouse islets, IGF-1R protein was present in b- but not a-cell
lines (Figure 3C). We used CHO cells as positive controls including
CHO/K1 (non-transfected CHO cells), CHO/IR (cells that over-
express IR) and CHO/IGF-1R (cells that over-express IGF-1R).
Thus eliminating IGF-1R on a cells as a candidate insulin
receptor. Therefore, we conclude that the effect of insulin on a-cell
proliferation is through IRs, not IGF-1Rs.
To prove that the IRs on a cells are functional, we treated
aTC1 cells with insulin and observed phosphorylation of IR by
immunofluoresence imaging as early as 10 min after insulin
treatment, reaching maximum phosphorylation by 30 minutes
(Figure 3D).
3. Insulin signaling pathway in pancreatic a cells3.1 Insulin signaling through IR/IRS2/AKT (PKB).
Since the proliferative effect of insulin on b cells is regulated
through the IR/IRS2/PDK1/AKT/FOXO1 signaling pathway
[26], we examined this pathway in a cells. We treated aTC1 cells
with increasing concentrations of insulin for 10 minutes and whole
cell lysate was then used for immunoprecipitation and western
blotting. We found that insulin treatment resulted in phosphorylation
of IR at Tyr1162/1163, and IRS1/2 at Tyr612 in a concentration
dependent manner (Figure 4A). To determine the functional isoforms
of IRS in a cells, IRS1 and IRS2 were immunoprecipitated,
separated by SDS-PAGE, and immunoblotted with antibodies that
specifically recognize phosphorylated IRS1 and 2 (Tyr612). The
immunoprecipitation (IP) of IRS1 showed no obvious
phosphorylated band (Figure 4B upper panel), but the IP of IRS2
showed an insulin-mediated, dose-dependent increase in IRS2
phosphorylation (Figure 4B, lower panel). Western blotting of
whole cell lysates revealed similar amounts of IRS1 in a cells
(aTC1) and b cells (MIN6) (Figure 4B, upper panel, black arrows).
However, IRS2 protein levels in a cells were four-fold higher than in
b cells (Figure 4B, lower panel, and red arrows). Therefore, we
conclude that the major insulin receptor signaling molecule in a cells
is IRS2.
Multiple growth factor signaling pathways converge at the level
of AKT(PKB) activation and further regulate p27, which controls
the cell cycle [27]. Similar to b cells [26] we also observed
phosphorylation of AKT(S473) and decreasing amounts of p27
(Figure 4A) in response to increasing concentrations of insulin.
However, unlike b cells, we found that there was no obvious
change in the phosphorylated states of PDK1 or FOXO1 in a cells
in response to insulin (Figure 4A). We conclude that a cells have
the ability to signal through IR and IRS2, with AKT acting as a
key factor in a-cell turnover as well as in b cells, but the down-
stream AKT signaling molecules involved in proliferation are not
the same as in b cells.
3.2 mTOR signaling in insulin pathway. mTOR, an
evolutionarily conserved serine-threonine kinase, interacts with
AKT and promotes protein translation and cell growth in response
to growth factors [28,29]. aTC1 cells were treated with insulin for
10 minutes on three separate occasions and lysates were
immunoblotted with phosphorylated and total mTOR
antibodies. We found that insulin clearly led to phosphorylation
of mTOR (Figure 4C).
Regulation of a-Cell Proliferation
PLoS ONE | www.plosone.org 3 January 2011 | Volume 6 | Issue 1 | e16096
Figure 1. a-cell numbers are increased in db/db and streptozotocin (STZ)-treated mice. (A) Immunofluorescent staining of insulin andglucagon in mice at ages shown. Glucagon-positive cells are on the rim of islets in non-diabetic mice (arrows). (B) Mean glucagon-positive area inislets over time, in non-diabetic and db/db mice. (C) Random plasma glucagon levels in non-diabetic and db/db mice. (D) Random plasma insulinlevels, over time, in db/db and non-diabetic mice. (E) Immunofluorescent staining of insulin and glucagon and quantification of glucagon-positivearea in islets of STZ-treated CD1 mice. (F) PCNA-positive nuclei in glucagon-positive cells in islets from four different db/db mice. (G)Immunofluorescent staining of insulin and glucagon in human pancreatic paraffin sections, demonstrating lack of stereotypy in the distribution of aand b cells in human islets.doi:10.1371/journal.pone.0016096.g001
Regulation of a-Cell Proliferation
PLoS ONE | www.plosone.org 4 January 2011 | Volume 6 | Issue 1 | e16096
To further confirm the role of mTOR in insulin-mediated
proliferation, we treated a cells with insulin in conjunction with
rapamycin, a specific mTOR inhibitor [30]. The cell proliferation
was assessed by both ELISA-based relative proliferation assay and
by counting the cells in S phase (Propidium iodide staining for
DNA cell cycle analysis). We observed that insulin-mediated
increases a-cell proliferation was completely abolished in the
presence of rapamycin (Figure 4D). Thus, we concluded that
insulin up-regulates a-cell proliferation through AKT/mTOR
signaling.
4. Glucagon regulates pancreatic a-cell proliferation4.1 Blocking GcgRs decreases a-cell proliferation in
vitro. In the early stages of T2DM, insulin levels are elevated
due to insulin resistance, so it is possible that on-going, sustained
elevated intra-islet insulin levels are conducive to a-cell
proliferation, especially if a-cell proliferative brakes are
dysfunctional, and it is also possible that as glucagon secretion
begins to rise that it serves to stimulate a-cell proliferation.
Blocking GcgRs has been reported to improve glucose homeostasis
[19–21], glucagon stimulates its own release and GcgRs are
Figure 2. Culturing a cells with MIN6 b cells or insulin increases a-cell proliferation. (A) aTC1 cells were co-cultured with MIN6 b cells(n = 16), aTC1 (n = 16), CHO-NEO (n = 12) and medium (n = 12) in transwell plates, as shown. Results show relative proliferation rates of a-TC1 cells. (B)and (C), glucagon and insulin levels in medium from aTC1 and MIN6 cells, assayed at the times shown. (D) aTC1 cells were treated with insulin for 5days at the concentration shown. EC50 = 2 nM, n = 6 separate experiments. All data are expressed as means6 SEM; ***p,0.0005.doi:10.1371/journal.pone.0016096.g002
Regulation of a-Cell Proliferation
PLoS ONE | www.plosone.org 5 January 2011 | Volume 6 | Issue 1 | e16096
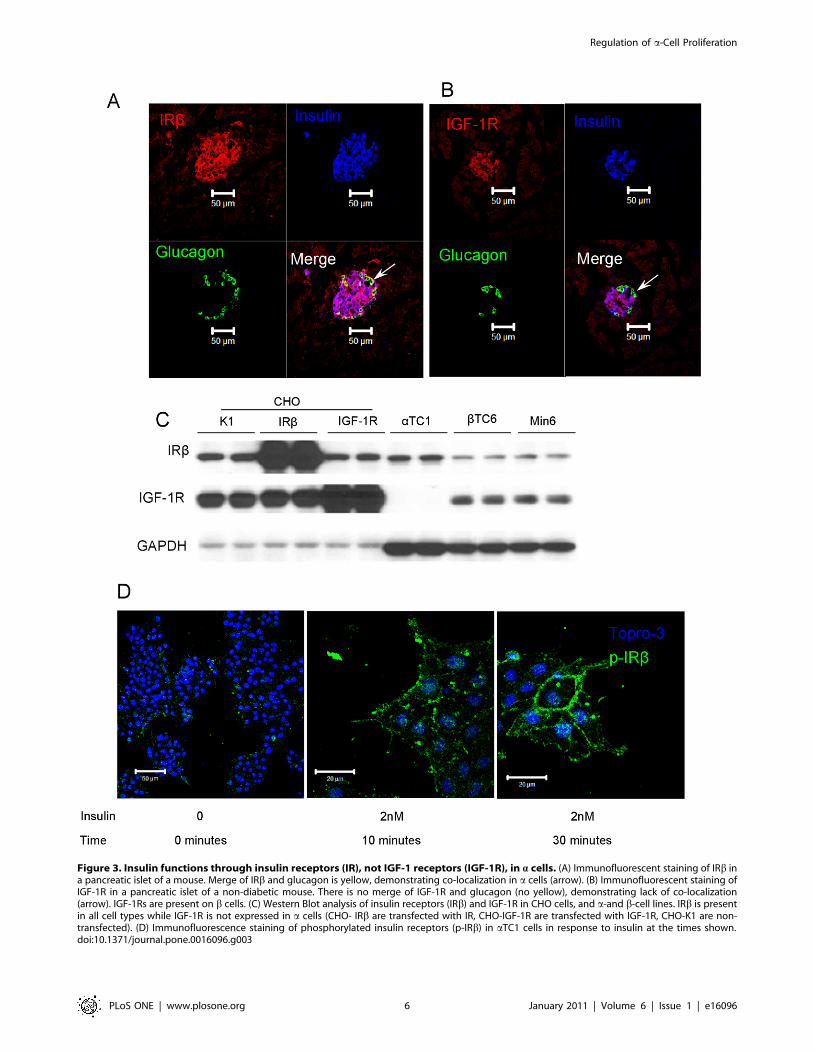
Figure 3. Insulin functions through insulin receptors (IR), not IGF-1 receptors (IGF-1R), in a cells. (A) Immunofluorescent staining of IRb ina pancreatic islet of a mouse. Merge of IRb and glucagon is yellow, demonstrating co-localization in a cells (arrow). (B) Immunofluorescent staining ofIGF-1R in a pancreatic islet of a non-diabetic mouse. There is no merge of IGF-1R and glucagon (no yellow), demonstrating lack of co-localization(arrow). IGF-1Rs are present on b cells. (C) Western Blot analysis of insulin receptors (IRb) and IGF-1R in CHO cells, and a-and b-cell lines. IRb is presentin all cell types while IGF-1R is not expressed in a cells (CHO- IRb are transfected with IR, CHO-IGF-1R are transfected with IGF-1R, CHO-K1 are non-transfected). (D) Immunofluorescence staining of phosphorylated insulin receptors (p-IRb) in aTC1 cells in response to insulin at the times shown.doi:10.1371/journal.pone.0016096.g003
Regulation of a-Cell Proliferation
PLoS ONE | www.plosone.org 6 January 2011 | Volume 6 | Issue 1 | e16096
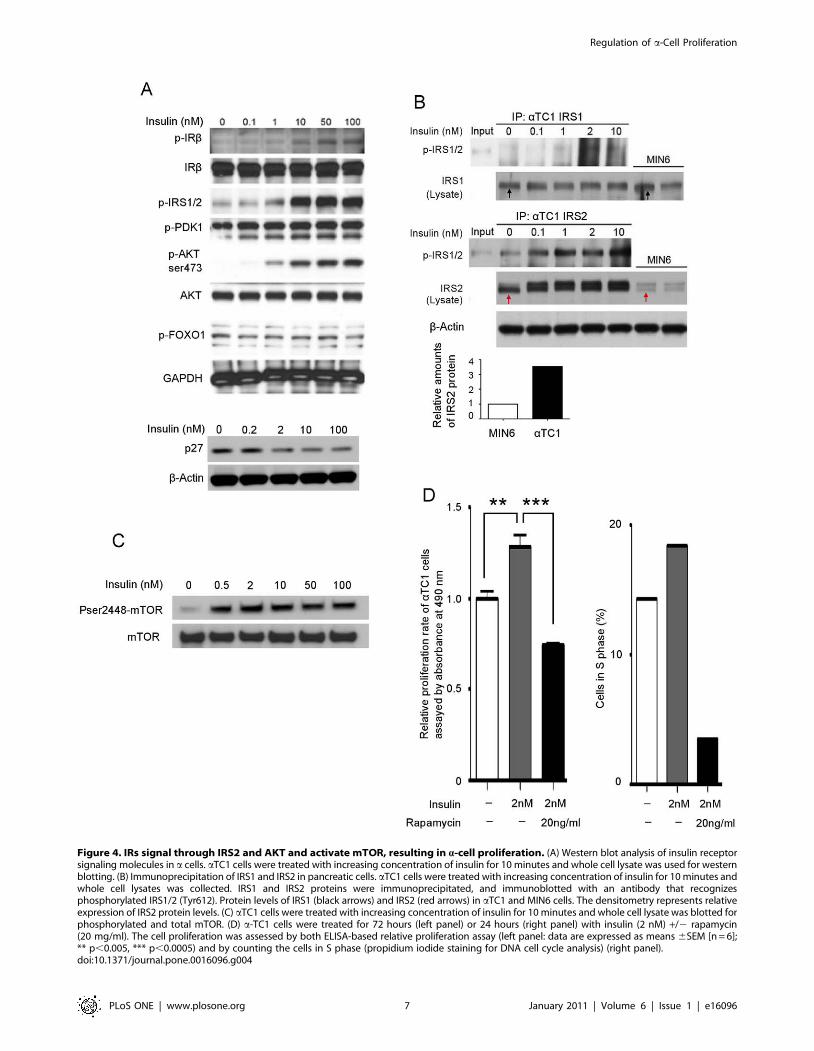
Figure 4. IRs signal through IRS2 and AKT and activate mTOR, resulting in a-cell proliferation. (A) Western blot analysis of insulin receptorsignaling molecules in a cells. aTC1 cells were treated with increasing concentration of insulin for 10 minutes and whole cell lysate was used for westernblotting. (B) Immunoprecipitation of IRS1 and IRS2 in pancreatic cells. aTC1 cells were treated with increasing concentration of insulin for 10 minutes andwhole cell lysates was collected. IRS1 and IRS2 proteins were immunoprecipitated, and immunoblotted with an antibody that recognizesphosphorylated IRS1/2 (Tyr612). Protein levels of IRS1 (black arrows) and IRS2 (red arrows) in aTC1 and MIN6 cells. The densitometry represents relativeexpression of IRS2 protein levels. (C) aTC1 cells were treated with increasing concentration of insulin for 10 minutes and whole cell lysate was blotted forphosphorylated and total mTOR. (D) a-TC1 cells were treated for 72 hours (left panel) or 24 hours (right panel) with insulin (2 nM) +/2 rapamycin(20 mg/ml). The cell proliferation was assessed by both ELISA-based relative proliferation assay (left panel: data are expressed as means 6SEM [n = 6];** p,0.005, *** p,0.0005) and by counting the cells in S phase (propidium iodide staining for DNA cell cycle analysis) (right panel).doi:10.1371/journal.pone.0016096.g004
Regulation of a-Cell Proliferation
PLoS ONE | www.plosone.org 7 January 2011 | Volume 6 | Issue 1 | e16096
reported to be present on a cells [10]. Immunofluorescent staining
confirmed the presence of GcgR on aTC1 cells (Figure 5A) and
after 72 hours of treatment with GcgR antagonist (14 mM) so as to
block the effects of the endogenously secreted glucagon, we
observed a 44% decrease in aTC1 cell proliferation compared
with the untreated group (Figure 5B left panel). We further
confirmed this by counting the cells in S phase, and found that
2 nM of insulin still increased aTC1 cell proliferation even in the
presence of GcgR antagonist (Figure 5B right panel).
4.2 Blocking GcgRs decreases a-cell number and
improves glucose homeostasis in diabetic mice. We next
treated db/db mice (2 months old, male, N = 4 mice per group)
with a GcgR antagonist or vehicle delivered by gavage daily, for
17 days. Compared to day 0, we observed a 50% decrease of
plasma glucose levels while in vehicle-treated animals blood
glucose levels continued to increase (Figure 5C). Compared with
the vehicle-treated group, we observed a 39% decrease of insulin
(Figure 5D) and a 56% decrease of glucagon plasma levels
(Figure 5E) and a 50% decrease in a-cell number (Figure 5F).
Immunofluorescent staining also showed increased intra-islet
insulin in the antagonist-treated mice (most likely due to less
degranulation of b cells) and smaller a cells (Figure 5G).
Discussion
Our results firmly establish that elevated levels of glucagon and
increased pancreatic a-cell number are two principle factors in the
progression of diabetes and, in fact, compounding the problem, a-
cell numbers continue to increase with worsening diabetes in db/
db mice. As the leptin receptor is inactivated in db/db mice leptin
cannot be directly impacting a-cell number, though it is indirectly
influencing a-cell number by causing diabetes. There is human
data that concur with our findings of increased a-cell numbers and
increased a- to b-cell ratios in T2DM [15]. Therefore, we
conclude that increased plasma glucagon levels in T2DM are
accompanied by increased a-cell numbers.
The molecular mechanisms underlying a-cell proliferation in
diabetes have not been studied. Insulin signaling in a cells is
involved in suppression of glucagon secretion and it was very
recently reported in mice that knockout of IRs in a cells (aIRKO
mice) leads to a decrease in a-cell mass, which becomes more
evident with age [13]. Our results support the notion that insulin
could potentially influence not only a-cell function but also
turnover. There is precedent for this notion in islets because
insulin regulates pancreatic b-cell proliferation through IR/IRS2/
PDK1/AKT/FOXO1 pathway and its knockout in mice leads to
reduced b-cell mass [26]. Our results indicate that AKT might be
a key molecule involved in insulin modulation of a-cell
proliferation, but neither PDK1 nor FOXO1 are involved. It
has been reported that mTOR is required for AKT-dependent cell
growth in human retinal cells [31] and our data show that insulin
activates mTOR in a cells. Furthermore, in the presence of
rapamycin, an mTOR inhibitor, the effect of insulin on a-cell
proliferation and mTOR phosphorylation is completely abolished.
In insulin resistant states, b cells attempt to compensate for the
resistance by secreting more insulin. In pancreatic islets, this results
in higher intra-islet insulin concentration than normal, resulting, in
turn, in increased IR signaling. This initially would be predicted to
cause a decrease in glucagon secretion but eventually, insulin
resistance must occur to the suppressant effect on secretion, and
ultimately dysregulation of glucagon secretion. We hypothesize
that, in the early stages of insulin resistance, there are counter-
regulatory systems to the trophic effects of insulin on a-cell
proliferation. But as insulin resistance increases, the counter-
regulatory measures within islets may become dysfunctional or
overridden by high insulin levels, leading to increased a-cell
turnover and ultimately more glucagon released into the
circulation. This will worsen insulin resistance in the liver, leading
to increased, non-suppressible gluconeogenesis and increased
fasting blood glucose. Moreover, glucagon, through its G
protein-coupled receptor on b cells, enhances insulin secretion
and b-cell mass (8), an effect that is likely to be of particular
importance in human islets because of the unique b-/a-cell
proximity: so increasing glucagon secretion could be another
compensatory attempt by the body to increase insulin secretion in
insulin resistant states.
It is probable that in T2DM a cells become resistant only to the
inhibitory effects of insulin on glucagon secretion and not to the
trophic effects. There is precedent for selective insulin resistance.
In the liver, the FOXO1 pathway becomes insulin resistant in
obese and diabetic states and this results in decreased glucose
uptake and continuing gluconeogenesis; and yet, despite this,
insulin sensitivity is maintained in the SREBP-1c pathway, which
leads to increased fatty acid synthesis and excess triglyceride
secretion from hepatocytes that further ultimately worsen insulin
resistance in muscle [32,33]. The inhibitory effects of insulin on
glucagon secretion are FOXO1-dependent because knockdown of
the IRs in a cells by siRNA led to markedly reduced pFOXO1
and increased glucagon secretion [13] and FOXO1 silencing
abolished the acute regulation by insulin of glucagon secretion
[34]. Analogous to the situation in hepatocytes, the a-cell FOXO1
pathway is probably insulin-resistant in T2DM. And as we found
that the trophic effects of insulin in a cells are not mediated by
FOXO1, it is reasonable to conclude that the effects of insulin on
a-cell proliferation are favored by the high intra-islet insulin levels,
while the suppressant effects on glucagon secretion are obviously
abrogated as plasma glucose rises in T2DM. It would be expected
that there may be increased amounts of other products of the
proglucagon molecule, GLP-1 for example, circulating in diabetic
conditions. However, GLP-1 levels are not elevated in type 2
diabetic conditions [35] and GLP-1 receptor seems to be exclusive
in islets to b cells [35,36]. Therefore, we do not think a
proglucagon product is the primary proliferative factor to a cells.
Our results show that blocking the glucagon receptor decreased
blood glucose, as expected, but it also decreased a-cell prolifer-
ation in both mice and aTC1 cells, leading us to conclude that
glucagon itself has a direct trophic effects on a cells, just as it does
in b cells. Furthermore, when pancreatic a-cell number was
decreased in half in db/db mice by a glucagon receptor
antagonist, plasma glucagon levels were significantly decreased,
again drawing a firm connection between increased a-cell number
and secretion. Interestingly, plasma levels of insulin dropped and
b-cell degranulation was lessened, most likely reflecting decreased
insulin secretion and decreased intra-islet insulin, which would also
lessen the trophic effects of insulin on a cells.
It should be borne in mind that the effects of a glucagon
antagonist would have different effects in non-diabetic compared
to diabetic mice. In non-diabetic mice, an antagonist causes low
blood glucose levels, which lead to a sympathetic nervous system
response and a-cell proliferation as the animals attempt to
compensate for neuroglucopenia [19]. In diabetic mice, no such
adrenergic response would be expected if blood glucose is not
lowered below normal.
Lowering plasma glucagon represents an attractive therapeutic
approach for T2DM, and recent success in this field has generated
considerable enthusiasm [19]. Blocking of glucagon receptors in
diabetic mice led to significantly improved blood glucose control
and decreased plasma insulin levels. This likely resulted from
Regulation of a-Cell Proliferation
PLoS ONE | www.plosone.org 8 January 2011 | Volume 6 | Issue 1 | e16096
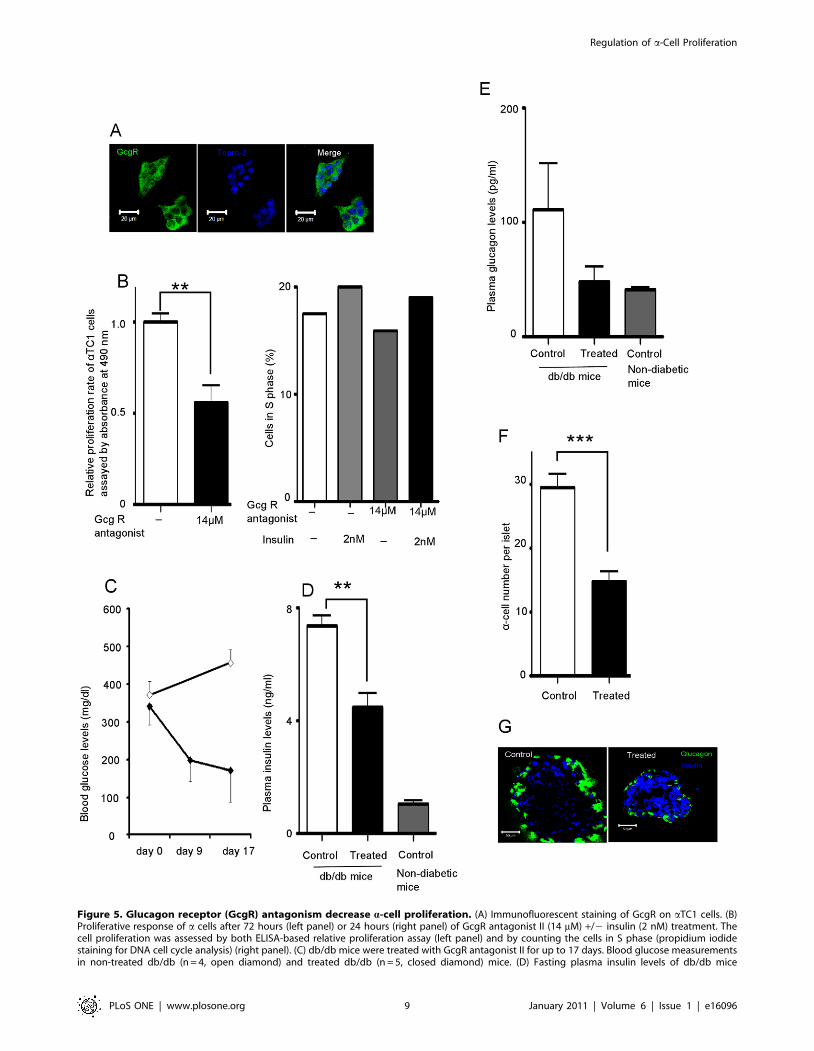
Figure 5. Glucagon receptor (GcgR) antagonism decrease a-cell proliferation. (A) Immunofluorescent staining of GcgR on aTC1 cells. (B)Proliferative response of a cells after 72 hours (left panel) or 24 hours (right panel) of GcgR antagonist II (14 mM) +/2 insulin (2 nM) treatment. Thecell proliferation was assessed by both ELISA-based relative proliferation assay (left panel) and by counting the cells in S phase (propidium iodidestaining for DNA cell cycle analysis) (right panel). (C) db/db mice were treated with GcgR antagonist II for up to 17 days. Blood glucose measurementsin non-treated db/db (n = 4, open diamond) and treated db/db (n = 5, closed diamond) mice. (D) Fasting plasma insulin levels of db/db mice
Regulation of a-Cell Proliferation
PLoS ONE | www.plosone.org 9 January 2011 | Volume 6 | Issue 1 | e16096
alleviation of the insulin resistance and a decrease in the stimulus
to insulin secretion by glucagon. Thus, the burden on b cells is
reduced, which results in, as showed in our data, less degranu-
lation of b cells.
In summary, we provide evidence that blocking mTOR
prevents a-cell proliferation. The mTOR pathway plays a crucial
role in tumorigenesis [37,38] and rapamycin and the other
inhibitors of mTOR have been investigated as anti-cancer
medications in recent years [39–42]. Very interestingly, rapamycin
just recently was shown to increase life-span in mice even when
given late in life [43] and mTOR inhibitors (or rapalogs that do
not have the immunosuppressant effects of rapamycin), are now
being explored by companies to extend human life [44]. Based on
our data, such analogs might be worth exploring in treating
T2DM. We also provide evidence that blocking glucagon
receptors in T2DM may not only lessen glucagon-mediated
gluconeogenesis, but may be beneficial to b cells.
Acknowlegments
We are very grateful to Dr. Michel Bernier and Dr. Nazli McDonnell for
valuable discussion.
Author Contributions
Conceived and designed the experiments: ZL JME. Performed the
experiments: ZL WK ZC YS ODC. Analyzed the data: ZL JME.
Contributed reagents/materials/analysis tools: ZL WK ZC JLF LX JKN
RS JOO QL. Wrote the paper: ZL JME.
References
1. Unger RH, Orci L (1975) The essential role of glucagon in the pathogenesis of
diabetes mellitus. Lancet 1: 14–16.
2. Dobbs R, Sakurai H, Sasaki H, Faloona G, Valverde I, et al. (1975) Glucagon:
role in the hyperglycemia of diabetes mellitus. Science 187: 544–547.
3. Sakurai H, Dobbs RE, Unger RH (1975) The role of glucagon in the
pathogenesis of the endogenous hyperglycemia of diabetes mellitus. Metabolism
24: 1287–1297.
4. Raskin P, Unger RH (1978) Hyperglucagonemia and its suppression.
Importance in the metabolic control of diabetes. N Engl J Med 299: 433–
436.
5. Reaven GM, Chen YD, Golay A, Swislocki AL, Jaspan JB (1987) Documen-
tation of hyperglucagonemia throughout the day in nonobese and obese patients
with noninsulin-dependent diabetes mellitus. J Clin Endocrinol Metab 64:
106–110.
6. Baron AD, Schaeffer L, Shragg P, Kolterman OG (1987) Role of hypergluca-
gonemia in maintenance of increased rates of hepatic glucose output in type II
diabetics. Diabetes 36: 274–283.
7. Li XC, Liao TD, Zhuo JL (2008) Long-term hyperglucagonaemia induces early
metabolic and renal phenotypes of Type 2 diabetes in mice. Clin Sci (Lond) 114:
591–601.
8. Gelling RW, Vuguin PM, Du XQ, Cui L, Romer J, et al. (2009) Pancreatic beta-
cell overexpression of the glucagon receptor gene results in enhanced beta-cell
function and mass. Am J Physiol Endocrinol Metab 297: E695–707.
9. Conarello SL, Jiang G, Mu J, Li Z, Woods J, et al. (2007) Glucagon receptor
knockout mice are resistant to diet-induced obesity and streptozotocin-mediated
beta cell loss and hyperglycaemia. Diabetologia 50: 142–150.
10. Ma X, Zhang Y, Gromada J, Sewing S, Berggren PO, et al. (2005) Glucagon
stimulates exocytosis in mouse and rat pancreatic alpha-cells by binding to
glucagon receptors. Mol Endocrinol 19: 198–212.
11. Cabrera O, Jacques-Silva MC, Speier S, Yang SN, Kohler M, et al. (2008)
Glutamate is a positive autocrine signal for glucagon release. Cell Metab 7:
545–554.
12. Quesada I, Tuduri E, Ripoll C, Nadal A (2008) Physiology of the pancreatic
alpha-cell and glucagon secretion: role in glucose homeostasis and diabetes.
J Endocrinol 199: 5–19.
13. Kawamori D, Kurpad AJ, Hu J, Liew CW, Shih JL, et al. (2009) Insulin
signaling in alpha cells modulates glucagon secretion in vivo. Cell Metab 9:
350–361.
14. Cassidy RS, Irwin N, Flatt PR (2008) Effects of gastric inhibitory polypeptide
(GIP) and related analogues on glucagon release at normo- and hyperglycaemia
in Wistar rats and isolated islets. Biol Chem 389: 189–193.
15. Iki K, Pour PM (2007) Distribution of pancreatic endocrine cells including
IAPP-expressing cells in non-diabetic and type 2 diabetic cases. J Histochem
Cytochem 55: 111–118.
16. Assmann A, Ueki K, Winnay JN, Kadowaki T, Kulkarni RN (2009) Glucose
effects on beta-cell growth and survival require activation of insulin receptors
and insulin receptor substrate 2. Mol Cell Biol 29: 3219–3228.
17. Muller D, Jones PM, Persaud SJ (2006) Autocrine anti-apoptotic and
proliferative effects of insulin in pancreatic beta-cells. FEBS Lett 580:
6977–6980.
18. Xu GG, Rothenberg PL (1998) Insulin receptor signaling in the beta-cell
influences insulin gene expression and insulin content: evidence for autocrine
beta-cell regulation. Diabetes 47: 1243–1252.
19. Yan H, Gu W, Yang J, Bi V, Shen Y, et al. (2009) Fully Human Monoclonal
Antibodies Antagonizing the Glucagon Receptor Improve Glucose Homeostasisin Mice and Monkeys. J Pharmacol Exp Ther 329: 102–111.
20. Li XC, Zhuo JL (2007) Targeting glucagon receptor signalling in treating
metabolic syndrome and renal injury in Type 2 diabetes: theory versus promise.
Clin Sci (Lond) 113: 183–193.
21. Petersen KF, Sullivan JT (2001) Effects of a novel glucagon receptor antagonist
(Bay 27-9955) on glucagon-stimulated glucose production in humans. Diabeto-logia 44: 2018–2024.
22. Berridge MV, Tan AS (1993) Characterization of the cellular reduction of 3-(4,5-dimethylthiazol-2-yl)-2,5-diphenyltetrazolium bromide (MTT): subcellular
localization, substrate dependence, and involvement of mitochondrial electrontransport in MTT reduction. Arch Biochem Biophys 303: 474–482.
23. Martin B, Golden E, Carlson OD, Pistell P, Zhou J, et al. (2009) Exendin-4improves glycemic control, ameliorates brain and pancreatic pathologies, and
extends survival in a mouse model of Huntington’s disease. Diabetes 58:318–328.
24. Brissova M, Fowler MJ, Nicholson WE, Chu A, Hirshberg B, et al. (2005)Assessment of human pancreatic islet architecture and composition by laser
scanning confocal microscopy. J Histochem Cytochem 53: 1087–1097.
25. Okada T, Liew CW, Hu J, Hinault C, Michael MD, et al. (2007) Insulin
receptors in beta-cells are critical for islet compensatory growth response toinsulin resistance. Proc Natl Acad Sci U S A 104: 8977–8982.
26. Holz GG, Chepurny OG (2005) Diabetes outfoxed by GLP-1? Sci STKE 2005:pe2.
27. Nakao T, Geddis AE, Fox NE, Kaushansky K (2008) PI3K/Akt/FOXO3apathway contributes to thrombopoietin-induced proliferation of primary
megakaryocytes in vitro and in vivo via modulation of p27(Kip1). Cell Cycle
7: 257–266.
28. Wullschleger S, Loewith R, Hall MN (2006) TOR signaling in growth and
metabolism. Cell 124: 471–484.
29. Hay N, Sonenberg N (2004) Upstream and downstream of mTOR. Genes Dev18: 1926–1945.
30. Mori H, Inoki K, Munzberg H, Opland D, Faouzi M, et al. (2009) Critical rolefor hypothalamic mTOR activity in energy balance. Cell Metab 9: 362–374.
31. Porstmann T, Santos CR, Griffiths B, Cully M, Wu M, et al. (2008) SREBPactivity is regulated by mTORC1 and contributes to Akt-dependent cell growth.
Cell Metab 8: 224–236.
32. Shimomura I, Matsuda M, Hammer RE, Bashmakov Y, Brown MS, et al.
(2000) Decreased IRS-2 and increased SREBP-1c lead to mixed insulinresistance and sensitivity in livers of lipodystrophic and ob/ob mice. Mol Cell 6:
77–86.
33. Brown MS, Goldstein JL (2008) Selective versus total insulin resistance: a
pathogenic paradox. Cell Metab 7: 95–96.
34. McKinnon CM, Ravier MA, Rutter GA (2006) FoxO1 is required for the
regulation of preproglucagon gene expression by insulin in pancreatic
alphaTC1-9 cells. J Biol Chem 281: 39358–39369.
35. Kim W, Egan JM (2008) The role of incretins in glucose homeostasis and
diabetes treatment. Pharmacol Rev 60: 470–512.
measured after 17days of GcgR antagonist treatment. For control db/db mice n = 4, treated db/db mice n = 5, non-diabetic mice n = 7. (E) Fastingplasma glucagon levels of db/db mice measured after 17days of GcgR antagonist II treatment. For control db/db mice n = 4, treated db/db mice n = 5,non-diabetic mice n = 7. (F) a-cell number in islets from db/db mice was counted (control n = 71 islets, treated n = 84 islets). (G) Immunofluorescentstaining of glucagon and insulin in frozen sections of pancreata from treated and non-treated db/db mice. Data are expressed as means 6SEM (n = 6);** p,0.005, *** p,0.0005.doi:10.1371/journal.pone.0016096.g005
Regulation of a-Cell Proliferation
PLoS ONE | www.plosone.org 10 January 2011 | Volume 6 | Issue 1 | e16096
36. Tornehave D, Kristensen P, Rømer J, Knudsen LB, Heller RS (2008)
Expression of the GLP-1 receptor in mouse, rat, and human pancreas.J Histochem Cytochem 56: 841–851.
37. McBride SM, Perez DA, Polley MY, Vandenberg SR, Smith JS, et al. (2009)
Activation of PI3K/mTOR pathway occurs in most adult low-grade gliomasand predicts patient survival. J Neurooncol 97: 33–40.
38. Hudes GR (2009) Targeting mTOR in renal cell carcinoma. Cancer 115:2313–2320.
39. Bae-Jump VL, Zhou C, Boggess JF, Gehrig PA (2009) Synergistic effect of
rapamycin and cisplatin in endometrial cancer cells. Cancer 115: 3887–3896.40. Scott KL, Kabbarah O, Liang MC, Ivanova E, Anagnostou V, et al. (2009)
GOLPH3 modulates mTOR signalling and rapamycin sensitivity in cancer.Nature 459: 1085–1090.
41. Wagner M, Roh V, Strehlen M, Laemmle A, Stroka D, et al. (2009) Effective
Treatment of Advanced Colorectal Cancer by Rapamycin and 5-FU/
Oxaliplatin Monitored by TIMP-1. J Gastrointest Surg 13: 1781–1790.
42. Schlosshauer PW, Li W, Lin KT, Chan JL, Wang LH (2009) Rapamycin by
itself and additively in combination with carboplatin inhibits the growth of
ovarian cancer cells. Gynecol Oncol 114: 516–522.
43. Harrison DE, Strong R, Sharp ZD, Nelson JF, Astle CM, et al. (2009)
Rapamycin fed late in life extends lifespan in genetically heterogeneous mice.
Nature 460: 392–395.
44. Cox LS, Mattison JA (2009) Increasing longevity through caloric restriction or
rapamycin feeding in mammals: common mechanisms for common outcomes?
Aging Cell.
Regulation of a-Cell Proliferation
PLoS ONE | www.plosone.org 11 January 2011 | Volume 6 | Issue 1 | e16096