injuries associated with specific motor vehicle hazards
TRANSCRIPT
\
U.S.Departmentof Transportation
National HighwayTraffic SafetyAdministration
1
DOT HS 808598 July 1997
Technical Report
Injuries Associated with Specific MotorVehicle Hazards: Radiators, Batteries,Power Windows, and Power Roofs
This document is available to the public from the National Technical Information Service, Springfield, Virginia 22161.
r
This publication is distributed by the U.S. Department ofTransportation, National Highway Traffic SafetyAdministration, in the interest of information exchange.The opinions, findings and conclusions expressed in thispublication are those of the author(s) and not necessarilythose of the Department of Transportation or the NationalHighway Traffic Safety Administration. The United StatesGovernment assumes no liability for its contents or usethereof. If trade or manufacturer’s name or products arementioned, it is because they are considered essential tothe object of the publication and should not be construedas an endorsement. The United States Government doesnot endorse products or manufacturers.

*
Technical Report Documentation Page1. RaPod No. 2. Government Accession No, 3. Recipient’s Cata!eg No.
DOT HS 8085984 litle and Subtitle 5. Report Date
Injuries Associated with Specific Motor Vehicle Hazards: Radiators, July1997
Batteries, Power Windows, and Power Roofs
~NRD-31
&Performing Organization Repoti No
Richardson, Henri A.
9. Performing Organization Name and Address 10. Work Unit No. (TRAIS)
Mathematical Analysis Division; National Center for Statistics and Analysis;Research and Development, National Highway Traffic Safety Administration;U.S. Department of Transportation400 Seventh Street, S. W.Washington, D. C. 20590 / 1!3. Type olRe@and Period Covered
12. Sponsoring Agency Nanw and Address NHTSA Technical Report
14. Sponsoring Agency Code
I,15 Supplementary Notas
16. Abstract
This report provides estimates of the numbers of persons injured as a result of hazards involving four
specific motor vehicle components: radiators, batteries, power windows, and power roofs. The injury estimates
are based upon data from the Consumer Product Safety Commission’s National Electronic Injury Surveillance
System (NEISS). NEISS collects data on a nationally representative sample of consumer product-related
injuries treated in hospital emergency rooms. NHTSA has used NEISS to obtain data on injuries associated with
specific motor vehicle hazards that are non-crash related. During the period 10/1/93 through 9/30/94, data from
591 (409 involving radiators; 171 involving batteries; 10 involving power windows; and 1 involving a power roof) cases
of persons injured and treated in hospital emergency rooms were collected in NEISS. Based upon these cases,
it is estimated that in a twelve-month period: 19,638 persons are injured due to radiators; 8,134 are injured due to
batteries (7,051 due to motor vehicle batteries); and 499 are injured due to power windows. The one case involving
a power roof was a result of the injured person being ejected due to a traffic crash, and therefore, not related to
a hazard associated with the power roof itself. The report provides breakdowns of the injury estimates for radiators,
batteries, and power windows by.activity producing the injury, injury diagnosis and severity, injured body region, and
age/sex of the injured.
17. Key Words 16 Distribution Statement
motor vehicle hazards, non-crash related, injury diagnosis, This document is available to the public through the
Injury severityNational Technical Information Service.
19. Sscwty Classif. (of this rapoti) 20. Security Ciassi. (of this page) 21. No. of Pages 22. Price
Unclassified Unclassified 52
Form DOT F 1700.7 (8-72) Reproduction of completed page authorized
I

Table of Contentgj
EagQ
Introduction . . . . . . . . . . . . . . . . . . . . . . . . . . . . . . . . . . . . . . . . . . . . . . . . . . . . . . . . . . . . . . 1Data Collection . . . . . . . . . . . . . . . . . . . . . . . . . . . . . . . . . . . . . . . . . . . . . . . . . . . . . . . . . . . . 2Possible Limitations of NEISS Data . . . . . . . . . . . . . . . . . . . . . . . . . . . . . . . . . . . . . . . . . . . 4Findings . . . . . . . . . . . . . . . . . . . . . . . . . . . . . . . . . . . . . . . . . . . . . . . . . . . . . . . . . . . . . . . . . 4
In.iuries Assoc ated w~th Motor Veh.
i icle Radiators . . . . . . . . . . . . . . . . . . . . . . . . . . . . ...5Body TypeofInvolvedMotorVehicle . . . . . . . . . . . . . . . . . . . . . . . . . . . . . . . . . . . . . ...8Vehicle Model Year . . . . . . . . . . . . . . . . . . . . . . . . . . . . . ... . . . . . . . . . . . . . . . . . . . . ...9Vehicle Manufacturer . . . . . . . . . . . . . . . . . . . . . . . . . . . . . . . . . . . . . . . . . . . . . . . . . . . .Age . . . . . . . . . . . . . . . . . . . . . . . . . . . . . . . . . . . . . . . . . . . . . . . . . . . . . . . . . . . . . . . . .Gender . . . . . . . . . . .. . . .. . . . . : . . . . . . . . . . . . . . . . . . . . . . . . . . . . . . . . . . . . . . . . . .Injury Diagnosis . . . . . . . . . . . . . . . . . . . . . . . . . . . . . . . . . . . . . . . . . . . . . . . . . . . . . . . .MostInjuredBodyPart . . . . . . . . . . . . . . . . . . . . . . . . . . . . . . . . . . . . . . . . . . . . . . . . . .Injury Severity . . . . . . . . . . . . . . . . . . . . . . . . . . . . . . . . . . . . . . . . . . . . . . . . . . . . . . . . .MedicalDisposition . . . . . . . . . . . . . . . . . . . . . . . . . . . . . . . . . . . . . . . . . . . . . . . . . . . . .Injury Severity and Medical Disposition . . . . . . . . . . . . . . . . . . . . . . . . . . . . . . . . . . . . . .Season . . . . . . . . . . . . . . . . . . . . . . . . . . . . . . . . . . . . . . . . . . . . . . . . . . . . . . . . . . . . . . .
Iniuries Associated wthMotoi r Vehicle Batte v Ex.pr *S . . . . . . . . . . . . . . . . . . . . . . .1Injury Producing Action . . . . . . . . . . . . . . . . . . . . . . . . . . . . . . . . . . . . . . . . . . . . . . . . . .Injury Diagnosis . . . . . . . . . . . . . . . . . . . . . . . . . . . . . . . . . . . . . . . . . . . . . . . . . . . . . . . .MostInjured Body Region . . . . . . . . . . . . . . . . . . . . . . . . . . . . . . . . . . . . . . . . . . . . . . . .Injury Severity . . . . . . . . . . . . . . . . . . . . . . . . . . . . . . . . . . . . . . . . . . . . . . . . . . . . . . . . .
lniuries Assoc atedwi ith Moto r Vehicle Power Window s . . . . . . . . . . . . . . . . . . . . . . . . .Injury Producing Action . . . . . . . . . . . . . . . . . . . . . . . . . . . . . . . . . . . . . . . . . . . . . . . . . .InjuryDiagnosis . . . . . . . . . . . . . . . . . . . . . . . . . . . . . . . . . . . . . . . . . . . . . . . . . . . . ...Most Injured Body Region . . . . . . . . . . . . . . . . . . . . . . . . . . . . . . . . . . . . . . . . . . . . . . . .Injury Severity . . . . . . . . . . . . . . . . . . . . . . . . . . . . . . . . . . . . . . . . . . . . . . . . . . . . . . . . .Age . . . . . . . . . . . . . . . . . . . . . . . . . . . . . . . . . . . . . . . . . . . . . . . . . . . . . . . . . . . . . . . . .
h-.
iuries Associated with Motor VehiclePowe roofs . . . . . . . . . . . . . . . . . . . . . . . . . . . . .
101112131416171819
2122222324
252626272728
29
References . . . . . . . . . . . . . . . . . . . . . . . . . . . . . . . . . . . . . . . . . . . . .....”.............3O
iii
A: The National Elect ronic Iniurv Surveillance SvstemOverview . . . . . . . . . . . . . . . . . . . . . . . . . . . . . . . . . . . . . . . . . . . . . . . . . . . . . . . . .. A-lThe NEISS Hospital Sample . . . . . . . . . . . . . . . . . . . . . . . . . . . . . . . . . . . . . . . . . . ..A-3Limitations ofNEISS Data . . . . . . . . . . . . . . . . . . . . . . . . . . . . . . . . . . . . . . . . . . . ..A-4
B: NHTSA Special Studv Va. riabl~
Descriptions of7VariablesCollected forAllSampleCases . . . . . . . . . . . . . . . . . . ..B-l
C: Telephone Follow-Back Quest ionnaireGeneral Questions . . . . . . . . . . . . . . . . . . . . . . . . . . . . . . . . . . . . . . . . . . . . . . . . ..C-lRadiators . . . . . . . . . . . . . . . . . . . . . . . . . . . . . . . . . . . . . . . . . . . . . . . . . . . . . . . . ..C-2BatteryExplosions . . . . . . . . . . . . . . . . . . . . . . . . . . . . . . . . . . . . . . . . . . . . . . . . . ..C-4Power-OperatedWindows . . . . . . . . . . . . . . . . . . . . . . . . . . . . . . . . . . . . . . . . . . . ..C-8Power-Operated Roofs . . . . . . . . . . . . . . . . . . . . . . . . . . . . . . . . . . . . . . . . . . . . . . ..C-9
iv
I
Introduction
. In recent years, the National Highway Traffic Safety Administration (NHTSA) has had acontinuing and growing need for reliable national estimates of the number of injuries associatedwith specific motor vehicle non-crash type occurrences, which generally involve stationaryvehicles. In this connection, there is a current need to monitor incidents associated injuries topersons involving four specific motor vehicle related hazards, i.e., radiator scalding; batteryexplosion; power window and power roof operation and/or malfunction.
NHTSA has a particular interest in injuries associated with motor vehicle radiators, asthese appear to be the most common of the four hazards examined in this study. This is mostcertainly related to the conditions under which motor vehicle radiators operate, i.e., motor vehicleengine cooling fluid (coolant) may operate at temperatures as high as 245-265 degrees F. and at16-17 lbs. of pressure. Under these temperature and pressure conditions, a hasty removal of thestandard radiator cap usually results in scalding fluid exploding out of the neck of the radiator,with sometimes severe burn injury to the person opening the radiator. Because incidents of thistype are not an uncommon occurrence, over the years NHTSA has received letters from thepublic and from medical personnel at hospital facilities in support of action to establish standardsfor safety locks for radiator caps.
In April 1992, NHTSA was petitioned to establish a new safety standard regarding motorvehicle radiator caps. The petitioner wanted the new standard to require any new vehicle sold inthe U.S. with a water-cooled engine to be equipped with a radiator cap that automatically locks ina closed position when the temperature of the engine coolant is 125 degrees F. or greater. Thecap would automatically unlock, allowing for a safe opening of the radiator, when the temperatureof the coolant falls below 125 degrees F. This type of radiator cap is generally referred to as a“thermal-locking radiator cap.” The purpose of this type of cap is to prevent the chance scaldingof motorists, gas station attendants and others who hastily open hot radiators of motor vehicles.
In support of a new radiator cap safety standard, this petition stated that:
1. Radiator cap scalding incidents are increasing, and will continue to increase as motorvehicle use rises despite safety education and manufacturer warning labels.
2. Over 100,000 radiator cap scalding incidents occur annually in the U.S., and over 20,000victims of such occurrences every year require treatment in hospital emergency rooms andother medical burn care facilities.
3. Enactment of a safety standard for thermal-locking radiator caps would result, not only ina number of economic and overall benefits to society as a whole, but in an overallimprovement in motor vehicle safety, especially for senior citizens, handicapped andotherwise frail persons. There would be a reduction in the pain, suffering and scarringsustained by radiator cap burn victims, especially in view of the fact that chemicalscurrently used in coolant mixtures compound the severity of scald injuries by increasingany resulting infections. Finally, enactment of the new safety standard for thermal-lockingradiator caps would have no adverse impact on the environment.
1

To support the contention that radiator cap scalding incidents are increasing and that over100,000 such incidents occur annually in the U.S., the petitioner submitted four (4) medicaljournal articles as supporting data. A subsequent NHTSA review of these articles found:
1. Two of the articles discussed radiator-related scalding that actually occurred outside of theU.S. The first of these articles states that over a 6-year period from 1982-1987,72 casesof car radiator burns (average of 12 per year) were treated at a hospital burn unit in Doha,Qatar. The second article states that during a 13-year period from 1975-1987,80 patients(average of approx. 6 per year) were treated at a hospital burn unit in Beersheva, Israel.
2. The third medical article notes that during the summer of 1989, 11 patients were treated inthe emergency room of the hospital in Nassau County, N.Y. for second and third degreeburns resulting from overheated car radiator fluid.
,,
3. The fourth and final article states that during a 3-year period from January, 1979 throughDecember 1981, 86 patients (average of 29 per year) with radiator-related burn injurieswere hospitalized at the University of Miami/Jackson Memorial Burn Center. This articlefurther states that, during the same 3-year period at that hospital, twice that number ofpatients (average of 58 per year) were treated for radiator-associated injuries and releasedwithout being hospitalized.
None of the articles included extrapolation of these data to national estimates of thenumber of injuries associated with the last two medical articles described above to extrapolate thedata to U.S. national totals. No similar attempt was made by the petitioner in support of thecontention that radiator cap scalding incidents are increasing, that more than 100,000 suchincidents occur annually in the U.S., and that 20,000 victims of these incidents are treated everyyear in hospital emergency rooms or at burn care facilities.
Of particular concern to NHTSA in this matter was that no data base was currentlyavailable within the Agency to validate and estimate the magnitude of the injury problemassociated with non-crash related motor vehicle hazards. Recalling that the U.S. ConsumerProduct Safety Commission (CPSC) had at one time tracked several automobile product-relatedinjuries, such as those from radiator caps in the late seventies and from exploding batteries in theearly eighties, it was concluded that CPSC was still the only existing and reliable source of thesemuch needed data, especially in view of the fact that CPSC data are sampled hospital emergencyroom data that can be projected to the U.S. national level. Thus, the decision was made toprovide funding to CPSC to add to its existing data collection effort some specific areas related toNHTSA’S crash avoidance mission. In addition to obtaining data on injuries involving radiatorcaps, NHTSA decided to gather information on injuries involving batteries, power windows, andpower roofs.
Data Collection
As a result of NHTSA’S need for injury data on certain non-crash type occurrencesinvolving motor vehicles, data from CPSC was obtained from twelve (12) consecutive months of
2

incidents of injuries to persons involving injuries associated with four (4) specific types of motorvehicle equipment: radiators, batteries, power windows and power roofs. These data weregathered for the twelve month period beginning October 1, 1993 through September 30, 1994under an Interagency Agreement between NHTSA and CPSC, using CPSC’s National ElectronicInjury Surveillance System (NEISS) to obtain data.
NEISS is a three level system which collects data on injuries related to consumer productsfrom a sampleof91 of the 6,127 hospitals nationwide with at least six beds that provideemergency care on a continuing twenty four hour basis. The three levels of the NEISS system are
.. the initial surveillance of emergency room injuries; follow-back telephone interviews with injuredpersons or witnesses; and more comprehensive on-site investigations with injured persons and/orwitnesses. Additional details regarding the NEISS data collection system can be found inAppendix A.
For this particular study, core surveillance and special study data to meet NHTSA’S needswere obtained on a selected sample of591 NEISS cases collected during the subject twelvemonth period. For 148 of the591 cases, telephone interviews were conducted to obtain additionalin-depth information on the circumstances of the incident involving the specific motor vehiclehazard. An interview was unsuccessfully attempted on 128 of the remaining 443 cases. Thebreakdown of total sample cases obtained, by hazard type and interview completion status, isgiven in Table 1.
Table 1Interview Completion Status for NEISS Cases in
NHTSA Motor Vehicle Hazard StudyOctober 1993- Sentember 1994— —
3—-—.-
Motor Vehicle Interview StatusProductInvolved Completed Attempted and No Interview Total
Not Completed
a
Radiator 105 97 207 409
Battery 34 31 106 171
Power Window 9 0 1 10
Power Roof
D 0 0 1 1148 128 315 591
Details regarding the surveillance, special study and telephone interview data gathered inNEISS for this study are provided in Appendices A, B and C, respectively. All NEISS datagathered for the study were used in the analysis for this report.
3

Possible Limitations of NEISS Data
This study provides national estimates of the number of persons injured each yem as aresult of hazards associated with four (4) speci.ilc types of motor vehicle equipment, i.e.,radiators, batteries, power windows, and power roofs. The injured were all treated in hospitalsequipped with emergency rooms. Because these injury estimates are based on NEISS datacollection, they are necessarily conservative for the following reasons. First, an indeterminatenumber of injury cases are not captured in the NEISS sample. NEISS does not collect injury datafrom other medical cme facilities (walk-in clinics, etc.) or from physicians in private practice.Secondly, an undeterminable number of injured persons that were treated at NEISS hospitalemergency rooms during the study period may not have been included by the NEISS datacollectors. This is mostly due to missing or incomplete information in the emergency room reportregarding details of the incident. These latter cases are the so-called “missed” NEISS cases,
generally a very small number compared to the far larger first catego~ of fully identilable,relevant cases excluded altogether from the NEISS sample. Additional and more complete det&lsregarding NEISS data limitations can be found in Appendix A.
Findings
The data shown in Tables 2 through 12 provide national estimates of the number ofpersons injured in non-crash incidents involving three of the four specific motor vehicle hazardsannually based upon the NEISS ,data. As discussed earlier, these estimates maybe consideredconservative due to the possible limitations of NEISS data. Tables 2 through 12 present nationalestimates for the number of persons injured due to hazards associated with motor vehicleradiators. Tables 13 through 16 and Tables 17 through 21 provide estimates of the number ofpersons injured due to hazards associated with motor vehicle batteries and motor vehicle powerwindows, respectively. (Percentages may not add to 100% in every table due to rounding.)A brief discussion regarding the fiidings for injuries associated with motor vehicle power roofs ispresented at the end of the report.
5

h. iuries Associated with Motor Vehicle Radiators
During the 12-month study period October 1, 1993 through September 30, 1994, anest.hnated 19,638 persons were injured nationwide as a result of involvement in various ways withmotor vehicle radiators. Of these 19,638 injured persons, the majority, approximately 77 percent,were injured as a result of activities associated with the radiator cap. Almost 73 percent of theradiator cap injuries were resulted from removing (or attempting to remove) the cap from theradiator. A surprising 25 percent of the radiator cap injuries were described as due to the radiatorcap “exploding”, i.e., the cap being ejected or dislodged from the neck of the radiator in someway. These situations involved mostly stationary vehicles, however, in situations in which thevehicle was moving, vehicle movement, coupled with excessive radiator pressure may have beencontributors to the radiator cap ejection. The remaining 2 percent of the radiator cap injurieswere associated with attempts to place the cap on the radiator, or because a loose, untightened, orbadly fitting cap allowed the radiator to boil over.
Not surprisingly, radiator hoses accounted for the second highest number of injuredpersons, about 12 percent (2,370/19,638). Most were injured while replacing or attempting toreplace a radiator hose, however, some were injured while doing something else such as checkingor working on the vehicle’s engine and accidentally brushing against or opening a hole in one ofthese hoses in the process.
Noteworthy in these data is that the radiator reservoir accounted for the third highestnumber of injured persons. Seven (7) percent (1,403/19,638) were injured as a direct result ofhandling the radiator reservoir (rather than the radiator cap), usually while attempting to addcoolant to the radiator.
The remaining 747 injured persons: approximately 4 percent of the estimated 19,638injured persons, occurred as follows: bum injury while working on some other part of thevehicle’s cooling system such as a heater, heater hose, water pump, or thermostat (316 persons);bum or non-bum injury directly or indirectly due to the radiator in some way (e.g., cut by, fell onradiator, etc.; 243 persons); and non-burn injury caused by the radiator fan, fan belt or grill, byfumes from overheating, or by accidental ingestion of radiator fluid (188 persons).
Tables 2-11 present descriptive details on the injuries to persons by the body type ofinvolved vehicle, vehicle model year, vehicle manufacturer, age, gender, injury diagnosis, the mostinjured body region, injury seventy category, medical disposition, injury severity and medicaldisposition combined, and by season of the year. Percentages may not add to 100% due torounding.
Automobiles were involved in nearly91 percent of the radiator cap injuries; pickups inapproximately 7 percen~ vans in about 3 percent and trucks in the remainder [Table 2]. Forinjuries involving the radiator reservoir, automobiles were involved 100 percent of the time.Injuries associated with the radiator hose appeared to follow a different pattern, i.e., vans wereassociated with 22 percent of the injuries, while automobiles were associated with 70 percent.
6

For the radiator cap injuries, almost two-thirds (65 percent) of the motor vehicles involvedwere 1980-89 models, with slightly more than one-half of these (52 percent) being model-year1980-84 [Table 3]. About 26 percent of these incidents involved 1975-79 models; about 2percent involved models older than 1975, and less than 1 percent involved later model years, i.e.,1990-94. For the radiator reservoir, almost one-half (49 percent) of the injuries involved 1985-89model year vehicles and no vehicles of model year older than 1975 were involved. A largeportion of the incidents associated with the injuries related to the radiator hose (41 percent)involved 1985-89 vehicles. For all of the radiator cases combined, two-thirds (67 percent) of thevehicles involved were 1980-89 models.
The manufacturer of the vehicles were involved in injuries associated with radiator capincidents were: General Motors -62 percen~ Chrysler -17 percen~ Ford -12 percen~ OtherDomestic and Foreign -3 and 6 percen~ respectively. The radiator reservoir injuries differedsomewhat in that 46 percent of the vehicles involved were manufactured by General Motors, andforeign vehicles were involved in 34 percent of the injuries [Table 4].
As might be expected, about 2 percent of the persons injured involving the radiator capwere less than 15 years of age [Table 5]. About 40 percent were 15-29 years of age, 37 percentwere 30-44, 17 percent were 45-59, and the remaining 4 percent were 60 years of age or older.Compared to the radiator cap cases, the frequency of those injured by hot fluid/steam from theradiator reservoir differed markedly for age groups 15-29 and 45-59. In the cases of injuries tochildren involving radiator hose incidents, the children appeared to be present as bystanders orpassed by while an adult was working with the vehicle. In these situations, children were sprayedwith hot radiator fluid from hoses that either broke open during repair (by adults) or burst openon their own, some even while the vehicle was moving. It is currently not known if these noteddifferences in proportions of injured persons, by type of radiator involvement for certain victimage groups, reflect actual differences in injury patterns for the type of activity associated withradiators or occurred due to chance.
More than 86 percent of the persons injured involving radiator caps were males. Allpersons injured involving the radiator reservoirs were male. Males represented 89 percent of allpersons injured in all types of incidents involving radiators [Table 6].
As expected, scalding burns from hot radiator fluid released from the radiator were thepredominant form of injury involving radiator caps. Almost91 percent were injured in thismanner [Table 7]. More than 7 percent of the persons injured in these incidents sustained chemicalor thermal burns, while almost 2 percent sustained contusions, abrasions, lacerations or fractures,mostly caused by striking against some part of the vehicle as a reaction to hot radiator fluid. Theremaining persons injured in incidents involving the radiator cap (less than one-half percent) werepoisoned due to having accidentally ingested radiator antifreeze. In incidents involving theradiator reservoir nearly 94 percent sustained scalding burn injuries, 4 percent received chemicalor thermal burns, while more than 2 percent sustained other injury. For those injured whileremoving or replacing a radiator hose, or by hose breakage in some manner, the distribution ofinjuries is generally similar to that of the reservoir cases.
7

The face, including eye area and nose, was the most severely injured body region fornearly 38 percent of the persons injured involving radiator caps [Table 8]. The lower arm wasinjured for about 26 percent of those injured and the upper trunk in 18percent. For those injuredinvolving the radiator reservoir, the face and lower arm were almost equally likely to be the bodyregions most affected, 38 percent and 39 percent respectively, for each. A sizeable portion, 15percent, sustained overall injury to 25 percent or more of the body. For persons injured inincidents involving the radiator hose, the face was the most severely injured body region for about34 percent of the cases. Fewer than 2 percent of all radiator hose injured persons sustainedoverall injury to 25 percent or more of the body.
Approximately 88 percent of the persons injured in incidents involving radiator capsreceived injuries of moderate severity, primarily fust and/or second degree burns that, in general,did not require hospitalization (see Table 10). Nearly 10 percent of these persons injured wereseriously injured, many of whom were hospitalized. The remaining persons injured involvingradiator caps, approximately 3 percent, received minor injuries. For incidents involving radiatorreservoirs, about 75 percent received injuries of moderate severity while almost 22 percent wereseriously injured [Table 9].
Approximately 93 percent of the persons injured in incidents involving radiator caps weretreated and released without hospitalization; the remaining 7 percent were hospitalized due tomore serious injuries [Table 10]. For those injured by the radiator reservoir, all 1,403 personsestimated to have been injured in this reamer were treated and released. For persons injuredinvolving radiator hoses, 97 percent were treated and released. In general, hospitalized casesinvolved second and third degree burns requiring special and immediate treatment. These data,however, may be misleading. A sizeable number of persons injured, some with only moderateinjuries, though treated at hospital emergency facilities and released because they did not requirehospitalization, had second and third degree burns that could be expected to require furthermedical treatrnen~ either at a hospital or with a private physician
Persons injured who required hospitalization tended to be those with the more seriousinjuries, i.e., for persons injured involving radiator caps, approximately 64 percent (929/1,456) ofthe seriously injured were hospitalized, compared with only slightly more than 1percent(184/13,266) of the moderately injured and none of those persons with minor injuries. Forpersons injured involving radiator reservoirs, none were hospitalized [Table 11]. For personsinjured involving radiator hoses, 67 percent (70/105) of the seriously injured were hospitalized,while none of those with moderate or minor injuries were hospitalized.
For persons injured in incidents involving radiator caps, about 44 percent occurred duringthe summer months of June, July and August [Table 12]. Approximately 25!%were injured inincidents involving radiator caps in winter, while roughly similar proportions of persons wereinjured in the fall and spring. For persons injured involving radiator reservoirs, the majority, 62percent, occurred during the summer. Nearly three-quarters of the persons injured involvingradiator hoses occurred during the spring and summer.
8

Table 2Estimates of Persons Injured by Motor Vehicle Radiators
By Type of Radiator Involvement and Body Type of Motor VehicleOctober 1993- September 1994*
1[
2&%_l‘Uto Va:od‘T::r‘rv~:‘“MRadiator Cap 13,711 373 955 79 15.118
% 91% I 2% 1 6% I ** 100%I i I I I
Removal 9,824I
Ejection(1) 3,704I
Closure I 119
Other(2) I 64
Radiator Reservoir 1,403I
373
0
0
0
0
748 I 79 I 11,024
60 I 01 3,764I I
1471 01 266I I
01 01 64I ,
‘o o 1,403
% 100% o 0 0 100%
Radiator Hose ~ 1,655 524 75 116 2.370
% 70% 22% 3% 5% 100%
Other Radiator (3) 141 6 7 34 188
Unspecified Radiator (4) 217 12 14 0 243
Other Cooling System 316 0 0 0 316(5)
Total 17,443 915 1,051 229 19,638
% 89% 5% 5% 1% 100%
(1) Exploded popped off, dislodged by vehicle motion, etc. without being touched.(2) Cap on radiator, but loose, not tightened or bad fit.(3) Fan, fan bel~ grill, fumes from overheating, radiator fluid got into eyes, unintentional ingestion of radiator fluid, etc.(4) Cut by/fell ou etc. or injury indirectly due to radiator.(5) Heater, heater hose, water pump, thermostat, etc.* Percentages may not add to 10(YZOdue to rounding.** Less than 1Yo.
9

Table 3Estimates of Persons Injured by Motor Vehicle Radiators
By Type of Radiator Involvement and Model Year of Involved VehicleOctober 1993- September 1994*
3
Type of Radiator Vehicle Model YearInvolvement
Pre 1975-1979 1980-1984 1985-1989 1990-1994 Total1975
Radiator Cap 1,228 3,893 5,143 4,728 126 15,118
% 8% 26% 34% 31% 1% 100%
Removal 1,168 3,311 3,325 3,094 126 11,024
Ejection(1) 60 582 1,607 1,515 0 3,764
Closure o 0 147 119 0 266
Other (2) o 0 64 0 0 64
Radiator Reservoir o 279 377 689 59 1,403
% o 20% 27% 49% 4% 100%
Radiator Hose 229 618 525 979 19 2,370
% 10% 26% 22% 41% 1% 100%
Other Radiator(3) o 39 58 91 0 188
Unspeci.tied o 61 91 91 0 243Radiator(4)
Other Cooling System o 0 316 0 0 316(5)
Total 1,457 4,890 6,510 6,578 203 19,638
% 7% 25% 33% 34% 1% 100%
(1) Exploded, popped off, dislodged by vehicle motion, etc. without being touched.(2) Cap on radiator, but loose, not tightened or bad fit.(3) Faq fan bel~ grill, fumes from overheadng, radiator fluid got into eyes, unintentional ingestion of radiator fluid, etc.(4) Cut by/fell on, etc. or injury indirectly due to radiator.(5) Heater, heater hose, water pump, thermostat, etc.
* Percentages may not add to 10(Modue to rounding.
10

Table 4Estimates of Persons Injured by Motor Vehicle Radiators
By Type of Radiator Involvement and Vehicle ManufacturerOctober 1993- September 1994*
5EZ-I::::‘sler‘e:;Man‘::.F=* To~
Radiator Cap 9,419 2,609 1,859 386 . 845 15,118
% 62% 17% 12% 3% 6% 100%
Removal 6,085 2,243 1,465 386 845 11,024
Ejection (1) 3,123 366 275 0 0 3,764
Closure 147 0 119 0 0 266
Other (2) 64 0 0 0 0 64
Radiator Reservoir 646 145 132 0 480 1,403
9% 46% 10% 9% o 34% 100%
Radiator Hose 1,140 315 781 25 108 2,370
% 48% 13% 33% 1% 5% 100%
Other Radiator (3) 139 23 26 0 0 188
Unspecified Radiator (4) 152 34 38 0 19 243
Other Cooling System 316 0 0 0 0 316(5)
Total 11,813 3,126 2,836 411 1,452 19,638
% 60% 16% 14% 2% 7% 100%
(1) Exploded, popped off, dislodged by vehicle motion, etc. without being touched.(2) Cap on radiator, but loose, not tightened or bad f%.(3) Fan, fan belt, grill, f~es from overheating, radiator fluid got into eyes,unintentionalingestionof radiatorfluid, etc.(4) Cut by/fell om etc. or injury indirectly due to radiator.(5) Heater, heater hose, water pump, thermostat, etc.* Percentages may not add to 100% due to rounding.
11
I

Table 5Estimates of Persons Injured by Motor Vehicle Radiators
By Type of Radiator Involvement and AgeOctober 1993- September 1994*
I “
Radiator Age of PersonInvolvement
0-14 15-29 30-44 45-59 60+ Total
Radiator Cap 320 5,973 5,609 2,561 655 15,118
% 2% 40% 37% 17% 4% 100%
Removal 294 2,960 4,911 2,266 593 11,024
Ejection (1) 26 2,747 698 231 62 3,764
Closure o 266 0 0 0 266
Other (2) o 0 0 64 0 64
Radiator 22 748 471 141 21 1,403Reservoir
% 2’% 53% 34% 10% 2% 100%
Radiator 149 854 1,104 131 132 2,370Hose
‘% 6% 36% 47% 6% 696 100%
Other o 52 102 0 34 188Radiator (3)
Unspeciiled 17 49 66 111 0 243Radiator (4)
Other Cooling o 0 316 0 0 316System (5)
Total 508 7,676 7,668 2,944 842 19,638
% 3% 39% 39% 15% 4% 100%
(l)Explode& popped off, chslodged by vehicle mohon, etc. without being touched.(2)Cap on racbator, but loose, not t@ened or bad fit.(3)Fan, fag bel~ grill, fumes from overheating, radiator fluid got into eyes, unintentional ingestion of radiator fluid, etc.(4)Cut by/fell on, etc. or injury indirectly due to radiator.(5)Heater, heater hose, water pump, thermostat, etc.* Percentages may not add to 100% due to rounding.
12
I

Table 6Estimates of Persons Injured by Motor Vehicle Radiators
By Type of Radiator Involvement and GenderOctober 1993- September 1994
II
A Male ::: TOM
Radiator Cap 13,074 2,044 15,118
% 86% 14% 100%
Removal 9,153 1,871 11,024
Ejection (1) I 3,626 ! 138 I 3,764
Closure 231 I 35 I 266
Closure (2) I 64 I 01 64
Radiator Reservoir 1,403 0 1,403
% 100 0 100
Radiator Hose 2,328 42 2,370
% 98% 2% 100%
Other Radiator (3) ‘ 154 34 188
Unspecifl.d Radiator (4) ! 226 I 17 I 243
Other Cooling System (5) 316 0 316
Total 17,501 2,137 19,638
% 89% 11% 100%
(l)Exploded, popped off, dislodged by vehicle motion, etc. without being touched.(2) Cap on radiator, but loose, not tightened or bad fit.(3) FaILfan belq grill, fumes from overheating, radiator fluid got into eyes, unintentional ingestion of radiator fluirLetc.(4) Cut by/fell on, etc. or injury indirectly due to radiator.(5) Heater, heater hose, water pump, thermostat, etc.
13
I
Table 7Estimates of Persons Injured by Motor Vehicle RadiatorsBy Type of Radiator Involvement and Injury Diagnosis
October 1993- September 1994*II
__l gType of Radiator Injury Diagnosis
InvolvementBurns, Other Poisoning (7) Other Total
Scaldin Burns (6) Injury (8)
Radiator Cap 13,704 1,083 35 296 15,118
% 91% 7% ** 2% 100%
Removal 9,973 776 35 240 11,024
Ejection (1) 3,524 184 0 56 3,764
Closure 207 59 0 0 266
Other (2) o 64 0 0 64
Radiator Reservoir 1,313 56 0 34 1,403
% 94% 4% o 2% 100%
Radiator Hose 2,217 106 0 47 2,370
% 94% 4% o 2% 100%
Other Radiator (3) o 0 34 154 188
Unspecified o 0 0 243 243Radiator (4)
Other Cooling 316 0 0 0 316System (5)
Total 17,550 1,245 69 774 19,638
% I 89% I 6% I ** I 4% I 100%(1) Explode& popped off, dislodged by vehicle motion, etc. without being touched.(2) Cap on radiator, but loose, not tightened or bad fit.(3) F~, fan bel~ grill, fumes from overheating, radiator fluid got into eyes, unintentional ingestion of radiator fluid etc.(4) Cut by/fell on, etc. or injury indirectly due to radiator.(5) Heater, heater hose, water pump, thermostat, etc.(6) Chemical or thermal burns.(7) Due to ingesting radiator antifreeze.(8) Contusions, abrasions, lacerations or fractures.* Percentages may not add to loo~o”due to rounding.** Less than 1%.
14

Table 8Estimates of Persons Injured by Motor Vehicle Radiators
By Type of Radiator Involvement and Most Injured Body RegionOctober 1993- September 1994*
m Face‘~‘“ii?‘ii?0::(6‘“tRadiator Cap 5,677 3,874 2,782 2,032 753 15,118..
% 38’% 26% 18% 13% 5% 100%
Removal 3,715 2,910 2,162 1,685 552 11,024
Ejection (1) 1,929 841 561 237 196 3,764
Closure 33 123 0 110 0 266
Other (2) o 0 59 0 5 64
Radiator Reservoir 532 541 0 15 315 1,403
% 38% 39% o 1% 22% 100%
Radiator Hose 800 456 769 184 161 2,370
% 34% 19% 32% 8% , 7% 100%
Other Radiator (3) 34 34 0 86 34 188
Unspecified Radiator (4) 80 0 0 163 0 243
Other Cooling System 116 0 182 18 0 316(5)
Total 7,239 4,905 3,733 2,498 1,263 19,638
% 37% 25% 19% 13% 6% 100%(1) Explode& popped off, dislodged by vehicle mouon, etc. without being touched.(2) Cap on radiator, but loose, not tightened or bad fit.(3) Fan, fan bel~ grill, fumes from overheating, radiator fluid got into eyes, unintentional ingestion of radiator fluid, etc.(4) Cut by/fell on, etc. or injury indirectly due to radiator.(5) Heater, heater hose, water pump, thermostat, etc.(6) Face includes eyeball, eyelid, eye are% and nose; Hand/Wrist includes fmgec Upper arm includes shoulder andelbow.* Percentages may not add to 100% due to rounding.
15
..

Table 8 (continued):Estimates of Persons Injured by Motor Vehicle Radiators
By Type of Radiator Involvement and Most Injured Body RegionOctober 1993- September 1994*
,
YE51,ower,~~::::::0“::::)-.o~Radiator Cap 461 646 659 15,118
% 3% 4% 4% 100%
Removal 405 470 568 11,024
Ejection (1) I 56 I 176 I 91 I 3,764
Closure I 01 01 01 266
Other (2) I 01 01 01 64
Radiator o 210 0 1,403Reservoir
% o 15% o 100%
Radiator Hose 106 35 129 2,370
% 5% 2% 5% 100%
Other Radiator o 34 0 188(3)
Unspecified o 0 48 243Radiator (4)
Other Cooling 153 0 0 316System (5)
Total 720 925 836 19,638
% 4% 5% 4% 100%(1) Explod~ popped off, dislodged by vehicle motion, etc. without being touched.(2) Cap on radiator, but loose, not tightened or bad fit.(3) F~, fan belt, grill, fumes from overheating, radiator fluid got into eyes, unintentional ingestion of radiator tluit etc.(4) Cut by/fell on, etc. or injury indirectly due to radiator.(5) Heater, heater hose, water pump, thermostat, etc.(6) 25%+ of Body includes 2 categories of overall injury to the body 25-50% and more than 50%; All (lher includes
head, ear, upper and lower leg, knee, fooq and toe.
16

Table 9Estimates of Persons Injured by Motor Vehicle Radiators
By Type of Radiator Involvement and Injury Severity “October 1993- September 1994*
= Minor M.::s “’:,,0.s ToM
Radiator Cap 396 13,266 1,456 15,118
% 3% 88% 10% 100%
Removal 313 9,559 1,152 11,024
Ejection(1) 83 I 304 I 3,764
Closure I 266 I 01 266
Other (2) 01 64 I 01 64
Radiator Reservoir I 48 I 1,050 I 305 I 1,403
% 3% I 75% I 22% I 100%[ 1 1 ,
Radiator Hose 871 2,178 I 105 I 2.370
% 4% 92% 4% 1009%
Other Radiator (3) 120 68 0 188
Unspecified Radiator (4) 163 80 0 243
Other Cooling System o 316 0 316(5)
Total 814 I 16,958 I 1,866 I 19,638I I I I
% 4% I 86% I 10% I 1009%
(1) Exploded, popped of, dislodged by vehicle motion, etc. without being touched.(2) Cap on radiator, but loose, not tightened or bad fit.(3) F~, fan bel~ grill, fumes from o&rheating, radiator fluid got into eyes, unintentional ingestion of radiator fluid etc.(4) Cut by/fell OILetc. or injury indirectly due to radiator.(5) Heater, heater hose, water pump, thermostat, etc.* Percentages may not add to 100% due to rounding.
17
Table 10Estimates of Persons Injured by Motor Vehicle RadiatorsBy Type of Radiator Involvement and Medical Disr)osition
October 1993- September 1994 -
T~
Radiator Cap 14,005 1,113 15,1181
z? 93% 7% 100%
?emoval 10,069 955 11,024
Zjection (1) 3,606 158 3,764
~losu.re I 266 01 266
3ther (2) I 64 I 01 64
<adiator Reservoir I 1,403 I 01 1.403
% 100% o 100%
tadiator Hose 2,300 70 2,370
b 97% 3% 100%
)ther Radiator (3) 188 0 188
UnspecifiedRadiator (4) I 243 01 243
)ther Cooling System:5) I 316 0 316
rOtd 18,455 1,183 19,638
% 94% 6% 100%
(1) Explode& popped off, dislodged by vehicle motion, etc. without being touched.(2) Cap on radiator, but loose, not tightened or bad fit.(3) F~, fan belt, grill, fumes from o~erheating, radiator fluid got into yes, unintentional ingestion of radiator fluid, etc.(4) Cut by/fell on, etc. or injury indirectly due to radiator.(5) Heater, heater hose, water pump, thermosta~ etc.
18

Table 11Estimates of Persons Injured by Motor Vehicle Radiators
By Type of Radiator Involvement, Injury Severityand Medical Disposition
October 1993- September 1994~h
Type of Radiator Medical DispositionInvolvement & Injury
Severitv Treated & Hospitalized Total
Radiator Cap (1) 14,005 1,113 15,118
Minor 396 0 396
Moderate I 13,082 I 184 I 13,266
Serious 527 929 1,456
RadiatorReservoir 1,403 0 1,403
Minor I 48 I 01 48
Moderate I 1,050 I 01 1,050
Serious 305 0 305
Radiator Hose 2,300 70 2,370
Minor 87 0 87
Moderate ‘2,178 o 2,178
Serious I 35 I 70 I 105I I
All Other Radiator I 747 I 01 747
Minor I 283 I 01 28?
Moderate I 464 I 01 464
Serious I o 0 (
Total 18,455 1,183 19,63$I 1 I
Minor 814 0 814I I I
Moderate I 16,774 I 184 ! 16,95$
Serious 867 I 999 I l,86f
(1) Cap removal, ejection, C1OSWWloose or badly fitting cap.(2) Other and unspecified radiatoq other cooling system.
19

Table 12Estimates of Persons Injured by Motor Vehicle RadiatorsBy Type of Radiator Involvement and Season of the Year
October 1993- September 1994*
B FM winter “’s:::” “~er Tot~
Radiator Cap 3,742 1,702 2,981 6,693 15,118
% 25% 11% 20% 44% 100’%
Removal 2,937 1,254 2,151 4,682 11,024
Ejection (1) 679 342 824 1,919 3,764
Closure 128 106 0 32 266
Other (2) o 0 0 64 64
Radiator Reservoir 196 159 185 863 1,403
% 14% 11% 13% 62% 100%
Radiator Hose 436 181 968 785 2,370
% 18% 8% 41% 33% 100%
Other Radiator 85 0 35 68 188
Unspecified Radiator 65 17 113 48 243(4)
Other Cooling System o 0 136 180 316(5)
Total 4,524 2,059 4,749 8,637 19,638
% 23% 11% 23% 44% 100%
(1) Exploded, popped off, dislodged by vehicle motiou etc. without being touched.(2) Cap on radiator, but loose, not tightened or bad fit.(3) Fan, fan bel~ grill, fumes from overheating, radiator fluid got into eyes, unintentional ingestion of radiator fluid, etc.(4) Cut by/fell ou etc. or injury indirectly due to radiator.(5) Heater, heater hose, water pump, thermostat, etc.* Percentages may not add to 10W due to rounding.
20
Injuries Asso .ciated mth Motor Vehicle Batterv EXDIosions
During the 12-month period October 1993 through September 1994, data from 134 casesof injuries associated with motor vehicle batteries were obtained from NEISS. Based upon these134 cases, an estimated 7,051 persons were treated in hospital emergency rooms for injuriesresulting from an activity involving motor vehicle batteries nationwide during the 12-month studyperiod. The types of injuries sustained can be described by five general categories: batteryexplosions, chemical burns and/or contamination resulting from contact with battery acid, musclestrains and/or crush-type injuries associated with lifting or dropping the battery, and electricalshock from contacting battery cables and/or posts. Persons injured as a result of batteryexplosions, the type of injury of particular interest to NHTSA, comprised the largest of these fivegeneral categories. An estimated 2,280 persons (32% of 7,051 motor vehicle battery injuries)were injured as a direct result of a motor vehicle battery explosion. Tables 1 through 5 provideadditional details on the persons injured as a result of motor vehicle battery explosion during theperiod October 1, 1993- September 30, 1994 by the action which produced the injury, the regionof the body most severely injured, the injury diagnosis, the injury severity, and the age of theinjured person, respectively. (The percentages may not add to 1009ZOin every table due torounding.)
Thirty-one percent (31%) of the persons injured by battery explosions were charging thebattery (702 persons injured), as shown in Table 13. More than one-fourth (26%) of the injurieswere associated with an activity involving the battery cables (replacing, securing, or tightening).An almost equal number of persons were injured as a result of “jump starting” the battery (19%)or checkinzadding fluid ( 19’?40).Unfortunately, it is not known what activity led to the injury forabout 5%of the persons injured.
21

Table 13Estimated Number of Persons Injured by Motor Vehicle Battery “
Explosions by Injury Producing ActionOctober 1993-September 1994
, ,Injury Producing Action Estimated % Total
No. OfPersonsIniured
~hargingBattery 702 I 31%1 1
.eplacing, Securing, or 581 26%ightening Cables
Imp Starting Battery I I 19%
I@cing Fluid Level I 442 19%rid/or Adding Water
Mcnown I 111 I 5%
‘Otal I 2,280 I 10090
Table 14Estimated Number of Persons Injured by Motor Vehicle
Battery Explosions by fijury DiagnosisOctober 1993-Ser)tember 1994
Diagnosis Estimated % TotalNo. OfPersonsInjured
Chemical 1,421 62%Burns
Contusion or 185 8%Abrasion
Laceration 475 21%
Conjunctivitis 199 9%
Total 2,280 100%
22

The majority (62%) of the 2,280 persons estimated to have been injured by motor vehiclebattery explosions were diagnosed as having chemical burns [Table 14]. Twenty-one percent(21%) of the persons injured were diagnosed with lacerations. Almost three-fourths (72%) ofthose injured suffered an eye injury [Table 15]. Unfortunately, a sizeable portion (43%) of thepersons injured were diagnosed as having a serious injury [Table 16]. None of the 2,280 personsinjured, however, were hospitalized. This may be misleading, as 80% of the persons injured (43%+ 37%) were diagnosed as having a serious or moderate injury [Table 16], indicating that whilehospitalization may not have been warranted, further medical treatment would probably benecessary.
Table 15Estimated Number of Persons Injured by Motor Vehicle
Battery Explosions by Most Injured Body RegionOctober 1993-September 1994
Body Region Estimated No. %TotalInjured Of Persons
Injured
Eye 1,648 72%
Face 501 22%
All Other 131 6%(Including Head,Hands, Fingers)
Total 2,280 100%
23
Table 16Estimated Number of Persons Injured by Motor Vehicle
Battery Explosions by Injury SeverityOctober 1993-September 1994
Injury Estimated %TotalSeverity No. Of
PersonsInjured
Minor 464 20%
Moderate .844 37%
Serious 972 43%
Total 2,280 100%
24
I
Iniuries Associated with Motor Vehicle Power Windows
During the 12-month study period October 1993 through September 1994, data on 10cases of injuries associated with motor vehicle power windows were obtained from CPSC’SNEISS. Based upon these 10 cases, an estimated 499 persons were treated in hospital emergencyrooms for injuries associated with motor vehicle power windows nationwide during the twelvemonth study period. Ninety-three percent (465/499) of the injured persons were injured inconnection with passenger car power windows. Ninety-one percent (456/499) of those injuredwere treated and released from the emergency room without hospitalization. Tables 17 through21 provide additional details on the estimated number of persons injured during the periodOctober 1993- September 1994 by the action which produced the injury, the region of the bodymost severely injured, the injury diagnosis, the injury severity, and the age of the injured person,respectively. (Percentages may not add to 1007oin every table due to rounding.)
.,
As shown in Table 17, 88% of the estimated 499 persons injured were injured as a resultof [unintentionally] closing the power window on a finger, wrist, or hand (either one’s own oranother person’s). Another 4% were injured as a result of attempting to work on or repair thewindow and/or was cut by broken glass. Just under 9?%0attributed the cause of the injury to a“faulty” power window. Table 18 presents data on the diagnosis of the injury sustained by theestimated 499 persons injured. A large proportion were diagnosed as having a fracture (3890) orhad a body part considered as crushed (30%).
25

Table 17Estimated Number of Persons Injured by Motor Vehicle Power
Windows by Injury Producing Actionoctoher 1993-Sentemher 1994*
Injury ProducingAction
Closing Window on aHand, Wrist, or Finger
Faulty Power Window
Working on PowerWindow and/or Cut byBroken Glass
Total.-
.J------- --—. --
r437 88%
=
43 9%
19 4%
I
499 I 100%.,---- .,
+ Percentages may not actcito 1WYOdue to rourmmg.
Table 18Estimated Number of Persons Injured by Motor Vehicle
Power Windows by Injury DiagnosisOctober 1993-September 1994
Diagnosis Estimated % TotalNo. OfPersonsInjured
Fracture 192 38%
Crushing I 150 I 30%
Contusion or 77 15%Abrasion
Dislocation I 43 I 9%
Laceration I 19 I 4%
Strain or 18 4%Sprain
Total 499 I 100%
26

For the majority of the 499 persons estimated to have been injured by power windows, the bodyregion most severely injured was a finger (77%). In fact, all of the injuries sustained were confined to aportion of an upper extremity (finger, wrist, or hand). These data are presented in Table 19. As seen inTable 20, more than half (53%) of the injuries sustained were considered “minor.” The majority (64%) ofthe persons injured were children under the age of fiiteen, with half of these being less than six years ofage. Table 21 presents data on the age of the injured person.
Table 19Estimated Number of Persons Injured by Motor Vehicle
Power Windows by Injured Body RegionOctober 1993-September 1994
Body Estimated ‘%TotalRegion No. OfInjured Persons
Injured
Finger 384 . 77%
wrist 61 12%
Hand 54 11%
Total 499 100%
Table 20Estimated Number of Persons Injured by Motor Vehicle
Power Windows by Injury SeverityOctober 1993-September 1994
Severity of Estimated %TotalInjury No. Of
Personshjured
Minor 264 53%
Moderate 235 47%
Total 499 100%
27

Table 21Estimated Number of Persons Injured by Motor Vehicle’
Power Windows-by AgeOctober 1993-SeI.)tember1994*
Age of Estimated 9%TotalPerson No. Of
PersonsInjured
0-5 Years 158 32%
6-14 Years 158 32%
15-29 68 14%Years
30-44 38 8%Years
45-59 43 9%Years
Over 60 34 7%Years
Total 499 100%
*Percentages maynot add to IOOYodueto rounding.
28
Iniuries Associated with Motor Vehicle Power Roofs
One case of an injury associated with a motor vehicle power roof was obtained from CPSC’SNEISS during the 12-month study period of October 1993- September 1994. As this case involvedejection through a power roof due to a motor vehicle crash, it may not be related to a hazard ormalfunction associated with the power roof use and/or operation. When projected to the national level,this case represents 34 similar injury cases treated in hospital emergency rooms in the U.S. during this 12-month study period.
29

Referenc~
1. U.S. Consumer Product Safety Commission, Division of Hazard and Injury Data Systems: “NEISS -The National Electronic Injury Surveillance System. A Description of Its Role in the U.S. ConsumerProduct Safety Commission,” March 1990, pp. 1-10.
2. U.S. ConsumerProductSafety Commission, Division of Hazardand InjuryData Systems: “TheNEISSSample (Design and Implementation),”March 1986 (Revised February, 1994), pp. 22-23.
3. Annest JL, Mercy JA, Gibson DR, Ryan GW. “NationalEstimates of Nonfatal Firearm-RelatedInjuries. Beyond the Tip of the Iceberg,”Journalof the American Medical Association, June 14, 1995, Vol273, N0.22, pp. 1749-1754.
30
APPENDIX AThe NationalElemomc lnmrv Smeillance Svstem. .
Q!eIYiwThe U.S. Consumer Product Safety Commission (CPSC) currently operates a national probability survey ofhospital emergency departments, designated the National Electronic Injury Surveillance System (NEISS),in order to monitor consumer products involved in injury-producing incidents. This system enables CPSCto make national estimates of the number, type and severity of injuries associated with specific consumerproducts. The current NEISS provides for three (3) levels of data collection: surveillance of hospitalemergency room injuries; follow-back telephone interviews with injured persons or informed respondentsregarding the incident and more comprehensive on-site investigations with injured persons and/orwitnesses to the incident. One, two or all three levels are used by the CPSC as primary data collectiontools. Each level is described below:
1. -Surv” * - The NEISS is a surveillance-type reporting system in that it continuouslymonitors product-related injuries treated in NEISS hospital emergency rooms. These injuries arereported daily, 365 days a year. Data collection begins when the patient tells a clerk, nurse orphysician how the injury occurred, and this information is then placed in the patient’s medicalrecord. At the end of the day, a NEISS data coder reviews the medical records and extracts thefollowing routine or core data from each in-scope study case:
o0000000000
treatment datehospital identifiercase record numberage and sex of victiminjury diagnosis and body region injuredmedical disposition of case (treated & released, etc.)incident locale (home, street, farm, etc.)fme and/or motor vehicle involvementidentification of up to 2 specitlc products involvedindication of whether a third product was involvedtwo lines of free-text comments describing how the injury occurred as stated in themedical record
Except for the free-text comments which are entered as-is, these data are entered in coded forminto a personal computer at the hospital, computer-edited for coding accuracy, checked forcompleteness and timeliness of reporting, then transmitted via modem hookup to the NEISS database at CPSC headquarters in Washington, DC. Data are transmitted nightly and thus becomeimmediately available to CPSC staff for review and analysis.
NEISS is also available for special studies involving product-related cases of particular interest, orinjury cases that are actually non product-related. For these studies, the additional informationneeded is gathered by the hospital emergency room staff, coded as required by the NEISS data
A-1

coders, computer-edited, etc., and entered into the NEISS system as “special study” data along .with the routine surveillance data noted above.
2. Telephone Follow-Back Interviews -In general, less than one percent of product-relatedsurveillance cases are selected for follow-back investigation. This percentage, however, may bemuch greater for a NEISS special study. These investigations are based on telephone interviewswith victims, witnesses to, or knowledgeable respondents reg~ding, the incident. The purpose isto gather additional information about the sequence of events, human behavior and role ofconsumer product(s) in the incident. These investigations also describe the environrnen~ the victim(including injury and medical treatment), and the consumer product(s) involved. The interview isconducted using either a structured questionnaire containing a series of questions, or a guidelinedesigned to gather more extensive information pertinent to the specific product and its involvementin the incident.
.!
3. On-Site Follow-Ba@ Invest. .g.ahsms - For selected cases requiringfurtherdetail, an on-site
investigation is conducted. This is to obtainvery specific and fully reliable informationabouttheconsumerproductand its role in the incident, the sequence of events involved, humanbehavior, thevictim, and the environmentin which the injuryoccurred. Photographsmay be taken of the victim,the product and where the injuryoccurred. The productmay be examined or collected forlaboratorystudy. Reconstruc~on of the incident is frequently performedby talking to the victim,victim’sfamily, witnesses, attendingmedicalpersonnelor anyone else having knowledge of thefactorsinvolved. Police, fire and coroner’sreportsmay be examined andincluded in theinvestigator’sreport.
A-2
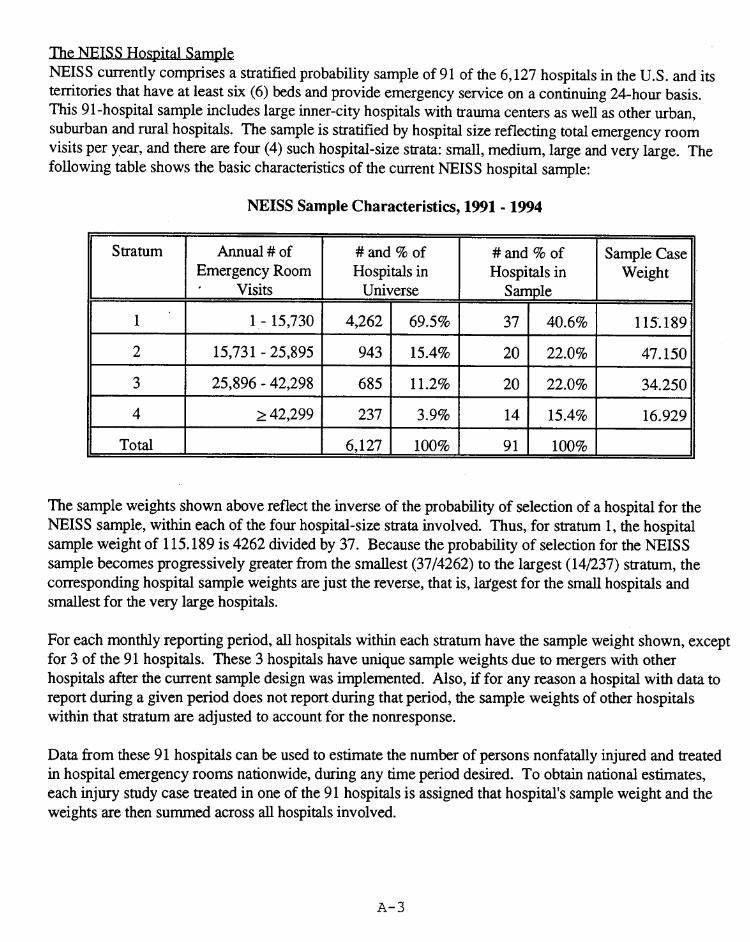
e NEISS Ho~tal SamdeNEISS currently comprises a stratified probability sample of 91 of the 6,127 hospitals in the U.S. and itsterritories that have at least six (6) beds and provide emergency service on a continuing 24-hour basis.This 91-hospital sample includes large inner-city hospitals with trauma centers as well as other urban,suburban and rural hospitals. The sample is stratified by hospital size reflecting total emergency roomvisits per year, and there are four (4) such hospital-size strata: small, medium, large and very large. Thefollowing table shows the basic characteristics of the current NEISS hospital sample:
NEISS Sample Characteristics, 1991-1994
Stratum Annual #of # and % of # and % ofEmergency Room Hospitals in Hospitals in# Visits Universe Sample
1’ 1-15,730 4,262 69.5% 37 40.6%
2 I 15,731-25,895 I 943 I 15.4% I 20 I 22.0%
3 I 25,896-42,298 I 685 I 11.2% I 20 I 22.0!%
4 I >42,299 237 I 3.9% I 14 I 15.4%
Total I 6,127 I 100% I 91 I 100%
Sample CaseWeight
115’.189
47.150
34.250
16.929
The sample weights shown above reflect the inverse of the probability of selection of a hospital for theNEISS sample, within each of the four hospital-size strata involved. Thus, for stratum 1, the hospitalsample weight of 115.189 is 4262 divided by 37. Because the probability of selection for the NEISSsample becomes progressively greater from the smallest (37/4262) to the largest (14/237) stratum, thecorresponding hospital sample weights are just the reverse, that is, la.tgest for the small hospitals andsmallest for the very large hospitals.
For each monthly reporting period, all hospitals within each stratum have the sample weight shown, exceptfor 3 of the 91 hospitals. These 3 hospitals have unique sample weights due to mergers with otherhospitals after the current sample design was implemented. Also, if for any reason a hospital with data toreport during a given period does not report during that period, the sample weights of other hospitalswithin that stratum are adjusted to account for the nonresponse.
Data from these 91 hospitals can be used to estimate the number of persons nonfatally injured and treatedin hospital emergency rooms nationwide, during any time period desired. To obtain national estimates,each injury study case treated in one of the 91 hospitals is assigned that hospital’s sample weight and theweights are then summed across all hospitals involved.
A-3

1. Injury estimates based on NEISS data collection are necessarily conservative for the followingreasons:
a) NEISS is limited to data on injuries treated in hospital emergency departments and, for thisreason, an undeterminable number of injury cases are continually excluded from the NEISS sample.Patients with injuries that are untreated or treated in other types of medical care systems will bemissed through NEISS. NEISS excludes not only smaller hospitals, those without emergencydepartments or with less than six beds, but all walk-in clinics such as urgent/emergency/family carecenters, most managed health care providers such as HMOS (though the NEIS S sample doesinclude a few HMO hospitals), and physicians in private practice.
b) An undeterminable number of injury cases treated at NEISS hospital emergency rooms thatproperly belong to a study based on NEISS data may not be included in that study (by the NEISSdata coders). This is generally due to missing or incomplete information in the emergency roommedical record regarding details of the accident. These are the so-called “missed” NEISS cases,usually a very small number compared to the far larger category of fully identifiable, relevant injurycases excluded from the NEISS sample, as noted in item a) above.
2. Even though an injury case has been fully identified as a NEISS study case, there maybe limitationsto the information obtained about that case fi-omthe hospital emergency room medical record.Study protocols involving NEISS data collection generally require orientation of emergency roomstaff regarding documentation of appropriate case study data. Complete documentation, however,may not be done, may be done improperly, or may not even be possible. Note that a patient in needof resuscitation or immediate surgery may not be able to provide all (or even any) details of theaccident (reference 3).
3. CPSC normally does not automate any of the information obtained from telephone or on-sitefollow-back investigations. The completed investigation reports are generally delivered to the user,as-is, in hard-copy format. There are two problems in this regard:
a) Because this additional case information is routinely not included in the NEISS data base, theuser must then perform the task of incorporating, if necessary, these hard-copy data with theautomated files of NEISS injury surveillance/special study data obtained horn CPSC at theconclusion of data collection.
b) Data obtained from the follow-back investigation(s) may not always agree with correspondingsurveillance or special study data obtained from the emergency room medical record. Thisdisagreement in corresponding data items may require the usage of, say, the follow-back data asbasic “control” data for the analysis of all NEISS data. This procedure is equivalen~ statistically, tousage of a subsample within the NEISS data sample.
4. The NEISS core data (surveillance+ special study) may have discrepancies. This is especially true
A-4

for the special study data which should be in agreement with corresponding data items reflected inthe free-text comments of surveillance data that describe the injury incident.
5. Some of the patients treated in NEISS hospital emergency rooms with injuries severe enough torequire hospitalization may die in the hospital. These medical outcomes, however, may not be fullyupdated in the NEISS data base. At the time of admittance to the emergency room, patients arecategorized as nonfatally injured at some level of severity. Thus, based on NEISS data, estimatesof persons nonfatally vs. fatally injured (and treated in hospital emergency rooms) may be inflatedto some extent on the one hand, and deflated on the other, depending on the nature and severity ofinjuries involved (reference 3).
6. NEISS cannot provide data for estimates of injuries treated in hospital emergency rooms on a stateor local regional basis. NEIS S currently can provide these data only for nationwide estimates.
A-5
APPENDIX BSA Spec al Studyi Data Varia~
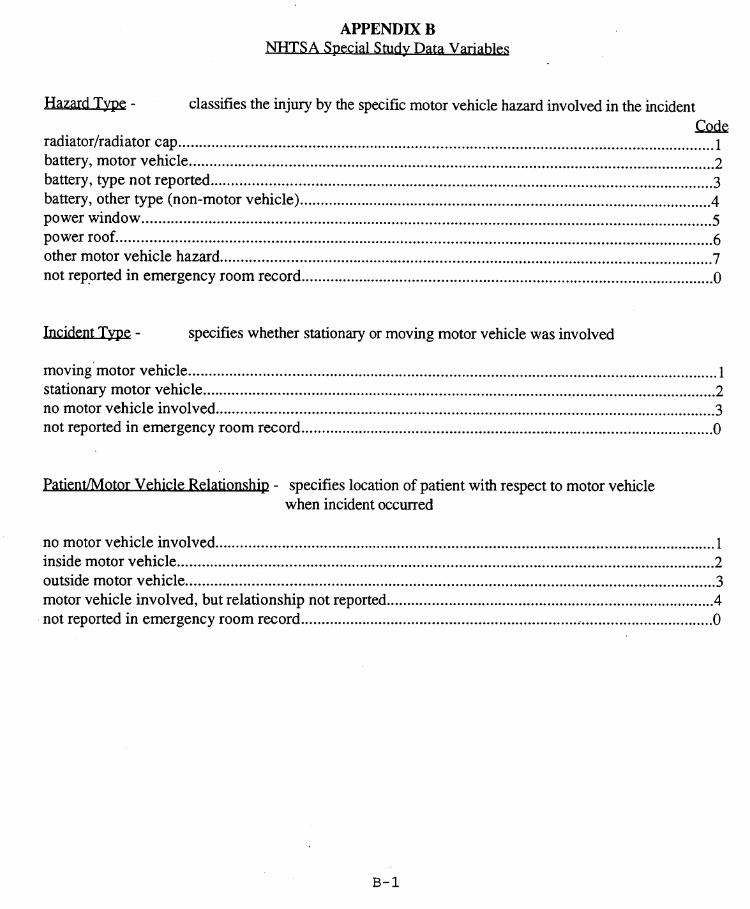
~- classi.ties the injury by the specific motor vehicle hazard involved in the incidentCode
radiator/radiator cap .................................................................................................................................1battery, motor vehicle ...............................................................................................................................2battery, type not reported .........................................................................................................................3battery, other type (non-motor vehicle) ....................................................................................................4power window .........................................................................................................................................5power roof ............................................................................................................................................... 6other motor vehicle hazard .......................................................................................................................7not reported in emergency room record ....................................................................................................0
t Type - specifies whether stationary or moving motor vehicle was involved
moving’motor vehicle ................................................................................................................................1stationary motor vehicle ............................................................................................................................2no motor vehicle involved .........................................................................................................................3not reported in emergency room record ....................................................................................................O
nt.lhlotor Vehicle R~ - specifies location of patient with respect to motor vehiclewhen incident occurred
B-1
no motor vehicle involved .........................................................................................................................1inside motor vehicle ..................................................................................................................................2outside motor vehicle ................................................................................................................................3motor vehicle involved, but relationship not reported ................................................................................4not reported in emergency room record ....................................................................................................O
I

Motor Vehicle Bodv TvD~- classtiles the injury by the body style of the involved vehicle
automobile .......................................................................................................................................... 1motorcycle .......................................................................................................................................... 2bus ......................................................................................................................................................3van ................................................................................................................................................ ......4pickup truck ........................................................................................................................................5other light truck (not pickup) ...............................................................................................................6heavy mck ..........................................................................................................................................7truck, typ,e not reported .......................................................................................................................gother motor vehicle (not specified above) ............................................................................................9not reported in emergency room record ...............................................................................................0
Jnjured Person- specifies the person type of the patient with respect to the involved motor vehicle
driver ............................................................................................................................................ ....... 1passenger ............................................................................................................................................ .2occupant, type not reported in emergency room record ........................................................................3pedestrian ............................................................................................................................................ 4pedalcyclist ..........................................................................................................................................5other nonoccupant of a motor vehicle ..... .............................................................................................6not reported in emergency room record ...............................................................................................O
Patient at Wosk - identifies work-related motor vehicle incidents
yes .......................................................................................................................................................lno............................................................................................................................................ ............ 2not reported in emergency room record ...............................................................................................O
t Usual Occ-
(Free-text response such as engineer, secretary, truck driver, retired, student, none, etc.)
B-2
I

APPENDIX C’Telephone Follow-Back Questionnaire
GENERAI , OUESTTONS
14
2.
3.
4.
I understand that (you were/the victim was) treated at Hospital on (date) for aninjury that involved a motor vehicle (radiator, battery, power window or power roof)? Isthat correct?
1 yes (continue)2 no (stop after obtaining correct product information)9 don’t know (ask if anyone else in household lmows more about the incident and can respond.
If necessary, setup time to call back.)
Respondent is:
1 injured person (skip to question 2)2 parent of an injured child under 163 other specify:
Respondent:
1 witnessed the incident2 did not witness the incident
Please tell me how the incident happened.during and after the incident happened?
That is, what (were you/was the victim) doing before,
Was the vehicle in the incident owned by (your/the victim’s) household?
1 yes2 no Who owns the vehicle?3 no vehicle was involved9 don’t know
What is the year of the motor vehicle? 19_
9 don’t knowPlease estimate the age of the vehicle,speci@ing years or months.
c-1

5. Who is the manufacturer or what is the make of the vehicle?
9 don’t know
6. What is the vehicle model name or number?
9 don’t know
DIATORS
1. Which part of the vehicle’s cooling system was involved in the incident such as the radiator, radiatorcap, radiator hoses, water pump, heater hoses or something else? (Multiple responses allowed.)
1 radiator2 radiator cap3 radiator hoses4 water pump5 heater hoses6 something else9 don’t know
Specify:
w: If respondent’s answer is 3-9, skip to question 7.
2. Did the incident involve opening or closing the radiator, or did it involve something else?
1 opening2 closing3 something else Specify:9 don’t know
3. Did the incident involve removing or putting on the radiator cap, or did it involve something else?
1removing2 putting on3 something else Specify:(skip to question 7)9 don’t know (skip to question 7)
c-2

4. Was this the radiator cap that came with the vehicle when the vehicle was new, or was this a radiatorcap that had been replaced at some time?
‘1 radiator cap that came with vehicle when vehicle was new2 replacement cap9 don’t know
5.
..1 yes2 no
Was there a pressure release valve on this radiator cap?handle on the radiator cap.
(skip to question 7)
The pressure release valve is a little red
9 don’t know (skip to question 7)
6. Did (you/the victim) open this release valve by lifting up on it just before removing/putting on theradiator cap?
1 yes2 no9 don’t know
7. Was the motor running when the incident occurred, or had the motor been cut off.before it occurred?
1 running2 cut off9 don’t know
8. Was the motor (radiator) cool or just a little warm, hot from running, or was it actually overheated?
1 cool or just a little warm2 hot from running3 overheated9 don’t know
9. Did the radiator boil over?
1 yes2 no (skip to question 11)9 don’t know (skip to question 11)
c-3
10. Did the radiator boil over with so much force that it seemed to explode or blow up?
1 yes2 no9 don’t know
11. Was the injury caused by hot radiator fluid or steam that burned (you/the victim), or by somethingelse that made contact with (you/the victim)?
1 hot radiator fluid or steam2 something else Specify:9 don’t know
12. (Were you/was the victim) the driver, a passenger in the vehicle, or someone else?
1 driver2 passenger3 someone else Specify:9 don’t know
J3attery F.xplosions
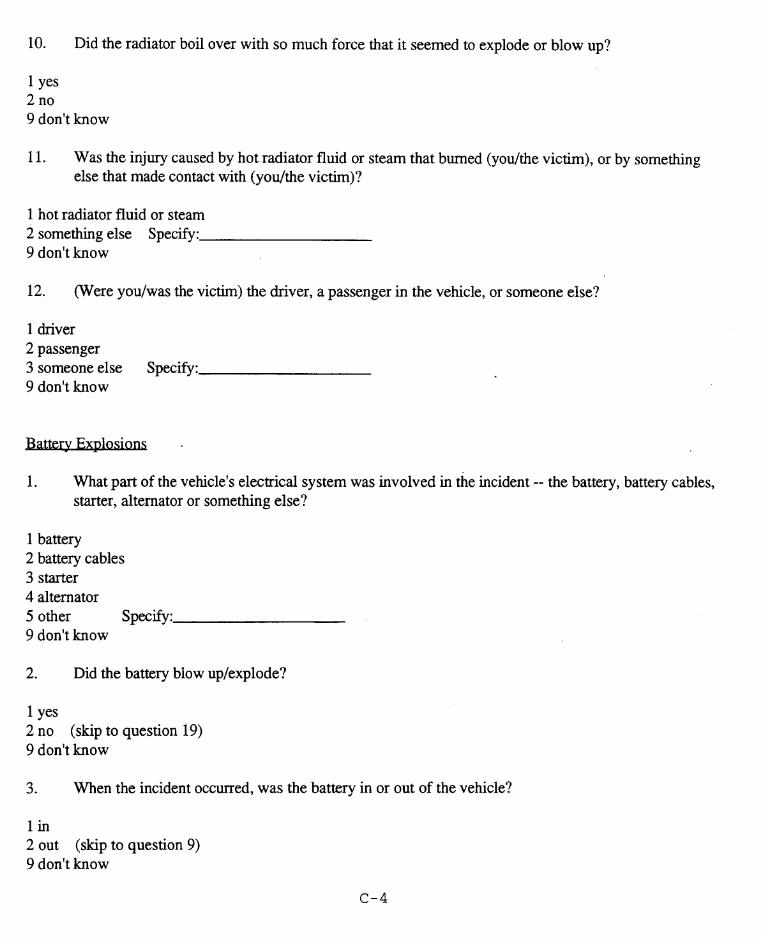
1. What part of the vehicle’s electrical system was involved in the incident -- the battery, battery cables,starter, alternator or something else?
1 battery2 battery cables3 starter4 alternator5 other specify:9 don’t know
2. Did the battery blow up/explode?
1 yes2 no (skip to question 19)9 don’t know
3. When the incident occurred, was the battery in or out of the vehicle?
lin2 out (skip to question 9)9 don’t know
c-4

4. Were the keys in the ignition W was the ignition turned to the “on” or “start” position?
1 yes2 no (skip to question 6)9 don’t know
5. Was the motor running when the incident occurred?
1yes2 no9 don’t know
6. Was the battery involved in jump-starting, that is, did this battery have cables that were attached to itand to the battery of another vehicle?
1 yes2 no (skip to question 9)9 don’t know (skip to question 9)
7. How were the jumper cables hooked up? Were m connected to the battery, or was there mdy onecable to the battery while the other was attached to the vehicle itself or to the motor?
1M cables were attached to the battery2 ~ cable was attached9 don’t know
8. Did the explosion
to the battery and the other was attached to the vehicle or motor
occur before jumping (while the cables were being hooked up to the battery),during jumping, or after jumping (while the cables were being removed from the battery)?
1 before jumping while the cables were being hooked up2 during jumping3 after jumping while the cables were being removed9 don’t know
(W: after respondent answers this question, skip to question 15)
9. Was the battery being charged, that is, were cables from a battery charger hooked up to the battery?
1 yes2 no (skip to question 12)9 don’t know (skip to question 12)
c-5

10. Did the explosion occur before charging (while the cables were being hooked up to the battery),during charging, or m charging (while the cables were being removed from the battery)?
1 before charging while the cables were being attached2 during charging (skip to question 15)3 after charging while the cables were being removed9 don’t know
11. Was the battery charger turned on and working when the explosion happened?
1 yes2 no9 don’t know
(~: after respondent answers this question, skip to question 15)
12. Was some other work being done that involved the battery?
1 yes2 no (skip to question 14)9 don’t know (skip to question 14)
13. What work was being done -- cleaning or replacing the battery or battery cables, using the battery totest some other electrical part, working on some other part of the electrical system such as the starteror alternator or something else?
1 cleaning the battery or battery cables2 replacing the battery or battery cables3 testing an electrical part of the vehicle4 working on the starter5 working on the alternator6 someth~g else9 don’t know
14. Was thereor electric
Specify:
aflame or electric spark close to the battery when it exploded, such as from an acetylenewelding torch, or from a stove or space heater?
1 yes, a flame/spark Specify:2 no9 don’t know
C-6

15. Was there a lighted cigarette, cigar or pipe close to the battery when it exploded?
1 yes Specify:2 no9 don’t know
16. Was the injury associated with the battery explosion, or with something else?
1 battery explosion2 something else Specify:9 don’t know
17. What was the “make” of the battery?
9 don’t know
18. What was the approximate age of the battery?
months
years9 don’t know
19. Was the injury caused by battery fluid (acid) that made contact with (you/the victim), by flames thatburned (you/the victim), by both battery fluid and flames, or was the injury caused by somethingelse?
1 battery fluid2 flames3 both battery fluid and flames4 something else Specify:9 don’t know
20. (were you/was the victim) the driver, a passenger in the vehicle, or someone else?
1 driver2 passenger3 someone else Specify:9 don’t know
c-7

POWER-OPERATEDWINDOWS1. Was the incident associated in any way with a power-o- or manuallv-oDeratec1window of the
vehicle? (Note that power-operated windows are controlled by a push-button or electric switch,whereas manually-operated windows are controlled by hand, usually by turning a handle or moving alatch.)
1 power-operated window2 manually-operated window9 don’t know
2. Was the incident associated with opening or closing the window, or doing something else with or tothe window (such as working on it)?
1 opening2 closing ,.
3 something else Specify:9 don’t know
3. Did (you/the victim) or someone else open/close or do something else with or to the window?
1 you/the victim2 someone else Specify:9 don’t know
4. Did the incident occur while (you were/the victim was) inside or outside the vehicle?
1 inside2 outside9 don’t know
5. Were the keys in the ignition A was the ignition in the “on,” “start” or “accessory” position whenthe incident occurred?
1 yes (keys in ignition and turned to “on,” “start” or “accessory” position)2 no9 don’t know
6. Was the vehicle moving when the incident occurred?
1 yes2 no9 don’t know
c-8
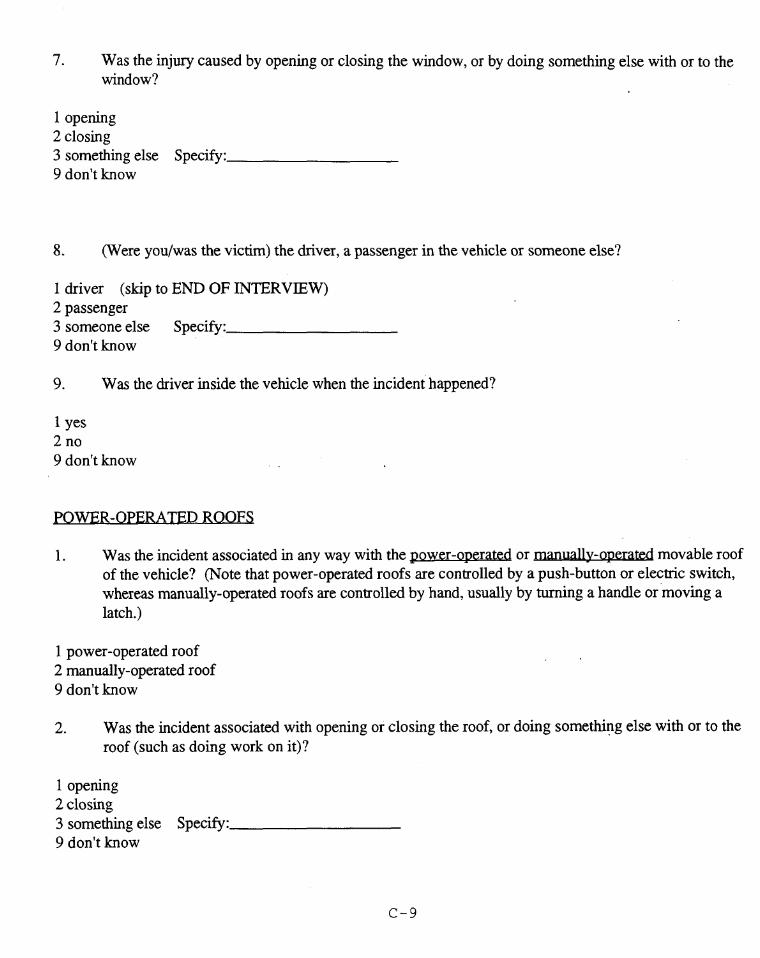
7. Was the injury caused by opening or closing the window, or by doing something else with or to thewindow?
1 opening2 closing3 something else Specify:9 don’t know
8. (Were you/was the victim) the driver, a passenger in the vehicle or someone else?
1 driver (skip to END OF INTERVIEW)2 passenger3 someone else Specify:9 don’t know
9. Was the driver inside the vehicle when the incident happened?
1 yes2 no9 don’t know
1. Was the incident associated in any way with the power-operated or maaually-operated movable roof
12
of the vehicle? (Note that power-operated roofs are controlled by a push-button or electric switch,whereas manually-operated roofs are controlled by hand, usually by turning a handle or ‘moving alatch.)
power-operated roofmanually-operated roof
9 don’t know
2. Was the incident associated with opening or closing the roof, or doing something else with or to theroof (such as doing work on it)?
1 opening2 closing3 something else Specify:9 don’t know
c-9

3. Did (you/the victim) or someone else open/close or do something else with or to the roof?
1 you/the victim2 someone else Specify:9 don’t know
4. Did the incident occur while (you were/the victim was) inside or outside the vehicle?
1 inside2 ou~~ide9 don’t know
5. Were the keys in the ignition M was the ignition in the “on,” “start” or “accessory” position whenthe incident occurred?
1 yes (keys in ignition and ignition in the “on,” “start” or “accessory” position)2 no9 don’t know
6. Was the vehicle moving when the incident occurred?
1 yes2 no9 don’t know
7. Was the injury caused by opening or closing the roof, or by doing something else with or to the roof?
1 opening2 closing3 something else Specify:9 don’t know
8. (Were you/was the victim) the driver, a passenger in the vehicle or someone else?
1 driver (skip to END OF INTERVIEW)2 passenger3 someone else Specify:9 don’t know
9. Was the driver inside the vehicle when the incident occurred?
1 yes2 no9 don’t know
c-lo
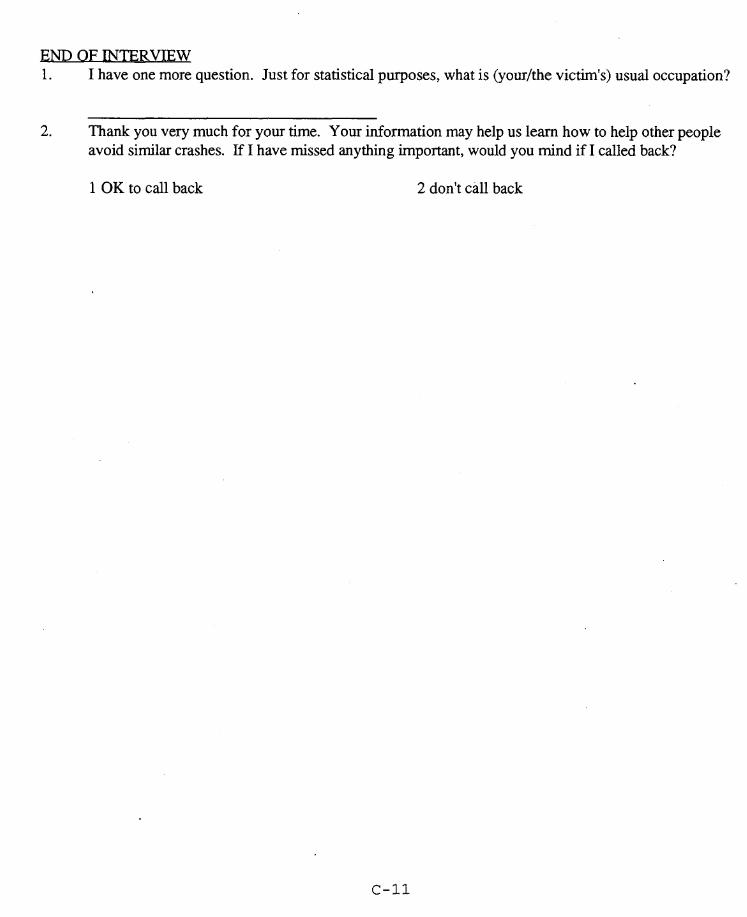
F.ND OF INTERVIEW1. I have one more question. Just for statistical purposes, what is (your/the victim’s) usual occupation?
2. Thank you very much for your time. Your information may help us learn how to help other peopleavoid similar crashes. If I have missed anything important, would you mind if I called back?
1 OK to call back 2 don’t call back
C-II