influence of internal curing and viscosity modifiers on resistance to sulfate attack
TRANSCRIPT
ORIGINAL ARTICLE
Influence of internal curing and viscosity modifierson resistance to sulfate attack
Dale P. Bentz • Jeffrey M. Davis • Max A. Peltz •
Kenneth A. Snyder
Received: 28 February 2013 / Accepted: 19 April 2013
� RILEM 2013
Abstract Sulfate attack is one of the common
degradation mechanisms for concrete in severe envi-
ronments. While various strategies for minimizing
sulfate attack are well recognized, including using an
ASTM C150 Type V cement, employing supplemen-
tary cementitious materials, and/or reducing water-to-
cementitious materials ratio, this paper explores two
new approaches for increasing a mortar’s resistance to
sulfate attack. In internal curing, fine lightweight
aggregates (LWAs) are pre-wetted to provide addi-
tional curing water to maximize cement hydration and
enhance the microstructure of the interfacial transition
zone. The concurrent reductions in connected porosity
should contribute to a reduction in the transport rates
of sulfate from the environment into the concrete,
while the isolated pores present in the LWA may help
to accommodate the formation of expansive degrada-
tion products, such as ettringite, without creating
substantial stresses and subsequent cracking. In the
second approach, previously verified for its efficacy to
reduce chloride ingress, a viscosity modifier is added
to the concrete mixture to increase the viscosity of the
pore solution and thus slow down the ingress of
sulfates from the environment. While each approach is
observed to significantly reduce the measured expan-
sion of mortar bars in standard ASTM C1012 testing,
the best performance is observed when the two are
combined together by pre-wetting the LWA with a
50:50 solution of the viscosity modifier in water. With
the combined approach, the time for the mortar bars to
reach a critical expansion level of 0.05 % was over
80 % longer than that measured for the control mortar
specimens. The expansion measurements are sup-
ported by accompanying measurements of mortar bar
mass and surface resistivity throughout their exposure
to the sulfate solution, along with micro X-ray
fluorescence imaging and X-ray microtomography
analysis of specimens extracted from the mortar bars
after 9 months of exposure to the sulfate solution.
Keywords Durability � Internal curing �Micro X-ray
fluorescence � Shrinkage-reducing admixture � Sulfate
attack � Viscosity modifier
1 Introduction
Sulfate attack is a common degradation mechanism
for concretes in certain geographic locations with the
United States [1]. Best practices to minimize the
effects of sulfate attack include specifying an ASTM
D. P. Bentz (&) � M. A. Peltz � K. A. Snyder
Engineering Laboratory, Materials and Structural Systems
Division, National Institute of Standards and Technology,
100 Bureau Drive, Stop 8615, Gaithersburg,
MD 20899-8615, USA
e-mail: [email protected]
J. M. Davis
Material Measurement Laboratory, Materials
Measurement Science Division, National Institute of
Standards and Technology, 100 Bureau Drive, Stop 8615,
Gaithersburg, MD 20899-8615, USA
Materials and Structures
DOI 10.1617/s11527-013-0081-x
C150 Type V cement [2], replacing a portion of the
cement in the concrete mixture with fly ash, and/or
reducing the water-to-cementitious materials ratio
(w/cm) of the concrete mixture, the latter typically
producing reduced transport coefficients in the field
concrete so as to limit the ingress of sulfates from the
surrounding soils. Recently, a new paradigm has been
introduced for reducing ionic transport and sorption of
concrete by modifying the viscosity and surface
tension of the concrete pore solution [3–6]. This new
technology has been given the acronym VERDiCT,
standing for Viscosity Enhancers Reducing Diffusion
in Concrete Technology. While the technology has
been shown to reduce the ingress of chloride ions into
mortar [4, 5] and concrete [6] specimens, a similar
evaluation with respect to sulfates has been lacking. It
is known that the viscosity modifier alters the disso-
lution and diffusion of sulfate and other ions during the
early-age hydration process [7], so it should have
beneficial effects in slowing sulfate ingress over the
long term, while also possibly altering the morphology
of the precipitates of ettringite that form during
conventional sulfate attack.
One of the preferred methods for introducing the
viscosity modifier into the mortar or concrete is to pre-
wet fine lightweight aggregates (LWAs) with a 50:50
solution of the chemical admixture in water [4–6]. In
this paper, the viscosity modifier will be introduced
both via direct addition to the mixing water and via
such pre-wetting of LWA. The performance of a
mortar prepared with conventional internal curing (IC)
[8], as achieved by pre-wetting the LWA with only
water, will also be evaluated. As indicated by the
generally exemplary performance of lightweight con-
crete in severe environments [9], internal curing could
increase resistance to sulfate attack, both by enhancing
hydration of the cement and by providing some
additional available porosity to ‘accommodate’
expansive degradation products such as ettringite.
The sulfate attack resistance of cement-based
materials is typically evaluated using the ASTM
C1012 standard test method [10] to measure the
expansion of mortar bar specimens, although efforts to
reduce specimen size and focus on the evaluation of
pastes as opposed to mortars have progressed in recent
years [11, 12]. Since the present study includes an
evaluation of the influence of internal curing, a
technology based on replacing a portion of the
aggregates in concrete with a lightweight counterpart,
evaluations of resistance to sulfate attack will be based
on the existing mortar bar tests [10], as opposed to the
tests based on pastes that are currently under
development.
2 Materials and experimental procedures
Four mortar mixtures were prepared using a locally
available ASTM C150 Type I/II cement [2] with a
Blaine fineness of 362 m2/kg and a calculated Bogue
phase composition of 52.7 % C3S, 16.2 % C2S, 7.3 %
C3A, and 10.1 % C4AF on a mass basis. According to
its millsheet, the cement contains 3.35 % limestone
powder by mass. Mortars were prepared with a water-
to-cement ratio (w/c) of 0.485, by mass, with a 57 %
volume percentage (on an air-free basis) of ASTM
C778 sand [13] in the control mortar. For the mortar
mixture with the shrinkage-reducing admixture/vis-
cosity modifier (Tetraguard AS201) in the mixing
water, 10 % of the mix water was replaced by the
liquid chemical admixture. For the mortar mixture
with IC, 21.7 % of the sand on a volume basis was
replaced with an equal volume of pre-wetted fine
LWA of a similar size distribution. The LWA had a
measured total absorption of 26.5 % on a dry mass
basis (24 h soak in distilled water), with 90 % of this
water released when exposed to a 93 % relative
humidity environment, and was oven-dried before
being pre-wetted with either distilled water or a
solution of the viscosity modifier in water for use in
this study. At the 21.7 % LWA for sand replacement
level, the available IC water would thus approximately
correspond to an additional 0.10 units of water per unit
mass of cement in the mortar. This level of IC water is
above the nominally recommended value of 0.07 [8],
but was selected based on achieving the same overall
dosage of the viscosity modifier in the subsequent
mortar mixture where it was introduced by pre-wetting
the LWA as when it was added directly to the mixing
water at a 10 % replacement level. For the final mortar
mixture with both IC and the viscosity modifier
introduced via the pre-wetted LWA, this third set of
1 Certain commercial products are identified in this paper to
specify the materials used and procedures employed. In no case
does such identification imply endorsement by the National
Institute of Standards and Technology, nor does it indicate that
the products are necessarily the best available for the purpose.
Materials and Structures
mixture proportions (IC only) was maintained, but the
water used to pre-wet the LWA was replaced by a
50:50 solution (mass basis) of the viscosity modifier in
distilled water, achieving the same overall dosage of
the admixture as when it was added directly to the
mixing water. A 10 % solution of the admixture
exhibits a viscosity approximately 50 % higher than
that of distilled water, while its surface tension is
decreased by about a factor of two [14]. For a 50:50
mixture, the viscosity is about twelve times that of
distilled water, while the surface tension reduction
remains at approximately 50 % [6].
Mortar mixing was performed according to the
procedures provided in ASTM C305 [15]. Cup
weights were used to estimate the air content of each
mixture. For the control mortar, mortar with viscosity
modifier in the mixing water, mortar with IC, and
mortar with viscosity modifier solution in the LWA,
these estimated air contents were 8.4, 5.8, 7.1 and
3.3 %, respectively. This indicates that the shrinkage-
reducing admixture/viscosity modifier had a tendency
to produce significantly lower air contents in the fresh
mortars, as has been observed previously [16].
For each mixture, eight mortar bars were prepared
and evaluated for expansion according to the ASTM
C1012 standard test method [10], while cubes
prepared in accordance with ASTM C109 [17] were
produced for evaluating compressive strength. Both
mortar bar and cube specimens were cured in their
molds in a sealed container with water on the bottom,
the container being placed in an environmental
chamber maintained at 35 ± 3 �C for the first 24 h
(such sealed storage conditions for ASTM C1012
specimens are currently under ballot within ASTM).
For the control mortar and the mortar with the
viscosity modifier in the mix water, demolding was
performed at 24 h, resulting in the breakage of one of
the eight mortar bars for the former and five of the
eight mortar bars for the latter mixture. To avoid this
breakage in the subsequent mixtures, following
removal from the environmental chamber at 24 h,
the mortar bar and cube specimens remained in their
sealed containers stored at 23 ± 2 �C for a second
24 h period, being then demolded 48 h after casting.
For the subsequent two mortar mixtures processed in
this manner, all eight mortar bars were successfully
demolded without breakage. As per the ASTM C1012
standard [10], the bars and cubes were subsequently
cured at 23 �C in limewater, until the cubes reached a
strength level of 20.0 MPa or greater. For the control
mortar, mortar with viscosity modifier in the mixing
water, mortar with IC, and mortar with viscosity
modifier solution in the LWA, these curing times were
6, 8, 5 and 6 days, respectively. These times are
consistent with previous observations that the viscos-
ity modifier slightly retards the hydration reactions [4,
6, 7], while internal curing can accelerate them [8]. As
per the ASTM C1012 standard [10], once achieving
this strength level, the mortar bars were placed into the
sulfate solution and their expansions were measured
after exposure periods of 1, 2, 3, 4, 8, 13, 15 weeks, 4,
6 and 9 months, with the used sulfate exposure
solution being replaced by freshly prepared solution
at each measurement time. In addition to the expan-
sion measurements, the mass of each mortar bar
specimen (free surface water removed) and its surface
resistivity, measured using a 4-point Wenner probe,
were also periodically assessed. As mentioned previ-
ously, seven mortar bars were evaluated for the control
mortar, three for the mortar with the viscosity modifier
in the mix water, and eight for each of the two
subsequent mixtures.
At an age near 9 months, pieces were cut from the
central region of several of the bars for each mortar
mixture, for evaluation using X-ray microtomography
[18]. Typical exposure conditions in the X-ray com-
puted tomography (CT) unit were about 90 kV and
110 lA, using a 0.5 mm Al filter, with a 4.1 s
acquisition time for each image. The resultant 3-D
data sets each consisted of a cubic volume, 2,048
elements on a side, obtained with a linear resolution of
17.1 lm/voxel.
Nine specimens were presented for imaging in the
Eagle III (EDAX) micro X-ray fluorescence (lXRF)
system. Imaging is accomplished by stepping the stage
and addressing a focused X-ray beam to an array of
equally spaced points. At each point, a full X-ray
spectrum is collected and the elements of interest are
integrated over their respective spectral ranges [19].
The per pixel dwell time was determined by first
analyzing a random selection of points on the sample.
The average count rate of the sulfur (S) channel was
11 counts/s, of which 3 counts/s were background due
to incoherent scattering of the incident X-ray beam.
For a high quality image, based on previous work for
imaging sulfur in concrete [20], it was determined that
at least 10 counts were required in each pixel. Thus,
the time per pixel was increased to 1.5 s. In addition, a
Materials and Structures
25 lm thick Al window was used to filter the
incoming radiation and remove the portion of the
background due to Rayleigh (coherent) scattering.
Finally, a vacuum equivalent to 100 Pa was used to
improve the count rate in the Al, Si and S regions as
these elements are heavily absorbed by atmospheric
N2 and O2.
3 Results and discussion
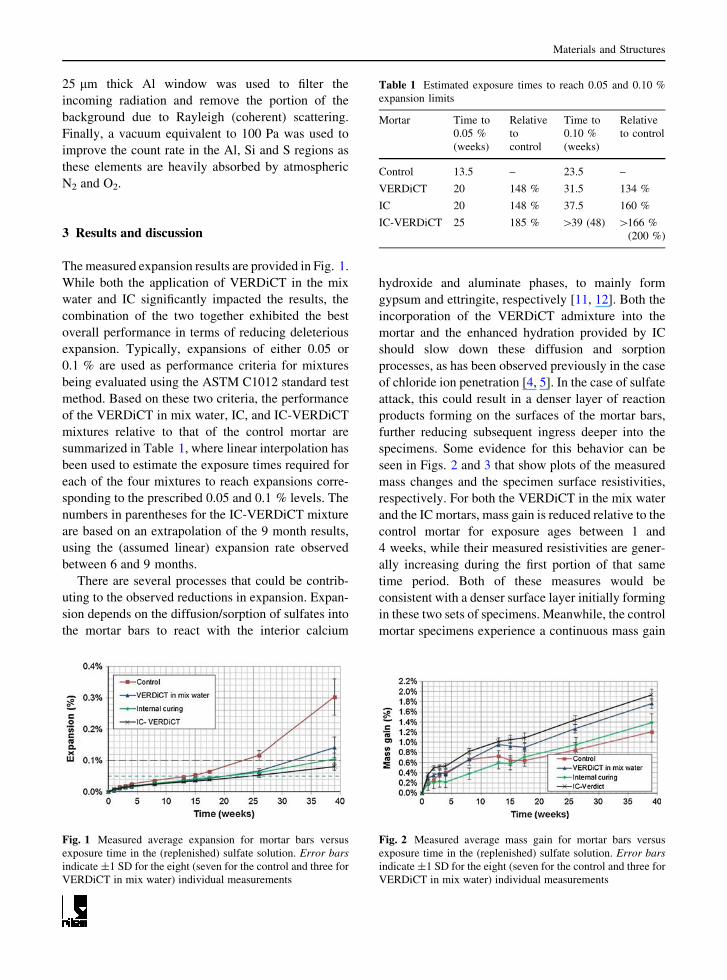
The measured expansion results are provided in Fig. 1.
While both the application of VERDiCT in the mix
water and IC significantly impacted the results, the
combination of the two together exhibited the best
overall performance in terms of reducing deleterious
expansion. Typically, expansions of either 0.05 or
0.1 % are used as performance criteria for mixtures
being evaluated using the ASTM C1012 standard test
method. Based on these two criteria, the performance
of the VERDiCT in mix water, IC, and IC-VERDiCT
mixtures relative to that of the control mortar are
summarized in Table 1, where linear interpolation has
been used to estimate the exposure times required for
each of the four mixtures to reach expansions corre-
sponding to the prescribed 0.05 and 0.1 % levels. The
numbers in parentheses for the IC-VERDiCT mixture
are based on an extrapolation of the 9 month results,
using the (assumed linear) expansion rate observed
between 6 and 9 months.
There are several processes that could be contrib-
uting to the observed reductions in expansion. Expan-
sion depends on the diffusion/sorption of sulfates into
the mortar bars to react with the interior calcium
hydroxide and aluminate phases, to mainly form
gypsum and ettringite, respectively [11, 12]. Both the
incorporation of the VERDiCT admixture into the
mortar and the enhanced hydration provided by IC
should slow down these diffusion and sorption
processes, as has been observed previously in the case
of chloride ion penetration [4, 5]. In the case of sulfate
attack, this could result in a denser layer of reaction
products forming on the surfaces of the mortar bars,
further reducing subsequent ingress deeper into the
specimens. Some evidence for this behavior can be
seen in Figs. 2 and 3 that show plots of the measured
mass changes and the specimen surface resistivities,
respectively. For both the VERDiCT in the mix water
and the IC mortars, mass gain is reduced relative to the
control mortar for exposure ages between 1 and
4 weeks, while their measured resistivities are gener-
ally increasing during the first portion of that same
time period. Both of these measures would be
consistent with a denser surface layer initially forming
in these two sets of specimens. Meanwhile, the control
mortar specimens experience a continuous mass gain
Fig. 1 Measured average expansion for mortar bars versus
exposure time in the (replenished) sulfate solution. Error barsindicate ±1 SD for the eight (seven for the control and three for
VERDiCT in mix water) individual measurements
Table 1 Estimated exposure times to reach 0.05 and 0.10 %
expansion limits
Mortar Time to
0.05 %
(weeks)
Relative
to
control
Time to
0.10 %
(weeks)
Relative
to control
Control 13.5 – 23.5 –
VERDiCT 20 148 % 31.5 134 %
IC 20 148 % 37.5 160 %
IC-VERDiCT 25 185 % [39 (48) [166 %
(200 %)
Fig. 2 Measured average mass gain for mortar bars versus
exposure time in the (replenished) sulfate solution. Error barsindicate ±1 SD for the eight (seven for the control and three for
VERDiCT in mix water) individual measurements
Materials and Structures
and little change in their measured resistivity during
this time, suggesting a deeper (more uniform) pene-
tration of sulfate ions and accompanying precipitation
of expansive reaction products. Surprisingly, the
highest mass gain was measured for the IC-VERDiCT
combination, but produced little expansion. The
presence of the porous LWA, along with the moderate
retardation produced by the VERDiCT additive, likely
produced a mortar with a higher initial porosity,
allowing for a rapid diffusion/sorption of sulfates
during the first few weeks of exposure. Even for this
system, though, the rate of mass gain was slowed
significantly between 2 and 4 weeks of exposure
relative to that measured for the control mortar.
The additional porosity provided by the fine LWA
in the IC and IC-VERDiCT mortars may contribute an
accommodation mechanism, whereby expansive reac-
tion products first precipitate and grow within the
largest (solution-filled) pores present in the mortar
microstructure, perhaps including some of those
present within the LWA particles, before proceeding
to form in the smaller capillary pores within the
hydrated cement paste. The expansive stresses and
strains would therefore be much less in the systems
containing the LWA for either IC or admixture
distribution, leading to less overall expansion, as is
indeed observed in Fig. 1.
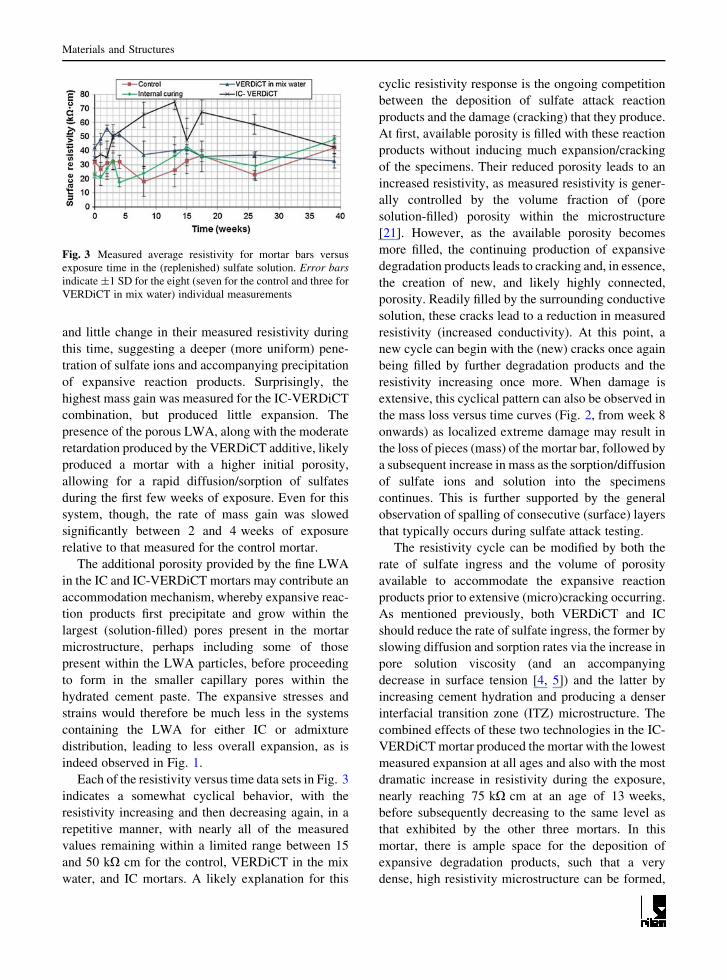
Each of the resistivity versus time data sets in Fig. 3
indicates a somewhat cyclical behavior, with the
resistivity increasing and then decreasing again, in a
repetitive manner, with nearly all of the measured
values remaining within a limited range between 15
and 50 kX cm for the control, VERDiCT in the mix
water, and IC mortars. A likely explanation for this
cyclic resistivity response is the ongoing competition
between the deposition of sulfate attack reaction
products and the damage (cracking) that they produce.
At first, available porosity is filled with these reaction
products without inducing much expansion/cracking
of the specimens. Their reduced porosity leads to an
increased resistivity, as measured resistivity is gener-
ally controlled by the volume fraction of (pore
solution-filled) porosity within the microstructure
[21]. However, as the available porosity becomes
more filled, the continuing production of expansive
degradation products leads to cracking and, in essence,
the creation of new, and likely highly connected,
porosity. Readily filled by the surrounding conductive
solution, these cracks lead to a reduction in measured
resistivity (increased conductivity). At this point, a
new cycle can begin with the (new) cracks once again
being filled by further degradation products and the
resistivity increasing once more. When damage is
extensive, this cyclical pattern can also be observed in
the mass loss versus time curves (Fig. 2, from week 8
onwards) as localized extreme damage may result in
the loss of pieces (mass) of the mortar bar, followed by
a subsequent increase in mass as the sorption/diffusion
of sulfate ions and solution into the specimens
continues. This is further supported by the general
observation of spalling of consecutive (surface) layers
that typically occurs during sulfate attack testing.
The resistivity cycle can be modified by both the
rate of sulfate ingress and the volume of porosity
available to accommodate the expansive reaction
products prior to extensive (micro)cracking occurring.
As mentioned previously, both VERDiCT and IC
should reduce the rate of sulfate ingress, the former by
slowing diffusion and sorption rates via the increase in
pore solution viscosity (and an accompanying
decrease in surface tension [4, 5]) and the latter by
increasing cement hydration and producing a denser
interfacial transition zone (ITZ) microstructure. The
combined effects of these two technologies in the IC-
VERDiCT mortar produced the mortar with the lowest
measured expansion at all ages and also with the most
dramatic increase in resistivity during the exposure,
nearly reaching 75 kX cm at an age of 13 weeks,
before subsequently decreasing to the same level as
that exhibited by the other three mortars. In this
mortar, there is ample space for the deposition of
expansive degradation products, such that a very
dense, high resistivity microstructure can be formed,
Fig. 3 Measured average resistivity for mortar bars versus
exposure time in the (replenished) sulfate solution. Error barsindicate ±1 SD for the eight (seven for the control and three for
VERDiCT in mix water) individual measurements
Materials and Structures
before ultimately succumbing to the never ending and
consistently replenished external sulfate solution.
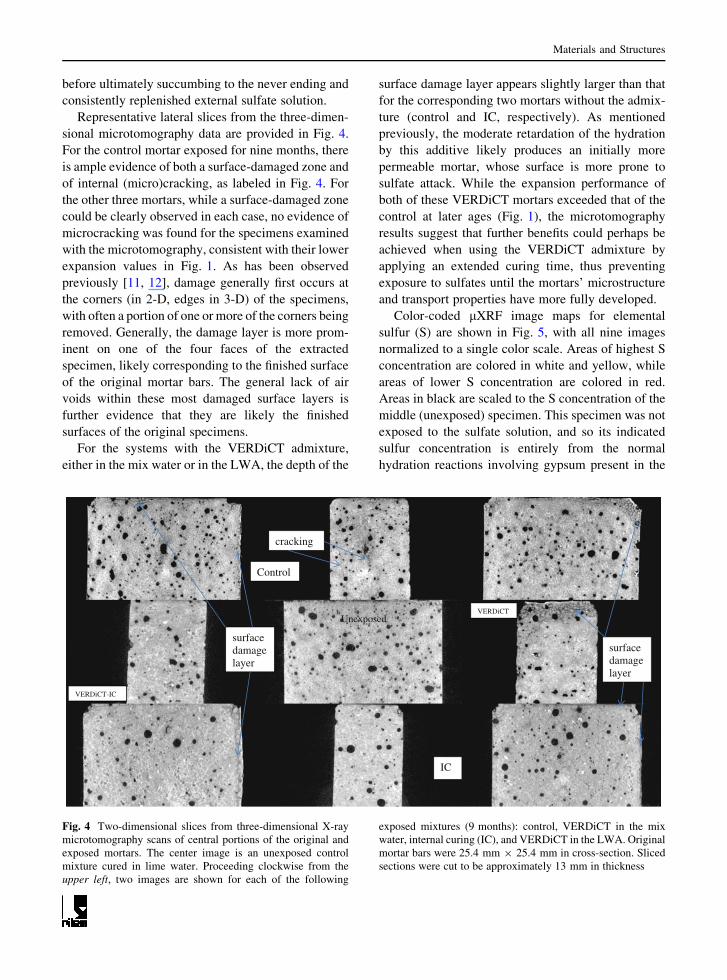
Representative lateral slices from the three-dimen-
sional microtomography data are provided in Fig. 4.
For the control mortar exposed for nine months, there
is ample evidence of both a surface-damaged zone and
of internal (micro)cracking, as labeled in Fig. 4. For
the other three mortars, while a surface-damaged zone
could be clearly observed in each case, no evidence of
microcracking was found for the specimens examined
with the microtomography, consistent with their lower
expansion values in Fig. 1. As has been observed
previously [11, 12], damage generally first occurs at
the corners (in 2-D, edges in 3-D) of the specimens,
with often a portion of one or more of the corners being
removed. Generally, the damage layer is more prom-
inent on one of the four faces of the extracted
specimen, likely corresponding to the finished surface
of the original mortar bars. The general lack of air
voids within these most damaged surface layers is
further evidence that they are likely the finished
surfaces of the original specimens.
For the systems with the VERDiCT admixture,
either in the mix water or in the LWA, the depth of the
surface damage layer appears slightly larger than that
for the corresponding two mortars without the admix-
ture (control and IC, respectively). As mentioned
previously, the moderate retardation of the hydration
by this additive likely produces an initially more
permeable mortar, whose surface is more prone to
sulfate attack. While the expansion performance of
both of these VERDiCT mortars exceeded that of the
control at later ages (Fig. 1), the microtomography
results suggest that further benefits could perhaps be
achieved when using the VERDiCT admixture by
applying an extended curing time, thus preventing
exposure to sulfates until the mortars’ microstructure
and transport properties have more fully developed.
Color-coded lXRF image maps for elemental
sulfur (S) are shown in Fig. 5, with all nine images
normalized to a single color scale. Areas of highest S
concentration are colored in white and yellow, while
areas of lower S concentration are colored in red.
Areas in black are scaled to the S concentration of the
middle (unexposed) specimen. This specimen was not
exposed to the sulfate solution, and so its indicated
sulfur concentration is entirely from the normal
hydration reactions involving gypsum present in the
cracking
surface damage layer
surface damage layer
IC
Control
VERDiCT-IC
VERDiCTUnexposed
Fig. 4 Two-dimensional slices from three-dimensional X-ray
microtomography scans of central portions of the original and
exposed mortars. The center image is an unexposed control
mixture cured in lime water. Proceeding clockwise from the
upper left, two images are shown for each of the following
exposed mixtures (9 months): control, VERDiCT in the mix
water, internal curing (IC), and VERDiCT in the LWA. Original
mortar bars were 25.4 mm 9 25.4 mm in cross-section. Sliced
sections were cut to be approximately 13 mm in thickness
Materials and Structures
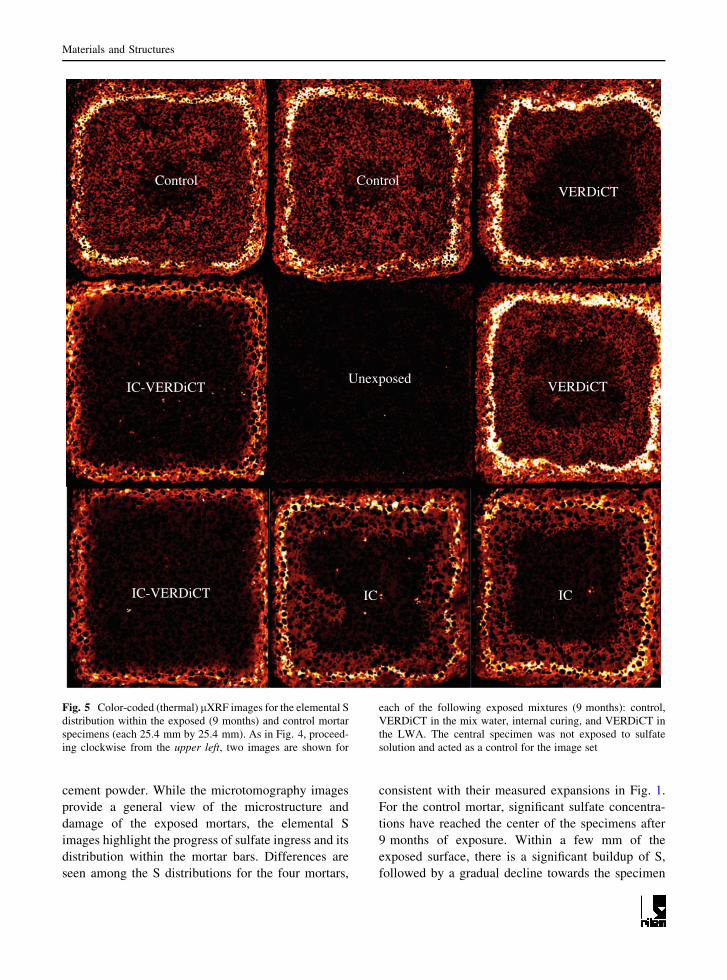
cement powder. While the microtomography images
provide a general view of the microstructure and
damage of the exposed mortars, the elemental S
images highlight the progress of sulfate ingress and its
distribution within the mortar bars. Differences are
seen among the S distributions for the four mortars,
consistent with their measured expansions in Fig. 1.
For the control mortar, significant sulfate concentra-
tions have reached the center of the specimens after
9 months of exposure. Within a few mm of the
exposed surface, there is a significant buildup of S,
followed by a gradual decline towards the specimen
IC-VERDiCT
IC-VERDiCT
IC
VERDiCT
VERDiCTControlControl
Unexposed
IC
Fig. 5 Color-coded (thermal) lXRF images for the elemental S
distribution within the exposed (9 months) and control mortar
specimens (each 25.4 mm by 25.4 mm). As in Fig. 4, proceed-
ing clockwise from the upper left, two images are shown for
each of the following exposed mixtures (9 months): control,
VERDiCT in the mix water, internal curing, and VERDiCT in
the LWA. The central specimen was not exposed to sulfate
solution and acted as a control for the image set
Materials and Structures
center. This pattern is consistent with scanning
electron microscopy observations from previous stud-
ies [11, 12], the outer zone corresponding to a region
where significant leaching of hydration products to
create a more porous microstructure (see porosity and
damage in Fig. 4 also) has occurred. All elements,
including S, have been depleted as the capillary
porosity of this outer zone is greatly increased. The
zone or layer where S is greatest corresponds to a
region of the microstructure where the hydrated
cement paste has undergone substantial reactions with
the ingressing sulfates, gypsum (calcium sulfate
dihydrate) replacing calcium hydroxide and unreacted
aluminates and previously formed monosulfate phase
being converted to ettringite [12]. From this point
inward, a typical diffusion front of S into the specimen
is observed.
The sulfur distributions are modified by both the
VERDiCT additive and IC. Consistent with slowing
down the diffusion (and sorption) of sulfate ions, the
VERDiCT in the mix water mortar specimens indicate
less S reaching the interior of the specimen after the
9 month exposure. However, as mentioned previ-
ously, the extent of the (damaged) surface zone is
slightly greater, due perhaps to the retardation pro-
duced by this additive at early ages, and the maximum
concentration of S in zone 2 (gypsum and ettringite
formation) appears greater as well.
The influence of IC (and VERDiCT-IC) on the
sulfate ingress is particularly dramatic in Fig. 5 and
consistent with the reduced damage observed in Fig. 4
for these two mortars. In these systems, the central
portion of each specimen exhibits a level of S that is
only a little above that observed in the unexposed
specimen, indicating that minimal sulfate ions have
penetrated to the specimen center during the 9 month
exposure. IC has slowed down the diffusion of the
sulfate ions (due to both hydration enhancement and
improvement of ITZ microstructure), provided addi-
tional space to accommodate any expansive reaction
products forming at the surfaces exposed to the sulfate
solution, and thus substantially reduced the expansion
and its accompanying stress and microcracking (dam-
age). This produces a mortar where sulfates from the
surrounding solution do not penetrate to the specimen
interior and resistance to sulfate attack is greatly
enhanced. The combination of distributing the viscos-
ity modifier via pre-wetting of the LWA (VERDiCT-
IC) is shown in Fig. 5 to produce a mortar that is
clearly superior to the other mortars in terms of
minimizing sulfate ingress and thus its accompanying
expansion/damage (Figs. 1, 4).
4 Conclusions
Two new approaches to increasing the resistance to
sulfate attack of mortar bars in standardized testing have
been evaluated, namely the use of a viscosity modifier
(VERDiCT) and the application of internal curing (IC).
While each significantly reduced the measured mortar
bar expansion over the course of a 9 month exposure,
the combination of the two produced a mortar with the
best overall performance. Mass and resistivity measure-
ments provided useful additional information to aid in
interpreting the expansion trends and the cyclic process
of densification and damage that is produced by the
expansive (degradation) reactions. The expansion rank-
ings of the four mortars were also consistent with their
overall microstructure/damage as observed using X-ray
microtomography and the elemental distribution of
(ingressing) sulfur as examined using micro X-ray
fluorescence. The latter technique is particularly pow-
erful for directly observing the penetration of sulfate
ions due to the exposure and could be analyzed further to
produce quantitative sulfur distribution maps.
Acknowledgments The authors would like to thank BASF,
Big River Industries, and the Lehigh Cement Company for
supplying materials for this study. The suggestion of an
accommodation mechanism with respect to IC by Mr. Thomas
Holm (retired) is gratefully acknowledged.
References
1. Marchand J, Skalny JP (eds) 1999 Materials science of
concrete: sulfate attack mechanisms, American Ceramic
Society, Westerville, pp 371
2. ASTM C150-12 (2012) Standard specification for Portland
cement, ASTM International, West Conshohocken
3. Bentz DP, Snyder KA, Cass LC, Peltz MA (2008) Doubling
the service life of concrete. I: reducing ion mobility using
nanoscale viscosity modifiers. Cem Concr Compos 30(8):
674–678
4. Bentz DP, Snyder KA, Peltz MA (2010) Doubling the ser-
vice life of concrete structures. II: performance of nanoscale
viscosity modifiers in mortars. Cem Concr Compos 32(3):
187–193
5. Snyder KA, Bentz DP, Davis JM (2012) Using viscosity
modifiers to reduce effective diffusivity in mortars. ASCE J
Mater Civil Eng 24(8):1017–1024
Materials and Structures
6. Bentz DP, Snyder KA, Peltz MA, Obla K, Kim H (2013)
Viscosity Modifiers to Enhance Concrete Performance, ACI
Mater J. (accepted)
7. Rajabipour F, Sant G, Weiss WJ (2008) Interactions
between shrinkage reducing admixtures (SRAs) and cement
paste’s pore solution. Cem Concr Res 38(5):606–615
8. Bentz DP, Weiss WJ (2011) Internal curing: a 2010 state-of-
the-art review. NISTIR 7765, U.S. Department of Com-
merce, February
9. Holm TA, Bremner TW, Newman JB (1984) Lightweight
aggregate concrete subject to severe weathering. Concr Int
6:49–54
10. ASTM C1012/C1012M-12 (2012) Standard test method for
length change of hydraulic-cement mortars exposed to a
sulfate solution, ASTM International, West Conshohocken
11. Ferraris CF, Stutzman PE, Peltz MA, Winpigler JA (2005)
Developing a more rapid test to assess sulfate resistance of
hydraulic cements. J Res Nat Inst Stand Technol 110(5):
529–540
12. Ferraris CF, Stutzman PE, Snyder KA (2006) Sulfate
resistance of concrete: a new approach, R&D Serial No.
2486, Portland Cement Association, Skokie, pp 93
13. ASTM C778-12 (2012) Standard specification for standard
sand, ASTM International, West Conshohocken
14. Sant G, Eberhardt A, Bentz D, Weiss J (2010) Influence of
shrinkage-reducing admixtures on moisture absorption in
cementitious materials at early ages. ASCE J Mater Civil
Eng 22(3):277–286
15. ASTM C305-12 (2012) Standard practice for mechanical
mixing of hydraulic cement pastes and mortars of plastic
consistency, ASTM International, West Conshohocken
16. Bentz DP (2005) Capitalizing on self-desiccation for
autogenous distribution of chemical admixtures in concrete.
In: Persson B, Bentz D, Nilsson L-O (eds) Proceedings of
the 4th International Seminar on Self-Desiccation and Its
Importance in Concrete Technology, Lund University,
Lund, pp 189–196
17. ASTM C109/C109M-12 (2012) Standard test method for
compressive strength of hydraulic cement mortars (using
2-in. or [50-mm] cube specimens), ASTM International,
West Conshohocken
18. Bentz DP, Martys NS, Stutzman PE, Levenson MS, Gar-
boczi EJ, Dunsmuir J, Schwartz LM (1995) X-ray micro-
tomography of an ASTM C109 mortar exposed to sulfate
attack. In: MRS Symposium Proceedings, vol 370, Micro-
structure of cement-based systems/bonding and interfaces
in cementitious materials, pp 77–82
19. Davis JM, Newbury DE, Fahey A, Ritchie NWM, Vicenzi
EP, Bentz DP (2011) Bridging the micro-to-macro gap: a
new application for micro X-ray fluorescence. Microsc
Microanal 17(3):410–417
20. Davis JM, Newbury DE, Rangaraju PR, Soundarapandian S,
Giebson C (2009) Milli X-ray fluorescence X-ray spectrum
imaging for measuring potassium ion intrusion into concrete
samples. Cem Concr Compos 31(3):171–175
21. Weiss WJ, Snyder KA, Bullard JW, Bentz DP (2013) Using
a saturation function to interpret the electrical properties of
partially saturated concrete, ASCE J Mater Civil Eng.
(accepted)
Materials and Structures