influence of hydrogeochemical processes and assessment of suitability for groundwater uses in busan...
TRANSCRIPT
1 23
Environment, Development andSustainabilityA Multidisciplinary Approach to theTheory and Practice of SustainableDevelopment ISSN 1387-585XVolume 17Number 3 Environ Dev Sustain (2015) 17:423-441DOI 10.1007/s10668-014-9552-7
Influence of hydrogeochemical processesand assessment of suitability forgroundwater uses in Busan City, Korea
S. Y. Chung, S. Venkatramanan,T. H. Kim, D. S. Kim & T. Ramkumar
Influence of hydrogeochemical processes and assessmentof suitability for groundwater uses in Busan City, Korea
S. Y. Chung • S. Venkatramanan • T. H. Kim • D. S. Kim •
T. Ramkumar
Received: 20 February 2014 / Accepted: 29 May 2014 / Published online: 13 June 2014� Springer Science+Business Media Dordrecht 2014
Abstract This study was carried out to understand the hydrogeochemical processes of
groundwater quality and groundwater use in the Suyeong District of Busan city, Korea.
Groundwater samples were collected from 40 wells in February, 2010. The abundance of
major cations concentration in groundwater is Na?[Ca2?[Mg2?[K?, while that of
anions is Cl-[HCO3-[SO4
2-[NO3-[F-. According to hydrogeochemical facies,
Ca (HCO3)2, Ca Cl2 and NaCl are the dominant groundwater types in this study area.
Mechanism controlling the water chemistry (Gibbs) indicates that most of groundwater
samples fall at rock-weathering dominance zone. The geochemical processes and temporal
variation in groundwater in this area are influenced by evaporation processes, ion exchange
and dissolution of minerals. According to water quality index (WQI) of the study area
exhibits 8 % of the groundwater samples fall at the unsuitable zone for drinking purpose.
The spatial distribution map of WQI shows the poor quality of the water decrease toward
the southern part of the study area. The results of SAR, Na%, PI, RSC and MH show that
majority of groundwater samples are suitable for domestic and agricultural purposes. By
the hydrogeochemical analysis, aquifer rock weathering, seawater intrusion, sewer leakage
S. Y. Chung � S. Venkatramanan (&)Institute of Environmental Geosciences, Department of Earth and Environmental Sciences,Pukyong National University, 599-1 Daeyeon-dong Nam-gu, Busan 608-737, Koreae-mail: [email protected]
S. Y. Chunge-mail: [email protected]
T. H. KimDivision of Water Resources, Pan Asia Water Company, 1031 Dunsan-dong,Seo-gu, Daejeon 302-121, Korea
D. S. KimEnvironmental Infrastructure Research Department, National Institute of Environmental Research,Hwangyong-ro 42, Seo-gu, Incheon 404-708, Korea
T. RamkumarDepartment of Earth Sciences, Annamalai University, Annamalai Nagar,Chidambaram 608-002, Tamil Nadu, India
123
Environ Dev Sustain (2015) 17:423–441DOI 10.1007/s10668-014-9552-7
Author's personal copy
are the dominant factors that determine the major ionic composition. The proper man-
agement plan is necessary to preserve valuable groundwater resources.
Keywords Hydrogeochemical processes � Hydrogeochemical facies � WQI �Evaporation � Saturation index � Ion exchange
1 Introduction
Groundwater is a natural resource, which is being renewed by different processes. Geo-
chemical processes occurring within the groundwater and reactions with dissolved minerals
have a profound effect on water quality. Groundwater quality may be affected by natural
factors, such as geology and geochemical processes. Geogenic sources are one of the causes
of the variation in chemical composition of groundwater, which changes with space and time
(Madhavan and Subramanian 2006; Zahid et al. 2008; Vikas et al. 2009; Gunduz et al. 2009;
Mamatha and Rao 2009; Brindha and Elango 2012; Kraiem et al. 2013). It depends on the
parent rock, intensity of weathering, residence time and external factors, such as precipita-
tion, temperature. Hydrogeochemical processes, such as weathering, dissolution, mixing and
ion exchange. control the concentration of major and minor ions in groundwater (Rajmohan
and Elango 2004; Liu et al. 2008; Singh et al. 2008; Zhu and Schwartz 2011; Rajesh et al.
2012). Hence, this various process is very essential to understand the geochemical sources of
the groundwater. The geochemical properties of groundwater depend on the chemistry of
water in recharge an area as well as on the different geological processes that take place in the
subsurface. The groundwater chemically evolved due to the interaction with aquifer minerals
or intermixing among different groundwater reservoirs along flow paths in the subsurface
(Domenico 1972). Hydrogeochemical studies assist in taking proper measures to protect
aquifers from groundwater contamination by natural phenomena or anthropogenic activities.
Generally, the groundwater quality of a metropolitan city is affected by anthropogenic
sources such as improperly treated industrial, municipal or domestic effluents. In case of
metropolitan city near the sea, seawater intrusion is a main source of groundwater contam-
ination (Shim et al. 2004; Kim and Chung 2011; Anithamary et al. 2012).
Water quality index (WQI) is an effective tool to assess the state of an ecosystem, and this
method is based on a group of physico-chemical and biological characteristics ofwater samples
(Namibian 2007; Simoes et al. 2008). Therefore, several researchers have developed various
indices, technically referred to asWQI (Lermontov et al. 2009).Usually,WQI is a practical and
comparatively simple approach of evaluating the composite influence of overall pollution and
hardly provides evidences in pollution sources. The pollution indices were proposed to provide
useful and comprehensible guiding tool for water quality executives, environmental managers,
decision makers and potential users of a given water system. The chemical ions those are
present in groundwater due to these reasons to determine its suitability for drinking, agriculture
and industrial purposes. Assessment ofwater quality is of paramount importance, especially, in
populated regions, which depend on groundwater. Water uses standards regulated by World
Health Organization (WHO 2004), United States Environmental Protection Agency (USEPA
2003), KoreaMinistry of Environment (KMOE 2012), etc. determine the usability of water for
various purposes. Assessment of groundwater quality in populated regions, including large
cities based on drinking water standards, have been carried out by several researchers (Ozcan
et al. 2007; Umar et al. 2009; Gupta et al. 2009; Dar et al. 2011).
Busan is one of the metropolitan cities in Korea and has several industrial areas in its
outskirts. Many residents of the city are using groundwater for their living, even though the
424 S. Y. Chung et al.
123
Author's personal copy
surface water is the main source supplied by the city. The reason is because they believe
that groundwater quality is better than surface water quality. By the way, groundwater is
frequently contaminated by leaked sewage, seawater intrusion, industrial wastewater and
fertilizer for grass plantation in the municipal area (Shim et al. 2002; Chung et al. 2012).
Groundwater problems in Busan City have not been thoroughly studied yet. On the other
hand, groundwater contamination (Kim 2004; Chae et al. 2008; Hosono et al. 2009) and
heavy groundwater discharge (Kim et al. 2001; Kim et al. 2005) around the subway tunnel
due to the domestic and industrial waste water contamination have been studied in Seoul,
Korea. The objective of this study is to assess the present quality of groundwater and to
determine the suitability of groundwater use for various purposes on the basis of various
geochemical processes and WQI. Hence, this study will serve as a foundation to access the
improvement of groundwater quality in future.
2 Study area
Busan Metropolitan city is the second populated city in Korea. Metropolitan area covers
770,000 km2 with a population of 3.7 million people. The weather is relatively mild during
most of the time in a year. In summer, the temperature ranges from23 to 31 �C, and inwinter itvaries from-1.5 to 10 �C. The average annual rainfall is about 1,560 mm. The city usually
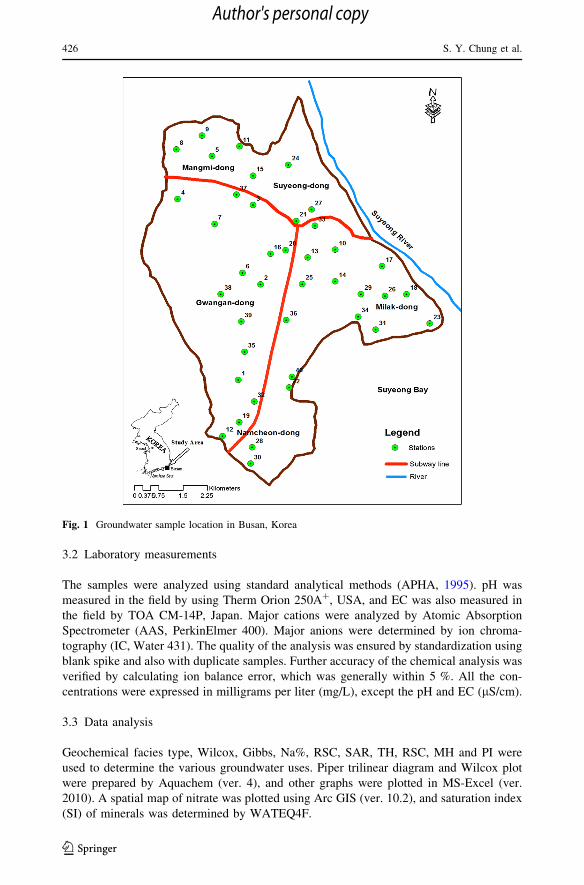
receives heavy rainfall through typhoon in August or September. The study area is the
SuyeongDistrict in BusanMetropolitan City (Fig. 1). Suyeong River is located at the eastern
side of the study area, and its southern part is connected to the sea. Geology of the study area is
composed of andesitic volcanic breccias, tuffaceous sedimentary rocks, rhyolitic rocks and
intrusive granodiorites and granite porphyries (Chang et al. 1983; Son et al. 1978). The
geologic time of the study area is the Cretaceous Period in the Mesozoic Era. Groundwater
along the Suyeong Bay is relatively vulnerable to seawater intrusion, because the area is
composed of sand beach and reclaimed land. In this study area, there are no irrigation
activities, whereas grass plantation process is done around this area. There are 377 wells
registered in the Suyeong District. Forty wells were developed in shallow aquifer of less than
50 m depth and the rest wells in deep aquifer of over 50 m. Groundwater level and quality of
pH and electrical conductivity were measured for 119 wells in August, 2009 and February,
2010. The average groundwater level was 10.5 m and 9.83 m above mean sea level,
respectively, and the variation in water level was 0.67 m. The average pHwas 7.01 and 7.09,
respectively, and the variation in pH was 0.08.
3 Materials and methods
3.1 Sample collection
Groundwater samples were collected in February, 2010 at 40 sampling wells, which were
selected on the basis of detailed well inventory. The groundwater of borehole wells was
directly sampled from water faucets after pumping for approximately 10 min to remove
stagnant water. Groundwater was poured into high-quality polyethylene bottles through
0.45-lm cellulose nitric membrane filter to eliminate suspended materials. Groundwater
samples for the analysis of metal components were acidified to pH\ 2.0 in the field. All
samples were stored in ice chests at 4 �C and transported directly to the laboratory where
they were analyzed within 2 weeks.
Influence of hydrogeochemical processes and assessment of suitability 425
123
Author's personal copy
3.2 Laboratory measurements
The samples were analyzed using standard analytical methods (APHA, 1995). pH was
measured in the field by using Therm Orion 250A?, USA, and EC was also measured in
the field by TOA CM-14P, Japan. Major cations were analyzed by Atomic Absorption
Spectrometer (AAS, PerkinElmer 400). Major anions were determined by ion chroma-
tography (IC, Water 431). The quality of the analysis was ensured by standardization using
blank spike and also with duplicate samples. Further accuracy of the chemical analysis was
verified by calculating ion balance error, which was generally within 5 %. All the con-
centrations were expressed in milligrams per liter (mg/L), except the pH and EC (lS/cm).
3.3 Data analysis
Geochemical facies type, Wilcox, Gibbs, Na%, RSC, SAR, TH, RSC, MH and PI were
used to determine the various groundwater uses. Piper trilinear diagram and Wilcox plot
were prepared by Aquachem (ver. 4), and other graphs were plotted in MS-Excel (ver.
2010). A spatial map of nitrate was plotted using Arc GIS (ver. 10.2), and saturation index
(SI) of minerals was determined by WATEQ4F.
Fig. 1 Groundwater sample location in Busan, Korea
426 S. Y. Chung et al.
123
Author's personal copy
WQI is defined as a technique of rating that provides the composite influence of
individual water quality parameters on the overall quality of water for human consumption
(Mitra 1998). For this purpose, 10 water quality parameters were selected. Parameter
consideration to develop a WQI depends on the purpose for which water is used.
Parameters were selected according to the availability of data as well as their relative
importance in defining water quality for human consumption. The standard set for this
purpose follows the WHO guidelines (WHO 2004). WQI is calculated by assigning
weights to the measured parameters based on their relative importance. The maximum
weight 5 was assigned to parameters like sodium, chloride, TDS and sulfate because the
components are very closely related with groundwater contamination. The minimum
weight 1 is given to bicarbonate since it doesn’t contribute to groundwater contamination
(Vasanthavigar et al. 2010; Sajil Kumar et al. 2013). In the second step, the relative weight
(Wi) is computed with the following equation:
Wi ¼ wi=Xn
i¼1
wi ð1Þ
where, Wi is the relative weight, wi is the weight of each parameter, n is the number of
parameters.
In third step, a quality rating scale (qi) for each parameter is assigned by dividing its
concentration in each water sample by its respective standard according to the guidelines
laid down in the WHO (2004), and the result is multiplied by 100:
qi ¼ ðCi=SiÞ � 100 ð2Þ
where, qi is quality rating, Ci is concentration of each chemical parameter in milligrams per
liter, Si is WHO standard for each chemical parameter in milligrams per liter according to
the guidelines of WHO (2004).
For computing WQI, SI is firstly determined for each chemical parameter with the
following equation:
SIi ¼ Wi � qi ð3Þ
WQI ¼X
SIi ð4Þ
where, SIi is the subindex of ith parameter, qi is the rating based on concentration of ith
parameter, n is the number of parameters.
A map of WQI was produced by computing the individual point data and then plotted
using Arc GIS (Ver. 10.2) in this study.
4 Results and discussion
4.1 Hydrogeochemical processes
4.1.1 General water chemistry
The statistics of water chemistry is represented in Table 1. The quality of groundwater is very
important because it is the main factor determining its suitability for drinking, domestic,
agricultural and industrial purposes. pH values of groundwater ranged from 6.19 to 7.94 with
an average value of 6.96. This shows that the groundwater of the study area is a little acidic to
Influence of hydrogeochemical processes and assessment of suitability 427
123
Author's personal copy
alkaline in nature. EC values are between 227.1 and 21,400 lS/cm. TDS values ranged from
154.3 to 15,000 mg/L. The chemical composition of the groundwater samples of the study is
shown in Table 1. The general dominance of anion was in the order of Cl-[HCO3-[ -
SO42-[NO3
-[F-. The concentration of Cl- ranges from 15.88 to 24,525 mg/L in
groundwater samples due to seawater intrusion, industrial and domestic activities (Ramku-
mar et al. 2011; Venkatramanan et al. 2012, 2013). SO42- ranged from 13.43 to 2,875 mg/L
with the average of 167.3 mg/L. Most of groundwater samples have moderate sulfate con-
centrations, and some groundwater around the beach area are affected by seawater intrusion.
However, sulfate might come from dissolution of sulfate minerals precipitated in the soil
(Miller 1979; Craig and Anderson 1979). HCO3- was from 70.8 to 878.4 mg/L with the
average of 246.3 mg/L. Most of groundwater has moderate bicarbonate concentrations, and
some groundwater have high concentrations. Bicarbonate is originated from the reaction of
groundwater with CO2 in soil and air. NO3-was from 0.31 to 126.9 mg/Lwith the average of
34.02 mg/L, and some groundwaters have high concentrations. Nitrate comes mainly from
leached sewage and partly from fertilizers for plants in the municipal area.
F- concentrations ranged from 0.06 to 0.8 mg/L due to the interaction with fluoride rich
minerals like apatite, fluorspar, fluorapatite and biotite from andesite, rhyolite and
granodiorite rocks. Fluoride concentrations regularly are proportional to the degree of
water–rock interaction because fluoride primarily originates from the geology. It is also
reported that fluoride in groundwater is negatively related to anthropogenic contaminates
that may infiltrate from the land surface (Brindha and Elango 2013a, b). General domi-
nance of cations was in the order of Na?[Ca2?[Mg2?[K?. For cations, Na? was
from 10.57 to 6,675 mg/L. High potassium was resulted from seawater intrusion,
anthropogenic sources and the weathering of plagioclase-bearing rocks. K? concentrations
were between 0.4 and 439 mg/L due to seawater intrusion and the weathering of feldspar.
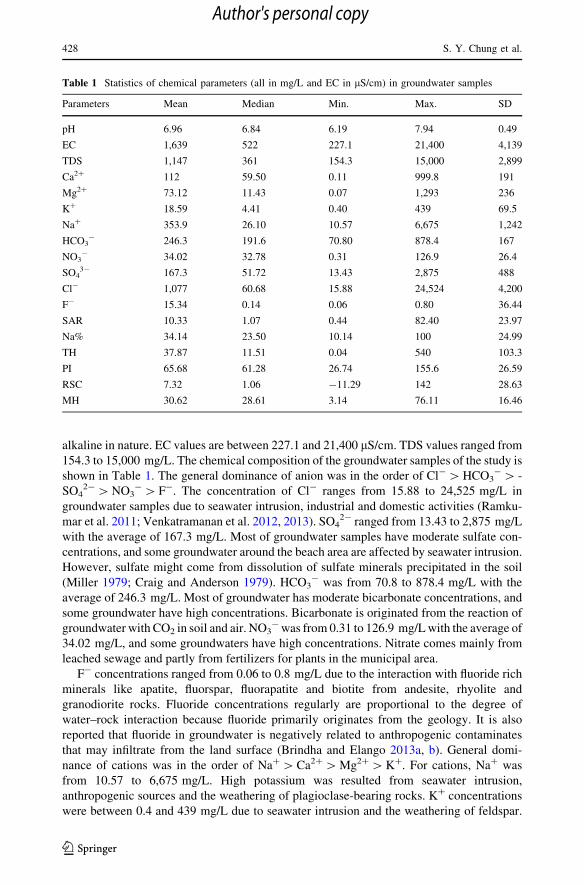
Table 1 Statistics of chemical parameters (all in mg/L and EC in lS/cm) in groundwater samples
Parameters Mean Median Min. Max. SD
pH 6.96 6.84 6.19 7.94 0.49
EC 1,639 522 227.1 21,400 4,139
TDS 1,147 361 154.3 15,000 2,899
Ca2? 112 59.50 0.11 999.8 191
Mg2? 73.12 11.43 0.07 1,293 236
K? 18.59 4.41 0.40 439 69.5
Na? 353.9 26.10 10.57 6,675 1,242
HCO3- 246.3 191.6 70.80 878.4 167
NO3- 34.02 32.78 0.31 126.9 26.4
SO43- 167.3 51.72 13.43 2,875 488
Cl- 1,077 60.68 15.88 24,524 4,200
F- 15.34 0.14 0.06 0.80 36.44
SAR 10.33 1.07 0.44 82.40 23.97
Na% 34.14 23.50 10.14 100 24.99
TH 37.87 11.51 0.04 540 103.3
PI 65.68 61.28 26.74 155.6 26.59
RSC 7.32 1.06 -11.29 142 28.63
MH 30.62 28.61 3.14 76.11 16.46
428 S. Y. Chung et al.
123
Author's personal copy
Ca2? ranged from 0.11 to 999.8 mg/L, with the average of 112 mg/L, and much amount of
calcium came from seawater. Mg2? was between 0.07 and 1,293 mg/L. Sewage and
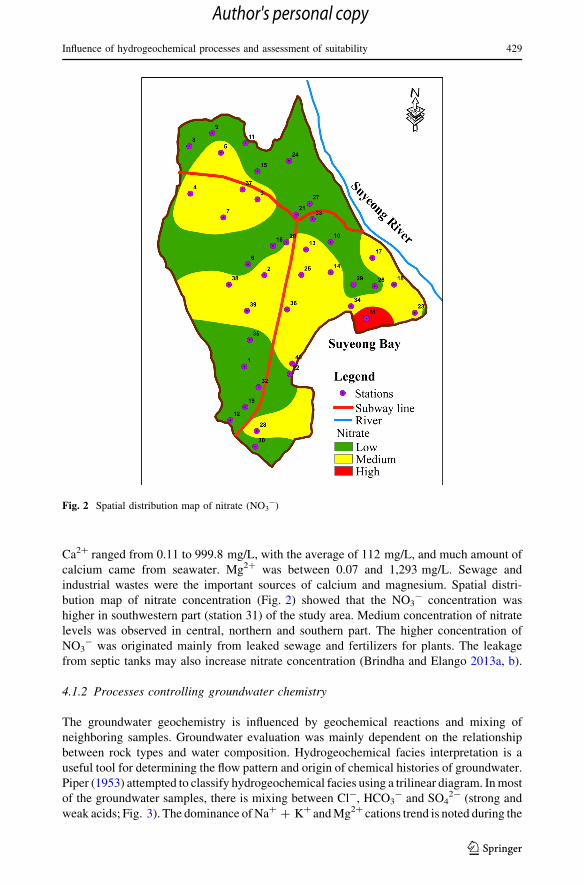
industrial wastes were the important sources of calcium and magnesium. Spatial distri-
bution map of nitrate concentration (Fig. 2) showed that the NO3- concentration was
higher in southwestern part (station 31) of the study area. Medium concentration of nitrate
levels was observed in central, northern and southern part. The higher concentration of
NO3- was originated mainly from leaked sewage and fertilizers for plants. The leakage
from septic tanks may also increase nitrate concentration (Brindha and Elango 2013a, b).
4.1.2 Processes controlling groundwater chemistry
The groundwater geochemistry is influenced by geochemical reactions and mixing of
neighboring samples. Groundwater evaluation was mainly dependent on the relationship
between rock types and water composition. Hydrogeochemical facies interpretation is a
useful tool for determining the flow pattern and origin of chemical histories of groundwater.
Piper (1953) attempted to classify hydrogeochemical facies using a trilinear diagram. Inmost
of the groundwater samples, there is mixing between Cl-, HCO3- and SO4
2- (strong and
weak acids; Fig. 3). The dominance ofNa? ? K? andMg2? cations trend is noted during the
Fig. 2 Spatial distribution map of nitrate (NO3-)
Influence of hydrogeochemical processes and assessment of suitability 429
123
Author's personal copy
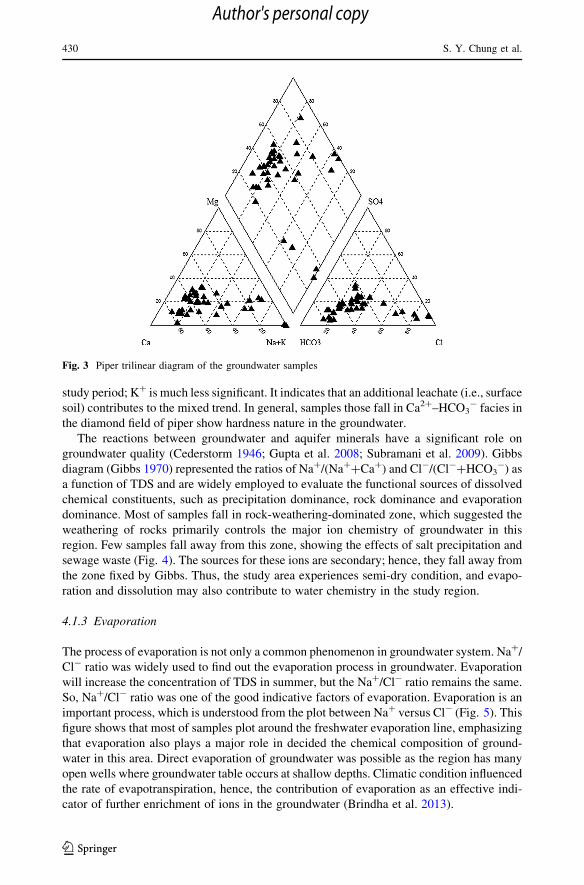
study period; K? is much less significant. It indicates that an additional leachate (i.e., surface
soil) contributes to the mixed trend. In general, samples those fall in Ca2?–HCO3- facies in
the diamond field of piper show hardness nature in the groundwater.
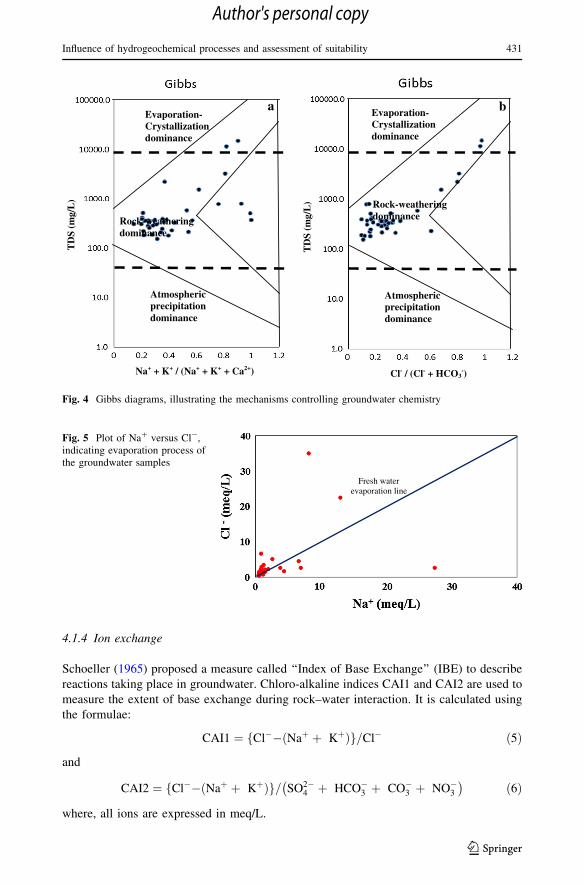
The reactions between groundwater and aquifer minerals have a significant role on
groundwater quality (Cederstorm 1946; Gupta et al. 2008; Subramani et al. 2009). Gibbs
diagram (Gibbs 1970) represented the ratios of Na?/(Na??Ca?) and Cl-/(Cl-?HCO3-) as
a function of TDS and are widely employed to evaluate the functional sources of dissolved
chemical constituents, such as precipitation dominance, rock dominance and evaporation
dominance. Most of samples fall in rock-weathering-dominated zone, which suggested the
weathering of rocks primarily controls the major ion chemistry of groundwater in this
region. Few samples fall away from this zone, showing the effects of salt precipitation and
sewage waste (Fig. 4). The sources for these ions are secondary; hence, they fall away from
the zone fixed by Gibbs. Thus, the study area experiences semi-dry condition, and evapo-
ration and dissolution may also contribute to water chemistry in the study region.
4.1.3 Evaporation
The process of evaporation is not only a common phenomenon in groundwater system. Na?/
Cl- ratio was widely used to find out the evaporation process in groundwater. Evaporation
will increase the concentration of TDS in summer, but the Na?/Cl- ratio remains the same.
So, Na?/Cl- ratio was one of the good indicative factors of evaporation. Evaporation is an
important process, which is understood from the plot between Na? versus Cl- (Fig. 5). This
figure shows that most of samples plot around the freshwater evaporation line, emphasizing
that evaporation also plays a major role in decided the chemical composition of ground-
water in this area. Direct evaporation of groundwater was possible as the region has many
open wells where groundwater table occurs at shallow depths. Climatic condition influenced
the rate of evapotranspiration, hence, the contribution of evaporation as an effective indi-
cator of further enrichment of ions in the groundwater (Brindha et al. 2013).
Fig. 3 Piper trilinear diagram of the groundwater samples
430 S. Y. Chung et al.
123
Author's personal copy
4.1.4 Ion exchange
Schoeller (1965) proposed a measure called ‘‘Index of Base Exchange’’ (IBE) to describe
reactions taking place in groundwater. Chloro-alkaline indices CAI1 and CAI2 are used to
measure the extent of base exchange during rock–water interaction. It is calculated using
the formulae:
CAI1 ¼ Cl��ðNaþ þ KþÞf g=Cl� ð5Þ
and
CAI2 ¼ Cl��ðNaþ þ KþÞf g= SO2�4 þ HCO�
3 þ CO�3 þ NO�
3
� �ð6Þ
where, all ions are expressed in meq/L.
Evaporation-Crystallizationdominance
Rock-weatheringdominance
Atmospheric precipitationdominance
Na+ + K+ / (Na+ + K+ + Ca2+)
TD
S (m
g/L
)
a Evaporation-Crystallizationdominance
Rock-weatheringdominance
Atmospheric precipitationdominance
Cl- / (Cl- + HCO3-)
TD
S (m
g/L
)
b
Fig. 4 Gibbs diagrams, illustrating the mechanisms controlling groundwater chemistry
Fresh water evaporation line
Fig. 5 Plot of Na? versus Cl-,indicating evaporation process ofthe groundwater samples
Influence of hydrogeochemical processes and assessment of suitability 431
123
Author's personal copy
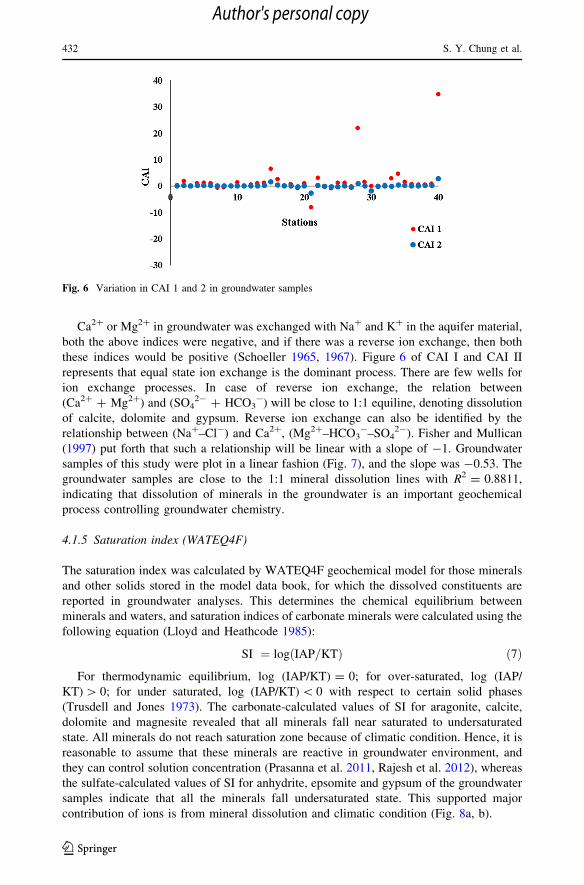
Ca2? or Mg2? in groundwater was exchanged with Na? and K? in the aquifer material,
both the above indices were negative, and if there was a reverse ion exchange, then both
these indices would be positive (Schoeller 1965, 1967). Figure 6 of CAI I and CAI II
represents that equal state ion exchange is the dominant process. There are few wells for
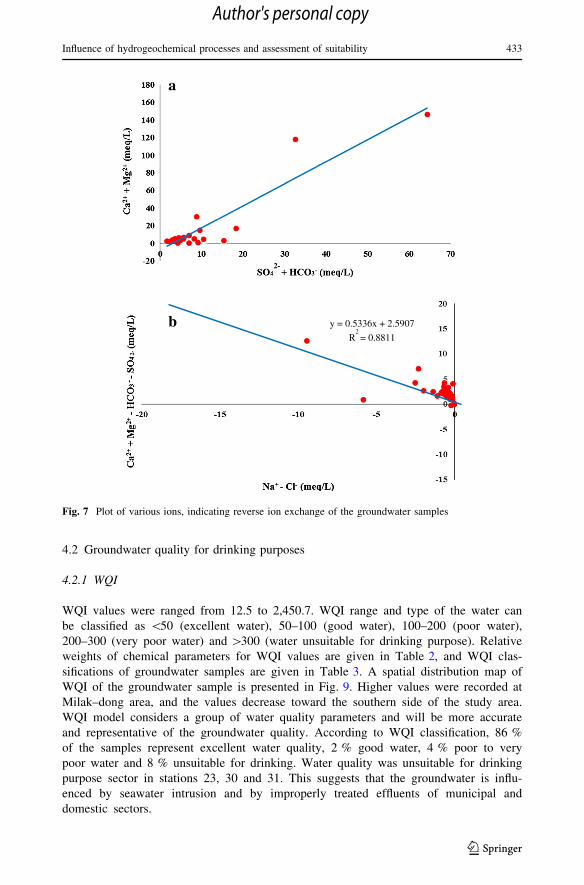
ion exchange processes. In case of reverse ion exchange, the relation between
(Ca2? ? Mg2?) and (SO42- ? HCO3
-) will be close to 1:1 equiline, denoting dissolution
of calcite, dolomite and gypsum. Reverse ion exchange can also be identified by the
relationship between (Na?–Cl-) and Ca2?, (Mg2?–HCO3-–SO4
2-). Fisher and Mullican
(1997) put forth that such a relationship will be linear with a slope of -1. Groundwater
samples of this study were plot in a linear fashion (Fig. 7), and the slope was -0.53. The
groundwater samples are close to the 1:1 mineral dissolution lines with R2 = 0.8811,
indicating that dissolution of minerals in the groundwater is an important geochemical
process controlling groundwater chemistry.
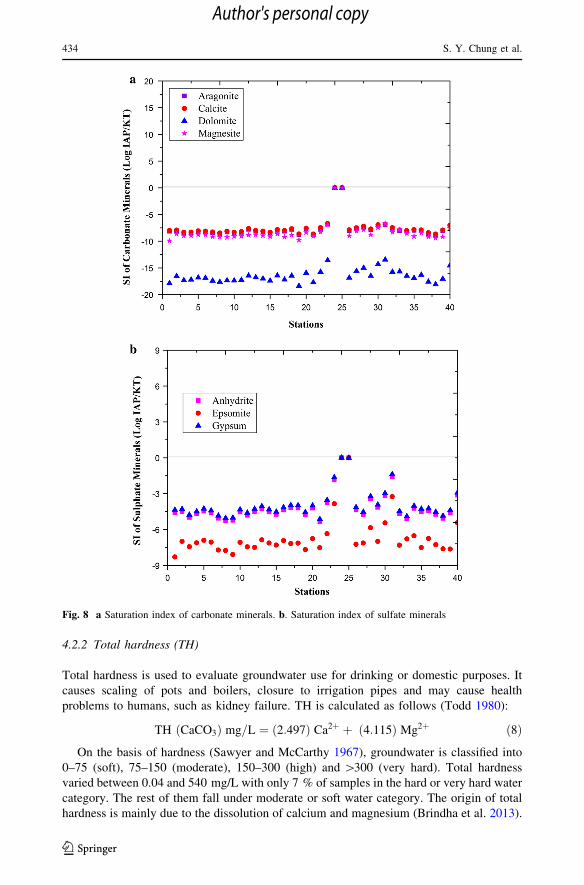
4.1.5 Saturation index (WATEQ4F)
The saturation index was calculated by WATEQ4F geochemical model for those minerals
and other solids stored in the model data book, for which the dissolved constituents are
reported in groundwater analyses. This determines the chemical equilibrium between
minerals and waters, and saturation indices of carbonate minerals were calculated using the
following equation (Lloyd and Heathcode 1985):
SI ¼ log IAP=KTð Þ ð7ÞFor thermodynamic equilibrium, log (IAP/KT) = 0; for over-saturated, log (IAP/
KT)[ 0; for under saturated, log (IAP/KT)\ 0 with respect to certain solid phases
(Trusdell and Jones 1973). The carbonate-calculated values of SI for aragonite, calcite,
dolomite and magnesite revealed that all minerals fall near saturated to undersaturated
state. All minerals do not reach saturation zone because of climatic condition. Hence, it is
reasonable to assume that these minerals are reactive in groundwater environment, and
they can control solution concentration (Prasanna et al. 2011, Rajesh et al. 2012), whereas
the sulfate-calculated values of SI for anhydrite, epsomite and gypsum of the groundwater
samples indicate that all the minerals fall undersaturated state. This supported major
contribution of ions is from mineral dissolution and climatic condition (Fig. 8a, b).
Fig. 6 Variation in CAI 1 and 2 in groundwater samples
432 S. Y. Chung et al.
123
Author's personal copy
4.2 Groundwater quality for drinking purposes
4.2.1 WQI
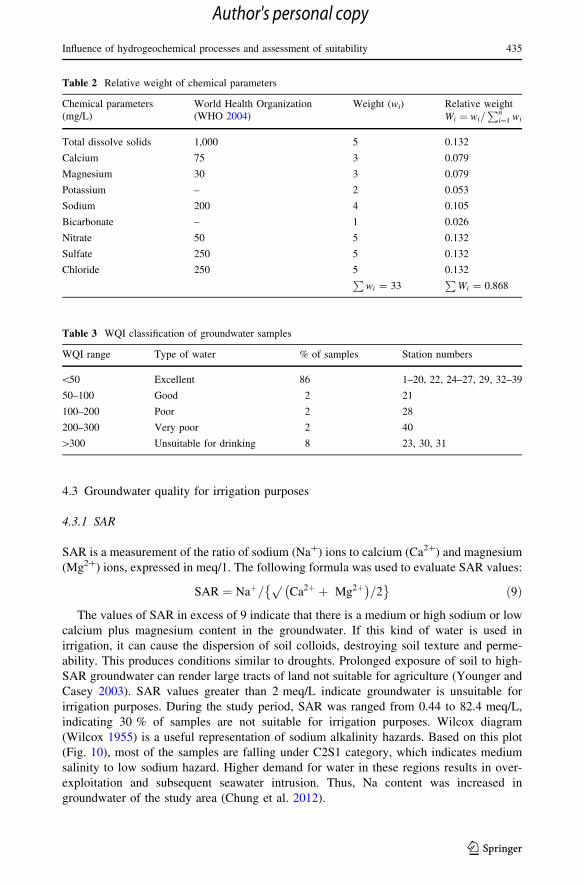
WQI values were ranged from 12.5 to 2,450.7. WQI range and type of the water can
be classified as \50 (excellent water), 50–100 (good water), 100–200 (poor water),
200–300 (very poor water) and[300 (water unsuitable for drinking purpose). Relative
weights of chemical parameters for WQI values are given in Table 2, and WQI clas-
sifications of groundwater samples are given in Table 3. A spatial distribution map of
WQI of the groundwater sample is presented in Fig. 9. Higher values were recorded at
Milak–dong area, and the values decrease toward the southern side of the study area.
WQI model considers a group of water quality parameters and will be more accurate
and representative of the groundwater quality. According to WQI classification, 86 %
of the samples represent excellent water quality, 2 % good water, 4 % poor to very
poor water and 8 % unsuitable for drinking. Water quality was unsuitable for drinking
purpose sector in stations 23, 30 and 31. This suggests that the groundwater is influ-
enced by seawater intrusion and by improperly treated effluents of municipal and
domestic sectors.
a
2-
y = 0.5336x + 2.5907
R2 = 0.8811
b
2-
Fig. 7 Plot of various ions, indicating reverse ion exchange of the groundwater samples
Influence of hydrogeochemical processes and assessment of suitability 433
123
Author's personal copy
4.2.2 Total hardness (TH)
Total hardness is used to evaluate groundwater use for drinking or domestic purposes. It
causes scaling of pots and boilers, closure to irrigation pipes and may cause health
problems to humans, such as kidney failure. TH is calculated as follows (Todd 1980):
TH CaCO3ð Þ mg=L ¼ 2:497ð Þ Ca2þ þ 4:115ð Þ Mg2þ ð8ÞOn the basis of hardness (Sawyer and McCarthy 1967), groundwater is classified into
0–75 (soft), 75–150 (moderate), 150–300 (high) and [300 (very hard). Total hardness
varied between 0.04 and 540 mg/L with only 7 % of samples in the hard or very hard water
category. The rest of them fall under moderate or soft water category. The origin of total
hardness is mainly due to the dissolution of calcium and magnesium (Brindha et al. 2013).
Fig. 8 a Saturation index of carbonate minerals. b. Saturation index of sulfate minerals
434 S. Y. Chung et al.
123
Author's personal copy
4.3 Groundwater quality for irrigation purposes
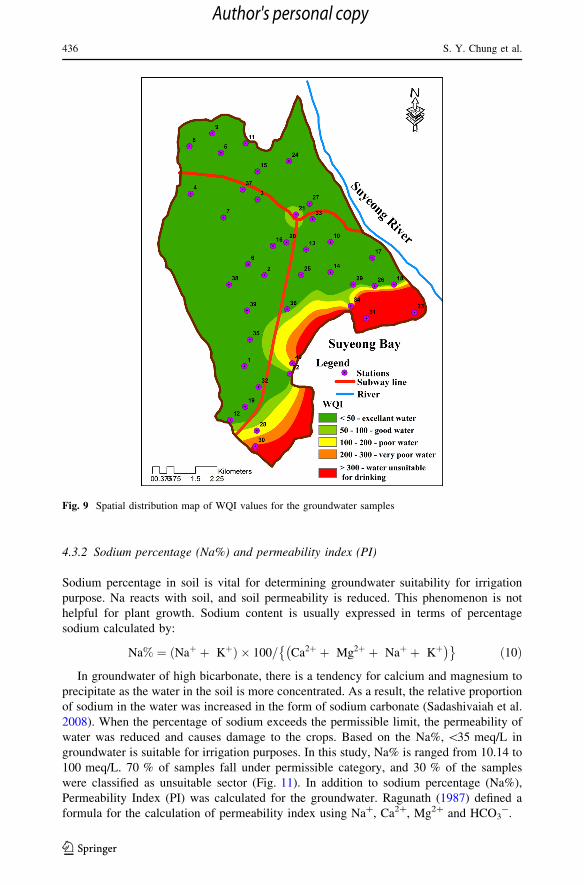
4.3.1 SAR
SAR is a measurement of the ratio of sodium (Na?) ions to calcium (Ca2?) and magnesium
(Mg2?) ions, expressed in meq/1. The following formula was used to evaluate SAR values:
SAR ¼ Naþ=p
Ca2þ þ Mg2þ� �
=2� �
ð9Þ
The values of SAR in excess of 9 indicate that there is a medium or high sodium or low
calcium plus magnesium content in the groundwater. If this kind of water is used in
irrigation, it can cause the dispersion of soil colloids, destroying soil texture and perme-
ability. This produces conditions similar to droughts. Prolonged exposure of soil to high-
SAR groundwater can render large tracts of land not suitable for agriculture (Younger and
Casey 2003). SAR values greater than 2 meq/L indicate groundwater is unsuitable for
irrigation purposes. During the study period, SAR was ranged from 0.44 to 82.4 meq/L,
indicating 30 % of samples are not suitable for irrigation purposes. Wilcox diagram
(Wilcox 1955) is a useful representation of sodium alkalinity hazards. Based on this plot
(Fig. 10), most of the samples are falling under C2S1 category, which indicates medium
salinity to low sodium hazard. Higher demand for water in these regions results in over-
exploitation and subsequent seawater intrusion. Thus, Na content was increased in
groundwater of the study area (Chung et al. 2012).
Table 2 Relative weight of chemical parameters
Chemical parameters(mg/L)
World Health Organization(WHO 2004)
Weight (wi) Relative weight
Wi ¼ wi=Pn
i¼1 wi
Total dissolve solids 1,000 5 0.132
Calcium 75 3 0.079
Magnesium 30 3 0.079
Potassium – 2 0.053
Sodium 200 4 0.105
Bicarbonate – 1 0.026
Nitrate 50 5 0.132
Sulfate 250 5 0.132
Chloride 250 5 0.132P
wi = 33P
Wi = 0.868
Table 3 WQI classification of groundwater samples
WQI range Type of water % of samples Station numbers
\50 Excellent 86 1–20, 22, 24–27, 29, 32–39
50–100 Good 2 21
100–200 Poor 2 28
200–300 Very poor 2 40
[300 Unsuitable for drinking 8 23, 30, 31
Influence of hydrogeochemical processes and assessment of suitability 435
123
Author's personal copy
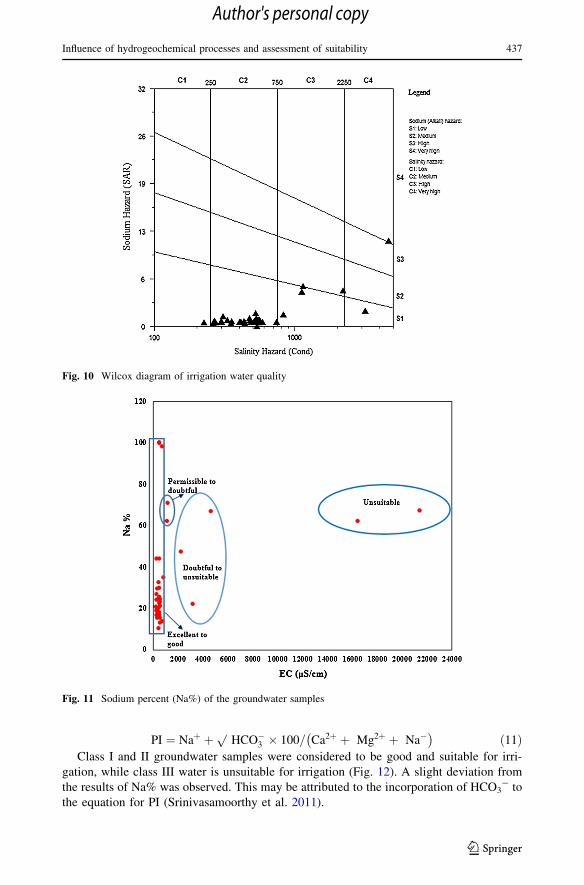
4.3.2 Sodium percentage (Na%) and permeability index (PI)
Sodium percentage in soil is vital for determining groundwater suitability for irrigation
purpose. Na reacts with soil, and soil permeability is reduced. This phenomenon is not
helpful for plant growth. Sodium content is usually expressed in terms of percentage
sodium calculated by:
Na% ¼ Naþ þ Kþð Þ � 100= Ca2þ þ Mg2þ þ Naþ þ Kþ� �� �ð10Þ
In groundwater of high bicarbonate, there is a tendency for calcium and magnesium to
precipitate as the water in the soil is more concentrated. As a result, the relative proportion
of sodium in the water was increased in the form of sodium carbonate (Sadashivaiah et al.
2008). When the percentage of sodium exceeds the permissible limit, the permeability of
water was reduced and causes damage to the crops. Based on the Na%,\35 meq/L in
groundwater is suitable for irrigation purposes. In this study, Na% is ranged from 10.14 to
100 meq/L. 70 % of samples fall under permissible category, and 30 % of the samples
were classified as unsuitable sector (Fig. 11). In addition to sodium percentage (Na%),
Permeability Index (PI) was calculated for the groundwater. Ragunath (1987) defined a
formula for the calculation of permeability index using Na?, Ca2?, Mg2? and HCO3-.
Fig. 9 Spatial distribution map of WQI values for the groundwater samples
436 S. Y. Chung et al.
123
Author's personal copy
PI ¼ Naþ þ pHCO�
3 � 100= Ca2þ þ Mg2þ þ Na�� �
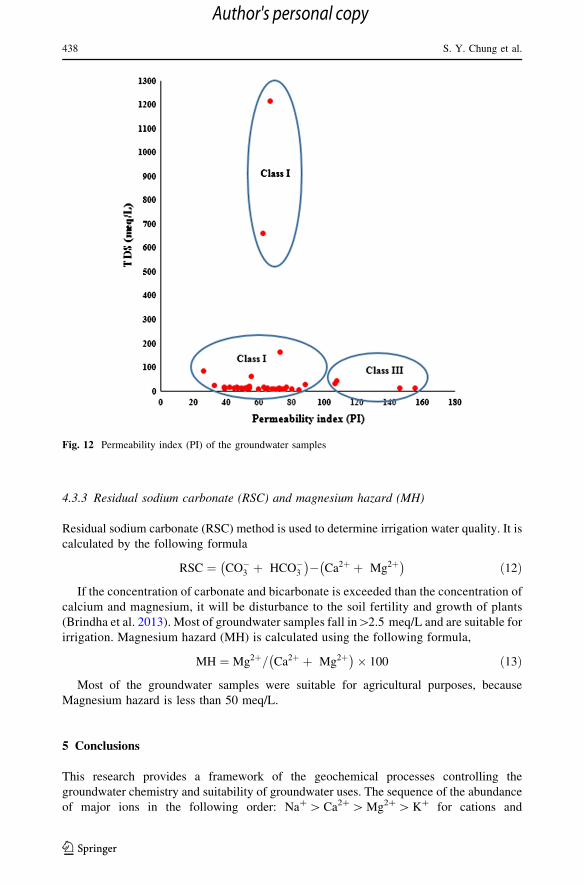
ð11ÞClass I and II groundwater samples were considered to be good and suitable for irri-
gation, while class III water is unsuitable for irrigation (Fig. 12). A slight deviation from
the results of Na% was observed. This may be attributed to the incorporation of HCO3- to
the equation for PI (Srinivasamoorthy et al. 2011).
Fig. 10 Wilcox diagram of irrigation water quality
Fig. 11 Sodium percent (Na%) of the groundwater samples
Influence of hydrogeochemical processes and assessment of suitability 437
123
Author's personal copy
4.3.3 Residual sodium carbonate (RSC) and magnesium hazard (MH)
Residual sodium carbonate (RSC) method is used to determine irrigation water quality. It is
calculated by the following formula
RSC ¼ CO�3 þ HCO�
3
� �� Ca2þ þ Mg2þ� �
ð12Þ
If the concentration of carbonate and bicarbonate is exceeded than the concentration of
calcium and magnesium, it will be disturbance to the soil fertility and growth of plants
(Brindha et al. 2013). Most of groundwater samples fall in[2.5 meq/L and are suitable for
irrigation. Magnesium hazard (MH) is calculated using the following formula,
MH ¼ Mg2þ= Ca2þ þ Mg2þ� �
� 100 ð13Þ
Most of the groundwater samples were suitable for agricultural purposes, because
Magnesium hazard is less than 50 meq/L.
5 Conclusions
This research provides a framework of the geochemical processes controlling the
groundwater chemistry and suitability of groundwater uses. The sequence of the abundance
of major ions in the following order: Na?[Ca2?[Mg2?[K? for cations and
Fig. 12 Permeability index (PI) of the groundwater samples
438 S. Y. Chung et al.
123
Author's personal copy
Cl-[HCO3-[SO4
2-[NO3-[F- for anions. According to hydrogeochemical facies,
the groundwater samples belong to Ca (HCO3)2, Ca Cl2 and NaCl types. Gibbs plot reveals
that most of the groundwater samples fall in rock-weathering dominance zone. Evaporation
and ion exchange were the dominant processes controlling the groundwater chemical
composition. SI index of the carbonate and sulfate minerals fall saturated to undersaturated
state, indicating the dissolution and ion exchange process. By WQI values, 12 % of the
groundwater samples fall at poor to very poor quality in the southern part of the study area.
This contrast in hydrochemistry is attributed to the heavy population in the southern side
and to subsequent over-exploitation of groundwater. However, irrigation indices (SAR,
Na%, PI. RSC and MH) represent that 70 % of groundwater samples were suitable for
agricultural purpose. Wilcox plot indicates most of the samples fall in C2S1 sector. It is
due to the long residence time of water, dissolution of minerals from lithological com-
position, seawater intrusion and domestic, industrial waste waters. This study results will
be very helpful for sustainable management of groundwater resources, and it will enable
planners and policymakers to evolve a strategy to solve similar problems elsewhere.
Acknowledgments This work was supported by a Research Grant of Pukyong National University (2014Year). The manuscript was greatly benefited from the constructive comments of an anonymous reviewer.
References
Anithamary, I., Ramkumar, T., Venkatramanan, S. (2012). Application of statistical analysis for the hy-drogeochemistry of saline groundwater in Kodiakarai, Tamilnadu, India. Journal of Coastal Research,28, 89–98.
APHA. (1995). Standard methods for the examination of water and wastewater (19th ed.). New York:American Public Health Association.
Brindha, K., & Elango, L. (2012). Impact of tanning industries on groundwater quality near a metropolitancity in India. Water Resource Management, 26, 1747–1761.
Brindha, K., & Elango, L. (2013a). Soil and groundwater quality with reference to nitrate in a semiaridagricultural region. Arabian Journal of Geosciences. doi:10.1007/s12517-013-1100-5.
Brindha. K., & Elango, L. (2013b). Geochemistry of fluoride rich groundwater in a weathered granitic rockregion, southern India. Water Quality, Exposure and Health. doi:10.1007/s12403-013-0096-0.
Brindha, K., Neena Vaman, K. V., Srinivasan, K, Sathis Babu, M., & Elango, L. (2013). Identification ofsurface water-groundwater interaction by hydrogeochemical indicators and assessing its suitability fordrinking and irrigational purposes in Chennai, Southern India. Applied Water Science. doi:10.1007/s13201-013-0138-6.
Cederstorm, D. J. (1946). Genesis of groundwater in the coastal plain of Virginia. Environmental Geology,41, 218–245.
Chae, G. T., Yun, S. T., Choi, B. Y., Yu, S. Y., Jo, H. Y., Mayer, B., et al. (2008). Hydrochemistry of urbangroundwater, Seoul, Korea: The impact of subway tunnels on groundwater quality. Journal of Con-taminated Hydrology, 101, 42–52.
Chang, T. W., Kang, P. C., Park, S. H., Hwang, S. K., & Lee, D. W. (1983). The geological map of Busanand Gadeog (1:50,000). Korea Institute of Energy and Resources. 22.
Chung, S. Y., Kim, T. H., & Park, N. (2012). The influence of the surrounding groundwater by groundwaterdischarge from the subway tunnel at Suyeong district, Busan city. Journal of Soil and GroundwaterEnvironment, 17, 28–36.
Craig, E., & Anderson, M. P. (1979). The effects of urbanization of ground water quality. A case study ofground water ecosystems. Environmental Conservation, 30, 104–130.
Dar, I. A., Sankar, K., & Dar, M. A. (2011). Spatial assessment of groundwater quality in Mamundiyarbasin, Tamil Nadu, India. Environmental Monitoring and Assessment, 178, 437–447.
Domenico, P. A. (1972). Concepts and models in groundwater hydrology. New York: McGraw-Hill.Fisher, S. R., & Mullican, W. F. (1997). Hydrogeochemical evolution of sodium-sulfate and sodium-
chloride groundwater beneath the northern Chihuahua desert, Trans-Pecos, Texas, USA. Journal ofHydrogeology, 5, 4–16.
Influence of hydrogeochemical processes and assessment of suitability 439
123
Author's personal copy
Gibbs, R. J. (1970). Mechanisms controlling world water chemistry. Science, 170, 1088–1090.Gunduz, O., Simsek, C., & Hasozbek, A. (2009). Arsenic pollution in the groundwater of Simav Plain,
Turkey: its impact on water quality and human health. Water, Air, and Soil pollution, 205, 43–62.Gupta, S., Dandele, P. S., Verma, M. B., & Maithani, P. B. (2009). Geochemical assessment of groundwater
around Macherla-Karempudi Area, Guntur District, Andhra Pradesh. Journal Geological Society ofIndia, 73, 202–212.
Gupta, S. K., Gupta, R. C., Chhabra, S. K., Eskiocak, S., Gupta, A. B., & Gupta, R. (2008). Health issuesrelated to N pollution in water and air. Current Science, 94, 1469–1477.
Hosono, T., Ikawa, R., Shimada, J., Nakano, T., Saito, M., Onodera, S. I., et al. (2009). Human impacts ongroundwater flow and contamination deduced by multiple isotopes in Seoul City, South Korea. Scienceof the Total Environments, 407, 3189–3197.
Kim, Y. Y. (2004). Analysis of hydrochemical processes controlling the urban groundwater system in Seoularea, Korea. Geoscience Journal, 8, 313–318.
Kim, H., & Chung, S. Y. (2011). Application of Multivariate statistical analysis for the evaluation ofgroundwater contamination characteristics at the Suyeong-gu of Busan city, Korea. Journal of theGeological Society of Korea, 47, 45–58.
Kim, S. J., Hyun, Y., & Lee, K. K. (2005). Time series modeling for evaluation of groundwater dischargerates into an urban subway system. Geoscience Journal, 9, 15–22.
Kim, Y. Y., Lee, K. K., & Sung, I. H. (2001). Urbanization and the groundwater budget, metropolitan Seoularea, Korea. Hydrogeology Journal, 9, 401–412.
Kraiem, Z., Zouari, K., Chkir, N., & Agoune, A. (2013). Geochemical characteristics of arid shallowaquifers in Chott Djerid, south-western Tunisia. Journal of Hydro-environment Research, doi:10.1016/j.jher.2013.06.002.
Lermontov, A., Yokoyama, L., Lermontov, M., & Machado, M. A. S. (2009). River quality analysis usingfuzzy water quality index: Ribeira do Iguape river watershed, Brazil. Ecological Indicators, 9,1188–1197.
Liu, C. W., Jang, C. S., Chen, C. P., Lin, C. N., & Lou, K. L. (2008). Characterization of groundwaterquality in Kinmen Island using multivariate analysis and geochemical modelling. Hydrological Pro-cesses, 22, 376–383.
Lloyd, J. W., & Heathcode, J. A. (1985). Nature inorganic hydrochemistry in relation to groundwater. NewYork: Oxford University Press.
Madhavan, N., & Subramanian, V. (2006). Environmental impact assessment including evolution of fluorideand arsenic contamination process in groundwater and remediation of contaminated groundwatersystem. In: M. Thangarajan (Ed.), Sustainable development and mangement of groundwater reserve(pp. 128–155). New Delhi: Capital Publishing Company.
Mamatha, P., & Rao, S. M. (2009). Geochemistry of fluoride rich ground-water in Kolar and TumkurDistricts of Karnataka. Environmental Earth Sciences, 61, 131–142.
Miller, G. T. (1979). Living in the environment. Belmond, CA: Wadsworth Publishing Company.Mitra, B. K. (1998). Spatial and temporal variation of ground water quality in sand dune area of aomori
prefecture in Japan. Paper number 062023, 2006 ASAE Annual Meeting.Namibian, M. (2007). A new Water Quality Index for environmental contamination contributed by mineral
processing: a case study of Amang (tin tailing) processing activity. Journal of Applied Sciences, 7,2977–2987.
Ozcan, H., Ekinci, H., Baba, A., Kavdır, Y., Yuksel, O., & Yigini, Y. (2007). Assessment of the water qualityof Troia for the multipurpose usages. Environmental Monitoring and Assessment, 130, 389–402.
Piper, A. M., (1953). Agraphic procedure I the geo-chemical interpretation of water analysis. USGSGroundwater Note no. 12.
Prasanna, M. V., Chidambaram, S., Senthil Kumar, G., Ramanathan, A. L., & Nainwal, H. C. (2011).Hydrogeochemical assessment of groundwater in Neyveli Basin, Cuddalore district, South India.Arabian Journal of Geosciences, 4, 319–330.
Ragunath, H. M. (1987). Groundwater (p. 563). New Delhi: Wiley Eastern Ltd.Rajesh, R., Brindha, K., Murugan, R., & Elango, L. (2012). Influence of hydrogeochemical processes on
temporal changes in groundwater quality in a part of Nalgonda district, Andhra Pradesh, India.Environmental Earth Sciences, 65, 1203–1213.
Rajmohan, N., & Elango, L. (2004). Identification and evolution of hydrogeochemical processes in thegroundwater environment in an area of the Palar and Cheyyar River Basins, Southern India. Envi-ronmental Geology, 46, 47–61.
Ramkumar, T., Venkatramanan, S., Anithamary, I., & Ibrahim, S. (2011). Evaluation of hydrogeochemicalparameters and quality assessment of the groundwater in Kottur blocks, Tiruvarur district, Tamilnadu,India. Arabian Journal of Geosciences, 6, 101–108.
440 S. Y. Chung et al.
123
Author's personal copy
Sadashivaiah, C., Ramakrishnaiah, C. R., & Ranganna, G. (2008). Hydrochemical analysis and evaluation ofgroundwater quality in Tumkur Taluk, Karnataka State, India. International Journal of EnvironmentalResearch and Public Health, 5, 158–164.
Sajil Kumar, P. J., Elango, L., James, E. J. (2013). Assessment of hydrochemistry and groundwater qualityin the coastal area of South Chennai, India. Arabian Journal of Geosciences. doi:10.1007/s12517-013-0940-3.
Sawyer, G. N., & McCarthy, D. L. (1967). Chemistry of sanitary engineers (2nd ed., p. 518). New York:McGraw Hill.
Schoeller, H., (1965). Qualitative evaluation of groundwater resources. In: Methods and techniques ofgroundwater investigations and development. UNESCO, pp. 54–83.
Schoeller, H. (1967). Geochemistry of groundwater-an international guide for research and practice,Chapter 15 (pp. 1–18). Paris: UNESCO.
Shim, B. Y., Chung, S. Y., Kim, H. J., & Sung, I. H. (2004). Intrinsic random function of order k-kriging ofelectrical resistivity data for estimating the extent of saltwater intrusion in a coastal aquifer system.Environmental Geology, 46, 533–541.
Shim, B. Y., Chung, S. Y., Kim, H. J., Sung, I. H., & Kim, B. W. (2002). Characteristics of Sea waterintrusion using geostatistical analysis of geophysical surveys at the southeastern coastal area of Busan,Korea. Journal of Soil and Groundwater Environment, 7, 3–17.
Simoes, F. S., Moreira, A. B., Bisinoti, M. C., Gimenez, S. M. N., & Yabe, M. J. S. (2008). Water QualityIndex as a simple indicator of aquaculture effects on aquatic bodies. Ecological Indicators, 8, 476–484.
Singh, A. K., Mondal, G. C., Kumar, S., Singh, T. B., Tewary, B. K., & Sinha, A. (2008). Major ionchemistry, weathering processes and water quality assessment in upper catchment of Damodar Riverbasin, India. Environmental Geology, 54, 745–758.
Son, C. M, Lee, S. M., Kim, Y. K., Kim, S. W., Kim, H. S. (1978). The Geological Map of Dongrae andWeolnae (1:50,000). Korea Research Institute of Geoscience and Mineral Resources.
Srinivasamoorthy, K., Vasanthavigar, M., Vijayaraghavan, K., Sarathidasan, R., & Gopinath, S. (2011).Hydrochemistry of groundwater in a coastal region of Cuddalore district, Tamilnadu, India: Impli-cation for quality assessment. Arabian Journal of Geosciences,. doi:10.1007/s12517-011-0351-2.
Subramani, T., Rajmohan, N., & Elango, L. (2009). Groundwater geochemistry and identification of hy-drogeochemical processes in a hard rock region, Southern India. Environmental Monitoring andAssessment doi:10.1007/s10661-009-0781-4.
Todd, D. K. (1980). Ground water hydrology (p. 535). New York: Wiley.Trusdell, A. H., & Jones, B. F. (1973). Wateq: A computer program for calculating chemical equilibria of
natural waters. National Technical Information Service, VA, USA.Umar, R., Ahmed, I., Alam, F., & Khan, M. M. (2009). Hydrochemical characteristics and seasonal vari-
ations in groundwater quality of an alluvial aquifer in parts of Central Ganga Plain, Western UttarPradesh, India. Environmental Geology, 58, 1295–1300.
USEPA. (2003). Human health toxicity values in super- fund risk assessments. OSWER Directive 9285.753.December 5, 2003.
Vasanthavigar, M., Srinivasamoorthy, K., Vijayaragavan, K., Rajiv Ganthi, R., Chidambaram, S., Anand-han, P., et al. (2010). Application of water quality index for groundwater quality assessment: Thiru-manimuttar sub-basin, Tamilnadu, India. Environmental Monitoring and Assessment, 171, 595–609.
Venkatramanan, S., Chung, S. Y., Ramkumar, T., Gnanachandrasamy, G., & Vasudevan, S. (2013). Amultivariate statistical approaches on physicochemical characteristics of groundwater in and aroundNagapatttinam district, Cauvery deltaic region of Tamil Nadu, India. Earth Science Research Journal,17, 97–103.
Venkatramanan, S., Ramkumar, T., & Anithamary, I. (2012). A statistical approach on hydrogeochemistryof groundwater in Muthupet coastal region, Tamilnadu, India. Carpathian Journal of Earth andEnvironmental Sciences, 7, 47–54.
Vikas, C., Kushwaha, R. K., & Pandit, M. K. (2009). Hydrochemical status of groundwater in district Ajmer(NW India) with reference to fluoride distribution. Journal Geological Society of India, 73, 773–784.
WHO. (2004). Guidelines for drinking water quality V.1 Recommendations (p. 130). Switzerland: Geneva.Wilcox, L. V. (1955). Classification and use of irrigation water. US Geol Dep Agri Arc, 969, 19.Younger, P., & Casey, V. (2003). A simple method for determining the suit- ability of brackish ground-
waters for irrigation. Waterlines, 22, 11–13.Zahid, A., Hassan, M. Q., Balke, K. D., Flegr, M., & Clark, D. W. (2008). Groundwater chemistry and
occurrence of arsenic in the Meghna floodplain aquifer, southeastern Bangladesh. EnvironmentalGeology, 54, 1247–1260.
Zhu, C., & Schwartz, W. (2011). Hydrogeochemical processes and controls on water quality and watermanagement. Elements, 7, 169–174.
Influence of hydrogeochemical processes and assessment of suitability 441
123
Author's personal copy
1 23
Your article is protected by copyright and all
rights are held exclusively by Springer Science
+Business Media Dordrecht. This e-offprint
is for personal use only and shall not be self-
archived in electronic repositories. If you wish
to self-archive your article, please use the
accepted manuscript version for posting on
your own website. You may further deposit
the accepted manuscript version in any
repository, provided it is only made publicly
available 12 months after official publication
or later and provided acknowledgement is
given to the original source of publication
and a link is inserted to the published article
on Springer's website. The link must be
accompanied by the following text: "The final
publication is available at link.springer.com”.