influence of algal exudates and bacteria on growth and survival of white shrimp larvae fed entirely...
TRANSCRIPT

Influence of algal exudates and bacteria on growthand survival of white shrimp larvae fed entirely onmicroencapsulated diets
A.O. ALABI,* Z. CHE COB†, D.A. JONES and J.W. LATCHFORDSchool of Ocean Sciences, University of Wales, Bangor, Menai-Bridge, Anglesey, LL59 5EY, U.K.
(Received 7 April 1997; accepted 25 April 1999)
Abstract. Intact microencapsulated protozoeal diets (MED), added to 5 mm filtered hatchery water atthe recommended concentration of 4 mg L–1 gave no significant difference in bacterial numbers after 6 h,over a 48 h period compared to control groups in autoclaved hatchery water. Disruption of the MEDresulted in a significant increase in bacterial numbers up to 12 h compared to controls with intactmicrocapsules. Protein leach rates were similar in sterile water and 5 mm filtered water, indicating thatleaching was independent of microbial activity. MED leached significantly less dietary solublescompared to a microparticulate diet (MPD). There was no evidence to suggest significant attachment ofbacteria to diet particles for at least 48 h.
In low-quality water after algal blooms, survival of white shrimp (Penaeus indicus) larvae was poorwhen reared in both sterile and 5 mm filtered water. The addition of bacteria filtered from xenic algalcultures together with the algal exudates to such water gave significant improvements in survival tolarvae fed MED in 5 mm filtered water but not in autoclaved culture water. Live algal diets promote highlarval survival and growth irrespective of the inclusion of bacteria.
It is suggested that algal exudates act as selective bacteriocides and total replacement of algae withMED requires a balanced bacterial community which can be attained at times from natural sea water, orwhen the natural bacterial community balance is disturbed, corrected by the use of algal exudates.
Key words: algal exudates, bacterial balance, larval culture, microencapsulated diets, white shrimp(Penaeus indicus)
Introduction
Microencapsulated diets (MED) (Jones et al., 1984; 1987) designed to overcomeproblems of disintegration of larval shrimp diets in water, have been widely used inpenaeid larval culture (Jones et al., 1993). However, recent reports (Muir and Sutton,1994) have questioned the stability of MED, suggesting that they are rapidly degradedby bacteria and that their use in larval cultures may provide an oral route of entry forpotentially pathogenic bacteria into the larvae. Despite this, Ottogalli (1992) reared
* Author to whom correspondence should be addressed at: Island Scallops Ltd., 5552 West IslandHighway, Qualicum Beach, B.C. V9K 2C8, Canada.
† Current address: Matriculation Centre, National Universtiy of Malaysia, 43600 Bangi, Selangi,Malaysia.
Aquaculture International 7: 137–158, 1999.© 1999 Kluwer Academic Publishers. Printed in the Netherlands.

penaeid larvae in commercial scale hatcheries by totally replacing algae with MED andspecifically including bacteria. The first aim of these experiments was to test theefficacy of microencapsulation in reducing bacterial loading in culture waters andthe extent of microbial participation in the degradation of MED.
Successful modification of the microbial flora of the culture water through the useof probiotics has been shown to enhance crustacean larval cultures (Nogami andMaeda, 1992; Garriques and Arevalo, 1995) and bivalve larval cultures (Douillet andLangdon, 1993; 1994; Riquelme et al., 1996; 1997) and it has been suggested thatthe maintenance of natural bacterial populations may benefit penaeid (Alabi et al.,1997) and bivalve (Douillet and Langdon, 1994) larval cultures. These enhancementshowever depend on initial good water quality. Sea water quality in North Walesvaries seasonally and periods of poor water quality are usually associated with thebreakdown of spring diatom blooms from May to July, which also coincides with theappearance of the colonial alga, Phaeocystis pouchetti (Al-Hassan et al., 1975). Thispoor water quality has been implicated in variations in the growth of Ostrea edulislarvae (Utting and Helm, 1985). Poor growth has been related to a higher mineralcontent and to fine particulates in the water (Walne, 1970). Removal of organicmatter by foam separation or filtration through activated carbon (Wickins and Helm,1981), and treatment with EDTA, EDTA 1 sodium metasilicate or alumina, magne-sium trisilicate or Fuller’s earth (Utting and Helm, 1985) sometimes improved waterquality. However, their mode of action during and immediately following suchphytoplankton blooms is unknown (Utting and Helm, 1985). Some researchers(Douillet and Langdon, 1993; 1994) have reported that additions of specific strains ofbacteria to xenic cultures of Crassostrea gigas larvae consistently enhanced larvalgrowth irrespective of season, while others (Skjermo et al., 1997), have reportedincreased survival of turbot (Scopthalmus maximus) larvae using microbiallymatured water in a manner which selects for non-opportunistic microbes at theexpense of opportunistic and presumably pathogenic bacteria. The second aim ofthese experiments was to investigate the effects of established bacterial populationsfrom xenic algal cultures as potential probiotics to provide improved growth andsurvival to penaeid larvae fed MED.
Materials and methods
Diets
Protozoea (PZ) stage diets used were the micro-encapsulated diet (MED), FrippakCrustacean Algal Replacement (CAR) and a commercial micro-particulate diet(MPD). The mysis (M) stage diet used was the MED Frippak Crustacean diet number2 (CD2), (INVE Aquaculture, Belgium). The live diets used were a mixture of thealgae Skeletonema costatum and Tetraselmis chuii fed at concentrations of 45 and 25
138

cells ml–1 respectively to the PZ1-PZ3 stages, reduced to 15 and 10 cells ml–1
respectively at the M1 stage where the experiments were stopped.
Water treatment methods
Rearing water from cultures of post-larval P. indicus at the School of Ocean Sciencesor fresh sea water were filtered through 5 mm cartridge filters (Hytrex 11) to removealgae and larger particles (5 mmSW). Sterile controls consisted of 5 mmSW auto-claved in 2 L volumes, at 121 °C and 1.055g mm–2 for 15 min (AuW). Sterility ofAuW was routinely confirmed by spreading aliquots of randomly selected sampleson modified Sea Water Complex (SWC) (Reichelt and Baumann, 1973) agar. Watersamples were put into either sterile acid-washed 2 L round-bottomed flasks (RBFs)or 250 ml conical Erhlenmeyer flasks. Where aeration was required, air pipes andglass tubes were treated prior to use by a 30 min immersion in 10% sodiumhypochlorite and thoroughly rinsed with sterile water. Flask necks were plugged withsterile wads of cotton and air was supplied through 0.2 mm air filters (GELMAN).
Larval rearing methods
PZ1 stage larvae of P. indicus were stocked at 100 larvae L–1 in 2 L RBFs. Gentleaeration was supplied through a glass tube at the bottom of each flask at the rate of1–2 bubbles s–1. This provided dissolved oxygen as well as keeping the diet particlesin suspension. MED were re-hydrated daily in sterile distilled water and fed to thelarvae at 4 mg L–1 day–1 in three equal rations at 0700, 1500 and 2300 h. Algal-fedlarvae were fed on mixed algae (S. costatum and T. chuii) at 45 and 25 cells ml–1
respectively daily.
Determination of total protein content, and protein leaching rates
Initial protein contents of the diets were determined from analyses of total nitrogen(N) content in the diets. These were performed in an elemental analyser (Roboprep-CN Biological Sample Converter: Europa Scientific) using acetinilide as standard.Each sample was replicated five times. Protein content was estimated as N × 6.25.
To assess the effect of bacteria on protein leaching rates, 2 L RBFs containing 2 Lof 5 mmSW from P. indicus post-larval cultures were inoculated with 1g L–1 of eitherCAR, CD2 or MPD diets. These inclusion rates were much higher than the 4mg L–1
and 7mg L–1 recommended by the MED manufacturers for the PZ and M stage dietsrespectively to facilitate detection of small amounts of leached proteins. Controlsconsisted of AuW with identical diet concentrations. Additional controls containedboth 5 mmSW and AuW with no added diets. Flasks were incubated at 28(1) °C withmoderate aeration to allow full mixing of the diets. After incubation for 0, 1, 2, 4, 6,9,12, 24 and 48 h intervals, 2 ml samples were removed from each treatment for
139

determination of dissolved protein using the bicinchoninic acid reaction method(Smith et al., 1985; Shihabi and Dyer, 1988) with bovine serum albumin as standard.The amount of protein leached from each diet treatment was expressed as apercentage of the total protein content of the diet added as determined from totalprotein content analyses. The protein concentration in the unfed controls wereexpressed as mg soluble protein present per ml of solution.
Percentage of total organic material in diets
In tests to determine the total organic content of the diets, CAR, CD2 and MPD dietswere dried to constant weight at 60 °C and l g of each diet was measured into pre-weighed crucibles which were then combusted in a muffle furnace at 400–500 °C for7 h. The final weights of the remaining ash from the samples were measured and theweights of the organic content of the diets were expressed as percentages of the totalamounts of diets initially added.
Diet stability
In tests to assess the stability of the diets in water, 1 g of each of the above nameddiets was weighed into sterile 250 ml conical flasks with 200 ml of distilled watereach. The flask necks were plugged with wool and incubated in a shaking incubatorat 28(1) °C and 150 rpm. After 6 h, the different treatments were drained on pre-weighed filter papers and dehydrated in an oven at 60 °C for 22 h. The differencesbetween the initial and final weights was taken as the amount that had been lost tothe water and expressed as percentage loss of dietary solubles h–1.
Bacterial growth
To determine the increase in bacterial loading of culture waters due to added diets,RBFs, each with 2 L of 5 mmSW, were inoculated with the manufacturer’s maximumrecommended concentrations of the diets: 4 mg L–1 for the PZ stage diets (CAR andMPD) and 7mg L–1 for the M stage (CD2) diet. Controls consisted of 5 mmSWwithout added diets. The flasks were incubated at 28(1) °C with moderate aeration.To obtain total viable counts (TVC) of bacteria, the flasks were well shaken and 1 mlsamples were removed at 0, 6, 12, 24 and 48 h. Ten-fold serial dilutions wereprepared with sterile saline and 50 ml aliquots of each dilution were spread ontoSWC agar plates. The agar plates were incubated at 28 °C for 48 h and the TVC perml were calculated from the resulting bacterial growth.
Bacterial attachment to diets
The TVC of bacteria associated with the diet particles were determined by removing50 ml aliquots from each treatment at 6, 12, 24 and 48 h which were then filtered
140

through a 3 mm membrane filter (Nucleopore) to retain only the diet particles andassociated bacteria. The bacterial counts in the filtrates were determined by takingl ml aliquots from each filtrate, serially diluting in sterile saline, and spreading ontoSWC agar plates. The filter membranes were rinsed three times with 200 ml of sterilesea water each time and resuspended in l0 ml of sterile saline, vigorously vortex-shaken for 3 min to dislodge the diet particles and serially diluted in sterile saline.Fifty microliter aliquots of each dilution were then spread on SWC agar plates andthe TVC of bacteria associated with the diets in the original sample volume wasestimated using the formula:
x 5 b/a (1)where x 5 TVC associated with diet particles ml–1 in original sample
a 5 initial volume of water removed from samples (50 ml)b 5 TVC in final volume of solution (10 ml)
The precision was verified by matching the sum of the viable bacteria associated withthe food particles and the viable bacteria in the filtrates to the TVC (2 × 10³)cfu ml–1.
The efficacy of microencapsulation in reduction of bacterial concentrations
In additional tests to assess the efficacy of microencapsulation in reducing bacterialloading, 3 g of CAR was suspended in l50 ml of distilled water and the capsulesbroken by sonication for 45 min. The mixture was then divided into three 250 mlconical flasks to give final concentrations of 0.5g L–1 in 5 mmSW from a P. indicuspost-larval rearing tank. Controls used whole capsules (0.5g L–1) in similarly treatedwater. The flasks were incubated in a shaking incubator at 28(1) °C and TVCs weretaken at 0, 3, 6, 12, 24 and 48 h.
Effect of algal exudates and bacteria on larval growth and survival
These experiments were carried out after periods of spring diatom blooms in theMenai Strait when the water was high in organic nutrients due to algal decay andwith bacterial numbers .3 × 106 cells cm3 (Blight et al., 1995). Abbreviation codesused in these tests and their use are described below:
1. Water treatments were either 5 mm filtered sea water (5 mmSW) or AuW(AuW).
2. Diet treatments were either mixed algae (AI) or microencapsuIated diets(MED).
3. The addition or not of bacteria from algal culture populations was indicated eitherby 1B (added bacteria) or 2B (no added bacteria).
The codes were used in the following sequence: water treatment before diet treatmentand finally, the inclusion or not of bacteria. Thus, SWMED-B refers to a treatment
141

with 5 mm filtered sea water, fed with MED and without the inclusion of bacteriafiltered from algal diets.
Protozoea 1 stage larvae of P. indicus were reared in 5 mmSW and fed asfollows:
a. Mixed algae (S. costatum and T. chuii) from xenic algal cultures at the rate of 45and 25 cells ml–1 respectively (5 mmSWAI1B).
b. Mixed algae as in treatment group (a), from which the culture water and most ofthe associated bacteria had been removed by sieving out the algae on 3 mmmembrane filters. The filter membranes were rinsed with 200 ml of sterile waterthree times and the membranes were vortexed in sterile saline for 2–3 min to re-suspend the algae which were then fed to the shrimp (5 mmSWAI–B).
c. MED (CAR) at the rate of 4 mg l–1 day–1 with the addition of algaI culturemedium containing bacteria which had been removed from treatment group (b)above. These bacteria when necessary were concentrated on 0.22 mm membranefilters (Nucleopore) before being fed to the larvae (5 mmSWMED1B).
d. MED (CAR) at the rate of 4 mg l–1 day –1 (5 mmSWMED2B).
Control shrimps were raised in autoclaved sea water and fed using the sametreatments as above. Abbreviation codes for the different treatments are similar tothose above with AuW (AuW) replacing the 5 mmSW codes:
a. (AuWAI1B).b. (AuWAI–B).c. (AuWMED1B).d. (AuWMED–B).
Surviving larvae were counted at the M1 stage, and growth was measured as increasein total lengths using an eyepiece graticule. TVCs (on SWC) and presumptive viableVibrio sp. counts (PVVC) (on TCBS), were taken at 0 h (when the larvae werestocked) and the end of the experiments.
To determine the effect of algal exudates on larval growth and survival, supple-mentary larval rearing trials were performed in 5 mmSW fed CAR with the additionof bacteria from algal cultures filtered to 3 mm to remove the algae in one treatmentand further filtered to 0.22 mm to retain all the bacteria and allow passage of only thealgal culture water in the other treatment. In control treatments, the algae were 3 mmfiltered and the filterates were autoclaved to destroy any anti-bacterial activitypresent in algal exudates (Austin and Day, 1990), before being added to 5 mmSW.Negative controls were with 5 mmSW alone.
In additional tests, culture water samples containing bacteria were taken from aculture of P. indicus PZ2 stage larvae reared in 5 mmSW and fed exclusively onCAR. These samples were stored at 2 20 °C in sterile glycerol added to 40% (v/v)total volume. 2 L of sterile sea water was inoculated with 50 ml of this mixture and
142

aerated for 24 h prior to addition of P. indicus PZ1 stage larvae at the rate of 100larvae L–1. Controls used 5 mmSW without added bacteria. A second control groupconsisted of AuW with no added bacteria. Rearing water was not changed during thetests and larvae were fed CAR at 4 mg L–1 day–1. Surviving larvae were counted atthe M1 stage. TVCs and PVVC counts were taken at the beginning and the end of thetrials.
Statistical analysis of data
Unless otherwise stated, all trials had three replicates. Data on bacterial concentra-tions were subjected to logarithmic transformations and larval survival values weretransformed to the angular (arc-sine) transformation of percentage survival values.All data obtained were tested for normality and homogeneity of variance beforefurther analysis. Where these conditions were satisfied, parametric test such asT-tests and analysis of variance (ANOVA) were used in data analysis. Where theconditions of normality or homogeneity were violated, the non-parametric alter-natives such as the Kruskal–Wallis tests and Mann–Whitney Rank sum tests wereused. Significant levels of difference was set at P , 0.05 (Sokal and Rohlf, 1995).
Results
Protein analyses, diet stability and leaching rates of protein from diets
Analyses of total protein content of the diets gave averages of 525.9(19.4) mg,554.0(21.7) mg and 455.5(7.7) mg per mg of diet for the CAR, CD2 and MPD dietsrespectively. ANOVA revealed that the MPD diet had significantly lower proteincontent compared to the two MED diets (f 5 42.51; p , 0.001).
Protein leach rates showed high variabilities even within treatments, but onaverage they were generally lower in the 5 mmSW samples compared to the AuWsamples within treatment groups up to 9 h (CAR and CD2) (Fig.1). For the MPD diettreatment, these differences lasted only until 4 h where leach rates were significantlylower (p 5 0.045; t 5 2.87) in the 5 mmSW than in the AuW treatment. Apart fromthis, two sample T-tests comparing protein leach rates obtained for each diettreatment tested showed no significant differences when diets were incubated in bothAuW or 5 mmSW over 48 h.
Investigation of diet stability by percentage loss of dietary solubles in sterile waterindicated that all the diets lost over 37.0% of their dietary soluble contents into theculture water within 6 h (Table 1), with the MED PZ stage diet leaching the least,followed by the M stage MED diet. The highest leaching rates occurred in the MPD
143
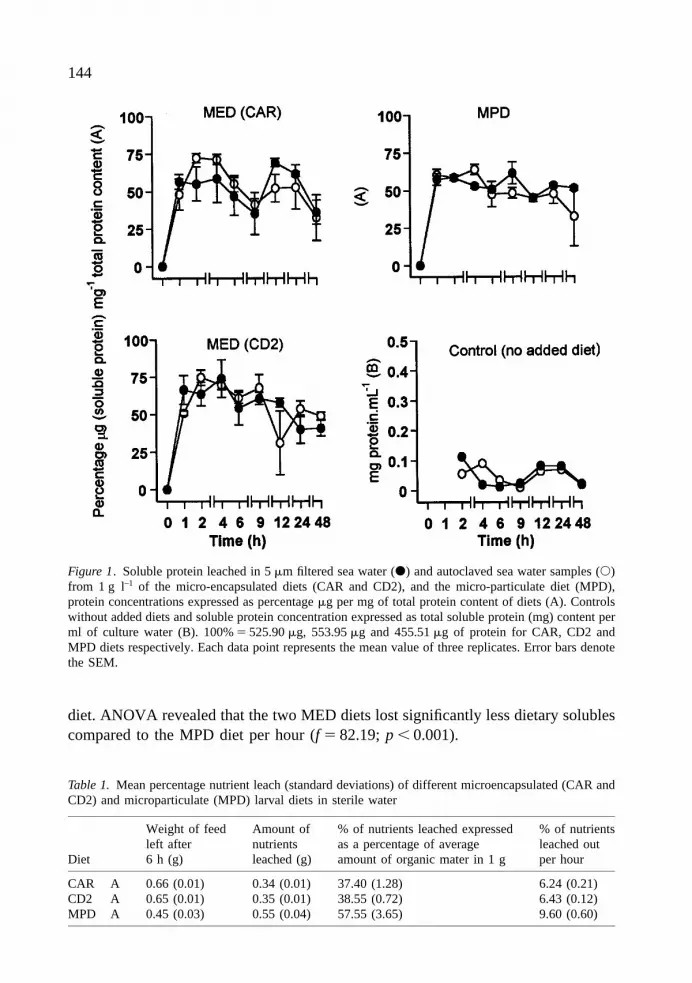
diet. ANOVA revealed that the two MED diets lost significantly less dietary solublescompared to the MPD diet per hour (f 5 82.19; p , 0.001).
Figure 1. Soluble protein leached in 5 mm filtered sea water (d) and autoclaved sea water samples (s)from 1 g l–1 of the micro-encapsulated diets (CAR and CD2), and the micro-particulate diet (MPD),protein concentrations expressed as percentage mg per mg of total protein content of diets (A). Controlswithout added diets and soluble protein concentration expressed as total soluble protein (mg) content perml of culture water (B). 100% 5 525.90 mg, 553.95 mg and 455.51 mg of protein for CAR, CD2 andMPD diets respectively. Each data point represents the mean value of three replicates. Error bars denotethe SEM.
Table 1. Mean percentage nutrient leach (standard deviations) of different microencapsulated (CAR andCD2) and microparticulate (MPD) larval diets in sterile water
Diet
Weight of feedleft after6 h (g)
Amount ofnutrientsleached (g)
% of nutrients leached expressedas a percentage of averageamount of organic mater in 1 g
% of nutrientsleached outper hour
CAR A 0.66 (0.01) 0.34 (0.01) 37.40 (1.28) 6.24 (0.21)CD2 A 0.65 (0.01) 0.35 (0.01) 38.55 (0.72) 6.43 (0.12)MPD A 0.45 (0.03) 0.55 (0.04) 57.55 (3.65) 9.60 (0.60)
144

Bacterial growth in 5mm filtered sea water fed with microencapsulated andmicroparticulate diets
Mean log TVCs obtained in 5 mmSW were lowest in the unfed control treatments forthe duration of the trial (Table 2). Despite this, ANOVA revealed that the differencesbetween diet treatments and controls were significant only up to 6 h for the PZ stagediets and 12 h for the M stage diet. At 6 h, there were no significant differences in logTVC obtained between the MED treatments. In addition, both had significantlyhigher log TVCs compared to the MPD treatment which in turn had significantlyhigher log TVC than in the unfed controls (f 5 31.85; p , 0.001).
At 12 h, apart from the CD2 treatment which still had significantly higher log TVCthan the controls, there were no significant differences in log TVCs between the other
Table 2. Mean log total viable counts (TVC) of bacteria ml21 (log TVC of bacteria in cultures) in 5 mmfiltered sea water to which different diets were added and mean log TVCs of bacteria attached to thesediets (log TVC of bacteria attached to diets)
Log TVC of bacteria in cultures
Time (h) Diet treatment
CAR A CD2 B MPD C CONTROL D0 4.6 (0.3) 4.6 (0.3) 4.6 (0.3) 4.6 (0.3)6 5.9 (0.1) 6.0 (0.1) 5.5 (0.1) 5.2 (0.1)
Abcd ABcd abCD abcD12 6.4 (0.1) 6.6 (0.1) 6.5 (0.2) 6.2 (0.1)
ABCD ABCd ABCD AbCD24 6.5 (0.0) 6.5 (0.1) 6.5 (0.0) 6.4 (0.0)
ABCD ABCD ABCD ABCD48 5.5 (0.1) 5.5 (0.1) 5.5 (0.2) 5.3 (0.3)
ABCD ABCD ABCD ABCD
Log TVC of bacteria attached to diets
Time (h) Diet treatment
CAR A CD2 B MPD C CONTROL D6 4.5 (0.5) 4.3 (0.1) 4.1 (0.3) 3.5 (0.2)
ABCd ABCd ABCD abCD12 5.0 (0.1) 5.1 (0.2) 5.0 (0.1) 4.3 (0.2)
ABCd ABCd ABCd abcD24 5.3 (0.1) 5.2 (0.1) 5.2 (0.1) 5.4 (0.0)
ABCD ABCd ABCD AbCD48 5.1 (0.1) 4.6 (0.5) 4.7 (0.2) 4.7 (0.3)
ABCD ABCD ABCD ABCD
A, B, and C 5 comparison code letters for CAR, CD2 and MPD diet treatments respectively. D 5 Control treatmentwith 5 mm filtered sea water but no added diet. Readings with the same code letter in upper case characters denotesno significant difference (a 5 0.05). Readings with the same code letters in both upper and lower case charactersindicates a significant difference. Each data point is the mean value of three replicates.
145

diet treatments and the control (ANOVA: f 5 4.43; p 5 0.04). After 12 h, there wereno significant differences in TVCs between all the treatments and the controlswithout added diets up to 48 h (f 5 0.82; p 5 0.519) suggesting that TVC obtainedwas dependent on both protein content and leach rates from the diets.
Bacterial attachment to diets
In all the treatments, mean log TVC attached to diets showed an increase up to 24 h,followed by a slight decrease of 0.24 log units, 0.53 log units, 0.46 log units and 0.66log units for the CAR, CD2, MPD and control diet treatments respectively between24 and 48 h. At 6 h and 12 h, the lowest log TVCs obtained were in the unfedcontrols (Table 2). Mean log TVCs obtained in the other diet treatments at thesetimes were (CAR 5 4.46(0.5) and 5.0(0.1)cfu ml–1), (CD2 5 4.3(0.1) and 5.1(0.2)cfu ml–1) and (MPD 5 4.1(0.3) and 5.0(0.1) cfu ml–1) at 6 and 12 h respectively.
There were no significant differences in the log TVC per ml of bacteria attachedto the diet particles at 6 h. In addition, (except for the MPD treatment), log TVC ofbacteria associated with the diet treatments were significantly higher than log TVCassociated with other particles obtained in the controls at this time (f 5 6.07;p 5 0.019). However by 12 h, there were no significant differences in log TVCobtained between all the diet treatments though they all had significantly higher logTVC when compared to the controls (f 5 18.61; p 5 0.001).
At 24 and 48 h, the CD2 diet treatment exhibited the lowest log TVCs(means 5 5.2(0.1) and 4.6(0.5) cfu ml–1 respectively) compared to the CAR, MPDand control treatments which had mean log TVCs of (5.3(0.1) and 5.1(0.1) cfu ml–1),(5.2(0.1) and 4.7(0.2) cfu ml–1) and (5.4(0.1) and 4.7(0.3) cfu ml–1) at 24 and 48 hrespectively. At 24 h, the log TVC in the CD2 diet treatment was significantly lowercompared to the controls (f 5 5.07; p 5 0.030), after which time there were nosignificant differences in TVC between all groups up to 48 h (f 5 1.40; p 5 0.318).
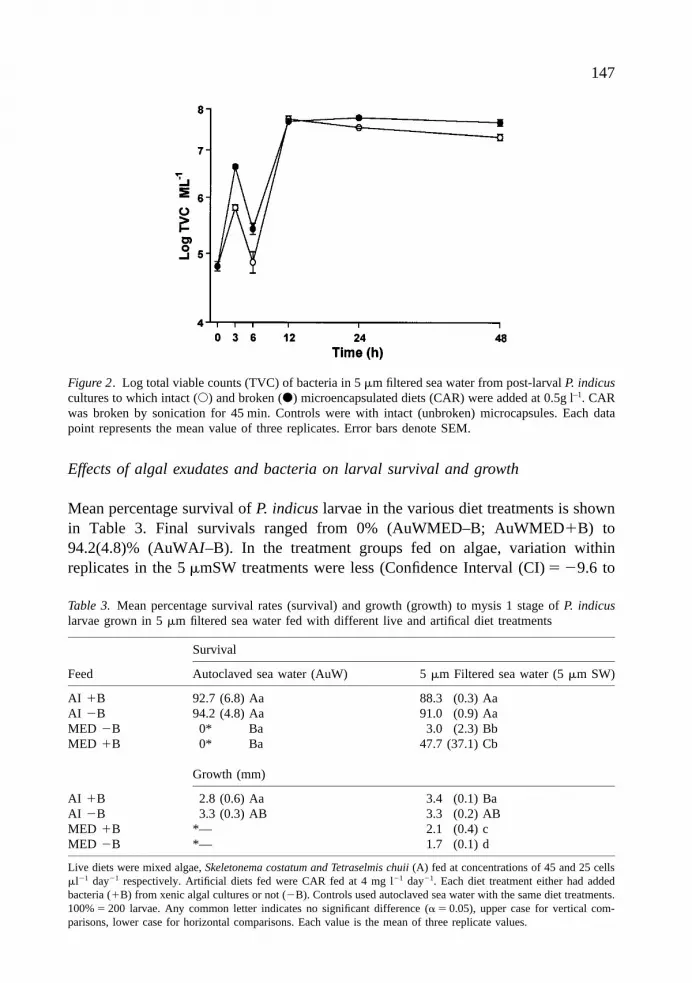
TVCs increased in 5 mmSW fed with both sonicated and intact microcapsules(Fig. 2), but the treatment with sonicated MED showed the greater increase (about60-fold) from an initial log concentration of 4.8(4.3) cfu ml–1 to 6.6(5.8)cfu ml–1
within 3 h compared to the intact microcapsule group which showed a lower (about10-fold) increase to 5.8(5.1)cfu ml–1 during the same period.
After the initial exponential growth phase, both treatment groups showed a slight(about 1 log) reduction in bacterial numbers at 6 h followed by a greater (about 2 log)increase in both treatments which was maintained until 48 h (Fig. 2). Lower tailedT-tests on the differences in the log TVCs per ml obtained in both groups over 48 h,revealed that log TVCs were significantly lower in the water sample containing intactMED compared to the treatment containing broken MED throughout the experi-mental period apart from the 12 h interval where there were no significant differencesin log TVC (p 5 0.75, t 5 0.75).
146
Effects of algal exudates and bacteria on larval survival and growth
Mean percentage survival of P. indicus larvae in the various diet treatments is shownin Table 3. Final survivals ranged from 0% (AuWMED–B; AuWMED1B) to94.2(4.8)% (AuWAI–B). In the treatment groups fed on algae, variation withinreplicates in the 5 mmSW treatments were less (Confidence Interval (CI) 5 29.6 to
Figure 2. Log total viable counts (TVC) of bacteria in 5 mm filtered sea water from post-larval P. indicuscultures to which intact (s) and broken (d) microencapsulated diets (CAR) were added at 0.5g l–1. CARwas broken by sonication for 45 min. Controls were with intact (unbroken) microcapsules. Each datapoint represents the mean value of three replicates. Error bars denote SEM.
Table 3. Mean percentage survival rates (survival) and growth (growth) to mysis 1 stage of P. indicuslarvae grown in 5 mm filtered sea water fed with different live and artifical diet treatments
Survival
Feed Autoclaved sea water (AuW) 5 mm Filtered sea water (5 mm SW)
AI 1B 92.7 (6.8) Aa 88.3 (0.3) AaAI 2B 94.2 (4.8) Aa 91.0 (0.9) AaMED 2B 0* Ba 3.0 (2.3) BbMED 1B 0* Ba 47.7 (37.1) Cb
Growth (mm)
AI 1B 2.8 (0.6) Aa 3.4 (0.1) BaAI 2B 3.3 (0.3) AB 3.3 (0.2) ABMED 1B *— 2.1 (0.4) cMED 2B *— 1.7 (0.1) d
Live diets were mixed algae, Skeletonema costatum and Tetraselmis chuii (A) fed at concentrations of 45 and 25 cellsml21 day21 respectively. Artificial diets fed were CAR fed at 4 mg l21 day21. Each diet treatment either had addedbacteria (1B) from xenic algal cultures or not (2B). Controls used autoclaved sea water with the same diet treatments.100% 5 200 larvae. Any common letter indicates no significant difference (a 5 0.05), upper case for vertical com-parisons, lower case for horizontal comparisons. Each value is the mean of three replicate values.
147

22.5) compared to the AuW treatments (CI 5 243.5 to 37.5%). Despite this, lowertailed two-sample T-tests showed that survival to MI stage was similar within watertreatment groups fed algae and the inclusion or not of bacteria with the algae seemsto have no effect on larval survival (AuW treatment groups = (t 5 20.22; p 5 0.58)and 5 mmSW groups = (t 5 24.76; p 5 1.0)).
Larval survivals in all treatments with algae were also higher than in the treat-ments fed MED without algae where survivals showed greater variation ranging frommeans of 0% (AuWMED2B; AuWMED1B) to 47.7(37.1)% (5 mSWMED1B)(Table 3). Unlike the survival obtained in larval groups fed on algae, it appears thatthe addition of bacteria from algae to the 5 mmSW treatment enhanced larvalsurvival in MED fed treatments. Although percentage larval survival obtained inthe 5 mmSWMED1B treatment was higher (mean 5 47.8(37.1)%) than5 mmSWMED2B (mean 5 3.0(2.3)%), there were large variabilities obtained withinreplicates, hence a lower tailed t-test gave no significant difference between bothtreatments (t 5 22.1; p 5 0.09).
Raising larvae on artificial feeds in AuW with or without added bacteria from algalcultures resulted in complete culture collapse.
Only the water treatments fed on algae contained larvae moulting to M1 stage atthe termination of the trial. By comparison, the treatments without algae showedretarded development with the 5 mmSWMED1B treatment at the PZ3 and the5 mmSWMED2B treatment at the PZ2 larval stages respectively.
Table 3 shows final lengths (mm) obtained in the different water and diet treatmentgroups. From an initial mean length of 0.9(0.04) mm at the PZ1 stage, larvae fed onalgae and reared in 5 mmSWAI1B treatment had significantly higher final lengths(mean 5 3.4(0.3) mm) compared to larvae reared in the AuWAI1B treatment group(mean 5 2.8(0.4) mm) (Upper tailed U test:point estimate 5 0.64 mm, w 5 1158.5).There were no significant differences in final lengths obtained when larvae weregrown in both the AuWAI1B (mean 5 3.3(0.3) mm) and the 5 mmSWAI2B(mean 5 3.3(0.2) mm) treatment groups.
In the surviving treatments fed on MED, the addition of bacteria from algalcultures significantly enhanced growth. From the same initial lengths of0.9(0.04) mm, larvae reared in the 5 mmSWMED1B treatment group had sig-nificantly higher final total lengths (mean 5 2.1(0.4) mm) compared to the5 mmSWMED2B treatment group (mean 5 1.7(0.1) mm) (Upper tailed U test: pointestimate 5 0.54 mm; w 5 511.5).
ANOVA also reveals significant differences in log TVC values obtained in all thedifferent water and diet treatments at the end of the experiments. Within both the5 mmSW and AuW treatment groups, the addition of algae with or without theassociated bacteria consistently gave lower log TVCs compared to MED fedtreatments. However, these differences were not always significant (Table 4).Generally, log TVCs were higher in the treatment groups with AuW in contrast tocorresponding 5 mmSW treatment groups. The addition of bacteria from algal
148

cultures sometimes led to a significant lowering of log TVC within each watertreatment group.
ANOVA on log PVVC concentrations obtained revealed significant differencesoccurring between some of the treatments (Table 4). Treatment groups with addedalgae exhibited lower PVVC values compared to MED fed treatments. In addition,apart from the 5 mmSWAI1B which had higher PVVC.ml–1 compared to the5 mmSWAI2B treatment, the addition of bacteria from algal cultures to diettreatments gave lower PVVC ml–1 when compared with equivalent treatmentswithout added bacteria (Table 4).
Figure 3 shows further effects of the presence or absence of algal exudates onlarval survival. Survival in 5 mmSW with the addition of 3 mm filtered algal culture
Table 4. Mean log total viable counts (TVCs) of bacteria ml21 (total bacterial counts) and total viablepresumed Vibrio sp. (PVVC) counts (total presumed vibrio sp. counts) of bacteria ml21 obtained incultures of P. indicus larvae grown in 5 mm filtered sea water to mysis 1 stage and fed with different liveand artificial diet treatments
Total bacterial counts
Diet treatmentComparisoncode letters
Number ofreplicates
Mean log TVCper ml Comparisons
AuWAI 1B A 3 5.4 (0.2) ABcdEFGHAuWAI 2B B 3 5.5 (0.1) ABcDEFGHAuWMED 2B C 3 6.2 (0.1) abCDefgHAuWMED 1B D 3 6.0 (0.5) aBCDefGH5 mmSWAI 1B E 3 5.1 (0.2) ABcdEFGH5 mmSWAI 2B F 3 4.9 (0.2) ABcdEFgh5 mmSWMED 2B G 3 5.6 (0.3) ABCDEfGH5 mmSWMED 1B H 3 5.7 (0.6) ABCDEfGH
Total presumed vibrio sp. counts
Diet treatmentComparisoncode letters
Number ofreplicates
Mean PVVCper ml Comparisons
AuWAI1B A 3 3.4 (2.9) ABcDEFGHAuWAI2B B 3 3.4 (2.8) ABcDEFgHAuWMED2B C 3 3.8 (2.6) abCdEfghAuWMED1B D 3 3.4 (2.9) ABcDEFGH5 mmSWAI1B E 3 3.6 (3.2) ABCDEfgh5 mmSWAI2B F 3 3.2 (2.8) ABcDeFgH5 mmSWMED2B G 3 2.6 (2.0) AbcDefGH5 mmSWMED1B H 3 3.3 (3.4) ABcDeFGH
AuWAI 5 AuW 1 AlgaeAuWMED 5 AuW 1 MED (CAR)5mmSWAI 5 5 mm filtered sea water 1 Algae5mmSWMED 5 5 mm filtered sea water 1 MED (CAR)Each diet treatment either had added bacteria (1B) from xenic algal cultures or not (2B). A, B, C, D, E, F, G andH 5 comparison code letters for the different diet treatments respectively. Readings with the same code letter in uppercase characters denotes no significant difference (a 5 0.05). Two readings with the same code letters in both upper andlower case characters indicate a significant difference. Each data point is the mean value of three replicates.
149

water excluding algal cells (mean 5 48.8(12.7)%) was not significantly differentfrom survival obtained when the algal culture water added was 0.22 mm filtered toremove the algal cells and bacteria (mean 5 44.3(8.6)%). These two treatments hadsignificantly higher larval survival when compared to the controls in which the addedalgal culture water had been sterilised by autoclaving (mean 5 9.5(4.1)%) and thenegative controls with no addition of algal culture water (mean 5 3.0(1.3)%)(f 5 21.89; p , 0.001). This confirms that the beneficial effect of algal exudates on5 mmSW is lost if the solution in which they are contained is autoclaved.
ANOVA also revealed significant differences in the log TVC of bacteria obtainedin the different treatments at the end of the experiments f 5 5.10; p 5 0.004) (Table4). Generally, log TVCs were higher in the treatment group with AuW in comparisonto 5 mmSW treatment groups. The addition of bacteria from algal cultures sometimesled to a significant lowering of TVC within each water treatment group. Also, witheach water treatment group, the addition of algae with or without the associatedbacteria, consistently gave a lower log TVC compared to MED fed treatments withinthe same water treatment group, although these differences were not alwayssignificant. ANOVA carried out on the PVVC in the cultures also showed a
Figure 3. Percentage survival to mysis 1 stage of P. indicus larvae fed wholly on microencapsulated diets(CAR). Larvae were fed at 4 mg l–1 day–1 in 5 mm filtered natural sea water to which had been added3 mm filtered mixed algal (Skeletonema costatum and Tetraselmis chuii) culture water (3 mmAW),0.22 mm filtered algal culture water (0.22 mmAW) and autoclaved 3 m filtered algal water (Auto AW).Controls were with 5 mm filtered sea water alone (Cont.) 100% 5 200 larvae. Each data point is the meanof three replicate values. Error bars denote the SEM.
150

significant difference occurring between some of the treatments (f 5 5.91; p 5 0.002)(Table 4). Again, PVVC within water treatment groups was also lower in groupswith added algae compared to MED fed treatments. Here though, apart from the5 mmSWAI1B which had higher PVVC compared to the 5 mmSWAI2B treatment,the addition of algal bacteria to diet treatments also gave lower PVVC comparedwith equivalent treatments without added bacteria.
In the final experiment, (Fig. 4) P. indicus larvae fed on MED were reared in AuW,5 mmSW and AuW to which bacteria taken from a healthy PZ2 culture also fed onMED had been added. These bacteria were preserved in sterile glycerol and latergrown in sterile sea water before the addition of PZ1 larvae when TVC had reacheda mean of 3.50 × 10⁴ cfu ml–1. TVC in the control treatment with 5 mmSW at thebeginning was 1.60 × 10⁴ cfu ml–1 and PVVC in all treatment groups was 0.
Survival to M1 was 3.3 (4.9)%, 19.2 (17.6)% and 34.2 (13.7)% for larvae rearedin AuW, AuW plus added bacteria and 5 mmSW respectively. Despite these, thehighly variable survivals obtained within treatments meant that ANOVA showed nosignificant difference among all treatments (f 5 4.04; p 5 0.077).
Figure 4. Percentage survival to mysis 1 stage of P. indicus larvae fed solely on microencapsulated diets(CAR) in autoclaved sea water, autoclaved sea water to which preserved bacteria from a successful larvalculture fed exclusively on MED were added and 5 mm filtered natural sea water. Larvae were fed at4 mg l–1 day–1. 100% 5 200 larvae. Each data point is the mean of three replicate values. Error barsdenote the SEM.
151

Log TVCs in the 5 mmSW treatment was significantly lower than in the AuW pluspreserved bacteria treatment, which in turn was significantly lower than log TVCobtained in the AuW treatment (f 5 108.3; p , 0.001). The AuW treatment hadhigher log PVVC (mean 5 2.23), but the wide variability observed between repli-cates (0–3.93) ensured no significant difference in log PVVC when compared to theAuW plus preserved bacteria treatment (mean 5 0.67, range 5 0–2.0) (p 5 0.87;t 5 1.32). There was no PVVC growth observed on plates from the 5 mmSW.
Discussion
In the estimation of total diet proteins, some error may have been introduced by theuse of a conversion factor of 6.25 which is derived from fish proteins (Jobling,1983;Osborne and Voogt, 1978). However the calculated values for the CAR and CD2diets, respectively, are very close to the value of 55% (total protein content) claimedby the manufacturer.
No significant differences were observed in leach rates when diets were incubatedin either sterile or bacterial contaminated water samples over 48 h. The AuWsamples were randomly subjected to initial sterility checks before use. Despite these,bacteria may have been introduced into the cultures with the feed. However, solubleprotein measurements taken within the initial 2 h (before any introduced bacterialcells would have grown exponentially), should have revealed significant differencesin leach rates between the sterile and bacterial contaminated water samples ifbacterial activity were implicated. Thus, there does not appear to be any evidencethat bacteria are responsible for increasing leach rates from MED or MPD over48 h.
The higher total protein content of the MED diets compared to the MPD diet isreflected in significantly higher TVCs compared to the MPD treatment. Although theMPD treatment had significantly lower TVCs compared with the MED diets at 6 h,this was not due to better stability and/or reduced leach rates as the diet stability testshave shown, but may be attributed to the lower content of soluble protein. Theoccurrence of significantly higher TVCs in the CD2 diet compared with the othertreatments at 12 h is attributed to the higher concentration of that diet addedcompared with the other two (PZ stage) diets. After 6 h and 12 h respectively, therewere no significant differences in TVCs obtained for all the diet treatments and thecontrols, reflecting that the rate of bacterial growth in a medium is dependent on therate at which soluble nutrients become available.
TVC attached to diet particles also showed a similar trend in that there were nosignificant differences between the MPD and control treatments at 6 h. This sug-gested that most of the nutrients in the MPD treatment were probably already insolution supplying enough nutrients for the bacteria. Increased adhesion to particleshas been reported to be a consequence of nutrient depletion observed in several
152

marine bacteria (Dawson et al., 1981; Kjelleberg and Hermansson, 1984; Albrightet al., 1986; Conway et al., 1986; Hermansson et al., 1987) and the higher TVCsattached to the MED diets at 6 h would therefore confirm better stability and lessleaching by these diets compared with the MPD. This also agrees with Hermanssonet al. (1987) who hypothesised that in a growth deficient medium, non-growing smallcells may be transferred by active or passive processes to a particle in the vicinitywhere adsorbed dissolved nutrients are found to allow growth (Neihof and Loeb,1972).
By 12 h, there were no significant differences in TVC of bacteria attached to alldiets. There were no significant differences between all the treatments and the controlat 24 and 48 h. No diets were added to the controls, but this result may be explainedby increased bacterial adhesion to other bacterial cells as well as to inorganicmicroparticles which may have passed through the 5 mm filter. Such bacterialadhesion to non-metabolites and inanimate surfaces has been reported (ZoBell, 1943;Kjelleberg and Hermansson, 1984; Hermansson et al., 1987; Karunasagar et al.,1995) and through interaction with or adhesion to non-metabolites, increasedbacterial activity has been stimulated (Conn and Conn, 1940; Bigger and Nelson,1941). Furthermore, Fletcher and Floodgate (1973) demonstrated production of asecondary adhesive, fibrous reticular polysaccharide by bacteria attached to solidsurfaces. These processes would lead to increases in both the general TVCs as wellas the TVC of bacteria attached to the inanimate surfaces being retained on the 3 mmfilters in the control groups with no added diets.
The more rapid increase in TVCs in treatments with broken MED compared withthe intact MED groups reflects the higher amounts of nutrients which wereimmediately available to the bacteria and confirm that microencapsulation initiallyreduces the rate of loss of dietary solubles.
Additions of bacterial populations from established algal cultures to P. indicuslarvae fed on MED and grown in 5 mmSW (5 mmSWMED1B), enhanced larvalgrowth and survival. The same result however was not obtained for larvae reared inAuW and fed MED (AuWMED1B and AuWMED2B). The survival with5 mmSWMED2B was also poor. This demonstrates that the presence of a balancedbacterial population is necessary to achieve good growth and survival of penaeidlarvae when fed MED in the absence of microalgae, and is in agreement with thefindings of Ottogalli (1992). The absence of natural populations of bacteria from seawater in AuW cultures fed MED resulted in total mortality despite the addition ofbacteria from algal cultures. However, addition of similar quantities of bacteria tolarvae fed MED in 5 mmSW containing natural populations of bacteria produced asignificant improvement in survival, suggesting that the addition of bacteria fromalgal cultures may correct for seasonal variations in bacterial populations found innatural sea water. Such variations have been reported for Crassostrea gigas (Helmet al., 1973).
153

When penaeid larvae were fed on live algae, there was no difference in theelevated levels of survival between AuW and 5 mmSW nor when bacteria wereadded or removed. While improved growth and survival of larvae on live algae mightbe attributed to nutrition, Kumlu and Jones (1995) have demonstrated that live algalsupplements of as few as 15 cells ml–1 added to MED can give growth and survivalequal to that achieved on full algal rations. They demonstrated that the contributionmade by live algae was in stimulating larval enzyme secretion and hence facilitatingdigestion of MED. These authors also calculated that the energetic contribution madeby 15 cells ml–1 could not account for the increase in larval production achieved.Larval survival levels on MED in the absence of algae (50.75%) (Kumlu and Jones,1995) were very similar to those obtained in the present work.
In contrast to results obtained when larvae were fed only on MED, the addition ofbacteria from algal cultures had no effect on survival when larvae were fed on livealgae. This suggested that the presence of live algae may not only stimulate enzymesecretion, but also control the bacterial balance in penaeid cultures.
In general, addition of live algae appeared to depress both levels of TVC andPVVC in culture water and while addition of bacteria from algal cultures had littleeffect on TVC, it appeared to reduce PVVC in cultures fed with MED. Similarselective suppression of Vibrio sp growth by Skeletonema costatum has been reportedby Kogure et al. (1979). Control of bacterial populations by microalgae (Bell et al.,1974; Kogure et al., 1979; Kellam and Walker, 1989; Austin and Day, 1990; Austinet al., 1992) as well as macroalgal extracts (Reichelt and Borowitzka, 1984; Kellamand Walker, 1989; de Nys et al., 1995; Givskov et al., 1996; Gram et al., 1996) havebeen reported.
The overall suppression of bacterial levels (TVC) in the presence of live algae maybe due to the continuous production of an algal metabolite inhibiting bacterialgrowth, as declining efficacies have been reported for algal extracts over time(Austin and Day, 1990; de Nys et al., 1995). This reduction in activity may alsoaccount for the lower effectiveness of filterates from algal cultures in promotingsurvival of larvae fed MED in the absence of live algae.
It would appear that the algal exudates are capable of regulating the compositionof bacterial communities, and it is the composition of the bacterial community that isconducive to larval survival when fed on MED, rather than overall total numbers.This view is supported by the enhanced larval survival observed when bacteria freealgal water containing algal exudates was added to 5 mmSW compared to controls inwhich the algal exudates added had been destroyed by autoclaving.
The increased larval survival obtained when bacteria from a successful larvalculture were inoculated into autoclaved culture water confirms that when a balancednatural bacterial community exists in natural sea water, live algae may be totallyreplaced by MED (Ottogalli, 1992). If this balance is disturbed as in the aftermath ofalgal blooms (Blight et al., 1995), supplementation of MED with live algae or algalexudates is necessary.
154

The method by which algae or algal extracts exert this bacteriostatic effect isunknown. Apart from inhibiting bacterial growth (Austin and Day, 1990; Austinet al., 1992; de Nys et al., 1995), algal extracts have also been reported to haveinhibitory effects on bacterial swarming co-ordination, thereby reducing their abili-ties to colonize surfaces and establish disease (Givskov et al., 1996; Gram et al.,1996).
Austin et al. (1992) obtained significantly increased survivals of Atlantic salmonfollowing prophylactic treatment with 1% spray dried T. suecica incorporated intothe diet and subsequent challenge by pathogens, which suggested a possiblerelationship of the algal metabolites of T. suecica to glucans, reported to enhance thenon-specific immune systems of both shrimp (Vargas-Albores, 1995; Sung et al.,1996) and salmon (Robertsen et al., 1990). However if this were the case in thepresent work, the mortalities observed in the (AuWMED1B) treatment should havebeen avoided. This suggests an environmental rather than an immunological role forthe algal exudates in maintaining the balance of bacterial communities as theenhanced survival in the (5 mmSWMED1B) shows. This is further confirmed by theincreased survival observed when samples from a balanced bacterial population wereinoculated in sterile sea water.
Conclusions and recommendations
1. This study demonstrated that maintenance of the natural microbial communitywas beneficial for the survival of shrimp larvae. However, this natural micro-bial community was itself sometimes disturbed due to seasonal changes inwater quality.
2. In such periods addition of bacteria or algal extracts from algal cultures tolarval cultures fed MED and reared in 5 mmSW, corrected for deteriorations insea water quality.
3. Bacteria from algal cultures depressed PVVC levels when added to larvalcultures fed MED, suggesting a role for such bacteria in maintaining thebalance of bacterial populations in culture water when larvae are fed MED
4. The exact methods by which algae and algal extracts exert their bacteriostaticeffects are largely unknown but they seem to enhance growth of non-pathogenic competitors of Vibrio sp.
5. Regardless of the mode of operation, these findings indicated the advantages ofusing such algal species as larval diets.
6. Some caution must be exercised in selecting suitable species of algae, as algae-bacteria interactions are species-specific and stimulation as well as inhibition ofvarious bacterial species by algae and algal extracts have been reported.
7. Further study is required to identify such potentially beneficial species of algaeand the exact mode of operation.
155

Acknowledgements
The authors are grateful to Inve Technologies for the supply of the MED diets andto Vivienne Ellis for technical assistance with the elemental analyser. This study waspart funded by a Commonwealth scholarship awarded to the first author.
References
Alabi, A.O., Yudiati, E., Jones, D.A. and Latchford, J.W. 1997. Bacterial levels in penaeid larvalcultures. In: Diseases in Asian Aquaculture III, T. W. Flegel and I.H. MacRae (eds), pp. 381–388. FishHealth Section, Asian Fisheries Society, Manila.
Albright, L.J., McCrae, S.K. and May, B.E. 1986. Attached and free-floating bacterioplankton in HoweSound, British Columbia, a coastal marine fjord-embayment. Applied and Environmental Micro-biology 51, 614–621.
Al-Hassan, R.H., Coughlan, S.J., Pant, A. and Fogg, G.E. 1975. Seasonal variations in phytoplankton andglycollate concentrations in the Menai Straits, Anglesey. Journal of the Marine Biological Associationof the United Kingdom 55, 557–565.
Austin, B. and Day, J.G. 1990. Inhibition of prawn pathogenic Vibrio sp. by a commercial spray-driedpreparation of Tetraselmis suecica. Aquaculture 90, 389–392.
Austin, B., Baudet, E. and Stobie, M. 1992. Inhibition of bacterial fish pathogens by Tetraselmis suecica.Journal of Fish Diseases 15, 55–61.
Bell, W.H., Lang, J.M. and Mitchell, R. 1974. Selective stimulation of marine bacteria by algalextracellular products. Limnology and Oceanography 19, 833–839.
Bigger, J.W. and Nelson, J.H. 1941. The growth of coliform bacilli in distilled water. Journal ofPathology and Bacteriology 53, 189–206.
Blight, S.P., Bentley, T.L., Lefevre, D., Robinson, C., Rodrigues, R., Rowlands, J. and Williams, P.J.IeB.1995. Phasing of autotrophic and heterotrophic plankton metabolism in a temperate coastal ecosystem.Marine Ecology Progress Series 128, 61–75.
Conn, H.J. and Conn, J.E. 1940. The stimulating effect of colloids upon the growth of certain bacteria.Journal of Bacteriology 39, 99–100.
Conway, P.L., Maki, R., Mitchell, R. and Kjellberg, S. 1986. Starvation of marine flounder, squid andlaboratory mice and its effect on the intestinal microbiota. FEMS Microbiology Ecology 38,187–195.
Dawson, M.P., Humphrey, B.A. and Marshall, K.C. 1981. Adhesion: a tactic in the survival strategy ofa marine vibrio during starvation. Current Microbiology 6, 195–199.
de Nys, R., Steinberg, P.D., Willemsen, P., Dwoijanyn, S.A., Gabelish, C.L. and King, R.J. 1995. Broadspectrum effects of secondary metabolites from the red alga Delisea pulchra in antifouling assays.Biofouling 8, 259–271.
Douillet, P.A. and Langdon, C.J. 1993. Effects of marine bacteria on the culture of axenic oysterCrassostrea gigas (Thunberg) larvae. Biological Bulletin 184, 36–51.
Douillet, P.A. and Langdon, C.J. 1994. Use of a probiotic for the culture of larvae of the Pacific oyster(Crassostrea gigas Thunberg). Aquaculture 119, 25–40.
Fletcher, M. and Floodgate, G.D. 1973. An electron-microscope demonstration of an acidic polysaccha-ride involved in the adhesion of a marine bacterium to solid surfaces. Journal of General Microbiology74, 325–334.
Garriques, D. and Arevalo, G. 1995. An evaluation of the production and use of a live bacterial isolateto manipulate the microbial flora in the commercial production of Penaeus vannamei post larvae inEcuador. In: Swimming Through Troubled Water, Proceedings of the special session on shrimpfarming, Aquaculture ’95, C.L. Browdy and J.S. Hopkins (eds), pp. 53–59. World AquacultureSociety, Baton Rouge, Louisiana, USA.
156

Givskov, M., de Nys, R., Manefield, M., Gram, L., Maximilien, R.I.A., Eberl, L.E.O., Molin, S.,Steinberg, P.D. and Kjelleberg, S. 1996. Eukaryotic interference with homoserine lactone-mediatedprokaryotic signalling. Journal of Bacteriology 178, 6618–6622.
Gram, L., de Nys, R., Maximilien, R.I.A., Givskov, M., Steinberg, P.D. and Kjelleberg, S. 1996.Inhibitory effects of secondary metabolites from the red alga Delisea pulchra on swarming motility ofproteus mirabillis. Applied and Environmental Microbiology 62, 4284–4287.
Helm, M.M., Holland, D.L. and Stephenson, R.R. 1973. The effect of supplementary algal feeding of ahatchery breeding stock of Ostrea edulis L. on larval vigour. Journal of Marine Biology 53,673–684.
Hermansson, M., Joes, G.W. and Kjelleberg, S. 1987. Frequency of antibiotic and heavy metal resistanceand plasmids in bacteria of the marine air-water interphase. Applied and Environmental Microbiology53, 2338–2342.
Jobling, M. 1983. A short review and critique of the methodology used in fish growth and nutrition.Journal of Fish Biology 23, 685–703.
Jones, D.A., Holland, D.L. and Jabborie, S. 1984. Current status of microencapsulated diets foraquaculture. Applied Biochemistry and Biotechnology 10, 275–288.
Jones, D.A., Kurmaly, K. and Arshad, A. 1987. Penaeid shrimp hatchery trials using microencapsulateddiets. Aquaculture 64, 133–146.
Jones, D.A., Kamarudin, M.S. and LeVay, L. 1993. The potential for replacement of live feeds in larvalculture. Journal of the World Aquaculture Society 24, 199–201.
Karunasagar, I., Otta, S.K. and Karunasagar, I. 1995. Biofilm formation by Vibrio harveyi on surfaces.Aquaculture 140, 241–245.
Kellam, S.J. and Walker, J.M. 1989. Antibacterial activity from marine microalgae in laboratory culture.British Phycological Journal 24, 191–194.
Kjelleberg, S. and Hermansson, M. 1984. Starvation-induced effects on bacterial surface characteristics.Applied and Environmental Microbiology 48, 487–503.
Kogure, K., Simidu, U. and Taga, N. 1979. The effect of Skeletonema costatum (Grev.) Cleve on thegrowth of marine bacteria. Journal of Experimental Marine Biology and Ecology 36, 201–215.
Kumlu, M. and Jones, D.A. 1995. The effect of live and artificial diets on growth, survival and trypsinactivity in larvae of Penaeus indicus. Journal of the World Aquaculture Society 26, 406–415.
Muir, P.R. and Sutton, D.C. 1994. Bacterial degradation of microencapsulated foods used in larvalculture. Journal of the World Aquaculture Society 25, 371–378.
Neihof, R. and Loeb, G. 1972. Molecular fouling of surfaces in sea water. In: Proceedings of the 3rdInternational Congress on Marine Corrosion and Fouling, M.D. Gaithersburg (ed.), pp. 716–718. 2–6Oct. 1972.
Nogami, K. and Maeda, M. 1992. Bacteria as biocontrol agents for rearing larvae of the crab Portunustrituberculatus. Canadian Journal of Fisheries and Aquatic Sciences 49: 2372–2376.
Osborne, D.R. and Voogt, P. 1978. The Analysis of Nutrients in Foods. pp. 251. Academic Press,London.
Ottogalli, L. 1992. Nueva gestion del agua en as crias de Peneidos en Nueva Caledonia. Memorias lCongreso Ecuatoriano de Acuicultura, 87–91.
Reichelt, J.L. and Baumann, L. 1973. Taxonomy of the marine luminous bacteria. Archives Micro-biology 94, 283–330.
Reichelt, J.L. and Borowitzka, M.A. 1984. Antimicrobial activity from marine algae: Results of a large-scale screening programme. Hydrobiologia 116/117, 158–168.
Riquelme, C., Haayashida, G., Araya, R., Uchida, A., Satomi, M. and Ishida, Y. 1996. Isolation of anative bacterial strain from the scallop Argopecten purpuratus with inhibitory effects againstpathogenic vibrios. Journal of Shellfish Research 15(2):369–374.
Riquelme, C., Araya, R., Vergara, N., Rojas, A., Guaita, M. and Candia, M. 1997. Potential probioticstrains in the culture of the Chilean scallop Argopecten purpuratus (Lamarck, 1819). Aquaculture154:17–26.
Robertsen, B., Rørstad, G., Engstad, R. and Raa, J. 1990. Enhancement of non-specific disease resistancein Atlantic salmon, Salmo salar L., by a glucan from Saccharomyces cerevisiae cell walls. Journal ofFish Diseases 13, 391–400.
157

Shihabi, Z. and Dyer, D. 1988. Protein analysis with bicinchoninic acid. Annals of Cllnical andLaboratory Science 18, 235–239.
Skjermo, J., Salvesen, I., Øie, G., Olsen, Y. and Vadstein, O. 1997. Microbially matured water: atechnique for selection of a non-opportunistic bacterial flora in water that may improve performanceof marine larvae. Aquaculture International 5, 13–28.
Smith, P.K., Krohn, R.I., Hermanson, G.T., Mallia, A.K., Gartner, F.H., Provenzano, M.D., Fujimoto,E.K., Goeke, N.M., Olson, B.J. and Klenck, D.C. 1985. Measurement of protein using bicinchoninicacid. Analytical Biochemistry 150, 76–85.
Sokal, R.R. and Rohlf, F.J. 1995. Biomety. The principles and practice of statistics in biological research.Third edn, pp. 887. W.H. Freeman and Company. New York.
Sung, H.H., Yang, Y.L. and Song, Y.L. 1996. Enhancement of microbicidal activity in the tiger shrimpPenaeus monodon via immunostimulation. Journal of Crustacean Biology 16, 278–284.
Utting, S.D. and Helm, M.M. 1985. Improvement of sea water quality by physical and chemicalpretreatment in a bivalve hatchery. Aquaculture 44,133–144.
Vargas-Albores, F. 1995. The defence system of brown shrimp (Penaeus californiensis): Humoralrecognition and cellular responses. Journal of Marine Biotechnology 3, 153–156.
Walne, P.R. 1970. Present problems in the culture of Ostrea edulis. Helgolander WissenschaftlicheMeeresuntersuchungen 20, 514–525.
Wickins, J.F. and Helm, M.M. 1981. Sea water treatment. In: Aquarium Systems, A.D. Hawkins (ed.),pp. 63–128. Academic Press, London.
ZoBell, C.E. 1943. The effect of solid surfaces upon bacterial activity. Journal of Bacteriology 46,39–56.
158