indication of a very large proton diffusion in ice ih
TRANSCRIPT
Indication of a Very Large Proton Diffusion in Ice Ih
Anna Uritski, Itay Presiado, and Dan Huppert*Raymond and BeVerly Sackler Faculty of Exact Sciences, School of Chemistry, Tel AViV UniVersity,Tel AViV 69978, Israel
ReceiVed: February 26, 2008; ReVised Manuscript ReceiVed: April 30, 2008
A time-resolved emission technique was employed to study the photoprotolytic cycle of the 2-naphthol-6,8-disulfonate (2N68DS) photoacid in the presence of a low concentration of a strong HCl acid. We found thatan excess of protons in ice has a very large and profound effect on the photoprotolytic cycle. The excessproton reacts with the deprotonated form of the photoacid. An analysis of the experimental data reveals thatthe proton diffusion constant in ice in the temperature range of 240-270 K is much larger than in the liquidstate. Under certain assumptions and approximations, the calculated proton diffusion constant in ice is 10times larger than in water at 295 K, i.e., DH+ice ) 1.2 × 10⁻³ cm2/s.
Introduction
Proton transfer has attracted considerable interest in physics,chemistry, and biology, as it is the key process in importantreactions1–4 such as autoionization in water, proton conductivity(von Grotthuss mechanism), acid-base neutralization reactions,rearrangement in photostabilizers, and proton pumping throughmembrane protein channels. Over the past two decades,intermolecular proton transfer in the excited state (ESPT) hasbeen studied extensively in the liquid phase and has providedpertinent information about the mechanisms and parameterscontrolling acid-base reactions.5–12 In the past, the physics ofice13–16 was studied extensively. The unique properties of icehave interested scientists for hundreds of years. Bacon, Hooke,Faraday, and Kelvin carried out experiments on ice and posedmany questions that still puzzle us today.14
Pure ice exhibits a high static relative permittivity that iscomparable to that of liquid water. Ice also provides a goodexample of electrical conduction by transfer of protons that havemobilities of about the same order of magnitude as liquidwater.17,18 A particularly important issue concerns the role ofcrystal defects in the peculiar electrical properties. The theoryof Jaccard19 is used to explain the electrical conduction and thedielectric properties of ice. According to Jaccard’s theory, theelectrical properties of ice are largely due to two types of defectswithin the crystal structure. (1) Ion defects are produced whena proton moves from one end of the bond to the other, thuscreating a H3O+, OH- ion pair. Conduction is then possible bymeans of successive proton jumps. (2) Bjerrum defects20 areorientational defects caused by the rotation of a water moleculeto produce either a doubly occupied bond (D-defect) or a bondwith no protons (L-defect). The mechanism of excess protontransfer in ice was investigated by Ohmine and co-workers21,22
using the QM/MM method. They proposed that the excessproton is localized in an L-defect in ice. Podeszwa and Buch23
studied the structure and dynamics of orientational defects inice by molecular dynamics simulation. They found the defectstructure to be quite different from the one originally proposedby Bjerrum.20 For the L-defect, one water molecule is displaced
at ∼1 Å from the crystal lattice site. Defect jumps occur viavibrational phase coincidence.
The electrical conductivity measurements of Eigen4 in theearly 1960s produced a surprisingly large mobility for the protonin ice. It was estimated4 that the proton mobility in ice is 10-100times larger than in water. Ice conductance was extensivelystudied for more than 40 years. Until today, the mobility valuesof each of the four individual defects is only known within alarge uncertainty. The mobility of the L-bonding defect wasgiven by Granicher24 as 2 × 10⁻⁴ cm2/(V · s) and later on thiswas raised25 to 5 × 10⁻⁴ cm2/(V · s). The mobility of the ionicdefects fluctuated much more, from Eigen’s large value26 of0.075 to 0.00027 to 0.006 cm2/(V · s).25,27
Takei and Maeno28,29 studied the electrical conductivity andthe dielectric properties of HCl-doped ice single crystals grownfrom HCl liquid solutions of 4 × 10⁻⁶ M to 1 × 10⁻⁴ M HCl.The concentration of HCl incorporated in the ice is much less,but not directly measurable. The ion conductivity of all samplesin Takei and Maeno’s study28,29 is almost temperature indepen-dent in the range of 220 < T < 270 K. At lower temperatures,the conductivity decreases with a relatively large activationenergy of 0.31 eV.
Photoacids are ideal systems to study the proton transferdynamics in real time. To initiate proton reactions in the liquidand solid phases, protic solvent solutions of photoacids areirradiated by short (femtosecond to picosecond) laser pulses.30,31
Proton transfer is then made possible by the optical trigger pulse.Consequently, the excited-state molecules dissociate very rapidlyby transferring a proton to a nearby solvent molecule. Theexcited-state deprotonated form, RO*-, is negatively charged.Thus, the reversible geminate recombination process is stronglyenhanced. The proton transfer rate could be determined eitherby the initial decay time of the time-resolved fluorescence ofthe protonated form (RO*H), or by the slow rise time of theemission of the deprotonated species (RO*-). Over the pastdecade we used a model for an intermolecular ESPT processthat accounts for the geminate recombination (GR) of thetransferred proton.12,32,33
The study of the proton reaction in the solid phase, andparticularly in ice, is rare and uncommon.34,35 Pure ice is knownto be a bad solvent. Devlin35,36 studied doped ice samples thatwere prepared by careful and controlled deposition of water
* Corresponding author. E-mail: [email protected]; phone: 972-3-6407012; fax: 972-3-6407491.
J. Phys. Chem. C 2008, 112, 11991–12002 11991
10.1021/jp801664d CCC: $40.75 2008 American Chemical SocietyPublished on Web 07/11/2008
molecules on cold surfaces by spraying water and dopants. Inmany studies they found that the dopants tend to diffuse towardthe sample surface. Molecular dynamics simulations by Devlinet al.34 confirm the experimental observation of the tendencyof dopants to extract from the bulk and be positioned at thesurface. Devlin found that protons stay in the bulk, while thecounterion, the chloride in the case of HCl, tends to move tothe surface area.
In this work we used time-resolved and steady-state methodsto study the properties of the photoprotolytic cycle32,33,37–39 ofa photoacid in ice in the presence of an excess proton introducedby adding a strong mineral acid, HCl, at a small concentrationof c < 5 mM. From the analysis of the experimental results wededuce the excess proton diffusion constant. We found thatproton diffusion in ice is about 10 times larger than in liquidwater at 295 K. These striking results are in accord with thefindings of Eigen and deMaeyer in the late 1950s.26,40
Experimental Section
We used the time-correlated single-photon counting (TCSPC)technique to measure the time-resolved emission of the photo-acids. For sample excitations we used a cavity dumpedTi:sapphire femtosecond laser (Mira, Coherent), which providesshort, 80 fs, pulses. The laser harmonics SHG and THG (thirdharmonic generation) operate over the spectral range of 380-400nm, and THG operates in the range of 260-290 nm. The cavitydumper operates with the relatively low repetition rate of 500kHz. The TCSPC detection system is based on a Hamamatsu3809U, photomultiplier, and Edinburgh Instruments TCC 900computer module for TCSPC. The overall instrumental responsewas about 35 ps (fwhm). The excitation pulse energy wasreduced to about 10 pJ by neutral density filters.
2-Naphthol-6,8-disulfonate sodium salt (2N68DS) of analyti-cal grade was purchased from Kodak. HCl (1N) was purchasedfrom Aldrich. For transient measurements, the sample concen-trations were between 2 × 10⁻⁴ and 2 × 10⁻⁵ M. Deionizedwater had a resistance of <10 MΩ. Methanol of analytical gradewas purchased from Fluka. All chemicals were used withoutfurther purification.
The temperature of the irradiated sample was controlled byplacing the sample in a liquid N2 cryostat with a thermal stabilityof approximately 1.5 K.
Ice samples were prepared by first placing the cryogenicsample cell for about 20 min at a supercooled liquid temperatureof about 260 K. The second step involved a relatively rapidcooling (5 min) to a temperature of about 250 K. Subsequently,the sample froze within 5 min. To ensure ice equilibration, priorto the time-resolved measurements, the sample temperature waskept for another 20 min at about 250 K.
Models for Data Analysis
Reversible Diffusion-Influenced Two-Step Proton TransferModel. In this model12,36,41 the photoprotolytic cycle can besubdivided into the two consecutive steps of reaction anddiffusion. In the reactive step, a rapid proton transfer creates asolvent-stabilized ion pair. This is followed by a diffusive stage,when the proton and RO*- break away from each other as aresult of their thermal random motion. The reverse process is ageminate recombination of the proton and the RO*- to reformthe excited photoacid RO*H.
Mathematically, one considers the probability density, p(r,t),of the RO*--H+ pair to be separated by a distance r at time tafter excitation. The observed (normalized) signals from theexcited RO*H acid and the RO*- anion correspond to the
probability of finding the RO*H form, P(t), and the survivalprobability of the separated pair, S(t), which is also theprobability to find the excited photoacid in its RO*- form.
S(t) ≡ 4π∫a
∞p(r, t)r2dr (1a)
P(t)) 1- S(t) (1b)
The separated pair at time t, p(r,t), is assumed to obey aspherically symmetric Debye-Smoluchowski equation (DSE)in three dimensions, coupled to a kinetic equation for P(t), whichserves as the boundary condition for the differential equa-tion.12,36,41
Simple Kinetics Models for the Acid Effect on ESPT. Thekinetics of reversible chemical reactions, either in the groundor the excited state, are traditionally described by conventionalchemical kinetics.42 Consider an excited photoacid RO*H,dissociating (rate coefficient kPT) to produce the excitedconjugate base, RO*-. The latter, in turn, may associatebimolecularly with an excess proton (rate coefficient ka) toregenerate the excited photoacid, RO*H.
RO*HVk0
\kPT
ka
RO*Vk ′0
-+H+ (1c)
When the protons are in large excess, i.e., c ≡ [H+] . [RO*H](the RO*H concentration is ∼10-7 M, whereas the protonconcentration is ∼10-3 M), the pseudounimolecular recombina-tion rate coefficient is cka. In order to solve a simpler kineticscheme, we multiply the concentrations of both ROH and RO-
by exp(k0t). For equal excited-state lifetimes of acid and base(1/k0) ) (1/k0
′ ), the reaction is equivalent to ABa A + B, whenwe set [AB] ) [RO*H] exp(k0t) and [A] ) [RO*-] exp(k0t).
From simple chemical kinetics with no diffusional effect, thetime-dependence of the relative concentration of the acid,provided that initially (t ) 0) only the ROH* has been excited,is given by
[RO*H](t)[RO*H](0)
) e-k0t
1+ cKeq[e-(kPT+cka)t + cKeq] (2)
Here Keq, the equilibrium rate coefficient of the excited-state,is given by Keq ) ka/kPT. The time dependence of RO*H startsfrom unity and decays to the product of the excited-stateequilibrium concentration, cKeq/(1 + cKeq), and the excited-state radiative decay function, exp(-k0t). While the RO*Hconcentration decays biexponentially, the approach of RO*Hexp(k0t) to equilibrium is uniexponential, i.e., exp[–(1 +cKeq)kPTt]. This solution is at odds with the exact asymptoticsolution to the reversible diffusion-influenced reaction at long-times, and even with approximate solutions to the short/intermediate-time behavior (for more details, see reference 43).
Long-Time Asymptotics. When the diffusion of the protonis taken into account, the conclusion from the simple kineticstheory no longer holds. As three-dimensional diffusional effectsdevelop, the kinetics slow down and eventually transform intoan asymptotic power-law decay44–47
[R * OH](t)[R * OH](0)
) e-k0t
1+ cKeq[ Keq
(1+ cKeq)2(4πDt)3 ⁄ 2
+ cKeq](3)
The equilibrium coefficient is given by
Keq ) kaeq ⁄ kPT (4)
where, in the absence of potential interactions, kaeq ≡ ka. It is
convenient to denote that
11992 J. Phys. Chem. C, Vol. 112, No. 31, 2008 Uritski et al.
P(t)) [RO * H](t)[RO * H](0)
ek0t (5)
∆P(t;c) ) P(t) - P(∞) and its long-time approach to equilibrium
∆P(t;c) ∼Keq
(1+ cKeq)3(4πDt)3 ⁄ 2
(6)
depend only on Keq and not on the individual rate parameters.As may be determined from the equilibrium plateau, P(∞) )cKeq/(1 + cKeq), the asymptotic behavior could be tested withoutany adjustable parameters.
Different Excited-State Lifetimes. The photoacid 2N68DSexhibits two different excited-state lifetimes; for the RO*H, τROH
) 8.5 ns, and for the RO*-, τRO*- ) 13 ns. Therefore, eq 3,which was derived for equal lifetimes, is not applicable in thiscase. For the data processing of the time-resolved emission, weused the solution of the chemical kinetic equations for thedifferent lifetime case.43
[R * OH](t)[R * OH](0)
) 1λ1 - λ2
[(µ1 - λ2)e-λ1t + (λ1 - µ1)e
-λ2t]
(7)
The two exponents (eigenvalues) are given by
λ1,2 ) [µ1 + µ2 (∆] ⁄ 2 (8)
where we have defined
µ1 ≡ kd+k0, µ2 ≡ cka + k0′ (9)
and
∆2 ≡ (µ1 - µ2)2+4ckakd
The Smoluchowski Model. The Smoluchowski model isused, in general, to describe the diffusion-assisted irreversiblereaction A + Bf AB, where B is largely in excess as compared
to A. In this study it is used to justify the use of a diffusion-controlled rate constant for the fit of the RO*H time-resolvedemission decay in the presence of excess protons in the icesample.
We assume that the excess proton transport toward the RO*-
is the rate limiting step. The mathematical and computationaldetails of the Smoluchowski model are given elsewhere.48
According to the Smoluchowski model, the survival probabilityof a single (static) acceptor (RO-*) as a result of its irreversiblereaction with a c ) [H+] concentration of proton is given by49–51
S(t)) exp(-c∫0
tk(t′)dt′) (10)
where k(t) is the time-dependent rate coefficient for thedonor-acceptor pair
k(t)) kap(a, t) (11)
whose intrinsic proton-recombination rate constant is ka. Thepair (RO*-/H+) density distribution, p(r, t), is governed by aSmoluchowski equation [diffusion in a potential U(r)] in threedimensions.52
For U(r) ) 0, it is possible to solve the above equationsanalytically for k(t).50 This is no longer true when U(r) * 0. Inthis case, Szabo51 found an approximate expression for the time-dependent rate constant.
When a potential is introduced, it behaves correctly at botht ) 0 and t ) ∞:
k(0)) kPTe-U(a), k(∞)) [k(0)-1 + kD-1]-1 (12)
where kD ) 4πDae is the diffusion-control rate constant, andae is an effective radius.51 The nonexponentiality in S(t) is aresult of a time-dependent rate constant, k(t), as depicted bythe ratio k(0)/k(∞) ) 1 + k(0)/kD.
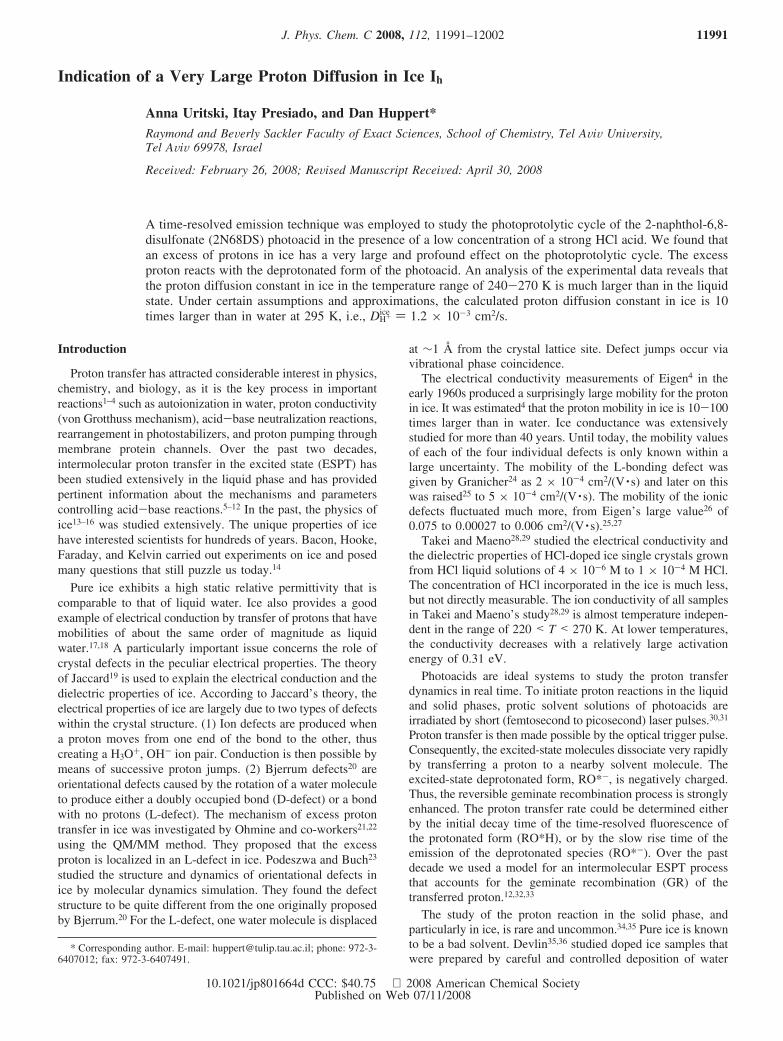
Figure 1. Time-resolved emission of RO*H of 2N68DS in a 0.01% methanol-doped aqueous sample, measured at 380 nm at several temperatures.Each frame contains two samples: a neutral pH sample and 1 mM HCl.
Very Large Proton Diffusion In Ice Ih J. Phys. Chem. C, Vol. 112, No. 31, 2008 11993
Results
Figure 1 shows the time-resolved emission of the RO*H, theprotonated form of 2N68DS in methanol-doped ice of twosamples: that of a neutral pH and that of a sample that contains1 mM HCl. The methanol doping was of 0.01% mole ratio.The figure shows the time-resolved emission of liquid samplesas well as the solid samples at several temperatures. In allsamples the short time signals are almost identical for bothneutral and acidic samples. At intermediate and long times thesignals of the neutral and the acidic samples differ strongly inice, but in the liquid state the signals are quite similar. In bothliquid and ice, the neutral sample’s time-resolved signal decaysnonexponentially in a very specific time profile. At the shorttime, the signal decays nearly exponentially, and the rate almostexclusively depends on the proton transfer rate kPT, i.e., RO*H
fkPT
RO*- + H+. This part of the signal is almost independentof the proton concentration or the methanol concentration below1% mole ratio. In acid-free samples, the intermediate and long-time parts of the signals strongly depend on the proton geminate
recombination process RO*- + H+ fkr
RO*H. This process isinfluenced by the proton diffusion constant DH+, the intrinsicrecombination rate constant, ka at the reaction sphere, and theCoulomb potential V(r). The signal of the RO*H emissiondepends also on the excited-state lifetimes of both RO*H andRO*- and the forward reaction rate constant kPT. The lifetimecorrected long-time asymptotic decay of the RO*H is given by
ROH* exp(t ⁄ τf) ∝ [K eq/ ⁄ (4πD)3 ⁄ 2]t-3 ⁄ 2 (13)
The lifetime-corrected long-time RO*H signal decays as apower-law of t-3/2 for a reversible photoprotolytic process inthree dimensions. In general, the long-time asymptotic decayobeys a power law of t-d/2, where d is the dimension of thediffusion medium.
When comparing the RO*H signals of samples with andwithout acid, we can see that the intensity of the intermediate
and long-time signals of the acidic sample increases with respectto the neutral sample. In the liquid, the long-time signal intensityincreases only slightly, whereas in ice the long-time signalincreases by more than an order of magnitude. Equations 2 and7 predict that the RO*H signal decay of the protonated form isbiexponential. The short-time exponent mainly depends on theproton transfer rate kPT. The amplitude of the long-time exponentaccording to eq 2 depends on cKeq, where Keq ) ka/kPT. Therecombination process ka in the simple chemical kineticsequation formalism depends only on the intrinsic rate constantregardless of the transport of the proton toward the RO*-. In aprevious study41 we provided an approximate expression forthe RO*H signal that takes into account the reversibility of thephotoprotolytic signal and the excess proton transport. In an
irreversible recombination process, A + B fkirr(t)
AB, where B isin large excess (based on the Debye-Smoluchowski equation),Szabo51 derived an expression for a time-dependent rate constantthat takes into account the transport of B toward the encounterwith an A to form AB.
At short times, kirr(0) ) ka exp[-U(a)], and at long timeskirr(∞)-1 ) [k(0)-1 + kD
-1]-1 (see eq 11), where
kD ) 4 πN ′ RDDH+
is a bimolecular diffusion-controlled rate constant in unitsof M-1 s-1. When k(0) < kD, then k(∞) ≈ kD. In that case,the constant flux of particles B toward the target controls thereaction rate. From the long-time signal of the RO*H in theacidic sample, one can estimate the proton diffusion constantby replacing the recombination constant ka with kD. The largeamplitude of the long-time RO*H signal arises from a largeincrease of the proton diffusion constant in ice as comparedwith its value in the supercooled liquid. The long-time signalamplitude scales linearly with the proton diffusion constant.
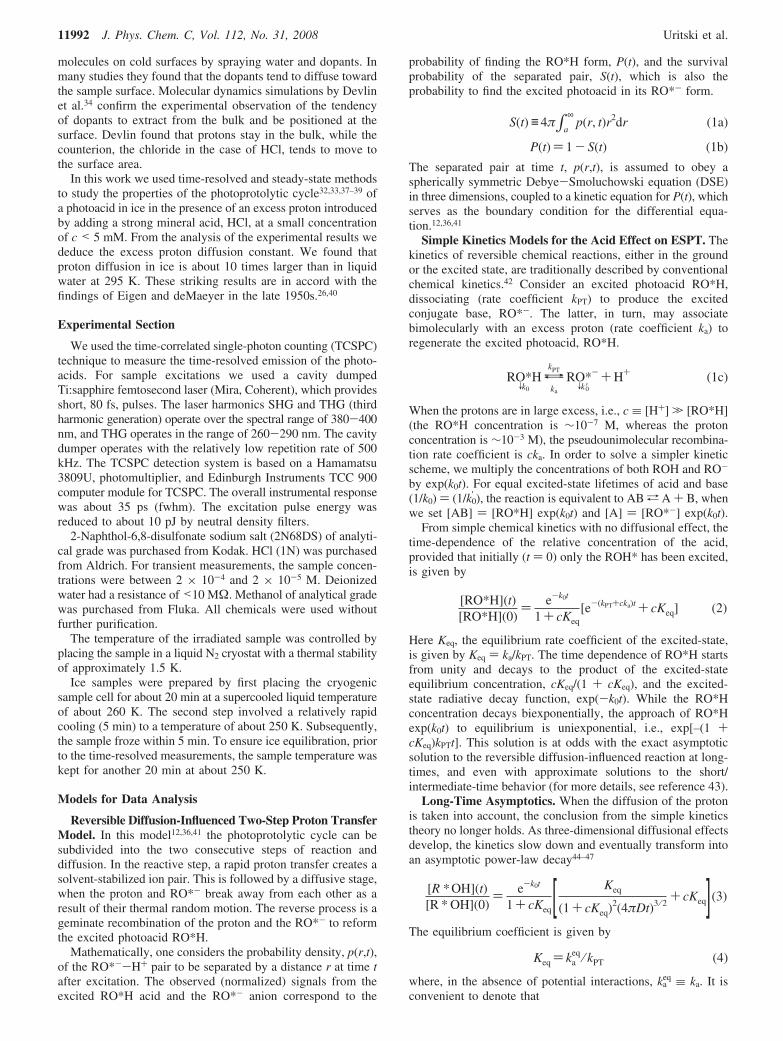
Figure 2 shows the time-resolved emission of the RO*-, thedeprotonated form of 2N68DS in methanol-doped liquid waterand solid ice samples. The samples contained 1 mM of HCl
Figure 2. Time-resolved emission of RO*- of 2N68DS in a 0.01% methanol-doped aqueous sample, measured at 470 nm at several temperatures.Each frame contains two samples: a neutral pH sample and 1 mM HCl.
11994 J. Phys. Chem. C, Vol. 112, No. 31, 2008 Uritski et al.
acid, and the methanol doping is 0.01% mole ratio. The figurealso shows the RO*- signal of a neutral pH solution. The shorttime signal shows a fast response limited by the time resolutionof the TCSPC system with an amplitude of about 0.3. The fastcomponent is followed by a slow rise of a few tens ofpicoseconds in liquid at high temperature ice samples, and aslower rise of a few hundred picoseconds in ice at a temperatureof T < 250 K. The slow part of the signal build-up arises from
the deprotonation process RO*H fkPT
RO*- + H+ of thephotoprotolytic cycle.
The fast component is due to the overlap between the twoemission bands, the RO*H and the RO*-. In neutral samples(in the absence of HCl) at long times, the signal decays nearlyexponentially with a decay time that is equal to the excited-state lifetime of the RO*- (τ = 13 ns). The signals in icesamples that contain 1 mM HCl at intermediate and long timesexhibit a nonexponential decay. This phenomenon is attributedto an irreversible proton recombination process, which leads toa ground-state ROH. Naphthol and naphthol derivates are knownto follow such a proton driven quenching mechanism.
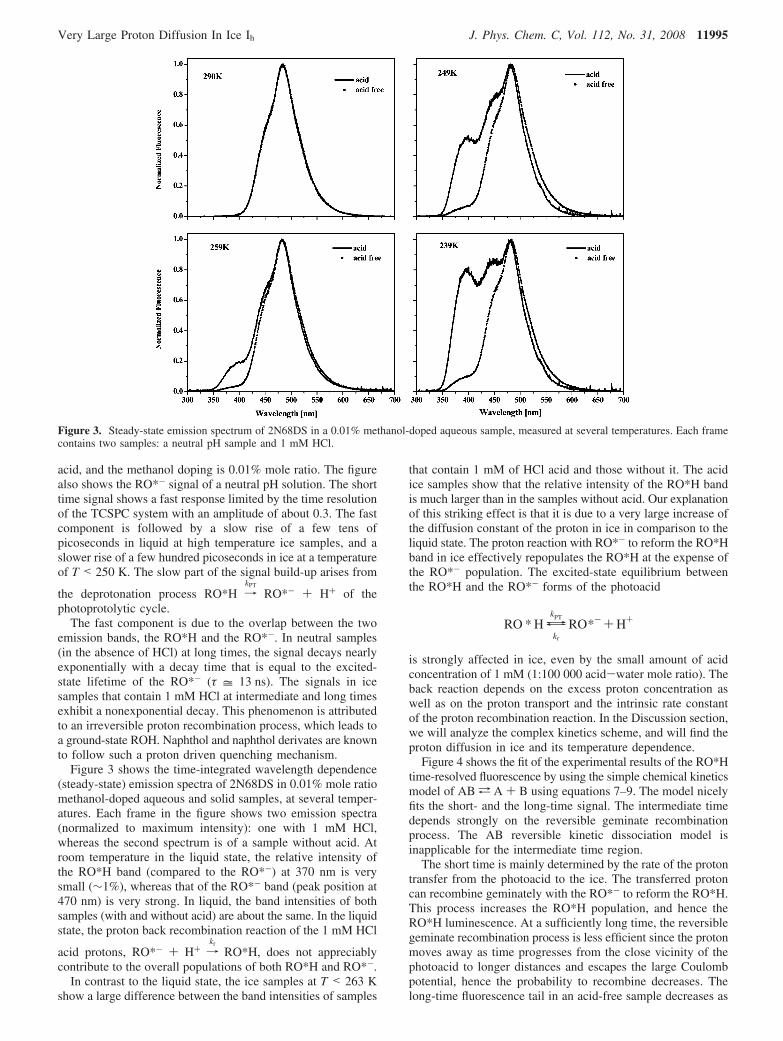
Figure 3 shows the time-integrated wavelength dependence(steady-state) emission spectra of 2N68DS in 0.01% mole ratiomethanol-doped aqueous and solid samples, at several temper-atures. Each frame in the figure shows two emission spectra(normalized to maximum intensity): one with 1 mM HCl,whereas the second spectrum is of a sample without acid. Atroom temperature in the liquid state, the relative intensity ofthe RO*H band (compared to the RO*-) at 370 nm is verysmall (∼1%), whereas that of the RO*- band (peak position at470 nm) is very strong. In liquid, the band intensities of bothsamples (with and without acid) are about the same. In the liquidstate, the proton back recombination reaction of the 1 mM HCl
acid protons, RO*- + H+ fkr
RO*H, does not appreciablycontribute to the overall populations of both RO*H and RO*-.
In contrast to the liquid state, the ice samples at T < 263 Kshow a large difference between the band intensities of samples
that contain 1 mM of HCl acid and those without it. The acidice samples show that the relative intensity of the RO*H bandis much larger than in the samples without acid. Our explanationof this striking effect is that it is due to a very large increase ofthe diffusion constant of the proton in ice in comparison to theliquid state. The proton reaction with RO*- to reform the RO*Hband in ice effectively repopulates the RO*H at the expense ofthe RO*- population. The excited-state equilibrium betweenthe RO*H and the RO*- forms of the photoacid
RO * H \kPT
kr
RO*-+H+
is strongly affected in ice, even by the small amount of acidconcentration of 1 mM (1:100 000 acid-water mole ratio). Theback reaction depends on the excess proton concentration aswell as on the proton transport and the intrinsic rate constantof the proton recombination reaction. In the Discussion section,we will analyze the complex kinetics scheme, and will find theproton diffusion in ice and its temperature dependence.
Figure 4 shows the fit of the experimental results of the RO*Htime-resolved fluorescence by using the simple chemical kineticsmodel of ABa A + B using equations 7–9. The model nicelyfits the short- and the long-time signal. The intermediate timedepends strongly on the reversible geminate recombinationprocess. The AB reversible kinetic dissociation model isinapplicable for the intermediate time region.
The short time is mainly determined by the rate of the protontransfer from the photoacid to the ice. The transferred protoncan recombine geminately with the RO*- to reform the RO*H.This process increases the RO*H population, and hence theRO*H luminescence. At a sufficiently long time, the reversiblegeminate recombination process is less efficient since the protonmoves away as time progresses from the close vicinity of thephotoacid to longer distances and escapes the large Coulombpotential, hence the probability to recombine decreases. Thelong-time fluorescence tail in an acid-free sample decreases as
Figure 3. Steady-state emission spectrum of 2N68DS in a 0.01% methanol-doped aqueous sample, measured at several temperatures. Each framecontains two samples: a neutral pH sample and 1 mM HCl.
Very Large Proton Diffusion In Ice Ih J. Phys. Chem. C, Vol. 112, No. 31, 2008 11995
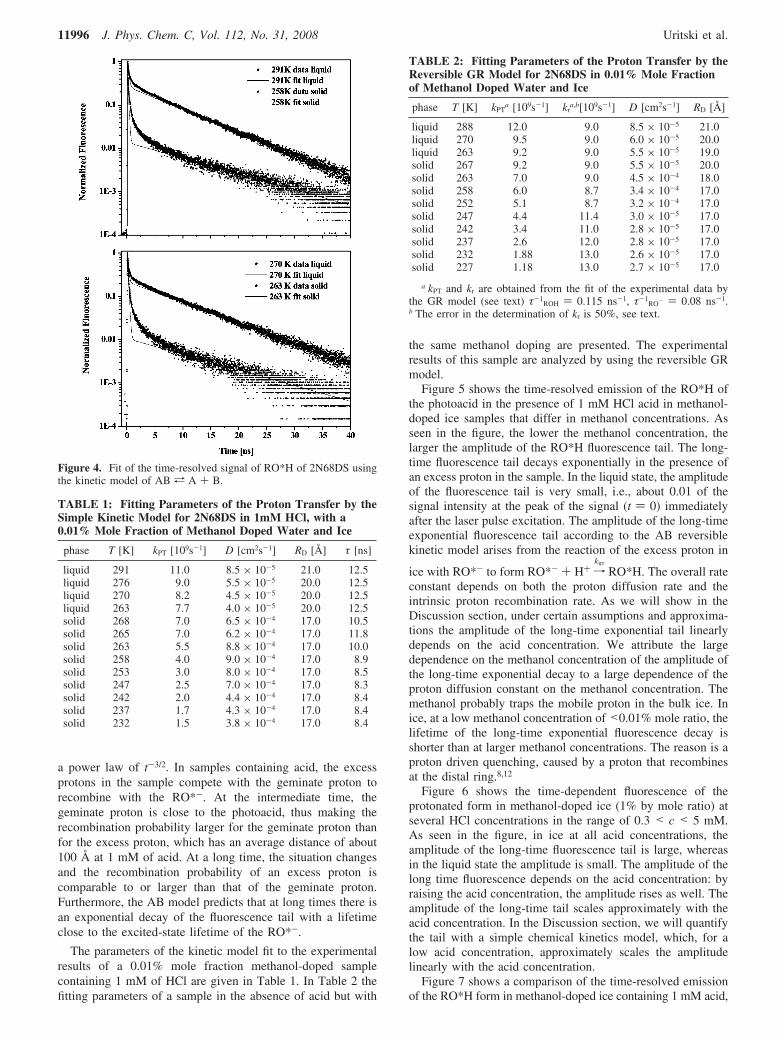
a power law of t-3/2. In samples containing acid, the excessprotons in the sample compete with the geminate proton torecombine with the RO*-. At the intermediate time, thegeminate proton is close to the photoacid, thus making therecombination probability larger for the geminate proton thanfor the excess proton, which has an average distance of about100 Å at 1 mM of acid. At a long time, the situation changesand the recombination probability of an excess proton iscomparable to or larger than that of the geminate proton.Furthermore, the AB model predicts that at long times there isan exponential decay of the fluorescence tail with a lifetimeclose to the excited-state lifetime of the RO*-.
The parameters of the kinetic model fit to the experimentalresults of a 0.01% mole fraction methanol-doped samplecontaining 1 mM of HCl are given in Table 1. In Table 2 thefitting parameters of a sample in the absence of acid but with
the same methanol doping are presented. The experimentalresults of this sample are analyzed by using the reversible GRmodel.
Figure 5 shows the time-resolved emission of the RO*H ofthe photoacid in the presence of 1 mM HCl acid in methanol-doped ice samples that differ in methanol concentrations. Asseen in the figure, the lower the methanol concentration, thelarger the amplitude of the RO*H fluorescence tail. The long-time fluorescence tail decays exponentially in the presence ofan excess proton in the sample. In the liquid state, the amplitudeof the fluorescence tail is very small, i.e., about 0.01 of thesignal intensity at the peak of the signal (t ) 0) immediatelyafter the laser pulse excitation. The amplitude of the long-timeexponential fluorescence tail according to the AB reversiblekinetic model arises from the reaction of the excess proton in
ice with RO*- to form RO*- + H+fkirr
RO*H. The overall rateconstant depends on both the proton diffusion rate and theintrinsic proton recombination rate. As we will show in theDiscussion section, under certain assumptions and approxima-tions the amplitude of the long-time exponential tail linearlydepends on the acid concentration. We attribute the largedependence on the methanol concentration of the amplitude ofthe long-time exponential decay to a large dependence of theproton diffusion constant on the methanol concentration. Themethanol probably traps the mobile proton in the bulk ice. Inice, at a low methanol concentration of <0.01% mole ratio, thelifetime of the long-time exponential fluorescence decay isshorter than at larger methanol concentrations. The reason is aproton driven quenching, caused by a proton that recombinesat the distal ring.8,12
Figure 6 shows the time-dependent fluorescence of theprotonated form in methanol-doped ice (1% by mole ratio) atseveral HCl concentrations in the range of 0.3 < c < 5 mM.As seen in the figure, in ice at all acid concentrations, theamplitude of the long-time fluorescence tail is large, whereasin the liquid state the amplitude is small. The amplitude of thelong time fluorescence depends on the acid concentration: byraising the acid concentration, the amplitude rises as well. Theamplitude of the long-time tail scales approximately with theacid concentration. In the Discussion section, we will quantifythe tail with a simple chemical kinetics model, which, for alow acid concentration, approximately scales the amplitudelinearly with the acid concentration.
Figure 7 shows a comparison of the time-resolved emissionof the RO*H form in methanol-doped ice containing 1 mM acid,
Figure 4. Fit of the time-resolved signal of RO*H of 2N68DS usingthe kinetic model of AB a A + B.
TABLE 1: Fitting Parameters of the Proton Transfer by theSimple Kinetic Model for 2N68DS in 1mM HCl, with a0.01% Mole Fraction of Methanol Doped Water and Ice
phase T [K] kPT [109s-1] D [cm2s-1] RD [Å] τ [ns]
liquid 291 11.0 8.5 × 10⁻⁵ 21.0 12.5liquid 276 9.0 5.5 × 10⁻⁵ 20.0 12.5liquid 270 8.2 4.5 × 10⁻⁵ 20.0 12.5liquid 263 7.7 4.0 × 10⁻⁵ 20.0 12.5solid 268 7.0 6.5 × 10⁻⁴ 17.0 10.5solid 265 7.0 6.2 × 10⁻⁴ 17.0 11.8solid 263 5.5 8.8 × 10⁻⁴ 17.0 10.0solid 258 4.0 9.0 × 10⁻⁴ 17.0 8.9solid 253 3.0 8.0 × 10⁻⁴ 17.0 8.5solid 247 2.5 7.0 × 10⁻⁴ 17.0 8.3solid 242 2.0 4.4 × 10⁻⁴ 17.0 8.4solid 237 1.7 4.3 × 10⁻⁴ 17.0 8.4solid 232 1.5 3.8 × 10⁻⁴ 17.0 8.4
TABLE 2: Fitting Parameters of the Proton Transfer by theReversible GR Model for 2N68DS in 0.01% Mole Fractionof Methanol Doped Water and Ice
phase T [K] kPTa [109s-1] kr
a,b[109s-1] D [cm2s-1] RD [Å]
liquid 288 12.0 9.0 8.5 × 10⁻⁵ 21.0liquid 270 9.5 9.0 6.0 × 10⁻⁵ 20.0liquid 263 9.2 9.0 5.5 × 10⁻⁵ 19.0solid 267 9.2 9.0 5.5 × 10⁻⁵ 20.0solid 263 7.0 9.0 4.5 × 10⁻⁴ 18.0solid 258 6.0 8.7 3.4 × 10⁻⁴ 17.0solid 252 5.1 8.7 3.2 × 10⁻⁴ 17.0solid 247 4.4 11.4 3.0 × 10⁻⁵ 17.0solid 242 3.4 11.0 2.8 × 10⁻⁵ 17.0solid 237 2.6 12.0 2.8 × 10⁻⁵ 17.0solid 232 1.88 13.0 2.6 × 10⁻⁵ 17.0solid 227 1.18 13.0 2.7 × 10⁻⁵ 17.0
a kPT and kr are obtained from the fit of the experimental data bythe GR model (see text) τ-1
ROH ) 0.115 ns-1, τ-1RO- ) 0.08 ns-1.
b The error in the determination of kr is 50%, see text.
11996 J. Phys. Chem. C, Vol. 112, No. 31, 2008 Uritski et al.
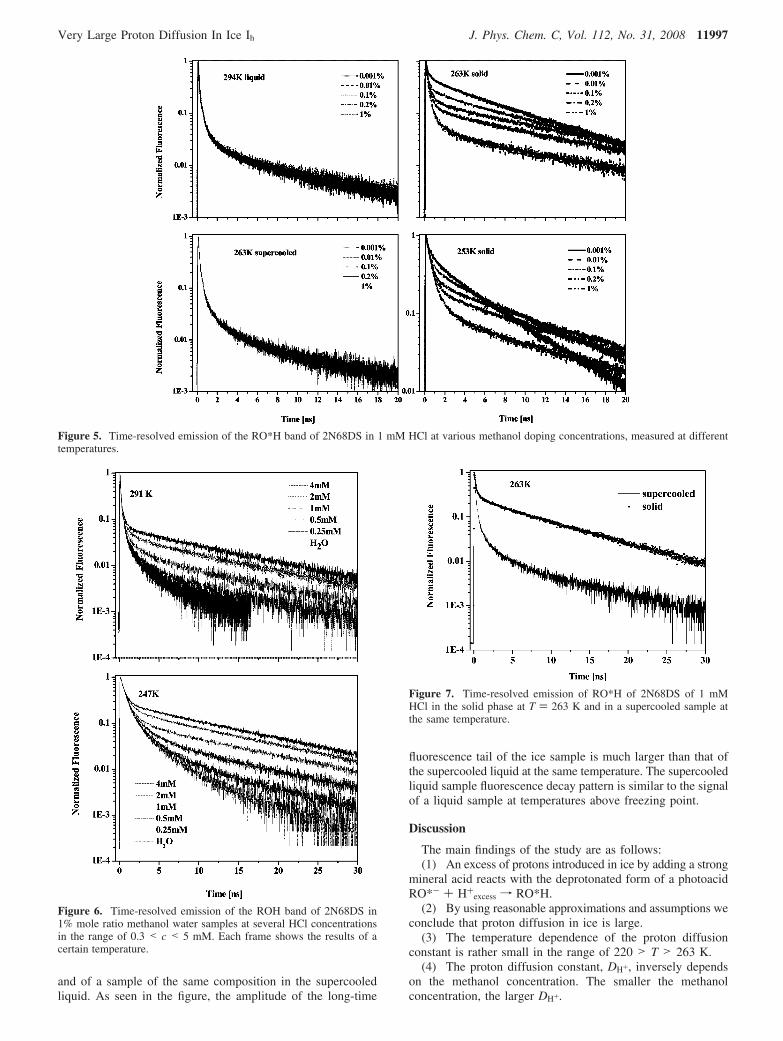
and of a sample of the same composition in the supercooledliquid. As seen in the figure, the amplitude of the long-time
fluorescence tail of the ice sample is much larger than that ofthe supercooled liquid at the same temperature. The supercooledliquid sample fluorescence decay pattern is similar to the signalof a liquid sample at temperatures above freezing point.
Discussion
The main findings of the study are as follows:(1) An excess of protons introduced in ice by adding a strong
mineral acid reacts with the deprotonated form of a photoacidRO*- + H+
excess f RO*H.(2) By using reasonable approximations and assumptions we
conclude that proton diffusion in ice is large.(3) The temperature dependence of the proton diffusion
constant is rather small in the range of 220 > T > 263 K.(4) The proton diffusion constant, DH+, inversely depends
on the methanol concentration. The smaller the methanolconcentration, the larger DH+.
Figure 5. Time-resolved emission of the RO*H band of 2N68DS in 1 mM HCl at various methanol doping concentrations, measured at differenttemperatures.
Figure 6. Time-resolved emission of the ROH band of 2N68DS in1% mole ratio methanol water samples at several HCl concentrationsin the range of 0.3 < c < 5 mM. Each frame shows the results of acertain temperature.
Figure 7. Time-resolved emission of RO*H of 2N68DS of 1 mMHCl in the solid phase at T ) 263 K and in a supercooled sample atthe same temperature.
Very Large Proton Diffusion In Ice Ih J. Phys. Chem. C, Vol. 112, No. 31, 2008 11997
(5) When the methanol concentration is smaller than 0.01%mole ratio, we observe a quenching of the RO*- fluorescence,causing a reduction in the effective excited-state lifetime of theRO*-. The excited-state lifetime is temperature dependent. Thelower the temperature, the shorter the decay time.
(6) When comparing the decay curves of the RO*- fluo-rescence in samples with and without acid, the RO*- signalquenching in the presence of an excess of protons is enhancedby it. This phenomenon is known for many naphthol derivatives,especially for 1-naphthol and its derivatives.
(7) In methanol-doped ice samples, in the absence of mineralacid, the proton diffusion constant extracted from the numericalfit of the experimental results by using the reversible diffusioninfluenced geminate recombination model is rather small andis comparable to supercooled liquid water.
When a photoacid is excited in an aqueous solution containinga strong mineral acid like HCl, the excess of homogeneousprotons reacts with the RO*- species formed by the photopro-tolytic reaction. The overall effect on the time-resolved emissionof the RO*H band in the presence of 1 mM of HCl in waterand in ice is shown in Figure 1. For reference, the RO*Hemission in neutral water and in ice is also shown in the figure.The comparison with the RO*H signal in the neutral sampleshows that the RO*H signal is modified by the excess protonreaction with the RO*-. As seen in the figure, at long times thedecay of the RO*H band in the presence of an excess of protonsin solution is almost exponential with a relatively largeamplitude compared to the signal maximum immediately afterthe pulse excitation. It is also noticeable that the amplitude ofthe long-time fluorescence tail in ice is larger by about a factorof 30 than in a supercooled water solution. A qualitative analysisof the time-resolved fluorescence of RO*H, based on theimportance of proton transport toward the RO*-, relates therelative amplitude of the exponential tail with the protondiffusion constant and the intrinsic reaction rate constants kPT
and ka. When the proton concentration is relatively small andthe intrinsic recombination rate constant ka is large, thepseudounimolecular recombination rate coefficient is ckD, wherec is the acid concentration and kD is the diffusion-controlledreaction rate constant for an excess proton with RO*-. In thecase of 2N68DS, the lifetimes of the acid and the conjugatebase forms are similar but not equal. For the simpler case ofequal lifetimes, 1/k0 ) 1/k0
′ , the reaction is equivalent to ABaA + B, when we modify the simple kinetic expression to takeinto account the radiative decay of both the excited-state formsROH* and RO-* [AB] ) [ROH*] exp(k0t) and [A] ) [RO*-]exp(k0t). From simple chemical kinetics, the time dependenceof the RO*H concentration is given by eq 2. According to eq2, the RO*H fluorescence signal starts from unity and decaysto the quasi-equilibrium distribution, cKeq/(1 + cKeq). In general,the overall proton recombination rate constant kr depends onboth ka and DH+. When the acid concentration is sufficientlylow (c < 10 mM) and the intrinsic recombination rate constantis larger than the kD, the recombination reaction roughly dependsonly on the transport rate of the excess proton from the bulkice toward the reaction sphere surrounding the photoacid RO*-.The important finding of this study is that the excess protondiffusion in ice is approximately 20 times larger than thecalculated value from the literature mobility. In dc conductionmeasurements of ice samples, the ion defect current must equalthe Bjerrum current. Thus, the two mechanisms effectively actin series. The dc conductivity is therefore chiefly determinedby the less effective of the two mechanisms, which for pure iceis the ion defect current.19 At high frequencies, the protons can
move back and forth along the same path. The interactionbetween different defect types is small, hence the two processesact independently and in parallel, and the high-frequencyconductivity σ∞ is given by
σ∞ ) σi + σB (14)
Measurements of σ and σ∞ enable the estimation of the relativeeffectiveness of the two processes. The value of the protondiffusion constant in ice as deduced from our photoacidexperiments is about 20 times larger than the value µH3O+ ≈10-7 m2 V-1 s-1 estimated from ice conductance measure-ments.16 The electrical conductivity measurements of Eigen4
in the early 1960s resulted in a surprisingly large mobility valuefor the proton in ice. The results of this study show that theproton mobility in ice is indeed larger than that in water, atleast on a nanometric distance scale. Already in 1983 Nagle53
advocated the existence of proton wires in ice and in enzymaticsystems in which the proton transport is carried out via aconcerted mechanism (Grotthuss mechanism) on a limited lengthscale. Ice conductance was extensively studied for more thanforty years. To date, the mobility values of each of the fourindividual defects is only known within a large uncertainty.Jaccard19 argued that the dielectric constant in ice is verysensitive to the number of charged OH- and H+ carriers, aswell as to the D and L orientational defects. The effectivedielectric constant next to an impurity might be strongly affectedby the impurity, as well as by the procedure of ice preparation.In a separate section we will discuss the possible implicationsof the change in the dielectric constant in acid-doped ice onour results and interpretations.
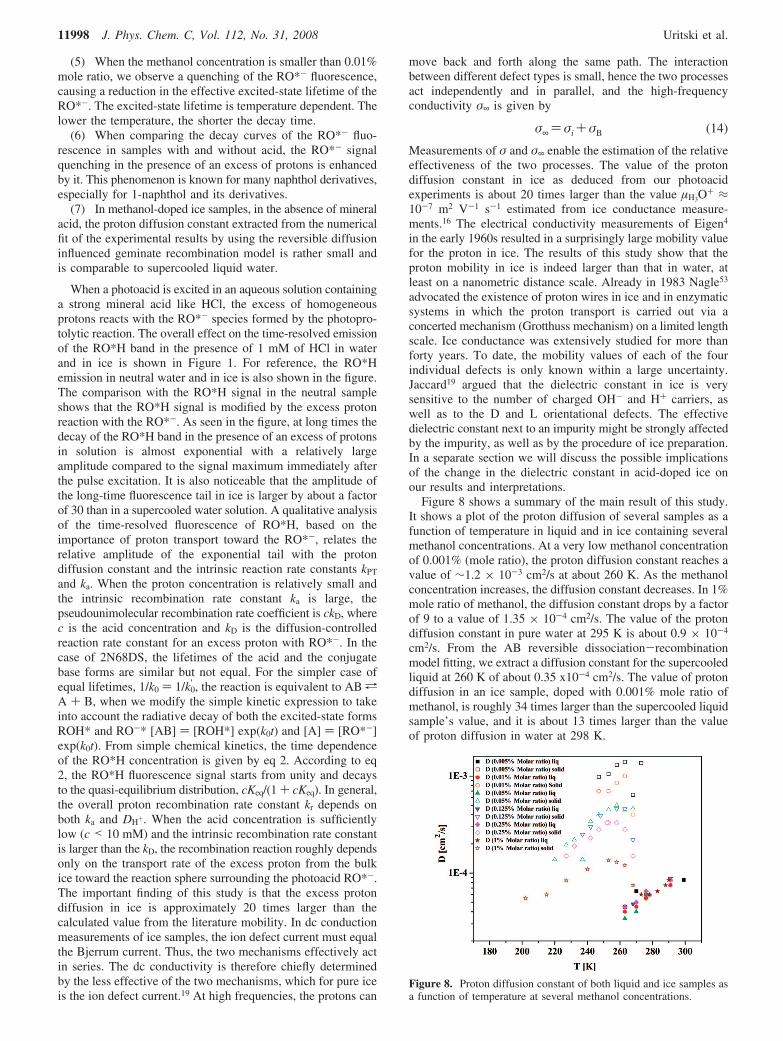
Figure 8 shows a summary of the main result of this study.It shows a plot of the proton diffusion of several samples as afunction of temperature in liquid and in ice containing severalmethanol concentrations. At a very low methanol concentrationof 0.001% (mole ratio), the proton diffusion constant reaches avalue of ∼1.2 × 10⁻³ cm2/s at about 260 K. As the methanolconcentration increases, the diffusion constant decreases. In 1%mole ratio of methanol, the diffusion constant drops by a factorof 9 to a value of 1.35 × 10⁻⁴ cm2/s. The value of the protondiffusion constant in pure water at 295 K is about 0.9 × 10⁻⁴
cm2/s. From the AB reversible dissociation-recombinationmodel fitting, we extract a diffusion constant for the supercooledliquid at 260 K of about 0.35 x10⁻⁴ cm2/s. The value of protondiffusion in an ice sample, doped with 0.001% mole ratio ofmethanol, is roughly 34 times larger than the supercooled liquidsample’s value, and it is about 13 times larger than the valueof proton diffusion in water at 298 K.
Figure 8. Proton diffusion constant of both liquid and ice samples asa function of temperature at several methanol concentrations.
11998 J. Phys. Chem. C, Vol. 112, No. 31, 2008 Uritski et al.
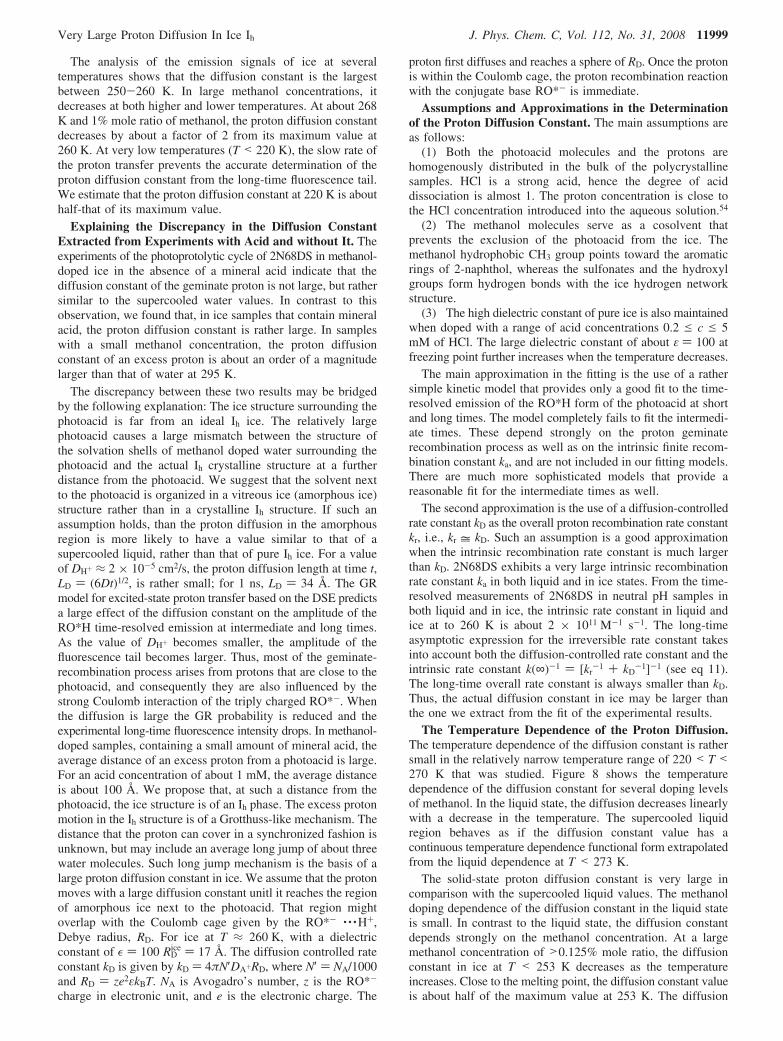
The analysis of the emission signals of ice at severaltemperatures shows that the diffusion constant is the largestbetween 250-260 K. In large methanol concentrations, itdecreases at both higher and lower temperatures. At about 268K and 1% mole ratio of methanol, the proton diffusion constantdecreases by about a factor of 2 from its maximum value at260 K. At very low temperatures (T < 220 K), the slow rate ofthe proton transfer prevents the accurate determination of theproton diffusion constant from the long-time fluorescence tail.We estimate that the proton diffusion constant at 220 K is abouthalf-that of its maximum value.
Explaining the Discrepancy in the Diffusion ConstantExtracted from Experiments with Acid and without It. Theexperiments of the photoprotolytic cycle of 2N68DS in methanol-doped ice in the absence of a mineral acid indicate that thediffusion constant of the geminate proton is not large, but rathersimilar to the supercooled water values. In contrast to thisobservation, we found that, in ice samples that contain mineralacid, the proton diffusion constant is rather large. In sampleswith a small methanol concentration, the proton diffusionconstant of an excess proton is about an order of a magnitudelarger than that of water at 295 K.
The discrepancy between these two results may be bridgedby the following explanation: The ice structure surrounding thephotoacid is far from an ideal Ih ice. The relatively largephotoacid causes a large mismatch between the structure ofthe solvation shells of methanol doped water surrounding thephotoacid and the actual Ih crystalline structure at a furtherdistance from the photoacid. We suggest that the solvent nextto the photoacid is organized in a vitreous ice (amorphous ice)structure rather than in a crystalline Ih structure. If such anassumption holds, than the proton diffusion in the amorphousregion is more likely to have a value similar to that of asupercooled liquid, rather than that of pure Ih ice. For a valueof DH+ ≈ 2 × 10⁻⁵ cm2/s, the proton diffusion length at time t,LD ) (6Dt)1/2, is rather small; for 1 ns, LD ) 34 Å. The GRmodel for excited-state proton transfer based on the DSE predictsa large effect of the diffusion constant on the amplitude of theRO*H time-resolved emission at intermediate and long times.As the value of DH+ becomes smaller, the amplitude of thefluorescence tail becomes larger. Thus, most of the geminate-recombination process arises from protons that are close to thephotoacid, and consequently they are also influenced by thestrong Coulomb interaction of the triply charged RO*-. Whenthe diffusion is large the GR probability is reduced and theexperimental long-time fluorescence intensity drops. In methanol-doped samples, containing a small amount of mineral acid, theaverage distance of an excess proton from a photoacid is large.For an acid concentration of about 1 mM, the average distanceis about 100 Å. We propose that, at such a distance from thephotoacid, the ice structure is of an Ih phase. The excess protonmotion in the Ih structure is of a Grotthuss-like mechanism. Thedistance that the proton can cover in a synchronized fashion isunknown, but may include an average long jump of about threewater molecules. Such long jump mechanism is the basis of alarge proton diffusion constant in ice. We assume that the protonmoves with a large diffusion constant unitl it reaches the regionof amorphous ice next to the photoacid. That region mightoverlap with the Coulomb cage given by the RO*- · · ·H+,Debye radius, RD. For ice at T ≈ 260 K, with a dielectricconstant of ε ) 100 RD
ice ) 17 Å. The diffusion controlled rateconstant kD is given by kD ) 4πN′DA+RD, where N′ ) NA/1000and RD ) ze2εkBT. NA is Avogadro’s number, z is the RO*-
charge in electronic unit, and e is the electronic charge. The
proton first diffuses and reaches a sphere of RD. Once the protonis within the Coulomb cage, the proton recombination reactionwith the conjugate base RO*- is immediate.
Assumptions and Approximations in the Determinationof the Proton Diffusion Constant. The main assumptions areas follows:
(1) Both the photoacid molecules and the protons arehomogenously distributed in the bulk of the polycrystallinesamples. HCl is a strong acid, hence the degree of aciddissociation is almost 1. The proton concentration is close tothe HCl concentration introduced into the aqueous solution.54
(2) The methanol molecules serve as a cosolvent thatprevents the exclusion of the photoacid from the ice. Themethanol hydrophobic CH3 group points toward the aromaticrings of 2-naphthol, whereas the sulfonates and the hydroxylgroups form hydrogen bonds with the ice hydrogen networkstructure.
(3) The high dielectric constant of pure ice is also maintainedwhen doped with a range of acid concentrations 0.2 e c e 5mM of HCl. The large dielectric constant of about ε ) 100 atfreezing point further increases when the temperature decreases.
The main approximation in the fitting is the use of a rathersimple kinetic model that provides only a good fit to the time-resolved emission of the RO*H form of the photoacid at shortand long times. The model completely fails to fit the intermedi-ate times. These depend strongly on the proton geminaterecombination process as well as on the intrinsic finite recom-bination constant ka, and are not included in our fitting models.There are much more sophisticated models that provide areasonable fit for the intermediate times as well.
The second approximation is the use of a diffusion-controlledrate constant kD as the overall proton recombination rate constantkr, i.e., kr = kD. Such an assumption is a good approximationwhen the intrinsic recombination rate constant is much largerthan kD. 2N68DS exhibits a very large intrinsic recombinationrate constant ka in both liquid and in ice states. From the time-resolved measurements of 2N68DS in neutral pH samples inboth liquid and in ice, the intrinsic rate constant in liquid andice at to 260 K is about 2 × 10¹¹ M-1 s-1. The long-timeasymptotic expression for the irreversible rate constant takesinto account both the diffusion-controlled rate constant and theintrinsic rate constant k(∞)-1 ) [kr
-1 + kD-1]-1 (see eq 11).
The long-time overall rate constant is always smaller than kD.Thus, the actual diffusion constant in ice may be larger thanthe one we extract from the fit of the experimental results.
The Temperature Dependence of the Proton Diffusion.The temperature dependence of the diffusion constant is rathersmall in the relatively narrow temperature range of 220 < T <270 K that was studied. Figure 8 shows the temperaturedependence of the diffusion constant for several doping levelsof methanol. In the liquid state, the diffusion decreases linearlywith a decrease in the temperature. The supercooled liquidregion behaves as if the diffusion constant value has acontinuous temperature dependence functional form extrapolatedfrom the liquid dependence at T < 273 K.
The solid-state proton diffusion constant is very large incomparison with the supercooled liquid values. The methanoldoping dependence of the diffusion constant in the liquid stateis small. In contrast to the liquid state, the diffusion constantdepends strongly on the methanol concentration. At a largemethanol concentration of >0.125% mole ratio, the diffusionconstant in ice at T < 253 K decreases as the temperatureincreases. Close to the melting point, the diffusion constant valueis about half of the maximum value at 253 K. The diffusion
Very Large Proton Diffusion In Ice Ih J. Phys. Chem. C, Vol. 112, No. 31, 2008 11999
constant at T > 253 K decreases linearly with the decrease intemperature. At about 220 K, its value is half of that at 253 K.The small temperature dependence of the diffusion constant isalso seen in the conductivity of the ion defect σ( /e( of theHCl doped sample measured by Takei and Maeno.28,29 Theresults show that the conductivity is almost constant in the hightemperature range of T > 220 K, whereas at lower temperaturesof T < 220 K it obeys an Arrhenius activation behavior, withan activation energy of 0.3 eV.
Acid Concentration Dependence on the Proton Diffusion.We measured the photoprotolytic cycle of 2N68DS in 1% moleratio methanol-doped samples in the presence of HCl at arelatively large concentration range of 0.25 < c < 5 mM. Wefound that in the large temperature range of 220 < T < 298 K,the diffusion constant obtained from the fit of the experimentaldata by the AB kinetic dissociation recombination model isindependent of the acid concentration in 1% methanol-dopedice samples. In doped ice samples with lower methanolconcentration, we used only a few acid concentrations: Theanalysis of the experimental results of those samples alsoprovides the same conclusion; the proton diffusion constantderived from the fit to the experimental data is independent ofthe HCl concentration.
Proton Diffusion Dependence on the Methanol Concen-tration. Pure ice is known to be a bad solvent.16 Upon slowlycontrolled freezing, most of the dopants are extracted from ofthe crystal and consequently concentrate at the grain boundary.In our initial experiments on the photoprotolytic cycle of thephotoacid in pure ice,55–57 we noticed that the frozen samplesare nonfluorescent, while in the liquid samples the fluorescenceis at least 3 orders of magnitude more intense. We explainedthe lack of fluorescence of the photoacid in “pure” ice samplesby the aggregation of the photoacid molecules at the grainboundary. Dimerization of two photoacid molecules causes theannihilation of the overall transition dipole moment, which willlead to the reduction of the fluorescence intensity. We found aprocedure to overcome the aggregation of the photoacidmolecules upon freezing. To prevent the aggregation, we added1% of methanol (mole ratio) to a pure aqueous solution. Themethanol probably serves as a mediator between the hydropho-bic aromatic rings of the photoacid with the ice water molecules.In numerous experiments we found that the fluorescenceintensity of the frozen methanol-doped ice sample containingthe photoacid is “behaving properly”.
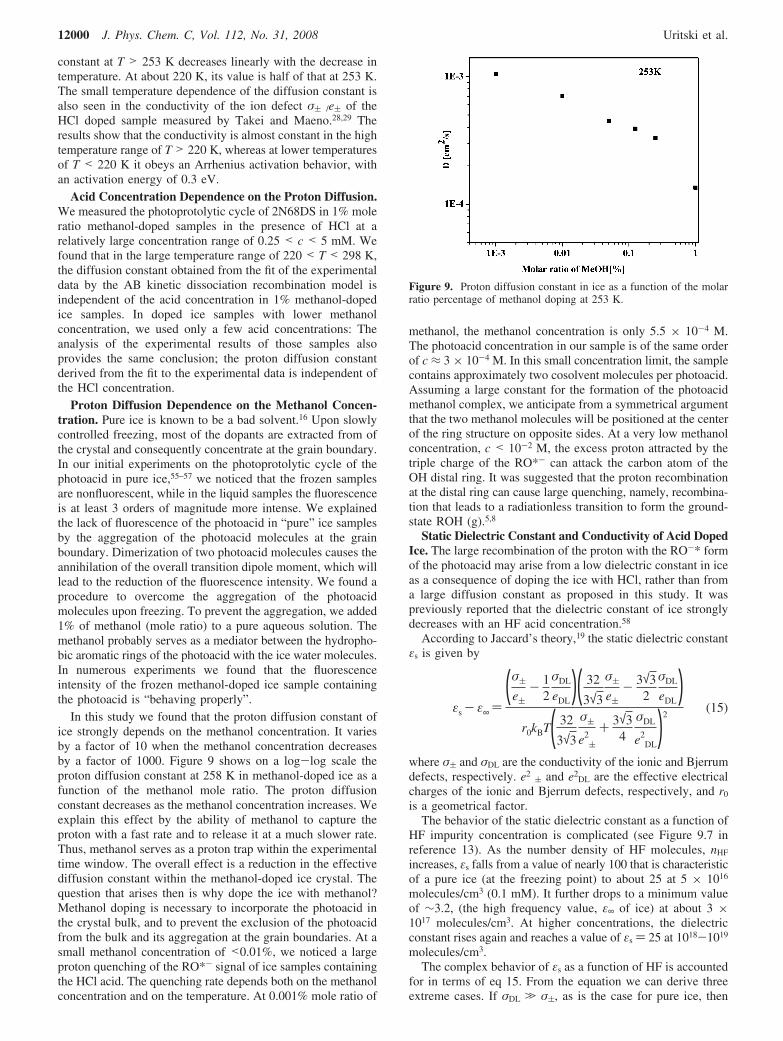
In this study we found that the proton diffusion constant ofice strongly depends on the methanol concentration. It variesby a factor of 10 when the methanol concentration decreasesby a factor of 1000. Figure 9 shows on a log-log scale theproton diffusion constant at 258 K in methanol-doped ice as afunction of the methanol mole ratio. The proton diffusionconstant decreases as the methanol concentration increases. Weexplain this effect by the ability of methanol to capture theproton with a fast rate and to release it at a much slower rate.Thus, methanol serves as a proton trap within the experimentaltime window. The overall effect is a reduction in the effectivediffusion constant within the methanol-doped ice crystal. Thequestion that arises then is why dope the ice with methanol?Methanol doping is necessary to incorporate the photoacid inthe crystal bulk, and to prevent the exclusion of the photoacidfrom the bulk and its aggregation at the grain boundaries. At asmall methanol concentration of <0.01%, we noticed a largeproton quenching of the RO*- signal of ice samples containingthe HCl acid. The quenching rate depends both on the methanolconcentration and on the temperature. At 0.001% mole ratio of
methanol, the methanol concentration is only 5.5 × 10⁻⁴ M.The photoacid concentration in our sample is of the same orderof c ≈ 3 × 10⁻⁴ M. In this small concentration limit, the samplecontains approximately two cosolvent molecules per photoacid.Assuming a large constant for the formation of the photoacidmethanol complex, we anticipate from a symmetrical argumentthat the two methanol molecules will be positioned at the centerof the ring structure on opposite sides. At a very low methanolconcentration, c < 10-2 M, the excess proton attracted by thetriple charge of the RO*- can attack the carbon atom of theOH distal ring. It was suggested that the proton recombinationat the distal ring can cause large quenching, namely, recombina-tion that leads to a radiationless transition to form the ground-state ROH (g).5,8
Static Dielectric Constant and Conductivity of Acid DopedIce. The large recombination of the proton with the RO-* formof the photoacid may arise from a low dielectric constant in iceas a consequence of doping the ice with HCl, rather than froma large diffusion constant as proposed in this study. It waspreviously reported that the dielectric constant of ice stronglydecreases with an HF acid concentration.58
According to Jaccard’s theory,19 the static dielectric constantεs is given by
εs - ε∞ )(σ(
e(- 1
2
σDL
eDL)( 32
3√3
σ(
e(- 3√3
2
σDL
eDL)
r0kBT( 32
3√3
σ(
e2(
+ 3√34
σDL
e2DL
)2(15)
where σ( and σDL are the conductivity of the ionic and Bjerrumdefects, respectively. e2
( and e2DL are the effective electrical
charges of the ionic and Bjerrum defects, respectively, and r0
is a geometrical factor.The behavior of the static dielectric constant as a function of
HF impurity concentration is complicated (see Figure 9.7 inreference 13). As the number density of HF molecules, nHF
increases, εs falls from a value of nearly 100 that is characteristicof a pure ice (at the freezing point) to about 25 at 5 × 10¹⁶
molecules/cm3 (0.1 mM). It further drops to a minimum valueof ∼3.2, (the high frequency value, ε∞ of ice) at about 3 ×10¹⁷ molecules/cm3. At higher concentrations, the dielectricconstant rises again and reaches a value of εs ) 25 at 1018-1019
molecules/cm3.The complex behavior of εs as a function of HF is accounted
for in terms of eq 15. From the equation we can derive threeextreme cases. If σDL . σ(, as is the case for pure ice, then
Figure 9. Proton diffusion constant in ice as a function of the molarratio percentage of methanol doping at 253 K.
12000 J. Phys. Chem. C, Vol. 112, No. 31, 2008 Uritski et al.
εs(DL)= ε∞ +4
3√3
eDL2
kBTr0) 100 (16)
whereas, if σ( . σDL,
εs(()= ε∞ +3√332
e(2
kBTr0) 21 (17)
If σ( = (1/2)σDL, then εs = ε∞.In pure ice, the number of Bjerrum defects is much larger
than the ionic defects, and σDL > σ(. For HF, a weak acid inan aqueous solution (pKa = 3), the H+ concentration in dopedice is small, and nH+ is proportional to (nHF)1/2. In such a case,the value of the dielectric constant oscillates as a function ofan HF concentration. At a very low HF concentration, εs ) 100,whereas at nHF ) 3 × 10¹⁷ molecules,58 σ( ) (1/2)σDL and εs
) ε∞. As the HF concentration continues to increase, so doesεs since σ( . σDL. Unlike the weak acid HF, HCl is a verystrong acid, and therefore we consider that all the HCl moleculesdissociated in the small concentration range we explored (0.25< c e 5 mM), and in such a case σ( . (1/2)σDL. According toJaccard’s theory, εs is expected to be 21 in the HCl doping levelof our experiments.
Takei and Maeno28,29 studied the electrical conductivity andthe dielectric properties of HCl-doped ice single crystals grownfrom HCl liquid solutions of 4 × 10⁻⁶ M to 1 × 10⁻⁴ M HCl.Two out of three samples described in that work30 behavesimilarly to HF. The concentration of HCl incorporated in theice is much less, but not directly measurable. The static dielectricconstant decreases with temperature, and crosses the minimumpoint twice: at -45 °C and at -85 °C. One sample (sample E,grown from a 4 × 10⁻⁶ M solution, (see Figure 4 in reference52) shows a similar temperature dependence of the dielectricconstant of the pure ice sample, namely, the static dielectricconstant increases as the temperature decreases. The staticdielectric constant of the two extreme samples ranges between80 and 100 in the high temperature range of 253 < T < 270 K.The ion conductivity σ( of all samples in Takei and Maeno’sstudy28,29 is almost temperature independent in the range of 220< T < 270 K. At lower temperatures, the σ( conductivitydecreases with a relatively large activation energy of 0.31 eV.Comparing the behavior of our samples with the data of thestudy of Takei and Maeno strengthens our assumption regardingthe dielectric constant and the degree of dissociation of HCl inthe sample. We assumed that the dielectric constant is close to100 and that the degree of acid dissociation is almost 1. Wealso found that the proton diffusion constant is only slightlytemperature dependent (within a factor of 2) in the range of220-270 K. The conductivity of the ion defects is given by
σ() ∑i)1
2ni µi|ei|
where n is the ion defects number density, |ei| is the ion effectivecharge, and µ is the mobility that scales linearly with thediffusion constant by the Stokes-Einstein relation, µ( ) (e/kBT)DH+.
If the dielectric constant decreases with temperature in thepresence of HCl, the diffusion-controlled rate constant isstrongly affected. The Debye radius RD scales inversely withthe dielectric constant RD ) (ze2)/(εkBT). The diffusion-controlled rate constant depends on RD, i.e., kD ) 4πN′DH+RD.The large increase in the amplitude of the fluorescence tail inice arises not only because of a large increase in DH+, but ispartially arises from the large increase of RD.
The study of Steinmann58 shows that the dielectric constantof HF-doped ice strongly depends on the acid concentration.In our experiments, the value of the proton diffusion constantextracted from the fit of the experimental results by using thekinetic model is independent of the proton concentration in therange of 0.25 < c < 5 mM.
This finding suggests that the effective dielectric constant inthe acid-doped ice studied in this work was almost constant atall acid concentrations, whereas some of the measurements ofTakei and Maeno29 show a large reduction in εs. In the extremecase where the dielectric constant decreases to εs ) 21 accordingto equation 16 and kD = 4πN′RDDH+, RD should increase by afactor of about 5, whereas the proton diffusion constant thatwe calculated from the experimental time-resolved emissionresults should, in fact, be reduced by a factor of 5 from thevalue we deduced for εs ) 100. If this was the situation, thenproton diffusion in ice should only be 2.7 times larger than inwater at 295 K or about 9 times larger than in super cooledliquid at ∼265 K.
Proton RO-* Recombination at the Polycrystalline GrainBoundaries. The second possible explanation to the strikinglylarge acid effect on the amplitude of the long-time exponentialfluorescence tail in ice is along the lines of many otherobservations,35,36 suggesting that dopants tend to exclude fromthe ice bulk and to aggregate on grain boundaries. If that is thecase, then the photoacid molecules in our experiments are notincorporated in the bulk of a microcrystal of ice, rather thephotoacid position is at the grain boundaries. The proton reactionwith the RO*- is taking place at the grain boundaries ratherthan in the bulk.
Devlin35,36 studied acid-doped ice samples, where a controlleddeposition of water molecules was achieved through sprayingwater and HCl on cold surfaces. They found that protons stayin the bulk, while the counterion, the chloride in the case ofHCl, tends to move to the surface area. Let us assume that thephotoacids themselves are at the grain boundaries, as are thecounterions (sodium ions from the sulfonates of 2N68DS aswell as the chlorides from the HCl), while the protons stay insidethe bulk of the microcrystals. In that case, the photoacidconcentration is very large at the surface, whereas the excessproton concentration is small. The photoprotolytic cycle takesplace at the surface of the polycrystalline ice. The experimentalresults then are still indicative of a very large proton diffusionconstant in the bulk ice, and it is much larger than in liquidwater. The proton transport toward the surface is by diffusionin the bulk. The proton recombination occurs at the grainboundaries where the photoacid molecules tend to situate. Theoverall process can be described by a one-dimensional diffusioncontrolled reaction rate constant.
In a recent paper59 we characterized the position of thephotoacid in methanol doped ice samples by employing theForster electronic energy transfer (EET) process between twochromophores. We used the EET process to estimate the averagedistance between two large aromatic compounds in polycrys-talline samples. For a 10 µm cubic crystal with a bulkconcentration of 1 mM, the average distance between adjacentphotoacid molecules at the grain boundaries of a microcrystalwith a size of 10 µM should be equivalent to about 5 Å. Weused 2N68DS in its deprotonated form, RO*- as the EET donor,and fluorescien disodium salt as the acceptor. We comparedexperimental results of the time-resolved emission EET ofsamples in aqueous liquid state with the results in ice. The EETprocess at a concentration of 0.2 < c < 1 mM for the acceptorshowed a small and similar energy transfer rate for both liquid
Very Large Proton Diffusion In Ice Ih J. Phys. Chem. C, Vol. 112, No. 31, 2008 12001
and ice samples (the critical radius being R0 ) 56 Å). Weconcluded that both the donor (the photoacid) and the acceptorat these low concentrations are situated in the bulk of the icemicrocrystal rather than at the grain boundaries of the micro-crystal, where the distances between donor and acceptor aresuppose to be much shorter than R0, and hence the EET processwill be very efficient. Forster’s EET experiment indicates that,in methanol-doped ice, the photoacid molecules tend to stay inthe bulk of the microcrystal rather than aggregate at the grainboundaries upon freezing of the sample.
Summary
We studied the photoprotolytic cycle of the photoacid2-naphthol-6,8-disulfonate (2N68DS) in liquid water and in icein the presence of small concentrations of a strong mineral acidHCl. We used a time-resolved emission technique as well as asteady-state emission to monitor the excess proton effect onthe photoprotolytic cycle. In the presence of an excess of protonsin both liquid water and ice, we found an increase of the long-time fluorescence tail of the protonated form RO*H. The long-time fluorescence tail decays nearly exponentially with thelifetime of the deprotonated form of the RO*-. We used asimple kinetic model to analyze the experimental time-resolveddata. In ice in the presence of HCl, we found that the exponentialfluorescence long-time tail had surprisingly large amplitude,even in an excess proton concentration as low as a fraction of1 mM. We deduced the proton diffusion constant in ice fromthe experimental data fit by using a simple kinetic model. Wefound that the proton diffusion in ice Ih at 250-260 K is about10 times larger than in liquid water at 295 K. This large protondiffusion is in accord with the findings of Eigen and deMaeyerfrom about 50 years ago, but contradicts conductivity measure-ments of ice from 1968 to this day. We explained thediscrepancy between the results of this study and the conductiv-ity measurements by the length scale of the two types ofmeasurements. In our measurement, we monitored a smallsphere of about 50 nm around a photoacid, whereas in theconductance measurements, the distances between electrodeswere in the range of 1 mm.
Acknowledgment. This work was supported by a grant fromthe James-Franck German-Israel Program in Laser-MatterInteraction.
References and Notes
(1) Bell, R. P. The Proton in Chemistry, 2nd ed; Chapman and Hall:London, 1973.
(2) Proton Transfer Reaction Caldin, E.F., Gold, V., Eds.; Chapmanand Hall: London, 1975.
(3) (a) Weller, A. Prog. React. Kinet. 1961, 1, 189. (b) Weller, A. Z.Phys. Chem. N. F. 1958, 17, 224.
(4) (a) Eigen, M. Proton transfer. Angew. Chem., 1964, 3, 1. (b) Eigen,M.; Kruse, W.; Maass, G.; De Maeyer, L. Prog. React. Kinet. 1964, 2,285.
(5) Ireland, J. E.; Wyatt, P. A. AdV. Phys. Org. Chem. 1976, 12, 131.(6) (a) Gutman, M.; Nachliel, E. Biochem. Biophys. Acta 1990, 391,
1015. (b) Pines, E.; Huppert, D. J. Phys. Chem. 1983, 87, 4471.(7) Kosower, E. M.; Huppert, D. Annu. ReV. Phys. Chem. 1986, 37,
127.(8) Tolbert, L. M.; Solntsev, K. M. Acc. Chem. Res. 2002, 35, 19.(9) (a) Rini, M.; Magnes, B. Z.; Pines, E.; Nibbering, E.T. J. Science
2003, 301, 349. (b) Mohammed, O. F.; Pines, D.; Dreyer, J.; Pines, E.;Nibbering, E. T. J. Science 2005, 310, 5745.
(10) Prayer, C.; Gustavsson, T.; Tarn-Thi, T. H. Fast ElementaryProcesses in Chemical and Biological Systems; 54th International Meetingof Physical Chemistry; AIP: New York, 1996; p 333.
(11) Tran-Thi, T. H.; Gustavsson, T.; Prayer, C.; Pommeret, S.; Hynes,J. T. Chem. Phys. Lett. 2000, 329–421.
(12) Agmon, N. J. Phys. Chem. A 2005, 109, 13.(13) Fletcher, N. H. The Chemical Physics of Ice, Cambridge University
Press: London, 1970; Chapter 9.(14) Hobbs. P. V. Ice Physics; Clarendon Press; Oxford, U.K., 1974;
Chapter 2.(15) Von Hippel, A.; Runck, A. H.; Westphal, W. B. Physics and
Chemistry of Ice; Walley, E., Jones, S. J., Gold, L. W., Eds.; Royal Societyof Canada: Ottawa, 1973; p 236.
(16) Petrenko, V. F.; Whitworth, R. W. The Physics of Ice; OxfordUniversity Press: Oxford, U.K., 1999.
(17) Kelly, I. J.; Salomon, R. R. J. Phys. Chem. 1969, 50, 75.(18) Kunst, M.; Warman, J. M. J. Phys. Chem. 1983, 87, 4093.(19) Jaccard, C. Ann. N. Y. Acad. Sci. 1965, 125, 390–400.(20) Bjerrum, N. Science 1952, 115, 385.(21) Kobayashi, C.; Saito, S.; Ohmine, I. J. Chem. Phys. 2001, 115–
4742.(22) Kobayashi, C.; Saito, S.; Ohmine, I. J. Chem. Phys. 2000, 113–
9090.(23) Podeszwa, R.; Buch, V. Phys. ReV. Lett. 1999, 83, 4570.(24) Granicher, H. Phys. Kondens. Mater. 1963, 1, 1.(25) Camplin, G.; Glen, J. W.; Paren, J. Glaciology 1978, 21, 123.(26) Eigen, M.; deMaeyer, L.; Spatz, H. Ber. Bunsen-Ges. Phys. Chem.
1964, 68, 19.(27) Kunst, M.; Warman, J. Nature (London) 1980, 288, 465.(28) Takei, I.; Maeno, N. J. Phys. Chem. 1984, 81, 6186.(29) Takei, I.; Maeno, N. J. Phys. (Paris) 1987, 48, 121, Colloque C1.(30) Smith, K. K.; Huppert, D.; Gutman, M.; Kaufmann, K. J. Chem.
Phys. Lett. 1979, 64, 522.(31) Clark, J. H.; Shapiro, S. L.; Campillo, A. J.; Winn, K. J. J. Am.
Chem. Soc. 1979, 101, 746.(32) Pines, E.; Huppert, D. J. Chem. Phys. 1986, 84, 3576.(33) Pines, E.; Huppert, D.; Agmon, N. J. Chem. Phys. 1988, 88, 5620.(34) Uras-Aytemiz, N.; Joyce, C.; Devlin, J. P. J. Phys. Chem. A 2001,
105, 10497.(35) Devlin, J. P.; Gulluru, D. B.; Buch, V. J. Phys. Chem. B 2005,
109, 3392.(36) Devlin, J. P.; Uras, N.; Sadlej, J.; Buch, V. Nature 2002, 417, 269.(37) Goldberg, S. Y.; Pines, E.; Huppert, D. Chem. Phys. Lett. 1992,
192, 77.(38) Pines, E.; Huppert, D.; Agmon, N. J. Phys. Chem. 1991, 95, 666.(39) Agmon, N.; Goldberg, S. Y.; Huppert, D. J. Mol. Liq. 1995, 64,
161.(40) Eigen, M.; deMaeyer, L. Proc. R. Soc. London 1958, 247, 505.(41) Agmon, N.; Pines, E.; Huppert, D. J. Chem. Phys. 1988, 88, 5631.(42) Laidler, K. J. Chemical Kinetics, 3rd ed.; Harper and Row: New
York, 1987.(43) Solntsev, K.; Huppert D.; Agmon, N. J. Phys. Chem. A 2001, 105,
5868–5876.(44) Naumann, W.; Shokhirev, N. V.; Szabo, A. Phys. ReV. Lett. 1997,
79, 3074–3077.(45) Sung, J.; Shin, K. J.; Lee, S. J. Chem. Phys. 1997, 107, 9418–
9436.(46) Sung, J.; Lee, S. J. Chem. Phys. 1999, 111, 10159–10170.(47) Gopich, I. V.; Agmon, N. Phys. ReV. Lett. 2000, 84, 2730–2733.(48) Cohen, B.; Huppert, D.; Agmon, N. J. Phys. Chem. A 2001, 105,
7165.(49) Von Smoluchowski, M. Z. Phys. Chem. 1917, 92, 129.(50) Tachiya, M. Radiat. Phys. Chem. 1983, 21, 167.(51) Szabo, A. J. Phys. Chem. 1989, 93, 6929.(52) Agmon, N.; Szabo, A. J. Chem. Phys. 1990, 92, 5270–5284.(53) Nagle, J. F. J. Phys. Chem. 1983, 87, 4086.(54) Devlin, J. P. J. Chem. Phys. 1988, 89, 5967.(55) Leiderman, P.; Gepshtein, R.; Uritski, A.; Genosar, L.; Huppert,
D. J. Phys.Chem. A 2006, 110, 9039.(56) Leiderman, P.; Gepshtein, R.; Uritski, A.; Genosar, L.; Huppert,
D. J. Phys.Chem. A 2006, 110, 5573.(57) Uritski, A.; Leiderman, P.; Huppert D, J. Phys. Chem A 2006, 110,
13686.(58) Steinemann, S. HelV. Phys. Acta 1957, 30, 581.(59) Uritski, A., Huppert, D. J. Phys. Chem. A, 2008, 112, 4415.
JP801664D
12002 J. Phys. Chem. C, Vol. 112, No. 31, 2008 Uritski et al.