india daily, july 28, 2010
TRANSCRIPT
For Private Circulation Only. FOR IMPORTANT INFORMATION ABOUT KOTAK SECURITIES’ RATING SYSTEM AND OTHER DISCLOSURES. REFER TO THE END OF THIS MATERIAL.
INDIA DAILYJuly 28, 2010 India 27-Jul 1-day1-mo 3-mo
Sensex 18,078 0.3 1.7 4.0
Nifty 5,431 0.2 1.8 4.1
Global/Regional indices
Dow Jones 10,538 0.1 3.9 (4.6)
Nasdaq Composite 2,288 (0.4) 3.0 (7.4)
FTSE 5,366 0.3 5.8 (4.0)
Nikkie 9,680 1.9 (0.1) (11.4)
Hang Seng 20,962 (0.1) 1.1 0.1
KOSPI 1,766 (0.1) 1.9 1.8
Value traded – India
Cash (NSE+BSE) 170 162 168
Derivatives (NSE) 1,149 774 915
Deri. open interest 1,709 1,053 1,387
Forex/money market
Change, basis points
27-Jul 1-day 1-mo 3-mo
Rs/US$ 46.7 (18) 54 230
10yr govt bond, % 7.7 4 6 (40)
Net investment (US$mn)
26-Jul MTD CYTD
FIIs 101 2,343 9,043
MFs (95) (520) (282)
Top movers -3mo basis
Change, %
Best performers 27-Jul 1-day 1-mo 3-mo
HPCL IN Equity 433.2 0.5 0.0 43.4
BJFIN IN Equity 430.0 1.8 1.0 31.5
IOCL IN Equity 363.4 (0.4) (8.6) 29.9
AL IN Equity 71.9 0.2 12.3 28.8
BJAUT IN Equity 2654.2 5.0 8.0 28.5
Worst performers
RNR IN Equity 43.3 (0.6) (35.2) (34.6)
ABAN IN Equity 825.2 (0.8) 4.4 (29.6)
PUNJ IN Equity 130.3 (1.5) (3.2) (20.1)
ICEM IN Equity 104.5 (0.3) (3.7) (19.8)
JPA IN Equity 120.6 (0.5) (8.4) (17.3)
Contents
Results Reliance Industries: In-line results; nothing new
Larsen & Toubro: Downgrade on recent outperformance, large risky projects and execution issues
Cairn India: Too hot to handle
Hindustan Unilever: The gross margin puzzle
Oil India: Everything seems in order
Asian Paints: Another positive surprise; another upgrade to our highest-on-Street estimates
JSW Steel: Balance sheet de-leveraged after JFE deal
Titan Industries: Keeps shining
Ashok Leyland: Costs rising with capacity
HT Media: Investment cycle resumes, a tad earlier than expected
Update Economy: RBI signals tighter monetary policy ahead
News Round-up
The RBI raise the reverse repurchase rate at which it drains resources from banks to 4.5% from 4% & the repurchase rate at which it lends to banks to 5.75% from 5.5%. Economic growth & inflation forecasts were also increased due to surging demand. Home loan rates may rise, deposits to fetch more. (ECNT)
Century Textiles (CENT IN) will re-enter the shipping business five years after it exit. It will foray into the business by acquiring oil tankers & carriers. (ECNT)
The govt. has forfeited a service tax claim of over USD 468.09 mn on PowerGrid Corp (PWGR IN), a move that could facilitate smooth sailing for the proposed stake sale in the country's largest transmission utility. (ECNT)
DB Realty Ltd (DBRL IN) has received a Letter of Intent (LoI) from the government of Maharashtra to develop Sector J of the government colony at Bandra (East) in Mumbai which measures approximately 57 acres. The company will be developing approximately 8 mn sqft over the next five years. (FNLE)
JSW Steel (JSTL IN) will sell 14.99% stake to Japan's steel maker, JFE Holdings, for USD 1.21 bn. (BSTD)
The government will consider a decision on disinvestment in ONGC (ONGC IN) and IOC (IOCL IN) in the current financial year. (BSTD)
Opto Circuits (OPTC IN) has acquired US-based Unetixs Vascular Inc for a cash consideration of around USD 9.7 mn. (BSTD)
SpiceJet (SJET IN) said it will order 30 Boeing aircraft for USD 2.7 bn.
The planes will be delivered between 2014 and 2018. (BSTD)
'RBI raises GDP growth forecast to 8.5%. Adds reason to IMF's projections. (BSTD)
Source: ECNT= Economic Times, BSTD = Business Standard, FNLE = Financial Express, THBL = Business Line.
For private Circulation Only. FOR IMPORTANT INFORMATION ABOUT KOTAK SECURITIES’ RATING SYSTEM AND OTHER DISCLOSURES, REFER TO THE END OF THIS MATERIAL.
Strong growth in EBITDA yoy but up modest 2.3% qoq and 2.1% below our expectation
RIL’s 1QFY11 EBITDA increased 46% yoy and 2.3% qoq to `93.4 bn but was marginally below our `95.4 bn estimate. Higher refining and E&P volumes and higher refining margins drove yoy and qoq performance. 1QFY11 refining margin was US$7.3/bbl (+US$0.5/bbl yoy and -US$0.2/bbl qoq), chemical segment performed strongly but KG D-6 gas volumes stagnated at 60 mcm/d.
DD&A increased sharply yoy but grew modestly qoq
DD&A jumped 86% yoy to `34.9 bn reflecting full commissioning of new SEZ refinery and higher KG D-6 production volumes. However, flat volumes in KG D-6 gas production and moderate growth in oil volumes resulted in a more modest growth on a qoq basis (+2.7% qoq). Interest expense climbed 18% yoy to `5.4 bn reflecting lower interest capitalized (`1 bn versus `4.4 bn in 1QFY10). RIL’s effective tax rate increased to 19.7% against 19.3% in 4QFY10.
Cut EPS estimates for FY2011E and FY2012E
We have cut FY2011E and FY2012E EPS to `59 and `74 from `63 and `80 previously. The changes reflect (1) lower gas production at RIL’s KG D-6 gas production, (2) lower chemical and refining margins, (3) weaker Indian Rupee-US Dollar assumptions and (4) minor other changes. We see downside risks to earnings from (1) higher-than-expected taxation, (2) lower-than-expected gas production and (3) weaker-than-expected chemical and refining margins; both continue to be very weak.
SOTP-based valuation of `1,060 on FY2012E basis; retain SELL
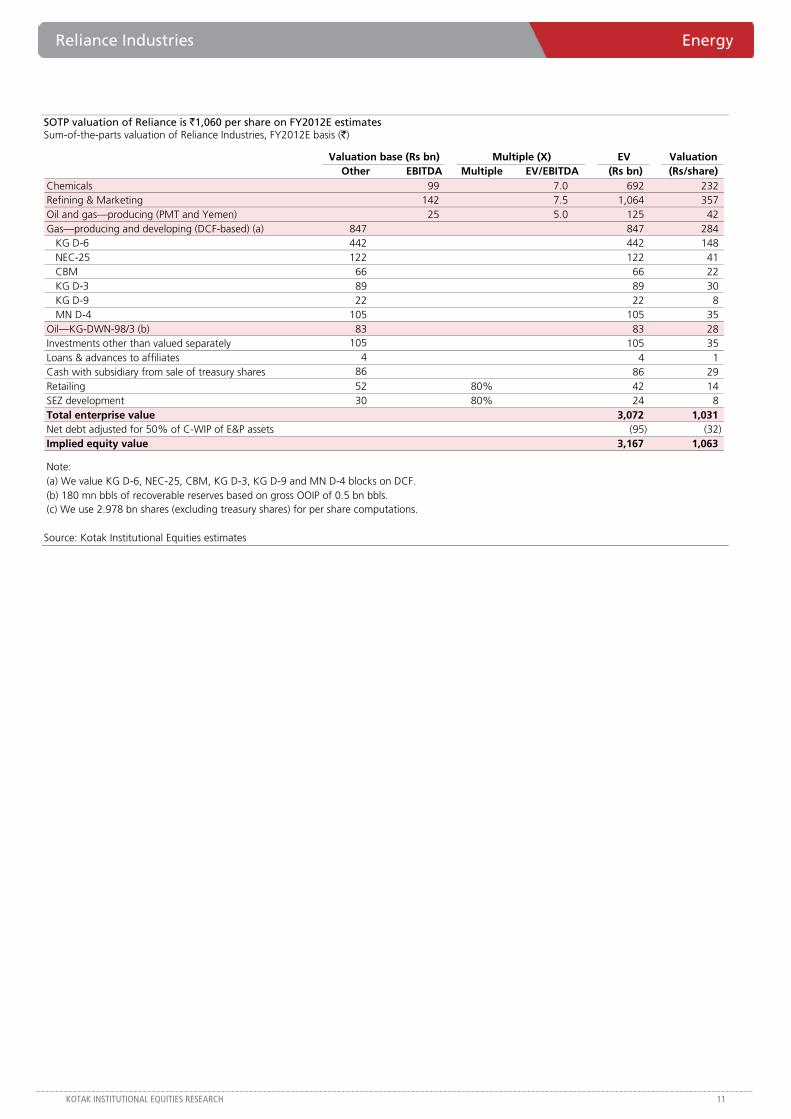
Our revised SOTP-based 12-month fair valuation for RIL stock is `1,060 based on FY2012E estimates versus `985 previously based on average of FY2011E and FY2012E estimates. We use 7X and 7.5X EBITDA multiple to value the chemicals and refining businesses and factor in `73 of fair valuation of potential upside from gas discoveries in KG D-3, KG D-9 and MN D-4 blocks.
.dot
Reliance Industries (RIL)
Energy
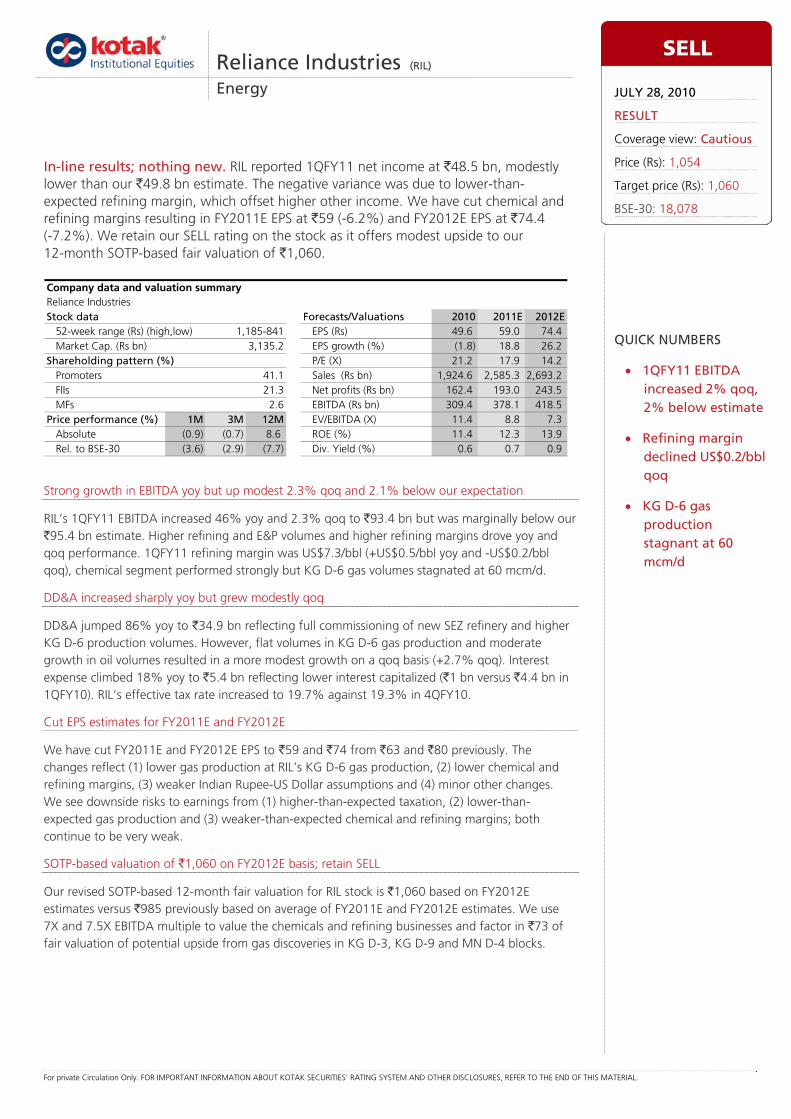
In-line results; nothing new. RIL reported 1QFY11 net income at `48.5 bn, modestly lower than our `49.8 bn estimate. The negative variance was due to lower-than-expected refining margin, which offset higher other income. We have cut chemical and refining margins resulting in FY2011E EPS at `59 (-6.2%) and FY2012E EPS at `74.4 (-7.2%). We retain our SELL rating on the stock as it offers modest upside to our 12-month SOTP-based fair valuation of `1,060.
Reliance IndustriesStock data Forecasts/Valuations 2010 2011E 2012E
52-week range (Rs) (high,low) EPS (Rs) 49.6 59.0 74.4Market Cap. (Rs bn) 3,135.2 EPS growth (%) (1.8) 18.8 26.2
Shareholding pattern (%) P/E (X) 21.2 17.9 14.2Promoters 41.1 Sales (Rs bn) 1,924.6 2,585.3 2,693.2FIIs 21.3 Net profits (Rs bn) 162.4 193.0 243.5MFs 2.6 EBITDA (Rs bn) 309.4 378.1 418.5
Price performance (%) 1M 3M 12M EV/EBITDA (X) 11.4 8.8 7.3Absolute (0.9) (0.7) 8.6 ROE (%) 11.4 12.3 13.9Rel. to BSE-30 (3.6) (2.9) (7.7) Div. Yield (%) 0.6 0.7 0.9
Company data and valuation summary
1,185-841
SELL
JULY 28, 2010
RESULT
Coverage view: Cautious
Price (Rs): 1,054
Target price (Rs): 1,060
BSE-30: 18,078
QUICK NUMBERS
• 1QFY11 EBITDA increased 2% qoq, 2% below estimate
• Refining margin declined US$0.2/bbl qoq
• KG D-6 gas production stagnant at 60 mcm/d
Reliance Industries Energy
KOTAK INSTITUTIONAL EQUITIES RESEARCH 3
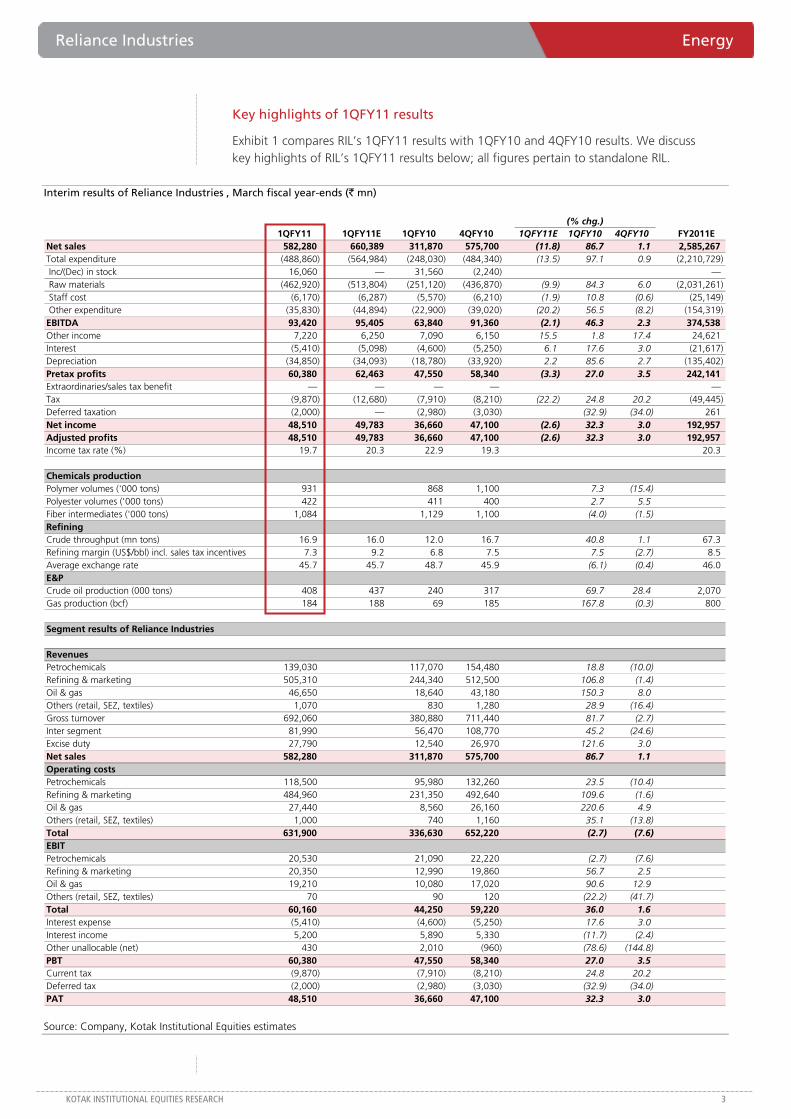
Key highlights of 1QFY11 results
Exhibit 1 compares RIL’s 1QFY11 results with 1QFY10 and 4QFY10 results. We discuss key highlights of RIL’s 1QFY11 results below; all figures pertain to standalone RIL.
Interim results of Reliance Industries , March fiscal year-ends (` mn)
(% chg.)1QFY11 1QFY11E 1QFY10 4QFY10 1QFY11E 1QFY10 4QFY10 FY2011E
Net sales 582,280 660,389 311,870 575,700 (11.8) 86.7 1.1 2,585,267 Total expenditure (488,860) (564,984) (248,030) (484,340) (13.5) 97.1 0.9 (2,210,729) Inc/(Dec) in stock 16,060 — 31,560 (2,240) — Raw materials (462,920) (513,804) (251,120) (436,870) (9.9) 84.3 6.0 (2,031,261) Staff cost (6,170) (6,287) (5,570) (6,210) (1.9) 10.8 (0.6) (25,149) Other expenditure (35,830) (44,894) (22,900) (39,020) (20.2) 56.5 (8.2) (154,319) EBITDA 93,420 95,405 63,840 91,360 (2.1) 46.3 2.3 374,538 Other income 7,220 6,250 7,090 6,150 15.5 1.8 17.4 24,621 Interest (5,410) (5,098) (4,600) (5,250) 6.1 17.6 3.0 (21,617) Depreciation (34,850) (34,093) (18,780) (33,920) 2.2 85.6 2.7 (135,402) Pretax profits 60,380 62,463 47,550 58,340 (3.3) 27.0 3.5 242,141 Extraordinaries/sales tax benefit — — — — —Tax (9,870) (12,680) (7,910) (8,210) (22.2) 24.8 20.2 (49,445) Deferred taxation (2,000) — (2,980) (3,030) (32.9) (34.0) 261 Net income 48,510 49,783 36,660 47,100 (2.6) 32.3 3.0 192,957 Adjusted profits 48,510 49,783 36,660 47,100 (2.6) 32.3 3.0 192,957 Income tax rate (%) 19.7 20.3 22.9 19.3 20.3
Chemicals productionPolymer volumes ('000 tons) 931 868 1,100 7.3 (15.4) Polyester volumes ('000 tons) 422 411 400 2.7 5.5 Fiber intermediates ('000 tons) 1,084 1,129 1,100 (4.0) (1.5) RefiningCrude throughput (mn tons) 16.9 16.0 12.0 16.7 40.8 1.1 67.3 Refining margin (US$/bbl) incl. sales tax incentives 7.3 9.2 6.8 7.5 7.5 (2.7) 8.5 Average exchange rate 45.7 45.7 48.7 45.9 (6.1) (0.4) 46.0 E&PCrude oil production (000 tons) 408 437 240 317 69.7 28.4 2,070 Gas production (bcf) 184 188 69 185 167.8 (0.3) 800
Segment results of Reliance Industries
RevenuesPetrochemicals 139,030 117,070 154,480 18.8 (10.0) Refining & marketing 505,310 244,340 512,500 106.8 (1.4) Oil & gas 46,650 18,640 43,180 150.3 8.0 Others (retail, SEZ, textiles) 1,070 830 1,280 28.9 (16.4) Gross turnover 692,060 380,880 711,440 81.7 (2.7) Inter segment 81,990 56,470 108,770 45.2 (24.6) Excise duty 27,790 12,540 26,970 121.6 3.0 Net sales 582,280 311,870 575,700 86.7 1.1 Operating costsPetrochemicals 118,500 95,980 132,260 23.5 (10.4) Refining & marketing 484,960 231,350 492,640 109.6 (1.6) Oil & gas 27,440 8,560 26,160 220.6 4.9 Others (retail, SEZ, textiles) 1,000 740 1,160 35.1 (13.8) Total 631,900 336,630 652,220 (2.7) (7.6) EBITPetrochemicals 20,530 21,090 22,220 (2.7) (7.6) Refining & marketing 20,350 12,990 19,860 56.7 2.5 Oil & gas 19,210 10,080 17,020 90.6 12.9 Others (retail, SEZ, textiles) 70 90 120 (22.2) (41.7) Total 60,160 44,250 59,220 36.0 1.6 Interest expense (5,410) (4,600) (5,250) 17.6 3.0 Interest income 5,200 5,890 5,330 (11.7) (2.4) Other unallocable (net) 430 2,010 (960) (78.6) (144.8) PBT 60,380 47,550 58,340 27.0 3.5 Current tax (9,870) (7,910) (8,210) 24.8 20.2 Deferred tax (2,000) (2,980) (3,030) (32.9) (34.0) PAT 48,510 36,660 47,100 32.3 3.0
Source: Company, Kotak Institutional Equities estimates
Energy Reliance Industries
4 KOTAK INSTITUTIONAL EQUITIES RESEARCH
Financial highlights—modest growth in profits qoq. RIL’s 1QFY11 EBITDA increased 2.3% qoq and 46% yoy to `93.4 bn. 1QFY11 net income increased 3% qoq and 32% yoy to `48.5 bn.
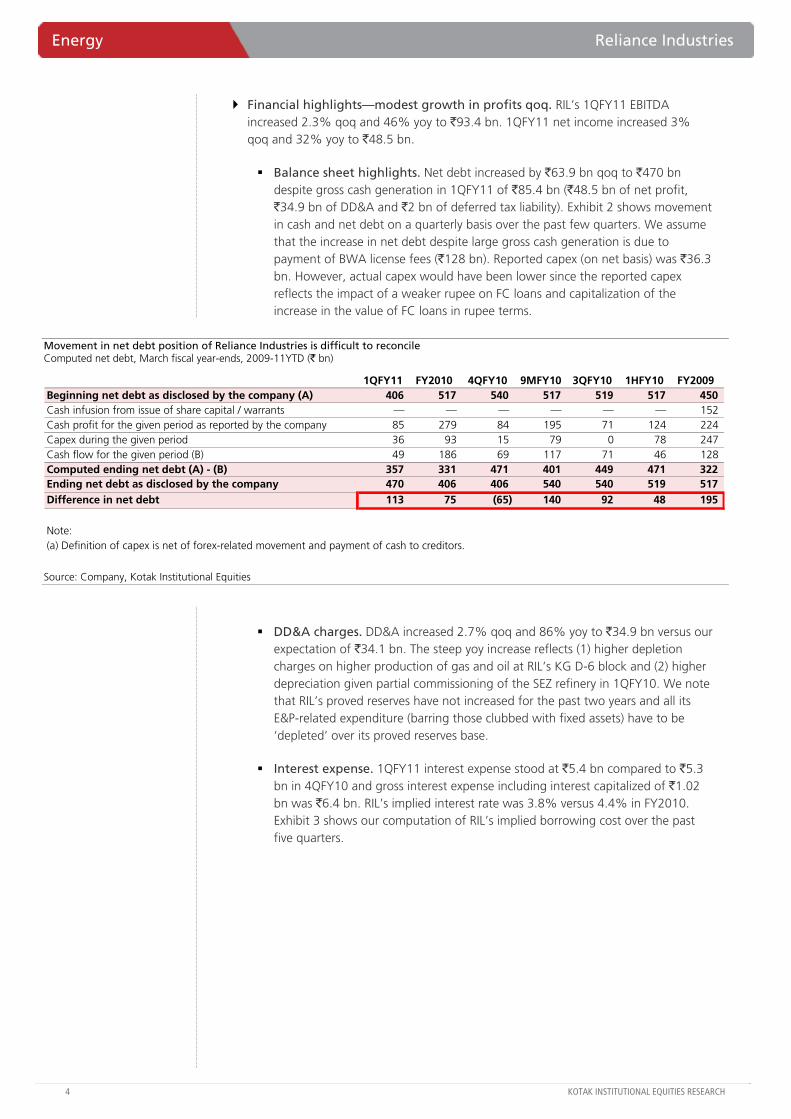
Balance sheet highlights. Net debt increased by `63.9 bn qoq to `470 bn despite gross cash generation in 1QFY11 of `85.4 bn (`48.5 bn of net profit, `34.9 bn of DD&A and `2 bn of deferred tax liability). Exhibit 2 shows movement in cash and net debt on a quarterly basis over the past few quarters. We assume that the increase in net debt despite large gross cash generation is due to payment of BWA license fees (`128 bn). Reported capex (on net basis) was `36.3 bn. However, actual capex would have been lower since the reported capex reflects the impact of a weaker rupee on FC loans and capitalization of the increase in the value of FC loans in rupee terms.
Movement in net debt position of Reliance Industries is difficult to reconcile Computed net debt, March fiscal year-ends, 2009-11YTD (` bn)
1QFY11 FY2010 4QFY10 9MFY10 3QFY10 1HFY10 FY2009Beginning net debt as disclosed by the company (A) 406 517 540 517 519 517 450 Cash infusion from issue of share capital / warrants — — — — — — 152 Cash profit for the given period as reported by the company 85 279 84 195 71 124 224 Capex during the given period 36 93 15 79 0 78 247 Cash flow for the given period (B) 49 186 69 117 71 46 128 Computed ending net debt (A) - (B) 357 331 471 401 449 471 322 Ending net debt as disclosed by the company 470 406 406 540 540 519 517 Difference in net debt 113 75 (65) 140 92 48 195
Note:(a) Definition of capex is net of forex-related movement and payment of cash to creditors.
Source: Company, Kotak Institutional Equities
DD&A charges. DD&A increased 2.7% qoq and 86% yoy to `34.9 bn versus our expectation of `34.1 bn. The steep yoy increase reflects (1) higher depletion charges on higher production of gas and oil at RIL’s KG D-6 block and (2) higher depreciation given partial commissioning of the SEZ refinery in 1QFY10. We note that RIL’s proved reserves have not increased for the past two years and all its E&P-related expenditure (barring those clubbed with fixed assets) have to be ‘depleted’ over its proved reserves base.
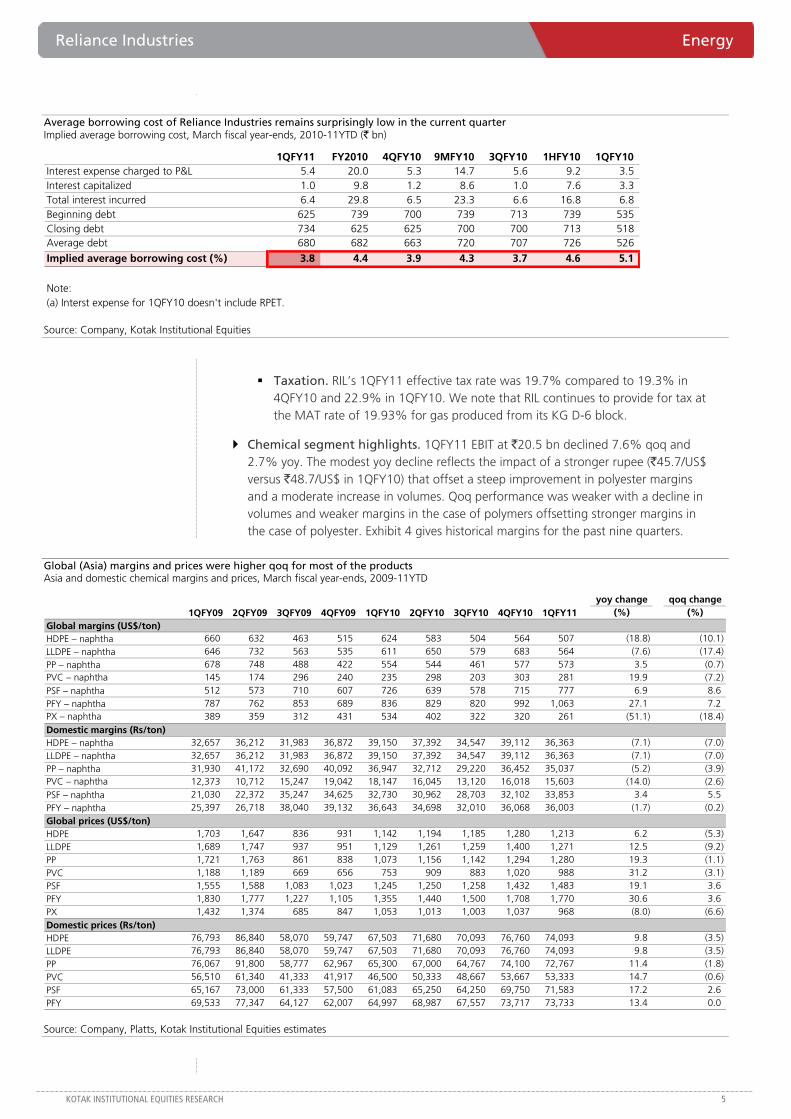
Interest expense. 1QFY11 interest expense stood at `5.4 bn compared to `5.3 bn in 4QFY10 and gross interest expense including interest capitalized of `1.02 bn was `6.4 bn. RIL’s implied interest rate was 3.8% versus 4.4% in FY2010. Exhibit 3 shows our computation of RIL’s implied borrowing cost over the past five quarters.
Reliance Industries Energy
KOTAK INSTITUTIONAL EQUITIES RESEARCH 5
Average borrowing cost of Reliance Industries remains surprisingly low in the current quarter Implied average borrowing cost, March fiscal year-ends, 2010-11YTD (` bn)
1QFY11 FY2010 4QFY10 9MFY10 3QFY10 1HFY10 1QFY10Interest expense charged to P&L 5.4 20.0 5.3 14.7 5.6 9.2 3.5 Interest capitalized 1.0 9.8 1.2 8.6 1.0 7.6 3.3 Total interest incurred 6.4 29.8 6.5 23.3 6.6 16.8 6.8 Beginning debt 625 739 700 739 713 739 535 Closing debt 734 625 625 700 700 713 518 Average debt 680 682 663 720 707 726 526
Implied average borrowing cost (%) 3.8 4.4 3.9 4.3 3.7 4.6 5.1
Note:(a) Interst expense for 1QFY10 doesn't include RPET.
Source: Company, Kotak Institutional Equities
Taxation. RIL’s 1QFY11 effective tax rate was 19.7% compared to 19.3% in 4QFY10 and 22.9% in 1QFY10. We note that RIL continues to provide for tax at the MAT rate of 19.93% for gas produced from its KG D-6 block.
Chemical segment highlights. 1QFY11 EBIT at `20.5 bn declined 7.6% qoq and 2.7% yoy. The modest yoy decline reflects the impact of a stronger rupee (`45.7/US$ versus `48.7/US$ in 1QFY10) that offset a steep improvement in polyester margins and a moderate increase in volumes. Qoq performance was weaker with a decline in volumes and weaker margins in the case of polymers offsetting stronger margins in the case of polyester. Exhibit 4 gives historical margins for the past nine quarters.
Global (Asia) margins and prices were higher qoq for most of the products Asia and domestic chemical margins and prices, March fiscal year-ends, 2009-11YTD
yoy change qoq change1QFY09 2QFY09 3QFY09 4QFY09 1QFY10 2QFY10 3QFY10 4QFY10 1QFY11 (%) (%)
Global margins (US$/ton)HDPE – naphtha 660 632 463 515 624 583 504 564 507 (18.8) (10.1) LLDPE – naphtha 646 732 563 535 611 650 579 683 564 (7.6) (17.4) PP – naphtha 678 748 488 422 554 544 461 577 573 3.5 (0.7) PVC – naphtha 145 174 296 240 235 298 203 303 281 19.9 (7.2) PSF – naphtha 512 573 710 607 726 639 578 715 777 6.9 8.6 PFY – naphtha 787 762 853 689 836 829 820 992 1,063 27.1 7.2 PX – naphtha 389 359 312 431 534 402 322 320 261 (51.1) (18.4) Domestic margins (Rs/ton)HDPE – naphtha 32,657 36,212 31,983 36,872 39,150 37,392 34,547 39,112 36,363 (7.1) (7.0) LLDPE – naphtha 32,657 36,212 31,983 36,872 39,150 37,392 34,547 39,112 36,363 (7.1) (7.0) PP – naphtha 31,930 41,172 32,690 40,092 36,947 32,712 29,220 36,452 35,037 (5.2) (3.9) PVC – naphtha 12,373 10,712 15,247 19,042 18,147 16,045 13,120 16,018 15,603 (14.0) (2.6) PSF – naphtha 21,030 22,372 35,247 34,625 32,730 30,962 28,703 32,102 33,853 3.4 5.5 PFY – naphtha 25,397 26,718 38,040 39,132 36,643 34,698 32,010 36,068 36,003 (1.7) (0.2) Global prices (US$/ton)HDPE 1,703 1,647 836 931 1,142 1,194 1,185 1,280 1,213 6.2 (5.3) LLDPE 1,689 1,747 937 951 1,129 1,261 1,259 1,400 1,271 12.5 (9.2) PP 1,721 1,763 861 838 1,073 1,156 1,142 1,294 1,280 19.3 (1.1) PVC 1,188 1,189 669 656 753 909 883 1,020 988 31.2 (3.1) PSF 1,555 1,588 1,083 1,023 1,245 1,250 1,258 1,432 1,483 19.1 3.6 PFY 1,830 1,777 1,227 1,105 1,355 1,440 1,500 1,708 1,770 30.6 3.6 PX 1,432 1,374 685 847 1,053 1,013 1,003 1,037 968 (8.0) (6.6) Domestic prices (Rs/ton)HDPE 76,793 86,840 58,070 59,747 67,503 71,680 70,093 76,760 74,093 9.8 (3.5) LLDPE 76,793 86,840 58,070 59,747 67,503 71,680 70,093 76,760 74,093 9.8 (3.5) PP 76,067 91,800 58,777 62,967 65,300 67,000 64,767 74,100 72,767 11.4 (1.8) PVC 56,510 61,340 41,333 41,917 46,500 50,333 48,667 53,667 53,333 14.7 (0.6) PSF 65,167 73,000 61,333 57,500 61,083 65,250 64,250 69,750 71,583 17.2 2.6 PFY 69,533 77,347 64,127 62,007 64,997 68,987 67,557 73,717 73,733 13.4 0.0
Source: Company, Platts, Kotak Institutional Equities estimates
Energy Reliance Industries
6 KOTAK INSTITUTIONAL EQUITIES RESEARCH
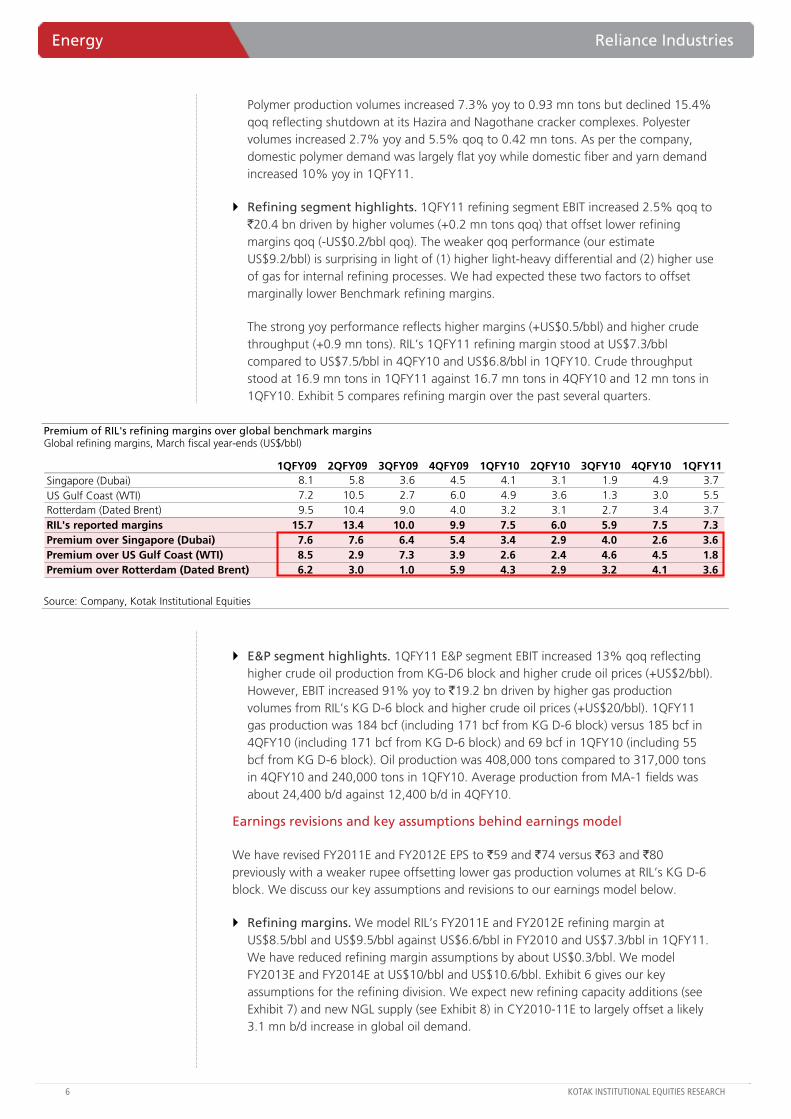
Polymer production volumes increased 7.3% yoy to 0.93 mn tons but declined 15.4% qoq reflecting shutdown at its Hazira and Nagothane cracker complexes. Polyester volumes increased 2.7% yoy and 5.5% qoq to 0.42 mn tons. As per the company, domestic polymer demand was largely flat yoy while domestic fiber and yarn demand increased 10% yoy in 1QFY11.
Refining segment highlights. 1QFY11 refining segment EBIT increased 2.5% qoq to `20.4 bn driven by higher volumes (+0.2 mn tons qoq) that offset lower refining margins qoq (-US$0.2/bbl qoq). The weaker qoq performance (our estimate US$9.2/bbl) is surprising in light of (1) higher light-heavy differential and (2) higher use of gas for internal refining processes. We had expected these two factors to offset marginally lower Benchmark refining margins.
The strong yoy performance reflects higher margins (+US$0.5/bbl) and higher crude throughput (+0.9 mn tons). RIL’s 1QFY11 refining margin stood at US$7.3/bbl compared to US$7.5/bbl in 4QFY10 and US$6.8/bbl in 1QFY10. Crude throughput stood at 16.9 mn tons in 1QFY11 against 16.7 mn tons in 4QFY10 and 12 mn tons in 1QFY10. Exhibit 5 compares refining margin over the past several quarters.
Premium of RIL's refining margins over global benchmark margins Global refining margins, March fiscal year-ends (US$/bbl)
1QFY09 2QFY09 3QFY09 4QFY09 1QFY10 2QFY10 3QFY10 4QFY10 1QFY11Singapore (Dubai) 8.1 5.8 3.6 4.5 4.1 3.1 1.9 4.9 3.7 US Gulf Coast (WTI) 7.2 10.5 2.7 6.0 4.9 3.6 1.3 3.0 5.5 Rotterdam (Dated Brent) 9.5 10.4 9.0 4.0 3.2 3.1 2.7 3.4 3.7 RIL's reported margins 15.7 13.4 10.0 9.9 7.5 6.0 5.9 7.5 7.3 Premium over Singapore (Dubai) 7.6 7.6 6.4 5.4 3.4 2.9 4.0 2.6 3.6 Premium over US Gulf Coast (WTI) 8.5 2.9 7.3 3.9 2.6 2.4 4.6 4.5 1.8 Premium over Rotterdam (Dated Brent) 6.2 3.0 1.0 5.9 4.3 2.9 3.2 4.1 3.6
Source: Company, Kotak Institutional Equities
E&P segment highlights. 1QFY11 E&P segment EBIT increased 13% qoq reflecting higher crude oil production from KG-D6 block and higher crude oil prices (+US$2/bbl). However, EBIT increased 91% yoy to `19.2 bn driven by higher gas production volumes from RIL’s KG D-6 block and higher crude oil prices (+US$20/bbl). 1QFY11 gas production was 184 bcf (including 171 bcf from KG D-6 block) versus 185 bcf in 4QFY10 (including 171 bcf from KG D-6 block) and 69 bcf in 1QFY10 (including 55 bcf from KG D-6 block). Oil production was 408,000 tons compared to 317,000 tons in 4QFY10 and 240,000 tons in 1QFY10. Average production from MA-1 fields was about 24,400 b/d against 12,400 b/d in 4QFY10.
Earnings revisions and key assumptions behind earnings model
We have revised FY2011E and FY2012E EPS to `59 and `74 versus `63 and `80 previously with a weaker rupee offsetting lower gas production volumes at RIL’s KG D-6 block. We discuss our key assumptions and revisions to our earnings model below.
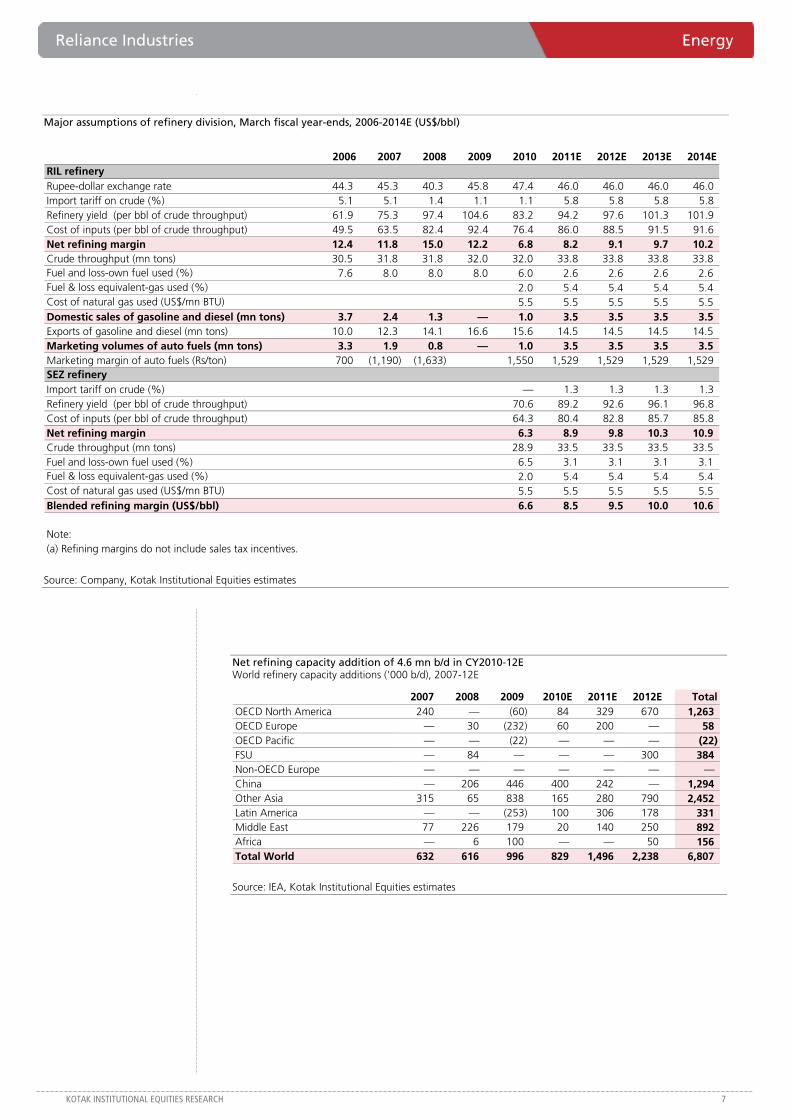
Refining margins. We model RIL’s FY2011E and FY2012E refining margin at US$8.5/bbl and US$9.5/bbl against US$6.6/bbl in FY2010 and US$7.3/bbl in 1QFY11. We have reduced refining margin assumptions by about US$0.3/bbl. We model FY2013E and FY2014E at US$10/bbl and US$10.6/bbl. Exhibit 6 gives our key assumptions for the refining division. We expect new refining capacity additions (see Exhibit 7) and new NGL supply (see Exhibit 8) in CY2010-11E to largely offset a likely 3.1 mn b/d increase in global oil demand.
Reliance Industries Energy
KOTAK INSTITUTIONAL EQUITIES RESEARCH 7
Major assumptions of refinery division, March fiscal year-ends, 2006-2014E (US$/bbl)
2006 2007 2008 2009 2010 2011E 2012E 2013E 2014ERIL refineryRupee-dollar exchange rate 44.3 45.3 40.3 45.8 47.4 46.0 46.0 46.0 46.0 Import tariff on crude (%) 5.1 5.1 1.4 1.1 1.1 5.8 5.8 5.8 5.8 Refinery yield (per bbl of crude throughput) 61.9 75.3 97.4 104.6 83.2 94.2 97.6 101.3 101.9 Cost of inputs (per bbl of crude throughput) 49.5 63.5 82.4 92.4 76.4 86.0 88.5 91.5 91.6 Net refining margin 12.4 11.8 15.0 12.2 6.8 8.2 9.1 9.7 10.2 Crude throughput (mn tons) 30.5 31.8 31.8 32.0 32.0 33.8 33.8 33.8 33.8 Fuel and loss-own fuel used (%) 7.6 8.0 8.0 8.0 6.0 2.6 2.6 2.6 2.6 Fuel & loss equivalent-gas used (%) 2.0 5.4 5.4 5.4 5.4 Cost of natural gas used (US$/mn BTU) 5.5 5.5 5.5 5.5 5.5 Domestic sales of gasoline and diesel (mn tons) 3.7 2.4 1.3 — 1.0 3.5 3.5 3.5 3.5 Exports of gasoline and diesel (mn tons) 10.0 12.3 14.1 16.6 15.6 14.5 14.5 14.5 14.5 Marketing volumes of auto fuels (mn tons) 3.3 1.9 0.8 — 1.0 3.5 3.5 3.5 3.5 Marketing margin of auto fuels (Rs/ton) 700 (1,190) (1,633) 1,550 1,529 1,529 1,529 1,529SEZ refineryImport tariff on crude (%) — 1.3 1.3 1.3 1.3 Refinery yield (per bbl of crude throughput) 70.6 89.2 92.6 96.1 96.8 Cost of inputs (per bbl of crude throughput) 64.3 80.4 82.8 85.7 85.8 Net refining margin 6.3 8.9 9.8 10.3 10.9 Crude throughput (mn tons) 28.9 33.5 33.5 33.5 33.5 Fuel and loss-own fuel used (%) 6.5 3.1 3.1 3.1 3.1 Fuel & loss equivalent-gas used (%) 2.0 5.4 5.4 5.4 5.4 Cost of natural gas used (US$/mn BTU) 5.5 5.5 5.5 5.5 5.5 Blended refining margin (US$/bbl) 6.6 8.5 9.5 10.0 10.6
Note:(a) Refining margins do not include sales tax incentives.
Source: Company, Kotak Institutional Equities estimates
Net refining capacity addition of 4.6 mn b/d in CY2010-12E World refinery capacity additions ('000 b/d), 2007-12E
2007 2008 2009 2010E 2011E 2012E TotalOECD North America 240 — (60) 84 329 670 1,263 OECD Europe — 30 (232) 60 200 — 58 OECD Pacific — — (22) — — — (22)FSU — 84 — — — 300 384 Non-OECD Europe — — — — — — —China — 206 446 400 242 — 1,294 Other Asia 315 65 838 165 280 790 2,452 Latin America — — (253) 100 306 178 331 Middle East 77 226 179 20 140 250 892 Africa — 6 100 — — 50 156 Total World 632 616 996 829 1,496 2,238 6,807
Source: IEA, Kotak Institutional Equities estimates
Energy Reliance Industries
8 KOTAK INSTITUTIONAL EQUITIES RESEARCH
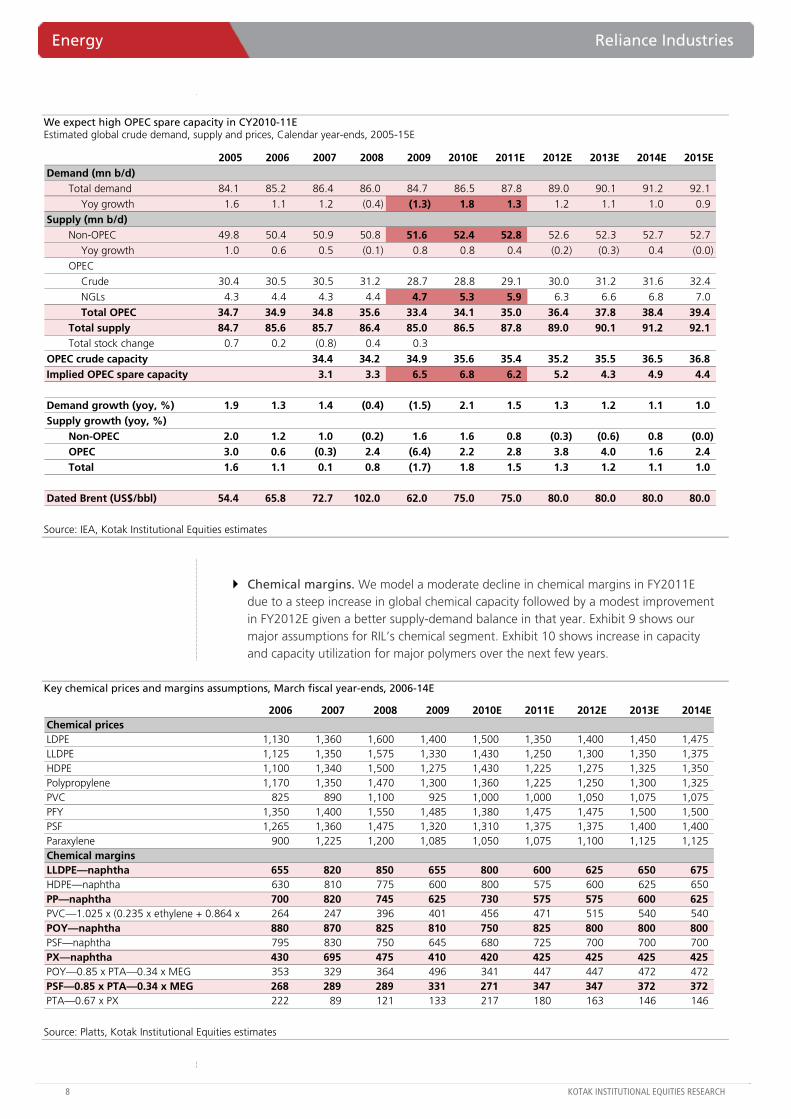
We expect high OPEC spare capacity in CY2010-11E Estimated global crude demand, supply and prices, Calendar year-ends, 2005-15E
2005 2006 2007 2008 2009 2010E 2011E 2012E 2013E 2014E 2015EDemand (mn b/d)
Total demand 84.1 85.2 86.4 86.0 84.7 86.5 87.8 89.0 90.1 91.2 92.1Yoy growth 1.6 1.1 1.2 (0.4) (1.3) 1.8 1.3 1.2 1.1 1.0 0.9
Supply (mn b/d)Non-OPEC 49.8 50.4 50.9 50.8 51.6 52.4 52.8 52.6 52.3 52.7 52.7
Yoy growth 1.0 0.6 0.5 (0.1) 0.8 0.8 0.4 (0.2) (0.3) 0.4 (0.0)OPEC
Crude 30.4 30.5 30.5 31.2 28.7 28.8 29.1 30.0 31.2 31.6 32.4NGLs 4.3 4.4 4.3 4.4 4.7 5.3 5.9 6.3 6.6 6.8 7.0
Total OPEC 34.7 34.9 34.8 35.6 33.4 34.1 35.0 36.4 37.8 38.4 39.4Total supply 84.7 85.6 85.7 86.4 85.0 86.5 87.8 89.0 90.1 91.2 92.1Total stock change 0.7 0.2 (0.8) 0.4 0.3
OPEC crude capacity 34.4 34.2 34.9 35.6 35.4 35.2 35.5 36.5 36.8Implied OPEC spare capacity 3.1 3.3 6.5 6.8 6.2 5.2 4.3 4.9 4.4
Demand growth (yoy, %) 1.9 1.3 1.4 (0.4) (1.5) 2.1 1.5 1.3 1.2 1.1 1.0Supply growth (yoy, %)
Non-OPEC 2.0 1.2 1.0 (0.2) 1.6 1.6 0.8 (0.3) (0.6) 0.8 (0.0)OPEC 3.0 0.6 (0.3) 2.4 (6.4) 2.2 2.8 3.8 4.0 1.6 2.4Total 1.6 1.1 0.1 0.8 (1.7) 1.8 1.5 1.3 1.2 1.1 1.0
Dated Brent (US$/bbl) 54.4 65.8 72.7 102.0 62.0 75.0 75.0 80.0 80.0 80.0 80.0
Source: IEA, Kotak Institutional Equities estimates
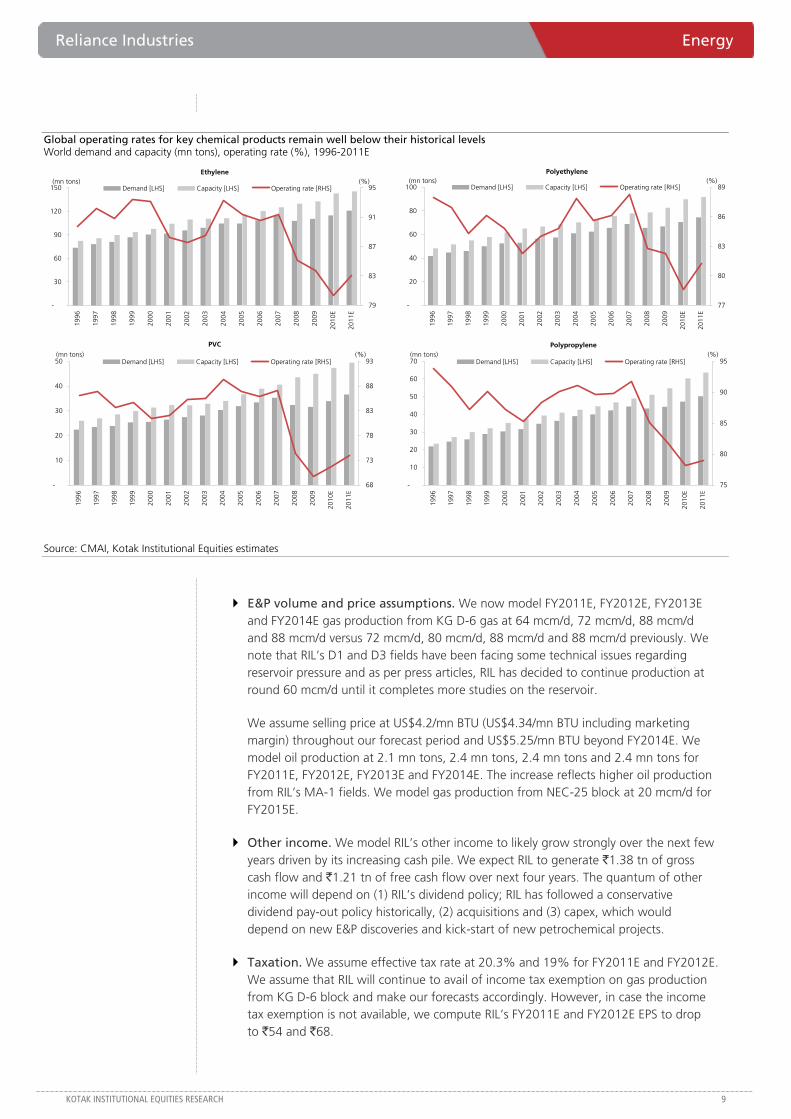
Chemical margins. We model a moderate decline in chemical margins in FY2011E due to a steep increase in global chemical capacity followed by a modest improvement in FY2012E given a better supply-demand balance in that year. Exhibit 9 shows our major assumptions for RIL’s chemical segment. Exhibit 10 shows increase in capacity and capacity utilization for major polymers over the next few years.
Key chemical prices and margins assumptions, March fiscal year-ends, 2006-14E
2006 2007 2008 2009 2010E 2011E 2012E 2013E 2014EChemical pricesLDPE 1,130 1,360 1,600 1,400 1,500 1,350 1,400 1,450 1,475LLDPE 1,125 1,350 1,575 1,330 1,430 1,250 1,300 1,350 1,375HDPE 1,100 1,340 1,500 1,275 1,430 1,225 1,275 1,325 1,350Polypropylene 1,170 1,350 1,470 1,300 1,360 1,225 1,250 1,300 1,325PVC 825 890 1,100 925 1,000 1,000 1,050 1,075 1,075PFY 1,350 1,400 1,550 1,485 1,380 1,475 1,475 1,500 1,500PSF 1,265 1,360 1,475 1,320 1,310 1,375 1,375 1,400 1,400Paraxylene 900 1,225 1,200 1,085 1,050 1,075 1,100 1,125 1,125Chemical marginsLLDPE—naphtha 655 820 850 655 800 600 625 650 675 HDPE—naphtha 630 810 775 600 800 575 600 625 650 PP—naphtha 700 820 745 625 730 575 575 600 625 PVC—1.025 x (0.235 x ethylene + 0.864 x 264 247 396 401 456 471 515 540 540 POY—naphtha 880 870 825 810 750 825 800 800 800 PSF—naphtha 795 830 750 645 680 725 700 700 700 PX—naphtha 430 695 475 410 420 425 425 425 425 POY—0.85 x PTA—0.34 x MEG 353 329 364 496 341 447 447 472 472 PSF—0.85 x PTA—0.34 x MEG 268 289 289 331 271 347 347 372 372 PTA—0.67 x PX 222 89 121 133 217 180 163 146 146
Source: Platts, Kotak Institutional Equities estimates
Reliance Industries Energy
KOTAK INSTITUTIONAL EQUITIES RESEARCH 9
Global operating rates for key chemical products remain well below their historical levels World demand and capacity (mn tons), operating rate (%), 1996-2011E
-
30
60
90
120
150
1996
1997
1998
1999
2000
2001
2002
2003
2004
2005
2006
2007
2008
2009
2010
E
2011
E
(mn tons)
79
83
87
91
95(%)
Demand [LHS] Capacity [LHS] Operating rate [RHS]
-
20
40
60
80
100
1996
1997
1998
1999
2000
2001
2002
2003
2004
2005
2006
2007
2008
2009
2010
E
2011
E
(mn tons)
77
80
83
86
89(%)
Demand [LHS] Capacity [LHS] Operating rate [RHS]
-
10
20
30
40
50
1996
1997
1998
1999
2000
2001
2002
2003
2004
2005
2006
2007
2008
2009
2010
E
2011
E(mn tons)
68
73
78
83
88
93(%)
Demand [LHS] Capacity [LHS] Operating rate [RHS]
-
10
20
30
40
50
60
70
1996
1997
1998
1999
2000
2001
2002
2003
2004
2005
2006
2007
2008
2009
2010
E
2011
E
(mn tons)
75
80
85
90
95(%)
Demand [LHS] Capacity [LHS] Operating rate [RHS]
Ethylene Polyethylene
PVC Polypropylene
Source: CMAI, Kotak Institutional Equities estimates
E&P volume and price assumptions. We now model FY2011E, FY2012E, FY2013E and FY2014E gas production from KG D-6 gas at 64 mcm/d, 72 mcm/d, 88 mcm/d and 88 mcm/d versus 72 mcm/d, 80 mcm/d, 88 mcm/d and 88 mcm/d previously. We note that RIL’s D1 and D3 fields have been facing some technical issues regarding reservoir pressure and as per press articles, RIL has decided to continue production at round 60 mcm/d until it completes more studies on the reservoir.
We assume selling price at US$4.2/mn BTU (US$4.34/mn BTU including marketing margin) throughout our forecast period and US$5.25/mn BTU beyond FY2014E. We model oil production at 2.1 mn tons, 2.4 mn tons, 2.4 mn tons and 2.4 mn tons for FY2011E, FY2012E, FY2013E and FY2014E. The increase reflects higher oil production from RIL’s MA-1 fields. We model gas production from NEC-25 block at 20 mcm/d for FY2015E.
Other income. We model RIL’s other income to likely grow strongly over the next few years driven by its increasing cash pile. We expect RIL to generate `1.38 tn of gross cash flow and `1.21 tn of free cash flow over next four years. The quantum of other income will depend on (1) RIL’s dividend policy; RIL has followed a conservative dividend pay-out policy historically, (2) acquisitions and (3) capex, which would depend on new E&P discoveries and kick-start of new petrochemical projects.
Taxation. We assume effective tax rate at 20.3% and 19% for FY2011E and FY2012E. We assume that RIL will continue to avail of income tax exemption on gas production from KG D-6 block and make our forecasts accordingly. However, in case the income tax exemption is not available, we compute RIL’s FY2011E and FY2012E EPS to drop to `54 and `68.
Energy Reliance Industries
10 KOTAK INSTITUTIONAL EQUITIES RESEARCH
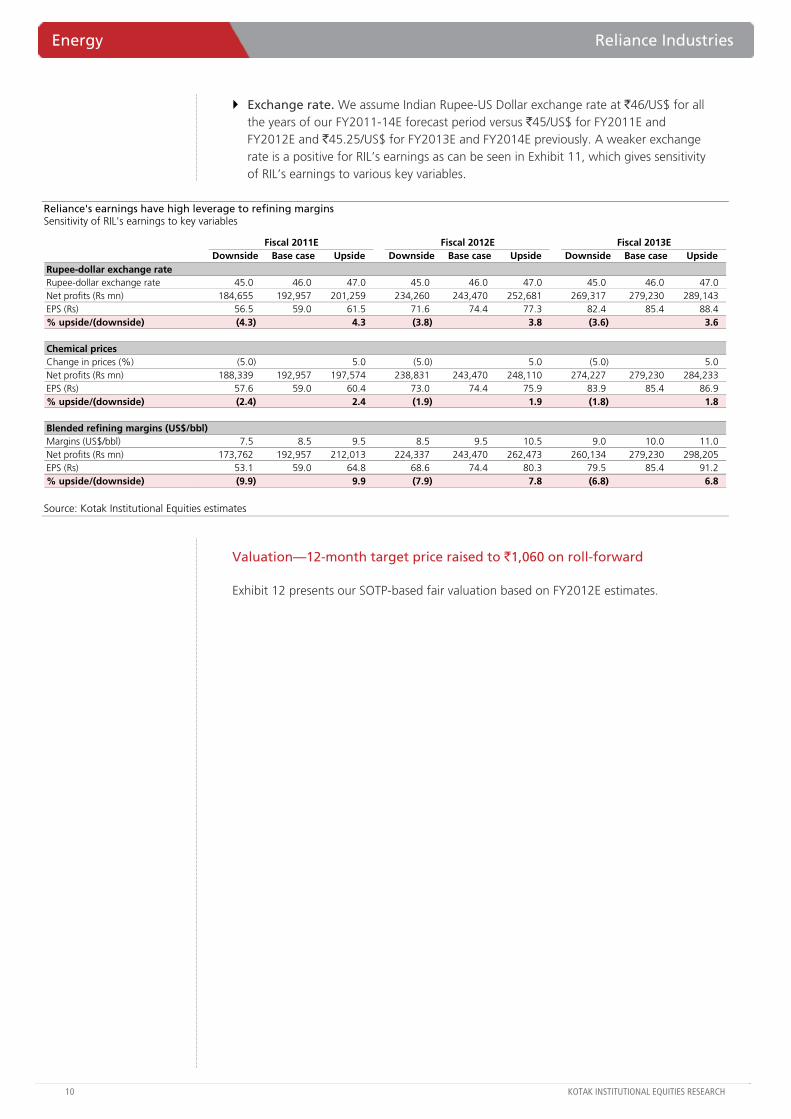
Exchange rate. We assume Indian Rupee-US Dollar exchange rate at `46/US$ for all the years of our FY2011-14E forecast period versus `45/US$ for FY2011E and FY2012E and `45.25/US$ for FY2013E and FY2014E previously. A weaker exchange rate is a positive for RIL’s earnings as can be seen in Exhibit 11, which gives sensitivity of RIL’s earnings to various key variables.
Reliance's earnings have high leverage to refining margins Sensitivity of RIL's earnings to key variables
Fiscal 2011E Fiscal 2012E Fiscal 2013EDownside Base case Upside Downside Base case Upside Downside Base case Upside
Rupee-dollar exchange rateRupee-dollar exchange rate 45.0 46.0 47.0 45.0 46.0 47.0 45.0 46.0 47.0 Net profits (Rs mn) 184,655 192,957 201,259 234,260 243,470 252,681 269,317 279,230 289,143 EPS (Rs) 56.5 59.0 61.5 71.6 74.4 77.3 82.4 85.4 88.4 % upside/(downside) (4.3) 4.3 (3.8) 3.8 (3.6) 3.6
Chemical pricesChange in prices (%) (5.0) 5.0 (5.0) 5.0 (5.0) 5.0 Net profits (Rs mn) 188,339 192,957 197,574 238,831 243,470 248,110 274,227 279,230 284,233 EPS (Rs) 57.6 59.0 60.4 73.0 74.4 75.9 83.9 85.4 86.9 % upside/(downside) (2.4) 2.4 (1.9) 1.9 (1.8) 1.8
Blended refining margins (US$/bbl)Margins (US$/bbl) 7.5 8.5 9.5 8.5 9.5 10.5 9.0 10.0 11.0 Net profits (Rs mn) 173,762 192,957 212,013 224,337 243,470 262,473 260,134 279,230 298,205 EPS (Rs) 53.1 59.0 64.8 68.6 74.4 80.3 79.5 85.4 91.2 % upside/(downside) (9.9) 9.9 (7.9) 7.8 (6.8) 6.8
Source: Kotak Institutional Equities estimates
Valuation—12-month target price raised to `1,060 on roll-forward
Exhibit 12 presents our SOTP-based fair valuation based on FY2012E estimates.
Reliance Industries Energy
KOTAK INSTITUTIONAL EQUITIES RESEARCH 11
SOTP valuation of Reliance is `1,060 per share on FY2012E estimates Sum-of-the-parts valuation of Reliance Industries, FY2012E basis (`)
Valuation base (Rs bn) Multiple (X) EV ValuationOther EBITDA Multiple EV/EBITDA (Rs bn) (Rs/share)
Chemicals 99 7.0 692 232Refining & Marketing 142 7.5 1,064 357Oil and gas—producing (PMT and Yemen) 25 5.0 125 42Gas—producing and developing (DCF-based) (a) 847 847 284 KG D-6 442 442 148 NEC-25 122 122 41 CBM 66 66 22 KG D-3 89 89 30 KG D-9 22 22 8 MN D-4 105 105 35Oil—KG-DWN-98/3 (b) 83 83 28Investments other than valued separately 105 105 35Loans & advances to affiliates 4 4 1Cash with subsidiary from sale of treasury shares 86 86 29Retailing 52 80% 42 14SEZ development 30 80% 24 8Total enterprise value 3,072 1,031Net debt adjusted for 50% of C-WIP of E&P assets (95) (32)Implied equity value 3,167 1,063
Note:(a) We value KG D-6, NEC-25, CBM, KG D-3, KG D-9 and MN D-4 blocks on DCF.(b) 180 mn bbls of recoverable reserves based on gross OOIP of 0.5 bn bbls.(c) We use 2.978 bn shares (excluding treasury shares) for per share computations.
Source: Kotak Institutional Equities estimates
Energy Reliance Industries
12 KOTAK INSTITUTIONAL EQUITIES RESEARCH
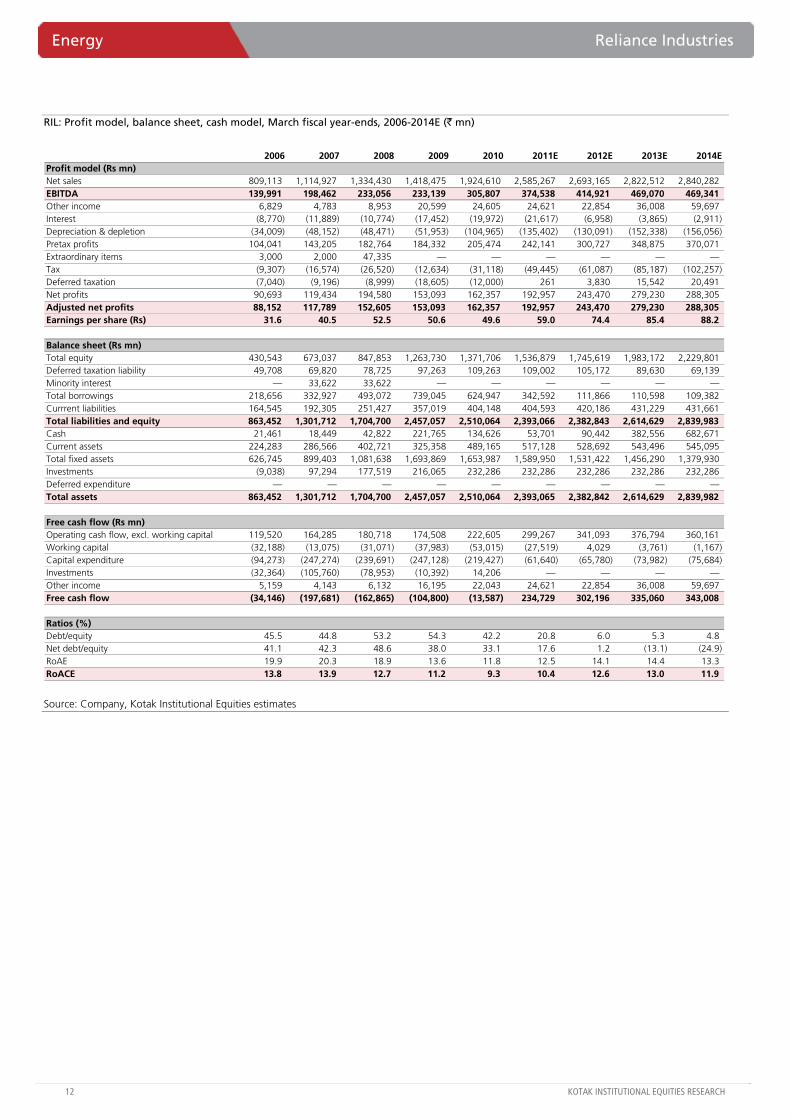
RIL: Profit model, balance sheet, cash model, March fiscal year-ends, 2006-2014E (` mn)
2006 2007 2008 2009 2010 2011E 2012E 2013E 2014EProfit model (Rs mn)Net sales 809,113 1,114,927 1,334,430 1,418,475 1,924,610 2,585,267 2,693,165 2,822,512 2,840,282EBITDA 139,991 198,462 233,056 233,139 305,807 374,538 414,921 469,070 469,341Other income 6,829 4,783 8,953 20,599 24,605 24,621 22,854 36,008 59,697Interest (8,770) (11,889) (10,774) (17,452) (19,972) (21,617) (6,958) (3,865) (2,911)Depreciation & depletion (34,009) (48,152) (48,471) (51,953) (104,965) (135,402) (130,091) (152,338) (156,056)Pretax profits 104,041 143,205 182,764 184,332 205,474 242,141 300,727 348,875 370,071Extraordinary items 3,000 2,000 47,335 — — — — — —Tax (9,307) (16,574) (26,520) (12,634) (31,118) (49,445) (61,087) (85,187) (102,257)Deferred taxation (7,040) (9,196) (8,999) (18,605) (12,000) 261 3,830 15,542 20,491Net profits 90,693 119,434 194,580 153,093 162,357 192,957 243,470 279,230 288,305Adjusted net profits 88,152 117,789 152,605 153,093 162,357 192,957 243,470 279,230 288,305Earnings per share (Rs) 31.6 40.5 52.5 50.6 49.6 59.0 74.4 85.4 88.2
Balance sheet (Rs mn)Total equity 430,543 673,037 847,853 1,263,730 1,371,706 1,536,879 1,745,619 1,983,172 2,229,801Deferred taxation liability 49,708 69,820 78,725 97,263 109,263 109,002 105,172 89,630 69,139Minority interest — 33,622 33,622 — — — — — —Total borrowings 218,656 332,927 493,072 739,045 624,947 342,592 111,866 110,598 109,382Currrent liabilities 164,545 192,305 251,427 357,019 404,148 404,593 420,186 431,229 431,661Total liabilities and equity 863,452 1,301,712 1,704,700 2,457,057 2,510,064 2,393,066 2,382,843 2,614,629 2,839,983Cash 21,461 18,449 42,822 221,765 134,626 53,701 90,442 382,556 682,671Current assets 224,283 286,566 402,721 325,358 489,165 517,128 528,692 543,496 545,095Total fixed assets 626,745 899,403 1,081,638 1,693,869 1,653,987 1,589,950 1,531,422 1,456,290 1,379,930Investments (9,038) 97,294 177,519 216,065 232,286 232,286 232,286 232,286 232,286Deferred expenditure — — — — — — — — —Total assets 863,452 1,301,712 1,704,700 2,457,057 2,510,064 2,393,065 2,382,842 2,614,629 2,839,982
Free cash flow (Rs mn)Operating cash flow, excl. working capital 119,520 164,285 180,718 174,508 222,605 299,267 341,093 376,794 360,161Working capital (32,188) (13,075) (31,071) (37,983) (53,015) (27,519) 4,029 (3,761) (1,167)Capital expenditure (94,273) (247,274) (239,691) (247,128) (219,427) (61,640) (65,780) (73,982) (75,684)Investments (32,364) (105,760) (78,953) (10,392) 14,206 — — — —Other income 5,159 4,143 6,132 16,195 22,043 24,621 22,854 36,008 59,697Free cash flow (34,146) (197,681) (162,865) (104,800) (13,587) 234,729 302,196 335,060 343,008
Ratios (%)Debt/equity 45.5 44.8 53.2 54.3 42.2 20.8 6.0 5.3 4.8 Net debt/equity 41.1 42.3 48.6 38.0 33.1 17.6 1.2 (13.1) (24.9) RoAE 19.9 20.3 18.9 13.6 11.8 12.5 14.1 14.4 13.3 RoACE 13.8 13.9 12.7 11.2 9.3 10.4 12.6 13.0 11.9
Source: Company, Kotak Institutional Equities estimates
For private Circulation Only. FOR IMPORTANT INFORMATION ABOUT KOTAK SECURITIES’ RATING SYSTEM AND OTHER DISCLOSURES, REFER TO THE END OF THIS MATERIAL.
Inflow skew can’t explain nil growth in E&C; lengthening execution cycle and client side issues can
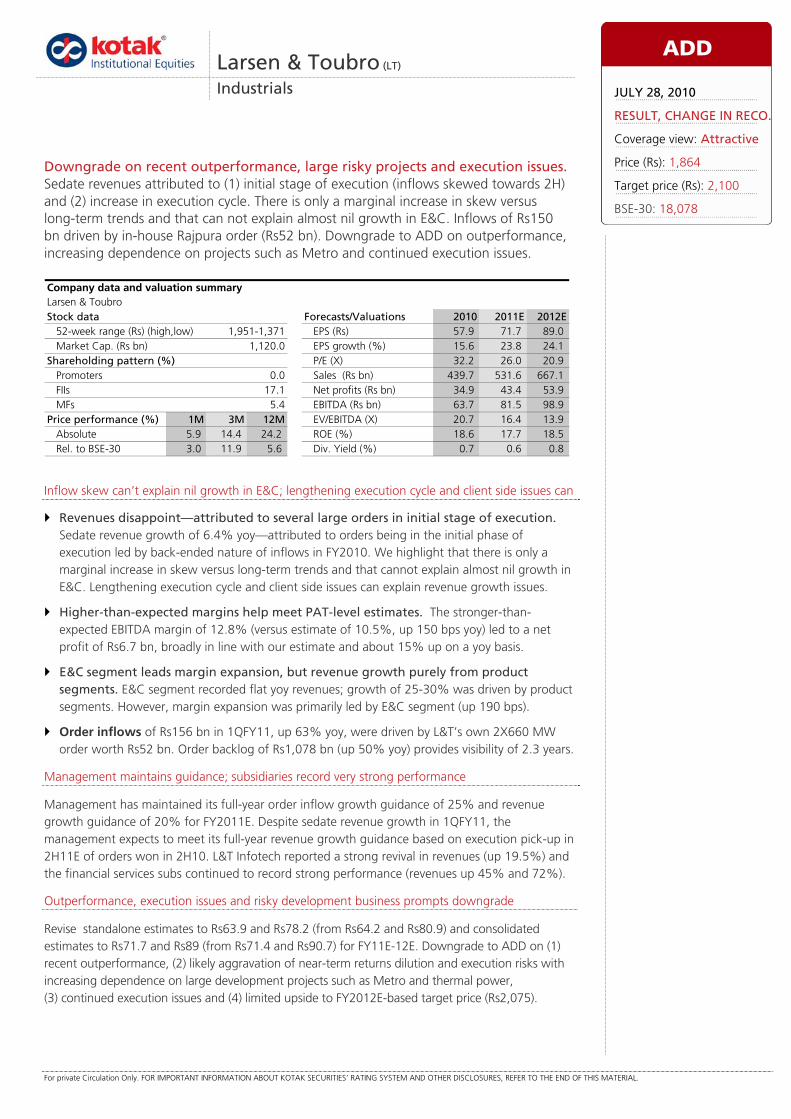
Revenues disappoint—attributed to several large orders in initial stage of execution. Sedate revenue growth of 6.4% yoy—attributed to orders being in the initial phase of execution led by back-ended nature of inflows in FY2010. We highlight that there is only a marginal increase in skew versus long-term trends and that cannot explain almost nil growth in E&C. Lengthening execution cycle and client side issues can explain revenue growth issues.
Higher-than-expected margins help meet PAT-level estimates. The stronger-than-expected EBITDA margin of 12.8% (versus estimate of 10.5%, up 150 bps yoy) led to a net profit of Rs6.7 bn, broadly in line with our estimate and about 15% up on a yoy basis.
E&C segment leads margin expansion, but revenue growth purely from product segments. E&C segment recorded flat yoy revenues; growth of 25-30% was driven by product segments. However, margin expansion was primarily led by E&C segment (up 190 bps).
Order inflows of Rs156 bn in 1QFY11, up 63% yoy, were driven by L&T’s own 2X660 MW order worth Rs52 bn. Order backlog of Rs1,078 bn (up 50% yoy) provides visibility of 2.3 years.
Management maintains guidance; subsidiaries record very strong performance
Management has maintained its full-year order inflow growth guidance of 25% and revenue growth guidance of 20% for FY2011E. Despite sedate revenue growth in 1QFY11, the management expects to meet its full-year revenue growth guidance based on execution pick-up in 2H11E of orders won in 2H10. L&T Infotech reported a strong revival in revenues (up 19.5%) and the financial services subs continued to record strong performance (revenues up 45% and 72%).
Outperformance, execution issues and risky development business prompts downgrade
Revise standalone estimates to Rs63.9 and Rs78.2 (from Rs64.2 and Rs80.9) and consolidated estimates to Rs71.7 and Rs89 (from Rs71.4 and Rs90.7) for FY11E-12E. Downgrade to ADD on (1) recent outperformance, (2) likely aggravation of near-term returns dilution and execution risks with increasing dependence on large development projects such as Metro and thermal power, (3) continued execution issues and (4) limited upside to FY2012E-based target price (Rs2,075).
Larsen & Toubro (LT)
Industrials
Downgrade on recent outperformance, large risky projects and execution issues. Sedate revenues attributed to (1) initial stage of execution (inflows skewed towards 2H) and (2) increase in execution cycle. There is only a marginal increase in skew versus long-term trends and that can not explain almost nil growth in E&C. Inflows of Rs150 bn driven by in-house Rajpura order (Rs52 bn). Downgrade to ADD on outperformance, increasing dependence on projects such as Metro and continued execution issues.
Larsen & ToubroStock data Forecasts/Valuations 2010 2011E 2012E
52-week range (Rs) (high,low) EPS (Rs) 57.9 71.7 89.0Market Cap. (Rs bn) 1,120.0 EPS growth (%) 15.6 23.8 24.1
Shareholding pattern (%) P/E (X) 32.2 26.0 20.9Promoters 0.0 Sales (Rs bn) 439.7 531.6 667.1FIIs 17.1 Net profits (Rs bn) 34.9 43.4 53.9MFs 5.4 EBITDA (Rs bn) 63.7 81.5 98.9
Price performance (%) 1M 3M 12M EV/EBITDA (X) 20.7 16.4 13.9Absolute 5.9 14.4 24.2 ROE (%) 18.6 17.7 18.5Rel. to BSE-30 3.0 11.9 5.6 Div. Yield (%) 0.7 0.6 0.8
Company data and valuation summary
1,951-1,371
ADD
JULY 28, 2010
RESULT, CHANGE IN RECO.
Coverage view: Attractive
Price (Rs): 1,864
Target price (Rs): 2,100
BSE-30: 18,078
Industrials Larsen & Toubro
14 KOTAK INSTITUTIONAL EQUITIES RESEARCH
Revenues disappoint—slow as several large projects in initial stage of execution
L&T reported disappointing revenues of Rs79 bn, about 15% below our estimates of Rs93 bn, recording modest 6.4% growth yoy. Our strong revenue growth estimate of 25% yoy was based on execution of the order backlog and a pick-up in execution of the orders that had slowed down in the first nine months of FY2010. The sedate revenue growth was attributed to (1) several large projects being in the initial stages of execution (due to the back-ended nature of order inflows in FY2010)—the management expects execution of these orders to pick up in 2HFY10, (2) increase in average execution-cycle of the backlog; about a third of the current order book comprise of orders with an execution cycle of 3-5 years and (3) higher international order inflows which is yet to translate into revenues.
Higher-than-expected EBITDA margin helps meet PAT-level estimates; margins likely to remain flat for full-year FY2011E
L&T reported a stronger-than-expected EBITDA margin of 12.8%, up 150 bps yoy and about 230 bps higher than our estimate of 10.5%. The gross margin of L&T (net of variable expenses—raw material, subcontracting and other manufacturing expenses) expanded by 190 bps yoy to 24.6% in 1QFY11 from 22.8% in 1QFY10. We had expected a slight contraction in margins as we believed that the uptick in commodity prices in 4QFY10 would adversely impact the raw material costs. L&T did report a 120 bps increase in raw material expenses as a percentage of sales; however, this was completely offset by decrease in subcontracting expenses as a percentage of sales leading to the gross margin expansion. The lower subcontracting expense in the quarter was attributed to completion of a large order in the previous quarter (Delhi airport order). The higher-than-expected EBITDA margin led to a net profit of Rs6.7 bn, broadly inline with our estimate and about 15% up on a yoy basis.
The management suggested that the full-year FY2011E margin is likely to remain broadly at FY2010 levels of about 13%. The margin expansion witnessed in 1QFY11 is unlikely to sustain for the remaining of FY2011.
Larsen & Toubro Industrials
KOTAK INSTITUTIONAL EQUITIES RESEARCH 15
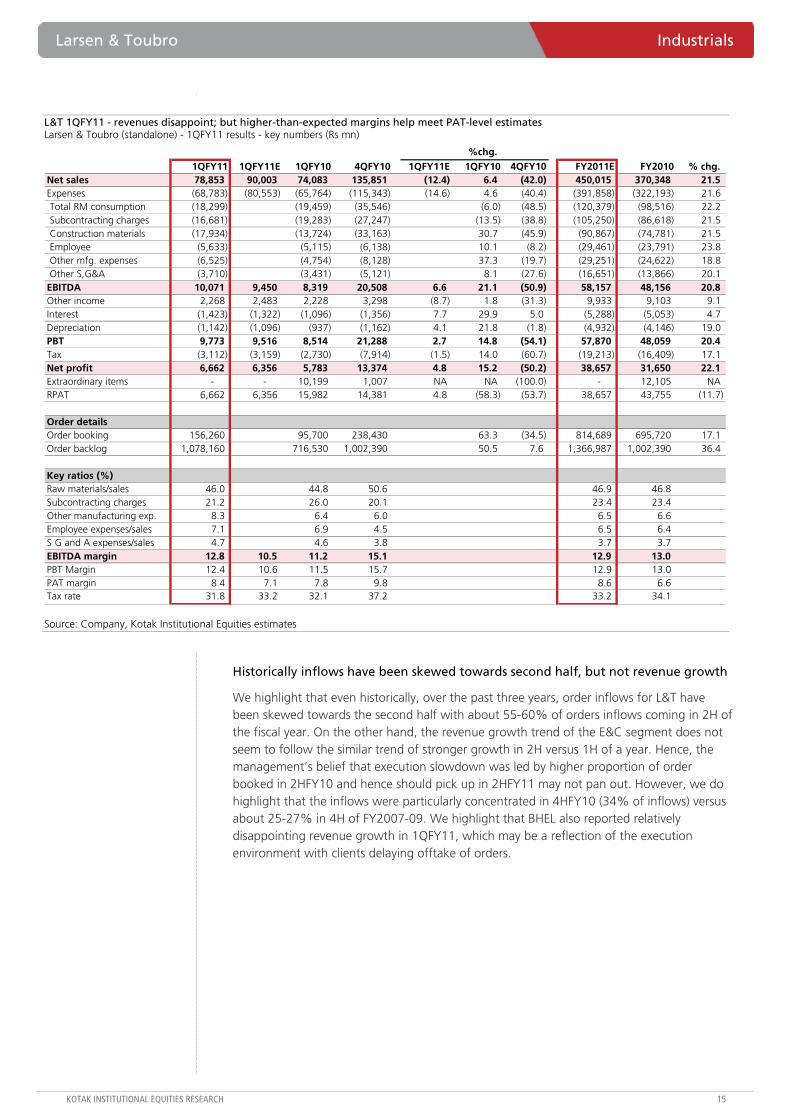
L&T 1QFY11 - revenues disappoint; but higher-than-expected margins help meet PAT-level estimates Larsen & Toubro (standalone) - 1QFY11 results - key numbers (Rs mn)
%chg.1QFY11 1QFY11E 1QFY10 4QFY10 1QFY11E 1QFY10 4QFY10 FY2011E FY2010 % chg.
Net sales 78,853 90,003 74,083 135,851 (12.4) 6.4 (42.0) 450,015 370,348 21.5 Expenses (68,783) (80,553) (65,764) (115,343) (14.6) 4.6 (40.4) (391,858) (322,193) 21.6 Total RM consumption (18,299) (19,459) (35,546) (6.0) (48.5) (120,379) (98,516) 22.2 Subcontracting charges (16,681) (19,283) (27,247) (13.5) (38.8) (105,250) (86,618) 21.5 Construction materials (17,934) (13,724) (33,163) 30.7 (45.9) (90,867) (74,781) 21.5 Employee (5,633) (5,115) (6,138) 10.1 (8.2) (29,461) (23,791) 23.8 Other mfg. expenses (6,525) (4,754) (8,128) 37.3 (19.7) (29,251) (24,622) 18.8 Other S,G&A (3,710) (3,431) (5,121) 8.1 (27.6) (16,651) (13,866) 20.1 EBITDA 10,071 9,450 8,319 20,508 6.6 21.1 (50.9) 58,157 48,156 20.8 Other income 2,268 2,483 2,228 3,298 (8.7) 1.8 (31.3) 9,933 9,103 9.1 Interest (1,423) (1,322) (1,096) (1,356) 7.7 29.9 5.0 (5,288) (5,053) 4.7 Depreciation (1,142) (1,096) (937) (1,162) 4.1 21.8 (1.8) (4,932) (4,146) 19.0 PBT 9,773 9,516 8,514 21,288 2.7 14.8 (54.1) 57,870 48,059 20.4 Tax (3,112) (3,159) (2,730) (7,914) (1.5) 14.0 (60.7) (19,213) (16,409) 17.1 Net profit 6,662 6,356 5,783 13,374 4.8 15.2 (50.2) 38,657 31,650 22.1 Extraordinary items - - 10,199 1,007 NA NA (100.0) - 12,105 NARPAT 6,662 6,356 15,982 14,381 4.8 (58.3) (53.7) 38,657 43,755 (11.7)
Order detailsOrder booking 156,260 95,700 238,430 63.3 (34.5) 814,689 695,720 17.1 Order backlog 1,078,160 716,530 1,002,390 50.5 7.6 1,366,987 1,002,390 36.4
Key ratios (%)Raw materials/sales 46.0 44.8 50.6 46.9 46.8 Subcontracting charges 21.2 26.0 20.1 23.4 23.4 Other manufacturing exp. 8.3 6.4 6.0 6.5 6.6 Employee expenses/sales 7.1 6.9 4.5 6.5 6.4 S G and A expenses/sales 4.7 4.6 3.8 3.7 3.7 EBITDA margin 12.8 10.5 11.2 15.1 12.9 13.0 PBT Margin 12.4 10.6 11.5 15.7 12.9 13.0 PAT margin 8.4 7.1 7.8 9.8 8.6 6.6 Tax rate 31.8 33.2 32.1 37.2 33.2 34.1
Source: Company, Kotak Institutional Equities estimates
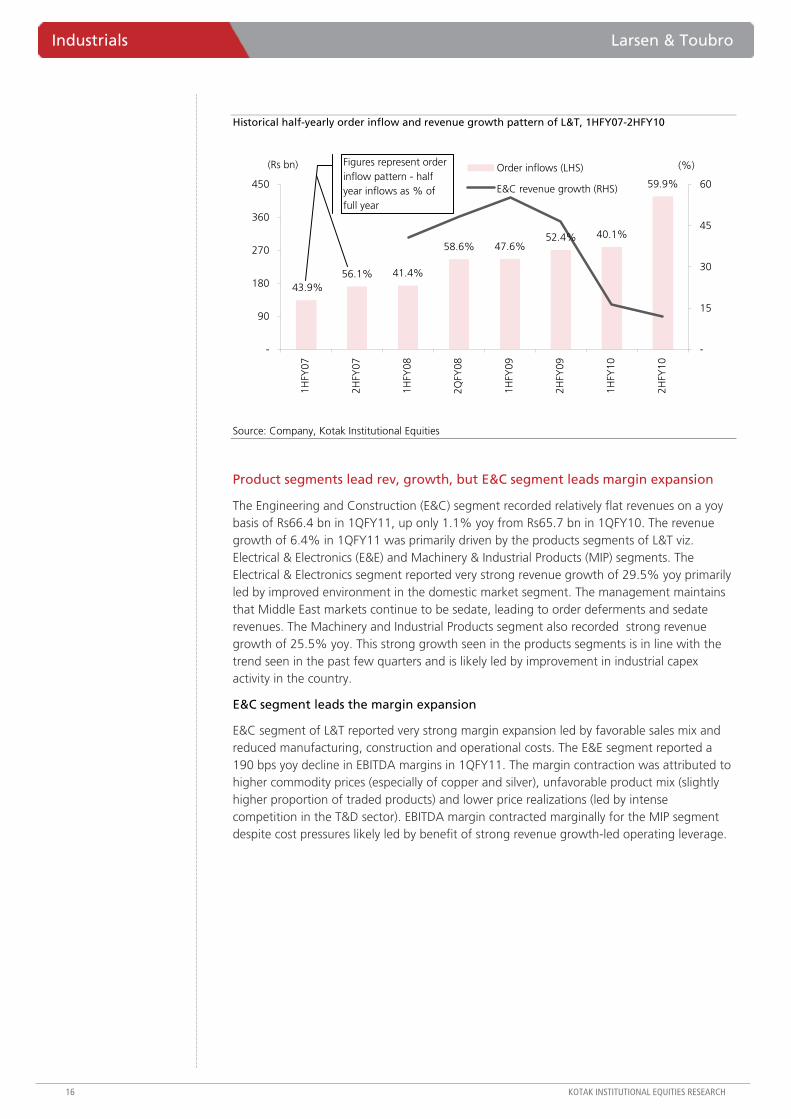
Historically inflows have been skewed towards second half, but not revenue growth
We highlight that even historically, over the past three years, order inflows for L&T have been skewed towards the second half with about 55-60% of orders inflows coming in 2H of the fiscal year. On the other hand, the revenue growth trend of the E&C segment does not seem to follow the similar trend of stronger growth in 2H versus 1H of a year. Hence, the management’s belief that execution slowdown was led by higher proportion of order booked in 2HFY10 and hence should pick up in 2HFY11 may not pan out. However, we do highlight that the inflows were particularly concentrated in 4HFY10 (34% of inflows) versus about 25-27% in 4H of FY2007-09. We highlight that BHEL also reported relatively disappointing revenue growth in 1QFY11, which may be a reflection of the execution environment with clients delaying offtake of orders.
Industrials Larsen & Toubro
16 KOTAK INSTITUTIONAL EQUITIES RESEARCH
Historical half-yearly order inflow and revenue growth pattern of L&T, 1HFY07-2HFY10
56.1% 41.4%
58.6% 47.6%52.4% 40.1%
59.9%
43.9%
-
90
180
270
360
450
1HFY
07
2HFY
07
1HFY
08
2QFY
08
1HFY
09
2HFY
09
1HFY
10
2HFY
10
(Rs bn)
-
15
30
45
60
(%)Order inflows (LHS)
E&C revenue growth (RHS)
Figures represent order inflow pattern - half year inflows as % of full year
Source: Company, Kotak Institutional Equities
Product segments lead rev, growth, but E&C segment leads margin expansion
The Engineering and Construction (E&C) segment recorded relatively flat revenues on a yoy basis of Rs66.4 bn in 1QFY11, up only 1.1% yoy from Rs65.7 bn in 1QFY10. The revenue growth of 6.4% in 1QFY11 was primarily driven by the products segments of L&T viz. Electrical & Electronics (E&E) and Machinery & Industrial Products (MIP) segments. The Electrical & Electronics segment reported very strong revenue growth of 29.5% yoy primarily led by improved environment in the domestic market segment. The management maintains that Middle East markets continue to be sedate, leading to order deferments and sedate revenues. The Machinery and Industrial Products segment also recorded strong revenue growth of 25.5% yoy. This strong growth seen in the products segments is in line with the trend seen in the past few quarters and is likely led by improvement in industrial capex activity in the country.
E&C segment leads the margin expansion
E&C segment of L&T reported very strong margin expansion led by favorable sales mix and reduced manufacturing, construction and operational costs. The E&E segment reported a 190 bps yoy decline in EBITDA margins in 1QFY11. The margin contraction was attributed to higher commodity prices (especially of copper and silver), unfavorable product mix (slightly higher proportion of traded products) and lower price realizations (led by intense competition in the T&D sector). EBITDA margin contracted marginally for the MIP segment despite cost pressures likely led by benefit of strong revenue growth-led operating leverage.
Larsen & Toubro Industrials
KOTAK INSTITUTIONAL EQUITIES RESEARCH 17
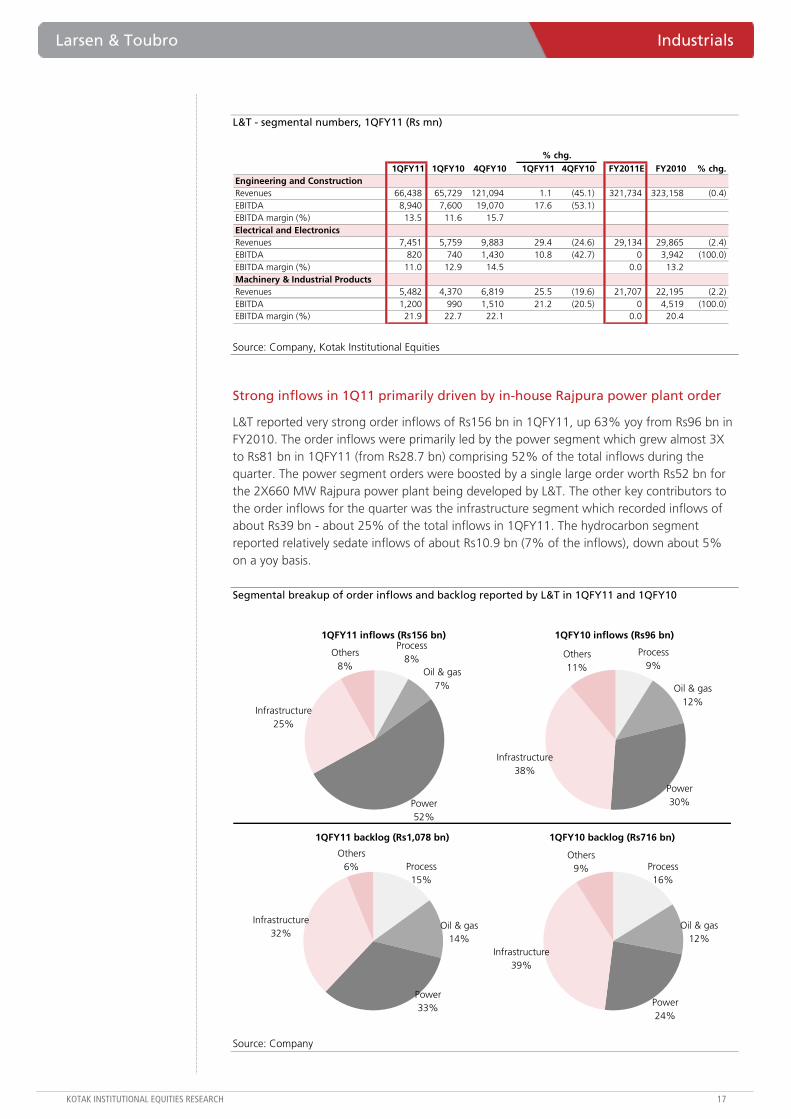
L&T - segmental numbers, 1QFY11 (Rs mn)
1QFY11 1QFY10 4QFY10 1QFY11 4QFY10 FY2011E FY2010 % chg.Engineering and ConstructionRevenues 66,438 65,729 121,094 1.1 (45.1) 321,734 323,158 (0.4)EBITDA 8,940 7,600 19,070 17.6 (53.1)EBITDA margin (%) 13.5 11.6 15.7Electrical and ElectronicsRevenues 7,451 5,759 9,883 29.4 (24.6) 29,134 29,865 (2.4)EBITDA 820 740 1,430 10.8 (42.7) 0 3,942 (100.0)EBITDA margin (%) 11.0 12.9 14.5 0.0 13.2Machinery & Industrial ProductsRevenues 5,482 4,370 6,819 25.5 (19.6) 21,707 22,195 (2.2)EBITDA 1,200 990 1,510 21.2 (20.5) 0 4,519 (100.0)EBITDA margin (%) 21.9 22.7 22.1 0.0 20.4
% chg.
Source: Company, Kotak Institutional Equities
Strong inflows in 1Q11 primarily driven by in-house Rajpura power plant order
L&T reported very strong order inflows of Rs156 bn in 1QFY11, up 63% yoy from Rs96 bn in FY2010. The order inflows were primarily led by the power segment which grew almost 3X to Rs81 bn in 1QFY11 (from Rs28.7 bn) comprising 52% of the total inflows during the quarter. The power segment orders were boosted by a single large order worth Rs52 bn for the 2X660 MW Rajpura power plant being developed by L&T. The other key contributors to the order inflows for the quarter was the infrastructure segment which recorded inflows of about Rs39 bn - about 25% of the total inflows in 1QFY11. The hydrocarbon segment reported relatively sedate inflows of about Rs10.9 bn (7% of the inflows), down about 5% on a yoy basis.
Segmental breakup of order inflows and backlog reported by L&T in 1QFY11 and 1QFY10
1QFY11 inflows (Rs156 bn)
Infrastructure25%
Oil & gas7%
Process8%
Others8%
Power52%
1QFY10 inflows (Rs96 bn)
Power30%
Others11%
Process9%
Oil & gas12%
Infrastructure38%
1QFY11 backlog (Rs1,078 bn)
Power33%
Others6% Process
15%
Oil & gas14%
Infrastructure32%
1QFY10 backlog (Rs716 bn)
Infrastructure39%
Oil & gas12%
Process16%
Others9%
Power24%
Source: Company
Industrials Larsen & Toubro
18 KOTAK INSTITUTIONAL EQUITIES RESEARCH
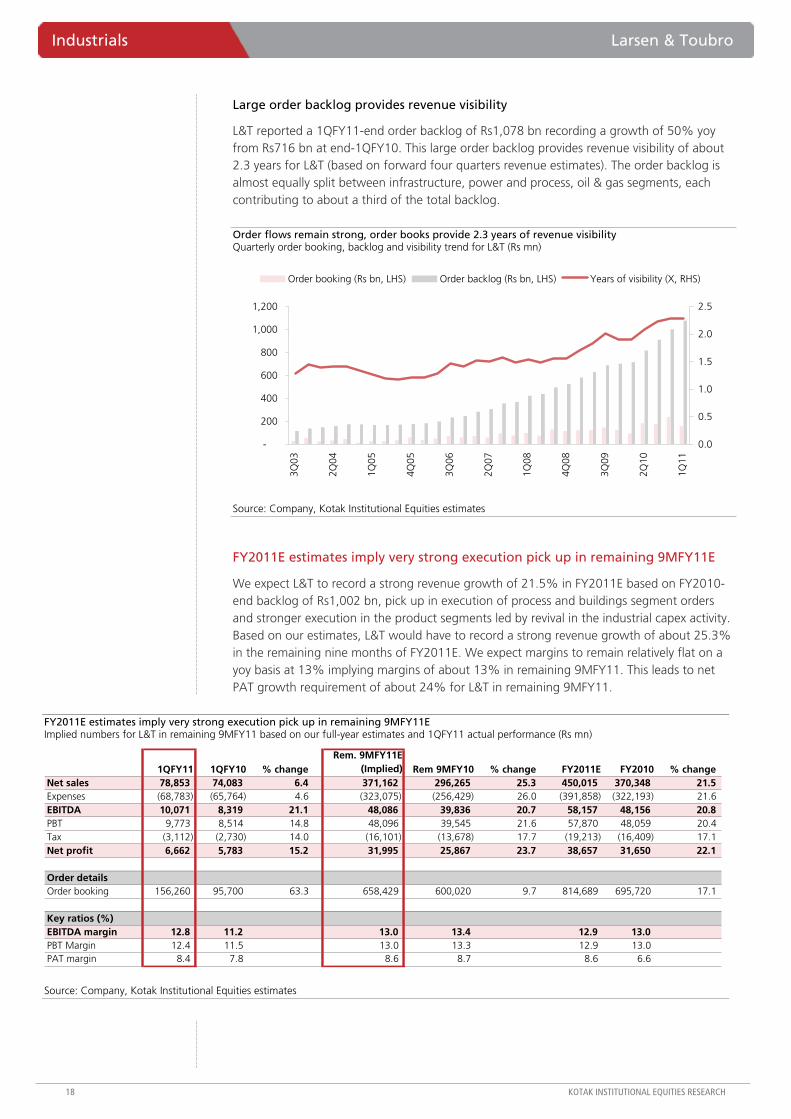
Large order backlog provides revenue visibility
L&T reported a 1QFY11-end order backlog of Rs1,078 bn recording a growth of 50% yoy from Rs716 bn at end-1QFY10. This large order backlog provides revenue visibility of about 2.3 years for L&T (based on forward four quarters revenue estimates). The order backlog is almost equally split between infrastructure, power and process, oil & gas segments, each contributing to about a third of the total backlog.
Order flows remain strong, order books provide 2.3 years of revenue visibility Quarterly order booking, backlog and visibility trend for L&T (Rs mn)
-
200
400
600
800
1,000
1,2003Q
03
2Q04
1Q05
4Q05
3Q06
2Q07
1Q08
4Q08
3Q09
2Q10
1Q11
0.0
0.5
1.0
1.5
2.0
2.5
Order booking (Rs bn, LHS) Order backlog (Rs bn, LHS) Years of visibility (X, RHS)
Source: Company, Kotak Institutional Equities estimates
FY2011E estimates imply very strong execution pick up in remaining 9MFY11E
We expect L&T to record a strong revenue growth of 21.5% in FY2011E based on FY2010-end backlog of Rs1,002 bn, pick up in execution of process and buildings segment orders and stronger execution in the product segments led by revival in the industrial capex activity. Based on our estimates, L&T would have to record a strong revenue growth of about 25.3% in the remaining nine months of FY2011E. We expect margins to remain relatively flat on a yoy basis at 13% implying margins of about 13% in remaining 9MFY11. This leads to net PAT growth requirement of about 24% for L&T in remaining 9MFY11.
FY2011E estimates imply very strong execution pick up in remaining 9MFY11E Implied numbers for L&T in remaining 9MFY11 based on our full-year estimates and 1QFY11 actual performance (Rs mn)
1QFY11 1QFY10 % changeRem. 9MFY11E
(Implied) Rem 9MFY10 % change FY2011E FY2010 % changeNet sales 78,853 74,083 6.4 371,162 296,265 25.3 450,015 370,348 21.5 Expenses (68,783) (65,764) 4.6 (323,075) (256,429) 26.0 (391,858) (322,193) 21.6 EBITDA 10,071 8,319 21.1 48,086 39,836 20.7 58,157 48,156 20.8 PBT 9,773 8,514 14.8 48,096 39,545 21.6 57,870 48,059 20.4 Tax (3,112) (2,730) 14.0 (16,101) (13,678) 17.7 (19,213) (16,409) 17.1 Net profit 6,662 5,783 15.2 31,995 25,867 23.7 38,657 31,650 22.1
Order detailsOrder booking 156,260 95,700 63.3 658,429 600,020 9.7 814,689 695,720 17.1
Key ratios (%)EBITDA margin 12.8 11.2 13.0 13.4 12.9 13.0 PBT Margin 12.4 11.5 13.0 13.3 12.9 13.0 PAT margin 8.4 7.8 8.6 8.7 8.6 6.6
Source: Company, Kotak Institutional Equities estimates
Larsen & Toubro Industrials
KOTAK INSTITUTIONAL EQUITIES RESEARCH 19
Management maintains FY2011E guidance of 25% order inflow growth and 20% execution growth
L&T management has retained its full-year FY2011E guidance of 25% growth in order inflows and 20% growth in 20%. The 25% order inflow growth target includes the Rs121 bn potential orders for the Hyderabad Metro project as well as certain road development projects where L&T has been awarded the project but is awaiting financial closure. Despite sedate revenue growth in 1QFY11 the management has retained its full-year revenue growth guidance of 20%. The management cited that as majority of order inflows in FY2010 (about 60%) was booked in 2HFY10 the revenues in this fiscal is also likely to be skewed towards the second half. On an average, a large order takes about six months for the initial monetization and engineering activities. The revenues from the order would start kicking in only six months post winning the order. Hence, L&T management expects execution to record a sharp pick up in 2HFY11.
Seemed more confident on inflow guidance versus revenues—a bit surprising
L&T management seemed much more confident of achieving its full-year inflow growth guidance of 25% (likely led by large infrastructure and power projects) than its revenue growth guidance of 20%. We find this a bit surprising as we believe revenues are likely to be relatively more in control/ in the hands of the company versus order inflows.
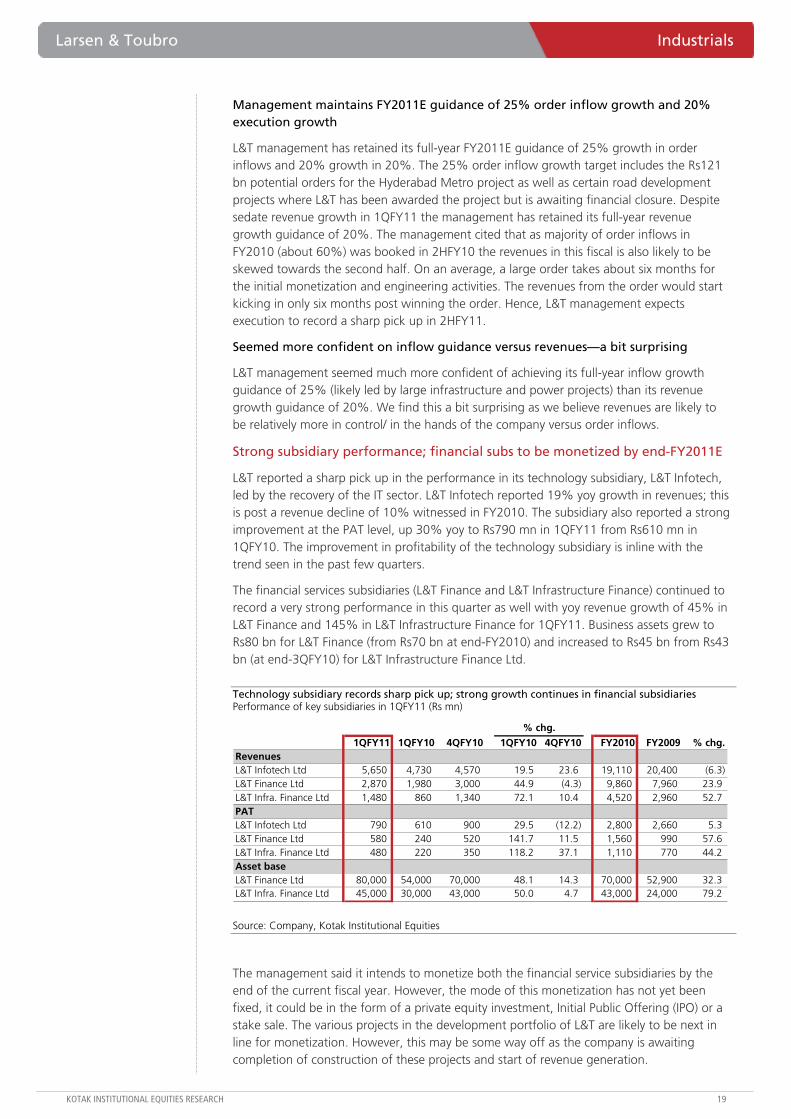
Strong subsidiary performance; financial subs to be monetized by end-FY2011E
L&T reported a sharp pick up in the performance in its technology subsidiary, L&T Infotech, led by the recovery of the IT sector. L&T Infotech reported 19% yoy growth in revenues; this is post a revenue decline of 10% witnessed in FY2010. The subsidiary also reported a strong improvement at the PAT level, up 30% yoy to Rs790 mn in 1QFY11 from Rs610 mn in 1QFY10. The improvement in profitability of the technology subsidiary is inline with the trend seen in the past few quarters.
The financial services subsidiaries (L&T Finance and L&T Infrastructure Finance) continued to record a very strong performance in this quarter as well with yoy revenue growth of 45% in L&T Finance and 145% in L&T Infrastructure Finance for 1QFY11. Business assets grew to Rs80 bn for L&T Finance (from Rs70 bn at end-FY2010) and increased to Rs45 bn from Rs43 bn (at end-3QFY10) for L&T Infrastructure Finance Ltd.
Technology subsidiary records sharp pick up; strong growth continues in financial subsidiaries Performance of key subsidiaries in 1QFY11 (Rs mn)
1QFY11 1QFY10 4QFY10 1QFY10 4QFY10 FY2010 FY2009 % chg.RevenuesL&T Infotech Ltd 5,650 4,730 4,570 19.5 23.6 19,110 20,400 (6.3) L&T Finance Ltd 2,870 1,980 3,000 44.9 (4.3) 9,860 7,960 23.9 L&T Infra. Finance Ltd 1,480 860 1,340 72.1 10.4 4,520 2,960 52.7 PATL&T Infotech Ltd 790 610 900 29.5 (12.2) 2,800 2,660 5.3 L&T Finance Ltd 580 240 520 141.7 11.5 1,560 990 57.6 L&T Infra. Finance Ltd 480 220 350 118.2 37.1 1,110 770 44.2 Asset baseL&T Finance Ltd 80,000 54,000 70,000 48.1 14.3 70,000 52,900 32.3 L&T Infra. Finance Ltd 45,000 30,000 43,000 50.0 4.7 43,000 24,000 79.2
% chg.
Source: Company, Kotak Institutional Equities
The management said it intends to monetize both the financial service subsidiaries by the end of the current fiscal year. However, the mode of this monetization has not yet been fixed, it could be in the form of a private equity investment, Initial Public Offering (IPO) or a stake sale. The various projects in the development portfolio of L&T are likely to be next in line for monetization. However, this may be some way off as the company is awaiting completion of construction of these projects and start of revenue generation.
Industrials Larsen & Toubro
20 KOTAK INSTITUTIONAL EQUITIES RESEARCH
Annual report highlights working capital improvement, returns dilution and moderate capex
Key highlights from L&T’s annual report include:
Net adjusted working capital surprisingly low at 12 days on better credit and advances; strong operating cash: L&T reported surprisingly low working capital of just 12 days of sales (adj. for loans & advances to subsidiaries) from 29 days in FY2009. The reduction in working capital, led by better credit terms and customer advances, led to strong operating cash generation of Rs41 bn. The operating cash, funds from QIP/FCCB (Rs29 bn) and divestiture (Rs12 bn) were applied towards capex (Rs14 bn), increase in investments in subsidiaries (Rs28 bn) and increase in current investments (Rs31 bn).
Large investments in new businesses and infrastructure projects lead to near-term returns dilution. Reported RoCE and RoE has diluted to 16% (from 21.5%) and 20.6 (from 28.4%) over the last two years. L&T has, over the last year, made several large investments into new business areas such as power equipment and development and several infrastructure SPVs. However, L&T’s RoCE adjusted for investment in subsidiaries and non-business related loans & advances to subsidiaries has remained very high at 30% for the past three years. Projects such as Hyd. metro would exacerbate the problem.
Buys 4.6% in IDPL implying Rs53 bn value; Seawoods stuck others (Tamco, FZE, Associates) do well. L&T has bought back 4.6% in IDPL from IDF for Rs2.45 bn, implying valuation of Rs53 bn, (our estimate of Rs82 bn). External investors were inducted to bring arms length relationship between development and construction however intention to pursue growth across verticals, large projects (Hyd. metro) and asymmetric benefits for partners must have led to buy back. Seawoods remains stuck (Rs8.5 bn equity and likely Rs11 bn debt); however, other subs do well (Tamco - Rs0.75 bn PAT, Associate PAT of Rs1.9 bn versus Rs1.4 bn, FZE PAT positive versus Rs3 bn loss).
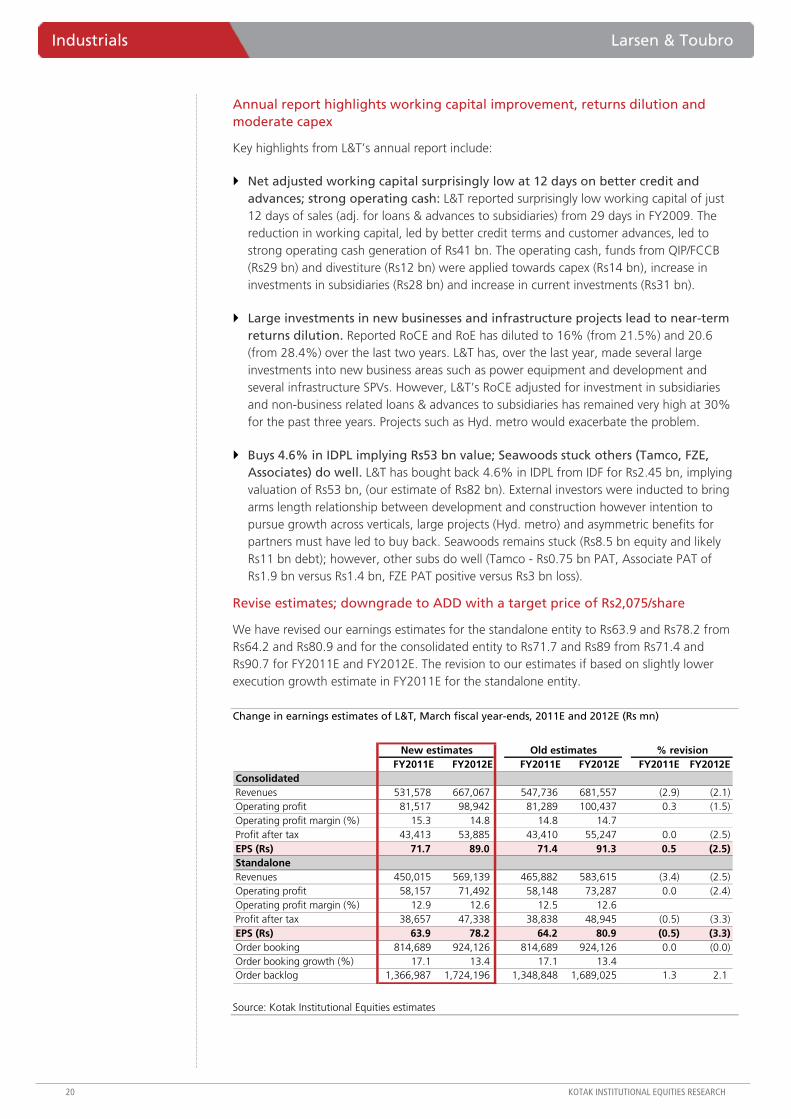
Revise estimates; downgrade to ADD with a target price of Rs2,075/share
We have revised our earnings estimates for the standalone entity to Rs63.9 and Rs78.2 from Rs64.2 and Rs80.9 and for the consolidated entity to Rs71.7 and Rs89 from Rs71.4 and Rs90.7 for FY2011E and FY2012E. The revision to our estimates if based on slightly lower execution growth estimate in FY2011E for the standalone entity.
Change in earnings estimates of L&T, March fiscal year-ends, 2011E and 2012E (Rs mn)
FY2011E FY2012E FY2011E FY2012E FY2011E FY2012EConsolidatedRevenues 531,578 667,067 547,736 681,557 (2.9) (2.1)Operating profit 81,517 98,942 81,289 100,437 0.3 (1.5)Operating profit margin (%) 15.3 14.8 14.8 14.7Profit after tax 43,413 53,885 43,410 55,247 0.0 (2.5)EPS (Rs) 71.7 89.0 71.4 91.3 0.5 (2.5)StandaloneRevenues 450,015 569,139 465,882 583,615 (3.4) (2.5)Operating profit 58,157 71,492 58,148 73,287 0.0 (2.4)Operating profit margin (%) 12.9 12.6 12.5 12.6Profit after tax 38,657 47,338 38,838 48,945 (0.5) (3.3)EPS (Rs) 63.9 78.2 64.2 80.9 (0.5) (3.3)Order booking 814,689 924,126 814,689 924,126 0.0 (0.0)Order booking growth (%) 17.1 13.4 17.1 13.4Order backlog 1,366,987 1,724,196 1,348,848 1,689,025 1.3 2.1
New estimates Old estimates % revision
Source: Kotak Institutional Equities estimates
Larsen & Toubro Industrials
KOTAK INSTITUTIONAL EQUITIES RESEARCH 21
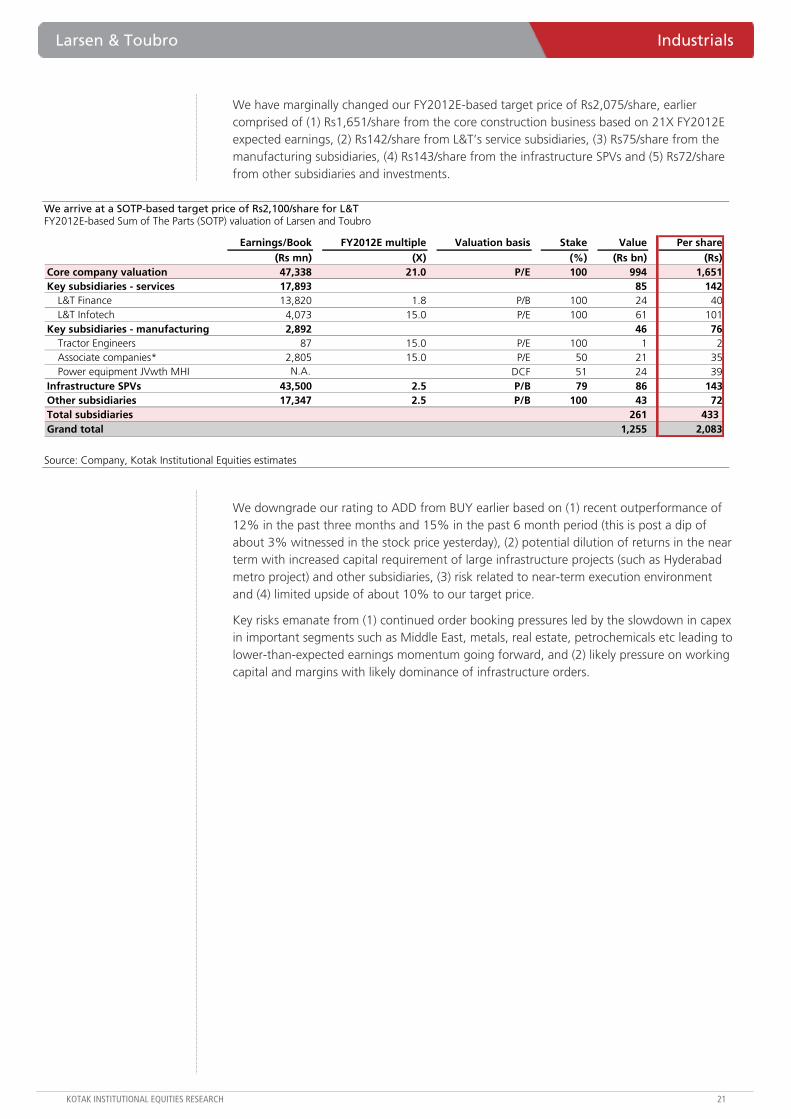
We have marginally changed our FY2012E-based target price of Rs2,075/share, earlier comprised of (1) Rs1,651/share from the core construction business based on 21X FY2012E expected earnings, (2) Rs142/share from L&T’s service subsidiaries, (3) Rs75/share from the manufacturing subsidiaries, (4) Rs143/share from the infrastructure SPVs and (5) Rs72/share from other subsidiaries and investments.
We arrive at a SOTP-based target price of Rs2,100/share for L&T FY2012E-based Sum of The Parts (SOTP) valuation of Larsen and Toubro
Earnings/Book FY2012E multiple Valuation basis Stake Value Per share (Rs mn) (X) (%) (Rs bn) (Rs)
Core company valuation 47,338 21.0 P/E 100 994 1,651 Key subsidiaries - services 17,893 85 142
L&T Finance 13,820 1.8 P/B 100 24 40 L&T Infotech 4,073 15.0 P/E 100 61 101
Key subsidiaries - manufacturing 2,892 46 76 Tractor Engineers 87 15.0 P/E 100 1 2 Associate companies* 2,805 15.0 P/E 50 21 35 Power equipment JVwth MHI N.A. DCF 51 24 39
Infrastructure SPVs 43,500 2.5 P/B 79 86 143 Other subsidiaries 17,347 2.5 P/B 100 43 72 Total subsidiaries 261 433 Grand total 1,255 2,083
Source: Company, Kotak Institutional Equities estimates
We downgrade our rating to ADD from BUY earlier based on (1) recent outperformance of 12% in the past three months and 15% in the past 6 month period (this is post a dip of about 3% witnessed in the stock price yesterday), (2) potential dilution of returns in the near term with increased capital requirement of large infrastructure projects (such as Hyderabad metro project) and other subsidiaries, (3) risk related to near-term execution environment and (4) limited upside of about 10% to our target price.
Key risks emanate from (1) continued order booking pressures led by the slowdown in capex in important segments such as Middle East, metals, real estate, petrochemicals etc leading to lower-than-expected earnings momentum going forward, and (2) likely pressure on working capital and margins with likely dominance of infrastructure orders.
Industrials Larsen & Toubro
22 KOTAK INSTITUTIONAL EQUITIES RESEARCH
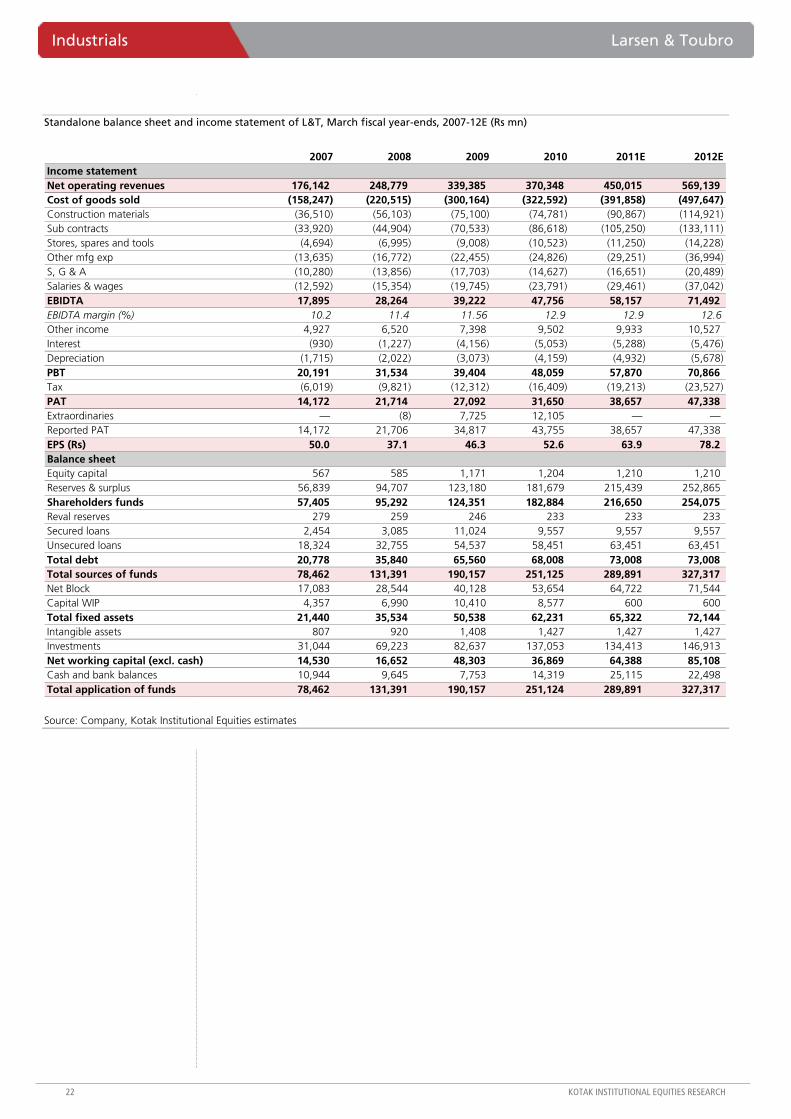
Standalone balance sheet and income statement of L&T, March fiscal year-ends, 2007-12E (Rs mn)
2007 2008 2009 2010 2011E 2012EIncome statementNet operating revenues 176,142 248,779 339,385 370,348 450,015 569,139Cost of goods sold (158,247) (220,515) (300,164) (322,592) (391,858) (497,647)Construction materials (36,510) (56,103) (75,100) (74,781) (90,867) (114,921)Sub contracts (33,920) (44,904) (70,533) (86,618) (105,250) (133,111)Stores, spares and tools (4,694) (6,995) (9,008) (10,523) (11,250) (14,228)Other mfg exp (13,635) (16,772) (22,455) (24,826) (29,251) (36,994)S, G & A (10,280) (13,856) (17,703) (14,627) (16,651) (20,489)Salaries & wages (12,592) (15,354) (19,745) (23,791) (29,461) (37,042)EBIDTA 17,895 28,264 39,222 47,756 58,157 71,492EBIDTA margin (%) 10.2 11.4 11.56 12.9 12.9 12.6Other income 4,927 6,520 7,398 9,502 9,933 10,527Interest (930) (1,227) (4,156) (5,053) (5,288) (5,476)Depreciation (1,715) (2,022) (3,073) (4,159) (4,932) (5,678)PBT 20,191 31,534 39,404 48,059 57,870 70,866Tax (6,019) (9,821) (12,312) (16,409) (19,213) (23,527)PAT 14,172 21,714 27,092 31,650 38,657 47,338Extraordinaries — (8) 7,725 12,105 — —Reported PAT 14,172 21,706 34,817 43,755 38,657 47,338EPS (Rs) 50.0 37.1 46.3 52.6 63.9 78.2Balance sheetEquity capital 567 585 1,171 1,204 1,210 1,210 Reserves & surplus 56,839 94,707 123,180 181,679 215,439 252,865 Shareholders funds 57,405 95,292 124,351 182,884 216,650 254,075 Reval reserves 279 259 246 233 233 233 Secured loans 2,454 3,085 11,024 9,557 9,557 9,557 Unsecured loans 18,324 32,755 54,537 58,451 63,451 63,451 Total debt 20,778 35,840 65,560 68,008 73,008 73,008 Total sources of funds 78,462 131,391 190,157 251,125 289,891 327,317 Net Block 17,083 28,544 40,128 53,654 64,722 71,544 Capital WIP 4,357 6,990 10,410 8,577 600 600 Total fixed assets 21,440 35,534 50,538 62,231 65,322 72,144 Intangible assets 807 920 1,408 1,427 1,427 1,427 Investments 31,044 69,223 82,637 137,053 134,413 146,913 Net working capital (excl. cash) 14,530 16,652 48,303 36,869 64,388 85,108 Cash and bank balances 10,944 9,645 7,753 14,319 25,115 22,498 Total application of funds 78,462 131,391 190,157 251,124 289,891 327,317
Source: Company, Kotak Institutional Equities estimates
For private Circulation Only. FOR IMPORTANT INFORMATION ABOUT KOTAK SECURITIES’ RATING SYSTEM AND OTHER DISCLOSURES, REFER TO THE END OF THIS MATERIAL.
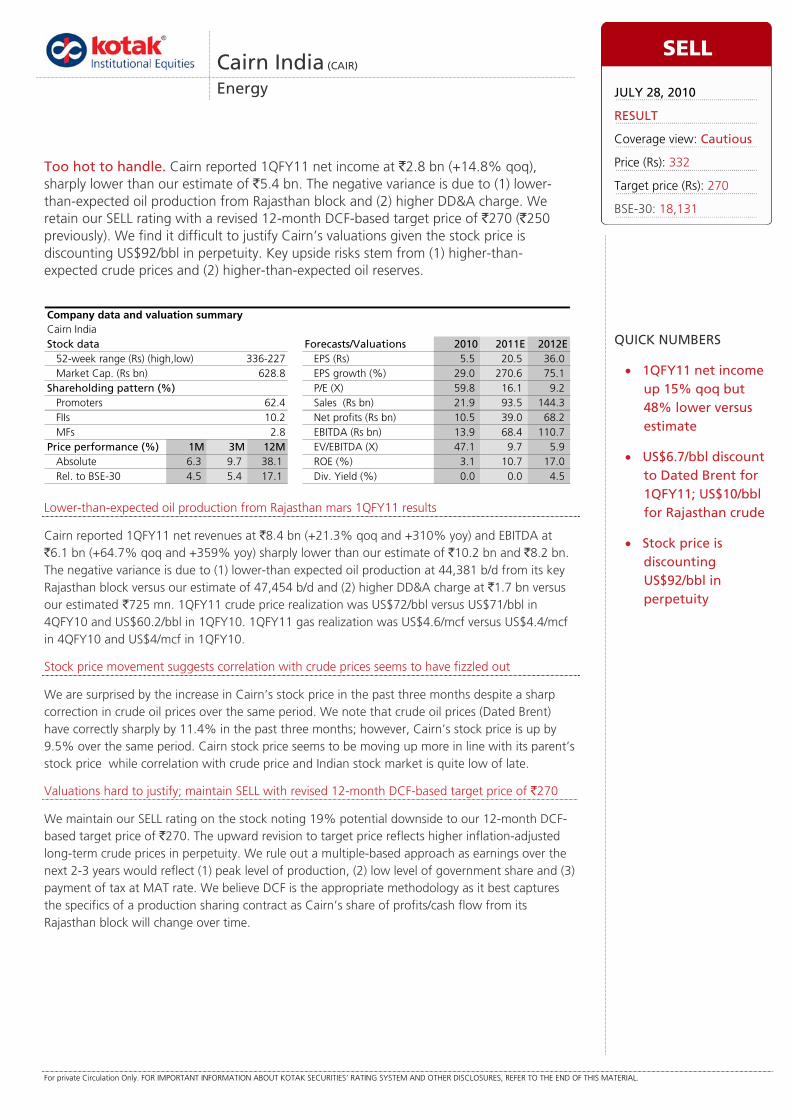
Lower-than-expected oil production from Rajasthan mars 1QFY11 results
Cairn reported 1QFY11 net revenues at `8.4 bn (+21.3% qoq and +310% yoy) and EBITDA at `6.1 bn (+64.7% qoq and +359% yoy) sharply lower than our estimate of `10.2 bn and `8.2 bn. The negative variance is due to (1) lower-than expected oil production at 44,381 b/d from its key Rajasthan block versus our estimate of 47,454 b/d and (2) higher DD&A charge at `1.7 bn versus our estimated `725 mn. 1QFY11 crude price realization was US$72/bbl versus US$71/bbl in 4QFY10 and US$60.2/bbl in 1QFY10. 1QFY11 gas realization was US$4.6/mcf versus US$4.4/mcf in 4QFY10 and US$4/mcf in 1QFY10.
Stock price movement suggests correlation with crude prices seems to have fizzled out
We are surprised by the increase in Cairn’s stock price in the past three months despite a sharp correction in crude oil prices over the same period. We note that crude oil prices (Dated Brent) have correctly sharply by 11.4% in the past three months; however, Cairn’s stock price is up by 9.5% over the same period. Cairn stock price seems to be moving up more in line with its parent’s stock price while correlation with crude price and Indian stock market is quite low of late.
Valuations hard to justify; maintain SELL with revised 12-month DCF-based target price of `270
We maintain our SELL rating on the stock noting 19% potential downside to our 12-month DCF-based target price of `270. The upward revision to target price reflects higher inflation-adjusted long-term crude prices in perpetuity. We rule out a multiple-based approach as earnings over the next 2-3 years would reflect (1) peak level of production, (2) low level of government share and (3) payment of tax at MAT rate. We believe DCF is the appropriate methodology as it best captures the specifics of a production sharing contract as Cairn’s share of profits/cash flow from its Rajasthan block will change over time.
Cairn India (CAIR)
Energy
Too hot to handle. Cairn reported 1QFY11 net income at `2.8 bn (+14.8% qoq), sharply lower than our estimate of `5.4 bn. The negative variance is due to (1) lower-than-expected oil production from Rajasthan block and (2) higher DD&A charge. We retain our SELL rating with a revised 12-month DCF-based target price of `270 (`250 previously). We find it difficult to justify Cairn’s valuations given the stock price is discounting US$92/bbl in perpetuity. Key upside risks stem from (1) higher-than-expected crude prices and (2) higher-than-expected oil reserves.
Cairn IndiaStock data Forecasts/Valuations 2010 2011E 2012E
52-week range (Rs) (high,low) EPS (Rs) 5.5 20.5 36.0Market Cap. (Rs bn) 628.8 EPS growth (%) 29.0 270.6 75.1
Shareholding pattern (%) P/E (X) 59.8 16.1 9.2Promoters 62.4 Sales (Rs bn) 21.9 93.5 144.3FIIs 10.2 Net profits (Rs bn) 10.5 39.0 68.2MFs 2.8 EBITDA (Rs bn) 13.9 68.4 110.7
Price performance (%) 1M 3M 12M EV/EBITDA (X) 47.1 9.7 5.9Absolute 6.3 9.7 38.1 ROE (%) 3.1 10.7 17.0Rel. to BSE-30 4.5 5.4 17.1 Div. Yield (%) 0.0 0.0 4.5
Company data and valuation summary
336-227
SELL
JULY 28, 2010
RESULT
Coverage view: Cautious
Price (Rs): 332
Target price (Rs): 270
BSE-30: 18,131
QUICK NUMBERS
• 1QFY11 net income up 15% qoq but 48% lower versus estimate
• US$6.7/bbl discount to Dated Brent for 1QFY11; US$10/bbl for Rajasthan crude
• Stock price is discounting US$92/bbl in perpetuity
Energy Cairn India
24 KOTAK INSTITUTIONAL EQUITIES RESEARCH
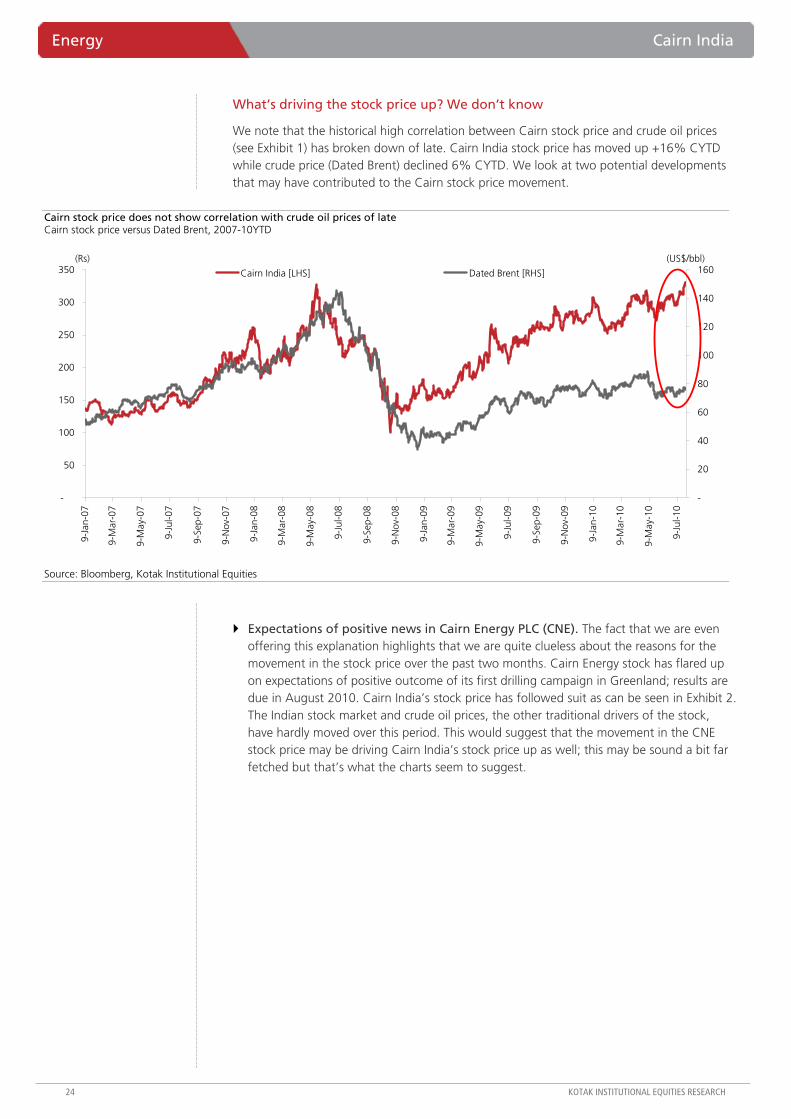
What’s driving the stock price up? We don’t know
We note that the historical high correlation between Cairn stock price and crude oil prices (see Exhibit 1) has broken down of late. Cairn India stock price has moved up +16% CYTD while crude price (Dated Brent) declined 6% CYTD. We look at two potential developments that may have contributed to the Cairn stock price movement.
Cairn stock price does not show correlation with crude oil prices of late Cairn stock price versus Dated Brent, 2007-10YTD
-
50
100
150
200
250
300
350
9-Ja
n-07
9-M
ar-0
7
9-M
ay-0
7
9-Ju
l-07
9-Se
p-07
9-N
ov-0
7
9-Ja
n-08
9-M
ar-0
8
9-M
ay-0
8
9-Ju
l-08
9-Se
p-08
9-N
ov-0
8
9-Ja
n-09
9-M
ar-0
9
9-M
ay-0
9
9-Ju
l-09
9-Se
p-09
9-N
ov-0
9
9-Ja
n-10
9-M
ar-1
0
9-M
ay-1
0
9-Ju
l-10
-
20
40
60
80
100
120
140
160Cairn India [LHS] Dated Brent [RHS]
(Rs) (US$/bbl)
Source: Bloomberg, Kotak Institutional Equities
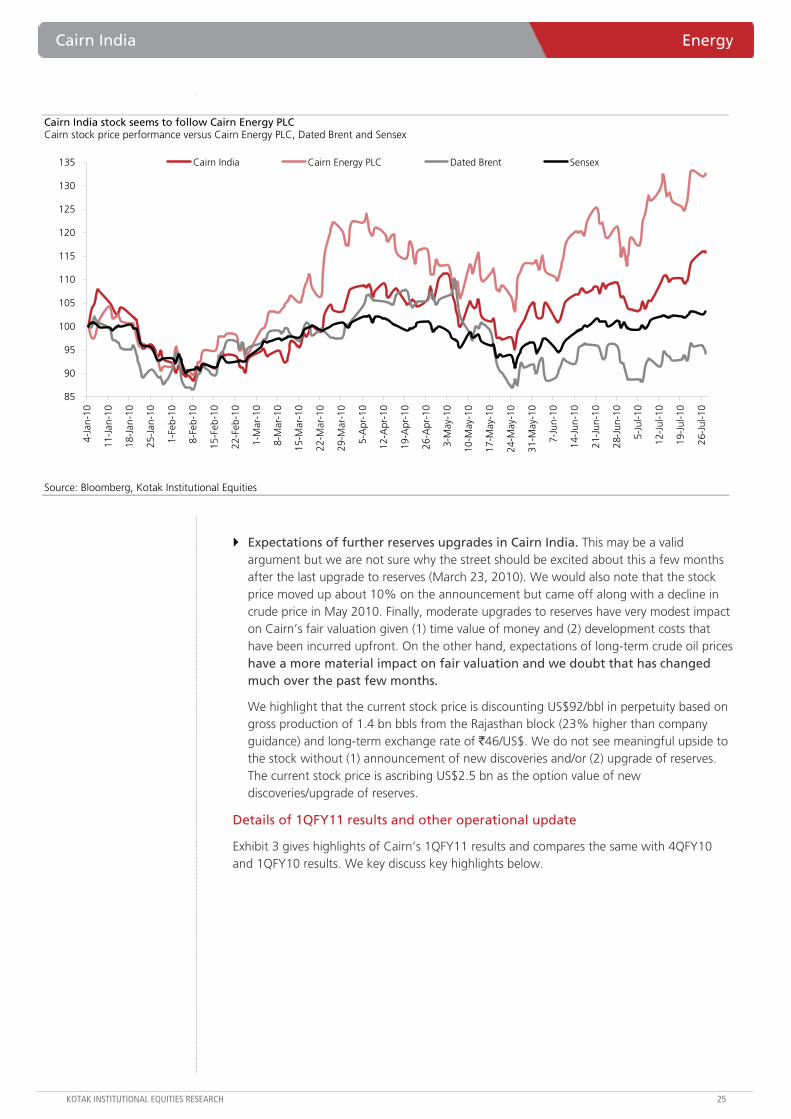
Expectations of positive news in Cairn Energy PLC (CNE). The fact that we are even offering this explanation highlights that we are quite clueless about the reasons for the movement in the stock price over the past two months. Cairn Energy stock has flared up on expectations of positive outcome of its first drilling campaign in Greenland; results are due in August 2010. Cairn India’s stock price has followed suit as can be seen in Exhibit 2. The Indian stock market and crude oil prices, the other traditional drivers of the stock, have hardly moved over this period. This would suggest that the movement in the CNE stock price may be driving Cairn India’s stock price up as well; this may be sound a bit far fetched but that’s what the charts seem to suggest.
Cairn India Energy
KOTAK INSTITUTIONAL EQUITIES RESEARCH 25
Cairn India stock seems to follow Cairn Energy PLC Cairn stock price performance versus Cairn Energy PLC, Dated Brent and Sensex
85
90
95
100
105
110
115
120
125
130
135
4-Ja
n-10
11-J
an-1
0
18-J
an-1
0
25-J
an-1
0
1-Fe
b-10
8-Fe
b-10
15-F
eb-1
0
22-F
eb-1
0
1-M
ar-1
0
8-M
ar-1
0
15-M
ar-1
0
22-M
ar-1
0
29-M
ar-1
0
5-A
pr-1
0
12-A
pr-1
0
19-A
pr-1
0
26-A
pr-1
0
3-M
ay-1
0
10-M
ay-1
0
17-M
ay-1
0
24-M
ay-1
0
31-M
ay-1
0
7-Ju
n-10
14-J
un-1
0
21-J
un-1
0
28-J
un-1
0
5-Ju
l-10
12-J
ul-1
0
19-J
ul-1
0
26-J
ul-1
0
Cairn India Cairn Energy PLC Dated Brent Sensex
Source: Bloomberg, Kotak Institutional Equities
Expectations of further reserves upgrades in Cairn India. This may be a valid argument but we are not sure why the street should be excited about this a few months after the last upgrade to reserves (March 23, 2010). We would also note that the stock price moved up about 10% on the announcement but came off along with a decline in crude price in May 2010. Finally, moderate upgrades to reserves have very modest impact on Cairn’s fair valuation given (1) time value of money and (2) development costs that have been incurred upfront. On the other hand, expectations of long-term crude oil prices have a more material impact on fair valuation and we doubt that has changed much over the past few months.
We highlight that the current stock price is discounting US$92/bbl in perpetuity based on gross production of 1.4 bn bbls from the Rajasthan block (23% higher than company guidance) and long-term exchange rate of `46/US$. We do not see meaningful upside to the stock without (1) announcement of new discoveries and/or (2) upgrade of reserves. The current stock price is ascribing US$2.5 bn as the option value of new discoveries/upgrade of reserves.
Details of 1QFY11 results and other operational update
Exhibit 3 gives highlights of Cairn’s 1QFY11 results and compares the same with 4QFY10 and 1QFY10 results. We key discuss key highlights below.
Energy Cairn India
26 KOTAK INSTITUTIONAL EQUITIES RESEARCH
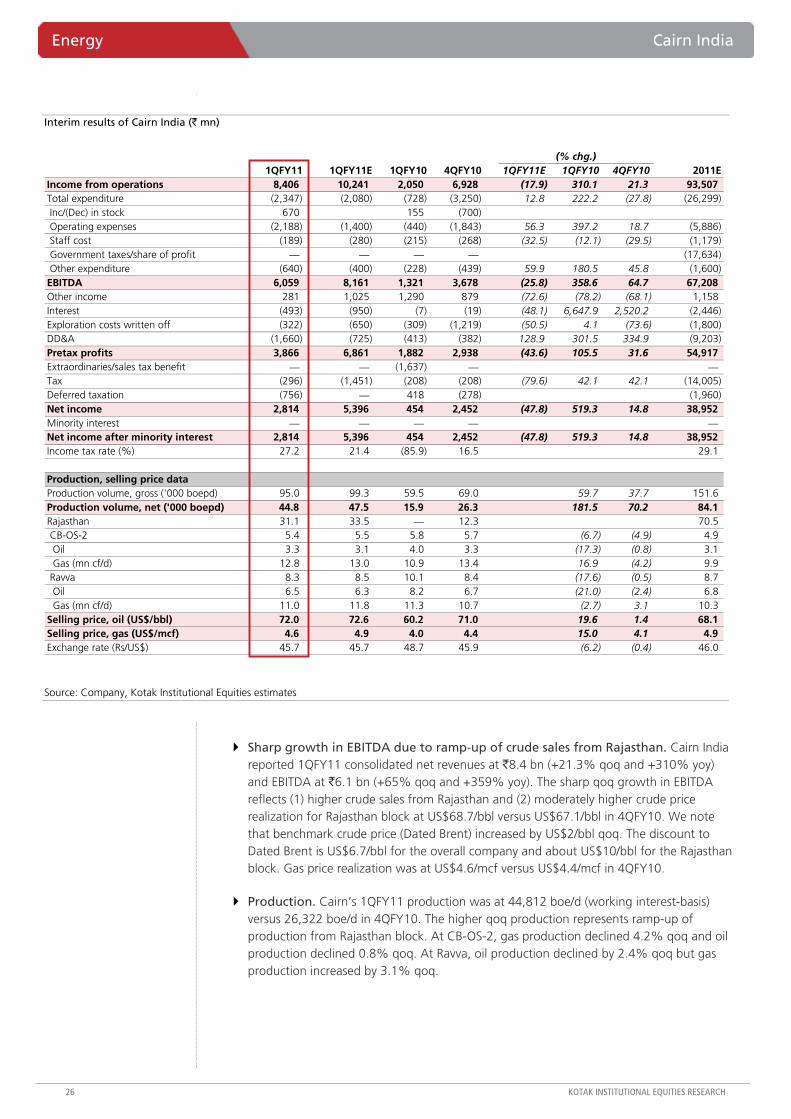
Interim results of Cairn India (` mn)
(% chg.)1QFY11 1QFY11E 1QFY10 4QFY10 1QFY11E 1QFY10 4QFY10 2011E
Income from operations 8,406 10,241 2,050 6,928 (17.9) 310.1 21.3 93,507 Total expenditure (2,347) (2,080) (728) (3,250) 12.8 222.2 (27.8) (26,299) Inc/(Dec) in stock 670 155 (700) Operating expenses (2,188) (1,400) (440) (1,843) 56.3 397.2 18.7 (5,886) Staff cost (189) (280) (215) (268) (32.5) (12.1) (29.5) (1,179) Government taxes/share of profit — — — — (17,634) Other expenditure (640) (400) (228) (439) 59.9 180.5 45.8 (1,600)EBITDA 6,059 8,161 1,321 3,678 (25.8) 358.6 64.7 67,208 Other income 281 1,025 1,290 879 (72.6) (78.2) (68.1) 1,158Interest (493) (950) (7) (19) (48.1) 6,647.9 2,520.2 (2,446)Exploration costs written off (322) (650) (309) (1,219) (50.5) 4.1 (73.6) (1,800)DD&A (1,660) (725) (413) (382) 128.9 301.5 334.9 (9,203)Pretax profits 3,866 6,861 1,882 2,938 (43.6) 105.5 31.6 54,917 Extraordinaries/sales tax benefit — — (1,637) — —Tax (296) (1,451) (208) (208) (79.6) 42.1 42.1 (14,005)Deferred taxation (756) — 418 (278) (1,960)Net income 2,814 5,396 454 2,452 (47.8) 519.3 14.8 38,952 Minority interest — — — — —Net income after minority interest 2,814 5,396 454 2,452 (47.8) 519.3 14.8 38,952 Income tax rate (%) 27.2 21.4 (85.9) 16.5 29.1
Production, selling price dataProduction volume, gross ('000 boepd) 95.0 99.3 59.5 69.0 59.7 37.7 151.6 Production volume, net ('000 boepd) 44.8 47.5 15.9 26.3 181.5 70.2 84.1 Rajasthan 31.1 33.5 — 12.3 70.5 CB-OS-2 5.4 5.5 5.8 5.7 (6.7) (4.9) 4.9 Oil 3.3 3.1 4.0 3.3 (17.3) (0.8) 3.1 Gas (mn cf/d) 12.8 13.0 10.9 13.4 16.9 (4.2) 9.9 Ravva 8.3 8.5 10.1 8.4 (17.6) (0.5) 8.7 Oil 6.5 6.3 8.2 6.7 (21.0) (2.4) 6.8 Gas (mn cf/d) 11.0 11.8 11.3 10.7 (2.7) 3.1 10.3 Selling price, oil (US$/bbl) 72.0 72.6 60.2 71.0 19.6 1.4 68.1 Selling price, gas (US$/mcf) 4.6 4.9 4.0 4.4 15.0 4.1 4.9 Exchange rate (Rs/US$) 45.7 45.7 48.7 45.9 (6.2) (0.4) 46.0
Source: Company, Kotak Institutional Equities estimates
Sharp growth in EBITDA due to ramp-up of crude sales from Rajasthan. Cairn India reported 1QFY11 consolidated net revenues at `8.4 bn (+21.3% qoq and +310% yoy) and EBITDA at `6.1 bn (+65% qoq and +359% yoy). The sharp qoq growth in EBITDA reflects (1) higher crude sales from Rajasthan and (2) moderately higher crude price realization for Rajasthan block at US$68.7/bbl versus US$67.1/bbl in 4QFY10. We note that benchmark crude price (Dated Brent) increased by US$2/bbl qoq. The discount to Dated Brent is US$6.7/bbl for the overall company and about US$10/bbl for the Rajasthan block. Gas price realization was at US$4.6/mcf versus US$4.4/mcf in 4QFY10.
Production. Cairn’s 1QFY11 production was at 44,812 boe/d (working interest-basis) versus 26,322 boe/d in 4QFY10. The higher qoq production represents ramp-up of production from Rajasthan block. At CB-OS-2, gas production declined 4.2% qoq and oil production declined 0.8% qoq. At Ravva, oil production declined by 2.4% qoq but gas production increased by 3.1% qoq.
Cairn India Energy
KOTAK INSTITUTIONAL EQUITIES RESEARCH 27
Cairn’s entitlement was 74% in Rajasthan output. We note that Cairn’s entitlement in its Rajasthan block was 74% versus its participating interest of 70% in the block. This is on account of cairn’s entitlement to recover the initial exploration expenses that were incurred by cairn solely. The management has guided that Cairn’s entitlement will be at 74% for FY2011E.
DD&A charges up 335% qoq. Cairn reported DD&A expenses at `1.7 bn (+335%qoq and +302% yoy). The sharp increase in DD&A expenses reflects (1) higher depreciation charge due to commissioning of the pipeline in 1QFY11 and (2) higher depletion charge due to higher production.
Other income was 68% lower qoq. Cairn’s other income was lower at `281 mn (-68% qoq) as 4QFY10 other income included forex gains. We note that 1QFY11 other expenditure includes `413 mn as foreign exchange fluctuation loss.
Execution on track with commissioning of Train 3 at its Rajasthan block. Cairn commissioned the second train with a capacity of 50,000 b/d in May 2010 and the third train with a capacity of 50,000 b/d in June 2010. Cairn is currently producing over 100,000 b/d.
Earnings revision and key assumptions
We have fine-tuned our FY2011E, FY2012E and FY2013E EPS to `21, `36 and `44 from `28, `40 and `48 to reflect (1) moderately higher production and (2) weaker rupee. We discuss our key assumptions behind earnings estimates below.
Production. We model gross production from Rajasthan block at 5 mn tons (101,000 b/d) for FY2011E, 8.3 mn tons (167,000 b/d) for FY2012E and 11.3 mn tons (225,000 b/d) for FY2013E. We assume gross production of 1.4 bn bbls (1.13 bn bbls net to Cairn) over the life of the field.
Crude price assumption. We maintain our crude price (Dated Brent) assumptions at US$75/bbl for FY2011E, US$75/bbl for FY2012E and US$80/bbl for FY2013E. However, we increase crude prices by 2% in perpetuity beyond FY2013E to reflect the impact of inflation. We model discount for Rajasthan crude to Dated Brent at US$8/bbl (US$6/bbl previously).
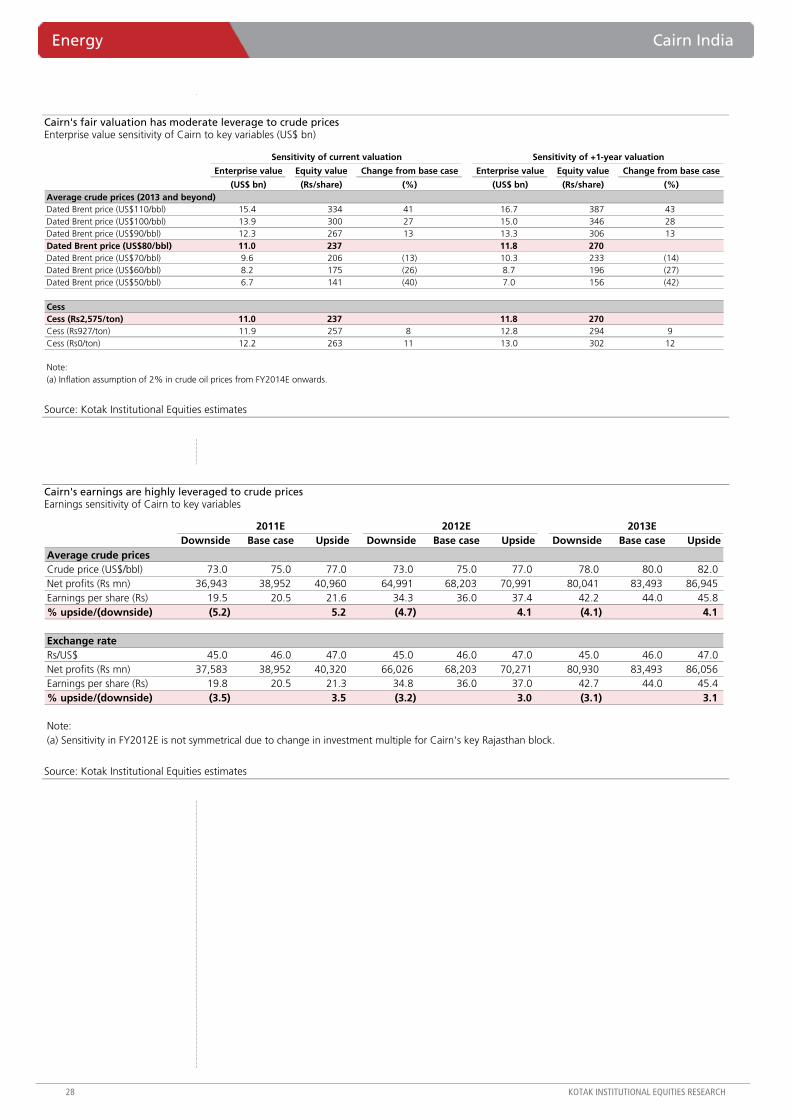
Cess. Our earnings estimates and valuation for Cairn India reflect payment of cess on crude oil from its Rajasthan block. Cairn is paying cess under protest and we believe it is best to factor in the payment for making financial estimates. Our fair valuation of `271 assumes cess payment at `2,575/ton. Our fair valuation of the stock would increase by `294 if we assume that Cairn will have to bear cess at `927/ton and it would increase by `302 if we assume Cairn will not have to bear any cess (see Exhibit 4).
Energy Cairn India
28 KOTAK INSTITUTIONAL EQUITIES RESEARCH
Cairn's fair valuation has moderate leverage to crude prices Enterprise value sensitivity of Cairn to key variables (US$ bn)
Sensitivity of current valuation Sensitivity of +1-year valuation
Enterprise value Equity value Change from base case Enterprise value Equity value Change from base case
(US$ bn) (Rs/share) (%) (US$ bn) (Rs/share) (%)Average crude prices (2013 and beyond)Dated Brent price (US$110/bbl) 15.4 334 41 16.7 387 43Dated Brent price (US$100/bbl) 13.9 300 27 15.0 346 28Dated Brent price (US$90/bbl) 12.3 267 13 13.3 306 13Dated Brent price (US$80/bbl) 11.0 237 11.8 270 Dated Brent price (US$70/bbl) 9.6 206 (13) 10.3 233 (14)Dated Brent price (US$60/bbl) 8.2 175 (26) 8.7 196 (27)Dated Brent price (US$50/bbl) 6.7 141 (40) 7.0 156 (42)
CessCess (Rs2,575/ton) 11.0 237 11.8 270 Cess (Rs927/ton) 11.9 257 8 12.8 294 9Cess (Rs0/ton) 12.2 263 11 13.0 302 12
Note:(a) Inflation assumption of 2% in crude oil prices from FY2014E onwards.
Source: Kotak Institutional Equities estimates
Cairn's earnings are highly leveraged to crude prices Earnings sensitivity of Cairn to key variables
2011E 2012E 2013EDownside Base case Upside Downside Base case Upside Downside Base case Upside
Average crude pricesCrude price (US$/bbl) 73.0 75.0 77.0 73.0 75.0 77.0 78.0 80.0 82.0Net profits (Rs mn) 36,943 38,952 40,960 64,991 68,203 70,991 80,041 83,493 86,945Earnings per share (Rs) 19.5 20.5 21.6 34.3 36.0 37.4 42.2 44.0 45.8% upside/(downside) (5.2) 5.2 (4.7) 4.1 (4.1) 4.1
Exchange rateRs/US$ 45.0 46.0 47.0 45.0 46.0 47.0 45.0 46.0 47.0Net profits (Rs mn) 37,583 38,952 40,320 66,026 68,203 70,271 80,930 83,493 86,056Earnings per share (Rs) 19.8 20.5 21.3 34.8 36.0 37.0 42.7 44.0 45.4% upside/(downside) (3.5) 3.5 (3.2) 3.0 (3.1) 3.1
Note:(a) Sensitivity in FY2012E is not symmetrical due to change in investment multiple for Cairn's key Rajasthan block.
Source: Kotak Institutional Equities estimates
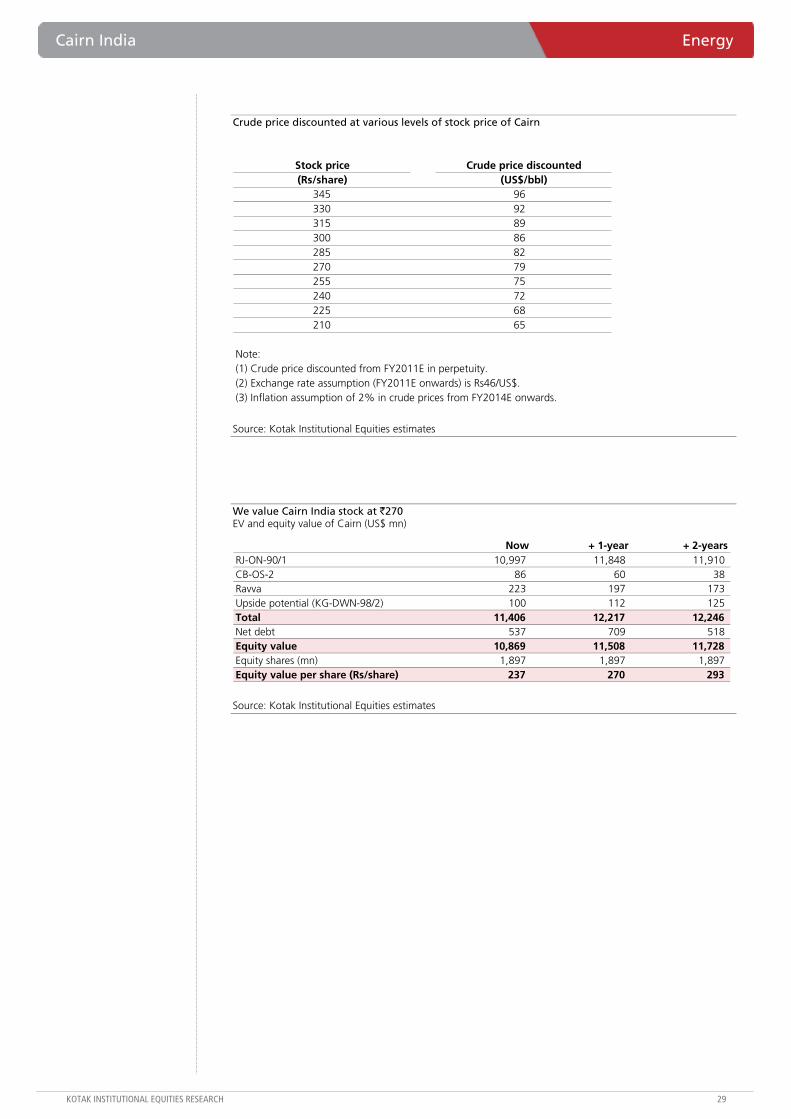
Cairn India Energy
KOTAK INSTITUTIONAL EQUITIES RESEARCH 29
Crude price discounted at various levels of stock price of Cairn
Stock price Crude price discounted(Rs/share) (US$/bbl)
345 96 330 92 315 89 300 86 285 82 270 79 255 75 240 72 225 68 210 65
Note:(1) Crude price discounted from FY2011E in perpetuity.(2) Exchange rate assumption (FY2011E onwards) is Rs46/US$.(3) Inflation assumption of 2% in crude prices from FY2014E onwards.
Source: Kotak Institutional Equities estimates
We value Cairn India stock at `270 EV and equity value of Cairn (US$ mn)
Now + 1-year + 2-yearsRJ-ON-90/1 10,997 11,848 11,910 CB-OS-2 86 60 38 Ravva 223 197 173 Upside potential (KG-DWN-98/2) 100 112 125 Total 11,406 12,217 12,246 Net debt 537 709 518 Equity value 10,869 11,508 11,728 Equity shares (mn) 1,897 1,897 1,897 Equity value per share (Rs/share) 237 270 293
Source: Kotak Institutional Equities estimates
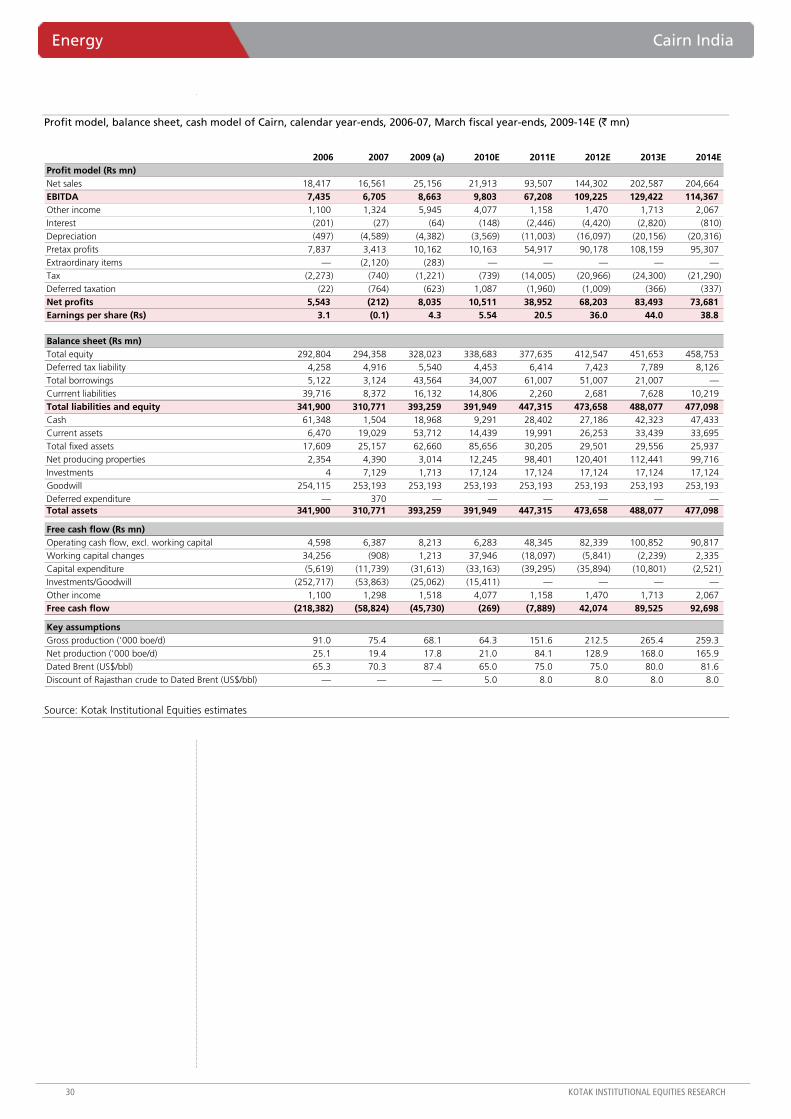
Energy Cairn India
30 KOTAK INSTITUTIONAL EQUITIES RESEARCH
Profit model, balance sheet, cash model of Cairn, calendar year-ends, 2006-07, March fiscal year-ends, 2009-14E (` mn)
2006 2007 2009 (a) 2010E 2011E 2012E 2013E 2014EProfit model (Rs mn)Net sales 18,417 16,561 25,156 21,913 93,507 144,302 202,587 204,664EBITDA 7,435 6,705 8,663 9,803 67,208 109,225 129,422 114,367Other income 1,100 1,324 5,945 4,077 1,158 1,470 1,713 2,067Interest (201) (27) (64) (148) (2,446) (4,420) (2,820) (810)Depreciation (497) (4,589) (4,382) (3,569) (11,003) (16,097) (20,156) (20,316)Pretax profits 7,837 3,413 10,162 10,163 54,917 90,178 108,159 95,307Extraordinary items — (2,120) (283) — — — — —Tax (2,273) (740) (1,221) (739) (14,005) (20,966) (24,300) (21,290)Deferred taxation (22) (764) (623) 1,087 (1,960) (1,009) (366) (337)Net profits 5,543 (212) 8,035 10,511 38,952 68,203 83,493 73,681Earnings per share (Rs) 3.1 (0.1) 4.3 5.54 20.5 36.0 44.0 38.8
Balance sheet (Rs mn)Total equity 292,804 294,358 328,023 338,683 377,635 412,547 451,653 458,753Deferred tax liability 4,258 4,916 5,540 4,453 6,414 7,423 7,789 8,126Total borrowings 5,122 3,124 43,564 34,007 61,007 51,007 21,007 —Currrent liabilities 39,716 8,372 16,132 14,806 2,260 2,681 7,628 10,219Total liabilities and equity 341,900 310,771 393,259 391,949 447,315 473,658 488,077 477,098Cash 61,348 1,504 18,968 9,291 28,402 27,186 42,323 47,433Current assets 6,470 19,029 53,712 14,439 19,991 26,253 33,439 33,695Total fixed assets 17,609 25,157 62,660 85,656 30,205 29,501 29,556 25,937Net producing properties 2,354 4,390 3,014 12,245 98,401 120,401 112,441 99,716Investments 4 7,129 1,713 17,124 17,124 17,124 17,124 17,124Goodwill 254,115 253,193 253,193 253,193 253,193 253,193 253,193 253,193Deferred expenditure — 370 — — — — — —Total assets 341,900 310,771 393,259 391,949 447,315 473,658 488,077 477,098
Free cash flow (Rs mn)Operating cash flow, excl. working capital 4,598 6,387 8,213 6,283 48,345 82,339 100,852 90,817Working capital changes 34,256 (908) 1,213 37,946 (18,097) (5,841) (2,239) 2,335Capital expenditure (5,619) (11,739) (31,613) (33,163) (39,295) (35,894) (10,801) (2,521)Investments/Goodwill (252,717) (53,863) (25,062) (15,411) — — — —Other income 1,100 1,298 1,518 4,077 1,158 1,470 1,713 2,067Free cash flow (218,382) (58,824) (45,730) (269) (7,889) 42,074 89,525 92,698
Key assumptionsGross production ('000 boe/d) 91.0 75.4 68.1 64.3 151.6 212.5 265.4 259.3 Net production ('000 boe/d) 25.1 19.4 17.8 21.0 84.1 128.9 168.0 165.9 Dated Brent (US$/bbl) 65.3 70.3 87.4 65.0 75.0 75.0 80.0 81.6 Discount of Rajasthan crude to Dated Brent (US$/bbl) — — — 5.0 8.0 8.0 8.0 8.0
Source: Kotak Institutional Equities estimates
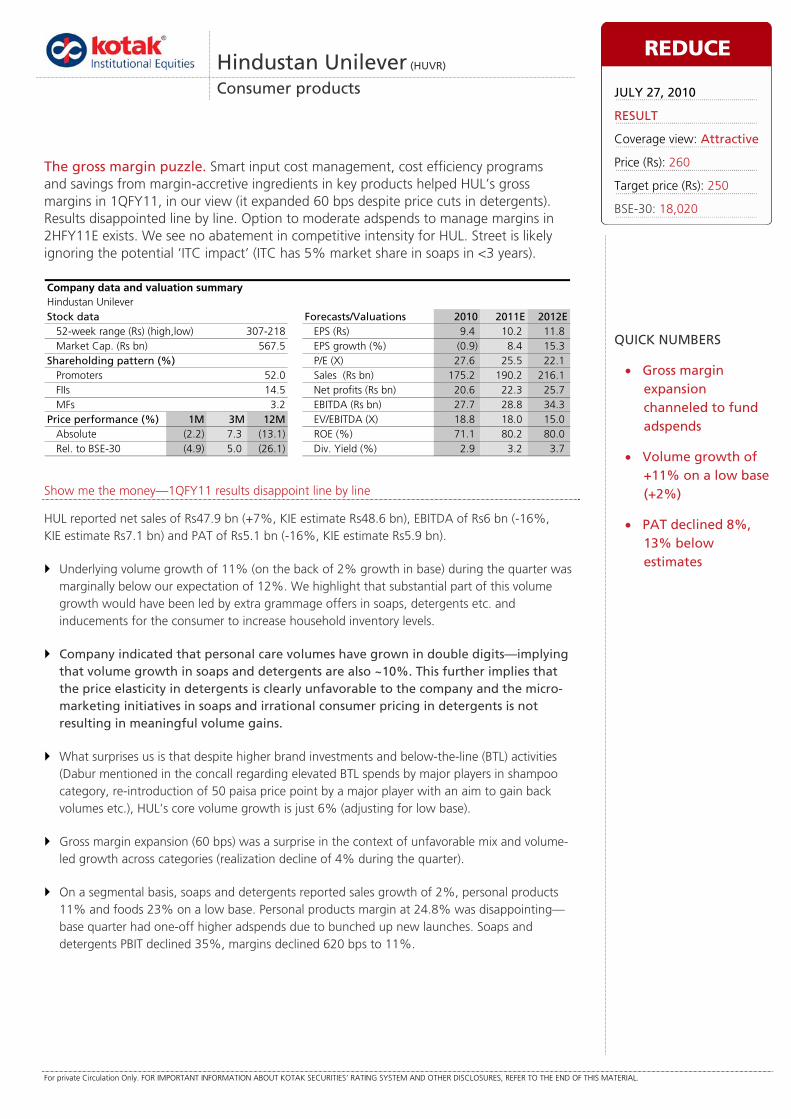
For private Circulation Only. FOR IMPORTANT INFORMATION ABOUT KOTAK SECURITIES’ RATING SYSTEM AND OTHER DISCLOSURES, REFER TO THE END OF THIS MATERIAL.
Show me the money—1QFY11 results disappoint line by line
HUL reported net sales of Rs47.9 bn (+7%, KIE estimate Rs48.6 bn), EBITDA of Rs6 bn (-16%, KIE estimate Rs7.1 bn) and PAT of Rs5.1 bn (-16%, KIE estimate Rs5.9 bn).
Underlying volume growth of 11% (on the back of 2% growth in base) during the quarter was marginally below our expectation of 12%. We highlight that substantial part of this volume growth would have been led by extra grammage offers in soaps, detergents etc. and inducements for the consumer to increase household inventory levels.
Company indicated that personal care volumes have grown in double digits—implying that volume growth in soaps and detergents are also ~10%. This further implies that the price elasticity in detergents is clearly unfavorable to the company and the micro-marketing initiatives in soaps and irrational consumer pricing in detergents is not resulting in meaningful volume gains.
What surprises us is that despite higher brand investments and below-the-line (BTL) activities (Dabur mentioned in the concall regarding elevated BTL spends by major players in shampoo category, re-introduction of 50 paisa price point by a major player with an aim to gain back volumes etc.), HUL’s core volume growth is just 6% (adjusting for low base).
Gross margin expansion (60 bps) was a surprise in the context of unfavorable mix and volume-led growth across categories (realization decline of 4% during the quarter).
On a segmental basis, soaps and detergents reported sales growth of 2%, personal products 11% and foods 23% on a low base. Personal products margin at 24.8% was disappointing— base quarter had one-off higher adspends due to bunched up new launches. Soaps and detergents PBIT declined 35%, margins declined 620 bps to 11%.
Hindustan Unilever (HUVR)
Consumer products
The gross margin puzzle. Smart input cost management, cost efficiency programs and savings from margin-accretive ingredients in key products helped HUL’s gross margins in 1QFY11, in our view (it expanded 60 bps despite price cuts in detergents). Results disappointed line by line. Option to moderate adspends to manage margins in 2HFY11E exists. We see no abatement in competitive intensity for HUL. Street is likely ignoring the potential ‘ITC impact’ (ITC has 5% market share in soaps in <3 years).
Hindustan UnileverStock data Forecasts/Valuations 2010 2011E 2012E
52-week range (Rs) (high,low) EPS (Rs) 9.4 10.2 11.8Market Cap. (Rs bn) 567.5 EPS growth (%) (0.9) 8.4 15.3
Shareholding pattern (%) P/E (X) 27.6 25.5 22.1Promoters 52.0 Sales (Rs bn) 175.2 190.2 216.1FIIs 14.5 Net profits (Rs bn) 20.6 22.3 25.7MFs 3.2 EBITDA (Rs bn) 27.7 28.8 34.3
Price performance (%) 1M 3M 12M EV/EBITDA (X) 18.8 18.0 15.0Absolute (2.2) 7.3 (13.1) ROE (%) 71.1 80.2 80.0Rel. to BSE-30 (4.9) 5.0 (26.1) Div. Yield (%) 2.9 3.2 3.7
Company data and valuation summary
307-218
REDUCE
JULY 27, 2010
RESULT
Coverage view: Attractive
Price (Rs): 260
Target price (Rs): 250
BSE-30: 18,020
QUICK NUMBERS
• Gross margin expansion channeled to fund adspends
• Volume growth of +11% on a low base (+2%)
• PAT declined 8%, 13% below estimates
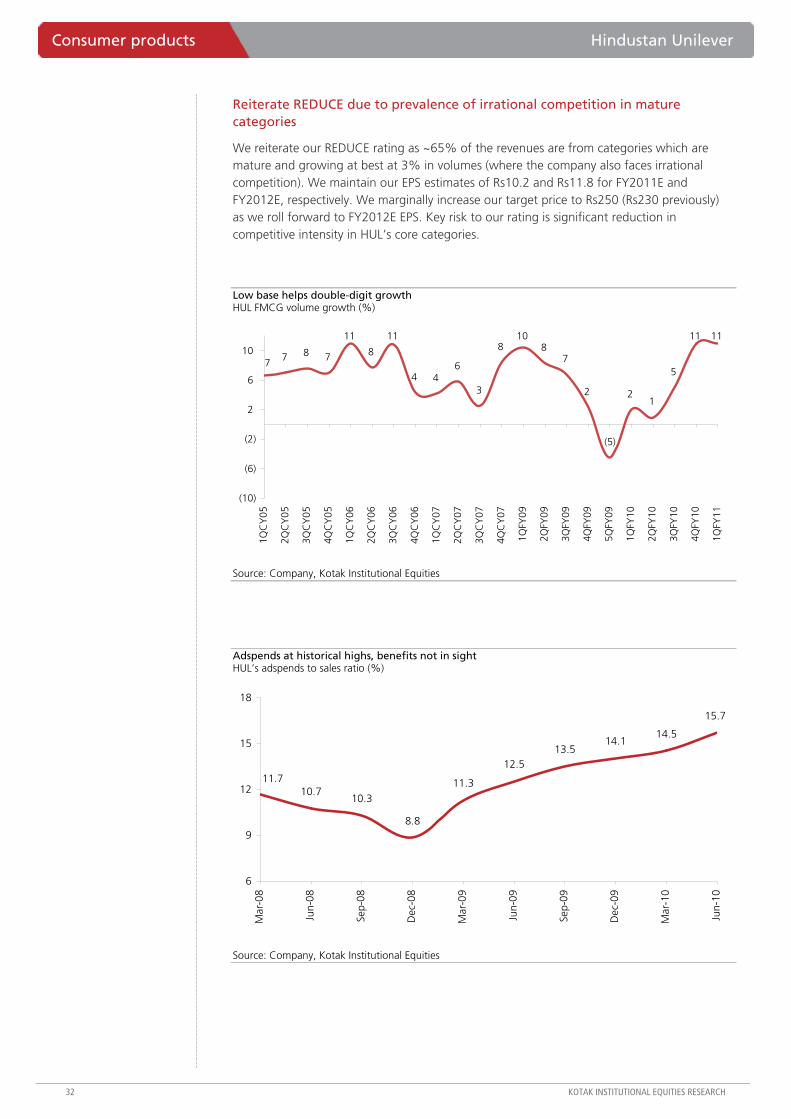
Consumer products Hindustan Unilever
32 KOTAK INSTITUTIONAL EQUITIES RESEARCH
Reiterate REDUCE due to prevalence of irrational competition in mature categories
We reiterate our REDUCE rating as ~65% of the revenues are from categories which are mature and growing at best at 3% in volumes (where the company also faces irrational competition). We maintain our EPS estimates of Rs10.2 and Rs11.8 for FY2011E and FY2012E, respectively. We marginally increase our target price to Rs250 (Rs230 previously) as we roll forward to FY2012E EPS. Key risk to our rating is significant reduction in competitive intensity in HUL’s core categories.
Low base helps double-digit growth HUL FMCG volume growth (%)
7 8 7
11
8
11
4 46
3
810
87
2
(5)
21
5
11 11
7
(10)
(6)
(2)
2
6
10
1QC
Y05
2QC
Y05
3QC
Y05
4QC
Y05
1QC
Y06
2QC
Y06
3QC
Y06
4QC
Y06
1QC
Y07
2QC
Y07
3QC
Y07
4QC
Y07
1QFY
09
2QFY
09
3QFY
09
4QFY
09
5QFY
09
1QFY
10
2QFY
10
3QFY
10
4QFY
10
1QFY
11
Source: Company, Kotak Institutional Equities
Adspends at historical highs, benefits not in sight HUL’s adspends to sales ratio (%)
10.710.3
8.8
11.3
12.513.5
14.114.5
15.7
11.7
6
9
12
15
18
Mar
-08
Jun-
08
Sep-
08
Dec
-08
Mar
-09
Jun-
09
Sep-
09
Dec
-09
Mar
-10
Jun-
10
Source: Company, Kotak Institutional Equities
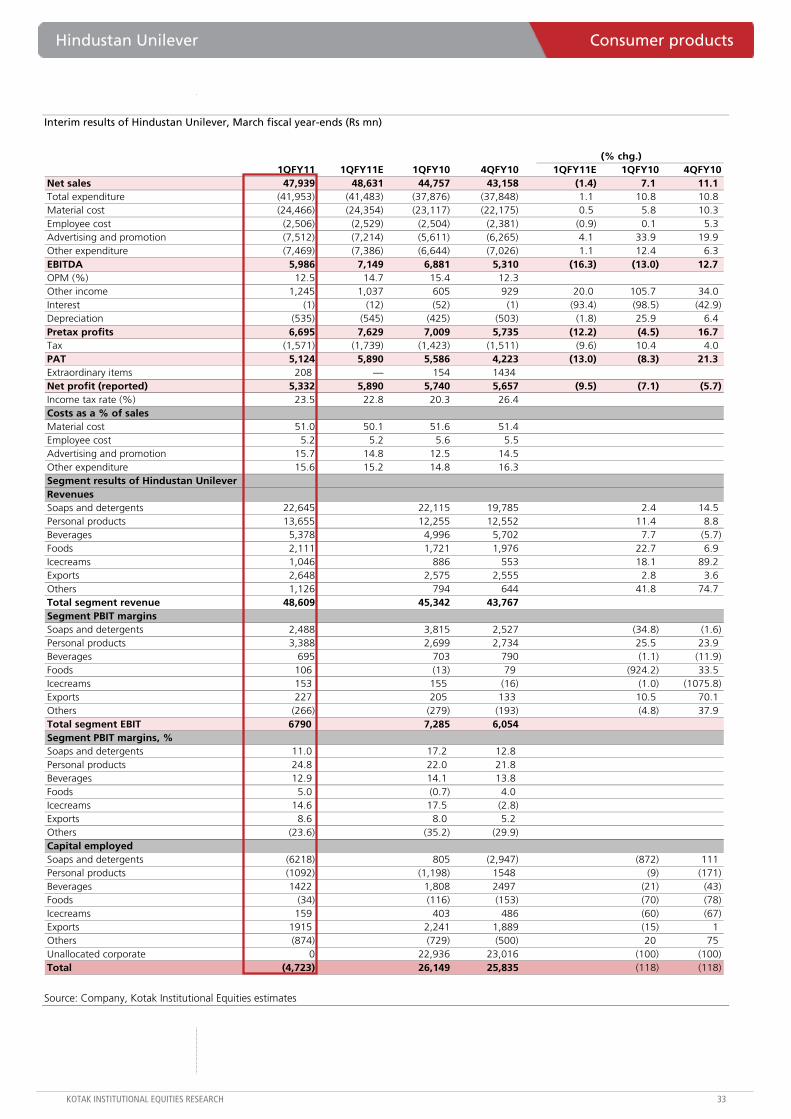
Hindustan Unilever Consumer products
KOTAK INSTITUTIONAL EQUITIES RESEARCH 33
Interim results of Hindustan Unilever, March fiscal year-ends (Rs mn)
(% chg.)1QFY11 1QFY11E 1QFY10 4QFY10 1QFY11E 1QFY10 4QFY10
Net sales 47,939 48,631 44,757 43,158 (1.4) 7.1 11.1Total expenditure (41,953) (41,483) (37,876) (37,848) 1.1 10.8 10.8Material cost (24,466) (24,354) (23,117) (22,175) 0.5 5.8 10.3Employee cost (2,506) (2,529) (2,504) (2,381) (0.9) 0.1 5.3Advertising and promotion (7,512) (7,214) (5,611) (6,265) 4.1 33.9 19.9Other expenditure (7,469) (7,386) (6,644) (7,026) 1.1 12.4 6.3EBITDA 5,986 7,149 6,881 5,310 (16.3) (13.0) 12.7OPM (%) 12.5 14.7 15.4 12.3Other income 1,245 1,037 605 929 20.0 105.7 34.0Interest (1) (12) (52) (1) (93.4) (98.5) (42.9)Depreciation (535) (545) (425) (503) (1.8) 25.9 6.4Pretax profits 6,695 7,629 7,009 5,735 (12.2) (4.5) 16.7Tax (1,571) (1,739) (1,423) (1,511) (9.6) 10.4 4.0PAT 5,124 5,890 5,586 4,223 (13.0) (8.3) 21.3Extraordinary items 208 — 154 1434Net profit (reported) 5,332 5,890 5,740 5,657 (9.5) (7.1) (5.7)Income tax rate (%) 23.5 22.8 20.3 26.4Costs as a % of salesMaterial cost 51.0 50.1 51.6 51.4Employee cost 5.2 5.2 5.6 5.5Advertising and promotion 15.7 14.8 12.5 14.5Other expenditure 15.6 15.2 14.8 16.3Segment results of Hindustan UnileverRevenuesSoaps and detergents 22,645 22,115 19,785 2.4 14.5Personal products 13,655 12,255 12,552 11.4 8.8Beverages 5,378 4,996 5,702 7.7 (5.7)Foods 2,111 1,721 1,976 22.7 6.9Icecreams 1,046 886 553 18.1 89.2Exports 2,648 2,575 2,555 2.8 3.6Others 1,126 794 644 41.8 74.7Total segment revenue 48,609 45,342 43,767Segment PBIT marginsSoaps and detergents 2,488 3,815 2,527 (34.8) (1.6)Personal products 3,388 2,699 2,734 25.5 23.9Beverages 695 703 790 (1.1) (11.9)Foods 106 (13) 79 (924.2) 33.5Icecreams 153 155 (16) (1.0) (1075.8)Exports 227 205 133 10.5 70.1Others (266) (279) (193) (4.8) 37.9Total segment EBIT 6790 7,285 6,054Segment PBIT margins, %Soaps and detergents 11.0 17.2 12.8Personal products 24.8 22.0 21.8Beverages 12.9 14.1 13.8Foods 5.0 (0.7) 4.0Icecreams 14.6 17.5 (2.8)Exports 8.6 8.0 5.2Others (23.6) (35.2) (29.9)Capital employedSoaps and detergents (6218) 805 (2,947) (872) 111Personal products (1092) (1,198) 1548 (9) (171)Beverages 1422 1,808 2497 (21) (43)Foods (34) (116) (153) (70) (78)Icecreams 159 403 486 (60) (67)Exports 1915 2,241 1,889 (15) 1Others (874) (729) (500) 20 75Unallocated corporate 0 22,936 23,016 (100) (100)Total (4,723) 26,149 25,835 (118) (118)
Source: Company, Kotak Institutional Equities estimates
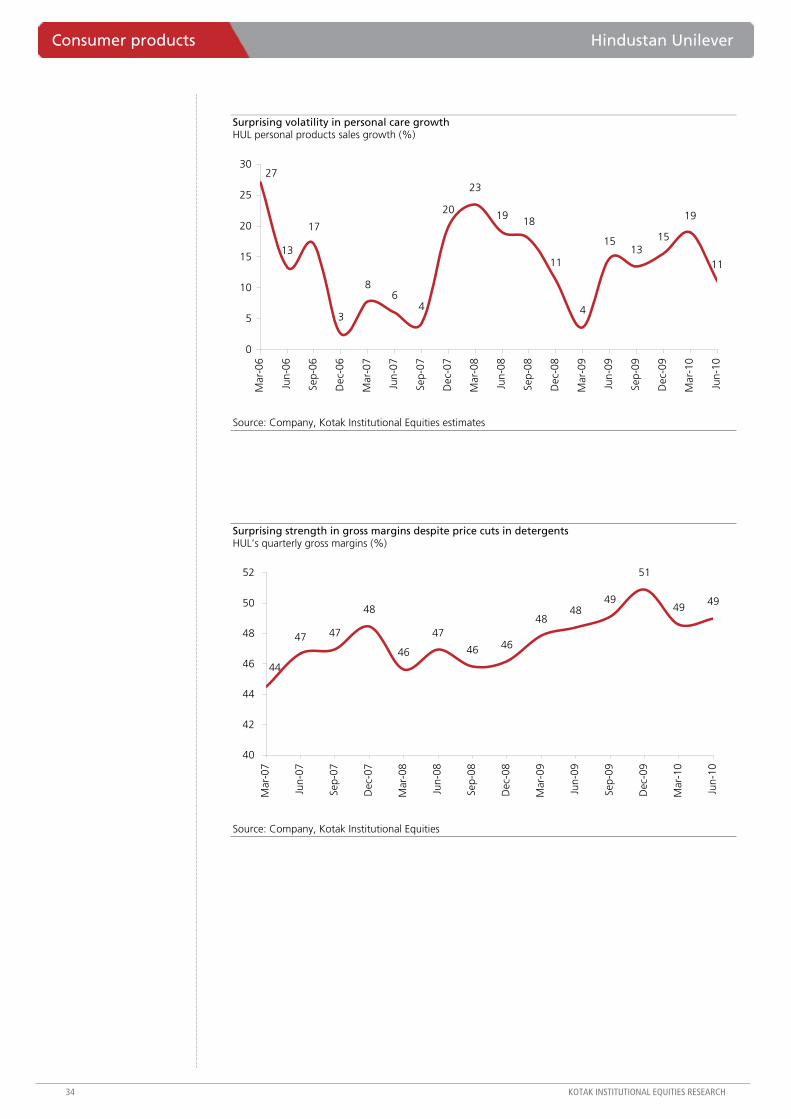
Consumer products Hindustan Unilever
34 KOTAK INSTITUTIONAL EQUITIES RESEARCH
Surprising volatility in personal care growth HUL personal products sales growth (%)
13
17
3
86
4
20
23
19 18
11
4
1513
15
19
11
27
0
5
10
15
20
25
30
Mar
-06
Jun-
06
Sep-
06
Dec
-06
Mar
-07
Jun-
07
Sep-
07
Dec
-07
Mar
-08
Jun-
08
Sep-
08
Dec
-08
Mar
-09
Jun-
09
Sep-
09
Dec
-09
Mar
-10
Jun-
10
Source: Company, Kotak Institutional Equities estimates
Surprising strength in gross margins despite price cuts in detergents HUL’s quarterly gross margins (%)
47 47
48
46
47
46 46
4848
49
51
49 49
44
40
42
44
46
48
50
52
Mar
-07
Jun-
07
Sep-
07
Dec
-07
Mar
-08
Jun-
08
Sep-
08
Dec
-08
Mar
-09
Jun-
09
Sep-
09
Dec
-09
Mar
-10
Jun-
10
Source: Company, Kotak Institutional Equities
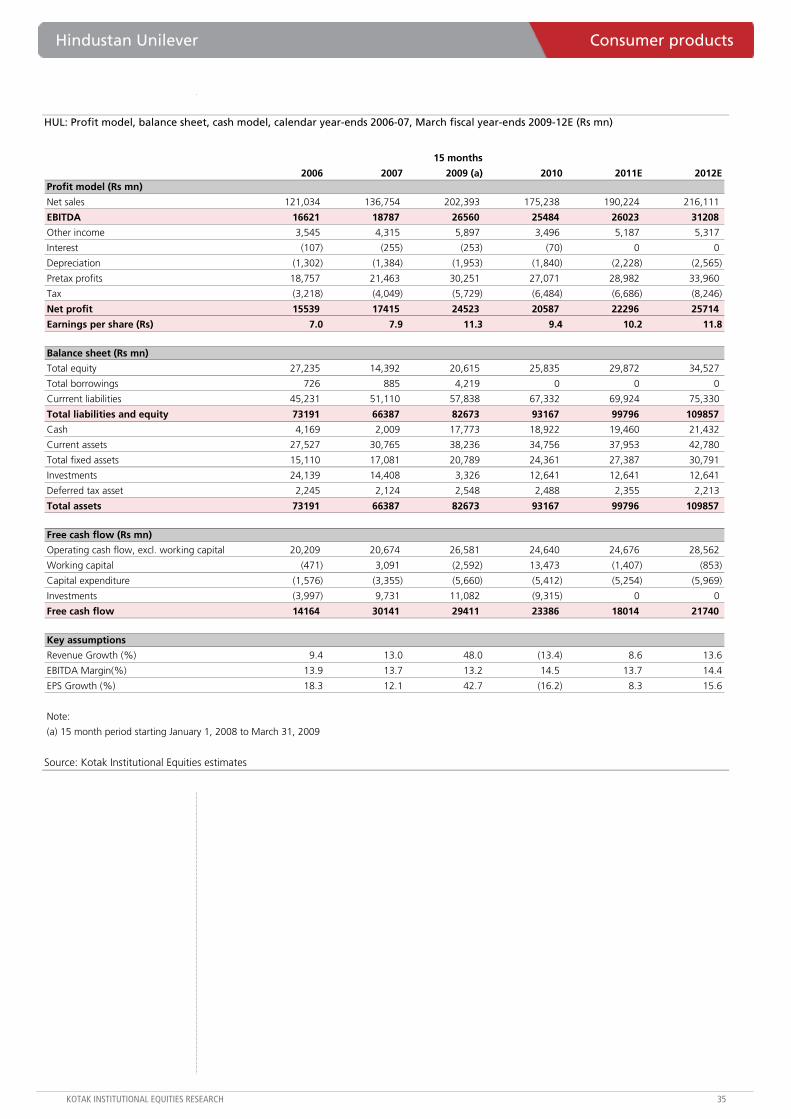
Hindustan Unilever Consumer products
KOTAK INSTITUTIONAL EQUITIES RESEARCH 35
HUL: Profit model, balance sheet, cash model, calendar year-ends 2006-07, March fiscal year-ends 2009-12E (Rs mn)
15 months
2006 2007 2009 (a) 2010 2011E 2012EProfit model (Rs mn)
Net sales 121,034 136,754 202,393 175,238 190,224 216,111
EBITDA 16621 18787 26560 25484 26023 31208
Other income 3,545 4,315 5,897 3,496 5,187 5,317
Interest (107) (255) (253) (70) 0 0
Depreciation (1,302) (1,384) (1,953) (1,840) (2,228) (2,565)
Pretax profits 18,757 21,463 30,251 27,071 28,982 33,960
Tax (3,218) (4,049) (5,729) (6,484) (6,686) (8,246)
Net profit 15539 17415 24523 20587 22296 25714
Earnings per share (Rs) 7.0 7.9 11.3 9.4 10.2 11.8
Balance sheet (Rs mn)
Total equity 27,235 14,392 20,615 25,835 29,872 34,527
Total borrowings 726 885 4,219 0 0 0
Currrent liabilities 45,231 51,110 57,838 67,332 69,924 75,330
Total liabilities and equity 73191 66387 82673 93167 99796 109857
Cash 4,169 2,009 17,773 18,922 19,460 21,432
Current assets 27,527 30,765 38,236 34,756 37,953 42,780
Total fixed assets 15,110 17,081 20,789 24,361 27,387 30,791
Investments 24,139 14,408 3,326 12,641 12,641 12,641
Deferred tax asset 2,245 2,124 2,548 2,488 2,355 2,213
Total assets 73191 66387 82673 93167 99796 109857
Free cash flow (Rs mn)
Operating cash flow, excl. working capital 20,209 20,674 26,581 24,640 24,676 28,562
Working capital (471) 3,091 (2,592) 13,473 (1,407) (853)
Capital expenditure (1,576) (3,355) (5,660) (5,412) (5,254) (5,969)
Investments (3,997) 9,731 11,082 (9,315) 0 0
Free cash flow 14164 30141 29411 23386 18014 21740
Key assumptions
Revenue Growth (%) 9.4 13.0 48.0 (13.4) 8.6 13.6
EBITDA Margin(%) 13.9 13.7 13.2 14.5 13.7 14.4
EPS Growth (%) 18.3 12.1 42.7 (16.2) 8.3 15.6
Note:
(a) 15 month period starting January 1, 2008 to March 31, 2009
Source: Kotak Institutional Equities estimates
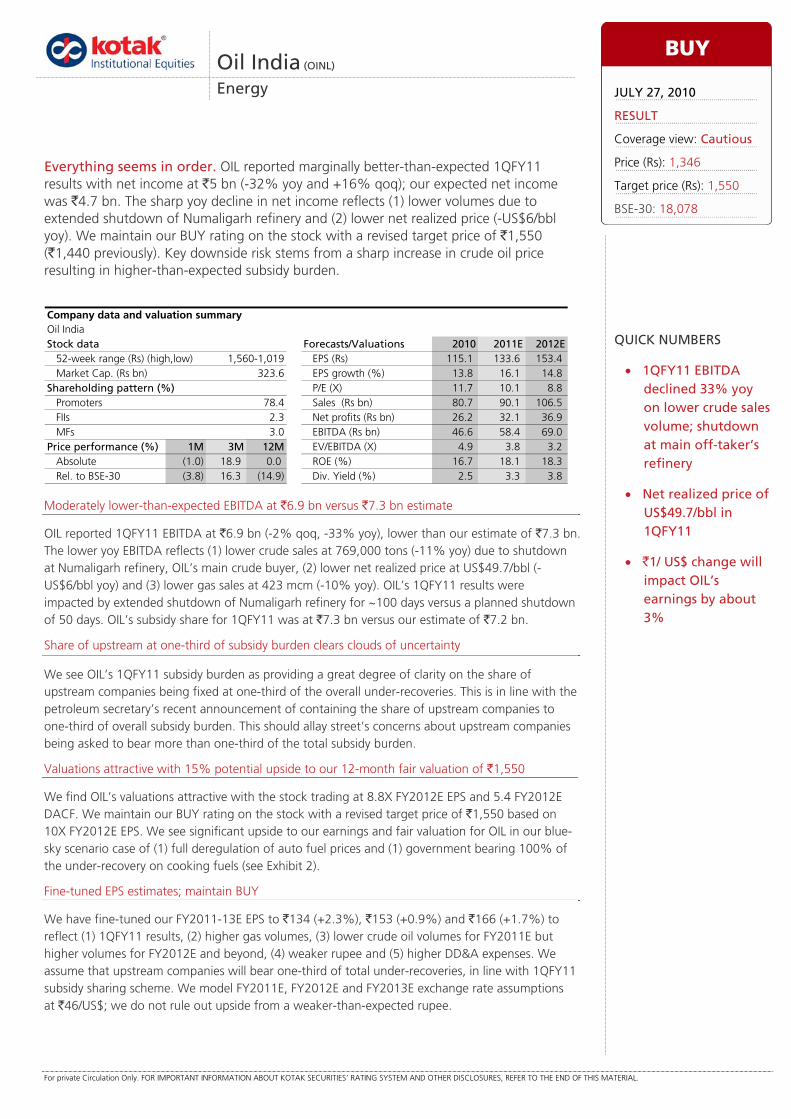
For private Circulation Only. FOR IMPORTANT INFORMATION ABOUT KOTAK SECURITIES’ RATING SYSTEM AND OTHER DISCLOSURES, REFER TO THE END OF THIS MATERIAL.
Moderately lower-than-expected EBITDA at `6.9 bn versus `7.3 bn estimate
OIL reported 1QFY11 EBITDA at `6.9 bn (-2% qoq, -33% yoy), lower than our estimate of `7.3 bn. The lower yoy EBITDA reflects (1) lower crude sales at 769,000 tons (-11% yoy) due to shutdown at Numaligarh refinery, OIL’s main crude buyer, (2) lower net realized price at US$49.7/bbl (-US$6/bbl yoy) and (3) lower gas sales at 423 mcm (-10% yoy). OIL’s 1QFY11 results were impacted by extended shutdown of Numaligarh refinery for ~100 days versus a planned shutdown of 50 days. OIL’s subsidy share for 1QFY11 was at `7.3 bn versus our estimate of `7.2 bn.
Share of upstream at one-third of subsidy burden clears clouds of uncertainty
We see OIL’s 1QFY11 subsidy burden as providing a great degree of clarity on the share of upstream companies being fixed at one-third of the overall under-recoveries. This is in line with the petroleum secretary’s recent announcement of containing the share of upstream companies to one-third of overall subsidy burden. This should allay street’s concerns about upstream companies being asked to bear more than one-third of the total subsidy burden.
Valuations attractive with 15% potential upside to our 12-month fair valuation of `1,550
We find OIL’s valuations attractive with the stock trading at 8.8X FY2012E EPS and 5.4 FY2012E DACF. We maintain our BUY rating on the stock with a revised target price of `1,550 based on 10X FY2012E EPS. We see significant upside to our earnings and fair valuation for OIL in our blue-sky scenario case of (1) full deregulation of auto fuel prices and (1) government bearing 100% of the under-recovery on cooking fuels (see Exhibit 2).
Fine-tuned EPS estimates; maintain BUY
We have fine-tuned our FY2011-13E EPS to `134 (+2.3%), `153 (+0.9%) and `166 (+1.7%) to reflect (1) 1QFY11 results, (2) higher gas volumes, (3) lower crude oil volumes for FY2011E but higher volumes for FY2012E and beyond, (4) weaker rupee and (5) higher DD&A expenses. We assume that upstream companies will bear one-third of total under-recoveries, in line with 1QFY11 subsidy sharing scheme. We model FY2011E, FY2012E and FY2013E exchange rate assumptions at `46/US$; we do not rule out upside from a weaker-than-expected rupee.
Oil India (OINL)
Energy
Everything seems in order. OIL reported marginally better-than-expected 1QFY11 results with net income at `5 bn (-32% yoy and +16% qoq); our expected net income was `4.7 bn. The sharp yoy decline in net income reflects (1) lower volumes due to extended shutdown of Numaligarh refinery and (2) lower net realized price (-US$6/bbl yoy). We maintain our BUY rating on the stock with a revised target price of `1,550 (`1,440 previously). Key downside risk stems from a sharp increase in crude oil price resulting in higher-than-expected subsidy burden.
Oil IndiaStock data Forecasts/Valuations 2010 2011E 2012E
52-week range (Rs) (high,low) EPS (Rs) 115.1 133.6 153.4Market Cap. (Rs bn) 323.6 EPS growth (%) 13.8 16.1 14.8
Shareholding pattern (%) P/E (X) 11.7 10.1 8.8Promoters 78.4 Sales (Rs bn) 80.7 90.1 106.5FIIs 2.3 Net profits (Rs bn) 26.2 32.1 36.9MFs 3.0 EBITDA (Rs bn) 46.6 58.4 69.0
Price performance (%) 1M 3M 12M EV/EBITDA (X) 4.9 3.8 3.2Absolute (1.0) 18.9 0.0 ROE (%) 16.7 18.1 18.3Rel. to BSE-30 (3.8) 16.3 (14.9) Div. Yield (%) 2.5 3.3 3.8
Company data and valuation summary
1,560-1,019
BUY
JULY 27, 2010
RESULT
Coverage view: Cautious
Price (Rs): 1,346
Target price (Rs): 1,550
BSE-30: 18,078
QUICK NUMBERS
• 1QFY11 EBITDA declined 33% yoy on lower crude sales volume; shutdown at main off-taker’s refinery
• Net realized price of US$49.7/bbl in 1QFY11
• `1/ US$ change will impact OIL’s earnings by about 3%
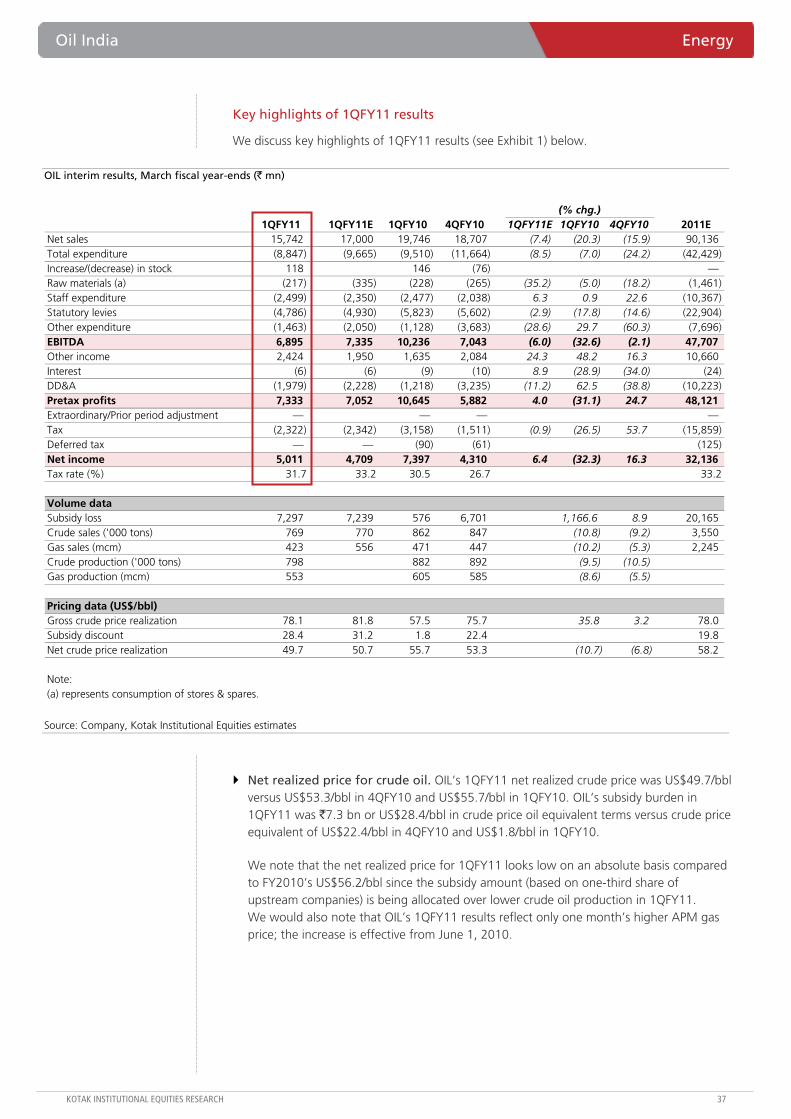
Oil India Energy
KOTAK INSTITUTIONAL EQUITIES RESEARCH 37
Key highlights of 1QFY11 results
We discuss key highlights of 1QFY11 results (see Exhibit 1) below.
OIL interim results, March fiscal year-ends (` mn)
(% chg.)1QFY11 1QFY11E 1QFY10 4QFY10 1QFY11E 1QFY10 4QFY10 2011E
Net sales 15,742 17,000 19,746 18,707 (7.4) (20.3) (15.9) 90,136 Total expenditure (8,847) (9,665) (9,510) (11,664) (8.5) (7.0) (24.2) (42,429) Increase/(decrease) in stock 118 146 (76) —Raw materials (a) (217) (335) (228) (265) (35.2) (5.0) (18.2) (1,461) Staff expenditure (2,499) (2,350) (2,477) (2,038) 6.3 0.9 22.6 (10,367) Statutory levies (4,786) (4,930) (5,823) (5,602) (2.9) (17.8) (14.6) (22,904) Other expenditure (1,463) (2,050) (1,128) (3,683) (28.6) 29.7 (60.3) (7,696) EBITDA 6,895 7,335 10,236 7,043 (6.0) (32.6) (2.1) 47,707 Other income 2,424 1,950 1,635 2,084 24.3 48.2 16.3 10,660 Interest (6) (6) (9) (10) 8.9 (28.9) (34.0) (24) DD&A (1,979) (2,228) (1,218) (3,235) (11.2) 62.5 (38.8) (10,223) Pretax profits 7,333 7,052 10,645 5,882 4.0 (31.1) 24.7 48,121 Extraordinary/Prior period adjustment — — — —Tax (2,322) (2,342) (3,158) (1,511) (0.9) (26.5) 53.7 (15,859) Deferred tax — — (90) (61) (125) Net income 5,011 4,709 7,397 4,310 6.4 (32.3) 16.3 32,136 Tax rate (%) 31.7 33.2 30.5 26.7 33.2
Volume dataSubsidy loss 7,297 7,239 576 6,701 1,166.6 8.9 20,165 Crude sales ('000 tons) 769 770 862 847 (10.8) (9.2) 3,550 Gas sales (mcm) 423 556 471 447 (10.2) (5.3) 2,245 Crude production ('000 tons) 798 882 892 (9.5) (10.5)Gas production (mcm) 553 605 585 (8.6) (5.5)
Pricing data (US$/bbl)Gross crude price realization 78.1 81.8 57.5 75.7 35.8 3.2 78.0 Subsidy discount 28.4 31.2 1.8 22.4 19.8 Net crude price realization 49.7 50.7 55.7 53.3 (10.7) (6.8) 58.2
Note:(a) represents consumption of stores & spares.
Source: Company, Kotak Institutional Equities estimates
Net realized price for crude oil. OIL’s 1QFY11 net realized crude price was US$49.7/bbl versus US$53.3/bbl in 4QFY10 and US$55.7/bbl in 1QFY10. OIL’s subsidy burden in 1QFY11 was `7.3 bn or US$28.4/bbl in crude price oil equivalent terms versus crude price equivalent of US$22.4/bbl in 4QFY10 and US$1.8/bbl in 1QFY10.
We note that the net realized price for 1QFY11 looks low on an absolute basis compared to FY2010’s US$56.2/bbl since the subsidy amount (based on one-third share of upstream companies) is being allocated over lower crude oil production in 1QFY11. We would also note that OIL’s 1QFY11 results reflect only one month’s higher APM gas price; the increase is effective from June 1, 2010.
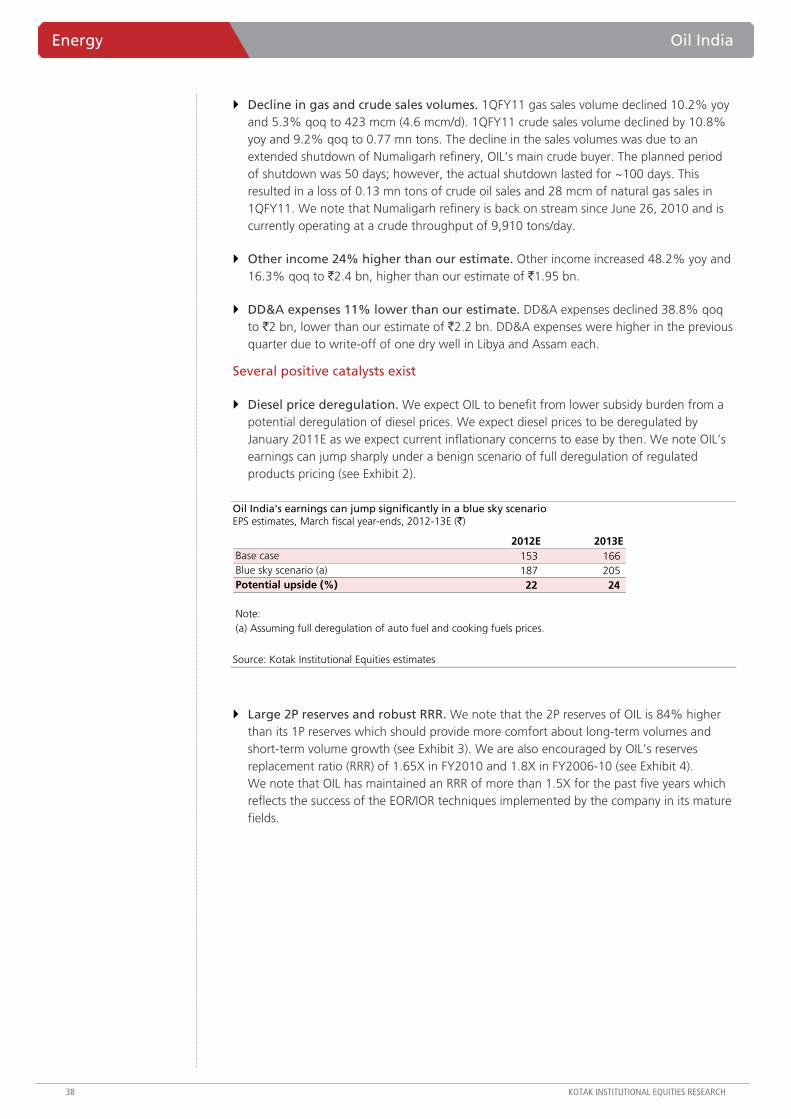
Energy Oil India
38 KOTAK INSTITUTIONAL EQUITIES RESEARCH
Decline in gas and crude sales volumes. 1QFY11 gas sales volume declined 10.2% yoy and 5.3% qoq to 423 mcm (4.6 mcm/d). 1QFY11 crude sales volume declined by 10.8% yoy and 9.2% qoq to 0.77 mn tons. The decline in the sales volumes was due to an extended shutdown of Numaligarh refinery, OIL’s main crude buyer. The planned period of shutdown was 50 days; however, the actual shutdown lasted for ~100 days. This resulted in a loss of 0.13 mn tons of crude oil sales and 28 mcm of natural gas sales in 1QFY11. We note that Numaligarh refinery is back on stream since June 26, 2010 and is currently operating at a crude throughput of 9,910 tons/day.
Other income 24% higher than our estimate. Other income increased 48.2% yoy and 16.3% qoq to `2.4 bn, higher than our estimate of `1.95 bn.
DD&A expenses 11% lower than our estimate. DD&A expenses declined 38.8% qoq to `2 bn, lower than our estimate of `2.2 bn. DD&A expenses were higher in the previous quarter due to write-off of one dry well in Libya and Assam each.
Several positive catalysts exist
Diesel price deregulation. We expect OIL to benefit from lower subsidy burden from a potential deregulation of diesel prices. We expect diesel prices to be deregulated by January 2011E as we expect current inflationary concerns to ease by then. We note OIL’s earnings can jump sharply under a benign scenario of full deregulation of regulated products pricing (see Exhibit 2).
Oil India's earnings can jump significantly in a blue sky scenario EPS estimates, March fiscal year-ends, 2012-13E (`)
2012E 2013EBase case 153 166 Blue sky scenario (a) 187 205 Potential upside (%) 22 24
Note:(a) Assuming full deregulation of auto fuel and cooking fuels prices.
Source: Kotak Institutional Equities estimates
Large 2P reserves and robust RRR. We note that the 2P reserves of OIL is 84% higher than its 1P reserves which should provide more comfort about long-term volumes and short-term volume growth (see Exhibit 3). We are also encouraged by OIL’s reserves replacement ratio (RRR) of 1.65X in FY2010 and 1.8X in FY2006-10 (see Exhibit 4). We note that OIL has maintained an RRR of more than 1.5X for the past five years which reflects the success of the EOR/IOR techniques implemented by the company in its mature fields.
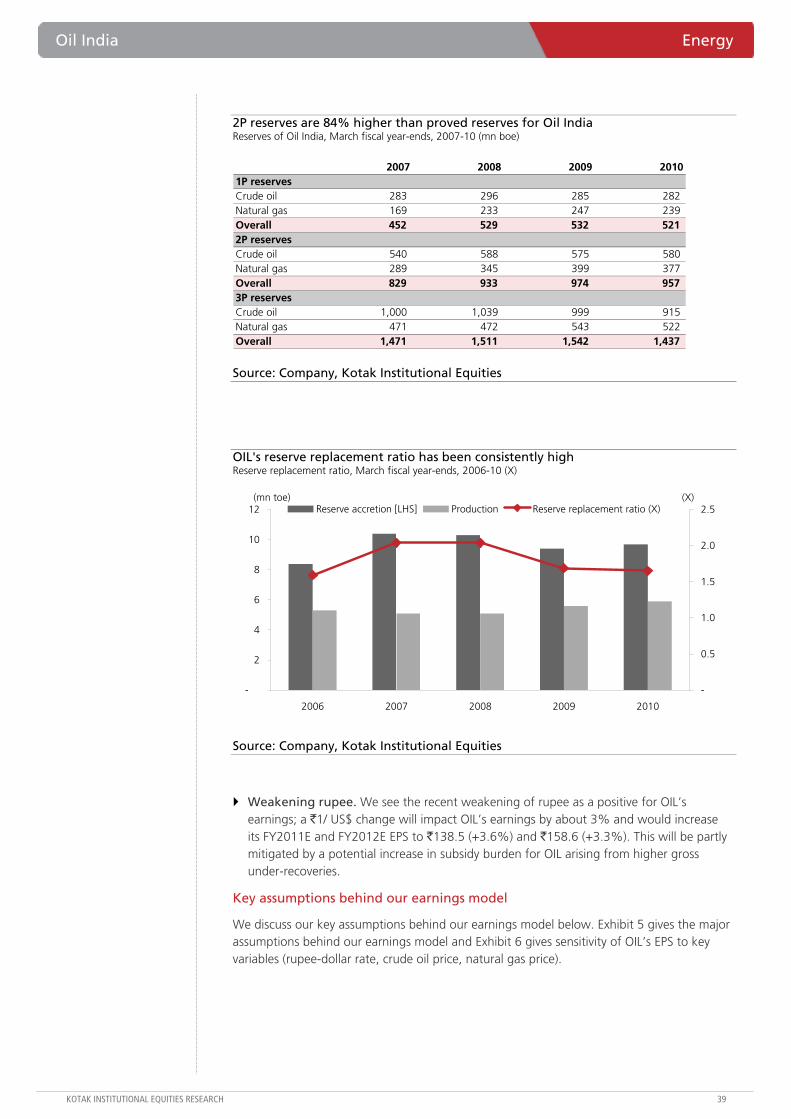
Oil India Energy
KOTAK INSTITUTIONAL EQUITIES RESEARCH 39
2P reserves are 84% higher than proved reserves for Oil India Reserves of Oil India, March fiscal year-ends, 2007-10 (mn boe)
2007 2008 2009 20101P reservesCrude oil 283 296 285 282 Natural gas 169 233 247 239 Overall 452 529 532 521 2P reservesCrude oil 540 588 575 580 Natural gas 289 345 399 377 Overall 829 933 974 957 3P reservesCrude oil 1,000 1,039 999 915 Natural gas 471 472 543 522 Overall 1,471 1,511 1,542 1,437
Source: Company, Kotak Institutional Equities
OIL's reserve replacement ratio has been consistently high Reserve replacement ratio, March fiscal year-ends, 2006-10 (X)
(mn toe)
-
2
4
6
8
10
12
2006 2007 2008 2009 2010
-
0.5
1.0
1.5
2.0
2.5Reserve accretion [LHS] Production Reserve replacement ratio (X)(X)
Source: Company, Kotak Institutional Equities
Weakening rupee. We see the recent weakening of rupee as a positive for OIL’s earnings; a `1/ US$ change will impact OIL’s earnings by about 3% and would increase its FY2011E and FY2012E EPS to `138.5 (+3.6%) and `158.6 (+3.3%). This will be partly mitigated by a potential increase in subsidy burden for OIL arising from higher gross under-recoveries.
Key assumptions behind our earnings model
We discuss our key assumptions behind our earnings model below. Exhibit 5 gives the major assumptions behind our earnings model and Exhibit 6 gives sensitivity of OIL’s EPS to key variables (rupee-dollar rate, crude oil price, natural gas price).
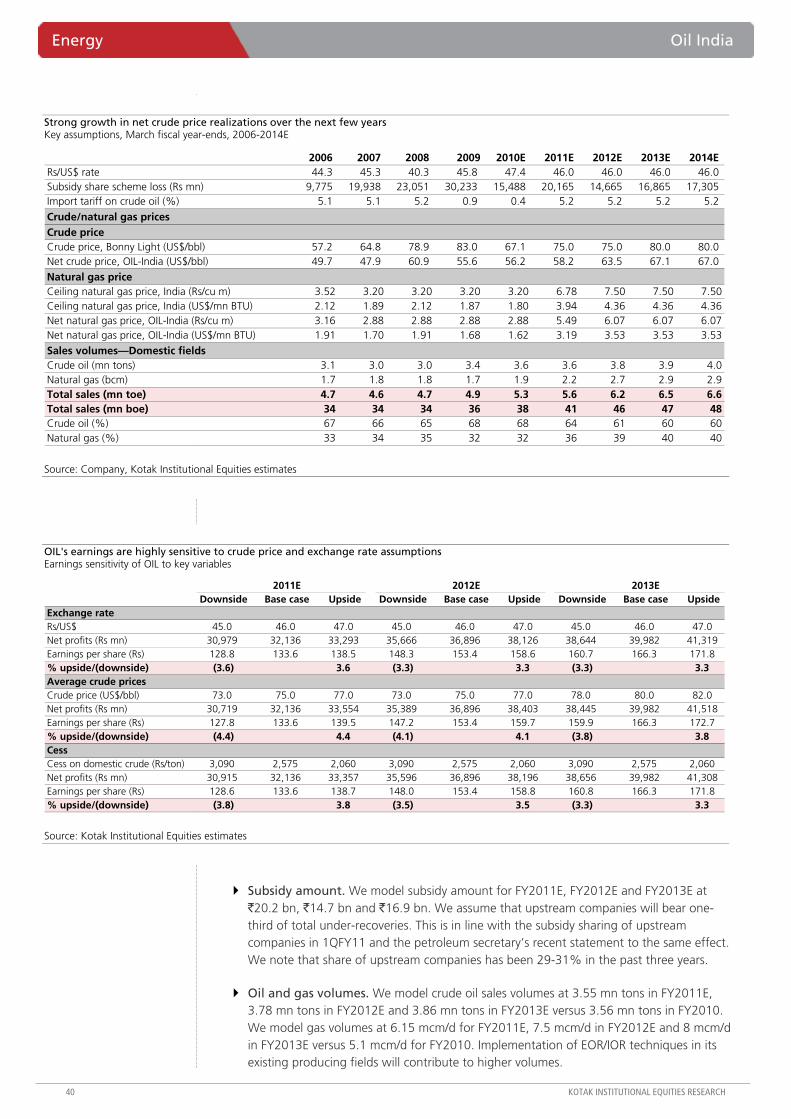
Energy Oil India
40 KOTAK INSTITUTIONAL EQUITIES RESEARCH
Strong growth in net crude price realizations over the next few years Key assumptions, March fiscal year-ends, 2006-2014E
2006 2007 2008 2009 2010E 2011E 2012E 2013E 2014E Rs/US$ rate 44.3 45.3 40.3 45.8 47.4 46.0 46.0 46.0 46.0 Subsidy share scheme loss (Rs mn) 9,775 19,938 23,051 30,233 15,488 20,165 14,665 16,865 17,305 Import tariff on crude oil (%) 5.1 5.1 5.2 0.9 0.4 5.2 5.2 5.2 5.2
Crude/natural gas pricesCrude priceCrude price, Bonny Light (US$/bbl) 57.2 64.8 78.9 83.0 67.1 75.0 75.0 80.0 80.0 Net crude price, OIL-India (US$/bbl) 49.7 47.9 60.9 55.6 56.2 58.2 63.5 67.1 67.0
Natural gas priceCeiling natural gas price, India (Rs/cu m) 3.52 3.20 3.20 3.20 3.20 6.78 7.50 7.50 7.50Ceiling natural gas price, India (US$/mn BTU) 2.12 1.89 2.12 1.87 1.80 3.94 4.36 4.36 4.36Net natural gas price, OIL-India (Rs/cu m) 3.16 2.88 2.88 2.88 2.88 5.49 6.07 6.07 6.07Net natural gas price, OIL-India (US$/mn BTU) 1.91 1.70 1.91 1.68 1.62 3.19 3.53 3.53 3.53
Sales volumes—Domestic fieldsCrude oil (mn tons) 3.1 3.0 3.0 3.4 3.6 3.6 3.8 3.9 4.0Natural gas (bcm) 1.7 1.8 1.8 1.7 1.9 2.2 2.7 2.9 2.9Total sales (mn toe) 4.7 4.6 4.7 4.9 5.3 5.6 6.2 6.5 6.6Total sales (mn boe) 34 34 34 36 38 41 46 47 48Crude oil (%) 67 66 65 68 68 64 61 60 60Natural gas (%) 33 34 35 32 32 36 39 40 40
Source: Company, Kotak Institutional Equities estimates
OIL's earnings are highly sensitive to crude price and exchange rate assumptions Earnings sensitivity of OIL to key variables
2011E 2012E 2013EDownside Base case Upside Downside Base case Upside Downside Base case Upside
Exchange rateRs/US$ 45.0 46.0 47.0 45.0 46.0 47.0 45.0 46.0 47.0Net profits (Rs mn) 30,979 32,136 33,293 35,666 36,896 38,126 38,644 39,982 41,319Earnings per share (Rs) 128.8 133.6 138.5 148.3 153.4 158.6 160.7 166.3 171.8% upside/(downside) (3.6) 3.6 (3.3) 3.3 (3.3) 3.3Average crude pricesCrude price (US$/bbl) 73.0 75.0 77.0 73.0 75.0 77.0 78.0 80.0 82.0Net profits (Rs mn) 30,719 32,136 33,554 35,389 36,896 38,403 38,445 39,982 41,518Earnings per share (Rs) 127.8 133.6 139.5 147.2 153.4 159.7 159.9 166.3 172.7% upside/(downside) (4.4) 4.4 (4.1) 4.1 (3.8) 3.8CessCess on domestic crude (Rs/ton) 3,090 2,575 2,060 3,090 2,575 2,060 3,090 2,575 2,060Net profits (Rs mn) 30,915 32,136 33,357 35,596 36,896 38,196 38,656 39,982 41,308Earnings per share (Rs) 128.6 133.6 138.7 148.0 153.4 158.8 160.8 166.3 171.8% upside/(downside) (3.8) 3.8 (3.5) 3.5 (3.3) 3.3
Source: Kotak Institutional Equities estimates
Subsidy amount. We model subsidy amount for FY2011E, FY2012E and FY2013E at `20.2 bn, `14.7 bn and `16.9 bn. We assume that upstream companies will bear one-third of total under-recoveries. This is in line with the subsidy sharing of upstream companies in 1QFY11 and the petroleum secretary’s recent statement to the same effect. We note that share of upstream companies has been 29-31% in the past three years.
Oil and gas volumes. We model crude oil sales volumes at 3.55 mn tons in FY2011E, 3.78 mn tons in FY2012E and 3.86 mn tons in FY2013E versus 3.56 mn tons in FY2010. We model gas volumes at 6.15 mcm/d for FY2011E, 7.5 mcm/d in FY2012E and 8 mcm/d in FY2013E versus 5.1 mcm/d for FY2010. Implementation of EOR/IOR techniques in its existing producing fields will contribute to higher volumes.
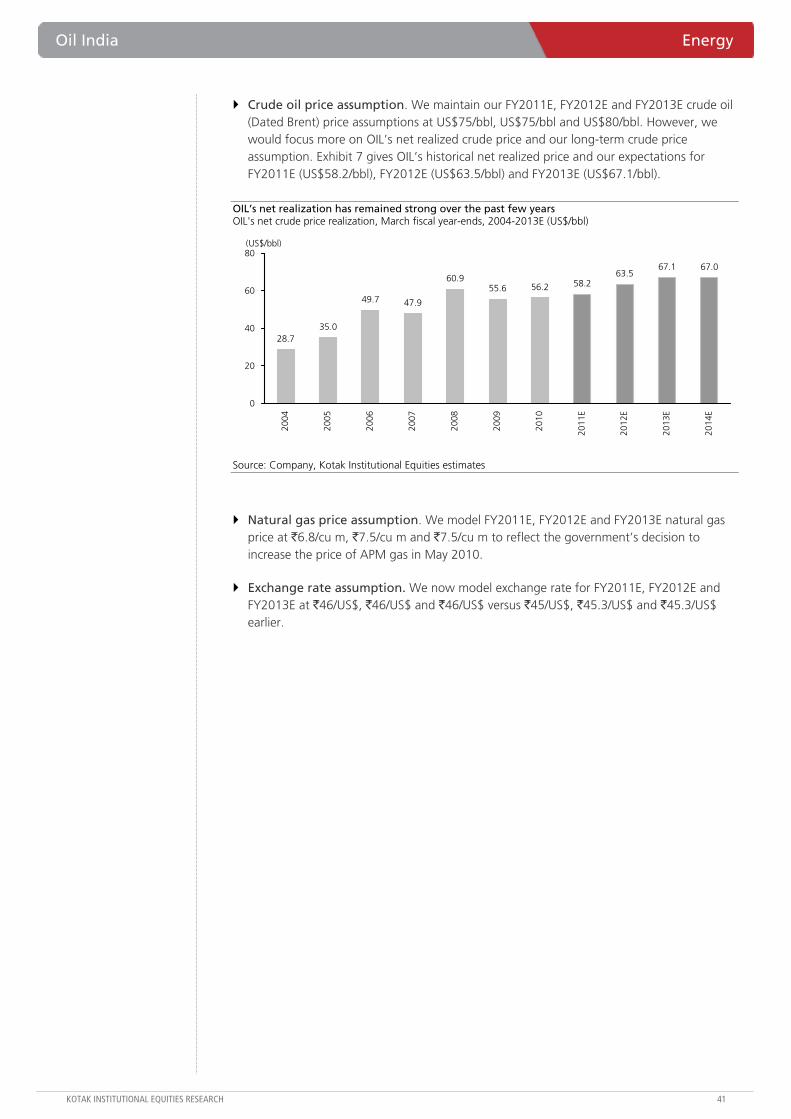
Oil India Energy
KOTAK INSTITUTIONAL EQUITIES RESEARCH 41
Crude oil price assumption. We maintain our FY2011E, FY2012E and FY2013E crude oil (Dated Brent) price assumptions at US$75/bbl, US$75/bbl and US$80/bbl. However, we would focus more on OIL’s net realized crude price and our long-term crude price assumption. Exhibit 7 gives OIL’s historical net realized price and our expectations for FY2011E (US$58.2/bbl), FY2012E (US$63.5/bbl) and FY2013E (US$67.1/bbl).
OIL’s net realization has remained strong over the past few years OIL's net crude price realization, March fiscal year-ends, 2004-2013E (US$/bbl)
28.735.0
49.7 47.9
60.955.6 56.2 58.2
63.567.1 67.0
0
20
40
60
80
2004
2005
2006
2007
2008
2009
2010
2011
E
2012
E
2013
E
2014
E
(US$/bbl)
Source: Company, Kotak Institutional Equities estimates
Natural gas price assumption. We model FY2011E, FY2012E and FY2013E natural gas price at `6.8/cu m, `7.5/cu m and `7.5/cu m to reflect the government’s decision to increase the price of APM gas in May 2010.
Exchange rate assumption. We now model exchange rate for FY2011E, FY2012E and FY2013E at `46/US$, `46/US$ and `46/US$ versus `45/US$, `45.3/US$ and `45.3/US$ earlier.
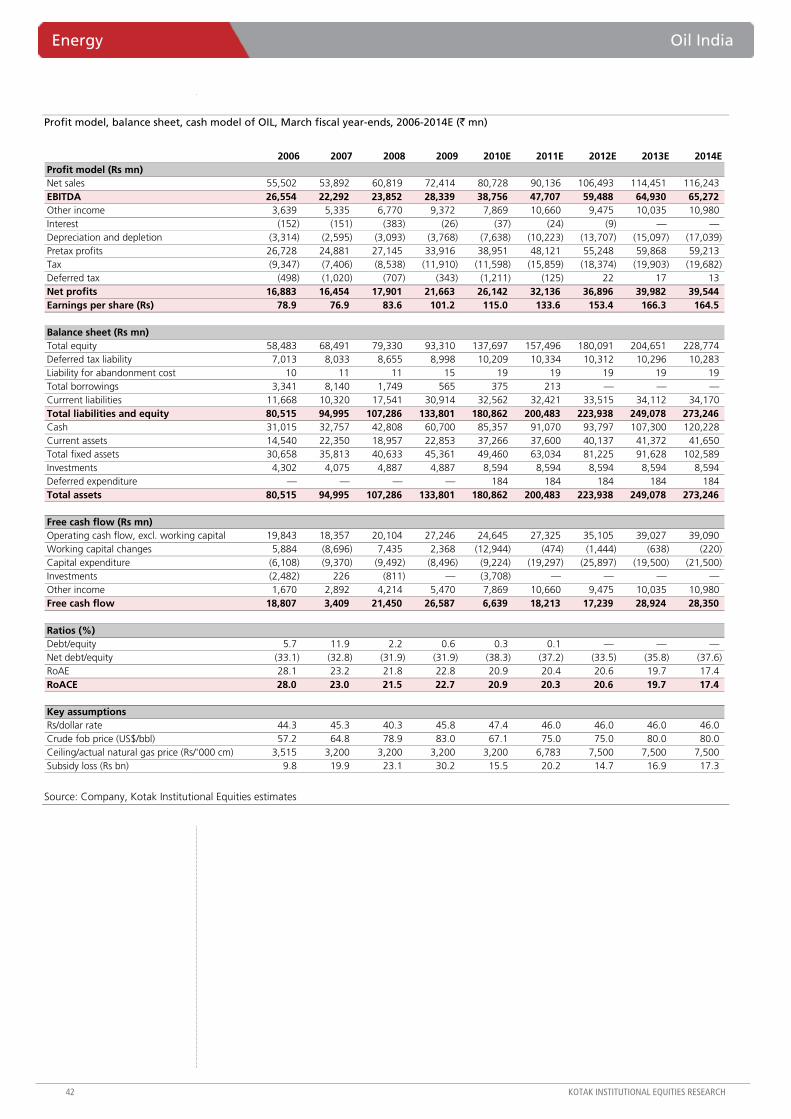
Energy Oil India
42 KOTAK INSTITUTIONAL EQUITIES RESEARCH
Profit model, balance sheet, cash model of OIL, March fiscal year-ends, 2006-2014E (` mn)
2006 2007 2008 2009 2010E 2011E 2012E 2013E 2014EProfit model (Rs mn)Net sales 55,502 53,892 60,819 72,414 80,728 90,136 106,493 114,451 116,243EBITDA 26,554 22,292 23,852 28,339 38,756 47,707 59,488 64,930 65,272Other income 3,639 5,335 6,770 9,372 7,869 10,660 9,475 10,035 10,980Interest (152) (151) (383) (26) (37) (24) (9) — —Depreciation and depletion (3,314) (2,595) (3,093) (3,768) (7,638) (10,223) (13,707) (15,097) (17,039)Pretax profits 26,728 24,881 27,145 33,916 38,951 48,121 55,248 59,868 59,213Tax (9,347) (7,406) (8,538) (11,910) (11,598) (15,859) (18,374) (19,903) (19,682)Deferred tax (498) (1,020) (707) (343) (1,211) (125) 22 17 13Net profits 16,883 16,454 17,901 21,663 26,142 32,136 36,896 39,982 39,544Earnings per share (Rs) 78.9 76.9 83.6 101.2 115.0 133.6 153.4 166.3 164.5
Balance sheet (Rs mn)Total equity 58,483 68,491 79,330 93,310 137,697 157,496 180,091 204,651 228,774Deferred tax liability 7,013 8,033 8,655 8,998 10,209 10,334 10,312 10,296 10,283Liability for abandonment cost 10 11 11 15 19 19 19 19 19Total borrowings 3,341 8,140 1,749 565 375 213 — — —Currrent liabilities 11,668 10,320 17,541 30,914 32,562 32,421 33,515 34,112 34,170Total liabilities and equity 80,515 94,995 107,286 133,801 180,862 200,483 223,938 249,078 273,246Cash 31,015 32,757 42,808 60,700 85,357 91,070 93,797 107,300 120,228Current assets 14,540 22,350 18,957 22,853 37,266 37,600 40,137 41,372 41,650Total fixed assets 30,658 35,813 40,633 45,361 49,460 63,034 81,225 91,628 102,589Investments 4,302 4,075 4,887 4,887 8,594 8,594 8,594 8,594 8,594Deferred expenditure — — — — 184 184 184 184 184Total assets 80,515 94,995 107,286 133,801 180,862 200,483 223,938 249,078 273,246
Free cash flow (Rs mn)Operating cash flow, excl. working capital 19,843 18,357 20,104 27,246 24,645 27,325 35,105 39,027 39,090Working capital changes 5,884 (8,696) 7,435 2,368 (12,944) (474) (1,444) (638) (220)Capital expenditure (6,108) (9,370) (9,492) (8,496) (9,224) (19,297) (25,897) (19,500) (21,500)Investments (2,482) 226 (811) — (3,708) — — — —Other income 1,670 2,892 4,214 5,470 7,869 10,660 9,475 10,035 10,980Free cash flow 18,807 3,409 21,450 26,587 6,639 18,213 17,239 28,924 28,350
Ratios (%)Debt/equity 5.7 11.9 2.2 0.6 0.3 0.1 — — —Net debt/equity (33.1) (32.8) (31.9) (31.9) (38.3) (37.2) (33.5) (35.8) (37.6)RoAE 28.1 23.2 21.8 22.8 20.9 20.4 20.6 19.7 17.4RoACE 28.0 23.0 21.5 22.7 20.9 20.3 20.6 19.7 17.4
Key assumptionsRs/dollar rate 44.3 45.3 40.3 45.8 47.4 46.0 46.0 46.0 46.0 Crude fob price (US$/bbl) 57.2 64.8 78.9 83.0 67.1 75.0 75.0 80.0 80.0 Ceiling/actual natural gas price (Rs/'000 cm) 3,515 3,200 3,200 3,200 3,200 6,783 7,500 7,500 7,500 Subsidy loss (Rs bn) 9.8 19.9 23.1 30.2 15.5 20.2 14.7 16.9 17.3
Source: Company, Kotak Institutional Equities estimates
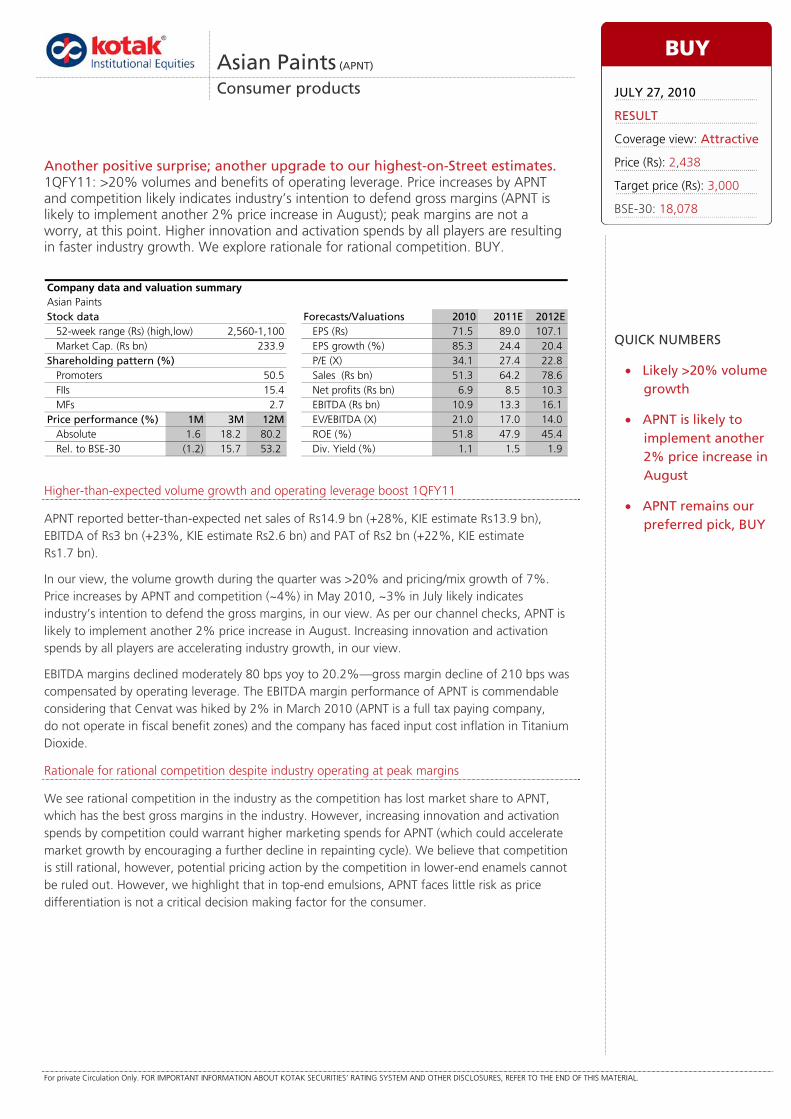
For private Circulation Only. FOR IMPORTANT INFORMATION ABOUT KOTAK SECURITIES’ RATING SYSTEM AND OTHER DISCLOSURES, REFER TO THE END OF THIS MATERIAL.
Higher-than-expected volume growth and operating leverage boost 1QFY11
APNT reported better-than-expected net sales of Rs14.9 bn (+28%, KIE estimate Rs13.9 bn), EBITDA of Rs3 bn (+23%, KIE estimate Rs2.6 bn) and PAT of Rs2 bn (+22%, KIE estimate Rs1.7 bn).
In our view, the volume growth during the quarter was >20% and pricing/mix growth of 7%. Price increases by APNT and competition (~4%) in May 2010, ~3% in July likely indicates industry’s intention to defend the gross margins, in our view. As per our channel checks, APNT is likely to implement another 2% price increase in August. Increasing innovation and activation spends by all players are accelerating industry growth, in our view.
EBITDA margins declined moderately 80 bps yoy to 20.2%—gross margin decline of 210 bps was compensated by operating leverage. The EBITDA margin performance of APNT is commendable considering that Cenvat was hiked by 2% in March 2010 (APNT is a full tax paying company, do not operate in fiscal benefit zones) and the company has faced input cost inflation in Titanium Dioxide.
Rationale for rational competition despite industry operating at peak margins
We see rational competition in the industry as the competition has lost market share to APNT, which has the best gross margins in the industry. However, increasing innovation and activation spends by competition could warrant higher marketing spends for APNT (which could accelerate market growth by encouraging a further decline in repainting cycle). We believe that competition is still rational, however, potential pricing action by the competition in lower-end enamels cannot be ruled out. However, we highlight that in top-end emulsions, APNT faces little risk as price differentiation is not a critical decision making factor for the consumer.
Asian Paints (APNT)
Consumer products
Another positive surprise; another upgrade to our highest-on-Street estimates. 1QFY11: >20% volumes and benefits of operating leverage. Price increases by APNT and competition likely indicates industry’s intention to defend gross margins (APNT is likely to implement another 2% price increase in August); peak margins are not a worry, at this point. Higher innovation and activation spends by all players are resulting in faster industry growth. We explore rationale for rational competition. BUY.
Asian PaintsStock data Forecasts/Valuations 2010 2011E 2012E
52-week range (Rs) (high,low) EPS (Rs) 71.5 89.0 107.1Market Cap. (Rs bn) 233.9 EPS growth (%) 85.3 24.4 20.4
Shareholding pattern (%) P/E (X) 34.1 27.4 22.8Promoters 50.5 Sales (Rs bn) 51.3 64.2 78.6FIIs 15.4 Net profits (Rs bn) 6.9 8.5 10.3MFs 2.7 EBITDA (Rs bn) 10.9 13.3 16.1
Price performance (%) 1M 3M 12M EV/EBITDA (X) 21.0 17.0 14.0Absolute 1.6 18.2 80.2 ROE (%) 51.8 47.9 45.4Rel. to BSE-30 (1.2) 15.7 53.2 Div. Yield (%) 1.1 1.5 1.9
Company data and valuation summary
2,560-1,100
BUY
JULY 27, 2010
RESULT
Coverage view: Attractive
Price (Rs): 2,438
Target price (Rs): 3,000
BSE-30: 18,078
QUICK NUMBERS
• Likely >20% volume growth
• APNT is likely to implement another 2% price increase in August
• APNT remains our preferred pick, BUY
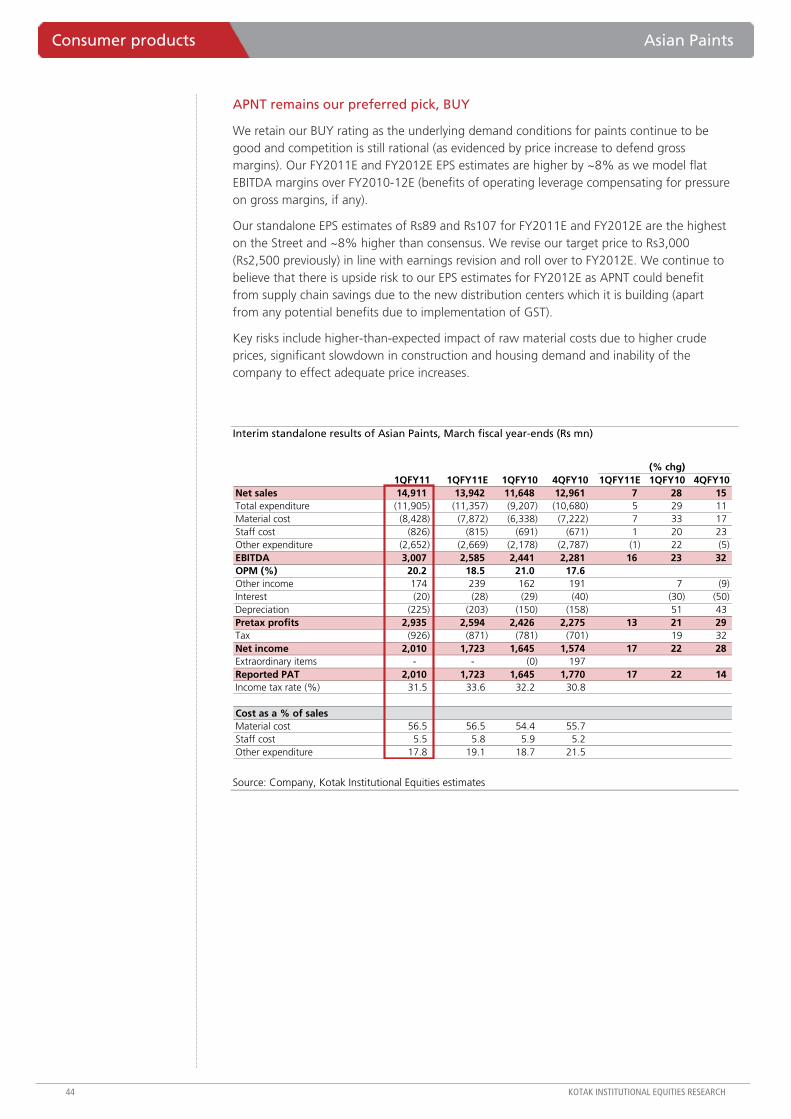
Consumer products Asian Paints
44 KOTAK INSTITUTIONAL EQUITIES RESEARCH
APNT remains our preferred pick, BUY
We retain our BUY rating as the underlying demand conditions for paints continue to be good and competition is still rational (as evidenced by price increase to defend gross margins). Our FY2011E and FY2012E EPS estimates are higher by ~8% as we model flat EBITDA margins over FY2010-12E (benefits of operating leverage compensating for pressure on gross margins, if any).
Our standalone EPS estimates of Rs89 and Rs107 for FY2011E and FY2012E are the highest on the Street and ~8% higher than consensus. We revise our target price to Rs3,000 (Rs2,500 previously) in line with earnings revision and roll over to FY2012E. We continue to believe that there is upside risk to our EPS estimates for FY2012E as APNT could benefit from supply chain savings due to the new distribution centers which it is building (apart from any potential benefits due to implementation of GST).
Key risks include higher-than-expected impact of raw material costs due to higher crude prices, significant slowdown in construction and housing demand and inability of the company to effect adequate price increases.
Interim standalone results of Asian Paints, March fiscal year-ends (Rs mn)
1QFY11 1QFY11E 1QFY10 4QFY10 1QFY11E 1QFY10 4QFY10Net sales 14,911 13,942 11,648 12,961 7 28 15 Total expenditure (11,905) (11,357) (9,207) (10,680) 5 29 11 Material cost (8,428) (7,872) (6,338) (7,222) 7 33 17 Staff cost (826) (815) (691) (671) 1 20 23 Other expenditure (2,652) (2,669) (2,178) (2,787) (1) 22 (5) EBITDA 3,007 2,585 2,441 2,281 16 23 32 OPM (%) 20.2 18.5 21.0 17.6 Other income 174 239 162 191 7 (9) Interest (20) (28) (29) (40) (30) (50) Depreciation (225) (203) (150) (158) 51 43 Pretax profits 2,935 2,594 2,426 2,275 13 21 29 Tax (926) (871) (781) (701) 19 32 Net income 2,010 1,723 1,645 1,574 17 22 28 Extraordinary items - - (0) 197 Reported PAT 2,010 1,723 1,645 1,770 17 22 14 Income tax rate (%) 31.5 33.6 32.2 30.8
Cost as a % of salesMaterial cost 56.5 56.5 54.4 55.7 Staff cost 5.5 5.8 5.9 5.2 Other expenditure 17.8 19.1 18.7 21.5
(% chg)
Source: Company, Kotak Institutional Equities estimates
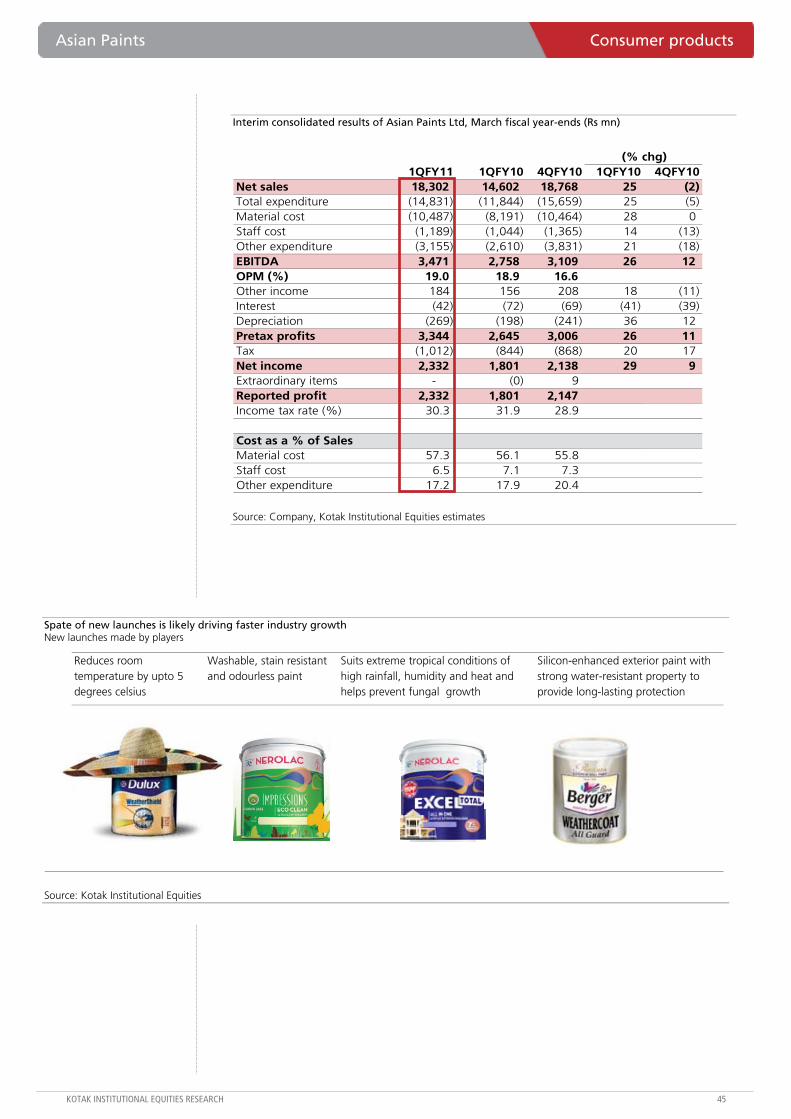
Asian Paints Consumer products
KOTAK INSTITUTIONAL EQUITIES RESEARCH 45
Interim consolidated results of Asian Paints Ltd, March fiscal year-ends (Rs mn)
1QFY11 1QFY10 4QFY10 1QFY10 4QFY10Net sales 18,302 14,602 18,768 25 (2) Total expenditure (14,831) (11,844) (15,659) 25 (5) Material cost (10,487) (8,191) (10,464) 28 0 Staff cost (1,189) (1,044) (1,365) 14 (13) Other expenditure (3,155) (2,610) (3,831) 21 (18) EBITDA 3,471 2,758 3,109 26 12 OPM (%) 19.0 18.9 16.6 Other income 184 156 208 18 (11) Interest (42) (72) (69) (41) (39) Depreciation (269) (198) (241) 36 12 Pretax profits 3,344 2,645 3,006 26 11 Tax (1,012) (844) (868) 20 17 Net income 2,332 1,801 2,138 29 9 Extraordinary items - (0) 9 Reported profit 2,332 1,801 2,147 Income tax rate (%) 30.3 31.9 28.9
Cost as a % of SalesMaterial cost 57.3 56.1 55.8 Staff cost 6.5 7.1 7.3 Other expenditure 17.2 17.9 20.4
(% chg)
Source: Company, Kotak Institutional Equities estimates
Spate of new launches is likely driving faster industry growth New launches made by players
Reduces room temperature by upto 5 degrees celsius
Washable, stain resistant and odourless paint
Suits extreme tropical conditions of high rainfall, humidity and heat and helps prevent fungal growth
Silicon-enhanced exterior paint with strong water-resistant property to provide long-lasting protection
Source: Kotak Institutional Equities
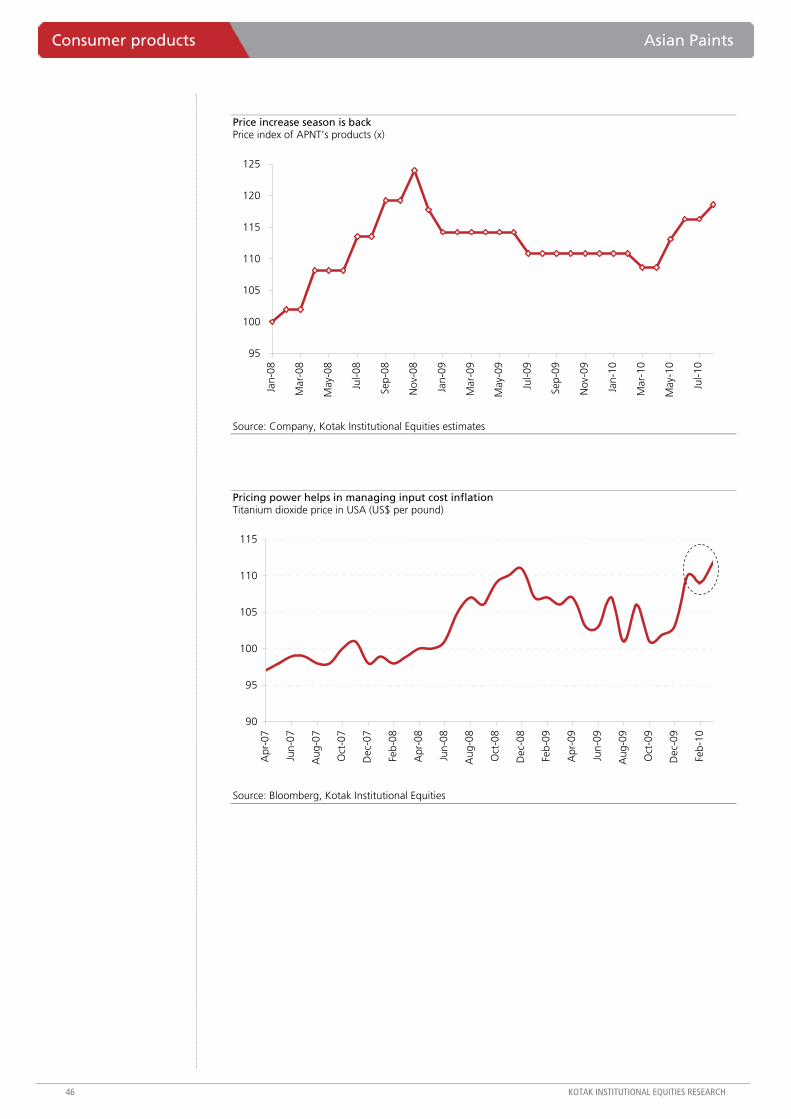
Consumer products Asian Paints
46 KOTAK INSTITUTIONAL EQUITIES RESEARCH
Price increase season is back Price index of APNT’s products (x)
95
100
105
110
115
120
125
Jan-
08
Mar
-08
May
-08
Jul-0
8
Sep-
08
Nov
-08
Jan-
09
Mar
-09
May
-09
Jul-0
9
Sep-
09
Nov
-09
Jan-
10
Mar
-10
May
-10
Jul-1
0
Source: Company, Kotak Institutional Equities estimates
Pricing power helps in managing input cost inflation Titanium dioxide price in USA (US$ per pound)
90
95
100
105
110
115
Apr
-07
Jun-
07
Aug
-07
Oct
-07
Dec
-07
Feb-
08
Apr
-08
Jun-
08
Aug
-08
Oct
-08
Dec
-08
Feb-
09
Apr
-09
Jun-
09
Aug
-09
Oct
-09
Dec
-09
Feb-
10
Source: Bloomberg, Kotak Institutional Equities
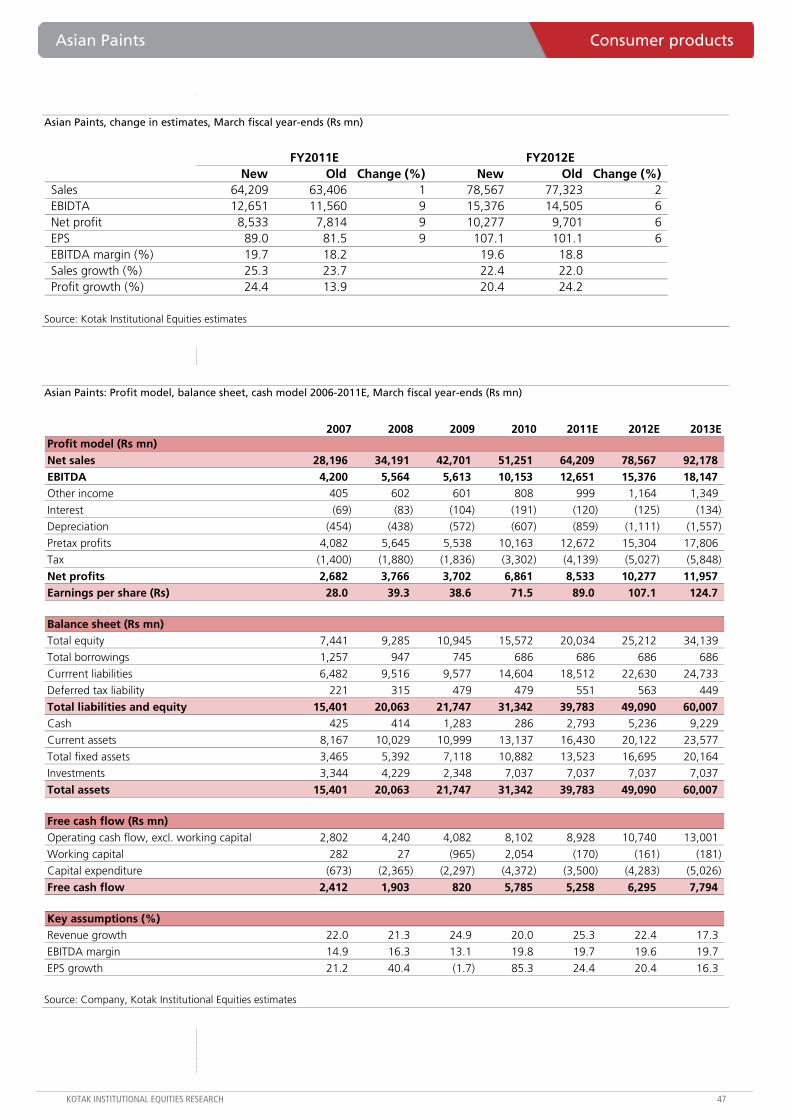
Asian Paints Consumer products
KOTAK INSTITUTIONAL EQUITIES RESEARCH 47
Asian Paints, change in estimates, March fiscal year-ends (Rs mn)
New Old Change (%) New Old Change (%)Sales 64,209 63,406 1 78,567 77,323 2 EBIDTA 12,651 11,560 9 15,376 14,505 6 Net profit 8,533 7,814 9 10,277 9,701 6 EPS 89.0 81.5 9 107.1 101.1 6 EBITDA margin (%) 19.7 18.2 19.6 18.8 Sales growth (%) 25.3 23.7 22.4 22.0 Profit growth (%) 24.4 13.9 20.4 24.2
FY2011E FY2012E
Source: Kotak Institutional Equities estimates
Asian Paints: Profit model, balance sheet, cash model 2006-2011E, March fiscal year-ends (Rs mn)
2007 2008 2009 2010 2011E 2012E 2013EProfit model (Rs mn)Net sales 28,196 34,191 42,701 51,251 64,209 78,567 92,178EBITDA 4,200 5,564 5,613 10,153 12,651 15,376 18,147Other income 405 602 601 808 999 1,164 1,349
Interest (69) (83) (104) (191) (120) (125) (134)
Depreciation (454) (438) (572) (607) (859) (1,111) (1,557)
Pretax profits 4,082 5,645 5,538 10,163 12,672 15,304 17,806
Tax (1,400) (1,880) (1,836) (3,302) (4,139) (5,027) (5,848)
Net profits 2,682 3,766 3,702 6,861 8,533 10,277 11,957Earnings per share (Rs) 28.0 39.3 38.6 71.5 89.0 107.1 124.7
Balance sheet (Rs mn)Total equity 7,441 9,285 10,945 15,572 20,034 25,212 34,139
Total borrowings 1,257 947 745 686 686 686 686
Currrent liabilities 6,482 9,516 9,577 14,604 18,512 22,630 24,733
Deferred tax liability 221 315 479 479 551 563 449
Total liabilities and equity 15,401 20,063 21,747 31,342 39,783 49,090 60,007Cash 425 414 1,283 286 2,793 5,236 9,229
Current assets 8,167 10,029 10,999 13,137 16,430 20,122 23,577
Total fixed assets 3,465 5,392 7,118 10,882 13,523 16,695 20,164
Investments 3,344 4,229 2,348 7,037 7,037 7,037 7,037
Total assets 15,401 20,063 21,747 31,342 39,783 49,090 60,007
Free cash flow (Rs mn)Operating cash flow, excl. working capital 2,802 4,240 4,082 8,102 8,928 10,740 13,001
Working capital 282 27 (965) 2,054 (170) (161) (181)
Capital expenditure (673) (2,365) (2,297) (4,372) (3,500) (4,283) (5,026)
Free cash flow 2,412 1,903 820 5,785 5,258 6,295 7,794
Key assumptions (%)Revenue growth 22.0 21.3 24.9 20.0 25.3 22.4 17.3
EBITDA margin 14.9 16.3 13.1 19.8 19.7 19.6 19.7
EPS growth 21.2 40.4 (1.7) 85.3 24.4 20.4 16.3
Source: Company, Kotak Institutional Equities estimates
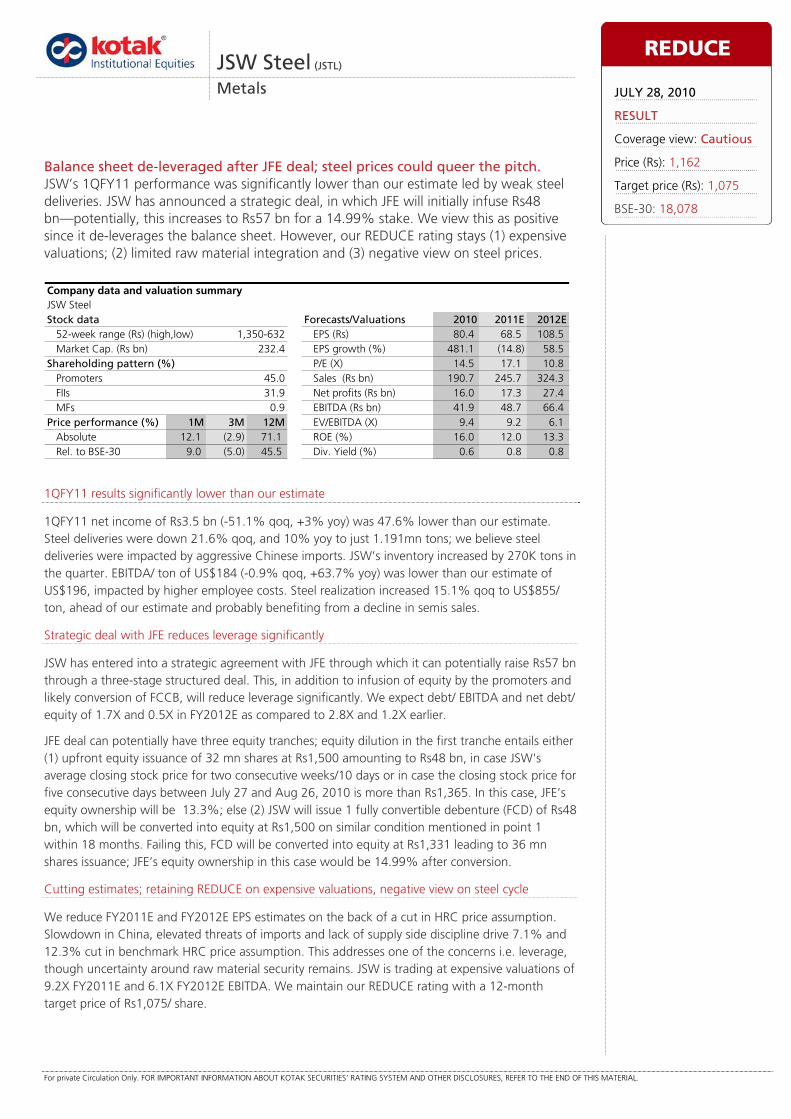
For private Circulation Only. FOR IMPORTANT INFORMATION ABOUT KOTAK SECURITIES’ RATING SYSTEM AND OTHER DISCLOSURES, REFER TO THE END OF THIS MATERIAL.
1QFY11 results significantly lower than our estimate
1QFY11 net income of Rs3.5 bn (-51.1% qoq, +3% yoy) was 47.6% lower than our estimate. Steel deliveries were down 21.6% qoq, and 10% yoy to just 1.191mn tons; we believe steel deliveries were impacted by aggressive Chinese imports. JSW’s inventory increased by 270K tons in the quarter. EBITDA/ ton of US$184 (-0.9% qoq, +63.7% yoy) was lower than our estimate of US$196, impacted by higher employee costs. Steel realization increased 15.1% qoq to US$855/ ton, ahead of our estimate and probably benefiting from a decline in semis sales.
Strategic deal with JFE reduces leverage significantly
JSW has entered into a strategic agreement with JFE through which it can potentially raise Rs57 bn through a three-stage structured deal. This, in addition to infusion of equity by the promoters and likely conversion of FCCB, will reduce leverage significantly. We expect debt/ EBITDA and net debt/ equity of 1.7X and 0.5X in FY2012E as compared to 2.8X and 1.2X earlier.
JFE deal can potentially have three equity tranches; equity dilution in the first tranche entails either (1) upfront equity issuance of 32 mn shares at Rs1,500 amounting to Rs48 bn, in case JSW's average closing stock price for two consecutive weeks/10 days or in case the closing stock price for five consecutive days between July 27 and Aug 26, 2010 is more than Rs1,365. In this case, JFE’s equity ownership will be 13.3%; else (2) JSW will issue 1 fully convertible debenture (FCD) of Rs48 bn, which will be converted into equity at Rs1,500 on similar condition mentioned in point 1 within 18 months. Failing this, FCD will be converted into equity at Rs1,331 leading to 36 mn shares issuance; JFE’s equity ownership in this case would be 14.99% after conversion.
Cutting estimates; retaining REDUCE on expensive valuations, negative view on steel cycle
We reduce FY2011E and FY2012E EPS estimates on the back of a cut in HRC price assumption. Slowdown in China, elevated threats of imports and lack of supply side discipline drive 7.1% and 12.3% cut in benchmark HRC price assumption. This addresses one of the concerns i.e. leverage, though uncertainty around raw material security remains. JSW is trading at expensive valuations of 9.2X FY2011E and 6.1X FY2012E EBITDA. We maintain our REDUCE rating with a 12-month target price of Rs1,075/ share.
JSW Steel (JSTL)
Metals
Balance sheet de-leveraged after JFE deal; steel prices could queer the pitch. JSW’s 1QFY11 performance was significantly lower than our estimate led by weak steel deliveries. JSW has announced a strategic deal, in which JFE will initially infuse Rs48 bn—potentially, this increases to Rs57 bn for a 14.99% stake. We view this as positive since it de-leverages the balance sheet. However, our REDUCE rating stays (1) expensive valuations; (2) limited raw material integration and (3) negative view on steel prices.
JSW SteelStock data Forecasts/Valuations 2010 2011E 2012E
52-week range (Rs) (high,low) EPS (Rs) 80.4 68.5 108.5Market Cap. (Rs bn) 232.4 EPS growth (%) 481.1 (14.8) 58.5
Shareholding pattern (%) P/E (X) 14.5 17.1 10.8Promoters 45.0 Sales (Rs bn) 190.7 245.7 324.3FIIs 31.9 Net profits (Rs bn) 16.0 17.3 27.4MFs 0.9 EBITDA (Rs bn) 41.9 48.7 66.4
Price performance (%) 1M 3M 12M EV/EBITDA (X) 9.4 9.2 6.1Absolute 12.1 (2.9) 71.1 ROE (%) 16.0 12.0 13.3Rel. to BSE-30 9.0 (5.0) 45.5 Div. Yield (%) 0.6 0.8 0.8
Company data and valuation summary
1,350-632
REDUCE
JULY 28, 2010
RESULT
Coverage view: Cautious
Price (Rs): 1,162
Target price (Rs): 1,075
BSE-30: 18,078
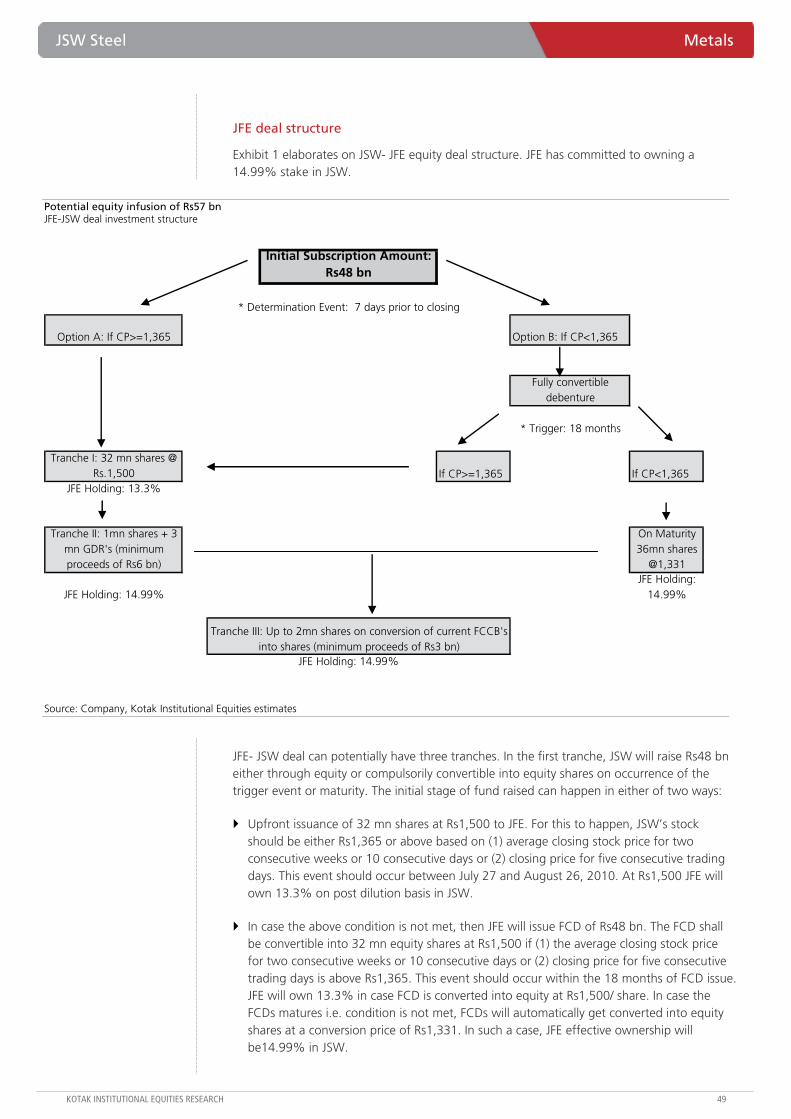
JSW Steel Metals
KOTAK INSTITUTIONAL EQUITIES RESEARCH 49
JFE deal structure
Exhibit 1 elaborates on JSW- JFE equity deal structure. JFE has committed to owning a 14.99% stake in JSW.
Potential equity infusion of Rs57 bn JFE-JSW deal investment structure
Initial Subscription Amount: Rs48 bn
* Determination Event: 7 days prior to closing
Option A: If CP>=1,365 Option B: If CP<1,365
Fully convertible debenture
* Trigger: 18 months
Tranche I: 32 mn shares @ Rs.1,500 If CP>=1,365 If CP<1,365
JFE Holding: 13.3%
Tranche II: 1mn shares + 3 mn GDR's (minimum proceeds of Rs6 bn)
On Maturity 36mn shares
@1,331
JFE Holding: 14.99%JFE Holding:
14.99%
JFE Holding: 14.99%
Tranche III: Up to 2mn shares on conversion of current FCCB's into shares (minimum proceeds of Rs3 bn)
Source: Company, Kotak Institutional Equities estimates
JFE- JSW deal can potentially have three tranches. In the first tranche, JSW will raise Rs48 bn either through equity or compulsorily convertible into equity shares on occurrence of the trigger event or maturity. The initial stage of fund raised can happen in either of two ways:
Upfront issuance of 32 mn shares at Rs1,500 to JFE. For this to happen, JSW’s stock should be either Rs1,365 or above based on (1) average closing stock price for two consecutive weeks or 10 consecutive days or (2) closing price for five consecutive trading days. This event should occur between July 27 and August 26, 2010. At Rs1,500 JFE will own 13.3% on post dilution basis in JSW.
In case the above condition is not met, then JFE will issue FCD of Rs48 bn. The FCD shall be convertible into 32 mn equity shares at Rs1,500 if (1) the average closing stock price for two consecutive weeks or 10 consecutive days or (2) closing price for five consecutive trading days is above Rs1,365. This event should occur within the 18 months of FCD issue. JFE will own 13.3% in case FCD is converted into equity at Rs1,500/ share. In case the FCDs matures i.e. condition is not met, FCDs will automatically get converted into equity shares at a conversion price of Rs1,331. In such a case, JFE effective ownership will be14.99% in JSW.
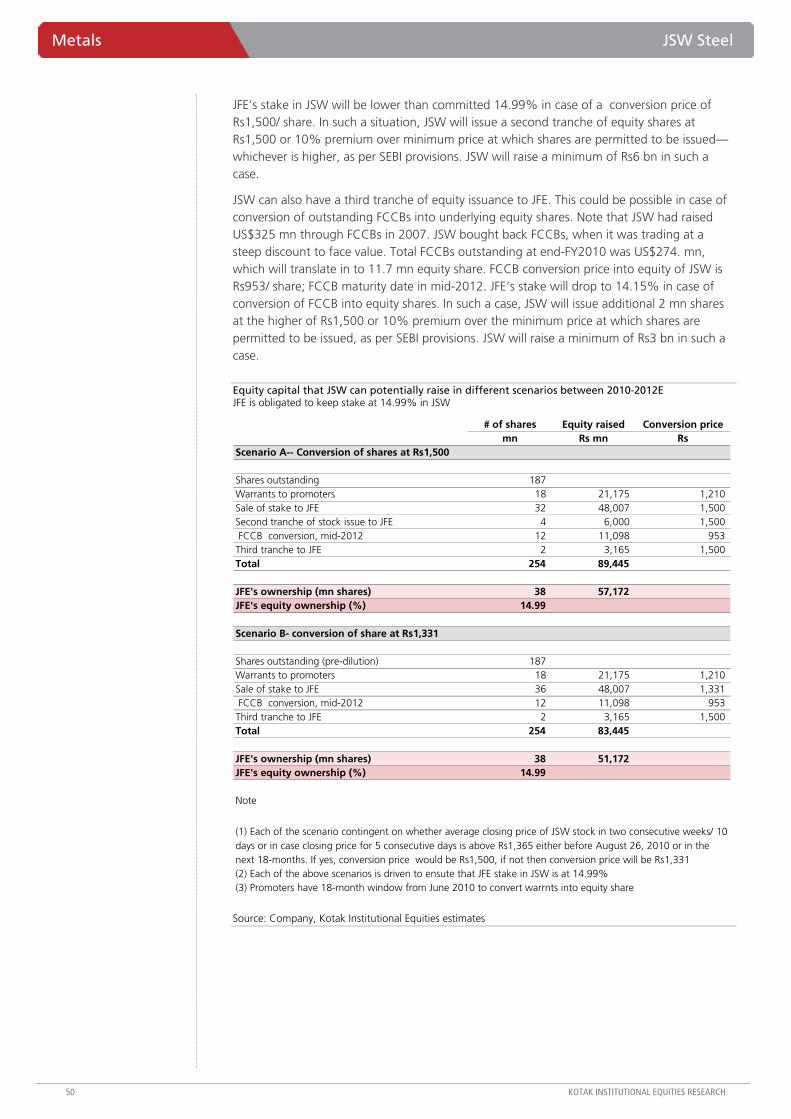
Metals JSW Steel
50 KOTAK INSTITUTIONAL EQUITIES RESEARCH
JFE’s stake in JSW will be lower than committed 14.99% in case of a conversion price of Rs1,500/ share. In such a situation, JSW will issue a second tranche of equity shares at Rs1,500 or 10% premium over minimum price at which shares are permitted to be issued—whichever is higher, as per SEBI provisions. JSW will raise a minimum of Rs6 bn in such a case.
JSW can also have a third tranche of equity issuance to JFE. This could be possible in case of conversion of outstanding FCCBs into underlying equity shares. Note that JSW had raised US$325 mn through FCCBs in 2007. JSW bought back FCCBs, when it was trading at a steep discount to face value. Total FCCBs outstanding at end-FY2010 was US$274. mn, which will translate in to 11.7 mn equity share. FCCB conversion price into equity of JSW is Rs953/ share; FCCB maturity date in mid-2012. JFE’s stake will drop to 14.15% in case of conversion of FCCB into equity shares. In such a case, JSW will issue additional 2 mn shares at the higher of Rs1,500 or 10% premium over the minimum price at which shares are permitted to be issued, as per SEBI provisions. JSW will raise a minimum of Rs3 bn in such a case.
Equity capital that JSW can potentially raise in different scenarios between 2010-2012E JFE is obligated to keep stake at 14.99% in JSW
# of shares Equity raised Conversion pricemn Rs mn Rs
Scenario A-- Conversion of shares at Rs1,500
Shares outstanding 187 Warrants to promoters 18 21,175 1,210 Sale of stake to JFE 32 48,007 1,500 Second tranche of stock issue to JFE 4 6,000 1,500 FCCB conversion, mid-2012 12 11,098 953 Third tranche to JFE 2 3,165 1,500 Total 254 89,445
JFE's ownership (mn shares) 38 57,172 JFE's equity ownership (%) 14.99
Scenario B- conversion of share at Rs1,331
Shares outstanding (pre-dilution) 187 Warrants to promoters 18 21,175 1,210 Sale of stake to JFE 36 48,007 1,331 FCCB conversion, mid-2012 12 11,098 953 Third tranche to JFE 2 3,165 1,500 Total 254 83,445
JFE's ownership (mn shares) 38 51,172 JFE's equity ownership (%) 14.99
Note
(2) Each of the above scenarios is driven to ensute that JFE stake in JSW is at 14.99%(3) Promoters have 18-month window from June 2010 to convert warrnts into equity share
(1) Each of the scenario contingent on whether average closing price of JSW stock in two consecutive weeks/ 10 days or in case closing price for 5 consecutive days is above Rs1,365 either before August 26, 2010 or in the next 18-months. If yes, conversion price would be Rs1,500, if not then conversion price will be Rs1,331
Source: Company, Kotak Institutional Equities estimates
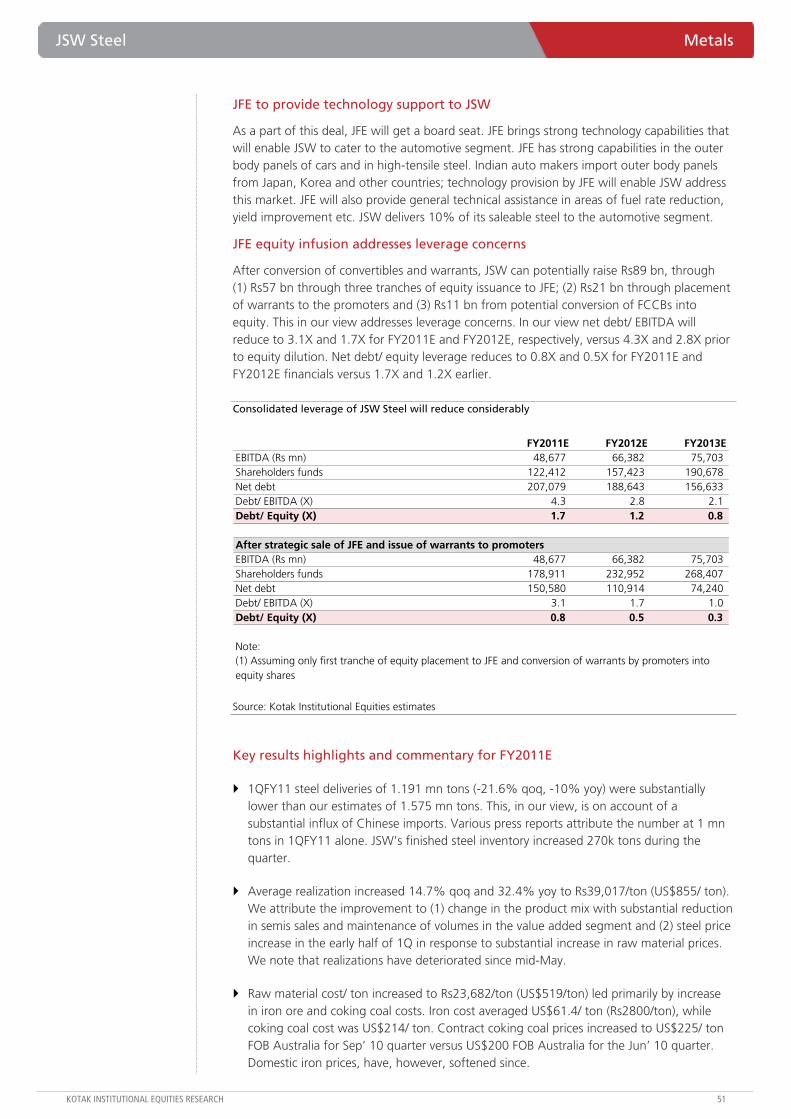
JSW Steel Metals
KOTAK INSTITUTIONAL EQUITIES RESEARCH 51
JFE to provide technology support to JSW
As a part of this deal, JFE will get a board seat. JFE brings strong technology capabilities that will enable JSW to cater to the automotive segment. JFE has strong capabilities in the outer body panels of cars and in high-tensile steel. Indian auto makers import outer body panels from Japan, Korea and other countries; technology provision by JFE will enable JSW address this market. JFE will also provide general technical assistance in areas of fuel rate reduction, yield improvement etc. JSW delivers 10% of its saleable steel to the automotive segment.
JFE equity infusion addresses leverage concerns
After conversion of convertibles and warrants, JSW can potentially raise Rs89 bn, through (1) Rs57 bn through three tranches of equity issuance to JFE; (2) Rs21 bn through placement of warrants to the promoters and (3) Rs11 bn from potential conversion of FCCBs into equity. This in our view addresses leverage concerns. In our view net debt/ EBITDA will reduce to 3.1X and 1.7X for FY2011E and FY2012E, respectively, versus 4.3X and 2.8X prior to equity dilution. Net debt/ equity leverage reduces to 0.8X and 0.5X for FY2011E and FY2012E financials versus 1.7X and 1.2X earlier.
Consolidated leverage of JSW Steel will reduce considerably
FY2011E FY2012E FY2013EEBITDA (Rs mn) 48,677 66,382 75,703 Shareholders funds 122,412 157,423 190,678 Net debt 207,079 188,643 156,633 Debt/ EBITDA (X) 4.3 2.8 2.1 Debt/ Equity (X) 1.7 1.2 0.8
After strategic sale of JFE and issue of warrants to promotersEBITDA (Rs mn) 48,677 66,382 75,703 Shareholders funds 178,911 232,952 268,407 Net debt 150,580 110,914 74,240 Debt/ EBITDA (X) 3.1 1.7 1.0 Debt/ Equity (X) 0.8 0.5 0.3
Note:(1) Assuming only first tranche of equity placement to JFE and conversion of warrants by promoters into equity shares
Source: Kotak Institutional Equities estimates
Key results highlights and commentary for FY2011E
1QFY11 steel deliveries of 1.191 mn tons (-21.6% qoq, -10% yoy) were substantially lower than our estimates of 1.575 mn tons. This, in our view, is on account of a substantial influx of Chinese imports. Various press reports attribute the number at 1 mn tons in 1QFY11 alone. JSW’s finished steel inventory increased 270k tons during the quarter.
Average realization increased 14.7% qoq and 32.4% yoy to Rs39,017/ton (US$855/ ton). We attribute the improvement to (1) change in the product mix with substantial reduction in semis sales and maintenance of volumes in the value added segment and (2) steel price increase in the early half of 1Q in response to substantial increase in raw material prices. We note that realizations have deteriorated since mid-May.
Raw material cost/ ton increased to Rs23,682/ton (US$519/ton) led primarily by increase in iron ore and coking coal costs. Iron cost averaged US$61.4/ ton (Rs2800/ton), while coking coal cost was US$214/ ton. Contract coking coal prices increased to US$225/ ton FOB Australia for Sep’ 10 quarter versus US$200 FOB Australia for the Jun’ 10 quarter. Domestic iron prices, have, however, softened since.
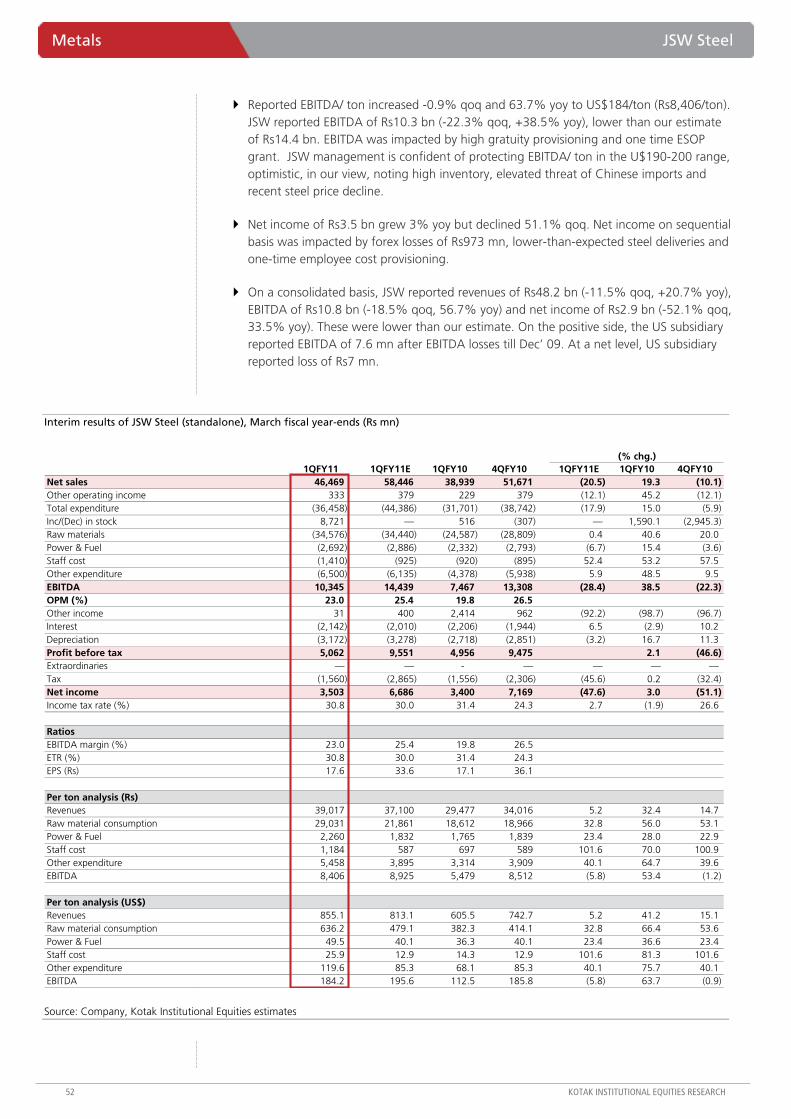
Metals JSW Steel
52 KOTAK INSTITUTIONAL EQUITIES RESEARCH
Reported EBITDA/ ton increased -0.9% qoq and 63.7% yoy to US$184/ton (Rs8,406/ton). JSW reported EBITDA of Rs10.3 bn (-22.3% qoq, +38.5% yoy), lower than our estimate of Rs14.4 bn. EBITDA was impacted by high gratuity provisioning and one time ESOP grant. JSW management is confident of protecting EBITDA/ ton in the U$190-200 range, optimistic, in our view, noting high inventory, elevated threat of Chinese imports and recent steel price decline.
Net income of Rs3.5 bn grew 3% yoy but declined 51.1% qoq. Net income on sequential basis was impacted by forex losses of Rs973 mn, lower-than-expected steel deliveries and one-time employee cost provisioning.
On a consolidated basis, JSW reported revenues of Rs48.2 bn (-11.5% qoq, +20.7% yoy), EBITDA of Rs10.8 bn (-18.5% qoq, 56.7% yoy) and net income of Rs2.9 bn (-52.1% qoq, 33.5% yoy). These were lower than our estimate. On the positive side, the US subsidiary reported EBITDA of 7.6 mn after EBITDA losses till Dec’ 09. At a net level, US subsidiary reported loss of Rs7 mn.
Interim results of JSW Steel (standalone), March fiscal year-ends (Rs mn)
(% chg.)1QFY11 1QFY11E 1QFY10 4QFY10 1QFY11E 1QFY10 4QFY10
Net sales 46,469 58,446 38,939 51,671 (20.5) 19.3 (10.1) Other operating income 333 379 229 379 (12.1) 45.2 (12.1) Total expenditure (36,458) (44,386) (31,701) (38,742) (17.9) 15.0 (5.9) Inc/(Dec) in stock 8,721 — 516 (307) — 1,590.1 (2,945.3) Raw materials (34,576) (34,440) (24,587) (28,809) 0.4 40.6 20.0 Power & Fuel (2,692) (2,886) (2,332) (2,793) (6.7) 15.4 (3.6) Staff cost (1,410) (925) (920) (895) 52.4 53.2 57.5 Other expenditure (6,500) (6,135) (4,378) (5,938) 5.9 48.5 9.5 EBITDA 10,345 14,439 7,467 13,308 (28.4) 38.5 (22.3) OPM (%) 23.0 25.4 19.8 26.5 Other income 31 400 2,414 962 (92.2) (98.7) (96.7) Interest (2,142) (2,010) (2,206) (1,944) 6.5 (2.9) 10.2 Depreciation (3,172) (3,278) (2,718) (2,851) (3.2) 16.7 11.3 Profit before tax 5,062 9,551 4,956 9,475 2.1 (46.6) Extraordinaries — — - — — — —Tax (1,560) (2,865) (1,556) (2,306) (45.6) 0.2 (32.4) Net income 3,503 6,686 3,400 7,169 (47.6) 3.0 (51.1) Income tax rate (%) 30.8 30.0 31.4 24.3 2.7 (1.9) 26.6
RatiosEBITDA margin (%) 23.0 25.4 19.8 26.5 ETR (%) 30.8 30.0 31.4 24.3 EPS (Rs) 17.6 33.6 17.1 36.1
Per ton analysis (Rs)Revenues 39,017 37,100 29,477 34,016 5.2 32.4 14.7 Raw material consumption 29,031 21,861 18,612 18,966 32.8 56.0 53.1 Power & Fuel 2,260 1,832 1,765 1,839 23.4 28.0 22.9 Staff cost 1,184 587 697 589 101.6 70.0 100.9 Other expenditure 5,458 3,895 3,314 3,909 40.1 64.7 39.6 EBITDA 8,406 8,925 5,479 8,512 (5.8) 53.4 (1.2)
Per ton analysis (US$)Revenues 855.1 813.1 605.5 742.7 5.2 41.2 15.1 Raw material consumption 636.2 479.1 382.3 414.1 32.8 66.4 53.6 Power & Fuel 49.5 40.1 36.3 40.1 23.4 36.6 23.4 Staff cost 25.9 12.9 14.3 12.9 101.6 81.3 101.6 Other expenditure 119.6 85.3 68.1 85.3 40.1 75.7 40.1 EBITDA 184.2 195.6 112.5 185.8 (5.8) 63.7 (0.9)
Source: Company, Kotak Institutional Equities estimates
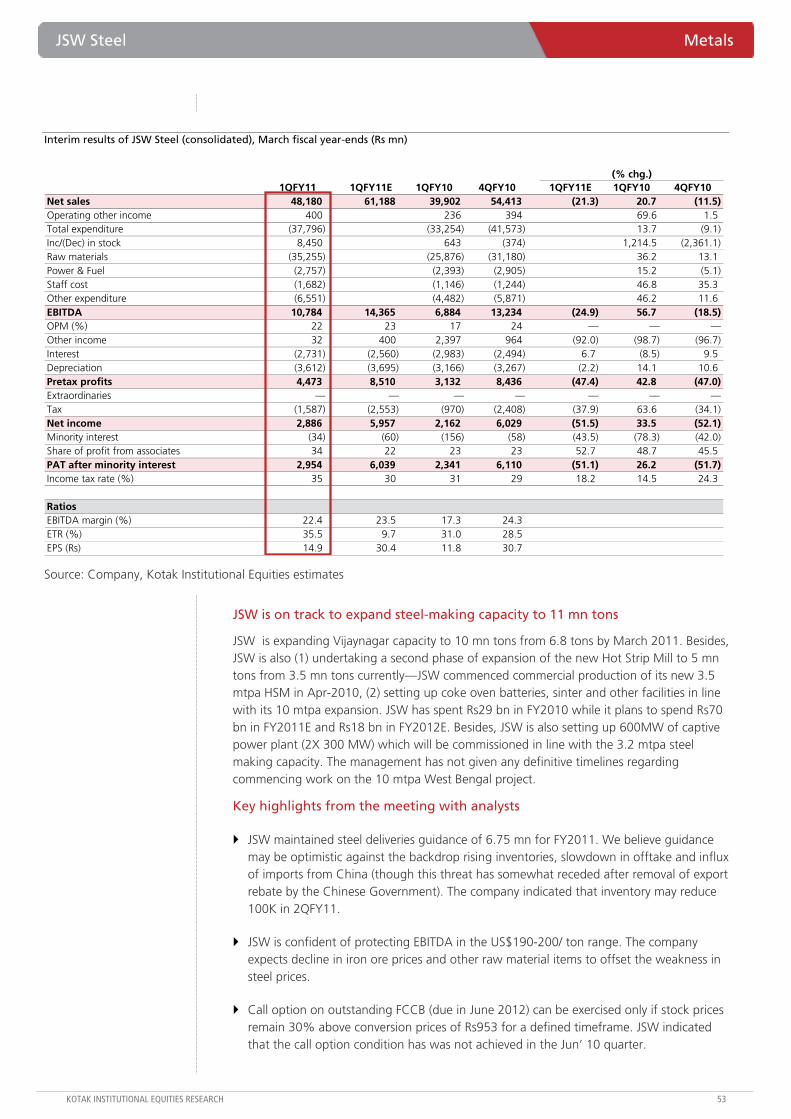
JSW Steel Metals
KOTAK INSTITUTIONAL EQUITIES RESEARCH 53
Interim results of JSW Steel (consolidated), March fiscal year-ends (Rs mn)
(% chg.)1QFY11 1QFY11E 1QFY10 4QFY10 1QFY11E 1QFY10 4QFY10
Net sales 48,180 61,188 39,902 54,413 (21.3) 20.7 (11.5) Operating other income 400 236 394 69.6 1.5 Total expenditure (37,796) (33,254) (41,573) 13.7 (9.1) Inc/(Dec) in stock 8,450 643 (374) 1,214.5 (2,361.1) Raw materials (35,255) (25,876) (31,180) 36.2 13.1 Power & Fuel (2,757) (2,393) (2,905) 15.2 (5.1) Staff cost (1,682) (1,146) (1,244) 46.8 35.3 Other expenditure (6,551) (4,482) (5,871) 46.2 11.6 EBITDA 10,784 14,365 6,884 13,234 (24.9) 56.7 (18.5) OPM (%) 22 23 17 24 — — —Other income 32 400 2,397 964 (92.0) (98.7) (96.7) Interest (2,731) (2,560) (2,983) (2,494) 6.7 (8.5) 9.5 Depreciation (3,612) (3,695) (3,166) (3,267) (2.2) 14.1 10.6 Pretax profits 4,473 8,510 3,132 8,436 (47.4) 42.8 (47.0) Extraordinaries — — — — — — —Tax (1,587) (2,553) (970) (2,408) (37.9) 63.6 (34.1) Net income 2,886 5,957 2,162 6,029 (51.5) 33.5 (52.1) Minority interest (34) (60) (156) (58) (43.5) (78.3) (42.0) Share of profit from associates 34 22 23 23 52.7 48.7 45.5 PAT after minority interest 2,954 6,039 2,341 6,110 (51.1) 26.2 (51.7) Income tax rate (%) 35 30 31 29 18.2 14.5 24.3
RatiosEBITDA margin (%) 22.4 23.5 17.3 24.3 ETR (%) 35.5 9.7 31.0 28.5 EPS (Rs) 14.9 30.4 11.8 30.7
Source: Company, Kotak Institutional Equities estimates
JSW is on track to expand steel-making capacity to 11 mn tons
JSW is expanding Vijaynagar capacity to 10 mn tons from 6.8 tons by March 2011. Besides, JSW is also (1) undertaking a second phase of expansion of the new Hot Strip Mill to 5 mn tons from 3.5 mn tons currently—JSW commenced commercial production of its new 3.5 mtpa HSM in Apr-2010, (2) setting up coke oven batteries, sinter and other facilities in line with its 10 mtpa expansion. JSW has spent Rs29 bn in FY2010 while it plans to spend Rs70 bn in FY2011E and Rs18 bn in FY2012E. Besides, JSW is also setting up 600MW of captive power plant (2X 300 MW) which will be commissioned in line with the 3.2 mtpa steel making capacity. The management has not given any definitive timelines regarding commencing work on the 10 mtpa West Bengal project.
Key highlights from the meeting with analysts
JSW maintained steel deliveries guidance of 6.75 mn for FY2011. We believe guidance may be optimistic against the backdrop rising inventories, slowdown in offtake and influx of imports from China (though this threat has somewhat receded after removal of export rebate by the Chinese Government). The company indicated that inventory may reduce 100K in 2QFY11.
JSW is confident of protecting EBITDA in the US$190-200/ ton range. The company expects decline in iron ore prices and other raw material items to offset the weakness in steel prices.
Call option on outstanding FCCB (due in June 2012) can be exercised only if stock prices remain 30% above conversion prices of Rs953 for a defined timeframe. JSW indicated that the call option condition has was not achieved in the Jun’ 10 quarter.
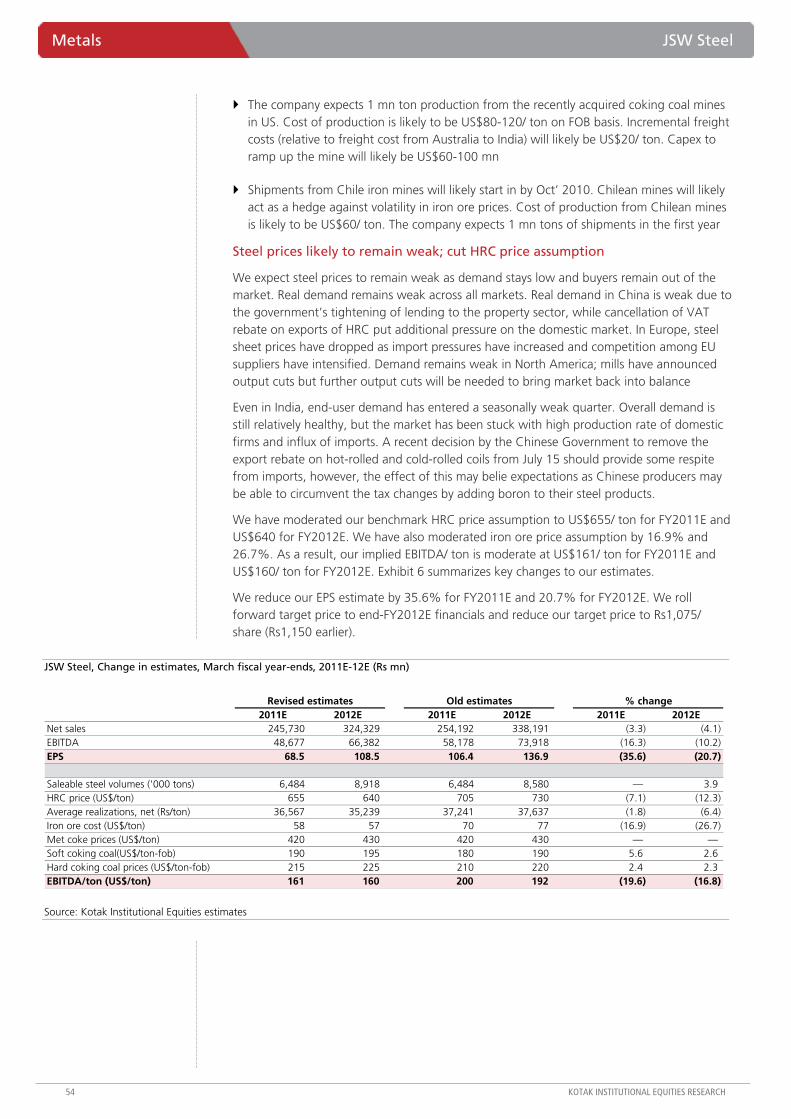
Metals JSW Steel
54 KOTAK INSTITUTIONAL EQUITIES RESEARCH
The company expects 1 mn ton production from the recently acquired coking coal mines in US. Cost of production is likely to be US$80-120/ ton on FOB basis. Incremental freight costs (relative to freight cost from Australia to India) will likely be US$20/ ton. Capex to ramp up the mine will likely be US$60-100 mn
Shipments from Chile iron mines will likely start in by Oct’ 2010. Chilean mines will likely act as a hedge against volatility in iron ore prices. Cost of production from Chilean mines is likely to be US$60/ ton. The company expects 1 mn tons of shipments in the first year
Steel prices likely to remain weak; cut HRC price assumption
We expect steel prices to remain weak as demand stays low and buyers remain out of the market. Real demand remains weak across all markets. Real demand in China is weak due to the government’s tightening of lending to the property sector, while cancellation of VAT rebate on exports of HRC put additional pressure on the domestic market. In Europe, steel sheet prices have dropped as import pressures have increased and competition among EU suppliers have intensified. Demand remains weak in North America; mills have announced output cuts but further output cuts will be needed to bring market back into balance
Even in India, end-user demand has entered a seasonally weak quarter. Overall demand is still relatively healthy, but the market has been stuck with high production rate of domestic firms and influx of imports. A recent decision by the Chinese Government to remove the export rebate on hot-rolled and cold-rolled coils from July 15 should provide some respite from imports, however, the effect of this may belie expectations as Chinese producers may be able to circumvent the tax changes by adding boron to their steel products.
We have moderated our benchmark HRC price assumption to US$655/ ton for FY2011E and US$640 for FY2012E. We have also moderated iron ore price assumption by 16.9% and 26.7%. As a result, our implied EBITDA/ ton is moderate at US$161/ ton for FY2011E and US$160/ ton for FY2012E. Exhibit 6 summarizes key changes to our estimates.
We reduce our EPS estimate by 35.6% for FY2011E and 20.7% for FY2012E. We roll forward target price to end-FY2012E financials and reduce our target price to Rs1,075/ share (Rs1,150 earlier).
JSW Steel, Change in estimates, March fiscal year-ends, 2011E-12E (Rs mn)
2011E 2012E 2011E 2012E 2011E 2012ENet sales 245,730 324,329 254,192 338,191 (3.3) (4.1) EBITDA 48,677 66,382 58,178 73,918 (16.3) (10.2) EPS 68.5 108.5 106.4 136.9 (35.6) (20.7)
Saleable steel volumes ('000 tons) 6,484 8,918 6,484 8,580 — 3.9 HRC price (US$/ton) 655 640 705 730 (7.1) (12.3) Average realizations, net (Rs/ton) 36,567 35,239 37,241 37,637 (1.8) (6.4) Iron ore cost (US$/ton) 58 57 70 77 (16.9) (26.7) Met coke prices (US$/ton) 420 430 420 430 — —Soft coking coal(US$/ton-fob) 190 195 180 190 5.6 2.6 Hard coking coal prices (US$/ton-fob) 215 225 210 220 2.4 2.3 EBITDA/ton (US$/ton) 161 160 200 192 (19.6) (16.8)
% changeRevised estimates Old estimates
Source: Kotak Institutional Equities estimates
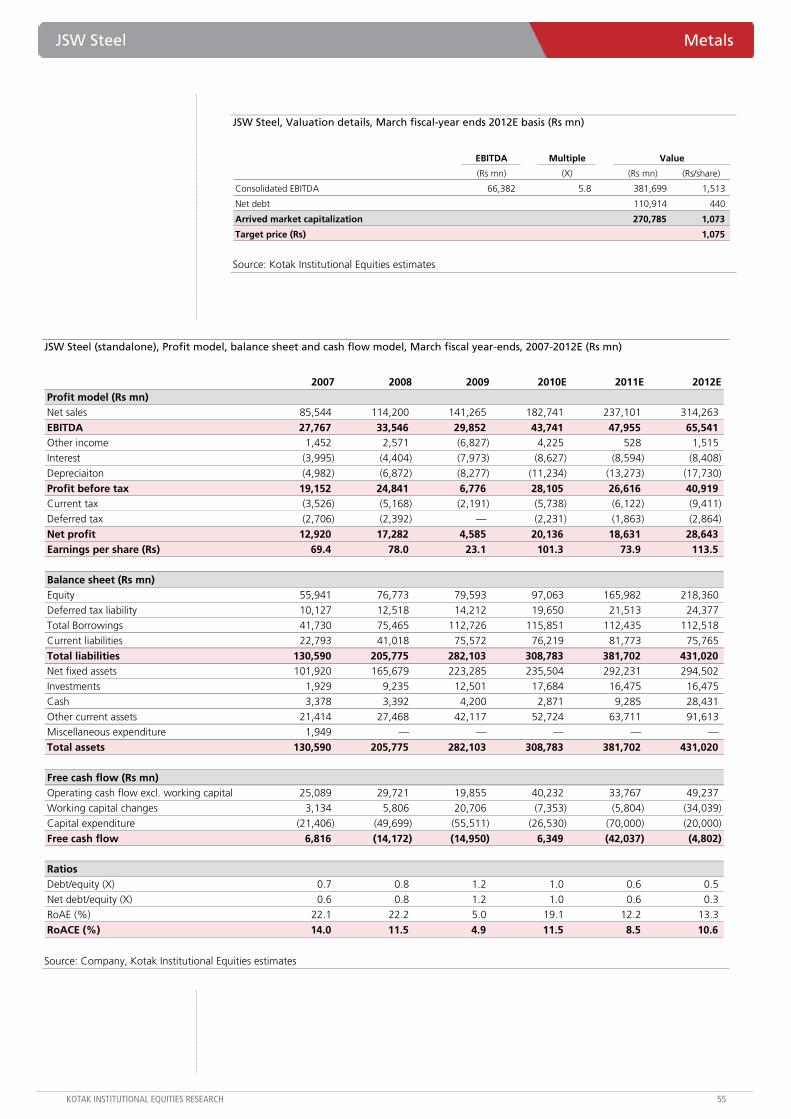
JSW Steel Metals
KOTAK INSTITUTIONAL EQUITIES RESEARCH 55
JSW Steel, Valuation details, March fiscal-year ends 2012E basis (Rs mn)
EBITDA Multiple
(Rs mn) (X) (Rs mn) (Rs/share)
Consolidated EBITDA 66,382 5.8 381,699 1,513
Net debt 110,914 440
Arrived market capitalization 270,785 1,073
Target price (Rs) 1,075
Value
Source: Kotak Institutional Equities estimates
JSW Steel (standalone), Profit model, balance sheet and cash flow model, March fiscal year-ends, 2007-2012E (Rs mn)
2007 2008 2009 2010E 2011E 2012EProfit model (Rs mn)Net sales 85,544 114,200 141,265 182,741 237,101 314,263
EBITDA 27,767 33,546 29,852 43,741 47,955 65,541 Other income 1,452 2,571 (6,827) 4,225 528 1,515 Interest (3,995) (4,404) (7,973) (8,627) (8,594) (8,408) Depreciaiton (4,982) (6,872) (8,277) (11,234) (13,273) (17,730)
Profit before tax 19,152 24,841 6,776 28,105 26,616 40,919 Current tax (3,526) (5,168) (2,191) (5,738) (6,122) (9,411) Deferred tax (2,706) (2,392) — (2,231) (1,863) (2,864)
Net profit 12,920 17,282 4,585 20,136 18,631 28,643 Earnings per share (Rs) 69.4 78.0 23.1 101.3 73.9 113.5
Balance sheet (Rs mn)Equity 55,941 76,773 79,593 97,063 165,982 218,360 Deferred tax liability 10,127 12,518 14,212 19,650 21,513 24,377 Total Borrowings 41,730 75,465 112,726 115,851 112,435 112,518 Current liabilities 22,793 41,018 75,572 76,219 81,773 75,765
Total liabilities 130,590 205,775 282,103 308,783 381,702 431,020 Net fixed assets 101,920 165,679 223,285 235,504 292,231 294,502 Investments 1,929 9,235 12,501 17,684 16,475 16,475 Cash 3,378 3,392 4,200 2,871 9,285 28,431 Other current assets 21,414 27,468 42,117 52,724 63,711 91,613 Miscellaneous expenditure 1,949 — — — — —
Total assets 130,590 205,775 282,103 308,783 381,702 431,020
Free cash flow (Rs mn)Operating cash flow excl. working capital 25,089 29,721 19,855 40,232 33,767 49,237 Working capital changes 3,134 5,806 20,706 (7,353) (5,804) (34,039) Capital expenditure (21,406) (49,699) (55,511) (26,530) (70,000) (20,000)
Free cash flow 6,816 (14,172) (14,950) 6,349 (42,037) (4,802)
RatiosDebt/equity (X) 0.7 0.8 1.2 1.0 0.6 0.5 Net debt/equity (X) 0.6 0.8 1.2 1.0 0.6 0.3 RoAE (%) 22.1 22.2 5.0 19.1 12.2 13.3
RoACE (%) 14.0 11.5 4.9 11.5 8.5 10.6
Source: Company, Kotak Institutional Equities estimates
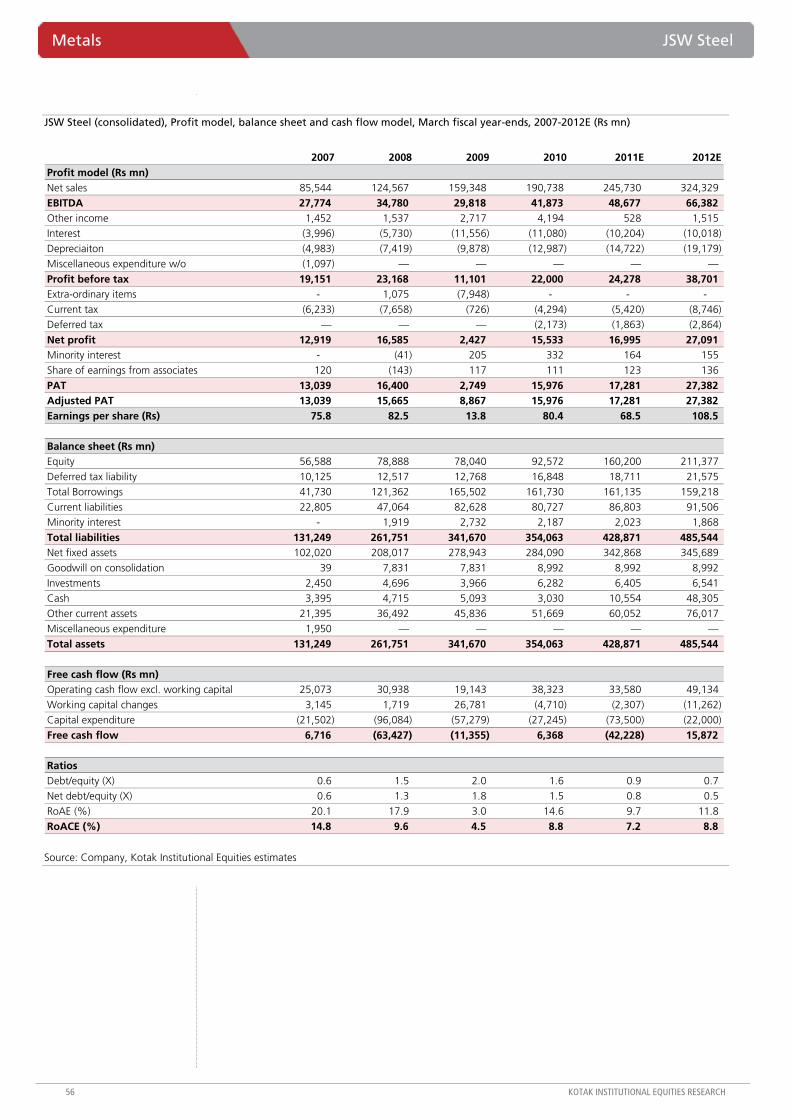
Metals JSW Steel
56 KOTAK INSTITUTIONAL EQUITIES RESEARCH
JSW Steel (consolidated), Profit model, balance sheet and cash flow model, March fiscal year-ends, 2007-2012E (Rs mn)
2007 2008 2009 2010 2011E 2012EProfit model (Rs mn)Net sales 85,544 124,567 159,348 190,738 245,730 324,329 EBITDA 27,774 34,780 29,818 41,873 48,677 66,382 Other income 1,452 1,537 2,717 4,194 528 1,515 Interest (3,996) (5,730) (11,556) (11,080) (10,204) (10,018) Depreciaiton (4,983) (7,419) (9,878) (12,987) (14,722) (19,179) Miscellaneous expenditure w/o (1,097) — — — — —
Profit before tax 19,151 23,168 11,101 22,000 24,278 38,701 Extra-ordinary items - 1,075 (7,948) - - - Current tax (6,233) (7,658) (726) (4,294) (5,420) (8,746) Deferred tax — — — (2,173) (1,863) (2,864)
Net profit 12,919 16,585 2,427 15,533 16,995 27,091 Minority interest - (41) 205 332 164 155 Share of earnings from associates 120 (143) 117 111 123 136
PAT 13,039 16,400 2,749 15,976 17,281 27,382 Adjusted PAT 13,039 15,665 8,867 15,976 17,281 27,382 Earnings per share (Rs) 75.8 82.5 13.8 80.4 68.5 108.5
Balance sheet (Rs mn)Equity 56,588 78,888 78,040 92,572 160,200 211,377 Deferred tax liability 10,125 12,517 12,768 16,848 18,711 21,575 Total Borrowings 41,730 121,362 165,502 161,730 161,135 159,218 Current liabilities 22,805 47,064 82,628 80,727 86,803 91,506 Minority interest - 1,919 2,732 2,187 2,023 1,868
Total liabilities 131,249 261,751 341,670 354,063 428,871 485,544 Net fixed assets 102,020 208,017 278,943 284,090 342,868 345,689 Goodwill on consolidation 39 7,831 7,831 8,992 8,992 8,992 Investments 2,450 4,696 3,966 6,282 6,405 6,541 Cash 3,395 4,715 5,093 3,030 10,554 48,305 Other current assets 21,395 36,492 45,836 51,669 60,052 76,017 Miscellaneous expenditure 1,950 — — — — —
Total assets 131,249 261,751 341,670 354,063 428,871 485,544
Free cash flow (Rs mn)Operating cash flow excl. working capital 25,073 30,938 19,143 38,323 33,580 49,134 Working capital changes 3,145 1,719 26,781 (4,710) (2,307) (11,262) Capital expenditure (21,502) (96,084) (57,279) (27,245) (73,500) (22,000)
Free cash flow 6,716 (63,427) (11,355) 6,368 (42,228) 15,872
RatiosDebt/equity (X) 0.6 1.5 2.0 1.6 0.9 0.7 Net debt/equity (X) 0.6 1.3 1.8 1.5 0.8 0.5 RoAE (%) 20.1 17.9 3.0 14.6 9.7 11.8 RoACE (%) 14.8 9.6 4.5 8.8 7.2 8.8
Source: Company, Kotak Institutional Equities estimates
For private Circulation Only. FOR IMPORTANT INFORMATION ABOUT KOTAK SECURITIES’ RATING SYSTEM AND OTHER DISCLOSURES, REFER TO THE END OF THIS MATERIAL.
Results beat expectations line by line
Titan reported net sales of Rs12.5 bn (+42%, KIE estimate Rs11.2 bn), EBITDA of Rs1,113 mn (+40%, KIE estimate Rs1,034 mn) and PAT of Rs813 mn (+77%, KIE estimate Rs658 mn).
Jewelry business which forms ~76% of the overall sales mix grew by robust 50% (~22% price growth, ~33% volumes and ~5% inferior mix) and the watches business which contributes ~20% of sales grew by 22% during the quarter. A good wedding season coupled with rising discretionary spends has driven growth in both the categories.
At a margin level, we note that in 1QFY10, jewelry margins included a benefit of Rs300 mn on account of change in valuation methodology of gold inventory to FIFO from a weighted average cost basis. Adjusting for this, jewelry margins improved 380 bps to 7.2% in 1QFY11 versus 3.4% in 1QFY10, likely due to lower other expenditure (higher operating leverage). In watches, margins continued to be strong at 16.4%, an improvement of 230 bps, due to mix improvement with consumers uptrading to premium-end watches (brands like Titan-Edge, Titan-Bandhan, Nebula, Xylys).
We continue to like the story…
Likely higher discretionary spends augur well. We model net sales CAGR of 30% in FY2010-12E with sales likely to touch Rs79 bn in FY2012E. We believe that with the return of consumer spending, discretionary spends will continue to be robust. We expect jewelry sales to increase at CAGR of 34% with volume growth of 21% during FY2010-12E and watches sales to increase at CAGR of 16% with 13% volume growth.
Penetration and consumption-led growth. We believe that there is huge opportunity for penetration and consumption-led growth with rising disposable income pushing up aspiration levels and encouraging conversion from unbranded to branded jewelry and watches. We believe that Titan’s Sonata range of watches has good potential to address the <Rs500 price point (to induce conversion to branded segment). In the jewelry segment, Gold Plus, the mass market brand has been a success recording 22% growth in FY2010.
Titan Industries (TTAN)
Retail
Keeps shining. 1QFY11 results beat expectations line by line with 50% sales growth in jewelry business (~33% volumes) and 22% growth in watches. Jewelry margins could potentially improve as Titan has switched entirely to variable billing (making charges as a % of gold value). Growth in watches is broad-based; potential to grow <Rs500 and >Rs2,000 segment exists. We like the unorganized to organized industry conversion opportunity for Titan in watches (~70%) and jewelry (~90%). ADD.
Titan IndustriesStock data Forecasts/Valuations 2010 2011E 2012E
52-week range (Rs) (high,low) EPS (Rs) 57.3 83.4 110.2Market Cap. (Rs bn) 125.6 EPS growth (%) 29.3 45.6 32.2
Shareholding pattern (%) P/E (X) 49.4 33.9 25.7Promoters 53.1 Sales (Rs bn) 46.8 62.9 79.1FIIs 10.8 Net profits (Rs bn) 2.5 3.7 4.9MFs 8.6 EBITDA (Rs bn) 4.0 5.5 7.1
Price performance (%) 1M 3M 12M EV/EBITDA (X) 31.4 22.9 17.5Absolute 25.0 36.8 111.8 ROE (%) 38.7 41.8 39.4Rel. to BSE-30 21.5 33.9 80.1 Div. Yield (%) 0.5 0.4 0.5
Company data and valuation summary
2,873-1,120
ADD
JULY 27, 2010
RESULT
Coverage view: Neutral
Price (Rs): 2,830
Target price (Rs): 3,000
BSE-30: 18,078
Retail Titan Industries
58 KOTAK INSTITUTIONAL EQUITIES RESEARCH
Mix improvement. We like the company’s efforts to encourage mix improvement and thus aid margin expansion. In the jewelry business, the share of diamond jewelry is increasing. During the quarter, the company launched its new high-value diamond jewelry campaign. We highlight that the jewelry segment profitability is largely driven by the growth in diamond and studded jewelry which generate substantially higher margins than plain gold sales (>5X, in our view). With increasing contribution of diamond and studded jewelry to overall sales mix, the vulnerability of the company to volatility in gold prices will reduce.
….and upgrading our estimates, rolling over target price to FY2012E
We roll over to FY2012E with a TP of Rs3,000. Our EPS estimates are Rs83 (Rs76 previously) and Rs110 (Rs96 previously) for FY2011E and FY2012E, respectively. Our optimism stems from the fact that Titan had delivered EPS CAGR of 36% over FY2007-10, we forecast EPS CAGR of 39% over FY2010-12E.
Key risks are (1) any slowdown in discretionary spending, (2) higher competitive intensity in the branded jewelry market (Reliance’s venture, Rajesh Exports’ venture etc.), (3) higher than-expected competitive activity in watches from any global player (this could hurt Titan in terms of higher adspends, will not affect sales, in our view) and (4) higher-than-estimated losses in eyewear business.
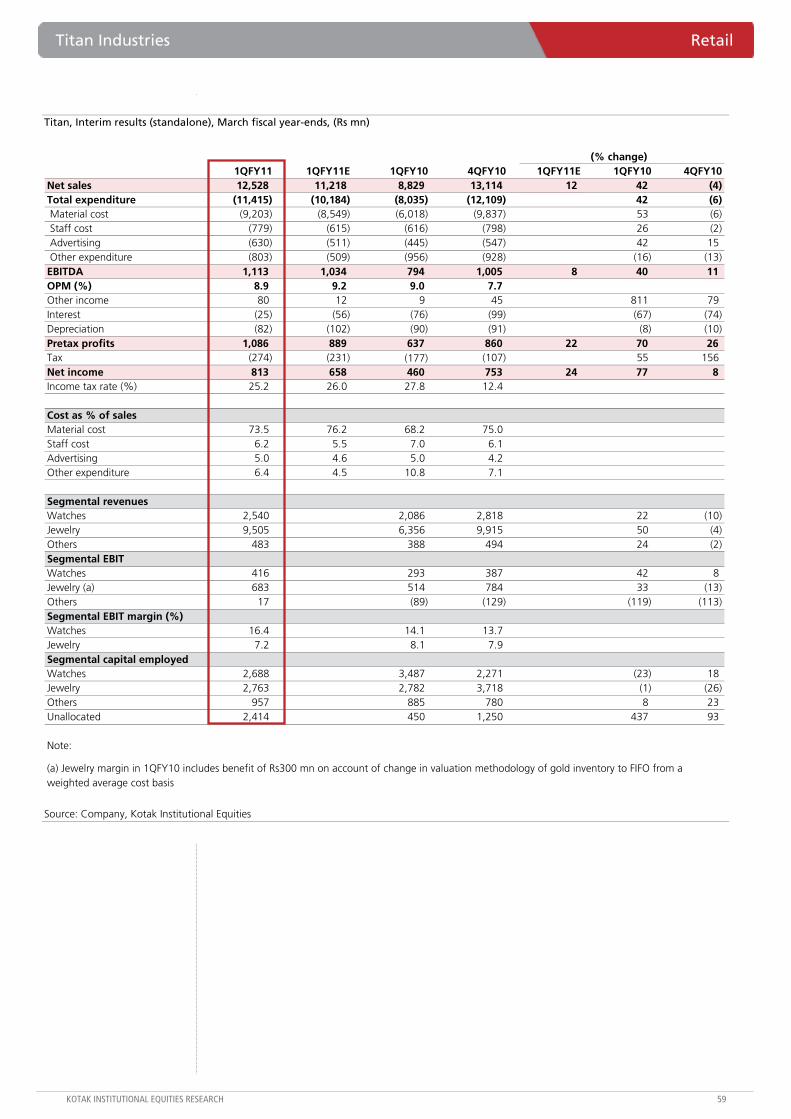
Titan Industries Retail
KOTAK INSTITUTIONAL EQUITIES RESEARCH 59
Titan, Interim results (standalone), March fiscal year-ends, (Rs mn)
(% change)1QFY11 1QFY11E 1QFY10 4QFY10 1QFY11E 1QFY10 4QFY10
Net sales 12,528 11,218 8,829 13,114 12 42 (4) Total expenditure (11,415) (10,184) (8,035) (12,109) 42 (6) Material cost (9,203) (8,549) (6,018) (9,837) 53 (6) Staff cost (779) (615) (616) (798) 26 (2) Advertising (630) (511) (445) (547) 42 15 Other expenditure (803) (509) (956) (928) (16) (13) EBITDA 1,113 1,034 794 1,005 8 40 11 OPM (%) 8.9 9.2 9.0 7.7 Other income 80 12 9 45 811 79 Interest (25) (56) (76) (99) (67) (74) Depreciation (82) (102) (90) (91) (8) (10) Pretax profits 1,086 889 637 860 22 70 26 Tax (274) (231) (177) (107) 55 156 Net income 813 658 460 753 24 77 8 Income tax rate (%) 25.2 26.0 27.8 12.4
Cost as % of salesMaterial cost 73.5 76.2 68.2 75.0 Staff cost 6.2 5.5 7.0 6.1 Advertising 5.0 4.6 5.0 4.2 Other expenditure 6.4 4.5 10.8 7.1
Segmental revenuesWatches 2,540 2,086 2,818 22 (10) Jewelry 9,505 6,356 9,915 50 (4) Others 483 388 494 24 (2) Segmental EBITWatches 416 293 387 42 8 Jewelry (a) 683 514 784 33 (13) Others 17 (89) (129) (119) (113) Segmental EBIT margin (%)Watches 16.4 14.1 13.7 Jewelry 7.2 8.1 7.9 Segmental capital employedWatches 2,688 3,487 2,271 (23) 18 Jewelry 2,763 2,782 3,718 (1) (26) Others 957 885 780 8 23 Unallocated 2,414 450 1,250 437 93
Note:
(a) Jewelry margin in 1QFY10 includes benefit of Rs300 mn on account of change in valuation methodology of gold inventory to FIFO from a weighted average cost basis
Source: Company, Kotak Institutional Equities
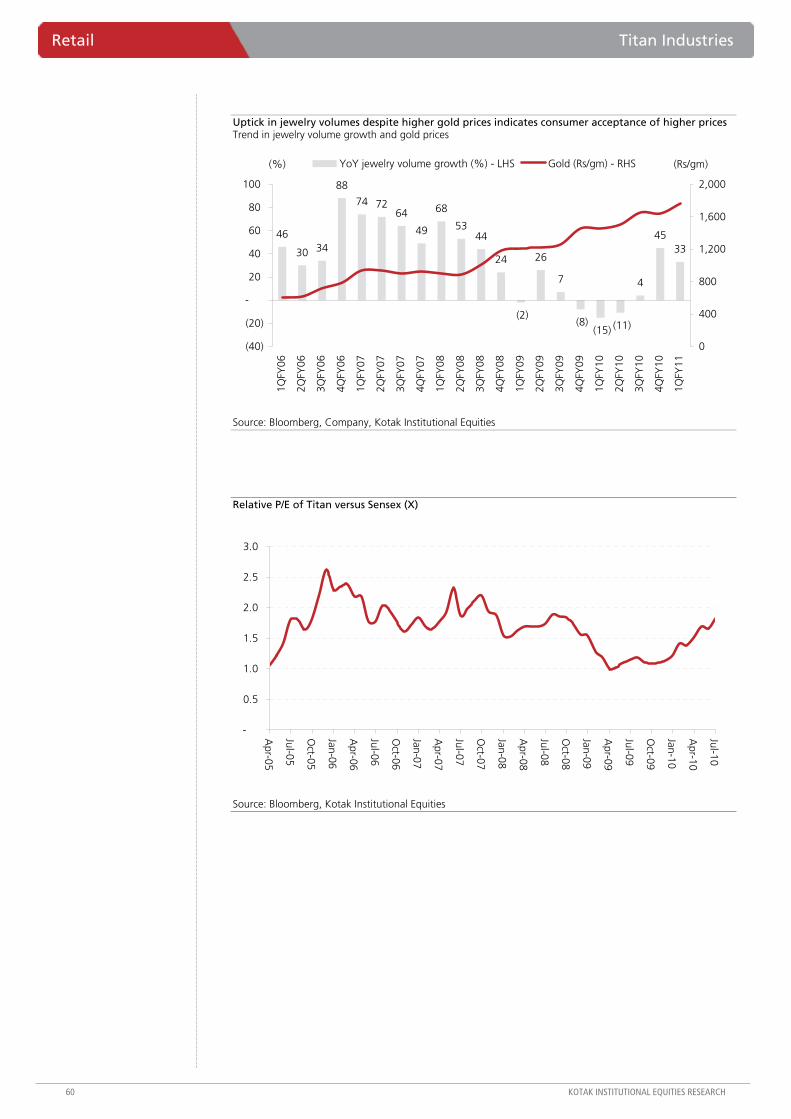
Retail Titan Industries
60 KOTAK INSTITUTIONAL EQUITIES RESEARCH
Uptick in jewelry volumes despite higher gold prices indicates consumer acceptance of higher prices Trend in jewelry volume growth and gold prices
46
30 34
88
74 7264
49
68
5344
24
(2)
26
7
(8)(15) (11)
4
4533
(40)
(20)
-
20
40
60
80
100
1QFY
06
2QFY
06
3QFY
06
4QFY
06
1QFY
07
2QFY
07
3QFY
07
4QFY
07
1QFY
08
2QFY
08
3QFY
08
4QFY
08
1QFY
09
2QFY
09
3QFY
09
4QFY
09
1QFY
10
2QFY
10
3QFY
10
4QFY
10
1QFY
11
(%)
0
400
800
1,200
1,600
2,000
(Rs/gm)YoY jewelry volume growth (%) - LHS Gold (Rs/gm) - RHS
Source: Bloomberg, Company, Kotak Institutional Equities
Relative P/E of Titan versus Sensex (X)
-
0.5
1.0
1.5
2.0
2.5
3.0
Apr-05
Jul-05
Oct-05
Jan-06
Apr-06
Jul-06
Oct-06
Jan-07
Apr-07
Jul-07
Oct-07
Jan-08
Apr-08
Jul-08
Oct-08
Jan-09
Apr-09
Jul-09
Oct-09
Jan-10
Apr-10
Jul-10
Source: Bloomberg, Kotak Institutional Equities
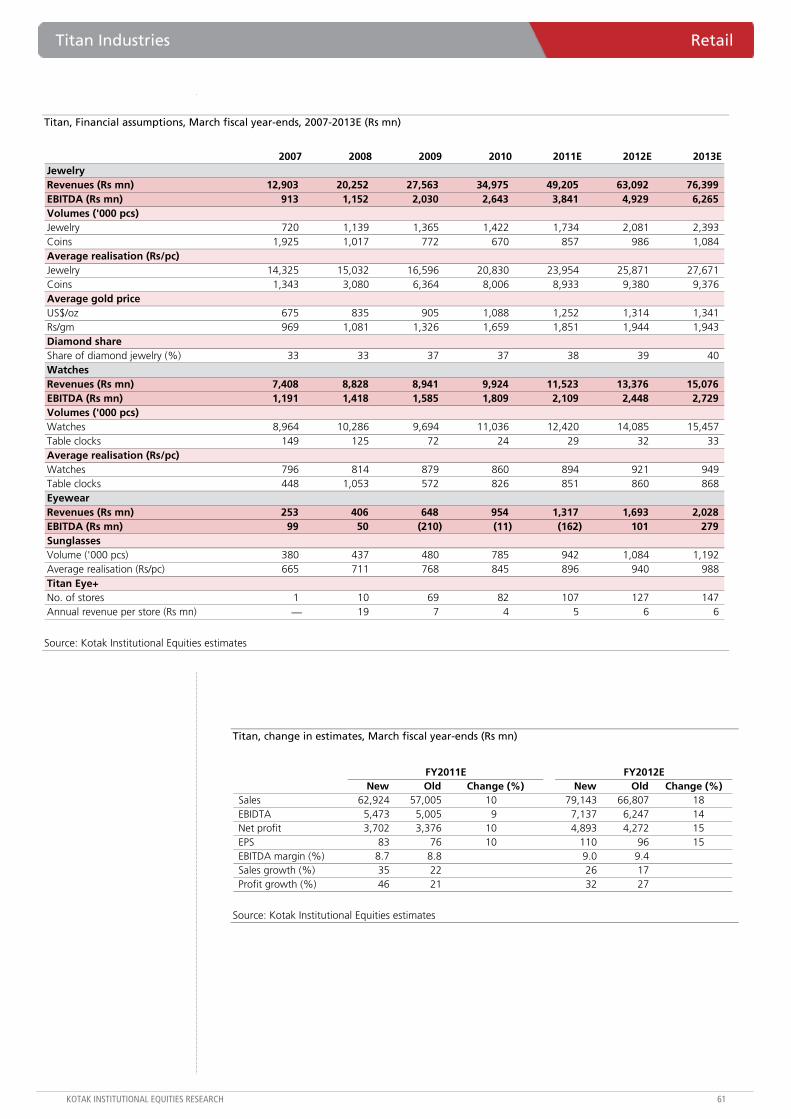
Titan Industries Retail
KOTAK INSTITUTIONAL EQUITIES RESEARCH 61
Titan, Financial assumptions, March fiscal year-ends, 2007-2013E (Rs mn)
2007 2008 2009 2010 2011E 2012E 2013EJewelryRevenues (Rs mn) 12,903 20,252 27,563 34,975 49,205 63,092 76,399 EBITDA (Rs mn) 913 1,152 2,030 2,643 3,841 4,929 6,265 Volumes ('000 pcs)Jewelry 720 1,139 1,365 1,422 1,734 2,081 2,393 Coins 1,925 1,017 772 670 857 986 1,084 Average realisation (Rs/pc)Jewelry 14,325 15,032 16,596 20,830 23,954 25,871 27,671 Coins 1,343 3,080 6,364 8,006 8,933 9,380 9,376 Average gold priceUS$/oz 675 835 905 1,088 1,252 1,314 1,341 Rs/gm 969 1,081 1,326 1,659 1,851 1,944 1,943 Diamond shareShare of diamond jewelry (%) 33 33 37 37 38 39 40 WatchesRevenues (Rs mn) 7,408 8,828 8,941 9,924 11,523 13,376 15,076 EBITDA (Rs mn) 1,191 1,418 1,585 1,809 2,109 2,448 2,729 Volumes ('000 pcs)Watches 8,964 10,286 9,694 11,036 12,420 14,085 15,457 Table clocks 149 125 72 24 29 32 33 Average realisation (Rs/pc)Watches 796 814 879 860 894 921 949 Table clocks 448 1,053 572 826 851 860 868 EyewearRevenues (Rs mn) 253 406 648 954 1,317 1,693 2,028 EBITDA (Rs mn) 99 50 (210) (11) (162) 101 279 SunglassesVolume ('000 pcs) 380 437 480 785 942 1,084 1,192 Average realisation (Rs/pc) 665 711 768 845 896 940 988 Titan Eye+No. of stores 1 10 69 82 107 127 147 Annual revenue per store (Rs mn) — 19 7 4 5 6 6
Source: Kotak Institutional Equities estimates
Titan, change in estimates, March fiscal year-ends (Rs mn)
FY2011ENew Old Change (%) New Old Change (%)
Sales 62,924 57,005 10 79,143 66,807 18 EBIDTA 5,473 5,005 9 7,137 6,247 14 Net profit 3,702 3,376 10 4,893 4,272 15 EPS 83 76 10 110 96 15 EBITDA margin (%) 8.7 8.8 9.0 9.4 Sales growth (%) 35 22 26 17 Profit growth (%) 46 21 32 27
FY2012E
Source: Kotak Institutional Equities estimates
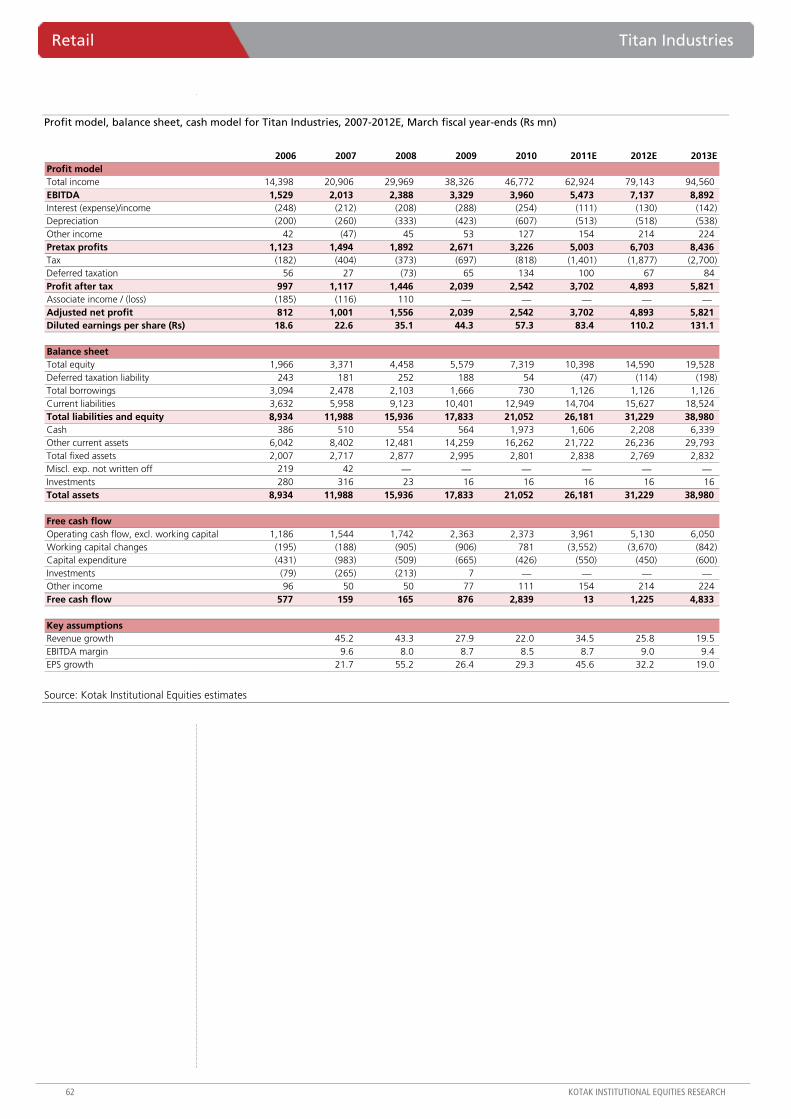
Retail Titan Industries
62 KOTAK INSTITUTIONAL EQUITIES RESEARCH
Profit model, balance sheet, cash model for Titan Industries, 2007-2012E, March fiscal year-ends (Rs mn)
2006 2007 2008 2009 2010 2011E 2012E 2013EProfit model Total income 14,398 20,906 29,969 38,326 46,772 62,924 79,143 94,560 EBITDA 1,529 2,013 2,388 3,329 3,960 5,473 7,137 8,892 Interest (expense)/income (248) (212) (208) (288) (254) (111) (130) (142) Depreciation (200) (260) (333) (423) (607) (513) (518) (538) Other income 42 (47) 45 53 127 154 214 224 Pretax profits 1,123 1,494 1,892 2,671 3,226 5,003 6,703 8,436 Tax (182) (404) (373) (697) (818) (1,401) (1,877) (2,700) Deferred taxation 56 27 (73) 65 134 100 67 84 Profit after tax 997 1,117 1,446 2,039 2,542 3,702 4,893 5,821 Associate income / (loss) (185) (116) 110 — — — — — Adjusted net profit 812 1,001 1,556 2,039 2,542 3,702 4,893 5,821 Diluted earnings per share (Rs) 18.6 22.6 35.1 44.3 57.3 83.4 110.2 131.1
Balance sheetTotal equity 1,966 3,371 4,458 5,579 7,319 10,398 14,590 19,528 Deferred taxation liability 243 181 252 188 54 (47) (114) (198) Total borrowings 3,094 2,478 2,103 1,666 730 1,126 1,126 1,126 Current liabilities 3,632 5,958 9,123 10,401 12,949 14,704 15,627 18,524 Total liabilities and equity 8,934 11,988 15,936 17,833 21,052 26,181 31,229 38,980 Cash 386 510 554 564 1,973 1,606 2,208 6,339 Other current assets 6,042 8,402 12,481 14,259 16,262 21,722 26,236 29,793 Total fixed assets 2,007 2,717 2,877 2,995 2,801 2,838 2,769 2,832 Miscl. exp. not written off 219 42 — — — — — — Investments 280 316 23 16 16 16 16 16 Total assets 8,934 11,988 15,936 17,833 21,052 26,181 31,229 38,980
Free cash flowOperating cash flow, excl. working capital 1,186 1,544 1,742 2,363 2,373 3,961 5,130 6,050 Working capital changes (195) (188) (905) (906) 781 (3,552) (3,670) (842) Capital expenditure (431) (983) (509) (665) (426) (550) (450) (600) Investments (79) (265) (213) 7 — — — — Other income 96 50 50 77 111 154 214 224 Free cash flow 577 159 165 876 2,839 13 1,225 4,833
Key assumptionsRevenue growth 45.2 43.3 27.9 22.0 34.5 25.8 19.5 EBITDA margin 9.6 8.0 8.7 8.5 8.7 9.0 9.4 EPS growth 21.7 55.2 26.4 29.3 45.6 32.2 19.0
Source: Kotak Institutional Equities estimates
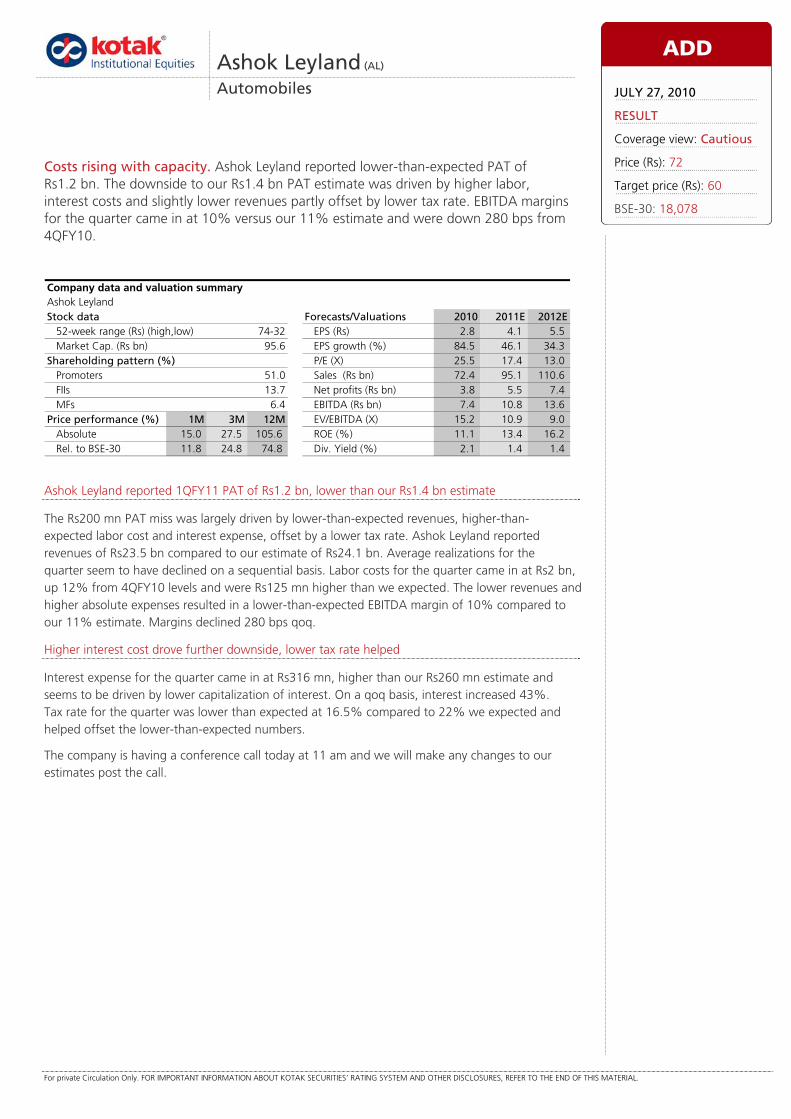
For private Circulation Only. FOR IMPORTANT INFORMATION ABOUT KOTAK SECURITIES’ RATING SYSTEM AND OTHER DISCLOSURES, REFER TO THE END OF THIS MATERIAL.
Ashok Leyland reported 1QFY11 PAT of Rs1.2 bn, lower than our Rs1.4 bn estimate
The Rs200 mn PAT miss was largely driven by lower-than-expected revenues, higher-than-expected labor cost and interest expense, offset by a lower tax rate. Ashok Leyland reported revenues of Rs23.5 bn compared to our estimate of Rs24.1 bn. Average realizations for the quarter seem to have declined on a sequential basis. Labor costs for the quarter came in at Rs2 bn, up 12% from 4QFY10 levels and were Rs125 mn higher than we expected. The lower revenues and higher absolute expenses resulted in a lower-than-expected EBITDA margin of 10% compared to our 11% estimate. Margins declined 280 bps qoq.
Higher interest cost drove further downside, lower tax rate helped
Interest expense for the quarter came in at Rs316 mn, higher than our Rs260 mn estimate and seems to be driven by lower capitalization of interest. On a qoq basis, interest increased 43%. Tax rate for the quarter was lower than expected at 16.5% compared to 22% we expected and helped offset the lower-than-expected numbers.
The company is having a conference call today at 11 am and we will make any changes to our estimates post the call.
Ashok Leyland (AL)
Automobiles
Costs rising with capacity. Ashok Leyland reported lower-than-expected PAT of Rs1.2 bn. The downside to our Rs1.4 bn PAT estimate was driven by higher labor, interest costs and slightly lower revenues partly offset by lower tax rate. EBITDA margins for the quarter came in at 10% versus our 11% estimate and were down 280 bps from 4QFY10.
Ashok LeylandStock data Forecasts/Valuations 2010 2011E 2012E
52-week range (Rs) (high,low) EPS (Rs) 2.8 4.1 5.5Market Cap. (Rs bn) 95.6 EPS growth (%) 84.5 46.1 34.3
Shareholding pattern (%) P/E (X) 25.5 17.4 13.0Promoters 51.0 Sales (Rs bn) 72.4 95.1 110.6FIIs 13.7 Net profits (Rs bn) 3.8 5.5 7.4MFs 6.4 EBITDA (Rs bn) 7.4 10.8 13.6
Price performance (%) 1M 3M 12M EV/EBITDA (X) 15.2 10.9 9.0Absolute 15.0 27.5 105.6 ROE (%) 11.1 13.4 16.2Rel. to BSE-30 11.8 24.8 74.8 Div. Yield (%) 2.1 1.4 1.4
Company data and valuation summary
74-32
ADD
JULY 27, 2010
RESULT
Coverage view: Cautious
Price (Rs): 72
Target price (Rs): 60
BSE-30: 18,078
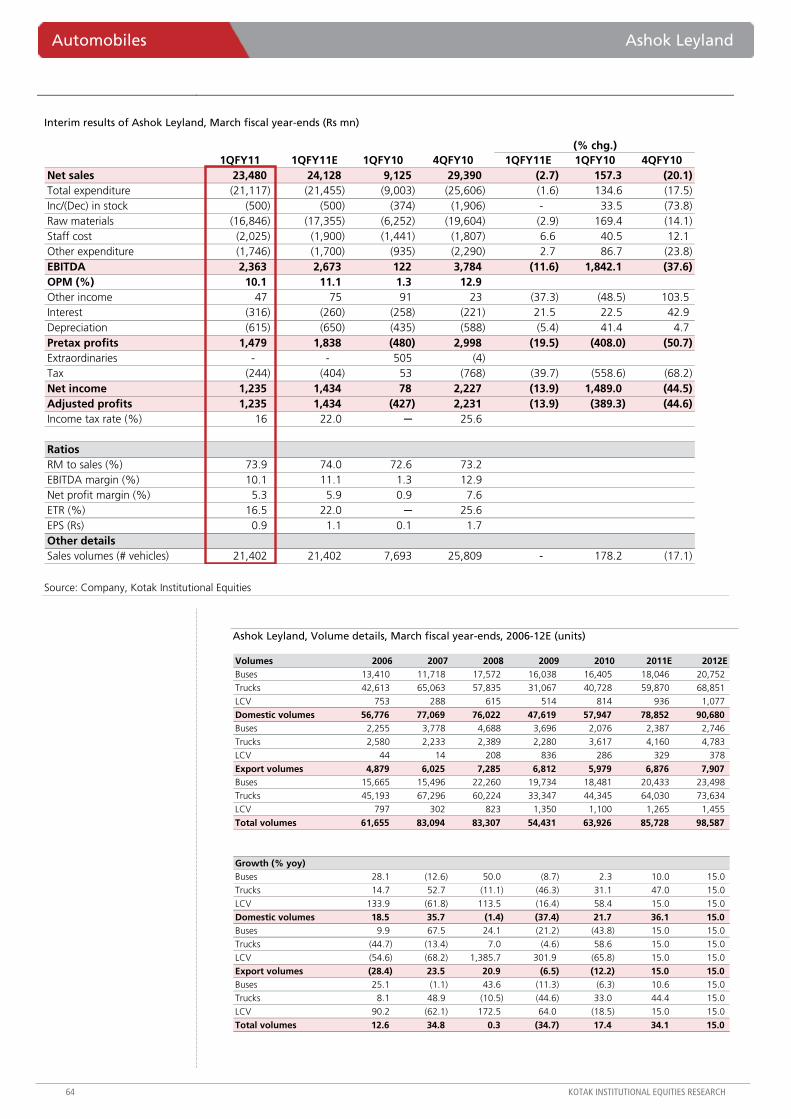
Automobiles Ashok Leyland
64 KOTAK INSTITUTIONAL EQUITIES RESEARCH
Interim results of Ashok Leyland, March fiscal year-ends (Rs mn)
(% chg.)1QFY11 1QFY11E 1QFY10 4QFY10 1QFY11E 1QFY10 4QFY10
Net sales 23,480 24,128 9,125 29,390 (2.7) 157.3 (20.1) Total expenditure (21,117) (21,455) (9,003) (25,606) (1.6) 134.6 (17.5) Inc/(Dec) in stock (500) (500) (374) (1,906) - 33.5 (73.8) Raw materials (16,846) (17,355) (6,252) (19,604) (2.9) 169.4 (14.1) Staff cost (2,025) (1,900) (1,441) (1,807) 6.6 40.5 12.1 Other expenditure (1,746) (1,700) (935) (2,290) 2.7 86.7 (23.8) EBITDA 2,363 2,673 122 3,784 (11.6) 1,842.1 (37.6) OPM (%) 10.1 11.1 1.3 12.9 Other income 47 75 91 23 (37.3) (48.5) 103.5 Interest (316) (260) (258) (221) 21.5 22.5 42.9 Depreciation (615) (650) (435) (588) (5.4) 41.4 4.7 Pretax profits 1,479 1,838 (480) 2,998 (19.5) (408.0) (50.7) Extraordinaries - - 505 (4) Tax (244) (404) 53 (768) (39.7) (558.6) (68.2) Net income 1,235 1,434 78 2,227 (13.9) 1,489.0 (44.5) Adjusted profits 1,235 1,434 (427) 2,231 (13.9) (389.3) (44.6) Income tax rate (%) 16 22.0 ─ 25.6
RatiosRM to sales (%) 73.9 74.0 72.6 73.2 EBITDA margin (%) 10.1 11.1 1.3 12.9 Net profit margin (%) 5.3 5.9 0.9 7.6 ETR (%) 16.5 22.0 ─ 25.6 EPS (Rs) 0.9 1.1 0.1 1.7 Other detailsSales volumes (# vehicles) 21,402 21,402 7,693 25,809 - 178.2 (17.1)
Source: Company, Kotak Institutional Equities
Ashok Leyland, Volume details, March fiscal year-ends, 2006-12E (units)
Volumes 2006 2007 2008 2009 2010 2011E 2012EBuses 13,410 11,718 17,572 16,038 16,405 18,046 20,752 Trucks 42,613 65,063 57,835 31,067 40,728 59,870 68,851 LCV 753 288 615 514 814 936 1,077
Domestic volumes 56,776 77,069 76,022 47,619 57,947 78,852 90,680 Buses 2,255 3,778 4,688 3,696 2,076 2,387 2,746 Trucks 2,580 2,233 2,389 2,280 3,617 4,160 4,783 LCV 44 14 208 836 286 329 378
Export volumes 4,879 6,025 7,285 6,812 5,979 6,876 7,907 Buses 15,665 15,496 22,260 19,734 18,481 20,433 23,498 Trucks 45,193 67,296 60,224 33,347 44,345 64,030 73,634 LCV 797 302 823 1,350 1,100 1,265 1,455
Total volumes 61,655 83,094 83,307 54,431 63,926 85,728 98,587
Growth (% yoy)Buses 28.1 (12.6) 50.0 (8.7) 2.3 10.0 15.0 Trucks 14.7 52.7 (11.1) (46.3) 31.1 47.0 15.0 LCV 133.9 (61.8) 113.5 (16.4) 58.4 15.0 15.0
Domestic volumes 18.5 35.7 (1.4) (37.4) 21.7 36.1 15.0 Buses 9.9 67.5 24.1 (21.2) (43.8) 15.0 15.0 Trucks (44.7) (13.4) 7.0 (4.6) 58.6 15.0 15.0 LCV (54.6) (68.2) 1,385.7 301.9 (65.8) 15.0 15.0
Export volumes (28.4) 23.5 20.9 (6.5) (12.2) 15.0 15.0 Buses 25.1 (1.1) 43.6 (11.3) (6.3) 10.6 15.0 Trucks 8.1 48.9 (10.5) (44.6) 33.0 44.4 15.0 LCV 90.2 (62.1) 172.5 64.0 (18.5) 15.0 15.0
Total volumes 12.6 34.8 0.3 (34.7) 17.4 34.1 15.0
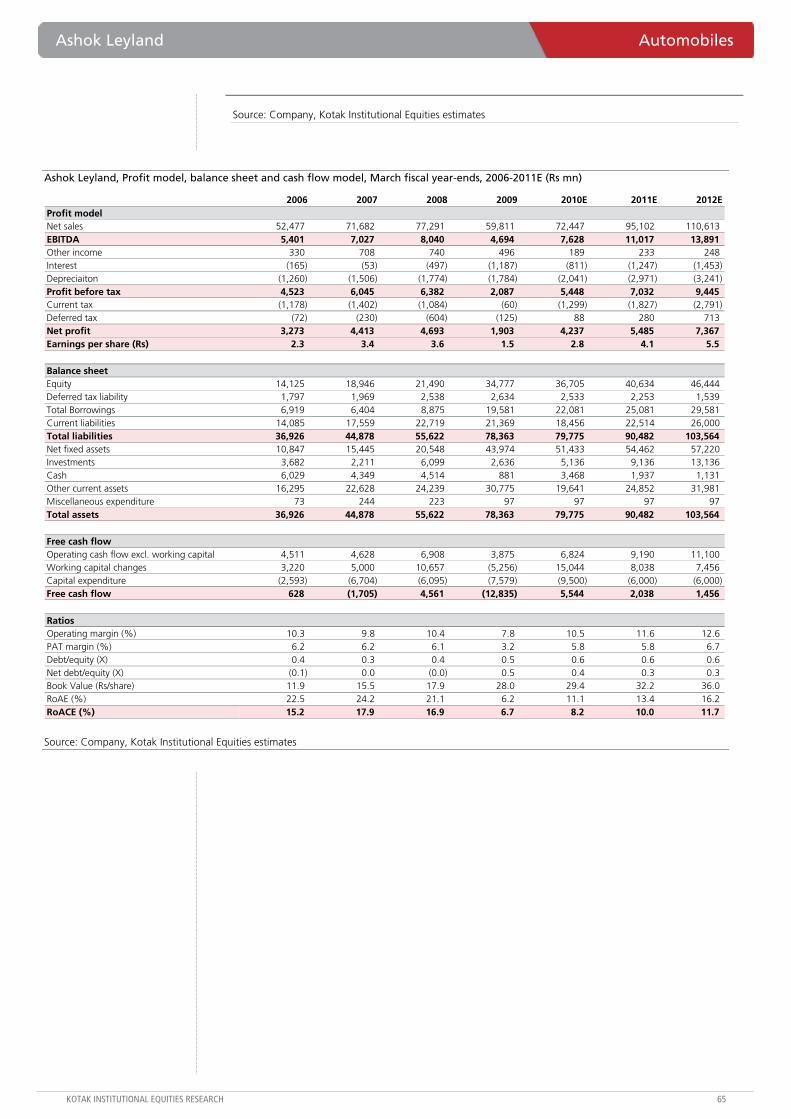
Ashok Leyland Automobiles
KOTAK INSTITUTIONAL EQUITIES RESEARCH 65
Source: Company, Kotak Institutional Equities estimates
Ashok Leyland, Profit model, balance sheet and cash flow model, March fiscal year-ends, 2006-2011E (Rs mn)
2006 2007 2008 2009 2010E 2011E 2012EProfit modelNet sales 52,477 71,682 77,291 59,811 72,447 95,102 110,613 EBITDA 5,401 7,027 8,040 4,694 7,628 11,017 13,891 Other income 330 708 740 496 189 233 248 Interest (165) (53) (497) (1,187) (811) (1,247) (1,453) Depreciaiton (1,260) (1,506) (1,774) (1,784) (2,041) (2,971) (3,241) Profit before tax 4,523 6,045 6,382 2,087 5,448 7,032 9,445 Current tax (1,178) (1,402) (1,084) (60) (1,299) (1,827) (2,791) Deferred tax (72) (230) (604) (125) 88 280 713 Net profit 3,273 4,413 4,693 1,903 4,237 5,485 7,367 Earnings per share (Rs) 2.3 3.4 3.6 1.5 2.8 4.1 5.5
Balance sheetEquity 14,125 18,946 21,490 34,777 36,705 40,634 46,444 Deferred tax liability 1,797 1,969 2,538 2,634 2,533 2,253 1,539 Total Borrowings 6,919 6,404 8,875 19,581 22,081 25,081 29,581 Current liabilities 14,085 17,559 22,719 21,369 18,456 22,514 26,000 Total liabilities 36,926 44,878 55,622 78,363 79,775 90,482 103,564 Net fixed assets 10,847 15,445 20,548 43,974 51,433 54,462 57,220 Investments 3,682 2,211 6,099 2,636 5,136 9,136 13,136 Cash 6,029 4,349 4,514 881 3,468 1,937 1,131 Other current assets 16,295 22,628 24,239 30,775 19,641 24,852 31,981 Miscellaneous expenditure 73 244 223 97 97 97 97 Total assets 36,926 44,878 55,622 78,363 79,775 90,482 103,564
Free cash flowOperating cash flow excl. working capital 4,511 4,628 6,908 3,875 6,824 9,190 11,100 Working capital changes 3,220 5,000 10,657 (5,256) 15,044 8,038 7,456 Capital expenditure (2,593) (6,704) (6,095) (7,579) (9,500) (6,000) (6,000) Free cash flow 628 (1,705) 4,561 (12,835) 5,544 2,038 1,456
RatiosOperating margin (%) 10.3 9.8 10.4 7.8 10.5 11.6 12.6 PAT margin (%) 6.2 6.2 6.1 3.2 5.8 5.8 6.7 Debt/equity (X) 0.4 0.3 0.4 0.5 0.6 0.6 0.6 Net debt/equity (X) (0.1) 0.0 (0.0) 0.5 0.4 0.3 0.3 Book Value (Rs/share) 11.9 15.5 17.9 28.0 29.4 32.2 36.0 RoAE (%) 22.5 24.2 21.1 6.2 11.1 13.4 16.2 RoACE (%) 15.2 17.9 16.9 6.7 8.2 10.0 11.7
Source: Company, Kotak Institutional Equities estimates
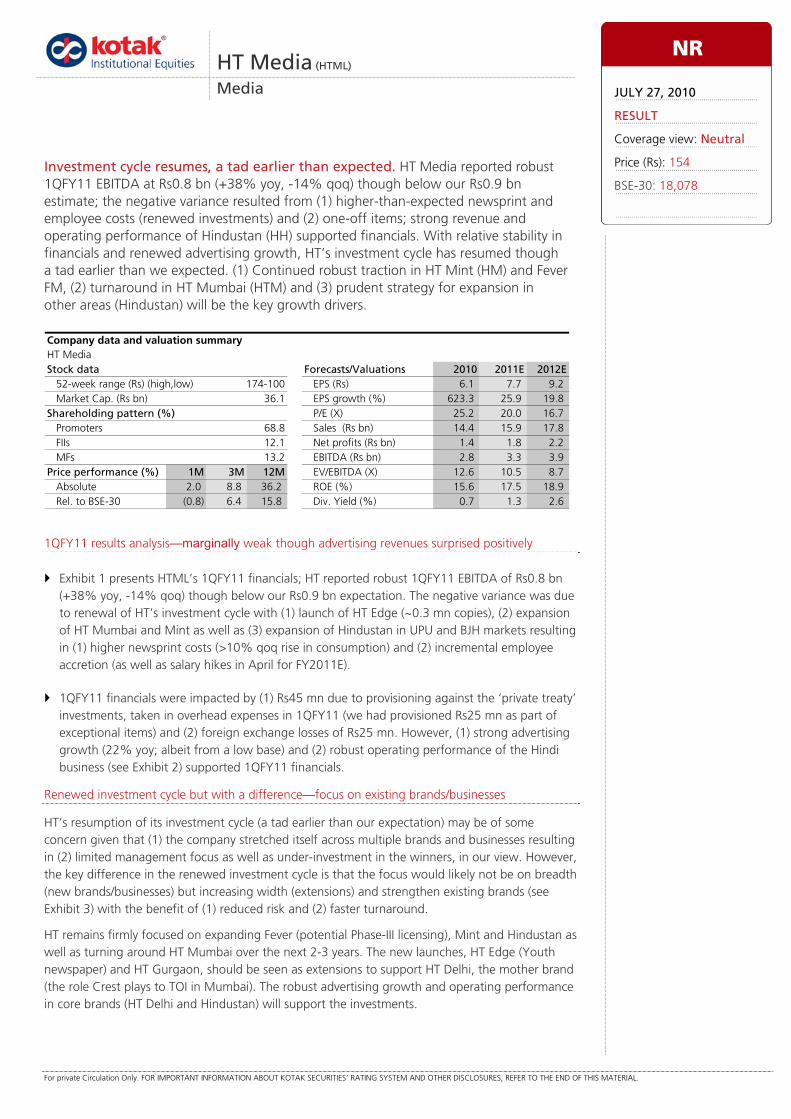
For private Circulation Only. FOR IMPORTANT INFORMATION ABOUT KOTAK SECURITIES’ RATING SYSTEM AND OTHER DISCLOSURES, REFER TO THE END OF THIS MATERIAL.
1QFY11 results analysis—marginally weak though advertising revenues surprised positively
Exhibit 1 presents HTML’s 1QFY11 financials; HT reported robust 1QFY11 EBITDA of Rs0.8 bn (+38% yoy, -14% qoq) though below our Rs0.9 bn expectation. The negative variance was due to renewal of HT’s investment cycle with (1) launch of HT Edge (~0.3 mn copies), (2) expansion of HT Mumbai and Mint as well as (3) expansion of Hindustan in UPU and BJH markets resulting in (1) higher newsprint costs (>10% qoq rise in consumption) and (2) incremental employee accretion (as well as salary hikes in April for FY2011E).
1QFY11 financials were impacted by (1) Rs45 mn due to provisioning against the ‘private treaty’ investments, taken in overhead expenses in 1QFY11 (we had provisioned Rs25 mn as part of exceptional items) and (2) foreign exchange losses of Rs25 mn. However, (1) strong advertising growth (22% yoy; albeit from a low base) and (2) robust operating performance of the Hindi business (see Exhibit 2) supported 1QFY11 financials.
Renewed investment cycle but with a difference—focus on existing brands/businesses
HT’s resumption of its investment cycle (a tad earlier than our expectation) may be of some concern given that (1) the company stretched itself across multiple brands and businesses resulting in (2) limited management focus as well as under-investment in the winners, in our view. However, the key difference in the renewed investment cycle is that the focus would likely not be on breadth (new brands/businesses) but increasing width (extensions) and strengthen existing brands (see Exhibit 3) with the benefit of (1) reduced risk and (2) faster turnaround.
HT remains firmly focused on expanding Fever (potential Phase-III licensing), Mint and Hindustan as well as turning around HT Mumbai over the next 2-3 years. The new launches, HT Edge (Youth newspaper) and HT Gurgaon, should be seen as extensions to support HT Delhi, the mother brand (the role Crest plays to TOI in Mumbai). The robust advertising growth and operating performance in core brands (HT Delhi and Hindustan) will support the investments.
HT Media (HTML)
Media
Investment cycle resumes, a tad earlier than expected. HT Media reported robust 1QFY11 EBITDA at Rs0.8 bn (+38% yoy, -14% qoq) though below our Rs0.9 bn estimate; the negative variance resulted from (1) higher-than-expected newsprint and employee costs (renewed investments) and (2) one-off items; strong revenue and operating performance of Hindustan (HH) supported financials. With relative stability in financials and renewed advertising growth, HT’s investment cycle has resumed though a tad earlier than we expected. (1) Continued robust traction in HT Mint (HM) and Fever FM, (2) turnaround in HT Mumbai (HTM) and (3) prudent strategy for expansion in other areas (Hindustan) will be the key growth drivers.
HT MediaStock data Forecasts/Valuations 2010 2011E 2012E
52-week range (Rs) (high,low) EPS (Rs) 6.1 7.7 9.2Market Cap. (Rs bn) 36.1 EPS growth (%) 623.3 25.9 19.8
Shareholding pattern (%) P/E (X) 25.2 20.0 16.7Promoters 68.8 Sales (Rs bn) 14.4 15.9 17.8FIIs 12.1 Net profits (Rs bn) 1.4 1.8 2.2MFs 13.2 EBITDA (Rs bn) 2.8 3.3 3.9
Price performance (%) 1M 3M 12M EV/EBITDA (X) 12.6 10.5 8.7Absolute 2.0 8.8 36.2 ROE (%) 15.6 17.5 18.9Rel. to BSE-30 (0.8) 6.4 15.8 Div. Yield (%) 0.7 1.3 2.6
Company data and valuation summary
174-100
NR
JULY 27, 2010
RESULT
Coverage view: Neutral
Price (Rs): 154
BSE-30: 18,078
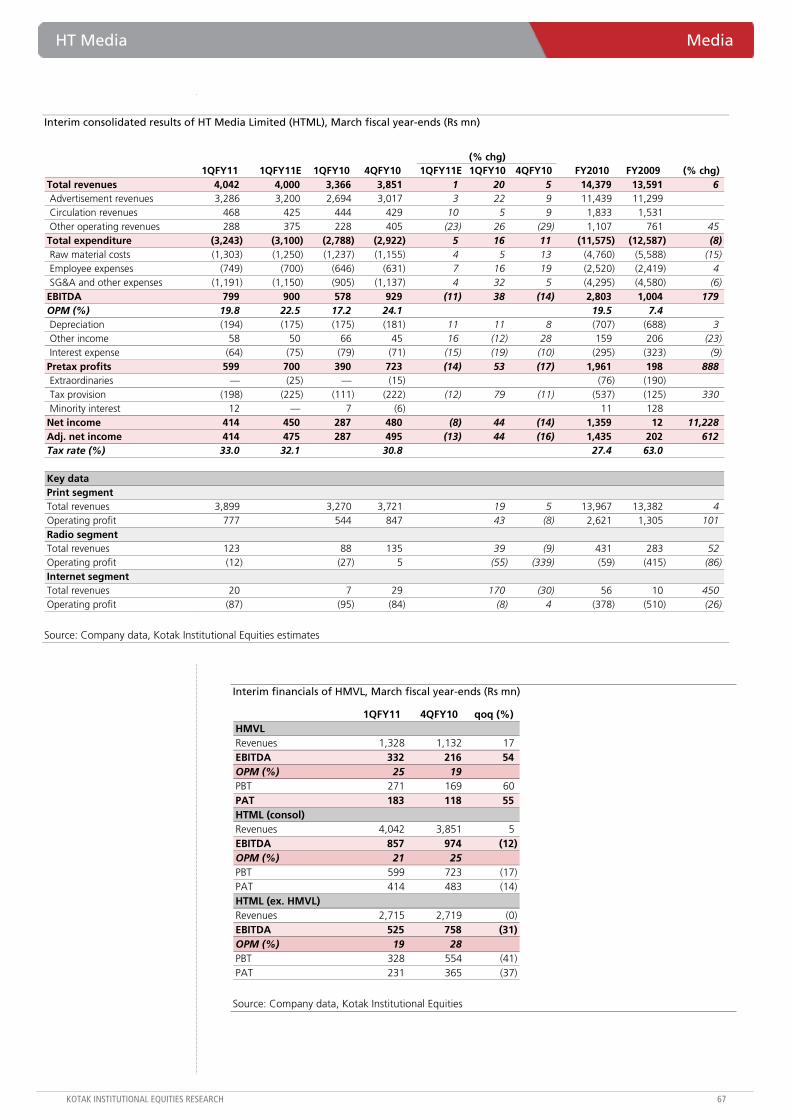
HT Media Media
KOTAK INSTITUTIONAL EQUITIES RESEARCH 67
Interim consolidated results of HT Media Limited (HTML), March fiscal year-ends (Rs mn)
(% chg)1QFY11 1QFY11E 1QFY10 4QFY10 1QFY11E 1QFY10 4QFY10 FY2010 FY2009 (% chg)
Total revenues 4,042 4,000 3,366 3,851 1 20 5 14,379 13,591 6 Advertisement revenues 3,286 3,200 2,694 3,017 3 22 9 11,439 11,299 Circulation revenues 468 425 444 429 10 5 9 1,833 1,531 Other operating revenues 288 375 228 405 (23) 26 (29) 1,107 761 45
Total expenditure (3,243) (3,100) (2,788) (2,922) 5 16 11 (11,575) (12,587) (8) Raw material costs (1,303) (1,250) (1,237) (1,155) 4 5 13 (4,760) (5,588) (15) Employee expenses (749) (700) (646) (631) 7 16 19 (2,520) (2,419) 4 SG&A and other expenses (1,191) (1,150) (905) (1,137) 4 32 5 (4,295) (4,580) (6)
EBITDA 799 900 578 929 (11) 38 (14) 2,803 1,004 179 OPM (%) 19.8 22.5 17.2 24.1 19.5 7.4 Depreciation (194) (175) (175) (181) 11 11 8 (707) (688) 3 Other income 58 50 66 45 16 (12) 28 159 206 (23) Interest expense (64) (75) (79) (71) (15) (19) (10) (295) (323) (9)
Pretax profits 599 700 390 723 (14) 53 (17) 1,961 198 888 Extraordinaries — (25) — (15) (76) (190) Tax provision (198) (225) (111) (222) (12) 79 (11) (537) (125) 330 Minority interest 12 — 7 (6) 11 128
Net income 414 450 287 480 (8) 44 (14) 1,359 12 11,228 Adj. net income 414 475 287 495 (13) 44 (16) 1,435 202 612 Tax rate (%) 33.0 32.1 30.8 27.4 63.0
Key dataPrint segmentTotal revenues 3,899 3,270 3,721 19 5 13,967 13,382 4 Operating profit 777 544 847 43 (8) 2,621 1,305 101 Radio segmentTotal revenues 123 88 135 39 (9) 431 283 52 Operating profit (12) (27) 5 (55) (339) (59) (415) (86) Internet segmentTotal revenues 20 7 29 170 (30) 56 10 450 Operating profit (87) (95) (84) (8) 4 (378) (510) (26)
Source: Company data, Kotak Institutional Equities estimates
Interim financials of HMVL, March fiscal year-ends (Rs mn)
1QFY11 4QFY10 qoq (%)HMVLRevenues 1,328 1,132 17 EBITDA 332 216 54 OPM (%) 25 19 PBT 271 169 60 PAT 183 118 55 HTML (consol)Revenues 4,042 3,851 5 EBITDA 857 974 (12) OPM (%) 21 25 PBT 599 723 (17) PAT 414 483 (14) HTML (ex. HMVL)Revenues 2,715 2,719 (0) EBITDA 525 758 (31) OPM (%) 19 28 PBT 328 554 (41) PAT 231 365 (37)
Source: Company data, Kotak Institutional Equities
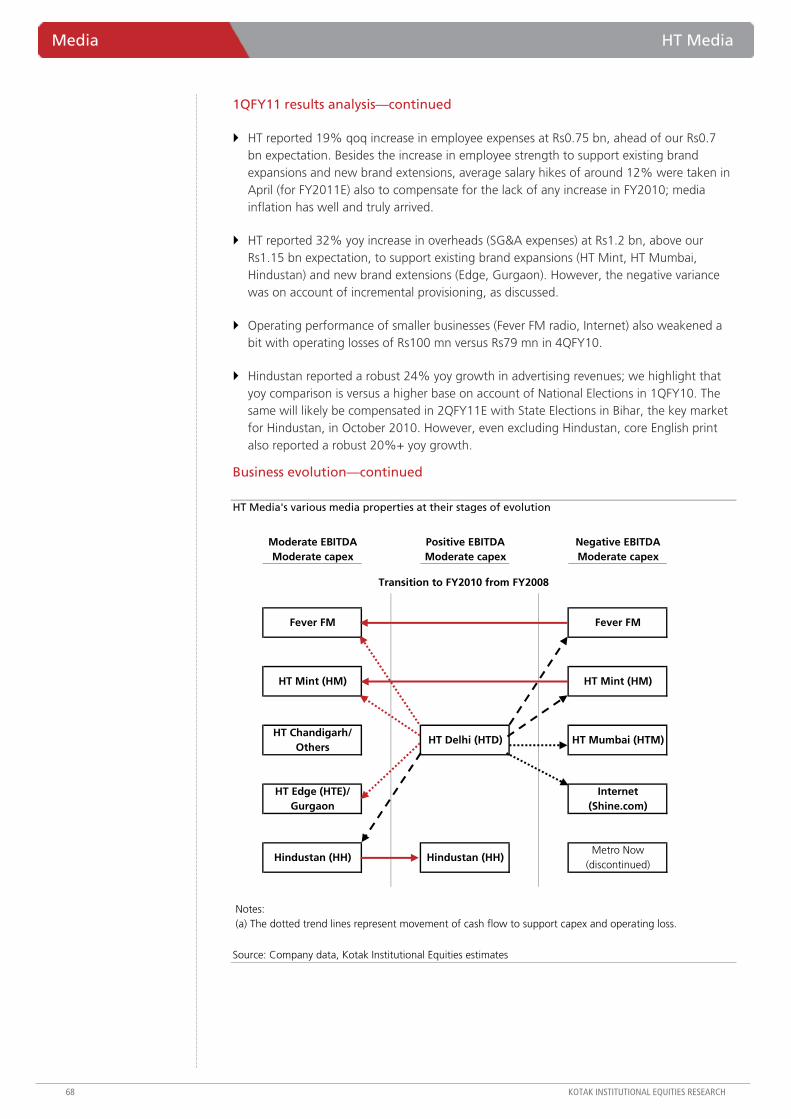
Media HT Media
68 KOTAK INSTITUTIONAL EQUITIES RESEARCH
1QFY11 results analysis—continued
HT reported 19% qoq increase in employee expenses at Rs0.75 bn, ahead of our Rs0.7 bn expectation. Besides the increase in employee strength to support existing brand expansions and new brand extensions, average salary hikes of around 12% were taken in April (for FY2011E) also to compensate for the lack of any increase in FY2010; media inflation has well and truly arrived.
HT reported 32% yoy increase in overheads (SG&A expenses) at Rs1.2 bn, above our Rs1.15 bn expectation, to support existing brand expansions (HT Mint, HT Mumbai, Hindustan) and new brand extensions (Edge, Gurgaon). However, the negative variance was on account of incremental provisioning, as discussed.
Operating performance of smaller businesses (Fever FM radio, Internet) also weakened a bit with operating losses of Rs100 mn versus Rs79 mn in 4QFY10.
Hindustan reported a robust 24% yoy growth in advertising revenues; we highlight that yoy comparison is versus a higher base on account of National Elections in 1QFY10. The same will likely be compensated in 2QFY11E with State Elections in Bihar, the key market for Hindustan, in October 2010. However, even excluding Hindustan, core English print also reported a robust 20%+ yoy growth.
Business evolution—continued
HT Media's various media properties at their stages of evolution
Moderate EBITDA Positive EBITDA Negative EBITDAModerate capex Moderate capex Moderate capex
Notes:(a) The dotted trend lines represent movement of cash flow to support capex and operating loss.
Fever FM
Metro Now (discontinued)
Hindustan (HH)Hindustan (HH)
Fever FM
HT Mint (HM)
HT Mumbai (HTM)
Internet (Shine.com)
HT Delhi (HTD)HT Chandigarh/
Others
HT Mint (HM)
HT Edge (HTE)/ Gurgaon
Transition to FY2010 from FY2008
Source: Company data, Kotak Institutional Equities estimates
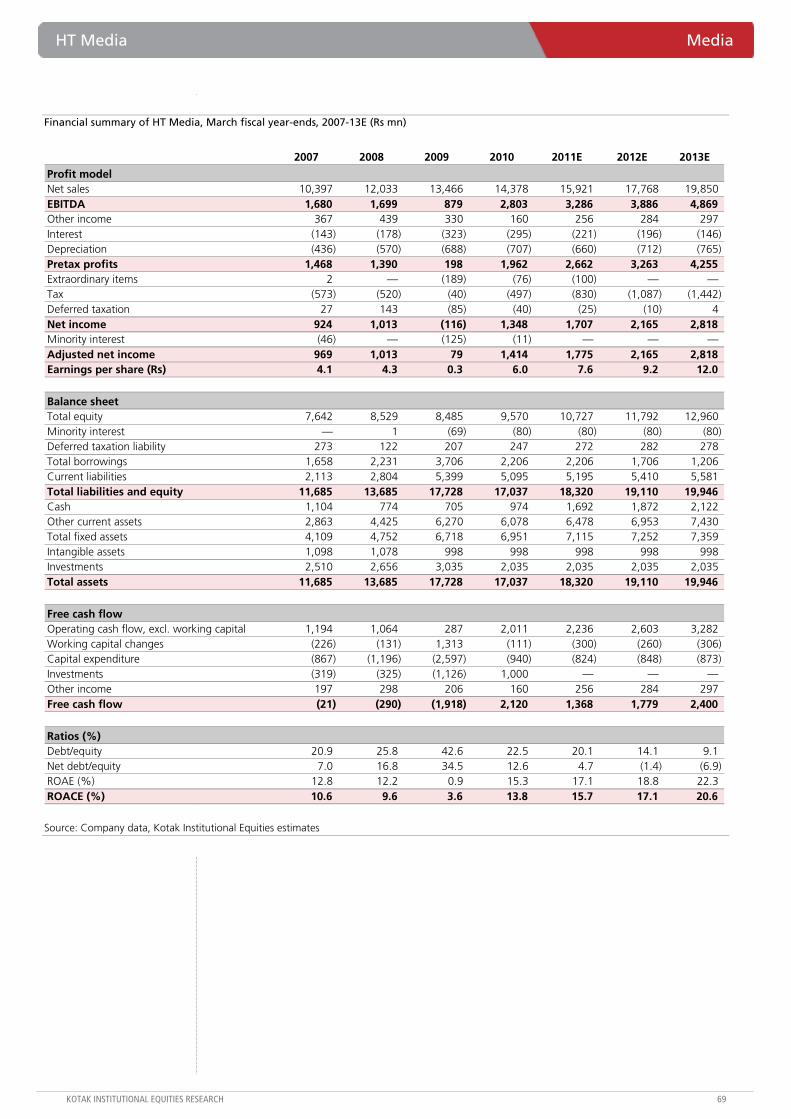
HT Media Media
KOTAK INSTITUTIONAL EQUITIES RESEARCH 69
Financial summary of HT Media, March fiscal year-ends, 2007-13E (Rs mn)
2007 2008 2009 2010 2011E 2012E 2013E
Profit modelNet sales 10,397 12,033 13,466 14,378 15,921 17,768 19,850EBITDA 1,680 1,699 879 2,803 3,286 3,886 4,869Other income 367 439 330 160 256 284 297Interest (143) (178) (323) (295) (221) (196) (146)Depreciation (436) (570) (688) (707) (660) (712) (765)Pretax profits 1,468 1,390 198 1,962 2,662 3,263 4,255Extraordinary items 2 — (189) (76) (100) — — Tax (573) (520) (40) (497) (830) (1,087) (1,442)Deferred taxation 27 143 (85) (40) (25) (10) 4Net income 924 1,013 (116) 1,348 1,707 2,165 2,818Minority interest (46) — (125) (11) — — — Adjusted net income 969 1,013 79 1,414 1,775 2,165 2,818 Earnings per share (Rs) 4.1 4.3 0.3 6.0 7.6 9.2 12.0
Balance sheet Total equity 7,642 8,529 8,485 9,570 10,727 11,792 12,960Minority interest — 1 (69) (80) (80) (80) (80)Deferred taxation liability 273 122 207 247 272 282 278Total borrowings 1,658 2,231 3,706 2,206 2,206 1,706 1,206Current liabilities 2,113 2,804 5,399 5,095 5,195 5,410 5,581Total liabilities and equity 11,685 13,685 17,728 17,037 18,320 19,110 19,946 Cash 1,104 774 705 974 1,692 1,872 2,122Other current assets 2,863 4,425 6,270 6,078 6,478 6,953 7,430Total fixed assets 4,109 4,752 6,718 6,951 7,115 7,252 7,359Intangible assets 1,098 1,078 998 998 998 998 998Investments 2,510 2,656 3,035 2,035 2,035 2,035 2,035Total assets 11,685 13,685 17,728 17,037 18,320 19,110 19,946
Free cash flow Operating cash flow, excl. working capital 1,194 1,064 287 2,011 2,236 2,603 3,282Working capital changes (226) (131) 1,313 (111) (300) (260) (306)Capital expenditure (867) (1,196) (2,597) (940) (824) (848) (873)Investments (319) (325) (1,126) 1,000 — — — Other income 197 298 206 160 256 284 297Free cash flow (21) (290) (1,918) 2,120 1,368 1,779 2,400
Ratios (%)Debt/equity 20.9 25.8 42.6 22.5 20.1 14.1 9.1Net debt/equity 7.0 16.8 34.5 12.6 4.7 (1.4) (6.9)ROAE (%) 12.8 12.2 0.9 15.3 17.1 18.8 22.3ROACE (%) 10.6 9.6 3.6 13.8 15.7 17.1 20.6
Source: Company data, Kotak Institutional Equities estimates
For private Circulation Only. FOR IMPORTANT INFORMATION ABOUT KOTAK SECURITIES’ RATING SYSTEM AND OTHER DISCLOSURES,REFER TO THE END OF THIS MATERIAL.
RBI compresses interest rate corridor in line with our thinking
RBI raised repo rate by 25 bps to 5.75% and reverse repo rate 50 bps to 4.5%, thus compressing the overnight interest rate corridor to 125 bps from 150 bps. This is largely in line with our thinking. We has in our Economy report of July 26, 2010, ‘Does RBI still have the tools to anchor inflation?’ advocated a 25 bps repo rate and a 75 bps reverse repo rate hike, compressing interest rate corridor to 100 bps to speed up monetary transmission.
Growth and inflation projection raised
RBI revised its FY2011E GDP growth projection to 8.5% from ’8% with an upside bias’. RBI also raised its end-FY2011E inflation projection to 6% from 5.5%. We see these forecasts consistent with its shift in stance to primacy to inflation control.
RBI signals tighter monetary policy ahead, shifts to more frequent policy setting
We find the RBI policy communication commendable in its clarity. There is no doubt left that the RBI would continue its tightening bias focusing on inflation ahead. The intent of the RBI is to keep liquidity marginally short, as the policy transmission works best. With this, we expect RBI to seek to maintain liquidity consistent with net repo levels of Rs200-400 bn in daily LAF. We also expect RBI to raise policy rates by a further 75-100 bps in the rest of FY2011E.
Interest rates set to rise over next 6 months
We expect short-term rates, bond yields in 1-3 year segment, mortgage rates, corporate bond spreads and credit curve to move up over the next 6 months given the RBI’s rate action, compression of interest rate corridor, hardening of monetary policy stance and a shift to more frequent monetary policy changes. We do not expect the benchmark 10-year bond yield to change much given its funded nature and for now retain our 10-year benchmark yield target of 7.5% at end-FY2011E given the credible action of fiscal consolidation that may lower GFD/GDP ratio to 5.1% in FY2011E and 4.8% or less in FY2012E. We see the policy marginally positive for rupee.
Economy.dot
Economy
RBI signals tighter monetary policy ahead. RBI unequivocally signaled further monetary tightening. In our view, interest rates are set to go up in the Indian economy, more at the short end, but also across the curve. RBI has clearly communicated tight liquidity and continued monetary tightening bias, both in words and action. We view the reduction in the interest rate corridor to 125 bps from 150 bps, in line with our thinking, as a major step to improve monetary transmission to counter inflationary pressures.
INDIA
JULY 27, 2010
UPDATE
BSE-30: 18,078
QUICK NUMBERS
• RBI raise repo rate 25 bps to 5.75% and reverse repo rate 50 bps to 4.5%, shrinks corridor
• RBI ups forecasts for growth to 8.5% from 8%, end-year inflation to 6% from 5.5% for FY2011E
• RBI to review policy 8 times a year instead of 4 currently
Economy
KOTAK INSTITUTIONAL EQUITIES RESEARCH 71
RBI breaks from inertial rate hikes, tightens monetary policy further
RBI broke from the recent inertial rate hikes that raised repo and reverse repo rates symmetrically by 25 bps+25 bps. On July 27, 2010 it:
Raised repo rate by 25 bps to 5.75%. Repo rate is the rate at which RBI injects deficit liquidity by collateralized overnight lending against SLR securities.
Raised reverse repo rate by a larger 50 bps to 4.5%. Reverse repo rate is the rate at which RBI absorbs surplus liquidity by collateralized borrowing against SLR securities.
Left CRR unchanged at 6% and SLR unchanged at 25%.
RBI had earlier raised CRR by 100 bps and both the policy rates – repo and reverse repo by 75 bps so far in current tightening cycle. As currently money market liquidity is short and not excess, the operational policy rate is repo and not reverse repo. The overnight interest rates – call, CBLO, market repo – gets anchored around repo or reverse repo rate depending upon system shortage or surplus in liquidity, thus setting an interest rate corridor.
RBI compresses interest rate corridor to improve transmission
With an asymmetric hike of 25 bps in repo and 50 bps in reverse repo, the spread between the two that sets the interest rate corridor has got narrowed to 125 bps from 150 bps. We had advocated the narrowing of the interest rate corridor to 100 bps through 75 bps reverse repo rate hike in our Economy report of July 26, 2010, ‘Does RBI still have the tools to anchor inflation?’ We had advocated this for the following reasons:
It would help introduce monetary policy surprise by breaking from inertial rate hikes of a series of 25 bps hikes.
It would set a higher floor for interest rates, should the liquidity conditions transit again from deficit to surplus and prevent interest rates from falling too much given the high inflation. With the likelihood of liquidity easing to near zero or small surplus by mid-August, this is important for monetary measures to take effect.
It would reduce short-term interest rate volatility as currently with a swing in liquidity conditions from deficit to surplus mode or vice versa, overnight interest rates can move down or up 150 bps with very little to anchor rates in between the LAF.
It could remove uncertainty by communicating the tight bias more firmly with this credible action.
This would also remove uncertainty for banks in pricing their products and the new base rate. It could improve sanctity of the base rate as banks may have less incentive to use innovative methods, such as through use of Interest Rate Swaps (IRS) to set rates away from base rate in a non-transparent manner.
All of the above, would ultimately help improve monetary transmission by improving its speed and size, and so serve the inflation objective better.
RBI revises its macro-projections, enables it to alter growth-inflation trade-off
RBI has amongst its macro-economic projections (see Exhibit 1):
Revised its FY2011E growth projections upwards to 8.5% from ‘8% with upside bias’.
Revised its end-FY2011E inflation projections up wards to 6% from 5.5%.
Retained its M3 (17%), aggregate deposit (18%) and non-food credit (20%) projections.
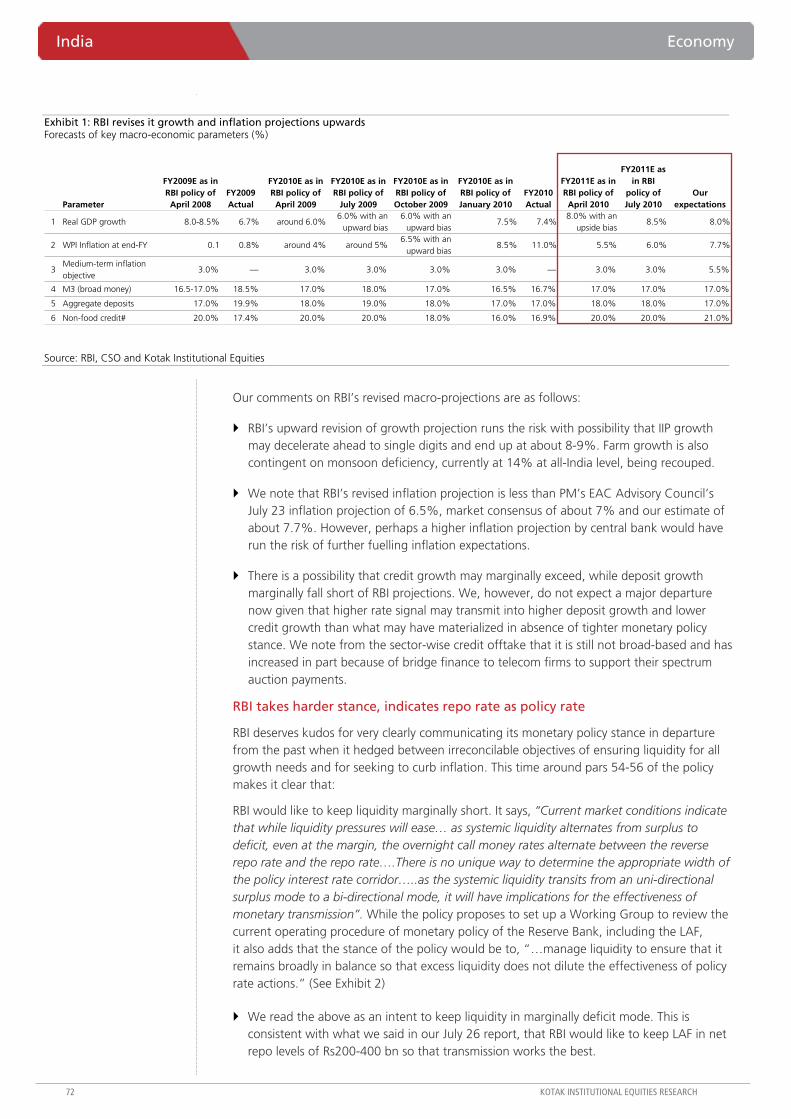
India Economy
72 KOTAK INSTITUTIONAL EQUITIES RESEARCH
Exhibit 1: RBI revises it growth and inflation projections upwards Forecasts of key macro-economic parameters (%)
3Medium-term inflation objective
3.0% — 3.0% 3.0% 3.0% 3.0% — 3.0% 3.0% 5.5%
4 M3 (broad money) 16.5-17.0% 18.5% 17.0% 18.0% 17.0% 16.5% 16.7% 17.0% 17.0% 17.0%
5 Aggregate deposits 17.0% 19.9% 18.0% 19.0% 18.0% 17.0% 17.0% 18.0% 18.0% 17.0%
6 Non-food credit# 20.0% 17.4% 20.0% 20.0% 18.0% 16.0% 16.9% 20.0% 20.0% 21.0%
FY2010E as in RBI policy of
April 2009
FY2010E as in RBI policy of
July 2009
around 6.0%8.0-8.5% 6.7%Real GDP growth1
FY2010 Actual
7.5% 7.4%
Parameter
FY2009E as in RBI policy of April 2008
FY2009 Actual
6.0% with an upward bias
FY2010E as in RBI policy of October 2009
6.0% with an upward bias
FY2010E as in RBI policy of January 2010
8.5% 11.0%6.5% with an
upward bias2 WPI Inflation at end-FY 0.1 0.8% around 4% around 5%
FY2011E as in RBI policy of April 20108.0% with an
upside bias
5.5%
Our expectations
8.0%
7.7%
FY2011E as in RBI
policy of July 2010
8.5%
6.0%
Source: RBI, CSO and Kotak Institutional Equities
Our comments on RBI’s revised macro-projections are as follows:
RBI’s upward revision of growth projection runs the risk with possibility that IIP growth may decelerate ahead to single digits and end up at about 8-9%. Farm growth is also contingent on monsoon deficiency, currently at 14% at all-India level, being recouped.
We note that RBI’s revised inflation projection is less than PM’s EAC Advisory Council’s July 23 inflation projection of 6.5%, market consensus of about 7% and our estimate of about 7.7%. However, perhaps a higher inflation projection by central bank would have run the risk of further fuelling inflation expectations.
There is a possibility that credit growth may marginally exceed, while deposit growth marginally fall short of RBI projections. We, however, do not expect a major departure now given that higher rate signal may transmit into higher deposit growth and lower credit growth than what may have materialized in absence of tighter monetary policy stance. We note from the sector-wise credit offtake that it is still not broad-based and has increased in part because of bridge finance to telecom firms to support their spectrum auction payments.
RBI takes harder stance, indicates repo rate as policy rate
RBI deserves kudos for very clearly communicating its monetary policy stance in departure from the past when it hedged between irreconcilable objectives of ensuring liquidity for all growth needs and for seeking to curb inflation. This time around pars 54-56 of the policy makes it clear that:
RBI would like to keep liquidity marginally short. It says, “Current market conditions indicate that while liquidity pressures will ease… as systemic liquidity alternates from surplus to deficit, even at the margin, the overnight call money rates alternate between the reverse repo rate and the repo rate….There is no unique way to determine the appropriate width of the policy interest rate corridor…..as the systemic liquidity transits from an uni-directional surplus mode to a bi-directional mode, it will have implications for the effectiveness of monetary transmission”. While the policy proposes to set up a Working Group to review the current operating procedure of monetary policy of the Reserve Bank, including the LAF, it also adds that the stance of the policy would be to, “…manage liquidity to ensure that it remains broadly in balance so that excess liquidity does not dilute the effectiveness of policy rate actions.” (See Exhibit 2)
We read the above as an intent to keep liquidity in marginally deficit mode. This is consistent with what we said in our July 26 report, that RBI would like to keep LAF in net repo levels of Rs200-400 bn so that transmission works the best.
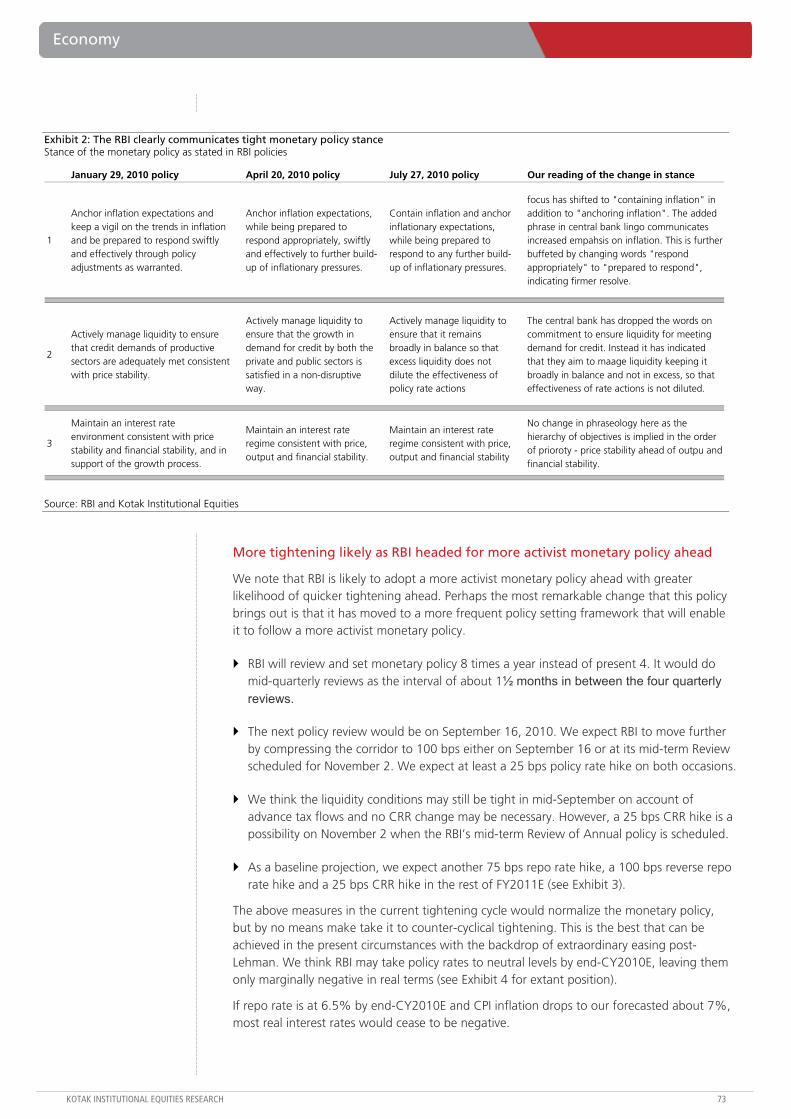
Economy
KOTAK INSTITUTIONAL EQUITIES RESEARCH 73
Exhibit 2: The RBI clearly communicates tight monetary policy stance Stance of the monetary policy as stated in RBI policies
January 29, 2010 policy April 20, 2010 policy July 27, 2010 policy Our reading of the change in stance
1
Anchor inflation expectations and keep a vigil on the trends in inflation and be prepared to respond swiftly and effectively through policy adjustments as warranted.
Anchor inflation expectations, while being prepared to respond appropriately, swiftly and effectively to further build-up of inflationary pressures.
Contain inflation and anchor inflationary expectations, while being prepared to respond to any further build-up of inflationary pressures.
focus has shifted to "containing inflation" in addition to "anchoring inflation". The added phrase in central bank lingo communicates increased empahsis on inflation. This is further buffeted by changing words "respond appropriately" to "prepared to respond", indicating firmer resolve.
2
Actively manage liquidity to ensure that credit demands of productive sectors are adequately met consistent with price stability.
Actively manage liquidity to ensure that the growth in demand for credit by both the private and public sectors is satisfied in a non-disruptive way.
Actively manage liquidity to ensure that it remains broadly in balance so that excess liquidity does not dilute the effectiveness of policy rate actions
The central bank has dropped the words on commitment to ensure liquidity for meeting demand for credit. Instead it has indicated that they aim to maage liquidity keeping it broadly in balance and not in excess, so that effectiveness of rate actions is not diluted.
3
Maintain an interest rate environment consistent with price stability and financial stability, and in support of the growth process.
Maintain an interest rate regime consistent with price, output and financial stability.
Maintain an interest rate regime consistent with price, output and financial stability
No change in phraseology here as the hierarchy of objectives is implied in the order of prioroty - price stability ahead of outpu and financial stability.
Source: RBI and Kotak Institutional Equities
More tightening likely as RBI headed for more activist monetary policy ahead
We note that RBI is likely to adopt a more activist monetary policy ahead with greater likelihood of quicker tightening ahead. Perhaps the most remarkable change that this policy brings out is that it has moved to a more frequent policy setting framework that will enable it to follow a more activist monetary policy.
RBI will review and set monetary policy 8 times a year instead of present 4. It would do mid-quarterly reviews as the interval of about 1½ months in between the four quarterly reviews.
The next policy review would be on September 16, 2010. We expect RBI to move further by compressing the corridor to 100 bps either on September 16 or at its mid-term Review scheduled for November 2. We expect at least a 25 bps policy rate hike on both occasions.
We think the liquidity conditions may still be tight in mid-September on account of advance tax flows and no CRR change may be necessary. However, a 25 bps CRR hike is a possibility on November 2 when the RBI’s mid-term Review of Annual policy is scheduled.
As a baseline projection, we expect another 75 bps repo rate hike, a 100 bps reverse repo rate hike and a 25 bps CRR hike in the rest of FY2011E (see Exhibit 3).
The above measures in the current tightening cycle would normalize the monetary policy, but by no means make take it to counter-cyclical tightening. This is the best that can be achieved in the present circumstances with the backdrop of extraordinary easing post-Lehman. We think RBI may take policy rates to neutral levels by end-CY2010E, leaving them only marginally negative in real terms (see Exhibit 4 for extant position).
If repo rate is at 6.5% by end-CY2010E and CPI inflation drops to our forecasted about 7%, most real interest rates would cease to be negative.
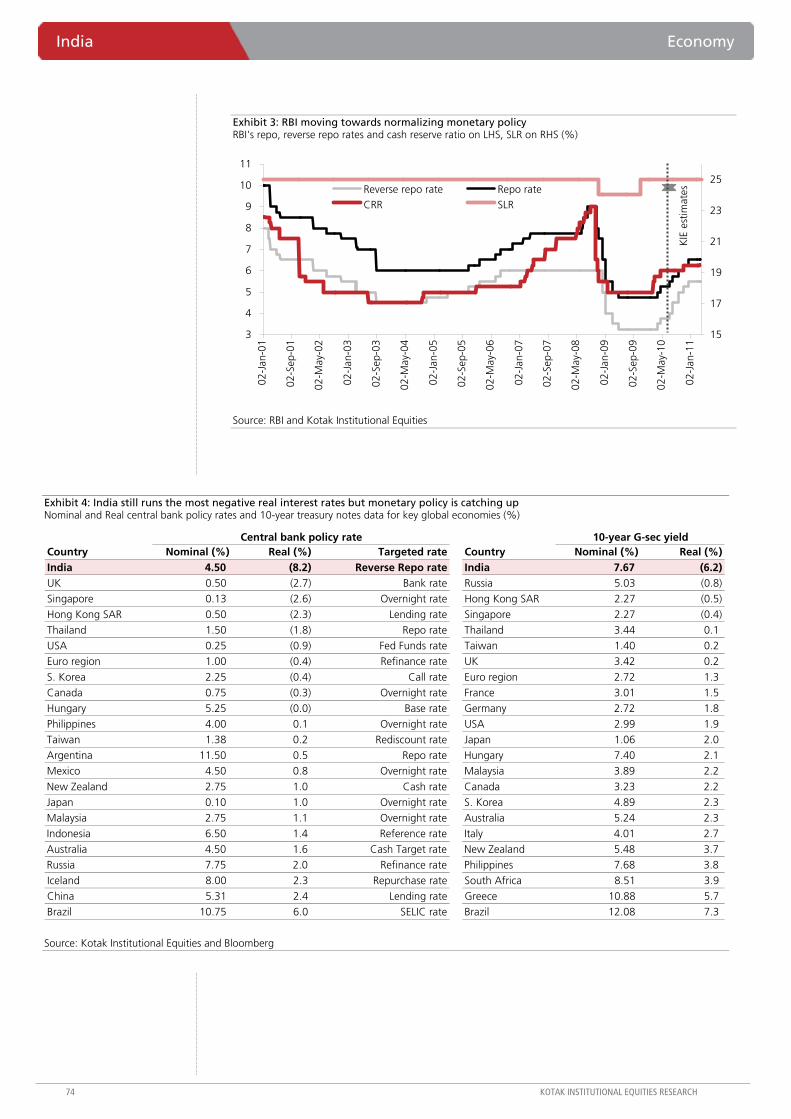
India Economy
74 KOTAK INSTITUTIONAL EQUITIES RESEARCH
Exhibit 3: RBI moving towards normalizing monetary policy RBI's repo, reverse repo rates and cash reserve ratio on LHS, SLR on RHS (%)
3
4
5
6
7
8
9
10
11
02-J
an-0
1
02-S
ep-0
1
02-M
ay-0
2
02-J
an-0
3
02-S
ep-0
3
02-M
ay-0
4
02-J
an-0
5
02-S
ep-0
5
02-M
ay-0
6
02-J
an-0
7
02-S
ep-0
7
02-M
ay-0
8
02-J
an-0
9
02-S
ep-0
9
02-M
ay-1
0
02-J
an-1
1
15
17
19
21
23
25Reverse repo rate Repo rateCRR SLR
KIE
est
imat
es
Source: RBI and Kotak Institutional Equities
Exhibit 4: India still runs the most negative real interest rates but monetary policy is catching up Nominal and Real central bank policy rates and 10-year treasury notes data for key global economies (%)
Central bank policy rate 10-year G-sec yieldCountry Nominal (%) Real (%) Targeted rate Country Nominal (%) Real (%)India 4.50 (8.2) Reverse Repo rate India 7.67 (6.2) UK 0.50 (2.7) Bank rate Russia 5.03 (0.8) Singapore 0.13 (2.6) Overnight rate Hong Kong SAR 2.27 (0.5) Hong Kong SAR 0.50 (2.3) Lending rate Singapore 2.27 (0.4) Thailand 1.50 (1.8) Repo rate Thailand 3.44 0.1 USA 0.25 (0.9) Fed Funds rate Taiwan 1.40 0.2 Euro region 1.00 (0.4) Refinance rate UK 3.42 0.2
S. Korea 2.25 (0.4) Call rate Euro region 2.72 1.3 Canada 0.75 (0.3) Overnight rate France 3.01 1.5 Hungary 5.25 (0.0) Base rate Germany 2.72 1.8 Philippines 4.00 0.1 Overnight rate USA 2.99 1.9 Taiwan 1.38 0.2 Rediscount rate Japan 1.06 2.0 Argentina 11.50 0.5 Repo rate Hungary 7.40 2.1 Mexico 4.50 0.8 Overnight rate Malaysia 3.89 2.2
New Zealand 2.75 1.0 Cash rate Canada 3.23 2.2 Japan 0.10 1.0 Overnight rate S. Korea 4.89 2.3 Malaysia 2.75 1.1 Overnight rate Australia 5.24 2.3 Indonesia 6.50 1.4 Reference rate Italy 4.01 2.7 Australia 4.50 1.6 Cash Target rate New Zealand 5.48 3.7 Russia 7.75 2.0 Refinance rate Philippines 7.68 3.8
Iceland 8.00 2.3 Repurchase rate South Africa 8.51 3.9 China 5.31 2.4 Lending rate Greece 10.88 5.7 Brazil 10.75 6.0 SELIC rate Brazil 12.08 7.3
Source: Kotak Institutional Equities and Bloomberg
Economy
KOTAK INSTITUTIONAL EQUITIES RESEARCH 75
Interest rates likely to firm up over next 6 months
In our assessment, most interest rates are likely to firm up over next 6 months as a fallout of the tighter monetary policy. But this is entirely desirable from macro-economic point of view point and in fact necessary for India to remain on sustainable growth path of 7.5-8%. Our expectations on financial market reaction to the policy tightening are that:
Immediate reaction on mortgage rates, including teaser rates that may go up by about 50 bps in near term.
G-sec yields in 1-3 year segment to rise by about 25 bps over next two months, though the funded 10-year segment may not be impacted much.
AAA Corporate bond spreads over 1-year risk free rate could widen to about 250 bps from 150 bps over a quarter or two.
Credit curve could shift by about 100 bps over a quarter or two in response to tighter liquidity conditions.
INR could ceteris paribus appreciate by about 25-40 paise versus US dollar pricing in the rate hikes over next quarter.
We see RBI move as positive for equity markets as it removes the fear amongst global investors that RBI staying behind the curve can cause a bubble that would explode fast on back of hard landing in face of exploding inflation. We now see sustainable capital inflows in FY2011E. Total capital account flows may exceed our earlier estimate of US$55-60 bn by about US$15-20 bn as India may likely avoid hard landing as a result of RBI getting into the act of catching up with the curve.
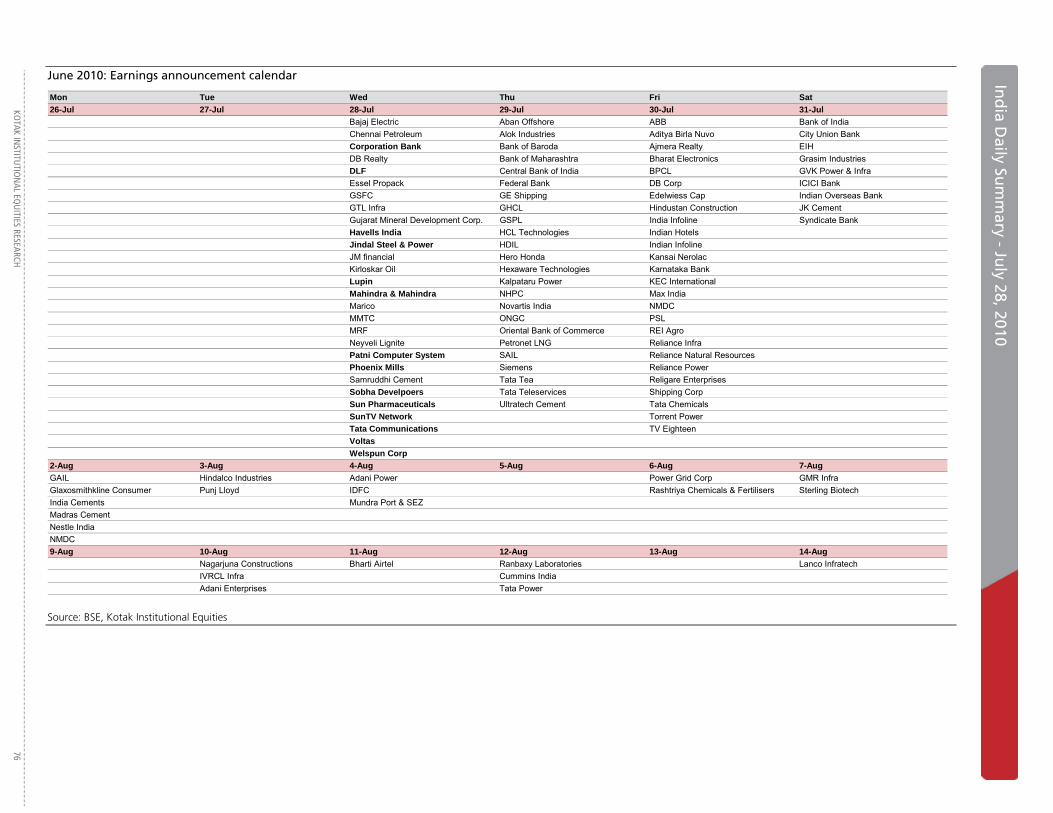
KO
TAK INSTITU
TION
AL EQU
ITIES RESEARCH 76
In
dia D
aily Sum
mary - Ju
ly 2
Ind
ia Daily Su
mm
ary - July 28, 2010
June 2010: Earnings announcement calendar
Mon Tue Wed Thu Fri Sat26-Jul 27-Jul 28-Jul 29-Jul 30-Jul 31-JulBharat Forge Ashok Leyland Bajaj Electric Aban Offshore ABB Bank of IndiaCentury Textiles Asian Paints Chennai Petroleum Alok Industries Aditya Birla Nuvo City Union BankDabur India Binani Cement Corporation Bank Bank of Baroda Ajmera Realty EIHDena Bank Blue Dart DB Realty Bank of Maharashtra Bharat Electronics Grasim IndustriesEssar Oil Cadila Healthacare DLF Central Bank of India BPCL GVK Power & InfraGlaxosmithkline Pharma Cairn India Essel Propack Federal Bank DB Corp ICICI BankMaharashtra Seamless Everest Kanto GSFC GE Shipping Edelwiess Cap Indian Overseas BankMahindra Holidays Firstsource Solutions GTL Infra GHCL Hindustan Construction JK CementNTPC Glenmark Pharmaceuticals Gujarat Mineral Development Corp. GSPL India Infoline Syndicate BankSterlite Industries Godrej Industries Havells India HCL Technologies Indian HotelsTech Mahindra GTL Jindal Steel & Power HDIL Indian InfolineUnion Bank Hindustan Unilever JM financial Hero Honda Kansai NerolacUnited Phosporus IRB Infrastructure Kirloskar Oil Hexaware Technologies Karnataka Bank
JSW Steel Lupin Kalpataru Power KEC InternationalJubilant Organosys Mahindra & Mahindra NHPC Max IndiaL&T Marico Novartis India NMDCManglore Refinery and Petrochemicals MMTC ONGC PSLOil India MRF Oriental Bank of Commerce REI AgroPatni Computer System Neyveli Lignite Petronet LNG Reliance InfraReliance Industries Patni Computer System SAIL Reliance Natural ResourcesTitan Industries Phoenix Mills Siemens Reliance Power
Samruddhi Cement Tata Tea Religare EnterprisesSobha Develpoers Tata Teleservices Shipping CorpSun Pharmaceuticals Ultratech Cement Tata ChemicalsSunTV Network Torrent PowerTata Communications TV EighteenVoltasWelspun Corp
2-Aug 3-Aug 4-Aug 5-Aug 6-Aug 7-AugGAIL Hindalco Industries Adani Power Power Grid Corp GMR InfraGlaxosmithkline Consumer Punj Lloyd IDFC Rashtriya Chemicals & Fertilisers Sterling BiotechIndia Cements Mundra Port & SEZMadras CementNestle IndiaNMDC9-Aug 10-Aug 11-Aug 12-Aug 13-Aug 14-Aug
Nagarjuna Constructions Bharti Airtel Ranbaxy Laboratories Lanco InfratechIVRCL Infra Cummins IndiaAdani Enterprises Tata Power
Source: BSE, Kotak Institutional Equities
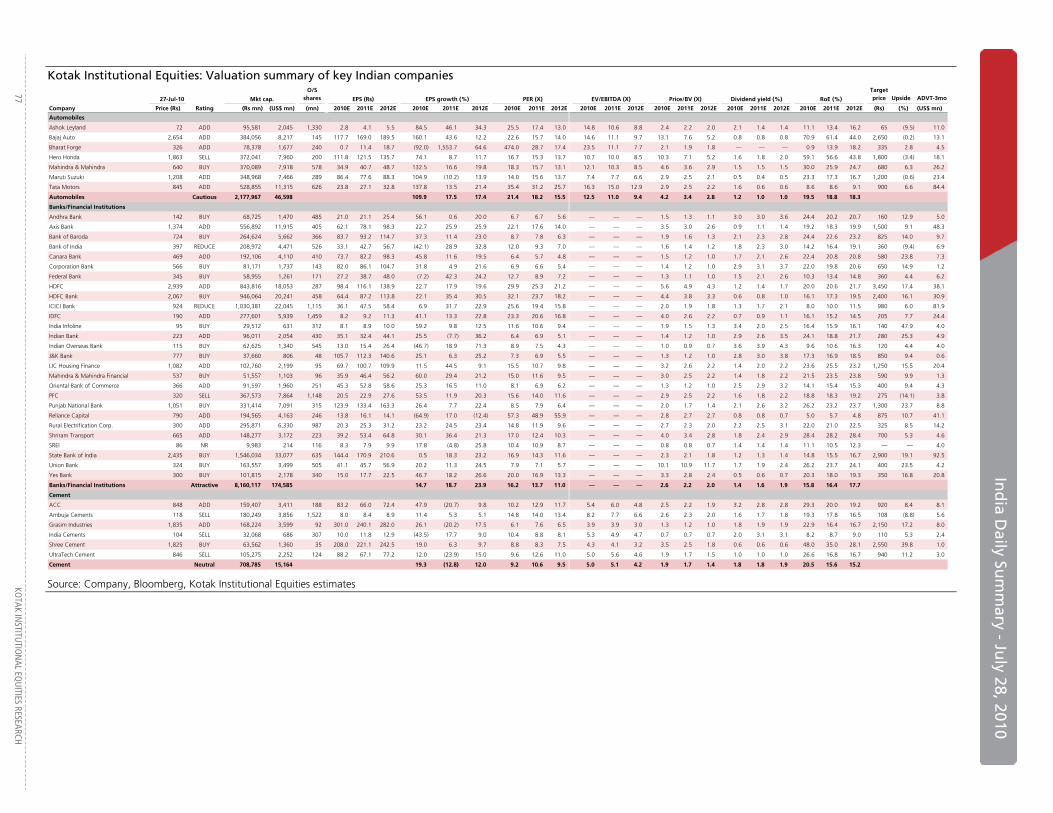
In
dia D
aily Sum
mary - Ju
ly 28, 2010
77
KOTAK IN
STITUTIO
NAL EQ
UITIES RESEARCH
Kotak Institutional Equities: Valuation summary of key Indian companies
27-Jul-10 Mkt cap.
O/S shares EPS (Rs) EPS growth (%) PER (X)
Company Price (Rs) Rating (Rs mn) (US$ mn) (mn) 2010E 2011E 2012E 2010E 2011E 2012E 2010E 2011E 2012E
Automobiles
Ashok Leyland 72 ADD 95,581 2,045 1,330 2.8 4.1 5.5 84.5 46.1 34.3 25.5 17.4 13.0
Bajaj Auto 2,654 ADD 384,056 8,217 145 117.7 169.0 189.5 160.1 43.6 12.2 22.6 15.7 14.0
Bharat Forge 326 ADD 78,378 1,677 240 0.7 11.4 18.7 (92.0) 1,553.7 64.6 474.0 28.7 17.4
Hero Honda 1,863 SELL 372,041 7,960 200 111.8 121.5 135.7 74.1 8.7 11.7 16.7 15.3 13.7
Mahindra & Mahindra 640 BUY 370,089 7,918 578 34.9 40.7 48.7 132.5 16.6 19.8 18.3 15.7 13.1
Maruti Suzuki 1,208 ADD 348,968 7,466 289 86.4 77.6 88.3 104.9 (10.2) 13.9 14.0 15.6 13.7
Tata Motors 845 ADD 528,855 11,315 626 23.8 27.1 32.8 137.8 13.5 21.4 35.4 31.2 25.7
Automobiles Cautious 2,177,967 46,598 109.9 17.5 17.4 21.4 18.2 15.5
Banks/Financial Institutions
Andhra Bank 142 BUY 68,725 1,470 485 21.0 21.1 25.4 56.1 0.6 20.0 6.7 6.7 5.6
Axis Bank 1,374 ADD 556,892 11,915 405 62.1 78.1 98.3 22.7 25.9 25.9 22.1 17.6 14.0
Bank of Baroda 724 BUY 264,624 5,662 366 83.7 93.2 114.7 37.3 11.4 23.0 8.7 7.8 6.3
Bank of India 397 REDUCE 208,972 4,471 526 33.1 42.7 56.7 (42.1) 28.9 32.8 12.0 9.3 7.0
Canara Bank 469 ADD 192,106 4,110 410 73.7 82.2 98.3 45.8 11.6 19.5 6.4 5.7 4.8
Corporation Bank 566 BUY 81,171 1,737 143 82.0 86.1 104.7 31.8 4.9 21.6 6.9 6.6 5.4
Federal Bank 345 BUY 58,955 1,261 171 27.2 38.7 48.0 (7.2) 42.3 24.2 12.7 8.9 7.2
HDFC 2,939 ADD 843,816 18,053 287 98.4 116.1 138.9 22.7 17.9 19.6 29.9 25.3 21.2
HDFC Bank 2,067 BUY 946,064 20,241 458 64.4 87.2 113.8 22.1 35.4 30.5 32.1 23.7 18.2
ICICI Bank 924 REDUCE 1,030,381 22,045 1,115 36.1 47.5 58.4 6.9 31.7 22.9 25.6 19.4 15.8
IDFC 190 ADD 277,601 5,939 1,459 8.2 9.2 11.3 41.1 13.3 22.8 23.3 20.6 16.8
India Infoline 95 BUY 29,512 631 312 8.1 8.9 10.0 59.2 9.8 12.5 11.6 10.6 9.4
Indian Bank 223 ADD 96,011 2,054 430 35.1 32.4 44.1 25.5 (7.7) 36.2 6.4 6.9 5.1
Indian Overseas Bank 115 BUY 62,625 1,340 545 13.0 15.4 26.4 (46.7) 18.9 71.3 8.9 7.5 4.3
J&K Bank 777 BUY 37,660 806 48 105.7 112.3 140.6 25.1 6.3 25.2 7.3 6.9 5.5
LIC Housing Finance 1,082 ADD 102,760 2,199 95 69.7 100.7 109.9 11.5 44.5 9.1 15.5 10.7 9.8
Mahindra & Mahindra Financial 537 BUY 51,557 1,103 96 35.9 46.4 56.2 60.0 29.4 21.2 15.0 11.6 9.5
Oriental Bank of Commerce 366 ADD 91,597 1,960 251 45.3 52.8 58.6 25.3 16.5 11.0 8.1 6.9 6.2
PFC 320 SELL 367,573 7,864 1,148 20.5 22.9 27.6 53.5 11.9 20.3 15.6 14.0 11.6
Punjab National Bank 1,051 BUY 331,414 7,091 315 123.9 133.4 163.3 26.4 7.7 22.4 8.5 7.9 6.4
Reliance Capital 790 ADD 194,565 4,163 246 13.8 16.1 14.1 (64.9) 17.0 (12.4) 57.3 48.9 55.9
Rural Electrification Corp. 300 ADD 295,871 6,330 987 20.3 25.3 31.2 23.2 24.5 23.4 14.8 11.9 9.6
Shriram Transport 665 ADD 148,277 3,172 223 39.2 53.4 64.8 30.1 36.4 21.3 17.0 12.4 10.3
SREI 86 NR 9,983 214 116 8.3 7.9 9.9 17.8 (4.8) 25.8 10.4 10.9 8.7
State Bank of India 2,435 BUY 1,546,034 33,077 635 144.4 170.9 210.6 0.5 18.3 23.2 16.9 14.3 11.6
Union Bank 324 BUY 163,557 3,499 505 41.1 45.7 56.9 20.2 11.3 24.5 7.9 7.1 5.7
Yes Bank 300 BUY 101,815 2,178 340 15.0 17.7 22.5 46.7 18.2 26.6 20.0 16.9 13.3
Banks/Financial Institutions Attractive 8,160,117 174,585 14.7 18.7 23.9 16.2 13.7 11.0
Cement
ACC 848 ADD 159,407 3,411 188 83.2 66.0 72.4 47.9 (20.7) 9.8 10.2 12.9 11.7
Ambuja Cements 118 SELL 180,249 3,856 1,522 8.0 8.4 8.9 11.4 5.3 5.1 14.8 14.0 13.4
Grasim Industries 1,835 ADD 168,224 3,599 92 301.0 240.1 282.0 26.1 (20.2) 17.5 6.1 7.6 6.5
India Cements 104 SELL 32,068 686 307 10.0 11.8 12.9 (43.5) 17.7 9.0 10.4 8.8 8.1
Shree Cement 1,825 BUY 63,562 1,360 35 208.0 221.1 242.5 19.0 6.3 9.7 8.8 8.3 7.5
UltraTech Cement 846 SELL 105,275 2,252 124 88.2 67.1 77.2 12.0 (23.9) 15.0 9.6 12.6 11.0
Cement Neutral 708,785 15,164 19.3 (12.8) 12.0 9.2 10.6 9.5
EV/EBITDA (X) Price/BV (X) RoE (%)
Target price Upside ADVT-3mo
2010E 2011E 2012E 2010E 2011E 2012E 2010E 2011E 2012E 2010E 2011E 2012E (Rs) (%) (US$ mn)
14.8 10.6 8.8 2.4 2.2 2.0 2.1 1.4 1.4 11.1 13.4 16.2 65 (9.5) 11.0
14.6 11.1 9.7 13.1 7.6 5.2 0.8 0.8 0.8 70.9 61.4 44.0 2,650 (0.2) 13.1
23.5 11.1 7.7 2.1 1.9 1.8 — — — 0.9 13.9 18.2 335 2.8 4.5
10.7 10.0 8.5 10.3 7.1 5.2 1.6 1.8 2.0 59.1 56.6 43.8 1,800 (3.4) 18.1
12.1 10.3 8.5 4.6 3.6 2.9 1.5 1.5 1.5 30.0 25.9 24.7 680 6.3 26.2
7.4 7.7 6.6 2.9 2.5 2.1 0.5 0.4 0.5 23.3 17.3 16.7 1,200 (0.6) 23.4
16.3 15.0 12.9 2.9 2.5 2.2 1.6 0.6 0.6 8.6 8.6 9.1 900 6.6 84.4
12.5 11.0 9.4 4.2 3.4 2.8 1.2 1.0 1.0 19.5 18.8 18.3
— — — 1.5 1.3 1.1 3.0 3.0 3.6 24.4 20.2 20.7 160 12.9 5.0
— — — 3.5 3.0 2.6 0.9 1.1 1.4 19.2 18.3 19.9 1,500 9.1 48.3
— — — 1.9 1.6 1.3 2.1 2.3 2.8 24.4 22.6 23.2 825 14.0 9.7
— — — 1.6 1.4 1.2 1.8 2.3 3.0 14.2 16.4 19.1 360 (9.4) 6.9
— — — 1.5 1.2 1.0 1.7 2.1 2.6 22.4 20.8 20.8 580 23.8 7.3
— — — 1.4 1.2 1.0 2.9 3.1 3.7 22.0 19.8 20.6 650 14.9 1.2
— — — 1.3 1.1 1.0 1.5 2.1 2.6 10.3 13.4 14.8 360 4.4 6.2
— — — 5.6 4.9 4.3 1.2 1.4 1.7 20.0 20.6 21.7 3,450 17.4 38.1
— — — 4.4 3.8 3.3 0.6 0.8 1.0 16.1 17.3 19.5 2,400 16.1 30.9
— — — 2.0 1.9 1.8 1.3 1.7 2.1 8.0 10.0 11.5 980 6.0 81.9
— — — 4.0 2.6 2.2 0.7 0.9 1.1 16.1 15.2 14.5 205 7.7 24.4
— — — 1.9 1.5 1.3 3.4 2.0 2.5 16.4 15.9 16.1 140 47.9 4.0
— — — 1.4 1.2 1.0 2.9 2.6 3.5 24.1 18.8 21.7 280 25.3 4.9
— — — 1.0 0.9 0.7 3.6 3.9 4.3 9.6 10.6 16.3 120 4.4 4.0
— — — 1.3 1.2 1.0 2.8 3.0 3.8 17.3 16.9 18.5 850 9.4 0.6
— — — 3.2 2.6 2.2 1.4 2.0 2.2 23.6 25.5 23.2 1,250 15.5 20.4
— — — 3.0 2.5 2.2 1.4 1.8 2.2 21.5 23.5 23.8 590 9.9 1.3
— — — 1.3 1.2 1.0 2.5 2.9 3.2 14.1 15.4 15.3 400 9.4 4.3
— — — 2.9 2.5 2.2 1.6 1.8 2.2 18.8 18.3 19.2 275 (14.1) 3.8
— — — 2.0 1.7 1.4 2.1 2.6 3.2 26.2 23.2 23.7 1,300 23.7 8.8
— — — 2.8 2.7 2.7 0.8 0.8 0.7 5.0 5.7 4.8 875 10.7 41.1
— — — 2.7 2.3 2.0 2.2 2.5 3.1 22.0 21.0 22.5 325 8.5 14.2
— — — 4.0 3.4 2.8 1.8 2.4 2.9 28.4 28.2 28.4 700 5.3 4.6
— — — 0.8 0.8 0.7 1.4 1.4 1.4 11.1 10.5 12.3 — — 4.0
— — — 2.3 2.1 1.8 1.2 1.3 1.4 14.8 15.5 16.7 2,900 19.1 92.5
— — — 10.1 10.9 11.7 1.7 1.9 2.4 26.2 23.7 24.1 400 23.5 4.2
— — — 3.3 2.8 2.4 0.5 0.6 0.7 20.3 18.0 19.3 350 16.8 20.8
— — — 2.6 2.2 2.0 1.4 1.6 1.9 15.8 16.4 17.7
5.4 6.0 4.8 2.5 2.2 1.9 3.2 2.8 2.8 29.3 20.0 19.2 920 8.4 8.1
8.2 7.7 6.6 2.6 2.3 2.0 1.6 1.7 1.8 19.3 17.8 16.5 108 (8.8) 5.6
3.9 3.9 3.0 1.3 1.2 1.0 1.8 1.9 1.9 22.9 16.4 16.7 2,150 17.2 8.0
5.3 4.9 4.7 0.7 0.7 0.7 2.0 3.1 3.1 8.2 8.7 9.0 110 5.3 2.4
4.3 4.1 3.2 3.5 2.5 1.8 0.6 0.6 0.6 48.0 35.0 28.1 2,550 39.8 1.0
5.0 5.6 4.6 1.9 1.7 1.5 1.0 1.0 1.0 26.6 16.8 16.7 940 11.2 3.0
5.0 5.1 4.2 1.9 1.7 1.4 1.8 1.8 1.9 20.5 15.6 15.2
Dividend yield (%)
Source: Company, Bloomberg, Kotak Institutional Equities estimates
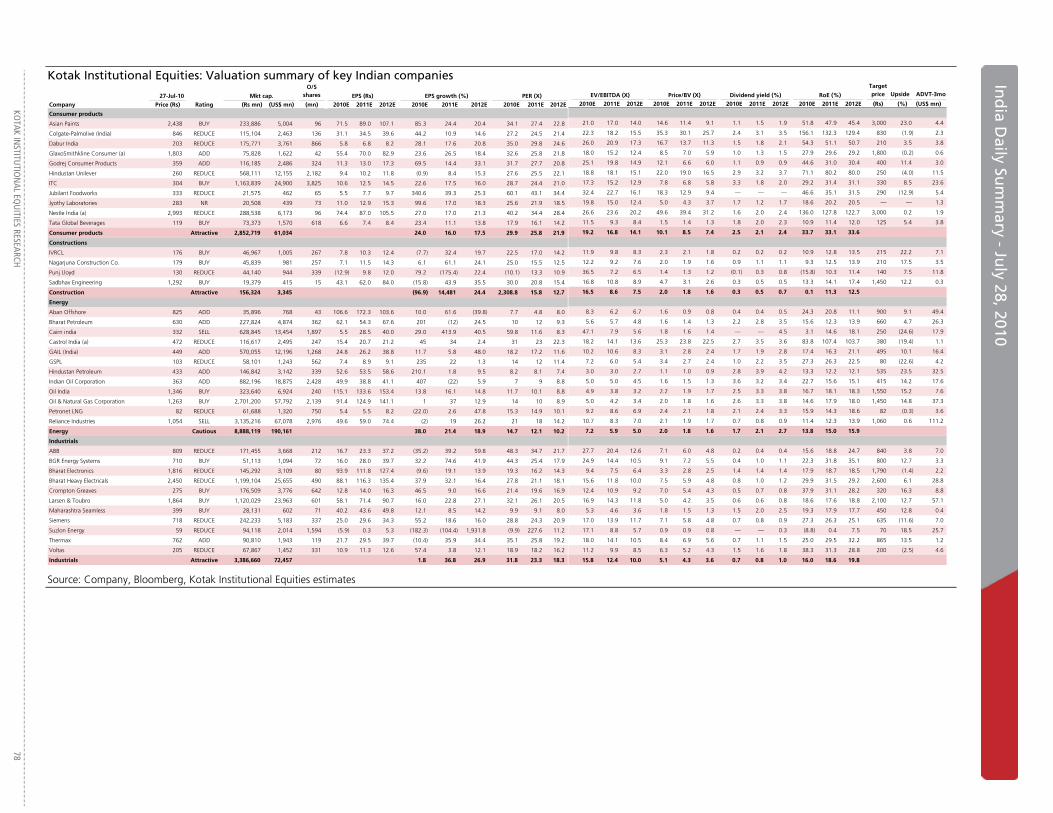
KO
TAK INSTITU
TION
AL EQU
ITIES RESEARCH 78
In
dia D
aily Sum
mary - Ju
ly 2
Ind
ia Daily Su
mm
ary - July 28, 2010
Kotak Institutional Equities: Valuation summary of key Indian companies
27-Jul-10 Mkt cap.
O/S shares EPS (Rs) EPS growth (%) PER (X)
Company Price (Rs) Rating (Rs mn) (US$ mn) (mn) 2010E 2011E 2012E 2010E 2011E 2012E 2010E 2011E 2012E
Consumer products
Asian Paints 2,438 BUY 233,886 5,004 96 71.5 89.0 107.1 85.3 24.4 20.4 34.1 27.4 22.8
Colgate-Palmolive (India) 846 REDUCE 115,104 2,463 136 31.1 34.5 39.6 44.2 10.9 14.6 27.2 24.5 21.4
Dabur India 203 REDUCE 175,771 3,761 866 5.8 6.8 8.2 28.1 17.6 20.8 35.0 29.8 24.6
GlaxoSmithkline Consumer (a) 1,803 ADD 75,828 1,622 42 55.4 70.0 82.9 23.6 26.5 18.4 32.6 25.8 21.8
Godrej Consumer Products 359 ADD 116,185 2,486 324 11.3 13.0 17.3 69.5 14.4 33.1 31.7 27.7 20.8
Hindustan Unilever 260 REDUCE 568,111 12,155 2,182 9.4 10.2 11.8 (0.9) 8.4 15.3 27.6 25.5 22.1
ITC 304 BUY 1,163,839 24,900 3,825 10.6 12.5 14.5 22.6 17.5 16.0 28.7 24.4 21.0
Jubilant Foodworks 333 REDUCE 21,575 462 65 5.5 7.7 9.7 340.6 39.3 25.3 60.1 43.1 34.4
Jyothy Laboratories 283 NR 20,508 439 73 11.0 12.9 15.3 99.6 17.0 18.3 25.6 21.9 18.5
Nestle India (a) 2,993 REDUCE 288,538 6,173 96 74.4 87.0 105.5 27.0 17.0 21.3 40.2 34.4 28.4
Tata Global Beverages 119 BUY 73,373 1,570 618 6.6 7.4 8.4 23.4 11.1 13.8 17.9 16.1 14.2
Consumer products Attractive 2,852,719 61,034 24.0 16.0 17.5 29.9 25.8 21.9
Constructions
IVRCL 176 BUY 46,967 1,005 267 7.8 10.3 12.4 (7.7) 32.4 19.7 22.5 17.0 14.2
Nagarjuna Construction Co. 179 BUY 45,839 981 257 7.1 11.5 14.3 6.1 61.1 24.1 25.0 15.5 12.5
Punj Lloyd 130 REDUCE 44,140 944 339 (12.9) 9.8 12.0 79.2 (175.4) 22.4 (10.1) 13.3 10.9
Sadbhav Engineering 1,292 BUY 19,379 415 15 43.1 62.0 84.0 (15.8) 43.9 35.5 30.0 20.8 15.4
Construction Attractive 156,324 3,345 (96.9) 14,481 24.4 2,308.8 15.8 12.7
Energy
Aban Offshore 825 ADD 35,896 768 43 106.6 172.3 103.6 10.0 61.6 (39.8) 7.7 4.8 8.0
Bharat Petroleum 630 ADD 227,824 4,874 362 62.1 54.3 67.6 201 (12) 24.5 10 12 9.3
Cairn india 332 SELL 628,845 13,454 1,897 5.5 28.5 40.0 29.0 413.9 40.5 59.8 11.6 8.3
Castrol India (a) 472 REDUCE 116,617 2,495 247 15.4 20.7 21.2 45 34 2.4 31 23 22.3
GAIL (India) 449 ADD 570,055 12,196 1,268 24.8 26.2 38.8 11.7 5.8 48.0 18.2 17.2 11.6
GSPL 103 REDUCE 58,101 1,243 562 7.4 8.9 9.1 235 22 1.3 14 12 11.4
Hindustan Petroleum 433 ADD 146,842 3,142 339 52.6 53.5 58.6 210.1 1.8 9.5 8.2 8.1 7.4
Indian Oil Corporation 363 ADD 882,196 18,875 2,428 49.9 38.8 41.1 407 (22) 5.9 7 9 8.8
Oil India 1,346 BUY 323,640 6,924 240 115.1 133.6 153.4 13.8 16.1 14.8 11.7 10.1 8.8
Oil & Natural Gas Corporation 1,263 BUY 2,701,200 57,792 2,139 91.4 124.9 141.1 1 37 12.9 14 10 8.9
Petronet LNG 82 REDUCE 61,688 1,320 750 5.4 5.5 8.2 (22.0) 2.6 47.8 15.3 14.9 10.1
Reliance Industries 1,054 SELL 3,135,216 67,078 2,976 49.6 59.0 74.4 (2) 19 26.2 21 18 14.2
Energy Cautious 8,888,119 190,161 38.0 21.4 18.9 14.7 12.1 10.2
Industrials
ABB 809 REDUCE 171,455 3,668 212 16.7 23.3 37.2 (35.2) 39.2 59.8 48.3 34.7 21.7
BGR Energy Systems 710 BUY 51,113 1,094 72 16.0 28.0 39.7 32.2 74.6 41.9 44.3 25.4 17.9
Bharat Electronics 1,816 REDUCE 145,292 3,109 80 93.9 111.8 127.4 (9.6) 19.1 13.9 19.3 16.2 14.3
Bharat Heavy Electricals 2,450 REDUCE 1,199,104 25,655 490 88.1 116.3 135.4 37.9 32.1 16.4 27.8 21.1 18.1
Crompton Greaves 275 BUY 176,509 3,776 642 12.8 14.0 16.3 46.5 9.0 16.6 21.4 19.6 16.9
Larsen & Toubro 1,864 BUY 1,120,029 23,963 601 58.1 71.4 90.7 16.0 22.8 27.1 32.1 26.1 20.5
Maharashtra Seamless 399 BUY 28,131 602 71 40.2 43.6 49.8 12.1 8.5 14.2 9.9 9.1 8.0
Siemens 718 REDUCE 242,233 5,183 337 25.0 29.6 34.3 55.2 18.6 16.0 28.8 24.3 20.9
Suzlon Energy 59 REDUCE 94,118 2,014 1,594 (5.9) 0.3 5.3 (182.3) (104.4) 1,931.8 (9.9) 227.6 11.2
Thermax 762 ADD 90,810 1,943 119 21.7 29.5 39.7 (10.4) 35.9 34.4 35.1 25.8 19.2
Voltas 205 REDUCE 67,867 1,452 331 10.9 11.3 12.6 57.4 3.8 12.1 18.9 18.2 16.2
Industrials Attractive 3,386,660 72,457 1.8 36.8 26.9 31.8 23.3 18.3
EV/EBITDA (X) Price/BV (X) RoE (%)
Target price Upside ADVT-3mo
2010E 2011E 2012E 2010E 2011E 2012E 2010E 2011E 2012E 2010E 2011E 2012E (Rs) (%) (US$ mn)
21.0 17.0 14.0 14.6 11.4 9.1 1.1 1.5 1.9 51.8 47.9 45.4 3,000 23.0 4.4
22.3 18.2 15.5 35.3 30.1 25.7 2.4 3.1 3.5 156.1 132.3 129.4 830 (1.9) 2.3
26.0 20.9 17.3 16.7 13.7 11.3 1.5 1.8 2.1 54.3 51.1 50.7 210 3.5 3.8
18.0 15.2 12.4 8.5 7.0 5.9 1.0 1.3 1.5 27.9 29.6 29.2 1,800 (0.2) 0.6
25.1 19.8 14.9 12.1 6.6 6.0 1.1 0.9 0.9 44.6 31.0 30.4 400 11.4 3.0
18.8 18.1 15.1 22.0 19.0 16.5 2.9 3.2 3.7 71.1 80.2 80.0 250 (4.0) 11.5
17.3 15.2 12.9 7.8 6.8 5.8 3.3 1.8 2.0 29.2 31.4 31.1 330 8.5 23.6
32.4 22.7 16.1 18.3 12.9 9.4 — — — 46.6 35.1 31.5 290 (12.9) 5.4
19.8 15.0 12.4 5.0 4.3 3.7 1.7 1.2 1.7 18.6 20.2 20.5 — — 1.3
26.6 23.6 20.2 49.6 39.4 31.2 1.6 2.0 2.4 136.0 127.8 122.7 3,000 0.2 1.9
11.5 9.3 8.4 1.5 1.4 1.3 1.8 2.0 2.3 10.9 11.4 12.0 125 5.4 3.8
19.2 16.8 14.1 10.1 8.5 7.4 2.5 2.1 2.4 33.7 33.1 33.6
11.9 9.8 8.3 2.3 2.1 1.8 0.2 0.2 0.2 10.9 12.8 13.5 215 22.2 7.1
12.2 9.2 7.6 2.0 1.9 1.6 0.9 1.1 1.1 9.3 12.5 13.9 210 17.5 3.5
36.5 7.2 6.5 1.4 1.3 1.2 (0.1) 0.3 0.8 (15.8) 10.3 11.4 140 7.5 11.8
16.8 10.8 8.9 4.7 3.1 2.6 0.3 0.5 0.5 13.3 14.1 17.4 1,450 12.2 0.3
16.5 8.6 7.5 2.0 1.8 1.6 0.3 0.5 0.7 0.1 11.3 12.5
8.3 6.2 6.7 1.6 0.9 0.8 0.4 0.4 0.5 24.3 20.8 11.1 900 9.1 49.4
5.6 5.7 4.8 1.6 1.4 1.3 2.2 2.8 3.5 15.6 12.3 13.9 660 4.7 26.3
47.1 7.9 5.6 1.8 1.6 1.4 — — 4.5 3.1 14.6 18.1 250 (24.6) 17.9
18.2 14.1 13.6 25.3 23.8 22.5 2.7 3.5 3.6 83.8 107.4 103.7 380 (19.4) 1.1
10.2 10.6 8.3 3.1 2.8 2.4 1.7 1.9 2.8 17.4 16.3 21.1 495 10.1 16.4
7.2 6.0 5.4 3.4 2.7 2.4 1.0 2.2 3.5 27.3 26.3 22.5 80 (22.6) 4.2
3.0 3.0 2.7 1.1 1.0 0.9 2.8 3.9 4.2 13.3 12.2 12.1 535 23.5 32.5
5.0 5.0 4.5 1.6 1.5 1.3 3.6 3.2 3.4 22.7 15.6 15.1 415 14.2 17.6
4.9 3.8 3.2 2.2 1.9 1.7 2.5 3.3 3.8 16.7 18.1 18.3 1,550 15.2 7.6
5.0 4.2 3.4 2.0 1.8 1.6 2.6 3.3 3.8 14.6 17.9 18.0 1,450 14.8 37.3
9.2 8.6 6.9 2.4 2.1 1.8 2.1 2.4 3.3 15.9 14.3 18.6 82 (0.3) 3.6
10.7 8.3 7.0 2.1 1.9 1.7 0.7 0.8 0.9 11.4 12.3 13.9 1,060 0.6 111.2
7.2 5.9 5.0 2.0 1.8 1.6 1.7 2.1 2.7 13.8 15.0 15.9
27.7 20.4 12.6 7.1 6.0 4.8 0.2 0.4 0.4 15.6 18.8 24.7 840 3.8 7.0
24.9 14.4 10.5 9.1 7.2 5.5 0.4 1.0 1.1 22.3 31.8 35.1 800 12.7 3.3
9.4 7.5 6.4 3.3 2.8 2.5 1.4 1.4 1.4 17.9 18.7 18.5 1,790 (1.4) 2.2
15.6 11.8 10.0 7.5 5.9 4.8 0.8 1.0 1.2 29.9 31.5 29.2 2,600 6.1 28.8
12.4 10.9 9.2 7.0 5.4 4.3 0.5 0.7 0.8 37.9 31.1 28.2 320 16.3 8.8
16.9 14.3 11.8 5.0 4.2 3.5 0.6 0.6 0.8 18.6 17.6 18.8 2,100 12.7 57.1
5.3 4.6 3.6 1.8 1.5 1.3 1.5 2.0 2.5 19.3 17.9 17.7 450 12.8 0.4
17.0 13.9 11.7 7.1 5.8 4.8 0.7 0.8 0.9 27.3 26.3 25.1 635 (11.6) 7.0
17.1 8.8 5.7 0.9 0.9 0.8 — — 0.3 (8.8) 0.4 7.5 70 18.5 25.7
18.0 14.1 10.5 8.4 6.9 5.6 0.7 1.1 1.5 25.0 29.5 32.2 865 13.5 1.2
11.2 9.9 8.5 6.3 5.2 4.3 1.5 1.6 1.8 38.3 31.3 28.8 200 (2.5) 4.6
15.8 12.4 10.0 5.1 4.3 3.6 0.7 0.8 1.0 16.0 18.6 19.8
Dividend yield (%)
Source: Company, Bloomberg, Kotak Institutional Equities estimates
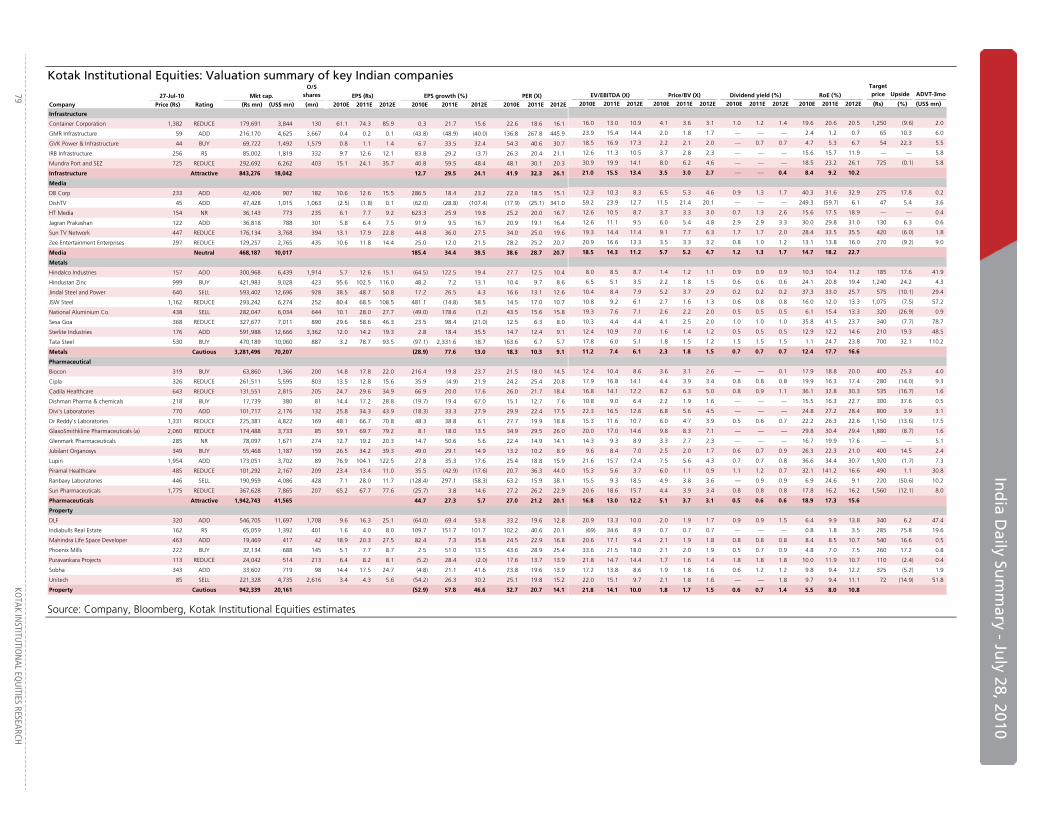
In
dia D
aily Sum
mary - Ju
ly 28, 2010
79
KOTAK IN
STITUTIO
NAL EQ
UITIES RESEARCH
Kotak Institutional Equities: Valuation summary of key Indian companies
27-Jul-10 Mkt cap.
O/S shares EPS (Rs) EPS growth (%) PER (X)
Company Price (Rs) Rating (Rs mn) (US$ mn) (mn) 2010E 2011E 2012E 2010E 2011E 2012E 2010E 2011E 2012E
Infrastructure
Container Corporation 1,382 REDUCE 179,691 3,844 130 61.1 74.3 85.9 0.3 21.7 15.6 22.6 18.6 16.1
GMR Infrastructure 59 ADD 216,170 4,625 3,667 0.4 0.2 0.1 (43.8) (48.9) (40.0) 136.8 267.8 445.9
GVK Power & Infrastructure 44 BUY 69,722 1,492 1,579 0.8 1.1 1.4 6.7 33.5 32.4 54.3 40.6 30.7
IRB Infrastructure 256 RS 85,002 1,819 332 9.7 12.6 12.1 83.8 29.2 (3.7) 26.3 20.4 21.1
Mundra Port and SEZ 725 REDUCE 292,692 6,262 403 15.1 24.1 35.7 40.8 59.5 48.4 48.1 30.1 20.3
Infrastructure Attractive 843,276 18,042 12.7 29.5 24.1 41.9 32.3 26.1
Media
DB Corp 233 ADD 42,406 907 182 10.6 12.6 15.5 286.5 18.4 23.2 22.0 18.5 15.1
DishTV 45 ADD 47,428 1,015 1,063 (2.5) (1.8) 0.1 (62.0) (28.8) (107.4) (17.9) (25.1) 341.0
HT Media 154 NR 36,143 773 235 6.1 7.7 9.2 623.3 25.9 19.8 25.2 20.0 16.7
Jagran Prakashan 122 ADD 36,818 788 301 5.8 6.4 7.5 91.9 9.5 16.7 20.9 19.1 16.4
Sun TV Network 447 REDUCE 176,134 3,768 394 13.1 17.9 22.8 44.8 36.0 27.5 34.0 25.0 19.6
Zee Entertainment Enterprises 297 REDUCE 129,257 2,765 435 10.6 11.8 14.4 25.0 12.0 21.5 28.2 25.2 20.7
Media Neutral 468,187 10,017 185.4 34.4 38.5 38.6 28.7 20.7
Metals
Hindalco Industries 157 ADD 300,968 6,439 1,914 5.7 12.6 15.1 (64.5) 122.5 19.4 27.7 12.5 10.4
Hindustan Zinc 999 BUY 421,983 9,028 423 95.6 102.5 116.0 48.2 7.2 13.1 10.4 9.7 8.6
Jindal Steel and Power 640 SELL 593,402 12,696 928 38.5 48.7 50.8 17.2 26.5 4.3 16.6 13.1 12.6
JSW Steel 1,162 REDUCE 293,242 6,274 252 80.4 68.5 108.5 481.1 (14.8) 58.5 14.5 17.0 10.7
National Aluminium Co. 438 SELL 282,047 6,034 644 10.1 28.0 27.7 (49.0) 178.6 (1.2) 43.5 15.6 15.8
Sesa Goa 368 REDUCE 327,677 7,011 890 29.6 58.6 46.3 23.5 98.4 (21.0) 12.5 6.3 8.0
Sterlite Industries 176 ADD 591,988 12,666 3,362 12.0 14.2 19.3 2.8 18.4 35.5 14.7 12.4 9.1
Tata Steel 530 BUY 470,189 10,060 887 3.2 78.7 93.5 (97.1) 2,331.6 18.7 163.6 6.7 5.7
Metals Cautious 3,281,496 70,207 (28.9) 77.6 13.0 18.3 10.3 9.1
Pharmaceutical
Biocon 319 BUY 63,860 1,366 200 14.8 17.8 22.0 216.4 19.8 23.7 21.5 18.0 14.5
Cipla 326 REDUCE 261,511 5,595 803 13.5 12.8 15.6 35.9 (4.9) 21.9 24.2 25.4 20.8
Cadila Healthcare 643 REDUCE 131,551 2,815 205 24.7 29.6 34.9 66.9 20.0 17.6 26.0 21.7 18.4
Dishman Pharma & chemicals 218 BUY 17,739 380 81 14.4 17.2 28.8 (19.7) 19.4 67.0 15.1 12.7 7.6
Divi's Laboratories 770 ADD 101,717 2,176 132 25.8 34.3 43.9 (18.3) 33.3 27.9 29.9 22.4 17.5
Dr Reddy's Laboratories 1,331 REDUCE 225,381 4,822 169 48.1 66.7 70.8 48.3 38.8 6.1 27.7 19.9 18.8
GlaxoSmithkline Pharmaceuticals (a) 2,060 REDUCE 174,488 3,733 85 59.1 69.7 79.2 8.1 18.0 13.5 34.9 29.5 26.0
Glenmark Pharmaceuticals 285 NR 78,097 1,671 274 12.7 19.2 20.3 14.7 50.6 5.6 22.4 14.9 14.1
Jubilant Organosys 349 BUY 55,468 1,187 159 26.5 34.2 39.3 49.0 29.1 14.9 13.2 10.2 8.9
Lupin 1,954 ADD 173,051 3,702 89 76.9 104.1 122.5 27.8 35.3 17.6 25.4 18.8 15.9
Piramal Healthcare 485 REDUCE 101,292 2,167 209 23.4 13.4 11.0 35.5 (42.9) (17.6) 20.7 36.3 44.0
Ranbaxy Laboratories 446 SELL 190,959 4,086 428 7.1 28.0 11.7 (128.4) 297.1 (58.3) 63.2 15.9 38.1
Sun Pharmaceuticals 1,775 REDUCE 367,628 7,865 207 65.2 67.7 77.6 (25.7) 3.8 14.6 27.2 26.2 22.9
Pharmaceuticals Attractive 1,942,743 41,565 44.7 27.3 5.7 27.0 21.2 20.1
Property
DLF 320 ADD 546,705 11,697 1,708 9.6 16.3 25.1 (64.0) 69.4 53.8 33.2 19.6 12.8
Indiabulls Real Estate 162 RS 65,059 1,392 401 1.6 4.0 8.0 109.7 151.7 101.7 102.2 40.6 20.1
Mahindra Life Space Developer 463 ADD 19,469 417 42 18.9 20.3 27.5 82.4 7.3 35.8 24.5 22.9 16.8
Phoenix Mills 222 BUY 32,134 688 145 5.1 7.7 8.7 2.5 51.0 13.5 43.6 28.9 25.4
Puravankara Projects 113 REDUCE 24,042 514 213 6.4 8.2 8.1 (5.2) 28.4 (2.0) 17.6 13.7 13.9
Sobha 343 ADD 33,602 719 98 14.4 17.5 24.7 (4.8) 21.1 41.6 23.8 19.6 13.9
Unitech 85 SELL 221,328 4,735 2,616 3.4 4.3 5.6 (54.2) 26.3 30.2 25.1 19.8 15.2
Property Cautious 942,339 20,161 (52.9) 57.8 46.6 32.7 20.7 14.1
EV/EBITDA (X) Price/BV (X) RoE (%)
Target price Upside ADVT-3mo
2010E 2011E 2012E 2010E 2011E 2012E 2010E 2011E 2012E 2010E 2011E 2012E (Rs) (%) (US$ mn)
16.0 13.0 10.9 4.1 3.6 3.1 1.0 1.2 1.4 19.6 20.6 20.5 1,250 (9.6) 2.0
23.9 15.4 14.4 2.0 1.8 1.7 — — — 2.4 1.2 0.7 65 10.3 6.0
18.5 16.9 17.3 2.2 2.1 2.0 — 0.7 0.7 4.7 5.3 6.7 54 22.3 5.5
12.6 11.3 10.5 3.7 2.8 2.3 — — — 15.6 15.7 11.9 — — 5.8
30.9 19.9 14.1 8.0 6.2 4.6 — — — 18.5 23.2 26.1 725 (0.1) 5.8
21.0 15.5 13.4 3.5 3.0 2.7 — — 0.4 8.4 9.2 10.2
12.3 10.3 8.3 6.5 5.3 4.6 0.9 1.3 1.7 40.3 31.6 32.9 275 17.8 0.2
59.2 23.9 12.7 11.5 21.4 20.1 — — — 249.3 (59.7) 6.1 47 5.4 3.6
12.6 10.5 8.7 3.7 3.3 3.0 0.7 1.3 2.6 15.6 17.5 18.9 — — 0.4
12.6 11.1 9.5 6.0 5.4 4.8 2.9 2.9 3.3 30.0 29.8 31.0 130 6.3 0.6
19.3 14.4 11.4 9.1 7.7 6.3 1.7 1.7 2.0 28.4 33.5 35.5 420 (6.0) 1.8
20.9 16.6 13.3 3.5 3.3 3.2 0.8 1.0 1.2 13.1 13.8 16.0 270 (9.2) 9.0
18.5 14.3 11.2 5.7 5.2 4.7 1.2 1.3 1.7 14.7 18.2 22.7
8.0 8.5 8.7 1.4 1.2 1.1 0.9 0.9 0.9 10.3 10.4 11.2 185 17.6 41.9
6.5 5.1 3.5 2.2 1.8 1.5 0.6 0.6 0.6 24.1 20.8 19.4 1,240 24.2 4.3
10.4 8.4 7.9 5.2 3.7 2.9 0.2 0.2 0.2 37.3 33.0 25.7 575 (10.1) 29.4
10.8 9.2 6.1 2.7 1.6 1.3 0.6 0.8 0.8 16.0 12.0 13.3 1,075 (7.5) 57.2
19.3 7.6 7.1 2.6 2.2 2.0 0.5 0.5 0.5 6.1 15.4 13.3 320 (26.9) 0.9
10.3 4.4 4.4 4.1 2.5 2.0 1.0 1.0 1.0 35.8 41.5 23.7 340 (7.7) 78.7
12.4 10.9 7.0 1.6 1.4 1.2 0.5 0.5 0.5 12.9 12.2 14.6 210 19.3 48.5
17.8 6.0 5.1 1.8 1.5 1.2 1.5 1.5 1.5 1.1 24.7 23.8 700 32.1 110.2
11.2 7.4 6.1 2.3 1.8 1.5 0.7 0.7 0.7 12.4 17.7 16.6
12.4 10.4 8.6 3.6 3.1 2.6 — — 0.1 17.9 18.8 20.0 400 25.3 4.0
17.9 16.8 14.1 4.4 3.9 3.4 0.8 0.8 0.8 19.9 16.3 17.4 280 (14.0) 9.3
16.8 14.1 12.2 8.2 6.3 5.0 0.8 0.9 1.1 36.1 32.8 30.3 535 (16.7) 1.6
10.8 9.0 6.4 2.2 1.9 1.6 — — — 15.5 16.3 22.7 300 37.6 0.5
22.3 16.5 12.6 6.8 5.6 4.5 — — — 24.8 27.2 28.4 800 3.9 3.1
15.3 11.6 10.7 6.0 4.7 3.9 0.5 0.6 0.7 22.2 26.3 22.6 1,150 (13.6) 17.5
20.0 17.0 14.6 9.8 8.3 7.1 — — — 29.8 30.4 29.4 1,880 (8.7) 1.6
14.3 9.3 8.9 3.3 2.7 2.3 — — — 16.7 19.9 17.6 — — 5.1
9.6 8.4 7.0 2.5 2.0 1.7 0.6 0.7 0.9 26.3 22.3 21.0 400 14.5 2.4
21.6 15.7 12.4 7.5 5.6 4.3 0.7 0.7 0.8 36.6 34.4 30.7 1,920 (1.7) 7.3
15.3 5.6 3.7 6.0 1.1 0.9 1.1 1.2 0.7 32.1 141.2 16.6 490 1.1 30.8
15.5 9.3 18.5 4.9 3.8 3.6 — 0.9 0.9 6.9 24.6 9.1 220 (50.6) 10.2
20.6 18.6 15.7 4.4 3.9 3.4 0.8 0.8 0.8 17.8 16.2 16.2 1,560 (12.1) 8.0
16.8 13.0 12.2 5.1 3.7 3.1 0.5 0.6 0.6 18.9 17.3 15.6
20.9 13.3 10.0 2.0 1.9 1.7 0.9 0.9 1.5 6.4 9.9 13.8 340 6.2 47.4
(69) 34.6 8.9 0.7 0.7 0.7 — — — 0.8 1.8 3.5 285 75.8 19.6
20.6 17.1 9.4 2.1 1.9 1.8 0.8 0.8 0.8 8.4 8.5 10.7 540 16.6 0.5
33.6 21.5 18.0 2.1 2.0 1.9 0.5 0.7 0.9 4.8 7.0 7.5 260 17.2 0.8
21.8 14.7 14.4 1.7 1.6 1.4 1.8 1.8 1.8 10.0 11.9 10.7 110 (2.4) 0.4
17.2 13.8 8.6 1.9 1.8 1.6 0.6 1.2 1.2 9.8 9.4 12.2 325 (5.2) 1.9
22.0 15.1 9.7 2.1 1.8 1.6 — — 1.8 9.7 9.4 11.1 72 (14.9) 51.8
21.8 14.1 10.0 1.8 1.7 1.5 0.6 0.7 1.4 5.5 8.0 10.8
Dividend yield (%)
Source: Company, Bloomberg, Kotak Institutional Equities estimates
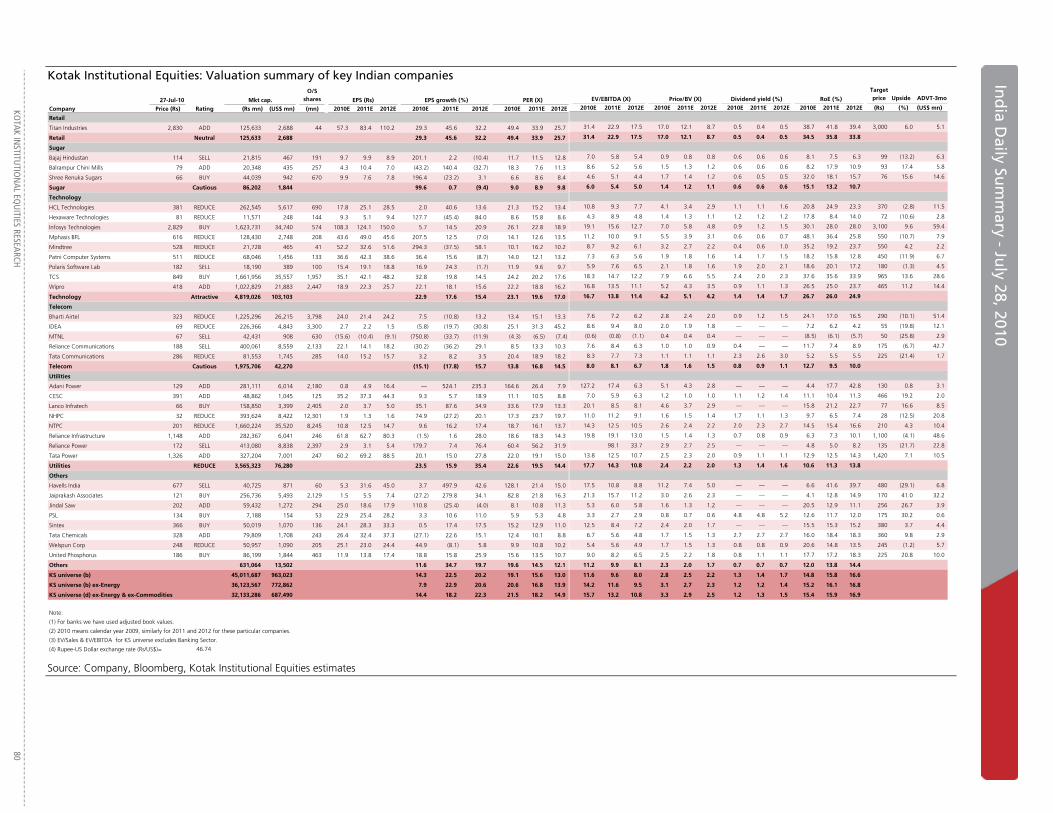
KO
TAK INSTITU
TION
AL EQU
ITIES RESEARCH 80
In
dia D
aily Sum
mary - Ju
ly 2
Ind
ia Daily Su
mm
ary - July 28, 2010
Kotak Institutional Equities: Valuation summary of key Indian companies
27-Jul-10 Mkt cap.
O/S shares EPS (Rs) EPS growth (%) PER (X)
Company Price (Rs) Rating (Rs mn) (US$ mn) (mn) 2010E 2011E 2012E 2010E 2011E 2012E 2010E 2011E 2012E
Retail
Titan Industries 2,830 ADD 125,633 2,688 44 57.3 83.4 110.2 29.3 45.6 32.2 49.4 33.9 25.7
Retail Neutral 125,633 2,688 29.3 45.6 32.2 49.4 33.9 25.7
Sugar
Bajaj Hindustan 114 SELL 21,815 467 191 9.7 9.9 8.9 201.1 2.2 (10.4) 11.7 11.5 12.8
Balrampur Chini Mills 79 ADD 20,348 435 257 4.3 10.4 7.0 (43.2) 140.4 (32.7) 18.3 7.6 11.3
Shree Renuka Sugars 66 BUY 44,039 942 670 9.9 7.6 7.8 196.4 (23.2) 3.1 6.6 8.6 8.4
Sugar Cautious 86,202 1,844 99.6 0.7 (9.4) 9.0 8.9 9.8
Technology
HCL Technologies 381 REDUCE 262,545 5,617 690 17.8 25.1 28.5 2.0 40.6 13.6 21.3 15.2 13.4
Hexaware Technologies 81 REDUCE 11,571 248 144 9.3 5.1 9.4 127.7 (45.4) 84.0 8.6 15.8 8.6
Infosys Technologies 2,829 BUY 1,623,731 34,740 574 108.3 124.1 150.0 5.7 14.5 20.9 26.1 22.8 18.9
Mphasis BFL 616 REDUCE 128,430 2,748 208 43.6 49.0 45.6 207.5 12.5 (7.0) 14.1 12.6 13.5
Mindtree 528 REDUCE 21,728 465 41 52.2 32.6 51.6 294.3 (37.5) 58.1 10.1 16.2 10.2
Patni Computer Systems 511 REDUCE 68,046 1,456 133 36.6 42.3 38.6 36.4 15.6 (8.7) 14.0 12.1 13.2
Polaris Software Lab 182 SELL 18,190 389 100 15.4 19.1 18.8 16.9 24.3 (1.7) 11.9 9.6 9.7
TCS 849 BUY 1,661,956 35,557 1,957 35.1 42.1 48.2 32.8 19.8 14.5 24.2 20.2 17.6
Wipro 418 ADD 1,022,829 21,883 2,447 18.9 22.3 25.7 22.1 18.1 15.6 22.2 18.8 16.2
Technology Attractive 4,819,026 103,103 22.9 17.6 15.4 23.1 19.6 17.0
Telecom
Bharti Airtel 323 REDUCE 1,225,296 26,215 3,798 24.0 21.4 24.2 7.5 (10.8) 13.2 13.4 15.1 13.3
IDEA 69 REDUCE 226,366 4,843 3,300 2.7 2.2 1.5 (5.8) (19.7) (30.8) 25.1 31.3 45.2
MTNL 67 SELL 42,431 908 630 (15.6) (10.4) (9.1) (750.8) (33.7) (11.9) (4.3) (6.5) (7.4)
Reliance Communications 188 SELL 400,061 8,559 2,133 22.1 14.1 18.2 (30.2) (36.2) 29.1 8.5 13.3 10.3
Tata Communications 286 REDUCE 81,553 1,745 285 14.0 15.2 15.7 3.2 8.2 3.5 20.4 18.9 18.2
Telecom Cautious 1,975,706 42,270 (15.1) (17.8) 15.7 13.8 16.8 14.5
Utilities
Adani Power 129 ADD 281,111 6,014 2,180 0.8 4.9 16.4 — 524.1 235.3 164.6 26.4 7.9
CESC 391 ADD 48,862 1,045 125 35.2 37.3 44.3 9.3 5.7 18.9 11.1 10.5 8.8
Lanco Infratech 66 BUY 158,850 3,399 2,405 2.0 3.7 5.0 35.1 87.6 34.9 33.6 17.9 13.3
NHPC 32 REDUCE 393,624 8,422 12,301 1.9 1.3 1.6 74.9 (27.2) 20.1 17.3 23.7 19.7
NTPC 201 REDUCE 1,660,224 35,520 8,245 10.8 12.5 14.7 9.6 16.2 17.4 18.7 16.1 13.7
Reliance Infrastructure 1,148 ADD 282,367 6,041 246 61.8 62.7 80.3 (1.5) 1.6 28.0 18.6 18.3 14.3
Reliance Power 172 SELL 413,080 8,838 2,397 2.9 3.1 5.4 179.7 7.4 76.4 60.4 56.2 31.9
Tata Power 1,326 ADD 327,204 7,001 247 60.2 69.2 88.5 20.1 15.0 27.8 22.0 19.1 15.0
Utilities REDUCE 3,565,323 76,280 23.5 15.9 35.4 22.6 19.5 14.4
Others
Havells India 677 SELL 40,725 871 60 5.3 31.6 45.0 3.7 497.9 42.6 128.1 21.4 15.0
Jaiprakash Associates 121 BUY 256,736 5,493 2,129 1.5 5.5 7.4 (27.2) 279.8 34.1 82.8 21.8 16.3
Jindal Saw 202 ADD 59,432 1,272 294 25.0 18.6 17.9 110.8 (25.4) (4.0) 8.1 10.8 11.3
PSL 134 BUY 7,188 154 53 22.9 25.4 28.2 3.3 10.6 11.0 5.9 5.3 4.8
Sintex 366 BUY 50,019 1,070 136 24.1 28.3 33.3 0.5 17.4 17.5 15.2 12.9 11.0
Tata Chemicals 328 ADD 79,809 1,708 243 26.4 32.4 37.3 (27.1) 22.6 15.1 12.4 10.1 8.8
Welspun Corp 248 REDUCE 50,957 1,090 205 25.1 23.0 24.4 44.9 (8.1) 5.8 9.9 10.8 10.2
United Phosphorus 186 BUY 86,199 1,844 463 11.9 13.8 17.4 18.8 15.8 25.9 15.6 13.5 10.7
Others 631,064 13,502 11.6 34.7 19.7 19.6 14.5 12.1
KS universe (b) 45,011,687 963,023 14.3 22.5 20.2 19.1 15.6 13.0
KS universe (b) ex-Energy 36,123,567 772,862 7.9 22.9 20.6 20.6 16.8 13.9
KS universe (d) ex-Energy & ex-Commodities 32,133,286 687,490 14.4 18.2 22.3 21.5 18.2 14.9
Note:
(1) For banks we have used adjusted book values.
(2) 2010 means calendar year 2009, similarly for 2011 and 2012 for these particular companies.
(3) EV/Sales & EV/EBITDA for KS universe excludes Banking Sector.
(4) Rupee-US Dollar exchange rate (Rs/US$)= 46.74
EV/EBITDA (X) Price/BV (X) RoE (%)
Target price Upside ADVT-3mo
2010E 2011E 2012E 2010E 2011E 2012E 2010E 2011E 2012E 2010E 2011E 2012E (Rs) (%) (US$ mn)
31.4 22.9 17.5 17.0 12.1 8.7 0.5 0.4 0.5 38.7 41.8 39.4 3,000 6.0 5.1
31.4 22.9 17.5 17.0 12.1 8.7 0.5 0.4 0.5 34.5 35.8 33.8
7.0 5.8 5.4 0.9 0.8 0.8 0.6 0.6 0.6 8.1 7.5 6.3 99 (13.2) 6.3
8.6 5.2 5.6 1.5 1.3 1.2 0.6 0.6 0.6 8.2 17.9 10.9 93 17.4 5.8
4.6 5.1 4.4 1.7 1.4 1.2 0.6 0.5 0.5 32.0 18.1 15.7 76 15.6 14.6
6.0 5.4 5.0 1.4 1.2 1.1 0.6 0.6 0.6 15.1 13.2 10.7
10.8 9.3 7.7 4.1 3.4 2.9 1.1 1.1 1.6 20.8 24.9 23.3 370 (2.8) 11.5
4.3 8.9 4.8 1.4 1.3 1.1 1.2 1.2 1.2 17.8 8.4 14.0 72 (10.6) 2.8
19.1 15.6 12.7 7.0 5.8 4.8 0.9 1.2 1.5 30.1 28.0 28.0 3,100 9.6 59.4
11.2 10.0 9.1 5.5 3.9 3.1 0.6 0.6 0.7 48.1 36.4 25.8 550 (10.7) 7.9
8.7 9.2 6.1 3.2 2.7 2.2 0.4 0.6 1.0 35.2 19.2 23.7 550 4.2 2.2
7.3 6.3 5.6 1.9 1.8 1.6 1.4 1.7 1.5 18.2 15.8 12.8 450 (11.9) 6.7
5.9 7.6 6.5 2.1 1.8 1.6 1.9 2.0 2.1 18.6 20.1 17.2 180 (1.3) 4.5
18.3 14.7 12.2 7.9 6.6 5.5 2.4 2.0 2.3 37.6 35.6 33.9 965 13.6 28.6
16.8 13.5 11.1 5.2 4.3 3.5 0.9 1.1 1.3 26.5 25.0 23.7 465 11.2 14.4
16.7 13.8 11.4 6.2 5.1 4.2 1.4 1.4 1.7 26.7 26.0 24.9
7.6 7.2 6.2 2.8 2.4 2.0 0.9 1.2 1.5 24.1 17.0 16.5 290 (10.1) 51.4
8.6 9.4 8.0 2.0 1.9 1.8 — — — 7.2 6.2 4.2 55 (19.8) 12.1
(0.6) (0.8) (1.1) 0.4 0.4 0.4 — — — (8.5) (6.1) (5.7) 50 (25.8) 2.9
7.6 8.4 6.3 1.0 1.0 0.9 0.4 — — 11.7 7.4 8.9 175 (6.7) 42.7
8.3 7.7 7.3 1.1 1.1 1.1 2.3 2.6 3.0 5.2 5.5 5.5 225 (21.4) 1.7
8.0 8.1 6.7 1.8 1.6 1.5 0.8 0.9 1.1 12.7 9.5 10.0
127.2 17.4 6.3 5.1 4.3 2.8 — — — 4.4 17.7 42.8 130 0.8 3.1
7.0 5.9 6.3 1.2 1.0 1.0 1.1 1.2 1.4 11.1 10.4 11.3 466 19.2 2.0
20.1 8.5 8.1 4.6 3.7 2.9 — — — 15.8 21.2 22.7 77 16.6 8.5
11.0 11.2 9.1 1.6 1.5 1.4 1.7 1.1 1.3 9.7 6.5 7.4 28 (12.5) 20.8
14.3 12.5 10.5 2.6 2.4 2.2 2.0 2.3 2.7 14.5 15.4 16.6 210 4.3 10.4
19.8 19.1 13.0 1.5 1.4 1.3 0.7 0.8 0.9 6.3 7.3 10.1 1,100 (4.1) 48.6
98.1 33.7 2.9 2.7 2.5 — — — 4.8 5.0 8.2 135 (21.7) 22.8
13.8 12.5 10.7 2.5 2.3 2.0 0.9 1.1 1.1 12.9 12.5 14.3 1,420 7.1 10.5
17.7 14.3 10.8 2.4 2.2 2.0 1.3 1.4 1.6 10.6 11.3 13.8
17.5 10.8 8.8 11.2 7.4 5.0 — — — 6.6 41.6 39.7 480 (29.1) 6.8
21.3 15.7 11.2 3.0 2.6 2.3 — — — 4.1 12.8 14.9 170 41.0 32.2
5.3 6.0 5.8 1.6 1.3 1.2 — — — 20.5 12.9 11.1 256 26.7 3.9
3.3 2.7 2.9 0.8 0.7 0.6 4.8 4.8 5.2 12.6 11.7 12.0 175 30.2 0.6
12.5 8.4 7.2 2.4 2.0 1.7 — — — 15.5 15.3 15.2 380 3.7 4.4
6.7 5.6 4.8 1.7 1.5 1.3 2.7 2.7 2.7 16.0 18.4 18.3 360 9.8 2.9
5.4 5.6 4.9 1.7 1.5 1.3 0.8 0.8 0.9 20.6 14.8 13.5 245 (1.2) 5.7
9.0 8.2 6.5 2.5 2.2 1.8 0.8 1.1 1.1 17.7 17.2 18.3 225 20.8 10.0
11.2 9.9 8.1 2.3 2.0 1.7 0.7 0.7 0.7 12.0 13.8 14.4
11.6 9.6 8.0 2.8 2.5 2.2 1.3 1.4 1.7 14.8 15.8 16.6
14.2 11.6 9.5 3.1 2.7 2.3 1.2 1.2 1.4 15.2 16.1 16.8
15.7 13.2 10.8 3.3 2.9 2.5 1.2 1.3 1.5 15.4 15.9 16.9
Dividend yield (%)
Source: Company, Bloomberg, Kotak Institutional Equities estimates
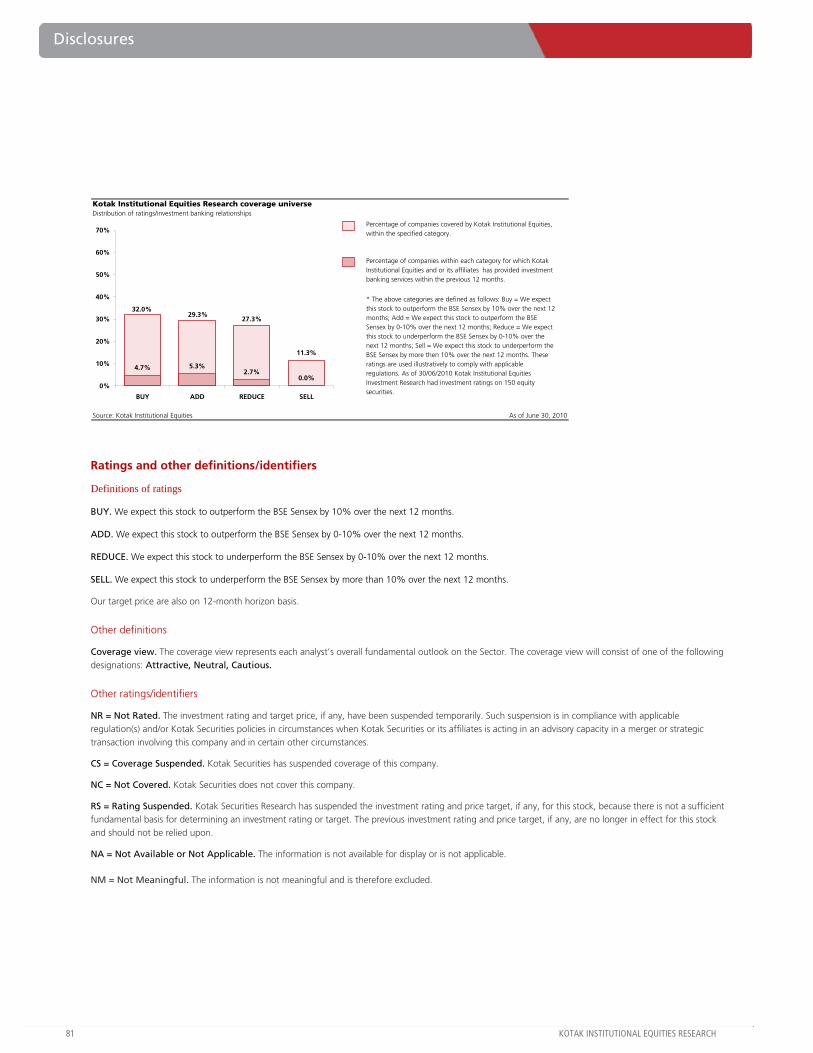
81 KOTAK INSTITUTIONAL EQUITIES RESEARCH
Disclosures
Kotak Institutional Equities Research coverage universeDistribution of ratings/investment banking relationships
Source: Kotak Institutional Equities As of June 30, 2010
* The above categories are defined as follows: Buy = We expect this stock to outperform the BSE Sensex by 10% over the next 12 months; Add = We expect this stock to outperform the BSE Sensex by 0-10% over the next 12 months; Reduce = We expect this stock to underperform the BSE Sensex by 0-10% over the next 12 months; Sell = We expect this stock to underperform the BSE Sensex by more then 10% over the next 12 months. These ratings are used illustratively to comply with applicable regulations. As of 30/06/2010 Kotak Institutional Equities Investment Research had investment ratings on 150 equity securities.
Percentage of companies covered by Kotak Institutional Equities, within the specified category.
Percentage of companies within each category for which Kotak Institutional Equities and or its affiliates has provided investment banking services within the previous 12 months.
11.3%
32.0%29.3%
27.3%
4.7% 5.3%2.7%
0.0%0%
10%
20%
30%
40%
50%
60%
70%
BUY ADD REDUCE SELL
Ratings and other definitions/identifiers
Definitions of ratings
BUY. We expect this stock to outperform the BSE Sensex by 10% over the next 12 months.
ADD. We expect this stock to outperform the BSE Sensex by 0-10% over the next 12 months.
REDUCE. We expect this stock to underperform the BSE Sensex by 0-10% over the next 12 months.
SELL. We expect this stock to underperform the BSE Sensex by more than 10% over the next 12 months.
Our target price are also on 12-month horizon basis.
Other definitions
Coverage view. The coverage view represents each analyst’s overall fundamental outlook on the Sector. The coverage view will consist of one of the following designations: Attractive, Neutral, Cautious.
Other ratings/identifiers
NR = Not Rated. The investment rating and target price, if any, have been suspended temporarily. Such suspension is in compliance with applicable regulation(s) and/or Kotak Securities policies in circumstances when Kotak Securities or its affiliates is acting in an advisory capacity in a merger or strategic transaction involving this company and in certain other circumstances.
CS = Coverage Suspended. Kotak Securities has suspended coverage of this company.
NC = Not Covered. Kotak Securities does not cover this company.
RS = Rating Suspended. Kotak Securities Research has suspended the investment rating and price target, if any, for this stock, because there is not a sufficient fundamental basis for determining an investment rating or target. The previous investment rating and price target, if any, are no longer in effect for this stock and should not be relied upon.
NA = Not Available or Not Applicable. The information is not available for display or is not applicable.
NM = Not Meaningful. The information is not meaningful and is therefore excluded.
Corporate Office Overseas Offices
Kotak Securities Ltd.
Bakhtawar, 1st Floor
229, Nariman Point
Mumbai 400 021, India
Tel: +91-22-6634-1100
Kotak Mahindra (UK) Ltd
6th Floor, Portsoken House
155-157 The Minories
London EC 3N 1 LS
Tel: +44-20-7977-6900 / 6940
Kotak Mahindra Inc
50 Main Street, Suite No.310
Westchester Financial Centre
White Plains, New York 10606
Tel:+1-914-997-6120
Copyright 2010 Kotak Institutional Equities (Kotak Securities Limited). All rights reserved.
1. Note that the research analysts contributing to this report may not be registered/qualified as research analysts with FINRA; and
2. Such research analysts may not be associated persons of Kotak Mahindra Inc and therefore, may not be subject to NASD Rule 2711 restrictions on communications with a subject company, public appearances and trading securities held by a research analyst account.
Kotak Securities Limited and its affiliates are a full-service, integrated investment banking, investment management, brokerage and financing group. We along with our affiliates are leading underwriter of securities and participants in virtually all securities trading markets in India. We and our affiliates have investment banking and other business relationships with a significant percentage of the companies covered by our Investment Research Department. Our research professionals provide important input into our investment banking and other business selection processes. Investors should assume that Kotak Securities Limited and/or its affiliates are seeking or will seek investment banking or other business from the company or companies that are the subject of this material and that the research professionals who were involved in preparing this material may participate in the solicitation of such business. Our research professionals are paid in part based on the profitability of Kotak Securities Limited, which include earnings from investment banking and other business. Kotak Securities Limited generally prohibits its analysts, persons reporting to analysts, and members of their households from maintaining a financial interest in the securities or derivatives of any companies that the analysts cover. Additionally, Kotak Securities Limited generally prohibits its analysts and persons reporting to analysts from serving as an officer, director, or advisory board member of any companies that the analysts cover. Our salespeople, traders, and other professionals may provide oral or written market commentary or trading strategies to our clients that reflect opinions that are contrary to the opinions expressed herein, and our proprietary trading and investing businesses may make investment decisions that are inconsistent with the recommendations expressed herein. In reviewing these materials, you should be aware that any or all of the foregoing, among other things, may give rise to real or potential conflicts of interest. Additionally, other important information regarding our relationships with the company or companies that are the subject of this material is provided herein.
This material should not be construed as an offer to sell or the solicitation of an offer to buy any security in any jurisdiction where such an offer or solicitation would be illegal. We are not soliciting any action based on this material. It is for the general information of clients of Kotak Securities Limited. It does not constitute a personal recommendation or take into account the particular investment objectives, financial situations, or needs of individual clients. Before acting on any advice or recommendation in this material, clients should consider whether it is suitable for their particular circumstances and, if necessary, seek professional advice. The price and value of the investments referred to in this material and the income from them may go down as well as up, and investors may realize losses on any investments. Past performance is not a guide for future performance, future returns are not guaranteed and a loss of original capital may occur. Kotak Securities Limited does not provide tax advise to its clients, and all investors are strongly advised to consult with their tax advisers regarding any potential investment.
Certain transactions -including those involving futures, options, and other derivatives as well as non-investment-grade securities - give rise to substantial risk and are not suitable for all investors. The material is based on information that we consider reliable, but we do not represent that it is accurate or complete, and it should not be relied on as such. Opinions expressed are our current opinions as of the date appearing on this material only. We endeavor to update on a reasonable basis the information discussed in this material, but regulatory, compliance, or other reasons may prevent us from doing so. We and our affiliates, officers, directors, and employees, including persons involved in the preparation or issuance of this material, may from time to time have “long” or “short” positions in, act as principal in, and buy or sell the securities or derivatives thereof of companies mentioned herein. For the purpose of calculating whether Kotak Securities Limited and its affiliates holds beneficially owns or controls, including the right to vote for directors, 1% of more of the equity shares of the subject issuer of a research report, the holdings does not include accounts managed by Kotak Mahindra Mutual Fund. Kotak Securities Limited and its non US affiliates may, to the extent permissible under applicable laws, have acted on or used this research to the extent that it relates to non US issuers, prior to or immediately following its publication. Foreign currency denominated securities are subject to fluctuations in exchange rates that could have an adverse effect on the value or price of or income derived from the investment. In addition, investors in securities such as ADRs, the value of which are influenced by foreign currencies affectively assume currency risk. In addition options involve risks and are not suitable for all investors. Please ensure that you have read and understood the current derivatives risk disclosure document before entering into any derivative transactions.
This report has not been prepared by Kotak Mahindra Inc. (KMInc). However KMInc has reviewed the report and, in so far as it includes current or historical information, it is believed to be reliable, although its accuracy and completeness cannot be guaranteed. Any reference to Kotak Securities Limited shall also be deemed to mean and include Kotak Mahindra Inc.