independent component analysis reveals atypical electroencephalographic activity during visual...
TRANSCRIPT
IEPE
Buo
Mei
ReSipo
Cd
Ks
IHeFi(iTadi
twcg
F
A
R
0d
ndependent Component Analysis Reveals Atypicallectroencephalographic Activity During Visualerception in Individuals with Autism
lizabeth Milne, Alison Scope, Olivier Pascalis, David Buckley, and Scott Makeig
ackground: Individuals with autistic spectrum disorder (ASD) experience atypical visual perception, yet the etiology of this remainsnknown. The aim of this study was to investigate the neural correlates of visual perception in individuals with and without ASD by carryingut a detailed analysis of the dynamic brain processes elicited by perception of a simple visual stimulus.
ethods: We investigated perception in 20 individuals with ASD and 20 control subjects with electroencephalography (EEG). Visualvoked potentials elicited by Gabor patches of varying spatial frequency and stimulus-induced changes in �- and �-frequency bands of
ndependent components were compared in those with and without ASD.
esults: By decomposing the EEG data into independent components, we identified several processes that contributed to the averagevent related potential recorded at the scalp. Differences between the ASD and control groups were found only in some of these processes.pecifically, in those components that were in or near the striate or extrastriate cortex, stimulus spatial frequency exerted a smaller effect on
nduced increases in �- and �-band power, and time to peak �-band power was reduced, in the participants with ASD. Induced �-bandower of components that were in or near the cingulate gyrus was increased in the participants with ASD, and the components that were inr near the parietal cortex did not differ between the two groups.
onclusions: Atypical processing is evident in individuals with ASD during perception of simple visual stimuli. The implications of these
ata for existing theories of atypical perception in ASD are discussed.ey Words: � power, autism, cingulate gyrus, � power, perception,patial frequency, visual cortex
n addition to impairments in social behavior and communi-cation, atypical visual perception is also recognized as beingpart of the autistic spectrum disorder (ASD) phenotype.
owever, the degree to which visual abnormalities reflect annhancement or a reduction of perceptual sensitivity is unclear.or example, individuals with ASD respond faster when detect-ng visual targets than their typically developing counterparts1,2), yet they show impairment in tasks that involve perceptualntegration such as detecting random dot motion in noise (3).his contradiction is mirrored by the weak central coherenceccount of autism (4) that, on the one hand, suggests superioris-embedding and, on the other, highlights reduced integrationn individuals with ASD.
No model has yet been able to explain parsimoniously bothhe superior and inferior perceptual skills shown by individualsith ASD, although it has been suggested that “reduced effi-
iency of neuro-integrative mechanisms” (5; page 2431) mightive rise to atypical perception in ASD or that area V1 (primary
rom the Department of Psychology (EM, AS, OP), The University of Shef-field, Academic Unit of Ophthalmology and Orthoptics (DB), School ofMedicine & Biomedical Sciences, Sheffield, United Kingdom; and the SwartzCenter for Computational Neuroscience (EM, SM), Institute for Neural Com-putation, University of California San Diego, La Jolla, California.
ddress reprint requests to Elizabeth Milne, Ph.D., Department of Psychol-ogy, Western Bank, Sheffield, South Yorkshire, S10 2TN, UK; E-mail:[email protected].
eceived January 23, 2007; revised July 13, 2008; accepted July 24, 2008.
006-3223/09/$36.00oi:10.1016/j.biopsych.2008.07.017
visual cortex) might be hyper-active in individuals with ASD (6).However, these suggestions have been neither supported norrefuted by experimental evidence, because there have been fewattempts to measure the neural correlates of visual perception inindividuals with ASD.
The technique of electroencephalography (EEG) is wellsuited to the investigation of neural integration, because changesin EEG power provide an index of (partial) synchronization ofneuronal field potentials. Evoked increases in EEG power aremodulated by stimulus characteristics, including spatial fre-quency (7,8). Gratings of various spatial frequencies thereforeprovide an idea stimulus with which to investigate perception inASD.
A recent study compared event related potentials (ERPs)elicited by the onset of low and high spatial frequency gratingsin children with ASD and a control group and found reducedERP amplitude in the participants with ASD (9). However, EEGmeasured at the scalp is the sum of many electrical processes,including those with neural or muscular origin (for an elegantexample see [10], page 106). The far-field potential from eachof these sources is recorded, to a greater or lesser degree, byeach scalp electrode. This raises the uncomfortable possibilitythat when comparing EEG response averages between groupsthere could be many reasons why differences might or mightnot be found. Independent Component Analysis (ICA) hasbeen successfully applied to EEG data to separate these mixedsignals into temporally independent processes, thus providinga more functionally relevant analysis of brain dynamics (11).
Therefore, in the following study we recorded EEG whileparticipants with and without ASD viewed the sudden onset ofGabor patches, the properties of which form a good representa-tion of the profiles of simple cell receptive fields in area V1 (12).
We present analysis of the ERP and the changes in �- and �-bandBIOL PSYCHIATRY 2009;65:22–30© 2009 Society of Biological Psychiatry
ps
M
P
dtdlcI(8ocdmifhtvaiebfRsSwdfSfm
1
E. Milne et al. BIOL PSYCHIATRY 2009;65:22–30 23
ower induced1 by these stimuli, after applying ICA decompo-ition to the scalp data.
ethods and Materials
articipantsTwenty children with ASD (2 female) and 20 typically
eveloping (TD) control subjects (2 female) were recruited tohis study. All children in the ASD group had received a formaliagnosis of ASD from a child development team within aocal clinic. The diagnoses were based on DSM-IV (13)lassifications and standardized criteria with the Diagnosticnterview for Social and Communication Disorders (DISCO)14) and included autism (n � 9), Asperger’s syndrome (n �), or atypical autism/pervasive developmental disorder–nottherwise specified (n � 3). Two children with ASD hadomorbid symptoms of attention-deficit/hyperactivity disor-er, and one had Tourette’s Syndrome. One child had takenedication (sodium picosulfate) within 24 hours of taking part
n the study. The typically developing children were recruitedrom an e-mail list of volunteers and were screened for anyistory of developmental disorder. The IQ was measured withhe Wechsler Abbreviated Scales of Intelligence (15), andisual acuity was assessed by measuring contrast sensitivity atrange of spatial frequencies (VectorVision, 1991). No partic-
pant had contrast sensitivity thresholds that deviated fromstablished norms, and there were no significant differencesetween the mean contrast sensitivity of the two groups (forurther details see Supplement 1). The Childhood Autismating Scales (CARS) (16) was used to measure autisticymptomatology, and parents were asked to complete theocial Communication Questionnaire (SCQ) (17). One childas subsequently excluded from the ASD group, becauseespite having a clinical diagnosis of Asperger’s syndrome sheailed to reach cut-off for autism on either the CARS or theCQ. Her matched control participant was also removed fromurther analysis to maintain equivalence between the experi-ental and control groups. Further participant information is
Two terms are frequently used to describe event-related changes inspectral power measured by EEG: induced and evoked. Activityinduced by events is activity time-locked to the events but notnecessarily phase-locked to them. In contrast, activity evoked byevents is phase-locked at a particular latency (relative to the onset ofevents) across single trials. When activity within a frequency band isphase-locked across trials, it contributes to the ERP; however, this isnot true in the case of non–phase-locked activity (i.e., random phase).Therefore in the EEG literature, the term “evoked” has come to beused when spectral change is computed by performing time/fre-quency analysis on the ERP itself, and the term “induced” is used fortime/frequency decomposition of single-trial activity. All of thetime/frequency transforms reported in this manuscript were carriedout on the single trials, because this reveals both evoked and inducedactivity. To highlight the use of single-trial rather than ERP time/frequency decomposition, we have used the term “induced” todescribe changes in spectral power (relative to baseline) reportedhere. However, when phase-locking of activity (as measured withinter-trial coherence) is reasonably high—as was the case in thecomponents of clusters 5, 11, 13, and 20—mean energy at the dominantERP frequency band in single trials is nearly the same as the mean ofthe single trials (the ERP), indicating that phenomenologically, if notpractically, the term “evoked” would have been suitable to describe
these cases.presented in Table 1. The procedures followed were inaccordance with the ethical standards of the South SheffieldNational Health Service ethics committee and the Declarationof Helsinki.
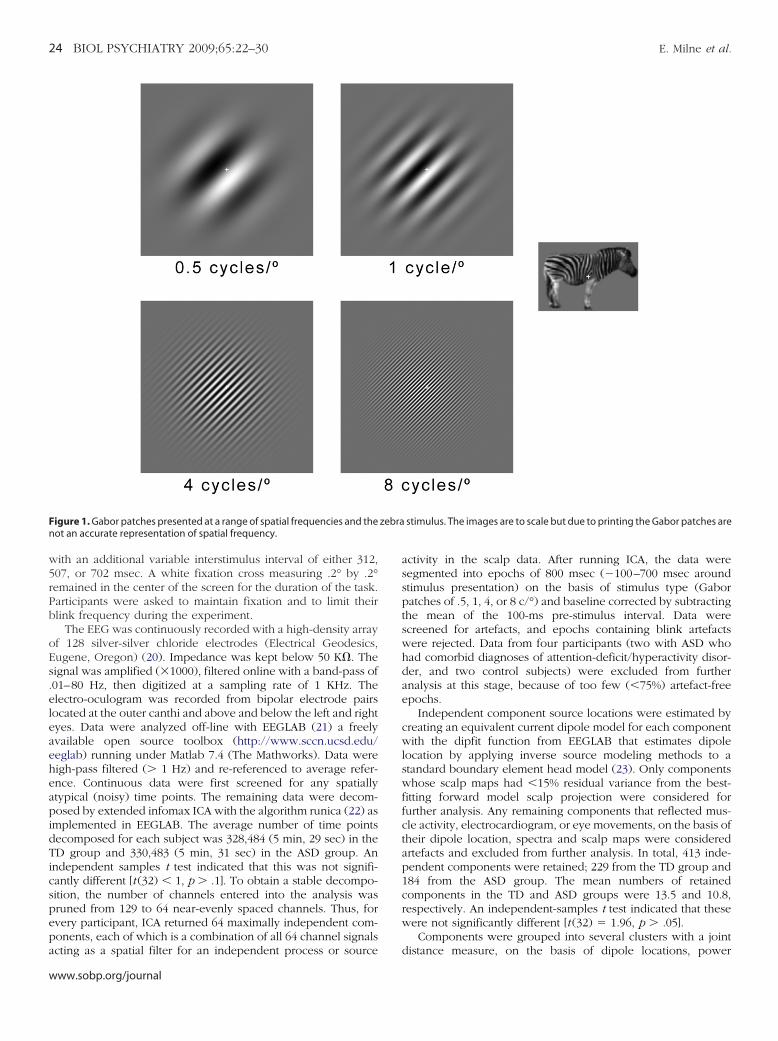
Stimuli and ProcedureGabor patches, illustrated in Figure 1, were created with
Matlab 6.5 (The Mathworks, Natick, Massachusetts) and thepsychophysics toolbox (18,19). They were presented on a 17-inch monitor, which refreshed at 75 Hz. Stimuli were centrallypresented on a grey background (average luminance � 14.4cd/m2). The space-average luminance of each grating was 16.3cd/m2, and the Michelson contrast, defined by (Lmax � Lmin)/(Lmax � Lmin), was 68%. The slight difference between theaverage luminance of the background and the stimuli was notvisibly apparent and did not lead to any visible edges around thestimuli. At a viewing distance of 114 cm the patches subtended6.78° � 6.78° of visual angle. All patches were presented indiagonal (45°) orientation, had a gaussian envelope with SD of.68°, and with spatial frequency modulation of .5, 1, 4, or 8 c/°.An additional stimulus, a grey-scaled image of a zebra waspresented. Participants were instructed to respond by pressing aresponse button with the index finger of their dominant hand asquickly as possible whenever they saw the zebra. This was toensure that participants paid attention to the screen. There wereno group differences in the behavioral responses to the zebrastimuli (Supplement 2).
Each of the four Gabor patches was shown 72 times; the zebrawas shown 36 times. The order of stimulus presentation was
Table 1. Mean Age, IQ, CARS, and SCQ Scores
ASD TD t, p Values
Chronological AgeMean 12y 2m 13y 5m �1.4, �.1SD 2y 8m 2y 8mRange 8y 4m–18y 0m 8y 3m–18y 3m
Full-Scale IQMean 102.2 110.3 �1.6, �.1SD 16.9 13.3Range 65–134 78–129
Verbal IQMean 102.3 108.2 �1, �.1SD 19.5 17.2Range 65–136 79–133
Performance IQMean 102.2 108.4 �1.3, �.1SD 16.6 11.0Range 70–127 81–124
CARS Scorea
Mean 31.4 N/ASD 3.6Range 25–39.5
SCQ Scoreb
Mean 24.4 N/ASD 6.7Range 9–34
CARS, Childhood Autism Rating Scale; SCQ, Social CommunicationQuestionnaire; ASD, autism spectrum disorder; TD, typically developing.
aCut-off for autism is 30.bCut-off for autism is 22.
randomized. Each stimulus remained on screen for 507 msec,
www.sobp.org/journal
w5rPb
oEs.eleaeheapidTicspepa
Fn
24 BIOL PSYCHIATRY 2009;65:22–30 E. Milne et al.
w
ith an additional variable interstimulus interval of either 312,07, or 702 msec. A white fixation cross measuring .2° by .2°emained in the center of the screen for the duration of the task.articipants were asked to maintain fixation and to limit theirlink frequency during the experiment.
The EEG was continuously recorded with a high-density arrayf 128 silver-silver chloride electrodes (Electrical Geodesics,ugene, Oregon) (20). Impedance was kept below 50 K. Theignal was amplified (�1000), filtered online with a band-pass of01–80 Hz, then digitized at a sampling rate of 1 KHz. Thelectro-oculogram was recorded from bipolar electrode pairsocated at the outer canthi and above and below the left and rightyes. Data were analyzed off-line with EEGLAB (21) a freelyvailable open source toolbox (http://www.sccn.ucsd.edu/eglab) running under Matlab 7.4 (The Mathworks). Data wereigh-pass filtered (� 1 Hz) and re-referenced to average refer-nce. Continuous data were first screened for any spatiallytypical (noisy) time points. The remaining data were decom-osed by extended infomax ICA with the algorithm runica (22) as
mplemented in EEGLAB. The average number of time pointsecomposed for each subject was 328,484 (5 min, 29 sec) in theD group and 330,483 (5 min, 31 sec) in the ASD group. An
ndependent samples t test indicated that this was not signifi-antly different [t (32) � 1, p � .1]. To obtain a stable decompo-ition, the number of channels entered into the analysis wasruned from 129 to 64 near-evenly spaced channels. Thus, forvery participant, ICA returned 64 maximally independent com-onents, each of which is a combination of all 64 channel signals
igure 1. Gabor patches presented at a range of spatial frequencies and theot an accurate representation of spatial frequency.
cting as a spatial filter for an independent process or source
ww.sobp.org/journal
activity in the scalp data. After running ICA, the data weresegmented into epochs of 800 msec (�100–700 msec aroundstimulus presentation) on the basis of stimulus type (Gaborpatches of .5, 1, 4, or 8 c/°) and baseline corrected by subtractingthe mean of the 100-ms pre-stimulus interval. Data werescreened for artefacts, and epochs containing blink artefactswere rejected. Data from four participants (two with ASD whohad comorbid diagnoses of attention-deficit/hyperactivity disor-der, and two control subjects) were excluded from furtheranalysis at this stage, because of too few (�75%) artefact-freeepochs.
Independent component source locations were estimated bycreating an equivalent current dipole model for each componentwith the dipfit function from EEGLAB that estimates dipolelocation by applying inverse source modeling methods to astandard boundary element head model (23). Only componentswhose scalp maps had �15% residual variance from the best-fitting forward model scalp projection were considered forfurther analysis. Any remaining components that reflected mus-cle activity, electrocardiogram, or eye movements, on the basis oftheir dipole location, spectra and scalp maps were consideredartefacts and excluded from further analysis. In total, 413 inde-pendent components were retained; 229 from the TD group and184 from the ASD group. The mean numbers of retainedcomponents in the TD and ASD groups were 13.5 and 10.8,respectively. An independent-samples t test indicated that thesewere not significantly different [t (32) � 1.96, p � .05].
Components were grouped into several clusters with a joint
stimulus. The images are to scale but due to printing the Gabor patches are
zebradistance measure, on the basis of dipole locations, power
sPsbpf
R
E
6doc
Fpd the Cg evelo
E. Milne et al. BIOL PSYCHIATRY 2009;65:22–30 25
pectra, scalp projections, and mean Event Related Spectralerturbation (ERSP) and Inter-Trial phase Coherence (ITC) mea-ures. These data from each subject were initially decomposedy Principal Component Analysis (PCA), and the resulting com-onent distances were clustered with a k-means algorithm (forurther details of this method see 10).
esults
RP Channel Data
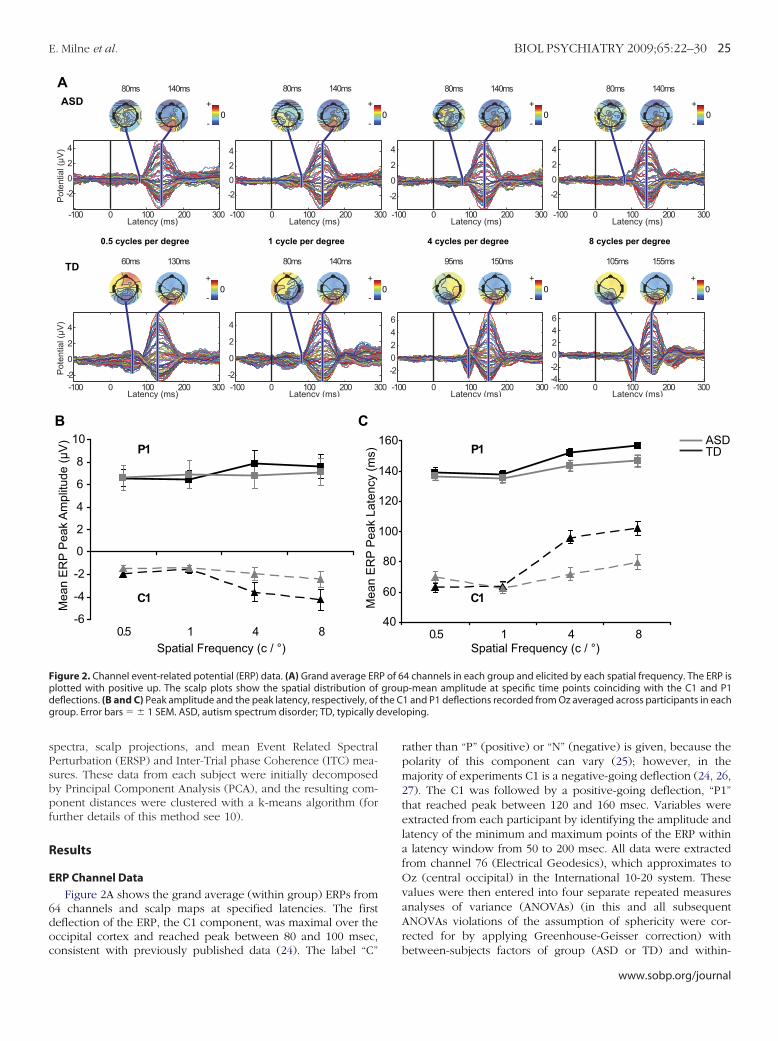
Figure 2A shows the grand average (within group) ERPs from4 channels and scalp maps at specified latencies. The firsteflection of the ERP, the C1 component, was maximal over theccipital cortex and reached peak between 80 and 100 msec,
-100 0 100 200 3
-2024
80ms 140ms
-100 0 100 200 300
-2
0
2
4
Pot
entia
l (µV
)
80ms 140ms
Latency (ms)Latency (ms)
0
+
-0
+
-
ASD
-100 0 100 200 300-2
0
2
4
Latency (ms)
60ms 130ms
-100 0 100 200 3-2
0
2
4
Latency (ms)
80ms 140ms
Pot
entia
l (µV
)
+
-0
+
-
0.5 cycles per degree 1 cycle per degree
TD
A
Mea
n E
RP
Pea
k La
tenc
y (m
s)
-6
-4
-2
0
2
4
6
8
10
0.5 1 4 8Spatial Frequency (c / °)
Mea
n E
RP
Pea
k A
mpl
itude
(μV
)
P1
C1
B C
igure 2. Channel event-related potential (ERP) data. (A) Grand average ERlotted with positive up. The scalp plots show the spatial distribution ofeflections. (B and C) Peak amplitude and the peak latency, respectively, ofroup. Error bars � 1 SEM. ASD, autism spectrum disorder; TD, typically d
onsistent with previously published data (24). The label “C”
rather than “P” (positive) or “N” (negative) is given, because thepolarity of this component can vary (25); however, in themajority of experiments C1 is a negative-going deflection (24, 26,27). The C1 was followed by a positive-going deflection, “P1”that reached peak between 120 and 160 msec. Variables wereextracted from each participant by identifying the amplitude andlatency of the minimum and maximum points of the ERP withina latency window from 50 to 200 msec. All data were extractedfrom channel 76 (Electrical Geodesics), which approximates toOz (central occipital) in the International 10-20 system. Thesevalues were then entered into four separate repeated measuresanalyses of variance (ANOVAs) (in this and all subsequentANOVAs violations of the assumption of sphericity were cor-rected for by applying Greenhouse-Geisser correction) with
80ms
0 100 200 300
140ms
-100 0 100 200 300
-2
0
2
4
80ms 140ms
Latency (ms) Latency (ms)
+
-0
+
-0
0 100 200 300Latency (ms)
95ms 150ms
-100 0 100 200 300-4-20246
Latency (ms)
105ms 155ms
+
-0
+
-0
4 cycles per degree 8 cycles per degree
0.5 1 4 8Spatial Frequency (c / °)
P1
C1
ASDTD
4 channels in each group and elicited by each spatial frequency. The ERP isp-mean amplitude at specific time points coinciding with the C1 and P11 and P1 deflections recorded from Oz averaged across participants in eachping.
00 -100
-2
0
2
4
0
00 -100
-20246
0
40
60
80
100
120
140
160
P of 6grou
between-subjects factors of group (ASD or TD) and within-
www.sobp.org/journal

sEm
te8stTsw[p
iT
es
I
sfTop
t
FEnpc f the cA
26 BIOL PSYCHIATRY 2009;65:22–30 E. Milne et al.
w
ubjects factors of stimulus spatial frequency (.5, 1, 4, or 8 c/°).ach participant’s ERP from channel Oz is illustrated in Supple-ent 3.Peak latency of C1 occurred earlier in the ASD group than in
he TD group [F (1,32) � 10.7, p � .001, �p2 � .25]. This main
ffect interacted with stimulus spatial frequency [F (2,7,86.2) �.8, p � .001, �p
2 �.21]. Simple effects analyses indicated thattimulus spatial frequency influenced C1 latency to peak less inhe ASD group [F (2.7,44.2) � 3.2, p � .05, �p
2 � .17] than in theD group [F (2.5,39.7) � 36.0, p � .01, �p
2 � .69]. Independentamples t tests indicated that the group difference was significanthen C1 was elicited by the higher spatial frequency stimuli only
4 c/°, t (32) � 3.88, p � .01, Cohen’s d � 1.4, 8 c/°, t (32) � 3.58,� .01, Cohen’s d � 1.2].There was a trend toward peak latency of P1 occurring earlier
n the ASD than the TD group [F (1,32) � 3.2, p � .08, �p2 � .09].
his did not interact with spatial frequency.There was no significant group difference in amplitude of
ither C1 P1 deflection and no interaction between group andpatial frequency.
ndependent ComponentsFigure 3 shows the scalp maps, mean dipole location, and
pectrograms of the seven clusters of components that accountedor the most variance in the scalp EEG between 50 and 200 msec.he estimated Talairach coordinates and the nearest grey matterf the mean equivalent current dipole of each cluster (28) areresented in Table 2.
These seven clusters were divided into three sub-categories:
-0.2 -0.1 0 0.1
-3
-2
-1
1
2
3
4
5
6
Pot
entia
l (µV
)
0
Cls 16TD = 8ASD=4
0 0.2 0.4
Cls 11TD = 7
ASD = 5
-6
0
6
0 0.2 0.4 0 0.2 0.4
Cls 5TD = 10ASD = 6
45
35
25
158
Freq
uenc
y (H
z)A
B
C
D
igure 3. Mean spectrogram (A), dipole (B) and scalp map (C) of each of theRP (D). (A): Mean event related spectral perturbation, changes are relaonsignificant changes (based on bootstrap statistics with p � .01) are maslot, indicating the relative weights with which the cluster projects to eachhannel values at each latency; colored lines, envelope of the contributions obbreviations as in Figure 2.
hose comprising components that primarily showed stimulus-
ww.sobp.org/journal
induced increases in power around 100 msec after stimulus onset(clusters 5, 11, 13, and 20); those comprising components thatprimarily showed decreases in power approximately 300 msecafter stimulus onset (clusters 16 and 3); and cluster 4, whichshowed a small but significant increase in low �-band powerapproximately 300 msec after stimulus onset.
Time/frequency transforms were computed in EEGLAB withwavelets with a 3-cycle window centered at 100 msec. In eachtime/frequency analysis we computed the mean change inpower (measured in dB) across single-trial epoch latencies,relative to the pre-stimulus baseline. Values were extracted from
0.2 0.3 0.4 0.5cy (s)
0+
-
0 0.2 0.4
Cls 3TD = 23
ASD = 17
-3
0
3
0 0.2 0.4
Cls 20TD = 3
ASD = 4
0 0.2 0.4
Cls 13TD = 13ASD = 6
0.4
24 27
cy (s)
dB
component clusters that accounted for most variance in the grand averageo the pre-stimulus baseline (NB range– 6 to 6 dB in clusters 16 and 11),y green shading. C: Weights of the mixing matrix back-projected to a heade scalp channels. D: Black traces, envelope of the maximum and minimumlusters to the ERP; blue shading, the summed contribution of these clusters.
Table 2. Talairach Coordinates and Nearest Grey Matter to the AverageDipole Location of Each of the Seven Clusters of IndependentComponents
ClusterNumber
TalairachCoordinates
LobeNearest Grey
Matter BAx y z
16 16 �64 23 R Parietal Precuneus 3111 7 �77 25 R Occipital Cuneus 18
5 34 �61 31 R Temporal MT (V5) 394 �17 �2 46 L Limbic Cingulate gyrus 24
13 14 �78 �16 R Occipital Lingual gyrus 1820 7 �54 45 R Parietal Precuneus 31
3 5 �59 47 R Parietal Precuneus 7
This localization is approximate, because not all of the equivalent cur-rent dipoles from each independent component in the cluster were locatedat the site of the mean dipole. Furthermore, the position of the electrodeswas co-registered with the Montreal Neurological Institute average (adult)
Laten
0 0.2
Cls 4TD =
ASD =
Laten
seventive tked bof th
brain. BA, Brodmann area; MT, middle temporal.
ts3cDift4aic5nnpm
Ta
afea[[tr
Flbb1is
E. Milne et al. BIOL PSYCHIATRY 2009;65:22–30 27
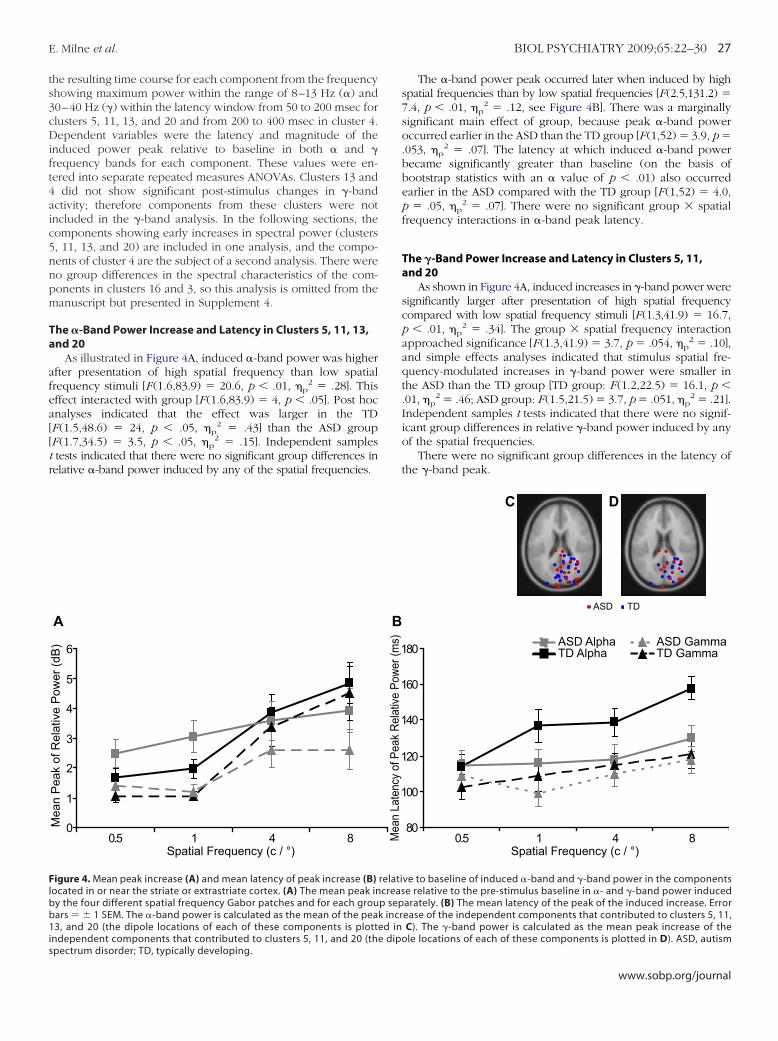
he resulting time course for each component from the frequencyhowing maximum power within the range of 8–13 Hz (�) and0–40 Hz (�) within the latency window from 50 to 200 msec forlusters 5, 11, 13, and 20 and from 200 to 400 msec in cluster 4.ependent variables were the latency and magnitude of the
nduced power peak relative to baseline in both � and �requency bands for each component. These values were en-ered into separate repeated measures ANOVAs. Clusters 13 and
did not show significant post-stimulus changes in �-bandctivity; therefore components from these clusters were notncluded in the �-band analysis. In the following sections, theomponents showing early increases in spectral power (clusters, 11, 13, and 20) are included in one analysis, and the compo-ents of cluster 4 are the subject of a second analysis. There wereo group differences in the spectral characteristics of the com-onents in clusters 16 and 3, so this analysis is omitted from theanuscript but presented in Supplement 4.
he �-Band Power Increase and Latency in Clusters 5, 11, 13,nd 20
As illustrated in Figure 4A, induced �-band power was higherfter presentation of high spatial frequency than low spatialrequency stimuli [F (1.6,83.9) � 20.6, p � .01, �p
2 � .28]. Thisffect interacted with group [F (1.6,83.9) � 4, p � .05]. Post hocnalyses indicated that the effect was larger in the TDF (1.5,48.6) � 24, p � .05, �p
2 � .43] than the ASD groupF (1.7,34.5) � 3.5, p � .05, �p
2 � .15]. Independent samplestests indicated that there were no significant group differences inelative �-band power induced by any of the spatial frequencies.
0
1
2
3
4
5
6
Mea
n P
eak
of R
elat
ive
Pow
er (d
B)
0.5 1 4 8Spatial Frequency (c / °)
A
igure 4. Mean peak increase (A) and mean latency of peak increase (B)ocated in or near the striate or extrastriate cortex. (A) The mean peak iny the four different spatial frequency Gabor patches and for each grouars � 1 SEM. The �-band power is calculated as the mean of the pea3, and 20 (the dipole locations of each of these components is plott
ndependent components that contributed to clusters 5, 11, and 20 (th
pectrum disorder; TD, typically developing.The �-band power peak occurred later when induced by highspatial frequencies than by low spatial frequencies [F(2.5,131.2) �7.4, p � .01, �p
2 � .12, see Figure 4B]. There was a marginallysignificant main effect of group, because peak �-band poweroccurred earlier in the ASD than the TD group [F (1,52) � 3.9, p �.053, �p
2 � .07]. The latency at which induced �-band powerbecame significantly greater than baseline (on the basis ofbootstrap statistics with an � value of p � .01) also occurredearlier in the ASD compared with the TD group [F (1,52) � 4.0,p � .05, �p
2 � .07]. There were no significant group � spatialfrequency interactions in �-band peak latency.
The �-Band Power Increase and Latency in Clusters 5, 11,and 20
As shown in Figure 4A, induced increases in �-band power weresignificantly larger after presentation of high spatial frequencycompared with low spatial frequency stimuli [F(1.3,41.9) � 16.7,p � .01, �p
2 � .34]. The group � spatial frequency interactionapproached significance [F (1.3,41.9) � 3.7, p � .054, �p
2 � .10],and simple effects analyses indicated that stimulus spatial fre-quency-modulated increases in �-band power were smaller inthe ASD than the TD group [TD group: F (1.2,22.5) � 16.1, p �.01, �p
2 � .46; ASD group: F (1.5,21.5) � 3.7, p � .051, �p2 � .21].
Independent samples t tests indicated that there were no signif-icant group differences in relative �-band power induced by anyof the spatial frequencies.
There were no significant group differences in the latency ofthe �-band peak.
ASD GammaASD AlphaTD Alpha TD Gamma
80
00
20
40
60
80
0.5 1 4 8Spatial Frequency (c / °)
C D
TDASD
ve to baseline of induced �-band and �-band power in the componentse relative to the pre-stimulus baseline in �- and �-band power inducedarately. (B) The mean latency of the peak of the induced increase. Errorease of the independent components that contributed to clusters 5, 11,C). The �-band power is calculated as the mean peak increase of thele locations of each of these components is plotted in D). ASD, autism
1
1
1
1
1
Mea
n La
tenc
y of
Pea
k Re
lativ
e Po
wer (
ms)
B
relaticreasp sepk incred ine dipo
www.sobp.org/journal
L
wTo
RP
rPp1Is[.
D
aitFdnv
Fiidb
28 BIOL PSYCHIATRY 2009;65:22–30 E. Milne et al.
w
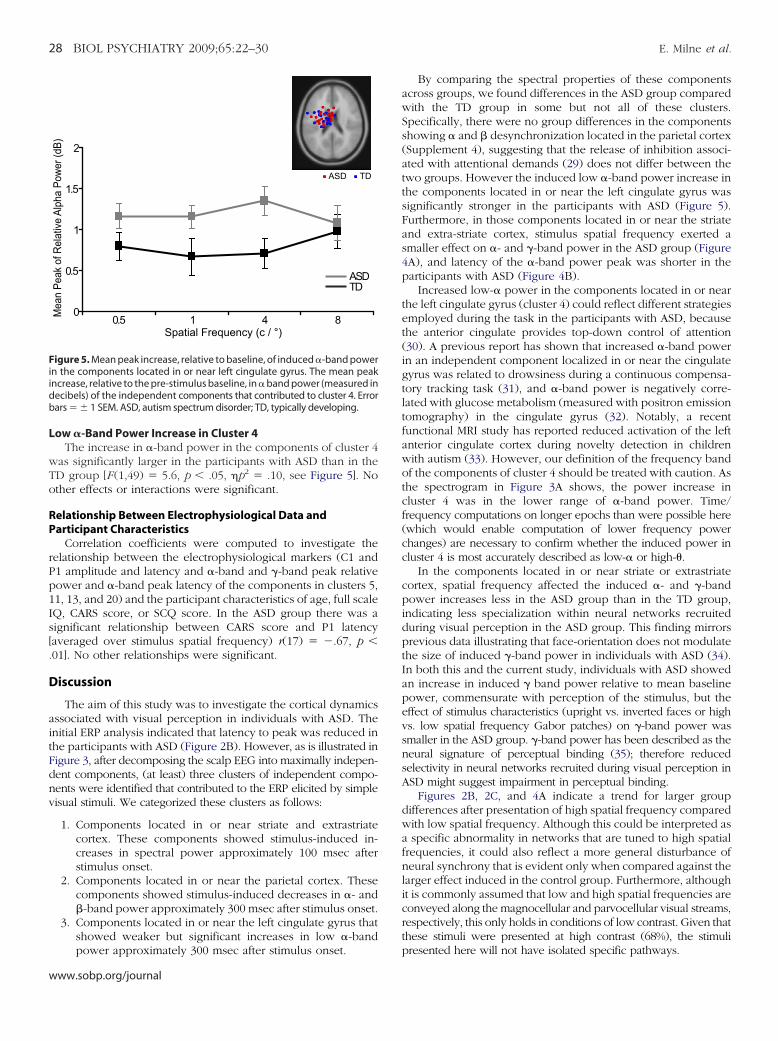
ow �-Band Power Increase in Cluster 4The increase in �-band power in the components of cluster 4
as significantly larger in the participants with ASD than in theD group [F (1,49) � 5.6, p � .05, �p2 � .10, see Figure 5]. Nother effects or interactions were significant.
elationship Between Electrophysiological Data andarticipant Characteristics
Correlation coefficients were computed to investigate theelationship between the electrophysiological markers (C1 and1 amplitude and latency and �-band and �-band peak relativeower and �-band peak latency of the components in clusters 5,1, 13, and 20) and the participant characteristics of age, full scaleQ, CARS score, or SCQ score. In the ASD group there was aignificant relationship between CARS score and P1 latencyaveraged over stimulus spatial frequency) r(17) � �.67, p �01]. No other relationships were significant.
iscussion
The aim of this study was to investigate the cortical dynamicsssociated with visual perception in individuals with ASD. Thenitial ERP analysis indicated that latency to peak was reduced inhe participants with ASD (Figure 2B). However, as is illustrated inigure 3, after decomposing the scalp EEG into maximally indepen-ent components, (at least) three clusters of independent compo-ents were identified that contributed to the ERP elicited by simpleisual stimuli. We categorized these clusters as follows:
1. Components located in or near striate and extrastriatecortex. These components showed stimulus-induced in-creases in spectral power approximately 100 msec afterstimulus onset.
2. Components located in or near the parietal cortex. Thesecomponents showed stimulus-induced decreases in �- and�-band power approximately 300 msec after stimulus onset.
3. Components located in or near the left cingulate gyrus thatshowed weaker but significant increases in low �-band
0
0.5
1
1.5
2
0.5 1 4 8Spatial Frequency (c / °)
Mea
n Pe
ak o
f Rel
ative
Alp
ha P
ower
(dB)
ASDTD
TDASD
igure 5. Mean peak increase, relative to baseline, of induced �-band powern the components located in or near left cingulate gyrus. The mean peakncrease, relative to the pre-stimulus baseline, in � band power (measured inecibels) of the independent components that contributed to cluster 4. Errorars � 1 SEM. ASD, autism spectrum disorder; TD, typically developing.
power approximately 300 msec after stimulus onset.
ww.sobp.org/journal
By comparing the spectral properties of these componentsacross groups, we found differences in the ASD group comparedwith the TD group in some but not all of these clusters.Specifically, there were no group differences in the componentsshowing � and � desynchronization located in the parietal cortex(Supplement 4), suggesting that the release of inhibition associ-ated with attentional demands (29) does not differ between thetwo groups. However the induced low �-band power increase inthe components located in or near the left cingulate gyrus wassignificantly stronger in the participants with ASD (Figure 5).Furthermore, in those components located in or near the striateand extra-striate cortex, stimulus spatial frequency exerted asmaller effect on �- and �-band power in the ASD group (Figure4A), and latency of the �-band power peak was shorter in theparticipants with ASD (Figure 4B).
Increased low-� power in the components located in or nearthe left cingulate gyrus (cluster 4) could reflect different strategiesemployed during the task in the participants with ASD, becausethe anterior cingulate provides top-down control of attention(30). A previous report has shown that increased �-band powerin an independent component localized in or near the cingulategyrus was related to drowsiness during a continuous compensa-tory tracking task (31), and �-band power is negatively corre-lated with glucose metabolism (measured with positron emissiontomography) in the cingulate gyrus (32). Notably, a recentfunctional MRI study has reported reduced activation of the leftanterior cingulate cortex during novelty detection in childrenwith autism (33). However, our definition of the frequency bandof the components of cluster 4 should be treated with caution. Asthe spectrogram in Figure 3A shows, the power increase incluster 4 was in the lower range of �-band power. Time/frequency computations on longer epochs than were possible here(which would enable computation of lower frequency powerchanges) are necessary to confirm whether the induced power incluster 4 is most accurately described as low-� or high- .
In the components located in or near striate or extrastriatecortex, spatial frequency affected the induced �- and �-bandpower increases less in the ASD group than in the TD group,indicating less specialization within neural networks recruitedduring visual perception in the ASD group. This finding mirrorsprevious data illustrating that face-orientation does not modulatethe size of induced �-band power in individuals with ASD (34).In both this and the current study, individuals with ASD showedan increase in induced � band power relative to mean baselinepower, commensurate with perception of the stimulus, but theeffect of stimulus characteristics (upright vs. inverted faces or highvs. low spatial frequency Gabor patches) on �-band power wassmaller in the ASD group. �-band power has been described as theneural signature of perceptual binding (35); therefore reducedselectivity in neural networks recruited during visual perception inASD might suggest impairment in perceptual binding.
Figures 2B, 2C, and 4A indicate a trend for larger groupdifferences after presentation of high spatial frequency comparedwith low spatial frequency. Although this could be interpreted asa specific abnormality in networks that are tuned to high spatialfrequencies, it could also reflect a more general disturbance ofneural synchrony that is evident only when compared against thelarger effect induced in the control group. Furthermore, althoughit is commonly assumed that low and high spatial frequencies areconveyed along the magnocellular and parvocellular visual streams,respectively, this only holds in conditions of low contrast. Given thatthese stimuli were presented at high contrast (68%), the stimuli
presented here will not have isolated specific pathways.
eHnihd(pwswadHc(ewaifwdfcsnt�mpbialvotispmgt
natNTpLwt
p
o
E. Milne et al. BIOL PSYCHIATRY 2009;65:22–30 29
We found, contrary to suggestion in the literature (6), novidence for hyper-activity in area V1 in individuals with ASD.owever, we do find support for “reduced efficiency ofeuro-integrative mechanisms operating at a perceptual leveln autism” (Bertone et al., 2005, p. 2431). The “complexity-ypothesis” put forward by this group is based on behavioralata showing enhanced perception of simple visual stimulifirst-order parallel gratings) and reduced perception of com-lex stimuli (second-order parallel gratings) in individualsith ASD (36). This hypothesis proposes that simple visual
timuli can be processed in a single brain area (typically V1),hereas complex stimuli are processed in multiple brainreas, and that reduced functional connectivity in ASD leads toeficient processing of complex but not simple stimuli (5).owever, the results of the current study highlight someaveats to this hypothesis. Firstly, as is shown in our dataFigure 3) and has been reported elsewhere (27), the onset ofven a simple visual stimulus perturbs the activity of aidespread network including sensory, parietal, and limbicreas. Secondly, we find evidence of disruptions in neuralntegration after presentation of stimuli that would be classi-ied as “simple” by the complexity hypothesis. In conclusion,e report evidence of neurophysiological abnormality in ASDuring visual processing of simple visual stimuli. We identi-ied, in addition to increased relative low-� power in theomponents that were in or near the cingulate gyrus, twoeemingly separate differences in the independent compo-ents localized in or near the striate or extrastriate cortex inhe participants with ASD. Specifically, the stimulus-induced-band peak occurred sooner, and stimulus spatial frequencyodulation of �- and �-band power was attenuated in thearticipants with ASD. There was a negative correlationetween P1 peak latency and CARS scores in the ASD group,ndicating that the participants with higher CARS scores werelso the ones with reduced peak latencies. Reduced peakatency might underpin faster reaction time when detectingisual features in ASD, supporting the argument that the originf so-called enhanced discrimination in this group is percep-ual rather than attentional. Furthermore, given that stimulus-nduced increases in spectral power indicate increases in theynchrony and size of the neural networks recruited duringerceptual processing, reduced modulation of these networksight suggest abnormality in the mechanisms of neural inte-ration in ASD, which in turn might contribute to the disrup-ion in perceptual binding reported in this group (37).
This work was supported by the Bial Foundation, an Eco-omic and Social Research Council Postdoctoral fellowship, andWorld University Network travel grant. Dr. Makeig’s contribu-
ion was supported in part by the Swartz Foundation (Old Field,ew York). Additional funding was provided by a Wellcomerust Value in People award. We would like to thank all thearticipants and their families, the staff at the Ryegate Centre,aurence Vigon for helpful discussions of an earlier draft of thisork, and Simon Hamilton and Robin Farr for technical assis-
ance with the figures.The authors reported no biomedical financial interests or
otential conflicts of interest.
Supplementary material cited in this article is availablenline.
1. O‘Riordan M, Plaisted K, Driver J, Baron-Cohen S (2001): Superior visual
search in autism. J Exp Psychol Hum Percept Perform 27:719 –730.2. Shah A, Frith U (1983): An islet of ability in autistic children: A researchnote. J Child Psychol Psychiatry 24:613– 620.
3. Milne E, Swettenham J, Hansen P, Campbell R, Jeffries H, Plaisted K(2002): High motion coherence thresholds in children with autism.J Child Psychol Psychiatry 43:255–263.
4. Frith U (1989): Autism: Explaining the Enigma. Oxford: Blackwell ScientificPublications.
5. Bertone A, Mottron L, Jelenic P, Faubert J (2005): Enhanced and dimin-ished visuo-spatial information processing in autism depends on stim-ulus complexity. Brain 128:2430 –2441.
6. Mottron L, Dawson M, Soulieres I, Hubert B, Burack JA (2006): Enhancedperceptual functioning in autism: An update and eight principles ofautistic perception. J Autism Dev Disord 36:27– 43.
7. von Stein A, Sarnthein J (2000): Different frequencies for different scalesof cortical inegration: From local gamma to long range alpha/thetasynchronization. Int J Psychophysiol 38:310 –313.
8. Fründ I, Busch NA, Körner U, Schadow J, Herrmann CS (2007): EEGoscillations in the gamma and alpha range respond differently to spatialfrequency. Vision Res 47:2086 –2098.
9. Boeschoten MA, Kenemnas JL, van Engeland H, Kemner C (2007): Ab-normal spatial frequency processing in high-functioning children withpervasive developmental disorder (PDD). Clin Neurophysiol 118:2076 –2088.
10. Onton J, Makeig S (2006): Information-based modeling of event-relatedbrain dynamics. Prog Brain Res 159:99 –120.
11. Debener S, Makeig S, Delorme A, Engel AK (2005): What is novel in thenovelty oddball paradigm? Functional significance of the novelty P3event-related potential as revealed by independent component analy-sis. Cognitive Brain Research 22:309 –321.
12. Fredericksen RE, Bex PJ, Verstraten FAJ (1997): How big is a Gabor patchand why should we care? J Opt Soc Am A 14:1–12.
13. American Psychiatric Association (1994): Diagnostic and Statistical Man-ual of Mental Disorders, 4th ed. Washington DC: American PsychiatricPress.
14. Wing L, Leekam SR, Libby SJ, Gould J, Larcombe M (2002): The Diagnos-tic Interview for Social and Communication Disorders: Background, in-ter-rater reliability and clinical use. J Child Psychol Psychiatry 43:307–325.
15. Wechsler D (1999): Wechsler Abbreviated Scale of Intelligence. San Anto-nio, Texas: The Psychological Corporation.
16. Schopler E, Reichler RJ, Renner BR (1988): The Childhood Autism RatingScale. Los Angeles: Western Psychological Services.
17. Berument SK, Rutter M, Lord C, Pickles A, Bailey A (1999): Autism Screen-ing Questionnaire: Diagnostic validity. Br J Psychiatry 175:444 – 451.
18. Brainard DH (1997): The psychophysics toolbox. Spat Vis 10:433– 436.19. Pelli DG (1997): The VideoToolbox software for visual psychophysics:
Transforming numbers into movies. Spat Vis 10:437– 442.20. Tucker D (1993): Spatial sampling of head electrical fields: The geodesic
sensor net. Electroencephalogr Clin Neurophysiol 87:154 –163.21. Delorme A, Makeig S (2004): EEGLAB: An open source toolbox for anal-
ysis of single-trial EEG dynamics including independent componentanalysis. J Neurosci Methods 134:9 –21.
22. Makeig S, Jung T-P, Bell AJ, Ghahremani D, Sejnowski TJ (1997): Blindseparation of auditory event-related brain responses into independentcomponents. Proc Natl Acad Sci U S A 94:10979 –10984.
23. Oostendorp TF, van Oosterom A (1989): Source parameter estimation ininhomogeneous volume conductors of arbitrary shape. IEEE TransBiomed Eng 47:1487–1492.
24. Ellemberg D, Hammarrenger B, Lepore F, Roy MS, Guillemot J-P (2001):Contrast dependency of VEPs as a function of spatial frequency: Theparvocellular and magnocellular contributions to human VEPs. Spat Vis15:99 –111.
25. Clark VP, Fan S, Hillyard SA (1995): Identification of early visually evokedpotential generators by retinotopic and topographic analyses. HumBrain Mapp 2:170 –187.
26. Romani A, Callieco R, Tavazzi E, Cosi V (2003): The effects of collinearityand orientation on texture visual evoked potentials. Clin Neurophysiol114:1021–1026.
27. Foxe JJ, Simpson GV (2002): Flow of activation from V1 to frontal cortexin humans. Exp Brain Res 142:139 –150.
28. Lancaster JL, Woldorff MG, Parsons LM, Liotti M, Freitas CS, Rainey L, etal. (2000): Automated Talairach Atlas labels for functional brain map-
ping. Hum Brain Mapp 10:120 –131.www.sobp.org/journal
2
3
3
3
30 BIOL PSYCHIATRY 2009;65:22–30 E. Milne et al.
w
9. Michels L, Moazami-Goudarzi M, Jeanmonod D, Sarnthein J (2008): EEGalpha distinguishes between cuneal and precuneal activation in work-ing memory. Neuroimage 15:1296 –1310.
0. Takarae Y, Minshew NJ, Luna B, Sweeny JA (2007): Atypical involvementof frontostriatal systems during sensori-motor control in autism. Psychi-atry Res 156:117–127.
1. Huang R-S, Jung T-P, Makeig S (2005): Analyzing event-related braindynamics in continuous compensatory tracking tasks. IEEE Eng Med BiolMag 6:5750 –5753.
2. Oakes TR, Pizzagalli DA, Hendrick AM, Horras KA, Larson CL, Abercrombie
HC, et al. (2004): Functional coupling of simultaneous electrical and meta-bolic activity in the human brain. Hum Brain Mapp 21:257–270.ww.sobp.org/journal
33. Gomot M, Bernard FA, Davis MH, Belmonte MK, Ashwin C, Bullmore ET,et al. (2006): Change detection in children with autism: An auditoryevent-related fMRI study. Neuroimage 29:475– 484.
34. Grice SJ, Spratling MJ, Karmiloff-Smith A, Halit H, Csibra G, de Haan M, etal. (2001): Disordered visual processing and oscillatory brain activity inautism and Williams Syndrome. Neuroreport 12:2697–2700.
35. Engel AK, Singer W (2001): Temporal binding and the neural correlatesof sensory awareness. Trends Cogn Sci 5:16 –25.
36. Bertone A, Mottron L, Jelenic P, Faubert J (2003): Motion perception inautism: A “Complex” Issue. J Cogn Neurosci 15:1– 8.
37. Brock J, Brown C, Boucher J, Rippon G (2002): The temporal bindingdeficit hypothesis of autism. Dev Psychopathol 14:209 –224.